UNITED STATES
SECURITIES AND EXCHANGE COMMISSION
Washington, D.C. 20549
FORMN-CSRS
CERTIFIED SHAREHOLDER REPORT OF REGISTERED
MANAGEMENT INVESTMENT COMPANIES
Investment Company Act File Number811-04878
SEI Institutional Managed Trust
SEI Investments
One Freedom Valley Drive
Oaks, PA 19456
(Address of principal executive offices) (Zip code)
Timothy D. Barto, Esq.
SEI Investments
One Freedom Valley Drive
Oaks, PA 19456
(Name and address of agent for service)
Registrant’s telephone number, including area code:610-676-1000
Date of fiscal year end: September 30, 2019
Date of reporting period: March 31, 2019
| Item 1. | Reports to Stockholders. |

March 31, 2019
SEMI-ANNUAL REPORT
SEI Institutional Managed Trust
| › | | Tax-Managed Large Cap Fund |
| › | | Tax-Managed Small/Mid Cap Fund |
| › | | U.S. Managed Volatility Fund |
| › | | Global Managed Volatility Fund |
| › | | Tax-Managed Managed Volatility Fund |
| › | | Tax-Managed International Managed Volatility Fund |
| › | | Conservative Income Fund |
| › | | Tax-Free Conservative Income Fund |
| › | | Dynamic Asset Allocation Fund |
| › | | Multi-Strategy Alternative Fund |
| › | | Multi-Asset Accumulation Fund |
| › | | Multi-Asset Income Fund |
| › | | Multi-Asset Inflation Managed Fund |
| › | | Multi-Asset Capital Stability Fund |
| › | | Long/Short Alternative Fund |
Beginning on January 1, 2021, as permitted by regulations adopted by the Securities and Exchange Commission, paper copies of the Funds’ shareholder reports like this one will no longer be sent by mail, unless you specifically request paper copies of the reports from the Funds or from your financial intermediary, such as a broker-dealer or bank. Instead, the reports will be made available on a website, and you will be notified by mail each time a report is posted and provided with a website link to access the report.
If you already elected to receive shareholder reports electronically, you will not be affected by this change and you need not take any action. You may elect to receive shareholder reports and other communications from the Funds electronically by contacting your financial intermediary.
You may elect to receive all future reports in paper free of charge. If you invest through a financial intermediary, you can follow the instructions included with this disclosure, if applicable, or you can contact your financial intermediary to inform it that you wish to continue receiving paper copies of your shareholder reports. If you invest directly with the Funds, you can inform the Funds that you wish to continue receiving paper copies of your shareholder reports by calling 1-800-DIAL-SEI. Your election to receive reports in paper will apply to all funds held with the SEI Funds or your financial intermediary.

TABLE OF CONTENTS
The Trust files its complete schedule of portfolio holdings with the Securities and Exchange Commission for the first and third quarters of each fiscal year as an exhibit to its reports on Form N-PORT. The Trust’s Form N-PORT reports are available on the Commission’s website at http://www.sec.gov.
A description of the policies and procedures that the Trust uses to determine how to vote proxies relating to portfolio securities, as well as information relating to how a Fund voted proxies relating to portfolio securities during the most recent 12-month period ended June 30, is available (i) without charge, upon request, by calling 1-800-DIAL-SEI; and (ii) on the Commission’s website at http://www.sec.gov.
SUMMARY SCHEDULE OF INVESTMENTS (Unaudited)
March 31, 2019
Large Cap Fund
†Percentages are based on total investments. Includes investments held as collateral for securities held on loan (see Note 10).
| | | | | | | | | | | | |
| | | | |
| Description | | Percentage of Net Assets (%) | | Shares | | Market Value ($ Thousands) |
| |
COMMON STOCK — 97.9% | | | | | |
| |
Communication Services — 7.1% | | | | | |
Alphabet Inc, Cl A * | | | 1.3 | % | | | 24,804 | | | $ | 29,192 | |
Alphabet Inc, Cl C * | | | 0.1 | | | | 2,151 | | | | 2,524 | |
AT&T Inc | | | 0.7 | | | | 501,527 | | | | 15,728 | |
Facebook Inc, Cl A * | | | 1.3 | | | | 176,696 | | | | 29,453 | |
Omnicom Group Inc | | | 0.7 | | | | 211,517 | | | | 15,439 | |
Verizon Communications Inc | | | 1.1 | | | | 451,877 | | | | 26,719 | |
Other Securities | | | 1.9 | | | | | | | | 47,546 | |
| | | | | | | | | | | 166,601 | |
Consumer Discretionary — 10.0% | | | | | |
Amazon.com Inc, Cl A * | | | 2.3 | | | | 30,715 | | | | 54,696 | |
Dollar General Corp | | | 0.7 | | | | 142,657 | | | | 17,019 | |
Lowe’s Cos Inc | | | 0.7 | | | | 139,789 | | | | 15,303 | |
Ross Stores Inc | | | 0.8 | | | | 192,997 | | | | 17,968 | |
Other Securities (A) | | | 5.5 | | | | | | | | 129,545 | |
| | | | | | | | | | | 234,531 | |
Consumer Staples — 6.9% | | | | | |
JM Smucker Co/The | | | 0.7 | | | | 139,997 | | | | 16,310 | |
Kroger Co/The | | | 0.7 | | | | 641,242 | | | | 15,775 | |
Philip Morris International Inc | | | 0.8 | | | | 222,296 | | | | 19,649 | |
Unilever NV | | | 0.6 | | | | 257,120 | | | | 14,987 | |
Other Securities | | | 4.1 | | | | | | | | 94,363 | |
| | | | | | | | | | | 161,084 | |
Energy — 6.3% | | | | | |
Chevron Corp | | | 1.4 | | | | 267,288 | | | | 32,924 | |
Marathon Petroleum Corp | | | 0.8 | | | | 330,584 | | | | 19,785 | |
Schlumberger Ltd, Cl A | | | 0.8 | | | | 401,281 | | | | 17,484 | |
Other Securities (A) | | | 3.3 | | | | | | | | 78,395 | |
| | | | | | | | | | | 148,588 | |
Financials — 16.5% | | | | | |
Aflac Inc | | | 0.7 | | | | 348,811 | | | | 17,441 | |
Bank of America Corp | | | 1.2 | | | | 981,805 | | | | 27,088 | |
Berkshire Hathaway Inc, Cl B * | | | 1.1 | | | | 126,314 | | | | 25,375 | |
Citigroup Inc | | | 1.4 | | | | 513,200 | | | | 31,931 | |
| | | | | | | | | | | | |
| | | | |
| Description | | Percentage of Net Assets (%) | | Shares | | Market Value ($ Thousands) |
| |
COMMON STOCK (continued) | | | | | |
JPMorgan Chase & Co | | | 1.3 | % | | | 301,012 | | | $ | 30,471 | |
Markel Corp * | | | 0.7 | | | | 17,107 | | | | 17,043 | |
State Street Corp | | | 0.6 | | | | 205,088 | | | | 13,497 | |
US Bancorp | | | 0.6 | | | | 280,419 | | | | 13,513 | |
Other Securities
‡(A)(B) | | | 8.9 | | | | | | | | 210,428 | |
| | | | | | | | | | | 386,787 | |
Health Care — 14.9% | | | | | | | | | | | | |
Abbott Laboratories | | | 1.4 | | | | 424,218 | | | | 33,912 | |
AmerisourceBergen Corp, Cl A | | | 0.8 | | | | 243,656 | | | | 19,375 | |
Amgen Inc, Cl A | | | 0.9 | | | | 108,639 | | | | 20,639 | |
CVS Health Corp | | | 0.6 | | | | 282,416 | | | | 15,231 | |
Humana Inc | | | 0.6 | | | | 55,343 | | | | 14,721 | |
Johnson & Johnson | | | 1.6 | | | | 276,269 | | | | 38,620 | |
Merck & Co Inc | | | 1.3 | | | | 367,900 | | | | 30,598 | |
Pfizer Inc | | | 0.7 | | | | 404,922 | | | | 17,197 | |
Teleflex Inc | | | 0.6 | | | | 46,383 | | | | 14,015 | |
UnitedHealth Group Inc | | | 1.4 | | | | 135,344 | | | | 33,465 | |
Zimmer Biomet Holdings Inc | | | 0.6 | | | | 112,033 | | | | 14,307 | |
Other Securities | | | 4.4 | | | | | | | | 99,297 | |
| | | | | | | | | | | 351,377 | |
Industrials — 10.0% | | | | | |
Honeywell International Inc | | | 1.5 | | | | 217,424 | | | | 34,553 | |
Roper Technologies Inc | | | 0.7 | | | | 47,516 | | | | 16,249 | |
Other Securities | | | 7.8 | | | | | | | | 185,379 | |
| | | | | | | | | | | 236,181 | |
Information Technology — 18.0% | | | | | |
Adobe Inc * | | | 1.2 | | | | 105,389 | | | | 28,085 | |
Apple Inc | | | 1.0 | | | | 122,748 | | | | 23,316 | |
Cisco Systems Inc | | | 0.7 | | | | 321,695 | | | | 17,368 | |
Intel Corp | | | 0.8 | | | | 345,841 | | | | 18,572 | |
Intuit Inc | | | 1.1 | | | | 97,447 | | | | 25,474 | |
Microchip Technology Inc (A) | | | 1.1 | | | | 308,253 | | | | 25,573 | |
Microsoft Corp | | | 1.9 | | | | 370,704 | | | | 43,721 | |
Oracle Corp, Cl B | | | 0.6 | | | | 282,015 | | | | 15,147 | |
salesforce.com * | | | 0.8 | | | | 123,745 | | | | 19,598 | |
Visa Inc, Cl A | | | 1.2 | | | | 182,351 | | | | 28,481 | |
Other Securities | | | 7.6 | | | | | | | | 177,256 | |
| | | | | | | | | | | 422,591 | |
Materials — 3.6% | | | | | |
DowDuPont Inc | | | 0.6 | | | | 258,426 | | | | 13,777 | |
Other Securities | | | 3.0 | | | | | | | | 70,043 | |
| | | | | | | | | | | 83,820 | |
Real Estate — 2.9% | | | | | |
American Tower Corp, Cl A‡ | | | 1.1 | | | | 132,231 | | | | 26,057 | |
Crown Castle International Corp‡ | | | 0.6 | | | | 108,136 | | | | 13,841 | |
Other Securities‡ | | | 1.2 | | | | | | | | 28,774 | |
| | | | | | | | | | | 68,672 | |
| | |
SEI Institutional Managed Trust / Semi-Annual Report / March 31, 2019 | | 1 |
SUMMARY SCHEDULE OF INVESTMENTS (Unaudited)
March 31, 2019
Large Cap Fund(Concluded)
| | | | | | | | | | | | |
| | | | |
| Description | | Percentage of Net Assets (%) | | Shares | | Market Value ($ Thousands) |
| |
COMMON STOCK (continued) | | | | | |
| | | |
Utilities — 1.7% | | | | | | | | | | | | |
Other Securities | | | 1.7 | % | | | | | | $ | 40,205 | |
| |
Total Common Stock
(Cost $1,866,690) ($ Thousands) | | | | 2,300,437 | |
| |
AFFILIATED PARTNERSHIP — 0.6% | | | | | |
SEI Liquidity Fund, L.P. | | | | | |
2.480% **†(C) | | | 0.6 | | | | 14,869,849 | | | | 14,878 | |
| |
Total Affiliated Partnership
(Cost $14,867) ($ Thousands) | | | | 14,878 | |
|
CASH EQUIVALENT — 2.0% | |
SEI Daily Income Trust, Government Fund, Cl F | | | | | | | | | | | | |
2.220% **† | | | 2.0 | | | | 46,074,280 | | | | 46,074 | |
| |
Total Cash Equivalent
(Cost $46,074) ($ Thousands) | | | | 46,074 | |
| |
Total Investments in Securities — 100.5%
(Cost $1,927,631) ($ Thousands) | | | $ | 2,361,389 | |
| | | | | | | | | | | | |
A list of the open futures contracts held at March 31, 2019 is as follows:
| | | | | | | | | | | | | | | | | | | | |
Type of Contract | | Number of Contracts Long/(Short) | | Expiration
Date | | | Notional Amount
(Thousands) | | Value
(Thousands) | | Unrealized
Appreciation
(Depreciation)
(Thousands) |
S&P 500 Index E-MINI | | | 182 | | | | Jun-2019 | | | | $ 25,401 | | | $ | 25,824 | | | $ | 423 | |
S&P Mid Cap 400 Index E-MINI | | | 12 | | | | Jun-2019 | | | | 2,259 | | | | 2,280 | | | | 21 | |
| | | | | | | | | | | $ 27,660 | | | $ | 28,104 | | | $ | 444 | |
| | | | | | | | | | | | |
| | Percentages are based on a Net Assets of $2,349,301 ($ Thousands). |
| * | Non-income producing security. |
| ** | The rate reported is the 7-day effective yield as of March 31, 2019. |
| ‡ | Real Estate Investment Trust. |
| † | Investment in Affiliated Security (see Note 6). |
| (A) | Certain securities or partial positions of certain securities are on loan at March 31, 2019 (see Note 10). The total market value of securities on loan at March 31, 2019, was $14,761 ($ Thousands). |
| (B) | Security is a Master Limited Partnership. At March 31, 2019, such securities amounted to $7,538 ($ Thousands), or 0.3% of Net Assets (See Note 2). |
| (C) | This security was purchased with cash collateral held from securities on loan (see Note 10). The total market value of such securities as of March 31, 2019 was $14,878 ($ Thousands). |
Cl — Class
L.P. — Limited Partnership
Ltd. — Limited
S&P — Standard & Poor’s
| | |
2 | | SEI Institutional Managed Trust / Semi-Annual Report / March 31, 2019 |
The Summary Schedule of Investments does not reflect the complete portfolio holdings. It includes the Fund’s 50 largest holdings and each investment of any issuer that exceeds 1% of the Fund’s net assets. “Other Securities” represent all issues not required to be disclosed under the rules adopted by the U.S. Securities and Exchange Commission (“SEC”). In certain instances, securities for which footnotes listed above may otherwise apply are included in the Other Securities caption. The complete schedule of portfolio holdings is available (i) without charge, upon request, by calling (800) 342-5734; and (ii) on the SEC’s website at http://www.sec.gov.
The following is a list of the level of inputs used as of March 31, 2019, in valuing the Fund’s investments and other financial instruments carried at value ($ Thousands):
| | | | | | | | | | | | | | | | |
| | | | | |
Investments in
Securities | | Level 1 | | Level 2 | | Level 3 | | Total |
Common Stock | | $ | 2,300,437 | | | $ | – | | | $ | – | | | $ | 2,300,437 | |
Affiliated Partnership | | | – | | | | 14,878 | | | | – | | | | 14,878 | |
Cash Equivalent | | | 46,074 | | | | – | | | | – | | | | 46,074 | |
| | | | | | | | | | | | | | | | |
Total Investments in Securities | | $ | 2,346,511 | | | $ | 14,878 | | | $ | – | | | $ | 2,361,389 | |
| | | | | | | | | | | | | | | | |
| | | | | | | | | | | | | | | | |
Other Financial
Instruments | | Level 1 | | Level 2 | | Level 3 | | Total |
Futures Contracts* | | | | | | | | | | | | | | | | |
Unrealized Appreciation | | $ | 444 | | | $ | – | | | $ | – | | | $ | 444 | |
| | | | | | | | | | | | | | | | |
Total Other Financial Instruments | | $ | 444 | | | $ | – | | | $ | – | | | $ | 444 | |
| | | | | | | | | | | | | | | | |
* Futures contracts are valued at the unrealized appreciation on the instrument.
For the period ended March 31, 2019, there were no transfers between Level 1 and Level 2 assets and liabilities.
For the period ended March 31, 2019, there were no transfers between Level 2 and Level 3 assets and liabilities.
For more information on valuation inputs, see Note 2 — Significant Accounting Policies in Notes to Financial Statements.
The following is a summary of the Fund’s transactions with affiliates for the period ended March 31, 2019 ($ Thousands):
| | | | | | | | | | | | | | |
| Security Description | | Value at 9/30/18 | | Purchases at
Cost | | Proceeds from
Sales | | Realized Gain | | Change in Unrealized
Depreciation | | Value 3/31/19 | | Income |
| SEI Daily Income Trust, Government Fund, Cl F | | $ 57,680 | | $ 316,891 | | $ (328,497) | | $ — | | $ — | | $ 46,074 | | $ 551 |
SEI Liquidity Fund, L.P. | | 52,638 | | 125,593 | | (163,358) | | 5 | | — | | 14,878 | | 52 |
| | | | | | | | | | | | | | |
Totals | | $ 110,318 | | $ 442,484 | | $ (491,855) | | $ 5 | | $ — | | $ 60,952 | | $ 603 |
| | | | | | | | | | | | | | |
Amounts designated as “—” are either $0 or have been rounded to $0.
The accompanying notes are an integral part of the financial statements.
| | |
SEI Institutional Managed Trust / Semi-Annual Report / March 31, 2019 | | 3 |
SUMMARY SCHEDULE OF INVESTMENTS (Unaudited)
March 31, 2019
Large Cap Value Fund
†Percentages are based on total investments. Includes investments held as collateral for securities held on loan (see Note 10).
| | | | | | | | | | | | |
| | | | |
| Description | | Percentage of Net Assets (%) | | Shares | | Market Value ($ Thousands) |
| |
COMMON STOCK — 97.5% | | | | | |
| |
Communication Services — 6.3% | | | | | |
AT&T Inc | | | 2.4 | % | | | 1,025,830 | | | $ | 32,170 | |
BCE Inc | | | 0.7 | | | | 219,735 | | | | 9,754 | |
Verizon Communications Inc | | | 1.0 | | | | 237,848 | | | | 14,064 | |
Other Securities | | | 2.2 | | | | | | | | 29,600 | |
| | | | | | | | | | | 85,588 | |
Consumer Discretionary — 7.6% | | | | | |
General Motors Co | | | 1.0 | | | | 367,789 | | | | 13,645 | |
Genuine Parts Co | | | 0.9 | | | | 109,513 | | | | 12,269 | |
Target Corp, Cl A | | | 0.6 | | | | 105,907 | | | | 8,500 | |
Other Securities (A) | | | 5.1 | | | | | | | | 68,534 | |
| | | | | | | | | | | 102,948 | |
Consumer Staples — 8.2% | | | | | |
Altria Group Inc | | | 0.6 | | | | 132,361 | | | | 7,601 | |
Diageo PLC ADR | | | 0.7 | | | | 61,169 | | | | 10,008 | |
Kimberly-Clark Corp | | | 0.8 | | | | 88,522 | | | | 10,968 | |
Philip Morris International Inc | | | 1.0 | | | | 156,750 | | | | 13,855 | |
Tyson Foods Inc, Cl A | | | 0.6 | | | | 107,097 | | | | 7,436 | |
Unilever NV | | | 0.6 | | | | 140,802 | | | | 8,207 | |
Walgreens Boots Alliance Inc | | | 0.8 | | | | 178,672 | | | | 11,305 | |
Walmart Inc | | | 1.0 | | | | 135,544 | | | | 13,220 | |
Other Securities | | | 2.1 | | | | | | | | 27,638 | |
| | | | | | | | | | | 110,238 | |
Energy — 11.0% | | | | | |
Chevron Corp | | | 2.1 | | | | 235,172 | | | | 28,969 | |
ConocoPhillips | | | 1.7 | | | | 345,296 | | | | 23,045 | |
Exxon Mobil Corp | | | 1.9 | | | | 316,864 | | | | 25,603 | |
Marathon Petroleum Corp | | | 0.7 | | | | 153,825 | | | | 9,206 | |
Royal Dutch Shell PLC ADR, Cl A | | | 0.6 | | | | 139,866 | | | | 8,754 | |
Valero Energy Corp | | | 0.7 | | | | 104,174 | | | | 8,837 | |
Other Securities | | | 3.3 | | | | | | | | 44,466 | |
| | | | | | | | | | | 148,880 | |
Financials — 19.9% | | | | | |
Aflac Inc | | | 0.6 | | | | 149,859 | | | | 7,493 | |
Allstate Corp/The | | | 0.6 | | | | 78,965 | | | | 7,437 | |
Bank of America Corp | | | 1.2 | | | | 591,845 | | | | 16,329 | |
| | | | | | | | | | | | |
| | | | |
| Description | | Percentage of Net Assets (%) | | Shares | | Market Value ($ Thousands) |
| |
COMMON STOCK (continued) | | | | | |
Berkshire Hathaway Inc, Cl B * | | | 1.2 | % | | | 82,741 | | | $ | 16,622 | |
Chubb Ltd | | | 0.8 | | | | 73,483 | | | | 10,294 | |
Citigroup Inc | | | 1.5 | | | | 323,897 | | | | 20,153 | |
JPMorgan Chase & Co | | | 2.9 | | | | 384,576 | | | | 38,931 | |
KKR & Co Inc | | | 0.6 | | | | 321,877 | | | | 7,561 | |
SunTrust Banks Inc | | | 1.0 | | | | 234,504 | | | | 13,894 | |
Travelers Cos Inc/The | | | 1.0 | | | | 97,005 | | | | 13,305 | |
Wells Fargo & Co | | | 1.1 | | | | 312,120 | | | | 15,082 | |
Other Securities
‡(A)(B) | | | 7.4 | | | | | | | | 100,543 | |
| | | | | | | | | | | 267,644 | |
Health Care — 14.2% | | | | | |
Bristol-Myers Squibb Co | | | 0.6 | | | | 176,482 | | | | 8,420 | |
Eli Lilly & Co | | | 1.1 | | | | 107,835 | | | | 13,993 | |
Johnson & Johnson | | | 2.4 | | | | 229,920 | | | | 32,141 | |
Merck & Co Inc | | | 2.0 | | | | 327,493 | | | | 27,238 | |
Novartis AG ADR | | | 0.8 | | | | 109,770 | | | | 10,553 | |
Pfizer Inc | | | 2.7 | | | | 859,268 | | | | 36,493 | |
Other Securities (C) | | | 4.6 | | | | | | | | 61,963 | |
| | | | | | | | | | | 190,801 | |
Industrials — 7.2% | | | | | |
3M Co | | | 0.6 | | | | 40,786 | | | | 8,475 | |
Delta Air Lines Inc, Cl A | | | 0.6 | | | | 152,815 | | | | 7,893 | |
Johnson Controls International plc | | | 0.7 | | | | 242,079 | | | | 8,942 | |
Raytheon Co | | | 0.7 | | | | 54,023 | | | | 9,837 | |
Other Securities | | | 4.6 | | | | | | | | 61,339 | |
| | | | | | | | | | | 96,486 | |
Information Technology — 11.2% | | | | | |
Cisco Systems Inc | | | 2.5 | | | | 617,328 | | | | 33,330 | |
Corning Inc, Cl B | | | 0.9 | | | | 386,238 | | | | 12,784 | |
Intel Corp | | | 2.3 | | | | 584,123 | | | | 31,367 | |
Microsoft Corp | | | 1.2 | | | | 135,407 | | | | 15,970 | |
Other Securities | | | 4.3 | | | | | | | | 57,534 | |
| | | | | | | | | | | 150,985 | |
Materials — 3.9% | | | | | |
DowDuPont Inc | | | 1.0 | | | | 258,229 | | | | 13,766 | |
Other Securities | | | 2.9 | | | | | | | | 38,723 | |
| | | | | | | | | | | 52,489 | |
Real Estate — 3.4% | | | | | |
HCP Inc‡ | | | 0.7 | | | | 284,637 | | | | 8,909 | |
Welltower Inc‡ | | | 1.2 | | | | 200,627 | | | | 15,569 | |
Other Securities‡(A) | | | 1.5 | | | | | | | | 21,296 | |
| | | | | | | | | | | 45,774 | |
Utilities — 4.6% | | | | | |
Exelon Corp | | | 0.9 | | | | 248,451 | | | | 12,455 | |
NextEra Energy Inc | | | 1.3 | | | | 91,339 | | | | 17,658 | |
Other Securities | | | 2.4 | | | | | | | | 31,897 | |
| | | | | | | | | | | 62,010 | |
Total Common Stock
(Cost $1,084,172) ($ Thousands) | | | | 1,313,843 | |
| | |
4 | | SEI Institutional Managed Trust / Semi-Annual Report / March 31, 2019 |
| | | | | | | | | | | | |
| | | | |
| Description | | Percentage of Net Assets (%) | | Shares | | Market Value ($ Thousands) |
| |
AFFILIATED PARTNERSHIP — 0.3% | | | | | |
SEI Liquidity Fund, L.P. | | | | | | | | | | | | |
2.480% **† (D) | | | 0.3 | % | | | 4,536,876 | | | $ | 4,538 | |
| |
Total Affiliated Partnership
(Cost $4,536) ($ Thousands) | | | | 4,538 | |
| | | | | | | | | | | | |
| | | | |
| Description | | Percentage of Net Assets (%) | | Shares | | Market Value ($ Thousands) |
| |
CASH EQUIVALENT — 2.3% | | | | | |
SEI Daily Income Trust,
Government Fund, Cl F | | | | | |
2.220% **† | | | 2.3 | % | | | 31,561,067 | | | $ | 31,561 | |
Total Cash Equivalent
(Cost $31,561) ($ Thousands) | | | | 31,561 | |
| |
Total Investments in Securities — 100.1%
(Cost $1,120,269) ($ Thousands) | | | $ | 1,349,942 | |
| | | | | | | | | | | | |
A list of the open futures contracts held at March 31, 2019 is as follows:
| | | | | | | | | | | | | | | | | | | | |
Type of Contract | | Number of Contracts Long | | Expiration Date | | | Notional Amount (Thousands) | | Value
(Thousands) | | Unrealized
Appreciation
(Thousands) |
S&P 500 Index E-MINI | | | 71 | | | | Jun-2019 | | | $ | 9,804 | | | $ | 10,074 | | | $ | 270 | |
S&P Mid Cap 400 Index E-MINI | | | 41 | | | | Jun-2019 | | | | 7,672 | | | | 7,794 | | | | 122 | |
| | | | | | | | | | $ | 17,476 | | | $ | 17,868 | | | $ | 392 | |
| | | | | | | | | | | | |
| | Percentages are based on a Net Assets of $1,348,144 ($ Thousands). |
| * | Non-income producing security. |
| ** | The rate reported is the 7-day effective yield as of March 31, 2019. |
| ‡ | Real Estate Investment Trust. |
| † | Investment in Affiliated Security (see Note 6). |
| (A) | Certain securities or partial positions of certain securities are on loan at March 31, 2019 (see Note 10). The total market value of securities on loan at March 31, 2019, was $4,377 ($ Thousands). |
| (B) | Security is a Master Limited Partnership. At March 31, 2019, such securities amounted to $5,817 ($ Thousands), or 0.4% of Net Assets (See Note 2). |
| (C) | Securities considered illiquid. The total value of such securities as of March 31, 2019 was $4,595 ($ Thousands) and represented 0.3% of Net Assets. |
| (D) | This security was purchased with cash collateral held from securities on loan (see Note 10). The total market value of such securities as of March 31, 2019 was $4,538 ($ Thousands). |
ADR — American Depositary Receipt
Cl — Class
L.P. — Limited Partnership
PLC — Public Limited Company
S&P — Standard & Poor’s
The Summary Schedule of Investments does not reflect the complete portfolio holdings. It includes the Fund’s 50 largest holdings and each investment of any issuer that exceeds 1% of the Fund’s net assets. “Other Securities” represent all issues not required to be disclosed under the rules adopted by the U.S. Securities and Exchange Commission (“SEC”). In certain instances, securities for which footnotes listed above may otherwise apply are included in the Other Securities caption. The complete schedule of portfolio holdings is available (i) without charge, upon request, by calling (800) 342-5734; and (ii) on the SEC’s website at http://www.sec.gov.
The following is a list of the level of inputs used as of March 31, 2019, in valuing the Fund’s investments carried and other financial instruments at value ($ Thousands):
| | | | | | | | | | | | | | |
| | | | | |
| Investments in Securities | | Level 1 | | Level 2 | | Level 3 | | Total |
Common Stock | | $ 1,313,843 | | $ | – | | | $ | – | | | $ | 1,313,843 | |
Affiliated Partnership | | – | | | 4,538 | | | | – | | | | 4,538 | |
Cash Equivalent | | 31,561 | | | – | | | | – | | | | 31,561 | |
| | | | | | | | | | | | | | |
Total Investments in Securities | | $ 1,345,404 | | $ | 4,538 | | | $ | – | | | $ | 1,349,942 | |
| | | | | | | | | | | | | | |
| | | | | | | | | | | | | | |
Other Financial
Instruments | | Level 1 | | Level 2 | | Level 3 | | Total |
Futures Contracts * | | | | | | | | | | | | |
Unrealized Appreciation | | $ 392 | | $ | – | | | $ | – | | | $ | 392 | |
| | | | | | | | | | | | | | |
Total Other Financial Instruments | | $ 392 | | $ | – | | | $ | – | | | $ | 392 | |
| | | | | | | | | | | | | | |
* Futures contracts are valued at the unrealized appreciation on the instrument.
For the period ended March 31, 2019, there were no transfers between Level 1 and Level 2 assets and liabilities.
For the period ended March 31, 2019, there were no transfers between Level 2 and Level 3 assets and liabilities.
For more information on valuation inputs, see Note 2 — Significant Accounting Policies in Notes to Financial Statements.
| | |
SEI Institutional Managed Trust / Semi-Annual Report / March 31, 2019 | | 5 |
SUMMARY SCHEDULE OF INVESTMENTS (Unaudited)
March 31, 2019
Large Cap Value Fund(Concluded)
The following is a summary of the Fund’s transactions with affiliates for the period ended March 31, 2019 ($ Thousands):
| | | | | | | | | | | | | | | | | | | | | | | | | | | | |
| Security Description | | Value 9/30/18 | | Purchases at
Cost | | Proceeds from
Sales | | Realized Gain | | Change in Unrealized
Appreciation | | Value 3/31/19 | | Income |
| SEI Liquidity Fund, L.P. | | | $ 10,516 | | | | $ 93,706 | | | | $ (99,688) | | | | $ 3 | | | | $ 1 | | | | $ 4,538 | | | | $ 24 | |
| SEI Daily Income Trust, Government Fund, Cl F | | | 42,653 | | | | 101,670 | | | | (112,762) | | | | — | | | | — | | | | 31,561 | | | | 369 | |
| | | | | | | | | | | | | | | | | | | | | | | | | | | | |
Totals | | | $ 53,169 | | | | $ 195,376 | | | | $ (212,450) | | | | $ 3 | | | | $ 1 | | | | $ 36,099 | | | | $ 393 | |
| | | | | | | | | | | | | | | | | | | | | | | | | | | | |
Amounts designated as “—” are either $0 or have been rounded to $0.
The accompanying notes are an integral part of the financial statements.
| | |
6 | | SEI Institutional Managed Trust / Semi-Annual Report / March 31, 2019 |
SUMMARY SCHEDULE OF INVESTMENTS (Unaudited)
March 31, 2019
Large Cap Growth Fund
†Percentages are based on total investments. Includes investments held as collateral for securities held on loan (see Note 10).
| | | | | | | | | | | | |
| | | | |
| Description | | Percentage of Net Assets (%) | | Shares | | Market Value ($ Thousands) |
| |
COMMON STOCK — 98.2% | | | | | |
| |
Communication Services — 10.2% | | | | | |
Alphabet Inc, Cl A * | | | 3.8 | % | | | 47,240 | | | $ | 55,596 | |
Alphabet Inc, Cl C * | | | 0.9 | | | | 10,824 | | | | 12,700 | |
Facebook Inc, Cl A * | | | 2.2 | | | | 198,862 | | | | 33,148 | |
T-Mobile US Inc * | | | 0.7 | | | | 147,591 | | | | 10,199 | |
Other Securities (A) | | | 2.6 | | | | | | | | 38,963 | |
| | | | | | | | | | | 150,606 | |
Consumer Discretionary — 15.6% | | | | | |
Alibaba Group Holding Ltd ADR * | | | 1.1 | | | | 88,263 | | | | 16,104 | |
Amazon.com Inc, Cl A * | | | 5.3 | | | | 44,429 | | | | 79,117 | |
AutoZone Inc * | | | 1.5 | | | | 22,155 | | | | 22,689 | |
Lowe’s Cos Inc | | | 0.8 | | | | 102,559 | | | | 11,227 | |
Lululemon Athletica Inc * | | | 0.7 | | | | 63,993 | | | | 10,486 | |
NIKE Inc, Cl B | | | 1.0 | | | | 172,922 | | | | 14,562 | |
TJX Cos Inc/The | | | 1.2 | | | | 339,896 | | | | 18,086 | |
Other Securities | | | 4.0 | | | | | | | | 59,192 | |
| | | | | | | | | | | 231,463 | |
Consumer Staples — 4.2% | | | | | |
Colgate-Palmolive Co | | | 0.9 | | | | 184,478 | | | | 12,644 | |
Hershey Co/The | | | 0.7 | | | | 92,045 | | | | 10,569 | |
PepsiCo Inc | | | 1.3 | | | | 157,598 | | | | 19,314 | |
Other Securities | | | 1.3 | | | | | | | | 18,870 | |
| | | | | | | | | | | 61,397 | |
Energy — 0.3% | | | | | |
Other Securities | | | 0.3 | | | | | | | | 4,241 | |
| | | |
Financials — 7.8% | | | | | | | | | | | | |
CME Group Inc | | | 0.8 | | | | 72,684 | | | | 11,962 | |
Moody’s Corp | | | 1.6 | | | | 129,490 | | | | 23,449 | |
MSCI Inc, Cl A | | | 1.1 | | | | 78,786 | | | | 15,666 | |
Progressive Corp/The | | | 1.6 | | | | 319,594 | | | | 23,040 | |
US Bancorp | | | 0.9 | | | | 273,464 | | | | 13,178 | |
Other Securities | | | 1.8 | | | | | | | | 28,577 | |
| | | | | | | | | | | 115,872 | |
Health Care — 15.5% | | | | | | | | | | | | |
Abbott Laboratories | | | 1.1 | | | | 205,567 | | | | 16,433 | |
| | | | | | | | | | | | |
| | | | |
| Description | | Percentage of Net Assets (%) | | Shares | | Market Value ($ Thousands) |
| |
COMMON STOCK (continued) | | | | | |
Becton Dickinson and Co | | | 1.4 | % | | | 81,942 | | | $ | 20,463 | |
Danaher Corp, Cl A | | | 0.8 | | | | 89,177 | | | | 11,773 | |
Johnson & Johnson | | | 1.4 | | | | 150,630 | | | | 21,057 | |
Mettler-Toledo International Inc * | | | 1.0 | | | | 21,426 | | | | 15,491 | |
Regeneron Pharmaceuticals
Inc * | | | 0.7 | | | | 26,257 | | | | 10,782 | |
UnitedHealth Group Inc | | | 3.5 | | | | 207,463 | | | | 51,297 | |
Varian Medical Systems Inc * | | | 0.7 | | | | 74,409 | | | | 10,545 | |
Vertex Pharmaceuticals
Inc * | | | 0.8 | | | | 63,443 | | | | 11,670 | |
Other Securities (B) | | | 4.1 | | | | | | | | 60,638 | |
| | | | | | | | | | | 230,149 | |
Industrials — 10.3% | | | | | |
3M Co | | | 1.0 | | | | 70,234 | | | | 14,593 | |
Boeing Co/The | | | 1.8 | | | | 67,507 | | | | 25,749 | |
Cintas Corp | | | 1.0 | | | | 75,177 | | | | 15,194 | |
Graco Inc | | | 1.0 | | | | 300,933 | | | | 14,902 | |
Middleby Corp/The * | | | 0.8 | | | | 87,227 | | | | 11,342 | |
Robert Half International Inc | | | 0.7 | | | | 157,721 | | | | 10,277 | |
Union Pacific Corp | | | 1.1 | | | | 97,386 | | | | 16,283 | |
United Technologies Corp | | | 0.9 | | | | 106,872 | | | | 13,775 | |
Other Securities | | | 2.0 | | | | | | | | 31,047 | |
| | | | | | | | | | | 153,162 | |
Information Technology — 29.5% | | | | | |
Adobe Inc * | | | 2.1 | | | | 116,876 | | | | 31,146 | |
Analog Devices Inc | | | 1.0 | | | | 147,089 | | | | 15,484 | |
Apple Inc | | | 2.7 | | | | 214,018 | | | | 40,653 | |
Broadcom Inc | | | 1.3 | | | | 62,672 | | | | 18,846 | |
Mastercard Inc, Cl A | | | 2.7 | | | | 171,148 | | | | 40,297 | |
Microsoft Corp | | | 5.8 | | | | 731,873 | | | | 86,317 | |
Oracle Corp, Cl B | | | 1.0 | | | | 274,986 | | | | 14,770 | |
PayPal Holdings Inc * | | | 0.7 | | | | 104,842 | | | | 10,887 | |
salesforce.com * | | | 1.5 | | | | 137,437 | | | | 21,766 | |
Visa Inc, Cl A | | | 3.0 | | | | 283,381 | | | | 44,261 | |
VMware Inc, Cl A * | | | 0.7 | | | | 59,886 | | | | 10,810 | |
Zebra Technologies Corp, Cl A * | | | 0.7 | | | | 49,225 | | | | 10,314 | |
Other Securities (A) | | | 6.3 | | | | | | | | 91,846 | |
| | | | | | | | | | | 437,397 | |
Materials — 3.1% | | | | | |
Linde PLC | | | 0.8 | | | | 64,004 | | | | 11,260 | |
Sherwin-Williams Co/The, Cl A | | | 1.5 | | | | 51,845 | | | | 22,330 | |
Other Securities | | | 0.8 | | | | | | | | 11,681 | |
| | | | | | | | | | | 45,271 | |
Real Estate — 1.3% | | | | | | | | | | | | |
EPR Properties, Cl A‡ | | | 0.8 | | | | 142,436 | | | | 10,953 | |
Other Securities‡ | | | 0.5 | | | | | | | | 8,024 | |
| | | | | | | | | | | 18,977 | |
| | |
SEI Institutional Managed Trust / Semi-Annual Report / March 31, 2019 | | 7 |
SUMMARY SCHEDULE OF INVESTMENTS (Unaudited)
March 31, 2019
Large Cap Growth Fund(Concluded)
| | | | | | | | | | | | |
| | | | |
Description | | Percentage of Net Assets (%) | | Shares | | | Market Value ($ Thousands) | |
| |
COMMON STOCK (continued) | | | | | |
| |
Utilities — 0.4% | | | | | |
Other Securities | | | 0.4 | % | | | | | | $ | 6,511 | |
| |
Total Common Stock
(Cost $993,297) ($ Thousands) | | | | 1,455,046 | |
| |
AFFILIATED PARTNERSHIP — 0.8% | | | | | |
SEI Liquidity Fund, L.P. | | | | | |
2.480% **†(C) | | | 0.8 | | | | 11,088,940 | | | | 11,089 | |
| |
Total Affiliated Partnership
(Cost $11,088) ($ Thousands) | | | | 11,089 | |
| | | | | | | | | | | | |
| | | | |
Description | | Percentage of Net Assets (%) | | Shares | | | Market Value ($ Thousands) | |
| |
CASH EQUIVALENT — 1.4% | | | | | |
SEI Daily Income Trust,
Government Fund, Cl F | | | | | |
2.220% **† | | | 1.4 | % | | | 21,242,105 | | | $ | 21,242 | |
| |
Total Cash Equivalent
(Cost $21,242) ($ Thousands) | | | | 21,242 | |
| |
Total Investments in Securities — 100.4%
(Cost $1,025,627) ($ Thousands) | | | $ | 1,487,377 | |
| | | | | | | | | | | | |
A list of the open futures contracts held at March 31, 2019 is as follows:
| | | | | | | | | | | | | | | | | | | | |
Type of Contract | | Number of
Contracts
Long | | Expiration
Date | | | Notional Amount
(Thousands) | | Value
(Thousands) | | Unrealized
Appreciation
(Thousands) |
S&P 500 Index E-MINI | | | 110 | | | | Jun-2019 | | | $ | 15,305 | | | $ | 15,608 | | | $ | 303 | |
| | Percentages are based on Net Assets of $1,481,763 ($ Thousands). |
| * | Non-income producing security. |
| ** | Rate shown is the 7-day effective yield as of March 31, 2019. |
| † | Investment in Affiliated Security (see Note 6). |
| ‡ | Real Estate Investment Trust. |
| (A) | Certain securities or partial positions of certain securities are on loan at March 31, 2019 (see Note 10). The total market value of securities on loan at March 31, 2019 was $11,014 ($ Thousands). |
| (B) | Securities considered illiquid. The total value of such securities as of March 31, 2019 was $5,576 ($ Thousands) and represented 0.4% of the Net Assets of the Fund. |
| (C) | This security was purchased with cash collateral held from securities on loan (see Note 10). The total market value of such securities as of March 31, 2019 was $11,089 ($ Thousands). |
ADR — American Depositary Receipt
Cl — Class
L.P. — Limited Partnership
Ltd. — Limited
S&P — Standard & Poor’s
The Summary Schedule of Investments does not reflect the complete portfolio holdings. It includes the Fund’s 50 largest holdings and each investment of any issuer that exceeds 1% of the Fund’s net assets.
“Other Securities” represent all issues not required to be disclosed under the rules adopted by the U.S. Securities and Exchange Commission (“SEC”). In certain instances, securities for which footnotes listed above may otherwise apply are included in the Other Securities caption. The complete schedule of portfolio holdings is available (i) without charge, upon request, by calling (800) 342-5734; and (ii) on the SEC’s website at http://www.sec.gov.
The following is a list of the level of inputs used as of March 31, 2019, in valuing the Fund’s investments and other financial instrument carried at value ($ Thousands):
| | | | | | | | | | | | | | | | |
| | | | | |
Investments in
Securities | | Level 1 | | | Level 2 | | | Level 3 | | | Total | |
Common Stock | | $ | 1,455,046 | | | $ | – | | | $ | – | | | $ | 1,455,046 | |
Affiliated Partnership | | | – | | | | 11,089 | | | | – | | | | 11,089 | |
Cash Equivalent | | | 21,242 | | | | – | | | | – | | | | 21,242 | |
| | | | | | | | | | | | | | | | |
Total Investments in Securities | | $ | 1,476,288 | | | $ | 11,089 | | | $ | – | | | $ | 1,487,377 | |
| | | | | | | | | | | | | | | | |
| | | | | | | | | | | | | | | | |
Other Financial
Instruments | | Level 1 | | | Level 2 | | | Level 3 | | | Total | |
Futures Contracts* | | | | | | | | | | | | | |
Unrealized Appreciation | | $ | 303 | | | $ | – | | | $ | – | | | $ | 303 | |
| | | | | | | | | | | | | | | | |
Total Other Financial Instruments | | $ | 303 | | | $ | – | | | $ | – | | | $ | 303 | |
| | | | | | | | | | | | | | | | |
* Futures contracts are valued at the unrealized appreciation on the instrument.
For the period ended March 31, 2019, there were no transfers between Level 1 and Level 2 assets and liabilities.
For the period ended March 31, 2019, there were no transfers between Level 2 and Level 3 assets and liabilities.
For more information on valuation inputs, see Note 2 — Significant Accounting Policies in Notes to Financial Statements.
| | |
8 | | SEI Institutional Managed Trust / Semi-Annual Report / March 31, 2019 |
The following is a summary of the Fund’s transactions with affiliates for the period ended March 31, 2019 ($ Thousands):
| | | | | | | | | | | | | | |
| Security Description | | Value at 9/30/18 | | Purchases at
Cost | | Proceeds from Sales | | Realized Gain | | Change in
Unrealized
Appreciation | | Value 3/31/19 | | Income |
| SEI Daily Income Trust, Government Fund, Cl F | | $ 46,852 | | $ 152,380 | | $ (177,990) | | $ — | | $ — | | $ 21,242 | | $ 392 |
| SEI Liquidity Fund, L.P. | | 18,951 | | 70,563 | | (78,427) | | — | | 2 | | 11,089 | | 187 |
| | | | | | | | | | | | | | |
| Totals | | $ 65,803 | | $ 222,943 | | $ (256,417) | | $ — | | $ 2 | | $ 32,331 | | $ 579 |
| | | | | | | | | | | | | | |
Amounts designated as “—” are either $0 or have been rounded to $0.
The accompanying notes are an integral part of the financial statements.
| | |
SEI Institutional Managed Trust / Semi-Annual Report / March 31, 2019 | | 9 |
SUMMARY SCHEDULE OF INVESTMENTS (Unaudited)
March 31, 2019
Large Cap Index Fund
†Percentages are based on total investments. Includes investments held as collateral for securities held on loan (see Note 10).
| | | | | | | | | | | | |
| | | | |
| Description | | Percentage of
Net Assets (%) | | Shares | | Market Value ($ Thousands) |
| |
COMMON STOCK — 97.9% | | | | | |
| |
Communication Services — 9.3% | | | | | |
Alphabet Inc, Cl A * | | | 1.3 | % | | | 3,425 | | | $ | 4,031 | |
Alphabet Inc, Cl C * | | | 1.3 | | | | 3,491 | | | | 4,096 | |
AT&T Inc | | | 0.9 | | | | 83,521 | | | | 2,619 | |
Comcast Corp, Cl A | | | 0.7 | | | | 51,701 | | | | 2,067 | |
Facebook Inc, Cl A * | | | 1.5 | | | | 27,345 | | | | 4,558 | |
Netflix Inc * | | | 0.6 | | | | 4,828 | | | | 1,721 | |
Verizon Communications Inc | | | 0.9 | | | | 47,515 | | | | 2,810 | |
Walt Disney Co/The | | | 0.7 | | | | 20,167 | | | | 2,239 | |
Other Securities | | | 1.4 | | | | | | | | 4,674 | |
| | | | | | | | | | | 28,815 | |
Consumer Discretionary — 10.0% | | | | | |
Amazon.com Inc, Cl A * | | | 2.7 | | | | 4,718 | | | | 8,402 | |
Home Depot Inc/The | | | 0.8 | | | | 13,014 | | | | 2,497 | |
McDonald’s Corp | | | 0.6 | | | | 8,936 | | | | 1,697 | |
Other Securities | | | 5.9 | | | | | | | | 18,407 | |
| | | | | | | | | | | 31,003 | |
Consumer Staples — 6.7% | | | | | |
Altria Group Inc | | | 0.4 | | | | 21,662 | | | | 1,244 | |
Coca-Cola Co/The | | | 0.7 | | | | 43,980 | | | | 2,061 | |
PepsiCo Inc | | | 0.6 | | | | 16,235 | | | | 1,989 | |
Philip Morris International Inc | | | 0.5 | | | | 17,950 | | | | 1,587 | |
Procter & Gamble Co/The | | | 1.0 | | | | 28,579 | | | | 2,974 | |
Walmart Inc | | | 0.5 | | | | 16,110 | | | | 1,571 | |
Other Securities | | | 3.0 | | | | | | | | 9,238 | |
| | | | | | | | | | | 20,664 | |
Energy — 5.1% | | | | | | | | | | | | |
Chevron Corp | | | 0.9 | | | | 21,928 | | | | 2,701 | |
Exxon Mobil Corp | | | 1.3 | | | | 48,657 | | | | 3,931 | |
Other Securities | | | 2.9 | | | | | | | | 9,025 | |
| | | | | | | | | | | 15,657 | |
Financials — 12.6% | | | | | | | | | | | | |
Bank of America Corp | | | 0.9 | | | | 103,564 | | | | 2,857 | |
Berkshire Hathaway Inc, Cl B * | | | 1.5 | | | | 22,309 | | | | 4,482 | |
| | | | | | | | | | | | |
| | | | |
| Description | | Percentage of
Net Assets (%) | | Shares | | Market Value ($ Thousands) |
| |
COMMON STOCK (continued) | | | | | |
Citigroup Inc | | | 0.6 | % | | | 27,322 | | | $ | 1,700 | |
JPMorgan Chase & Co | | | 1.3 | | | | 38,087 | | | | 3,856 | |
SEI Investments Co† | | | 0.0 | | | | 1,500 | | | | 78 | |
Wells Fargo & Co | | | 0.8 | | | | 47,610 | | | | 2,301 | |
Other Securities‡(A) | | | 7.5 | | | | | | | | 23,709 | |
| | | | | | | | | | | 38,983 | |
Health Care — 13.9% | | | | | | | | | | | | |
Abbott Laboratories | | | 0.5 | | | | 19,636 | | | | 1,570 | |
AbbVie Inc | | | 0.5 | | | | 17,504 | | | | 1,411 | |
Amgen Inc, Cl A | | | 0.5 | | | | 7,308 | | | | 1,388 | |
Eli Lilly & Co | | | 0.4 | | | | 10,116 | | | | 1,313 | |
Johnson & Johnson | | | 1.4 | | | | 30,900 | | | | 4,319 | |
Medtronic PLC | | | 0.5 | | | | 15,659 | | | | 1,426 | |
Merck & Co Inc | | | 0.8 | | | | 29,910 | | | | 2,488 | |
Pfizer Inc | | | 0.9 | | | | 66,089 | | | | 2,807 | |
Thermo Fisher Scientific Inc | | | 0.4 | | | | 4,664 | | | | 1,277 | |
UnitedHealth Group Inc | | | 0.9 | | | | 10,975 | | | | 2,714 | |
Other Securities | | | 7.1 | | | | | | | | 22,422 | |
| | | | | | | | | | | 43,135 | |
Industrials — 9.6% | | | | | | | | | | | | |
3M Co | | | 0.4 | | | | 6,410 | | | | 1,332 | |
Boeing Co/The | | | 0.8 | | | | 6,138 | | | | 2,341 | |
Honeywell International Inc | | | 0.4 | | | | 8,379 | | | | 1,332 | |
Union Pacific Corp | | | 0.5 | | | | 8,340 | | | | 1,394 | |
Other Securities | | | 7.5 | | | | | | | | 23,223 | |
| | | | | | | | | | | 29,622 | |
Information Technology — 21.1% | | | | | |
Accenture PLC, Cl A | | | 0.4 | | | | 7,437 | | | | 1,309 | |
Adobe Inc * | | | 0.5 | | | | 5,641 | | | | 1,503 | |
Apple Inc | | | 3.4 | | | | 54,666 | | | | 10,384 | |
Broadcom Inc | | | 0.5 | | | | 4,732 | | | | 1,423 | |
Cisco Systems Inc | | | 0.9 | | | | 52,076 | | | | 2,812 | |
Intel Corp | | | 0.9 | | | | 51,850 | | | | 2,784 | |
International Business Machines Corp | | | 0.5 | | | | 10,595 | | | | 1,495 | |
Mastercard Inc, Cl A | | | 0.8 | | | | 10,494 | | | | 2,471 | |
Microsoft Corp | | | 3.3 | | | | 87,225 | | | | 10,287 | |
Oracle Corp, Cl B | | | 0.5 | | | | 27,738 | | | | 1,490 | |
PayPal Holdings Inc * | | | 0.5 | | | | 13,436 | | | | 1,395 | |
salesforce.com Inc * | | | 0.4 | | | | 8,329 | | | | 1,319 | |
Visa Inc, Cl A | | | 1.0 | | | | 20,270 | | | | 3,166 | |
Other Securities | | | 7.5 | | | | | | | | 23,540 | |
| | | | | | | | | | | 65,378 | |
Materials — 2.8% | | | | | | | | | | | | |
DowDuPont Inc | | | 0.5 | | | | 26,019 | | | | 1,387 | |
Other Securities | | | 2.3 | | | | | | | | 7,327 | |
| | | | | | | | | | | 8,714 | |
Real Estate — 3.7% | | | | | | | | | | | | |
Other Securities ‡ | | | 3.7 | | | | | | | | 11,402 | |
| | |
10 | | SEI Institutional Managed Trust / Semi-Annual Report / March 31, 2019 |
| | | | | | | | | | | | |
| | | | |
| Description | | Percentage of
Net Assets (%) | | Shares | | Market Value ($ Thousands) |
| |
COMMON STOCK (continued) | | | | | |
| | | |
Utilities — 3.1% | | | | | | | | | | | | |
Other Securities | | | 3.1 | % | | | | | | $ | 9,646 | |
| |
Total Common Stock
(Cost $293,892) ($ Thousands) | | | | 303,019 | |
| |
AFFILIATED PARTNERSHIP — 0.0% | | | | | |
SEI Liquidity Fund, L.P. | | | | | | | | | | | | |
2.480% **† (B) | | | 0.0 | | | | 867 | | | | 1 | |
| |
Total Affiliated Partnership
(Cost $1) ($ Thousands) | | | | 1 | |
| | | | | | | | | | | | |
| | | | |
| Description | | Percentage of
Net Assets (%) | | Shares | | Market Value ($ Thousands) |
|
CASH EQUIVALENT — 2.3% | |
SEI Daily Income Trust,
Government Fund, Cl F | | | | | |
2.220% **† | | | 2.3 | % | | | 7,163,345 | | | $ | 7,163 | |
| |
Total Cash Equivalent
(Cost $7,163) ($ Thousands) | | | | 7,163 | |
| |
Total Investments in Securities — 100.2%
(Cost $301,056) ($ Thousands) | | | $ | 310,183 | |
| | | | | | | | | | | | |
A list of the open futures contracts held by the Fund at March 31, 2019 is as follows:
| | | | | | | | | | | | | | | | | | | | |
Type of Contract | | Number of
Contracts
Long | | Expiration
Date | | | Notional Amount
(Thousands) | | Value
(Thousands) | | Unrealized
Appreciation
(Thousands) |
S&P 500 Index E-MINI | | | 40 | | | | Jun-2019 | | | $ | 5,539 | | | $ | 5,676 | | | $ | 137 | |
S&P Mid Cap 400 Index E-MINI | | | 3 | | | | Jun-2019 | | | | 563 | | | | 570 | | | | 7 | |
| | | | | | | | | | $ | 6,102 | | | $ | 6,246 | | | $ | 144 | |
| | | | | | | | | | | | | | | | | | | | |
| | Percentages are based on a Net Assets of $309,517 ($ Thousands). |
| * | Non-income producing security. |
| ** | The rate reported is the 7-day effective yield as of March 31, 2019. |
| ‡ | Real Estate Investment Trust. |
| † | Investment in Affiliated Security (see Note 6). |
| (A) | Security is a Master Limited Partnership. At March 31, 2019, such securities amounted to $43 ($ Thousands), or 0.0% of the Net Assets of the Fund (See Note 2). |
| (B) | This security was purchased with cash collateral held from securities on loan (see Note 10). The total market value of such securities as of March 31, 2019 was $1 ($ Thousands). |
Cl — Class
L.P. — Limited Partnership
PLC — Public Limited Company
S&P — Standard & Poor’s
The Summary Schedule of Investments does not reflect the complete portfolio holdings. It includes the Fund’s 50 largest holdings and each investment of any issuer that exceeds 1% of the Fund’s net assets. “Other Securities” represent all issues not required to be disclosed under the rules adopted by the U.S. Securities and Exchange Commission (“SEC”). In certain instances, securities for which footnotes listed above may otherwise apply are included in the Other Securities caption. The complete schedule of portfolio holdings is available (i) without charge, upon request, by calling (800) 342-5734; and (ii) on the SEC’s website at http://www.sec.gov.
The following is a list of the level of inputs used as of March 31, 2019, in valuing the Fund’s investments and other financial instruments carried at value ($ Thousands):
| | | | | | | | | | | | | | | | |
| | | | | |
Investments in Securities | | Level 1 | | Level 2 | | Level 3 | | Total |
Common Stock | | $ | 303,019 | | | $ | – | | | $ | – | | | $ | 303,019 | |
Affiliated Partnership | | | – | | | | 1 | | | | – | | | | 1 | |
Cash Equivalent | | | 7,163 | | | | – | | | | – | | | | 7,163 | |
| | | | | | | | | | | | | | | | |
Total Investments in Securities | | $ | 310,182 | | | $ | 1 | | | $ | – | | | $ | 310,183 | |
| | | | | | | | | | | | | | | | |
| | | | | | | | | | | | | | | | |
Other Financial Instruments | | Level 1 | | Level 2 | | Level 3 | | Total |
Futures Contracts* | | | | | | | | | | | | | | | | |
Unrealized Appreciation | | $ | 144 | | | $ | – | | | $ | – | | | $ | 144 | |
| | | | | | | | | | | | | | | | |
Total Other Financial Instruments | | $ | 144 | | | $ | – | | | $ | – | | | $ | 144 | |
| | | | | | | | | | | | | | | | |
* Futures contracts are valued at the unrealized appreciation on the instrument.
For the period ended March 31, 2019, there were no transfers between Level 1 and Level 2 assets and liabilities.
For the period ended March 31, 2019, there were no transfers between Level 2 and Level 3 assets and liabilities.
For more information on valuation inputs, see Note 2 — Significant Accounting Policies in Notes to Financial Statements.
| | |
SEI Institutional Managed Trust / Semi-Annual Report / March 31, 2019 | | 11 |
SUMMARY SCHEDULE OF INVESTMENTS (Unaudited)
March 31, 2019
Large Cap Index Fund(Concluded)
The following is a summary of the Fund’s transactions with affiliates for the period ended March 31, 2019 ($ Thousands):
| | | | | | | | | | | | | | | | | | | | | | | | | | | | |
| Security Description | | Value
9/30/18 | | Purchases at Cost | | Proceeds from
Sales | | Realized Gain | | Change in Unrealized
Depreciation | | Value
3/31/19 | | Income |
| SEI Investments Co | | | $ 73 | | | | $ 16 | | | | $ — | | | | $ — | | | | $ (11) | | | | $ 78 | | | | $ — | |
| SEI Daily Income Trust, Government Fund, Cl F | | | 4,849 | | | | 49,660 | | | | (47,346) | | | | — | | | | — | | | | 7,163 | | | | 59 | |
| SEI Liquidity Fund, L.P. | | | 173 | | | | 1,629 | | | | (1,801) | | | | — | | | | — | | | | 1 | | | | 3 | |
| | | | | | | | | | | | | | | | | | | | | | | | | | | | |
| Totals | | | $ 5,095 | | | | $ 51,305 | | | | $ (49,147) | | | | $ — | | | | $ (11) | | | | $ 7,242 | | | | $ 62 | |
| | | | | | | | | | | | | | | | | | | | | | | | | | | | |
Amounts designated as “—” are either $0 or have been rounded to $0.
The accompanying notes are an integral part of the financial statements.
| | |
12 | | SEI Institutional Managed Trust / Semi-Annual Report / March 31, 2019 |
SUMMARY SCHEDULE OF INVESTMENTS (Unaudited)
March 31, 2019
Tax-Managed Large Cap Fund
†Percentages are based on total investments. Includes investments held as collateral for securities held on loan (see Note 10).
| | | | | | | | | | | | |
| | | | |
| Description | | Percentage of Net Assets (%) | | Shares | | Market Value ($ Thousands) |
| |
COMMON STOCK — 99.0% | | | | | |
| |
Communication Services — 4.5% | | | | | |
Alphabet Inc,
Cl A * | | | 0.8 | % | | | 26,214 | | | $ | 30,851 | |
Alphabet Inc,
Cl C * | | | 0.8 | | | | 26,751 | | | | 31,387 | |
AT&T Inc | | | 0.6 | | | | 755,611 | | | | 23,696 | |
Facebook Inc,
Cl A * | | | 0.8 | | | | 173,490 | | | | 28,919 | |
Other Securities | | | 1.5 | | | | | | | | 62,825 | |
| | | | | | | | | | | 177,678 | |
Consumer Discretionary — 10.7% | | | | | |
Amazon.com Inc, Cl A * | | | 2.0 | | | | 43,128 | | | | 76,800 | |
Dollar General Corp | | | 1.3 | | | | 420,873 | | | | 50,210 | |
Home Depot Inc/The | | | 0.6 | | | | 118,848 | | | | 22,806 | |
Lowe’s Cos Inc | | | 1.3 | | | | 461,327 | | | | 50,501 | |
NIKE Inc, Cl B | | | 0.8 | | | | 389,570 | | | | 32,806 | |
Ross Stores Inc | | | 0.6 | | | | 243,090 | | | | 22,632 | |
Other Securities | | | 4.1 | | | | | | | | 163,632 | |
| | | | | | | | | | | 419,387 | |
Consumer Staples — 8.6% | | | | | |
Diageo PLC ADR | | | 0.7 | | | | 156,683 | | | | 25,635 | |
JM Smucker Co/The | | | 0.6 | | | | 188,990 | | | | 22,017 | |
PepsiCo Inc | | | 0.6 | | | | 208,706 | | | | 25,577 | |
Philip Morris International Inc | | | 1.0 | | | | 438,408 | | | | 38,751 | |
Procter & Gamble Co/The | | | 0.6 | | | | 233,806 | | | | 24,328 | |
Unilever NV | | | 0.6 | | | | 408,590 | | | | 23,817 | |
Other Securities | | | 4.5 | | | | | | | | 175,952 | |
| | | | | | | | | | | 336,077 | |
| | | | | | | | | | | | |
Energy — 6.2% | | | | | |
Chevron Corp | | | 1.1 | | | | 357,036 | | | | 43,980 | |
Exxon Mobil Corp | | | 0.6 | | | | 287,776 | | | | 23,252 | |
Occidental Petroleum Corp | | | 0.6 | | | | 339,288 | | | | 22,461 | |
Other Securities | | | 3.9 | | | | | | | | 150,964 | |
| | | | | | | | | | | 240,657 | |
Financials — 16.7% | | | | | |
Aflac Inc | | | 0.7 | | | | 525,317 | | | | 26,266 | |
Bank of America Corp | | | 1.1 | | | | 1,550,747 | | | | 42,785 | |
Citigroup Inc | | | 0.6 | | | | 379,987 | | | | 23,643 | |
| | | | | | | | | | | | |
| | | | |
| Description | | Percentage of Net Assets (%) | | Shares | | Market Value ($ Thousands) |
| |
COMMON STOCK (continued) | | | | | |
JPMorgan Chase & Co | | | 1.2 | % | | | 478,943 | | | $ | 48,483 | |
Moody’s Corp | | | 1.3 | | | | 288,575 | | | | 52,258 | |
MSCI Inc, Cl A | | | 1.1 | | | | 225,501 | | | | 44,839 | |
US Bancorp | | | 0.7 | | | | 529,468 | | | | 25,515 | |
Other Securities
‡(A)(B) | | | 10.0 | | | | | | | | 388,157 | |
| | | | | | | | | | | 651,946 | |
Health Care — 16.5% | | | | | |
Abbott Laboratories | | | 0.6 | | | | 274,129 | | | | 21,914 | |
Amgen Inc, Cl A | | | 0.7 | | | | 145,948 | | | | 27,727 | |
Becton Dickinson and Co | | | 1.6 | | | | 250,061 | | | | 62,448 | |
Eli Lilly & Co | | | 0.7 | | | | 209,143 | | | | 27,138 | |
Johnson & Johnson | | | 2.5 | | | | 707,789 | | | | 98,942 | |
Merck & Co Inc | | | 1.8 | | | | 866,971 | | | | 72,106 | |
Pfizer Inc | | | 0.9 | | | | 861,349 | | | | 36,581 | |
UnitedHealth Group Inc | | | 2.2 | | | | 343,376 | | | | 84,903 | |
Other Securities (C) | | | 5.5 | | | | | | | | 212,674 | |
| | | | | | | | | | | 644,433 | |
Industrials — 10.3% | | | | | |
3M Co | | | 0.8 | | | | 157,724 | | | | 32,772 | |
Graco Inc | | | 0.7 | | | | 568,764 | | | | 28,165 | |
Middleby Corp/The * | | | 0.7 | | | | 198,419 | | | | 25,800 | |
Roper Technologies Inc | | | 0.6 | | | | 67,713 | | | | 23,156 | |
Other Securities | | | 7.5 | | | | | | | | 293,794 | |
| | | | | | | | | | | 403,687 | |
Information Technology — 16.5% | | | | | |
Adobe Inc * | | | 0.9 | | | | 137,412 | | | | 36,619 | |
Apple Inc | | | 1.3 | | | | 266,564 | | | | 50,634 | |
Cisco Systems Inc | | | 0.8 | | | | 569,792 | | | | 30,763 | |
Intel Corp | | | 0.8 | | | | 571,741 | | | | 30,702 | |
Intuit Inc | | | 1.1 | | | | 156,005 | | | | 40,781 | |
Mastercard Inc, Cl A | | | 1.7 | | | | 286,090 | | | | 67,360 | |
Microchip Technology Inc (A) | | | 0.7 | | | | 304,799 | | | | 25,286 | |
Microsoft Corp | | | 1.8 | | | | 592,146 | | | | 69,838 | |
Oracle Corp, Cl B | | | 0.7 | | | | 512,747 | | | | 27,540 | |
Visa Inc, Cl A | | | 1.4 | | | | 358,604 | | | | 56,010 | |
Other Securities | | | 5.3 | | | | | | | | 208,159 | |
| | | | | | | | | | | 643,692 | |
Materials — 4.0% | | | | | |
Ecolab Inc | | | 0.6 | | | | 134,113 | | | | 23,676 | |
Sherwin-Williams Co/The, Cl A | | | 1.0 | | | | 89,695 | | | | 38,633 | �� |
Other Securities | | | 2.4 | | | | | | | | 94,079 | |
| | | | | | | | | | | 156,388 | |
Real Estate — 2.9% | | | | | |
American Tower Corp, Cl A ‡ | | | 0.7 | | | | 132,020 | | | | 26,016 | |
HCP Inc ‡ | | | 0.6 | | | | 775,087 | | | | 24,260 | |
Other Securities‡ | | | 1.6 | | | | | | | | 64,475 | |
| | | | | | | | | | | 114,751 | |
| | |
SEI Institutional Managed Trust / Semi-Annual Report / March 31, 2019 | | 13 |
SUMMARY SCHEDULE OF INVESTMENTS (Unaudited)
March 31, 2019
Tax-Managed Large Cap Fund(Concluded)
| | | | | | | | | | | | |
| | | | |
| Description | | Percentage of Net Assets (%) | | Shares | | Market Value ($ Thousands) |
| |
COMMON STOCK (continued) | | | | | |
| | | |
Utilities — 2.1% | | | | | | | | | | | | |
Other Securities | | | 2.1 | % | | | | | | $ | 81,060 | |
| |
Total Common Stock
(Cost $2,141,705) ($ Thousands) | | | | 3,869,756 | |
| |
AFFILIATED PARTNERSHIP — 0.9% | | | | | |
SEI Liquidity Fund, L.P. | | | | | |
2.480% **†(D) | | | 0.9 | | | | 36,664,327 | | | | 36,664 | |
| |
Total Affiliated Partnership
(Cost $36,662) ($ Thousands) | | | | 36,664 | |
| | | | | | | | | | | | |
| | | | |
| Description | | Percentage of Net Assets (%) | | Shares | | Market Value ($ Thousands) |
|
CASH EQUIVALENT — 0.9% | |
SEI Daily Income Trust, Government Fund, Cl F | | | | | | | | | | | | |
2.220% **† | | | 0.9 | % | | | 36,551,380 | | | $ | 36,551 | |
| |
Total Cash Equivalent
(Cost $36,551) ($ Thousands) | | | | 36,551 | |
| |
Total Investments in Securities — 100.8%
(Cost $2,214,918) ($ Thousands) | | | $ | 3,942,971 | |
| | | | | | | | | | | | |
A list of the open futures contracts held at March 31, 2019 is as follows:
| | | | | | | | | | | | | | | | | | | | |
Type of Contract | | Number of Contracts Long/(Short) | | | Expiration
Date | | | Notional Amount
(Thousands) | | | Value
(Thousands) | | | Unrealized
Appreciation
(Thousands) | |
| S&P 500 Index E-MINI | | | 180 | | | | Jun-2019 | | | $ | 25,019 | | | $ | 25,540 | | | $ | 521 | |
| S&P Mid Cap 400 Index E-MINI | | | 11 | | | | Jun-2019 | | | | 2,058 | | | | 2,091 | | | | 33 | |
| | | | | | | | | | $ | 27,077 | | | $ | 27,631 | | | $ | 554 | |
| | | | | | | | | | | | | | | | | | | | |
| | Percentages are based on a Net Assets of $3,909,752 ($ Thousands). |
| * | Non-income producing security. |
| ** | The rate reported is the 7-day effective yield as of March 31, 2019. |
| ‡ | Real Estate Investment Trust. |
| † | Investment in Affiliated Security (see Note 6). |
| (A) | Certain securities or partial positions of certain securities are on loan at March 31, 2019 (see Note 10). The total market value of securities on loan at March 31, 2019, was $36,153 ($ Thousands). |
| (B) | Security is a Master Limited Partnership. At March 31, 2019, such securities amounted to $1,563 ($ Thousands), or 0.0% of Net Assets (See Note 2). |
| (C) | Securities considered illiquid. The total value of such securities as of March 31, 2019 was $4,397 ($ Thousands) and represented 0.1% of Net Assets. |
| (D) | This security was purchased with cash collateral held from securities on loan (see Note 10). The total market value of such securities as of March 31, 2019 was $36,664 ($ Thousands). |
ADR — American Depositary Receipt
Cl — Class
L.P. — Limited Partnership
PLC — Public Limited Company
S&P — Standard & Poor’s
The Summary Schedule of Investments does not reflect the complete portfolio holdings. It includes the Fund’s 50 largest holdings and each investment of any issuer that exceeds 1% of the Fund’s net assets. “Other Securities” represent all issues not required to be disclosed under the rules adopted by the U.S. Securities and Exchange Commission (“SEC”). In certain instances, securities for which footnotes listed above may otherwise apply are included in the Other Securities caption. The complete schedule of portfolio holdings is available (i) without charge, upon request, by calling (800) 342-5734; and (ii) on the SEC’s website at http://www.sec.gov.
The following is a list of the level of inputs used as of March 31, 2019, in valuing the Fund’s investments carried at value ($ Thousands):
| | | | | | | | | | | | | | | | |
| | | | | |
Investments in
Securities | | Level 1 | | Level 2 | | Level 3 | | Total |
Common Stock | | $ | 3,869,756 | | | $ | – | | | $ | – | | | $ | 3,869,756 | |
Affiliated Partnership | | | – | | | | 36,664 | | | | – | | | | 36,664 | |
Cash Equivalent | | | 36,551 | | | | – | | | | – | | | | 36,551 | |
| | | | | | | | | | | | | | | | |
Total Investments in Securities | | $ | 3,906,307 | | | $ | 36,664 | | | $ | – | | | $ | 3,942,971 | |
| | | | | | | | | | | | | | | | |
| | | | | | | | | | | | | | | | |
Other Financial
Instruments | | Level 1 | | Level 2 | | Level 3 | | Total |
Futures Contracts* | | | | | | | | | | | | | | | | |
Unrealized Appreciation | | $ | 554 | | | $ | – | | | $ | – | | | $ | 554 | |
| | | | | | | | | | | | | | | | |
Total Other Financial Instruments | | $ | 554 | | | $ | – | | | $ | – | | | $ | 554 | |
| | | | | | | | | | | | | | | | |
* Futures contracts are valued at the unrealized appreciation on the instrument.
For the period ended March 31, 2019, there were no transfers between Level 1 and Level 2 assets and liabilities.
For the period ended March 31, 2019, there were no transfers between Level 2 and Level 3 assets and liabilities.
For more information on valuation inputs, see Note 2 — Significant Accounting Policies in Notes to Financial Statements.
| | |
14 | | SEI Institutional Managed Trust / Semi-Annual Report / March 31, 2019 |
The following is a summary of the Fund’s transactions with affiliates for the period ended March 31, 2019 ($ Thousands):
| | | | | | | | | | | | | | |
| Security Description | | Value 9/30/18 | | Purchases at
Cost | | Proceeds from
Sales | | Realized Gain | | Change in Unrealized
Appreciation | | Value 3/31/19 | | Income |
SEI Liquidity Fund, L.P. | | $ 37,560 | | $ 178,454 | | $ (179,362) | | $ 10 | | $ 2 | | $ 36,664 | | $ 44 |
| SEI Daily Income Trust, Government Fund, Cl F | | 14,303 | | 294,577 | | (272,329) | | — | | — | | 36,551 | | 500 |
| | | | | | | | | | | | | | |
Totals | | $ 51,863 | | $ 473,031 | | $ (451,691) | | $ 10 | | $ 2 | | $ 73,215 | | $ 544 |
Amounts designated as “—” are either $0 or have been rounded to $0.
The accompanying notes are an integral part of the financial statements.
| | |
SEI Institutional Managed Trust / Semi-Annual Report / March 31, 2019 | | 15 |
SUMMARY SCHEDULE OF INVESTMENTS (Unaudited)
March 31, 2019
S&P 500 Index Fund
†Percentages are based on total investments. Includes investments held as collateral for securities held on loan (see Note 10).
| | | | | | | | | | | | |
| | | | |
| Description | | Percentage of
Net Assets (%) | | Shares | | Market Value
($ Thousands) |
| |
COMMON STOCK — 98.5% | | | | | |
| |
Communication Services — 9.9% | | | | | |
Alphabet Inc, Cl A * | | | 1.5 | % | | | 10,300 | | | $ | 12,122 | |
Alphabet Inc, Cl C * | | | 1.5 | | | | 10,612 | | | | 12,451 | |
AT&T Inc | | | 1.0 | | | | 251,293 | | | | 7,880 | |
Comcast Corp, Cl A | | | 0.8 | | | | 155,896 | | | | 6,233 | |
Facebook Inc, Cl A * | | | 1.7 | | | | 82,309 | | | | 13,720 | |
Netflix Inc * | | | 0.7 | | | | 15,100 | | | | 5,384 | |
Verizon Communications Inc | | | 1.0 | | | | 142,596 | | | | 8,432 | |
Walt Disney Co/The | | | 0.8 | | | | 60,194 | | | | 6,683 | |
Other Securities | | | 0.9 | | | | | | | | 9,407 | |
| | | | | | | | | | | 82,312 | |
Consumer Discretionary — 10.0% | | | | | |
Amazon.com Inc, Cl A * | | | 3.1 | | | | 14,252 | | | | 25,379 | |
Home Depot Inc/The | | | 0.9 | | | | 39,045 | | | | 7,492 | |
McDonald’s Corp | | | 0.6 | | | | 26,517 | | | | 5,036 | |
Other Securities | | | 5.4 | | | | | | | | 44,888 | |
| | | | | | | | | | | 82,795 | |
Consumer Staples — 7.2% | | | | | |
Coca-Cola Co/The | | | 0.8 | | | | 133,549 | | | | 6,258 | |
PepsiCo Inc | | | 0.7 | | | | 48,515 | | | | 5,945 | |
Philip Morris International Inc | | | 0.6 | | | | 53,787 | | | | 4,754 | |
Procter & Gamble Co/The | | | 1.1 | | | | 86,308 | | | | 8,980 | |
Walmart Inc | | | 0.6 | | | | 49,461 | | | | 4,824 | |
Other Securities | | | 3.4 | | | | | | | | 29,099 | |
| | | | | | | | | | | 59,860 | |
Energy — 5.4% | | | | | |
Chevron Corp | | | 1.0 | | | | 65,623 | | | | 8,083 | |
Exxon Mobil Corp | | | 1.4 | | | | 146,446 | | | | 11,833 | |
Other Securities | | | 3.0 | | | | | | | | 24,436 | |
| | | | | | | | | | | 44,352 | |
Financials — 12.5% | | | | | |
Bank of America Corp | | | 1.0 | | | | 309,945 | | | | 8,551 | |
Berkshire Hathaway Inc, Cl B * | | | 1.6 | | | | 67,117 | | | | 13,483 | |
Citigroup Inc | | | 0.6 | | | | 81,651 | | | | 5,080 | |
JPMorgan Chase & Co | | | 1.4 | | | | 113,000 | | | | 11,439 | |
Wells Fargo & Co | | | 0.8 | | | | 141,215 | | | | 6,823 | |
| | | | | | | | | | | | |
| | | | |
| Description | | Percentage of
Net Assets (%) | | Shares | | Market Value
($ Thousands) |
| |
COMMON STOCK (continued) | | | | | |
Other Securities | | | 7.1 | % | | | | | | $ | 58,172 | |
| | | | | | | | | | | 103,548 | |
Health Care — 14.4% | | | | | |
Abbott Laboratories | | | 0.6 | | | | 60,719 | | | | 4,854 | |
AbbVie Inc | | | 0.5 | | | | 50,868 | | | | 4,099 | |
Amgen Inc, Cl A | | | 0.5 | | | | 21,629 | | | | 4,109 | |
Eli Lilly & Co | | | 0.5 | | | | 29,906 | | | | 3,881 | |
Johnson & Johnson | | | 1.5 | | | | 91,954 | | | | 12,854 | |
Medtronic PLC | | | 0.5 | | | | 46,572 | | | | 4,242 | |
Merck & Co Inc | | | 0.9 | | | | 89,274 | | | | 7,425 | |
Pfizer Inc | | | 1.0 | | | | 191,556 | | | | 8,135 | |
Thermo Fisher Scientific Inc | | | 0.5 | | | | 13,952 | | | | 3,819 | |
UnitedHealth Group Inc | | | 1.0 | | | | 33,128 | | | | 8,191 | |
Other Securities | | | 6.9 | | | | | | | | 57,257 | |
| | | | | | | | | | | 118,866 | |
Industrials — 9.3% | | | | | |
3M Co | | | 0.5 | | | | 20,001 | | | | 4,156 | |
Boeing Co/The | | | 0.8 | | | | 18,141 | | | | 6,919 | |
Honeywell International Inc | | | 0.5 | | | | 25,151 | | | | 3,997 | |
Union Pacific Corp | | | 0.5 | | | | 24,893 | | | | 4,162 | |
Other Securities | | | 7.0 | | | | | | | | 58,090 | |
| | | | | | | | | | | 77,324 | |
Information Technology — 20.9% | | | | | |
Accenture PLC, Cl A | | | 0.5 | | | | 22,204 | | | | 3,908 | |
Adobe Inc * | | | 0.5 | | | | 16,841 | | | | 4,488 | |
Apple Inc | | | 3.5 | | | | 154,682 | | | | 29,382 | |
Broadcom Inc | | | 0.5 | | | | 13,646 | | | | 4,103 | |
Cisco Systems Inc | | | 1.0 | | | | 151,861 | | | | 8,199 | |
Intel Corp | | | 1.0 | | | | 155,163 | | | | 8,332 | |
International Business Machines Corp | | | 0.5 | | | | 30,933 | | | | 4,365 | |
Mastercard Inc, Cl A | | | 0.9 | | | | 31,217 | | | | 7,350 | |
Microsoft Corp | | | 3.8 | | | | 264,889 | | | | 31,241 | |
Oracle Corp, Cl B | | | 0.6 | | | | 88,523 | | | | 4,755 | |
PayPal Holdings Inc * | | | 0.5 | | | | 40,549 | | | | 4,211 | |
salesforce.com Inc * | | | 0.5 | | | | 26,609 | | | | 4,214 | |
Visa Inc, Cl A | | | 1.1 | | | | 60,418 | | | | 9,437 | |
Other Securities | | | 6.0 | | | | | | | | 48,924 | |
| | | | | | | | | | | 172,909 | |
Materials — 2.6% | | | | | |
DowDuPont Inc | | | 0.5 | | | | 77,721 | | | | 4,143 | |
Other Securities | | | 2.1 | | | | | | | | 17,332 | |
| | | | | | | | | | | 21,475 | |
Real Estate — 3.0% | | | | | |
Other Securities‡ | | | 3.0 | | | | | | | | 25,098 | |
| |
Utilities — 3.3% | | | | | |
Other Securities | | | 3.3 | | | | | | | | 27,159 | |
| | |
Total Common Stock
(Cost $331,078) ($ Thousands) | | | | | | | | 815,698 | |
| | |
16 | | SEI Institutional Managed Trust / Semi-Annual Report / March 31, 2019 |
| | | | | | | | | | | | |
| | | | |
| Description | | Percentage of
Net Assets (%) | | Shares | | Market Value
($ Thousands) |
| |
U.S. TREASURY OBLIGATION — 0.1% | | | | | |
Other Securities
(A)(B) | | | 0.1 | % | | | | | | $ | 796 | |
| | |
Total U.S. Treasury Obligation
(Cost $796) ($ Thousands) | | | | | | | | 796 | |
| |
AFFILIATED PARTNERSHIP — 0.0% | | | | | |
SEI Liquidity Fund, L.P. | | | | | | | | | | | | |
2.480% **†(C) | | | 0.0 | | | | 2,074 | | | | 2 | |
| | |
Total Affiliated Partnership
(Cost $2) ($ Thousands) | | | | | | | | 2 | |
| | | | | | | | | | | | |
| | | | |
| Description | | Percentage of
Net Assets (%) | | Shares | | Market Value
($ Thousands) |
| |
CASH EQUIVALENT — 1.3% | | | | | |
SEI Daily Income Trust, Government Fund, Cl F | | | | | | | | | | | | |
2.220% **† | | | 1.3 | % | | | 10,857,162 | | | $ | 10,857 | |
| |
Total Cash Equivalent
(Cost $10,857) ($ Thousands) | | | | 10,857 | |
| |
Total Investments in Securities — 99.9%
(Cost $342,733) ($ Thousands) | | | $ | 827,353 | |
| | | | | | | | | | | | |
A list of the open futures contracts held by the Fund at March 31, 2019 is as follows:
| | | | | | | | | | | | | | | | | | | | |
Type of Contract | | Number of
Contracts
Long | | | Expiration
Date | | | Notional Amount
(Thousands) | | | Value
(Thousands) | | | Unrealized
Appreciation
(Thousands) | |
S&P 500 Index E-MINI | | | 88 | | | | Jun-2019 | | | $ | 12,186 | | | $ | 12,486 | | | $ | 300 | |
| | | | | | | | | | | | | | | | | | | | |
| | Percentages are based on Net Assets of $828,017 ($ Thousands). |
| * | Non-income producing security. |
| ** | Rate shown is the 7-day effective yield as of March 31, 2019. |
| ‡ | Real Estate Investment Trust. |
| † | Investment in Affiliated Security (see Note 6). |
| (A) | Security, or portion thereof, has been pledged as collateral on open futures contracts. |
| (B) | Zero coupon security. The rate shown on the Schedule of Investments is the security’s effective yield at the time of purchase. |
| (C) | This security was purchased with cash collateral held from securities on loan. The total market value of such securities as of March 31, 2019 was $2 ($ Thousands). |
Cl — Class
L.P. — Limited Partnership
PLC — Public Limited Company
S&P — Standard & Poor’s
The Summary Schedule of Investments does not reflect the complete portfolio holdings. It includes the Fund’s 50 largest holdings and each investment of any issuer that exceeds 1% of the Fund’s net assets. “Other Securities” represent all issues not required to be disclosed under the rules adopted by the U.S. Securities and Exchange Commission (“SEC”). In certain instances, securities for which footnotes listed above may otherwise apply are included in the Other Securities caption. The complete schedule of portfolio holdings is available (i) without charge, upon request, by calling (800) 342-5734; and (ii) on the SEC’s website at http://www.sec.gov.
The following is a list of the level of inputs used as of March 31, 2019, in valuing the Fund’s investments and other financial instruments carried at value ($ Thousands):
| | | | | | | | | | | | | | | | |
| | | | | |
Investments in Securities | | Level 1 | | Level 2 | | Level 3 | | Total |
Common Stock | | $ | 815,698 | | | $ | – | | | $ | – | | | $ | 815,698 | |
U.S. Treasury Obligation | | | – | | | | 796 | | | | – | | | | 796 | |
Affiliated Partnership | | | – | | | | 2 | | | | – | | | | 2 | |
Cash Equivalent | | | 10,857 | | | | – | | | | – | | | | 10,857 | |
| | | | | | | | | | | | | | | | |
Total Investments in Securities | | $ | 826,555 | | | $ | 798 | | | $ | – | | | $ | 827,353 | |
| | | | | | | | | | | | | | | | |
| | | | | | | | | | | | | | | | |
Other Financial
Instruments | | Level 1 | | Level 2 | | Level 3 | | Total |
Futures Contracts* | | | | | | | | | | | | | | | | |
Unrealized Appreciation | | $ | 300 | | | $ | – | | | $ | – | | | $ | 300 | |
| | | | | | | | | | | | | | | | |
Total Other Financial Instruments | | $ | 300 | | | $ | – | | | $ | – | | | $ | 300 | |
| | | | | | | | | | | | | | | | |
* Futures contracts are valued at the unrealized appreciation on the instrument.
For the period ended March 31, 2019, there were no transfers between Level 1 and Level 2 assets and liabilities.
For the period ended March 31, 2019, there were no transfers between Level 2 and Level 3 assets and liabilities.
For more information on valuation inputs, see Note 2 — Significant Accounting Policies in Notes to Financial Statements.
| | |
SEI Institutional Managed Trust / Semi-Annual Report / March 31, 2019 | | 17 |
SUMMARY SCHEDULE OF INVESTMENTS (Unaudited)
March 31, 2019
S&P 500 Index Fund(Concluded)
The following is a summary of the Fund’s transactions with affiliates for the period ended March 31, 2019 ($ Thousands):
| | | | | | | | | | | | | | | | | | | | | | | | | | | | |
| Security Description | | Value
9/30/18 | | | Purchases at Cost | | | Proceeds from
Sales | | | Realized Gain | | | Change in Unrealized
Depreciation | | | Value
3/31/19 | | | Income | |
SEI Liquidity Fund, L.P. | | | $ 1,791 | | | | $ 6,940 | | | | $ (8,729) | | | | $ — | | | | $ — | | | | $ 2 | | | | $ 6 | |
| SEI Daily Income Trust, Government Fund, Cl F | | | 18,431 | | | | 61,940 | | | | (69,514) | | | | — | | | | — | | | | 10,857 | | | | 112 | |
| | | | | | | | | | | | | | | | | | | | | | | | | | | | |
Totals | | | $ 20,222 | | | | $ 68,880 | | | | $ (78,243) | | | | $ — | | | | $ — | | | | $ 10,859 | | | | $ 118 | |
| | | | | | | | | | | | | | | | | | | | | | | | | | | | |
Amounts designated as “—” are either $0 or have been rounded to $0.
The accompanying notes are an integral part of the financial statements.
| | |
18 | | SEI Institutional Managed Trust / Semi-Annual Report / March 31, 2019 |
SUMMARY SCHEDULE OF INVESTMENTS (Unaudited)
March 31, 2019
Small Cap Fund
†Percentages are based on total investments. Includes investments held as collateral for securities held on loan (see Note 10).
| | | | | | | | | | | | |
| | | | |
| Description | | Percentage of
Net Assets (%) | | Shares | | Market Value
($ Thousands) |
|
COMMON STOCK — 97.3% | |
| |
Communication Services — 3.2% | | | | | |
Cable One Inc | | | 0.4 | % | | | 2,531 | | | $ | 2,484 | |
Cogent Communications Holdings Inc | | | 0.5 | | | | 52,086 | | | | 2,826 | |
Nexstar Media Group Inc, Cl A | | | 0.6 | | | | 31,330 | | | | 3,395 | |
Other Securities (A) | | | 1.7 | | | | | | | | 11,020 | |
| | | | | | | | | | | 19,725 | |
Consumer Discretionary — 12.8% | | | | | |
Big Lots Inc | | | 0.8 | | | | 126,909 | | | | 4,825 | |
Modine Manufacturing Co * | | | 0.5 | | | | 227,034 | | | | 3,149 | |
Pool Corp | | | 0.5 | | | | 18,001 | | | | 2,970 | |
Skechers U.S.A. Inc, Cl A * | | | 0.8 | | | | 138,228 | | | | 4,646 | |
Tractor Supply Co | | | 0.4 | | | | 26,898 | | | | 2,630 | |
Other Securities (A) | | | 9.8 | | | | | | | | 61,300 | |
| | | | | | | | | | | 79,520 | |
Consumer Staples — 5.2% | | | | | | | | | |
Church & Dwight Co Inc | | | 0.4 | | | | 33,935 | | | | 2,417 | |
Hain Celestial Group Inc/The * | | | 0.9 | | | | 232,099 | | | | 5,366 | |
Pilgrim’s Pride Corp * | | | 0.7 | | | | 196,859 | | | | 4,388 | |
TreeHouse Foods Inc * | | | 0.5 | | | | 43,996 | | | | 2,840 | |
Other Securities | | | 2.7 | | | | | | | | 17,488 | |
| | | | | | | | | | | 32,499 | |
Energy — 3.1% | | | | | | | | | |
Gulfport Energy Corp * | | | 0.5 | | | | 377,859 | | | | 3,031 | |
Range Resources Corp | | | 0.5 | | | | 252,291 | | | | 2,836 | |
Other Securities
(A)(B) | | | 2.1 | | | | | | | | 13,188 | |
| | | | | | | | | | | 19,055 | |
Financials — 16.1% | | | | | | | | | |
Affiliated Managers Group Inc | | | 0.5 | | | | 27,509 | | | | 2,947 | |
American Equity Investment Life Holding Co | | | 0.7 | | | | 165,173 | | | | 4,463 | |
Bank OZK | | | 0.4 | | | | 93,895 | | | | 2,721 | |
| | | | | | | | | | | | |
| | | | |
| Description | | Percentage of
Net Assets (%) | | Shares | | Market Value
($ Thousands) |
| | |
COMMON STOCK (continued) | | | | | | | | | |
BankUnited Inc | | | 1.1 | % | | | 197,240 | | | $ | 6,588 | |
CNO Financial Group Inc | | | 0.7 | | | | 277,492 | | | | 4,490 | |
First Commonwealth Financial Corp | | | 0.6 | | | | 284,206 | | | | 3,581 | |
FNB Corp/PA | | | 1.1 | | | | 620,026 | | | | 6,572 | |
Great Western Bancorp Inc | | | 0.5 | | | | 105,024 | | | | 3,318 | |
MarketAxess Holdings Inc | | | 0.4 | | | | 10,279 | | | | 2,529 | |
MSCI Inc, Cl A | | | 0.4 | | | | 12,477 | | | | 2,481 | |
National General Holdings Corp | | | 0.8 | | | | 204,145 | | | | 4,844 | |
Umpqua Holdings Corp | | | 0.8 | | | | 288,953 | | | | 4,768 | |
Other Securities‡(A) | | | 8.1 | | | | | | | | 50,323 | |
| | | | | | | | | | | 99,625 | |
Health Care — 12.6% | | | | | | | | | |
Ensign Group Inc/The | | | 0.6 | | | | 67,723 | | | | 3,467 | |
Integra LifeSciences Holdings Corp * | | | 0.3 | | | | 30,297 | | | | 1,688 | |
Ligand Pharmaceuticals Inc * | | | 0.5 | | | | 23,725 | | | | 2,982 | |
Magellan Health Inc * | | | 0.8 | | | | 70,639 | | | | 4,657 | |
STERIS PLC | | | 0.4 | | | | 19,822 | | | | 2,538 | |
Other Securities (A) | | | 10.0 | | | | | | | | 62,784 | |
| | | | | | | | | | | 78,116 | |
Industrials — 15.8% | | | | | | | | | |
AECOM * | | | 0.5 | | | | 99,526 | | | | 2,953 | |
Apogee Enterprises Inc | | | 0.8 | | | | 127,895 | | | | 4,795 | |
Atlas Air Worldwide Holdings Inc * | | | 0.8 | | | | 95,014 | | | | 4,804 | |
Badger Meter Inc | | | 0.5 | | | | 49,771 | | | | 2,769 | |
BWX Technologies Inc, Cl W | | | 0.5 | | | | 61,980 | | | | 3,073 | |
KAR Auction Services Inc | | | 0.5 | | | | 53,585 | | | | 2,749 | |
Other Securities
(A)(B)(D) | | | 12.2 | | | | | | | | 76,591 | |
| | | | | | | | | | | 97,734 | |
Information Technology — 17.7% | | | | | |
Euronet Worldwide Inc * | | | 0.4 | | | | 18,940 | | | | 2,701 | |
FireEye Inc * | | | 0.4 | | | | 150,099 | | | | 2,520 | |
j2 Global Inc | | | 0.6 | | | | 40,014 | | | | 3,465 | |
MACOM Technology Solutions Holdings Inc * | | | 0.4 | | | | 161,371 | | | | 2,696 | |
NCR Corp * | | | 0.4 | | | | 95,181 | | | | 2,597 | |
Semtech Corp * | | | 0.4 | | | | 46,727 | | | | 2,379 | |
Super Micro Computer Inc *(D) | | | 0.9 | | | | 265,590 | | | | 5,611 | |
Trade Desk Inc/The, Cl A * | | | 0.5 | | | | 14,586 | | | | 2,887 | |
Other Securities (A) | | | 13.7 | | | | | | | | 85,144 | |
| | | | | | | | | | | 110,000 | |
Materials — 5.2% | | | | | | | | | |
Commercial Metals Co, Cl A | | | 0.5 | | | | 193,282 | | | | 3,301 | |
Owens-Illinois Inc | | | 0.9 | | | | 276,467 | | | | 5,247 | |
United States Steel Corp | | | 0.4 | | | | 132,028 | | | | 2,573 | |
Other Securities (A) | | | 3.4 | | | | | | | | 21,098 | |
| | | | | | | | | | | 32,219 | |
Real Estate — 3.5% | | | | | | | | | |
Other Securities‡ | | | 3.5 | | | | | | | | 21,909 | |
| | |
SEI Institutional Managed Trust / Semi-Annual Report / March 31, 2019 | | 19 |
SUMMARY SCHEDULE OF INVESTMENTS (Unaudited)
March 31, 2019
Small Cap Fund(Concluded)
| | | | | | | | | | | | |
| | | | |
| Description | | Percentage of
Net Assets (%) | | Shares | | Market Value
($ Thousands) |
| |
COMMON STOCK (continued) | | | | | |
| | | |
Utilities — 2.1% | | | | | | | | | | | | |
American States Water Co | | | 0.4 | % | | | 35,874 | | | $ | 2,558 | |
Portland General Electric Co | | | 0.5 | | | | 51,351 | | | | 2,662 | |
Other Securities (A) | | | 1.2 | | | | | | | | 7,567 | |
| | | | | | | | | | | 12,787 | |
Total Common Stock
(Cost $557,214) ($ Thousands) | | | | 603,189 | |
| |
EXCHANGE TRADED FUND — 0.2% | | | | | |
Other Securities (A) | | | 0.2 | | | | | | | | 1,404 | |
Total Exchange Traded Fund
(Cost $1,505) ($ Thousands) | | | | 1,404 | |
| |
AFFILIATED PARTNERSHIP — 3.8% | | | | | |
SEI Liquidity Fund, L.P. | | | | | | | | | | | | |
2.480% **†(C) | | | 3.8 | | | | 23,189,100 | | | | 23,186 | |
| |
Total Affiliated Partnership
(Cost $23,188) ($ Thousands) | | | | 23,186 | |
| |
CASH EQUIVALENT — 2.4% | | | | | |
SEI Daily Income Trust, Government Fund, Cl F | | | | | | | | | | | | |
2.220% **† | | | 2.4 | | | | 14,894,231 | | | | 14,894 | |
| |
Total Cash Equivalent
(Cost $14,894) ($ Thousands) | | | | 14,894 | |
| |
Total Investments in Securities — 103.7%
(Cost $596,801) ($ Thousands) | | | $ | 642,673 | |
| | | | | | | | | | | | |
| | Percentages are based on a Net Assets of $619,789 ($ Thousands). |
| * | Non-income producing security. |
| ** | The rate reported is the 7-day effective yield as of March 31, 2019. |
| ‡ | Real Estate Investment Trust. |
| † | Investment in Affiliated Security (see Note 6). |
| (A) | Certain securities or partial positions of certain securities are on loan at March 31, 2019 (see Note 10). The total market value of securities on loan at March 31, 2019, was $22,756 ($ Thousands). |
| (B) | Security is a Master Limited Partnership. At March 31, 2019, such securities amounted to $3,254 ($ Thousands), or 0.5% of Net Assets (See Note 2). |
| (C) | This security was purchased with cash collateral held from securities on loan (see Note 10). The total market value of such securities as of March 31, 2019 was $23,186 ($ Thousands). |
| (D) | Securities considered illiquid. The total value of such securities as of March 31, 2019 was $6,184 ($ Thousands) and 1.0% of Net Assets. |
Cl — Class
L.P. — Limited Partnership
PLC — Public Limited Company
The Summary Schedule of Investments does not reflect the complete portfolio holdings. It includes the Fund’s 50 largest holdings and each investment of any issuer that exceeds 1% of the Fund’s net assets. “Other Securities” represent all issues not required to be disclosed under the rules adopted by the U.S. Securities and Exchange Commission (“SEC”). In certain instances, securities for which footnotes listed above may otherwise apply are included in the Other Securities caption. The complete schedule of portfolio holdings is available (i) without charge, upon request, by calling (800) 342-5734; and (ii) on the SEC’s website at http://www.sec.gov.
| | |
20 | | SEI Institutional Managed Trust / Semi-Annual Report / March 31, 2019 |
The following is a list of the level of inputs used as of March 31, 2019, in valuing the Fund’s investments and other financial instruments carried at value ($ Thousands):
| | | | | | | | | | | | | | | | |
| | | | | |
| Investments in Securities | | Level 1 | | Level 2 | | Level 3 | | Total |
Common Stock | | $ | 603,189 | | | $ | – | | | $ | – | | | $ | 603,189 | |
Exchange Traded Fund | | | 1,404 | | | | – | | | | – | | | | 1,404 | |
Affiliated Partnership | | | – | | | | 23,186 | | | | – | | | | 23,186 | |
Cash Equivalent | | | 14,894 | | | | – | | | | – | | | | 14,894 | |
| | | | | | | | | | | | | | | | |
Total Investments in Securities | | $ | 619,487 | | | $ | 23,186 | | | $ | – | | | $ | 642,673 | |
| | | | | | | | | | | | | | | | |
For the period ended March 31, 2019, there were no transfers between Level 1 and Level 2 assets and liabilities.
For the period ended March 31, 2019, there were no transfers between Level 2 and Level 3 assets and liabilities.
For more information on valuation inputs, see Note 2 — Significant Accounting Policies in Notes to Financial Statements.
The following is a summary of the Fund’s transactions with affiliates for the period ended March 31, 2019 ($ Thousands):
| | | | | | | | | | | | | | |
| Security Description | | Value 9/30/2018 | | Purchases at
Cost | | Proceeds from
Sales | | Realized Gain
(Loss) | | Change in
Unrealized
Appreciation
(Depreciation) | | Value
3/31/2019 | | Income |
| SEI Liquidity Fund, L.P. | | $ 50,875 | | $ 68,728 | | $ (96,420) | | $ — | | $ 3 | | $ 23,186 | | $ 97 |
| SEI Daily Income Trust, Government Fund, CI F | | 16,607 | | 66,474 | | (68,187) | | — | | — | | 14,894 | | 127 |
| | | | | | | | | | | | | | |
Totals | | $ 67,482 | | $ 135,202 | �� | $ (164,607) | | $ — | | $ 3 | | $ 38,080 | | $ 224 |
| | | | | | | | | | | | | | |
Amounts designated as “—” are either $0 or have been rounded to $0.
The accompanying notes are an integral part of the financial statements.
| | |
SEI Institutional Managed Trust / Semi-Annual Report / March 31, 2019 | | 21 |
SUMMARY SCHEDULE OF INVESTMENTS (Unaudited)
March 31, 2019
Small Cap Value Fund
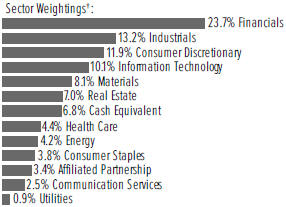
†Percentages are based on total investments. Includes investments held as collateral for securities held on loan (see Note 10).
| | | | | | | | | | | | |
| | | | |
| Description | | Percentage of
Net Assets (%) | | Shares | | Market Value ($ Thousands) |
| |
COMMON STOCK — 92.6% | | | | | |
| |
Communication Services — 2.5% | | | | | |
IAC/InterActiveCorp * | | | 1.3 | % | | | 20,159 | | | $ | 4,236 | |
Other Securities | | | 1.2 | | | | | | | | 4,134 | |
| | | | | | | | | | | 8,370 | |
Consumer Discretionary — 12.3% | | | | | |
Big Lots Inc | | | 0.9 | | | | 81,080 | | | | 3,083 | |
Extended Stay America Inc | | | 0.5 | | | | 96,511 | | | | 1,732 | |
Lithia Motors Inc, Cl A | | | 0.6 | | | | 20,345 | | | | 1,887 | |
Modine Manufacturing Co * | | | 0.7 | | | | 162,134 | | | | 2,249 | |
Six Flags Entertainment Corp | | | 0.7 | | | | 48,732 | | | | 2,405 | |
Skechers U.S.A. Inc, Cl A * | | | 0.8 | | | | 74,115 | | | | 2,491 | |
Wendy’s Co/The | | | 0.6 | | | | 105,507 | | | | 1,887 | |
Other Securities (A) | | | 7.5 | | | | | | | | 24,506 | |
| | | | | | | | | | | 40,240 | |
Consumer Staples — 3.9% | | | | | |
Hain Celestial Group Inc/The * | | | 0.7 | | | | 98,747 | | | | 2,283 | |
Hostess Brands Inc, Cl A * | | | 0.6 | | | | 149,767 | | | | 1,872 | |
Pilgrim’s Pride Corp * | | | 0.7 | | | | 105,616 | | | | 2,354 | |
Spectrum Brands Holdings Inc (A) | | | 0.5 | | | | 30,699 | | | | 1,682 | |
Other Securities | | | 1.4 | | | | | | | | 4,606 | |
| | | | | | | | | | | 12,797 | |
Energy — 4.3% | | | | | |
Gulfport Energy Corp * | | | 0.7 | | | | 269,372 | | | | 2,160 | |
PBF Energy Inc, Cl A | | | 0.5 | | | | 51,988 | | | | 1,619 | |
Other Securities (B) | | | 3.1 | | | | | | | | 10,488 | |
| | | | | | | | | | | 14,267 | |
Financials — 24.5% | | | | | |
Affiliated Managers Group Inc | | | 0.5 | | | | 14,740 | | | | 1,579 | |
American Equity Investment Life Holding Co | | | 0.8 | | | | 92,081 | | | | 2,488 | |
BankUnited Inc | | | 1.2 | | | | 120,163 | | | | 4,013 | |
BGC Partners Inc, Cl A | | | 0.6 | | | | 354,191 | | | | 1,881 | |
CNO Financial Group Inc | | | 1.1 | | | | 228,963 | | | | 3,705 | |
Columbia Banking System Inc | | | 0.8 | | | | 80,757 | | | | 2,640 | |
| | | | | | | | | | | | |
| | | | |
| Description | | Percentage of
Net Assets (%) | | Shares | | Market Value ($ Thousands) |
| |
COMMON STOCK (continued) | | | | | |
First Commonwealth Financial Corp | | | 0.9 | % | | | 221,075 | | | $ | 2,786 | |
FNB Corp/PA | | | 1.0 | | | | 298,350 | | | | 3,162 | |
Great Western Bancorp Inc | | | 0.5 | | | | 56,311 | | | | 1,779 | |
National General Holdings Corp | | | 0.8 | | | | 104,332 | | | | 2,476 | |
OFG Bancorp | | | 0.5 | | | | 86,492 | | | | 1,712 | |
PacWest Bancorp | | | 1.3 | | | | 114,937 | | | | 4,323 | |
Starwood Property Trust Inc ‡ | | | 0.8 | | | | 113,711 | | | | 2,541 | |
Umpqua Holdings Corp | | | 0.8 | | | | 149,720 | | | | 2,470 | |
Other Securities‡(A) | | | 12.9 | | | | | | | | 42,798 | |
| | | | | | | | | | | 80,353 | |
Health Care — 4.6% | | | | | |
Ligand Pharmaceuticals Inc *(A) | | | 0.9 | | | | 23,421 | | | | 2,944 | |
Magellan Health Inc * | | | 0.8 | | | | 40,330 | | | | 2,659 | |
Syneos Health Inc, Cl A * | | | 0.8 | | | | 51,297 | | | | 2,655 | |
Other Securities (A) | | | 2.1 | | | | | | | | 6,830 | |
| | | | | | | | | | | 15,088 | |
Industrials — 13.6% | | | | | |
AECOM * | | | 0.5 | | | | 53,318 | | | | 1,582 | |
Apogee Enterprises Inc | | | 0.8 | | | | 69,561 | | | | 2,608 | |
Atlas Air Worldwide Holdings Inc * | | | 1.0 | | | | 65,374 | | | | 3,305 | |
Genesee & Wyoming Inc, Cl A * | | | 0.8 | | | | 30,063 | | | | 2,620 | |
KAR Auction Services Inc | | | 1.3 | | | | 81,411 | | | | 4,177 | |
Teledyne Technologies Inc * | | | 0.8 | | | | 10,824 | | | | 2,565 | |
Other Securities (A)(C) | | | 8.4 | | | | | | | | 27,764 | |
| | | | | | | | | | | 44,621 | |
Information Technology — 10.4% | | | | | |
ACI Worldwide Inc * | | | 1.3 | | | | 126,549 | | | | 4,160 | |
Insight Enterprises Inc * | | | 0.6 | | | | 34,330 | | | | 1,890 | |
j2 Global Inc | | | 0.6 | | | | 24,330 | | | | 2,107 | |
Super Micro Computer Inc *(C) | | | 0.9 | | | | 142,131 | | | | 3,003 | |
Tech Data Corp * | | | 0.7 | | | | 21,929 | | | | 2,246 | |
Other Securities | | | 6.3 | | | | | | | | 20,684 | |
| | | | | | | | | | | 34,090 | |
Materials — 8.4% | | | | | |
Ashland Global Holdings Inc | | | 0.5 | | | | 21,090 | | | | 1,648 | |
Commercial Metals Co, Cl A | | | 0.6 | | | | 106,715 | | | | 1,823 | |
FMC Corp | | | 1.3 | | | | 55,002 | | | | 4,225 | |
Livent Corp *(A) | | | 0.5 | | | | 130,141 | | | | 1,598 | |
Owens-Illinois Inc | | | 0.9 | | | | 164,855 | | | | 3,129 | |
Silgan Holdings Inc | | | 0.7 | | | | 82,066 | | | | 2,432 | |
Other Securities | | | 3.9 | | | | | | | | 12,697 | |
| | | | | | | | | | | 27,552 | |
Real Estate — 7.2% | | | | | |
Gaming and Leisure Properties Inc‡ | | | 0.9 | | | | 80,438 | | | | 3,102 | |
Medical Properties Trust Inc‡ | | | 1.2 | | | | 219,644 | | | | 4,066 | |
Other Securities‡(A) | | | 5.1 | | | | | | | | 16,412 | |
| | | | | | | | | | | 23,580 | |
| | |
22 | | SEI Institutional Managed Trust / Semi-Annual Report / March 31, 2019 |
| | | | | | | | | | | | |
| | | | |
| Description | | Percentage of Net Assets (%) | | Shares | | Market Value ($ Thousands) |
| |
COMMON STOCK (continued) | | | | | |
| |
Utilities — 0.9% | | | | | |
Portland General Electric Co | | | 0.6 | % | | | 38,970 | | | $ | 2,020 | |
Other Securities | | | 0.3 | | | | | | | | 893 | |
| | | | | | | | | | | 2,913 | |
| |
Total Common Stock
(Cost $282,185) ($ Thousands) | | | | 303,871 | |
| | | | | | | | | | | | |
| | | | |
| Description | | Percentage of Net Assets (%) | | Shares | | | Market Value ($ Thousands) |
| |
AFFILIATED PARTNERSHIP — 3.5% | | | | | |
SEI Liquidity Fund, L.P. | | | | | |
2.480% **†(D) | | | 3.5 | % | | | 11,385,010 | | | $ | 11,386 | |
| |
Total Affiliated Partnership
(Cost $11,384) ($ Thousands) | | | | 11,386 | |
| |
CASH EQUIVALENT — 7.0% | | | | | |
SEI Daily Income Trust,
Government Fund, Cl F | | | | | |
2.220% **† | | | 7.0 | | | | 22,993,085 | | | | 22,993 | |
| |
Total Cash Equivalent
(Cost $22,993) ($ Thousands) | | | | 22,993 | |
| |
Total Investments in Securities — 103.1%
(Cost $316,562) ($ Thousands) | | | $ | 338,250 | |
| | | | | | | | | | | | |
A list of the open futures contracts held at March 31, 2019 is as follows:
| | | | | | | | | | | | | | | | | | | | |
Type of Contract | | Number of
Contracts
Long | | | Expiration
Date | | | Notional Amount
(Thousands) | | | Value
(Thousands) | | | Unrealized
Appreciation
(Thousands) | |
Russell 2000 Index E-MINI | | | 154 | | | | Jun-2019 | | | $ | 11,754 | | | $ | 11,887 | | | $ | 133 | |
| | | | | | | | | | | | |
| | Percentages are based on Net Assets of $328,005 ($ Thousands). |
| * | Non-income producing security. |
| ** | Rate shown is the 7-day effective yield as of March 31, 2019. |
| ‡ | Real Estate Investment Trust. |
| † | Investment in Affiliated Security (see Note 6). |
| (A) | Certain securities or partial positions of certain securities are on loan at March 31, 2019 (see Note 10). The total market value of securities on loan at March 31, 2019 was $11,176 ($ Thousands). |
| (B) | Security is a Master Limited Partnership. At March 31, 2019, such securities amounted to $1,068 ($ Thousands), or 0.3% of the Net Assets of the Fund (see Note 2). |
| (C) | Securities considered illiquid. The total value of such securities as of March 31, 2019 was $3,277 ($ Thousands) and represented 1.0% of the Net Assets of the Fund. |
| (D) | This security was purchased with cash collateral held from securities on loan (see Note 10). The total market value of such securities as of March 31, 2019 was $11,386 ($ Thousands). |
ADR — American Depositary Receipt
Cl — Class
L.P. — Limited Partnership
PLC — Public Limited Company
The Summary Schedule of Investments does not reflect the complete portfolio holdings. It includes the Fund’s 50 largest holdings and each investment of any issuer that exceeds 1% of the Fund’s net assets. “Other Securities” represent all issues not required to be disclosed under the rules adopted by the U.S. Securities and Exchange Commission (“SEC”). In certain instances, securities for which footnotes listed above may otherwise apply are included in the Other Securities caption. The complete schedule of portfolio holdings is available (i) without charge, upon request, by calling (800) 342-5734; and (ii) on the SEC’s website at http://www.sec.gov.
The following is a list of the level of inputs used as of March 31, 2019, in valuing the Fund’s investments and other financial instruments carried at value ($ Thousands):
| | | | | | | | | | | | | | | | |
| | | | | |
Investments in Securities | | Level 1 | | Level 2 | | Level 3 | | Total |
Common Stock | | $ | 303,871 | | | $ | – | | | $ | – | | | $ | 303,871 | |
Affiliated Partnership | | | – | | | | 11,386 | | | | – | | | | 11,386 | |
Cash Equivalent | | | 22,993 | | | | – | | | | – | | | | 22,993 | |
| | | | | | | | | | | | | | | | |
Total Investments in Securities | | $ | 326,864 | | | $ | 11,386 | | | $ | – | | | $ | 338,250 | |
| | | | | | | | | | | | | | | | |
| | | | | | | | | | | | | | | | |
Other Financial
Instruments | | Level 1 | | Level 2 | | Level 3 | | Total |
Futures Contracts * | | | | | | | | | | | | | | | | |
| | | | |
Unrealized Appreciation | | $ | 133 | | | $ | – | | | $ | – | | | $ | 133 | |
| | | | | | | | | | | | | | | | |
Total Other Financial Instruments | | $ | 133 | | | $ | – | | | $ | – | | | $ | 133 | |
| | | | | | | | | | | | | | | | |
* Futures contracts are valued at the unrealized appreciation on the instrument.
For the period ended March 31, 2019, there were no transfers between Level 1 and Level 2 assets and liabilities.
For the period ended March 31, 2019, there were no transfers between Level 2 and Level 3 assets and liabilities.
For more information on valuation inputs, see Note 2 — Significant Accounting Policies in Notes to Financial Statements.
| | |
SEI Institutional Managed Trust / Semi-Annual Report / March 31, 2019 | | 23 |
SUMMARY SCHEDULE OF INVESTMENTS (Unaudited)
March 31, 2019
Small Cap Value Fund(Concluded)
The following is a summary of the Fund’s transactions with affiliates for the period ended March 31, 2019 ($ Thousands):
| | | | | | | | | | | | | | | | | | | | | | | | | | | | |
| Security Description | | Value 9/30/18 | | Purchases at
Cost | | Proceeds from
Sales | | Realized Gain | | Change in Unrealized
Appreciation | | Value 3/31/19 | | Income |
SEI Liquidity Fund, L.P. | | | $ 57,595 | | | | $ 31,480 | | | | $ (77,717) | | | | $ 23 | | | | $ 5 | | | | $ 11,386 | | | | $ 113 | |
| SEI Daily Income Trust, Government Fund, Cl F | | | 10,473 | | | | 50,203 | | | | (37,683) | | | | — | | | | — | | | | 22,993 | | | | 94 | |
| | | | | | | | | | | | | | | | | | | | | | | | | | | | |
Totals | | | $ 68,068 | | | | $ 81,683 | | | | $ (115,400) | | | | $ 23 | | | | $ 5 | | | | $ 34,379 | | | | $ 207 | |
| | | | | | | | | | | | | | | | | | | | | | | | | | | | |
Amounts designated as “—” are either $0 or have been rounded to $0.
The accompanying notes are an integral part of the financial statements.
| | |
24 | | SEI Institutional Managed Trust / Semi-Annual Report / March 31, 2019 |
SUMMARY SCHEDULE OF INVESTMENTS (Unaudited)
March 31, 2019
Small Cap Growth Fund
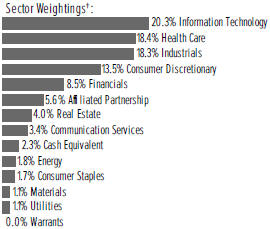
†Percentages are based on total investments. Includes investments held as collateral for securities held on loan (see Note 10).
| | | | | | | | | | | | |
| | | | |
| Description | | Percentage of Net Assets (%) | | Shares | | Market Value ($ Thousands) |
| |
COMMON STOCK — 97.6% | | | | | |
| |
Communication Services — 3.6% | | | | | |
Vonage Holdings Corp * | | | 0.4 | % | | | 131,394 | | | $ | 1,319 | |
Other Securities | | | 3.2 | | | | | | | | 10,803 | |
| | | | | | | | | | | 12,122 | |
Consumer Discretionary — 14.3% | | | | | |
Carter’s Inc | | | 0.4 | | | | 13,896 | | | | 1,401 | |
Eldorado Resorts Inc * | | | 0.7 | | | | 53,272 | | | | 2,487 | |
Grand Canyon Education Inc * | | | 1.0 | | | | 28,933 | | | | 3,313 | |
Jack in the Box Inc | | | 0.6 | | | | 25,675 | | | | 2,081 | |
PlayAGS Inc * | | | 1.1 | | | | 150,505 | | | | 3,602 | |
Sally Beauty Holdings Inc *(A) | | | 0.7 | | | | 123,589 | | | | 2,275 | |
Shutterstock Inc * | | | 0.5 | | | | 33,943 | | | | 1,583 | |
Skechers U.S.A. Inc, Cl A * | | | 1.0 | | | | 98,110 | | | | 3,297 | |
Strategic Education Inc | | | 0.5 | | | | 12,732 | | | | 1,672 | |
Other Securities (A) | | | 7.8 | | | | | | | | 26,556 | |
| | | | | | | | | | | 48,267 | |
Consumer Staples — 1.7% | | | | | |
Other Securities (A) | | | 1.7 | | | | | | | | 5,868 | |
| |
Energy — 1.9% | | | | | |
ProPetro Holding Corp * | | | 0.4 | | | | 61,379 | | | | 1,384 | |
Other Securities (A) | | | 1.5 | | | | | | | | 4,981 | |
| | | | | | | | | | | 6,365 | |
Financials — 9.0% | | | | | |
Other Securities‡(A)(B)(C)(D)(E) | | | 9.0 | | | | | | | | 30,526 | |
| |
Health Care — 19.5% | | | | | |
BioTelemetry Inc * | | | 0.7 | | | | 36,323 | | | | 2,275 | |
Cardiovascular Systems Inc * | | | 0.6 | | | | 48,137 | | | | 1,861 | |
Integra LifeSciences Holdings Corp * | | | 0.5 | | | | 31,928 | | | | 1,779 | |
Ligand Pharmaceuticals Inc *(A) | | | 0.7 | | | | 17,707 | | | | 2,226 | |
Merit Medical Systems Inc * | | | 0.8 | | | | 45,746 | | | | 2,828 | |
NeoGenomics Inc * | | | 0.6 | | | | 94,313 | | | | 1,930 | |
| | | | | | | | | | | | |
| | | | |
| Description | | Percentage of Net Assets (%) | | Shares | | Market Value ($ Thousands) |
|
COMMON STOCK (continued) | |
Omnicell Inc * | | | 0.5 | % | | | 18,890 | | | $ | 1,527 | |
Syneos Health Inc, Cl A * | | | 0.4 | | | | 26,292 | | | | 1,361 | |
Veracyte Inc * | | | 0.4 | | | | 56,800 | | | | 1,421 | |
Other Securities (A) | | | 14.3 | | | | | | | | 48,666 | |
| | | | | | | | | | | 65,874 | |
Industrials — 19.4% | | | | | |
ABM Industries Inc | | | 0.5 | | | | 41,424 | | | | 1,506 | |
ASGN Inc * | | | 0.5 | | | | 23,883 | | | | 1,516 | |
Brink’s Co/The | | | 0.4 | | | | 18,455 | | | | 1,392 | |
Clean Harbors Inc * | | | 0.8 | | | | 36,900 | | | | 2,639 | |
Fortress Transportation & Infrastructure Investors LLC (F) | | | 0.5 | | | | 104,624 | | | | 1,790 | |
Heartland Express Inc | | | 0.4 | | | | 68,691 | | | | 1,324 | |
Heritage-Crystal Clean Inc * | | | 0.7 | | | | 87,988 | | | | 2,415 | |
John Bean Technologies Corp, Cl A | | | 0.6 | | | | 20,861 | | | | 1,917 | |
Kennametal Inc | | | 0.4 | | | | 40,646 | | | | 1,494 | |
Kirby Corp * | | | 0.6 | | | | 27,176 | | | | 2,041 | |
MasTec Inc * | | | 0.6 | | | | 43,208 | | | | 2,078 | |
Matson Inc | | | 0.5 | | | | 42,691 | | | | 1,541 | |
Tennant Co | | | 0.4 | | | | 22,745 | | | | 1,412 | |
TriNet Group Inc * | | | 0.6 | | | | 35,688 | | | | 2,132 | |
TrueBlue Inc * | | | 0.5 | | | | 75,659 | | | | 1,789 | |
WageWorks Inc * | | | 0.4 | | | | 38,240 | | | | 1,444 | |
Other Securities (A) | | | 11.0 | | | | | | | | 36,840 | |
| | | | | | | | | | | 65,270 | |
Information Technology — 21.5% | | | | | |
2U Inc * | | | 0.6 | | | | 28,503 | | | | 2,020 | |
Carbonite Inc * | | | 0.6 | | | | 81,044 | | | | 2,011 | |
Cornerstone OnDemand Inc * | | | 0.7 | | | | 40,655 | | | | 2,227 | |
Euronet Worldwide Inc * | | | 0.4 | | | | 9,935 | | | | 1,417 | |
Everbridge Inc * | | | 0.6 | | | | 27,496 | | | | 2,063 | |
Fabrinet * | | | 0.4 | | | | 27,096 | | | | 1,419 | |
FireEye Inc * | | | 0.8 | | | | 160,592 | | | | 2,696 | |
Five9 Inc * | | | 0.8 | | | | 48,007 | | | | 2,536 | |
LogMeIn Inc | | | 0.9 | | | | 38,853 | | | | 3,112 | |
MAXIMUS Inc | | | 0.4 | | | | 20,929 | | | | 1,486 | |
Perficient Inc * | | | 0.5 | | | | 61,124 | | | | 1,674 | |
Presidio Inc | | | 0.4 | | | | 93,410 | | | | 1,383 | |
Proofpoint Inc * | | | 0.7 | | | | 18,232 | | | | 2,214 | |
Other Securities (A)(B)(C)(D) | | | 13.7 | | | | | | | | 46,228 | |
| | | | | | | | | | | 72,486 | |
Materials — 1.2% | | | | | |
Other Securities (A) | | | 1.2 | | | | | | | | 4,039 | |
| |
Real Estate — 4.3% | | | | | |
Medical Properties Trust Inc ‡ | | | 0.5 | | | | 86,325 | | | | 1,598 | |
Other Securities ‡(A) | | | 3.8 | | | | | | | | 12,787 | |
| | | | | | | | | | | 14,385 | |
| | |
SEI Institutional Managed Trust / Semi-Annual Report / March 31, 2019 | | 25 |
SUMMARY SCHEDULE OF INVESTMENTS (Unaudited)
March 31, 2019
Small Cap Growth Fund(Concluded)
| | | | | | | | | | | | |
| | | | |
| Description | | Percentage of Net Assets (%) | | Shares | | Market Value ($ Thousands) |
| |
COMMON STOCK (continued) | | | | | |
| | |
Utilities — 1.2% | | | | | | | | | |
Other Securities (A) | | | 1.2 | % | | | | | | $ | 3,933 | |
| |
Total Common Stock
(Cost $297,215) ($ Thousands) | | | | 329,135 | |
| | |
WARRANTS — 0.0% | | | | | | | | | |
Other Securities | | | 0.0 | | | | | | | | 108 | |
| |
Total Warrants
(Cost $79) ($ Thousands) | | | | 108 | |
| |
AFFILIATED PARTNERSHIP — 6.0% | | | | | |
SEI Liquidity Fund, L.P. | | | | | | | | | | | | |
2.480% **†(G) | | | 6.0 | | | | 20,173,837 | | | | 20,172 | |
| |
Total Affiliated Partnership
(Cost $20,173) ($ Thousands) | | | | 20,172 | |
| |
CASH EQUIVALENT — 2.5% | | | | | |
SEI Daily Income Trust, Government Fund, Cl F | | | | | |
2.220% **† | | | 2.5 | | | | 8,325,467 | | | | 8,325 | |
| | |
Total Cash Equivalent (Cost $8,325) ($ Thousands) | | | | | | | | 8,325 | |
| |
Total Investments in Securities — 106.1%
(Cost $325,792) ($ Thousands) | | | $ | 357,740 | |
| | | | | | | | | | | | |
| | Percentages are based on a Net Assets of $337,109 ($ Thousands). |
| * | Non-income producing security. |
| ** | The rate reported is the 7-day effective yield as of March 31, 2019. |
| ‡ | Real Estate Investment Trust. |
| † | Investment in Affiliated Security (see Note 6). |
| (A) | Certain securities or partial positions of certain securities are on loan at March 31, 2019 (see Note 10). The total market value of securities on loan at March 31, 2019, was $19,784 ($ Thousands). |
| (B) | Securities considered illiquid. The total value of such securities as of March 31, 2019 was $3,108 ($ Thousands) and 0.9% of Net Assets. |
| (C) | Security fair valued using methods determined in good faith by the Valuation Committee of the Board of Trustees. The total market value of such securities as of March 31, 2019 was $124 ($Thousands) and represented 0.0% of the Net Assets of the Fund. |
| (D) | Level 3 security in accordance with fair value hierarchy. |
| (E) | Securities considered restricted. The total market value of such securities as of March 31, 2019 was $57 ($ Thousands) and represented 0.0% of Net Assets. |
| (F) | Security is a Master Limited Partnership. At March 31, 2019, such securities amounted to $1,790 ($ Thousands), or 0.5% of Net Assets (See Note 2). |
| (G) | This security was purchased with cash collateral held from securities on loan (see Note 10). The total market value of such securities as of March 31, 2019 was $20,172 ($ Thousands). |
Cl — Class
LLC — Limited Liability Company
L.P. — Limited Partnership
The Summary Schedule of Investments does not reflect the complete portfolio holdings. It includes the Fund’s 50 largest holdings and each investment of any issuer that exceeds 1% of the Fund’s net assets. “Other Securities” represent all issues not required to be disclosed under the rules adopted by the U.S. Securities and Exchange Commission (“SEC”). In certain instances, securities for which footnotes
listed above may otherwise apply are included in the Other Securities caption. The complete schedule of portfolio holdings is available (i) without charge, upon request, by calling (800) 342-5734; and (ii) on the SEC’s website at http://www.sec.gov.
The following is a list of the level of inputs used as of March 31, 2019, in valuing the Fund’s investments and other financial instruments carried at value ($ Thousands):
| | | | | | | | | | | | | | | | | | | | | | | | | | | | |
| | | | | | | | |
| Investments in Securities | | Level 1 | | | | Level 2 | | | | Level 3(1) | | | | Total |
Common Stock | | $ | 329,011 | | | | | | | $ | – | | | | | | | $ | 124 | | | | | | | $ | 329,135 | |
Warrants | | | 108 | | | | | | | | – | | | | | | | | – | | | | | | | | 108 | |
Affiliated Partnership | | | – | | | | | | | | 20,172 | | | | | | | | – | | | | | | | | 20,172 | |
Cash Equivalent | | | 8,325 | | | | | | | | – | | | | | | | | – | | | | | | | | 8,325 | |
Total Investments in Securities | | $ | 337,444 | | | | | | | $ | 20,172 | | | | | | | $ | 124 | | | | | | | $ | 357,740 | |
| | | | | | | | | | | | | | | | | | | | | | | | | | | | |
(1) A reconciliation of Level 3 investments is presented when the Fund has a significant amount of Level 3 investments at the beginning and/or end of the period in relation to the net assets. Management has concluded that Level 3 investments are not material in relation to net assets.
For the period ended March 31, 2019, there were no transfers between Level 1 and Level 2 assets and liabilities.
For the period ended March 31, 2019, there were no transfers between Level 2 and Level 3 assets and liabilities.
For more information on valuation inputs, see Note 2 — Significant Accounting Policies in Notes to Financial Statements.
| | |
26 | | SEI Institutional Managed Trust / Semi-Annual Report / March 31, 2019 |
The following is a summary of the Fund’s transactions with affiliates for the period ended March 31, 2019 ($ Thousands):
| | | | | | | | | | | | | | |
| Security Description | | Value 9/30/2018 | | Purchases at Cost | | Proceeds from Sales | | Realized Gain (Loss) | | Change in Unrealized
Appreciation | | Value
3/31/2019 | | Income |
SEI Liquidity Fund, L.P. | | $ 25,165 | | $ 57,683 | | $ (62,682) | | $ 5 | | $ 1 | | $ 20,172 | | $ 92 |
| SEI Daily Income Trust, Government Fund, CI F | | 17,517 | | 59,948 | | (69,140) | | — | | — | | 8,325 | | 91 |
| | | | | | | | | | | | | | |
Totals | | $ 42,682 | | $ 117,631 | | $ (131,822) | | $ 5 | | $ 1 | | $ 28,497 | | $ 183 |
| | | | | | | | | | | | | | |
Amounts designated as “—” are either $0 or have been rounded to $0.
The accompanying notes are an integral part of the financial statements.
| | |
SEI Institutional Managed Trust / Semi-Annual Report / March 31, 2019 | | 27 |
SUMMARY SCHEDULE OF INVESTMENTS (Unaudited)
March 31, 2019
Tax-Managed Small/Mid Cap Fund
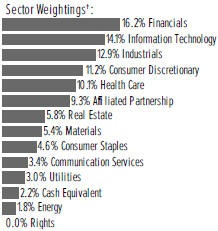
†Percentages are based on total investments. Includes investments held as collateral for securities held on loan (see Note 10).
| | | | | | | | | | | | |
| | | | |
| Description | | Percentage of Net Assets (%) | | Shares | | Market Value ($ Thousands) |
|
COMMON STOCK — 97.2% | |
|
Communication Services — 3.7% | |
IAC/InterActiveCorp * | | | 1.4 | % | | | 56,249 | | | $ | 11,818 | |
Nexstar Media Group Inc, Cl A (A) | | | 0.6 | | | | 47,039 | | | | 5,098 | |
Other Securities (A) | | | 1.7 | | | | | | | | 15,009 | |
| | | | | | | | | | | 31,925 | |
Consumer Discretionary — 12.3% | |
Big Lots Inc | | | 0.6 | | | | 136,893 | | | | 5,205 | |
Cheesecake Factory Inc/The (A) | | | 0.5 | | | | 90,237 | | | | 4,414 | |
Lithia Motors Inc, Cl A (A) | | | 0.6 | | | | 56,842 | | | | 5,272 | |
Pool Corp | | | 0.5 | | | | 24,064 | | | | 3,970 | |
Six Flags Entertainment Corp | | | 0.7 | | | | 126,299 | | | | 6,233 | |
Skechers U.S.A. Inc, Cl A * | | | 0.7 | | | | 184,516 | | | | 6,202 | |
Wendy’s Co/The | | | 0.5 | | | | 220,433 | | | | 3,944 | |
Other Securities (A) | | | 8.2 | | | | | | | | 71,105 | |
| | | | | | | | | | | 106,345 | |
Consumer Staples — 5.1% | |
Hain Celestial Group Inc/The * | | | 0.5 | | | | 178,101 | | | | 4,118 | |
Hostess Brands Inc, Cl A * | | | 0.7 | | | | 455,006 | | | | 5,688 | |
Pilgrim’s Pride Corp * | | | 0.6 | | | | 215,356 | | | | 4,800 | |
Spectrum Brands Holdings Inc (A) | | | 0.4 | | | | 63,363 | | | | 3,471 | |
Other Securities (A) | | | 2.9 | | | | | | | | 26,087 | |
| | | | | | | | | | | 44,164 | |
Energy — 2.0% | |
Other Securities (A) | | | 2.0 | | | | | | | | 16,915 | |
|
Financials — 17.8% | |
American Equity Investment | | | | | | | | | | | | |
Life Holding Co | | | 0.6 | | | | 203,817 | | | | 5,507 | |
BankUnited Inc | | | 0.7 | | | | 179,461 | | | | 5,994 | |
BGC Partners Inc, Cl A | | | 0.4 | | | | 672,412 | | | | 3,571 | |
Columbia Banking System Inc (A) | | | 0.7 | | | | 196,637 | | | | 6,428 | |
| | | | | | | | | | | | |
| | | | |
| Description | | Percentage of Net Assets (%) | | Shares | | Market Value ($ Thousands) |
|
COMMON STOCK (continued) | |
National General Holdings Corp | | | 0.7 | % | | | 257,621 | | | $ | 6,113 | |
OFG Bancorp | | | 0.5 | | | | 219,022 | | | | 4,334 | |
PacWest Bancorp | | | 1.2 | | | | 280,427 | | | | 10,547 | |
Starwood Property Trust Inc ‡ | | | 0.6 | | | | 240,140 | | | | 5,367 | |
Umpqua Holdings Corp | | | 0.6 | | | | 294,810 | | | | 4,864 | |
Other Securities‡(A) | | | 11.8 | | | | | | | | 101,684 | |
| | | | | | | | | | | 154,409 | |
Health Care — 11.1% | |
Ligand Pharmaceuticals Inc *(A) | | | 1.1 | | | | 75,013 | | | | 9,430 | |
Magellan Health Inc * | | | 0.5 | | | | 63,448 | | | | 4,183 | |
Premier Inc, Cl A * | | | 0.4 | | | | 100,268 | | | | 3,458 | |
Syneos Health Inc, Cl A *(A) | | | 0.7 | | | | 108,524 | | | | 5,617 | |
Other Securities (A) | | | 8.4 | | | | | | | | 73,198 | |
| | | | | | | | | | | 95,886 | |
Industrials — 14.2% | |
Atlas Air Worldwide Holdings Inc * | | | 0.6 | | | | 99,124 | | | | 5,012 | |
CoStar Group Inc * | | | 0.5 | | | | 9,928 | | | | 4,631 | |
Genesee & Wyoming Inc, Cl A * | | | 0.9 | | | | 87,615 | | | | 7,635 | |
KAR Auction Services Inc | | | 1.3 | | | | 226,271 | | | | 11,610 | |
Teledyne Technologies Inc * | | | 0.8 | | | | 27,753 | | | | 6,578 | |
Other Securities (A)(B) | | | 10.1 | | | | | | | | 87,312 | |
| | | | | | | | | | | 122,778 | |
Information Technology — 15.4% | |
ACI Worldwide Inc * | | | 1.6 | | | | 428,876 | | | | 14,097 | |
Cadence Design Systems Inc * | | | 0.4 | | | | 54,862 | | | | 3,484 | |
Cypress Semiconductor Corp | | | 0.6 | | | | 345,310 | | | | 5,152 | |
j2 Global Inc (A) | | | 1.0 | | | | 95,339 | | | | 8,256 | |
MAXIMUS Inc | | | 0.4 | | | | 53,612 | | | | 3,805 | |
ON Semiconductor Corp * | | | 0.4 | | | | 178,810 | | | | 3,678 | |
Semtech Corp * | | | 0.5 | | | | 88,152 | | | | 4,488 | |
Super Micro Computer Inc *(B) | | | 0.9 | | | | 350,560 | | | | 7,406 | |
Trade Desk Inc/The, Cl A *(A) | | | 0.6 | | | | 25,821 | | | | 5,111 | |
Wix.com Ltd * | | | 0.5 | | | | 36,039 | | | | 4,355 | |
Other Securities (A) | | | 8.5 | | | | | | | | 73,831 | |
| | | | | | | | | | | 133,663 | |
Materials — 5.9% | |
Ashland Global Holdings Inc | | | 0.4 | | | | 48,756 | | | | 3,809 | |
FMC Corp | | | 1.3 | | | | 141,171 | | | | 10,845 | |
Owens-Illinois Inc | | | 0.6 | | | | 248,936 | | | | 4,725 | |
Silgan Holdings Inc | | | 0.7 | | | | 207,309 | | | | 6,143 | |
United States Steel Corp | | | 0.4 | | | | 178,732 | | | | 3,483 | |
Valvoline Inc (A) | | | 0.5 | | | | 216,872 | | | | 4,025 | |
Other Securities (A) | | | 2.0 | | | | | | | | 18,177 | |
| | | | | | | | | | | 51,207 | |
Real Estate — 6.4% | |
Gaming and Leisure Properties Inc‡ | | | 0.8 | | | | 179,643 | | | | 6,929 | |
Howard Hughes Corp/The * | | | 0.4 | | | | 31,604 | | | | 3,476 | |
Medical Properties Trust Inc‡(A) | | | 0.9 | | | | 428,546 | | | | 7,932 | |
| | |
28 | | SEI Institutional Managed Trust / Semi-Annual Report / March 31, 2019 |
| | | | | | | | | | | | |
| | | | |
| Description | | Percentage of Net Assets (%) | | Shares | | Market Value ($ Thousands) |
|
COMMON STOCK (continued) | |
Other Securities ‡(A) | | | 4.3 | % | | | | | | $ | 36,580 | |
| | | | | | | | | | | 54,917 | |
|
Utilities — 3.3% | |
Other Securities | | | 3.3 | | | | | | | | 28,732 | |
| |
Total Common Stock
(Cost $616,414) ($ Thousands) | | | | 840,941 | |
|
RIGHTS — 0.0% | |
Other Securities‡‡ | | | 0.0 | | | | | | | | 103 | |
| | |
Total Rights
(Cost $–) ($ Thousands) | | | | | | | | 103 | |
|
AFFILIATED PARTNERSHIP — 10.2% | |
SEI Liquidity Fund, L.P. | | | | | |
2.480% **†(C) | | | 10.2 | | | | 88,103,789 | | | | 88,097 | |
| |
Total Affiliated Partnership
(Cost $88,103) ($ Thousands) | | | | 88,097 | |
|
CASH EQUIVALENT — 2.4% | |
SEI Daily Income Trust, Government Fund, Cl F | | | | | | | | | | | | |
2.220% **† | | | 2.4 | | | | 20,889,500 | | | | 20,890 | |
| |
Total Cash Equivalent
(Cost $20,890) ($ Thousands) | | | | 20,890 | |
| |
Total Investments in Securities — 109.8%
(Cost $725,407) ($ Thousands) | | | $ | 950,031 | |
| | | | | | | | | | | | |
| | Percentages are based on a Net Assets of $865,349 ($ Thousands). |
| * | Non-income producing security. |
| ** | The rate reported is the 7-day effective yield as of March 31, 2019. |
| ‡ | Real Estate Investment Trust. |
| ‡‡ | Expiration date not available. |
| † | Investment in Affiliated Security (see Note 6). |
| (A) | Certain securities or partial positions of certain securities are on loan at March 31, 2019 (see Note 10). The total market value of securities on loan at March 31, 2019, was $86,388 ($ Thousands). |
| (B) | Securities considered illiquid. The total value of such securities as of March 31, 2019 was $8,424 ($ Thousands) and represented 1.0% of Net Assets. |
| (C) | This security was purchased with cash collateral held from securities on loan (see Note 10). The total market value of such securities as of March 31, 2019 was $88,097 ($ Thousands). |
Cl — Class
L.P. — Limited Partnership
Ltd. — Limited
The Summary Schedule of Investments does not reflect the complete portfolio holdings. It includes the Fund’s 50 largest holdings and each investment of any issuer that exceeds 1% of the Fund’s net assets. “Other Securities” represent all issues not required to be disclosed under the rules adopted by the U.S. Securities and Exchange Commission (“SEC”). In certain instances, securities for which footnotes listed above may otherwise apply are included in the Other Securities caption. The complete schedule of portfolio holdings is available (i) without charge, upon request, by calling (800) 342-5734; and (ii) on the SEC’s website at http://www.sec.gov.
The following is a list of the level of inputs used as of March 31, 2019, in valuing the Fund’s investments carried at value ($ Thousands):
| | | | | | | | | | | | | | | | |
Investments in
Securities | | Level 1 | | Level 2 | | Level 3 | | Total |
Common Stock | | $ | 840,941 | | | $ | – | | | $ | – | | | $ | 840,941 | |
Rights | | | 103 | | | | – | | | | – | | | | 103 | |
Affiliated Partnership | | | – | | | | 88,097 | | | | – | | | | 88,097 | |
Cash Equivalent | | | 20,890 | | | | – | | | | – | | | | 20,890 | |
| | | | | | | | | | | | | | | | |
Total Investments in Securities | | $ | 861,934 | | | $ | 88,097 | | | $ | – | | | $ | 950,031 | |
| | | | | | | | | | | | | | | | |
For the period ended March 31, 2019, there were no transfers between Level 1 and Level 2 assets and liabilities.
For the period ended March 31, 2019, there were no transfers between Level 2 and Level 3 assets and liabilities.
For more information on valuation inputs, see Note 2 — Significant Accounting Policies in Notes to Financial Statements.
The following is a summary of the Fund’s transactions with affiliates for the period ended March 31, 2019 ($ Thousands):
| | | | | | | | | | | | | | | | | | | | | | | | | | | | |
| Security Description | | Value 9/30/2018 | | Purchases at Cost | | Proceeds from Sales | | Realized Gain
(Loss) | | Change in
Unrealized
Appreciation | | Value
3/31/2019 | | Income |
SEI Liquidity Fund, L.P. | | $ | 173,797 | | | $ | 81,421 | | | $ | (167,184 | ) | | $ | 54 | | | $ | 9 | | | $ | 88,097 | | | $ | 251 | |
| SEI Daily Income Trust, Government Fund, CI F | | | 32,302 | | | | 70,814 | | | | (82,226 | ) | | | - | | | | - | | | | 20,890 | | | | 229 | |
| | | | | | | | | | | | | | | | | | | | | | | | | | | | |
Total | | $ | 206,099 | | | $ | 152,235 | | | $ | (249,410 | ) | | $ | 54 | | | $ | 9 | | | $ | 108,987 | | | $ | 480 | |
| | | | | | | | | | | | | | | | | | | | | | | | | | | | |
Amounts designated as “—” are either $0 or have been rounded to $0.
The accompanying notes are an integral part of the financial statements.
| | |
SEI Institutional Managed Trust / Semi-Annual Report / March 31, 2019 | | 29 |
SUMMARY SCHEDULE OF INVESTMENTS (Unaudited)
March 31, 2019
Mid-Cap Fund
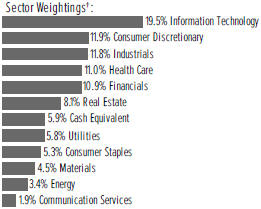
†Percentages are based on total investments.
| | | | | | | | | | | | |
| | | | |
| Description | | Percentage of Net Assets (%) | | Shares | | Market Value ($ Thousands) |
| |
COMMON STOCK — 95.8% | | | | | |
| |
Communication Services — 2.0% | | | | | |
Other Securities | | | 2.0 | % | | | | | | $ | 2,136 | |
| |
Consumer Discretionary — 12.2% | | | | | |
Expedia Group Inc | | | 0.7 | | | | 6,000 | | | | 714 | |
Genuine Parts Co | | | 0.7 | | | | 7,000 | | | | 784 | |
Kohl’s Corp | | | 0.7 | | | | 11,783 | | | | 810 | |
Norwegian Cruise Line Holdings Ltd * | | | 0.7 | | | | 13,700 | | | | 753 | |
Ross Stores Inc | | | 0.8 | | | | 9,400 | | | | 875 | |
Royal Caribbean Cruises Ltd | | | 0.8 | | | | 7,100 | | | | 814 | |
Yum China Holdings Inc | | | 0.8 | | | | 19,600 | | | | 880 | |
Other Securities | | | 7.0 | | | | | | | | 7,659 | |
| | | | | | | | | | | 13,289 | |
Consumer Staples — 5.4% | | | | | |
Archer-Daniels-Midland Co | | | 0.8 | | | | 21,100 | | | | 910 | |
JM Smucker Co/The | | | 0.7 | | | | 6,400 | | | | 746 | |
Kellogg Co | | | 0.7 | | | | 12,500 | | | | 717 | |
Tyson Foods Inc, Cl A | | | 0.8 | | | | 13,200 | | | | 917 | |
Other Securities | | | 2.4 | | | | | | | | 2,630 | |
| | | | | | | | | | | 5,920 | |
Energy — 3.5% | | | | | |
Other Securities | | | 3.5 | | | | | | | | 3,810 | |
| |
Financials — 11.0% | | | | | |
Ameriprise Financial Inc | | | 0.8 | | | | 6,600 | | | | 845 | |
Citizens Financial Group Inc | | | 0.7 | | | | 23,100 | | | | 751 | |
Fifth Third Bancorp | | | 0.7 | | | | 30,500 | | | | 769 | |
Lincoln National Corp | | | 0.6 | | | | 12,200 | | | | 716 | |
Other Securities‡ | | | 8.2 | | | | | | | | 8,994 | |
| | | | | | | | | | | 12,075 | |
Health Care — 11.2% | | | | | |
Agilent Technologies Inc | | | 1.0 | | | | 13,600 | | | | 1,093 | |
Centene Corp * | | | 0.8 | | | | 16,100 | | | | 855 | |
Edwards Lifesciences Corp, Cl A * | | | 0.8 | | | | 4,600 | | | | 880 | |
Incyte Corp * | | | 0.9 | | | | 11,000 | | | | 946 | |
| | | | | | | | | | | | |
| | | | |
| Description | | Percentage of Net Assets (%) | | Shares | | Market Value ($ Thousands) |
| |
COMMON STOCK (continued) | | | | | |
IQVIA Holdings Inc * | | | 0.8 | % | | | 6,100 | | | $ | 877 | |
Zimmer Biomet Holdings Inc | | | 0.9 | | | | 7,500 | | | | 958 | |
Other Securities | | | 6.0 | | | | | | | | 6,666 | |
| | | | | | | | | | | 12,275 | |
Industrials — 12.0% | | | | | |
AMETEK Inc | | | 0.8 | | | | 10,900 | | | | 904 | |
Cummins Inc | | | 1.0 | | | | 6,600 | | | | 1,042 | |
Old Dominion Freight Line Inc, Cl A | | | 0.7 | | | | 5,100 | | | | 736 | |
PACCAR Inc | | | 0.9 | | | | 14,500 | | | | 988 | |
Other Securities | | | 8.6 | | | | | | | | 9,425 | |
| | | | | | | | | | | 13,095 | |
Information Technology — 19.8% | | | | | |
Analog Devices Inc | | | 1.0 | | | | 10,300 | | | | 1,084 | |
Arista Networks Inc * | | | 0.9 | | | | 3,200 | | | | 1,006 | |
Autodesk Inc, Cl A * | | | 1.0 | | | | 6,700 | | | | 1,044 | |
Cadence Design Systems Inc * | | | 0.9 | | | | 16,300 | | | | 1,035 | |
CDW Corp/DE | | | 0.9 | | | | 9,800 | | | | 944 | |
DXC Technology Co | | | 0.7 | | | | 12,100 | | | | 778 | |
Fidelity National Information Services Inc, Cl B | | | 1.0 | | | | 9,500 | | | | 1,074 | |
Fortinet Inc * | | | 0.8 | | | | 10,800 | | | | 907 | |
Qorvo Inc * | | | 0.7 | | | | 10,100 | | | | 725 | |
SS&C Technologies Holdings Inc | | | 0.8 | | | | 13,600 | | | | 866 | |
Symantec Corp, Cl A | | | 0.7 | | | | 31,700 | | | | 729 | |
Synopsys Inc * | | | 0.9 | | | | 9,000 | | | | 1,036 | |
Xilinx Inc | | | 1.0 | | | | 9,000 | | | | 1,141 | |
Zebra Technologies Corp, Cl A * | | | 0.8 | | | | 4,300 | | | | 901 | |
Other Securities | | | 7.7 | | | | | | | | 8,436 | |
| | | | | | | | | | | 21,706 | |
Materials — 4.6% | | | | | |
Nucor Corp | | | 0.7 | | | | 13,400 | | | | 782 | |
Other Securities | | | 3.9 | | | | | | | | 4,214 | |
| | | | | | | | | | | 4,996 | |
Real Estate — 8.2% | | | | | |
CBRE Group Inc, Cl A * | | | 0.9 | | | | 19,600 | | | | 969 | |
Equity Residential‡ | | | 0.9 | | | | 13,300 | | | | 1,002 | |
Host Hotels & Resorts Inc ‡ | | | 0.7 | | | | 38,700 | | | | 731 | |
SBA Communications Corp, Cl A *‡ | | | 0.8 | | | | 4,300 | | | | 859 | |
Other Securities‡ | | | 4.9 | | | | | | | | 5,437 | |
| | | | | | | | | | | 8,998 | |
Utilities — 5.9% | | | | | |
AES Corp/VA | | | 0.8 | | | | 51,600 | | | | 933 | |
CenterPoint Energy Inc | | | 0.7 | | | | 25,900 | | | | 795 | |
Eversource Energy | | | 0.7 | | | | 10,200 | | | | 724 | |
NRG Energy Inc | | | 0.8 | | | | 20,800 | | | | 884 | |
Public Service Enterprise Group Inc | | | 0.8 | | | | 14,600 | | | | 867 | |
UGI Corp | | | 0.7 | | | | 14,900 | | | | 826 | |
| | |
30 | | SEI Institutional Managed Trust / Semi-Annual Report / March 31, 2019 |
| | | | | | | | | | | | |
| | | | |
| Description | | Percentage of Net Assets (%) | | Shares | | Market Value ($ Thousands) |
| |
COMMON STOCK (continued) | | | | | |
Other Securities | | | 1.4 | % | | | | | | $ | 1,465 | |
| | | | | | | | | | | 6,494 | |
| |
Total Common Stock
(Cost $97,605) ($ Thousands) | | | | 104,794 | |
| |
CASH EQUIVALENT — 5.9% | | | | | |
SEI Daily Income Trust, Government Fund, Cl F | | | | | | | | | | | | |
2.220% **† | | | 5.9 | | | | 6,508,656 | | | | 6,509 | |
| |
Total Cash Equivalent
(Cost $6,509) ($ Thousands) | | | | 6,509 | |
| |
Total Investments in Securities — 101.7%
(Cost $104,114) ($ Thousands) | | | $ | 111,303 | |
| | | | | | | | | | | | |
| | Percentages are based on a Net Assets of $109,389 ($ Thousands). |
| * | Non-income producing security. |
| ** | The rate reported is the 7-day effective yield as of March 31, 2019. |
| ‡ | Real Estate Investment Trust. |
| † | Investment in Affiliated Security (see Note 6). |
Cl — Class
Ltd. — Limited
The Summary Schedule of Investments does not reflect the complete portfolio holdings. It includes the Fund’s 50 largest holdings and each investment of any issuer that exceeds 1% of the Fund’s net assets. “Other Securities” represent all issues not required to be disclosed under the rules adopted by the U.S. Securities and Exchange Commission (“SEC”). In certain instances, securities for which footnotes listed above may otherwise apply are included in the Other Securities caption. The complete schedule of portfolio holdings is available (i) without charge, upon request, by calling (800) 342-5734; and (ii) on the SEC’s website at http://www.sec.gov.
As of March 31, 2019, all of the Fund’s investments were considered level 1, in accordance with the authoritative guidance on fair value measurements and disclosure under U.S. GAAP.
For the period ended March 31, 2019, there were no transfers between Level 1 and Level 2 assets and liabilities.
For the period ended March 31, 2019, there were no transfers between Level 2 and Level 3 assets and liabilities.
For more information on valuation inputs, see Note 2 — Significant Accounting Policies in Notes to Financial Statements.
The following is a summary of the Fund’s transactions with affiliates for the period ended March 31, 2019 ($ Thousands):
| | | | | | | | | | | | | | |
| Security Description | | Value 9/30/2018 | | Purchases at Cost | | Proceeds from Sales | | Realized Gain (Loss) | | Change in Unrealized Appreciation
(Depreciation) | | Value 3/31/2019 | | Income |
| SEI Liquidity Fund, L.P. | | $ — | | $ 993 | | $ (993) | | $ — | | $ — | | $ — | | $ 4 |
| SEI Daily Income Trust, Government Fund, CI F | | 5,737 | | 30,850 | | (30,078) | | — | | — | | 6,509 | | 43 |
| | | | | | | | | | | | | | |
Totals | | $ 5,737 | | $ 31,843 | | $ (31,071) | | $ — | | $ — | | $ 6,509 | | $ 47 |
| | | | | | | | | | | | | | |
Amounts designated as “—” are either $0 or have been rounded to $0.
The accompanying notes are an integral part of the financial statements.
| | |
SEI Institutional Managed Trust / Semi-Annual Report / March 31, 2019 | | 31 |
SUMMARY SCHEDULE OF INVESTMENTS (Unaudited)
March 31, 2019
U.S. Managed Volatility Fund
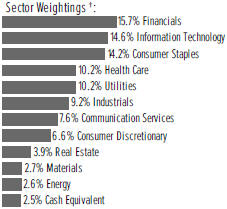
†Percentages are based on total investments.
| | | | | | | | | | | | |
| | | | |
| Description | | Percentage of
Net Assets (%) | | Shares | | | Market Value
($ Thousands) | |
| |
COMMON STOCK — 97.1% | | | | | |
| |
Communication Services — 7.5% | | | | | |
AT&T Inc | | | 1.0 | % | | | 560,800 | | | $ | 17,587 | |
Comcast Corp, Cl A | | | 0.8 | | | | 370,900 | | | | 14,829 | |
Omnicom Group Inc | | | 0.7 | | | | 162,121 | | | | 11,833 | |
Verizon Communications | | | 1.8 | | | | 537,900 | | | | 31,806 | |
Other Securities | | | 3.2 | | | | | | | | 58,571 | |
| | | | | | | | | | | 134,626 | |
| |
Consumer Discretionary — 6.6% | | | | | |
AutoZone Inc * | | | 1.1 | | | | 19,300 | | | | 19,766 | |
Target Corp, Cl A | | | 1.4 | | | | 320,200 | | | | 25,699 | |
Other Securities | | | 4.1 | | | | | | | | 72,675 | |
| | | | | | | | | | | 118,140 | |
| |
Consumer Staples — 14.1% | | | | | |
Altria Group Inc | | | 1.2 | | | | 370,054 | | | | 21,252 | |
Coca-Cola Co/The | | | 0.7 | | | | 264,548 | | | | 12,397 | |
Costco Wholesale Corp | | | 0.6 | | | | 46,980 | | | | 11,376 | |
Hershey Co/The | | | 0.6 | | | | 98,982 | | | | 11,366 | |
JM Smucker Co/The | | | 0.6 | | | | 96,000 | | | | 11,184 | |
Kroger Co/The | | | 0.7 | | | | 524,000 | | | | 12,890 | |
PepsiCo Inc | | | 0.7 | | | | 103,777 | | | | 12,718 | |
Procter & Gamble Co/The | | | 0.7 | | | | 120,821 | | | | 12,571 | |
Sysco Corp, Cl A | | | 0.6 | | | | 167,386 | | | | 11,175 | |
Tyson Foods Inc, Cl A | | | 1.3 | | | | 342,897 | | | | 23,807 | |
Walgreens Boots Alliance Inc | | | 1.3 | | | | 371,300 | | | | 23,492 | |
Walmart Inc | | | 1.2 | | | | 219,400 | | | | 21,398 | |
Other Securities | | | 3.9 | | | | | | | | 67,515 | |
| | | | | | | | | | | 253,141 | |
| |
Energy — 2.6% | | | | | |
Chevron Corp | | | 0.7 | | | | 97,600 | | | | 12,022 | |
Phillips 66 | | | 0.6 | | | | 122,600 | | | | 11,668 | |
Other Securities | | | 1.3 | | | | | | | | 23,499 | |
| | | | | | | | | | | 47,189 | |
| |
Financials — 15.7% | | | | | |
Aflac Inc | | | 1.1 | | | | 402,300 | | | | 20,115 | |
Allstate Corp/The | | | 1.3 | | | | 253,100 | | | | 23,837 | |
| | | | | | | | | | |
| | | | |
| Description | | Percentage of
Net Assets (%) | | Shares | | | Market Value
($ Thousands) | |
| |
COMMON STOCK (continued) | | | | | |
American Financial Group Inc/OH | | 1.0% | | | 177,246 | | | $ | 17,053 | |
Annaly Capital Management Inc ‡ | | 0.9 | | | 1,635,604 | | | | 16,340 | |
Berkshire Hathaway Inc, Cl B * | | 1.3 | | | 112,100 | | | | 22,520 | |
Progressive Corp/The | | 0.7 | | | 172,924 | | | | 12,466 | |
Two Harbors Investment Corp ‡ | | 0.6 | | | 819,851 | | | | 11,093 | |
Other Securities ‡ | | 8.8 | | | | | | | 157,401 | |
| | | | | | | | | 280,825 | |
| |
Health Care — 10.2% | | | | | |
Eli Lilly & Co | | 1.0 | | | 132,000 | | | | 17,128 | |
HCA Healthcare Inc | | 0.7 | | | 94,000 | | | | 12,256 | |
Johnson & Johnson | | 1.7 | | | 223,100 | | | | 31,187 | |
Merck & Co Inc | | 2.3 | | | 489,157 | | | | 40,683 | |
Pfizer Inc | | 1.8 | | | 754,300 | | | | 32,035 | |
Other Securities | | 2.7 | | | | | | | 48,840 | |
| | | | | | | | | 182,129 | |
| |
Industrials — 9.1% | | | | | |
Eaton Corp PLC | | 0.6 | | | 137,400 | | | | 11,069 | |
Raytheon Co | | 1.2 | | | 119,671 | | | | 21,790 | |
Republic Services Inc | | 1.8 | | | 392,738 | | | | 31,568 | |
Waste Management Inc | | 1.8 | | | 305,558 | | | | 31,751 | |
Other Securities | | 3.7 | | | | | | | 67,364 | |
| | | | | | | | | 163,542 | |
| |
Information Technology — 14.6% | | | | | |
Amdocs Ltd | | 1.6 | | | 540,205 | | | | 29,230 | |
Apple Inc | | 0.7 | | | 62,100 | | | | 11,796 | |
Cisco Systems Inc | | 1.6 | | | 537,800 | | | | 29,036 | |
Intel Corp | | 1.3 | | | 440,000 | | | | 23,628 | |
International Business Machines Corp | | 0.7 | | | 90,300 | | | | 12,741 | |
Motorola Solutions Inc | | 0.9 | | | 119,339 | | | | 16,758 | |
Oracle Corp, Cl B | | 1.1 | | | 351,500 | | | | 18,879 | |
Western Union Co/The | | 0.7 | | | 715,900 | | | | 13,223 | |
Other Securities | | 6.0 | | | | | | | 105,657 | |
| | | | | | | | | 260,948 | |
| |
Materials — 2.7% | | | | | |
Sonoco Products Co | | 0.7 | | | 212,380 | | | | 13,068 | |
Other Securities | | 2.0 | | | | | | | 35,041 | |
| | | | | | | | | 48,109 | |
| |
Real Estate — 3.9% | | | | | |
Other
Securities ‡(A) | | 3.9 | | | | | | | 68,797 | |
| |
Utilities — 10.1% | | | | | |
Ameren Corp | | 1.3 | | | 310,564 | | | | 22,842 | |
American Electric Power Co Inc | | 0.8 | | | 172,521 | | | | 14,449 | |
Entergy Corp | | 1.4 | | | 261,300 | | | | 24,988 | |
Exelon Corp | | 1.4 | | | 496,900 | | | | 24,910 | |
NextEra Energy Inc | | 0.8 | | | 70,715 | | | | 13,671 | |
| | |
32 | | SEI Institutional Managed Trust / Semi-Annual Report / March 31, 2019 |
| | | | | | | | | | | | |
| | | | |
| Description | | Percentage of
Net Assets (%) | | | Shares | | | Market Value
($ Thousands) | |
| |
COMMON STOCK (continued) | | | | | |
Other Securities | | | 4.4% | | | | | | | $ | 80,141 | |
| | | | | | | | | | | 181,001 | |
Total Common Stock
(Cost $1,498,983) ($ Thousands) | | | | 1,738,447 | |
| | | | | | | | | | | | |
| | | | |
| Description | | Percentage of
Net Assets (%) | | Shares | | | Market Value
($ Thousands) | |
| |
CASH EQUIVALENT — 2.5% | | | | | |
SEI Daily Income Trust, Government Fund, Cl F | | | | | | | | | | | | |
2.220% **† | | | 2.5 | % | | | 44,714,082 | | | $ | 44,714 | |
| |
Total Cash Equivalent
(Cost $44,714) ($ Thousands) | | | | 44,714 | |
| |
Total Investments in Securities — 99.6%
(Cost $1,543,697) ($ Thousands) | | | $ | 1,783,161 | |
| | | | | | | | | | | | |
A list of the open futures contracts held by the Fund at March 31, 2019, is as follows:
| | | | | | | | | | | | | | | | | | | | |
Type of Contract | | Number of
Contracts
Long | | | Expiration
Date | | | Notional Amount
(Thousands) | | | Value
(Thousands) | | | Unrealized
Appreciation
(Thousands) | |
| | | | | |
| | | | | | | | | | | | | | | | | | | | |
S&P 500 Index E-MINI | | | 190 | | | | Jun-2019 | | | $ | 26,202 | | | $ | 26,959 | | | $ | 757 | |
| | | | | | | | | | | | | | | | | | | | |
| | Percentages are based on Net Assets of $1,789,829 ($ Thousands). |
| * | Non-income producing security. |
| ** | Rate shown is the 7-day effective yield as of March 31, 2019. |
| ‡ | Real Estate Investment Trust. |
| † | Investment in Affiliated Security (see Note 6). |
| (A) | Securities considered illiquid. The total value of such securities as of March 31, 2019 was $9,803 ($ Thousands) and represented 0.5% of the Net Assets of the Fund. |
Cl — Class
PLC — Public Limited Company
S&P — Standard & Poor’s
Ltd — Limited
The Summary Schedule of Investments does not reflect the complete portfolio holdings. It includes the Fund’s 50 largest holdings and each investment of any issuer that exceeds 1% of the Fund’s net assets. “Other Securities” represent all issues not required to be disclosed under the rules adopted by the U.S. Securities and Exchange Commission (“SEC”). In certain instances, securities for which footnotes listed above may otherwise apply are included in the Other Securities caption. The complete schedule of portfolio holdings is available (i) without charge, upon request, by calling (800) 342-5734; and (ii) on the SEC’s website at http://www.sec.gov.
The following is a list of the level of inputs used as of March 31, 2019, in valuing the Fund’s investments and other financial instruments carried at value ($ Thousands):
| | | | | | | | | | | | | | | | |
| | | | | |
Investments in Securities | | Level 1 | | Level 2 | | Level 3 | | Total |
Common Stock | | $ | 1,738,447 | | | $ | – | | | $ | – | | | $ | 1,738,447 | |
Cash Equivalent | | | 44,714 | | | | – | | | | – | | | | 44,714 | |
| | | | | | | | | | | | | | | | |
Total Investments in Securities | | $ | 1,783,161 | | | $ | – | | | $ | – | | | $ | 1,783,161 | |
| | | | | | | | | | | | | | | | |
| | | | | | | | | | | | | | | | |
Other Financial
Instruments | | Level 1 | | Level 2 | | Level 3 | | Total |
Futures Contracts * | | | | | | | | | | | | | | | | |
Unrealized Appreciation | | $ | 757 | | | $ | – | | | $ | – | | | $ | 757 | |
| | | | | | | | | | | | | | | | |
Total Other Financial Instruments | | $ | 757 | | | $ | – | | | $ | – | | | $ | 757 | |
| | | | | | | | | | | | | | | | |
* Futures Contracts are valued at the unrealized appreciation on the instrument.
For the period March 31, 2019, there were no transfers between Level 1 and Level 2 assets and liabilities.
For the period March 31, 2019, there were no transfers between Level 2 and Level 3 assets and liabilities.
For more information on valuation inputs, see Note 2 — Significant Accounting Policies in Notes to Financial Statements.
Amounts designated as “—” are either $0 or have been rounded to $0.
The following is a summary of the Fund’s transactions with affiliates for the period ended March 31, 2019 ($ Thousands):
| | | | | | | | | | | | | | | | | | | | | | | | | | | | | | | | | | | |
| Security Description | | Value 9/30/18 | | Purchases at
Cost | | Proceeds
from Sales | | Realized Gain
(Loss) | | Change in
Unrealized
Appreciation
(Depreciation) | | Value
3/31/19 | | Income |
| SEI Daily Income Trust, Government Fund, Cl F | | | $ | 28,046 | | | | $ | 403,501 | | | | $ | (386,833) | | | | $ | - | | | | $ | - | | | | $ | 44,714 | | | | $ | 425 | |
| | | | | | | | | | | | | | | | | | | | | | | | | | | | | | | | | | | |
Total | | | $ | 28,046 | | | | $ | 403,501 | | | | $ | (386,833) | | | | $ | - | | | | $ | - | | | | $ | 44,714 | | | | $ | 425 | |
| | | | | | | | | | | | | | | | | | | | | | | | | | | | | | | | | | | |
The accompanying notes are an integral part of the financial statements.
| | |
SEI Institutional Managed Trust / Semi-Annual Report / March 31, 2019 | | 33 |
SUMMARY SCHEDULE OF INVESTMENTS (Unaudited)
March 31, 2019
Global Managed Volatility Fund
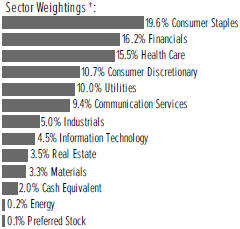
†Percentages are based on total investments.
| | | | | | | | | | | | |
| | | | |
| Description | | Percentage of
Net Assets (%) | | Shares | | Market Value ($ Thousands) |
| |
COMMON STOCK — 96.7% | | | | | |
| | | |
Australia — 3.3% | | | | | | | | | | | | |
Rio Tinto Ltd | | | 0.8 | % | | | 140,374 | | | $ | 9,763 | |
Other Securities‡ | | | 2.5 | | | | | | | | 32,632 | |
| | | |
| | | | | | | | | | | 42,395 | |
Austria — 0.5% | | | | | | | | | | | | |
Other Securities | | | 0.5 | | | | | | | | 6,548 | |
| | | |
Belgium — 0.4% | | | | | | | | | | | | |
Other Securities | | | 0.4 | | | | | | | | 4,716 | |
| | | |
Canada — 7.2% | | | | | | | | | | | | |
BCE Inc | | | 0.7 | | | | 205,126 | | | | 9,105 | |
Rogers Communications Inc, Cl B | | | 1.1 | | | | 274,000 | | | | 14,740 | |
Other Securities‡ | | | 5.4 | | | | | | | | 69,336 | |
| | | |
| | | | | | | | | | | 93,181 | |
Denmark — 0.8% | | | | | | | | | | | | |
Carlsberg A/S, Cl B | | | 0.6 | | | | 60,035 | | | | 7,505 | |
Other Securities | | | 0.2 | | | | | | | | 2,311 | |
| | | |
| | | | | | | | | | | 9,816 | |
Finland — 0.1% | | | | | | | | | | | | |
Other Securities | | | 0.1 | | | | | | | | 813 | |
| | | |
France — 1.2% | | | | | | | | | | | | |
Other Securities | | | 1.2 | | | | | | | | 15,670 | |
| | | |
Germany — 1.8% | | | | | | | | | | | | |
Other Securities | | | 1.8 | | | | | | | | 22,892 | |
| | | |
Guernsey — 0.1% | | | | | | | | | | | | |
Other Securities | | | 0.1 | | | | | | | | 1,353 | |
| | | | | | | | | | | | |
| | | | |
| Description | | Percentage of
Net Assets (%) | | Shares | | | Market Value ($ Thousands) | |
| |
COMMON STOCK (continued) | | | | | |
| |
Hong Kong — 4.8% | | | | | |
CLP Holdings Ltd, Cl B | | | 1.5 | % | | | 1,656,656 | | | $ | 19,205 | |
Link REIT ‡ | | | 0.6 | | | | 710,000 | | | | 8,303 | |
Other Securities | | | 2.7 | | | | | | | | 34,884 | |
| | | |
| | | | | | | | | | | 62,392 | |
Ireland — 0.1% | | | | | |
Other Securities | | | 0.1 | | | | | | | | 1,650 | |
| |
Israel — 1.7% | | | | | |
Bank Hapoalim BM | | | 0.6 | | | | 1,179,985 | | | | 7,824 | |
Bank Leumi Le-Israel BM | | | 0.8 | | | | 1,523,061 | | | | 9,948 | |
Other Securities | | | 0.3 | | | | | | | | 3,965 | |
| | | |
| | | | | | | | | | | 21,737 | |
Italy — 0.4% | | | | | |
Other Securities | | | 0.4 | | | | | | | | 4,680 | |
| |
Japan — 10.0% | | | | | |
Japan Post Holdings Co Ltd | | | 0.7 | | | | 759,200 | | | | 8,889 | |
NTT DOCOMO Inc | | | 0.7 | | | | 377,500 | | | | 8,361 | |
Other Securities ‡(A) | | | 8.6 | | | | | | | | 111,759 | |
| | | |
| | | | | | | | | | | 129,009 | |
Netherlands — 0.4% | | | | | |
Other Securities | | | 0.4 | | | | | | | | 4,709 | |
| |
New Zealand — 1.8% | | | | | |
Fisher & Paykel Healthcare Corp Ltd | | | 0.6 | | | | 664,248 | | | | 7,112 | |
Other Securities ‡(A) | | | 1.2 | | | | | | | | 16,851 | |
| | | |
| | | | | | | | | | | 23,963 | |
Norway — 1.5% | | | | | |
Orkla ASA | | | 0.7 | | | | 1,121,458 | | | | 8,621 | |
Telenor ASA | | | 0.8 | | | | 522,333 | | | | 10,475 | |
Other Securities | | | 0.0 | | | | | | | | 860 | |
| | | |
| | | | | | | | | | | 19,956 | |
Panama — 0.1% | | | | | |
Other Securities | | | 0.1 | | | | | | | | 1,425 | |
| |
Portugal — 0.1% | | | | | |
Other Securities | | | 0.1 | | | | | | | | 1,218 | |
| |
Singapore — 1.5% | | | | | |
Other Securities‡ | | | 1.5 | | | | | | | | 19,342 | |
| |
Sweden — 1.9% | | | | | |
ICA Gruppen AB | | | 0.8 | | | | 278,598 | | | | 11,204 | |
| | |
34 | | SEI Institutional Managed Trust / Semi-Annual Report / March 31, 2019 |
| | | | | | | | | | | | |
| | | | |
| Description | | Percentage of Net Assets (%) | | Shares | | | Market Value
($ Thousands) | |
| |
COMMON STOCK (continued) | | | | | |
| | |
Sweden (continued) | | | | | | | | | |
Swedish Match AB | | | 0.6 | % | | | 153,240 | | | $ | 7,829 | |
Other Securities | | | 0.5 | | | | | | | | 6,108 | |
| | | |
| | | | | | | | | | | 25,141 | |
Switzerland — 5.4% | | | | | |
Nestle SA | | | 0.7 | | | | 100,371 | | | | 9,564 | |
Novartis AG | | | 0.7 | | | | 98,011 | | | | 9,426 | |
Roche Holding AG | | | 1.1 | | | | 50,791 | | | | 13,992 | |
Swisscom AG | | | 0.9 | | | | 22,788 | | | | 11,143 | |
Other Securities | | | 2.0 | | | | | | | | 25,141 | |
| | | |
| | | | | | | | | | | 69,266 | |
United Kingdom — 2.7% | | | | | |
Other Securities‡ | | | 2.7 | | | | | | | | 34,353 | |
| |
United States — 48.9% | | | | | |
AGNC Investment Corp‡ | | | 0.8 | | | | 547,865 | | | | 9,862 | |
Anthem Inc | | | 0.8 | | | | 34,447 | | | | 9,886 | |
Berkshire Hathaway Inc, Cl B * | | | 0.6 | | | | 37,787 | | | | 7,591 | |
CenterPoint Energy Inc | | | 0.8 | | | | 326,669 | | | | 10,029 | |
Chemed Corp | | | 0.9 | | | | 34,253 | | | | 10,963 | |
Citrix Systems Inc | | | 0.6 | | | | 81,465 | | | | 8,119 | |
Coca-Cola Co/The | | | 1.0 | | | | 260,355 | | | | 12,200 | |
Coca-Cola European Partners PLC | | | 0.8 | | | | 209,619 | | | | 10,846 | |
Colgate-Palmolive Co | | | 0.7 | | | | 127,114 | | | | 8,712 | |
Costco Wholesale Corp | | | 0.7 | | | | 38,004 | | | | 9,202 | |
Danaher Corp, Cl A | | | 0.7 | | | | 71,638 | | | | 9,458 | |
Darden Restaurants Inc | | | 0.8 | | | | 78,887 | | | | 9,582 | |
DTE Energy Co | | | 0.6 | | | | 56,193 | | | | 7,010 | |
Encompass Health Corp | | | 0.6 | | | | 127,627 | | | | 7,453 | |
Estee Lauder Cos Inc/The, Cl A | | | 1.3 | | | | 98,019 | | | | 16,227 | |
Exelon Corp | | | 0.8 | | | | 200,301 | | | | 10,041 | |
Home Depot Inc/The | | | 0.9 | | | | 62,784 | | | | 12,048 | |
Humana Inc | | | 0.7 | | | | 34,960 | | | | 9,299 | |
Lincoln National Corp | | | 0.6 | | | | 134,150 | | | | 7,875 | |
Motorola Solutions Inc | | | 0.6 | | | | 51,314 | | | | 7,206 | |
PepsiCo Inc | | | 1.5 | | | | 154,668 | | | | 18,955 | |
Procter & Gamble Co/The | | | 1.4 | | | | 177,532 | | | | 18,472 | |
Prudential Financial Inc | | | 0.6 | | | | 82,948 | | | | 7,621 | |
Starwood Property Trust Inc‡ | | | 0.6 | | | | 350,822 | | | | 7,841 | |
TJX Cos Inc/The | | | 0.7 | | | | 174,474 | | | | 9,284 | |
UnitedHealth Group Inc | | | 0.7 | | | | 36,206 | | | | 8,952 | |
Universal Health Services Inc, Cl B | | | 0.6 | | | | 61,528 | | | | 8,231 | |
Verizon Communications Inc | | | 0.7 | | | | 142,568 | | | | 8,430 | |
Waste Management Inc | | | 0.6 | | | | 75,811 | | | | 7,878 | |
Yum! Brands Inc | | | 0.8 | | | | 104,707 | | | | 10,451 | |
| | | | | | | | | | | | |
| | | | |
| Description | | Percentage of Net Assets (%) | | Shares | | | Market Value
($ Thousands) | |
| |
COMMON STOCK (continued) | | | | | |
| |
United States (continued) | | | | | |
Zoetis Inc, Cl A | | | 0.6 | % | | | 78,822 | | | $ | 7,935 | |
Other Securities‡(A) | | | 24.8 | | | | | | | | 323,253 | |
| | | |
| | | | | | | | | | | 630,912 | |
Total Common Stock
(Cost $1,103,705) ($ Thousands) | | | | 1,247,137 | |
| | |
PREFERRED STOCK — 0.1% | | | | | | | | | |
| | | |
Germany — 0.1% | | | | | | | | | | | | |
Other Securities (B) | | | 0.1 | | | | | | | | 890 | |
| | | |
Sweden — 0.0% | | | | | | | | | | | | |
Other Securities (B) | | | 0.0 | | | | | | | | 339 | |
| |
Total Preferred Stock
(Cost $1,443) ($ Thousands) | | | | 1,229 | |
| | |
CASH EQUIVALENT — 2.0% | | | | | | | | | |
SEI Daily Income Trust, Government Fund, Cl F | | | | | | | | | |
2.220% **† | | | 2.0 | | | | 25,120,070 | | | | 25,120 | |
| |
Total Cash Equivalent
(Cost $25,120) ($ Thousands) | | | | 25,120 | |
| |
Total Investments in Securities — 98.8%
(Cost $1,130,268) ($ Thousands) | | | $ | 1,273,486 | |
| | | | | | | | | | | | |
| | |
SEI Institutional Managed Trust / Semi-Annual Report / March 31, 2019 | | 35 |
SUMMARY SCHEDULE OF INVESTMENTS (Unaudited)
March 31, 2019
Global Managed Volatility Fund(Concluded)
A list of the open futures contracts held by the Fund at March 31, 2019, is as follows:
| | | | | | | | | | | | | | | | | | | | |
| Type of Contract | | Number of
Contracts
Long | | | Expiration
Date | | | Notional Amount
(Thousands) | | Value
(Thousands) | | Unrealized
Appreciation
(Thousands) |
DJ Euro Stoxx 50 Index | | | 69 | | | | Jun-2019 | | | $ | 2,506 | | | $ | 2,535 | | | $ | 35 | |
FTSE 100 Index | | | 16 | | | | Jun-2019 | | | | 1,493 | | | | 1,504 | | | | 22 | |
Hang Seng Index | | | 3 | | | | Apr-2019 | | | | 547 | | | | 556 | | | | 9 | |
S&P 500 Index E-MINI | | | 80 | | | | Jun-2019 | | | | 11,103 | | | | 11,351 | | | | 248 | |
SPI 200 Index | | | 6 | | | | Jun-2019 | | | | 658 | | | | 658 | | | | – | |
TOPIX Index | | | 13 | | | | Jun-2019 | | | | 1,859 | | | | 1,870 | | | | 1 | |
| | | | | | | | | | | | | | | | | | | | |
| | | | | | | | | | $ | 18,166 | | | $ | 18,474 | | | $ | 315 | |
| | | | | | | | | | | | | | | | |
A list of the open forward foreign currency contracts held by the Fund at March 31, 2019, is as follows:
| | | | | | | | | | | | | | | | | | | | | | | | |
| Counterparty | | Settlement Date | | | | | | Currency to Deliver
(Thousands) | | | | | | Currency to Receive
(Thousands) | | | Unrealized
Appreciation
(Depreciation)
(Thousands) | |
Brown Brothers Harriman | | | 04/25/19 | | | | USD | | | | 92 | | | | DKK | | | | 604 | | | $ | (1 | ) |
| | | | | | |
Brown Brothers Harriman | | | 04/25/19 | | | | USD | | | | 17 | | | | SGD | | | | 23 | | | | — | |
| | | | | | |
Brown Brothers Harriman | | | 04/25/19 | | | | USD | | | | 224 | | | | SGD | | | | 302 | | | | (1 | ) |
| | | | | | |
Brown Brothers Harriman | | | 04/25/19 | | | | USD | | | | 284 | | | | GBP | | | | 215 | | | | (4 | ) |
| | | | | | |
Brown Brothers Harriman | | | 04/25/19 | | | | USD | | | | 2 | | | | NOK | | | | 13 | | | | — | |
| | | | | | |
Brown Brothers Harriman | | | 04/25/19 | | | | USD | | | | 355 | | | | NOK | | | | 3,020 | | | | (4 | ) |
| | | | | | |
Brown Brothers Harriman | | | 04/25/19 | | | | USD | | | | 433 | | | | SEK | | | | 3,983 | | | | (3 | ) |
| | | | | | |
Brown Brothers Harriman | | | 04/25/19 | | | | USD | | | | 718 | | | | HKD | | | | 5,633 | | | | — | |
| | | | | | |
Brown Brothers Harriman | | | 04/25/19 | | | | USD | | | | 174 | | | | CHF | | | | 173 | | | | — | |
| | | | | | |
Brown Brothers Harriman | | | 04/25/19 | | | | USD | | | | 832 | | | | CHF | | | | 823 | | | | (3 | ) |
| | | | | | |
Brown Brothers Harriman | | | 04/25/19 | | | | USD | | | | 1,058 | | | | EUR | | | | 931 | | | | (11 | ) |
| | | | | | |
Brown Brothers Harriman | | | 04/25/19 | | | | USD | | | | 891 | | | | CAD | | | | 1,194 | | | | 3 | |
| | | | | | |
Brown Brothers Harriman | | | 04/25/19 | | | | USD | | | | 191 | | | | CAD | | | | 255 | | | | — | |
| | | | | | |
Brown Brothers Harriman | | | 04/25/19 | | | | USD | | | | 923 | | | | JPY | | | | 102,150 | | | | 2 | |
| | | | | | |
Brown Brothers Harriman | | | 04/25/19 | | | | USD | | | | 636 | | | | JPY | | | | 69,821 | | | | (4 | ) |
| | | | | | |
Brown Brothers Harriman | | | 04/25/19 | | | | SGD | | | | 13,413 | | | | USD | | | | 9,937 | | | | 28 | |
| | | | | | |
Brown Brothers Harriman | | | 04/25/19 | | | | SGD | | | | 131 | | | | USD | | | | 97 | | | | — | |
| | | | | | |
Brown Brothers Harriman | | | 04/25/19 | | | | GBP | | | | 13,802 | | | | USD | | | | 18,225 | | | | 223 | |
| | | | | | |
Brown Brothers Harriman | | | 04/25/19 | | | | DKK | | | | 25,750 | | | | USD | | | | 3,925 | | | | 44 | |
| | | | | | |
Brown Brothers Harriman | | | 04/25/19 | | | | CHF | | | | 565 | | | | USD | | | | 569 | | | | 1 | |
| | | | | | |
Brown Brothers Harriman | | | 04/25/19 | | | | CHF | | | | 34,744 | | | | USD | | | | 34,910 | | | | (60 | ) |
| | | | | | |
Brown Brothers Harriman | | | 04/25/19 | | | | EUR | | | | 39,763 | | | | USD | | | | 45,238 | | | | 508 | |
| | | | | | |
Brown Brothers Harriman | | | 04/25/19 | | | | CAD | | | | 58,057 | | | | USD | | | | 43,583 | | | | 97 | |
| | | | | | |
Brown Brothers Harriman | | | 04/25/19 | | | | CAD | | | | 1,192 | | | | USD | | | | 889 | | | | (4 | ) |
| | | | | | |
Brown Brothers Harriman | | | 04/25/19 | | | | NOK | | | | 87,698 | | | | USD | | | | 10,277 | | | | 81 | |
| | | | | | |
Brown Brothers Harriman | | | 04/25/19 | | | | NOK | | | | 1,621 | | | | USD | | | | 188 | | | | (1 | ) |
| | | | | | |
Brown Brothers Harriman | | | 04/25/19 | | | | SEK | | | | 121,304 | | | | USD | | | | 13,233 | | | | 130 | |
| | | | | | |
Brown Brothers Harriman | | | 04/25/19 | | | | SEK | | | | 3,964 | | | | USD | | | | 427 | | | | (1 | ) |
| | | | | | |
Brown Brothers Harriman | | | 04/25/19 | | | | HKD | | | | 3,420 | | | | USD | | | | 436 | | | | — | |
| | | | | | |
Brown Brothers Harriman | | | 04/25/19 | | | | HKD | | | | 261,179 | | | | USD | | | | 33,287 | | | | (11 | ) |
| | | | | | |
Brown Brothers Harriman | | | 04/25/19 | | | | JPY | | | | 48,552 | | | | USD | | | | 441 | | | | 1 | |
| | | | | | |
Brown Brothers Harriman | | | 04/25/19 | | | | JPY | | | | 7,605,103 | | | | USD | | | | 68,391 | | | | (470 | ) |
| | | | | | |
Brown Brothers Harriman | | | 04/26/19 | | | | USD | | | | 28 | | | | NZD | | | | 42 | | | | — | |
| | | | | | |
Brown Brothers Harriman | | | 04/26/19 | | | | USD | | | | 354 | | | | NZD | | | | 513 | | | | (4 | ) |
| | | | | | |
Brown Brothers Harriman | | | 04/26/19 | | | | USD | | | | 61 | | | | AUD | | | | 87 | | | | — | |
| | |
36 | | SEI Institutional Managed Trust / Semi-Annual Report / March 31, 2019 |
| | | | | | | | | | | | | | | | | | | | | | | | |
| Counterparty | | Settlement Date | | | | | | Currency to Deliver
(Thousands) | | | | | | Currency to Receive
(Thousands) | | | Unrealized
Appreciation (Depreciation)
(Thousands) |
Brown Brothers Harriman | | | 04/26/19 | | | | USD | | | | 658 | | | | AUD | | | | 924 | | | $ | (1) | |
| | | | | | |
Brown Brothers Harriman | | | 04/26/19 | | | | NZD | | | | 16,822 | | | | USD | | | | 11,520 | | | | 45 | |
| | | | | | |
Brown Brothers Harriman | | | 04/26/19 | | | | NZD | | | | 418 | | | | USD | | | | 284 | | | | (1) | |
| | | | | | |
Brown Brothers Harriman | | | 04/26/19 | | | | AUD | | | | 31,435 | | | | USD | | | | 22,284 | | | | (53) | |
| | | | | | | | | | | | | | | | | | | | | | | | |
| | | | | | | | | | | | | | | | | | | | | | $ | 526 | |
| | | | | | | | | | | | | | | | | | | | | | | | |
| | Percentages are based on a Net Assets of $1,289,481 ($ Thousands). |
| * | Non-income producing security. |
| ** | The rate reported is the 7-day effective yield as of March 31, 2019. |
| ‡ | Real Estate Investment Trust. |
| † | Investment in Affiliated Security (see Note 6). |
| (A) | Securities considered illiquid. The total value of such securities as of March 31, 2019 was $5,715 ($ Thousands) and represented 0.4% of Net Assets. |
| (B) | There is currently no rate available. |
AUD — Australian Dollar
CAD — Canadian Dollar
CHF — Swiss Franc
Cl — Class
DJ — Dow Jones
DKK — Danish Krone
EUR — Euro
FTSE — Financial Times and the London Stock Exchange
GBP — British Pound Sterling
HKD — Hong Kong Dollar
JPY — Japanese Yen
Ltd — Limited
NOK — Norwegian Krone
NZD — New Zealand Dollar
S&P — Standard & Poor’s
SEK — Swedish Krona
SGD — Singapore Dollar
SPI — Share Price Index
TOPIX — Tokyo Price Index
USD — United States Dollar
The Summary Schedule of Investments does not reflect the complete portfolio holdings. It includes the Fund’s 50 largest holdings and each investment of any issuer that exceeds 1% of the Fund’s net assets. “Other Securities” represent all issues not required to be disclosed under the rules adopted by the U.S. Securities and Exchange Commission (“SEC”). In certain instances, securities for which footnotes listed above may otherwise apply are included in the Other Securities caption. The complete schedule of portfolio holdings is available (i) without charge, upon request, by calling (800) 342-5734; and (ii) on the SEC’s website at http://www.sec.gov.
The following is a list of the level of inputs used as of March 31, 2019, in valuing the Fund’s investments and other financial instruments carried at value ($ Thousands):
| | | | | | | | | | | | | | | | |
| | | | | |
Investments in
Securities | | Level 1 | | | Level 2 | | | Level 3 | | | Total | |
Common Stock | | $ | 1,247,137 | | | $ | – | | | $ | – | | | $ | 1,247,137 | |
Preferred Stock | | | 1,229 | | | | – | | | | – | | | | 1,229 | |
Cash Equivalent | | | 25,120 | | | | – | | | | – | | | | 25,120 | |
| | | | | | | | | | | | | | | | |
Total Investments in Securities | | $ | 1,273,486 | | | $ | – | | | $ | – | | | $ | 1,273,486 | |
| | | | | | | | | | | | | | | | |
| | | | | | | | | | | | | | | | |
Other Financial
Instruments | | Level 1 | | | Level 2 | | | Level 3 | | | Total | |
Futures Contracts * | | | | | | | | | | | | | | | | |
Unrealized Appreciation | | $ | 315 | | | $ | – | | | $ | – | | | $ | 315 | |
Forwards Contracts * | | | | | | | | | | | | | | | | |
Unrealized Appreciation | | | – | | | | 1,163 | | | | – | | | | 1,163 | |
Unrealized Depreciation | | | – | | | | (637) | | | | – | | | | (637) | |
| | | | | | | | | | | | | | | | |
Total Other Financial Instruments | | $ | 315 | | | $ | 526 | | | $ | – | | | $ | 841 | |
| | | | | | | | | | | | | | | | |
* Futures contracts and forwards contracts are valued at unrealized appreciation (depreciation) on the instrument.
For the period ended March 31, 2019, there were no transfers between Level 1 and Level 2 assets and liabilities.
For the period ended March 31, 2019, there were no transfers between Level 2 and Level 3 assets and liabilities.
For more information on valuation inputs, see Note 2 — Significant Accounting Policies in Notes to Financial Statements.
Amounts designated as “—” are either $0 or have been rounded to $0.
The following is a summary of the Fund’s transactions with affiliates for the period ended March 31, 2019 ($ Thousands):
| | | | | | | | | | | | | | | | | | | | | | | | | | | | |
| Security Description | | Value 9/30/18 | | | Purchases at
Cost | | | Proceeds
from Sales | | | Realized Gain
(Loss) | | | Change in
Unrealized
Appreciation
(Depreciation) | | | Value 3/31/19 | | | Income | |
| SEI Daily Income Trust, Government Fund, Cl F | | $ | 26,205 | | | $ | 125,128 | | | $ | (126,213) | | | $ | - | | | $ | - | | | $ | 25,120 | | | $ | 139 | |
| | | | | | | | | | | | | | | | | | | | | | | | | | | | |
The accompanying notes are an integral part of the financial statements.
| | |
SEI Institutional Managed Trust / Semi-Annual Report / March 31, 2019 | | 37 |
SUMMARY SCHEDULE OF INVESTMENTS (Unaudited)
March 31, 2019
Tax-Managed Managed Volatility Fund
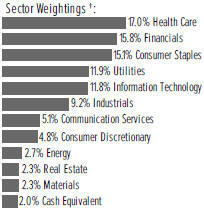
†Percentages are based on total investments.
| | | | | | | | | | | | |
| | | | |
| Description | | Percentage of
Net Assets (%) | | Shares | | Market Value
($ Thousands) |
| |
COMMON STOCK — 97.8% | | | | | |
| |
Communication Services — 5.1% | | | | | |
Verizon Communications Inc | | | 1.7 | % | | | 307,339 | | | $ | 18,173 | |
Walt Disney Co/The | | | 1.0 | | | | 93,498 | | | | 10,381 | |
Other Securities | | | 2.4 | | | | | | | | 25,316 | |
| | | | | | | | | | | 53,870 | |
| |
Consumer Discretionary — 4.8% | | | | | |
Darden Restaurants Inc | | | 0.8 | | | | 65,500 | | | | 7,956 | |
Other Securities | | | 4.0 | | | | | | | | 42,992 | |
| | | | | | | | | | | 50,948 | |
| |
Consumer Staples — 15.0% | | | | | |
Altria Group Inc | | | 1.2 | | | | 217,281 | | | | 12,478 | |
Church & Dwight Co Inc | | | 0.7 | | | | 102,803 | | | | 7,323 | |
Clorox Co/The | | | 0.7 | | | | 46,743 | | | | 7,500 | |
Costco Wholesale Corp | | | 0.8 | | | | 36,346 | | | | 8,801 | |
McCormick & Co Inc/MD | | | 0.8 | | | | 55,408 | | | | 8,346 | |
PepsiCo Inc | | | 0.7 | | | | 64,572 | | | | 7,913 | |
Tyson Foods Inc, Cl A | | | 1.2 | | | | 183,000 | | | | 12,706 | |
Walgreens Boots Alliance Inc | | | 1.4 | | | | 233,800 | | | | 14,793 | |
Walmart Inc | | | 2.3 | | | | 247,524 | | | | 24,141 | |
Other Securities | | | 5.2 | | | | | | | | 54,848 | |
| | | | | | | | | | | 158,849 | |
| |
Energy — 2.7% | | | | | |
Valero Energy Corp | | | 0.8 | | | | 95,870 | | | | 8,133 | |
Other Securities | | | 1.9 | | | | | | | | 20,304 | |
| | | | | | | | | | | 28,437 | |
| |
Financials — 15.7% | | | | | |
Berkshire Hathaway Inc, Cl B * | | | 1.1 | | | | 59,100 | | | | 11,873 | |
Cboe Global Markets Inc | | | 0.7 | | | | 80,058 | | | | 7,641 | |
Everest Re Group Ltd | | | 0.9 | | | | 43,466 | | | | 9,387 | |
Progressive Corp/The | | | 0.8 | | | | 115,800 | | | | 8,348 | |
RenaissanceRe Holdings Ltd | | | 1.1 | | | | 83,889 | | | | 12,038 | |
Travelers Cos Inc/The | | | 1.1 | | | | 83,472 | | | | 11,449 | |
Other Securities‡ | | | 10.0 | | | | | | | | 105,305 | |
| | | | | | | | | | | 166,041 | |
| |
Health Care — 17.0% | | | | | |
Anthem Inc | | | 1.2 | | | | 44,047 | | | | 12,641 | |
| | | | | | | | | | | | |
| | | | |
| Description | | Percentage of
Net Assets (%) | | Shares | | Market Value
($ Thousands) |
| |
COMMON STOCK (continued) | | | | | |
Baxter International Inc | | | 0.7 | % | | | 87,932 | | | $ | 7,150 | |
Eli Lilly & Co | | | 1.9 | | | | 156,104 | | | | 20,256 | |
Humana Inc | | | 1.0 | | | | 38,120 | | | | 10,140 | |
Johnson & Johnson | | | 2.6 | | | | 195,171 | | | | 27,283 | |
Merck & Co Inc | | | 2.1 | | | | 271,437 | | | | 22,575 | |
Pfizer Inc | | | 2.4 | | | | 600,276 | | | | 25,494 | |
UnitedHealth Group Inc | | | 0.8 | | | | 35,650 | | | | 8,815 | |
Other Securities (A) | | | 4.3 | | | | | | | | 44,748 | |
| | | | | | | | | | | 179,102 | |
| |
Industrials — 9.2% | | | | | |
Boeing Co/The | | | 1.2 | | | | 32,700 | | | | 12,472 | |
Lockheed Martin Corp | | | 0.7 | | | | 25,675 | | | | 7,707 | |
Northrop Grumman Corp | | | 1.2 | | | | 45,529 | | | | 12,275 | |
Raytheon Co | | | 1.4 | | | | 80,261 | | | | 14,614 | |
Republic Services Inc | | | 1.1 | | | | 146,100 | | | | 11,743 | |
Waste Management Inc | | | 1.3 | | | | 133,069 | | | | 13,827 | |
Other Securities | | | 2.3 | | | | | | | | 24,179 | |
| | | | | | | | | | | 96,817 | |
| |
Information Technology — 11.8% | | | | | |
Amdocs Ltd | | | 0.9 | | | | 171,424 | | | | 9,276 | |
Apple Inc | | | 1.4 | | | | 75,762 | | | | 14,391 | |
Cisco Systems Inc | | | 1.6 | | | | 306,400 | | | | 16,543 | |
Intel Corp | | | 1.6 | | | | 307,300 | | | | 16,502 | |
Microsoft Corp | | | 1.0 | | | | 85,745 | | | | 10,113 | |
Motorola Solutions Inc | | | 1.2 | | | | 89,937 | | | | 12,629 | |
Oracle Corp, Cl B | | | 0.9 | | | | 176,000 | | | | 9,453 | |
Synopsys Inc * | | | 0.8 | | | | 74,285 | | | | 8,554 | |
Other Securities | | | 2.4 | | | | | | | | 27,353 | |
| | | | | | | | | | | 124,814 | |
| |
Materials — 2.3% | | | | | |
Other Securities | | | 2.3 | | | | | | | | 24,170 | |
| |
Real Estate — 2.3% | | | | | |
Other Securities‡ | | | 2.3 | | | | | | | | 24,205 | |
| |
Utilities — 11.9% | | | | | |
American Electric Power Co Inc | | | 1.0 | | | | 126,917 | | | | 10,629 | |
Consolidated Edison Inc | | | 1.3 | | | | 160,960 | | | | 13,651 | |
Edison International | | | 0.7 | | | | 120,856 | | | | 7,483 | |
Entergy Corp | | | 1.1 | | | | 119,200 | | | | 11,399 | |
Eversource Energy | | | 0.8 | | | | 113,201 | | | | 8,032 | |
Exelon Corp | | | 1.1 | | | | 227,300 | | | | 11,395 | |
Public Service Enterprise Group | | | | | | | | | | | | |
Inc | | | 1.0 | | | | 183,544 | | | | 10,904 | |
WEC Energy Group Inc | | | 0.9 | | | | 117,465 | | | | 9,289 | |
Other Securities | | | 4.0 | | | | | | | | 42,331 | |
| | | | | | | | | | | 125,113 | |
Total Common Stock
(Cost $654,658)
($ Thousands) | | | | | | | | | | | 1,032,366 | |
| | |
38 | | SEI Institutional Managed Trust / Semi-Annual Report / March 31, 2019 |
| | | | | | | | | | |
| | | | |
| Description | | Percentage of
Net Assets (%) | | Shares | | | Market Value
($ Thousands) |
| |
CASH EQUIVALENT — 2.0% | | | | | |
SEI Daily Income Trust, Government Fund, Cl F | | | | | | | | |
2.220% ** | | 2.0% | | | 20,855,746 | | | $ | 20,856 | |
| |
Total Cash Equivalent
(Cost $20,856) ($ Thousands) | | | | 20,856 | |
| |
Total Investments in Securities — 99.8%
(Cost $675,514) ($ Thousands) | | | $ | 1,053,222 | |
| | | | | | | | | | |
A list of the open futures contracts held by the Fund at March 31, 2019, is as follows:
| | | | | | | | | | | | | | | | | | | | |
| | | | | | |
Type of Contract | | Number of
Contracts
Long/(Short) | | | Expiration
Date | | | Notional Amount
(Thousands) | | | Value
(Thousands) | | | Unrealized
Appreciation
(Depreciation)
(Thousands) | |
S&P 500 Index E-MINI | | | 67 | | | | Jun-2019 | | | $ | 9,229 | | | $ | 9,507 | | | $ | 278 | |
| | | | | | | | | | $ | 9,229 | | | $ | 9,507 | | | $ | 278 | |
| | | | | | | | | | | | | | | | | | | | |
| | Percentages are based on a Net Assets of $1,055,211 ($ Thousands). |
| * | Non-income producing security. |
| ** | The rate reported is the 7-day effective yield as of March 31, 2019. |
| ‡ | Real Estate Investment Trust. |
| (A) | Securities considered illiquid. The total value of such securities as of March 31, 2019 was $4,715 ($ Thousands) and represented 0.4% of Net Assets. |
ADR — American Depositary Receipt
Cl — Class
L.P. — Limited Partnership
Ltd. — Limited
PLC — Public Limited Company
The Summary Schedule of Investments does not reflect the complete portfolio holdings. It includes the Fund’s 50 largest holdings and each investment of any issuer that exceeds 1% of the Fund’s net assets. “Other Securities” represent all issues not required to be disclosed under the rules adopted by the U.S. Securities and Exchange Commission (“SEC”). In certain instances, securities for which footnotes listed above may otherwise apply are included in the Other Securities caption. The complete schedule of portfolio holdings is available (i) without charge, upon request, by calling (800) 342-5734; and (ii) on the SEC’s website at http://www.sec.gov.
The following is a list of the level of inputs used as of March 31, 2019, in valuing the Fund’s investments and other financial instruments carried at value ($ Thousands):
| | | | | | | | | | | | | | | | |
| | | | | |
Investments in
Securities | | Level 1 | | | Level 2 | | | Level 3 | | | Total | |
Common Stock | | | $ 1,032,366 | | | $ | – | | | $ | – | | | $ | 1,032,366 | |
Cash Equivalent | | | 20,856 | | | | – | | | | – | | | | 20,856 | |
| | | | | | | | | | | | | | | | |
Total Investments in Securities | | | $ 1,053,222 | | | $ | – | | | $ | – | | | $ | 1,053,222 | |
| | | | | | | | | | | | | | | | |
| | | | | | | | | | | | | | | | |
Other Financial
Instruments | | Level 1 | | | Level 2 | | | Level 3 | | | Total | |
Futures Contracts * | | | | | | | | | | | | | | | | |
Unrealized Appreciation | | $ | 278 | | | $ | – | | | $ | – | | | $ | 278 | |
| | | | | | | | | | | | | | | | |
Total Other Financial Instruments | | $ | 278 | | | $ | – | | | $ | – | | | $ | 278 | |
| | | | | | | | | | | | | | | | |
| * | Futures contracts are valued at unrealized appreciation on the instrument. |
For the period ended March 31, 2019, there were no transfers between Level 1 and Level 2 assets and liabilities.
For the period ended March 31, 2019, there were no transfers between Level 2 and Level 3 assets and liabilities.
For more information on valuation inputs, see Note 2 — Significant Accounting Policies in Notes to Financial Statements.
Amounts designated as “–” are either $0 or have been rounded to $0.
The following is a summary of the Fund’s transactions with affiliates for the period ended March 31, 2019 ($ Thousands):
| | | | | | | | | | | | | | | | | | | | | | | | | | | | |
| Security Description | | Value 9/30/18 | | | Purchases at
Cost | | | Proceeds
from Sales | | | Realized Gain
(Loss) | | | Change in
Unrealized
Appreciation
(Depreciation) | | | Value 3/31/19 | | | Income | |
SEI Daily Income Trust, Government Fund, Cl F | | $ | 17,479 | | | $ | 137,335 | | | | $ (133,958) | | | $ | - | | | $ | - | | | $ | 20,856 | | | $ | 273 | |
| | | | | | | | | | | | | | | | | | | | | | | | | | | | |
Total | | $ | 17,479 | | | $ | 137,335 | | | | $ (133,958) | | | $ | - | | | $ | - | | | $ | 20,856 | | | $ | 273 | |
| | | | | | | | | | | | | | | | | | | | | | | | | | | | |
The accompanying notes are an integral part of the financial statements.
| | |
SEI Institutional Managed Trust / Semi-Annual Report / March 31, 2019 | | 39 |
SUMMARY SCHEDULE OF INVESTMENTS (Unaudited)
March 31, 2019
Tax-Managed International Managed Volatility Fund
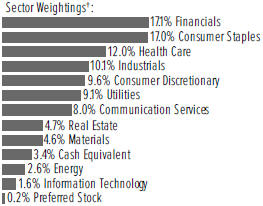
†Percentages are based on total investments.
| | | | | | | | | | | | |
| | | | |
| Description | | Percentage of
Net Assets (%) | | Shares | | Market Value
($ Thousands) |
| | |
COMMON STOCK — 94.6% | | | | | | | | | |
| | | |
Australia — 7.8% | | | | | | | | | | | | |
AGL Energy Ltd | | | 0.8 | % | | | 185,423 | | | $ | 2,867 | |
ASX Ltd | | | 0.6 | | | | 42,439 | | | | 2,105 | |
Coca-Cola Amatil Ltd | | | 0.5 | | | | 324,187 | | | | 1,992 | |
Macquarie Group Ltd | | | 0.6 | | | | 22,760 | | | | 2,092 | |
Rio Tinto Ltd | | | 0.8 | | | | 42,230 | | | | 2,937 | |
Woolworths Group Ltd | | | 0.6 | | | | 104,549 | | | | 2,258 | |
Other Securities‡ | | | 3.9 | | | | | | | | 14,337 | |
| | | |
| | | | | | | | | | | 28,588 | |
| | | |
Austria — 1.2% | | | | | | | | | | | | |
Other Securities | | | 1.2 | | | | | | | | 4,255 | |
| | | |
Belgium — 1.7% | | | | | | | | | | | | |
Colruyt SA | | | 0.8 | | | | 41,376 | | | | 3,062 | |
Other Securities | | | 0.9 | | | | | | | | 3,297 | |
| | | |
| | | | | | | | | | | 6,359 | |
| | | |
Canada — 2.3% | | | | | | | | | | | | |
TELUS Corp | | | 0.7 | | | | 70,718 | | | | 2,618 | |
Toronto-Dominion Bank/The | | | 0.7 | | | | 48,192 | | | | 2,616 | |
Other Securities | | | 0.9 | | | | | | | | 3,254 | |
| | | |
| | | | | | | | | | | 8,488 | |
| | | |
Denmark — 2.1% | | | | | | | | | | | | |
Other Securities | | | 2.1 | | | | | | | | 7,604 | |
| | | |
Finland — 1.1% | | | | | | | | | | | | |
Other Securities | | | 1.1 | | | | | | | | 3,870 | |
| | | |
France — 6.3% | | | | | | | | | | | | |
Cie Generale des Etablissements | | | | | | | | | | | | |
Michelin SCA | | | 0.5 | | | | 16,319 | | | | 1,931 | |
Engie SA | | | 0.5 | | | | 126,141 | | | | 1,881 | |
Orange SA | | | 0.7 | | | | 146,678 | | | | 2,388 | |
Sanofi | | | 1.4 | | | | 56,743 | | | | 5,017 | |
| | | | | | | | | | | | |
| | | | |
| Description | | Percentage of
Net Assets (%) | | Shares | | Market Value
($ Thousands) |
| |
COMMON STOCK (continued) | | | | | |
| | | |
France (continued) | | | | | | | | | | | | |
TOTAL SA | | | 0.7 | % | | | 42,611 | | | $ | 2,369 | |
Other Securities (A) | | | 2.5 | | | | | | | | 9,215 | |
| | | |
| | | | | | | | | | | 22,801 | |
| | | |
Germany — 5.5% | | | | | | | | | | | | |
Deutsche Telekom AG | | | 0.6 | | | | 131,358 | | | | 2,182 | |
Hannover Rueck SE | | | 0.5 | | | | 12,686 | | | | 1,823 | |
Merck KGaA | | | 0.8 | | | | 25,871 | | | | 2,953 | |
METRO AG | | | 0.5 | | | | 112,029 | | | | 1,861 | |
Muenchener Rueckversicherungs- Gesellschaft AG in Muenchen | | | 0.8 | | | | 12,870 | | | | 3,049 | |
Other Securities | | | 2.3 | | | | | | | | 8,332 | |
| | | |
| | | | | | | | | | | 20,200 | |
| | | |
Hong Kong — 5.9% | | | | | | | | | | | | |
CLP Holdings Ltd, Cl B | | | 1.2 | | | | 368,500 | | | | 4,272 | |
Kerry Properties Ltd | | | 0.6 | | | | 480,000 | | | | 2,143 | |
WH Group Ltd | | | 0.7 | | | | 2,423,000 | | | | 2,593 | |
Other Securities‡(A) | | | 3.4 | | | | | | | | 12,504 | |
| | | |
| | | | | | | | | | | 21,512 | |
| | | |
Ireland — 0.2% | | | | | | | | | | | | |
Other Securities‡ | | | 0.2 | | | | | | | | 613 | |
| | | |
Israel — 1.6% | | | | | | | | | | | | |
Bank Hapoalim BM | | | 0.8 | | | | 410,265 | | | | 2,720 | |
Other Securities | | | 0.8 | | | | | | | | 3,139 | |
| | | |
| | | | | | | | | | | 5,859 | |
| | | |
Italy — 1.1% | | | | | | | | | | | | |
Other Securities | | | 1.1 | | | | | | | | 3,825 | |
| | | |
Japan — 21.1% | | | | | | | | | | | | |
Astellas Pharma Inc | | | 0.8 | | | | 201,500 | | | | 3,019 | |
ITOCHU | | | 0.4 | | | | 90,100 | | | | 1,630 | |
Japan Airlines Co Ltd | | | 0.5 | | | | 51,800 | | | | 1,825 | |
JXTG Holdings | | | 0.3 | | | | 249,000 | | | | 1,139 | |
KDDI Corp | | | 0.7 | | | | 115,200 | | | | 2,482 | |
Mizuho Financial Group Inc | | | 0.9 | | | | 2,085,300 | | | | 3,227 | |
Nippon Telegraph & Telephone Corp | | | 1.2 | | | | 102,000 | | | | 4,334 | |
Nissan Motor Co Ltd | | | 0.5 | | | | 225,200 | | | | 1,848 | |
NTT DOCOMO Inc | | | 0.7 | | | | 122,100 | | | | 2,704 | |
Other Securities‡(A) | | | 15.1 | | | | | | | | 54,862 | |
| | | |
| | | | | | | | | | | 77,070 | |
| | | |
Netherlands — 2.6% | | | | | | | | | | | | |
Koninklijke Ahold Delhaize NV | | | 0.9 | | | | 126,640 | | | | 3,374 | |
| | |
40 | | SEI Institutional Managed Trust / Semi-Annual Report / March 31, 2019 |
| | | | | | | | | | | | |
| | | | |
| Description | | Percentage of
Net Assets (%) | | Shares | | Market Value
($ Thousands) |
| |
COMMON STOCK (continued) | | | | | |
| | |
Netherlands (continued) | | | | | | | | | |
NN Group NV | | | 0.8 | % | | | 68,275 | | | $ | 2,839 | |
Other Securities | | | 0.9 | | | | | | | | 3,138 | |
| | | |
| | | | | | | | | | | 9,351 | |
| |
New Zealand — 2.0% | | | | | |
Fisher & Paykel Healthcare Corp Ltd | | | 0.5 | | | | 184,452 | | | | 1,975 | |
Other Securities‡(A) | | | 1.5 | | | | | | | | 5,291 | |
| | | |
| | | | | | | | | | | 7,266 | |
| |
Norway — 1.3% | | | | | |
Other Securities | | | 1.3 | | | | | | | | 4,621 | |
| | |
Portugal — 0.1% | | | | | | | | | |
Other Securities | | | 0.1 | | | | | | | | 459 | |
| | |
Singapore — 3.7% | | | | | | | | | |
CapitaLand Mall Trust ‡ | | | 0.6 | | | | 1,336,100 | | | | 2,348 | |
DBS Group Holdings Ltd | | | 0.9 | | | | 167,700 | | | | 3,124 | |
Other Securities‡(A) | | | 2.2 | | | | | | | | 7,899 | |
| | | |
| | | | | | | | | | | 13,371 | |
| | |
Spain — 1.9% | | | | | | | | | |
Endesa SA | | | 0.9 | | | | 130,857 | | | | 3,341 | |
Iberdrola SA | | | 0.5 | | | | 210,398 | | | | 1,849 | |
Other Securities | | | 0.5 | | | | | | | | 1,799 | |
| | | |
| | | | | | | | | | | 6,989 | |
| | |
Sweden — 2.6% | | | | | | | | | |
ICA Gruppen AB | | | 0.9 | | | | 77,256 | | | | 3,107 | |
Other Securities | | | 1.7 | | | | | | | | 6,543 | |
| | | |
| | | | | | | | | | | 9,650 | |
| | |
Switzerland — 9.4% | | | | | | | | | |
Roche Holding AG | | | 1.9 | | | | 24,986 | | | | 6,883 | |
Sonova Holding AG | | | 0.6 | | | | 10,159 | | | | 2,010 | |
Swiss Life Holding AG | | | 1.3 | | | | 10,494 | | | | 4,621 | |
Zurich Insurance Group AG | | | 0.9 | | | | 9,498 | | | | 3,143 | |
Other Securities | | | 4.7 | | | | | | | | 17,727 | |
| | | |
| | | | | | | | | | | 34,384 | |
| | |
United Kingdom — 12.1% | | | | | | | | | |
BAE Systems PLC | | | 0.5 | | | | 296,852 | | | | 1,866 | |
BP PLC | | | 0.7 | | | | 345,444 | | | | 2,514 | |
GlaxoSmithKline PLC | | | 1.1 | | | | 190,001 | | | | 3,953 | |
Imperial Brands PLC | | | 0.8 | | | | 89,525 | | | | 3,062 | |
Tate & Lyle PLC | | | 0.6 | | | | 215,499 | | | | 2,038 | |
Other Securities ‡ | | | 8.4 | | | | | | | | 30,607 | |
| | | |
| | | | | | | | | | | 44,040 | |
| | | | | | | | | | | | |
| | | | |
| Description | | Percentage of
Net Assets (%) | | Shares | | Market Value
($ Thousands) |
| |
COMMON STOCK (continued) | | | | | |
| | |
United States — 1.0% | | | | | | | | | |
Coca-Cola European Partners PLC | | | 0.6 | % | | | 43,981 | | | $ | 2,276 | |
Other Securities | | | 0.4 | | | | | | | | 1,442 | |
| | | |
| | | | | | | | | | | 3,718 | |
| |
Total Common Stock
(Cost $309,286) ($ Thousands) | | | | 344,893 | |
| |
PREFERRED STOCK — 0.2% | | | | | |
| | |
Germany — 0.2% | | | | | | | | | |
Other Securities (B) | | | 0.2 | | | | | | | | 820 | |
| |
Total Preferred Stock
(Cost $880) ($ Thousands) | | | | 820 | |
| | |
CASH EQUIVALENT — 3.4% | | | | | | | | | |
SEI Daily Income Trust, | | | | | | | | | | | | |
Government Fund, Cl F | | | | | | | | | | | | |
2.220% **† | | | 3.4 | | | | 12,316,988 | | | | 12,317 | |
| | |
Total Cash Equivalent
(Cost $12,317) ($ Thousands) | | | | | | | | 12,317 | |
| |
Total Investments in Securities — 98.2%
(Cost $322,483)($ Thousands) | | | $ | 358,030 | |
| | | | | | | | | | | | |
| | |
SEI Institutional Managed Trust / Semi-Annual Report / March 31, 2019 | | 41 |
SUMMARY SCHEDULE OF INVESTMENTS (Unaudited)
March 31, 2019
Tax-Managed International Managed Volatility Fund(Concluded)
A list of the open futures contracts held by the Fund at March 31, 2019, is as follows:
| | | | | | | | | | | | | | | | | | | | |
| | | | | | |
| Type of Contract | | Number of
Contracts
Long (Short) | | | Expiration
Date | | | Notional
Amount
(Thousands) | | Value
(Thousands) | | Unrealized
Appreciation/
(Depreciation)
(Thousands) |
DJ Euro Stoxx 50 Index | | | 95 | | | | Jun-2019 | | | $ | 3,430 | | | $ | 3,490 | | | $ | 60 | |
FTSE 100 Index | | | 22 | | | | Jun-2019 | | | | 2,032 | | | | 2,067 | | | | 46 | |
Hang Seng Index | | | 1 | | | | Apr-2019 | | | | 183 | | | | 185 | | | | 2 | |
SPI 200 Index | | | 8 | | | | Jun-2019 | | | | 879 | | | | 877 | | | | (3 | ) |
TOPIX Index | | | 17 | | | | Jun-2019 | | | | 2,429 | | | | 2,445 | | | | (3 | ) |
| | | | | | | | | | | | | | | | | | | | |
| | | | | | | | | | $ | 8,953 | | | $ | 9,064 | | | $ | 102 | |
| | | | | | | | | | | | | | | | | | | | |
| | Percentages are based on a Net Assets of $364,622 ($ Thousands). |
| ** | The rate reported is the 7-day effective yield as of March 31, 2019. |
| ‡ | Real Estate Investment Trust. |
| † | Investment in Affiliated Security (see Note 6). |
| (A) | Securities considered illiquid. The total value of such securities as of March 31, 2019 was $1,675 ($ Thousands) and represented 0.5% of Net Assets. |
| (B) | There is currently no rate available. |
Cl — Class
DJ — Dow Jones
FTSE — Financial Times and Stock Exchange
Ltd. — Limited
PLC — Public Limited Company
SPI — Share Price Index
TOPIX — Tokyo Stock Price Index
The Summary Schedule of Investments does not reflect the complete portfolio holdings. It includes the Fund’s 50 largest holdings and each investment of any issuer that exceeds 1% of the Fund’s net assets. “Other Securities” represent all issues not required to be disclosed under the rules adopted by the U.S. Securities and Exchange Commission (“SEC”). In certain instances, securities for which footnotes listed above may otherwise apply are included in the Other Securities caption. The complete schedule of portfolio holdings is available (i) without charge, upon request, by calling (800) 342-5734; and (ii) on the SEC’s website at http://www.sec.gov.
The following is a list of the level of inputs used as of March 31, 2019, in valuing the Fund’s investments and other financial instruments carried at value ($ Thousands):
| | | | | | | | | | | | | | | | |
| | | | | |
| Investments in Securities | | Level 1 | | | Level 2 | | | Level 3 | | | Total | |
Common Stock | | $ | 344,893 | | | $ | – | | | $ | – | | | $ | 344,893 | |
Preferred Stock | | | 820 | | | | – | | | | – | | | | 820 | |
Cash Equivalent | | | 12,317 | | | | – | | | | – | | | | 12,317 | |
| | | | | | | | | | | | | | | | |
Total Investments in Securities | | $ | 358,030 | | | $ | – | | | $ | – | | | $ | 358,030 | |
| | | | | | | | | | | | | | | | |
| | | | | | | | | | | | | | | | |
| Other Financial Instruments | | Level 1 | | | Level 2 | | | Level 3 | | | Total | |
Futures Contracts * | | | | | | | | | | | | | | | | |
Unrealized Appreciation | | $ | 108 | | | $ | – | | | $ | – | | | $ | 108 | |
Unrealized Depreciation | | | (6) | | | | – | | | | – | | | | (6) | |
| | | | | | | | | | | | | | | | |
Total Other Financial Instruments | | $ | 102 | | | $ | – | | | $ | – | | | $ | 102 | |
| | | | | | | | | | | | | | | | |
* Futures contracts are valued at unrealized appreciation/(depreciation) on the instrument.
For the period ended March 31, 2019, there were no transfers between Level 1 and Level 2 assets and liabilities.
For the period ended March 31, 2019, there were no transfers between Level 2 and Level 3 assets and liabilities.
For more information on valuation inputs, see Note 2 — Significant Accounting Policies in Notes to Financial Statements.
Amounts designated as “–” are either $0 or have been rounded to $0.
The following is a summary of the Fund’s transactions with affiliates for the period ended March 31, 2019 ($ Thousands):
| | | | | | | | | | | | | | | | | | | | | | | | | | | | |
| Security Description | | Value 9/30/2018 | | | Purchases at
Cost | | | Proceeds from
Sales | | | Realized Gain
(Loss) | | | Change in
Unrealized
Appreciation
(Depreciation) | | | Value 3/31/2019 | | | Income | |
SEI Daily Income Trust, Government Fund, CI F | | | $ 6,054 | | | | $ 30,025 | | | | $ (23,762) | | | | $ — | | | | $ — | | | | $ 12,317 | | | | $ 83 | |
| | | | | | | | | | | | | | | | | | | | | | | | | | | | |
Totals | | | $ 6,054 | | | | $ 30,025 | | | | $ (23,762) | | | | $ — | | | | $ — | | | | $ 12,317 | | | | $ 83 | |
| | | | | | | | | | | | | | | | | | | | | | | | | | | | |
The accompanying notes are an integral part of the financial statements.
| | |
42 | | SEI Institutional Managed Trust / Semi-Annual Report / March 31, 2019 |
SCHEDULE OF INVESTMENTS (Unaudited)
March 31, 2019
Real Estate Fund
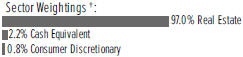
†Percentages are based on total investments.
| | | | | | | | | | | | |
| | | | |
| Description | | Percentage of
Net Assets (%) | | Shares | | Market Value
($ Thousands) |
|
COMMON STOCK — 98.5% | |
|
Consumer Discretionary — 0.8% | |
Hilton Worldwide Holdings Inc | | | 0.8 | % | | | 13,020 | | | $ | 1,082 | |
| |
Real Estate — 97.7% | | | | | |
Alexandria Real Estate Equities Inc‡ | | | 2.4 | | | | 22,362 | | | | 3,188 | |
American Homes 4 Rent, Cl A‡ | | | 2.6 | | | | 151,360 | | | | 3,439 | |
Americold Realty
Trust‡ | | | 1.0 | | | | 45,530 | | | | 1,389 | |
AvalonBay Communities
Inc‡ | | | 4.7 | | | | 31,420 | | | | 6,307 | |
Boston Properties
Inc‡ | | | 3.0 | | | | 29,810 | | | | 3,991 | |
Brandywine Realty Trust‡ | | | 0.7 | | | | 59,335 | | | | 941 | |
Brixmor Property Group Inc‡ | | | 1.4 | | | | 105,390 | | | | 1,936 | |
Camden Property
Trust‡ | | | 2.8 | | | | 37,390 | | | | 3,795 | |
Chesapeake Lodging Trust‡ | | | 0.8 | | | | 37,140 | | | | 1,033 | |
Columbia Property Trust Inc‡ | | | 0.9 | | | | 55,267 | | | | 1,244 | |
CoreSite Realty
Corp‡ | | | 0.6 | | | | 7,820 | | | | 837 | |
CubeSmart‡ | | | 2.3 | | | | 95,230 | | | | 3,051 | |
CyrusOne Inc‡ | | | 2.6 | | | | 67,030 | | | | 3,515 | |
Duke Realty Corp‡ | | | 2.0 | | | | 88,810 | | | | 2,716 | |
Empire State Realty Trust Inc, Cl A‡ | | | 1.4 | | | | 119,810 | | | | 1,893 | |
Equinix Inc‡ | | | 5.5 | | | | 16,320 | | | | 7,396 | |
Equity Residential‡ | | | 4.2 | | | | 75,810 | | | | 5,710 | |
Essex Property Trust Inc‡ | | | 1.3 | | | | 5,830 | | | | 1,686 | |
Extra Space Storage Inc‡ | | | 1.1 | | | | 15,060 | | | | 1,535 | |
Federal Realty Investment
Trust‡ | | | 0.6 | | | | 5,850 | | | | 806 | |
HCP Inc‡ | | | 3.2 | | | | 138,440 | | | | 4,333 | |
Healthcare Trust of America | | | | | | | | | | | | |
Inc, Cl A‡ | | | 2.0 | | | | 95,976 | | | | 2,744 | |
Highwoods Properties Inc‡ | | | 0.6 | | | | 16,620 | | | | 778 | |
Host Hotels & Resorts Inc‡ | | | 1.3 | | | | 89,280 | | | | 1,687 | |
Invitation Homes
Inc‡ | | | 1.6 | | | | 87,810 | | | | 2,136 | |
Iron Mountain Inc‡ | | | 0.8 | | | | 31,510 | | | | 1,117 | |
JBG SMITH
Properties‡ | | | 0.4 | | | | 13,940 | | | | 576 | |
Kilroy Realty Corp‡ | | | 2.8 | | | | 49,980 | | | | 3,796 | |
Kite Realty Group
Trust‡ | | | 0.4 | | | | 32,360 | | | | 517 | |
Liberty Property
Trust‡ | | | 1.7 | | | | 47,789 | | | | 2,314 | |
Macerich Co/The‡ | | | 1.5 | | | | 45,930 | | | | 1,991 | |
Mack-Cali Realty
Corp‡ | | | 1.2 | | | | 75,781 | | | | 1,682 | |
Park Hotels & Resorts Inc‡ | | | 1.4 | | | | 62,190 | | | | 1,933 | |
Prologis Inc‡ | | | 6.4 | | | | 119,800 | | | | 8,620 | |
Public Storage‡ | | | 4.1 | | | | 25,490 | | | | 5,551 | |
QTS Realty Trust Inc, Cl A‡ | | | 0.2 | | | | 6,790 | | | | 306 | |
Regency Centers
Corp‡ | | | 1.7 | | | | 34,090 | | | | 2,301 | |
| | | | | | | | | | | | |
| | | | |
| Description | | Percentage of
Net Assets (%) | | Shares | | Market Value
($ Thousands) |
|
COMMON STOCK (continued) | |
Retail Opportunity Investments
Corp‡ | | | 0.5 | % | | | 41,941 | | | $ | 727 | |
Retail Properties of America Inc, Cl A‡ | | | 1.5 | | | | 160,520 | | | | 1,957 | |
Sabra Health Care REIT Inc ‡ | | | 1.1 | | | | 73,650 | | | | 1,434 | |
Simon Property Group Inc ‡ | | | 6.0 | | | | 44,524 | | | | 8,113 | |
Sun Communities
Inc ‡ | | | 3.0 | | | | 33,949 | | | | 4,024 | |
Sunstone Hotel Investors Inc ‡ | | | 1.0 | | | | 98,160 | | | | 1,414 | |
Taubman Centers Inc ‡ | | | 1.0 | | | | 25,670 | | | | 1,357 | |
UDR Inc ‡ | | | 1.3 | | | | 38,250 | | | | 1,739 | |
Urban Edge Properties ‡ | | | 0.5 | | | | 32,307 | | | | 614 | |
Ventas Inc‡ | | | 5.3 | | | | 111,520 | | | | 7,116 | |
Vornado Realty
Trust ‡ | | | 1.2 | | | | 24,570 | | | | 1,657 | |
WP Carey Inc ‡ | | | 2.1 | | | | 36,355 | | | | 2,848 | |
| | | | | | | | | | | 131,790 | |
| |
Total Common Stock
(Cost $108,471) ($ Thousands) | | | | 132,872 | |
|
CASH EQUIVALENT — 2.2% | |
SEI Daily Income Trust, Government Fund, Cl F | | | | | | | | | |
2.220% **† | | | 2.2 | | | | 3,047,027 | | | | 3,047 | |
Total Cash Equivalent
(Cost $3,047) ($ Thousands) | | | | 3,047 | |
| | | | | | | | | | | | |
| |
Total Investments in Securities — 100.7%
(Cost $111,518)($ Thousands) | | | $ | 135,919 | |
| | | | | | | | | | | | |
| | Percentages are based on Net Assets of $134,938 ($ Thousands). |
| ** | Rate shown is the 7-day effective yield as of March 31, 2019. |
| ‡ | Real Estate Investment Trust. |
| † | Investment in Affiliated Security (see Note 6). |
Cl — Class
L.P. — Limited Partnership
As of March 31, 2019, all of the Fund’s investments were considered level 1, in accordance with the authoritative guidance on fair value measurements and disclosure under U.S. GAAP.
For the period ended March 31, 2019, there were no transfers between Level 1 and Level 2 assets and liabilities.
For the period ended March 31, 2019, there were no transfers between Level 2 and Level 3 assets and liabilities.
For more information on valuation inputs, see Note 2 – Significant Accounting Policies in Notes to Financial Statements.
| | |
SEI Institutional Managed Trust / Semi-Annual Report / March 31, 2019 | | 43 |
SCHEDULE OF INVESTMENTS (Unaudited)
March 31, 2019
Real Estate Fund(Concluded)
The following is a summary of the Fund’s transactions with affiliates for the period ended March 31, 2019 ($ Thousands):
| | | | | | | | | | | | | | | | | | | | | | | | | | | | | | | | | | | |
| Security Description | | Value
9/30/18 | | Purchases at Cost | | Proceeds from
Sales | | Realized Gain | | Change in
Unrealized
Depreciation | | Value
3/31/19 | | Income |
SEI Daily Income Trust, Government Fund, Cl F | | | $ | 2,582 | | | | $ | 27,006 | | | | $ | (26,541 | ) | | | $ | — | | | | $ | — | | | | $ | 3,047 | | | | $ | 27 | |
SEI Liquidity Fund, L.P. | | | | 668 | | | | | 809 | | | | | (1,477 | ) | | | | — | | | | | — | | | | | — | | | | | 1 | |
| | | | | | | | | | | | | | | | | | | | | | | | | | | | | | | | | | | |
Totals | | | $ | 3,250 | | | | $ | 27,815 | | | | $ | (28,018 | ) | | | $ | — | | | | $ | — | | | | $ | 3,047 | | | | $ | 28 | |
| | | | | | | | | | | | | | | | | | | | | | | | | | | | | | | | | | | |
The accompanying notes are an integral part of the financial statements.
| | |
44 | | SEI Institutional Managed Trust / Semi-Annual Report / March 31, 2019 |
SCHEDULE OF INVESTMENTS (Unaudited)
March 31, 2019
Enhanced Income Fund
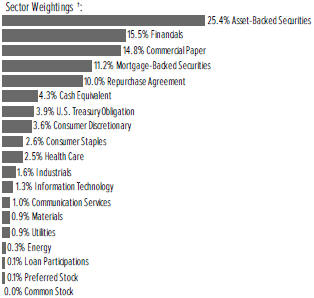
†Percentages are based on total investments.
| | | | | | | | |
| | | |
| Description | | Face Amount
(Thousands) | | Market Value ($ Thousands) |
| |
CORPORATE OBLIGATIONS — 29.0% | | | | | |
| |
Communication Services — 1.0% | | | | | |
AT&T | | | | | | | | |
3.531%, VAR ICE LIBOR USD 3 Month+0.930%, 06/30/2020 | | $ | 300 | | | $ | 302 | |
Comcast | | | | | | | | |
3.032%, VAR ICE LIBOR USD 3 Month+0.440%, 10/01/2021 | | | 300 | | | | 300 | |
Discovery Communications | | | | | | | | |
2.200%, 09/20/2019 | | | 50 | | | | 50 | |
| | | | | | | 652 | |
| |
Consumer Discretionary — 3.4% | | | | | |
AutoZone | | | | | | | | |
1.625%, 04/21/2019 | | | 70 | | | | 70 | |
Daimler Finance North America | | | | | | | | |
3.128%, VAR ICE LIBOR USD 3 Month+0.390%, 05/04/2020 (A) | | | 175 | | | | 175 | |
Dollar Tree | | | | | | | | |
3.473%, VAR ICE LIBOR USD 3 Month+0.700%, 04/17/2020 | | | 195 | | | | 195 | |
eBay | | | | | | | | |
3.621%, VAR ICE LIBOR USD 3 Month+0.870%, 01/30/2023 | | | 300 | | | | 299 | |
Ford Motor Credit LLC | | | | | | | | |
1.897%, 08/12/2019 | | | 350 | | | | 349 | |
General Motors Financial | | | | | | | | |
3.727%, VAR ICE LIBOR USD 3 Month+0.930%, 04/13/2020 | | | 150 | | | | 150 | |
3.647%, VAR ICE LIBOR USD 3 Month+0.850%, 04/09/2021 | | | 150 | | | | 149 | |
| | | | | | | | |
| | | |
| Description | | Face Amount
(Thousands) | | Market Value ($ Thousands) |
|
CORPORATE OBLIGATIONS (continued) | |
Hyundai Capital America | | | | | | | | |
3.744%, VAR ICE LIBOR USD 3 Month+0.940%, 07/08/2021 (A) | | $ | 125 | | | $ | 125 | |
Marriott International | | | | | | | | |
3.226%, VAR ICE LIBOR USD 3 Month+0.600%, 12/01/2020 | | | 300 | | | | 300 | |
Nissan Motor Acceptance MTN | | | | | | | | |
3.687%, VAR ICE LIBOR USD 3 Month+0.890%, 01/13/2022 (A) | | | 200 | | | | 198 | |
Volkswagen Group of America Finance | | | | | | | | |
3.638%, VAR ICE LIBOR USD 3 Month+0.940%, 11/12/2021 (A) | | | 300 | | | | 301 | |
| | | | | | | 2,311 | |
| | |
Consumer Staples — 2.5% | | | | | | | | |
Alimentation Couche-Tard | | | | | | | | |
3.108%, VAR ICE LIBOR USD 3 Month+0.500%, 12/13/2019 (A) | | | 200 | | | | 200 | |
2.350%, 12/13/2019 (A) | | | 200 | | | | 199 | |
Conagra Brands | | | | | | | | |
3.511%, VAR ICE LIBOR USD 3 Month+0.750%, 10/22/2020 | | | 300 | | | | 300 | |
Constellation Brands Inc | | | | | | | | |
3.384%, VAR ICE LIBOR USD 3 Month+0.700%, 11/15/2021 | | | 210 | | | | 210 | |
2.000%, 11/07/2019 | | | 125 | | | | 124 | |
Kraft Heinz Foods | | | | | | | | |
3.517%, VAR ICE LIBOR USD 3 Month+0.820%, 08/10/2022 | | | 275 | | | | 275 | |
Molson Coors Brewing | | | | | | | | |
1.450%, 07/15/2019 | | | 140 | | | | 139 | |
Reckitt Benckiser Treasury Services | | | | | | | | |
3.162%, VAR ICE LIBOR USD 3 Month+0.560%, 06/24/2022 (A) | | | 200 | | | | 198 | |
| | | | | | | 1,645 | |
| | |
Energy — 0.3% | | | | | | | | |
Andeavor Logistics | | | | | | | | |
5.500%, 10/15/2019 | | | 90 | | | | 91 | |
Phillips 66 | | | | | | | | |
3.537%, VAR ICE LIBOR USD 3 Month+0.750%, 04/15/2020 (A) | | | 125 | | | | 125 | |
| | | | | | | 216 | |
| | |
Financials — 14.9% | | | | | | | | |
ABN AMRO Bank MTN | | | | | | | | |
3.209%, VAR ICE LIBOR USD 3 Month+0.570%, 08/27/2021 (A) | | | 250 | | | | 250 | |
AIG Global Funding | | | | | | | | |
3.080%, VAR ICE LIBOR USD 3 Month+0.480%, 07/02/2020 (A) | | | 250 | | | | 250 | |
| | |
SEI Institutional Managed Trust / Semi-Annual Report / March 31, 2019 | | 45 |
SCHEDULE OF INVESTMENTS (Unaudited)
March 31, 2019
Enhanced Income Fund(Continued)
| | | | | | | | |
| | | |
| Description | | Face Amount
(Thousands) | | Market Value ($ Thousands) |
| |
CORPORATE OBLIGATIONS (continued) | | | | | |
American Express | | | | | | | | |
3.208%, VAR ICE LIBOR USD 3 Month+0.525%, 05/17/2021 | | $ | 200 | | | $ | 200 | |
Assurant | | | | | | | | |
3.860%, VAR ICE LIBOR USD 3 Month+1.250%, 03/26/2021 | | | 130 | | | | 130 | |
Bank of America MTN | | | | | | | | |
3.921%, VAR ICE LIBOR USD 3 Month+1.160%, 01/20/2023 | | | 150 | | | | 152 | |
3.242%, VAR ICE LIBOR USD 3 Month+0.650%, 10/01/2021 | | | 225 | | | | 225 | |
BPCE MTN | | | | | | | | |
3.883%, VAR ICE LIBOR USD 3 Month+1.220%, 05/22/2022 (A) | | | 250 | | | | 251 | |
Canadian Imperial Bank of Commerce | | | | | | | | |
3.335%, VAR ICE LIBOR USD 3 Month+0.720%, 06/16/2022 | | | 275 | | | | 276 | |
Capital One | | | | | | | | |
3.901%, VAR ICE LIBOR USD 3 Month+1.150%, 01/30/2023 | | | 250 | | | | 250 | |
Citibank | | | | | | | | |
3.097%, VAR ICE LIBOR USD 3 Month+0.500%, 06/12/2020 | | | 250 | | | | 251 | |
Citizens Bank | | | | | | | | |
3.456%, VAR ICE LIBOR USD 3 Month+0.810%, 05/26/2022 | | | 275 | | | | 275 | |
Compass Bank | | | | | | | | |
3.331%, VAR ICE LIBOR USD 3 Month+0.730%, 06/11/2021 | | | 250 | | | | 249 | |
Cooperatieve Rabobank UA | | | | | | | | |
3.613%, VAR ICE LIBOR USD 3 Month+0.830%, 01/10/2022 | | | 300 | | | | 303 | |
Credit Agricole MTN | | | | | | | | |
3.571%, VAR ICE LIBOR USD 3 Month+0.970%, 06/10/2020 (A) | | | 250 | | | | 252 | |
Danske Bank | | | | | | | | |
3.188%, VAR ICE LIBOR USD 3 Month+0.580%, 09/06/2019 (A) | | | 200 | | | | 200 | |
Deutsche Bank MTN | | | | | | | | |
2.850%, 05/10/2019 | | | 225 | | | | 225 | |
Fifth Third Bank | | | | | | | | |
3.205%, VAR ICE LIBOR USD 3 Month+0.440%, 07/26/2021 | | | 200 | | | | 199 | |
3.001%, VAR ICE LIBOR USD 3 Month+0.250%, 10/30/2020 | | | 250 | | | | 250 | |
Goldman Sachs Group | | | | | | | | |
3.875%, VAR ICE LIBOR USD 3 Month+1.110%, 04/26/2022 | | | 250 | | | | 251 | |
3.854%, VAR ICE LIBOR USD 3 Month+1.170%, 11/15/2021 | | | 275 | | | | 278 | |
3.811%, VAR ICE LIBOR USD 3 Month+1.040%, 04/25/2019 | | | 600 | | | | 600 | |
| | | | | | | | |
| | | |
| Description | | Face Amount
(Thousands) | | Market Value ($ Thousands) |
|
CORPORATE OBLIGATIONS (continued) | |
HSBC Holdings | | | | | | | | |
3.247%, VAR ICE LIBOR USD 3 Month+0.650%, 09/11/2021 | | $ | 200 | | | $ | 200 | |
Huntington National Bank | | | | | | | | |
3.111%, VAR ICE LIBOR USD 3 Month+0.510%, 03/10/2020 | | | 250 | | | | 251 | |
ING Bank | | | | | | | | |
3.282%, VAR ICE LIBOR USD 3 Month+0.690%, 10/01/2019 (A) | | | 200 | | | | 201 | |
Intesa Sanpaolo NY | | | | | | | | |
3.403%, VAR ICE LIBOR USD 3 Month+0.630%, 07/17/2019 | | | 100 | | | | 100 | |
Jackson National Life Global Funding | | | | | | | | |
3.339%, VAR ICE LIBOR USD 3 Month+0.730%, 06/27/2022 (A) | | | 125 | | | | 126 | |
Manufacturers & Traders Trust | | | | | | | | |
3.304%, VAR ICE LIBOR USD 3 Month+0.610%, 05/18/2022 | | | 250 | | | | 248 | |
Morgan Stanley | | | | | | | | |
3.941%, VAR ICE LIBOR USD 3 Month+1.180%, 01/20/2022 | | | 175 | | | | 177 | |
National Bank of Canada MTN | | | | | | | | |
3.157%, VAR ICE LIBOR USD 3 Month+0.560%, 06/12/2020 | | | 250 | | | | 251 | |
Nordea Bank | | | | | | | | |
3.569%, VAR ICE LIBOR USD 3 Month+0.940%, 08/30/2023 (A) | | | 200 | | | | 197 | |
PNC Bank | | | | | | | | |
2.947%, VAR ICE LIBOR USD 3 Month+0.350%, 03/12/2021 | | | 250 | | | | 250 | |
Regions Bank | | | | | | | | |
3.188%, VAR ICE LIBOR USD 3 Month+0.500%, 08/13/2021 | | | 300 | | | | 298 | |
Santander UK PLC | | | | | | | | |
3.246%, VAR ICE LIBOR USD 3 Month+0.620%, 06/01/2021 | | | 300 | | | | 300 | |
Skandinaviska Enskilda Banken | | | | | | | | |
3.113%, VAR ICE LIBOR USD 3 Month+0.430%, 05/17/2021 (A) | | | 250 | | | | 250 | |
Standard Chartered | | | | | | | | |
3.911%, VAR ICE LIBOR USD 3 Month+1.150%, 01/20/2023 (A) | | | 200 | | | | 199 | |
Sumitomo Mitsui Banking | | | | | | | | |
3.123%, VAR ICE LIBOR USD 3 Month+0.350%, 01/17/2020 | | | 250 | | | | 250 | |
SunTrust Bank | | | | | | | | |
3.328%, VAR ICE LIBOR USD 3 Month+0.590%, 08/02/2022 | | | 250 | | | | 248 | |
3.274%, VAR ICE LIBOR USD 3 Month+0.530%, 01/31/2020 | | | 250 | | | | 251 | |
Svenska Handelsbanken MTN | | | | | | | | |
3.121%, VAR ICE LIBOR USD 3 Month+0.470%, 05/24/2021 | | | 250 | | | | 251 | |
| | |
46 | | SEI Institutional Managed Trust / Semi-Annual Report / March 31, 2019 |
| | | | | | | | |
| | | |
| Description | | Face Amount
(Thousands) | | Market Value ($ Thousands) |
|
CORPORATE OBLIGATIONS (continued) | |
Synchrony Financial | | | | | | | | |
3.968%, VAR ICE LIBOR USD 3 Month+1.230%, 02/03/2020 | | $ | 200 | | | $ | 201 | |
Wells Fargo | | | | |
3.889%, VAR ICE LIBOR USD 3 Month+1.110%, 01/24/2023 | | | 150 | | | | 152 | |
3.272%, VAR ICE LIBOR USD 3 Month+0.500%, 07/23/2021 | | | 250 | | | | 250 | |
| | | | | | | 9,968 | |
Health Care — 2.4% | | | | |
Amgen | | | | |
3.147%, VAR ICE LIBOR USD 3 Month+0.450%, 05/11/2020 | | | 150 | | | | 151 | |
Anthem | | | | |
2.500%, 11/21/2020 | | | 150 | | | | 149 | |
Bayer US Finance II | | | | |
3.232%, VAR ICE LIBOR USD 3 Month+0.630%, 06/25/2021 (A) | | | 200 | | | | 198 | |
Cardinal Health | | | | |
3.381%, VAR ICE LIBOR USD 3 Month+0.770%, 06/15/2022 | | | 275 | | | | 273 | |
Cigna | | | | |
3.265%, VAR ICE LIBOR USD 3 Month+0.650%, 09/17/2021 (A) | | | 150 | | | | 150 | |
3.200%, 09/17/2020 (A) | | | 150 | | | | 151 | |
CVS Health | | | | |
3.321%, VAR ICE LIBOR USD 3 Month+0.720%, 03/09/2021 | | | 140 | | | | 140 | |
HCA | | | | |
6.500%, 02/15/2020 | | | 150 | | | | 154 | |
UnitedHealth Group | | | | |
2.871%, VAR ICE LIBOR USD 3 Month+0.260%, 06/15/2021 | | | 225 | | | | 225 | |
| | | | | | | 1,591 | |
Industrials — 1.5% | | | | | | | | |
Air Lease | | | | |
2.125%, 01/15/2020 | | | 250 | | | | 249 | |
Aviation Capital Group | | | | |
3.421%, VAR ICE LIBOR USD 3 Month+0.670%, 07/30/2021 (A) | | | 215 | | | | 214 | |
Equifax | | | | |
3.554%, VAR ICE LIBOR USD 3 Month+0.870%, 08/15/2021 | | | 150 | | | | 149 | |
Fortive | | | | |
1.800%, 06/15/2019 | | | 37 | | | | 37 | |
John Deere Capital MTN | | | | |
2.350%, 01/08/2021 | | | 105 | | | | 104 | |
| | | | | | | | |
| | | |
| Description | | Face Amount
(Thousands) | | Market Value ($ Thousands) |
|
CORPORATE OBLIGATIONS (continued) | |
United Technologies | | | | | | | | |
3.333%, VAR ICE LIBOR USD 3 Month+0.650%, 08/16/2021 | | $ | 275 | | | $ | 275 | |
| | | | | | | 1,028 | |
Information Technology — 1.2% | |
Broadcom | | | | | | | | |
2.375%, 01/15/2020 | | | 300 | | | | 299 | |
DXC Technology | | | | | | | | |
2.875%, 03/27/2020 | | | 105 | | | | 105 | |
Hewlett Packard Enterprise | | | | | | | | |
3.515%, VAR ICE LIBOR USD 3 Month+0.720%, 10/05/2021 | | | 175 | | | | 174 | |
2.100%, 10/04/2019 (A) | | | 250 | | | | 249 | |
| | | | | | | 827 | |
Materials — 0.9% | | | | | |
DowDuPont | | | | | | | | |
3.394%, VAR ICE LIBOR USD 3 Month+0.710%, 11/15/2020 | | | 300 | | | | 302 | |
International Flavors & Fragrances | | | | | | | | |
3.400%, 09/25/2020 | | | 100 | | | | 100 | |
Syngenta Finance | | | | | | | | |
3.698%, 04/24/2020 (A) | | | 200 | | | | 201 | |
| | | | | | | 603 | |
Utilities — 0.9% | | | | | | | | |
DTE Energy | | | | | | | | |
1.500%, 10/01/2019 | | | 260 | | | | 258 | |
Emera US Finance | | | | | | | | |
2.150%, 06/15/2019 | | | 175 | | | | 175 | |
Sempra Energy | | | | | | | | |
1.625%, 10/07/2019 | | | 155 | | | | 154 | |
Texas Energy (Escrow Security) 3.726%, 12/31/2034 (B)(C) | | | 4 | | | | – | |
| | | | | | | 587 | |
| | |
Total Corporate Obligations
(Cost $19,433) ($ Thousands) | | | | | | | 19,428 | |
| |
ASSET-BACKED SECURITIES — 24.4% | | | | | |
Automotive — 7.8% | | | | | | | | |
| | |
American Credit Acceptance Receivables Trust, Ser 2018-2, Cl A | | | | | | | | |
2.940%, 01/10/2022 (A) | | | 88 | | | | 88 | |
| | |
American Credit Acceptance Receivables Trust, Ser 2018-3, Cl A | | | | | | | | |
2.920%, 08/12/2021 (A) | | | 67 | | | | 67 | |
| | |
SEI Institutional Managed Trust / Semi-Annual Report / March 31, 2019 | | 47 |
SCHEDULE OF INVESTMENTS (Unaudited)
March 31, 2019
Enhanced Income Fund(Continued)
| | | | | | | | |
| | | |
| Description | | Face Amount
(Thousands) | | Market Value ($ Thousands) |
|
ASSET-BACKED SECURITIES (continued) | |
American Credit Acceptance Receivables Trust, Ser 2019-1, Cl A | | | | | | | | |
3.060%, 07/12/2022 (A) | | $ | 195 | | | $ | 195 | |
AmeriCredit Automobile Receivables Trust, Ser 2018-1, Cl A2A | | | | | | | | |
2.710%, 07/19/2021 | | | 68 | | | | 68 | |
Canadian Pacer Auto Receivables Trust, Ser 2018-1A, Cl A2A | | | | | | | | |
2.700%, 08/19/2020 (A) | | | 65 | | | | 65 | |
Chesapeake Funding II, Ser 2017-2A, Cl A1 | | | | | | | | |
1.990%, 05/15/2029 (A) | | | 117 | | | | 117 | |
Chesapeake Funding II, Ser 2018-1A, Cl A1 | | | | | | | | |
3.040%, 04/15/2030 (A) | | | 97 | | | | 98 | |
CIG Auto Receivables Trust, Ser 2017-1A, Cl A | | | | | | | | |
2.710%, 05/15/2023 (A) | | | 22 | | | | 22 | |
CPS Auto Receivables Trust, Ser 2018-D, Cl A | | | | | | | | |
3.060%, 01/18/2022 (A) | | | 126 | | | | 126 | |
CPS Auto Trust, Ser 2018-C, Cl A | | | | | | | | |
2.870%, 09/15/2021 (A) | | | 71 | | | | 71 | |
Credit Acceptance Auto Loan Trust, Ser 2017- 2A, Cl A | | | | | | | | |
2.550%, 02/17/2026 (A) | | | 250 | | | | 249 | |
Drive Auto Receivables Trust, Ser 2018-3, Cl A2 | | | | | | | | |
2.750%, 10/15/2020 | | | 7 | | | | 7 | |
Drive Auto Receivables Trust, Ser 2018-4, Cl A3 | | | | | | | | |
3.040%, 11/15/2021 | | | 85 | | | | 85 | |
DT Auto Owner Trust, Ser 2017-4A, Cl B | | | | | | | | |
2.440%, 01/15/2021 (A) | | | 76 | | | | 76 | |
DT Auto Owner Trust, Ser 2018-3A, Cl A | | | | | | | | |
3.020%, 02/15/2022 (A) | | | 190 | | | | 190 | |
DT Auto Owner Trust, Ser 2019-1A, Cl A | | | | | | | | |
3.080%, 09/15/2022 (A) | | | 108 | | | | 108 | |
Enterprise Fleet Financing, Ser 2016-2, Cl A2 | | | | | | | | |
1.740%, 02/22/2022 (A) | | | 43 | | | | 43 | |
Enterprise Fleet Financing, Ser 2017-2, Cl A2 | | | | | | | | |
1.970%, 01/20/2023 (A) | | | 58 | | | | 58 | |
Exeter Automobile Receivables Trust, Ser 2018-3A, Cl A | | | | | | | | |
2.900%, 01/18/2022 (A) | | | 106 | | | | 106 | |
Exeter Automobile Receivables Trust, Ser 2018-4A, Cl A | | | | | | | | |
3.050%, 12/15/2021 (A) | | | 198 | | | | 198 | |
First Investors Auto Owner Trust, Ser 2017- 2A, Cl A1 | | | | | | | | |
1.860%, 10/15/2021 (A) | | | 9 | | | | 9 | |
First Investors Auto Owner Trust, Ser 2018- 1A, Cl A1 | | | | | | | | |
2.840%, 05/16/2022 (A) | | | 39 | | | | 39 | |
Flagship Credit Auto Trust, Ser 2017-2, Cl A | | | | | | | | |
1.850%, 07/15/2021 (A) | | | 24 | | | | 24 | |
| | | | | | | | |
| | | |
| Description | | Face Amount
(Thousands) | | Market Value ($ Thousands) |
|
ASSET-BACKED SECURITIES (continued) | |
Flagship Credit Auto Trust, Ser 2017-3, Cl A | | | | | | | | |
1.880%, 10/15/2021 (A) | | $ | 47 | | | $ | 47 | |
Flagship Credit Auto Trust, Ser 2018-3, Cl A | | | | | | | | |
3.070%, 02/15/2023 (A) | | | 117 | | | | 117 | |
Flagship Credit Auto Trust, Ser 2019-1, Cl A | | | | | | | | |
3.110%, 08/15/2023 (A) | | | 132 | | | | 132 | |
Ford Credit Auto Lease Trust, Ser 2018-A, Cl A2A | | | | | | | | |
2.710%, 12/15/2020 | | | 109 | | | | 109 | |
Ford Credit Floorplan Master Owner Trust, Ser 2016-5, Cl A1 | | | | | | | | |
1.950%, 11/15/2021 | | | 150 | | | | 149 | |
GLS Auto Receivables Trust, Ser 2017-1A, Cl A2 | | | | | | | | |
2.670%, 04/15/2021 (A) | | | 38 | | | | 38 | |
GLS Auto Receivables Trust, Ser 2018-1A, Cl A | | | | | | | | |
2.820%, 07/15/2022 (A) | | | 96 | | | | 96 | |
GLS Auto Receivables Trust, Ser 2018-2A, Cl A | | | | | | | | |
3.250%, 04/18/2022 (A) | | | 153 | | | | 153 | |
GLS Auto Receivables Trust, Ser 2018-3A, Cl A | | | | | | | | |
3.350%, 08/15/2022 (A) | | | 125 | | | | 125 | |
GLS Auto Receivables Trust, Ser 2019-1A, Cl A | | | | | | | | |
3.370%, 01/17/2023 (A) | | | 101 | | | | 101 | |
GM Financial Automobile Leasing Trust, Ser 2019-1, Cl A2A | | | | | | | | |
2.910%, 04/20/2021 | | | 130 | | | | 130 | |
OneMain Direct Auto Receivables Trust, Ser 2018-1A, Cl A | | | | | | | | |
3.430%, 12/16/2024 (A) | | | 300 | | | | 303 | |
Prestige Auto Receivables Trust, Ser 2018-1A, Cl A2 | | | | | | | | |
2.970%, 12/15/2021 (A) | | | 122 | | | | 122 | |
Santander Drive Auto Receivables Trust, Ser 2016-3, Cl C | | | | | | | | |
2.460%, 03/15/2022 | | | 150 | | | | 150 | |
Santander Drive Auto Receivables Trust, Ser 2018-2, Cl A2A | | | | | | | | |
2.580%, 10/15/2020 | | | 58 | | | | 58 | |
Santander Drive Auto Receivables Trust, Ser 2018-3, Cl A2A | | | | | | | | |
2.780%, 03/15/2021 | | | 69 | | | | 69 | |
Santander Drive Auto Receivables Trust, Ser 2019-1, Cl A2A | | | | | | | | |
2.910%, 01/18/2022 | | | 350 | | | | 350 | |
Securitized Term Auto Receivables Trust, Ser 2017-2A, Cl A2A | | | | | | | | |
1.775%, 01/27/2020 (A) | | | 4 | | | | 4 | |
Securitized Term Auto Receivables Trust, Ser 2018-1A, Cl A2 | | | | | | | | |
2.807%, 12/29/2020 (A) | | | 195 | | | | 195 | |
Securitized Term Auto Receivables Trust, Ser 2019-1A, Cl A3 | | | | | | | | |
2.986%, 02/27/2023 (A) | | | 230 | | | | 231 | |
| | |
48 | | SEI Institutional Managed Trust / Semi-Annual Report / March 31, 2019 |
| | | | | | | | |
| | | |
| Description | | Face Amount
(Thousands) | | Market Value ($ Thousands) |
|
ASSET-BACKED SECURITIES (continued) | |
Skopos Auto Receivables Trust, Ser 2018-1A, Cl A | | | | | | | | |
3.190%, 09/15/2021 (A)(C) | | $ | 49 | | | $ | 49 | |
Toyota Auto Receivables Owner Trust, Ser 2016-B, Cl A3 | | | | | | | | |
1.300%, 04/15/2020 | | | 13 | | | | 13 | |
United Auto Credit Securitization Trust, Ser 2018-2, Cl A | | | | | | | | |
2.890%, 03/10/2021 (A) | | | 49 | | | | 49 | |
Westlake Automobile Receivables Trust, Ser 2018-2A, Cl A2A | | | | | | | | |
2.840%, 09/15/2021 (A) | | | 79 | | | | 79 | |
Westlake Automobile Receivables Trust, Ser 2018-3A, Cl A2A | | | | | | | | |
2.980%, 01/18/2022 (A) | | | 110 | | | | 110 | |
Westlake Automobile Receivables Trust, Ser 2019-1A, Cl A2A | | | | | | | | |
3.060%, 05/16/2022 (A) | | | 155 | | | | 155 | |
| | | | | | | 5,243 | |
|
Mortgage Related Securities — 0.2% | |
| | |
New Residential Mortgage Loan Trust, Ser 2017-6A, Cl A1 | | | | | | | | |
4.000%, 08/27/2057 (A)(D) | | | 110 | | | | 111 | |
|
Other Asset-Backed Securities — 16.4% | |
| | |
Accredited Mortgage Loan Trust, Ser 2004-4, Cl A1A | | | | | | | | |
3.166%, VAR ICE LIBOR USD 1 Month+0.680%, 01/25/2035 | | | 87 | | | | 87 | |
Ajax Mortgage Loan Trust, Ser 2017-B, Cl A | | | | | | | | |
3.163%, 09/25/2056 (A)(D) | | | 139 | | | | 138 | |
ALM VI, Ser 2018-6A, Cl A1B3 | | | | | | | | |
3.987%, VAR ICE LIBOR USD 3 Month+1.200%, 07/15/2026 (A) | | | 250 | | | | 250 | |
Babson CLO, Ser 2014-3RA, Cl A1 | | | | | | | | |
3.711%, VAR ICE LIBOR USD 3 Month+0.950%, 07/20/2029 (A) | | | 250 | | | | 247 | |
Bayview Opportunity Master Fund IVb Trust, Ser 2017-RT6, Cl A | | | | | | | | |
3.500%, 10/28/2057 (A)(D) | | | 89 | | | | 89 | |
Bayview Opportunity Master Fund Trust IIb, Ser 2018-RN5, Cl A1 | | | | | | | | |
3.820%, 04/28/2033 (A) | | | 32 | | | | 33 | |
BlueMountain CLO, Ser 2018-2A, Cl A1R | | | | | | | | |
3.710%, VAR ICE LIBOR USD 3 Month+0.930%, 07/18/2027 (A) | | | 270 | | | | 267 | |
BlueMountain CLO, Ser 2018-2A, Cl BR2 | | | | | | | | |
4.094%, VAR ICE LIBOR USD 3 Month+1.450%, 11/20/2028 (A) | | | 250 | | | | 247 | |
| | | | | | | | |
| | | |
| Description | | Face Amount
(Thousands) | | Market Value ($ Thousands) |
|
ASSET-BACKED SECURITIES (continued) | |
Carlyle Global Market Strategies CLO, Ser 2018-2A, Cl A1R | | | | | | | | |
3.545%, VAR ICE LIBOR USD 3 Month+0.780%, 04/27/2027 (A) | | $ | 250 | | | $ | 249 | |
CIFC Funding, Ser 2017-1A, Cl A1R | | | | | | | | |
4.029%, VAR ICE LIBOR USD 3 Month+1.250%, 07/16/2030 (A) | | | 250 | | | | 250 | |
CLUB Credit Trust, Ser 2017-P2, Cl A | | | | | | | | |
2.610%, 01/15/2024 (A)(C) | | | 37 | | | | 36 | |
Cole Park CLO, Ser 2018-1A, Cl AR | | | | | | | | |
3.811%, VAR ICE LIBOR USD 3 Month+1.050%, 10/20/2028 (A) | | | 250 | | | | 249 | |
Colombia Cent CLO, Ser 2018-27A, Cl A1 | | | | | | | | |
3.640%, VAR ICE LIBOR USD 3 Month+1.150%, 10/25/2028 (A) | | | 285 | | | | 284 | |
Credit Suisse Trust, Ser 2018-LD1 | | | | | | | | |
3.420%, 07/25/2024 (C) | | | 52 | | | | 52 | |
Dryden 54 Senior Loan Fund, Ser 2017-54A, Cl A | | | | | | | | |
3.961%, VAR ICE LIBOR USD 3 Month+1.200%, 10/19/2029 (A) | | | 300 | | | | 299 | |
Dryden XXV Senior Loan Fund, Ser 2017-25A, Cl ARR | | | | | | | | |
3.687%, VAR ICE LIBOR USD 3 Month+0.900%, 10/15/2027 (A) | | | 250 | | | | 249 | |
Engs Commercial Finance Trust, Ser 2018- 1A, Cl A1 | | | | | | | | |
2.970%, 02/22/2021 (A)(C) | | | 48 | | | | 48 | |
Finance of America Structured Securities Trust, Ser 2018-HB1, Cl A | | | | | | | | |
3.375%, 09/25/2028 (A)(D) | | | 102 | | | | 102 | |
Great American Auto Leasing, Ser 2019-1, Cl A2 | | | | | | | | |
2.970%, 06/15/2021 (A) | | | 175 | | | | 175 | |
KKR CLO, Ser 2018-21, Cl A | | | | | | | | |
3.787%, VAR ICE LIBOR USD 3 Month+1.000%, 04/15/2031 (A) | | | 250 | | | | 245 | |
Magnetite VII, Ser 2018-7A, Cl A1R2 | | | | | | | | |
3.587%, VAR ICE LIBOR USD 3 Month+0.800%, 01/15/2028 (A) | | | 250 | | | | 246 | |
Magnetite VIII, Ser 2018-8A, Cl AR2 | | | | | | | | |
3.767%, VAR ICE LIBOR USD 3 Month+0.980%, 04/15/2031 (A) | | | 250 | | | | 248 | |
Marlette Funding Trust, Ser 2017-3A, Cl A | | | | | | | | |
2.360%, 12/15/2024 (A)(C) | | | 19 | | | | 19 | |
Marlette Funding Trust, Ser 2018-1A, Cl A | | | | | | | | |
2.610%, 03/15/2028 (A)(C) | | | 37 | | | | 37 | |
Marlette Funding Trust, Ser 2018-2A, Cl A | | | | | | | | |
3.060%, 07/17/2028 (A)(C) | | | 85 | | | | 85 | |
Marlette Funding Trust, Ser 2018-4A, Cl A | | | | | | | | |
3.710%, 12/15/2028 (A)(C) | | | 134 | | | | 135 | |
Marlette Funding Trust, Ser 2019-1A, Cl A | | | | | | | | |
3.440%, 04/16/2029 (A) | | | 124 | | | | 124 | |
| | |
SEI Institutional Managed Trust / Semi-Annual Report / March 31, 2019 | | 49 |
SCHEDULE OF INVESTMENTS (Unaudited)
March 31, 2019
Enhanced Income Fund(Continued)
| | | | | | | | |
| | | |
| Description | | Face Amount
(Thousands) | | Market Value ($ Thousands) |
|
ASSET-BACKED SECURITIES (continued) | |
Mill City Mortgage Loan Trust, Ser 2017-3, Cl A1 | | | | | | | | |
2.750%, 01/25/2061 (A)(D) | | $ | 72 | | | $ | 71 | |
Mill City Mortgage Loan Trust, Ser 2018-1, Cl A1 | | | | | | | | |
3.250%, 05/25/2062 (A)(D) | | | 90 | | | | 90 | |
Nationstar HECM Loan Trust, Ser 2017-2A, Cl A1 | | | | | | | | |
2.038%, 09/25/2027 (A)(D) | | | 28 | | | | 28 | |
Nationstar HECM Loan Trust, Ser 2018-1A, Cl A | | | | | | | | |
2.760%, 02/25/2028 (A)(D) | | | 35 | | | | 35 | |
Nationstar HECM Loan Trust, Ser 2018-2A, Cl A | | | | | | | | |
3.188%, 07/25/2028 (A)(D) | | | 54 | | | | 55 | |
New Residential Mortgage Loan Trust, Ser 2018-FNT1, Cl A | | | | | | | | |
3.610%, 05/25/2023 (A) | | | 180 | | | | 181 | |
New Residential Mortgage Loan Trust, Ser 2018-FNT2, Cl A | | | | | | | | |
3.790%, 07/25/2054 (A) | | | 119 | | | | 120 | |
NRZ Excess Spread-Collateralized Notes, Ser 2018-PLS1, Cl A | | | | | | | | |
3.193%, 01/25/2023 (A) | | | 88 | | | | 88 | |
NRZ Excess Spread-Collateralized Notes, Ser 2018-PLS2, Cl A | | | | | | | | |
3.265%, 02/25/2023 (A) | | | 76 | | | | 76 | |
NYCTL Trust, Ser 2017-A, Cl A | | | | | | | | |
1.870%, 11/10/2030 (A) | | | 39 | | | | 39 | |
NYCTL Trust, Ser 2018-A, Cl A | | | | | | | | |
3.220%, 11/10/2031 (A) | | | 332 | | | | 332 | |
Octagon Investment Partners, Ser 2017-1A, Cl AR | | | | | | | | |
3.828%, VAR ICE LIBOR USD 3 Month+1.130%, 08/12/2026 (A) | | | 185 | | | | 185 | |
OneMain Financial Issuance Trust, Ser 2016- 1A, Cl B | | | | | | | | |
4.570%, 02/20/2029 (A) | | | 100 | | | | 101 | |
OZLM VII, Ser 2018-7RA, Cl A1R | | | | | | | | |
3.783%, VAR ICE LIBOR USD 3 Month+1.010%, 07/17/2029 (A) | | | 250 | | | | 247 | |
OZLM XII, Ser 2018-12A, Cl A1R | | | | | | | | |
3.801%, VAR ICE LIBOR USD 3 Month+1.050%, 04/30/2027 (A) | | | 275 | | | | 273 | |
Palmer Square CLO, Ser 2018-3A, Cl A2 | | | | | | | | |
4.034%, VAR ICE LIBOR USD 3 Month+1.350%, 08/15/2026 (A) | | | 250 | | | | 245 | |
Palmer Square Loan Funding, Ser 2017-1A, Cl A1 | | | | | | | | |
3.527%, VAR ICE LIBOR USD 3 Month+0.740%, 10/15/2025 (A) | | | 269 | | | | 269 | |
| | | | | | | | |
| | | |
| Description | | Face Amount
(Thousands) | | Market Value ($ Thousands) |
|
ASSET-BACKED SECURITIES (continued) | |
Pretium Mortgage Credit Partners I, Ser 2018-NPL2, Cl A1 | | | | | | | | |
3.700%, , 6.700%, 03/27/2021, 03/27/2033 (A)(E) | | $ | 183 | | | $ | 183 | |
Prosper Marketplace Issuance Trust, Ser 2017-3A, Cl A | | | | | | | | |
2.360%, 11/15/2023 (A) | | | 8 | | | | 8 | |
Prosper Marketplace Issuance Trust, Ser 2018-1A, Cl A | | | | | | | | |
3.110%, 06/17/2024 (A) | | | 131 | | | | 131 | |
PRPM, Ser 2018-1A, Cl A1 | | | | | | | | |
3.750%, 04/25/2023 (A)(D) | | | 88 | | | | 88 | |
Regional Management Issuance Trust, Ser 2018-1, Cl A | | | | | | | | |
3.830%, 07/15/2027 (A)(C) | | | 110 | | | | 110 | |
Shackleton, Ser 2018-6RA, Cl A | | | | | | | | |
3.793%, VAR ICE LIBOR USD 3 Month+1.020%, 07/17/2028 (A) | | | 250 | | | | 249 | |
SLM Student Loan Trust, Ser 2005-4, Cl A3 | | | | | | | | |
2.891%, VAR ICE LIBOR USD 3 Month+0.120%, 01/25/2027 | | | 86 | | | | 85 | |
SLM Student Loan Trust, Ser 2008-5, Cl A4 | | | | | | | | |
4.471%, VAR ICE LIBOR USD 3 Month+1.700%, 07/25/2023 | | | 142 | | | | 144 | |
SLM Student Loan Trust, Ser 2008-9, Cl A | | | | | | | | |
4.271%, VAR ICE LIBOR USD 3 Month+1.500%, 04/25/2023 | | | 67 | | | | 68 | |
SLM Student Loan Trust, Ser 2011-1, Cl A1 | | | | | | | | |
3.006%, VAR ICE LIBOR USD 1 Month+0.520%, 03/25/2026 | | | 94 | | | | 94 | |
SoFi Consumer Loan Program, Ser 2016-2, Cl A | | | | | | | | |
3.090%, 10/27/2025 (A)(C) | | | 124 | | | | 124 | |
SoFi Consumer Loan Program, Ser 2016-3, Cl A | | | | | | | | |
3.050%, 12/26/2025 (A)(C) | | | 132 | | | | 132 | |
SoFi Consumer Loan Program, Ser 2017-1, Cl A | | | | | | | | |
3.280%, 01/26/2026 (A)(C) | | | 141 | | | | 142 | |
SoFi Consumer Loan Program, Ser 2017-6, Cl A1 | | | | | | | | |
2.200%, 11/25/2026 (A) | | | 19 | | | | 19 | |
SoFi Consumer Loan Program, Ser 2018-1, Cl A1 | | | | | | | | |
2.550%, 02/25/2027 (A) | | | 40 | | | | 39 | |
SoFi Consumer Loan Program, Ser 2018-2, Cl A1 | | | | | | | | |
2.930%, 04/26/2027 (A) | | | 57 | | | | 57 | |
SoFi Consumer Loan Program, Ser 2018-3, Cl A1 | | | | | | | | |
3.200%, 08/25/2027 (A) | | | 69 | | | | 69 | |
| | |
50 | | SEI Institutional Managed Trust / Semi-Annual Report / March 31, 2019 |
| | | | | | | | |
| | | |
| Description | | Face Amount
(Thousands) | | Market Value ($ Thousands) |
|
ASSET-BACKED SECURITIES (continued) | |
SoFi Consumer Loan Program, Ser 2019-1, Cl A | | | | | | | | |
3.240%, 02/25/2028 (A) | | $ | 138 | | | $ | 138 | |
Sofi Professional Loan Program, Ser 2014-A, Cl A1 | | | | | | | | |
4.086%, VAR ICE LIBOR USD 1 Month+1.600%, 06/25/2025 (A) | | | 37 | | | | 37 | |
Springleaf Funding Trust, Ser 2016-AA, Cl A | | | | | | | | |
2.900%, 11/15/2029 (A) | | | 264 | | | | 264 | |
Stanwich Mortgage Loan Trust, Ser 2018- NPB1, Cl A1 | | | | | | | | |
4.016%, , 7.516%, 05/16/2021, 05/16/2023 (A)(E) | | | 206 | | | | 206 | |
Towd Point Mortgage Trust, Ser 2015-4, Cl A1B | | | | | | | | |
2.750%,
04/25/2055 (A)(D) | | | 65 | | | | 64 | |
Towd Point Mortgage Trust, Ser 2015-5, Cl A1B | | | | | | | | |
2.750%,
05/25/2055 (A)(D) | | | 73 | | | | 72 | |
Towd Point Mortgage Trust, Ser 2016-1, Cl A1B | | | | | | | | |
2.750%,
02/25/2055 (A)(D) | | | 68 | | | | 68 | |
Towd Point Mortgage Trust, Ser 2016-3, Cl A1 | | | | | | | | |
2.250%,
04/25/2056 (A)(D) | | | 156 | | | | 154 | |
Towd Point Mortgage Trust, Ser 2016-4, Cl A1 | | | | | | | | |
2.250%,
07/25/2056 (A)(D) | | | 263 | | | | 257 | |
Towd Point Mortgage Trust, Ser 2017-6, Cl A1 | | | | | | | | |
2.750%,
10/25/2057 (A)(D) | | | 80 | | | | 79 | |
Treman Park CLO, Ser 2018-1A, Cl ARR | | | | | | | | |
3.831%, VAR ICE LIBOR USD 3 Month+1.070%, 10/20/2028 (A) | | | 275 | | | | 275 | |
Tryon Park CLO, Ser 2018-1A, Cl A1SR | | | | | | | | |
3.677%, VAR ICE LIBOR USD 3 Month+0.890%, 04/15/2029 (A) | | | 270 | | | | 268 | |
Venture XIX CLO, Ser 2018-19A, Cl X | | | | | | | | |
3.437%, VAR ICE LIBOR USD 3 Month+0.650%, 01/15/2032 (A) | | | 125 | | | | 125 | |
VOLT LXIV, Ser 2017-NP11, Cl A1 | | | | | | | | |
3.375%, , 6.375%, 10/25/2020, 10/25/2047 (A)(E) | | | 89 | | | | 88 | |
VOLT LXX, Ser 2018-NPL6, Cl A1A | | | | | | | | |
4.115%, , 7.115%, 09/25/2021, 09/25/2048 (A)(E) | | | 132 | | | | 132 | |
VOLT LXXI, Ser 2018-NPL7, Cl A1A | | | | | | | | |
3.967%, , 6.967%, 09/25/2021, 09/25/2048 (A)(E) | | | 87 | | | | 88 | |
| | | | | | | 10,982 | |
Total Asset-Backed Securities
(Cost $16,385) ($ Thousands) | | | | 16,336 | |
| | | | | | | | |
| | | |
| Description | | Face Amount
(Thousands) | | Market Value ($ Thousands) |
|
COMMERCIAL PAPER (F) — 14.2% | |
ABN AMRO Funding USA LLC | | | | | | | | |
2.473%, 04/15/2019 | | $ | 300 | | | $ | 300 | |
Barton Capital | | | | | | | | |
2.524%, 04/15/2019 | | | 1,500 | | | | 1,498 | |
Chariot Funding | | | | | | | | |
2.451%, 04/02/2019 | | | 625 | | | | 625 | |
CRC Funding LLC | | | | | | | | |
2.482%, 04/08/2019 | | | 650 | | | | 650 | |
Fairway Finance | | | | | | | | |
2.453%, 04/15/2019 | | | 625 | | | | 624 | |
Group BPCE | | | | | | | | |
2.556%, 05/01/2019 | | | 450 | | | | 449 | |
Hydro-Quebec | | | | | | | | |
2.467%, 05/06/2019 | | | 300 | | | | 299 | |
John Deere | | | | | | | | |
2.465%, 04/22/2019 | | | 300 | | | | 299 | |
Novartis Finance Corp. | | | | | | | | |
0.070%, 05/09/2019 | | | 1,500 | | | | 1,496 | |
NRW Bank | | | | | | | | |
2.522%, 04/12/2019 | | | 500 | | | | 500 | |
Ontario Teachers Finance Trust | | | | | | | | |
2.537%, 05/06/2019 | | | 350 | | | | 349 | |
2.456%, 04/29/2019 | | | 350 | | | | 349 | |
Pfizer | | | | | | | | |
2.452%, 04/05/2019 | | | 625 | | | | 625 | |
Santander UK PLC | | | | | | | | |
2.568%, 05/07/2019 | | | 300 | | | | 299 | |
Thunder Bay Funding LLC | | | | | | | | |
2.474%, 04/23/2019 | | | 650 | | | | 649 | |
Walmart Stores | | | | | | | | |
2.467%, 05/06/2019 | | | 475 | | | | 474 | |
| | |
Total Commercial Paper
(Cost $9,486) ($ Thousands) | | | | | | | 9,485 | |
|
MORTGAGE-BACKED SECURITIES — 10.7% | |
|
Agency Mortgage-Backed Obligations — 1.2% | |
FHLMC | | | | | | | | |
6.000%, 09/01/2026 | | | 31 | | | | 34 | |
FNMA | | | | | | | | |
6.500%, 09/01/2026 | | | 23 | | | | 26 | |
6.000%, 11/01/2026 to 04/01/2040 | | | 201 | | | | 218 | |
5.000%, 02/01/2023 to 03/01/2025 | | | 33 | | | | 34 | |
FREMF Mortgage Trust, Ser 2010-K7, Cl B | | | | | | | | |
5.502%,
04/25/2020 (A)(D) | | | 95 | | | | 97 | |
FREMF Mortgage Trust, Ser 2012-K712, Cl B | | | | | | | | |
3.359%,
05/25/2045 (A)(D) | | | 30 | | | | 30 | |
FREMF Mortgage Trust, Ser 2014-K503, Cl C | | | | | | | | |
3.042%,
10/25/2047 (A)(D) | | | 155 | | | | 154 | |
| | |
SEI Institutional Managed Trust / Semi-Annual Report / March 31, 2019 | | 51 |
SCHEDULE OF INVESTMENTS (Unaudited)
March 31, 2019
Enhanced Income Fund(Continued)
| | | | | | | | |
| | | |
| Description | | Face Amount
(Thousands) | | Market Value ($ Thousands) |
|
MORTGAGE-BACKED SECURITIES (continued) | |
FREMF Multifamily Aggregation Risk Transfer Trust, Ser 2017-KT01, Cl A | | | | | | | | |
2.811%, VAR LIBOR USD 1 Month+0.320%, 02/25/2020 | | $ | 65 | | | $ | 65 | |
NCUA Guaranteed Notes, Ser 2010-R1, Cl 1A | | | | | | | | |
2.931%, VAR ICE LIBOR USD 1 Month+0.450%, 10/07/2020 | | | 116 | | | | 116 | |
NCUA Guaranteed Notes, Ser 2011-R3, Cl 1A | | | | | | | | |
2.892%, VAR ICE LIBOR USD 1 Month+0.400%, 03/11/2020 | | | 46 | | | | 46 | |
| | |
| | | | | | | 820 | |
|
Non-Agency Mortgage-Backed Obligations — 9.5% | |
Angel Oak Mortgage Trust, Ser 2017-3, Cl A1 | | | | | | | | |
2.708%, 11/25/2047 (A)(D) | | | 39 | | | | 39 | |
Angel Oak Mortgage Trust, Ser 2018-3, Cl A1 | | | | | | | | |
3.649%, 09/25/2048 (A)(D) | | | 122 | | | | 123 | |
Arroyo Mortgage Trust, Ser 2019-1, Cl A1 | | | | | | | | |
3.805%, 01/25/2049 (A)(D) | | | 113 | | | | 114 | |
BAMLL Commercial Mortgage Securities Trust, Ser 2018-DSNY, Cl A | | | | | | | | |
3.334%, VAR LIBOR USD 1 Month+0.850%, 09/15/2034 (A) | | | 300 | | | | 298 | |
Banc of America Mortgage Securities, Ser 2004-J, Cl 2A1 | | | | | | | | |
4.559%, 11/25/2034 (D) | | | 21 | | | | 21 | |
Banc of America Mortgage Securities, Ser 2005-C, Cl 2A2 | | | | | | | | |
4.364%, 04/25/2035 (D) | | | 106 | | | | 101 | |
Banc of America Mortgage Securities, Ser 2005-I, Cl 2A1 | | | | | | | | |
4.447%, 10/25/2035 (D) | | | 76 | | | | 75 | |
Barclays Commercial Mortgage Securities, Ser 2017-DELC, Cl A | | | | | | | | |
3.334%, VAR LIBOR USD 1 Month+0.850%, 08/15/2036 (A) | | | 250 | | | | 249 | |
BX Commercial Mortgage Trust, Ser 2018- IND, Cl A | | | | | | | | |
3.234%, VAR LIBOR USD 1 Month+0.750%, 11/15/2035 (A) | | | 106 | | | | 106 | |
BX Trust, Ser 2018-MCSF, Cl A | | | | | | | | |
3.061%, VAR LIBOR USD 1 Month+0.577%, 04/15/2035 (A) | | | 140 | | | | 138 | |
CIM Trust, Ser 2017-7, Cl A | | | | | | | | |
3.000%, 04/25/2057 (A)(D) | | | 121 | | | | 120 | |
Citigroup Commercial Mortgage Trust, Ser 2019-SST2, Cl A | | | | | | | | |
3.404%, 12/15/2036 | | | 225 | | | | 224 | |
Citigroup Mortgage Loan Trust, Ser 2004- HYB3, Cl 1A | | | | | | | | |
4.469%, 09/25/2034 (D) | | | 19 | | | | 19 | |
| | | | | | | | |
| | | |
| Description | | Face Amount
(Thousands) | | Market Value ($ Thousands) |
|
MORTGAGE-BACKED SECURITIES (continued) | |
Citigroup Mortgage Loan Trust, Ser 2018- RP2, Cl A1 | | | | | | | | |
3.500%, 02/25/2058 (A)(D) | | $ | 109 | | | $ | 110 | |
COLT Mortgage Loan Trust, Ser 2016-3, Cl A3 | | | | | | | | |
3.750%, 12/26/2046 (A)(D) | | | 46 | | | | 46 | |
COLT Mortgage Loan Trust, Ser 2017-1, Cl A1 | | | | | | | | |
2.614%, 05/27/2047 (A)(D) | | | 56 | | | | 56 | |
COLT Mortgage Loan Trust, Ser 2018-1, Cl A1 | | | | | | | | |
2.930%, 02/25/2048 (A)(D) | | | 48 | | | | 47 | |
COLT Mortgage Loan Trust, Ser 2018-2, Cl A1 | | | | | | | | |
3.470%, 07/27/2048 (A)(D) | | | 131 | | | | 131 | |
COLT Mortgage Loan Trust, Ser 2018-3, Cl A1 | | | | | | | | |
3.692%, 10/26/2048 (A)(D) | | | 85 | | | | 85 | |
COLT Mortgage Loan Trust, Ser 2018-4, Cl A1 | | | | | | | | |
4.006%, 12/28/2048 (A)(D) | | | 185 | | | | 186 | |
Deephaven Residential Mortgage Trust, Ser 2017-1A, Cl A1 | | | | | | | | |
2.725%, 12/26/2046 (A)(D) | | | 27 | | | | 26 | |
Deephaven Residential Mortgage Trust, Ser 2017-2A, Cl A1 | | | | | | | | |
2.453%, 06/25/2047 (A)(D) | | | 39 | | | | 39 | |
Deephaven Residential Mortgage Trust, Ser 2017-3A, Cl A1 | | | | | | | | |
2.577%, 10/25/2047 (A)(D) | | | 42 | | | | 42 | |
Deephaven Residential Mortgage Trust, Ser 2018-1A, Cl A1 | | | | | | | | |
2.976%, 12/25/2057 (A)(D) | | | 52 | | | | 52 | |
Deephaven Residential Mortgage Trust, Ser 2018-2A, Cl A1 | | | | | | | | |
3.479%, 04/25/2058 (A)(D) | | | 131 | | | | 132 | |
Deephaven Residential Mortgage Trust, Ser 2018-3A, Cl A1 | | | | | | | | |
3.789%, 08/25/2058 (A)(D) | | | 227 | | | | 228 | |
FHLMC Structured Agency Credit Risk Debt Notes, Ser 2014-DN2, Cl M2 | | | | | | | | |
4.136%, VAR ICE LIBOR USD 1 Month+1.650%, 04/25/2024 | | | 101 | | | | 101 | |
FHLMC Structured Agency Credit Risk Debt Notes, Ser 2015-HQ1, Cl M3 | | | | | | | | |
6.286%, VAR ICE LIBOR USD 1 Month+3.800%, 03/25/2025 | | | 246 | | | | 259 | |
FHLMC Structured Agency Credit Risk Debt Notes, Ser 2015-HQA2, Cl M2 | | | | | | | | |
5.286%, VAR ICE LIBOR USD 1 Month+2.800%, 05/25/2028 | | | 218 | | | | 223 | |
FHLMC Structured Agency Credit Risk Debt Notes, Ser 2016-DNA3, Cl M2 | | | | | | | | |
4.486%, VAR ICE LIBOR USD 1 Month+2.000%, 12/25/2028 | | | 278 | | | | 280 | |
FHLMC Structured Agency Credit Risk Debt Notes, Ser 2017-HQA1, Cl M1 | | | | | | | | |
3.686%, VAR ICE LIBOR USD 1 Month+1.200%, 08/25/2029 | | | 161 | | | | 162 | |
| | |
52 | | SEI Institutional Managed Trust / Semi-Annual Report / March 31, 2019 |
| | | | | | | | |
| | | |
| Description | | Face Amount
(Thousands) | | Market Value ($ Thousands) |
|
MORTGAGE-BACKED SECURITIES (continued) | |
FHLMC Structured Agency Credit Risk Debt Notes, Ser 2018-SPI2, Cl M1 | | | | | | | | |
3.819%,
05/25/2048 (A)(D) | | $ | 126 | | | $ | 126 | |
Flagstar Mortgage Trust, Ser 2018-5, Cl A7 | | | | | | | | |
4.000%,
09/25/2048 (A)(D) | | | 128 | | | | 130 | |
FNMA Connecticut Avenue Securities, Ser 2014-C02, Cl 1M1 | | | | | | | | |
3.436%, VAR ICE LIBOR USD 1 Month+0.950%, 05/25/2024 | | | 12 | | | | 12 | |
FNMA Connecticut Avenue Securities, Ser 2017-C02, Cl 2M1 | | | | | | | | |
3.636%, VAR ICE LIBOR USD 1 Month+1.150%, 09/25/2029 | | | 57 | | | | 58 | |
FNMA Connecticut Avenue Securities, Ser 2018-C04, Cl 2M1 | | | | | | | | |
3.236%, VAR ICE LIBOR USD 1 Month+0.750%, 12/25/2030 | | | 115 | | | | 115 | |
FNMA Connecticut Avenue Securities, Ser 2018-C05, Cl 1M1 | | | | | | | | |
3.206%, VAR ICE LIBOR USD 1 Month+0.720%, 01/25/2031 | | | 80 | | | | 80 | |
GS Mortgage Securities Corp., Ser 2010-C2, Cl A1 | | | | | | | | |
3.849%, 12/10/2043 (A) | | | 25 | | | | 25 | |
GS Mortgage Securities Trust, Ser 2017- 500K, Cl A | | | | | | | | |
3.184%, VAR LIBOR USD 1 Month+0.700%, 07/15/2032 (A) | | | 135 | | | | 135 | |
Impac CMB Trust, Ser 2005-1, Cl 1A1 | | | | | | | | |
3.006%, VAR ICE LIBOR USD 1 Month+0.520%, 04/25/2035 | | | 114 | | | | 111 | |
JPMorgan Mortgage Trust, Ser 2018-7FRB, Cl A2 | | | | | | | | |
3.240%, VAR ICE LIBOR USD 1 Month+0.750%, 04/25/2046 (A) | | | 155 | | | | 155 | |
LSTAR Securities Investment, Ser 2017-8, Cl A | | | | | | | | |
4.152%, VAR ICE LIBOR USD 1 Month+1.650%, 11/01/2022 (A) | | | 45 | | | | 45 | |
Metlife Securitization Trust, Ser 2017-1A, Cl A | | | | | | | | |
3.000%,
04/25/2055 (A)(D) | | | 80 | | | | 79 | |
MFA Trust, Ser 2017-RPL1, Cl A1 | | | | | | | | |
2.588%,
02/25/2057 (A)(D) | | | 60 | | | | 59 | |
MortgageIT Trust, Ser 2005-5, Cl A1 | | | | | | | | |
2.746%, VAR ICE LIBOR USD 1 Month+0.260%, 12/25/2035 | | | 285 | | | | 283 | |
MSCG Trust, Ser 2018-SELF, Cl A | | | | | | | | |
3.384%, VAR LIBOR USD 1 Month+0.900%, 10/15/2037 (A) | | | 105 | | | | 105 | |
MTRO Commercial Mortgage Trust, Ser 2019- TECH, Cl A | | | | | | | | |
3.384%, VAR LIBOR USD 1 Month+0.900%, 12/15/2033 (A) | | | 150 | | | | 150 | |
| | | | | | | | |
| | | |
| Description | | Face Amount
(Thousands) | | Market Value ($ Thousands) |
|
MORTGAGE-BACKED SECURITIES (continued) | |
New Residential Mortgage Loan Trust, Ser 2017-3A, Cl A1 | | | | | | | | |
4.000%, 04/25/2057 (A)(D) | | $ | 83 | | | $ | 85 | |
Sequoia Mortgage Trust, Ser 2004-10, Cl A2 | | | | | | | | |
3.128%, VAR ICE LIBOR USD 1 Month+0.640%, 11/20/2034 | | | 67 | | | | 66 | |
Sequoia Mortgage Trust, Ser 2004-11, Cl A1 | | | | | | | | |
3.088%, VAR ICE LIBOR USD 1 Month+0.600%, 12/20/2034 | | | 47 | | | | 46 | |
Sequoia Mortgage Trust, Ser 2005-2, Cl A1 | | | | | | | | |
2.708%, VAR ICE LIBOR USD 1 Month+0.220%, 03/20/2035 | | | 29 | | | | 28 | |
Sequoia Mortgage Trust, Ser 2018-CH3, Cl A1 | | | | | | | | |
4.500%, 08/25/2048 (A)(D) | | | 122 | | | | 125 | |
SG Residential Mortgage Trust, Ser 2018-1, Cl A1 | | | | | | | | |
3.425%, 04/27/2048 (A)(D) | | | 122 | | | | 122 | |
Verus Securitization Trust, Ser 2018-2, Cl A1 | | | | | | | | |
3.677%, 06/01/2058 (A)(D) | | | 181 | | | | 182 | |
Washington Mutual Mortgage Pass-Through Certificates, Ser 2006-AR2, Cl 1A1 | | | | | | | | |
4.259%, 03/25/2036 (D) | | | 140 | | | | 136 | |
Wells Fargo Mortgage-Backed Securities Trust, Ser 2004-BB, Cl A2 | | | | | | | | |
4.940%, 01/25/2035 (D) | | | 62 | | | | 63 | |
| | |
| | | | | | | 6,353 | |
| | |
Total Mortgage-Backed Securities
(Cost $7,174) ($ Thousands) | | | | | | | 7,173 | |
|
U.S. TREASURY OBLIGATION — 3.7% | |
U.S. Treasury Notes | | | | | | | | |
2.540%, VAR US Treasury 3 Month Bill Money Market Yield+0.115%, 01/31/2021 | | | 2,500 | | | | 2,498 | |
| | |
Total U.S. Treasury Obligation
(Cost $2,499) ($ Thousands) | | | | | | | 2,498 | |
|
LOAN PARTICIPATIONS — 0.1% | |
BPA Laboratories, Term Loan, 2nd Lien | | | | | | | | |
10.553%, 04/29/2020 (B)(C) | | | 44 | | | | 40 | |
Diebold Nixdorf, Term Loan B, 1st Lien | | | | | | | | |
5.313%, VAR LIBOR+2.750%, 11/06/2023 (G) | | | 2 | | | | 2 | |
| | |
SEI Institutional Managed Trust / Semi-Annual Report / March 31, 2019 | | 53 |
SCHEDULE OF INVESTMENTS (Unaudited)
March 31, 2019
Enhanced Income Fund(Concluded)
| | | | | | | | |
| | | |
| Description | | Face Amount
(Thousands) | | Market Value ($ Thousands) |
| |
LOAN PARTICIPATIONS (continued) | | | | | |
Gardner Denver Inc., Term Loan B, 1st Lien | | | | | | | | |
5.243%, VAR LIBOR+2.750%, 07/30/2024 | | $ | 2 | | | $ | 2 | |
| | |
Total Loan Participations
(Cost $37) ($ Thousands) | | | | | | | 44 | |
| | |
| | | Shares | | |
| |
PREFERRED STOCK — 0.1% | | | | | |
TE Holdcorp, 0.000% *(B)(C) | | | 17,950 | | | | 40 | |
| | |
Total Preferred Stock
(Cost $156) ($ Thousands) | | | | | | | 40 | |
| |
COMMON STOCK — 0.0% | | | | | |
Boart Longyear *(C) | | | 694,591 | | | | 2 | |
TE Holdcorp *(C) | | | 11,340 | | | | 4 | |
| | |
Total Common Stock
(Cost $381) ($ Thousands) | | | | | | | 6 | |
| | | | | | | | |
| | | |
| Description | | Shares | | | Market Value ($ Thousands) | |
| |
CASH EQUIVALENT — 4.2% | | | | | |
SEI Daily Income Trust, Government Fund, Cl F | | | | | | | | |
2.220%**† | | | 2,792,886 | | | $ | 2,793 | |
| | |
Total Cash Equivalent
(Cost $2,793) ($ Thousands) | | | | | | | 2,793 | |
| | |
| | | Face Amount
(Thousands) | | | | |
| |
REPURCHASE AGREEMENT — 9.5% | | | | | |
Goldman Sachs | | | | | | | | |
2.550%, dated 03/29/2019, to be repurchased on 04/01/2019, repurchase price $6,401,360 (collateralized by U.S. Government obligations, ranging in par value $1,890,488 - $5,127,424, 2.500% - 5.000%, 12/15/2035 - 09/20/2047; total market value $6,528,000) (H) | | $ | 6,400 | | | | 6,400 | |
| | |
Total Repurchase Agreement
(Cost $6,400) ($ Thousands) | | | | | | | 6,400 | |
| |
Total Investments in Securities — 95.9%
(Cost $64,744) ($ Thousands) | | | $ | 64,203 | |
| | | | | | | | |
A list of the open futures contracts held by the Fund at March 31, 2019, is as follows:
| | | | | | | | | | | | | | | | | | | | |
Type of Contract | | Number of
Contracts
Long/(Short) | | | Expiration
Date | | | Notional Amount
(Thousands) | | | Value
(Thousands) | | | Unrealized
Depreciation
(Thousands) | |
U.S. 10-Year Treasury Notes | | | (8 | ) | | | Jun-2019 | | | $ | (980 | ) | | $ | (994) | | | $ | (14 | ) |
U.S. 2-Year Treasury Notes | | | (20 | ) | | | Jul-2019 | | | | (4,246 | ) | | | (4,262) | | | | (16 | ) |
| | | | | | | | | | $ | (5,226 | ) | | $ | (5,256) | | | $ | (30 | ) |
| | | | | | | | | | | | | | | | | | | | |
Percentages are based on Net Assets of $66,958 ($ Thousands).
| * | Non-income producing security. |
| ** | Rate shown is the 7-day effective yield as of March 31, 2019. |
| † | Investment in Affiliated Security (see Note 6). |
| (A) | Security exempt from registration under Rule 144A of the Securities Act of 1933. These securities may be resold in transactions exempt from registration normally to qualified institutions. On March 31, 2019, the value of these securities amounted to $23,649 ($ Thousands), representing 35.3% of the Net Assets of the Fund. |
| (B) | Level 3 security in accordance with fair value hierarchy. |
| (C) | Securities considered illiquid. The total value of such securities as of March 31, 2019 was $1,055 ($ Thousands) and represented 1.6% of the Net Assets of the Fund. |
| (D) | Variable or floating rate security, the interest rate of which adjusts periodically based on changes in current interest rates and prepayments on the underlying pool of assets. |
| (E) | Step Bonds – Represents the current rate, the step rate, the step date and the final maturity date. |
| (F) | Zero coupon security. The rate shown on the Schedule of Investments is the security’s effective yield at the time of purchase. |
| (G) | Unsettled bank loan. Interest rate may not be available. |
| (H) | Tri-Party Repurchase Agreement. |
Cl — Class
CLO — Collateralized Loan Obligation
FHLMC — Federal Home Loan Mortgage Corporation
FNMA — Federal National Mortgage Association
FREMF— Freddie Mac Multi-Family
ICE— Intercontinental Exchange
LIBOR — London Interbank Offered Rate
LLC — Limited Liability Company
MTN — Medium Term Note
NCUA — National Credit Union Association
PLC — Public Limited Company
Ser — Series
USD — United States Dollar
VAR — Variable Rate
| | |
54 | | SEI Institutional Managed Trust / Semi-Annual Report / March 31, 2019 |
The following is a list of the level of inputs used as of March 31, 2019, in valuing the Fund’s investments and other financial instruments carried at value ($ Thousands):
| | | | | | | | | | | | | | | | |
Investments in
Securities | | Level 1 | | Level 2 | | Level 3(1) | | Total |
Corporate Obligations | | $ | – | | | $ | 19,428 | | | $ | – | | | $ | 19,428 | |
Asset-Backed Securities | | | – | | | | 16,336 | | | | – | | | | 16,336 | |
Commercial Paper | | | – | | | | 9,485 | | | | – | | | | 9,485 | |
Mortgage-Backed Securities | | | – | | | | 7,173 | | | | – | | | | 7,173 | |
U.S. Treasury Obligation | | | – | | | | 2,498 | | | | – | | | | 2,498 | |
Loan Participations | | | – | | | | 4 | | | | 40 | | | | 44 | |
Preferred Stock | | | – | | | | – | | | | 40 | | | | 40 | |
Common Stock | | | 2 | | | | 4 | | | | – | | | | 6 | |
Cash Equivalent | | | 2,793 | | | | – | | | | – | | | | 2,793 | |
Repurchase Agreement | | | – | | | | 6,400 | | | | – | | | | 6,400 | |
| | | | | | | | | | | | | | | | |
Total Investments in Securities | | $ | 2,795 | | | $ | 61,328 | | | $ | 80 | | | $ | 64,203 | |
| | | | | | | | | | | | | | | | |
| | | | | | | | | | | | | | | | |
| | | | | |
| Other Financial Instruments | | Level 1 | | | Level 2 | | | Level 3 | | | Total | |
Futures Contracts* | | | | | | | | | | | | | | | | |
Unrealized Depreciation | | $ | (30) | | | $ | – | | | $ | – | | | $ | (30) | |
| | | | | | | | | | | | | | | | |
| | | | |
Total Other Financial Instruments | | $ | (30) | | | $ | – | | | $ | – | | | $ | (30) | |
| | | | | | | | | | | | | | | | |
* Futures contracts are valued at the unrealized depreciation on the instrument.
(1) A reconciliation of Level 3 investments is presented when the Fund has a significant amount of Level 3 investments at the beginning and/or end of the period in relation to net assets. Management has concluded that Level 3 investments are not material in relation to net assets.
For the period ended March 31, 2019, there were no transfers between Level 1 and Level 2 assets and liabilities.
For the period ended March 31, 2019, there were no transfers between Level 2 and Level 3 assets and liabilities.
For more information on valuation inputs, see Note 2 — Significant Accounting Policies in Notes to Financial Statements.
Amounts designated as “–” are either $0 or have been rounded to $0.
The following is a summary of the Fund’s transactions with affiliated for the period ended March 31, 2019 ($ Thousands):
| | | | | | | | | | | | | | |
| Security Description | | Value 9/30/18 | | Purchases at
Cost | | Proceeds
from Sales | | Realized Gain
(Loss) | | Change in
Unrealized
Appreciation
(Depreciation) | | Value 3/31/19 | | Income |
SEI Daily Income Trust, Government Fund, Cl F | | $ 2,514 | | $ 24,695 | | $ (24,416) | | $ - | | $ - | | $ 2,793 | | $ 24 |
| | | | | | | | | | | | | | |
The accompanying notes are an integral part of the financial statements.
| | |
SEI Institutional Managed Trust / Semi-Annual Report / March 31, 2019 | | 55 |
SCHEDULE OF INVESTMENTS (Unaudited)
March 31, 2019
Core Fixed Income Fund
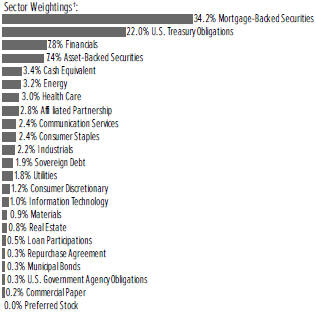
†Percentages are based on total investments. Includes investments held as collateral for securities held on loan (see Note 10).
| | | | | | | | |
| Description | | Face Amount
(Thousands) | | Market Value
($ Thousands) |
|
MORTGAGE-BACKED SECURITIES — 37.4% | |
|
Agency Mortgage-Backed Obligations — 31.6% | |
FHLMC | | | | | | | | |
10.000%, 03/17/2026 | | $ | 7 | | | $ | 7 | |
7.500%, 05/01/2031 to 02/01/2038 | | | 460 | | | | 510 | |
7.000%, 05/01/2024 to 03/01/2039 | | | 210 | | | | 232 | |
6.500%, 10/01/2031 to 09/01/2039 | | | 296 | | | | 332 | |
6.000%, 03/01/2020 to 09/01/2038 | | | 640 | | | | 683 | |
5.500%, 06/01/2020 to 08/01/2037 | | | 334 | | | | 357 | |
5.000%, 06/01/2019 to 04/01/2049 | | | 18,102 | | | | 19,277 | |
4.500%, 06/01/2027 to 10/01/2048 | | | 23,703 | | | | 24,887 | |
4.000%, 04/01/2019 to 01/01/2049 | | | 63,591 | | | | 66,144 | |
3.500%, 12/01/2033 to 03/01/2049 | | | 119,065 | | | | 121,449 | |
3.000%, 03/01/2031 to 03/01/2049 | | | 51,997 | | | | 51,842 | |
2.500%, 09/01/2031 to 12/01/2031 | | | 2,445 | | | | 2,435 | |
FHLMC ARM | | | | | | | | |
3.859%, VAR ICE LIBOR USD 12 Month+1.640%, 07/01/2048 | | | 628 | | | | 649 | |
FHLMC CMO, Ser 1997-1983, Cl Z | | | | | | | | |
6.500%, 12/15/2023 | | | 235 | | | | 249 | |
FHLMC CMO, Ser 2001-2277, Cl B | | | | | | | | |
7.500%, 01/15/2031 | | | 73 | | | | 85 | |
FHLMC CMO, Ser 2002-2399, Cl XG | | | | | | | | |
6.500%, 01/15/2032 | | | 386 | | | | 424 | |
FHLMC CMO, Ser 2006-R007, Cl ZA | | | | | | | | |
6.000%, 05/15/2036 | | | 1,054 | | | | 1,186 | |
FHLMC CMO, Ser 2007-3281, Cl AI, IO | | | | | | | | |
3.946%, VAR LIBOR USD 1 Month+6.430%, 02/15/2037 | | | 77 | | | | 12 | |
| | | | | | | | |
| Description | | Face Amount
(Thousands) | | Market Value
($ Thousands) |
|
MORTGAGE-BACKED SECURITIES (continued) | |
FHLMC CMO, Ser 2007-3294, Cl CB | | | | | | | | |
5.500%, 03/15/2037 | | $ | 129 | | | $ | 141 | |
FHLMC CMO, Ser 2007-3316, Cl JO, PO | | | | | | | | |
0.000%, 05/15/2037 (A) | | | 2 | | | | 2 | |
FHLMC CMO, Ser 2008-3451, Cl SB, IO | | | | | | | | |
3.546%, VAR LIBOR USD 1 Month+6.030%, 05/15/2038 | | | 33 | | | | 3 | |
FHLMC CMO, Ser 2010-3621, Cl SB, IO | | | | | | | | |
3.746%, VAR LIBOR USD 1 Month+6.230%, 01/15/2040 | | | 55 | | | | 8 | |
FHLMC CMO, Ser 2011-3947, Cl SG, IO | | | | | | | | |
3.466%, VAR LIBOR USD 1 Month+5.950%, 10/15/2041 | | | 780 | | | | 117 | |
FHLMC CMO, Ser 2012-264, Cl 30 | | | | | | | | |
3.000%, 07/15/2042 | | | 3,129 | | | | 3,119 | |
FHLMC CMO, Ser 2012-271, Cl 30 | | | | | | | | |
3.000%, 08/15/2042 | | | 659 | | | | 657 | |
FHLMC CMO, Ser 2012-283, Cl IO, IO | | | | | | | | |
3.500%, 10/15/2027 | | | 547 | | | | 49 | |
FHLMC CMO, Ser 2012-4054, Cl SA, IO | | | | | | | | |
3.566%, VAR LIBOR USD 1 Month+6.050%, 08/15/2039 | | | 737 | | | | 91 | |
FHLMC CMO, Ser 2012-4146, Cl DI, IO | | | | | | | | |
3.000%, 12/15/2031 | | | 787 | | | | 70 | |
FHLMC CMO, Ser 2013-4174, Cl SA, IO | | | | | | | | |
3.716%, VAR LIBOR USD 1 Month+6.200%, 05/15/2039 | | | 218 | | | | 19 | |
FHLMC CMO, Ser 2013-4194, Cl BI, IO | | | | | | | | |
3.500%, 04/15/2043 | | | 352 | | | | 53 | |
FHLMC CMO, Ser 2013-4203, Cl PS, IO | | | | | | | | |
3.766%, VAR LIBOR USD 1 Month+6.250%, 09/15/2042 | | | 546 | | | | 79 | |
FHLMC CMO, Ser 2013-4210, Cl Z | | | | | | | | |
3.000%, 05/15/2043 | | | 233 | | | | 217 | |
FHLMC CMO, Ser 2013-4239, Cl IO, IO | | | | | | | | |
3.500%, 06/15/2027 | | | 407 | | | | 36 | |
FHLMC CMO, Ser 2014-326, Cl 300 | | | | | | | | |
3.000%, 03/15/2044 | | | 2,515 | | | | 2,508 | |
FHLMC CMO, Ser 2014-328, Cl S4, IO | | | | | | | | |
1.681%, 02/15/2038 (B) | | | 31 | | | | 2 | |
FHLMC CMO, Ser 2014-4335, Cl SW, IO | | | | | | | | |
3.516%, VAR LIBOR USD 1 Month+6.000%, 05/15/2044 | | | 116 | | | | 19 | |
FHLMC CMO, Ser 2014-4415, Cl IO, IO | | | | | | | | |
1.522%, 04/15/2041 (B) | | | 421 | | | | 21 | |
FHLMC CMO, Ser 2016-353, Cl S1, IO | | | | | | | | |
3.516%, VAR LIBOR USD 1 Month+6.000%, 12/15/2046 | | | 647 | | | | 115 | |
FHLMC CMO, Ser 2016-4639, Cl HZ | | | | | | | | |
2.750%, 04/15/2053 | | | 1,610 | | | | 1,594 | |
FHLMC CMO, Ser 2017-356, Cl 300 | | | | | | | | |
3.000%, 09/15/2047 | | | 1,003 | | | | 999 | |
| | |
56 | | SEI Institutional Managed Trust / Semi-Annual Report / March 31, 2019 |
| | | | | | | | |
| Description | | Face Amount
(Thousands) | | Market Value
($ Thousands) |
|
MORTGAGE-BACKED SECURITIES (continued) | |
FHLMC CMO, Ser 2017-360, Cl 300 | | | | | | | | |
3.000%, 11/15/2047 | | $ | 2,214 | | | $ | 2,215 | |
FHLMC CMO, Ser 2017-4705, Cl A | | | | | | | | |
4.500%, 09/15/2042 | | | 1,586 | | | | 1,679 | |
FHLMC CMO, Ser 2017-4742, Cl PA | | | | | | | | |
3.000%, 10/15/2047 | | | 7,233 | | | | 7,224 | |
FHLMC CMO, Ser 2018-4763, Cl CA | | | | | | | | |
3.000%, 09/15/2038 | | | 417 | | | | 423 | |
FHLMC CMO, Ser 2018-4767, Cl KA | | | | | | | | |
3.000%, 03/15/2048 | | | 1,922 | | | | 1,943 | |
FHLMC CMO, Ser 2018-4786, Cl DP | | | | | | | | |
4.500%, 07/15/2042 | | | 1,171 | | | | 1,212 | |
FHLMC CMO, Ser 2018-4787, Cl AK | | | | | | | | |
3.000%, 05/15/2048 | | | 3,215 | | | | 3,174 | |
FHLMC CMO, Ser 2018-4793, Cl CM | | | | | | | | |
3.000%, 05/15/2048 | | | 1,021 | | | | 1,006 | |
FHLMC CMO, Ser 2018-4796, Cl AK | | | | | | | | |
3.000%, 05/15/2048 | | | 4,102 | | | | 4,050 | |
FHLMC CMO, Ser 2018-4802, Cl A | | | | | | | | |
3.000%, 06/15/2048 | | | 3,872 | | | | 3,833 | |
FHLMC CMO, Ser 2018-4813, Cl CJ | | | | | | | | |
3.000%, 08/15/2048 | | | 2,382 | | | | 2,357 | |
FHLMC CMO, Ser 2018-4818, Cl CA | | | | | | | | |
3.000%, 04/15/2048 | | | 2,932 | | | | 2,899 | |
FHLMC CMO, Ser 2018-4846, Cl PA | | | | | | | | |
4.000%, 06/15/2047 | | | 774 | | | | 802 | |
FHLMC Multifamily Structured Pass-Through | | | | | | | | |
Certificates, Ser K015, Cl X1, IO | | | | | | | | |
1.569%, 07/25/2021 (B) | | | 1,274 | | | | 39 | |
FHLMC Multifamily Structured Pass-Through Certificates, Ser K016, Cl X1, IO | | | | | | | | |
1.479%, 10/25/2021 (B) | | | 260 | | | | 8 | |
FHLMC Multifamily Structured Pass-Through Certificates, Ser K032, Cl X1, IO | | | | | | | | |
0.103%, 05/25/2023 (B) | | | 33,619 | | | | 149 | |
FHLMC Multifamily Structured Pass-Through Certificates, Ser K064, Cl X1, IO | | | | | | | | |
0.608%, 03/25/2027 (B) | | | 4,956 | | | | 207 | |
FHLMC Multifamily Structured Pass-Through Certificates, Ser K158, Cl A3 | | | | | | | | |
3.900%, 10/25/2033 (B) | | | 2,000 | | | | 2,147 | |
FHLMC Multifamily Structured Pass-Through Certificates, Ser K723, Cl X1, IO | | | | | | | | |
0.951%, 08/25/2023 (B) | | | 7,561 | | | | 254 | |
FHLMC Multifamily Structured Pass-Through Certificates, Ser KF52, Cl A | | | | | | | | |
2.910%, VAR LIBOR USD 1 Month+0.420%, 09/25/2028 | | | 2,235 | | | | 2,222 | |
FHLMC Multifamily Structured Pass-Through Certificates, Ser KF57, Cl A | | | | | | | | |
3.030%, VAR LIBOR USD 1 Month+0.540%, 12/25/2028 | | | 360 | | | | 360 | |
| | | | | | | | |
| Description | | Face Amount
(Thousands) | | Market Value
($ Thousands) |
|
MORTGAGE-BACKED SECURITIES (continued) | |
FHLMC Multifamily Structured Pass-Through Certificates, Ser Q006, Cl APT2 | | | | | | | | |
2.483%, 09/25/2026 (B) | | $ | 4,478 | | | $ | 4,774 | |
FHLMC Multifamily Structured Pass-Through Certificates, Ser S8FX, Cl A2 | | | | | | | | |
3.291%, 03/25/2027 | | | 320 | | | | 328 | |
FHLMC Multifamily Structured Pass-Through Certificates, Ser X3FX, Cl A2FX | | | | | | | | |
3.000%, 06/25/2027 | | | 475 | | | | 472 | |
FHLMC Structured Agency Credit Risk Debt Notes, Ser 2014-DN1, Cl M2 | | | | | | | | |
4.686%, VAR ICE LIBOR USD 1 Month+2.200%, 02/25/2024 | | | 324 | | | | 329 | |
FHLMC Structured Agency Credit Risk Debt Notes, Ser 2015-DNA2, Cl M2 | | | | | | | | |
5.086%, VAR ICE LIBOR USD 1 Month+2.600%, 12/25/2027 | | | 154 | | | | 156 | |
FHLMC Structured Agency Credit Risk Debt Notes, Ser 2017-DNA1, Cl M1 | | | | | | | | |
3.686%, VAR ICE LIBOR USD 1 Month+1.200%, 07/25/2029 | | | 550 | | | | 553 | |
FHLMC Structured Pass-Through Certificates, Ser 2007-76, Cl 2A | | | | | | | | |
2.471%, 10/25/2037 (B) | | | 126 | | | | 133 | |
FHLMC TBA | | | | | | | | |
5.000%, 04/01/2036 | | | 600 | | | | 635 | |
4.500%, 04/13/2039 | | | 7,015 | | | | 7,321 | |
4.000%, 04/15/2045 | | | 3,500 | | | | 3,603 | |
FNMA | | | | | | | | |
7.500%, 10/01/2037 to 04/01/2039 | | | 162 | | | | 192 | |
7.000%, 09/01/2026 to 02/01/2039 | | | 695 | | | | 767 | |
6.500%, 05/01/2027 to 05/01/2040 | | | 248 | | | | 276 | |
6.000%, 10/01/2019 to 10/01/2040 | | | 2,244 | | | | 2,460 | |
5.500%, 02/01/2021 to 09/01/2056 | | | 1,089 | | | | 1,179 | |
5.000%, 01/01/2020 to 03/01/2049 | | | 36,951 | | | | 39,856 | |
4.500%, 04/01/2025 to 09/01/2057 | | | 113,747 | | | | 119,492 | |
4.360%, 05/01/2021 | | | 929 | | | | 963 | |
4.350%, 04/01/2021 | | | 723 | | | | 747 | |
4.300%, 04/01/2021 | | | 228 | | | | 236 | |
4.200%, 04/01/2021 | | | 645 | | | | 666 | |
4.000%, 08/01/2020 to 06/01/2057 | | | 118,036 | | | | 122,192 | |
3.715%, 11/25/2017 | | | 611 | | | | 92 | |
3.590%, 12/01/2020 | | | 425 | | | | 432 | |
3.500%, 09/01/2033 to 03/01/2057 | | | 64,625 | | | | 65,963 | |
3.490%, 02/01/2033 | | | 1,315 | | | | 1,351 | |
3.480%, 08/01/2028 | | | 2,025 | | | | 2,108 | |
3.410%, 10/01/2030 | | | 805 | | | | 832 | |
3.390%, 05/01/2030 | | | 6,902 | | | | 7,097 | |
3.340%, 07/01/2030 | | | 600 | | | | 612 | |
3.290%, 10/01/2020 to 09/01/2032 | | | 972 | | | | 983 | |
3.260%, 10/01/2030 | | | 705 | | | | 719 | |
3.240%, 06/01/2029 | | | 955 | | | | 974 | |
3.190%, 05/01/2030 | | | 1,267 | | | | 1,278 | |
| | |
SEI Institutional Managed Trust / Semi-Annual Report / March 31, 2019 | | 57 |
SCHEDULE OF INVESTMENTS (Unaudited)
March 31, 2019
Core Fixed Income Fund(Continued)
| | | | | | | | |
| | | |
| Description | | Face Amount
(Thousands) | | Market Value
($ Thousands) |
|
MORTGAGE-BACKED SECURITIES (continued) | |
3.120%, 06/01/2035 | | $ | 850 | | | $ | 835 | |
3.110%, 02/01/2028 | | | 465 | | | | 471 | |
3.080%, 04/01/2030 | | | 492 | | | | 494 | |
3.040%, 04/01/2030 | | | 492 | | | | 493 | |
3.000%, 02/01/2032 to 09/01/2047 | | | 38,348 | | | | 38,417 | |
2.900%, 11/01/2029 | | | 500 | | | | 491 | |
2.820%, 07/01/2027 | | | 590 | | | | 588 | |
2.510%, 08/01/2026 | | | 1,283 | | | | 1,267 | |
2.500%, 10/01/2042 | | | 806 | | | | 787 | |
FNMA ACES, Ser 2012-M14, Cl X2, IO | | | | | | | | |
0.419%, 09/25/2022 (B) | | | 14,764 | | | | 174 | |
FNMA ACES, Ser 2014-M12, Cl FA | | | | | | | | |
2.781%, VAR LIBOR USD 1 Month+0.300%, 10/25/2021 | | | 232 | | | | 232 | |
FNMA ACES, Ser 2014-M2, Cl A2 | | | | | | | | |
3.513%, 12/25/2023 (B) | | | 1,726 | | | | 1,786 | |
FNMA ACES, Ser 2017-M7, Cl A2 | | | | | | | | |
2.961%, 02/25/2027 (B) | | | 440 | | | | 441 | |
FNMA ARM | | | | | | | | |
4.281%, VAR 12 Month Treas Avg+1.944%, 11/01/2035 | | | 146 | | | | 151 | |
4.223%, VAR 12 Month Treas Avg+1.917%, 11/01/2035 | | | 567 | | | | 586 | |
4.137%, VAR 12 Month Treas Avg+1.833%, 10/01/2035 | | | 599 | | | | 617 | |
4.112%, VAR 12 Month Treas Avg+1.808%, 10/01/2035 | | | 97 | | | | 100 | |
3.855%, VAR ICE LIBOR USD 12 Month+1.620%, 10/01/2048 | | | 931 | | | | 962 | |
3.752%, VAR ICE LIBOR USD 12 Month+1.620%, 08/01/2048 | | | 589 | | | | 607 | |
3.734%, VAR ICE LIBOR USD 12 Month+1.620%, 07/01/2048 | | | 1,052 | | | | 1,083 | |
3.727%, VAR ICE LIBOR USD 12 Month+1.620%, 08/01/2048 | | | 1,182 | | | | 1,217 | |
3.672%, VAR ICE LIBOR USD 12 Month+1.611%, 12/01/2048 | | | 713 | | | | 731 | |
3.126%, VAR ICE LIBOR USD 12 Month+1.620%, 03/01/2047 | | | 1,243 | | | | 1,260 | |
2.953%, VAR ICE LIBOR USD 12 Month+1.599%, 08/01/2047 | | | 863 | | | | 873 | |
FNMA CMO STRIPS, Ser 2012-409, Cl C22, IO | | | | | | | | |
4.500%, 11/25/2039 | | | 407 | | | | 82 | |
FNMA CMO STRIPS, Ser 2012-409, Cl C2, IO | | | | | | | | |
3.000%, 04/25/2027 | | | 498 | | | | 35 | �� |
FNMA CMO STRIPS, Ser 2012-409, Cl C13, IO | | | | | | | | |
3.500%, 11/25/2041 | | | 393 | | | | 73 | |
FNMA CMO, Ser 1999-11, Cl Z | | | | | | | | |
5.500%, 03/25/2029 | | | 223 | | | | 229 | |
FNMA CMO, Ser 2005-117, Cl LC | | | | | | | | |
5.500%, 11/25/2035 | | | 525 | | | | 546 | |
FNMA CMO, Ser 2005-29, Cl ZA | | | | | | | | |
5.500%, 04/25/2035 | | | 214 | | | | 240 | |
| | | | | | | | |
| | | |
| Description | | Face Amount
(Thousands) | | Market Value
($ Thousands) |
|
MORTGAGE-BACKED SECURITIES (continued) | |
FNMA CMO, Ser 2005-360, Cl 2, IO | | | | | | | | |
5.000%, 08/25/2035 | | $ | 1,235 | | | $ | 239 | |
FNMA CMO, Ser 2006-112, Cl ST, IO | | | | | | | | |
4.215%, VAR LIBOR USD 1 Month+6.700%, 11/25/2036 | | | 963 | | | | 77 | |
FNMA CMO, Ser 2008-22, Cl SI, IO | | | | | | | | |
3.945%, VAR LIBOR USD 1 Month+6.430%, 03/25/2037 | | | 1,018 | | | | 17 | |
FNMA CMO, Ser 2009-103, Cl MB | | | | | | | | |
4.315%, 12/25/2039 (B) | | | 52 | | | | 56 | |
FNMA CMO, Ser 2009-86, Cl BO, PO | | | | | | | | |
0.000%, 03/25/2037 (A) | | | 1,332 | | | | 1,208 | |
FNMA CMO, Ser 2010-150, Cl SK, IO | | | | | | | | |
4.045%, VAR LIBOR USD 1 Month+6.530%, 01/25/2041 | | | 320 | | | | 56 | |
FNMA CMO, Ser 2011-59, Cl NZ | | | | | | | | |
5.500%, 07/25/2041 | | | 1,926 | | | | 2,134 | |
FNMA CMO, Ser 2011-87, Cl SG, IO | | | | | | | | |
4.065%, VAR LIBOR USD 1 Month+6.550%, 04/25/2040 | | | 270 | | | | 32 | |
FNMA CMO, Ser 2011-90, Cl QI, IO | | | | | | | | |
5.000%, 05/25/2034 | | | 238 | | | | 9 | |
FNMA CMO, Ser 2011-96, Cl SA, IO | | | | | | | | |
4.065%, VAR LIBOR USD 1 Month+6.550%, 10/25/2041 | | | 1,090 | | | | 173 | |
FNMA CMO, Ser 2012-101, Cl BI, IO | | | | | | | | |
4.000%, 09/25/2027 | | | 90 | | | | 7 | |
FNMA CMO, Ser 2012-101, Cl AI, IO | | | | | | | | |
3.000%, 06/25/2027 | | | 400 | | | | 29 | |
FNMA CMO, Ser 2012-118, Cl CI, IO | | | | | | | | |
3.500%, 12/25/2039 | | | 429 | | | | 40 | |
FNMA CMO, Ser 2012-133, Cl CS, IO | | | | | | | | |
3.665%, VAR LIBOR USD 1 Month+6.150%, 12/25/2042 | | | 343 | | | | 59 | |
FNMA CMO, Ser 2012-28, Cl B | | | | | | | | |
6.500%, 06/25/2039 | | | 39 | | | | 42 | |
FNMA CMO, Ser 2012-35, Cl SC, IO | | | | | | | | |
4.015%, VAR LIBOR USD 1 Month+6.500%, 04/25/2042 | | | 201 | | | | 35 | |
FNMA CMO, Ser 2012-46, Cl BA | | | | | | | | |
6.000%, 05/25/2042 | | | 269 | | | | 291 | |
FNMA CMO, Ser 2012-70, Cl YS, IO | | | | | | | | |
4.165%, VAR LIBOR USD 1 Month+6.650%, 02/25/2041 | | | 73 | | | | 8 | |
FNMA CMO, Ser 2012-74, Cl SA, IO | | | | | | | | |
4.165%, VAR LIBOR USD 1 Month+6.650%, 03/25/2042 | | | 340 | | | | 46 | |
FNMA CMO, Ser 2012-74, Cl OA, PO | | | | | | | | |
0.000%, 03/25/2042 (A) | | | 26 | | | | 23 | |
FNMA CMO, Ser 2012-75, Cl AO, PO | | | | | | | | |
0.000%, 03/25/2042 (A) | | | 52 | | | | 46 | |
FNMA CMO, Ser 2013-111, Cl PL | | | | | | | | |
2.000%, 12/25/2042 | | | 375 | | | | 350 | |
| | |
58 | | SEI Institutional Managed Trust / Semi-Annual Report / March 31, 2019 |
| | | | | | | | |
| Description | | Face Amount
(Thousands) | | Market Value
($ Thousands) |
|
MORTGAGE-BACKED SECURITIES (continued) | |
FNMA CMO, Ser 2013-124, Cl SB, IO | | | | | | | | |
3.465%, VAR LIBOR USD 1 Month+5.950%, 12/25/2043 | | $ | 543 | | | $ | 100 | |
FNMA CMO, Ser 2013-126, Cl CS, IO | | | | | | | | |
3.665%, VAR LIBOR USD 1 Month+6.150%, 09/25/2041 | | | 456 | | | | 58 | |
FNMA CMO, Ser 2013-30, Cl CA | | | | | | | | |
1.500%, 04/25/2043 | | | 412 | | | | 395 | |
FNMA CMO, Ser 2013-35, Cl CL | | | | | | | | |
3.000%, 02/25/2043 | | | 6,875 | | | | 6,799 | |
FNMA CMO, Ser 2013-54, Cl BS, IO | | | | | | | | |
3.665%, VAR LIBOR USD 1 Month+6.150%, 06/25/2043 | | | 218 | | | | 42 | |
FNMA CMO, Ser 2013-73, Cl IA, IO | | | | | | | | |
3.000%, 09/25/2032 | | | 548 | | | | 54 | |
FNMA CMO, Ser 2013-73, Cl IB, IO | | | | | | | | |
3.500%, 07/25/2028 | | | 122 | | | | 10 | |
FNMA CMO, Ser 2013-9, Cl BC | | | | | | | | |
6.500%, 07/25/2042 | | | 300 | | | | 343 | |
FNMA CMO, Ser 2013-9, Cl SA, IO | | | | | | | | |
3.665%, VAR LIBOR USD 1 Month+6.150%, 03/25/2042 | | | 419 | | | | 53 | |
FNMA CMO, Ser 2013-9, Cl CB | | | | | | | | |
5.500%, 04/25/2042 | | | 2,321 | | | | 2,552 | |
FNMA CMO, Ser 2014-40, Cl EP | | | | | | | | |
3.500%, 10/25/2042 | | | 668 | | | | 690 | |
FNMA CMO, Ser 2014-47, Cl AI, IO | | | | | | | | |
1.647%, 08/25/2044 (B) | | | 250 | | | | 13 | |
FNMA CMO, Ser 2015-55, Cl IO, IO | | | | | | | | |
1.465%, 08/25/2055 (B) | | | 617 | | | | 31 | |
FNMA CMO, Ser 2015-56, Cl AS, IO | | | | | | | | |
3.665%, VAR LIBOR USD 1 Month+6.150%, 08/25/2045 | | | 67 | | | | 14 | |
FNMA CMO, Ser 2016-60, Cl QS, IO | | | | | | | | |
3.615%, VAR LIBOR USD 1 Month+6.100%, 09/25/2046 | | | 375 | | | | 55 | |
FNMA CMO, Ser 2017-13, Cl PA | | | | | | | | |
3.000%, 08/25/2046 | | | 1,220 | | | | 1,234 | |
FNMA CMO, Ser 2017-76, Cl SB, IO | | | | | | | | |
3.615%, VAR LIBOR USD 1 Month+6.100%, 10/25/2057 | | | 2,025 | | | | 354 | |
FNMA CMO, Ser 2018-12, Cl P | | | | | | | | |
3.000%, 03/25/2046 | | | 1,385 | | | | 1,385 | |
FNMA CMO, Ser 2018-14, Cl KC | | | | | | | | |
3.000%, 03/25/2048 | | | 2,157 | | | | 2,204 | |
FNMA CMO, Ser 2018-15, Cl AB | | | | | | | | |
3.000%, 03/25/2048 | | | 505 | | | | 501 | |
FNMA CMO, Ser 2018-38, Cl LA | | | | | | | | |
3.000%, 06/25/2048 | | | 4,055 | | | | 4,013 | |
FNMA CMO, Ser 2018-4, Cl HC | | | | | | | | |
2.500%, 12/25/2047 | | | 1,189 | | | | 1,173 | |
FNMA CMO, Ser 2018-43, Cl CT | | | | | | | | |
3.000%, 06/25/2048 | | | 3,864 | | | | 3,826 | |
| | | | | | | | |
| Description | | Face Amount
(Thousands) | | Market Value
($ Thousands) |
|
MORTGAGE-BACKED SECURITIES (continued) | |
FNMA CMO, Ser 2018-45, Cl GA | | | | | | | | |
3.000%, 06/25/2048 | | $ | 8,383 | | | $ | 8,301 | |
FNMA CMO, Ser 2018-50, Cl BA | | | | | | | | |
3.000%, 07/25/2048 | | | 8,231 | | | | 8,098 | |
FNMA CMO, Ser 2018-54, Cl KA | | | | | | | | |
3.500%, 01/25/2047 | | | 2,373 | | | | 2,425 | |
FNMA CMO, Ser 2018-56, Cl CH | | | | | | | | |
3.000%, 08/25/2048 | | | 1,900 | | | | 1,880 | |
FNMA CMO, Ser 2018-57, Cl PT | | | | | | | | |
3.000%, 08/25/2048 | | | 1,647 | | | | 1,624 | |
FNMA CMO, Ser 2018-59, Cl DA | | | | | | | | |
3.000%, 08/25/2048 | | | 4,189 | | | | 4,130 | |
FNMA CMO, Ser 2018-63, Cl DA | | | | | | | | |
3.500%, 09/25/2048 | | | 1,185 | | | | 1,216 | |
FNMA CMO, Ser 2018-8, Cl KL | | | | | | | | |
2.500%, 03/25/2047 | | | 727 | | | | 713 | |
FNMA Interest CMO, Ser 2012-414, Cl A35 | | | | | | | | |
3.500%, 10/25/2042 | | | 3,065 | | | | 3,144 | |
FNMA TBA | | | | | | | | |
5.000%, 04/30/2037 to 05/01/2038 | | | 8,570 | | | | 9,055 | |
4.500%, 04/14/2033 | | | 15,915 | | | | 16,582 | |
4.000%, 04/01/2039 | | | 12,115 | | | | 12,461 | |
3.500%, 04/01/2041 | | | 60,065 | | | | 61,051 | |
3.000%, 04/25/2026 to 05/15/2045 | | | 9,335 | | | | 9,316 | |
FNMA, Ser 141, Cl 1 | | | | | | | | |
2.964%, 05/01/2027 | | | 1,824 | | | | 1,848 | |
FNMA, Ser 2014-M8, Cl X2, IO | | | | | | | | |
0.381%, 06/25/2024 (B) | | | 8,010 | | | | 126 | |
FNMA, Ser 2015-M10, Cl A2 | | | | | | | | |
3.092%, 04/25/2027 (B) | | | 544 | | | | 548 | |
FNMA, Ser M10, Cl A2 | | | | | | | | |
3.385%, 07/25/2028 (B) | | | 6,100 | | | | 6,290 | |
FNMA, Ser M12, Cl A1 | | | | | | | | |
3.546%, 02/25/2030 | | | 2,460 | | | | 2,574 | |
FNMA, Ser M13, Cl A1 | | | | | | | | |
3.697%, 03/25/2030 (B) | | | 1,052 | | | | 1,119 | |
FREMF Mortgage Trust, Ser 2010-K8, Cl B | | | | | | | | |
5.279%,
09/25/2043 (B)(C) | | | 290 | | | | 297 | |
FREMF Mortgage Trust, Ser 2012-K20, Cl X2A, IO | | | | | | | | |
0.200%, 05/25/2045 (C) | | | 11,995 | | | | 62 | |
FREMF Mortgage Trust, Ser 2014-K503, Cl B | | | | | | | | |
3.042%, 10/25/2047 (B)(C) | | | 795 | | | | 794 | |
FRESB Mortgage Trust, Ser 2018-SB50, Cl A10F | | | | | | | | |
3.350%, 04/25/2028 (B) | | | 100 | | | | 101 | |
GNMA | | | | | | | | |
8.000%, 11/15/2029 to 09/15/2030 | | | 46 | | | | 50 | |
7.500%, 03/15/2029 to 10/15/2037 | | | 81 | | | | 95 | |
7.000%, 09/15/2031 | | | 31 | | | | 35 | |
6.500%, 07/15/2028 to 12/15/2035 | | | 1,646 | | | | 1,839 | |
6.000%, 12/15/2028 to 10/20/2040 | | | 2,776 | | | | 3,061 | |
| | |
SEI Institutional Managed Trust / Semi-Annual Report / March 31, 2019 | | 59 |
SCHEDULE OF INVESTMENTS (Unaudited)
March 31, 2019
Core Fixed Income Fund(Continued)
| | | | | | | | |
| Description | | Face Amount
(Thousands) | | Market Value
($ Thousands) |
|
MORTGAGE-BACKED SECURITIES (continued) | |
5.075%, 07/20/2060 (B) | | $ | 248 | | | $ | 253 | |
5.000%, 12/20/2039 to 05/20/2049 | | | 51,214 | | | | 53,778 | |
4.500%, 04/20/2041 to 03/20/2049 | | | 44,061 | | | | 45,911 | |
4.000%, 08/20/2047 to 05/20/2049 | | | 27,624 | | | | 28,538 | |
3.500%, 06/20/2044 to 06/15/2048 | | | 49,263 | | | | 50,398 | |
3.375%, VAR US Treas Yield Curve Rate T Note Const Mat 1 Yr+1.500%, 02/20/2034 | | | 209 | | | | 217 | |
3.000%, 09/15/2042 to 04/20/2048 | | | 34,938 | | | | 35,126 | |
GNMA CMO, Ser 2007-17, Cl IB, IO | | | | | | | | |
3.762%, VAR LIBOR USD 1 Month+6.250%, 04/20/2037 | | | 540 | | | | 66 | |
GNMA CMO, Ser 2007-51, Cl SG, IO | | | | | | | | |
4.092%, VAR LIBOR USD 1 Month+6.580%, 08/20/2037 | | | 71 | | | | 12 | |
GNMA CMO, Ser 2007-78, Cl SA, IO | | | | | | | | |
4.048%, VAR LIBOR USD 1 Month+6.530%, 12/16/2037 | | | 632 | | | | 78 | |
GNMA CMO, Ser 2009-66, Cl XS, IO | | | | | | | | |
4.318%, VAR LIBOR USD 1 Month+6.800%, 07/16/2039 | | | 646 | | | | 79 | |
GNMA CMO, Ser 2010-31, Cl GS, IO | | | | | | | | |
4.012%, VAR LIBOR USD 1 Month+6.500%, 03/20/2039 | | | 35 | | | | 1 | |
GNMA CMO, Ser 2010-4, Cl NS, IO | | | | | | | | |
3.908%, VAR LIBOR USD 1 Month+6.390%, 01/16/2040 | | | 4,971 | | | | 834 | |
GNMA CMO, Ser 2010-85, Cl HS, IO | | | | | | | | |
4.162%, VAR LIBOR USD 1 Month+6.650%, 01/20/2040 | | | 55 | | | | 5 | |
GNMA CMO, Ser 2010-H11, Cl FA | | | | | | | | |
3.479%, VAR ICE LIBOR USD 1 Month+1.000%, 06/20/2060 | | | 446 | | | | 453 | |
GNMA CMO, Ser 2010-H27, Cl FA | | | | | | | | |
2.889%, VAR ICE LIBOR USD 1 Month+0.380%, 12/20/2060 | | | 1,224 | | | | 1,220 | |
GNMA CMO, Ser 2010-H28, Cl FE | | | | | | | | |
2.909%, VAR ICE LIBOR USD 1 Month+0.400%, 12/20/2060 | | | 593 | | | | 591 | |
GNMA CMO, Ser 2011-H08, Cl FG | | | | | | | | |
2.989%, VAR ICE LIBOR USD 1 Month+0.480%, 03/20/2061 | | | 713 | | | | 713 | |
GNMA CMO, Ser 2011-H08, Cl FD | | | | | | | | |
3.009%, VAR ICE LIBOR USD 1 Month+0.500%, 02/20/2061 | | | 295 | | | | 295 | |
GNMA CMO, Ser 2011-H09, Cl AF | | | | | | | | |
3.009%, VAR ICE LIBOR USD 1 Month+0.500%, 03/20/2061 | | | 496 | | | | 497 | |
GNMA CMO, Ser 2012-141, Cl WA | | | | | | | | |
4.530%, 11/16/2041 (B) | | | 378 | | | | 409 | |
GNMA CMO, Ser 2012-34, Cl SA, IO | | | | | | | | |
3.562%, VAR LIBOR USD 1 Month+6.050%, 03/20/2042 | | | 551 | | | | 79 | |
| | | | | | | | |
| Description | | Face Amount
(Thousands) | | Market Value
($ Thousands) |
|
MORTGAGE-BACKED SECURITIES (continued) | |
GNMA CMO, Ser 2012-43, Cl SN, IO | | | | | | | | |
4.118%, VAR LIBOR USD 1 Month+6.600%, 04/16/2042 | | $ | 101 | | | $ | 21 | |
GNMA CMO, Ser 2012-66, Cl CI, IO | | | | | | | | |
3.500%, 02/20/2038 | | | 426 | | | | 28 | |
GNMA CMO, Ser 2012-98, Cl SA, IO | | | | | | | | |
3.618%, VAR LIBOR USD 1 Month+6.100%, 08/16/2042 | | | 258 | | | | 42 | |
GNMA CMO, Ser 2012-H25, Cl FA | | | | | | | | |
3.209%, VAR ICE LIBOR USD 1 Month+0.700%, 12/20/2061 | | | 115 | | | | 115 | |
GNMA CMO, Ser 2012-H27, Cl AI, IO | | | | | | | | |
1.763%, VAR ICE LIBOR USD 1 Month+0.000%, 10/20/2062 | | | 1,523 | | | | 75 | |
GNMA CMO, Ser 2013-53, Cl OI, IO | | | | | | | | |
3.500%, 04/20/2043 | | | 276 | | | | 37 | |
GNMA CMO, Ser 2013-69, Cl AI, IO | | | | | | | | |
3.500%, 05/20/2043 | | | 479 | | | | 75 | |
GNMA CMO, Ser 2014-117, Cl SJ, IO | | | | | | | | |
3.112%, VAR LIBOR USD 1 Month+5.600%, 08/20/2044 | | | 168 | | | | 22 | |
GNMA CMO, Ser 2014-5, Cl SP, IO | | | | | | | | |
3.668%, VAR LIBOR USD 1 Month+6.150%, 06/16/2043 | | | 363 | | | | 38 | |
GNMA CMO, Ser 2014-H10, Cl TA | | | | | | | | |
3.109%, VAR ICE LIBOR USD 1 Month+0.600%, 04/20/2064 | | | 601 | | | | 603 | |
GNMA CMO, Ser 2015-167, Cl OI, IO | | | | | | | | |
4.000%, 04/16/2045 | | | 181 | | | | 34 | |
GNMA CMO, Ser 2015-H10, Cl FC | | | | | | | | |
2.989%, VAR ICE LIBOR USD 1 Month+0.480%, 04/20/2065 | | | 386 | | | | 386 | |
GNMA CMO, Ser 2015-H18, Cl FA | | | | | | | | |
2.959%, VAR ICE LIBOR USD 1 Month+0.450%, 06/20/2065 | | | 276 | | | | 275 | |
GNMA CMO, Ser 2015-H20, Cl FA | | | | | | | | |
2.979%, VAR ICE LIBOR USD 1 Month+0.470%, 08/20/2065 | | | 282 | | | | 282 | |
GNMA CMO, Ser 2016-135, Cl SB, IO | | | | | | | | |
3.618%, VAR LIBOR USD 1 Month+6.100%, 10/16/2046 | | | 329 | | | | 89 | |
GNMA CMO, Ser 2017-167, Cl BQ | | | | | | | | |
2.500%, 08/20/2044 | | | 1,744 | | | | 1,742 | |
GNMA CMO, Ser 2017-H15, Cl KI, IO | | | | | | | | |
2.228%, VAR ICE LIBOR USD 12 Month+0.000%, 07/20/2067 | | | 895 | | | | 119 | |
GNMA CMO, Ser 2017-H18, Cl BI, IO | | | | | | | | |
1.578%, VAR ICE LIBOR USD 12 Month+0.000%, 09/20/2067 | | | 5,689 | | | | 523 | |
GNMA CMO, Ser 2017-H20, Cl IB, IO | | | | | | | | |
2.001%, VAR ICE LIBOR USD 12 Month+0.000%, 10/20/2067 | | | 398 | | | | 45 | |
| | |
60 | | SEI Institutional Managed Trust / Semi-Annual Report / March 31, 2019 |
| | | | | | | | |
| | | |
| Description | | Face Amount
(Thousands) | | Market Value
($ Thousands) |
|
MORTGAGE-BACKED SECURITIES (continued) | |
GNMA CMO, Ser 2017-H22, Cl IC, IO | | | | | | | | |
2.174%, VAR ICE LIBOR USD 12 Month+0.000%, 11/20/2067 | | $ | 182 | | | $ | 21 | |
GNMA CMO, Ser 2018-H04, Cl FJ | | | | | | | | |
3.061%, VAR ICE LIBOR USD 12 Month+0.040%, 03/20/2068 | | | 613 | | | | 605 | |
GNMA CMO, Ser 2018-H06, Cl PF | | | | | | | | |
2.809%, VAR ICE LIBOR USD 1 Month+0.300%, 02/20/2068 | | | 632 | | | | 629 | |
GNMA CMO, Ser 2018-H07, Cl FD | | | | | | | | |
2.809%, VAR ICE LIBOR USD 1 Month+0.300%, 05/20/2068 | | | 1,117 | | | | 1,111 | |
GNMA CMO, Ser 2018-H13, Cl DF | | | | | | | | |
2.850%, VAR ICE LIBOR USD 12 Month+0.020%, 07/20/2068 | | | 3,726 | | | | 3,669 | |
GNMA CMO, Ser 2019-20, Cl JK | | | | | | | | |
3.500%, 02/20/2049 | | | 4,073 | | | | 4,130 | |
GNMA TBA | | | | | | | | |
4.500%, 04/01/2039 | | | 7,240 | | | | 7,520 | |
4.000%, 04/01/2040 to 05/01/2042 | | | 19,600 | | | | 20,231 | |
3.500%, 04/15/2045 | | | 22,900 | | | | 23,395 | |
3.000%, 04/15/2043 | | | 3,100 | | | | 3,113 | |
GNMA, Ser 2012-112, Cl IO, IO | |
0.277%, 02/16/2053 (B) | | | 942 | | | | 18 | |
GNMA, Ser 2012-152, Cl IO, IO | |
0.789%, 01/16/2054 (B) | | | 7,357 | | | | 377 | |
GNMA, Ser 2012-27, Cl IO, IO | | | | | | | | |
0.955%, 04/16/2053 (B) | | | 1,351 | | | | 40 | |
GNMA, Ser 2013-145, Cl IO, IO | |
1.066%, 09/16/2044 (B) | | | 1,142 | | | | 55 | |
GNMA, Ser 2013-96, Cl IO, IO | | | | | | | | |
0.520%, 10/16/2054 (B) | | | 1,889 | | | | 48 | |
GNMA, Ser 2014-47, Cl IA, IO | | | | | | | | |
0.243%, 02/16/2048 (B) | | | 239 | | | | 5 | |
GNMA, Ser 2014-50, Cl IO, IO | | | | | | | | |
0.838%, 09/16/2055 (B) | | | 699 | | | | 37 | |
GNMA, Ser 2014-92, Cl IX, IO | | | | | | | | |
0.628%, 05/16/2054 (B) | | | 5,927 | | | | 164 | |
GNMA, Ser 2015-5, Cl IK, IO | | | | | | | | |
0.667%, 11/16/2054 (B) | | | 6,151 | | | | 245 | |
GNMA, Ser 28, Cl AB | | | | | | | | |
3.150%, 06/16/2060 (B) | | | 670 | | | | 665 | |
GNMA, Ser 98, Cl A | | | | | | | | |
3.000%, 10/16/2050 | | | 109 | | | | 108 | |
GNMA, Ser 99, Cl A | | | | | | | | |
3.200%, 01/16/2052 | | | 168 | | | | 168 | |
| | | | | | | | |
| | | | | | | 1,264,690 | |
| | | | | | | | |
|
Non-Agency Mortgage-Backed Obligations — 5.8% | |
1211 Avenue of the Americas Trust, Ser 2015- 1211, Cl A1A2 | | | | | | | | |
3.901%, 08/10/2035 (C) | | | 805 | | | | 842 | |
| | | | | | | | |
| | | |
| Description | | Face Amount
(Thousands) | | Market Value
($ Thousands) |
|
MORTGAGE-BACKED SECURITIES (continued) | |
A10 Term Asset Financing, Ser 1A, Cl A1FX | |
2.340%, 03/15/2036 (C) | | $ | 153 | | | $ | 153 | |
Adjustable Rate Mortgage Trust, Ser 2004-2, Cl 3A1 | | | | | | | | |
3.511%, 02/25/2035 (B) | | | 581 | | | | 563 | |
Adjustable Rate Mortgage Trust, Ser 2007-1, Cl 5A31 | | | | | | | | |
2.626%, VAR ICE LIBOR USD 1 Month+0.140%, 03/25/2037 | | | 1,517 | | | | 1,403 | |
Alternative Loan Trust, Ser 2006-18CB, Cl A6 | | | | | | | | |
18.658%, VAR ICE LIBOR USD 1 Month+28.600%, 07/25/2036 | | | 244 | | | | 349 | |
American Home Mortgage Investment Trust, Ser 2004-4, Cl 4A | | | | | | | | |
4.812%, VAR ICE LIBOR USD 6 Month+2.000%, 02/25/2045 | | | 280 | | | | 284 | |
American Home Mortgage Investment Trust, Ser 2005-1, Cl 6A | | | | | | | | |
4.704%, VAR ICE LIBOR USD 6 Month+2.000%, 06/25/2045 | | | 1,985 | | | | 2,005 | |
American Home Mortgage Investment Trust, Ser 2005-4, Cl 5A | | | | | | | | |
4.435%, VAR ICE LIBOR USD 6 Month+1.750%, 11/25/2045 | | | 1,219 | | | | 898 | |
American Home Mortgage Investment Trust, Ser 2006-1, Cl 12A1 | | | | | | | | |
2.886%, VAR ICE LIBOR USD 1 Month+0.400%, 03/25/2046 | | | 4,397 | | | | 4,202 | |
Angel Oak Mortgage Trust I, Ser 2019-2, Cl A1 | | | | | | | | |
3.628%, 03/25/2049 (B)(C) | | | 675 | | | | 675 | |
AOA Mortgage Trust, Ser 2015-1177, Cl A | | | | | | | | |
2.957%, 12/13/2029 (C) | | | 930 | | | | 930 | |
BAMLL Commercial Mortgage Securities Trust, Ser 2018-PARK, Cl A | | | | | | | | |
4.091%, 08/10/2038 (B)(C) | | | 1,790 | | | | 1,912 | |
BAMLL Re-REMIC Trust, Ser 2016-GG10, Cl AJA | | | | | | | | |
5.779%, 08/10/2045 (B)(C) | | | 1,661 | | | | 1,168 | |
Banc of America Funding Trust, Ser 2004-C, Cl 1A1 | | | | | | | | |
4.961%, 12/20/2034 (B) | | | 13 | | | | 13 | |
Banc of America Funding Trust, Ser 2006-G, Cl 2A4 | | | | | | | | |
2.778%, VAR ICE LIBOR USD 1 Month+0.290%, 07/20/2036 | | | 692 | | | | 691 | |
BANK, Ser 2017-BNK5, Cl A3 | | | | | | | | |
3.020%, 06/15/2060 | | | 500 | | | | 501 | |
BBCMS Trust, Ser CBM, Cl A | | | | | | | | |
3.484%, VAR LIBOR USD 1 Month+1.000%, 07/15/2037 (C) | | | 375 | | | | 373 | |
BB-UBS Trust, Ser 2012-SHOW, Cl A | | | | | | | | |
3.430%, 11/05/2036 (C) | | | 600 | | | | 610 | |
| | |
SEI Institutional Managed Trust / Semi-Annual Report / March 31, 2019 | | 61 |
SCHEDULE OF INVESTMENTS (Unaudited)
March 31, 2019
Core Fixed Income Fund(Continued)
| | | | | | | | |
| | | |
| Description | | Face Amount
(Thousands) | | Market Value
($ Thousands) |
|
MORTGAGE-BACKED SECURITIES (continued) | |
BB-UBS Trust, Ser 2012-TFT, Cl A | | | | | | | | |
2.892%, 06/05/2030 (C) | | $ | 150 | | | $ | 149 | |
BCAP LLC Trust, Ser 2009-RR5, Cl 8A1 | | | | | | | | |
5.500%,
11/26/2034 (B)(C) | | | 58 | | | | 59 | |
BCAP Trust, Ser 2015-RR2, Cl 21A1 | | | | | | | | |
4.052%,
03/28/2037 (B)(C) | | | 897 | | | | 874 | |
Bear Stearns Adjustable Rate Mortgage Trust, Ser 2004-2, Cl 14A | | | | | | | | |
4.444%, 05/25/2034 (B) | | | 12 | | | | 12 | |
Bear Stearns Adjustable Rate Mortgage Trust, Ser 2004-2, Cl 24A | | | | | | | | |
2.388%, 05/25/2034 (B) | | | 76 | | | | 71 | |
Bear Stearns ALT-A Trust, Ser 2004-6, Cl 1A | | | | | | | | |
3.126%, VAR ICE LIBOR USD 1 Month+0.640%, 07/25/2034 | | | 47 | | | | 46 | |
Bear Stearns ARM Trust, Ser 2003-7, Cl 9A | | | | | | | | |
4.749%, 10/25/2033 (B) | | | 442 | | | | 447 | |
Bear Stearns Asset-Backed Securities I Trust, Ser 2005-AC6, Cl 1A3 | | | | | | | | |
5.500%, 09/25/2035 (B) | | | 1,032 | | | | 1,035 | |
Bear Stearns Asset-Backed Securities I Trust, Ser 2005-AC8, Cl A3, IO | | | | | | | | |
5.165%, VAR ICE LIBOR USD 1 Month+7.650%, 11/25/2035 | | | 3,365 | | | | 943 | |
Bear Stearns Commercial Mortgage Securities, Ser 2005-PWR8, Cl X1, IO | | | | | | | | |
0.212%,
06/11/2041 (B)(C) | | | 22 | | | | – | |
Bear Stearns Mortgage Funding Trust, Ser 2007-AR3, Cl 1A1 | | | | | | | | |
2.626%, VAR ICE LIBOR USD 1 Month+0.140%, 03/25/2037 | | | 5,055 | | | | 4,871 | |
Benchmark Mortgage Trust, Ser 2018-B1, Cl ASB | | | | | | | | |
3.602%, 01/15/2051 (B) | | | 349 | | | | 361 | |
Benchmark Mortgage Trust, Ser 2019-B10, Cl A3 | | | | | | | | |
3.455%, 03/15/2062 | | | 726 | | | | 741 | |
Benchmark Mortgage Trust, Ser 2019-B9, Cl A5 | | | | | | | | |
4.016%, 03/15/2052 | | | 1,630 | | | | 1,730 | |
Benchmark Mortgage Trust, Ser 2019-B9, Cl A4 | | | | | | | | |
3.751%, 03/15/2052 | | | 772 | | | | 803 | |
Benchmark Mortgage Trust, Ser B8, Cl A5 | | | | | | | | |
4.232%, 01/15/2052 | | | 595 | | | | 641 | |
Bunker Hill Loan Depositary Trust, Ser 2019- 1, Cl A1 | | | | | | | | |
3.613%, 10/26/2048 (C) | | | 448 | | | | 449 | |
BX Commercial Mortgage Trust, Ser IND, Cl H | | | | | | | | |
5.484%, VAR LIBOR USD 1 Month+3.000%, 11/15/2035 (C) | | | 4,792 | | | | 4,807 | |
| | | | | | | | |
| | | |
| Description | | Face Amount
(Thousands) | | Market Value
($ Thousands) |
|
MORTGAGE-BACKED SECURITIES (continued) | |
BX Trust, Ser 2017-APPL, Cl A | | | | | | | | |
3.364%, VAR LIBOR USD 1 Month+0.880%, 07/15/2034 (C) | | $ | 501 | | | $ | 500 | |
BX Trust, Ser 2017-IMC, Cl A | | | | | | | | |
3.534%, VAR LIBOR USD 1 Month+1.050%, 10/15/2032 (C) | | | 920 | | | | 917 | |
Cali Mortgage Trust, Ser 2019-101C, Cl A | | | | | | | | |
3.957%, 03/10/2029 | | | 1,280 | | | | 1,345 | |
CAMB Commercial Mortgage Trust, Ser 2019- LIFE, Cl A | | | | | | | | |
3.554%, VAR LIBOR USD 1 Month+1.070%, 12/15/2037 (C) | | | 725 | | | | 726 | |
CD Commercial Mortgage Trust, Ser 2007- CD4, Cl AJ | | | | | | | | |
5.398%, 12/11/2049 (B) | | | 6 | | | | 4 | |
CD Commercial Mortgage Trust, Ser 2016- CD1, Cl A1 | | | | | | | | |
1.443%, 08/10/2049 | | | 213 | | | | 209 | |
CD Commercial Mortgage Trust, Ser 2017- CD3, Cl A4 | | | | | | | | |
3.631%, 02/10/2050 | | | 310 | | | | 320 | |
CD Commercial Mortgage Trust, Ser 2017- CD4, Cl ASB | | | | | | | | |
3.317%, 05/10/2050 | | | 474 | | | | 481 | |
CD Commercial Mortgage Trust, Ser 2017- CD5, Cl XA, IO | | | | | | | | |
0.909%, 08/15/2050 (B) | | | 8,676 | | | | 473 | |
CD Commercial Mortgage Trust, Ser 2017- CD6, Cl ASB | | | | | | | | |
3.332%, 11/13/2050 | | | 1,156 | | | | 1,172 | |
CD Mortgage Trust, Ser 2017-CD4, Cl A4 | | | | | | | | |
3.514%, 05/10/2050 (B) | | | 522 | | | | 535 | |
CFCRE Commercial Mortgage Trust, Ser 2016-C3, Cl A1 | | | | | | | | |
1.793%, 01/10/2048 | | | 304 | | | | 301 | |
CFCRE Commercial Mortgage Trust, Ser 2016-C4, Cl A4 | | | | | | | | |
3.283%, 05/10/2058 | | | 605 | | | | 604 | |
CFCRE Commercial Mortgage Trust, Ser 2016-C4, Cl ASB | | | | | | | | |
3.091%, 05/10/2058 | | | 615 | | | | 619 | |
CFCRE Commercial Mortgage Trust, Ser 2016-C7, Cl A2 | | | | | | | | |
3.585%, 12/10/2054 | | | 622 | | | | 638 | |
CFCRE Commercial Mortgage Trust, Ser 2016-C7, Cl A3 | | | | | | | | |
3.839%, 12/10/2054 | | | 467 | | | | 486 | |
CFCRE Commercial Mortgage Trust, Ser 2017-C8, Cl A1 | | | | | | | | |
1.965%, 06/15/2050 | | | 283 | | | | 279 | |
CFCRE Commercial Mortgage Trust, Ser 2017-C8, Cl ASB | | | | | | | | |
3.367%, 06/15/2050 | | | 494 | | | | 503 | |
| | |
62 | | SEI Institutional Managed Trust / Semi-Annual Report / March 31, 2019 |
| | | | | | | | |
| | | |
| Description | | Face Amount
(Thousands) | | Market Value
($ Thousands) |
|
MORTGAGE-BACKED SECURITIES (continued) | |
CFCRE Commercial Mortgage Trust, Ser 2017-C8, Cl A4 | | | | | | | | |
3.572%, 06/15/2050 | | $ | 371 | | | $ | 378 | |
CGRBS Commercial Mortgage Trust, Ser 2013-VN05, Cl A | | | | | | | | |
3.369%, 03/13/2035 (C) | | | 660 | | | | 674 | |
Chase Mortgage Finance, Ser 2007-A1, Cl 2A1 | | | | | | | | |
4.478%, 02/25/2037 (B) | | | 21 | | | | 22 | |
Chase Mortgage Finance, Ser 2007-A1, Cl 9A1 | | | | | | | | |
4.510%, 02/25/2037 (B) | | | 14 | | | | 14 | |
Chase Mortgage Finance, Ser 2007-A2, Cl 1A1 | | | | | | | | |
4.263%, 07/25/2037 (B) | | | 30 | | | | 30 | |
CHT Mortgage Trust, Ser 2017-CSMO, Cl A | | | | | | | | |
3.414%, VAR LIBOR USD 1 Month+0.930%, 11/15/2036 (C) | | | 790 | | | | 789 | |
Citigroup Commercial Mortgage Trust, Ser 2013-375P, Cl A | | | | | | | | |
3.251%, 05/10/2035 (C) | | | 895 | | | | 905 | |
Citigroup Commercial Mortgage Trust, Ser 2015-GC29, Cl A2 | | | | | | | | |
2.674%, 04/10/2048 | | | 863 | | | | 860 | |
Citigroup Commercial Mortgage Trust, Ser 2015-GC29, Cl AS | | | | | | | | |
3.457%, 04/10/2048 | | | 289 | | | | 293 | |
Citigroup Commercial Mortgage Trust, Ser 2015-GC33, Cl A4 | | | | | | | | |
3.778%, 09/10/2058 | | | 30 | | | | 31 | |
Citigroup Global Markets Mortgage Securities VII, Ser 2003-HYB1, Cl A | | | | | | | | |
4.740%, 09/25/2033 (B) | | | 16 | | | | 16 | |
Citigroup/Deutsche Bank Commercial Mortgage Trust, Ser 2006-CD2, Cl X, IO | | | | | | | | |
0.023%,
01/15/2046 (B)(C) | | | 406 | | | | – | |
Citigroup/Deutsche Bank Commercial Mortgage Trust, Ser 2007-CD4, Cl XC, IO | | | | | | | | |
0.614%,
12/11/2049 (B)(C) | | | 36 | | | | – | |
CityLine Commercial Mortgage Trust, Ser 2016-CLNE, Cl A | | | | | | | | |
2.778%,
11/10/2031 (B)(C) | | | 720 | | | | 716 | |
Cold Storage Trust, Ser 2017-ICE3, Cl A | | | | | | | | |
3.484%, VAR LIBOR USD 1 Month+1.000%, 04/15/2036 (C) | | | 1,050 | | | | 1,050 | |
Cold Storage Trust, Ser 2017-ICE3, Cl B | | | | | | | | |
3.734%, VAR LIBOR USD 1 Month+1.250%, 04/15/2036 (C) | | | 1,740 | | | | 1,740 | |
COLT Mortgage Loan Trust, Ser 2019-1, Cl A1 | | | | | | | | |
3.705%,
03/25/2049 (B)(C) | | | 692 | | | | 695 | |
COLT Mortgage Loan Trust, Ser 2019-2, Cl A1 | | | | | | | | |
3.337%,
05/25/2049 (B)(C) | | | 1,250 | | | | 1,250 | |
| | | | | | | | |
| | | |
| Description | | Face Amount
(Thousands) | | Market Value
($ Thousands) |
|
MORTGAGE-BACKED SECURITIES (continued) | |
COMM Mortgage Trust, Ser 2010-C1, Cl XWB, IO | | | | | | | | |
0.785%, 07/10/2046 (B)(C)(D) | | $ | 13,060 | | | $ | 139 | |
COMM Mortgage Trust, Ser 2012-CR4, Cl A2 | | | | | | | | |
1.801%, 10/15/2045 | | | 98 | | | | 95 | |
COMM Mortgage Trust, Ser 2012-LC4, Cl A4 | | | | | | | | |
3.288%, 12/10/2044 | | | 77 | | | | 78 | |
COMM Mortgage Trust, Ser 2013-300P, Cl A1 | | | | | | | | |
4.353%, 08/10/2030 (C) | | | 835 | | | | 881 | |
COMM Mortgage Trust, Ser 2013-CR10, Cl A2 | | | | | | | | |
2.972%, 08/10/2046 | | | 14 | | | | 15 | |
COMM Mortgage Trust, Ser 2013-CR12, Cl A4 | | | | | | | | |
4.046%, 10/10/2046 | | | 502 | | | | 524 | |
COMM Mortgage Trust, Ser 2013-CR12, Cl C | | | | | | | | |
5.084%, 10/10/2046 (B) | | | 70 | | | | 73 | |
COMM Mortgage Trust, Ser 2013-CR12, Cl B | | | | | | | | |
4.762%, 10/10/2046 (B) | | | 120 | | | | 126 | |
COMM Mortgage Trust, Ser 2013-CR12, Cl AM | | | | | | | | |
4.300%, 10/10/2046 | | | 130 | | | | 136 | |
COMM Mortgage Trust, Ser 2013-CR6, Cl B | | | | | | | | |
3.397%, 03/10/2046 (C) | | | 299 | | | | 296 | |
COMM Mortgage Trust, Ser 2013-LC6, Cl AM | | | | | | | | |
3.282%, 01/10/2046 | | | 315 | | | | 318 | |
COMM Mortgage Trust, Ser 2014-CR18, Cl XA, IO | | | | | | | | |
1.145%, 07/15/2047 (B) | | | 3,441 | | | | 129 | |
COMM Mortgage Trust, Ser 2014-UBS2, Cl A5 | | | | | | | | |
3.961%, 03/10/2047 | | | 236 | | | | 247 | |
COMM Mortgage Trust, Ser 2014-UBS2, Cl XA, IO | | | | | | | | |
1.217%, 03/10/2047 (B) | | | 1,956 | | | | 86 | |
COMM Mortgage Trust, Ser 2014-UBS3, Cl AM | | | | | | | | |
4.012%, 06/10/2047 | | | 285 | | | | 292 | |
COMM Mortgage Trust, Ser 2014-UBS4, Cl AM | | | | | | | | |
3.968%, 08/10/2047 | | | 661 | | | | 678 | |
COMM Mortgage Trust, Ser 2014-UBS6, Cl A5 | | | | | | | | |
3.644%, 12/10/2047 | | | 903 | | | | 933 | |
COMM Mortgage Trust, Ser 2015-DC1, Cl A5 | | | | | | | | |
3.350%, 02/10/2048 | | | 696 | | | | 705 | |
COMM Mortgage Trust, Ser 2015-LC19, Cl XA, IO | | | | | | | | |
1.167%, 02/10/2048 (B) | | | 6,115 | | | | 323 | |
COMM Mortgage Trust, Ser 2016-787S, Cl A | | | | | | | | |
3.545%, 02/10/2036 (C) | | | 960 | | | | 980 | |
COMM Mortgage Trust, Ser 2016-COR1, Cl ASB | | | | | | | | |
2.972%, 10/10/2049 | | | 480 | | | | 478 | |
COMM Mortgage Trust, Ser 2016-GCT, Cl A | | | | | | | | |
2.681%, 08/10/2029 (C) | | | 370 | | | | 368 | |
COMM Mortgage Trust, Ser 2017-PANW, Cl A | | | | | | | | |
3.244%, 10/10/2029 (C) | | | 410 | | | | 413 | |
| | |
SEI Institutional Managed Trust / Semi-Annual Report / March 31, 2019 | | 63 |
SCHEDULE OF INVESTMENTS (Unaudited)
March 31, 2019
Core Fixed Income Fund(Continued)
| | | | | | | | |
| | | |
| Description | | Face Amount
(Thousands) | | Market Value
($ Thousands) |
|
MORTGAGE-BACKED SECURITIES (continued) | |
Commercial Mortgage Pass-Through Certificates, Ser 2012-CR3, Cl A3 | | | | | | | | |
2.822%, 10/15/2045 | | $ | 489 | | | $ | 487 | |
Commercial Mortgage Pass-Through Certificates, Ser 2012-CR4, Cl AM | | | | | | | | |
3.251%, 10/15/2045 | | | 590 | | | | 583 | |
Commercial Mortgage Pass-Through Certificates, Ser CR14, Cl B | | | | | | | | |
4.643%, 02/10/2047 (B) | | | 850 | | | | 892 | |
Connecticut Avenue Securities Trust, Ser 2019-R02, Cl 1M2 | | | | | | | | |
4.786%, VAR ICE LIBOR USD 1 Month+2.300%, 08/25/2031 (C) | | | 2,880 | | | | 2,899 | |
Core Industrial Trust, Ser 2015-CALW, Cl A | | | | | | | | |
3.040%, 02/10/2034 (C) | | | 1,119 | | | | 1,127 | |
Core Industrial Trust, Ser 2019-CORE, Cl A | | | | | | | | |
3.380%, 12/15/2031 | | | 2,200 | | | | 2,201 | |
Credit Suisse Commercial Mortgage Trust, Ser 2006-C3, Cl AJ | | | | | | | | |
6.159%, 06/15/2038 (B) | | | 42 | | | | 23 | |
Credit Suisse Commercial Mortgage Trust, Ser 2006-C5, Cl AJ | | | | | | | | |
5.373%, 12/15/2039 | | | 244 | | | | 161 | |
Credit Suisse Commercial Mortgage Trust, Ser 2007-C5, Cl AM | | | | | | | | |
5.869%, 09/15/2040 (B) | | | 104 | | | | 78 | |
Credit Suisse First Boston Mortgage Securities, Ser 2003-27, Cl 5A3 | | | | | | | | |
5.250%, 11/25/2033 | | | 45 | | | | 46 | |
Credit Suisse First Boston Mortgage Securities, Ser 2003-29, Cl 5A1 | | | | | | | | |
7.000%, 12/25/2033 | | | 46 | | | | 50 | |
Credit Suisse First Boston Mortgage Securities, Ser 2003-AR24, Cl 2A4 | | | | | | | | |
4.668%, 10/25/2033 (B) | | | 922 | | | | 920 | |
Credit Suisse Group Funding Guernsey, Ser 2015-3GNA, Cl A1 | | | | | | | | |
3.408%, 03/12/2020 (D) | | GBP | 1,072 | | | | 1,362 | |
Credit Suisse Group Funding Guernsey, Ser 2015-3GNA, Cl A2 | | | | | | | | |
4.675%, 03/12/2020 (D) | | | 377 | | | | 479 | |
Credit Suisse Mortgage Trust, Ser 2016- NXSR, Cl A4 | | | | | | | | |
3.795%, 12/15/2049 (B) | | $ | 1,089 | | | | 1,127 | |
CSAIL Commercial Mortgage Trust, Ser 2014- C3, Cl A4 | | | | | | | | |
3.718%, 08/15/2048 | | | 651 | | | | 674 | |
CSAIL Commercial Mortgage Trust, Ser 2015- C2, Cl A4 | | | | | | | | |
3.504%, 06/15/2057 | | | 508 | | | | 520 | |
CSAIL Commercial Mortgage Trust, Ser 2015- C3, Cl A3 | | | | | | | | |
3.447%, 08/15/2048 | | | 490 | | | | 500 | |
| | | | | | | | |
| | | |
| Description | | Face Amount
(Thousands) | | Market Value
($ Thousands) |
|
MORTGAGE-BACKED SECURITIES (continued) | |
CSAIL Commercial Mortgage Trust, Ser 2015- C4, Cl A4 | | | | | | | | |
3.808%, 11/15/2048 | | $ | 1,046 | | | $ | 1,087 | |
CSAIL Commercial Mortgage Trust, Ser 2016- C5, Cl ASB | | | | | | | | |
3.533%, 11/15/2048 | | | 202 | | | | 207 | |
CSAIL Commercial Mortgage Trust, Ser 2019- C15, Cl A4 | | | | | | | | |
4.053%, 03/15/2052 | | | 508 | | | | 537 | |
CSMC Trust, Ser 2017-CHOP, Cl G | | | | | | | | |
8.104%, VAR LIBOR USD 1 Month+5.620%, 07/15/2032 (C) | | | 1,000 | | | | 983 | |
CSMC Trust, Ser 2017-PFHP, Cl A | | | | | | | | |
3.434%, VAR LIBOR USD 1 Month+0.950%, 12/15/2030 (C) | | | 1,190 | | | | 1,186 | |
CSMC Trust, Ser 2017-RPL3, Cl A1 | | | | | | | | |
4.000%,
08/01/2057 (B)(C) | | | 1,116 | | | | 1,130 | |
CSMC, Ser 2009-2R, Cl 1A14 | | | | | | | | |
4.618%,
09/26/2034 (B)(C) | | | 503 | | | | 510 | |
CSMC, Ser 2009-2R, Cl 1A16 | | | | | | | | |
4.618%,
09/26/2034 (B)(C) | | | 444 | | | | 449 | |
CSMC, Ser 2014-11R, Cl 9A2 | | | | | | | | |
2.630%, VAR ICE LIBOR USD 1 Month+0.140%, 10/27/2036 (C) | | | 2,620 | | | | 2,033 | |
CSMC, Ser 2014-7R, Cl 8A1 | | | | | | | | |
3.785%,
07/27/2037 (B)(C) | | | 384 | | | | 383 | |
CSMC, Ser 2014-USA, Cl E | | | | | | | | |
4.373%, 09/15/2037 (C) | | | 290 | | | | 266 | |
CSMC, Ser 2014-USA, Cl A2 | | | | | | | | |
3.953%, 09/15/2037 (C) | | | 2,065 | | | | 2,129 | |
CSMC, Ser 2015-4R, Cl 3A1 | | | | | | | | |
3.110%, VAR ICE LIBOR USD 1 Month+0.310%, 10/27/2036 (C) | | | 44 | | | | 39 | |
CSMC, Ser 2015-5R, Cl 1A1 | | | | | | | | |
3.172%,
09/27/2046 (B)(C) | | | 518 | | | | 515 | |
CSMC, Ser 2018-J1, Cl A2 | | | | | | | | |
3.500%,
02/25/2048 (B)(C) | | | 8,669 | | | | 8,458 | |
DBCCRE Mortgage Trust, Ser 2014-ARCP, Cl A | | | | | | | | |
4.238%, 01/10/2034 (C) | | | 1,175 | | | | 1,226 | |
DBCCRE Mortgage Trust, Ser 2018-ARCP, Cl C | | | | | | | | |
4.935%,
01/10/2034 (B)(C) | | | 315 | | | | 320 | |
DBJPM Mortgage Trust, Ser 2017-C6, Cl ASB | | | | | | | | |
3.121%, 06/10/2050 | | | 281 | | | | 283 | |
DBUBS Mortgage Trust, Ser 2011-LC2A, Cl A4 | | | | | | | | |
4.537%, 07/10/2044 (C) | | | 100 | | | | 103 | |
Downey Savings & Loan Association Mortgage Loan Trust, Ser 2004-AR2, Cl A2B | | | | | | | | |
3.282%, VAR ICE LIBOR USD 1 Month+0.800%, 11/19/2044 | | | 683 | | | | 641 | |
EverBank Mortgage Loan Trust, Ser 2018-1, Cl A22 | | | | | | | | |
3.500%,
02/25/2048 (B)(C) | | | 844 | | | | 842 | |
| | |
64 | | SEI Institutional Managed Trust / Semi-Annual Report / March 31, 2019 |
| | | | | | | | |
| | | |
| Description | | Face Amount
(Thousands) | | Market Value
($ Thousands) |
|
MORTGAGE-BACKED SECURITIES (continued) | |
FHLMC Structured Agency Credit Risk Debt Notes, Ser 2014-DN2, Cl M2 | | | | | | | | |
4.136%, VAR ICE LIBOR USD 1 Month+1.650%, 04/25/2024 | | $ | 171 | | | $ | 172 | |
FHLMC Structured Agency Credit Risk Debt Notes, Ser 2016-DNA2, Cl M3 | | | | | | | | |
7.136%, VAR ICE LIBOR USD 1 Month+4.650%, 10/25/2028 | | | 360 | | | | 402 | |
Flagstar Mortgage Trust, Ser 2018-2, Cl A4 | | | | | | | | |
3.500%,
04/25/2048 (B)(C) | | | 3,564 | | | | 3,537 | |
FNMA Connecticut Avenue Securities, Ser 2014-C03, Cl 1M2 | | | | | | | | |
5.486%, VAR ICE LIBOR USD 1 Month+3.000%, 07/25/2024 | | | 4,098 | | | | 4,351 | |
GS Mortgage Securities II, Ser 2010-C1, Cl A2 | | | | | | | | |
4.592%, 08/10/2043 (C) | | | 750 | | | | 761 | |
GS Mortgage Securities II, Ser 2013-KING, Cl A | | | | | | | | |
2.706%, 12/10/2027 (C) | | | 95 | | | | 95 | |
GS Mortgage Securities II, Ser 2017-SLP, Cl C | | | | | | | | |
3.924%, 10/10/2032 (C) | | | 1,310 | | | | 1,328 | |
GS Mortgage Securities II, Ser GC30, Cl B | | | | | | | | |
4.013%, 05/10/2050 (B) | | | 480 | | | | 491 | |
GS Mortgage Securities II, Ser GS10, Cl A5 | | | | | | | | |
4.155%, 07/10/2051 (B) | | | 1,000 | | | | 1,067 | |
GS Mortgage Securities Trust, Ser 2006-GG8, Cl AJ | | | | | | | | |
5.622%, 11/10/2039 | | | 261 | | | | 224 | |
GS Mortgage Securities Trust, Ser 2006-GG8, Cl X, IO | | | | | | | | |
0.871%,
11/10/2039 (B)(C) | | | 307 | | | | 2 | |
GS Mortgage Securities Trust, Ser 2012-GC6, Cl A3 | | | | | | | | |
3.482%, 01/10/2045 | | | 435 | | | | 441 | |
GS Mortgage Securities Trust, Ser 2012-GCJ7, Cl AAB | | | | | | | | |
2.935%, 05/10/2045 | | | 66 | | | | 66 | |
GS Mortgage Securities Trust, Ser 2013- GC16, Cl B | | | | | | | | |
5.161%, 11/10/2046 (B) | | | 270 | | | | 292 | |
GS Mortgage Securities Trust, Ser 2014-GC18, Cl A3 | | | | | | | | |
3.801%, 01/10/2047 | | | 388 | | | | 400 | |
GS Mortgage Securities Trust, Ser 2014- GC26, Cl B | | | | | | | | |
4.215%, 11/10/2047 (B) | | | 680 | | | | 693 | |
GS Mortgage Securities Trust, Ser 2015- GC34, Cl A4 | | | | | | | | |
3.506%, 10/10/2048 | | | 2,339 | | | | 2,398 | |
GS Mortgage Securities Trust, Ser 2016-GS3, Cl A4 | | | | | | | | |
2.850%, 10/10/2049 | | | 413 | | | | 406 | |
| | | | | | | | |
| | | |
| Description | | Face Amount
(Thousands) | | Market Value
($ Thousands) |
|
MORTGAGE-BACKED SECURITIES (continued) | |
GS Mortgage Securities Trust, Ser 2016-GS3, Cl AAB | | | | | | | | |
2.777%, 10/10/2049 | | $ | 619 | | | $ | 616 | |
GS Mortgage Securities Trust, Ser 2017-GS7, Cl A4 | | | | | | | | |
3.430%, 08/10/2050 | | | 522 | | | | 528 | |
GS Mortgage Securities Trust, Ser 2018-SRP5 | | | | | | | | |
3.281%, 06/09/2021 | | | 2,900 | | | | 2,854 | |
GS Mortgage-Backed Securities Trust, Ser 2018-RPL1, Cl A1A | | | | | | | | |
3.750%, 10/25/2057 (C) | | | 5,237 | | | | 5,316 | |
GSMPS Mortgage Loan Trust, Ser 1998-1, Cl A | | | | | | | | |
8.000%, 09/19/2027 (B)(C) | | | 17 | | | | 17 | |
GSR Mortgage Loan Trust, Ser 2003-13, Cl 1A1 | | | | | | | | |
4.297%, 10/25/2033 (B) | | | 234 | | | | 241 | |
GSR Mortgage Loan Trust, Ser 2004-8F, Cl 2A3 | | | | | | | | |
6.000%, 09/25/2034 | | | 20 | | | | 21 | |
GSR Mortgage Loan Trust, Ser 2007-1F, Cl 2A4 | | | | | | | | |
5.500%, 01/25/2037 | | | 9 | | | | 9 | |
HarborView Mortgage Loan, Ser 2004-3, Cl 1A | | | | | | | | |
4.702%, 05/19/2034 (B) | | | 970 | | | | 992 | |
Impac Secured Assets Trust, Ser 2006-2, Cl 2A1 | | | | | | | | |
2.840%, VAR ICE LIBOR USD 1 Month+0.350%, 08/25/2036 | | | 29 | | | | 28 | |
Impact Funding, Ser 2010-1, Cl A1 | | | | | | | | |
5.314%, 01/25/2051 (C) | | | 1,866 | | | | 2,021 | |
JPMBB Commercial Mortgage Securities Trust, Ser 2013-C17, Cl B | | | | | | | | |
4.892%, 01/15/2047 (B) | | | 130 | | | | 139 | |
JPMBB Commercial Mortgage Securities Trust, Ser 2014-C22, Cl C | | | | | | | | |
4.561%, 09/15/2047 (B) | | | 120 | | | | 120 | |
JPMBB Commercial Mortgage Securities Trust, Ser 2014-C23, Cl A4 | | | | | | | | |
3.670%, 09/15/2047 | | | 541 | | | | 559 | |
JPMBB Commercial Mortgage Securities Trust, Ser 2015-C28, Cl A3 | | | | | | | | |
2.912%, 10/15/2048 | | | 2,581 | | | | 2,566 | |
JPMBB Commercial Mortgage Securities Trust, Ser 2015-C28, Cl A2 | | | | | | | | |
2.773%, 10/15/2048 | | | 373 | | | | 372 | |
JPMBB Commercial Mortgage Securities Trust, Ser 2015-C33, Cl A4 | | | | | | | | |
3.770%, 12/15/2048 | | | 272 | | | | 283 | |
JPMBB Commercial Mortgage Securities Trust, Ser 2016-C1, Cl A5 | | | | | | | | |
3.576%, 03/15/2049 | | | 348 | | | | 358 | |
| | |
SEI Institutional Managed Trust / Semi-Annual Report / March 31, 2019 | | 65 |
SCHEDULE OF INVESTMENTS (Unaudited)
March 31, 2019
Core Fixed Income Fund(Continued)
| | | | | | | | |
| | | |
| Description | | Face Amount
(Thousands) | | Market Value
($ Thousands) |
|
MORTGAGE-BACKED SECURITIES (continued) | |
JPMCC Commercial Mortgage Securities Trust, Ser 2019-COR4, Cl A5 | | | | | | | | |
4.029%, 03/10/2052 | | $ | 966 | | | $ | 1,023 | |
JPMDB Commercial Mortgage Securities Trust, Ser 2017-C5, Cl A5 | | | | | | | | |
3.694%, 03/15/2050 | | | 875 | | | | 908 | |
JPMDB Commercial Mortgage Securities Trust, Ser 2017-C5, Cl ASB | | | | | | | | |
3.492%, 03/15/2050 | | | 187 | | | | 192 | |
JPMDB Commercial Mortgage Securities Trust, Ser 2018-C8, Cl ASB | | | | | | | | |
4.145%, 06/15/2051 | | | 575 | | | | 612 | |
JPMorgan Chase Commercial Mortgage Securities Trust, Ser 2006-CB15, Cl X1, IO | | | | | | | | |
0.369%, 06/12/2043 (B) | | | 1,003 | | | | 1 | |
JPMorgan Chase Commercial Mortgage Securities Trust, Ser 2006-LDP9, Cl A3SF | | | | | | | | |
2.639%, VAR LIBOR USD 1 Month+0.155%, 05/15/2047 | | | 11 | | | | 11 | |
JPMorgan Chase Commercial Mortgage Securities Trust, Ser 2007-CB18, Cl AJ | | | | | | | | |
5.502%, 06/12/2047 (B) | | | 505 | | | | 381 | |
JPMorgan Chase Commercial Mortgage Securities Trust, Ser 2007-CB19, Cl AJ | | | | | | | | |
5.607%, 02/12/2049 (B) | | | 222 | | | | 158 | |
JPMorgan Chase Commercial Mortgage Securities Trust, Ser 2007-LD12, Cl AJ | | | | | | | | |
6.201%, 02/15/2051 (B) | | | 4 | | | | 3 | |
JPMorgan Chase Commercial Mortgage Securities Trust, Ser 2011-C5, Cl B | | | | | | | | |
5.383%, 08/15/2046 (B)(C) | | | 296 | | | | 309 | |
JPMorgan Chase Commercial Mortgage Securities Trust, Ser 2012-CBX, Cl A4 | | | | | | | | |
3.483%, 06/15/2045 | | | 785 | | | | 796 | |
JPMorgan Chase Commercial Mortgage Securities Trust, Ser 2012-HSBC, Cl A | | | | | | | | |
3.093%, 07/05/2032 (C) | | | 711 | | | | 718 | |
JPMorgan Chase Commercial Mortgage Securities Trust, Ser 2013-C13, Cl A2 | | | | | | | | |
2.665%, 01/15/2046 | | | 36 | | | | 36 | |
JPMorgan Chase Commercial Mortgage Securities Trust, Ser 2014-C20, Cl C | | | | | | | | |
4.582%, 07/15/2047 (B) | | | 380 | | | | 391 | |
JPMorgan Chase Commercial Mortgage Securities Trust, Ser 2014-C20, Cl A2 | | | | | | | | |
2.872%, 07/15/2047 | | | 116 | | | | 116 | |
JPMorgan Chase Commercial Mortgage Securities Trust, Ser 2015-JP1, Cl ASB | | | | | | | | |
3.733%, 01/15/2049 | | | 576 | | | | 596 | |
JPMorgan Chase Commercial Mortgage Securities Trust, Ser 2016-JP2, Cl ASB | | | | | | | | |
2.713%, 08/15/2049 | | | 600 | | | | 595 | |
| | | | | | | | |
| | | |
| Description | | Face Amount
(Thousands) | | Market Value
($ Thousands) |
|
MORTGAGE-BACKED SECURITIES (continued) | |
JPMorgan Chase Commercial Mortgage Securities Trust, Ser 2016-JP2, Cl A1 | | | | | | | | |
1.324%, 08/15/2049 | | $ | 457 | | | $ | 451 | |
JPMorgan Chase Commercial Mortgage Securities Trust, Ser 2017-JP5, Cl ASB | | | | | | | | |
3.549%, 03/15/2050 | | | 1,373 | | | | 1,413 | |
JPMorgan Chase Commercial Mortgage Securities Trust, Ser 2017-JP6, Cl ASB | | | | | | | | |
3.283%, 07/15/2050 | | | 529 | | | | 537 | |
JPMorgan Chase Commercial Mortgage Securities Trust, Ser WPT, Cl AFX | | | | | | | | |
4.248%, 07/05/2033 (C) | | | 160 | | | | 168 | |
JPMorgan Mortgage Trust, Ser 2006-A2, Cl 5A3 | | | | | | | | |
4.628%, 11/25/2033 (B) | | | 38 | | | | 39 | |
JPMorgan Mortgage Trust, Ser 2006-A2, Cl 4A1 | | | | | | | | |
4.482%, 08/25/2034 (B) | | | 83 | | | | 85 | |
JPMorgan Mortgage Trust, Ser 2015-5, Cl A9 | | | | | | | | |
3.271%, 05/25/2045 (B)(C) | | | 186 | | | | 185 | |
JPMorgan Mortgage Trust, Ser 2016-5, Cl A1 | | | | | | | | |
2.638%, 12/25/2046 (B)(C) | | | 1,388 | | | | 1,374 | |
JPMorgan Mortgage Trust, Ser 2017-5, Cl A1 | | | | | | | | |
3.175%, 10/26/2048 (B)(C) | | | 3,200 | | | | 3,198 | |
JPMorgan Mortgage Trust, Ser 2018-3, Cl A1 | | | | | | | | |
3.500%, 09/25/2048 (B)(C) | | | 4,501 | | | | 4,511 | |
JPMorgan Mortgage Trust, Ser 2018-4, Cl A1 | | | | | | | | |
3.500%, 10/25/2048 (B)(C) | | | 1,751 | | | | 1,742 | |
JPMorgan Mortgage Trust, Ser 2018-5, Cl A1 | | | | | | | | |
3.500%, 10/25/2048 (B)(C) | | | 5,955 | | | | 5,924 | |
LB-UBS Commercial Mortgage Trust, Ser 2006-C1, Cl XCL, IO | | | | | | | | |
0.377%, 02/15/2041 (B)(C) | | | 323 | | | | – | |
Lehman XS Trust, Ser 2007-16N, Cl 2A2 | | | | | | | | |
3.336%, VAR ICE LIBOR USD 1 Month+0.850%, 09/25/2047 | | | 5,229 | | | | 5,070 | |
Liberty Street Trust, Ser 2016-225L, Cl A | | | | | | | | |
3.597%, 02/10/2036 (C) | | | 1,160 | | | | 1,191 | |
LMREC, Ser CRE2, Cl A | | | | | | | | |
4.190%, VAR LIBOR USD 1 Month+1.700%, 11/24/2031 (C) | | | 584 | | | | 584 | |
Lone Star Portfolio Trust, Ser 2015-LSP, Cl E | | | | | | | | |
8.334%, VAR LIBOR USD 1 Month+5.850%, 09/15/2028 (C) | | | 589 | | | | 592 | |
LSTAR Commercial Mortgage Trust, Ser 2015- 3, Cl A2 | | | | | | | | |
2.729%, 04/20/2048 (B)(C) | | | 774 | | | | 771 | |
Madison Avenue Trust, Ser 2013-650M, Cl A | | | | | | | | |
3.843%, 10/12/2032 (C) | | | 245 | | | | 247 | |
Master Resecuritization Trust, Ser 2005-PO, Cl 3PO, PO | | | | | | | | |
0.000%,
05/28/2035 (A)(C)(D) | | | 5 | | | | 4 | |
| | |
66 | | SEI Institutional Managed Trust / Semi-Annual Report / March 31, 2019 |
| | | | | | | | |
| | | |
| Description | | Face Amount
(Thousands) | | Market Value
($ Thousands) |
|
MORTGAGE-BACKED SECURITIES (continued) | |
MASTR Reperforming Loan Trust, Ser 2005-1, Cl 1A1 | | | | | | | | |
6.000%, 08/25/2034 (C) | | $ | 1,407 | | | $ | 1,314 | |
Merrill Lynch Mortgage Investors Trust, Ser 2003-A4, Cl 2A | | | | | | | | |
4.590%, 07/25/2033 (B) | | | 17 | | | | 17 | |
Merrill Lynch Mortgage Investors Trust, Ser 2004-A1, Cl 4A | | | | | | | | |
5.125%, 02/25/2034 (B) | | | 42 | | | | 43 | |
Merrill Lynch/Countrywide Commercial Mortgage Trust, Ser 2006-4, Cl XC, IO | | | | | | | | |
0.242%,
12/12/2049 (B)(C) | | | 49 | | | | – | |
ML-CFC Commercial Mortgage Trust, Ser 2007-5, Cl AJFL | | | | | | | | |
5.450%,
08/12/2048 (B)(C) | | | 30 | | | | 22 | |
ML-CFC Commercial Mortgage Trust, Ser 2007-5, Cl AJ | | | | | | | | |
5.450%, 08/12/2048 (B) | | | 230 | | | | 166 | |
ML-CFC Commercial Mortgage Trust, Ser 2007-9, Cl AJ | | | | | | | | |
5.920%, 09/12/2049 (B) | | | 569 | | | | 358 | |
Morgan Stanley BAML Trust, Ser 2012-CKSV, Cl A2 | | | | | | | | |
3.277%, 10/15/2022 | | | 760 | | | | 754 | |
Morgan Stanley Bank of America Merrill Lynch Trust, Ser 2012-C6, Cl B | | | | | | | | |
3.930%, 11/15/2045 | | | 390 | | | | 397 | |
Morgan Stanley Bank of America Merrill Lynch Trust, Ser 2013-C9, Cl AS | | | | | | | | |
3.456%, 05/15/2046 | | | 80 | | | | 81 | |
Morgan Stanley Bank of America Merrill Lynch Trust, Ser 2015-C20, Cl A4 | | | | | | | | |
3.249%, 02/15/2048 | | | 138 | | | | 140 | |
Morgan Stanley Bank of America Merrill Lynch Trust, Ser 2015-C25, Cl A5 | | | | | | | | |
3.635%, 10/15/2048 | | | 852 | | | | 879 | |
Morgan Stanley Bank of America Merrill Lynch Trust, Ser 2015-C27, Cl A4 | | | | | | | | |
3.753%, 12/15/2047 | | | 155 | | | | 161 | |
Morgan Stanley Bank of America Merrill Lynch Trust, Ser 2016-C28, Cl A4 | | | | | | | | |
3.544%, 01/15/2049 | | | 317 | | | | 325 | |
Morgan Stanley Bank of America Merrill Lynch Trust, Ser 2016-C30, Cl A4 | | | | | | | | |
2.600%, 09/15/2049 | | | 927 | | | | 895 | |
Morgan Stanley Capital I Trust, Ser 2006- IQ12, Cl AJ | | | | | | | | |
5.399%, 12/15/2043 | | | 250 | | | | 187 | |
Morgan Stanley Capital I Trust, Ser 2007- HQ11, Cl X, IO | | | | | | | | |
0.401%,
02/12/2044 (B)(C) | | | 80 | | | | – | |
| | | | | | | | |
| | | |
| Description | | Face Amount
(Thousands) | | Market Value
($ Thousands) |
|
MORTGAGE-BACKED SECURITIES (continued) | |
Morgan Stanley Capital I Trust, Ser 2007- IQ16, Cl AJ | | | | | | | | |
6.113%, 12/12/2049 (B) | | $ | 767 | | | $ | 578 | |
Morgan Stanley Capital I Trust, Ser 2007- T27, Cl AJ | | | | | | | | |
5.947%, 06/11/2042 (B) | | | 1,728 | | | | 1,824 | |
Morgan Stanley Capital I Trust, Ser 2014- CPT, Cl A | | | | | | | | |
3.350%, 07/13/2029 (C) | | | 590 | | | | 597 | |
Morgan Stanley Capital I Trust, Ser 2014- MP, Cl A | | | | | | | | |
3.469%, 08/11/2033 (C) | | | 440 | | | | 446 | |
Morgan Stanley Capital I Trust, Ser 2015- 420, Cl A | | | | | | | | |
3.727%, 10/12/2050 (C) | | | 440 | | | | 450 | |
Morgan Stanley Capital I Trust, Ser 2016- BNK2, Cl XA, IO | | | | | | | | |
1.091%, 11/15/2049 (B) | | | 3,425 | | | | 198 | |
Morgan Stanley Capital I Trust, Ser 2016- UB11, Cl ASB | | | | | | | | |
2.606%, 08/15/2049 | | | 468 | | | | 461 | |
Morgan Stanley Capital I Trust, Ser 2016- UB11, Cl A1 | | | | | | | | |
1.445%, 08/15/2049 | | | 513 | | | | 506 | |
Morgan Stanley Capital I Trust, Ser 2016- UBS9, Cl A1 | | | | | | | | |
1.711%, 03/15/2049 | | | 303 | | | | 299 | |
Morgan Stanley Capital I Trust, Ser 2017- ASHF, Cl A | | | | | | | | |
3.334%, VAR LIBOR USD 1 Month+0.850%, 11/15/2034 (C) | | | 40 | | | | 40 | |
Morgan Stanley Capital Trust, Ser 2019-L3, Cl A4 | | | | | | | | |
4.071%, 02/15/2029 | | | 339 | | | | 361 | |
MSCG Trust, Ser 2015-ALDR, Cl A2 | | | | | | | | |
3.462%, 06/07/2035 (B)(C) | | | 250 | | | | 249 | |
MSCG Trust, Ser 2016-SNR, Cl C | | | | | | | | |
5.205%, 11/15/2034 (C) | | | 255 | | | | 255 | |
NCUA Guaranteed Notes Trust CMO, Ser 2010-R3, Cl 3A | | | | | | | | |
2.400%, 12/08/2020 | | | 97 | | | | 97 | |
New Residential Mortgage Loan Trust, Ser 2017-1A, Cl A1 | | | | | | | | |
4.000%, 02/25/2057 (B)(C) | | | 1,432 | | | | 1,457 | |
New Residential Mortgage Loan Trust, Ser 2019-NQM2, Cl A1 | | | | | | | | |
3.600%, 04/25/2049 (B)(C) | | | 648 | | | | 650 | |
Nomura Asset Acceptance Alternative Loan Trust, Ser 2007-1, Cl 1A3 | | | | | | | | |
5.957%, 03/25/2047 | | | 102 | | | | 104 | |
Nomura Asset Acceptance Alternative Loan Trust, Ser 2007-1, Cl 1A4 | | | | | | | | |
6.138%, 03/25/2047 | | | 84 | | | | 86 | |
| | |
SEI Institutional Managed Trust / Semi-Annual Report / March 31, 2019 | | 67 |
SCHEDULE OF INVESTMENTS (Unaudited)
March 31, 2019
Core Fixed Income Fund(Continued)
| | | | | | | | |
| | | |
| Description | | Face Amount
(Thousands) | | Market Value
($ Thousands) |
|
MORTGAGE-BACKED SECURITIES (continued) | |
OBX Trust, Ser 2018-1, Cl A2 | | | | | | | | |
3.136%, VAR ICE LIBOR USD 1 Month+0.650%, 06/25/2057 (C) | | $ | 565 | | | $ | 560 | |
OBX Trust, Ser 2019-INV1, Cl A8 | | | | | | | | |
4.000%,
11/25/2048 (B)(C) | | | 1,757 | | | | 1,786 | |
Prime Mortgage Trust, Ser 2004-CL1, Cl 1A1 | | | | | | | | |
6.000%, 02/25/2034 | | | 21 | | | | 22 | |
Prime Mortgage Trust, Ser 2004-CL1, Cl 1PO, PO | | | | | | | | |
0.000%,
02/25/2034 (A)(D) | | | 6 | | | | 5 | |
Prime Mortgage Trust, Ser 2006-DR1, Cl 2A1 | | | | | | | | |
5.500%, 05/25/2035 (C) | | | 1,123 | | | | 906 | |
Radnor RE, Ser 2018-1, Cl M2 | | | | | | | | |
5.186%, VAR ICE LIBOR USD 1 Month+2.700%, 03/25/2028 (C) | | | 7,270 | | | | 7,263 | |
RAMP Trust, Ser 2004-SL1, Cl A8 | | | | | | | | |
6.500%, 11/25/2031 | | | 245 | | | | 256 | |
RBSCF Trust, Ser 2013-GSP, Cl A | | | | | | | | |
3.834%,
01/15/2032 (B)(C) | | | 920 | | | | 950 | |
Residential Asset Securitization Trust, Ser 2004-IP2, Cl 2A1 | | | | | | | | |
4.458%, 12/25/2034 (B) | | | 384 | | | | 384 | |
Rosslyn Portfolio Trust, Ser 2017-R17, Cl A | | | | | | | | |
3.434%, VAR LIBOR USD 1 Month+0.950%, 06/15/2033 (C) | | | 330 | | | | 330 | |
Seasoned Credit Risk Transfer Trust, Ser 2016-1, Cl M2 | | | | | | | | |
3.750%,
09/25/2055 (B)(C) | | | 2,960 | | | | 2,621 | |
Seasoned Loans Structured Transaction, Ser 2018-2, Cl A1 | | | | | | | | |
3.500%, 11/25/2028 | | | 2,612 | | | | 2,667 | |
SFAVE Commercial Mortgage Securities Trust, Ser 2015-5AVE, Cl A1 | | | | | | | | |
3.872%,
01/05/2043 (B)(C) | | | 390 | | | | 391 | |
Silverstone Master Issuer, Ser 2018-1A, Cl 1A | | | | | | | | |
3.166%, VAR ICE LIBOR USD 3 Month+0.390%, 01/21/2070 (C) | | | 256 | | | | 255 | |
Structured Asset Mortgage Investments II Trust, Ser 2007-AR3, Cl 2A1 | | | | | | | | |
2.676%, VAR ICE LIBOR USD 1 Month+0.190%, 09/25/2047 | | | 5,609 | | | | 5,386 | |
Structured Asset Securities Mortgage Pass-Through Certificates, Ser 2003-24A, Cl 3A2 | | | | | | | | |
4.695%, 07/25/2033 (B) | | | 73 | | | | 73 | |
Structured Asset Securities Mortgage Pass- Through Certificates, Ser 2003-37A, Cl 2A | | | | | | | | |
4.448%, 12/25/2033 (B) | | | 22 | | | | 22 | |
Structured Asset Securities Mortgage Pass- Through Certificates, Ser 2005-17, Cl 5A1 | | | | | | | | |
5.500%, 10/25/2035 | | | 584 | | | | 445 | |
| | | | | | | | |
| | | |
| Description | | Face Amount
(Thousands) | | | Market Value
($ Thousands) | |
|
MORTGAGE-BACKED SECURITIES (continued) | |
Towd Point Mortgage Funding, Ser 2016- V1A, Cl A1 | | | | | | | | |
2.059%, VAR ICE LIBOR GBP 3 Month+1.200%, 02/20/2054 (C) | | GBP | 557 | | | $ | 727 | |
UBS-Barclays Commercial Mortgage Trust, Ser 2012-C2, Cl A4 | | | | | | | | |
3.525%, 05/10/2063 | | $ | 452 | | | | 462 | |
UBS-Barclays Commercial Mortgage Trust, Ser 2012-C4, Cl D | | | | | | | | |
4.480%,
12/10/2045 (B)(C) | | | 670 | | | | 639 | |
Verus Securitization Trust, Ser 2019-1, Cl A1 | | | | | | | | |
3.836%,
02/25/2059 (B)(C) | | | 587 | | | | 592 | |
Verus Securitization Trust, Ser 2019-INV1, Cl A1 | | | | | | | | |
3.402%,
12/25/2059 (B)(C) | | | 831 | | | | 831 | |
VNDO Mortgage Trust, Ser��2012-6AVE, Cl C | | | | | | | | |
3.337%,
11/15/2030 (B)(C) | | | 987 | | | | 983 | |
VNO Mortgage Trust, Ser 2012-6AVE, Cl A | | | | | | | | |
2.996%, 11/15/2030 (C) | | | 1,210 | | | | 1,218 | |
VNO Mortgage Trust, Ser 2013-PENN, Cl A | | | | | | | | |
3.808%, 12/13/2029 (C) | | | 1,335 | | | | 1,353 | |
WaMu Mortgage Pass-Through Certificates, Ser 2003-AR10, Cl A7 | | | | | | | | |
4.481%, 10/25/2033 (B) | | | 53 | | | | 53 | |
WaMu Mortgage Pass-Through Certificates, Ser 2003-AR7, Cl A7 | | | | | | | | |
4.148%, 08/25/2033 (B) | | | 27 | | | | 27 | |
WaMu Mortgage Pass-Through Certificates, Ser 2003-AR9, Cl 1A6 | | | | | | | | |
4.346%, 09/25/2033 (B) | | | 49 | | | | 50 | |
WaMu Mortgage Pass-Through Certificates, Ser 2003-S4, Cl 2A10 | | | | | | | | |
10.627%, VAR ICE LIBOR USD 1 Month+17.463%, 06/25/2033 | | | 7 | | | | 8 | |
WaMu Mortgage Pass-Through Certificates, Ser 2003-S9, Cl A8 | | | | | | | | |
5.250%, 10/25/2033 | | | 117 | | | | 119 | |
WaMu Mortgage Pass-Through Certificates, Ser 2004-AR3, Cl A2 | | | | | | | | |
4.050%, 06/25/2034 (B) | | | 32 | | | | 32 | |
WaMu Mortgage Pass-Through Certificates, Ser 2004-RA4, Cl 3A | | | | | | | | |
7.500%, 07/25/2034 | | | 94 | | | | 101 | |
WaMu Mortgage Pass-Through Certificates, Ser 2005-AR13, Cl A1A3 | | | | | | | | |
3.266%, VAR ICE LIBOR USD 1 Month+0.780%, 10/25/2045 | | | 454 | | | | 473 | |
WaMu Mortgage Pass-Through Certificates, Ser 2005-AR15, Cl A1A1 | | | | | | | | |
2.746%, VAR ICE LIBOR USD 1 Month+0.260%, 11/25/2045 | | | 4,836 | | | | 4,791 | |
| | |
68 | | SEI Institutional Managed Trust / Semi-Annual Report / March 31, 2019 |
| | | | | | | | |
| | | |
| Description | | Face Amount
(Thousands) | | Market Value
($ Thousands) |
|
MORTGAGE-BACKED SECURITIES (continued) | |
WaMu Mortgage Pass-Through Certificates, Ser 2007-OA1, Cl A1A | | | | | | | | |
3.097%, VAR 12 Month Treas Avg+0.700%, 02/25/2047 | | $ | 2,011 | | | $ | 1,893 | |
Washington Mutual Mortgage Pass-Through Certificates Trust, Ser 2007-OA2, Cl 2A | | | | | | | | |
3.097%, VAR 12 Month Treas Avg+0.700%, 01/25/2047 | | | 1,191 | | | | 976 | |
Waterfall Commercial Mortgage Trust, Ser 2015-SBC5, Cl A | | | | | | | | |
4.104%,
09/14/2022 (B)(C) | | | 457 | | | | 463 | |
Wells Fargo Commercial Mortgage Trust, Ser 2012-LC5, Cl C | | | | | | | | |
4.693%, 10/15/2045 (B) | | | 780 | | | | 797 | |
Wells Fargo Commercial Mortgage Trust, Ser 2013-LC12, Cl B | | | | | | | | |
4.287%, 07/15/2046 (B) | | | 20 | | | | 21 | |
Wells Fargo Commercial Mortgage Trust, Ser 2014-LC18, Cl A5 | | | | | | | | |
3.405%, 12/15/2047 | | | 570 | | | | 580 | |
Wells Fargo Commercial Mortgage Trust, Ser 2016-C36, Cl XA, IO | | | | | | | | |
1.338%, 11/15/2059 (B) | | | 5,588 | | | | 408 | |
Wells Fargo Commercial Mortgage Trust, Ser 2016-C37, Cl A5 | | | | | | | | |
3.794%, 12/15/2049 | | | 550 | | | | 571 | |
Wells Fargo Commercial Mortgage Trust, Ser 2016-LC24, Cl A4 | | | | | | | | |
2.942%, 10/15/2049 | | | 750 | | | | 737 | |
Wells Fargo Mortgage Backed Securities Trust, Ser 2005-AR7, Cl B1 | | | | | | | | |
4.420%, 05/25/2035 (B) | | | 2,237 | | | | 2,269 | |
Wells Fargo Mortgage-Backed Securities Trust, Ser 2004-EE, Cl 2A1 | | | | | | | | |
4.558%, 12/25/2034 (B) | | | 33 | | | | 34 | |
Wells Fargo Mortgage-Backed Securities Trust, Ser 2004-H, Cl A1 | | | | | | | | |
4.437%, 06/25/2034 (B) | | | 370 | | | | 378 | |
Wells Fargo Mortgage-Backed Securities Trust, Ser 2004-I, Cl 1A1 | | | | | | | | |
4.836%, 07/25/2034 (B) | | | 57 | | | | 58 | |
Wells Fargo Mortgage-Backed Securities Trust, Ser 2005-AR8, Cl 2A1 | | | | | | | | |
4.903%, 06/25/2035 (B) | | | 35 | | | | 36 | |
Wells Fargo Mortgage-Backed Securities Trust, Ser 2015-5R, Cl 2A1 | | | | | | | | |
4.500%,
03/26/2035 (B)(C) | | | 262 | | | | 269 | |
WFRBS Commercial Mortgage Trust, Ser 2011-C3, Cl XA, IO | | | | | | | | |
1.327%,
03/15/2044 (B)(C) | | | 5,764 | | | | 125 | |
WFRBS Commercial Mortgage Trust, Ser 2011-C4, Cl A3 | | | | | | | | |
4.394%, 06/15/2044 (C) | | | 58 | | | | 58 | |
| | | | | | | | |
| | | |
| Description | | Face Amount
(Thousands) | | Market Value
($ Thousands) |
|
MORTGAGE-BACKED SECURITIES (continued) | |
WFRBS Commercial Mortgage Trust, Ser 2012-C7, Cl XA, IO | | | | | | | | |
1.387%, 06/15/2045 (B)(C) | | $ | 636 | | | $ | 21 | |
WFRBS Commercial Mortgage Trust, Ser 2013-C13, Cl XA, IO | | | | | | | | |
1.200%, 05/15/2045 (B)(C) | | | 899 | | | | 37 | |
WFRBS Commercial Mortgage Trust, Ser 2014-C19, Cl B | | | | | | | | |
4.723%, 03/15/2047 (B) | | | 110 | | | | 116 | |
WFRBS Commercial Mortgage Trust, Ser 2014-C20, Cl XA, IO | | | | | | | | |
1.006%, 01/15/2024 | | | 2,739 | | | | 108 | |
WFRBS Commercial Mortgage Trust, Ser 2014-C21, Cl B | | | | | | | | |
4.213%, 08/15/2047 (B) | | | 300 | | | | 307 | |
| | | | | | | | |
| | |
| | | | | | | 231,493 | |
| | | | | | | | |
Total Mortgage-Backed Securities
(Cost $1,503,402) ($ Thousands) | | | | 1,496,183 | |
| | | | | | | | |
|
CORPORATE OBLIGATIONS — 29.3% | |
|
Communication Services — 2.6% | |
America Movil | | | | | | | | |
5.000%, 10/16/2019 | | | 1,050 | | | | 1,063 | |
5.000%, 03/30/2020 | | | 750 | | | | 765 | |
AT&T | | | | | | | | |
6.000%, 08/15/2040 | | | 1,770 | | | | 1,989 | |
5.450%, 03/01/2047 (E) | | | 247 | | | | 264 | |
5.250%, 03/01/2037 | | | 2,580 | | | | 2,703 | |
5.150%, 03/15/2042 | | | 25 | | | | 25 | |
5.150%, 02/15/2050 | | | 1,092 | | | | 1,115 | |
4.850%, 03/01/2039 | | | 1,431 | | | | 1,440 | |
4.800%, 06/15/2044 | | | 2,870 | | | | 2,818 | |
4.750%, 05/15/2046 | | | 986 | | | | 963 | |
4.500%, 03/09/2048 | | | 608 | | | | 570 | |
4.350%, 03/01/2029 (E) | | | 1,049 | | | | 1,072 | |
4.350%, 06/15/2045 | | | 800 | | | | 734 | |
4.300%, 02/15/2030 | | | 1,721 | | | | 1,741 | |
3.950%, 01/15/2025 | | | 300 | | | | 306 | |
3.875%, 08/15/2021 | | | 70 | | | | 72 | |
3.400%, 05/15/2025 (E) | | | 3,540 | | | | 3,503 | |
3.000%, 06/30/2022 | | | 180 | | | | 181 | |
CBS | | | | | | | | |
3.700%, 08/15/2024 | | | 810 | | | | 824 | |
3.700%, 06/01/2028 | | | 300 | | | | 292 | |
3.375%, 02/15/2028 | | | 700 | | | | 667 | |
CCO Holdings | | | | | | | | |
5.250%, 09/30/2022 | | | 50 | | | | 51 | |
5.125%, 05/01/2027 (C)(E) | | | 480 | | | | 483 | |
5.000%, 02/01/2028 (C)(E) | | | 110 | | | | 108 | |
| | |
SEI Institutional Managed Trust / Semi-Annual Report / March 31, 2019 | | 69 |
SCHEDULE OF INVESTMENTS (Unaudited)
March 31, 2019
Core Fixed Income Fund(Continued)
| | | | | | | | |
| | | |
| Description | | Face Amount
(Thousands) | | Market Value
($ Thousands) |
|
CORPORATE OBLIGATIONS (continued) | |
Charter Communications Operating | |
6.834%, 10/23/2055 | | $ | 70 | | | $ | 79 | |
6.484%, 10/23/2045 | | | 660 | | | | 740 | |
6.384%, 10/23/2035 | | | 850 | | | | 948 | |
5.750%,
04/01/2048 (E) | | | 643 | | | | 672 | |
5.375%, 04/01/2038 | | | 1,024 | | | | 1,030 | |
5.375%,
05/01/2047 (E) | | | 141 | | | | 140 | |
5.050%, 03/30/2029 | | | 1,565 | | | | 1,649 | |
4.908%,
07/23/2025 (E) | | | 2,990 | | | | 3,155 | |
4.500%, 02/01/2024 | | | 750 | | | | 780 | |
4.464%, 07/23/2022 | | | 336 | | | | 348 | |
4.200%, 03/15/2028 | | | 973 | | | | 965 | |
3.750%, 02/15/2028 | | | 1,795 | | | | 1,730 | |
3.579%, 07/23/2020 | | | 400 | | | | 403 | |
Comcast | | | | | | | | |
7.050%, 03/15/2033 | | | 90 | | | | 119 | |
6.500%, 11/15/2035 | | | 480 | | | | 608 | |
4.950%, 10/15/2058 | | | 608 | | | | 671 | |
4.700%, 10/15/2048 | | | 110 | | | | 119 | |
4.600%, 10/15/2038 | | | 4,506 | | | | 4,823 | |
4.400%, 08/15/2035 | | | 1,770 | | | | 1,848 | |
4.250%, 10/15/2030 | | | 700 | | | | 744 | |
4.200%, 08/15/2034 | | | 220 | | | | 229 | |
4.150%,
10/15/2028 (E) | | | 3,004 | | | | 3,162 | |
4.000%, 03/01/2048 | | | 522 | | | | 509 | |
3.999%, 11/01/2049 | | | 199 | | | | 194 | |
3.969%, 11/01/2047 | | | 78 | | | | 75 | |
3.950%, 10/15/2025 | | | 624 | | | | 653 | |
3.900%, 03/01/2038 | | | 540 | | | | 531 | |
3.700%, 04/15/2024 | | | 1,864 | | | | 1,925 | |
3.450%, 10/01/2021 | | | 1,568 | | | | 1,599 | |
3.417%, VAR ICE LIBOR USD 3 Month+0.630%, 04/15/2024 | | | 870 | | | | 871 | |
3.300%, 10/01/2020 | | | 1,952 | | | | 1,970 | |
3.150%, 03/01/2026 | | | 160 | | | | 159 | |
2.350%, 01/15/2027 | | | 1,205 | | | | 1,126 | |
Comcast Cable Communications Holdings | |
9.455%, 11/15/2022 | | | 180 | | | | 221 | |
Comcast Cable Holdings | | | | | | | | |
10.125%, 04/15/2022 | | | 45 | | | | 54 | |
Discovery Communications | | | | | | | | |
5.200%, 09/20/2047 | | | 638 | | | | 620 | |
3.950%, 03/20/2028 | | | 537 | | | | 522 | |
DISH DBS | |
7.750%,
07/01/2026 (E) | | | 130 | | | | 113 | |
5.875%,
11/15/2024 (E) | | | 700 | | | | 588 | |
Fox | | | | | | | | |
5.576%,
01/25/2049 (C) | | | 559 | | | | 629 | |
5.476%,
01/25/2039 (C) | | | 470 | | | | 520 | |
4.709%,
01/25/2029 (C) | | | 3,218 | | | | 3,450 | |
4.030%,
01/25/2024 (C) | | | 712 | | | | 738 | |
| | | | | | | | |
| | | |
| Description | | Face Amount
(Thousands) | | Market Value
($ Thousands) |
|
CORPORATE OBLIGATIONS (continued) | |
NBCUniversal Enterprise | |
1.974%,
04/15/2019 (C) | | $ | 200 | | | $ | 200 | |
NBCUniversal Media | | | | | | | | |
5.950%, 04/01/2041 | | | 455 | | | | 559 | |
4.375%, 04/01/2021 | | | 270 | | | | 279 | |
Netflix | | | | | | | | |
5.375%, 02/01/2021 | | | 120 | | | | 125 | |
Sprint | | | | | | | | |
7.875%, 09/15/2023 | | | 340 | | | | 356 | |
7.250%, 09/15/2021 | | | 460 | | | | 483 | |
Sprint Capital | | | | | | | | |
8.750%, 03/15/2032 | | | 190 | | | | 201 | |
Sprint Spectrum | | | | | | | | |
4.738%,
03/20/2025 (C) | | | 4,010 | | | | 4,055 | |
3.360%,
09/20/2021 (C) | | | 3,200 | | | | 3,199 | |
Telecom Italia | | | | | | | | |
5.303%,
05/30/2024 (C) | | | 400 | | | | 402 | |
Telefonica Emisiones | | | | | | | | |
5.877%, 07/15/2019 | | | 90 | | | | 91 | |
5.462%, 02/16/2021 | | | 23 | | | | 24 | |
5.213%, 03/08/2047 | | | 150 | | | | 152 | |
5.134%, 04/27/2020 | | | 662 | | | | 677 | |
4.103%, 03/08/2027 | | | 630 | | | | 639 | |
UPCB Finance IV | | | | | | | | |
5.375%,
01/15/2025 (C)(E) | | | 400 | | | | 406 | |
Verizon Communications | | | | | | | | |
5.500%,
03/16/2047 (E) | | | 568 | | | | 665 | |
5.250%, 03/16/2037 | | | 1,930 | | | | 2,171 | |
4.862%,
08/21/2046 (E) | | | 290 | | | | 309 | |
4.672%, 03/15/2055 | | | 181 | | | | 184 | |
4.522%,
09/15/2048 (E) | | | 778 | | | | 798 | |
4.500%, 08/10/2033 | | | 1,625 | | | | 1,718 | |
4.400%,
11/01/2034 (E) | | | 3,288 | | | | 3,420 | |
4.329%, 09/21/2028 | | | 2,226 | | | | 2,354 | |
4.272%, 01/15/2036 | | | 1,927 | | | | 1,949 | |
4.125%,
08/15/2046 (E) | | | 1,063 | | | | 1,030 | |
4.016%,
12/03/2029 (C) | | | 1,074 | | | | 1,105 | |
3.875%, 02/08/2029 | | | 210 | | | | 215 | |
3.850%, 11/01/2042 | | | 550 | | | | 517 | |
3.500%, 11/01/2024 | | | 120 | | | | 123 | |
3.376%, 02/15/2025 | | | 218 | | | | 221 | |
2.625%, 08/15/2026 | | | 1,000 | | | | 954 | |
Viacom | | | | | | | | |
5.850%, 09/01/2043 | | | 288 | | | | 313 | |
4.250%,
09/01/2023 (E) | | | 1,380 | | | | 1,435 | |
3.875%, 04/01/2024 | | | 130 | | | | 132 | |
Vodafone Group | | | | | | | | |
5.250%, 05/30/2048 | | | 490 | | | | 486 | |
4.375%,
05/30/2028 (E) | | | 2,555 | | | | 2,597 | |
3.750%, 01/16/2024 | | | 664 | | | | 669 | |
Walt Disney | | | | | | | | |
6.900%,
08/15/2039 (C) | | | 10 | | | | 14 | |
| | |
70 | | SEI Institutional Managed Trust / Semi-Annual Report / March 31, 2019 |
| | | | | | | | |
| | | |
| Description | | Face Amount
(Thousands) | | Market Value
($ Thousands) |
|
CORPORATE OBLIGATIONS (continued) | |
6.750%,
01/09/2038 (C) | | $ | 20 | | | $ | 28 | |
6.650%,
11/15/2037 (C) | | | 235 | | | | 324 | |
6.200%,
12/15/2034 (C) | | | 65 | | | | 85 | |
6.150%,
03/01/2037 (C)(E) | | | 1,120 | | | | 1,449 | |
6.150%,
02/15/2041 (C) | | | 15 | | | | 20 | |
4.950%,
10/15/2045 (C) | | | 350 | | | | 417 | |
Walt Disney MTN | | | | | | | | |
4.125%,
06/01/2044 (E) | | | 180 | | | | 192 | |
| | | | | | | | |
| | | | | | | 103,520 | |
| | | | | | | | |
|
Consumer Discretionary — 1.4% | |
1011778 BC ULC / New Red Finance | |
4.250%,
05/15/2024 (C)(E) | | | 130 | | | | 129 | |
Altice France | | | | | | | | |
7.375%,
05/01/2026 (C) | | | 820 | | | | 804 | |
Amazon.com | | | | | | | | |
5.200%, 12/03/2025 | | | 570 | | | | 647 | |
4.950%, 12/05/2044 | | | 500 | | | | 596 | |
4.050%,
08/22/2047 (E) | | | 380 | | | | 402 | |
3.875%, 08/22/2037 | | | 300 | | | | 312 | |
3.150%,
08/22/2027 (E) | | | 680 | | | | 685 | |
2.800%,
08/22/2024 (E) | | | 898 | | | | 899 | |
BMW US Capital | | | | | | | | |
3.100%,
04/12/2021 (C) | | | 780 | | | | 785 | |
2.150%,
04/06/2020 (C) | | | 325 | | | | 323 | |
1.850%,
09/15/2021 (C)(E) | | | 100 | | | | 98 | |
Cox Communications | | | | | | | | |
3.250%,
12/15/2022 (C) | | | 540 | | | | 544 | |
Daimler Finance North America | | | | | | | | |
3.350%,
05/04/2021 (C)(E) | | | 1,415 | | | | 1,424 | |
2.300%,
01/06/2020 (C)(E) | | | 1,520 | | | | 1,513 | |
Fiat Chrysler Automobiles | | | | | | | | |
4.500%, 04/15/2020 | | | 200 | | | | 202 | |
Ford Motor | | | | | | | | |
5.291%, 12/08/2046 | | | 747 | | | | 626 | |
4.750%, 01/15/2043 | | | 304 | | | | 238 | |
Ford Motor Credit | | | | | | | | |
8.125%, 01/15/2020 | | | 1,450 | | | | 1,503 | |
5.596%,
01/07/2022 (E) | | | 3,740 | | | | 3,857 | |
5.584%,
03/18/2024 (E) | | | 636 | | | | 645 | |
4.250%,
09/20/2022 (E) | | | 1,000 | | | | 993 | |
3.815%,
11/02/2027 (E) | | | 261 | | | | 228 | |
3.813%, 10/12/2021 | | | 390 | | | | 386 | |
3.810%,
01/09/2024 (E) | | | 300 | | | | 284 | |
3.677%, VAR ICE LIBOR USD 3 Month+0.880%, 10/12/2021 | | | 1,040 | | | | 1,008 | |
3.339%, 03/28/2022 | | | 1,035 | | | | 1,005 | |
2.597%, 11/04/2019 | | | 1,170 | | | | 1,167 | |
2.343%, 11/02/2020 | | | 2,770 | | | | 2,708 | |
General Motors | | | | | | | | |
6.600%,
04/01/2036 (E) | | | 670 | | | | 701 | |
6.250%, 10/02/2043 | | | 260 | | | | 259 | |
| | | | | | | | |
| | | |
| Description | | Face Amount
(Thousands) | | Market Value
($ Thousands) |
|
CORPORATE OBLIGATIONS (continued) | |
5.950%, 04/01/2049 | | $ | 811 | | | $ | 786 | |
5.150%,
04/01/2038 (E) | | | 571 | | | | 522 | |
4.875%,
10/02/2023 (E) | | | 1,995 | | | | 2,074 | |
3.539%, VAR ICE LIBOR USD 3 Month+0.800%, 08/07/2020 | | | 1,000 | | | | 999 | |
General Motors Financial | | | | | | | | |
5.650%, 01/17/2029 | | | 462 | | | | 477 | |
4.375%, 09/25/2021 | | | 180 | | | | 184 | |
4.350%, 01/17/2027 | | | 110 | | | | 107 | |
4.250%,
05/15/2023 (E) | | | 110 | | | | 112 | |
4.150%, 06/19/2023 | | | 83 | | | | 84 | |
3.450%,
04/10/2022 (E) | | | 120 | | | | 120 | |
3.200%, 07/13/2020 | | | 118 | | | | 118 | |
2.450%, 11/06/2020 | | | 210 | | | | 208 | |
2.400%, 05/09/2019 | | | 530 | | | | 530 | |
Hanesbrands | | | | | | | | |
4.875%,
05/15/2026 (C)(E) | | | 210 | | | | 207 | |
4.625%,
05/15/2024 (C)(E) | | | 30 | | | | 30 | |
Hilton Domestic Operating | | | | | | | | |
5.125%,
05/01/2026 (C) | | | 100 | | | | 102 | |
Hilton Worldwide Finance | | | | | | | | |
4.875%,
04/01/2027 (E) | | | 370 | | | | 374 | |
4.625%, 04/01/2025 | | | 20 | | | | 20 | |
Home Depot | | | | | | | | |
4.500%, 12/06/2048 | | | 512 | | | | 567 | |
4.250%, 04/01/2046 | | | 48 | | | | 51 | |
3.900%,
12/06/2028 (E) | | | 645 | | | | 685 | |
3.750%,
02/15/2024 (E) | | | 66 | | | | 69 | |
Kohl’s | | | | | | | | |
5.550%, 07/17/2045 | | | 910 | | | | 881 | |
Lennar | | | | | | | | |
5.000%, 06/15/2027 | | | 30 | | | | 30 | |
4.750%, 11/29/2027 | | | 460 | | | | 460 | |
4.500%,
04/30/2024 (E) | | | 170 | | | | 173 | |
McDonald’s MTN | | | | | | | | |
4.875%, 12/09/2045 | | | 260 | | | | 281 | |
4.450%, 03/01/2047 | | | 240 | | | | 245 | |
4.450%, 09/01/2048 | | | 72 | | | | 74 | |
3.800%, 04/01/2028 | | | 1,355 | | | | 1,398 | |
3.700%,
01/30/2026 (E) | | | 140 | | | | 145 | |
3.500%, 03/01/2027 | | | 400 | | | | 405 | |
Myriad International Holdings BV | |
4.850%,
07/06/2027 (C)(E) | | | 550 | | | | 565 | |
NCL | | | | | | | | |
4.750%,
12/15/2021 (C) | | | 32 | | | | 32 | |
Newell Brands | | | | | | | | |
4.200%, 04/01/2026 | | | 360 | | | | 344 | |
3.850%,
04/01/2023 (E) | | | 420 | | | | 415 | |
NVR | | | | | | | | |
3.950%, 09/15/2022 | | | 700 | | | | 719 | |
QVC | | | | | | | | |
5.950%, 03/15/2043 | | | 30 | | | | 28 | |
| | |
SEI Institutional Managed Trust / Semi-Annual Report / March 31, 2019 | | 71 |
SCHEDULE OF INVESTMENTS (Unaudited)
March 31, 2019
Core Fixed Income Fund(Continued)
| | | | | | | | |
| | | |
| Description | | Face Amount
(Thousands) | | | Market Value
($ Thousands) |
|
CORPORATE OBLIGATIONS (continued) | |
4.375%, 03/15/2023 | | $ | 645 | | | $ | 654 | |
Sands China | | | | | | | | |
5.400%, 08/08/2028 | | | 320 | | | | 335 | |
5.125%,
08/08/2025 (E) | | | 650 | | | | 677 | |
4.600%,
08/08/2023 (E) | | | 610 | | | | 629 | |
Sky PLC | | | | | | | | |
3.750%,
09/16/2024 (C) | | | 1,090 | | | | 1,129 | |
Starbucks | | | | | | | | |
4.500%, 11/15/2048 | | | 14 | | | | 14 | |
3.800%, 08/15/2025 | | | 36 | | | | 37 | |
Time Warner Cable | |
8.250%, 04/01/2019 | | | 2,465 | | | | 2,465 | |
7.300%, 07/01/2038 | | | 530 | | | | 617 | |
6.550%, 05/01/2037 | | | 381 | | | | 421 | |
5.875%, 11/15/2040 | | | 130 | | | | 133 | |
5.500%, 09/01/2041 | | | 1,044 | | | | 1,027 | |
5.000%, 02/01/2020 | | | 320 | | | | 325 | |
Time Warner Entertainment | |
8.375%, 07/15/2033 | | | 270 | | | | 352 | |
TJX | | | | | | | | |
2.250%, 09/15/2026 | | | 120 | | | | 114 | |
Toll Brothers Finance | | | | | | | | |
4.375%, 04/15/2023 | | | 120 | | | | 120 | |
Toyota Motor Credit MTN | | | | | | | | |
2.600%, 01/11/2022 | | | 1,205 | | | | 1,206 | |
VOC Escrow | | | | | | | | |
5.000%,
02/15/2028 (C) | | | 380 | | | | 370 | |
Warner Media | | | | | | | | |
5.375%, 10/15/2041 | | | 577 | | | | 612 | |
5.350%, 12/15/2043 | | | 218 | | | | 229 | |
3.800%, 02/15/2027 | | | 1,497 | | | | 1,491 | |
3.550%, 06/01/2024 | | | 1,750 | | | | 1,766 | |
William Lyon Homes | | | | | | | | |
7.000%, 08/15/2022 | | | 100 | | | | 100 | |
| | | | | | | | |
| | | | | | | 54,415 | |
| | | | | | | | |
|
Consumer Staples — 2.6% | |
Alimentation Couche-Tard | | | | | | | | |
4.500%,
07/26/2047 (C) | | | 63 | | | | 59 | |
3.550%,
07/26/2027 (C) | | | 650 | | | | 634 | |
Altria Group | | | | | | | | |
9.250%, 08/06/2019 | | | 2,370 | | | | 2,423 | |
6.200%, 02/14/2059 | | | 190 | | | | 204 | |
5.950%, 02/14/2049 | | | 310 | | | | 333 | |
5.800%, 02/14/2039 | | | 2,290 | | | | 2,422 | |
5.375%,
01/31/2044 (E) | | | 180 | | | | 180 | |
4.800%, 02/14/2029 | | | 1,465 | | | | 1,510 | |
4.750%, 05/05/2021 | | | 200 | | | | 208 | |
4.400%,
02/14/2026 (E) | | | 2,803 | | | | 2,881 | |
3.800%,
02/14/2024 (E) | | | 390 | | | | 397 | |
3.490%,
02/14/2022 (E) | | | 260 | | | | 264 | |
2.850%,
08/09/2022 (E) | | | 190 | | | | 189 | |
| | | | | | | | |
| | | |
| Description | | Face Amount
(Thousands) | | | Market Value
($ Thousands) | |
|
CORPORATE OBLIGATIONS (continued) | |
Anheuser-Busch | | | | | | | | |
4.900%,
02/01/2046 (C) | | $ | 4,469 | | | $ | 4,489 | |
3.650%,
02/01/2026 (C) | | | 1,851 | | | | 1,856 | |
Anheuser-Busch InBev Finance | | | | | | | | |
3.300%, 02/01/2023 | | | 820 | | | | 832 | |
2.650%, 02/01/2021 | | | 274 | | | | 273 | |
Anheuser-Busch InBev Worldwide | | | | | | | | |
5.800%, 01/23/2059 | | | 1,060 | | | | 1,179 | |
5.550%, 01/23/2049 | | | 2,432 | | | | 2,669 | |
5.450%, 01/23/2039 | | | 1,450 | | | | 1,570 | |
4.900%, 01/23/2031 | | | 608 | | | | 656 | |
4.750%,
01/23/2029 (E) | | | 3,620 | | | | 3,857 | |
4.600%, 04/15/2048 | | | 940 | | | | 903 | |
4.150%, 01/23/2025 | | | 2,592 | | | | 2,701 | |
4.000%, 04/13/2028 | | | 680 | | | | 691 | |
3.750%, 07/15/2042 | | | 230 | | | | 199 | |
2.500%,
07/15/2022 (E) | | | 630 | | | | 624 | |
Bacardi | | | | | | | | |
4.700%,
05/15/2028 (C) | | | 1,190 | | | | 1,190 | |
BAT Capital | | | | | | | | |
4.540%, 08/15/2047 | | | 2,117 | | | | 1,855 | |
4.390%,
08/15/2037 (E) | | | 71 | | | | 64 | |
3.557%, 08/15/2027 | | | 3,550 | | | | 3,361 | |
3.222%, 08/15/2024 | | | 167 | | | | 163 | |
2.764%, 08/15/2022 | | | 715 | | | | 703 | |
2.297%, 08/14/2020 | | | 653 | | | | 646 | |
Campbell Soup | | | | | | | | |
3.300%, 03/15/2021 | | | 625 | | | | 629 | |
3.115%, VAR ICE LIBOR USD 3 Month+0.500%, 03/16/2020 | | | 1,000 | | | | 997 | |
Conagra Brands | | | | | | | | |
5.400%, 11/01/2048 | | | 680 | | | | 684 | |
4.850%, 11/01/2028 | | | 500 | | | | 525 | |
Constellation Brands | | | | | | | | |
4.650%, 11/15/2028 | | | 610 | | | | 646 | |
4.400%, 11/15/2025 | | | 469 | | | | 492 | |
4.250%,
05/01/2023 (E) | | | 650 | | | | 681 | |
3.700%, 12/06/2026 | | | 292 | | | | 291 | |
3.600%, 02/15/2028 | | | 548 | | | | 536 | |
3.500%, 05/09/2027 | | | 248 | | | | 242 | |
3.200%, 02/15/2023 | | | 175 | | | | 176 | |
Costco Wholesale | | | | | | | | |
3.000%, 05/18/2027 | | | 1,462 | | | | 1,461 | |
2.750%, 05/18/2024 | | | 1,071 | | | | 1,078 | |
Cott Holdings | | | | | | | | |
5.500%,
04/01/2025 (C) | | | 220 | | | | 222 | |
Danone | | | | | | | | |
2.947%,
11/02/2026 (C) | | | 2,902 | | | | 2,782 | |
2.589%,
11/02/2023 (C) | | | 1,645 | | | | 1,610 | |
2.077%,
11/02/2021 (C) | | | 230 | | | | 225 | |
Diageo Capital PLC | | | | | | | | |
4.828%, 07/15/2020 | | | 1,450 | | | | 1,490 | |
| | |
72 | | SEI Institutional Managed Trust / Semi-Annual Report / March 31, 2019 |
| | | | | | | | |
| | | |
| Description | | Face Amount
(Thousands) | | Market Value
($ Thousands) |
|
CORPORATE OBLIGATIONS (continued) | |
Diageo Investment | | | | | | | | |
2.875%, 05/11/2022 | | $ | 580 | | | $ | 583 | |
General Mills | | | | | | | | |
4.700%,
04/17/2048 (E) | | | 525 | | | | 524 | |
4.200%, 04/17/2028 | | | 780 | | | | 811 | |
Keurig Dr Pepper | | | | | | | | |
4.417%,
05/25/2025 (C) | | | 280 | | | | 290 | |
Kraft Heinz Foods | | | | | | | | |
6.500%, 02/09/2040 | | | 265 | | | | 289 | |
5.375%, 02/10/2020 | | | 331 | | | | 338 | |
5.200%, 07/15/2045 | | | 573 | | | | 553 | |
5.000%, 07/15/2035 | | | 30 | | | | 29 | |
5.000%, 06/04/2042 | | | 35 | | | | 33 | |
4.875%,
02/15/2025 (C) | | | 1,761 | | | | 1,801 | |
4.625%,
01/30/2029 (E) | | | 1,485 | | | | 1,527 | |
4.375%, 06/01/2046 | | | 1,358 | | | | 1,175 | |
4.000%, 06/15/2023 | | | 30 | | | | 31 | |
3.950%,
07/15/2025 (E) | | | 1,030 | | | | 1,038 | |
3.500%, 07/15/2022 | | | 575 | | | | 580 | |
3.000%,
06/01/2026 (E) | | | 696 | | | | 649 | |
2.800%, 07/02/2020 | | | 1,042 | | | | 1,041 | |
Kroger | | | | | | | | |
5.400%, 01/15/2049 | | | 1,185 | | | | 1,228 | |
Lamb Weston Holdings | | | | | | | | |
4.625%,
11/01/2024 (C)(E) | | | 210 | | | | 212 | |
Land O’ Lakes | | | | | | | | |
6.000%,
11/15/2022 (C) | | | 1,020 | | | | 1,053 | |
Mars | | | | | | | | |
4.125%,
04/01/2054 (C) | | | 437 | | | | 449 | |
3.600%,
04/01/2034 (C) | | | 437 | | | | 437 | |
3.200%,
04/01/2030 (C) | | | 1,115 | | | | 1,114 | |
2.700%,
04/01/2025 (C) | | | 370 | | | | 368 | |
Molson Coors Brewing | | | | | | | | |
3.500%,
05/01/2022 (E) | | | 100 | | | | 101 | |
Mondelez International Holdings | |
Netherlands BV | | | | | | | | |
2.000%,
10/28/2021 (C) | | | 2,970 | | | | 2,895 | |
Nestle Holdings | | | | | | | | |
4.000%,
09/24/2048 (C) | | | 476 | | | | 498 | |
3.900%,
09/24/2038 (C) | | | 414 | | | | 431 | |
3.625%,
09/24/2028 (C) | | | 402 | | | | 419 | |
3.500%,
09/24/2025 (C) | | | 1,226 | | | | 1,271 | |
3.350%,
09/24/2023 (C) | | | 1,489 | | | | 1,534 | |
3.100%,
09/24/2021 (C) | | | 1,190 | | | | 1,205 | |
PepsiCo | | | | | | | | |
4.250%, 10/22/2044 | | | 100 | | | | 108 | |
4.000%, 03/05/2042 | | | 160 | | | | 167 | |
3.100%, 07/17/2022 | | | 59 | | | | 60 | |
3.000%, 08/25/2021 | | | 31 | | | | 31 | |
Pernod Ricard | | | | | | | | |
4.450%,
01/15/2022 (C) | | | 550 | | | | 571 | |
| | | | | | | | |
| | | |
| Description | | Face Amount
(Thousands) | | Market Value
($ Thousands) |
|
CORPORATE OBLIGATIONS (continued) | |
Philip Morris International | | | | | | | | |
4.500%, 03/20/2042 | | $ | 130 | | | $ | 128 | |
2.900%, 11/15/2021 | | | 370 | | | | 372 | |
2.500%, 08/22/2022 | | | 590 | | | | 585 | |
2.500%, 11/02/2022 | | | 680 | | | | 674 | |
2.000%, 02/21/2020 | | | 685 | | | | 681 | |
1.875%, 11/01/2019 | | | 560 | | | | 557 | |
Reckitt Benckiser Treasury Services | |
2.750%,
06/26/2024 (C) | | | 1,860 | | | | 1,828 | |
Reynolds American | | | | | | | | |
8.125%, 06/23/2019 | | | 1,390 | | | | 1,406 | |
8.125%, 05/01/2040 | | | 570 | | | | 702 | |
5.850%, 08/15/2045 | | | 1,332 | | | | 1,367 | |
3.250%,
06/12/2020 (E) | | | 216 | | | | 216 | |
Spectrum Brands | | | | | | | | |
5.750%,
07/15/2025 (E) | | | 130 | | | | 131 | |
Sysco | | | | | | | | |
3.550%, 03/15/2025 | | | 1,055 | | | | 1,070 | |
Tyson Foods | | | | | | | | |
4.000%, 03/01/2026 | | | 540 | | | | 552 | |
Walgreens Boots Alliance | | | | | | | | |
4.800%, 11/18/2044 | | | 1,100 | | | | 1,054 | |
3.450%, 06/01/2026 | | | 2,070 | | | | 2,026 | |
3.300%, 11/18/2021 | | | 912 | | | | 922 | |
Walmart | | | | | | | | |
4.050%, 06/29/2048 | | | 181 | | | | 192 | |
3.950%,
06/28/2038 (E) | | | 783 | | | | 822 | |
3.700%,
06/26/2028 (E) | | | 3,732 | | | | 3,931 | |
3.550%, 06/26/2025 | | | 902 | | | | 936 | |
3.400%, 06/26/2023 | | | 223 | | | | 230 | |
3.300%,
04/22/2024 (E) | | | 60 | | | | 62 | |
Wm Wrigley Jr | | | | | | | | |
2.900%,
10/21/2019 (C) | | | 670 | | | | 669 | |
| | | | | | | | |
| | | | | | | 103,509 | |
| | | | | | | | |
| | |
Energy — 3.5% | | | | | | | | |
Anadarko Finance, Ser B | | | | | | | | |
7.500%, 05/01/2031 | | | 870 | | | | 1,086 | |
Anadarko Petroleum | | | | | | | | |
6.600%, 03/15/2046 | | | 360 | | | | 438 | |
6.450%,
09/15/2036 (E) | | | 280 | | | | 322 | |
5.550%,
03/15/2026 (E) | | | 220 | | | | 239 | |
4.850%, 03/15/2021 | | | 538 | | | | 558 | |
4.500%, 07/15/2044 | | | 525 | | | | 494 | |
Andeavor Logistics | | | | | | | | |
5.200%, 12/01/2047 | | | 493 | | | | 494 | |
3.500%, 12/01/2022 | | | 398 | | | | 402 | |
Antero Resources | | | | | | | | |
5.375%, 11/01/2021 | | | 200 | | | | 201 | |
Apache | | | | | | | | |
5.250%, 02/01/2042 | | | 50 | | | | 51 | |
5.100%, 09/01/2040 | | | 285 | | | | 280 | |
| | |
SEI Institutional Managed Trust / Semi-Annual Report / March 31, 2019 | | 73 |
SCHEDULE OF INVESTMENTS (Unaudited)
March 31, 2019
Core Fixed Income Fund(Continued)
| | | | | | | | |
| | | |
| Description | | Face Amount
(Thousands) | | Market Value
($ Thousands) |
|
CORPORATE OBLIGATIONS (continued) | |
4.750%, 04/15/2043 | | $ | 300 | | | $ | 282 | |
4.375%,
10/15/2028 (E) | | | 310 | | | | 312 | |
4.250%, 01/15/2044 | | | 890 | | | | 789 | |
3.250%, 04/15/2022 | | | 86 | | | | 86 | |
BG Energy Capital PLC | | | | | | | | |
4.000%,
10/15/2021 (C) | | | 1,485 | | | | 1,521 | |
Blue Racer Midstream | | | | | | | | |
6.125%,
11/15/2022 (C) | | | 230 | | | | 233 | |
BP Capital Markets America | |
3.937%, 09/21/2028 | | | 2,405 | | | | 2,520 | |
3.796%, 09/21/2025 | | | 1,045 | | | | 1,083 | |
3.410%, 02/11/2026 | | | 2,053 | | | | 2,090 | |
3.245%, 05/06/2022 | | | 250 | | | | 254 | |
3.216%, 11/28/2023 | | | 2,565 | | | | 2,595 | |
3.119%, 05/04/2026 | | | 230 | | | | 229 | |
BP Capital Markets PLC | | | | | | | | |
3.994%, 09/26/2023 | | | 95 | | | | 100 | |
3.561%,
11/01/2021 (E) | | | 50 | | | | 51 | |
3.535%, 11/04/2024 | | | 100 | | | | 103 | |
3.506%,
03/17/2025 (E) | | | 520 | | | | 530 | |
Canadian Natural Resources | | | | | | | | |
6.450%, 06/30/2033 | | | 50 | | | | 60 | |
3.850%,
06/01/2027 (E) | | | 462 | | | | 463 | |
Cenovus Energy | | | | | | | | |
4.250%, 04/15/2027 | | | 1,260 | | | | 1,239 | |
Cheniere Corpus Christi Holdings | | | | | | | | |
5.125%,
06/30/2027 (E) | | | 200 | | | | 210 | |
Chesapeake Energy | | | | | | | | |
8.000%,
06/15/2027 (E) | | | 40 | | | | 39 | |
6.625%, 08/15/2020 | | | 50 | | | | 51 | |
6.125%, 02/15/2021 | | | 120 | | | | 124 | |
Chevron | | | | | | | | |
3.191%, 06/24/2023 | | | 22 | | | | 23 | |
2.954%, 05/16/2026 | | | 680 | | | | 685 | |
2.895%,
03/03/2024 (E) | | | 2,055 | | | | 2,078 | |
2.355%,
12/05/2022 (E) | | | 15 | | | | 15 | |
Cimarex Energy | | | | | | | | |
4.375%,
06/01/2024 (E) | | | 799 | | | | 830 | |
4.375%, 03/15/2029 | | | 1,013 | | | | 1,042 | |
3.900%,
05/15/2027 (E) | | | 666 | | | | 664 | |
CNOOC Finance 2015 USA | | | | | | | | |
4.375%,
05/02/2028 (E) | | | 360 | | | | 385 | |
CNOOC Nexen Finance | | | | | | | | |
4.250%, 04/30/2024 | | | 200 | | | | 209 | |
3.500%, 05/05/2025 | | | 2,210 | | | | 2,234 | |
Concho Resources | | | | | | | | |
4.375%, 01/15/2025 | | | 170 | | | | 175 | |
4.300%, 08/15/2028 | | | 610 | | | | 629 | |
3.750%, 10/01/2027 | | | 50 | | | | 50 | |
Conoco Funding | | | | | | | | |
7.250%, 10/15/2031 | | | 180 | | | | 245 | |
| | | | | | | | |
| | | |
| Description | | Face Amount
(Thousands) | | Market Value
($ Thousands) |
|
CORPORATE OBLIGATIONS (continued) | |
ConocoPhillips | | | | | | | | |
5.900%, 10/15/2032 | | $ | 10 | | | $ | 12 | |
5.900%, 05/15/2038 | | | 420 | | | | 528 | |
4.150%, 11/15/2034 | | | 280 | | | | 287 | |
Continental Resources | | | | | | | | |
4.500%, 04/15/2023 (E) | | | 250 | | | | 259 | |
4.375%, 01/15/2028 | | | 310 | | | | 318 | |
3.800%, 06/01/2024 | | | 250 | | | | 252 | |
Devon Energy | | | | | | | | |
5.850%, 12/15/2025 | | | 990 | | | | 1,123 | |
5.600%, 07/15/2041 | | | 1,055 | | | | 1,163 | |
5.000%, 06/15/2045 (E) | | | 902 | | | | 945 | |
4.750%, 05/15/2042 | | | 37 | | | | 37 | |
3.250%, 05/15/2022 (E) | | | 407 | | | | 411 | |
Devon Financing LLC | | | | | | | | |
7.875%, 09/30/2031 | | | 660 | | | | 863 | |
Diamondback Energy | | | | | | | | |
5.375%, 05/31/2025 (E) | | | 110 | | | | 115 | |
Ecopetrol | | | | | | | | |
5.875%, 05/28/2045 | | | 2,710 | | | | 2,808 | |
4.125%, 01/16/2025 | | | 203 | | | | 205 | |
Enbridge | | | | | | | | |
2.900%, 07/15/2022 | | | 738 | | | | 736 | |
Enbridge Energy Partners | | | | | | | | |
7.375%, 10/15/2045 | | | 199 | | | | 275 | |
Encana | | | | | | | | |
6.625%, 08/15/2037 | | | 322 | | | | 380 | |
6.500%, 02/01/2038 | | | 537 | | | | 630 | |
Energy Transfer Operating | | | | | | | | |
8.250%, 11/15/2029 | | | 1,990 | | | | 2,480 | |
6.500%, 02/01/2042 | | | 238 | | | | 264 | |
6.250%, 04/15/2049 | | | 1,055 | | | | 1,182 | |
6.125%, 12/15/2045 | | | 572 | | | | 622 | |
6.000%, 06/15/2048 | | | 41 | | | | 44 | |
5.500%, 06/01/2027 (E) | | | 934 | | | | 1,012 | |
5.250%, 04/15/2029 | | | 2,086 | | | | 2,237 | |
5.150%, 03/15/2045 (E) | | | 14 | | | | 14 | |
4.950%, 06/15/2028 | | | 110 | | | | 115 | |
4.500%, 04/15/2024 (E) | | | 1,025 | | | | 1,069 | |
Energy Transfer Partners | | | | | | | | |
4.500%, 11/01/2023 | | | 690 | | | | 719 | |
Eni | | | | | | | | |
4.000%, 09/12/2023 (C) | | | 1,940 | | | | 1,990 | |
Enterprise Products Operating | |
5.700%, 02/15/2042 | | | 40 | | | | 47 | |
4.150%, 10/16/2028 (E) | | | 730 | | | | 767 | |
3.750%, 02/15/2025 | | | 346 | | | | 357 | |
EOG Resources | | | | | | | | |
4.150%, 01/15/2026 (E) | | | 320 | | | | 339 | |
2.625%, 03/15/2023 | | | 1,083 | | | | 1,075 | |
EQM Midstream Partners | | | | | | | | |
5.500%, 07/15/2028 | | | 670 | | | | 677 | |
| | |
74 | | SEI Institutional Managed Trust / Semi-Annual Report / March 31, 2019 |
| | | | | | | | |
| | | |
| Description | | Face Amount
(Thousands) | | | Market Value
($ Thousands) | |
|
CORPORATE OBLIGATIONS (continued) | |
Equinor | | | | | | | | |
3.700%, 03/01/2024 | | $ | 565 | | | $ | 591 | |
Exxon Mobil | | | | | | | | |
4.114%, 03/01/2046 | | | 533 | | | | 577 | |
3.043%,
03/01/2026 (E) | | | 660 | | | | 670 | |
2.397%, 03/06/2022 | | | 100 | | | | 100 | |
Florida Gas Transmission | | | | | | | | |
7.900%,
05/15/2019 (C) | | | 1,350 | | | | 1,358 | |
Halliburton | | | | | | | | |
5.000%,
11/15/2045 (E) | | | 80 | | | | 85 | |
4.850%, 11/15/2035 | | | 60 | | | | 63 | |
3.800%, 11/15/2025 | | | 730 | | | | 746 | |
3.500%, 08/01/2023 | | | 50 | | | | 51 | |
Hess | | | | | | | | |
6.000%, 01/15/2040 | | | 880 | | | | 916 | |
HollyFrontier | | | | | | | | |
5.875%, 04/01/2026 | | | 452 | | | | 484 | |
KazMunayGas National JSC | | | | | | | | |
5.750%,
04/19/2047 (C) | | | 340 | | | | 355 | |
5.375%,
04/24/2030 (C) | | | 760 | | | | 796 | |
Kerr-McGee | | | | | | | | |
7.875%, 09/15/2031 | | | 610 | | | | 773 | |
6.950%, 07/01/2024 | | | 298 | | | | 343 | |
Kinder Morgan | | | | | | | | |
5.550%, 06/01/2045 | | | 471 | | | | 514 | |
5.300%, 12/01/2034 | | | 500 | | | | 542 | |
5.200%, 03/01/2048 | | | 775 | | | | 814 | |
5.000%,
02/15/2021 (C) | | | 1,062 | | | | 1,098 | |
4.300%, 06/01/2025 | | | 150 | | | | 156 | |
4.300%, 03/01/2028 | | | 1,150 | | | | 1,188 | |
3.150%,
01/15/2023 (E) | | | 193 | | | | 193 | |
Kinder Morgan Energy Partners | | | | | | | | |
5.500%, 03/01/2044 | | | 615 | | | | 659 | |
3.500%, 03/01/2021 | | | 190 | | | | 192 | |
Marathon Petroleum | | | | | | | | |
4.750%, 09/15/2044 | | | 376 | | | | 374 | |
MPLX | | | | | | | | |
5.500%, 02/15/2049 | | | 854 | | | | 911 | |
5.200%, 03/01/2047 | | | 83 | | | | 84 | |
4.875%,
12/01/2024 (E) | | | 320 | | | | 342 | |
4.800%, 02/15/2029 | | | 330 | | | | 348 | |
4.700%, 04/15/2048 | | | 1,223 | | | | 1,168 | |
4.500%, 04/15/2038 | | | 990 | | | | 940 | |
4.125%, 03/01/2027 | | | 415 | | | | 418 | |
4.000%, 03/15/2028 | | | 440 | | | | 437 | |
Murphy Oil | | | | | | | | |
5.875%, 12/01/2042 | | | 563 | | | | 502 | |
National Oilwell Varco | | | | | | | | |
2.600%, 12/01/2022 | | | 1,025 | | | | 1,005 | |
Newfield Exploration | | | | | | | | |
5.375%,
01/01/2026 (E) | | | 1,134 | | | | 1,222 | |
| | | | | | | | |
| | | |
| Description | | Face Amount
(Thousands) | | | Market Value
($ Thousands) | |
|
CORPORATE OBLIGATIONS (continued) | |
Noble Energy | | | | | | | | |
5.250%, 11/15/2043 | | $ | 260 | | | $ | 265 | |
5.050%,
11/15/2044 (E) | | | 29 | | | | 29 | |
4.950%,
08/15/2047 (E) | | | 240 | | | | 237 | |
4.150%, 12/15/2021 | | | 920 | | | | 942 | |
3.850%, 01/15/2028 | | | 450 | | | | 443 | |
Northwest Pipeline | | | | | | | | |
4.000%, 04/01/2027 | | | 219 | | | | 221 | |
Oasis Petroleum | | | | | | | | |
6.875%,
01/15/2023 (E) | | | 80 | | | | 80 | |
Occidental Petroleum | | | | | | | | |
4.625%, 06/15/2045 | | | 280 | | | | 306 | |
4.400%, 04/15/2046 | | | 140 | | | | 148 | |
4.200%, 03/15/2048 | | | 170 | | | | 177 | |
4.100%, 02/15/2047 | | | 580 | | | | 594 | |
3.500%, 06/15/2025 | | | 45 | | | | 46 | |
3.400%,
04/15/2026 (E) | | | 270 | | | | 276 | |
3.125%,
02/15/2022 (E) | | | 330 | | | | 335 | |
3.000%,
02/15/2027 (E) | | | 350 | | | | 348 | |
2.700%,
02/15/2023 (E) | | | 129 | | | | 129 | |
Panhandle Eastern Pipeline | | | | | | | | |
8.125%, 06/01/2019 | | | 2,000 | | | | 2,014 | |
Pertamina Persero | | | | | | | | |
6.000%,
05/03/2042 (C)(E) | | | 300 | | | | 325 | |
Petrobras Global Finance BV | | | | | | | | |
7.375%, 01/17/2027 | | | 310 | | | | 341 | |
6.900%, 03/19/2049 | | | 1,550 | | | | 1,534 | |
6.850%, 06/05/2115 | | | 820 | | | | 793 | |
6.250%, 03/17/2024 | | | 1,394 | | | | 1,497 | |
6.125%, 01/17/2022 | | | 45 | | | | 47 | |
5.750%, 02/01/2029 | | | 300 | | | | 297 | |
5.299%,
01/27/2025 (E) | | | 1,278 | | | | 1,297 | |
Petroleos del Peru | | | | | | | | |
4.750%,
06/19/2032 (C) | | | 1,220 | | | | 1,252 | |
Petroleos Mexicanos | | | | | | | | |
6.625%, 06/15/2035 | | | 767 | | | | 723 | |
6.500%,
03/13/2027 (E) | | | 1,165 | | | | 1,173 | |
6.500%,
01/23/2029 (C) | | | 1,920 | | | | 1,903 | |
6.375%, 01/23/2045 | | | 990 | | | | 874 | |
6.350%,
02/12/2048 (C) | | | 961 | | | | 847 | |
5.625%,
01/23/2046 (E) | | | 480 | | | | 396 | |
5.500%, 06/27/2044 | | | 120 | | | | 98 | |
5.350%,
02/12/2028 (C) | | | 585 | | | | 543 | |
4.875%, 01/18/2024 | | | 32 | | | | 31 | |
2.460%, 12/15/2025 | | | 1,292 | | | | 1,286 | |
2.378%, 04/15/2025 | | | 660 | | | | 655 | |
Petroleos Mexicanos MTN | | | | | | | | |
6.875%,
08/04/2026 (E) | | | 120 | | | | 125 | |
6.750%, 09/21/2047 | | | 1,104 | | | | 1,013 | |
4.625%, 09/21/2023 | | | 675 | | | | 665 | |
Plains All American Pipeline | | | | | | | | |
4.650%, 10/15/2025 | | | 1,485 | | | | 1,547 | |
| | |
SEI Institutional Managed Trust / Semi-Annual Report / March 31, 2019 | | 75 |
SCHEDULE OF INVESTMENTS (Unaudited)
March 31, 2019
Core Fixed Income Fund(Continued)
| | | | | | | | |
| | | |
| Description | | Face Amount
(Thousands) | | | Market Value
($ Thousands) |
|
CORPORATE OBLIGATIONS (continued) | |
2.850%, 01/31/2023 | | $ | 250 | | | $ | 244 | |
QEP Resources | | | | | | | | |
6.875%, 03/01/2021 | | | 230 | | | | 236 | |
Range Resources | | | | | | | | |
5.875%, 07/01/2022 | | | 10 | | | | 10 | |
5.000%,
03/15/2023 (E) | | | 340 | | | | 333 | |
4.875%,
05/15/2025 (E) | | | 70 | | | | 65 | |
Ruby Pipeline | | | | | | | | |
6.000%,
04/01/2022 (C)(E) | | | 1,472 | | | | 1,438 | |
Sabine Pass Liquefaction | | | | | | | | |
5.750%,
05/15/2024 (E) | | | 1,485 | | | | 1,636 | |
5.625%, 03/01/2025 | | | 1,200 | | | | 1,319 | |
5.000%, 03/15/2027 | | | 690 | | | | 732 | |
Schlumberger Finance Canada | |
2.650%,
11/20/2022 (C)(E) | | | 1,020 | | | | 1,017 | |
Schlumberger Holdings | | | | | | | | |
4.000%,
12/21/2025 (C) | | | 1,737 | | | | 1,791 | |
3.000%,
12/21/2020 (C) | | | 2,690 | | | | 2,701 | |
Schlumberger Investment | | | | | | | | |
3.650%, 12/01/2023 | | | 61 | | | | 63 | |
3.300%,
09/14/2021 (C) | | | 47 | | | | 48 | |
Shell International Finance BV | |
4.550%, 08/12/2043 | | | 280 | | | | 312 | |
4.375%, 03/25/2020 | | | 830 | | | | 844 | |
4.375%, 05/11/2045 | | | 795 | | | | 868 | |
4.125%,
05/11/2035 (E) | | | 1,761 | | | | 1,876 | |
4.000%,
05/10/2046 (E) | | | 180 | | | | 187 | |
3.500%, 11/13/2023 | | | 579 | | | | 599 | |
3.250%, 05/11/2025 | | | 738 | | | | 752 | |
2.875%,
05/10/2026 (E) | | | 900 | | | | 896 | |
2.125%, 05/11/2020 | | | 56 | | | | 56 | |
Sinopec Group Overseas Development | |
4.375%,
04/10/2024 (C) | | | 1,240 | | | | 1,301 | |
Southern Natural Gas LLC | | | | | | | | |
8.000%, 03/01/2032 | | | 170 | | | | 231 | |
Spectra Energy Partners | | | | | | | | |
5.950%, 09/25/2043 | | | 30 | | | | 35 | |
3.500%, 03/15/2025 | | | 815 | | | | 815 | |
Sunoco Logistics Partners Operations | | | | | | | | |
5.400%, 10/01/2047 | | | 1,833 | | | | 1,831 | |
Targa Resources Partners | | | | | | | | |
6.875%,
01/15/2029 (C)(E) | | | 220 | | | | 239 | |
6.500%,
07/15/2027 (C) | | | 170 | | | | 183 | |
5.875%,
04/15/2026 (C) | | | 150 | | | | 159 | |
5.375%,
02/01/2027 (E) | | | 50 | | | | 51 | |
4.250%, 11/15/2023 | | | 140 | | | | 139 | |
TC PipeLines | | | | | | | | |
3.900%,
05/25/2027 (E) | | | 2,400 | | | | 2,373 | |
Tennessee Gas Pipeline LLC | | | | | | | | |
8.375%, 06/15/2032 | | | 2,143 | | | | 2,826 | |
TransCanada PipeLines | | | | | | | | |
4.625%, 03/01/2034 | | | 1,185 | | | | 1,247 | |
| | | | | | | | |
| | | |
| Description | | Face Amount
(Thousands) | | | Market Value
($ Thousands) |
|
CORPORATE OBLIGATIONS (continued) | |
Transcontinental Gas Pipe Line | |
7.850%, 02/01/2026 | | $ | 1,070 | | | $ | 1,338 | |
Western Midstream Operating | | | | | | | | |
5.500%, 08/15/2048 | | | 54 | | | | 53 | |
5.375%, 06/01/2021 | | | 25 | | | | 26 | |
5.300%, 03/01/2048 | | | 162 | | | | 153 | |
4.650%, 07/01/2026 | | | 40 | | | | 41 | |
4.000%, 07/01/2022 | | | 35 | | | | 35 | |
Whiting Petroleum | | | | | | | | |
5.750%,
03/15/2021 (E) | | | 220 | | | | 222 | |
Williams | | | | | | | | |
7.875%, 09/01/2021 | | | 735 | | | | 812 | |
7.750%, 06/15/2031 | | | 841 | | | | 1,071 | |
7.500%,
01/15/2031 (E) | | | 100 | | | | 126 | |
5.750%, 06/24/2044 | | | 263 | | | | 289 | |
5.400%,
03/04/2044 (E) | | | 84 | | | | 89 | |
5.250%, 03/15/2020 | | | 230 | | | | 235 | |
4.550%, 06/24/2024 | | | 1,454 | | | | 1,535 | |
4.500%, 11/15/2023 | | | 45 | | | | 47 | |
3.900%, 01/15/2025 | | | 750 | | | | 766 | |
3.750%,
06/15/2027 (E) | | | 124 | | | | 123 | |
3.700%, 01/15/2023 | | | 261 | | | | 266 | |
3.600%, 03/15/2022 | | | 600 | | | | 609 | |
WPX Energy | |
8.250%, 08/01/2023 | | | 50 | | | | 56 | |
6.000%, 01/15/2022 | | | 10 | | | | 11 | |
| | | | | | | | |
| | | | | | | 139,373 | |
| | | | | | | | |
| | |
Financials — 8.5% | | | | | | | | |
ABN AMRO Bank | | | | | | | | |
4.750%,
07/28/2025 (C) | | | 360 | | | | 374 | |
AIB Group MTN | | | | | | | | |
4.750%,
10/12/2023 (C) | | | 1,067 | | | | 1,102 | |
Ally Financial | | | | | | | | |
7.500%,
09/15/2020 (E) | | | 526 | | | | 558 | |
Ambac Assurance | | | | | | | | |
5.100%,
06/07/2020 (C) | | | 8 | | | | 12 | |
Ambac LSNI | | | | | | | | |
7.592%, VAR ICE LIBOR USD 3 Month+5.000%, 02/12/2023 (C) | | | 37 | | | | 37 | |
American Express | | | | | | | | |
3.700%, 08/03/2023 | | | 381 | | | | 390 | |
3.400%, 02/27/2023 | | | 414 | | | | 420 | |
2.500%, 08/01/2022 | | | 1,825 | | | | 1,804 | |
American Express Credit MTN | | | | | | | | |
2.375%, 05/26/2020 | | | 554 | | | | 552 | |
2.250%, 08/15/2019 | | | 190 | | | | 190 | |
American International Group | | | | | | | | |
6.250%, 05/01/2036 | | | 397 | | | | 456 | |
6.250%, VAR ICE LIBOR USD 3 Month+2.056%, 03/15/2037 | | | 1,220 | | | | 1,208 | |
4.750%, 04/01/2048 | | | 130 | | | | 129 | |
| | |
76 | | SEI Institutional Managed Trust / Semi-Annual Report / March 31, 2019 |
| | | | | | | | |
| | | |
| Description | | Face Amount
(Thousands) | | | Market Value
($ Thousands) | |
|
CORPORATE OBLIGATIONS (continued) | |
4.500%, 07/16/2044 | | $ | 296 | | | $ | 284 | |
4.375%, 01/15/2055 | | | 268 | | | | 240 | |
4.200%, 04/01/2028 (E) | | | 662 | | | | 673 | |
4.125%, 02/15/2024 | | | 107 | | | | 110 | |
3.900%, 04/01/2026 | | | 850 | | | | 855 | |
3.875%, 01/15/2035 | | | 30 | | | | 28 | |
Aon | | | | | | | | |
6.250%, 09/30/2040 | | | 19 | | | | 23 | |
3.500%, 06/14/2024 | | | 65 | | | | 66 | |
Apollo Management Holdings | | | | | | | | |
5.000%, 03/15/2048 (C) | | | 885 | | | | 875 | |
4.400%, 05/27/2026 (C) | | | 555 | | | | 562 | |
Athene Global Funding | | | | | | | | |
2.750%, 04/20/2020 (C) | | | 1,090 | | | | 1,087 | |
Athene Holding | | | | | | | | |
4.125%, 01/12/2028 | | | 820 | | | | 788 | |
AXA Equitable Holdings | | | | | | | | |
3.900%, 04/20/2023 | | | 770 | | | | 789 | |
Banco Santander | | | | | | | | |
4.379%, 04/12/2028 | | | 1,400 | | | | 1,416 | |
3.917%, VAR ICE LIBOR USD 3 Month+1.120%, 04/12/2023 | | | 400 | | | | 395 | |
3.848%, 04/12/2023 | | | 600 | | | | 605 | |
3.800%, 02/23/2028 | | | 1,400 | | | | 1,357 | |
Bank of America | | | | | | | | |
6.250%, VAR ICE LIBOR USD 3 Month+3.705%, 09/29/2049 | | | 510 | | | | 541 | |
6.100%, VAR ICE LIBOR USD 3 Month+3.898%, 12/29/2049 | | | 210 | | | | 222 | |
3.946%, VAR ICE LIBOR USD 3 Month+1.190%, 01/23/2049 | | | 570 | | | | 557 | |
3.419%, VAR ICE LIBOR USD 3 Month+1.040%, 12/20/2028 | | | 7,426 | | | | 7,262 | |
3.004%, VAR ICE LIBOR USD 3 Month+0.790%, 12/20/2023 | | | 5,660 | | | | 5,637 | |
Bank of America MTN | | | | | | | | |
5.000%, 01/21/2044 | | | 1,010 | | | | 1,135 | |
4.450%, 03/03/2026 | | | 847 | | | | 883 | |
4.330%, VAR ICE LIBOR USD 3 Month+1.520%, 03/15/2050 (E) | | | 875 | | | | 900 | |
4.271%, VAR ICE LIBOR USD 3 Month+1.310%, 07/23/2029 | | | 1,585 | | | | 1,650 | |
4.244%, VAR ICE LIBOR USD 3 Month+1.814%, 04/24/2038 | | | 562 | | | | 575 | |
4.200%, 08/26/2024 (E) | | | 1,530 | | | | 1,584 | |
4.125%, 01/22/2024 (E) | | | 290 | | | | 304 | |
4.100%, 07/24/2023 (E) | | | 340 | | | | 355 | |
4.000%, 04/01/2024 | | | 2,661 | | | | 2,776 | |
4.000%, 01/22/2025 | | | 1,493 | | | | 1,523 | |
3.974%, VAR ICE LIBOR USD 3 Month+1.210%, 02/07/2030 | | | 2,226 | | | | 2,269 | |
3.864%, VAR ICE LIBOR USD 3 Month+0.940%, 07/23/2024 | | | 1,751 | | | | 1,801 | |
| | | | | | | | |
| | | |
| Description | | Face Amount
(Thousands) | | | Market Value
($ Thousands) | |
|
CORPORATE OBLIGATIONS (continued) | |
3.824%, VAR ICE LIBOR USD 3 Month+1.575%, 01/20/2028 | | $ | 524 | | | $ | 531 | |
3.705%, VAR ICE LIBOR USD 3 Month+1.512%, 04/24/2028 | | | 1,393 | | | | 1,399 | |
3.593%, VAR ICE LIBOR USD 3 Month+1.370%, 07/21/2028 | | | 2,464 | | | | 2,457 | |
3.550%, VAR ICE LIBOR USD 3 Month+0.780%, 03/05/2024 | | | 860 | | | | 873 | |
3.500%, 04/19/2026 (E) | | | 780 | | | | 787 | |
3.499%, VAR ICE LIBOR USD 3 Month+0.630%, 05/17/2022 | | | 775 | | | | 784 | |
3.458%, VAR ICE LIBOR USD 3 Month+0.970%, 03/15/2025 | | | 2,570 | | | | 2,596 | |
3.300%, 01/11/2023 (E) | | | 1,995 | | | | 2,020 | |
3.248%, 10/21/2027 | | | 26 | | | | 25 | |
3.093%, VAR ICE LIBOR USD 3 Month+1.090%, 10/01/2025 | | | 2,145 | | | | 2,127 | |
2.250%, 04/21/2020 | | | 100 | | | | 99 | |
Bank of New York Mellon | | | | | | | | |
3.550%, 09/23/2021 | | | 34 | | | | 34 | |
3.400%, 05/15/2024 | | | 1,945 | | | | 1,987 | |
Bank of New York Mellon MTN | |
4.600%, 01/15/2020 | | | 40 | | | | 41 | |
3.250%, 09/11/2024 | | | 100 | | | | 101 | |
2.661%, VAR ICE LIBOR USD 3 Month+0.634%, 05/16/2023 | | | 685 | | | | 682 | |
2.500%, 04/15/2021 | | | 327 | | | | 326 | |
Bank of Nova Scotia | | | | | | | | |
3.125%, 04/20/2021 | | | 1,590 | | | | 1,601 | |
1.850%, 04/14/2020 | | | 160 | | | | 159 | |
Barclays | | | | | | | | |
4.610%, VAR ICE LIBOR USD 3 Month+1.400%, 02/15/2023 | | | 960 | | | | 980 | |
Barclays MTN | | | | | | | | |
4.972%, VAR ICE LIBOR USD 3 Month+1.902%, 05/16/2029 | | | 1,215 | | | | 1,256 | |
4.338%, VAR ICE LIBOR USD 3 Month+1.356%, 05/16/2024 | | | 700 | | | | 708 | |
BB&T | | | | | | | | |
5.250%, 11/01/2019 | | | 200 | | | | 203 | |
BB&T MTN | | | | | | | | |
3.875%, 03/19/2029 | | | 1,898 | | | | 1,917 | |
3.050%, 06/20/2022 | | | 1,201 | | | | 1,208 | |
Berkshire Hathaway | | | | | | | | |
3.750%, 08/15/2021 | | | 500 | | | | 515 | |
Berkshire Hathaway Finance | | | | | | | | |
4.400%, 05/15/2042 | | | 1,000 | | | | 1,068 | |
4.250%, 01/15/2049 | | | 870 | | | | 911 | |
4.200%, 08/15/2048 | | | 2,100 | | | | 2,176 | |
BGC Partners | | | | | | | | |
5.375%, 07/24/2023 | | | 355 | | | | 366 | |
| | |
SEI Institutional Managed Trust / Semi-Annual Report / March 31, 2019 | | 77 |
SCHEDULE OF INVESTMENTS (Unaudited)
March 31, 2019
Core Fixed Income Fund(Continued)
| | | | | | | | |
| | | |
| Description | | Face Amount
(Thousands) | | | Market Value
($ Thousands) | |
|
CORPORATE OBLIGATIONS (continued) | |
BNP Paribas | | | | | | | | |
6.625%, VAR USD Swap Semi 30/360 5 Yr Curr+4.149%, 09/25/2167 (C) | | $ | 670 | | | $ | 669 | |
5.198%, VAR ICE LIBOR USD 3 Month+2.567%, 01/10/2030 (C)(E) | | | 900 | | | | 972 | |
4.705%, VAR ICE LIBOR USD 3 Month+2.235%, 01/10/2025 (C)(E) | | | 1,970 | | | | 2,043 | |
4.625%, 03/13/2027 (C) | | | 200 | | | | 205 | |
4.400%, 08/14/2028 (C)(E) | | | 1,447 | | | | 1,489 | |
3.375%, 01/09/2025 (C) | | | 290 | | | | 284 | |
BNP Paribas MTN | | | | | | | | |
4.375%, VAR USD Swap Semi 30/360 5 Yr Curr+1.483%, 03/01/2033 (C) | | | 600 | | | | 590 | |
3.500%, 03/01/2023 (C) | | | 464 | | | | 464 | |
Boeing Capital | | | | | | | | |
4.700%, 10/27/2019 | | | 490 | | | | 495 | |
BPCE | | | | | | | | |
5.150%, 07/21/2024 (C) | | | 410 | | | | 428 | |
Brighthouse Financial | | | | | | | | |
3.700%, 06/22/2027 | | | 358 | | | | 325 | |
Canadian Imperial Bank of Commerce | | | | | | | | |
3.500%, 09/13/2023 | | | 1,330 | | | | 1,362 | |
3.100%, 04/02/2024 | | | 1,913 | | | | 1,908 | |
Capital One Financial | | | | | | | | |
4.250%, 04/30/2025 | | | 807 | | | | 838 | |
3.800%, 01/31/2028 | | | 345 | | | | 340 | |
Chubb INA Holdings | | | | | | | | |
3.350%, 05/03/2026 | | | 200 | | | | 203 | |
3.150%, 03/15/2025 | | | 74 | | | | 75 | |
2.875%, 11/03/2022 | | | 39 | | | | 39 | |
2.300%, 11/03/2020 | | | 210 | | | | 209 | |
CIT Group | | | | | | | | |
5.250%, 03/07/2025 | | | 140 | | | | 149 | |
4.750%, 02/16/2024 | | | 450 | | | | 467 | |
Citibank | | | | | | | | |
2.100%, 06/12/2020 | | | 3,995 | | | | 3,966 | |
Citigroup | | | | | | | | |
8.500%, 05/22/2019 | | | 460 | | | | 464 | |
8.125%, 07/15/2039 | | | 1,214 | | | | 1,825 | |
6.675%, 09/13/2043 | | | 70 | | | | 89 | |
6.625%, 06/15/2032 | | | 100 | | | | 123 | |
6.300%, VAR ICE LIBOR USD 3 Month+3.423%, 12/29/2049 | | | 520 | | | | 529 | |
5.950%, VAR ICE LIBOR USD 3 Month+3.905%, 12/31/2049 | | | 1,250 | | | | 1,275 | |
5.950%, VAR ICE LIBOR USD 3 Month+4.068%, 12/29/2049 | | | 360 | | | | 366 | |
5.900%, VAR ICE LIBOR USD 3 Month+4.230%, 12/31/2049 | | | 140 | | | | 143 | |
5.500%, 09/13/2025 (E) | | | 950 | | | | 1,041 | |
5.350%, VAR ICE LIBOR USD 3 Month+3.466%, 05/29/2049 | | | 390 | | | | 384 | |
5.300%, 05/06/2044 | | | 225 | | | | 248 | |
| | | | | | | | |
| | | |
| Description | | Face Amount
(Thousands) | | | Market Value
($ Thousands) | |
|
CORPORATE OBLIGATIONS (continued) | |
4.750%, 05/18/2046 (E) | | $ | 100 | | | $ | 104 | |
4.650%, 07/30/2045 | | | 903 | | | | 960 | |
4.650%, 07/23/2048 | | | 1,350 | | | | 1,447 | |
4.500%, 01/14/2022 | | | 380 | | | | 396 | |
4.450%, 09/29/2027 | | | 1,815 | | | | 1,865 | |
4.400%, 06/10/2025 | | | 1,080 | | | | 1,118 | |
4.300%, 11/20/2026 (E) | | | 240 | | | | 244 | |
4.125%, 07/25/2028 (E) | | | 210 | | | | 211 | |
4.075%, VAR ICE LIBOR USD 3 Month+1.192%, 04/23/2029 | | | 81 | | | | 83 | |
4.050%, 07/30/2022 | | | 70 | | | | 72 | |
3.980%, VAR ICE LIBOR USD 3 Month+1.338%, 03/20/2030 | | | 2,881 | | | | 2,929 | |
3.887%, VAR ICE LIBOR USD 3 Month+1.563%, 01/10/2028 | | | 69 | | | | 70 | |
3.878%, VAR ICE LIBOR USD 3 Month+1.168%, 01/24/2039 (E) | | | 59 | | | | 57 | |
3.700%, 01/12/2026 | | | 1,500 | | | | 1,524 | |
3.668%, VAR ICE LIBOR USD 3 Month+1.390%, 07/24/2028 | | | 1,355 | | | | 1,351 | |
3.500%, 05/15/2023 (E) | | | 630 | | | | 639 | |
3.400%, 05/01/2026 | | | 260 | | | | 258 | |
3.300%, 04/27/2025 (E) | | | 120 | | | | 120 | |
3.200%, 10/21/2026 | | | 2,787 | | | | 2,730 | |
3.142%, VAR ICE LIBOR USD 3 Month+0.722%, 01/24/2023 | | | 1,935 | | | | 1,942 | |
CME Group | | | | | | | | |
3.000%, 03/15/2025 | | | 51 | | | | 51 | |
Commonwealth Bank of Australia MTN | |
5.000%, 10/15/2019 (C) | | | 10 | | | | 10 | |
3.900%, 07/12/2047 (C) | | | 210 | | | | 211 | |
Compass Bank | | | | | | | | |
3.875%, 04/10/2025 | | | 430 | | | | 426 | |
Cooperatieve Rabobank UA | | | | | | | | |
11.000%, VAR ICE LIBOR USD 3 Month+10.868%, 12/31/2167 (C) | | | 920 | | | | 937 | |
5.250%, 08/04/2045 | | | 310 | | | | 350 | |
4.625%, 12/01/2023 (E) | | | 1,630 | | | | 1,703 | |
4.375%, 08/04/2025 | | | 2,150 | | | | 2,216 | |
Cooperatieve Rabobank UA MTN | |
4.750%, 01/15/2020 (C) | | | 730 | | | | 741 | |
3.875%, 02/08/2022 | | | 30 | | | | 31 | |
Credit Agricole | | | | | | | | |
8.375%, VAR ICE LIBOR USD 3 Month+6.982%, 04/13/2167 (C) | | | 1,260 | | | | 1,291 | |
Credit Agricole MTN | | | | | | | | |
4.000%, VAR USD Swap Semi 30/360 5 Yr Curr+1.644%, 01/10/2033 (C) | | | 500 | | | | 483 | |
2.500%, 04/15/2019 (C) | | | 250 | | | | 250 | |
Credit Suisse Group | | | | | | | | |
4.207%, VAR ICE LIBOR USD 3 Month+1.240%, 06/12/2024 (C) | | | 1,085 | | | | 1,111 | |
| | |
78 | | SEI Institutional Managed Trust / Semi-Annual Report / March 31, 2019 |
| | | | | | | | |
| | | |
| Description | | Face Amount
(Thousands) | | Market Value
($ Thousands) |
| |
CORPORATE OBLIGATIONS (continued) | | | | | |
3.869%, VAR ICE LIBOR USD 3 Month+1.410%, 01/12/2029 (C) | | $ | 250 | | | $ | 245 | |
Credit Suisse Group Funding Guernsey | | | | | |
4.875%, 05/15/2045 (E) | | | 1,920 | | | | 2,083 | |
Danske Bank | | | | | | | | |
5.375%, 01/12/2024 (C) | | | 650 | | | | 676 | |
5.000%, 01/12/2022 (C) | | | 600 | | | | 615 | |
3.875%, 09/12/2023 (C) | | | 1,010 | | | | 992 | |
Danske Bank MTN | | | | | | | | |
4.375%, 06/12/2028 (C) | | | 200 | | | | 192 | |
Discover Bank | | | | | | | | |
4.650%, 09/13/2028 | | | 875 | | | | 914 | |
Farmers Exchange Capital | | | | | | | | |
7.200%, 07/15/2048 (C) | | | 1,021 | | | | 1,203 | |
7.050%, 07/15/2028 (C) | | | 1,000 | | | | 1,149 | |
Farmers Exchange Capital II | | | | | | | | |
6.151%, VAR ICE LIBOR USD 3 Month+3.744%, 11/01/2053 (C) | | | 1,650 | | | | 1,729 | |
Fifth Third Bancorp | | | | | | | | |
3.650%, 01/25/2024 | | | 1,000 | | | | 1,024 | |
Fifth Third Bank | | | | | | | | |
3.950%, 07/28/2025 | | | 339 | | | | 355 | |
2.875%, 10/01/2021 | | | 730 | | | | 731 | |
First Union Capital II | | | | | | | | |
7.950%, 11/15/2029 | | | 295 | | | | 380 | |
General Electric MTN | | | | | | | | |
6.750%, 03/15/2032 | | | 130 | | | | 150 | |
Goldman Sachs Capital II | | | | | | | | |
4.000%, VAR ICE LIBOR USD 3 Month+0.768%, 06/01/2043 | | | 10 | | | | 8 | |
Goldman Sachs Group | | | | | | | | |
6.750%, 10/01/2037 | | | 30 | | | | 37 | |
6.250%, 02/01/2041 | | | 1,050 | | | | 1,295 | |
5.750%, 01/24/2022 (E) | | | 110 | | | | 118 | |
5.250%, 07/27/2021 | | | 740 | | | | 777 | |
5.150%, 05/22/2045 | | | 960 | | | | 1,015 | |
4.750%, 10/21/2045 (E) | | | 920 | | | | 978 | |
4.411%, VAR ICE LIBOR USD 3 Month+1.430%, 04/23/2039 | | | 1,207 | | | | 1,209 | |
4.250%, 10/21/2025 (E) | | | 1,120 | | | | 1,146 | |
4.223%, VAR ICE LIBOR USD 3 Month+1.301%, 05/01/2029 | | | 1,885 | | | | 1,926 | |
3.814%, VAR ICE LIBOR USD 3 Month+1.158%, 04/23/2029 | | | 4,320 | | | | 4,280 | |
3.750%, 02/25/2026 | | | 560 | | | | 562 | |
3.691%, VAR ICE LIBOR USD 3 Month+1.510%, 06/05/2028 | | | 1,380 | | | | 1,367 | |
3.625%, 02/20/2024 (E) | | | 343 | | | | 347 | |
3.500%, 11/16/2026 | | | 2,106 | | | | 2,078 | |
3.272%, VAR ICE LIBOR USD 3 Month+1.201%, 09/29/2025 | | | 4,450 | | | | 4,393 | |
3.200%, 02/23/2023 | | | 470 | | | | 471 | |
| | | | | | | | |
| | | |
| Description | | Face Amount
(Thousands) | | Market Value
($ Thousands) |
| |
CORPORATE OBLIGATIONS (continued) | | | | | |
2.876%, VAR ICE LIBOR USD 3 Month+0.821%, 10/31/2022 | | $ | 379 | | | $ | 376 | |
2.750%, 09/15/2020 | | | 35 | | | | 35 | |
Goldman Sachs Group MTN | | | | | | | | |
6.000%, 06/15/2020 | | | 1,050 | | | | 1,089 | |
5.375%, 03/15/2020 | | | 2,530 | | | | 2,589 | |
4.515%, VAR ICE LIBOR USD 3 Month+1.750%, 10/28/2027 | | | 1,470 | | | | 1,485 | |
4.000%, 03/03/2024 (E) | | | 1,090 | | | | 1,124 | |
3.850%, 07/08/2024 (E) | | | 951 | | | | 969 | |
2.905%, VAR ICE LIBOR USD 3 Month+0.990%, 07/24/2023 | | | 880 | | | | 870 | |
Guardian Life Global Funding | | | | | | | | |
1.950%, 10/27/2021 (C) | | | 935 | | | | 911 | |
HSBC Bank | | | | | | | | |
7.650%, 05/01/2025 | | | 340 | | | | 402 | |
HSBC Bank PLC | | | | | | | | |
4.750%, 01/19/2021 (C) | | | 1,760 | | | | 1,814 | |
4.125%, 08/12/2020 (C) | | | 100 | | | | 102 | |
HSBC Bank USA NY | | | | | | | | |
5.875%, 11/01/2034 | | | 610 | | | | 729 | |
HSBC Holdings | | | | | | | | |
4.875%, 01/14/2022 | | | 100 | | | | 105 | |
4.583%, VAR ICE LIBOR USD 3 Month+1.535%, 06/19/2029 | | | 3,606 | | | | 3,791 | |
4.375%, 11/23/2026 | | | 345 | | | | 353 | |
4.300%, 03/08/2026 | | | 1,710 | | | | 1,774 | |
4.250%, 03/14/2024 | | | 510 | | | | 522 | |
4.250%, 08/18/2025 | | | 760 | | | | 776 | |
4.000%, 03/30/2022 (E) | | | 536 | | | | 552 | |
3.950%, VAR ICE LIBOR USD 3 Month+0.987%, 05/18/2024 | | | 610 | | | | 622 | |
3.803%, VAR ICE LIBOR USD 3 Month+1.211%, 03/11/2025 | | | 2,483 | | | | 2,517 | |
3.400%, 03/08/2021 | | | 1,910 | | | | 1,927 | |
2.650%, 01/05/2022 | | | 200 | | | | 198 | |
HSBC USA | | | | | | | | |
2.350%, 03/05/2020 | | | 100 | | | | 100 | |
ILFC E-Capital Trust II | | | | | | | | |
4.850%, VAR N/A+1.800%, 12/21/2065 (C) | | | 400 | | | | 314 | |
ING Bank | | | | | | | | |
5.800%, 09/25/2023 (C) | | | 2,220 | | | | 2,393 | |
Intercontinental Exchange | | | | | | | | |
4.000%, 10/15/2023 | | | 65 | | | | 68 | |
Intesa Sanpaolo | | | | | | | | |
3.375%, 01/12/2023 (C) | | | 440 | | | | 430 | |
3.125%, 07/14/2022 (C) | | | 600 | | | | 584 | |
Intesa Sanpaolo MTN | | | | | | | | |
5.017%, 06/26/2024 (C) | | | 2,320 | | | | 2,242 | |
John Deere Capital | | | | | | | | |
1.700%, 01/15/2020 | | | 160 | | | | 159 | |
| | |
SEI Institutional Managed Trust / Semi-Annual Report / March 31, 2019 | | 79 |
SCHEDULE OF INVESTMENTS (Unaudited)
March 31, 2019
Core Fixed Income Fund(Continued)
| | | | | | | | |
| | | |
| Description | | Face Amount
(Thousands) | | Market Value
($ Thousands) |
| |
CORPORATE OBLIGATIONS (continued) | | | | | |
JPMorgan Chase | | | | | | | | |
8.750%, 09/01/2030 | | $ | 320 | | | $ | 437 | |
4.950%, 06/01/2045 | | | 180 | | | | 199 | |
4.500%, 01/24/2022 | | | 840 | | | | 879 | |
4.452%, VAR ICE LIBOR USD 3 Month+1.330%, 12/05/2029 | | | 870 | | | | 926 | |
4.400%, 07/22/2020 | | | 210 | | | | 215 | |
4.350%, 08/15/2021 | | | 160 | | | | 166 | |
4.260%, VAR ICE LIBOR USD 3 Month+1.580%, 02/22/2048 | | | 84 | | | | 86 | |
4.250%, 10/15/2020 | | | 330 | | | | 337 | |
4.250%, 10/01/2027 | | | 720 | | | | 748 | |
4.203%, VAR ICE LIBOR USD 3 Month+1.260%, 07/23/2029 | | | 1,800 | | | | 1,878 | |
4.125%, 12/15/2026 (E) | | | 520 | | | | 537 | |
4.032%, VAR ICE LIBOR USD 3 Month+1.460%, 07/24/2048 | | | 795 | | | | 785 | |
4.023%, VAR ICE LIBOR USD 3 Month+1.000%, 12/05/2024 | | | 6,909 | | | | 7,170 | |
4.005%, VAR ICE LIBOR USD 3 Month+1.120%, 04/23/2029 | | | 685 | | | | 704 | |
3.900%, 07/15/2025 (E) | | | 2,490 | | | | 2,587 | |
3.882%, VAR ICE LIBOR USD 3 Month+1.360%, 07/24/2038 | | | 1,577 | | | | 1,546 | |
3.875%, 09/10/2024 (E) | | | 2,080 | | | | 2,132 | |
3.625%, 05/13/2024 | | | 230 | | | | 236 | |
3.625%, 12/01/2027 | | | 360 | | | | 358 | |
3.540%, VAR ICE LIBOR USD 3 Month+1.380%, 05/01/2028 | | | 1,000 | | | | 1,001 | |
3.250%, 09/23/2022 | | | 285 | | | | 289 | |
3.220%, VAR ICE LIBOR USD 3 Month+1.155%, 03/01/2025 | | | 4,605 | | | | 4,604 | |
3.207%, VAR ICE LIBOR USD 3 Month+0.695%, 04/01/2023 | | | 2,225 | | | | 2,238 | |
3.200%, 01/25/2023 | | | 100 | | | | 101 | |
2.950%, 10/01/2026 | | | 377 | | | | 368 | |
2.776%, VAR ICE LIBOR USD 3 Month+0.935%, 04/25/2023 | | | 1,600 | | | | 1,591 | |
2.700%, 05/18/2023 | | | 1,180 | | | | 1,168 | |
KeyBank | | | | | | | | |
3.300%, 02/01/2022 | | | 475 | | | | 483 | |
KKR Group Finance II | | | | | | | | |
5.500%, 02/01/2043 (C) | | | 80 | | | | 86 | |
KKR Group Finance III | | | | | | | | |
5.125%, 06/01/2044 (C) | | | 615 | | | | 629 | |
Lazard Group | | | | | | | | |
4.500%, 09/19/2028 | | | 707 | | | | 728 | |
4.375%, 03/11/2029 | | | 108 | | | | 109 | |
Liberty Mutual Group | | | | | | | | |
4.569%, 02/01/2029 (C) | | | 964 | | | | 1,002 | |
4.250%, 06/15/2023 (C) | | | 77 | | | | 80 | |
Lloyds Bank | | | | | | | | |
3.300%, 05/07/2021 | | | 710 | | | | 716 | |
| | | | | | | | |
| | | |
| Description | | Face Amount
(Thousands) | | Market Value
($ Thousands) |
| |
CORPORATE OBLIGATIONS (continued) | | | | | |
Lloyds Banking Group | | | | | | | | |
4.550%, 08/16/2028 (E) | | $ | 260 | | | $ | 269 | |
4.375%, 03/22/2028 (E) | | | 1,125 | | | | 1,152 | |
4.344%, 01/09/2048 | | | 558 | | | | 501 | |
4.050%, 08/16/2023 | | | 200 | | | | 204 | |
3.900%, 03/12/2024 (E) | | | 1,609 | | | | 1,630 | |
3.574%, VAR ICE LIBOR USD 3 Month+1.205%, 11/07/2028 | | | 200 | | | | 192 | |
3.100%, 07/06/2021 | | | 490 | | | | 490 | |
2.907%, VAR ICE LIBOR USD 3 Month+0.810%, 11/07/2023 | | | 1,915 | | | | 1,868 | |
Lloyds TSB Bank MTN | | | | | | | | |
5.800%, 01/13/2020 (C) | | | 310 | | | | 317 | |
Macquarie Group | | | | | | | | |
6.250%, 01/14/2021 (C) | | | 166 | | | | 175 | |
Massachusetts Mutual Life Insurance | |
8.875%, 06/01/2039 (C) | | | 55 | | | | 86 | |
MetLife | | | | | | | | |
6.400%, 12/15/2036 (E) | | | 420 | | | | 450 | |
5.700%, 06/15/2035 | | | 15 | | | | 18 | |
MetLife Capital Trust IV | | | | | | | | |
7.875%, 12/15/2037 (C) | | | 800 | | | | 976 | |
Metropolitan Life Global Funding I | | | | | |
3.450%, 12/18/2026 (C) | | | 1,955 | | | | 1,991 | |
2.400%, 01/08/2021 (C) | | | 890 | | | | 885 | |
Mitsubishi UFJ Financial Group | | | | | | | | |
3.407%, 03/07/2024 | | | 1,565 | | | | 1,593 | |
3.218%, 03/07/2022 | | | 635 | | | | 640 | |
2.998%, 02/22/2022 | | | 230 | | | | 231 | |
Morgan Stanley MTN | | | | | | | | |
7.300%, 05/13/2019 | | | 240 | | | | 241 | |
5.625%, 09/23/2019 | | | 150 | | | | 152 | |
4.431%, VAR ICE LIBOR USD 3 Month+1.628%, 01/23/2030 (E) | | | 1,215 | | | | 1,280 | |
3.971%, VAR ICE LIBOR USD 3 Month+1.455%, 07/22/2038 | | | 119 | | | | 117 | |
3.875%, 04/29/2024 | | | 465 | | | | 478 | |
3.772%, VAR ICE LIBOR USD 3 Month+1.140%, 01/24/2029 | | | 1,450 | | | | 1,455 | |
3.691%, VAR ICE LIBOR USD 3 Month+0.930%, 07/22/2022 | | | 3,045 | | | | 3,061 | |
3.125%, 01/23/2023 | | | 1,120 | | | | 1,124 | |
3.125%, 07/27/2026 | | | 190 | | | | 185 | |
2.750%, 05/19/2022 | | | 5 | | | | 5 | |
2.625%, 11/17/2021 | | | 2,791 | | | | 2,778 | |
2.500%, 04/21/2021 | | | 280 | | | | 278 | |
MUFG Bank | | | | | | | | |
4.100%, 09/09/2023 (C) | | | 200 | | | | 208 | |
National City | | | | | | | | |
6.875%, 05/15/2019 | | | 50 | | | | 50 | |
Nationwide Building Society | | | | | | | | |
4.363%, VAR ICE LIBOR USD 3 Month+1.392%, 08/01/2024 (C) | | | 300 | | | | 305 | |
| | |
80 | | SEI Institutional Managed Trust / Semi-Annual Report / March 31, 2019 |
| | | | | | | | |
| | | |
| Description | | Face Amount
(Thousands) | | Market Value
($ Thousands) |
| |
CORPORATE OBLIGATIONS (continued) | | | | | |
Nationwide Mutual Insurance | | | | | | | | |
4.901%, VAR ICE LIBOR USD 3 Month+2.290%, 12/15/2024 (C) | | $ | 3,735 | | | $ | 3,712 | |
New York Life Global Funding | | | | | | | | |
2.150%, 06/18/2019 (C) | | | 73 | | | | 73 | |
New York Life Insurance | | | | | | | | |
6.750%, 11/15/2039 (C) | | | 390 | | | | 535 | |
Nordea Bank Abp | | | | | | | | |
4.875%, 05/13/2021 (C) | | | 250 | | | | 256 | |
Northwestern Mutual Life Insurance | | | | | | | | |
6.063%, 03/30/2040 (C) | | | 892 | | | | 1,140 | |
Ontario Teachers’ Cadillac Fairview Properties Trust | | | | | | | | |
4.125%, 02/01/2029 (C) | | | 430 | | | | 451 | |
Pipeline Funding | | | | | | | | |
7.500%, 01/15/2030 (C) | | | 423 | | | | 506 | |
PNC Bank | | | | | | | | |
3.500%, 06/08/2023 | | | 464 | | | | 477 | |
1.450%, 07/29/2019 | | | 1,000 | | | | 996 | |
PNC Financial Services Group | | | | | | | | |
3.500%, 01/23/2024 | | | 1,375 | | | | 1,408 | |
Prudential Financial MTN | | | | | | | | |
5.625%, 05/12/2041 | | | 10 | | | | 11 | |
4.600%, 05/15/2044 | | | 177 | | | | 188 | |
4.350%, 02/25/2050 | | | 1,420 | | | | 1,468 | |
Raymond James Financial | | | | | | | | |
4.950%, 07/15/2046 | | | 650 | | | | 687 | |
Reliance Standard Life Global Funding II MTN | | | | | | | | |
2.500%, 01/15/2020 (C) | | | 160 | | | | 159 | |
Royal Bank of Canada | | | | | | | | |
1.875%, 02/05/2020 | | | 180 | | | | 179 | |
Royal Bank of Canada MTN | | | | | | | | |
3.200%, 04/30/2021 | | | 480 | | | | 485 | |
2.150%, 10/26/2020 | | | 420 | | | | 417 | |
Royal Bank of Scotland Group | | | | | | | | |
4.269%, VAR ICE LIBOR USD 3
Month+1.762%, 03/22/2025 | | | 650 | | | | 657 | |
Royal Bank of Scotland Group PLC | | | | | | | | |
6.125%, 12/15/2022 | | | 390 | | | | 415 | |
6.100%, 06/10/2023 | | | 550 | | | | 584 | |
6.000%, 12/19/2023 | | | 860 | | | | 918 | |
5.125%, 05/28/2024 | | | 490 | | | | 503 | |
5.076%, VAR ICE LIBOR USD 3
Month+1.905%, 01/27/2030 | | | 436 | | | | 459 | |
4.892%, VAR ICE LIBOR USD 3
Month+1.754%, 05/18/2029 | | | 808 | | | | 839 | |
4.519%, VAR ICE LIBOR USD 3
Month+1.550%, 06/25/2024 | | | 830 | | | | 849 | |
3.875%, 09/12/2023 | | | 720 | | | | 723 | |
Santander Holdings USA | | | | | | | | |
4.500%, 07/17/2025 | | | 80 | | | | 83 | |
4.450%, 12/03/2021 | | | 1,325 | | | | 1,365 | |
| | | | | | | | |
| | | |
| Description | | Face Amount
(Thousands) | | Market Value
($ Thousands) |
| |
CORPORATE OBLIGATIONS (continued) | | | | | |
Santander UK | | | | | | | | |
5.000%, 11/07/2023 (C) | | $ | 260 | | | $ | 266 | |
3.400%, 06/01/2021 | | | 1,930 | | | | 1,945 | |
2.375%, 03/16/2020 | | | 260 | | | | 259 | |
Santander UK Group Holdings | | | | | | | | |
4.796%, VAR ICE LIBOR USD 3 Month+1.570%, 11/15/2024 | | | 1,105 | | | | 1,137 | |
3.373%, VAR ICE LIBOR USD 3 Month+1.080%, 01/05/2024 | | | 760 | | | | 745 | |
2.875%, 08/05/2021 | | | 3,255 | | | | 3,227 | |
Standard Chartered | | | | | | | | |
5.700%,
03/26/2044 (C)(E) | | | 1,360 | | | | 1,477 | |
State Street | | | | | | | | |
3.300%, 12/16/2024 | | | 70 | | | | 72 | |
Sumitomo Mitsui Financial Group | | | | | | | | |
2.058%, 07/14/2021 | | | 340 | | | | 334 | |
SunTrust Bank | | | | | | | | |
4.050%, 11/03/2025 | | | 535 | | | | 564 | |
Svenska Handelsbanken MTN | | | | | | | | |
3.350%, 05/24/2021 | | | 500 | | | | 506 | |
Synchrony Financial | | | | | | | | |
5.150%, 03/19/2029 | | | 720 | | | | 732 | |
4.375%, 03/19/2024 | | | 501 | | | | 508 | |
Teachers Insurance & Annuity Association of America | | | | | | | | |
6.850%, 12/16/2039 (C) | | | 124 | | | | 171 | |
4.900%, 09/15/2044 (C) | | | 240 | | | | 268 | |
Torchmark | | | | | | | | |
4.550%, 09/15/2028 | | | 1,045 | | | | 1,103 | |
Toronto-Dominion Bank MTN | | | | | | | | |
3.250%, 06/11/2021 | | | 590 | | | | 597 | |
2.125%, 04/07/2021 | | | 820 | | | | 811 | |
UBS | | | | | | | | |
2.450%, 12/01/2020 (C) | | | 820 | | | | 815 | |
UBS MTN | | | | | | | | |
4.500%, 06/26/2048 (C) | | | 200 | | | | 224 | |
UBS Group Funding Switzerland | | | | | | | | |
7.000%, VAR USD Swap Semi 30/360 5 Yr Curr+4.344%, 07/31/2167 (C) | | | 1,640 | | | | 1,665 | |
4.253%, 03/23/2028 (C) | | | 1,130 | | | | 1,175 | |
4.125%, 09/24/2025 (C) | | | 200 | | | | 206 | |
3.491%, 05/23/2023 (C) | | | 1,650 | | | | 1,658 | |
2.650%, 02/01/2022 (C) | | | 1,303 | | | | 1,291 | |
UniCredit MTN | | | | | | | | |
6.572%, 01/14/2022 (C) | | | 1,000 | | | | 1,046 | |
US Bancorp MTN | | | | | | | | |
2.950%, 07/15/2022 (E) | | | 25 | | | | 25 | |
US Bank | | | | | | | | |
3.150%, 04/26/2021 | | | 550 | | | | 555 | |
Validus Holdings | | | | | | | | |
8.875%, 01/26/2040 | | | 430 | | | | 632 | |
| | |
SEI Institutional Managed Trust / Semi-Annual Report / March 31, 2019 | | 81 |
SCHEDULE OF INVESTMENTS (Unaudited)
March 31, 2019
Core Fixed Income Fund(Continued)
| | | | | | | | |
| | | |
| Description | | Face Amount
(Thousands) | | Market Value
($ Thousands) |
| |
CORPORATE OBLIGATIONS (continued) | | | | | |
Voya Financial | | | | | | | | |
3.125%, 07/15/2024 | | $ | 305 | | | $ | 301 | |
Wachovia Capital Trust III | | | | | | | | |
5.570%, VAR ICE LIBOR USD 3 Month+0.930%, 12/31/2049 | | | 2,790 | | | | 2,754 | |
WEA Finance | | | | | | | | |
4.750%, 09/17/2044 (C) | | | 230 | | | | 243 | |
3.750%, 09/17/2024 (C) | | | 990 | | | | 1,011 | |
Wells Fargo | | | | | | | | |
5.875%, VAR ICE LIBOR USD 3 Month+3.990%, 06/15/2167 | | | 120 | | | | 128 | |
5.375%, 11/02/2043 | | | 400 | | | | 450 | |
3.000%, 04/22/2026 (E) | | | 5,865 | | | | 5,731 | |
3.000%, 10/23/2026 | | | 2,240 | | | | 2,184 | |
2.100%, 07/26/2021 | | | 1,945 | | | | 1,914 | |
Wells Fargo MTN | | | | | | | | |
4.900%, 11/17/2045 (E) | | | 1,034 | | | | 1,101 | |
4.750%, 12/07/2046 | | | 1,075 | | | | 1,128 | |
4.650%, 11/04/2044 | | | 261 | | | | 268 | |
4.600%, 04/01/2021 | | | 160 | | | | 165 | |
4.400%, 06/14/2046 (E) | | | 1,370 | | | | 1,365 | |
4.300%, 07/22/2027 | | | 2,510 | | | | 2,613 | |
4.150%, 01/24/2029 | | | 1,775 | | | | 1,856 | |
4.125%, 08/15/2023 | | | 900 | | | | 933 | |
3.750%, 01/24/2024 | | | 250 | | | | 257 | |
3.500%, 03/08/2022 | | | 430 | | | | 438 | |
3.450%, 02/13/2023 | | | 660 | | | | 667 | |
2.625%, 07/22/2022 | | | 8,371 | | | | 8,310 | |
2.150%, 01/30/2020 | | | 70 | | | | 70 | |
Wells Fargo Bank | | | | | | | | |
3.625%, 10/22/2021 | | | 1,930 | | | | 1,966 | |
Westpac Banking | | | | | | | | |
4.875%, 11/19/2019 | | | 170 | | | | 172 | |
3.300%, 02/26/2024 | | | 866 | | | | 876 | |
2.600%, 11/23/2020 | | | 500 | | | | 499 | |
2.300%, 05/26/2020 | | | 50 | | | | 50 | |
Willis North America | | | | | | | | |
4.500%, 09/15/2028 | | | 1,082 | | | | 1,125 | |
| | | | | | | 341,237 | |
| |
Health Care — 3.3% | | | | | |
Abbott Laboratories | | | | | | | | |
4.900%, 11/30/2046 | | | 1,448 | | | | 1,674 | |
4.750%, 11/30/2036 | | | 260 | | | | 291 | |
3.875%, 09/15/2025 | | | 143 | | | | 150 | |
3.750%, 11/30/2026 | | | 1,094 | | | | 1,137 | |
3.400%, 11/30/2023 | | | 2,506 | | | | 2,558 | |
AbbVie | | | | | | | | |
4.875%, 11/14/2048 | | | 844 | | | | 830 | |
4.500%, 05/14/2035 | | | 715 | | | | 700 | |
4.450%, 05/14/2046 | | | 500 | | | | 464 | |
4.250%, 11/14/2028 | | | 1,452 | | | | 1,483 | |
| | | | | | | | |
| | | |
| Description | | Face Amount
(Thousands) | | Market Value
($ Thousands) |
| |
CORPORATE OBLIGATIONS (continued) | | | | | |
3.600%, 05/14/2025 | | $ | 610 | | | $ | 611 | |
3.200%, 11/06/2022 | | | 44 | | | | 44 | |
2.900%, 11/06/2022 (E) | | | 10 | | | | 10 | |
2.500%, 05/14/2020 | | | 2,629 | | | | 2,621 | |
Aetna | | | | | | | | |
4.125%, 06/01/2021 | | | 1,000 | | | | 1,021 | |
3.875%, 08/15/2047 | | | 90 | | | | 78 | |
2.800%, 06/15/2023 | | | 2,650 | | | | 2,602 | |
Allergan Finance | | | | | | | | |
4.625%, 10/01/2042 | | | 38 | | | | 36 | |
3.250%, 10/01/2022 | | | 513 | | | | 513 | |
Allergan Funding SCS | | | | | | | | |
4.750%, 03/15/2045 (E) | | | 125 | | | | 124 | |
4.550%, 03/15/2035 (E) | | | 270 | | | | 265 | |
3.850%, 06/15/2024 | | | 500 | | | | 506 | |
3.800%, 03/15/2025 | | | 620 | | | | 628 | |
3.450%, 03/15/2022 (E) | | | 370 | | | | 373 | |
Allergan Sales | | | | | | | | |
5.000%, 12/15/2021 (C) | | | 535 | | | | 557 | |
Amgen | | | | | | | | |
5.150%, 11/15/2041 | | | 660 | | | | 707 | |
4.663%, 06/15/2051 | | | 646 | | | | 650 | |
4.400%, 05/01/2045 | | | 1,812 | | | | 1,776 | |
3.875%, 11/15/2021 | | | 150 | | | | 154 | |
3.625%, 05/22/2024 (E) | | | 130 | | | | 133 | |
2.125%, 05/01/2020 | | | 110 | | | | 110 | |
Anthem | | | | | | | | |
4.625%, 05/15/2042 | | | 41 | | | | 42 | |
3.650%, 12/01/2027 | | | 590 | | | | 589 | |
3.500%, 08/15/2024 | | | 590 | | | | 597 | |
3.350%, 12/01/2024 | | | 1,425 | | | | 1,435 | |
3.125%, 05/15/2022 | | | 468 | | | | 472 | |
2.950%, 12/01/2022 | | | 661 | | | | 661 | |
AstraZeneca | | | | | | | | |
3.500%, 08/17/2023 | | | 805 | | | | 821 | |
3.375%, 11/16/2025 | | | 500 | | | | 505 | |
3.125%, 06/12/2027 | | | 355 | | | | 347 | |
Bausch Health | | | | | | | | |
9.000%,
12/15/2025 (C)(E) | | | 140 | | | | 152 | |
7.000%,
03/15/2024 (C)(E) | | | 210 | | | | 222 | |
6.125%,
04/15/2025 (C)(E) | | | 570 | | | | 565 | |
5.625%, 12/01/2021 (C) | | | 59 | | | | 59 | |
Bausch Health Americas | | | | | | | | |
8.500%, 01/31/2027 (C) | | | 30 | | | | 32 | |
Baxalta | | | | | | | | |
3.600%, 06/23/2022 | | | 546 | | | | 549 | |
2.875%, 06/23/2020 | | | 149 | | | | 149 | |
Bayer US Finance | | | | | | | | |
3.375%,
10/08/2024 (C)(E) | | | 2,300 | | | | 2,249 | |
Bayer US Finance II | | | | | | | | |
4.375%, 12/15/2028 (C) | | | 3,200 | | | | 3,177 | |
3.500%, 06/25/2021 (C) | | | 630 | | | | 633 | |
| | |
82 | | SEI Institutional Managed Trust / Semi-Annual Report / March 31, 2019 |
| | | | | | | | |
| | | |
| Description | | Face Amount
(Thousands) | | Market Value
($ Thousands) |
| |
CORPORATE OBLIGATIONS (continued) | | | | | |
Becton Dickinson | | | | | | | | |
4.685%, 12/15/2044 | | $ | 931 | | | $ | 961 | |
3.734%, 12/15/2024 | | | 1,970 | | | | 2,000 | |
3.700%, 06/06/2027 | | | 767 | | | | 764 | |
3.476%, VAR ICE LIBOR USD 3 Month+0.875%, 12/29/2020 (E) | | | 726 | | | | 726 | |
3.363%, 06/06/2024 | | | 2,423 | | | | 2,423 | |
3.250%, 11/12/2020 | | | 600 | | | | 602 | |
2.404%, 06/05/2020 | | | 1,434 | | | | 1,424 | |
Biogen | | | | | | | | |
3.625%, 09/15/2022 | | | 430 | | | | 437 | |
Boston Scientific | | | | | | | | |
4.700%, 03/01/2049 | | | 378 | | | | 402 | |
4.000%, 03/01/2029 | | | 766 | | | | 791 | |
3.750%, 03/01/2026 | | | 567 | | | | 578 | |
Cardinal Health | | | | | | | | |
3.079%, 06/15/2024 | | | 350 | | | | 342 | |
2.616%, 06/15/2022 (E) | | | 270 | | | | 266 | |
Celgene | | | | | | | | |
5.250%, 08/15/2043 | | | 40 | | | | 43 | |
5.000%, 08/15/2045 | | | 1,930 | | | | 2,025 | |
4.550%, 02/20/2048 | | | 166 | | | | 168 | |
4.350%, 11/15/2047 | | | 51 | | | | 50 | |
3.900%, 02/20/2028 | | | 1,737 | | | | 1,773 | |
3.875%, 08/15/2025 | | | 430 | | | | 440 | |
3.625%, 05/15/2024 (E) | | | 69 | | | | 70 | |
3.550%, 08/15/2022 (E) | | | 360 | | | | 368 | |
2.875%, 02/19/2021 | | | 423 | | | | 423 | |
2.750%, 02/15/2023 | | | 1,539 | | | | 1,524 | |
2.250%, 08/15/2021 | | | 420 | | | | 413 | |
Centene | | | | | | | | |
6.125%, 02/15/2024 | | | 210 | | | | 220 | |
5.625%, 02/15/2021 | | | 50 | | | | 51 | |
4.750%, 05/15/2022 | | | 110 | | | | 112 | |
4.750%, 01/15/2025 (E) | | | 130 | | | | 132 | |
Centene Escrow I | | | | | | | | |
5.375%,
06/01/2026 (C)(E) | | | 480 | | | | 501 | |
Cigna | | | | | | | | |
4.900%,
12/15/2048 (C)(E) | | | 1,674 | | | | 1,727 | |
4.800%, 08/15/2038 (C) | | | 78 | | | | 80 | |
4.375%, 10/15/2028 (C) | | | 3,003 | | | | 3,115 | |
4.125%,
11/15/2025 (C)(E) | | | 290 | | | | 300 | |
3.750%,
07/15/2023 (C)(E) | | | 1,970 | | | | 2,020 | |
3.400%,
09/17/2021 (C)(E) | | | 1,163 | | | | 1,175 | |
3.200%, 09/17/2020 (C) | | | 320 | | | | 322 | |
Cigna Holding | | | | | | | | |
3.050%, 10/15/2027 | | | 1,745 | | | | 1,648 | |
CVS Health | | | | | | | | |
5.125%, 07/20/2045 | | | 1,556 | | | | 1,582 | |
5.050%, 03/25/2048 (E) | | | 3,284 | | | | 3,308 | |
4.780%, 03/25/2038 | | | 2,146 | | | | 2,125 | |
4.300%, 03/25/2028 (E) | | | 4,835 | | | | 4,899 | |
| | | | | | | | |
| | | |
| Description | | Face Amount
(Thousands) | | Market Value
($ Thousands) |
| |
CORPORATE OBLIGATIONS (continued) | | | | | |
4.100%, 03/25/2025 | | $ | 1,590 | | | $ | 1,633 | |
4.000%, 12/05/2023 | | | 518 | | | | 532 | |
3.875%, 07/20/2025 (E) | | | 515 | | | | 521 | |
3.700%, 03/09/2023 | | | 3,306 | | | | 3,359 | |
3.500%, 07/20/2022 | | | 160 | | | | 162 | |
3.350%, 03/09/2021 | | | 1,140 | | | | 1,149 | |
2.750%, 12/01/2022 (E) | | | 510 | | | | 503 | |
CVS Pass-Through Trust | | | | | | | | |
5.926%, 01/10/2034 (C) | | | 78 | | | | 86 | |
Edwards Lifesciences | | | | | | | | |
4.300%, 06/15/2028 | | | 553 | | | | 580 | |
Eli Lilly | | | | | | | | |
3.100%, 05/15/2027 (E) | | | 150 | | | | 151 | |
EMD Finance | | | | | | | | |
2.400%, 03/19/2020 (C) | | | 1,425 | | | | 1,418 | |
Fresenius Medical Care US Finance II | | | | | | | | |
5.875%,
01/31/2022 (C)(E) | | | 170 | | | | 180 | |
5.625%,
07/31/2019 (C)(E) | | | 1,750 | | | | 1,761 | |
Gilead Sciences | | | | | | | | |
5.650%, 12/01/2041 | | | 35 | | | | 41 | |
4.750%, 03/01/2046 | | | 790 | | | | 827 | |
4.500%, 02/01/2045 | | | 10 | | | | 10 | |
4.150%, 03/01/2047 | | | 70 | | | | 68 | |
3.700%, 04/01/2024 | | | 410 | | | | 423 | |
3.650%, 03/01/2026 | | | 460 | | | | 469 | |
3.250%, 09/01/2022 | | | 670 | | | | 683 | |
2.550%, 09/01/2020 | | | 130 | | | | 130 | |
1.850%, 09/20/2019 | | | 140 | | | | 139 | |
GlaxoSmithKline Capital | | | | | | | | |
2.850%, 05/08/2022 | | | 170 | | | | 171 | |
HCA | | | | | | | | |
5.625%, 09/01/2028 | | | 50 | | | | 53 | |
5.500%, 06/15/2047 | | | 60 | | | | 64 | |
5.250%, 04/15/2025 | | | 820 | | | | 880 | |
5.250%, 06/15/2026 | | | 30 | | | | 32 | |
5.000%, 03/15/2024 | | | 1,100 | | | | 1,166 | |
4.500%, 02/15/2027 | | | 20 | | | | 21 | |
Humana | | | | | | | | |
4.950%, 10/01/2044 | | | 60 | | | | 64 | |
4.800%, 03/15/2047 | | | 30 | | | | 32 | |
4.625%, 12/01/2042 | | | 170 | | | | 175 | |
3.950%, 03/15/2027 | | | 70 | | | | 71 | |
3.850%, 10/01/2024 | | | 1,470 | | | | 1,498 | |
3.150%, 12/01/2022 | | | 560 | | | | 562 | |
2.900%, 12/15/2022 | | | 750 | | | | 744 | |
2.500%, 12/15/2020 | | | 1,015 | | | | 1,007 | |
Johnson & Johnson | | | | | | | | |
4.500%, 12/05/2043 | | | 150 | | | | 169 | |
3.700%, 03/01/2046 | | | 170 | | | | 172 | |
3.625%, 03/03/2037 | | | 260 | | | | 263 | |
3.500%, 01/15/2048 (E) | | | 92 | | | | 90 | |
3.400%, 01/15/2038 | | | 1,023 | | | | 1,006 | |
| | |
SEI Institutional Managed Trust / Semi-Annual Report / March 31, 2019 | | 83 |
SCHEDULE OF INVESTMENTS (Unaudited)
March 31, 2019
Core Fixed Income Fund(Continued)
| | | | | | | | |
| | | |
| Description | | Face Amount
(Thousands) | | Market Value
($ Thousands) |
| |
CORPORATE OBLIGATIONS (continued) | | | | | |
2.625%, 01/15/2025 | | $ | 86 | | | $ | 86 | |
Medtronic | | | | | | | | |
4.625%, 03/15/2045 | | | 11 | | | | 13 | |
4.375%, 03/15/2035 | | | 76 | | | | 83 | |
3.625%, 03/15/2024 | | | 1,055 | | | | 1,095 | |
3.500%, 03/15/2025 | | | 1,040 | | | | 1,072 | |
Medtronic Global Holdings SCA | | | | | | | | |
3.350%, 04/01/2027 (E) | | | 520 | | | | 529 | |
Merck | | | | | | | | |
4.000%, 03/07/2049 | | | 581 | | | | 603 | |
3.400%, 03/07/2029 | | | 616 | | | | 632 | |
2.750%, 02/10/2025 | | | 330 | | | | 330 | |
2.400%, 09/15/2022 | | | 29 | | | | 29 | |
Mylan | | | | | | | | |
3.950%, 06/15/2026 | | | 620 | | | | 591 | |
New York and Presbyterian Hospital | | | | | | | | |
3.563%, 08/01/2036 | | | 730 | | | | 708 | |
Pfizer | | | | | | | | |
4.400%, 05/15/2044 | | | 345 | | | | 375 | |
4.200%, 09/15/2048 | | | 843 | | | | 899 | |
4.100%, 09/15/2038 | | | 196 | | | | 206 | |
4.000%, 12/15/2036 | | | 815 | | | | 845 | |
3.450%, 03/15/2029 | | | 757 | | | | 776 | |
2.950%, 03/15/2024 | | | 860 | | | | 871 | |
2.800%, 03/11/2022 | | | 1,032 | | | | 1,041 | |
Providence St. Joseph Health Obligated Group | | | | | | | | |
2.746%, 10/01/2026 | | | 1,700 | | | | 1,614 | |
RWJ Barnabas Health | | | | | | | | |
3.949%, 07/01/2046 | | | 1,030 | | | | 1,023 | |
Sanofi | | | | | | | | |
3.375%, 06/19/2023 | | | 951 | | | | 975 | |
Shire Acquisitions Investments Ireland DAC | | | | | | | | |
2.400%, 09/23/2021 | | | 500 | | | | 494 | |
1.900%, 09/23/2019 | | | 1,500 | | | | 1,493 | |
Stryker | | | | | | | | |
4.625%, 03/15/2046 | | | 675 | | | | 726 | |
Takeda Pharmaceutical | | | | | | | | |
5.000%, 11/26/2028 (C) | | | 800 | | | | 867 | |
4.400%, 11/26/2023 (C) | | | 1,580 | | | | 1,659 | |
Teva Pharmaceutical Finance BV | | | | | | | | |
3.650%, 11/10/2021 | | | 720 | | | | 706 | |
Teva Pharmaceutical Finance IV BV | | | | | | | | |
3.650%, 11/10/2021 | | | 200 | | | | 196 | |
Teva Pharmaceutical Finance Netherlands III BV | | | | | | | | |
2.800%, 07/21/2023 (E) | | | 120 | | | | 107 | |
2.200%, 07/21/2021 | | | 1,260 | | | | 1,201 | |
1.700%, 07/19/2019 | | | 130 | | | | 130 | |
UnitedHealth Group | | | | | | | | |
5.800%, 03/15/2036 | | | 280 | | | | 344 | |
4.750%, 07/15/2045 | | | 1,150 | | | | 1,300 | |
| | | | | | | | |
| | | |
| Description | | Face Amount
(Thousands) | | Market Value
($ Thousands) |
| |
CORPORATE OBLIGATIONS (continued) | | | | | |
4.625%, 07/15/2035 | | $ | 523 | | | $ | 586 | |
4.450%, 12/15/2048 | | | 288 | | | | 312 | |
4.250%, 04/15/2047 | | | 450 | | | | 471 | |
3.875%, 10/15/2020 | | | 710 | | | | 721 | |
3.875%, 12/15/2028 | | | 170 | | | | 178 | |
3.750%, 07/15/2025 (E) | | | 70 | | | | 73 | |
3.700%, 12/15/2025 | �� | | 385 | | | | 401 | |
3.500%, 02/15/2024 | | | 578 | | | | 595 | |
3.375%, 11/15/2021 | | | 75 | | | | 76 | |
3.350%, 07/15/2022 (E) | | | 28 | | | | 29 | |
2.875%, 12/15/2021 | | | 290 | | | | 292 | |
2.875%, 03/15/2023 | | | 50 | | | | 50 | |
2.700%, 07/15/2020 | | | 440 | | | | 441 | |
Wyeth LLC | | | | | | | | |
5.950%, 04/01/2037 | | | 470 | | | | 598 | |
Zimmer Biomet Holdings | | | | | | | | |
3.375%, VAR ICE LIBOR USD 3 Month+0.750%, 03/19/2021 | | | 1,500 | | | | 1,495 | |
| | | | | | | 131,394 | |
Industrials — 2.4% | | | | | | | | |
ABB Finance USA | | | | | | | | |
4.375%, 05/08/2042 | | | 110 | | | | 119 | |
AerCap Ireland Capital DAC | | | | | | | | |
5.000%, 10/01/2021 | | | 1,250 | | | | 1,297 | |
4.875%, 01/16/2024 (E) | | | 1,500 | | | | 1,560 | |
4.625%, 07/01/2022 | | | 210 | | | | 217 | |
4.500%, 05/15/2021 | | | 2,140 | | | | 2,186 | |
3.750%, 05/15/2019 | | | 520 | | | | 520 | |
3.500%, 01/15/2025 | | | 232 | | | | 224 | |
Air Lease | | | | | | | | |
4.750%, 03/01/2020 | | | 1,765 | | | | 1,793 | |
3.625%, 04/01/2027 | | | 526 | | | | 495 | |
3.625%, 12/01/2027 | | | 1,125 | | | | 1,051 | |
3.500%, 01/15/2022 | | | 2,385 | | | | 2,407 | |
Allison Transmission | | | | | | | | |
5.000%, 10/01/2024 (C) | | | 40 | | | | 40 | |
Aviation Capital Group | | | | | | | | |
6.750%, 04/06/2021 (C) | | | 120 | | | | 128 | |
BAE Systems | | | | | | | | |
4.750%, 10/11/2021 (C) | | | 2,100 | | | | 2,185 | |
Beacon Roofing Supply | | | | | | | | |
4.875%,
11/01/2025 (C)(E) | | | 100 | | | | 94 | |
Boeing | | | | | | | | |
4.875%, 02/15/2020 | | | 210 | | | | 214 | |
3.850%, 11/01/2048 | | | 69 | | | | 68 | |
3.625%, 03/01/2048 | | | 23 | | | | 22 | |
3.550%, 03/01/2038 | | | 217 | | | | 209 | |
3.500%, 03/01/2039 | | | 367 | | | | 351 | |
Burlington Northern Santa Fe | | | | | | | | |
7.290%, 06/01/2036 | | | 90 | | | | 125 | |
5.400%, 06/01/2041 | | | 50 | | | | 60 | |
| | |
84 | | SEI Institutional Managed Trust / Semi-Annual Report / March 31, 2019 |
| | | | | | | | |
| | | |
| Description | | Face Amount
(Thousands) | | Market Value
($ Thousands) |
| |
CORPORATE OBLIGATIONS (continued) | | | | | |
4.900%, 04/01/2044 | | $ | 196 | | | $ | 224 | |
4.150%, 12/15/2048 | | | 150 | | | | 158 | |
4.050%, 06/15/2048 | | | 124 | | | | 128 | |
3.450%, 09/15/2021 | | | 91 | | | | 92 | |
Canadian Pacific Railway | | | | | | | | |
6.125%, 09/15/2115 | | | 44 | | | | 54 | |
Caterpillar Financial Services MTN | | | | | | | | |
2.750%, 08/20/2021 | | | 1,025 | | | | 1,027 | |
Cintas No. 2 | | | | | | | | |
3.700%, 04/01/2027 | | | 400 | | | | 411 | |
2.900%, 04/01/2022 | | | 400 | | | | 401 | |
CommonSpirit Health | | | | | | | | |
4.350%, 11/01/2042 | | | 110 | | | | 106 | |
Continental AirlinesPass-Through Trust, Ser 1999-2, Cl C2 | | | | | | | | |
7.256%, 03/15/2020 | | | 141 | | | | 142 | |
Continental AirlinesPass-Through Trust, Ser 2000-1 | | | | | | | | |
8.048%, 11/01/2020 | | | 120 | | | | 124 | |
Continental AirlinesPass-Through Trust, Ser 2007-1, Cl A | | | | | | | | |
5.983%, 04/19/2022 | | | 1,723 | | | | 1,813 | |
Continental AirlinesPass-Through Trust, Ser 2009-2 | | | | | | | | |
7.250%, 11/10/2019 | | | 118 | | | | 120 | |
Crowley Conro | | | | | | | | |
4.181%, 08/15/2043 | | | 496 | | | | 529 | |
CSX | | | | | | | | |
4.750%, 11/15/2048 | | | 248 | | | | 268 | |
4.250%, 03/15/2029 | | | 352 | | | | 374 | |
3.950%, 05/01/2050 | | | 21 | | | | 20 | |
DAE Funding | | | | | | | | |
5.750%,
11/15/2023 (C)(E) | | | 190 | | | | 195 | |
Delta Air Lines | | | | | | | | |
4.375%, 04/19/2028 | | | 398 | | | | 390 | |
3.800%, 04/19/2023 | | | 241 | | | | 243 | |
Delta Air Lines Pass-Through Trust,
Ser 2007- 1, Cl A | | | | | | | | |
6.821%, 08/10/2022 | | | 411 | | | | 449 | |
DP World MTN | | | | | | | | |
5.625%, 09/25/2048 (C) | | | 990 | | | | 1,029 | |
Eaton | | | | | | | | |
7.625%, 04/01/2024 | | | 75 | | | | 87 | |
4.150%, 11/02/2042 | | | 550 | | | | 551 | |
2.750%, 11/02/2022 | | | 900 | | | | 896 | |
Equifax | | | | | | | | |
3.950%, 06/15/2023 | | | 1,612 | | | | 1,650 | |
FedEx | | | | | | | | |
4.950%, 10/17/2048 | | | 651 | | | | 671 | |
4.550%, 04/01/2046 | | | 384 | | | | 370 | |
4.050%, 02/15/2048 | | | 980 | | | | 879 | |
| | | | | | | | |
| | | |
| Description | | Face Amount
(Thousands) | | Market Value
($ Thousands) |
| |
CORPORATE OBLIGATIONS (continued) | | | | | |
GE Capital International Funding Unlimited Co | | | | | | | | |
4.418%, 11/15/2035 | | $ | 2,354 | | | $ | 2,176 | |
2.342%, 11/15/2020 | | | 4,960 | | | | 4,899 | |
General Electric | | | | | | | | |
4.500%, 03/11/2044 | | | 2,127 | | | | 1,943 | |
2.100%, 12/11/2019 | | | 30 | | | | 30 | |
General Electric MTN | | | | | | | | |
6.875%, 01/10/2039 | | | 1,216 | | | | 1,438 | |
6.150%, 08/07/2037 | | | 394 | | | | 431 | |
6.000%, 08/07/2019 | | | 185 | | | | 187 | |
5.875%, 01/14/2038 | | | 803 | | | | 854 | |
5.550%, 01/05/2026 | | | 1,740 | | | | 1,842 | |
5.500%, 01/08/2020 | | | 2,935 | | | | 2,998 | |
5.300%, 02/11/2021 | | | 293 | | | | 303 | |
4.650%, 10/17/2021 | | | 1,235 | | | | 1,280 | |
4.625%, 01/07/2021 | | | 2,515 | | | | 2,582 | |
4.375%, 09/16/2020 | | | 40 | | | | 41 | |
3.164%, VAR ICE LIBOR USD 3 Month+0.480%, 08/15/2036 | | | 2,400 | | | | 1,845 | |
2.200%, 01/09/2020 | | | 43 | | | | 43 | |
Harris | | | | | | | | |
5.054%, 04/27/2045 | | | 270 | | | | 298 | |
4.854%, 04/27/2035 | | | 80 | | | | 86 | |
IHS Markit | | | | | | | | |
5.000%, 11/01/2022 (C) | | | 750 | | | | 782 | |
4.750%, 02/15/2025 (C) | | | 355 | | | | 370 | |
4.750%, 08/01/2028 | | | 1,215 | | | | 1,271 | |
Ingersoll-Rand Luxembourg Finance | | | | | | | | |
3.800%, 03/21/2029 | | | 743 | | | | 753 | |
3.500%, 03/21/2026 | | | 559 | | | | 564 | |
International Lease Finance | | | | | | | | |
8.625%, 01/15/2022 | | | 180 | | | | 204 | |
5.875%, 04/01/2019 | | | 400 | | | | 400 | |
L3 Technologies | | | | | | | | |
4.400%, 06/15/2028 | | | 2,190 | | | | 2,298 | |
Lockheed Martin | | | | | | | | |
4.500%, 05/15/2036 | | | 90 | | | | 98 | |
4.090%, 09/15/2052 | | | 289 | | | | 294 | |
4.070%, 12/15/2042 | | | 702 | | | | 715 | |
3.550%, 01/15/2026 | | | 1,410 | | | | 1,455 | |
3.100%, 01/15/2023 | | | 50 | | | | 50 | |
Northrop Grumman | | | | | | | | |
4.030%, 10/15/2047 | | | 602 | | | | 594 | |
3.250%, 08/01/2023 | | | 2,983 | | | | 3,019 | |
3.250%, 01/15/2028 (E) | | | 3,296 | | | | 3,241 | |
2.930%, 01/15/2025 | | | 862 | | | | 850 | |
2.550%, 10/15/2022 | | | 1,425 | | | | 1,409 | |
Park Aerospace Holdings | | | | | | | | |
5.500%, 02/15/2024 (C) | | | 100 | | | | 104 | |
5.250%, 08/15/2022 (C) | | | 360 | | | | 369 | |
4.500%, 03/15/2023 (C) | | | 40 | | | | 40 | |
| | |
SEI Institutional Managed Trust / Semi-Annual Report / March 31, 2019 | | 85 |
SCHEDULE OF INVESTMENTS (Unaudited)
March 31, 2019
Core Fixed Income Fund(Continued)
| | | | | | | | |
| | | |
| Description | | Face Amount
(Thousands) | | Market Value
($ Thousands) |
| |
CORPORATE OBLIGATIONS (continued) | | | | | |
Raytheon | | | | | | | | |
3.125%, 10/15/2020 | | $ | 430 | | | $ | 433 | |
Republic Services | | | | | | | | |
3.950%, 05/15/2028 | | | 935 | | | | 980 | |
Siemens
Financieringsmaatschappij | | | | | |
2.900%, 05/27/2022 (C) | | | 1,045 | | | | 1,048 | |
2.000%, 09/15/2023 (C) | | | 1,030 | | | | 992 | |
Union Pacific | | | | | | | | |
4.500%, 09/10/2048 | | | 1,030 | | | | 1,093 | |
4.300%, 03/01/2049 | | | 928 | | | | 959 | |
3.950%, 09/10/2028 (E) | | | 2,780 | | | | 2,914 | |
3.750%, 07/15/2025 | | | 340 | | | | 354 | |
3.700%, 03/01/2029 (E) | | | 1,143 | | | | 1,175 | |
3.150%, 03/01/2024 | | | 756 | | | | 767 | |
2.950%, 03/01/2022 | | | 984 | | | | 992 | |
United Business Media | | | | | | | | |
5.750%, 11/03/2020 (C) | | | 490 | | | | 507 | |
United Parcel Service | | | | | | | | |
3.050%, 11/15/2027 | | | 160 | | | | 160 | |
2.500%, 04/01/2023 | | | 230 | | | | 229 | |
United Rentals North America | | | | | | | | |
6.500%, 12/15/2026 | | | 180 | | | | 190 | |
5.500%, 07/15/2025 (E) | | | 150 | | | | 153 | |
4.875%, 01/15/2028 | | | 150 | | | | 146 | |
United Technologies | | | | | | | | |
8.875%, 11/15/2019 | | | 110 | | | | 114 | |
4.625%, 11/16/2048 | | | 435 | | | | 462 | |
4.500%, 06/01/2042 | | | 170 | | | | 176 | |
4.450%, 11/16/2038 | | | 525 | | | | 543 | |
4.150%, 05/15/2045 | | | 59 | | | | 58 | |
4.125%, 11/16/2028 | | | 1,766 | | | | 1,835 | |
3.950%, 08/16/2025 | | | 1,977 | | | | 2,053 | |
3.750%, 11/01/2046 | | | 685 | | | | 629 | |
3.650%, 08/16/2023 | | | 1,752 | | | | 1,798 | |
3.350%, 08/16/2021 | | | 700 | | | | 709 | |
1.950%, 11/01/2021 | | | 85 | | | | 83 | |
US Airways Pass-Through Trust, Ser 2012-2, Cl A | | | | | | | | |
4.625%, 06/03/2025 | | | 653 | | | | 681 | |
Valmont Industries | | | | | | | | |
5.250%, 10/01/2054 | | | 10 | | | | 9 | |
5.000%, 10/01/2044 | | | 336 | | | | 316 | |
Wabtec | | | | | | | | |
4.950%, 09/15/2028 | | | 758 | | | | 769 | |
4.400%, 03/15/2024 | | | 572 | | | | 582 | |
Waste Management | | | | | | | | |
7.375%, 05/15/2029 | | | 330 | | | | 425 | |
4.600%, 03/01/2021 | | | 90 | | | | 93 | |
3.500%, 05/15/2024 | | | 370 | | | | 379 | |
| | | | | | | | |
| | | |
| Description | | Face Amount
(Thousands) | | Market Value
($ Thousands) |
| |
CORPORATE OBLIGATIONS (continued) | | | | | |
XPO Logistics | | | | | | | | |
6.500%, 06/15/2022 (C) | | $ | 170 | | | $ | 173 | |
| | | | | | | 95,901 | |
Information Technology — 1.2% | | | | | |
Apple | | | | | | | | |
4.650%, 02/23/2046 | | | 270 | | | | 305 | |
4.500%, 02/23/2036 | | | 348 | | | | 390 | |
4.375%, 05/13/2045 | | | 682 | | | | 742 | |
4.250%, 02/09/2047 | | | 640 | | | | 683 | |
3.450%, 02/09/2045 | | | 31 | | | | 30 | |
3.200%, 05/13/2025 | | | 281 | | | | 286 | |
3.200%, 05/11/2027 | | | 1,536 | | | | 1,549 | |
2.850%, 05/06/2021 | | | 113 | | | | 114 | |
2.850%, 05/11/2024 | | | 653 | | | | 655 | |
2.450%, 08/04/2026 (E) | | | 1,410 | | | | 1,362 | |
2.150%, 02/09/2022 | | | 82 | | | | 81 | |
2.000%, 11/13/2020 | | | 500 | | | | 496 | |
1.550%, 08/04/2021 | | | 230 | | | | 225 | |
Avnet | | | | | | | | |
3.750%, 12/01/2021 | | | 1,000 | | | | 1,010 | |
Broadcom | | | | | | | | |
4.750%, 04/15/2029 | | | 872 | | | | 868 | |
4.250%, 04/15/2026 (C) | | | 3,631 | | | | 3,604 | |
3.125%, 04/15/2021 | | | 1,135 | | | | 1,134 | |
3.125%, 01/15/2025 | | | 420 | | | | 402 | |
2.375%, 01/15/2020 | | | 3,005 | | | | 2,989 | |
CommScope Technologies | | | | | | | | |
5.000%, 03/15/2027 (C) | | | 130 | | | | 115 | |
Dell International | | | | | | | | |
8.350%, 07/15/2046 (C) | | | 910 | | | | 1,098 | |
6.020%, 06/15/2026 (C) | | | 39 | | | | 42 | |
4.420%, 06/15/2021 (C) | | | 1,890 | | | | 1,939 | |
First Data | | | | | | | | |
5.000%, 01/15/2024 (C) | | | 230 | | | | 236 | |
Fiserv | | | | | | | | |
4.200%, 10/01/2028 | | | 59 | | | | 61 | |
Hewlett Packard Enterprise | | | | | | | | |
6.350%, 10/15/2045 | | | 515 | | | | 540 | |
Intel | | | | | | | | |
3.734%, 12/08/2047 | | | 130 | | | | 131 | |
3.700%, 07/29/2025 | | | 223 | | | | 234 | |
3.300%, 10/01/2021 | | | 35 | | | | 36 | |
3.100%, 07/29/2022 | | | 35 | | | | 35 | |
International Business Machines | | | | | | | | |
4.700%, 02/19/2046 (E) | | | 289 | | | | 316 | |
Lam Research | | | | | | | | |
4.875%, 03/15/2049 | | | 463 | | | | 486 | |
4.000%, 03/15/2029 | | | 1,338 | | | | 1,366 | |
3.750%, 03/15/2026 | | | 1,493 | | | | 1,520 | |
Marvell Technology Group | | | | | | | | |
4.200%, 06/22/2023 | | | 810 | | | | 826 | |
| | |
86 | | SEI Institutional Managed Trust / Semi-Annual Report / March 31, 2019 |
| | | | | | | | |
| | | |
| Description | | Face Amount
(Thousands) | | Market Value
($ Thousands) |
| |
CORPORATE OBLIGATIONS (continued) | | | | | |
Mastercard | | | | | | | | |
3.375%, 04/01/2024 | | $ | 250 | | | $ | 258 | |
Microsoft | | | | | | | | |
4.750%, 11/03/2055 | | | 43 | | | | 52 | |
4.500%, 02/06/2057 | | | 421 | | | | 482 | |
4.250%, 02/06/2047 | | | 889 | | | | 990 | |
4.100%, 02/06/2037 (E) | | | 1,108 | | | | 1,205 | |
4.000%, 02/12/2055 | | | 482 | | | | 505 | |
3.950%, 08/08/2056 | | | 240 | | | | 250 | |
3.750%, 02/12/2045 (E) | | | 130 | | | | 133 | |
3.700%, 08/08/2046 | | | 170 | | | | 174 | |
3.625%, 12/15/2023 | | | 89 | | | | 93 | |
3.500%, 02/12/2035 | | | 1,012 | | | | 1,026 | |
3.450%, 08/08/2036 | | | 30 | | | | 30 | |
3.300%, 02/06/2027 (E) | | | 2,250 | | | | 2,310 | |
2.875%, 02/06/2024 (E) | | | 1,010 | | | | 1,021 | |
2.700%, 02/12/2025 | | | 250 | | | | 250 | |
2.400%, 02/06/2022 (E) | | | 600 | | | | 599 | |
2.400%, 08/08/2026 (E) | | | 1,700 | | | | 1,648 | |
2.375%, 02/12/2022 | | | 20 | | | | 20 | |
2.375%, 05/01/2023 (E) | | | 20 | | | | 20 | |
1.550%, 08/08/2021 | | | 400 | | | | 391 | |
NXP BV | | | | | | | | |
5.350%, 03/01/2026 (C) | | | 355 | | | | 382 | |
4.875%, 03/01/2024 (C) | | | 418 | | | | 441 | |
4.625%, 06/01/2023 (C) | | | 753 | | | | 782 | |
Oracle | | | | | | | | |
3.900%, 05/15/2035 | | | 1,720 | | | | 1,758 | |
3.800%, 11/15/2037 | | | 258 | | | | 258 | |
2.950%, 11/15/2024 | | | 252 | | | | 253 | |
2.625%, 02/15/2023 | | | 471 | | | | 471 | |
QUALCOMM | | | | | | | | |
2.600%, 01/30/2023 | | | 910 | | | | 899 | |
salesforce.com | | | | | | | | |
3.700%, 04/11/2028 (E) | | | 670 | | | | 701 | |
3.250%, 04/11/2023 | | | 480 | | | | 492 | |
Tencent Holdings MTN | | | | | | | | |
3.595%, 01/19/2028 (C) | | | 570 | | | | 562 | |
Texas Instruments | | | | | | | | |
4.150%, 05/15/2048 | | | 300 | | | | 322 | |
3.875%, 03/15/2039 | | | 514 | | | | 532 | |
Visa | | | | | | | | |
4.300%, 12/14/2045 (E) | | | 690 | | | | 761 | |
3.650%, 09/15/2047 (E) | | | 235 | | | | 236 | |
3.150%, 12/14/2025 | | | 1,410 | | | | 1,432 | |
2.800%, 12/14/2022 | | | 40 | | | | 40 | |
2.200%, 12/14/2020 | | | 80 | | | | 80 | |
| | | | | | | 47,765 | |
Materials — 1.0% | | | | | | | | |
Air Liquide Finance | | | | | | | | |
2.250%, 09/27/2023 (C) | | | 590 | | | | 571 | |
| | | | | | | | |
| | | |
| Description | | Face Amount
(Thousands) | | Market Value
($ Thousands) |
| |
CORPORATE OBLIGATIONS (continued) | | | | | |
Alcoa Nederland Holding BV | | | | | | | | |
6.750%, 09/30/2024 (C) | | $ | 270 | | | $ | 286 | |
6.125%, 05/15/2028 (C) | | | 200 | | | | 206 | |
Amcor Finance USA | | | | | | | | |
4.500%, 05/15/2028 (C) | | | 360 | | | | 378 | |
3.625%, 04/28/2026 (C) | | | 2,425 | | | | 2,375 | |
Anglo American Capital | | | | | | | | |
4.750%, 04/10/2027 (C) | | | 720 | | | | 734 | |
4.000%, 09/11/2027 (C) | | | 200 | | | | 194 | |
3.750%, 04/10/2022 (C) | | | 280 | | | | 281 | |
3.625%, 09/11/2024 (C) | | | 710 | | | | 703 | |
ArcelorMittal | | | | | | | | |
7.000%, 10/15/2039 (E) | | | 120 | | | | 137 | |
6.250%, 02/25/2022 (E) | | | 120 | | | | 129 | |
6.125%, 06/01/2025 (E) | | | 100 | | | | 111 | |
4.550%, 03/11/2026 (E) | | | 300 | | | | 306 | |
Avery Dennison | | | | | | | | |
4.875%, 12/06/2028 | | | 238 | | | | 255 | |
Barrick | | | | | | | | |
5.250%, 04/01/2042 | | | 80 | | | | 86 | |
Barrick North America Finance | | | | | | | | |
5.750%, 05/01/2043 (E) | | | 555 | | | | 643 | |
5.700%, 05/30/2041 (E) | | | 924 | | | | 1,056 | |
Berry Global | | | | | | | | |
4.500%,
02/15/2026 (C)(E) | | | 50 | | | | 47 | |
BHP Billiton Finance USA | | | | | | | | |
6.750%, VAR USD Swap Semi 30/360 5 Yr Curr+5.093%, 10/19/2075 (C) | | | 830 | | | | 919 | |
5.000%, 09/30/2043 (E) | | | 410 | | | | 482 | |
4.125%, 02/24/2042 | | | 40 | | | | 42 | |
2.875%, 02/24/2022 | | | 50 | | | | 50 | |
Dow Chemical | | | | | | | | |
5.250%, 11/15/2041 | | | 25 | | | | 26 | |
3.000%, 11/15/2022 | | | 1,780 | | | | 1,781 | |
DowDuPont | | | | | | | | |
5.419%, 11/15/2048 | | | 394 | | | | 449 | |
4.725%, 11/15/2028 | | | 357 | | | | 386 | |
4.493%, 11/15/2025 | | | 2,235 | | | | 2,381 | |
4.205%, 11/15/2023 | | | 527 | | | | 551 | |
3.766%, 11/15/2020 | | | 1,155 | | | | 1,176 | |
EI du Pont de Nemours | | | | | | | | |
3.266%, VAR ICE LIBOR USD 3 Month+0.530%, 05/01/2020 | | | 855 | | | | 857 | |
Equate Petrochemical BV MTN | | | | | | | | |
4.250%, 11/03/2026 (C) | | | 780 | | | | 787 | |
Freeport-McMoRan | | | | | | | | |
6.875%, 02/15/2023 (E) | | | 50 | | | | 53 | |
5.450%, 03/15/2043 | | | 195 | | | | 171 | |
4.550%, 11/14/2024 (E) | | | 40 | | | | 39 | |
4.000%, 11/14/2021 | | | 700 | | | | 703 | |
3.875%, 03/15/2023 (E) | | | 20 | | | | 20 | |
| | |
SEI Institutional Managed Trust / Semi-Annual Report / March 31, 2019 | | 87 |
SCHEDULE OF INVESTMENTS (Unaudited)
March 31, 2019
Core Fixed Income Fund(Continued)
| | | | | | | | |
| | | |
| Description | | Face Amount
(Thousands) | | Market Value
($ Thousands) |
| |
CORPORATE OBLIGATIONS (continued) | | | | | |
Freeport-McMoRan Copper | | | | | | | | |
3.550%, 03/01/2022 | | $ | 130 | | | $ | 129 | |
Glencore Funding | | | | | | | | |
4.125%,
05/30/2023 (C)(E) | | | 200 | | | | 204 | |
4.125%,
03/12/2024 (C) | | | 1,170 | | | | 1,181 | |
4.000%,
03/27/2027 (C)(E) | | | 1,240 | | | | 1,203 | |
3.875%,
10/27/2027 (C) | | | 410 | | | | 392 | |
3.000%,
10/27/2022 (C)(E) | | | 320 | | | | 315 | |
2.875%,
04/16/2020 (C) | | | 140 | | | | 139 | |
Huntsman International | | | | | | | | |
5.125%, 11/15/2022 | | | 286 | | | | 299 | |
4.500%, 05/01/2029 | | | 683 | | | | 681 | |
International Flavors & Fragrances | | | | | | | | |
5.000%, 09/26/2048 (E) | | | 1,720 | | | | 1,806 | |
International Paper | | | | | | | | |
4.350%, 08/15/2048 | | | 295 | | | | 275 | |
LyondellBasell Industries | | | | | | | | |
5.750%, 04/15/2024 | | | 200 | | | | 218 | |
Nacional del Cobre de Chile | | | | | | | | |
3.625%,
08/01/2027 (C)(E) | | | 680 | | | | 681 | |
Nutrien | | | | | | | | |
4.875%, 03/30/2020 | | | 280 | | | | 286 | |
OCP | | | | | | | | |
4.500%, 10/22/2025 (C) | | | 1,940 | | | | 1,918 | |
Resolute Forest Products | | | | | | | | |
5.875%, 05/15/2023 (E) | | | 680 | | | | 673 | |
Reynolds Group | | | | | | | | |
6.875%, 02/15/2021 | | | 62 | | | | 63 | |
Reynolds Group Issuer | | | | | | | | |
5.125%,
07/15/2023 (C)(E) | | | 170 | | | | 173 | |
Southern Copper | | | | | | | | |
6.750%, 04/16/2040 (E) | | | 170 | | | | 204 | |
5.875%, 04/23/2045 (E) | | | 450 | | | | 504 | |
5.250%, 11/08/2042 (E) | | | 2,030 | | | | 2,112 | |
3.875%, 04/23/2025 | | | 396 | | | | 401 | |
Suzano Austria GmbH | | | | | | | | |
6.000%, 01/15/2029 (C) | | | 220 | | | | 234 | |
Syngenta Finance | | | | | | | | |
3.933%, 04/23/2021 (C) | | | 650 | | | | 653 | |
Teck Resources | | | | | | | | |
6.250%, 07/15/2041 | | | 637 | | | | 678 | |
6.000%, 08/15/2040 | | | 30 | | | | 31 | |
Vale Overseas | | | | | | | | |
6.875%, 11/21/2036 (E) | | | 874 | | | | 1,000 | |
6.250%, 08/10/2026 (E) | | | 1,222 | | | | 1,328 | |
Westlake Chemical | | | | | | | | |
5.000%, 08/15/2046 | | | 199 | | | | 194 | |
WestRock MWV | | | | | | | | |
7.375%, 09/01/2019 | | | 750 | | | | 763 | |
WestRock RKT | | | | | | | | |
4.000%, 03/01/2023 (E) | | | 70 | | | | 71 | |
3.500%, 03/01/2020 | | | 320 | | | | 322 | |
| | | | | | | | |
| | | |
| Description | | Face Amount
(Thousands) | | Market Value
($ Thousands) |
| |
CORPORATE OBLIGATIONS (continued) | | | | | |
WRKCo | | | | | | | | |
4.900%, 03/15/2029 (E) | | $ | 1,165 | | | $ | 1,261 | |
3.000%, 09/15/2024 (E) | | | 750 | | | | 737 | |
| | | | | | | 40,500 | |
| | |
Real Estate — 0.8% | | | | | | | | |
Alexandria Real Estate Equities | | | | | | | | |
3.450%, 04/30/2025 | | | 750 | | | | 746 | |
American Campus Communities Operating Partnership | | | | | | | | |
3.750%, 04/15/2023 | | | 1,350 | | | | 1,368 | |
3.625%, 11/15/2027 | | | 745 | | | | 728 | |
Boston Properties | | | | | | | | |
4.500%, 12/01/2028 | | | 697 | | | | 739 | |
3.800%, 02/01/2024 | | | 1,250 | | | | 1,284 | |
3.200%, 01/15/2025 | | | 495 | | | | 491 | |
Brandywine Operating Partnership | | | | | | | | |
3.950%, 11/15/2027 | | | 17 | | | | 17 | |
CC Holdings GS V | | | | | | | | |
3.849%, 04/15/2023 | | | 700 | | | | 717 | |
Crown Castle International | | | | | | | | |
5.200%, 02/15/2049 | | | 394 | | | | 415 | |
CubeSmart | | | | | | | | |
4.375%, 02/15/2029 | | | 365 | | | | 374 | |
Digital Realty Trust | | | | | | | | |
3.625%, 10/01/2022 | | | 1,260 | | | | 1,278 | |
Duke Realty | | | | | | | | |
4.375%, 06/15/2022 | | | 50 | | | | 52 | |
ERP Operating | | | | | | | | |
4.625%, 12/15/2021 | | | 64 | | | | 67 | |
4.150%, 12/01/2028 | | | 385 | | | | 410 | |
GLP Capital | | | | | | | | |
5.375%, 04/15/2026 | | | 2,410 | | | | 2,518 | |
5.300%, 01/15/2029 | | | 1,882 | | | | 1,964 | |
5.250%, 06/01/2025 | | | 80 | | | | 84 | |
HCP | | | | | | | | |
4.250%, 11/15/2023 | | | 2,080 | | | | 2,167 | |
4.200%, 03/01/2024 | | | 765 | | | | 792 | |
4.000%, 12/01/2022 | | | 450 | | | | 462 | |
3.150%, 08/01/2022 (E) | | | 1,000 | | | | 1,001 | |
Healthcare Realty Trust | | | | | | | | |
3.875%, 05/01/2025 | | | 200 | | | | 200 | |
3.750%, 04/15/2023 | | | 1,400 | | | | 1,409 | |
Life Storage | | | | | | | | |
3.875%, 12/15/2027 | | | 915 | | | | 896 | |
Mid-America Apartments | | | | | | | | |
4.300%, 10/15/2023 | | | 365 | | | | 380 | |
4.000%, 11/15/2025 | | | 436 | | | | 449 | |
3.950%, 03/15/2029 | | | 154 | | | | 156 | |
3.750%, 06/15/2024 | | | 851 | | | | 867 | |
3.600%, 06/01/2027 | | | 243 | | | | 242 | |
| | |
88 | | SEI Institutional Managed Trust / Semi-Annual Report / March 31, 2019 |
| | | | | | | | |
| | | |
| Description | | Face Amount
(Thousands) | | Market Value
($ Thousands) |
| |
CORPORATE OBLIGATIONS (continued) | | | | | |
Public Storage | | | | | | | | |
3.094%, 09/15/2027 | | $ | 751 | | | $ | 732 | |
Realty Income | | | | | | | | |
3.250%, 10/15/2022 | | | 70 | | | | 71 | |
Reckson Operating Partnership | | | | | | | | |
7.750%, 03/15/2020 | | | 2,350 | | | | 2,450 | |
Regency Centers | | | | | | | | |
4.125%, 03/15/2028 | | | 242 | | | | 249 | |
3.600%, 02/01/2027 | | | 346 | | | | 344 | |
Simon Property Group | | | | | | | | |
4.375%, 03/01/2021 | | | 38 | | | | 39 | |
SITE Centers | | | | | | | | |
4.625%, 07/15/2022 | | | 303 | | | | 312 | |
4.250%, 02/01/2026 (E) | | | 159 | | | | 160 | |
STORE Capital | | | | | | | | |
4.625%, 03/15/2029 | | | 446 | | | | 453 | |
4.500%, 03/15/2028 | | | 1,341 | | | | 1,352 | |
Tanger Properties | | | | | | | | |
3.875%, 12/01/2023 | | | 465 | | | | 467 | |
3.750%, 12/01/2024 | | | 422 | | | | 415 | |
UDR | | | | | | | | |
3.700%, 10/01/2020 | | | 675 | | | | 682 | |
Ventas Realty | | | | | | | | |
4.875%, 04/15/2049 | | | 346 | | | | 361 | |
4.125%, 01/15/2026 (E) | | | 29 | | | | 30 | |
3.850%, 04/01/2027 | | | 500 | | | | 502 | |
Welltower | | | | | | | | |
4.950%, 01/15/2021 | | | 820 | | | | 845 | |
4.500%, 01/15/2024 | | | 102 | | | | 107 | |
4.000%, 06/01/2025 | | | 625 | | | | 643 | |
3.750%, 03/15/2023 | | | 500 | | | | 513 | |
| | | | | | | 33,000 | |
| |
Utilities — 2.0% | | | | | |
AEP Texas | | | | | | | | |
6.650%, 02/15/2033 | | | 500 | | | | 642 | |
AEP Texas Central Transition Funding II | | | | | | | | |
5.306%, 07/01/2020 | | | 273 | | | | 277 | |
Alabama Power | | | | | | | | |
3.700%, 12/01/2047 | | | 1,810 | | | | 1,764 | |
Alliant Energy Finance | | | | | | | | |
4.250%, 06/15/2028 (C) | | | 21 | | | | 21 | |
American Transmission Systems | | | | | | | | |
5.000%, 09/01/2044 (C) | | | 68 | | | | 74 | |
Appalachian Power | | | | | | | | |
3.300%, 06/01/2027 | | | 229 | | | | 226 | |
Arizona Public Service | | | | | | | | |
2.200%, 01/15/2020 | | | 20 | | | | 20 | |
Berkshire Hathaway Energy | | | | | | | | |
3.750%, 11/15/2023 | | | 156 | | | | 162 | |
Boston Gas | | | | | | | | |
4.487%, 02/15/2042 (C) | | | 35 | | | | 37 | |
| | | | | | | | |
| | | |
| Description | | Face Amount
(Thousands) | | Market Value
($ Thousands) |
| |
CORPORATE OBLIGATIONS (continued) | | | | | |
Carolina Power & Light | | | | | | | | |
2.800%, 05/15/2022 | | $ | 25 | | | $ | 25 | |
CenterPoint Energy | | | | | | | | |
4.250%, 11/01/2028 | | | 514 | | | | 531 | |
3.850%, 02/01/2024 | | | 240 | | | | 245 | |
3.600%, 11/01/2021 | | | 595 | | | | 604 | |
2.500%, 09/01/2022 | | | 72 | | | | 70 | |
Cleco Power | | | | | | | | |
6.000%, 12/01/2040 | | | 700 | | | | 824 | |
Comision Federal de Electricidad | | | | | | | | |
4.750%, 02/23/2027 (C) | | | 240 | | | | 242 | |
Commonwealth Edison | | | | | | | | |
4.000%, 03/01/2049 | | | 659 | | | | 676 | |
Consolidated Edison of New York | | | | | | | | |
4.650%, 12/01/2048 | | | 1,500 | | | | 1,651 | |
4.450%, 03/15/2044 | | | 1,500 | | | | 1,581 | |
Dominion Energy | | | | | | | | |
3.176%, VAR ICE LIBOR USD 3 Month+0.550%, 06/01/2019 (C) | | | 1,000 | | | | 1,001 | |
2.000%, 08/15/2021 | | | 501 | | | | 489 | |
1.600%, 08/15/2019 | | | 658 | | | | 655 | |
Dominion Energy Gas Holdings | | | | | | | | |
4.800%, 11/01/2043 | | | 51 | | | | 55 | |
DTE Energy | | | | | | | | |
1.500%, 10/01/2019 | | | 885 | | | | 879 | |
Duke Energy | | | | | | | | |
3.950%, 08/15/2047 | | | 130 | | | | 125 | |
3.550%, 09/15/2021 | | | 76 | | | | 77 | |
3.150%, 08/15/2027 | | | 540 | | | | 530 | |
2.400%, 08/15/2022 | | | 340 | | | | 336 | |
1.800%, 09/01/2021 | | | 930 | | | | 908 | |
Duke Energy Carolinas | | | | | | | | |
4.300%, 06/15/2020 | | | 39 | | | | 40 | |
4.250%, 12/15/2041 | | | 628 | | | | 666 | |
4.000%, 09/30/2042 | | | 1,000 | | | | 1,028 | |
3.750%, 06/01/2045 | | | 680 | | | | 673 | |
Duke Energy Florida | | | | | | | | |
3.850%, 11/15/2042 | | | 380 | | | | 380 | |
3.200%, 01/15/2027 (E) | | | 1,080 | | | | 1,088 | |
Duke Energy Indiana | | | | | | | | |
4.200%, 03/15/2042 | | | 30 | | | | 31 | |
3.750%, 07/15/2020 | | | 52 | | | | 53 | |
3.750%, 05/15/2046 | | | 170 | | | | 165 | |
Duke Energy Progress | | | | | | | | |
4.100%, 05/15/2042 | | | 425 | | | | 438 | |
3.450%, 03/15/2029 | | | 562 | | | | 576 | |
Duquesne Light Holdings | | | | | | | | |
6.400%, 09/15/2020 (C) | | | 1,950 | | | | 2,035 | |
Electricite de France | | | | | | | | |
5.000%, 09/21/2048 (C) | | | 295 | | | | 304 | |
4.875%, 09/21/2038 (C) | | | 590 | | | | 601 | |
| | |
SEI Institutional Managed Trust / Semi-Annual Report / March 31, 2019 | | 89 |
SCHEDULE OF INVESTMENTS (Unaudited)
March 31, 2019
Core Fixed Income Fund(Continued)
| | | | | | | | |
| | | |
| Description | | Face Amount
(Thousands) | | Market Value
($ Thousands) |
| |
CORPORATE OBLIGATIONS (continued) | | | | | |
Emera US Finance | | | | | | | | |
4.750%, 06/15/2046 | | $ | 539 | | | $ | 559 | |
2.150%, 06/15/2019 | | | 2,049 | | | | 2,045 | |
Enel Finance International | | | | | | | | |
4.625%, 09/14/2025 (C) | | | 1,310 | | | | 1,355 | |
Entergy | | | | | | | | |
5.125%, 09/15/2020 | | | 400 | | | | 409 | |
Eversource Energy | | | | | | | | |
2.900%, 10/01/2024 | | | 1,610 | | | | 1,598 | |
Exelon | | | | | | | | |
5.625%, 06/15/2035 | | | 760 | | | | 862 | |
3.950%, 06/15/2025 | | | 375 | | | | 388 | |
2.850%, 06/15/2020 | | | 1,090 | | | | 1,089 | |
FirstEnergy | | | | | | | | |
4.850%, 07/15/2047 | | | 33 | | | | 35 | |
4.250%, 03/15/2023 | | | 340 | | | | 355 | |
3.900%, 07/15/2027 | | | 940 | | | | 954 | |
FirstEnergy, Ser C | | | | | | | | |
7.375%, 11/15/2031 | | | 3,685 | | | | 4,875 | |
FirstEnergy Transmission | | | | | | | | |
5.450%, 07/15/2044 (C) | | | 184 | | | | 208 | |
4.550%, 04/01/2049 (C) | | | 68 | | | | 69 | |
Fortis | | | | | | | | |
3.055%, 10/04/2026 | | | 169 | | | | 161 | |
Indiana Michigan Power | | | | | | | | |
4.550%, 03/15/2046 | | | 676 | | | | 722 | |
IPALCO Enterprises | | | | | | | | |
3.700%, 09/01/2024 | | | 651 | | | | 654 | |
ITC Holdings | | | | | | | | |
4.050%, 07/01/2023 | | | 1,152 | | | | 1,175 | |
3.650%, 06/15/2024 | | | 633 | | | | 637 | |
Jersey Central Power & Light | | | | | | | | |
4.700%, 04/01/2024 (C) | | | 700 | | | | 745 | |
Kansas City Power & Light | | | | | | | | |
5.300%, 10/01/2041 | | | 100 | | | | 117 | |
4.125%, 04/01/2049 | | | 85 | | | | 88 | |
KCP&L Greater Missouri Operations | | | | | | | | |
8.270%, 11/15/2021 | | | 2,700 | | | | 3,034 | |
KeySpan Gas East | | | | | | | | |
2.742%, 08/15/2026 (C) | | | 1,025 | | | | 981 | |
Louisville Gas & Electric | | | | | | | | |
4.250%, 04/01/2049 | | | 170 | | | | 179 | |
Metropolitan Edison | | | | | | | | |
4.300%, 01/15/2029 (C) | | | 625 | | | | 654 | |
3.500%, 03/15/2023 (C) | | | 2,775 | | | | 2,806 | |
MidAmerican Energy | | | | | | | | |
4.800%, 09/15/2043 | | | 830 | | | | 944 | |
4.250%, 05/01/2046 | | | 700 | | | | 742 | |
Mid-Atlantic Interstate Transmission | | | | | | | | |
4.100%, 05/15/2028 (C) | | | 845 | | | | 867 | |
Mississippi Power | | | | | | | | |
3.950%, 03/30/2028 | | | 874 | | | | 885 | |
| | | | | | | | |
| | | |
| Description | | Face Amount
(Thousands) | | Market Value
($ Thousands) |
| |
CORPORATE OBLIGATIONS (continued) | | | | | |
3.259%, VAR ICE LIBOR USD 3 Month+0.650%, 03/27/2020 | | $ | 2,100 | | | $ | 2,099 | |
NextEra Energy Capital Holdings | | | | | | | | |
3.500%, 04/01/2029 | | | 371 | | | | 370 | |
3.218%, VAR ICE LIBOR USD 3 Month+0.480%, 05/04/2021 | | | 4,400 | | | | 4,398 | |
3.150%, 04/01/2024 | | | 739 | | | | 742 | |
2.300%, 04/01/2019 | | | 500 | | | | 500 | |
NiSource | | | | | | | | |
5.800%, 02/01/2042 | | | 149 | | | | 171 | |
2.650%, 11/17/2022 | | | 600 | | | | 591 | |
Oncor Electric Delivery | | | | | | | | |
5.750%, 03/15/2029 | | | 565 | | | | 675 | |
5.250%, 09/30/2040 | | | 250 | | | | 300 | |
4.550%, 12/01/2041 | | | 690 | | | | 766 | |
Pacific Gas & Electric | | | | | | | | |
3.500%,
10/01/2020 (E)(F) | | | 310 | | | | 285 | |
PacifiCorp | | | | | | | | |
4.150%, 02/15/2050 | | | 411 | | | | 426 | |
PECO Energy | | | | | | | | |
4.150%, 10/01/2044 | | | 1,140 | | | | 1,183 | |
Pennsylvania Electric | | | | | | | | |
5.200%, 04/01/2020 | | | 200 | | | | 204 | |
Perusahaan Listrik Negara MTN | | | | | | | | |
6.150%, 05/21/2048 (C) | | | 500 | | | | 556 | |
5.450%, 05/21/2028 (C) | | | 250 | | | | 267 | |
4.125%, 05/15/2027 (C) | | | 670 | | | | 659 | |
PPL Capital Funding | | | | | | | | |
3.100%, 05/15/2026 | | | 515 | | | | 497 | |
Progress Energy | | | | | | | | |
3.150%, 04/01/2022 | | | 280 | | | | 282 | |
Public Service Electric & Gas MTN | | | | | | | | |
3.700%, 05/01/2028 | | | 1,545 | | | | 1,606 | |
Public Service of New Hampshire | | | | | | | | |
3.500%, 11/01/2023 | | | 515 | | | | 532 | |
San Diego Gas & Electric | | | | | | | | |
4.150%, 05/15/2048 | | | 240 | | | | 240 | |
Sempra Energy | | | | | | | | |
4.000%, 02/01/2048 | | | 732 | | | | 666 | |
3.400%, 02/01/2028 | | | 197 | | | | 190 | |
2.900%, 02/01/2023 | | | 841 | | | | 829 | |
Southern | | | | | | | | |
4.400%, 07/01/2046 | | | 515 | | | | 518 | |
Southern California Edison | | | | | | | | |
4.125%, 03/01/2048 (E) | | | 2,016 | | | | 1,922 | |
4.050%, 03/15/2042 | | | 5 | | | | 5 | |
4.000%, 04/01/2047 | | | 62 | | | | 58 | |
3.700%, 08/01/2025 | | | 511 | | | | 508 | |
3.650%, 03/01/2028 (E) | | | 72 | | | | 70 | |
3.500%, 10/01/2023 | | | 288 | | | | 286 | |
Southern Gas Capital | | | | | | | | |
4.400%, 05/30/2047 | | | 500 | | | | 503 | |
| | |
90 | | SEI Institutional Managed Trust / Semi-Annual Report / March 31, 2019 |
| | | | | | | | |
| | | |
| Description | | Face Amount
(Thousands) | | Market Value
($ Thousands) |
| |
CORPORATE OBLIGATIONS (continued) | | | | | |
Southwestern Electric Power | | | | | | | | |
3.900%, 04/01/2045 | | $ | 229 | | | $ | 217 | |
3.850%, 02/01/2048 | | | 148 | | | | 139 | |
Texas-New Mexico Power | | | | | | | | |
9.500%, 04/01/2019 (C) | | | 1,100 | | | | 1,100 | |
Union Electric | | | | | | | | |
3.500%, 03/15/2029 | | | 685 | | | | 702 | |
Virginia Electric & Power | | | | | | | | |
4.650%, 08/15/2043 | | | 585 | | | | 638 | |
2.950%, 01/15/2022 | | | 330 | | | | 331 | |
2.750%, 03/15/2023 | | | 500 | | | | 499 | |
WEC Energy Group | | | | | | | | |
3.375%, 06/15/2021 | | | 1,000 | | | | 1,012 | |
Wisconsin Public Service | | | | | | | | |
3.350%, 11/21/2021 | | | 410 | | | | 416 | |
| | | | | | | 80,955 | |
Total Corporate Obligations
(Cost $1,144,440) ($ Thousands) | | | | 1,171,569 | |
| |
U.S. TREASURY OBLIGATIONS — 24.0% | | | | | |
U.S. Treasury Bills | | | | | | | | |
2.435%, 07/25/2019 (A) | | | 8,915 | | | | 8,848 | |
2.413%, 06/20/2019 (A) | | | 1,521 | | | | 1,513 | |
2.379%, 04/09/2019 (A) | | | 30,400 | | | | 30,384 | |
U.S. Treasury Bonds | | | | | | | | |
6.250%, 08/15/2023 | | | 5,068 | | | | 5,906 | |
3.750%, 11/15/2043 | | | 19,059 | | | | 22,343 | |
3.375%, 11/15/2048 | | | 9,716 | | | | 10,813 | |
3.125%, 05/15/2048 | | | 1,080 | | | | 1,145 | |
3.000%, 11/15/2045 | | | 472 | | | | 490 | |
3.000%, 05/15/2047 | | | 13,500 | | | | 13,990 | |
3.000%, 02/15/2048 | | | 14,874 | | | | 15,389 | |
3.000%, 08/15/2048 | | | 29,658 | | | | 30,701 | |
3.000%, 02/15/2049 | | | 106,808 | | | | 110,663 | |
2.875%, 08/15/2045 | | | 39,890 | | | | 40,421 | |
2.750%, 08/15/2047 | | | 6,967 | | | | 6,868 | |
2.750%, 11/15/2047 | | | 13,933 | | | | 13,732 | |
2.500%, 02/15/2045 | | | 35,745 | | | | 33,726 | |
2.500%, 02/15/2046 | | | 33,390 | | | | 31,404 | |
2.500%, 05/15/2046 | | | 7,382 | | | | 6,938 | |
2.250%, 08/15/2046 | | | 5,680 | | | | 5,065 | |
U.S. Treasury Inflation Protected Securities | | | | | | | | |
1.375%, 02/15/2044 | | | 2,819 | | | | 3,113 | |
1.000%, 02/15/2049 | | | 3,991 | | | | 4,091 | |
0.750%, 07/15/2028 | | | 4,187 | | | | 4,278 | |
0.750%, 02/15/2042 | | | 2,417 | | | | 2,352 | |
0.625%, 02/15/2043 | | | 1,500 | | | | 1,410 | |
0.375%, 07/15/2025 | | | 2,654 | | | | 2,651 | |
0.125%, 07/15/2024 | | | 366 | | | | 361 | |
| | | | | | | | |
| | | |
| Description | | Face Amount
(Thousands) | | Market Value
($ Thousands) |
| |
U.S. TREASURY OBLIGATIONS (continued) | | | | | |
U.S. Treasury Notes | | | | | | | | |
3.125%, 11/15/2028 | | $ | 3,452 | | | $ | 3,662 | |
2.875%, 10/31/2020 | | | 2,735 | | | | 2,757 | |
2.875%, 10/15/2021 | | | 410 | | | | 416 | |
2.875%, 11/15/2021 | | | 13,835 | | | | 14,051 | |
2.875%, 09/30/2023 | | | 70 | | | | 72 | |
2.875%, 08/15/2028 | | | 2,831 | | | | 2,941 | |
2.750%, 09/30/2020 | | | 3,731 | | | | 3,752 | |
2.750%, 08/15/2021 | | | 7,542 | | | | 7,626 | |
2.625%, 07/31/2020 | | | 9,167 | | | | 9,196 | |
2.625%, 05/15/2021 | | | 20,347 | | | | 20,489 | |
2.625%, 12/31/2023 | | | 2,300 | | | | 2,339 | |
2.625%, 02/15/2029 | | | 58,594 | | | | 59,670 | |
2.500%, 05/31/2020 | | | 10,670 | | | | 10,683 | |
2.500%, 06/30/2020 | | | 11,774 | | | | 11,789 | |
2.500%, 01/31/2021 | | | 32,325 | | | | 32,436 | |
2.500%, 02/28/2021 | | | 32,525 | | | | 32,651 | |
2.500%, 01/15/2022 | | | 19,618 | | | | 19,751 | |
2.500%, 02/15/2022 | | | 679 | | | | 684 | |
2.500%, 01/31/2024 | | | 8,595 | | | | 8,695 | |
2.500%, 02/28/2026 | | | 11,700 | | | | 11,833 | |
2.375%, 04/30/2020 | | | 4,180 | | | | 4,179 | |
2.375%, 04/15/2021 | | | 2,688 | | | | 2,693 | |
2.375%, 03/15/2022 | | | 2,878 | | | | 2,891 | |
2.375%, 02/29/2024 | | | 42,504 | | | | 42,781 | |
2.250%, 03/31/2021 | | | 1,830 | | | | 1,829 | |
2.250%, 01/31/2024 | | | 5 | | | | 5 | |
2.250%, 11/15/2025 | | | 3,659 | | | | 3,642 | |
2.250%, 08/15/2027 | | | 23,977 | | | | 23,748 | |
2.125%, 01/31/2021 | | | 263 | | | | 262 | |
2.125%, 08/15/2021 | | | 716 | | | | 714 | |
2.125%, 03/31/2024 | | | 95,072 | | | | 94,545 | |
2.000%, 08/31/2021 | | | 5,840 | | | | 5,803 | |
2.000%, 10/31/2022 | | | 278 | | | | 276 | |
2.000%, 08/15/2025 | | | 1,265 | | | | 1,241 | |
2.000%, 11/15/2026 | | | 7,233 | | | | 7,057 | |
1.875%, 12/31/2019 | | | 1,745 | | | | 1,738 | |
1.875%, 08/31/2022 | | | 320 | | | | 316 | |
1.625%, 06/30/2020 | | | 1,280 | | | | 1,268 | |
1.625%, 10/15/2020 | | | 1,299 | | | | 1,285 | |
1.625%, 08/31/2022 | | | 4,954 | | | | 4,855 | |
1.625%, 04/30/2023 | | | 3,127 | | | | 3,052 | |
1.625%, 02/15/2026 | | | 16,199 | | | | 15,478 | |
1.500%, 05/31/2020 | | | 19,500 | | | | 19,297 | |
1.500%, 06/15/2020 | | | 16,520 | | | | 16,343 | |
1.500%, 07/15/2020 | | | 99 | | | | 98 | |
1.500%, 01/31/2022 | | | 275 | | | | 269 | |
1.375%, 04/30/2020 | | | 955 | | | | 944 | |
1.375%, 05/31/2020 | | | 8,680 | | | | 8,578 | |
1.375%, 09/30/2020 | | | 12,997 | | | | 12,808 | |
1.375%, 05/31/2021 | | | 570 | | | | 559 | |
| | |
SEI Institutional Managed Trust / Semi-Annual Report / March 31, 2019 | | 91 |
SCHEDULE OF INVESTMENTS (Unaudited)
March 31, 2019
Core Fixed Income Fund(Continued)
| | | | | | | | |
| | | |
| Description | | Face Amount
(Thousands) | | Market Value
($ Thousands) |
| |
U.S. TREASURY OBLIGATIONS (continued) | | | | | |
1.125%, 02/28/2021 | | $ | 19,779 | | | $ | 19,344 | |
Total U.S. Treasury Obligations
(Cost $947,601) ($ Thousands) | | | | 961,986 | |
| |
ASSET-BACKED SECURITIES — 8.1% | | | | | |
| | |
Automotive — 1.2% | | | | | | | | |
| | |
Ally Auto Receivables Trust,
Ser 2015-2, Cl A4 | | | | | | | | |
1.840%, 06/15/2020 | | | 157 | | | | 157 | |
Ally Auto Receivables Trust, Ser 2017-1, Cl A3 | | | | | | | | |
1.700%, 06/15/2021 | | | 827 | | | | 824 | |
Americredit Automobile Receivables Trust, Ser 2018-1, Cl A3 | | | | | | | | |
3.070%, 12/19/2022 | | | 540 | | | | 543 | |
Avis Budget Rental Car Funding AESOP, Ser 2017-1A, Cl A | | | | | | | | |
3.070%, 09/20/2023 (C) | | | 333 | | | | 333 | |
Avis Budget Rental Car Funding AESOP, Ser 2019-1A, Cl A | | | | | | | | |
3.450%, 03/20/2023 (C) | | | 1,650 | | | | 1,667 | |
Avis Budget Rental Car Funding AESOP, Ser 2019-1A, Cl C | | | | | | | | |
4.530%, 03/20/2023 (C) | | | 1,140 | | | | 1,154 | |
BMW Vehicle Lease Trust, Ser 2019-1, Cl A2 | | | | | | | | |
2.790%, 03/22/2021 | | | 550 | | | | 551 | |
Capital Auto Receivables Asset Trust, Ser 2016-1, Cl A4 | | | | | | | | |
1.980%, 10/20/2020 | | | 267 | | | | 267 | |
Capital Auto Receivables Asset Trust, Ser 2016-2, Cl A4 | | | | | | | | |
1.630%, 01/20/2021 | | | 170 | | | | 170 | |
Chesapeake Funding II, Ser 2019-1A, Cl A1 | | | | | | | | |
2.940%, 04/15/2031 (C) | | | 1,325 | | | | 1,329 | |
Drive Auto Receivables Trust, Ser 2016-CA, Cl C | | | | | | | | |
3.020%, 11/15/2021 (C) | | | 1,833 | | | | 1,834 | |
Ford Credit Auto Lease Trust, Ser 2017-A, Cl A3 | | | | | | | | |
1.880%, 04/15/2020 | | | 249 | | | | 249 | |
Ford Credit Auto Owner Trust, Ser 2014-1, Cl A | | | | | | | | |
2.260%, 11/15/2025 (C) | | | 1,665 | | | | 1,664 | |
Ford Credit Auto Owner Trust, Ser 2014-2, Cl A | | | | | | | | |
2.310%, 04/15/2026 (C) | | | 1,705 | | | | 1,700 | |
Ford Credit Auto Owner Trust, Ser 2015-1, Cl A | | | | | | | | |
2.120%, 07/15/2026 (C) | | | 2,295 | | | | 2,283 | |
Ford Credit Auto Owner Trust, Ser 2017-1, Cl A | | | | | | | | |
2.620%, 08/15/2028 (C) | | | 444 | | | | 441 | |
| | | | | | | | |
| | | |
| Description | | Face Amount
(Thousands) | | Market Value
($ Thousands) |
| |
ASSET-BACKED SECURITIES (continued) | | | | | |
Ford Credit Auto Owner Trust, Ser 2017-2, Cl A | | | | | | | | |
2.360%, 03/15/2029 (C) | | $ | 1,674 | | | $ | 1,646 | |
Ford Credit Auto Owner Trust, Ser 2017-A, Cl A4 | | | | | | | | |
1.920%, 04/15/2022 | | | 774 | | | | 766 | |
Ford Credit Auto Owner Trust, Ser 2018-1, Cl A | | | | | | | | |
3.190%, 07/15/2031 (C) | | | 1,806 | | | | 1,807 | |
Ford Credit Auto Owner Trust, Ser 2018-2, Cl A | | | | | | | | |
3.470%, 01/15/2030 (C) | | | 1,453 | | | | 1,478 | |
Ford Credit Auto Owner Trust, Ser 2019-1, Cl A | | | | | | | | |
3.520%, 07/15/2030 (C) | | | 1,975 | | | | 2,013 | |
Ford Credit Auto Owner Trust, Ser 2019-A, Cl A2A | | | | | | | | |
2.780%, 02/15/2022 | | | 1,680 | | | | 1,681 | |
Ford Credit Floorplan Master Owner Trust,
Ser 2016-5, Cl A1 | | | | | | | | |
1.950%, 11/15/2021 | | | 395 | | | | 393 | |
Foursight Capital Automobile Receivables Trust, Ser 2018-1, Cl A3 | | | | | | | | |
3.240%, 09/15/2022 (C) | | | 800 | | | | 802 | |
GM Financial Automobile Leasing Trust, Ser 2019-1, Cl A2A | | | | | | | | |
2.910%, 04/20/2021 | | | 360 | | | | 360 | |
GM Financial Consumer Automobile Receivables Trust, Ser 2018-3, Cl A2A | | | | | | | | |
2.740%, 07/16/2021 | | | 838 | | | | 838 | |
GM Financial Consumer Automobile Receivables Trust, Ser 2019-1, Cl A2 | | | | | | | | |
2.990%, 03/16/2022 | | | 1,375 | | | | 1,379 | |
Hertz Fleet Lease Funding, Ser 2017-1, Cl A2 | | | | | | | | |
2.130%, 04/10/2031 (C) | | | 432 | | | | 431 | |
Hertz Vehicle Financing II, Ser 2015-1A, Cl A | | | | | | | | |
2.730%, 03/25/2021 (C) | | | 1,160 | | | | 1,156 | |
Hertz Vehicle Financing II, Ser 2015-1A, Cl C | | | | | | | | |
4.350%, 03/25/2021 (C) | | | 650 | | | | 650 | |
Hertz Vehicle Financing II, Ser 2015-3A, Cl A | | | | | | | | |
2.670%, 09/25/2021 (C) | | | 902 | | | | 896 | |
Hertz Vehicle Financing II, Ser 2016-2A, Cl A | | | | | | | | |
2.950%, 03/25/2022 (C) | | | 810 | | | | 806 | |
Hertz Vehicle Financing II, Ser 2016-3A, Cl B | | | | | | | | |
3.110%, 07/25/2020 (C) | | | 487 | | | | 486 | |
Hertz Vehicle Financing II, Ser 2017-1A, Cl A | | | | | | | | |
2.960%, 10/25/2021 (C) | | | 1,016 | | | | 1,013 | |
Hertz Vehicle Financing II, Ser 2017-2A, Cl A | | | | | | | | |
3.290%, 10/25/2023 (C) | | | 739 | | | | 738 | |
Hertz Vehicle Financing II, Ser 2018-1A, Cl A | | | | | | | | |
3.290%, 02/25/2024 (C) | | | 1,790 | | | | 1,782 | |
Hertz Vehicle Financing II, Ser 2019-1A, Cl A | | | | | | | | |
3.710%, 03/25/2023 (C) | | | 1,508 | | | | 1,527 | |
| | |
92 | | SEI Institutional Managed Trust / Semi-Annual Report / March 31, 2019 |
| | | | | | | | |
| | | |
| Description | | Face Amount
(Thousands) | | Market Value
($ Thousands) |
| |
ASSET-BACKED SECURITIES (continued) | | | | | |
Hertz Vehicle Financing, Ser 2018-2A, Cl A | | | | | | | | |
3.650%, 06/27/2022 (C) | | $ | 1,028 | | | $ | 1,037 | |
Hertz Vehicle Financing, Ser 2018-3A, Cl A | | | | | | | | |
4.030%, 07/25/2024 (C) | | | 996 | | | | 1,021 | |
Hyundai Auto Lease Securitization Trust,
Ser 2019-A, Cl A2 | | | | | | | | |
2.920%, 07/15/2021 (C) | | | 430 | | | | 431 | |
Hyundai Auto Receivables Trust, Ser 2018-B, Cl A2 | | | | | | | | |
3.040%, 06/15/2021 | | | 300 | | | | 301 | |
Mercedes-Benz Auto Lease Trust, Ser 2017-A, Cl A3 | | | | | | | | |
1.790%, 04/15/2020 | | | 1,389 | | | | 1,387 | |
Mercedes-Benz Auto Lease Trust, Ser 2019-A, Cl A3 | | | | | | | | |
3.100%, 11/15/2021 | | | 675 | | | | 679 | |
Nissan Auto Receivables Owner Trust,
Ser 2018-C, Cl A2A | | | | | | | | |
3.070%, 10/15/2021 | | | 455 | | | | 457 | |
Prestige Auto Receivables Trust, Ser 2017-1A, Cl B | | | | | | | | |
2.390%, 05/16/2022 (C) | | | 3,335 | | | | 3,320 | |
World Omni Auto Receivables Trust,
Ser 2016-A, Cl A4 | | | | | | | | |
1.950%, 05/16/2022 | | | 1,052 | | | | 1,044 | |
| | | | | | | 47,491 | |
| | |
Credit Cards — 0.3% | | | | | | | | |
American Express Credit Account Master Trust,
Ser 2017-4, Cl A | | | | | | | | |
1.640%, 12/15/2021 | | | 1,390 | | | | 1,388 | |
American Express Credit Account Master Trust, Ser 2019-1, Cl A | | | | | | | | |
2.870%, 10/15/2024 | | | 1,556 | | | | 1,570 | |
Capital One Multi-Asset Execution Trust, Ser 2017-A1, Cl A1 | | | | | | | | |
2.000%, 01/17/2023 | | | 475 | | | | 472 | |
Capital One Multi-Asset Execution Trust,
Ser 2017-A4, Cl A4 | | | | | | | | |
1.990%, 07/17/2023 | | | 1,100 | | | | 1,091 | |
Citibank Credit Card Issuance Trust,
Ser 2017-A3, Cl A3 | | | | | | | | |
1.920%, 04/07/2022 | | | 2,715 | | | | 2,696 | |
Synchrony Card Funding, Ser 2019-A1, Cl A | | | | | | | | |
2.950%, 03/17/2025 | | | 1,855 | | | | 1,867 | |
World Financial Network Credit Card Master Trust, Ser 2016-A, Cl A | | | | | | | | |
2.030%, 04/15/2025 | | | 2,798 | | | | 2,753 | |
World Financial Network Credit Card Master Trust, Ser 2016-C, Cl A | | | | | | | | |
1.720%, 08/15/2023 | | | 661 | | | | 657 | |
| | | | | | | | |
| | | |
| Description | | Face Amount
(Thousands) | | Market Value
($ Thousands) |
| |
ASSET-BACKED SECURITIES (continued) | | | | | |
World Financial Network Credit Card Master Trust, Ser 2019-A, Cl A | | | | | | | | |
3.140%, 12/15/2025 | | $ | 257 | | | $ | 259 | |
| | | | | | | 12,753 | |
| |
Mortgage Related Securities — 0.6% | | | | | |
| | |
ACE Securities Home Equity Loan Trust, Ser 2006-NC1, Cl A1 | | | | | | | | |
2.926%, VAR ICE LIBOR USD 1 Month+0.440%, 12/25/2035 | | | 232 | | | | 232 | |
Aegis Asset-Backed Securities Trust,
Ser 2003-3, Cl M1 | | | | | | | | |
3.540%, VAR ICE LIBOR USD 1 Month+1.050%, 10/27/2008 | | | 505 | | | | 477 | |
Aegis Asset-Backed Securities Trust,
Ser 2005-5, Cl 2A | | | | | | | | |
2.736%, VAR ICE LIBOR USD 1 Month+0.250%, 12/25/2035 | | | 808 | | | | 806 | |
Argent Securities, Ser 2003-W5, Cl M1 | | | | | | | | |
3.540%, VAR ICE LIBOR USD 1 Month+1.050%, 10/25/2033 | | | 149 | | | | 149 | |
Bear Stearns Asset-Backed Securities Trust, Ser 2004-HE10, Cl M1 | | | | | | | | |
3.461%, VAR ICE LIBOR USD 1 Month+0.975%, 12/25/2034 | | | 424 | | | | 424 | |
Centex Home Equity,
Ser 2006-A, Cl AV4 | | | | | | | | |
2.736%, VAR ICE LIBOR USD 1 Month+0.250%, 06/25/2036 | | | 1,695 | | | | 1,689 | |
Citifinancial Mortgage Securities, Ser 2004- 1, Cl AF4 | | | | | | | | |
5.070%, 04/25/2034 | | | 289 | | | | 296 | |
Citigroup Global Markets Mortgage Securities VII, Ser 2003-UP1, Cl A | | | | | | | | |
3.950%, 04/25/2032 (C) | | | 10 | | | | 9 | |
Citigroup Mortgage Loan Trust, Ser 2006-HE2, Cl A2D | | | | | | | | |
2.726%, VAR ICE LIBOR USD 1 Month+0.240%, 08/25/2036 | | | 5,405 | | | | 5,382 | |
Citigroup Mortgage Loan Trust, Ser 2006-HE2, Cl M1 | | | | | | | | |
2.776%, VAR ICE LIBOR USD 1 Month+0.290%, 08/25/2036 | | | 4,960 | | | | 4,849 | |
Master Asset-Backed Securities Trust, Ser 2007-HE1, Cl A4 | | | | | | | | |
2.766%, VAR ICE LIBOR USD 1 Month+0.280%, 05/25/2037 | | | 5,500 | | | | 4,708 | |
Morgan Stanley ABS Capital I Trust, Ser 2005-HE1, Cl M1 | | | | | | | | |
3.161%, VAR ICE LIBOR USD 1 Month+0.675%, 12/25/2034 | | | 566 | | | | 553 | |
| | |
SEI Institutional Managed Trust / Semi-Annual Report / March 31, 2019 | | 93 |
SCHEDULE OF INVESTMENTS (Unaudited)
March 31, 2019
Core Fixed Income Fund(Continued)
| | | | | | | | |
| | | |
| Description | | Face Amount
(Thousands) | | Market Value
($ Thousands) |
| |
ASSET-BACKED SECURITIES (continued) | | | | | |
New Century Home Equity Loan Trust, Ser 2003-A, Cl A | | | | | | | | |
3.206%, VAR ICE LIBOR USD 1
Month+0.720%, 10/25/2033 (C) | | $ | 121 | | | $ | 118 | |
New Century Home Equity Loan Trust, Ser 2005-3, Cl M2 | | | | | | | | |
3.221%, VAR ICE LIBOR USD 1 Month+0.735%, 07/25/2035 | | | 348 | | | | 348 | |
Option One Mortgage Loan Trust, Ser 2005- 4, Cl M1 | | | | | | | | |
2.926%, VAR ICE LIBOR USD 1
Month+0.440%, 11/25/2035 | | | 636 | | | | 636 | |
Option One Mortgage Loan Trust, Ser 2006- 1, Cl 1A1 | | | | | | | | |
2.706%, VAR ICE LIBOR USD 1 Month+0.220%, 01/25/2036 | | | 1,631 | | | | 1,616 | |
Saxon Asset Securities Trust, Ser 2003-1, Cl AF6 | | | | | | | | |
4.675%, 06/25/2033 | | | 4 | | | | 4 | |
Structured Asset Securities Mortgage Pass-Through Certificates, Ser 2002-AL1, Cl A2 | | | | | | | | |
3.450%, 02/25/2032 | | | 25 | | | | 24 | |
| | | | | | | 22,320 | |
|
Other Asset-Backed Securities — 6.0% | |
| | |
Academic Loan Funding Trust, Ser 2012-1A, Cl A2 | | | | | | | | |
3.586%, VAR ICE LIBOR USD 1
Month+1.100%, 12/27/2044 (C) | | | 1,802 | | | | 1,810 | |
Airspeed, Ser 2007-1A, Cl G2 | | | | | | | | |
2.764%, VAR LIBOR USD 1 Month+0.280%, 06/15/2032 (C) | | | 60 | | | | 58 | |
American Tower Trust, Ser 2013-13, Cl 2A | | | | | | | | |
3.070%, 03/15/2048 (C) | | | 350 | | | | 349 | |
Ameriquest Mortgage Security Asset-Backed Pass-Through Certificates, Ser 2005-R10, Cl M1 | | | | | | | | |
2.896%, VAR ICE LIBOR USD 1 Month+0.410%, 01/25/2036 | | | 1,173 | | | | 1,174 | |
Babson CLO, Ser 2017-IA, Cl AR | | | | | | | | |
3.561%, VAR ICE LIBOR USD 3 Month+0.800%, 01/20/2028 (C) | | | 1,175 | | | | 1,163 | |
Brazos Higher Education Authority, Ser 2010- 1, Cl A2 | | | | | | | | |
3.851%, VAR ICE LIBOR USD 3
Month+1.200%, 02/25/2035 | | | 3,050 | | | | 3,089 | |
Brazos Higher Education Authority, Ser 2011- 2, Cl A3 | | | | | | | | |
3.771%, VAR ICE LIBOR USD 3 Month+1.000%, 10/27/2036 | | | 2,150 | | | | 2,150 | |
BSPRT Issuer, Ser 2018-FL4, Cl A | | | | | | | | |
3.534%, VAR ICE LIBOR USD 1
Month+1.050%, 09/15/2035 (C) | | | 1,135 | | | | 1,131 | |
| | | | | | | | |
| | | |
| Description | | Face Amount
(Thousands) | | Market Value
($ Thousands) |
|
ASSET-BACKED SECURITIES (continued) | |
Business Loan Express Business Loan Trust, Ser 2004-A, Cl A | | | | | | | | |
2.916%, VAR ICE LIBOR USD 1 Month+0.430%, 02/25/2031 (C) | | $ | 58 | | | $ | 57 | |
Chase Funding Mortgage Loan Asset-Backed Certificates, Ser 2003-6, Cl 1A5 | | | | | | | | |
5.041%, 11/25/2034 | | | 57 | | | | 59 | |
CIT Education Loan Trust, Ser 2007-1, Cl A | | | | | | | | |
2.692%, VAR ICE LIBOR USD 3 Month+0.090%, 03/25/2042 (C) | | | 1,340 | | | | 1,291 | |
Citicorp Residential Mortgage Trust, Ser 2007-1, Cl A5 | | | | | | | | |
5.349%, 03/25/2037 | | | 1,970 | | | | 2,052 | |
Citicorp Residential Mortgage Trust, Ser 2007-1, Cl M1 | | | | | | | | |
5.349%, 03/25/2037 | | | 1,430 | | | | 1,485 | |
College Avenue Student Loans, Ser 2017-A, Cl A1 | | | | | | | | |
4.136%, VAR ICE LIBOR USD 1 Month+1.650%, 11/26/2046 (C) | | | 891 | | | | 911 | |
College Avenue Student Loans, Ser 2018-A, Cl A2 | | | | | | | | |
4.130%, 12/26/2047 (C) | | | 300 | | | | 312 | |
Commonbond Student Loan Trust, Ser 2018- BGS, Cl A1 | | | | | | | | |
3.560%, 09/25/2045 (C) | | | 5,112 | | | | 5,141 | |
Commonbond Student Loan Trust, Ser 2018- CGS, Cl A1 | | | | | | | | |
3.870%, 02/25/2046 (C) | | | 2,356 | | | | 2,388 | |
Community Funding CLO, Ser 2015-1A, Cl A | | | | | | | | |
5.750%,
11/01/2027 (C)(D) | | | 1,487 | | | | 1,542 | |
Countrywide Asset-Backed Certificates, Ser 2004-5, Cl 1A | | | | | | | | |
2.986%, VAR ICE LIBOR USD 1
Month+0.500%, 10/25/2034 | | | 495 | | | | 490 | |
Countrywide Asset-Backed Certificates, Ser 2004-6, Cl 1A1 | | | | | | | | |
3.026%, VAR ICE LIBOR USD 1 Month+0.540%, 12/25/2034 | | | 374 | | | | 371 | |
Countrywide Asset-Backed Certificates, Ser 2007-13, Cl 2A2 | | | | | | | | |
3.286%, VAR ICE LIBOR USD 1 Month+0.800%, 10/25/2047 | | | 2,087 | | | | 2,012 | |
Countrywide Home Equity Loan Trust, Ser 2006-F, Cl 2A1A | | | | | | | | |
2.624%, VAR ICE LIBOR USD 1 Month+0.140%, 07/15/2036 | | | 492 | | | | 473 | |
CSMC Trust, Ser 2017-RPL1, Cl M2 | | | | | | | | |
3.091%,
07/25/2057 (B)(C) | | | 1,760 | | | | 1,431 | |
CWABS Revolving Home Equity Loan
Trust, Ser 2004-K, Cl 2A | | | | | | | | |
2.784%, VAR ICE LIBOR USD 1 Month+0.300%, 02/15/2034 | | | 108 | | | | 108 | |
| | |
94 | | SEI Institutional Managed Trust / Semi-Annual Report / March 31, 2019 |
| | | | | | | | |
| | | |
| Description | | Face Amount
(Thousands) | | Market Value
($ Thousands) |
|
ASSET-BACKED SECURITIES (continued) | |
DRB Prime Student Loan Trust, Ser 2015-D, Cl A2 | | | | | | | | |
3.200%, 01/25/2040 (C) | | $ | 209 | | | $ | 208 | |
Dryden 61 CLO, Ser 2018-61A, Cl A1 | | | | | | | | |
3.597%, VAR ICE LIBOR USD 3 Month+1.160%, 01/17/2032 (C) | | | 1,250 | | | | 1,243 | |
Dryden 71 CLO, Ser 2019-71A, Cl A | | | | | | | | |
3.843%, VAR ICE LIBOR USD 3 Month+1.150%, 01/15/2029 (C) | | | 3,000 | | | | 3,002 | |
Dryden XXVI Senior Loan Fund, Ser 2018- 26A, Cl AR | | | | | | | | |
3.687%, VAR ICE LIBOR USD 3 Month+0.900%, 04/15/2029 (C) | | | 1,150 | | | | 1,139 | |
Earnest Student Loan Program, Ser 2016-D, Cl A2 | | | | | | | | |
2.720%, 01/25/2041 (C) | | | 460 | | | | 457 | |
Educational Funding of the South, Ser 2011- 1, Cl A2 | | | | | | | | |
3.421%, VAR ICE LIBOR USD 3 Month+0.650%, 04/25/2035 | | | 1,017 | | | | 1,012 | |
Encore Credit Receivables Trust, Ser 2005-3, Cl M2 | | | | | | | | |
3.221%, VAR ICE LIBOR USD 1 Month+0.735%, 10/25/2035 | | | 153 | | | | 153 | |
Finance of America Structured Securities Trust, Ser 2018-HB1, Cl M2 | | | | | | | | |
4.087%,
09/25/2028 (B)(C) | | | 2,000 | | | | 1,972 | |
First Franklin Mortgage Loan Asset-Backed Certificates, Ser 2004-FF5, Cl A3C | | | | | | | | |
3.486%, VAR ICE LIBOR USD 1 Month+1.000%, 08/25/2034 | | | 525 | | | | 510 | |
First Franklin Mortgage Loan Asset-Backed Certificates, Ser 2005-FF8, Cl M1 | | | | | | | | |
3.221%, VAR ICE LIBOR USD 1 Month+0.735%, 09/25/2035 | | | 871 | | | | 874 | |
Ford Credit Floorplan Master Owner Trust A, Ser 2016-3, Cl A1 | | | | | | | | |
1.550%, 07/15/2021 | | | 1,350 | | | | 1,345 | |
Ford Credit Floorplan Master Owner Trust A, Ser 2018-4, Cl A | | | | | | | | |
4.060%, 11/15/2030 | | | 1,860 | | | | 1,938 | |
Global SC Finance, Ser 2014-1A, Cl A2 | | | | | | | | |
3.090%, 07/17/2029 (C) | | | 901 | | | | 889 | |
GoldenTree Loan Opportunities IX, Ser 2018- 9A, Cl AR2 | | | | | | | | |
3.862%, VAR ICE LIBOR USD 3 Month+1.110%, 10/29/2029 (C) | | | 3,000 | | | | 2,992 | |
Greenpoint Manufactured Housing, Ser 2001-2, Cl IA2 | | | | | | | | |
5.631%, 02/20/2032 (B) | | | 25 | | | | 25 | |
GSAMP Trust, Ser 2003-SEA, Cl A1 | | | | | | | | |
2.886%, VAR ICE LIBOR USD 1 Month+0.400%, 02/25/2033 | | | 838 | | | | 827 | |
| | | | | | | | |
| | | |
| Description | | Face Amount
(Thousands) | | Market Value
($ Thousands) |
|
ASSET-BACKED SECURITIES (continued) | |
GSAMP Trust, Ser 2006-HE1, Cl A2D | | | | | | | | |
2.796%, VAR ICE LIBOR USD 1 Month+0.310%, 01/25/2036 | | $ | 525 | | | $ | 525 | |
GSAMP Trust, Ser 2006-HE3, Cl A2D | | | | | | | | |
2.736%, VAR ICE LIBOR USD 1 Month+0.250%, 05/25/2046 | | | 3,300 | | | | 3,111 | |
GSAMP Trust, Ser 2006-NC1, Cl A3 | | | | | | | | |
2.776%, VAR ICE LIBOR USD 1 Month+0.290%, 02/25/2036 | | | 2,027 | | | | 2,024 | |
Higher Education Funding, Ser 2014-1, Cl A | | | | | | | | |
3.701%, VAR ICE LIBOR USD 3 Month+1.050%, 05/25/2034 (C) | | | 1,955 | | | | 1,969 | |
Hilton Grand Vacations Trust, Ser 2017-AA, Cl A | | | | | | | | |
2.660%, 12/26/2028 (C) | | | 925 | | | | 918 | |
HSI Asset Securitization Trust, Ser 2006- OPT3, Cl 3A3 | | | | | | | | |
2.666%, VAR ICE LIBOR USD 1 Month+0.180%, 02/25/2036 | | | 244 | | | | 243 | |
HSI Asset Securitization Trust, Ser 2006- OPT4, Cl 1A1 | | | | | | | | |
2.656%, VAR ICE LIBOR USD 1 Month+0.170%, 03/25/2036 | | | 1,328 | | | | 1,319 | |
JGWPT XXX, Ser 2013-3A, Cl A | | | | | | | | |
4.080%, 01/17/2073 (C) | | | 980 | | | | 1,014 | |
JGWPT XXXII, Ser 2014-2A, Cl A | | | | | | | | |
3.610%, 01/17/2073 (C) | | | 1,321 | | | | 1,339 | |
LCM XXI, Ser 2018-21A, Cl AR | | | | | | | | |
3.641%, VAR ICE LIBOR USD 3 Month+0.880%, 04/20/2028 (C) | | | 1,290 | | | | 1,278 | |
Lehman Manufactured Housing Contract Trust, Ser 2001-B, Cl A4 | | | | | | | | |
5.270%, 04/15/2040 | | | 7 | | | | 7 | |
Magnetite VII, Ser 2018-7A, Cl A1R2 | | | | | | | | |
3.587%, VAR ICE LIBOR USD 3 Month+0.800%, 01/15/2028 (C) | | | 1,000 | | | | 983 | |
Magnetite XI, Ser 2017-11A, Cl A1R | | | | | | | | |
3.900%, VAR ICE LIBOR USD 3 Month+1.120%, 01/18/2027 (C) | | | 1,730 | | | | 1,731 | |
Mid-State Trust, Ser 2003-11, Cl A1 | | | | | | | | |
4.864%, 07/15/2038 | | | 2,306 | | | | 2,416 | |
Mill City Mortgage Trust, Ser 2015-2, Cl A2 | | | | | | | | |
3.000%,
09/25/2057 (B)(C) | | | 2,185 | | | | 2,180 | |
Morgan Stanley Resecuritization Trust, Ser 2015-R7, Cl 1BXA | | | | | | | | |
8.956%,
02/26/2029 (B)(C) | | | 930 | | | | 1,010 | |
Nationstar HECM Loan Trust, Ser 2018-1A, Cl M2 | | | | | | | | |
3.469%,
02/25/2028 (B)(C) | | | 1,115 | | | | 1,107 | |
Navient Private Education Loan Trust, Ser 2014-AA, Cl A3 | | | | | | | | |
4.084%, VAR ICE LIBOR USD 1 Month+1.600%, 10/15/2031 (C) | | | 1,330 | | | | 1,368 | |
| | |
SEI Institutional Managed Trust / Semi-Annual Report / March 31, 2019 | | 95 |
SCHEDULE OF INVESTMENTS (Unaudited)
March 31, 2019
Core Fixed Income Fund(Continued)
| | | | | | | | |
| | | |
| Description | | Face Amount
(Thousands) | | Market Value
($ Thousands) |
|
ASSET-BACKED SECURITIES (continued) | |
Navient Private Education Loan Trust, Ser 2014-CTA, Cl A | | | | | | | | |
3.184%, VAR ICE LIBOR USD 1 Month+0.700%, 09/16/2024 (C) | | $ | 266 | | | $ | 267 | |
Navient Private Education Loan Trust, Ser 2015-CA, Cl B | | | | | | | | |
3.250%, 05/15/2040 (C) | | | 489 | | | | 489 | |
Navient Private Education Loan Trust, Ser 2016-AA, Cl A2B | | | | | | | | |
4.634%, VAR ICE LIBOR USD 1 Month+2.150%, 12/15/2045 (C) | | | 637 | | | | 661 | |
Navient Private Education Loan Trust, Ser 2017-A, Cl A2B | | | | | | | | |
3.384%, VAR ICE LIBOR USD 1 Month+0.900%, 12/16/2058 (C) | | | 1,884 | | | | 1,881 | |
Navient Private Education Loan Trust, Ser 2018-BA, Cl A2A | | | | | | | | |
3.610%, 12/15/2059 (C) | | | 423 | | | | 431 | |
Navient Private Education Refi Loan Trust, Ser 2018-A, Cl A2 | | | | | | | | |
3.190%, 02/18/2042 (C) | | | 475 | | | | 476 | |
Navient Private Education Refi Loan Trust, Ser 2018-CA, Cl A2 | | | | | | | | |
3.520%, 06/16/2042 (C) | | | 526 | | | | 533 | |
Navient Private Education Refi Loan Trust, Ser 2018-DA, Cl A2A | | | | | | | | |
4.000%, 12/15/2059 (C) | | | 1,816 | | | | 1,884 | |
Navient Private Education Refi Loan Trust, Ser 2019-A, Cl A2A | | | | | | | | |
3.420%, 01/15/2043 (C) | | | 2,108 | | | | 2,137 | |
Navient Student Loan Trust, Ser 2014-1, Cl A3 | | | | | | | | |
2.996%, VAR ICE LIBOR USD 1 Month+0.510%, 06/25/2031 | | | 4,601 | | | | 4,566 | |
Navient Student Loan Trust, Ser 2014-2, Cl A | | | | | | | | |
3.126%, VAR ICE LIBOR USD 1 Month+0.640%, 03/25/2083 | | | 2,757 | | | | 2,730 | |
Navient Student Loan Trust, Ser 2014-3, Cl A | | | | | | | | |
3.106%, VAR ICE LIBOR USD 1 Month+0.620%, 03/25/2083 | | | 2,821 | | | | 2,795 | |
Navient Student Loan Trust, Ser 2014-4, Cl A | | | | | | | | |
3.106%, VAR ICE LIBOR USD 1 Month+0.620%, 03/25/2083 | | | 1,951 | | | | 1,920 | |
Navient Student Loan Trust, Ser 2015-1, Cl A2 | | | | | | | | |
3.086%, VAR ICE LIBOR USD 1 Month+0.600%, 04/25/2040 | | | 2,259 | | | | 2,254 | |
Navient Student Loan Trust, Ser 2016-1A, Cl A | | | | | | | | |
3.186%, VAR ICE LIBOR USD 1 Month+0.700%, 02/25/2070 (C) | | | 2,063 | | | | 2,057 | |
Navient Student Loan Trust, Ser 2016-2A, Cl A3 | | | | | | | | |
3.986%, VAR ICE LIBOR USD 1 Month+1.500%, 06/25/2065 (C) | | | 1,270 | | | | 1,305 | |
| | | | | | | | |
| | | |
| Description | | Face Amount
(Thousands) | | Market Value
($ Thousands) |
|
ASSET-BACKED SECURITIES (continued) | |
Navient Student Loan Trust, Ser 2016-3A, Cl A2 | | | | | | | | |
3.336%, VAR ICE LIBOR USD 1 Month+0.850%, 06/25/2065 (C) | | $ | 482 | | | $ | 485 | |
Navient Student Loan Trust, Ser 2017-1A, Cl A3 | | | | | | | | |
3.636%, VAR ICE LIBOR USD 1 Month+1.150%, 07/26/2066 (C) | | | 1,000 | | | | 1,015 | |
Navient Student Loan Trust, Ser 2017-3A, Cl A3 | | | | | | | | |
3.536%, VAR ICE LIBOR USD 1 Month+1.050%, 07/26/2066 (C) | | | 2,900 | | | | 2,929 | |
Navient Student Loan Trust, Ser 2017-5A, Cl A | | | | | | | | |
3.286%, VAR ICE LIBOR USD 1 Month+0.800%, 07/26/2066 (C) | | | 719 | | | | 720 | |
Navient Student Loan Trust, Ser 2018-EA, Cl A2 | | | | | | | | |
4.000%, 12/15/2059 (C) | | | 1,170 | | | | 1,217 | |
Navient Student Loan Trust, Ser 2019-BA, Cl A2A | | | | | | | | |
3.390%, 12/15/2059 (C) | | | 1,416 | | | | 1,416 | |
Nelnet Student Loan Trust, Ser 2004-3, Cl A5 | | | | | | | | |
2.951%, VAR ICE LIBOR USD 3 Month+0.180%, 10/27/2036 | | | 802 | | | | 789 | |
Nelnet Student Loan Trust, Ser 2004-4, Cl A5 | | | | | | | | |
2.931%, VAR ICE LIBOR USD 3 Month+0.160%, 01/25/2037 | | | 1,438 | | | | 1,414 | |
Nelnet Student Loan Trust, Ser 2005-1, Cl A5 | | | | | | | | |
2.881%, VAR ICE LIBOR USD 3 Month+0.110%, 10/25/2033 | | | 3,424 | | | | 3,384 | |
Nelnet Student Loan Trust, Ser 2005-2, Cl A5 | | | | | | | | |
2.707%, VAR ICE LIBOR USD 3 Month+0.100%, 03/23/2037 | | | 3,093 | | | | 3,067 | |
Nelnet Student Loan Trust, Ser 2005-3, Cl A5 | | | | | | | | |
2.727%, VAR ICE LIBOR USD 3 Month+0.120%, 12/24/2035 | | | 3,993 | | | | 3,975 | |
Nelnet Student Loan Trust, Ser 2005-4, Cl A4 | | | | | | | | |
2.787%, VAR ICE LIBOR USD 3 Month+0.180%, 03/22/2032 | | | 596 | | | | 577 | |
Nelnet Student Loan Trust, Ser 2007-2A, Cl A3L | | | | | | | | |
2.952%, VAR ICE LIBOR USD 3 Month+0.350%, 03/25/2026 (C) | | | 71 | | | | 70 | |
Nelnet Student Loan Trust, Ser 2010-2A, Cl A | | | | | | | | |
3.452%, VAR ICE LIBOR USD 3 Month+0.850%, 09/25/2048 (C) | | | 2,946 | | | | 2,953 | |
Nelnet Student Loan Trust, Ser 2011-1A, Cl A | | | | | | | | |
3.336%, VAR ICE LIBOR USD 1 Month+0.850%, 02/25/2048 (C) | | | 399 | | | | 403 | |
Nelnet Student Loan Trust, Ser 2012-4A, Cl A | | | | | | | | |
3.186%, VAR ICE LIBOR USD 1 Month+0.700%, 09/27/2038 (C) | | | 2,371 | | | | 2,367 | |
| | |
96 | | SEI Institutional Managed Trust / Semi-Annual Report / March 31, 2019 |
| | | | | | | | |
| | | |
| Description | | Face Amount
(Thousands) | | Market Value
($ Thousands) |
| |
ASSET-BACKED SECURITIES (continued) | | | | | |
Nelnet Student Loan Trust, Ser 2014-1A, Cl A | | | | | | | | |
3.056%, VAR ICE LIBOR USD 1 Month+0.570%, 09/25/2041 (C) | | $ | 492 | | | $ | 490 | |
Nelnet Student Loan Trust, Ser 2014-2A, Cl A3 | | | | | | | | |
3.336%, VAR ICE LIBOR USD 1 Month+0.850%, 07/27/2037 (C) | | | 950 | | | | 947 | |
Nelnet Student Loan Trust, Ser 2014-4A, Cl A2 | | | | | | | | |
3.436%, VAR ICE LIBOR USD 1 Month+0.950%, 11/25/2048 (C) | | | 2,155 | | | | 2,135 | |
Nelnet Student Loan Trust, Ser 2015-2A, Cl A2 | | | | | | | | |
3.086%, VAR ICE LIBOR USD 1 Month+0.600%, 09/25/2047 (C) | | | 975 | | | | 970 | |
Nelnet Student Loan Trust, Ser 2016-1A, Cl A | | | | | | | | |
3.286%, VAR ICE LIBOR USD 1 Month+0.800%, 09/25/2065 (C) | | | 1,717 | | | | 1,723 | |
Nelnet Student Loan Trust, Ser 2017-2A, Cl A | | | | | | | | |
3.256%, VAR ICE LIBOR USD 1 Month+0.770%, 09/25/2065 (C) | | | 1,876 | | | | 1,883 | |
Nelnet Student Loan Trust, Ser 2017-3A, Cl A | | | | | | | | |
3.336%, VAR ICE LIBOR USD 1 Month+0.850%, 02/25/2066 (C) | | | 1,597 | | | | 1,591 | |
Nelnet Student Loan Trust, Ser 2018-3A, Cl A2 | | | | | | | | |
2.926%, VAR ICE LIBOR USD 1 Month+0.440%, 09/27/2066 (C) | | | 486 | | | | 485 | |
Octagon Investment Partners 25, Ser 2018- 1A, Cl AR | | | | | | | | |
3.561%, VAR ICE LIBOR USD 3 Month+0.800%, 10/20/2026 (C) | | | 910 | | | | 905 | |
Origen Manufactured Housing, Ser 2006-A, Cl A2 | | | | | | | | |
4.322%, 10/15/2037 (B) | | | 1,518 | | | | 1,426 | |
PFCA Home Equity Investment Trust, Ser 2004-GP2, Cl A | | | | | | | | |
3.880%,
08/25/2035 (B)(C) | | | 1,412 | | | | 1,394 | |
RAMP Trust, Ser 2006-RZ1, Cl M1 | | | | | | | | |
2.886%, VAR ICE LIBOR USD 1 Month+0.400%, 03/25/2036 | | | 275 | | | | 275 | |
RAMP Trust, Ser 2006-RZ3, Cl M1 | | | | | | | | |
2.836%, VAR ICE LIBOR USD 1 Month+0.350%, 08/25/2036 | | | 6,530 | | | | 6,464 | |
RMF Buyout Issuance Trust, Ser 2018-1, Cl A | | | | | | | | |
3.436%,
11/25/2028 (B)(C) | | | 1,694 | | | | 1,696 | |
SBA Small Business Investment, Ser 2018- 10B, Cl 1 | | | | | | | | |
3.548%, 09/11/2028 | | | 637 | | | | 658 | |
SBA Small Business Investment, Ser 2019-10A, Cl 1 | | | | | | | | |
3.113%, 03/10/2029 | | | 840 | | | | 852 | |
Scholar Funding Trust, Ser 2011-A, Cl A | | | | | | | | |
3.665%, VAR ICE LIBOR USD 3 Month+0.900%, 10/28/2043 (C) | | | 708 | | | | 707 | |
| | | | | | | | |
| | | |
| Description | | Face Amount
(Thousands) | | Market Value
($ Thousands) |
| |
ASSET-BACKED SECURITIES (continued) | | | | | |
SLC Student Loan Trust, Ser 2005-3, Cl A4 | | | | | | | | |
2.761%, VAR ICE LIBOR USD 3 Month+0.150%, 12/15/2039 | | $ | 1,240 | | | $ | 1,176 | |
SLM Private Credit Student Loan Trust, Ser 2005-A, Cl A4 | | | | | | | | |
2.921%, VAR ICE LIBOR USD 3 Month+0.310%, 12/15/2038 | | | 1,560 | | | | 1,509 | |
SLM Student Loan Trust, Ser 2003-1, Cl A5C | | | | | | | | |
3.361%, VAR ICE LIBOR USD 3 Month+0.750%, 12/15/2032 (C) | | | 825 | | | | 802 | |
SLM Student Loan Trust, Ser 2003-7A, Cl A5A | | | | | | | | |
3.811%, VAR ICE LIBOR USD 3 Month+1.200%, 12/15/2033 (C) | | | 2,719 | | | | 2,720 | |
SLM Student Loan Trust, Ser 2005-4, Cl A4 | | | | | | | | |
2.941%, VAR ICE LIBOR USD 3 Month+0.170%, 07/25/2040 | | | 3,000 | | | | 2,858 | |
SLM Student Loan Trust, Ser 2006-1, Cl A5 | | | | | | | | |
2.881%, VAR ICE LIBOR USD 3 Month+0.110%, 07/26/2021 | | | 2,617 | | | | 2,583 | |
SLM Student Loan Trust, Ser 2006-10, Cl A6 | | | | | | | | |
2.921%, VAR ICE LIBOR USD 3 Month+0.150%, 03/25/2044 | | | 4,805 | | | | 4,637 | |
SLM Student Loan Trust, Ser 2006-2, Cl A6 | | | | | | | | |
2.941%, VAR ICE LIBOR USD 3 Month+0.170%, 01/25/2041 | | | 511 | | | | 499 | |
SLM Student Loan Trust, Ser 2006-3, Cl A5 | | | | | | | | |
2.871%, VAR ICE LIBOR USD 3 Month+0.100%, 01/25/2021 | | | 1,537 | | | | 1,523 | |
SLM Student Loan Trust, Ser 2006-8, Cl A6 | | | | | | | | |
2.931%, VAR ICE LIBOR USD 3 Month+0.160%, 01/25/2041 | | | 2,440 | | | | 2,367 | |
SLM Student Loan Trust, Ser 2007-2, Cl A4 | | | | | | | | |
2.831%, VAR ICE LIBOR USD 3 Month+0.060%, 07/25/2022 | | | 2,126 | | | | 2,085 | |
SLM Student Loan Trust, Ser 2007-7, Cl B | | | | | | | | |
3.521%, VAR ICE LIBOR USD 3 Month+0.750%, 10/27/2070 | | | 1,050 | | | | 981 | |
SLM Student Loan Trust, Ser 2008-2, Cl A3 | | | | | | | | |
3.240%, VAR ICE LIBOR USD 3 Month+0.750%, 04/25/2023 | | | 1,023 | | | | 1,013 | |
SLM Student Loan Trust, Ser 2008-2, Cl B | | | | | | | | |
3.971%, VAR ICE LIBOR USD 3 Month+1.200%, 01/25/2083 | | | 685 | | | | 658 | |
SLM Student Loan Trust, Ser 2008-3, Cl B | | | | | | | | |
3.971%, VAR ICE LIBOR USD 3 Month+1.200%, 04/26/2083 | | | 685 | | | | 655 | |
SLM Student Loan Trust, Ser 2008-4, Cl A4 | | | | | | | | |
4.140%, VAR ICE LIBOR USD 3 Month+1.650%, 07/25/2022 | | | 834 | | | | 844 | |
SLM Student Loan Trust, Ser 2008-4, Cl B | | | | | | | | |
4.621%, VAR ICE LIBOR USD 3 Month+1.850%, 04/25/2073 | | | 685 | | | | 692 | |
| | |
SEI Institutional Managed Trust / Semi-Annual Report / March 31, 2019 | | 97 |
SCHEDULE OF INVESTMENTS (Unaudited)
March 31, 2019
Core Fixed Income Fund(Continued)
| | | | | | | | |
| | | |
| Description | | Face Amount
(Thousands) | | Market Value
($ Thousands) |
|
ASSET-BACKED SECURITIES (continued) | |
SLM Student Loan Trust, Ser 2008-5, Cl A4 | | | | | | | | |
4.471%, VAR ICE LIBOR USD 3 Month+1.700%, 07/25/2023 | | | $ 154 | | | | $ 156 | |
SLM Student Loan Trust, Ser 2008-5, Cl B | | | | | | | | |
4.621%, VAR ICE LIBOR USD 3 Month+1.850%, 07/25/2073 | | | 685 | | | | 695 | |
SLM Student Loan Trust, Ser 2008-6, Cl A4 | | | | | | | | |
3.871%, VAR ICE LIBOR USD 3 Month+1.100%, 07/25/2023 | | | 4,074 | | | | 4,074 | |
SLM Student Loan Trust, Ser 2008-6, Cl B | | | | | | | | |
4.621%, VAR ICE LIBOR USD 3 Month+1.850%, 07/26/2083 | | | 685 | | | | 696 | |
SLM Student Loan Trust, Ser 2008-7, Cl B | | | | | | | | |
4.621%, VAR ICE LIBOR USD 3 Month+1.850%, 07/26/2083 | | | 685 | | | | 694 | |
SLM Student Loan Trust, Ser 2008-8, Cl B | | | | | | | | |
5.021%, VAR ICE LIBOR USD 3 Month+2.250%, 10/25/2075 | | | 685 | | | | 700 | |
SLM Student Loan Trust, Ser 2008-9, Cl A | | | | | | | | |
4.271%, VAR ICE LIBOR USD 3 Month+1.500%, 04/25/2023 | | | 1,903 | | | | 1,925 | |
SLM Student Loan Trust, Ser 2008-9, Cl B | | | | | | | | |
5.021%, VAR ICE LIBOR USD 3 Month+2.250%, 10/25/2083 | | | 685 | | | | 701 | |
SLM Student Loan Trust, Ser 2009-3, Cl A | | | | | | | | |
3.538%, VAR ICE LIBOR USD 1 Month+0.750%, 01/25/2045 (C) | | | 686 | | | | 683 | |
SLM Student Loan Trust, Ser 2010-1, Cl A | | | | | | | | |
2.886%, VAR ICE LIBOR USD 1 Month+0.400%, 03/25/2025 | | | 461 | | | | 451 | |
SLM Student Loan Trust, Ser 2012-1, Cl A3 | | | | | | | | |
3.436%, VAR ICE LIBOR USD 1 Month+0.950%, 09/25/2028 | | | 2,242 | | | | 2,231 | |
SLM Student Loan Trust, Ser 2012-2, Cl A | | | | | | | | |
3.186%, VAR ICE LIBOR USD 1 Month+0.700%, 01/25/2029 | | | 1,904 | | | | 1,876 | |
SLM Student Loan Trust, Ser 2012-6, Cl A3 | | | | | | | | |
3.236%, VAR ICE LIBOR USD 1 Month+0.750%, 05/26/2026 | | | 430 | | | | 426 | |
SLM Student Loan Trust, Ser 2013-B, Cl A2B | | | | | | | | |
3.584%, VAR ICE LIBOR USD 1 Month+1.100%, 06/17/2030 (C) | | | 60 | | | | 60 | |
SLM Student Loan Trust, Ser 2013-C, Cl A2A | | | | | | | | |
2.940%, 10/15/2031 (C) | | | 51 | | | | 51 | |
SLM Student Loan Trust, Ser 2013-M1, Cl M1 | | | | | | | | |
3.500%, 10/28/2029 (C) | | | 483 | | | | 477 | |
SMB Private Education Loan Trust, Ser 2015-A, Cl A2B | | | | | | | | |
3.484%, VAR ICE LIBOR USD 1 Month+1.000%, 06/15/2027 (C) | | | 902 | | | | 907 | |
| | | | | | | | |
| | | |
| Description | | Face Amount
(Thousands) | | Market Value
($ Thousands) |
|
ASSET-BACKED SECURITIES (continued) | |
SMB Private Education Loan Trust, Ser 2015-C, Cl A2B | | | | | | | | |
3.884%, VAR ICE LIBOR USD 1 Month+1.400%, 07/15/2027 (C) | | | $ 440 | | | | $ 447 | |
SMB Private Education Loan Trust, Ser 2016-A, Cl A2A | | | | | | | | |
2.700%, 05/15/2031 (C) | | | 1,572 | | | | 1,563 | |
SMB Private Education Loan Trust, Ser 2016-A, Cl A2B | | | | | | | | |
3.984%, VAR ICE LIBOR USD 1 Month+1.500%, 05/15/2031 (C) | | | 2,142 | | | | 2,183 | |
SMB Private Education Loan Trust, Ser 2016-B, Cl A2A | | | | | | | | |
2.430%, 02/17/2032 (C) | | | 766 | | | | 753 | |
SMB Private Education Loan Trust, Ser 2016-B, Cl A2B | | | | | | | | |
3.934%, VAR ICE LIBOR USD 1 Month+1.450%, 02/17/2032 (C) | | | 2,459 | | | | 2,500 | |
SMB Private Education Loan Trust, Ser 2016-C, Cl A2A | | | | | | | | |
2.340%, 09/15/2034 (C) | | | 2,134 | | | | 2,092 | |
SMB Private Education Loan Trust, Ser 2016-C, Cl A2B | | | | | | | | |
3.584%, VAR ICE LIBOR USD 1 Month+1.100%, 09/15/2034 (C) | | | 829 | | | | 833 | |
SMB Private Education Loan Trust, Ser 2017-A, Cl A2B | | | | | | | | |
3.384%, VAR ICE LIBOR USD 1 Month+0.900%, 09/15/2034 (C) | | | 2,699 | | | | 2,704 | |
SMB Private Education Loan Trust, Ser 2017-B, Cl A2B | | | | | | | | |
3.234%, VAR ICE LIBOR USD 1 Month+0.750%, 10/15/2035 (C) | | | 1,738 | | | | 1,738 | |
SMB Private Education Loan Trust, Ser 2018-A, Cl A2B | | | | | | | | |
3.284%, VAR ICE LIBOR USD 1 Month+0.800%, 02/15/2036 (C) | | | 426 | | | | 425 | |
SMB Private Education Loan Trust, Ser 2018-C, Cl A2A | | | | | | | | |
3.630%, 11/15/2035 (C) | | | 337 | | | | 346 | |
SMB Private Education Loan Trust, Ser 2018-C, Cl A2B | | | | | | | | |
3.234%, VAR ICE LIBOR USD 1 Month+0.750%, 11/15/2035 (C) | | | 862 | | | | 860 | |
SMB Private Education Loan Trust, Ser 2019-A, Cl A2A | | | | | | | | |
3.440%, 07/15/2036 (C) | | | 1,593 | | | | 1,617 | |
SoFi Consumer Loan Program Trust, Ser 2017-4, Cl A | | | | | | | | |
2.500%, 05/26/2026 (C) | | | 2,354 | | | | 2,337 | |
Sofi Consumer Loan Program Trust, Ser 2018-1, Cl A2 | | | | | | | | |
3.140%, 02/25/2027 (C) | | | 100 | | | | 100 | |
| | |
98 | | SEI Institutional Managed Trust / Semi-Annual Report / March 31, 2019 |
| | | | | | | | |
| | | |
| Description | | Face Amount
(Thousands) | | | Market Value
($ Thousands) | |
| |
ASSET-BACKED SECURITIES (continued) | | | | | |
Sofi Consumer Loan Program Trust, Ser 2018-2, Cl A2 | | | | | | | | |
3.350%, 04/26/2027 (C) | | | $ 425 | | | | $ 426 | |
SoFi Consumer Loan Program Trust, Ser 2018-4, Cl A | | | | | | | | |
3.540%, 11/26/2027 (C) | | | 2,024 | | | | 2,036 | |
SoFi Consumer Loan Program, Ser 2017-6,
Cl A2 | | | | | | | | |
2.820%, 11/25/2026 (C) | | | 220 | | | | 219 | |
Sofi Consumer Loan Program, Ser 2018-1,
Cl A1 | | | | | | | | |
2.550%, 02/25/2027 (C) | | | 613 | | | | 612 | |
Sofi Consumer Loan Program, Ser 2018-3,
Cl A1 | | | | | | | | |
3.200%, 08/25/2027 (C) | | | 1,947 | | | | 1,948 | |
SoFi Professional Loan Program, Ser 2016-D,
Cl A1 | | | | | | | | |
3.436%, VAR ICE LIBOR USD 1 Month+0.950%, 01/25/2039 (C) | | | 138 | | | | 139 | |
SoFi Professional Loan Program, Ser 2016-E,
Cl A1 | | | | | | | | |
3.336%, VAR ICE LIBOR USD 1 Month+0.850%, 07/25/2039 (C) | | | 312 | | | | 313 | |
SoFi Professional Loan Program, Ser 2017-A,
Cl A1 | | | | | | | | |
3.186%, VAR ICE LIBOR USD 1 Month+0.700%, 03/26/2040 (C) | | | 297 | | | | 298 | |
SoFi Professional Loan Program, Ser 2017-E,
Cl A1 | | | | | | | | |
2.986%, VAR ICE LIBOR USD 1 Month+0.500%, 11/26/2040 (C) | | | 240 | | | | 240 | |
SoFi Professional Loan Program, Ser 2017-E,
Cl A2B | | | | | | | | |
2.720%, 11/26/2040 (C) | | | 2,162 | | | | 2,137 | |
Sofi Professional Loan Program, Ser 2019-A,
Cl A2FX | | | | | | | | |
3.690%, 06/15/2048 (C) | | | 485 | | | | 498 | |
South Carolina Student Loan, Ser 2015-A, Cl A | | | | | | | | |
3.986%, VAR ICE LIBOR USD 1 Month+1.500%, 01/25/2036 | | | 1,456 | | | | 1,467 | |
Structured Asset Investment Loan Trust, Ser 2004-8,
Cl A2 | | | | | | | | |
3.036%, VAR ICE LIBOR USD 1 Month+0.550%, 09/25/2034 | | | 495 | | | | 485 | |
Structured Asset Investment Loan Trust, Ser 2005-HE1, Cl M1 | | | | | | | | |
2.956%, VAR ICE LIBOR USD 1 Month+0.470%, 07/25/2035 | | | 834 | | | | 834 | |
| | | | | | | | |
| | | |
| Description | | Face Amount
(Thousands) | | | Market Value
($ Thousands) | |
| |
ASSET-BACKED SECURITIES (continued) | | | | | |
Structured Asset Securities Mortgage Pass-Through Certificates, Ser 2005-WF4, Cl M2 | | | | | | | | |
3.131%, VAR ICE LIBOR USD 1 Month+0.645%, 11/25/2035 | | | $ 24 | | | | $ 24 | |
TCI-Flatiron CLO, Ser 2016-1A, Cl AR | | | | | | | | |
3.733%, VAR ICE LIBOR USD 3 Month+1.220%, 07/17/2028 (C) | | | 1,500 | | | | 1,499 | |
Towd Point Mortgage Trust, Ser 2017-4, Cl A1 | | | | | | | | |
2.750%, 06/25/2057 (B)(C) | | | 2,094 | | | | 2,060 | |
Towd Point Mortgage Trust, Ser 2017-5, Cl A1 | | | | | | | | |
3.086%, VAR ICE LIBOR USD 1 Month+0.600%, 02/25/2057 (C) | | | 1,764 | | | | 1,750 | |
Verizon Owner Trust, Ser 2016-1A, Cl A | | | | | | | | |
1.420%, 01/20/2021 (C) | | | 667 | | | | 665 | |
Verizon Owner Trust, Ser 2016-2A, Cl A | | | | | | | | |
1.680%, 05/20/2021 (C) | | | 1,799 | | | | 1,793 | |
Verizon Owner Trust, Ser 2017-1A, Cl A | | | | | | | | |
2.060%, 09/20/2021 (C) | | | 1,725 | | | | 1,720 | |
Verizon Owner Trust, Ser 2017-2A, Cl A | | | | | | | | |
1.920%, 12/20/2021 (C) | | | 1,780 | | | | 1,770 | |
Verizon Owner Trust, Ser 2019-A, Cl A1A | | | | | | | | |
2.930%, 09/20/2023 | | | 543 | | | | 547 | |
Wells Fargo Home Equity Asset-Backed Securities Trust, Ser 2006-2, Cl A4 | | | | | | | | |
2.736%, VAR ICE LIBOR USD 1 Month+0.250%, 07/25/2036 | | | 836 | | | | 834 | |
| | | | | | | 241,160 | |
| | |
Total Asset-Backed Securities
(Cost $318,442) ($ Thousands) | | | | | | | 323,724 | |
| |
SOVEREIGN DEBT — 2.1% | | | | | |
| | |
Abu Dhabi Government International Bond | | | | | | | | |
2.500%, 10/11/2022 (C) | | | 1,850 | | | | 1,832 | |
Argentine Bonos del Tesoro | | | | | | | | |
18.200%, 10/03/2021 | | | ARS 19,870 | | | | 320 | |
Argentine Republic Government International Bond | | | | | | | | |
7.625%, 04/22/2046 (E) | | | $180 | | | | 142 | |
7.500%, 04/22/2026 | | | 470 | | | | 399 | |
7.125%, 07/06/2036 | | | 220 | | | | 169 | |
6.875%, 04/22/2021 | | | 190 | | | | 173 | |
6.875%, 01/11/2048 | | | 2,950 | | | | 2,168 | |
5.625%, 01/26/2022 | | | 1,300 | | | | 1,121 | |
2.500%, 5.250%,
03/31/2029, 12/31/2038 (G) | | | 240 | | | | 139 | |
Brazil Notas do Tesouro Nacional, Ser F | | | | | | | | |
10.000%, 01/01/2021 | | | BRL 23,399 | | | | 6,274 | |
10.000%, 01/01/2023 | | | 3,994 | | | | 1,083 | |
10.000%, 01/01/2027 | | | 571 | | | | 155 | |
| | |
SEI Institutional Managed Trust / Semi-Annual Report / March 31, 2019 | | 99 |
SCHEDULE OF INVESTMENTS (Unaudited)
March 31, 2019
Core Fixed Income Fund(Continued)
| | | | | | | | |
| | | |
| Description | | Face Amount
(Thousands) | | | Market Value
($ Thousands) | |
|
SOVEREIGN DEBT (continued) | |
Brazilian Government International Bond | | | | | | | | |
5.625%, 01/07/2041 | | | $ 1,120 | | | | $ 1,123 | |
5.000%, 01/27/2045 | | | 3,400 | | | | 3,131 | |
4.625%, 01/13/2028 | | | 4,440 | | | | 4,476 | |
2.625%, 01/05/2023 | | | 200 | | | | 194 | |
China Government Bond | | | | | | | | |
3.390%, 05/21/2025 | | | CNY 2,000 | | | | 302 | |
3.310%, 11/30/2025 | | | 11,500 | | | | 1,722 | |
Colombia Government International Bond | | | | | | | | |
5.625%, 02/26/2044 | | | $ 1,510 | | | | 1,702 | |
5.200%, 05/15/2049 | | | 526 | | | | 566 | |
5.000%, 06/15/2045 | | | 830 | | | | 871 | |
Ecuador Government International Bond | | | | | | | | |
7.875%, 01/23/2028 (C) | | | 380 | | | | 361 | |
Egypt Government International Bond | | | | | | | | |
5.577%, 02/21/2023 (C) | | | 410 | | | | 407 | |
Export-Import Bank of India | | | | | | | | |
3.375%, 08/05/2026 (C) | | | 350 | | | | 337 | |
Indonesia Government International Bond | | | | | | | | |
5.875%, 03/13/2020 | | | 240 | | | | 247 | |
5.875%, 01/15/2024 (C) | | | 840 | | | | 926 | |
5.250%, 01/08/2047 (C) | | | 400 | | | | 433 | |
5.125%, 01/15/2045 (C) | | | 400 | | | | 426 | |
4.450%, 02/11/2024 | | | 482 | | | | 502 | |
4.350%, 01/11/2048 (E) | | | 460 | | | | 453 | |
3.850%, 07/18/2027 (C) | | | 800 | | | | 800 | |
3.750%, 04/25/2022 (C) | | | 740 | | | | 749 | |
3.500%, 01/11/2028 (E) | | | 400 | | | | 389 | |
Japan Finance Organization for Municipalities | | | | | | | | |
4.000%, 01/13/2021 | | | 1,800 | | | | 1,844 | |
Kazakhstan Government International Bond | | | | | | | | |
4.875%, 10/14/2044 (C) | | | 660 | | | | 702 | |
Kenya Government International Bond | | | | | | | | |
7.250%, 02/28/2028 (C) | | | 200 | | | | 202 | |
6.875%, 06/24/2024 | | | 200 | | | | 205 | |
Korea International Bond | | | | | | | | |
3.875%, 09/20/2048 | | | 440 | | | | 469 | |
3.500%, 09/20/2028 | | | 605 | | | | 629 | |
Kuwait International Government Bond | | | | | | | | |
3.500%, 03/20/2027 (C) | | | 1,230 | | | | 1,256 | |
Mexico Government International Bond | | | | | | | | |
6.050%, 01/11/2040 (E) | | | 1,210 | | | | 1,384 | |
4.750%, 03/08/2044 | | | 9,200 | | | | 9,039 | |
4.600%, 02/10/2048 | | | 1,045 | | | | 1,011 | |
4.500%, 04/22/2029 | | | 1,707 | | | | 1,768 | |
3.750%, 01/11/2028 (E) | | | 390 | | | | 385 | |
3.600%, 01/30/2025 | | | 3,300 | | | | 3,300 | |
Nigeria Government International Bond | | | | | | | | |
7.143%, 02/23/2030 (C) | | | 240 | | | | 240 | |
6.500%, 11/28/2027 (C) | | | 220 | | | | 217 | |
| | | | | | | | |
| | | |
| Description | | Face Amount
(Thousands) | | | Market Value
($ Thousands) | |
|
SOVEREIGN DEBT (continued) | |
Panama Government International Bond | | | | | | | | |
6.700%, 01/26/2036 | | | $ 440 | | | | $ 574 | |
4.500%, 05/15/2047 | | | 640 | | | | 675 | |
Paraguay Government International Bond | | | | | | | | |
5.400%, 03/30/2050 (C) | | | 841 | | | | 881 | |
Peruvian Government International Bond | | | | | | | | |
6.550%, 03/14/2037 | | | 1,220 | | | | 1,642 | |
5.625%, 11/18/2050 | | | 600 | | | | 770 | |
Province of Quebec Canada | | | | | | | | |
2.625%, 02/13/2023 | | | 620 | | | | 622 | |
Provincia de Buenos Aires | | | | | | | | |
9.125%, 03/16/2024 (C) | | | 230 | | | | 190 | |
7.875%, 06/15/2027 (C) | | | 250 | | | | 182 | |
6.500%, 02/15/2023 (C) | | | 300 | | | | 244 | |
Qatar Government International Bond | | | | | | | | |
4.817%, 03/14/2049 (C) | | | 1,962 | | | | 2,063 | |
4.000%, 03/14/2029 (C) | | | 880 | | | | 907 | |
3.875%, 04/23/2023 | | | 430 | | | | 442 | |
3.375%, 03/14/2024 (C) | | | 1,736 | | | | 1,753 | |
3.250%, 06/02/2026 | | | 200 | | | | 198 | |
Republic of Poland Government International Bond | | | | | | | | |
5.000%, 03/23/2022 | | | 100 | | | | 106 | |
4.000%, 01/22/2024 | | | 3,067 | | | | 3,206 | |
Russian Federal Bond - OFZ | | | | | | | | |
8.150%, 02/03/2027 | | | RUB 315,940 | | | | 4,836 | |
7.000%, 01/25/2023 | | | 34,160 | | | | 506 | |
7.000%, 08/16/2023 | | | 231,430 | | | | 3,410 | |
Russian Foreign Bond - Eurobond | | | | | | | | |
7.500%, 03/31/2030 (C) | | | $ 745 | | | | 830 | |
5.625%, 04/04/2042 | | | 1,800 | | | | 1,946 | |
4.875%, 09/16/2023 | | | 200 | | | | 210 | |
Saudi Government International Bond MTN | | | | | | | | |
2.875%, 03/04/2023 (C) | | | 360 | | | | 357 | |
Uruguay Government International Bond | | | | | | | | |
5.100%, 06/18/2050 (E) | | | 650 | | | | 694 | |
| | |
Total Sovereign Debt
(Cost $83,970) ($ Thousands) | | | | | | | 83,987 | |
|
LOAN PARTICIPATIONS — 0.6% | |
1011778 BC ULC / New Red Finance, Term Loan B3, 1st Lien | | | | | | | | |
4.749%, VAR LIBOR+2.250%, 02/16/2024 | | | 159 | | | | 157 | |
4.743%, VAR LIBOR+2.250%, 02/16/2024 | | | 128 | | | | 126 | |
Air Medical Group Holdings Inc., Term Loan B, 1st Lien | | | | | | | | |
5.739%, VAR LIBOR+3.250%, 04/28/2022 | | | 471 | | | | 443 | |
| | |
100 | | SEI Institutional Managed Trust / Semi-Annual Report / March 31, 2019 |
| | | | | | | | |
| | | |
| Description | | Face Amount
(Thousands) | | Market Value
($ Thousands) | |
| |
LOAN PARTICIPATIONS (continued) | | | | | |
Albertson’s LLC, 218 Term B-7 Loan, 1st Lien | | | | | | | | |
5.499%, 11/17/2025 | | | $ 184 | | | | $ 182 | |
Albertson’s LLC, Term B-6 Loan, 1st Lien, Ser 2017-1 | | | | | | | | |
5.479%, VAR LIBOR+3.000%, 06/22/2023 | | | 201 | | | | 199 | |
American Axle & Manufacturing, Inc., Term Loan B, 1st Lien | | | | | | | | |
4.740%, VAR LIBOR+2.250%, 04/06/2024 | | | 197 | | | | 192 | |
American Builders & Contractors Supply, Term Loan B2, 1st Lien | | | | | | | | |
4.499%, VAR LIBOR+2.000%, 10/31/2023 | | | 266 | | | | 259 | |
Aramark Intermediate HoldCo Corp., Term Loan B, 1st Lien | | | | | | | | |
4.249%, VAR LIBOR+1.750%, 03/11/2025 | | | 424 | | | | 420 | |
Asurion LLC, Term Loan B, 1st Lien | | | | | | | | |
5.499%, 11/03/2024 | | | 410 | | | | 407 | |
Asurion, Cov-Lite, Term Loan B4, 1st Lien | | | | | | | | |
5.499%, VAR LIBOR+2.750%, 08/04/2022 | | | 370 | | | | 368 | |
Athenahealth, Inc. Term Loan B, 1st Lien | | | | | | | | |
7.197%, 02/11/2026 | | | 530 | | | | 522 | |
Atlantic Aviation FBO, Term Loan B, 1st Lien | | | | | | | | |
6.240%, 12/06/2025 | | | 160 | | | | 161 | |
Avolon TLB Borrower 1 (US) LLC, Term Loan B3, 1st Lien | | | | | | | | |
4.488%, VAR LIBOR+2.000%, 01/15/2025 | | | 268 | | | | 265 | |
Bausch Health Companies Inc., Term Loan B, 1st Lien | | | | | | | | |
5.481%, VAR LIBOR+3.000%, 06/02/2025 | | | 210 | | | | 208 | |
Beacon Roofing Supply, Inc., Term Loan B, 1st Lien | | | | | | | | |
4.749%, VAR LIBOR+2.250%, 01/02/2025 | | | 446 | | | | 434 | |
Berry Global, Inc. (fka Berry Plastics Corporation), Term Q Loan, 1st Lien | | | | | | | | |
4.610%, VAR LIBOR+2.000%, 10/01/2022 | | | 490 | | | | 487 | |
Boyd Gaming Corporation, Refinancing Term B Loan | | | | | | | | |
4.658%, VAR LIBOR+2.500%, 09/15/2023 | | | 155 | | | | 153 | |
Brightview Landscapes LLC, Initial Term Loan, 1st Lien | | | | | | | | |
5.000%, 08/15/2025 | | | 159 | | | | 158 | |
| | | | | | | | |
| | | |
| Description | | Face Amount
(Thousands) | | | Market Value
($ Thousands) | |
| |
LOAN PARTICIPATIONS (continued) | | | | | |
Caesars Resort Collection LLC, Term Loan B, 1st Lien | | | | | | | | |
5.249%, VAR LIBOR+2.750%, 12/23/2024 | | | $ 419 | | | | $ 413 | |
Catalent Pharma Solutions, Term Loan B, 1st Lien | | | | | | | | |
4.743%, 05/20/2024 | | | 150 | | | | 149 | |
CBS Radio Inc., Additional Term B-1 Loan, 1st Lien | | | | | | | | |
5.249%, VAR LIBOR+2.750%, 11/18/2024 | | | 48 | | | | 47 | |
Change Healthcare Holdings, Inc. (fka Emdeon Inc.), Closing Date Term Loan, 1st Lien | | | | | | | | |
5.249%, VAR LIBOR+2.750%, 03/01/2024 | | | 1,265 | | | | 1,247 | |
Charter Communications Operating LLC, Term Loan B, 1st Lien | | | | | | | | |
4.500%, VAR LIBOR+2.000%, 04/30/2025 | | | 218 | | | | 216 | |
CityCenter Holdings, LLC, Term B Loan, 1st Lien | | | | | | | | |
4.749%, VAR LIBOR+2.250%, 04/18/2024 | | | 58 | | | | 56 | |
Dell International LLC (EMC Corporation), Refinancing Term B Loan | | | | | | | | |
4.500%, VAR LIBOR+2.000%, 09/07/2023 | | | 196 | | | | 193 | |
Delos Finance, New Loan (2018), 1st Lien | | | | | | | | |
4.553%, VAR LIBOR+1.750%, 10/06/2023 | | | 810 | | | | 809 | |
Edelman Financial Center, Term Loan B | | | | | | | | |
6.037%, 06/26/2025 (H) | | | 420 | | | | 416 | |
Envision Healthcare Corp., Term Loan, 1st Lien | | | | | | | | |
6.249%, 10/10/2025 | | | 170 | | | | 159 | |
First Data Corporation, 2022D New Dollar Term Loan, Ser 2022-D | | | | | | | | |
4.486%, VAR LIBOR+2.000%, 07/08/2022 | | | 30 | | | | 30 | |
First Data Corporation, Term Loan, 1st Lien, Ser 2024-A | | | | | | | | |
4.486%, VAR LIBOR+2.000%, 04/26/2024 | | | 420 | | | | 419 | |
First Eagle Holdings, Inc. (fka Arnhold and S. Bleichroeder Holdings, Inc.), Refinancing Term Loan | | | | | | | | |
5.351%, 12/26/2024 | | | 180 | | | | 179 | |
Flying Fortress Holdings, LLC (fka Flying Fortress Inc.), New Loan (2018), 1st Lien | | | | | | | | |
4.553%, VAR LIBOR+1.750%, 10/30/2022 (H) | | | 560 | | | | 558 | |
| | |
SEI Institutional Managed Trust / Semi-Annual Report / March 31, 2019 | | 101 |
SCHEDULE OF INVESTMENTS (Unaudited)
March 31, 2019
Core Fixed Income Fund(Continued)
| | | | | | |
| | | |
| Description | | Face Amount
(Thousands) | | Market Value
($ Thousands) |
| |
LOAN PARTICIPATIONS (continued) | | | | |
Focus Financial Partners, LLC, 1st Lien | | | | | | |
4.999%, 07/03/2024 | | $ 40 | | | $ 40 | |
Four Seasons, 1st Lien | | | | | | |
4.499%, 11/30/2023 | | 268 | | | 266 | |
Golden Nugget Inc., Term Loan B, 1st Lien | | | | | | |
5.234%, VAR LIBOR+2.750%, 10/04/2023 | | 139 | | | 137 | |
Golden Nugget, Inc., Term Loan B, 1st Lien | | | | | | |
5.249%, 10/04/2023 | | 174 | | | 172 | |
HCA Inc., Tranche B-10 Term Loan | | | | | | |
4.499%, VAR LIBOR+2.000%, 03/13/2025 | | 336 | | | 335 | |
Hilton Worldwide Holdings Inc., Term Loan, 1st Lien | | | | | | |
4.236%, VAR LIBOR+1.750%, 10/25/2023 | | 428 | | | 427 | |
Intelset Jackson Holdings S.A., Term Loan B3, 1st Lien | | | | | | |
6.240%, 11/27/2023 | | 250 | | | 246 | |
Intrawest ULC, Term Loan, 1st Lien | | | | | | |
5.493%, VAR LIBOR+3.250%, 07/31/2024 | | 580 | | | 576 | |
Jaguar Holding Co I, Term Loan, 1st Lien | | | | | | |
4.993%, VAR LIBOR+2.500%, 08/18/2022 | | 395 | | | 390 | |
Level 3 Financing, Inc., Term Loan B, 1st Lien | | | | | | |
4.736%, VAR LIBOR+2.250%, 02/22/2024 | | 488 | | | 482 | |
LPL Holdings, Term Loan B (2017) | | | | | | |
4.641%, 09/11/2024 | | 110 | | | 109 | |
McAfee, LLC, Term B USD Loan | | | | | | |
6.249%, 09/30/2024 | | 260 | | | 260 | |
MGM Growth Properties, Term B Loan, 1st Lien | | | | | | |
4.499%, VAR LIBOR+2.000%, 04/25/2023 | | 376 | | | 370 | |
Michaels Stores, Inc., 2018 New Replacement Term B Loan | | | | | | |
4.993%, VAR LIBOR+2.500%, 01/30/2023 | | 319 | | | 313 | |
4.991%, VAR LIBOR+2.500%, 01/30/2023 | | 114 | | | 111 | |
Micro Focus, MA FinanceCo | | | | | | |
4.999%, 06/21/2024 | | 12 | | | 12 | |
MPH Acquisition Holdings LLC, Initial Term Loan, 1st Lien | | | | | | |
5.351%, VAR LIBOR+2.750%, 06/07/2023 | | 686 | | | 663 | |
Numericable U.S. LLC, Term Loan B, 1st Lien | | | | | | |
6.171%, 01/31/2026 | | 289 | | | 274 | |
| | | | | | |
| | | |
| Description | | Face Amount
(Thousands) | | Market Value
($ Thousands) |
| |
LOAN PARTICIPATIONS (continued) | | | | |
ON Semiconductor Corporation, Term Loan B3, 1st Lien | | | | | | |
4.243%, VAR LIBOR+1.750%, 03/31/2023 | | $ 159 | | | $ 157 | |
Panther BF Aggregator 2 Power Solutions, Term Loan, 1st Lien | | | | | | |
0.000%, 03/18/2026 (H) | | 1,010 | | | 998 | |
Party City Holdings Inc., 2018 Replacement Term Loan | | | | | | |
5.000%, 08/19/2022 | | 257 | | | 255 | |
PetSmart Inc., Term Loan B2, 1st Lien | | | | | | |
5.490%, VAR LIBOR+3.000%, 03/11/2022 | | 538 | | | 482 | |
Post Holdings, Inc., Series A Incremental Term Loan | | | | | | |
4.490%, VAR LIBOR+2.000%, 05/24/2024 | | 439 | | | 434 | |
Prime Security Services Borrower, LLC (aka Protection 1 Security Solutions), Refinancing Term B-1 Loan | | | | | | |
5.249%, VAR LIBOR+2.750%, 05/02/2022 | | 452 | | | 447 | |
Prime Security Services, Term Loan | | | | | | |
5.243%, 05/02/2022 | | 31 | | | 30 | |
Quikrete Holdings, Inc., Initial Loan | | | | | | |
2.499%, VAR LIBOR+2.750%, 11/15/2023 | | 103 | | | 100 | |
RegionalCare Hospital Partners Holdings, Term Loan, 1st Lien | | | | | | |
6.982%, 11/16/2025 | | 440 | | | 435 | |
Reynolds Group Holdings Inc., Term Loan, 1st Lien | | | | | | |
5.249%, VAR LIBOR+2.750%, 02/05/2023 | | 632 | | | 624 | |
RPI Finance Trust, Initial Term Loan B-6 | | | | | | |
4.499%, VAR LIBOR+2.000%, 03/27/2023 | | 39 | | | 39 | |
Scientific Games International Inc., Term Loan B, 1st Lien | | | | | | |
5.329%, VAR LIBOR+2.750%, 08/14/2024 | | 1,053 | | | 1,024 | |
5.249%, VAR LIBOR+2.750%, 08/14/2024 | | 253 | | | 246 | |
Seattle SpinCo, Inc., Initial Term Loan, 1st Lien | | | | | | |
4.999%, VAR LIBOR+2.750%, 06/21/2024 | | 82 | | | 80 | |
Sprint Communications, Inc., Initial Term Loan, 1st Lien | | | | | | |
5.000%, VAR LIBOR+2.500%, 02/02/2024 | | 62 | | | 60 | |
| | |
102 | | SEI Institutional Managed Trust / Semi-Annual Report / March 31, 2019 |
| | | | | | | | |
| | | |
| Description | | Face Amount
(Thousands) | | | Market Value
($ Thousands) | |
| |
LOAN PARTICIPATIONS (continued) | | | | | |
The Servicemaster Company LLC, Term Loan, 1st Lien | | | | | | | | |
4.993%, 11/08/2023 | | | $ 21 | | | | $ 21 | |
Trans Union, LLC, Term Loan B3, 1st Lien | | | | | | | | |
4.499%, VAR LIBOR+2.000%, 04/10/2023 | | | 316 | | | | 313 | |
Unitymedia Finance LLC, Term Loan D, 1st Lien | | | | | | | | |
4.734%, VAR LIBOR+2.250%, 01/15/2026 | | | 470 | | | | 464 | |
Univision Communications Inc., Term Loan, 1st Lien | | | | | | | | |
5.249%, VAR LIBOR+2.750%, 03/15/2024 | | | 1,069 | | | | 1,005 | |
UPC Financing Partnership, Term Loan, 1st Lien | | | | | | | | |
4.984%, VAR LIBOR+2.500%, 01/15/2026 | | | 321 | | | | 320 | |
VICI Properties 1 LLC, Term Loan B, 1st Lien | | | | | | | | |
4.491%, VAR LIBOR+2.000%, 12/20/2024 | | | 125 | | | | 122 | |
Virgin Media Bristol LLC, K Facility, Term Loan, 1st Lien | | | | | | | | |
4.984%, VAR LIBOR+2.500%, 01/15/2026 | | | 147 | | | | 145 | |
Western Digital Corporation, Term Loan B-4 | | | | | | | | |
4.249%, VAR LIBOR+1.750%, 04/29/2023 | | | 164 | | | | 160 | |
XPO Logistics, Inc., Term Loan B, 1st Lien | | | | | | | | |
4.499%, VAR LIBOR+2.000%, 02/24/2025 | | | 159 | | | | 156 | |
Ziggo Secured Finance Partnership, Term Loan E Facility, 1st Lien | | | | | | | | |
4.984%, VAR LIBOR+2.500%, 04/15/2025 | | | 121 | | | | 118 | |
| | |
Total Loan Participations
(Cost $23,810)
($ Thousands) | | | | | | | 23,450 | |
| |
MUNICIPAL BONDS — 0.3% | | | | | |
California — 0.1% | | | | | | | | |
California State, Build America Project, GO | | | | | | | | |
6.650%, 03/01/2022 | | | 250 | | | | 275 | |
California State, GO | | | | | | | | |
7.600%, 11/01/2040 | | | 335 | | | | 520 | |
Los Angeles, Community College District, GO | | | | | | | | |
6.750%, 08/01/2049 | | | 1,048 | | | | 1,584 | |
San Jose, Redevelopment Agency Successor Agency, Ser A-T, TA | | | | | | | | |
3.176%, 08/01/2026 | | | 1,000 | | | | 1,011 | |
| | |
| | | | | | | 3,390 | |
| | | | | | | | |
| | | |
| Description | | Face Amount
(Thousands) | | | Market Value
($ Thousands) | |
| |
MUNICIPAL BONDS (continued) | | | | | |
Illinois — 0.0% | | | | | | | | |
Carlyle City, GO | | | | | | | | |
4.762%, 07/15/2019 | | | $ 4 | | | | $ 4 | |
Illinois State, GO | | | | | | | | |
5.100%, 06/01/2033 (E) | | | 225 | | | | 221 | |
| | |
| | | | | | | 225 | |
| | |
Nevada — 0.0% | | | | | | | | |
Clark County, Department of Aviation, Ser C, RB | | | | | | | | |
6.820%, 07/01/2045 | | | 728 | | | | 1,101 | |
| | |
New York — 0.2% | | | | | | | | |
New York and New Jersey, Port Authority, RB | | | | | | | | |
4.458%, 10/01/2062 | | | 1,460 | | | | 1,636 | |
New York City, GO | | | | | | | | |
Callable 12/01/2020 @ 100 | | | | | | | | |
6.646%, 12/01/2031 | | | 900 | | | | 958 | |
New York City, Transitional Finance Authority, Future Tax Secured Revenue, RB | | | | | | | | |
5.508%, 08/01/2037 | | | 275 | | | | 334 | |
New York City, Transitional Finance Authority, Future Tax Secured Revenue, Sub-Ser A-5, RB | | | | | | | | |
Callable 08/01/2027 @ 100 | | | | | | | | |
3.280%, 08/01/2029 | | | 595 | | | | 591 | |
New York City, Transitional Finance Authority, Future Tax Secured Revenue, Sub-Ser F-2, RB | | | | | | | | |
2.900%, 05/01/2026 | | | 1,250 | | | | 1,252 | |
New York City, Water & Sewer System, RB | | | | | | | | |
5.952%, 06/15/2042 | | | 750 | | | | 1,023 | |
New York State, Dormitory Authority, RB | | | | | | | | |
5.500%, 03/15/2030 | | | 400 | | | | 466 | |
5.289%, 03/15/2033 | | | 850 | | | | 995 | |
| | |
| | | | | | | 7,255 | |
| | |
Ohio — 0.0% | | | | | | | | |
Ohio State University, Ser A, RB | | | | | | | | |
4.800%, 06/01/2111 | | | 433 | | | | 501 | |
| | |
Texas — 0.0% | | | | | | | | |
North Texas, Tollway Authority, Ser B, RB | | | | | | | | |
6.718%, 01/01/2049 (E) | | | 632 | | | | 940 | |
| | |
Total Municipal Bonds
(Cost $11,954) ($ Thousands) | | | | | | | 13,412 | |
| | |
SEI Institutional Managed Trust / Semi-Annual Report / March 31, 2019 | | 103 |
SCHEDULE OF INVESTMENTS (Unaudited)
March 31, 2019
Core Fixed Income Fund(Continued)
| | | | | | | | |
| | | |
| Description | | Face Amount
(Thousands) | | Market Value
($ Thousands) |
|
U.S. GOVERNMENT AGENCY OBLIGATIONS — 0.3% | |
FHLB | | | | | | | | |
2.125%, 02/11/2020 | | $ | 430 | | | $ | 429 | |
1.375%, 11/15/2019 | | | 1,370 | | | | 1,361 | |
FHLB DN | | | | | | | | |
2.441%, 04/22/2019 (A) | | | 2,630 | | | | 2,626 | |
FNMA | | | | | | | | |
3.040%, 10/09/2019 (A) | | | 5,040 | | | | 4,976 | |
Tennessee Valley Authority | | | | | | | | |
3.875%, 02/15/2021 | | | 1,510 | | | | 1,551 | |
| | |
Total U.S. Government Agency Obligations
(Cost $10,904)
($ Thousands) | | | | | | | 10,943 | |
| |
COMMERCIAL PAPER — 0.2% | | | | | |
Banco Santander SA | | | | | | | | |
2.729%, 05/01/2019 (A) | | | 7,680 | | | | 7,663 | |
| | |
Total Commercial Paper
(Cost $7,663) ($ Thousands) | | | | | | | 7,663 | |
| | |
| | | Shares | | |
| |
PREFERRED STOCK — 0.0% | | | | | |
Citigroup Capital XIII, 9.121% | | | 18,975 | | | | 519 | |
| | |
Total Preferred Stock
(Cost $491) ($ Thousands) | | | | | | | 519 | |
| |
AFFILIATED PARTNERSHIP — 3.0% | | | | | |
SEI Liquidity Fund, L.P. | | | | | | | | |
2.480% **†(I) | | | 120,961,533 | | | | 120,929 | |
| | |
Total Affiliated Partnership
(Cost $120,935) ($
Thousands) | | | | | | | 120,929 | |
| | | | | | | | |
| | | |
| Description | | Shares | | Market Value
($ Thousands) |
| |
CASH EQUIVALENT — 3.7% | | | | | |
SEI Daily Income Trust, Government Fund, Cl F | | | | | | | | |
2.220%**† | | | 150,063,675 | | | $ | 150,064 | |
Total Cash Equivalent
(Cost $150,064)
($ Thousands) | | | | | | | 150,064 | |
| | |
| | | Face Amount
(Thousands) | | |
| |
REPURCHASE AGREEMENT — 0.4% | | | | | |
Deutsche Bank | | | | | | | | |
2.550%, dated 03/29/2019, to be repurchased on 04/01/2019, repurchase price $15,003,188 (collateralized by Treasury Inflation Protected Security, par value $14,523,000, 0.125%, 04/15/2021; total market value $15,309,921) (J) | | $ | 15,000 | | | | 15,000 | |
| | |
Total Repurchase Agreement
(Cost $15,000)
($ Thousands) | | | | | | | 15,000 | |
| | |
Total Investments in Securities — 109.4%
(Cost $4,338,676)
($ Thousands) | | | | | | $ | 4,379,429 | |
| | | | | | | | |
| | |
| | | Contracts | | |
| |
PURCHASED OPTIONS* — 0.0% | | | | | |
| | |
Total Purchased Options(K) | | | | | | | | |
(Cost $560)
($ Thousands) | | | 11,977,314 | | | $ | 384 | |
| | | | | | | | |
| |
WRITTEN OPTIONS* — 0.0% | | | | | |
| | |
Total Written Options(K) (Premiums Received
$411) ($ Thousands) | | | (2,111 | ) | | $ | (759 | ) |
| | | | | | | | |
A list of the exchange traded option contracts held by the Fund at March 31, 2019, is as follows:
| | | | | | | | | | | | | | | | | | | | |
| Description | | Number of Contracts | | | Notional Amount
(Thousands) | | | Exercise Price | | | Expiration Date | | | Value
(Thousands) | |
PURCHASED OPTIONS — 0.0% | | | | | | | | | | | | | | | | | |
Put Options | | | | | | | | | | | | | | | | | | | | |
June 2019, U.S. 10 Year Future Option* | | | 242 | | | $ | 30,061 | | | | $120.00 | | | | 05/18/19 | | | $ | 7 | |
May 2019, U.S. 10 Year Future Option* | | | 702 | | | | 87,202 | | | | 123.00 | | | | 04/20/19 | | | | 77 | |
May 2019, U.S. 5 Year Future Option* | | | 569 | | | | 65,906 | | | | 115.00 | | | | 04/20/19 | | | | 36 | |
May 2019, U.S. 5 Year Future Option* | | | 1,023 | | | | 118,492 | | | | 115.25 | | | | 04/20/19 | | | | 112 | |
May 2019, U.S. Bond Future Option* | | | 330 | | | | 49,386 | | | | 143.00 | | | | 04/20/19 | | | | 10 | |
May 2019, U.S. Bond Future Option* | | | 204 | | | | 30,530 | | | | 147.00 | | | | 04/20/19 | | | | 45 | |
| | |
104 | | SEI Institutional Managed Trust / Semi-Annual Report / March 31, 2019 |
| | | | | | | | | | | | | | | | | | | | | | | | | | |
| Description | | Number of Contracts | | Notional Amount
(Thousands) | | | | Exercise Price | | | | Expiration Date | | Value
(Thousands) |
| | | | | | | |
PURCHASED OPTIONS (continued) | | | | | | | | | | | | | | | | | | | | | | | | | | |
| | | | | | | |
| | | | | | | | $ | 381,577 | | | | | | | | | | | | | | | $ | 287 | |
| | | | | | | |
Call Options | | | | | | | | | | | | | | | | | | | | | | | | | | |
June 2019, U.S. 5 Year Future Option* | | | | 198 | | | | | 22,934 | | | | | $120.75 | | | | | | 05/18/19 | | | | | 5 | |
June 2019, U.S. 5 Year Future Option* | | | | 1,331 | | | | | 154,167 | | | | | 121.25 | | | | | | 05/18/19 | | | | | 21 | |
| | | | | | | |
| | | | | | | | | 177,101 | | | | | | | | | | | | | | | | 26 | |
Total Purchased Options | | | | | | | | $ | 558,678 | | | | | | | | | | | | | | | $ | 313 | |
| | | | | | | | | | | | | | | | | | | | | | | | | | |
| | | | | | | |
WRITTEN OPTIONS — 0.0% | | | | | | | | | | | | | | | | | | | | | | | | | | |
| | | | | | | |
Put Options | | | | | | | | | | | | | | | | | | | | | | | | | | |
May 2019, U.S. 10 Year Future Option* | | | | (234) | | | | $ | (29,067 | ) | | | | $124.00 | | | | | | 04/20/19 | | | | $ | (99 | ) |
May 2019, U.S. 5 Year Future Option* | | | | (569) | | | | | (65,906 | ) | | | | 114.00 | | | | | | 04/20/19 | | | | | (4 | ) |
May 2019, U.S. 5 Year Future Option* | | | | (341) | | | | | (39,497 | ) | | | | 115.75 | | | | | | 04/20/19 | | | | | (104 | ) |
May 2019, U.S. Bond Future Option* | | | | (68) | | | | | (10,177 | ) | | | | 149.00 | | | | | | 04/20/19 | | | | | (54 | ) |
| | | | | | | |
| | | | | | | | | (144,647 | ) | | | | | | | | | | | | | | | (261 | ) |
| | | | | | | |
Call Options | | | | | | | | | | | | | | | | | | | | | | | | | | |
May 2019, U.S. 5 Year Future Option* | | | | (569) | | | | | (65,906 | ) | | | | 118.00 | | | | | | 04/20/19 | | | | | (18 | ) |
May 2019, U.S. Bond Future Option* | | | | (330) | | | | | (49,387 | ) | | | | 149.00 | | | | | | 04/20/19 | | | | | (480 | ) |
| | | | | | | |
| | | | | | | | | (115,293 | ) | | | | | | | | | | | | | | | (498 | ) |
| | | | | | | |
Total Written Options | | | | | | | | | $ (259,940 | ) | | | | | | | | | | | | | | $ | (759 | ) |
| | | | | | | | | | | | | | | | | | | | | | | | | | |
A list of the OTC option contracts held by the Fund at March 31, 2019, is as follows:
| | | | | | | | | | | | | | | | | | | | | | | | |
| Description | | Counterparty | | | Number of Contracts | | | Notional Amount
(Thousands) | | | Exercise Price | | | Expiration Date | | | Value
(Thousands) |
| | | | | |
PURCHASED OPTIONS — 0.0% | | | | | | | | | | | | | | | | | | | | | |
| | | | | | |
Put Options | | | | | | | | | | | | | | | | | | | | | | | | |
June 2019, USD Put EUR Call* | | | Goldman Sachs | | | | 10,200,000 | | | $ | 9,091 | | | | $1.16 | | | | 06/22/19 | | | $ | 34 | |
| | | | | | |
Call Options | | | | | | | | | | | | | | | | | | | | | | | | |
November 2019, USD Call EUR Put* | | | Citigroup | | | | 1,772,715 | | | | 1,580 | | | | 1.14 | | | | 11/16/19 | | | | 37 | |
Total Purchased Option | | | | | | | | | | $ | 10,671 | | | | | | | | | | | $ | 71 | |
| | | | | | | | | | | | | | | | | | | | | | | | |
A list of the open futures contracts held by the Fund at March 31, 2019, is as follows:
| | | | | | | | | | | | | | | | | | |
| Type of Contract | | Number of Contracts Long (Short) | | Expiration Date | | | Notional Amount (Thousands) | | Value (Thousands) | | Unrealized Appreciation/ (Depreciation) (Thousands) |
90-Day Euro$ | | 74 | | | Mar-2021 | | | $ | 17,965 | | | $ | 18,108 | | | $ | 143 | |
90-Day Euro$ | | 218 | | | Jun-2020 | | | | 52,908 | | | | 53,287 | | | | 379 | |
90-Day Euro$ | | 1,337 | | | Dec-2019 | | | | 324,793 | | | | 326,128 | | | | 1,335 | |
Euro | | (18) | | | Jun-2019 | | | | (2,571 | ) | | | (2,540 | ) | | | 31 | |
Euro-Bob | | (184) | | | Jun-2019 | | | | (27,484 | ) | | | (27,507 | ) | | | (226 | ) |
Euro-BTP | | 94 | | | Jun-2019 | | | | 13,519 | | | | 13,665 | | | | 330 | |
Euro-Bund | | (730) | | | Jun-2019 | | | | (135,392 | ) | | | (136,346 | ) | | | (2,497 | ) |
Euro-Buxl 30 Year Bond | | (5) | | | Jun-2019 | | | | (1,031 | ) | | | (1,076 | ) | | | (53 | ) |
U.S. 2-Year Treasury Note | | 2,484 | | | Jul-2019 | | | | 527,367 | | | | 529,325 | | | | 1,958 | |
U.S. 5-Year Treasury Note | | 1,055 | | | Jul-2019 | | | | 121,044 | | | | 122,199 | | | | 1,155 | |
U.S. 5-Year Treasury Note | | (2,156) | | | Jul-2019 | | | | (249,391 | ) | | | (249,725 | ) | | | (334 | ) |
| | |
SEI Institutional Managed Trust / Semi-Annual Report / March 31, 2019 | | 105 |
SCHEDULE OF INVESTMENTS (Unaudited)
March 31, 2019
Core Fixed Income Fund(Continued)
| | | | | | | | | | | | | | | | | | |
| Type of Contract | | Number of Contracts Long (Short) | | Expiration Date | | | Notional Amount (Thousands) | | Value (Thousands) | | Unrealized Appreciation/ (Depreciation) (Thousands) |
U.S. 10-Year Treasury Note | | 2,505 | | | Jun-2019 | | | $ | 308,620 | | | $ | 311,168 | | | $ | 2,548 | |
U.S. Long Treasury Bond | | (896) | | | Jun-2019 | | | | (131,585 | ) | | | (134,092 | ) | | | (2,507 | ) |
U.S. Ultra Long Treasury Bond | | 775 | | | Jun-2019 | | | | 125,701 | | | | 130,200 | | | | 4,499 | |
U.S. Ultra Long Treasury Bond | | (194) | | | Jun-2019 | | | | (31,467 | ) | | | (32,592 | ) | | | (1,125 | ) |
Ultra 10-Year U.S. Treasury Note | | 587 | | | Jun-2019 | | | | 76,327 | | | | 77,943 | | | | 1,616 | |
Ultra 10-Year U.S. Treasury Note | | (266) | | | Jun-2019 | | | | (34,526 | ) | | | (35,320 | ) | | | (794 | ) |
| | | | | | | | | | | | | | | | | | |
| | | | | | | | $ | 954,797 | | | $ | 962,825 | | | $ | 6,458 | |
| | | | | | | | | | | | | | | | | | |
A list of the open forward foreign currency contracts held by the Fund at March 31, 2019, is as follows:
| | | | | | | | | | | | | | | | | | | | | | | | |
| Counterparty | | Settlement Date | | | | | | Currency to Deliver
(Thousands) | | | | | | Currency to Receive
(Thousands) | | | Unrealized
Appreciation
(Depreciation)
(Thousands) | |
| | | | | | |
Citigroup | | | 04/16/19 | | | | USD | | | | 4,277 | | | | INR | | | | 301,350 | | | $ | 61 | |
| | | | | | |
Citigroup | | | 04/17/19 | | | | GBP | | | | 1,835 | | | | USD | | | | 2,355 | | | | (38) | |
| | | | | | |
Citigroup | | | 04/17/19 | | | | USD | | | | 2,323 | | | | EUR | | | | 2,017 | | | | (55) | |
| | | | | | |
Citigroup | | | 04/17/19 | | | | AUD | | | | 3,958 | | | | USD | | | | 2,832 | | | | 20 | |
| | | | | | |
Citigroup | | | 04/17/19 | | | | EUR | | | | 4,540 | | | | USD | | | | 5,153 | | | | 49 | |
| | | | | | |
Citigroup | | | 04/17/19 | | | | USD | | | | 4,569 | | | | KRW | | | | 5,123,175 | | | | (58) | |
| | | | | | |
Citigroup | | | 04/17/19 | | | | USD | | | | 5,399 | | | | AUD | | | | 7,522 | | | | (55) | |
| | | | | | |
Citigroup | | | 04/17/19 | | | | USD | | | | 6,929 | | | | RUB | | | | 470,078 | | | | 207 | |
| | | | | | |
Citigroup | | | 04/17/19 | | | | USD | | | | 7,713 | | | | JPY | | | | 828,591 | | | | (215) | |
| | | | | | |
Citigroup | | | 04/17/19 | | | | USD | | | | 9,490 | | | | IDR | | | | 138,186,080 | | | | 181 | |
| | | | | | |
Citigroup | | | 04/17/19 | | | | USD | | | | 1,826 | | | | IDR | | | | 25,658,270 | | | | (30) | |
| | | | | | |
Citigroup | | | 04/17/19 - 07/17/19 | | | | USD | | | | 32,732 | | | | BRL | | | | 123,945 | | | | (981) | |
| | | | | | |
Citigroup | | | 04/17/19 | | | | USD | | | | 10,189 | | | | CAD | | | | 13,612 | | | | 5 | |
| | | | | | |
Citigroup | | | 04/17/19 | | | | USD | | | | 25,317 | | | | CAD | | | | 33,439 | | | | (274) | |
| | | | | | |
Citigroup | | | 04/17/19 | | | | BRL | | | | 38,670 | | | | USD | | | | 9,979 | | | | 51 | |
| | | | | | |
Citigroup | | | 04/17/19 | | | | CNY | | | | 68,783 | | | | USD | | | | 10,024 | | | | (214) | |
| | | | | | |
Citigroup | | | 04/17/19 | | | | JPY | | | | 828,591 | | | | USD | | �� | | 7,713 | | | | 214 | |
| | | | | | |
Citigroup | | | 04/17/19 | | | | COP | | | | 5,189,635 | | | | USD | | | | 1,621 | | | | (8) | |
| | | | | | |
Citigroup | | | 09/23/19 | | | | USD | | | | 690 | | | | ARS | | | | 34,070 | | | | (60) | |
| | | | | | |
Deutsche Bank | | | 05/15/19 | | | | PHP | | | | 180,380 | | | | USD | | | | 3,420 | | | | 8 | |
| | | | | | |
Deutsche Bank | | | 05/15/19 | | | | PHP | | | | 120,240 | | | | USD | | | | 2,263 | | | | (10) | |
| | | | | | |
Goldman Sachs | | | 04/17/19 | | | | CNH | | | | 13,759 | | | | USD | | | | 2,008 | | | | (40) | |
| | | | | | |
Goldman Sachs | | | 04/17/19 | | | | KRW | | | | 5,123,175 | | | | USD | | | | 4,596 | | | | 85 | |
| | | | | | | | | | | | | | | | | | | | | | | | |
| | | | | | | | | | | | | | | | | | | | | | $ | (1,157) | |
| | | | | | | | | | | | | | | | | | | | | | | | |
A list of the OTC swap agreements held by the Fund at March 31, 2019 is as follows:
| | | | | | | | | | | | | | | | | | | | | | | | | | | | | | | | | | |
| | | | | | | | Interest Rate Swaps | | | | | | | | | |
| Counterparty | | Fund Pays | | Fund Receives | | | Payment Frequency | | | Termination Date | | | Currency | | | Notional
Amount
(Thousands) | | Value
(Thousands) | | Upfront
Payments
(Thousands) | | Net Unrealized
Appreciation
(Thousands) |
Citigroup | | 1-DAY BRL - CETIP | | | 8.41% | | | | Annually | | | | 01/03/2020 | | | | BRL | | | | 16,400 | | | $ | 60 | | | $ | 8 | | | $ | 52 | |
Citigroup | | 1-DAY BRL - CETIP | | | 8.41% | | | | Annually | | | | 01/03/2020 | | | | BRL | | | | 10,800 | | | | 39 | | | | 3 | | | | 36 | |
Citigroup | | 1-DAY BRL - CETIP | | | 8.41% | | | | Annually | | | | 01/03/2020 | | | | BRL | | | | 5,011 | | | | 18 | | | | 3 | | | | 15 | |
Citigroup | | 1-DAY BRL - CETIP | | | 8.41% | | | | Annually | | | | 01/03/2020 | | | | BRL | | | | 47,489 | | | | 173 | | | | – | | | | 173 | |
Citigroup | | 1-DAY BRL - CETIP | | | 8.41% | | | | Annually | | | | 01/03/2020 | | | | BRL | | | | 9,700 | | | | 35 | | | | 1 | | | | 34 | |
| | | | | | | | | | | | | | | | | | | | | | | | | | | | | | | | | | |
| | | | | | | | | | | | | | | | | | | | | | | | $ | 325 | | | $ | 15 | | | $ | 310 | |
| | | | | | | | | | | | | | | | | | | | | | | | | | | | | | | | | | |
| | | | | | | | | | | | | | | | | | | | | | | | | | | | | | | | | | |
| | |
106 | | SEI Institutional Managed Trust / Semi-Annual Report / March 31, 2019 |
A list of the open centrally cleared swap agreements held by the Fund at March 31, 2019 is as follows:
| | | | | | | | | | | | | | | | | | | | | | | | | | | | | | | | |
| Interest Rate Swaps | |
| Fund Pays | | Fund Receives | | | Payment
Frequency | | | Termination Date | | | Currency | | | Notional
Amount
(Thousands) | | Value (Thousands) | | Upfront
Payments/
Receipts (Thousands) | | Net Unrealized
Appreciation
(Depreciation)
(Thousands) |
3 MONTH USD - LIBOR | | | 3.0708 | | | | Semi-Annually | | | | 02/21/2021 | | | | USD | | | | 63,180 | | | $ | 992 | | | $ | – | | | $ | 992 | |
6M GBP LIBOR | | | 1.271% | | | | Semi-Annually | | | | 10/26/2021 | | | | GBP | | | | 10,354 | | | | (81 | ) | | | 5 | | | | (86 | ) |
6M GBP LIBOR | | | 1.385% | | | | Annually | | | | 10/30/2021 | | | | GBP | | | | 50,975 | | | | (295 | ) | | | (16 | ) | | | (279 | ) |
3.0818 | | | 3 MONTH USD-LIBOR | | | | Quarterly | | | | 02/21/2024 | | | | USD | | | | 25,975 | | | | (987 | ) | | | – | | | | (987 | ) |
3M LIBOR | | | 1D FEDL01 | | | | Quarterly | | | | 06/19/2024 | | | | USD | | | | 51,525 | | | | 11 | | | | – | | | | 11 | |
2.25% | | | FEDL01 | | | | Annually | | | | 12/31/2025 | | | | USD | | | | 37,013 | | | | (446 | ) | | | (225 | ) | | | (221 | ) |
2.25% | | | 3MLIBOR | | | | Quarterly | | | | 12/31/2025 | | | | USD | | | | 13,392 | | | | 56 | | | | 18 | | | | 38 | |
2.5% | | | 3MLIBOR | | | | Quarterly | | | | 01/31/2026 | | | | USD | | | | 57,849 | | | | (638 | ) | | | (778 | ) | | | 140 | |
3MLIBOR | | | 3.00% | | | | Semi-Annually | | | | 02/15/2036 | | | | USD | | | | 18,209 | | | | 1,095 | | | | 10 | | | | 1,085 | |
3.33% | | | 3M USD LIBOR -BBA | | | | Quarterly | | | | 02/15/2044 | | | | USD | | | | 13,959 | | | | (1,880 | ) | | | (1 | ) | | | (1,879 | ) |
3.00% | | | 3MLIBOR | | | | Quarterly | | | | 05/15/2044 | | | | USD | | | | 13,468 | | | | (986 | ) | | | 10 | | | | (996 | ) |
2.875% | | | 3M LIBOR | | | | Quarterly | | | | 05/15/2044 | | | | USD | | | | 11,544 | | | | (571 | ) | | | 48 | | | | (619 | ) |
2.75% | | | 3MLIBOR | | | | Quarterly | | | | 08/15/2044 | | | | USD | | | | 13,311 | | | | (339 | ) | | | (45 | ) | | | (294 | ) |
1.498 | | | 6-MONTH EUR - EURIBOR | | | | Semi-Annually | | | | 08/23/2047 | | | | EUR | | | | 678 | | | | (86 | ) | | | (1 | ) | | | (85 | ) |
| | | | | | | | | | | | | | | | | | | | | | | | | | | | | | | | |
| | | | | | | | | | | | | | | | | | | | | | $ | (4,155 | ) | | $ | (975 | ) | | $ | (3,180 | ) |
| | | | | | | | | | | | | | | | | |
| | | | | | | | | | | | | | | | | | | | | | | | | | | | | | | | |
| Credit Default Swaps | |
| Reference Entity/Obligation | | Buy/Sell Protection | | | (Pays)/
Receives Rate | | | Payment
Frequency | | | Termination Date | | | Notional Amount
(Thousands) | | | Value
(Thousands) | | | Upfront Payments/
Receipts
(Thousands) | | | Net Unrealized
Appreciation
(Depreciation)
(Thousands) | |
CDX.NA.HY.32 | | | Sell | | | | 5.00% | | | | Quarterly | | | | 06/20/2024 | | | | (16,130 | ) | | $ | 1,077 | | | $ | 983 | | | $ | 94 | |
CDX.NA.IG.32 | | | Sell | | | | 1.00% | | | | Quarterly | | | | 06/20/2024 | | | | (90,190 | ) | | | 1,619 | | | | 1,451 | | | | 168 | |
| | | | | | | | | | | | | | | | | | | | | | | | | | | | | | | | |
| | | | | | | | | | | | | | | | | | | | | | $ | 2,696 | | | $ | 2,434 | | | $ | 262 | |
| | | | | | | | | | | | | | | | | |
| | Percentages are based on Net Assets of $4,004,472 ($ Thousands). |
| * | Non-income producing security. |
| ** | Rate shown is the 7-day effective yield as of March 31, 2019. |
| † | Investment in Affiliated Security (see Note 6). |
| (A) | Zero coupon security. The rate shown on the Schedule of Investments is the security’s effective yield at the time of purchase. |
| (B) | Variable or floating rate security, the interest rate of which adjusts periodically based on changes in current interest rates and prepayments on the underlying pool of assets. |
| (C) | Security exempt from registration under Rule 144A of the Securities Act of 1933. These securities may be resold in transactions exempt from registration normally to qualified institutions. On March 31, 2019, the value of these securities amounted to $499,387 ($ Thousands), representing 12.5% of the Net Assets of the Fund. |
| (D) | Securities considered illiquid. The total value of such securities as of March 31, 2019 was $3,531 ($ Thousands) and represented 0.1% of the Net Assets of the Fund. |
| (E) | Certain securities or partial positions of certain securities are on loan at March 31, 2019. The total market value of securities on loan at March 31, 2019 was $118,052 ($ Thousands). |
| (F) | Security is in default on interest payment. |
| (G) | Step Bonds – Represents the current rate, the step rate, the step date and the final maturity date. |
| (H) | Unsettled bank loan. Interest rate may not be available. |
| (I) | This security was purchased with cash collateral held from securities on loan. The total market value of such securities as of March 31, 2019 was $120,929 ($ Thousands). |
| (J) | Tri-Party Repurchase Agreement. |
| (K) | Refer to table below for details on Options Contracts. |
ABS — Asset-Backed Security
ACES — Alternative Credit Enhancement Structure
ARM — Adjustable Rate Mortgage
ARS — Argentine Peso
AUD — Australian Dollar
BRL — Brazilian Real
CAD — Canadian Dollar
Cl — Class
CLO — Collateralized Loan Obligation
CMO — Collateralized Mortgage Obligation
CNH — Chinese Yuan Offshore
CNY — Chinese Yuan Onshore
COP — Colombian Peso
DN — Discount Note
EUR — Euro
EURIBOR — Euro London Interbank Offered Rate
FHLB — Federal Home Loan Bank
FHLMC — Federal Home Loan Mortgage Corporation
FNMA — Federal National Mortgage Association
FREMF— Freddie Mac Multi-Family
GBP — British Pound Sterling
GNMA — Government National Mortgage Association
GO — General Obligation
ICE — Intercontinental Exchange
IDR — Indonesian Rupiah
INR — Indian Rupee
IO — Interest Only — face amount represents notional amount.
JPY — Japanese Yen
| | |
SEI Institutional Managed Trust / Semi-Annual Report / March 31, 2019 | | 107 |
SCHEDULE OF INVESTMENTS (Unaudited)
March 31, 2019
Core Fixed Income Fund(Concluded)
JSC — Joint-Stock Company
KRW — Korean Won
LIBOR — London Interbank Offered Rate
LLC — Limited Liability Company
L.P. — Limited Partnership
MTN — Medium Term Note
NCUA — National Credit Union Association
PHP — Philippine Peso
PLC — Public Limited Company
PO — Principal Only
RB — Revenue Bond
REMIC — Real Estate Mortgage Investment Conduit
RUB — Russian Ruble
Ser — Series
STRIPS — Separately Traded Registered Interest and Principal Securities
TA — Tax Allocation
TBA — To Be Announced
TLB — Term Loan B
ULC — Unlimited Liability Company
USD — United States Dollar
VAR — Variable Rate
The following is a list of the level of inputs used as of March 31, 2019, in valuing the Fund’s investments and other financial instruments carried at value ($ Thousands):
| | | | | | | | | | | | | | | | |
| | | | | |
Investments in
Securities | | Level 1 | | | Level 2 | | | Level 3 | | | Total | |
Mortgage-Backed Securities | | $ | – | | | $ | 1,496,183 | | | $ | – | | | $ | 1,496,183 | |
Corporate Obligations | | | – | | | | 1,171,569 | | | | – | | | | 1,171,569 | |
U.S. Treasury Obligations | | | – | | | | 961,986 | | | | – | | | | 961,986 | |
Asset-Backed Securities | | | – | | | | 323,724 | | | | – | | | | 323,724 | |
Sovereign Debt | | | – | | | | 83,987 | | | | – | | | | 83,987 | |
Loan Participations | | | – | | | | 23,450 | | | | – | | | | 23,450 | |
Municipal Bonds | | | – | | | | 13,412 | | | | – | | | | 13,412 | |
U.S. Government Agency Obligations | | | – | | | | 10,943 | | | | – | | | | 10,943 | |
Commercial Paper | | | – | | | | 7,663 | | | | – | | | | 7,663 | |
Preferred Stock | | | 519 | | | | – | | | | – | | | | 519 | |
Affiliated Partnership | | | – | | | | 120,929 | | | | – | | | | 120,929 | |
Cash Equivalent | | | 150,064 | | | | – | | | | – | | | | 150,064 | |
Repurchase Agreement | | | – | | | | 15,000 | | | | – | | | | 15,000 | |
| | | | | | | | | | | | | | | | |
Total Investments in Securities | | $ | 150,583 | | | $ | 4,228,846 | | | $ | – | | | $ | 4,379,429 | |
| | | | | | | | | | | | | | | | |
| | | | | | | | | | | | | | | | |
| | | | | | | | | | | | | | | | |
| Other Financial Instruments | | Level 1 | | | Level 2 | | | Level 3 | | | Total | |
Purchased Options | | $ | 384 | | | $ | – | | | $ | – | | | $ | 384 | |
Written Options | | | (759) | | | | – | | | | – | | | | (759) | |
Futures Contracts* | | | | | | | | | | | | | | | | |
Unrealized Appreciation | | | 13,994 | | | | – | | | | – | | | | 13,994 | |
Unrealized Depreciation | | | (7,536) | | | | – | | | | – | | | | (7,536) | |
Forwards Contracts* | | | | | | | | | | | | | | | | |
Unrealized Appreciation | | | – | | | | 881 | | | | – | | | | 881 | |
Unrealized Depreciation | | | – | | | | (2,038) | | | | – | | | | (2,038) | |
OTC Swaps | | | | | | | | | | | | | | | | |
Interest Rate Swaps* | | | | | | | | | | | | | | | | |
Unrealized Appreciation | | | – | | | | 310 | | | | – | | | | 310 | |
Centrally Cleared Swaps | | | | | | | | | | | | | | | | |
Interest Rate Swaps* | | | | | | | | | | | | | | | | |
Unrealized Appreciation | | | – | | | | 2,266 | | | | – | | | | 2,266 | |
Unrealized Depreciation | | | – | | | | (5,446) | | | | – | | | | (5,446) | |
Credit Default Swaps* | | | | | | | | | | | | | | | | |
Unrealized Appreciation | | | – | | | | 262 | | | | – | | | | 262 | |
| | | | | | | | | | | | | | | | |
Total Other Financial Instruments | | $ | 6,083 | | | $ | (3,765) | | | $ | – | | | $ | 2,318 | |
| | | | | | | | | | | | | | | | |
| | | | | | | | | | | | | | | | |
| * | Futures contracts, forward contracts and swaps contracts are valued at the unrealized appreciation (depreciation) on the instrument. |
For the period ended March 31, 2019, there were no transfers between Level 1 and Level 2 assets and liabilities.
For the period ended March 31, 2019, there were no transfers between Level 2 and Level 3 assets and liabilities.
For more information on valuation inputs, see Note 2 – Significant Accounting Policies in Notes to Financial Statements.
Amounts designated as “—” are either $0 or have been rounded to $0.
The following is a summary of the Fund’s transactions with affiliates for the period ended March 31, 2019 ($ Thousands):
| | | | | | | | | | | | | | |
| Security Description | | Value 9/30/2018 | | Purchases at
Cost | | Proceeds from
Sales | | Realized Gain | | Change in
Unrealized
Appreciation | | Value
3/31/2019 | | Income |
SEI Liquidity Fund, L.P. | | $106,255 | | $808,778 | | $(794,112) | | $— | | $8 | | $120,929 | | $88 |
SEI Daily Income Trust, Government Fund, CI F | | 198,093 | | 1,351,011 | | (1,399,040) | | — | | — | | 150,064 | | 1,043 |
| | | | | | | | | | | | | | |
Totals | | $304,348 | | $2,159,789 | | $(2,193,152) | | $— | | $8 | | $270,993 | | $1,131 |
| | | | | | | | | | | | | | |
| | | | | | | | | | | | | | |
Amounts designated as “—” are either $0 or have been rounded to $0.
The accompanying notes are an integral part of the financial statements.
| | |
108 | | SEI Institutional Managed Trust / Semi-Annual Report / March 31, 2019 |
SCHEDULE OF INVESTMENTS (Unaudited)
March 31, 2019
High Yield Bond Fund
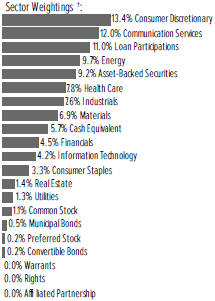
†Percentages are based on total investments.
| | | | | | | | |
| | | |
| Description | | Face Amount
(Thousands) | | Market Value
($ Thousands) | |
|
CORPORATE OBLIGATIONS — 71.7% | |
|
Communication Services — 12.0% | |
Altice France | | | | | | | | |
6.250%, 05/15/2024 (A) | | $ | 1,000 | | | $ | 1,007 | |
AMC Entertainment Holdings | | | | | | | | |
5.875%, 11/15/2026 | | | 19 | | | | 17 | |
5.750%, 06/15/2025 | | | 415 | | | | 388 | |
AMC Networks | | | | | | | | |
5.000%, 04/01/2024 | | | 865 | | | | 869 | |
4.750%, 08/01/2025 | | | 3,725 | | | | 3,697 | |
C&W Senior Financing DAC | | | | | | | | |
7.500%, 10/15/2026 (A) | | | 1,185 | | | | 1,221 | |
C&W Senior Financing Designated Activity | | | | | | | | |
6.875%, 09/15/2027 (A) | | | 810 | | | | 812 | |
CB Escrow | | | | | | | | |
8.000%, 10/15/2025 (A) | | | 2,280 | | | | 2,080 | |
CCO Holdings | | | | | | | | |
5.875%, 04/01/2024 (A) | | | 1,785 | | | | 1,865 | |
5.750%, 02/15/2026 (A) | | | 4,352 | | | | 4,553 | |
5.500%, 05/01/2026 (A) | | | 3,720 | | | | 3,841 | |
5.375%, 05/01/2025 (A) | | | 2,020 | | | | 2,086 | |
5.125%, 05/01/2027 (A) | | | 4,168 | | | | 4,194 | |
5.000%, 02/01/2028 (A) | | | 1,080 | | | | 1,065 | |
CenturyLink | | | | | | | | |
7.500%, 04/01/2024 | | | 2,375 | | | | 2,511 | |
6.750%, 12/01/2023 | | | 3,130 | | | | 3,267 | |
5.800%, 03/15/2022 | | | 1,044 | | | | 1,064 | |
5.625%, 04/01/2025 | | | 2,342 | | | | 2,266 | |
Cincinnati Bell | | | | | | | | |
7.000%, 07/15/2024 (A) | | | 150 | | | | 138 | |
Cinemark USA | | | | | | | | |
4.875%, 06/01/2023 | | | 435 | | | | 442 | |
| | | | | | | | |
| | | |
| Description | | Face Amount
(Thousands) | | Market Value
($ Thousands) |
| |
CORPORATE OBLIGATIONS (continued) | | | | | |
Clear Channel Worldwide Holdings | | | | | | | | |
9.250%, 02/15/2024 (A) | | $ | 3,970 | | | $ | 4,208 | |
6.500%, 11/15/2022 | | | 3,085 | | | | 3,153 | |
Cogent Communications Finance | | | | | | | | |
5.625%, 04/15/2021 (A) | | | 940 | | | | 952 | |
Cogent Communications Group | | | | | | | | |
5.375%, 03/01/2022 (A) | | | 610 | | | | 624 | |
Digicel | | | | | | | | |
6.000%, 04/15/2021 (A) | | | 1,525 | | | | 1,270 | |
Digicel Group | | | | | | | | |
6.750%, 03/01/2023 (A) | | | 1,040 | | | | 666 | |
DISH DBS | | | | | | | | |
7.750%, 07/01/2026 | | | 3,557 | | | | 3,095 | |
5.875%, 07/15/2022 | | | 670 | | | | 648 | |
5.875%, 11/15/2024 | | | 10,759 | | | | 9,038 | |
5.000%, 03/15/2023 | | | 3,080 | | | | 2,772 | |
DISH Network | | | | | | | | |
3.375%, 08/15/2026 | | | 425 | | | | 361 | |
DKT Finance ApS | | | | | | | | |
9.375%, 06/17/2023 (A) | | | 4,450 | | | | 4,764 | |
EW Scripps | | | | | | | | |
5.125%, 05/15/2025 (A) | | | 1,570 | | | | 1,495 | |
Frontier Communications | | | | | | | | |
11.000%, 09/15/2025 | | | 3,377 | | | | 2,223 | |
10.500%, 09/15/2022 | | | 4,331 | | | | 3,302 | |
8.500%, 04/01/2026 (A) | | | 1,480 | | | | 1,377 | |
8.000%, 04/01/2027 (A) | | | 1,483 | | | | 1,531 | |
7.625%, 04/15/2024 | | | 1,890 | | | | 1,035 | |
7.125%, 01/15/2023 | | | 2,255 | | | | 1,364 | |
6.875%, 01/15/2025 | | | 4,535 | | | | 2,443 | |
Gannett | | | | | | | | |
5.500%, 09/15/2024 (A) | | | 1,425 | | | | 1,439 | |
Gray Television | | | | | | | | |
7.000%, 05/15/2027 (A) | | | 3,282 | | | | 3,487 | |
5.125%, 10/15/2024 (A) | | | 2,129 | | | | 2,138 | |
Inmarsat Finance | | | | | | | | |
6.500%, 10/01/2024 (A) | | | 1,041 | | | | 1,093 | |
4.875%, 05/15/2022 (A) | | | 2,325 | | | | 2,360 | |
Intelsat Jackson Holdings | | | | | | | | |
9.750%, 07/15/2025 (A) | | | 780 | | | | 792 | |
8.500%, 10/15/2024 (A) | | | 3,000 | | | | 2,917 | |
8.000%, 02/15/2024 (A) | | | 1,165 | | | | 1,215 | |
5.500%, 08/01/2023 | | | 3,737 | | | | 3,317 | |
Intelsat Luxembourg | | | | | | | | |
8.125%, 06/01/2023 | | | 822 | | | | 571 | |
Lee Enterprises | | | | | | | | |
9.500%, 03/15/2022 (A) | | | 1,581 | | | | 1,615 | |
Level 3 Financing | | | | | | | | |
5.625%, 02/01/2023 | | | 265 | | | | 268 | |
5.375%, 01/15/2024 | | | 2,575 | | | | 2,623 | |
5.375%, 05/01/2025 | | | 6,095 | | | | 6,170 | |
| | |
SEI Institutional Managed Trust / Semi-Annual Report / March 31, 2019 | | 109 |
SCHEDULE OF INVESTMENTS (Unaudited)
March 31, 2019
High Yield Bond Fund(Continued)
| | | | | | | | |
| | | |
| Description | | Face Amount
(Thousands) | | Market Value
($ Thousands) |
| |
CORPORATE OBLIGATIONS (continued) | | | | | |
Live Nation Entertainment | | | | | | | | |
5.625%, 03/15/2026 (A) | | $ | 504 | | | $ | 520 | |
4.875%, 11/01/2024 (A) | | | 2,320 | | | | 2,335 | |
McClatchy | | | | | | | | |
9.000%, 07/15/2026 (A) | | | 1,853 | | | | 1,848 | |
Meredith | | | | | | | | |
6.875%, 02/01/2026 (A) | | | 395 | | | | 415 | |
Netflix | | | | | | | | |
5.875%, 02/15/2025 | | | 1,845 | | | | 1,994 | |
5.875%, 11/15/2028 (A) | | | 470 | | | | 496 | |
4.875%, 04/15/2028 | | | 3,032 | | | | 3,002 | |
Nexstar Broadcasting | | | | | | | | |
6.125%, 02/15/2022 (A) | | | 160 | | | | 162 | |
5.625%, 08/01/2024 (A) | | | 1,366 | | | | 1,387 | |
Qwest | | | | | | | | |
6.875%, 09/15/2033 | | | 510 | | | | 507 | |
Qwest Capital Funding | | | | | | | | |
7.750%, 02/15/2031 | | | 305 | | | | 275 | |
Radiate Holdco | | | | | | | | |
6.625%, 02/15/2025 (A) | | | 4,507 | | | | 4,349 | |
Sinclair Television Group | | | | | | | | |
6.125%, 10/01/2022 | | | 715 | | | | 727 | |
5.625%, 08/01/2024 (A) | | | 100 | | | | 101 | |
5.125%, 02/15/2027 (A) | | | 2,991 | | | | 2,864 | |
Sirius XM Radio | | | | | | | | |
6.000%, 07/15/2024 (A) | | | 1,308 | | | | 1,356 | |
5.375%, 04/15/2025 (A) | | | 2,250 | | | | 2,309 | |
5.375%, 07/15/2026 (A) | | | 2,240 | | | | 2,288 | |
5.000%, 08/01/2027 (A) | | | 513 | | | | 513 | |
Sprint | | | | | | | | |
7.875%, 09/15/2023 | | | 7,768 | | | | 8,137 | |
7.625%, 02/15/2025 | | | 8,278 | | | | 8,444 | |
7.625%, 03/01/2026 | | | 2,038 | | | | 2,065 | |
7.250%, 09/15/2021 | | | 2,341 | | | | 2,458 | |
7.125%, 06/15/2024 | | | 913 | | | | 927 | |
Sprint Capital | | | | | | | | |
8.750%, 03/15/2032 | | | 2,455 | | | | 2,590 | |
Sprint Communications | | | | | | | | |
6.000%, 11/15/2022 | | | 2,963 | | | | 2,986 | |
Telecom Italia | | | | | | | | |
5.303%, 05/30/2024 (A) | | | 1,160 | | | | 1,166 | |
Telecom Italia Capital | | | | | | | | |
6.375%, 11/15/2033 | | | 400 | | | | 386 | |
6.000%, 09/30/2034 | | | 1,365 | | | | 1,263 | |
T-Mobile USA | | | | | | | | |
6.500%, 01/15/2024 | | | 535 | | | | 556 | |
6.500%, 01/15/2026 | | | 1,370 | | | | 1,463 | |
6.375%, 03/01/2025 | | | 2,445 | | | | 2,546 | |
5.375%, 04/15/2027 | | | 305 | | | | 315 | |
4.750%, 02/01/2028 | | | 5,806 | | | | 5,755 | |
0.000%, 01/15/2024 (B) | | | 535 | | | | – | |
0.000%, 03/01/2025 (B) | | | 1,905 | | | | – | |
| | | | | | | | |
| | | |
| Description | | Face Amount
(Thousands) | | Market Value
($ Thousands) |
| |
CORPORATE OBLIGATIONS (continued) | | | | | |
0.000%,
01/15/2026 (B)(C) | | $ | 3,126 | | | $ | – | |
Townsquare Media | | | | | | | | |
6.500%, 04/01/2023 (A) | | | 1,940 | | | | 1,858 | |
Tribune Media | | | | | | | | |
5.875%, 07/15/2022 | | | 2,290 | | | | 2,337 | |
United States Cellular | | | | | | | | |
6.700%, 12/15/2033 | | | 1,289 | | | | 1,374 | |
UPCB Finance IV | | | | | | | | |
5.375%, 01/15/2025 (A) | | | 1,630 | | | | 1,654 | |
Videotron | | | | | | | | |
5.375%, 06/15/2024 (A) | | | 660 | | | | 689 | |
5.125%, 04/15/2027 (A) | | | 240 | | | | 245 | |
Wind Tre | | | | | | | | |
5.000%, 01/20/2026 (A) | | | 535 | | | | 487 | |
Windstream Services | | | | | | | | |
10.500%,
06/30/2024 (A)(D) | | | 320 | | | | 236 | |
9.000%,
06/30/2025 (A)(D) | | | 3,358 | | | | 2,283 | |
8.625%,
10/31/2025 (A)(D) | | | 100 | | | | 95 | |
7.750%, 10/15/2020 (D) | | | 443 | | | | 111 | |
| | | | | | | 193,583 | |
|
Consumer Discretionary — 13.3% | |
1011778 BC ULC / New Red Finance | | | | | | | | |
5.000%, 10/15/2025 (A) | | | 1,638 | | | | 1,618 | |
4.250%, 05/15/2024 (A) | | | 1,975 | | | | 1,955 | |
Adelphia Communications (Escrow Security) | | | | | | | | |
10.250%,
06/15/2011 (C)(D) | | | 150 | | | | 1 | |
9.500%,
02/15/2004 (C)(D) | | | 25 | | | | – | |
7.875%,
01/15/2009 (C)(D) | | | 225 | | | | – | |
Adient Global Holdings | | | | | | | | |
4.875%, 08/15/2026 (A) | | | 1,733 | | | | 1,269 | |
Altice | | | | | | | | |
7.750%, 05/15/2022 (A) | | | 2,634 | | | | 2,634 | |
7.625%, 02/15/2025 (A) | | | 4,587 | | | | 4,025 | |
Altice Financing | | | | | | | | |
7.500%, 05/15/2026 (A) | | | 6,912 | | | | 6,822 | |
6.625%, 02/15/2023 (A) | | | 345 | | | | 353 | |
Altice France | | | | | | | | |
8.125%, 02/01/2027 (A) | | | 3,289 | | | | 3,326 | |
7.375%, 05/01/2026 (A) | | | 6,471 | | | | 6,342 | |
Altice Luxembourg | | | | | | | | |
7.625%, 02/15/2025 | | | 784 | | | | 688 | |
American Axle & Manufacturing | | | | | | | | |
6.625%, 10/15/2022 | | | 53 | | | | 54 | |
6.500%, 04/01/2027 | | | 964 | | | | 933 | |
6.250%, 04/01/2025 | | | 615 | | | | 599 | |
6.250%, 03/15/2026 | | | 560 | | | | 540 | |
Aramark Services | | | | | | | | |
5.000%, 02/01/2028 (A) | | | 2,489 | | | | 2,479 | |
Ashtead Capital | | | | | | | | |
4.125%, 08/15/2025 (A) | | | 375 | | | | 368 | |
| | |
110 | | SEI Institutional Managed Trust / Semi-Annual Report / March 31, 2019 |
| | | | | | | | |
| Description | | Face Amount
(Thousands) | | | Market Value
($ Thousands) |
| |
CORPORATE OBLIGATIONS (continued) | | | | | |
Aventine (Escrow Security) | | | | | | | | |
0.000%,
10/15/2049 (C)(D)(E) | | $ | 2,750 | | | $ | – | |
Bon-Ton Department Stores | | | | | | | | |
8.000%, 06/15/2021 (D) | | | 2,985 | | | | 239 | |
Boyd Gaming | | | | | | | | |
6.000%, 08/15/2026 | | | 300 | | | | 308 | |
Boyne USA | | | | | | | | |
7.250%, 05/01/2025 (A) | | | 125 | | | | 134 | |
Cablevision Systems | | | | | | | | |
5.875%, 09/15/2022 | | | 1,500 | | | | 1,568 | |
Caesars Resort Collection | | | | | | | | |
5.250%, 10/15/2025 (A) | | | 1,525 | | | | 1,469 | |
CBS Radio | | | | | | | | |
7.250%, 11/01/2024 (A) | | | 3,580 | | | | 3,562 | |
CCM Merger | | | | | | | | |
6.000%, 03/15/2022 (A) | | | 695 | | | | 713 | |
Cedar Fair | | | | | | | | |
5.375%, 06/01/2024 | | | 2,019 | | | | 2,062 | |
Cengage Learning | | | | | | | | |
9.500%, 06/15/2024 (A) | | | 3,340 | | | | 2,756 | |
Churchill Downs | | | | | | | | |
5.500%, 04/01/2027 (A) | | | 1,490 | | | | 1,511 | |
4.750%, 01/15/2028 (A) | | | 542 | | | | 515 | |
Cirsa Finance International Sarl | | | | | | | | |
7.875%, 12/20/2023 (A) | | | 1,920 | | | | 1,982 | |
Constellation | | | | | | | | |
8.500%, 09/15/2025 (A) | | | 485 | | | | 443 | |
Cooper-Standard Automotive | | | | | | | | |
5.625%, 11/15/2026 (A) | | | 875 | | | | 768 | |
CSC Holdings | | | | | | | | |
10.875%, 10/15/2025 (A) | | | 1,647 | | | | 1,901 | |
7.750%, 07/15/2025 (A) | | | 1,330 | | | | 1,426 | |
7.500%, 04/01/2028 (A) | | | 1,750 | | | | 1,875 | |
6.750%, 11/15/2021 | | | 1,250 | | | | 1,336 | |
6.625%, 10/15/2025 (A) | | | 420 | | | | 445 | |
6.500%, 02/01/2029 (A) | | | 3,305 | | | | 3,520 | |
5.500%, 05/15/2026 (A) | | | 960 | | | | 987 | |
5.500%, 04/15/2027 (A) | | | 856 | | | | 874 | |
5.375%, 07/15/2023 (A) | | | 1,946 | | | | 1,983 | |
5.250%, 06/01/2024 | | | 1,182 | | | | 1,200 | |
Dana | | | | | | | | |
6.000%, 09/15/2023 | | | 575 | | | | 589 | |
Dana Financing Luxembourg Sarl | | | | | | | | |
6.500%, 06/01/2026 (A) | | | 730 | | | | 745 | |
Delphi Technologies | | | | | | | | |
5.000%, 10/01/2025 (A) | | | 5,873 | | | | 5,171 | |
Diamond Resorts International | | | | | | | | |
10.750%, 09/01/2024 (A) | | | 2,290 | | | | 2,161 | |
Enterprise Development Authority | | | | | | | | |
12.000%, 07/15/2024 (A) | | | 1,240 | | | | 1,259 | |
ESH Hospitality | | | | | | | | |
5.250%, 05/01/2025 (A) | | | 3,910 | | | | 3,884 | |
| | | | | | | | |
| Description | | Face Amount
(Thousands) | | | Market Value
($ Thousands) |
| |
CORPORATE OBLIGATIONS (continued) | | | | | |
Fontainebleau Las Vegas Holdings | | | | | | | | |
0.000%,
06/15/2015 (A)(C)(D) | | $ | 3,108 | | | $ | – | |
Ford Motor | | | | | | | | |
7.450%, 07/16/2031 | | | 786 | | | | 838 | |
Ford Motor Credit | | | | | | | | |
4.687%, 06/09/2025 | | | 1,155 | | | | 1,103 | |
4.250%, 09/20/2022 | | | 997 | | | | 990 | |
Getty Images | | | | | | | | |
9.750%, 03/01/2027 (A) | | | 220 | | | | 221 | |
Golden Nugget | | | | | | | | |
8.750%, 10/01/2025 (A) | | | 2,951 | | | | 3,099 | |
Group 1 Automotive | | | | | | | | |
5.250%, 12/15/2023 (A) | | | 194 | | | | 195 | |
5.000%, 06/01/2022 | | | 1,875 | | | | 1,880 | |
Guitar Center | | | | | | | | |
5.000% cash/8.000% PIK, | | | | | | | | |
04/15/2022 (A) | | | 5,698 | | | | 4,644 | |
Guitar Center Escrow Issuer | | | | | | | | |
9.500%, 10/15/2021 (A) | | | 2,490 | | | | 2,390 | |
Hanesbrands | | | | | | | | |
4.875%, 05/15/2026 (A) | | | 260 | | | | 257 | |
Herc Rentals | | | | | | | | |
7.750%, 06/01/2024 (A) | | | 588 | | | | 624 | |
7.500%, 06/01/2022 (A) | | | 174 | | | | 181 | |
Hilton Domestic Operating | | | | | | | | |
5.125%, 05/01/2026 (A) | | | 562 | | | | 571 | |
Hilton Worldwide Finance | | | | | | | | |
4.875%, 04/01/2027 | | | 960 | | | | 971 | |
4.625%, 04/01/2025 | | | 430 | | | | 434 | |
iHeartCommunications | | | | | | | | |
14.000%, 02/01/2021 (D) | | | 6,076 | | | | 805 | |
10.625%, 03/15/2023 (D) | | | 951 | | | | 670 | |
9.000%, 12/15/2019 (D) | | | 2,859 | | | | 2,030 | |
9.000%, 03/01/2021 (D) | | | 1,210 | | | | 853 | |
9.000%, 09/15/2022 (D) | | | 2,173 | | | | 1,532 | |
IHO Verwaltungs GmbH | | | | | | | | |
4.500% cash/5.250% PIK, 09/15/2023 (A) | | | 510 | | | | 506 | |
Inn of the Mountain Gods Resort & Casino | | | | | | | | |
9.250% cash/9.250% PIK, 11/30/2020 | | | 2,482 | | | | 2,457 | |
International Game Technology | | | | | | | | |
6.500%, 02/15/2025 (A) | | | 625 | | | | 650 | |
6.250%, 01/15/2027 (A) | | | 3,234 | | | | 3,315 | |
IRB Holding | | | | | | | | |
6.750%, 02/15/2026 (A) | | | 4,272 | | | | 4,016 | |
Jack Ohio Finance | | | | | | | | |
6.750%, 11/15/2021 (A) | | | 2,150 | | | | 2,215 | |
JC Penney | | | | | | | | |
6.375%, 10/15/2036 (B) | | | 3,915 | | | | 1,370 | |
KFC Holding | | | | | | | | |
5.250%, 06/01/2026 (A) | | | 660 | | | | 666 | |
5.000%, 06/01/2024 (A) | | | 1,587 | | | | 1,619 | |
| | |
SEI Institutional Managed Trust / Semi-Annual Report / March 31, 2019 | | 111 |
SCHEDULE OF INVESTMENTS (Unaudited)
March 31, 2019
High Yield Bond Fund(Continued)
| | | | | | | | |
| Description | | Face Amount
(Thousands) | | | Market Value
($ Thousands) |
| |
CORPORATE OBLIGATIONS (continued) | | | | | |
L Brands | | | | | | | | |
6.875%, 11/01/2035 | | $ | 362 | | | $ | 313 | |
6.750%, 07/01/2036 | | | 1,225 | | | | 1,029 | |
5.250%, 02/01/2028 | | | 1,010 | | | | 900 | |
Liberty Interactive | | | | | | | | |
8.250%, 02/01/2030 | | | 2,205 | | | | 2,249 | |
Marriott Ownership Resorts | | | | | | | | |
6.500%, 09/15/2026 (A) | | | 520 | | | | 545 | |
Mattamy Group | | | | | | | | |
6.500%, 10/01/2025 (A) | | | 2,390 | | | | 2,346 | |
Mattel | | | | | | | | |
6.750%, 12/31/2025 (A) | | | 3,379 | | | | 3,324 | |
McGraw-Hill Global Education Holdings | | | | | | | | |
7.875%, 05/15/2024 (A) | | | 595 | | | | 476 | |
Men’s Wearhouse | | | | | | | | |
7.000%, 07/01/2022 | | | 2,224 | | | | 2,191 | |
Merlin Entertainments | | | | | | | | |
5.750%, 06/15/2026 (A) | | | 355 | | | | 366 | |
MGM Resorts International | | | | | | | | |
6.000%, 03/15/2023 | | | 2,185 | | | | 2,305 | |
5.750%, 06/15/2025 | | | 2,570 | | | | 2,660 | |
5.500%, 04/15/2027 | | | 1,142 | | | | 1,154 | |
4.625%, 09/01/2026 | | | 1,572 | | | | 1,529 | |
Millennium (Escrow Security) | | | | | | | | |
7.625%,
11/15/2026 (B)(C)(D) | | | 175 | | | | – | |
Monitronics International | | | | | | | | |
9.125%, 04/01/2020 | | | 5,936 | | | | 1,187 | |
Neiman Marcus Group | | | | | | | | |
8.750% cash/9.500% PIK, 10/15/2021(A) | | | 2,016 | | | | 1,078 | |
8.000%, 10/15/2021 (A) | | | 1,720 | | | | 912 | |
Newell Brands | | | | | | | | |
4.200%, 04/01/2026 | | | 1,054 | | | | 1,006 | |
Panther BF Aggregator 2 | | | | | | | | |
8.500%, 05/15/2027 (A) | | | 428 | | | | 429 | |
6.250%, 05/15/2026 (A) | | | 1,748 | | | | 1,783 | |
Party City Holdings | | | | | | | | |
6.625%, 08/01/2026 (A) | | | 2,211 | | | | 2,200 | |
6.125%, 08/15/2023 (A) | | | 964 | | | | 976 | |
Penske Automotive Group | | | | | | | | |
5.500%, 05/15/2026 | | | 976 | | | | 961 | |
PetSmart | | | | | | | | |
8.875%, 06/01/2025 (A) | | | 420 | | | | 314 | |
7.125%, 03/15/2023 (A) | | | 1,225 | | | | 912 | |
5.875%, 06/01/2025 (A) | | | 340 | | | | 285 | |
PulteGroup | | | | | | | | |
5.000%, 01/15/2027 | | | 987 | | | | 980 | |
Quebecor Media | | | | | | | | |
5.750%, 01/15/2023 | | | 460 | | | | 480 | |
QVC | | | | | | | | |
4.450%, 02/15/2025 | | | 889 | | | | 887 | |
| | | | | | | | |
| Description | | Face Amount
(Thousands) | | | Market Value
($ Thousands) |
| |
CORPORATE OBLIGATIONS (continued) | | | | | |
Rivers Pittsburgh Borrower | | | | | | | | |
6.125%, 08/15/2021 (A) | | $ | 2,075 | | | $ | 2,075 | |
Sally Holdings | | | | | | | | |
5.625%, 12/01/2025 | | | 528 | | | | 525 | |
Scientific Games International | | | | | | | | |
8.250%, 03/15/2026 (A) | | | 809 | | | | 826 | |
5.000%, 10/15/2025 (A) | | | 3,037 | | | | 2,976 | |
Service International | | | | | | | | |
7.500%, 04/01/2027 | | | 1,295 | | | | 1,489 | |
ServiceMaster | | | | | | | | |
5.125%, 11/15/2024 (A) | | | 621 | | | | 623 | |
Six Flags Entertainment | | | | | | | | |
5.500%, 04/15/2027 (A) | | | 1,675 | | | | 1,656 | |
4.875%, 07/31/2024 (A) | | | 3,203 | | | | 3,165 | |
Staples | | | | | | | | |
8.500%, 09/15/2025 (A) | | | 1,030 | | | | 1,124 | |
Stars Group Holdings BV | | | | | | | | |
7.000%, 07/15/2026 (A) | | | 3,660 | | | | 3,816 | |
Station Casinos | | | | | | | | |
5.000%, 10/01/2025 (A) | | | 1,980 | | | | 1,940 | |
Sugarhouse HSP Gaming Prop Mezz | | | | | | | | |
5.875%, 05/15/2025 (A) | | | 3,705 | | | | 3,661 | |
Telenet Finance Luxembourg Notes Sarl | | | | | | | | |
5.500%, 03/01/2028 (A) | | | 1,000 | | | | 980 | |
Tempur Sealy International | | | | | | | | |
5.625%, 10/15/2023 | | | 455 | | | | 463 | |
5.500%, 06/15/2026 | | | 455 | | | | 455 | |
Tenneco | | | | | | | | |
5.375%, 12/15/2024 | | | 170 | | | | 153 | |
5.000%, 07/15/2026 | | | 940 | | | | 752 | |
Uber Technologies | | | | | | | | |
8.000%, 11/01/2026 (A) | | | 5,232 | | | | 5,566 | |
Univision Communications | | | | | | | | |
5.125%, 02/15/2025 (A) | | | 1,186 | | | | 1,104 | |
Urban One | | | | | | | | |
7.375%, 04/15/2022 (A) | | | 4,652 | | | | 4,489 | |
Viking Cruises | | | | | | | | |
6.250%, 05/15/2025 (A) | | | 1,850 | | | | 1,878 | |
Virgin Media Secured Finance | | | | | | | | |
5.500%, 08/15/2026 (A) | | | 480 | | | | 488 | |
5.250%, 01/15/2026 (A) | | | 2,955 | | | | 2,974 | |
Vista Outdoor | | | | | | | | |
5.875%, 10/01/2023 | | | 1,105 | | | | 1,028 | |
Weight Watchers International | | | | | | | | |
8.625%, 12/01/2025 (A) | | | 2,481 | | | | 2,227 | |
William Carter | | | | | | | | |
5.625%, 03/15/2027 (A) | | | 225 | | | | 233 | |
Williams Scotsman International | | | | | | | | |
6.875%, 08/15/2023 (A) | | | 1,480 | | | | 1,480 | |
Wynn Las Vegas | | | | | | | | |
5.500%, 03/01/2025 (A) | | | 1,265 | | | | 1,249 | |
| | |
112 | | SEI Institutional Managed Trust / Semi-Annual Report / March 31, 2019 |
| | | | | | | | |
| Description | | Face Amount
(Thousands) | | | Market Value
($ Thousands) |
| |
CORPORATE OBLIGATIONS (continued) | | | | | |
Yum! Brands | | | | | | | | |
6.875%, 11/15/2037 | | $ | 1,915 | | | $ | 1,934 | |
5.350%, 11/01/2043 | | | 130 | | | | 113 | |
Ziggo Bond BV | | | | | | | | |
6.000%, 01/15/2027 (A) | | | 2,273 | | | | 2,182 | |
Ziggo BV | | | | | | | | |
5.500%, 01/15/2027 (A) | | | 3,520 | | | | 3,476 | |
| | | | | | | | |
| | | | | | | 215,371 | |
| | | | | | | | |
| | |
Consumer Staples — 3.3% | | | | | | | | |
Albertsons | | | | | | | | |
7.500%, 03/15/2026 (A) | | | 2,925 | | | | 3,009 | |
5.750%, 03/15/2025 | | | 1,207 | | | | 1,145 | |
Avon International Operations | | | | | | | | |
7.875%, 08/15/2022 (A) | | | 1,699 | | | | 1,761 | |
B&G Foods | | | | | | | | |
5.250%, 04/01/2025 | | | 3,597 | | | | 3,449 | |
Central Garden & Pet | | | | | | | | |
6.125%, 11/15/2023 | | | 495 | | | | 516 | |
5.125%, 02/01/2028 | | | 765 | | | | 702 | |
Clearwater Seafoods | | | | | | | | |
6.875%, 05/01/2025 (A) | | | 1,275 | | | | 1,262 | |
Cott Holdings | | | | | | | | |
5.500%, 04/01/2025 (A) | | | 2,455 | | | | 2,476 | |
Coty | | | | | | | | |
6.500%, 04/15/2026 (A) | | | 670 | | | | 655 | |
Energizer Holdings | | | | | | | | |
7.750%, 01/15/2027 (A) | | | 350 | | | | 373 | |
6.375%, 07/15/2026 (A) | | | 110 | | | | 113 | |
5.500%, 06/15/2025 (A) | | | 670 | | | | 663 | |
First Quality Finance | | | | | | | | |
5.000%, 07/01/2025 (A) | | | 1,716 | | | | 1,669 | |
High Ridge Brands | | | | | | | | |
8.875%, 03/15/2025 (A) | | | 445 | | | | 178 | |
HLF Financing Sarl | | | | | | | | |
7.250%, 08/15/2026 (A) | | | 1,425 | | | | 1,468 | |
Kronos Acquisition Holdings | | | | | | | | |
9.000%, 08/15/2023 (A) | | | 290 | | | | 249 | |
New Albertsons | | | | | | | | |
8.700%, 05/01/2030 | | | 1,030 | | | | 948 | |
8.000%, 05/01/2031 | | | 5,020 | | | | 4,524 | |
7.750%, 06/15/2026 | | | 325 | | | | 296 | |
7.450%, 08/01/2029 | | | 2,895 | | | | 2,562 | |
NVA Holdings | | | | | | | | |
6.875%, 04/01/2026 (A) | | | 1,440 | | | | 1,424 | |
Pilgrim’s Pride | | | | | | | | |
5.875%, 09/30/2027 (A) | | | 3,198 | | | | 3,222 | |
Post Holdings | | | | | | | | |
5.750%, 03/01/2027 (A) | | | 995 | | | | 999 | |
5.500%, 03/01/2025 (A) | | | 565 | | | | 571 | |
5.000%, 08/15/2026 (A) | | | 3,628 | | | | 3,528 | |
| | | | | | | | |
| Description | | Face Amount
(Thousands) | | | Market Value
($ Thousands) |
| |
CORPORATE OBLIGATIONS (continued) | | | | | |
Revlon Consumer Products | | | | | | | | |
6.250%, 08/01/2024 | | $ | 287 | | | $ | 148 | |
5.750%, 02/15/2021 | | | 196 | | | | 169 | |
Rite Aid | | | | | | | | |
7.700%, 02/15/2027 | | | 2,915 | | | | 1,822 | |
6.875%, 12/15/2028 (A) | | | 600 | | | | 348 | |
6.125%, 04/01/2023 (A) | | | 3,940 | | | | 3,250 | |
Sigma Holdco BV | | | | | | | | |
7.875%, 05/15/2026 (A) | | | 2,360 | | | | 2,177 | |
Simmons Foods | | | | | | | | |
7.750%, 01/15/2024 (A) | | | 450 | | | | 479 | |
5.750%, 11/01/2024 (A) | | | 1,800 | | | | 1,580 | |
Spectrum Brands | | | | | | | | |
5.750%, 07/15/2025 | | | 1,409 | | | | 1,420 | |
TreeHouse Foods | | | | | | | | |
6.000%, 02/15/2024 (A) | | | 630 | | | | 654 | |
Vector Group | | | | | | | | |
10.500%, 11/01/2026 (A) | | | 2,860 | | | | 2,695 | |
| | | | | | | | |
| | | | | | | 52,504 | |
| | | | | | | | |
| | |
Energy — 9.6% | | | | | | | | |
Andeavor Logistics | | | | | | | | |
6.375%, 05/01/2024 | | | 250 | | | | 262 | |
6.250%, 10/15/2022 | | | 95 | | | | 97 | |
Antero Midstream Partners | | | | | | | | |
5.750%, 03/01/2027 (A) | | | 767 | | | | 779 | |
5.375%, 09/15/2024 | | | 280 | | | | 282 | |
Antero Resources | | | | | | | | |
5.625%, 06/01/2023 | | | 420 | | | | 426 | |
5.125%, 12/01/2022 | | | 455 | | | | 457 | |
Archrock Partners | | | | | | | | |
6.875%, 04/01/2027 (A) | | | 949 | | | | 968 | |
Blue Racer Midstream | | | | | | | | |
6.625%, 07/15/2026 (A) | | | 205 | | | | 209 | |
6.125%, 11/15/2022 (A) | | | 2,466 | | | | 2,503 | |
Brazos Valley Longhorn | | | | | | | | |
6.875%, 02/01/2025 | | | 535 | | | | 538 | |
Bruin E&P Partners | | | | | | | | |
8.875%, 08/01/2023 (A) | | | 1,463 | | | | 1,401 | |
Calfrac Holdings | | | | | | | | |
8.500%, 06/15/2026 (A) | | | 2,748 | | | | 2,130 | |
California Resources | | | | | | | | |
8.000%, 12/15/2022 (A) | | | 3,600 | | | | 2,827 | |
Calumet Specialty Products Partners | | | | | | | | |
6.500%, 04/15/2021 | | | 3,021 | | | | 2,961 | |
Carrizo Oil & Gas | | | | | | | | |
8.250%, 07/15/2025 | | | 1,733 | | | | 1,785 | |
6.250%, 04/15/2023 | | | 1,177 | | | | 1,158 | |
Centennial Resource Production | | | | | | | | |
6.875%, 04/01/2027 (A) | | | 2,639 | | | | 2,665 | |
5.375%, 01/15/2026 (A) | | | 1,030 | | | | 987 | |
| | |
SEI Institutional Managed Trust / Semi-Annual Report / March 31, 2019 | | 113 |
SCHEDULE OF INVESTMENTS (Unaudited)
March 31, 2019
High Yield Bond Fund(Continued)
| | | | | | | | |
| Description | | Face Amount
(Thousands) | | | Market Value
($ Thousands) | |
| |
CORPORATE OBLIGATIONS (continued) | | | | | |
Cheniere Corpus Christi Holdings | | | | | | | | |
7.000%, 06/30/2024 | | $ | 845 | | | $ | 954 | |
5.875%, 03/31/2025 | | | 360 | | | | 392 | |
5.125%, 06/30/2027 | | | 4,213 | | | | 4,418 | |
Cheniere Energy Partners | | | | | | | | |
5.625%, 10/01/2026 (A) | | | 549 | | | | 563 | |
Chesapeake Energy | | | | | | | | |
8.000%, 01/15/2025 | | | 2,445 | | | | 2,494 | |
8.000%, 06/15/2027 | | | 2,428 | | | | 2,392 | |
7.500%, 10/01/2026 | | | 140 | | | | 137 | |
Citgo Holding | | | | | | | | |
10.750%, 02/15/2020 (A) | | | 676 | | | | 693 | |
CITGO Petroleum | | | | | | | | |
6.250%, 08/15/2022 (A) | | | 1,181 | | | | 1,174 | |
CNX Midstream Partners | | | | | | | | |
6.500%, 03/15/2026 (A) | | | 2,400 | | | | 2,322 | |
Continental Resources | | | | | | | | |
4.375%, 01/15/2028 | | | 864 | | | | 887 | |
Covey Park Energy | | | | | | | | |
7.500%, 05/15/2025 (A) | | | 485 | | | | 449 | |
Crestwood Midstream Partners | | | | | | | | |
6.250%, 04/01/2023 | | | 565 | | | | 579 | |
5.750%, 04/01/2025 | | | 1,495 | | | | 1,532 | |
DCP Midstream Operating | | | | | | | | |
8.125%, 08/16/2030 | | | 1,285 | | | | 1,502 | |
Delek Logistics Partners | | | | | | | | |
6.750%, 05/15/2025 | | | 811 | | | | 803 | |
Denbury Resources | | | | | | | | |
9.250%, 03/31/2022 (A) | | | 484 | | | | 467 | |
9.000%, 05/15/2021 (A) | | | 1,628 | | | | 1,583 | |
Energy Transfer | | | | | | | | |
5.500%, 06/01/2027 | | | 1,564 | | | | 1,658 | |
EnLink Midstream Partners | | | | | | | | |
4.850%, 07/15/2026 | | | 1,610 | | | | 1,598 | |
4.400%, 04/01/2024 | | | 365 | | | | 362 | |
Ensco | | | | | | | | |
5.750%, 10/01/2044 | | | 1,705 | | | | 1,095 | |
EP Energy | | | | | | | | |
9.375%, 05/01/2020 | | | 972 | | | | 437 | |
9.375%, 05/01/2024 (A) | | | 1,017 | | | | 361 | |
8.000%, 11/29/2024 (A) | | | 370 | | | | 205 | |
8.000%, 02/15/2025 (A) | | | 653 | | | | 225 | |
7.750%, 05/15/2026 (A) | | | 2,855 | | | | 2,320 | |
6.375%, 06/15/2023 | | | 669 | | | | 131 | |
Exterran Energy Solutions | | | | | | | | |
8.125%, 05/01/2025 | | | 2,791 | | | | 2,847 | |
Extraction Oil & Gas | | | | | | | | |
7.375%, 05/15/2024 (A) | | | 589 | | | | 492 | |
5.625%, 02/01/2026 (A) | | | 4,233 | | | | 3,249 | |
FTS International | | | | | | | | |
6.250%, 05/01/2022 | | | 2,586 | | | | 2,502 | |
| | | | | | | | |
| Description | | Face Amount
(Thousands) | | | Market Value
($ Thousands) | |
| |
CORPORATE OBLIGATIONS (continued) | | | | | |
Genesis Energy | | | | | | | | |
6.500%, 10/01/2025 | | $ | 805 | | | $ | 783 | |
Great Western Petroleum | | | | | | | | |
9.000%, 09/30/2021 (A) | | | 154 | | | | 116 | |
Gulfport Energy | | | | | | | | |
6.375%, 05/15/2025 | | | 115 | | | | 104 | |
6.375%, 01/15/2026 | | | 1,073 | | | | 949 | |
6.000%, 10/15/2024 | | | 165 | | | | 150 | |
Halcon Resources | | | | | | | | |
6.750%, 02/15/2025 | | | 3,455 | | | | 2,073 | |
Hess Infrastructure Partners | | | | | | | | |
5.625%, 02/15/2026 (A) | | | 1,670 | | | | 1,699 | |
Hilcorp Energy I | | | | | | | | |
6.250%, 11/01/2028 (A) | | | 596 | | | | 598 | |
5.750%, 10/01/2025 (A) | | | 601 | | | | 590 | |
5.000%, 12/01/2024 (A) | | | 2,291 | | | | 2,229 | |
IronGate Energy Services | | | | | | | | |
11.000%,
07/01/2018 (A)(D) | | | 400 | | | | 140 | |
Jagged Peak Energy | | | | | | | | |
5.875%, 05/01/2026 | | | 215 | | | | 213 | |
KCA Deutag UK Finance | | | | | | | | |
9.875%, 04/01/2022 (A) | | | 2,015 | | | | 1,733 | |
9.625%, 04/01/2023 (A) | | | 265 | | | | 222 | |
Laredo Petroleum | | | | | | | | |
5.625%, 01/15/2022 | | | 1,355 | | | | 1,238 | |
McDermott Technology Americas | | | | | | | | |
10.625%, 05/01/2024 (A) | | | 390 | | | | 323 | |
MEG Energy | | | | | | | | |
7.000%, 03/31/2024 (A) | | | 1,075 | | | | 1,003 | |
6.500%, 01/15/2025 (A) | | | 1,192 | | | | 1,174 | |
6.375%, 01/30/2023 (A) | | | 375 | | | | 347 | |
Midstates Petroleum | | | | | | | | |
10.750%, 10/15/2020 (D) | | | 2,540 | | | | – | |
10.000%, 06/01/2020 (D) | | | 720 | | | | – | |
9.250%, 06/01/2021 (D) | | | 360 | | | | – | |
Murphy Oil | | | | | | | | |
5.750%, 08/15/2025 | | | 894 | | | | 922 | |
Murray Energy | | | | | | | | |
9.000% cash/3.000% PIK, 04/15/2024 (A) | | | 1,253 | | | | 526 | |
Nabors Industries | | | | | | | | |
5.750%, 02/01/2025 | | | 1,284 | | | | 1,151 | |
NGL Energy Partners | | | | | | | | |
7.500%, 11/01/2023 | | | 705 | | | | 729 | |
6.125%, 03/01/2025 | | | 1,148 | | | | 1,108 | |
NGPL PipeCo | | | | | | | | |
4.875%, 08/15/2027 (A) | | | 95 | | | | 96 | |
Noble Holding International | | | | | | | | |
8.950%, 04/01/2045 | | | 1,755 | | | | 1,369 | |
7.750%, 01/15/2024 | | | 2,295 | | | | 2,066 | |
Northern Oil and Gas | | | | | | | | |
8.500% cash/1.000% PIK, 05/15/2023 | | | 1,355 | | | | 1,402 | |
| | |
114 | | SEI Institutional Managed Trust / Semi-Annual Report / March 31, 2019 |
| | | | | | | | |
| Description | | Face Amount
(Thousands) | | | Market Value
($ Thousands) |
| |
CORPORATE OBLIGATIONS (continued) | | | | | |
Oasis Petroleum | | | | | | | | |
6.875%, 03/15/2022 | | $ | 35 | | | $ | 35 | |
6.875%, 01/15/2023 | | | 790 | | | | 790 | |
6.250%, 05/01/2026(A) | | | 1,550 | | | | 1,477 | |
Parker Drilling | | | | | | | | |
7.500%,
08/01/2020 (C)(D) | | | 130 | | | | 70 | |
6.750%,
07/15/2022 (C)(D) | | | 3,360 | | | | 1,638 | |
Parsley Energy | | | | | | | | |
5.375%, 01/15/2025 (A) | | | 1,889 | | | | 1,884 | |
5.250%, 08/15/2025 (A) | | | 1,995 | | | | 1,965 | |
PBF Holding | | | | | | | | |
7.000%, 11/15/2023 | | | 805 | | | | 828 | |
Peabody Energy | | | | | | | | |
6.375%, 03/31/2025 (A) | | | 4,195 | | | | 4,086 | |
Precision Drilling | | | | | | | | |
7.750%, 12/15/2023 | | | 280 | | | | 288 | |
7.125%, 01/15/2026 (A) | | | 285 | | | | 283 | |
6.500%, 12/15/2021 | | | 39 | | | | 39 | |
Pride International | | | | | | | | |
7.875%, 08/15/2040 | | | 930 | | | | 744 | |
Range Resources | | | | | | | | |
5.000%, 03/15/2023 | | | 953 | | | | 915 | |
4.875%, 05/15/2025 | | | 615 | | | | 570 | |
Rowan | | | | | | | | |
7.375%, 06/15/2025 | | | 4,703 | | | | 4,115 | |
5.850%, 01/15/2044 | | | 2,915 | | | | 1,866 | |
5.400%, 12/01/2042 | | | 370 | | | | 227 | |
SemGroup | | | | | | | | |
5.625%, 07/15/2022 | | | 2,565 | | | | 2,536 | |
SESI | | | | | | | | |
7.750%, 09/15/2024 | | | 985 | | | | 815 | |
Seven Generations Energy | | | | | | | | |
5.375%, 09/30/2025 (A) | | | 2,787 | | | | 2,724 | |
Seventy Seven Energy (Escrow) | | | | | | | | |
6.500%, 10/15/2020 (D) | | | 305 | | | | – | |
Seventy Seven Operating (Escrow) | | | | | | | | |
0.000%,
10/15/2020 (C)(D) | | | 1,869 | | | | – | |
Shelf Drilling Holdings | | | | | | | | |
8.250%, 02/15/2025 (A) | | | 428 | | | | 407 | |
SM Energy | | | | | | | | |
6.625%, 01/15/2027 | | | 258 | | | | 245 | |
6.125%, 11/15/2022 | | | 105 | | | | 105 | |
5.625%, 06/01/2025 | | | 295 | | | | 273 | |
5.000%, 01/15/2024 | | | 1,288 | | | | 1,191 | |
Southwestern Energy | | | | | | | | |
7.750%, 10/01/2027 | | | 744 | | | | 760 | |
7.500%, 04/01/2026 | | | 744 | | | | 759 | |
6.200%, 01/23/2025 | | | 357 | | | | 350 | |
SRC Energy | | | | | | | | |
6.250%, 12/01/2025 | | | 1,873 | | | | 1,672 | |
Summit Midstream Holdings | | | | | | | | |
5.750%, 04/15/2025 | | | 1,786 | | | | 1,683 | |
| | | | | | | | |
| Description | | Face Amount
(Thousands) | | | Market Value
($ Thousands) |
| |
CORPORATE OBLIGATIONS (continued) | | | | | |
5.500%, 08/15/2022 | | $ | 1,548 | | | $ | 1,533 | |
Sunoco | | | | | | | | |
5.875%, 03/15/2028 | | | 1,585 | | | | 1,573 | |
5.500%, 02/15/2026 | | | 1,515 | | | | 1,500 | |
Tallgrass Energy Partners | | | | | | | | |
5.500%, 01/15/2028 (A) | | | 430 | | | | 431 | |
Targa Resources Partners | | | | | | | | |
6.875%, 01/15/2029 (A) | | | 1,558 | | | | 1,692 | |
6.750%, 03/15/2024 | | | 3,375 | | | | 3,535 | |
6.500%, 07/15/2027 (A) | | | 1,103 | | | | 1,190 | |
5.875%, 04/15/2026 (A) | | | 1,024 | | | | 1,082 | |
5.000%, 01/15/2028 | | | 2,056 | | | | 2,028 | |
4.250%, 11/15/2023 | | | 65 | | | | 65 | |
Transocean | | | | | | | | |
9.000%, 07/15/2023 (A) | | | 2,369 | | | | 2,526 | |
7.500%, 01/15/2026 (A) | | | 355 | | | | 350 | |
7.500%, 04/15/2031 | | | 2,711 | | | | 2,318 | |
7.250%, 11/01/2025 (A) | | | 305 | | | | 302 | |
Transocean Guardian | | | | | | | | |
5.875%, 01/15/2024 (A) | | | 595 | | | | 604 | |
Transocean Pontus | | | | | | | | |
6.125%, 08/01/2025 (A) | | | 503 | | | | 509 | |
Transocean Poseidon | | | | | | | | |
6.875%, 02/01/2027 (A) | | | 877 | | | | 912 | |
USA Compression Partners | | | | | | | | |
6.875%, 04/01/2026 | | | 1,805 | | | | 1,852 | |
6.875%, 09/01/2027 (A) | | | 336 | | | | 342 | |
Vine Oil & Gas | | | | | | | | |
9.750%, 04/15/2023 (A) | | | 1,824 | | | | 1,505 | |
Weatherford International | | | | | | | | |
9.875%, 02/15/2024 | | | 2,655 | | | | 1,912 | |
9.875%, 03/01/2025 | | | 275 | | | | 194 | |
9.875%, 03/01/2039 | | | 495 | | | | 314 | |
5.950%, 04/15/2042 | | | 2,015 | | | | 1,128 | |
Whiting Petroleum | | | | | | | | |
6.625%, 01/15/2026 | | | 350 | | | | 343 | |
6.250%, 04/01/2023 | | | 350 | | | | 352 | |
WPX Energy | | | | | | | | |
8.250%, 08/01/2023 | | | 560 | | | | 630 | |
6.000%, 01/15/2022 | | | 76 | | | | 79 | |
5.750%, 06/01/2026 | | | 199 | | | | 202 | |
| | | | | | | | |
| | | | | | | 154,654 | |
| | | | | | | | |
| | |
Financials — 4.3% | | | | | | | | |
Acrisure | | | | | | | | |
8.125%, 02/15/2024 (A) | | | 3,201 | | | | 3,317 | |
7.000%, 11/15/2025 (A) | | | 1,150 | | | | 1,035 | |
AHP Health Partners | | | | | | | | |
9.750%, 07/15/2026 (A) | | | 992 | | | | 1,069 | |
Alliant Holdings Intermediate | | | | | | | | |
8.250%, 08/01/2023 (A) | | | 1,930 | | | | 1,978 | |
| | |
SEI Institutional Managed Trust / Semi-Annual Report / March 31, 2019 | | 115 |
SCHEDULE OF INVESTMENTS (Unaudited)
March 31, 2019
High Yield Bond Fund(Continued)
| | | | | | | | |
| Description | | Face Amount
(Thousands) | | | Market Value
($ Thousands) |
| |
CORPORATE OBLIGATIONS (continued) | | | | | |
Ally Financial | | | | | | | | |
5.750%, 11/20/2025 | | $ | 2,096 | | | $ | 2,233 | |
4.625%, 05/19/2022 | | | 905 | | | | 923 | |
ASP AMC | | | | | | | | |
8.000%, 05/15/2025 (A) | | | 3,720 | | | | 1,674 | |
AssuredPartners | | | | | | | | |
7.000%, 08/15/2025 (A) | | | 1,419 | | | | 1,313 | |
BCD Acquisition | | | | | | | | |
9.625%, 09/15/2023 (A) | | | 1,890 | | | | 2,003 | |
Citigroup | | | | | | | | |
5.950%, VAR ICE LIBOR USD 3 Month+3.905%, 12/31/2049 | | | 50 | | | | 51 | |
5.875%, VAR ICE LIBOR USD 3 Month+4.059%, 12/29/2049 | | | 280 | | | | 283 | |
5.800%, VAR ICE LIBOR USD 3 Month+4.093%, 11/29/2049 | | | 280 | | | | 282 | |
City National Bank | | | | | | | | |
9.000%,
08/12/2019 (B)(C) | | | 3,384 | | | | 3,454 | |
Credit Acceptance | | | | | | | | |
6.625%, 03/15/2026 (A) | | | 1,520 | | | | 1,545 | |
Credit Suisse Group | | | | | | | | |
7.500%, VAR USD Swap Semi 30/360 5 Yr Curr+4.598%, 12/31/2049 (A) | | | 765 | | | | 809 | |
CTR Partnership | | | | | | | | |
5.250%, 06/01/2025 | | | 2,110 | | | | 2,118 | |
Donnelley Financial Solutions | | | | | | | | |
8.250%, 10/15/2024 | | | 1,206 | | | | 1,215 | |
Fidelity & Guaranty Life Holdings | | | | | | | | |
5.500%, 05/01/2025 (A) | | | 2,075 | | | | 2,083 | |
Freedom Mortgage | | | | | | | | |
8.250%, 04/15/2025 (A) | | | 3,450 | | | | 3,062 | |
8.125%, 11/15/2024 (A) | | | 840 | | | | 745 | |
FS Energy & Power Fund | | | | | | | | |
7.500%, 08/15/2023 (A) | | | 1,945 | | | | 1,995 | |
Genworth Holdings | | | | | | | | |
4.900%, 08/15/2023 | | | 768 | | | | 647 | |
HUB International | | | | | | | | |
7.000%, 05/01/2026 (A) | | | 2,003 | | | | 1,983 | |
Hunt | | | | | | | | |
6.250%, 02/15/2026 (A) | | | 937 | | | | 874 | |
Lions Gate Capital Holdings | | | | | | | | |
6.375%, 02/01/2024 (A) | | | 810 | | | | 849 | |
Lloyds Banking Group | | | | | | | | |
7.500%, VAR USD Swap Semi 30/360 5 Yr Curr+4.760%, 12/01/2099 | | | 1,965 | | | | 2,024 | |
LPL Holdings | | | | | | | | |
5.750%, 09/15/2025 (A) | | | 1,722 | | | | 1,744 | |
MGM Growth Properties Operating Partnership | | | | | | | | |
5.750%, 02/01/2027 (A) | | | 606 | | | | 627 | |
5.625%, 05/01/2024 | | | 1,130 | | | | 1,175 | |
4.500%, 09/01/2026 | | | 2,461 | | | | 2,394 | |
| | | | | | | | |
| Description | | Face Amount
(Thousands) | | | Market Value
($ Thousands) |
| |
CORPORATE OBLIGATIONS (continued) | | | | | |
4.500%, 01/15/2028 | | $ | 95 | | | $ | 89 | |
MSCI | | | | | | | | |
5.375%, 05/15/2027 (A) | | | 300 | | | | 317 | |
Nationstar Mortgage Holdings | | | | | | | | |
9.125%, 07/15/2026 (A) | | | 3,876 | | | | 3,934 | |
8.125%, 07/15/2023 (A) | | | 995 | | | | 1,025 | |
Navient | | | | | | | | |
7.250%, 09/25/2023 | | | 576 | | | | 608 | |
Quicken Loans | | | | | | | | |
5.250%, 01/15/2028 (A) | | | 3,386 | | | | 3,170 | |
Refinitiv US Holdings | | | | | | | | |
6.250%, 05/15/2026 (A) | | | 2,639 | | | | 2,675 | |
Royal Bank of Scotland Group PLC | | | | | | | | |
8.000%, VAR USD Swap Semi 30/360 5 Yr Curr+5.720%, 12/29/2049 | | | 740 | | | | 794 | |
Springleaf Finance | | | | | | | | |
7.125%, 03/15/2026 | | | 3,085 | | | | 3,141 | |
6.875%, 03/15/2025 | | | 1,715 | | | | 1,769 | |
6.125%, 05/15/2022 | | | 810 | | | | 838 | |
6.125%, 03/15/2024 | | | 1,342 | | | | 1,372 | |
Starwood Property Trust | | | | | | | | |
4.750%, 03/15/2025 | | | 940 | | | | 935 | |
WeWork | | | | | | | | |
7.875%, 05/01/2025 (A) | | | 4,225 | | | | 3,887 | |
| | | | | | | | |
| | | | | | | 70,058 | |
| | | | | | | | |
| | |
Health Care — 7.8% | | | | | | | | |
21st Century Oncology | | | | | | | | |
10.000% cash/12.000% PIK, 04/30/2023 (B)(C) | | | 370 | | | | 281 | |
Acadia Healthcare | | | | | | | | |
5.625%, 02/15/2023 | | | 2,890 | | | | 2,908 | |
5.125%, 07/01/2022 | | | 536 | | | | 537 | |
Air Medical Group Holdings | | | | | | | | |
6.375%, 05/15/2023 (A) | | | 3,726 | | | | 3,130 | |
Avantor | | | | | | | | |
9.000%, 10/01/2025 (A) | | | 1,124 | | | | 1,218 | |
6.000%, 10/01/2024 (A) | | | 1,468 | | | | 1,523 | |
Bausch Health | | | | | | | | |
9.000%, 12/15/2025 (A) | | | 1,216 | | | | 1,321 | |
7.000%, 03/15/2024 (A) | | | 495 | | | | 524 | |
6.500%, 03/15/2022 (A) | | | 900 | | | | 932 | |
6.125%, 04/15/2025 (A) | | | 4,920 | | | | 4,871 | |
5.875%, 05/15/2023 (A) | | | 1,091 | | | | 1,105 | |
5.750%, 08/15/2027 (A) | | | 1,036 | | | | 1,062 | |
5.500%, 03/01/2023 (A) | | | 2,479 | | | | 2,491 | |
5.500%, 11/01/2025 (A) | | | 1,340 | | | | 1,368 | |
Bausch Health Americas | | | | | | | | |
9.250%, 04/01/2026 (A) | | | 4,674 | | | | 5,115 | |
8.500%, 01/31/2027 (A) | | | 3,096 | | | | 3,282 | |
BioScrip | | | | | | | | |
8.875%, 02/15/2021 | | | 3,211 | | | | 3,243 | |
| | |
116 | | SEI Institutional Managed Trust / Semi-Annual Report / March 31, 2019 |
| | | | | | | | |
| Description | | Face Amount
(Thousands) | | | Market Value
($ Thousands) |
| |
CORPORATE OBLIGATIONS (continued) | | | | | |
Centene | | | | | | | | |
6.125%, 02/15/2024 | | $ | 200 | | | $ | 209 | |
4.750%, 01/15/2025 | | | 5,030 | | | | 5,131 | |
Centene Escrow I | | | | | | | | |
5.375%, 06/01/2026 (A) | | | 887 | | | | 926 | |
Charles River Laboratories International | | | | | | | | |
5.500%, 04/01/2026 (A) | | | 1,720 | | | | 1,784 | |
CHS | | | | | | | | |
8.625%, 01/15/2024 (A) | | | 2,105 | | | | 2,108 | |
8.000%, 03/15/2026 (A) | | | 1,888 | | | | 1,812 | |
6.875%, 02/01/2022 | | | 540 | | | | 359 | |
6.250%, 03/31/2023 | | | 955 | | | | 899 | |
DaVita | | | | | | | | |
5.000%, 05/01/2025 | | | 1,687 | | | | 1,617 | |
Encompass Health | | | | | | | | |
5.750%, 09/15/2025 | | | 672 | | | | 683 | |
Endo | | | | | | | | |
6.000%, 07/15/2023 (A) | | | 2,619 | | | | 2,017 | |
Endo Finance | | | | | | | | |
5.750%, 01/15/2022 (A) | | | 981 | | | | 934 | |
Envision Healthcare | | | | | | | | |
8.750%, 10/15/2026 (A) | | | 2,210 | | | | 1,970 | |
Gates Global | | | | | | | | |
6.000%, 07/15/2022 (A) | | | 555 | | | | 557 | |
Hadrian Merger Sub | | | | | | | | |
8.500%, 05/01/2026 (A) | | | 1,325 | | | | 1,224 | |
HCA | | | | | | | | |
5.875%, 05/01/2023 | | | 1,485 | | | | 1,583 | |
5.875%, 02/15/2026 | | | 3,765 | | | | 4,066 | |
5.875%, 02/01/2029 | | | 3,569 | | | | 3,846 | |
5.625%, 09/01/2028 | | | 130 | | | | 138 | |
5.375%, 02/01/2025 | | | 11,039 | | | | 11,701 | |
5.375%, 09/01/2026 | | | 1,856 | | | | 1,956 | |
5.250%, 06/15/2026 | | | 550 | | | | 589 | |
Hill-Rom Holdings | | | | | | | | |
5.750%, 09/01/2023 (A) | | | 2,235 | | | | 2,305 | |
5.000%, 02/15/2025 (A) | | | 625 | | | | 634 | |
Hologic | | | | | | | | |
4.375%, 10/15/2025 (A) | | | 440 | | | | 438 | |
inVentiv Group Holdings | | | | | | | | |
7.500%, 10/01/2024 (A) | | | 424 | | | | 446 | |
IQVIA | | | | | | | | |
5.000%, 10/15/2026 (A) | | | 3,233 | | | | 3,308 | |
Kinetic Concepts | | | | | | | | |
7.875%, 02/15/2021 (A) | | | 612 | | | | 627 | |
Mallinckrodt International Finance | | | | | | | | |
5.625%, 10/15/2023 (A) | | | 315 | | | | 262 | |
5.500%, 04/15/2025 (A) | | | 630 | | | | 491 | |
Molina Healthcare | | | | | | | | |
5.375%, 11/15/2022 | | | 1,983 | | | | 2,059 | |
4.875%, 06/15/2025 (A) | | | 3,019 | | | | 2,985 | |
| | | | | | | | |
| Description | | Face Amount
(Thousands) | | | Market Value
($ Thousands) |
| |
CORPORATE OBLIGATIONS (continued) | | | | | |
MPH Acquisition Holdings | | | | | | | | |
7.125%, 06/01/2024 (A) | | $ | 2,483 | | | $ | 2,477 | |
Ortho-Clinical Diagnostics | | | | | | | | |
6.625%, 05/15/2022 (A) | | | 1,585 | | | | 1,504 | |
Par Pharmaceutical | | | | | | | | |
7.500%, 04/01/2027 (A) | | | 4,464 | | | | 4,526 | |
Prestige Brands | | | | | | | | |
6.375%, 03/01/2024 (A) | | | 400 | | | | 407 | |
RegionalCare Hospital Partners Holdings | | | | | | | | |
9.750%, 12/01/2026 (A) | | | 1,615 | | | | 1,676 | |
8.250%, 05/01/2023 (A) | | | 1,057 | | | | 1,124 | |
Sotera Health Holdings | | | | | | | | |
6.500%, 05/15/2023 (A) | | | 1,785 | | | | 1,798 | |
Surgery Center Holdings | | | | | | | | |
6.750%, 07/01/2025 (A) | | | 403 | | | | 365 | |
Tenet Healthcare | | | | | | | | |
8.125%, 04/01/2022 | | | 450 | | | | 484 | |
7.000%, 08/01/2025 | | | 3,139 | | | | 3,173 | |
6.750%, 06/15/2023 | | | 4,150 | | | | 4,274 | |
6.250%, 02/01/2027 (A) | | | 2,358 | | | | 2,448 | |
5.125%, 05/01/2025 | | | 1,524 | | | | 1,532 | |
4.625%, 07/15/2024 | | | 3,492 | | | | 3,497 | |
4.500%, 04/01/2021 | | | 580 | | | | 589 | |
WellCare Health Plans | | | | | | | | |
5.250%, 04/01/2025 | | | 1,865 | | | | 1,930 | |
| | | | | | | | |
| | | | | | | 126,379 | |
| | | | | | | | |
| | |
Industrials — 7.6% | | | | | | | | |
ACCO Brands | | | | | | | | |
5.250%, 12/15/2024 (A) | | | 420 | | | | 412 | |
Actuant | | | | | | | | |
5.625%, 06/15/2022 | | | 3,000 | | | | 3,026 | |
Allison Transmission | | | | | | | | |
5.875%, 06/01/2029 (A) | | | 210 | | | | 212 | |
4.750%, 10/01/2027 (A) | | | 1,365 | | | | 1,302 | |
American Tire Distributors | | | | | | | | |
10.250%,
03/01/2022 (A)(C)(D) | | | 205 | | | | 32 | |
American Woodmark | | | | | | | | |
4.875%, 03/15/2026 (A) | | | 455 | | | | 445 | |
AMN Healthcare | | | | | | | | |
5.125%, 10/01/2024 (A) | | | 909 | | | | 897 | |
Arconic | | | | | | | | |
5.900%, 02/01/2027 | | | 535 | | | | 556 | |
Avis Budget Car Rental | | | | | | | | |
6.375%, 04/01/2024 (A) | | | 1,270 | | | | 1,291 | |
5.250%, 03/15/2025 (A) | | | 70 | | | | 67 | |
Avolon Holdings Funding | | | | | | | | |
5.250%, 05/15/2024 (A) | | | 682 | | | | 703 | |
5.125%, 10/01/2023 (A) | | | 2,077 | | | | 2,113 | |
Bombardier | | | | | | | | |
7.875%, 04/15/2027 (A) | | | 1,956 | | | | 2,018 | |
7.500%, 12/01/2024 (A) | | | 2,113 | | | | 2,195 | |
| | |
SEI Institutional Managed Trust / Semi-Annual Report / March 31, 2019 | | 117 |
SCHEDULE OF INVESTMENTS (Unaudited)
March 31, 2019
High Yield Bond Fund(Continued)
| | | | | | | | |
| Description | | Face Amount
(Thousands) | | | Market Value
($ Thousands) |
| |
CORPORATE OBLIGATIONS (continued) | | | | | |
7.500%, 03/15/2025 (A) | | $ | 475 | | | $ | 488 | |
6.000%, 10/15/2022 (A) | | | 1,490 | | | | 1,503 | |
BWX Technologies | | | | | | | | |
5.375%, 07/15/2026 (A) | | | 1,433 | | | | 1,455 | |
CDW | | | | | | | | |
5.000%, 09/01/2025 | | | 550 | | | | 564 | |
Cloud Crane | | | | | | | | |
10.125%, 08/01/2024 (A) | | | 1,295 | | | | 1,392 | |
Colfax | | | | | | | | |
6.375%, 02/15/2026 (A) | | | 85 | | | | 91 | |
6.000%, 02/15/2024 (A) | | | 35 | | | | 36 | |
Core & Main | | | | | | | | |
6.125%, 08/15/2025 (A) | | | 3,958 | | | | 3,870 | |
CPG Merger | | | | | | | | |
8.000%, 10/01/2021 (A) | | | 765 | | | | 761 | |
DAE Funding | | | | | | | | |
5.750%, 11/15/2023 (A) | | | 1,095 | | | | 1,125 | |
4.500%, 08/01/2022 (A) | | | 660 | | | | 665 | |
EnPro Industries | | | | | | | | |
5.750%, 10/15/2026 (A) | | | 328 | | | | 330 | |
Fortress Transportation & Infrastructure Investors | | | | | | | | |
6.750%, 03/15/2022 (A) | | | 1,975 | | | | 2,010 | |
6.500%, 10/01/2025 (A) | | | 640 | | | | 632 | |
Garda World Security | | | | | | | | |
8.750%, 05/15/2025 (A) | | | 795 | | | | 755 | |
GFL Environmental | | | | | | | | |
5.375%, 03/01/2023 (A) | | | 4,633 | | | | 4,378 | |
Global A&T Electronics | | | | | | | | |
8.500%, 01/12/2023 | | | 5,269 | | | | 4,898 | |
H&E Equipment Services | | | | | | | | |
5.625%, 09/01/2025 | | | 2,006 | | | | 2,001 | |
Hertz | | | | | | | | |
7.625%, 06/01/2022 (A) | | | 785 | | | | 804 | |
6.250%, 10/15/2022 | | | 310 | | | | 293 | |
5.500%, 10/15/2024 (A) | | | 1,630 | | | | 1,367 | |
Hillman Group | | | | | | | | |
6.375%, 07/15/2022 (A) | | | 3,338 | | | | 2,988 | |
Hulk Finance | | | | | | | | |
7.000%, 06/01/2026 (A) | | | 2,660 | | | | 2,520 | |
Icahn Enterprises | | | | | | | | |
5.875%, 02/01/2022 | | | 1,499 | | | | 1,518 | |
James Hardie International Finance DAC | | | | | | | | |
5.000%, 01/15/2028 (A) | | | 1,224 | | | | 1,184 | |
4.750%, 01/15/2025 (A) | | | 200 | | | | 197 | |
JELD-WEN | | | | | | | | |
4.875%, 12/15/2027 (A) | | | 1,872 | | | | 1,765 | |
4.625%, 12/15/2025 (A) | | | 494 | | | | 469 | |
KAR Auction Services | | | | | | | | |
5.125%, 06/01/2025 (A) | | | 451 | | | | 446 | |
Kratos Defense & Security Solutions | | | | | | | | |
6.500%, 11/30/2025 (A) | | | 110 | | | | 116 | |
| | | | | | | | |
| Description | | Face Amount
(Thousands) | | | Market Value
($ Thousands) |
| |
CORPORATE OBLIGATIONS (continued) | | | | | |
LTF Merger | | | | | | | | |
8.500%, 06/15/2023 (A) | | $ | 830 | | | $ | 852 | |
Mueller Water Products | | | | | | | | |
5.500%, 06/15/2026 (A) | | | 195 | | | | 198 | |
Multi-Color | | | | | | | | |
4.875%, 11/01/2025 (A) | | | 1,319 | | | | 1,362 | |
New Enterprise Stone & Lime | | | | | | | | |
10.125%, 04/01/2022 (A) | | | 1,945 | | | | 1,969 | |
6.250%, 03/15/2026 (A) | | | 2,935 | | | | 2,855 | |
Nielsen Finance | | | | | | | | |
5.000%, 04/15/2022 (A) | | | 1,582 | | | | 1,562 | |
Nielsen Luxembourg Sarl | | | | | | | | |
5.000%, 02/01/2025 (A) | | | 1,549 | | | | 1,489 | |
Novelis | | | | | | | | |
6.250%, 08/15/2024 (A) | | | 200 | | | | 205 | |
5.875%, 09/30/2026 (A) | | | 3,453 | | | | 3,440 | |
PGT Escrow Issuer | | | | | | | | |
6.750%, 08/01/2026 (A) | | | 300 | | | | 311 | |
Prime Security Services Borrower | | | | | | | | |
5.750%, 04/15/2026 (A) | | | 864 | | | | 864 | |
5.250%, 04/15/2024 (A) | | | 1,345 | | | | 1,345 | |
RBS Global | | | | | | | | |
4.875%, 12/15/2025 (A) | | | 3,008 | | | | 2,970 | |
Remington Arms | | | | | | | | |
0.000%, 12/31/2049 (B) | | | 1,245 | | | | – | |
RR Donnelley & Sons | | | | | | | | |
6.000%, 04/01/2024 | | | 1,990 | | | | 2,014 | |
Sensata Technologies | | | | | | | | |
5.000%, 10/01/2025 (A) | | | 1,083 | | | | 1,110 | |
4.875%, 10/15/2023 (A) | | | 1,600 | | | | 1,648 | |
Sensata Technologies UK Financing | | | | | | | | |
6.250%, 02/15/2026 (A) | | | 1,595 | | | | 1,691 | |
SPX FLOW | | | | | | | | |
5.875%, 08/15/2026 (A) | | | 360 | | | | 362 | |
5.625%, 08/15/2024 (A) | | | 170 | | | | 171 | |
Standard Industries | | | | | | | | |
5.000%, 02/15/2027 (A) | | | 590 | | | | 571 | |
4.750%, 01/15/2028 (A) | | | 725 | | | | 692 | |
Stevens Holding | | | | | | | | |
6.125%, 10/01/2026 (A) | | | 210 | | | | 216 | |
Summit Materials | | | | | | | | |
6.125%, 07/15/2023 | | | 817 | | | | 834 | |
5.125%, 06/01/2025 (A) | | | 2,523 | | | | 2,428 | |
Teck Resources | | | | | | | | |
6.125%, 10/01/2035 | | | 676 | | | | 719 | |
Terex | | | | | | | | |
5.625%, 02/01/2025 (A) | | | 530 | | | | 527 | |
Titan International | | | | | | | | |
6.500%, 11/30/2023 | | | 2,105 | | | | 1,939 | |
TransDigm | | | | | | | | |
6.500%, 07/15/2024 | | | 450 | | | | 462 | |
6.500%, 05/15/2025 | | | 1,336 | | | | 1,356 | |
| | |
118 | | SEI Institutional Managed Trust / Semi-Annual Report / March 31, 2019 |
| | | | | | | | |
| | | |
| Description | | Face Amount
(Thousands) | | Market Value
($ Thousands) |
|
CORPORATE OBLIGATIONS (continued) | |
6.375%, 06/15/2026 | | $ | 623 | | | $ | 617 | |
6.250%, 03/15/2026 (A) | | | 2,921 | | | | 3,042 | |
TransDigm UK Holdings | | | | | | | | |
6.875%, 05/15/2026 (A) | | | 780 | | | | 776 | |
TriMas | | | | | | | | |
4.875%, 10/15/2025 (A) | | | 205 | | | | 202 | |
Triumph Group | | | | | | | | |
7.750%, 08/15/2025 | | | 2,395 | | | | 2,287 | |
4.875%, 04/01/2021 | | | 355 | | | | 346 | |
Tutor Perini | | | | | | | | |
6.875%, 05/01/2025 (A) | | | 5,000 | | | | 4,982 | |
United Rentals North America | | | | | | | | |
6.500%, 12/15/2026 | | | 4,145 | | | | 4,363 | |
5.875%, 09/15/2026 | | | 1,355 | | | | 1,401 | |
5.750%, 11/15/2024 | | | 300 | | | | 308 | |
5.500%, 05/15/2027 | | | 991 | | | | 1,001 | |
4.875%, 01/15/2028 | | | 1,621 | | | | 1,577 | |
4.625%, 10/15/2025 | | | 1,660 | | | | 1,639 | |
Vertiv Group | | | | | | | | |
9.250%, 10/15/2024 (A) | | | 1,915 | | | | 1,905 | |
Wabash National | | | | | | | | |
5.500%, 10/01/2025 (A) | | | 340 | | | | 317 | |
Weekley Homes | | | | | | | | |
6.625%, 08/15/2025 | | | 3,395 | | | | 3,242 | |
Welbilt | | | | | | | | |
9.500%, 02/15/2024 | | | 240 | | | | 259 | |
XPO Logistics | | | | | | | | |
6.750%, 08/15/2024 (A) | | | 1,531 | | | | 1,562 | |
6.500%, 06/15/2022 (A) | | | 240 | | | | 244 | |
6.125%, 09/01/2023 (A) | | | 220 | | | | 222 | |
| | | | | | | 122,344 | |
|
Information Technology — 4.2% | |
ACI Worldwide | | | | | | | | |
5.750%, 08/15/2026 (A) | | | 379 | | | | 388 | |
Amkor Technology | | | | | | | | |
6.625%, 09/15/2027 (A) | | | 1,576 | | | | 1,600 | |
6.375%, 10/01/2022 | | | 1,175 | | | | 1,195 | |
Anixter | | | | | | | | |
6.000%, 12/01/2025 (A) | | | 225 | | | | 236 | |
5.500%, 03/01/2023 | | | 230 | | | | 238 | |
Ascend Learning | | | | | | | | |
6.875%, 08/01/2025 (A) | | | 530 | | | | 526 | |
Banff Merger Sub | | | | | | | | |
9.750%, 09/01/2026 (A) | | | 2,263 | | | | 2,195 | |
Cardtronics | | | | | | | | |
5.500%, 05/01/2025 (A) | | | 671 | | | | 656 | |
CDK Global | | | | | | | | |
5.875%, 06/15/2026 | | | 686 | | | | 719 | |
CommScope Finance | | | | | | | | |
8.250%, 03/01/2027 (A) | | | 4,365 | | | | 4,529 | |
6.000%, 03/01/2026 (A) | | | 2,120 | | | | 2,193 | |
| | | | | | | | |
| | | |
| Description | | Face Amount
(Thousands) | | Market Value
($ Thousands) |
|
CORPORATE OBLIGATIONS (continued) | |
5.500%, 03/01/2024 (A) | | $ | 2,075 | | | $ | 2,122 | |
CommScope Technologies | | | | | | | | |
6.000%, 06/15/2025 (A) | | | 2,650 | | | | 2,576 | |
Dell International | | | | | | | | |
6.020%, 06/15/2026 (A) | | | 3,250 | | | | 3,496 | |
Entegris | | | | | | | | |
4.625%, 02/10/2026 (A) | | | 1,858 | | | | 1,839 | |
First Data | | | | | | | | |
5.750%, 01/15/2024 (A) | | | 2,415 | | | | 2,483 | |
5.375%, 08/15/2023 (A) | | | 1,489 | | | | 1,521 | |
5.000%, 01/15/2024 (A) | | | 1,290 | | | | 1,323 | |
Gartner | | | | | | | | |
5.125%, 04/01/2025 (A) | | | 245 | | | | 248 | |
GCI | | | | | | | | |
6.875%, 04/15/2025 | | | 2,370 | | | | 2,474 | |
6.750%, 06/01/2021 | | | 640 | | | | 643 | |
Genesys Telecommunications Laboratories | | | | | | | | |
10.000%, 11/30/2024 (A) | | | 1,245 | | | | 1,357 | |
GTT Communications | | | | | | | | |
7.875%, 12/31/2024 (A) | | | 1,650 | | | | 1,444 | |
Harland Clarke Holdings | | | | | | | | |
6.875%, 03/01/2020 (A) | | | 945 | | | | 933 | |
Hughes Satellite Systems | | | | | | | | |
7.625%, 06/15/2021 | | | 1,200 | | | | 1,290 | |
6.625%, 08/01/2026 | | | 140 | | | | 137 | |
5.250%, 08/01/2026 | | | 900 | | | | 893 | |
Infor Software Parent | | | | | | | | |
7.125% cash/7.875% PIK, 05/01/2021 (A) | | | 880 | | | | 879 | |
Infor US | | | | | | | | |
6.500%, 05/15/2022 | | | 2,360 | | | | 2,392 | |
Informatica | | | | | | | | |
7.125%, 07/15/2023 (A) | | | 735 | | | | 749 | |
MagnaChip Semiconductor | | | | | | | | |
6.625%, 07/15/2021 | | | 405 | | | | 385 | |
NCR | | | | | | | | |
6.375%, 12/15/2023 | | | 1,420 | | | | 1,459 | |
5.000%, 07/15/2022 | | | 2,405 | | | | 2,399 | |
Nuance Communications | | | | | | | | |
5.625%, 12/15/2026 | | | 2,570 | | | | 2,641 | |
Rackspace Hosting | | | | | | | | |
8.625%, 11/15/2024 (A) | | | 4,520 | | | | 4,027 | |
Solera | | | | | | | | |
10.500%, 03/01/2024 (A) | | | 1,220 | | | | 1,322 | |
SS&C Technologies | | | | | | | | |
5.500%, 09/30/2027 (A) | | | 2,307 | | | | 2,330 | |
Symantec | | | | | | | | |
5.000%, 04/15/2025 (A) | | | 3,185 | | | | 3,190 | |
TIBCO Software | | | | | | | | |
11.375%, 12/01/2021 (A) | | | 1,374 | | | | 1,463 | |
VeriSign | | | | | | | | |
4.750%, 07/15/2027 | | | 539 | | | | 539 | |
| | |
SEI Institutional Managed Trust / Semi-Annual Report / March 31, 2019 | | 119 |
SCHEDULE OF INVESTMENTS (Unaudited)
March 31, 2019
High Yield Bond Fund(Continued)
| | | | | | | | |
| | | |
| Description | | Face Amount
(Thousands) | | Market Value
($ Thousands) |
|
CORPORATE OBLIGATIONS (continued) | |
Zayo Group | | | | | | | | |
6.375%, 05/15/2025 | | $ | 2,885 | | | $ | 2,899 | |
6.000%, 04/01/2023 | | | 415 | | | | 420 | |
5.750%, 01/15/2027 (A) | | | 1,080 | | | | 1,078 | |
| | | | | | | 67,426 | |
| | |
Materials — 6.9% | | | | | | | | |
AK Steel | | | | | | | | |
7.625%, 10/01/2021 | | | 135 | | | | 135 | |
7.000%, 03/15/2027 | | | 1,444 | | | | 1,210 | |
Alcoa Nederland Holding BV | | | | | | | | |
7.000%, 09/30/2026 (A) | | | 285 | | | | 307 | |
6.750%, 09/30/2024 (A) | | | 495 | | | | 524 | |
6.125%, 05/15/2028 (A) | | | 1,098 | | | | 1,131 | |
Alpha 2 BV | | | | | | | | |
8.750% cash/9.500% PIK, 06/01/2023 (A) | | | 1,475 | | | | 1,434 | |
Alpha 3 BV | | | | | | | | |
6.250%, 02/01/2025 (A) | | | 1,800 | | | | 1,737 | |
ARD Finance | | | | | | | | |
7.125% cash/7.875% PIK, 09/15/2023 | | | 2,224 | | | | 2,216 | |
ARD Securities Finance SARL | | | | | | | | |
8.750% cash/8.750% PIK, 01/31/2023 (A) | | | 732 | | | | 691 | |
Ardagh Packaging Finance | | | | | | | | |
7.250%, 05/15/2024 (A) | | | 2,450 | | | | 2,581 | |
6.000%, 02/15/2025 (A) | | | 2,155 | | | | 2,155 | |
Axalta Coating Systems | | | | | | | | |
4.875%, 08/15/2024 (A) | | | 290 | | | | 290 | |
Baffinland Iron Mines | | | | | | | | |
8.750%, 07/15/2026 (A) | | | 2,435 | | | | 2,444 | |
Berry Global | | | | | | | | |
5.500%, 05/15/2022 | | | 640 | | | | 649 | |
4.500%, 02/15/2026 (A) | | | 1,953 | | | | 1,856 | |
Boart Longyear Management Pty | | | | | | | | |
10.000%, 12/31/2022 (B) | | | 1,843 | | | | 1,603 | |
BWAY Holding | | | | | | | | |
7.250%, 04/15/2025 (A) | | | 979 | | | | 944 | |
5.500%, 04/15/2024 (A) | | | 1,350 | | | | 1,340 | |
CENVO Corp (Escrow) | | | | | | | | |
0.000%,
09/15/2022 (B)(C)(F) | | | 5,650 | | | | 77 | |
CF Industries | | | | | | | | |
5.150%, 03/15/2034 | | | 1,255 | | | | 1,192 | |
Chemours | | | | | | | | |
6.625%, 05/15/2023 | | | 525 | | | | 543 | |
5.375%, 05/15/2027 | | | 511 | | | | 507 | |
Clearwater Paper | | | | | | | | |
5.375%, 02/01/2025 (A) | | | 910 | | | | 846 | |
Cleveland-Cliffs | | | | | | | | |
4.875%, 01/15/2024 (A) | | | 998 | | | | 986 | |
Constellium | | | | | | | | |
6.625%, 03/01/2025 (A) | | | 350 | | | | 357 | |
| | | | | | | | |
| | | |
| Description | | Face Amount
(Thousands) | | Market Value
($ Thousands) |
|
CORPORATE OBLIGATIONS (continued) | |
5.875%, 02/15/2026 (A) | | $ | 1,601 | | | $ | 1,572 | |
5.750%, 05/15/2024 (A) | | | 1,299 | | | | 1,295 | |
Cornerstone Chemical | | | | | | | | |
6.750%, 08/15/2024 (A) | | | 4,285 | | | | 4,028 | |
Crown Americas | | | | | | | | |
4.750%, 02/01/2026 | | | 3,670 | | | | 3,688 | |
CVR Partners | | | | | | | | |
9.250%, 06/15/2023 (A) | | | 1,385 | | | | 1,451 | |
Eldorado | | | | | | | | |
6.125%, 12/15/2020 (A) | | | 2,060 | | | | 2,016 | |
Element Solutions | | | | | | | | |
5.875%, 12/01/2025 (A) | | | 2,050 | | | | 2,057 | |
First Quantum Minerals | | | | | | | | |
7.500%, 04/01/2025 (A) | | | 2,885 | | | | 2,762 | |
7.250%, 04/01/2023 (A) | | | 955 | | | | 934 | |
6.875%, 03/01/2026 (A) | | | 1,380 | | | | 1,280 | |
6.500%, 03/01/2024 (A) | | | 560 | | | | 524 | |
Flex Acquisition | | | | | | | | |
7.875%, 07/15/2026 (A) | | | 822 | | | | 793 | |
6.875%, 01/15/2025 (A) | | | 2,259 | | | | 2,158 | |
FMG Resources August 2006 Pty | | | | | | | | |
5.125%, 05/15/2024 (A) | | | 1,485 | | | | 1,489 | |
Freeport-McMoRan | | | | | | | | |
5.450%, 03/15/2043 | | | 2,936 | | | | 2,569 | |
5.400%, 11/14/2034 | | | 685 | | | | 623 | |
4.550%, 11/14/2024 | | | 70 | | | | 69 | |
4.000%, 11/14/2021 | | | 728 | | | | 732 | |
3.875%, 03/15/2023 | | | 1,908 | | | | 1,881 | |
GCP Applied Technologies | | | | | | | | |
5.500%, 04/15/2026 (A) | | | 485 | | | | 493 | |
Greif | | | | | | | | |
6.500%, 03/01/2027 (A) | | | 345 | | | | 353 | |
HB Fuller | | | | | | | | |
4.000%, 02/15/2027 | | | 1,150 | | | | 1,018 | |
Hexion | | | | | | | | |
10.000%, 04/15/2020 | | | 1,604 | | | | 1,339 | |
6.625%, 04/15/2020 | | | 6,020 | | | | 5,072 | |
INEOS Group Holdings | | | | | | | | |
5.625%, 08/01/2024 (A) | | | 1,340 | | | | 1,337 | |
Kraton Polymers | | | | | | | | |
7.000%, 04/15/2025 (A) | | | 2,274 | | | | 2,297 | |
LSB Industries | | | | | | | | |
9.625%, 05/01/2023 (A) | | | 1,935 | | | | 2,003 | |
Mountain Province Diamonds | | | | | | | | |
8.000%, 12/15/2022 (A) | | | 2,250 | | | | 2,244 | |
New Gold | | | | | | | | |
6.375%, 05/15/2025 (A) | | | 644 | | | | 521 | |
6.250%, 11/15/2022 (A) | | | 2,252 | | | | 1,982 | |
Noranda Aluminum Acquistion Escrow | | | | | | | | |
11.000%, 06/01/2019 (D) | | | 355 | | | | – | |
NOVA Chemicals | | | | | | | | |
5.250%, 06/01/2027 (A) | | | 225 | | | | 221 | |
| | |
120 | | SEI Institutional Managed Trust / Semi-Annual Report / March 31, 2019 |
| | | | | | | | |
| | | |
| Description | | Face Amount
(Thousands) | | Market Value
($ Thousands) |
|
CORPORATE OBLIGATIONS (continued) | |
5.000%, 05/01/2025 (A) | | $ | 1,700 | | | $ | 1,666 | |
4.875%, 06/01/2024 (A) | | | 300 | | | | 295 | |
OI European Group BV | | | | | | | | |
4.000%, 03/15/2023 (A) | | | 1,346 | | | | 1,321 | |
Owens-Brockway Glass Container | | | | | | | | |
6.375%, 08/15/2025 (A) | | | 600 | | | | 632 | |
5.875%, 08/15/2023 (A) | | | 1,015 | | | | 1,063 | |
Rain CII Carbon | | | | | | | | |
7.250%, 04/01/2025 (A) | | | 5,105 | | | | 4,518 | |
Reichhold Industries | | | | | | | | |
9.000%,
05/08/2017 (A)(C)(D) | | | 859 | | | | – | |
Reynolds Group | | | | | | | | |
7.000%, 07/15/2024 (A) | | | 1,594 | | | | 1,642 | |
5.750%, 10/15/2020 | | | 1,061 | | | | 1,063 | |
Reynolds Group Issuer | | | | | | | | |
6.287%, VAR ICE LIBOR USD 3 Month+3.500%, 07/15/2021 (A) | | | 600 | | | | 602 | |
Scotts Miracle-Gro | | | | | | | | |
6.000%, 10/15/2023 | | | 730 | | | | 757 | |
5.250%, 12/15/2026 | | | 705 | | | | 695 | |
Starfruit Finco BV | | | | | | | | |
8.000%, 10/01/2026 (A) | | | 2,819 | | | | 2,840 | |
SunCoke Energy Partners | | | | | | | | |
7.500%, 06/15/2025 (A) | | | 1,980 | | | | 2,005 | |
Taseko Mines | | | | | | | | |
8.750%, 06/15/2022 (A) | | | 978 | | | | 900 | |
TPC Group | | | | | | | | |
8.750%, 12/15/2020 (A) | | | 3,324 | | | | 3,274 | |
Trident Merger Sub | | | | | | | | |
6.625%, 11/01/2025 (A) | | | 1,596 | | | | 1,492 | |
Trinseo Materials Operating | | | | | | | | |
5.375%, 09/01/2025 (A) | | | 675 | | | | 640 | |
Tronox | | | | | | | | |
6.500%, 04/15/2026 (A) | | | 914 | | | | 872 | |
Tronox Finance | | | | | | | | |
5.750%, 10/01/2025 (A) | | | 2,001 | | | | 1,851 | |
United States Steel | | | | | | | | |
6.875%, 08/15/2025 | | | 792 | | | | 770 | |
6.250%, 03/15/2026 | | | 1,324 | | | | 1,235 | |
Vale Overseas | | | | | | | | |
4.375%, 01/11/2022 | | | 811 | | | | 827 | |
Venator Finance Sarl | | | | | | | | |
5.750%, 07/15/2025 (A) | | | 761 | | | | 666 | |
Warrior Met Coal | | | | | | | | |
8.000%, 11/01/2024 (A) | | | 1,650 | | | | 1,723 | |
| | | | | | | 111,905 | |
| | |
Real Estate — 1.4% | | | | | | | | |
CoreCivic | | | | | | | | |
5.000%, 10/15/2022 | | | 245 | | | | 241 | |
4.625%, 05/01/2023 | | | 475 | | | | 457 | |
| | | | | | | | |
| | | |
| Description | | Face Amount
(Thousands) | | Market Value
($ Thousands) |
|
CORPORATE OBLIGATIONS (continued) | |
Equinix | | | | | | | | |
5.875%, 01/15/2026 | | $ | 940 | | | $ | 990 | |
5.750%, 01/01/2025 | | | 70 | | | | 73 | |
GEO Group | | | | | | | | |
6.000%, 04/15/2026 | | | 1,370 | | | | 1,148 | |
5.875%, 01/15/2022 | | | 1,165 | | | | 1,124 | |
5.125%, 04/01/2023 | | | 1,225 | | | | 1,087 | |
GLP Capital | | | | | | | | |
5.750%, 06/01/2028 | | | 410 | | | | 440 | |
5.250%, 06/01/2025 | | | 410 | | | | 430 | |
Iron Mountain | | | | | | | | |
5.750%, 08/15/2024 | | | 1,480 | | | | 1,495 | |
5.250%, 03/15/2028 (A) | | | 1,809 | | | | 1,748 | |
4.875%, 09/15/2027 (A) | | | 1,535 | | | | 1,473 | |
Kennedy-Wilson | | | | | | | | |
5.875%, 04/01/2024 | | | 350 | | | | 348 | |
Lamar Media | | | | | | | | |
5.750%, 02/01/2026 (A) | | | 715 | | | | 747 | |
MPT Operating Partnership | | | | | | | | |
5.000%, 10/15/2027 | | | 998 | | | | 1,015 | |
Newmark Group | | | | | | | | |
6.125%, 11/15/2023 | | | 1,576 | | | | 1,624 | |
Realogy Group | | | | | | | | |
9.375%, 04/01/2027 (A) | | | 325 | | | | 333 | |
4.875%, 06/01/2023 (A) | | | 4,014 | | | | 3,743 | |
RHP Hotel Properties | | | | | | | | |
5.000%, 04/15/2021 | | | 530 | | | | 530 | |
Sabra Health Care | | | | | | | | |
5.125%, 08/15/2026 | | | 866 | | | | 848 | |
SBA Communications | | | | | | | | |
4.875%, 09/01/2024 | | | 485 | | | | 490 | |
Uniti Group | | | | | | | | |
8.250%, 10/15/2023 | | | 870 | | | | 785 | |
7.125%, 12/15/2024 (A) | | | 775 | | | | 667 | |
6.000%, 04/15/2023 (A) | | | 700 | | | | 663 | |
VICI Properties 1 | | | | | | | | |
8.000%, 10/15/2023 | | | 590 | | | | 646 | |
| | | | | | | 23,145 | |
| | |
Utilities — 1.3% | | | | | | | | |
AES | | | | | | | | |
6.000%, 05/15/2026 | | | 140 | | | | 148 | |
5.500%, 04/15/2025 | | | 155 | | | | 161 | |
AmeriGas Partners | | | | | | | | |
5.875%, 08/20/2026 | | | 485 | | | | 484 | |
5.750%, 05/20/2027 | | | 1,182 | | | | 1,167 | |
5.500%, 05/20/2025 | | | 1,988 | | | | 1,981 | |
Calpine | | | | | | | | |
5.250%, 06/01/2026 (A) | | | 783 | | | | 779 | |
Clearway Energy Operating | | | | | | | | |
5.750%, 10/15/2025 (A) | | | 814 | | | | 817 | |
| | |
SEI Institutional Managed Trust / Semi-Annual Report / March 31, 2019 | | 121 |
SCHEDULE OF INVESTMENTS (Unaudited)
March 31, 2019
High Yield Bond Fund(Continued)
| | | | | | | | |
| | | |
| Description | | Face Amount
(Thousands) | | Market Value
($ Thousands) |
|
CORPORATE OBLIGATIONS (continued) | |
FirstEnergy Solutions | | | | | | | | |
6.050%, 08/15/2021 (D) | | $ | 755 | | | $ | 659 | |
NextEra Energy Operating Partners | | | | | | | | |
4.500%, 09/15/2027 (A) | | | 2,139 | | | | 2,085 | |
NRG Energy | | | | | | | | |
7.250%, 05/15/2026 | | | 1,795 | | | | 1,975 | |
NSG Holdings | | | | | | | | |
7.750%, 12/15/2025 (A) | | | 1,524 | | | | 1,631 | |
Talen Energy Supply | | | | | | | | |
6.500%, 06/01/2025 | | | 161 | | | | 142 | |
TerraForm Power Operating | | | | | | | | |
5.000%, 01/31/2028 (A) | | | 3,844 | | | | 3,709 | |
4.250%, 01/31/2023 (A) | | | 529 | | | | 523 | |
Texas Energy (Escrow Security) | | | | | | | | |
3.726%,
12/31/2034 (B)(C) | | | 167 | | | | 11 | |
Vistra Operations | | | | | | | | |
5.625%, 02/15/2027 (A) | | | 2,294 | | | | 2,386 | |
5.500%, 09/01/2026 (A) | | | 1,924 | | | | 2,001 | |
| | | | | | | 20,659 | |
| | |
Total Corporate Obligations
(Cost $1,192,770)
($ Thousands) | | | | | | | 1,158,028 | |
|
LOAN PARTICIPATIONS — 11.0% | |
1011778 BC ULC / New Red Finance, Term Loan B3, 1st Lien | | | | | | | | |
4.749%, VAR LIBOR+2.250%, 02/16/2024 | | | 482 | | | | 474 | |
4.743%, VAR LIBOR+2.250%, 02/16/2024 | | | 391 | | | | 384 | |
Academy Ltd., Term Loan, 1st Lien | | | | | | | | |
6.490%, VAR LIBOR+4.000%, 07/01/2022 | | | 1,394 | | | | 999 | |
6.489%, VAR LIBOR+4.000%, 07/01/2022 | | | 2,978 | | | | 2,136 | |
Accudyne Industries Borrower S.C.A., Term Loan, 1st Lien | | | | | | | | |
5.499%, VAR LIBOR+3.250%, 08/18/2024 | | | 688 | | | | 688 | |
Acrisure, Term Loan B, 1st Lien | | | | | | | | |
6.379%, 11/22/2023 | | | 2 | | | | 2 | |
Acrisure, Term Loan B2, 1st Lien | | | | | | | | |
6.879%, 11/22/2023 | | | 1,342 | | | | 1,332 | |
Air Medical Group Holdings Inc., Term Loan B, 1st Lien | | | | | | | | |
5.739%, VAR LIBOR+3.250%, 04/28/2022 | | | 758 | | | | 713 | |
Air Medical Group Holdings Inc., Term Loan, 1st Lien | | | | | | | | |
6.740%, VAR LIBOR+4.250%, 03/14/2025 | | | 1,029 | | | | 966 | |
| | | | | | | | |
| | | |
| Description | | Face Amount
(Thousands) | | Market Value
($ Thousands) |
|
LOAN PARTICIPATIONS (continued) | |
Akorn Inc., Loan Loan, 1st Lien | | | | | | | | |
8.000%, VAR LIBOR+4.250%, 04/16/2021 | | $ | 783 | | | $ | 632 | |
AkzoNobel, Term Loan B, 1st Lien | | | | | | | | |
5.740%, 10/01/2025 | | | 761 | | | | 749 | |
Aleris International, Term Loan, 1st Lien | | | | | | | | |
7.243%, 02/27/2023 | | | 1,944 | | | | 1,940 | |
Alvogen Pharma, Tem Loan, 1st Lien | | | | | | | | |
7.240%, 04/01/2022 | | | 1,334 | | | | 1,295 | |
AMC Entertainment, Term Loan B, 1st Lien | | | | | | | | |
0.000%, 03/20/2026 (G) | | | 1,085 | | | | 1,076 | |
American Tire Distributors, Term Loan, 1st Lien | | | | | | | | |
10.129%, VAR LIBOR+4.250%, 09/02/2024 | | | 1,844 | | | | 1,641 | |
Arby’s Restaurant Group Inc., Term Loan B, 1st Lien | | | | | | | | |
5.739%, 02/05/2025 | | | 947 | | | | 922 | |
Arby’s Restaurant Group Inc.. Term Loan B, 1st Lien | | | | | | | | |
5.690%, 02/05/2025 | | | 2 | | | | 2 | |
Ascend Learning, Term Loan B, 1st Lien | | | | | | | | |
5.499%, VAR LIBOR+3.250%, 07/12/2024 | | | 143 | | | | 140 | |
Asurion LLC, Term Loan B, 2nd Lien | | | | | | | | |
8.999%, VAR LIBOR+6.000%, 08/04/2025 | | | 2,313 | | | | 2,341 | |
Avaya Inc., Term Loan B, 1st Lien | | | | | | | | |
6.849%, 12/15/2024 | | | 323 | | | | 321 | |
6.734%, 12/15/2024 | | | 536 | | | | 533 | |
Bausch Health Companies Inc., Term Loan B, 1st Lien | | | | | | | | |
5.481%, VAR LIBOR+3.000%, 06/02/2025 | | | 565 | | | | 561 | |
Big River Steel LLC, Term Loan, 1st Lien | | | | | | | | |
7.601%, VAR LIBOR+5.000%, 08/23/2023 | | | 1,305 | | | | 1,309 | |
Bison Midstream, Term Loan B, 1st Lien | | | | | | | | |
6.487%, 05/21/2025 | | | 673 | | | | 638 | |
Boart Longyear, Term Loan, 1st Lien | | | | | | | | |
11.000%,
10/23/2020 (B)(C) | | | 163 | | | | 163 | |
BPA Laboratories, Term Loan, 2nd Lien | | | | | | | | |
10.553%,
04/29/2020 (B)(C) | | | 181 | | | | 166 | |
Broadriders, Term Loan B, 1st Lien | | | | | | | | |
8.999%, 04/23/2024 | | | 1,583 | | | | 1,570 | |
Brookfield Property REIT Inc., Term Loan B, 1st Lien | | | | | | | | |
4.996%, 08/27/2025 | | | 1,386 | | | | 1,332 | |
4.993%, 08/27/2025 | | | 344 | | | | 331 | |
Builders FirstSource Inc., Term Loan B, 1st Lien | | | | | | | | |
5.601%, 02/29/2024 | | | 1,015 | | | | 981 | |
| | |
122 | | SEI Institutional Managed Trust / Semi-Annual Report / March 31, 2019 |
| | | | | | | | |
| | | |
| Description | | Face Amount
(Thousands) | | Market Value
($ Thousands) |
| |
LOAN PARTICIPATIONS (continued) | | | | | |
Burlington Coat Factory Warehouse Corp., Term Loan B, 1st Lien | | | | | | | | |
4.490%, 11/17/2024 | | $ | 794 | | | $ | 786 | |
BWAY Holding Company, Term Loan B, 1st Lien | | | | | | | | |
6.033%, VAR LIBOR+3.250%, 04/03/2024 | | | 4,071 | | | | 3,967 | |
Caesars Resort Collection LLC, Term Loan B, 1st Lien | | | | | | | | |
5.249%, VAR LIBOR+2.750%, 12/23/2024 | | | 967 | | | | 953 | |
California Resources Corp., Term Loan, 1st Lien | | | | | | | | |
12.871%, VAR LIBOR+10.375%, 12/31/2021 | | | 3,262 | | | | 3,436 | |
7.246%, VAR LIBOR+4.750%, 12/31/2022 | | | 1,482 | | | | 1,455 | |
Camping World, Term Loan B, 1st Lien | | | | | | | | |
5.240%, 11/08/2023 | | | 324 | | | | 291 | |
Carestream Health Inc., Extended Term Loan, 1st Lien | | | | | | | | |
8.249%, 02/28/2021 | | | 1,030 | | | | 1,004 | |
Cengage Learning Inc., Term Loan B, 1st Lien | | | | | | | | |
6.736%, VAR LIBOR+4.250%, 06/07/2023 | | | 3,576 | | | | 3,209 | |
CenturyLink Inc., Term Loan B, 1st Lien | | | | | | | | |
5.249%, VAR LIBOR+2.750%, 01/31/2025 | | | 933 | | | | 914 | |
Cenveo Corp., Term Loan, 1st Lien | | | | | | | | |
11.487%, 06/07/2023 | | | 1,400 | | | | 1,290 | |
Ceridian HCM Holding Inc., Term Loan B, 1st Lien | | | | | | | | |
5.743%, 04/30/2025 | | | 1,072 | | | | 1,068 | |
Charter Communications Operating LLC, Term Loan B, 1st Lien | | | | | | | | |
4.500%, VAR LIBOR+2.000%, 04/30/2025 | | | 964 | | | | 956 | |
Claire’s Stores, Term Loan, 1st Lien | | | | | | | | |
6.250%,
10/12/2038 (C)(F) | | | 581 | | | | 872 | |
Clear Channel Communications Inc., Term Loan D, 1st Lien | | | | | | | | |
11.243%, VAR LIBOR+6.750%, 01/30/2020 (D) | | | 760 | | | | 540 | |
ClubCorp Club Operations Inc., Term Loan B, 1st Lien | | | | | | | | |
5.553%, VAR LIBOR+3.250%, 09/18/2024 | | | 984 | | | | 929 | |
Contura Energy Inc., Term Loan, 1st Lien | | | | | | | | |
7.493%, VAR LIBOR+5.000%, 11/10/2025 (C) | | | 1,342 | | | | 1,325 | |
Cumulus Media New Holdings Inc., Term Loan, 1st Lien | | | | | | | | |
7.000%, 05/13/2022 | | | 6,044 | | | | 5,933 | |
| | | | | | | | |
| | | |
| Description | | Face Amount
(Thousands) | | Market Value
($ Thousands) |
|
LOAN PARTICIPATIONS (continued) | |
CWGS Group LLC, Term Loan B, 1st Lien | | | | | | | | |
5.249%, 11/08/2023 | | $ | 2 | | | $ | 2 | |
Diebold Nixdorf, Term Loan A1, 1st Lien | | | | | | | | |
11.750%, 08/31/2022 | | | 937 | | | | 992 | |
Diebold Nixdorf, Term Loan B, 1st Lien | | | | | | | | |
5.313%, VAR LIBOR+2.750%, 11/06/2023 (G) | | | 23 | | | | 22 | |
Ditech Holding Corporation, Term Loan, 1st Lien | | | | | | | | |
12.500%, VAR LIBOR+6.000%, 06/30/2022 (D) | | | 19 | | | | 13 | |
East Valley Tourist Development Authority, Term Loan, 1st Lien | | | | | | | | |
10.601%, VAR LIBOR+8.000%, 09/30/2020 (C) | | | 2,263 | | | | 2,240 | |
Envision Healthcare Corp., Term Loan, 1st Lien | | | | | | | | |
6.249%, 10/10/2025 | | | 3,035 | | | | 2,835 | |
Epic Crude Services L.P., Term Loan B, 1st Lien | | | | | | | | |
7.490%, 02/21/2026 | | | 1,720 | | | | 1,698 | |
EPIC Y-Grade Services, Term Loan, 1st Lien | | | | | | | | |
7.999%, 06/13/2024 (C) | | | 2,078 | | | | 2,021 | |
Equinox Holdings, Term Loan, 1st Lien | | | | | | | | |
5.493%, 03/08/2024 | | | 1,846 | | | | 1,833 | |
Equitrans Midstream, Term Loan, 1st Lien | | | | | | | | |
7.000%, 01/31/2024 | | | 600 | | | | 600 | |
Evergreen Skills Lux S.À R.L., Term Loan, 1st Lien | | | | | | | | |
7.243%, VAR LIBOR+4.750%, 04/28/2021 | | | 1,920 | | | | 1,606 | |
Financial & Risk US Holdings Inc., Term Loan B, 1st Lien | | | | | | | | |
6.249%, 10/01/2025 | | | 2,656 | | | | 2,577 | |
Flex Acquisition Company Inc., Term Loan, 1st Lien | | | | | | | | |
5.626%, VAR LIBOR+3.000%, 12/29/2023 | | | 1,052 | | | | 1,017 | |
4.695%, 12/29/2023 | | | 3 | | | | 3 | |
Foresight Energy LLC, Term Loan, 1st Lien | | | | | | | | |
8.379%, VAR LIBOR+5.750%, 03/28/2022 | | | 1,253 | | | | 1,223 | |
Formula One Management Ltd., Term Loan B, 1st Lien | | | | | | | | |
4.999%, VAR LIBOR+2.500%, 02/01/2024 | | | 2,700 | | | | 2,597 | |
Forterra Finance LLC, Term Loan B, 1st Lien | | | | | | | | |
5.499%, VAR LIBOR+3.000%, 10/25/2023 | | | 2,692 | | | | 2,472 | |
Frontier Communications Corp., Term Loan B1, 1st Lien | | | | | | | | |
6.250%, VAR LIBOR+3.750%, 06/15/2024 | | | 1,537 | | | | 1,499 | |
| | |
SEI Institutional Managed Trust / Semi-Annual Report / March 31, 2019 | | 123 |
SCHEDULE OF INVESTMENTS (Unaudited)
March 31, 2019
High Yield Bond Fund(Continued)
| | | | | | | | |
| | | |
| Description | | Face Amount
(Thousands) | | Market Value
($ Thousands) |
|
LOAN PARTICIPATIONS (continued) | |
Frontier Communications Corp., Term Loan, 1st Lien | | | | | | | | |
5.250%, 03/31/2021 | | $ | 249 | | | $ | 249 | |
Gardner Denver Inc., Term Loan B, 1st Lien | | | | | | | | |
5.243%, VAR LIBOR+2.750%, 07/30/2024 | | | 1,361 | | | | 1,359 | |
General Nutrition Centers Inc., Term Loan, 1st Lien | | | | | | | | |
9.500%, VAR LIBOR+7.000%, 12/31/2022 | | | 580 | | | | 585 | |
Go Wireless Inc., Term Loan B, 1st Lien | | | | | | | | |
8.999%, 12/24/2022 | | | 743 | | | | 726 | |
Golden Nugget Inc., Term Loan B, 1st Lien | | | | | | | | |
5.243%, VAR LIBOR+2.750%, 10/04/2023 | | | 1,446 | | | | 1,431 | |
5.234%, VAR LIBOR+2.750%, 10/04/2023 | | | 270 | | | | 267 | |
Green Energy Partners/Stonewall LLC, Term Loan B1, 1st Lien | | | | | | | | |
8.303%, VAR LIBOR+5.500%, 11/13/2021 | | | 406 | | | | 401 | |
Gulf Finance LLC, Term Loan B, 1st Lien | | | | | | | | |
8.060%, 08/25/2023 | | | 335 | | | | 266 | |
7.750%, VAR LIBOR+5.250%, 08/25/2023 | | | 928 | | | | 737 | |
Hillman Group, Term Loan B, 1st Lien | | | | | | | | |
6.803%, 05/30/2025 | | | 505 | | | | 481 | |
Hub International Ltd., Term Loan B, 1st Lien | | | | | | | | |
5.515%, 04/25/2025 | | | 1,026 | | | | 991 | |
5.375%, 04/25/2025 | | | 3 | | | | 2 | |
Husky IMS, Term Loan B, 1st Lien | | | | | | | | |
5.499%, 03/28/2025 | | | 1,092 | | | | 1,013 | |
Indivior Finance S.a.r.l., Term Loan B, 1st Lien | | | | | | | | |
7.250%, 12/19/2022 | | | 665 | | | | 650 | |
Intelsat Jackson Holdings S.A., Term Loan B4, 1st Lien | | | | | | | | |
6.990%, 01/02/2024 | | | 325 | | | | 326 | |
Intelset Jackson Holdings S.A., Term Loan B3, 1st Lien | | | | | | | | |
6.240%, 11/27/2023 | | | 209 | | | | 206 | |
Iron Mountain Inc., Term Loan, 1st Lien | | | | | | | | |
4.231%, 06/04/2023 (C) | | | 1,370 | | | | 1,333 | |
JBS USA Lux S.A., Term Loan B, 1st Lien | | | | | | | | |
4.999%, VAR LIBOR+2.500%, 10/30/2022 | | | 146 | | | | 145 | |
4.982%, VAR LIBOR+2.500%, 10/30/2022 | | | 854 | | | | 847 | |
KCA, Term Loan B, 1st Lien | | | | | | | | |
9.351%, 02/28/2023 | | | 234 | | | | 199 | |
KIK Custom Products, Term Loan, 1st Lien | | | | | | | | |
6.493%, 05/15/2023 | | | 325 | | | | 303 | |
| | | | | | | | |
| | | |
| Description | | Face Amount
(Thousands) | | Market Value
($ Thousands) |
|
LOAN PARTICIPATIONS (continued) | |
Life Time Fitness Inc., Term Loan, 1st Lien | | | | | | | | |
5.379%, VAR LIBOR+3.000%, 06/10/2022 | | $ | 1,579 | | | $ | 1,558 | |
5.243%, 06/10/2022 | | | 4 | | | | 4 | |
Lifescan, Term Loan, 1st Lien | | | | | | | | |
8.797%, 10/01/2024 | | | 1,985 | | | | 1,906 | |
Ligado Networks LLC, Term Loan, 2nd Lien | | | | | | | | |
15.270%, VAR LIBOR+12.500%, 12/07/2020 (C)(G) | | | 36 | | | | 9 | |
MA Financeco LLC, Term Loan B2, 1st Lien | | | | | | | | |
4.749%, VAR LIBOR+2.500%, 11/19/2021 | | | 1,350 | | | | 1,316 | |
Mashantucket (Western) Pequot Tribe, Term Loan A, 1st Lien | | | | | | | | |
10.624%, VAR LIBOR+8.125%, 06/30/2020 (C) | | | 7,012 | | | | 6,959 | |
Mashantucket (Western) Pequot Tribe, Term Loan, 1st Lien | | | | | | | | |
5.999%, VAR LIBOR+3.750%, 06/30/2020 (C) | | | 225 | | | | 223 | |
Mavenir Systems Inc., Term Loan B, 1st Lien | | | | | | | | |
8.500%, 05/08/2025 | | | 2,987 | | | | 2,965 | |
McDermott International Inc., Term Loan B, 1st Lien | | | | | | | | |
7.493%, 05/12/2025 | | | 1,322 | | | | 1,264 | |
McGraw-Hill Global Education Holdings LLC, Term Loan B, 1st Lien | | | | | | | | |
6.499%, VAR LIBOR+4.000%, 05/04/2022 | | | 2,546 | | | | 2,336 | |
Medical Card System Inc., Term Loan, 1st Lien | | | | | | | | |
5.500%, VAR LIBOR+0.500%, 09/02/2019 (B)(C)(F) | | | 1,448 | | | | 1,388 | |
MEG Energy Corp., Term Loan, 1st Lien | | | | | | | | |
6.000%, VAR LIBOR+3.500%, 12/31/2023 | | | 55 | | | | 55 | |
Metroflag, 2nd Lien | | | | | | | | |
14.000%, 01/06/2009 (C) | | | 300 | | | | – | |
MGM Resorts International, Term Loan A, 1st Lien | | | | | | | | |
4.749%, 12/21/2023 | | | 385 | | | | 381 | |
Mitel Networks, Term Loan, 1st Lien | | | | | | | | |
6.993%, 11/30/2025 | | | 820 | | | | 804 | |
Mohegan Tribal Gaming Authority, Term Loan B, 1st Lien | | | | | | | | |
6.499%, VAR LIBOR+4.000%, 10/13/2023 | | | 1,620 | | | | 1,530 | |
Moneygram International Inc., Term Loan, 1st Lien | | | | | | | | |
5.743%, VAR LIBOR+3.250%, 03/27/2020 | | | 1,191 | | | | 1,114 | |
| | |
124 | | SEI Institutional Managed Trust / Semi-Annual Report / March 31, 2019 |
| | | | | | | | |
| | | |
| Description | | Face Amount
(Thousands) | | Market Value
($ Thousands) |
|
LOAN PARTICIPATIONS (continued) | |
Monitronics International Inc., Term Loan B2, 1st Lien | | | | | | | | |
8.101%, 09/30/2022 | | $ | 4,846 | | | $ | 4,035 | |
Murray Energy Corp., Term Loan B2, 1st Lien | | | | | | | | |
9.879%, 10/17/2022 | | | 2,375 | | | | 1,952 | |
Navistar Inc., Term Loan B, 1st Lien | | | | | | | | |
6.000%, 11/06/2024 | | | 2,835 | | | | 2,822 | |
Neiman Marcus Group Inc., Term Loan, 1st Lien | | | | | | | | |
5.733%, VAR LIBOR+3.250%, 10/25/2020 | | | 2,059 | | | | 1,909 | |
New LightSquared LLC, Term Loan, 1st Lien | | | | | | | | |
11.357%, VAR LIBOR+0.000%, 12/07/2020 | | | 107 | | | | 79 | |
New rue21 LLC, Term Loan, 1st Lien | | | | | | | | |
12.500%, VAR FIXED+12.500%, 09/22/2022 | | | 135 | | | | 108 | |
Nielsen Finance LLC, Term Loan B4, 1st Lien | | | | | | | | |
4.493%, 10/04/2023 | | | 373 | | | | 365 | |
Nine West Holdings Inc., Term Loan (Unsecured) | | | | | | | | |
6.954%, VAR LIBOR+5.250%, 01/08/2020 (C)(D) | | | 3,793 | | | | 1,991 | |
Nine West Holdings Inc., Term Loan, 1st Lien | | | | | | | | |
0.000%, 03/19/2024 (G) | | | 1,865 | | | | 1,840 | |
Onex Carestream Finance L.P., Term Loan, 2nd Lien | | | | | | | | |
10.993%, VAR LIBOR+8.500%, 12/07/2019 (C) | | | 1,621 | | | | 1,578 | |
P2 Upstream Acquisition Co., Term Loan, 1st Lien | | | | | | | | |
6.740%, VAR LIBOR+4.000%, 10/30/2020 | | | 712 | | | | 703 | |
Panther BF Aggregator 2 Power Solutions, Term Loan, 1st Lien | | | | | | | | |
0.000%, 03/18/2026 (G) | | | 1,515 | | | | 1,497 | |
Paperworks, Term Loan, 1st Lien | | | | | | | | |
13.000%, 02/22/2023 (C) | | | 726 | | | | 762 | |
Patterson Companies, Term Loan B, 1st Lien | | | | | | | | |
7.384%, 08/29/2022 | | | 3 | | | | 3 | |
Patterson Medical, Term Loan, 1st Lien | | | | | | | | |
7.494%, 08/29/2022 | | | 1,992 | | | | 1,907 | |
Petco Animal Supplies Inc., Term Loan B1, 1st Lien | | | | | | | | |
5.994%, VAR LIBOR+3.000%, 01/26/2023 | | | 2,551 | | | | 1,933 | |
PetSmart Inc., Term Loan B2, 1st Lien | | | | | | | | |
5.490%, VAR LIBOR+3.000%, 03/11/2022 | | | 1,639 | | | | 1,468 | |
Plantronics Inc., Term Loan B, 1st Lien | | | | | | | | |
4.993%, 07/02/2025 | | | 620 | | | | 608 | |
Prairie ECI Acquiroro L.P., Term Loan, 1st Lien | | | | | | | | |
7.366%, 03/11/2026 | | | 1,399 | | | | 1,401 | |
| | | | | | | | |
| | | |
| Description | | Face Amount
(Thousands) | | Market Value
($ Thousands) |
| |
LOAN PARTICIPATIONS (continued) | | | | | |
Pure Fishing, Term Loan, 1st Lien | | | | | | | | |
7.322%, 12/22/2025 | | $ | 1,540 | | | $ | 1,523 | |
Quorum Health Corp., Term Loan, 1st Lien | | | | | | | | |
9.243%, VAR LIBOR+6.750%, 04/29/2022 | | | 922 | | | | 905 | |
Radio One Inc., Initial Term Loan, 1st Lien | | | | | | | | |
6.500%, VAR LIBOR+4.000%, 04/18/2023 | | | 611 | | | | 581 | |
RegionalCare Hospital Partners Holdings, Term Loan, 1st Lien | | | | | | | | |
6.982%, 11/16/2025 | | | 4,749 | | | | 4,691 | |
Revlon Consumer Products Corp., Term Loan B, 1st Lien | | | | | | | | |
6.129%, VAR LIBOR+3.500%, 09/07/2023 | | | 2,073 | | | | 1,496 | |
6.101%, VAR LIBOR+3.500%, 09/07/2023 | | | 10 | | | | 7 | |
Schenectady International Group Inc., Term Loan, 1st Lien | | | | | | | | |
7.537%, 10/15/2025 | | | 951 | | | | 948 | |
Scientific Games International Inc., Term Loan B, 1st Lien | | | | | | | | |
5.329%, VAR LIBOR+2.750%, 08/14/2024 | | | 2,393 | | | | 2,328 | |
5.249%, VAR LIBOR+2.750%, 08/14/2024 | | | 430 | | | | 418 | |
5.243%, 08/14/2024 | | | 4 | | | | 3 | |
Sequa Mezzanine Holdings LLC, Term Loan, 1st Lien | | | | | | | | |
7.776%, VAR LIBOR+5.000%, 11/28/2021 | | | 1,046 | | | | 1,021 | |
7.728%, VAR LIBOR+5.000%, 11/28/2021 | | | 3 | | | | 3 | |
SI Group, Term Loan, 1st Lien | | | | | | | | |
7.537%, 10/15/2025 | | | 957 | | | | 955 | |
Sprint Communications Inc., Term Loan, 1st Lien | | | | | | | | |
5.500%, 02/02/2024 (C) | | | 1,276 | | | | 1,255 | |
Staples Inc., Term Loan B, 1st Lien | | | | | | | | |
6.489%, VAR LIBOR+4.000%, 09/12/2024 | | | 1,948 | | | | 1,931 | |
Starfruit Finco BV, Term Loan B, 1st Lien | | | | | | | | |
5.740%, 10/01/2025 | | | 148 | | | | 146 | |
Steinway Musical Instruments Inc., Term Loan B, 1st Lien | | | | | | | | |
6.232%, 02/14/2025 | | | 1,340 | | | | 1,306 | |
Syniverse Holdings Inc., Term Loan, 1st Lien | | | | | | | | |
7.484%, VAR LIBOR+5.000%, 03/09/2023 | | | 2,971 | | | | 2,721 | |
Team Health Holdings, Term Loan, 1st Lien | | | | | | | | |
5.249%, VAR LIBOR+2.750%, 02/06/2024 | | | 2,700 | | | | 2,394 | |
| | |
SEI Institutional Managed Trust / Semi-Annual Report / March 31, 2019 | | 125 |
SCHEDULE OF INVESTMENTS (Unaudited)
March 31, 2019
High Yield Bond Fund(Continued)
| | | | | | | | |
| | | |
| Description | | Face Amount
(Thousands) | | Market Value
($ Thousands) |
|
LOAN PARTICIPATIONS (continued) | |
Thor Industries, Term Loan B, 1st Lien | | | | | | | | |
6.250%, 02/01/2026 | | $ | 1,473 | | | $ | 1,402 | |
TransDigm Inc., Term Loan E, 1st Lien | | | | | | | | |
4.999%, 05/30/2025 | | | 248 | | | | 241 | |
Traverse Midstream Partners LLC, Term Loan B, 1st Lien | | | | | | | | |
6.500%, VAR LIBOR+4.000%, 09/27/2024 | | | 1,106 | | | | 1,104 | |
Ultra Resources, Term Loan, 1st Lien | | | | | | | | |
6.481%, 04/12/2024 | | | 1,484 | | | | 1,281 | |
Vistra Operations Company LLC, Term Loan B3, 1st Lien | | | | | | | | |
4.493%, 12/31/2025 | | | 122 | | | | 120 | |
4.482%, 12/31/2025 | | | 332 | | | | 326 | |
Weight Watchers International Inc., Term Loan B, 1st Lien | | | | | | | | |
7.560%, 11/29/2024 | | | 798 | | | | 758 | |
Weight Watchers International, Term Loan B, 1st Lien | | | | | | | | |
7.150%, 11/29/2024 | | | 11 | | | | 10 | |
Windstream Services LLC, Term Loan B, 1st Lien | | | | | | | | |
10.500%, VAR LIBOR+4.000%, 03/29/2021 | | | 2,069 | | | | 2,071 | |
9.750%, VAR LIBOR+3.250%, 02/17/2024 | | | 579 | | | | 573 | |
Woodford Express, Term Loan B, 1st Lien | | | | | | | | |
7.499%, 01/27/2025 | | | 1,249 | | | | 1,207 | |
| |
Total Loan Participations
(Cost $181,121) ($ Thousands) | | | | 177,530 | |
| |
ASSET-BACKED SECURITIES — 9.2% | | | | | |
| |
Other Asset-Backed Securities — 9.2% | | | | | |
| | |
Airplanes Pass-Through Trust, Ser 2001-1A, Cl A9 | | | | | | | | |
3.005%, VAR ICE LIBOR USD 1 Month+0.550%, 03/15/2019 (A)(C) | | | 587 | | | | 20 | |
B&M CLO, Ser 2014-1A, Cl E | | | | | | | | |
8.529%, VAR ICE LIBOR USD 3 Month+5.750%, 04/16/2026 (A)(C) | | | 2,480 | | | | 2,130 | |
Battalion CLO IV, Ser 2013-4A | | | | | | | | |
0.000%,
10/22/2025 (A)(C)(H) | | | 5,640 | | | | 28 | |
Battalion CLO V, Ser 2014-5A | | | | | | | | |
0.000%,
04/17/2026 (A)(C)(H) | | | 3,274 | | | | 229 | |
Battalion CLO VII, Ser 2014-7A | | | | | | | | |
0.000%,
07/17/2028 (A)(C)(H) | | | 4,490 | | | | 1,931 | |
Battalion CLO VIII, Ser 2015-8A | | | | | | | | |
0.000%,
04/18/2030
(A)(C)(F)(H) | | | 3,390 | | | | 2,170 | |
Battalion CLO X, Ser 2016-10A | | | | | | | | |
0.000%,
01/24/2029
(A)(C)(F)(H) | | | 4,450 | | | | 3,693 | |
| | | | | | | | |
| | | |
| Description | | Face Amount
(Thousands) | | Market Value
($ Thousands) |
|
ASSET-BACKED SECURITIES (continued) | |
Battalion CLO XI, Ser 2017-11A | | | | | | | | |
0.000%,
10/24/2029 (A)(C)(H) | | $ | 5,857 | | | $ | 4,569 | |
Battalion CLO XII, Ser 2018-12A | | | | | | | | |
0.000%,
05/17/2031 (A)(C)(H) | | | 4,663 | | | | 3,824 | |
Battalion CLO XIV, Ser 2019-14A | | | | | | | | |
0.000%,
04/20/2032 (C)(H) | | | 3,427 | | | | 3,063 | |
Benefit Street Partners CLO III, Ser 2013-IIIA | | | | | | | | |
0.000%,
07/20/2029 (A)(C)(F)(H) | | | 2,531 | | | | 1,164 | |
Benefit Street Partners CLO IV | | | | | | | | |
0.000%,
07/20/2026 (A)(C)(H) | | | 3 | | | | 1,608 | |
Benefit Street Partners CLO IX | | | | | | | | |
0.000%,
07/20/2025 (A)(C)(H) | | | 2,293 | | | | 1,972 | |
Benefit Street Partners CLO V | | | | | | | | |
0.000%,
10/20/2026 (A)(C)(H) | | | 6,387 | | | | 192 | |
Benefit Street Partners CLO V-B | | | | | | | | |
0.000%,
04/20/2031 (C)(H) | | | 10,259 | | | | 7,961 | |
Benefit Street Partners CLO VI, Ser 2015-VIA | | | | | | | | |
0.000%,
10/18/2029 (A)(C)(H) | | | 7,502 | | | | 5,326 | |
Benefit Street Partners CLO VII, Ser 2015-VIII | | | | | | | | |
0.000%,
07/18/2027 (C)(H) | | | 6,715 | | | | 5,000 | |
Benefit Street Partners CLO VIII | | | | | | | | |
0.000%,
01/20/2028 (A)(C)(F)(H) | | | 6,720 | | | | 5,645 | |
Benefit Street Partners CLO X, Ser 2016-10A | | | | | | | | |
0.000%,
01/15/2029 (A)(C)(H) | | | 6,228 | | | | 4,360 | |
Benefit Street Partners CLO XIV, Warehouse Note, Ser 2018-14A | | | | | | | | |
0.000%,
04/20/2031 (A)(C)(H) | | | 3,809 | | | | 3,085 | |
Benefit Street Partners Static CLO, Warehouse Note | | | | | | | | |
0.000%, (C)(H)(I) | | | 1,371 | | | | 1,355 | |
Cathedral Lake CLO, Ser 2015-3A | | | | | | | | |
0.000%,
01/15/2026 (A)(C)(H) | | | 1,869 | | | | 1,514 | |
Cathedral Lake V, Ser 2018-5A | | | | | | | | |
0.000%,
10/21/2030 (A)(C)(H) | | | 3,139 | | | | 2,699 | |
CVP Cascade CLO, Ser 2014-2A, Cl D | | | | | | | | |
7.580%, VAR ICE LIBOR USD 3 Month+4.800%, 07/18/2026 (A)(C) | | | 759 | | | | 689 | |
CVP Cascade CLO, Ser 2014-2A, Cl E | | | | | | | | |
8.580%, VAR ICE LIBOR USD 3 Month+5.800%, 07/18/2026 (A)(C) | | | 2,469 | | | | 2,061 | |
Dryden 75 CLO, Ser 2019-75A | | | | | | | | |
0.000%,
01/15/2029 (A)(C)(H) | | | 2,269 | | | | 1,883 | |
Fifth Street Senior Loan Fund, Ser 2015-1A, Cl E | | | | | | | | |
9.961%, VAR ICE LIBOR USD 3 Month+7.200%, 01/20/2027 (A)(C) | | | 3,890 | | | | 3,754 | |
Figueroa CLO, Ser 2013-2A | | | | | | | | |
0.000%,
06/20/2027 (A)(C)(H) | | | 2,907 | | | | 1,197 | |
Great Lakes CLO, Ser 2014-1A | | | | | | | | |
0.000%,
10/15/2029 (A)(C)(H) | | | 4,860 | | | | 3,985 | |
Great Lakes CLO, Ser 2015-1A | | | | | | | | |
0.000%,
01/16/2030 (A)(C)(H) | | | 4,519 | | | | 3,344 | |
| | |
126 | | SEI Institutional Managed Trust / Semi-Annual Report / March 31, 2019 |
| | | | | | | | |
| | | |
| Description | | Face Amount
(Thousands) | | Market Value
($ Thousands) |
|
ASSET-BACKED SECURITIES (continued) | |
Great Lakes CLO, Ser 2015-1A, Cl ER | | | | | | | | |
10.147%, VAR ICE LIBOR USD 3 Month+7.360%, 01/16/2030 (A)(C) | | $ | 3,253 | | | $ | 3,043 | |
Great Lakes CLO, Ser 2015-1A, Cl FR | | | | | | | | |
12.787%, VAR ICE LIBOR USD 3 Month+10.000%, 01/16/2030 (A)(C) | | | 1,198 | | | | 1,022 | |
Great Lakes CLO, Ser 2017-1A, Cl ER | | | | | | | | |
10.287%, VAR ICE LIBOR USD 3 Month+7.500%, 10/15/2029 (A)(C) | | | 3,321 | | | | 3,220 | |
Great Lakes CLO, Ser 2017-1A, Cl FR | | | | | | | | |
12.787%, VAR ICE LIBOR USD 3 Month+10.000%, 10/15/2029 (A)(C) | | | 1,940 | | | | 1,739 | |
Ivy Hill Middle Market Credit Fund VII, Ser 2013-7A | | | | | | | | |
0.000%,
10/20/2029 (A)(C)(H) | | | 2,484 | | | | 1,838 | |
Ivy Hill Middle Market Credit Fund XII, Ser 2017-12A | | | | | | | | |
0.000%,
07/20/2029 (A)(C)(H) | | | 651 | | | | 566 | |
Ivy Hill Middle Market Credit Fund XII, Ser 2017-12A, Cl D | | | | | | | | |
10.321%, VAR ICE LIBOR USD 3 Month+7.560%, 07/07/2029 (A)(C) | | | 3,223 | | | | 3,025 | |
IVY Hill Middle Market Credit Fund XIV, Ser 2018-14A | | | | | | | | |
0.000%,
04/18/2030 (A)(C)(H) | | | 1,169 | | | | 1,017 | |
Ivy Hill Middle Market Credit Fund XIV, Ser 2018-14A, Cl D | | | | | | | | |
9.850%, VAR ICE LIBOR USD 3 Month+7.070%, 04/18/2030 (A)(C) | | | 1,559 | | | | 1,442 | |
Lockwood Grove CLO, Ser 2014-1A | | | | | | | | |
0.000%,
01/25/2030 (A)(C)(H) | | | 3,797 | | | | 2,886 | |
Lockwood Grove CLO, Ser 2018-1A, Cl ERR | | | | | | | | |
8.621%, VAR ICE LIBOR USD 3 Month+5.850%, 01/25/2030 (A)(C) | | | 2,499 | | | | 2,299 | |
Neuberger Berman CLO XVI-S, Ser 2018-16SA | | | | | | | | |
0.000%,
01/15/2028 (A)(C)(H) | | | 1,459 | | | | 1,262 | |
Neuberger Berman CLO XXII, Ser 2016-22A | | | | | | | | |
0.000%,
10/17/2027 (A)(C)(H) | | | 3,640 | | | | 2,439 | |
Neuberger Berman CLO XXII, Ser 2016-22A, Cl F | | | | | | | | |
0.100%,
10/17/2030 (A)(C) | | | 112 | | | | 51 | |
NewStar Clarendon Fund CLO, Ser 2015-1A, Cl E | | | | | | | | |
8.821%, VAR ICE LIBOR USD 3 Month+6.050%, 01/25/2027 (A)(C) | | | 3,439 | | | | 3,370 | |
NewStar Fairfield Fund CLO, Ser 2015-2A | | | | | | | | |
0.000%,
04/20/2030 (A)(C)(H) | | | 7,983 | | | | 5,044 | |
OCP CLO, Ser 2012-2A | | | | | | | | |
0.000%,
11/22/2025 (A)(C)(H) | | | 2,615 | | | | 190 | |
OCP CLO, Ser 2017-14A | | | | | | | | |
0.000%,
11/20/2030 (A)(C)(H) | | | 1,655 | | | | 1,192 | |
Shackleton CLO, Ser 2014-6A | | | | | | | | |
0.000%,
07/17/2026 (A)(C)(H) | | | 7,935 | | | | 24 | |
| | | | | | | | |
| | | |
| Description | | Face Amount
(Thousands) | | Market Value
($ Thousands) |
|
ASSET-BACKED SECURITIES (continued) | |
Shackleton CLO, Ser 2014-6RA | | | | | | | | |
0.000%, 07/17/2028 (C)(H) | | $ | 6,388 | | | $ | 4,791 | |
TCP Whitney CLO, Ser 2017-1I | | | | | | | | |
0.000%, 08/20/2029 (C)(H) | | | 9,085 | | | | 7,806 | |
TCW CLO, Ser 2017-1A | | | | | | | | |
0.000%,
07/29/2029 (A)(C)(H) | | | 4,194 | | | | 3,083 | |
TCW CLO, Ser 2018-1A | | | | | | | | |
0.000%,
04/25/2031 (A)(C)(H) | | | 2,978 | | | | 2,198 | |
Venture 35 CLO, Ser 2018-35A | | | | | | | | |
0.000%,
10/22/2031 (A)(C)(H) | | | 11,892 | | | | 9,662 | |
Venture CDO, Ser 2016-25A | | | | | | | | |
0.000%,
04/20/2029 (A)(C)(H) | | | 2,030 | | | | 1,533 | |
Venture XXVI CLO, Ser 2017-26A | | | | | | | | |
0.000%,
01/20/2029 (A)(C)(H) | | | 1,609 | | | | 1,126 | |
Venture XXVIII CLO, Ser 2017-28A | | | | | | | | |
0.000%,
07/20/2030 (A)(C)(H) | | | 3,228 | | | | 2,647 | |
| | |
Total Asset-Backed Securities
(Cost $126,511) ($ Thousands) | | | | | | | 148,966 | |
| | |
| | | Shares | | |
| | |
COMMON STOCK — 1.1% | | | | | | | | |
21st Century
Oncology *(B)(C)(F) | | | 1,533 | | | | 65 | |
Amplify Energy Corp *(B) | | | 87,414 | | | | 595 | |
Aspect Software,
Cl CR1 *(B)(C) | | | 27,500 | | | | — | |
Aspect Software,
Cl CR2 *(B)(C) | | | 11,134 | | | | — | |
Avaya Holdings Corp * | | | 26,343 | | | | 443 | |
Berry Petroleum (Escrow Security) *(C) | | | 3,278,000 | | | | — | |
Berry Petroleum Corp | | | 323,765 | | | | 3,736 | |
Boart Longyear *(B) | | | 66,285,402 | | | | 188 | |
Caesars Entertainment Corp * | | | 38,612 | | | | 336 | |
Cenveo Corp *(B) | | | 38,426 | | | | 500 | |
CEVA Holdings *(C) | | | 561 | | | | 12 | |
CHC Group LLC * | | | 1,075 | | | | — | |
CUI Acquisition *(B)(C)(F) | | | 3 | | | | 150 | |
Cumulus Media Inc, Cl A *(B) | | | 59,587 | | | | 1,073 | |
Global Aviation Holdings Inc,
Cl A *(C) | | | 97,655 | | | | — | |
Gymboree *(B)(C) | | | 40,312 | | | | 20 | |
Halcon Resources Corp * | | | 68,040 | | | | 92 | |
Jupiter Resources *(B) | | | 317,569 | | | | 992 | |
Medical Card Systems *(B)(C) | | | 284,758 | | | | — | |
Mmodal *(C) | | | 148,769 | | | | 785 | |
Paperworks Industries,
Inc. *(C)(F) | | | 52,360 | | | | 1,058 | |
Quad/Graphics Inc | | | 166 | | | | 2 | |
Reichhold Industries *(B)(C)(F) | | | 1,427 | | | | 1,234 | |
Remington Outdoor Company Inc *(B)(C)(F) | | | 12,794 | | | | 22 | |
Rue 21 * | | | 55,057 | | | | 143 | |
SandRidge Energy *(B) | | | 3,760,982 | | | | 64 | |
TE Holdcorp *(B) | | | 50,160 | | | | 16 | |
Titan Energy LLC * | | | 22,243 | | | | 1 | |
UCI International
Holdings *(B)(C)(F) | | | 27,268 | | | | 539 | |
VICI Properties Inc (B) | | | 93,193 | | | | 2,039 | |
| | |
SEI Institutional Managed Trust / Semi-Annual Report / March 31, 2019 | | 127 |
SCHEDULE OF INVESTMENTS (Unaudited)
March 31, 2019
High Yield Bond Fund(Continued)
| | | | | | | | |
| | | |
| Description | | Shares | | Market Value
($ Thousands) |
| | |
COMMON STOCK (continued) | | | | | | | | |
Vistra Energy Corp | | | 114,326 | | | $ | 2,976 | |
| | |
Total Common Stock
(Cost $23,571) ($ Thousands) | | | | | | | 17,081 | |
| | |
| | | Face Amount
(Thousands) | | |
| | |
MUNICIPAL BONDS — 0.5% | | | | | | | | |
| | |
Connecticut — 0.2% | | | | | | | | |
Mohegan Tribal, Finance Authority, RB | | | | | | | | |
Callable 02/01/2023 @ 100 | | | | | | | | |
7.000%, 02/01/2045 (A)(C) | | $ | 3,540 | | | | 3,663 | |
| | |
Puerto Rico — 0.3% | | | | | | | | |
Commonwealth of Puerto Rico, GDB Debt | | | | | | | | |
Recovery Authority, RB | | | | | | | | |
7.500%, 08/20/2040 | | | 1,449 | | | | 1,090 | |
Commonwealth of Puerto Rico, Ser A, GO | | | | | | | | |
Callable 07/01/2022 @ 100 | | | | | | | | |
5.250%, 07/01/2023 (C)(D) | | | 350 | | | | 185 | |
5.125%, 07/01/2037 (D) | | | 340 | | | | 178 | |
5.000%, 07/01/2041 (D) | | | 765 | | | | 400 | |
Puerto Rico Electric Power Authority, Ser TT, RB | | | | | | | | |
5.000%, 07/01/2032 (D) | | | 250 | | | | 176 | |
Puerto Rico Electric Power Authority, Ser WW, RB | | | | | | | | |
5.500%, 07/01/2020 (C)(D) | | | 165 | | | | 117 | |
5.500%, 07/01/2021 (C)(D) | | | 170 | | | | 121 | |
Puerto Rico, Electric Power Authority, Ser A, RB | | | | | | | | |
Callable 07/01/2022 @ 100 | | | | | | | | |
5.000%, 07/01/2042 (D) | | | 345 | | | | 243 | |
Puerto Rico, Electric Power Authority, Ser AAA, RB | | | | | | | | |
Callable 07/01/2020 @ 100 | | | | | | | | |
5.250%, 07/01/2025 (C)(D) | | | 190 | | | | 135 | |
5.250%, 07/01/2027 (D) | | | 245 | | | | 173 | |
Puerto Rico, Electric Power Authority, Ser CCC, RB | | | | | | | | |
5.250%, 07/01/2026 (C)(D) | | | 480 | | | | 340 | |
Puerto Rico, Electric Power Authority, Ser CCC, RB | | | | | | | | |
Callable 07/01/2020 @ 100 | | | | | | | | |
5.250%, 07/01/2027 (D) | | | 320 | | | | 226 | |
Puerto Rico, Electric Power Authority, Ser NN, RB | | | | | | | | |
5.500%, 07/01/2020 (C)(D) | | | 390 | | | | 277 | |
Puerto Rico, Electric Power Authority, Ser WW, RB | | | | | | | | |
5.500%, 07/01/2038 (D) | | | 75 | | | | 53 | |
5.250%, 07/01/2033 (D) | | | 105 | | | | 74 | |
| | | | | | | | |
| | | |
| Description | | Face Amount
(Thousands) | | Market Value
($ Thousands) |
| |
MUNICIPAL BONDS (continued) | | | | | |
Puerto Rico, Electric Power Authority, Ser XX, RB | | | | | | | | |
5.250%, 07/01/2035 (C)(D) | | $ | 60 | | | $ | 42 | |
| | |
| | | | | | | 3,830 | |
| | |
Total Municipal Bonds
(Cost $7,370) ($ Thousands) | | | | | | | 7,493 | |
| | |
CONVERTIBLE BONDS — 0.4% | | | | | | | | |
CHC Group CV to 125.0000 | | | | | | | | |
10.717%, 10/01/2020 (C) | | | 55 | | | | 19 | |
Cheniere Energy CV to 83.03 | | | | | | | | |
4.250%, 03/15/2045 | | | 615 | | | | 481 | |
Chesapeake Energy CV to 116.7134 | | | | | | | | |
5.500%, 09/15/2026 | | | 100 | | | | 93 | |
DISH Network CV to 12.1630 | | | | | | | | |
2.375%, 03/15/2024 | | | 602 | | | | 496 | |
GenOn CV to 14.7167 | | | | | | | | |
0.000%, 06/15/2021 (C) | | | 2,200 | | | | – | |
Liberty Media CV to 16.7764 | | | | | | | | |
3.750%, 02/15/2030 | | | 4,061 | | | | 2,762 | |
Liberty Media CV to 22.94686 | | | | | | | | |
4.000%, 11/15/2029 | | | 494 | | | | 339 | |
MagnaChip Semiconductor CV to 121.1387 | | | | | | | | |
5.000%, 03/01/2021 | | | 300 | | | | 339 | |
MGIC Investment CV to 74.0741 | | | | | | | | |
9.000%, 04/01/2063 (A) | | | 1,710 | | | | 2,199 | |
Weatherford International CV to 129.1656 | | | | | | | | |
5.875%, 07/01/2021 | | | 425 | | | | 343 | |
| | |
Total Convertible Bonds
(Cost $6,837) ($ Thousands) | | | | | | | 7,071 | |
| | |
| | | Shares | | |
| | |
PREFERRED STOCK — 0.2% | | | | | | | | |
21st Century Oncology, 0.000% *(B)(C)(F) | | | 1,943 | | | | 461 | |
CEVA Holdings, 0.000% *(C) | | | 1,214 | | | | 26 | |
Claire’s Stores, 0.000% *(B)(C) | | | 739 | | | | 793 | |
Crestwood Equity Partners, 9.250% | | | 82,000 | | | | 764 | |
FHLMC, 0.000% * | | | 16,903 | | | | 258 | |
FNMA, 0.000% * | | | 24,650 | | | | 411 | |
TE Holdcorp, 0.000% *(B)(C) | | | 81,045 | | | | 182 | |
VICI Properties, 0.000% (B) | | | 38,747 | | | | 848 | |
| | |
Total Preferred Stock
(Cost $4,403) ($ Thousands) | | | | | | | 3,743 | |
| | |
128 | | SEI Institutional Managed Trust / Semi-Annual Report / March 31, 2019 |
| | | | | | | | |
| | | |
| Description | | Number of
Warrants | | Market Value
($ Thousands) |
| | |
WARRANTS — 0.0% | | | | | | | | |
Cumulus Media, Expires 12/30/2027
Strike Price $– * | | | 10,632 | | | $ | 178 | |
Guitar Center, Expires 12/30/2027
Strike Price $– *(C) | | | 12,965 | | | | – | |
Jack Cooper Holdings, Expires 04/26/2027
Strike Price $– *(B)(C) | | | 2,496 | | | | – | |
Lion Holding, Expires 12/30/2027
Strike Price $– *(B) | | | 1,575 | | | | – | |
Remington Arms, Expires
Strike Price $– *(B) | | | 12,902 | | | | – | |
SandRidge Energy, Expires 10/04/2022
Strike Price $42 *(B) | | | 3,108 | | | | – | |
SandRidge Energy, Expires 10/04/2022
Strike Price $41 *(B) | | | 7,382 | | | | – | |
| | |
Total Warrants
(Cost $186) ($ Thousands) | | | | | | | 178 | |
| | |
| | | Number of
Rights | | |
| | |
RIGHTS — 0.0% | | | | | | | | |
Texas Competitive Electric Holdings LLC | | | | | | | | |
0.000 *‡‡(B) | | | 218,213 | | | | 157 | |
| | |
Total Rights
(Cost $295) ($ Thousands) | | | | | | | 157 | |
| | |
| | | Shares | | |
| |
AFFILIATED PARTNERSHIP — 0.0% | | | | | |
SEI Liquidity Fund, L.P. | | | | | | | | |
2.480% **†(J) | | | 1,142 | | | | 1 | |
| | |
Total Affiliated Partnership
(Cost $1) ($ Thousands) | | | | | | | 1 | |
| | |
CASH EQUIVALENT — 5.7% | | | | | | | | |
SEI Daily Income Trust, Government Fund, Cl F | | | | | | | | |
2.220%**† | | | 91,287,078 | | | | 91,287 | |
| | |
Total Cash Equivalent
(Cost $91,287) ($ Thousands) | | | | | | | 91,287 | |
| |
Total Investments in Securities — 99.8%
(Cost $1,634,352) ($ Thousands) | | | $ | 1,611,535 | |
| | | | | | | | |
| | |
SEI Institutional Managed Trust / Semi-Annual Report / March 31, 2019 | | 129 |
SCHEDULE OF INVESTMENTS (Unaudited)
March 31, 2019
High Yield Bond Fund(Concluded)
A list of the open centrally cleared swap agreements held by the Fund at March 31, 2019 is as follows:
| | | | | | | | | | | | | | | | | | | | | | | | |
| Credit Default Swaps | |
| Reference Entity/Obligation | | Buy/Sell Protection | | (Pays)/Receives
Rate | | Payment Frequency | | Termination Date | | Notional Amount (Thousands) | | | Value
(Thousands) | | Upfront Payments/
Receipts (Thousands) | | Net Unrealized
Appreciation
(Thousands) |
CDX NA.HY.29 5Y | | Sell | | 5.00% | | Quarterly | | 12/20/2022 | | | (7,014 | ) | | $ | 472 | | | $ | 436 | | | $ | 36 | |
CDX.NA.HY.30.5Y | | Sell | | 5.00% | | Quarterly | | 06/20/2023 | | | (2,100 | ) | | | 144 | | | | 138 | | | | 6 | |
CDX.NA.HY.31.5Y | | Sell | | 5.00% | | Quarterly | | 12/20/2023 | | | (792 | ) | | | 52 | | | | (43 | ) | | | 95 | |
| | | | | | | | | | | | | | | | | | | | | | | | |
| | | | | | | | | | | | | | $ | 668 | | | $ | 531 | | | $ | 137 | |
| | | | | | | | | | | | | | | | | | | | | | | | |
A list of the open OTC swap agreements held by the Fund at March 31, 2019 is as follows:
| | | | | | | | | | | | | | | | | | | | | | | | | | | | | | | | | | | | | | |
| Total Return Swaps | |
| Counterparty | | Reference Entity/ Obligation | | | Fund Pays | | Fund Receives | | | Payment
Frequency | | | Termination
Date | | | Currency | | | Notional
Amount
(Thousands) | | | Value
(Thousands) | | Upfront
Payments/
Receipts (Thousands) | | Net Unrealized
Depreciation (Thousands) |
Bank of America | | | IBOXHY_JUN19_280.40 | | | IBOXX USD LIQUID HIGH YIELD | | | 3-MONTH USD LIBOR | | | | Quarterly | | | | 06/20/2019 | | | | USD | | | | 9,466 | | | $ | (137 | ) | | $ | 50 | | | $ | (187 | ) |
JPMorgan Chase | | | IBOXHY_JUN19_280.25 | | | IBOXX USD LIQUID HIGH YIELD | | | 3-MONTH USD LIBOR | | | | Quarterly | | | | 06/20/2019 | | | | USD | | | | 8,650 | | | | (130 | ) | | | 44 | | | | (174 | ) |
JPMorgan Chase | | | IBOXHY_JUN19_281.25 | | | IBOXX USD LIQUID HIGH YIELD | | | 3-MONTH USD LIBOR | | | | Quarterly | | | | 06/20/2019 | | | | USD | | | | 458 | | | | (6 | ) | | | 2 | | | | (8 | ) |
JPMorgan Chase | | | IBOXHY_JUN19_281.63 | | | IBOXX USD LIQUID HIGH YIELD | | | 3-MONTH USD LIBOR | | | | Quarterly | | | | 06/20/2019 | | | | USD | | | | 458 | | | | (5 | ) | | | 2 | | | | (7 | ) |
| | | | | | | | | | | | | | | | | | | | | | | | | | | | | | |
| | | | | | | | | | | | | | | | | | | | | | | | | | | | $ | (278 | ) | | $ | 98 | | | $ | (376 | ) |
| | | | | | | | | | | | | | | | | | | | | | | | | | | | | | |
| | Percentages are based on Net Assets of $1,615,485 ($ Thousands). |
| * | Non-income producing security. |
| ** | Rate shown is the 7-day effective yield as of March 31, 2019. |
| ‡‡ | Expiration date not available. |
| † | Investment in Affiliated Security (see Note 6). |
| (A) | Security exempt from registration under Rule 144A of the Securities Act of 1933. These securities may be resold in transactions exempt from registration normally to qualified institutions. On March 31, 2019, the value of these securities amounted to $821,457 ($ Thousands), representing 50.8% of the Net Assets of the Fund. |
| (B) | Securities considered illiquid. The total value of such securities as of March 31, 2019 was $18,389 ($ Thousands) and represented 1.1% of the Net Assets of the Fund. |
| (C) | Level 3 security in accordance with fair value hierarchy. |
| (D) | Security is in default on interest payment. |
| (E) | Securities considered restricted. The total market value of such securities as of March 31, 2019 was $0 ($ Thousands) and represented 0.0% of the Net Assets of the Fund. |
| (F) | Security fair valued using methods determined in good faith by the Valuation Committee of the Board of Trustees. The total market value of such securities as of March 31, 2019 was $19,494 ($ Thousands) and represented 1.2% of the Net Assets of the Fund. |
| (G) | Unsettled bank loan. Interest rate may not be available. |
| (H) | Interest rate unavailable. |
| (I) | Maturity date not available. |
| (J) | This security was purchased with cash collateral held from securities on loan. The total market value of such securities as of March 31, 2019 was $1 ($ Thousands). |
CDO — Collateralized Debt Obligation
Cl — Class
CLO — Collateralized Loan Obligation
CV — Convertible Security
FNMA — Federal National Mortgage Association
GO — General Obligation
ICE— Intercontinental Exchange
LIBOR — London Interbank Offered Rate
LLC — Limited Liability Company
L.P. — Limited Partnership
Ltd. — Limited
OTC — Over the counter
PIK — Payment-in-Kind
PLC — Public Limited Company
Pty — Proprietary
RB — Revenue Bond
Ser — Series
ULC — Unlimited Liability Company
USD — United States Dollar
VAR — Variable Rate
| | |
130 | | SEI Institutional Managed Trust / Semi-Annual Report / March 31, 2019 |
The following is a list of the level of inputs used as of March 31, 2019, in valuing the Fund’s investments and other financial instruments carried at value ($ Thousands):
| | | | | | | | | | | | | | | | |
Investments in Securities | | Level 1 | | Level 2 | | Level 3 | | Total |
Corporate Obligations | | $ | – | | | $ | 1,152,464 | | | $ | 5,564 | | | $ | 1,158,028 | |
Loan Participations | | | – | | | | 155,245 | | | | 22,285 | | | | 177,530 | |
Asset-Backed Securities | | | – | | | | – | | | | 148,966 | | | | 148,966 | |
Common Stock | | | 11,545 | | | | 1,651 | | | | 3,885 | | | | 17,081 | |
Municipal Bonds | | | – | | | | 2,614 | | | | 4,879 | | | | 7,493 | |
Convertible Bonds | | | – | | | | 7,052 | | | | 19 | | | | 7,071 | |
Preferred Stock | | | 1,175 | | | | 1,107 | | | | 1,461 | | | | 3,743 | |
Warrants | | | – | | | | 178 | | | | – | | | | 178 | |
Rights | | | – | | | | 157 | | | | – | | | | 157 | |
Affiliated Partnership | | | – | | | | 1 | | | | – | | | | 1 | |
Cash Equivalent | | | 91,287 | | | | – | | | | – | | | | 91,287 | |
| | | | | | | | | | | | | | | | |
Total Investments in Securities | | $ | 104,007 | | | $ | 1,320,469 | | | $ | 187,059 | | | $ | 1,611,535 | |
| | | | | | | | | | | | | | | | |
| | | | | | | | | | |
Other Financial
Instruments | | Level 1 | | Level 2 | | Level 3 | | Total |
Centrally Cleared Swaps | | | | | | | | | | |
Credit Default Swaps * | | | | | | | | | | |
Unrealized Appreciation | | $ — | | $ 137 | | $ — | | $ | 137 | |
OTC Swaps | | | | | | | | | | |
Total Return Swaps * | | | | | | | | | | |
Unrealized Depreciation | | — | | (376) | | — | | | (376 | ) |
| | | | | | | | | | |
Total Other Financial Instruments | | $ — | | $ (239) | | $ — | | | $ (239) | |
| | | | | | | | | | |
| * | Swap contracts are valued at the unrealized appreciation (depreciation) on the instrument. |
The following is a reconciliation of the investments in which significant unobservable inputs (Level 3) were used in determining value ($ Thousands):
| | | | | | | | | | | | | | | | | | | | | | | | | | | | |
| | | Investments
in Corporate
Obligations | | Investments
in Loan
Participations | | Investments in
Asset-Backed
Securities | | Investments in
Common Stock | | Investments in
Municipal Bonds | | Investments
in Convertible
Bonds | | Investments in
Preferred Stock |
Balance as of October 1, 2018 | | $ | 7,195 | | | $ | 18,137 | | | $ | 160,025 | | | $ | 6,587 | | | $ | 5,126 | | | $ | 55 | | | $ | 1,046 | |
Accrued discounts/premiums | | | 2 | | | | (81 | ) | | | 92 | | | | – | | | | – | | | | 9 | | | | – | |
Realized gain/(loss) | | | – | | | | (2,481 | ) | | | 4,766 | | | | 3,945 | | | | 21 | | | | – | | | | 871 | |
Change in unrealized appreciation/ (depreciation) | | | (128 | ) | | | 2,003 | | | | (6,866 | ) | | | (2,095 | ) | | | 11 | | | | (45 | ) | | | (619 | ) |
Purchases | | | – | | | | 729 | | | | 18,682 | | | | – | | | | – | | | | – | | | | 163 | |
Sales | | | – | | | | (5,371 | ) | | | (27,733 | ) | | | (5,214 | ) | | | (1,495 | ) | | | – | | | | – | |
Net transfer into
Level 3 | | | 1,740 | | | | 16,115 | | | | – | | | | 804 | | | | 1,216 | | | | – | | | | – | |
Net transfer out of Level 3 | | | (3,245 | ) | | | (6,766 | ) | | | – | | | | (142 | ) | | | – | | | | – | | | | – | |
| | | | |
Ending Balance as of March 31, 2019(1) | | $ | 5,564 | | | $ | 22,285 | | | $ | 148,966 | | | $ | 3,885 | | | $ | 4,879 | | | $ | 19 | | | $ | 1,461 | |
| | | | |
Changes in unrealized gains/(losses) included in earnings related to securities still held at reporting date | | $ | (4,310 | ) | | $ | 1,895 | | | $ | (3,707 | ) | | $ | (511 | ) | | $ | 134 | | | $ | (27 | ) | | $ | (581 | ) |
| | | | |
(1) Of the $187,059 ($ Thousands) in Level 3 securities as of March 31, 2019, $6,822 ($ Thousands) or 0.4% of the Net Assets of the Fund are not valued via third party pricing vendors and broker quotes. If significant, the disclosure of the unobservable inputs and the interrelationships and sensitivity between these inputs are required for those Level 3 securities that are not valued by third party pricing vendors or broker quotes. The value of these securities is immaterial and no further disclosure is required.
For the period ended March 31, 2019, there were no transfers between Level 1 and Level 2 assets and liabilities.
For the period ended March 31, 2019, there were transfers between Level 2 and Level 3 assets and liabilities due to the availability of observable inputs to determine fair value.
For more information on valuation inputs, see Note 2 – Significant Accounting Policies in Notes to Financial Statements.
Amounts designated as “—” are either $0 or have been rounded to $0.
The following is a summary of the Fund’s transactions with affiliates for the period ended March 31, 2019 ($ Thousands):
| | | | | | | | | | | | | | |
| Security Description | | Value 9/30/18 | | Purchases at Cost | | Proceeds from
Sales | | Realized Gain | | Change in
Unrealized
Depreciation | | Value 3/31/19 | | Income |
SEI Liquidity Fund, L.P. | | $— | | $1 | | $ — | | $— | | $ — | | $1 | | $— |
SEI Daily Income Trust, Government Fund, Cl F | | 70,705 | | 380,284 | | (359,702) | | — | | — | | 91,287 | | 717 |
| | | | | | | | | | | | | | |
Totals | | $70,705 | | $380,285 | | $(359,702) | | $ — | | $ — | | $91,288 | | $717 |
| | | | | | | | | | | | | | |
The accompanying notes are an integral part of the financial statements.
| | |
SEI Institutional Managed Trust / Semi-Annual Report / March 31, 2019 | | 131 |
SCHEDULE OF INVESTMENTS (Unaudited)
March 31, 2019
Conservative Income Fund
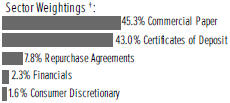
†Percentages are based on total investments.
| | | | | | | | |
| | | |
| Description | | Face Amount
(Thousands) | | | Market Value
($ Thousands) | |
| |
COMMERCIAL PAPER — 45.4% | | | | | |
| | |
Banks — 3.8% | | | | | | | | |
BPCE | | | | | | | | |
2.689%,
10/01/2019 (A)(B) | | $ | 1,500 | | | $ | 1,480 | |
Oversea-Chinese Banking | | | | | | | | |
2.652%,
04/08/2019 (B) | | | 4,000 | | | | 4,000 | |
United Overseas Bank | | | | | | | | |
2.910%,
05/17/2019 (A)(B) | | | 4,000 | | | | 3,986 | |
| | | | | | | | |
| | |
| | | | | | | 9,466 | |
| | | | | | | | |
Communication Services — 0.9% | | | | | |
Rogers Communications | | | | | | | | |
2.709%,
04/22/2019 (A)(B) | | | 2,200 | | | | 2,196 | |
| | | | | | | | |
| |
Consumer Discretionary — 0.9% | | | | | |
Autozone | | | | | | | | |
2.654%,
04/18/2019 (A) | | | 2,300 | | | | 2,296 | |
| | | | | | | | |
| | |
Consumer Staples — 1.5% | | | | | | | | |
Nestle Finance International | | | | | | | | |
2.580%,
08/21/2019 (A)(B) | | | 4,000 | | | | 3,959 | |
| | | | | | | | |
| | |
Financials — 35.4% | | | | | | | | |
Albion Capital | | | | | | | | |
2.531%,
04/05/2019 (A) | | | 5,536 | | | | 5,533 | |
Atlantic Asset Securitization | | | | | | | | |
2.420%,
04/01/2019 (A) | | | 1,100 | | | | 1,100 | |
Australia & New Zealand Banking Group | | | | | |
2.893%,
01/10/2020 (B) | | | 1,500 | | | | 1,503 | |
Bennington Stark Capital | | | | | | | | |
2.501%,
04/03/2019 (A) | | | 4,000 | | | | 3,999 | |
CAFCO | | | | | | | | |
2.770%,
04/12/2019 (A) | | | 5,000 | | | | 4,995 | |
2.608%,
05/14/2019 (A) | | | 3,000 | | | | 2,991 | |
Chariot Funding | | | | | | | | |
2.860%,
04/30/2019 (A)(B) | | | 2,800 | | | | 2,794 | |
2.660%,
10/07/2019 (A) | | | 4,000 | | | | 3,945 | |
2.451%,
04/02/2019 (A) | | | 3,000 | | | | 2,999 | |
CPPIB Capital | | | | | | | | |
2.701%,
03/09/2020 (A) | | | 3,000 | | | | 2,920 | |
Crown Point Capital | | | | | | | | |
2.501%,
04/01/2019 (A)(B) | | | 4,500 | | | | 4,499 | |
Federation Des Caisses Desjardins | | | | | | | | |
2.863%,
12/10/2019 (B) | | | 2,000 | | | | 2,003 | |
2.728%,
04/12/2019 (A) | | | 4,000 | | | | 3,996 | |
| | | | | | | | |
| | | |
| Description | | Face Amount
(Thousands) | | | Market Value
($ Thousands) | |
| |
COMMERCIAL PAPER (continued) | | | | | |
Landesbank Baden-Wurttemberg | | | | | |
2.501%, 04/05/2019 (A) | | $ | 7,000 | | | $ | 6,997 | |
Lexington Parker Capital | | | | | | | | |
2.603%, 05/06/2019 (A) | | | 2,000 | | | | 1,995 | |
Liberty Street Funding | | | | | | | | |
2.597%, 05/13/2019 (A) | | | 3,000 | | | | 2,991 | |
Manhattan Asset Funding | | | | | | | | |
2.508%, 04/23/2019 (A) | | | 4,000 | | | | 3,993 | |
Metlife Short Term Fund | | | | | | | | |
2.624%, 09/09/2019 (A) | | | 3,000 | | | | 2,965 | |
Old Line Funding | | | | | | | | |
2.845%, 08/14/2019 (B) | | | 4,000 | | | | 3,961 | |
2.840%, 04/26/2019 (A)(B) | | | 2,000 | | | | 1,996 | |
Omers Finance Trust | | | | | | | | |
2.668%, 05/06/2019 (A)(B) | | | 8,000 | | | | 7,979 | |
Sumitomo Mitsui Trust Bank | | | | | | | | |
2.579%, 07/09/2019 (A) | | | 2,000 | | | | 1,985 | |
Suncorp-Metway | | | | | | | | |
2.895%, 06/11/2019 (A)(B) | | | 3,000 | | | | 2,984 | |
2.840%, 05/01/2019 (A)(B) | | | 2,000 | | | | 1,995 | |
2.810%, 04/23/2019 (A)(B) | | | 1,000 | | | | 998 | |
Swedbank | | | | | | | | |
2.599%, 05/17/2019 (A) | | | 5,000 | | | | 4,984 | |
UBS | | | | | | | | |
2.945%, 12/19/2019 (B) | | $ | 1,500 | | | | 1,502 | |
| | | | | | | | |
| | |
| | | | | | | 90,602 | |
| | | | | | | | |
Industrials — 2.0% | | | | | | | | |
Coca-Cola | | | | | | | | |
3.065%, 12/09/2019 (A)(B) | | | 3,000 | | | | 2,943 | |
Eaton Corporation | | | | | | | | |
2.663%, 04/10/2019 (A) | | | 2,300 | | | | 2,298 | |
| | | | | | | | |
| | |
| | | | | | | 5,241 | |
| | | | | | | | |
Materials — 0.9% | | | | | | | | |
Nutrien | | | | | | | | |
2.681%, 04/03/2019 (A) | | | 2,300 | | | | 2,299 | |
| | | | | | | | |
| | |
Total Commercial Paper
(Cost $116,057) ($ Thousands) | | | | | | | 116,059 | |
| | | | | | | | |
|
CORPORATE OBLIGATIONS — 3.9% | |
|
Consumer Discretionary — 1.6% | |
Jets Stadium Development | | | | | | | | |
2.490%, 04/01/2047 (B) (C) | | | 4,000 | | | | 4,000 | |
| | | | | | | | |
| | |
Financials — 2.3% | | | | | | | | |
Australia & New Zealand Banking Group MTN | | | | | |
1.600%, 07/15/2019 | | | 1,500 | | | | 1,495 | |
Bank of Montreal | | | | | | | | |
3.129%, VAR ICE LIBOR USD 3 Month+0.330%, 07/11/2019 | | | 2,500 | | | | 2,502 | |
| | |
132 | | SEI Institutional Managed Trust / Semi-Annual Report / March 31, 2019 |
| | | | | | | | |
| | | |
| Description | | Face Amount
(Thousands) | | | Market Value
($ Thousands) | |
| |
CORPORATE OBLIGATIONS (continued) | | | | | |
National Australia Bank | | | | | | | | |
1.375%, 07/12/2019 | | $ | 2,000 | | | $ | 1,993 | |
| | | | | | | | |
| | | | | | | 5,990 | |
| | | | | | | | |
| | |
Total Corporate Obligations
(Cost $9,988)
($ Thousands) | | | | | | | 9,990 | |
| | | | | | | | |
|
CERTIFICATES OF DEPOSIT — 43.1% | |
Bank of Montreal | | | | | | | | |
2.893%, 12/10/2019 | | | 2,000 | | | | 2,004 | |
2.862%, 01/17/2020 | | | 1,500 | | | | 1,503 | |
Bank of Nova Scotia | | | | | | | | |
2.833%, 09/20/2019 | | | 2,000 | | | | 2,002 | |
Bedford Row Funding | | | | | | | | |
2.830%,
08/02/2019 (B) | | | 2,000 | | | | 2,000 | |
BNP Paribas | | | | | | | | |
2.930%, 04/18/2019 | | | 2,000 | | | | 2,000 | |
2.874%, 04/04/2019 | | | 1,500 | | | | 1,500 | |
2.799%, 09/27/2019 | | | 3,000 | | | | 3,002 | |
2.784%, 05/15/2019 | | | 2,000 | | | | 2,001 | |
Canadian Imperial Bank of Commerce | | | | | |
2.873%, 12/06/2019 | | | 1,000 | | | | 1,002 | |
2.792%, 07/16/2019 | | | 2,000 | | | | 2,001 | |
2.786%, 07/25/2019 | | | 2,500 | | | | 2,502 | |
2.653%, 04/10/2019 | | | 2,000 | | | | 2,000 | |
MUFG Bank | | | | | | | | |
2.843%, 02/24/2020 | | | 1,500 | | | | 1,500 | |
Credit Agricole | | | | | | | | |
2.763%, 03/20/2020 | | | 1,000 | | | | 1,000 | |
Credit Suisse Ag | | | | | | | | |
2.830%, 07/12/2019 | | | 2,000 | | | | 2,002 | |
HSBC Bank | | | | | | | | |
2.929%,
04/24/2019 (A)(B) | | | 3,000 | | | | 3,000 | |
Ing Us Funding | | | | | | | | |
2.860%, 10/04/2019 | | | 3,000 | | | | 3,004 | |
Landesbank Hessen Thueringen Giroz | | | | | |
2.450%, 04/04/2019 | | | 10,000 | | | | 10,000 | |
Mitsubishi Ufj Trust And Banking | | | | | |
2.650%, 06/07/2019 | | | 3,000 | | | | 3,000 | |
Mizuho Bank NY | | | | | | | | |
2.930%,
04/18/2019 (B) | | | 2,000 | | | | 2,000 | |
2.772%, 05/08/2019 (B) | | | 6,000 | | | | 6,002 | |
2.761%,
07/30/2019 (B) | | | 2,000 | | | | 2,000 | |
National Australia Bank | | | | | | | | |
2.740%,
04/02/2019 (B) | | | 3,000 | | | | 3,000 | |
National Bank Of Canada | | | | | | | | |
2.623%, 12/11/2019 | | | 3,000 | | | | 3,000 | |
Royal Bank of Canada | | | | | | | | |
2.930%, 01/09/2020 | | | 2,500 | | | | 2,505 | |
2.794%, 05/20/2019 | | | 2,000 | | | | 2,001 | |
2.792%, 08/16/2019 | | | 1,300 | | | | 1,301 | |
| | | | | | | | |
| | | |
| Description | | Face Amount
(Thousands) | | | Market Value
($ Thousands) | |
|
CERTIFICATES OF DEPOSIT (continued) | |
Skandinaviska Enskilda Banken | | | | | |
2.713%, 06/14/2019 | | $ | 3,000 | | | $ | 3,001 | |
Standard Chartered Bank | | | | | | | | |
3.009%, 04/24/2019 | | | 2,500 | | | | 2,500 | |
Sumitomo Mitsui Banking | | | | | | | | |
2.897%, 04/15/2019 | | | 3,500 | | | | 3,500 | |
Sumitomo Mitsui Trust Bank | | | | | | | | |
2.895%, 04/05/2019 | | | 2,000 | | | | 2,000 | |
2.841%, 02/25/2020 | | | 2,000 | | | | 2,000 | |
2.829%, 08/16/2019 | | | 1,500 | | | | 1,501 | |
Svenska Handelsbanken | | | | | | | | |
2.887%, 06/07/2019 (B) | | | 2,750 | | | | 2,752 | |
2.835%, 12/19/2019 (B) | | | 2,500 | | | | 2,503 | |
2.731%, 05/07/2019 (B) | | | 3,000 | | | | 3,000 | |
Swedbank | | | | | | | | |
2.747%, 05/21/2019 | | | 3,500 | | | | 3,501 | |
UBS | | | | | | | | |
3.124%, 04/04/2019 (B) | | | 1,500 | | | | 1,500 | |
2.972%, 07/23/2019 (B) | | | 2,500 | | | | 2,501 | |
2.913%, 05/31/2019 (B) | | | 2,500 | | | | 2,502 | |
2.890%, 07/02/2019 (B) | | | 1,000 | | | | 1,001 | |
2.756%, 08/28/2019 (B) | | | 1,500 | | | | 1,500 | |
Westpac Banking | | | | | | | | |
2.916%, 11/01/2019 (B) | | | 1,000 | | | | 1,000 | |
2.812%, 11/08/2019 (B) | | | 2,000 | | | | 2,002 | |
2.778%, 02/03/2020 | | | 3,000 | | | | 3,000 | |
| | | | | | | | |
| |
Total Certificates of Deposit
(Cost $110,051) ($ Thousands) | | | | 110,096 | |
| | | | | | | | |
|
REPURCHASE AGREEMENTS — 7.8% | |
Goldman Sachs | | | | | | | | |
2.550%, dated 03/29/2019, to be repurchased on 04/01/2019, repurchase price $2,000,425 (collateralized by FNMA obligations, par value $1,982,466, 4.000%, 11/20/2048; total market value $2,040,000) (D) | | | 2,000 | | | | 2,000 | |
TD Securities | | | | | | | | |
2.600%, dated 03/29/2019, to be repurchased on 04/01/2019, repurchase price $2,003,900 (collateralized by FNMA obligations, par value $18,275,414, 4.000%, 12/01/2048; total market value $18,540,001) (D) | | | 18,000 | | | | 18,000 | |
| | | | | | | | |
| |
Total Repurchase Agreements
(Cost $20,000) ($ Thousands) | | | | 20,000 | |
| | | | | | | | |
| |
Total Investments in Securities — 100.2%
(Cost $256,096) ($ Thousands) | | | $ | 256,145 | |
| | | | | | | | |
| | |
SEI Institutional Managed Trust / Semi-Annual Report / March 31, 2019 | | 133 |
SCHEDULE OF INVESTMENTS (Unaudited)
March 31, 2019
Conservative Income Fund(Concluded)
Percentages are based on Net Assets of $255,595 ($ Thousands).
| (A) | Zero coupon security. The rate shown on the Schedule of Investments is the security’s effective yield at the time of purchase. |
| (B) | Security exempt from registration under Rule 144A of the Securities Act of 1933. These securities may be resold in transactions exempt from registration normally to qualified institutions. On March 31, 2019, the value of these securities amounted to $93,041 ($ Thousands), representing 36.4% of the Net Assets of the Fund. |
| (C) | Variable or floating rate security, the interest rate of which adjusts periodically based on prevailing interest rates. |
| (D) | Tri-Party Repurchase Agreement. |
Cl— Class
ICE— Intercontinental Exchange
LIBOR— London Interbank Offered Rate
MTN — Medium Term Note
USD — United States Dollar
VAR — Variable Rate
As of March 31, 2019, all of the Fund’s investments were considered Level 2, in accordance with the authoritative guidance on fair value measurements and disclosure under U.S. GAAP.
For the period ended March 31, 2019, there were no transfers between Level 1 and Level 2 assets and liabilities.
For the period ended March 31, 2019, there were no transfers between Level 2 and Level 3 assets and liabilities.
For more information on valuation inputs, see Note 2 – Significant Accounting Policies in Notes to Financial Statements.
Amounts designated as “—” are either $0 or have been rounded to $0.
The accompanying notes are an integral part of the financial statements.
| | |
134 | | SEI Institutional Managed Trust / Semi-Annual Report / March 31, 2019 |
SCHEDULE OF INVESTMENTS (Unaudited)
March 31, 2019
Tax-Free Conservative Income Fund
†Percentages are based on total investments.
| | | | | | | | |
| | | |
| Description | | Face Amount
(Thousands) | | | Market Value
($ Thousands) | |
| |
MUNICIPAL BONDS — 79.1% | | | | | |
Alaska — 1.8% | | | | | | | | |
Alaska State, Housing Finance Authority, Ser B, RB | | | | | | | | |
Callable 04/04/2019 @ 100 | | | | | | | | |
1.480%,
12/01/2041 (A) | | $ | 3,300 | | | $ | 3,300 | |
| | | | | | | | |
| | |
Arizona — 1.1% | | | | | | | | |
Yavapai County, Industrial Development Authority, Drake Cement Project, Ser A, RB | | | | | | | | |
1.530%,
09/01/2035 (A)(B) | | | 2,000 | | | | 2,000 | |
| | | | | | | | |
|
Connecticut — 3.1% | |
Connecticut State, Housing Finance Authority, Mortgage Finance Program,Sub-SerA-3, RB | | | | | | | | |
1.500%,
11/15/2045 (A) | | | 1,150 | | | | 1,150 | |
Connecticut State, Housing Finance Authority, Mortgage Finance Program, Sub-Ser C-3, RB | | | | | | | | |
1.500%,
11/15/2045 (A) | | | 1,000 | | | | 1,000 | |
Connecticut State, Ser C, GO | | | | | | | | |
1.570%,
05/15/2034 (A) | | | 3,570 | | | | 3,570 | |
| | | | | | | | |
| | |
| | | | | | | 5,720 | |
| | | | | | | | |
District of Columbia — 2.6% | |
District of Columbia, Community Connections Real Estate Foundation Project, Ser A, RB | | | | | | | | |
Callable 04/01/2019 @ 100 | | | | | | | | |
1.550%,
07/01/2032 (A)(B) | | | 2,400 | | | | 2,400 | |
District of Columbia, Georgetown University Project, RB | | | | | | | | |
1.500%,
04/01/2041 (A)(B) | | | 390 | | | | 390 | |
District of Columbia, Medlantic/Helix Project, Ser A, RB | | | | | | | | |
Callable 04/01/2019 @ 100 | | | | | | | | |
1.470%,
08/15/2038 (A)(B) | | | 50 | | | | 50 | |
RBC Municipal Products Trust, Ser 2018- G63, GO | | | | | | | | |
1.530%,
12/01/2023
(A)(B)(C) | | | 2,000 | | | | 2,000 | |
| | | | | | | | |
| | |
| | | | | | | 4,840 | |
| | | | | | | | |
Florida — 3.1% | |
Escambia County, Health Facilities Authority, Azalea Trace Project, Ser B, RB, AGC | | | | | | | | |
Callable 04/01/2019 @ 100 | | | | | | | | |
1.600%,
11/15/2029 (A) | | | 80 | | | | 80 | |
| | | | | | | | |
| | | |
| Description | | Face Amount
(Thousands) | | | Market Value
($ Thousands) | |
|
MUNICIPAL BONDS (continued) | |
Miami-Dade County, Industrial Development Authority, Dave and Mary Alper Jewish Community Center Project, RB | | | | | | | | |
1.600%,
04/01/2032 (A)(B) | | $ | 5,695 | | | $ | 5,695 | |
| | | | | | | | |
| | |
| | | | | | | 5,775 | |
| | | | | | | | |
Georgia — 1.1% | |
Monroe County, Development Authority, Oglethorpe Power Project, Ser B, RB | | | | | | | | |
1.600%,
01/01/2036 (A)(B) | | | 2,000 | | | | 2,000 | |
| | | | | | | | |
|
Illinois — 5.6% | |
Illinois State, Finance Authority, Advocate Healthcare Network Project, Sub-Ser C2B, RB | | | | | | | | |
1.600%, 11/01/2038 (A) | | | 1,800 | | | | 1,800 | |
Illinois State, Finance Authority, Sub-Ser C-1, RB | | | | | | | | |
1.600%, 11/01/2038 (A) | | | 700 | | | | 700 | |
Illinois State, Finance Authority, YMCA Metropolitan Chicago Project, RB | | | | | | | | |
1.600%,
06/01/2029 (A)(B) | | | 1,800 | | | | 1,800 | |
Illinois State, Housing Development Authority,Sub-Ser, RB | | | | | | | | |
1.470%, 02/01/2038 (A) | | | 1,000 | | | | 1,000 | |
Tender Option Bond Trust Receipts, Ser 2015- XF1043, RB | | | | | | | | |
1.560%,
03/01/2033 (A)(C) | | | 4,250 | | | | 4,250 | |
Tender Option Bond Trust Receipts, Ser 2017- XG0133, RB | | | | | | | | |
1.540%,
01/04/2020 (A)(C) | | | 840 | | | | 840 | |
| | | | | | | | |
| | |
| | | | | | | 10,390 | |
| | | | | | | | |
Indiana — 6.0% | |
Elkhart County, Multi-Family Housing Authority, Ashton Pines Apartments Project, Ser A, RB | | | | | | | | |
1.490%,
09/01/2043 (A)(B) | | | 4,100 | | | | 4,100 | |
Indiana State, Finance Authority, RB | | | | | | | | |
1.550%, 02/01/2039 (A) | | | 7,100 | | | | 7,100 | |
| | | | | | | | |
| | |
| | | | | | | 11,200 | |
| | | | | | | | |
Iowa — 5.7% | |
Iowa State, Finance Authority, Midwestern Disaster Area Economic Development, CJ Bio America Project, RB | | | | | | | | |
1.920%,
04/01/2022 (A)(B) | | | 6,300 | | | | 6,300 | |
Iowa State, Finance Authority, Pollution Control Facilities, MidAmerican Energy Project, RB | | | | | | | | |
Callable 04/01/2019 @ 100 | | | | | | | | |
1.520%, 09/01/2036 (A) | | | 1,500 | | | | 1,500 | |
| | |
SEI Institutional Managed Trust / Semi-Annual Report / March 31, 2019 | | 135 |
SCHEDULE OF INVESTMENTS (Unaudited)
March 31, 2019
Tax-Free Conservative Income Fund(Continued)
| | | | | | | | |
| | | |
| Description | | Face Amount
(Thousands) | | | Market Value
($ Thousands) | |
| |
MUNICIPAL BONDS (continued) | | | | | |
Iowa State, Finance Authority, Pollution Control Facilities, MidAmerican Energy Project, Ser B, RB | | | | | | | | |
1.520%,
05/01/2023 (A) | | $ | 2,700 | | | $ | 2,700 | |
| | | | | | | | |
| | |
| | | | | | | 10,500 | |
| | | | | | | | |
| | |
Kansas — 1.1% | | | | | | | | |
Manhattan, Industrial Development Authority, Florence Kansas Project, AMT, RB | | | | | | | | |
1.560%,
04/01/2028 (A)(B) | | | 2,000 | | | | 2,000 | |
| | | | | | | | |
| | |
Louisiana — 1.8% | | | | | | | | |
Ascension Parish, Industrial Development Board, BASF Project, RB | | | | | | | | |
Callable 04/01/2019 @ 100 | | | | | | | | |
1.560%,
10/01/2039 (A) | | | 2,000 | | | | 2,000 | |
Saint Charles Parish, Pollution Control, Shell Oil Project, Ser B, RB | | | | | | | | |
1.510%,
10/01/2022 (A) | | | 1,400 | | | | 1,400 | |
| | | | | | | | |
| | |
| | | | | | | 3,400 | |
| | | | | | | | |
| | |
Maryland — 2.0% | | | | | | | | |
Maryland State, Community Development Administration, Department of Housing and Community Development, Crusader Arms Apartments Project, Ser D, RB | | | | | | | | |
Callable 04/01/2019 @ 100 | | | | | | | | |
1.530%,
02/01/2041 (A) | | | 1,070 | | | | 1,070 | |
Maryland State, Economic Development Authority, Academy of Sciences Project, RB | | | | | | | | |
1.700%,
04/01/2033 (A)(B) | | | 1,000 | | | | 1,000 | |
Maryland State, Industrial Development Financing Authority, RB | | | | | | | | |
1.710%,
03/01/2030 (A) | | | 1,600 | | | | 1,600 | |
| | | | | | | | |
| | |
| | | | | | | 3,670 | |
| | | | | | | | |
| | |
Massachusetts — 1.3% | | | | | | | | |
Massachusetts State, Water Resources Authority,Sub-Ser A-3, RB | | | | | | | | |
1.470%,
08/01/2037 (A) | | | 1,600 | | | | 1,600 | |
University of Massachusetts, Building Authority, Ser 1, RB | | | | | | | | |
1.520%,
11/01/2034 (A) | | | 800 | | | | 800 | |
| | | | | | | | |
| | |
| | | | | | | 2,400 | |
| | | | | | | | |
| | |
Michigan — 4.1% | | | | | | | | |
Central Michigan University, Ser A, RB | | | | | | | | |
1.580%,
10/01/2032 (A)(B) | | | 1,000 | | | | 1,000 | |
Michigan State University, Ser A, RB | | | | | | | | |
1.580%,
02/15/2033 (A) | | | 1,800 | | | | 1,800 | |
| | | | | | | | |
| | | |
| Description | | Face Amount
(Thousands) | | | Market Value
($ Thousands) | |
| | |
MUNICIPAL BONDS (continued) | | | | | | | | |
Michigan State, Building Authority, Multi-Model Facilities Program, Ser I, RB | | | | | | | | |
Callable 04/01/2019 @ 100 | | | | | | | | |
1.470%,
10/15/2052 (A)(B) | | $ | 1,970 | | | $ | 1,970 | |
Michigan State, Housing Development Authority, Single Family Mortgage Project, Ser D-REM, RB | | | | | | | | |
Callable 04/01/2019 @ 100 | | | | | | | | |
1.540%, 06/01/2030 (A) | | | 2,900 | | | | 2,900 | |
| | | | | | | | |
| | |
| | | | | | | 7,670 | |
| | | | | | | | |
| | |
Missouri — 3.1% | | | | | | | | |
Kansas City, Special Obligation, H Roe Bartle Project, Ser E, RB | | | | | | | | |
1.500%,
04/15/2034 (A)(B) | | | 2,300 | | | | 2,300 | |
RBC Municipal Products Trust, Ser C-16, RB | | | | | | | | |
1.560%,
09/01/2039 (A)(B)(C) | | | 3,500 | | | | 3,500 | |
| | | | | | | | |
| | |
| | | | | | | 5,800 | |
| | | | | | | | |
| | |
New York — 12.5% | | | | | | | | |
New York City, Housing Development Authority, Hewitt House Apartments Project, Ser A, RB | | | | | | | | |
1.550%,
11/01/2048 (A)(B) | | | 1,500 | | | | 1,500 | |
New York City, Sub-Ser A-3, GO | | | | | | | | |
1.650%,
10/01/2040 (A)(B) | | | 2,400 | | | | 2,400 | |
New York City, Sub-Ser J-8-R, GO | | | | | | | | |
Callable 04/29/2019 @ 100 | | | | | | | | |
1.600%,
08/01/2021 (A)(B) | | | 1,955 | | | | 1,955 | |
New York City, Water & Sewer System, RB | | | | | | | | |
1.650%, 06/15/2048 (A) | | | 1,100 | | | | 1,100 | |
1.490%, 06/15/2039 (A) | | | 1,300 | | | | 1,300 | |
New York City, Water & Sewer System, Ser F-1, RB | | | | | | | | |
Callable 04/15/2019 @ 100 | | | | | | | | |
1.650%, 06/15/2033 (A) | | | 900 | | | | 900 | |
New York State, Energy Research & Development Authority, Consolidated Edison Project, AMT, RB | | | | | | | | |
1.520%,
06/01/2036 (A)(B) | | | 400 | | | | 400 | |
New York State, Energy Research & Development Authority, Sub-Ser A-1, RB | | | | | | | | |
1.480%,
05/01/2039 (A)(B) | | | 600 | | | | 600 | |
New York State, Housing Finance Agency, 600 W. 42nd Street Project, Ser A, RB | | | | | | | | |
1.520%,
05/15/2041 (A)(B) | | | 4,500 | | | | 4,500 | |
New York State, Local Government Assistance, Sub-Ser, RB | | | | | | | | |
1.580%, 04/01/2019 (A) | | | 400 | | | | 400 | |
Oneida County, Industrial Development Agency, Mohawk Valley Community College Dormitory Project, Ser A, RB | | | | | | | | |
1.550%,
08/01/2038 (A)(B) | | | 1,200 | | | | 1,200 | |
| | |
136 | | SEI Institutional Managed Trust / Semi-Annual Report / March 31, 2019 |
| | | | | | | | |
| | | |
| Description | | Face Amount
(Thousands) | | | Market Value
($ Thousands) | |
| |
MUNICIPAL BONDS (continued) | | | | | |
Oswego County, Industrial Development | | | | | | | | |
Agency, O.H. Properties Project, Ser A, RB | | | | | | | | |
1.750%, 06/01/2024 (A)(B) | | $ | 685 | | | $ | 685 | |
RBC Municipal Products Trust, Ser 2018-G5, GO | | | | | | | | |
1.530%,
10/01/2025
(A)(B)(C) | | | 1,900 | | | | 1,900 | |
Tender Option Bond Trust Receipts, Ser 2016- XF0499, RB | | | | | | | | |
Callable 11/15/2026 @ 100 | | | | | | | | |
1.620%,
11/15/2056 (A)(C) | | | 2,030 | | | | 2,030 | |
Tender Option Bond Trust Receipts, Ser 2017- XF0550, RB | | | | | | | | |
Callable 02/15/2027 @ 100 | | | | | | | | |
1.550%,
02/15/2042 (A)(C) | | | 2,000 | | | | 2,000 | |
Westchester County, Industrial Development Authority, Northern West Chester Hospital Project, RB | | | | | | | | |
1.460%,
11/01/2024 (A)(B) | | | 400 | | | | 400 | |
| | | | | | | | |
| | |
| | | | | | | 23,270 | |
| | | | | | | | |
|
North Carolina — 0.2% | |
Charlotte-Mecklenburg, Hospital Authority, Ser E, RB | | | | | | | | |
1.450%,
01/15/2044 (A)(B) | | | 300 | | | | 300 | |
| | | | | | | | |
| | |
Ohio — 5.9% | | | | | | | | |
American Municipal Power, Electric System Improvement, Village of Holiday City Project, RB | | | | | | | | |
3.000%, 04/30/2019 | | | 1,000 | | | | 1,001 | |
American Municipal Power, Electric System Improvement, Village of Jackson Center Project, RB | | | | | | | | |
3.000%, 08/15/2019 | | | 280 | | | | 282 | |
Berea, GO | | | | | | | | |
3.000%, 03/12/2020 | | | 3,445 | | | | 3,482 | |
Hamilton County, HealthCare Facilities Authority, Children’s Home Project, RB | | | | | | | | |
1.500%,
03/01/2033 (A)(B) | | | 800 | | | | 800 | |
Lakewood Ohio, Income Tax Revenue Notes, RB | | | | | | | | |
3.000%, 03/26/2020 | | | 3,000 | | | | 3,038 | |
Lorain County, Various Purpose, GO | | | | | | | | |
3.000%, 02/07/2020 | | | 2,400 | | | | 2,423 | |
| | | | | | | | |
| | |
| | | | | | | 11,026 | |
| | | | | | | | |
|
Pennsylvania — 0.4% | |
Montgomery County, Industrial Development Authority, Acts Retirement Life | | | | | | | | |
Communities, RB, AGC | | | | | | | | |
Callable 04/01/2019 @ 100 | | | | | | | | |
1.600%,
11/15/2029 (A) | | | 195 | | | | 195 | |
| | | | | | | | |
| | | |
| Description | | Face Amount
(Thousands) | | | Market Value
($ Thousands) | |
| |
MUNICIPAL BONDS (continued) | | | | | |
Philadelphia, Gas Works Authority, Ser D, RB | | | | | | | | |
Callable 04/01/2019 @ 100 | | | | | | | | |
1.500%,
08/01/2031 (A)(B) | | $ | 600 | | | $ | 600 | |
| | | | | | | | |
| | |
| | | | | | | 795 | |
| | | | | | | | |
| | |
Tennessee — 4.8% | | | | | | | | |
Clarksville, Public Building Authority, Pooled Financing, RB | | | | | | | | |
Callable 04/01/2019 @ 100 | | | | | | | | |
1.550%,
06/01/2029 (A)(B) | | | 3,500 | | | | 3,500 | |
Shelby County, Health Educational & Housing Facilities Authority, Providence Place Apartments Project, RB | | | | | | | | |
Callable 04/04/2019 @ 100 | | | | | | | | |
1.500%,
12/15/2042 (A)(B) | | | 5,500 | | | | 5,500 | |
| | | | | | | | |
| | |
| | | | | | | 9,000 | |
| | | | | | | | |
| | |
Texas — 7.0% | | | | | | | | |
Port Arthur, Navigation District, Industrial Development, Total Petrochemicals Project, Ser A, RB | | | | | | | | |
Callable 04/01/2019 @ 100 | | | | | | | | |
1.560%,
12/01/2040 (A) | | | 1,000 | | | | 1,000 | |
Port Arthur, Navigation District, Total Petrochemicals Project, RB | | | | | | | | |
Callable 06/03/2019 @ 100 | | | | | | | | |
1.560%,
03/01/2039 (A) | | | 5,300 | | | | 5,300 | |
Texas State, Tax Revenue Anticipation Notes, RB | | | | | | | | |
4.000%, 08/29/2019 | | | 4,000 | | | | 4,039 | |
Texas State, Veterans Bonds, GO | | | | | | | | |
Callable 04/01/2019 @ 100 | | | | | | | | |
1.540%,
12/01/2047 (A) | | | 2,595 | | | | 2,595 | |
| | | | | | | | |
| | |
| | | | | | | 12,934 | |
| | | | | | | | |
|
Washington — 2.7% | |
Tender Option Bond Trust Receipts, Ser 2016- XL0007, RB | | | | | | | | |
Callable 06/01/2019 @ 100 | | | | | | | | |
1.650%,
06/15/2033 (A)(C) | | | 1,000 | | | | 1,000 | |
Washington State, Housing Finance Commission, RB | | | | | | | | |
1.500%,
08/01/2049 (A)(B) | | | 4,000 | | | | 4,000 | |
| | | | | | | | |
| | |
| | | | | | | 5,000 | |
| | | | | | | | |
|
Wisconsin — 2.1% | |
Oshkosh, Industrial Development Authority, Oshkosh Coil Spring Project, Ser A, AMT, RB | | | | | | | | |
1.700%,
12/01/2020 (A)(B) | | | 420 | | | | 420 | |
| | |
SEI Institutional Managed Trust / Semi-Annual Report / March 31, 2019 | | 137 |
SCHEDULE OF INVESTMENTS (Unaudited)
March 31, 2019
Tax-Free Conservative Income Fund(Concluded)
| | | | | | | | |
| | | |
| Description | | Face Amount
(Thousands) | | | Market Value
($ Thousands) | |
| |
MUNICIPAL BONDS (continued) | | | | | |
Wisconsin State, Housing & Economic Development Authority, Ser C, RB | | | | | | | | |
1.600%, 05/01/2046 (A) | | $ | 2,000 | | | $ | 2,000 | |
1.490%, 03/01/2031 (A) | | | 1,400 | | | | 1,400 | |
| | | | | | | | |
| | |
| | | | | | | 3,820 | |
| | | | | | | | |
| | |
Total Municipal Bonds (Cost $146,792) ($ Thousands) | | | | | | | 146,810 | |
| | | | | | | | |
|
TAX-EXEMPT COMMERCIAL PAPER — 20.7% | |
Fort Bend | | | | | | | | |
1.860%, 05/24/2019 | | | 4,000 | | | | 4,000 | |
Garland | | | | | | | | |
1.680%, 06/06/2019 | | | 2,000 | | | | 2,000 | |
Harris County | | | | | | | | |
1.800%, 05/16/2019 | | | 6,000 | | | | 6,001 | |
1.650%, 05/13/2019 | | | 3,000 | | | | 2,999 | |
Lincoln | | | | | | | | |
1.700%, 05/01/2019 | | | 5,000 | | | | 5,000 | |
Memphis | | | | | | | | |
1.780%, 06/06/2019 | | | 2,000 | | | | 2,000 | |
Miami-Dade County | | | | | | | | |
1.650%, 05/02/2019 | | | 1,000 | | | | 1,000 | |
1.650%, 05/16/2019 | | | 1,700 | | | | 1,700 | |
1.630%, 05/16/2019 | | | 2,000 | | | | 2,000 | |
Michigan State University | | | | | | | | |
1.930%, 06/03/2019 | | | 6,000 | | | | 6,001 | |
Minneapolis, University Gateway Project | | | | | | | | |
1.500%, 12/01/2040 | | | 500 | | | | 500 | |
San Antonio | | | | | | | | |
1.810%, 06/06/2019 | | | 2,200 | | | | 2,201 | |
University of Minnesota | | | | | | | | |
1.870%, 06/04/2019 | | | 3,000 | | | | 3,001 | |
| | | | | | | | |
| |
Total Tax-Exempt Commercial Paper
(Cost $38,400) ($ Thousands) | | | | 38,403 | |
| | | | | | | | |
| |
Total Investments in Securities — 99.8% (Cost $185,192) ($ Thousands) | | | $ | 185,213 | |
| | | | | | | | |
| | Percentages are based on Net Assets of $185,566 ($ Thousands). |
| (A) | Variable or floating rate security, the interest rate of which adjusts periodically based on prevailing interest rates. |
| (B) | Securities are held in connection with a letter of credit issued by a major bank. |
| (C) | Security exempt from registration under Rule 144A of the Securities Act of 1933. These securities may be resold in transactions exempt from registration normally to qualified institutions. On March 31, 2019, the value of these securities amounted to $17,520 ($ Thousands), representing 9.4% of the Net Assets of the Fund. |
AGC — Assured Guaranty Corporation
AMT — Alternative Minimum Tax
GO — General Obligation
RB — Revenue Bond
Ser — Series
As of March 31, 2019, all of the Fund’s investments were considered Level 2, in accordance with the authoritative guidance on fair value measurements and disclosure under U.S. GAAP.
For the period ended March 31, 2019, there were no transfers between Level 1 and Level 2 assets and liabilities.
For the period ended March 31, 2019, there were no transfers between Level 2 and Level 3 assets and liabilities.
For more information on valuation inputs, see Note 2 – Significant Accounting Policies in Notes to Financial Statements.
The accompanying notes are an integral part of the financial statements.
| | |
138 | | SEI Institutional Managed Trust / Semi-Annual Report / March 31, 2019 |
SCHEDULE OF INVESTMENTS (Unaudited)
March 31, 2019
Real Return Fund

†Percentages are based on total investments.
| | | | | | | | |
| Description | | Face Amount
(Thousands) | | | Market Value
($ Thousands) | |
| |
U.S.TREASURY OBLIGATIONS — 99.0% | | | | | |
U.S. Treasury Inflation Protected Securities | | | | | |
1.250%, 07/15/2020 | | $ | 15,170 | | | $ | 15,392 | |
1.125%, 01/15/2021 | | | 17,375 | | | | 17,595 | |
0.625%, 07/15/2021 | | | 18,456 | | | | 18,619 | |
0.625%, 04/15/2023 | | | 21,066 | | | | 21,212 | |
0.625%, 01/15/2024 | | | 20,889 | | | | 21,087 | |
0.375%, 07/15/2023 | | | 20,954 | | | | 21,004 | |
0.125%, 04/15/2020 | | | 25,415 | | | | 25,295 | |
0.125%, 04/15/2021 | | | 22,078 | | | | 21,902 | |
0.125%, 01/15/2022 | | | 20,358 | | | | 20,195 | |
0.125%, 04/15/2022 | | | 21,525 | | | | 21,303 | |
0.125%, 07/15/2022 | | | 21,016 | | | | 20,903 | |
0.125%, 01/15/2023 | | | 21,112 | | | | 20,871 | |
| | | | | | | | |
| |
Total U.S. Treasury Obligations
(Cost $245,666) ($ Thousands) | | | | 245,378 | |
| | | | | | | | |
| | | | | | | | |
| Description | | Shares | | | Market Value
($ Thousands) | |
| |
CASH EQUIVALENT — 1.0% | | | | | |
SEI Daily Income Trust, Government Fund, Cl F | | | | | | | | |
2.220%**† | | | 2,462,155 | | | $ | 2,462 | |
| | | | | | | | |
| | |
Total Cash Equivalent (Cost $2,462) ($ Thousands) | | | | | | | 2,462 | |
| | | | | | | | |
| |
Total Investments in Securities — 100.0% (Cost $248,128) ($ Thousands) | | | $ | 247,840 | |
| | | | | | | | |
| | Percentages are based on Net Assets of $247,831 ($ Thousands). |
| ** | Rate shown is the 7-day effective yield as of March 31, 2019. |
| † | Investment in Affiliated Security (See Note 10). |
Cl — Class
| | | | | | | | | | | | | | | | |
| | | | | |
| Investments in Securities | | Level 1 | | | Level 2 | | | Level 3 | | | Total | |
U.S. Treasury Obligations | | $ | – | | | $ | 245,378 | | | $ | – | | | $ | 245,378 | |
Cash Equivalent | | | 2,462 | | | | – | | | | – | | | | 2,462 | |
| | | | | | | | | | | | | | | | |
Total Investments in Securities | | $ | 2,462 | | | $ | 245,378 | | | $ | – | | | $ | 247,840 | |
| | | | | | | | | | | | | | | | |
For the period ended March 31, 2019, there were no transfers between Level 1 and Level 2 assets and liabilities.
For the period ended March 31, 2019, there were no transfers between Level 2 and Level 3 assets and liabilities
For more information on valuation inputs, see Note 2 — Significant Accounting Policies in Notes to Financial Statements.
Amounts designated as “—” are either $0 or have been rounded to $0.
The following is a summary of the transactions with affiliates for the period ended March 31, 2019 ($Thousands):
| | | | | | | | | | | | | | | | | | | | | | | | | | | | |
| Security Description | | Value 9/30/18 | | | Purchases at
Cost | | | Proceeds from Sales | | | Realized Gain (Loss) | | | Change in Unrealized Appreciation (Depreciation) | | | Value 3/31/19 | | | Income | |
SEI Daily Income Trust, Government Fund, Cl F | | | $ 101 | | | | $ 13,100 | | | | $ (10,739) | | | | $ - | | | | $ - | | | | $ 2,462 | | | | $ 9 | |
| | | | | | | | | | | | | | | | | | | | | | | | | | | | |
The accompanying notes are an integral part of the financial statements.
| | |
SEI Institutional Managed Trust / Semi-Annual Report / March 31, 2019 | | 139 |
CONSOLIDATED SUMMARY SCHEDULE OF INVESTMENTS (Unaudited)
March 31, 2019
Dynamic Asset Allocation Fund
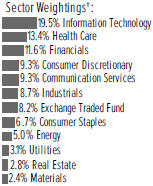
†Percentages are based on total investments.
| | | | | | | | | | | | | | | |
| | | | |
| Description | | Percentage of
Net Assets (%) | | Shares | | Market Value
($ Thousands) |
| |
COMMON STOCK — 92.9% | | | | | | |
| |
Communication Services — 9.4% | | | | | | |
Alphabet Inc,
Cl A * | | | | 1.4 | % | | | | 9,369 | | | | $ | 11,026 | |
Alphabet Inc,
Cl C * | | | | 1.4 | | | | | 9,593 | | | | | 11,256 | |
AT&T Inc | | | | 0.9 | | | | | 227,703 | | | | | 7,141 | |
Comcast Corp,
Cl A | | | | 0.7 | | | | | 141,080 | | | | | 5,640 | |
Facebook Inc,
Cl A * | | | | 1.6 | | | | | 74,671 | | | | | 12,447 | |
Netflix Inc * | | | | 0.6 | | | | | 13,620 | | | | | 4,856 | |
Verizon Communications Inc | | | | 1.0 | | | | | 129,198 | | | | | 7,640 | |
Walt Disney Co/The | | | | 0.8 | | | | | 54,550 | | | | | 6,057 | |
Other Securities | | | | 1.0 | | | | | | | | | | 8,587 | |
| | | | | | | | | | | | | | 74,650 | |
Consumer Discretionary — 9.5% | | | | | | |
Amazon.com Inc, Cl A * | | | | 2.9 | | | | | 12,936 | | | | | 23,036 | |
Home Depot Inc/The | | | | 0.9 | | | | | 35,382 | | | | | 6,789 | |
McDonald’s Corp | | | | 0.6 | | | | | 23,907 | | | | | 4,540 | |
Other Securities | | | | 5.1 | | | | | | | | | | 40,816 | |
| | | | | | | | | | | | | | 75,181 | |
Consumer Staples — 6.8% | | | | | | |
Coca-Cola Co/The | | | | 0.7 | | | | | 120,782 | | | | | 5,660 | |
PepsiCo Inc | | | | 0.7 | | | | | 43,840 | | | | | 5,373 | |
Philip Morris International Inc | | | | 0.5 | | | | | 48,837 | | | | | 4,317 | |
Procter & Gamble Co/The | | | | 1.0 | | | | | 78,409 | | | | | 8,158 | |
Walmart Inc | | | | 0.5 | | | | | 44,476 | | | | | 4,338 | |
Other Securities | | | | 3.4 | | | | | | | | | | 26,331 | |
| | | | | | | | | | | | | | 54,177 | |
Energy — 5.0% | | | | | | |
Chevron Corp | | | | 0.9 | | | | | 59,426 | | | | | 7,320 | |
Exxon Mobil Corp | | | | 1.3 | | | | | 132,500 | | | | | 10,706 | |
Other Securities | | | | 2.8 | | | | | | | | | | 22,101 | |
| | | | | | | | | | | | | | 40,127 | |
Financials — 11.7% | | | | | | |
Bank of America Corp | | | | 1.0 | | | | | 281,645 | | | | | 7,771 | |
Berkshire Hathaway Inc, Cl B * | | | | 1.5 | | | | | 60,830 | | | | | 12,220 | |
Citigroup Inc | | | | 0.6 | | | | | 73,445 | | | | | 4,570 | |
JPMorgan Chase & Co | | | | 1.3 | | | | | 102,417 | | | | | 10,368 | |
Wells Fargo & Co | | | | 0.8 | | | | | 128,333 | | | | | 6,201 | |
Other Securities | | | | 6.5 | | | | | | | | | | 51,867 | |
| | | | | | | | | | | | | | 92,997 | |
| | | | | | | | | | | | | | | |
| | | |
| Description | | Percentage of
Net Assets (%) | | Shares | | Market Value
($ Thousands) |
| |
COMMON STOCK (continued) | | | | | | |
| |
Health Care — 13.6% | | | | | | |
Abbott Laboratories | | | | 0.6 | % | | | | 54,824 | | | | $ | 4,383 | |
AbbVie Inc | | | | 0.5 | | | | | 46,325 | | | | | 3,733 | |
Amgen Inc, Cl A | | | | 0.5 | | | | | 19,563 | | | | | 3,717 | |
Eli Lilly & Co | | | | 0.4 | | | | | 27,066 | | | | | 3,512 | |
Johnson & Johnson | | | | 1.5 | | | | | 83,344 | | | | | 11,651 | |
Medtronic PLC | | | | 0.5 | | | | | 42,141 | | | | | 3,838 | |
Merck & Co Inc | | | | 0.8 | | | | | 80,966 | | | | | 6,734 | |
Pfizer Inc | | | | 0.9 | | | | | 173,557 | | | | | 7,371 | |
UnitedHealth Group Inc | | | | 0.9 | | | | | 30,111 | | | | | 7,445 | |
Other Securities (A) | | | | 7.0 | | | | | | | | | | 55,422 | |
| | | | | | | | | | | | | | 107,806 | |
| |
Industrials — 8.8% | | | | | | |
3M Co | | | | 0.5 | | | | | 17,926 | | | | | 3,725 | |
Boeing Co/The | | | | 0.8 | | | | | 16,409 | | | | | 6,259 | |
Honeywell International Inc | | | | 0.5 | | | | | 22,752 | | | | | 3,616 | |
Union Pacific Corp | | | | 0.5 | | | | | 22,719 | | | | | 3,799 | |
Other Securities | | | | 6.5 | | | | | | | | | | 52,756 | |
| | | | | | | | | | | | | | 70,155 | |
| |
Information Technology — 19.7% | | | | | | |
Accenture PLC,
Cl A | | | | 0.4 | | | | | 20,048 | | | | | 3,529 | |
Adobe Inc * | | | | 0.5 | | | | | 15,264 | | | | | 4,068 | |
Apple Inc | | | | 3.3 | | | | | 140,230 | | | | | 26,637 | |
Broadcom Inc | | | | 0.5 | | | | | 12,375 | | | | | 3,721 | |
Cisco Systems Inc | | | | 0.9 | | | | | 138,072 | | | | | 7,455 | |
Intel Corp | | | | 1.0 | | | | | 140,997 | | | | | 7,572 | |
International Business Machines Corp | | | | 0.5 | | | | | 27,968 | | | | | 3,946 | |
Mastercard Inc,
Cl A | | | | 0.8 | | | | | 28,182 | | | | | 6,635 | |
Microsoft Corp | | | | 3.6 | | | | | 240,196 | | | | | 28,329 | |
Oracle Corp, Cl B | | | | 0.5 | | | | | 79,533 | | | | | 4,272 | |
PayPal Holdings
Inc * | | | | 0.5 | | | | | 36,885 | | | | | 3,830 | |
salesforce.com Inc * | | | | 0.5 | | | | | 23,972 | | | | | 3,796 | |
Visa Inc, Cl A | | | | 1.1 | | | | | 54,732 | | | | | 8,549 | |
Other Securities | | | | 5.6 | | | | | | | | | | 44,526 | |
| | | | | | | | | | | | | | 156,865 | |
| |
Materials — 2.4% | | | | | | |
DowDuPont Inc | | | | 0.5 | | | | | 70,875 | | | | | 3,778 | |
Other Securities | | | | 1.9 | | | | | | | | | | 15,689 | |
| | | | | | | | | | | | | | 19,467 | |
| |
Real Estate — 2.9% | | | | | | |
Other Securities‡ | | | | 2.9 | | | | | | | | | | 22,876 | |
| |
Utilities — 3.1% | | | | | | |
Other Securities | | | | 3.1 | | | | | | | | | | 24,620 | |
| | |
Total Common Stock
(Cost $528,650) ($ Thousands) | | | | | | | | | | 738,921 | |
| | |
140 | | SEI Institutional Managed Trust / Semi-Annual Report / March 31, 2019 |
| | | | | | | | |
| | | | |
| Description | | Percentage of Net Assets (%) | | Shares | | Market Value
($ Thousands) | |
|
EXCHANGE TRADED FUND — 3.9% | |
| | | |
SPDR S&P 500 ETF
Trust (B) | | 3.9% | | 109 | | $ | 30,910 | |
| | | | | | | | |
| |
Total Exchange Traded Fund
(Cost $29,213) ($ Thousands) | | | 30,910 | |
| | | | | | | | |
| |
Total Investments in Securities — 96.8%
(Cost $557,863) ($ Thousands) | | $ | 769,831 | |
| | | | | | | | |
| | | | | | | | | | |
| | | | |
| Description | | | | Contracts | | | Market Value
($ Thousands) | |
|
PURCHASED OPTION(C) — 0.0% | |
Total Purchased Option
(Cost $468) ($ Thousands) | | | 185,586,452 | | | $ | 155 | |
| | | | | | | | | | |
|
PURCHASED SWAPTION(D) — 0.3% | |
Total Purchased Swaption
(Cost $2,357) ($ Thousands) | | | 864,868,000 | | | $ | 2,720 | |
| | | | | | | | | | |
A list of the OTC option contracts held by the Fund at March 31, 2019, is as follows:
| | | | | | | | | | | | | | | | | | | | | | | | |
| Description | | Counterparty | | | Number of Contracts | | | Notional Amount
(Thousands) | | | Exercise Price | | | Expiration Date | | | Value
(Thousands) | |
| | | | | | |
PURCHASED OPTION — 0.0% | | | | | | | | | | | | | | | | | | | | | | | | |
| | | | | | |
Put Options | | | | | | | | | | | | | | | | | | | | | | | | |
April 2019, EUR Put USD Call* | | | Bank of Montreal | | | | 185,586,452 | | | $ | 208,154 | | | | $1.10 | | | | 04/20/19 | | | $ | 155 | |
| | | | | | | | | | | | | | | | | | | | | | | | |
Total Purchased Options | | | | | | | | | | $ | 208,154 | | | | | | | | | | | $ | 155 | |
| | | | | | | | | | | | | | | | | | | | | | | | |
A list of the open OTC swaption contracts held by the Fund at March 31, 2019, is as follows:
| | | | | | | | | | | | | | | | | | |
| Description | | Counterparty | | Number of Contracts/
Notional Amount | | | Exercise Price | | | Expiration Date | | | Value
(Thousands) | |
| | | | | |
PURCHASED SWAPTION — 0.3% | | | | | | | | | | | | | | | | | | |
| | | | | |
Call Swaptions — 0.3% | | | | | | | | | | | | | | | | | | |
CMS One Look* | | Bank of America Merrill Lynch | | | 864,868,000 | | | | $0.14 | | | | 07/17/21 | | | $ | 2,720 | |
| | | | | | | | | | | | | | | | | | |
| | | | | |
Total Purchased Swaption
(Cost $2,357) ($ Thousands) | | | | | | | | | | | | | | | | $ | 2,720 | |
| | | | | | | | | | | | | | | | | | |
A list of the open futures contracts held by the Fund at March 31, 2019, is as follows:
| | | | | | | | | | | | | | | | | | | | |
| Type of Contract | | Number of
Contracts
Long (Short) | | | Expiration
Date | | | Notional Amount
(Thousands) | | | Value
(Thousands) | | | Unrealized
Appreciation/
(Depreciation)
(Thousands) | |
Amsterdam Index | | | (65) | | | | Apr-2019 | | | $ | (7,782) | | | $ | (7,998) | | | $ | (214) | |
CAC40 10 Euro Index | | | (133) | | | | Apr-2019 | | | | (7,829) | | | | (7,979) | | | | (147) | |
DAX Index | | | (25) | | | | Jun-2019 | | | | (8,066) | | | | (8,095) | | | | (25) | |
FTSE MIB Index | | | (66) | | | | Jun-2019 | | | | (7,434) | | | | (7,685) | | | | (251) | |
IBEX | | | (77) | | | | Apr-2019 | | | | (7,855) | | | | (7,944) | | | | (87) | |
MSCI EAFE Index E-MINI | | | (338) | | | | Jun-2019 | | | | (31,160) | | | | (31,542) | | | | (382) | |
MSCI Emerging Markets | | | 2,274 | | | | Jun-2019 | | | | 119,811 | | | | 120,226 | | | | 415 | |
S&P 500 Index E-MINI | | | (185) | | | | Jun-2019 | | | | (25,559) | | | | (26,250) | | | | (691) | |
| | | | | | | | | | | | | | | | | | | | |
| | | | | | | | | | $ | 24,126 | | | $ | 22,733 | | | $ | (1,382) | |
| | | | | | | | | | | | | | | | | | | | |
| | |
SEI Institutional Managed Trust / Semi-Annual Report / March 31, 2019 | | 141 |
CONSOLIDATED SUMMARY SCHEDULE OF INVESTMENTS (Unaudited)
March 31, 2019
Dynamic Asset Allocation Fund(Concluded)
A list of the open forward foreign currency contracts held by the Fund at March 31, 2019, is as follows:
| | | | | | | | | | | | | | | | | | | | | | | | |
| Counterparty | | Settlement Date | | | | | | Currency to Deliver
(Thousands) | | | | | | Currency to Receive
(Thousands) | | | Unrealized
Appreciation
(Depreciation)
(Thousands) | |
| | | | | | |
Bank of America | | | 01/09/20 | | | | USD | | | | 894 | | | | SAR | | | | 3,355 | | | $ | — | |
| | | | | | |
Bank of America | | | 01/09/20 | | | | SAR | | | | 152,334 | | | | USD | | | | 40,507 | | | | (85) | |
| | | | | | |
Barclays PLC | | | 04/09/19 | | | | USD | | | | 1,476 | | | | EUR | | | | 1,313 | | | | — | |
| | | | | | |
Barclays PLC | | | 04/09/19 | | | | USD | | | | 74,878 | | | | JPY | | | | 8,004,844 | | | | (2,495) | |
| | | | | | |
Barclays PLC | | | 04/09/19 | | | | JPY | | | | 223,304 | | | | USD | | | | 2,018 | | | | (2) | |
| | | | | | |
BNP Paribas | | | 04/09/19 | | | | EUR | | | | 38,458 | | | | USD | | | | 43,881 | | | | 667 | |
| | | | | | |
Goldman Sachs | | | 04/09/19 | | | | USD | | | | 5,799 | | | | JPY | | | | 626,187 | | | | (136) | |
| | | | | | |
JPMorgan Chase Bank | | | 04/09/19 | | | | EUR | | | | 68,928 | | | | USD | | | | 79,013 | | | | 1,562 | |
| | | | | | |
RBC | | | 04/09/19 | | | | USD | | | | 3,406 | | | | JPY | | | | 375,744 | | | | (9) | |
| | | | | | | | | | | | | | | | | | | | | | | | |
| | | | | | | | | | | | | | | | | | | | | | $ | (498) | |
| | | | | | | | | | | | | | | | | | | | | | | | |
A list of the open OTC swap agreements held by the Fund at March 31, 2019, is as follows:
| | | | | | | | | | | | | | | | | | | | | | | | | | | | | | | | | | |
| Total Return Swaps | |
| Counterparty | | Reference Entity/
Obligation | | Fund Pays | | Fund Receives | | Payment
Frequency | | | Termination
Date | | | Currency | | | Notional
Amount
(Thousands) | | | Value
(Thousands) | | | Upfront
Payments/
Receipts
(Thousands) | | | Net Unrealized
Appreciation
(Depreciation)
(Thousands) | |
BNP Paribas(B) | | Bloomberg Commodity Index Total Return | | USD T-BILL AUCTION HIGH RATE + 11 BPS | | INDEX RETURN | | | Quarterly | | | | 05/10/2019 | | | | USD | | | | (73,205) | | | $ | 1,295 | | | $ | — | | | $ | 1,295 | |
HSBC | | Russell 1000 Growth Total Return | | INDEX RETURN | | 3-MONTH USD - LIBOR PLUS 16 BPS | | | Quarterly | | | | 04/23/2019 | | | | USD | | | | 41,873 | | | | (4,050) | | | | — | | | | (4,050) | |
HSBC | | Russell 1000 Value Index Total Return | | 3-MONTH USD - LIBOR PLUS 20 BPS | | INDEX RETURN | | | Quarterly | | | | 04/23/2019 | | | | USD | | | | (41,002) | | | | 2,291 | | | | — | | | | 2,291 | |
Morgan Stanley | | Russell 1000 Growth Total Return | | INDEX RETURN | | 3-MONTH USD - LIBOR PLUS 20 BPS | | | Quarterly | | | | 09/19/2019 | | | | USD | | | | 85,959 | | | | (621) | | | | — | | | | (621) | |
Morgan Stanley | | Russell 1000 Value Index Total Return | | 3-MONTH USD - LIBOR PLUS 24 BPS | | INDEX RETURN | | | Quarterly | | | | 09/19/2019 | | | | USD | | | | (86,911) | | | | (701) | | | | — | | | | (701) | |
| | | | | | | | | | | | | | | | | | | | | | | | | | |
| | | | | | | | | | | | | | | | | | | | | | | | $ | (1,786) | | | $ | — | | | $ | (1,786) | |
| | | | | | | | | | | | | | | | | | | | | | | | | | |
Percentages are based on a Net Assets of $795,513 ($ Thousands).
| * | Non-income producing security. |
| ‡ | Real Estate Investment Trust. |
| (A) | Securities considered illiquid. The total value of such securities as of March 31, 2019 was $1,917 ($ Thousands) and represented 0.2% of Net Assets. |
| (B) | Security is held by the Dynamic Commodity Strategy Subsidiary Ltd. as of March 31, 2019. |
| (C) | Refer to table below for details on Option Contracts. |
| (D) | Refer to table below for details on Swaption Contracts. |
BPS — Basis Point
Cl — Class
CMS — Constant Maturity Swap
DAX — German Stock Index
EAFE — Europe, Australasia and Far East
ETF — Exchange-Traded Fund
EUR — Euro
FTSE— Financial Times and Stock Exchange
IBEX — Spanish Exchange Index
JPY — Japanese Yen
LIBOR — London Interbank Offered Rate
MIB — Milano Indice di Borsa
MSCI — Morgan Stanley Capital International
OTC — Over-The-Counter
PLC — Public Limited Company
S&P— Standard & Poor’s
SAR — Saudi Riyal
SPDR — Standard & Poor’s Depositary Receipt
USD — United States Dollar
The Summary Schedule of Investments does not reflect the complete portfolio holdings. It includes the Fund’s 50 largest holdings and each investment of any issuer that exceeds 1% of the Fund’s net assets. “Other Securities” represent all issues not required to be disclosed under the rules adopted by the U.S. Securities and Exchange Commission (“SEC”). In certain instances, securities for which footnotes listed above may otherwise apply are included in the Other Securities caption. The complete schedule of portfolio holdings is available (i) without charge, upon request, by calling (800) 342-5734; and (ii) on the SEC’s website at http://www.sec.gov.
| | |
142 | | SEI Institutional Managed Trust / Semi-Annual Report / March 31, 2019 |
The following is a list of the level of inputs used as of March 31, 2019, in valuing the Fund’s investments and other financial instruments carried at value ($ Thousands):
| | | | | | | | | | | | | | | | |
| | | | | |
| Investments in Securities | | Level 1 | | | Level 2 | | | Level 3 | | | Total | |
Common Stock | | $ | 738,921 | | | $ | – | | | $ | – | | | $ | 738,921 | |
Exchange Traded Fund | | | 30,910 | | | | – | | | | – | | | | 30,910 | |
| | | | | | | | | | | | | | | | |
Total Investments in Securities | | $ | 769,831 | | | $ | – | | | $ | – | | | $ | 769,831 | |
| | | | | | | | | | | | | | | | |
| | | | | | | | | | | | | | | | |
| | | | | |
Other Financial
Instruments | | Level 1 | | | Level 2 | | | Level 3 | | | Total | |
Purchased Option | | $ | 155 | | | $ | — | | | $ | — | | | $ | 155 | |
Purchased Swaption | | | — | | | | 2,720 | | | | — | | | | 2,720 | |
Futures Contracts * | | | | | | | | | | | | | | | | |
Unrealized Appreciation | | | 415 | | | | — | | | | — | | | | 415 | |
Unrealized Depreciation | | | (1,797) | | | | — | | | | — | | | | (1,797) | |
Forwards Contracts * | | | | | | | | | | | | | | | | |
Unrealized Appreciation | | | — | | | | 2,229 | | | | — | | | | 2,229 | |
Unrealized Depreciation | | | — | | | | (2,727) | | | | — | | | | (2,727) | |
OTC Swaps | | | | | | | | | | | | | | | | |
Total Return Swaps * | | | | | | | | | | | | | | | | |
Unrealized Appreciation | | | — | | | | 3,586 | | | | — | | | | 3,586 | |
Unrealized Depreciation | | | — | | | | (5,372) | | | | — | | | | (5,372) | |
| | | | | | | | | | | | | | | | |
Total Other Financial Instruments | | $ | (1,227) | | | $ | 436 | | | $ | — | | | $ | (791) | |
| | | | | | | | | | | | | | | | |
* Futures contracts, forward contracts and swap contracts are valued at the unrealized appreciation (depreciation) on the instruments.
For the period ended March 31, 2019, there were no transfers between Level 1 and Level 2 assets and liabilities.
For the period ended March 31, 2019, there were no transfers between Level 2 and Level 3 assets and liabilities.
For more information on valuation inputs, see Note 2 — Significant Accounting Policies in Notes to Financial Statements.
Amounts designated as “—” are either $0 or have been rounded to $0.
The accompanying notes are an integral part of the financial statements.
| | |
SEI Institutional Managed Trust / Semi-Annual Report / March 31, 2019 | | 143 |
SCHEDULE OF INVESTMENTS (Unaudited)
March 31, 2019
Multi-Strategy Alternative Fund
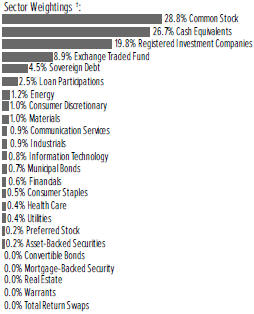
†Percentages are based on total investments.
| | | | | | | | |
| | | |
| Description | | Shares | | | Market Value ($ Thousands) | |
| | |
COMMON STOCK — 26.5% | | | | | | | | |
| |
Communication Services — 2.4% | | | | | |
Alphabet Inc, Cl A * | | | 1,435 | | | $ | 1,689 | |
Cars.com Inc * | | | 5,981 | | | | 136 | |
Charter Communications Inc, Cl A * | | | 1,479 | | | | 513 | |
Cumulus Media Inc, Cl A *(A) | | | 5,075 | | | | 92 | |
DISH Network Corp, Cl A * | | | 25,140 | | | | 797 | |
Electronic Arts Inc * | | | 8,464 | | | | 860 | |
Intelsat SA * | | | 57,225 | | | | 896 | |
Madison Square Garden Co/The * | | | 7,455 | | | | 2,185 | |
Nintendo Co Ltd | | | 10,406 | | | | 2,967 | |
Walt Disney Co/The | | | 14,409 | | | | 1,600 | |
| | | | | | | | |
| | |
| | | | | | | 11,735 | |
| | | | | | | | |
| |
Consumer Discretionary — 7.4% | | | | | |
Adtalem Global Education Inc * | | | 7,397 | | | | 343 | |
Advance Auto Parts Inc | | | 7,000 | | | | 1,194 | |
American Axle & Manufacturing Holdings
Inc * | | | 99,790 | | | | 1,428 | |
Aramark | | | 122,640 | | | | 3,624 | |
Caesars Entertainment
Corp * | | | 67,739 | | | | 589 | |
Callaway Golf Co | | | 82,201 | | | | 1,309 | |
Capri Holdings Ltd * | | | 26,134 | | | | 1,196 | |
Cedar Fair LP (B)(C) | | | 36,256 | | | | 1,908 | |
Cenveo Corp * | | | 2,777 | | | | 36 | |
Children’s Place Inc/The | | | 14,654 | | | | 1,425 | |
Churchill Downs Inc | | | 23,438 | | | | 2,115 | |
Delphi Automotive PLC * | | | 8,168 | | | | 649 | |
Eldorado Resorts Inc * | | | 20,494 | | | | 957 | |
Extended Stay America Inc | | | 98,819 | | | | 1,774 | |
Gap Inc/The | | | 55,847 | | | | 1,462 | |
| | | | | | | | |
| | | |
| Description | | Shares | | | Market Value
($ Thousands) | |
| | |
COMMON STOCK (continued) | | | | | | | | |
Groupon Inc, Cl A * | | | 82,209 | | | $ | 292 | |
GrubHub Inc * | | | 12,335 | | | | 857 | |
Jack in the Box Inc | | | 1,195 | | | | 97 | |
Lennar Corp, Cl A | | | 45,327 | | | | 2,225 | |
Melco Resorts & Entertainment Ltd ADR | | | 18,251 | | | | 412 | |
Papa John’s International Inc, Cl A | | | 17,468 | | | | 925 | |
Red Rock Resorts Inc, Cl A | | | 15,033 | | | | 389 | |
Skyline Champion Corp * | | | 87,087 | | | | 1,655 | |
Sotheby’s * | | | 60,105 | | | | 2,269 | |
Target Corp, Cl A | | | 783 | | | | 63 | |
Toll Brothers Inc | | | 37,437 | | | | 1,355 | |
Veoneer Inc * | | | 26,732 | | | | 611 | |
William Lyon Homes, Cl A *(B) | | | 117,279 | | | | 1,802 | |
Wyndham Hotels & Resorts Inc (B) | | | 39,713 | | | | 1,985 | |
Wynn Resorts Ltd | | | 6,058 | | | | 723 | |
| | | | | | | | |
| | |
| | | | | | | 35,669 | |
| | | | | | | | |
| | |
Consumer Staples — 0.5% | | | | | | | | |
Cott Corp | | | 49,753 | | | | 727 | |
Nomad Foods Ltd * | | | 18,166 | | | | 372 | |
Tyson Foods Inc, Cl A | | | 15,182 | | | | 1,054 | |
| | | | | | | | |
| | |
| | | | | | | 2,153 | |
| | | | | | | | |
| | |
Energy — 0.2% | | | | | | | | |
EQT Corp | | | 34,941 | | | | 725 | |
Jupiter Resources * | | | 24,396 | | | | 76 | |
| | | | | | | | |
| | |
| | | | | | | 801 | |
| | | | | | | | |
| | |
Financials — 1.3% | | | | | | | | |
Genworth Financial Inc, Cl A * | | | 51,834 | | | | 199 | |
Oaktree Capital Group
LLC (C) | | | 35,731 | | | | 1,774 | |
Raymond James Financial Inc | | | 13,459 | | | | 1,082 | |
SunTrust Banks Inc | | | 3,416 | | | | 202 | |
Texas Capital Bancshares
Inc * | | | 58,474 | | | | 3,192 | |
| | | | | | | | |
| | |
| | | | | | | 6,449 | |
| | | | | | | | |
| | |
Health Care — 1.1% | | | | | | | | |
BioScrip Inc * | | | 26,278 | | | | 53 | |
Bristol-Myers Squibb Co | | | 115 | | | | 5 | |
Celgene Corp, Cl A * | | | 1,874 | | | | 177 | |
Magellan Health Inc * | | | 9,518 | | | | 627 | |
Spark Therapeutics Inc * | | | 36,729 | | | | 4,183 | |
WellCare Health Plans Inc * | | | 905 | | | | 244 | |
| | | | | | | | |
| | |
| | | | | | | 5,289 | |
| | | | | | | | |
| | |
Industrials — 3.1% | | | | | | | | |
ADT Inc | | | 72,660 | | | | 464 | |
Alaska Air Group Inc | | | 8,457 | | | | 475 | |
American Airlines Group Inc | | | 40,642 | | | | 1,291 | |
Builders FirstSource Inc *(B) | | | 115,857 | | | | 1,545 | |
BWX Technologies Inc,
Cl W (B) | | | 40,825 | | | | 2,024 | |
Delta Air Lines Inc, Cl A | | | 28,081 | | | | 1,450 | |
| | |
144 | | SEI Institutional Managed Trust / Semi-Annual Report / March 31, 2019 |
| | | | | | | | |
| | | |
| Description | | Shares | | | Market Value
($ Thousands) | |
| |
COMMON STOCK (continued) | | | | | |
Gol Linhas Aereas Inteligentes SA ADR * | | | 82,981 | | | $ | 1,083 | |
JetBlue Airways Corp * | | | 108,766 | | | | 1,779 | |
Lyft Inc, Cl A * | | | 13,815 | | | | 995 | |
Nielsen Holdings PLC | | | 15,633 | | | | 370 | |
Quad/Graphics Inc | | | 13,560 | | | | 161 | |
Senior PLC | | | 303,012 | | | | 862 | |
United Continental Holdings Inc *(B) | | | 21,870 | | | | 1,745 | |
WABCO Holdings Inc * | | | 4,171 | | | | 550 | |
| | | | | | | | |
| | |
| | | | | | | 14,794 | |
| | | | | | | | |
| |
Information Technology — 6.8% | | | | | |
Avaya Holdings Corp * | | | 3,459 | | | | 58 | |
Avnet Inc | | | 40,235 | | | | 1,745 | |
Finisar Corp * | | | 18,714 | | | | 434 | |
First Data Corp, Cl A * | | | 118,769 | | | | 3,120 | |
First Solar Inc * | | | 36,456 | | | | 1,926 | |
Integrated Device Technology Inc * | | | 11,146 | | | | 546 | |
KLA-Tencor Corp | | | 624 | | | | 75 | |
Luxoft Holding Inc, Cl A * | | | 26,220 | | | | 1,540 | |
Maxwell Technologies Inc * | | | 112,125 | | | | 501 | |
Mellanox Technologies Ltd * | | | 27,512 | | | | 3,256 | |
Microchip Technology Inc | | | 13,119 | | | | 1,088 | |
Mmodal *(D) | | | 6,952 | | | | 36 | |
Red Hat Inc * | | | 24,908 | | | | 4,551 | |
Ultimate Software Group Inc/The * | | | 23,800 | | | | 7,857 | |
Vishay Intertechnology
Inc (B) | | | 97,985 | | | | 1,810 | |
Worldpay Inc, Cl A * | | | 36,363 | | | | 4,127 | |
| | | | | | | | |
| | |
| | | | | | | 32,670 | |
| | | | | | �� | | |
| | |
Materials — 2.5% | | | | | | | | |
Allegheny Technologies
Inc *(B) | | | 76,028 | | | | 1,944 | |
Bemis Co Inc | | | 52,790 | | | | 2,929 | |
Commercial Metals Co, Cl A | | | 44,771 | | | | 765 | |
Constellium NV, Cl A *(B) | | | 219,697 | | | | 1,753 | |
Graphic Packaging Holding Co | | | 224,878 | | | | 2,840 | |
Ingevity Corp *(B) | | | 17,159 | | | | 1,812 | |
Neo Lithium Corp * | | | 117,002 | | | | 75 | |
| | | | | | | | |
| | |
| | | | | | | 12,118 | |
| | | | | | | | |
| | |
Real Estate — 0.8% | | | | | | | | |
Braemar Hotels & Resorts Inc | | | 146,001 | | | | 1,783 | |
Kimco Realty Corp ‡ | | | 41,524 | | | | 768 | |
RLJ Lodging Trust ‡ | | | 73,966 | | | | 1,300 | |
| | | | | | | | |
| | |
| | | | | | | 3,851 | |
| | | | | | | | |
| | |
Utilities — 0.4% | | | | | | | | |
Clearway Energy Inc,
Cl C (B) | | | 138,338 | | | | 2,090 | |
| | | | | | | | |
| | |
Total Common Stock
(Cost $127,820)
($ Thousands) | | | | | | | 127,619 | |
| | | | | | | | |
| | | | | | | | |
| Description | | Shares | | | Market Value
($ Thousands) | |
|
REGISTERED INVESTMENT COMPANIES — 18.2% | |
AQR Managed Futures Strategy HV Fund Cl I * | | | 539,169 | | | $ | 4,254 | |
ASG Managed Futures Strategy Fund Cl Y * | | | 502,355 | | | | 4,642 | |
Merger Fund/The Cl L | | | 3,016,513 | | | | 50,225 | |
SEI Institutional Managed Trust Long Short Alternative Fund Cl Y † | | | 2,991,560 | | | | 28,569 | |
| | | | | | | | |
| |
Total Registered Investment Companies
(Cost $87,405) ($ Thousands) | | | | 87,690 | |
| | | | | | | | |
|
EXCHANGE TRADED FUND — 8.2% | |
BlackRock Global Long/Short Credit Fund | | | 4,000,634 | | | | 39,366 | |
| | | | | | | | |
| | |
Total Exchange Traded Fund
(Cost $42,979)
($ Thousands) | | | | | | | 39,366 | |
| | | | | | | | |
| | |
| | | Face Amount
(Thousands) | | | | |
| |
CORPORATE OBLIGATIONS — 7.0% | | | | | |
| |
Communication Services — 0.9% | | | | | |
CenturyLink | | | | | | | | |
5.625%, 04/01/2025 | | $ | 170 | | | | 165 | |
Digicel | | | | | | | | |
6.000%,
04/15/2021 (E) | | | 135 | | | | 112 | |
Digicel Group | | | | | | | | |
6.750%,
03/01/2023 (E) | | | 85 | | | | 54 | |
DISH DBS | | | | | | | | |
5.875%, 11/15/2024 | | | 450 | | | | 378 | |
Frontier Communications | | | | | | | | |
10.500%, 09/15/2022 | | | 165 | | | | 126 | |
8.500%,
04/01/2026 (E) | | | 110 | | | | 102 | |
7.125%, 01/15/2023 | | | 240 | | | | 145 | |
6.875%, 01/15/2025 | | | 85 | | | | 46 | |
Inmarsat Finance | | | | | | | | |
6.500%,
10/01/2024 (E) | | | 126 | | | | 132 | |
McClatchy | | | | | | | | |
9.000%,
07/15/2026 (E) | | | 158 | | | | 158 | |
Netflix | | | | | | | | |
5.875%, 02/15/2025 | | | 160 | | | | 173 | |
Sprint | | | | | | | | |
7.875%, 09/15/2023 | | | 300 | | | | 314 | |
Telecom Italia | | | | | | | | |
5.303%,
05/30/2024 (E) | | | 85 | | | | 85 | |
Telecom Italia Capital | | | | | | | | |
6.000%,
09/30/2034 | | | 85 | | | | 79 | |
T-Mobile USA | | | | | | | | |
5.375%, 04/15/2027 | | | 15 | | | | 15 | |
4.750%, 02/01/2028 | | | 45 | | | | 45 | |
Tribune Media | | | | | | | | |
5.875%, 07/15/2022 | | | 1,974 | | | | 2,015 | |
Windstream Services | | | | | | | | |
10.500%,
06/30/2024 (E)(F) | | | 25 | | | | 18 | |
| | |
SEI Institutional Managed Trust / Semi-Annual Report / March 31, 2019 | | 145 |
SCHEDULE OF INVESTMENTS (Unaudited)
March 31, 2019
Multi-Strategy Alternative Fund(Continued)
| | | | | | | | |
| | | |
| Description | | Face Amount
(Thousands) | | | Market Value
($ Thousands) | |
| | |
CORPORATE OBLIGATIONS (continued) | | | | | |
9.000%,
06/30/2025 (E)(F) | | $ | 70 | | | $ | 48 | |
| | | | | | | | |
| | | | | | | 4,210 | |
| | | | | | | | |
| |
Consumer Discretionary — 0.9% | | | | | |
Altice | | | | | | | | |
7.625%,
02/15/2025 (E) | | | 160 | | | | 140 | |
Altice Financing | | | | | | | | |
7.500%,
05/15/2026 (E) | | | 170 | | | | 168 | |
Altice France | | | | | | | | |
7.375%,
05/01/2026 (E) | | | 185 | | | | 181 | |
Bon-Ton Department Stores | | | | | | | | |
8.000%,
06/15/2021 (F) | | | 255 | | | | 20 | |
CBS Radio | | | | | | | | |
7.250%,
11/01/2024 (E) | | | 125 | | | | 124 | |
Cengage Learning | | | | | | | | |
9.500%,
06/15/2024 (E) | | | 255 | | | | 210 | |
CSC Holdings | | | | | | | | |
6.500%,
02/01/2029 (E) | | | 165 | | | | 176 | |
Delphi Technologies | | | | | | | | |
5.000%,
10/01/2025 (E) | | | 180 | | | | 159 | |
Diamond Resorts International | | | | | | | | |
10.750%,
09/01/2024 (E) | | | 205 | | | | 194 | |
Getty Images | | | | | | | | |
9.750%,
03/01/2027 (E) | | | 20 | | | | 20 | |
Guitar Center | | | | | | | | |
5.000% cash/0% PIK, 04/15/2022 (E) | | | 575 | | | | 469 | |
Guitar Center Escrow Issuer | | | | | | | | |
9.500%,
10/15/2021 (E) | | | 120 | | | | 115 | |
Hilton Domestic Operating | | | | | | | | |
4.250%, 09/01/2024 | | | 105 | | | | 105 | |
iHeartCommunications | | | | | | | | |
14.000%,
02/01/2021 (F) | | | 756 | | | | 100 | |
9.000%, 12/15/2019 (F) | | | 105 | | | | 75 | |
9.000%, 03/01/2021 (F) | | | 185 | | | | 130 | |
Inn of the Mountain Gods Resort & Casino | | | | | | | | |
9.250% cash/0% PIK, 11/30/2020 | | | 153 | | | | 152 | |
Jacobs Entertainment | | | | | | | | |
7.875%,
02/01/2024 (E) | | | 115 | | | | 121 | |
JC Penney | | | | | | | | |
6.375%, 10/15/2036 | | | 300 | | | | 105 | |
KFC Holding | | | | | | | | |
5.250%,
06/01/2026 (E) | | | 150 | | | | 151 | |
McGraw-Hill Global Education Holdings | | | | | | | | |
7.875%,
05/15/2024 (E) | | | 50 | | | | 40 | |
Monitronics International | | | | | | | | |
9.125%, 04/01/2020 (F) | | | 465 | | | | 93 | |
Penn National Gaming | | | | | | | | |
5.625%,
01/15/2027 (E) | | | 165 | | | | 160 | |
Rivers Pittsburgh Borrower | | | | | | | | |
6.125%,
08/15/2021 (E) | | | 170 | | | | 170 | |
Silversea Cruise Finance | | | | | | | | |
7.250%,
02/01/2025 (E) | | | 135 | | | | 146 | |
| | | | | | | | |
| | | |
| Description | | Face Amount
(Thousands) | | | Market Value
($ Thousands) | |
| | |
CORPORATE OBLIGATIONS (continued) | | | | | |
Sugarhouse HSP Gaming Prop Mezz | | | | | | | | |
5.875%, 05/15/2025 (E) | | $ | 375 | | | $ | 371 | |
Urban One | | | | | | | | |
7.375%, 04/15/2022 (E) | | | 335 | | | | 323 | |
Ziggo BV | | | | | | | | |
5.500%, 01/15/2027 (E) | | | 155 | | | | 153 | |
| | | | | | | | |
| | |
| | | | | | | 4,371 | |
| | | | | | | | |
| | |
Consumer Staples — 0.5% | | | | | | | | |
Dean Foods | | | | | | | | |
6.500%, 03/15/2023 (E) | | | 965 | | | | 630 | |
New Albertsons | | | | | | | | |
8.700%, 05/01/2030 | | | 100 | | | | 92 | |
8.000%, 05/01/2031 | | | 155 | | | | 140 | |
7.750%, 06/15/2026 | | | 5 | | | | 4 | |
7.450%, 08/01/2029 | | | 515 | | | | 456 | |
Rite Aid | | | | | | | | |
7.700%, 02/15/2027 | | | 215 | | | | 134 | |
6.875%, 12/15/2028 (E) | | | 70 | | | | 41 | |
6.125%, 04/01/2023 (E) | | | 415 | | | | 342 | |
Vector Group | | | | | | | | |
10.500%, 11/01/2026 (E) | | | 250 | | | | 236 | |
| | | | | | | | |
| | |
| | | | | | | 2,075 | |
| | | | | | | | |
| | |
Energy — 1.1% | | | | | | | | |
Cheniere Corpus Christi Holdings | | | | | | | | |
7.000%, 06/30/2024 | | | 75 | | | | 84 | |
5.125%, 06/30/2027 | | | 80 | | | | 84 | |
Crestwood Midstream Partners | | | | | | | | |
5.750%, 04/01/2025 | | | 155 | | | | 159 | |
Ensco | | | | | | | | |
5.750%, 10/01/2044 | | | 165 | | | | 106 | |
EP Energy | | | | | | | | |
7.750%, 05/15/2026 (E) | | | 135 | | | | 110 | |
EP PetroEcuador via Noble Sovereign Funding I | | | | | | | | |
8.240%, VAR ICE LIBOR USD 3 Month+5.630%, 09/24/2019 | | | 53 | | | | 53 | |
Extraction Oil & Gas | | | | | | | | |
5.625%, 02/01/2026 (E) | | | 130 | | | | 100 | |
KCA Deutag UK Finance | | | | | | | | |
9.875%, 04/01/2022 (E) | | | 160 | | | | 138 | |
9.625%, 04/01/2023 (E) | | | 65 | | | | 54 | |
Noble Holding International | | | | | | | | |
8.950%, 04/01/2045 | | | 180 | | | | 140 | |
7.750%, 01/15/2024 | | | 110 | | | | 99 | |
Parker Drilling | | | | | | | | |
7.500%,
08/01/2020 (D)(F) | | | 10 | | | | 6 | |
6.750%,
07/15/2022 (D)(F) | | | 185 | | | | 90 | |
Petrobras Global Finance | | | | | | | | |
8.750%, 05/23/2026 | | | 354 | | | | 419 | |
| | |
146 | | SEI Institutional Managed Trust / Semi-Annual Report / March 31, 2019 |
| | | | | | | | |
| | | |
| Description | | Face Amount
(Thousands) | | | Market Value
($ Thousands) | |
|
CORPORATE OBLIGATIONS (continued) | |
Petrobras Global Finance BV | | | | | | | | |
6.900%, 03/19/2049 | | $ | 362 | | | $ | 358 | |
6.250%, 03/17/2024 | | | 197 | | | | 212 | |
Petroleos de Venezuela | | | | | | | | |
6.000%, 10/28/2022 (F) | | | 367 | | | | 63 | |
Petroleos Mexicanos | | | | | | | | |
5.500%, 01/21/2021 | | | 362 | | | | 368 | |
4.875%, 01/24/2022 | | | 587 | | | | 592 | |
3.500%, 01/30/2023 | | | 440 | | | | 420 | |
Petroleos Mexicanos MTN | | | | | | | | |
4.625%, 09/21/2023 | | | 616 | | | | 607 | |
Pride International | | | | | | | | |
7.875%, 08/15/2040 | | | 50 | | | | 40 | |
Rowan | | | | | | | | |
5.850%, 01/15/2044 | | | 435 | | | | 278 | |
5.400%, 12/01/2042 | | | 55 | | | | 34 | |
Transocean | | | | | | | | |
6.800%, 03/15/2038 | | | 290 | | | | 225 | |
USA Compression Partners | | | | | | | | |
6.875%, 09/01/2027 (E) | | | 145 | | | | 147 | |
Weatherford International | | | | | | | | |
9.875%, 02/15/2024 | | | 190 | | | | 137 | |
9.875%, 03/01/2039 | | | 40 | | | | 26 | |
5.950%, 04/15/2042 | | | 90 | | | | 50 | |
| | | | | | | | |
| | |
| | | | | | | 5,199 | |
| | | | | | | | |
| | |
Financials — 0.5% | | | | | | | | |
BCD Acquisition | | | | | | | | |
9.625%, 09/15/2023 (E) | | | 140 | | | | 148 | |
Freedom Mortgage | | | | | | | | |
8.250%, 04/15/2025 (E) | | | 240 | | | | 213 | |
8.125%, 11/15/2024 (E) | | | 20 | | | | 18 | |
FS Energy & Power Fund | | | | | | | | |
7.500%, 08/15/2023 (E) | | | 125 | | | | 128 | |
HSBC Bank MTN | | | | | | | | |
17.854%, 08/08/2019
(E)(G) | | EGP | 2,850 | | | | 153 | |
JPMorgan Chase | | | | | | | | |
5.150%, VAR ICE LIBOR USD 3 Month+3.250%, 12/29/2049 | | $ | 150 | | | | 151 | |
Nationstar Mortgage Holdings | | | | | | | | |
9.125%, 07/15/2026 (E) | | | 125 | | | | 127 | |
Springleaf Finance | | | | | | | | |
7.125%, 03/15/2026 | | | 150 | | | | 153 | |
6.875%, 03/15/2025 | | | 290 | | | | 299 | |
Travelport Corporate Finance | | | | | | | | |
6.000%, 03/15/2026 (E) | | | 359 | | | | 388 | |
VTB Bank Via VTB Capital | | | | | | | | |
6.950%, 10/17/2022 | | | 453 | | | | 466 | |
WeWork | | | | | | | | |
7.875%, 05/01/2025 (E) | | | 305 | | | | 280 | |
| | | | | | | | |
| | |
| | | | | | | 2,524 | |
| | | | | | | | |
| | | | | | | | |
| | | |
| Description | | Face Amount
(Thousands) | | | Market Value
($ Thousands) | |
|
CORPORATE OBLIGATIONS (continued) | |
Health Care — 0.4% | | | | | | | | |
Air Medical Group Holdings | | | | | | | | |
6.375%, 05/15/2023 (E) | | $ | 180 | | | $ | 151 | |
Bausch Health Americas | | | | | | | | |
9.250%, 04/01/2026 (E) | | | 150 | | | | 164 | |
8.500%, 01/31/2027 (E) | | | 45 | | | | 48 | |
BioScrip | | | | | | | | |
8.875%, 02/15/2021 | | | 679 | | | | 686 | |
Centene | | | | | | | | |
4.750%, 01/15/2025 | | | 165 | | | | 168 | |
Endo | | | | | | | | |
6.000%, 07/15/2023 (E) | | | 98 | | | | 76 | |
Endo Finance | | | | | | | | |
5.375%, 01/15/2023 (E) | | | 75 | | | | 62 | |
HCA | | | | | | | | |
5.875%, 02/01/2029 | | | 160 | | | | 172 | |
Par Pharmaceutical | | | | | | | | |
7.500%, 04/01/2027 (E) | | | 90 | | | | 91 | |
Tenet Healthcare | | | | | | | | |
6.250%,
02/01/2027 (E) | | | 155 | | | | 161 | |
| | | | | | | | |
| | |
| | | | | | | 1,779 | |
| | | | | | | | |
| | |
Industrials — 0.8% | | | | | | | | |
Deck Chassis Acquisition | | | | | | | | |
10.000%, 06/15/2023 (E) | | | 791 | | | | 837 | |
Global A&T Electronics | | | | | | | | |
8.500%, 01/12/2023 | | | 474 | | | | 441 | |
Icahn Enterprises | | | | | | | | |
6.250%, 02/01/2022 | | | 145 | | | | 149 | |
Multi-Color | | | | | | | | |
6.125%, 12/01/2022 (E) | | | 152 | | | | 157 | |
4.875%, 11/01/2025 (E) | | | 871 | | | | 899 | |
New Enterprise Stone & Lime | | | | | | | | |
6.250%, 03/15/2026 (E) | | | 220 | | | | 214 | |
Titan International | | | | | | | | |
6.500%, 11/30/2023 | | | 160 | | | | 147 | |
Triumph Group | | | | | | | | |
7.750%, 08/15/2025 | | | 180 | | | | 172 | |
Tutor Perini | | | | | | | | |
6.875%, 05/01/2025 (E) | | | 170 | | | | 169 | |
United Rentals North America | | | | | | | | |
6.500%, 12/15/2026 | | | 250 | | | | 263 | |
USG | | | | | | | | |
5.500%, 03/01/2025 (E) | | | 43 | | | | 44 | |
Vertiv Group | | | | | | | | |
9.250%, 10/15/2024 (E) | | | 160 | | | | 159 | |
Weekley Homes | | | | | | | | |
6.625%, 08/15/2025 | | | 230 | | | | 220 | |
| | | | | | | | |
| | |
| | | | | | | 3,871 | |
| | | | | | | | |
| | |
SEI Institutional Managed Trust / Semi-Annual Report / March 31, 2019 | | 147 |
SCHEDULE OF INVESTMENTS (Unaudited)
March 31, 2019
Multi-Strategy Alternative Fund(Continued)
| | | | | | | | |
| | | |
| Description | | Face Amount
(Thousands) | | | Market Value
($ Thousands) | |
|
CORPORATE OBLIGATIONS (continued) | |
Information Technology — 0.7% | | | | | |
CommScope Finance | | | | | | | | |
8.250%, 03/01/2027 (E) | | $ | 30 | | | $ | 31 | |
6.000%, 03/01/2026 (E) | | | 175 | | | | 181 | |
CommScope Technologies | | | | | | | | |
6.000%, 06/15/2025 (E) | | | 40 | | | | 39 | |
First Data | | | | | | | | |
5.750%, 01/15/2024 (E) | | | 2,007 | | | | 2,064 | |
Rackspace Hosting | | | | | | | | |
8.625%, 11/15/2024 (E) | | | 390 | | | | 347 | |
Symantec | | | | | | | | |
5.000%, 04/15/2025 (E) | | | 200 | | | | 200 | |
Versum Materials | | | | | | | | |
5.500%, 09/30/2024 (E) | | | 576 | | | | 606 | |
| | | | | | | | |
| | |
| | | | | | | 3,468 | |
| | | | | | | | |
| | |
Materials — 0.9% | | | | | | | | |
Aleris International | | | | | | | | |
10.750%,
07/15/2023 (E) | | | 1,629 | | | | 1,710 | |
Allegheny Technologies | | | | | | | | |
7.875%, 08/15/2023 | | | 145 | | | | 157 | |
Alpha 3 BV | | | | | | | | |
6.250%, 02/01/2025 (E) | | | 100 | | | | 96 | |
Baffinland Iron Mines | | | | | | | | |
8.750%, 07/15/2026 (E) | | | 5 | | | | 5 | |
CENVO Corp (Escrow Security) | | | | | | | | |
0.000%,
09/15/2022 (A)(D)(H) | | | 505 | | | | 7 | |
Cornerstone Chemical | | | | | | | | |
6.750%, 08/15/2024 (E) | | | 305 | | | | 287 | |
Eldorado | | | | | | | | |
6.125%, 12/15/2020 (E) | | | 60 | | | | 59 | |
First Quantum Minerals | | | | | | | | |
7.500%, 04/01/2025 (E) | | | 135 | | | | 129 | |
7.250%, 04/01/2023 (E) | | | 35 | | | | 34 | |
7.000%, 02/15/2021 (E) | | | 47 | | | | 48 | |
Freeport-McMoRan | | | | | | | | |
5.450%, 03/15/2043 | | | 170 | | | | 149 | |
Hexion | | | | | | | | |
6.625%, 04/15/2020 | | | 475 | | | | 400 | |
LSB Industries | | | | | | | | |
9.625%, 05/01/2023 (E) | | | 160 | | | | 166 | |
Mountain Province Diamonds | | | | | | | | |
8.000%, 12/15/2022 (E) | | | 170 | | | | 170 | |
Northwest Acquisitions ULC | | | | | | | | |
7.125%, 11/01/2022 (E) | | | 305 | | | | 268 | |
Rain CII Carbon | | | | | | | | |
7.250%, 04/01/2025 (E) | | | 395 | | | | 350 | |
Starfruit Finco BV | | | | | | | | |
8.000%, 10/01/2026 (E) | | | 165 | | | | 166 | |
| | | | | | | | |
| | | |
| Description | | Face Amount
(Thousands) | | | Market Value
($ Thousands) | |
|
CORPORATE OBLIGATIONS (continued) | |
TPC Group | | | | | | | | |
8.750%,
12/15/2020 (E) | | $ | 165 | | | $ | 163 | |
| | | | | | | | |
| | |
| | | | | | | 4,364 | |
| | | | | | | | |
| | |
Real Estate — 0.0% | | | | | | | | |
Realogy Group | | | | | | | | |
9.375%,
04/01/2027 (E) | | | 35 | | | | 36 | |
Uniti Group | | | | | | | | |
7.125%,
12/15/2024 (E) | | | 50 | | | | 43 | |
6.000%,
04/15/2023 (E) | | | 40 | | | | 38 | |
| | | | | | | | |
| | |
| | | | | | | 117 | |
| | | | | | | | |
| | |
Utilities — 0.3% | | | | | | | | |
Eskom Holdings SOC | | | | | | | | |
5.750%, 01/26/2021 | | | 400 | | | | 394 | |
Eskom Holdings SOC MTN | | | | | | | | |
8.450%, 08/10/2028 | | | 595 | | | | 624 | |
NRG Energy | | | | | | | | |
7.250%, 05/15/2026 | | | 155 | | | | 171 | |
Pacific Gas & Electric | | | | | | | | |
3.300%, 03/15/2027 (F) | | | 135 | | | | 118 | |
Vistra Operations | | | | | | | | |
5.500%,
09/01/2026 (E) | | | 260 | | | | 270 | |
| | | | | | | | |
| | |
| | | | | | | 1,577 | |
| | | | | | | | |
| |
Total Corporate Obligations
(Cost $35,058) ($ Thousands) | | | | 33,555 | |
| | | | | | | | |
| | |
SOVEREIGN DEBT — 4.2% | | | | | | | | |
Argentina POM Politica Monetaria | | | | | | | | |
67.546%, VAR Argentina Central Bank 7 Day Repo Rate+0.000%, 06/21/2020 | | ARS | 5,761 | | | | 146 | |
Argentina Treasury Bill | | | | | | | | |
0.000%,
04/30/2020 (G) | | | 12,929 | | | | 326 | |
0.000%,
07/31/2020 (G) | | | 8,883 | | | | 196 | |
Argentine Republic Government International Bond | | | | | | | | |
5.625%, 01/26/2022 | | $ | 1,559 | | | | 1,345 | |
4.625%, 01/11/2023 | | | 822 | | | | 673 | |
3.875%, 01/15/2022 | | EUR | 776 | | | | 737 | |
3.380%, 4.740%, 03/31/2029, 12/31/2038 (I) | | | 1,324 | | | | 838 | |
Bahrain Government International Bond | | | | | | | | |
7.000%, 01/26/2026 | | $ | 400 | | | | 430 | |
Brazilian Government International Bond | | | | | | | | |
4.875%, 01/22/2021 | | | 566 | | | | 584 | |
Ecuador Government International Bond | | | | | | | | |
10.750%, 03/28/2022 | | | 263 | | | | 294 | |
Indonesia Government International Bond | | | | | | | | |
4.450%, 02/11/2024 | | | 200 | | | | 208 | |
| | |
148 | | SEI Institutional Managed Trust / Semi-Annual Report / March 31, 2019 |
| | | | | | | | |
| | | |
| Description | | Face Amount
(Thousands) | | | Market Value
($ Thousands) | |
|
SOVEREIGN DEBT (continued) | |
MDC-GMTN BV MTN | | | | | | | | |
4.500%, 11/07/2028 | | $ | 200 | | | $ | 213 | |
National Highways Authority of India | | | | | | | | |
7.300%, 05/18/2022 | | INR | 30,000 | | | | 422 | |
Nigeria Government International Bond | | | | | | | | |
7.625%, 11/21/2025 | | $ | 263 | | | | 280 | |
Paraguay Government International Bond | | | | | | | | |
4.625%, 01/25/2023 | | | 733 | | | | 755 | |
Qatar Government International Bond | | | | | | | | |
4.817%, 03/14/2049 (E) | | | 353 | | | | 371 | |
4.000%, 03/14/2029 (E) | | | 279 | | | | 288 | |
Republic of South Africa Government Bond | | | | | | | | |
10.500%, 12/21/2026 | | ZAR | 25,597 | | | | 1,958 | |
8.750%, 02/28/2048 | | | 23,203 | | | | 1,453 | |
Republic of South Africa Government International Bond | | | | | | | | |
6.300%, 06/22/2048 | | $ | 677 | | | | 688 | |
5.500%, 03/09/2020 | | | 713 | | | | 724 | |
Russian Federal Bond - OFZ | | | | | | | | |
7.250%, 05/10/2034 | | RUB | 92,520 | | | | 1,277 | |
Russian Foreign Bond - Eurobond | | | | | | | | |
5.250%, 06/23/2047 | | $ | 2,000 | | | | 2,012 | |
5.100%, 03/28/2035 (E) | | | 600 | | | | 609 | |
5.000%, 04/29/2020 | | | 300 | | | | 305 | |
4.500%, 04/04/2022 | | | 600 | | | | 617 | |
Saudi Government International Bond | | | | | | | | |
5.250%, 01/16/2050 | | | 617 | | | | 658 | |
2.375%, 10/26/2021 | | | 633 | | | | 622 | |
Turkey Government International Bond | | | | | | | | |
7.000%, 06/05/2020 | | | 879 | | | | 887 | |
5.625%, 03/30/2021 | | | 215 | | | | 212 | |
| | | | | | | | |
| | |
Total Sovereign Debt
(Cost $20,743) ($ Thousands) | | | | | | | 20,128 | |
| | | | | | | | |
|
LOAN PARTICIPATIONS — 2.3% | |
84 Lumber, 1st Lien | | | | | | | | |
7.736%, 10/25/2023 | | | 137 | | | | 135 | |
Academy Ltd., Term Loan, 1st Lien | | | | | | | | |
6.490%, VAR LIBOR+4.000%, 07/01/2022 | | | 130 | | | | 93 | |
6.489%, VAR LIBOR+4.000%, 07/01/2022 | | | 277 | | | | 198 | |
Advantage Sales, Term B-2 Loan, 1st Lien | | | | | | | | |
5.749%, 07/23/2021 | | | — | | | | — | |
Advantage Solutions, Term Loan B, 1st Lien | | | | | | | | |
5.749%, 07/23/2021 | | | 105 | | | | 89 | |
Affinity Game, Term Loan 2, 2nd Lien | | | | | | | | |
10.749%, 01/31/2025 | | | 300 | | | | 286 | |
AgroFresh, Term Loan, 1st Lien | | | | | | | | |
7.553%, 07/31/2021 (D) | | | 79 | | | | 78 | |
| | | | | | | | |
| | | |
| Description | | Face Amount
(Thousands) | | | Market Value
($ Thousands) | |
| |
LOAN PARTICIPATIONS (continued) | | | | | |
Air Medical Group Holdings Inc., Term Loan B, 1st Lien | | | | | | | | |
5.739%, VAR LIBOR+3.250%, 04/28/2022 | | $ | 173 | | | $ | 163 | |
American Tire Distributors, Term Loan, 1st Lien | | | | | | | | |
10.129%, VAR LIBOR+4.250%, 09/02/2024 | | | 33 | | | | 30 | |
Apex Tool Group, Term Loan, 1st Lien | | | | | | | | |
6.249%, VAR LIBOR+3.750%, 02/01/2022 | | | — | | | | — | |
Aptos, 1st Lien | | | | | | | | |
7.993%, 07/23/2025 | | | 80 | | | | 79 | |
BMC Software Finance, Inc., Term Loan, 1st Lien | | | | | | | | |
6.851%, 10/02/2025 | | | 130 | | | | 127 | |
Bright BIDCO BV, Term Loan B, 1st Lien | | | | | | | | |
5.999%, 06/30/2024 (D) | | | 22 | | | | 17 | |
Bright Bidco, Term Loan, 1st Lien | | | | | | | | |
6.101%, 06/30/2024 (D) | | | 106 | | | | 81 | |
5.999%, 06/30/2024 (D) | | | 28 | | | | 22 | |
Broadriders, Term Loan B, 1st Lien | | | | | | | | |
8.999%, 04/23/2024 | | | 129 | | | | 128 | |
Caesars Resort Collection LLC, Term Loan B, 1st Lien | | | | | | | | |
5.249%, VAR LIBOR+2.750%, 12/23/2024 | | | 125 | | | | 123 | |
Carestream Health Inc., Extended Term Loan, 1st Lien | | | | | | | | |
8.249%, 02/28/2021 | | | 325 | | | | 317 | |
Cengage Learning Inc., Term Loan B, 1st Lien | | | | | | | | |
6.736%, VAR LIBOR+4.250%, 06/07/2023 | | | 419 | | | | 376 | |
CenturyLink Inc., Term Loan B, 1st Lien | | | | | | | | |
5.249%, VAR LIBOR+2.750%, 01/31/2025 | | | 162 | | | | 159 | |
Change Healthcare Holdings, Inc. (fka Emdeon Inc.), Closing Date Term Loan, 1st Lien | | | | | | | | |
5.249%, VAR LIBOR+2.750%, 03/01/2024 | | | 156 | | | | 154 | |
Checkers Drive-In, Term Loan, 1st Lien | | | | | | | | |
6.880%, 04/25/2024 | | | 118 | | | | 99 | |
6.750%, 04/25/2024 | | | — | | | | — | |
ConvergeOne Holdings, Corp., Initial Term Loan | | | | | | | | |
7.499%, 01/04/2026 | | | 120 | | | | 115 | |
Coral, Term Loan B-4, 1st Lien | | | | | | | | |
5.749%, 01/30/2026 | | | 160 | | | | 159 | |
Cumulus Media New Holdings Inc., Term Loan, 1st Lien | | | | | | | | |
7.000%, 05/13/2022 | | | 346 | | | | 339 | |
| | |
SEI Institutional Managed Trust / Semi-Annual Report / March 31, 2019 | | 149 |
SCHEDULE OF INVESTMENTS (Unaudited)
March 31, 2019
Multi-Strategy Alternative Fund(Continued)
| | | | | | | | |
| | | |
| Description | | Face Amount
(Thousands) | | | Market Value
($ Thousands) | |
|
LOAN PARTICIPATIONS (continued) | |
Doncasters, Cov-Lite, 1st Lien | | | | | | | | |
6.101%, 04/09/2020 | | $ | 21 | | | $ | 18 | |
Doncasters, Term Loan, 1st Lien | | | | | | | | |
6.101%, 04/09/2020 | | | 96 | | | | 85 | |
East Valley Tourist Development Authority, Term Loan, 1st Lien | | | | | | | | |
10.601%, VAR LIBOR+8.000%, 09/30/2020 (D) | | | 136 | | | | 135 | |
ELO Touch Solutions, Term Loan B, 1st Lien | | | | | | | | |
9.093%, 12/14/2025 | | | 183 | | | | 182 | |
Envision Healthcare Corp., Term Loan, 1st Lien | | | | | | | | |
6.249%, 10/10/2025 | | | 175 | | | | 163 | |
EPIC Y-Grade Services, Term Loan, 1st Lien | | | | | | | | |
7.999%, 06/13/2024 (D) | | | 237 | | | | 231 | |
Financial & Risk US Holdings Inc., Term Loan B, 1st Lien | | | | | | | | |
6.249%, 10/01/2025 | | | 252 | | | | 244 | |
Forterra Finance LLC, Term Loan B, 1st Lien | | | | | | | | |
5.499%, VAR LIBOR+3.000%, 10/25/2023 | | | 124 | | | | 114 | |
Gates Global LLC, Term Loan B, 1st Lien | | | | | | | | |
5.249%, 04/01/2024 | | | 119 | | | | 117 | |
Glass Mountain, Term Loan B, 1st Lien | | | | | | | | |
7.000%, 12/23/2024 | | | 69 | | | | 67 | |
Hoffmaster Group, Term Loan B, 1st Lien | | | | | | | | |
6.493%, 11/21/2023 | | | 196 | | | | 195 | |
Horseshoe Baltimore, Cov-Lite, Term Loan B, 1st Lien | | | | | | | | |
6.499%, 07/08/2024 | | | 212 | | | | 211 | |
Husky IMS, Term Loan B, 1st Lien | | | | | | | | |
5.499%, 03/28/2025 | | | 144 | | | | 134 | |
Lantheus, 1st Lien | | | | | | | | |
6.243%, 06/30/2022 | | | 89 | | | | 89 | |
Leap Legal Software, Term Loan B, 1st Lien | | | | | | | | |
7.669%, 09/12/2022 (D) | | | 296 | | | | 210 | |
7.633%, 09/12/2022 (D) | | | 100 | | | | 71 | |
Libbey Glass, 1st Lien | | | | | | | | |
5.493%, 04/09/2021 (D) | | | 102 | | | | 91 | |
Lifescan, Term Loan, 1st Lien | | | | | | | | |
8.797%, 10/01/2024 | | | 250 | | | | 240 | |
Mashantucket (Western) Pequot Tribe, Term Loan A, 1st Lien | | | | | | | | |
10.624%, VAR LIBOR+8.125%, 06/30/2020 (D) | | | 578 | | | | 574 | |
Mashantucket (Western) Pequot Tribe, Term Loan, 1st Lien | | | | | | | | |
5.999%, VAR LIBOR+3.750%, 06/30/2020 (D) | | | 21 | | | | 21 | |
Mavenir Systems Inc., Term Loan B, 1st Lien | | | | | | | | |
8.500%, 05/08/2025 | | | 159 | | | | 158 | |
| | | | | | | | |
| | | |
| Description | | Face Amount
(Thousands) | | | Market Value
($ Thousands) | |
|
LOAN PARTICIPATIONS (continued) | |
McGraw-Hill Global Education Holdings LLC, Term Loan B, 1st Lien | | | | | | | | |
6.499%, VAR LIBOR+4.000%, 05/04/2022 | | $ | 295 | | | $ | 271 | |
Misys Ltd, Term Loan B, 1st Lien | | | | | | | | |
6.101%, VAR LIBOR+3.500%, 06/13/2024 | | | 192 | | | | 185 | |
Mohegan Tribal Gaming Authority, Term Loan B, 1st Lien | | | | | | | | |
6.499%, VAR LIBOR+4.000%, 10/13/2023 | | | 143 | | | | 135 | |
Nine West Holdings Inc., Term Loan, 1st Lien | | | | | | | | |
0.000%, 03/19/2024 (J) | | | 130 | | | | 128 | |
Numericable U.S. LLC (SFR), Term Loan B-13 | | | | | | | | |
6.484%, 08/14/2026 | | | 75 | | | | 72 | |
Ortho-Clinical Diagnostics, Inc., Term Loan B, 1st Lien | | | | | | | | |
5.749%, 06/30/2025 | | | 136 | | | | 131 | |
Pacific Gas & Electric, Term Loan | | | | | | | | |
1.125%, 12/31/2020 | | | 125 | | | | — | |
Patterson Companies, Term Loan B, 1st Lien | | | | | | | | |
7.384%, 08/29/2022 | | | 1 | | | | 1 | |
Patterson Medical, Term Loan, 1st Lien | | | | | | | | |
7.494%, 08/29/2022 | | | 394 | | | | 378 | |
Peak, Term Loan B, 1st Lien | | | | | | | | |
6.101%, 08/01/2024 | | | 232 | | | | 212 | |
Rackspace Hosting, Inc., Term B Loan | | | | | | | | |
5.738%, 11/03/2023 | | | 210 | | | | 197 | |
5.625%, 11/03/2023 | | | — | | | | — | |
Radio One Inc., Initial Term Loan, 1st Lien | | | | | | | | |
6.500%, VAR LIBOR+4.000%, 04/18/2023 | | | 112 | | | | 106 | |
Red Lobster Management LLC, Initial Term Loan, 1st Lien | | | | | | | | |
7.749%, 07/28/2021 (D) | | | 145 | | | | 143 | |
RegionalCare Hospital Partners Holdings, Term Loan, 1st Lien | | | | | | | | |
6.982%, 11/16/2025 | | | 130 | | | | 128 | |
Revlon Consumer Products Corp., Term Loan B, 1st Lien | | | | | | | | |
6.129%, VAR LIBOR+3.500%, 09/07/2023 | | | 295 | | | | 213 | |
6.101%, VAR LIBOR+3.500%, 09/07/2023 | | | — | | | | — | |
Spencer Gifts LLC (Spirit Halloween Superstores LLC), Term B-1 Loan | | | | | | | | |
6.750%, 07/16/2021 (D) | | | 238 | | | | 235 | |
Spencer Gifts LLC (Spirit Halloween Superstores LLC), Term Loan, 2nd Lien | | | | | | | | |
10.750%, 06/29/2022 | | | 65 | | | | 62 | |
| | |
150 | | SEI Institutional Managed Trust / Semi-Annual Report / March 31, 2019 |
| | | | | | | | |
| | | |
| Description | | Face Amount
(Thousands) | | | Market Value
($ Thousands) | |
| |
LOAN PARTICIPATIONS (continued) | | | | | |
Sprint Communications, Inc., Initial Term Loan, 1st Lien | | | | | | | | |
5.000%, VAR LIBOR+2.500%, 02/02/2024 | | $ | 155 | | | $ | 150 | |
Syniverse Holdings Inc., Term Loan, 1st Lien | | | | | | | | |
7.484%, VAR LIBOR+5.000%, 03/09/2023 | | | 418 | | | | 383 | |
Team Health Holdings, Term Loan, 1st Lien | | | | | | | | |
5.249%, VAR LIBOR+2.750%, 02/06/2024 | | | 408 | | | | 362 | |
Thor Industries, Term Loan B, 1st Lien | | | | | | | | |
6.250%, 02/01/2026 | | | 151 | | | | 144 | |
Transdigm Inc., New Tranche G Term Loan | | | | | | | | |
4.999%, VAR LIBOR+2.500%, 08/22/2024 | | | 142 | | | | 138 | |
UPC Financing Partnership, Term Loan, 1st Lien | | | | | | | | |
4.984%, VAR LIBOR+2.500%, 01/15/2026 | | | 117 | | | | 116 | |
Windstream Services LLC, Term Loan B, 1st Lien | | | | | | | | |
10.500%, VAR LIBOR+4.000%, 03/29/2021 | | | 516 | | | | 517 | |
9.750%, VAR LIBOR+3.250%, 02/17/2024 | | | 50 | | | | 49 | |
| | | | | | | | |
| | |
Total Loan Participations
(Cost $11,508)
($ Thousands) | | | | | | | 11,173 | |
| | | | | | | | |
| |
MUNICIPAL BONDS — 0.6% | | | | | |
| |
Puerto Rico — 0.6% | | | | | |
Commonwealth of Puerto Rico, GDB Debt Recovery Authority, RB | | | | | | | | |
7.500%, 08/20/2040 | | | 240 | | | | 180 | |
Commonwealth of Puerto Rico, Ser A, GO | | | | | | | | |
5.000%,
07/01/2020 (F) | | | 5 | | | | 3 | |
Commonwealth of Puerto Rico, Ser A, GO | | | | | | | | |
Callable 04/29/2019 @ 100 | | | | | | | | |
5.250%,
07/01/2025 (D)(F) | | | 5 | | | | 3 | |
Commonwealth of Puerto Rico, Ser A, GO | | | | | | | | |
Callable 07/01/2020 @ 100 | | | | | | | | |
8.000%,
07/01/2035 (F) | | | 2,655 | | | | 1,377 | |
Commonwealth of Puerto Rico, Ser A, GO | | | | | | | | |
Callable 07/01/2021 @ 100 | | | | | | | | |
5.750%,
07/01/2041 (F) | | | 315 | | | | 180 | |
Commonwealth of Puerto Rico, Ser A, GO | | | | | | | | |
Callable 07/01/2022 @ 100 | | | | | | | | |
5.500%,
07/01/2026 (D)(F) | | | 5 | | | | 3 | |
5.500%,
07/01/2039 (F) | | | 680 | | | | 359 | |
5.250%,
07/01/2023 (D)(F) | | | 30 | | | | 16 | |
5.125%,
07/01/2037 (F) | | | 20 | | | | 10 | |
| | | | | | | | |
| | | |
| Description | | Face Amount (Thousands) | | | Market Value ($ Thousands) | |
| |
MUNICIPAL BONDS (continued) | | | | | |
5.000%, 07/01/2032 (F) | | $ | 5 | | | $ | 3 | |
5.000%, 07/01/2041 (F) | | | 705 | | | | 368 | |
Commonwealth of Puerto Rico, Ser B, GO | | | | | | | | |
4.400%, 07/01/2020 (F) | | | 10 | | | | 5 | |
4.250%, 07/01/2019 (F) | | | 5 | | | | 2 | |
Commonwealth of Puerto Rico, Ser B, GO | | | | | | | | |
Callable 07/01/2019 @ 100 | | | | | | | | |
5.750%, 07/01/2038 (F) | | | 20 | | | | 13 | |
Commonwealth of Puerto Rico, Ser C, GO | | | | | | | | |
Callable 04/29/2019 @ 100 | | | | | | | | |
6.000%,
07/01/2032 (D)(F) | | | 5 | | | | 3 | |
Commonwealth of Puerto Rico, Ser C, GO | | | | | | | | |
Callable 07/01/2019 @ 100 | | | | | | | | |
6.000%, 07/01/2039 (F) | | | 5 | | | | 3 | |
Commonwealth of Puerto Rico, Ser C, GO | | | | | | | | |
Callable 07/01/2021 @ 100 | | | | | | | | |
6.500%, 07/01/2040 (F) | | | 5 | | | | 3 | |
Commonwealth of Puerto Rico, Ser D, GO | | | | | | | | |
5.000%, 07/01/2019 (F) | | | 5 | | | | 3 | |
5.000%,
07/01/2020 (D)(F) | | | 5 | | | | 3 | |
Commonwealth of Puerto Rico, Ser E, GO | | | | | | | | |
5.625%, 07/01/2032 (F) | | | 5 | | | | 3 | |
Commonwealth of Puerto Rico, Ser E, GO | | | | | | | | |
Callable 07/01/2021 @ 100 | | | | | | | | |
5.375%, 07/01/2030 (F) | | | 5 | | | | 3 | |
Puerto Rico Sales Tax Financing Sales Tax Revenue, Ser A-1, RB | | | | | | | | |
4.239%, 07/01/2027 (G) | | | 4 | | | | 3 | |
0.000%, 07/01/2024 (G) | | | 1 | | | | 1 | |
Puerto Rico Sales Tax Financing Sales Tax Revenue, Ser A-1, RB | | | | | | | | |
Callable 07/01/2025 @ 100 | | | | | | | | |
4.500%, 07/01/2034 | | | 4 | | | | 4 | |
Puerto Rico Sales Tax Financing Sales Tax Revenue, Ser A-1, RB | | | | | | | | |
Callable 07/01/2028 @ 30 | | | | | | | | |
7.771%, 07/01/2051 (G) | | | 66 | | | | 10 | |
Puerto Rico Sales Tax Financing Sales Tax Revenue, Ser A-1, RB | | | | | | | | |
Callable 07/01/2028 @ 41 | | | | | | | | |
7.228%, 07/01/2046 (G) | | | 86 | | | | 18 | |
Puerto Rico Sales Tax Financing Sales Tax Revenue, Ser A-1, RB | | | | | | | | |
Callable 07/01/2028 @ 86 | | | | | | | | |
6.253%, 07/01/2033 (G) | | | 7 | | | | 4 | |
Puerto Rico Sales Tax Financing Sales Tax Revenue, Ser A-1, RB | | | | | | | | |
Callable 07/01/2028 @ 92 | | | | | | | | |
5.536%, 07/01/2031 (G) | | | 4 | | | | 2 | |
Puerto Rico Sales Tax Financing Sales Tax Revenue, Ser A-1, RB | | | | | | | | |
Callable 07/01/2028 @ 99 | | | | | | | | |
4.744%, 07/01/2029 (G) | | | 4 | | | | 3 | |
| | |
SEI Institutional Managed Trust / Semi-Annual Report / March 31, 2019 | | 151 |
SCHEDULE OF INVESTMENTS (Unaudited)
March 31, 2019
Multi-Strategy Alternative Fund(Continued)
| | | | | | | | |
| | | |
| Description | | Face Amount
(Thousands) | | | Market Value ($ Thousands) | |
| |
MUNICIPAL BONDS (continued) | | | | | |
Puerto Rico Sales Tax Financing Sales Tax Revenue, Ser A-1, RB | | | | | | | | |
Callable 07/01/2028 @ 100 | | | | | | | | |
5.000%, 07/01/2058 | | $ | 60 | | | $ | 59 | |
4.750%, 07/01/2053 | | | 22 | | | | 21 | |
4.550%, 07/01/2040 | | | 1 | | | | 1 | |
Puerto Rico Sales Tax Financing Sales Tax Revenue, Ser A-2, RB | | | | | | | | |
Callable 07/01/2028 @ 100 | | | | | | | | |
5.000%, 07/01/2058 | | | 11 | | | | 10 | |
4.550%, 07/01/2040 | | | 32 | | | | 28 | |
Puerto Rico, Electric Power Authority, Ser A, RB | | | | | | | | |
Callable 07/01/2022 @ 100 | | | | | | | | |
5.000%,
07/01/2042 (F) | | | 35 | | | | 25 | |
Puerto Rico, Electric Power Authority, Ser AAA, RB | | | | | | | | |
Callable 07/01/2020 @ 100 | | | | | | | | |
5.250%,
07/01/2021 (F) | | | 10 | | | | 7 | |
5.250%,
07/01/2022 (D)(F) | | | 10 | | | | 7 | |
5.250%,
07/01/2025 (D)(F) | | | 15 | | | | 11 | |
5.250%,
07/01/2027 (F) | | | 20 | | | | 14 | |
Puerto Rico, Electric Power Authority, Ser CCC, RB | | | | | | | | |
Callable 04/29/2019 @ 100 | | | | | | | | |
5.250%,
07/01/2026 (D)(F) | | | 45 | | | | 32 | |
Puerto Rico, Electric Power Authority, Ser CCC, RB | | | | | | | | |
Callable 07/01/2020 @ 100 | | | | | | | | |
5.250%,
07/01/2027 (F) | | | 30 | | | | 21 | |
5.250%,
07/01/2028 (D)(F) | | | 5 | | | | 4 | |
Puerto Rico, Electric Power Authority, Ser NN, RB | | | | | | | | |
5.500%,
07/01/2020 (D)(F) | | | 35 | | | | 25 | |
Puerto Rico, Electric Power Authority, Ser TT, RB | | | | | | | | |
Callable 04/29/2019 @ 100 | | | | | | | | |
5.000%,
07/01/2023 (D)(F) | | | 10 | | | | 7 | |
5.000%,
07/01/2032 (F) | | | 25 | | | | 18 | |
Puerto Rico, Electric Power Authority, Ser WW, RB | | | | | | | | |
5.500%,
07/01/2020 (D)(F) | | | 15 | | | | 11 | |
5.500%,
07/01/2021 (D)(F) | | | 15 | | | | 11 | |
5.500%,
07/01/2038 (F) | | | 5 | | | | 3 | |
5.250%,
07/01/2033 (F) | | | 20 | | | | 14 | |
Puerto Rico, Electric Power Authority, RB | | | | | | | | |
5.250%,
07/01/2035 (D)(F) | | | 5 | | | | 3 | |
Puerto Rico, Electric Power Authority, RB | | | | | | | | |
| | | | | | | | |
| | | |
| Description | | Face Amount (Thousands) | | | Market Value ($ Thousands) | |
| |
MUNICIPAL BONDS (continued) | | | | | |
5.250%,
07/01/2040 (F) | | $ | 30 | | | $ | 21 | |
| | | | | | | | |
| | |
Total Municipal Bonds
(Cost $2,855)
($ Thousands) | | | | | | | 2,941 | |
| | | | | | | | |
| | |
| | | Shares | | | | |
| |
PREFERRED STOCK — 0.2% | | | | | |
| |
Financials — 0.2% | | | | | |
FHLMC, 8.375% * | | | 36,486 | | | | 366 | |
FNMA, 8.250% * | | | 35,173 | | | | 364 | |
| | | | | | | | |
| | |
| | | | | | | 730 | |
| | | | | | | | |
| |
Real Estate — 0.0% | | | | | |
Colony Capital, 7.150% | | | 9,135 | | | | 206 | |
| | | | | | | | |
| | |
Total Preferred Stock
(Cost $615)
($ Thousands) | | | | | | | 936 | |
| | | | | | | | |
| | |
| | | Face Amount
(Thousands) | | | | |
| |
ASSET-BACKED SECURITIES — 0.2% | | | | | |
| |
Other Asset-Backed Securities — 0.2% | | | | | |
| | |
CIFC Funding, Ser 2018-4RA, Cl C | | | | | | | | |
5.973%, VAR ICE LIBOR USD 3 Month+3.200%, 10/17/2030 (E) | | $ | 250 | | | | 243 | |
THL Credit Wind River CLO,
Ser 2017-2A, Cl DR | | | | | | | | |
5.387%, VAR ICE LIBOR USD 3 Month+2.600%, 10/15/2027 (E) | | | 250 | | | | 241 | |
Tryon Park CLO, Ser 2018-1A, Cl CR | | | | | | | | |
5.487%, VAR ICE LIBOR USD 3 Month+2.700%, 04/15/2029 (E) | | | 250 | | | | 243 | |
Venture XVII CLO, Ser 2018-17A, Cl DRR | | | | | | | | |
5.607%, VAR ICE LIBOR USD 3 Month+2.820%, 04/15/2027 (E) | | | 200 | | | | 194 | |
| | | | | | | | |
| | |
Total Asset-Backed Securities
(Cost $946)
($ Thousands) | | | | | | | 921 | |
| | | | | | | | |
| |
CONVERTIBLE BONDS — 0.2% | | | | | |
Liberty Media CV to 16.7764 | | | | | | | | |
3.750%, 02/15/2030 | | | 264 | | | | 180 | |
Liberty Media CV to 22.94686 | | | | | | | | |
4.000%, 11/15/2029 | | | 369 | | | | 253 | |
MGIC Investment CV to 74.0741 | | | | | | | | |
9.000%,
04/01/2063 (E) | | | 230 | | | | 296 | |
| | | | | | | | |
| | |
Total Convertible Bonds
(Cost $717)
($ Thousands) | | | | | | | 729 | |
| | | | | | | | |
| | |
152 | | SEI Institutional Managed Trust / Semi-Annual Report / March 31, 2019 |
| | | | | | | | |
| | | |
| Description | | Face Amount
(Thousands) | | | Market Value ($ Thousands) | |
| |
MORTGAGE-BACKED SECURITY — 0.0% | | | | | |
|
Non-Agency Mortgage-Backed Obligations — 0.0% | |
CHT Mortgage Trust, Ser CSMO, Cl F | | | | | |
6.225%, VAR LIBOR USD 1 Month+3.741%, 11/15/2036 (D)(E) | | $ | 175 | | | $ | 175 | |
| | | | | | | | |
| | |
Total Mortgage-Backed Security (Cost $175) ($ Thousands) | | | | | | | 175 | |
| | | | | | | | |
| | |
| | | Number of
Warrants | | | | |
| |
WARRANT — 0.0% | | | | | |
Guitar Center, Expires 12/30/2027 Strike Price $– *(D) | | | 1,360 | | | | – | |
| | | | | | | | |
| | |
Total Warrant
(Cost $—) ($ Thousands) | | | | | | | – | |
| | | | | | | | |
| | |
| | | Shares | | | | |
| |
CASH EQUIVALENTS — 24.6% | | | | | |
Morgan Stanley Institutional Liquidity Fund Government Portfolio | | | | | | | | |
2.330%** | | | 100,000 | | | | 100 | |
Morgan Stanley Institutional Liquidity Fund Prime Portfolio | | | | | | | | |
2.540%** | | | 99,873 | | | | 100 | |
Morgan Stanley Institutional Liquidity Fund Treasury Securities Portfolio | | | | | | | | |
2.300%** | | | 100,000 | | | | 100 | |
Morgan Stanley Institutional Liquidity Funds - Money Market Portfolio | | | | | | | | |
2.540%*** | | | 99,896 | | | | 100 | |
SEI Daily Income Trust, Government Fund, Cl F | | | | | | | | |
2.220%**† | | | 117,894,710 | | | | 117,895 | |
| | | | | | | | |
| | |
Total Cash Equivalents
(Cost $118,295)
($ Thousands) | | | | | | | 118,295 | |
| | | | | | | | |
| |
Total Investments in Securities — 92.2%
(Cost $449,116) ($ Thousands) | | | $ | 443,528 | |
| | | | | | | | |
|
COMMON STOCK SOLD SHORT— (11.2)% | |
|
Communication Services — (2.0)% | |
CBS Corp, Cl B | | | (7,341) | | | $ | (349) | |
Consolidated Communications Holdings Inc | | | (25,692) | | | | (280) | |
DISH Network Corp, Cl A * | | | (13,134) | | | | (416) | |
Facebook Inc, Cl A * | | | (3,195) | | | | (533) | |
Netflix Inc * | | | (1,208) | | | | (431) | |
| | | | | | | | |
| | | |
| Description | | Shares | | | Market Value ($ Thousands) | |
|
COMMON STOCK SOLD SHORT (continued) | |
New York Times Co/The, Cl A | | | (27,133) | | | $ | (891) | |
Nexstar Media Group Inc, Cl A | | | (5,633) | | | | (610) | |
TEGNA Inc | | | (39,290) | | | | (554) | |
Tribune Media Co, Cl A | | | (118,714) | | | | (5,478) | |
| | | | | | | | |
| | |
| | | | | | | (9,542) | |
| | | | | | | | |
|
Consumer Discretionary — (3.0)% | |
adidas AG | | | (5,182) | | | | (1,260) | |
CarMax Inc * | | | (17,466) | | | | (1,219) | |
Carvana Co, Cl A * | | | (12,026) | | | | (698) | |
Choice Hotels International Inc | | | (14,911) | | | | (1,159) | |
Dick’s Sporting Goods Inc | | | (19,491) | | | | (717) | |
Fossil Group Inc * | | | (9,057) | | | | (124) | |
Gentex Corp | | | (35,154) | | | | (727) | |
Hilton Worldwide Holdings Inc | | | (19,190) | | | | (1,595) | |
Las Vegas Sands Corp | | | (14,712) | | | | (897) | |
MGM Resorts International | | | (34,665) | | | | (889) | |
Ross Stores Inc | | | (3,093) | | | | (288) | |
Service Corp International/US | | | (8,836) | | | | (355) | |
Sleep Number Corp * | | | (25,381) | | | | (1,193) | |
Sodexo SA | | | (7,100) | | | | (783) | |
Tiffany & Co | | | (8,592) | | | | (907) | |
VF Corp | | | (16,599) | | | | (1,443) | |
| | | | | | | | |
| | |
| | | | | | | (14,254) | |
| | | | | | | | |
| |
Consumer Staples — (1.7)% | | | | | |
Brown-Forman Corp, Cl B | | | (14,266) | | | | (753) | |
Clorox Co/The | | | (10,163) | | | | (1,631) | |
Costco Wholesale Corp | | | (2,995) | | | | (725) | |
Energizer Holdings Inc | | | (9,936) | | | | (446) | |
Hershey Co/The | | | (10,134) | | | | (1,164) | |
Hormel Foods Corp | | | (26,745) | | | | (1,197) | |
Hostess Brands Inc, Cl A * | | | (37,877) | | | | (474) | |
Pilgrim’s Pride Corp * | | | (35,715) | | | | (796) | |
Sanderson Farms Inc | | | (3,490) | | | | (460) | |
Walmart Inc | | | (7,299) | | | | (712) | |
| | | | | | | | |
| | |
| | | | | | | (8,358) | |
| | | | | | | | |
| |
Financials — (0.6)% | | | | | |
Ashmore Group PLC | | | (36,004) | | | | (201) | |
BB&T Corp | | | (4,429) | | | | (206) | |
Brookfield Asset Management Inc, Cl A | | | (19,659) | | | | (917) | |
FactSet Research Systems Inc | | | (3,526) | | | | (875) | |
Navigators Group Inc/The | | | (198) | | | | (14) | |
Trupanion Inc * | | | (22,790) | | | | (746) | |
| | | | | | | | |
| | |
| | | | | | | (2,959) | |
| | | | | | | | |
| |
Health Care — (0.5)% | | | | | |
Align Technology Inc * | | | (1,416) | | | | (403) | |
Centene Corp * | | | (763) | | | | (41) | |
| | |
SEI Institutional Managed Trust / Semi-Annual Report / March 31, 2019 | | 153 |
SCHEDULE OF INVESTMENTS (Unaudited)
March 31, 2019
Multi-Strategy Alternative Fund(Continued)
| | | | | | | | |
| | | |
| Description | | Shares | | | Market Value
($ Thousands) | |
|
COMMON STOCK SOLD SHORT (continued) | |
Cooper Cos Inc/The, Cl A | | | (1,797) | | | $ | (532) | |
Demant A/S * | | | (20,168) | | | | (597) | |
iRhythm Technologies Inc * | | | (4,154) | | | | (311) | |
Pacific Biosciences of California Inc * | | | (72,638) | | | | (525) | |
| | | | | | | | |
| | |
| | | | | | | (2,409) | |
| | | | | | | | |
Industrials — (1.1)% | | | | | |
ArcBest Corp | | | (4,272) | | | | (131) | |
Axon Enterprise Inc * | | | (7,921) | | | | (431) | |
Deere & Co | | | (4,433) | | | | (708) | |
Kennametal Inc | | | (9,759) | | | | (359) | |
LSC Communications Inc | | | (21,693) | | | | (142) | |
PACCAR Inc | | | (10,460) | | | | (713) | |
Robert Half International Inc | | | (8,116) | | | | (529) | |
Snap-on Inc | | | (11,134) | | | | (1,743) | |
Wesco Aircraft Holdings Inc * | | | (37,494) | | | | (329) | |
| | | | | | | | |
| | |
| | | | | | | (5,085) | |
| | | | | | | | |
Information Technology — (2.2)% | | | | | |
Adobe Inc * | | | (2,713) | | | | (723) | |
Blackbaud Inc,
Cl A | | | (9,206) | | | | (734) | |
Citrix Systems Inc | | | (3,533) | | | | (352) | |
Fidelity National Information Services Inc,
Cl B | | | (33,746) | | | | (3,817) | |
Fiserv Inc, Cl A * | | | (35,914) | | | | (3,170) | |
II-VI Inc * | | | (4,204) | | | | (157) | |
KLA-Tencor Corp | | | (632) | | | | (75) | |
MKS Instruments Inc | | | (1,825) | | | | (170) | |
Nutanix Inc, Cl A * | | | (5,767) | | | | (218) | |
SolarEdge Technologies Inc * | | | (4,688) | | | | (177) | |
Teradyne Inc | | | (21,396) | | | | (852) | |
Trimble Inc * | | | (2,320) | | | | (94) | |
| | | | | | | | |
| | |
| | | | | | | (10,539) | |
| | | | | | | | |
| |
Materials — (0.2)% | | | | | |
International Paper Co | | | (15,731) | | | | (728) | |
| | | | | | | | |
| |
Total Common Stock Sold Short
(Proceeds $51,561) ($ Thousands) | | | | (53,874) | |
| | | | | | | | |
|
EXCHANGE TRADED FUNDS SOLD SHORT— (1.6)% | |
| |
Exchange Traded Fund — (1.6)% | | | | | |
iShares Russell 2000 ETF | | | (9,263) | | | | (1,418) | |
SPDR S&P 500 ETF Trust | | | (22,887) | | | | (6,465) | |
| | | | | | | | |
| |
Total Exchange Traded Funds Sold Short
(Proceeds $7,793) ($ Thousands) | | | | (7,883) | |
| | | | | | | | |
| | | | | | | | |
| | | |
| Description | | Shares | | | Market Value
($ Thousands) | |
|
EXCHANGE TRADED FUNDS SOLD SHORT (continued) | |
| | |
Total Investments Sold Short — (12.9)%
(Proceeds $59,354)
($ Thousands) | | | | | | $ | (61,757) | |
| | | | | | | | |
| | |
| | | Contracts | | | | | |
PURCHASED OPTIONS* — 0.1% | | | | | |
| | |
Total Purchased
Options(K) (Cost $443)
($ Thousands) | | | 4,659 | | | $ | 271 | |
| | | | | | | | |
| |
WRITTEN OPTIONS* — 0.0% | | | | | |
| | |
Total Written Options(K)
(Premiums Received $93)
($ Thousands) | | | (507) | | | $ | (50) | |
| | | | | | | | |
| | |
154 | | SEI Institutional Managed Trust / Semi-Annual Report / March 31, 2019 |
A list of the open exchange traded options contracts for the Fund at March 31, 2019, is as follows:
| | | | | | | | | | | | | | | | | | | | |
| Description | | Number of Contracts | | Notional Amount
(Thousands) | | Exercise Price | | | Expiration Date | | | Value
(Thousands) |
| | | | | |
PURCHASED OPTIONS — 0.1% | | | | | | | | | | | | | | | | | | | | |
| | | | | |
Put Options | | | | | | | | | | | | | | | | | | | | |
April 19 Puts on SPX* | | | 31 | | | $ | 8,787 | | | $ | 2,800.00 | | | | 04/20/19 | | | $ | 57 | |
April 19 Puts on SPX* | | | 6 | | | | 1,701 | | | | 2,600.00 | | | | 04/20/19 | | | | 1 | |
April 19 Puts on SPX* | | | 31 | | | | 8,787 | | | | 2,600.00 | | | | 04/20/19 | | | | 5 | |
April 19 Puts on SPX* | | | 6 | | | | 1,701 | | | | 2,800.00 | | | | 04/20/19 | | | | 8 | |
BB&T Corp* | | | 9 | | | | 42 | | | | 47.00 | | | | 06/22/19 | | | | 2 | |
Fifth Third Bancorp* | | | 19 | | | | 48 | | | | 25.00 | | | | 05/18/19 | | | | 1 | |
Fiserv Inc* | | | 31 | | | | 274 | | | | 75.00 | | | | 06/22/19 | | | | 1 | |
Harris Corp* | | | 18 | | | | 287 | | | | 140.00 | | | | 05/18/19 | | | | 2 | |
II-VI Inc* | | | 31 | | | | 115 | | | | 30.00 | | | | 04/20/19 | | | | – | |
KLA-Tencor Corp* | | | 21 | | | | 251 | | | | 90.00 | | | | 06/22/19 | | | | 1 | |
KLA-Tencor Corp* | | | 38 | | | | 454 | | | | 95.00 | | | | 06/22/19 | | | | 2 | |
Luxoft Holding Inc* | | | 70 | | | | 411 | | | | 45.00 | | | | 07/20/19 | | | | – | |
Nexstar Media Group Inc* | | | 14 | | | | 152 | | | | 95.00 | | | | 04/20/19 | | | | – | |
Nexstar Media Group Inc* | | | 15 | | | | 163 | | | | 85.00 | | | | 05/18/19 | | | | 1 | |
Nexstar Media Group Inc* | | | 12 | | | | 130 | | | | 75.00 | | | | 05/18/19 | | | | – | |
Nexstar Media Group Inc* | | | 29 | | | | 314 | | | | 85.00 | | | | 04/20/19 | | | | – | |
Nielsen Holdings PLC* | | | 31 | | | | 73 | | | | 23.00 | | | | 04/20/19 | | | | 3 | |
Nielsen Holdings PLC* | | | 63 | | | | 149 | | | | 25.00 | | | | 05/18/19 | | | | 16 | |
Nielsen Holdings PLC* | | | 16 | | | | 38 | | | | 23.00 | | | | 05/18/19 | | | | 2 | |
Red Hat Inc* | | | 6 | | | | 110 | | | | 150.00 | | | | 05/18/19 | | | | – | |
Red Hat Inc* | | | 29 | | | | 530 | | | | 175.00 | | | | 06/22/19 | | | | 4 | |
Red Hat Inc* | | | 63 | | | | 1,151 | | | | 150.00 | | | | 09/21/19 | | | | 9 | |
Spark Therapeutics Inc* | | | 20 | | | | 228 | | | | 100.00 | | | | 04/20/19 | | | | – | |
Spark Therapeutics Inc* | | | 1 | | | | 11 | | | | 65.00 | | | | 09/21/19 | | | | – | |
Spark Therapeutics Inc* | | | 17 | | | | 194 | | | | 75.00 | | | | 04/20/19 | | | | – | |
Spark Therapeutics Inc* | | | 58 | | | | 660 | | | | 105.00 | | | | 04/20/19 | | | | 4 | |
Spark Therapeutics Inc* | | | 12 | | | | 137 | | | | 110.00 | | | | 04/20/19 | | | | 1 | |
Spark Therapeutics Inc* | | | 58 | | | | 660 | | | | 70.00 | | | | 04/20/19 | | | | 1 | |
Spark Therapeutics Inc* | | | 1,251 | | | | 14,246 | | | | 55.00 | | | | 04/20/19 | | | | 6 | |
Spark Therapeutics Inc* | | | 357 | | | | 4,065 | | | | 60.00 | | | | 04/20/19 | | | | 2 | |
Spark Therapeutics Inc* | | | 291 | | | | 3,314 | | | | 50.00 | | | | 04/20/19 | | | | 1 | |
Symantec Corp* | | | 43 | | | | 99 | | | | 21.00 | | | | 04/20/19 | | | | – | |
Symantec Corp* | | | 22 | | | | 51 | | | | 22.00 | | | | 04/20/19 | | | | 1 | |
Technology Select Sector SPDR Fund* | | | 94 | | | | 696 | | | | 70.00 | | | | 06/22/19 | | | | 11 | |
Technology Select Sector SPDR Fund* | | | 42 | | | | 311 | | | | 71.00 | | | | 06/22/19 | | | | 6 | |
Tesla Inc* | | | 6 | | | | 168 | | | | 245.00 | | | | 04/20/19 | | | | – | |
T-Mobile US Inc* | | | 29 | | | | 200 | | | | 67.50 | | | | 05/18/19 | | | | 7 | |
T-Mobile US Inc* | | | 8 | | | | 55 | | | | 70.00 | | | | 05/18/19 | | | | 3 | |
T-Mobile US Inc* | | | 30 | | | | 207 | | | | 65.00 | | | | 05/18/19 | | | | 4 | |
TransDigm Group Inc* | | | 8 | | | | 363 | | | | 370.00 | | | | 05/18/19 | | | | 1 | |
Tribune Media Co* | | | 63 | | | | 291 | | | | 45.00 | | | | 01/18/20 | | | | 1 | |
VanEck Vectors Semiconductor ETF* | | | 51 | | | | 542 | | | | 100.00 | | | | 05/18/19 | | | | 8 | |
VanEck Vectors Semiconductor ETF* | | | 12 | | | | 128 | | | | 95.00 | | | | 04/20/19 | | | | – | |
Versum Materials Inc* | | | 50 | | | | 251 | | | | 40.00 | | | | 04/20/19 | | | | 1 | |
| | | | | |
| | | | | | | 49,143 | | | | | | | | | | | | 173 | |
| | | | | |
Call Options | | | | | | | | | | | | | | | | | | | | |
Avaya Holdings Corp* | | | 31 | | | | 52 | | | | 17.50 | | | | 04/20/19 | | | | 3 | |
Avaya Holdings Corp* | | | 63 | | | | 106 | | | | 17.50 | | | | 05/18/19 | | | | 8 | |
Bristol-Myers Squibb Co* | | | 157 | | | | 749 | | | | 50.00 | | | | 05/18/19 | | | | 16 | |
Bristol-Myers Squibb Co* | | | 19 | | | | 91 | | | | 52.50 | | | | 06/22/19 | | | | 1 | |
| | |
SEI Institutional Managed Trust / Semi-Annual Report / March 31, 2019 | | 155 |
SCHEDULE OF INVESTMENTS (Unaudited)
March 31, 2019
Multi-Strategy Alternative Fund(Continued)
| | | | | | | | | | | | | | | | | | | | |
| Description | | Number of Contracts | | Notional Amount
(Thousands) | | Exercise Price | | | Expiration Date | | | Value
(Thousands) |
| | | | |
PURCHASED OPTIONS (continued) | | | | | | | | | | | | | | | | | |
Bristol-Myers Squibb Co* | | | 25 | | | $ | 119 | | | | $60.00 | | | | 04/20/19 | | | $ | – | |
Caesars Entertainment Corp* | | | 284 | | | | 247 | | | | 10.00 | | | | 06/22/19 | | | | 10 | |
Denbury Resources Inc* | | | 73 | | | | 15 | | | | 2.00 | | | | 06/22/19 | | | | 3 | |
Denbury Resources Inc* | | | 81 | | | | 17 | | | | 2.50 | | | | 06/22/19 | | | | 2 | |
Denbury Resources Inc* | | | 70 | | | | 14 | | | | 2.50 | | | | 01/18/20 | | | | 3 | |
Kraft Heinz Co/The* | | | 29 | | | | 95 | | | | 35.00 | | | | 07/20/19 | | | | 3 | |
Kraft Heinz Co/The* | | | 29 | | | | 95 | | | | 37.50 | | | | 10/19/19 | | | | 3 | |
Nielsen Holdings PLC* | | | 63 | | | | 149 | | | | 25.00 | | | | 06/22/19 | | | | 10 | |
Nielsen Holdings PLC* | | | 16 | | | | 38 | | | | 27.00 | | | | 04/20/19 | | | | 1 | |
Spark Therapeutics Inc* | | | 16 | | | | 182 | | | | 115.00 | | | | 04/20/19 | | | | – | |
SPDR S&P 500 ETF Trust* | | | 56 | | | | 1,582 | | | | 287.00 | | | | 04/20/19 | | | | 4 | |
SPDR S&P 500 ETF Trust* | | | 38 | | | | 1,073 | | | | 286.00 | | | | 04/20/19 | | | | 4 | |
SPDR S&P 500 ETF Trust* | | | 307 | | | | 8,672 | | | | 289.00 | | | | 04/20/19 | | | | 2 | |
SPDR S&P 500 ETF Trust* | | | 83 | | | | 2,345 | | | | 285.00 | | | | 04/20/19 | | | | 13 | |
SPDR S&P 500 ETF Trust* | | | 42 | | | | 1,186 | | | | 287.00 | | | | 04/20/19 | | | | 1 | |
Zayo Group Holdings Inc* | | | 65 | | | | 185 | | | | 30.00 | | | | 06/22/19 | | | | 11 | |
| | | | | |
| | | | | | | 16,863 | | | | | | | | | | | | 98 | |
Total Purchased Options | | | | | | $ | 66,006 | | | | | | | | | | | $ | 271 | |
| | | | | | | | | | | | | | | | | | | | |
| | | | | |
WRITTEN OPTIONS — 0.0% | | | | | | | | | | | | | | | | | | | | |
| | | | | |
Put Options | | | | | | | | | | | | | | | | | | | | |
April 19 Puts on SPX* | | | (12 | ) | | $ | (3,401 | ) | | | 2,700.00 | | | | 04/20/19 | | | $ | (6 | ) |
April 19 Puts on SPX* | | | (62 | ) | | | (17,573 | ) | | | 2,700.00 | | | | 04/20/19 | | | | (30 | ) |
Papa John’s International Inc* | | | (55 | ) | | | (291 | ) | | | 37.50 | | | | 04/20/19 | | | | – | |
Tesla Inc* | | | (6 | ) | | | (168 | ) | | | 225.00 | | | | 04/20/19 | | | | – | |
| | | | | |
| | | | | | | (18,032 | ) | | | | | | | | | | | (36 | ) |
| | | | | |
Call Options | | | | | | | | | | | | | | | | | | | | |
Bristol-Myers Squibb Co* | | | (19 | ) | | | (91 | ) | | | 60.00 | | | | 06/22/19 | | | | – | |
Caesars Entertainment Corp* | | | (284 | ) | | | (247 | ) | | | 13.00 | | | | 06/22/19 | | | | (2 | ) |
Papa John’s International Inc* | | | (55 | ) | | | (291 | ) | | | 55.00 | | | | 04/20/19 | | | | (5 | ) |
Sanderson Farms Inc* | | | (14 | ) | | | (185 | ) | | | 130.00 | | | | 04/20/19 | | | | (7 | ) |
| | | | | |
| | | | | | | (814 | ) | | | | | | | | | | | (14 | ) |
| | | | | |
Total Written Options | | | | | | $ | (18,846 | ) | | | | | | | | | | $ | (50 | ) |
| | | | | | | | | | | | | | | | | | | | |
A list of the open futures contracts held by the Fund at March 31, 2019 is as follows:
| | | | | | | | | | | | | | | | | | | | |
| Type of Contract | | Number of
Contracts
Long (Short) | | | Expiration
Date | | | Notional Amount
(Thousands) | | Value (Thousands) | | Unrealized
Appreciation/ (Depreciation) (Thousands) |
Euro-Buxl 30 Year Bond | | | (2 | ) | | | Jun-2019 | | | $ | (412 | ) | | $ | (430 | ) | | $ | (21 | ) |
S&P 500 Index E-MINI | | | (6 | ) | | | Jun-2019 | | | | (826 | ) | | | (851 | ) | | | (25 | ) |
U.S. Long Treasury Bond | | | 4 | | | | Jun-2019 | | | | 583 | | | | 599 | | | | 16 | |
| | | | | | | | | | | | | | | | | | | | |
| | | | | | | | | | $ | (655 | ) | | $ | (682 | ) | | $ | (30 | ) |
| | | | | | | | | | | | | | | | | | | | |
| | |
156 | | SEI Institutional Managed Trust / Semi-Annual Report / March 31, 2019 |
A list of the open forward foreign currency contracts held by the Fund at March 31, 2019 is as follows:
| | | | | | | | | | | | | | | | | | | | | | | | |
| Counterparty | | Settlement Date | | | | | | Currency to Deliver
(Thousands) | | | | | | Currency to Receive
(Thousands) | | | Unrealized
Appreciation
(Depreciation)
(Thousands) | |
Barclays PLC | | | 04/02/19 | | | | BRL | | | | 3,495 | | | | USD | | | | 922 | | | $ | 24 | |
Barclays PLC | | | 05/03/19 | | | | USD | | | | 1,671 | | | | BRL | | | | 6,564 | | | | 13 | |
Barclays PLC | | | 04/02/19 | | | | USD | | | | 2,660 | | | | BRL | | | | 10,058 | | | | (76) | |
Barclays PLC | | | 04/08/19 | | | | USD | | | | 1,310 | | | | PHP | | | | 68,561 | | | | (7) | |
Barclays PLC | | | 04/08/19 | | | | PHP | | | | 68,561 | | | | USD | | | | 1,292 | | | | (12) | |
Barclays PLC | | | 04/11/19 | | | | USD | | | | 655 | | | | IDR | | | | 9,297,455 | | | | (4) | |
Barclays PLC | | | 05/13/19 | | | | USD | | | | 482 | | | | ARS | | | | 21,153 | | | | (22) | |
Barclays PLC | | | 06/14/19 | | | | EUR | | | | 117 | | | | USD | | | | 133 | | | | 1 | |
Barclays PLC | | | 06/14/19 | | | | AUD | | | | 395 | | | | USD | | | | 280 | | | | (1) | |
Barclays PLC | | | 06/19/19 | | | | USD | | | | 226 | | | | COP | | | | 701,604 | | | | (6) | |
Barclays PLC | | | 06/19/19 | | | | USD | | | | 384 | | | | TRY | | | | 2,278 | | | | (8) | |
Barclays PLC | | | 06/19/19 | | | | USD | | | | 645 | | | | MXN | | | | 12,692 | | | | 1 | |
Barclays PLC | | | 06/19/19 | | | | ZAR | | | | 838 | | | | USD | | | | 57 | | | | — | |
Barclays PLC | | | 06/19/19 | | | | USD | | | | 1,034 | | | | HUF | | | | 283,598 | | | | (37) | |
Barclays PLC | | | 06/19/19 | | | | USD | | | | 1,318 | | | | EUR | | | | 1,160 | | | | (7) | |
Barclays PLC | | | 06/19/19 | | | | EUR | | | | 1,740 | | | | USD | | | | 1,987 | | | | 20 | |
Barclays PLC | | | 06/19/19 | | | | TRY | | | | 4,630 | | | | USD | | | | 793 | | | | 28 | |
Barclays PLC | | | 06/19/19 | | | | MXN | | | | 12,692 | | | | USD | | | | 649 | | | | 3 | |
Barclays PLC | | | 06/19/19 | | | | INR | | | | 30,634 | | | | USD | | | | 425 | | | | (12) | |
Barclays PLC | | | 06/19/19 | | | | RUB | | | | 32,588 | | | | USD | | | | 492 | | | | 1 | |
Barclays PLC | | | 06/19/19 | | | | ZAR | | | | 35,887 | | | | USD | | | | 2,489 | | | | 24 | |
Barclays PLC | | | 06/19/19 | | | | HUF | | | | 113,606 | | | | EUR | | | | 362 | | | | 10 | |
Barclays PLC | | | 06/19/19 | | | | HUF | | | | 283,598 | | | | USD | | | | 1,016 | | | | 19 | |
Deutsche Bank | | | 06/19/19 | | | | EUR | | | | 1,346 | | | | USD | | | | 1,546 | | | | 25 | |
Deutsche Bank | | | 06/19/19 | | | | USD | | | | 1,605 | | | | COP | | | | 4,987,072 | | | | (45) | |
Merrill Lynch | | | 04/11/19 | | | | IDR | | | | 9,297,455 | | | | USD | | | | 649 | | | | (3) | |
Merrill Lynch | | | 06/19/19 | | | | EUR | | | | 3 | | | | USD | | | | 3 | | | | — | |
Merrill Lynch | | | 06/19/19 | | | | USD | | | | 23 | | | | ZAR | | | | 341 | | | | — | |
Merrill Lynch | | | 06/19/19 | | | | USD | | | | 643 | | | | IDR | | | | 9,297,455 | | | | 2 | |
Morgan Stanley | | | 06/19/19 | | | | USD | | | | 202 | | | | TRY | | | | 1,212 | | | | (1) | |
Morgan Stanley | | | 06/19/19 | | | | EUR | | | | 359 | | | | HUF | | | | 113,606 | | | | (7) | |
Morgan Stanley | | | 06/19/19 | | | | RUB | | | | 31,994 | | | | USD | | | | 480 | | | | (2) | |
| | | | | | | | | | | | | | | | | | | | | | | | |
| | | | | | | | | | | | | | | | | | | | | | $ | (79) | |
| | | | | | | | | | | | | | | | | | | | | | | | |
| | |
SEI Institutional Managed Trust / Semi-Annual Report / March 31, 2019 | | 157 |
SCHEDULE OF INVESTMENTS (Unaudited)
March 31, 2019
Multi-Strategy Alternative Fund(Continued)
A list of the open OTC swap agreements held by the Fund at March 31, 2019 is as follows:
| | | | | | | | | | | | | | | | | | | | | | | | | | | | | | | | |
| Interest Rate Swap | |
| Counterparty | | Fund Pays | | | Fund Receives | | Payment Frequency | | | Termination
Date | | | Currency | | Notional
Amount
(Thousands) | | | Value
(Thousands) | | | Upfront
Payments
(Thousands) | | | Net Unrealized
Appreciation
(Depreciation)
(Thousands) | |
Bank of America | | | 6.6715 | % | | 6M INR 1.0 X IN000/N +
0.0 BPS | | | Semi-Annually | | | | 06/20/2023 | | | INR | | | 47,112 | | | $ | (18) | | | $ | – | | | $ | (18) | |
| | | | | | | | | | | | | | | | | | | | | | | | | | | | | | | | |
| | | | | | | | | | | | | | | | | | | | | | | | | | | | | | | | | | | | | | | | |
| Total Return Swaps | |
| Counterparty | | Reference Entity/
Obligation | | | Fund Pays | | | Fund Receives | | | Payment
Frequency | | | Termination
Date | | | Currency | | | Notional
Amount (Thousands) | | | Value (Thousands) | | | Upfront
Payments/
Receipts
(Thousands) | | | Net Unrealized
Appreciation
(Depreciation)
(Thousands) | |
Bank of America | | | PAYB IBOXHY_JUN19_280.4 | | |
| IBOXX USD LIQUID
HIGH YIELD |
| | | 3-MONTH USD LIBOR | | | | Quarterly | | | | 06/20/2019 | | | | USD | | | | 1,093 | | | $ | (16 | ) | | $ | 6 | | | $ | (22 | ) |
Deutsche Bank | | | PAYB EGYTB 0% 8/13/19 | | |
| CASH DEPOSIT
OF NOTIONAL
AMOUNT |
| | | PRICE RETURN | | | | Monthly | | | | 08/13/2019 | | | | EGP | | | | 9,266 | | | | 531 | | | | 518 | | | | 13 | |
JPMorgan Chase | | | IBOXHY_JUN19_280.25 | | |
| IBOXX USD LIQUID
HIGH YIELD |
| | | 3-MONTH USD LIBOR | | | | Quarterly | | | | 06/20/2019 | | | | USD | | | | 962 | | | | (15 | ) | | | 5 | | | | (20 | ) |
JPMorgan Chase | | | IBOXHY_JUN19_281.63 | | |
| IBOXX USD LIQUID
HIGH YIELD |
| | | 3-MONTH USD LIBOR | | | | Quarterly | | | | 06/20/2019 | | | | USD | | | | 617 | | | | (6 | ) | | | 3 | | | | (9 | ) |
JPMorgan Chase | |
| PAYB
IBOXHY_JUN19_281.25 |
| |
| IBOXX USD LIQUID
HIGH YIELD |
| | | 3-MONTH USD LIBOR | | | | Quarterly | | | | 06/20/2019 | | | | USD | | | | 617 | | | | (7 | ) | | | 3 | | | | (10 | ) |
JPMorgan Chase | | | PAYB IBOXHY_JUN19_282 | | |
| IBOXX USD LIQUID
HIGH YIELD |
| | | 3-MONTH USD LIBOR | | | | Quarterly | | | | 06/20/2019 | | | | USD | | | | 478 | | | | (4 | ) | | | 3 | | | | (7 | ) |
Morgan Stanley | | | AMCOR LIMITED | | | | FEDEF-1D | | | | AMCOR LIMITED | | | | Monthly | | | | 08/07/2020 | | | | USD | | | | 2,479 | | | | (218 | ) | | | – | | | | (218 | ) |
Morgan Stanley | | | BTG PLC (S) | | | | SONIA-1D | | | | BTG PLC | | | | Monthly | | | | 02/06/2021 | | | | GBP | | | | 976 | | | | (4 | ) | | | – | | | | (4 | ) |
Morgan Stanley | | | GEMALTO NV (S) | | |
| 1 MONTH EUR -
LIBOR |
| | | GEMALTO (SHORT) | | | | Monthly | | | | 12/27/2019 | | | | EUR | | | | 1,045 | | | | (11 | ) | | | – | | | | (11 | ) |
Morgan Stanley | | | INNOGY SE | | |
| 1 MONTH EUR -
EURIBOR |
| | | INNOGY SE | | | | Annually | | | | 11/06/2020 | | | | EUR | | | | (20) | | | | 1 | | | | – | | | | 1 | |
Morgan Stanley | | | INNOGY SE-NEW | | |
| 1 MONTH EUR -
EURIBOR |
| | | INNOGY SE | | | | Annually | | | | 11/06/2020 | | | | EUR | | | | (40) | | | | 1 | | | | – | | | | 1 | |
Morgan Stanley | | | JARDINE LLOYD (S) | | | | SONIA-1D | | |
| JARDINE
LLOYDTHOMPSON
GROUP |
| | | Annually | | | | 03/11/2021 | | | | GBP | | | | – | | | | – | | | | – | | | | – | |
Morgan Stanley | | | LEONI AG N | | |
| 1 MONTH EUR -
EURIBOR |
| | | LEONI AG N | | | | Annually | | | | 12/18/2020 | | | | EUR | | | | (117) | | | | 1 | | | | – | | | | 1 | |
Morgan Stanley | | | OSRAM LICHT AG | | |
| 1 MONTH EUR -
EURIBOR |
| | | OSRAM LICHT AG | | | | Annually | | | | 03/27/2021 | | | | EUR | | | | (408) | | | | (28 | ) | | | – | | | | (28 | ) |
Morgan Stanley | | | SCOUT24 | | |
| 1 MONTH EUR -
EURIBOR |
| | | SCOUT24 | | | | Annually | | | | 12/17/2020 | | | | EUR | | | | (3,838) | | | | 12 | | | | – | | | | 12 | |
| | | | | | | | | | | | | | | | | | | | | | | | | | | | | | | | |
| | | | | | | | | | | | | | | | | | | | | | | | | | | | | | $ | 237 | | | $ | 538 | | | $ | (301 | ) |
| | | | | | | | | | | | | | | | | | | | | | | | | | | | | | | | |
A list of the open centrally cleared swap agreements held by the Fund at March 31, 2019 is as follows:
| | | | | | | | | | | | | | | | | | | | | | | | | | | | | | | | |
| Credit Default Swaps | |
| Reference Entity/Obligation | | Buy/Sell Protection | | | (Pays)/Receives
Rate | | | Payment
Frequency | | | Termination Date | | | Notional Amount
(Thousands) | | | Value
(Thousands) | | | Upfront
Payments/
Receipts
(Thousands) | | | Net Unrealized
Appreciation
(Depreciation)
(Thousands) | |
Mexico | | | Buy | | | | 1.00% | | | | Quarterly | | | | 06/20/2023 | | | $ | 1,211 | | | $ | (2 | ) | | $ | 1 | | | $ | (3 | ) |
Mexico | | | Buy | | | | 1.00% | | | | Quarterly | | | | 12/20/2023 | | | | 458 | | | | 2 | | | | 5 | | | | (3 | ) |
Mexico | | | Buy | | | | 1.00% | | | | Quarterly | | | | 12/20/2023 | | | | 776 | | | | 3 | | | | 13 | | | | (10 | ) |
Republic of Korea | | | Buy | | | | 1.00% | | | | Quarterly | | | | 06/20/2024 | | | | 1,345 | | | | (44 | ) | | | (45 | ) | | | 1 | |
Republic of South Africa | | | Buy | | | | 1.00% | | | | Quarterly | | | | 06/20/2022 | | | | 1,140 | | | | 16 | | | | 36 | | | | (20 | ) |
Republic of South Africa | | | Buy | | | | 1.00% | | | | Quarterly | | | | 12/20/2022 | | | | 87 | | | | 2 | | | | 2 | | | | — | |
Republic of South Africa | | | Sell | | | | 1.00% | | | | Quarterly | | | | 12/20/2022 | | | | (632 | ) | | | (13 | ) | | | (9 | ) | | | (4 | ) |
Republic of South Africa | | | Buy | | | | 1.00% | | | | Quarterly | | | | 06/20/2024 | | | | 2,949 | | | | 137 | | | | 129 | | | | 8 | |
Republic of Turkey | | | Sell | | | | 1.00% | | | | Quarterly | | | | 12/20/2022 | | | | (654 | ) | | | (65 | ) | | | (21 | ) | | | (44 | ) |
Republic of Turkey | | | Buy | | | | 1.00% | | | | Quarterly | | | | 06/20/2024 | | | | 2,443 | | | | 345 | | | | 245 | | | | 100 | |
Russia | | | Sell | | | | 1.00% | | | | Quarterly | | | | 06/20/2024 | | | | (2,857 | ) | | | (48 | ) | | | (44 | ) | | | (4 | ) |
| | | | | | | | | | | | | | | | | | | | | | | | | | | | | | | | |
| | | | | | | | | | | | | | | | | | | | | | $ | 333 | | | $ | 312 | | | $ | 21 | |
| | | | | | | | | | | | | | | | | | | | | | | | | | | | | | | | |
| | |
158 | | SEI Institutional Managed Trust / Semi-Annual Report / March 31, 2019 |
| | | | | | | | | | | | | | | | | | | | | | | | | | | | | | | | |
| |
| Interest Rate Swaps | |
| Fund Pays | | Fund Receives | | Payment
Frequency | | Termination
Date | | Currency | | Notional
Amount
(Thousands) | | | Value
(Thousands) | | | | | | Upfront
Payments/
Receipts
(Thousands) | | | | | | Net Unrealized
Appreciation
(Depreciation)
(Thousands) | |
1.0 X BZDIOVRA + 0.0 BPS | | 8.36% | | Annually | | 01/02/2023 | | BRL | | | 10,400 | | | $ | 13 | | | | | | | $ | – | | | | | | | $ | 13 | |
1.0 X BZDIOVRA + 0.0 BPS | | 8.33% | | Annually | | 01/02/2023 | | BRL | | | 10,419 | | | | 10 | | | | | | | | – | | | | | | | | 10 | |
28-DAY MXN - TIIE | | 7.91% | | Monthly | | 09/13/2023 | | MXN | | | 12,405 | | | | 3 | | | | | | | | – | | | | | | | | 3 | |
28-DAY MXN - TIIE | | 7.89% | | Monthly | | 09/13/2023 | | MXN | | | 13,148 | | | | 2 | | | | | | | | – | | | | | | | | 2 | |
28-DAY MXN - TIIE | | 7.945% | | Monthly | | 09/13/2023 | | MXN | | | 19,183 | | | | 6 | | | | | | | | – | | | | | | | | 6 | |
28D MXN MXIBTIIE | | 8.067% | | Monthly | | 12/13/2023 | | MXN | | | 15,371 | | | | 9 | | | | | | | | – | | | | | | | | 9 | |
1.0 X MXIBTIIE + 0.0 BPS | | 8.8125% | | Monthly | | 12/13/2023 | | MXN | | | 39,597 | | | | 84 | | | | | | | | – | | | | | | | | 84 | |
1.0 X MXIBTIIE + 0.0 BPS | | 8.08% | | Monthly | | 03/13/2024 | | MXN | | | 14,943 | | | | 9 | | | | | | | | – | | | | | | | | 9 | |
1.41% | | 6-MONTH GBP - LIBOR | | Semi-Annually | | 08/04/2067 | | GBP | | | 322 | | | | (20) | | | | | | | | – | | | | | | | | (20) | |
1.47% | | 1.0 X BP0006M + 0.0 BPS | | Semi-Annually | | 09/18/2069 | | GBP | | | 980 | | | | (78) | | | | | | | | – | | | | | | | | (78) | |
| | | | | | | | | | | | | | | | | | | | | | | | | | | | | | | | |
| | | | | | | | | | | | | | $ | 38 | | | | | | | $ | – | | | | | | | $ | 38 | |
| | | | | | | | | | | | | | | | | | | | | | | | | | | | | | | | |
| | Percentages are based on Net Assets of $480,981 ($ Thousands). |
| * | Non-income producing security. |
| ** | Rate shown is the 7-day effective yield as of March 31, 2019. |
| ‡ | Real Estate Investment Trust. |
| † | Investment in Affiliated Security (see Note 6). |
| (A) | Securities considered illiquid. The total value of such securities as of March 31, 2019 was $98 ($ Thousands) and represented 0.0% of the Net Assets of the Fund. |
| (B) | Security, or a portion thereof, has been pledged as collateral on reverse repurchase agreements, securities sold short and open centrally cleared interest rate swap agreements. |
| (C) | Security is a Master Limited Partnership. At March 31, 2019, such securities amounted to $3,682 ($ Thousands), or 0.8% of the net assets of the Fund. |
| (D) | Level 3 security in accordance with fair value hierarchy. |
| (E) | Security exempt from registration under Rule 144A of the Securities Act of 1933. These securities may be resold in transactions exempt from registration normally to qualified institutions. On March 31, 2019, the value of these securities amounted to $20,951 ($ Thousands), representing 4.4% of the Net Assets of the Fund. |
| (F) | Security is in default on interest payment. |
| (G) | Zero coupon security. The rate shown on the Schedule of Investments is the security’s effective yield at the time of purchase. |
| (H) | Security fair valued using methods determined in good faith by the Valuation Committee of the Board of Trustees. The total market value of such securities as of March 31, 2019 was $7 ($ Thousands) and represented 0.0% of the Net Assets of the Fund. |
| (I) | Step Bonds – Represents the current rate, the step rate, the step date and the final maturity date. |
| (J) | Unsettled bank loan. Interest rate may not be available. |
| (K) | Refer to table below for details on Options Contracts. |
ADR — American Depositary Receipt
ARS — Argentine Peso
AUD — Australian Dollar
BPS — Basis Point
BRL — Brazilian Real
Cl — Class
CLO — Collateralized Loan Obligation
COP — Colombian Peso
CV — Convertible Security
EGP — Egyptian Pound
ETF — Exchange-Traded Fund
EUR — Euro
EURIBOR — Euro Interbank Offered Rate
FHLMC — Federal Home Loan Mortgage Corporation
FNMA — Federal National Mortgage Association
GO — General Obligation
HUF — Hungarian Forint
ICE— Intercontinental Exchange
IDR — Indonesian Rupiah
INR — Indian Rupee
LIBOR— London Interbank Offered Rate
LLC — Limited Liability Company
L.P. — Limited Partnership
Ltd. — Limited
MTN — Medium Term Note
MXN — Mexican Peso
OTC — Over-the-counter
PHP— Philippine Peso
PIK — Payment-in-Kind
PLC — Public Limited Company
RB — Revenue Bond
RUB — Russian Ruble
S&P— Standard & Poor’s
Ser — Series
SPDR — Standard & Poor’s Depository Receipt
SPX — Standard & Poor’s 500 Index
TIIE — Interbank Equilibrium Interest Rate
TRY — Turkish Lira
ULC — Unlimited Liability Company
USD — United States Dollar
VAR — Variable Rate
ZAR — South African Rand
The following is a list of the level of inputs used as of March 31, 2019, in valuing the Fund’s investments and other financial instruments carried at value ($thousands).
| | | | | | | | | | | | | | | | |
| | | | | |
| Investments in Securities | | Level 1 | | | Level 2 | | | Level 3^ | | | Total | |
Common Stock | | $ | 127,471 | | | $ | 112 | | | $ | 36 | | | $ | 127,619 | |
Registered Investment | | | | | | | | | | | | | | | | |
Companies | | | 87,690 | | | | – | | | | – | | | | 87,690 | |
Exchange Traded Fund | | | 39,366 | | | | – | | | | – | | | | 39,366 | |
Corporate Obligations | | | – | | | | 33,452 | | | | 103 | | | | 33,555 | |
Sovereign Debt | | | – | | | | 20,128 | | | | – | | | | 20,128 | |
Loan Participations | | | – | | | | 9,264 | | | | 1,909 | | | | 11,173 | |
Municipal Bonds | | | – | | | | 2,803 | | | | 138 | | | | 2,941 | |
Preferred Stock | | | 936 | | | | – | | | | – | | | | 936 | |
| | |
SEI Institutional Managed Trust / Semi-Annual Report / March 31, 2019 | | 159 |
SCHEDULE OF INVESTMENTS (Unaudited)
March 31, 2019
Multi-Strategy Alternative Fund(Concluded)
| | | | | | | | | | | | | | | | |
| | | | | |
| Investments in Securities | | Level 1 | | | Level 2 | | | Level 3^ | | | Total | |
Asset-Backed Securities | | $ | – | | | $ | 921 | | | $ | – | | | $ | 921 | |
Convertible Bonds | | | – | | | | 729 | | | | – | | | | 729 | |
Mortgage-Backed Security | | | – | | | | – | | | | 175 | | | | 175 | |
Warrant | | | – | | | | – | | | | – | | | | – | |
Cash Equivalents | | | 118,295 | | | | – | | | | – | | | | 118,295 | |
| | | | | | | | | | | | | | | | |
Total Investments in Securities | | $ | 373,758 | | | $ | 67,409 | | | $ | 2,361 | | | $ | 443,528 | |
| | | | | | | | | | | | | | | | |
| | | | |
| Securities Sold Short | | Level 1 | | | Level 2 | | | Level 3 | | | Total | |
Common Stock | | $ | (53,874 | ) | | $ | – | | | $ | – | | | $ | (53,874 | ) |
Exchange Traded Funds | | | (7,883 | ) | | | – | | | | – | | | | (7,883 | ) |
| | | | | | | | | | | | | | | | |
Total Securities Sold Short | | $ | (61,757 | ) | | $ | – | | | $ | – | | | $ | (61,757 | ) |
| | | | | | | | | | | | | | | | |
| | | | | | | | | | | | | | | | |
| Other Financial Instruments | | Level 1 | | | Level 2 | | | Level 3 | | | Total | |
Purchased Options | | $ | 271 | | | $ | — | | | $ | — | | | $ | 271 | |
Written Options | | | (50 | ) | | | — | | | | — | | | | (50 | ) |
Futures Contracts * | | | | | | | | | | | | | | | | |
Unrealized Appreciation | | | 16 | | | | — | | | | — | | | | 16 | |
Unrealized Depreciation | | | (46 | ) | | | — | | | | — | | | | (46 | ) |
Forwards Contracts * | | | | | | | | | | | | | | | | |
Unrealized Appreciation | | | — | | | | 171 | | | | — | | | | 171 | |
Unrealized Depreciation | | | — | | | | (250 | ) | | | — | | | | (250 | ) |
OTC Swaps | | | | | | | | | | | | | | | | |
Interest Rate Swaps * | | | | | | | | | | | | | | | | |
Unrealized Depreciation | | | — | | | | (18 | ) | | | — | | | | (18 | ) |
Total Return Swaps * | | | | | | | | | | | | | | | | |
Unrealized Appreciation | | | — | | | | 28 | | | | — | | | | 28 | |
Unrealized Depreciation | | | — | | | | (329 | ) | | | — | | | | (329 | ) |
Centrally Cleared Swaps | | | | | | | | | | | | | | | | |
Credit Default Swaps * | | | | | | | | | | | | | | | | |
Unrealized Appreciation | | | — | | | | 109 | | | | — | | | | 109 | |
Unrealized Depreciation | | | — | | | | (88 | ) | | | — | | | | (88 | ) |
Interest Rate Swaps * | | | | | | | | | | | | | | | | |
Unrealized Appreciation | | | — | | | | 136 | | | | — | | | | 136 | |
Unrealized Depreciation | | | — | | | | (98 | ) | | | — | | | | (98 | ) |
| | | | | | | | | | | | | | | | |
Total Other Financial Instruments | | $ | 191 | | | $ | (339 | ) | | $ | — | | | $ | (148 | ) |
| | | | | | | | | | | | | | | | |
^ A reconciliation of Level 3 investments and disclosures of significant unobservable inputs are presented when the Fund has a significant amount of Level 3 investments at the beginning and/or end of the period in relation to Net Assets. Management has concluded that Level 3 investments are not material in relation to Net Assets.
* Futures contracts, forward contracts and swap contracts are valued at the unrealized appreciation (depreciation) on the instrument.
For the period ended March 31, 2019, there were no transfers between Level 1 and Level 2 assets and liabilities.
For the period ended March 31, 2019, there were no transfers between Level 2 and Level 3 assets and liabilities.
For more information on valuation inputs, see Note 2 – Significant Accounting Policies in Notes to Financial Statements.
The following is a summary of the Fund’s transactions with affiliates for the period ended March 31, 2019 ($ Thousands):
| | | | | | | | | | | | | | |
| | | | | | | | |
| Security Description | | Value 9/30/18 | | Purchases at
Cost | | Proceeds from
Sales | | Realized Gain | | Change in
Unrealized
Depreciation | | Value 3/31/19 | | Income |
SEI Institutional Managed Trust Long/Short Alternative Fund, Class Y | | $32,435 | | $— | | $(2,024) | | $510 | | $(2,352) | | $28,569 | | $621 |
SEI Daily Income Trust, Government Fund, Cl F | | 107,257 | | 338,520 | | (327,882) | | — | | — | | 117,895 | | 1,232 |
| | | | | | | | | | | | | | |
Totals | | $139,692 | | $338,520 | | $(329,906) | | $510 | | $(2,352) | | $146,464 | | $1,853 |
| | | | | | | | | | | | | | |
Amounts designated as “—” are either $0 or have been rounded to $0.
The accompanying notes are an integral part of the financial statements.
| | |
160 | | SEI Institutional Managed Trust / Semi-Annual Report / March 31, 2019 |
CONSOLIDATED SCHEDULE OF INVESTMENTS (Unaudited)
March 31, 2019
Multi-Asset Accumulation Fund
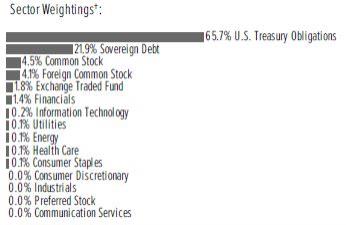
†Percentages are based on total investments.
| | | | | | | | |
| | | |
| Description | | Face Amount
(Thousands) | | | Market Value
($ Thousands) | |
|
U.S. TREASURY OBLIGATIONS — 48.0% | |
U.S. Treasury Bills | | | | | | | | |
2.527%, 06/06/2019 (A) | | $ | 5,379 | | | $ | 5,356 | |
2.517%, 06/20/2019 (A) | | | 23,934 | | | | 23,808 | |
2.491%, 07/18/2019 (A) | | | 99,246 | | | | 98,543 | |
2.481%, 08/01/2019 (A) | | | 170,917 | | | | 169,545 | |
2.481%, 08/15/2019 (A) | | | 20,150 | | | | 19,969 | |
2.471%, 07/11/2019 (A) | | | 91,420 | | | | 90,812 | |
2.470%, 07/25/2019 (A) | | | 90,000 | | | | 89,320 | |
2.470%, 08/08/2019 (A) | | | 11,570 | | | | 11,472 | |
2.445%, 09/19/2019 (A) | | | 2,639 | | | | 2,609 | |
2.445%, 09/26/2019 (A) | | | 4,350 | | | | 4,299 | |
2.409%, 04/11/2019 (A) | | | 53,171 | | | | 53,136 | |
2.408%, 05/02/2019 (A) | | | 180,000 | | | | 179,636 | |
2.407%, 04/18/2019 (A) | | | 30,000 | | | | 29,966 | |
2.400%, 04/30/2019 (A) | | | 112,000 | | | | 111,784 | |
2.363%, 04/04/2019 (A) | | | 12,623 | | | | 12,621 | |
United States Treasury Inflation
Indexed Bonds | |
3.875%, 04/15/2029 | | | 4,471 | | | | 5,905 | |
3.625%, 04/15/2028 | | | 4,669 | | | | 5,925 | |
3.375%, 04/15/2032 | | | 2,127 | | | | 2,865 | |
2.500%, 01/15/2029 | | | 2,176 | | | | 2,578 | |
2.375%, 01/15/2025 | | | 3,297 | | | | 3,660 | |
2.375%, 01/15/2027 | | | 1,872 | | | | 2,140 | |
2.125%, 02/15/2040 | | | 5,823 | | | | 7,260 | |
2.125%, 02/15/2041 | | | 2,874 | | | | 3,602 | |
2.000%, 01/15/2026 | | | 3,912 | | | | 4,315 | |
1.875%, 07/15/2019 | | | 1,773 | | | | 1,794 | |
1.750%, 01/15/2028 | | | 1,170 | | | | 1,292 | |
1.375%, 01/15/2020 | | | 2,762 | | | | 2,785 | |
1.375%, 02/15/2044 | | | 1,080 | | | | 1,193 | |
1.250%, 07/15/2020 | | | 3,294 | | | | 3,342 | |
1.125%, 01/15/2021 | | | 2,108 | | | | 2,135 | |
1.000%, 02/15/2046 | | | 3,187 | | | | 3,246 | |
0.750%, 02/15/2042 | | | 1,615 | | | | 1,572 | |
0.750%, 02/15/2045 | | | 802 | | | | 770 | |
| | | | | | | | |
| | | |
| Description | | Face Amount
(Thousands) | | | Market Value
($ Thousands) | |
|
U.S. TREASURY OBLIGATIONS (continued) | |
0.625%, 07/15/2021 | | $ | 3,551 | | | $ | 3,583 | |
0.625%, 04/15/2023 | | | 79,808 | | | | 80,360 | |
0.625%, 01/15/2024 | | | 3,560 | | | | 3,594 | |
0.625%, 01/15/2026 | | | 52,628 | | | | 53,216 | |
0.625%, 02/15/2043 | | | 3,011 | | | | 2,830 | |
0.375%, 07/15/2023 | | | 1,082 | | | | 1,084 | |
0.375%, 07/15/2025 | | | 31,068 | | | | 31,040 | |
0.375%, 07/15/2027 | | | 28,544 | | | | 28,326 | |
0.250%, 01/15/2025 | | | 4,038 | | | | 3,994 | |
0.125%, 04/15/2019 | | | 3,223 | | | | 3,225 | |
0.125%, 04/15/2021 | | | 2,124 | | | | 2,107 | |
0.125%, 01/15/2022 | | | 1,891 | | | | 1,875 | |
0.125%, 04/15/2022 | | | 106,938 | | | | 105,832 | |
0.125%, 07/15/2022 | | | 2,134 | | | | 2,123 | |
0.125%, 01/15/2023 | | | 1,799 | | | | 1,779 | |
0.125%, 07/15/2024 | | | 6,891 | | | | 6,803 | |
0.125%, 07/15/2026 | | | 57,021 | | | | 55,766 | |
Total U.S. Treasury Obligations
(Cost $1,343,500) ($ Thousands) | | | | | | | 1,346,792 | |
|
SOVEREIGN DEBT — 16.0% | |
African Development Bank | | | | | | | | |
2.125%, 11/16/2022 (B) | | | 500 | | | | 496 | |
1.875%, 03/16/2020 (B) | | | 500 | | | | 497 | |
1.375%, 02/12/2020 (B) | | | 1,250 | | | | 1,238 | |
1.250%, 07/26/2021 (B) | | | 1,750 | | | | 1,707 | |
Asian Development Bank MTN | | | | | | | | |
2.625%, 01/12/2027 (B) | | | 750 | | | | 757 | |
2.000%, 02/16/2022 (B) | | | 500 | | | | 496 | |
2.000%, 04/24/2026 (B) | | | 500 | | | | 484 | |
1.625%, 05/05/2020 (B) | | | 500 | | | | 495 | |
1.625%, 08/26/2020 (B) | | | 1,000 | | | | 989 | |
Chile Government International Bond | |
3.875%, 08/05/2020 (B) | | | 250 | | | | 254 | |
Council of Europe Development Bank | |
1.625%, 03/16/2021 (B) | | | 500 | | | | 493 | |
Deutsche Bundesrepublik Inflation
Linked Bond | |
1.750%, 04/15/2020 | | EUR | 6,028 | | | | 7,002 | |
0.500%, 04/15/2030 | | | 7,980 | | | | 10,705 | |
0.100%, 04/15/2023 | | | 39,070 | | | | 46,865 | |
0.100%, 04/15/2026 | | | 40,473 | | | | 50,372 | |
0.100%, 04/15/2046 | | | 2,849 | | | | 4,107 | |
European Bank for Reconstruction &
Development MTN | |
2.125%, 03/07/2022 (B) | | $ | 750 | | | | 745 | |
2.000%, 02/01/2021 (B) | | | 1,000 | | | | 993 | |
1.750%, 06/14/2019 (B) | | | 1,000 | | | | 998 | |
1.750%, 11/26/2019 (B) | | | 1,000 | | | | 995 | |
1.625%, 05/05/2020 (B) | | | 500 | | | | 495 | |
| | |
SEI Institutional Managed Trust / Semi-Annual Report / March 31, 2019 | | 161 |
CONSOLIDATED SCHEDULE OF INVESTMENTS (Unaudited)
March 31, 2019
Multi-Asset Accumulation Fund(Continued)
| | | | | | | | |
| | | |
| Description | | Face Amount
(Thousands) | | | Market Value
($ Thousands) | |
|
SOVEREIGN DEBT (continued) | |
1.500%, 03/16/2020 (B) | | $ | 250 | | | $ | 248 | |
1.125%, 08/24/2020 (B) | | | 500 | | | | 491 | |
European Investment Bank | | | | | | | | |
4.875%, 02/15/2036 (B) | | | 250 | | | | 316 | |
3.250%, 01/29/2024 (B) | | | 750 | | | | 780 | |
2.250%, 03/15/2022 (B) | | | 750 | | | | 748 | |
2.125%, 10/15/2021 (B) | | | 1,000 | | | | 995 | |
2.125%, 04/13/2026 (B) | | | 500 | | | | 490 | |
Export Development Canada | | | | | | | | |
2.000%, 05/17/2022 (B) | | | 2,000 | | | | 1,978 | |
1.750%, 07/21/2020 (B) | | | 1,000 | | | | 991 | |
1.625%, 01/17/2020 (B) | | | 250 | | | | 248 | |
1.500%, 05/26/2021 (B) | | | 1,000 | | | | 982 | |
1.375%, 10/21/2021 (B) | | | 500 | | | | 488 | |
FMS Wertmanagement | | | | | | | | |
2.000%, 08/01/2022 (B) | | | 500 | | | | 494 | |
1.750%, 01/24/2020 (B) | | | 500 | | | | 497 | |
1.750%, 03/17/2020 (B) | | | 500 | | | | 497 | |
French Republic Government Bond OAT | | | | | | | | |
3.400%, 07/25/2029 | | EUR | 1,295 | | | | 2,111 | |
3.150%, 08/25/2032 | | | 5,781 | | | | 9,983 | |
2.250%, 07/25/2020 | | | 2,549 | | | | 3,043 | |
2.100%, 07/25/2023 | | | 2,510 | | | | 3,236 | |
1.850%, 07/25/2027 | | | 13,073 | | | | 18,445 | |
1.800%, 07/25/2040 (C) | | | 2,446 | | | | 4,066 | |
1.300%, 07/25/2019 | | | 249 | | | | 284 | |
1.100%, 07/25/2022 | | | 1,264 | | | | 1,554 | |
0.700%, 07/25/2030 (C) | | | 8,613 | | | | 11,354 | |
0.250%, 07/25/2024 | | | 14,841 | | | | 18,187 | |
0.100%, 03/01/2021 | | | 2,079 | | | | 2,427 | |
0.100%, 07/25/2021 | | | 1,253 | | | | 1,461 | |
0.100%, 03/01/2025 | | | 15,118 | | | | 18,141 | |
0.100%, 03/01/2028 | | | 8,063 | | | | 9,785 | |
Inter-American Development Bank | | | | | | | | |
7.000%, 06/15/2025 (B) | | $ | 500 | | | | 615 | |
3.000%, 10/04/2023 (B) | | | 250 | | | | 257 | |
3.000%, 02/21/2024 (B) | | | 250 | | | | 257 | |
2.125%, 11/09/2020 (B) | | | 250 | | | | 249 | |
2.000%, 06/02/2026 (B) | | | 500 | | | | 485 | |
1.875%, 03/15/2021 (B) | | | 500 | | | | 495 | |
1.625%, 05/12/2020 (B) | | | 500 | | | | 496 | |
International Bank for Reconstruction & Development | | | | | | | | |
4.750%, 02/15/2035 (B) | | | 250 | | | | 309 | |
2.500%, 11/25/2024 (B) | | | 500 | | | | 503 | |
2.000%, 01/26/2022 (B) | | | 500 | | | | 496 | |
1.875%, 10/07/2022 (B) | | | 500 | | | | 492 | |
1.375%, 05/24/2021 (B) | | | 500 | | | | 490 | |
International Finance MTN | | | | | | | | |
2.125%, 04/07/2026 (B) | | | 750 | | | | 734 | |
1.625%, 07/16/2020 (B) | | | 1,000 | | | | 990 | |
| | | | | | | | |
| | | |
| Description | | Face Amount
(Thousands) | | | Market Value
($ Thousands) | |
|
SOVEREIGN DEBT (continued) | |
Italy Buoni Poliennali Del Tesoro | | | | | | | | |
3.100%, 09/15/2026 (C) | | EUR | 2,204 | | | $ | 2,794 | |
2.600%, 09/15/2023 (C) | | | 2,336 | | | | 2,853 | |
2.550%, 09/15/2041 (C) | | | 994 | | | | 1,176 | |
2.350%, 09/15/2019 (C) | | | 2,301 | | | | 2,657 | |
2.350%, 09/15/2024 (C) | | | 3,133 | | | | 3,784 | |
2.350%, 09/15/2035 (C) | | | 2,490 | | | | 2,991 | |
2.100%, 09/15/2021 (C) | | | 1,520 | | | | 1,814 | |
1.250%, 09/15/2032 (C) | | | 5,114 | | | | 5,311 | |
Korea Development Bank | | | | | | | | |
4.625%, 11/16/2021 (B) | | $ | 250 | | | | 262 | |
Korea International Bond | | | | | | | | |
2.750%, 01/19/2027 (B) | | | 1,000 | | | | 990 | |
Nordic Investment Bank | | | | | | | | |
2.125%, 02/01/2022 (B) | | | 750 | | | | 745 | |
1.250%, 08/02/2021 (B) | | | 500 | | | | 487 | |
North American Development Bank | | | | | | | | |
2.400%, 10/26/2022 (B) | | | 200 | | | | 197 | |
Province of Alberta Canada | | | | | | | | |
2.200%, 07/26/2022 (B) | | | 750 | | | | 740 | |
Province of British Columbia Canada | | | | | | | | |
6.500%, 01/15/2026 (B) | | | 250 | | | | 305 | |
2.650%, 09/22/2021 (B) | | | 1,000 | | | | 1,005 | |
2.000%, 10/23/2022 (B) | | | 750 | | | | 739 | |
Province of Manitoba Canada | | | | | | | | |
3.050%, 05/14/2024 (B) | | | 250 | | | | 255 | |
2.125%, 05/04/2022 (B) | | | 250 | | | | 247 | |
Province of Ontario Canada | | | | | | | | |
4.000%, 10/07/2019 (B) | | | 500 | | | | 504 | |
2.450%, 06/29/2022 (B) | | | 250 | | | | 249 | |
2.400%, 02/08/2022 (B) | | | 750 | | | | 748 | |
2.250%, 05/18/2022 (B) | | | 500 | | | | 496 | |
2.200%, 10/03/2022 (B) | | | 500 | | | | 494 | |
Province of Quebec Canada | | | | | | | | |
7.500%, 09/15/2029 (B) | | | 200 | | | | 282 | |
2.500%, 04/20/2026 (B) | | | 750 | | | | 742 | |
Svensk Exportkredit MTN | | | | | | | | |
1.750%, 03/10/2021 (B) | | | 1,000 | | | | 987 | |
United Kingdom Gilt Inflation Linked | | | | | | | | |
4.125%, 07/22/2030 | | GBP | 500 | | | | 2,446 | |
2.500%, 04/16/2020 | | | 429 | | | | 2,003 | |
2.500%, 07/17/2024 | | | 340 | | | | 1,617 | |
2.000%, 01/26/2035 | | | 932 | | | | 3,427 | |
1.875%, 11/22/2022 | | | 1,651 | | | | 2,528 | |
1.250%, 11/22/2027 | | | 2,187 | | | | 3,845 | |
1.250%, 11/22/2032 | | | 748 | | | | 1,505 | |
1.250%, 11/22/2055 | | | 1,325 | | | | 4,445 | |
1.125%, 11/22/2037 | | | 1,091 | | | | 2,438 | |
0.750%, 03/22/2034 | | | 1,036 | | | | 2,023 | |
0.750%, 11/22/2047 | | | 1,362 | | | | 3,498 | |
0.625%, 03/22/2040 | | | 1,921 | | | | 4,170 | |
0.625%, 11/22/2042 | | | 1,365 | | | | 3,130 | |
| | |
162 | | SEI Institutional Managed Trust / Semi-Annual Report / March 31, 2019 |
| | | | | | | | | | | | |
| | | | |
| Description | | | | | Face Amount
(Thousands) | | | Market Value
($ Thousands) | |
| |
SOVEREIGN DEBT (continued) | | | | | |
0.500%, 03/22/2050 | | | GBP | | | | 1,724 | | | $ | 4,407 | |
0.375%, 03/22/2062 | | | | | | | 1,132 | | | | 3,496 | |
0.250%, 03/22/2052 | | | | | | | 1,754 | | | | 4,398 | |
0.125%, 03/22/2024 | | | | | | | 40,275 | | | | 59,697 | |
0.125%, 03/22/2026 | | | | | | | 23,890 | | | | 37,033 | |
0.125%, 03/22/2029 | | | | | | | 1,788 | | | | 2,952 | |
0.125%, 03/22/2044 | | | | | | | 1,751 | | | | 3,714 | |
0.125%, 03/22/2058 | | | | | | | 1,659 | | | | 4,449 | |
0.125%, 11/22/2065 | | | | | | | 1,185 | | | | 3,671 | |
0.125%, 03/22/2068 | | | | | | | 453 | | | | 1,482 | |
| | | | | | | | | | | | |
| | | |
Total Sovereign Debt | | | | | | | | | | | | |
(Cost $439,063) ($ Thousands) | | | | 448,599 | |
| | | | | | | | | | | | |
| | | |
| | | | | | Shares | | | | |
COMMON STOCK — 3.3% | |
Communication Services — 0.3% | |
Activision Blizzard Inc | | | | | | | 5,637 | | | | 257 | |
Alphabet Inc, Cl A * | | | | | | | 225 | | | | 265 | |
Alphabet Inc, Cl C * | | | | | | | 212 | | | | 249 | |
AT&T Inc | | | | | | | 20,624 | | | | 647 | |
CBS Corp, Cl B | | | | | | | 4,075 | | | | 194 | |
CenturyLink Inc | | | | | | | 43,896 | | | | 526 | |
Charter Communications Inc, Cl A * | | | | | | | 702 | | | | 243 | |
Comcast Corp, Cl A | | | | | | | 6,389 | | | | 255 | |
Discovery Inc, Cl A * | | | | | | | 9,297 | | | | 251 | |
Discovery Inc, Cl C * | | | | | | | 11,324 | | | | 288 | |
DISH Network Corp, Cl A * | | | | | | | 8,704 | | | | 276 | |
Electronic Arts Inc * | | | | | | | 2,803 | | | | 285 | |
Facebook Inc, Cl A * | | | | | | | 1,409 | | | | 235 | |
Fox Corp * | | | | | | | 12,967 | | | | 471 | |
Interpublic Group of Cos Inc/The | | | | | | | 13,924 | | | | 293 | |
Netflix Inc * | | | | | | | 703 | | | | 251 | |
News Corp, Cl A | | | | | | | 20,927 | | | | 260 | |
News Corp, Cl B | | | | | | | 21,707 | | | | 271 | |
Omnicom Group Inc | | | | | | | 4,167 | | | | 304 | |
Take-Two Interactive Software Inc, Cl A * | | | | | | | 2,472 | | | | 233 | |
TripAdvisor Inc * | | | | | | | 8,089 | | | | 416 | |
Twitter Inc * | | | | | | | 8,010 | | | | 263 | |
Verizon Communications Inc | | | | | | | 9,395 | | | | 555 | |
Viacom Inc, Cl B | | | | | | | 8,692 | | | | 244 | |
Walt Disney Co/The | | | | | | | 4,297 | | | | 477 | |
| | | | | | | | | | | | |
| | | |
| | | | | | | | | | | 8,009 | |
| | | | | | | | | | | | |
Consumer Discretionary — 0.3% | |
Advance Auto Parts Inc | | | | | | | 1,136 | | | | 194 | |
Amazon.com Inc, Cl A * | | | | | | | 72 | | | | 128 | |
AutoZone Inc * | | | | | | | 218 | | | | 223 | |
Best Buy Co Inc | | | | | | | 2,195 | | | | 156 | |
Booking Holdings Inc * | | | | | | | 80 | | | | 140 | |
BorgWarner Inc | | | | | | | 4,754 | | | | 183 | |
Capri Holdings Ltd * | | | | | | | 3,411 | | | | 156 | |
| | | | | | | | |
| | | |
| Description | | Shares | | | Market Value
($ Thousands) | |
|
COMMON STOCK (continued) | |
CarMax Inc * | | | 2,511 | | | $ | 175 | |
Chipotle Mexican Grill Inc, Cl A * | | | 286 | | | | 203 | |
Darden Restaurants Inc | | | 1,472 | | | | 179 | |
Delphi Automotive PLC * | | | 1,925 | | | | 153 | |
Dollar General Corp | | | 990 | | | | 118 | |
Dollar Tree Inc * | | | 2,221 | | | | 233 | |
DR Horton Inc | | | 3,316 | | | | 137 | |
eBay Inc | | | 1,485 | | | | 55 | |
Expedia Group Inc | | | 1,393 | | | | 166 | |
Foot Locker Inc, Cl A | | | 3,089 | | | | 187 | |
Ford Motor Co | | | 8,016 | | | | 70 | |
Gap Inc/The | | | 5,746 | | | | 150 | |
General Motors Co | | | 2,986 | | | | 111 | |
H&R Block Inc | | | 4,731 | | | | 113 | |
Hanesbrands Inc | | | 12,220 | | | | 219 | |
Harley-Davidson Inc, Cl A | | | 4,066 | | | | 145 | |
Hasbro Inc | | | 1,503 | | | | 128 | |
Hilton Worldwide Holdings Inc | | | 1,532 | | | | 127 | |
Home Depot Inc/The | | | 660 | | | | 127 | |
Kohl’s Corp | | | 2,286 | | | | 157 | |
L Brands Inc | | | 5,618 | | | | 155 | |
Leggett & Platt Inc | | | 4,641 | | | | 196 | |
Lennar Corp, Cl A | | | 3,927 | | | | 193 | |
LKQ Corp * | | | 6,539 | | | | 186 | |
Lowe’s Cos Inc | | | 1,189 | | | | 130 | |
Macy’s Inc | | | 5,542 | | | | 133 | |
Marriott International Inc/MD, Cl A | | | 1,166 | | | | 146 | |
Mattel Inc * | | | 10,881 | | | | 141 | |
McDonald’s Corp | | | 63 | | | | 12 | |
MGM Resorts International | | | 6,494 | | | | 167 | |
Mohawk Industries Inc * | | | 1,015 | | | | 128 | |
Newell Brands Inc, Cl B | | | 7,690 | | | | 118 | |
NIKE Inc, Cl B | | | 338 | | | | 28 | |
Nordstrom Inc | | | 1,762 | | | | 78 | |
Norwegian Cruise Line Holdings Ltd * | | | 2,900 | | | | 159 | |
O’Reilly Automotive Inc * | | | 530 | | | | 206 | |
PVH Corp | | | 1,907 | | | | 233 | |
Ralph Lauren Corp, Cl A | | | 1,286 | | | | 167 | |
Ross Stores Inc | | | 2,214 | | | | 206 | |
Royal Caribbean Cruises Ltd | | | 1,248 | | | | 143 | |
Starbucks Corp | | | 2,467 | | | | 183 | |
Tapestry Inc | | | 3,725 | | | | 121 | |
Target Corp, Cl A | | | 2,518 | | | | 202 | |
Tiffany & Co | | | 1,465 | | | | 155 | |
TJX Cos Inc/The | | | 4,144 | | | | 221 | |
Tractor Supply Co | | | 2,314 | | | | 226 | |
Ulta Beauty Inc * | | | 691 | | | | 241 | |
Under Armour Inc, Cl A * | | | 5,297 | | | | 112 | |
Under Armour Inc, Cl C * | | | 9,532 | | | | 180 | |
VF Corp | | | 2,192 | | | | 191 | |
Whirlpool Corp | | | 864 | | | | 115 | |
| | |
SEI Institutional Managed Trust / Semi-Annual Report / March 31, 2019 | | 163 |
CONSOLIDATED SCHEDULE OF INVESTMENTS (Unaudited)
March 31, 2019
Multi-Asset Accumulation Fund(Continued)
| | | | | | | | |
| Description | | Shares | | | Market Value
($ Thousands) | |
| |
COMMON STOCK (continued) | | | | | |
Wynn Resorts Ltd | | | 1,040 | | | $ | 124 | |
| | | | | | | | |
| | | | | | | 9,129 | |
| | | | | | | | |
Consumer Staples — 0.4% | | | | | |
Altria Group Inc | | | 7,264 | | | | 417 | |
Archer-Daniels-Midland Co | | | 6,839 | | | | 295 | |
Brown-Forman Corp, Cl B | | | 7,215 | | | | 381 | |
Campbell Soup Co | | | 12,199 | | | | 465 | |
Church & Dwight Co Inc | | | 5,724 | | | | 408 | |
Clorox Co/The | | | 3,472 | | | | 557 | |
Coca-Cola European Partners PLC | | | 1,540 | | | | 80 | |
Colgate-Palmolive Co | | | 4,415 | | | | 303 | |
Conagra Brands Inc | | | 13,514 | | | | 375 | |
Constellation Brands Inc, Cl A | | | 1,639 | | | | 287 | |
Coty Inc, Cl A | | | 22,172 | | | | 255 | |
Estee Lauder Cos Inc/The, Cl A | | | 3,029 | | | | 502 | |
General Mills Inc | | | 11,660 | | | | 603 | |
Hershey Co/The | | | 5,283 | | | | 607 | |
Hormel Foods Corp | | | 9,556 | | | | 428 | |
JM Smucker Co/The | | | 4,668 | | | | 544 | |
Kellogg Co | | | 5,138 | | | | 295 | |
Kimberly-Clark Corp | | | 4,208 | | | | 521 | |
Kraft Heinz Co/The | | | 6,717 | | | | 219 | |
Kroger Co/The | | | 11,876 | | | | 292 | |
Lamb Weston Holdings Inc | | | 2,857 | | | | 214 | |
McCormick & Co Inc/MD | | | 2,763 | | | | 416 | |
Molson Coors Brewing Co, Cl B | | | 6,673 | | | | 398 | |
Mondelez International Inc, Cl A | | | 8,619 | | | | 430 | |
Monster Beverage Corp * | | | 7,622 | | | | 416 | |
PepsiCo Inc | | | 2,423 | | | | 297 | |
Philip Morris International Inc | | | 4,052 | | | | 358 | |
Procter & Gamble Co/The | | | 4,040 | | | | 420 | |
Sysco Corp, Cl A | | | 4,913 | | | | 328 | |
Tyson Foods Inc, Cl A | | | 6,591 | | | | 458 | |
Walgreens Boots Alliance Inc | | | 4,912 | | | | 311 | |
Walmart Inc | | | 1,858 | | | | 181 | |
| | | | | | | | |
| | | | | | | 12,061 | |
| | | | | | | | |
Energy — 0.3% | | | | | |
Anadarko Petroleum Corp, Cl A | | | 4,928 | | | | 224 | |
Apache Corp | | | 8,239 | | | | 286 | |
Baker Hughes a GE Co, Cl A | | | 10,487 | | | | 291 | |
Cabot Oil & Gas Corp | | | 9,943 | | | | 260 | |
Chevron Corp | | | 2,251 | | | | 277 | |
Cimarex Energy Co | | | 3,733 | | | | 261 | |
Concho Resources Inc | | | 2,397 | | | | 266 | |
ConocoPhillips | | | 5,566 | | | | 371 | |
Devon Energy Corp | | | 5,871 | | | | 185 | |
Diamondback Energy Inc, Cl A | | | 3,000 | | | | 305 | |
EOG Resources Inc | | | 2,565 | | | | 244 | |
Exxon Mobil Corp | | | 2,881 | | | | 233 | |
Halliburton Co | | | 5,574 | | | | 163 | |
| | | | | | | | |
| Description | | Shares | | | Market Value
($ Thousands) | |
| |
COMMON STOCK (continued) | | | | | |
Helmerich & Payne Inc | | | 5,012 | | | $ | 278 | |
Hess Corp | | | 3,251 | | | | 196 | |
HollyFrontier Corp | | | 4,290 | | | | 211 | |
Kinder Morgan Inc/DE | | | 14,279 | | | | 286 | |
Marathon Oil Corp | | | 12,842 | | | | 215 | |
Marathon Petroleum Corp | | | 4,163 | | | | 249 | |
National Oilwell Varco Inc, Cl A | | | 7,252 | | | | 193 | |
Noble Energy Inc | | | 10,357 | | | | 256 | |
Occidental Petroleum Corp | | | 4,454 | | | | 295 | |
ONEOK Inc | | | 5,808 | | | | 406 | |
Phillips 66 | | | 2,695 | | | | 256 | |
Pioneer Natural Resources Co | | | 1,705 | | | | 260 | |
Schlumberger Ltd, Cl A | | | 3,371 | | | | 147 | |
TechnipFMC PLC | | | 11,797 | | | | 277 | |
Valero Energy Corp | | | 2,503 | | | | 212 | |
Williams Cos Inc/The | | | 11,377 | | | | 327 | |
| | | | | | | | |
| | | | | | | 7,430 | |
| | | | | | | | |
Financials — 0.2% | | | | | |
Affiliated Managers Group Inc | | | 1,162 | | | | 124 | |
Allstate Corp/The | | | 963 | | | | 91 | |
American Express Co | | | 421 | | | | 46 | |
American International Group Inc | | | 1,882 | | | | 81 | |
Ameriprise Financial Inc | | | 614 | | | | 79 | |
Aon PLC | | | 680 | | | | 116 | |
Assurant Inc | | | 976 | | | | 93 | |
Bank of America Corp | | | 3,101 | | | | 86 | |
Bank of New York Mellon Corp/The | | | 1,593 | | | | 80 | |
BB&T Corp | | | 2,425 | | | | 113 | |
BlackRock Inc | | | 215 | | | | 92 | |
Brighthouse Financial Inc * | | | 1,974 | | | | 72 | |
Capital One Financial Corp | | | 1,140 | | | | 93 | |
Cboe Global Markets Inc | | | 1,513 | | | | 144 | |
Charles Schwab Corp/The | | | 1,358 | | | | 58 | |
Chubb Ltd | | | 852 | | | | 119 | |
Cincinnati Financial Corp | | | 2,017 | | | | 173 | |
Citizens Financial Group Inc | | | 2,888 | | | | 94 | |
Comerica Inc | | | 1,435 | | | | 105 | |
Discover Financial Services | | | 1,159 | | | | 83 | |
E*TRADE Financial Corp | | | 2,501 | | | | 116 | |
Fifth Third Bancorp | | | 3,964 | | | | 100 | |
Franklin Resources Inc | | | 2,773 | | | | 92 | |
Goldman Sachs Group Inc/The | | | 641 | | | | 123 | |
Hartford Financial Services Group Inc/The | | | 2,184 | | | | 109 | |
Huntington Bancshares Inc/OH | | | 9,087 | | | | 115 | |
Intercontinental Exchange Inc | | | 1,550 | | | | 118 | |
Invesco Ltd | | | 6,593 | | | | 127 | |
Jefferies Financial Group Inc | | | 4,320 | | | | 81 | |
JPMorgan Chase & Co | | | 873 | | | | 88 | |
KeyCorp | | | 8,346 | | | | 131 | |
Lincoln National Corp | | | 1,000 | | | | 59 | |
Loews Corp | | | 1,583 | | | | 76 | |
| | |
164 | | SEI Institutional Managed Trust / Semi-Annual Report / March 31, 2019 |
| | | | | | | | |
| Description | | Shares | | | Market Value
($ Thousands) | |
| |
COMMON STOCK (continued) | | | | | |
M&T Bank Corp | | | 598 | | | $ | 94 | |
MetLife Inc | | | 1,562 | | | | 67 | |
Morgan Stanley | | | 1,873 | | | | 79 | |
MSCI Inc, Cl A | | | 449 | | | | 89 | |
Nasdaq Inc, Cl A | | | 1,585 | | | | 139 | |
Northern Trust Corp | | | 1,046 | | | | 95 | |
People’s United Financial Inc | | | 8,554 | | | | 141 | |
PNC Financial Services Group Inc/The | | | 607 | | | | 74 | |
Principal Financial Group Inc, Cl A | | | 1,498 | | | | 75 | |
Progressive Corp/The | | | 2,497 | | | | 180 | |
Prudential Financial Inc | | | 736 | | | | 68 | |
Raymond James Financial Inc | | | 1,182 | | | | 95 | |
Regions Financial Corp | | | 6,723 | | | | 95 | |
State Street Corp | | | 770 | | | | 51 | |
SunTrust Banks Inc | | | 2,220 | | | | 132 | |
SVB Financial Group, Cl B * | | | 365 | | | | 81 | |
Synchrony Financial | | | 3,561 | | | | 114 | |
T Rowe Price Group Inc | | | 1,887 | | | | 189 | |
Torchmark Corp, Cl A | | | 870 | | | | 71 | |
Travelers Cos Inc/The | | | 849 | | | | 116 | |
Unum Group | | | 4,210 | | | | 142 | |
US Bancorp | | | 2,336 | | | | 113 | |
Wells Fargo & Co | | | 1,955 | | | | 94 | |
Willis Towers Watson PLC | | | 490 | | | | 86 | |
| | | | | | | | |
| | | | | | | 5,757 | |
| | | | | | | | |
Health Care — 0.3% | | | | | |
Abbott Laboratories | | | 2,344 | | | | 187 | |
AbbVie Inc | | | 1,754 | | | | 141 | |
ABIOMED Inc * | | | 143 | | | | 41 | |
Agilent Technologies Inc | | | 3,209 | | | | 258 | |
Alexion Pharmaceuticals Inc * | | | 1,323 | | | | 179 | |
Allergan PLC | | | 990 | | | | 145 | |
AmerisourceBergen Corp, Cl A | | | 1,376 | | | | 109 | |
Amgen Inc, Cl A | | | 840 | | | | 160 | |
Anthem Inc | | | 458 | | | | 131 | |
Baxter International Inc | | | 2,892 | | | | 235 | |
Becton Dickinson and Co | | | 951 | | | | 237 | |
BeiGene Ltd ADR * | | | 1,443 | | | | 190 | |
Boston Scientific Corp * | | | 7,038 | | | | 270 | |
Bristol-Myers Squibb Co | | | 2,871 | | | | 137 | |
Cardinal Health Inc | | | 2,281 | | | | 110 | |
Centene Corp * | | | 2,552 | | | | 135 | |
Cerner Corp * | | | 3,217 | | | | 184 | |
Cooper Cos Inc/The, Cl A | | | 642 | | | | 190 | |
Covetrus Inc * | | | 1 | | | | — | |
CVS Health Corp | | | 3,025 | | | | 163 | |
Danaher Corp, Cl A | | | 1,722 | | | | 227 | |
DaVita Inc * | | | 2,885 | | | | 157 | |
DENTSPLY SIRONA Inc | | | 2,721 | | | | 135 | |
Edwards Lifesciences Corp, Cl A * | | | 740 | | | | 142 | |
Gilead Sciences Inc | | | 2,209 | | | | 144 | |
| | | | | | | | |
| Description | | Shares | | | Market Value
($ Thousands) | |
| |
COMMON STOCK (continued) | | | | | |
HCA Healthcare Inc | | | 1,320 | | | $ | 172 | |
Henry Schein Inc * | | | 2,812 | | | | 169 | |
Hologic Inc * | | | 3,960 | | | | 192 | |
Humana Inc | | | 533 | | | | 142 | |
IDEXX Laboratories Inc * | | | 915 | | | | 205 | |
Illumina Inc * | | | 591 | | | | 184 | |
Incyte Corp * | | | 1,195 | | | | 103 | |
Intuitive Surgical Inc * | | | 369 | | | | 210 | |
Johnson & Johnson | | | 894 | | | | 125 | |
Laboratory Corp of America Holdings * | | | 1,268 | | | | 194 | |
McKesson Corp | | | 792 | | | | 93 | |
Medtronic PLC | | | 1,787 | | | | 163 | |
Mettler-Toledo International Inc * | | | 275 | | | | 199 | |
Mylan NV * | | | 3,267 | | | | 93 | |
Nektar Therapeutics, Cl A * | | | 1,939 | | | | 65 | |
PerkinElmer Inc | | | 2,942 | | | | 283 | |
Pfizer Inc | | | 4,453 | | | | 189 | |
Quest Diagnostics Inc | | | 2,292 | | | | 206 | |
Stryker Corp | | | 1,159 | | | | 229 | |
Teva Pharmaceutical Industries Ltd ADR * | | | 13,592 | | | | 213 | |
UnitedHealth Group Inc | | | 559 | | | | 138 | |
Universal Health Services Inc, Cl B | | | 1,151 | | | | 154 | |
Varian Medical Systems Inc * | | | 1,691 | | | | 240 | |
Vertex Pharmaceuticals Inc * | | | 910 | | | | 167 | |
Waters Corp * | | | 930 | | | | 234 | |
Zimmer Biomet Holdings Inc | | | 1,684 | | | | 215 | |
Zoetis Inc, Cl A | | | 2,499 | | | | 252 | |
| | | | | | | | |
| | | | | | | 8,836 | |
| | | | | | | | |
Industrials — 0.3% | | | | | |
3M Co | | | 677 | | | | 141 | |
Alaska Air Group Inc | | | 850 | | | | 48 | |
Allegion PLC | | | 1,615 | | | | 146 | |
American Airlines Group Inc | | | 2,578 | | | | 82 | |
AMETEK Inc | | | 2,335 | | | | 194 | |
AO Smith Corp | | | 2,700 | | | | 144 | |
Arconic Inc | | | 5,255 | | | | 100 | |
Boeing Co/The | | | 456 | | | | 174 | |
CH Robinson Worldwide Inc | | | 2,024 | | | | 176 | |
Cintas Corp | | | 931 | | | | 188 | |
Copart Inc * | | | 2,400 | | | | 145 | |
Cummins Inc | | | 871 | | | | 138 | |
Delta Air Lines Inc, Cl A | | | 3,091 | | | | 160 | |
Dover Corp | | | 1,914 | | | | 180 | |
Emerson Electric Co | | | 2,411 | | | | 165 | |
Equifax Inc | | | 1,030 | | | | 122 | |
Expeditors International of Washington Inc | | | 2,620 | | | | 199 | |
Fastenal Co, Cl A | | | 1,391 | | | | 89 | |
Flowserve Corp | | | 3,192 | | | | 144 | |
Fluor Corp | | | 3,126 | | | | 115 | |
Fortive Corp | | | 1,754 | | | | 147 | |
Fortune Brands Home & Security Inc | | | 2,268 | | | | 108 | |
| | |
SEI Institutional Managed Trust / Semi-Annual Report / March 31, 2019 | | 165 |
CONSOLIDATED SCHEDULE OF INVESTMENTS (Unaudited)
March 31, 2019
Multi-Asset Accumulation Fund(Continued)
| | | | | | | | |
| Description | | Shares | | | Market Value
($ Thousands) | |
| |
COMMON STOCK (continued) | | | | | |
General Dynamics Corp | | | 849 | | | $ | 144 | |
General Electric Co | | | 5,173 | | | | 52 | |
Harris Corp | | | 1,193 | | | | 191 | |
Honeywell International Inc | | | 835 | | | | 133 | |
Huntington Ingalls Industries Inc, Cl A | | | 757 | | | | 157 | |
IHS Markit Ltd * | | | 3,200 | | | | 174 | |
Illinois Tool Works Inc | | | 606 | | | | 87 | |
Ingersoll-Rand PLC | | | 1,653 | | | | 178 | |
Jacobs Engineering Group Inc | | | 1,976 | | | | 149 | |
JB Hunt Transport Services Inc | | | 832 | | | | 84 | |
Johnson Controls International plc | | | 3,007 | | | | 111 | |
Kansas City Southern | | | 1,165 | | | | 135 | |
L3 Technologies Inc | | | 894 | | | | 184 | |
Lockheed Martin Corp | | | 518 | | | | 155 | |
Masco Corp | | | 3,446 | | | | 135 | |
Nielsen Holdings PLC | | | 5,302 | | | | 126 | |
Norfolk Southern Corp | | | 1,093 | | | | 204 | |
Northrop Grumman Corp | | | 572 | | | | 154 | |
PACCAR Inc | | | 2,161 | | | | 147 | |
Parker-Hannifin Corp, Cl A | | | 549 | | | | 94 | |
Pentair PLC | | | 5,438 | | | | 242 | |
Quanta Services Inc | | | 3,494 | | | | 132 | |
Raytheon Co | | | 1,052 | | | | 192 | |
Robert Half International Inc | | | 3,077 | | | | 201 | |
Rockwell Automation Inc | | | 996 | | | | 175 | |
Snap-on Inc | | | 986 | | | | 154 | |
Southwest Airlines Co, Cl A | | | 2,241 | | | | 116 | |
Stanley Black & Decker Inc | | | 854 | | | | 116 | |
Textron Inc | | | 2,415 | | | | 122 | |
TransDigm Group Inc * | | | 313 | | | | 142 | |
United Continental Holdings Inc * | | | 579 | | | | 46 | |
United Technologies Corp | | | 1,503 | | | | 194 | |
Verisk Analytics Inc, Cl A | | | 1,825 | | | | 243 | |
Wabtec Corp | | | 37 | | | | 3 | |
Waste Management Inc | | | 830 | | | | 86 | |
Xylem Inc/NY | | | 1,487 | | | | 118 | |
| | | | | | | | |
| | | | | | | 8,181 | |
| | | | | | | | |
Information Technology — 0.3% | | | | | |
Adobe Inc * | | | 587 | | | | 156 | |
Advanced Micro Devices Inc * | | | 3,357 | | | | 86 | |
Akamai Technologies Inc * | | | 1,677 | | | | 120 | |
Alliance Data Systems Corp | | | 609 | | | | 107 | |
Amphenol Corp, Cl A | | | 1,663 | | | | 157 | |
Analog Devices Inc | | | 1,714 | | | | 180 | |
Applied Materials Inc | | | 3,039 | | | | 121 | |
Arista Networks Inc * | | | 506 | | | | 159 | |
Autodesk Inc, Cl A * | | | 1,057 | | | | 165 | |
Automatic Data Processing Inc | | | 1,586 | | | | 253 | |
Broadcom Inc | | | 452 | | | | 136 | |
Cadence Design Systems Inc * | | | 2,281 | | | | 145 | |
CGI Inc, Cl A * | | | 5,643 | | | | 388 | |
| | | | | | | | |
| Description | | Shares | | | Market Value
($ Thousands) | |
| |
COMMON STOCK (continued) | | | | | |
Cisco Systems Inc | | | 4,373 | | | $ | 236 | |
Citrix Systems Inc | | | 1,812 | | | | 181 | |
Cognizant Technology Solutions Corp, Cl A | | | 2,178 | | | | 158 | |
Corning Inc, Cl B | | | 4,549 | | | | 151 | |
DXC Technology Co | | | 1,620 | | | | 104 | |
F5 Networks Inc, Cl A * | | | 1,077 | | | | 169 | |
Fidelity National Information Services Inc, Cl B | | | 1,370 | | | | 155 | |
Fiserv Inc, Cl A * | | | 2,440 | | | | 215 | |
FleetCor Technologies Inc * | | | 390 | | | | 96 | |
FLIR Systems Inc | | | 2,599 | | | | 124 | |
Fortinet Inc * | | | 818 | | | | 69 | |
Gartner Inc * | | | 1,047 | | | | 159 | |
Global Payments Inc | | | 1,650 | | | | 225 | |
Hewlett Packard Enterprise Co | | | 8,829 | | | | 136 | |
HP Inc | | | 7,329 | | | | 142 | |
Intel Corp | | | 2,194 | | | | 118 | |
International Business Machines Corp | | | 793 | | | | 112 | |
Intuit Inc | | | 640 | | | | 167 | |
Juniper Networks Inc | | | 4,939 | | | | 131 | |
KLA-Tencor Corp | | | 1,572 | | | | 188 | |
Microchip Technology Inc | | | 1,703 | | | | 141 | |
Microsoft Corp | | | 1,573 | | | | 186 | |
Motorola Solutions Inc | | | 1,647 | | | | 231 | |
NetApp Inc | | | 2,629 | | | | 182 | |
Oracle Corp, Cl B | | | 2,724 | | | | 146 | |
Paychex Inc | | | 2,240 | | | | 180 | |
Qorvo Inc * | | | 1,591 | | | | 114 | |
QUALCOMM Inc | | | 2,828 | | | | 161 | |
Red Hat Inc * | | | 772 | | | | 141 | |
salesforce.com Inc * | | | 952 | | | | 151 | |
Seagate Technology PLC | | | 1,886 | | | | 90 | |
Skyworks Solutions Inc | | | 1,430 | | | | 118 | |
Symantec Corp, Cl A | | | 7,762 | | | | 178 | |
Synopsys Inc * | | | 1,972 | | | | 227 | |
Texas Instruments Inc | | | 1,935 | | | | 205 | |
Total System Services Inc | | | 1,556 | | | | 148 | |
VeriSign Inc * | | | 1,056 | | | | 192 | |
Western Union Co/The | | | 7,451 | | | | 138 | |
| | | | | | | | |
| | | | | | | 8,138 | |
| | | | | | | | |
| |
Materials — 0.3% | | | | | |
Air Products & Chemicals Inc | | | 2,754 | | | | 526 | |
Albemarle Corp | | | 4,077 | | | | 334 | |
Avery Dennison Corp | | | 4,309 | | | | 487 | |
CF Industries Holdings Inc | | | 8,474 | | | | 347 | |
DowDuPont Inc | | | 3,752 | | | | 200 | |
Eastman Chemical Co | | | 4,183 | | | | 318 | |
Ecolab Inc | | | 2,840 | | | | 502 | |
FMC Corp | | | 4,104 | | | | 315 | |
Freeport-McMoRan Inc, Cl B | | | 23,066 | | | | 297 | |
International Flavors & Fragrances Inc | | | 2,340 | | | | 301 | |
| | |
166 | | SEI Institutional Managed Trust / Semi-Annual Report / March 31, 2019 |
| | | | | | | | |
| | | |
| Description | | Shares | | | Market Value
($ Thousands) | |
| |
COMMON STOCK (continued) | | | | | |
Linde PLC | | | 2,704 | | | $ | 476 | |
Livent Corp * | | | 3,838 | | | | 47 | |
Martin Marietta Materials Inc, Cl A | | | 2,228 | | | | 448 | |
Mosaic Co/The | | | 13,758 | | | | 376 | |
Newmont Mining Corp | | | 14,038 | | | | 502 | |
Nucor Corp | | | 6,312 | | | | 368 | |
Packaging Corp of America | | | 4,149 | | | | 412 | |
PPG Industries Inc | | | 3,051 | | | | 344 | |
Sealed Air Corp | | | 4,758 | | | | 219 | |
Sherwin-Williams Co/The, Cl A | | | 639 | | | | 275 | |
Vulcan Materials Co | | | 4,404 | | | | 522 | |
Westrock Co | | | 4,534 | | | | 174 | |
| | | | | | | | |
| | | | | | | 7,790 | |
| | | | | | | | |
Real Estate — 0.1% | | | | | | | | |
Alexandria Real Estate Equities Inc ‡ | | | 1,025 | | | | 146 | |
Apartment Investment & Management Co, Cl A ‡ | | | 2,812 | | | | 141 | |
Boston Properties Inc ‡ | | | 114 | | | | 15 | |
Digital Realty Trust Inc, Cl A ‡ | | | 1,000 | | | | 119 | |
Duke Realty Corp ‡ | | | 4,733 | | | | 145 | |
Equinix Inc ‡ | | | 207 | | | | 94 | |
Equity Residential ‡ | | | 1,670 | | | | 126 | |
Essex Property Trust Inc ‡ | | | 681 | | | | 197 | |
Federal Realty Investment Trust ‡ | | | 1,020 | | | | 141 | |
HCP Inc ‡ | | | 3,955 | | | | 124 | |
Host Hotels & Resorts Inc ‡ | | | 7,223 | | | | 136 | |
Kimco Realty Corp ‡ | | | 6,490 | | | | 120 | |
Macerich Co/The ‡ | | | 1,962 | | | | 85 | |
Mid-America Apartment Communities Inc ‡ | | | 1,107 | | | | 121 | |
Prologis Inc ‡ | | | 2,009 | | | | 144 | |
Realty Income Corp ‡ | | | 2,310 | | | | 170 | |
Regency Centers Corp ‡ | | | 1,875 | | | | 126 | |
SBA Communications Corp, Cl A *‡ | | | 900 | | | | 180 | |
SL Green Realty Corp ‡ | | | 1,090 | | | | 98 | |
UDR Inc ‡ | | | 2,944 | | | | 134 | |
Ventas Inc ‡ | | | 3,347 | | | | 214 | |
Vornado Realty Trust ‡ | | | 2,208 | | | | 149 | |
Welltower Inc ‡ | | | 1,515 | | | | 117 | |
Weyerhaeuser Co ‡ | | | 3,289 | | | | 87 | |
| | | | | | | | |
| | | | | | | 3,129 | |
| | | | | | | | |
Utilities — 0.5% | | | | | | | | |
AES Corp/VA | | | 25,990 | | | | 470 | |
Alliant Energy Corp | | | 14,731 | | | | 694 | |
Ameren Corp | | | 9,333 | | | | 686 | |
American Electric Power Co Inc | | | 6,545 | | | | 548 | |
American Water Works Co Inc | | | 4,182 | | | | 436 | |
CenterPoint Energy Inc | | | 17,055 | | | | 524 | |
CMS Energy Corp | | | 10,372 | | | | 576 | |
Consolidated Edison Inc | | | 8,391 | | | | 712 | |
DTE Energy Co | | | 5,956 | | | | 743 | |
| | | | | | | | |
| | | |
| Description | | Shares | | | Market Value
($ Thousands) | |
| |
COMMON STOCK (continued) | | | | | |
Duke Energy Corp | | | 6,400 | | | $ | 576 | |
Edison International | | | 7,889 | | | | 488 | |
Entergy Corp | | | 5,814 | | | | 556 | |
Evergy Inc | | | 7,600 | | | | 441 | |
Eversource Energy | | | 9,458 | | | | 671 | |
Exelon Corp | | | 12,325 | | | | 618 | |
FirstEnergy Corp | | | 14,493 | | | | 603 | |
NextEra Energy Inc | | | 2,742 | | | | 530 | |
NiSource Inc | | | 20,884 | | | | 599 | |
NRG Energy Inc | | | 9,094 | | | | 386 | |
Pinnacle West Capital Corp | | | 2,937 | | | | 281 | |
PPL Corp | | | 20,593 | | | | 654 | |
Public Service Enterprise Group Inc | | | 11,012 | | | | 654 | |
Sempra Energy | | | 4,307 | | | | 542 | |
Southern Co/The | | | 10,786 | | | | 557 | |
WEC Energy Group Inc | | | 8,658 | | | | 685 | |
Xcel Energy Inc | | | 12,339 | | | | 694 | |
| | | | | | | | |
| | | | | | | 14,924 | |
| | | | | | | | |
Total Common Stock
(Cost $68,972) ($ Thousands) | | | | | | | 93,384 | |
| | | | | | | | |
FOREIGN COMMON STOCK — 3.0% | |
Australia — 0.2% | | | | | | | | |
AGL Energy Ltd | | | 25,712 | | | | 398 | |
Amcor Ltd/Australia | | | 2,573 | | | | 28 | |
APA Group | | | 46,575 | | | | 330 | |
Aristocrat Leisure Ltd | | | 3,092 | | | | 54 | |
ASX Ltd | | | 2,472 | | | | 123 | |
Aurizon Holdings Ltd | | | 21,309 | | | | 69 | |
AusNet Services | | | 267,963 | | | | 338 | |
BHP Group Ltd | | | 169 | | | | 5 | |
Brambles Ltd | | | 6,302 | | | | 53 | |
Caltex Australia Ltd | | | 12,394 | | | | 231 | |
CIMIC Group Ltd | | | 2,946 | | | | 101 | |
Coca-Cola Amatil Ltd | | | 21,108 | | | | 130 | |
Cochlear Ltd | | | 1,412 | | | | 174 | |
Computershare Ltd | | | 16,645 | | | | 202 | |
Crown Resorts Ltd | | | 10,576 | | | | 86 | |
CSL Ltd | | | 1,573 | | | | 218 | |
Domino’s Pizza Enterprises Ltd | | | 2,369 | | | | 73 | |
Flight Centre Travel Group Ltd | | | 2,687 | | | | 80 | |
Fortescue Metals Group Ltd | | | 16,775 | | | | 85 | |
Harvey Norman Holdings Ltd | | | 38,002 | | | | 108 | |
Incitec Pivot Ltd | | | 29,314 | | | | 65 | |
Insurance Australia Group Ltd | | | 17,240 | | | | 94 | |
Lendlease Group | | | 3,959 | | | | 35 | |
Oil Search Ltd | | | 38,708 | | | | 216 | |
Orica Ltd | | | 2,883 | | | | 36 | |
Origin Energy Ltd | | | 37,673 | | | | 193 | |
Ramsay Health Care Ltd | | | 2,420 | | | | 111 | |
| | |
SEI Institutional Managed Trust / Semi-Annual Report / March 31, 2019 | | 167 |
CONSOLIDATED SCHEDULE OF INVESTMENTS (Unaudited)
March 31, 2019
Multi-Asset Accumulation Fund(Continued)
| | | | | | | | |
| | | |
| Description | | Shares | | | Market Value
($ Thousands) | |
|
FOREIGN COMMON STOCK (continued) | |
REA Group Ltd | | | 2,759 | | | $ | 146 | |
Rio Tinto Ltd | | | 197 | | | | 14 | |
Santos Ltd | | | 17,669 | | | | 86 | |
Scentre Group | | | 11,668 | | | | 34 | |
SEEK Ltd | | | 7,445 | | | | 93 | |
Sonic Healthcare Ltd | | | 9,228 | | | | 161 | |
Sydney Airport | | | 20,066 | | | | 106 | |
Tabcorp Holdings Ltd | | | 30,312 | | | | 99 | |
Telstra Corp Ltd, Cl B | | | 100,746 | | | | 237 | |
TPG Telecom Ltd | | | 39,201 | | | | 193 | |
Transurban Group | | | 13,849 | | | | 130 | |
Treasury Wine Estates Ltd | | | 13,519 | | | | 143 | |
Unibail-Rodamco-Westfield | | | 16 | | | | — | |
Wesfarmers Ltd | | | 4,242 | | | | 104 | |
Westpac Banking Corp | | | 2,441 | | | | 45 | |
Woodside Petroleum Ltd | | | 7,821 | | | | 192 | |
Woolworths Group Ltd | | | 7,504 | | | | 162 | |
| | | | | | | | |
| | | | | | | 5,581 | |
| | | | | | | | |
Austria — 0.0% | | | | | | | | |
ANDRITZ AG | | | 2,783 | | | | 120 | |
Erste Group Bank AG | | | 2,889 | | | | 106 | |
OMV AG | | | 6,519 | | | | 354 | |
Raiffeisen Bank International AG | | | 1,802 | | | | 41 | |
voestalpine AG | | | 7,580 | | | | 230 | |
| | | | | | | | |
| | | | | | | 851 | |
| | | | | | | | |
Belgium — 0.1% | | | | | | | | |
Ageas | | | 2,714 | | | | 131 | |
Anheuser-Busch InBev SA/NV | | | 2,858 | | | | 240 | |
Colruyt SA | | | 13,720 | | | | 1,015 | |
Groupe Bruxelles Lambert SA | | | 357 | | | | 35 | |
KBC Group NV | | | 1,942 | | | | 136 | |
Proximus SADP | | | 17,108 | | | | 494 | |
Solvay SA | | | 4,567 | | | | 494 | |
Telenet Group Holding NV * | | | 13,365 | | | | 644 | |
UCB SA, Cl A | | | 3,328 | | | | 286 | |
Umicore SA | | | 2,183 | | | | 97 | |
| | | | | | | | |
| | | | | | | 3,572 | |
| | | | | | | | |
Canada — 0.3% | | | | | | | | |
Alimentation Couche-Tard Inc, Cl B | | | 4,333 | | | | 255 | |
Atco Ltd/Canada, Cl I | | | 6,462 | | | | 218 | |
Aurora Cannabis Inc * | | | 14,989 | | | | 136 | |
Bank of Montreal | | | 1,058 | | | | 79 | |
Bank of Nova Scotia/The, Cl C | | | 1,590 | | | | 85 | |
Barrick Gold Corp | | | 8,539 | | | | 117 | |
Bausch Health Cos Inc * | | | 7,641 | | | | 189 | |
BCE Inc | | | 4,971 | | | | 221 | |
BlackBerry Ltd * | | | 10,863 | | | | 109 | |
Bombardier Inc, Cl B * | | | 23,691 | | | | 46 | |
Cameco Corp | | | 5,969 | | | | 70 | |
| | | | | | | | |
| | | |
| Description | | Shares | | | Market Value
($ Thousands) | |
|
FOREIGN COMMON STOCK (continued) | |
Canadian Natural Resources Ltd | | | 1,707 | | | $ | 47 | |
Canadian Pacific Railway Ltd | | | 641 | | | | 132 | |
Canadian Tire Corp Ltd, Cl A | | | 758 | | | | 82 | |
Canadian Utilities Ltd, Cl A | | | 6,352 | | | | 173 | |
Canopy Growth Corp * | | | 1,983 | | | | 86 | |
CCL Industries Inc, Cl B | | | 2,224 | | | | 90 | |
CI Financial Corp | | | 3,354 | | | | 46 | |
Constellation Software Inc/Canada | | | 153 | | | | 130 | |
Dollarama Inc | | | 1,227 | | | | 33 | |
Emera Inc | | | 7,671 | | | | 287 | |
Empire Co Ltd, Cl A | | | 8,687 | | | | 188 | |
Enbridge Inc | | | 2,263 | | | | 82 | |
First Capital Realty Inc | | | 4,150 | | | | 66 | |
First Quantum Minerals Ltd (Canada) | | | 2,143 | | | | 24 | |
Fortis Inc/Canada | | | 10,332 | | | | 382 | |
Franco-Nevada Corp | | | 1,600 | | | | 120 | |
George Weston Ltd | | | 1,233 | | | | 89 | |
Gildan Activewear Inc | | | 3,594 | | | | 129 | |
H&R Real Estate Investment Trust | | | 4,787 | | | | 84 | |
Hydro One Ltd | | | 12,827 | | | | 199 | |
Imperial Oil Ltd | | | 2,707 | | | | 74 | |
Loblaw Cos Ltd | | | 4,092 | | | | 202 | |
Magna International Inc, Cl A | | | 3,188 | | | | 155 | |
Methanex Corp | | | 1,070 | | | | 61 | |
Metro Inc, Cl A | | | 7,578 | | | | 279 | |
National Bank of Canada | | | 2,170 | | | | 98 | |
Nutrien Ltd | | | 1,762 | | | | 93 | |
Open Text Corp | | | 5,957 | | | | 229 | |
PrairieSky Royalty Ltd | | | 2,615 | | | | 35 | |
Restaurant Brands International Inc | | | 1,026 | | | | 67 | |
Rogers Communications Inc, Cl B | | | 3,483 | | | | 187 | |
Royal Bank of Canada | | | 1,066 | | | | 80 | |
Saputo Inc | | | 3,456 | | | | 118 | |
Shaw Communications Inc, Cl B | | | 7,879 | | | | 164 | |
Shopify Inc, Cl A * | | | 675 | | | | 139 | |
SNC-Lavalin Group Inc | | | 3,554 | | | | 90 | |
Stars Group Inc/The * | | | 2,951 | | | | 52 | |
Suncor Energy Inc | | | 1,544 | | | | 50 | |
Teck Resources Ltd, Cl B | | | 2,423 | | | | 56 | |
TELUS Corp | | | 7,021 | | | | 260 | |
Toronto-Dominion Bank/The | | | 1,857 | | | | 101 | |
TransCanada Corp | | | 2,000 | | | | 90 | |
Turquoise Hill Resources Ltd * | | | 33,850 | | | | 56 | |
Vermilion Energy Inc | | | 2,483 | | | | 61 | |
Wheaton Precious Metals Corp | | | 4,550 | | | | 108 | |
| | | | | | | | |
| | | | | | | 6,899 | |
| | | | | | | | |
China — 0.0% | | | | | | | | |
Sands China Ltd | | | 18,800 | | | | 95 | |
| | | | | | | | |
Denmark — 0.1% | | | | | | | | |
AP Moller - Maersk A/S, Cl A | | | 102 | | | | 123 | |
| | |
168 | | SEI Institutional Managed Trust / Semi-Annual Report / March 31, 2019 |
| | | | | | | | |
| | | |
| Description | | Shares | | | Market Value
($ Thousands) | |
|
FOREIGN COMMON STOCK (continued) | |
AP Moller - Maersk A/S, Cl B | | | 47 | | | $ | 60 | |
Carlsberg A/S, Cl B | | | 2,560 | | | | 320 | |
Chr Hansen Holding A/S | | | 3,131 | | | | 318 | |
Coloplast A/S, Cl B | | | 1,982 | | | | 218 | |
Danske Bank A/S | | | 10,789 | | | | 189 | |
Demant A/S * | | | 3,903 | | | | 115 | |
Genmab A/S * | | | 1,899 | | | | 330 | |
H Lundbeck A/S, Cl H | | | 4,565 | | | | 198 | |
Novo Nordisk A/S, Cl B | | | 3,217 | | | | 169 | |
Novozymes A/S, Cl B | | | 6,171 | | | | 284 | |
Orsted A/S (C) | | | 5,565 | | | | 422 | |
Pandora A/S | | | 4,686 | | | | 220 | |
Tryg A/S | | | 13,990 | | | | 384 | |
Vestas Wind Systems A/S | | | 1,356 | | | | 114 | |
| | | | | | | | |
| | | | | | | 3,464 | |
| | | | | | | | |
Finland — 0.1% | | | | | | | | |
Elisa OYJ | | | 10,169 | | | | 459 | |
Fortum OYJ | | | 11,559 | | | | 237 | |
Kone OYJ, Cl B | | | 2,993 | | | | 151 | |
Metso OYJ | | | 2,878 | | | | 99 | |
Neste | | | 3,921 | | | | 418 | |
Nokia OYJ | | | 75,877 | | | | 432 | |
Nokian Renkaat OYJ | | | 3,215 | | | | 108 | |
Orion Oyj, Cl B | | | 6,931 | | | | 260 | |
Stora Enso OYJ, Cl R | | | 7,053 | | | | 86 | |
UPM-Kymmene OYJ, Cl V | | | 3,841 | | | | 112 | |
Wartsila OYJ Abp | | | 6,954 | | | | 113 | |
| | | | | | | | |
| | | | | | | 2,475 | |
| | | | | | | | |
France — 0.2% | | | | | | | | |
Aeroports de Paris, Cl A | | | 373 | | | | 72 | |
Air Liquide SA | | | 1,133 | | | | 144 | |
Atos SE | | | 2,099 | | | | 203 | |
AXA SA | | | 1,932 | | | | 49 | |
BioMerieux | | | 1,418 | | | | 117 | |
Bouygues SA | | | 892 | | | | 32 | |
Capgemini SE | | | 1,472 | | | | 179 | |
Carrefour SA | | | 6,251 | | | | 117 | |
CNP Assurances | | | 1,903 | | | | 42 | |
Covivio | | | 434 | | | | 46 | |
Credit Agricole SA | | | 1,767 | | | | 21 | |
Dassault Systemes SE | | | 2,182 | | | | 325 | |
Electricite de France SA | | | 14,933 | | | | 204 | |
Engie SA | | | 13,671 | | | | 204 | |
EssilorLuxottica SA | | | 1,928 | | | | 211 | |
Eurofins Scientific SE | | | 129 | | | | 53 | |
Eutelsat Communications SA | | | 5,109 | | | | 89 | |
Gecina SA | | | 699 | | | | 103 | |
Getlink SE | | | 4,624 | | | | 70 | |
ICADE | | | 512 | | | | 43 | |
Iliad SA | | | 971 | | | | 98 | |
| | | | | | | | |
| | | |
| Description | | Shares | | | Market Value
($ Thousands) | |
|
FOREIGN COMMON STOCK (continued) | |
Imerys SA | | | 2,203 | | | $ | 110 | |
Ingenico Group SA | | | 1,563 | | | | 112 | |
Ipsen SA | | | 1,367 | | | | 188 | |
JCDecaux SA | | | 1,173 | | | | 36 | |
L’Oreal SA | | | 607 | | | | 163 | |
LVMH Moet Hennessy Louis Vuitton SE | | | 396 | | | | 146 | |
Natixis SA | | | 5,679 | | | | 30 | |
Orange SA | | | 5,449 | | | | 89 | |
Pernod Ricard SA | | | 240 | | | | 43 | |
Remy Cointreau SA | | | 117 | | | | 16 | |
Renault SA | | | 1,250 | | | | 83 | |
Rexel SA | | | 3,641 | | | | 41 | |
Sanofi | | | 1,510 | | | | 134 | |
Sartorius Stedim Biotech | | | 1,305 | | | | 165 | |
Schneider Electric SE | | | 577 | | | | 45 | |
SCOR SE | | | 1,457 | | | | 62 | |
Societe BIC SA | | | 447 | | | | 40 | |
STMicroelectronics NV | | | 5,260 | | | | 78 | |
Suez | | | 11,567 | | | | 153 | |
Thales SA, Cl A | | | 440 | | | | 53 | |
TOTAL SA | | | 2,499 | | | | 139 | |
Ubisoft Entertainment SA * | | | 803 | | | | 72 | |
Valeo SA | | | 2,727 | | | | 79 | |
Veolia Environnement SA | | | 6,091 | | | | 136 | |
Vinci SA | | | 822 | | | | 80 | |
Vivendi SA | | | 5,328 | | | | 155 | |
Wendel SA | | | 681 | | | | 86 | |
| | | | | | | | |
| | | | | | | 4,956 | |
| | | | | | | | |
Germany — 0.2% | | | | | | | | |
1&1 Drillisch AG | | | 1,551 | | | | 55 | |
adidas AG | | | 369 | | | | 90 | |
Allianz SE | | | 347 | | | | 77 | |
BASF SE | | | 1,028 | | | | 76 | |
Bayer AG | | | 1,449 | | | | 94 | |
Beiersdorf AG | | | 1,293 | | | | 135 | |
Brenntag AG | | | 527 | | | | 27 | |
Commerzbank AG | | | 5,497 | | | | 43 | |
Continental AG | | | 286 | | | | 43 | |
Covestro AG | | | 1,507 | | | | 83 | |
Delivery Hero SE *(C) | | | 1,703 | | | | 62 | |
Deutsche Bank AG | | | 2,043 | | | | 17 | |
Deutsche Telekom AG | | | 6,506 | | | | 108 | |
Deutsche Wohnen SE | | | 1,750 | | | | 85 | |
E.ON SE | | | 20,435 | | | | 227 | |
Fraport AG Frankfurt Airport Services Worldwide | | | 1,521 | | | | 117 | |
Fresenius SE & Co KGaA | | | 295 | | | | 16 | |
GEA Group AG | | | 1,568 | | | | 41 | |
Hannover Rueck SE | | | 619 | | | | 89 | |
HeidelbergCement AG | | | 879 | | | | 63 | |
Henkel AG & Co KGaA | | | 1,543 | | | | 147 | |
| | |
SEI Institutional Managed Trust / Semi-Annual Report / March 31, 2019 | | 169 |
CONSOLIDATED SCHEDULE OF INVESTMENTS (Unaudited)
March 31, 2019
Multi-Asset Accumulation Fund(Continued)
| | | | | | | | |
| | | |
| Description | | Shares | | | Market Value
($ Thousands) | |
|
FOREIGN COMMON STOCK (continued) | |
HUGO BOSS AG | | | 1,366 | | | $ | 93 | |
Infineon Technologies AG | | | 8,574 | | | | 170 | |
Innogy SE (C) | | | 7,476 | | | | 346 | |
LANXESS AG | | | 1,587 | | | | 85 | |
Merck KGaA | | | 1,220 | | | | 139 | |
METRO AG | | | 10,579 | | | | 176 | |
Muenchener Rueckversicherungs- Gesellschaft AG in Muenchen | | | 274 | | | | 65 | |
OSRAM Licht AG | | | 1,575 | | | | 54 | |
Puma SE | | | 32 | | | | 19 | |
QIAGEN NV * | | | 4,245 | | | | 172 | |
RTL Group SA | | | 1,417 | | | | 77 | |
RWE AG | | | 3,134 | | | | 84 | |
SAP SE | | | 1,978 | | | | 229 | |
Siemens Healthineers AG (C) | | | 4,368 | | | | 182 | |
Symrise AG, Cl A | | | 1,058 | | | | 95 | |
Telefonica Deutschland Holding AG | | | 26,444 | | | | 83 | |
thyssenkrupp AG | | | 3,604 | | | | 50 | |
Uniper SE | | | 5,506 | | | | 166 | |
United Internet AG | | | 3,201 | | | | 117 | |
Volkswagen AG | | | 135 | | | | 22 | |
Wirecard AG | | | 1,325 | | | | 166 | |
Zalando SE *(C) | | | 1,425 | | | | 56 | |
| | | | | | | | |
| | | | | | | 4,341 | |
| | | | | | | | |
Hong Kong — 0.2% | |
AIA Group Ltd | | | 13,800 | | | | 137 | |
ASM Pacific Technology Ltd | | | 17,728 | | | | 198 | |
CK Asset Holdings Ltd | | | 5,708 | | | | 51 | |
CK Hutchison Holdings Ltd | | | 8,208 | | | | 86 | |
CK Infrastructure Holdings Ltd | | | 41,339 | | | | 339 | |
CLP Holdings Ltd, Cl B | | | 40,838 | | | | 473 | |
Galaxy Entertainment Group Ltd * | | | 15,000 | | | | 102 | |
HK Electric Investments & HK Electric Investments Ltd | | | 467,000 | | | | 477 | |
HKT Trust & HKT Ltd | | | 450,010 | | | | 723 | |
Hong Kong & China Gas Co Ltd | | | 119,234 | | | | 286 | |
Kerry Properties Ltd | | | 13,000 | | | | 58 | |
MGM China Holdings Ltd | | | 30,000 | | | | 63 | |
Minth Group Ltd | | | 18,000 | | | | 57 | |
NWS Holdings Ltd | | | 8,569 | | | | 19 | |
PCCW Ltd | | | 745,000 | | | | 463 | |
Power Assets Holdings Ltd | | | 41,474 | | | | 288 | |
Shangri-La Asia Ltd | | | 82,000 | | | | 117 | |
SJM Holdings Ltd | | | 122,000 | | | | 139 | |
Swire Pacific Ltd, Cl A | | | 4,000 | | | | 52 | |
Swire Properties Ltd | | | 18,400 | | | | 79 | |
Techtronic Industries Co Ltd | | | 1,501 | | | | 10 | |
WH Group Ltd | | | 341,000 | | | | 365 | |
Wynn Macau Ltd | | | 27,600 | | | | 65 | |
| | | | | | | | |
| | | |
| Description | | Shares | | | Market Value
($ Thousands) | |
|
FOREIGN COMMON STOCK (continued) | |
Yue Yuen Industrial Holdings Ltd | | | 67,694 | | | $ | 233 | |
| | | | | | | | |
| | | | | | | 4,880 | |
| | | | | | | | |
Ireland — 0.1% | | | | | | | | |
Accenture PLC, Cl A | | | 1,029 | | | | 181 | |
AerCap Holdings NV * | | | 2,475 | | | | 115 | |
AIB Group PLC | | | 40,348 | | | | 181 | |
Bank of Ireland Group PLC | | | 30,752 | | | | 183 | |
CRH PLC | | | 8,115 | | | | 252 | |
Eaton Corp PLC | | | 2,114 | | | | 170 | |
James Hardie Industries PLC | | | 6,087 | | | | 79 | |
Kerry Group PLC, Cl A | | | 3,687 | | | | 412 | |
Paddy Power Betfair PLC | | | 12,744 | | | | 984 | |
Ryanair Holdings PLC ADR * | | | 2,240 | | | | 168 | |
| | | | | | | | |
| | | | | | | 2,725 | |
| | | | | | | | |
Israel — 0.1% | | | | | | | | |
Azrieli Group Ltd | | | 1,204 | | | | 71 | |
Bank Leumi Le-Israel BM | | | 3,728 | | | | 24 | |
Bezeq The Israeli Telecommunication Corp Ltd * | | | 560,067 | | | | 402 | |
Check Point Software Technologies Ltd * | | | 3,477 | | | | 440 | |
Elbit Systems Ltd | | | 1,925 | | | | 249 | |
International Flavors & Fragrances Inc | | | 1 | | | | — | |
Israel Chemicals Ltd | | | 67,621 | | | | 352 | |
Nice Ltd * | | | 3,452 | | | | 407 | |
Wix.com Ltd * | | | 2,155 | | | | 260 | |
| | | | | | | | |
| | | | | | | 2,205 | |
| | | | | | | | |
Italy — 0.1% | | | | | | | | |
Assicurazioni Generali SpA | | | 2,134 | | | | 40 | |
Atlantia SpA | | | 3,095 | | | | 80 | |
Davide Campari-Milano SpA | | | 3,158 | | | | 31 | |
Enel SpA | | | 35,087 | | | | 225 | |
Eni SpA | | | 9,713 | | | | 172 | |
EXOR NV | | | 1,900 | | | | 123 | |
Ferrari NV | | | 904 | | | | 121 | |
Fiat Chrysler Automobiles NV | | | 4,810 | | | | 72 | |
Intesa Sanpaolo SpA | | | 31,593 | | | | 77 | |
Leonardo SpA | | | 10,324 | | | | 120 | |
Mediobanca Banca di Credito Finanziario SpA | | | 8,384 | | | | 87 | |
Moncler SpA | | | 2,434 | | | | 98 | |
Poste Italiane SpA (C) | | | 10,226 | | | | 100 | |
Prysmian SpA | | | 5,661 | | | | 107 | |
Recordati SpA | | | 5,489 | | | | 214 | |
Snam SpA | | | 74,423 | | | | 383 | |
Telecom Italia SpA/Milano * | | | 716,038 | | | | 424 | |
Tenaris SA | | | 20,864 | | | | 293 | |
Terna Rete Elettrica Nazionale SpA | | | 51,888 | | | | 329 | |
| | | | | | | | |
| | | | | | | 3,096 | |
| | | | | | | | |
| | |
170 | | SEI Institutional Managed Trust / Semi-Annual Report / March 31, 2019 |
| | | | | | | | |
| | | |
| Description | | Shares | | | Market Value
($ Thousands) | |
|
FOREIGN COMMON STOCK (continued) | |
Japan — 0.3% | | | | | | | | |
Air Water Inc | | | 3,900 | | | $ | 57 | |
Aisin Seiki Co Ltd | | | 1,500 | | | | 54 | |
Ajinomoto Co Inc | | | 3,200 | | | | 51 | |
ANA Holdings Inc | | | 2,000 | | | | 73 | |
Aozora Bank Ltd | | | 3,100 | | | | 77 | |
Asahi Group Holdings Ltd | | | 800 | | | | 36 | |
Asahi Kasei Corp | | | 9,000 | | | | 93 | |
Astellas Pharma Inc | | | 100 | | | | 2 | |
Calbee Inc | | | 2,000 | | | | 54 | |
Canon Inc | | | 2,600 | | | | 75 | |
Central Japan Railway Co | | | 400 | | | | 93 | |
Chubu Electric Power Co Inc | | | 3,300 | | | | 52 | |
Chugai Pharmaceutical Co Ltd | | | 900 | | | | 62 | |
Chugoku Electric Power Co Inc/The | | | 17,500 | | | | 218 | |
Credit Saison Co Ltd | | | 5,700 | | | | 75 | |
Daicel Corp | | | 3,800 | | | | 41 | |
Dentsu Inc | | | 1,800 | | | | 76 | |
Eisai Co Ltd | | | 1,200 | | | | 67 | |
Electric Power Development Co Ltd | | | 6,100 | | | | 149 | |
FamilyMart UNY Holdings Co Ltd, Cl H | | | 3,600 | | | | 92 | |
FUJIFILM Holdings Corp | | | 3,100 | | | | 141 | |
Hankyu Hanshin Holdings Inc | | | 1,400 | | | | 52 | |
Hino Motors Ltd | | | 8,200 | | | | 69 | |
Hirose Electric Co Ltd | | | 882 | | | | 93 | |
Hitachi Chemical Co Ltd | | | 3,039 | | | | 67 | |
Idemitsu Kosan Co Ltd | | | 14,398 | | | | 482 | |
Inpex Corp | | | 22,100 | | | | 211 | |
J Front Retailing Co Ltd | | | 5,200 | | | | 62 | |
Japan Post Bank Co Ltd | | | 7,900 | | | | 86 | |
Japan Prime Realty Investment Corp, Cl A ‡ | | | 24 | | | | 99 | |
Japan Real Estate Investment Corp | | | 16 | | | | 94 | |
Japan Retail Fund Investment Corp, Cl A | | | 32 | | | | 64 | |
JXTG Holdings Inc | | | 11,300 | | | | 52 | |
Kamigumi Co Ltd | | | 4,000 | | | | 93 | |
Kaneka Corp | | | 2,400 | | | | 90 | |
Kansai Electric Power Co Inc/The | | | 14,400 | | | | 212 | |
Kansai Paint Co Ltd | | | 3,000 | | | | 57 | |
Kao Corp | | | 400 | | | | 32 | |
KDDI Corp | | | 3,300 | | | | 71 | |
Keikyu Corp | | | 4,000 | | | | 68 | |
Kyocera Corp | | | 1,500 | | | | 88 | |
Kyushu Electric Power Co Inc | | | 3,700 | | | | 44 | |
Lawson Inc | | | 2,100 | | | | 117 | |
LIXIL Group Corp | | | 3,000 | | | | 40 | |
Marubeni Corp | | | 14,900 | | | | 103 | |
Maruichi Steel Tube Ltd | | | 3,200 | | | | 93 | |
McDonald’s Holdings Co Japan Ltd | | | 1,723 | | | | 80 | |
Mebuki Financial Group Inc | | | 32,230 | | | | 82 | |
MEIJI Holdings Co Ltd | | | 600 | | | | 49 | |
Mitsubishi Chemical Holdings Corp, Cl B | | | 4,700 | | | | 33 | |
Mitsubishi Motors Corp | | | 8,800 | | | | 47 | |
| | | | | | | | |
| | | |
| Description | | Shares | | | Market Value
($ Thousands) | |
|
FOREIGN COMMON STOCK (continued) | |
Mitsubishi Tanabe Pharma Corp | | | 7,400 | | | $ | 99 | |
Mitsui Chemicals Inc | | | 1,800 | | | | 43 | |
Murata Manufacturing Co Ltd | | | 1,500 | | | | 75 | |
NEC Corp | | | 3,300 | | | | 112 | |
NGK Spark Plug Co Ltd | | | 2,600 | | | | 48 | |
Nippon Building Fund Inc | | | 13 | | | | 88 | |
Nippon Prologis REIT Inc ‡ | | | 36 | | | | 77 | |
Nippon Telegraph & Telephone Corp | | | 2,200 | | | | 93 | |
Nisshin Seifun Group Inc | | | 4,515 | | | | 104 | |
Nomura Research Institute Ltd | | | 2,178 | | | | 99 | |
NTT Data Corp | | | 10,000 | | | | 110 | |
NTT DOCOMO Inc | | | 3,700 | | | | 82 | |
Obic Co Ltd | | | 900 | | | | 91 | |
Odakyu Electric Railway Co Ltd | | | 3,300 | | | | 80 | |
Oji Holdings Corp | | | 12,000 | | | | 74 | |
Ono Pharmaceutical Co Ltd | | | 500 | | | | 10 | |
Oracle Corp Japan * | | | 1,200 | | | | 81 | |
Otsuka Holdings Co Ltd | | | 600 | | | | 24 | |
Pan Pacific International Holdings Corp | | | 2,800 | | | | 185 | |
Ryohin Keikaku Co Ltd | | | 400 | | | | 101 | |
Sankyo Co Ltd | | | 2,500 | | | | 95 | |
Sekisui Chemical Co Ltd | | | 5,300 | | | | 85 | |
Seven & i Holdings Co Ltd | | | 2,100 | | | | 79 | |
Shimizu Corp | | | 8,200 | | | | 71 | |
Shizuoka Bank Ltd/The | | | 12,000 | | | | 91 | |
SoftBank Group Corp | | | 400 | | | | 39 | |
Subaru Corp | | | 4,000 | | | | 91 | |
Sumitomo Corp | | | 6,500 | | | | 90 | |
Sumitomo Rubber Industries Ltd | | | 6,900 | | | | 83 | |
Sysmex Corp | | | 1,700 | | | | 103 | |
Taisei Corp | | | 1,000 | | | | 46 | |
Taisho Pharmaceutical Holdings Co Ltd | | | 200 | | | | 19 | |
Takeda Pharmaceutical Co Ltd | | | 4,318 | | | | 176 | |
Teijin Ltd | | | 4,800 | | | | 79 | |
Terumo Corp | | | 1,000 | | | | 31 | |
Tobu Railway Co Ltd | | | 3,400 | | | | 98 | |
Toho Co Ltd/Tokyo | | | 2,600 | | | | 104 | |
Toho Gas Co Ltd | | | 2,512 | | | | 113 | |
Tohoku Electric Power Co Inc | | | 12,200 | | | | 156 | |
Tokyo Electric Power Co Holdings Inc * | | | 31,100 | | | | 197 | |
Tokyo Gas Co Ltd | | | 6,300 | | | | 170 | |
Tokyu Corp | | | 4,400 | | | | 77 | |
Toray Industries Inc | | | 10,000 | | | | 64 | |
TOTO Ltd | | | 1,000 | | | | 42 | |
Toyo Seikan Group Holdings Ltd | | | 1,900 | | | | 39 | |
Toyo Suisan Kaisha Ltd | | | 3,000 | | | | 114 | |
Toyota Industries Corp | | | 1,900 | | | | 95 | |
Toyota Motor Corp | | | 1,700 | | | | 100 | |
Trend Micro Inc/Japan | | | 2,000 | | | | 97 | |
Unicharm Corp | | | 1,200 | | | | 40 | |
United Urban Investment Corp | | | 66 | | | | 104 | |
Yamaguchi Financial Group Inc | | | 9,000 | | | | 76 | |
| | |
SEI Institutional Managed Trust / Semi-Annual Report / March 31, 2019 | | 171 |
CONSOLIDATED SCHEDULE OF INVESTMENTS (Unaudited)
March 31, 2019
Multi-Asset Accumulation Fund(Continued)
| | | | | | | | |
| | | |
| Description | | Shares | | | Market Value
($ Thousands) | |
|
FOREIGN COMMON STOCK (continued) | |
Yamazaki Baking Co Ltd | | | 5,000 | | | $ | 81 | |
| | | | | | | | |
| | |
| | | | | | | 9,089 | |
| | | | | | | | |
|
Luxembourg — 0.0% | |
SES SA, Cl A | | | 5,154 | | | | 80 | |
| | | | | | | | |
|
Netherlands — 0.1% | |
ABN AMRO Group NV | | | 1,275 | | | | 29 | |
Adyen NV *(C) | | | 188 | | | | 147 | |
Aegon NV | | | 1,120 | | | | 5 | |
Akzo Nobel NV | | | 1,738 | | | | 154 | |
ArcelorMittal | | | 2,789 | | | | 57 | |
ASML Holding NV | | | 1,281 | | | | 240 | |
Heineken Holding NV | | | 333 | | | | 33 | |
Heineken NV | | | 1,392 | | | | 147 | |
ING Groep NV | | | 10,046 | | | | 122 | |
Koninklijke Ahold Delhaize NV | | | 4,320 | | | | 115 | |
Koninklijke DSM NV | | | 1,275 | | | | 139 | |
Koninklijke KPN NV | | | 126,877 | | | | 403 | |
Koninklijke Philips NV | | | 6,834 | | | | 279 | |
Koninklijke Vopak NV | | | 6,630 | | | | 318 | |
LyondellBasell Industries NV, Cl A | | | 3,960 | | | | 333 | |
NXP Semiconductors NV | | | 1,949 | | | | 172 | |
Randstad NV | | | 1,641 | | | | 80 | |
Unibail-Rodamco-Westfield | | | 139 | | | | 23 | |
Unilever NV | | | 3,228 | | | | 188 | |
Wolters Kluwer NV | | | 2,040 | | | | 139 | |
| | | | | | | | |
| | |
| | | | | | | 3,123 | |
| | | | | | | | |
New Zealand — 0.1% | |
a2 Milk Co Ltd * | | | 30,385 | | | | 297 | |
Auckland International Airport Ltd | | | 21,194 | | | | 118 | |
Fisher & Paykel Healthcare Corp Ltd | | | 32,232 | | | | 345 | |
Fletcher Building Ltd | | | 67,052 | | | | 226 | |
Meridian Energy Ltd | | | 164,211 | | | | 469 | |
Ryman Healthcare Ltd | | | 37,156 | | | | 310 | |
Spark New Zealand Ltd | | | 103,227 | | | | 267 | |
| | | | | | | | |
| | |
| | | | | | | 2,032 | |
| | | | | | | | |
Norway — 0.1% | |
Aker BP ASA | | | 3,935 | | | | 140 | |
DNB ASA, Cl A | | | 9,226 | | | | 170 | |
Equinor ASA | | | 8,101 | | | | 178 | |
Gjensidige Forsikring ASA | | | 3,646 | | | | 63 | |
Mowi ASA | | | 27,299 | | | | 610 | |
Norsk Hydro ASA | | | 54,716 | | | | 222 | |
Orkla ASA | | | 30,555 | | | | 235 | |
Schibsted ASA, Cl B | | | 10,678 | | | | 383 | |
Telenor ASA | | | 15,704 | | | | 315 | |
Yara International ASA | | | 3,013 | | | | 124 | |
| | | | | | | | |
| | |
| | | | | | | 2,440 | |
| | | | | | | | |
| | | | | | | | |
| | | |
| Description | | Shares | | | Market Value
($ Thousands) | |
|
FOREIGN COMMON STOCK (continued) | |
|
Panama — 0.0% | |
Carnival Corp | | | 1,461 | | | $ | 74 | |
| | | | | | | | |
|
Portugal — 0.0% | |
Banco Espirito Santo SA * | | | 50,830 | | | | — | |
EDP - Energias de Portugal SA | | | 51,467 | | | | 202 | |
Galp Energia SGPS SA | | | 12,892 | | | | 207 | |
Jeronimo Martins SGPS SA | | | 8,743 | | | | 129 | |
| | | | | | | | |
| | |
| | | | | | | 538 | |
| | | | | | | | |
Singapore — 0.1% | |
CapitaLand Commercial Trust | | | 53,667 | | | | 77 | |
CapitaLand Ltd | | | 33,800 | | | | 91 | |
City Developments Ltd | | | 7,600 | | | | 51 | |
ComfortDelGro Corp Ltd | | | 64,800 | | | | 123 | |
Dairy Farm International Holdings Ltd | | | 54,200 | | | | 455 | |
Genting Singapore Ltd | | | 242,300 | | | | 186 | |
Golden Agri-Resources Ltd | | | 1,474,000 | | | | 305 | |
Jardine Cycle & Carriage Ltd | | | 9,300 | | | | 223 | |
Jardine Strategic Holdings Ltd | | | 2,500 | | | | 94 | |
Keppel Corp Ltd | | | 16,600 | | | | 76 | |
Oversea-Chinese Banking Corp Ltd | | | 12,800 | | | | 104 | |
SATS Ltd | | | 8,100 | | | | 31 | |
Sembcorp Industries Ltd | | | 31,300 | | | | 59 | |
Singapore Airlines Ltd | | | 4,200 | | | | 30 | |
Singapore Press Holdings Ltd | | | 204,200 | | | | 363 | |
Singapore Technologies Engineering Ltd | | | 25,400 | | | | 70 | |
Singapore Telecommunications Ltd | | | 133,900 | | | | 298 | |
United Overseas Bank Ltd | | | 5,300 | | | | 99 | |
UOL Group Ltd | | | 7,072 | | | | 36 | |
Venture Corp Ltd | | | 19,800 | | | | 262 | |
Wilmar International Ltd | | | 116,800 | | | | 285 | |
Yangzijiang Shipbuilding Holdings Ltd | | | 115,350 | | | | 128 | |
| | | | | | | | |
| | |
| | | | | | | 3,446 | |
| | | | | | | | |
Spain — 0.1% | |
ACS Actividades de Construccion y Servicios SA | | | 2,833 | | | | 125 | |
Aena SME SA (C) | | | 765 | | | | 138 | |
Amadeus IT Group SA, Cl A | | | 2,397 | | | | 192 | |
Banco Bilbao Vizcaya Argentaria SA | | | 10,923 | | | | 63 | |
Banco Santander SA | | | 16,470 | | | | 77 | |
Bankia SA | | | 20,227 | | | | 52 | |
Bankinter SA | | | 7,228 | | | | 55 | |
Enagas SA | | | 17,643 | | | | 514 | |
Endesa SA | | | 8,610 | | | | 220 | |
Ferrovial SA | | | 4,529 | | | | 106 | |
Grifols SA | | | 9,996 | | | | 280 | |
Iberdrola SA | | | 26,058 | | | | 229 | |
Industria de Diseno Textil SA | | | 4,514 | | | | 133 | |
International Consolidated Airlines Group SA | | | 11,138 | | | | 74 | |
Naturgy Energy Group SA | | | 6,561 | | | | 184 | |
| | |
172 | | SEI Institutional Managed Trust / Semi-Annual Report / March 31, 2019 |
| | | | | | | | |
| Description | | Shares | | | Market Value
($ Thousands) | |
|
FOREIGN COMMON STOCK (continued) | |
Red Electrica Corp SA | | | 10,145 | | | $ | 216 | |
Repsol SA, Cl A | | | 6,235 | | | | 107 | |
Siemens Gamesa Renewable Energy SA | | | 5,394 | | | | 86 | |
Telefonica SA | | | 4,820 | | | | 40 | |
| | | | | | | | |
| | | | | | | 2,891 | |
| | | | | | | | |
Sweden — 0.1% | | | | | | | | |
Alfa Laval AB | | | 3,670 | | | | 84 | |
Atlas Copco AB, Cl A | | | 1,818 | | | | 49 | |
Atlas Copco AB, Cl B | | | 1,891 | | | | 47 | |
Boliden AB | | | 1,050 | | | | 30 | |
Electrolux AB | | | 10,068 | | | | 259 | |
Epiroc AB, Cl A | | | 1,818 | | | | 18 | |
Epiroc AB, Cl B | | | 1,891 | | | | 18 | |
Essity AB, Cl B | | | 7,171 | | | | 207 | |
Hennes & Mauritz AB, Cl B | | | 16,068 | | | | 269 | |
Hexagon AB, Cl B | | | 2,068 | | | | 108 | |
Husqvarna AB, Cl B | | | 17,924 | | | | 147 | |
ICA Gruppen AB | | | 7,278 | | | | 293 | |
Industrivarden AB, Cl C | | | 4,865 | | | | 102 | |
Kinnevik AB | | | 1,565 | | | | 41 | |
Lundin Petroleum AB | | | 7,477 | | | | 254 | |
Millicom International Cellular SA | | | 1,589 | | | | 97 | |
Nordea Bank Abp | | | 6,982 | | | | 53 | |
Skandinaviska Enskilda Banken AB, Cl A | | | 7,936 | | | | 69 | |
Svenska Handelsbanken AB, Cl A | | | 7,194 | | | | 76 | |
Swedbank AB, Cl A | | | 4,910 | | | | 70 | |
Swedish Match AB | | | 4,369 | | | | 223 | |
Tele2 AB, Cl B | | | 6,112 | | | | 82 | |
Telefonaktiebolaget LM Ericsson, Cl B | | | 42,385 | | | | 390 | |
Telia Co AB | | | 63,713 | | | | 288 | |
Volvo AB, Cl B | | | 6,277 | | | | 97 | |
| | | | | | | | |
| | | | | | | 3,371 | |
| | | | | | | | |
Switzerland — 0.2% | | | | | | | | |
ABB Ltd | | | 4,545 | | | | 85 | |
Adecco Group AG | | | 1,187 | | | | 63 | |
Baloise Holding AG | | | 496 | | | | 82 | |
Barry Callebaut AG | | | 61 | | | | 110 | |
Chocoladefabriken Lindt & Spruengli AG | | | 31 | | | | 354 | |
Cie Financiere Richemont SA | | | 1,741 | | | | 127 | |
Clariant AG | | | 1,232 | | | | 26 | |
Dufry AG | | | 1,505 | | | | 158 | |
EMS-Chemie Holding AG | | | 62 | | | | 34 | |
Geberit AG | | | 215 | | | | 88 | |
Givaudan SA | | | 28 | | | | 72 | |
Kuehne + Nagel International AG | | | 661 | | | | 91 | |
LafargeHolcim Ltd | | | 1,540 | | | | 76 | |
Lonza Group AG | | | 312 | | | | 97 | |
Nestle SA | | | 1,850 | | | | 176 | |
Novartis AG | | | 1,161 | | | | 112 | |
Partners Group Holding AG | | | 140 | | | | 102 | |
| | | | | | | | |
| Description | | Shares | | | Market Value
($ Thousands) | |
|
FOREIGN COMMON STOCK (continued) | |
Roche Holding AG | | | 898 | | | $ | 247 | |
Schindler Holding AG | | | 542 | | | | 112 | |
SGS SA, Cl B | | | 41 | | | | 102 | |
Sonova Holding AG | | | 638 | | | | 126 | |
Straumann Holding AG | | | 271 | | | | 221 | |
Swatch Group AG/The | | | 3,136 | | | | 173 | |
Swatch Group AG/The, Cl B | | | 494 | | | | 141 | |
Swiss Life Holding AG | | | 254 | | | | 112 | |
Swiss Re AG | | | 978 | | | | 96 | |
Swisscom AG | | | 920 | | | | 450 | |
TE Connectivity Ltd | | | 1,862 | | | | 150 | |
Temenos AG | | | 882 | | | | 130 | |
UBS Group AG | | | 5,937 | | | | 72 | |
Vifor Pharma AG | | | 721 | | | | 97 | |
Zurich Insurance Group AG | | | 87 | | | | 29 | |
| | | | | | | | |
| | | | | | | 4,111 | |
| | | | | | | | |
United Kingdom — 0.2% | | | | | | | | |
Admiral Group PLC | | | 3,076 | | | | 87 | |
Associated British Foods PLC | | | 2,191 | | | | 70 | |
AstraZeneca PLC | | | 2,062 | | | | 165 | |
Aviva PLC | | | 17,112 | | | | 92 | |
Barratt Developments PLC | | | 14,410 | | | | 113 | |
BP PLC | | | 32,264 | | | | 235 | |
British American Tobacco PLC | | | 1,681 | | | | 70 | |
BT Group PLC, Cl A | | | 31,533 | | | | 92 | |
Bunzl PLC | | | 3,000 | | | | 99 | |
Burberry Group PLC | | | 3,826 | | | | 97 | |
Centrica PLC | | | 85,316 | | | | 127 | |
Coca-Cola HBC AG | | | 3,429 | | | | 117 | |
ConvaTec Group PLC (C) | | | 45,774 | | | | 84 | |
Diageo PLC | | | 2,888 | | | | 118 | |
easyJet PLC | | | 3,512 | | | | 51 | |
Experian PLC | | | 2,610 | | | | 71 | |
G4S PLC | | | 16,567 | | | | 40 | |
GlaxoSmithKline PLC | | | 7,569 | | | | 157 | |
Imperial Brands PLC | | | 3,182 | | | | 109 | |
Informa PLC | | | 13,266 | | | | 129 | |
InterContinental Hotels Group PLC | | | 1,158 | | | | 70 | |
Intertek Group PLC | | | 544 | | | | 34 | |
ITV PLC | | | 52,450 | | | | 87 | |
J Sainsbury PLC | | | 21,670 | | | | 67 | |
John Wood Group PLC | | | 27,090 | | | | 179 | |
Johnson Matthey PLC | | | 1,866 | | | | 76 | |
Kingspan Group PLC | | | 6,500 | | | | 301 | |
Marks & Spencer Group PLC | | | 10,789 | | | | 39 | |
Micro Focus International PLC | | | 9,338 | | | | 243 | |
National Grid PLC | | | 24,779 | | | | 275 | |
NMC Health PLC | | | 2,427 | | | | 72 | |
Pearson PLC | | | 16,363 | | | | 178 | |
Persimmon PLC | | | 1,979 | | | | 56 | |
Reckitt Benckiser Group PLC | | | 1,075 | | | | 89 | |
| | |
SEI Institutional Managed Trust / Semi-Annual Report / March 31, 2019 | | 173 |
CONSOLIDATED SCHEDULE OF INVESTMENTS (Unaudited)
March 31, 2019
Multi-Asset Accumulation Fund(Continued)
| | | | | | | | |
| | | |
| Description | | Shares | | | Market Value
($ Thousands) | |
|
FOREIGN COMMON STOCK (continued) | |
RELX PLC | | | 3,034 | | | $ | 65 | |
Rio Tinto PLC | | | 2,159 | | | | 125 | |
Royal Dutch Shell PLC, Cl A | | | 4,870 | | | | 153 | |
Royal Dutch Shell PLC, Cl B | | | 4,366 | | | | 138 | |
Royal Mail PLC | | | 6,924 | | | | 21 | |
RSA Insurance Group PLC | | | 16,014 | | | | 106 | |
Sage Group PLC/The | | | 25,020 | | | | 229 | |
Severn Trent PLC | | | 8,989 | | | | 231 | |
Smith & Nephew PLC | | | 8,008 | | | | 159 | |
Smiths Group PLC | | | 4,570 | | | | 85 | |
Smurfit Kappa Group PLC | | | 5,974 | | | | 167 | |
SSE PLC | | | 11,068 | | | | 171 | |
Standard Life Aberdeen PLC | | | 22,285 | | | | 77 | |
TUI AG | | | 3,217 | | | | 31 | |
Unilever PLC | | | 2,107 | | | | 121 | |
United Utilities Group PLC, Cl B | | | 9,009 | | | | 96 | |
Vodafone Group PLC | | | 42,865 | | | | 78 | |
Whitbread PLC | | | 1,095 | | | | 72 | |
Wm Morrison Supermarkets PLC | | | 34,659 | | | | 103 | |
WPP PLC | | | 8,141 | | | | 86 | |
| | | | | | | | |
| | |
| | | | | | | 6,203 | |
| | | | | | | | |
Total Foreign Common Stock
(Cost $71,230) ($ Thousands) | | | | | | | 82,538 | |
| | | | | | | | |
| | |
| | | Face Amount
(Thousands) | | | | |
CORPORATE OBLIGATIONS — 1.5% | | | | | |
Communication Services — 0.0% | | | | | |
Alphabet Inc | | | | | | | | |
3.625%, 05/19/2021 (B) | | $ | 150 | | | | 154 | |
| | | | | | | | |
| |
Consumer Discretionary — 0.0% | | | | | |
Toyota Motor Credit MTN | | | | | | | | |
3.200%, 01/11/2027 (B) | | | 750 | | | | 762 | |
University of Southern California | | | | | | | | |
5.250%, 10/01/2111 (B) | | | 100 | | | | 127 | |
| | | | | | | | |
| | | | | | | 889 | |
| | | | | | | | |
Consumer Staples — 0.0% | | | | | | | | |
Coca-Cola | | | | | | | | |
3.200%, 11/01/2023 (B) | | | 500 | | | | 514 | |
Colgate-Palmolive MTN | | | | | | | | |
2.300%, 05/03/2022 (B) | | | 250 | | | | 249 | |
Procter & Gamble | | | | | | | | |
1.850%, 02/02/2021 (B) | | | 250 | | | | 247 | |
| | | | | | | | |
| | | | | | | 1,010 | |
| | | | | | | | |
Energy — 0.1% | | | | | | | | |
Chevron | | | | | | | | |
2.954%, 05/16/2026 (B) | | | 1,000 | | | | 1,007 | |
| | | | | | | | |
| | | |
| Description | | Face Amount
(Thousands) | | | Market Value
($ Thousands) | |
|
CORPORATE OBLIGATIONS (continued) | |
Equinor | | | | | | | | |
2.450%, 01/17/2023 (B) | | $ | 250 | | | $ | 248 | |
Nexen Energy ULC | | | | | | | | |
5.875%, 03/10/2035 (B) | | | 100 | | | | 120 | |
Shell International Finance BV | | | | | | | | |
3.250%, 05/11/2025 (B) | | | 250 | | | | 255 | |
XTO Energy | | | | | | | | |
6.750%, 08/01/2037 (B) | | | 300 | | | | 419 | |
| | | | | | | | |
| | | | | | | 2,049 | |
| | | | | | | | |
Financials — 1.0% | | | | | | | | |
African Development Bank MTN | | | | | | | | |
2.375%, 09/23/2021 (B) | | | 1,750 | | | | 1,751 | |
Australia & New Zealand Banking Group NY MTN | | | | | | | | |
2.250%, 06/13/2019 (B) | | | 1,300 | | | | 1,299 | |
Bank of Montreal MTN | | | | | | | | |
2.550%, 11/06/2022 (B) | | | 250 | | | | 249 | |
1.900%, 08/27/2021 (B) | | | 750 | | | | 737 | |
1.500%, 07/18/2019 (B) | | | 1,000 | | | | 997 | |
Bank of New York Mellon | | | | | | | | |
3.550%, 09/23/2021 (B) | | | 200 | | | | 204 | |
Bank of Nova Scotia | | | | | | | | |
4.375%, 01/13/2021 (B) | | | 250 | | | | 257 | |
2.700%, 03/07/2022 (B) | | | 500 | | | | 501 | |
Berkshire Hathaway | | | | | | | | |
3.400%, 01/31/2022 (B) | | | 150 | | | | 154 | |
2.750%, 03/15/2023 (B) | | | 1,000 | | | | 1,006 | |
Canadian Imperial Bank of Commerce | | | | | | | | |
1.600%, 09/06/2019 (B) | | | 1,000 | | | | 996 | |
CME Group | | | | | | | | |
3.000%, 09/15/2022 (B) | | | 100 | | | | 101 | |
3.000%, 03/15/2025 (B) | | | 1,000 | | | | 1,005 | |
Commonwealth Bank of Australia NY | | | | | | | | |
2.550%, 03/15/2021 (B) | | | 1,750 | | | | 1,741 | |
HSBC Holdings | | | | | | | | |
5.100%, 04/05/2021 (B) | | | 250 | | | | 261 | |
JPMorgan Chase Bank | | | | | | | | |
1.650%, 09/23/2019 (B) | | | 1,000 | | | | 995 | |
Kreditanstalt fuer Wiederaufbau | | | | | | | | |
2.375%, 08/25/2021 (B) | | | 1,000 | | | | 1,001 | |
2.125%, 03/07/2022 (B) | | | 500 | | | | 497 | |
2.125%, 06/15/2022 (B) | | | 500 | | | | 497 | |
2.125%, 01/17/2023 (B) | | | 500 | | | | 495 | |
1.875%, 11/30/2020 (B) | | | 1,000 | | | | 992 | |
1.500%, 06/15/2021 (B) | | | 500 | | | | 491 | |
Landwirtschaftliche Rentenbank | | | | | | | | |
2.375%, 06/10/2025 (B) | | | 250 | | | | 249 | |
2.250%, 10/01/2021 (B) | | | 1,000 | | | | 997 | |
2.000%, 01/13/2025 (B) | | | 250 | | | | 244 | |
1.750%, 04/15/2019 (B) | | | 200 | | | | 200 | |
1.375%, 10/23/2019 (B) | | | 500 | | | | 497 | |
| | |
174 | | SEI Institutional Managed Trust / Semi-Annual Report / March 31, 2019 |
| | | | | | | | |
| | | |
| Description | | Face Amount
(Thousands) | | | Market Value
($ Thousands) | |
|
CORPORATE OBLIGATIONS (continued) | |
Landwirtschaftliche Rentenbank MTN | | | | | | | | |
1.750%, 07/27/2026 (B) | | $ | 750 | | | $ | 711 | |
National Australia Bank | | | | | | | | |
3.000%, 01/20/2023 (B) | | | 200 | | | | 200 | |
1.875%, 07/12/2021 (B) | | | 750 | | | | 734 | |
Nordic Investment Bank MTN | | | | | | | | |
1.500%, 09/29/2020 (B) | | | 1,000 | | | | 987 | |
Oesterreichische Kontrollbank | | | | | | | | |
1.875%, 01/20/2021 (B) | | | 750 | | | | 743 | |
Royal Bank of Canada MTN | | | | | | | | |
1.500%, 07/29/2019 (B) | | | 1,000 | | | | 996 | |
Svenska Handelsbanken MTN | | | | | | | | |
2.450%, 03/30/2021 (B) | | | 1,000 | | | | 995 | |
Toronto-Dominion Bank MTN | | | | | | | | |
2.125%, 04/07/2021 (B) | | | 500 | | | | 495 | |
US Bank | | | | | | | | |
2.125%, 10/28/2019 (B) | | | 400 | | | | 399 | |
Wells Fargo Bank | | | | | | | | |
1.750%, 05/24/2019 (B) | | | 1,000 | | | | 999 | |
Wells Fargo Bank MTN | | | | | | | | |
2.150%, 12/06/2019 (B) | | | 500 | | | | 498 | |
Westpac Banking | | | | | | | | |
4.875%, 11/19/2019 (B) | | | 200 | | | | 203 | |
2.600%, 11/23/2020 (B) | | | 1,000 | | | | 998 | |
2.000%, 08/19/2021 (B) | | | 750 | | | | 737 | |
| | |
| | | | | | | | |
| | | | | | | 28,109 | |
| | | | | | | | |
| | |
Health Care — 0.1% | | | | | | | | |
Johnson & Johnson | | | | | | | | |
5.950%, 08/15/2037 (B) | | | 300 | | | | 390 | |
3.375%, 12/05/2023 (B) | | | 500 | | | | 521 | |
2.450%, 03/01/2026 (B) | | | 1,000 | | | | 977 | |
Sanofi | | | | | | | | |
4.000%, 03/29/2021 (B) | | | 150 | | | | 154 | |
| | |
| | | | | | | | |
| | | | | | | 2,042 | |
| | | | | | | | |
| | |
Industrials — 0.0% | | | | | | | | |
3M MTN | | | | | | | | |
5.700%, 03/15/2037 (B) | | | 150 | | | | 189 | |
GE Capital International Funding Unlimited Co | | | | | | | | |
4.418%, 11/15/2035 (B) | | | 750 | | | | 694 | |
| | |
| | | | | | | | |
| | | | | | | 883 | |
| | | | | | | | |
| |
Information Technology — 0.2% | | | | | |
Apple Inc | | | | | | | | |
2.850%, 02/23/2023 (B) | | | 1,000 | | | | 1,009 | |
2.500%, 02/09/2022 (B) | | | 500 | | | | 499 | |
2.400%, 05/03/2023 (B) | | | 250 | | | | 248 | |
Automatic Data Processing | | | | | | | | |
2.250%, 09/15/2020 (B) | | | 500 | | | | 497 | |
| | | | | | | | |
| | | |
| Description | | Face Amount
(Thousands) | | | Market Value
($ Thousands) | |
|
CORPORATE OBLIGATIONS (continued) | |
Microsoft | | | | | | | | |
3.700%, 08/08/2046 (B) | | $ | 500 | | | $ | 510 | |
3.300%, 02/06/2027 (B) | | | 1,000 | | | | 1,027 | |
2.125%, 11/15/2022 (B) | | | 500 | | | | 494 | |
| | | | | | | | |
| | | | | | | 4,284 | |
| | | | | | | | |
| | |
Utilities — 0.1% | | | | | | | | |
Duke Energy Carolinas LLC | | | | | | | | |
2.950%, 12/01/2026 (B) | | | 1,000 | | | | 989 | |
Florida Power & Light | | | | | | | | |
3.125%, 12/01/2025 (B) | | | 1,000 | | | | 1,015 | |
Southern California Gas | | | | | | | | |
5.125%, 11/15/2040 (B) | | | 150 | | | | 173 | |
| | |
| | | | | | | | |
| | | | | | | 2,177 | |
| | | | | | | | |
| | |
Total Corporate Obligations
(Cost $41,925) ($ Thousands) | | | | | | | 41,597 | |
| | | | | | | | |
| | |
| | | Shares | | | | |
EXCHANGE TRADED FUND — 1.3% | | | | | |
iShares iBoxx $ Investment Grade Corporate Bond ETF | | | 315,193 | | | | 37,527 | |
| | | | | | | | |
| | |
Total Exchange Traded Fund
(Cost $36,402) ($ Thousands) | | | | | | | 37,527 | |
| | | | | | | | |
| | |
PREFERRED STOCK — 0.0% | | | | | | | | |
| | |
Consumer Discretionary — 0.0% | | | | | | | | |
Porsche Automobil Holding SE (D) | | | 342 | | | | 21 | |
Volkswagen AG (D) | | | 220 | | | | 35 | |
| | | | | | | | |
| | |
| | | | | | | 56 | |
| | | | | | | | |
| | |
Consumer Staples — 0.0% | | | | | | | | |
Henkel AG & Co KGaA (D) | | | 1,296 | | | | 132 | |
| | | | | | | | |
| | |
Health Care — 0.0% | | | | | | | | |
Sartorius AG (D) | | | 665 | | | | 114 | |
| | | | | | | | |
| | |
Materials — 0.0% | | | | | | | | |
FUCHS PETROLUB SE (D) | | | 1,520 | | | | 63 | |
| | | | | | | | |
| | |
Total Preferred Stock
(Cost $365) ($ Thousands) | | | | | | | 365 | |
| | | | | | | | |
| | |
Total Investments in
Securities — 73.1%
(Cost $2,001,457) ($ Thousands) | | | | | | $ | 2,050,802 | |
| | | | | | | | |
| | |
SEI Institutional Managed Trust / Semi-Annual Report / March 31, 2019 | | 175 |
CONSOLIDATED SCHEDULE OF INVESTMENTS (Unaudited)
March 31, 2019
Multi-Asset Accumulation Fund(Continued)
A list of the open futures contracts held by the Fund at March 31, 2019, is as follows:
| | | | | | | | | | | | | | | | | | | | |
| Type of Contract | | Number of
Contracts
Long (Short) | | | Expiration
Date | | | Notional Amount
(Thousands) | | Value
(Thousands) | | Unrealized
Appreciation/
(Depreciation)
(Thousands) |
Amsterdam Index | | | 96 | | | | Apr-2019 | | | $ | 11,552 | | | $ | 11,813 | | | $ | 310 | |
Australian 10-Year Bond | | | 2,116 | | | | Jun-2019 | | | | 203,401 | | | | 208,264 | | | | 4,159 | |
Brent Crude** | | | 663 | | | | Jun-2019 | | | | 43,909 | | | | 44,560 | | | | 652 | |
CAC40 10 Euro Index | | | 530 | | | | Apr-2019 | | | | 31,352 | | | | 31,797 | | | | 575 | |
Canadian 10-Year Bond | | | 1,980 | | | | Jun-2019 | | | | 204,436 | | | | 206,070 | | | | 4,295 | |
CBT 5-Year DSF | | | 237 | | | | Jun-2019 | | | | 24,254 | | | | 24,498 | | | | 244 | |
CBT 10-Year DSF | | | 952 | | | | Jun-2019 | | | | 97,862 | | | | 100,034 | | | | 2,173 | |
Coffee C | | | 184 | | | | Jul-2019 | | | | 6,835 | | | | 6,696 | | | | (139 | ) |
Copper | | | 67 | | | | Jun-2019 | | | | 4,674 | | | | 4,918 | | | | 244 | |
Corn** | | | 386 | | | | Jul-2019 | | | | 7,360 | | | | 7,069 | | | | (291 | ) |
Cotton No. 2** | | | 162 | | | | Jul-2019 | | | | 6,234 | | | | 6,343 | | | | 109 | |
Crude Oil** | | | 996 | | | | May-2019 | | | | 57,412 | | | | 60,039 | | | | 2,627 | |
DAX Index | | | 56 | | | | Jun-2019 | | | | 18,216 | | | | 18,132 | | | | (11 | ) |
DAX Index | | | 16 | | | | Jun-2019 | | | | 5,201 | | | | 5,181 | | | | — | |
DJ Euro Stoxx 50 Index | | | 1,993 | | | | Jun-2019 | | | | 72,379 | | | | 73,222 | | | | 1,143 | |
Dow Jones-UBS Commodity Index | | | 816 | | | | Jun-2019 | | | | 6,588 | | | | 6,626 | | | | 38 | |
Euro-Bob | | | 676 | | | | Jun-2019 | | | | 101,606 | | | | 101,060 | | | | 876 | |
Euro-BTP | | | 421 | | | | Jun-2019 | | | | 60,618 | | | | 61,203 | | | | 1,441 | |
Euro-Bund | | | 3,544 | | | | Jun-2019 | | | | 658,007 | | | | 661,931 | | | | 12,552 | |
Euro-Buxl 30 Year Bond | | | 117 | | | | Jun-2019 | | | | 24,262 | | | | 25,179 | | | | 1,263 | |
Feeder Cattle** | | | 29 | | | | Aug-2019 | | | | 2,202 | | | | 2,266 | | | | 64 | |
Feeder Cattle | | | 63 | | | | May-2019 | | | | 4,725 | | | | 4,686 | | | | (39 | ) |
FTSE 100 Index | | | 883 | | | | Jun-2019 | | | | 81,585 | | | | 82,975 | | | | 1,803 | |
FTSE MIB Index | | | 99 | | | | Jun-2019 | | | | 11,312 | | | | 11,528 | | | | 283 | |
FTSE/JSE Top 40 Index | | | 75 | | | | Jun-2019 | | | | 2,634 | | | | 2,641 | | | | 5 | |
Gasoline** | | | 118 | | | | Jun-2019 | | | | 9,060 | | | | 9,258 | | | | 198 | |
Gold | | | 113 | | | | Jun-2019 | | | | 14,762 | | | | 14,673 | | | | (89 | ) |
Gold** | | | 396 | | | | Jun-2019 | | | | 51,310 | | | | 51,421 | | | | 111 | |
Hang Seng China Enterprises Index | | | 247 | | | | Apr-2019 | | | | 17,778 | | | | 17,894 | | | | 120 | |
Hang Seng Index | | | 99 | | | | Apr-2019 | | | | 18,099 | | | | 18,335 | | | | 240 | |
IBEX 35 Index | | | 63 | | | | Apr-2019 | | | | 6,489 | | | | 6,500 | | | | 41 | |
Japanese 10-Year Bond | | | 457 | | | | Jun-2019 | | | | 628,314 | | | | 632,868 | | | | 2,300 | |
Japanese 10-Year Bond E-MINI | | | 1,740 | | | | Jun-2019 | | | | 236,958 | | | | 240,961 | | | | 1,412 | |
KC HRW Wheat** | | | 65 | | | | Jul-2019 | | | | 1,435 | | | | 1,423 | | | | (12 | ) |
KOSPI 200 Index | | | 158 | | | | Jun-2019 | | | | 9,648 | | | | 9,646 | | | | 18 | |
Lean Hogs | | | 4 | | | | Aug-2019 | | | | 125 | | | | 149 | | | | 24 | |
Lean Hogs | | | 224 | | | | Jun-2019 | | | | 6,854 | | | | 7,934 | | | | 1,080 | |
Live Cattle | | | 364 | | | | Jul-2019 | | | | 17,429 | | | | 17,326 | | | | (103 | ) |
LME Copper** | | | 160 | | | | Jun-2019 | | | | 24,380 | | | | 25,946 | | | | 1,566 | |
LME Lead** | | | 59 | | | | Jun-2019 | | | | 2,964 | | | | 2,975 | | | | 11 | |
LME Nickel** | | | 170 | | | | Jun-2019 | | | | 12,016 | | | | 13,245 | | | | 1,229 | |
LME Primary Aluminum | | | 208 | | | | Jun-2019 | | | | 9,803 | | | | 9,937 | | | | 134 | |
LME Zinc** | | | 154 | | | | Jun-2019 | | | | 10,156 | | | | 11,299 | | | | 1,143 | |
Long Gilt 10-Year Bond | | | 786 | | | | Jun-2019 | | | | 130,833 | | | | 132,500 | | | | 1,931 | |
Low Sulphur Gasoil | | | 56 | | | | May-2019 | | | | 3,424 | | | | 3,401 | | | | (23 | ) |
Low Sulphur Gasoil** | | | 226 | | | | Jun-2019 | | | | 13,758 | | | | 13,775 | | | | 16 | |
MSCI Emerging Markets | | | 1,334 | | | | Jun-2019 | | | | 69,658 | | | | 70,529 | | | | 870 | |
MSCI Taiwan Index | | | 560 | | | | Apr-2019 | | | | 21,651 | | | | 21,879 | | | | 228 | |
Natural Gas** | | | 202 | | | | Jun-2019 | | | | 5,806 | | | | 5,480 | | | | (326 | ) |
Natural Gas | | | 46 | | | | Jun-2019 | | | | 1,297 | | | | 1,275 | | | | (22 | ) |
Natural Gas | | | 199 | | | | May-2019 | | | | 5,470 | | | | 5,297 | | | | (173 | ) |
NY Harbor ULSD** | | | 142 | | | | Jun-2019 | | | | 11,844 | | | | 11,778 | | | | (66 | ) |
NYMEX Cocoa | | | 28 | | | | Sep-2019 | | | | 614 | | | | 636 | | | | 21 | |
| | |
176 | | SEI Institutional Managed Trust / Semi-Annual Report / March 31, 2019 |
| | | | | | | | | | | | | | | | | | | | |
| Type of Contract | | Number of
Contracts
Long (Short) | | | Expiration
Date | | | Notional Amount
(Thousands) | | | Value
(Thousands) | | | Unrealized
Appreciation/
(Depreciation)
(Thousands) | |
NYMEX Cocoa** | | | 147 | | | | Jul-2019 | | | $ | 3,261 | | | $ | 3,337 | | | $ | 75 | |
NYMEX Cocoa | | | 196 | | | | Jul-2019 | | | | 4,678 | | | | 4,449 | | | | (229) | |
OMX Stockholm 30 Index | | | 284 | | | | Apr-2019 | | | | 4,647 | | | | 4,734 | | | | 42 | |
Russell 2000 Index E-MINI | | | 2,034 | | | | Jun-2019 | | | | 155,873 | | | | 157,004 | | | | 1,132 | |
S&P - Goldman Sachs Commodity Index | | | 350 | | | | Apr-2019 | | | | 36,996 | | | | 37,958 | | | | 961 | |
S&P 500 Index E-MINI | | | 3,270 | | | | Jun-2019 | | | | 452,077 | | | | 463,980 | | | | 11,903 | |
S&P Mid Cap 400 Index E-MINI | | | 238 | | | | Jun-2019 | | | | 44,639 | | | | 45,244 | | | | 605 | |
S&P TSX 60 Index | | | 291 | | | | Jun-2019 | | | | 41,368 | | | | 41,696 | | | | 156 | |
Silver | | | 325 | | | | Jun-2019 | | | | 25,967 | | | | 24,554 | | | | (1,413) | |
Silver** | | | 58 | | | | Aug-2019 | | | | 4,409 | | | | 4,409 | | | | – | |
Soybean** | | | 314 | | | | Jul-2019 | | | | 14,301 | | | | 14,095 | | | | (207) | |
Soybean Meal | | | 89 | | | | Jul-2019 | | | | 2,836 | | | | 2,759 | | | | (77) | |
Soybean Meal** | | | 138 | | | | Jul-2019 | | | | 4,248 | | | | 4,278 | | | | 30 | |
Soybean Oil** | | | 356 | | | | May-2019 | | | | 6,503 | | | | 6,058 | | | | (446) | |
Soybean Oil** | | | 343 | | | | Jul-2019 | | | | 6,030 | | | | 5,904 | | | | (125) | |
SPI 200 Index | | | 218 | | | | Jun-2019 | | | | 23,859 | | | | 23,890 | | | | 4 | |
SPI 200 Index | | | 86 | | | | Jun-2019 | | | | 9,456 | | | | 9,425 | | | | (37) | |
Sugar No. 11** | | | 783 | | | | Jul-2019 | | | | 11,011 | | | | 11,094 | | | | 83 | |
TOPIX Index | | | 520 | | | | Jun-2019 | | | | 74,355 | | | | 74,792 | | | | (333) | |
U.S. 2-Year Treasury Note | | | 1 | | | | Jul-2019 | | | | 212 | | | | 213 | | | | 1 | |
U.S. 10-Year Treasury Note | | | 8,046 | | | | Jun-2019 | | | | 984,623 | | | | 999,464 | | | | 14,841 | |
U.S. Long Treasury Bond | | | 527 | | | | Jun-2019 | | | | 76,651 | | | | 78,869 | | | | 2,218 | |
Wheat** | | | 260 | | | | Jul-2019 | | | | 5,786 | | | | 6,026 | | | | 240 | |
Wheat | | | 159 | | | | Jul-2019 | | | | 3,743 | | | | 3,685 | | | | (58) | |
| | | | | | | | | | | | | | | | | | | | |
| | | | | | | | | | $ | 5,088,080 | | | $ | 5,154,988 | | | $ | 75,621 | |
| | | | | | | | | | | | | | | | | | | | |
A list of the open forward foreign currency contracts held by the Fund at March 31, 2019, is as follows:
| | | | | | | | | | | | | | | | | | | | | | | | |
| Counterparty | | Settlement Date | | | | | | Currency to Deliver
(Thousands) | | | | | | Currency to Receive
(Thousands) | | | Unrealized
Appreciation
(Depreciation)
(Thousands) | |
BNP Paribas | | | 04/26/19 | | | | CHF | | | | 3,900 | | | | USD | | | | 3,933 | | | $ | 6 | |
BNP Paribas | | | 04/26/19 | | | | CAD | | | | 9,700 | | | | USD | | | | 7,253 | | | | (13) | |
Brown Brothers Harriman | | | 04/26/19 | | | | EUR | | | | 44 | | | | USD | | | | 49 | | | | — | |
Citigroup | | | 06/19/19 | | | | CHF | | | | 117 | | | | USD | | | | 118 | | | | 1 | |
Citigroup | | | 06/19/19 | | | | CHF | | | | 818 | | | | USD | | | | 824 | | | | (4) | |
Citigroup | | | 06/19/19 | | | | USD | | | | 159 | | | | GBP | | | | 122 | | | | 1 | |
Citigroup | | | 06/19/19 | | | | USD | | | | 1,934 | | | | GBP | | | | 1,464 | | | | (19) | |
Citigroup | | | 06/19/19 | | | | USD | | | | 4,308 | | | | CLP | | | | 2,832,100 | | | | (142) | |
Citigroup | | | 06/19/19 | | | | USD | | | | 4,462 | | | | CZK | | | | 100,550 | | | | (79) | |
Citigroup | | | 06/19/19 | | | | INR | | | | 4,700 | | | | USD | | | | 65 | | | | (1) | |
Citigroup | | | 06/19/19 | | | | USD | | | | 6,036 | | | | HUF | | | | 1,670,550 | | | | (165) | |
Citigroup | | | 06/19/19 | | | | HKD | | | | 6,088 | | | | USD | | | | 778 | | | | 1 | |
Citigroup | | | 06/19/19 | | | | HKD | | | | 2,449 | | | | USD | | | | 313 | | | | — | |
Citigroup | | | 06/19/19 | | | | BRL | | | | 9,800 | | | | USD | | | | 2,537 | | | | 33 | |
Citigroup | | | 06/19/19 | | | | USD | | | | 791 | | | | EUR | | | | 700 | | | | 1 | |
Citigroup | | | 06/19/19 | | | | USD | | | | 10,484 | | | | EUR | | | | 9,173 | | | | (114) | |
Citigroup | | | 06/19/19 | | | | USD | | | | 1,228 | | | | PLN | | | | 4,701 | | | | 2 | |
Citigroup | | | 06/19/19 | | | | USD | | | | 11,026 | | | | PLN | | | | 41,799 | | | | (92) | |
Citigroup | | | 06/19/19 | | | | PLN | | | | 11,950 | | | | USD | | | | 3,156 | | | | 30 | |
Citigroup | | | 06/19/19 | | | | PLN | | | | 3,050 | | | | USD | | | | 796 | | | | (2) | |
Citigroup | | | 06/19/19 | | | | USD | | | | 6,261 | | | | CNH | | | | 42,240 | | | | 25 | |
| | |
SEI Institutional Managed Trust / Semi-Annual Report / March 31, 2019 | | 177 |
CONSOLIDATED SCHEDULE OF INVESTMENTS (Unaudited)
March 31, 2019
Multi-Asset Accumulation Fund(Continued)
| | | | | | | | | | | | | | | | | | | | | | | | |
| Counterparty | | Settlement Date | | | | | | Currency to Deliver
(Thousands) | | | | | | Currency to Receive
(Thousands) | | | Unrealized
Appreciation
(Depreciation)
(Thousands) | |
Citigroup | | | 06/19/19 | | | | USD | | | | 10,135 | | | | CNH | | | | 67,810 | | | $ | (45) | |
Citigroup | | | 06/19/19 | | | | HUF | | | | 18,200 | | | | USD | | | | 66 | | | | 2 | |
Citigroup | | | 06/19/19 | | | | USD | | | | 21,092 | | | | ZAR | | | | 300,150 | | | | (475) | |
Citigroup | | | 06/19/19 | | | | USD | | | | 21,656 | | | | BRL | | | | 82,150 | | | | (661) | |
Citigroup | | | 06/19/19 | | | | USD | | | | 20,655 | | | | INR | | | | 1,485,550 | | | | 542 | |
Citigroup | | | 06/19/19 | | | | USD | | | | 2,901 | | | | INR | | | | 201,600 | | | | (24) | |
Citigroup | | | 06/19/19 | | | | USD | | | | 23,842 | | | | KRW | | | | 26,729,250 | | | | (273) | |
Citigroup | | | 06/19/19 | | | | GBP | | | | 33,051 | | | | USD | | | | 43,630 | | | | 397 | |
Citigroup | | | 06/19/19 | | | | GBP | | | | 2,428 | | | | USD | | | | 3,156 | | | | (20) | |
Citigroup | | | 06/19/19 | | | | USD | | | | 8,396 | | | | MXN | | | | 165,962 | | | | 52 | |
Citigroup | | | 06/19/19 | | | | USD | | | | 30,922 | | | | MXN | | | | 603,788 | | | | (187) | |
Citigroup | | | 06/19/19 | | | | ZAR | | | | 48,050 | | | | USD | | | | 3,328 | | | | 27 | |
Citigroup | | | 06/19/19 | | | | ZAR | | | | 14,150 | | | | USD | | | | 965 | | | | (7) | |
Citigroup | | | 06/19/19 | | | | MXN | | | | 12,350 | | | | USD | | | | 630 | | | | 1 | |
Citigroup | | | 06/19/19 | | | | MXN | | | | 50,150 | | | | USD | | | | 2,547 | | | | (6) | |
Citigroup | | | 06/19/19 | | | | EUR | | | | 148,805 | | | | USD | | | | 170,082 | | | | 1,872 | |
Citigroup | | | 06/19/19 | | | | KRW | | | | 3,867,875 | | | | USD | | | | 3,436 | | | | 26 | |
JPMorgan Chase Bank | | | 04/26/19 | | | | JPY | | | | 1,009,700 | | | | USD | | | | 9,153 | | | | 8 | |
JPMorgan Chase Bank | | | 06/19/19 | | | | CHF | | | | 117 | | | | USD | | | | 118 | | | | — | |
JPMorgan Chase Bank | | | 06/19/19 | | | | CHF | | | | 818 | | | | USD | | | | 824 | | | | (5) | |
JPMorgan Chase Bank | | | 06/19/19 | | | | USD | | | | 159 | | | | GBP | | | | 122 | | | | 1 | |
JPMorgan Chase Bank | | | 06/19/19 | | | | USD | | | | 1,934 | | | | GBP | | | | 1,464 | | | | (19) | |
JPMorgan Chase Bank | | | 06/19/19 | | | | USD | | | | 4,308 | | | | CLP | | | | 2,832,100 | | | | (143) | |
JPMorgan Chase Bank | | | 06/19/19 | | | | USD | | | | 4,462 | | | | CZK | | | | 100,550 | | | | (79) | |
JPMorgan Chase Bank | | | 06/19/19 | | | | INR | | | | 4,700 | | | | USD | | | | 65 | | | | (2) | |
JPMorgan Chase Bank | | | 06/19/19 | | | | USD | | | | 6,036 | | | | HUF | | | | 1,670,550 | | | | (166) | |
JPMorgan Chase Bank | | | 06/19/19 | | | | HKD | | | | 6,088 | | | | USD | | | | 778 | | | | — | |
JPMorgan Chase Bank | | | 06/19/19 | | | | HKD | | | | 2,449 | | | | USD | | | | 313 | | | | — | |
JPMorgan Chase Bank | | | 06/19/19 | | | | BRL | | | | 9,800 | | | | USD | | | | 2,537 | | | | 32 | |
JPMorgan Chase Bank | | | 06/19/19 | | | | USD | | | | 791 | | | | EUR | | | | 700 | | | | — | |
JPMorgan Chase Bank | | | 06/19/19 | | | | USD | | | | 10,484 | | | | EUR | | | | 9,173 | | | | (115) | |
JPMorgan Chase Bank | | | 06/19/19 | | | | USD | | | | 1,228 | | | | PLN | | | | 4,701 | | | | 1 | |
JPMorgan Chase Bank | | | 06/19/19 | | | | USD | | | | 11,026 | | | | PLN | | | | 41,799 | | | | (92) | |
JPMorgan Chase Bank | | | 06/19/19 | | | | PLN | | | | 11,950 | | | | USD | | | | 3,156 | | | | 30 | |
JPMorgan Chase Bank | | | 06/19/19 | | | | PLN | | | | 3,050 | | | | USD | | | | 796 | | | | (2) | |
JPMorgan Chase Bank | | | 06/19/19 | | | | USD | | | | 6,261 | | | | CNH | | | | 42,240 | | | | 24 | |
JPMorgan Chase Bank | | | 06/19/19 | | | | USD | | | | 10,135 | | | | CNH | | | | 67,810 | | | | (46) | |
JPMorgan Chase Bank | | | 06/19/19 | | | | HUF | | | | 18,200 | | | | USD | | | | 66 | | | | 1 | |
JPMorgan Chase Bank | | | 06/19/19 | | | | USD | | | | 21,092 | | | | ZAR | | | | 300,150 | | | | (475) | |
JPMorgan Chase Bank | | | 06/19/19 | | | | USD | | | | 21,656 | | | | BRL | | | | 82,150 | | | | (661) | |
JPMorgan Chase Bank | | | 06/19/19 | | | | USD | | | | 20,655 | | | | INR | | | | 1,485,550 | | | | 542 | |
JPMorgan Chase Bank | | | 06/19/19 | | | | USD | | | | 2,901 | | | | INR | | | | 201,600 | | | | (25) | |
JPMorgan Chase Bank | | | 06/19/19 | | | | USD | | | | 23,842 | | | | KRW | | | | 26,729,250 | | | | (273) | |
JPMorgan Chase Bank | | | 06/19/19 | | | | GBP | | | | 33,051 | | | | USD | | | | 43,630 | | | | 396 | |
JPMorgan Chase Bank | | | 06/19/19 | | | | GBP | | | | 2,428 | | | | USD | | | | 3,156 | | | | (21) | |
JPMorgan Chase Bank | | | 06/19/19 | | | | USD | | | | 8,396 | | | | MXN | | | | 165,962 | | | | 52 | |
JPMorgan Chase Bank | | | 06/19/19 | | | | USD | | | | 30,922 | | | | MXN | | | | 603,788 | | | | (188) | |
JPMorgan Chase Bank | | | 06/19/19 | | | | ZAR | | | | 48,050 | | | | USD | | | | 3,328 | | | | 27 | |
JPMorgan Chase Bank | | | 06/19/19 | | | | ZAR | | | | 14,150 | | | | USD | | | | 965 | | | | (8) | |
| | |
178 | | SEI Institutional Managed Trust / Semi-Annual Report / March 31, 2019 |
| | | | | | | | | | | | | | | | | | | | | | | | |
| Counterparty | | Settlement
Date | | | | | | Currency to Deliver
(Thousands) | | | | | | Currency to Receive
(Thousands) | | | Unrealized
Appreciation
(Depreciation)
(Thousands) | |
JPMorgan Chase Bank | | | 06/19/19 | | | | MXN | | | | 12,350 | | | | USD | | | | 630 | | | $ | 1 | |
JPMorgan Chase Bank | | | 06/19/19 | | | | MXN | | | | 50,150 | | | | USD | | | | 2,547 | | | | (6 | ) |
JPMorgan Chase Bank | | | 06/19/19 | | | | EUR | | | | 148,805 | | | | USD | | | | 170,082 | | | | 1,872 | |
JPMorgan Chase Bank | | | 06/19/19 | | | | KRW | | | | 3,867,875 | | | | USD | | | | 3,436 | | | | 25 | |
State Street | | | 04/26/19 | | | | AUD | | | | 7,900 | | | | USD | | | | 5,645 | | | | 31 | |
State Street | | | 04/26/19 | | | | HKD | | | | 38,400 | | | | USD | | | | 4,896 | | | | — | |
State Street | | | 04/26/19 | | | | GBP | | | | 59,599 | | | | USD | | | | 78,680 | | | | 937 | |
State Street | | | 04/26/19 | | | | EUR | | | | 108,925 | | | | USD | | | | 123,913 | | | | 1,354 | |
| | | | | | | | | | | | | | | | | | | | | | | | |
| | | | | | | | | | | | | | | | | | | | | | $ | 3,698 | |
| | | | | | | | | | | | | | | | | | | | | | | | |
A list of the open OTC swap agreements held by the Fund at March 31, 2019 is as follows:
| | | | | | | | | | | | | | | | | | | | | | | | | | | | | | | | | | | | | | |
| Total Return Swaps | |
| Counterparty | | Reference Entity/
Obligation | | Fund Pays | | | Fund Receives | | | Payment
Frequency | | | Termination
Date | | | Currency | | | Notional
Amount | | | Value
($ Thousands) | | | Upfront
Payments
($ Thousands) | | | Net
Unrealized
Appreciation
(Depreciation)
($ Thousands) | |
| | | | | | | | | | |
Merrill Lynch | | TAIEX Index | | | Negative Price Return | | | | Positive Price Return | | | | At Maturity | | | | 04/17/2019 | | | | TWD | | | | 4,139 | | | $ | 4,195 | | | $ | — | | | $ | 55 | |
Bank of America | | Bovespa Index | | | Negative Price Return | | | | Positive Price Return | | | | At Maturity | | | | 04/17/2019 | | | | BRL | | | | 18,826 | | | | 17,920 | | | | — | | | | (139 | ) |
JPMorgan Chase | | TAIEX Index | | | Negative Price Return | | | | Positive Price Return | | | | At Maturity | | | | 04/17/2019 | | | | TWD | | | | 943 | | | | 963 | | | | — | | | | 17 | |
Bank of America | | H-Shares Index | | | Negative Price Return | | | | Positive Price Return | | | | At Maturity | | | | 04/29/2019 | | | | HKD | | | | 33,158 | | | | 33,470 | | | | — | | | | 321 | |
Bank of America | | Hang Seng Index | | | Negative Price Return | | | | Positive Price Return | | | | At Maturity | | | | 04/29/2019 | | | | HKD | | | | 10,198 | | | | 10,371 | | | | — | | | | 177 | |
JPMorgan Chase | | H-Shares Index | | | Negative Price Return | | | | Positive Price Return | | | | At Maturity | | | | 04/29/2019 | | | | HKD | | | | 24,943 | | | | 25,211 | | | | — | | | | 272 | |
Bank of America | | KOSPI 200 Index | | | Negative Price Return | | | | Positive Price Return | | | | At Maturity | | | | 06/13/2019 | | | | KRW | | | | 6,176 | | | | 6,166 | | | | — | | | | 1 | |
JPMorgan Chase | | KOSPI 200 Index | | | Negative Price Return | | | | Positive Price Return | | | | At Maturity | | | | 06/13/2019 | | | | KRW | | | | 11,498 | | | | 11,539 | | | | — | | | | 31 | |
Bank of America | | Live Hog** | | | Negative Price Return | | | | Positive Price Return | | | | At Maturity | | | | 06/14/2019 | | | | USD | | | | 31 | | | | 36 | | | | — | | | | 5 | |
Bank of America | | Swiss Market Index | | | Negative Price Return | | | | Positive Price Return | | | | At Maturity | | | | 06/21/2019 | | | | CHF | | | | 42,644 | | | | 43,983 | | | | — | | | | 784 | |
Merrill Lynch | | Live Cattle** | | | Negative Price Return | | | | Positive Price Return | | | | At Maturity | | | | 06/28/2019 | | | | USD | | | | 2,449 | | | | 2,428 | | | | — | | | | (21 | ) |
Merrill Lynch | | Sugar** | | | Negative Price Return | | | | Positive Price Return | | | | At Maturity | | | | 06/28/2019 | | | | USD | | | | 111 | | | | 114 | | | | — | | | | 3 | |
Citigroup | | Sugar** | | | Negative Price Return | | | | Positive Price Return | | | | At Maturity | | | | 06/28/2019 | | | | USD | | | | 14 | | | | 14 | | | | — | | | | – | |
Merrill Lynch | | Cotton No.2** | | | Negative Price Return | | | | Positive Price Return | | | | At Maturity | | | | 07/09/2019 | | | | USD | | | | 415 | | | | 431 | | | | — | | | | 16 | |
Citigroup | | Soybean** | | | Negative Price Return | | | | Positive Price Return | | | | At Maturity | | | | 07/12/2019 | | | | USD | | | | 15,520 | | | | 15,306 | | | | — | | | | (214 | ) |
Citigroup | | Soybean Mel** | | | Negative Price Return | | | | Positive Price Return | | | | At Maturity | | | | 07/12/2019 | | | | USD | | | | 464 | | | | 465 | | | | — | | | | 1 | |
Citigroup | | Corn** | | | Negative Price Return | | | | Positive Price Return | | | | At Maturity | | | | 07/12/2019 | | | | USD | | | | 206 | | | | 201 | | | | — | | | | (5 | ) |
Merrill Lynch | | Corn** | | | Negative Price Return | | | | Positive Price Return | | | | At Maturity | | | | 07/12/2019 | | | | USD | | | | 353 | | | | 348 | | | | — | | | | (5 | ) |
Merrill Lynch | | Wheat** | | | Negative Price Return | | | | Positive Price Return | | | | At Maturity | | | | 07/12/2019 | | | | USD | | | | 607 | | | | 625 | | | | — | | | | 18 | |
Citigroup | | Cocoa** | | | Negative Price Return | | | | Positive Price Return | | | | At Maturity | | | | 07/16/2019 | | | | USD | | | | 176 | | | | 181 | | | | — | | | | 5 | |
Merrill Lynch | | Cocoa** | | | Negative Price Return | | | | Positive Price Return | | | | At Maturity | | | | 07/16/2019 | | | | USD | | | | 66 | | | | 68 | | | | — | | | | 2 | |
Citigroup | | Coffee ‘C’** | | | Negative Price Return | | | | Positive Price Return | | | | At Maturity | | | | 07/19/2019 | | | | USD | | | | 150 | | | | 145 | | | | — | | | | (5 | ) |
| | | | | | | | | | | | | | | | | | | | | | | | | | | | | | | | | | | | | | |
| | | | | | | | | | | | | | | | | | | | | | | | | | | | $ | 174,180 | | | $ | — | | | $ | 1,319 | |
| | | | | | | | | | | | | | | | | | | | | | | | | |
A list of the open centrally cleared swap agreements held by the Fund at March 31, 2019 is as follows:
| | | | | | | | | | | | | | | | | | | | | | | | | | | | | | | | |
| Interest Rate Swaps | |
| Fund Pays | | Fund Receives | | | Payment
Frequency | | | Termination Date | | | Currency | | | Notional
Amount
(Thousands) | | | Value
(Thousands) | | | Upfront
Payments/
Receipts
(Thousands) | | | Net
Unrealized
Appreciation
(Thousands) | |
3-MONTH USD - LIBOR | | | 3.00% | | | | Semi-Annually | | | | 06/19/2021 | | | | USD | | | | 73,000 | | | $ | 947 | | | $ | 512 | | | $ | 435 | |
3-MONTH USD - LIBOR | | | 3.00% | | | | Semi-Annually | | | | 09/18/2021 | | | | USD | | | | 319,196 | | | | 4,473 | | | | 2,955 | | | | 1,517 | |
3-MONTH USD - LIBOR | | | 3.00% | | | | Semi-Annually | | | | 06/19/2024 | | | | USD | | | | 114,334 | | | | 3,904 | | | | 579 | | | | 3,325 | |
| | | | | | | | | | | | | | | | | | | | | | | | | | | | | | | | |
| | | | | | | | | | | | | | | | | | | | | | $ | 9,324 | | | $ | 4,046 | | | $ | 5,277 | |
| | | | | | | | | | | | | | | | | |
Percentages are based on Net Assets of $2,804,406 ($ Thousands).
| * | Non-income producing security. |
| ** | Futures and swap contracts held by the Accumulation Commodity Strategy Subsidiary, Ltd. as of March 31, 2019. |
| ‡ | Real Estate Investment Trust. |
| | |
SEI Institutional Managed Trust / Semi-Annual Report / March 31, 2019 | | 179 |
CONSOLIDATED SCHEDULE OF INVESTMENTS (Unaudited)
March 31, 2019
Multi-Asset Accumulation Fund(Concluded)
| (A) | Zero coupon security. The rate shown on the Schedule of Investments is the security’s effective yield at the time of purchase. |
| (B) | Security, or a portion thereof, is held by the Accumulation Commodity Strategy Subsidiary, Ltd. as of March 31, 2019. |
| (C) | Security exempt from registration under Rule 144A of the Securities Act of 1933. These securities may be resold in transactions exempt from registration normally to qualified institutions. On March 31, 2019, the value of these securities amounted to $40,648 ($ Thousands), representing 1.4% of the Net Assets of the Fund. |
| (D) | There is currently no rate available. |
ADR — American Depositary Receipt
AUD — Australian Dollar
BRL — Brazilian Real
CAD — Canadian Dollar
CBT — Chicago Board of Trade
CHF — Swiss Franc
Cl — Class
CLP — Chilean Peso
CNH — Chinese Yuan Offshore
CZK — Czech Koruna
DAX — German Stock Index
DJ — Dow Jones
ETF — Exchange-Traded Fund
EUR — Euro
FTSE— Financial Times and Stock Exchange
GBP — British Pound Sterling
HKD — Hong Kong Dollar
HUF — Hungarian Forint
IBEX —Spanish Stock Exchange Index
INR — Indian Rupee
JPY — Japanese Yen
JSE — Johannesburg Stock Exchange
KOSPI — Korea Composite Stock Price Index
KRW — Korean Won
LIBOR— London Interbank Offered Rate
LME — London Metal Exchange
L.P. — Limited Partnership
Ltd. — Limited
MSCI — Morgan Stanley Capital International
MXN — Mexican Peso
NYMEX — New York Mercantile Exchange
OMX — Offset Market Exchange
OTC — Over the Counter
PLC — Public Limited Company
PLN — Polish Zloty
REIT — Real Estate investment Trust
S&P— Standard & Poor’s
Ser — Series
SPI — Share Price Index
TAIEX — Taiwan Capitalization Weighted Stock Index
TOPIX — Tokyo Stock Exchange
TSX — Toronto Stock Exchange
ULSD — Ultra-Low Sulfur Diesel
USD — United States Dollar
ZAR — South African Rand
The following is a list of the level of inputs used as of March 31, 2019, in valuing the Fund’s investments and other financial instruments carried at value ($ Thousands):
| | | | | | | | | | | | | | | | |
Investments in
Securities | | Level 1 | | | Level 2 | | | Level 3 | | | Total | |
U.S. Treasury Obligations | | $ | – | | | $ | 1,346,792 | | | $ | – | | | $ | 1,346,792 | |
Sovereign Debt | | | – | | | | 448,599 | | | | – | | | | 448,599 | |
Common Stock | | | 93,384 | | | | – | | | | – | | | | 93,384 | |
Foreign Common Stock | | | 82,538 | | | | – | | | | – | | | | 82,538 | |
Corporate Obligations | | | – | | | | 41,597 | | | | – | | | | 41,597 | |
Exchange Traded Fund | | | 37,527 | | | | – | | | | – | | | | 37,527 | |
Preferred Stock | | | 365 | | | | – | | | | – | | | | 365 | |
| | | | | | | | | | | | | | | | |
Total Investments in Securities | | $ | 213,814 | | | $ | 1,836,988 | | | $ | – | | | $ | 2,050,802 | |
| | | | | | | | | | | | | | | | |
| | | | | | | | | | | | | | | | |
Other Financial
Instruments | | Level 1 | | | Level 2 | | | Level 3 | | | Total | |
Futures Contracts* | | | | | | | | | | | | | | | | |
Unrealized Appreciation | | $ | 79,840 | | | $ | – | | | $ | – | | | $ | 79,840 | |
Unrealized Depreciation | | | (4,219 | ) | | | – | | | | – | | | | (4,219 | ) |
Forwards Contracts* | | | | | | | | | | | | | | | | |
Unrealized Appreciation | | | – | | | | 8,353 | | | | – | | | | 8,353 | |
Unrealized Depreciation | | | – | | | | (4,655 | ) | | | – | | | | (4,655 | ) |
OTC Swaps | | | | | | | | | | | | | | | | |
Total Return Swaps* | | | | | | | | | | | | | | | | |
Unrealized Appreciation | | | – | | | | 1,708 | | | | – | | | | 1,708 | |
Unrealized Depreciation | | | – | | | | (389 | ) | | | – | | | | (389 | ) |
Centrally Cleared Swaps | | | | | | | | | | | | | | | | |
Interest Rate Swaps* | | | | | | | | | | | | | | | | |
Unrealized Appreciation | | | – | | | | 5,277 | | | | – | | | | 5,277 | |
| | | | | | | | | | | | | | | | |
Total Other Financial Instruments | | $ | 75,621 | | | $ | 10,294 | | | $ | – | | | $ | 85,915 | |
| | | | | | | | | | | | | | | | |
* Futures contracts, forward contracts and swap contracts are valued at the unrealized appreciation (depreciation) on the instrument.
For the period ended March 31, 2019, there were no transfers between Level 1 and Level 2 assets and liabilities.
For the period ended March 31, 2019, there were no transfers between Level 2 and Level 3 assets and liabilities.
For more information on valuation inputs, see Note 2 – Significant Accounting Policies in Notes to Financial Statements.
Amounts designated as “—” are either $0 or have been rounded to $0.
| | |
180 | | SEI Institutional Managed Trust / Semi-Annual Report / March 31, 2019 |
SCHEDULE OF INVESTMENTS (Unaudited)
March 31, 2019
Multi-Asset Income Fund
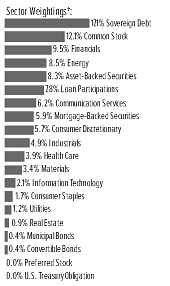
†Percentages are based on total investments.
| | | | | | | | | | |
| | | | |
| Description | | | | Face Amount (Thousands) | | Market Value
($ Thousands) |
| |
CORPORATE OBLIGATIONS — 45.3% | | | | | |
| |
Communication Services — 5.9% | | | | | |
21st Century Fox America | | | | | | | | | | |
4.950%, 10/15/2045 | | $ | | | 250 | | | $ | 297 | |
Altice France | | | | | | | | | | |
6.250%, 05/15/2024 (A) | | | | | 1,250 | | | | 1,259 | |
AMC Entertainment Holdings | | | | | | | | | | |
5.750%, 06/15/2025 | | | | | 1,000 | | | | 935 | |
AMC Networks | | | | | | | | | | |
5.000%, 04/01/2024 | | | | | 400 | | | | 402 | |
American Media | | | | | | | | | | |
10.500%, 12/31/2026 | | | | | 1,420 | | | | 1,393 | |
AT&T | | | | | | | | | | |
4.250%, 03/01/2027 | | | | | 900 | | | | 925 | |
4.125%, 02/17/2026 | | | | | 400 | | | | 409 | |
3.600%, 02/17/2023 | | | | | 1,300 | | | | 1,325 | |
CCO Holdings | | | | | | | | | | |
5.750%, 02/15/2026 (A) | | | | | 675 | | | | 706 | |
5.125%, 02/15/2023 | | | | | 720 | | | | 733 | |
5.000%, 02/01/2028 (A) | | | | | 1,640 | | | | 1,617 | |
CenturyLink | | | | | | | | | | |
5.800%, 03/15/2022 | | | | | 1,200 | | | | 1,222 | |
Charter Communications Operating | | | | | | | | | | |
5.375%, 04/01/2038 | | | | | 250 | | | | 251 | |
4.908%, 07/23/2025 | | | | | 2,175 | | | | 2,295 | |
4.464%, 07/23/2022 | | | | | 1,300 | | | | 1,345 | |
4.200%, 03/15/2028 | | | | | 320 | | | | 318 | |
Clear Channel Worldwide Holdings | | | | | | | | | | |
9.250%, 02/15/2024 (A) | | | | | 500 | | | | 530 | |
Cogent Communications Group | | | | | | | | | | |
5.375%, 03/01/2022 (A) | | | | | 660 | | | | 675 | |
| | | | | | | | | | |
| | | | |
| Description | | | | Face Amount (Thousands) | | Market Value ($ Thousands) |
| |
CORPORATE OBLIGATIONS (continued) | | | | | |
Comcast | | | | | | | | | | |
3.950%, 10/15/2025 | | $ | | | 1,350 | | | $ | 1,412 | |
Comunicaciones Celulares Via Comcel Trust | | | | | | | | | | |
6.875%, 02/06/2024 | | | | | 200 | | | | 208 | |
Digicel | | | | | | | | | | |
6.000%, 04/15/2021 | | | | | 600 | | | | 500 | |
Digicel Group One | | | | | | | | | | |
8.250%, 12/30/2022 (A) | | | | | 61 | | | | 37 | |
Digicel Group Two | | | | | | | | | | |
8.250%, 09/30/2022 (A) | | | | | 263 | | | | 88 | |
DISH DBS | | | | | | | | | | |
7.750%, 07/01/2026 | | | | | 2,600 | | | | 2,262 | |
6.750%, 06/01/2021 | | | | | 1,850 | | | | 1,907 | |
DISH Network | | | | | | | | | | |
3.375%, 08/15/2026 | | | | | 490 | | | | 416 | |
Fox | | | | | | | | | | |
5.476%, 01/25/2039 (A) | | | | | 110 | | | | 122 | |
4.709%, 01/25/2029 (A) | | | | | 600 | | | | 643 | |
4.030%, 01/25/2024 (A) | | | | | 300 | | | | 311 | |
Frontier Communications | | | | | | | | | | |
8.500%, 04/01/2026 (A) | | | | | 1,300 | | | | 1,209 | |
Intelsat Jackson Holdings | | | | | | | | | | |
9.750%, 07/15/2025 (A) | | | | | 650 | | | | 660 | |
Level 3 Financing | | | | | | | | | | |
5.625%, 02/01/2023 | | | | | 1,150 | | | | 1,163 | |
Match Group | | | | | | | | | | |
5.000%, 12/15/2027 (A) | | | | | 880 | | | | 887 | |
Mauritius Investments | | | | | | | | | | |
6.500%, 10/13/2026 (A) | | | | | 320 | | | | 325 | |
4.755%, 11/11/2024 | | | | | 400 | | | | 380 | |
Meredith | | | | | | | | | | |
6.875%, 02/01/2026 | | | | | 825 | | | | 866 | |
Millicom International Cellular | | | | | | | | | | |
6.625%, 10/15/2026 (A) | | | | | 440 | | | | 462 | |
6.250%, 03/25/2029 (A) | | | | | 530 | | | | 539 | |
5.125%, 01/15/2028 (A) | | | | | 280 | | | | 268 | |
Netflix | | | | | | | | | | |
6.375%, 05/15/2029 (A) | | | | | 680 | | | | 735 | |
5.875%, 11/15/2028 (A) | | | | | 560 | | | | 592 | |
4.875%, 04/15/2028 | | | | | 800 | | | | 792 | |
Nexstar Broadcasting | | | | | | | | | | |
5.625%, 08/01/2024 (A) | | | | | 1,150 | | | | 1,167 | |
Sirius XM Radio | | | | | | | | | | |
5.375%, 04/15/2025 (A) | | | | | 400 | | | | 411 | |
SoftBank Group | | | | | | | | | | |
6.000%, VAR USD ICE Swap 11:00 NY 5 Yr+4.226%, 12/31/2049 | | | | | 200 | | | | 187 | |
Sprint | | | | | | | | | | |
7.875%, 09/15/2023 | | | | | 950 | | | | 995 | |
7.625%, 03/01/2026 | | | | | 1,310 | | | | 1,328 | |
7.250%, 09/15/2021 | | | | | 1,850 | | | | 1,942 | |
| | |
SEI Institutional Managed Trust / Semi-Annual Report / March 31, 2019 | | 181 |
SCHEDULE OF INVESTMENTS (Unaudited)
March 31, 2019
Multi-Asset Income Fund(Continued)
| | | | | | | | | | |
| | | | |
| Description | | | | Face Amount (Thousands) | | Market Value ($ Thousands) |
| |
CORPORATE OBLIGATIONS (continued) | | | | | |
Sprint Capital | | | | | | | | | | |
8.750%, 03/15/2032 | | $ | | | 650 | | | $ | 686 | |
6.875%, 11/15/2028 | | | | | 250 | | | | 240 | |
Sprint Communications | | | | | | | | | | |
11.500%, 11/15/2021 | | | | | 650 | | | | 749 | |
7.000%, 08/15/2020 | | | | | 500 | | | | 516 | |
Telecom Italia | | | | | | | | | | |
5.303%, 05/30/2024 (A) | | | | | 3,440 | | | | 3,457 | |
Telecom Italia Capital | | | | | | | | | | |
6.000%, 09/30/2034 | | | | | 500 | | | | 463 | |
Telefonica Europe BV | | | | | | | | | | |
5.875%, VAR EUR Swap Annual 10 Yr+4.301%, 03/31/2049 | | EUR | | | 1,100 | | | | 1,371 | |
T-Mobile USA | | | | | | | | | | |
4.750%, 02/01/2028 | | $ | | | 570 | | | | 565 | |
4.500%, 02/01/2026 | | | | | 600 | | | | 600 | |
0.000%, 03/01/2025 | | | | | 300 | | | | – | |
0.000%, 01/15/2026 | | | | | 600 | | | | – | |
Verizon Communications | | | | | | | | | | |
4.329%, 09/21/2028 | | | | | 1,971 | | | | 2,084 | |
3.875%, 02/08/2029 | | | | | 275 | | | | 282 | |
3.500%, 11/01/2024 | | | | | 625 | | | | 640 | |
3.376%, 02/15/2025 | | | | | 2,325 | | | | 2,352 | |
Vodafone Group | | | | | | | | | | |
3.750%, 01/16/2024 | | | | | 800 | | | | 807 | |
Wind Tre | | | | | | | | | | |
5.000%, 01/20/2026 (A) | | | | | 340 | | | | 310 | |
2.625%, 01/20/2023 (A) | | EUR | | | 730 | | | | 794 | |
| | | | | | | | | | |
| | | | | | | | | 55,367 | |
| | | | | | | | | | |
| |
Consumer Discretionary — 5.4% | | | | | |
1011778 BC ULC / New Red Finance | | | | | | | | | | |
4.250%, 05/15/2024 (A) | | $ | | | 880 | | | | 871 | |
Altice | | | | | | | | | | |
7.750%, 05/15/2022 (A) | | | | | 2,320 | | | | 2,320 | |
Altice Financing | | | | | | | | | | |
7.500%, 05/15/2026 (A) | | | | | 4,800 | | | | 4,738 | |
Altice France | | | | | | | | | | |
7.375%, 05/01/2026 (A) | | | | | 2,700 | | | | 2,646 | |
Amazon.com | | | | | | | | | | |
3.150%, 08/22/2027 | | | | | 2,025 | | | | 2,039 | |
American Axle & Manufacturing | | | | | | | | | | |
6.500%, 04/01/2027 | | | | | 780 | | | | 755 | |
6.250%, 04/01/2025 | | | | | 1,300 | | | | 1,266 | |
Ashtead Capital | | | | | | | | | | |
4.375%, 08/15/2027 (A) | | | | | 450 | | | | 434 | |
Boyd Gaming | | | | | | | | | | |
6.000%, 08/15/2026 | | | | | 250 | | | | 256 | |
CalAtlantic Group | | | | | | | | | | |
5.250%, 06/01/2026 | | | | | 330 | | | | 338 | |
Carriage Services | | | | | | | | | | |
6.625%, 06/01/2026 (A) | | | | | 840 | | | | 859 | |
| | | | | | | | | | |
| | | | |
| Description | | | | Face Amount (Thousands) | | Market Value ($ Thousands) |
| |
CORPORATE OBLIGATIONS (continued) | | | | | |
CSC Holdings | | | | | | | | | | |
6.500%, 02/01/2029 (A) | | $ | | | 2,370 | | | $ | 2,524 | |
Delphi Technologies | | | | | | | | | | |
5.000%, 10/01/2025 (A) | | | | | 1,200 | | | | 1,057 | |
Europcar Mobility Group | | | | | | | | | | |
5.750%, 06/15/2022 | | EUR | | | 420 | | | | 483 | |
4.125%, 11/15/2024 (A) | | | | | 650 | | | | 729 | |
Ford Motor Credit | | | | | | | | | | |
5.875%, 08/02/2021 | | $ | | | 350 | | | | 362 | |
Getty Images | | | | | | | | | | |
9.750%, 03/01/2027 (A) | | | | | 100 | | | | 101 | |
Gohl Capital | | | | | | | | | | |
4.250%, 01/24/2027 | | | | | 320 | | | | 318 | |
Hanesbrands | | | | | | | | | | |
4.875%, 05/15/2026 (A) | | | | | 1,130 | | | | 1,115 | |
Hilton Domestic Operating | | | | | | | | | | |
5.125%, 05/01/2026 (A) | | | | | 380 | | | | 386 | |
Hilton Worldwide Finance | | | | | | | | | | |
4.875%, 04/01/2027 | | | | | 1,090 | | | | 1,102 | |
4.625%, 04/01/2025 | | | | | 90 | | | | 91 | |
Jack Ohio Finance | | | | | | | | | | |
10.250%, 11/15/2022 (A) | | | | | 770 | | | | 826 | |
L Brands | | | | | | | | | | |
5.625%, 10/15/2023 | | | | | 490 | | | | 501 | |
5.250%, 02/01/2028 | | | | | 1,440 | | | | 1,283 | |
Lennar | | | | | | | | | | |
5.250%, 06/01/2026 | | | | | 750 | | | | 772 | |
4.750%, 11/29/2027 | | | | | 570 | | | | 570 | |
Levi Strauss | | | | | | | | | | |
5.000%, 05/01/2025 | | | | | 370 | | | | 381 | |
MGM Resorts International | | | | | | | | | | |
6.000%, 03/15/2023 | | | | | 1,450 | | | | 1,530 | |
Mohegan Gaming & Entertainment | | | | | | | | | | |
7.875%, 10/15/2024 (A) | | | | | 500 | | | | 495 | |
Myriad International Holdings BV | | | | | | | | | | |
4.850%, 07/06/2027 (A) | | | | | 1,140 | | | | 1,170 | |
NCL | | | | | | | | | | |
4.750%, 12/15/2021 (A) | | | | | 830 | | | | 839 | |
Panther BF Aggregator 2 | | | | | | | | | | |
6.250%, 05/15/2026 (A) | | | | | 850 | | | | 867 | |
Sally Holdings | | | | | | | | | | |
5.625%, 12/01/2025 | | | | | 180 | | | | 179 | |
Sands China | | | | | | | | | | |
5.125%, 08/08/2025 | | | | | 700 | | | | 730 | |
Scientific Games International | | | | | | | | | | |
10.000%, 12/01/2022 | | | | | 1,710 | | | | 1,797 | |
8.250%, 03/15/2026 (A) | | | | | 700 | | | | 714 | |
5.000%, 10/15/2025 (A) | | | | | 1,550 | | | | 1,519 | |
Service International | | | | | | | | | | |
7.500%, 04/01/2027 | | | | | 70 | | | | 80 | |
Silversea Cruise Finance | | | | | | | | | | |
7.250%, 02/01/2025 (A) | | | | | 600 | | | | 649 | |
| | |
182 | | SEI Institutional Managed Trust / Semi-Annual Report / March 31, 2019 |
| | | | | | | | | | |
| | | | |
| Description | | | | Face Amount
(Thousands) | | Market Value ($ Thousands) |
|
CORPORATE OBLIGATIONS (continued) | |
Speedway Motorsports | | | | | | | | | | |
5.125%, 02/01/2023 | | $ | | | 690 | | | $ | 693 | |
Starbucks | | | | | | | | | | |
3.800%, 08/15/2025 | | | | | 875 | | | | 902 | |
Telecom Argentina | | | | | | | | | | |
6.500%, 06/15/2021 (A) | | | | | 150 | | | | 149 | |
Univision Communications | | | | | | | | | | |
6.750%, 09/15/2022 (A) | | | | | 230 | | | | 233 | |
5.125%, 05/15/2023 (A) | | | | | 3,200 | | | | 3,030 | |
UPC Holding BV | | | | | | | | | | |
5.500%, 01/15/2028 (A) | | | | | 330 | | | | 329 | |
Viking Cruises | | | | | | | | | | |
5.875%, 09/15/2027 (A) | | | | | 1,260 | | | | 1,226 | |
Virgin Media Secured Finance | |
5.500%, 01/15/2025 | | GBP | | | 243 | | | | 324 | |
5.000%, 04/15/2027 | | | | | 800 | | | | 1,048 | |
VOC Escrow | | | | | | | | | | |
5.000%, 02/15/2028 (A) | | $ | | | 1,970 | | | | 1,916 | |
Weight Watchers International | |
8.625%, 12/01/2025 (A) | | | | | 800 | | | | 718 | |
William Carter | | | | | | | | | | |
5.625%, 03/15/2027 (A) | | | | | 320 | | | | 331 | |
WMG Acquisition | | | | | | | | | | |
5.500%, 04/15/2026 (A) | | | | | 200 | | | | 205 | |
ZF North America Capital | | | | | | | | | | |
4.750%, 04/29/2025 (A) | | | | | 440 | | | | 427 | |
| | | | | | | | | 51,223 | |
|
Consumer Staples — 1.6% | |
Altria Group | | | | | | | | | | |
4.800%, 02/14/2029 | | | | | 380 | | | | 392 | |
4.400%, 02/14/2026 | | | | | 135 | | | | 139 | |
3.800%, 02/14/2024 | | | | | 875 | | | | 890 | |
Anheuser-Busch | | | | | | | | | | |
3.650%, 02/01/2026 (A) | | | | | 3,450 | | | | 3,460 | |
Anheuser-Busch InBev Finance | | | | | | | | | | |
3.300%, 02/01/2023 | | | | | 2,475 | | | | 2,510 | |
Anheuser-Busch InBev Worldwide | | | | | | | | | | |
5.800%, 01/23/2059 | | | | | 120 | | | | 133 | |
5.550%, 01/23/2049 | | | | | 1,450 | | | | 1,592 | |
Central American Bottling | | | | | | | | | | |
5.750%, 01/31/2027 (A) | | | | | 180 | | | | 185 | |
Constellation Brands | | | | | | | | | | |
4.400%, 11/15/2025 | | | | | 325 | | | | 341 | |
Constellation Brands Inc | | | | | | | | | | |
3.384%, VAR ICE LIBOR USD 3 Month+0.700%, 11/15/2021 | | | | | 950 | | | | 950 | |
Cott Holdings | | | | | | | | | | |
5.500%, 04/01/2025 (A) | | | | | 500 | | | | 504 | |
HLF Financing Sarl | | | | | | | | | | |
7.250%, 08/15/2026 (A) | | | | | 700 | | | | 721 | |
| | | | | | | | | | |
| | | | |
| Description | | | | Face Amount
(Thousands) | | Market Value ($ Thousands) |
|
CORPORATE OBLIGATIONS (continued) | |
Kraft Heinz Foods | | | | | | | | | | |
5.000%, 07/15/2035 | | $ | | | 300 | | | $ | 296 | |
Lamb Weston Holdings | | | | | | | | | | |
4.875%, 11/01/2026 (A) | | | | | 720 | | | | 730 | |
Lindley | | | | | | | | | | |
4.625%, 04/12/2023 | | | | | 190 | | | | 193 | |
Performance Food Group | | | | | | | | | | |
5.500%, 06/01/2024 (A) | | | | | 300 | | | | 303 | |
Post Holdings | | | | | | | | | | |
5.750%, 03/01/2027 (A) | | | | | 600 | | | | 602 | |
5.625%, 01/15/2028 (A) | | | | | 800 | | | | 794 | |
Prosperous Ray | | | | | | | | | | |
4.625%, 11/12/2023 | | | | | 500 | | | | 523 | |
Reynolds American | | | | | | | | | | |
4.450%, 06/12/2025 | | | | | 125 | | | | 129 | |
| | | | | | | | | 15,387 | |
| |
Energy — 8.0% | | | | | |
Abu Dhabi Crude Oil Pipeline | | | | | | | | | | |
4.600%, 11/02/2047 (A) | | | | | 1,760 | | | | 1,815 | |
Anadarko Petroleum | | | | | | | | | | |
6.600%, 03/15/2046 | | | | | 180 | | | | 219 | |
5.550%, 03/15/2026 | | | | | 300 | | | | 327 | |
Antero Resources | | | | | | | | | | |
5.125%, 12/01/2022 | | | | | 1,050 | | | | 1,056 | |
Berry Petroleum | | | | | | | | | | |
7.000%, 02/15/2026 (A) | | | | | 1,000 | | | | 990 | |
Blue Racer Midstream | | | | | | | | | | |
6.625%, 07/15/2026 (A) | | | | | 480 | | | | 490 | |
BP Capital Markets America | | | | | | | | | | |
3.224%, 04/14/2024 | | | | | 1,025 | | | | 1,038 | |
2.112%, 09/16/2021 | | | | | 350 | | | | 345 | |
Cheniere Corpus Christi Holdings | | | | | | | | | | |
7.000%, 06/30/2024 | | | | | 250 | | | | 282 | |
5.125%, 06/30/2027 | | | | | 850 | | | | 892 | |
Cheniere Energy Partners | | | | | | | | | | |
5.250%, 10/01/2025 | | | | | 635 | | | | 649 | |
Chesapeake Energy | | | | | | | | | | |
8.000%, 01/15/2025 | | | | | 750 | | | | 765 | |
8.000%, 06/15/2027 | | | | | 1,150 | | | | 1,133 | |
7.000%, 10/01/2024 | | | | | 50 | | | | 50 | |
6.125%, 02/15/2021 | | | | | 370 | | | | 381 | |
Concho Resources | | | | | | | | | | |
4.300%, 08/15/2028 | | | | | 425 | | | | 438 | |
Continental Resources | | | | | | | | | | |
4.500%, 04/15/2023 | | | | | 650 | | | | 673 | |
4.375%, 01/15/2028 | | | | | 100 | | | | 103 | |
Covey Park Energy | | | | | | | | | | |
7.500%, 05/15/2025 (A) | | | | | 1,340 | | | | 1,239 | |
DCP Midstream Operating | | | | | | | | | | |
6.750%, 09/15/2037 (A) | | | | | 770 | | | | 793 | |
5.375%, 07/15/2025 | | | | | 1,000 | | | | 1,043 | |
| | |
SEI Institutional Managed Trust / Semi-Annual Report / March 31, 2019 | | 183 |
SCHEDULE OF INVESTMENTS (Unaudited)
March 31, 2019
Multi-Asset Income Fund(Continued)
| | | | | | | | | | |
| | | | |
| Description | | | | Face Amount
(Thousands) | | Market Value
($ Thousands) |
|
CORPORATE OBLIGATIONS (continued) | |
Devon Energy | | | | | | | | | | |
5.850%, 12/15/2025 | | $ | | | 1,021 | | | $ | 1,158 | |
5.000%, 06/15/2045 | | | | | 400 | | | | 419 | |
3.250%, 05/15/2022 | | | | | 200 | | | | 202 | |
Diamondback Energy Inc | | | | | | | | | | |
4.750%, 11/01/2024 (A) | | | | | 1,390 | | | | 1,421 | |
Endeavor Energy Resources | | | | | | | | | | |
5.500%, 01/30/2026 (A) | | | | | 400 | | | | 410 | |
Energy Transfer Operating | | | | | | | | | | |
6.250%, 04/15/2049 | | | | | 110 | | | | 123 | |
4.950%, 06/15/2028 | | | | | 150 | | | | 157 | |
4.200%, 09/15/2023 | | | | | 3,225 | | | | 3,333 | |
Enterprise Products Operating | | | | | | | | | | |
3.750%, 02/15/2025 | | | | | 500 | | | | 516 | |
3.700%, 02/15/2026 | | | | | 300 | | | | 308 | |
EQM Midstream Partners | | | | | | | | | | |
4.750%, 07/15/2023 | | | | | 1,474 | | | | 1,503 | |
Eterna Capital Pte | | | | | | | | | | |
8.000%, 12/11/2022 | | | | | 40 | | | | 36 | |
Exterran Energy Solutions | | | | | | | | | | |
8.125%, 05/01/2025 | | | | | 700 | | | | 714 | |
Extraction Oil & Gas | | | | | | | | | | |
7.375%, 05/15/2024 (A) | | | | | 90 | | | | 75 | |
5.625%, 02/01/2026 (A) | | | | | 930 | | | | 714 | |
Gazprom OAO Via Gaz Capital | | | | | | | | | | |
5.150%, 02/11/2026 (A) | | | | | 940 | | | | 955 | |
4.950%, 03/23/2027 (A) | | | | | 800 | | | | 801 | |
Gazprom OAO Via Gaz Capital MTN | | | | | | | | | | |
7.288%, 08/16/2037 | | | | | 300 | | | | 350 | |
Genesis Energy | | | | | | | | | | |
6.000%, 05/15/2023 | | | | | 990 | | | | 997 | |
GNL Quintero | | | | | | | | | | |
4.634%, 07/31/2029 | | | | | 400 | | | | 413 | |
Gulfport Energy | | | | | | | | | | |
6.375%, 05/15/2025 | | | | | 1,800 | | | | 1,629 | |
Indigo Natural Resources | | | | | | | | | | |
6.875%, 02/15/2026 (A) | | | | | 30 | | | | 27 | |
KazMunayGas National JSC | | | | | | | | | | |
4.750%, 04/19/2027 (A) | | | | | 1,100 | | | | 1,128 | |
KazTransGas JSC | | | | | | | | | | |
4.375%, 09/26/2027 (A) | | | | | 1,190 | | | | 1,154 | |
Laredo Petroleum | | | | | | | | | | |
5.625%, 01/15/2022 | | | | | 1,000 | | | | 914 | |
Lukoil International Finance BV | | | | | | | | | | |
4.563%, 04/24/2023 | | | | | 220 | | | | 224 | |
Marathon Petroleum | | | | | | | | | | |
3.800%, 04/01/2028 (A) | | | | | 325 | | | | 322 | |
3.625%, 09/15/2024 | | | | | 350 | | | | 353 | |
MEG Energy | | | | | | | | | | |
7.000%, 03/31/2024 (A) | | | | | 2,160 | | | | 2,014 | |
Montage Resources | | | | | | | | | | |
8.875%, 07/15/2023 | | | | | 290 | | | | 276 | |
| | | | | | | | | | |
| | | | |
| Description | | | | Face Amount
(Thousands) | | Market Value
($ Thousands) |
|
CORPORATE OBLIGATIONS (continued) | |
MPLX | | | | | | | | | | |
4.800%, 02/15/2029 | | $ | | | 250 | | | $ | 263 | |
4.000%, 03/15/2028 | | | | | 950 | | | | 944 | |
Newfield Exploration | | | | | | | | | | |
5.625%, 07/01/2024 | | | | | 650 | | | | 710 | |
NGPL PipeCo | | | | | | | | | | |
7.768%, 12/15/2037 (A) | | | | | 910 | | | | 1,092 | |
Noble Holding International | | | | | | | | | | |
6.050%, 03/01/2041 | | | | | 900 | | | | 562 | |
Northern Oil and Gas | | | | | | | | | | |
8.500% cash/0% PIK, 05/15/2023 | | | | | 50 | | | | 52 | |
Oasis Petroleum | | | | | | | | | | |
6.875%, 03/15/2022 | | | | | 1,200 | | | | 1,212 | |
ONEOK | | | | | | | | | | |
4.550%, 07/15/2028 | | | | | 800 | | | | 827 | |
Petrobras Global Finance | | | | | | | | | | |
8.750%, 05/23/2026 | | | | | 300 | | | | 355 | |
Petrobras Global Finance BV | | | | | | | | | | |
7.375%, 01/17/2027 | | | | | 220 | | | | 242 | |
6.900%, 03/19/2049 | | | | | 220 | | | | 218 | |
5.750%, 02/01/2029 | | | | | 570 | | | | 564 | |
5.299%, 01/27/2025 | | | | | 3,160 | | | | 3,206 | |
Petroleos de Venezuela | | | | | | | | | | |
6.000%, 10/28/2022 (B) | | | | | 8,860 | | | | 1,533 | |
6.000%, 05/16/2024 (B) | | | | | 3,790 | | | | 847 | |
6.000%, 11/15/2026 (B) | | | | | 1,110 | | | | 247 | |
5.500%, 04/12/2037 (B) | | | | | 130 | | | | 29 | |
5.375%, 04/12/2027 (B) | | | | | 2,570 | | | | 582 | |
Petroleos Mexicanos | | | | | | | | | | |
6.625%, 06/15/2035 | | | | | 30 | | | | 28 | |
6.500%, 03/13/2027 | | | | | 630 | | | | 634 | |
6.375%, 01/23/2045 | | | | | 112 | | | | 99 | |
6.350%, 02/12/2048 | | | | | 120 | | | | 106 | |
Petroleos Mexicanos MTN | | | | | | | | | | |
6.875%, 08/04/2026 | | | | | 400 | | | | 417 | |
6.750%, 09/21/2047 | | | | | 20 | | | | 18 | |
5.125%, 03/15/2023 | | EUR | | | 1,040 | | | | 1,273 | |
4.875%, 02/21/2028 | | | | | 100 | | | | 114 | |
Phillips 66 | | | | | | | | | | |
3.900%, 03/15/2028 | | $ | | | 650 | | | | 661 | |
Plains All American Pipeline | | | | | | | | | | |
4.500%, 12/15/2026 | | | | | 400 | | | | 410 | |
3.650%, 06/01/2022 | | | | | 1,700 | | | | 1,711 | |
3.600%, 11/01/2024 | | | | | 175 | | | | 174 | |
QEP Resources | | | | | | | | | | |
5.625%, 03/01/2026 | | | | | 1,300 | | | | 1,177 | |
Range Resources | | | | | | | | | | |
5.000%, 03/15/2023 | | | | | 900 | | | | 882 | |
Reliance Industries | | | | | | | | | | |
4.125%, 01/28/2025 | | | | | 250 | | | | 254 | |
3.667%, 11/30/2027 (A) | | | | | 490 | | | | 477 | |
| | |
184 | | SEI Institutional Managed Trust / Semi-Annual Report / March 31, 2019 |
| | | | | | | | | | |
| | | | |
| Description | | | | Face Amount (Thousands) | | Market Value
($ Thousands) |
| |
CORPORATE OBLIGATIONS (continued) | | | | | |
Rockies Express Pipeline | | | | | | | | | | |
7.500%, 07/15/2038 (A) | | $ | | | 840 | | | $ | 943 | |
Sabine Pass Liquefaction | | | | | | | | | | |
6.250%, 03/15/2022 | | | | | 700 | | | | 757 | |
5.625%, 03/01/2025 | | | | | 800 | | | | 879 | |
Shelf Drilling Holdings | | | | | | | | | | |
8.250%, 02/15/2025 (A) | | | | | 870 | | | | 827 | |
SM Energy | | | | | | | | | | |
6.750%, 09/15/2026 | | | | | 200 | | | | 192 | |
5.000%, 01/15/2024 | | | | | 1,075 | | | | 994 | |
Targa Resources Partners | | | | | | | | | | |
6.875%, 01/15/2029 (A) | | | | | 680 | | | | 739 | |
6.500%, 07/15/2027 (A) | | | | | 400 | | | | 431 | |
5.250%, 05/01/2023 | | | | | 1,000 | | | | 1,018 | |
Transocean | | | | | | | | | | |
7.500%, 01/15/2026 (A) | | | | | 500 | | | | 494 | |
Transportadora de Gas del Sur | | | | | | | | | | |
6.750%, 05/02/2025 (A) | | | | | 1,250 | | | | 1,176 | |
Weatherford International | | | | | | | | | | |
6.500%, 08/01/2036 | | | | | 150 | | | | 85 | |
Western Midstream Operating | | | | | | | | | | |
4.000%, 07/01/2022 | | | | | 200 | | | | 203 | |
Whiting Petroleum | | | | | | | | | | |
6.250%, 04/01/2023 | | | | | 950 | | | | 955 | |
5.750%, 03/15/2021 | | | | | 100 | | | | 101 | |
Williams | | | | | | | | | | |
8.750%, 03/15/2032 | | | | | 1,660 | | | | 2,310 | |
3.600%, 03/15/2022 | | | | | 1,700 | | | | 1,725 | |
WPX Energy | | | | | | | | | | |
8.250%, 08/01/2023 | | | | | 300 | | | | 337 | |
5.750%, 06/01/2026 | | | | | 380 | | | | 386 | |
YPF | | | | | | | | | | |
8.500%, 03/23/2021 | | | | | 1,650 | | | | 1,665 | |
| | | | | | | | | 75,504 | |
| | | |
Financials — 9.0% | | | | | | | | | | |
AIA Group | | | | | | | | | | |
3.900%, 04/06/2028 (A) | | | | | 475 | | | | 490 | |
AIA Group MTN | | | | | | | | | | |
3.200%, 03/11/2025 (A) | | | | | 425 | | | | 422 | |
AIB Group MTN | | | | | | | | | | |
4.750%, 10/12/2023 (A) | | | | | 550 | | | | 568 | |
Akbank T.A.S. | | | | | | | | | | |
6.797%, VAR USD Swap Semi 30/360 5 Yr Curr+4.029%, 04/27/2028 | | | | | 200 | | | | 164 | |
Alternative Loan Trust, Ser 2005-81, Cl A1 | | | | | | | | | | |
2.766%, VAR ICE LIBOR USD 1 Month+0.280%, 02/25/2037 | | | | | 861 | | | | 782 | |
American International Group | | | | | | | | | | |
4.200%, 04/01/2028 | | | | | 275 | | | | 280 | |
3.900%, 04/01/2026 | | | | | 325 | | | | 327 | |
| | | | | | | | | | |
| | | | |
| Description | | | | Face Amount (Thousands) | | Market Value
($ Thousands) |
| |
CORPORATE OBLIGATIONS (continued) | | | | | |
Arch Capital Finance | | | | | | | | | | |
4.011%, 12/15/2026 | | $ | | | 1,025 | | | $ | 1,065 | |
ASP AMC | | | | | | | | | | |
8.000%, 05/15/2025 (A) | | | | | 990 | | | | 445 | |
Banco Bilbao Vizcaya Argentaria | | | | | | | | | | |
5.875%, VAR EUR Swap Annual 5 Yr+5.660%, 12/24/2167 | | EUR | | | 800 | | | | 872 | |
Banco de Bogota | | | | | | | | | | |
6.250%, 05/12/2026 (A) | | $ | | | 780 | | | | 842 | |
Banco de Sabadell | | | | | | | | | | |
6.500%, VAR EUR Swap Annual 5 Yr+6.414%, 08/18/2166 | | EUR | | | 800 | | | | 852 | |
Banco do Brasil | | | | | | | | | | |
9.000%, VAR US Treas Yield Curve Rate T Note Const Mat 10 Yr+6.362%, 06/29/2049 | | $ | | | 200 | | | | 211 | |
6.250%, VAR US Treas Yield Curve Rate T Note Const Mat 10 Yr+4.398%, 12/12/2049 | | | | | 1,140 | | | | 1,027 | |
Banco Mercantil del Norte | | | | | | | | | | |
7.625%, VAR US Treas Yield Curve Rate T Note Const Mat 10 Yr+5.353%, 12/31/2049 (A) | | | | | 200 | | | | 200 | |
Banco Santander | | | | | | | | | | |
4.250%, 04/11/2027 | | | | | 400 | | | | 400 | |
Bank of America | | | | | | | | | | |
6.250%, VAR ICE LIBOR USD 3 Month+3.705%, 09/29/2049 | | | | | 150 | | | | 159 | |
3.419%, VAR ICE LIBOR USD 3 Month+1.040%, 12/20/2028 | | | | | 515 | | | | 504 | |
Bank of America MTN | | | | | | | | | | |
4.200%, 08/26/2024 | | | | | 550 | | | | 569 | |
3.824%, VAR ICE LIBOR USD 3 Month+1.575%, 01/20/2028 | | | | | 1,525 | | | | 1,546 | |
3.248%, 10/21/2027 | | | | | 1,000 | | | | 979 | |
2.816%, VAR ICE LIBOR USD 3 Month+0.930%, 07/21/2023 | | | | | 575 | | | | 571 | |
Banque Centrale de Tunisie International Bond | | | | | | | | | | |
6.750%, 10/31/2023 (A) | | EUR | | | 440 | | | | 479 | |
Barclays | | | | | | | | | | |
8.000%, VAR US Treas Yield Curve Rate T Note Const Mat 5 Yr+5.672%, 09/15/2167 | | $ | | | 1,370 | | | | 1,401 | |
7.750%, VAR USD Swap Semi 30/360 5 Yr Curr+4.842%, 09/15/2023 | | | | | 370 | | | | 371 | |
7.625%, 11/21/2022 | | | | | 350 | | | | 380 | |
4.610%, VAR ICE LIBOR USD 3 Month+1.400%, 02/15/2023 | | | | | 1,225 | | | | 1,250 | |
Barclays MTN | | | | | | | | | | |
4.972%, VAR ICE LIBOR USD 3 Month+1.902%, 05/16/2029 | | | | | 500 | | | | 517 | |
| | |
SEI Institutional Managed Trust / Semi-Annual Report / March 31, 2019 | | 185 |
SCHEDULE OF INVESTMENTS (Unaudited)
March 31, 2019
Multi-Asset Income Fund(Continued)
| | | | | | | | | | |
| | | | |
| Description | | | | Face Amount
(Thousands) | | Market Value
($ Thousands) |
|
CORPORATE OBLIGATIONS (continued) | |
BBVA Bancomer | | | | | | | | | | |
5.125%, VAR US Treas Yield Curve Rate T Note Const Mat 5 Yr+2.650%, 01/18/2033 (A) | | $ | | | 410 | | | $ | 377 | |
BNP Paribas | | | | | | | | | | |
7.375%, VAR USD Swap Semi 30/360 5 Yr Curr+5.150%, 02/19/2167 (A) | | | | | 400 | | | | 424 | |
3.375%, 01/09/2025 (A) | | | | | 1,000 | | | | 980 | |
BPCE | | | | | | | | | | |
4.625%, 09/12/2028 (A) | | | | | 500 | | | | 522 | |
4.000%, 09/12/2023 (A) | | | | | 950 | | | | 964 | |
China Evergrande Group | | | | | | | | | | |
8.250%, 03/23/2022 | | | | | 400 | | | | 392 | |
CIT Group | | | | | | | | | | |
6.125%, 03/09/2028 | | | | | 195 | | | | 217 | |
5.250%, 03/07/2025 | | | | | 185 | | | | 197 | |
Citigroup | | | | | | | | | | |
6.300%, VAR ICE LIBOR USD 3 Month+3.423%, 12/29/2049 | | | | | 1,250 | | | | 1,272 | |
6.250%, VAR ICE LIBOR USD 3 Month+4.517%, 02/15/2168 | | | | | 3,289 | | | | 3,462 | |
5.950%, VAR ICE LIBOR USD 3 Month+3.905%, 12/31/2049 | | | | | 124 | | | | 126 | |
5.950%, VAR ICE LIBOR USD 3 Month+4.095%, 12/29/2049 | | | | | 700 | | | | 707 | |
5.900%, VAR ICE LIBOR USD 3 Month+4.230%, 12/31/2049 | | | | | 675 | | | | 688 | |
4.125%, 07/25/2028 | | | | | 650 | | | | 653 | |
3.700%, 01/12/2026 | | | | | 825 | | | | 838 | |
3.400%, 05/01/2026 | | | | | 1,675 | | | | 1,665 | |
Cooperatieve Rabobank UA | | | | | | | | | | |
4.625%, VAR EUR Swap Annual 5 Yr+4.098%, 12/29/2167 | | EUR | | | 1,400 | | | | 1,596 | |
Country Garden Holdings | | | | | | | | | | |
7.250%, 04/04/2021 | | $ | | | 500 | | | | 506 | |
Credit Agricole | | | | | | | | | | |
8.125%, VAR USD Swap Semi 30/360 5 Yr Curr+6.185%, 12/31/2049 (A) | | | | | 250 | | | | 281 | |
6.500%, VAR EUR Swap Annual 5 Yr+5.120%, 12/31/2049 | | EUR | | | 490 | | | | 588 | |
Credit Bank of Moscow Via CBOM Finance | | | | | | | | | | |
7.500%, VAR USD Swap Semi 30/360 5 Yr Curr+5.416%, 10/05/2027 | | $ | | | 470 | | | | 390 | |
Credit Suisse Group | | | | | | | | | | |
7.500%, VAR USD Swap Semi 30/360 5 Yr Curr+4.600%, 01/17/2167 (A) | | | | | 410 | | | | 422 | |
7.250%, VAR USD Swap Semi 30/360 5 Yr Curr+4.332%, 03/12/2167 (A) | | | | | 200 | | | | 201 | |
6.250%, VAR USD Swap Semi 30/360 5 Yr Curr+3.455%, 12/31/2049 (A) | | | | | 200 | | | | 199 | |
3.869%, VAR ICE LIBOR USD 3 Month+1.410%, 01/12/2029 (A) | | | | | 600 | | | | 588 | |
| | | | | | | | | | |
| | | | |
| Description | | | | Face Amount
(Thousands) | | Market Value
($ Thousands) |
|
CORPORATE OBLIGATIONS (continued) | |
Credit Suisse Group Funding Guernsey | | | | | | | | | | |
4.550%, 04/17/2026 | | $ | | | 802 | | | $ | 838 | |
CTR Partnership | | | | | | | | | | |
5.250%, 06/01/2025 | | | | | 280 | | | | 281 | |
Danske Bank | | | | | | | | | | |
5.750%, VAR EUR Swap Annual 6 Yr+4.640%, 10/06/2167 | | EUR | | | 550 | | | | 617 | |
5.375%, 01/12/2024 (A) | | $ | | | 210 | | | | 218 | |
5.000%, 01/12/2022 (A) | | | | | 200 | | | | 205 | |
Deutsche Bank | | | | | | | | | | |
4.500%, 04/01/2025 | | | | | 950 | | | | 909 | |
Deutsche Bank NY | | | | | | | | | | |
4.875%, VAR USD ICE Swap 11:00 NY 5 Yr+2.553%, 12/01/2032 | | | | | 1,200 | | | | 1,057 | |
Goldman Sachs Group | | | | | | | | | | |
5.150%, 05/22/2045 | | | | | 700 | | | | 740 | |
HSBC Holdings | | | | | | | | | | |
6.500%, VAR USD ICE Swap 11:00 NY 5 Yr+3.606%, 09/23/2166 | | | | | 500 | | | | 495 | |
5.250%, VAR EUR Swap Annual 5 Yr+4.383%, 03/16/2167 | | EUR | | | 700 | | | | 830 | |
3.803%, VAR ICE LIBOR USD 3 Month+1.211%, 03/11/2025 | | $ | | | 700 | | | | 710 | |
Huarong Finance 2017 | | | | | | | | | | |
4.500%, VAR US Treas Yield Curve Rate T Note Const Mat 5 Yr+7.773%, 12/29/2049 | | | | | 200 | | | | 199 | |
Huarong Finance 2017 MTN | | | | | | | | | | |
4.000%, VAR US Treas Yield Curve Rate T Note Const Mat 5 Yr+6.983%, 05/07/2166 | | | | | 310 | | | | 299 | |
Huarong Finance II MTN | | | | | | | | | | |
5.000%, 11/19/2025 | | | | | 210 | | | | 220 | |
Hunt | | | | | | | | | | |
6.250%, 02/15/2026 (A) | | | | | 250 | | | | 233 | |
ICICI Bank | | | | | | | | | | |
5.750%, 11/16/2020 | | | | | 420 | | | | 435 | |
Intesa Sanpaolo MTN | | | | | | | | | | |
5.710%, 01/15/2026 (A) | | | | | 3,080 | | | | 3,007 | |
5.017%, 06/26/2024 (A) | | | | | 500 | | | | 483 | |
Itau CorpBanca | | | | | | | | | | |
3.875%, 09/22/2019 | | | | | 1,000 | | | | 1,004 | |
JPMorgan Chase & Co | | | | | | | | | | |
5.300%, VAR ICE LIBOR USD 3 Month+3.800%, 12/31/2049 | | | | | 800 | | | | 808 | |
5.000%, VAR ICE LIBOR USD 3 Month+3.320%, 12/29/2049 | | | | | 900 | | | | 895 | |
3.782%, VAR ICE LIBOR USD 3 Month+1.337%, 02/01/2028 | | | | | 2,850 | | | | 2,903 | |
2.972%, 01/15/2023 | | | | | 900 | | | | 900 | |
Kaisa Group Holdings | | | | | | | | | | |
9.375%, 06/30/2024 | | | | | 400 | | | | 358 | |
8.500%, 06/30/2022 | | | | | 200 | | | | 185 | |
| | |
186 | | SEI Institutional Managed Trust / Semi-Annual Report / March 31, 2019 |
| | | | | | | | | | |
| | | | |
| Description | | | | Face Amount
(Thousands) | | Market Value
($ Thousands) |
|
CORPORATE OBLIGATIONS (continued) | |
Lloyds Banking Group | | | | | | | | | | |
6.375%, VAR EUR Swap Annual 5 Yr+5.290%, 06/27/2049 | | EUR | | | 1,000 | | | $ | 1,154 | |
4.650%, 03/24/2026 | | $ | | | 500 | | | | 506 | |
MGM Growth Properties Operating Partnership | | | | | | | | | | |
5.625%, 05/01/2024 | | | | | 1,100 | | | | 1,144 | |
Morgan Stanley | | | | | | | | | | |
5.550%, VAR ICE LIBOR USD 3 Month+3.810%, 12/29/2049 | | | | | 1,050 | | | | 1,069 | |
3.625%, 01/20/2027 | | | | | 900 | | | | 902 | |
Morgan Stanley MTN | | | | | | | | | | |
3.950%, 04/23/2027 | | | | | 1,100 | | | | 1,100 | |
3.700%, 10/23/2024 | | | | | 2,675 | | | | 2,722 | |
Navient | | | | | | | | | | |
6.625%, 07/26/2021 | | | | | 1,100 | | | | 1,149 | |
NE Property BV | | | | | | | | | | |
3.750%, 02/26/2021 | | EUR | | | 200 | | | | 226 | |
Nuveen | | | | | | | | | | |
4.000%, 11/01/2028 (A) | | $ | | | 575 | | | | 613 | |
Oversea-Chinese Banking MTN | | | | | | | | | | |
4.250%, 06/19/2024 | | | | | 800 | | | | 823 | |
Prudential Financial MTN | | | | | | | | | | |
3.878%, 03/27/2028 | | | | | 1,100 | | | | 1,154 | |
Quicken Loans | | | | | | | | | | |
5.750%, 05/01/2025 (A) | | | | | 1,770 | | | | 1,776 | |
Refinitiv US Holdings | | | | | | | | | | |
8.250%, 11/15/2026 (A) | | | | | 750 | | | | 736 | |
Royal Bank of Scotland Group | | | | | | | | | | |
4.921%, VAR ICE LIBOR USD 3 Month+2.320%, 09/29/2027 | | | | | 1,000 | | | | 930 | |
3.498%, VAR ICE LIBOR USD 3 Month+1.480%, 05/15/2023 | | | | | 700 | | | | 695 | |
Royal Bank of Scotland Group PLC | | | | | | | | | | |
8.000%, VAR USD Swap Semi 30/360 5 Yr Curr+5.720%, 12/29/2049 | | | | | 750 | | | | 804 | |
Standard Chartered | | | | | | | | | | |
4.247%, VAR ICE LIBOR USD 3 Month+1.150%, 01/20/2023 (A) | | | | | 1,325 | | | | 1,346 | |
Swiss Re Finance Luxembourg | | | | | | | | | | |
5.000%, VAR US Treas Yield Curve Rate T Note Const Mat 5 Yr+3.582%, 04/02/2049 (A) | | | | | 400 | | | | 405 | |
TC Ziraat Bankasi MTN | | | | | | | | | | |
5.125%, 09/29/2023 (A) | | | | | 200 | | | | 174 | |
Turkiye Vakiflar Bankasi TAO | | | | | | | | | | |
8.125%, 03/28/2024 (A) | | | | | 260 | | | | 245 | |
UBS Group | | | | | | | | | | |
7.000%, VAR USD Swap Semi 30/360 5 Yr Curr+4.866%, 12/29/2049 | | | | | 1,050 | | | | 1,106 | |
5.750%, VAR EUR Swap Annual 5 Yr+5.287%, 12/29/2049 | | EUR | | | 750 | | | | 918 | |
| | | | | | | | | | |
| | | | |
| Description | | | | Face Amount
(Thousands) | | Market Value
($ Thousands) |
|
CORPORATE OBLIGATIONS (continued) | |
UBS Group Funding Switzerland | | | | | | | | | | |
7.000%, VAR USD Swap Semi 30/360 5 Yr Curr+4.344%, 07/31/2167 (A) | | $ | | | 710 | | | $ | 721 | |
UniCredit | | | | | | | | | | |
8.000%, VAR USD Swap Semi 30/360 5 Yr Curr+5.180%, 04/03/2049 | | | | | 1,050 | | | | 982 | |
UniCredit MTN | | | | | | | | | | |
7.296%, VAR USD ICE Swap 11:00 NY 5 Yr+4.914%, 04/02/2034 (A) | | | | | 660 | | | | 665 | |
Wells Fargo | | | | | | | | | | |
5.875%, VAR ICE LIBOR USD 3 Month+3.990%, 06/15/2167 | | | | | 2,449 | | | | 2,617 | |
3.000%, 10/23/2026 | | | | | 675 | | | | 658 | |
Wells Fargo MTN | | | | | | | | | | |
3.550%, 09/29/2025 | | | | | 600 | | | | 610 | |
Wells Fargo Bank | | | | | | | | | | |
3.550%, 08/14/2023 | | | | | 1,100 | | | | 1,129 | |
Westpac Banking | | | | | | | | | | |
5.000%, VAR USD ICE Swap 11:00 NY 5 Yr+2.888%, 09/21/2065 | | | | | 300 | | | | 268 | |
Yapi ve Kredi Bankasi MTN | | | | | | | | | | |
8.250%, 10/15/2024 (A) | | | | | 500 | | | | 477 | |
6.100%, 03/16/2023 | | | | | 200 | | | | 181 | |
| | | | | | | | | 84,762 | |
| | | |
Health Care — 3.7% | | | | | | | | | | |
AbbVie | | | | | | | | | | |
3.600%, 05/14/2025 | | | | | 900 | | | | 902 | |
Acadia Healthcare | | | | | | | | | | |
5.625%, 02/15/2023 | | | | | 1,200 | | | | 1,208 | |
Bausch Health | | | | | | | | | | |
6.125%, 04/15/2025 (A) | | | | | 240 | | | | 237 | |
5.875%, 05/15/2023 (A) | | | | | 700 | | | | 709 | |
Bausch Health Americas | | | | | | | | | | |
9.250%, 04/01/2026 (A) | | | | | 1,500 | | | | 1,642 | |
8.500%, 01/31/2027 (A) | | | | | 1,140 | | | | 1,208 | |
Bayer US Finance II | | | | | | | | | | |
4.375%, 12/15/2028 (A) | | | | | 300 | | | | 298 | |
4.250%, 12/15/2025 (A) | | | | | 500 | | | | 506 | |
3.500%, 06/25/2021 (A) | | | | | 1,325 | | | | 1,330 | |
Becton Dickinson | | | | | | | | | | |
3.363%, 06/06/2024 | | | | | 1,200 | | | | 1,200 | |
2.894%, 06/06/2022 | | | | | 1,850 | | | | 1,841 | |
BioScrip | | | | | | | | | | |
8.875%, 02/15/2021 | | | | | 1,510 | | | | 1,525 | |
Celgene | | | | | | | | | | |
3.900%, 02/20/2028 | | | | | 100 | | | | 102 | |
Centene | | | | | | | | | | |
6.125%, 02/15/2024 | | | | | 1,440 | | | | 1,509 | |
Centene Escrow I | | | | | | | | | | |
5.375%, 06/01/2026 (A) | | | | | 200 | | | | 209 | |
| | |
SEI Institutional Managed Trust / Semi-Annual Report / March 31, 2019 | | 187 |
SCHEDULE OF INVESTMENTS (Unaudited)
March 31, 2019
Multi-Asset Income Fund(Continued)
| | | | | | | | | | |
| | | | |
| Description | | | | Face Amount
(Thousands) | | Market Value
($ Thousands) |
|
CORPORATE OBLIGATIONS (continued) | |
CHS | | | | | | | | | | |
8.000%, 03/15/2026 (A) | | $ | | | 490 | | | $ | 470 | |
Cigna | | | | | | | | | | |
3.750%, 07/15/2023 (A) | | | | | 2,050 | | | | 2,102 | |
CVS Health | | | | | | | | | | |
4.780%, 03/25/2038 | | | | | 1,130 | | | | 1,119 | |
4.300%, 03/25/2028 | | | | | 230 | | | | 233 | |
4.100%, 03/25/2025 | | | | | 2,750 | | | | 2,823 | |
3.875%, 07/20/2025 | | | | | 2,307 | | | | 2,335 | |
DaVita HealthCare Partners | | | | | | | | | | |
5.125%, 07/15/2024 | | | | | 1,000 | | | | 988 | |
Endo Dac | | | | | | | | | | |
6.000%, 02/01/2025 (A) | | | | | 400 | | | | 289 | |
Envision Healthcare | | | | | | | | | | |
8.750%, 10/15/2026 (A) | | | | | 500 | | | | 446 | |
HCA | | | | | | | | | | |
5.875%, 05/01/2023 | | | | | 950 | | | | 1,013 | |
5.625%, 09/01/2028 | | | | | 1,760 | | | | 1,861 | |
5.500%, 06/15/2047 | | | | | 1,280 | | | | 1,361 | |
5.375%, 02/01/2025 | | | | | 340 | | | | 360 | |
Immucor | | | | | | | | | | |
11.125%, 02/15/2022 (A) | | | | | 650 | | | | 660 | |
Magellan Health | | | | | | | | | | |
4.900%, 09/22/2024 | | | | | 480 | | | | 457 | |
MPH Acquisition Holdings | | | | | | | | | | |
7.125%, 06/01/2024 (A) | | | | | 670 | | | | 668 | |
Polaris Intermediate | | | | | | | | | | |
8.500% cash/0% PIK, 12/01/2022 (A) | | | | | 300 | | | | 296 | |
RegionalCare Hospital Partners Holdings | | | | | | | | | | |
8.250%, 05/01/2023 (A) | | | | | 460 | | | | 489 | |
Tenet Healthcare | | | | | | | | | | |
8.125%, 04/01/2022 | | | | | 1,440 | | | | 1,549 | |
Teva Pharmaceutical Finance Netherlands III BV | | | | | | | | | | |
2.800%, 07/21/2023 | | | | | 750 | | | | 669 | |
| | | | | | | | | 34,614 | |
| | | |
Industrials — 4.6% | | | | | | | | | | |
AECOM | | | | | | | | | | |
5.125%, 03/15/2027 | | | | | 950 | | | | 918 | |
AerCap Ireland Capital DAC | | | | | | | | | | |
4.875%, 01/16/2024 | | | | | 400 | | | | 416 | |
4.625%, 07/01/2022 | | | | | 2,300 | | | | 2,373 | |
Aeropuertos Dominicanos Siglo XXI | | | | | | | | | | |
6.750%, 03/30/2029 (A) | | | | | 350 | | | | 358 | |
Avis Budget Car Rental | | | | | | | | | | |
6.375%, 04/01/2024 (A) | | | | | 700 | | | | 711 | |
Avolon Holdings Funding | | | | | | | | | | |
5.125%, 10/01/2023 (A) | | | | | 690 | | | | 702 | |
Boeing | | | | | | | | | | |
3.450%, 11/01/2028 | | | | | 375 | | | | 382 | |
3.250%, 03/01/2028 | | | | | 425 | | | | 427 | |
| | | | | | | | | | |
| | | | |
| Description | | | | Face Amount
(Thousands) | | Market Value
($ Thousands) |
|
CORPORATE OBLIGATIONS (continued) | |
2.600%, 10/30/2025 | | $ | | | 475 | | | $ | 463 | |
Bombardier | | | | | | | | | | |
7.500%, 03/15/2025 (A) | | | | | 1,000 | | | | 1,029 | |
6.125%, 01/15/2023 (A) | | | | | 2,050 | | | | 2,078 | |
Burlington Northern Santa Fe | | | | | | | | | | |
3.650%, 09/01/2025 | | | | | 800 | | | | 830 | |
Cleaver-Brooks | | | | | | | | | | |
7.875%, 03/01/2023 (A) | | | | | 460 | | | | 425 | |
DAE Funding | | | | | | | | | | |
5.750%, 11/15/2023 (A) | | | | | 1,530 | | | | 1,572 | |
DP World MTN | | | | | | | | | | |
5.625%, 09/25/2048 (A) | | | | | 1,150 | | | | 1,195 | |
Embraer Netherlands Finance | | | | | | | | | | |
5.050%, 06/15/2025 | | | | | 67 | | | | 71 | |
Embraer Netherlands Finance BV | | | | | | | | | | |
5.400%, 02/01/2027 | | | | | 100 | | | | 108 | |
Embraer Overseas | | | | | | | | | | |
5.696%, 09/16/2023 | | | | | 170 | | | | 182 | |
Fortune Brands Home & Security | | | | | | | | | | |
4.000%, 09/21/2023 | | | | | 1,275 | | | | 1,310 | |
GE Capital International Funding Unlimited Co | | | | | | | | | | |
3.373%, 11/15/2025 | | | | | 200 | | | | 194 | |
General Electric | | | | | | | | | | |
2.700%, 10/09/2022 | | | | | 100 | | | | 98 | |
General Electric MTN | | | | | | | | | | |
6.875%, 01/10/2039 | | | | | 1,200 | | | | 1,419 | |
3.100%, 01/09/2023 | | | | | 275 | | | | 273 | |
H&E Equipment Services | | | | | | | | | | |
5.625%, 09/01/2025 | | | | | 750 | | | | 748 | |
Hertz | | | | | | | | | | |
7.625%, 06/01/2022 (A) | | | | | 450 | | | | 461 | |
5.875%, 10/15/2020 | | | | | 270 | | | | 270 | |
JB Poindexter | | | | | | | | | | |
7.125%, 04/15/2026 (A) | | | | | 910 | | | | 913 | |
Lockheed Martin | | | | | | | | | | |
3.550%, 01/15/2026 | | | | | 325 | | | | 335 | |
Mexico City Airport Trust | | | | | | | | | | |
5.500%, 10/31/2046 (A) | | | | | 400 | | | | 369 | |
5.500%, 07/31/2047 (A) | | | | | 892 | | | | 821 | |
4.250%, 10/31/2026 (A) | | | | | 210 | | | | 202 | |
3.875%, 04/30/2028 (A) | | | | | 1,190 | | | | 1,075 | |
MHP Lux | | | | | | | | | | |
6.950%, 04/03/2026 | | | | | 220 | | | | 207 | |
Neovia Logistics Services | | | | | | | | | | |
8.875%, 08/01/2020 (A) | | | | | 840 | | | | 798 | |
Northrop Grumman | | | | | | | | | | |
3.250%, 01/15/2028 | | | | | 1,950 | | | | 1,918 | |
2.930%, 01/15/2025 | | | | | 1,000 | | | | 986 | |
Novelis | | | | | | | | | | |
5.875%, 09/30/2026 (A) | | | | | 1,400 | | | | 1,395 | |
| | |
188 | | SEI Institutional Managed Trust / Semi-Annual Report / March 31, 2019 |
| | | | | | | | | | |
| | | | |
| Description | | | | Face Amount
(Thousands) | | Market Value
($ Thousands) |
|
CORPORATE OBLIGATIONS (continued) | |
Park Aerospace Holdings | | | | | | | | | | |
5.250%, 08/15/2022 (A) | | $ | | | 900 | | | $ | 923 | |
4.500%, 03/15/2023 (A) | | | | | 170 | | | | 169 | |
Park-Ohio Industries | | | | | | | | | | |
6.625%, 04/15/2027 | | | | | 1,570 | | | | 1,562 | |
Prime Security Services Borrower | | | | | | | | | | |
9.250%, 05/15/2023 (A) | | | | | 901 | | | | 946 | |
5.750%, 04/15/2026 (A) | | | | | 460 | | | | 460 | |
5.250%, 04/15/2024 (A) | | | | | 140 | | | | 140 | |
RBS Global | | | | | | | | | | |
4.875%, 12/15/2025 (A) | | | | | 400 | | | | 395 | |
Standard Industries | | | | | | | | | | |
6.000%, 10/15/2025 (A) | | | | | 1,100 | | | | 1,152 | |
Stanley Black & Decker | | | | | | | | | | |
4.250%, 11/15/2028 | | | | | 650 | | | | 698 | |
Star Merger Sub | | | | | | | | | | |
6.875%, 08/15/2026 (A) | | | | | 1,150 | | | | 1,176 | |
Swire Pacific Financing MTN | | | | | | | | | | |
4.500%, 10/09/2023 | | | | | 950 | | | | 1,003 | |
Titan Acquisition | | | | | | | | | | |
7.750%, 04/15/2026 (A) | | | | | 1,400 | | | | 1,208 | |
TransDigm | | | | | | | | | | |
6.500%, 05/15/2025 | | | | | 200 | | | | 203 | |
6.375%, 06/15/2026 | | | | | 994 | | | | 984 | |
United Rentals North America | | | | | | | | | | |
6.500%, 12/15/2026 | | | | | 1,310 | | | | 1,379 | |
4.875%, 01/15/2028 | | | | | 1,100 | | | | 1,070 | |
4.625%, 07/15/2023 | | | | | 140 | | | | 142 | |
United Technologies | | | | | | | | | | |
3.333%, VAR ICE LIBOR USD 3 Month+0.650%, 08/16/2021 | | | | | 325 | | | | 325 | |
XPO CNW | | | | | | | | | | |
6.700%, 05/01/2034 | | | | | 2,140 | | | | 1,851 | |
XPO Logistics | | | | | | | | | | |
6.125%, 09/01/2023 (A) | | | | | 150 | | | | 151 | |
| | | | | | | | | 43,969 | |
| |
Information Technology — 2.0% | | | | | |
Amkor Technology | | | | | | | | | | |
6.625%, 09/15/2027 (A) | | | | | 780 | | | | 792 | |
Apple | | | | | | | | | | |
3.200%, 05/11/2027 | | | | | 525 | | | | 529 | |
2.900%, 09/12/2027 | | | | | 2,075 | | | | 2,046 | |
Banff Merger Sub | | | | | | | | | | |
9.750%, 09/01/2026 (A) | | | | | 200 | | | | 194 | |
Broadcom | | | | | | | | | | |
4.250%, 04/15/2026 (A) | | | | | 625 | | | | 620 | |
3.625%, 01/15/2024 | | | | | 2,925 | | | | 2,917 | |
3.625%, 10/15/2024 (A) | | | | | 800 | | | | 794 | |
3.125%, 10/15/2022 (A) | | | | | 1,100 | | | | 1,095 | |
3.125%, 01/15/2025 | | | | | 50 | | | | 48 | |
| | | | | | | | | | |
| | | | |
| Description | | | | Face Amount
(Thousands) | | Market Value
($ Thousands) |
|
CORPORATE OBLIGATIONS (continued) | |
CommScope Technologies | | | | | | | | | | |
5.000%, 03/15/2027 (A) | | $ | | | 390 | | | $ | 346 | |
Dell International | | | | | | | | | | |
6.020%, 06/15/2026 (A) | | | | | 475 | | | | 511 | |
5.450%, 06/15/2023 (A) | | | | | 525 | | | | 559 | |
EIG Investors | | | | | | | | | | |
10.875%, 02/01/2024 | | | | | 100 | | | | 105 | |
EMC | | | | | | | | | | |
3.375%, 06/01/2023 | | | | | 1,650 | | | | 1,601 | |
First Data | | | | | | | | | | |
5.000%, 01/15/2024 (A) | | | | | 500 | | | | 513 | |
Fiserv | | | | | | | | | | |
4.200%, 10/01/2028 | | | | | 500 | | | | 515 | |
3.800%, 10/01/2023 | | | | | 300 | | | | 307 | |
Hewlett Packard Enterprise | | | | | | | | | | |
4.900%, 10/15/2025 | | | | | 865 | | | | 919 | |
3.515%, VAR ICE LIBOR USD 3 Month+0.720%, 10/05/2021 | | | | | 925 | | | | 921 | |
3.500%, 10/05/2021 | | | | | 500 | | | | 507 | |
j2 Cloud Services | | | | | | | | | | |
6.000%, 07/15/2025 (A) | | | | | 740 | | | | 769 | |
Micron Technology | | | | | | | | | | |
4.975%, 02/06/2026 | | | | | 525 | | | | 536 | |
NXP BV | | | | | | | | | | |
4.625%, 06/15/2022 (A) | | | | | 1,000 | | | | 1,035 | |
Seagate HDD Cayman | | | | | | | | | | |
4.750%, 06/01/2023 | | | | | 360 | | | | 364 | |
| | | | | | | | | 18,543 | |
| | | |
Materials — 3.2% | | | | | | | | | | |
ABJA Investment Pte | | | | | | | | | | |
5.950%, 07/31/2024 | | | | | 200 | | | | 204 | |
5.450%, 01/24/2028 | | | | | 200 | | | | 189 | |
Alcoa Nederland Holding BV | | | | | | | | | | |
6.125%, 05/15/2028 (A) | | | | | 1,420 | | | | 1,463 | |
Anglo American Capital | | | | | | | | | | |
4.000%, 09/11/2027 (A) | | | | | 250 | | | | 243 | |
ARD Finance | | | | | | | | | | |
7.125% cash/0% PIK, 09/15/2023 | | | | | 500 | | | | 498 | |
Ardagh Packaging Finance | | | | | | | | | | |
4.750%, 07/15/2027 | | GBP | | | 700 | | | | 863 | |
Barrick North America Finance | | | | | | | | | | |
5.750%, 05/01/2043 | | $ | | | 250 | | | | 290 | |
BHP Billiton Finance USA | | | | | | | | | | |
6.750%, VAR USD Swap Semi 30/360 5 Yr Curr+5.093%, 10/19/2075 (A) | | | | | 830 | | | | 919 | |
Braskem Netherlands Finance BV | | | | | | | | | | |
4.500%, 01/10/2028 (A) | | | | | 1,200 | | | | 1,167 | |
Constellium | | | | | | | | | | |
5.750%, 05/15/2024 (A) | | | | | 500 | | | | 499 | |
DowDuPont | | | | | | | | | | |
4.493%, 11/15/2025 | | | | | 450 | | | | 479 | |
| | |
SEI Institutional Managed Trust / Semi-Annual Report / March 31, 2019 | | 189 |
SCHEDULE OF INVESTMENTS (Unaudited)
March 31, 2019
Multi-Asset Income Fund(Continued)
| | | | | | | | | | |
| | | | |
| Description | | | | Face Amount
(Thousands) | | Market Value ($ Thousands) |
| |
CORPORATE OBLIGATIONS (continued) | | | | | |
4.205%, 11/15/2023 | | $ | | | 725 | | | $ | 758 | |
First Quantum Minerals | | | | | | | | | | |
7.250%, 04/01/2023 (A) | | | | | 1,530 | | | | 1,496 | |
6.500%, 03/01/2024 (A) | | | | | 290 | | | | 271 | |
Freeport-McMoRan | | | | | | | | | | |
5.450%, 03/15/2043 | | | | | 2,760 | | | | 2,415 | |
3.550%, 03/01/2022 | | | | | 1,000 | | | | 989 | |
Glencore Funding | | | | | | | | | | |
4.125%, 03/12/2024 (A) | | | | | 400 | | | | 404 | |
4.000%, 04/16/2025 (A) | | | | | 750 | | | | 753 | |
4.000%, 03/27/2027 (A) | | | | | 1,275 | | | | 1,237 | |
Hudbay Minerals | | | | | | | | | | |
7.625%, 01/15/2025 (A) | | | | | 760 | | | | 780 | |
7.250%, 01/15/2023 (A) | | | | | 10 | | | | 10 | |
Huntsman International | | | | | | | | | | |
4.500%, 05/01/2029 | | | | | 375 | | | | 374 | |
Metinvest BV | | | | | | | | | | |
7.750%, 04/23/2023 (A) | | | | | 375 | | | | 366 | |
Northwest Acquisitions ULC | | | | | | | | | | |
7.125%, 11/01/2022 (A) | | | | | 410 | | | | 361 | |
Pactiv | | | | | | | | | | |
8.375%, 04/15/2027 | | | | | 650 | | | | 663 | |
Phosagro OAO Via Phosagro Bond Funding DAC | | | | | | | | | | |
3.949%, 04/24/2023 (A) | | | | | 550 | | | | 536 | |
PQ | | | | | | | | | | |
6.750%, 11/15/2022 (A) | | | | | 900 | | | | 934 | |
Resolute Forest Products | | | | | | | | | | |
5.875%, 05/15/2023 | | | | | 820 | | | | 812 | |
Samarco Mineracao | | | | | | | | | | |
5.750%, 10/24/2023 (B) | | | | | 200 | | | | 132 | |
SASOL Financing USA | | | | | | | | | | |
5.875%, 03/27/2024 | | | | | 1,080 | | | | 1,145 | |
Sherwin-Williams | | | | | | | | | | |
3.450%, 08/01/2025 | | | | | 875 | | | | 875 | |
3.450%, 06/01/2027 | | | | | 357 | | | | 351 | |
Sociedad Quimica y Minera de Chile | | | | | | | | | | |
4.375%, 01/28/2025 | | | | | 220 | | | | 221 | |
Starfruit Finco BV | | | | | | | | | | |
8.000%, 10/01/2026 (A) | | | | | 650 | | | | 655 | |
Suzano Austria GmbH | | | | | | | | | | |
6.000%, 01/15/2029 (A) | | | | | 1,130 | | | | 1,204 | |
5.750%, 07/14/2026 | | | | | 400 | | | | 426 | |
Syngenta Finance | | | | | | | | | | |
5.182%, 04/24/2028 | | | | | 220 | | | | 224 | |
Syngenta Finance MTN | | | | | | | | | | |
1.250%, 09/10/2027 | | EUR | | | 200 | | | | 205 | |
Teck Resources | | | | | | | | | | |
6.000%, 08/15/2040 | | $ | | | 200 | | | | 207 | |
5.400%, 02/01/2043 | | | | | 480 | | | | 473 | |
Vale Overseas | | | | | | | | | | |
6.250%, 08/10/2026 | | | | | 1,134 | | | | 1,233 | |
| | | | | | | | | | |
| | | | |
| Description | | | | Face Amount (Thousands) | | Market Value ($ Thousands) |
| |
CORPORATE OBLIGATIONS (continued) | | | | | |
Valvoline | | | | | | | | | | |
5.500%, 07/15/2024 | | $ | | | 650 | | | $ | 661 | |
4.375%, 08/15/2025 | | | | | 500 | | | | 479 | |
Yamana | | | | | | | | | | |
4.950%, 07/15/2024 | | | | | 1,837 | | | | 1,888 | |
| | | | | | | | | 30,352 | |
| | | |
Real Estate — 0.8% | | | | | | | | | | |
Alexandria Real Estate Equities | | | | | | | | | | |
3.800%, 04/15/2026 | | | | | 350 | | | | 355 | |
American Tower | | | | | | | | | | |
5.000%, 02/15/2024 | | | | | 1,000 | | | | 1,076 | |
3.375%, 05/15/2024 | | | | | 925 | | | | 932 | |
3.300%, 02/15/2021 | | | | | 350 | | | | 353 | |
CoreCivic | | | | | | | | | | |
4.625%, 05/01/2023 | | | | | 1,000 | | | | 962 | |
Five Point Operating | | | | | | | | | | |
7.875%, 11/15/2025 (A) | | | | | 310 | | | | 297 | |
GLP Capital | | | | | | | | | | |
5.750%, 06/01/2028 | | | | | 190 | | | | 204 | |
5.375%, 04/15/2026 | | | | | 40 | | | | 42 | |
iStar | | | | | | | | | | |
4.625%, 09/15/2020 | | | | | 530 | | | | 536 | |
MPT Operating Partnership | | | | | | | | | | |
6.375%, 03/01/2024 | | | | | 895 | | | | 936 | |
5.000%, 10/15/2027 | | | | | 710 | | | | 723 | |
Newmark Group | | | | | | | | | | |
6.125%, 11/15/2023 | | | | | 350 | | | | 360 | |
VEREIT Operating Partnership | | | | | | | | | | |
4.875%, 06/01/2026 | | | | | 1,000 | | | | 1,041 | |
| | | | | | | | | 7,817 | |
| | | |
Utilities — 1.1% | | | | | | | | | | |
Alliant Energy Finance | | | | | | | | | | |
4.250%, 06/15/2028 (A) | | | | | 125 | | | | 128 | |
3.750%, 06/15/2023 (A) | | | | | 325 | | | | 331 | |
AmeriGas Partners | | | | | | | | | | |
5.875%, 08/20/2026 | | | | | 75 | | | | 75 | |
Berkshire Hathaway Energy | | | | | | | | | | |
3.250%, 04/15/2028 | | | | | 550 | | | | 546 | |
Duke Energy Carolinas | | | | | | | | | | |
3.950%, 11/15/2028 | | | | | 700 | | | | 745 | |
Eskom Holdings SOC MTN | | | | | | | | | | |
6.750%, 08/06/2023 | | | | | 230 | | | | 227 | |
Greenko Investment | | | | | | | | | | |
4.875%, 08/16/2023 (A) | | | | | 410 | | | | 391 | |
Minejesa Capital BV | | | | | | | | | | |
4.625%, 08/10/2030 | | | | | 400 | | | | 388 | |
NiSource | | | | | | | | | | |
3.650%, 06/15/2023 | | | | | 525 | | | | 534 | |
3.490%, 05/15/2027 | | | | | 1,325 | | | | 1,321 | |
| | |
190 | | SEI Institutional Managed Trust / Semi-Annual Report / March 31, 2019 |
| | | | | | | | | | |
| | | | |
| Description | | | | Face Amount
(Thousands) | | Market Value
($ Thousands) |
|
CORPORATE OBLIGATIONS (continued) | |
NRG Energy | | | | | | | | | | |
7.250%, 05/15/2026 | | $ | | | 1,000 | | | $ | 1,100 | |
Pacific Gas & Electric | | | | | | | | | | |
3.250%, 09/15/2021 (B) | | | | | 260 | | | | 237 | |
Perusahaan Listrik Negara MTN | | | | | | | | | | |
4.125%, 05/15/2027 (A) | | | | | 1,190 | | | | 1,171 | |
Sempra Energy | | | | | | | | | | |
3.400%, 02/01/2028 | | | | | 1,075 | | | | 1,037 | |
Southern | | | | | | | | | | |
3.250%, 07/01/2026 | | | | | 700 | | | | 686 | |
Southern California Edison | | | | | | | | | | |
4.200%, 03/01/2029 | | | | | 450 | | | | 457 | |
Suburban Propane Partners | | | | | | | | | | |
5.500%, 06/01/2024 | | | | | 250 | | | | 243 | |
Vistra Energy | | | | | | | | | | |
7.625%, 11/01/2024 | | | | | 900 | | | | 952 | |
| | | | | | | | | 10,569 | |
| | | |
Total Corporate Obligations
(Cost $426,568) ($ Thousands) | | | | | | | | | 428,107 | |
|
SOVEREIGN DEBT — 16.1% | |
| | | |
Abu Dhabi Government International Bond | | | | | | | | | | |
4.125%, 10/11/2047 (A) | | | | | 1,500 | | | | 1,513 | |
3.125%, 05/03/2026 | | | | | 850 | | | | 851 | |
3.125%, 10/11/2027 (A) | | | | | 810 | | | | 804 | |
Angolan Government International Bond | | | | | | | | | | |
9.375%, 05/08/2048 (A) | | | | | 400 | | | | 432 | |
8.250%, 05/09/2028 (A) | | | | | 1,620 | | | | 1,688 | |
Argentina Bonar Bonds | | | | | | | | | | |
45.325%, VAR 30-35d Argentina BADLAR Private Banks+3.250%, 03/01/2020 | | ARS | | | 3,100 | | | | 70 | |
Argentina Treasury Bond BONCER | | | | | | | | | | |
2.500%, 07/22/2021 | | | | | 1,575 | | | | 67 | |
Argentine Republic Government International Bond | | | | | | | | | | |
8.280%, 12/31/2033 | | $ | | | 1,640 | | | | 1,355 | |
7.820%, 12/31/2033 | | EUR | | | 491 | | | | 476 | |
7.125%, 07/06/2036 | | $ | | | 2,980 | | | | 2,287 | |
6.875%, 01/26/2027 | | | | | 830 | | | | 672 | |
6.875%, 01/11/2048 | | | | | 330 | | | | 243 | |
6.250%, 11/09/2047 | | EUR | | | 110 | | | | 88 | |
5.875%, 01/11/2028 | | $ | | | 380 | | | | 291 | |
5.625%, 01/26/2022 | | | | | 1,100 | | | | 949 | |
5.250%, 01/15/2028 | | EUR | | | 760 | | | | 627 | |
4.625%, 01/11/2023 | | $ | | | 1,050 | | | | 860 | |
3.750%, 5.250%, 03/31/2029, 12/31/2038 (C) | | | | | 1,330 | | | | 768 | |
3.380%, 4.740%, 03/31/2029, 12/31/2038 (C) | | EUR | | | 70 | | | | 44 | |
| | | | | | | | | | |
| | | | |
| Description | | | | Face Amount
(Thousands) | | | Market Value
($ Thousands) |
|
SOVEREIGN DEBT (continued) | |
3.375%, 01/15/2023 | | EUR | | | 790 | | | $ | 711 | |
Bermuda Government International Bond | | | | | | | | | | |
3.717%, 01/25/2027 (A) | | $ | | | 240 | | | | 237 | |
Bonos de la Nacion Argentina con Ajuste por CER | | | | | | | | | | |
4.000%, 03/06/2020 | | ARS | | | 58,000 | | | | 1,958 | |
Bonos De La Nacion Argentina En Moneda Dua | | | | | | | | | | |
4.500%, 06/21/2019 | | $ | | | 150 | | | | 153 | |
4.500%, 02/13/2020 | | | | | 330 | | | | 314 | |
Brazil Minas SPE via State of Minas Gerais | | | | | | | | | | |
5.333%, 02/15/2028 | | | | | 180 | | | | 185 | |
Brazil Notas do Tesouro Nacional, Ser F | | | | | | | | | | |
10.000%, 01/01/2021 | | BRL | | | 8,967 | | | | 2,404 | |
10.000%, 01/01/2027 | | | | | 11,500 | | | | 3,130 | |
Colombia Government International Bond | | | | | | | | | | |
5.200%, 05/15/2049 | | $ | | | 620 | | | | 667 | |
4.500%, 01/28/2026 | | | | | 200 | | | | 211 | |
4.500%, 03/15/2029 | | | | | 610 | | | | 644 | |
3.875%, 04/25/2027 | | | | | 200 | | | | 203 | |
Costa Rica Government International Bond | | | | | | | | | | |
7.158%, 03/12/2045 | | | | | 880 | | | | 849 | |
5.625%, 04/30/2043 | | | | | 400 | | | | 339 | |
Dominican Republic International Bond | | | | | | | | | | |
6.850%, 01/27/2045 | | | | | 660 | | | | 706 | |
6.500%, 02/15/2048 (A) | | | | | 1,270 | | | | 1,308 | |
6.000%, 07/19/2028 (A) | | | | | 1,300 | | | | 1,364 | |
Eastern & Southern African Trade & Development Bank MTN | | | | | | | | | | |
5.375%, 03/14/2022 | | | | | 210 | | | | 214 | |
Ecuador Government International Bond | | | | | | | | | | |
10.750%, 01/31/2029 (A) | | | | | 2,020 | | | | 2,225 | |
9.650%, 12/13/2026 (A) | | | | | 990 | | | | 1,037 | |
9.625%, 06/02/2027 (A) | | | | | 1,350 | | | | 1,404 | |
8.875%, 10/23/2027 (A) | | | | | 1,500 | | | | 1,500 | |
8.750%, 06/02/2023 (A) | | | | | 1,140 | | | | 1,194 | |
Egypt Government International Bond | | | | | | | | | | |
8.700%, 03/01/2049 (A) | | | | | 520 | | | | 541 | |
8.500%, 01/31/2047 | | | | | 650 | | | | 663 | |
7.903%, 02/21/2048 (A) | | | | | 360 | | | | 349 | |
7.600%, 03/01/2029 (A) | | | | | 510 | | | | 523 | |
5.625%, 04/16/2030 (A) | | EUR | | | 620 | | | | 668 | |
4.750%, 04/16/2026 | | | | | 680 | | | | 752 | |
Egypt Treasury Bills | | | | | | | | | | |
19.354%, 06/04/2019 (D) | | EGP | | | 20,900 | | | | 1,172 | |
17.454%, 01/21/2020 (D) | | | | | 32,400 | | | | 1,645 | |
El Salvador Government International Bond | | | | | | | | | | |
5.875%, 01/30/2025 | | $ | | | 30 | | | | 29 | |
Gabon Government International Bond | | | | | | | | | | |
6.375%, 12/12/2024 | | | | | 1,460 | | | | 1,397 | |
Ghana Government International Bond | | | | | | | | | | |
10.750%, 10/14/2030 | | | | | 210 | | | | 256 | |
| | |
SEI Institutional Managed Trust / Semi-Annual Report / March 31, 2019 | | 191 |
SCHEDULE OF INVESTMENTS (Unaudited)
March 31, 2019
Multi-Asset Income Fund(Continued)
| | | | | | | | | | |
| | | | |
| Description | | | | Face Amount (Thousands) | | Market Value ($ Thousands) |
|
SOVEREIGN DEBT (continued) | |
8.627%, 06/16/2049 | | $ | | | 1,070 | | | $ | 1,043 | |
8.125%, 01/18/2026 | | | | | 1,950 | | | | 1,999 | |
8.125%, 03/26/2032 (A) | | | | | 1,650 | | | | 1,642 | |
7.875%, 03/26/2027 (A) | | | | | 260 | | | | 262 | |
7.625%, 05/16/2029 | | | | | 1,180 | | | | 1,154 | |
Guatemala Government Bond | | | | | | | | | | |
5.750%, 06/06/2022 | | | | | 700 | | | | 731 | |
4.875%, 02/13/2028 | | | | | 210 | | | | 208 | |
4.500%, 05/03/2026 (A) | | | | | 970 | | | | 947 | |
4.375%, 06/05/2027 (A) | | | | | 1,290 | | | | 1,239 | |
Hazine Mustesarligi Varlik Kiralama | | | | | | | | | | |
5.004%, 04/06/2023 (A) | | | | | 1,930 | | | | 1,816 | |
Honduras Government International Bond | | | | | | | | | | |
7.500%, 03/15/2024 | | | | | 660 | | | | 724 | |
Indonesia Government International Bond | | | | | | | | | | |
5.250%, 01/17/2042 | | | | | 3,850 | | | | 4,135 | |
4.750%, 01/08/2026 | | | | | 2,270 | | | | 2,398 | |
4.350%, 01/08/2027 (A) | | | | | 320 | | | | 331 | |
4.125%, 01/15/2025 | | | | | 300 | | | | 307 | |
3.850%, 07/18/2027 (A) | | | | | 1,170 | | | | 1,169 | |
3.750%, 06/14/2028 (A) | | EUR | | | 200 | | | | 260 | |
3.375%, 07/30/2025 | | | | | 1,290 | | | | 1,619 | |
Indonesia Treasury Bond | | | | | | | | | | |
7.000%, 05/15/2027 | | IDR | | | 121,764,000 | | | | 8,231 | |
Ivory Coast Government International Bond | | | | | | | | | | |
6.625%, 03/22/2048 (A) | | EUR | | | 420 | | | | 449 | |
5.250%, 03/22/2030 | | | | | 390 | | | | 418 | |
Kazakhstan Government International Bond MTN | | | | | | | | | | |
5.125%, 07/21/2025 | | $ | | | 1,300 | | | | 1,417 | |
Kenya Government International Bond | | | | | | | | | | |
8.250%, 02/28/2048 (A) | | | | | 260 | | | | 263 | |
Kuwait International Government Bond | | | | | | | | | | |
3.500%, 03/20/2027 (A) | | | | | 1,360 | | | | 1,389 | |
2.750%, 03/20/2022 | | | | | 380 | | | | 380 | |
Mexican Bonos | | | | | | | | | | |
6.500%, 06/09/2022 | | MXN | | | 16,290 | | | | 809 | |
Mexico Government International Bond | | | | | | | | | | |
4.750%, 03/08/2044 | | $ | | | 440 | | | | 432 | |
3.600%, 01/30/2025 | | | | | 1,200 | | | | 1,200 | |
Nigeria Government International Bond | | | | | | | | | | |
9.248%, 01/21/2049 (A) | | | | | 260 | | | | 288 | |
8.747%, 01/21/2031 (A) | | | | | 1,720 | | | | 1,895 | |
7.875%, 02/16/2032 | | | | | 230 | | | | 239 | |
7.696%, 02/23/2038 (A) | | | | | 1,280 | | | | 1,270 | |
7.625%, 11/28/2047 (A) | | | | | 1,580 | | | | 1,537 | |
North Macedonia Government International Bond | | | | | | | | | | |
5.625%, 07/26/2023 (A) | | EUR | | | 700 | | | | 907 | |
2.750%, 01/18/2025 (A) | | | | | 2,040 | | | | 2,370 | |
Oman Government International Bond | | | | | | | | | | |
6.750%, 01/17/2048 (A) | | $ | | | 1,910 | | | | 1,695 | |
| | | | | | | | | | |
| | | | |
| Description | | | | Face Amount (Thousands) | | Market Value ($ Thousands) |
| |
SOVEREIGN DEBT (continued) | | | | | |
5.625%, 01/17/2028 (A) | | $ | | | 560 | | | $ | 525 | |
Pakistan Government International Bond | | | | | | | | | | |
8.250%, 09/30/2025 | | | | | 370 | | | | 396 | |
Papua New Guinea Government International Bond | | | | | | | | | | |
8.375%, 10/04/2028 (A) | | | | | 290 | | | | 313 | |
Paraguay Government International Bond | | | | | | | | | | |
6.100%, 08/11/2044 | | | | | 350 | | | | 396 | |
5.600%, 03/13/2048 (A) | | | | | 560 | | | | 599 | |
5.400%, 03/30/2050 (A) | | | | | 320 | | | | 335 | |
5.000%, 04/15/2026 (A) | | | | | 440 | | | | 463 | |
4.700%, 03/27/2027 (A) | | | | | 570 | | | | 593 | |
4.625%, 01/25/2023 | | | | | 550 | | | | 567 | |
Perusahaan Penerbit SBSN Indonesia III | | | | | | | | | | |
4.550%, 03/29/2026 (A) | | | | | 530 | | | | 551 | |
4.450%, 02/20/2029 (A) | | | | | 330 | | | | 339 | |
4.400%, 03/01/2028 (A) | | | | | 3,160 | | | | 3,247 | |
4.150%, 03/29/2027 (A) | | | | | 1,090 | | | | 1,101 | |
Province of Santa Fe | | | | | | | | | | |
7.000%, 03/23/2023 (A) | | | | | 300 | | | | 257 | |
Provincia de Buenos Aires | | | | | | | | | | |
54.893%, 05/31/2022 (D) | | | | | 2,070 | | | | 46 | |
9.950%, 06/09/2021 | | | | | 600 | | | | 559 | |
9.125%, 03/16/2024 (A) | | | | | 310 | | | | 257 | |
7.875%, 06/15/2027 (A) | | | | | 400 | | | | 291 | |
6.500%, 02/15/2023 (A) | | | | | 2,240 | | | | 1,820 | |
Provincia de la Rioja | | | | | | | | | | |
9.750%, 02/24/2025 (A) | | | | | 270 | | | | 213 | |
Qatar Government International Bond | | | | | | | | | | |
5.103%, 04/23/2048 (A) | | | | | 1,890 | | | | 2,070 | |
4.817%, 03/14/2049 (A) | | | | | 1,130 | | | | 1,188 | |
4.500%, 04/23/2028 | | | | | 200 | | | | 214 | |
4.000%, 03/14/2029 (A) | | | | | 470 | | | | 484 | |
Republic of Azerbaijan International Bond | | | | | | | | | | |
3.500%, 09/01/2032 (A) | | | | | 1,360 | | | | 1,193 | |
Republic of South Africa Government Bond | | | | | | | | | | |
9.000%, 01/31/2040 | | ZAR | | | 785 | | | | 51 | |
8.875%, 02/28/2035 | | | | | 3,910 | | | | 255 | |
8.750%, 01/31/2044 | | | | | 2,130 | | | | 134 | |
8.250%, 03/31/2032 | | | | | 2,480 | | | | 157 | |
8.000%, 01/31/2030 | | | | | 1,310 | | | | 84 | |
7.000%, 02/28/2031 | | | | | 6,370 | | | | 370 | |
6.500%, 02/28/2041 | | | | | 660 | | | | 32 | |
6.250%, 03/31/2036 | | | | | 2,220 | | | | 112 | |
Republic of South Africa Government International Bond | | | | | | | | | | |
5.875%, 06/22/2030 | | $ | | | 220 | | | | 225 | |
5.650%, 09/27/2047 | | | | | 1,520 | | | | 1,447 | |
4.850%, 09/27/2027 | | | | | 640 | | | | 624 | |
4.300%, 10/12/2028 | | | | | 200 | | | | 187 | |
Republic of Suriname | | | | | | | | | | |
9.250%, 10/26/2026 (A) | | | | | 740 | | | | 726 | |
| | |
192 | | SEI Institutional Managed Trust / Semi-Annual Report / March 31, 2019 |
| | | | | | | | | | | | |
| | | | |
| Description | | | | | Face Amount (Thousands) | | Market Value ($ Thousands) |
|
SOVEREIGN DEBT (continued) | |
Republic of Uzbekistan Bond MTN | | | | | | | | | | | | |
5.375%, 02/20/2029 (A) | | | $ | | | | 250 | | | $ | 248 | |
4.750%, 02/20/2024 (A) | | | | | | | 340 | | | | 338 | |
Romanian Government International Bond | | | | | | | | | | | | |
5.125%, 06/15/2048 (A) | | | | | | | 600 | | | | 597 | |
4.625%, 04/03/2049 (A) | | | EUR | | | | 180 | | | | 210 | |
3.875%, 10/29/2035 | | | | | | | 570 | | | | 663 | |
3.375%, 02/08/2038 (A) | | | | | | | 330 | | | | 359 | |
2.875%, 05/26/2028 | | | | | | | 650 | | | | 750 | |
2.375%, 04/19/2027 (A) | | | | | | | 230 | | | | 262 | |
2.000%, 12/08/2026 (A) | | | | | | | 590 | | | | 662 | |
Russian Federal Bond - OFZ | | | | | | | | | | | | |
7.050%, 01/19/2028 | | | RUB | | | | 478,430 | | | | 6,794 | |
Russian Foreign Bond - Eurobond | | | | | | | | | | | | |
5.250%, 06/23/2047 | | | $ | | | | 200 | | | | 201 | |
4.750%, 05/27/2026 | | | | | | | 3,600 | | | | 3,708 | |
Senegal Government International Bond | | | | | | | | | | | | |
6.750%, 03/13/2048 (A) | | | | | | | 1,070 | | | | 987 | |
6.250%, 05/23/2033 (A) | | | | | | | 1,070 | | | | 1,027 | |
4.750%, 03/13/2028 (A) | | | EUR | | | | 510 | | | | 566 | |
South Africa Government International Bond | | | | | | | | | | | | |
5.875%, 09/16/2025 | | | $ | | | | 450 | | | | 475 | |
Sri Lanka Government International Bond | | | | | | | | | | | | |
7.850%, 03/14/2029 (A) | | | | | | | 440 | | | | 459 | |
6.850%, 03/14/2024 (A) | | | | | | | 1,440 | | | | 1,468 | |
6.850%, 11/03/2025 | | | | | | | 790 | | | | 795 | |
6.825%, 07/18/2026 (A) | | | | | | | 250 | | | | 250 | |
6.750%, 04/18/2028 (A) | | | | | | | 920 | | | | 906 | |
6.250%, 10/04/2020 | | | | | | | 410 | | | | 416 | |
6.200%, 05/11/2027 (A) | | | | | | | 380 | | | | 365 | |
6.125%, 06/03/2025 | | | | | | | 200 | | | | 195 | |
5.875%, 07/25/2022 | | | | | | | 470 | | | | 470 | |
5.750%, 01/18/2022 (A) | | | | | | | 200 | | | | 199 | |
5.750%, 04/18/2023 (A) | | | | | | | 1,240 | | | | 1,223 | |
Turkey Government International Bond | | | | | | | | | | | | |
7.625%, 04/26/2029 | | | | | | | 780 | | | | 772 | |
7.375%, 02/05/2025 | | | | | | | 360 | | | | 361 | |
6.875%, 03/17/2036 | | | | | | | 130 | | | | 118 | |
6.625%, 02/17/2045 | | | | | | | 270 | | | | 233 | |
6.125%, 10/24/2028 | | | | | | | 200 | | | | 182 | |
6.000%, 01/14/2041 | | | | | | | 1,220 | | | | 1,002 | |
5.750%, 05/11/2047 | | | | | | | 1,550 | | | | 1,228 | |
5.200%, 02/16/2026 | | | EUR | | | | 520 | | | | 576 | |
4.875%, 10/09/2026 | | | $ | | | | 210 | | | | 181 | |
4.250%, 04/14/2026 | | | | | | | 530 | | | | 445 | |
3.250%, 06/14/2025 | | | EUR | | | | 740 | | | | 749 | |
Ukraine Government International Bond | | | | | | | | | | | | |
9.750%, 11/01/2028 (A) | | | $ | | | | 1,970 | | | | 2,029 | |
7.750%, 09/01/2023 | | | | | | | 230 | | | | 224 | |
7.750%, 09/01/2024 | | | | | | | 930 | | | | 895 | |
7.750%, 09/01/2025 | | | | | | | 870 | | | | 828 | |
7.750%, 09/01/2026 | | | | | | | 100 | | | | 94 | |
| | | | | | | | | | | | |
| | | | |
| Description | | | | �� | Face Amount (Thousands) | | Market Value ($ Thousands) |
|
SOVEREIGN DEBT (continued) | |
7.750%, 09/01/2027 | | | $ | | | | 840 | | | $ | 783 | |
7.375%, 09/25/2032 (A) | | | | | | | 400 | | | | 356 | |
2.074%, 05/31/2040 (E) | | | | | | | 590 | | | | 376 | |
Uruguay Government International Bond | | | | | | | | | | | | |
4.375%, 10/27/2027 | | | | | | | 600 | | | | 631 | |
Zambia Government International Bond | | | | | | | | | | | | |
8.970%, 07/30/2027 | | | | | | | 200 | | | | 146 | |
5.375%, 09/20/2022 | | | | | | | 760 | | | | 543 | |
| | | |
Total Sovereign Debt
(Cost $154,417) ($ Thousands) | | | | | | | | | | | 151,976 | |
| | |
| | | Shares | | | |
|
COMMON STOCK — 11.4% | |
|
Communication Services — 1.2% | |
Activision Blizzard Inc | | | | | | | 3,482 | | | | 159 | |
Alphabet Inc, Cl A * | | | | | | | 1,383 | | | | 1,628 | |
Alphabet Inc, Cl C * | | | | | | | 1,414 | | | | 1,659 | |
AT&T Inc | | | | | | | 33,397 | | | | 1,047 | |
CBS Corp, Cl B | | | | | | | 1,447 | | | | 69 | |
CenturyLink Inc | | | | | | | 4,030 | | | | 48 | |
Charter Communications Inc, Cl A * | | | | | | | 798 | | | | 277 | |
Comcast Corp, Cl A | | | | | | | 20,755 | | | | 830 | |
Discovery Inc, Cl A * | | | | | | | 684 | | | | 18 | |
Discovery Inc, Cl C * | | | | | | | 1,539 | | | | 39 | |
DISH Network Corp, Cl A * | | | | | | | 966 | | | | 31 | |
Electronic Arts Inc * | | | | | | | 1,331 | | | | 135 | |
Facebook Inc, Cl A * | | | | | | | 10,905 | | | | 1,818 | |
Fox Corp * | | | | | | | 2,366 | | | | 86 | |
Interpublic Group of Cos Inc/The | | | | | | | 1,552 | | | | 33 | |
Netflix Inc * | | | | | | | 1,997 | | | | 712 | |
News Corp, Cl A | | | | | | | 1,532 | | | | 19 | |
News Corp, Cl B | | | | | | | 450 | | | | 6 | |
Omnicom Group Inc | | | | | | | 997 | | | | 73 | |
Take-Two Interactive Software Inc, Cl A * | | | | | | | 492 | | | | 46 | |
TripAdvisor Inc * | | | | | | | 414 | | | | 21 | |
Twitter Inc * | | | | | | | 3,285 | | | | 108 | |
Verizon Communications Inc | | | | | | | 18,964 | | | | 1,121 | |
Viacom Inc, Cl B | | | | | | | 1,527 | | | | 43 | |
Walt Disney Co/The | | | | | | | 7,997 | | | | 888 | |
| | | |
| | | | | | | | | | | 10,914 | |
|
Consumer Discretionary — 1.2% | |
Advance Auto Parts Inc | | | | | | | 313 | | | | 53 | |
Amazon.com Inc, Cl A * | | | | | | | 1,885 | | | | 3,357 | |
AutoZone Inc * | | | | | | | 114 | | | | 117 | |
Best Buy Co Inc | | | | | | | 1,060 | | | | 75 | |
Booking Holdings Inc * | | | | | | | 208 | | | | 363 | |
BorgWarner Inc | | | | | | | 797 | | | | 31 | |
Capri Holdings Ltd * | | | | | | | 608 | | | | 28 | |
CarMax Inc * | | | | | | | 740 | | | | 52 | |
Carnival Corp | | | | | | | 1,747 | | | | 89 | |
| | |
SEI Institutional Managed Trust / Semi-Annual Report / March 31, 2019 | | 193 |
SCHEDULE OF INVESTMENTS (Unaudited)
March 31, 2019
Multi-Asset Income Fund(Continued)
| | | | | | | | |
| | | |
| Description | | Shares | | Market Value ($ Thousands) |
|
COMMON STOCK (continued) | |
Cengage Learning Holdings II Inc * | | | 5,114 | | | $ | 33 | |
Chipotle Mexican Grill Inc, Cl A * | | | 110 | | | | 78 | |
Darden Restaurants Inc | | | 545 | | | | 66 | |
Delphi Automotive PLC * | | | 1,217 | | | | 97 | |
Dollar General Corp | | | 1,196 | | | | 143 | |
Dollar Tree Inc * | | | 1,093 | | | | 115 | |
DR Horton Inc | | | 1,500 | | | | 62 | |
eBay Inc | | | 4,001 | | | | 149 | |
Expedia Group Inc | | | 498 | | | | 59 | |
Foot Locker Inc, Cl A | | | 455 | | | | 28 | |
Ford Motor Co | | | 17,804 | | | | 156 | |
Gap Inc/The | | | 932 | | | | 24 | |
Garmin Ltd | | | 525 | | | | 45 | |
General Motors Co | | | 6,015 | | | | 223 | |
Genuine Parts Co | | | 649 | | | | 73 | |
H&R Block Inc | | | 821 | | | | 20 | |
Hanesbrands Inc | | | 1,495 | | | | 27 | |
Harley-Davidson Inc, Cl A | | | 659 | | | | 24 | |
Hasbro Inc | | | 462 | | | | 39 | |
Hilton Worldwide Holdings Inc | | | 1,348 | | | | 112 | |
Home Depot Inc/The | | | 5,182 | | | | 994 | |
Kohl’s Corp | | | 759 | | | | 52 | |
L Brands Inc | | | 995 | | | | 27 | |
Leggett & Platt Inc | | | 534 | | | | 23 | |
Lennar Corp, Cl A | | | 1,262 | | | | 62 | |
LKQ Corp * | | | 1,349 | | | | 38 | |
Lowe’s Cos Inc | | | 3,651 | | | | 400 | |
Macy’s Inc | | | 1,471 | | | | 35 | |
Marriott International Inc/MD, Cl A | | | 1,282 | | | | 160 | |
Mattel Inc * | | | 1,637 | | | | 21 | |
McDonald’s Corp | | | 3,520 | | | | 669 | |
MGM Resorts International | | | 2,429 | | | | 62 | |
Mohawk Industries Inc * | | | 261 | | | | 33 | |
Newell Brands Inc, Cl B | | | 1,757 | | | | 27 | |
NIKE Inc, Cl B | | | 5,804 | | | | 489 | |
Nordstrom Inc | | | 454 | | | | 20 | |
Norwegian Cruise Line Holdings Ltd * | | | 900 | | | | 50 | |
O’Reilly Automotive Inc * | | | 360 | | | | 140 | |
PulteGroup Inc | | | 1,166 | | | | 33 | |
PVH Corp | | | 313 | | | | 38 | |
Ralph Lauren Corp, Cl A | | | 219 | | | | 28 | |
Ross Stores Inc | | | 1,689 | | | | 157 | |
Royal Caribbean Cruises Ltd | | | 735 | | | | 84 | |
Starbucks Corp | | | 5,645 | | | | 420 | |
Tapestry Inc | | | 1,201 | | | | 39 | |
Target Corp, Cl A | | | 2,368 | | | | 190 | |
Tiffany & Co | | | 459 | | | | 48 | |
TJX Cos Inc/The | | | 5,598 | | | | 298 | |
Tractor Supply Co | | | 511 | | | | 50 | |
Ulta Beauty Inc * | | | 241 | | | | 84 | |
Under Armour Inc, Cl A * | | | 727 | | | | 15 | |
Under Armour Inc, Cl C * | | | 920 | | | | 17 | |
| | | | | | | | |
| | | |
| Description | | Shares | | Market Value ($ Thousands) |
|
COMMON STOCK (continued) | |
VF Corp | | | 1,477 | | | $ | 128 | |
Whirlpool Corp | | | 271 | | | | 36 | |
Wynn Resorts Ltd | | | 423 | | | | 51 | |
Yum! Brands Inc | | | 1,395 | | | | 139 | |
| | |
| | | | | | | 10,895 | |
|
Consumer Staples — 0.8% | |
Altria Group Inc | | | 8,564 | | | | 492 | |
Archer-Daniels-Midland Co | | | 2,551 | | | | 110 | |
Brown-Forman Corp, Cl B | | | 747 | | | | 39 | |
Campbell Soup Co | | | 807 | | | | 31 | |
Church & Dwight Co Inc | | | 1,095 | | | | 78 | |
Clorox Co/The | | | 583 | | | | 94 | |
Coca-Cola Co/The | | | 17,774 | | | | 833 | |
Colgate-Palmolive Co | | | 3,961 | | | | 271 | |
Conagra Brands Inc | | | 2,134 | | | | 59 | |
Constellation Brands Inc, Cl A | | | 744 | | | | 130 | |
Costco Wholesale Corp | | | 1,997 | | | | 484 | |
Coty Inc, Cl A | | | 1,806 | | | | 21 | |
Estee Lauder Cos Inc/The, Cl A | | | 996 | | | | 165 | |
General Mills Inc | | | 2,708 | | | | 140 | |
Hershey Co/The | | | 617 | | | | 71 | |
Hormel Foods Corp | | | 1,192 | | | | 53 | |
JM Smucker Co/The | | | 524 | | | | 61 | |
Kellogg Co | | | 1,147 | | | | 66 | |
Kimberly-Clark Corp | | | 1,576 | | | | 195 | |
Kraft Heinz Co/The | | | 2,793 | | | | 91 | |
Kroger Co/The | | | 3,564 | | | | 88 | |
Lamb Weston Holdings Inc | | | 600 | | | | 45 | |
McCormick & Co Inc/MD | | | 548 | | | | 83 | |
Molson Coors Brewing Co, Cl B | | | 772 | | | | 46 | |
Mondelez International Inc, Cl A | | | 6,653 | | | | 332 | |
Monster Beverage Corp * | | | 1,765 | | | | 96 | |
PepsiCo Inc | | | 6,451 | | | | 791 | |
Philip Morris International Inc | | | 7,098 | | | | 627 | |
Procter & Gamble Co/The | | | 11,556 | | | | 1,202 | |
Sysco Corp, Cl A | | | 2,149 | | | | 143 | |
Tyson Foods Inc, Cl A | | | 1,347 | | | | 94 | |
Walgreens Boots Alliance Inc | | | 3,680 | | | | 233 | |
Walmart Inc | | | 6,500 | | | | 634 | |
| | |
| | | | | | | 7,898 | |
| | |
Energy — 0.6% | | | | | | | | |
Anadarko Petroleum Corp, Cl A | | | 2,276 | | | | 103 | |
Apache Corp | | | 1,761 | | | | 61 | |
Baker Hughes a GE Co, Cl A | | | 2,273 | | | | 63 | |
Cabot Oil & Gas Corp | | | 1,880 | | | | 49 | |
Chevron Corp | | | 8,768 | | | | 1,080 | |
Cimarex Energy Co | | | 475 | | | | 33 | |
Concho Resources Inc | | | 903 | | | | 100 | |
ConocoPhillips | | | 5,231 | | | | 349 | |
Devon Energy Corp | | | 2,058 | | | | 65 | |
| | |
194 | | SEI Institutional Managed Trust / Semi-Annual Report / March 31, 2019 |
| | | | | | | | |
| | | |
| Description | | Shares | | Market Value ($ Thousands) |
|
COMMON STOCK (continued) | |
Diamondback Energy Inc, Cl A | | | 700 | | | $ | 71 | |
EOG Resources Inc | | | 2,664 | | | | 254 | |
Exxon Mobil Corp | | | 19,460 | | | | 1,572 | |
Halliburton Co | | | 3,947 | | | | 116 | |
Helmerich & Payne Inc | | | 451 | | | | 25 | |
Hess Corp | | | 1,133 | | | | 68 | |
HollyFrontier Corp | | | 665 | | | | 33 | |
Kinder Morgan Inc/DE | | | 8,983 | | | | 180 | |
Marathon Oil Corp | | | 3,620 | | | | 60 | |
Marathon Petroleum Corp | | | 3,082 | | | | 184 | |
National Oilwell Varco Inc, Cl A | | | 1,759 | | | | 47 | |
Noble Energy Inc | | | 2,020 | | | | 50 | |
Occidental Petroleum Corp | | | 3,418 | | | | 226 | |
ONEOK Inc | | | 1,868 | | | | 130 | |
Phillips 66 | | | 1,919 | | | | 183 | |
Pioneer Natural Resources Co | | | 752 | | | | 115 | |
Schlumberger Ltd, Cl A | | | 6,375 | | | | 278 | |
TechnipFMC PLC | | | 1,998 | | | | 47 | |
Titan Energy LLC * | | | 12,743 | | | | 1 | |
Valero Energy Corp | | | 1,928 | | | | 164 | |
Williams Cos Inc/The | | | 5,368 | | | | 154 | |
| | |
| | | | | | | 5,861 | |
|
Financials — 1.4% | |
Affiliated Managers Group Inc | | | 225 | | | | 24 | |
Aflac Inc | | | 3,450 | | | | 173 | |
Allstate Corp/The | | | 1,510 | | | | 142 | |
American Express Co | | | 3,184 | | | | 348 | |
American International Group Inc | | | 3,991 | | | | 172 | |
Ameriprise Financial Inc | | | 630 | | | | 81 | |
Aon PLC | | | 1,097 | | | | 187 | |
Arthur J Gallagher & Co | | | 815 | | | | 64 | |
Aspect *(F) | | | 57 | | | | – | |
Assurant Inc | | | 273 | | | | 26 | |
Bank of America Corp | | | 41,493 | | | | 1,145 | |
Bank of New York Mellon Corp/The | | | 4,028 | | | | 203 | |
BB&T Corp | | | 3,483 | | | | 162 | |
Berkshire Hathaway Inc, Cl B * | | | 8,947 | | | | 1,797 | |
BlackRock Inc | | | 559 | | | | 239 | |
Brighthouse Financial Inc * | | | 401 | | | | 15 | |
Capital One Financial Corp | | | 2,143 | | | | 175 | |
Cboe Global Markets Inc | | | 463 | | | | 44 | |
Charles Schwab Corp/The | | | 5,450 | | | | 233 | |
Chubb Ltd | | | 2,110 | | | | 296 | |
Cincinnati Financial Corp | | | 667 | | | | 57 | |
Citigroup Inc | | | 10,862 | | | | 676 | |
Citizens Financial Group Inc | | | 2,010 | | | | 65 | |
CME Group Inc | | | 1,646 | | | | 271 | |
Comerica Inc | | | 700 | | | | 51 | |
Discover Financial Services | | | 1,504 | | | | 107 | |
E*TRADE Financial Corp | | | 1,080 | | | | 50 | |
Everest Re Group Ltd | | | 166 | | | | 36 | |
| | | | | | | | |
| | | |
| Description | | Shares | | Market Value ($ Thousands) |
|
COMMON STOCK (continued) | |
Fifth Third Bancorp | | | 3,620 | | | $ | 91 | |
First Republic Bank/CA | | | 700 | | | | 70 | |
Franklin Resources Inc | | | 1,278 | | | | 42 | |
Goldman Sachs Group Inc/The | | | 1,578 | | | | 303 | |
Hartford Financial Services Group Inc/The | | | 1,654 | | | | 82 | |
Huntington Bancshares Inc/OH | | | 4,636 | | | | 59 | |
Intercontinental Exchange Inc | | | 2,571 | | | | 196 | |
Invesco Ltd | | | 1,887 | | | | 36 | |
Jefferies Financial Group Inc | | | 1,216 | | | | 23 | |
JPMorgan Chase & Co | | | 15,125 | | | | 1,531 | |
KeyCorp | | | 4,537 | | | | 71 | |
Lincoln National Corp | | | 899 | | | | 53 | |
Loews Corp | | | 1,207 | | | | 58 | |
M&T Bank Corp | | | 637 | | | | 100 | |
Marsh & McLennan Cos Inc | | | 2,316 | | | | 217 | |
MetLife Inc | | | 4,437 | | | | 189 | |
Moody’s Corp | | | 735 | | | | 133 | |
Morgan Stanley | | | 5,970 | | | | 252 | |
MSCI Inc, Cl A | | | 375 | | | | 75 | |
Nasdaq Inc, Cl A | | | 500 | | | | 44 | |
Northern Trust Corp | | | 1,010 | | | | 91 | |
People’s United Financial Inc | | | 1,719 | | | | 28 | |
PNC Financial Services Group Inc/The | | | 2,086 | | | | 256 | |
Principal Financial Group Inc, Cl A | | | 1,213 | | | | 61 | |
Progressive Corp/The | | | 2,673 | | | | 193 | |
Prudential Financial Inc | | | 1,865 | | | | 171 | |
Raymond James Financial Inc | | | 535 | | | | 43 | |
Regions Financial Corp | | | 4,531 | | | | 64 | |
S&P Global Inc | | | 1,141 | | | | 240 | |
State Street Corp | | | 1,716 | | | | 113 | |
SunTrust Banks Inc | | | 2,054 | | | | 122 | |
SVB Financial Group, Cl B * | | | 224 | | | | 50 | |
Synchrony Financial | | | 2,941 | | | | 94 | |
T Rowe Price Group Inc | | | 1,068 | | | | 107 | |
Torchmark Corp, Cl A | | | 429 | | | | 35 | |
Travelers Cos Inc/The | | | 1,204 | | | | 165 | |
Unum Group | | | 910 | | | | 31 | |
US Bancorp | | | 6,906 | | | | 333 | |
Wells Fargo & Co | | | 18,914 | | | | 914 | |
Willis Towers Watson PLC | | | 574 | | | | 101 | |
Zions Bancorp NA | | | 884 | | | | 40 | |
| | |
| | | | | | | 13,716 | |
|
Health Care — 1.7% | |
Abbott Laboratories | | | 8,019 | | | | 641 | |
AbbVie Inc | | | 6,861 | | | | 553 | |
ABIOMED Inc * | | | 200 | | | | 57 | |
Agilent Technologies Inc | | | 1,449 | | | | 116 | |
Alexion Pharmaceuticals Inc * | | | 1,015 | | | | 137 | |
Align Technology Inc * | | | 311 | | | | 88 | |
Allergan PLC | | | 1,433 | | | | 210 | |
AmerisourceBergen Corp, Cl A | | | 686 | | | | 55 | |
| | |
SEI Institutional Managed Trust / Semi-Annual Report / March 31, 2019 | | 195 |
SCHEDULE OF INVESTMENTS (Unaudited)
March 31, 2019
Multi-Asset Income Fund(Continued)
| | | | | | | | |
| | | |
| Description | | Shares | | Market Value
($ Thousands) |
|
COMMON STOCK (continued) | |
Amgen Inc, Cl A | | | 2,879 | | | $ | 547 | |
Anthem Inc | | | 1,176 | | | | 338 | |
Baxter International Inc | | | 2,176 | | | | 177 | |
Becton Dickinson and Co | | | 1,239 | | | | 309 | |
Biogen Inc * | | | 905 | | | | 214 | |
Boston Scientific Corp * | | | 6,364 | | | | 244 | |
Bristol-Myers Squibb Co | | | 7,425 | | | | 354 | |
Cardinal Health Inc | | | 1,321 | | | | 64 | |
Celgene Corp, Cl A * | | | 3,276 | | | | 309 | |
Centene Corp * | | | 1,806 | | | | 96 | |
Cerner Corp * | | | 1,455 | | | | 83 | |
Cigna Corp (G) | | | 1,749 | | | | 281 | |
Cooper Cos Inc/The, Cl A | | | 204 | | | | 60 | |
Covetrus Inc * | | | 1 | | | | – | |
CVS Health Corp | | | 6,035 | | | | 325 | |
Danaher Corp, Cl A | | | 2,902 | | | | 383 | |
DaVita Inc * | | | 525 | | | | 29 | |
DENTSPLY SIRONA Inc | | | 969 | | | | 48 | |
Edwards Lifesciences Corp, Cl A * | | | 927 | | | | 177 | |
Eli Lilly & Co | | | 3,896 | | | | 506 | |
Gilead Sciences Inc | | | 5,886 | | | | 383 | |
HCA Healthcare Inc | | | 1,196 | | | | 156 | |
Henry Schein Inc * | | | 634 | | | | 38 | |
Hologic Inc * | | | 1,116 | | | | 54 | |
Humana Inc | | | 619 | | | | 165 | |
IDEXX Laboratories Inc * | | | 398 | | | | 89 | |
Illumina Inc * | | | 660 | | | | 205 | |
Incyte Corp * | | | 814 | | | | 70 | |
Intuitive Surgical Inc * | | | 527 | | | | 301 | |
IQVIA Holdings Inc * | | | 701 | | | | 101 | |
Johnson & Johnson | | | 12,176 | | | | 1,702 | |
Laboratory Corp of America Holdings * | | | 438 | | | | 67 | |
McKesson Corp | | | 886 | | | | 104 | |
Medtronic PLC | | | 6,128 | | | | 558 | |
Merck & Co Inc | | | 11,928 | | | | 992 | |
Mettler-Toledo International Inc * | | | 111 | | | | 80 | |
Mylan NV * | | | 2,195 | | | | 62 | |
Nektar Therapeutics, Cl A * | | | 763 | | | | 26 | |
PerkinElmer Inc | | | 524 | | | | 51 | |
Perrigo Co PLC | | | 599 | | | | 29 | |
Pfizer Inc | | | 25,645 | | | | 1,089 | |
Quest Diagnostics Inc | | | 623 | | | | 56 | |
Regeneron Pharmaceuticals Inc * | | | 348 | | | | 143 | |
ResMed Inc | | | 633 | | | | 66 | |
Stryker Corp | | | 1,423 | | | | 281 | |
Teleflex Inc | | | 200 | | | | 60 | |
Thermo Fisher Scientific Inc | | | 1,834 | | | | 502 | |
UnitedHealth Group Inc | | | 4,417 | | | | 1,092 | |
Universal Health Services Inc, Cl B | | | 355 | | | | 48 | |
Varian Medical Systems Inc * | | | 372 | | | | 53 | |
Vertex Pharmaceuticals Inc * | | | 1,172 | | | | 216 | |
Waters Corp * | | | 319 | | | | 80 | |
| | | | | | | | |
| | | |
| Description | | Shares | | | Market Value
($ Thousands) |
|
COMMON STOCK (continued) | |
WellCare Health Plans Inc * | | | 219 | | | $ | 59 | |
Zimmer Biomet Holdings Inc | | | 925 | | | | 118 | |
Zoetis Inc, Cl A | | | 2,195 | | | | 221 | |
| | | | | | | 15,718 | |
| | |
Industrials — 1.1% | | | | | | | | |
3M Co | | | 2,656 | | | | 552 | |
Alaska Air Group Inc | | | 494 | | | | 28 | |
Allegion PLC | | | 415 | | | | 38 | |
American Airlines Group Inc | | | 1,751 | | | | 56 | |
AMETEK Inc | | | 1,047 | | | | 87 | |
AO Smith Corp | | | 649 | | | | 35 | |
Arconic Inc | | | 1,864 | | | | 36 | |
Boeing Co/The | | | 2,423 | | | | 924 | |
Caterpillar Inc, Cl A | | | 2,659 | | | | 360 | |
CH Robinson Worldwide Inc | | | 578 | | | | 50 | |
Cintas Corp | | | 387 | | | | 78 | |
Copart Inc * | | | 900 | | | | 55 | |
CSX Corp | | | 3,579 | | | | 268 | |
Cummins Inc | | | 676 | | | | 107 | |
Deere & Co | | | 1,462 | | | | 234 | |
Delta Air Lines Inc, Cl A | | | 2,811 | | | | 145 | |
Dover Corp | | | 613 | | | | 57 | |
Eaton Corp PLC | | | 1,933 | | | | 156 | |
Emerson Electric Co | | | 2,838 | | | | 194 | |
Equifax Inc | | | 533 | | | | 63 | |
Expeditors International of Washington Inc | | | 721 | | | | 55 | |
Fastenal Co, Cl A | | | 1,298 | | | | 83 | |
FedEx Corp | | | 1,100 | | | | 200 | |
Flowserve Corp | | | 514 | | | | 23 | |
Fluor Corp | | | 563 | | | | 21 | |
Fortive Corp | | | 1,352 | | | | 113 | |
Fortune Brands Home & Security Inc | | | 568 | | | | 27 | |
General Dynamics Corp | | | 1,242 | | | | 210 | |
General Electric Co | | | 39,579 | | | | 395 | |
Harris Corp | | | 552 | | | | 88 | |
Honeywell International Inc | | | 3,376 | | | | 536 | |
Huntington Ingalls Industries Inc, Cl A | | | 177 | | | | 37 | |
IHS Markit Ltd * | | | 1,632 | | | | 89 | |
Illinois Tool Works Inc | | | 1,382 | | | | 198 | |
Ingersoll-Rand PLC | | | 1,096 | | | | 118 | |
Jacobs Engineering Group Inc | | | 501 | | | | 38 | |
JB Hunt Transport Services Inc | | | 373 | | | | 38 | |
Johnson Controls International plc | | | 4,158 | | | | 154 | |
Kansas City Southern | | | 457 | | | | 53 | |
L3 Technologies Inc | | | 353 | | | | 73 | |
Lockheed Martin Corp | | | 1,125 | | | | 338 | |
Masco Corp | | | 1,287 | | | | 51 | |
Nielsen Holdings PLC | | | 1,634 | | | | 39 | |
Norfolk Southern Corp | | | 1,227 | | | | 229 | |
Northrop Grumman Corp | | | 778 | | | | 210 | |
PACCAR Inc | | | 1,512 | | | | 103 | |
| | |
196 | | SEI Institutional Managed Trust / Semi-Annual Report / March 31, 2019 |
| | | | | | | | |
| | | |
| Description | | Shares | | Market Value ($ Thousands) |
|
COMMON STOCK (continued) | |
Parker-Hannifin Corp, Cl A | | | 572 | | | $ | 98 | |
Pentair PLC | | | 658 | | | | 29 | |
Quanta Services Inc | | | 570 | | | | 21 | |
Raytheon Co | | | 1,281 | | | | 233 | |
Republic Services Inc | | | 961 | | | | 77 | |
Robert Half International Inc | | | 536 | | | | 35 | |
Rockwell Automation Inc | | | 539 | | | | 95 | |
Rollins Inc | | | 630 | | | | 26 | |
Roper Technologies Inc | | | 463 | | | | 158 | |
Snap-on Inc | | | 234 | | | | 37 | |
Southwest Airlines Co, Cl A | | | 2,251 | | | | 117 | |
Stanley Black & Decker Inc | | | 674 | | | | 92 | |
Textron Inc | | | 1,087 | | | | 55 | |
TransDigm Group Inc * | | | 216 | | | | 98 | |
Union Pacific Corp | | | 3,362 | | | | 562 | |
United Continental Holdings Inc * | | | 1,025 | | | | 82 | |
United Parcel Service Inc, Cl B | | | 3,159 | | | | 353 | |
United Rentals Inc * | | | 344 | | | | 39 | |
United Technologies Corp | | | 3,698 | | | | 477 | |
Verisk Analytics Inc, Cl A | | | 748 | | | | 99 | |
Wabtec Corp | | | 598 | | | | 44 | |
Waste Management Inc | | | 1,793 | | | | 186 | |
WW Grainger Inc | | | 201 | | | | 60 | |
Xylem Inc/NY | | | 838 | | | | 66 | |
| | |
| | | | | | | 10,181 | |
|
Information Technology — 2.4% | |
Accenture PLC, Cl A | | | 2,905 | | | | 511 | |
Adobe Inc * | | | 2,228 | | | | 594 | |
Advanced Micro Devices Inc * | | | 3,891 | | | | 99 | |
Akamai Technologies Inc * | | | 751 | | | | 54 | |
Alliance Data Systems Corp | | | 193 | | | | 34 | |
Amphenol Corp, Cl A | | | 1,353 | | | | 128 | |
Analog Devices Inc | | | 1,684 | | | | 177 | |
ANSYS Inc * | | | 354 | | | | 65 | |
Apple Inc | | | 20,461 | | | | 3,887 | |
Applied Materials Inc | | | 4,337 | | | | 172 | |
Arista Networks Inc * | | | 232 | | | | 73 | |
Autodesk Inc, Cl A * | | | 998 | | | | 155 | |
Automatic Data Processing Inc | | | 2,006 | | | | 320 | |
Broadcom Inc | | | 1,830 | | | | 550 | |
Broadridge Financial Solutions Inc | | | 544 | | | | 56 | |
Cadence Design Systems Inc * | | | 1,180 | | | | 75 | |
Cisco Systems Inc | | | 20,334 | | | | 1,098 | |
Citrix Systems Inc | | | 550 | | | | 55 | |
Cognizant Technology Solutions Corp, Cl A | | | 2,604 | | | | 189 | |
Corning Inc, Cl B | | | 3,652 | | | | 121 | |
DXC Technology Co | | | 1,199 | | | | 77 | |
F5 Networks Inc, Cl A * | | | 278 | | | | 44 | |
Fidelity National Information Services Inc, Cl B | | | 1,461 | | | | 165 | |
Fiserv Inc, Cl A * | | | 1,807 | | | | 160 | |
| | | | | | | | |
| | | |
| Description | | Shares | | Market Value ($ Thousands) |
|
COMMON STOCK (continued) | |
FleetCor Technologies Inc * | | | 400 | | | $ | 99 | |
FLIR Systems Inc | | | 564 | | | | 27 | |
Fortinet Inc * | | | 600 | | | | 50 | |
Gartner Inc * | | | 416 | | | | 63 | |
Global Payments Inc | | | 734 | | | | 100 | |
Hewlett Packard Enterprise Co | | | 6,201 | | | | 96 | |
HP Inc | | | 6,973 | | | | 135 | |
Intel Corp | | | 20,949 | | | | 1,125 | |
International Business Machines Corp | | | 4,147 | | | | 585 | |
Intuit Inc | | | 1,178 | | | | 308 | |
IPG Photonics Corp * | | | 143 | | | | 22 | |
Jack Henry & Associates Inc | | | 335 | | | | 46 | |
Juniper Networks Inc | | | 1,505 | | | | 40 | |
Keysight Technologies Inc * | | | 800 | | | | 70 | |
KLA-Tencor Corp | | | 711 | | | | 85 | |
Lam Research Corp | | | 692 | | | | 124 | |
Mastercard Inc, Cl A | | | 4,167 | | | | 981 | |
Maxim Integrated Products Inc | | | 1,200 | | | | 64 | |
Microchip Technology Inc | | | 1,069 | | | | 89 | |
Micron Technology Inc * | | | 5,034 | | | | 208 | |
Microsoft Corp | | | 35,043 | | | | 4,133 | |
Motorola Solutions Inc | | | 739 | | | | 104 | |
NetApp Inc | | | 1,101 | | | | 76 | |
NVIDIA Corp | | | 2,779 | | | | 499 | |
Oracle Corp, Cl B | | | 11,632 | | | | 625 | |
Paychex Inc | | | 1,437 | | | | 115 | |
PayPal Holdings Inc * | | | 5,374 | | | | 558 | |
Qlik *(F) | | | 3,600 | | | | — | |
Qlik, Cl A *(F) | | | 56 | | | | 57 | |
Qlik, Cl B *(F) | | | 13,812 | | | | — | |
Qorvo Inc * | | | 515 | | | | 37 | |
QUALCOMM Inc | | | 5,575 | | | | 318 | |
Red Hat Inc * | | | 805 | | | | 147 | |
salesforce.com Inc * | | | 3,490 | | | | 553 | |
Seagate Technology PLC | | | 1,080 | | | | 52 | |
Skyworks Solutions Inc | | | 770 | | | | 63 | |
Symantec Corp, Cl A | | | 2,893 | | | | 66 | |
Synopsys Inc * | | | 667 | | | | 77 | |
TE Connectivity Ltd | | | 1,541 | | | | 124 | |
Texas Instruments Inc | | | 4,377 | | | | 464 | |
Total System Services Inc | | | 722 | | | | 69 | |
VeriSign Inc * | | | 472 | | | | 86 | |
Visa Inc, Cl A | | | 8,068 | | | | 1,260 | |
Western Digital Corp | | | 1,350 | | | | 65 | |
Western Union Co/The | | | 1,834 | | | | 34 | |
Xerox Corp | | | 827 | | | | 26 | |
Xilinx Inc | | | 1,152 | | | | 146 | |
| | |
| | | | | | | 22,930 | |
| | |
Materials — 0.3% | | | | | | | | |
Air Products & Chemicals Inc | | | 1,005 | | | | 192 | |
Albemarle Corp | | | 448 | | | | 37 | |
| | |
SEI Institutional Managed Trust / Semi-Annual Report / March 31, 2019 | | 197 |
SCHEDULE OF INVESTMENTS (Unaudited)
March 31, 2019
Multi-Asset Income Fund(Continued)
| | | | | | | | |
| | | |
| Description | | Shares | | | Market Value ($ Thousands) |
| |
COMMON STOCK (continued) | | | | | |
Avery Dennison Corp | | | 356 | | | $ | 40 | |
Ball Corp | | | 1,471 | | | | 85 | |
Celanese Corp, Cl A | | | 588 | | | | 58 | |
CF Industries Holdings Inc | | | 935 | | | | 38 | |
DowDuPont Inc | | | 10,470 | | | | 558 | |
Eastman Chemical Co | | | 653 | | | | 50 | |
Ecolab Inc | | | 1,150 | | | | 203 | |
FMC Corp | | | 544 | | | | 42 | |
Freeport-McMoRan Inc, Cl B | | | 6,259 | | | | 81 | |
International Flavors & Fragrances Inc | | | 445 | | | | 57 | |
International Paper Co | | | 1,792 | | | | 83 | |
Linde PLC | | | 2,509 | | | | 441 | |
LyondellBasell Industries NV, Cl A | | | 1,423 | | | | 120 | |
Martin Marietta Materials Inc, Cl A | | | 274 | | | | 55 | |
Mosaic Co/The | | | 1,663 | | | | 45 | |
Newmont Mining Corp | | | 2,379 | | | | 85 | |
Nucor Corp | | | 1,430 | | | | 84 | |
Packaging Corp of America | | | 383 | | | | 38 | |
PPG Industries Inc | | | 1,075 | | | | 121 | |
Sealed Air Corp | | | 652 | | | | 30 | |
Sherwin-Williams Co/The, Cl A | | | 372 | | | | 160 | |
Vulcan Materials Co | | | 596 | | | | 71 | |
Westrock Co | | | 1,156 | | | | 44 | |
| | |
| | | | | | | 2,818 | |
| | |
Real Estate — 0.3% | | | | | | | | |
Alexandria Real Estate Equities Inc ‡ | | | 534 | | | | 76 | |
American Tower Corp, Cl A ‡ | | | 2,003 | | | | 395 | |
Apartment Investment & Management Co, | | | | | | | | |
Cl A ‡ | | | 659 | | | | 33 | |
AvalonBay Communities Inc ‡ | | | 606 | | | | 122 | |
Boston Properties Inc ‡ | | | 701 | | | | 94 | |
CBRE Group Inc, Cl A *‡ | | | 1,389 | | | | 69 | |
Crown Castle International Corp ‡ | | | 1,908 | | | | 244 | |
Digital Realty Trust Inc, Cl A ‡ | | | 939 | | | | 112 | |
Duke Realty Corp ‡ | | | 1,455 | | | | 44 | |
Equinix Inc ‡ | | | 381 | | | | 173 | |
Equity Residential ‡ | | | 1,677 | | | | 126 | |
Essex Property Trust Inc ‡ | | | 294 | | | | 85 | |
Extra Space Storage Inc ‡ | | | 559 | | | | 57 | |
Federal Realty Investment Trust ‡ | | | 325 | | | | 45 | |
HCP Inc ‡ | | | 2,116 | | | | 66 | |
Host Hotels & Resorts Inc ‡ | | | 3,427 | | | | 65 | |
Iron Mountain Inc ‡ | | | 1,253 | | | | 44 | |
Kimco Realty Corp ‡ | | | 1,773 | | | | 33 | |
Macerich Co/The ‡ | | | 418 | | | | 18 | |
Mid-America Apartment Communities Inc ‡ | | | 499 | | | | 54 | |
Prologis Inc ‡ | | | 2,887 | | | | 208 | |
Public Storage ‡ | | | 683 | | | | 149 | |
Realty Income Corp ‡ | | | 1,297 | | | | 95 | |
Regency Centers Corp ‡ | | | 713 | | | | 48 | |
SBA Communications Corp, Cl A *‡ | | | 507 | | | | 101 | |
| | | | | | | | |
| | | |
| Description | | Shares | | | Market Value ($ Thousands) |
| |
COMMON STOCK (continued) | | | | | |
Simon Property Group Inc ‡ | | | 1,419 | | | $ | 259 | |
SL Green Realty Corp ‡ | | | 353 | | | | 32 | |
UDR Inc ‡ | | | 1,209 | | | | 55 | |
Ventas Inc ‡ | | | 1,615 | | | | 103 | |
Vornado Realty Trust ‡ | | | 717 | | | | 48 | |
Welltower Inc ‡ | | | 1,784 | | | | 138 | |
Weyerhaeuser Co ‡ | | | 3,478 | | | | 92 | |
| | |
| | | | | | | 3,283 | |
| | |
Utilities — 0.4% | | | | | | | | |
AES Corp/VA | | | 2,901 | | | | 52 | |
Alliant Energy Corp | | | 1,029 | | | | 48 | |
Ameren Corp | | | 1,093 | | | | 80 | |
American Electric Power Co Inc | | | 2,257 | | | | 189 | |
American Water Works Co Inc | | | 815 | | | | 85 | |
Atmos Energy Corp | | | 500 | | | | 51 | |
CenterPoint Energy Inc | | | 2,203 | | | | 68 | |
CMS Energy Corp | | | 1,278 | | | | 71 | |
Consolidated Edison Inc | | | 1,401 | | | | 119 | |
Dominion Energy Inc | | | 3,692 | | | | 283 | |
DTE Energy Co | | | 814 | | | | 102 | |
Duke Energy Corp | | | 3,337 | | | | 300 | |
Edison International | | | 1,465 | | | | 91 | |
Entergy Corp | | | 832 | | | | 80 | |
Evergy Inc | | | 1,200 | | | | 70 | |
Eversource Energy | | | 1,437 | | | | 102 | |
Exelon Corp | | | 4,447 | | | | 223 | |
FirstEnergy Corp | | | 2,333 | | | | 97 | |
NextEra Energy Inc | | | 2,176 | | | | 421 | |
NiSource Inc | | | 1,591 | | | | 46 | |
NRG Energy Inc | | | 1,306 | | | | 55 | |
Pinnacle West Capital Corp | | | 451 | | | | 43 | |
PPL Corp | | | 3,145 | | | | 100 | |
Public Service Enterprise Group Inc | | | 2,297 | | | | 136 | |
Sempra Energy | | | 1,249 | | | | 157 | |
Southern Co/The | | | 4,833 | | | | 250 | |
WEC Energy Group Inc | | | 1,451 | | | | 115 | |
Xcel Energy Inc | | | 2,326 | | | | 131 | |
| | |
| | | | | | | 3,565 | |
| |
Total Common Stock
(Cost $76,883) ($ Thousands) | | | | 107,779 | |
| | |
| | | Face Amount
(Thousands) | | | |
| |
ASSET-BACKED SECURITIES — 7.9% | | | | | |
| |
Other Asset-Backed Securities — 7.9% | | | | | |
| | |
Academic Loan Funding Trust, Ser 2012-1A, Cl A2 | | | | | | | | |
3.586%, VAR ICE LIBOR USD 1 Month+1.100%, 12/27/2044 (A) | | $ | 1,158 | | | | 1,164 | |
| | |
198 | | SEI Institutional Managed Trust / Semi-Annual Report / March 31, 2019 |
| | | | | | | | |
| | | |
| Description | | Face Amount (Thousands) | | | Market Value ($ Thousands) |
|
ASSET-BACKED SECURITIES (continued) | |
ACE Securities Home Equity Loan Trust, Ser 2004-HE3, Cl M1 | | | | | | | | |
3.416%, VAR ICE LIBOR USD 1 Month+0.930%, 11/25/2034 | | $ | 820 | | | $ | 817 | |
ACIS CLO, Ser 2014-4A, Cl A | | | | | | | | |
4.156%, VAR ICE LIBOR USD 3 Month+1.420%, 05/01/2026 (A) | | | 500 | | | | 500 | |
Aegis Asset Backed Securities Trust, Ser 2005-5, Cl M1 | | | | | | | | |
2.916%, VAR ICE LIBOR USD 1 Month+0.430%, 12/25/2035 | | | 990 | | | | 956 | |
American Tower Trust, Ser 2013-13, Cl 2A | | | | | | | | |
3.070%, 03/15/2048 (A) | | | 1,660 | | | | 1,655 | |
Ares XXV CLO, Ser 2013-3A, Cl SUB | | | | | | | | |
0.000%, 01/17/2024
(A)(H) | | | 750 | | | | 1 | |
Atlas Senior Loan Fund III, Ser 2017-1A, Cl AR | | | | | | | | |
3.513%, VAR ICE LIBOR USD 3 Month+0.830%, 11/17/2027 (A) | | | 1,000 | | | | 995 | |
Avery Point VI CLO, Ser 2018-6A, Cl DR | | | | | | | | |
5.683%, VAR ICE LIBOR USD 3 Month+2.950%, 08/05/2027 (A) | | | 860 | | | | 840 | |
BCAP Trust, Ser 2006-AA2, Cl A1 | | | | | | | | |
2.656%, VAR ICE LIBOR USD 1 Month+0.170%, 01/25/2037 | | | 596 | | | | 557 | |
BlueMountain CLO, Ser 2018-1A, Cl CR | | | | | | | | |
4.611%, VAR ICE LIBOR USD 3 Month+1.850%, 04/20/2027 (A) | | | 700 | | | | 685 | |
BlueMountain CLO, Ser 2018-2A, Cl ER | | | | | | | | |
7.980%, VAR ICE LIBOR USD 3 Month+5.200%, 07/18/2027 (A) | | | 1,000 | | | | 933 | |
BX Trust, Ser 2018-GWMZ, Cl MC | | | | | | | | |
7.972%, VAR LIBOR USD 1 Month+5.488%, 05/15/2037 (A) | | | 1,100 | | | | 1,095 | |
California Street CLO IX, Ser 2016-9A, Cl ER | | | | | | | | |
9.959%, VAR ICE LIBOR USD 3 Month+7.180%, 10/16/2028 (A) | | | 810 | | | | 807 | |
Carlyle US CLO, Ser 2017-1A, Cl A1B | | | | | | | | |
3.991%, VAR ICE LIBOR USD 3 Month+1.230%, 04/20/2031 (A) | | | 650 | | | | 647 | |
Catskill Park CLO, Ser 2017-1A, Cl D | | | | | | | | |
8.761%, VAR ICE LIBOR USD 3 Month+6.000%, 04/20/2029 (A) | | | 700 | | | | 676 | |
Cent CLO 24, Ser 2018-24A, Cl CR | | | | | | | | |
5.937%, VAR ICE LIBOR USD 3 Month+3.150%, 10/15/2026 (A) | | | 520 | | | | 512 | |
Copper River CLO, Ser 2007-1A, Cl INC | | | | | | | | |
0.000%, 01/20/2021
(A)(H) | | | 3,000 | | | | 122 | |
Crown Point CLO III, Ser 2017-3A, Cl A1BR | | | | | | | | |
3.697%, VAR ICE LIBOR USD 3 Month+0.910%, 12/31/2027 (A) | | | 2,000 | | | | 1,988 | |
Cumberland Park CLO, Ser 2018-2A, Cl ER | | | | | | | | |
8.411%, VAR ICE LIBOR USD 3 Month+5.650%, 07/20/2028 (A) | | | 600 | | | | 590 | |
| | | | | | | | |
| | | |
| Description | | Face Amount (Thousands) | | | Market Value ($ Thousands) |
|
ASSET-BACKED SECURITIES (continued) | |
DB Master Finance, Ser 2015-1A, Cl A2II | | | | | | | | |
3.980%, 02/20/2045 (A) | | $ | 1,008 | | | $ | 1,007 | |
Dryden 57 CLO, Ser 2018-57A, Cl B | | | | | | | | |
4.034%, VAR ICE LIBOR USD 3 Month+1.350%, 05/15/2031 (A) | | | 1,250 | | | | 1,214 | |
Dryden 57 CLO, Ser 2018-57A, Cl C | | | | | | | | |
4.384%, VAR ICE LIBOR USD 3 Month+1.700%, 05/15/2031 (A) | | | 1,250 | | | | 1,191 | |
ECMC Group Student Loan Trust, Ser 2016-1A, Cl A | | | | | | | | |
3.840%, VAR ICE LIBOR USD 1 Month+1.350%, 07/26/2066 (A) | | | 828 | | | | 835 | |
ECMC Group Student Loan Trust, Ser 2018-1A, Cl A | | | | | | | | |
3.236%, VAR ICE LIBOR USD 1 Month+0.750%, 02/27/2068 (A) | | | 3,379 | | | | 3,346 | |
EFS Volunteer No. 2, Ser 2012-1, Cl A2 | | | | | | | | |
3.836%, VAR ICE LIBOR USD 1 Month+1.350%, 03/25/2036 (A) | | | 1,300 | | | | 1,323 | |
EFS Volunteer No. 3, Ser 2012-1, Cl A3 | | | | | | | | |
3.486%, VAR ICE LIBOR USD 1 Month+1.000%, 04/25/2033 (A) | | | 789 | | | | 791 | |
FHLMC STACR Trust, Ser 2019-DNA1, Cl M2 | | | | | | | | |
5.136%, VAR ICE LIBOR USD 1 Month+2.650%, 01/25/2049 (A) | | | 270 | | | | 274 | |
Flagship VII, Ser 2017-7A, Cl A1R | | | | | | | | |
3.881%, VAR ICE LIBOR USD 3 Month+1.120%, 01/20/2026 (A) | | | 316 | | | | 315 | |
Flagship VII, Ser 2017-7A, Cl CR | | | | | | | | |
5.111%, VAR ICE LIBOR USD 3 Month+2.350%, 01/20/2026 (A) | | | 1,500 | | | | 1,487 | |
Gilbert Park CLO, Ser 2017-1A, Cl E | | | | | | | | |
9.187%, VAR ICE LIBOR USD 3 Month+6.400%, 10/15/2030 (A) | | | 750 | | | | 740 | |
GMACM Mortgage Loan Trust, Ser 2005-AF2, Cl A1 | | | | | | | | |
6.000%, 12/25/2035 | | | 1,574 | | | | 1,517 | |
Great Lakes CLO, Ser 2012-1A, Cl SUB | | | | | | | | |
0.000%, 01/15/2023
(A)(H) | | | 1,000 | | | | – | |
Halcyon Loan Advisors Funding, Ser 2012- 1A, Cl B | | | | | | | | |
5.684%, VAR ICE LIBOR USD 3 Month+3.000%, 08/15/2023 (A) | | | 500 | | | | 499 | |
Halcyon Loan Advisors Funding, Ser 2013- 1A, Cl A1 | | | | | | | | |
3.937%, VAR ICE LIBOR USD 3 Month+1.150%, 04/15/2025 (A) | | | 69 | | | | 69 | |
Hertz Vehicle Financing II, Ser 2016-2A, Cl C | | | | | | | | |
4.990%, 03/25/2022 (A) | | | 3,000 | | | | 3,054 | |
Jackson Mill CLO, Ser 2018-1A, Cl DR | | | | | | | | |
5.587%, VAR ICE LIBOR USD 3 Month+2.800%, 04/15/2027 (A) | | | 750 | | | | 730 | |
| | |
SEI Institutional Managed Trust / Semi-Annual Report / March 31, 2019 | | 199 |
SCHEDULE OF INVESTMENTS (Unaudited)
March 31, 2019
Multi-Asset Income Fund(Continued)
| | | | | | | | |
| | | |
| Description | | Face Amount (Thousands) | | | Market Value ($ Thousands) |
|
ASSET-BACKED SECURITIES (continued) | |
Jamestown CLO X, Ser 2017-10A, Cl A1 | | | | | | | | |
4.023%, VAR ICE LIBOR USD 3 Month+1.250%, 07/17/2029 (A) | | $ | 750 | | | $ | 748 | |
KKR CLO, Ser 2018-21, Cl A | | | | | | | | |
3.787%, VAR ICE LIBOR USD 3 Month+1.000%, 04/15/2031 (A) | | | 500 | | | | 490 | |
LCM XXII, Ser 2018-22A, Cl DR | | | | | | | | |
8.261%, VAR ICE LIBOR USD 3 Month+5.500%, 10/20/2028 (A) | | | 600 | | | | 568 | |
Legacy Mortgage Asset Trust, Ser 2019-GS1, Cl A1 | | | | | | | | |
4.000%, 01/25/2059 (A) | | | 810 | | | | 815 | |
Lone Star Portfolio Trust, Ser 2015-LSP, Cl F | | | | | | | | |
9.634%, VAR LIBOR USD 1 Month+7.150%, 09/15/2028 (A) | | | 768 | | | | 771 | |
Madison Park Funding XXIV, Ser 2016-24A, Cl D | | | | | | | | |
6.611%, VAR ICE LIBOR USD 3 Month+3.850%, 01/20/2028 (A) | | | 650 | | | | 649 | |
Marathon CLO II, Ser 2005-2A, Cl INC | | | | | | | | |
0.000%, 12/20/2019
(A)(H) | | | 750 | | | | – | |
Marathon CLO V, Ser 2017-5A, Cl A1R | | | | | | | | |
3.511%, VAR ICE LIBOR USD 3 Month+0.870%, 11/21/2027 (A) | | | 1,200 | | | | 1,188 | |
Marathon CLO V, Ser 2017-5A, Cl A2R | | | | | | | | |
4.091%, VAR ICE LIBOR USD 3 Month+1.450%, 11/21/2027 (A) | | | 1,000 | | | | 995 | |
Mariner CLO, Ser 2017-4A, Cl A | | | | | | | | |
3.975%, VAR ICE LIBOR USD 3 Month+1.210%, 10/26/2029 (A) | | | 2,650 | | | | 2,640 | |
MidOcean Credit CLO I, Ser 2018-1A, Cl A2RR | | | | | | | | |
4.087%, VAR ICE LIBOR USD 3 Month+1.300%, 01/15/2024 (A) | | | 1,000 | | | | 986 | |
MidOcean Credit CLO VII, Ser 2017-7A, Cl B | | | | | | | | |
4.687%, VAR ICE LIBOR USD 3 Month+1.900%, 07/15/2029 (A) | | | 750 | | | | 745 | |
Montana Higher Education Student Assistance, Ser 2012-1, Cl A3 | | | | | | | | |
3.530%, VAR ICE LIBOR USD 1 Month+1.050%, 07/20/2043 | | | 700 | | | | 702 | |
Motel 6 Trust, Ser 2017-MTL6, Cl F | | | | | | | | |
6.734%, VAR LIBOR USD 1 Month+4.250%, 08/15/2034 (A) | | | 1,353 | | | | 1,358 | |
Neuberger Berman CLO XVII, Ser 2017-17A, Cl ER | | | | | | | | |
9.311%, VAR ICE LIBOR USD 3 Month+6.550%, 04/22/2029 (A) | | | 250 | | | | 243 | |
Nomura Asset Acceptance Alternative Loan Trust, Ser 2003-A1, Cl M | | | | | | | | |
6.564%, 05/25/2033 (E) | | | 807 | | | | 825 | |
N-Star REL CDO VIII, Ser 2006-8A, Cl A2 | | | | | | | | |
2.849%, VAR LIBOR USD 1 Month+0.360%, 02/01/2041 (A) | | | 650 | | | | 649 | |
| | | | | | | | |
| | | |
| Description | | Face Amount (Thousands) | | | Market Value ($ Thousands) |
|
ASSET-BACKED SECURITIES (continued) | |
OCP CLO, Ser 2017-13A, Cl A1A | | | | | | | | |
4.047%, VAR ICE LIBOR USD 3 Month+1.260%, 07/15/2030 (A) | | $ | 1,700 | | | $ | 1,693 | |
Octagon Investment Partners XIX, Ser 2017- 1A, Cl AR | | | | | | | | |
3.887%, VAR ICE LIBOR USD 3 Month+1.100%, 04/15/2026 (A) | | | 560 | | | | 560 | |
Octagon Investment Partners XXIII, Ser 2018- 1A, Cl ER | | | | | | | | |
8.537%, VAR ICE LIBOR USD 3 Month+5.750%, 07/15/2027 (A) | | | 450 | | | | 444 | |
OZLM VII, Ser 2018-7RA, Cl CR | | | | | | | | |
5.773%, VAR ICE LIBOR USD 3 Month+3.000%, 07/17/2029 (A) | | | 900 | | | | 865 | |
OZLM XI, Ser 2017-11A, Cl BR | | | | | | | | |
5.051%, VAR ICE LIBOR USD 3 Month+2.300%, 10/30/2030 (A) | | | 600 | | | | 584 | |
OZLM XII, Ser 2015-12A, Cl D | | | | | | | | |
8.151%, VAR ICE LIBOR USD 3 Month+5.400%, 04/30/2027 (A) | | | 700 | | | | 676 | |
Panhandle-Plains Higher Education Authority, Ser 2011-1, Cl A2 | | | | | | | | |
3.747%, VAR ICE LIBOR USD 3 Month+0.950%, 07/01/2024 | | | 164 | | | | 164 | |
Recette CLO, Ser 2017-1A, Cl BR | | | | | | | | |
4.061%, VAR ICE LIBOR USD 3 Month+1.300%, 10/20/2027 (A) | | | 1,000 | | | | 986 | |
Scholar Funding Trust, Ser 2011-A, Cl A | | | | | | | | |
3.665%, VAR ICE LIBOR USD 3 Month+0.900%, 10/28/2043 (A) | | | 1,124 | | | | 1,123 | |
Scholar Funding Trust, Ser 2012-B, Cl A2 | | | | | | | | |
3.596%, VAR ICE LIBOR USD 1 Month+1.100%, 03/28/2046 (A) | | | 1,283 | | | | 1,293 | |
Seasoned Credit Risk Transfer Trust, Ser 2018-3, Cl M | | | | | | | | |
4.750%, 08/25/2057
(A)(E) | | | 1,125 | | | | 1,041 | |
Shackleton VIII CLO, Ser 2017-8A, Cl A2R | | | | | | | | |
3.696%, VAR ICE LIBOR USD 3 Month+0.920%, 10/20/2027 (A) | | | 4,500 | | | | 4,467 | |
Shops at Crystals Trust, Ser 2106-CSTL, Cl D | | | | | | | | |
3.731%, 07/05/2036
(A)(E) | | | 1,765 | | | | 1,606 | |
Sound Point CLO III, Ser 2018-2RA, Cl A1 | | | | | | | | |
3.737%, VAR ICE LIBOR USD 3 Month+0.950%, 04/15/2029 (A) | | | 2,100 | | | | 2,074 | |
Stonemont Portfolio Trust, Ser 2017-MONT, Cl F | | | | | | | | |
6.088%, VAR LIBOR USD 1 Month+3.600%, 08/20/2030 (A) | | | 1,954 | | | | 1,959 | |
Tralee CLO III, Ser 2017-3A, Cl BRR | | | | | | | | |
4.211%, VAR ICE LIBOR USD 3 Month+1.450%, 10/20/2027 (A) | | | 2,300 | | | | 2,266 | |
| | |
200 | | SEI Institutional Managed Trust / Semi-Annual Report / March 31, 2019 |
| | | | | | | | | | |
| | | | |
| Description | | | | Face Amount (Thousands) | | Market Value ($ Thousands) |
|
ASSET-BACKED SECURITIES (continued) | |
Tryon Park CLO, Ser 2018-1A, Cl A1SR | | | | | | | | | | |
3.677%, VAR ICE LIBOR USD 3 Month+0.890%, 04/15/2029 (A) | | $ | | | 2,100 | | | $ | 2,088 | |
Voya CLO, Ser 2018-2A, Cl ER | | | | | | | | | | |
8.172%, VAR ICE LIBOR USD 3 Month+5.400%, 07/23/2027 (A) | | | | | 750 | | | | 729 | |
Voya CLO, Ser 2018-3A, Cl A1A | | | | | | | | | | |
3.610%, VAR ICE LIBOR USD 3 Month+1.150%, 10/15/2031 (A) | | | | | 750 | | | | 746 | |
Wachovia Asset Securitization Issuance II, Ser 2007-HE1, Cl A | | | | | | | | | | |
2.626%, VAR ICE LIBOR USD 1 Month+0.140%, 07/25/2037 (A) | | | | | 472 | | | | 442 | |
Whitehorse XII, Ser 2018-12A, Cl D | | | | | | | | | | |
6.076%, VAR ICE LIBOR USD 3 Month+3.650%, 10/15/2031 (A) | | | | | 250 | | | | 242 | |
| |
Total Asset-Backed Securities
(Cost $80,480) ($ Thousands) | | | | 74,352 | |
| |
LOAN PARTICIPATIONS — 7.3% | | | | | |
1011778 BC ULC / New Red Finance, Term Loan B3, 1st Lien | | | | | | | | | | |
4.749%, VAR LIBOR+2.250%, 02/16/2024 | | | | | 525 | | | | 516 | |
4.743%, VAR LIBOR+2.250%, 02/16/2024 | | | | | 423 | | | | 416 | |
Academy Ltd., Term Loan, 1st Lien | | | | | | | | | | |
6.490%, VAR LIBOR+4.000%, 07/01/2022 | | | | | 165 | | | | 118 | |
6.489%, VAR LIBOR+4.000%, 07/01/2022 | | | | | 505 | | | | 362 | |
Acosta Inc., Term Loan, 1st Lien | | | | | | | | | | |
7.750%, 09/26/2019 (F) | | | | | 297 | | | | 164 | |
Acosta, Dollar Revolving Credit Loan, 1st Lien | | | | | | | | | | |
5.758%, VAR LIBOR+3.250%, 09/26/2019 (F) | | | | | 342 | | | | 188 | |
Acosta, Multicurrency Revolving Credit Loan, 1st Lien | | | | | | | | | | |
7.750%, VAR LIBOR+3.250%, 09/26/2019 (F) | | | | | 862 | | | | 474 | |
Air Medical Group Holdings Inc., Term Loan B, 1st Lien | | | | | | | | | | |
5.739%, VAR LIBOR+3.250%, 04/28/2022 | | | | | 794 | | | | 747 | |
Air Medical Group Holdings Inc., Term Loan, 1st Lien | | | | | | | | | | |
6.740%, VAR LIBOR+4.250%, 03/14/2025 | | | | | 948 | | | | 890 | |
AkzoNobel, Term Loan B, 1st Lien | | | | | | | | | | |
5.740%, 10/01/2025 | | | | | 1,600 | | | | 1,575 | |
| | | | | | | | | | |
| | | | |
| Description | | | | Face Amount
(Thousands) | | | Market Value
($ Thousands) |
|
LOAN PARTICIPATIONS (continued) | |
Albany Molecular Research, Term Loan, 1st Lien | | | | | | | | | | |
5.743%, 08/30/2024 | | $ | | | 744 | | | $ | 731 | |
Albertson’s LLC, Term B-6 Loan, 1st Lien, Ser 2017-1 | | | | | | | | | | |
5.479%, VAR LIBOR+3.000%, 06/22/2023 | | | | | 744 | | | | 737 | |
AMC Entertainment, Term Loan B, 1st Lien | | | | | | | | | | |
0.000%, 03/20/2026 (H) | | | | | 650 | | | | 645 | |
American Axle & Manufacturing, Inc., Term Loan B, 1st Lien | | | | | | | | | | |
4.740%, VAR LIBOR+2.250%, 04/06/2024 | | | | | 494 | | | | 482 | |
American Builders & Contractors Supply, Term Loan B2, 1st Lien | | | | | | | | | | |
4.499%, VAR LIBOR+2.000%, 10/31/2023 | | | | | 953 | | | | 927 | |
American Renal Associates, Term Loan, 1st Lien | | | | | | | | | | |
5.743%, VAR LIBOR+3.250%, 06/21/2024 | | | | | 933 | | | | 886 | |
Arby’s Restaurant Group Inc., Term Loan B, 1st Lien | | | | | | | | | | |
5.739%, 02/05/2025 | | | | | 1,190 | | | | 1,159 | |
Asurion, Cov-Lite, Term Loan B4, 1st Lien | | | | | | | | | | |
5.499%, VAR LIBOR+2.750%, 08/04/2022 | | | | | 360 | | | | 358 | |
Athenahealth, Inc. Term Loan B, 1st LIen | | | | | | | | | | |
7.197%, 02/11/2026 | | | | | 530 | | | | 522 | |
Avolon TLB Borrower 1 (US) LLC, Term Loan B3, 1st Lien | | | | | | | | | | |
4.488%, VAR LIBOR+2.000%, 01/15/2025 | | | | | 1,656 | | | | 1,641 | |
Bausch Health Companies Inc., Term Loan, 1st Lien | | | | | | | | | | |
5.231%, 11/27/2025 | | | | | 1,998 | | | | 1,973 | |
Berry Global, Inc. (fka Berry Plastics Corporation), Term Q Loan, 1st Lien | | | | | | | | | | |
4.610%, VAR LIBOR+2.000%, 10/01/2022 | | | | | 826 | | | | 820 | |
Boyd Gaming Corporation, Refinancing Term B Loan | | | | | | | | | | |
4.658%, VAR LIBOR+2.500%, 09/15/2023 | | | | | 496 | | | | 491 | |
Brookfield Property REIT Inc., Term Loan B, 1st Lien | | | | | | | | | | |
4.996%, 08/27/2025 | | | | | 711 | | | | 684 | |
4.993%, 08/27/2025 | | | | | 237 | | | | 227 | |
BWAY Holding Company, Term Loan B, 1st Lien | | | | | | | | | | |
6.033%, VAR LIBOR+3.250%, 04/03/2024 | | | | | 948 | | | | 923 | |
| | |
SEI Institutional Managed Trust / Semi-Annual Report / March 31, 2019 | | 201 |
SCHEDULE OF INVESTMENTS (Unaudited)
March 31, 2019
Multi-Asset Income Fund(Continued)
| | | | | | | | | | |
| | | | |
| Description | | | | Face Amount (Thousands) | | | Market Value ($ Thousands) |
|
LOAN PARTICIPATIONS (continued) | |
Caesars Resort Collection LLC, Term Loan B, 1st Lien | | | | | | | | | | |
5.249%, VAR LIBOR+2.750%, 12/23/2024 | | $ | | | 1,489 | | | $ | 1,467 | |
Camping World, Term Loan B, 1st Lien | | | | | | | | | | |
5.240%, 11/08/2023 | | | | | 902 | | | | 809 | |
Catalent Pharma Solutions, Term Loan B, 1st Lien | | | | | | | | | | |
4.743%, 05/20/2024 | | | | | 472 | | | | 469 | |
CBS Radio Inc., Additional Term B-1 Loan, 1st Lien | | | | | | | | | | |
5.249%, VAR LIBOR+2.750%, 11/18/2024 | | | | | 670 | | | | 651 | |
Change Healthcare Holdings, Inc. (fka Emdeon Inc.), Closing Date Term Loan, 1st Lien | | | | | | | | | | |
5.249%, VAR LIBOR+2.750%, 03/01/2024 | | | | | 1,871 | | | | 1,845 | |
Charter NEX Films, Term Loan B, 1st Lien | | | | | | | | | | |
5.243%, VAR LIBOR+3.250%, 05/16/2024 | | | | | 950 | | | | 921 | |
CityCenter Holdings, LLC, Term B Loan, 1st Lien | | | | | | | | | | |
4.749%, VAR LIBOR+2.250%, 04/18/2024 | | | | | 744 | | | | 730 | |
CommScope, Inc., Term Loan B, 1st Lien | | | | | | | | | | |
0.000%, 02/06/2026 (H) | | | | | 525 | | | | 524 | |
Consolidated Communications, Term Loan B | | | | | | | | | | |
5.500%, 10/05/2023 | | | | | 948 | | | | 895 | |
CPG International LLC (fka CPG International), New Term Loan, 1st Lien | | | | | | | | | | |
6.633%, VAR LIBOR+3.750%, 05/05/2024 (F) | | | | | 648 | | | | 642 | |
Crosby US Acquisition Corp., Initial Term Loan, 1st Lien | | | | | | | | | | |
5.481%, VAR LIBOR+3.000%, 11/23/2020 | | | | | 1,217 | | | | 1,184 | |
Crown Finance US, Inc., Initial Dollar Tracnhe Term Loan | | | | | | | | | | |
4.999%, 02/28/2025 | | | | | 1,465 | | | | 1,429 | |
CSC Holdings LLC, Term Loan B, 1st Lien | | | | | | | | | | |
4.984%, 01/25/2026 | | | | | 450 | | | | 440 | |
CSC Holdings, LLC (fka CSC Holdings, Inc.), March 2017 Refinancing Term Loan | | | | | | | | | | |
4.734%, VAR LIBOR+2.250%, 07/17/2025 | | | | | 500 | | | | 485 | |
CWGS Group LLC, Term Loan B, 1st Lien | | | | | | | | | | |
5.249%, 11/08/2023 | | | | | 4 | | | | 3 | |
Dana Corp., Term Loan B, 1st Lien | | | | | | | | | | |
4.749%, 11/14/2025 | | | | | 200 | | | | 198 | |
Digicert, Term Loan B-2 | | | | | | | | | | |
6.499%, 10/31/2024 | | | | | 948 | | | | 929 | |
| | | | | | | | | | |
| | | | |
| Description | | | | Face Amount (Thousands) | | | Market Value ($ Thousands) |
|
LOAN PARTICIPATIONS (continued) | |
Financial & Risk US Holdings Inc., Term Loan B, 1st Lien | | | | | | | | | | |
6.249%, 10/01/2025 | | $ | | | 748 | | | $ | 726 | |
First Data Corporation, 2022D New Dollar Term Loan, Ser 2022-D | | | | | | | | | | |
4.486%, VAR LIBOR+2.000%, 07/08/2022 | | | | | 115 | | | | 115 | |
First Data Corporation, Term Loan, 1st Lien, Ser 2024-A | | | | | | | | | | |
4.486%, VAR LIBOR+2.000%, 04/26/2024 | | | | | 1,160 | | | | 1,156 | |
Four Seasons, 1st Lien | | | | | | | | | | |
4.499%, 11/30/2023 | | | | | 933 | | | | 925 | |
Getty Images, Term Loan, 1st Lien | | | | | | | | | | |
7.063%, 02/19/2026 | | | | | 574 | | | | 569 | |
Golden Nugget Inc., Term Loan B, 1st Lien | | | | | | | | | | |
5.234%, VAR LIBOR+2.750%, 10/04/2023 | | | | | 303 | | | | 299 | |
Golden Nugget, Inc., Term Loan B, 1st Lien | | | | | | | | | | |
5.249%, 10/04/2023 | | | | | 381 | | | | 377 | |
Greatbatch Ltd, Term Loan | | | | | | | | | | |
5.490%, 10/27/2022 | | | | | 12 | | | | 12 | |
Hoya Midco LLC, Term Loan B, 1st Lien | | | | | | | | | | |
5.993%, 06/30/2024 | | | | | 948 | | | | 915 | |
Immucor, Term B-3 Loan, 1st Lien | | | | | | | | | | |
7.803%, VAR LIBOR+5.000%, 06/15/2021 | | | | | 443 | | | | 442 | |
Intelset Jackson Holdings S.A., Term Loan B3, 1st Lien | | | | | | | | | | |
6.240%, 11/27/2023 | | | | | 267 | | | | 262 | |
Intrawest ULC, Term Loan, 1st Lien | | | | | | | | | | |
5.493%, VAR LIBOR+3.250%, 07/31/2024 | | | | | 496 | | | | 493 | |
Jaguar Holding Co I, Term Loan, 1st Lien | | | | | | | | | | |
4.993%, VAR LIBOR+2.500%, 08/18/2022 | | | | | 943 | | | | 932 | |
Lineage Logistics LLC Term Loan, 2nd Lien | | | | | | | | | | |
5.493%, 02/27/2025 | | | | | 397 | | | | 385 | |
Lions Gate Capital Holdings LLC, Term B Loan, 1st Lien | | | | | | | | | | |
4.749%, 03/24/2025 | | | | | 496 | | | | 489 | |
MacDermid/Element Solutions, Term Loan B, 1st Lien | | | | | | | | | | |
4.749%, 01/30/2026 (H) | | | | | 299 | | | | 296 | |
McAfee, LLC, Term B USD Loan | | | | | | | | | | |
6.249%, 09/30/2024 | | | | | 82 | | | | 82 | |
McGraw-Hill Global Education Holdings LLC, Term Loan B, 1st Lien | | | | | | | | | | |
6.499%, VAR LIBOR+4.000%, 05/04/2022 | | | | | 504 | | | | 462 | |
McGraw-Hill Global Education Holdings LLC, Term Loan, 1st Lien | | | | | | | | | | |
11.000%, 04/20/2022 (F) | | | | | 300 | | | | 254 | |
| | |
202 | | SEI Institutional Managed Trust / Semi-Annual Report / March 31, 2019 |
| | | | | | | | | | |
| | | | |
| Description | | | | Face Amount (Thousands) | | | Market Value ($ Thousands) |
|
LOAN PARTICIPATIONS (continued) | |
Michaels Stores, Inc., 2018 New Replacement Term B Loan | | | | | | | | | | |
4.993%, VAR LIBOR+2.500%, 01/30/2023 | | $ | | | 705 | | | $ | 690 | |
4.991%, VAR LIBOR+2.500%, 01/30/2023 | | | | | 250 | | | | 245 | |
Misys Ltd, Term Loan B, 1st Lien | | | | | | | | | | |
6.101%, VAR LIBOR+3.500%, 06/13/2024 | | | | | 457 | | | | 440 | |
Mitchell International, Inc., Initial Term Loan | | | | | | | | | | |
5.749%, 11/29/2024 | | | | | 997 | | | | 957 | |
MPH Acquisition Holdings LLC, Initial Term Loan, 1st Lien | | | | | | | | | | |
5.351%, VAR LIBOR+2.750%, 06/07/2023 | | | | | 914 | | | | 884 | |
Navistar Inc., Term Loan B, 1st Lien | | | | | | | | | | |
6.000%, 11/06/2024 | | | | | 545 | | | | 542 | |
Panther BF Aggregator 2 Power Solutions, Term Loan, 1st Lien | | | | | | | | | | |
0.000%, 03/18/2026 (H) | | | | | 840 | | | | 830 | |
Parexel International Corporation, Term Loan, 1st Lien | | | | | | | | | | |
5.243%, VAR LIBOR+2.750%, 09/27/2024 | | | | | 674 | | | | 649 | |
Party City Holdings Inc., 2018 Replacement Term Loan | | | | | | | | | | |
5.000%, 08/19/2022 | | | | | 582 | | | | 577 | |
Petco Animal Supplies Inc., Term Loan B1, 1st Lien | | | | | | | | | | |
5.994%, VAR LIBOR+3.000%, 01/26/2023 | | | | | 744 | | | | 564 | |
PetSmart Inc., Term Loan B2, 1st Lien | | | | | | | | | | |
5.490%, VAR LIBOR+3.000%, 03/11/2022 | | | | | 992 | | | | 889 | |
Pisces Midco, Inc., Term Loan B, 1st Lien | | | | | | | | | | |
6.547%, 04/12/2025 | | | | | 1,746 | | | | 1,670 | |
Post Holdings, Inc., Series A Incremental Term Loan | | | | | | | | | | |
4.490%, VAR LIBOR+2.000%, 05/24/2024 | | | | | 388 | | | | 385 | |
PQ Corp, Term Loan B | | | | | | | | | | |
5.244%, 02/08/2025 | | | | | 893 | | | | 882 | |
Prime Security Services Borrower, LLC (aka Protection 1 Security Solutions), Refinancing Term B-1 Loan | | | | | | | | | | |
5.249%, VAR LIBOR+2.750%, 05/02/2022 | | | | | 443 | | | | 437 | |
Prime Security Services, Term Loan | | | | | | | | | | |
5.243%, 05/02/2022 | | | | | 54 | | | | 53 | |
Quikrete Holdings, Inc., Initial Loan | | | | | | | | | | |
2.499%, VAR LIBOR+2.750%, 11/15/2023 | | | | | 389 | | | | 379 | |
| | | | | | | | | | |
| | | | |
| Description | | | | Face Amount (Thousands) | | | Market Value ($ Thousands) |
|
LOAN PARTICIPATIONS (continued) | |
Reynolds Group Holdings Inc., Term Loan, 1st Lien | | | | | | | | | | |
5.249%, VAR LIBOR+2.750%, 02/05/2023 | | $ | | | 2,330 | | | $ | 2,301 | |
Robertshaw US Holding, Term Loan B, 1st Lien | | | | | | | | | | |
6.000%, 02/28/2025 | | | | | 747 | | | | 700 | |
Scientific Games International Inc., Term Loan B, 1st Lien | | | | | | | | | | |
5.329%, VAR LIBOR+2.750%, 08/14/2024 | | | | | 673 | | | | 654 | |
5.249%, VAR LIBOR+2.750%, 08/14/2024 | | | | | 161 | | | | 157 | |
Shearer’s Foods LLC, Term Loan, 2nd Lien | | | | | | | | | | |
9.243%, VAR LIBOR+6.750%, 06/30/2022 | | | | | 810 | | | | 780 | |
6.743%, VAR LIBOR+3.938%, 06/30/2021 | | | | | 872 | | | | 857 | |
SS&C Technologies, Term Loan B3, 1st Lien | | | | | | | | | | |
4.749%, 04/16/2025 | | | | | 822 | | | | 815 | |
SS&C Technologies, Term Loan B4, 1st Lien | | | | | | | | | | |
4.749%, 04/16/2025 | | | | | 315 | | | | 312 | |
Staples Inc., Term Loan B, 1st Lien | | | | | | | | | | |
6.489%, VAR LIBOR+4.000%, 09/12/2024 | | | | | 1,165 | | | | 1,155 | |
Sterigenics-Nordion Holdings LLC, Term Loan, 1st Lien | | | | | | | | | | |
5.493%, VAR LIBOR+3.000%, 05/15/2022 | | | | | 948 | | | | 930 | |
Superior Vision/Davis Vision, Term Loan B, 1st Lien | | | | | | | | | | |
5.499%, 12/02/2024 | | | | | 781 | | | | 755 | |
Travelport Finance (LUX), Term Loan, 1st Lien | | | | | | | | | | |
0.000%, 03/18/2026 (H) | | | | | 925 | | | | 898 | |
Travelport, Term Loan B, 1st Lien | | | | | | | | | | |
5.184%, 03/17/2025 | | | | | 918 | | | | 917 | |
UFC Holdings, Term Loan, 1st Lien | | | | | | | | | | |
5.750%, 08/18/2023 | | | | | 744 | | | | 738 | |
Unitymedia, Term Loan B, 1st Lien | | | | | | | | | | |
4.734%, 09/30/2025 | | | | | 750 | | | | 741 | |
Univision Communications Inc., Term Loan, 1st Lien | | | | | | | | | | |
5.249%, VAR LIBOR+2.750%, 03/15/2024 | | | | | 482 | | | | 454 | |
UPC Financing Partnership, Term Loan, 1st Lien | | | | | | | | | | |
4.984%, VAR LIBOR+2.500%, 01/15/2026 | | | | | 766 | | | | 764 | |
USI, Inc. (fka Compass Investors Inc.), 2017 New Term Loan, 1st Lien | | | | | | | | | | |
5.601%, 05/16/2024 | | | | | 948 | | | | 918 | |
Vertafore, Term Loan B, 1st Lien | | | | | | | | | | |
6.053%, 07/02/2025 (H) | | | | | 950 | | | | 932 | |
| | |
SEI Institutional Managed Trust / Semi-Annual Report / March 31, 2019 | | 203 |
SCHEDULE OF INVESTMENTS (Unaudited)
March 31, 2019
Multi-Asset Income Fund(Continued)
| | | | | | | | | | |
| | | | |
| Description | | | | Face Amount (Thousands) | | Market Value ($ Thousands) |
|
LOAN PARTICIPATIONS (continued) | |
Virgin Media Bristol LLC, K Facility, Term Loan, 1st Lien | | | | | | | | | | |
4.984%, VAR LIBOR+2.500%, 01/15/2026 | | $ | | | 935 | | | $ | 924 | |
Welbilt, Inc., Term Loan B, 1st Lien | | | | | | | | | | |
4.993%, 10/23/2025 (F) | | | | | 350 | | | | 345 | |
| | | |
Total Loan Participations (Cost $71,300) ($ Thousands) | | | | | | | | | 69,588 | |
|
MORTGAGE-BACKED SECURITIES — 5.5% | |
|
Agency Mortgage-Backed Obligations — 1.2% | |
FHLMC CMO, Ser 2014-4320, Cl SD, IO | | | | | | | | | | |
3.616%, VAR LIBOR USD 1 Month+6.100%, 07/15/2039 | | | | | 607 | | | | 88 | |
FHLMC Structured Agency Credit Risk Debt Notes, Ser 2015-HQA2, Cl M3 | | | | | | | | | | |
7.286%, VAR ICE LIBOR USD 1 Month+4.800%, 05/25/2028 | | | | | 360 | | | | 408 | |
FHLMC Structured Agency Credit Risk Debt Notes, Ser 2016-DNA3, Cl M3 | | | | | | | | | | |
7.486%, VAR ICE LIBOR USD 1 Month+5.000%, 12/25/2028 | | | | | 250 | | | | 283 | |
FHLMC Structured Agency Credit Risk Debt Notes, Ser 2016-DNA4, Cl M3 | | | | | | | | | | |
6.286%, VAR ICE LIBOR USD 1 Month+3.800%, 03/25/2029 | | | | | 300 | | | | 330 | |
FNMA | | | | | | | | | | |
3.500%, 02/01/2047 | | | | | 3,273 | | | | 3,329 | |
FNMA CMO, Ser 2012-115, Cl DS, IO | | | | | | | | | | |
3.615%, VAR LIBOR USD 1 Month+6.100%, 10/25/2042 | | | | | 773 | | | | 137 | |
FNMA CMO, Ser 2015-30, Cl SJ, IO | | | | | | | | | | |
3.115%, VAR LIBOR USD 1 Month+5.600%, 05/25/2045 | | | | | 979 | | | | 129 | |
FNMA CMO, Ser 2016-69, Cl BS, IO | | | | | | | | | | |
3.615%, VAR LIBOR USD 1 Month+6.100%, 10/25/2046 | | | | | 1,385 | | | | 204 | |
FNMA Connecticut Avenue Securities, Ser 2017-C05, Cl 1M2 | | | | | | | | | | |
4.686%, VAR ICE LIBOR USD 1 Month+2.200%, 01/25/2030 | | | | | 1,275 | | | | 1,291 | |
FNMA Connecticut Avenue Securities, Ser 2018-C03, Cl 1M2C | | | | | | | | | | |
4.636%, VAR ICE LIBOR USD 1 Month+2.150%, 10/25/2030 | | | | | 2,470 | | | | 2,374 | |
FNMA Connecticut Avenue Securities, Ser 2018-C06, Cl 1M2 | | | | | | | | | | |
4.486%, VAR ICE LIBOR USD 1 Month+2.000%, 03/25/2031 | | | | | 410 | | | | 407 | |
| | | | | | | | | | |
| | | | |
| Description | | | | Face Amount (Thousands) | | Market Value ($ Thousands) |
|
MORTGAGE-BACKED SECURITIES (continued) | |
GNMA CMO, Ser 2010-9, Cl XD, IO | | | | | | | | | | |
4.118%, VAR LIBOR USD 1 Month+6.600%, 01/16/2040 | | $ | | | 3,077 | | | $ | 501 | |
GNMA CMO, Ser 2013-124, Cl CS, IO | | | | | | | | | | |
3.562%, VAR LIBOR USD 1 Month+6.050%, 08/20/2043 | | | | | 329 | | | | 52 | |
GNMA CMO, Ser 2014-117, Cl SJ, IO | | | | | | | | | | |
3.112%, VAR LIBOR USD 1 Month+5.600%, 08/20/2044 | | | | | 942 | | | | 123 | |
GNMA CMO, Ser 2014-158, Cl SA, IO | | | | | | | | | | |
3.118%, VAR LIBOR USD 1 Month+5.600%, 10/16/2044 | | | | | 442 | | | | 57 | |
GNMA CMO, Ser 2015-110, Cl MS, IO | | | | | | | | | | |
3.222%, VAR LIBOR USD 1 Month+5.710%, 08/20/2045 | | | | | 537 | | | | 70 | |
GNMA CMO, Ser 2015-111, Cl IM, IO | | | | | | | | | | |
4.000%, 08/20/2045 | | | | | 4,597 | | | | 722 | |
GNMA CMO, Ser 2015-126, Cl IQ, IO | | | | | | | | | | |
4.000%, 09/20/2045 | | | | | 1,061 | | | | 170 | |
GNMA CMO, Ser 2015-126, Cl IM, IO | | | | | | | | | | |
4.000%, 09/20/2045 | | | | | 1,061 | | | | 149 | |
GNMA CMO, Ser 2015-168, Cl IP, IO | | | | | | | | | | |
4.000%, 11/20/2045 | | | | | 1,922 | | | | 211 | |
GNMA CMO, Ser 2015-57, Cl AS, IO | | | | | | | | | | |
3.112%, VAR LIBOR USD 1 Month+5.600%, 04/20/2045 | | | | | 3,695 | | | | 434 | |
GNMA CMO, Ser 2016-109, Cl IH, IO | | | | | | | | | | |
4.000%, 10/20/2045 | | | | | 2,578 | | | | 362 | |
GNMA CMO, Ser 2016-27, Cl IA, IO | | | | | | | | | | |
4.000%, 06/20/2045 | | | | | 1,425 | | | | 195 | |
| | | |
| | | | | | | | | 12,026 | |
|
Non-Agency Mortgage-Backed Obligations — 4.3% | |
Bancorp Commercial Mortgage Trust, Ser 2018-CR3, Cl A | | | | | | | | | | |
3.334%, VAR LIBOR USD 1 Month+0.850%, 01/15/2033 (A) | | | | | 1,052 | | | | 1,044 | |
BCAP Trust, Ser 2007-AA2, Cl 2A7 | | | | | | | | | | |
6.000%, 04/25/2037 | | | | | 788 | | | | 620 | |
BX Commercial Mortgage Trust, Ser 2018- BIOA, Cl E | | | | | | | | | | |
4.435%, VAR LIBOR USD 1 Month+1.951%, 03/15/2037 (A) | | | | | 2,000 | | | | 2,000 | |
BX Trust, Ser 2017-IMC, Cl A | | | | | | | | | | |
3.534%, VAR LIBOR USD 1 Month+1.050%, 10/15/2032 (A) | | | | | 910 | | | | 907 | |
Capmark Military Housing Trust, Ser 2007- AET2, Cl A | | | | | | | | | | |
6.063%, 10/10/2052 (A) | | | | | 956 | | | | 1,052 | |
CGMS Commercial Mortgage Trust, Ser 2017- MDRA, Cl C | | | | | | | | | | |
3.752%, 07/10/2030 (A)(E) | | | | | 1,620 | | | | 1,555 | |
| | |
204 | | SEI Institutional Managed Trust / Semi-Annual Report / March 31, 2019 |
| | | | | | | | | | |
| | | | |
| Description | | | | Face Amount (Thousands) | | | Market Value ($ Thousands) |
|
MORTGAGE-BACKED SECURITIES (continued) | |
Chase Mortgage Finance Trust, Ser 2007-S5, Cl 1A3 | | | | | | | | | | |
6.000%, 07/25/2037 | | $ | | | 1,253 | | | $ | 936 | |
Citigroup Mortgage Loan Trust, Ser 2005- OPT4, Cl M5 | | | | | | | | | | |
3.106%, VAR ICE LIBOR USD 1 Month+0.620%, 07/25/2035 | | | | | 500 | | | | 498 | |
Connecticut Avenue Securities Trust, Ser 2018-R07, Cl 1M2 | | | | | | | | | | |
4.886%, VAR ICE LIBOR USD 1 Month+2.400%, 04/25/2031 (A) | | | | | 820 | | | | 828 | |
CSMC, Ser 2014-USA, Cl E | | | | | | | | | | |
4.373%, 09/15/2037 (A) | | | | | 320 | | | | 293 | |
FHLMC Structured Agency Credit Risk Debt Notes, Ser 2017-DNA1, Cl M2 | | | | | | | | | | |
5.736%, VAR ICE LIBOR USD 1 Month+3.250%, 07/25/2029 | | | | | 1,570 | | | | 1,685 | |
First Franklin Mortgage Loan Trust, Ser 2006-FF15, Cl A5 | | | | | | | | | | |
2.646%, VAR ICE LIBOR USD 1 Month+0.160%, 11/25/2036 | | | | | 1,943 | | | | 1,887 | |
GAHR Commercial Mortgage Trust, Ser 2015-NRF, Cl GFX | | | | | | | | | | |
3.382%, 12/15/2034
(A)(E) | | | | | 3,177 | | | | 3,113 | |
GE Business Loan Trust, Ser 2007-1, Cl C | | | | | | | | | | |
2.934%, VAR LIBOR USD 1 Month+0.450%, 04/16/2035 (A) | | | | | 575 | | | | 552 | |
GreenPoint Mortgage Funding Trust, Ser 2005-AR1, Cl A2 | | | | | | | | | | |
2.926%, VAR ICE LIBOR USD 1 Month+0.440%, 06/25/2045 | | | | | 482 | | | | 462 | |
GreenPoint Mortgage Funding Trust, Ser 2006-AR1, Cl A1A | | | | | | | | | | |
3.066%, VAR ICE LIBOR USD 1 Month+0.580%, 02/25/2036 | | | | | 1,203 | | | | 1,192 | |
GS Mortgage Securities Trust, Ser 2014-GSFL, Cl D | | | | | | | | | | |
6.035%, VAR LIBOR USD 1 Month+3.900%, 07/15/2031 (A) | | | | | 266 | | | | 266 | |
GS Mortgage Securities Trust, Ser 2017-STAY, Cl E | | | | | | | | | | |
4.634%, VAR LIBOR USD 1 Month+2.150%, 07/15/2032 (A) | | | | | 1,000 | | | | 975 | |
GS Mortgage Securities Trust, Ser 2018-SRP5 | | | | | | | | | | |
5.731%, 09/15/2031 | | | | | 1,970 | | | | 1,972 | |
HarborView Mortgage Loan Trust, Ser 2006- 10, Cl 2A1B | | | | | | | | | | |
2.722%, VAR ICE LIBOR USD 1 Month+0.240%, 11/19/2036 | | | | | 3,310 | | | | 2,811 | |
Impac CMB Trust, Ser 2005-4, Cl 1M1 | | | | | | | | | | |
3.131%, VAR ICE LIBOR USD 1 Month+0.645%, 05/25/2035 | | | | | 1,859 | | | | 1,767 | |
| | | | | | | | | | |
| | | | |
| Description | | | | Face Amount (Thousands) | | Market Value ($ Thousands) |
|
MORTGAGE-BACKED SECURITIES (continued) | |
JPMorgan Mortgage Acquisition Trust, Ser 2007-CH5, Cl A5 | | | | | | | | | | |
2.746%, VAR ICE LIBOR USD 1 Month+0.260%, 06/25/2037 | | $ | | | 1,400 | | | $ | 1,372 | |
Lone Star Portfolio Trust, Ser 2015-LSP, Cl E | | | | | | | | | | |
8.334%, VAR LIBOR USD 1 Month+5.850%, 09/15/2028 (A) | | | | | 1,280 | | | | 1,288 | |
LSTAR Securities Investment, Ser 2017-9, Cl A | | | | | | | | | | |
4.052%, VAR ICE LIBOR USD 1 Month+1.550%, 12/01/2022 (A) | | | | | 2,327 | | | | 2,328 | |
Morgan Stanley Re-REMIC Trust, Ser 2010- R5, Cl 4B | | | | | | | | | | |
3.883%, 06/26/2036 (A) | | | | | 497 | | | | 456 | |
Nomura Resecuritization Trust, Ser 2015-4R, Cl 5A1 | | | | | | | | | | |
1.748%, VAR ICE LIBOR USD 1 Month+0.430%, 03/26/2036 (A) | | | | | 665 | | | | 641 | |
PFP III, Ser 2017-3, Cl C | | | | | | | | | | |
4.984%, VAR LIBOR USD 1 Month+2.500%, 01/14/2035 (A) | | | | | 675 | | | | 672 | |
Popular ABS Mortgage Pass-Through Trust, Ser 2005-6, Cl A4 | | | | | | | | | | |
3.786%, 01/25/2036 | | | | | 1,000 | | | | 998 | |
RALI Series Trust, Ser 2006-QO2, Cl A2 | | | | | | | | | | |
2.756%, VAR ICE LIBOR USD 1 Month+0.270%, 02/25/2046 | | | | | 1,605 | | | | 647 | |
RALI Series Trust, Ser 2007-QO2, Cl A1 | | | | | | | | | | |
2.636%, VAR ICE LIBOR USD 1 Month+0.150%, 02/25/2047 | | | | | 1,202 | | | | 682 | |
Structured Adjustable Rate Mortgage Loan Trust, Ser 2005-19XS, Cl 2A1 | | | | | | | | | | |
2.786%, VAR ICE LIBOR USD 1 Month+0.300%, 10/25/2035 | | | | | 573 | | | | 570 | |
Structured Asset Securities Mortgage Loan Trust, Ser 2006-GEL4, Cl M1 | | | | | | | | | | |
2.866%, VAR ICE LIBOR USD 1 Month+0.380%, 10/25/2036 (A) | | | | | 2,490 | | | | 2,467 | |
WaMu Mortgage Pass-Through Certificates Trust, Ser 2007-OA2, Cl 1A | | | | | | | | | | |
3.097%, VAR 12 Month Treas Avg+0.700%, 03/25/2047 | | | | | 831 | | | | 771 | |
Wells Fargo Mortgage-Backed Securities Trust, Ser 2005-AR12, Cl 2A5 | | | | | | | | | | |
4.881%, 06/25/2035 (E) | | | | | 253 | | | | 260 | |
| | |
SEI Institutional Managed Trust / Semi-Annual Report / March 31, 2019 | | 205 |
SCHEDULE OF INVESTMENTS (Unaudited)
March 31, 2019
Multi-Asset Income Fund(Continued)
| | | | | | | | |
| | | |
| Description | | Face Amount
(Thousands) | | Market Value ($ Thousands) | |
|
MORTGAGE-BACKED SECURITIES (continued) | |
WFCG Commercial Mortgage Trust, Ser 2015- BXRP, Cl C | | | | | | | | |
4.255%, VAR LIBOR USD 1 Month+1.772%, 11/15/2029 (A) | | $ | 844 | | | $ | 844 | |
| | | | | | | 40,411 | |
Total Mortgage-Backed Securities
(Cost $51,550) ($ Thousands) | | | | 52,437 | |
| |
MUNICIPAL BONDS — 0.4% | | | | | |
| | |
Illinois — 0.2% | | | | | | | | |
Illinois State, GO | | | | | | | | |
7.350%, 07/01/2035 | | | 225 | | | | 256 | |
5.100%, 06/01/2033 | | | 1,895 | | | | 1,862 | |
| | | | | | | 2,118 | |
| | |
Puerto Rico — 0.2% | | | | | | | | |
Puerto Rico, Sales Tax Financing, Sales Tax Revenue, Ser A, RB | | | | | | | | |
6.130%, 08/01/2028 (B) | | | 15 | | | | 13 | |
6.130%, 08/01/2029 (B) | | | 10 | | | | 8 | |
6.130%, 08/01/2030 (B) | | | 40 | | | | 33 | |
6.130%, 08/01/2037 (B) | | | 120 | | | | 100 | |
6.130%, 08/01/2038 (B) | | | 75 | | | | 63 | |
Puerto Rico, Sales Tax Financing, Sales Tax Revenue, Ser B, RB | | | | | | | | |
6.050%, 08/01/2036 (B) | | | 270 | | | | 225 | |
6.050%, 08/01/2037 (B) | | | 30 | | | | 25 | |
6.050%, 08/01/2039 (B) | | | 15 | | | | 13 | |
Puerto Rico, Sales Tax Financing, Sales Tax Revenue, Ser C, RB | | | | | | | | |
5.000%, 08/01/2021 (B) | | | 10 | | | | 9 | |
Puerto Rico, Sales Tax Financing, Sales Tax Revenue, Ser C, RB | | | | | | | | |
6.000%, 08/01/2031 (B) | | | 135 | | | | 113 | |
6.000%, 08/01/2032 (B) | | | 35 | | | | 29 | |
6.000%, 08/01/2038 (B) | | | 120 | | | | 100 | |
Puerto Rico, Sales Tax Financing, Sales Tax Revenue, Ser C, RB | | | | | | | | |
Callable 08/01/2019 @ 100 | | | | | | | | |
5.750%, 08/01/2057 (B) | | | 5 | | | | 4 | |
Puerto Rico, Sales Tax Financing, Sales Tax Revenue, Ser C, RB | | | | | | | | |
Callable 08/01/2021 @ 100 | | | | | | | | |
5.250%, 08/01/2040 (B) | | | 85 | | | | 72 | |
5.000%, 08/01/2040 (B) | | | 65 | | | | 55 | |
5.000%, 08/01/2046 (B) | | | 25 | | | | 21 | |
Puerto Rico, Sales Tax Financing, Sales Tax Revenue, Ser D, RB | | | | | | | | |
Callable 08/01/2021 @ 100 | | | | | | | | |
4.850%, 08/01/2036 (B) | | | 10 | | | | 8 | |
| | | | | | | | |
| | | |
| Description | | Face Amount
(Thousands) | | Market Value ($ Thousands) | |
|
MUNICIPAL BONDS (continued) | |
Puerto Rico, Sales Tax Financing, Sales Tax Revenue, Sub-Ser A, RB | | | | | | | | |
6.500%, 08/01/2044 (B) | | $ | 1,020 | | | $ | 520 | |
5.750%, 08/01/2037 (B) | | | 240 | | | | 122 | |
5.500%, 08/01/2028 (B) | | | 5 | | | | 3 | |
Puerto Rico, Sales Tax Financing, Sales Tax Revenue, Sub-Ser A, RB | | | | | | | | |
Callable 02/01/2020 @ 100 | | | | | | | | |
5.500%, 08/01/2037 (B) | | | 15 | | | | 8 | |
5.375%, 08/01/2039 (B) | | | 210 | | | | 107 | |
Puerto Rico, Sales Tax Financing, Sales Tax Revenue, Sub-Ser A-1, RB | | | | | | | | |
Callable 08/01/2021 @ 100 | | | | | | | | |
5.000%, 08/01/2043 (B) | | | 20 | | | | 10 | |
| | | | | | | 1,661 | |
| |
Total Municipal Bonds
(Cost $3,637) ($ Thousands) | | | | 3,779 | |
| |
CONVERTIBLE BONDS — 0.4% | | | | | |
Chegg | | | | | | | | |
0.125%, 03/15/2025 (A) | | | 270 | | | | 266 | |
Cheniere Energy CV to 83.03 | | | | | | | | |
4.250%, 03/15/2045 | | | 200 | | | | 156 | |
DP World | | | | | | | | |
1.750%, 06/19/2024 | | | 600 | | | | 579 | |
Innovate Capital Pte | | | | | | | | |
6.000%, 12/11/2024 | | | 62 | | | | 36 | |
Liberty Media | | | | | | | | |
2.125%, 03/31/2048 (A) | | | 1,460 | | | | 1,394 | |
2.250%, 12/01/2048 (A) | | | 90 | | | | 101 | |
Twitter | | | | | | | | |
1.000%, 09/15/2021 | | | 580 | | | | 546 | |
0.250%, 06/15/2024 (A) | | | 290 | | | | 268 | |
Western Digital | | | | | | | | |
1.500%, 02/01/2024 (A) | | | 190 | | | | 167 | |
| |
Total Convertible Bonds
(Cost $3,514) ($ Thousands) | | | | 3,513 | |
| | |
| | | Shares | | | |
| |
PREFERRED STOCK — 0.0% | | | | | |
| | |
Financials — 0.0% | | | | | | | | |
B. Riley Financial, 6.875% | | | 6,625 | | | | 168 | |
GSC Partners Fund V, Ser 2004-5I,
0.000% *(F) | | | 100 | | | | – | |
| | |
Total Preferred Stock
(Cost $204)
($ Thousands) | | | | | | | 168 | |
| | |
206 | | SEI Institutional Managed Trust / Semi-Annual Report / March 31, 2019 |
| | | | | | | | |
| | | |
| Description | | Face Amount
(Thousands) | | Market Value
($ Thousands) |
|
U.S. TREASURY OBLIGATION — 0.0% | |
U.S. Treasury Bonds | | | | | | | | |
3.375%, 11/15/2048 | | $ | 60 | | | $ | 67 | |
| | |
Total U.S. Treasury Obligation
(Cost $64) ($ Thousands) | | | | | | | 67 | |
| | |
Total Investments in
Securities — 94.3%
(Cost $868,617) ($ Thousands) | | | | | | $ | 891,766 | |
| | | | | | | | |
| | | | | | | | |
| | | |
| Description | | Contracts | | Market Value ($ Thousands) |
| |
PURCHASED OPTIONS* — 0.0% | | | | | |
| | |
Total Purchased Options(I)
(Cost $301) ($ Thousands) | | | 19,930,137 | | | $ | 206 | |
| | | | | | | | |
| |
WRITTEN OPTIONS* — (0.4)% | | | | | |
| | |
Total Written Options(I)
(Premiums Received $2,445) ($ Thousands) | | | (8,000,651 | ) | | $ | (3,460 | ) |
| | | | | | | | |
A list of the open exchange traded options contracts for the Fund at March 31, 2019, is as follows:
| | | | | | | | | | | | | | | | | | | | |
| Description | | Number of Contracts | | Notional Amount (Thousands) | | Exercise Price | | | Expiration Date | | | Value (Thousands) |
| | | |
PURCHASED OPTIONS — 0.0% | | | | | | | | | | | | | |
| | | | | |
Put Options | | | | | | | | | | | | | | | | | | | | |
June 2019, BRL Call USD Put* | | | 1,600,000 | | | $ | 30 | † | | | $3.82 | | | | 06/22/19 | | | $ | 23 | |
May 2019, S&P 500 E-mini 3rd Week Option* | | | 16 | | | | 16 | † | | | 2,500.00 | | | | 05/18/19 | | | | 3 | |
May 2019, S&P 500 E-mini 3rd Week Option* | | | 32 | | | | 28 | † | | | 2,550.00 | | | | 05/18/19 | | | | 10 | |
May 2019, S&P 500 E-mini 3rd Week Option* | | | 18 | | | | 32 | † | | | 2,600.00 | | | | 05/18/19 | | | | 8 | |
June 2019, S&P 500 E-mini Option* | | | 71 | | | | 82 | † | | | 2,600.00 | | | | 06/22/19 | | | | 71 | |
| | | | | |
| | | | | | | 188 | | | | | | | | | | | | 115 | |
Call Options | | | | | | | | | | | | | | | | | | | | |
June 2019, USD Call EUR Put* | | | 3,200,000 | | | | 22 | † | | | 1.14 | | | | 06/22/19 | | | | 26 | |
| | | | | |
Total Purchased Options | | | | | | $ | 210 | | | | | | | | | | | $ | 141 | |
| | | | | | | | | | | | | | | | | | | | |
| | | |
WRITTEN OPTIONS — (0.4)% | | | | | | | | | | | | | |
| | | | | |
Put Options | | | | | | | | | | | | | | | | | | | | |
May 2019, S&P 500 E-mini 3rd Week Option* | | | (32 | ) | | $ | (11 | )† | | | 2,350.00 | | | | 05/18/19 | | | $ | (3 | ) |
May 2019, S&P 500 E-mini 3rd Week Option* | | | (18 | ) | | | (15 | )† | | | 2,450.00 | | | | 05/18/19 | | | | (3 | ) |
June 2019, S&P 500 E-mini Option* | | | (71 | ) | | | (32 | )† | | | 2,400.00 | | | | 06/22/19 | | | | (25 | ) |
| | | | | |
| | | | | | | (58 | ) | | | | | | | | | | | (31 | ) |
| | | | | |
Call Options | | | | | | | | | | | | | | | | | | | | |
June 2019, USD Call BRL Put* | | | (1,600,000 | ) | | $ | (30 | )† | | | 4.02 | | | | 06/22/19 | | | $ | (32 | ) |
June 2019, USD Call CAD Put* | | | (3,200,000 | ) | | | (15 | )† | | | 1.37 | | | | 06/22/19 | | | | (9 | ) |
June 2019, USD Call EUR Put* | | | (1,600,000 | ) | | | (8 | )† | | | 1.11 | | | | 06/22/19 | | | | (12 | ) |
June 2019, USD Call EUR Put* | | | (1,600,000 | ) | | | (8 | )† | | | 1.10 | | | | 06/22/19 | | | | (47 | ) |
SPX US 4/18/19 C2780* | | | (260 | ) | | | (73,695 | ) | | | 2,780.00 | | | | 04/20/19 | | | | (1,738 | ) |
SPX US 4/18/19 C2790* | | | (260 | ) | | | (73,694 | ) | | | 2,790.00 | | | | 04/20/19 | | | | (1,584 | ) |
May 2019, U.S. 5 Year Future Option* | | | (10 | ) | | | (1,158 | ) | | | 115.25 | | | | 04/20/19 | | | | (7 | ) |
| | | | | | | (148,547 | ) | | | | | | | | | | | (3,429 | ) |
Total Written Options | | | | | | $ | (148,605 | ) | | | | | | | | | | $ | (3,460 | ) |
| | | | | | | | | | | | | | | | | | | | |
| | |
SEI Institutional Managed Trust / Semi-Annual Report / March 31, 2019 | | 207 |
SCHEDULE OF INVESTMENTS (Unaudited)
March 31, 2019
Multi-Asset Income Fund(Continued)
A list of the open OTC options contracts for the Fund at March 31, 2019, is as follows:
| | | | | | | | | | | | | | | | | | | | | | | | |
| Description | | Counterparty | | | Number of Contracts | | | Notional Amount
(Thousands)† | | | Exercise Price | | Expiration Date | | | Value
(Thousands) |
| | | | | |
PURCHASED OPTIONS — 0.0% | | | | | | | | | | | | | | | | | | | | | |
| | | | | | |
Put Options | | | | | | | | | | | | | | | | | | | | | | | | |
April 2019, AUD Call USD Put* | | | JPMorgan Chase Bank | | | | 3,240,000 | | | $ | 26 | | | | $0.74 | | | | 04/20/19 | | | $ | – | |
| | | | | | |
Call Options | | | | | | | | | | | | | | | | | | | | | | | | |
April 2019, USD Call CNH Put* | | | JPMorgan Chase Bank | | | | 8,650,000 | | | | 30 | | | | 6.78 | | | | 04/20/19 | | | | 18 | |
May 2019, USD Call AUD Put* | | | JPMorgan Chase Bank | | | | 3,240,000 | | | | 36 | | | | 0.70 | | | | 05/18/19 | | | | 47 | |
Total Purchased Option | | | | | | | | | | $ | 92 | | | | | | | | | | | $ | 65 | |
| | | | | | | | | | | | | | | | | | | | | | | | |
| | | | | | |
† Represents cost. | | | | | | | | | | | | | | | | | | | | | | | | |
A list of the open futures contracts held by the Fund at March 31, 2019, is as follows:
| | | | | | | | | | | | | | | | | | | | | | | | |
| Type of Contract | | Number of
Contracts
Long (Short) | | | Expiration
Date | | | Notional Amount
(Thousands) | | | | Value
(Thousands) | | | | Unrealized
Appreciation/
(Depreciation)
(Thousands) |
90-Day Euro$ | | | 127 | | | | Dec-2019 | | | $ | 30,809 | | | | | $ | 30,978 | | | | | $ | 170 | |
90-Day Euro$ | | | 284 | | | | Jun-2020 | | | | 68,871 | | | | | | 69,420 | | | | | | 550 | |
Australian 10-Year Bond | | | 21 | | | | Jun-2019 | | | | 2,041 | | | | | | 2,067 | | | | | | 25 | |
Euro-Bund | | | (76 | ) | | | Jun-2019 | | | | (14,062 | ) | | | | | (14,195 | ) | | | | | (301 | ) |
Long Gilt 10-Year Bond | | | (12 | ) | | | Jun-2019 | | | | (1,997 | ) | | | | | (2,023 | ) | | | | | (31 | ) |
S&P 500 Index E-MINI | | | 262 | | | | Jun-2019 | | | | 36,282 | | | | | | 37,175 | | | | | | 893 | |
U.S. 2-Year Treasury Note | | | 167 | | | | Jul-2019 | | | | 35,458 | | | | | | 35,587 | | | | | | 129 | |
U.S. 2-Year Treasury Note | | | (1 | ) | | | Jul-2019 | | | | (212 | ) | | | | | (213 | ) | | | | | (1 | ) |
U.S. 5-Year Treasury Note | | | (726 | ) | | | Jul-2019 | | | | (83,612 | ) | | | | | (84,091 | ) | | | | | (479 | ) |
U.S. 5-Year Treasury Note | | | 190 | | | | Jul-2019 | | | | 21,790 | | | | | | 22,007 | | | | | | 217 | |
U.S. 10-Year Treasury Note | | | 612 | | | | Jun-2019 | | | | 75,270 | | | | | | 76,022 | | | | | | 752 | |
U.S. Long Treasury Bond | | | (29 | ) | | | Jun-2019 | | | | (4,220 | ) | | | | | (4,340 | ) | | | | | (120 | ) |
U.S. Long Treasury Bond | | | 82 | | | | Jun-2019 | | | | 11,944 | | | | | | 12,272 | | | | | | 328 | |
U.S. Ultra Long Treasury Bond | | | 158 | | | | Jun-2019 | | | | 25,641 | | | | | | 26,544 | | | | | | 903 | |
Ultra 10-Year U.S. Treasury Note | | | (113 | ) | | | Jun-2019 | | | | (14,693 | ) | | | | | (15,006 | ) | | | | | (313 | ) |
| | | | | | | | | | $ | 189,310 | | | | | $ | 192,204 | | | | | $ | 2,722 | |
| | | | | | | | | | | | | | | | | | | | | | | | |
A list of the open forward foreign currency contracts held by the Fund at March 31, 2019, is as follows:
| | | | | | | | | | | | | | | | | | | | |
| Counterparty | | Settlement Date | | | | | Currency to Deliver (Thousands) | | | | | Currency to Receive (Thousands) | | | Unrealized
Appreciation
(Depreciation)
(Thousands) |
Barclays PLC | | | 04/01/19 - 04/17/19 | | | USD | | | 3,044 | | | CAD | | | 4,032 | | | $ | (25 | ) |
Barclays PLC | | | 04/16/19 | | | USD | | | 1,257 | | | INR | | | 89,201 | | | | 27 | |
Barclays PLC | | | 04/17/19 | | | USD | | | 25 | | | TWD | | | 752 | | | | – | |
Barclays PLC | | | 04/17/19 | | | AUD | | | 120 | | | USD | | | 86 | | | | – | |
Barclays PLC | | | 04/17/19 | | | GBP | | | 10 | | | USD | | | 13 | | | | – | |
Barclays PLC | | | 04/17/19 | | | GBP | | | 150 | | | USD | | | 195 | | | | – | |
Barclays PLC | | | 04/17/19 | | | USD | | | 1,280 | | | MXN | | | 24,697 | | | | (10 | ) |
Barclays PLC | | | 04/17/19 | | | CAD | | | 2,640 | | | USD | | | 1,996 | | | | 19 | |
Barclays PLC | | | 04/17/19 | | | EUR | | | 4,250 | | | USD | | | 4,922 | | | | 143 | |
Barclays PLC | | | 04/17/19 | | | RUB | | | 127,580 | | | USD | | | 1,935 | | | | (2 | ) |
Barclays PLC | | | 05/15/19 | | | ARS | | | 32,011 | | | USD | | | 778 | | | | 84 | |
Citigroup | | | 04/17/19 | | | USD | | | 609 | | | BRL | | | 2,360 | | | | (3 | ) |
Citigroup | | | 04/17/19 | | | USD | | | 993 | | | AUD | | | 1,380 | | | | (12 | ) |
Citigroup | | | 04/17/19 | | | CAD | | | 1,100 | | | USD | | | 830 | | | | 7 | |
Citigroup | | | 04/17/19 | | | USD | | | 1,981 | | | MXN | | | 38,429 | | | | (5 | ) |
Citigroup | | | 04/17/19 | | | USD | | | 2,193 | | | IDR | | | 31,932,290 | | | | 42 | |
| | |
208 | | SEI Institutional Managed Trust / Semi-Annual Report / March 31, 2019 |
| | | | | | | | | | | | | | | | | | | | | | | | |
| Counterparty | | Settlement Date | | | | | | Currency to Deliver (Thousands) | | | | | | Currency to Receive (Thousands) | | | Unrealized Appreciation (Depreciation) (Thousands) |
| | | | | | |
Citigroup | | | 04/17/19 | | | | AUD | | | | 2,563 | | | | USD | | | | 1,838 | | | $ | 17 | |
| | | | | | |
Citigroup | | | 04/17/19 | | | | AUD | | | | 65 | | | | USD | | | | 46 | | | | – | |
| | | | | | |
Citigroup | | | 04/17/19 | | | | USD | | | | 2,874 | | | | JPY | | | | 308,715 | | | | (80 | ) |
| | | | | | |
Citigroup | | | 04/17/19 | | | | USD | | | | 1,155 | | | | GBP | | | | 900 | | | | 18 | |
| | | | | | |
Citigroup | | | 04/17/19 | | | | USD | | | | 2,710 | | | | GBP | | | | 2,051 | | | | (35 | ) |
| | | | | | |
Citigroup | | | 04/17/19 | | | | USD | | | | 4,174 | | | | EUR | | | | 3,660 | | | | (59 | ) |
| | | | | | |
Citigroup | | | 04/17/19 | | | | EUR | | | | 4,386 | | | | USD | | | | 5,072 | | | | 140 | |
| | | | | | |
Citigroup | | | 04/17/19 | | | | RUB | | | | 141,970 | | | | USD | | | | 2,093 | | | | (63 | ) |
| | | | | | |
Citigroup | | | 04/17/19 | | | | JPY | | | | 176,340 | | | | USD | | | | 1,591 | | | | (5 | ) |
| | | | | | |
Citigroup | | | 05/15/19 | | | | ARS | | | | 8,120 | | | | USD | | | | 198 | | | | 22 | |
| | | | | | |
Citigroup | | | 07/17/19 | | | | BRL | | | | 2,360 | | | | USD | | | | 605 | | | | 3 | |
| | | | | | |
Goldman Sachs | | | 04/26/19 | | | | EUR | | | | 17,765 | | | | USD | | | | 20,375 | | | | 386 | |
| | | | | | |
JPMorgan Chase Bank | | | 04/01/19 - 04/17/19 | | | | CAD | | | | 2,210 | | | | USD | | | | 1,678 | | | | 22 | |
| | | | | | |
JPMorgan Chase Bank | | | 04/03/19 | | | | ZAR | | | | 20,054 | | | | USD | | | | 1,432 | | | | 42 | |
| | | | | | |
JPMorgan Chase Bank | | | 04/12/19 | | | | GBP | | | | 1,418 | | | | USD | | | | 1,828 | | | | (20 | ) |
| | | | | | |
JPMorgan Chase Bank | | | 04/17/19 | | | | GBP | | | | 50 | | | | USD | | | | 65 | | | | (1 | ) |
| | | | | | |
JPMorgan Chase Bank | | | 04/17/19 | | | | USD | | | | 648 | | | | CAD | | | | 870 | | | | 4 | |
| | | | | | |
JPMorgan Chase Bank | | | 04/17/19 | | | | TWD | | | | 752 | | | | USD | | | | 24 | | | | – | |
| | | | | | |
JPMorgan Chase Bank | | | 04/17/19 | | | | BRL | | | | 2,360 | | | | USD | | | | 630 | | | | 24 | |
| | | | | | |
JPMorgan Chase Bank | | | 04/17/19 - 04/26/19 | | | | USD | | | | 3,485 | | | | EUR | | | | 3,086 | | | | (15 | ) |
| | | | | | |
JPMorgan Chase Bank | | | 04/17/19 | | | | EUR | | | | 9,869 | | | | USD | | | | 11,312 | | | | 216 | |
| | | | | | |
JPMorgan Chase Bank | | | 04/26/19 | | | | EUR | | | | 1,288 | | | | USD | | | | 1,464 | | | | 15 | |
| | | | | | |
JPMorgan Chase Bank | | | 07/17/19 | | | | USD | | | | 24 | | | | TWD | | | | 752 | | | | – | |
| | | | | | |
Standard Bank | | | 04/26/19 | | | | USD | | | | 365 | | | | EUR | | | | 322 | | | | (3 | ) |
| | | | | | | | | | | | | | | | | | | | | | | | |
| | | | | | | | | | | | | | | | | | | | | | $ | 893 | |
| | | | | | | | | |
A list of the open centrally cleared swap agreements held by the Fund at March 31, 2019 is as follows:
| | | | | | | | | | | | | | | | | | | | | | | | | | | | | | | | |
| Credit Default Swaps | |
| Reference Entity/ Obligation | | Buy/Sell
Protection | | | (Pays)/ Receives Rate | | | Payment Frequency | | | Termination Date | | | Notional Amount (Thousands) | | | Value (Thousands) | | Upfront Payments/
Receipts (Thousands) | | Net Unrealized Appreciation (Depreciation) (Thousands) |
CDX.NA.HY.30 | | | Sell | | | | 5.00% | | | | Quarterly | | | | 06/20/2023 | | | | $(24,075 | ) | | | $ 1,657 | | | | $ 1,573 | | | | $ 84 | |
CDX.NA.HY.31 | | | Sell | | | | 5.00% | | | | Quarterly | | | | 12/20/2023 | | | | (8,000 | ) | | | 524 | | | | 286 | | | | 238 | |
CDX.NA.HY.32 | | | Buy | | | | 5.00% | | | | Quarterly | | | | 06/20/2024 | | | | 3,090 | | | | (207 | ) | | | (187 | ) | | | (19 | ) |
CDX.NA.IG.31 | | | Sell | | | | 1.00% | | | | Quarterly | | | | 12/20/2023 | | | | (14,475 | ) | | | 282 | | | | 284 | | | | (3 | ) |
ICE CD BA | | | Sell | | | | 1.00% | | | | Quarterly | | | | 06/20/2024 | | | | (525 | ) | | | 12 | | | | 13 | | | | (1 | ) |
ICE CD CDXIG | | | Sell | | | | 1.00% | | | | Quarterly | | | | 06/20/2024 | | | | (19,125 | ) | | | 343 | | | | 296 | | | | 47 | |
ICE CD CXPHY | | | Sell | | | | 5.00% | | | | Quarterly | | | | 06/20/2024 | | | | $(2,450 | ) | | | 164 | | | | 154 | | | | 9 | |
ICE CD ITXEB | | | Buy | | | | 1.00% | | | | Quarterly | | | | 06/20/2024 | | | | 15,925 | | | | (324 | ) | | | (295 | ) | | | (29 | ) |
ICE CD RUSSIA | | | Buy | | | | 1.00% | | | | Quarterly | | | | 06/20/2023 | | | | 350 | | | | 2 | | | | 3 | | | | (1 | ) |
ICE CD RUSSIA | | | Buy | | | | 1.00% | | | | Quarterly | | | | 12/20/2023 | | | | 1,720 | | | | 20 | | | | 21 | | | | (1 | ) |
ICE CD SOAF | | | Buy | | | | 1.00% | | | | Quarterly | | | | 12/20/2023 | | | | 3,450 | | | | 129 | | | | 108 | | | | 21 | |
ICE CD TURKEY | | | Buy | | | | 1.00% | | | | Quarterly | | | | 12/12/2023 | | | | 530 | | | | 67 | | | | 47 | | | | 21 | |
ICE CD TURKEY | | | Sell | | | | 1.00% | | | | Quarterly | | | | 06/20/2024 | | | | (580 | ) | | | (27 | ) | | | (79 | ) | | | 51 | |
US195325BB02 | | | Sell | | | | 1.00% | | | | Quarterly | | | | 12/20/2023 | | | | (5,060 | ) | | | 6 | | | | (51 | ) | | | 58 | |
US718286AP29 | | | Sell | | | | 1.00% | | | | Quarterly | | | | 12/20/2023 | | | | (740 | ) | | | 15 | | | | 2 | | | | 13 | |
| | | | | | | | | | | | | | | | | | | | | | | | | | | | | | | | |
| | | | | | | | | | | | | | | | | | | | | | | $ 2,663 | | | | $ 2,175 | | | | $ 488 | |
| | | | | | | | | | | | | | | | | | | | | | | | | | | | | | | | |
| | |
SEI Institutional Managed Trust / Semi-Annual Report / March 31, 2019 | | 209 |
SCHEDULE OF INVESTMENTS (Unaudited)
March 31, 2019
Multi-Asset Income Fund(Concluded)
| | | | | | | | | | | | | | | | | | | | | | | | |
| Interest Rate Swaps | |
| Fund Pays | | Fund Receives | | Payment Frequency | | Termination Date | | Currency | | Notional
Amount
(Thousands) | | | Value (Thousands) | | Upfront Payments/ Receipts (Thousands) | | Net Unrealized Appreciation (Depreciation) (Thousands) |
8.36% | | 28D MXN-TIIE-Banxico | | Monthly | | 03/18/2020 | | MXN | | | 280,725 | | | | $ (6 | ) | | | $ (4 | ) | | | $ (2 | ) |
3-MONTH ZAR - JIBOR | �� | 7.50% | | Quarterly | | 09/19/2020 | | ZAR | | | 13,450 | | | | 5 | | | | 1 | | | | 5 | |
BZDIOVRA | | 8.00% | | Monthly | | 01/04/2021 | | BRL | | | 3,700 | | | | 14 | | | | – | | | | 13 | |
7.95% | | 28D MXN-TIIE-BANXICO | | Monthly | | 06/16/2021 | | MXN | | | 35,450 | | | | (1 | ) | | | – | | | | (1 | ) |
6M GBP LIBOR | | 1.271% | | Semi-Annually | | 10/26/2021 | | GBP | | | 3,462 | | | | (20 | ) | | | 1 | | | | (21 | ) |
0.25% | | 6-MONTH EUR - EURIBOR | | Semi-Annually | | 06/19/2022 | | EUR | | | 2,290 | | | | (29 | ) | | | (20 | ) | | | (9 | ) |
BZDIOVRA | | 7.90% | | Monthly | | 01/02/2023 | | BRL | | | 7,775 | | | | (24 | ) | | | (2 | ) | | | (23 | ) |
0.50% | | 6-MONTH EUR - EURIBOR | | Semi-Annually | | 06/19/2024 | | EUR | | | 4,390 | | | | (114 | ) | | | (72 | ) | | | (41 | ) |
2.25% | | 3MLIBOR | | Quarterly | | 12/31/2025 | | USD | | | 4,464 | | | | 15 | | | | 6 | | | | 9 | |
2.50% | | 3MLIBOR | | Quarterly | | 01/31/2026 | | USD | | | 18,546 | | | | (169 | ) | | | (262 | ) | | | 92 | |
0.75% | | 6-MONTH EUR - EURIBOR | | Semi-Annually | | 06/19/2026 | | EUR | | | 5,650 | | | | (233 | ) | | | (145 | ) | | | (88 | ) |
1.50% | | 6M LIBOR-BBA | | Semi-Annually | | 06/19/2029 | | GBP | | | 680 | | | | (24 | ) | | | 1 | | | | (25 | ) |
1.00% | | 6-MONTH EUR - EURIBOR | | Semi-Annually | | 06/19/2029 | | EUR | | | 1,360 | | | | (64 | ) | | | (41 | ) | | | (22 | ) |
1.50% | | 6-MONTH EUR - EURIBOR | | Semi-Annually | | 06/19/2039 | | EUR | | | 480 | | | | (50 | ) | | | (27 | ) | | | (23 | ) |
2.875% | | 3M LIBOR | | Quarterly | | 05/15/2044 | | USD | | | 4,292 | | | | (238 | ) | | | 20 | | | | (258 | ) |
2.75% | | 3MLIBOR | | Quarterly | | 08/15/2044 | | USD | | | 4,284 | | | | (134 | ) | | | (14 | ) | | | (120 | ) |
| | | | | | | | | | | | | | | | | | | | | | | | |
| | | | | | | | | | | | | | | $ (1,072 | ) | | | $ (558 | ) | | | $ (514 | ) |
| | | | | | | | | | | | | | | | | | | | | | | | |
| | Percentages are based on Net Assets of $945,586 ($ Thousands). |
| * | Non-income producing security. |
| ‡ | Real Estate Investment Trust. |
| (A) | Security exempt from registration under Rule 144A of the Securities Act of 1933. These securities may be resold in transactions exempt from registration normally to qualified institutions. On March 31, 2019, the value of these securities amounted to $299,449 ($ Thousands), representing 31.7% of the Net Assets of the Fund. |
| (B) | Security is in default on interest payment. |
| (C) | Step Bonds – Represents the current rate, the step rate, the step date and the final maturity date. |
| (D) | Zero coupon security. The rate shown on the Schedule of Investments is the security’s effective yield at the time of purchase. |
| (E) | Variable or floating rate security, the interest rate of which adjusts periodically based on changes in current interest rates and prepayments on the underlying pool of assets. |
| (F) | Level 3 security in accordance with fair value hierarchy. |
| (G) | Securities considered illiquid. The total value of such securities as of March 31, 2019 was $281 ($ Thousands) and represented 0.0% of the Net Assets of the Fund. |
| (H) | Interest rate may not be available. |
| (I) | Refer to table below for details on Options Contracts. |
ABS — Asset-Backed Security
ARS — Argentine Peso
AUD — Australian Dollar
BADLAR— Buenos Aires Deposits of Large Amount Rate
BBA — British Bankers Association
BRL — Brazilian Real
CAD — Canadian Dollar
CDO — Collateralized Debt Obligation
Cl — Class
CLO — Collateralized Loan Obligation
CMO — Collateralized Mortgage Obligation
CNH — Chinese Yuan onshore
DAC — Designated Activity Company
EGP — Egyptian Pound
EUR — Euro
EURIBOR — Euro Interbank Offered Rate
FHLMC — Federal Home Loan Mortgage Corporation
FNMA — Federal National Mortgage Association
GBP — British Pound Sterling
GNMA — Government National Mortgage Association
GO — General Obligation
ICE— Intercontinental Exchange
IDR — Indonesian Rupiah
INR — Indian Rupee
IO — Interest Only — face amount represents notional amount.
JIBOR — Jakarta Interbank Offered Rate
JPY — Japanese Yen
JSC — Joint-Stock Company
LIBOR— London Interbank Offered Rate
LLC — Limited Liability Company
L.P. — Limited Partnership
Ltd. — Limited
MTN — Medium Term Note
MXN — Mexican Peso
MXN-TIIE-BANXICO — Interbank Equilibrium Interest Rate for MXN
NASDAQ – National Association of Securities Dealers and Automated Quotations
PIK — Payment-in-Kind
PLC — Public Limited Company
RB — Revenue Bond
REIT — Real Estate investment Trust
REREMIC — Resecuritization of Real Estate Mortgage Investment Conduit
RUB — Russian Ruble
S&P— Standard & Poor’s
SPX — Standard & Poor’s 500 Index
TWD — Taiwan Dollar
ULC — Unlimited Liability Company
USD — United States Dollar
VAR — Variable Rate
ZAR — South African Rand
| | |
210 | | SEI Institutional Managed Trust / Semi-Annual Report / March 31, 2019 |
The following is a list of the level of inputs used as of March 31, 2019, in valuing the Fund’s investments and other financial instruments carried at value ($ Thousands):
| | | | | | | | | | | | | | | | |
Investments in Securities | | Level 1 | | Level 2 | | Level 3(1) | | Total |
Corporate Obligations | | $ | – | | | $ | 428,107 | | | $ | – | | | $ | 428,107 | |
Sovereign Debt | | | – | | | | 151,976 | | | | – | | | | 151,976 | |
Common Stock | | | 107,689 | | | | 33 | | | | 57 | | | | 107,779 | |
Asset-Backed Securities | | | – | | | | 74,351 | | | | 1 | | | | 74,352 | |
Loan Participations | | | – | | | | 67,521 | | | | 2,067 | | | | 69,588 | |
Mortgage-Backed Securities | | | – | | | | 52,437 | | | | – | | | | 52,437 | |
Municipal Bonds | | | – | | | | 3,779 | | | | – | | | | 3,779 | |
Convertible Bonds | | | – | | | | 3,513 | | | | – | | | | 3,513 | |
Preferred Stock | | | 168 | | | | – | | | | – | | | | 168 | |
U.S. Treasury Obligation | | | – | | | | 67 | | | | – | | | | 67 | |
| | | | | | | | | | | | | | | | |
Total Investments in Securities | | $ | 107,857 | | | $ | 781,784 | | | $ | 2,125 | | | $ | 891,766 | |
| | | | | | | | | | | | | | | | |
| | | | | | | | | | | | | | | | |
Other Financial
Instruments | | Level 1 | | Level 2 | | Level 3 | | Total |
Purchased Options | | $ | 206 | | | $ | – | | | $ | – | | | $ | 206 | |
Written Options | | | (3,460 | ) | | | – | | | | – | | | | (3,460 | ) |
Futures Contracts* | | | | | | | | | | | | | | | | |
Unrealized Appreciation | | | 3,967 | | | | – | | | | – | | | | 3,967 | |
Unrealized Depreciation | | | (1,245 | ) | | | – | | | | – | | | | (1,245 | ) |
Forwards Contracts* | | | | | | | | | | | | | | | | |
Unrealized Appreciation | | | – | | | | 1,231 | | | | – | | | | 1,231 | |
Unrealized Depreciation | | | – | | | | (338 | ) | | | – | | | | (338 | ) |
Centrally Cleared Swaps | | | | | | | | | | | | | | | | |
Credit Default Swaps* | | | | | | | | | | | | | | | | |
Unrealized Appreciation | | | – | | | | 542 | | | | – | | | | 542 | |
Unrealized Depreciation | | | – | | | | (54 | ) | | | – | | | | (54 | ) |
Interest Rate Swaps* | | | | | | | | | | | | | | | | |
Unrealized Appreciation | | | – | | | | 119 | | | | – | | | | 119 | |
Unrealized Depreciation | | | – | | | | (633 | ) | | | – | | | | (633 | ) |
| | | | | | | | | | | | | | | | |
Total Other Financial Instruments | | $ | (532 | ) | | $ | 867 | | | $ | – | | | $ | 335 | |
| | | | | | | | | | | | | | | | |
(1) A reconciliation of Level 3 investments and disclosures of significant unobservable inputs are presented when the Fund has 1% of Level 3 investments at the beginning and/or end of the period in relation to net assets. Management has concluded that Level 3 investments are not material in relation to net assets.
* Futures contracts, forward contracts and swap contracts are valued at the unrealized appreciation (depreciation) on the instrument.
For the period ended March 31, 2019, there were no transfers between Level 1 and Level 2 assets and liabilities.
For the period ended March 31, 2019, there were transfers between Level 2 and Level 3 assets and liabilities due to the availability of observable inputs to determine fair value.
For more information on valuation inputs, see Note 2 – Significant Accounting Policies in Notes to Financial Statements.
Amounts designated as “—” are either $0 or have been rounded to $0.
The accompanying notes are an integral part of the financial statements.
| | |
SEI Institutional Managed Trust / Semi-Annual Report / March 31, 2019 | | 211 |
CONSOLIDATED SCHEDULE OF INVESTMENTS (Unaudited)
March 31, 2019
Multi-Asset Inflation Managed Fund
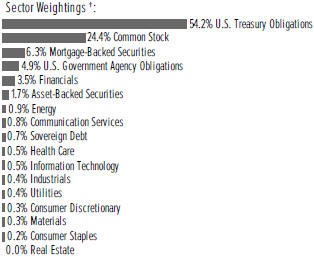
†Percentages are based on total investments.
| | | | | | | | |
| | | |
| Description | | Face Amount
(Thousands) | | | Market Value
($ Thousands) | |
|
U.S. TREASURY OBLIGATIONS — 64.5% | |
U.S. Treasury Bills ** | | | | | | | | |
2.504%, 07/18/2019 (A) | | $ | 34,500 | | | $ | 34,256 | |
2.451%, 08/15/2019 (A) | | | 40,500 | | | | 40,135 | |
U.S. Treasury Inflation Protected Securities | | | | | | | | |
1.250%, 07/15/2020 | | | 59,856 | | | | 60,736 | |
0.625%, 07/15/2021 | | | 100,365 | | | | 101,253 | |
0.625%, 04/15/2023 | | | 55,041 | | | | 55,422 | |
0.375%, 07/15/2023 | | | 11,298 | | | | 11,324 | |
0.375%, 07/15/2025 | | | 21,752 | | | | 21,732 | |
0.125%, 04/15/2020 | | | 51,167 | | | | 50,924 | |
0.125%, 04/15/2021 | | | 27,434 | | | | 27,215 | |
0.125%, 04/15/2022 | | | 35,956 | | | | 35,584 | |
0.125%, 07/15/2022 | | | 53,698 | | | | 53,409 | |
0.125%, 01/15/2023 | | | 13,806 | | | | 13,648 | |
0.125%, 07/15/2024 | | | 19,293 | | | | 19,049 | |
0.125%, 07/15/2026 | | | 14,600 | | | | 14,279 | |
U.S. Treasury Notes | | | | | | | | |
2.540%, VAR US Treasury 3 Month Bill Money Market Yield+0.115%, 01/31/2021 | | | 9,700 | | | | 9,691 | |
2.445%, VAR US Treasury 3 Month Bill Money Market Yield+0.045%, 10/31/2020 | | | 5,000 | | | | 4,993 | |
2.443%, VAR US Treasury 3 Month Bill Money Market Yield+0.043%, 07/31/2020 | | | 6,000 | | | | 5,994 | |
2.433%, VAR US Treasury 3 Month Bill Money Market Yield+0.033%, 04/30/2020 | | | 2,000 | | | | 1,999 | |
| |
Total U.S. Treasury Obligations (Cost $561,094) ($ Thousands) | | | | 561,643 | |
| | | | | | | | |
| | | |
| Description | | Shares | | | Market Value
($ Thousands) | |
|
COMMON STOCK — 29.1% | |
| |
Communication Services — 2.3% | | | | | |
Activision Blizzard Inc | | | 7,273 | | | $ | 331 | |
Alphabet Inc, Cl A * | | | 1,892 | | | | 2,227 | |
Alphabet Inc, Cl C * | | | 1,926 | | | | 2,260 | |
AT&T Inc (F) | | | 102,331 | | | | 3,209 | |
CenturyLink Inc | | | 13,415 | | | | 161 | |
Cinemark Holdings Inc | | | 2,200 | | | | 88 | |
Cogent Communications Holdings Inc | | | 600 | | | | 32 | |
Consolidated Communications Holdings Inc | | | 3,466 | | | | 38 | |
Electronic Arts Inc * | | | 2,883 | | | | 293 | |
Facebook Inc, Cl A * | | | 15,568 | | | | 2,595 | |
Fox Corp * | | | 5,433 | | | | 198 | |
IAC/InterActiveCorp * | | | 400 | | | | 84 | |
Iridium Communications Inc * | | | 2,600 | | | | 69 | |
Liberty Media Corp-Liberty Formula One, Cl C * | | | 3,000 | | | | 105 | |
Live Nation Entertainment Inc * | | | 1,600 | | | | 102 | |
Madison Square Garden Co/The * | | | 200 | | | | 58 | |
Netflix Inc * | | | 4,005 | | | | 1,428 | |
Shenandoah Telecommunications Co | | | 1,300 | | | | 58 | |
Sprint Corp * | | | 9,008 | | | | 51 | |
Take-Two Interactive Software Inc, Cl A * | | | 1,100 | | | | 104 | |
Telephone & Data Systems Inc | | | 3,122 | | | | 96 | |
T-Mobile US Inc * | | | 4,127 | | | | 285 | |
TripAdvisor Inc * | | | 800 | | | | 41 | |
Twitter Inc * | | | 4,192 | | | | 138 | |
Verizon Communications Inc | | | 56,944 | | | | 3,367 | |
Viacom Inc, Cl B | | | 4,000 | | | | 112 | |
Vonage Holdings Corp * | | | 4,800 | | | | 48 | |
Walt Disney Co/The | | | 19,724 | | | | 2,190 | |
World Wrestling Entertainment Inc, Cl A | | | 400 | | | | 35 | |
Zayo Group Holdings Inc * | | | 3,761 | | | | 107 | |
Zynga Inc, Cl A * | | | 14,800 | | | | 79 | |
| | |
| | | | | | | 19,989 | |
| |
Consumer Staples — 7.4% | | | | | |
Altria Group Inc (F) | | | 65,414 | | | | 3,757 | |
Andersons Inc/The | | | 1,500 | | | | 48 | |
Archer-Daniels-Midland Co | | | 20,079 | | | | 866 | |
B&G Foods Inc, Cl A | | | 2,329 | | | | 57 | |
BJ’s Wholesale Club Holdings Inc * | | | 2,000 | | | | 55 | |
Boston Beer Co Inc/The, Cl A * | | | 350 | | | | 103 | |
Brown-Forman Corp, Cl A | | | 1,828 | | | | 94 | |
Brown-Forman Corp, Cl B | | | 9,369 | | | | 495 | |
Bunge Ltd | | | 5,136 | | | | 273 | |
Calavo Growers Inc | | | 954 | | | | 80 | |
Cal-Maine Foods Inc | | | 650 | | | | 29 | |
Campbell Soup Co | | | 6,496 | | | | 248 | |
Casey’s General Stores Inc | | | 1,297 | | | | 167 | |
Central Garden & Pet Co, Cl A * | | | 2,800 | | | | 65 | |
Church & Dwight Co Inc | | | 8,468 | | | | 603 | |
Clorox Co/The | | | 4,581 | | | | 735 | |
| | |
212 | | SEI Institutional Managed Trust / Semi-Annual Report / March 31, 2019 |
| | | | | | | | |
| | | |
| Description | | Shares | | | Market Value
($ Thousands) | |
| |
COMMON STOCK (continued) | | | | | |
Coca-Cola Co/The (F) | | | 130,164 | | | $ | 6,099 | |
Coca-Cola Consolidated Inc | | | 300 | | | | 86 | |
Colgate-Palmolive Co | | | 29,548 | | | | 2,025 | |
Conagra Brands Inc | | | 17,086 | | | | 474 | |
Constellation Brands Inc, Cl A | | | 5,273 | | | | 925 | |
Costco Wholesale Corp | | | 15,079 | | | | 3,651 | |
Coty Inc, Cl A | | | 16,565 | | | | 191 | |
Darling Ingredients Inc * | | | 5,936 | | | | 129 | |
Edgewell Personal Care Co * | | | 1,834 | | | | 81 | |
Energizer Holdings Inc | | | 2,713 | | | | 122 | |
Estee Lauder Cos Inc/The, Cl A | | | 7,617 | | | | 1,261 | |
Flowers Foods Inc | | | 7,407 | | | | 158 | |
Fresh Del Monte Produce Inc | | | 1,189 | | | | 32 | |
Freshpet Inc * | | | 1,300 | | | | 55 | |
General Mills Inc | | | 20,514 | | | | 1,062 | |
Hain Celestial Group Inc/The * | | | 2,634 | | | | 61 | |
Herbalife Nutrition Ltd * | | | 4,608 | | | | 244 | |
Hershey Co/The | | | 4,694 | | | | 539 | |
Hormel Foods Corp | | | 9,218 | | | | 413 | |
Hostess Brands Inc, Cl A * | | | 3,370 | | | | 42 | |
Ingles Markets Inc, Cl A | | | 1,453 | | | | 40 | |
Ingredion Inc | | | 2,682 | | | | 254 | |
Inter Parfums Inc | | | 900 | | | | 68 | |
J&J Snack Foods Corp | | | 727 | | | | 115 | |
JM Smucker Co/The | | | 3,614 | | | | 421 | |
Kellogg Co | | | 8,803 | | | | 505 | |
Keurig Dr Pepper Inc | | | 6,485 | | | | 181 | |
Kimberly-Clark Corp | | | 12,078 | | | | 1,496 | |
Kraft Heinz Co/The | | | 20,418 | | | | 667 | |
Kroger Co/The | | | 28,131 | | | | 692 | |
Lamb Weston Holdings Inc | | | 5,205 | | | | 390 | |
Lancaster Colony Corp | | | 650 | | | | 102 | |
McCormick & Co Inc/MD | | | 4,273 | | | | 644 | |
Medifast Inc | | | 400 | | | | 51 | |
MGP Ingredients Inc | | | 900 | | | | 69 | |
Molson Coors Brewing Co, Cl B | | | 6,015 | | | | 359 | |
Mondelez International Inc, Cl A | | | 48,525 | | | | 2,422 | |
Monster Beverage Corp * | | | 12,831 | | | | 700 | |
National Beverage Corp, Cl A | | | 433 | | | | 25 | |
Nu Skin Enterprises Inc, Cl A | | | 1,702 | | | | 81 | |
PepsiCo Inc | | | 48,396 | | | | 5,931 | |
Performance Food Group Co * | | | 4,195 | | | | 166 | |
Philip Morris International Inc | | | 53,763 | | | | 4,752 | |
Pilgrim’s Pride Corp * | | | 1,078 | | | | 24 | |
Post Holdings Inc * | | | 2,172 | | | | 238 | |
PriceSmart Inc | | | 1,550 | | | | 91 | |
Procter & Gamble Co/The (F) | | | 86,329 | | | | 8,983 | |
Rite Aid Corp * | | | 63,819 | | | | 41 | |
Sanderson Farms Inc | | | 601 | | | | 79 | |
Seaboard Corp | | | 7 | | | | 30 | |
Simply Good Foods Co/The * | | | 3,900 | | | | 80 | |
SpartanNash Co | | | 1,522 | | | | 24 | |
| | | | | | | | |
| | | |
| Description | | Shares | | | Market Value
($ Thousands) | |
| |
COMMON STOCK (continued) | | | | | |
Spectrum Brands Holdings Inc | | | 1,766 | | | $ | 97 | |
Sprouts Farmers Market Inc * | | | 5,028 | | | | 108 | |
Sysco Corp, Cl A | | | 16,329 | | | | 1,090 | |
TreeHouse Foods Inc * | | | 1,957 | | | | 126 | |
Tyson Foods Inc, Cl A (F) | | | 9,621 | | | | 668 | |
Universal Corp/VA | | | 822 | | | | 47 | |
US Foods Holding Corp * | | | 7,556 | | | | 264 | |
USANA Health Sciences Inc * | | | 500 | | | | 42 | |
Vector Group Ltd | | | 5,076 | | | | 55 | |
Walgreens Boots Alliance Inc | | | 28,063 | | | | 1,776 | |
Walmart Inc | | | 48,553 | | | | 4,735 | |
WD-40 Co | | | 627 | | | | 106 | |
| | | | | | | | |
| | |
| | | | | | | 64,160 | |
| | | | | | | | |
| | |
Energy — 7.2% | | | | | | | | |
Anadarko Petroleum Corp, Cl A | | | 22,367 | | | | 1,017 | |
Antero Resources Corp * | | | 9,447 | | | | 83 | |
Apache Corp | | | 17,667 | | | | 612 | |
Apergy Corp * | | | 3,400 | | | | 140 | |
Arch Coal Inc | | | 600 | | | | 55 | |
Archrock Inc | | | 6,500 | | | | 64 | |
Baker Hughes a GE Co, Cl A | | | 22,940 | | | | 636 | |
C&J Energy Services Inc * | | | 1,586 | | | | 25 | |
Cabot Oil & Gas Corp | | | 20,225 | | | | 528 | |
Cactus Inc, Cl A * | | | 2,200 | | | | 78 | |
California Resources Corp * | | | 1,300 | | | | 33 | |
Callon Petroleum Co * | | | 8,628 | | | | 65 | |
Carrizo Oil & Gas Inc * | | | 2,700 | | | | 34 | |
Centennial Resource Development Inc/DE, Cl A * | | | 7,800 | | | | 69 | |
Cheniere Energy Inc * | | | 10,780 | | | | 737 | |
Chesapeake Energy Corp * | | | 37,322 | | | | 116 | |
Chevron Corp (F) | | | 82,694 | | | | 10,186 | |
Cimarex Energy Co | | | 4,788 | | | | 335 | |
CNX Resources Corp * | | | 9,162 | | | | 99 | |
Concho Resources Inc | | | 8,598 | | | | 954 | |
ConocoPhillips | | | 51,576 | | | | 3,442 | |
CONSOL Energy Inc * | | | 1,235 | | | | 42 | |
Continental Resources Inc/OK, Cl A * | | | 4,004 | | | | 179 | |
CVR Energy Inc | | | 1,600 | | | | 66 | |
Delek US Holdings Inc | | | 3,658 | | | | 133 | |
Denbury Resources Inc * | | | 15,000 | | | | 31 | |
Devon Energy Corp | | | 20,733 | | | | 654 | |
Diamond Offshore Drilling Inc * | | | 2,200 | | | | 23 | |
Diamondback Energy Inc, Cl A | | | 6,978 | | | | 708 | |
Dril-Quip Inc * | | | 1,388 | | | | 64 | |
Encana Corp | | | 3,113 | | | | 23 | |
EOG Resources Inc | | | 25,387 | | | | 2,416 | |
EQT Corp | | | 11,198 | | | | 232 | |
Equitrans Midstream Corp | | | 9,198 | | | | 200 | |
Exxon Mobil Corp (F) | | | 184,448 | | | | 14,903 | |
GasLog Ltd | | | 2,800 | | | | 49 | |
| | |
SEI Institutional Managed Trust / Semi-Annual Report / March 31, 2019 | | 213 |
CONSOLIDATED SCHEDULE OF INVESTMENTS (Unaudited)
March 31, 2019
Multi-Asset Inflation Managed Fund(Continued)
| | | | | | | | |
| | | |
| Description | | Shares | | | Market Value
($ Thousands) | |
| |
COMMON STOCK (continued) | | | | | |
Golar LNG Ltd | | | 4,877 | | | $ | 103 | |
Green Plains Inc | | | 3,800 | | | | 63 | |
Gulfport Energy Corp * | | | 7,258 | | | | 58 | |
Halliburton Co | | | 38,827 | | | | 1,138 | |
Helix Energy Solutions Group Inc * | | | 7,900 | | | | 62 | |
Helmerich & Payne Inc | | | 4,838 | | | | 269 | |
Hess Corp | | | 11,753 | | | | 708 | |
HollyFrontier Corp | | | 7,431 | | | | 366 | |
Jagged Peak Energy Inc * | | | 5,500 | | | | 58 | |
Keane Group Inc * | | | 3,200 | | | | 35 | |
Kinder Morgan Inc/DE | | | 83,046 | | | | 1,662 | |
Kosmos Energy Ltd | | | 12,600 | | | | 79 | |
Laredo Petroleum Inc * | | | 6,591 | | | | 20 | |
Liberty Oilfield Services Inc, Cl A | | | 1,700 | | | | 26 | |
Marathon Oil Corp | | | 38,774 | | | | 648 | |
Marathon Petroleum Corp | | | 29,671 | | | | 1,776 | |
Matador Resources Co * | | | 4,364 | | | | 84 | |
McDermott International Inc * | | | 7,683 | | | | 57 | |
Murphy Oil Corp | | | 7,658 | | | | 224 | |
Nabors Industries Ltd | | | 12,151 | | | | 42 | |
National Oilwell Varco Inc, Cl A | | | 17,623 | | | | 469 | |
Newpark Resources Inc, Cl A * | | | 5,566 | | | | 51 | |
Noble Corp plc * | | | 11,500 | | | | 33 | |
Noble Energy Inc | | | 22,240 | | | | 550 | |
Oasis Petroleum Inc * | | | 10,300 | | | | 62 | |
Occidental Petroleum Corp | | | 33,272 | | | | 2,203 | |
Oceaneering International Inc, Cl A * | | | 4,468 | | | | 70 | |
Oil States International Inc * | | | 2,170 | | | | 37 | |
ONEOK Inc | | | 18,420 | | | | 1,286 | |
Parsley Energy Inc, Cl A * | | | 13,291 | | | | 257 | |
Patterson-UTI Energy Inc | | | 10,159 | | | | 142 | |
PBF Energy Inc, Cl A | | | 5,129 | | | | 160 | |
PDC Energy Inc, Cl A * | | | 2,550 | | | | 104 | |
Peabody Energy Corp | | | 3,825 | | | | 108 | |
Penn Virginia Corp * | | | 600 | | | | 26 | |
Phillips 66 | | | 18,467 | | | | 1,758 | |
Pioneer Natural Resources Co | | | 7,671 | | | | 1,168 | |
ProPetro Holding Corp * | | | 4,200 | | | | 95 | |
QEP Resources Inc * | | | 11,994 | | | | 93 | |
Range Resources Corp | | | 9,059 | | | | 102 | |
Renewable Energy Group Inc * | | | 2,200 | | | | 48 | |
Rowan Cos Plc, Cl A * | | | 5,104 | | | | 55 | |
RPC Inc | | | 4,128 | | | | 47 | |
Schlumberger Ltd, Cl A | | | 61,316 | | | | 2,672 | |
Scorpio Tankers Inc | | | 1,889 | | | | 37 | |
SEACOR Holdings Inc, Cl A * | | | 1,100 | | | | 47 | |
SemGroup Corp, Cl A | | | 2,990 | | | | 44 | |
Ship Finance International Ltd | | | 5,300 | | | | 65 | |
SM Energy Co | | | 4,463 | | | | 78 | |
Southwestern Energy Co * | | | 28,922 | | | | 136 | |
SRC Energy Inc * | | | 9,664 | | | | 49 | |
Superior Energy Services Inc * | | | 7,681 | | | | 36 | |
| | | | | | | | |
| | | |
| Description | | Shares | | | Market Value
($ Thousands) | |
| |
COMMON STOCK (continued) | | | | | |
Targa Resources Corp | | | 10,343 | | | $ | 430 | |
Tellurian Inc * | | | 6,700 | | | | 75 | |
Tidewater Inc * | | | 2,500 | | | | 58 | |
Transocean Ltd * (F) | | | 26,625 | | | | 232 | |
Unit Corp * | | | 3,271 | | | | 47 | |
US Silica Holdings Inc | | | 3,378 | | | | 59 | |
Valero Energy Corp (F) | | | 18,615 | | | | 1,579 | |
W&T Offshore Inc * | | | 3,300 | | | | 23 | |
Weatherford International PLC * | | | 43,950 | | | | 31 | |
Whiting Petroleum Corp * | | | 3,552 | | | | 93 | |
Williams Cos Inc/The | | | 54,492 | | | | 1,565 | |
World Fuel Services Corp | | | 2,874 | | | | 83 | |
WPX Energy Inc * | | | 17,910 | | | | 235 | |
| | | | | | | | |
| | |
| | | | | | | 63,107 | |
| | | | | | | | |
| | |
Health Care — 5.7% | | | | | | | | |
Abbott Laboratories | | | 20,229 | | | | 1,617 | |
AbbVie Inc | | | 18,995 | | | | 1,531 | |
ABIOMED Inc * | | | 424 | | | | 121 | |
Acadia Healthcare Co Inc, Cl A * | | | 1,066 | | | | 31 | |
ACADIA Pharmaceuticals Inc * | | | 2,800 | | | | 75 | |
Aerie Pharmaceuticals Inc * | | | 1,013 | | | | 48 | |
Agilent Technologies Inc | | | 4,436 | | | | 357 | |
Agios Pharmaceuticals Inc * | | | 700 | | | | 47 | |
Alexion Pharmaceuticals Inc * | | | 3,003 | | | | 406 | |
Align Technology Inc * | | | 1,001 | | | | 285 | |
Alkermes PLC * | | | 2,411 | | | | 88 | |
Allergan PLC | | | 4,169 | | | | 610 | |
Allscripts Healthcare Solutions Inc * | | | 5,900 | | | | 56 | |
Alnylam Pharmaceuticals Inc * | | | 1,101 | | | | 103 | |
Amedisys Inc * | | | 400 | | | | 49 | |
AmerisourceBergen Corp, Cl A | | | 2,433 | | | | 193 | |
Amgen Inc, Cl A (F) | | | 7,740 | | | | 1,470 | |
Amicus Therapeutics Inc * | | | 2,893 | | | | 39 | |
AMN Healthcare Services Inc * | | | 1,300 | | | | 61 | |
Anthem Inc | | | 3,178 | | | | 912 | |
Arena Pharmaceuticals Inc * | | | 1,200 | | | | 54 | |
Array BioPharma Inc * | | | 2,163 | | | | 53 | |
Avanos Medical Inc * | | | 637 | | | | 27 | |
Baxter International Inc (F) | | | 6,357 | | | | 517 | |
Becton Dickinson and Co | | | 3,381 | | | | 844 | |
Biogen Inc * | | | 2,424 | | | | 573 | |
BioMarin Pharmaceutical Inc * | | | 2,643 | | | | 235 | |
Bio-Rad Laboratories Inc, Cl A * | | | 282 | | | | 86 | |
Bio-Techne Corp | | | 450 | | | | 89 | |
Bluebird Bio Inc * | | | 597 | | | | 94 | |
Blueprint Medicines Corp * | | | 540 | | | | 43 | |
Boston Scientific Corp * | | | 16,750 | | | | 643 | |
Bristol-Myers Squibb Co | | | 19,901 | | | | 949 | |
Brookdale Senior Living Inc, Cl A * | | | 3,877 | | | | 26 | |
Bruker Corp | | | 1,100 | | | | 42 | |
Cambrex Corp * | | | 1,000 | | | | 39 | |
| | |
214 | | SEI Institutional Managed Trust / Semi-Annual Report / March 31, 2019 |
| | | | | | | | |
| | | |
| Description | | Shares | | | Market Value
($ Thousands) | |
| |
COMMON STOCK (continued) | | | | | |
Cantel Medical Corp | | | 300 | | | $ | 20 | |
Cardinal Health Inc | | | 3,775 | | | | 182 | |
Catalent Inc * | | | 2,556 | | | | 104 | |
Celgene Corp, Cl A * | | | 8,707 | | | | 821 | |
Centene Corp * | | | 5,286 | | | | 281 | |
Cerner Corp * | | | 3,814 | | | | 218 | |
Charles River Laboratories International Inc * | | | 753 | | | | 109 | |
Chemed Corp | | | 280 | | | | 90 | |
Cigna Corp (B) | | | 4,657 | | | | 749 | |
Cooper Cos Inc/The, Cl A | | | 772 | | | | 229 | |
Covetrus Inc * | | | 881 | | | | 28 | |
CVS Health Corp | | | 15,737 | | | | 849 | |
Danaher Corp, Cl A | | | 7,683 | | | | 1,014 | |
DaVita Inc * | | | 1,958 | | | | 106 | |
DENTSPLY SIRONA Inc | | | 3,604 | | | | 179 | |
DexCom Inc * | | | 1,100 | | | | 131 | |
Edwards Lifesciences Corp, Cl A * | | | 2,757 | | | | 527 | |
Elanco Animal Health Inc * | | | 2,400 | | | | 77 | |
Eli Lilly & Co | | | 11,403 | | | | 1,480 | |
Emergent BioSolutions Inc * | | | 1,100 | | | | 56 | |
Encompass Health Corp | | | 1,978 | | | | 116 | |
Endo International PLC * | | | 2,400 | | | | 19 | |
Ensign Group Inc/The | | | 1,319 | | | | 68 | |
Exact Sciences Corp * | | | 1,239 | | | | 107 | |
Exelixis Inc * | | | 3,701 | | | | 88 | |
FibroGen Inc * | | | 1,286 | | | | 70 | |
Gilead Sciences Inc (F) | | | 15,301 | | | | 995 | |
Global Blood Therapeutics Inc * | | | 1,600 | | | | 85 | |
Globus Medical Inc, Cl A * | | | 800 | | | | 40 | |
Haemonetics Corp * | | | 628 | | | | 55 | |
Halozyme Therapeutics Inc * | | | 3,568 | | | | 57 | |
HCA Healthcare Inc | | | 3,351 | | | | 437 | |
HealthEquity Inc * | | | 500 | | | | 37 | |
Henry Schein Inc * | | | 2,203 | | | | 132 | |
Heron Therapeutics Inc * | | | 1,314 | | | | 32 | |
Hill-Rom Holdings Inc | | | 1,251 | | | | 132 | |
HMS Holdings Corp * | | | 1,600 | | | | 47 | |
Hologic Inc * | | | 3,515 | | | | 170 | |
Horizon Pharma Plc * | | | 1,628 | | | | 43 | |
Humana Inc | | | 1,582 | | | | 421 | |
ICU Medical Inc * | | | 324 | | | | 78 | |
IDEXX Laboratories Inc * | | | 1,148 | | | | 257 | |
Illumina Inc * | | | 1,822 | | | | 566 | |
Immunomedics Inc * | | | 2,254 | | | | 43 | |
Incyte Corp * | | | 2,543 | | | | 219 | |
Inogen Inc * | | | 200 | | | | 19 | |
Insulet Corp * | | | 578 | | | | 55 | |
Integer Holdings Corp * | | | 400 | | | | 30 | |
Integra LifeSciences Holdings Corp * | | | 628 | | | | 35 | |
Intercept Pharmaceuticals Inc * | | | 700 | | | | 78 | |
Intuitive Surgical Inc * | | | 1,337 | | | | 763 | |
| | | | | | | | |
| | | |
| Description | | Shares | | | Market Value
($ Thousands) | |
| |
COMMON STOCK (continued) | | | | | |
Ionis Pharmaceuticals Inc * | | | 1,876 | | | $ | 152 | |
IQVIA Holdings Inc * | | | 2,182 | | | | 314 | |
Jazz Pharmaceuticals PLC * | | | 629 | | | | 90 | |
Johnson & Johnson (F) | | | 32,246 | | | | 4,508 | |
Laboratory Corp of America Holdings * | | | 1,412 | | | | 216 | |
LHC Group Inc * | | | 300 | | | | 33 | |
Ligand Pharmaceuticals Inc * | | | 278 | | | | 35 | |
LivaNova PLC * | | | 1,157 | | | | 113 | |
Magellan Health Inc * | | | 600 | | | | 40 | |
Masimo Corp * | | | 892 | | | | 123 | |
McKesson Corp | | | 2,553 | | | | 299 | |
Medidata Solutions Inc * | | | 529 | | | | 39 | |
MEDNAX Inc * | | | 1,127 | | | | 31 | |
Medtronic PLC | | | 16,505 | | | | 1,503 | |
Merck & Co Inc | | | 31,751 | | | | 2,641 | |
Merit Medical Systems Inc * | | | 1,500 | | | | 93 | |
Mettler-Toledo International Inc * | | | 340 | | | | 246 | |
Molina Healthcare Inc * | | | 738 | | | | 105 | |
Mylan NV * | | | 6,687 | | | | 189 | |
Myriad Genetics Inc * | | | 2,300 | | | | 76 | |
National HealthCare Corp | | | 900 | | | | 68 | |
Nektar Therapeutics, Cl A * | | | 2,284 | | | | 77 | |
Neogen Corp, Cl B * | | | 469 | | | | 27 | |
Neurocrine Biosciences Inc * | | | 1,128 | | | | 99 | |
Novocure Ltd * | | | 1,000 | | | | 48 | |
NuVasive Inc * | | | 1,200 | | | | 68 | |
Omnicell Inc * | | | 550 | | | | 44 | |
Patterson Cos Inc | | | 2,077 | | | | 45 | |
Penumbra Inc * | | | 250 | | | | 37 | |
PerkinElmer Inc | | | 1,752 | | | | 169 | |
Perrigo Co PLC | | | 2,330 | | | | 112 | |
Pfizer Inc | | | 70,604 | | | | 2,999 | |
PRA Health Sciences Inc * | | | 798 | | | | 88 | |
Premier Inc, Cl A * | | | 828 | | | | 29 | |
QIAGEN NV * | | | 4,404 | | | | 179 | |
Quest Diagnostics Inc | | | 1,833 | | | | 165 | |
Regeneron Pharmaceuticals Inc * | | | 950 | | | | 390 | |
Repligen Corp * | | | 388 | | | | 23 | |
ResMed Inc | | | 1,933 | | | | 201 | |
Sage Therapeutics Inc * | | | 797 | | | | 127 | |
Sarepta Therapeutics Inc * | | | 909 | | | | 108 | |
Seattle Genetics Inc * | | | 1,652 | | | | 121 | |
Spark Therapeutics Inc * | | | 600 | | | | 68 | |
STERIS PLC | | | 1,398 | | | | 179 | |
Stryker Corp | | | 4,102 | | | | 810 | |
Supernus Pharmaceuticals Inc * | | | 1,500 | | | | 53 | |
Syneos Health Inc, Cl A * | | | 1,073 | | | | 56 | |
Teladoc Health Inc * | | | 1,000 | | | | 56 | |
Teleflex Inc | | | 600 | | | | 181 | |
Tenet Healthcare Corp * | | | 2,000 | | | | 58 | |
Theravance Biopharma Inc * | | | 1,182 | | | | 27 | |
Thermo Fisher Scientific Inc | | | 4,886 | | | | 1,337 | |
| | |
SEI Institutional Managed Trust / Semi-Annual Report / March 31, 2019 | | 215 |
CONSOLIDATED SCHEDULE OF INVESTMENTS (Unaudited)
March 31, 2019
Multi-Asset Inflation Managed Fund(Continued)
| | | | | | | | |
| | | |
| Description | | Shares | | | Market Value
($ Thousands) | |
| |
COMMON STOCK (continued) | | | | | |
Ultragenyx Pharmaceutical Inc * | | | 476 | | | $ | 33 | |
United Therapeutics Corp * | | | 722 | | | | 85 | |
UnitedHealth Group Inc | | | 11,412 | | | | 2,822 | |
Universal Health Services Inc, Cl B | | | 898 | | | | 120 | |
US Physical Therapy Inc | | | 600 | | | | 63 | |
Varian Medical Systems Inc * | | | 1,102 | | | | 156 | |
Veeva Systems Inc, Cl A * | | | 1,421 | | | | 180 | |
Vertex Pharmaceuticals Inc * | | | 3,124 | | | | 575 | |
Waters Corp * | | | 1,101 | | | | 277 | |
WellCare Health Plans Inc * | | | 822 | | | | 222 | |
West Pharmaceutical Services Inc | | | 1,251 | | | | 138 | |
Wright Medical Group NV * | | | 1,277 | | | | 40 | |
Zimmer Biomet Holdings Inc | | | 2,803 | | | | 358 | |
Zoetis Inc, Cl A | | | 6,094 | | | | 613 | |
| | | | | | | | |
| | |
| | | | | | | 49,534 | |
| | | | | | | | |
| |
Information Technology — 2.0% | | | | | |
Accenture PLC, Cl A | | | 3,360 | | | | 591 | |
Adobe Inc * | | | 2,844 | | | | 758 | |
Akamai Technologies Inc * | | | 637 | | | | 46 | |
Alliance Data Systems Corp | | | 320 | | | | 56 | |
Amdocs Ltd | | | 1,853 | | | | 100 | |
ANSYS Inc * | | | 601 | | | | 110 | |
Aspen Technology Inc * | | | 476 | | | | 50 | |
Atlassian Corp PLC, Cl A * | | | 800 | | | | 90 | |
Autodesk Inc, Cl A * | | | 1,402 | | | | 218 | |
Automatic Data Processing Inc | | | 2,360 | | | | 377 | |
Black Knight Inc * | | | 900 | | | | 49 | |
Booz Allen Hamilton Holding Corp, Cl A | | | 600 | | | | 35 | |
Broadridge Financial Solutions Inc | | | 700 | | | | 73 | |
Cadence Design Systems Inc * | | | 1,982 | | | | 126 | |
Cass Information Systems Inc | | | 1,080 | | | | 51 | |
CDK Global Inc | | | 965 | | | | 57 | |
Citrix Systems Inc | | | 800 | | | | 80 | |
Cognizant Technology Solutions Corp, Cl A | | | 3,345 | | | | 242 | |
Conduent Inc * | | | 2,908 | | | | 40 | |
DXC Technology Co | | | 1,902 | | | | 122 | |
EPAM Systems Inc * | | | 250 | | | | 42 | |
Euronet Worldwide Inc * | | | 327 | | | | 47 | |
Fair Isaac Corp * | | | 200 | | | | 54 | |
Fidelity National Information Services Inc, Cl B | | | 1,953 | | | | 221 | |
First Data Corp, Cl A * | | | 1,850 | | | | 49 | |
Fiserv Inc, Cl A * | | | 2,404 | | | | 212 | |
FleetCor Technologies Inc * | | | 552 | | | | 136 | |
Fortinet Inc * | | | 750 | | | | 63 | |
Gartner Inc * | | | 400 | | | | 61 | |
Global Payments Inc | | | 1,000 | | | | 136 | |
GoDaddy Inc, Cl A * | | | 495 | | | | 37 | |
Guidewire Software Inc, Cl Z * | | | 400 | | | | 39 | |
International Business Machines Corp (F) | | | 4,887 | | | | 689 | |
Intuit Inc | | | 1,403 | | | | 367 | |
| | | | | | | | |
| | | |
| Description | | Shares | | | Market Value
($ Thousands) | |
| |
COMMON STOCK (continued) | | | | | |
Jack Henry & Associates Inc | | | 451 | | | $ | 63 | |
Leidos Holdings Inc | | | 1,200 | | | | 77 | |
Mastercard Inc, Cl A | | | 4,953 | | | | 1,166 | |
Microsoft Corp | | | 40,387 | | | | 4,763 | |
Nuance Communications Inc * | | | 3,100 | | | | 52 | |
Nutanix Inc, Cl A * | | | 1,000 | | | | 38 | |
Oracle Corp, Cl B | | | 13,751 | | | | 739 | |
Palo Alto Networks Inc * | | | 596 | | | | 145 | |
Paychex Inc | | | 1,875 | | | | 150 | |
Paycom Software Inc * | | | 300 | | | | 57 | |
PayPal Holdings Inc * | | | 6,386 | | | | 663 | |
PTC Inc * | | | 500 | | | | 46 | |
Red Hat Inc * | | | 952 | | | | 174 | |
RingCentral Inc, Cl A * | | | 600 | | | | 65 | |
Sabre Corp | | | 2,300 | | | | 49 | |
salesforce.com Inc * | | | 4,078 | | | | 646 | |
ServiceNow Inc * | | | 1,013 | | | | 250 | |
Splunk Inc * | | | 805 | | | | 100 | |
Square Inc, Cl A * | | | 1,777 | | | | 133 | |
SS&C Technologies Holdings Inc | | | 1,260 | | | | 80 | |
Symantec Corp, Cl A (F) | | | 5,506 | | | | 127 | |
Synopsys Inc * | | | 943 | | | | 109 | |
Tableau Software Inc, Cl A * | | | 500 | | | | 64 | |
Teradata Corp * | | | 1,000 | | | | 44 | |
Total System Services Inc | | | 861 | | | | 82 | |
Twilio Inc, Cl A * | | | 400 | | | | 52 | |
Tyler Technologies Inc * | | | 229 | | | | 47 | |
Ultimate Software Group Inc/The * | | | 150 | | | | 49 | |
VeriSign Inc * | | | 491 | | | | 89 | |
Visa Inc, Cl A | | | 9,408 | | | | 1,469 | |
VMware Inc, Cl A | | | 420 | | | | 76 | |
Western Union Co/The | | | 4,200 | | | | 78 | |
WEX Inc * | | | 200 | | | | 38 | |
Workday Inc, Cl A * | | | 851 | | | | 164 | |
Worldpay Inc, Cl A * | | | 1,957 | | | | 222 | |
Zendesk Inc * | | | 700 | | | | 59 | |
| | | | | | | | |
| | |
| | | | | | | 17,649 | |
| | | | | | | | |
| | |
Real Estate — 3.0% | | | | | | | | |
Acadia Realty Trust ‡ | | | 2,627 | | | | 72 | |
Agree Realty Corp ‡ | | | 800 | | | | 55 | |
Alexander & Baldwin Inc ‡ | | | 2,438 | | | | 62 | |
Alexandria Real Estate Equities Inc ‡ | | | 2,314 | | | | 330 | |
American Assets Trust Inc ‡ | | | 1,635 | | | | 75 | |
American Campus Communities Inc ‡ | | | 2,970 | | | | 141 | |
American Homes 4 Rent, Cl A ‡ | | | 5,994 | | | | 136 | |
American Tower Corp, Cl A ‡ | | | 9,335 | | | | 1,840 | |
Americold Realty Trust ‡ | | | 2,200 | | | | 67 | |
Apartment Investment & Management Co, Cl A ‡ | | | 3,555 | | | | 179 | |
Apple Hospitality Inc ‡ | | | 4,014 | | | | 65 | |
Ashford Hospitality Trust Inc ‡ | | | 8,487 | | | | 40 | |
| | |
216 | | SEI Institutional Managed Trust / Semi-Annual Report / March 31, 2019 |
| | | | | | | | |
| | | |
| Description | | Shares | | | Market Value
($ Thousands) | |
| |
COMMON STOCK (continued) | | | | | |
AvalonBay Communities Inc ‡ | | | 2,853 | | | $ | 573 | |
Boston Properties Inc ‡ | | | 3,211 | | | | 430 | |
Brandywine Realty Trust ‡ | | | 5,821 | | | | 92 | |
Brixmor Property Group Inc ‡ | | | 9,167 | | | | 168 | |
Brookfield Property Inc, Cl A ‡ | | | 2,800 | | | | 57 | |
Camden Property Trust ‡ | | | 1,903 | | | | 193 | |
CareTrust Inc ‡ | | | 2,300 | | | | 54 | |
CBRE Group Inc, Cl A *‡ | | | 7,678 | | | | 380 | |
Chatham Lodging Trust ‡ | | | 3,100 | | | | 60 | |
Chesapeake Lodging Trust ‡ | | | 1,850 | | | | 51 | |
Colony Capital Inc ‡ | | | 14,866 | | | | 79 | |
Columbia Property Trust Inc ‡ | | | 4,550 | | | | 102 | |
CoreCivic Inc ‡ | | | 3,867 | | | | 75 | |
CoreSite Realty Corp ‡ | | | 886 | | | | 95 | |
Corporate Office Properties Trust ‡ | | | 2,828 | | | | 77 | |
Cousins Properties Inc, Cl A ‡ | | | 10,662 | | | | 103 | |
Crown Castle International Corp ‡ | | | 9,096 | | | | 1,164 | |
CubeSmart ‡ | | | 4,581 | | | | 147 | |
CyrusOne Inc ‡ | | | 2,136 | | | | 112 | |
DiamondRock Hospitality Co ‡ | | | 6,442 | | | | 70 | |
Digital Realty Trust Inc, Cl A ‡ | | | 4,502 | | | | 536 | |
Douglas Emmett Inc ‡ | | | 3,469 | | | | 140 | |
Duke Realty Corp ‡ | | | 8,459 | | | | 259 | |
Easterly Government Properties Inc ‡ | | | 3,375 | | | | 61 | |
EastGroup Properties Inc ‡ | | | 976 | | | | 109 | |
Empire State Realty Trust Inc, Cl A ‡ | | | 4,528 | | | | 72 | |
EPR Properties, Cl A ‡ | | | 1,353 | | | | 104 | |
Equinix Inc ‡ | | | 1,731 | | | | 784 | |
Equity Commonwealth ‡ | | | 3,150 | | | | 103 | |
Equity LifeStyle Properties Inc ‡ | | | 1,950 | | | | 223 | |
Equity Residential ‡ | | | 7,768 | | | | 585 | |
Essex Property Trust Inc ‡ | | | 1,251 | | | | 362 | |
Extra Space Storage Inc ‡ | | | 2,881 | | | | 294 | |
Federal Realty Investment Trust ‡ | | | 1,619 | | | | 223 | |
First Industrial Realty Trust Inc ‡ | | | 3,230 | | | | 114 | |
Four Corners Property Trust Inc ‡ | | | 2,200 | | | | 65 | |
Front Yard Residential Corp ‡ | | | 608 | | | | 6 | |
Gaming and Leisure Properties Inc ‡ | | | 5,056 | | | | 195 | |
GEO Group Inc/The ‡ | | | 3,947 | | | | 76 | |
Getty Realty Corp ‡ | | | 2,400 | | | | 77 | |
Gladstone Commercial Corp ‡ | | | 3,038 | | | | 63 | |
HCP Inc ‡ | | | 10,808 | | | | 338 | |
Healthcare Realty Trust Inc ‡ | | | 3,504 | | | | 113 | |
Healthcare Trust of America Inc, Cl A ‡ | | | 4,841 | | | | 138 | |
HFF Inc, Cl A | | | 900 | | | | 43 | |
Highwoods Properties Inc ‡ | | | 2,551 | | | | 119 | |
Hospitality Properties Trust ‡ | | | 3,452 | | | | 91 | |
Host Hotels & Resorts Inc ‡ | | | 16,388 | | | | 310 | |
Howard Hughes Corp/The * | | | 1,809 | | | | 199 | |
Hudson Pacific Properties Inc ‡ | | | 3,282 | | | | 113 | |
Industrial Logistics Properties Trust | | | 1,369 | | | | 28 | |
Investors Real Estate Trust | | | 1,244 | | | | 75 | |
| | | | | | | | |
| | | |
| Description | | Shares | | | Market Value
($ Thousands) | |
| |
COMMON STOCK (continued) | | | | | |
Invitation Homes Inc ‡ | | | 6,683 | | | $ | 163 | |
Iron Mountain Inc ‡ | | | 6,157 | | | | 218 | |
JBG SMITH Properties ‡ | | | 1,800 | | | | 74 | |
Jones Lang LaSalle Inc | | | 989 | | | | 152 | |
Kennedy-Wilson Holdings Inc | | | 2,345 | | | | 50 | |
Kilroy Realty Corp ‡ | | | 2,328 | | | | 177 | |
Kimco Realty Corp ‡ | | | 11,427 | | | | 211 | |
Lamar Advertising Co, Cl A ‡ | | | 1,784 | | | | 141 | |
Lexington Realty Trust ‡ | | | 4,000 | | | | 36 | |
Liberty Property Trust ‡ | | | 3,787 | | | | 183 | |
Life Storage Inc ‡ | | | 1,300 | | | | 126 | |
LTC Properties Inc ‡ | | | 1,379 | | | | 63 | |
Macerich Co/The ‡ | | | 3,212 | | | | 139 | |
Mack-Cali Realty Corp ‡ | | | 2,924 | | | | 65 | |
Medical Properties Trust Inc ‡ | | | 7,858 | | | | 145 | |
Mid-America Apartment Communities Inc ‡ | | | 2,219 | | | | 243 | |
Monmouth Real Estate Investment Corp, Cl A ‡ | | | 2,573 | | | | 34 | |
National Health Investors Inc ‡ | | | 1,041 | | | | 82 | |
National Retail Properties Inc ‡ | | | 3,400 | | | | 188 | |
National Storage Affiliates Trust ‡ | | | 1,700 | | | | 48 | |
Office Properties Income Trust | | | 2,033 | | | | 56 | |
Omega Healthcare Investors Inc ‡ | | | 4,074 | | | | 155 | |
Outfront Media Inc ‡ | | | 3,922 | | | | 92 | |
Paramount Group Inc ‡ | | | 6,407 | | | | 91 | |
Park Hotels & Resorts Inc ‡ | | | 5,793 | | | | 180 | |
Pebblebrook Hotel Trust ‡ | | | 2,577 | | | | 80 | |
Pennsylvania Real Estate Investment Trust ‡ | | | 5,061 | | | | 32 | |
Physicians Realty Trust ‡ | | | 5,878 | | | | 111 | |
Piedmont Office Realty Trust Inc, Cl A ‡ | | | 3,766 | | | | 79 | |
PotlatchDeltic Corp ‡ | | | 1,763 | | | | 67 | |
Preferred Apartment Communities Inc, Cl A ‡ | | | 3,424 | | | | 51 | |
Prologis Inc ‡ | | | 13,670 | | | | 984 | |
PS Business Parks Inc ‡ | | | 502 | | | | 79 | |
Public Storage ‡ | | | 3,125 | | | | 681 | |
QTS Realty Trust Inc, Cl A ‡ | | | 1,702 | | | | 77 | |
Rayonier Inc ‡ | | | 3,708 | | | | 117 | |
Realogy Holdings Corp | | | 3,701 | | | | 42 | |
Realty Income Corp ‡ | | | 6,299 | | | | 463 | |
Redfin Corp * | | | 2,531 | | | | 51 | |
Regency Centers Corp ‡ | | | 3,462 | | | | 234 | |
Retail Opportunity Investments Corp ‡ | | | 5,100 | | | | 88 | |
Retail Properties of America Inc, Cl A ‡ | | | 7,590 | | | | 93 | |
Rexford Industrial Realty Inc ‡ | | | 1,128 | | | | 40 | |
RLJ Lodging Trust ‡ | | | 4,599 | | | | 81 | |
Ryman Hospitality Properties Inc ‡ | | | 972 | | | | 80 | |
Sabra Health Care Inc ‡ | | | 4,681 | | | | 91 | |
Saul Centers Inc ‡ | | | 834 | | | | 43 | |
SBA Communications Corp, Cl A *‡ | | | 2,453 | | | | 490 | |
Senior Housing Properties Trust ‡ | | | 6,344 | | | | 75 | |
Seritage Growth Properties ‡ | | | 600 | | | | 27 | |
Simon Property Group Inc ‡ | | | 6,733 | | | | 1,227 | |
| | |
SEI Institutional Managed Trust / Semi-Annual Report / March 31, 2019 | | 217 |
CONSOLIDATED SCHEDULE OF INVESTMENTS (Unaudited)
March 31, 2019
Multi-Asset Inflation Managed Fund(Continued)
| | | | | | | | |
| | | |
| Description | | Shares | | | Market Value
($ Thousands) | |
| |
COMMON STOCK (continued) | | | | | |
SITE Centers Corp ‡ | | | 4,485 | | | $ | 61 | |
SL Green Realty Corp ‡ | | | 1,870 | | | | 168 | |
Spirit Realty Capital Inc ‡ | | | 2,641 | | | | 105 | |
STAG Industrial Inc ‡ | | | 1,478 | | | | 44 | |
STORE Capital Corp ‡ | | | 4,155 | | | | 139 | |
Summit Hotel Properties Inc ‡ | | | 5,100 | | | | 58 | |
Sun Communities Inc ‡ | | | 1,752 | | | | 208 | |
Sunstone Hotel Investors Inc ‡ | | | 5,706 | | | | 82 | |
Tanger Factory Outlet Centers Inc ‡ | | | 2,478 | | | | 52 | |
Taubman Centers Inc ‡ | | | 1,535 | | | | 81 | |
Terreno Realty Corp ‡ | | | 978 | | | | 41 | |
Tier Inc ‡ | | | 1,628 | | | | 47 | |
UDR Inc ‡ | | | 6,057 | | | | 275 | |
Uniti Group Inc ‡ | | | 4,262 | | | | 48 | |
Urban Edge Properties ‡ | | | 2,748 | | | | 52 | |
Ventas Inc ‡ | | | 7,783 | | | | 497 | |
VEREIT Inc ‡ | | | 20,920 | | | | 175 | |
VICI Properties Inc ‡(B) | | | 7,900 | | | | 173 | |
Vornado Realty Trust ‡ | | | 3,678 | | | | 248 | |
Washington Prime Group Inc ‡ | | | 6,200 | | | | 35 | |
Washington Real Estate Investment Trust ‡ | | | 2,478 | | | | 70 | |
Weingarten Realty Investors ‡ | | | 2,977 | | | | 87 | |
Welltower Inc ‡ | | | 8,621 | | | | 669 | |
Weyerhaeuser Co ‡ | | | 17,237 | | | | 454 | |
WP Carey Inc ‡ | | | 3,279 | | | | 257 | |
Xenia Hotels & Resorts Inc ‡ | | | 4,200 | | | | 92 | |
| | | | | | | | |
| | |
| | | | | | | 25,975 | |
| | | | | | | | |
| | |
Utilities — 1.5% | | | | | | | | |
AES Corp/VA | | | 11,142 | | | | 201 | |
ALLETE Inc | | | 650 | | | | 54 | |
Alliant Energy Corp | | | 3,728 | | | | 176 | |
Ameren Corp | | | 3,454 | | | | 254 | |
American Electric Power Co Inc | | | 6,479 | | | | 543 | |
American States Water Co | | | 500 | | | | 36 | |
American Water Works Co Inc | | | 2,091 | | | | 218 | |
Aqua America Inc | | | 3,003 | | | | 109 | |
Atmos Energy Corp | | | 1,437 | | | | 148 | |
Avista Corp | | | 600 | | | | 24 | |
Black Hills Corp, Cl A | | | 1,200 | | | | 89 | |
California Water Service Group, Cl A | | | 1,200 | | | | 65 | |
CenterPoint Energy Inc | | | 7,208 | | | | 221 | |
Clearway Energy Inc, Cl C | | | 3,419 | | | | 52 | |
CMS Energy Corp | | | 4,004 | | | | 222 | |
Connecticut Water Service Inc | | | 1,000 | | | | 69 | |
Consolidated Edison Inc | | | 3,056 | | | | 259 | |
Dominion Energy Inc | | | 9,974 | | | | 765 | |
DTE Energy Co | | | 2,433 | | | | 304 | |
Duke Energy Corp | | | 9,243 | | | | 832 | |
Edison International | | | 4,480 | | | | 277 | |
El Paso Electric Co, Cl A | | | 500 | | | | 29 | |
Entergy Corp | | | 2,593 | | | | 248 | |
| | | | | | | | |
| | | |
| Description | | Shares | | | Market Value
($ Thousands) | |
| |
COMMON STOCK (continued) | | | | | |
Evergy Inc | | | 3,401 | | | $ | 197 | |
Eversource Energy | | | 3,705 | | | | 263 | |
Exelon Corp | | | 12,362 | | | | 620 | |
FirstEnergy Corp | | | 8,322 | | | | 346 | |
Hawaiian Electric Industries Inc | | | 1,428 | | | | 58 | |
IDACORP Inc, Cl A | | | 1,100 | | | | 110 | |
MDU Resources Group Inc | | | 3,645 | | | | 94 | |
MGE Energy Inc | | | 1,400 | | | | 95 | |
National Fuel Gas Co | | | 1,437 | | | | 88 | |
New Jersey Resources Corp | | | 1,772 | | | | 88 | |
NextEra Energy Inc | | | 6,268 | | | | 1,212 | |
NiSource Inc | | | 4,946 | | | | 142 | |
Northwest Natural Holding Co | | | 1,300 | | | | 85 | |
NorthWestern Corp | | | 601 | | | | 42 | |
NRG Energy Inc | | | 3,905 | | | | 166 | |
OGE Energy Corp | | | 3,290 | | | | 142 | |
ONE Gas Inc | | | 1,094 | | | | 97 | |
Otter Tail Corp | | | 350 | | | | 17 | |
Pattern Energy Group Inc, Cl A | | | 1,552 | | | | 34 | |
PG&E Corp * | | | 7,761 | | | | 138 | |
Pinnacle West Capital Corp | | | 1,650 | | | | 158 | |
PNM Resources Inc | | | 2,152 | | | | 102 | |
Portland General Electric Co | | | 1,876 | | | | 97 | |
PPL Corp | | | 9,280 | | | | 295 | |
Public Service Enterprise Group Inc | | | 6,437 | | | | 382 | |
Sempra Energy | | | 3,584 | | | | 451 | |
Southern Co/The | | | 13,524 | | | | 699 | |
Southwest Gas Holdings Inc | | | 976 | | | | 80 | |
Spire Inc | | | 494 | | | | 41 | |
UGI Corp | | | 2,447 | | | | 136 | |
Unitil Corp | | | 1,300 | | | | 70 | |
Vistra Energy Corp | | | 7,278 | | | | 189 | |
WEC Energy Group Inc | | | 3,915 | | | | 310 | |
Xcel Energy Inc | | | 6,898 | | | | 388 | |
| | | | | | | | |
| | |
| | | | | | | 12,627 | |
| | | | | | | | |
Total Common Stock | | | | | | | | |
(Cost $223,972) ($ Thousands) | | | | | | | 253,041 | |
| | | | | | | | |
| | |
| | | Face Amount
(Thousands) | | | | |
| |
CORPORATE OBLIGATIONS — 9.3% | | | | | |
| |
Communication Services — 0.9% | | | | | |
AT&T | | | | | | | | |
4.125%, 02/17/2026 | | $ | 574 | | | | 587 | |
3.400%, 05/15/2025 | | | 2,045 | | | | 2,023 | |
CBS | | | | | | | | |
3.500%, 01/15/2025 | | | 835 | | | | 835 | |
CCO Holdings | | | | | | | | |
5.000%, 02/01/2028 (C) | | | 282 | | | | 278 | |
4.000%, 03/01/2023 (C) | | | 603 | | | | 603 | |
| | |
218 | | SEI Institutional Managed Trust / Semi-Annual Report / March 31, 2019 |
| | | | | | | | |
| | | |
| Description | | Face Amount
(Thousands) | | | Market Value
($ Thousands) | |
| | | | | | | | |
|
CORPORATE OBLIGATIONS (continued) | |
Millicom International Cellular | | | | | | | | |
6.625%, 10/15/2026 (C) | | | $ 470 | | | $ | 493 | |
Sirius XM Radio | | | | | | | | |
5.000%, 08/01/2027 (C) | | | 360 | | | | 360 | |
Sprint Capital | | | | | | | | |
6.900%, 05/01/2019 | | | 1,485 | | | | 1,489 | |
Verizon Communications | | | | | | | | |
4.862%, 08/21/2046 | | | 279 | | | | 297 | |
Vodafone Group | | | | | | | | |
4.125%, 05/30/2025 | | | 827 | | | | 843 | |
3.750%, 01/16/2024 | | | 378 | | | | 381 | |
| | | | | | | | |
| | | | | | | 8,189 | |
| | | | | | | | |
|
Consumer Discretionary — 0.4% | |
Cox Communications | | | | | | | | |
2.950%, 06/30/2023 (C) | | | 240 | | | | 238 | |
CSC Holdings | | | | | | | | |
6.750%, 11/15/2021 | | | 160 | | | | 171 | |
Expedia Group Inc | | | | | | | | |
3.800%, 02/15/2028 | | | 805 | | | | 777 | |
General Motors Financial | | | | | | | | |
5.100%, 01/17/2024 | | | 858 | | | | 894 | |
International Game Technology | | | | | | | | |
6.250%, 02/15/2022 (C) | | | 560 | | | | 582 | |
Panther BF Aggregator 2 | | | | | | | | |
4.375%, 05/15/2026 (C) | | | EUR 155 | | | | 177 | |
Time Warner Cable | | | | | | | | |
4.500%, 09/15/2042 | | | $ 330 | | | | 288 | |
Virgin Media Finance | | | | | | | | |
5.250%, 02/15/2022 | | | 200 | | | | 201 | |
| | | | | | | | |
| | | | | | | 3,328 | |
| | | | | | | | |
|
Consumer Staples — 0.2% | |
Anheuser-Busch InBev Worldwide | | | | | | | | |
5.550%, 01/23/2049 | | | 275 | | | | 302 | |
BRF | | | | | | | | |
3.950%, 05/22/2023 | | | 254 | | | | 237 | |
Minerva Luxembourg | | | | | | | | |
6.500%, 09/20/2026 (C) | | | 286 | | | | 284 | |
5.875%, 01/19/2028 | | | 200 | | | | 186 | |
Tyson Foods | | | | | | | | |
4.350%, 03/01/2029 | | | 120 | | | | 124 | |
4.000%, 03/01/2026 | | | 108 | | | | 110 | |
3.950%, 08/15/2024 | | | 715 | | | | 736 | |
2.650%, 08/15/2019 | | | 219 | | | | 219 | |
Virgolino de Oliveira Finance | | | | | | | | |
10.500%,
01/28/2018
(B)(C)(D) | | | 660 | | | | 39 | |
| | | | | | | | |
| | | | | | | 2,237 | |
| | | | | | | | |
|
Energy — 1.0% | |
Antero Resources | | | | | | | | |
5.125%, 12/01/2022 | | | 123 | | | | 124 | |
| | | | | | | | |
| | | |
| Description | | Face Amount
(Thousands) | | | Market Value
($ Thousands) | |
| | | | | | | | |
|
CORPORATE OBLIGATIONS (continued) | |
Cenovus Energy | | | | | | | | |
5.700%, 10/15/2019 | | | $ 96 | | | $ | 98 | |
3.000%, 08/15/2022 | | | 52 | | | | 51 | |
Cosan Luxembourg | | | | | | | | |
7.000%, 01/20/2027 | | | 250 | | | | 263 | |
Energy Transfer Operating | | | | | | | | |
5.200%, 02/01/2022 | | | 465 | | | | 488 | |
4.500%, 04/15/2024 | | | 260 | | | | 271 | |
Energy Transfer Partners | | | | | | | | |
4.500%, 11/01/2023 | | | 114 | | | | 119 | |
Enterprise Products Operating | | | | | | | | |
5.200%, 09/01/2020 | | | 340 | | | | 351 | |
3.700%, 02/15/2026 | | | 730 | | | | 749 | |
Hess | | | | | | | | |
4.300%, 04/01/2027 | | | 966 | | | | 957 | |
Marathon Petroleum | | | | | | | | |
5.125%, 03/01/2021 | | | 196 | | | | 204 | |
Nabors Industries | | | | | | | | |
5.500%, 01/15/2023 | | | 165 | | | | 157 | |
Noble Energy | | | | | | | | |
4.150%, 12/15/2021 | | | 838 | | | | 858 | |
3.900%, 11/15/2024 | | | 606 | | | | 612 | |
Pertamina Persero MTN | | | | | | | | |
6.450%, 05/30/2044 | | | 450 | | | | 513 | |
Plains All American Pipeline | | | | | | | | |
3.600%, 11/01/2024 | | | 477 | | | | 475 | |
Sabine Pass Liquefaction | | | | | | | | |
5.000%, 03/15/2027 | | | 720 | | | | 764 | |
Sunoco | | | | | | | | |
5.875%, 03/15/2028 | | | 257 | | | | 255 | |
4.875%, 01/15/2023 | | | 563 | | | | 572 | |
Transocean Poseidon | | | | | | | | |
6.875%, 02/01/2027 (C) | | | 294 | | | | 306 | |
Western Midstream Operating | | | | | | | | |
4.750%, 08/15/2028 | | | 190 | | | | 193 | |
4.500%, 03/01/2028 | | | 285 | | | | 282 | |
Williams | | | | | | | | |
3.900%, 01/15/2025 | | | 217 | | | | 221 | |
| | | | | | | | |
| | | | | | | 8,883 | |
| | | | | | | | |
|
Financials — 4.2% | |
ABN AMRO Bank | | | | | | | | |
4.750%, 07/28/2025 (C) | | | 269 | | | | 279 | |
American Express | | | | | | | | |
4.900%, VAR ICE LIBOR USD 3 Month+3.285%, 12/31/2049 | | | 359 | | | | 357 | |
Banco Santander | | | | | | | | |
5.179%, 11/19/2025 | | | 400 | | | | 422 | |
3.500%, 04/11/2022 | | | 600 | | | | 606 | |
Banco Santander MTN | | | | | | | | |
3.250%, 04/04/2026 | | | EUR 300 | | | | 364 | |
| | |
SEI Institutional Managed Trust / Semi-Annual Report / March 31, 2019 | | 219 |
CONSOLIDATED SCHEDULE OF INVESTMENTS (Unaudited)
March 31, 2019
Multi-Asset Inflation Managed Fund(Continued)
| | | | | | | | |
| | | |
| Description | | Face Amount
(Thousands) | | | Market Value
($ Thousands) | |
| | | | | | | | |
|
CORPORATE OBLIGATIONS (continued) | |
Bank of America | | | | | | | | |
6.500%, VAR ICE LIBOR USD 3 Month+4.174%, 12/31/2049 | | | $ 362 | | | $ | 393 | |
6.300%, VAR ICE LIBOR USD 3 Month+4.553%, 09/10/2167 | | | 233 | | | | 253 | |
Bank of America MTN | | | | | | | | |
3.950%, 04/21/2025 | | | 1,205 | | | | 1,226 | |
3.124%, VAR ICE LIBOR USD 3 Month+1.160%, 01/20/2023 | | | 1,200 | | | | 1,203 | |
Banque Federative du Credit Mutuel MTN | | | | | | | | |
2.750%, 10/15/2020 (C) | | | 470 | | | | 469 | |
Barclays | | | | | | | | |
6.860%, VAR ICE LIBOR USD 6 Month+1.730%, 12/31/2049 (C) | | | 131 | | | | 135 | |
3.684%, 01/10/2023 | | | 695 | | | | 694 | |
BB&T MTN | | | | | | | | |
2.625%, 06/29/2020 | | | 400 | | | | 400 | |
BNP Paribas | | | | | | | | |
2.375%, 05/21/2020 | | | 200 | | | | 199 | |
BNP Paribas MTN | | | | | | | | |
2.250%, 01/11/2027 | | | EUR 434 | | | | 504 | |
BPCE MTN | | | | | | | | |
2.750%, 01/11/2023 (C) | | | $ 397 | | | | 393 | |
Capital One Financial | | | | | | | | |
3.300%, 10/30/2024 | | | 1,152 | | | | 1,141 | |
CIT Group | | | | | | | | |
5.250%, 03/07/2025 | | | 476 | | | | 506 | |
Citigroup | | | | | | | | |
5.950%, VAR ICE LIBOR USD 3 Month+4.068%, 12/29/2049 | | | 311 | | | | 316 | |
5.950%, VAR ICE LIBOR USD 3 Month+4.095%, 12/29/2049 | | | 320 | | | | 323 | |
5.875%, VAR ICE LIBOR USD 3 Month+4.059%, 12/29/2049 | | | 360 | | | | 364 | |
3.875%, 03/26/2025 | | | 905 | | | | 912 | |
Compass Bank | | | | | | | | |
2.875%, 06/29/2022 | | | 905 | | | | 896 | |
Cooperatieve Rabobank UA | | | | | | | | |
4.375%, 08/04/2025 | | | 657 | | | | 677 | |
Credit Agricole MTN | | | | | | | | |
2.750%, 06/10/2020 (C) | | | 400 | | | | 400 | |
Credit Suisse Group Funding Guernsey | | | | | | | | |
4.550%, 04/17/2026 | | | 555 | | | | 580 | |
3.800%, 06/09/2023 | | | 530 | | | | 538 | |
Discover Bank | | | | | | | | |
4.682%, VAR USD Swap Semi 30/360 5 Yr Curr+1.730%, 08/09/2028 | | | 475 | | | | 483 | |
Goldman Sachs Group | | | | | | | | |
5.000%, VAR ICE LIBOR USD 3 Month+2.874%, 05/10/2166 | | | 603 | | | | 557 | |
2.350%, 11/15/2021 | | | 847 | | | | 834 | |
| | | | | | | | |
| | | |
| Description | | Face Amount
(Thousands) | | | Market Value
($ Thousands) | |
| | | | | | | | |
|
CORPORATE OBLIGATIONS (continued) | |
Goldman Sachs Group MTN | | | | | | | | |
4.229%, VAR ICE LIBOR USD 3 Month+1.600%, 11/29/2023 | | | $ 900 | | | $ | 920 | |
2.905%, VAR ICE LIBOR USD 3 Month+0.990%, 07/24/2023 | | | 728 | | | | 720 | |
Guardian Life Insurance of America | | | | | | | | |
4.850%, 01/24/2077 (C) | | | 145 | | | | 152 | |
HSBC Bank USA | | | | | | | | |
4.875%, 08/24/2020 | | | 450 | | | | 462 | |
HSBC Holdings | | | | | | | | |
4.292%, VAR ICE LIBOR USD 3 Month+1.348%, 09/12/2026 | | | 478 | | | | 493 | |
4.250%, 03/14/2024 | | | 1,041 | | | | 1,065 | |
ING Bank | | | | | | | | |
5.800%, 09/25/2023 (C) | | | 1,092 | | | | 1,177 | |
ING Groep | | | | | | | | |
4.100%, 10/02/2023 | | | 500 | | | | 514 | |
Intesa Sanpaolo MTN | | | | | | | | |
5.017%, 06/26/2024 (C) | | | 335 | | | | 324 | |
JPMorgan Chase MTN | | | | | | | | |
2.295%, 08/15/2021 | | | 551 | | | | 545 | |
Lincoln National | | | | | | | | |
4.200%, 03/15/2022 | | | 355 | | | | 368 | |
Lloyds Banking Group | | | | | | | | |
4.582%, 12/10/2025 | | | 741 | | | | 750 | |
Manufacturers & Traders Trust | | | | | | | | |
2.625%, 01/25/2021 | | | 786 | | | | 787 | |
MetLife | | | | | | | | |
5.700%, 06/15/2035 | | | 80 | | | | 96 | |
Metropolitan Life Global Funding I | | | | | | | | |
3.875%, 04/11/2022 (C) | | | 275 | | | | 283 | |
Morgan Stanley | | | | | | | | |
5.550%, VAR ICE LIBOR USD 3 Month+3.810%, 12/29/2049 | | | 160 | | | | 163 | |
Morgan Stanley MTN | | | | | | | | |
5.000%, 11/24/2025 | | | 275 | | | | 295 | |
4.350%, 09/08/2026 | | | 854 | | | | 876 | |
Nationwide Building Society | | | | | | | | |
4.000%, 09/14/2026 (C) | | | 747 | | | | 717 | |
Nationwide Financial Services | | | | | | | | |
5.375%, 03/25/2021 (C) | | | 470 | | | | 489 | |
Navient | | | | | | | | |
6.625%, 07/26/2021 | | | 770 | | | | 805 | |
Navient MTN | | | | | | | | |
7.250%, 01/25/2022 | | | 52 | | | | 55 | |
Royal Bank of Scotland Group | | | | | | | | |
8.625%, VAR USD Swap Semi 30/360 5 Yr Curr+7.598%, 12/31/2049 | | | 425 | | | | 453 | |
4.921%, VAR ICE LIBOR USD 3 Month+2.320%, 09/29/2027 | | | 600 | | | | 558 | |
Santander Holdings USA | | | | | | | | |
4.400%, 07/13/2027 | | | 1,135 | | | | 1,125 | |
| | |
220 | | SEI Institutional Managed Trust / Semi-Annual Report / March 31, 2019 |
| | | | | | | | |
| | | |
| Description | | Face Amount
(Thousands) | | | Market Value
($ Thousands) | |
|
CORPORATE OBLIGATIONS (continued) | |
Santander UK | | | | | | | | |
5.000%, 11/07/2023 (C) | | $ | 700 | | | $ | 717 | |
SBA Tower Trust | | | | | | | | |
3.156%, 10/08/2020 (C) | | | 950 | | | | 950 | |
Standard Chartered | | | | | | | | |
7.750%, VAR USD Swap Semi 30/360 5 Yr Curr+5.723%, 12/29/2049 (C) | | | 200 | | | | 209 | |
7.500%, VAR USD Swap Semi 30/360 5 Yr Curr+6.301%, 12/29/2049 | | | 412 | | | | 430 | |
4.261%, VAR ICE LIBOR USD 3 Month+1.510%, 01/29/2049 (C) | | | 400 | | | | 320 | |
Synchrony Financial | | | | | | | | |
4.500%, 07/23/2025 | | | 945 | | | | 949 | |
UBS Group Funding Switzerland | | | | | | | | |
4.125%, 09/24/2025 (C) | | | 689 | | | | 711 | |
US Bancorp | | | | | | | | |
5.300%, VAR ICE LIBOR USD 3 Month+2.914%, 12/29/2049 | | | 474 | | | | 482 | |
Voya Financial | | | | | | | | |
5.650%, VAR ICE LIBOR USD 3 Month+3.580%, 05/15/2053 | | | 258 | | | | 254 | |
Wells Fargo | | | | | | | | |
3.069%, 01/24/2023 | | | 881 | | | | 882 | |
| | | | | | | | |
| | | | | | | 36,520 | |
| | | | | | | | |
|
Health Care — 0.6% | |
AmerisourceBergen | | | | | | | | |
4.300%, 12/15/2047 | | | 365 | | | | 331 | |
Cigna | | | | | | | | |
4.375%, 10/15/2028 (C) | | | 382 | | | | 396 | |
4.125%, 11/15/2025 (C) | | | 286 | | | | 296 | |
3.750%, 07/15/2023 (C) | | | 242 | | | | 248 | |
Gilead Sciences | | | | | | | | |
2.550%, 09/01/2020 | | | 1,137 | | | | 1,136 | |
HCA | | | | | | | | |
5.375%, 09/01/2026 | | | 559 | | | | 589 | |
Mylan | | | | | | | | |
3.125%, 01/15/2023 (C) | | | 950 | | | | 928 | |
Takeda Pharmaceutical | | | | | | | | |
4.400%, 11/26/2023 (C) | | | 820 | | | | 861 | |
Zimmer Biomet Holdings | | | | | | | | |
2.700%, 04/01/2020 | | | 480 | | | | 479 | |
| | | | | | | | |
| | | | | | | 5,264 | |
| | | | | | | | |
|
Industrials — 0.5% | |
Adani Ports & Special Economic Zone | | | | | | | | |
3.950%, 01/19/2022 (C) | | | 670 | | | | 672 | |
Alfa | | | | | | | | |
5.250%, 03/25/2024 (C) | | | 660 | | | | 691 | |
Embraer Netherlands Finance BV | | | | | | | | |
5.400%, 02/01/2027 | | | 670 | | | | 722 | |
| | | | | | | | |
| | | |
| Description | | Face Amount
(Thousands) | | | Market Value
($ Thousands) | |
|
CORPORATE OBLIGATIONS (continued) | |
Odebrecht Finance | | | | | | | | |
7.125%, 06/26/2042 (C) | | $ | 444 | | | $ | 65 | |
Rumo Luxembourg Sarl | | | | | | | | |
5.875%, 01/18/2025 (C) | | | 409 | | | | 413 | |
TransDigm | | | | | | | | |
6.250%, 03/15/2026 (C) | | | 405 | | | | 422 | |
United Technologies | | | | | | | | |
3.950%, 08/16/2025 | | | 570 | | | | 592 | |
XPO Logistics | | | | | | | | |
6.750%, 08/15/2024 (C) | | | 450 | | | | 459 | |
| | | | | | | | |
| | | | | | | 4,036 | |
| | | | | | | | |
|
Information Technology — 0.6% | |
Broadcom | | | | | | | | |
4.250%, 04/15/2026 (C) | | | 360 | | | | 357 | |
3.875%, 01/15/2027 | | | 486 | | | | 464 | |
3.625%, 01/15/2024 | | | 226 | | | | 226 | |
3.625%, 10/15/2024 (C) | | | 360 | | | | 357 | |
CommScope Finance | | | | | | | | |
6.000%, 03/01/2026 (C) | | | 315 | | | | 326 | |
5.500%, 03/01/2024 (C) | | | 228 | | | | 233 | |
Hewlett Packard Enterprise | | | | | | | | |
2.100%, 10/04/2019 (C) | | | 794 | | | | 791 | |
Lam Research | | | | | | | | |
2.800%, 06/15/2021 | | | 640 | | | | 640 | |
Seagate HDD Cayman | | | | | | | | |
4.750%, 01/01/2025 | | | 427 | | | | 415 | |
Total System Services | | | | | | | | |
4.000%, 06/01/2023 | | | 392 | | | | 403 | |
Western Digital | | | | | | | | |
4.750%, 02/15/2026 | | | 838 | | | | 800 | |
| | | | | | | | |
| | | | | | | 5,012 | |
| | | | | | | | |
|
Materials — 0.4% | |
Dow Chemical | | | | | | | | |
4.250%, 11/15/2020 | | | 131 | | | | 133 | |
DowDuPont | | | | | | | | |
4.493%, 11/15/2025 | | | 690 | | | | 735 | |
4.205%, 11/15/2023 | | | 690 | | | | 722 | |
Eastman Chemical Co | | | | | | | | |
3.800%, 03/15/2025 | | | 318 | | | | 325 | |
Suzano Austria GmbH | | | | | | | | |
6.000%, 01/15/2029 (C) | | | 713 | | | | 759 | |
Vale Overseas | | | | | | | | |
6.250%, 08/10/2026 | | | 443 | | | | 482 | |
| | | | | | | | |
| | | | | | | 3,156 | |
| | | | | | | | |
|
Real Estate — 0.1% | |
Host Hotels & Resorts | | | | | | | | |
3.750%, 10/15/2023 | | | 16 | | | | 16 | |
| | |
SEI Institutional Managed Trust / Semi-Annual Report / March 31, 2019 | | 221 |
CONSOLIDATED SCHEDULE OF INVESTMENTS (Unaudited)
March 31, 2019
Multi-Asset Inflation Managed Fund(Continued)
| | | | | | | | |
| | | |
| Description | | Face Amount
(Thousands) | | | Market Value
($ Thousands) | |
|
CORPORATE OBLIGATIONS (continued) | |
Welltower | | | | | | | | |
4.000%, 06/01/2025 | | $ | 550 | | | $ | 566 | |
| | | | | | | | |
| | | | | | | 582 | |
| | | | | | | | |
Utilities — 0.4% | | | | | | | | |
AES | | | | | | | | |
4.000%, 03/15/2021 | | | 463 | | | | 469 | |
Enel Chile | | | | | | | | |
4.875%, 06/12/2028 | | | 650 | | | | 685 | |
Exelon Generation | | | | | | | | |
2.950%, 01/15/2020 | | | 619 | | | | 618 | |
Genneia | | | | | | | | |
8.750%, 01/20/2022 (C) | | | 327 | | | | 296 | |
Israel Electric | | | | | | | | |
5.000%, 11/12/2024 (C) | | | 792 | | | | 836 | |
Perusahaan Listrik Negara MTN | | | | | | | | |
5.450%, 05/21/2028 (C) | | | 594 | | | | 634 | |
Terraform Global Operating | | | | | | | | |
6.125%, 03/01/2026 (C) | | | 188 | | | | 183 | |
| | | | | | | | |
| | | | | | | 3,721 | |
| | | | | | | | |
| | |
Total Corporate Obligations
(Cost $80,245) ($ Thousands) | | | | | | | 80,928 | |
| | | | | | | | |
|
MORTGAGE-BACKED SECURITIES — 7.5% | |
|
Agency Mortgage-Backed Obligations — 0.6% | |
FHLMC CMO, Ser 2017-4693, Cl SL, IO | | | | | | | | |
3.666%, VAR LIBOR USD 1
Month+6.150%, 06/15/2047 | | | 2,523 | | | | 462 | |
FHLMC CMO, Ser 2017-4727, Cl SA, IO | | | | | | | | |
3.716%, VAR LIBOR USD 1
Month+6.200%, 11/15/2047 | | | 2,172 | | | | 374 | |
FNMA CMO, Ser 2011-131, Cl ST, IO | | | | | | | | |
4.055%, VAR LIBOR USD 1
Month+6.540%, 12/25/2041 | | | 1,295 | | | | 250 | |
FNMA CMO, Ser 2014-17, Cl SA, IO | | | | | | | | |
3.565%, VAR LIBOR USD 1
Month+6.050%, 04/25/2044 | | | 3,093 | | | | 545 | |
FNMA CMO, Ser 2014-78, Cl SE, IO | | | | | | | | |
3.615%, VAR LIBOR USD 1
Month+6.100%, 12/25/2044 | | | 2,344 | | | | 392 | |
FNMA CMO, Ser 2014-92, Cl SX, IO | | | | | | | | |
3.615%, VAR LIBOR USD 1
Month+6.100%, 01/25/2045 | | | 2,687 | | | | 497 | |
FNMA CMO, Ser 2016-77, Cl DS, IO | | | | | | | | |
3.515%, VAR LIBOR USD 1
Month+6.000%, 10/25/2046 | | | 2,465 | | | | 425 | |
FNMA CMO, Ser 2017-62, Cl AS, IO | | | | | | | | |
3.665%, VAR LIBOR USD 1
Month+6.150%, 08/25/2047 | | | 2,583 | | | | 448 | |
| | | | | | | | |
| | | |
| Description | | Face Amount
(Thousands) | | | Market Value
($ Thousands) | |
|
MORTGAGE-BACKED SECURITIES (continued) | |
FNMA CMO, Ser 2017-81, Cl SA, IO | | | | | | | | |
3.715%, VAR LIBOR USD 1
Month+6.200%, 10/25/2047 | | $ | 2,568 | | | $ | 463 | |
FNMA CMO, Ser 2017-97, Cl LS, IO | | | | | | | | |
3.715%, VAR LIBOR USD 1
Month+6.200%, 12/25/2047 | | | 2,714 | | | | 513 | |
GNMA CMO, Ser 2017-122, Cl SA, IO | | | | | | | | |
3.712%, VAR LIBOR USD 1
Month+6.200%, 08/20/2047 | | | 1,796 | | | | 336 | |
GNMA CMO, Ser 2017-134, Cl SE, IO | | | | | | | | |
3.712%, VAR LIBOR USD 1
Month+6.200%, 09/20/2047 | | | 2,055 | | | | 332 | |
| | | | | | | | |
| | |
| | | | | | | 5,037 | |
| | | | | | | | |
Non-Agency Mortgage-Backed Obligations — 6.9% | |
Alternative Loan Trust, Ser 2005-20CB, Cl 3A6 | | | | | | | | |
5.500%, 07/25/2035 | | | 90 | | | | 84 | |
Alternative Loan Trust, Ser 2005-57CB, Cl 4A3 | | | | | | | | |
5.500%, 12/25/2035 | | | 205 | | | | 173 | |
Alternative Loan Trust, Ser 2006-24CB, Cl A16 | | | | | | | | |
5.750%, 08/01/2036 | | | 375 | | | | 307 | |
Alternative Loan Trust, Ser 2006-28CB, Cl A14 | | | | | | | | |
6.250%, 10/25/2036 | | | 278 | | | | 222 | |
Alternative Loan Trust, Ser 2006-J1, Cl 1A13 | | | | | | | | |
5.500%, 02/25/2036 | | | 205 | | | | 183 | |
Ashford Hospitality Trust, Ser 2018-KEYS, Cl A | | | | | | | | |
3.484%, VAR LIBOR USD 1
Month+1.000%, 05/15/2035 (C) | | | 1,000 | | | | 999 | |
BAMLL Commercial Mortgage Securities Trust, Ser 2017-SCH, Cl AF | | | | | | | | |
3.484%, VAR LIBOR USD 1
Month+1.000%, 11/15/2033 (C) | | | 1,610 | | | | 1,586 | |
Bellemeade Re, Ser 2018-2A, Cl M1B | | | | | | | | |
3.836%, VAR ICE LIBOR USD 1
Month+1.350%, 08/25/2028 (C) | | | 289 | | | | 289 | |
Bellemeade Re, Ser 2018-3A, Cl M1B | | | | | | | | |
4.336%, VAR ICE LIBOR USD 1
Month+1.850%, 10/25/2027 (C) | | | 570 | | | | 572 | |
BHMS, Ser 2018-ATLS, Cl A | | | | | | | | |
3.734%, VAR LIBOR USD 1
Month+1.250%, 07/15/2035 (C) | | | 955 | | | | 954 | |
BX Trust, Ser 2017-IMC, Cl A | | | | | | | | |
3.534%, VAR LIBOR USD 1
Month+1.050%, 10/15/2032 (C) | | | 1,050 | | | | 1,047 | |
BX Trust, Ser 2018-EXCL, Cl A | | | | | | | | |
3.571%, VAR LIBOR USD 1
Month+1.088%, 09/15/2037 (C) | | | 901 | | | | 896 | |
| | |
222 | | SEI Institutional Managed Trust / Semi-Annual Report / March 31, 2019 |
| | | | | | | | |
| | | |
| Description | | Face Amount
(Thousands) | | | Market Value
($ Thousands) | |
|
MORTGAGE-BACKED SECURITIES (continued) | |
CCUBS Commercial Mortgage Trust, Ser 2017-C1, Cl A4 | | | | | | | | |
3.544%, 11/15/2050 | | $ | 1,115 | | | $ | 1,135 | |
CFCRE Commercial Mortgage Trust, Ser 2016-C4, Cl A4 | | | | | | | | |
3.283%, 05/10/2058 | | | 670 | | | | 669 | |
CGRBS Commercial Mortgage Trust, Ser 2013-VN05, Cl A | | | | | | | | |
3.369%, 03/13/2035 (C) | | | 915 | | | | 935 | |
Chase Mortgage Finance Trust, Ser 2007-S5, Cl 1A17 | | | | | | | | |
6.000%, 07/25/2037 | | | 132 | | | | 98 | |
CHL Mortgage Pass-Through Trust, Ser 2006-10, Cl 1A8 | | | | | | | | |
6.000%, 05/25/2036 | | | 218 | | | | 173 | |
CHL Mortgage Pass-Through Trust, Ser 2006-13, Cl 1A19 | | | | | | | | |
6.250%, 09/25/2036 | | | 104 | | | | 80 | |
Citigroup Commercial Mortgage Trust, Ser 2013-GC11, Cl D | | | | | | | | |
4.423%,
04/10/2046
(C)(E) | | | 343 | | | | 345 | |
Citigroup Commercial Mortgage Trust, Ser 2015-GC27, Cl A5 | | | | | | | | |
3.137%, 02/10/2048 | | | 980 | | | | 985 | |
Citigroup Commercial Mortgage Trust, Ser 2015-GC35, Cl A4 | | | | | | | | |
3.818%, 11/10/2048 | | | 435 | | | | 454 | |
Citigroup Commercial Mortgage Trust, Ser 2016-GC36, Cl A5 | | | | | | | | |
3.616%, 02/10/2049 | | | 540 | | | | 557 | |
Cloverleaf Cold Storage Trust, Ser 2019-CHL2, Cl A | | | | | | | | |
3.560%, VAR LIBOR USD 1 Month+1.080%, 03/15/2036 (C) | | | 923 | | | | 923 | |
COMM Mortgage Trust, Ser 2010-C1, Cl D | | | | | | | | |
6.128%,
07/10/2046
(C)(E) | | | 740 | | | | 758 | |
COMM Mortgage Trust, Ser 2013-CR12, Cl A4 | | | | | | | | |
4.046%, 10/10/2046 | | | 870 | | | | 909 | |
COMM Mortgage Trust, Ser 2015-CR24, Cl A5 | | | | | | | | |
3.696%, 08/10/2048 | | | 545 | | | | 564 | |
COMM Mortgage Trust, Ser 2015-DC1, Cl A5 | | | | | | | | |
3.350%, 02/10/2048 | | | 250 | | | | 253 | |
Commercial Mortgage Pass-Through Certificates, Ser 2013-SFS, Cl A1 | | | | | | | | |
1.873%, 04/12/2035 (C) | | | 213 | | | | 208 | |
Connecticut Avenue Securities Trust, Ser 2018-R07, Cl 1M2 | | | | | | | | |
4.886%, VAR ICE LIBOR USD 1 Month+2.400%, 04/25/2031 (C) | | | 537 | | | | 542 | |
Connecticut Avenue Securities Trust, Ser 2019-R02, Cl 1M2 | | | | | | | | |
4.786%, VAR ICE LIBOR USD 1 Month+2.300%, 08/25/2031 (C) | | | 336 | | | | 338 | |
| | | | | | | | |
| | | |
| Description | | Face Amount
(Thousands) | | | Market Value
($ Thousands) | |
|
MORTGAGE-BACKED SECURITIES (continued) | |
CSAIL Commercial Mortgage Trust, Ser 2015-C2, Cl A4 | | | | | | | | |
3.504%, 06/15/2057 | | $ | 436 | | | $ | 446 | |
CSAIL Commercial Mortgage Trust, Ser 2015-C4, Cl A4 | | | | | | | | |
3.808%, 11/15/2048 | | | 1,090 | | | | 1,133 | |
CSMC, Ser 2010-6R, Cl 3A2 | | | | | | | | |
5.875%, 01/26/2038 (C) | | | 448 | | | | 344 | |
CSMC, Ser 2016-MFF, Cl D | | | | | | | | |
7.084%, VAR LIBOR USD 1 Month+4.600%, 11/15/2033 (C) | | | 268 | | | | 269 | |
DBWF Mortgage Trust, Ser 2018-GLKS, Cl A | | | | | | | | |
3.512%, VAR LIBOR USD 1 Month+1.030%, 11/19/2035 (C) | | | 761 | | | | 761 | |
Deutsche Alt-A Securities Mortgage Loan Trust, Ser 2006-AR4, Cl A2 | | | | | | | | |
2.676%, VAR ICE LIBOR USD 1 Month+0.190%, 12/25/2036 | | | 488 | | | | 270 | |
Eagle RE, Ser 2018-1, Cl M1 | | | | | | | | |
4.186%, VAR ICE LIBOR USD 1 Month+1.700%, 11/25/2028 (C) | | | 247 | | | | 248 | |
FHLMC Structured Agency Credit Risk Debt Notes, Ser 2014-DN3, Cl M3 | | | | | | | | |
6.486%, VAR ICE LIBOR USD 1 Month+4.000%, 08/25/2024 | | | 897 | | | | 972 | |
FHLMC Structured Agency Credit Risk Debt Notes, Ser 2014-DN4, Cl M3 | | | | | | | | |
7.036%, VAR ICE LIBOR USD 1 Month+4.550%, 10/25/2024 | | | 179 | | | | 196 | |
FHLMC Structured Agency Credit Risk Debt Notes, Ser 2016-DNA2, Cl M3 | | | | | | | | |
7.136%, VAR ICE LIBOR USD 1 Month+4.650%, 10/25/2028 | | | 400 | | | | 446 | |
FHLMC Structured Agency Credit Risk Debt Notes, Ser 2017-DNA1, Cl M2 | | | | | | | | |
5.736%, VAR ICE LIBOR USD 1 Month+3.250%, 07/25/2029 | | | 635 | | | | 681 | |
FHLMC Structured Agency Credit Risk Debt Notes, Ser 2017-DNA3, Cl M2 | | | | | | | | |
4.986%, VAR ICE LIBOR USD 1 Month+2.500%, 03/25/2030 | | | 450 | | | | 461 | |
FHLMC Structured Agency Credit Risk Debt Notes, Ser 2017-HQA2, Cl M2 | | | | | | | | |
5.136%, VAR ICE LIBOR USD 1 Month+2.650%, 12/25/2029 | | | 250 | | | | 257 | |
First Horizon Alternative Mortgage Securities Trust, Ser 2006-FA3, Cl A9 | | | | | | | | |
6.000%, 07/25/2036 | | | 200 | | | | 158 | |
FNMA Connecticut Avenue Securities, Ser 2014-C03, Cl 1M2 | | | | | | | | |
5.486%, VAR ICE LIBOR USD 1 Month+3.000%, 07/25/2024 | | | 345 | | | | 366 | |
| | |
SEI Institutional Managed Trust / Semi-Annual Report / March 31, 2019 | | 223 |
CONSOLIDATED SCHEDULE OF INVESTMENTS (Unaudited)
March 31, 2019
Multi-Asset Inflation Managed Fund(Continued)
| | | | | | | | |
| | | |
| Description | | Face Amount
(Thousands) | | | Market Value
($ Thousands) | |
|
MORTGAGE-BACKED SECURITIES (continued) | |
FNMA Connecticut Avenue Securities,
Ser 2014-C04, Cl 2M2 | | | | | | | | |
7.486%, VAR ICE LIBOR USD 1 Month+5.000%, 11/25/2024 | | $ | 156 | | | $ | 174 | |
FNMA Connecticut Avenue Securities,
Ser 2015-C01, Cl 1M2 | | | | | | | | |
6.786%, VAR ICE LIBOR USD 1 Month+4.300%, 02/25/2025 | | | 322 | | | | 351 | |
FNMA Connecticut Avenue Securities,
Ser 2015-C02, Cl 1M2 | | | | | | | | |
6.486%, VAR ICE LIBOR USD 1 Month+4.000%, 05/25/2025 | | | 607 | | | | 655 | |
FNMA Connecticut Avenue Securities,
Ser 2015-C02, Cl 2M2 | | | | | | | | |
6.486%, VAR ICE LIBOR USD 1 Month+4.000%, 05/25/2025 | | | 359 | | | | 385 | |
FNMA Connecticut Avenue Securities,
Ser 2015-C03, Cl 1M2 | | | | | | | | |
7.486%, VAR ICE LIBOR USD 1 Month+5.000%, 07/25/2025 | | | 705 | | | | 785 | |
FNMA Connecticut Avenue Securities,
Ser 2015-C03, Cl 2M2 | | | | | | | | |
7.486%, VAR ICE LIBOR USD 1 Month+5.000%, 07/25/2025 | | | 744 | | | | 817 | |
FNMA Connecticut Avenue Securities,
Ser 2015-C04, Cl 1M2 | | | | | | | | |
8.186%, VAR ICE LIBOR USD 1 Month+5.700%, 04/25/2028 | | | 241 | | | | 275 | |
FNMA Connecticut Avenue Securities,
Ser 2015-C04, Cl 2M2 | | | | | | | | |
8.036%, VAR ICE LIBOR USD 1 Month+5.550%, 04/25/2028 | | | 693 | | | | 775 | |
FNMA Connecticut Avenue Securities,
Ser 2016-C01, Cl 2M2 | | | | | | | | |
9.436%, VAR ICE LIBOR USD 1 Month+6.950%, 08/25/2028 | | | 649 | | | | 751 | |
FNMA Connecticut Avenue Securities,
Ser 2016-C01, Cl 1M2 | | | | | | | | |
9.236%, VAR ICE LIBOR USD 1 Month+6.750%, 08/25/2028 | | | 961 | | | | 1,114 | |
FNMA Connecticut Avenue Securities,
Ser 2016-C02, Cl 1M2 | | | | | | | | |
8.486%, VAR ICE LIBOR USD 1 Month+6.000%, 09/25/2028 | | | 808 | | | | 920 | |
FNMA Connecticut Avenue Securities,
Ser 2016-C03, Cl 2M2 | | | | | | | | |
8.386%, VAR ICE LIBOR USD 1 Month+5.900%, 10/25/2028 | | | 1,462 | | | | 1,654 | |
FNMA Connecticut Avenue Securities,
Ser 2016-C05, Cl 2M2 | | | | | | | | |
6.936%, VAR ICE LIBOR USD 1 Month+4.450%, 01/25/2029 | | | 965 | | | | 1,056 | |
| | | | | | | | |
| | | |
| Description | | Face Amount
(Thousands) | | | Market Value
($ Thousands) | |
|
MORTGAGE-BACKED SECURITIES (continued) | |
FNMA Connecticut Avenue Securities,
Ser 2017-C04, Cl 2M2 | | | | | | | | |
5.336%, VAR ICE LIBOR USD 1 Month+2.850%, 11/25/2029 | | $ | 695 | | | $ | 721 | |
Great Wolf Trust,
Ser 2017-WOLF, Cl A | | | | | | | | |
3.484%, VAR LIBOR USD 1 Month+0.850%, 09/15/2034 (C) | | | 1,130 | | | | 1,127 | |
GS Mortgage Securities II,
Ser 2013-KING, Cl A | | | | | | | | |
2.706%, 12/10/2027 (C) | | | 696 | | | | 695 | |
GS Mortgage Securities II,
Ser 2018-GS9, Cl A4 | | | | | | | | |
3.992%, 03/10/2051 (E) | | | 1,350 | | | | 1,427 | |
GS Mortgage Securities Trust, Ser 2014-GC18, Cl D | | | | | | | | |
4.996%,
01/10/2047
(C)(E) | | | 679 | | | | 574 | |
Home RE, Ser 2018-1, Cl M1 | | | | | | | | |
4.086%, VAR ICE LIBOR USD 1 Month+1.600%, 10/25/2028 (C) | | | 436 | | | | 437 | |
HomeBanc Mortgage Trust,
Ser 2005-1, Cl A1 | | | | | | | | |
2.736%, VAR ICE LIBOR USD 1 Month+0.250%, 03/25/2035 | | | 156 | | | | 135 | |
JPMBB Commercial Mortgage Securities Trust, Ser 2014-C21, Cl A5 | | | | | | | | |
3.775%, 08/15/2047 | | | 925 | | | | 961 | |
JPMBB Commercial Mortgage Securities Trust, Ser 2014-C22, Cl XA, IO | | | | | | | | |
0.864%, 09/15/2047 (E) | | | 19,873 | | | | 733 | |
JPMBB Commercial Mortgage Securities Trust,
Ser 2015-C30, Cl A5 | | | | | | | | |
3.822%, 07/15/2048 | | | 540 | | | | 563 | |
JPMBB Commercial Mortgage Securities Trust, Ser 2015-C31,
Cl A3 | | | | | | | | |
3.801%, 08/15/2048 | | | 1,092 | | | | 1,136 | |
JPMBB Commercial Mortgage Securities Trust, Ser 2015-C32,
Cl C | | | | | | | | |
4.672%, 11/15/2048 (E) | | | 849 | | | | 872 | |
JPMCC Commercial Mortgage Securities Trust, Ser 2017-JP7,
Cl XA, IO | | | | | | | | |
1.083%, 09/15/2050 (E) | | | 6,755 | | | | 439 | |
JPMorgan Chase Commercial Mortgage Securities Trust,
Ser 2006-LDP9, Cl AM | | | | | | | | |
5.372%, 05/15/2047 | | | 45 | | | | 45 | |
JPMorgan Chase Commercial Mortgage Securities Trust,
Ser 2014-C20, Cl A5 | | | | | | | | |
3.805%, 07/15/2047 | | | 900 | | | | 936 | |
LB-UBS Commercial Mortgage Trust, Ser 2006-C6, Cl AJ | | | | | | | | |
5.452%, 09/15/2039 (E) | | | 227 | | | | 157 | |
LSTAR Commercial Mortgage Trust, Ser 2015-3, Cl A2 | | | | | | | | |
2.729%,
04/20/2048
(C)(E) | | | 454 | | | | 453 | |
| | |
224 | | SEI Institutional Managed Trust / Semi-Annual Report / March 31, 2019 |
| | | | | | | | |
| | | |
| Description | | Face Amount
(Thousands) | | | Market Value
($ Thousands) | |
|
MORTGAGE-BACKED SECURITIES (continued) | |
LSTAR Commercial Mortgage Trust, Ser 2016-4, Cl A2 | | | | | | | | |
2.579%, 03/10/2049 (C) | | $ | 971 | | | $ | 954 | |
Morgan Stanley Bank of America Merrill Lynch Trust,
Ser 2014-C16, Cl A5 | | | | | | | | |
3.892%, 06/15/2047 | | | 920 | | | | 961 | |
Morgan Stanley Capital I Trust,
Ser 2005-IQ9, Cl D | | | | | | | | |
5.000%, 07/15/2056 (B) | | | 545 | | | | 540 | |
Morgan Stanley Capital I Trust,
Ser 2015-XLF2, Cl SNMA | | | | | | | | |
4.434%, VAR LIBOR USD 1 Month+1.950%, 11/15/2026 (C) | | | 204 | | | | 203 | |
Morgan Stanley Capital I Trust,
Ser 2016-UB12, Cl A4 | | | | | | | | |
3.596%, 12/15/2049 | | | 835 | | | | 861 | |
Natixis Commercial Mortgage Securities Trust,
Ser 2018-850T, Cl A | | | | | | | | |
3.267%, VAR LIBOR USD 1 Month+0.784%, 07/15/2033 (C) | | | 910 | | | | 904 | |
PMT Credit Risk Transfer Trust,
Ser 2019-1R, Cl A | | | | | | | | |
4.484%, 03/27/2024 | | | 315 | | | | 316 | |
Radnor RE, Ser 2019-1, Cl M1B | | | | | | | | |
4.436%, VAR ICE LIBOR USD 1 Month+1.950%, 02/25/2029 (C) | | | 313 | | | | 314 | |
Starwood Retail Property Trust, Ser 2014, Cl A | | | | | | | | |
3.704%, VAR LIBOR USD 1 Month+1.220%, 11/15/2027 (C) | | | 1,638 | | | | 1,634 | |
UBS Commercial Mortgage Trust, Ser 2018-C10, Cl A4 | | | | | | | | |
4.313%, 05/15/2051 | | | 1,155 | | | | 1,247 | |
UBS Commercial Mortgage Trust, Ser 2018-C8, Cl A4 | | | | | | | | |
3.983%, 02/15/2051 | | | 900 | | | | 947 | |
UBS Commercial Mortgage Trust, Ser 2018-C9, Cl A4 | | | | | | | | |
4.117%, 03/15/2051 (E) | | | 1,410 | | | | 1,499 | |
UBS-Barclays Commercial Mortgage Trust,
Ser 2012-C4, Cl A5 | | | | | | | | |
2.850%, 12/10/2045 | | | 596 | | | | 597 | |
Wells Fargo Commercial Mortgage Trust,
Ser 2015-SG1, Cl A4 | | | | | | | | |
3.789%, 09/15/2048 | | | 485 | | | | 502 | |
Wells Fargo Commercial Mortgage Trust,
Ser 2015-SG1, Cl C | | | | | | | | |
4.469%, 09/15/2048 (E) | | | 794 | | | | 792 | |
Wells Fargo Commercial Mortgage Trust,
Ser 2016-C35, Cl XA, IO | | | | | | | | |
1.972%, 07/15/2048 (E) | | | 3,889 | | | | 418 | |
| | | | | | | | |
| | | |
| Description | | Face Amount
(Thousands) | | | Market Value
($ Thousands) | |
|
MORTGAGE-BACKED SECURITIES (continued) | |
Wells Fargo Commercial Mortgage Trust,
Ser 2016-NXS6, Cl C | | | | | | | | |
4.313%, 11/15/2049 (E) | | $ | 925 | | | $ | 951 | |
Wells Fargo Credit Risk Transfer Securities Trust,
Ser 2015-WF1, Cl 1M2 | | | | | | | | |
7.736%, VAR ICE LIBOR USD 1 Month+5.250%, 11/25/2025 (B)(C) | | | 538 | | | | 595 | |
Wells Fargo Credit Risk Transfer Securities Trust,
Ser 2015-WF1, Cl 2M2 | | | | | | | | |
7.986%, VAR ICE LIBOR USD 1 Month+5.500%, 11/25/2025 (B)(C) | | | 160 | | | | 172 | |
Wells Fargo Mortgage-Backed Securities Trust,
Ser 2007-8, Cl 2A5 | | | | | | | | |
5.750%, 07/25/2037 | | | 86 | | | | 85 | |
| | | | | | | | |
| | |
| | | | | | | 59,861 | |
| | | | | | | | |
| | |
Total Mortgage-Backed Securities
(Cost $64,144) ($ Thousands) | | | | | | | 64,898 | |
| | | | | | | | |
|
U.S. GOVERNMENT AGENCY OBLIGATIONS ** — 5.9% | |
FFCB | | | | | | | | |
2.700%, VAR Fed Res Daily Prime+-2.800%, 11/23/2021 | | | 4,000 | | | | 4,002 | |
2.700%, VAR Fed Res Daily Prime+-2.800%, 03/14/2022 | | | 2,500 | | | | 2,498 | |
2.670%, VAR US Federal Funds Effective Rate+0.220%, 10/12/2021 | | | 3,000 | | | | 3,002 | |
2.650%, VAR US Federal Funds Effective Rate+0.200%, 06/21/2021 | | | 1,000 | | | | 1,001 | |
2.643%, VAR ICE LIBOR USD 3 Month+0.010%, 09/20/2021 | | | 2,700 | | | | 2,701 | |
2.570%, VAR Fed Res Daily Prime+-2.930%, 09/24/2020 | | | 3,000 | | | | 3,001 | |
2.544%, VAR ICE LIBOR USD 1 Month+0.065%, 12/28/2020 | | | 1,000 | | | | 1,000 | |
2.540%, VAR US Treasury 3 Month Bill Money Market Yield+0.140%, 09/17/2021 | | | 8,000 | | | | 7,996 | |
2.540%, VAR US Treasury 3 Month Bill Money Market Yield+0.140%, 11/08/2021 | | | 4,000 | | | | 3,991 | |
2.517%, VAR ICE LIBOR USD 3 Month+-0.080%, 01/15/2021 | | | 2,400 | | | | 2,398 | |
2.494%, VAR ICE LIBOR USD 1 Month+0.010%, 12/11/2020 | | | 3,860 | | | | 3,857 | |
FHLB | | | | | | | | |
2.435%, VAR ICE LIBOR USD 3 Month+-0.163%, 07/05/2019 | | | 2,655 | | | | 2,655 | |
0.875%, 08/05/2019 | | | 1,800 | | | | 1,790 | |
FHLMC | | | | | | | | |
3.000%, 01/18/2022 | | | 1,800 | | | | 1,800 | |
| | |
SEI Institutional Managed Trust / Semi-Annual Report / March 31, 2019 | | 225 |
CONSOLIDATED SCHEDULE OF INVESTMENTS (Unaudited)
March 31, 2019
Multi-Asset Inflation Managed Fund(Continued)
| | | | | | | | |
| | | |
| Description | | Face Amount
(Thousands) | | | Market Value
($ Thousands) | |
|
U.S. GOVERNMENT AGENCY OBLIGATIONS (continued) | |
FNMA | | | | | | | | |
2.700%, VAR United States Secured Overnight Financing Rate+0.160%, 01/30/2020 | | $ | 5,000 | | | $ | 5,004 | |
2.530%, VAR United States Secured Overnight Financing Rate+0.100%, 04/30/2020 | | | 2,300 | | | | 2,301 | |
2.458%, VAR ICE LIBOR USD 3 Month+-0.150%, 03/13/2020 | | | 2,050 | | | | 2,049 | |
| | | | | | | | |
| | |
Total U.S. Government Agency Obligations
(Cost $51,058) ($ Thousands) | | | | | | | 51,046 | |
| | | | | | | | |
|
ASSET-BACKED SECURITIES — 2.0% | |
Automotive — 1.0% | | | | | | | | |
Avis Budget Rental Car Funding AESOP, Ser 2016-1A, Cl A | | | | | | | | |
2.990%, 06/20/2022 (C) | | | 646 | | | | 647 | |
Avis Budget Rental Car Funding AESOP, Ser 2018-1A, Cl A | | | | | | | | |
3.700%, 09/20/2024 (C) | | | 930 | | | | 949 | |
Avis Budget Rental Car Funding AESOP, Ser 2018-2A, Cl A | | | | | | | | |
4.000%, 03/20/2025 (C) | | | 1,080 | | | | 1,106 | |
CPS Auto Receivables Trust, Ser 2017-D, Cl A | | | | | | | | |
1.870%, 03/15/2021 (C) | | | 78 | | | | 78 | |
Exeter Automobile Receivables Trust, Ser 2016-1A, Cl D | | | | | | | | |
8.200%, 02/15/2023 (C) | | | 440 | | | | 457 | |
Exeter Automobile Receivables Trust, Ser 2017-2A, Cl A | | | | | | | | |
2.110%, 06/15/2021 (C) | | | 32 | | | | 32 | |
Flagship Credit Auto Trust, Ser 2016-2, Cl D | | | | | | | | |
8.560%, 11/15/2023 (C) | | | 545 | | | | 577 | |
Flagship Credit Auto Trust, Ser 2016-4, Cl A2 | | | | | | | | |
1.960%, 02/16/2021 (C) | | | 74 | | | | 74 | |
Flagship Credit Auto Trust, Ser 2016-4, Cl D | | | | | | | | |
3.890%, 11/15/2022 (C) | | | 450 | | | | 453 | |
Flagship Credit Auto Trust, Ser 2017-4, Cl A | | | | | | | | |
2.070%, 04/15/2022 (C) | | | 145 | | | | 144 | |
Flagship Credit Auto Trust, Ser 2018-3, Cl B | | | | | | | | |
3.590%, 12/16/2024 (C) | | | 925 | | | | 935 | |
Hertz Vehicle Financing II, Ser 2015-1A, Cl A | | | | | | | | |
2.730%, 03/25/2021 (C) | | | 675 | | | | 673 | |
Hertz Vehicle Financing II, Ser 2015-1A, Cl B | | | | | | | | |
3.520%, 03/25/2021 (C) | | | 491 | | | | 490 | |
Hertz Vehicle Financing II, Ser 2017-1A, Cl A | | | | | | | | |
2.960%, 10/25/2021 (C) | | | 1,160 | | | | 1,156 | |
Hertz Vehicle Financing II, Ser 2018-1A, Cl A | | | | | | | | |
3.290%, 02/25/2024 (C) | | | 470 | | | | 468 | |
| | | | | | | | |
| | | |
| Description | | Face Amount
(Thousands) | | | Market Value
($ Thousands) | |
|
ASSET-BACKED SECURITIES (continued) | |
Hertz Vehicle Financing II, Ser 2019-1A, Cl A | | | | | | | | |
3.710%, 03/25/2023 (C) | | $ | 535 | | | $ | 542 | |
| | | | | | | | |
| | | | | | | 8,781 | |
| | | | | | | | |
Credit Cards — 0.2% | | | | | | | | |
World Financial Network Credit Card Master Trust, Ser 2018-A, Cl A | | | | | | | | |
3.070%, 12/16/2024 | | | 1,405 | | | | 1,413 | |
World Financial Network Credit Card Master Trust, Ser 2018-B, Cl M | | | | | | | | |
3.810%, 07/15/2025 | | | 710 | | | | 720 | |
| | | | | | | | |
| | | | | | | 2,133 | |
| | | | | | | | |
Other Asset-Backed Securities — 0.8% | |
CLUB Credit Trust, Ser 2017-P2, Cl A | | | | | | | | |
2.610%, 01/15/2024 (B)(C) | | | 280 | | | | 279 | |
CNH Equipment Trust, Ser 2015-A, Cl A4 | | | | | | | | |
1.850%, 04/15/2021 | | | 286 | | | | 286 | |
Consumer Loan Underlying Bond Credit Trust, Ser 2018-P1, Cl A | | | | | | | | |
3.390%, 07/15/2025 (C) | | | 194 | | | | 195 | |
GMF Floorplan Owner Revolving Trust, Ser 2016-1, Cl A1 | | | | | | | | |
1.960%, 05/17/2021 (C) | | | 986 | | | | 985 | |
Marlette Funding Trust, Ser 2017-1A, Cl A | | | | | | | | |
2.827%, 03/15/2024 (C) | | | 6 | | | | 6 | |
Marlette Funding Trust, Ser 2017-2A, Cl A | | | | | | | | |
2.390%, 07/15/2024 (C) | | | 15 | | | | 15 | |
Marlette Funding Trust, Ser 2017-3A, Cl A | | | | | | | | |
2.360%, 12/15/2024 (B)(C) | | | 76 | | | | 76 | |
Marlette Funding Trust, Ser 2017-3A, Cl B | | | | | | | | |
3.010%, 12/15/2024 (C) | | | 276 | | | | 275 | |
Marlette Funding Trust, Ser 2018-1A, Cl A | | | | | | | | |
2.610%, 03/15/2028 (B)(C) | | | 224 | | | | 223 | |
Marlette Funding Trust, Ser 2018-3A, Cl A | | | | | | | | |
3.200%, 09/15/2028 (C) | | | 720 | | | | 720 | |
Marlette Funding Trust, Ser 2018-4A, Cl A | | | | | | | | |
3.710%, 12/15/2028 (B)(C) | | | 387 | | | | 389 | |
Prosper Marketplace Issuance Trust, Ser 2017-2A, Cl B | | | | | | | | |
3.480%, 09/15/2023 (C) | | | 174 | | | | 174 | |
SoFi Consumer Loan Program, Ser 2016-2, Cl A | | | | | | | | |
3.090%, 10/27/2025 (B)(C) | | | 146 | | | | 146 | |
SoFi Consumer Loan Program, Ser 2016-3, Cl A | | | | | | | | |
3.050%, 12/26/2025 (B)(C) | | | 212 | | | | 212 | |
SoFi Consumer Loan Program, Ser 2017-2, Cl A | | | | | | | | |
3.280%, 02/25/2026 (C) | | | 237 | | | | 238 | |
| | |
226 | | SEI Institutional Managed Trust / Semi-Annual Report / March 31, 2019 |
| | | | | | | | |
| | | |
| Description | | Face Amount
(Thousands) | | | Market Value
($ Thousands) | |
|
ASSET-BACKED SECURITIES (continued) | |
SoFi Consumer Loan Program, Ser 2017-5, Cl A2 | | | | | | | | |
2.780%, 09/25/2026 (C) | | $ | 780 | | | $ | 778 | |
SoFi Consumer Loan Program, Ser 2017-6, Cl A2 | | | | | | | | |
2.820%, 11/25/2026 (C) | | | 1,050 | | | | 1,046 | |
SoFi Consumer Loan Program, Ser 2018-3, Cl A2 | | | | | | | | |
3.670%, 08/25/2027 (C) | | | 697 | | | | 703 | |
| | | | | | | | |
| | | | | | | 6,746 | |
| | | | | | | | |
Total Asset-Backed Securities (Cost $17,523) ($ Thousands) | | | | | | | 17,660 | |
| | | | | | | | |
|
SOVEREIGN DEBT — 0.8% | |
| | |
Egypt Government International Bond MTN | | | | | | | | |
6.125%, 01/31/2022 (C) | | | 291 | | | | 294 | |
Japanese Government CPI Linked Bond | | | | | | | | |
0.100%, 03/10/2027 | | JPY | 477,171 | | | | 4,494 | |
Peru Government International Bond | | | | | | | | |
5.940%, 02/12/2029 (C) | | PEN | 7,100 | | | | 2,250 | |
| | | | | | | | |
| | |
Total Sovereign Debt
(Cost $7,127) ($ Thousands) | | | | | | | 7,038 | |
| | | | | | | | |
| |
Total Investments in Securities — 119.1%
(Cost $1,005,163) ($ Thousands) | | | $ | 1,036,254 | |
| | | | | | | | |
| | |
| | | Shares | | | | |
|
COMMON STOCK SOLD SHORT— (12.9)% | |
Communication Services — (0.6)% | |
AMC Networks Inc, Cl A * | | | (900) | | | | (51) | |
Cable One Inc | | | (100) | | | | (98) | |
CBS Corp, Cl B | | | (4,700) | | | | (223) | |
Charter Communications Inc, Cl A * | | | (2,260) | | | | (784) | |
Comcast Corp, Cl A | | | (60,100) | | | | (2,403) | |
Discovery Inc, Cl A * | | | (2,200) | | | | (59) | |
Discovery Inc, Cl C * | | | (4,700) | | | | (120) | |
DISH Network Corp, Cl A * | | | (3,100) | | | | (98) | |
Gannett Co Inc | | | (1,000) | | | | (11) | |
GCI Liberty Inc * | | | (2,200) | | | | (122) | |
Interpublic Group of Cos Inc/The | | | (5,000) | | | | (105) | |
John Wiley & Sons Inc, Cl A | | | (1,000) | | | | (44) | |
Liberty Broadband Corp, Cl C * | | | (1,300) | | | | (119) | |
Liberty Latin America Ltd, Cl C * | | | (2,600) | | | | (51) | |
Liberty Media Corp-Liberty SiriusXM * | | | (3,200) | | | | (122) | |
Meredith Corp | | | (1,000) | | | | (55) | |
New York Times Co/The, Cl A | | | (2,000) | | | | (66) | |
News Corp, Cl A | | | (4,700) | | | | (59) | |
News Corp, Cl B | | | (4,000) | | | | (50) | |
| | | | | | | | |
| | | |
| Description | | Shares | | | Market Value
($ Thousands) | |
|
COMMON STOCK SOLD SHORT (continued) | |
Nexstar Media Group Inc, Cl A | | | (600) | | | $ | (65) | |
Omnicom Group Inc | | | (3,100) | | | | (226) | |
Sirius XM Holdings Inc | | | (18,400) | | | | (104) | |
TEGNA Inc | | | (2,600) | | | | (37) | |
Tribune Media Co, Cl A | | | (1,400) | | | | (65) | |
| | | | | | | | |
| | |
| | | | | | | (5,137) | |
| | | | | | | | |
|
Consumer Discretionary — (8.4)% | |
Aaron’s Inc | | | (1,100) | | | | (58) | |
Acushnet Holdings Corp | | | (2,200) | | | | (51) | |
Adient PLC | | | (7,418) | | | | (96) | |
Adtalem Global Education Inc * | | | (1,347) | | | | (62) | |
Advance Auto Parts Inc | | | (729) | | | | (124) | |
Amazon.com Inc, Cl A * | | | (3,720) | | | | (6,624) | |
American Axle & Manufacturing Holdings Inc * | | | (10,057) | | | | (144) | |
American Eagle Outfitters Inc | | | (1,300) | | | | (29) | |
American Outdoor Brands Corp * | | | (3,600) | | | | (34) | |
Aramark | | | (7,148) | | | | (211) | |
AutoZone Inc * | | | (294) | | | | (301) | |
Bed Bath & Beyond Inc | | | (2,627) | | | | (45) | |
Belmond, Cl A * | | | (3,100) | | | | (77) | |
Best Buy Co Inc | | | (2,753) | | | | (196) | |
BJ’s Restaurants Inc | | | (800) | | | | (38) | |
Bloomin’ Brands Inc | | | (3,280) | | | | (67) | |
Booking Holdings Inc * | | | (556) | | | | (970) | |
BorgWarner Inc | | | (18,164) | | | | (698) | |
Boyd Gaming | | | (2,081) | | | | (57) | |
Bright Horizons Family Solutions Inc * | | | (2,079) | | | | (264) | |
Brinker International Inc | | | (777) | | | | (34) | |
Brunswick Corp/DE | | | (5,039) | | | | (254) | |
Burlington Stores Inc * | | | (684) | | | | (107) | |
Caesars Entertainment Corp * | | | (16,740) | | | | (145) | |
Callaway Golf Co | | | (5,733) | | | | (91) | |
Capri Holdings Ltd * | | | (6,908) | | | | (316) | |
CarMax Inc * | | | (2,266) | | | | (158) | |
Carnival Corp | | | (12,671) | | | | (643) | |
Carter’s Inc | | | (2,263) | | | | (228) | |
Cavco Industries Inc * | | | (400) | | | | (47) | |
Century Communities Inc * | | | (600) | | | | (14) | |
Cheesecake Factory Inc/The | | | (1,734) | | | | (85) | |
Chegg Inc * | | | (3,500) | | | | (133) | |
Chipotle Mexican Grill Inc, Cl A * | | | (698) | | | | (496) | |
Choice Hotels International Inc | | | (1,298) | | | | (101) | |
Churchill Downs Inc | | | (1,500) | | | | (135) | |
Columbia Sportswear Co | | | (1,552) | | | | (162) | |
Cooper Tire & Rubber Co | | | (4,508) | | | | (135) | |
Cooper-Standard Holdings Inc * | | | (1,651) | | | | (78) | |
Core-Mark Holding Co Inc, Cl A | | | (1,300) | | | | (48) | |
Cracker Barrel Old Country Store Inc | | | (706) | | | | (114) | |
Crocs Inc * | | | (3,000) | | | | (77) | |
Dana Inc | | | (12,223) | | | | (217) | |
| | |
SEI Institutional Managed Trust / Semi-Annual Report / March 31, 2019 | | 227 |
CONSOLIDATED SCHEDULE OF INVESTMENTS (Unaudited)
March 31, 2019
Multi-Asset Inflation Managed Fund(Continued)
| | | | | | | | |
| | | |
| Description | | Shares | | | Market Value ($ Thousands) | |
|
COMMON STOCK SOLD SHORT (continued) | |
Darden Restaurants Inc | | | (3,874) | | | $ | (471) | |
Dave & Buster’s Entertainment Inc | | | (1,437) | | | | (72) | |
Deckers Outdoor Corp * | | | (1,302) | | | | (191) | |
Delphi Automotive PLC * | | | (22,870) | | | | (1,818) | |
Dick’s Sporting Goods Inc | | | (1,400) | | | | (52) | |
Dine Brands Global Inc | | | (800) | | | | (73) | |
Dollar General Corp | | | (3,134) | | | | (374) | |
Dollar Tree Inc * | | | (3,164) | | | | (332) | |
Domino’s Pizza Inc | | | (1,273) | | | | (329) | |
Dorman Products Inc * | | | (2,452) | | | | (216) | |
DR Horton Inc | | | (17,904) | | | | (741) | |
Dunkin’ Brands Group Inc | | | (2,218) | | | | (167) | |
eBay Inc | | | (13,091) | | | | (486) | |
Eldorado Resorts Inc * | | | (2,093) | | | | (98) | |
Etsy Inc * | | | (1,200) | | | | (81) | |
Expedia Group Inc | | | (1,452) | | | | (173) | |
Five Below Inc * | | | (500) | | | | (62) | |
Foot Locker Inc, Cl A | | | (1,280) | | | | (78) | |
Ford Motor Co | | | (337,371) | | | | (2,962) | |
Fossil Group Inc * | | | (1,769) | | | | (24) | |
Fox Factory Holding Corp * | | | (3,322) | | | | (232) | |
Frontdoor Inc * | | | (1,700) | | | | (59) | |
Gap Inc/The | | | (3,504) | | | | (92) | |
Garmin Ltd | | | (6,222) | | | | (537) | |
Garrett Motion Inc * | | | (5,000) | | | | (74) | |
General Motors Co | | | (114,208) | | | | (4,237) | |
Gentex Corp | | | (24,461) | | | | (506) | |
Gentherm Inc * | | | (2,800) | | | | (103) | |
Genuine Parts Co | | | (2,435) | | | | (273) | |
G-III Apparel Group * | | | (2,073) | | | | (83) | |
Goodyear Tire & Rubber Co/The | | | (20,771) | | | | (377) | |
GoPro Inc, Cl A * | | | (8,139) | | | | (53) | |
Graham Holdings Co, Cl B | | | (111) | | | | (76) | |
Grand Canyon Education Inc * | | | (1,555) | | | | (178) | |
Groupon Inc, Cl A * | | | (11,000) | | | | (39) | |
GrubHub Inc * | | | (932) | | | | (65) | |
H&R Block Inc | | | (5,300) | | | | (127) | |
Hanesbrands Inc | | | (17,334) | | | | (310) | |
Harley-Davidson Inc, Cl A | | | (13,918) | | | | (496) | |
Hasbro Inc | | | (5,996) | | | | (510) | |
Helen of Troy Ltd * | | | (1,600) | | | | (186) | |
Hilton Grand Vacations Inc * | | | (3,600) | | | | (111) | |
Hilton Worldwide Holdings Inc | | | (8,965) | | | | (745) | |
Home Depot Inc/The | | | (13,359) | | | | (2,563) | |
Houghton Mifflin Harcourt Co * | | | (2,100) | | | | (15) | |
Hyatt Hotels Corp, Cl A | | | (1,294) | | | | (94) | |
Installed Building Products Inc * | | | (1,378) | | | | (67) | |
International Game Technology | | | (3,700) | | | | (48) | |
iRobot Corp * | | | (1,447) | | | | (170) | |
Jack in the Box Inc | | | (613) | | | | (50) | |
KB Home | | | (4,677) | | | | (113) | |
Kohl’s Corp | | | (1,739) | | | | (120) | |
| | | | | | | | |
| | | |
| Description | | Shares | | | Market Value ($ Thousands) | |
|
COMMON STOCK SOLD SHORT (continued) | |
L Brands Inc | | | (2,881) | | | $ | (79) | |
Las Vegas Sands Corp | | | (10,182) | | | | (621) | |
Laureate Education Inc, Cl A * | | | (3,600) | | | | (54) | |
La-Z-Boy Inc, Cl Z | | | (3,327) | | | | (110) | |
LCI Industries | | | (1,612) | | | | (124) | |
Lear Corp | | | (5,658) | | | | (768) | |
Leggett & Platt Inc | | | (7,108) | | | | (300) | |
Lennar Corp, Cl A | | | (15,120) | | | | (742) | |
Lennar Corp, Cl B | | | (600) | | | | (23) | |
LGI Homes * | | | (772) | | | | (46) | |
LKQ Corp * | | | (3,205) | | | | (91) | |
Lowe’s Cos Inc | | | (9,735) | | | | (1,066) | |
Lululemon Athletica Inc * | | | (4,725) | | | | (774) | |
M/I Homes Inc * | | | (2,200) | | | | (59) | |
Macy’s Inc | | | (3,778) | | | | (91) | |
Malibu Boats Inc, Cl A * | | | (1,000) | | | | (40) | |
Marriott International Inc/MD, Cl A | | | (8,341) | | | | (1,043) | |
Marriott Vacations Worldwide | | | (1,170) | | | | (109) | |
Mattel Inc * | | | (17,169) | | | | (223) | |
McDonald’s Corp | | | (22,665) | | | | (4,304) | |
MDC Holdings Inc | | | (3,094) | | | | (90) | |
Meritage Homes Corp * | | | (2,503) | | | | (112) | |
MGM Resorts International | | | (14,528) | | | | (373) | |
Modine Manufacturing Co * | | | (4,228) | | | | (59) | |
Mohawk Industries Inc * | | | (3,166) | | | | (399) | |
Movado Group Inc | | | (1,300) | | | | (47) | |
Newell Brands Inc, Cl B | | | (22,008) | | | | (338) | |
NIKE Inc, Cl B | | | (61,326) | | | | (5,164) | |
Nordstrom Inc | | | (1,200) | | | | (53) | |
Norwegian Cruise Line Holdings Ltd * | | | (6,938) | | | | (381) | |
NVR Inc * | | | (176) | | | | (487) | |
Ollie’s Bargain Outlet Holdings Inc * | | | (200) | | | | (17) | |
O’Reilly Automotive Inc * | | | (899) | | | | (349) | |
Oxford Industries Inc, Cl A | | | (976) | | | | (73) | |
Papa John’s International Inc, Cl A | | | (1,000) | | | | (53) | |
Penn National Gaming Inc * | | | (2,994) | | | | (60) | |
Planet Fitness Inc, Cl A * | | | (3,137) | | | | (216) | |
Polaris Industries Inc | | | (3,113) | | | | (263) | |
Pool Corp | | | (250) | | | | (41) | |
PulteGroup Inc | | | (12,830) | | | | (359) | |
PVH Corp | | | (4,001) | | | | (488) | |
Qurate Retail Inc * | | | (4,390) | | | | (70) | |
Ralph Lauren Corp, Cl A | | | (2,663) | | | | (345) | |
Red Rock Resorts Inc, Cl A | | | (1,813) | | | | (47) | |
Roku, Cl A * | | | (2,449) | | | | (158) | |
Ross Stores Inc | | | (4,297) | | | | (400) | |
Royal Caribbean Cruises Ltd | | | (4,872) | | | | (558) | |
Scientific Games Corp, Cl A * | | | (1,378) | | | | (28) | |
SeaWorld Entertainment Inc * | | | (1,700) | | | | (44) | |
Service Corp International/US | | | (7,217) | | | | (290) | |
ServiceMaster Global Holdings Inc * | | | (4,055) | | | | (189) | |
Shake Shack Inc, Cl A * | | | (800) | | | | (47) | |
| | |
228 | | SEI Institutional Managed Trust / Semi-Annual Report / March 31, 2019 |
| | | | | | | | |
| | | |
| Description | | Shares | | | Market Value ($ Thousands) | |
|
COMMON STOCK SOLD SHORT (continued) | |
Shutterfly Inc * | | | (600) | | | $ | (24) | |
Six Flags Entertainment Corp | | | (2,252) | | | | (111) | |
Skechers U.S.A. Inc, Cl A * | | | (6,908) | | | | (232) | |
Sotheby’s * | | | (1,359) | | | | (51) | |
Stamps.com Inc * | | | (200) | | | | (16) | |
Standard Motor Products Inc | | | (1,495) | | | | (73) | |
Starbucks Corp | | | (35,088) | | | | (2,608) | |
Steven Madden Ltd | | | (5,465) | | | | (185) | |
Stoneridge Inc * | | | (1,278) | | | | (37) | |
Strategic Education Inc | | | (560) | | | | (74) | |
Sturm Ruger & Co Inc | | | (800) | | | | (42) | |
Tapestry Inc | | | (14,194) | | | | (461) | |
Target Corp, Cl A | | | (6,373) | | | | (511) | |
Taylor Morrison Home Corp, Cl A * | | | (6,033) | | | | (107) | |
Tempur Sealy International Inc * | | | (2,511) | | | | (145) | |
Tenneco Inc, Cl A | | | (4,455) | | | | (99) | |
Tesla Inc * | | | (11,405) | | | | (3,192) | |
Texas Roadhouse Inc, Cl A | | | (2,528) | | | | (157) | |
Thor Industries Inc | | | (4,625) | | | | (288) | |
Tiffany & Co | | | (1,591) | | | | (168) | |
TJX Cos Inc/The | | | (15,142) | | | | (806) | |
Toll Brothers Inc | | | (7,349) | | | | (266) | |
TopBuild Corp * | | | (1,570) | | | | (102) | |
Tower International Inc | | | (927) | | | | (19) | |
Tractor Supply Co | | | (1,429) | | | | (140) | |
TRI Pointe Group Inc * | | | (7,759) | | | | (98) | |
Tupperware Brands Corp | | | (2,752) | | | | (70) | |
Ulta Beauty Inc * | | | (619) | | | | (216) | |
Under Armour Inc, Cl A * | | | (8,946) | | | | (189) | |
Under Armour Inc, Cl C * | | | (9,106) | | | | (172) | |
Urban Outfitters Inc * | | | (1,300) | | | | (39) | |
Vail Resorts Inc | | | (1,147) | | | | (249) | |
VF Corp | | | (15,874) | | | | (1,380) | |
Vista Outdoor Inc * | | | (3,600) | | | | (29) | |
Visteon Corp * | | | (2,422) | | | | (163) | |
Wayfair Inc, Cl A * | | | (576) | | | | (86) | |
Weight Watchers International Inc * | | | (1,061) | | | | (21) | |
Wendy’s Co/The | | | (6,628) | | | | (119) | |
Whirlpool Corp | | | (3,002) | | | | (399) | |
Williams-Sonoma Inc | | | (1,629) | | | | (92) | |
Wingstop Inc, Cl A | | | (1,100) | | | | (84) | |
Winnebago Industries | | | (2,303) | | | | (72) | |
Wolverine World Wide Inc | | | (4,774) | | | | (171) | |
Wyndham Destinations Inc | | | (3,476) | | | | (141) | |
Wyndham Hotels & Resorts Inc | | | (3,496) | | | | (175) | |
Wynn Resorts Ltd | | | (3,187) | | | | (380) | |
Yum China Holdings Inc | | | (10,782) | | | | (484) | |
Yum! Brands Inc | | | (9,087) | | | | (907) | |
| | | | | | | | |
| | |
| | | | | | | (73,388) | |
| | | | | | | | |
|
Information Technology — (2.4)% | |
Advanced Micro Devices Inc * | | | (6,222) | | | | (159) | |
| | | | | | | | |
| | | |
| Description | | Shares | | | Market Value ($ Thousands) | |
|
COMMON STOCK SOLD SHORT (continued) | |
Amphenol Corp, Cl A | | | (2,895) | | | $ | (273) | |
Analog Devices Inc | | | (3,110) | | | | (327) | |
Apple Inc | | | (35,647) | | | | (6,771) | |
Applied Materials Inc | | | (7,764) | | | | (308) | |
Arista Networks Inc * | | | (544) | | | | (171) | |
ARRIS International PLC * | | | (1,224) | | | | (39) | |
Arrow Electronics Inc, Cl A * | | | (1,402) | | | | (108) | |
Avnet Inc | | | (1,127) | | | | (49) | |
Broadcom Inc | | | (3,255) | | | | (979) | |
CDW Corp/DE | | | (1,705) | | | | (164) | |
Ciena Corp * | | | (900) | | | | (34) | |
Cisco Systems Inc | | | (36,648) | | | | (1,979) | |
Cognex Corp | | | (1,768) | | | | (90) | |
CommScope Holding Co Inc * | | | (2,081) | | | | (45) | |
Corning Inc, Cl B | | | (7,502) | | | | (248) | |
Cree Inc * | | | (450) | | | | (26) | |
Cypress Semiconductor Corp | | | (2,600) | | | | (39) | |
Dell Technologies Inc, Cl C * | | | (1,846) | | | | (108) | |
Dolby Laboratories Inc, Cl A | | | (984) | | | | (62) | |
Entegris Inc | | | (1,700) | | | | (61) | |
ePlus * | | | (68) | | | | (6) | |
F5 Networks Inc, Cl A * | | | (597) | | | | (94) | |
Finisar Corp * | | | (507) | | | | (12) | |
First Solar Inc * | | | (889) | | | | (47) | |
FLIR Systems Inc | | | (1,881) | | | | (89) | |
Hewlett Packard Enterprise Co | | | (12,135) | | | | (187) | |
HP Inc | | | (13,487) | | | | (262) | |
Integrated Device Technology Inc * | | | (1,050) | | | | (51) | |
Intel Corp | | | (36,958) | | | | (1,985) | |
IPG Photonics Corp * | | | (169) | | | | (26) | |
Jabil Inc | | | (3,122) | | | | (83) | |
Juniper Networks Inc | | | (4,191) | | | | (111) | |
Keysight Technologies Inc * | | | (1,553) | | | | (135) | |
KLA-Tencor Corp | | | (1,402) | | | | (167) | |
Lam Research Corp | | | (1,466) | | | | (262) | |
Littelfuse Inc | | | (200) | | | | (36) | |
Lumentum Holdings Inc * | | | (100) | | | | (6) | |
Marvell Technology Group Ltd | | | (3,599) | | | | (72) | |
Maxim Integrated Products Inc | | | (2,256) | | | | (120) | |
Microchip Technology Inc | | | (1,843) | | | | (153) | |
Micron Technology Inc * | | | (9,263) | | | | (383) | |
MKS Instruments Inc | | | (476) | | | | (44) | |
Monolithic Power Systems Inc | | | (422) | | | | (57) | |
Motorola Solutions Inc | | | (1,731) | | | | (243) | |
National Instruments Corp | | | (900) | | | | (40) | |
NCR Corp * | | | (2,577) | | | | (70) | |
NetApp Inc | | | (2,561) | | | | (178) | |
NETGEAR Inc * | | | (1,014) | | | | (34) | |
NVIDIA Corp | | | (4,545) | | | | (816) | |
NXP Semiconductors NV | | | (2,532) | | | | (224) | |
ON Semiconductor Corp * | | | (2,323) | | | | (48) | |
Pure Storage Inc, Cl A * | | | (1,800) | | | | (39) | |
| | |
SEI Institutional Managed Trust / Semi-Annual Report / March 31, 2019 | | 229 |
CONSOLIDATED SCHEDULE OF INVESTMENTS (Unaudited)
March 31, 2019
Multi-Asset Inflation Managed Fund(Continued)
| | | | | | | | |
| | | |
| Description | | Shares | | | Market Value
($ Thousands) | |
|
COMMON STOCK SOLD SHORT (continued) | |
Qorvo Inc * | | | (806) | | | $ | (58) | |
QUALCOMM Inc | | | (9,450) | | | | (539) | |
Semtech Corp * | | | (100) | | | | (5) | |
Silicon Laboratories Inc * | | | (562) | | | | (45) | |
Skyworks Solutions Inc | | | (1,752) | | | | (145) | |
SYNNEX Corp | | | (400) | | | | (38) | |
Tech Data Corp * | | | (589) | | | | (60) | |
Teradyne Inc | | | (1,734) | | | | (69) | |
Texas Instruments Inc | | | (8,370) | | | | (888) | |
Trimble Inc * | | | (1,874) | | | | (76) | |
Universal Display Corp | | | (422) | | | | (64) | |
ViaSat Inc * | | | (797) | | | | (62) | |
Western Digital Corp | | | (2,986) | | | | (144) | |
Xerox Corp | | | (2,849) | | | | (91) | |
Xilinx Inc | | | (1,996) | | | | (253) | |
Zebra Technologies Corp, Cl A * | | | (550) | | | | (115) | |
| | | | | | | | |
| | |
| | | | | | | (20,772) | |
| | | | | | | | |
|
Materials — (1.5)% | |
Air Products & Chemicals Inc | | | (3,879) | | | | (741) | |
Albemarle Corp | | | (1,562) | | | | (128) | |
Alcoa Corp * | | | (3,340) | | | | (94) | |
Allegheny Technologies Inc * | | | (1,150) | | | | (29) | |
AptarGroup Inc | | | (1,090) | | | | (116) | |
Ashland Global Holdings Inc | | | (1,051) | | | | (82) | |
Avery Dennison Corp | | | (1,528) | | | | (173) | |
Axalta Coating Systems Ltd * | | | (2,527) | | | | (64) | |
Balchem Corp | | | (700) | | | | (65) | |
Ball Corp | | | (5,406) | | | | (313) | |
Bemis Co Inc | | | (2,400) | | | | (133) | |
Berry Global Group Inc * | | | (1,802) | | | | (97) | |
Cabot Corp | | | (553) | | | | (23) | |
Celanese Corp, Cl A | | | (2,372) | | | | (234) | |
CF Industries Holdings Inc | | | (4,203) | | | | (172) | |
Chemours Co/The | | | (2,499) | | | | (93) | |
Cleveland-Cliffs Inc | | | (1,492) | | | | (15) | |
Commercial Metals Co, Cl A | | | (2,900) | | | | (50) | |
Crown Holdings Inc * | | | (2,363) | | | | (129) | |
DowDuPont Inc | | | (34,949) | | | | (1,863) | |
Eagle Materials Inc | | | (842) | | | | (71) | |
Eastman Chemical Co | | | (2,491) | | | | (189) | |
Ecolab Inc | | | (4,261) | | | | (752) | |
Element Solutions * | | | (4,300) | | | | (43) | |
Ferro * | | | (2,100) | | | | (40) | |
FMC Corp | | | (1,833) | | | | (141) | |
Freeport-McMoRan Inc, Cl B | | | (22,949) | | | | (296) | |
Graphic Packaging Holding Co | | | (4,952) | | | | (63) | |
Huntsman Corp | | | (3,519) | | | | (79) | |
Ingevity Corp * | | | (476) | | | | (50) | |
International Flavors & Fragrances Inc | | | (1,451) | | | | (187) | |
International Paper Co | | | (5,876) | | | | (272) | |
Linde PLC | | | (8,517) | | | | (1,498) | |
| | | | | | | | |
| | | |
| Description | | Shares | | | Market Value
($ Thousands) | |
|
COMMON STOCK SOLD SHORT (continued) | |
Livent Corp * | | | (1,714) | | | $ | (21) | |
Louisiana-Pacific Corp | | | (3,026) | | | | (74) | |
LyondellBasell Industries NV, Cl A | | | (5,075) | | | | (427) | |
Martin Marietta Materials Inc, Cl A | | | (904) | | | | (182) | |
Mosaic Co/The | | | (6,539) | | | | (179) | |
NewMarket Corp | | | (100) | | | | (43) | |
Newmont Mining Corp | | | (7,820) | | | | (280) | |
Nucor Corp | | | (5,565) | | | | (325) | |
Olin Corp | | | (2,032) | | | | (47) | |
Owens-Illinois Inc | | | (2,180) | | | | (41) | |
Packaging Corp of America | | | (1,302) | | | | (129) | |
PolyOne Corp | | | (1,400) | | | | (41) | |
PPG Industries Inc | | | (3,684) | | | | (416) | |
Reliance Steel & Aluminum Co | | | (1,198) | | | | (108) | |
Royal Gold Inc, Cl A | | | (1,460) | | | | (133) | |
RPM International Inc | | | (2,328) | | | | (135) | |
Scotts Miracle-Gro Co/The, Cl A | | | (900) | | | | (71) | |
Sealed Air Corp | | | (2,152) | | | | (99) | |
Sensient Technologies Corp | | | (1,000) | | | | (68) | |
Sherwin-Williams Co/The, Cl A | | | (1,386) | | | | (597) | |
Sonoco Products Co | | | (3,200) | | | | (197) | |
Southern Copper Corp | | | (1,921) | | | | (76) | |
Steel Dynamics Inc | | | (3,354) | | | | (118) | |
Trinseo SA | | | (868) | | | | (39) | |
United States Steel Corp | | | (2,100) | | | | (41) | |
Valvoline Inc | | | (3,294) | | | | (61) | |
Vulcan Materials Co | | | (2,228) | | | | (264) | |
Westlake Chemical Corp | | | (375) | | | | (25) | |
Westrock Co | | | (3,454) | | | | (132) | |
WR Grace & Co | | | (579) | | | | (45) | |
| | | | | | | | |
| | |
| | | | | | | (12,709) | |
| | | | | | | | |
Total Common Stock Sold Short
(Proceeds $101,946) ($ Thousands) | | | | (112,006) | |
| | | | | | | | |
Total Investments Sold Short — (12.9)%
(Proceeds $101,946) ($ Thousands) | | | $ | (112,006) | |
| | | | | | | | |
| | | | | | | | |
| |
| Contracts | | | | |
|
PURCHASED OPTIONS* — 0.0% | |
| | |
Total Purchased
Options **(G)
(Cost $114) ($ Thousands) | | | 253 | | | $ | 53 | |
| | | | | | | | |
| | | | | | | | |
|
WRITTEN OPTIONS* — 0.0% | |
| | |
Total Written Options **(G)
(Premiums Received $69) ($ Thousands) | | | (254 | ) | | $ | (184) | |
| | | | | | | | |
| | | | | | | | |
| | |
230 | | SEI Institutional Managed Trust / Semi-Annual Report / March 31, 2019 |
A list of open exchange traded options contracts for the Fund at March 31, 2019, is as follows:
| | | | | | | | | | | | | | | | | | | | |
| Description | | Number of Contracts | | Notional Amount
(Thousands) | | Exercise Price | | | Expiration Date | | | Value
(Thousands) |
| | | | | |
PURCHASED OPTIONS — 0.0% | | | | | | | | | | | | | | | | | | | | |
| | | | | |
Call Options ** | | | | | | | | | | | | | | | | | | | | |
May 2019, Coffee ‘C’ Future* | | | 20 | | | $ | 707 | | | | $105.00 | | | | 04/20/19 | | | $ | 1 | |
December 2019, Corn Future* | | | 64 | | | | 1,231 | | | | 500.00 | | | | 11/25/19 | | | | 10 | |
May 2019, Corn Future* | | | 32 | | | | 570 | | | | 390.00 | | | | 04/20/19 | | | | – | |
June 2019, Gold Future* | | | 32 | | | | 4,155 | | | | 1,350.00 | | | | 05/18/19 | | | | 16 | |
May 2019, Copper Future* | | | 25 | | | | 8 | | | | 305.00 | | | | 04/20/19 | | | | 8 | |
November 2019, Soy Bean Future* | | | 20 | | | | 918 | | | | 1,000.00 | | | | 10/19/19 | | | | 17 | |
May 2019, Wheat Future* | | | 30 | | | | 687 | | | | 510.00 | | | | 04/29/19 | | | | 1 | |
May 2019, Wheat Future* | | | 30 | | | | 687 | | | | 540.00 | | | | 04/29/19 | | | | – | |
| | | | | |
Total Purchased Options | | | | | | $ | 8,963 | | | | | | | | | | | $ | 53 | |
| | | | | | | | | | | | | | | | | | | | |
| | | | | |
WRITTEN OPTIONS — 0.0% | | | | | | | | | | | | | | | | | | | | |
| | | | | |
Put Options ** | | | | | | | | | | | | | | | | | | | | |
May 2019, Coffee ‘C’ Future* | | | (40 | ) | | $ | (1,414 | ) | | | 100.00 | | | | 04/15/19 | | | $ | (89 | ) |
November 2019, Soy Bean Future* | | | (4 | ) | | | (184 | ) | | | 840.00 | | | | 10/28/19 | | | | (3 | ) |
May 2019, Wheat Future* | | | (30 | ) | | | (686 | ) | | | 480.00 | | | | 04/29/19 | | | | (39 | ) |
May 2019, Wheat Future* | | | (30 | ) | | | (687 | ) | | | 490.00 | | | | 04/29/19 | | | | (51 | ) |
| | | | | |
| | | | | | | (2,971 | ) | | | | | | | | | | | (182 | ) |
| | | | | |
Call Options ** | | | | | | | | | | | | | | | | | | | | |
May 2019, Coffee ‘C’ Future* | | | (40 | ) | | | (1,414 | ) | | | 130.00 | | | | 04/15/19 | | | | – | |
November 2019, Soy Bean Future* | | | (20 | ) | | | (918 | ) | | | 1,200.00 | | | | 10/19/19 | | | | (2 | ) |
May 2019, Wheat Future* | | | (30 | ) | | | (687 | ) | | | 550.00 | | | | 04/29/19 | | | | – | |
May 2019, Wheat Future* | | | (30 | ) | | | (687 | ) | | | 620.00 | | | | 04/29/19 | | | | – | |
May 2019, Wheat Future* | | | (30 | ) | | | (687 | ) | | | 640.00 | | | | 04/29/19 | | | | – | |
| | | | | |
| | | | | | | (4,393 | ) | | | | | | | | | | | (2 | ) |
| | | | | |
Total Written Options | | | | | | $ | (7,364 | ) | | | | | | | | | | $ | (184 | ) |
| | | | | | | | | | | | | | | | | | | | |
A list of the open futures contracts held by the Fund at March 31, 2019, is as follows:
| | | | | | | | | | | | | | | | | | | | |
| Type of Contract | | Number of
Contracts
Long (Short) | | | Expiration Date | | | Notional Amount
(Thousands) | | Value
(Thousands) | | Unrealized
Appreciation/
(Depreciation)
(Thousands) |
Brent Crude ** | | | 107 | | | | May-2019 | | | $ | 7,031 | | | $ | 7,191 | | | $ | 160 | |
Canadian 10-Year Bond | | | (45 | ) | | | Jun-2019 | | | | (4,596 | ) | | | (4,683 | ) | | | (61 | ) |
Coffee C ** | | | (73 | ) | | | May-2019 | | | | (2,749 | ) | | | (2,587 | ) | | | 162 | |
Coffee C ** | | | 33 | | | | May-2019 | | | | 1,278 | | | | 1,169 | | | | (109 | ) |
Copper ** | | | 133 | | | | May-2019 | | | | 9,322 | | | | 9,762 | | | | 440 | |
Corn ** | | | 308 | | | | May-2019 | | | | 5,859 | | | | 5,490 | | | | (369 | ) |
Cotton No. 2 ** | | | 119 | | | | May-2019 | | | | 4,340 | | | | 4,618 | | | | 278 | |
Feeder Cattle ** | | | (31 | ) | | | May-2019 | | | | (2,372 | ) | | | (2,306 | ) | | | 66 | |
Gasoil ** | | | (35 | ) | | | May-2019 | | | | (2,152 | ) | | | (2,125 | ) | | | 27 | |
Gasoil ** | | | 37 | | | | May-2019 | | | | 2,143 | | | | 2,247 | | | | 104 | |
Gasoline ** | | | 99 | | | | Apr-2019 | | | | 7,041 | | | | 7,827 | | | | 786 | |
Gasoline ** | | | 26 | | | | Jun-2019 | | | | 1,999 | | | | 2,022 | | | | 23 | |
Gold ** | | | 66 | | | | Jun-2019 | | | | 8,606 | | | | 8,570 | | | | (36 | ) |
Japanese 10-Year Bond E-MINI | | | (34 | ) | | | Jun-2019 | | | | (4,651 | ) | | | (4,708 | ) | | | (20 | ) |
KC HRW Wheat ** | | | (35 | ) | | | Jul-2019 | | | | (960 | ) | | | (766 | ) | | | 194 | |
| | |
SEI Institutional Managed Trust / Semi-Annual Report / March 31, 2019 | | 231 |
CONSOLIDATED SCHEDULE OF INVESTMENTS (Unaudited)
March 31, 2019
Multi-Asset Inflation Managed Fund(Continued)
| | | | | | | | | | | | | | | | | | | | |
| Type of Contract | | Number of
Contracts
Long (Short) | | | Expiration
Date | | | Notional Amount
(Thousands) | | Value
(Thousands) | | Unrealized
Appreciation/
(Depreciation)
(Thousands) |
Lean Hogs ** | | | 34 | | | | Jun-2019 | | | $ | 1,248 | | | $ | 1,204 | | | $ | (44 | ) |
Lean Hogs ** | | | 50 | | | | Jun-2019 | | | | 1,580 | | | | 1,771 | | | | 191 | |
Live Cattle ** | | | 64 | | | | Jun-2019 | | | | 3,065 | | | | 3,046 | | | | (19 | ) |
Live Cattle ** | | | 76 | | | | Jun-2019 | | | | 3,601 | | | | 3,618 | | | | 17 | |
Live Cattle ** | | | 4 | | | | Apr-2019 | | | | 202 | | | | 202 | | | | – | |
LME Lead ** | | | (7 | ) | | | May-2019 | | | | (352 | ) | | | (352 | ) | | | – | |
LME Nickel ** | | | 40 | | | | May-2019 | | | | 3,026 | | | | 3,108 | | | | 82 | |
LME Nickel ** | | | 15 | | | | Jun-2019 | | | | 1,119 | | | | 1,169 | | | | 50 | |
LME Primary Aluminum ** | | | 7 | | | | Jun-2019 | | | | 332 | | | | 334 | | | | 2 | |
LME Primary Aluminum ** | | | 83 | | | | May-2019 | | | | 3,890 | | | | 3,945 | | | | 55 | |
LME Zinc ** | | | 6 | | | | May-2019 | | | | 398 | | | | 443 | | | | 45 | |
LME Zinc ** | | | 15 | | | | Dec-2019 | | | | 1,051 | | | | 1,067 | | | | 16 | |
LME Zinc ** | | | 16 | | | | Jun-2019 | | | | 1,163 | | | | 1,174 | | | | 11 | |
Long Gilt 10-Year Bond | | | (37 | ) | | | Jun-2019 | | | | (6,153 | ) | | | (6,237 | ) | | | (99 | ) |
MSCI EAFE Index E-MINI | | | (136 | ) | | | Jun-2019 | | | | (12,537 | ) | | | (12,692 | ) | | | (155 | ) |
Natural Gas ** | | | 324 | | | | May-2019 | | | | 8,810 | | | | 8,625 | | | | (185 | ) |
NY Harbor ULSD ** | | | (25 | ) | | | Apr-2019 | | | | (2,096 | ) | | | (2,070 | ) | | | 26 | |
NY Harbor ULSD ** | | | 21 | | | | Apr-2019 | | | | 1,678 | | | | 1,739 | | | | 61 | |
NYMEX Cocoa ** | | | (62 | ) | | | May-2019 | | | | (1,398 | ) | | | (1,414 | ) | | | (16 | ) |
Palladium ** | | | 5 | | | | Jun-2019 | | | | 730 | | | | 671 | | | | (59 | ) |
Platinum ** | | | 44 | | | | Jul-2019 | | | | 1,838 | | | | 1,879 | | | | 41 | |
S&P 500 Index E-MINI | | | (183 | ) | | | Jun-2019 | | | | (25,519 | ) | | | (25,966 | ) | | | (447 | ) |
Silver ** | | | 47 | | | | May-2019 | | | | 3,710 | | | | 3,551 | | | | (159 | ) |
Silver ** | | | (1 | ) | | | May-2019 | | | | (77 | ) | | | (76 | ) | | | 1 | |
Soybean ** | | | 113 | | | | May-2019 | | | | 5,224 | | | | 4,996 | | | | (228 | ) |
Soybean Meal ** | | | 83 | | | | May-2019 | | | | 2,583 | | | | 2,544 | | | | (39 | ) |
Soybean Meal ** | | | (17 | ) | | | May-2019 | | | | (532 | ) | | | (521 | ) | | | 11 | |
Soybean Oil ** | | | 171 | | | | May-2019 | | | | 3,144 | | | | 2,910 | | | | (234 | ) |
Sugar No. 11 ** | | | 439 | | | | Apr-2019 | | | | 6,197 | | | | 6,161 | | | | (36 | ) |
U.S. 2-Year Treasury Notes | | | (214 | ) | | | Jul-2019 | | | | (45,408 | ) | | | (45,602 | ) | | | (194 | ) |
U.S. 5-Year Treasury Notes | | | 17 | | | | Jul-2019 | | | | 1,969 | | | | 1,969 | | | | – | |
U.S. 10-Year Treasury Notes | | | (288 | ) | | | Jun-2019 | | | | (35,220 | ) | | | (35,775 | ) | | | (555 | ) |
U.S. Ultra Long Treasury Bond | | | (21 | ) | | | Jun-2019 | | | | (3,412 | ) | | | (3,528 | ) | | | (116 | ) |
Ultra 10-Year U.S. Treasury Notes | | | 29 | | | | Jun-2019 | | | | 3,817 | | | | 3,851 | | | | 34 | |
Wheat ** | | | (76 | ) | | | May-2019 | | | | (1,724 | ) | | | (1,634 | ) | | | 90 | |
Wheat ** | | | 134 | | | | May-2019 | | | | 3,173 | | | | 3,067 | | | | (106 | ) |
Wheat ** | | | 99 | | | | May-2019 | | | | 2,473 | | | | 2,128 | | | | (345 | ) |
WTI Crude Oil ** | | | (98 | ) | | | Nov-2019 | | | | (6,673 | ) | | | (5,902 | ) | | | 771 | |
WTI Crude Oil ** | | | 98 | | | | May-2019 | | | | 5,639 | | | | 5,907 | | | | 268 | |
WTI Crude Oil ** | | | 235 | | | | Apr-2019 | | | | 13,169 | | | | 14,133 | | | | 964 | |
| | | | | | | | | | | | | | | | | | | | |
| | | | | | | | | | $ | (26,133 | ) | | $ | (24,836 | ) | | $ | 1,345 | |
| | | | | | | | | | | | | | | | | | | | |
A list of the open forward foreign currency contracts held by the Fund at March 31, 2019, is as follows:
| | | | | | | | | | | | | | | | | | | | | | | | | | | | |
| Counterparty | | Settlement Date | | | | | | Currency to Deliver
(Thousands) | | | | | | Currency to Receive
(Thousands) | | | Unrealized
Appreciation
(Depreciation)
(Thousands) | |
ANZ | | | 04/23/19 | | | | AUD | | | | 1,475 | | | | USD | | | | 1,051 | | | $ | | | | | 3 | |
Barclays PLC | | | 07/16/19 | | | | USD | | | | 72 | | | | INR | | | | 5,098 | | | | | | | | — | |
BNP Paribas | | | 04/11/19 | | | | USD | | | | 1,099 | | | | JPY | | | | 121,663 | | | | | | | | 1 | |
BNP Paribas | | | 05/09/19 | | | | CAD | | | | 3,002 | | | | USD | | | | 2,252 | | | | | | | | 3 | |
Brown Brothers Harriman | | | 04/09/19 | | | | GBP | | | | 128 | | | | USD | | | | 169 | | | | | | | | 2 | |
Brown Brothers Harriman | | | 04/10/19 | | | | USD | | | | 11 | | | | EUR | | | | 10 | | | | | | | | — | |
Brown Brothers Harriman | | | 04/10/19 | | | | EUR | | | | 533 | | | | USD | | | | 608 | | | | | | | | 9 | |
Brown Brothers Harriman | | | 04/12/19 | | | | USD | | | | 954 | | | | NOK | | | | 8,125 | | | | | | | | (10 | ) |
| | |
232 | | SEI Institutional Managed Trust / Semi-Annual Report / March 31, 2019 |
| | | | | | | | | | | | | | | | | | | | | | | | | | | | |
| Counterparty | | Settlement Date | | | | | | Currency to Deliver
(Thousands) | | | | | | Currency to Receive
(Thousands) | | | Unrealized
Appreciation
(Depreciation)
(Thousands) | |
Citigroup | | | 04/02/19 | | | | BRL | | | | 4,120 | | | | USD | | | | 1,063 | | | $ | | | | | 4 | |
Citigroup | | | 04/10/19 | | | | EUR | | | | 996 | | | | USD | | | | 1,121 | | | | | | | | 2 | |
Citigroup | | | 05/16/19 | | | | KRW | | | | 1,000,669 | | | | USD | | | | 881 | | | | | | | | — | |
Citigroup | | | 05/23/19 | | | | PEN | | | | 1,943 | | | | USD | | | | 587 | | | | | | | | 4 | |
Citigroup | | | 06/12/19 | | | | USD | | | | 898 | | | | CNY | | | | 6,031 | | | | | | | | (1 | ) |
Citigroup | | | 06/13/19 | | | | MXN | | | | 12,205 | | | | USD | | | | 633 | | | | | | | | 11 | |
Citigroup | | | 07/16/19 | | | | USD | | | | 908 | | | | INR | | | | 63,685 | | | | | | | | (2 | ) |
Credit Suisse First Boston | | | 04/12/19 | | | | NOK | | | | 6,431 | | | | USD | | | | 753 | | | | | | | | 6 | |
Deutsche Bank | | | 04/26/19 | | | | JPY | | | | 545,486 | | | | USD | | | | 4,969 | | | | | | | | 28 | |
Deutsche Bank | | | 06/13/19 | | | | CHF | | | | 877 | | | | USD | | | | 876 | | | | | | | | (11 | ) |
HSBC | | | 05/03/19 | | | | BRL | | | | 2,567 | | | | USD | | | | 646 | | | | | | | | (12 | ) |
JPMorgan Chase Bank | | | 04/08/19 | | | | USD | | | | 1,115 | | | | PLN | | | | 4,181 | | | | | | | | (24 | ) |
JPMorgan Chase Bank | | | 04/11/19 | | | | JPY | | | | 89,134 | | | | USD | | | | 808 | | | | | | | | 2 | |
JPMorgan Chase Bank | | | 05/16/19 | | | | USD | | | | 1,795 | | | | KRW | | | | 2,010,013 | | | | | | | | (25 | ) |
JPMorgan Chase Bank | | | 06/13/19 | | | | USD | | | | 1,132 | | | | MXN | | | | 21,713 | | | | | | | | (26 | ) |
Morgan Stanley | | | 04/26/19 | | | | NZD | | | | 1,324 | | | | USD | | | | 910 | | | | | | | | 7 | |
Morgan Stanley | | | 05/23/19 | | | | PEN | | | | 3,682 | | | | USD | | | | 1,112 | | | | | | | | 5 | |
RBS | | | 04/09/19 | | | | GBP | | | | 723 | | | | USD | | | | 951 | | | | | | | | 9 | |
RBS | | | 04/10/19 | | | | USD | | | | 1,182 | | | | EUR | | | | 1,036 | | | | | | | | (18 | ) |
RBS | | | 04/23/19 | | | | USD | | | | 1,110 | | | | AUD | | | | 1,564 | | | | | | | | 2 | |
RBS | | | 05/09/19 | | | | CAD | | | | 1,354 | | | | USD | | | | 1,010 | | | | | | | | (4 | ) |
RBS | | | 05/23/19 | | | | PEN | | | | 1,882 | | | | USD | | | | 569 | | | | | | | | 3 | |
Standard Bank | | | 04/10/19 | | | | USD | | | | 1,558 | | | | EUR | | | | 1,363 | | | | | | | | (27 | ) |
Standard Bank | | | 06/13/19 | | | | USD | | | | 661 | | | | MXN | | | | 12,609 | | | | | | | | (19 | ) |
Standard Bank | | | 07/16/19 | | | | USD | | | | 1,042 | | | | INR | | | | 73,661 | | | | | | | | 6 | |
UBS | | | 04/10/19 | | | | EUR | | | | 1,315 | | | | USD | | | | 1,519 | | | | | | | | 42 | |
UBS | | | 05/16/19 | | | | KRW | | | | 1,011,445 | | | | USD | | | | 890 | | | | | | | | (1 | ) |
| | | | | | | | | | | | | | | | | | | | | | | | |
| | | | | | | | | | | | | | | | | | | | | | $ | | | | | (31 | ) |
| | | | | | | | | | | | | | | | | | | | | | | | |
A list of the open OTC swap agreements held by the Fund at March 31, 2019 is as follows:
| | | | | | | | | | | | | | | | | | | | | | | | | | | | |
| Credit Default Swaps | |
| Counterparty | | Reference Entity/Obligation | | Buy/Sell
Protection | | (Pays)/Receives Rate | | Payment Frequency | | Termination Date | | Notional Amount
(Thousands) | | Value
(Thousands) | | | Upfront Payments/
Receipts
(Thousands) | | | Net Unrealized
Appreciation
(Depreciation)
(Thousands) | |
Deutsche Bank | | CMBX.BBB.6 | | Sell | | 3.00% | | Monthly | | 05/11/2049 | | (634) | | | $(80 | ) | | $ | | | (51 | ) | | $ | | | (29 | ) |
Goldman Sachs | | CMBX.BBB.6 | | Sell | | 3.00% | | Monthly | | 12/31/2049 | | $(835) | | | (105 | ) | | | | | (63 | ) | | | | | (42 | ) |
Goldman Sachs | | CMBX.BBB.6 | | Sell | | 3.00% | | Monthly | | 12/31/2049 | | (261) | | | (33 | ) | | | | | (17 | ) | | | | | (16 | ) |
Citigroup | | CMBX.BBB.6 | | Buy | | 3.00% | | Monthly | | 09/17/2058 | | 245 | | | 15 | | | | | | 17 | | | | | | (2 | ) |
Citigroup | | CMBX.BBB.6 | | Buy | | 3.00% | | Monthly | | 09/17/2058 | | 258 | | | 15 | | | | | | 18 | | | | | | (3 | ) |
Citigroup | | CMBX.BBB.6 | | Buy | | 3.00% | | Monthly | | 09/17/2058 | | 257 | | | 15 | | | | | | 18 | | | | | | (3 | ) |
Goldman Sachs | | CMBX.BBB.6 | | Sell | | 3.00% | | Monthly | | 05/11/2063 | | (16) | | | (2 | ) | | | | | (1 | ) | | | | | (1 | ) |
Goldman Sachs | | CMBX.BBB.6 | | Sell | | 3.00% | | Monthly | | 05/11/2063 | | (32) | | | (4 | ) | | | | | (3 | ) | | | | | (1 | ) |
Citigroup | | CMBX.BBB.6 | | Sell | | 3.00% | | Monthly | | 05/11/2063 | | (356) | | | (45 | ) | | | | | (46 | ) | | | | | 1 | |
Citigroup | | CMBX.BBB.6 | | Sell | | 3.00% | | Monthly | | 05/11/2063 | | (89) | | | (11 | ) | | | | | (12 | ) | | | | | 1 | |
Goldman Sachs | | CMBX.BBB.6 | | Sell | | 3.00% | | Monthly | | 05/11/2063 | | (32) | | | (4 | ) | | | | | (3 | ) | | | | | (1 | ) |
Goldman Sachs | | CMBX.BBB.6 | | Sell | | 3.00% | | Monthly | | 05/11/2063 | | (65) | | | (8 | ) | | | | | (7 | ) | | | | | (1 | ) |
Citigroup | | CMBX.BBB.6 | | Sell | | 3.00% | | Monthly | | 05/11/2063 | | (52) | | | (7 | ) | | | | | (7 | ) | | | | | — | |
Citigroup | | CMBX.BBB.6 | | Sell | | 3.00% | | Monthly | | 05/11/2063 | | (254) | | | (32 | ) | | | | | (33 | ) | | | | | 1 | |
Deutsche Bank | | CMBX.BBB.6 | | Sell | | 3.00% | | Monthly | | 05/11/2063 | | (33) | | | (4 | ) | | | | | (4 | ) | | | | | — | |
Goldman Sachs | | CMBX.BBB.6 | | Sell | | 3.00% | | Monthly | | 05/11/2063 | | (194) | | | (25 | ) | | | | | (17 | ) | | | | | (8 | ) |
Citigroup | | CMBX.BBB.6 | | Sell | | 3.00% | | Monthly | | 05/11/2063 | | (220) | | | (28 | ) | | | | | (28 | ) | | | | | — | |
Citigroup | | CMBX.BBB.6 | | Sell | | 3.00% | | Monthly | | 05/11/2063 | | (250) | | | (32 | ) | | | | | (33 | ) | | | | | 1 | |
Credit Suisse | | CMBX.BBB.6 | | Sell | | 3.00% | | Monthly | | 05/11/2063 | | (3) | | | — | | | | | | — | | | | | | — | |
| | |
SEI Institutional Managed Trust / Semi-Annual Report / March 31, 2019 | | 233 |
CONSOLIDATED SCHEDULE OF INVESTMENTS (Unaudited)
March 31, 2019
Multi-Asset Inflation Managed Fund(Continued)
| | | | | | | | | | | | | | | | | | | | | | | | | | | | |
| Counterparty | | Reference Entity/Obligation | | Buy/Sell
Protection | | (Pays)/Receives Rate | | Payment Frequency | | Termination Date | | Notional Amount
(Thousands) | | Value
(Thousands) | | | Upfront Payments/
Receipts
(Thousands) | | | Net Unrealized
Appreciation
(Depreciation)
(Thousands) | |
Credit Suisse | | CMBX.BBB.6 | | Sell | | 3.00% | | Monthly | | 05/11/2063 | | $(106) | | | $(13 | ) | | | | $ | (13 | ) | | | | $ | — | |
Deutsche Bank | | CMBX.BBB.6 | | Sell | | 3.00% | | Monthly | | 05/11/2063 | | (201) | | | (25 | ) | | | | | (26 | ) | | | | | 1 | |
Citigroup | | CMBX.BBB.6 | | Sell | | 3.00% | | Monthly | | 05/11/2063 | | (20) | | | (3 | ) | | | | | (3 | ) | | | | | — | |
Goldman Sachs | | CMBX.NA.AAA.9 | | Buy | | 0.50% | | Monthly | | 09/17/2049 | | 964 | | | (8 | ) | | | | | 12 | | | | | | (20 | ) |
Deutsche Bank | | CMBX.NA.AAA.9 | | Buy | | 0.50% | | Monthly | | 09/17/2058 | | 996 | | | (9 | ) | | | | | 10 | | | | | | (19 | ) |
Goldman Sachs | | CMBX.NA.AAA.9 | | Buy | | 0.50% | | Monthly | | 09/17/2058 | | 216 | | | (2 | ) | | | | | 2 | | | | | | (4 | ) |
Deutsche Bank | | CMBX.NA.AAA.9 | | Buy | | 0.50% | | Monthly | | 09/17/2058 | | 3,320 | | | (29 | ) | | | | | 35 | | | | | | (64 | ) |
Credit Suisse | | CMBX.NA.AAA.9 | | Buy | | 0.50% | | Monthly | | 09/17/2058 | | 73 | | | (1 | ) | | | | | 1 | | | | | | (2 | ) |
Credit Suisse | | CMBX.NA.AAA.9 | | Buy | | 0.50% | | Monthly | | 09/17/2058 | | 25 | | | — | | | | | | — | | | | | | — | |
Credit Suisse | | CMBX.NA.AAA.9 | | Buy | | 0.50% | | Monthly | | 09/17/2058 | | 2,641 | | | (23 | ) | | | | | 32 | | | | | | (55 | ) |
Deutsche Bank | | CMBX.NA.AAA.9 | | Buy | | 0.50% | | Monthly | | 09/17/2058 | | 881 | | | (8 | ) | | | | | 12 | | | | | | (20 | ) |
Credit Suisse | | CMBX.NA.BBB-.6 | | Sell | | 3.00% | | Monthly | | 12/31/2049 | | (227) | | | (29 | ) | | | | | (16 | ) | | | | | (13 | ) |
Deutsche Bank | | CMBX.NA.BBB-.6 | | Sell | | 3.00% | | Monthly | | 12/31/2049 | | (42) | | | (5 | ) | | | | | (2 | ) | | | | | (3 | ) |
Credit Suisse | | CMBX.NA.BBB-.6 | | Sell | | 3.00% | | Monthly | | 12/31/2049 | | (812) | | | (103 | ) | | | | | (52 | ) | | | | | (51 | ) |
Deutsche Bank | | CMBX.NA.BBB-.6 | | Sell | | 3.00% | | Monthly | | 12/31/2049 | | (1,093) | | | (138 | ) | | | | | (76 | ) | | | | | (62 | ) |
Goldman Sachs | | CMBX.NA.BBB-.6 | | Sell | | 3.00% | | Monthly | | 12/31/2049 | | (1,324) | | | (167 | ) | | | | | 2 | | | | | | (169 | ) |
Deutsche Bank | | CMBX.NA.BBB-.6 | | Sell | | 3.00% | | Monthly | | 05/11/2063 | | (330) | | | (42 | ) | | | | | (36 | ) | | | | | (6 | ) |
Citigroup | | CMBX.NA.BBB-.6 | | Sell | | 3.00% | | Monthly | | 05/11/2063 | | (731) | | | (92 | ) | | | | | (82 | ) | | | | | (10 | ) |
Citigroup | | CMBX.NA.BBB-.6 | | Sell | | 3.00% | | Monthly | | 05/11/2063 | | (1,045) | | | (132 | ) | | | | | (117 | ) | | | | | (15 | ) |
Citigroup | | CMBX.NA.BBB-.6 | | Sell | �� | 3.00% | | Monthly | | 05/11/2063 | | (1,045) | | | (132 | ) | | | | | (119 | ) | | | | | (13 | ) |
Citigroup | | CMBX.NA.BBB-.6 | | Sell | | 3.00% | | Monthly | | 05/11/2063 | | (731) | | | (92 | ) | | | | | (83 | ) | | | | | (9 | ) |
JPMorgan Chase | | CMBX.NA.BBB-.6 | | Sell | | 3.00% | | Monthly | | 05/11/2063 | | (503) | | | (64 | ) | | | | | (63 | ) | | | | | (1 | ) |
Citigroup | | CMBX.NA.BBB-.6 | | Sell | | 3.00% | | Monthly | | 05/11/2063 | | (365) | | | (46 | ) | | | | | (43 | ) | | | | | (3 | ) |
Citibank | | CMBX.NA.BBB-.6 | | Sell | | 3.00% | | Monthly | | 05/11/2063 | | (783) | | | (99 | ) | | | | | (86 | ) | | | | | (13 | ) |
Deutsche Bank | | CMBX.NA.BBB-.6 | | Sell | | 3.00% | | Monthly | | 05/11/2063 | | (112) | | | (14 | ) | | | | | (13 | ) | | | | | (1 | ) |
Citibank | | CMBX.NA.BBB-.6 | | Sell | | 3.00% | | Monthly | | 05/11/2063 | | (240) | | | (30 | ) | | | | | (33 | ) | | | | | 3 | |
CGG | | CMBX.NA.BBB-.6 | | Sell | | 3.00% | | Monthly | | 05/11/2063 | | (254) | | | (32 | ) | | | | | (34 | ) | | | | | 2 | |
Goldman Sachs | | CMBX.NA.BBB-.6 | | Sell | | 3.00% | | Monthly | | 05/11/2063 | | (727) | | | (92 | ) | | | | | (85 | ) | | | | | (7 | ) |
Citigroup | | CMBX.NA.BBB-.6 | | Sell | | 3.00% | | Monthly | | 05/11/2063 | | (36) | | | (5 | ) | | | | | (6 | ) | | | | | 1 | |
Citigroup | | CMBX.NA.BBB-.6 | | Sell | | 3.00% | | Quarterly | | 05/11/2063 | | (290) | | | (37 | ) | | | | | (32 | ) | | | | | (5 | ) |
Goldman Sachs | | CMBX.NA.BBB-.6 | | Sell | | 3.00% | | Monthly | | 05/11/2063 | | (329) | | | (42 | ) | | | | | (46 | ) | | | | | 4 | |
Citigroup | | CMBX.NA.BBB-.6 | | Sell | | 3.00% | | Monthly | | 05/11/2063 | | (1,287) | | | (163 | ) | | | | | (140 | ) | | | | | (23 | ) |
JPMorgan Chase | | CMBX.NA.BBB-.6 | | Sell | | 3.00% | | Monthly | | 05/11/2063 | | (175) | | | (22 | ) | | | | | (22 | ) | | | | | — | |
Citigroup | | CMBX.NA.BBB-.6 | | Sell | | 3.00% | | Monthly | | 05/11/2063 | | (523) | | | (66 | ) | | | | | (61 | ) | | | | | (5 | ) |
Citigroup | | CMBX.NA.BBB-.6 | | Sell | | 3.00% | | Monthly | | 05/11/2063 | | (141) | | | (18 | ) | | | | | (17 | ) | | | | | (1 | ) |
Deutsche Bank | | CMBX.NA.BBB-.6 | | Sell | | 3.00% | | Monthly | | 05/11/2063 | | (113) | | | (14 | ) | | | | | (13 | ) | | | | | (1 | ) |
Goldman Sachs | | CMBX.NA.BBB-.6 | | Sell | | 3.00% | | Monthly | | 05/11/2063 | | (222) | | | (28 | ) | | | | | (24 | ) | | | | | (4 | ) |
Citigroup | | CMBX.NA.BBB-.6 | | Sell | | 3.00% | | Monthly | | 05/11/2063 | | (471) | | | (60 | ) | | | | | (58 | ) | | | | | (2 | ) |
Citigroup | | CMBX.NA.BBB-.9 | | Buy | | 3.00% | | Monthly | | 09/17/2058 | | 1,045 | | | 62 | | | | | | 77 | | | | | | (15 | ) |
Citigroup | | CMBX.NA.BBB-.9 | | Buy | | 3.00% | | Monthly | | 09/17/2058 | | 1,045 | | | 62 | | | | | | 80 | | | | | | (18 | ) |
Citigroup | | CMBX.NA.BBB-.9 | | Buy | | 3.00% | | Monthly | | 09/17/2058 | | 1,287 | | | 77 | | | | | | 92 | | | | | | (15 | ) |
Citigroup | | CMBX.NA.BBB-.9 | | Buy | | 3.00% | | Monthly | | 09/17/2058 | | 523 | | | 31 | | | | | | 43 | | | | | | (12 | ) |
Credit Suisse | | CMBX-A-.6 | | Sell | | 2.00% | | Monthly | | 05/11/2063 | | (1,305) | | | (28 | ) | | | | | (30 | ) | | | | | 2 | |
Goldman Sachs | | CMBX-BBB | | Sell | | 3.00% | | Monthly | | 05/11/2049 | | (276) | | | (35 | ) | | | | | (46 | ) | | | | | 11 | |
Goldman Sachs | | CMBX-BBB | | Sell | | 3.00% | | Monthly | | 05/11/2049 | | (198) | | | (25 | ) | | | | | (32 | ) | | | | | 7 | |
Citigroup | | CMBX-BBB | | Sell | | 3.00% | | Monthly | | 05/11/2049 | | (172) | | | (22 | ) | | | | | (26 | ) | | | | | 4 | |
Goldman Sachs | | CMBX-BBB | | Sell | | 3.00% | | Monthly | | 05/11/2063 | | (188) | | | (24 | ) | | | | | (29 | ) | | | | | 5 | |
Citibank | | Sprint Communications | | Buy | | 5.00% | | Quarterly | | 06/20/2019 | | 793 | | | (9 | ) | | | | | (2 | ) | | | | | (7 | ) |
Citibank | | Sprint Communications | | Buy | | 5.00% | | Quarterly | | 06/20/2019 | | 692 | | | (8 | ) | | | | | (2 | ) | | | | | (6 | ) |
| | | | | | | | | | | | | | | | | | | | | | | | | | | | |
| | | | | | | | | | | | | | | $(2,179 | ) | | | | $ | (1,442 | ) | | | | $ | (737 | ) |
| | | | | | | | | | | | | | | | | | | | | | | | | | | | |
| | |
234 | | SEI Institutional Managed Trust / Semi-Annual Report / March 31, 2019 |
| | | | | | | | | | | | | | | | | | | | | | | | | | | | | | | | | | | | | | |
Total Return Swaps | |
| Counterparty | | Reference Entity/
Obligation | | | Fund Pays | | | Fund Receives | | | Payment
Frequency | | | Termination
Date | | | Currency | | | Notional
Amount
(Thousands) | | Value
(Thousands) | | | Upfront
Payments/
Receipts
(Thousands) | | | Net Unrealized
Appreciation
(Depreciation)
(Thousands) | |
Macquarie Bank Limited | |
| BLOOMBERG
COMMODITY
INDEX 2 MONTH
FORWARD TR |
| |
| US T-BILL HIGH
DISCOUNT RATE +
16.5 BPS |
| | | INDEX RETURN | | | | Monthly | | | | 04/24/2019 | | | | USD | | | (1,025) | | $ | (16 | ) | | $ | – | | | $ | (16 | ) |
Macquarie Bank Limited | |
| BLOOMBERG
COMMODITY
INDEX TOTAL
RETURN |
| |
| US T-BILL HIGH
DISCOUNT RATE +
9 BPS |
| | | INDEX RETURN | | | | Monthly | | | | 04/24/2019 | | | | USD | | | (13,089) | | | (208 | ) | | | – | | | | (208 | ) |
Macquarie Bank Limited | |
| MACQUARIE
COMMODITY
PRODUCT 251E |
| | | 0.33% | | | | INDEX RETURN | | | | Monthly | | | | 04/06/2019 | | | | USD | | | (3,328) | | | 35 | | | | – | | | | 35 | |
Merrill Lynch | |
| BLOOMBERG
COMMODITY
INDEX 2 MONTH
FORWARD TR |
| |
| US T-BILL HIGH
DISCOUNT RATE +
13 BPS |
| | | INDEX RETURN | | | | Monthly | | | | 04/24/2019 | | | | USD | | | (1,671) | | | (26 | ) | | | – | | | | (26 | ) |
Merrill Lynch | |
| BLOOMBERG
COMMODITY
INDEX TOTAL
RETURN |
| |
| US T-BILL HIGH
DISCOUNT RATE +
12 BPS |
| | | INDEX RETURN | | | | Monthly | | | | 04/24/2019 | | | | USD | | | (12,466) | | | (198 | ) | | | – | | | | (198 | ) |
Merrill Lynch | |
| BOFA MERRILL
LYNCH
COMMODITY
MLBXCS3E
EXCESS |
| | | 0.21% | | | | INDEX RETURN | | | | Monthly | | | | 04/06/2019 | | | | USD | | | (3,224) | | | (10 | ) | | | – | | | | (10 | ) |
Societe Generale | |
| BLOOMBERG
COMMODITY
INDEX 2 MONTH
FORWARD TR |
| |
| US T-BILL HIGH
DISCOUNT RATE +
14 BPS |
| | | INDEX RETURN | | | | Monthly | | | | 04/24/2019 | | | | USD | | | (1,821) | | | (29 | ) | | | – | | | | (29 | ) |
Societe Generale | |
| BLOOMBERG
COMMODITY
INDEX TOTAL
RETURN |
| |
| US T-BILL HIGH
DISCOUNT RATE +
11 BPS |
| | | INDEX RETURN | | | | Monthly | | | | 04/24/2019 | | | | USD | | | (7,631) | | | (121 | ) | | | – | | | | (121 | ) |
Societe Generale | |
| SOCIETE
GENERALE
COMMODITIES
CUSTOM
ALPHA 061 |
| | | 0.35% | | | | INDEX RETURN | | | | Monthly | | | | 04/06/2019 | | | | USD | | | (3,797) | | | 13 | | | | – | | | | 13 | |
| | | | | | | | | | | | | | | | | | | | | | | | | | | | | | |
| | | | | | | | | | | | | | | | | | | | | | | | | | | | $ | (560 | ) | | $ | – | | | $ | (560 | ) |
| | | | | | | | | | | | | | | | | | | | | | | | | | | | | | |
A list of the open centrally cleared swap agreements held by the Fund at March 31, 2019 is as follows:
| | | | | | | | | | | | | | | | | | | | | | | | | | | | | | |
Credit Default Swap | |
| Reference Entity/Obligation | | Buy/Sell
Protection | | | (Pays)/
Receives Rate | | | Payment Frequency | | | Termination Date | | | Notional Amount
(Thousands) | | Value (Thousands) | | | Upfront Payments/
Receipts
(Thousands) | | | Net Unrealized
Depreciation
(Thousands) | |
CDX.NA.IG.31 | | | Buy | | | | 1.00% | | | | Quarterly | | | | 12/20/2023 | | | $7,070 | | $ | (126) | | | $ | (118) | | | $ | (8) | |
| | | | | | | | | | | | | | | | | | | | | | | | | | | | | | |
| | | | | | | | | | | | | | | | | | | | $ | (126) | | | $ | (118) | | | $ | (8) | |
| | | | | | | | | | | | | | | | | | | | | | | | | | | | | | |
| | | | | | | | | | | | | | | | | | | | | | | | |
Interest Rate Swaps | |
| Fund Pays | | Fund Receives | | Payment
Frequency | | Termination Date | | Currency | | Notional Amount
(Thousands) | | | Value
(Thousands) | | | Upfront
Payments/
Receipts
(Thousands) | | | Net Unrealized
Appreciation
(Depreciation)
(Thousands) | |
6-MONTH NOK - NIBOR | | 1.3775% | | Annually | | 06/22/2020 | | NOK | | | 422,650 | | | $ | (127 | ) | | $ | – | | | $ | (127 | ) |
1.501% | | 6-MONTH GBP - LIBOR | | Semi-Annually | | 03/01/2029 | | GBP | | | 2,900 | | | | (112 | ) | | | – | | | | (112 | ) |
1.515% | | 6-MONTH GBP - LIBOR | | Semi-Annually | | 03/01/2029 | | GBP | | | 4,580 | | | | (177 | ) | | | – | | | | (177 | ) |
2.18625% | | 6-MONTH NOK - NIBOR | | Semi-Annually | | 08/31/2028 | | NOK | | | 46,790 | | | | (119 | ) | | | – | | | | (119 | ) |
3-MONTH USD - LIBOR | | 2.9855% | | Semi-Annually | | 08/31/2028 | | USD | | | 2,800 | | | | 138 | | | | – | | | | 138 | |
2.3545 | | 3-MONTH USD - LIBOR | | Quarterly | | 07/12/2027 | | USD | | | 2,140 | | | | 6 | | | | – | | | | 6 | |
2.44 | | 3-MONTH USD - LIBOR | | Quarterly | | 04/04/2027 | | USD | | | 10,400 | | | | (106 | ) | | | – | | | | (106 | ) |
1.67 | | 3-MONTH USD - LIBOR | | Quarterly | | 11/09/2026 | | USD | | | 1,490 | | | | 70 | | | | – | | | | 70 | |
1.66 | | 3-MONTH USD - LIBOR | | Quarterly | | 11/08/2026 | | USD | | | 1,490 | | | | 72 | | | | – | | | | 72 | |
1.60% | | 3-MONTH USD - LIBOR | | Quarterly | | 10/25/2026 | | USD | | | 6,110 | | | | 310 | | | | – | | | | 310 | |
2.293% | | 3-MONTH USD - LIBOR | | Quarterly | | 08/04/2025 | | USD | | | 2,717 | | | | 7 | | | | – | | | | 7 | |
2.49 | | 3-MONTH USD - LIBOR | | Quarterly | | 06/09/2025 | | USD | | | 1,710 | | | | (27 | ) | | | – | | | | (27 | ) |
3-MONTH USD - LIBOR | | 2.31% | | Quarterly | | 05/18/2025 | | USD | | | 2,820 | | | | (14 | ) | | | – | | | | (14 | ) |
| | |
SEI Institutional Managed Trust / Semi-Annual Report / March 31, 2019 | | 235 |
CONSOLIDATED SCHEDULE OF INVESTMENTS (Unaudited)
March 31, 2019
Multi-Asset Inflation Managed Fund(Concluded)
| | | | | | | | | | | | | | | | | | | | | | | | |
| | | | | | | | | |
| Fund Pays | | Fund Receives | | Payment
Frequency | | Termination Date | | Currency | | Notional Amount
(Thousands) | | | Value
(Thousands) | | | Upfront
Payments/
Receipts
(Thousands) | | | Net Unrealized
Appreciation
(Depreciation)
(Thousands) | |
1.99% | | 3-MONTH USD - LIBOR | | Quarterly | | 04/21/2025 | | USD | | | 2,760 | | | $ | 41 | | | $ | – | | | $ | 41 | |
3-MONTH USD - LIBOR | | 2.896% | | Semi-Annually | | 09/10/2023 | | USD | | | 7,705 | | | | 197 | | | | – | | | | 197 | |
3-MONTH USD - LIBOR | | 2.886% | | Semi-Annually | | 08/22/2022 | | USD | | | 3,510 | | | | 67 | | | | – | | | | 67 | |
3-MONTH SEK - STIBOR | | 0.0975% | | Annually | | 04/02/2021 | | SEK | | | 180,300 | | | | (154 | ) | | | – | | | | (154 | ) |
3-MONTH SEK - STIBOR | | 0.0975% | | Annually | | 04/02/2021 | | SEK | | | 180,300 | | | | (154 | ) | | | – | | | | (154 | ) |
2.403% | | 3-MONTH USD - LIBOR | | Quarterly | | 04/02/2021 | | USD | | | 7,800 | | | | (7 | ) | | | – | | | | (7 | ) |
2.3935% | | 3-MONTH USD - LIBOR | | Quarterly | | 04/02/2021 | | USD | | | 7,800 | | | | (7 | ) | | | – | | | | (7 | ) |
2.631% | | 3M USD LIBOR | | Semi-Annually | | 03/05/2021 | | USD | | | 18,500 | | | | (79 | ) | | | – | | | | (79 | ) |
6-MONTH GBP - LIBOR | | 1.1125% | | Semi-Annually | | 03/01/2021 | | GBP | | | 38,100 | | | | 166 | | | | – | | | | 166 | |
2.631% | | 3-MONTH USD - LIBOR | | Quarterly | | 11/10/2035 | | USD | | | 1,190 | | | | (18 | ) | | | – | | | | (18 | ) |
.6725 | | 6-MONTH JPY - LIBOR | | Semi-Annually | | 01/08/2049 | | JPY | | | 183,000 | | | | (77 | ) | | | – | | | | (77 | ) |
| | | | | | | | | | | | | | | | | | | | | | | | |
| | | | | | | | | | | | | | $ | (104 | ) | | $ | – | | | $ | (104 | ) |
| | | | | | | | | | | | | | | | | | | | | | | | |
A list of the open reverse repurchase agreements held by the Fund at March 31, 2019 is as follows:
| | | | | | | | | | | | | | |
Principal Amount ($ Thousands) | | Counterparty | | Rate | | | Maturity | | | Value ($ Thousands) | |
$(33,887) | | Chase Securities | | | 2.65 | % | | | 04/29//2019 | | | | $(33,887) | |
(28,620) | | Chase Securities | | | 2.65 | % | | | 04/23/2019 | | | | (28,620) | |
(18,069) | | Chase Securities | | | 2.54 | % | | | Open Ended | | | | (18,069) | |
(30,962) | | Chase Securities | | | 2.53 | % | | | 04/15/2019 | | | | (30,962) | |
(39,155) | | Chase Securities | | | 2.52 | % | | | Open Ended | | | | (39,155) | |
(49,644) | | Chase Securities | | | 2.51 | % | | | Open Ended | | | | (49,644) | |
(42,922) | | Goldman Sachs | | | 2.59 | % | | | Open Ended | | | | (42,922) | |
| | | | | | | | | | | | | | |
| | | | | | | | | | | | | $(243,259) | |
| | | | | | | | | | | | | | |
| | Percentages are based on Net Assets of $870,378 ($ Thousands). |
| * | Non-income producing security. |
| ** | Security, or a portion thereof, is held by the Inflation Commodity Strategy Subsidiary, Ltd. as of March 31, 2019.. |
| ‡ | Real Estate Investment Trust. |
| (A) | Zero coupon security. The rate shown on the Schedule of Investments is the security’s effective yield at the time of purchase. |
| (B) | Securities considered illiquid. The total value of such securities as of March 31, 2019 was $3,594 ($ Thousands) and represented 0.4% of the Net Assets of the Fund. |
| (C) | Security exempt from registration under Rule 144A of the Securities Act of 1933. These securities may be resold in transactions exempt from registration normally to qualified institutions. On March 31, 2019, the value of these securities amounted to $59,169 ($ Thousands), representing 6.8% of the Net Assets of the Fund. |
| (D) | Security is in default on interest payment. |
| (E) | Variable or floating rate security, the interest rate of which adjusts periodically based on changes in current interest rates and prepayments on the underlying pool of assets. |
| (F) | Security, or a portion thereof, has been pledged as collateral for open short positions. |
| (G) | Refer to table below for details on Options Contracts. |
AUD — Australian Dollar
BRL — Brazilian Real
CAD — Canadian Dollar
CHF — Swiss Franc
Cl — Class
CMBX — Commercial Mortgage-Backed Index
CMO — Collateralized Mortgage Obligation
CNY — Chinese Yuan
EAFE — Europe, Australasia and Far East
EUR — Euro
FFCB — Federal Farm Credit Bank
FHLB — Federal Home Loan Bank
FHLMC — Federal Home Loan Mortgage Corporation
FNMA — Federal National Mortgage Association
GBP — British Pound Sterling
GNMA — Government National Mortgage Association
ICE— Intercontinental Exchange
INR — Indian Rupee
IO — Interest Only — face amount represents notional amount.
JPY — Japanese Yen
KC HRW — Kansas City Hard Red Winter
KRW — Korean Won
LIBOR — London Interbank Offered Rate
LME — London Metal Exchange
MSCI — Morgan Stanley Capital International
MTN — Medium Term Note
MXN — Mexican Peso
NIBOR — Norwegian Interbank Offered Rate
NOK — Norwegian Krone
NZD — New Zealand Dollar
OTC — Over the counter
PEN — Peruvian Sol
PLC — Public Limited Company
PLN — Polish Zloty
S&P — Standard & Poor’s
SEK — Swedish Krona
Ser — Series
STIBOR — Stockholm Interbank Offered Rate
ULSD — Ultra-Low Sulfur Diesel
USD — United States Dollar
VAR — Variable Rate
WTI — West Texas Intermediate
| | |
236 | | SEI Institutional Managed Trust / Semi-Annual Report / March 31, 2019 |
The following is a list of the level of inputs used as of March 31, 2019, in valuing the Fund’s investments and other financial instruments carried at value ($ Thousands):
| | | | | | | | | | | | | | | | |
Investments in
Securities | | Level 1 | | | Level 2 | | | Level 3 | | | Total | |
U.S. Treasury Obligations | | $ | – | | | $ | 561,643 | | | $ | – | | | $ | 561,643 | |
Common Stock | | | 253,041 | | | | – | | | | – | | | | 253,041 | |
Corporate Obligations | | | – | | | | 80,928 | | | | – | | | | 80,928 | |
Mortgage-Backed Securities | | | – | | | | 64,898 | | | | – | | | | 64,898 | |
U.S. Government Agency | | | | | | | | | | | | | | | | |
Obligations | | | – | | | | 51,046 | | | | – | | | | 51,046 | |
Asset-Backed Securities | | | – | | | | 17,660 | | | | – | | | | 17,660 | |
Sovereign Debt | | | – | | | | 7,038 | | | | – | | | | 7,038 | |
| | | | | | | | | | | | | | | | |
| Total Investments in Securities | | $ | 253,041 | | | $ | 783,213 | | | $ | – | | | $ | 1,036,254 | |
| | | | | | | | | | | | | | | | |
| | | | |
| Securities Sold Short | | Level 1 | | | Level 2 | | | Level 3 | | | Total | |
Common Stock | | | (112,006 | ) | | | – | | | | – | | | | (112,006 | ) |
| | | | | | | | | | | | | | | | |
Total Securities Sold Short | | $ | (112,006 | ) | | $ | – | | | $ | – | | | $ | (112,006 | ) |
| | | | | | | | | | | | | | | | |
| | | | | | | | | | | | | | | | |
| | | | | | | | |
| Other Financial Instruments | | Level 1 | | Level 2 | | Level 3 | | Total |
Purchased Options | | $ 53 | | $ — | | $ — | | $ 53 |
Written Options | | (184) | | — | | — | | (184) |
Futures Contracts * | | | | | | | | |
Unrealized Appreciation | | 4,976 | | — | | — | | 4,976 |
Unrealized Depreciation | | (3,631) | | — | | — | | (3,631) |
Forwards Contracts * | | | | | | | | |
Unrealized Appreciation | | — | | 149 | | — | | 149 |
Unrealized Depreciation | | — | | (180) | | — | | (180) |
OTC Swaps | | | | | | | | |
Credit Default Swaps * | | | | | | | | |
Unrealized Appreciation | | — | | 44 | | — | | 44 |
Unrealized Depreciation | | — | | (781) | | — | | (781) |
Total Return Swaps * | | | | | | | | |
Unrealized Appreciation | | — | | 48 | | — | | 48 |
Unrealized Depreciation | | — | | (608) | | — | | (608) |
Centrally Cleared Swaps | | | | | | | | |
Credit Default Swap * | | | | | | | | |
Unrealized Depreciation | | — | | (8) | | — | | (8) |
Interest Rate Swaps * | | | | | | | | |
Unrealized Appreciation | | — | | 1,074 | | — | | 1,074 |
Unrealized Depreciation | | — | | (1,178) | | — | | (1,178) |
Reverse Repurchase Agreements | | — | | (243,259) | | — | | (243,259) |
| | | | | | | | |
| Total Other Financial Instruments | | $ 1,214 | | $ (244,699) | | $ — | | $ (243,485) |
| | | | | | | | |
* Futures contracts, forward contracts and swap contracts are valued at the unrealized appreciation (depreciation) on the instrument.
For the period ended March 31, 2019, there were no transfers between Level 1 and Level 2 assets and liabilities.
For the period ended March 31, 2019, there were no transfers between Level 2 and Level 3 assets and liabilities.
For more information on valuation inputs, see Note 2 – Significant Accounting Policies in Notes to Financial Statements.
Amounts designated as “— ” are either $0 or have been rounded to $0.
The accompanying notes are an integral part of the financial statements.
| | |
SEI Institutional Managed Trust / Semi-Annual Report / March 31, 2019 | | 237 |
SCHEDULE OF INVESTMENTS (Unaudited)
March 31, 2019
Multi-Asset Capital Stability Fund
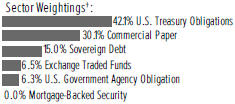
†Percentages are based on total investments.
| | | | | | | | |
| | | |
| Description | | Face Amount
(Thousands) | | | Market Value
($ Thousands) | |
|
U.S. TREASURY OBLIGATIONS — 40.7% | |
United States Treasury Bills | | | | | | | | |
2.390%, 05/16/2019 (A) | | $ | 147,497 | | | $ | 147,061 | |
2.381%, 05/09/2019 (A) | | | 36,914 | | | | 36,822 | |
United States Treasury Inflation Indexed Bonds | | | | | | | | |
3.875%, 04/15/2029 | | | 2,006 | | | | 2,649 | |
3.625%, 04/15/2028 | | | 242 | | | | 308 | |
3.375%, 04/15/2032 | | | 1,025 | | | | 1,381 | |
2.500%, 01/15/2029 | | | 1,606 | | | | 1,903 | |
2.375%, 01/15/2025 | | | 2,353 | | | | 2,612 | |
2.375%, 01/15/2027 | | | 1,482 | | | | 1,694 | |
2.125%, 02/15/2040 | | | 797 | | | | 993 | |
2.125%, 02/15/2041 | | | 1,100 | | | | 1,379 | |
2.000%, 01/15/2026 | | | 2,702 | | | | 2,980 | |
1.750%, 01/15/2028 | | | 1,903 | | | | 2,100 | |
1.375%, 01/15/2020 | | | 1,865 | | | | 1,881 | |
1.375%, 02/15/2044 | | | 1,745 | | | | 1,927 | |
1.250%, 07/15/2020 | | | 733 | | | | 744 | |
1.125%, 01/15/2021 | | | 3,438 | | | | 3,482 | |
1.000%, 02/15/2046 | | | 1,762 | | | | 1,795 | |
1.000%, 02/15/2048 | | | 1,664 | | | | 1,698 | |
1.000%, 02/15/2049 | | | 605 | | | | 620 | |
0.875%, 01/15/2029 | | | 1,356 | | | | 1,399 | |
0.875%, 02/15/2047 | | | 1,782 | | | | 1,762 | |
0.750%, 07/15/2028 | | | 3,119 | | | | 3,187 | |
0.750%, 07/15/2028 | | | 677 | | | | 692 | |
0.750%, 02/15/2042 | | | 1,753 | | | | 1,706 | |
0.750%, 02/15/2045 | | | 1,827 | | | | 1,755 | |
0.625%, 07/15/2021 | | | 2,362 | | | | 2,383 | |
0.625%, 04/15/2023 | | | 3,079 | | | | 3,100 | |
0.625%, 01/15/2024 | | | 4,045 | | | | 4,084 | |
0.625%, 01/15/2026 | | | 2,252 | | | | 2,277 | |
0.625%, 02/15/2043 | | | 1,260 | | | | 1,185 | |
0.500%, 01/15/2028 | | | 2,920 | | | | 2,913 | |
0.375%, 07/15/2023 | | | 2,917 | | | | 2,924 | |
0.375%, 07/15/2025 | | | 4,186 | | | | 4,182 | |
0.375%, 01/15/2027 | | | 3,227 | | | | 3,198 | |
0.375%, 07/15/2027 | | | 3,122 | | | | 3,098 | |
0.250%, 01/15/2025 | | | 3,283 | | | | 3,247 | |
0.125%, 04/15/2020 | | | 4,277 | | | | 4,256 | |
0.125%, 04/15/2021 | | | 3,430 | | | | 3,403 | |
0.125%, 01/15/2022 | | | 3,900 | | | | 3,868 | |
0.125%, 04/15/2022 | | | 5,723 | | | | 5,663 | |
| | | | | | | | |
| | | |
| Description | | Face Amount
(Thousands) | | | Market Value
($ Thousands) | |
|
U.S. TREASURY OBLIGATIONS (continued) | |
0.125%, 07/15/2022 | | $ | 5,426 | | | $ | 5,397 | |
0.125%, 01/15/2023 | | | 4,379 | | | | 4,329 | |
0.125%, 07/15/2024 | | | 5,366 | | | | 5,298 | |
0.125%, 07/15/2026 | | | 2,615 | | | | 2,558 | |
| | | | | | | | |
Total U.S. Treasury Obligations | | | | | | | | |
(Cost $289,748) ($ Thousands) | | | | | | | 291,893 | |
| | | | | | | | |
|
COMMERCIAL PAPER (A) — 29.1% | |
| |
Consumer Discretionary — 3.6% | | | | | |
CRP America | | | | | | | | |
2.681%, 04/01/2019 | | | 5,000 | | | | 4,999 | |
ETRCP | | | | | | | | |
2.871%, 06/06/2019 | | | 6,356 | | | | 6,321 | |
Ford Motor Credit Co | | | | | | | | |
2.479%, 05/01/2019 | | | 5,500 | | | | 5,484 | |
General Motors Financial Co | | | | | | | | |
2.884%, 04/05/2019 | | | 3,000 | | | | 2,998 | |
Nissan Motor | | | | | | | | |
2.779%, 05/20/2019 | | | 6,000 | | | | 5,979 | |
| | | | | | | | |
| | |
| | | | | | | 25,781 | |
| | | | | | | | |
| | |
Consumer Staples — 3.2% | | | | | | | | |
Anheuser-Busch InBev | | | | | | | | |
2.830%, 04/22/2019 | | | 5,000 | | | | 4,991 | |
Campbell Soup Co | | | | | | | | |
3.073%, 05/02/2019 | | | 5,500 | | | | 5,486 | |
Mondelez International | | | | | | | | |
2.840%, 05/03/2019 | | | 4,000 | | | | 3,989 | |
2.793%, 05/21/2019 | | | 2,250 | | | | 2,241 | |
Smithfield Food Inc | | | | | | | | |
3.378%, 04/02/2019 | | | 3,500 | | | | 3,499 | |
Walgreens Boots Alliance Inc | | | | | | | | |
2.910%, 04/29/2019 | | | 2,000 | | | | 1,995 | |
2.785%, 05/17/2019 | | | 750 | | | | 747 | |
| | | | | | | | |
| | |
| | | | | | | 22,948 | |
| | | | | | | | |
| | |
Energy — 5.6% | | | | | | | | |
CenterPoint Energy Inc | | | | | | | | |
2.800%, 04/29/2019 | | | 1,250 | | | | 1,247 | |
2.337%, 05/19/2019 | | | 4,750 | | | | 4,736 | |
Dominion Gas Holdings LLC | | | | | | | | |
2.819%, 05/02/2019 | | | 4,000 | | | | 3,990 | |
Enbridge | | | | | | | | |
2.921%, 06/11/2019 | | | 6,000 | | | | 5,965 | |
2.837%, 06/04/2019 | | | 250 | | | | 249 | |
Nextera Engergy | | | | | | | | |
2.865%, 04/02/2019 | | | 6,000 | | | | 5,998 | |
Puget Sound Engergy Inc | | | | | | | | |
2.727%, 04/22/2019 | | | 1,500 | | | | 1,497 | |
Sinopec Century Bright | | | | | | | | |
2.830%, 06/24/2019 | | | 5,000 | | | | 4,970 | |
| | |
238 | | SEI Institutional Managed Trust / Semi-Annual Report / March 31, 2019 |
| | | | | | | | |
| | | |
| Description | | Face Amount
(Thousands) | | | Market Value
($ Thousands) | |
|
COMMERCIAL PAPER (continued) | |
Suncor Enger Inc | | | | | | | | |
2.860%, 06/10/2019 | | $ | 2,000 | | | $ | 1,989 | |
TransCanada | | | | | | | | |
2.899%, 06/07/2019 | | | 4,250 | | | | 4,227 | |
2.880%, 06/04/2019 | | | 1,894 | | | | 1,884 | |
2.871%, 05/01/2019 | | | 1,250 | | | | 1,247 | |
WGL Holdings Inc | | | | | | | | |
3.188%, 04/03/2019 | | | 2,000 | | | | 1,999 | |
| | | | | | | | |
| | |
| | | | | | | 39,998 | |
| | | | | | | | |
| | |
Financials — 6.4% | | | | | | | | |
Banco Santander SA | | | | | | | | |
2.677%, 05/03/2019 | | | 895 | | | | 893 | |
BNP Paribas | | | | | | | | |
2.361%, 04/01/2019 | | | 8,800 | | | | 8,798 | |
CRH America Finance Inc | | | | | | | | |
2.919%, 06/05/2019 | | | 6,000 | | | | 5,968 | |
2.580%, 04/01/2019 | | | 4,750 | | | | 4,749 | |
Intesa Sanpaolo Funding LLC | | | | | | | | |
3.084%, 04/22/2019 | | | 500 | | | | 499 | |
3.053%, 05/06/2019 | | | 6,250 | | | | 6,231 | |
3.023%, 04/17/2019 | | | 2,500 | | | | 2,497 | |
ITC Holdings Corp | | | | | | | | |
2.743%, 04/05/2019 | | | 1,000 | | | | 999 | |
Santander UK PLC | | | | | | | | |
2.709%, 04/25/2019 | | | 1,250 | | | | 1,248 | |
Societe Generale | | | | | | | | |
2.390%, 04/01/2019 | | | 10,600 | | | | 10,598 | |
VW Credit Inc | | | | | | | | |
2.839%, 05/23/2019 | | | 3,250 | | | | 3,236 | |
| | | | | | | | |
| | |
| | | | | | | 45,716 | |
| | | | | | | | |
| | |
Health Care — 0.6% | | | | | | | | |
Cigna Corp | | | | | | | | |
2.971%, 05/06/2019 | | | 4,250 | | | | 4,238 | |
| | | | | | | | |
| | |
Industrials — 3.7% | | | | | | | | |
EI du Pont de Nemours | | | | | | | | |
2.857%, 04/22/2019 | | | 6,250 | | | | 6,239 | |
General Electric Co | | | | | | | | |
2.942%, 05/13/2019 | | | 5,500 | | | | 5,481 | |
2.820%, 06/06/2019 | | | 2,000 | | | | 1,989 | |
Hannover Funding LLC | | | | | | | | |
2.992%, 05/21/2019 | | | 6,750 | | | | 6,722 | |
San Diego Gas & Electric Co | | | | | | | | |
2.795%, 04/11/2019 | | | 6,250 | | | | 6,245 | |
| | | | | | | | |
| | |
| | | | | | | 26,676 | |
| | | | | | | | |
|
Information Technology — 0.3% | |
QUALCOMM Inc | | | | | | | | |
2.809%, 05/07/2019 | | | 2,450 | | | | 2,443 | |
| | | | | | | | |
| | |
Materials — 2.3% | | | | | | | | |
FMC Technologies Inc | | | | | | | | |
2.839%, 06/04/2019 | | | 2,500 | | | | 2,487 | |
| | | | | | | | |
| | | |
| Description | | Face Amount
(Thousands) | | | Market Value
($ Thousands) | |
|
COMMERCIAL PAPER (continued) | |
2.760%, 04/10/2019 | | | $ 4,000 | | | $ | 3,996 | |
Glencore Funding LLC | | | | | | | | |
3.226%, 04/16/2019 | | | 4,000 | | | | 3,995 | |
3.226%, 04/26/2019 | | | 250 | | | | 249 | |
3.226%, 04/29/2019 | | | 5,650 | | | | 5,637 | |
| | | | | | | | |
| | |
| | | | | | | 16,364 | |
| | | | | | | | |
| | |
Utilities — 3.4% | | | | | | | | |
Enel Financial America LLC | | | | | | | | |
2.862%, 05/13/2019 | | | 6,000 | | | | 5,979 | |
PPL Capital Funding Inc | | | | | | | | |
2.858%, 04/25/2019 | | | 6,000 | | | | 5,988 | |
Public Service Enterprise Group Inc | | | | | | | | |
2.802%, 04/23/2019 | | | 6,250 | | | | 6,238 | |
Southern | | | | | | | | |
2.812%, 05/06/2019 | | | 2,500 | | | | 2,493 | |
Southern California | | | | | | | | |
0.859%, 08/04/2019 | | | 4,000 | | | | 3,997 | |
| | | | | | | | |
| | |
| | | | | | | 24,695 | |
| | | | | | | | |
| | |
Total Commercial Paper | | | | | | | | |
(Cost $208,870) ($ Thousands) | | | | | | | 208,859 | |
| | | | | | | | |
|
SOVEREIGN DEBT — 14.5% | |
Japan Treasury Discount Bill | | | | | | | | |
-0.192%, 05/09/2019 (A)(B) | | JPY | 7,759,000 | | | | 70,113 | |
Japanese Government CPI Linked Bond | | | | | | | | |
0.100%, 03/10/2026 | | | 2,452,163 | | | | 23,014 | |
0.100%, 03/10/2027 | | | 1,112,892 | | | | 10,480 | |
| | | | | | | | |
| | |
Total Sovereign Debt | | | | | | | | |
(Cost $105,818) ($ Thousands) | | | | | | | 103,607 | |
| | | | | | | | |
| | |
| | | Shares | | | | |
|
EXCHANGE TRADED FUNDS — 6.3% | |
| | |
United States — 6.3% | | | | | | | | |
iShares Core MSCI Emerging Markets ETF | | | 51,500 | | | | 2,663 | |
iShares Core S&P 500 ETF | | | 65,046 | | | | 18,509 | |
iShares MSCI Emerging Markets ETF | | | 120,940 | | | | 5,191 | |
Vanguard S&P 500 ETF | | | 71,198 | | | | 18,479 | |
| | | | | | | | |
| | |
Total Exchange Traded Funds | | | | | | | | |
(Cost $42,325) ($ Thousands) | | | | | | | 44,842 | |
| | | | | | | | |
| | |
SEI Institutional Managed Trust / Semi-Annual Report / March 31, 2019 | | 239 |
SCHEDULE OF INVESTMENTS (Unaudited)
March 31, 2019
Multi-Asset Capital Stability Fund(Continued)
| | | | | | | | |
| | | |
| Description | | Face Amount
(Thousands) | | | Market Value
($ Thousands) | |
|
U.S. GOVERNMENT AGENCY OBLIGATION — 6.1% | |
FHLMC | | | | | | | | |
1.375%, 05/01/2020 | | $ | 44,150 | | | $ | 43,650 | |
| |
Total U.S. Government Agency Obligation
(Cost $43,602) ($ Thousands) | | | | 43,650 | |
|
MORTGAGE-BACKED SECURITY — 0.0% | |
|
Agency Mortgage-Backed Obligations — 0.0% | |
FNMA TBA | | | | | | | | |
5.000%, 05/01/2038 | | | 200 | | | | 211 | |
| |
Total Mortgage-Backed Security
(Cost $211) ($ Thousands) | | | | 211 | |
| |
Total Investments in Securities — 96.7%
(Cost $690,574) ($ Thousands) | | | $ | 693,062 | |
| | | | | | | | |
| | |
| | | Contracts | | | | |
| |
WRITTEN OPTIONS* — 0.0% | | | | | |
| | |
Total Written Options(C) | | | | | | | | |
(Premiums Received $48) ($ Thousands) | | | (14,690,528 | ) | | $ | (329 | ) |
| | | | | | | | |
A list of the open OTC options contracts held by the Fund at March 31, 2019, is as follows:
| | | | | | | | | | | | | | | | | | | | | | |
| Description | | Counterparty | | Number of Contracts | | Notional Amount
(Thousands) | | | Exercise Price | | | Expiration Date | | | Value
(Thousands) |
| | | | |
WRITTEN OPTIONS — 0.0% | | | | | | | | | | | | | | | | | |
| | | | | | |
Call Options | | | | | | | | | | | | | | | | | | | | | | |
April 2019, USD Call, TRY Put* | | Bank of America | | | (2,887,764 | ) | | $ | (2,048 | ) | | | $5.76 | | | | 04/20/19 | | | $ | (82 | ) |
April 2019, USD Call, TRY Put* | | JPMorgan Chase Bank | | | (8,651,764 | ) | | | (47,951 | ) | | | 5.76 | | | | 04/20/19 | | | | (246 | ) |
June 2019, AUD Call, USD Put* | | Morgan Stanley | | | (3,151,000 | ) | | | — | | | | 1.28 | | | | 06/22/19 | | | | (1 | ) |
Total Written Option | | | | | | | | $ | (49,999 | ) | | | | | | | | | | $ | (329 | ) |
| | | | | | | | | | | | | | | | | | | | | | |
A list of the open futures contracts held by the Fund at March 31, 2019, is as follows:
| | | | | | | | | | | | | | | | | | | | |
| Type of Contract | | Number of
Contracts
Long (Short) | | | Expiration
Date | | | Notional Amount
(Thousands) | | | Value
(Thousands) | | | Unrealized
Appreciation/
(Depreciation)
(Thousands) | |
Amsterdam Index | | | 20 | | | | Apr-2019 | | | $ | 2,462 | | | $ | 2,461 | | | $ | 17 | |
CAC40 10 Euro Index | | | 31 | | | | Apr-2019 | | | | 1,873 | | | | 1,860 | | | | – | |
Canadian 10-Year Bond | | | 197 | | | | Jun-2019 | | | | 20,374 | | | | 20,503 | | | | 384 | |
CBOE Volatility Index | | | (285) | | | | May-2019 | | | | (4,802 | ) | | | (4,653 | ) | | | 149 | |
CBOE Volatility Index | | | 327 | | | | Apr-2019 | | | | 5,374 | | | | 4,979 | | | | (395 | ) |
DAX Index | | | 4 | | | | Jun-2019 | | | | 1,314 | | | | 1,295 | | | | (11 | ) |
Euro-Bob | | | 1 | | | | Jun-2019 | | | | 150 | | | | 149 | | | | 1 | |
Euro-Bund | | | 70 | | | | Jun-2019 | | | | 12,976 | | | | 13,074 | | | | 191 | |
Euro-OAT | | | 116 | | | | Jun-2019 | | | | 20,892 | | | | 21,188 | | | | 447 | |
| | |
240 | | SEI Institutional Managed Trust / Semi-Annual Report / March 31, 2019 |
| | | | | | | | | | | | | | | | | | | | |
| Type of Contract | | Number of
Contracts
Long (Short) | | | Expiration
Date | | | Notional Amount
(Thousands) | | | Value
(Thousands) | | | Unrealized
Appreciation/
(Depreciation)
(Thousands) | |
FTSE 100 Index | | | 30 | | | | Jun-2019 | | | $ | 2,837 | | | $ | 2,819 | | | $ | 33 | |
FTSE MIB Index | | | 18 | | | | Jun-2019 | | | | 2,081 | | | | 2,096 | | | | 31 | |
IBEX | | | 9 | | | | Apr-2019 | | | | 933 | | | | 929 | | | | – | |
Japanese 10-Year Bond | | | (24 | ) | | | Jun-2019 | | | | (32,829) | | | | (33,236) | | | | (156) | |
Long Gilt 10-Year Bond | | | 63 | | | | Jun-2019 | | | | 10,499 | | | | 10,620 | | | | 194 | |
MSCI EAFE Index E-MINI | | | 387 | | | | Jun-2019 | | | | 36,015 | | | | 36,115 | | | | 100 | |
MSCI Emerging Markets | | | 164 | | | | Jun-2019 | | | | 8,578 | | | | 8,671 | | | | 93 | |
NASDAQ 100 Index E-MINI | | | 40 | | | | Jun-2019 | | | | 5,845 | | | | 5,920 | | | | 75 | |
Nikkei 225 Index | | | 24 | | | | Jun-2019 | | | | 4,620 | | | | 4,599 | | | | (62) | |
OMX Stockholm 30 Index | | | 117 | | | | Apr-2019 | | | | 1,959 | | | | 1,950 | | | | (14) | |
Russell 2000 Index E-MINI | | | 69 | | | | Jun-2019 | | | | 5,381 | | | | 5,326 | | | | (55) | |
S&P 500 Index E-MINI | | | 232 | | | | Jun-2019 | | | | 32,639 | | | | 32,918 | | | | 279 | |
S&P TSX 60 Index | | | 46 | | | | Jun-2019 | | | | 6,568 | | | | 6,591 | | | | 6 | |
SPI 200 Index | | | 63 | | | | Jun-2019 | | | | 6,919 | | | | 6,904 | | | | (22) | |
U.S. 5-Year Treasury Note | | | 480 | | | | Jul-2019 | | | | 55,026 | | | | 55,597 | | | | 571 | |
U.S. 10-Year Treasury Note | | | 377 | | | | Jun-2019 | | | | 46,230 | | | | 46,830 | | | | 600 | |
U.S. Ultra Long Treasury Bond | | | 81 | | | | Jun-2019 | | | | 13,168 | | | | 13,608 | | | | 440 | |
| | | | | | | | | | | | | | | | | | | | |
| | | | | | | | | | $ | 267,082 | | | $ | 269,113 | | | $ | 2,896 | |
| | | | | | | | | | | | | | | | | | | | |
| | | | | | | | | | | | | | | | | | | | |
A list of the open forward foreign currency contracts held by the Fund at March 31, 2019, is as follows:
| | | | | | | | | | | | | | | | | | | | | | | | |
| Counterparty | | Settlement Date | | | | | | Currency to Deliver
(Thousands) | | | | | | Currency to Receive
(Thousands) | | | Unrealized
Appreciation
(Depreciation)
(Thousands) |
| | | | | | |
ANZ | | | 04/10/19 | | | | USD | | | | 507 | | | | EUR | | | | 443 | | | $ | (9 | ) |
| | | | | | |
ANZ | | | 04/23/19 | | | | USD | | | | 503 | | | | AUD | | | | 708 | | | | — | |
| | | | | | |
ANZ | | | 06/13/19 | | | | USD | | | | 511 | | | | CHF | | | | 503 | | | | (2 | ) |
| | | | | | |
Bank of America | | | 05/16/19 | | | | USD | | | | 393 | | | | RUB | | | | 25,941 | | | | (1 | ) |
| | | | | | |
Barclays PLC | | | 04/02/19 | | | | USD | | | | 1,091 | | | | BRL | | | | 4,079 | | | | (43 | ) |
| | | | | | |
Barclays PLC | | | 04/09/19 | | | | GBP | | | | 573 | | | | USD | | | | 751 | | | | 4 | |
| | | | | | |
Barclays PLC | | | 04/11/19 | | | | JPY | | | | 55,999 | | | | USD | | | | 503 | | | | (4 | ) |
| | | | | | |
Barclays PLC | | | 04/12/19 | | | | USD | | | | 1,002 | | | | NOK | | | | 8,631 | | | | 1 | |
| | | | | | |
Barclays PLC | | | 04/16/19 | | | | ILS | | | | 4,412 | | | | USD | | | | 1,206 | | | | (11 | ) |
| | | | | | |
Barclays PLC | | | 05/16/19 | | | | USD | | | | 999 | | | | KRW | | | | 1,118,730 | | | | (14 | ) |
| | | | | | |
Barclays PLC | | | 05/16/19 | | | | RUB | | | | 25,941 | | | | USD | | | | 391 | | | | (1 | ) |
| | | | | | |
Barclays PLC | | | 05/16/19 | | | | KRW | | | | 559,360 | | | | USD | | | | 494 | | | | 2 | |
| | | | | | |
Barclays PLC | | | 06/10/19 | | | | USD | | | | 1,931 | | | | TWD | | | | 59,522 | | | | 3 | |
| | | | | | |
Barclays PLC | | | 06/13/19 | | | | CHF | | | | 500 | | | | USD | | | | 507 | | | | 2 | |
| | | | | | |
Barclays PLC | | | 06/17/19 | | | | USD | | | | 1,563 | | | | CAD | | | | 2,095 | | | | 8 | |
| | | | | | |
Barclays PLC | | | 06/28/19 | | | | AUD | | | | 737 | | | | USD | | | | 523 | | | | (1 | ) |
| | | | | | |
Barclays PLC | | | 07/16/19 | | | | USD | | | | 1,223 | | | | INR | | | | 86,796 | | | | 11 | |
| | | | | | |
BNP Paribas | | | 04/08/19 | | | | EUR | | | | 1,084 | | | | PLN | | | | 4,666 | | | | — | |
| | | | | | |
BNP Paribas | | | 04/09/19 | | | | USD | | | | 503 | | | | GBP | | | | 379 | | | | (9 | ) |
| | | | | | |
BNP Paribas | | | 04/10/19 | | | | USD | | | | 2,000 | | | | EUR | | | | 1,767 | | | | (14 | ) |
| | | | | | |
BNP Paribas | | | 04/10/19 | | | | TRY | | | | 3,952 | | | | EUR | | | | 638 | | | | 25 | |
| | | | | | |
Brown Brothers Harriman | | | 04/08/19 | | | | PLN | | | | 1,902 | | | | USD | | | | 498 | | | | 2 | |
| | | | | | |
Brown Brothers Harriman | | | 04/10/19 | | | | USD | | | | 576 | | | | EUR | | | | 500 | | | | (14 | ) |
| | | | | | |
Brown Brothers Harriman | | | 04/10/19 | | | | EUR | | | | 926 | | | | USD | | | | 1,063 | | | | 23 | |
| | | | | | |
Brown Brothers Harriman | | | 04/10/19 - 05/23/19 | | | | TRY | | | | 3,123 | | | | USD | | | | 546 | | | | 9 | |
| | | | | | |
Brown Brothers Harriman | | | 04/11/19 | | | | USD | | | | 266 | | | | JPY | | | | 29,281 | | | | (1 | ) |
| | | | | | |
Brown Brothers Harriman | | | 04/11/19 - 12/13/19 | | | | JPY | | | | 109,737 | | | | USD | | | | 1,006 | | | | 3 | |
| | |
SEI Institutional Managed Trust / Semi-Annual Report / March 31, 2019 | | 241 |
SCHEDULE OF INVESTMENTS (Unaudited)
March 31, 2019
Multi-Asset Capital Stability Fund(Continued)
| | | | | | | | | | | | | | | | | | | | | | | | |
| Counterparty | | Settlement Date | | | | | | Currency to Deliver
(Thousands) | | | | | | Currency to Receive
(Thousands) | | | Unrealized
Appreciation
(Depreciation)
(Thousands) |
| | | | | | |
Brown Brothers Harriman | | | 04/11/19 | | | | JPY | | | | 45,188 | | | | USD | | | | 405 | | | $ | (4 | ) |
| | | | | | |
Brown Brothers Harriman | | | 04/12/19 | | | | CHF | | | | 499 | | | | SEK | | | | 4,656 | | | | — | |
| | | | | | |
Brown Brothers Harriman | | | 04/12/19 | | | | SEK | | | | 3,468 | | | | NOK | | | | 3,203 | | | | (2 | ) |
| | | | | | |
Brown Brothers Harriman | | | 04/12/19 | | | | NOK | | | | 4,198 | | | | USD | | | | 493 | | | | 5 | |
| | | | | | |
Brown Brothers Harriman | | | 04/16/19 | | | | USD | | | | 498 | | | | ILS | | | | 1,804 | | | | — | |
| | | | | | |
Brown Brothers Harriman | | | 04/16/19 | | | | ILS | | | | 2,684 | | | | USD | | | | 743 | | | | 3 | |
| | | | | | |
Brown Brothers Harriman | | | 04/17/19 | | | | SGD | | | | 50 | | | | USD | | | | 37 | | | | — | |
| | | | | | |
Brown Brothers Harriman | | | 04/17/19 | | | | USD | | | | 390 | | | | ZAR | | | | 5,383 | | | | (17 | ) |
| | | | | | |
Brown Brothers Harriman | | | 04/17/19 | | | | ZAR | | | | 5,383 | | | | USD | | | | 391 | | | | 19 | |
| | | | | | |
Brown Brothers Harriman | | | 04/17/19 | | | | ZAR | | | | 3,631 | | | | USD | | | | 248 | | | | (3 | ) |
| | | | | | |
Brown Brothers Harriman | | | 06/28/19 | | | | AUD | | | | 391 | | | | USD | | | | 279 | | | | 1 | |
| | | | | | |
Brown Brothers Harriman | | | 04/23/19 | | | | AUD | | | | 520 | | | | USD | | | | 368 | | | | (1 | ) |
| | | | | | |
Brown Brothers Harriman | | | 04/26/19 | | | | USD | | | | 493 | | | | NZD | | | | 721 | | | | (1 | ) |
| | | | | | |
Brown Brothers Harriman | | | 04/26/19 | | | | NZD | | | | 731 | | | | USD | | | | 496 | | | | (3 | ) |
| | | | | | |
Brown Brothers Harriman | | | 05/09/19 | | | | CAD | | | | 336 | | | | USD | | | | 252 | | | | 1 | |
| | | | | | |
Brown Brothers Harriman | | | 05/09/19 - 06/17/19 | | | | CAD | | | | 1,139 | | | | USD | | | | 851 | | | | (4 | ) |
| | | | | | |
Brown Brothers Harriman | | | 05/09/19 | | | | USD | | | | 253 | | | | CAD | | | | 338 | | | | — | |
| | | | | | |
Brown Brothers Harriman | | | 06/17/19 | | | | USD | | | | 1,713 | | | | CAD | | | | 2,265 | | | | (14 | ) |
| | | | | | |
Brown Brothers Harriman | | | 06/13/19 | | | | MXN | | | | 4,810 | | | | USD | | | | 246 | | | | 1 | |
| | | | | | |
Brown Brothers Harriman | | | 05/10/21 | | | | GBP | | | | – | | | | USD | | | | – | | | | — | |
| | | | | | |
Citigroup | | | 04/02/19 | | | | USD | | | | 766 | | | | BRL | | | | 2,863 | | | | (30 | ) |
| | | | | | |
Citigroup | | | 04/02/19 | | | | BRL | | | | 1,872 | | | | USD | | | | 493 | | | | 12 | |
| | | | | | |
Citigroup | | | 05/03/19 | | | | BRL | | | | 3,903 | | | | USD | | | | 988 | | | | (13 | ) |
| | | | | | |
Citigroup | | | 04/08/19 | | | | USD | | | | 1,232 | | | | PLN | | | | 4,618 | | | | (27 | ) |
| | | | | | |
Citigroup | | | 04/09/19 | | | | USD | | | | 1,209 | | | | GBP | | | | 916 | | | | (15 | ) |
| | | | | | |
Citigroup | | | 04/10/19 | | | | EUR | | | | 496 | | | | USD | | | | 561 | | | | 4 | |
| | | | | | |
Citigroup | | | 04/10/19 | | | | EUR | | | | 961 | | | | USD | | | | 1,077 | | | | (3 | ) |
| | | | | | |
Citigroup | | | 04/12/19 | | | | USD | | | | 1,750 | | | | SEK | | | | 15,657 | | | | (60 | ) |
| | | | | | |
Citigroup | | | 04/12/19 | | | | SEK | | | | 6,843 | | | | USD | | | | 742 | | | | 4 | |
| | | | | | |
Citigroup | | | 04/16/19 | | | | ILS | | | | 1,821 | | | | USD | | | | 503 | | | | — | |
| | | | | | |
Citigroup | | | 06/12/19 | | | | USD | | | | 1,738 | | | | CNH | | | | 11,671 | | | | (1 | ) |
| | | | | | |
Citigroup | | | 06/13/19 | | | | USD | | | | 501 | | | | MXN | | | | 9,544 | | | | (14 | ) |
| | | | | | |
Citigroup | | | 06/17/19 | | | | JPY | | | | 3,692,337 | | | | USD | | | | 33,468 | | | | (103 | ) |
| | | | | | |
Citigroup | | | 12/13/19 | | | | USD | | | | 1,290 | | | | JPY | | | | 140,275 | | | | 4 | |
| | | | | | |
Credit Suisse First Boston | | | 06/28/19 | | | | AUD | | | | 699 | | | | USD | | | | 516 | | | | 19 | |
| | | | | | |
Deutsche Bank | | | 04/10/19 | | | | EUR | | | | 446 | | | | USD | | | | 506 | | | | 4 | |
| | | | | | |
Goldman Sachs | | | 04/02/19 | | | | BRL | | | | 2,858 | | | | USD | | | | 737 | | | | 3 | |
| | | | | | |
Goldman Sachs | | | 04/10/19 | | | | EUR | | | | 875 | | | | TRY | | | | 5,639 | | | | 4 | |
| | | | | | |
Goldman Sachs | | | 04/12/19 | | | | USD | | | | 763 | | | | NOK | | | | 6,493 | | | | (9 | ) |
| | | | | | |
Goldman Sachs | | | 05/03/19 | | | | USD | | | | 1,065 | | | | BRL | | | | 4,126 | | | | (7 | ) |
| | | | | | |
Goldman Sachs | | | 05/16/19 | | | | KRW | | | | 567,405 | | | | USD | | | | 500 | | | | 1 | |
| | | | | | |
Goldman Sachs | | | 05/16/19 | | | | JPY | | | | 7,782,876 | | | | USD | | | | 71,601 | | | | 1,006 | |
| | | | | | |
Goldman Sachs | | | 07/16/19 | | | | USD | | | | 739 | | | | INR | | | | 52,308 | | | | 5 | |
| | | | | | |
Goldman Sachs | | | 07/16/19 | | | | USD | | | | 522 | | | | INR | | | | 36,514 | | | | (3 | ) |
| | | | | | |
Goldman Sachs | | | 08/21/19 | | | | USD | | | | 1,554 | | �� | | MYR | | | | 6,328 | | | | (3 | ) |
| | | | | | |
JPMorgan Chase Bank | | | 08/01/07 | | | | USD | | | | 389 | | | | ZAR | | | | 1,232,535 | | | | — | |
| | | | | | |
JPMorgan Chase Bank | | | 04/08/19 - 04/10/19 | | | | USD | | | | 1,300 | | | | EUR | | | | 1,142 | | | | (17 | ) |
| | | | | | |
JPMorgan Chase Bank | | | 04/08/19 | | | | PLN | | | | 1,894 | | | | EUR | | | | 438 | | | | (2 | ) |
| | | | | | |
JPMorgan Chase Bank | | | 04/11/19 | | | | JPY | | | | 272,008 | | | | USD | | | | 2,465 | | | | 5 | |
| | |
242 | | SEI Institutional Managed Trust / Semi-Annual Report / March 31, 2019 |
| | | | | | | | | | | | | | | | | | | | | | | | |
| Counterparty | | Settlement Date | | | | | | Currency to Deliver
(Thousands) | | | | | | Currency to Receive
(Thousands) | | | Unrealized
Appreciation
(Depreciation)
(Thousands) |
| | | | | | |
JPMorgan Chase Bank | | | 05/16/19 | | | | USD | | | | 1,772 | | | | KRW | | | | 1,983,588 | | | $ | (25 | ) |
| | | | | | |
JPMorgan Chase Bank | | | 05/16/19 | | | | KRW | | | | 569,357 | | | | USD | | | | 506 | | | | 4 | |
| | | | | | |
JPMorgan Chase Bank | | | 05/23/19 | | | | USD | | | | 389 | | | | COP | | | | 1,232,535 | | | | (3 | ) |
| | | | | | |
JPMorgan Chase Bank | | | 06/10/19 | | | | TWD | | | | 59,522 | | | | USD | | | | 1,932 | | | | (3 | ) |
| | | | | | |
JPMorgan Chase Bank | | | 06/13/19 | | | | CHF | | | | 1,361 | | | | USD | | | | 1,360 | | | | (17 | ) |
| | | | | | |
JPMorgan Chase Bank | | | 06/17/19 | | | | USD | | | | 575 | | | | CAD | | | | 766 | | | | (1 | ) |
| | | | | | |
Morgan Stanley | | | 04/02/19 | | | | USD | | | | 501 | | | | BRL | | | | 1,914 | | | | (9 | ) |
| | | | | | |
Morgan Stanley | | | 04/09/19 | | | | GBP | | | | 916 | | | | USD | | | | 1,199 | | | | 5 | |
| | | | | | |
Morgan Stanley | | | 05/09/19 | | | | CAD | | | | 674 | | | | USD | | | | 503 | | | | (2 | ) |
| | | | | | |
Morgan Stanley | | | 05/16/19 | | | | USD | | | | 503 | | | | KRW | | | | 559,664 | | | | (10 | ) |
| | | | | | |
Morgan Stanley | | | 05/16/19 | | | | KRW | | | | 557,568 | | | | USD | | | | 495 | | | | 4 | |
| | | | | | |
Morgan Stanley | | | 05/23/19 | | | | USD | | | | 1,988 | | | | CLP | | | | 1,329,202 | | | | (33 | ) |
| | | | | | |
Morgan Stanley | | | 06/10/19 | | | | TWD | | | | 34,790 | | | | USD | | | | 1,129 | | | | (2 | ) |
| | | | | | |
Morgan Stanley | | | 06/17/19 | | | | NZD | | | | 3,281 | | | | USD | | | | 2,246 | | | | 5 | |
| | | | | | |
Morgan Stanley | | | 06/28/19 | | | | AUD | | | | 347 | | | | USD | | | | 257 | | | | 10 | |
| | | | | | |
Morgan Stanley | | | 06/28/19 | | | | USD | | | | 1,060 | | | | AUD | | | | 1,435 | | | | (39 | ) |
| | | | | | |
RBS | | | 04/23/19 | | | | USD | | | | 822 | | | | AUD | | | | 1,155 | | | | (1 | ) |
| | | | | | |
RBS | | | 04/23/19 | | | | AUD | | | | 1,391 | | | | USD | | | | 987 | | | | (1 | ) |
| | | | | | |
RBS | | | 05/09/19 | | | | CAD | | | | 990 | | | | USD | | | | 742 | | | | — | |
| | | | | | |
RBS | | | 05/23/19 | | | | USD | | | | 507 | | | | COP | | | | 1,606,153 | | | | (4 | ) |
| | | | | | |
RBS | | | 05/23/19 | | | | CLP | | | | 513,962 | | | | USD | | | | 752 | | | | (4 | ) |
| | | | | | |
RBS | | | 05/23/19 | | | | COP | | | | 1,232,535 | | | | USD | | | | 393 | | | | 7 | |
| | | | | | |
RBS | | | 12/13/19 | | | | JPY | | | | 54,912 | | | | USD | | | | 507 | | | | 1 | |
| | | | | | |
Standard Bank | | | 04/09/19 | | | | USD | | | | 755 | | | | GBP | | | | 571 | | | | (10 | ) |
| | | | | | |
Standard Bank | | | 04/10/19 | | | | EUR | | | | 1,537 | | | | USD | | | | 1,747 | | | | 19 | |
| | | | | | |
Standard Bank | | | 04/10/19 | | | | USD | | | | 1,548 | | | | EUR | | | | 1,352 | | | | (28 | ) |
| | | | | | |
Standard Bank | | | 04/11/19 | | | | USD | | | | 761 | | | | JPY | | | | 84,250 | | | | 1 | |
| | | | | | |
Standard Bank | | | 05/16/19 | | | | KRW | | | | 557,518 | | | | USD | | | | 495 | | | | 4 | |
| | | | | | |
Standard Bank | | | 06/13/19 | | | | USD | | | | 747 | | | | MXN | | | | 14,333 | | | | (17 | ) |
| | | | | | |
Standard Bank | | | 07/16/19 | | | | INR | | | | 52,061 | | | | USD | | | | 743 | | | | 3 | |
| | | | | | |
UBS | | | 04/09/19 | | | | GBP | | | | 379 | | | | USD | | | | 500 | | | | 6 | |
| | | | | | |
| | | | | | | | | | | | | | | | | | | | | | | | |
| | | | | | | | | | | | | | | | | | | | | | $ | 574 | |
| | | | | | | | | | | | | | | | | | | | | | | | |
A list of the open centrally cleared swap agreements held by the Fund at March 31, 2019 is as follows:
| | | | | | | | | | | | | | | | | | | | | | | | | | | | | | | | |
Credit Default Swaps | |
| Reference Entity/Obligation | | Buy/Sell
Protection | | | (Pays)/
Receives Rate | | | Payment
Frequency | | | Termination Date | | | Notional Amount
(Thousands) | | | Value
(Thousands) | | Upfront Payments/
Receipts
(Thousands) | | Net Unrealized
Appreciation
(Depreciation)
(Thousands) |
CDX.NA.IG.S32V1-5Y | | | Sell | | | | 1.00% | | | | Quarterly | | | | 06/20/2024 | | | | (5,534 | ) | | $ | 100 | | | $ | 85 | | | $ | 15 | |
CDX-NAHYS30V1-5Y | | | Sell | | | | 5.00% | | | | Quarterly | | | | 06/20/2023 | | | | (2,444 | ) | | | 168 | | | | 170 | | | | (2 | ) |
CDX-NAHYS31V3-5Y | | | Sell | | | | 5.00% | | | | Quarterly | | | | 12/20/2023 | | | | (9,054 | ) | | | 594 | | | | 609 | | | | (15 | ) |
CDX-NAIGS30V1-5Y | | | Sell | | | | 1.00% | | | | Quarterly | | | | 06/20/2023 | | | | (2,000 | ) | | | 40 | | | | 35 | | | | 5 | |
CDX-NAIGS31V1-5Y | | | Sell | | | | 1.00% | | | | Quarterly | | | | 12/20/2023 | | | | (7,430 | ) | | | 144 | | | | 134 | | | | 10 | |
ITRAXX.EUR.XOVER | | | Sell | | | | 5.00% | | | | Quarterly | | | | 06/20/2023 | | | | (471 | ) | | | 47 | | | | 49 | | | | (2 | ) |
ITRAXX.EUR.XOVER | | | Sell | | | | 5.00% | | | | Quarterly | | | | 12/20/2023 | | | | (400 | ) | | | 43 | | | | 44 | | | | (1 | ) |
ITRAXX.EUR.XOVER | | | Sell | | | | 5.00% | | | | Quarterly | | | | 12/20/2023 | | | | (1,090 | ) | | | 118 | | | | 121 | | | | (3 | ) |
| | | | | | | | | | | | | | | | | | | | | | | | | | | | | | | | |
| | | | | | | | | | | | | | | | | | | | | | $ | 1,254 | | | $ | 1,247 | | | $ | 7 | |
| | | | | | | | | | | | | | | | | |
| | |
SEI Institutional Managed Trust / Semi-Annual Report / March 31, 2019 | | 243 |
SCHEDULE OF INVESTMENTS (Unaudited)
March 31, 2019
Multi-Asset Capital Stability Fund(Concluded)
| | | | | | | | | | | | | | | | | | | | | | | | | | | | | | | | |
Interest Rate Swaps | |
| Fund Pays | | Fund Receives | | | Payment Frequency | | | Termination Date | | | Currency | | | Notional Amount (Thousands) | | | Value (Thousands) | | Upfront Payments/ Receipts (Thousands) | | Net Unrealized
Appreciation
(Thousands) |
6-MONTH AUD - BBSW | | | 2.845% | | | | Semi-Annually | | | | 07/11/2028 | | | | AUD | | | | 580 | | | $ | 30 | | | $ | – | | | $ | 30 | |
3-MONTH NZD - BKBM | | | 2.455% | | | | Semi-Annually | | | | 03/08/2029 | | | | NZD | | | | 750 | | | | 14 | | | | – | | | | 14 | |
6-MONTH AUD - BBSW | | | 2.306% | | | | Semi-Annually | | | | 03/07/2029 | | | | AUD | | | | 770 | | | | 14 | | | | – | | | | 14 | |
3-MONTH NZD - BKBM | | | 2.465% | | | | Semi-Annually | | | | 03/04/2029 | | | | NZD | | | | 580 | | | | 11 | | | | – | | | | 11 | |
6-MONTH AUD - BBSW | | | 2.38% | | | | Semi-Annually | | | | 03/01/2029 | | | | AUD | | | | 690 | | | | 16 | | | | – | | | | 16 | |
3-MONTH NZD - BKBM | | | 2.455% | | | | Semi-Annually | | | | 02/26/2029 | | | | NZD | | | | 1,410 | | | | 26 | | | | – | | | | 26 | |
6-MONTH AUD - BBSW | | | 2.3125% | | | | Semi-Annually | | | | 02/25/2029 | | | | AUD | | | | 1,440 | | | | 26 | | | | – | | | | 26 | |
3-MONTH NZD - BKBM | | | 2.4925% | | | | Semi-Annually | | | | 02/19/2029 | | | | NZD | | | | 1,420 | | | | 29 | | | | – | | | | 29 | |
6-MONTH AUD - BBSW | | | 2.372% | | | | Semi-Annually | | | | 02/18/2029 | | | | AUD | | | | 1,670 | | | | 37 | | | | – | | | | 37 | |
3-MONTH NZD - BKBM | | | 2.4025% | | | | Semi-Annually | | | | 02/11/2029 | | | | NZD | | | | 2,410 | | | | 37 | | | | – | | | | 37 | |
6-MONTH AUD - BBSW | | | 2.34% | | | | Semi-Annually | | | | 02/08/2029 | | | | AUD | | | | 2,690 | | | | 54 | | | | – | | | | 54 | |
6-MONTH AUD - BBSW | | | 2.22% | | | | Semi-Annually | | | | 03/19/2029 | | | | AUD | | | | 1,230 | | | | 15 | | | | – | | | | 15 | |
3-MONTH NZD - BKBM | | | 2.505% | | | | Semi-Annually | | | | 02/05/2029 | | | | NZD | | | | 1,670 | | | | 36 | | | | – | | | | 36 | |
6-MONTH AUD - BBSW | | | 2.5905% | | | | Semi-Annually | | | | 01/21/2029 | | | | AUD | | | | 1,510 | | | | 55 | | | | – | | | | 55 | |
3-MONTH NZD - BKBM | | | 2.786% | | | | Semi-Annually | | | | 12/11/2028 | | | | NZD | | | | 2,360 | | | | 92 | | | | – | | | | 92 | |
6-MONTH AUD - BBSW | | | 2.666% | | | | Semi-Annually | | | | 12/10/2028 | | | | AUD | | | | 2,380 | | | | 99 | | | | – | | | | 99 | |
3-MONTH NZD - BKBM | | | 2.86% | | | | Semi-Annually | | | | 10/05/2028 | | | | NZD | | | | 1,670 | | | | 73 | | | | – | | | | 73 | |
6-MONTH AUD - BBSW | | | 2.86% | | | | Semi-Annually | | | | 10/04/2028 | | | | AUD | | | | 1,480 | | | | 80 | | | | – | | | | 80 | |
3-MONTH NZD - BKBM | | | 2.8575% | | | | Semi-Annually | | | | 08/28/2028 | | | | NZD | | | | 2,300 | | | | 100 | | | | – | | | | 100 | |
6-MONTH AUD - BBSW | | | 2.74% | | | | Semi-Annually | | | | 08/27/2028 | | | | AUD | | | | 2,000 | | | | 92 | | | | – | | | | 92 | |
3-MONTH NZD - BKBM | | | 3.01% | | | | Semi-Annually | | | | 07/18/2028 | | | | NZD | | | | 1,810 | | | | 95 | | | | – | | | | 95 | |
6-MONTH AUD - BBSW | | | 2.8325% | | | | Semi-Annually | | | | 07/17/2028 | | | | AUD | | | | 1,670 | | | | 86 | | | | – | | | | 86 | |
3-MONTH NZD - BKBM | | | 3.048% | | | | Semi-Annually | | | | 07/12/2028 | | | | NZD | | | | 550 | | | | 30 | | | | – | | | | 30 | |
6-MONTH AUD - BBSW | | | 2.455% | | | | Semi-Annually | | | | 02/04/2029 | | | | AUD | | | | 1,860 | | | | 51 | | | | – | | | | 51 | |
3-MONTH NZD - BKBM | | | 2.363% | | | | Semi-Annually | | | | 03/20/2029 | | | | NZD | | | | 970 | | | | 12 | | | | – | | | | 12 | |
| | | | | | | | | | | | | | | | | | | | | | | | | | | | | | | | |
| | | | | | | | | | | | | | | | | | | | | | $ | 1,210 | | | $ | – | | | $ | 1,210 | |
| | | | | | | | | | | | | | | | | |
| | Percentages are based on Net Assets of $716,997 ($ Thousands). |
| * | Non-income producing security. |
| (A) | Zero coupon security. The rate shown on the Schedule of Investments is the security’s effective yield at the time of purchase. |
| (B) | Rate is negative due to the decrease in value of the foreign currency against the U.S. Dollar. |
| (C) | Refer to table below for details on Options Contracts. |
AUD – Australian Dollar
BBSW — Bank Bill Swap Rate
BKBM — Bank Bill Benchmark Rate
BRL — Brazilian Real
CAD — Canadian Dollar
CHF — Swiss Franc
CLP — Chilean Peso
CNH — Chinese Yuan Offshore
COP — Colombian Peso
DAX — German Stock Index
EAFE — Europe, Australasia and Far East
ETF — Exchange-Traded Fund
EUR — Euro
FHLMC — Federal Home Loan Mortgage Corporation
FNMA — Federal National Mortgage Association
FTSE— Financial Times and Stock Exchange
GBP — British Pound Sterling
INR — Indian Rupee
ILS — Israeli New Sheckels
JPY — Japanese Yen
KRW — Korean Won
LLC — Limited Liability Company
MSCI — Morgan Stanley Capital International
MXN — Mexican Peso
MYR — Malaysian Ringgit
NASDAQ — National Association of Securities Dealers and Automated Quotations
NOK — Norwegian Krone
NZD — New Zealand Dollar
PLN — Polish Zloty
RUB — Russian Ruble
S&P— Standard & Poor’s
SGD — Singapore Dollar
SEK — Swedish Krona
SPI — Share Price Index
TBA — To Be Announced
TRY — Turkish Lira
TSX — Toronto Stock Exchange
TWD — Taiwan Dollar
USD — United States Dollar
ZAR — South African Rand
| | |
244 | | SEI Institutional Managed Trust / Semi-Annual Report / March 31, 2019 |
The following is a list of the level of inputs used as of March 31, 2019, in valuing the Fund’s investments and other financial instruments carried at value ($ Thousands):
| | | | | | | | | | | | | | | | |
Investments in
Securities | | Level 1 | | | Level 2 | | | Level 3 | | | Total | |
U.S. Treasury Obligations | | $ | – | | | $ | 291,893 | | | $ | – | | | $ | 291,893 | |
Commercial Paper | | | – | | | | 208,859 | | | | – | | | | 208,859 | |
Sovereign Debt | | | – | | | | 103,607 | | | | – | | | | 103,607 | |
Exchange Traded Funds | | | 44,842 | | | | – | | | | – | | | | 44,842 | |
U.S. Government Agency Obligation | | | – | | | | 43,650 | | | | – | | | | 43,650 | |
Mortgage-Backed Security | | | – | | | | 211 | | | | – | | | | 211 | |
| | | | | | | | | | | | | | | | |
Total Investments in Securities | | $ | 44,842 | | | $ | 648,220 | | | $ | – | | | $ | 693,062 | |
| | | | | | | | | | | | | | | | |
| | | | | | | | | | | | | | | | |
Other Financial
Instruments | | Level 1 | | | Level 2 | | | Level 3 | | | Total | |
Written Options | | $ | (329) | | | $ | – | | | $ | – | | | $ | (329) | |
Futures
Contracts * | | | | | | | | | | | | | | | | |
Unrealized Appreciation | | | 3,611 | | | | – | | | | – | | | | 3,611 | |
Unrealized Depreciation | | | (715) | | | | – | | | | – | | | | (715) | |
Forwards Contracts * | | | | | | | | | | | | | | | | |
Unrealized Appreciation | | | – | | | | 1,263 | | | | – | | | | 1,263 | |
Unrealized Depreciation | | | – | | | | (689) | | | | – | | | | (689) | |
Centrally Cleared Swaps | | | | | | | | | | | | | | | | |
Credit Default Swaps * | | | | | | | | | | | | | | | | |
Unrealized Appreciation | | | – | | | | 30 | | | | – | | | | 30 | |
Unrealized Depreciation | | | – | | | | (23) | | | | – | | | | (23) | |
Interest Rate Swaps * | | | | | | | | | | | | | | | | |
Unrealized Appreciation | | | – | | | | 1,210 | | | | – | | | | 1,210 | |
| | | | | | | | | | | | | | | | |
Total Other Financial Instruments | | $ | 2,567 | | | $ | 1,791 | | | $ | – | | | $ | 4,358 | |
| | | | | | | | | | | | | | | | |
| | | | | | | | | | | | | | | | |
* Futures contracts, forward contracts and swap contracts are valued at the unrealized appreciation (depreciation) on the instrument.
For the period ended March 31, 2019, there were no transfers between Level 1 and Level 2 assets and liabilities.
For the period ended March 31, 2019, there were no transfers between Level 2 and Level 3 assets and liabilities.
For more information on valuation inputs, see Note 2 — Significant Accounting Policies in Notes to Financial Statements.
Amounts designated as “—” are either $0 or have been rounded to $0.
The accompanying notes are an integral part of the financial statements.
| | |
SEI Institutional Managed Trust / Semi-Annual Report / March 31, 2019 | | 245 |
SCHEDULE OF INVESTMENTS (Unaudited)
March 31, 2019
Long/Short Alternative Fund
| | | | | | | | |
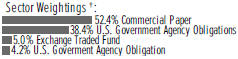
| |
|
†Percentages are based on total investments. | |
| | | |
| Description | | Face Amount
(Thousands) | | | Market Value
($ Thousands) | |
|
COMMERCIAL PAPER (A) — 48.8% | |
Banks — 19.4% | | | | | | | | |
Australia & New Zealand Bank | | | | | | | | |
2.454%, 04/25/2019 | | | $ 1,000 | | | | $ 998 | |
Bank of Nova Scotia | | | | | | | | |
2.467%, 04/04/2019 | | | 1,000 | | | | 1,000 | |
Commonwealth Bank Austria | | | | | | | | |
2.455%, 04/24/2019 | | | 1,000 | | | | 998 | |
Nordea Bank | | | | | | | | |
2.525%, 04/01/2019 | | | 1,000 | | | | 1,000 | |
Royal Bank of Canada | | | | | | | | |
2.520%, 05/30/2019 | | | 1,175 | | | | 1,170 | |
Svenska Handelsbanken | | | | | | | | |
2.545%, 05/03/2019 | | | 1,000 | | | | 998 | |
| | | | | | | | |
| | | | | | | 6,164 | |
| | | | | | | | |
Industrial & Other Commercial Paper — 29.4% | |
Coca-Cola | | | | | | | | |
2.381%, 04/01/2019 | | | 1,000 | | | | 1,000 | |
Colgate-Palmolive | | | | | | | | |
2.413%, 04/09/2019 | | | 1,100 | | | | 1,099 | |
Exxon Mobile | | | | | | | | |
2.413%, 04/05/2019 | | | 1,000 | | | | 999 | |
Nestle Capital | | | | | | | | |
2.411%, 04/01/2019 | | | 1,100 | | | | 1,100 | |
Novartis Finance | | | | | | | | |
2.456%, 04/08/2019 | | | 1,000 | | | | 999 | |
Pfizer | | | | | | | | |
2.452%, 04/05/2019 | | | 1,065 | | | | 1,064 | |
Unilever Capital | | | | | | | | |
2.512%, 04/30/2019 | | | 1,000 | | | | 998 | |
| | | | | | | | |
| | | |
| Description | | Face Amount
(Thousands) | | | Market Value
($ Thousands) | |
| |
COMMERCIAL PAPER (continued) | | | | | |
United Parcel Services | | | | | | | | |
2.406%, 04/03/2019 | | | $ 1,000 | | | | $ 1,000 | |
Wal-Mart | | | | | | | | |
2.454%, 04/15/2019 | | | 1,000 | | | | 999 | |
| | | | | | | | |
| | | | | | | 9,258 | |
| | | | | | | | |
| | |
Total Commercial Paper | | | | | | | | |
(Cost $15,425) ($ Thousands) | | | | | | | 15,422 | |
| | | | | | | | |
|
U.S. GOVERNMENT AGENCY OBLIGATIONS — 39.7% | |
FHLB DN (A) | | | | | | | | |
2.451%, 04/17/2019 | | | 1,252 | | | | 1,250 | |
2.413%, 04/12/2019 | | | 1,748 | | | | 1,747 | |
2.402%, 04/05/2019 | | | 1,100 | | | | 1,100 | |
2.402%, 04/11/2019 | | | 2,193 | | | | 2,191 | |
2.396%, 04/03/2019 | | | 1,983 | | | | 1,983 | |
2.393%, 04/04/2019 | | | 713 | | | | 713 | |
2.392%, 04/08/2019 | | | 1,063 | | | | 1,062 | |
2.382%, 04/02/2019 | | | 2,500 | | | | 2,500 | |
| | | | | | | | |
| | |
Total U.S. Government Agency Obligations | | | | | | | | |
(Cost $12,546) ($ Thousands) | | | | | | | 12,546 | |
| | | | | | | | |
| | |
| | | Shares | | | | |
| |
EXCHANGE TRADED FUND — 4.6% | | | | | |
iShares iBoxx High Yield Corporate Bond ETF | | | 16,998 | | | | 1,470 | |
| | | | | | | | |
| |
Total Exchange Traded Fund
(Cost $1,450) ($ Thousands) | | | | 1,470 | |
| |
Total Investments in Securities – 93.1%
(Cost $29,421) ($ Thousands) | | | $ | 29,438 | |
| | | | | | | | |
A list of the open futures contracts held by the Fund at March 31, 2019, is as follows:
| | | | | | | | | | | | | | | | | | | | |
Type of Contract | | Number of
Contracts
Long | | | Expiration
Date | | | Notional Amount
(Thousands) | | | Value
(Thousands) | | | Unrealized
Appreciation)
(Thousands) | |
| | | | | |
MSCI EAFE Index E-MINI | | | 18 | | | | Jun-2019 | | | $ | 1,668 | | | $ | 1,680 | | | $ | 12 | |
| | | | | |
MSCI Emerging Markets | | | 2 | | | | Jun-2019 | | | | 106 | | | | 106 | | | | – | |
| | | | | |
NASDAQ 100 Index E-MINI | | | 50 | | | | Jun-2019 | | | | 7,173 | | | | 7,400 | | | | 227 | |
| | | | | |
S&P Mid Cap 400 Index E-MINI | | | 15 | | | | Jun-2019 | | | | 2,843 | | | | 2,851 | | | | 8 | |
| | | | | |
U.S. Dollar Index | | | 194 | | | | Jun-2019 | | | | 18,695 | | | | 18,788 | | | | 93 | |
| | | | | | | | | | | | |
| | | | | | | | | | $ | 30,485 | | | $ | 30,825 | | | $ | 340 | |
| | | | | | | | | | | | |
| | |
246 | | SEI Institutional Managed Trust / Semi-Annual Report / March 31, 2019 |
| | Percentages are based on Net Assets of $31,619 ($ Thousands). |
| (A) | Zero coupon security. The rate shown on the Schedule of Investments is the security’s effective yield at the time of purchase. |
DN — Discount Note
EAFE — Europe, Australasia and Far East
ETF — Exchange-Traded Fund
FHLB — Federal Home Loan Bank
MSCI — Morgan Stanley Capital International
NASDAQ — National Association of Securities Dealers and Automated Quotations
S&P — Standard & Poor’s
The following is a list of the level of inputs used as of March 31, 2019, in valuing the Fund’s investments and other financial instruments carried at value ($ Thousands):
| | | | | | | | | | | | | | | | |
| Investments in Securities | | Level 1 | | | Level 2 | | | Level 3 | | | Total | |
Commercial Paper | | $ | – | | | $ | 15,422 | | | $ | – | | | $ | 15,422 | |
U.S. Government Agency Obligations | | | – | | | | 12,546 | | | | – | | | | 12,546 | |
Exchange Traded Fund | | | 1,470 | | | | – | | | | – | | | | 1,470 | |
| | | | | | | | | | | | | | | | |
Total Investments in Securities | | $ | 1,470 | | | $ | 27,968 | | | $ | – | | | $ | 29,438 | |
| | | | | | | | | | | | | | | | |
| | | | | | | | | | | | | | | | |
Other Financial
Instruments | | Level 1 | | | Level 2 | | | Level 3 | | | Total | |
Futures Contracts* | | | | | | | | | | | | | | | | |
| | | | | | | | | | | | | | | | |
Unrealized Appreciation | | $ | 340 | | | $ | – | | | $ | – | | | $ | 340 | |
| | | | | | | | | | | | | | | | |
* Futures contracts are valued at the unrealized appreciation on the instrument.
For the period ended March 31, 2019, there were no transfers between Level 1 and Level 2 assets and liabilities.
For the period ended March 31, 2019, there were no transfers between Level 2 and Level 3 assets and liabilities.
For more information on valuation inputs, see Note 2 – Significant Accounting Policies in Notes to Financial Statements.
Amounts designated as “–” are either $0 or have been rounded to $0.
The accompanying notes are an integral part of the financial statements.
| | |
SEI Institutional Managed Trust / Semi-Annual Report / March 31, 2019 | | 247 |
STATEMENTS OF ASSETS AND LIABILITIES ($ Thousands)
March 31, 2019 (Unaudited)
| | | | | | | | |
| | | Large Cap Fund | | | Large Cap Value Fund | |
Assets: | | | | | | | | |
Investments, at value† | | $ | 2,300,437* | | | $ | 1,313,843* | |
Affiliated investments, at value†† | | | 60,952 | | | | 36,099 | |
Cash and cash equivalents | | | – | | | | – | |
Cash pledged as collateral on futures contracts | | | 1,253 | | | | 788 | |
Foreign currency, at value††† | | | – | | | | – | |
Receivable for fund shares sold | | | 1,428 | | | | 914 | |
Receivable for investment securities sold | | | 7,410 | | | | – | |
Dividends and interest receivable | | | 2,879 | | | | 2,343 | |
Receivable for variation margin | | | 167 | | | | 87 | |
Foreign tax reclaim receivable | | | 35 | | | | 153 | |
Prepaid expenses | | | 63 | | | | 39 | |
Total Assets | | | 2,374,624 | | | | 1,354,266 | |
Liabilities: | | | | | | | | |
Payable upon return on securities loaned | | | 14,869 | | | | 4,539 | |
Payable for investment securities purchased | | | 6,905 | | | | – | |
Payable for fund shares redeemed | | | 1,795 | | | | 595 | |
Administration fees payable | | | 487 | | | | 320 | |
Shareholder servicing fees payable Class F | | | 466 | | | | 250 | |
Shareholder servicing fees payable Class I | | | – | | | | 1 | |
Due to custodian | | | 13 | | | | 10 | |
Investment advisory fees payable | | | 721 | | | | 372 | |
Trustees fees payable | | | 13 | | | | 7 | |
Chief Compliance Officer fees payable | | | 2 | | | | 1 | |
Administration servicing fees payable Class I | | | – | | | | – | |
Accrued expense payable | | | 52 | | | | 27 | |
Total Liabilities | | | 25,323 | | | | 6,122 | |
Net Assets | | $ | 2,349,301 | | | $ | 1,348,144 | |
† Cost of investments and repurchase agreements | | $ | 1,866,690 | | | $ | 1,084,172 | |
†† Cost of affiliated investments | | | 60,941 | | | | 36,097 | |
††† Cost of foreign currency | | | – | | | | – | |
* Includes market value of securities on loan | | | 14,761 | | | | 4,377 | |
Amounts designated as “–” are either $0 or have been rounded to $0.
The accompanying notes are an integral part of the financial statements.
| | |
248 | | SEI Institutional Managed Trust / Semi-Annual Report / March 31, 2019 |
| | | | | | | | | | | | | | | | | | | | | | | | | | | | | | |
Large Cap Growth
Fund | | | Large Cap Index
Fund | | | Tax-Managed Large
Cap Fund | | | S&P 500 Index Fund | | | Small Cap Fund | | | Small Cap Value Fund | | | Small Cap Growth
Fund | | | Tax-Managed Small/
Mid Cap Fund | |
| | | | | | | | | | | | | | | | | | | | | | | | | | | | | | |
| | $ 1,455,046* | | | | $ 302,941 | | | | $ 3,869,756* | | | | $ 816,494 | | | | $ 604,593* | | | | $ 303,871* | | | | $ 329,243* | | | | $ 841,044* | |
| | 32,331 | | | | 7,242 | | | | 73,215 | | | | 10,859 | | | | 38,080 | | | | 34,379 | | | | 28,497 | | | | 108,987 | |
| | – | | | | – | | | | – | | | | – | | | | – | | | | 4 | | | | – | | | | 2,196 | |
| | 474 | | | | 265 | | | | 1,184 | | | | – | | | | – | | | | 554 | | | | – | | | | – | |
| | – | | | | – | | | | 127 | | | | – | | | | – | | | | – | | | | – | | | | – | |
| | 998 | | | | 401 | | | | 1,089 | | | | 613 | | | | 394 | | | | 229 | | | | 267 | | | | 272 | |
| | 20,406 | | | | – | | | | – | | | | – | | | | 3,309 | | | | 233 | | | | 4,093 | | | | 6,705 | |
| | 655 | | | | 285 | | | | 5,546 | | | | 737 | | | | 613 | | | | 655 | | | | 210 | | | | 1,366 | |
| | 66 | | | | 35 | | | | 160 | | | | 74 | | | | – | | | | 29 | | | | – | | | | – | |
| | 3 | | | | – | | | | 266 | | | | 15 | | | | – | | | | – | | | | – | | | | – | |
| | 37 | | | | 7 | | | | 92 | | | | 22 | | | | 17 | | | | 9 | | | | 10 | | | | 36 | |
| | 1,510,016 | | | | 311,176 | | | | 3,951,435 | | | | 828,814 | | | | 647,006 | | | | 339,963 | | | | 362,320 | | | | 960,606 | |
| | | | | | | |
| | 11,089 | | | | 1 | | | | 36,667 | | | | 2 | | | | 23,190 | | | | 11,386 | | | | 20,174 | | | | 88,106 | |
| | 15,242 | | | | 1,450 | | | | – | | | | – | | | | 2,980 | | | | – | | | | 4,390 | | | | 5,760 | |
| | 847 | | | | 109 | | | | 2,182 | | | | 512 | | | | 455 | | | | 263 | | | | 332 | | | | 598 | |
| | 351 | | | | 21 | | | | 689 | | | | 96 | | | | 148 | | | | 79 | | | | 81 | | | | 206 | |
| | 277 | | | | 25 | | | | 728 | | | | 34 | | | | 123 | | | | 60 | | | | 63 | | | | 143 | |
| | 1 | | | | – | | | | – | | | | 1 | | | | – | | | | 1 | | | | 1 | | | | – | |
| | – | | | | – | | | | 9 | | | | 57 | | | | – | | | | – | | | | 6 | | | | – | |
| | 408 | | | | 5 | | | | 1,320 | | | | 14 | | | | 303 | | | | 159 | | | | 155 | | | | 420 | |
| | 8 | | | | – | | | | 20 | | | | 4 | | | | 3 | | | | 2 | | | | 2 | | | | 5 | |
| | 1 | | | | – | | | | 4 | | | | 1 | | | | 1 | | | | – | | | | – | | | | 1 | |
| | – | | | | – | | | | – | | | | 1 | | | | – | | | | – | | | | – | | | | – | |
| | 29 | | | | 48 | | | | 64 | | | | 75 | | | | 14 | | | | 8 | | | | 7 | | | | 18 | |
| | 28,253 | | | | 1,659 | | | | 41,683 | | | | 797 | | | | 27,217 | | | | 11,958 | | | | 25,211 | | | | 95,257 | |
| | $ 1,481,763 | | | | $ 309,517 | | | | $ 3,909,752 | | | | $ 828,017 | | | | $ 619,789 | | | | $ 328,005 | | | | $ 337,109 | | | | $ 865,349 | |
| | $ 993,297 | | | | $ 293,792 | | | | $ 2,141,705 | | | | $ 331,874 | | | | $ 558,719 | | | | $ 282,185 | | | | $ 297,294 | | | | $ 616,414 | |
| | 32,330 | | | | 7,264 | | | | 73,213 | | | | 10,859 | | | | 38,082 | | | | 34,377 | | | | 28,498 | | | | 108,993 | |
| | – | | | | – | | | | 129 | | | | – | | | | – | | | | – | | | | – | | | | – | |
| | 11,014 | | | | – | | | | 36,153 | | | | – | | | | 22,756 | | | | 11,176 | | | | 19,784 | | | | 86,388 | |
| | |
SEI Institutional Managed Trust / Semi-Annual Report / March 31, 2019 | | 249 |
STATEMENTS OF ASSETS AND LIABILITIES ($ Thousands)
March 31, 2019 (Unaudited)
| | | | | | | | |
| | | Large Cap Fund | | | Large Cap Value Fund | |
Net Assets: | | | | | | | | |
Paid-in capital – (unlimited authorization – no par value) | | $ | 1,833,736 | | | $ | 1,121,685 | |
Total distributable earnings | | | 515,565 | | | | 226,459 | |
Net Assets | | $ | 2,349,301 | | | $ | 1,348,144 | |
Net Asset Value, Offering and Redemption Price Per Share – Class F | | $ | 13.44 | | | $ | 22.89 | |
| | | ($2,217,204,717 | ÷ | | | ($1,192,682,596 | ÷ |
| | | | 164,972,521 shares) | | | | 52,094,024 shares) | |
Net Asset Value, Offering and Redemption Price Per Share – Class I | | | N/A | | | $ | 22.91 | |
| | | | | | | ($4,014,042 | ÷ |
| | | | | | | | 175,194 shares) | |
Net Asset Value, Offering and Redemption Price Per Share – Class Y | | $ | 13.45 | | | $ | 22.90 | |
| | | ($132,095,977 | ÷ | | | ($151,447,014 | ÷ |
| | | | 9,823,150 shares) | | | | 6,613,847 shares) | |
N/A – Not applicable. Share class currently not offered.
The accompanying notes are an integral part of the financial statements.
| | |
250 | | SEI Institutional Managed Trust / Semi-Annual Report / March 31, 2019 |
| | | | | | | | | | | | | | | | | | | | | | | | | | | | |
| Large Cap Growth Fund | | Large Cap Index
Fund | | | Tax-Managed Large
Cap Fund | | | S&P 500 Index Fund | | | Small Cap Fund | | | Small Cap Value Fund | | | Small Cap Growth
Fund | | | Tax-Managed Small/
Mid Cap Fund | |
| | | | | | | | | | | | | | | | | | | | | | | | | | | | |
| $ 986,658 | | | $ 300,145 | | | | $ 1,953,574 | | | | $ 333,678 | | | | $ 605,196 | | | | $ 312,993 | | | | $ 303,822 | | | | $ 610,565 | |
| 495,105 | | | 9,372 | | | | 1,956,178 | | | | 494,339 | | | | 14,593 | | | | 15,012 | | | | 33,287 | | | | 254,784 | |
| $ 1,481,763 | | | $ 309,517 | | | | $ 3,909,752 | | | | $ 828,017 | | | | $ 619,789 | | | | $ 328,005 | | | | $ 337,109 | | | | $ 865,349 | |
| $ 34.55 | | | $ 10.06 | | | | $ 26.42 | | | | $ 65.68 | | | | $ 11.07 | | | | $ 20.84 | | | | $ 32.99 | | | | $ 20.67 | |
| ($1,326,807,680 ÷ | | | ($309,517,090 | ÷ | | | ($3,475,848,249 | ÷ | | | ($822,223,445 | ÷ | | | ($584,101,064 | ÷ | | | ($283,074,186 | ÷ | | | ($300,619,758 | ÷ | | | ($768,972,520 | ÷ |
| 38,402,584 shares) | | | 30,763,728 shares) | | | | 131,579,025 shares) | | | | 12,517,830 shares) | | | | 52,757,241 shares) | | | | 13,583,479 shares) | | | | 9,111,645 shares) | | | | 37,194,693 shares) | |
| $ 33.65 | | | N/A | | | | N/A | | | | $ 66.05 | | | | N/A | | | | $ 20.63 | | | | $ 31.40 | | | | N/A | |
| ($3,424,397 ÷ | | | | | | | | | | | ($5,793,228 | ÷ | | | | | | | ($2,091,432 | ÷ | | | ($1,854,063 | ÷ | | | | |
| 101,757 shares) | | | | | | | | | | | 87,705 shares) | | | | | | | | 101,385 shares) | | | | 59,054 shares) | | | | | |
| $ 34.59 | | | N/A | | | | $ 26.43 | | | | N/A | | | | $ 11.18 | | | | $ 20.86 | | | | $ 33.32 | | | | $ 20.70 | |
| ($151,530,444 ÷ | | | | | | | ($433,903,489 | ÷ | | | | | | | ($35,688,002 | ÷ | | | ($42,839,314 | ÷ | | | ($34,635,219 | ÷ | | | ($96,376,849 | ÷ |
| 4,380,559 shares) | | | | | | | 16,417,330 shares) | | | | | | | | 3,192,932 shares) | | | | 2,054,123 shares) | | | | 1,039,391 shares) | | | | 4,655,772 shares) | |
| | |
SEI Institutional Managed Trust / Semi-Annual Report / March 31, 2019 | | 251 |
STATEMENTS OF ASSETS AND LIABILITIES ($ Thousands)
March 31, 2019 (Unaudited)
| | | | | | | | |
| | | Mid-Cap Fund | | | U.S. Managed Volatility
Fund | |
Assets: | | | | | | | | |
Investments, at value† | | $ | 104,794 | | | $ | 1,738,447 | |
Affiliated investments, at value†† | | | 6,509 | | | | 44,714 | |
Repurchase agreements† | | | – | | | | – | |
Cash and cash equivalents | | | 20 | | | | – | |
Cash pledged as collateral on swap contracts | | | – | | | | – | |
Cash pledged as collateral on futures contracts | | | – | | | | 1,128 | |
Foreign currency, at value††† | | | – | | | | 1,093 | |
Receivable for fund shares sold | | | 146 | | | | 2,177 | |
Receivable for investment securities sold | | | 309 | | | | – | |
Dividends and interest receivable | | | 180 | | | | 4,867 | |
Unrealized gain on forward foreign currency contracts | | | – | | | | – | |
OTC Swap contracts, at value†††† | | | – | | | | – | |
Options purchased, at value††††† | | | – | | | | – | |
Foreign tax reclaim receivable | | | – | | | | 11 | |
Receivable for variation margin | | | – | | | | 158 | |
Prepaid expenses | | | 3 | | | | 39 | |
Total Assets | | | 111,961 | | | | 1,792,634 | |
Liabilities: | | | | | | | | |
Payable for investment securities purchased | | | 2,313 | | | | – | |
Payable for fund shares redeemed | | | 167 | | | | 1,572 | |
Administration fees payable | | | 28 | | | | 420 | |
Shareholder servicing fees payable Class F | | | 23 | | | | 186 | |
Shareholder servicing fees payable Class I | | | – | | | | 1 | |
Payable upon return on securities loaned | | | – | | | | – | |
Income distribution payable | | | – | | | | – | |
OTC Swap contracts, at value†††† | | | – | | | | – | |
Options written, at value††††† | | | – | | | | – | |
Due to custodian | | | – | | | | 1 | |
Payable for variation margin | | | – | | | | – | |
Unrealized loss on foreign currency spot contracts | | | – | | | | – | |
Unrealized loss on forward foreign currency contracts | | | – | | | | – | |
Investment advisory fees payable | | | 38 | | | | 585 | |
Trustees fees payable | | | 1 | | | | 8 | |
Chief Compliance Officer fees payable | | | – | | | | 2 | |
Administration servicing fees payable Class I | | | – | | | | – | |
Accrued expense payable | | | 2 | | | | 30 | |
Total Liabilities | | | 2,572 | | | | 2,805 | |
Net Assets | | $ | 109,389 | | | $ | 1,789,829 | |
† Cost of investments and repurchase agreements | | $ | 97,605 | | | $ | 1,498,983 | |
†† Cost of affiliated investments | | | 6,509 | | | | 44,714 | |
††† Cost of foreign currency | | | – | | | | 1,092 | |
†††† Cost (premiums received) | | | – | | | | – | |
††††† Cost (premiums received) | | | – | | | | – | |
* Includes market value of securities on loan | | | – | | | | – | |
Amounts designated as “–” are either $0 or have been rounded to $0.
The accompanying notes are an integral part of the financial statements
| | |
252 | | SEI Institutional Managed Trust / Semi-Annual Report / March 31, 2019 |
| | | | | | | | | | | | | | | | | | | | | | | | | | |
Global Managed Volatility Fund | | | Tax-Managed Managed
Volatility Fund | | | Tax-Managed
International Managed
Volatility Fund | | | Real Estate Fund | | | Enhanced Income Fund | | | Core Fixed Income Fund | | | High Yield Bond Fund | |
| | | | | | | | | | | | | | | | | | | | | | | | | | |
| $ | 1,248,366 | | | $ | 1,032,366 | | | $ | 345,713 | | | $ | 132,872 | | | $ | 55,010 | | | $ | 4,093,436* | | | $ | 1,520,247 | |
| | 25,120 | | | | 20,856 | | | | 12,317 | | | | 3,047 | | | | 2,793 | | | | 270,993 | | | | 91,288 | |
| | – | | | | – | | | | – | | | | – | | | | 6,400 | | | | 15,000 | | | | – | |
| | 6,433 | | | | – | | | | 2,009 | | | | – | | | | – | | | | – | | | | 3,352 | |
| | – | | | | – | | | | – | | | | – | | | | – | | | | 5,010 | | | | 1,439 | |
| | 871 | | | | 414 | | | | 465 | | | | – | | | | – | | | | 1,384 | | | | – | |
| | 2,233 | | | | 54 | | | | 1,463 | | | | – | | | | 7 | | | | 3,026 | | | | 29 | |
| | 854 | | | | 1,345 | | | | 145 | | | | 26 | | | | 63 | | | | 2,894 | | | | 1,058 | |
| | 19 | | | | – | | | | – | | | | 31 | | | | 2,810 | | | | 218,994 | | | | 9,925 | |
| | 4,359 | | | | 2,043 | | | | 1,923 | | | | 588 | | | | 210 | | | | 21,386 | | | | 23,020 | |
| | 1,163 | | | | – | | | | – | | | | – | | | | – | | | | 881 | | | | – | |
| | – | | | | – | | | | – | | | | – | | | | – | | | | 325 | | | | – | |
| | – | | | | – | | | | – | | | | – | | | | – | | | | 384 | | | | – | |
| | 3,099 | | | | 7 | | | | 1,083 | | | | – | | | | – | | | | 54 | | | | 36 | |
| | 119 | | | | 58 | | | | 65 | | | | – | | | | 7 | | | | 1,828 | | | | 33 | |
| | 34 | | | | 27 | | | | 9 | | | | 3 | | | | 2 | | | | 105 | | | | 40 | |
| | 1,292,670 | | | | 1,057,170 | | | | 365,192 | | | | 136,567 | | | | 67,302 | | | | 4,635,700 | | | | 1,650,467 | |
| | | | | | | | | | | | | | | | | | | | | | | | | | |
| | – | | | | – | | | | – | | | | 68 | | | | 34 | | | | 498,504 | | | | 31,262 | |
| | 1,374 | | | | 755 | | | | 240 | | | | 1,136 | | | | 50 | | | | 3,598 | | | | 1,399 | |
| | 306 | | | | 267 | | | | 134 | | | | 34 | | | | 6 | | | | 542 | | | | 267 | |
| | 227 | | | | 203 | | | | 68 | | | | 21 | | | | 7 | | | | 746 | | | | 299 | |
| | – | | | | – | | | | – | | | | – | | | | – | | | | 1 | | | | 3 | |
| | – | | | | – | | | | – | | | | – | | | | – | | | | 120,936 | | | | 1 | |
| | – | | | | – | | | | – | | | | – | | | | – | | | | 870 | | | | 826 | |
| | – | | | | – | | | | – | | | | – | | | | – | | | | – | | | | 278 | |
| | – | | | | – | | | | – | | | | – | | | | – | | | | 759 | | | | – | |
| | – | | | | 337 | | | | – | | | | 302 | | | | 209 | | | | 60 | | | | – | |
| | – | | | | – | | | | – | | | | – | | | | – | | | | 2,385 | | | | – | |
| | 1 | | | | – | | | | – | | | | – | | | | – | | | | – | | | | – | |
| | 637 | | | | – | | | | – | | | | – | | | | – | | | | 2,038 | | | | – | |
| | 590 | | | | 388 | | | | 116 | | | | 65 | | | | 16 | | | | 702 | | | | 562 | |
| | 7 | | | | 6 | | | | 2 | | | | 1 | | | | – | | | | 20 | | | | 8 | |
| | 1 | | | | 1 | | | | – | | | | – | | | | – | | | | 4 | | | | 2 | |
| | – | | | | – | | | | – | | | | – | | | | – | | | | 1 | | | | 3 | |
| | 46 | | | | 2 | | | | 10 | | | | 2 | | | | 22 | | | | 62 | | | | 72 | |
| | 3,189 | | | | 1,959 | | | | 570 | | | | 1,629 | | | | 344 | | | | 631,228 | | | | 34,982 | |
| $ | 1,289,481 | | | $ | 1,055,211 | | | $ | 364,622 | | | $ | 134,938 | | | $ | 66,958 | | | $ | 4,004,472 | | | $ | 1,615,485 | |
| $ | 1,105,148 | | | $ | 654,658 | | | $ | 310,166 | | | $ | 108,471 | | | $ | 61,951 | | | $ | 4,067,677 | | | $ | 1,543,064 | |
| | 25,120 | | | | 20,856 | | | | 12,317 | | | | 3,047 | | | | 2,793 | | | | 270,999 | | | | 91,288 | |
| | 2,227 | | | | 55 | | | | 1,469 | | | | – | | | | 8 | | | | 2,963 | | | | 29 | |
| | – | | | | – | | | | – | | | | – | | | | – | | | | 15 | | | | 98 | |
| | – | | | | – | | | | – | | | | – | | | | – | | | | 149 | | | | – | |
| | – | | | | – | | | | – | | | | – | | | | – | | | | 118,052 | | | | – | |
| | |
SEI Institutional Managed Trust / Semi-Annual Report / March 31, 2019 | | 253 |
STATEMENTS OF ASSETS AND LIABILITIES ($ Thousands)
March 31, 2019 (Unaudited)
| | | | | | | | |
| | | Mid-Cap Fund | | | U.S. Managed Volatility Fund | |
Net Assets: | | | | | | | | |
Paid-in capital – (unlimited authorization – no par value) | | $ | 101,453 | | | $ | 1,529,735 | |
Total distributable earnings/(loss) | | | 7,936 | | | | 260,094 | |
Net Assets | | $ | 109,389 | | | $ | 1,789,829 | |
Net Asset Value, Offering and Redemption Price Per Share – Class F | | $ | 24.74 | | | $ | 16.89 | |
| | | ($105,811,553 ÷ | | | | ($895,162,764 ÷ | |
| | | 4,277,287 shares | ) | | | 52,997,842 shares) | |
Net Asset Value, Offering and Redemption Price Per Share – Class I | | $ | 24.70 | | | $ | 16.89 | |
| | | ($766,705 ÷ | | | | ($1,274,486 ÷ | |
| | | 31,040 shares) | | | | 75,472 shares) | |
Net Asset Value, Offering and Redemption Price Per Share – Class Y | | $ | 24.76 | | | $ | 16.90 | |
| | | ($2,810,502 ÷ | | | | ($893,391,281 ÷ | |
| | | | 113,515 shares) | | | | 52,865,617 shares) | |
N/A - Not applicable. Share class currently not offered.
The accompanying notes are an integral part of the financial statements.
| | |
254 | | SEI Institutional Managed Trust / Semi-Annual Report / March 31, 2019 |
| | | | | | | | | | | | | | | | | | | | | | | | |
Global Managed
Volatility Fund | | Tax-Managed Managed
Volatility Fund | | | Tax-Managed
International Managed
Volatility Fund | | | Real Estate Fund | | | Enhanced Income Fund | | | Core Fixed Income Fund | | | High Yield Bond Fund | |
| | | | | | | | | | | | | | | | | | | | | | | | |
| $ 1,140,351 | | | $ 663,381 | | | | $ 348,255 | | | | $ 110,095 | | | | $ 99,721 | | | | $ 4,045,356 | | | | $ 1,812,528 | |
| 149,130 | | | 391,830 | | | | 16,367 | | | | 24,843 | | | | (32,763) | | | | (40,884) | | | | (197,043) | |
| $ 1,289,481 | | | $ 1,055,211 | | | | $ 364,622 | | | | $ 134,938 | | | | $ 66,958 | | | | $ 4,004,472 | | | | $ 1,615,485 | |
| $ 10.82 | | | $ 16.61 | | | | $ 10.69 | | | | $ 15.80 | | | | $ 7.52 | | | | $ 11.20 | | | | $ 6.87 | |
| ($1,081,967,149 ÷ | | | ($969,810,154 | ÷ | | | ($326,306,152 ÷ | | | | ($98,548,450 ÷ | | | | ($59,591,313 ÷ | | | | ($3,579,316,335 ÷ | | | | ($1,426,094,325 ÷ | |
| 100,036,411 shares) | | | 58,402,461 shares) | | | | 30,533,721 shares) | | | | 6,236,891 shares) | | | | 7,922,236 shares) | | | | 319,715,027 shares) | | | | 207,720,223 shares) | |
| $ 10.57 | | | N/A | | | | N/A | | | | $ 15.78 | | | | $ 7.51 | | | | $ 11.19 | | | | $ 6.61 | |
| ($1,185,966 ÷ | | | | | | | | | | | ($487,073 ÷ | | | | ($115,761 ÷ | | | | ($4,843,882 ÷ | | | | ($11,915,209 ÷ | |
| 112,157 shares) | | | | | | | | | | | 30,864 shares) | | | | 15,420 shares) | | | | 432,970 shares) | | | | 1,801,616 shares) | |
| $ 10.83 | | | $ 16.61 | | | | $ 10.69 | | | | $ 15.80 | | | | $ 7.52 | | | | $ 11.20 | | | | $ 6.86 | |
| ($206,327,699 ÷ | | | ($85,400,538 ÷ | | | | ($38,315,982 ÷ | | | | ($35,902,560 ÷ | | | | ($7,251,072 ÷ | | | | ($420,312,242 ÷ | | | | ($177,475,166 ÷ | |
| 19,044,762 shares) | | | 5,141,263 shares) | | | | 3,583,542 shares) | | | | 2,272,197 shares) | | | | 964,653 shares) | | | | 37,532,380 shares) | | | | 25,852,290 shares) | |
| | |
SEI Institutional Managed Trust / Semi-Annual Report / March 31, 2019 | | 255 |
STATEMENTS OF ASSETS AND LIABILITIES/CONSOLIDATED STATEMENTS OF ASSETS AND LIABILITIES ($ Thousands)
March 31, 2019 (Unaudited)
| | | | | | | | | | | | | | |
| | | Conservative Income
Fund | | | | | | Tax-Free Conservative
Income Fund | | | |
Assets: | | | | | | | | | | | | | | |
Investments, at value† | | | $ 236,145 | | | | | | | | $ 185,213 | | | |
Affiliated investments, at value†† | | | – | | | | | | | | – | | | |
Repurchase agreements† | | | 20,000 | | | | | | | | – | | | |
Cash and cash equivalents | | | – | | | | | | | | 28 | | | |
Cash pledged as collateral on swap contracts | | | – | | | | | | | | – | | | |
Cash pledged as collateral on futures contracts | | | – | | | | | | | | – | | | |
Cash pledged as collateral on options contracts | | | – | | | | | | | | – | | | |
Foreign currency, at value††† | | | – | | | | | | | | – | | | |
Receivable for fund shares sold | | | 346 | | | | | | | | 76 | | | |
Dividends and interest receivable | | | 360 | | | | | | | | 464 | | | |
Receivable for investment securities sold | | | – | | | | | | | | – | | | |
Unrealized gain on forward foreign currency contracts | | | – | | | | | | | | – | | | |
Unrealized gain on foreign spot currency contracts | | | – | | | | | | | | – | | | |
OTC Swap contracts, at value†††† | | | – | | | | | | | | – | | | |
Options purchased, at value††††† | | | – | | | | | | | | – | | | |
Swaptions purchased, at value†††††† | | | – | | | | | | | | – | | | |
Foreign tax reclaim receivable | | | – | | | | | | | | – | | | |
Receivable for variation margin | | | – | | | | | | | | – | | | |
Prepaid expenses | | | 6 | | | | | | | | 5 | | | |
Total Assets | | | 256,857 | | | | | | | | 185,786 | | | |
Liabilities: | | | | | | | | | | | | | | |
Payable for fund shares redeemed | | | 1,003 | | | | | | | | 134 | | | |
Income distribution payable | | | 154 | | | | | | | | 39 | | | |
Due to custodian | | | 42 | | | | | | | | – | | | |
Administration fees payable | | | 23 | | | | | | | | 16 | | | |
Shareholder servicing fees payable Class F | | | 20 | | | | | | | | 14 | | | |
Payable for securities sold short@ | | | – | | | | | | | | – | | | |
Payable for investment securities purchased | | | – | | | | | | | | – | | | |
OTC Swap contracts, at value†††† | | | – | | | | | | | | – | | | |
Options written, at value††††† | | | – | | | | | | | | – | | | |
Reverse repurchase agreements | | | – | | | | | | | | – | | | |
Foreign currency payable to custodian, at value††† | | | – | | | | | | | | – | | | |
Payable for variation margin | | | – | | | | | | | | – | | | |
Unrealized loss on foreign currency spot contracts | | | – | | | | | | | | – | | | |
Unrealized loss on forward foreign currency contracts | | | – | | | | | | | | – | | | |
Investment advisory fees payable | | | 14 | | | | | | | | 9 | | | |
Trustees fees payable | | | 2 | | | | | | | | 1 | | | |
Chief Compliance Officer fees payable | | | – | | | | | | | | – | | | |
Interest payable | | | – | | | | | | | | – | | | |
Unfunded commitments on loan participations | | | – | | | | | | | | – | | | |
Accrued expense payable | | | 4 | | | | | | | | 7 | | | |
Total Liabilities | | | 1,262 | | | | | | | | 220 | | | |
Net Assets | | | $ 255,595 | | | | | | | | $ 185,566 | | | |
† Cost of investments and repurchase agreements | | | $ 256,096 | | | | | | | | $ 185,192 | | | |
†† Cost of affiliated investments | | | – | | | | | | | | – | | | |
††† Cost of foreign currency | | | – | | | | | | | | – | | | |
†††† Cost (premiums received) | | | – | | | | | | | | – | | | |
††††† Cost (premiums received) | | | – | | | | | | | | – | | | |
†††††† Cost (premiums received) | | | – | | | | | | | | – | | | |
@Proceeds from securities sold short | | | – | | | | | | | | – | | | |
Amounts designated as “–” are either $0 or have been rounded to $0.
The accompanying notes are an integral part of the financial statements.
| | |
256 | | SEI Institutional Managed Trust / Semi-Annual Report / March 31, 2019 |
| | | | | | | | | | | | | | | | | | | | | | | | | | | | | | | | |
| Real Return Fund | | | Dynamic Asset
Allocation Fund | | | Multi-Strategy
Alternative Fund | | | Multi-Asset
Accumulation Fund | | | Multi-Asset Income
Fund | | | Multi-Asset Inflation
Managed Fund | | | Multi-Asset Capital
Stability Fund | | | Long/Short
Alternative Fund | | | |
| | | | | | | | | | | | | | | | | | | | | | | | | | | | | | | | |
| | $ 245,378 | | | | $ 769,831 | | | | $ 297,064 | | | | $ 2,050,802 | | | | $ 891,766 | | | | $ 1,036,254 | | | | $ 693,062 | | | | $ 29,438 | | | |
| | 2,462 | | | | – | | | | 146,464 | | | | – | | | | – | | | | – | | | | – | | | | – | | | |
| | – | | | | – | | | | – | | | | – | | | | – | | | | – | | | | – | | | | – | | | |
| | – | | | | 11,131 | | | | 86,755 | | | | 657,236 | | | | 18,298 | | | | 172,214 | | | | 11,365 | | | | 4,475 | | | |
| | – | | | | – | | | | 3,126 | | | | 6,507 | | | | 6,671 | | | | 377 | | | | 2,040 | | | | – | | | |
| | – | | | | 11,223 | | | | 78 | | | | 87,120 | | | | 6,477 | | | | 7,217 | | | | 9,405 | | | | 1,000 | | | |
| | – | | | | – | | | | – | | | | – | | | | 33,337 | | | | – | | | | – | | | | – | | | |
| | – | | | | – | | | | 2,985 | | | | 7,379 | | | | – | | | | 831 | | | | 1,350 | | | | – | | | |
| | 215 | | | | 555 | | | | 322 | | | | 1,710 | | | | 726 | | | | 542 | | | | 857 | | | | – | | | |
| | 269 | | | | 784 | | | | 1,331 | | | | 2,468 | | | | 8,628 | | | | 2,199 | | | | 472 | | | | – | | | |
| | – | | | | 2,022 | | | | 25,756 | | | | – | | | | 2,929 | | | | 12,324 | | | | 2,193 | | | | – | | | |
| | – | | | | 2,229 | | | | 171 | | | | 8,353 | | | | 1,231 | | | | 149 | | | | 1,263 | | | | – | | | |
| | – | | | | – | | | | – | | | | – | | | | 1 | | | | 5 | | | | 10 | | | | – | | | |
| | – | | | | 3,586 | | | | 237 | | | | 1,708 | | | | – | | | | 326 | | | | – | | | | – | | | |
| | – | | | | 155 | | | | 271 | | | | – | | | | 206 | | | | 53 | | | | – | | | | – | | | |
| | – | | | | 2,720 | | | | – | | | | – | | | | – | | | | – | | | | – | | | | – | | | |
| | – | | | | – | | | | 60 | | | | 216 | | | | 30 | | | | 14 | | | | – | | | | – | | | |
| | – | | | | 1,150 | | | | 713 | | | | 743 | | | | 259 | | | | 1,345 | | | | 759 | | | | 80 | | | |
| | 6 | | | | 21 | | | | 13 | | | | 69 | | | | 24 | | | | 25 | | | | 18 | | | | – | | | |
| | 248,330 | | | | 805,407 | | | | 565,346 | | | | 2,824,311 | | | | 970,583 | | | | 1,233,875 | | | | 722,794 | | | | 34,993 | | | |
| | | | | | | | | | | | | | | | | | | | | | | | | | | | | | | | |
| | 408 | | | | 690 | | | | 552 | | | | 2,236 | | | | 1,025 | | | | 845 | | | | 1,302 | | | | – | | | |
| | – | | | | – | | | | – | | | | – | | | | 390 | | | | – | | | | – | | | | – | | | |
| | – | | | | – | | | | – | | | | – | | | | – | | | | – | | | | – | | | | – | | | |
| | 39 | | | | 192 | | | | 63 | | | | 581 | | | | 201 | | | | 209 | | | | 77 | | | | 8 | | | |
| | 19 | | | | 153 | | | | 99 | | | | 542 | | | | 67 | | | | 171 | | | | 56 | | | | 1 | | | |
| | – | | | | – | | | | 61,757 | | | | – | | | | – | | | | 112,006 | | | | – | | | | – | | | |
| | – | | | | – | | | | 20,486 | | | | 7,039 | | | | 16,374 | | | | 888 | | | | 2,423 | | | | 3,349 | | | |
| | – | | | | 5,372 | | | | 18 | | | | 389 | | | | – | | | | 3,065 | | | | – | | | | – | | | |
| | – | | | | – | | | | 50 | | | | – | | | | 3,460 | | | | 184 | | | | 329 | | | | – | | | |
| | – | | | | – | | | | – | | | | – | | | | – | | | | 243,259 | | | | – | | | | – | | | |
| | – | | | | – | | | | – | | | | – | | | | 1,351 | | | | – | | | | – | | | | – | | | |
| | – | | | | 626 | | | | 766 | | | | 2,906 | | | | 1,046 | | | | 1,086 | | | | 681 | | | | – | | | |
| | – | | | | – | | | | 12 | | | | 2 | | | | – | | | | 58 | | | | 3 | | | | – | | | |
| | – | | | | 2,727 | | | | 250 | | | | 4,655 | | | | 338 | | | | 180 | | | | 689 | | | | – | | | |
| | 27 | | | | 126 | | | | 286 | | | | 1,511 | | | | 337 | | | | 245 | | | | 218 | | | | 15 | | | |
| | 1 | | | | 4 | | | | 3 | | | | – | | | | 5 | | | | 5 | | | | 4 | | | | – | | | |
| | – | | | | 1 | | | | – | | | | 3 | | | | 1 | | | | 1 | | | | 1 | | | | – | | | |
| | – | | | | – | | | | – | | | | – | | | | – | | | | 1,271 | | | | – | | | | – | | | |
| | – | | | | – | | | | – | | | | – | | | | 319 | | | | – | | | | – | | | | – | | | |
| | 5 | | | | 3 | | | | 23 | | | | 41 | | | | 83 | | | | 24 | | | | 14 | | | | 1 | | | |
| | 499 | | | | 9,894 | | | | 84,365 | | | | 19,905 | | | | 24,997 | | | | 363,497 | | | | 5,797 | | | | 3,374 | | | |
| | $ 247,831 | | | | $ 795,513 | | | | $ 480,981 | | | | $ 2,804,406 | | | | $ 945,586 | | | | $ 870,378 | | | | $ 716,997 | | | | $ 31,619 | | | |
| | $ 245,666 | | | | $ 557,863 | | | | $ 301,186 | | | | $ 2,001,457 | | | | $ 868,617 | | | | $ 1,005,163 | | | | $ 690,574 | | | | $ 29,421 | | | |
| | 2,462 | | | | – | | | | 147,930 | | | | – | | | | – | | | | – | | | | – | | | | – | | | |
| | – | | | | – | | | | 3,025 | | | | 7,408 | | | | (1,359 | ) | | | 827 | | | | 1,352 | | | | – | | | |
| | – | | | | – | | | | 538 | | | | – | | | | – | | | | (1,442 | ) | | | – | | | | – | | | |
| | – | | | | 468 | | | | 350 | | | | – | | | | (2,144 | ) | | | 45 | | | | (48 | ) | | | – | | | |
| | – | | | | 2,357 | | | | – | | | | – | | | | – | | | | – | | | | – | | | | – | | | |
| | – | | | | – | | | | 59,354 | | | | – | | | | – | | | | (101,946 | ) | | | – | | | | – | | | |
| | |
SEI Institutional Managed Trust / Semi-Annual Report / March 31, 2019 | | 257 |
STATEMENTS OF ASSETS AND LIABILITIES/CONSOLIDATED STATEMENTS OF ASSETS AND LIABILITIES ($ Thousands)
March 31, 2019 (Unaudited)
| | | | | | | | |
| | | Conservative Income
Fund | | | Tax-Free Conservative
Income Fund | |
Net Assets: | | | | | | | | |
Paid-in capital — (unlimited authorization — no par value) | | $ | 255,544 | | | $ | 185,546 | |
Total distributable earnings/(loss) | | | 51 | | | | 20 | |
Net Assets | | $ | 255,595 | | | $ | 185,566 | |
Net Asset Value, Offering and Redemption Price Per Share — Class F | | $ | 10.00 | | | $ | 10.00 | |
| | | ($230,374,540 | ÷ | | | ($159,207,103 ÷ | |
| | | | 23,033,042 shares | ) | | | 15,919,222 shares) | |
Net Asset Value, Offering and Redemption Price Per Share — Class Y | | $ | 10.00 | | | $ | 10.00 | |
| | | ($25,220,160 | ÷ | | | ($26,358,517 ÷ | |
| | | | 2,521,506 shares | ) | | | 2,635,499 shares) | |
N/A - Not applicable. Share class currently not offered.
The accompanying notes are an integral part of the financial statements.
| | |
258 | | SEI Institutional Managed Trust / Semi-Annual Report / March 31, 2019 |
| | | | | | | | | | | | | | | | | | | | | | | | | | | | | | | | |
| Real Return Fund | | | Dynamic Asset
Allocation Fund | | | Multi-Strategy
Alternative Fund | | | Multi-Asset
Accumulation Fund | | | Multi-Asset Income
Fund | | | Multi-Asset Inflation
Managed Fund | | | Multi-Asset Capital
Stability Fund | | | Long/Short
Alternative Fund | | | |
| | | | | | | | | | | | | | | | | | | | | | | | | | | | | | | | |
| | $ 254,623 | | | | $ 610,474 | | | | $ 505,589 | | | | $ 2,880,857 | | | | $ 929,114 | | | | $ 1,014,217 | | | | $ 711,692 | | | | $ 33,250 | | | |
| | (6,792 | ) | | | 185,039 | | | | (24,608 | ) | | | (76,451 | ) | | | 16,472 | | | | (143,839 | ) | | | 5,305 | | | | (1,631 | ) | | |
| | $ 247,831 | | | | $ 795,513 | | | | $ 480,981 | | | | $ 2,804,406 | | | | $ 945,586 | | | | $ 870,378 | | | | $ 716,997 | | | | $ 31,619 | | | |
| | $ 9.93 | | | | $ 12.68 | | | | $ 9.42 | | | | $ 9.85 | | | | $ 10.80 | | | | $ 8.28 | | | | $ 10.14 | | | | $ 9.51 | | | |
| | ($228,516,680 | ÷ | | | ($723,597,303 | ÷ | | | ($471,132,268 | ÷ | | | ($2,578,459,363 | ÷ | | | ($786,695,436 | ÷ | | | ($805,335,766 | ÷ | | | ($667,686,217 | ÷ | | | ($3,045,605 | ÷ | | |
| | 23,015,449 shares | ) | | | 57,056,156 shares | ) | | | 50,009,336 shares | ) | | | 261,779,557 shares | ) | | | 72,873,128 shares | ) | | | 97,312,216 shares | ) | | | 65,856,041 shares | ) | | | 320,102 shares | ) | | |
| | $ 9.96 | | | | $ 12.69 | | | | $ 9.41 | | | | $ 9.91 | | | | $ 10.80 | | | | $ 8.28 | | | | $ 10.15 | | | | $ 9.55 | | | |
| | ($19,313,789 | ÷ | | | ($71,915,897 | ÷ | | | ($9,849,193 | ÷ | | | ($225,946,234 | ÷ | | | ($158,890,144 | ÷ | | | ($65,042,474 | ÷ | | | ($49,310,904 | ÷ | | | ($28,573,806 | ÷ | | |
| | 1,938,632 shares | ) | | | 5,665,330 shares | ) | | | 1,046,148 shares | ) | | | 22,805,111 shares | ) | | | 14,718,830 shares | ) | | | 7,857,511 shares | ) | | | 4,856,293 shares | ) | | | 2,991,570 shares | ) | | |
| | |
SEI Institutional Managed Trust / Semi-Annual Report / March 31, 2019 | | 259 |
STATEMENTS OF OPERATIONS ($ Thousands)
For the six month ended March 31, 2019 (Unaudited)
| | | | | | | | | | | | |
| | Large Cap Fund | | | Large Cap Value Fund | | | Large Cap Growth Fund | |
Investment Income: | | | | | | | | | | | | |
Dividends | | | $ 26,810 | | | | $ 21,294 | | | | $ 9,782 | |
Income from affiliated investments(1) | | | 551 | | | | 369 | | | | 392 | |
Interest income | | | – | | | | – | | | | – | |
Security lending income - net(1)(2) | | | 52 | | | | 24 | | | | 187 | |
Less: foreign taxes withheld | | | (110 | ) | | | (215 | ) | | | – | |
| | | | |
Total Investment Income | | | 27,303 | | | | 21,472 | | | | 10,361 | |
Expenses: | | | | | | | | | | | | |
Investment advisory fees | | | 4,531 | | | | 2,319 | | | | 2,828 | |
Administration fees | | | 3,225 | | | | 1,988 | | | | 2,121 | |
Shareholder servicing fees Class F | | | 2,747 | | | | 1,479 | | | | 1,597 | |
Shareholder servicing fees Class I | | | – | | | | 5 | | | | 4 | |
Trustees’ fees | | | 24 | | | | 13 | | | | 14 | |
Chief compliance officer fees | | | 6 | | | | 4 | | | | 4 | |
Administration servicing fees Class I | | | – | | | | 5 | | | | 4 | |
Printing fees | | | 148 | | | | 83 | | | | 88 | |
Custodian/Wire agent fees | | | 69 | | | | 40 | | | | 41 | |
Professional fees | | | 66 | | | | 37 | | | | 40 | |
Registration fees | | | 53 | | | | 28 | | | | 31 | |
Pricing fees | | | 27 | | | | 16 | | | | 16 | |
Other expenses | | | 21 | | | | 11 | | | | 12 | |
| | | | |
Total Expenses | | | 10,917 | | | | 6,028 | | | | 6,800 | |
Less: | | | | | | | | | | | | |
Waiver of investment advisory fees | | | (340 | ) | | | (170 | ) | | | (532 | ) |
Waiver of shareholder servicing fees Class F | | | (22 | ) | | | (12 | ) | | | (13 | ) |
Waiver of shareholder servicing fees Class I | | | – | | | | (1 | ) | | | – | |
Waiver of administration fees | | | (347 | ) | | | (103 | ) | | | (111 | ) |
| | | | |
Net Expenses | | | 10,208 | | | | 5,742 | | | | 6,144 | |
| | | |
Net Investment Income (Loss) | | | 17,095 | | | | 15,730 | | | | 4,217 | |
Net Realized Gain (Loss) on: | | | | | | | | | | | | |
Investments | | | 101,425 | | | | 3,849 | | | | 37,611 | |
Affiliated investments | | | 5 | | | | 3 | | | | – | |
Futures contracts | | | 1,334 | | | | (265 | ) | | | (580 | ) |
Net Change in Unrealized Appreciation (Depreciation) on: | | | | | | | | | | | | |
Investments | | | (202,915 | ) | | | (70,253 | ) | | | (66,862 | ) |
Affiliated investments | | | – | | | | 1 | | | | 2 | |
Futures contracts | | | 444 | | | | 425 | | | | 266 | |
Foreign currency translation of other assets and liabilities denominated in foreign currencies | | | – | | | | – | | | | – | |
| | | | |
Net Decrease in Net Assets Resulting from Operations | | | $ (82,612 | ) | | | $ (50,510 | ) | | | $ (25,346 | ) |
| (1) | See Note 6 in Notes to Financial Statements. |
| (2) | Income is from the investment of collateral in an affiliated security. |
Amounts designated as “—” are either $0 or have been rounded to $0.
The accompanying notes are an integral part of the financial statements.
| | |
260 | | SEI Institutional Managed Trust / Semi-Annual Report / March 31, 2019 |
| | | | | | | | | | | | | | | | | | | | | | | | | | |
| Large Cap Index Fund | | | Tax-Managed Large
Cap Fund | | | S&P 500 Index Fund | | | Small Cap Fund | | | Small Cap Value Fund | | | Small Cap Growth Fund | | | Tax-Managed Small/Mid
Cap Fund | |
| | | | | | | | | | | | | | | | | | | | | | | | | | |
| $ | 2,787 | | | $ | 40,047 | | | $ | 9,260 | | | $ | 3,692 | | | $ | 3,887 | | | $ | 1,117 | | | $ | 7,069 | |
| | 59 | | | | 500 | | | | 112 | | | | 127 | | | | 94 | | | | 91 | | | | 229 | |
| | – | | | | – | | | | 8 | | | | – | | | | – | | | | – | | | | – | |
| | 3 | | | | 44 | | | | 6 | | | | 97 | | | | 113 | | | | 92 | | | | 251 | |
| | – | | | | (370 | ) | | | – | | | | (8 | ) | | | – | | | | (3 | ) | | | (8 | ) |
| | | | | | | |
| | 2,849 | | | | 40,221 | | | | 9,386 | | | | 3,908 | | | | 4,094 | | | | 1,297 | | | | 7,541 | |
| | | | | | | | | | | | | | | | | | | | | | | | | | |
| | 63 | | | | 7,580 | | | | 121 | | | | 2,018 | | | | 1,066 | | | | 1,109 | | | | 2,803 | |
| | 376 | | | | 4,294 | | | | 885 | | | | 931 | | | | 492 | | | | 512 | | | | 1,294 | |
| | 313 | | | | 4,272 | | | | 999 | | | | 734 | | | | 358 | | | | 386 | | | | 972 | |
| | – | | | | – | | | | 7 | | | | – | | | | 3 | | | | 5 | | | | – | |
| | 2 | | | | 38 | | | | 8 | | | | 6 | | | | 3 | | | | 4 | | | | 9 | |
| | 1 | | | | 10 | | | | 2 | | | | – | | | | 1 | | | | 1 | | | | 2 | |
| | – | | | | – | | | | 7 | | | | – | | | | 3 | | | | – | | | | – | |
| | 15 | | | | 238 | | | | 50 | | | | 40 | | | | 21 | | | | 22 | | | | 55 | |
| | 6 | | | | 113 | | | | 26 | | | | 19 | | | | 10 | | | | 10 | | | | 26 | |
| | 7 | | | | 107 | | | | 22 | | | | 18 | | | | 9 | | | | 10 | | | | 24 | |
| | 2 | | | | 65 | | | | 17 | | | | 14 | | | | 8 | | | | 7 | | | | 20 | |
| | 5 | | | | 42 | | | | 10 | | | | 9 | | | | 5 | | | | 5 | | | | 12 | |
| | 24 | | | | 33 | | | | 51 | | | | 8 | | | | 3 | | | | 3 | | | | 8 | |
| | | | | | | |
| | 814 | | | | 16,792 | | | | 2,205 | | | | 3,797 | | | | 1,982 | | | | 2,074 | | | | 5,225 | |
| | | | | | | | | | | | | | | | | | | | | | | | | | |
| | (37 | ) | | | – | | | | (40 | ) | | | (239 | ) | | | (131 | ) | | | (189 | ) | | | (339 | ) |
| | (188 | ) | | | (34 | ) | | | (799 | ) | | | (6 | ) | | | (3 | ) | | | (3 | ) | | | (117 | ) |
| | – | | | | – | | | | – | | | | – | | | | – | | | | – | | | | – | |
| | (273 | ) | | | (319 | ) | | | (340 | ) | | | (48 | ) | | | (21 | ) | | | (21 | ) | | | (67 | ) |
| | | | | | | |
| | 316 | | | | 16,439 | | | | 1,026 | | | | 3,504 | | | | 1,827 | | | | 1,861 | | | | 4,702 | |
| | | | | | |
| | 2,533 | | | | 23,782 | | | | 8,360 | | | | 404 | | | | 2,267 | | | | (564 | ) | | | 2,839 | |
| | | | | | | | | | | | | | | | | | | | | | | | | | |
| | (763 | ) | | | 239,242 | | | | 11,215 | | | | (26,070 | ) | | | (3,864 | ) | | | 9,468 | | | | 34,620 | |
| | – | | | | 10 | | | | – | | | | – | | | | 23 | | | | 5 | | | | 54 | |
| | (208 | ) | | | 760 | | | | (1,072 | ) | | | (33 | ) | | | (496 | ) | | | (561 | ) | | | (217 | ) |
| | | | | | | | | | | | | | | | | | | | | | | | | | |
| | (2,659 | ) | | | (404,580 | ) | | | (41,849 | ) | | | (52,498 | ) | | | (33,644 | ) | | | (56,134 | ) | | | (140,877 | ) |
| | (11 | ) | | | 2 | | | | – | | | | 3 | | | | 5 | | | | 1 | | | | 9 | |
| | 120 | | | | 554 | | | | 219 | | | | – | | | | 149 | | | | 17 | | | | – | |
| | – | | | | (4 | ) | | | – | | | | – | | | | – | | | | – | | | | – | |
| | | | | | | |
| $ | (988 | ) | | $ | (140,234 | ) | | $ | (23,127 | ) | | $ | (78,194 | ) | | $ | (35,560 | ) | | $ | (47,768 | ) | | $ | (103,572 | ) |
| | |
SEI Institutional Managed Trust / Semi-Annual Report / March 31, 2019 | | 261 |
STATEMENTS OF OPERATIONS ($ Thousands)
For the six month ended March 31, 2019 (Unaudited)
| | | | | | | | | | | | |
| | Mid-Cap Fund | | | U.S. Managed Volatility Fund | | | Global Managed Volatility Fund | |
Investment Income: | | | | | | | | | | | | |
Dividends | | | $ 1,037 | | | | $ 23,311 | | | | $ 16,930 | |
Income from affiliated investments(1) | | | 43 | | | | 425 | | | | 139 | |
Interest income | | | – | | | | – | | | | – | |
Security lending income - net(1) (2) | | | 4 | | | | – | | | | – | |
Less: foreign taxes withheld | | | – | | | | (166 | ) | | | (1,053 | ) |
| | | | |
Total Investment Income | | | 1,084 | | | | 23,570 | | | | 16,016 | |
Expenses: | | | | | | | | | | | | |
Investment advisory fees | | | 227 | | | | 5,138 | | | | 4,172 | |
Administration fees | | | 170 | | | | 2,349 | | | | 1,926 | |
Shareholder servicing fees Class F | | | 137 | | | | 1,087 | | | | 1,343 | |
Shareholder servicing fees Class I | | | 1 | | | | 2 | | | | 2 | |
Trustees’ fees | | | 1 | | | | 15 | | | | 13 | |
Administration servicing fees Class I | | | 1 | | | | 2 | | | | 2 | |
Chief compliance officer fees | | | – | | | | 4 | | | | 3 | |
Printing fees | | | 7 | | | | 95 | | | | 81 | |
Custodian/Wire agent fees | | | 4 | | | | 45 | | | | 65 | |
Professional fees | | | 3 | | | | 43 | | | | 36 | |
Registration fees | | | 2 | | | | 34 | | | | 28 | |
Pricing fees | | | 2 | | | | 17 | | | | 22 | |
Overdraft fees | | | – | | | | – | | | | 3 | |
Other expenses | | | 1 | | | | 13 | | | | 11 | |
Total Expenses | | | 556 | | | | 8,844 | | | | 7,707 | |
Less: | | | | | | | | | | | | |
Waiver of investment advisory fees | | | – | | | | (2,073 | ) | | | (705 | ) |
Waiver of shareholder servicing fees Class F | | | (1 | ) | | | (9 | ) | | | (11 | ) |
Waiver of shareholder servicing fees Class I | | | – | | | | – | | | | – | |
Waiver of administration fees | | | (1 | ) | | | (123 | ) | | | (111 | ) |
Net Expenses | | | 554 | | | | 6,639 | | | | 6,880 | |
Net Investment Income | | | 530 | | | | 16,931 | | | | 9,136 | |
Net Realized Gain (Loss) on: | | | | | | | | | | | | |
Investments | | | 849 | | | | 25,579 | | | | 17,779 | |
Futures contracts | | | (179 | ) | | | 45 | | | | (667 | ) |
Foreign currency translation | | | – | | | | 13 | | | | (200 | ) |
Forward foreign currency contracts | | | – | | | | – | | | | 10,425 | |
Purchased and written options | | | – | | | | – | | | | – | |
Purchased and written swaptions | | | – | | | | – | | | | – | |
Swap contracts | | | – | | | | – | | | | – | |
Net Change in Unrealized Appreciation (Depreciation) on: | | | | | | | | | | | | |
Investments | | | (8,193 | ) | | | (11,829 | ) | | | (55,895 | ) |
Affiliated investments | | | – | | | | – | | | | – | |
Futures contracts | | | 14 | | | | 715 | | | | 309 | |
Purchased and written options | | | – | | | | – | | | | – | |
Purchased and written swaptions | | | – | | | | – | | | | – | |
Swap contracts | | | – | | | | – | | | | – | |
Foreign currency translation of other assets and liabilities denominated in foreign currencies | | | – | | | | 1 | | | | (74 | ) |
Forward foreign currency contracts | | | – | | | | – | | | | (2,432 | ) |
Net Increase (Decrease) in Net Assets Resulting from Operations | | | $ (6,979 | ) | | | $ 31,455 | | | | $ (21,619 | ) |
| (1) | See Note 6 in Notes to Financial Statements. |
| (2) | Income is from the investment of collateral in an affiliated security. |
Amounts designated as “–” are either $0 or have been rounded to $0.
The accompanying notes are an integral part of the financial statements.
| | |
262 | | SEI Institutional Managed Trust / Semi-Annual Report / March 31, 2019 |
| | | | | | | | | | | | | | | | | | | | | | | | | | |
Tax-Managed Managed
Volatility Fund | | | Tax-Managed
International Managed
Volatility Fund | | | Real Estate Fund | | | Enhanced Income Fund | | | Core Fixed Income Fund | | | High Yield Bond Fund | | | Conservative Income
Fund | |
| | | | | | | | | | | | | | | | | | | | | | | | | | |
| | $ 14,991 | | | | $ 5,329 | | | | $ 2,221 | | | | $ 1 | | | | $ 41 | | | | $ 777 | | | | $ – | |
| | 273 | | | | 83 | | | | 27 | | | | 24 | | | | 1,043 | | | | 717 | | | | 1 | |
| | – | | | | – | | | | – | | | | 1,428 | | | | 68,640 | | | | 51,026 | | | | 3,507 | |
| | – | | | | – | | | | 1 | | | | – | | | | 88 | | | | – | | | | – | |
| | (106 | ) | | | (505 | ) | | | – | | | | – | | | | – | | | | – | | | | – | |
| | | | | | | |
| | 15,158 | | | | 4,907 | | | | 2,249 | | | | 1,453 | | | | 69,812 | | | | 52,520 | | | | 3,508 | |
| | | | | | | | | | | | | | | | | | | | | | | | | | |
| | 3,365 | | | | 1,150 | | | | 414 | | | | 153 | | | | 5,388 | | | | 3,813 | | | | 135 | |
| | 1,553 | | | | 796 | | | | 191 | | | | 75 | | | | 3,165 | | | | 1,556 | | | | 270 | |
| | 1,198 | | | | 405 | | | | 115 | | | | 85 | | | | 4,399 | | | | 1,727 | | | | 305 | |
| | – | | | | – | | | | 1 | | | | – | | | | 7 | | | | 19 | | | | – | |
| | 10 | | | | 4 | | | | 1 | | | | 1 | | | | 40 | | | | 16 | | | | 3 | |
| | – | | | | – | | | | 1 | | | | – | | | | 7 | | | | 19 | | | | – | |
| | 3 | | | | 1 | | | | – | | | | – | | | | 10 | | | | 4 | | | | 1 | |
| | 65 | | | | 22 | | | | 8 | | | | 5 | | | | 244 | | | | 98 | | | | 17 | |
| | 31 | | | | 35 | | | | 4 | | | | 2 | | | | 104 | | | | 46 | | | | 7 | |
| | 29 | | | | 10 | | | | 4 | | | | 2 | | | | 109 | | | | 44 | | | | 7 | |
| | 21 | | | | 7 | | | | 3 | | | | 2 | | | | 74 | | | | 31 | | | | 5 | |
| | 12 | | | | 12 | | | | – | | | | 28 | | | | 231 | | | | 77 | | | | 5 | |
| | – | | | | 1 | | | | – | | | | – | | | | – | | | | – | | | | – | |
| | 10 | | | | 3 | | | | – | | | | 1 | | | | 35 | | | | 14 | | | | 2 | |
| | | | | | | |
| | 6,297 | | | | 2,446 | | | | 742 | | | | 354 | | | | 13,813 | | | | 7,464 | | | | 757 | |
| | | | | | | | | | | | | | | | | | | | | | | | | | |
| | (1,116 | ) | | | (488 | ) | | | (54 | ) | | | (47 | ) | | | (1,291 | ) | | | (607 | ) | | | (56 | ) |
| | (10 | ) | | | (3 | ) | | | (1 | ) | | | (38 | ) | | | (35 | ) | | | (2 | ) | | | (183 | ) |
| | – | | | | – | | | | – | | | | – | | | | (1 | ) | | | (14 | ) | | | – | |
| | (79 | ) | | | (24 | ) | | | – | | | | (46 | ) | | | – | | | | (55 | ) | | | (124 | ) |
| | | | | | | |
| | 5,092 | | | | 1,931 | | | | 687 | | | | 223 | | | | 12,486 | | | | 6,786 | | | | 394 | |
| | | | | | |
| | 10,066 | | | | 2,976 | | | | 1,562 | | | | 1,230 | | | | 57,326 | | | | 45,734 | | | | 3,114 | |
| | | | | | | | | | | | | | | | | | | | | | | | | | |
| | 13,248 | | | | (9,011 | ) | | | 744 | | | | (846 | ) | | | 6,090 | | | | (8,377 | ) | | | 2 | |
| | (1,100 | ) | | | 246 | | | | – | | | | (36 | ) | | | 1,336 | | | | – | | | | – | |
| | (7 | ) | | | (60 | ) | | | – | | | | – | | | | 201 | | | | (3 | ) | | | – | |
| | – | | | | – | | | | – | | | | – | | | | 196 | | | | – | | | | – | |
| | – | | | | – | | | | – | | | | – | | | | 1,506 | | | | – | | | | – | |
| | – | | | | – | | | | – | | | | – | | | | (276 | ) | | | – | | | | – | |
| | – | | | | – | | | | – | | | | – | | | | 3,317 | | | | (42 | ) | | | – | |
| | | | | | | | | | | | | | | | | | | | | | | | | | |
| | (21,578 | ) | | | (7,680 | ) | | | 6,717 | | | | 156 | | | | 104,020 | | | | (26,016 | ) | | | 40 | |
| | – | | | | – | | | | – | | | | – | | | | 8 | | | | – | | | | – | |
| | 264 | | | | (33 | ) | | | – | | | | (47 | ) | | | 6,869 | | | | – | | | | – | |
| | – | | | | – | | | | – | | | | – | | | | (318 | ) | | | – | | | | – | |
| | – | | | | – | | | | – | | | | – | | | | (18 | ) | | | – | | | | – | |
| | – | | | | – | | | | – | | | | – | | | | (1,916 | ) | | | (124 | ) | | | – | |
| | (3 | ) | | | (35 | ) | | | – | | | | – | | | | (34 | ) | | | 1 | | | | – | |
| | – | | | | – | | | | – | | | | – | | | | (393 | ) | | | – | | | | – | |
| | | | | | | |
| | $ 890 | | | | $ (13,597 | ) | | | $ 9,023 | | | | $ 457 | | | | $ 177,914 | | | | $ 11,173 | | | | $ 3,156 | |
| | |
SEI Institutional Managed Trust / Semi-Annual Report / March 31, 2019 | | 263 |
STATEMENTS OF OPERATIONS/CONSOLIDATED STATEMENTS OF OPERATIONS ($ Thousands)
For the six month ended March 31, 2019 (Unaudited)
| | | | | | | | | | | | |
| | | Tax-Free Conservative Income | | | | | | | |
| | | Fund | | | Real Return Fund | | | Dynamic Asset Allocation Fund | |
| | | |
Investment Income: | | | | | | | | | | | | |
Dividends | | | $ – | | | | $ – | | | | $ 8,988 | |
Income from affiliated investments(1) | | | – | | | | 9 | | | | – | |
Interest income | | | 1,464 | | | | 3 | | | | 43 | |
Less: foreign taxes withheld | | | – | | | | – | | | | (92 | ) |
Total Investment Income | | | 1,464 | | | | 12 | | | | 8,939 | |
| | | |
Expenses: | | | | | | | | | | | | |
Shareholder servicing fees Class F | | | 201 | | | | 288 | | | | 901 | |
Administration fees | | | 177 | | | | 248 | | | | 1,187 | |
Investment advisory fees | | | 88 | | | | 273 | | | | 2,374 | |
Trustees’ fees | | | 2 | | | | 2 | | | | 8 | |
Chief compliance officer fees | | | – | | | | 1 | | | | 2 | |
Printing fees | | | 11 | | | | 15 | | | | 50 | |
Pricing fees | | | 6 | | | | 3 | | | | 6 | |
Professional fees | | | 5 | | | | 7 | | | | 23 | |
Custodian/Wire agent fees | | | 5 | | | | 7 | | | | 8 | |
Registration fees | | | 4 | | | | 5 | | | | 15 | |
Dividend expense on securities sold short | | | – | | | | – | | | | – | |
Overdraft fees | | | – | | | | – | | | | 3 | |
Interest expense | | | – | | | | – | | | | – | |
Other expenses | | | 2 | | | | 1 | | | | 7 | |
Total Expenses | | | 501 | | | | 850 | | | | 4,584 | |
Less: | | | | | | | | | | | | |
Waiver of investment advisory fees | | | (37 | ) | | | (114 | ) | | | (1,644 | ) |
Waiver of shareholder servicing fees Class F | | | (120 | ) | | | (173 | ) | | | – | |
Waiver of administration fees | | | (85 | ) | | | (13 | ) | | | (53 | ) |
Net Expenses | | | 259 | | | | 550 | | | | 2,887 | |
Net Investment Income (Loss) | | | 1,205 | | | | (538 | ) | | | 6,052 | |
Net Realized Gain (Loss) on: | | | | | | | | | | | | |
Investments | | | – | | | | (697 | ) | | | 7,191 | |
Securities sold short | | | – | | | | – | | | | – | |
Affiliated investments | | | – | | | | – | | | | – | |
Futures contracts | | | – | | | | – | | | | (1,189 | ) |
Foreign currency translation | | | – | | | | – | | | | (17 | ) |
Forward foreign currency contracts | | | – | | | | – | | | | 3,163 | |
Purchased and written options | | | – | | | | – | | | | – | |
Swap contracts | | | – | | | | – | | | | (1,705 | ) |
Net Change in Unrealized Appreciation (Depreciation) on: | | | | | | | | | |
Investments | | | 26 | | | | 4,482 | | | | (34,649 | ) |
Securities sold short | | | – | | | | – | | | | – | |
Affiliated investments | | | – | | | | – | | | | – | |
Futures contracts | | | – | | | | – | | | | (1,414 | ) |
Purchased and written options | | | – | | | | – | | | | (313 | ) |
Purchased and written swaptions | | | – | | | | – | | | | 629 | |
Swap contracts | | | – | | | | – | | | | (535 | ) |
Foreign currency translation of other assets and liabilities denominated in foreign currencies | | | – | | | | – | | | | – | |
Forward foreign currency contracts | | | – | | | | – | | | | 2,428 | |
Net Increase (Decrease) in Net Assets Resulting from Operations | | | $ 1,231 | | | | $ 3,247 | | | | $ (20,359 | ) |
| (1) | See Note 6 in Notes to Financial Statements. |
Amounts designated as “–” are either $0 or have been rounded to $0.
The accompanying notes are an integral part of the financial statements.
| | |
264 | | SEI Institutional Managed Trust / Semi-Annual Report / March 31, 2019 |
| | | | | | | | | | | | | | | | | | | | | | |
| Multi-Strategy Alternative | | | Multi-Asset Accumulation | | | | | | Multi-Asset Inflation | | | Multi-Asset Capital Stability | | | | |
| Fund | | | Fund | | | Multi-Asset Income Fund | | | Managed Fund | | | Fund | | | Long/Short Alternative Fund | |
| | | | | | | | | | | | | | | | | | | | | | |
| | $ 5,136 | | | | $ 3,000 | | | | $ 1,205 | | | | $ 3,655 | | | | $ 395 | | | | $ 7 | |
| | 1,853 | | | | – | | | | – | | | | – | | | | – | | | | – | |
| | 2,371 | | | | 15,340 | | | | 22,595 | | | | 6,654 | | | | 6,177 | | | | 374 | |
| | – | | | | (120 | ) | | | (41 | ) | | | – | | | | – | | | | – | |
| | 9,360 | | | | 18,220 | | | | 23,759 | | | | 10,309 | | | | 6,572 | | | | 381 | |
| | | | | | | | | | | | | | | | | | | | | | |
| | 597 | | | | 3,129 | | | | 970 | | | | 1,019 | | | | 829 | | | | 5 | |
| | 727 | | | | 3,589 | | | | 1,410 | | | | 1,315 | | | | 1,062 | | | | 50 | |
| | 3,635 | | | | 10,196 | | | | 2,820 | | | | 2,410 | | | | 1,416 | | | | 132 | |
| | 5 | | | | 27 | | | | 9 | | | | 9 | | | | 7 | | | | – | |
| | 1 | | | | 7 | | | | 3 | | | | 2 | | | | 2 | | | | – | |
| | 30 | | | | 169 | | | | 59 | | | | 55 | | | | 44 | | | | 2 | |
| | 24 | | | | 48 | | | | 73 | | | | 33 | | | | 11 | | | | 1 | |
| | 13 | | | | 81 | | | | 26 | | | | 25 | | | | 20 | | | | 1 | |
| | 14 | | | | 53 | | | | 15 | | | | 20 | | | | 17 | | | | 1 | |
| | 10 | | | | 54 | | | | 18 | | | | 17 | | | | 14 | | | | 3 | |
| | 454 | | | | – | | | | – | | | | 1,343 | | | | – | | | | – | |
| | – | | | | – | | | | 8 | | | | – | | | | 3 | | | | – | |
| | – | | | | – | | | | – | | | | 2,679 | | | | – | | | | – | |
| | 1 | | | | 24 | | | | 8 | | | | 7 | | | | 6 | | | | 1 | |
| | 5,511 | | | | 17,377 | | | | 5,419 | | | | 8,934 | | | | 3,431 | | | | 196 | |
| | | | | | | | | | | | | | | | | | | | | | |
| | (1,940 | ) | | | (1,518 | ) | | | (856 | ) | | | (963 | ) | | | (148 | ) | | | (42 | ) |
| | (5 | ) | | | – | | | | (582 | ) | | | – | | | | (497 | ) | | | – | |
| | (357 | ) | | | (198 | ) | | | (293 | ) | | | (73 | ) | | | (606 | ) | | | – | |
| | 3,209 | | | | 15,661 | | | | 3,688 | | | | 7,898 | | | | 2,180 | | | | 154 | |
| | 6,151 | | | | 2,559 | | | | 20,071 | | | | 2,411 | | | | 4,392 | | | | 227 | |
| | | | | | | | | | | | | | | | | | | | | | |
| | (11,429 | ) | | | 1,987 | | | | (4,068 | ) | | | (3,745 | ) | | | (65 | ) | | | (1 | ) |
| | 695 | | | | – | | | | – | | | | (5,908 | ) | | | – | | | | – | |
| | 510 | | | | – | | | | – | | | | – | | | | – | | | | – | |
| | 15 | | | | (33,881 | ) | | | 39 | | | | (11,681 | ) | | | (1,088 | ) | | | (1,864 | ) |
| | (529 | ) | | | (1,598 | ) | | | (599 | ) | | | 38 | | | | 1,084 | | | | – | |
| | (510 | ) | | | 24,964 | | | | 1,163 | | | | (128 | ) | | | 88 | | | | – | |
| | (130 | ) | | | – | | | | 2,094 | | | | (442 | ) | | | (712 | ) | | | – | |
| | 775 | | | | 13,006 | | | | 1,630 | | | | (2,202 | ) | | | 357 | | | | – | |
| | | | | | | | | | | | | | | | | | | | | | |
| | (3,047 | ) | | | 7,430 | | | | 8,182 | | | | 8,662 | | | | 3,893 | | | | 22 | |
| | (991 | ) | | | – | | | | – | | | | 8,723 | | | | – | | | | – | |
| | (2,352 | ) | | | – | | | | – | | | | – | | | | – | | | | – | |
| | (17 | ) | | | 79,971 | | | | 4,226 | | | | 1,188 | | | | 2,929 | | | | 185 | |
| | 51 | | | | – | | | | (934 | ) | | | (85 | ) | | | (193 | ) | | | – | |
| | – | | | | – | | | | – | | | | – | | | | – | | | | – | |
| | (404 | ) | | | 4,308 | | | | (488 | ) | | | (2,782 | ) | | | 1,074 | | | | – | |
| (46 | ) | | | 81 | | | | (73 | ) | | | (53 | ) | | | 17 | | | | – | |
| | 154 | | | | (1,923 | ) | | | 710 | | | | (355 | ) | | | (1,755 | ) | | | – | |
| | $ (11,104 | ) | | | $ 96,904 | | | | $ 31,953 | | | | $ (6,359 | ) | | | $ 10,021 | | | | $ (1,431 | ) |
| | |
SEI Institutional Managed Trust / Semi-Annual Report / March 31, 2019 | | 265 |
STATEMENTS OF CHANGES IN NET ASSETS ($ Thousands)
For the six month period ended March 31, 2019 (Unaudited) and the year ended September 30,
| | | | | | | | | | | | | | | | | | | | | | | | |
| | | Large Cap Fund | | Large Cap Value Fund | | Large Cap Growth Fund |
| | | 10/01/18 to 03/31/19 | | 2018 | | | 10/01/18 to 03/31/19 | | 2018 | | | 10/01/18 to 03/31/19 | | 2018 |
Operations: | | | | | | | | | | | | | | | | | | | | | | | | |
Net investment income (loss) | | $ | 17,095 | | | $ | 23,108 | | | $ | 15,730 | | | $ | 21,729 | | | $ | 4,217 | | | $ | 2,819 | |
Net realized gain (loss) from investments, securities sold short, futures contracts, forward foreign currency contracts, options, swaptions and swap contracts | | | 102,764 | | | | 278,175 | | | | 3,587 | | | | 119,971 | | | | 37,031 | | | | 182,320 | |
Net change in unrealized appreciation (depreciation) on investments, securities sold short, futures contracts, forward foreign currency contracts, options, swaptions and swap contracts | | | (202,471 | ) | | | 109,625 | | | | (69,827 | ) | | | 14,060 | | | | (66,594 | ) | | | 153,660 | |
Net change in unrealized depreciation on foreign currency transactions | | | – | | | | – | | | | – | | | | – | | | | – | | | | – | |
Contribution from Adviser | | | – | | | | – | | | | – | | | | – | | | | – | | | | – | |
Net Increase (Decrease) in Net Assets Resulting from Operations | | | (82,612 | ) | | | 410,908 | | | | (50,510 | ) | | | 155,760 | | | | (25,346 | ) | | | 338,799 | |
Distributions:(1) | | | | | | | | | | | | | | | | | | | | | | | | |
Class E: | | | N/A | | | | N/A | | | | N/A | | | | N/A | | | | N/A | | | | N/A | |
Class F: | | | (282,339 | ) | | | (176,200 | ) | | | (113,250 | ) | | | (63,896 | ) | | | (156,640 | ) | | | (112,009 | ) |
Class I: | | | N/A | | | | N/A | | | | (383 | ) | | | (219 | ) | | | (407 | ) | | | (287 | ) |
Class Y: | | | (15,765 | ) | | | (10,974 | ) | | | (12,724 | ) | | | (6,783 | ) | | | (15,654 | ) | | | (10,493 | ) |
Total Distributions | | | (298,104 | ) | | | (187,174 | ) | | | (126,357 | ) | | | (70,898 | ) | | | (172,701 | ) | | | (122,789 | ) |
Capital Share Transactions:(2) | | | | | | | | | | | | | | | | | | | | | | | | |
Class E: | | | | | | | | | | | | | | | | | | | | | | | | |
Proceeds from shares issued | | | N/A | | | | N/A | | | | N/A | | | | N/A | | | | N/A | | | | N/A | |
Reinvestment of dividends & distributions | | | N/A | | | | N/A | | | | N/A | | | | N/A | | | | N/A | | | | N/A | |
Cost of shares redeemed | | | N/A | | | | N/A | | | | N/A | | | | N/A | | | | N/A | | | | N/A | |
Net decrease from Class E transactions | | | N/A | | | | N/A | | | | N/A | | | | N/A | | | | N/A | | | | N/A | |
Class F: | | | | | | | | | | | | | | | | | | | | | | | | |
Proceeds from shares issued | | | 188,280 | | | | 449,118 | | | | 104,992 | | | | 129,136 | | | | 119,794 | | | | 152,640 | |
Reinvestment of dividends & distributions | | | 263,177 | | | | 164,122 | | | | 106,378 | | | | 60,494 | | | | 147,584 | | | | 106,403 | |
Cost of shares redeemed | | | (311,989 | ) | | | (747,347 | ) | | | (144,696 | ) | | | (241,686 | ) | | | (175,576 | ) | | | (403,231 | ) |
Net increase (decrease) from Class F transactions | | | 139,468 | | | | (134,107 | ) | | | 66,674 | | | | (52,056 | ) | | | 91,802 | | | | (144,188 | ) |
Class I: | | | | | | | | | | | | | | | | | | | | | | | | |
Proceeds from shares issued | | | N/A | | | | N/A | | | | 340 | | | | 385 | | | | 153 | | | | 564 | |
Reinvestment of dividends & distributions | | | N/A | | | | N/A | | | | 324 | | | | 180 | | | | 326 | | | | 219 | |
Cost of shares redeemed | | | N/A | | | | N/A | | | | (518 | ) | | | (1,066 | ) | | | (427 | ) | | | (1,032 | ) |
Net increase (decrease) from Class I transactions | | | N/A | | | | N/A | | | | 146 | | | | (501 | ) | | | 52 | | | | (249 | ) |
Class Y: | | | | | | | | | | | | | | | | | | | | | | | | |
Proceeds from shares issued | | | 21,820 | | | | 12,129 | | | | 23,659 | | | | 22,865 | | | | 23,293 | | | | 14,638 | |
Reinvestment of dividends & distributions | | | 15,465 | | | | 10,806 | | | | 11,739 | | | | 6,173 | | | | 14,409 | | | | 9,449 | |
Cost of shares redeemed | | | (23,192 | ) | | | (54,616 | ) | | | (8,905 | ) | | | (15,743 | ) | | | (9,082 | ) | | | (27,250 | ) |
Net increase (decrease) from Class Y transactions | | | 14,093 | | | | (31,681 | ) | | | 26,493 | | | | 13,295 | | | | 28,620 | | | | (3,163 | ) |
Increase (Decrease) in Net Assets Derived from Capital Share Transactions | | | 153,561 | | | | (165,788 | ) | | | 93,313 | | | | (39,262 | ) | | | 120,474 | | | | (147,600 | ) |
Net Increase (Decrease) in Net Assets | | | (227,155 | ) | | | 57,946 | | | | (83,554 | ) | | | 45,600 | | | | (77,573 | ) | | | 68,410 | |
Net Assets | | | | | | | | | | | | | | | | | | | | | | | | |
Beginning of period | | | 2,576,456 | | | | 2,518,510 | | | | 1,431,698 | | | | 1,386,098 | | | | 1,559,336 | | | | 1,490,926 | |
End of period(6) | | $ | 2,349,301 | | | $ | 2,576,456 | | | $ | 1,348,144 | | | $ | 1,431,698 | | | $ | 1,481,763 | | | $ | 1,559,336 | |
| (1) | Current year presentation of distributions conforms withS-X Disclosure Simplification. Prior year distributions have been consolidated to conform withS-X Disclosure Simplification. |
| (2) | See Note 7 in Notes to Financial Statements for additional information. |
| (3) | Commenced operations on January 31, 2018 |
| (4) | See Note 6 in Notes to Financial Statements. |
| (5) | On April 20, 2018, the Class Y shares and Class E shares were converted to Class F shares. The performance and financial history shown of the class is solely that of the fund’s Class F shares. |
| (6) | Includes undistributed (distributed in excess) net investment income of $6,434, $10,637, $2,666, $858, $10,664, $3,360,$(17), as of year ended September 30, 2018. The SEC eliminated the requirement to disclose undistributed net investment income on November 5, 2018. |
N/A – Not applicable. Shares currently not offered.
Amounts designated as “–” are either $0 or have been rounded to $0.
The accompanying notes are an integral part of the financial statements.
| | |
266 | | SEI Institutional Managed Trust / Semi-Annual Report / March 31, 2019 |
| | | | | | | | | | | | | | | | | | | | | | | | | | | | |
Large Cap Index Fund(3)(4) | | | Tax-Managed Large Cap Fund | | | S&P 500 Index Fund(5) | | | Small Cap Fund | |
| 10/01/18 to 03/31/19 | | 01/31/18 - 09/30/18 | | | 10/01/18 to 03/31/19 | | | 2018 | | | 10/01/18 to 03/31/19 | | | 2018 | | | 10/01/18 to 03/31/19 | | | 2018 | |
| | | | | | | | | | | | | | | | | | | | | | | | | | | | |
$ 2,533 | | $ | 2,076 | | | $ | 23,782 | | | $ | 34,278 | | | $ | 8,360 | | | $ | 15,273 | | | | $ 404 | | | $ | (1,094) | |
(971) | | | 3 | | | | 240,012 | | | | 30,493 | | | | 10,143 | | | | 19,921 | | | | (26,103) | | | | 81,651 | |
(2,550) | | | 11,821 | | | | (404,024) | | | | 556,043 | | | | (41,630) | | | | 100,560 | | | | (52,495) | | | | 18,310 | |
– | | | – | | | | (4) | | | | (4) | | | | – | | | | – | | | | – | | | | – | |
– | | | 330 | | | | – | | | | – | | | | – | | | | – | | | | – | | | | – | |
(988) | | | 14,230 | | | | (140,234) | | | | 620,810 | | | | (23,127) | | | | 135,754 | | | | (78,194) | | | | 98,867 | |
| | | | | | | | | | | | | | | | | | | | | | | | | | | | |
N/A | | | N/A | | | | N/A | | | | N/A | | | | – | | | | (7,136) | | | | N/A | | | | N/A | |
(2,659) | | | (1,229) | | | | (43,782) | | | | (69,782) | | | | (24,055) | | | | (13,833) | | | | (74,497) | | | | (41,012) | |
N/A | | | N/A | | | | N/A | | | | N/A | | | | (153) | | | | (145) | | | | N/A | | | | N/A | |
N/A | | | N/A | | | | (4,848) | | | | (7,383) | | | | – | | | | (1,020) | | | | (3,967) | | | | (2,581) | |
(2,659) | | | (1,229) | | | | (48,630) | | | | (77,165) | | | | (24,208) | | | | (22,134) | | | | (78,464) | | | | (43,593) | |
| | | | | | | | | | | | | | | | | | | | | | | | | | | | |
| | | | | | | | | | | | | | | | | | | | | | | | | | | | |
N/A | | | N/A | | | | N/A | | | | N/A | | | | N/A | | | | 22,021 | | | | N/A | | | | N/A | |
N/A | | | N/A | | | | N/A | | | | N/A | | | | N/A | | | | 6,600 | | | | N/A | | | | N/A | |
N/A | | | N/A | | | | N/A | | | | N/A | | | | N/A | | | | (367,721) | | | | N/A | | | | N/A | |
N/A | | | N/A | | | | N/A | | | | N/A | | | | N/A | | | | (339,100) | | | | N/A | | | | N/A | |
| | | | | | | | | | | | | | | | | | | | | | | | | | | | |
110,455 | | | 244,620 | | | | 198,723 | | | | 453,442 | | | | 75,389 | | | | 542,277 | | | | 58,725 | | | | 131,930 | |
2,598 | | | 1,199 | | | | 39,335 | | | | 62,980 | | | | 22,002 | | | | 12,678 | | | | 69,878 | | | | 38,243 | |
(33,760) | | | (24,949) | | | | (359,991) | | | | (624,582) | | | | (132,955) | | | | (162,467) | | | | (85,730) | | | | (120,361) | |
79,293 | | | 220,870 | | | | (121,933) | | | | (108,160) | | | | (35,564) | | | | 392,488 | | | | 42,873 | | | | 49,812 | |
| | | | | | | | | | | | | | | | | | | | | | | | | | | | |
N/A | | | N/A | | | | N/A | | | | N/A | | | | 630 | | | | 950 | | | | N/A | | | | N/A | |
N/A | | | N/A | | | | N/A | | | | N/A | | | | 112 | | | | 104 | | | | N/A | | | | N/A | |
N/A | | | N/A | | | | N/A | | | | N/A | | | | (1,017) | | | | (1,848) | | | | N/A | | | | N/A | |
N/A | | | N/A | | | | N/A | | | | N/A | | | | (275) | | | | (794) | | | | N/A | | | | N/A | |
| | | | | | | | | | | | | | | | | | | | | | | | | | | | |
N/A | | | N/A | | | | 95,267 | | | | 49,579 | | | | – | | | | 7,953 | | | | 8,386 | | | | 3,674 | |
N/A | | | N/A | | | | 4,466 | | | | 6,905 | | | | – | | | | 960 | | | | 3,859 | | | | 2,529 | |
N/A | | | N/A | | | | (24,863) | | | | (49,662) | | | | – | | | | (53,919) | | | | (5,494) | | | | (11,956) | |
N/A | | | N/A | | | | 74,870 | | | | 6,822 | | | | – | | | | (45,006) | | | | 6,751 | | | | (5,753) | |
79,293 | | | 220,870 | | | | (47,063) | | | | (101,338) | | | | (35,839) | | | | 7,588 | | | | 49,624 | | | | 44,059 | |
75,646 | | | 233,871 | | | | (235,927) | | | | 442,307 | | | | (83,174) | | | | 121,208 | | | | (107,034) | | | | 99,333 | |
| | | | | | | | | | | | | | | | | | | | | | | | | | | | |
233,871 | | | – | | | | 4,145,679 | | | | 3,703,372 | | | | 911,191 | | | | 789,983 | | | | 726,823 | | | | 627,490 | |
$ 309,517 | | $ | 233,871 | | | $ | 3,909,752 | | | $ | 4,145,679 | | | $ | 828,017 | | | $ | 911,191 | | | | $ 619,789 | | | $ | 726,823 | |
| | |
SEI Institutional Managed Trust / Semi-Annual Report / March 31, 2019 | | 267 |
STATEMENTS OF CHANGES IN NET ASSETS ($ Thousands)
For the six month period ended March 31, 2019 (Unaudited) and the year ended September 30,
| | | | | | | | | | | | | | | | | | | | | | | | |
| | | | |
| | | Small Cap Value Fund | | Small Cap Growth Fund | | Tax-Managed Small/Mid Cap Fund |
| | | 10/01/18 to 03/31/19 | | 2018 | | | 10/01/18 to 03/31/19 | | 2018 | | | 10/01/18 to 03/31/19 | | 2018 |
Operations: | | | | | | | | | | | | | | | | | | | | | | | | |
Net investment income (loss) | | $ | 2,267 | | | $ | 2,744 | | | $ | (564) | | | $ | (1,884) | | | $ | 2,839 | | | $ | 796 | |
Net realized gain (loss) from investments, securities sold short, futures contracts, forward foreign currency contracts, options, swaptions and swap contracts | | | (4,337) | | | | 31,935 | | | | 8,912 | | | | 48,827 | | | | 34,457 | | | | 66,732 | |
Net realized gain (loss) on foreign currency transactions | | | – | | | | – | | | | – | | | | – | | | | – | | | | – | |
Net change in unrealized appreciation (depreciation) on investments, securities sold short, futures contracts, forward foreign currency contracts, options, swaptions and swap contracts | | | (33,490) | | | | (9,978) | | | | (56,116) | | | | 37,473 | | | | (140,868) | | | | 65,412 | |
Net change in unrealized appreciation (depreciation) on foreign currency transactions | | | – | | | | – | | | | – | | | | – | | | | – | | | | – | |
Net Increase (Decrease) in Net Assets Resulting from Operations | | | (35,560) | | | | 24,701 | | | | (47,768) | | | | 84,416 | | | | (103,572) | | | | 132,940 | |
Distributions:(1) | | | | | | | | | | | | | | | | | | | | | | | | |
Class F: | | | (28,289) | | | | (29,546) | | | | (41,646) | | | | (1,080) | | | | (61,570) | | | | (15,168) | |
Class I: | | | (202) | | | | (211) | | | | (251) | | | | (7) | | | | N/A | | | | N/A | |
Class Y: | | | (3,699) | | | | (3,431) | | | | (3,853) | | | | (99) | | | | (6,362) | | | | (1,561) | |
Total Distributions | | | (32,190) | | | | (33,188) | | | | (45,750) | | | | (1,186) | | | | (67,932) | | | | (16,729) | |
Capital Share Transactions:(2) | | | | | | | | | | | | | | | | | | | | | | | | |
Class F: | | | | | | | | | | | | | | | | | | | | | | | | |
Proceeds from shares issued | | | 26,884 | | | | 72,641 | | | | 27,457 | | | | 65,273 | | | | 59,983 | | | | 135,831 | |
Reinvestment of dividends & distributions | | | 26,232 | | | | 27,593 | | | | 38,613 | | | | 1,006 | | | | 54,479 | | | | 13,460 | |
Cost of shares redeemed | | | (46,479) | | | | (105,499) | | | | (65,780) | | | | (68,743) | | | | (96,313) | | | | (130,259) | |
Net increase (decrease) from Class F transactions | | | 6,637 | | | | (5,265) | | | | 290 | | | | (2,464) | | | | 18,149 | | | | 19,032 | |
Class I: | | | | | | | | | | | | | | | | | | | | | | | | |
Proceeds from shares issued | | | 188 | | | | 232 | | | | 143 | | | | 278 | | | | N/A | | | | N/A | |
Reinvestment of dividends & distributions | | | 184 | | | | 189 | | | | 222 | | | | 6 | | | | N/A | | | | N/A | |
Cost of shares redeemed | | | (213) | | | | (470) | | | | (151) | | | | (668) | | | | N/A | | | | N/A | |
Net increase (decrease) from Class I transactions | | | 159 | | | | (49) | | | | 214 | | | | (384) | | | | N/A | | | | N/A | |
Class Y: | | | | | | | | | | | | | | | | | | | | | | | | |
Proceeds from shares issued | | | 8,431 | | | | 4,571 | | | | 6,490 | | | | 2,725 | | | | 22,605 | | | | 12,545 | |
Reinvestment of dividends & distributions | | | 3,301 | | | | 3,042 | | | | 3,500 | | | | 90 | | | | 5,822 | | | | 1,445 | |
Cost of shares redeemed | | | (2,909) | | | | (2,681) | | | | (2,127) | | | | (4,221) | | | | (6,096) | | | | (10,492) | |
Net increase (decrease) from Class Y transactions | | | 8,823 | | | | 4,932 | | | | 7,863 | | | | (1,406) | | | | 22,331 | | | | 3,498 | |
Increase (Decrease) in Net Assets Derived from Capital Share Transactions | | | 15,619 | | | | (382) | | | | 8,367 | | | | (4,254) | | | | 40,480 | | | | 22,530 | |
Net Increase (Decrease) in Net Assets | | | (52,131) | | | | (8,869) | | | | (85,151) | | | | 78,976 | | | | (131,024) | | | | 138,741 | |
Net Assets | | | | | | | | | | | | | | | | | | | | | | | | |
Beginning of period | | | 380,136 | | | | 389,005 | | | | 422,260 | | | | 343,284 | | | | 996,373 | | | | 857,632 | |
End of period(3) | | $ | 328,005 | | | $ | 380,136 | | | $ | 337,109 | | | $ | 422,260 | | | $ | 865,349 | | | $ | 996,373 | |
| (1) | Current year presentation of distributions conforms withS-X Disclosure Simplification. Prior year distributions have been consolidated to conform withS-X Disclosure Simplification. |
| (2) | See Note 7 in Notes to Financial Statements for additional information. |
| (3) | Includes undistributed (distributed in excess) net investment income of $1,134, $(253), $11, $218, $5,747, $13,478, $3,420, $6,114, as of year ended September 30, 2018. The SEC eliminated the requirement to disclose undistributed net investment income on November 5, 2018. |
N/A – Not applicable. Shares currently not offered.
Amounts designated as “–” are either $0 or have been rounded to $0.
The accompanying notes are an integral part of the financial statements.
| | |
268 | | SEI Institutional Managed Trust / Semi-Annual Report / March 31, 2019 |
| | | | | | | | | | | | | | | | | | | | | | | | | | | | | | | | | | | | | | |
| Mid-Cap Fund | | | U.S. Managed Volatility Fund | | | Global Managed Volatility Fund | | | Tax-Managed Managed Volatility Fund | | | Tax-Managed International Managed
Volatility Fund | |
| 10/01/18 to 03/31/19 | | | 2018 | | | 10/01/18 to 03/31/19 | | | 2018 | | | 10/01/18 to 03/31/19 | | | 2018 | | | 10/01/18 to 03/31/19 | | | 2018 | | | 10/01/18 to 03/31/19 | | | 2018 | |
| | | | | | | | | | | | | | | | | | | | | | | | | | | | | | | | | | | | | | |
| | $ 530 | | | $ | 837 | | | $ | 16,931 | | | $ | 25,581 | | | $ | 9,136 | | | $ | 21,910 | | | $ | 10,066 | | | $ | 14,509 | | | $ | 2,976 | | | $ | 8,377 | |
| 670 | | | | 13,085 | | | | 25,624 | | | | 159,804 | | | | 27,537 | | | | 86,236 | | | | 12,148 | | | | 32,271 | | | | (8,765) | | | | (3,504) | |
| | – | | | | – | | | | 13 | | | | (16) | | | | (200) | | | | 14,114 | | | | (7) | | | | – | | | | (60) | | | | (172) | |
| (8,179) | | | | 1,363 | | | | (11,114) | | | | (5,759) | | | | (58,018) | | | | (8,380) | | | | (21,314) | | | | 79,784 | | | | (7,713) | | | | (1,624) | |
| – | | | | – | | | | 1 | | | | (22) | | | | (74) | | | | 516 | | | | (3) | | | | 5 | | | | (35) | | | | (23) | |
| | (6,979) | | | | 15,285 | | | | 31,455 | | | | 179,588 | | | | (21,619) | | | | 114,396 | | | | 890 | | | | 126,569 | | | | (13,597) | | | | 3,054 | |
| | | | | | | | | | | | | | | | | | | | | | | | | | | | | | | | | | | | | | |
| | (12,204) | | | | (9,154) | | | | (96,753) | | | | (87,983) | | | | (101,358) | | | | (86,097) | | | | (37,478) | | | | (40,751) | | | | (8,199) | | | | (8,730) | |
| | (85) | | | | (65) | | | | (125) | | | | (121) | | | | (108) | | | | (107) | | | | N/A | | | | N/A | | | | N/A | | | | N/A | |
| | (297) | | | | (195) | | | | (72,518) | | | | (71,712) | | | | (20,528) | | | | (16,212) | | | | (2,981) | | | | (2,734) | | | | (723) | | | | (411) | |
| | (12,586) | | | | (9,414) | | | | (169,396) | | | | (159,816) | | | | (121,994) | | | | (102,416) | | | | (40,459) | | | | (43,485) | | | | (8,922) | | | | (9,141) | |
| | | | | | | | | | | | | | | | | | | | | | | | | | | | | | | | | | | | | | |
| | | | | | | | | | | | | | | | | | | | | | | | | | | | | | | | | | | | | | |
| | 15,679 | | | | 31,606 | | | | 108,072 | | | | 158,429 | | | | 122,741 | | | | 243,616 | | | | 88,923 | | | | 173,645 | | | | 47,060 | | | | 115,712 | |
| | 10,265 | | | | 7,540 | | | | 85,162 | | | | 77,226 | | | | 89,285 | | | | 74,964 | | | | 32,737 | | | | 35,535 | | | | 7,132 | | | | 7,506 | |
| | (32,754) | | | | (25,654) | | | | (148,118) | | | | (316,096) | | | | (195,747) | | | | (386,385) | | | | (145,342) | | | | (250,349) | | | | (61,709) | | | | (98,753) | |
| | (6,810) | | | | 13,492 | | | | 45,116 | | | | (80,441) | | | | 16,279 | | | | (67,805) | | | | (23,682) | | | | (41,169) | | | | (7,517) | | | | 24,465 | |
| | | | | | | | | | | | | | | | | | | | | | | | | | | | | | | | | | | | | | |
| | 48 | | | | 156 | | | | 77 | | | | 100 | | | | 24 | | | | 247 | | | | N/A | | | | N/A | | | | N/A | | | | N/A | |
| | 85 | | | | 65 | | | | 125 | | | | 121 | | | | 107 | | | | 107 | | | | N/A | | | | N/A | | | | N/A | | | | N/A | |
| | (64) | | | | (293) | | | | (7) | | | | (486) | | | | (46) | | | | (702) | | | | N/A | | | | N/A | | | | N/A | | | | N/A | |
| | 69 | | | | (72) | | | | 195 | | | | (265) | | | | 85 | | | | (348) | | | | N/A | | | | N/A | | | | N/A | | | | N/A | |
| | | | | | | | | | | | | | | | | | | | | | | | | | | | | | | | | | | | | | |
| | 392 | | | | 871 | | | | 288,365 | | | | 554,095 | | | | 30,030 | | | | 78,885 | | | | 19,898 | | | | 21,788 | | | | 19,560 | | | | 13,354 | |
| | 289 | | | | 192 | | | | 70,001 | | | | 70,883 | | | | 19,814 | | | | 15,054 | | | | 2,556 | | | | 2,306 | | | | 656 | | | | 359 | |
| | (409) | | | | (485) | | | | (93,722) | | | | (527,771) | | | | (52,383) | | | | (76,223) | | | | (13,414) | | | | (12,402) | | | | (6,447) | | | | (1,204) | |
| | 272 | | | | 578 | | | | 264,644 | | | | 97,207 | | | | (2,539) | | | | 17,716 | | | | 9,040 | | | | 11,692 | | | | 13,769 | | | | 12,509 | |
| | (6,469) | | | | 13,998 | | | | 309,955 | | | | 16,501 | | | | 13,825 | | | | (50,437) | | | | (14,642) | | | | (29,477) | | | | 6,252 | | | | 36,974 | |
| | (26,034) | | | | 19,869 | | | | 172,014 | | | | 36,273 | | | | (129,788) | | | | (38,457) | | | | (54,211) | | | | 53,607 | | | | (16,267) | | | | 30,887 | |
| | | | | | | | | | | | | | | | | | | | | | | | | | | | | | | | | | | | | | |
| | 135,423 | | | | 115,554 | | | | 1,617,815 | | | | 1,581,542 | | | | 1,419,269 | | | | 1,457,726 | | | | 1,109,422 | | | | 1,055,815 | | | | 380,889 | | | | 350,002 | |
| $ | 109,389 | | | $ | 135,423 | | | $ | 1,789,829 | | | $ | 1,617,815 | | | $ | 1,289,481 | | | $ | 1,419,269 | | | $ | 1,055,211 | | | $ | 1,109,422 | | | $ | 364,622 | | | $ | 380,889 | |
| | |
SEI Institutional Managed Trust / Semi-Annual Report / March 31, 2019 | | 269 |
STATEMENTS OF CHANGES IN NET ASSETS ($ Thousands)
For the six month period ended March 31, 2019 (Unaudited) and the year ended September 30,
| | | | | | | | | | | | | | | | | | | | | | | | |
| | | Real Estate Fund | | Enhanced Income Fund | | Core Fixed Income Fund |
| | | 10/01/18 to 03/31/19 | | 2018 | | | 10/01/18 to 03/31/19 | | 2018 | | | 10/01/18 to 03/31/19 | | 2018 |
Operations: | | | | | | | | | | | | | | | | | | | | | | | | |
Net investment income (loss) | | | $ 1,562 | | | | $ 1,955 | | | | $ 1,230 | | | | $ 2,163 | | | | $ 57,326 | | | | $ 60,725 | |
Net realized gain (loss) from investments, securities sold short, futures contracts, forward foreign currency contracts, options, swaptions and swap contracts | | | 744 | | | | 20,291 | | | | (882 | ) | | | (341 | ) | | | 12,169 | | | | (34,309 | ) |
Net realized gain (loss) on foreign currency transactions | | | – | | | | – | | | | – | | | | – | | | | 201 | | | | (583 | ) |
Net change in unrealized appreciation (depreciation) on investments, securities sold short, futures contracts, forward foreign currency contracts, options, swaptions and swap contracts | | | 6,717 | | | | (14,490 | ) | | | 109 | | | | 24 | | | | 108,252 | | | | (66,691 | ) |
Net change in unrealized appreciation (depreciation) on foreign currency transactions | | | – | | | | – | | | | – | | | | (1 | ) | | | (34 | ) | | | (976 | ) |
Net Increase (Decrease) in Net Assets Resulting from Operations | | | 9,023 | | | | 7,756 | | | | 457 | | | | 1,845 | | | | 177,914 | | | | (41,834 | ) |
Distributions:(1) | | | | | | | | | | | | | | | | | | | | | | | | |
Class F: | | | (7,409 | ) | | | (12,172 | ) | | | (1,232 | ) | | | (1,764 | ) | | | (53,238 | ) | | | (54,886 | ) |
Class I: | | | (36 | ) | | | (51 | ) | | | (2 | ) | | | (4 | ) | | | (78 | ) | | | (137 | ) |
Class Y: | | | (2,804 | ) | | | (4,245 | ) | | | (120 | ) | | | (168 | ) | | | (6,455 | ) | | | (7,524 | ) |
Total Distributions | | | (10,249 | ) | | | (16,468 | ) | | | (1,354 | ) | | | (1,936 | ) | | | (59,771 | ) | | | (62,547 | ) |
Capital Share Transactions:(2) | | | | | | | | | | | | | | | | | | | | | |
Class F: | | | | | | | | | | | | | | | | | | | | | | | | |
Proceeds from shares issued | | | 12,177 | | | | 25,277 | | | | 10,287 | | | | 27,089 | | | | 334,663 | | | | 469,326 | |
Reinvestment of dividends & distributions | | | 6,681 | | | | 11,029 | | | | 1,160 | | | | 1,659 | | | | 48,486 | | | | 50,429 | |
Cost of shares redeemed | | | (14,199 | ) | | | (73,135 | ) | | | (28,376 | ) | | | (21,567 | ) | | | (510,353 | ) | | | (388,007 | ) |
Merger(3) | | | N/A | | | | N/A | | | | N/A | | | | N/A | | | | N/A | | | | 1,706,576 | |
Net increase (decrease) from Class F transactions | | | 4,659 | | | | (36,829 | ) | | | (16,929 | ) | | | 7,181 | | | | (127,204 | ) | | | 1,838,324 | |
Class I: | | | | | | | | | | | | | | | | | | | | | | | | |
Proceeds from shares issued | | | 8 | | | | 22 | | | | 4 | | | | 13 | | | | 2,323 | | | | 4,709 | |
Reinvestment of dividends & distributions | | | 36 | | | | 51 | | | | 2 | | | | 4 | | | | 46 | | | | 79 | |
Cost of shares redeemed | | | (8 | ) | | | (119 | ) | | | (3 | ) | | | (91 | ) | | | (3,916 | ) | | | (4,249 | ) |
Net increase (decrease) from Class I transactions | | | 36 | | | | (46 | ) | | | 3 | | | | (74 | ) | | | (1,547 | ) | | | 539 | |
Class Y: | | | | | | | | | | | | | | | | | | | | | | | | |
Proceeds from shares issued | | | 2,174 | | | | 4,800 | | | | 897 | | | | 3,524 | | | | 63,125 | | | | 73,389 | |
Reinvestment of dividends & distributions | | | 2,704 | | | | 4,089 | | | | 109 | | | | 156 | | | | 6,157 | | | | 7,067 | |
Cost of shares redeemed | | | (4,776 | ) | | | (7,233 | ) | | | (910 | ) | | | (2,375 | ) | | | (54,173 | ) | | | (48,320 | ) |
Merger(3) | | | N/A | | | | N/A | | | | N/A | | | | N/A | | | | – | | | | 146,687 | |
Net increase (decrease) from Class Y transactions | | | 102 | | | | 1,656 | | | | 96 | | | | 1,305 | | | | 15,109 | | | | 178,823 | |
Increase (Decrease) in Net Assets Derived from Capital Share Transactions | | | 4,797 | | | | (35,219 | ) | | | (16,830 | ) | | | 8,412 | | | | (113,642 | ) | | | 2,017,686 | |
Net Increase (Decrease) in Net Assets | | | 3,571 | | | | (43,931 | ) | | | (17,727 | ) | | | 8,321 | | | | 4,501 | | | | 1,913,305 | |
Net Assets | | | | | | | | | | | | | | | | | | | | | | | | |
Beginning of period | | | 131,367 | | | | 175,298 | | | | 84,685 | | | | 76,364 | | | | 3,999,971 | | | | 2,086,666 | |
End of period(4) | | | $ 134,938 | | | | $ 131,367 | | | | $ 66,958 | | | | $ 84,685 | | | | $ 4,004,472 | | | | $ 3,999,971 | |
| (1) | Current year presentation of distributions conforms withS-X Disclosure Simplification. Prior year distributions have been consolidated to confirm withS-X Disclosure Simplification. |
| (2) | See Note 7 in Notes to Financial Statements for additional information. |
| (3) | See Note 13 in Notes to Financial Statements for additional information. |
| (4) | Includes undistributed (distributed in excess) net investment income of $(696), $661, $(3,818), $16,200, $1, $1,$2,869, as of year ended September 30, 2018. The SEC eliminated the requirement to disclose undistributed net investment income on November 5, 2018. |
N/A – Not applicable. Shares currently not offered.
Amounts designated as “–” are either $0 or have been rounded to $0.
The accompanying notes are an integral part of the financial statements.
| | |
270 | | SEI Institutional Managed Trust / Semi-Annual Report / March 31, 2019 |
| | | | | | | | | | | | | | | | | | | | | | | | | | | | | | |
| High Yield Bond Fund | | | Conservative Income Fund | | | Tax-Free Conservative Income Fund | | | Real Return Fund | |
| 10/01/18 to 03/31/19 | | | 2018 | | | 10/01/18 to 03/31/19 | | | 2018 | | | 10/01/18 to 03/31/19 | | | 2018 | | | 10/01/18 to 03/31/19 | | | 2018 | |
| | | | | | | | | | | | | | | | | | | | | | | | | | | | | | |
| | $ 45,734 | | | | $ 88,581 | | | | $ 3,114 | | | | $ 3,623 | | | | $ 1,205 | | | | $ 1,666 | | | | $ (538 | ) | | | $ 6,644 | |
| (8,419 | ) | | | 4,702 | | | | 2 | | | | 1 | | | | – | | | | 6 | | | | (697 | ) | | | (1,192) | |
| | (3 | ) | | | 2 | | | | – | | | | – | | | | – | | | | – | | | | – | | | | – | |
| (26,140 | ) | | | (29,455 | ) | | | 40 | | | | (24 | ) | | | 26 | | | | 1 | | | | 4,482 | | | | (4,716) | |
| 1 | | | | (1 | ) | | | – | | | | – | | | | – | | | | – | | | | – | | | | – | |
| 11,173 | | | | 63,829 | | | | 3,156 | | | | 3,600 | | | | 1,231 | | | | 1,673 | | | | 3,247 | | | | 736 | |
| | | | | | | | | | | | | | | | | | | | | | | | | | | | | | |
| | (62,114 | ) | | | (96,089 | ) | | | (2,805 | ) | | | (3,261 | ) | | | (1,096 | ) | | | (1,598 | ) | | | (2,677 | ) | | | (3,522) | |
| | (631 | ) | | | (44 | ) | | | N/A | | | | N/A | | | | N/A | | | | N/A | | | | N/A | | | | N/A | |
| | (7,695 | ) | | | (12,215 | ) | | | (311 | ) | | | (364 | ) | | | (117 | ) | | | (62 | ) | | | (195 | ) | | | (247) | |
| | (70,440 | ) | | | (108,348 | ) | | | (3,116 | ) | | | (3,625 | ) | | | (1,213 | ) | | | (1,660 | ) | | | (2,872 | ) | | | (3,769) | |
| | | | | | | | | | | | | | | | | | | | | | | | | | | | | | |
| | | | | | | | | | | | | | | | | | | | | | | | | | | | | | |
| | 177,073 | | | | 375,071 | | | | 124,083 | | | | 111,401 | | | | 27,976 | | | | 63,554 | | | | 25,852 | | | | 50,004 | |
| | 56,044 | | | | 86,971 | | | | 1,993 | | | | 2,270 | | | | 866 | | | | 1,235 | | | | 2,199 | | | | 2,882 | |
| | (238,985 | ) | | | (407,553 | ) | | | (105,560 | ) | | | (94,266 | ) | | | (31,989 | ) | | | (65,682 | ) | | | (38,725 | ) | | | (63,482) | |
| | N/A | | | | N/A | | | | N/A | | | | N/A | | | | N/A | | | | N/A | | | | N/A | | | | N/A | |
| | (5,868 | ) | | | 54,489 | | | | 20,516 | | | | 19,405 | | | | (3,147 | ) | | | (893 | ) | | | (10,674 | ) | | | (10,596) | |
| | | | | | | | | | | | | | | | | | | | | | | | | | | | | | |
| | 39,509 | | | | 69 | | | | N/A | | | | N/A | | | | N/A | | | | N/A | | | | N/A | | | | N/A | |
| | 23 | | | | 42 | | | | N/A | | | | N/A | | | | N/A | | | | N/A | | | | N/A | | | | N/A | |
| | (27,539 | ) | | | (688 | ) | | | N/A | | | | N/A | | | | N/A | | | | N/A | | | | N/A | | | | N/A | |
| | 11,993 | | | | (577 | ) | | | N/A | | | | N/A | | | | N/A | | | | N/A | | | | N/A | | | | N/A | |
| | | | | | | | | | | | | | | | | | | | | | | | | | | | | | |
| | 23,502 | | | | 26,549 | | | | 8,345 | | | | 26,030 | | | | 22,297 | | | | 11,647 | | | | 5,971 | | | | 2,483 | |
| | 7,429 | | | | 11,818 | | | | 297 | | | | 353 | | | | 116 | | | | 59 | | | | 188 | | | | 242 | |
| | (24,929 | ) | | | (42,849 | ) | | | (10,923 | ) | | | (18,867 | ) | | | (7,182 | ) | | | (4,363 | ) | | | (3,609 | ) | | | (4,054) | |
| | N/A | | | | N/A | | | | N/A | | | | N/A | | | | N/A | | | | N/A | | | | N/A | | | | N/A | |
| | 6,002 | | | | (4,482 | ) | | | (2,281 | ) | | | 7,516 | | | | 15,231 | | | | 7,343 | | | | 2,550 | | | | (1,329) | |
| 12,127 | | | | 49,430 | | | | 18,235 | | | | 26,921 | | | | 12,084 | | | | 6,450 | | | | (8,124 | ) | | | (11,925) | |
| | (47,140 | ) | | | 4,911 | | | | 18,275 | | | | 26,896 | | | | 12,102 | | | | 6,463 | | | | (7,749 | ) | | | (14,958) | |
| | | | | | | | | | | | | | | | | | | | | | | | | | | | | | |
| | 1,662,625 | | | | 1,657,714 | | | | 237,320 | | | | 210,424 | | | | 173,464 | | | | 167,001 | | | | 255,580 | | | | 270,538 | |
| $ | 1,615,485 | | | $ | 1,662,625 | | | $ | 255,595 | | | $ | 237,320 | | | $ | 185,566 | | | $ | 173,464 | | | $ | 247,831 | | | | $ 255,580 | |
| | |
SEI Institutional Managed Trust / Semi-Annual Report / March 31, 2019 | | 271 |
STATEMENTS OF CHANGES IN NET ASSETS/CONSOLIDATED STATEMENTS OF CHANGES IN NET ASSETS ($ Thousands)
For the six month period ended March 31, 2019 (Unaudited) and the year ended September 30,
| | | | | | | | | | | | | | | | | | | | | | | | | | |
|
| | | Dynamic Asset Allocation Fund | | | Multi-Strategy Alternative Fund | | | Multi-Asset Accumulation Fund | | | |
|
| | | 10/01/18 to 03/31/19 | | | 2018 | | | 10/01/18 to 03/31/19 | | | 2018 | | | 10/01/18 to 03/31/19 | | | 2018 | | |
|
Operations: | | | | | | | | | | | | | | | | | | | | | | | | | | |
Net investment income | | $ | 6,052 | | | $ | 11,087 | | | $ | 6,151 | | | $ | 3,719 | | | | $ 2,559 | | | $ | 18,021 | | | |
Net realized gain (loss) from investments, securities sold short, futures contracts, forward foreign currency contracts, options, swaptions and swap contracts | | | 7,460 | | | | (29,497 | ) | | | (10,074 | ) | | | 13,086 | | | | 6,076 | | | | 91,889 | | | |
Net realized gain (loss) on foreign currency transactions | | | (17 | ) | | | (3,136 | ) | | | (529 | ) | | | 561 | | | | (1,598 | ) | | | (6,991 | ) | | |
Net change in unrealized appreciation (depreciation) on investments, securities sold short, futures contracts, forward foreign currency contracts, options, swaptions and swap contracts | | | (36,282 | ) | | | 109,935 | | | | (6,606 | ) | | | (6,176 | ) | | | 89,786 | | | | (33,623 | ) | | |
Net change in unrealized appreciation (depreciation) on foreign currency transactions | | | 2,428 | | | | (1,774 | ) | | | (46 | ) | | | (447 | ) | | | 81 | | | | 9,479 | | | |
|
Net Increase (Decrease) in Net Assets Resulting from Operations | | | (20,359 | ) | | | 86,615 | | | | (11,104 | ) | | | 10,743 | | | | 96,904 | | | | 78,775 | | | |
|
Distributions:(1) | | | | | | | | | | | | | | | | | | | | | | | | | | |
Class F: | | | (13,354 | ) | | | (11,364 | ) | | | (22,445 | ) | | | (11,092 | ) | | | (77,746 | ) | | | (123,715 | ) | | |
Class Y: | | | (1,480 | ) | | | (1,475 | ) | | | (259 | ) | | | (121 | ) | | | (6,828 | ) | | | (11,492 | ) | | |
Return of Capital: | | | | | | | | | | | | | | | | | | | | | | | | | | |
Class F: | | | – | | | | – | | | | – | | | | – | | | | – | | | | – | | | |
Class Y: | | | – | | | | – | | | | – | | | | – | | | | – | | | | – | | | |
|
Total Distributions | | | (14,834 | ) | | | (12,839 | ) | | | (22,704 | ) | | | (11,213 | ) | | | (84,574 | ) | | | (135,207 | ) | | |
|
Capital Share Transactions:(2) | | | | | | | | | | | | | | | | | | | | | | | | | | |
Class F: | | | | | | | | | | | | | | | | | | | | | | | | | | |
Proceeds from shares issued | | | 60,243 | | | | 180,178 | | | | 41,443 | | | | 96,356 | | | | 180,540 | | | | 568,202 | | | |
Reinvestment of dividends & distributions | | | 12,489 | | | | 10,569 | | | | 20,412 | | | | 10,009 | | | | 71,476 | | | | 112,874 | | | |
Cost of shares redeemed | | | (116,859 | ) | | | (154,254 | ) | | | (66,816 | ) | | | (104,381 | ) | | | (339,634 | ) | | | (442,055 | ) | | |
|
Net increase (decrease) from Class F transactions | | | (44,127 | ) | | | 36,493 | | | | (4,961 | ) | | | 1,984 | | | | (87,618 | ) | | | 239,021 | | | |
|
Class Y: | | | | | | | | | | | | | | | | | | | | | | | | | | |
Proceeds from shares issued | | | 10,232 | | | | 24,348 | | | | 5,287 | | | | 1,914 | | | | 30,381 | | | | 20,748 | | | |
Reinvestment of dividends & distributions | | | 1,468 | | | | 1,465 | | | | 248 | | | | 116 | | | | 6,790 | | | | 11,436 | | | |
Cost of shares redeemed | | | (15,183 | ) | | | (27,388 | ) | | | (1,295 | ) | | | (921 | ) | | | (40,913 | ) | | | (37,753 | ) | | |
|
Net increase (decrease) from Class Y transactions | | | (3,483 | ) | | | (1,575 | ) | | | 4,240 | | | | 1,109 | | | | (3,742 | ) | | | (5,569 | ) | | |
|
Increase (Decrease) in Net Assets Derived from Capital Share Transactions | | | (47,610 | ) | | | 34,918 | | | | (721 | ) | | | 3,093 | | | | (91,360 | ) | | | 233,452 | | | |
|
Net Increase (Decrease) in Net Assets | | | (82,803 | ) | | | 108,694 | | | | (34,529 | ) | | | 2,623 | | | | (79,030 | ) | | | 177,020 | | | |
|
Net Assets | | | | | | | | | | | | | | | | | | | | | | | | | | |
Beginning of period | | | 878,316 | | | | 769,622 | | | | 515,510 | | | | 512,887 | | | | 2,883,436 | | | | 2,706,416 | | | |
|
End of period(3) | | $ | 795,513 | | | $ | 878,316 | | | $ | 480,981 | | | $ | 515,510 | | | | $ 2,804,406 | | | $ | 2,883,436 | | | |
| (1) | Current year presentation of distributions conforms withS-X Disclosure Simplification. Prior year distributions have been consolidated to conform withS-X Disclosure Simplification. |
| (2) | See Note 7 in Notes to Financial Statements for additional information. |
| (3) | Includes undistributed (distributed in excess) net investment income of $8,131, $3,841, $(31,478), $(2,511), $2,525, $507, $122, as of year ended September 30,2018. The SEC eliminated the requirement to disclose undistributed net investment income on November 5, 2018. |
Amounts designated as “–” are either $0 or have been rounded to $0.
The accompanying notes are an integral part of the financial statements.
| | |
272 | | SEI Institutional Managed Trust / Semi-Annual Report / March 31, 2019 |
| | | | | | | | | | | | | | | | | | | | | | | | | | | | | | | | |
| Multi-Asset Income Fund | | | Multi-Asset Inflation Managed Fund | | | Multi-Asset Capital Stability Fund | | | Long/Short Alternative Fund | | | |
| |
| 10/01/18 to 03/31/19 | | | 2018 | | | 10/01/18 to 03/31/19 | | | 2018 | | | 10/01/18 to 03/31/19 | | | 2018 | | | 10/01/18 to 03/31/19 | | | 2018 | | | |
| |
| | | | | | | | | | | | | | | | | | | | | | | | | | | | | | | | |
| | $ 20,071 | | | $ | 37,225 | | | | $ 2,411 | | | $ | 17,829 | | | | $ 4,392 | | | $ | 6,604 | | | | $ 227 | | | $ | 251 | | | |
| | 858 | | | | (21,869 | ) | | | (24,106 | ) | | | (8,677 | ) | | | (1,420 | ) | | | 3,462 | | | | (1,865 | ) | | | 1,255 | | | |
| | (599 | ) | | | 405 | | | | 38 | | | | 294 | | | | 1,084 | | | | 1,483 | | | | – | | | | – | | | |
| | 11,696 | | | | (603 | ) | | | 15,351 | | | | (37 | ) | | | 5,948 | | | | 5,096 | | | | 207 | | | | (89 | ) | | |
| (73 | ) | | | 207 | | | | (53 | ) | | | 299 | | | | 17 | | | | (3,654 | ) | | | – | | | | – | | | |
| |
| | 31,953 | | | | 15,365 | | | | (6,359 | ) | | | 9,708 | | | | 10,021 | | | | 12,991 | | | | (1,431 | ) | | | 1,417 | | | |
| |
| | | | | | | | | | | | | | | | | | | | | | | | | | | | | | | | |
| | (13,864 | ) | | | (30,960 | ) | | | (14,874 | ) | | | (11,555 | ) | | | (3,555 | ) | | | (25,696 | ) | | | (154 | ) | | | (2 | ) | | |
| | (2,986 | ) | | | (6,868 | ) | | | (1,199 | ) | | | (1,099 | ) | | | (268 | ) | | | (1,843 | ) | | | (1,144 | ) | | | (3,297 | ) | | |
| | | | | | | | |
| | – | | | | (1,710 | ) | | | – | | | | – | | | | – | | | | – | | | | – | | | | – | | | |
| | – | | | | (385 | ) | | | – | | | | – | | | | – | | | | – | | | | – | | | | – | | | |
| |
| | (16,850 | ) | | | (39,923 | ) | | | (16,073 | ) | | | (12,654 | ) | | | (3,823 | ) | | | (27,539 | ) | | | (1,298 | ) | | | (3,299 | ) | | |
| |
| | | | | | | | |
| | 75,814 | | | | 215,339 | | | | 64,637 | | | | 195,293 | | | | 81,151 | | | | 162,884 | | | | 6,197 | | | | 4,203 | | | |
| | 11,841 | | | | 27,889 | | | | 13,675 | | | | 10,530 | | | | 2,824 | | | | 20,037 | | | | 154 | | | | 3 | | | |
| | (128,549 | ) | | | (221,840 | ) | | | (112,452 | ) | | | (163,885 | ) | | | (104,991 | ) | | | (180,605 | ) | | | (7,098 | ) | | | (111 | ) | | |
| |
| | (40,894 | ) | | | 21,388 | | | | (34,140 | ) | | | 41,938 | | | | (21,016 | ) | | | 2,316 | | | | (747 | ) | | | 4,095 | | | |
| |
| | | | | | | | |
| | 15,308 | | | | 39,982 | | | | 10,578 | | | | 5,855 | | | | 9,317 | | | | 4,907 | | | | – | | | | – | | | |
| | 2,933 | | | | 7,110 | | | | 1,168 | | | | 1,071 | | | | 267 | | | | 1,839 | | | | – | | | | – | | | |
| | (37,315 | ) | | | (34,218 | ) | | | (8,799 | ) | | | (11,612 | ) | | | (5,432 | ) | | | (11,444 | ) | | | (1,500 | ) | | | – | | | |
| |
| | (19,074 | ) | | | 12,874 | | | | 2,947 | | | | (4,686 | ) | | | 4,152 | | | | (4,698 | ) | | | (1,500 | ) | | | – | | | |
| |
| | (59,968 | ) | | | 34,262 | | | | (31,193 | ) | | | 37,252 | | | | (16,864 | ) | | | (2,382 | ) | | | (2,247 | ) | | | 4,095 | | | |
| |
| | (44,865 | ) | | | 9,704 | | | | (53,625 | ) | | | 34,306 | | | | (10,666 | ) | | | (16,930 | ) | | | (4,976 | ) | | | 2,213 | | | |
| |
| | | | | | | | |
| | 990,451 | | | | 980,747 | | | | 924,003 | | | | 889,697 | | | | 727,663 | | | | 744,593 | | | | 36,595 | | | | 34,382 | | | |
| |
| | $ 945,586 | | | $ | 990,451 | | | | $ 870,378 | | | $ | 924,003 | | | | $ 716,997 | | | $ | 727,663 | | | | $ 31,619 | | | $ | 36,595 | | | |
| | |
SEI Institutional Managed Trust / Semi-Annual Report / March 31, 2019 | | 273 |
CONSOLIDATED STATEMENT OF CASH FLOWS (Unaudited) ($ Thousands)
For the six months ended March 31, 2019
| | | | |
| | | Multi-Asset Inflation
Managed Fund | |
| |
Cash Flows from Operating Activities: | | | | |
| |
Net decrease in net assets from operations | | $ | (6,359) | |
| |
Adjustments to reconcile net increase in net assets resulting from operations to net cash provided by operating activities: | | | | |
| |
Purchase of investment securities | | | (272,453) | |
| |
Proceeds from disposition of investment securities | | | 321,263 | |
| |
Proceeds from securities sold short | | | 24,665 | |
| |
Purchases to cover securities sold short | | | (26,921) | |
| |
Purchased options/purchases to cover written options | | | (338) | |
| |
Amortization (accretion of market discount) | | | 169 | |
| |
Net Realized Gain/(Loss) on: | | | | |
| |
Investments, options contracts and securities sold short | | | 10,095 | |
| |
Net Change in Unrealized (Appreciation)/Depreciation on: | | | | |
| |
Investments, options contracts and securities sold short | | | (17,300) | |
| |
Changes in Assets: | | | | |
| |
Cash collateral on swaps | | | 106 | |
| |
Cash collateral on futures | | | 892 | |
| |
Foreign currency, at value | | | (804) | |
| |
Receivable for investment securities sold | | | (11,573) | |
| |
Dividends and interest receivable | | | (127) | |
| |
Unrealized gain on forward foreign currency contracts | | | 420 | |
| |
Unrealized gain of foreign spot currency contracts | | | 3 | |
| |
OTC swap contracts, at value | | | (42) | |
| |
Receivable for variation margin | | | 403 | |
| |
Due from broker | | | 292 | |
| |
Foreign tax reclaim receivable | | | 10 | |
| |
Prepaid expenses | | | (6) | |
| |
Changes in Liabilities: | | | | |
| |
Shareholder servicing fees payable, Class F | | | (5) | |
| |
Payable for investment securities purchased | | | 174 | |
| |
OTC swap contracts, at value | | | 1,070 | |
| |
Payable for variation margin | | | 96 | |
| |
Investment advisory fees payable | | | 2 | |
| |
Trustees fees payable | | | 4 | |
| |
Administration fees payable | | | (3) | |
| |
Unrealized loss on forward foreign currency contracts | | | (65) | |
| |
Unrealized loss on foreign currency spot contracts | | | 57 | |
| |
Interest payable | | | 529 | |
| |
Accrued expenses payable | | | (14) | |
| | |
Net cash provided by operating activities | | | 24,240 | |
| | |
| |
Cash Flows from Financing Activities | | | | |
| |
Reverse repurchase agreements | | | 54,447 | |
| |
Dividends and distributions | | | (16,073) | |
| |
Proceeds from shares issued | | | 75,259 | |
| |
Reinvestment of dividends and distributions | | | 14,843 | |
| |
Cost of shares redeemed | | | (121,333) | |
| | |
Net cash provided by financing activities | | | 7,143 | |
| | |
| |
Net Change in Cash | | | 31,383 | |
| |
Cash and cash equivalents at beginning of period | | $ | 140,831 | |
| | |
| |
Cash and cash equivalents at end of period | | $ | 172,214 | |
| | |
The accompanying notes are an integral part of the financial statements.
| | |
274 | | SEI Institutional Managed Trust / Semi-Annual Report / March 31, 2019 |
FINANCIAL HIGHLIGHTS
For the period ended March 31, 2019 (Unaudited) and the years or periods ended September 30, (unless otherwise indicated)
For a Share Outstanding Throughout the Periods
| | | | | | | | | | | | | | | | | | | | | | | | | | | | | | | | | | | | | | | | | | | | | | | | | | | | | | | | | | | | |
| | | Net Asset
Value,
Beginning of
Period | | Net Investment Income
(Loss)(1) | | Net Realized
and Unrealized
Gains (Losses) on
Investments(1) | | Total
from
Operations | | | Dividends
from Net
Investment
Income | | Distributions
from Net
Realized
Capital
Gains | | Total
Dividends
and
Distributions | | Net Asset Value,
End
of Period | | Total
Return† | | | Net Assets
End of Period
($ Thousands) | | Ratio of Net
Expenses
to Average
Net Assets | | Ratio of Expenses
to Average Net
Assets (Excluding
Fees Paid Indirectly
and Including
Waivers) | | Ratio of Expenses
to Average
Net Assets
(Excluding Fees
Paid Indirectly
and Waivers) | | Ratio of Net
Investment
Income (Loss)
to Average
Net Assets | | Portfolio
Turnover Rate† |
Large Cap Fund | | | | | | | | | | | | | | | | | | | | | | | | | | | | | | | | | | | | | | | | | | | | | | | | | | | | | | | | | |
Class F | | | | | | | | | | | | | | | | | | | | | | | | | | | | | | | | | | | | | | | | | | | | | | | | | | | | | | | | | |
2019@ | | $ | 15.92 | | | $ | 0.10 | | | $ | (0.72 | ) | | $ | (0.62) | | | $ | (0.09) | | | $ | (1.77) | | | $ | (1.86 | ) | | $ | 13.44 | | | | (3.04 | )% | | $ | 2,217,205 | | | | 0.89 | % | | | 0.89 | %�� | | | 0.95 | % | | | 1.46 | % | | | 44 | % |
2018 | | | 14.65 | | | | 0.13 | | | | 2.22 | | | | 2.35 | | | | (0.12) | | | | (0.96) | | | | (1.08 | ) | | | 15.92 | | | | 16.80 | | | | 2,439,320 | | | | 0.89 | | | | 0.89 | | | | 0.94 | | | | 0.87 | | | | 80 | |
2017 | | | 12.54 | | | | 0.12 | | | | 2.11 | | | | 2.23 | | | | (0.12) | | | | – | | | | (0.12 | ) | | | 14.65 | | | | 17.88 | | | | 2,362,180 | | | | 0.89 | | | | 0.89 | | | | 0.95 | | | | 0.91 | | | | 100 | |
2016 | | | 13.71 | | | | 0.12 | | | | 1.16 | | | | 1.28 | | | | (0.12) | | | | (2.33) | | | | (2.45 | ) | | | 12.54 | | | | 10.15 | | | | 2,237,663 | | | | 0.91 | (2) | | | 0.91 | (2) | | | 0.99 | (2) | | | 1.01 | | | | 68 | |
2015 | | | 15.19 | | | | 0.11 | | | | (0.30 | ) | | | (0.19 | ) | | | (0.09) | | | | (1.20) | | | | (1.29 | ) | | | 13.71 | | | | (1.73 | ) | | | 2,483,582 | | | | 0.89 | | | | 0.89 | | | | 0.97 | | | | 0.74 | | | | 110 | |
2014 | | | 13.95 | | | | 0.09 | | | | 2.19 | | | | 2.28 | | | | (0.09) | | | | (0.95) | | | | (1.04 | ) | | | 15.19 | | | | 16.96 | | | | 2,581,944 | | | | 0.89 | | | | 0.89 | | | | 1.01 | | | | 0.60 | | | | 57 | |
Class Y | | | | | | | | | | | | | | | | | | | | | | | | | | | | | | | | | | | | | | | | | | | | | | | | | | | | | | | | | |
2019@ | | $ | 15.93 | | | $ | 0.12 | | | $ | (0.72 | ) | | $ | (0.60 | ) | | $ | (0.11) | | | $ | (1.77) | | | $ | (1.88 | ) | | $ | 13.45 | | | | (2.90 | )% | | $ | 132,096 | | | | 0.64 | % | | | 0.64 | % | | | 0.70 | % | | | 1.71 | % | | | 44 | % |
2018 | | | 14.66 | | | | 0.17 | | | | 2.22 | | | | 2.39 | | | | (0.16) | | | | (0.96) | | | | (1.12 | ) | | | 15.93 | | | | 17.08 | | | | 137,136 | | | | 0.64 | | | | 0.64 | | | | 0.69 | | | | 1.11 | | | | 80 | |
2017 | | | 12.55 | | | | 0.16 | | | | 2.10 | | | | 2.26 | | | | (0.15) | | | | – | | | | (0.15 | ) | | | 14.66 | | | | 18.16 | | | | 156,329 | | | | 0.64 | | | | 0.64 | | | | 0.70 | | | | 1.16 | | | | 100 | |
2016 | | | 13.71 | | | | 0.16 | | | | 1.16 | | | | 1.32 | | | | (0.15) | | | | (2.33) | | | | (2.48 | ) | | | 12.55 | | | | 10.50 | | | | 164,611 | | | | 0.66 | (2) | | | 0.66 | (2) | | | 0.74 | (2) | | | 1.26 | | | | 68 | |
2015(3) | | | 14.62 | | | | 0.11 | | | | (0.94 | ) | | | (0.83 | ) | | | (0.08) | | | | – | | | | (0.08 | ) | | | 13.71 | | | | (5.74 | ) | | | 156,158 | | | | 0.64 | | | | 0.64 | | | | 0.72 | | | | 1.03 | | | | 110 | |
Large Cap Value Fund | | | | | | | | | | | | | | | | | | | | | | | | | | | | | | | | | | | | | | | | | | | | | | | | | |
Class F | | | | | | | | | | | | | | | | | | | | | | | | | | | | | | | | | | | | | | | | | | | | | | | | | | | | | | | | | |
2019@ | | $ | 26.21 | | | $ | 0.27 | | | $ | (1.29 | ) | | $ | (1.02 | ) | | $ | (0.24) | | | $ | (2.06) | | | $ | (2.30 | ) | | $ | 22.89 | | | | (3.43 | )% | | $ | 1,192,683 | | | | 0.89 | % | | | 0.89 | % | | | 0.94 | % | | | 2.35 | % | | | 24 | % |
2018 | | | 24.70 | | | | 0.39 | | | | 2.39 | | | | 2.78 | | | | (0.37) | | | | (0.90) | | | | (1.27 | ) | | | 26.21 | | | | 11.54 | | | | 1,285,571 | | | | 0.89 | | | | 0.89 | | | | 0.93 | | | | 1.51 | | | | 83 | |
2017 | | | 21.20 | | | | 0.32 | | | | 3.49 | | | | 3.81 | | | | (0.31) | | | | – | | | | (0.31 | ) | | | 24.70 | | | | 18.13 | | | | 1,261,075 | | | | 0.89 | | | | 0.89 | | | | 0.93 | | | | 1.38 | | | | 76 | |
2016 | | | 22.35 | | | | 0.32 | | | | 1.78 | | | | 2.10 | | | | (0.30) | | | | (2.95) | | | | (3.25 | ) | | | 21.20 | | | | 10.16 | | | | 1,300,029 | | | | 0.91 | (2) | | | 0.91 | (2) | | | 0.95 | (2) | | | 1.56 | | | | 70 | |
2015 | | | 25.71 | | | | 0.32 | | | | (1.72 | ) | | | (1.40 | ) | | | (0.25) | | | | (1.71) | | | | (1.96 | ) | | | 22.35 | | | | (6.15 | ) | | | 1,300,033 | | | | 0.89 | | | | 0.90 | | | | 0.93 | | | | 1.29 | | | | 96 | |
2014 | | | 21.94 | | | | 0.29 | | | | 3.76 | | | | 4.05 | | | | (0.28) | | | | – | | | | (0.28 | ) | | | 25.71 | | | | 18.55 | | | | 1,527,500 | | | | 0.89 | | | | 0.89 | | | | 0.97 | | | | 1.19 | | | | 58 | |
Class I | | | | | | | | | | | | | | | | | | | | | | | | | | | | | | | | | | | | | | | | | | | | | | | | | | | | | | | | | |
2019@ | | $ | 26.23 | | | $ | 0.25 | | | $ | (1.30 | ) | | $ | (1.05 | ) | | $ | (0.21) | | | $ | (2.06) | | | $ | (2.27 | ) | | $ | 22.91 | | | | (3.53 | )% | | $ | 4,014 | | | | 1.11 | % | | | 1.11 | % | | | 1.18 | % | | | 2.12 | % | | | 24 | % |
2018 | | | 24.71 | | | | 0.33 | | | | 2.40 | | | | 2.73 | | | | (0.31) | | | | (0.90) | | | | (1.21 | ) | | | 26.23 | | | | 11.30 | | | | 4,427 | | | | 1.11 | | | | 1.11 | | | | 1.18 | | | | 1.29 | | | | 83 | |
2017 | | | 21.21 | | | | 0.27 | | | | 3.49 | | | | 3.76 | | | | (0.26) | | | | – | | | | (0.26 | ) | | | 24.71 | | | | 17.84 | | | | 4,666 | | | | 1.11 | | | | 1.11 | | | | 1.18 | | | | 1.16 | | | | 76 | |
2016 | | | 22.35 | | | | 0.28 | | | | 1.78 | | | | 2.06 | | | | (0.25) | | | | (2.95) | | | | (3.20 | ) | | | 21.21 | | | | 9.93 | | | | 6,165 | | | | 1.13 | (2) | | | 1.13 | (2) | | | 1.20 | (2) | | | 1.33 | | | | 70 | |
2015 | | | 25.71 | | | | 0.27 | | | | (1.72 | ) | | | (1.45 | ) | | | (0.20) | | | | (1.71) | | | | (1.91 | ) | | | 22.35 | | | | (6.34 | ) | | | 7,477 | | | | 1.11 | | | | 1.12 | | | | 1.18 | | | | 1.06 | | | | 96 | |
2014 | | | 21.96 | | | | 0.24 | | | | 3.75 | | | | 3.99 | | | | (0.24) | | | | – | | | | (0.24 | ) | | | 25.71 | | | | 18.22 | | | | 9,499 | | | | 1.11 | | | | 1.11 | | | | 1.22 | | | | 0.97 | | | | 58 | |
Class Y | | | | | | | | | | | | | | | | | | | | | | | | | | | | | | | | | | | | | | | | | | | | | | | | | | | | | | | | | |
2019@ | | $ | 26.21 | | | $ | 0.30 | | | $ | (1.28 | ) | | $ | (0.98 | ) | | $ | (0.27) | | | $ | (2.06) | | | $ | (2.33 | ) | | $ | 22.90 | | | | (3.26 | )% | | $ | 151,447 | | | | 0.64 | % | | | 0.64 | % | | | 0.69 | % | | | 2.59 | % | | | 24 | % |
2018 | | | 24.70 | | | | 0.45 | | | | 2.40 | | | | 2.85 | | | | (0.44) | | | | (0.90) | | | | (1.34 | ) | | | 26.21 | | | | 11.82 | | | | 141,700 | | | | 0.64 | | | | 0.64 | | | | 0.68 | | | | 1.77 | | | | 83 | |
2017 | | | 21.21 | | | | 0.38 | | | | 3.48 | | | | 3.86 | | | | (0.37) | | | | – | | | | (0.37 | ) | | | 24.70 | | | | 18.37 | | | | 120,357 | | | | 0.64 | | | | 0.64 | | | | 0.69 | | | | 1.63 | | | | 76 | |
2016(4) | | | 23.90 | | | | 0.35 | | | | 0.16 | | | | 0.51 | | | | (0.25) | | | | (2.95) | | | | (3.20 | ) | | | 21.21 | | | | 2.88 | | | | 22,004 | | | | 0.66 | (2) | | | 0.66 | (2) | | | 0.70 | (2) | | | 1.89 | | | | 70 | |
| † | Returns and portfolio turnover rates are for the period indicated and have not been annualized. Returns do not reflect the deduction of taxes the shareholder would pay on fund distributions or redemption of fund shares. |
| @ | For thesix-month period ended March 31, 2019. All ratios for the period have been annualized. |
| (1) | Per share net investment income and net realized and unrealized gains (losses) calculated using average shares. |
| (2) | The expense ratio includes proxy expenses outside of the cap. |
| (3) | Commenced operations on December 31, 2014. All ratios for the period have been annualized. |
| (4) | Commenced operations on October 30, 2015. All ratios for the period have been annualized. |
Amounts designated as “–” are either $0 or have been rounded to $0.
| | |
SEI Institutional Managed Trust / Semi-Annual Report / March 31, 2019 | | 275 |
FINANCIAL HIGHLIGHTS
For the period ended March 31, 2019 (Unaudited) and the years or periods ended September 30, (unless otherwise indicated)
For a Share Outstanding Throughout the Periods
| | | | | | | | | | | | | | | | | | | | | | | | | | | | | | | | | | | | | | | | | | | | | | | | | | | | | | | | | | | | |
| | | | | | | | | | | | | | | | |
| | | Net Asset
Value,
Beginning of
Period | | Net
Investment
Income
(Loss)(1) | | Net Realized
and Unrealized
Gains (Losses) on
Investments(1) | | Total from
Operations | | | Dividends
from Net
Investment
Income | | Distributions
from Net
Realized
Capital
Gains | | Total
Dividends
and
Distributions | | Net Asset
Value,
End
of Period | | Total
Return† | | | Net Assets End of Period
($ Thousands) | | Ratio of Net
Expenses
to Average
Net Assets | | Ratio of Expenses
to Average Net
Assets (Excluding
Fees Paid Indirectly
and Including
Waivers) | | Ratio of Expenses
to Average Net Assets
(Excluding Fees
Paid Indirectly
and Waivers) | | Ratio of Net
Investment
Income (Loss)
to Average
Net Assets | | Portfolio
Turnover
Rate† |
Large Cap Growth Fund | | | | | | | | | | | | | | | | | | | | | | | | | | | | | | | | | | | | | | | | | | | | | | | | | | | | | |
Class F | | | | | | | | | | | | | | | | | | | | | | | | | | | | | | | | | | | | | | | | | | | | | | | | | | | | | | | | | |
2019@ | | $ | 39.89 | | | $ | 0.10 | | | $ | (1.05 | ) | | $ | (0.95 | ) | | $ | (0.06 | ) | | $ | (4.33) | | | $ | (4.39 | ) | | $ | 34.55 | | | | (1.29 | )% | | $ | 1,326,808 | | | | 0.89 | % | | | 0.89 | % | | | 0.98 | % | | | 0.57 | % | | | 49 | % |
2018 | | | 34.72 | | | | 0.06 | | | | 8.03 | | | | 8.09 | | | | (0.05 | ) | | | (2.87 | ) | | | (2.92 | ) | | | 39.89 | | | | 24.74 | | | | 1,416,472 | | | | 0.89 | | | | 0.89 | | | | 0.98 | | | | 0.16 | | | | 75 | |
2017 | | | 29.74 | | | | 0.06 | | | | 4.96 | | | | 5.02 | | | | (0.04 | ) | | | – | | | | (0.04 | ) | | | 34.72 | | | | 16.89 | | | | 1,364,211 | | | | 0.89 | | | | 0.89 | | | | 0.98 | | | | 0.20 | | | | 95 | |
2016 | | | 32.22 | | | | 0.02 | | | | 3.02 | | | | 3.04 | | | | (0.01 | ) | | | (5.51 | ) | | | (5.52 | ) | | | 29.74 | | | | 9.77 | | | | 1,421,656 | | | | 0.91 | (2) | | | 0.91 | (2) | | | 1.00 | (2) | | | 0.06 | | | | 93 | |
2015 | | | 33.82 | | | | 0.08 | | | | 0.97 | | | | 1.05 | | | | (0.05 | ) | | | (2.60 | ) | | | (2.65 | ) | | | 32.22 | | | | 2.87 | | | | 1,442,646 | | | | 0.89 | | | | 0.89 | | | | 0.98 | | | | 0.24 | | | | 110 | |
2014 | | | 30.28 | | | | 0.09 | | | | 4.25 | | | | 4.34 | | | | (0.09 | ) | | | (0.71 | ) | | | (0.80 | ) | | | 33.82 | | | | 14.51 | | | | 1,550,723 | | | | 0.89 | | | | 0.89 | | | | 1.02 | | | | 0.26 | | | | 61 | |
Class I | | | | | | | | | | | | | | | | | | | | | | | | | | | | | | | | | | | | | | | | | | | | | | | | | | | | | | | | | |
2019@ | | $ | 38.96 | | | $ | 0.06 | | | $ | (1.03 | ) | | $ | (0.97 | ) | | $ | (0.01 | ) | | $ | (4.33 | ) | | $ | (4.34 | ) | | $ | 33.65 | | | | (1.40 | )% | | $ | 3,425 | | | | 1.11 | % | | | 1.11 | % | | | 1.23 | % | | | 0.34 | % | | | 49 | % |
2018 | | | 34.02 | | | | (0.02 | ) | | | 7.84 | | | | 7.82 | | | | (0.01 | ) | | | (2.87 | ) | | | (2.88 | ) | | | 38.96 | | | | 24.42 | | | | 3,863 | | | | 1.11 | | | | 1.11 | | | | 1.23 | | | | (0.06 | ) | | | 75 | |
2017 | | | 29.17 | | | | (0.01 | ) | | | 4.86 | | | | 4.85 | | | | – | | | | – | | | | – | | | | 34.02 | | | | 16.63 | | | | 3,607 | | | | 1.11 | | | | 1.11 | | | | 1.23 | | | | (0.03 | ) | | | 95 | |
2016 | | | 31.75 | | | | (0.04 | ) | | | 2.97 | | | | 2.93 | | | | – | | | | (5.51 | ) | | | (5.51 | ) | | | 29.17 | | | | 9.54 | | | | 4,783 | | | | 1.13 | (2) | | | 1.13 | (2) | | | 1.25 | (2) | | | (0.15 | ) | | | 93 | |
2015 | | | 33.40 | | | | 0.01 | | | | 0.96 | | | | 0.97 | | | | (0.02 | ) | | | (2.60 | ) | | | (2.62 | ) | | | 31.75 | | | | 2.65 | | | | 5,558 | | | | 1.11 | | | | 1.11 | | | | 1.23 | | | | 0.02 | | | | 110 | |
2014 | | | 29.93 | | | | 0.01 | | | | 4.21 | | | | 4.22 | | | | (0.04 | ) | | | (0.71 | ) | | | (0.75 | ) | | | 33.40 | | | | 14.28 | | | | 7,245 | | | | 1.11 | | | | 1.11 | | | | 1.27 | | | | 0.05 | | | | 61 | |
Class Y | | | | | | | | | | | | | | | | | | | | | | | | | | | | | | | | | | | | | | | | | | | | | | | | | | | | | | | | | |
2019@ | | $ | 39.96 | | | $ | 0.14 | | | $ | (1.05 | ) | | $ | (0.91 | ) | | $ | (0.13 | ) | | $ | (4.33 | ) | | $ | (4.46 | ) | | $ | 34.59 | | | | (1.18 | )% | | $ | 151,530 | | | | 0.64 | % | | | 0.64 | % | | | 0.74 | % | | | 0.83 | % | | | 49 | % |
2018 | | | 34.76 | | | | 0.15 | | | | 8.04 | | | | 8.19 | | | | (0.12 | ) | | | (2.87 | ) | | | (2.99 | ) | | | 39.96 | | | | 25.04 | | | | 139,001 | | | | 0.64 | | | | 0.64 | | | | 0.73 | | | | 0.41 | | | | 75 | |
2017 | | | 29.80 | | | | 0.14 | | | | 4.96 | | | | 5.10 | | | | (0.14 | ) | | | – | | | | (0.14 | ) | | | 34.76 | | | | 17.17 | | | | 123,109 | | | | 0.64 | | | | 0.64 | | | | 0.74 | | | | 0.45 | | | | 95 | |
2016(3) | | | 34.91 | | | | 0.07 | | | | 0.36 | | | | 0.43 | | | | (0.03 | ) | | | (5.51 | ) | | | (5.54 | ) | | | 29.80 | | | | 1.58 | | | | 20,481 | | | | 0.66 | (2) | | | 0.66 | (2) | | | 0.75 | (2) | | | 0.25 | | | | 93 | |
Large Cap Index Fund | | | | | | | | | | | | | | | | | | | | | | | | | | | | | | | | | | | | | | | | | | | | | | | | | | | | | |
Class F | | | | | | | | | | | | | | | | | | | | | | | | | | | | | | | | | | | | | | | | | | | | | | | | | | | | | | | | | |
2019@ | | $ | 10.37 | | | $ | 0.10 | | | $ | (0.30 | ) | | $ | (0.20 | ) | | $ | (0.09 | ) | | $ | (0.02 | ) | | $ | (0.11 | ) | | $ | 10.06 | | | | (1.88 | )% | | $ | 309,517 | | | | 0.25 | % | | | 0.25 | % | | | 0.65 | % | | | 2.02 | % | | | 5 | % |
2018(4) | | | 10.00 | | | | 0.13 | | | | 0.31 | | | | 0.44 | | | | (0.07 | ) | | | – | | | | (0.07 | ) | | | 10.37 | | | | 4.47 | ‡ | | | 233,871 | | | | 0.25 | | | | 0.25 | | | | 0.64 | | | | 1.93 | | | | 6 | |
Tax-Managed Large Cap Fund | | | | | | | | | | | | | | | | | | | | | | | | | | | | | | | | | | | | | | | | | | | | | | | | | |
Class F | | | | | | | | | | | | | | | | | | | | | | | | | | | | | | | | | | | | | | | | | | | | | | | | | | | | | | | | | |
2019@ | | $ | 27.66 | | | $ | 0.16 | | | $ | (1.08 | ) | | $ | (0.92 | ) | | $ | (0.14 | ) | | $ | (0.18) | | | $ | (0.32 | ) | | $ | 26.42 | | | | (3.25 | )% | | $ | 3,475,848 | | | | 0.89 | % | | | 0.89 | % | | | 0.91 | % | | | 1.23 | % | | | 33 | % |
2018 | | | 24.11 | | | | 0.22 | | | | 3.83 | | | | 4.05 | | | | (0.20 | ) | | | (0.30 | ) | | | (0.50 | ) | | | 27.66 | | | | 16.99 | | | | 3,773,973 | | | | 0.89 | | | | 0.89 | | | | 0.90 | | | | 0.84 | | | | 44 | |
2017 | | | 20.74 | | | | 0.18 | | | | 3.37 | | | | 3.55 | | | | (0.18 | ) | | | – | | | | (0.18 | ) | | | 24.11 | | | | 17.19 | | | | 3,385,550 | | | | 0.90 | (5) | | | 0.90 | (5) | | | 0.94 | (5) | | | 0.82 | | | | 88 | |
2016 | | | 19.13 | | | | 0.19 | | | | 1.60 | | | | 1.79 | | | | (0.18 | ) | | | – | | | | (0.18 | ) | | | 20.74 | | | | 9.42 | | | | 3,427,251 | | | | 0.91 | (2) | | | 0.91 | (2) | | | 1.00 | (2) | | | 0.95 | | | | 89 | |
2015 | | | 19.64 | | | | 0.14 | | | | (0.52 | ) | | | (0.38 | ) | | | (0.13 | ) | | | – | | | | (0.13 | ) | | | 19.13 | | | | (1.99 | ) | | | 3,072,983 | | | | 0.89 | | | | 0.89 | | | | 0.98 | | | | 0.70 | | | | 85 | |
2014 | | | 16.81 | | | | 0.12 | | | | 2.84 | | | | 2.96 | | | | (0.13 | ) | | | – | | | | (0.13 | ) | | | 19.64 | | | | 17.63 | | | | 3,089,839 | | | | 0.89 | | | | 0.89 | | | | 1.02 | | | | 0.65 | | | | 39 | |
Class Y | | | | | | | | | | | | | | | | | | | | | | | | | | | | | | | | | | | | | | | | | | | | | | | | | | | | | | | | | |
2019@ | | $ | 27.67 | | | $ | 0.19 | | | $ | (1.08 | ) | | $ | (0.89 | ) | | $ | (0.17 | ) | | $ | (0.18 | ) | | $ | (0.35 | ) | | $ | 26.43 | | | | (3.12 | )% | | $ | 433,904 | | | | 0.64 | % | | | 0.64 | % | | | 0.66 | % | | | 1.51 | % | | | 33 | % |
2018 | | | 24.13 | | | | 0.28 | | | | 3.82 | | | | 4.10 | | | | (0.26 | ) | | | (0.30 | ) | | | (0.56 | ) | | | 27.67 | | | | 17.22 | | | | 371,706 | | | | 0.64 | | | | 0.64 | | | | 0.65 | | | | 1.08 | | | | 44 | |
2017 | | | 20.75 | | | | 0.24 | | | | 3.37 | | | | 3.61 | | | | (0.23 | ) | | | – | | | | (0.23 | ) | | | 24.13 | | | | 17.52 | | | | 317,822 | | | | 0.65 | (5) | | | 0.65 | (5) | | | 0.69 | (5) | | | 1.07 | | | | 88 | |
2016 | | | 19.13 | | | | 0.24 | | | | 1.61 | | | | 1.85 | | | | (0.23 | ) | | | – | | | | (0.23 | ) | | | 20.75 | | | | 9.75 | | | | 198,095 | | | | 0.66 | (2) | | | 0.66 | (2) | | | 0.75 | (2) | | | 1.20 | | | | 89 | |
2015(6) | | | 20.46 | | | | 0.15 | | | | (1.38 | ) | | | (1.23 | ) | | | (0.10 | ) | | | – | | | | (0.10 | ) | | | 19.13 | | | | (6.04 | ) | | | 129,791 | | | | 0.64 | | | | 0.64 | | | | 0.73 | | | | 1.00 | | | | 85 | |
| † | Returns and portfolio turnover rates are for the period indicated and have not been annualized. Returns do not reflect the deduction of taxes the shareholder would pay on fund distributions or redemption of fund shares. |
| ‡ | Includes contribution from SIMC. Without the cash contribution, the Fund’s return would have been 4.26% (See Note 6 in the Notes to Financial Statements). |
| @ | For thesix-month period ended March 31, 2019. All ratios for the period have been annualized. |
| (1) | Per share net investment income and net realized and unrealized gains (losses) calculated using average shares. |
| (2) | The expense ratio includes proxy expenses outside of the cap. |
| (3) | Commenced operations on October 30, 2015. All ratios for the period have been annualized. |
| (4) | Commenced operations on January 31, 2018. All ratios for the period have been annualized. |
| (5) | The expense ratio includes litigation expenses outside the cap. |
| (6) | Commenced operations on December 31, 2014. All ratios for the period have been annualized. |
Amounts designated as “–” are either $0 or have been rounded to $0.
| | |
276 | | SEI Institutional Managed Trust / Semi-Annual Report / March 31, 2019 |
FINANCIAL HIGHLIGHTS
For the period ended March 31, 2019 (Unaudited) and the years or periods ended September 30, (unless otherwise indicated)
For a Share Outstanding Throughout the Periods
| | | | | | | | | | | | | | | | | | | | | | | | | | | | | | | | | | | | | | | | | | | | | | | | | | | | | | | | | | | | |
| | | | | | | | | | | | | | | | |
| | | Net Asset
Value,
Beginning of
Period | | Net
Investment
Income
(Loss)(1) | | Net Realized
and Unrealized
Gains (Losses) on
Investments(1) | | Total from
Operations | | | Dividends
from Net
Investment
Income | | Distributions
from Net
Realized
Capital
Gains | | Total
Dividends
and
Distributions | | Net Asset
Value,
End
of Period | | Total
Return† | | | Net Assets End of Period
($ Thousands) | | Ratio of Net
Expenses
to Average
Net Assets | | Ratio of Expenses
to Average Net
Assets (Excluding
Fees Paid Indirectly
and Including
Waivers) | | Ratio of Expenses
to Average Net Assets
(Excluding Fees
Paid Indirectly
and Waivers) | | Ratio of Net
Investment
Income (Loss)
to Average
Net Assets | | Portfolio
Turnover
Rate† |
S&P 500 Index Fund | | | | | | | | | | | | | | | | | | | | | | | | | | | | | | | | | | | | | | | | | | | | | | | | | |
Class F (3) | | | | | | | | | | | | | | | | | | | | | | | | | | | | | | | | | | | | | | | | | | | | | | | | | | | | | | | | | |
2019@ | | $ | 68.94 | | | $ | 0.65 | | | $ | (2.04 | ) | | $ | (1.39 | ) | | $ | (0.63 | ) | | $ | (1.24 | ) | | $ | (1.87 | ) | | $ | 65.68 | | | | (1.80 | )% | | $ | 822,224 | | | | 0.25 | % | | | 0.25 | % | | | 0.55 | % | | | 2.08 | % | | | 6 | % |
2018 | | | 60.22 | | | | 1.20 | | | | 9.19 | | | | 10.39 | | | | (1.13 | ) | | | (0.54 | ) | | | (1.67 | ) | | | 68.94 | | | | 17.53 | | | | 904,819 | | | | 0.29 | | | | 0.29 | | | | 0.55 | | | | 1.85 | | | | 17 | |
2017 | | | 53.32 | | | | 0.89 | | | | 8.47 | | | | 9.36 | | | | (0.87 | ) | | | (1.59 | ) | | | (2.46 | ) | | | 60.22 | | | | 18.12 | | | | 417,308 | | | | 0.43 | | | | 0.43 | | | | 0.54 | | | | 1.58 | | | | 21 | |
2016 | | | 47.23 | | | | 0.86 | | | | 6.13 | | | | 6.99 | | | | (0.83 | ) | | | (0.07 | ) | | | (0.90 | ) | | | 53.32 | | | | 14.93 | | | | 386,477 | | | | 0.45 | (2) | | | 0.45 | (2) | | | 0.57 | (2) | | | 1.69 | | | | 10 | |
2015 | | | 53.00 | | | | 0.77 | | | | (0.99 | ) | | | (0.22 | ) | | | (0.86 | ) | | | (4.69 | ) | | | (5.55 | ) | | | 47.23 | | | | (0.97 | ) | | | 385,743 | | | | 0.43 | | | | 0.43 | | | | 0.54 | | | | 1.51 | | | | 12 | |
2014 | | | 46.20 | | | | 0.79 | | | | 7.91 | | | | 8.70 | | | | (0.83 | ) | | | (1.07 | ) | | | (1.90 | ) | | | 53.00 | | | | 19.23 | | | | 394,132 | | | | 0.43 | | | | 0.43 | | | | 0.54 | | | | 1.58 | | | | 10 | |
Class I | | | | | | | | | | | | | | | | | | | | | | | | | | | | | | | | | | | | | | | | | | | | | | | | | | | | | | | | | |
2019@ | | $ | 69.31 | | | $ | 0.53 | | | $ | (2.05 | ) | | $ | (1.52 | ) | | $ | (0.50 | ) | | $ | (1.24 | ) | | $ | (1.74 | ) | | $ | 66.05 | | | | (1.98 | )% | | $ | 5,793 | | | | 0.65 | % | | | 0.65 | % | | | 0.80 | % | | | 1.67 | % | | | 6 | % |
2018 | | | 60.56 | | | | 0.92 | | | | 9.30 | | | | 10.22 | | | | (0.93 | ) | | | (0.54 | ) | | | (1.47 | ) | | | 69.31 | | | | 17.13 | | | | 6,372 | | | | 0.65 | | | | 0.65 | | | | 0.80 | | | | 1.43 | | | | 17 | |
2017 | | | 53.58 | | | | 0.77 | | | | 8.52 | | | | 9.29 | | | | (0.72 | ) | | | (1.59 | ) | | | (2.31 | ) | | | 60.56 | | | | 17.87 | | | | 6,328 | | | | 0.65 | | | | 0.65 | | | | 0.79 | | | | 1.36 | | | | 21 | |
2016 | | | 47.46 | | | | 0.76 | | | | 6.15 | | | | 6.91 | | | | (0.72 | ) | | | (0.07 | ) | | | (0.79 | ) | | | 53.58 | | | | 14.67 | | | | 6,473 | | | | 0.67 | (2) | | | 0.67 | (2) | | | 0.82 | (2) | | | 1.49 | | | | 10 | |
2015 | | | 53.22 | | | | 0.66 | | | | (0.99 | ) | | | (0.33 | ) | | | (0.74 | ) | | | (4.69 | ) | | | (5.43 | ) | | | 47.46 | | | | (1.19 | ) | | | 7,774 | | | | 0.65 | | | | 0.65 | | | | 0.79 | | | | 1.28 | | | | 12 | |
2014 | | | 46.38 | | | | 0.68 | | | | 7.94 | | | | 8.62 | | | | (0.71 | ) | | | (1.07 | ) | | | (1.78 | ) | | | 53.22 | | | | 18.95 | | | | 7,962 | | | | 0.65 | | | | 0.65 | | | | 0.79 | | | | 1.35 | | | | 10 | |
Small Cap Fund | | | | | | | | | | | | | | | | | | | | | | | | | | | | | | | | | | | | | | | | | | | | | | | | | | | | | |
Class F | | | | | | | | | | | | | | | | | | | | | | | | | | | | | | | | | | | | | | | | | | | | | | | | | | | | | | | | | |
2019@ | | $ | 14.28 | | | $ | 0.01 | | | $ | (1.66 | ) | | $ | (1.65 | ) | | $ | – | | | $ | (1.56 | ) | | $ | (1.56 | ) | | $ | 11.07 | | | | (10.73 | )% | | $ | 584,101 | | | | 1.14 | % | | | 1.14 | % | | | 1.24 | % | | | 0.12 | % | | | 69 | % |
2018 | | | 13.25 | | | | (0.02 | ) | | | 1.97 | | | | 1.95 | | | | – | | | | (0.92 | ) | | | (0.92 | ) | | | 14.28 | | | | 15.56 | | | | 690,400 | | | | 1.14 | | | | 1.14 | | | | 1.24 | | | | (0.17) | | | | 162 | |
2017 | | | 11.61 | | | | (0.02 | ) | | | 1.68 | | | | 1.66 | | | | (0.02 | ) | | | – | | | | (0.02 | ) | | | 13.25 | | | | 14.29 | | | | 588,341 | | | | 1.14 | | | | 1.14 | | | | 1.24 | | | | (0.12) | | | | 135 | |
2016 | | | 11.99 | | | | – | | | | 0.88 | | | | 0.88 | | | | – | | | | (1.26 | ) | | | (1.26 | ) | | | 11.61 | | | | 7.76 | | | | 550,556 | | | | 1.16 | (2) | | | 1.16 | (2) | | | 1.26 | (2) | | | 0.03 | | | | 104 | |
2015 | | | 13.01 | | | | (0.01 | ) | | | 0.04 | | | | 0.03 | | | | – | | | | (1.05 | ) | | | (1.05 | ) | | | 11.99 | | | | (0.24 | ) | | | 495,245 | | | | 1.14 | | | | 1.14 | | | | 1.22 | | | | (0.11) | | | | 137 | |
2014 | | | 13.32 | | | | (0.03 | ) | | | 0.61 | | | | 0.58 | | | | –* | | | | (0.89 | ) | | | (0.89 | ) | | | 13.01 | | | | 4.38 | | | | 483,282 | | | | 1.14 | | | | 1.14 | | | | 1.28 | | | | (0.24) | | | | 72 | |
Class Y | | | | | | | | | | | | | | | | | | | | | | | | | | | | | | | | | | | | | | | | | | | | | | | | | | | | | | | | | |
2019@ | | $ | 14.38 | | | $ | 0.02 | | | $ | (1.66 | ) | | $ | (1.64 | ) | | $ | – | | | $ | (1.56 | ) | | $ | (1.56 | ) | | $ | 11.18 | | | | (10.57 | )% | | $ | 35,688 | | | | 0.89 | % | | | 0.89 | % | | | 0.99 | % | | | 0.37 | % | | | 69 | % |
2018 | | | 13.31 | | | | 0.01 | | | | 1.98 | | | | 1.99 | | | | –* | | | | (0.92 | ) | | | (0.92 | ) | | | 14.38 | | | | 15.83 | | | | 36,423 | | | | 0.89 | | | | 0.89 | | | | 0.98 | | | | 0.07 | | | | 162 | |
2017 | | | 11.66 | | | | 0.02 | | | | 1.67 | | | | 1.69 | | | | (0.04 | ) | | | – | | | | (0.04 | ) | | | 13.31 | | | | 14.51 | | | | 39,149 | | | | 0.89 | | | | 0.89 | | | | 0.99 | | | | 0.13 | | | | 135 | |
2016 | | | 12.01 | | | | 0.03 | | | | 0.89 | | | | 0.92 | | | | (0.01 | ) | | | (1.26 | ) | | | (1.27 | ) | | | 11.66 | | | | 8.08 | | | | 37,859 | | | | 0.91 | (2) | | | 0.91 | (2) | | | 1.01 | (2) | | | 0.28 | | | | 104 | |
2015(3) | | | 12.89 | | | | 0.01 | | | | (0.89 | ) | | | (0.88 | ) | | | – | | | | – | | | | – | | | | 12.01 | | | | (6.83 | ) | | | 32,810 | | | | 0.89 | | | | 0.89 | | | | 0.98 | | | | 0.11 | | | | 137 | |
| † | Returns and portfolio turnover rates are for the period indicated and have not been annualized. Returns do not reflect the deduction of taxes the shareholder would pay on fund distributions or redemption of fund shares. |
| * | Amount represents less than $0.01 per share. |
| @ | For thesix-month period ended March 31, 2019. All ratios for the period have been annualized. |
| (1) | Per share net investment income and net realized and unrealized gains (losses) calculated using average shares. |
| (2) | The expense ratio includes proxy expenses outside of the cap. |
| (3) | On April 20, 2018, the Class Y shares and Class E shares were converted to Class F shares. The performance and financial history shown of the class is solely that of the fund’s Class F shares. |
| (4) | Commenced operations on December 31, 2014. All ratios for the period have been annualized. |
Amounts designated as“–” are either $0 or have been rounded to $0.
| | |
SEI Institutional Managed Trust / Semi-Annual Report / March 31, 2019 | | 277 |
FINANCIAL HIGHLIGHTS
For the period ended March 31, 2019 (Unaudited) and the years or periods ended September 30, (unless otherwise indicated)
For a share outstanding throughout each period
| | | | | | | | | | | | | | | | | | | | | | | | | | | | | | | | | | | | | | | | | | | | | | | | | | | | | | | | | | | | |
| | | | | | | | | | | | | | | | |
| | | Net Asset
Value,
Beginning of
Period | | Net
Investment
Income
(Loss)(1) | | Net Realized
and Unrealized
Gains (Losses) on
Investments(1) | | Total from
Operations | | | Dividends
from Net
Investment
Income | | Distributions
from Net
Realized
Capital
Gains | | Total
Dividends
and
Distributions | | Net Asset
Value,
End
of Period | | Total
Return† | | | Net Assets End of Period
($ Thousands) | | Ratio of Net
Expenses
to Average
Net Assets | | Ratio of Expenses
to Average Net
Assets (Excluding
Fees Paid Indirectly
and Including
Waivers) | | Ratio of Expenses
to Average Net Assets
(Excluding Fees
Paid Indirectly
and Waivers) | | Ratio of Net
Investment
Income (Loss)
to Average
Net Assets | | Portfolio
Turnover
Rate† |
Small Cap Value Fund | | | | | | | | | | | | | | | | | | | | | | | | | | | | | | | | | | | | | | | | | | | | | | | | | |
Class F | | | | | | | | | | | | | | | | | | | | | | | | | | | | | | | | | | | | | | | | | | | | | | | | | | | | | | | | | |
2019@ | | $ | 25.54 | | | $ | 0.14 | | | $ | (2.62 | ) | | $ | (2.48 | ) | | $ | (0.12 | ) | | $ | (2.10 | ) | | $ | (2.22 | ) | | $ | 20.84 | | | | (9.13 | )% | | $ | 283,074 | | | | 1.14 | % | | | 1.14 | % | | | 1.24 | % | | | 1.35 | % | | | 41 | % |
2018 | | | 26.16 | | | | 0.17 | | | | 1.53 | | | | 1.70 | | | | (0.17 | ) | | | (2.15 | ) | | | (2.32 | ) | | | 25.54 | | | | 6.81 | | | | 336,361 | | | | 1.14 | | | | 1.14 | | | | 1.24 | | | | 0.68 | | | | 132 | |
2017 | | | 22.75 | | | | 0.11 | | | | 3.43 | | | | 3.54 | | | | (0.13 | ) | | | – | | | | (0.13 | ) | | | 26.16 | | | | 15.61 | | | | 349,296 | | | | 1.14 | | | | 1.14 | | | | 1.23 | | | | 0.45 | | | | 123 | |
2016 | | | 21.80 | | | | 0.14 | | | | 2.27 | | | | 2.41 | | | | (0.15 | ) | | | (1.31 | ) | | | (1.46 | ) | | | 22.75 | | | | 11.60 | | | | 362,348 | | | | 1.17 | (2) | | | 1.17 | (2) | | | 1.26 | (2) | | | 0.63 | | | | 87 | |
2015 | | | 23.97 | | | | 0.13 | | | | (0.19 | ) | | | (0.06 | ) | | | (0.15 | ) | | | (1.96 | ) | | | (2.11 | ) | | | 21.80 | | | | (0.76 | ) | | | 345,594 | | | | 1.14 | | | | 1.14 | | | | 1.23 | | | | 0.56 | | | | 87 | |
2014 | | | 23.24 | | | | 0.12 | | | | 0.95 | | | | 1.07 | | | | (0.14 | ) | | | (0.20 | ) | | | (0.34 | ) | | | 23.97 | | | | 4.54 | | | | 374,828 | | | | 1.14 | | | | 1.14 | | | | 1.27 | | | | 0.49 | | | | 52 | |
Class I | | | | | | | | | | | | | | | | | | | | | | | | | | | | | | | | | | | | | | | | | | | | | | | | | | | | | | | | | |
2019@ | | $ | 25.31 | | | $ | 0.12 | | | $ | (2.60 | ) | | $ | (2.48 | ) | | $ | (0.10 | ) | | $ | (2.10 | ) | | $ | (2.20 | ) | | $ | 20.63 | | | | (9.23 | )% | | $ | 2,092 | | | | 1.36 | % | | | 1.36 | % | | | 1.49 | % | | | 1.14 | % | | | 41 | % |
2018 | | | 25.94 | | | | 0.12 | | | | 1.51 | | | | 1.63 | | | | (0.11 | ) | | | (2.15 | ) | | | (2.26 | ) | | | 25.31 | | | | 6.59 | | | | 2,354 | | | | 1.36 | | | | 1.36 | | | | 1.49 | | | | 0.46 | | | | 132 | |
2017 | | | 22.57 | | | | 0.05 | | | | 3.41 | | | | 3.46 | | | | (0.09 | ) | | | – | | | | (0.09 | ) | | | 25.94 | | | | 15.37 | | | | 2,466 | | | | 1.36 | | | | 1.36 | | | | 1.48 | | | | 0.22 | | | | 123 | |
2016 | | | 21.64 | | | | 0.09 | | | | 2.25 | | | | 2.34 | | | | (0.10 | ) | | | (1.31 | ) | | | (1.41 | ) | | | 22.57 | | | | 11.34 | | | | 2,910 | | | | 1.39 | (2) | | | 1.39 | (2) | | | 1.51 | (2) | | | 0.40 | | | | 87 | |
2015 | | | 23.81 | | | | 0.08 | | | | (0.19 | ) | | | (0.11 | ) | | | (0.10 | ) | | | (1.96 | ) | | | (2.06 | ) | | | 21.64 | | | | (0.99 | ) | | | 3,736 | | | | 1.36 | | | | 1.36 | | | | 1.48 | | | | 0.34 | | | | 87 | |
2014 | | | 23.09 | | | | 0.07 | | �� | | 0.93 | | | | 1.00 | | | | (0.08 | ) | | | (0.20 | ) | | | (0.28 | ) | | | 23.81 | | | | 4.29 | | | | 4,179 | | | | 1.36 | | | | 1.36 | | | | 1.52 | | | | 0.27 | | | | 52 | |
Class Y | | | | | | | | | | | | | | | | | | | | | | | | | | | | | | | | | | | | | | | | | | | | | | | | | | | | | | | | | |
2019@ | | $ | 25.56 | | | $ | 0.17 | | | $ | (2.62 | ) | | $ | (2.45 | ) | | $ | (0.15 | ) | | $ | (2.10 | ) | | $ | (2.25 | ) | | $ | 20.86 | | | | (9.00 | )% | | $ | 42,839 | | | | 0.89 | % | | | 0.89 | % | | | 0.99 | % | | | 1.62 | % | | | 41 | % |
2018 | | | 26.18 | | | | 0.24 | | | | 1.52 | | | | 1.76 | | | | (0.23 | ) | | | (2.15 | ) | | | (2.38 | ) | | | 25.56 | | | | 7.07 | | | | 41,421 | | | | 0.89 | | | | 0.88 | | | | 0.99 | | | | 0.94 | | | | 132 | |
2017 | | | 22.76 | | | | 0.18 | | | | 3.43 | | | | 3.61 | | | | (0.19 | ) | | | – | | | | (0.19 | ) | | | 26.18 | | | | 15.94 | | | | 37,243 | | | | 0.89 | | | | 0.89 | | | | 0.99 | | | | 0.74 | | | | 123 | |
2016(3) | | | 22.95 | | | | 0.18 | | | | 1.09 | | | | 1.27 | | | | (0.15 | ) | | | (1.31 | ) | | | (1.46 | ) | | | 22.76 | | | | 6.04 | | | | 7,207 | | | | 0.92 | (2) | | | 0.92 | (2) | | | 1.02 | (2) | | | 0.91 | | | | 87 | |
Small Cap Growth Fund | | | | | | | | | | | | | | | | | | | | | | | | | | | | | | | | | | | | | | | | | | | | | | | | | |
Class F | | | | | | | | | | | | | | | | | | | | | | | | | | | | | | | | | | | | | | | | | | | | | | | | | | | | | | | | | |
2019@ | | $ | 42.96 | | | $ | (0.06 | ) | | $ | (4.98 | ) | | $ | (5.04 | ) | | $ | – | | | $ | (4.93 | ) | | $ | (4.93 | ) | | $ | 32.99 | | | | (10.90 | )% | | $ | 300,620 | | | | 1.11 | % | | | 1.11 | % | | | 1.24 | % | | | (0.35 | )% | | | 100 | % |
2018 | | | 34.42 | | | | (0.20 | ) | | | 8.86 | | | | 8.66 | | | | – | | | | (0.12 | ) | | | (0.12 | ) | | | 42.96 | | | | 25.25 | | | | 386,055 | | | | 1.11 | | | | 1.11 | | | | 1.24 | | | | (0.53) | | | | 168 | |
2017 | | | 28.86 | | | | (0.17 | ) | | | 5.73 | | | | 5.56 | | | | – | | | | – | | | | – | | | | 34.42 | | | | 19.27 | | | | 312,759 | | | | 1.11 | | | | 1.11 | | | | 1.23 | | | | (0.55) | | | | 116 | |
2016 | | | 26.60 | | | | (0.08 | ) | | | 2.34 | | | | 2.26 | | | | – | | | | – | | | | – | | | | 28.86 | | | | 8.50 | | | | 312,240 | | | | 1.14 | (2) | | | 1.14 | (2) | | | 1.26 | (2) | | | (0.31) | | | | 124 | |
2015 | | | 25.95 | | | | (0.14 | ) | | | 0.79 | | | | 0.65 | | | | – | | | | – | | | | – | | | | 26.60 | | | | 2.50 | | | | 325,353 | | | | 1.11 | | | | 1.11 | | | | 1.23 | | | | (0.48) | | | | 131 | |
2014 | | | 24.63 | | | | (0.15 | ) | | | 1.47 | | | | 1.32 | | | | –* | | | | – | | | | –* | | | | 25.95 | | | | 5.36 | | | | 335,849 | | | | 1.11 | | | | 1.11 | | | | 1.28 | | | | (0.57) | | | | 70 | |
Class I | | | | | | | | | | | | | | | | | | | | | | | | | | | | | | | | | | | | | | | | | | | | | | | | | | | | | | | | | |
2019@ | | $ | 41.21 | | | $ | (0.10 | ) | | $ | (4.78 | ) | | $ | (4.88 | ) | | $ | – | | | $ | (4.93 | ) | | $ | (4.93 | ) | | $ | 31.40 | | | | (10.98 | )% | | $ | 1,854 | | | | 1.36 | % | | | 1.36 | % | | | 1.49 | % | | | (0.60 | )% | | | 100 | % |
2018 | | | 33.11 | | | | (0.28 | ) | | | 8.50 | | | | 8.22 | | | | – | | | | (0.12 | ) | | | (0.12 | ) | | | 41.21 | | | | 24.92 | | | | 2,127 | | | | 1.36 | | | | 1.36 | | | | 1.49 | | | | (0.79) | | | | 168 | |
2017 | | | 27.83 | | | | (0.24 | ) | | | 5.52 | | | | 5.28 | | | | – | | | | – | | | | – | | | | 33.11 | | | | 18.97 | | | | 2,079 | | | | 1.36 | | | | 1.36 | | | | 1.48 | | | | (0.79) | | | | 116 | |
2016 | | | 25.71 | | | | (0.14 | ) | | | 2.26 | | | | 2.12 | | | | – | | | | – | | | | – | | | | 27.83 | | | | 8.25 | | | | 2,253 | | | | 1.39 | (2) | | | 1.39 | (2) | | | 1.51 | (2) | | | (0.56) | | | | 124 | |
2015 | | | 25.15 | | | | (0.20 | ) | | | 0.76 | | | | 0.56 | | | | – | | | | – | | | | – | | | | 25.71 | | | | 2.23 | | | | 2,774 | | | | 1.36 | | | | 1.36 | | | | 1.48 | | | | (0.73) | | | | 131 | |
2014 | | | 23.93 | | | | (0.21 | ) | | | 1.43 | | | | 1.22 | | | | – | | | | – | | | | – | | | | 25.15 | | | | 5.10 | | | | 2,968 | | | | 1.36 | | | | 1.36 | | | | 1.52 | | | | (0.82) | | | | 70 | |
Class Y | | | | | | | | | | | | | | | | | | | | | | | | | | | | | | | | | | | | | | | | | | | | | | | | | | | | | | | | | |
2019@ | | $ | 43.27 | | | $ | (0.01 | ) | | $ | (5.01 | ) | | $ | (5.02 | ) | | $ | – | | | $ | (4.93 | ) | | $ | (4.93 | ) | | $ | 33.32 | | | | (10.76 | )% | | $ | 34,635 | | | | 0.86 | % | | | 0.86 | % | | | 0.99 | % | | | (0.09 | )% | | | 100 | % |
2018 | | | 34.59 | | | | (0.11 | ) | | | 8.91 | | | | 8.80 | | | | – | | | | (0.12 | ) | | | (0.12 | ) | | | 43.27 | | | | 25.56 | | | | 34,078 | | | | 0.86 | | | | 0.86 | | | | 0.99 | | | | (0.28) | | | | 168 | |
2017 | | | 28.93 | | | | (0.11 | ) | | | 5.77 | | | | 5.66 | | | | – | | | | – | | | | – | | | | 34.59 | | | | 19.57 | | | | 28,446 | | | | 0.86 | | | | 0.86 | | | | 0.98 | | | | (0.36) | | | | 116 | |
2016(3) | | | 27.72 | | | | (0.02 | ) | | | 1.23 | | | | 1.21 | | | | – | | | | – | | | | – | | | | 28.93 | | | | 4.37 | | | | 7,243 | | | | 0.89 | (2) | | | 0.89 | (2) | | | 1.01 | (2) | | | (0.08) | | | | 124 | |
| † | Returns and portfolio turnover rates are for the period indicated and have not been annualized. Returns do not reflect the deduction of taxes the shareholder would pay on fund distributions or redemption of fund shares. |
| @ | For thesix-month period ended March 31, 2019. All ratios for the period have been annualized. |
| * | Amount represents less than $0.01 per share. |
| (1) | Per share net investment income and net realized and unrealized gains (losses) calculated using average shares. |
| (2) | The expense ratio includes proxy expenses outside of the cap. |
| (3) | Commenced operations on October 30, 2015. All ratios for the period have been annualized. |
Amounts designated as “–“ are either $0 or have been rounded to $0.
| | |
278 | | SEI Institutional Managed Trust / Semi-Annual Report / March 31, 2019 |
FINANCIAL HIGHLIGHTS
For the period ended March 31, 2019 (Unaudited) and the years or periods ended September 30, (unless otherwise indicated)
For a share outstanding throughout each period
| | | | | | | | | | | | | | | | | | | | | | | | | | | | | | | | | | | | | | | | | | | | | | | | | | | | | | | | | | | | |
| | | | | | | | | | | | | | | | |
| | | Net Asset
Value,
Beginning of
Period | | Net
Investment
Income
(Loss)(1) | | Net Realized
and Unrealized
Gains (Losses) on
Investments(1) | | Total from
Operations | | | Dividends
from Net
Investment
Income | | Distributions
from Net
Realized
Capital
Gains | | Total
Dividends
and
Distributions | | Net Asset
Value,
End
of Period | | Total
Return† | | | Net Assets End of Period
($ Thousands) | | Ratio of Net
Expenses
to Average
Net Assets | | Ratio of Expenses
to Average Net
Assets (Excluding
Fees Paid Indirectly
and Including
Waivers) | | Ratio of Expenses
to Average Net Assets
(Excluding Fees
Paid Indirectly
and Waivers) | | Ratio of Net
Investment
Income (Loss)
to Average
Net Assets | | Portfolio
Turnover
Rate† |
Tax-Managed Small/Mid Cap Fund | | | | | | | | | | | | | | | | | | | | | | | | | | | | | | | | | | | | | | | | | | | | | | | | | |
Class F | | | | | | | | | | | | | | | | | | | | | | | | | | | | | | | | | | | | | | | | | | | | | | | | | | | | | | | | | |
2019@ | | $ | 25.02 | | | $ | 0.07 | | | $ | (2.71 | ) | | $ | (2.64 | ) | | $ | (0.04 | ) | | $ | (1.67 | ) | | $ | (1.71 | ) | | $ | 20.67 | | | | (10.14 | )% | | $ | 768,972 | | | | 1.11 | % | | | 1.11 | % | | | 1.24 | % | | | 0.63 | % | | | 71 | % |
2018 | | | 22.09 | | | | 0.02 | | | | 3.34 | | | | 3.36 | | | | (0.02 | ) | | | (0.41 | ) | | | (0.43 | ) | | | 25.02 | | | | 15.38 | | | | 907,519 | | | | 1.11 | | | | 1.11 | | | | 1.23 | | | | 0.07 | | | | 186 | |
2017 | | | 18.97 | | | | 0.03 | | | | 3.17 | | | | 3.20 | | | | (0.08 | ) | | | – | | | | (0.08 | ) | | | 22.09 | | | | 16.91 | | | | 782,449 | | | | 1.11 | (2) | | | 1.11 | (2) | | | 1.24 | (2) | | | 0.12 | | | | 151 | |
2016 | | | 17.53 | | | | 0.06 | | | | 1.44 | | | | 1.50 | | | | (0.06 | ) | | | – | | | | (0.06 | ) | | | 18.97 | | | | 8.55 | | | | 643,288 | | | | 1.13 | (3) | | | 1.13 | (3) | | | 1.25 | (3) | | | 0.35 | | | | 107 | |
2015 | | | 17.62 | | | | 0.02 | | | | 0.09 | | | | 0.11 | | | | (0.01 | ) | | | (0.19 | ) | | | (0.20 | ) | | | 17.53 | | | | 0.58 | | | | 589,712 | | | | 1.11 | | | | 1.11 | | | | 1.23 | | | | 0.12 | | | | 98 | |
2014 | | | 17.10 | | | | 0.01 | | | | 1.40 | | | | 1.41 | | | | (0.02 | ) | | | (0.87 | ) | | | (0.89 | ) | | | 17.62 | | | | 8.44 | | | | 573,175 | | | | 1.11 | | | | 1.11 | | | | 1.28 | | | | 0.07 | | | | 61 | |
Class Y | | | | | | | | | | | | | | | | | | | | | | | | | | | | | | | | | | | | | | | | | | | | | | | | | | | | | | | | | |
2019@ | | $ | 25.07 | | | $ | 0.09 | | | $ | (2.72 | ) | | $ | (2.63 | ) | | $ | (0.07 | ) | | $ | (1.67 | ) | | $ | (1.74 | ) | | $ | 20.70 | | | | (10.05 | )% | | $ | 96,377 | | | | 0.89 | % | | | 0.89 | % | | | 0.99 | % | | | 0.88 | % | | | 71 | % |
2018 | | | 22.11 | | | | 0.07 | | | | 3.35 | | | | 3.42 | | | | (0.05 | ) | | | (0.41 | ) | | | (0.46 | ) | | | 25.07 | | | | 15.69 | | | | 88,854 | | | | 0.89 | | | | 0.89 | | | | 0.98 | | | | 0.29 | | | | 186 | |
2017 | | | 18.98 | | | | 0.07 | | | | 3.17 | | | | 3.24 | | | | (0.11 | ) | | | – | | | | (0.11 | ) | | | 22.11 | | | | 17.14 | | | | 75,183 | | | | 0.90 | (2) | | | 0.90 | (2) | | | 0.99 | (2) | | | 0.34 | | | | 151 | |
2016 | | | 17.55 | | | | 0.10 | | | | 1.44 | | | | 1.54 | | | | (0.11 | ) | | | – | | | | (0.11 | ) | | | 18.98 | | | | 8.79 | | | | 47,185 | | | | 0.91 | (3) | | | 0.91 | (3) | | | 1.00 | (3) | | | 0.58 | | | | 107 | |
2015(4) | | | 18.52 | | | | 0.05 | | | | (1.01 | ) | | | (0.96 | ) | | | (0.01 | ) | | | – | | | | (0.01 | ) | | | 17.55 | | | | (5.17 | ) | | | 28,090 | | | | 0.89 | | | | 0.89 | | | | 0.98 | | | | 0.32 | | | | 98 | |
Mid-Cap Fund | | | | | | | | | | | | | | | | | | | | | | | | | | | | | | | | | | | | | | | | | | | | | | | | | | | | | |
Class F | | | | | | | | | | | | | | | | | | | | | | | | | | | | | | | | | | | | | | | | | | | | | | | | | | | | | | | | | |
2019@ | | $ | 29.13 | | | $ | 0.12 | | | $ | (1.62 | ) | | $ | (1.50 | ) | | $ | (0.11 | ) | | $ | (2.78 | ) | | $ | (2.89 | ) | | $ | 24.74 | | | | (4.25 | )% | | $ | 105,812 | | | | 0.98 | % | | | 0.98 | % | | | 0.99 | % | | | 0.93 | % | | | 52 | % |
2018 | | | 27.81 | | | | 0.19 | | | | 3.37 | | | | 3.56 | | | | (0.21 | ) | | | (2.03 | ) | | | (2.24 | ) | | | 29.13 | | | | 13.41 | | | | 131,640 | | | | 0.98 | | | | 0.98 | | | | 0.99 | | | | 0.66 | | | | 99 | |
2017 | | | 24.00 | | | | 0.17 | | | | 3.99 | | | | 4.16 | | | | (0.16 | ) | | | (0.19 | ) | | | (0.35 | ) | | | 27.81 | | | | 17.52 | | | | 112,423 | | | | 0.98 | | | | 0.98 | | | | 0.99 | | | | 0.67 | | | | 112 | |
2016 | | | 25.08 | | | | 0.27 | | | | 2.86 | | | | 3.13 | | | | (0.34 | ) | | | (3.87 | ) | | | (4.21 | ) | | | 24.00 | | | | 14.10 | | | | 87,780 | | | | 1.01 | (3) | | | 1.01 | (3) | | | 1.01 | (3) | | | 1.16 | | | | 115 | |
2015 | | | 27.53 | | | | 0.17 | | | | 0.12 | | | | 0.29 | | | | (0.07 | ) | | | (2.67 | ) | | | (2.74 | ) | | | 25.08 | | | | 0.67 | | | | 93,923 | | | | 0.98 | | | | 0.98 | | | | 0.98 | | | | 0.63 | | | | 175 | |
2014 | | | 24.64 | | | | 0.04 | | | | 3.65 | | | | 3.69 | | | | (0.06 | ) | | | (0.74 | ) | | | (0.80 | ) | | | 27.53 | | | | 15.28 | | | | 93,705 | | | | 1.02 | | | | 1.02 | | | | 1.03 | | | | 0.16 | | | | 66 | |
Class I | | | | | | | | | | | | | | | | | | | | | | | | | | | | | | | | | | | | | | | | | | | | | | | | | | | | | | | | | |
2019@ | | $ | 29.09 | | | $ | 0.09 | | | $ | (1.62 | ) | | $ | (1.53 | ) | | $ | (0.08 | ) | | $ | (2.78 | ) | | $ | (2.86 | ) | | $ | 24.70 | | | | (4.36 | )% | | $ | 767 | | | | 1.20 | % | | | 1.20 | % | | | 1.24 | % | | | 0.71 | % | | | 52 | % |
2018 | | | 27.78 | | | | 0.12 | | | | 3.36 | | | | 3.48 | | | | (0.14 | ) | | | (2.03 | ) | | | (2.17 | ) | | | 29.09 | | | | 13.11 | | | | 821 | | | | 1.20 | | | | 1.21 | | | | 1.24 | | | | 0.42 | | | | 99 | |
2017 | | | 23.96 | | | | 0.12 | | | | 4.00 | | | | 4.12 | | | | (0.11 | ) | | | (0.19 | ) | | | (0.30 | ) | | | 27.78 | | | | 17.32 | | | | 864 | | | | 1.20 | | | | 1.20 | | | | 1.24 | | | | 0.46 | | | | 112 | |
2016 | | | 25.04 | | | | 0.22 | | | | 2.85 | | | | 3.07 | | | | (0.28 | ) | | | (3.87 | ) | | | (4.15 | ) | | | 23.96 | | | | 13.84 | | | | 871 | | | | 1.24 | (3) | | | 1.24 | (3) | | | 1.27 | (3) | | | 0.97 | | | | 115 | |
2015 | | | 27.52 | | | | 0.10 | | | | 0.12 | | | | 0.22 | | | | (0.03 | ) | | | (2.67 | ) | | | (2.70 | ) | | | 25.04 | | | | 0.43 | | | | 883 | | | | 1.20 | | | | 1.20 | | | | 1.23 | | | | 0.38 | | | | 175 | |
2014 | | | 24.64 | | | | (0.02 | ) | | | 3.65 | | | | 3.63 | | | | (0.01 | ) | | | (0.74 | ) | | | (0.75 | ) | | | 27.52 | | | | 15.01 | | | | 1,144 | | | | 1.26 | | | | 1.26 | | | | 1.28 | | | | (0.08) | | | | 66 | |
Class Y | | | | | | | | | | | | | | | | | | | | | | | | | | | | | | | | | | | | | | | | | | | | | | | | | | | | | | | | | |
2019@ | | $ | 29.15 | | | $ | 0.15 | | | $ | (1.62 | ) | | $ | (1.47 | ) | | $ | (0.14 | ) | | $ | (2.78 | ) | | $ | (2.92 | ) | | $ | 24.76 | | | | (4.13 | )% | | $ | 2,810 | | | | 0.73 | % | | | 0.73 | % | | | 0.74 | % | | | 1.19 | % | | | 52 | % |
2018 | | | 27.83 | | | | 0.26 | | | | 3.37 | | | | 3.63 | | | | (0.28 | ) | | | (2.03 | ) | | | (2.31 | ) | | | 29.15 | | | | 13.68 | | | | 2,962 | | | | 0.73 | | | | 0.74 | | | | 0.74 | | | | 0.92 | | | | 99 | |
2017 | | | 24.01 | | | | 0.24 | | | | 4.00 | | | | 4.24 | | | | (0.23 | ) | | | (0.19 | ) | | | (0.42 | ) | | | 27.83 | | | | 17.84 | | | | 2,267 | | | | 0.73 | | | | 0.73 | | | | 0.74 | | | | 0.93 | | | | 112 | |
2016(5) | | | 26.61 | | | | 0.30 | | | | 1.29 | | | | 1.59 | | | | (0.32 | ) | | | (3.87 | ) | | | (4.19 | ) | | | 24.01 | | | | 7.56 | | | | 479 | | | | 0.78 | (3) | | | 0.78 | (3) | | | 0.78 | (3) | | | 1.43 | | | | 115 | |
| † | Returns and portfolio turnover rates are for the period indicated and have not been annualized. Returns do not reflect the deduction of taxes the shareholder would pay on fund distributions or redemption of fund shares. |
| @ | For thesix-month period ended March 31, 2019. All ratios for the period have been annualized. |
| (1) | Per share net investment income and net realized and unrealized gains (losses) calculated using average shares. |
| (2) | The expense ratio includes litigation expenses outside the cap. |
| (3) | The expense ratio includes proxy expenses outside of the cap. |
| (4) | Commenced operations on December 31, 2014. All ratios for the period have been annualized. |
| (5) | Commenced operations on October 30, 2015. All ratios for the period have been annualized. |
Amounts designated as “–“ are either $0 or have been rounded to $0.
| | |
SEI Institutional Managed Trust / Semi-Annual Report / March 31, 2019 | | 279 |
FINANCIAL HIGHLIGHTS
For the period ended March 31, 2019 (Unaudited) and the years or periods ended September 30, (unless otherwise indicated)
For a share outstanding throughout each period
| | | | | | | | | | | | | | | | | | | | | | | | | | | | | | | | | | | | | | | | | | | | | | | | | | | | | | | | | | | | |
| | | | | | | | | | | | | | | | |
| | | Net Asset
Value,
Beginning of
Period | | Net
Investment
Income
(Loss)(1) | | Net Realized
and Unrealized
Gains (Losses) on
Investments(1) | | Total
from
Operations | | | Dividends
from Net
Investment
Income | | Distributions
from Net
Realized
Capital
Gains | | Total
Dividends
and
Distributions | | Net Asset
Value,
End
of Period | | Total
Return† | | | Net Assets
End of Period
($ Thousands) | | Ratio of Net
Expenses
to Average
Net Assets | | Ratio of Expenses
to Average Net
Assets (Excluding
Fees Paid Indirectly
and Including
Waivers) | | Ratio of Expenses
to Average
Net Assets
(Excluding Fees
Paid Indirectly
and Waivers) | | Ratio of Net
Investment
Income (Loss)
to Average
Net Assets | | Portfolio
Turnover
Rate† |
U.S. Managed Volatility Fund | | | | | | | | | | | | | | | | | | | | | | | | | | | | | | | | | | | | | | | | | | | | | | | | | |
Class F | | | | | | | | | | | | | | | | | | | | | | | | | | | | | | | | | | | | | | | | | | | | | | | | | | | | | | | | | |
2019@ | | $ | 18.69 | | | $ | 0.17 | | | $ | 0.01 | | | $ | 0.18 | | | $ | (0.15 | ) | | $ | (1.83 | ) | | $ | (1.98 | ) | | $ | 16.89 | | | | 1.55 | % | | $ | 895,163 | | | | 0.95% | | | | 0.95 | % | | | 1.23 | % | | | 2.00 | % | | | 26 | % |
2018 | | | 18.26 | | | | 0.26 | | | | 1.80 | | | | 2.06 | | | | (0.27 | ) | | | (1.36 | ) | | | (1.63 | ) | | | 18.69 | | | | 11.83 | | | | 934,551 | | | | 0.97 | | | | 0.97 | | | | 1.23 | | | | 1.44 | | | | 72 | |
2017 | | | 17.04 | | | | 0.25 | | | | 1.72 | | | | 1.97 | | | | (0.26 | ) | | | (0.49 | ) | | | (0.75 | ) | | | 18.26 | | | | 11.85 | | | | 994,387 | | | | 1.00 | | | | 1.00 | | | | 1.23 | | | | 1.45 | | | | 48 | |
2016 | | | 16.23 | | | | 0.25 | | | | 1.62 | | | | 1.87 | | | | (0.26 | ) | | | (0.80 | ) | | | (1.06 | ) | | | 17.04 | | | | 12.01 | | | | 1,126,685 | | | | 1.02(2) | | | | 1.02 | (2) | | | 1.25 | (2) | | | 1.53 | | | | 43 | |
2015 | | | 17.50 | | | | 0.25 | | | | 0.60 | | | | 0.85 | | | | (0.25 | ) | | | (1.87 | ) | | | (2.12 | ) | | | 16.23 | | | | 4.61 | | | | 959,241 | | | | 1.00 | | | | 1.00 | | | | 1.23 | | | | 1.47 | | | | 58 | |
2014 | | | 16.09 | | | | 0.23 | | | | 2.62 | | | | 2.85 | | | | (0.23 | ) | | | (1.21 | ) | | | (1.44 | ) | | | 17.50 | | | | 18.68 | | | | 1,001,565 | | | | 1.00 | | | | 1.00 | | | | 1.27 | | | | 1.38 | | | | 71 | |
Class I | | | | | | | | | | | | | | | | | | | | | | | | | | | | | | | | | | | | | | | | | | | | | | | | | | | | | | | | | |
2019@ | | $ | 18.69 | | | $ | 0.15 | | | $ | 0.01 | | | $ | 0.16 | | | $ | (0.13 | ) | | $ | (1.83 | ) | | $ | (1.96 | ) | | $ | 16.89 | | | | 1.42 | % | | $ | 1,274 | | | | 1.20% | | | | 1.20 | % | | | 1.48 | % | | | 1.76 | % | | | 26 | % |
2018 | | | 18.26 | | | | 0.21 | | | | 1.80 | | | | 2.01 | | | | (0.22 | ) | | | (1.36 | ) | | | (1.58 | ) | | | 18.69 | | | | 11.55 | | | | 1,183 | | | | 1.22 | | | | 1.22 | | | | 1.48 | | | | 1.18 | | | | 72 | |
2017 | | | 17.03 | | | | 0.21 | | | | 1.71 | | | | 1.92 | | | | (0.20 | ) | | | (0.49 | ) | | | (0.69 | ) | | | 18.26 | | | | 11.58 | | | | 1,426 | | | | 1.25 | | | | 1.25 | | | | 1.48 | | | | 1.21 | | | | 48 | |
2016 | | | 16.21 | | | | 0.21 | | | | 1.62 | | | | 1.83 | | | | (0.21 | ) | | | (0.80 | ) | | | (1.01 | ) | | | 17.03 | | | | 11.76 | | | | 1,928 | | | | 1.27(2) | | | | 1.27 | (2) | | | 1.50 | (2) | | | 1.28 | | | | 43 | |
2015 | | | 17.47 | | | | 0.21 | | | | 0.60 | | | | 0.81 | | | | (0.20 | ) | | | (1.87 | ) | | | (2.07 | ) | | | 16.21 | | | | 4.43 | | | | 1,469 | | | | 1.25 | | | | 1.25 | | | | 1.48 | | | | 1.22 | | | | 58 | |
2014 | | | 16.07 | | | | 0.19 | | | | 2.61 | | | | 2.80 | | | | (0.19 | ) | | | (1.21 | ) | | | (1.40 | ) | | | 17.47 | | | | 18.35 | | | | 1,280 | | | | 1.25 | | | | 1.25 | | | | 1.52 | | | | 1.13 | | | | 71 | |
Class Y | | | | | | | | | | | | | | | | | | | | | | | | | | | | | | | | | | | | | | | | | | | | | | | | | | | | | | | | | |
2019@ | | $ | 18.70 | | | $ | 0.19 | | | $ | 0.02 | | | $ | 0.21 | | | $ | (0.18 | ) | | $ | (1.83 | ) | | $ | (2.01 | ) | | $ | 16.90 | | | | 1.68 | % | | $ | 893,392 | | | | 0.70% | | | | 0.70 | % | | | 0.98 | % | | | 2.31 | % | | | 26 | % |
2018 | | | 18.27 | | | | 0.30 | | | | 1.80 | | | | 2.10 | | | | (0.31 | ) | | | (1.36 | ) | | | (1.67 | ) | | | 18.70 | | | | 12.11 | | | | 682,081 | | | | 0.72 | | | | 0.72 | | | | 0.98 | | | | 1.68 | | | | 72 | |
2017 | | | 17.05 | | | | 0.30 | | | | 1.71 | | | | 2.01 | | | | (0.30 | ) | | | (0.49 | ) | | | (0.79 | ) | | | 18.27 | | | | 12.13 | | | | 585,729 | | | | 0.75 | | | | 0.75 | | | | 0.98 | | | | 1.73 | | | | 48 | |
2016 | | | 16.24 | | | | 0.29 | | | | 1.62 | | | | 1.91 | | | | (0.30 | ) | | | (0.80 | ) | | | (1.10 | ) | | | 17.05 | | | | 12.28 | | | | 486,555 | | | | 0.77(2) | | | | 0.77 | (2) | | | 1.00 | (2) | | | 1.78 | | | | 43 | |
2015(3) | | | 16.51 | | | | 0.22 | | | | (0.35 | ) | | | (0.13 | ) | | | (0.14 | ) | | | – | | | | (0.14 | ) | | | 16.24 | | | | (1.97 | ) | | | 392,240 | | | | 0.75 | | | | 0.75 | | | | 0.99 | | | | 1.73 | | | | 58 | |
Global Managed Volatility Fund | | | | | | | | | | | | | | | | | | | | | | | | | | | | | | | | | | | | | | | | | | | | | | | | | |
Class F | | | | | | | | | | | | | | | | | | | | | | | | | | | | | | | | | | | | | | | | | | | | | | | | | | | | | | | | | |
2019@ | | $ | 12.08 | | | $ | 0.08 | | | $ | (0.28 | ) | | $ | (0.20 | ) | | $ | (0.29 | ) | | $ | (0.77 | ) | | $ | (1.06 | ) | | $ | 10.82 | | | | (1.10 | )% | | $ | 1,081,967 | | | | 1.11% | | | | 1.11 | % | | | 1.24 | % | | | 1.38 | % | | | 35 | % |
2018 | | | 11.97 | | | | 0.17 | | | | 0.77 | | | | 0.94 | | | | (0.18 | ) | | | (0.65 | ) | | | (0.83 | ) | | | 12.08 | | | | 8.12 | | | | 1,184,336 | | | | 1.11 | | | | 1.11 | | | | 1.24 | | | | 1.46 | | | | 55 | |
2017 | | | 11.51 | | | | 0.17 | | | | 1.03 | | | | 1.20 | | | | (0.32 | ) | | | (0.42 | ) | | | (0.74 | ) | | | 11.97 | | | | 11.16 | | | | 1,242,592 | | | | 1.11 | | | | 1.11 | | | | 1.24 | | | | 1.45 | | | | 61 | |
2016 | | | 10.83 | | | | 0.17 | | | | 1.20 | | | | 1.37 | | | | (0.55 | ) | | | (0.14 | ) | | | (0.69 | ) | | | 11.51 | | | | 13.08 | | | | 1,618,549 | | | | 1.13(2) | | | | 1.13 | (2) | | | 1.25 | (2) | | | 1.50 | | | | 58 | |
2015 | | | 11.41 | | | | 0.20 | | | | 0.47 | | | | 0.67 | | | | (0.57 | ) | | | (0.68 | ) | | | (1.25 | ) | | | 10.83 | | | | 5.87 | | | | 2,234,776 | | | | 1.11 | | | | 1.11 | | | | 1.23 | | | | 1.75 | | | | 52 | |
2014 | | | 11.00 | | | | 0.20 | | | | 1.24 | | | | 1.44 | | | | (0.50 | ) | | | (0.53 | ) | | | (1.03 | ) | | | 11.41 | | | | 13.97 | | | | 1,799,842 | | | | 1.11 | | | | 1.11 | | | | 1.28 | | | | 1.84 | | | | 68 | |
Class I | | | | | | | | | | | | | | | | | | | | | | | | | | | | | | | | | | | | | | | | | | | | | | | | | | | | | | | | | |
2019@ | | $ | 11.82 | | | $ | 0.06 | | | $ | (0.28 | ) | | $ | (0.22 | ) | | $ | (0.26 | ) | | $ | (0.77 | ) | | $ | (1.03 | ) | | $ | 10.57 | | | | (1.33 | )% | | $ | 1,186 | | | | 1.36% | | | | 1.36 | % | | | 1.49 | % | | | 1.14 | % | | | 35 | % |
2018 | | | 11.73 | | | | 0.14 | | | | 0.75 | | | | 0.89 | | | | (0.15 | ) | | | (0.65 | ) | | | (0.80 | ) | | | 11.82 | | | | 7.87 | | | | 1,225 | | | | 1.36 | | | | 1.36 | | | | 1.49 | | | | 1.19 | | | | 55 | |
2017 | | | 11.29 | | | | 0.14 | | | | 1.00 | | | | 1.14 | | | | (0.28 | ) | | | (0.42 | ) | | | (0.70 | ) | | | 11.73 | | | | 10.80 | | | | 1,573 | | | | 1.36 | | | | 1.36 | | | | 1.48 | | | | 1.24 | | | | 61 | |
2016 | | | 10.62 | | | | 0.15 | | | | 1.18 | | | | 1.33 | | | | (0.52 | ) | | | (0.14 | ) | | | (0.66 | ) | | | 11.29 | | | | 12.97 | | | | 2,734 | | | | 1.38(2) | | | | 1.38 | (2) | | | 1.51 | (2) | | | 1.41 | | | | 58 | |
2015 | | | 11.23 | | | | 0.17 | | | | 0.44 | | | | 0.61 | | | | (0.54 | ) | | | (0.68 | ) | | | (1.22 | ) | | | 10.62 | | | | 5.43 | | | | 1,301 | | | | 1.36 | | | | 1.36 | | | | 1.48 | | | | 1.50 | | | | 52 | |
2014 | | | 10.84 | | | | 0.17 | | | | 1.23 | | | | 1.40 | | | | (0.48 | ) | | | (0.53 | ) | | | (1.01 | ) | | | 11.23 | | | | 13.78 | | | | 1,034 | | | | 1.36 | | | | 1.36 | | | | 1.53 | | | | 1.59 | | | | 68 | |
Class Y | | | | | | | | | | | | | | | | | | | | | | | | | | | | | | | | | | | | | | | | | | | | | | | | | | | | | | | | | |
2019@ | | $ | 12.12 | | | $ | 0.09 | | | $ | (0.29 | ) | | $ | (0.20 | ) | | $ | (0.32 | ) | | $ | (0.77 | ) | | $ | (1.09 | ) | | $ | 10.83 | | | | (1.08 | )% | | $ | 206,328 | | | | 0.86% | | | | 0.86 | % | | | 0.99 | % | | | 1.63 | % | | | 35 | % |
2018 | | | 12.00 | | | | 0.20 | | | | 0.78 | | | | 0.98 | | | | (0.21 | ) | | | (0.65 | ) | | | (0.86 | ) | | | 12.12 | | | | 8.46 | | | | 233,708 | | | | 0.86 | | | | 0.86 | | | | 0.99 | | | | 1.74 | | | | 55 | |
2017 | | | 11.55 | | | | 0.22 | | | | 1.00 | | | | 1.22 | | | | (0.35 | ) | | | (0.42 | ) | | | (0.77 | ) | | | 12.00 | | | | 11.32 | | | | 213,561 | | | | 0.87 | | | | 0.87 | | | | 0.99 | | | | 1.87 | | | | 61 | |
2016 | | | 10.85 | | | | 0.21 | | | | 1.20 | | | | 1.41 | | | | (0.57 | ) | | | (0.14 | ) | | | (0.71 | ) | | | 11.55 | | | | 13.49 | | | | 102,388 | | | | 0.88(2) | | | | 0.88 | (2) | | | 1.01 | (2) | | | 1.86 | | | | 58 | |
2015(3) | | | 10.73 | | | | 0.19 | | | | (0.07 | ) | | | 0.12 | | | | – | | | | – | | | | – | | | | 10.85 | | | | 1.12 | | | | 94,522 | | | | 0.86 | | | | 0.86 | | | | 0.99 | | | | 2.23 | | | | 52 | |
| † | Returns and portfolio turnover rates are for the period indicated and have not been annualized. Returns do not reflect the deduction of taxes the shareholder would pay on fund distributions or redemption of fund shares. |
| @ | For thesix-month period ended March 31, 2019. All ratios for the period have been annualized. |
| (1) | Per share net investment income and net realized and unrealized gains (losses) calculated using average shares. |
| (2) | The expense ratio includes proxy expenses outside of the cap. |
| (3) | Commenced operations on December 31, 2014. All ratios for the period have been annualized. |
Amounts designated as “–” are either $0 or have been rounded to $0.
| | |
280 | | SEI Institutional Managed Trust / Semi-Annual Report / March 31, 2019 |
FINANCIAL HIGHLIGHTS
For the period ended March 31, 2019 (Unaudited) and the years or periods ended September 30, (unless otherwise indicated)
For a share outstanding throughout each period
| | | | | | | | | | | | | | | | | | | | | | | | | | | | | | | | | | | | | | | | | | | | | | | | | | | | | | | | | | | | |
| | | | | | | | | | | | | | | | |
| | | Net Asset
Value,
Beginning
of Period | | Net
Investment
Income
(Loss)(1) | | Net Realized
and Unrealized
Gains (Losses) on
Investments(1) | | Total
from
Operations | | | Dividends
from Net
Investment
Income | | Distributions
from Net
Realized
Capital
Gains | | Total
Dividends
and
Distributions | | Net Asset
Value,
End
of Period | | Total
Return† | | | Net Assets
End of Period
($ Thousands) | | Ratio of Net
Expenses
to Average
Net Assets | | Ratio of Expenses
to Average Net
Assets (Excluding
Fees Paid Indirectly
and Including
Waivers) | | Ratio of Expenses
to Average
Net Assets
(Excluding Fees
Paid Indirectly
and Waivers) | | Ratio of Net
Investment
Income (Loss)
to Average
Net Assets | | Portfolio
Turnover
Rate† |
Tax-Managed Managed Volatility Fund | | | | | | | | | | | | | | | | | | | | | | | | | | | | | | | | | | | | | | | | | | | | | | | | | |
Class F | | | | | | | | | | | | | | | | | | | | | | | | | | | | | | | | | | | | | | | | | | | | | | | | | | | | | | | | | |
2019@ | | $ | 17.22 | | | $ | 0.16 | | | $ | (0.13 | ) | | $ | 0.03 | | | $ | (0.15 | ) | | $ | (0.49 | ) | | $ | (0.64 | ) | | $ | 16.61 | | | | 0.34 | % | | $ | 969,810 | | | | 1.00 | % | | | 1.00 | % | | | 1.23 | % | | | 1.93 | % | | | 18 | % |
2018 | | | 15.96 | | | | 0.21 | | | | 1.70 | | | | 1.91 | | | | (0.22 | ) | | | (0.43 | ) | | | (0.65 | ) | | | 17.22 | | | | 12.26 | | | | 1,030,813 | | | | 1.00 | | | | 1.00 | | | | 1.23 | | | | 1.31 | | | | 24 | |
2017 | | | 14.74 | | | | 0.23 | | | | 1.61 | | | | 1.84 | | | | (0.23 | ) | | | (0.39 | ) | | | (0.62 | ) | | | 15.96 | | | | 12.84 | | | | 994,011 | | | | 1.00 | | | | 1.00 | | | | 1.23 | | | | 1.53 | | | | 22 | |
2016 | | | 13.88 | | | | 0.22 | | | | 1.41 | | | | 1.63 | | | | (0.21 | ) | | | (0.56 | ) | | | (0.77 | ) | | | 14.74 | | | | 12.24 | | | | 1,162,478 | | | | 1.02 | (2) | | | 1.02 | (2) | | | 1.25 | (2) | | | 1.52 | | | | 32 | |
2015 | | | 14.14 | | | | 0.20 | | | | 0.64 | | | | 0.84 | | | | (0.20 | ) | | | (0.90 | ) | | | (1.10 | ) | | | 13.88 | | | | 5.92 | | | | 901,026 | | | | 1.00 | | | | 1.00 | | | | 1.23 | | | | 1.40 | | | | 49 | |
2014 | | | 12.70 | | | | 0.19 | | | | 1.94 | | | | 2.13 | | | | (0.18 | ) | | | (0.51 | ) | | | (0.69 | ) | | | 14.14 | | | | 17.33 | | | | 765,744 | | | | 1.00 | | | | 1.00 | | | | 1.28 | | | | 1.38 | | | | 58 | |
Class Y | | | | | | | | | | | | | | | | | | | | | | | | | | | | | | | | | | | | | | | | | | | | | | | | | | | | | | | | | |
2019@ | | $ | 17.23 | | | $ | 0.18 | | | $ | (0.14 | ) | | $ | 0.04 | | | $ | (0.17 | ) | | $ | (0.49 | ) | | $ | (0.66 | ) | | $ | 16.61 | | | | 0.41 | % | | $ | 85,401 | | | | 0.75 | % | | | 0.75 | % | | | 0.99 | % | | | 2.18 | % | | | 18 | % |
2018 | | | 15.96 | | | | 0.26 | | | | 1.70 | | | | 1.96 | | | | (0.26 | ) | | | (0.43 | ) | | | (0.69 | ) | | | 17.23 | | | | 12.60 | | | | 78,609 | | | | 0.75 | | | | 0.75 | | | | 0.99 | | | | 1.56 | | | | 24 | |
2017 | | | 14.74 | | | | 0.27 | | | | 1.61 | | | | 1.88 | | | | (0.27 | ) | | | (0.39 | ) | | | (0.66 | ) | | | 15.96 | | | | 13.12 | | | | 61,804 | | | | 0.75 | | | | 0.75 | | | | 0.98 | | | | 1.80 | | | | 22 | |
2016 | | | 13.89 | | | | 0.26 | | | | 1.40 | | | | 1.66 | | | | (0.25 | ) | | | (0.56 | ) | | | (0.81 | ) | | | 14.74 | | | | 12.42 | | | | 37,017 | | | | 0.77 | (2) | | | 0.77 | (2) | | | 1.01 | (2) | | | 1.81 | | | | 32 | |
2015(3) | | | 14.25 | | | | 0.11 | | | | (0.42 | )(4) | | | (0.31 | ) | | | (0.05 | ) | | | – | | | | (0.05 | ) | | | 13.89 | | | | (2.17 | ) | | | 323 | | | | 0.81 | | | | 0.81 | | | | 1.06 | | | | 1.77 | | | | 49 | |
Tax-Managed International Managed Volatility Fund | | | | | | | | | | | | | | | | | | | | | | | | | | | | | | | | | | | | | | | | | |
Class F | | | | | | | | | | | | | | | | | | | | | | | | | | | | | | | | | | | | | | | | | | | | | | | | | | | | | | | | | |
2019@ | | $ | 11.38 | | | $ | 0.09 | | | $ | (0.51 | ) | | $ | (0.42 | ) | | $ | (0.27 | ) | | $ | – | | | $ | (0.27 | ) | | $ | 10.69 | | | | (3.48 | )% | | $ | 326,306 | | | | 1.11 | % | | | 1.11 | % | | | 1.40 | % | | | 1.63 | % | | | 31 | % |
2018 | | | 11.56 | | | | 0.26 | | | | (0.15 | ) | | | 0.11 | | | | (0.29 | ) | | | – | | | | (0.29 | ) | | | 11.38 | | | | 0.93 | | | | 355,027 | | | | 1.11 | | | | 1.11 | | | | 1.40 | | | | 2.21 | | | | 54 | |
2017(5) | | | 10.00 | | | | 0.23 | | | | 1.33 | | | | 1.56 | | | | – | | | | – | | | | – | | | | 11.56 | | | | 15.65 | | | | 336,350 | | | | 1.11 | | | | 1.11 | | | | 1.39 | | | | 2.29 | | | | 51 | |
Class Y | | | | | | | | | | | | | | | | | | | | | | | | | | | | | | | | | | | | | | | | | | | | | | | | | | | | | | | | | |
2019@ | | $ | 11.40 | | | $ | 0.12 | | | $ | (0.53 | ) | | $ | (0.41 | ) | | $ | (0.30 | ) | | $ | – | | | $ | (0.30 | ) | | $ | 10.69 | | | | (3.37 | )% | | $ | 38,316 | | | | 0.86 | % | | | 0.86 | % | | | 1.15 | % | | | 2.21 | % | | | 31 | % |
2018 | | | 11.58 | | | | 0.30 | | | | (0.16 | ) | | | 0.14 | | | | (0.32 | ) | | | – | | | | (0.32 | ) | | | 11.40 | | | | 1.16 | | | | 25,862 | | | | 0.86 | | | | 0.86 | | | | 1.15 | | | | 2.60 | | | | 54 | |
2017(5) | | | 10.00 | | | | 0.30 | | | | 1.29 | | | | 1.59 | | | | (0.01 | ) | | | – | | | | (0.01 | ) | | | 11.58 | | | | 15.90 | | | | 13,652 | | | | 0.86 | | | | 0.86 | | | | 1.15 | | | | 2.92 | | | | 51 | |
Real Estate Fund | | | | | | | | | | | | | | | | | | | | | | | | | | | | | | | | | | | | | | | | | | | | | | | | | | | | | |
Class F | | | | | | | | | | | | | | | | | | | | | | | | | | | | | | | | | | | | | | | | | | | | | | | | | | | | | | | | | |
2019@ | | $ | 16.06 | | | $ | 0.18 | | | $ | 0.83 | | | $ | 1.01 | | | $ | (0.12 | ) | | $ | (1.15 | ) | | $ | (1.27 | ) | | $ | 15.80 | | | | 6.92 | % | | $ | 98,548 | | | | 1.14 | % | | | 1.14 | % | | | 1.23 | % | | | 2.39 | % | | | 39 | % |
2018 | | | 17.15 | | | | 0.24 | | | | 0.62 | | | | 0.86 | | | | (0.23 | ) | | | (1.72 | ) | | | (1.95 | ) | | | 16.06 | | | | 5.04 | | | | 94,715 | | | | 1.14 | | | | 1.14 | | | | 1.24 | | | | 1.27 | | | | 103 | |
2017 | | | 19.37 | | | | 0.03 | | | | (0.21 | ) | | | (0.18 | ) | | | (0.41 | ) | | | (1.63 | ) | | | (2.04 | ) | | | 17.15 | | | | (0.57 | ) | | | 137,877 | | | | 1.14 | | | | 1.14 | | | | 1.24 | | | | 0.16 | | | | 67 | |
2016 | | | 17.96 | | | | 0.29 | | | | 2.69 | | | | 2.98 | | | | (0.16 | ) | | | (1.41 | ) | | | (1.57 | ) | | | 19.37 | | | | 17.13 | | | | 174,178 | | | | 1.16 | (2) | | | 1.16 | (2) | | | 1.25 | (2) | | | 1.54 | | | | 84 | |
2015 | | | 17.05 | | | | 0.08 | | | | 1.87 | | | | 1.95 | | | | (0.26 | ) | | | (0.78 | ) | | | (1.04 | ) | | | 17.96 | | | | 11.44 | | | | 193,006 | | | | 1.14 | | | | 1.14 | | | | 1.23 | | | | 0.42 | | | | 51 | |
2014 | | | 15.42 | | | | 0.29 | | | | 1.64 | | | | 1.93 | | | | (0.30 | ) | | | – | | | | (0.30 | ) | | | 17.05 | | | | 12.63 | | | | 226,780 | | | | 1.14 | | | | 1.14 | | | | 1.28 | | | | 1.76 | | | | 57 | |
Class I | | | | | | | | | | | | | | | | | | | | | | | | | | | | | | | | | | | | | | | | | | | | | | | | | | | | | | | | | |
2019@ | | $ | 16.03 | | | $ | 0.17 | | | $ | 0.83 | | | $ | 1.00 | | | $ | (0.10 | ) | | $ | (1.15 | ) | | $ | (1.25 | ) | | $ | 15.78 | | | | 6.82 | % | | $ | 487 | | | | 1.36 | % | | | 1.36 | % | | | 1.48 | % | | | 2.20 | % | | | 39 | % |
2018 | | | 17.13 | | | | 0.24 | | | | 0.58 | | | | 0.82 | | | | (0.20 | ) | | | (1.72 | ) | | | (1.92 | ) | | | 16.03 | | | | 4.80 | | | | 455 | | | | 1.36 | | | | 1.36 | | | | 1.49 | | | | 1.31 | | | | 103 | |
2017 | | | 19.35 | | | | (0.02 | ) | | | (0.20 | ) | | | (0.22 | ) | | | (0.37 | ) | | | (1.63 | ) | | | (2.00 | ) | | | 17.13 | | | | (0.80 | ) | | | 529 | | | | 1.36 | | | | 1.36 | | | | 1.49 | | | | (0.09) | | | | 67 | |
2016 | | | 17.94 | | | | 0.25 | | | | 2.69 | | | | 2.94 | | | | (0.12 | ) | | | (1.41 | ) | | | (1.53 | ) | | | 19.35 | | | | 16.90 | | | | 651 | | | | 1.38 | (2) | | | 1.38 | (2) | | | 1.50 | (2) | | | 1.33 | | | | 84 | |
2015 | | | 17.03 | | | | 0.03 | | | | 1.87 | | | | 1.90 | | | | (0.21 | ) | | | (0.78 | ) | | | (0.99 | ) | | | 17.94 | | | | 11.16 | | | | 720 | | | | 1.36 | | | | 1.36 | | | | 1.48 | | | | 0.17 | | | | 51 | |
2014 | | | 15.39 | | | | 0.25 | | | | 1.64 | | | | 1.89 | | | | (0.25 | ) | | | – | | | | (0.25 | ) | | | 17.03 | | | | 12.33 | | | | 622 | | | | 1.36 | | | | 1.36 | | | | 1.52 | | | | 1.51 | | | | 57 | |
Class Y | | | | | | | | | | | | | | | | | | | | | | | | | | | | | | | | | | | | | | | | | | | | | | | | | | | | | | | | | |
2019@ | | $ | 16.07 | | | $ | 0.20 | | | $ | 0.83 | | | $ | 1.03 | | | $ | (0.15 | ) | | $ | (1.15 | ) | | $ | (1.30 | ) | | $ | 15.80 | | | | 7.06 | % | | $ | 35,903 | | | | 0.89 | % | | | 0.89 | % | | | 0.98 | % | | | 2.63 | % | | | 39 | % |
2018 | | | 17.15 | | | | 0.32 | | | | 0.58 | | | | 0.90 | | | | (0.26 | ) | | | (1.72 | ) | | | (1.98 | ) | | | 16.07 | | | | 5.30 | | | | 36,197 | | | | 0.89 | | | | 0.89 | | | | 0.99 | | | | 1.76 | | | | 103 | |
2017 | | | 19.38 | | | | 0.07 | | | | (0.21 | ) | | | (0.14 | ) | | | (0.46 | ) | | | (1.63 | ) | | | (2.09 | ) | | | 17.15 | | | | (0.37 | ) | | | 36,892 | | | | 0.89 | | | | 0.89 | | | | 0.99 | | | | 0.41 | | | | 67 | |
2016 | | | 17.96 | | | | 0.32 | | | | 2.72 | | | | 3.04 | | | | (0.21 | ) | | | (1.41 | ) | | | (1.62 | ) | | | 19.38 | | | | 17.49 | | | | 36,591 | | | | 0.92 | (2) | | | 0.92 | (2) | | | 1.01 | (2) | | | 1.64 | | | | 84 | |
2015(6) | | | 19.00 | | | | 0.08 | | | | (0.65 | )(4) | | | (0.57 | ) | | | (0.14 | ) | | | (0.33 | ) | | | (0.47 | ) | | | 17.96 | | | | (2.97 | ) | | | 18,561 | | | | 0.89 | | | | 0.89 | | | | 0.98 | | | | 0.54 | | | | 51 | |
| † | Returns and portfolio turnover rates are for the period indicated and have not been annualized. Returns do not reflect the deduction of taxes the shareholder would pay on fund distributions or redemption of fund shares. |
| @ | For thesix-month period ended March 31, 2019. All ratios for the period have been annualized. |
| (1) | Per share net investment income and net realized and unrealized gains (losses) calculated using average shares. |
| (2) | The expense ratio includes proxy expenses outside of the cap. |
| (3) | Commenced operations on April 30, 2015. All ratios for the period have been annualized. |
| (4) | The amount shown for a share outstanding throughout the period does not accord with the aggregate net gains on investments for that period because the sales and repurchase of Fund shares in relation to the fluctuating market value of the Fund. |
| (5) | Commenced operations on October 17, 2016. All ratios for the period have been annualized. |
| (6) | Commenced operations on December 31, 2014. All ratios for the period have been annualized. |
Amounts designated as “–” are either $0 or have been rounded to $0.
| | |
SEI Institutional Managed Trust / Semi-Annual Report / March 31, 2019 | | 281 |
FINANCIAL HIGHLIGHTS
For the period ended March 31, 2019 (Unaudited) and the years or periods ended September 30, (unless otherwise indicated)
For a share outstanding throughout each period
| | | | | | | | | | | | | | | | | | | | | | | | | | | | | | | | | | | | | | | | | | | | | | | | | | | | | | | | | | | | |
| | | | | | | | | | | | | | | | |
| | | Net Asset
Value,
Beginning of
Period | | Net
Investment
Income
(Loss)(1) | | Net Realized
and Unrealized
Gains (Losses) on
Investments(1) | | Total
from
Operations | | | Dividends
from Net
Investment
Income | | Distributions
from Net
Realized
Capital
Gains | | Total
Dividends
and
Distributions | | Net Asset
Value,
End
of Period | | Total
Return† | | | Net Assets
End of Period
($ Thousands) | | Ratio of Net
Expenses
to Average
Net Assets | | Ratio of Expenses
to Average Net
Assets (Excluding
Fees Paid Indirectly
and Including
Waivers) | | Ratio of Expenses
to Average
Net Assets
(Excluding Fees
Paid Indirectly
and Waivers) | | Ratio of Net
Investment
Income (Loss)
to Average
Net Assets | | Portfolio
Turnover
Rate† |
Enhanced Income Fund | | | | | | | | | | | | | | | | | | | | | | | | | | | | | | | | | | | | | | | | | | | | | | | | | |
Class F | | | | | | | | | | | | | | | | | | | | | | | | | | | | | | | | | | | | | | | | | | | | | | | | | | | | | | | | | |
2019@ | | $ | 7.57 | | | $ | 0.12 | | | $ | (0.05 | ) | | $ | 0.07 | | | $ | (0.12 | ) | | $ | – | | | $ | (0.12 | ) | | $ | 7.52 | | | | 0.96 | % | | $ | 59,591 | | | | 0.60 | % | | | 0.60 | % | | | 0.96 | % | | | 3.25 | % | | | 17 | % |
2018 | | | 7.58 | | | | 0.21 | | | | (0.03 | ) | | | 0.18 | | | | (0.19 | ) | | | – | | | | (0.19 | ) | | | 7.57 | | | | 2.39 | | | | 77,372 | | | | 0.60 | | | | 0.60 | | | | 0.99 | | | | 2.78 | | | | 82 | |
2017 | | | 7.49 | | | | 0.16 | | | | 0.11 | | | | 0.27 | | | | (0.18 | ) | | | – | | | | (0.18 | ) | | | 7.58 | | | | 3.60 | | | | 70,279 | | | | 0.60 | | | | 0.60 | | | | 0.98 | | | | 2.06 | | | | 76 | |
2016 | | | 7.46 | | | | 0.15 | | | | 0.04 | | | | 0.19 | | | | (0.16 | ) | | | – | | | | (0.16 | ) | | | 7.49 | | | | 2.60 | | | | 181,059 | | | | 0.63 | (2) | | | 0.63 | (2) | | | 1.04 | (2) | | | 1.96 | | | | 90 | |
2015 | | | 7.60 | | | | 0.14 | | | | (0.13 | ) | | | 0.01 | | | | (0.15 | ) | | | – | | | | (0.15 | ) | | | 7.46 | | | | 0.07 | | | | 190,645 | | | | 0.60 | | | | 0.60 | | | | 1.02 | | | | 1.82 | | | | 89 | |
2014 | | | 7.61 | | | | 0.14 | | | | (0.01 | ) | | | 0.13 | | | | (0.14 | ) | | | – | | | | (0.14 | ) | | | 7.60 | | | | 1.69 | | | | 230,910 | | | | 0.60 | | | | 0.60 | | | | 1.05 | | | | 1.78 | | | | 106 | |
Class I | | | | | | | | | | | | | | | | | | | | | | | | | | | | | | | | | | | | | | | | | | | | | | | | | | | | | | | | | |
2019@ | | $ | 7.55 | | | $ | 0.11 | | | $ | (0.04 | ) | | $ | 0.07 | | | $ | (0.11 | ) | | $ | – | | | $ | (0.11 | ) | | $ | 7.51 | | | | 0.95 | % | | $ | 116 | | | | 0.85 | % | | | 0.85 | % | | | 1.21 | % | | | 3.01 | % | | | 17 | % |
2018 | | | 7.56 | | | | 0.19 | | | | (0.03 | ) | | | 0.16 | | | | (0.17 | ) | | | – | | | | (0.17 | ) | | | 7.55 | | | | 2.12 | | | | 115 | | | | 0.85 | | | | 0.85 | | | | 1.24 | | | | 2.48 | | | | 82 | |
2017 | | | 7.47 | | | | 0.14 | | | | 0.11 | | | | 0.25 | | | | (0.16 | ) | | | – | | | | (0.16 | ) | | | 7.56 | | | | 3.33 | | | | 188 | | | | 0.85 | | | | 0.85 | | | | 1.23 | | | | 1.81 | | | | 76 | |
2016 | | | 7.45 | | | | 0.13 | | | | 0.03 | | | | 0.16 | | | | (0.14 | ) | | | – | | | | (0.14 | ) | | | 7.47 | | | | 2.20 | | | | 255 | | | | 0.88 | (2) | | | 0.88 | (2) | | | 1.29 | (2) | | | 1.71 | | | | 90 | |
2015 | | | 7.58 | | | | 0.12 | | | | (0.12 | ) | | | – | | | | (0.13 | ) | | | – | | | | (0.13 | ) | | | 7.45 | | | | (0.06 | ) | | | 232 | | | | 0.85 | | | | 0.85 | | | | 1.26 | | | | 1.54 | | | | 89 | |
2014 | | | 7.59 | | | | 0.12 | | | | (0.01 | ) | | | 0.11 | | | | (0.12 | ) | | | – | | | | (0.12 | ) | | | 7.58 | | | | 1.44 | | | | 376 | | | | 0.85 | | | | 0.85 | | | | 1.30 | | | | 1.53 | | | | 106 | |
Class Y | | | | | | | | | | | | | | | | | | | | | | | | | | | | | | | | | | | | | | | | | | | | | | | | | | | | | | | | | |
2019@ | | $ | 7.56 | | | $ | 0.13 | | | $ | (0.04 | ) | | $ | 0.09 | | | $ | (0.13 | ) | | $ | – | | | $ | (0.13 | ) | | $ | 7.52 | | | | 1.16 | % | | $ | 7,251 | | | | 0.46 | % | | | 0.46 | % | | | 0.71 | % | | | 3.40 | % | | | 17 | % |
2018 | | | 7.57 | | | | 0.22 | | | | (0.03 | ) | | | 0.19 | | | | (0.20 | ) | | | – | | | | (0.20 | ) | | | 7.56 | | | | 2.54 | | | | 7,198 | | | | 0.46 | | | | 0.46 | | | | 0.74 | | | | 2.93 | | | | 82 | |
2017 | | | 7.48 | | | | 0.17 | | | | 0.11 | | | | 0.28 | | | | (0.19 | ) | | | – | | | | (0.19 | ) | | | 7.57 | | | | 3.76 | | | | 5,897 | | | | 0.46 | | | | 0.46 | | | | 0.72 | | | | 2.20 | | | | 76 | |
2016 | | | 7.46 | | | | 0.16 | | | | 0.03 | | | | 0.19 | | | | (0.17 | ) | | | – | | | | (0.17 | ) | | | 7.48 | | | | 2.61 | | | | 17,310 | | | | 0.49 | (2) | | | 0.49 | (2) | | | 0.79 | (2) | | | 2.11 | | | | 90 | |
2015(3) | | | 7.51 | | | | 0.11 | | | | (0.08 | ) | | | 0.03 | | | | (0.08 | ) | | | – | | | | (0.08 | ) | | | 7.46 | | | | 0.44 | | | | 11,264 | | | | 0.46 | | | | 0.46 | | | | 0.77 | | | | 1.89 | | | | 89 | |
Core Fixed Income Fund | | | | | | | | | | | | | | | | | | | | | | | | | | | | | | | | | | | | | | | | | | | | | | | | | |
Class F | | | | | | | | | | | | | | | | | | | | | | | | | | | | | | | | | | | | | | | | | | | | | | | | | | | | | | | | | |
2019@ | | $ | 10.86 | | | $ | 0.16 | | | $ | 0.34 | | | $ | 0.50 | | | $ | (0.16 | ) | | $ | – | | | $ | (0.16 | ) | | $ | 11.20 | | | | 4.69 | % | | $ | 3,579,316 | | | | 0.66 | % | | | 0.66 | % | | | 0.73 | % | | | 2.90 | % | | | 206 | % |
2018 | | | 11.32 | | | | 0.29 | | | | (0.46 | ) | | | (0.17 | ) | | | (0.29 | ) | | | – | | | | (0.29 | ) | | | 10.86 | | | | (1.53 | ) | | | 3,600,785 | | | | 0.67 | | | | 0.67 | | | | 0.77 | | | | 2.55 | | | | 384 | |
2017 | | | 11.71 | | | | 0.25 | | | | (0.15 | ) | | | 0.10 | | | | (0.26 | ) | | | (0.23 | ) | | | (0.49 | ) | | | 11.32 | | | | 1.02 | | | | 1,855,251 | | | | 0.67 | | | | 0.67 | | | | 0.80 | | | | 2.19 | | | | 386 | |
2016 | | | 11.47 | | | | 0.26 | | | | 0.37 | | | | 0.63 | | | | (0.27 | ) | | | (0.12 | ) | | | (0.39 | ) | | | 11.71 | | | | 5.64 | | | | 2,070,113 | | | | 0.69 | (2) | | | 0.69 | (2) | | | 0.88 | (2) | | | 2.29 | | | | 336 | |
2015 | | | 11.47 | | | | 0.27 | | | | – | | | | 0.27 | | | | (0.27 | ) | | | – | | | | (0.27 | ) | | | 11.47 | | | | 2.36 | | | | 2,068,581 | | | | 0.67 | | | | 0.67 | | | | 0.86 | | | | 2.32 | | | | 350 | |
2014 | | | 11.20 | | | | 0.29 | | | | 0.28 | | | | 0.57 | | | | (0.30 | ) | | | – | | | | (0.30 | ) | | | 11.47 | | | | 5.14 | | | | 2,041,268 | | | | 0.67 | | | | 0.67 | | | | 0.85 | | | | 2.59 | | | | 343 | |
Class I | | | | | | | | | | | | | | | | | | | | | | | | | | | | | | | | | | | | | | | | | | | | | | | | | | | | | | | | | |
2019@ | | $ | 10.86 | | | $ | 0.15 | | | $ | 0.33 | | | $ | 0.48 | | | $ | (0.15 | ) | | $ | – | | | $ | (0.15 | ) | | $ | 11.19 | | | | 4.48 | % | | $ | 4,844 | | | | 0.88 | % | | | 0.88 | % | | | 0.98 | % | | | 2.68 | % | | | 206 | % |
2018 | | | 11.31 | | | | 0.26 | | | | (0.45 | ) | | | (0.19 | ) | | | (0.26 | ) | | | – | | | | (0.26 | ) | | | 10.86 | | | | (1.66 | ) | | | 6,255 | | | | 0.89 | | | | 0.89 | | | | 1.02 | | | | 2.29 | | | | 384 | |
2017 | | | 11.70 | | | | 0.22 | | | | (0.14 | ) | | | 0.08 | | | | (0.24 | ) | | | (0.23 | ) | | | (0.47 | ) | | | 11.31 | | | | 0.80 | | | | 5,975 | | | | 0.89 | | | | 0.89 | | | | 1.05 | | | | 1.97 | | | | 386 | |
2016 | | | 11.46 | | | | 0.24 | | | | 0.36 | | | | 0.60 | | | | (0.24 | ) | | | (0.12 | ) | | | (0.36 | ) | | | 11.70 | | | | 5.41 | | | | 9,313 | | | | 0.91 | (2) | | | 0.91 | (2) | | | 1.13 | (2) | | | 2.07 | | | | 336 | |
2015 | | | 11.46 | | | | 0.24 | | | | 0.01 | | | | 0.25 | | | | (0.25 | ) | | | – | | | | (0.25 | ) | | | 11.46 | | | | 2.14 | | | | 12,504 | | | | 0.89 | | | | 0.89 | | | | 1.11 | | | | 2.10 | | | | 350 | |
2014 | | | 11.19 | | | | 0.27 | | | | 0.27 | | | | 0.54 | | | | (0.27 | ) | | | – | | | | (0.27 | ) | | | 11.46 | | | | 4.91 | | | | 10,488 | | | | 0.89 | | | | 0.89 | | | | 1.08 | | | | 2.38 | | | | 343 | |
Class Y | | | | | | | | | | | | | | | | | | | | | | | | | | | | | | | | | | | | | | | | | | | | | | | | | | | | | | | | | |
2019@ | | $ | 10.87 | | | $ | 0.17 | | | $ | 0.34 | | | $ | 0.51 | | | $ | (0.18 | ) | | $ | – | | | $ | (0.18 | ) | | $ | 11.20 | | | | 4.72 | % | | $ | 420,312 | | | | 0.41 | % | | | 0.41 | % | | | 0.48 | % | | | 3.15 | % | | | 206 | % |
2018 | | | 11.32 | | | | 0.31 | | | | (0.44 | ) | | | (0.13 | ) | | | (0.32 | ) | | | – | | | | (0.32 | ) | | | 10.87 | | | | (1.20 | ) | | | 392,931 | | | | 0.42 | | | | 0.42 | | | | 0.52 | | | | 2.80 | | | | 384 | |
2017 | | | 11.71 | | | | 0.28 | | | | (0.15 | ) | | | 0.13 | | | | (0.29 | ) | | | (0.23 | ) | | | (0.52 | ) | | | 11.32 | | | | 1.27 | | | | 225,440 | | | | 0.42 | | | | 0.42 | | | | 0.55 | | | | 2.46 | | | | 386 | |
2016 | | | 11.47 | | | | 0.29 | | | | 0.37 | | | | 0.66 | | | | (0.30 | ) | | | (0.12 | ) | | | (0.42 | ) | | | 11.71 | | | | 5.90 | | | | 70,916 | | | | 0.44 | (2) | | | 0.44 | (2) | | | 0.63 | (2) | | | 2.55 | | | | 336 | |
2015(4) | | | 11.47 | | | | 0.08 | | | | – | | | | 0.08 | | | | (0.08 | ) | | | – | | | | (0.08 | ) | | | 11.47 | | | | 0.69 | | | | 22,985 | | | | 0.42 | | | | 0.42 | | | | 0.63 | | | | 2.66 | | | | 350 | |
| † | Returns and portfolio turnover rates are for the period indicated and have not been annualized. Returns do not reflect the deduction of taxes the shareholder would pay on fund distributions or redemption of fund shares. |
| @ | For thesix-month period ended March 31, 2019. All ratios for the period have been annualized. |
| (1) | Per share net investment income and net realized and unrealized gains (losses) calculated using average shares. |
| (2) | The expense ratio includes proxy expenses outside of the cap. |
| (3) | Commenced operations on December 31, 2014. All ratios for the period have been annualized. |
| (4) | Commenced operations on June 30, 2015. All ratios for the period have been annualized. |
Amounts designated as “–” are either $0 or have been rounded to $0.
| | |
282 | | SEI Institutional Managed Trust / Semi-Annual Report / March 31, 2019 |
FINANCIAL HIGHLIGHTS/CONSOLIDATED FINANCIAL HIGHLIGHTS
For the period ended March 31, 2019 (Unaudited) and the years or periods ended September 30, (unless otherwise indicated)
For a share outstanding throughout each period
| | | | | | | | | | | | | | | | | | | | | | | | | | | | | | | | | | | | | | | | | | | | | | | | | | | | | | | | | | | | |
| | | | | | | | | | | | | | | | |
| | | Net Asset
Value,
Beginning
of Period | | Net
Investment
Income
(Loss)(1) | | Net Realized
and Unrealized
Gains
(Losses) on
Investments(1) | | Total
from
Operations | | | Dividends
from Net
Investment
Income | | Distributions
from Net
Realized
Capital
Gains | | Total
Dividends
and
Distributions | | Net Asset
Value,
End
of Period | | Total
Return† | | | Net Assets
End of Period
($ Thousands) | | Ratio of Net
Expenses
to Average
Net Assets | | Ratio of Expenses
to Average Net
Assets (Excluding
Fees Paid Indirectly
and Including
Waivers) | | Ratio of Expenses
to Average
Net Assets
(Excluding Fees
Paid Indirectly
and Waivers) | | Ratio of Net
Investment
Income (Loss)
to Average
Net Assets | | Portfolio
Turnover
Rate† |
High Yield Bond Fund | | | | | | | | | | | | | | | | | | | | | | | | | | | | | | | | | | | | | | | | | | | | | | | | | |
Class F | | | | | | | | | | | | | | | | | | | | | | | | | | | | | | | | | | | | | | | | | | | | | | | | | | | | | | | | | |
2019@ | | $ | 7.13 | | | $ | 0.20 | | | $ | (0.15 | ) | | $ | 0.05 | | | $ | (0.20 | ) | | $ | (0.11 | ) | | $ | (0.31 | ) | | $ | 6.87 | | | | 0.83 | % | | $ | 1,426,095 | | | | 0.89 | % | | | 0.89 | % | | | 0.98 | % | | | 5.82 | % | | | 32 | % |
2018 | | | 7.33 | | | | 0.38 | | | | (0.11 | ) | | | 0.27 | | | | (0.38 | ) | | | (0.09 | ) | | | (0.47 | ) | | | 7.13 | | | | 3.88 | | | | 1,484,436 | | | | 0.89 | | | | 0.89 | | | | 0.98 | | | | 5.38 | | | | 58 | |
2017 | | | 7.18 | | | | 0.42 | | | | 0.26 | | | | 0.68 | | | | (0.41 | ) | | | (0.12 | ) | | | (0.53 | ) | | | 7.33 | | | | 9.75 | | | | 1,469,480 | | | | 0.90 | (2) | | | 0.90 | (2) | | | 1.01 | (2) | | | 5.83 | | | | 62 | |
2016 | | | 7.01 | | | | 0.42 | | | | 0.26 | | | | 0.68 | | | | (0.42 | ) | | | (0.09 | ) | | | (0.51 | ) | | | 7.18 | | | | 10.44 | | | | 1,737,907 | | | | 0.91 | (3) | | | 0.91 | (3) | | | 1.10 | (3) | | | 6.16 | | | | 56 | |
2015 | | | 7.70 | | | | 0.42 | | | | (0.65 | ) | | | (0.23 | ) | | | (0.42 | ) | | | (0.04 | ) | | | (0.46 | ) | | | 7.01 | | | | (3.21 | ) | | | 1,548,778 | | | | 0.89 | | | | 0.89 | | | | 1.08 | | | | 5.61 | | | | 56 | |
2014 | | | 7.68 | | | | 0.43 | | | | 0.06 | ‡ | | | 0.49 | | | | (0.43 | ) | | | (0.04 | ) | | | (0.47 | ) | | | 7.70 | | | | 6.49 | | | | 1,707,482 | | | | 0.89 | | | | 0.89 | | | | 1.12 | | | | 5.47 | | | | 73 | |
Class I | | | | | | | | | | | | | | | | | | | | | | | | | | | | | | | | | | | | | | | | | | | | | | | | | | | | | | | | | |
2019@ | | $ | 6.88 | | | $ | 0.19 | | | $ | (0.17 | ) | | $ | 0.02 | | | $ | (0.18 | ) | | $ | (0.11 | ) | | $ | (0.29 | ) | | $ | 6.61 | | | | 0.47 | % | | $ | 11,915 | | | | 1.11 | % | | | 1.11 | % | | | 1.23 | % | | | 5.66 | % | | | 32 | % |
2018 | | | 7.08 | | | | 0.35 | | | | (0.11 | ) | | | 0.24 | | | | (0.35 | ) | | | (0.09 | ) | | | (0.44 | ) | | | 6.88 | | | | 3.61 | | | | 545 | | | | 1.10 | | | | 1.10 | | | | 1.22 | | | | 5.08 | | | | 58 | |
2017 | | | 6.93 | | | | 0.39 | | | | 0.26 | | | | 0.65 | | | | (0.38 | ) | | | (0.12 | ) | | | (0.50 | ) | | | 7.08 | | | | 9.65 | | | | 1,147 | | | | 1.12 | (2) | | | 1.12 | (2) | | | 1.25 | (2) | | | 5.58 | | | | 62 | |
2016 | | | 6.78 | | | | 0.40 | | | | 0.23 | | | | 0.63 | | | | (0.39 | ) | | | (0.09 | ) | | | (0.48 | ) | | | 6.93 | | | | 9.95 | | | | 1,078 | | | | 1.14 | (3) | | | 1.14 | (3) | | | 1.36 | (3) | | | 6.01 | | | | 56 | |
2015 | | | 7.48 | | | | 0.39 | | | | (0.67 | ) | | | (0.28 | ) | | | (0.38 | ) | | | (0.04 | ) | | | (0.42 | ) | | | 6.78 | | | | (3.91 | ) | | | 1,026 | | | | 1.11 | | | | 1.11 | | | | 1.32 | | | | 5.31 | | | | 56 | |
2014 | | | 7.49 | | | | 0.40 | | | | 0.03 | | | | 0.43 | | | | (0.40 | ) | | | (0.04 | ) | | | (0.44 | ) | | | 7.48 | | | | 5.81 | | | | 3,794 | | | | 1.11 | | | | 1.11 | | | | 1.37 | | | | 5.24 | | | | 73 | |
Class Y | | | | | | | | | | | | | | | | | | | | | | | | | | | | | | | | | | | | | | | | | | | | | | | | | | | | | | | | | |
2019@ | | $ | 7.13 | | | $ | 0.21 | | | $ | (0.16 | ) | | $ | 0.05 | | | $ | (0.21 | ) | | $ | (0.11 | ) | | $ | (0.32 | ) | | $ | 6.86 | | | | 0.81 | % | | $ | 177,475 | | | | 0.64 | % | | | 0.64 | % | | | 0.73 | % | | | 6.07 | % | | | 32 | % |
2018 | | | 7.32 | | | | 0.40 | | | | (0.11 | ) | | | 0.29 | | | | (0.39 | ) | | | (0.09 | ) | | | (0.48 | ) | | | 7.13 | | | | 4.27 | | | | 177,644 | | | | 0.64 | | | | 0.64 | | | | 0.73 | | | | 5.62 | | | | 58 | |
2017 | | | 7.18 | | | | 0.44 | | | | 0.25 | | | | 0.69 | | | | (0.43 | ) | | | (0.12 | ) | | | (0.55 | ) | | | 7.32 | | | | 9.87 | | | | 187,087 | | | | 0.65 | (2) | | | 0.65 | (2) | | | 0.76 | (2) | | | 6.08 | | | | 62 | |
2016 | | | 7.01 | | | | 0.44 | | | | 0.26 | | | | 0.70 | | | | (0.44 | ) | | | (0.09 | ) | | | (0.53 | ) | | | 7.18 | | | | 10.72 | | | | 199,015 | | | | 0.66 | (3) | | | 0.66 | (3) | | | 0.85 | (3) | | | 6.42 | | | | 56 | |
2015(4) | | | 7.44 | | | | 0.33 | | | | (0.44 | ) | | | (0.11 | ) | | | (0.32 | ) | | | – | | | | (0.32 | ) | | | 7.01 | | | | (1.75 | ) | | | 143,315 | | | | 0.64 | | | | 0.64 | | | | 0.83 | | | | 5.94 | | | | 56 | |
Conservative Income Fund | | | | | | | | | | | | | | | | | | | | | | | | | | | | | | | | | | | | | | | | | | | | | | | | | |
Class F | | | | | | | | | | | | | | | | | | | | | | | | | | | | | | | | | | | | | | | | | | | | | | | | | | | | | | | | | |
2019@ | | $ | 10.00 | | | $ | 0.11 | | | $ | – | | | $ | 0.11 | | | $ | (0.11 | ) | | $ | –# | | | $ | (0.11 | ) | | $ | 10.00 | | | | 1.15 | % | | $ | 230,375 | | | | 0.30 | % | | | 0.30 | % | | | 0.59 | % | | | 2.30 | % | | | –% | |
2018 | | | 10.00 | | | | 0.16 | | | | – | | | | 0.16 | | | | (0.16 | ) | | | – | | | | (0.16 | ) | | | 10.00 | | | | 1.60 | | | | 209,822 | | | | 0.30 | | | | 0.30 | | | | 0.59 | | | | 1.60 | | | | – | |
2017 | | | 10.00 | | | | 0.08 | | | | – | | | | 0.08 | | | | (0.08 | ) | | | – | | | | (0.08 | ) | | | 10.00 | | | | 0.83 | | | | 190,440 | | | | 0.30 | | | | 0.30 | | | | 0.58 | | | | 0.84 | | | | – | |
2016(5) | | | 10.00 | | | | 0.02 | | | | – | | | | 0.02 | | | | (0.02 | ) | | | – | | | | (0.02 | ) | | | 10.00 | | | | 0.16 | | | | 75,011 | | | | 0.30 | (3) | | | 0.30 | (3) | | | 0.61 | (3) | | | 0.37 | | | | – | |
Class Y | | | | | | | | | | | | | | | | | | | | | | | | | | | | | | | | | | | | | | | | | | | | | | | | | | | | | | | | | |
2019@ | | $ | 10.00 | | | $ | 0.12 | | | $ | – | | | $ | 0.12 | | | $ | (0.12 | ) | | $ | –# | | | $ | (0.12 | ) | | $ | 10.00 | | | | 1.20 | % | | $ | 25,220 | | | | 0.20 | % | | | 0.20 | % | | | 0.34 | % | | | 2.38 | % | | | –% | |
2018 | | | 10.00 | | | | 0.17 | | | | – | | | | 0.17 | | | | (0.17 | ) | | | – | | | | (0.17 | ) | | | 10.00 | | | | 1.70 | | | | 27,498 | | | | 0.20 | | | | 0.20 | | | | 0.34 | | | | 1.71 | | | | – | |
2017 | | | 10.00 | | | | 0.10 | | | | (0.01 | ) | | | 0.09 | | | | (0.09 | ) | | | – | | | | (0.09 | ) | | | 10.00 | | | | 0.94 | | | | 19,984 | | | | 0.20 | | | | 0.20 | | | | 0.33 | | | | 0.96 | | | | – | |
2016(5) | | | 10.00 | | | | 0.02 | | | | – | | | | 0.02 | | | | (0.02 | ) | | | – | | | | (0.02 | ) | | | 10.00 | | | | 0.20 | | | | 16,796 | | | | 0.20 | (3) | | | 0.20 | (3) | | | 0.36 | (3) | | | 0.47 | | | | – | |
| † | Returns and portfolio turnover rates are for the period indicated and have not been annualized. Returns do not reflect the deduction of taxes the shareholder would pay on fund distributions or redemption of fund shares. |
| ‡ | Includes redemption fees of $0.03 per share. |
| @ | For thesix-month period ended March 31, 2019. All ratios for the period have been annualized. |
| # | Amount is less than $0.005 per share. |
| (1) | Per share net investment income and net realized and unrealized gains (losses) calculated using average shares. |
| (2) | The expense ratio includes litigation expenses outside the cap. |
| (3) | The expense ratio includes proxy expenses outside of the cap. |
| (4) | Commenced operations on December 31, 2014. All ratios for the period have been annualized. |
| (5) | Commenced operations on April 22, 2016. All ratios for the period have been annualized. |
| Amounts | designated as “–” are either $0 or have been rounded to $0. |
| | |
SEI Institutional Managed Trust / Semi-Annual Report / March 31, 2019 | | 283 |
FINANCIAL HIGHLIGHTS/CONSOLIDATED FINANCIAL HIGHLIGHTS
For the period ended March 31, 2019 (Unaudited) and the years or periods ended September 30, (unless otherwise indicated)
For a share outstanding throughout each period
| | | | | | | | | | | | | | | | | | | | | | | | | | | | | | | | | | | | | | | | | | | | | | | | | | | | | | | | | | | | |
| | | | | | | | | | | | | | | | |
| | | Net Asset
Value,
Beginning of
Period | | Net
Investment
Income
(Loss)(1) | | Net Realized
and Unrealized
Gains (Losses) on
Investments(1) | | Total from Operations | | | Dividends
from Net
Investment
Income | | Distributions
from Net
Realized
Capital
Gains | | Total
Dividends
and
Distributions | | Net Asset
Value,
End
of Period | | Total
Return† | | | Net Assets End of Period
($ Thousands) | | Ratio of Net
Expenses
to Average
Net Assets | | Ratio of Expenses
to Average Net
Assets (Excluding
Fees Paid Indirectly
and Including
Waivers) | | Ratio of Expenses
to Average Net Assets
(Excluding Fees
Paid Indirectly
and Waivers) | | Ratio of Net
Investment
Income (Loss)
to Average
Net Assets | | Portfolio
Turnover
Rate† |
Tax-Free Conservative Income Fund | | | | | | | | | | | | | | | | | | | | | | | | | | | | | | | | | | | | | | | | | | | | | | | | | |
Class F | | | | | | | | | | | | | | | | | | | | | | | | | | | | | | | | | | | | | | | | | | | | | | | | | | | | | | | | | |
2019@ | | $ | 10.00 | | | $ | 0.07 | | | $ | – | | | $ | 0.07 | | | $ | (0.07) | | | $ | –# | | | $ | (0.07 | ) | | $ | 10.00 | | | | 0.68 | % | | $ | 159,207 | | | | 0.30% | | | | 0.30 | % | | | 0.59 | % | | | 1.35 | % | | | – | % |
2018 | | | 10.00 | | | | 0.10 | | | | – | | | | 0.10 | | | | (0.10) | | | | – | | | | (0.10 | ) | | | 10.00 | | | | 0.99 | | | | 162,338 | | | | 0.30 | | | | 0.30 | | | | 0.59 | | | | 0.99 | | | | – | |
2017 | | | 10.00 | | | | 0.05 | | | | – | | | | 0.05 | | | | (0.05) | | | | – | | | | (0.05 | ) | | | 10.00 | | | | 0.51 | | | | 163,219 | | | | 0.30 | | | | 0.30 | | | | 0.59 | | | | 0.51 | | | | – | |
2016(2) | | | 10.00 | | | | 0.01 | | | | – | | | | 0.01 | | | | (0.01) | | | | – | | | | (0.01 | ) | | | 10.00 | | | | 0.12 | | | | 30,946 | | | | 0.30(3) | | | | 0.30 | (3) | | | 0.60 | (3) | | | 0.27 | | | | – | |
Class Y | | | | | | | | | | | | | | | | | | | | | | | | | | | | | | | | | | | | | | | | | | | | | | | | | | | | | | | | | |
2019@ | | $ | 10.00 | | | $ | 0.07 | | | $ | – | | | $ | 0.07 | | | $ | (0.07 | ) | | $ | –# | | | $ | (0.07 | ) | | $ | 10.00 | | | | 0.73 | % | | $ | 26,359 | | | | 0.20% | | | | 0.20 | % | | | 0.34 | % | | | 1.45 | % | | | – | % |
2018 | | | 10.00 | | | | 0.11 | | | | – | | | | 0.11 | | | | (0.11 | ) | | | – | | | | (0.11 | ) | | | 10.00 | | | | 1.09 | | | | 11,126 | | | | 0.20 | | | | 0.20 | | | | 0.34 | | | | 1.13 | | | | – | |
2017 | | | 10.00 | | | | 0.06 | | | | – | | | | 0.06 | | | | (0.06 | ) | | | – | | | | (0.06 | ) | | | 10.00 | | | | 0.60 | | | | 3,782 | | | | 0.20 | | | | 0.20 | | | | 0.34 | | | | 0.63 | | | | – | |
2016(2) | | | 10.00 | | | | 0.02 | | | | – | | | | 0.02 | | | | (0.02 | ) | | | – | | | | (0.02 | ) | | | 10.00 | | | | 0.16 | | | | 13,922 | | | | 0.20(3) | | | | 0.20 | (3) | | | 0.35 | (3) | | | 0.37 | | | | – | |
Real Return Fund | | | | | | | | | | | | | | | | | | | | | | | | | | | | | | | | | | | | | | | | | | | | | | | | | |
Class F | | | | | | | | | | | | | | | | | | | | | | | | | | | | | | | | | | | | | | | | | | | | | | | | | | | | | | | | | |
2019@ | | $ | 9.91 | | | $ | (0.02 | ) | | $ | 0.15 | | | $ | 0.13 | | | $ | (0.11 | ) | | $ | – | | | $ | (0.11 | ) | | $ | 9.93 | | | | 1.36 | % | | $ | 228,517 | | | | 0.45% | | | | 0.45 | % | | | 0.70 | % | | | (0.44 | )% | | | 11 | % |
2018 | | | 10.03 | | | | 0.25 | | | | (0.23 | ) | | | 0.02 | | | | (0.14 | ) | | | – | | | | (0.14 | ) | | | 9.91 | | | | 0.24 | | | | 238,889 | | | | 0.45 | | | | 0.45 | | | | 0.71 | | | | 2.51 | | | | 35 | |
2017 | | | 10.14 | | | | 0.11 | | | | (0.11 | ) | | | – | | | | (0.11 | )(4) | | | – | | | | (0.11 | ) | | | 10.03 | | | | 0.03 | | | | 252,333 | | | | 0.45 | | | | 0.45 | | | | 0.73 | | | | 1.07 | | | | 49 | |
2016 | | | 9.91 | | | | – | | | | 0.23 | | | | 0.23 | | | | – | | | | – | | | | – | | | | 10.14 | | | | 2.32 | | | | 291,380 | | | | 0.47(3) | | | | 0.47 | (3) | | | 0.82 | (3) | | | (0.02 | ) | | | 38 | |
2015 | | | 10.08 | | | | (0.10 | ) | | | (0.06 | ) | | | (0.16 | ) | | | (0.01 | ) | | | – | | | | (0.01 | ) | | | 9.91 | | | | (1.57 | ) | | | 263,888 | | | | 0.45 | | | | 0.45 | | | | 0.80 | | | | (1.01 | ) | | | 37 | |
2014 | | | 10.19 | | | | 0.05 | | | | (0.08 | ) | | | (0.03 | ) | | | (0.04 | ) | | | (0.04 | ) | | | (0.08 | ) | | | 10.08 | | | | (0.30 | ) | | | 284,944 | | | | 0.45 | | | | 0.45 | | | | 0.84 | | | | 0.51 | | | | 34 | |
Class Y | | | | | | | | | | | | | | | | | | | | | | | | | | | | | | | | | | | | | | | | | | | | | | | | | | | | | | | | | |
2019@ | | $ | 9.94 | | | $ | (0.02 | ) | | $ | 0.16 | | | $ | 0.14 | | | $ | (0.12 | ) | | $ | – | | | $ | (0.12 | ) | | $ | 9.96 | | | | 1.41 | % | | $ | 19,314 | | | | 0.35% | | | | 0.35 | % | | | 0.45 | % | | | (0.43 | )% | | | 11 | % |
2018 | | | 10.06 | | | | 0.26 | | | | (0.23 | ) | | | 0.03 | | | | (0.15 | ) | | | – | | | | (0.15 | ) | | | 9.94 | | | | 0.29 | | | | 16,691 | | | | 0.35 | | | | 0.35 | | | | 0.46 | | | | 2.60 | | | | 35 | |
2017 | | | 10.17 | | | | 0.12 | | | | (0.11 | ) | | | 0.01 | | | | (0.12 | )(4) | | | – | | | | (0.12 | ) | | | 10.06 | | | | 0.11 | | | | 18,205 | | | | 0.35 | | | | 0.35 | | | | 0.48 | | | | 1.15 | | | | 49 | |
2016 | | | 9.92 | | | | 0.01 | | | | 0.24 | | | | 0.25 | | | | – | | | | – | | | | – | | | | 10.17 | | | | 2.52 | | | | 28,835 | | | | 0.37(3) | | | | 0.37 | (3) | | | 0.57 | (3) | | | 0.07 | | | | 38 | |
2015(5) | | | 9.91 | | | | (0.02 | ) | | | 0.03 | | | | 0.01 | | | | – | | | | – | | | | – | | | | 9.92 | | | | 0.10 | | | | 25,525 | | | | 0.35 | | | | 0.35 | | | | 0.55 | | | | (0.27 | ) | | | 37 | |
Dynamic Asset Allocation Fund | | | | | | | | | | | | | | | | | | | | | | | | | | | | | | | | | | | | | | | | | | | | | | | | | |
Class F | | | | | | | | | | | | | | | | | | | | | | | | | | | | | | | | | | | | | | | | | | | | | | | | | | | | | | | | | |
2019@ | | $ | 13.22 | | | $ | 0.09 | | | $ | (0.40 | ) | | $ | (0.31 | ) | | $ | (0.23 | ) | | $ | – | | | $ | (0.23 | ) | | $ | 12.68 | | | | (2.11 | )% | | $ | 723,597 | | | | 0.75% | | | | 0.75 | % | | | 1.18 | % | | | 1.47 | % | | | 3 | % |
2018 | | | 12.10 | | | | 0.17 | | | | 1.15 | | �� | | 1.32 | | | | (0.18 | ) | | | (0.02 | ) | | | (0.20 | ) | | | 13.22 | | | | 10.95 | | | | 800,036 | | | | 0.75 | | | | 0.75 | | | | 1.19 | | | | 1.30 | | | | 11 | |
2017 | | | 10.18 | | | | 0.15 | | | | 1.87 | | | | 2.02 | | | | (0.10 | ) | | | – | | | | (0.10 | ) | | | 12.10 | | | | 19.95 | | | | 696,463 | | | | 0.75 | | | | 0.75 | | | | 1.18 | | | | 1.30 | | | | 3 | |
2016 | | | 9.09 | | | | 0.14 | | | | 0.99 | | | | 1.13 | | | | (0.04 | ) | | | – | | | | (0.04 | ) | | | 10.18 | | | | 12.39 | | | | 488,778 | | | | 0.77(3) | | | | 0.77 | (3) | | | 1.21 | (3) | | | 1.42 | | | | 7 | |
2015(6) | | | 10.00 | | | | 0.03 | | | | (0.94 | ) | | | (0.91 | ) | | | – | | | | – | | | | – | | | | 9.09 | | | | (9.10 | ) | | | 21,514 | | | | 0.75 | | | | 0.75 | | | | 1.25 | | | | 1.62 | | | | 2 | |
Class Y | | | | | | | | | | | | | | | | | | | | | | | | | | | | | | | | | | | | | | | | | | | | | | | | | | | | | | | | | |
2019@ | | $ | 13.25 | | | $ | 0.10 | | | $ | (0.40 | ) | | $ | (0.30 | ) | | $ | (0.26 | ) | | $ | – | | | $ | (0.26 | ) | | $ | 12.69 | | | | (1.97 | )% | | $ | 71,916 | | | | 0.50% | | | | 0.50 | % | | | 0.93 | % | | | 1.66 | % | | | 3 | % |
2018 | | | 12.12 | | | | 0.19 | | | | 1.17 | | | | 1.36 | | | | (0.21 | ) | | | (0.02 | ) | | | (0.23 | ) | | | 13.25 | | | | 11.26 | | | | 78,280 | | | | 0.50 | | | | 0.50 | | | | 0.93 | | | | 1.51 | | | | 11 | |
2017 | | | 10.20 | | | | 0.17 | | | | 1.87 | | | | 2.04 | | | | (0.12 | ) | | | – | | | | (0.12 | ) | | | 12.12 | | | | 20.17 | | | | 73,159 | | | | 0.50 | | | | 0.50 | | | | 0.93 | | | | 1.55 | | | | 3 | |
2016 | | | 9.09 | | | | 0.16 | | | | 0.99 | | | | 1.15 | | | | (0.04 | ) | | | – | | | | (0.04 | ) | | | 10.20 | | | | 12.67 | | | | 48,523 | | | | 0.52(3) | | | | 0.52 | (3) | | | 0.96 | (3) | | | 1.66 | | | | 7 | |
2015(6) | | | 10.00 | | | | 0.03 | | | | (0.94 | ) | | | (0.91 | ) | | | – | | | | – | | | | – | | | | 9.09 | | | | (9.10 | ) | | | 48,229 | | | | 0.50 | | | | 0.50 | | | | 0.96 | | | | 1.97 | | | | 2 | |
| † | Returns and portfolio turnover rates are for the period indicated and have not been annualized. Returns do not reflect the deduction of taxes the shareholder would pay on fund distributions or redemption of fund shares. |
| @ | For thesix-month period ended March 31, 2019. All ratios for the period have been annualized. |
| # | Amount is less than $0.005 per share. |
| (1) | Per share net investment income and net realized and unrealized gains (losses) calculated using average shares. |
| (2) | Commenced operations on April 22, 2016. All ratios for the period have been annualized. |
| (3) | The expense ratio includes proxy expenses outside of the cap. |
| (4) | Includes return of capital of $0.01. |
| (5) | Commenced operations on December 31, 2014. All ratios for the period have been annualized. |
| (6) | Commenced operations on July 30, 2015. All ratios for the period have been annualized. |
Amounts designated as “–” are either $0 or have been rounded to $0.
| | |
284 | | SEI Institutional Managed Trust / Semi-Annual Report / March 31, 2019 |
FINANCIAL HIGHLIGHTS/CONSOLIDATED FINANCIAL HIGHLIGHTS
For the period ended March 31, 2019 (Unaudited) and the years or periods ended September 30, (unless otherwise indicated)
For a share outstanding throughout each period
| | | | | | | | | | | | | | | | | | | | | | | | | | | | | | | | | | | | | | | | | | | | | | | | | | | | | | | | | | | | |
| | | | | | | | | | | | | | | | |
| | | Net Asset
Value,
Beginning of
Period | | Net
Investment
Income
(Loss)(1) | | Net Realized
and Unrealized
Gains (Losses) on
Investments(1) | | Total from
Operations | | | Dividends
from Net
Investment
Income | | Distributions
from Net
Realized
Capital
Gains | | Total
Dividends
and
Distributions | | Net Asset
Value,
End
of Period | | Total
Return† | | | Net Assets End of Period
($ Thousands) | | Ratio of Net
Expenses
to Average
Net Assets | | Ratio of Expenses
to Average Net
Assets (Excluding
Fees Paid Indirectly
and Including
Waivers) | | Ratio of Expenses
to Average Net Assets
(Excluding Fees
Paid Indirectly
and Waivers) | | Ratio of Net
Investment
Income (Loss)
to Average
Net Assets | | Portfolio
Turnover
Rate† |
Multi-Strategy Alternative Fund | | | | | | | | | | | | | | | | | | | | | | | | | | | | | | | | | | | | | | | | | | | | | | | | | |
Class F | | | | | | | | | | | | | | | | | | | | | | | | | | | | | | | | | | | | | | | | | | | | | | | | | | | | | | | | | |
2019@ | | $ | 10.10 | | | $ | 0.12 | | | $ | (0.35 | ) | | $ | (0.23 | ) | | $ | (0.16 | ) | | $ | (0.29 | ) | | $ | (0.45 | ) | | $ | 9.42 | | | | (2.15 | )% | | $ | 471,132 | | | | 1.33 | %(12) | | | 1.33 | %(12) | | | 2.28 | %(12) | | | 2.54 | % | | | 160 | % |
2018 | | | 10.11 | | | | 0.07 | | | | 0.14 | | | | 0.21 | | | | (0.02 | ) | | | (0.20 | ) | | | (0.22 | ) | | | 10.10 | | | | 2.11 | | | | 509,559 | | | | 1.41 | (10) | | | 1.41 | (10) | | | 2.41 | (10) | | | 0.72 | | | | 266 | ‡ |
2017 | | | 9.67 | | | | (0.01 | ) | | | 0.46 | | | | 0.45 | | | | (0.01 | ) | | | – | | | | (0.01 | ) | | | 10.11 | | | | 4.62 | | | | 508,046 | | | | 1.41 | (2) | | | 1.41 | (2) | | | 2.44 | (2) | | | (0.12 | ) | | | 215 | ‡ |
2016 | | | 9.60 | | | | 0.09 | | | | 0.23 | | | | 0.32 | | | | (0.15 | ) | | | (0.10 | ) | | | (0.25 | ) | | | 9.67 | | | | 3.40 | | | | 573,752 | | | | 1.12 | (3)(4) | | | 1.12 | (3)(4) | | | 2.39 | (3)(4) | | | 0.95 | | | | 149 | |
2015 | | | 10.05 | | | | 0.19 | | | | (0.48 | ) | | | (0.29 | ) | | | (0.16 | ) | | | – | | | | (0.16 | ) | | | 9.60 | | | | (2.98 | ) | | | 527,792 | | | | 0.49 | | | | 0.49 | | | | 2.08 | | | | 1.88 | | | | 35 | |
2014 | | | 9.79 | | | | 0.06 | | | | 0.28 | | | | 0.34 | | | | (0.08 | ) | | | – | | | | (0.08 | ) | | | 10.05 | | | | 3.45 | | | | 498,090 | | | | 0.64 | (5) | | | 0.64 | (5) | | | 2.19 | (5) | | | 0.64 | | | | 72 | |
Class Y | | | | | | | | | | | | | | | | | | | | | | | | | | | | | | | | | | | | | | | | | | | | | | | | | | | | | | | | | |
2019@ | | $ | 10.11 | | | $ | 0.11 | | | $ | (0.33 | ) | | $ | (0.22 | ) | | $ | (0.19 | ) | | $ | (0.29 | ) | | $ | (0.48 | ) | | $ | 9.41 | | | | (2.09 | )% | | $ | 9,849 | | | | 1.09 | %(13) | | | 1.09 | %(13) | | | 2.04 | %(13) | | | 2.27 | % | | | 160 | % |
2018 | | | 10.12 | | | | 0.10 | | | | 0.14 | | | | 0.24 | | | | (0.05 | ) | | | (0.20 | ) | | | (0.25 | ) | | | 10.11 | | | | 2.36 | | | | 5,951 | | | | 1.16 | (11) | | | 1.16 | (11) | | | 2.16 | (11) | | | 0.95 | | | | 266 | ‡ |
2017 | | | 9.68 | | | | 0.03 | | | | 0.44 | | | | 0.47 | | | | (0.03 | ) | | | – | | | | (0.03 | ) | | | 10.12 | | | | 4.79 | | | | 4,841 | | | | 1.14 | (6) | | | 1.14 | (6) | | | 2.16 | (6) | | | 0.34 | | | | 215 | ‡ |
2016 | | | 9.60 | | | | – | | | | 0.36 | | | | 0.36 | | | | (0.18 | ) | | | (0.10 | ) | | | (0.28 | ) | | | 9.68 | | | | 3.77 | | | | 1,352 | | | | 0.96 | (3)(7) | | | 0.96 | (3)(7) | | | 2.18 | (3)(7) | | | – | | | | 149 | |
2015(8) | | | 9.97 | | | | 0.04 | | | | (0.41 | ) | | | (0.37 | ) | | | – | | | | – | | | | – | | | | 9.60 | | | | (3.71 | ) | | | 19 | | | | 0.25 | | | | 0.25 | | | | 1.83 | | | | 1.03 | | | | 35 | |
Multi-Asset Accumulation Fund | | | | | | | | | | | | | | | | | | | | | | | | | | | | | | | | | | | | | | | | | | | | | | | | | |
Class F | | | | | | | | | | | | | | | | | | | | | | | | | | | | | | | | | | | | | | | | | | | | | | | | | | | | | | | | | |
2019@ | | $ | 9.81 | | | $ | 0.01 | | | $ | 0.32 | | | $ | 0.33 | | | $ | (0.27 | ) | | $ | (0.02 | ) | | $ | (0.29 | ) | | $ | 9.85 | | | | 3.73 | % | | $ | 2,578,460 | | | | 1.17 | % | | | 1.17 | % | | | 1.30 | % | | | 0.20 | % | | | 11 | % |
2018 | | | 10.01 | | | | 0.06 | | | | 0.24 | | | | 0.30 | | | | – | | | | (0.50 | ) | | | (0.50 | ) | | | 9.81 | | | | 2.93 | | | | 2,655,399 | | | | 1.17 | | | | 1.17 | | | | 1.29 | | | | 0.64 | | | | 11 | |
2017 | | | 10.31 | | | | (0.01 | ) | | | 0.39 | | | | 0.38 | | | | (0.07 | ) | | | (0.61 | ) | | | (0.68 | ) | | | 10.01 | | | | 4.33 | | | | 2,468,847 | | | | 1.17 | | | | 1.17 | | | | 1.31 | | | | (0.12 | ) | | | 28 | |
2016 | | | 9.53 | | | | (0.05 | ) | | | 1.10 | | | | 1.05 | | | | – | | | | (0.27 | ) | | | (0.27 | ) | | | 10.31 | | | | 11.36 | | | | 2,076,240 | | | | 1.19 | (3) | | | 1.19 | (3) | | | 1.35 | (3) | | | (0.50 | ) | | | 55 | |
2015 | | | 10.89 | | | | (0.09 | ) | | | (0.28 | ) | | | (0.37 | ) | | | (0.11 | ) | | | (0.88 | ) | | | (0.99 | ) | | | 9.53 | | | | (3.98 | ) | | | 1,803,619 | | | | 1.17 | | | | 1.17 | | | | 1.33 | | | | (0.85 | ) | | | 94 | |
2014 | | | 10.30 | | | | (0.05 | ) | | | 0.96 | | | | 0.91 | | | | –* | | | | (0.32 | ) | | | (0.32 | ) | | | 10.89 | | | | 9.11 | | | | 1,865,846 | | | | 1.17 | | | | 1.17 | | | | 1.38 | | | | (0.47 | ) | | | 55 | |
Class Y | | | | | | | | | | | | | | | | | | | | | | | | | | | | | | | | | | | | | | | | | | | | | | | | | | | | | | | | | |
2019@ | | $ | 9.88 | | | $ | – | | | $ | 0.34 | | | $ | 0.34 | | | $ | (0.29 | ) | | $ | (0.02 | ) | | $ | (0.31 | ) | | $ | 9.91 | | | | 3.88 | % | | $ | 225,946 | | | | 0.92 | % | | | 0.92 | % | | | 1.05 | % | | | 0.06 | % | | | 11 | % |
2018 | | | 10.06 | | | | 0.05 | | | | 0.27 | | | | 0.32 | | | | – | | | | (0.50 | ) | | | (0.50 | ) | | | 9.88 | | | | 3.13 | | | | 228,037 | | | | 0.92 | | | | 0.92 | | | | 1.04 | | | | 0.52 | | | | 11 | |
2017 | | | 10.36 | | | | – | | | | 0.41 | | | | 0.41 | | | | (0.10 | ) | | | (0.61 | ) | | | (0.71 | ) | | | 10.06 | | | | 4.55 | | | | 237,569 | | | | 0.92 | | | | 0.92 | | | | 1.06 | | | | (0.03 | ) | | | 28 | |
2016 | | | 9.55 | | | | (0.03 | ) | | | 1.11 | | | | 1.08 | | | | – | | | | (0.27 | ) | | | (0.27 | ) | | | 10.36 | | | | 11.66 | | | | 202,865 | | | | 0.94 | (3) | | | 0.94 | (3) | | | 1.10 | (3) | | | (0.33 | ) | | | 55 | |
2015(9) | | | 10.11 | | | | (0.08 | ) | | | (0.48 | ) | | | (0.56 | ) | | | – | | | | – | | | | – | | | | 9.55 | | | | (5.54 | ) | | | 202,311 | | | | 0.92 | | | | 0.92 | | | | 1.08 | | | | (1.04 | ) | | | 94 | |
| † | Returns and portfolio turnover rates are for the period indicated and have not been annualized. Returns do not reflect the deduction of taxes the shareholder would pay on fund distributions or redemption of fund shares. |
| @ | For thesix-month period ended March 31, 2019. All ratios for the period have been annualized. |
| * | Amount represents less than $0.01 per share. |
| ‡ | The portfolio turnover rate in 2017 and 2018 have been changed from 37% to 215% and 373% to 266%, respectively. |
| (1) | Per share net investment income and net realized and unrealized gains (losses) calculated using average shares. |
| (2) | The expense ratio includes dividend and interest expense, and other expenses outside the cap. Had this expense been excluded the ratios would have been 1.06%, 1.06%, and 2.09%. |
| (3) | The expense ratio includes proxy expenses outside of the cap. |
| (4) | The expense ratio includes dividend and interest expense, and other expenses outside the cap. Had this expense been excluded the ratios would have been 0.85%, 0.85%, and 2.12%. |
| (5) | The expense ratio includes dividend expense and other expenses outside the cap. Had this expense been excluded the ratios would have been 0.58%, 0.58%, and 2.13%. |
| (6) | The expense ratio includes dividend and interest expense, and other expenses outside the cap. Had this expense been excluded the ratios would have been 0.79%, 0.79%, and 1.98%. |
| (7) | The expense ratio includes dividend and interest expense, and other expenses outside the cap. Had this expense been excluded the ratios would have been 0.69%, 0.69%, and 1.91%. |
| (8) | Commenced operations on April 30, 2015. All ratios for the period have been annualized. |
| (9) | Commenced operations on December 31, 2014. All ratios for the period have been annualized. |
| (10) | The expense ratio includes dividend expense and other expenses outside the cap. Had this expense been excluded the ratios would have been 1.09%, 1.09%, and 2.09%. |
| (11) | The expense ratio includes dividend and interest expense, and other expenses outside the cap. Had this expense been excluded the ratios would have been 0.84%, 0.84%, and 1.84%. |
| (12) | The expense ratio includes dividend expense and other expenses outside the cap. Had this expense been excluded the ratios would have been 1.14%, 1.14%, and 2.09%. |
| (13) | The expense ratio includes dividend and interest expense, and other expenses outside the cap. Had this expense been excluded the ratios would have been 0.89%, 0.89%, and 1.84%. |
Amounts designated as “–”are either $0 or have been rounded to $0.
| | |
SEI Institutional Managed Trust / Semi-Annual Report / March 31, 2019 | | 285 |
FINANCIAL HIGHLIGHTS/CONSOLIDATED FINANCIAL HIGHLIGHTS
For the period ended March 31, 2019 (Unaudited) and the years or periods ended September 30, (unless otherwise indicated)
For a share outstanding throughout each period
| | | | | | | | | | | | | | | | | | | | | | | | | | | | | | | | | | | | | | | | | | | | | | | | | | | | | | | | | | | | |
| | | | | | | | | | | | | | | | |
| | | Net Asset
Value,
Beginning of
Period | | Net
Investment
Income
(Loss)(1) | | Net Realized
and Unrealized
Gains (Losses) on
Investments(1) | | Total from
Operations | | | Dividends
from Net
Investment
Income | | Distributions
from Net
Realized
Capital
Gains | | Total
Dividends
and
Distributions | | | Net Asset
Value,
End
of Period | | Total
Return† | | | Net Assets
End of Period
($ Thousands) | | Ratio of Net
Expenses
to Average
Net Assets | | Ratio of Expenses
to Average Net
Assets (Excluding
Fees Paid Indirectly
and Including
Waivers) | | Ratio of Expenses
to Average Net Assets
(Excluding Fees
Paid Indirectly
and Waivers) | | Ratio of Net
Investment
Income (Loss)
to Average
Net Assets | | Portfolio
Turnover
Rate† |
Multi-Asset Income Fund | | | | | | | | | | | | | | | | | | | | | | | | | | | | | | | | | | | | | | | | | | | | | | | | | |
Class F | | | | | | | | | | | | | | | | | | | | | | | | | | | | | | | | | | | | | | | | | | | | | | | | | | | | | | | | | | | | |
2019@ | | $ | 10.61 | | | $ | 0.22 | | | $ | 0.16 | | | $ | 0.38 | | | $ | (0.19 | ) | | $ | – | | | $ | (0.19 | ) | | $ | 10.80 | | | | 3.62 | % | | $ | 786,696 | | | | 0.80 | % | | | 0.80 | % | | | 1.20 | % | | | 4.25 | % | | | 26 | % |
2018 | | | 10.88 | | | | 0.40 | | | | (0.24 | ) | | | 0.16 | | | | (0.34 | )(2) | | | (0.09 | ) | | | (0.43 | ) | | | 10.61 | | | | 1.56 | | | | 815,020 | | | | 0.80 | | | | 0.80 | | | | 1.21 | | | | 3.78 | | | | 119 | |
2017 | | | 10.56 | | | | 0.48 | | | | 0.24 | | | | 0.72 | | | | (0.40 | ) | | | – | | | | (0.40 | ) | | | 10.88 | | | | 6.90 | | | | 813,767 | | | | 0.80 | | | | 0.80 | | | | 1.21 | | | | 4.47 | | | | 77 | |
2016 | | | 10.46 | | | | 0.50 | | | | 0.23 | | | | 0.73 | | | | (0.53 | ) | | | (0.10 | ) | | | (0.63 | ) | | | 10.56 | | | | 7.38 | | | | 643,477 | | | | 0.82 | (3)(4) | | | 0.82 | (3)(4) | | | 1.23 | (3)(4) | | | 4.85 | | | | 72 | |
2015 | | | 10.60 | | | | 0.54 | | | | (0.19 | ) | | | 0.35 | | | | (0.44 | ) | | | (0.05 | ) | | | (0.49 | ) | | | 10.46 | | | | 3.33 | | | | 615,259 | | | | 0.85 | (5) | | | 0.85 | (5) | | | 1.25 | (5) | | | 5.06 | | | | 109 | |
2014 | | | 10.60 | | | | 0.51 | | | | 0.13 | (6) | | | 0.64 | | | | (0.47 | ) | | | (0.17 | ) | | | (0.64 | ) | | | 10.60 | | | | 6.19 | | | | 539,504 | | | | 0.83 | (7) | | | 0.83 | (7) | | | 1.27 | (7) | | | 4.76 | | | | 124 | |
Class Y | | | | | | | | | | | | | | | | | | | | | | | | | | | | | | | | | | | | | | | | | | | | | | | | | | | | | | | | | | | | |
2019@ | | $ | 10.61 | | | $ | 0.23 | | | $ | 0.15 | | | $ | 0.38 | | | $ | (0.19 | ) | | $ | – | | | $ | (0.19 | ) | | $ | 10.80 | | | | 3.66 | % | | $ | 158,890 | | | | 0.70 | % | | | 0.70 | % | | | 0.95 | % | | | 4.35 | % | | | 26 | % |
2018 | | | 10.88 | | | | 0.41 | | | | (0.24 | ) | | | 0.17 | | | | (0.35 | )(2) | | | (0.09 | ) | | | (0.44 | ) | | | 10.61 | | | | 1.66 | | | | 175,431 | | | | 0.70 | | | | 0.70 | | | | 0.96 | | | | 3.88 | | | | 119 | |
2017 | | | 10.56 | | | | 0.49 | | | | 0.24 | | | | 0.73 | | | | (0.41 | ) | | | – | | | | (0.41 | ) | | | 10.88 | | | | 7.00 | | | | 166,980 | | | | 0.70 | | | | 0.70 | | | | 0.96 | | | | 4.60 | | | | 77 | |
2016 | | | 10.46 | | | | 0.52 | | | | 0.22 | | | | 0.74 | | | | (0.54 | ) | | | (0.10 | ) | | | (0.64 | ) | | | 10.56 | | | | 7.49 | | | | 97,943 | | | | 0.72 | (3)(8) | | | 0.72 | (3)(8) | | | 0.98 | (3)(8) | | | 5.08 | | | | 72 | |
2015(9) | | | 10.62 | | | | 0.45 | | | | (0.26 | ) | | | 0.19 | | | | (0.35 | ) | | | – | | | | (0.35 | ) | | | 10.46 | | | | 1.81 | | | | 33,224 | | | | 0.76 | (10) | | | 0.76 | (10) | | | 1.00 | (10) | | | 5.60 | | | | 109 | |
Multi-Asset Inflation Managed Fund | | | | | | | | | | | | | | | | | | | | | | | | | | | | | | | | | | | | | | | | | | | | | | | | | |
Class F | | | | | | | | | | | | | | | | | | | | | | | | | | | | | | | | | | | | | | | | | | | | | | | | | | | | | | | | | | | | |
2019@ | | $ | 8.52 | | | $ | 0.02 | | | $ | (0.11 | ) | | $ | (0.09 | ) | | $ | (0.15 | ) | | $ | – | | | $ | (0.15 | ) | | $ | 8.28 | | | | (0.62 | )% | | $ | 805,336 | | | | 1.82 | %(16) | | | 1.82 | %(16) | | | 2.06 | %(16) | | | 0.57 | % | | | 35 | % |
2018 | | | 8.52 | | | | 0.17 | | | | (0.08 | ) | | | 0.09 | | | | (0.12 | ) | | | – | | | | (0.12 | ) | | | 8.49 | | | | 1.04 | | | | 860,457 | | | | 1.52 | (16) | | | 1.52 | (16) | | | 1.76 | (16) | | | 1.97 | | | | 32 | |
2017 | | | 8.80 | | | | 0.09 | | | | (0.27 | ) | | | (0.18 | ) | | | (0.10 | ) | | | – | | | | (0.10 | ) | | | 8.52 | | | | (2.07 | ) | | | 821,191 | | | | 1.33 | (11) | | | 1.33 | (11) | | | 1.56 | (11) | | | 1.01 | | | | 68 | |
2016 | | | 8.75 | | | | 0.05 | | | | 0.04 | | | | 0.09 | | | | (0.04 | ) | | | – | | | | (0.04 | ) | | | 8.80 | | | | 1.06 | | | | 990,931 | | | | 1.23 | (3)(11) | | | 1.23 | (3)(11) | | | 1.46 | (3)(11) | | | 0.59 | | | | 73 | |
2015 | | | 9.39 | | | | – | | | | (0.64 | ) | | | (0.64 | ) | | | – | | | | – | | | | – | | | | 8.75 | | | | (6.82 | ) | | | 924,048 | | | | 1.11 | (12) | | | 1.11 | (12) | | | 1.34 | (12) | | | (0.05 | ) | | | 115 | |
2014 | | | 9.42 | | | | 0.06 | | | | (0.09 | ) | | | (0.03 | ) | | | – | | | | – | | | | – | | | | 9.39 | | | | (0.32 | ) | | | 923,541 | | | | 1.02 | (13) | | | 1.02 | (13) | | | 1.30 | (13) | | | 0.65 | | | | 119 | |
Class Y | | | | | | | | | | | | | | | | | | | | | | | | | | | | | | | | | | | | | | | | | | | | | | | | | | | | | | | | | | | | |
2019@ | | $ | 8.53 | | | $ | 0.01 | | | $ | (0.09 | ) | | $ | (0.08 | ) | | $ | (0.17 | ) | | $ | – | | | $ | (0.17 | ) | | $ | 8.28 | | | | (0.47 | )% | | $ | 65,042 | | | | 1.57 | %(17) | | | 1.57 | %(17) | | | 1.81 | %(17) | | | 0.36 | % | | | 35 | % |
2018 | | | 8.53 | | | | 0.16 | | | | (0.05 | ) | | | 0.11 | | | | (0.14 | ) | | | – | | | | (0.14 | ) | | | 8.50 | | | | 1.29 | | | | 63,546 | | | | 1.27 | (17) | | | 1.27 | (17) | | | 1.50 | (17) | | | 1.90 | | | | 32 | |
2017 | | | 8.82 | | | | 0.10 | | | | (0.26 | ) | | | (0.16 | ) | | | (0.13 | ) | | | – | | | | (0.13 | ) | | | 8.53 | | | | (1.90 | ) | | | 68,506 | | | | 1.08 | (14) | | | 1.08 | (14) | | | 1.32 | (14) | | | 1.13 | | | | 68 | |
2016 | | | 8.77 | | | | 0.07 | | | | 0.04 | | | | 0.11 | | | | (0.06 | ) | | | – | | | | (0.06 | ) | | | 8.82 | | | | 1.30 | | | | 89,261 | | | | 0.98 | (3)(14) | | | 0.98 | (3)(14) | | | 1.21 | (3)(14) | | | 0.79 | | | | 73 | |
2015(9) | | | 8.96 | | | | 0.04 | | | | (0.23 | ) | | | (0.19 | ) | | | – | | | | – | | | | – | | | | 8.77 | | | | (2.12 | ) | | | 83,248 | | | | 0.92 | (15) | | | 0.92 | (15) | | | 1.15 | (15) | | | 0.53 | | | | 115 | |
| † | Returns and portfolio turnover rates are for the period indicated and have not been annualized. Returns do not reflect the deduction of taxes the shareholder would pay on fund distributions or redemption of fund shares. |
| @ | For thesix-month period ended March 31, 2019. All ratios for the period have been annualized. |
| (1) | Per share net investment income and net realized and unrealized gains (losses) calculated using average shares. |
| (2) | Includes return of capital of $0.02. |
| (3) | The expense ratio includes proxy expenses outside of the cap. |
| (4) | The expense ratio includes interest expense. Had this expense been excluded the ratios would have been 0.80%, 0.80%, and 1.21%. |
| (5) | The expense ratio includes interest expense. Had this expense been excluded the ratios would have been 0.80%, 0.80%, and 1.20%. |
| (6) | The amount shown for a share outstanding throughout the period does not accord with the aggregate net gains on investments for that period because the sales and repurchase of Fund shares in relation to the fluctuating market value of the Fund. |
| (7) | The expense ratio includes interest expense. Had this expense been excluded the ratios would have been 0.80%, 0.80%, and 1.24%. |
| (8) | The expense ratio includes interest expense. Had this expense been excluded the ratios would have been 0.70%, 0.70%, and 0.96%. |
| (9) | Commenced operations on December 31, 2014. All ratios for the period have been annualized. |
| (10) | The expense ratio includes interest expense. Had this expense been excluded the ratios would have been 0.70%, 0.70%, and 0.95%. |
| (11) | The expense ratio includes dividend and interest expense, and other expenses outside the cap. Had this expense been excluded the ratios would have been 0.90%, 0.90%, and 1.14%. |
| (12) | The expense ratio includes interest and dividend expense. Had this expense been excluded the ratios would have been 0.95%, 0.95%, and 1.18%. |
| (13) | The expense ratio includes dividend and interest expense, and other expenses outside the cap. Had this expense been excluded the ratios would have been 0.90%, 0.90%, and 1.18%. |
| (14) | The expense ratio includes dividend and interest expense, and other expenses outside the cap. Had this expense been excluded the ratios would have been 0.65%, 0.65%, and 0.89%. |
| (15) | The expense ratio includes dividend and interest expense. Had this expense been excluded the ratios would have been 0.70%, 0.70%, and 0.93%. |
| (16) | The expense ratio includes dividend and interest expense. Had this expense been excluded the ratios would have been 0.90%, 0.90%, and 1.14%. |
| (17) | The expense ratio includes dividend and interest expense. Had this expense been excluded the ratios would have been 0.65%, 0.65%, and 0.89%. |
Amounts designated as “–“are either $0 or have been rounded to $0.
| | |
286 | | SEI Institutional Managed Trust / Semi-Annual Report / March 31, 2019 |
FINANCIAL HIGHLIGHTS/CONSOLIDATED FINANCIAL HIGHLIGHTS
For the period ended March 31, 2019 (Unaudited) and the years or periods ended September 30, (unless otherwise indicated)
For a share outstanding throughout each period
| | | | | | | | | | | | | | | | | | | | | | | | | | | | | | | | | | | | | | | | | | | | | | | | | | | | | | | | | | | | |
| | | | | | | | | | | | | | | | |
| | | Net Asset
Value,
Beginning of
Period | | Net
Investment
Income
(Loss)(1) | | Net Realized
and Unrealized
Gains (Losses) on
Investments(1) | | Total from
Operations | | | Dividends
from Net
Investment
Income | | Distributions
from Net
Realized
Capital
Gains | | Total
Dividends
and
Distributions | | | Net Asset
Value,
End
of Period | | Total
Return† | | | Net Assets
End of Period
($ Thousands) | | Ratio of Net
Expenses
to Average
Net Assets | | Ratio of Expenses
to Average Net
Assets (Excluding
Fees Paid Indirectly
and Including
Waivers) | | Ratio of Expenses
to Average Net Assets
(Excluding Fees
Paid Indirectly
and Waivers) | | Ratio of Net
Investment
Income (Loss)
to Average
Net Assets | | Portfolio
Turnover
Rate† |
Multi-Asset Capital Stability Fund | | | | | | | | | | | | | | | | | | | | | | | | | | | | | | | | | | | | | | | | | | | | | | | | | |
Class F | | | | | | | | | | | | | | | | | | | | | | | | | | | | | | | | | | | | | | | | | | | | | | | | | | | | | | | | | | | | |
2019@ | | $ | 10.05 | | | $ | 0.06 | | | $ | 0.08 | | | $ | 0.14 | | | $ | (0.05 | ) | | | $ – | | | $ | (0.05 | ) | | $ | 10.14 | | | | 1.44 | % | | $ | 667,686 | | | | 0.62 | % | | | 0.62 | % | | | 0.98 | % | | | 1.25% | | | | 53 | % |
2018 | | | 10.25 | | | | 0.09 | | | | 0.09 | | | | 0.18 | | | | (0.20 | ) | | | (0.18) | | | | (0.38 | ) | | | 10.05 | | | | 1.75 | | | | 682,982 | | | | 0.62 | | | | 0.62 | | | | 0.98 | | | | 0.88 | | | | 228 | |
2017 | | | 10.14 | | | | – | | | | 0.18 | | | | 0.18 | | | | (0.02 | ) | | | (0.05) | | | | (0.07 | ) | | | 10.25 | | | | 1.78 | | | | 694,247 | | | | 0.62 | | | | 0.62 | | | | 0.98 | | | | 0.02 | | | | 159 | |
2016 | | | 10.11 | | | | (0.01 | ) | | | 0.16 | | | | 0.15 | | | | – | | | | (0.12) | | | | (0.12 | ) | | | 10.14 | | | | 1.47 | | | | 658,185 | | | | 0.64 | (2) | | | 0.64 | (2) | | | 1.00 | (2) | | | (0.07) | | | | 234 | |
2015 | | | 10.25 | | | | (0.04 | ) | | | 0.09 | | | | 0.05 | | | | – | | | | (0.19) | | | | (0.19 | ) | | | 10.11 | | | | 0.57 | | | | 565,709 | | | | 0.62 | | | | 0.62 | | | | 0.98 | | | | (0.39) | | | | 227 | |
2014 | | | 9.94 | | | | (0.01 | ) | | | 0.34 | | | | 0.33 | | | | – | | | | (0.02) | | | | (0.02 | ) | | | 10.25 | | | | 3.37 | | | | 541,602 | | | | 0.62 | | | | 0.62 | | | | 1.02 | | | | (0.12) | | | | 246 | |
Class Y | | | | | | | | | | | | | | | | | | | | | | | | | | | | | | | | | | | | | | | | | | | | | | | | | | | | | | | | | | | | |
2019@ | | $ | 10.07 | | | $ | 0.07 | | | $ | 0.07 | | | $ | 0.14 | | | $ | (0.06 | ) | | | $ – | | | $ | (0.06 | ) | | $ | 10.15 | | | | 1.44 | % | | $ | 49,311 | | | | 0.52 | % | | | 0.52 | % | | | 0.73 | % | | | 1.35% | | | | 53 | % |
2018 | | | 10.27 | | | | 0.10 | | | | 0.09 | | | | 0.19 | | | | (0.21 | ) | | | (0.18) | | | | (0.39 | ) | | | 10.07 | | | | 1.84 | | | | 44,681 | | | | 0.52 | | | | 0.52 | | | | 0.73 | | | | 0.97 | | | | 228 | |
2017 | | | 10.16 | | | | 0.01 | | | | 0.17 | | | | 0.18 | | | | (0.02 | ) | | | (0.05) | | | | (0.07 | ) | | | 10.27 | | | | 1.88 | | | | 50,346 | | | | 0.52 | | | | 0.52 | | | | 0.73 | | | | 0.11 | | | | 159 | |
2016 | | | 10.12 | | | | – | | | | 0.16 | | | | 0.16 | | | | – | | | | (0.12) | | | | (0.12 | ) | | | 10.16 | | | | 1.57 | | | | 51,496 | | | | 0.54 | (2) | | | 0.54 | (2) | | | 0.75 | (2) | | | 0.02 | | | | 234 | |
2015(3) | | | 10.06 | | | | (0.02 | ) | | | 0.08 | | | | 0.06 | | | | – | | | | – | | | | – | | | | 10.12 | | | | 0.60 | | | | 50,662 | | | | 0.52 | | | | 0.52 | | | | 0.74 | | | | (0.30) | | | | 227 | |
Long/Short Alternative Fund | | | | | | | | | | | | | | | | | | | | | | | | | | | | | | | | | | | | | | | | | | | | | | | | | |
Class F | | | | | | | | | | | | | | | | | | | | | | | | | | | | | | | | | | | | | | | | | | | | | | | | | | | | | | | | | | | | |
2019@ | | $ | 10.28 | | | $ | 0.06 | | | $ | (0.46 | ) | | $ | (0.40 | ) | | $ | (0.08 | ) | | | $(0.29) | | | $ | (0.37 | ) | | $ | 9.51 | | | | (3.87 | )% | | $ | 3,046 | | | | 1.15 | % | | | 1.15 | % | | | 1.41 | % | | | 1.15% | | | | 3 | % |
2018 | | | 10.88 | | | | 0.07 | | | | 0.36 | | | | 0.43 | | | | (0.02 | ) | | | (1.01) | | | | (1.03 | ) | | | 10.28 | | | | 4.21 | | | | 4,151 | | | | 1.16 | | | | 1.16 | | | | 1.44 | | | | 0.70 | | | | 4 | |
2017 | | | 9.79 | | | | (0.01 | ) | | | 1.10 | | | | 1.09 | | | | – | | | | – | | | | – | | | | 10.88 | | | | 11.13 | | | | 22 | | | | 1.14 | | | | 1.14 | | | | 1.42 | | | | (0.13) | | | | 111 | |
2016 | | | 9.67 | | | | (0.06 | ) | | | 0.18 | | | | 0.12 | | | | – | | | | – | | | | – | | | | 9.79 | | | | 1.24 | | | | 19 | | | | 1.17 | (2) | | | 1.17 | (2) | | | 1.40 | (2) | | | (0.57) | | | | 43 | |
2015(4) | | | 10.00 | | | | (0.08 | ) | | | (0.25 | ) | | | (0.33 | ) | | | – | | | | – | | | | – | | | | 9.67 | | | | (3.30 | ) | | | 19 | | | | 1.14 | | | | 1.14 | | | | 1.39 | | | | (0.99) | | | | 198 | |
Class Y | | | | | | | | | | | | | | | | | | | | | | | | | | | | | | | | | | | | | | | | | | | | | | | | | | | | | | | | | | | | |
2019@ | �� | $ | 10.32 | | | $ | 0.07 | | | $ | (0.45 | ) | | $ | (0.38 | ) | | $ | (0.10 | ) | | | $(0.29) | | | $ | (0.39 | ) | | $ | 9.55 | | | | (3.69 | )% | | $ | 28,574 | | | | 0.90 | % | | | 0.90 | % | | | 1.16 | % | | | 1.40% | | | | 3 | % |
2018 | | | 10.93 | | | | 0.08 | | | | 0.36 | | | | 0.44 | | | | (0.04 | ) | | | (1.01) | | | | (1.05 | ) | | | 10.32 | | | | 4.33 | | | | 32,444 | | | | 0.91 | | | | 0.91 | | | | 1.20 | | | | 0.74 | | | | 4 | |
2017 | | | 9.81 | | | | 0.01 | | | | 1.11 | | | | 1.12 | | | | –(5) | | | | – | | | | – | | | | 10.93 | | | | 11.42 | | | | 34,360 | | | | 0.90 | | | | 0.90 | | | | 1.17 | | | | 0.10 | | | | 111 | |
2016 | | | 9.67 | | | | (0.03 | ) | | | 0.17 | | | | 0.14 | | | | – | | | | – | | | | – | | | | 9.81 | | | | 1.45 | | | | 41,775 | | | | 0.92 | (2) | | | 0.92 | (2) | | | 1.15 | (2) | | | (0.32) | | | | 43 | |
2015(6) | | | 10.11 | | | | (0.03 | ) | | | (0.41 | ) | | | (0.44 | ) | | | – | | | | – | | | | – | | | | 9.67 | | | | (4.35 | ) | | | 41,164 | | | | 0.91 | | | | 0.91 | | | | 1.15 | | | | (0.81) | | | | 198 | |
| † | Returns and portfolio turnover rates are for the period indicated and have not been annualized. Returns do not reflect the deduction of taxes the shareholder would pay on fund distributions or redemption of fund shares. |
| @ | For thesix-month period ended March 31, 2019. All ratios for the period have been annualized. |
| (1) | Per share net investment income and net realized and unrealized gains (losses) calculated using average shares. |
| (2) | The expense ratio includes proxy expenses outside of the cap. |
| (3) | Commenced operations on December 31, 2014. All ratios for the period have been annualized. |
| (4) | Commenced operations on December 19, 2014. All ratios for the period have been annualized. |
| (5) | Includes return of capital of less than $0.01 per share. |
| (6) | Commenced operations on April 30, 2015. All ratios for the period have been annualized. |
Amounts designated as “—“are either $0 or have been rounded to $0.
| | |
SEI Institutional Managed Trust / Semi-Annual Report / March 31, 2019 | | 287 |
Notes to Financial Statements/Consolidated Notes to Financial Statements (Unaudited)
March 31, 2019
1. ORGANIZATION
SEI Institutional Managed Trust (the “Trust”) is organized as a Massachusetts business trust under a Declaration of Trust dated October 20, 1986.
The Trust is registered under the Investment Company Act of 1940, as amended, as anopen-end investment company with 29 funds: Large Cap, Large Cap Value, Large Cap Growth, Large Cap Index (commenced operations on January 31, 2018),Tax-Managed Large Cap, S&P 500 Index, Small Cap, Small Cap Value, Small Cap Growth,Tax-Managed Small/Mid Cap,Mid-Cap, U.S. Managed Volatility, Global Managed Volatility,Tax-Managed Managed Volatility,Tax-Managed International Managed Volatility, Real Estate, Enhanced Income, Core Fixed Income, High Yield Bond, Conservative Income,Tax-Free Conservative Income, Real Return, Dynamic Asset Allocation, Multi-Strategy Alternative, Multi-Asset Accumulation, Multi-Asset Income, Multi-Asset Inflation Managed, Multi-Asset Capital Stability and Long/Short Alternative (each a “Fund,” collectively the “Funds”) each of which are diversified Funds, with the exception of the Multi-Asset Accumulation and Multi-Asset Inflation Managed Funds.
The Dynamic Commodity Strategy Subsidiary, Ltd., the Accumulation Commodity Strategy Subsidiary, Ltd. and the Inflation Commodity Strategy Subsidiary, Ltd. are wholly-owned subsidiaries of the Dynamic Asset Allocation, Multi-Asset Accumulation and Multi-Asset Inflation Managed Funds, respectively, (each a “Subsidiary”, collectively the “Subsidiaries”). Each Subsidiary is organized under the laws of the Cayman Islands as an exempt limited company. Information regarding the Dynamic Asset Allocation, Multi-Asset Accumulation and Multi-Asset Inflation Managed Funds and their respective subsidiaries have been consolidated in the Consolidated Schedules of Investments, Consolidated Statements of Assets and Liabilities, Consolidated Statements of Operations, Consolidated Statements of Changes in Net Assets and Consolidated Statement of Cash Flows.
The Trust is registered to offer: Class F shares of the Funds and Class Y shares of the Funds except for the Large Cap Index and S&P 500 Index Funds; Class I shares of the Large Cap, Large Cap Value, Large Cap Growth, S&P 500 Index, Small Cap, Small Cap Value, Small Cap Growth,Mid-Cap, U.S. Managed Volatility, Global Managed Volatility, Real Estate, Enhanced Income, Core Fixed Income, High Yield Bond and Real Return Funds. The assets of each Fund are segregated, and a shareholder’s interest is limited to the Fund in which shares are held. Each Fund’s prospectus provides a description of its investment goal and its principal investment strategies and risks.
On January 25, 2018, the Trust’s Board of Trustees approved the merger of Class E shares and Class Y shares into Class F shares of the S&P 500 Index Fund effective April 20, 2018.
2. SIGNIFICANT ACCOUNTING POLICIES
The following are significant accounting policies, which are consistently followed in the preparation of its financial statements by the Funds. The Funds are investment companies that apply the accounting and reporting guidance issued in Topic 946 by the U.S. Financial Accounting Standards Board (“FASB”).
Use of Estimates— The preparation of financial statements, in conformity with U.S. GAAP requires management to make estimates and assumptions that affect the reported amounts of assets and liabilities and disclosure of contingent assets and liabilities as of the date of the financial statements and the reported amounts of increases and decreases in net assets from operations during the reporting period. Actual results could differ from those estimates.
Security Valuation— Securities listed on a securities exchange, market or automated quotation system for which quotations are readily available (other than securities traded on National Association of Securities Dealers Automated Quotations (NASDAQ) or as otherwise noted below) at the last quoted sale price on an exchange or market (foreign or domestic) on which the securities are traded, or, if there is no such reported sale, at the most recent quoted bid price. The Funds value securities traded on NASDAQ at the NASDAQ Official Closing Price. If available, debt securities, swaps (which are not centrally cleared), bank loans or collateralized debt obligations (including collateralized loan obligations), such as those held by the Funds, are priced based upon valuations provided by independent, third-party pricing agents. Such values generally reflect the last reported sales price if the security is actively traded. The third-party pricing agents may also value debt securities at an evaluated bid price by employing methodologies that utilize actual market transactions, broker-supplied valuations or other methodologies designed to identify the market value for such securities. Redeemable securities issued byopen-end investment companies are valued at the investment company’s applicable net asset value, with the exception of ETFs, which are priced as equity securities. The prices of foreign securities are reported in local currency and converted to U.S. dollars using currency exchange rates. If a security’s price cannot be obtained, as noted above, the Funds will value the securities using a bid price from at least one independent broker. If such prices are not readily available or cannot be valued using the methodologies described above, the Funds will value
| | |
288 | | SEI Institutional Managed Trust / Semi-Annual Report / March 31, 2019 |
the security using the Funds’ Fair Value Pricing Policies and Procedures (“Fair Value Procedures”), as described below.
On the first day a new debt security purchase is recorded, if a price is not available from a third-party pricing agent or an independent broker, the security may be valued at its purchase price. Each day thereafter, the debt security will be valued according to the Funds’ Fair Value Procedures until a price from an independent source can be secured. Securities held by a Fund with remaining maturities of 60 days or less may be valued by the amortized cost method, which involves valuing a security at its cost on the date of purchase and thereafter (absent unusual circumstances) assuming a constant amortization to maturity of any discount or premium, regardless of the impact of fluctuations in general market rates of interest on the value of the instrument. While this method provides certainty in valuation, it may result in periods during which value, as determined by this method, is higher or lower than the price a Fund would receive if it sold the instrument. Further, the value of securities in the Fund can be expected to vary inversely with changes in prevailing interest rates. Should existing credit, liquidity or interest rate conditions in the relevant markets and issuer-specific circumstances suggest that amortized cost does not approximate fair value, then the amortized cost method may not be used.
Options are valued at the last quoted sales price. If there is no such reported sale on the valuation date, long positions are valued at the most recent bid price, and short positions are valued at the most recent ask price.
Futures and swaps cleared through a central clearing house (“centrally cleared swaps”) are valued at the settlement price established each day by the board of exchange on which they are traded. The daily settlement prices for financial futures and centrally cleared swaps are provided by an independent source. On days when there is excessive volume, market volatility or the future or centrally cleared swap does not end trading by the time a Fund calculates its NAV, the settlement price may not be available at the time at which the Fund calculates its NAV. On such days, the best available price (which is typically the last sales price) may be used to value a Fund’s futures or centrally cleared swaps position.
Foreign currency forward contracts are valued at the current day’s interpolated foreign exchange rate, as calculated using the current day’s spot rate, and the thirty, sixty, ninety andone-hundred eighty day forward rates provided by an independent source.
Prices for most securities held by a Fund are provided daily by third party independent pricing agents. SEI
Investments Management Corporation (“SIMC”) or aSub-Adviser(“Sub-Adviser”), as applicable, reasonably believes that prices provided by independent pricing agents are reliable. However, there can be no assurance that such pricing service’s prices will be reliable. SIMC or aSub-Adviser, as applicable, will continuously monitor the reliability of prices obtained from any pricing service and shall promptly notify the Funds’ administrator if it believes that a particular pricing service is no longer a reliable source of prices. The Funds’ administrator, in turn, will notify the Fair Value Pricing Committee (the “Committee”) if it receives such notification from SIMC or aSub-Adviser, as applicable, or if the Funds’ administrator reasonably believes that a particular pricing service is no longer a reliable source for prices.
The Funds’ Fair Value Procedures provide that any change in a primary pricing agent or a pricing methodology requires prior approval by the Board of Trustees (“Board”) or its designatedsub-committee. However, when the change would not materially affect valuation of a Fund’s net assets or involve a material departure in pricing methodology from that of the Fund’s existing pricing agent or pricing methodology, approval may be obtained at the next regularly scheduled meeting of the Board.
Securities for which market prices are not readily available, for which market prices are determined to be unreliable, or which cannot be valued using the methodologies described above are valued in accordance with the Fair Value Procedures established by the Board. The Funds’ Fair Value Procedures are implemented through the Committee designated by the Board. The Committee is currently composed of two members of the Board, as well as representatives from SIMC and its affiliates. Some of the more common reasons that may necessitate that a security be valued using Fair Value Procedures include: (i) the security’s trading has been halted or suspended, (ii) the security has been delisted from a national exchange, (iii) the security’s primary trading market is temporarily closed at a time when under normal conditions it would be open, or (iv) the security’s primary pricing source is not able or willing to provide a price. When a security is valued in accordance with the Fair Value Procedures, the Committee will determine the value after taking into consideration relevant information reasonably available to the Committee. Examples of factors the Committee may consider include: (i) the facts giving rise to the need to fair value, (ii) the last trade price, (iii) the performance of the market or the issuer’s industry, (iv) the liquidity of the security, (v) the size of the holding in a Fund, or (vi) any other appropriate information.
| | |
SEI Institutional Managed Trust / Semi-Annual Report / March 31, 2019 | | 289 |
Notes to Financial Statements/Consolidated Notes to Financial Statements (Unaudited) (Continued)
March 31, 2019
The determination of a security’s fair value price often involves the consideration of a number of subjective factors, and is therefore subject to the unavoidable risk that the value assigned to a security may be higher or lower than the security’s value would be if a reliable market quotation for the security was readily available.
For securities that principally trade on a foreign market or exchange, a significant gap in time can exist between the time of a particular security’s last trade and the time at which a Fund calculates its Net Asset Value (“NAV”). The closing prices of such securities may no longer reflect their market value at the time a Fund calculates NAV if an event that could materially affect the value of those securities (a “Significant Event”), including substantial fluctuations in domestic or foreign markets or occurrences not tied directly to the securities markets, such as natural disasters, armed conflicts or significant governmental actions, has occurred between the time of the security’s last close and the time that the Fund calculates its NAV. A Fund may invest in securities that are primarily listed on foreign exchanges that trade on weekends or other days when the Fund does not price its shares. As a result, the NAV of the Fund’s shares may change on days when shareholders will not be able to purchase or redeem Fund shares.
A Significant Event may relate to a single issuer or to an entire market sector. If SIMC or aSub-Adviser becomes aware of a Significant Event that has occurred with respect to a security or group of securities after the closing of the exchange or market on which the security or securities principally trade, but before the time at which the Funds calculate NAV, it may request that a Committee meeting be called. In addition, the Funds use several processes, with respect to certain securities to monitor the pricing data supplied by various sources, including price comparisons and price movements. Any identified discrepancies are researched and subject to the procedures described above.
The Global Managed Volatility Fund also uses a third-party fair valuation vendor. The vendor provides a fair value for foreign securities held by the Fund based on certain factors and methodologies (involving, generally, tracking valuation correlations between the U.S. market and eachnon-U.S. security). Values from the fair value vendor are applied in the event that there is a movement in the U.S. market that exceeds a specific threshold that has been established by the Committee. The Committee has also established a “confidence interval” which is used to determine the level of historical correlation between the value of a specific foreign security and movements in the U.S. market before a particular security will be fair valued when the threshold is exceeded. In the event that the threshold established
by the Committee is exceeded on a specific day, the Global Managed Volatility Fund will value thenon-U.S. securities in its portfolio that exceed the applicable “confidence interval” based upon the adjusted prices provided by the fair valuation vendor.
In accordance with U.S. GAAP, fair value is defined as the price that a Fund would receive upon selling an investment in an orderly transaction to an independent buyer in the principal or most advantageous market of the investment. A three-tier hierarchy has been established to maximize the use of observable and minimize the use of unobservable inputs and to establish classification of fair value measurements for disclosure purposes. Inputs refer broadly to the assumptions that market participants would use in pricing an asset. Inputs may be observable or unobservable. Observable inputs are inputs that reflect the assumptions market participants would use in pricing the asset or liability based on market data obtained from sources independent of the reporting entity. Unobservable inputs are inputs that reflect the reporting entity’s own assumptions about the assumptions market participants would use in pricing the asset or liability based on the best information available in the circumstances.
The three-tier hierarchy of inputs is summarized in the three broad Levels listed below:
Level 1 — quoted prices in active markets for identical investments
Level 2 — other significant observable inputs (including quoted prices for similar investments, interest rates, prepayment speeds, credit risks, etc.)
Level 3 — significant unobservable inputs (including the Fund’s own assumptions in determining the fair value of investments)
Investments are classified within the level of the lowest significant input considered in determining fair value. Investments classified within Level 3 whose fair value measurement considers several inputs may include Level 1 or Level 2 inputs as components of the overall fair value measurement.
Debt securities are valued in accordance with the evaluated bid price supplied by the pricing service and generally categorized as Level 2 in the hierarchy. Other securities that are categorized as Level 2 in the hierarchy include, but are not limited to, preferred stocks, bank loans, warrants, swaps and forward contracts. The Fund may use a systematic fair valuation model provided by an independent pricing service to value foreign equity securities in order to adjust for stale pricing, which may occur between the close of certain
| | |
290 | | SEI Institutional Managed Trust / Semi-Annual Report / March 31, 2019 |
foreign exchanges and the NYSE. These are generally categorized as Level 2 in the hierarchy.
When independent prices are unavailable or unreliable, debt securities and swaps may be valued utilizing pricing matrices which consider similar factors that would be used by independent pricing services. These are generally categorized as Level 2 in the hierarchy but may be Level 3 depending on the circumstances. For certain collateralized debt obligations, corporate obligations, mortgage backed securities, auction rate preferred securities and loan participations where observable inputs are limited, assumptions about market activity and risk are used and are categorized as Level 3 in the hierarchy.
The valuation techniques used by the Funds to measure fair value during the six month period ended March 31, 2019, maximized the use of observable inputs and minimized the use of unobservable inputs. For details of the investment classification, reference the Summary Schedules of Investments/Schedules of Investments.
For the six month period ended March 31, 2019, there have been no significant changes to the Trust’s fair valuation methodologies.
The unobservable inputs used to determine fair value of reoccurring Level 3 assets may have similar or diverging impacts on valuation. Significant increases and decreases in these inputs in isolation and interrelationships between those inputs could result in significantly higher or lower fair value measurement.
Security Transactions and Investment Income— Security transactions are recorded on the trade date. Costs used in determining net realized capital gains and losses on the sale of securities are on the basis of specific identification. Dividend income is recognized on theex-dividend date, and interest income is recognized using the accrual basis of accounting. Income frompayment-in-kind securities is recorded daily based on the effective interest method of accrual.
Distributions received on securities that represent a return of capital or capital gain are recorded as a reduction of cost of investments and/or as a realized gain. The Trust estimates the components of distributions received that may be considered nontaxable distributions or capital gain distributions.
Amortization and accretion is calculated using the scientific interest method, which is not materially different from the effective interest method. Amortization of premiums and discounts is included in interest income.
For Treasury Inflation-Protected Securities, the principal amount is adjusted daily to keep pace with inflation.
Interest is accrued based on the adjusted principal amount. The adjustments to principal due to inflation are reflected as increases or decreases to interest in the accompanying Statements of Operations. Such adjustments may have a significant impact on a Fund’s distributions.
Repurchase Agreements—Securities pledged as collateral for repurchase agreements are held by each Fund’s custodian bank until the repurchase date of the repurchase agreement. The Funds may also invest intri-party repurchase agreements. Securities held as collateral fortri-party repurchase agreements are maintained by the broker’s custodian bank in a segregated account until the repurchase date of the repurchase agreement. Provisions of the repurchase agreements and the Trust’s policies require that the market value of the collateral, including accrued interest thereon, is sufficient in the event of default by the counterparty. If the counterparty defaults and the value of the collateral declines, or if the counterparty enters into an insolvency proceeding, realization of the collateral by the Funds may be delayed or limited.
Reverse Repurchase Agreements—To the extent consistent with its Investment Objective and Strategies, a Fund may issue reverse repurchase agreements. A reverse repurchase agreement involves the sale of portfolio assets together with an agreement to repurchase the same assets later at a fixed price. The segregated assets may consist of cash, U.S. Government securities, or other liquid securities at least equal in value to the obligations under the reverse repurchase agreements. In the event the buyer of securities under a reverse repurchase agreement files for bankruptcy or becomes insolvent, a Fund’s use of the proceeds under the agreement may be restricted pending a determination by the other party, or its trustee or receiver, whether to enforce the obligation to repurchase the securities.
Classes— Class-specific expenses are borne by that class of shares. Income, realized and unrealized gains/ losses and non class-specific expenses are allocated to the respective class on the basis of relative daily net assets.
Expenses— Expenses that are directly related to a Fund are charged directly to that Fund. Other operating expenses of the Funds are prorated to the Funds on the basis of relative daily net assets.
Commodity-Linked Investments— To the extent consistent with its Investment Objective and Strategies, the Multi-Asset Accumulation Fund, Multi-Asset Inflation Managed and Dynamic Asset Allocation Fund may invest in commodity investments to provide exposure to the investment returns of the commodities markets.
| | |
SEI Institutional Managed Trust / Semi-Annual Report / March 31, 2019 | | 291 |
Notes to Financial Statements/Consolidated Notes to Financial Statements (Unaudited) (Continued)
March 31, 2019
Commodity investments include notes with interest payments that are tied to an underlying commodity or commodity index, ETFs or other exchange-traded products that are tied to the performance of a commodity or commodity index or other types of investment vehicles or instruments that provide returns that are tied to commodities or commodity indices. The Multi-Asset Accumulation, Multi-Asset Inflation Managed and Dynamic Asset Allocation Funds may also invest in equity securities of issuers in commodity-related industries.
The Multi-Asset Accumulation, Multi-Asset Inflation Managed and Dynamic Asset Allocation Funds may also seek to gain exposure to the commodity markets, in whole or in part, through investments in a wholly owned Subsidiary. A Subsidiary, unlike the Fund, may invest to a significant extent directly in commodities and in equity-linked securities and commodity-linked derivative instruments, including options, futures contracts, swaps, options on futures contracts and commodity-linked structured notes. A Subsidiary may also invest in other instruments in which the Fund is permitted to invest, either as investments or to serve as margin or collateral for its derivative positions. A Fund may invest up to 25% of its total assets in its Subsidiary.
In order for a Fund to qualify as a regulated investment company under Subchapter M of the Code, the Fund must derive at least 90% of its gross income each taxable year from qualifying income. The status of certain commodity-linked derivative instruments as qualifying income has been addressed in Revenue Ruling2006-1 and Revenue Ruling 2006-31 which provide that income from certain commodity-linked derivative instruments in which the Fund invests will not be considered qualifying income. To the extent the Multi-Asset Accumulation, Multi-Asset Inflation Managed, and Dynamic Asset Allocation Funds invest in such instruments directly, each Fund will seek to restrict its income from commodity-linked derivative instruments that do not generate qualifying income, such as commodity-linked swaps, to a maximum of 10% of its gross income (when combined with its other investments that producenon-qualifying income).
Foreign Currency Translation— The books and records of the Funds are maintained in U.S. dollars on the following basis:
(I) market value of investment securities, assets and liabilities at the current rate of exchange; and
(II) purchases and sales of investment securities, income and expenses at the relevant rates of exchange prevailing on the respective dates of such transactions.
The Funds do not isolate that portion of gains and losses on investments in investment securities that is due to changes in the foreign exchange rates from that which is due to changes in market prices of investment securities.
The Funds report certain foreign-currency-related transactions as components of realized gains for financial reporting purposes, whereas such components are treated as ordinary income for Federal income tax purposes.
Forward Foreign Currency Contracts— To the extent consistent with its Investment Objective and Strategies, a Fund may enter into forward foreign currency contracts as hedges against either specific transactions, fund positions or anticipated fund positions. A Fund may also engage in currency transactions to enhance that Fund’s returns. All commitments are“marked-to-market” daily at the applicable foreign exchange rate, and any resulting unrealized gains or losses are recorded currently. The Funds realize gains and losses at the time forward contracts are extinguished. Unrealized gains or losses on outstanding positions in forward foreign currency contracts held at the close of the period are recognized as ordinary income or loss for Federal income tax purposes.
The Funds could be exposed to risk if the counterparties to the contracts are unable to meet the terms of the contract and from unanticipated movements in the value of a foreign currency relative to the U.S. dollar.
Finally, the risk exists that losses could exceed amounts disclosed on the Statements of Assets and Liabilities or Consolidated Statements of Assets and Liabilities. Refer to each Fund’s Schedule of Investments, Summary Schedule of Investments or Consolidated Schedule of Investments for details regarding open forward foreign currency contracts as of March 31, 2019, if applicable.
Futures Contracts— To the extent consistent with its Investment Objective and Strategies, a Fund may use futures contracts for tactical hedging purposes as well as to enhance the Fund’s returns. In addition, fixed income funds will utilize futures contracts to help manage duration and yield curve exposure. Initial margin deposits of cash or securities are made upon entering into futures contracts. The contracts are marked to market daily and the resulting changes in value are accounted for as unrealized gains and losses. Variation margin payments are paid or received, depending upon whether unrealized gains or losses are incurred. When the contract is closed, the Funds record a realized gain or loss equal to the difference between the proceeds
| | |
292 | | SEI Institutional Managed Trust / Semi-Annual Report / March 31, 2019 |
from (or cost of) the closing transaction and the amount invested in the contract.
Risks of entering into futures contracts include the possibility that there will be an imperfect price correlation between the futures and the underlying securities. Second, it is possible that a lack of liquidity for futures contracts could exist in the secondary market, resulting in an inability to close a position prior to its maturity date. Third, the futures contract involves the risk that the Fund could lose more than the original margin deposit required to initiate a futures transaction.
Finally, the risk exists that losses could exceed amounts disclosed on the Statements of Assets and Liabilities or Consolidated Statements of Assets and Liabilities. Refer to each Fund’s Schedule of Investments, Summary Schedule of Investments or Consolidated Schedule of Investments for details regarding open futures contracts as of March 31, 2019 if applicable.
Inflation-Indexed Bonds— Inflation-indexed bonds are fixed income securities whose principal value is periodically adjusted according to the rate of inflation. If the index measuring inflation rises or falls, the principal value of inflation-indexed bonds will be adjusted upward or downward, and consequently the interest payable on these securities calculated with respect to a larger or smaller principal amount) will be increased or reduced, respectively. Any upward or downward adjustment in the principal amount of an inflation-indexed bond will be included in interest income in the Statement of Operations, even though investors do not receive their principal until maturity. Repayment of the original bond principal upon maturity (as adjusted for inflation) is guaranteed in the case of U.S. Treasury inflation-indexed bonds. For bonds that do not provide a similar guarantee, the adjusted principal value of the bond repaid at maturity may be less than the original principal.
Master Limited Partnerships — Investments in units of master limited partnerships (“MLPs”) involve risks that differ from an investment in common stock. Holders of the units of master limited partnerships have more limited control and limited rights to vote on matters affecting the partnership. There are also certain tax risks associated with an investment in units of master limited partnerships. In addition, conflicts of interest may exist between common unit holders, subordinated unit holders and the general partner of a master limited partnership, including a conflict arising as a result of incentive distribution payments. The benefit a Fund derives from investment in MLP units is largely dependent on the MLPs being treated as partnerships and not as corporations for federal income tax purposes. If an MLP were classified as a corporation for federal income tax purposes, there would be reduction in the
after-tax return to a Fund of distributions from the MLP, likely causing a reduction in the value of a Fund’s shares. MLP entities are typically focused in the energy, natural resources and real estate sectors of the economy. A downturn in the energy, natural resources or real estate sectors of the economy could have an adverse impact on a Fund. At times, the performance of securities of companies in the energy, natural resources and real estate sectors of the economy may lag the performance of other sectors or the broader market as a whole.
Options/Swaptions Writing/Purchasing—To the extent consistent with its Investment Objective and Strategies, a Fund may invest in financial options/swaptions contracts for the purpose of hedging its existing fund securities or to enhance the Fund’s returns. When a Fund writes or purchases an option/swaption, an amount equal to the premium received or paid by the Fund is recorded as a liability or an asset and is subsequently adjusted to the current market value of the option/swaption written or purchased. Premiums received or paid from writing or purchasing options/swaptions which expire unexercised are treated by the Fund on the expiration date as realized gains or losses. The difference between the premium and the amount paid or received on effecting a closing purchase or sale transaction, including brokerage commissions, is also treated as a realized gain or loss. If an option/swaption is exercised, the premium paid or received is added to the cost of the purchase or proceeds from the sale in determining whether the Fund has realized a gain or a loss on investment transactions.
The risk in writing a call option/swaption is that the Funds give up the opportunity for profit if the market price of the security increases. The risk in writing a put option/swaption is that the Funds may incur a loss if the market price of the security decreases and the option/swaption is exercised. The risk in purchasing an option/swaption is that the Funds pay a premium whether or not the option/swaption is exercised. The Funds also have the additional risk of being unable to enter into a closing transaction at an acceptable price if a liquid secondary market does not exist. Option/swaption contracts also involve the risk that they may not work as intended due to unanticipated developments in market conditions or other causes.
Finally, the risk exists that losses on written options could exceed amounts disclosed on the Statements of Assets and Liabilities. Refer to each Fund’s Schedule of Investments, Summary Schedule of Investments or Consolidated Schedule of Investments for details regarding open option/swaption contracts as of March 31, 2019, if applicable.
| | |
SEI Institutional Managed Trust / Semi-Annual Report / March 31, 2019 | | 293 |
Notes to Financial Statements/Consolidated Notes to Financial Statements (Unaudited) (Continued)
March 31, 2019
Securities Sold Short—To the extent consistent with its Investment Objective and Strategies, a Fund may engage in short sales. Short sales are transactions under which a Fund sells a security it does not own. To complete such a transaction, the Fund must borrow the security to make delivery to the buyer. A Fund then is obligated to replace the security borrowed by purchasing the security at the market price at the time of the replacement. The price at such time may be more or less than the price at which the security was sold by a Fund. Until the security is replaced, a Fund is required to pay the lender amounts equal to any dividends or interest that accrue during the period of the loan. Dividends and interest are shown as an expense for financial reporting purposes. To borrow the security, a Fund also may be required to pay a premium, which would decrease proceeds of the security sold. The proceeds of the short sale are retained by the broker, to the extent necessary to meet margin requirements, until the short position is closed out. A gain, limited to the price at which a Fund sold the security short, or a loss, potentially unlimited in size, will be recognized upon the close of a short sale.
Refer to each Fund’s Schedule of Investments, Summary Schedule of Investments or Consolidated Schedule of Investments for details regarding securities sold short as of March 31, 2019, if applicable.
Swap Agreements— To the extent consistent with its Investment Objective and Strategies, a Fund may invest in swap contracts as an efficient means to synthetically obtain exposure to securities or baskets of securities and to manage a Fund’s interest rate duration and yield curve exposure. Swap contracts may also be used to mitigate a Fund’s overall level of risk and/or a Fund’s risk to particular types of securities, currencies or market segments. Interest rate swaps may further be used to manage a Fund’s yield spread sensitivity. A Fund may buy credit default swaps in an attempt to manage credit risk where a Fund has credit exposure to an issuer, and a Fund may sell credit default swaps to more efficiently gain credit exposure to a security or basket of securities. A swap agreement is atwo-party contract under which an agreement is made to exchange returns from predetermined investments or instruments, including a particular interest rate, foreign currency, or “basket” of securities representing a particular index. Swap agreements are privately negotiated in theover-the-counter market (“OTC swaps”) or may be executed in a multilateral or other trade facility platform, such as a registered commodities exchange (“Centrally Cleared swaps”). Interest rate swaps involve the exchange by a Fund with another party of their respective commitments to pay or receive interest (e.g., an exchange of floating rate payments for fixed rate payments) with respect to
a notional amount of principal. Credit-default swaps involve periodic payments by a Fund or counterparty based on a specified rate multiplied by a notional amount assigned to an underlying debt instrument or group of debt instruments in exchange for the assumption of credit risk on the same instruments. In the event of a credit event, usually in the form of a credit rating downgrade, the party receiving periodic payments (i.e. floating rate payer) must pay the other party (i.e. fixed rate payer) an amount equal to the recovery rate used to settle the contracts. The recovery rate is a function of how many credit default swap investors wish to deliver the security or receive the security. The recovery rate is determined through an auction process. Total return swaps allow an investor to benefit from the cash flow without ever actually owning the underlying security. The receiver must pay any decline in value to the payer at the end of the total return swap. However, the investor does not need to make a payment if there is no decline in price. Payments can be made on various indices, bonds (i.e. mortgage backed securities, bank debt and corporate), loans or commodities. The value of a total return swap is equal to the change in value of the underlying asset versus the accrued income payment based on LIBOR or some other form of indices on the notional amount. Payments received or made are recorded as realized gains or loss. A Fund could be exposed to credit or market risk due to unfavorable changes in the fluctuation of interest rates or if the counterparty defaults on its obligation to perform. Risk of loss may exceed amounts recognized on the statement of assets and liabilities. Interest rate swap contracts outstanding at year end, if any, are listed after a Fund’s portfolio. In connection with swap agreements securities may be set aside as collateral by a Fund’s custodian.
Swaps aremarked-to-market daily based upon quotations from market makers and the resulting changes in market values, if any, are recorded as an unrealized gain or loss in the Statement of Operations or Consolidated Statement of Operations. Centrally cleared swaps are valued at the settlement price established each day by the board of exchange on which they are traded. The daily settlement prices for centrally cleared swaps are provided by an independent source. Net payments of interest are recorded as realized gains or losses. Daily changes in valuation of Centrally Cleared swaps, if any, are recorded as a receivable or payable for the change in value as appropriate (“variation margin”) on the Statements of Assets and Liabilities or Consolidated Statement of Assets and Liabilities.
Entering into swap agreements involves, to varying degrees, elements of credit and market risk in excess of the amounts recognized on the Statement of Assets and Liabilities or Consolidated Statement of Assets and
| | |
294 | | SEI Institutional Managed Trust / Semi-Annual Report / March 31, 2019 |
Liabilities. Such risks involve the possibility that there will be no liquid market for these agreements, that the counterparty to the agreement may default on its obligation to perform and that there may be unfavorable changes in the fluctuation of interest rates. Risks also arise from potential losses from adverse market movements.
This risk is mitigated by having a master netting arrangement between a Fund and the counterparty and by having the counterparty post collateral to cover a Fund’s exposure to the counterparty. See Note 3 for further details. Refer to each Fund’s Schedule of Investments, Summary Schedule of Investments or Consolidated Schedule of Investments for details regarding open swap agreements as of March 31, 2019, if applicable.
Delayed Delivery Transactions— To the extent consistent with its Investment Objective and Strategies, a Fund may purchase or sell securities on a when-issued or delayed delivery basis. These transactions involve a commitment by the Fund to purchase or sell securities for a predetermined price or yield, with payment and delivery taking place beyond the customary settlement period. When delayed delivery purchases are outstanding, the Fund will set aside liquid assets in an amount sufficient to meet the purchase price. When purchasing a security on a delayed delivery basis, the Fund assumes the rights and risks of ownership of the security, including the risk of price and yield fluctuations, and takes such fluctuations into account when determining its net asset value. The Fund may dispose of or renegotiate a delayed delivery transaction after it is entered into, and may sell when-issued securities before they are delivered, which may result in a capital gain or loss. When the Fund has sold a security on delayed delivery basis, the Fund does not participate in future gains and losses with respect to the security.
Collateralized Debt Obligations— To the extent consistent with its Investment Objective and Strategies, a Fund may invest in collateralized debt obligations (“CDOs”), which include collateralized loan obligations (“CLOs”) and other similarly structured securities. CLOs are a type of asset-backed securities. A CLO is a trust typically collateralized by a pool of loans, which may include, among others, domestic and foreign senior secured loans, senior unsecured loans, and subordinate corporate loans, including loans that may be rated below investment grade or equivalent unrated loans. CDOs may charge management fees and administrative expenses.
For CDOs, the cash flows from the trust are split into two or more portions, called tranches, varying in risk and yield. The riskiest portion is the “equity” tranche
which bears the bulk of defaults from the bonds or loans in the trust and serves to protect the other, more senior tranches from default in all but the most severe circumstances. Since it is partially protected from defaults, a senior tranche from a CDO trust typically has a higher rating and lower yield than its underlying securities, and can be rated investment grade. Despite the protection from the equity tranche, CDO tranches can experience substantial losses due to actual defaults, increased sensitivity to defaults due to collateral default and disappearance of protecting tranches, market anticipation of defaults, as well as aversion to CDO securities as a class.
The risks of an investment in a CDO depend largely on its Class and its collateral securities. Normally, CLOs and other CDOs are privately offered and sold, and thus, are not registered under the securities laws. As a result, investments in CDOs may be characterized by the Funds as illiquid securities; however, an active dealer market may exist for CDOs, allowing a CDO to qualify for Rule 144A transactions. In addition to the normal risks associated with fixed income securities (e.g., interest rate risk and default risk), CDOs carry additional risks including, but not limited to: (i) the possibility that distributions from collateral securities will not be adequate to make interest or other payments; (ii) the quality of the collateral may decline in value or default; (iii) the Funds may invest in CDOs that are subordinate to other classes; and (iv) the complex structure of the security may not be fully understood at the time of investment and may produce disputes with the issuer or unexpected investment results.
Illiquid Securities— A security is considered illiquid if it cannot be sold or disposed of in the ordinary course of business within seven days or less for its approximate carrying value on the books of a Fund. Valuations of illiquid securities may differ significantly from the values that would have been used had an active market value for these securities existed.
Restricted Securities— At March 31, 2019, the following Funds owned private placement investments that were purchased through private offerings or acquired through initial public offerings and cannot be sold without prior registration under the Securities Act of 1933 or pursuant to an exemption therefrom. In addition, the Funds have generally agreed to further restrictions on the disposition of certain holdings as set forth in various agreements entered into in connection with the purchase of these investments. These investments are valued at fair value as determined in accordance with the procedures approved by the Board. The acquisition dates of these investments, the enforceable right to acquire these
| | |
SEI Institutional Managed Trust / Semi-Annual Report / March 31, 2019 | | 295 |
Notes to Financial Statements/Consolidated Notes to Financial Statements (Unaudited) (Continued)
March 31, 2019
securities, along with their cost and values at March 31,
2019, were as follows:
| | | | | | | | | | | | | | | | | | | | | | | | |
| | | Number of Shares/
Face Amount
($ Thousands) | | | Acquisition Date | | | Right to Acquire
Date | | | Cost
($ Thousands) | | | Market Value
($ Thousands) | | | % of Net Assets | |
Small Cap Growth Fund | | | | | | | | | | | | | | | | | | | | | | | | |
Value Creation | | | 145,600 | | | | 8/10/06 | | | | 8/10/06 | | | $ | 1,491 | | | $ | 57 | | | | 0.02% | |
| | | | | | | | | | | | | | | | | | | | | | | | |
High Yield Bond Fund | | | | | | | | | | | | | | | | | | | | | | | | |
Aventine (Escrow Security) | | | $ 2,750 | | | | 11/30/10 | | | | 11/30/10 | | | $ | – | | | $ | – | | | | 0.00% | |
| | | | | | | | | | | | | | | | | | | | | | | | |
Dividends and Distributions to Shareholders— Dividends from net investment income are declared and paid to shareholders quarterly for the Large Cap, Large Cap Value, Large Cap Growth, Large Cap Index,Tax-Managed Large Cap, S&P 500 Index, Small Cap, Small Cap Value, Small Cap Growth,Tax-Managed Small/Mid Cap,Mid-Cap, U.S. Managed Volatility,Tax-Managed Managed Volatility, Real Estate, Enhanced Income and Real Return Funds; are declared and paid annually for the Global Managed Volatility,Tax-Managed International Managed Volatility, Multi-Strategy Alternative, Multi-Asset Accumulation, Multi-Asset Inflation Managed, Multi-Asset Capital Stability, Dynamic Asset Allocation and Long/Short Alternative Funds; are declared daily and paid monthly for the Core Fixed Income, High Yield Bond, Conservative Income,Tax-Free Conservative Income, Multi-Asset Income and Multi-Asset Capital Stability Funds. Any net realized capital gains on sales of securities are distributed to shareholders at least annually. Dividends and distributions are recorded on theex-dividend date.
Investments in Real Estate Investment Trust— With respect to the Real Estate Fund, dividend income is recorded based on the income included in distributions received from the Real Estate Investment Trust (“REIT”) investments using published REIT reclassifications including some management estimates when actual amounts are not available. Distributions received in excess of this estimated amount are recorded as a reduction of the cost of investments or reclassified to capital gains. The actual amounts of income, return of capital, and capital gains are only determined by each REIT after its fiscal year end, and may differ from the estimated amounts.
Investment in Subsidiary— Each of the Multi-Asset Accumulation, Multi-Asset Inflation Managed and Dynamic Asset Allocation Funds may invest in its own Subsidiary. By investing in a Subsidiary, each Fund is indirectly exposed to the risks associated with such Subsidiary’s investments. The commodity-related instruments held by a Subsidiary are generally similar to those that are permitted to be held by the applicable Fund and are subject to the same risks that apply to similar investments if held directly by the Fund. A
Subsidiary, however, is not registered under the 1940 Act and will not be subject to all of the investor protections of the 1940 Act. Thus, the Multi-Asset Accumulation, Multi-Asset Inflation Managed and Dynamic Asset Allocation Funds, as investors in their respective Subsidiary, will not have all of the protections offered to investors in registered investment companies.
However, each Fund wholly owns and controls its respective Subsidiary, and the Funds and the Subsidiaries are all managed by SIMC, making it unlikely that a Subsidiary will take action contrary to the interests of the applicable Fund or its shareholders. While a Subsidiary has its own Board of Directors (“Directors”) that is responsible for overseeing the operations of such Subsidiary, the respective Fund’s Directors have oversight responsibility for the investment activities of the Fund, including its investment in the respective Subsidiary, and the Fund’s role as the sole shareholder of such Subsidiary. It is not currently expected that shares of any Subsidiary will be sold or offered to investors other than the respective Fund.
Changes in the laws of the United States and/or the Cayman Islands or governmental interpretation of such laws, under which the Funds and the Subsidiaries, respectively, are organized, could result in the inability of a Fund and/or its respective Subsidiary to operate as intended and could negatively affect the Funds and their shareholders. For example, Cayman Islands law does not currently impose any income, corporate or capital gains tax, estate duty, inheritance tax, gift tax or withholding tax on the Subsidiaries. If Cayman Islands law changes such that the Subsidiaries must pay Cayman Islands governmental authority taxes, Fund shareholders would likely suffer decreased investment return.
3. CREDIT DERIVATIVES
A Fund may use credit default swaps to reduce risk where a Fund has exposure to the issuer, or to take an active long or short position with respect to the likelihood of an event of default. The reference obligation of the swap can be a single issuer, a “basket” of issuers, or an index. The underlying referenced assets
| | |
296 | | SEI Institutional Managed Trust / Semi-Annual Report / March 31, 2019 |
are corporate debt, sovereign debt and asset backed securities.
The buyer of a credit default swap is generally obligated to pay the seller a periodic stream of payments over the term of the contract in return for a contingent payment upon the occurrence of a credit event with respect to an underlying reference obligation. Generally, a credit event for corporate or sovereign reference obligations means bankruptcy, failure to pay, obligation acceleration, repudiation/moratorium or restructuring. For credit default swaps on asset-backed securities, a credit event may be triggered by events such as failure to pay principal, maturity extension, rating downgrade or write-down.
If a Fund is a seller of protection, and a credit event occurs, as defined under the terms of that particular swap agreement, a Fund will generally either (i) pay to the buyer an amount equal to the notional amount of the swap and take delivery of the referenced obligation, other deliverable obligations, or underlying securities comprising a referenced index or (ii) pay a net settlement amount in the form of cash or securities equal to the notional amount of the swap less the recovery value of the referenced obligation or underlying securities comprising a referenced index.
If a Fund is a buyer of protection and a credit event occurs, as defined under the terms of that particular swap agreement, a Fund will either (i) receive from the seller of protection an amount equal to the notional amount of the swap and deliver the referenced obligation, other deliverable obligations or underlying securities comprising the referenced index or (ii) receive a net settlement amount in the form of cash or securities equal to the notional amount of the swap
less the recovery value of the referenced obligation or underlying securities comprising the referenced index. Recovery values are calculated by market makers considering either industry standard recovery rates or entity specific factors and considerations until a credit event occurs. If a credit event has occurred, the recovery value is determined by a facilitated auction whereby a minimum number of allowable broker bids, together with a specified valuation method, are used to calculate the settlement value.
Certain Funds are party to International Swap Dealers Association, Inc. Master Agreements (“ISDA Master Agreements”). These agreements are with select counterparties and they govern transactions, including certainover-the counter derivative and foreign exchange contracts, entered into by the Funds and the counterparty.
As of March 31, 2019, the Multi-Strategy Alternative Fund, Multi-Asset Income Fund, and the Multi-Asset Inflation Managed Fund are the buyers (“receiving protection”) on a total notional amount of $10.4 million, $25.1 million and $22.3 million, respectively. As of March 31, 2019, the Core Fixed Income Fund, High Yield Bond Fund, Multi-Strategy Alternative Fund, Multi-Asset Income Fund, Multi-Asset Inflation Managed Fund and Multi-Asset Capital Stability Fund are the sellers (“providing protection”) on a total notional amount of $106.3 million, $9.9 million, $4.1 million, $75.0 million, $ 19.7 million and $28.7 million, respectively. The notional amounts of the swaps are not recorded in the financial statements. The notional amounts approximate the maximum potential amount of future payments that the Fund could be required to make if the Fund was the seller of protection and a credit event was to occur.
Those credit default swaps (“CDS”) for which the Fund is providing protection at the balance sheet date are summarized as follows:
| | | | | | | | | | | | | | | | | | | | |
CORE FIXED INCOME FUND WRITTEN CREDIT DERIVATIVE CONTRACTS | | | SINGLE NAME CDS | | | | CDS ON AN INDEX | | | | | |
REFERENCE ASSET | |
| CORP
US$ |
| |
| SOVERIGN
US$ |
| |
| ABS
US$ |
| |
| CORP
US$ |
| | | Total | |
Fair value of written credit derivatives | | | $- | | | | $- | | | | $- | | | | $2,686,451 | | | | $2,686,451 | |
Maximum potential amount of future payments | | | - | | | | - | | | | - | | | | 106,320,000 | | | | 106,320,000 | |
Recourse provisions with third parties to recover any amounts paid under the credit derivative (including any purchased credit protection)1 | | | - | | | | - | | | | - | | | | - | | | | - | |
Collateral held by the Fund can obtain upon occurrence of triggering event | | | - | | | | - | | | | - | | | | - | | | | - | |
| | | | | | | | | | | | | | | | | | | | |
HIGH YIELD BOND FUND WRITTEN CREDIT DERIVATIVE CONTRACTS | | | SINGLE NAME CDS | | | | CDS ON AN INDEX | | | | | |
REFERENCE ASSET | |
| CORP
US$ |
| |
| SOVERIGN
US$ |
| |
| ABS
US$ |
| |
| CORP
US$ |
| | | Total | |
Fair value of written credit derivatives | | | $- | | | | $- | | | | $- | | | | $665,665 | | | | $665,665 | |
Maximum potential amount of future payments | | | - | | | | - | | | | - | | | | 9,906,000 | | | | 9,906,000 | |
| | |
SEI Institutional Managed Trust / Semi-Annual Report / March 31, 2019 | | 297 |
Notes to Financial Statements/Consolidated Notes to Financial Statements (Unaudited) (Continued)
March 31, 2019
| | | | | | | | | | | | | | | | | | | | |
Recourse provisions with third parties to recover any amounts paid under the credit derivative (including any purchased credit protection)1 | | | - | | | | - | | | | - | | | | - | | | | - | |
Collateral held by the Fund can obtain upon occurrence of triggering event | | | - | | | | - | | | | - | | | | - | | | | - | |
MULTI-STRATEGY ALTERNATIVE FUND WRITTEN CREDIT DERIVATIVE CONTRACTS | | | SINGLE NAME CDS | | | | CDS ON AN INDEX | | | | | |
REFERENCE ASSET | |
| CORP
US$ |
| |
| SOVERIGN
US$ |
| |
| ABS
US$ |
| |
| CORP
US$ |
| | | Total | |
Fair value of written credit derivatives | | | $- | | | | $(126,553) | | | | $- | | | | $- | | | | $(126,553) | |
Maximum potential amount of future payments | | | - | | | | 4,143,000 | | | | - | | | | - | | | | 4,143,000 | |
Recourse provisions with third parties to recover any amounts paid under the credit derivative (including any purchased credit protection)1 | | | - | | | | - | | | | - | | | | - | | | | - | |
Collateral held by the Fund can obtain upon occurrence of triggering event | | | - | | | | - | | | | - | | | | - | | | | - | |
| | | | | | | | | | | | | | | | | | | | |
MULTI-ASSET INCOME FUND WRITTEN CREDIT DERIVATIVE CONTRACTS | | | SINGLE NAME CDS | | | | CDS ON AN INDEX | | | | | |
REFERENCE ASSET | |
| CORP
US$ |
| |
| SOVERIGN
US$ |
| |
| ABS
US$ |
| |
| CORP
US$ |
| | | Total | |
Fair value of written credit derivatives | | | $- | | | | $- | | | | $- | | | | $2,963,834 | | | | $2,963,834 | |
Maximum potential amount of future payments | | | - | | | | - | | | | - | | | | 75,030,000 | | | | 75,030,000 | |
Recourse provisions with third parties to recover any amounts paid under the credit derivative (including any purchased credit protection)1 | | | - | | | | - | | | | - | | | | - | | | | - | |
Collateral held by the Fund can obtain upon occurrence of triggering event | | | - | | | | - | | | | - | | | | - | | | | - | |
| | | | | | | | | | | | | | | | | | | | |
MULTI-ASSET INFLATION MANAGED FUND WRITTEN CREDIT DERIVATIVE CONTRACTS | | | SINGLE NAME CDS | | | | CDS ON AN INDEX | | | | | |
REFERENCE ASSET | |
| CORP
US$ |
| |
| SOVERIGN
US$ |
| |
| ABS
US$ |
| |
| CORP
US$ |
| | | Total | |
Fair value of written credit derivatives | | | $- | | | | $- | | | | $2,369,808 | | | | $- | | | | $2,369,808 | |
Maximum potential amount of future payments | | | - | | | | - | | | | 19,743,000 | | | | - | | | | 19,743,000 | |
Recourse provisions with third parties to recover any amounts paid under the credit derivative (including any purchased credit protection)1 | | | - | | | | - | | | | - | | | | - | | | | - | |
Collateral held by the Fund can obtain upon occurrence of triggering event | | | - | | | | - | | | | - | | | | - | | | | - | |
| | | | | | | | | | | | | | | | | | | | |
MULTI-ASSET CAPITAL STABILITY FUND WRITTEN CREDIT DERIVATIVE CONTRACTS | | | SINGLE NAME CDS | | | | CDS ON AN INDEX | | | | | |
REFERENCE ASSET | |
| CORP
US$ |
| |
| SOVERIGN
US$ |
| |
| ABS
US$ |
| |
| CORP
US$ |
| | | Total | |
Fair value of written credit derivatives | | | $- | | | | $- | | | | $- | | | | $1,248,405 | | | | $1,248,405 | |
Maximum potential amount of future payments | | | - | | | | - | | | | - | | | | 28,663,981 | | | | 28,663,981 | |
Recourse provisions with third parties to recover any amounts paid under the credit derivative (including any purchased credit protection)1 | | | - | | | | - | | | | - | | | | - | | | | - | |
Collateral held by the Fund can obtain upon occurrence of triggering event | | | - | | | | - | | | | - | | | | - | | | | - | |
| 1 | Potential recoveries would include purchased credit derivatives to the extent they offset written credit derivatives which have an identical underlying, or a netting arrangement or credit support annex with the counterparty. There may be other potential recoveries from recourse provisions where agreements cover multiple derivative arrangements but those amounts have not been included. |
| | | | | | | | | | | | | | | | | | | | | | | | |
MAXIMUM POTENTIAL AMOUNT OF FUTURE PAYMENTS BY CONTRACT TERM | | | | | | | | | | | | |
CORE FIXED INCOME FUND | | | 0-6 MONTHS | | | | 6-12 MONTHS | | | | 1-5 YEARS | | | | 5-10 YEARS | | | | > 10 YEARS | | | | Total | |
Current credit spread* on underlying (in basis points) | | | | | | | | | | | | | | | | | |
0-100 | | | $- | | | | $- | | | | $90,190,000 | | | | $- | | | | $- | | | | $90,190,000 | |
101-200 | | | - | | | | - | | | | - | | | | - | | | | - | | | | - | |
201-300 | | | - | | | | - | | | | - | | | | - | | | | - | | | | - | |
301-400 | | | - | | | | - | | | | 16,130,000 | | | | - | | | | - | | | | 16,130,000 | |
> than 400 | | | - | | | | - | | | | - | | | | - | | | | - | | | | - | |
Total | | | $- | | | | $- | | | | $106,320,000 | | | | $- | | | | $- | | | | $106,320,000 | |
| | |
298 | | SEI Institutional Managed Trust / Semi-Annual Report / March 31, 2019 |
| | | | | | | | | | | | | | | | | | | | | | | | |
MAXIMUM POTENTIAL AMOUNT OF FUTURE PAYMENTS BY CONTRACT TERM | |
HIGH YIELD BOND FUND | | | 0-6 MONTHS | | | | 6-12 MONTHS | | | | 1-5 YEARS | | | | 5-10 YEARS | | | | > 10 YEARS | | | | Total | |
Current credit spread* on underlying (in basis points) | |
0-100 | | | $- | | | | $- | | | | $- | | | | $- | | | | $- | | | | $- | |
101-200 | | | - | | | | - | | | | - | | | | - | | | | - | | | | - | |
201-300 | | | - | | | | - | | | | - | | | | - | | | | - | | | | - | |
301-400 | | | - | | | | - | | | | 7,014,000 | | | | - | | | | - | | | | 7,014,000 | |
> than 400 | | | - | | | | - | | | | 2,892,000 | | | | - | | | | - | | | | 2,892,000 | |
Total | | | $- | | | | $- | | | | $9,906,000 | | | | $- | | | | $- | | | | $9,906,000 | |
| | | | | | | | | | | | | | | | | | | | | | | | | |
MAXIMUM POTENTIAL AMOUNT OF FUTURE PAYMENTS BY CONTRACT TERM | |
MULTI-STRATEGY ALTERNATIVE FUND | | | 0-6 MONTHS | | | | 6-12 MONTHS | | | | 1-5 YEARS | | | | 5-10 YEARS | | | | > 10 YEARS | | | | Total | |
Current credit spread* on underlying (in basis points) | |
0-100 | | | $- | | | | $- | | | | $- | | | | $- | | | | $- | | | | $- | |
101-200 | | | - | | | | - | | | | 3,489,000 | | | | - | | | | - | | | | 3,489,000 | |
201-300 | | | - | | | | - | | | | - | | | | - | | | | - | | | | - | |
301-400 | | | - | | | | - | | | | - | | | | - | | | | - | | | | - | |
> than 400 | | | - | | | | - | | | | 654,000 | | | | - | | | | - | | | | 654,000 | |
Total | | | $- | | | | $- | | | | $4,143,000 | | | | $- | | | | $- | | | | $4,143,000 | |
| | | | | | | | | | | | | | | | | | | | | | | | | |
MAXIMUM POTENTIAL AMOUNT OF FUTURE PAYMENTS BY CONTRACT TERM | |
MULTI-ASSET INCOME FUND | | | 0-6 MONTHS | | | | 6-12 MONTHS | | | | 1-5 YEARS | | | | 5-10 YEARS | | | | > 10 YEARS | | | | Total | |
Current credit spread* on underlying (in basis points) | |
0-100 | | | $- | | | | $- | | | | $39,925,000 | | | | $- | | | | $- | | | | $39,925,000 | |
101-200 | | | - | | | | - | | | | - | | | | - | | | | - | | | | - | |
201-300 | | | - | | | | - | | | | 580,000 | | | | - | | | | - | | | | 580,000 | |
301-400 | | | - | | | | - | | | | 34,525,000 | | | | - | | | | - | | | | 34,525,000 | |
> than 400 | | | - | | | | - | | | | - | | | | - | | | | - | | | | - | |
Total | | | $- | | | | $- | | | | $75,030,000 | | | | $- | | | | $- | | | | $75,030,000 | |
| | | | | | | | | | | | | | | | | | | | | | | | | |
MAXIMUM POTENTIAL AMOUNT OF FUTURE PAYMENTS BY CONTRACT TERM | |
MULTI-ASSET INFLATION MANAGED FUND | | | 0-6 MONTHS | | | | 6-12 MONTHS | | | | 1-5 YEARS | | | | 5-10 YEARS | | | | > 10 YEARS | | | | Total | |
Current credit spread* on underlying (in basis points) | |
0-100 | | | $- | | | | $- | | | | $- | | | | $- | | | | $- | | | | $- | |
101-200 | | | - | | | | - | | | | - | | | | - | | | | - | | | | - | |
201-300 | | | - | | | | - | | | | - | | | | - | | | | 1,305,000 | | | | 1,305,000 | |
301-400 | | | - | | | | - | | | | - | | | | - | | | | - | | | | - | |
> than 400 | | | - | | | | - | | | | - | | | | - | | | | 18,438,000 | | | | 18,438,000 | |
Total | | | $- | | | | $- | | | | $- | | | | $- | | | | $19,743,000 | | | | $19,743,000 | |
| | | | | | | | | | | | | | | | | | | | | | | | | |
MAXIMUM POTENTIAL AMOUNT OF FUTURE PAYMENTS BY CONTRACT TERM | |
MULTI-ASSET CAPITAL STABILITY FUND | | | 0-6 MONTHS | | | | 6-12 MONTHS | | | | 1-5 YEARS | | | | 5-10 YEARS | | | | > 10 YEARS | | | | Total | |
Current credit spread* on underlying (in basis points) | |
0-100 | | | $- | | | | $- | | | | $9,430,000 | | | | $5,534,000 | | | | $- | | | | $14,964,000 | |
101-200 | | | - | | | | - | | | | - | | | | - | | | | - | | | | - | |
201-300 | | | - | | | | - | | | | 2,201,681 | | | | - | | | | - | | | | 2,201,681 | |
301-400 | | | - | | | | - | | | | 11,498,300 | | | | - | | | | - | | | | 11,498,300 | |
> than 400 | | | - | | | | - | | | | - | | | | - | | | | - | | | | - | |
Total | | | $- | | | | $- | | | | $23,129,981 | | | | $5,534,000 | | | | $- | | | | $28,663,981 | |
| * | The credit spread on the underlying asset is generally indicative of the current status of the underlying risk of the Fund having to perform. The spread also reflects the cost of buying/selling protection and may include upfront payments required to be made to enter into a contract. Higher credit spreads with a shorter contract term is indicative of a higher likelihood of performance by the Fund. |
The credit spread disclosed above for each reference obligation where the Fund is the seller of protection is a representation of the current payment/performance risk of the swap.
| | |
SEI Institutional Managed Trust / Semi-Annual Report / March 31, 2019 | | 299 |
Notes to Financial Statements/Consolidated Notes to Financial Statements (Unaudited) (Continued)
March 31, 2019
4. DERIVATIVE TRANSACTIONS
The following tables include only Funds that had exposure to more than one type of risk on derivatives held throughout the year. For Funds that held derivatives throughout the six month period with only one type of risk exposure, additional information can be found on the Summary Schedule of Investments, Schedule of Investments or Consolidated Schedule of Investments and the Statement of Operations or Consolidated Statement of Operations.
The fair value of derivative instruments as of March 31, 2019 was as follows ($ Thousands):
| | | | | | | | | | | | |
| | | Asset Derivatives | | | | | | Liability Derivatives | | | | |
| | | Statement of Assets and Liabilities/ Consolidated Statement of Assets and Liabilities Location | | | Fair Value | | | Statement of Assets and Liabilities/ Consolidated Statement of Assets and Liabilities Location | | | Fair Value | |
Derivatives not accounted for as hedging instruments: | | | | | | | | | | |
Global Managed Volatility Fund | | | | | | | | | | |
Equity contracts | | Net Assets – Unrealized appreciation on futures contracts | | | $315* | | | Net Assets – Unrealized depreciation on futures contracts | | | $–* | |
| | | | |
Foreign exchange contracts | | Unrealized gain on forward foreign currency contracts | | | 1,163 | | | Unrealized loss on forward foreign currency contracts | | | 637 | |
| | | | | | | | | | | | |
Total Derivatives not accounted for as hedging instruments | | | $1,478 | | | | | | $637 | |
| | | | | | | | | | | | |
| | | |
Core Fixed Income Fund | | | | | | | | | | |
| | | | |
Interest rate contracts | | Net Assets – Unrealized appreciation on futures contracts | | | $13,994* | | | Net Assets – Unrealized depreciation on futures contracts | | | $7,536* | |
| | | | |
| | Net Assets – Unrealized appreciation on swap contracts | | | 2,576† | | | Net Assets – Unrealized depreciation on swap contracts | | | 5,446† | |
| | | | |
| | Options purchased, at value | | | 384 | | | Options written, at value | | | 759 | |
| | | | |
Foreign exchange contracts | | Unrealized gain on forward foreign currency contracts | | | 881 | | | Unrealized loss on forward foreign currency contracts | | | 2,038 | |
| | | | |
Credit contracts | | Net Assets – Unrealized appreciation on swap contracts | | | 262† | | | Net Assets – Unrealized depreciation on swap contracts | | | –† | |
| | | | | | | | | | | | |
Total Derivatives not accounted for as hedging instruments | | | $18,097 | | | | | | $15,779 | |
| | | | | | | | | | | | |
| | | |
High Yield Bond Fund | | | | | | | | | | |
| | | | |
Interest rate contracts | | Net Assets – Unrealized appreciation on swap contracts | | | $–† | | | Net Assets – Unrealized depreciation on swap contracts | | | $376† | |
| | | | |
Credit contracts | | Net Assets – Unrealized appreciation on swap contracts | | | 137† | | | Net Assets – Unrealized depreciation on swap contracts | | | –† | |
| | | | | | | | | | | | |
Total Derivatives not accounted for as hedging instruments | | | $137 | | | | | | $376 | |
| | | | | | | | | | | | |
| | | |
Dynamic Asset Allocation Fund | | | | | | | | | | |
| | | | |
Interest rate contracts | | Swaptions purchased, at value | | | $2,720 | | | Swaptions written, at value | | | $– | |
| | | | |
Equity contracts | | Net Assets – Unrealized appreciation on futures contracts | | | 415* | | | Net Assets – Unrealized depreciation on futures contracts | | | 1,797* | |
| | | | |
| | Net Assets – Unrealized appreciation on swap contracts | | | 2,291† | | | Net Assets – Unrealized depreciation on swap contracts | | | 5,372† | |
| | | | |
Foreign exchange contracts | | Unrealized gain on forward foreign currency contracts | | | 2,229 | | | Unrealized loss on forward foreign currency contracts | | | 2,727 | |
| | | | |
| | Options purchased, at value | | | 155 | | | Options written, at value | | | – | |
| | | | |
Commodity contracts | | Net Assets – Unrealized appreciation on swap contracts | | | 1,295† | | | Net Assets – Unrealized depreciation on swap contracts | | | –† | |
| | | | | | | | | | | | |
Total Derivatives not accounted for as hedging instruments | | | $9,105 | | | | | | $9,896 | |
| | | | | | | | | | | | |
| | |
300 | | SEI Institutional Managed Trust / Semi-Annual Report / March 31, 2019 |
| | | | | | | | | | | | |
| | | Asset Derivatives | | | | | | Liability Derivatives | | | | |
| | | Statement of Assets and Liabilities/ Consolidated Statement of Assets and Liabilities Location | | | Fair Value | | | Statement of Assets and Liabilities/ Consolidated Statement of Assets and Liabilities Location | | | Fair Value | |
Derivatives not accounted for as hedging instruments: | | | | | | | | | | |
| | | |
Multi-Strategy Alternative Fund | | | | | | | | | | |
Interest rate contracts | | Net Assets – Unrealized appreciation on futures contracts | | | $16* | | | Net Assets – Unrealized depreciation on futures contracts | | | $21* | |
| | | | |
| | Net Assets – Unrealized appreciation on swap contracts | | | 136† | | | Net Assets – Unrealized depreciation on swap contracts | | | 116† | |
| | | | |
Equity contracts | | Options purchased, at value | | | 271 | | | Options written, at value | | | 50 | |
| | | | |
| | Net Assets – Unrealized appreciation on futures contracts | | | –* | | | Net Assets – Unrealized depreciation on futures contracts | | | 25* | |
| | | | |
| | Net Assets – Unrealized appreciation on swap contracts | | | 28† | | | Net Assets – Unrealized depreciation on swap contracts | | | 329† | |
| | | | |
Foreign exchange contracts | | Unrealized gain on forward foreign currency contracts | | | 171 | | | Unrealized loss on forward foreign currency contracts | | | 250 | |
| | | | |
Credit contracts | | Net Assets – Unrealized appreciation on swap contracts | | | 109† | | | Net Assets – Unrealized depreciation on swap contracts | | | 88† | |
| | | | | | | | | | | | |
Total Derivatives not accounted for as hedging instruments | | | $731 | | | | | | $879 | |
| | | | | | | | | | | | |
| | | |
Multi-Asset Accumulation Fund | | | | | | | | | | |
| | | | |
Interest rate contracts | | Net Assets – Unrealized appreciation on futures contracts | | | $49,706* | | | Net Assets – Unrealized depreciation on futures contracts | | | $–* | |
| | | | |
| | Net Assets – Unrealized appreciation on swap contracts | | | 5,277† | | | Net Assets – Unrealized depreciation on swap contracts | | | –† | |
| | | | |
Equity contracts | | Net Assets – Unrealized appreciation on futures contracts | | | 19,478* | | | Net Assets – Unrealized depreciation on futures contracts | | | 381* | |
| | | | |
| | Net Assets – Unrealized appreciation on swap contracts | | | 1,658† | | | Net Assets – Unrealized depreciation on swap contracts | | | 139† | |
| | | | |
Foreign exchange contracts | | Unrealized gain on forward foreign currency contracts | | | 8,353 | | | Unrealized loss on forward foreign currency contracts | | | 4,655 | |
| | | | |
Commodity contracts | | Net Assets – Unrealized appreciation on futures contracts | | | 10,656* | | | Net Assets – Unrealized depreciation on futures contracts | | | 3,838* | |
| | | | |
| | Net Assets – Unrealized appreciation on swap contracts | | | 50† | | | Net Assets – Unrealized depreciation on swap contracts | | | 250† | |
| | | | | | | | | | | | |
Total Derivatives not accounted for as hedging instruments | | | $95,178 | | | | | | $9,263 | |
| | | | | | | | | | | | |
| | | |
Multi-Asset Income Fund | | | | | | | | | | |
| | | | |
Interest rate contracts | | Net Assets – Unrealized appreciation on futures contracts | | | $3,074 | | | Net Assets – Unrealized depreciation on futures contracts | | | $1,245 | |
| | | | |
| | Options purchased, at value | | | – | | | Options written, at value | | | 7 | |
| | | | |
| | Net Assets – Unrealized appreciation on swap contracts | | | 119† | | | Net Assets – Unrealized depreciation on swap contracts | | | 633† | |
| | | | |
Equity contracts | | Options purchased, at value | | | 92 | | | Options written, at value | | | 3,353 | |
| | | | |
| | Net Assets – Unrealized appreciation on futures contracts | | | 893 | | | Net Assets – Unrealized depreciation on futures contracts | | | –* | |
| | | | |
Foreign exchange contracts | | Unrealized gain on forward foreign currency contracts | | | 1,231 | | | Unrealized loss on forward foreign currency contracts | | | 338 | |
| | | | |
| | Options purchased, at value | | | 114 | | | Options written, at value | | | 100 | |
| | | | |
Credit contracts | | Net Assets – Unrealized appreciation on swap contracts | | | 542† | | | Net Assets – Unrealized depreciation on swap contracts | | | 54† | |
| | | | | | | | | | | | |
Total Derivatives not accounted for as hedging instruments | | | $6,065 | | | | | | $5,730 | |
| | | | | | | | | | | | |
| | |
SEI Institutional Managed Trust / Semi-Annual Report / March 31, 2019 | | 301 |
Notes to Financial Statements/Consolidated Notes to Financial Statements (Unaudited) (Continued)
March 31, 2019
| | | | | | | | | | | | |
| | | Asset Derivatives | | | | | | Liability Derivatives | | | | |
| | | Statement of Assets and Liabilities/ Consolidated Statement of Assets and Liabilities Location | | | Fair Value | | | Statement of Assets and Liabilities/ Consolidated Statement of Assets and Liabilities Location | | | Fair Value | |
Derivatives not accounted for as hedging instruments: | | | | | | | | | | |
| | | |
Multi-Asset Inflation Managed Fund | | | | | | | | | | |
| | | | |
Interest rate contracts | | Net Assets – Unrealized appreciation on futures contracts | | | $34* | | | Net Assets – Unrealized depreciation on futures contracts | | | $1,045* | |
| | | | |
| | Net Assets – Unrealized appreciation on swap contracts | | | 1,122† | | | Net Assets – Unrealized depreciation on swap contracts | | | 1,786† | |
| | | | |
Equity contracts | | Net Assets – Unrealized appreciation on futures contracts | | | –* | | | Net Assets – Unrealized depreciation on futures contracts | | | 602* | |
| | | | |
Foreign exchange contracts | | Unrealized gain on forward foreign currency contracts | | | 149 | | | Unrealized loss on forward foreign currency contracts | | | 180 | |
| | | | |
Commodity contracts | | Net Assets – Unrealized appreciation on futures contracts | | | 4,942* | | | Net Assets – Unrealized depreciation on future contracts | | | 1,984* | |
| | | | |
| | Options purchased, at value | | | 53 | | | Options written, at value | | | 184 | |
| | | | |
Credit contracts | | Net Assets – Unrealized appreciation on swaps contracts | | | 44† | | | Net Assets – Unrealized depreciation on swaps contracts | | | 789† | |
| | | | | | | | | | | | |
Total Derivatives not accounted for as hedging instruments | | | $6,344 | | | | | | $6,570 | |
| | | | | | | | | | | | |
| | | |
Multi-Asset Capital Stability Fund | | | | | | | | | | |
| | | | |
Interest rate contracts | | Net Assets – Unrealized appreciation on futures contracts | | | $2,828* | | | Net Assets – Unrealized depreciation on futures contracts | | | $156* | |
| | | | |
| | Net Assets – Unrealized appreciation on swap contracts | | | 1,210† | | | Net Assets – Unrealized depreciation on swap contracts | | | –† | |
| | | | |
Equity contracts | | Net Assets – Unrealized appreciation on futures contracts | | | 783* | | | Net Assets – Unrealized depreciation on futures contracts | | | 559* | |
| | | | |
Foreign exchange contracts | | Unrealized gain on forward foreign currency contracts | | | 1,263 | | | Unrealized loss on forward foreign currency contracts | | | 689 | |
| | | | |
| | Options purchased, at value | | | – | | | Options written, at value | | | 329 | |
| | | | |
Credit contracts | | Net Assets – Unrealized appreciation on swap contracts | | | 30† | | | Net Assets – Unrealized depreciation on swap contracts | | | 23† | |
| | | | | | | | | | | | |
Total Derivatives not accounted for as hedging instruments | | | $6,114 | | | | | | $1,756 | |
| | | | | | | | | | | | |
| * | Includes cumulative appreciation/depreciation of futures contracts as reported in the Schedules of Investments. Only current day’s variation margin is reported within the Statements of Assets & Liabilities or Consolidated Statements of Assets & Liabilities. |
| † | Includes cumulative appreciation/depreciation of swap contracts as reported in the Schedules of Investments. Market Value is reported within the Statements of Assets & Liabilities or Consolidated Statements of Assets & Liabilities for swap contracts that have paid premiums. |
The effect of derivative instruments on the Statements of Operations/Consolidated Statements of Operations for the six month period ended March 31, 2019.
Amount of realized gain or (loss) on derivatives recognized in income ($ Thousands):
| | | | | | | | | | | | | | | | | | | | | | | | |
| | | | | | | |
| Derivatives Not Accounted for as Hedging Instruments | | Options | | | Swaptions | | | Futures | | | Forward Foreign Currency
Contracts | | | Swaps | | | Total | |
Global Managed Volatility Fund | | | | | | | | | | | | | | | | | | | | | | | | |
| | | | | | |
Equity contracts | | $ | – | | | $ | – | | | $ | (667 | ) | | $ | – | | | $ | – | | | $ | (667 | ) |
| | | | | | |
Foreign exchange contracts | | | – | | | | – | | | | – | | | | 10,425 | | | | – | | | | 10,425 | |
Total | | $ | – | | | $ | – | | | $ | (667) | | | $ | 10,425 | | | $ | – | | | $ | 9,758 | |
| | |
302 | | SEI Institutional Managed Trust / Semi-Annual Report / March 31, 2019 |
| | | | | | | | | | | | | | | | | | | | | | | | |
| Derivatives Not Accounted for as Hedging Instruments | | Options | | | Swaptions | | | Futures | | | Forward
Foreign
Currency
Contracts | | | Swaps | | | Total | |
| | | | | | | | | | | | | | | | | | | | | | | | |
Core Fixed Income Fund | | | | | | | | | | | | | | | | | | | | | |
Interest rate contracts | | $ | 1,506 | | | $ | – | | | $ | (1,318 | ) | | $ | – | | | $ | 1,691 | | | $ | 1,879 | |
Equity contracts | | | – | | | | – | | | | 2,654 | | | | – | | | | – | | | | 2,654 | |
Foreign exchange contracts | | | – | | | | (276 | ) | | | – | | | | 196 | | | | – | | | | (80) | |
Credit contracts | | | – | | | | – | | | | – | | | | – | | | | 1,626 | | | | 1,626 | |
Total | | $ | 1,506 | | | $ | (276 | ) | | $ | 1,336 | | | $ | 196 | | | $ | 3,317 | | | $ | 6,079 | |
High Yield Bond Fund | | | | | | | | | | | | | | | | | | | | | |
Interest rate contracts | | $ | – | | | $ | – | | | $ | – | | | $ | – | | | $ | (18 | ) | | $ | (18) | |
Credit contracts | | | – | | | | – | | | | – | | | | – | | | | (24 | ) | | | (24) | |
Total | | $ | – | | | $ | – | | | $ | – | | | $ | – | | | $ | (42 | ) | | $ | (42) | |
Dynamic Asset Allocation Fund | | | | | | | | | | | | | | | | | | | | | |
Equity contracts | | $ | – | | | $ | – | | | $ | (1,189 | ) | | $ | – | | | $ | 2,561 | | | $ | 1,372 | |
Foreign exchange contracts | | | – | | | | – | | | | – | | | | 3,163 | | | | – | | | | 3,163 | |
Commodity contracts | | | – | | | | – | | | | – | | | | – | | | | (4,266 | ) | | | (4,266) | |
Total | | $ | – | | | $ | – | | | $ | (1,189 | ) | | $ | 3,163 | | | $ | (1,705 | ) | | $ | 269 | |
Multi-Strategy Alternative Fund | | | | | | | | | | | | | | | | | | | | | |
Credit contracts | | $ | – | | | $ | – | | | $ | – | | | $ | – | | | $ | (52 | ) | | $ | (52) | |
Equity contracts | | | (130 | ) | | | – | | | | 13 | | | | – | | | | 743 | | | | 626 | |
Interest rate contracts | | | – | | | | – | | | | 2 | | | | – | | | | 84 | | | | 86 | |
Foreign exchange contracts | | | – | | | | – | | | | – | | | | (510 | ) | | | – | | | | (510) | |
Total | | $ | (130 | ) | | $ | – | | | $ | 15 | | | $ | (510 | ) | | $ | 775 | | | $ | 150 | |
Multi-Asset Accumulation Fund | | | | | | | | | | | | | | | | | | | | | |
Equity contracts | | $ | – | | | $ | – | | | $ | (47,596 | ) | | $ | – | | | $ | 811 | | | $ | (46,785) | |
Interest rate contracts | | | – | | | | – | | | | 57,451 | | | | – | | | | 2,634 | | | | 60,085 | |
Foreign exchange contracts | | | – | | | | – | | | | – | | | | 24,964 | | | | – | | | | 24,964 | |
Commodity contracts | | | – | | | | – | | | | (43,736 | ) | | | – | | | | 9,561 | | | | (34,175) | |
Total | | $ | – | | | $ | – | | | $ | (33,881 | ) | | $ | 24,964 | | | $ | 13,006 | | | $ | 4,089 | |
Multi-Asset Income Fund | | | | | | | | | | | | | | | | | | | | | |
Credit contracts | | $ | – | | | $ | – | | | $ | – | | | $ | – | | | $ | 2,049 | | | $ | 2,049 | |
Equity contracts | | | 2,610 | | | | – | | | | (1,077 | ) | | | – | | | | – | | | | 1,533 | |
Interest rate contracts | | | (358 | ) | | | – | | | | 1,116 | | | | – | | | | (419 | ) | | | 339 | |
Foreign exchange contracts | | | (158 | ) | | | – | | | | – | | | | 1,163 | | | | – | | | | 1,005 | |
Total | | $ | 2,094 | | | $ | – | | | $ | 39 | | | $ | 1,163 | | | $ | 1,630 | | | $ | 4,926 | |
Multi-Asset Inflation Managed Fund | | | | | | | | | | | | | | | | | | | | | |
Credit contracts | | $ | – | | | $ | – | | | $ | – | | | $ | – | | | $ | (104 | ) | | $ | (104) | |
Equity contracts | | | – | | | | – | | | | 1,880 | | | | – | | | | – | | | | 1,880 | |
Interest rate contracts | | | – | | | | – | | | | (1,101 | ) | | | – | | | | (2,098 | ) | | | (3,199) | |
Foreign exchange contracts | | | – | | | | – | | | | – | | | | (128 | ) | | | – | | | | (128) | |
Commodity contracts | | | (442 | ) | | | – | | | | (12,460 | ) | | | – | | | | – | | | | (12,902) | |
Total | | $ | (442 | ) | | $ | – | | | $ | (11,681 | ) | | $ | (128 | ) | | $ | (2,202 | ) | | $ | (14,453) | |
Multi-Asset Capital Stability Fund | | | | | | | | | | | | | | | | | | | | | |
Credit contracts | | $ | – | | | $ | – | | | $ | – | | | $ | – | | | $ | 174 | | | $ | 174 | |
Equity contracts | | | (652 | ) | | | – | | | | (1,290 | ) | | | – | | | | – | | | | (1,942) | |
Interest rate contracts | | | – | | | | – | | | | 202 | | | | – | | | | 183 | | | | 385 | |
Foreign exchange contracts | | | (60 | ) | | | – | | | | – | | | | 88 | | | | – | | | | 28 | |
Total | | $ | (712 | ) | | $ | – | | | $ | (1,088 | ) | | $ | 88 | | | $ | 357 | | | $ | (1,355) | |
| | |
SEI Institutional Managed Trust / Semi-Annual Report / March 31, 2019 | | 303 |
Notes to Financial Statements/Consolidated Notes to Financial Statements (Unaudited) (Continued)
March 31, 2019
Change in unrealized appreciation or (depreciation) on derivatives recognized in income ($ Thousands):
| | | | | | | | | | | | | | | | | | | | | | | | |
| | | | | | | |
| Derivatives Not Accounted for as Hedging Instruments | | Options | | | Swaptions | | | Futures | | | Forward
Foreign
Currency
Contracts | | | Swaps | | | Total | |
Global Managed Volatility Fund | | | | | | | | | | | | | | | | | | | | | | | | |
| | | | | | |
Equity contracts | | $ | – | | | $ | – | | | $ | 309 | | | $ | – | | | $ | – | | | $ | 309 | |
| | | | | | |
Foreign exchange contracts | | | – | | | | – | | | | – | | | | (2,432) | | | | – | | | | (2,432) | |
Total | | $ | – | | | $ | – | | | $ | 309 | | | $ | (2,432) | | | $ | – | | | $ | (2,123) | |
Core Fixed Income Fund | | | | | | | | | | | | | | | | | | | | | | | | |
| | | | | | |
Credit contracts | | $ | – | | | $ | – | | | $ | – | | | $ | – | | | $ | (327) | | | $ | (327) | |
| | | | | | |
Interest rate contracts | | | (318) | | | | – | | | | 6,869 | | | | – | | | | (1,589) | | | | 4,962 | |
| | | | | | |
Foreign exchange contracts | | | – | | | | (18) | | | | – | | | | (393) | | | | – | | | | (411) | |
Total | | $ | (318) | | | $ | (18) | | | $ | 6,869 | | | $ | (393) | | | $ | (1,916) | | | $ | 4,224 | |
High Yield Bond Fund | | | | | | | | | | | | | | | | | | | | | | | | |
| | | | | | |
Interest rate contracts | | $ | – | | | $ | – | | | $ | – | | | $ | – | | | $ | (177) | | | $ | (177) | |
| | | | | | |
Credit contracts | | | – | | | | – | | | | – | | | | – | | | | 53 | | | | 53 | |
Total | | $ | – | | | $ | – | | | $ | – | | | $ | – | | | $ | (124) | | | $ | (124) | |
Dynamic Asset Allocation Fund | | | | | | | | | | | | | | | | | | | | | | | | |
| | | | | | |
Equity contracts | | $ | – | | | $ | – | | | $ | (1,414) | | | $ | – | | | $ | (988) | | | $ | (2,402) | |
| | | | | | |
Interest rate contracts | | | – | | | | 629 | | | | – | | | | – | | | | – | | | | 629 | |
| | | | | | |
Foreign exchange contracts | | | – | | | | – | | | | – | | | | 2,428 | | | | – | | | | 2,428 | |
| | | | | | |
Commodity contracts | | | – | | | | – | | | | – | | | | – | | | | 453 | | | | 453 | |
Total | | $ | – | | | $ | 629 | | | $ | (1,414) | | | $ | 2,428 | | | $ | (535) | | | $ | 1,108 | |
Multi-Strategy Alternative Fund | | | | | | | | | | | | | | | | | | | | | | | | |
| | | | | | |
Credit contracts | | $ | – | | | $ | – | | | $ | – | | | $ | – | | | $ | (17) | | | $ | (17) | |
| | | | | | |
Equity contracts | | | 51 | | | | – | | | | (23) | | | | – | | | | (162) | | | | (134) | |
| | | | | | |
Interest rate contracts | | | – | | | | – | | | | 6 | | | | – | | | | (225) | | | | (219) | |
| | | | | | |
Foreign exchange contracts | | | – | | | | – | | | | – | | | | 154 | | | | – | | | | 154 | |
Total | | $ | 51 | | | $ | – | | | $ | (17) | | | $ | 154 | | | $ | (404) | | | $ | (216) | |
Multi-Asset Accumulation Fund | | | | | | | | | | | | | | | | | | | | | | | | |
| | | | | | |
Equity contracts | | $ | – | | | $ | – | | | $ | 4,735 | | | $ | – | | | $ | (1,041) | | | $ | 3,694 | |
| | | | | | |
Interest rate contracts | | | – | | | | – | | | | 72,972 | | | | – | | | | 5,512 | | | | 78,484 | |
| | | | | | |
Foreign exchange contracts | | | – | | | | – | | | | – | | | | (1,923) | | | | – | | | | (1,923) | |
| | | | | | |
Commodity contracts | | | – | | | | – | | | | 2,264 | | | | – | | | | (163) | | | | 2,101 | |
Total | | $ | – | | | $ | – | | | $ | 79,971 | | | $ | (1,923) | | | $ | 4,308 | | | $ | 82,356 | |
Multi-Asset Income Fund | | | | | | | | | | | | | | | | | | | | | | | | |
| | | | | | |
Credit contracts | | $ | – | | | $ | – | | | $ | – | | | $ | – | | | $ | 252 | | | $ | 252 | |
| | | | | | |
Equity contracts | | | (892) | | | | – | | | | 723 | | | | – | | | | – | | | | (169) | |
| | | | | | |
Interest rate contracts | | | (10) | | | | – | | | | 3,503 | | | | – | | | | (740) | | | | 2,753 | |
| | | | | | |
Foreign exchange contracts | | | (32) | | | | – | | | | – | | | | 710 | | | | – | | | | 678 | |
Total | | $ | (934) | | | $ | – | | | $ | 4,226 | | | $ | 710 | | | $ | (488) | | | $ | 3,514 | |
Multi-Asset Inflation Managed Fund | | | | | | | | | | | | | | | | | | | | | | | | |
| | | | | | |
Credit contracts | | $ | – | | | $ | – | | | $ | – | | | $ | – | | | $ | (166) | | | $ | (166) | |
| | | | | | |
Equity contracts | | | – | | | | – | | | | (475) | | | | – | | | | – | | | | (475) | |
| | | | | | |
Interest rate contracts | | | – | | | | – | | | | (1,716) | | | | – | | | | (2,616) | | | | (4,332) | |
| | | | | | |
Foreign exchange contracts | | | – | | | | – | | | | – | | | | (355) | | | | – | | | | (355) | |
| | | | | | |
Commodity contracts | | | (85) | | | | – | | | | 3,379 | | | | – | | | | – | | | | 3,294 | |
Total | | $ | (85) | | | $ | – | | | $ | 1,188 | | | $ | (355) | | | $ | (2,782) | | | $ | (2,034) | |
| | |
304 | | SEI Institutional Managed Trust / Semi-Annual Report / March 31, 2019 |
| | | | | | | | | | | | | | | | | | | | | | | | |
| | | | | | | |
| Derivatives Not Accounted for as Hedging Instruments | | Options | | | Swaptions | | | Futures | | | Forward
Foreign
Currency
Contracts | | | Swaps | | | Total | |
Multi-Asset Capital Stability Fund | | | | | | | | | | | | | | | | | | | | | | | | |
| | | | | | |
Credit contracts | | $ | – | | | $ | – | | | $ | – | | | $ | – | | | $ | (64) | | | $ | (64) | |
| | | | | | |
Equity contracts | | | 21 | | | | – | | | | (790) | | | | – | | | | – | | | | (769) | |
| | | | | | |
Interest rate contracts | | | – | | | | – | | | | 3,719 | | | | – | | | | 1,138 | | | | 4,857 | |
| | | | | | |
Foreign exchange contracts | | | (214) | | | | – | | | | – | | | | (1,755) | | | | – | | | | (1,969) | |
Total | | $ | (193) | | | $ | – | | | $ | 2,929 | | | $ | (1,755) | | | $ | 1,074 | | | $ | 2,055 | |
The following table discloses the volume of the Fund’s futures contracts, option contracts, forward foreign currency contracts, swap contracts and swaption contracts activity during the period ended March 31, 2019 ($ Thousands):
| | | | | | | | | | | | | | | | | | | | | | |
| | | | | Large Cap Fund | | | Large Cap Value Fund | | | Large Cap Growth
Fund | | | Large Cap Index Fund | | | Tax-Managed Large
Cap Fund | |
Futures Contracts: | | | | | | | | | | | | | | | | | | | | | | |
| | | | | | |
Equity Contracts | | | | | | | | | | | | | | | | | | | | | | |
| | | | | | |
Average Notional Balance Long | | | | $ | 25,416 | | | $ | 13,240 | | | $ | 10,206 | | | $ | 5,939 | | | $ | 19,913 | |
| | | | | | |
Ending Notional Balance Long | | | | | 27,661 | | | | 17,476 | | | | 15,305 | | | | 6,102 | | | | 27,077 | |
| | | | | | |
| | | | | S&P 500 Index Fund | | | Small Cap Fund | | | Small Cap Value
Fund | | | Small Cap Growth
Fund | | | Tax-Managed Small/
Mid Cap Fund | |
Futures Contracts: | | | | | | | | | | | | | | | | | | | | | | |
| | | | | | |
Equity Contracts | | | | | | | | | | | | | | | | | | | | | | |
| | | | | | |
Average Notional Balance Long | | | | $ | 11,859 | | | $ | – | | | $ | 5,877 | | | $ | – | | | $ | – | |
| | | | | | |
Ending Notional Balance Long | | | | | 12,186 | | | | – | | | | 11,755 | | | | – | | | | – | |
| | | | | | |
| | | | | Mid-Cap Fund | | | U.S. Managed
Volatility Fund | | | Global Managed
Volatility Fund | | | Tax-Managed
Managed Volatility
Fund | | | Tax-Managed
International Managed Volatility Fund | |
Futures Contracts: | | | | | | | | | | | | | | | | | | | | | | |
| | | | | | |
Equity Contracts | | | | | | | | | | | | | | | | | | | | | | |
| | | | | | |
Average Notional Balance Long | | | | $ | – | | | $ | 22,190 | | | $ | 11,865 | | | $ | 8,773 | | | $ | 7,712 | |
| | | | | | |
Ending Notional Balance Long | | | | | – | | | | 26,202 | | | | 18,167 | | | | 9,229 | | | | 8,954 | |
|
Forward Foreign Currency Contracts: | |
| | | | | | |
Average Notional Balance Long | | | | | – | | | | – | | | | 363,159 | | | | – | | | | – | |
| | | | | | |
Average Notional Balance Short | | | | | – | | | | – | | | | 363,397 | | | | – | | | | – | |
| | | | | | |
Ending Notional Balance Long | | | | | – | | | | – | | | | 326,042 | | | | – | | | | – | |
| | | | | | |
Ending Notional Balance Short | | | | | – | | | | – | | | | 325,516 | | | | – | | | | – | |
| | | | | | | | | | | | | | | | | | | | | | | | |
| | | Enhanced Income Fund | | | Core Fixed Income
Fund | | | High Yield
Bond Fund | | | Dynamic Asset
Allocation Fund | | | Multi-Strategy
Alternative Fund | | | Multi-Asset
Accumulation Fund | |
Futures Contracts: | | | | | | | | | | | | | | | | | | | | | |
Commodity Contracts | | | | | | | | | | | | | | | | | | | | | |
| | | | | | |
Average Notional Balance Long | | $ | – | | | $ | – | | | $ | – | | | $ | – | | | $ | – | | | $ | 293,182 | |
| | | | | | |
Average Notional Balance Short | | | – | | | | – | | | | – | | | | – | | | | – | | | | – | |
| | | | | | |
Ending Notional Balance Long | | | – | | | | – | | | | – | | | | – | | | | – | | | | 379,152 | |
| | | | | | |
Ending Notional Balance Short | | | – | | | | – | | | | – | | | | – | | | | – | | | | – | |
Equity Contracts | | | | | | | | | | | | | | | | | | | | | | | | |
| | | | | | |
Average Notional Balance Long | | | – | | | | 83,001 | | | | – | | | | 94,103 | | | | – | | | | 1,557,445 | |
| | | | | | |
Average Notional Balance Short | | | – | | | | 48,542 | | | | – | | | | 80,349 | | | | 1,073 | | | | – | |
| | | | | | |
Ending Notional Balance Long | | | – | | | | – | | | | – | | | | 119,811 | | | | – | | | | 1,449,982 | |
| | | | | | |
Ending Notional Balance Short | | | – | | | | – | | | | – | | | | 95,685 | | | | 826 | | | | – | |
Interest Contracts | | | | | | | | | | | | | | | | | | | | | | | | |
| | | | | | |
Average Notional Balance Long | | | – | | | | 1,320,696 | | | | – | | | | – | | | | 570 | | | | 3,091,084 | |
| | | | | | |
Average Notional Balance Short | | | 5,092 | | | | 462,975 | | | | – | | | | – | | | | 206 | | | | – | |
| | | | | | |
Ending Notional Balance Long | | | – | | | | 1,568,242 | | | | – | | | | – | | | | 583 | | | | 3,432,037 | |
| | | | | | |
Ending Notional Balance Short | | | 5,226 | | | | 613,446 | | | | – | | | | – | | | | 412 | | | | – | |
| | |
SEI Institutional Managed Trust / Semi-Annual Report / March 31, 2019 | | 305 |
Notes to Financial Statements/Consolidated Notes to Financial Statements (Unaudited) (Continued)
March 31, 2019
| | | | | | | | | | | | | | | | | | | | | | | | |
| | | Enhanced Income Fund | | | Core Fixed Income
Fund | | | High Yield
Bond Fund | | | Dynamic Asset
Allocation Fund | | | Multi-Strategy
Alternative Fund | | | Multi-Asset
Accumulation Fund | |
| | | | | |
Futures Contracts: (continued) | | | | | | | | | | | | | | | | | | | | | |
| | | | | | |
Currency Contracts | | | | | | | | | | | | | | | | | | | | | | | | |
| | | | | | |
Average Notional Balance Short | | $ | – | | | $ | – | | | $ | – | | | $ | – | | | $ | – | | | $ | – | |
| | | | | | |
Ending Notional Balance Short | | | – | | | | – | | | | – | | | | – | | | | – | | | | – | |
| | | | | | |
Forward Foreign Currency Contracts: | | | | | | | | | | | | | | | | | | | | | | | | |
| | | | | | |
Average Notional Balance Long | | | – | | | | 135,824 | | | | – | | | | 259,503 | | | | 27,460 | | | | 1,062,452 | |
| | | | | | |
Average Notional Balance Short | | | – | | | | 136,813 | | | | – | | | | 257,870 | | | | 27,511 | | | | 1,060,140 | |
| | | | | | |
Ending Notional Balance Long | | | – | | | | 162,817 | | | | – | | | | 249,231 | | | | 28,356 | | | | 1,083,320 | |
| | | | | | |
Ending Notional Balance Short | | | – | | | | 163,974 | | | | – | | | | 249,729 | | | | 28,446 | | | | 1,079,623 | |
| | | | | | |
Swaps: | | | | | | | | | | | | | | | | | | | | | | | | |
| | | | | | |
Total Return Contracts | | | | | | | | | | | | | | | | | | | | | | | | |
| | | | | | |
Average Notional Balance Long | | | – | | | | – | | | | 9,317 | | | | – | | | | 1,888 | | | | – | |
| | | | | | |
Average Notional Balance Short | | | – | | | | – | | | | 9,697 | | | | – | | | | 1,916 | | | | – | |
| | | | | | |
Ending Notional Balance Long | | | – | | | | – | | | | – | | | | – | | | | 531 | | | | – | |
| | | | | | |
Ending Notional Balance Short | | | – | | | | – | | | | 19,395 | | | | – | | | | 3,831 | | | | – | |
| | | | | | |
Credit Contracts | | | | | | | | | | | | | | | | | | | | | | | | |
| | | | | | |
Average Notional Balance Long | | | – | | | | 4,300 | | | | – | | | | – | | | | 10,265 | | | | – | |
| | | | | | |
Average Notional Balance Short | | | – | | | | 102,770 | | | | 10,077 | | | | – | | | | 4,011 | | | | – | |
| | | | | | |
Ending Notional Balance Long | | | – | | | | – | | | | – | | | | – | | | | 10,409 | | | | – | |
| | | | | | |
Ending Notional Balance Short | | | – | | | | 106,320 | | | | 9,906 | | | | – | | | | 4,143 | | | | – | |
| | | | | | |
Interest Contracts | | | | | | | | | | | | | | | | | | | | | | | | |
| | | | | | |
Average Notional Balance Long | | | – | | | | 470,695 | | | | – | | | | – | | | | 16,800 | | | | 468,326 | |
| | | | | | |
Average Notional Balance Short | | | – | | | | 470,695 | | | | – | | | | – | | | | 16,800 | | | | 468,326 | |
| | | | | | |
Ending Notional Balance Long | | | – | | | | 423,073 | | | | – | | | | – | | | | 13,636 | | | | 506,530 | |
| | | | | | |
Ending Notional Balance Short | | | – | | | | 423,073 | | | | – | | | | – | | | | 13,636 | | | | 506,530 | |
| | | | | | |
Foreign Exchange Contracts | | | | | | | | | | | | | | | | | | | | | | | | |
| | | | | | |
Average Notional Balance Long | | | – | | | | – | | | | – | | | | – | | | | – | | | | – | |
| | | | | | |
Average Notional Balance Short | | | – | | | | – | | | | – | | | | – | | | | – | | | | – | |
| | | | | | |
Equity Contracts | | | | | | | | | | | | | | | | | | | | | | | | |
| | | | | | |
Average Notional Balance Long | | | – | | | | – | | | | – | | | | 122,993 | | | | 5,450 | | | | – | |
| | | | | | |
Average Notional Balance Short | | | – | | | | – | | | | – | | | | 123,696 | | | | 4,403 | | | | – | |
| | | | | | |
Ending Notional Balance Long | | | – | | | | – | | | | – | | | | 129,919 | | | | 5,087 | | | | – | |
| | | | | | |
Ending Notional Balance Short | | | – | | | | – | | | | – | | | | 132,912 | | | | 5,507 | | | | – | |
| | | | | | |
Commodity Contracts | | | | | | | | | | | | | | | | | | | | | | | | |
| | | | | | |
Average Notional Balance Long | | | – | | | | – | | | | – | | | | 73,414 | | | | – | | | | – | |
| | | | | | |
Ending Notional Balance Long | | | – | | | | – | | | | – | | | | 75,203 | | | | – | | | | – | |
| | | | | | |
Options: | | | | | | | | | | | | | | | | | | | | | | | | |
| | | | | | |
Equity | | | | | | | | | | | | | | | | | | | | | | | | |
| | | | | | |
Average Notional Balance Long† | | | – | | | | – | | | | – | | | | – | | | | 506 | | | | – | |
| | | | | | |
Average Notional Balance Short† | | | – | | | | – | | | | – | | | | – | | | | 127 | | | | – | |
| | | | | | |
Ending Notional Balance Long† | | | – | | | | – | | | | – | | | | – | | | | 443 | | | | – | |
| | | | | | |
Ending Notional Balance Short† | | | – | | | | – | | | | – | | | | – | | | | 93 | | | | – | |
| | | | | | |
Interest | | | | | | | | | | | | | | | | | | | | | | | | |
| | | | | | |
Average Notional Balance Long† | | | – | | | | 420 | | | | – | | | | – | | | | – | | | | – | |
| | | | | | |
Average Notional Balance Short† | | | – | | | | 450 | | | | – | | | | – | | | | – | | | | – | |
| | | | | | |
Ending Notional Balance Long† | | | – | | | | 457 | | | | – | | | | – | | | | – | | | | – | |
| | | | | | |
Ending Notional Balance Short† | | | – | | | | 411 | | | | – | | | | – | | | | – | | | | – | |
| | | | | | |
Currency: | | | | | | | | | | | | | | | | | | | | | | | | |
| | | | | | |
Average Notional Balance Long† | | | – | | | | 108 | | | | – | | | | 234 | | | | – | | | | – | |
| | | | | | |
Average Notional Balance Short† | | | – | | | | – | | | | – | | | | – | | | | – | | | | – | |
| | | | | | |
Ending Notional Balance Long† | | | – | | | | 104 | | | | – | | | | 469 | | | | – | | | | – | |
| | | | | | |
Ending Notional Balance Short† | | | – | | | | – | | | | – | | | | – | | | | – | | | | – | |
| | | | | | |
Swaptions: | | | | | | | | | | | | | | | | | | | | | | | | |
| | | | | | |
Interest | | | | | | | | | | | | | | | | | | | | | | | | |
| | | | | | |
Average Notional Balance Long | | | – | | | | – | | | | – | | | | 2,357 | | | | – | | | | – | |
| | | | | | |
Ending Notional Balance Long | | | – | | | | – | | | | – | | | | 2,357 | | | | – | | | | – | |
| | | | | | |
Credit | | | | | | | | | | | | | | | | | | | | | | | | |
| | | | | | |
Average Notional Balance Long | | | – | | | | 10 | | | | – | | | | – | | | | – | | | | – | |
| | | | | | |
Average Notional Balance Short | | | – | | | | 10 | | | | – | | | | – | | | | – | | | | – | |
| | |
306 | | SEI Institutional Managed Trust / Semi-Annual Report / March 31, 2019 |
| | | | | | | | | | | | | | | | |
| | | Multi-Asset Income
Fund | | | Multi-Asset Inflation
Managed Fund | | | Multi-Asset Capital
Stability Fund | | | Long/Short
Alternative Fund | |
Futures Contracts: | | | | | | | | | | | | | | | | |
| | | |
Commodity Contracts | | | | | | | | | | | | | |
| | | | |
Average Notional Balance Long | | $ | – | | | $ | 63,880 | | | $ | – | | | $ | – | |
| | | | |
Average Notional Balance Short | | | – | | | | 13,853 | | | | – | | | | – | |
| | | | |
Ending Notional Balance Long | | | – | | | | 44,674 | | | | – | | | | – | |
| | | | |
Ending Notional Balance Short | | | – | | | | 9,775 | | | | – | | | | – | |
|
Equity Contracts | |
| | | | |
Average Notional Balance Long | | | 47,389 | | | | 72,551 | | | | 97,947 | | | | 18,370 | |
| | | | |
Average Notional Balance Short | | | 8,353 | | | | 49,194 | | | | 5,609 | | | | – | |
| | | | |
Ending Notional Balance Long | | | 36,282 | | | | 81,986 | | | | 125,400 | | | | 11,790 | |
| | | | |
Ending Notional Balance Short | | | – | | | | 49,367 | | | | 4,802 | | | | – | |
|
Interest Contracts | |
| | | | |
Average Notional Balance Long | | | 284,540 | | | | 12,033 | | | | 129,173 | | | | – | |
| | | | |
Average Notional Balance Short | | | 107,066 | | | | 107,520 | | | | 31,233 | | | | 3,974 | |
| | | | |
Ending Notional Balance Long | | | 271,823 | | | | 5,786 | | | | 179,316 | | | | – | |
| | | | |
Ending Notional Balance Short | | | 118,795 | | | | 99,439 | | | | 32,829 | | | | 7,948 | |
|
Currency Contracts | |
| | | | |
Average Notional Balance Long | | | – | | | | – | | | | – | | | | 9,348 | |
| | | | |
Ending Notional Balance Long | | | – | | | | – | | | | – | | | | 18,695 | |
|
Forward Foreign Currency Contracts: | |
| | | | |
Average Notional Balance Long | | | 86,098 | | | | 46,251 | | | | 200,792 | | | | – | |
| | | | |
Average Notional Balance Short | | | 85,549 | | | | 46,589 | | | | 201,490 | | | | – | |
| | | | |
Ending Notional Balance Long | | | 87,719 | | | | 43,408 | | | | 195,150 | | | | – | |
| | | | |
Ending Notional Balance Short | | | 86,826 | | | | 43,492 | | | | 194,570 | | | | – | |
Swaps: | | | | | | | | | | | | | | | | |
| | | | |
Total Return Contracts | | | | | | | | | | | | | | | | |
| | | | |
Average Notional Balance Long | | | – | | | | 36,433 | | | | – | | | | – | |
| | | | |
Ending Notional Balance Long | | | – | | | | 37,336 | | | | – | | | | – | |
| | | | |
Credit Contracts | | | | | | | | | | | | | | | | |
| | | | |
Average Notional Balance Long | | | 18,717 | | | | 22,331 | | | | – | | | | – | |
| | | | |
Average Notional Balance Short | | | 114,888 | | | | 19,098 | | | | 18,375 | | | | – | |
| | | | |
Ending Notional Balance Long | | | 27,021 | | | | 22,331 | | | | – | | | | – | |
| | | | |
Ending Notional Balance Short | | | 75,030 | | | | 19,743 | | | | 28,664 | | | | – | |
| | | | |
Interest Contracts | | | | | | | | | | | | | | | | |
| | | | |
Average Notional Balance Long | | | 64,825 | | | | 171,669 | | | | 19,660 | | | | – | |
| | | | |
Average Notional Balance Short | | | 64,825 | | | | 171,669 | | | | 19,660 | | | | – | |
| | | | |
Ending Notional Balance Long | | | 73,075 | | | | 235,378 | | | | 26,393 | | | | – | |
| | | | |
Ending Notional Balance Short | | | 73,075 | | | | 235,378 | | | | 26,393 | | | | – | |
| | | | |
Equity Contracts | | | | | | | | | | | | | | | | |
| | | | |
Average Notional Balance Short | | | – | | | | – | | | | – | | | | – | |
| | | | |
Options: | | | | | | | | | | | | | | | | |
| | | | |
Commodity | | | | | | | | | | | | | | | | |
| | | | |
Average Notional Balance Long† | | | – | | | | 224 | | | | – | | | | – | |
| | | | |
Average Notional Balance Short† | | | – | | | | 124 | | | | – | | | | – | |
| | | | |
Ending Notional Balance Long† | | | – | | | | 114 | | | | – | | | | – | |
| | | | |
Ending Notional Balance Short† | | | – | | | | 69 | | | | – | | | | – | |
| | | | |
Equity | | | | | | | | | | | | | | | | |
| | | | |
Average Notional Balance Long† | | | 79 | | | | – | | | | 138 | | | | – | |
| | | | |
Average Notional Balance Short† | | | 2,876 | | | | – | | | | 106 | | | | – | |
| | | | |
Ending Notional Balance Long† | | | 158 | | | | – | | | | 276 | | | | – | |
| | | | |
Ending Notional Balance Short† | | | 2,381 | | | | – | | | | 212 | | | | – | |
| | | | |
Interest | | | | | | | | | | | | | | | | |
| | | | |
Average Notional Balance Long† | | | 147 | | | | 7 | | | | – | | | | – | |
| | | | |
Average Notional Balance Short† | | | 24 | | | | 5 | | | | – | | | | – | |
| | | | |
Ending Notional Balance Long† | | | – | | | | – | | | | – | | | | – | |
| | | | |
Ending Notional Balance Short† | | | 2 | | | | – | | | | – | | | | – | |
| | | | |
Currency | | | | | | | | | | | | | | | | |
| | | | |
Average Notional Balance Long† | | | 169 | | | | – | | | | 90 | | | | – | |
| | | | |
Average Notional Balance Short† | | | 91 | | | | – | | | | 76 | | | | – | |
| | |
SEI Institutional Managed Trust / Semi-Annual Report / March 31, 2019 | | 307 |
Notes to Financial Statements/Consolidated Notes to Financial Statements (Unaudited) (Continued)
March 31, 2019
| | | | | | | | | | | | | | | | |
| | | Multi-Asset Income
Fund | | | Multi-Asset Inflation
Managed Fund | | | Multi-Asset Capital
Stability Fund | | | Long/Short
Alternative Fund | |
Options: (continued) | | | | | | | | | | | | | | | | |
| | | | |
Ending Notional Balance Long† | | $ | 143 | | | $ | – | | | $ | – | | | $ | – | |
| | | | |
Ending Notional Balance Short† | | | 61 | | | | – | | | | 48 | | | | – | |
† Represents cost.
A Fund is subject to various netting arrangements with select counterparties (“Master Agreements”). Master Agreements govern the terms of certain transactions, and reduce the counterparty risk associated with relevant transactions by specifying credit protection mechanisms and providing standardization that improves legal certainty. Since different types of transactions have different mechanics and are sometimes traded out of different legal entities of a particular counterparty organization, each type of transaction may be covered by a different Master Agreement, resulting in the need for multiple agreements with a single counterparty. As the Master Agreements are specific to unique operations of different asset types, they allow a Fund to close out and net its total exposure to a specific counterparty entity in the event of a default with respect to all the transactions governed under a single agreement with a specific counterparty entity.
Master Agreements can also help limit counterparty risk by specifying collateral posting arrangements atpre-arranged exposure levels. Under the Master Agreements, collateral is routinely transferred if the total net exposure to certain transactions (net of existing collateral already in place) governed under the relevant Master Agreement with a counterparty in a given account exceeds a specified threshold, which typically ranges from zero to $250,000 depending on the counterparty and the type of Master Agreement. United States Treasury Securities and U.S. dollar cash
are generally the preferred forms of collateral. Securities and cash pledged as collateral are reflected as assets on the Statements of Assets and Liabilities or Consolidated Statements of Assets and Liabilities as either a component of investments at value (securities) or deposits due from counterparties (cash). Cash collateral received is not typically held in a segregated account and as such is reflected as a liability on the Statements of Assets and Liabilities or Consolidated Statements of Assets and Liabilities as deposits due to counterparties. The market value of any securities received as collateral is not reflected as a component of net asset value. A Fund’s overall exposure to counterparty risk can change substantially within a short period, as it is affected by each transaction subject to the relevant Master Agreement.
Customer Account Agreements and related addendums govern exchange traded derivatives transactions such as futures, options on futures, and centrally cleared swaps. Exchange traded derivative transactions require posting of initial margin as determined by each relevant clearing agency which is segregated at a broker account registered with the Commodities Futures Trading Commission (“CFTC”), or the applicable regulator. In the U.S., counterparty risk is reduced as placement due to the Fund assets in the segregated account. Additionally, portability of exposure in the event of default further reduces risk to the Funds. Variation margin, or changes in market value, are exchanged daily, but may not be netted between futures and cleared OTC derivatives.
The following is a summary of the market value and variation margin of exchange-traded or centrally cleared financial derivative instruments of the Funds as of March 31, 2019 ($ Thousands):
| | | | | | | | | | | | | | | | | | | | | | | | | | | | | | | | | | | | |
| | | Financial Derivative Assets | | | | | | Financial Derivative Liabilities | |
| | | Market Value | | | Variation Margin Asset | | | | | | | | | Market Value | | | Variation Margin Liability | | | | |
| Fund | | Purchased
Options | | | Futures | | | Swap
Agreements | | | Total | | | | | | Written
Options | | | Futures | | | Swap
Agreements | | | Total | |
| | | | | | | | | |
Large Cap Fund | | | $ — | | | | $ 167 | | | | $ — | | | | $ 167 | | | | | | | | $ — | | | | $ — | | | | $ — | | | | $ — | |
| | | | | | | | | |
Large Cap Value Fund | | | — | | | | 87 | | | | — | | | | 87 | | | | | | | | — | | | | — | | | | — | | | | — | |
| | | | | | | | | |
Large Cap Growth Fund | | | — | | | | 66 | | | | — | | | | 66 | | | | | | | | — | | | | — | | | | — | | | | — | |
| | | | | | | | | |
Large Cap Index Fund | | | — | | | | 35 | | | | — | | | | 35 | | | | | | | | — | | | | — | | | | — | | | | — | |
| | | | | | | | | |
Tax-Managed Large Cap Fund | | | — | | | | 160 | | | | — | | | | 160 | | | | | | | | — | | | | — | | | | — | | | | — | |
| | | | | | | | | |
S&P 500 Index Fund | | | — | | | | 74 | | | | — | | | | 74 | | | | | | | | — | | | | — | | | | — | | | | — | |
| | | | | | | | | |
Small Cap Value Fund | | | — | | | | 29 | | | | — | | | | 29 | | | | | | | | — | | | | — | | | | — | | | | — | |
| | | | | | | | | |
U.S. Managed Volatility Fund | | | — | | | | 158 | | | | — | | | | 158 | | | | | | | | — | | | | — | | | | — | | | | — | |
| | | | | | | | | |
Global Managed Volatility Fund | | | — | | | | 119 | | | | — | | | | 119 | | | | | | | | — | | | | — | | | | — | | | | — | |
| | | | | | | | | |
Tax-Managed Managed Volatility Fund | | | — | | | | 58 | | | | — | | | | 58 | | | | | | | | — | | | | — | | | | — | | | | — | |
| | | | | | | | | |
Tax-Managed International Managed Volatility Fund | | | — | | | | 65 | | | | — | | | | 65 | | | | | | | | — | | | | — | | | | — | | | | — | |
| | | | | | | | | |
Enhanced Income Fund | | | — | | | | 7 | | | | — | | | | 7 | | | | | | | | — | | | | — | | | | — | | | | — | |
| | | | | | | | | |
Core Fixed Income Fund | | | 313 | | | | 1,038 | | | | 790 | | | | 2,141 | | | | | | | | 759 | | | | 227 | | | | 2,158 | | | | 3,144 | |
| | |
308 | | SEI Institutional Managed Trust / Semi-Annual Report / March 31, 2019 |
| | | | | | | | | | | | | | | | | | | | | | | | | | | | | | | | | | | | |
| | | Financial Derivative Assets | | | | | | Financial Derivative Liabilities | |
| | | Market Value | | | Variation Margin Asset | | | | | | | | | Market Value | | | Variation Margin Liability | | | | |
| Fund | | Purchased
Options | | | Futures | | | Swap
Agreements | | | Total | | | | | | Written
Options | | | Futures | | | Swap
Agreements | | | Total | |
| | | | | | | | | |
High Yield Bond Fund | | | — | | | | — | | | | 33 | | | | 33 | | | | | | | | — | | | | — | | | | — | | | | — | |
| | | | | | | | | |
Dynamic Asset Allocation Fund | | | — | | | | 1,150 | | | | — | | | | 1,150 | | | | | | | | — | | | | 626 | | | | — | | | | 626 | |
| | | | | | | | | |
Multi-Strategy Alternative Fund | | | 271 | | | | 2 | | | | 711 | | | | 984 | | | | | | | | 50 | | | | 7 | | | | 759 | | | | 816 | |
| | | | | | | | | |
Multi-Asset Accumulation Fund | | | — | | | | 743 | | | | — | | | | 743 | | | | | | | | — | | | | 2,207 | | | | 699 | | | | 2,906 | |
| | | | | | | | | |
Multi-Asset Income Fund | | | 206 | | | | 30 | | | | 229 | | | | 465 | | | | | | | | 3,460 | | | | 219 | | | | 827 | | | | 4,506 | |
| | | | | | | | | |
Multi-Asset Inflation Managed Fund | | | 53 | | | | 172 | | | | 1,173 | | | | 1,398 | | | | | | | | 184 | | | | 211 | | | | 875 | | | | 1,270 | |
| | | | | | | | | |
Multi-Asset Capital Stability Fund | | | — | | | | 687 | | | | 72 | | | | 759 | | | | | | | | — | | | | 546 | | | | 135 | | | | 681 | |
| | | | | | | | | |
Long/Short Alternative Fund | | | — | | | | 80 | | | | — | | | | 80 | | | | | | | | — | | | | — | | | | — | | | | — | |
| | | | | | | | | | | | |
| | | | | | | | | |
Total Exchange-Traded or Centrally Cleared | | | $843 | | | | $4,927 | | | | $3,008 | | | | $8,778 | | | | | | | | $4,453 | | | | $4,043 | | | | $5,453 | | | | $13,949 | |
| | | | | | | | | | | | |
Securities with an aggregate market value of $0 ($ Thousands) have been pledged and $186,886 ($ Thousands) in cash has been pledged as collateral for exchange-traded and centrally cleared derivative instruments as of March 31, 2019.
The table below summarizes the collateral pledged by Fund:
| | | | | | | | | | | | |
| | | Securities at
Aggregate
Market Value
($ Thousands) | | | Cash
($ Thousands) | | | Total *
($ Thousands) | |
| | | |
Large Cap Fund | | $ | – | | | $ | 1,253 | | | $ | 1,253 | |
| | | |
Large Cap Value Fund | | | – | | | | 788 | | | | 788 | |
| | | |
Large Cap Growth Fund | | | – | | | | 474 | | | | 474 | |
| | | |
Large Cap Index Fund | | | – | | | | 265 | | | | 265 | |
| | | |
Tax-Managed Large Cap Fund | | | – | | | | 1,184 | | | | 1,184 | |
| | | |
Small Cap Value Fund | | | – | | | | 554 | | | | 554 | |
| | | |
U.S. Managed Volatility Fund | | | – | | | | 1,128 | | | | 1,128 | |
| | | |
Global Managed Volatility Fund | | | – | | | | 871 | | | | 871 | |
| | | |
Tax-Managed Managed Volatility Fund | | | – | | | | 414 | | | | 414 | |
| | | |
Tax-Managed International Managed Volatility Fund | | | – | | | | 465 | | | | 465 | |
| | | |
Core Fixed Income Fund | | | – | | | | 6,394 | | | | 6,394 | |
| | | |
High Yield Bond Fund | | | – | | | | 1,439 | | | | 1,439 | |
| | | |
Dynamic Asset Allocation Fund | | | – | | | | 11,223 | | | | 11,223 | |
| | | |
Multi-Strategy Alternative Fund | | | – | | | | 3,204 | | | | 3,204 | |
| | | | | | | | | | | | |
| | | Securities at
aggregate
Market Value
($ Thousands) | | | Cash
($ Thousands) | | | Total
($ Thousands) | |
| | | |
Multi-Asset Accumulation Fund | | $ | – | | | $ | 93,377 | | | $ | 93,377 | |
| | | |
Multi-Asset Income Fund | | | – | | | | 43,814 | | | | 43,814 | |
| | | |
Multi-Asset Inflation Managed Fund | | | – | | | | 7,594 | | | | 7,594 | |
| | | |
Multi-Asset Capital Stability Fund | | | – | | | | 11,445 | | | | 11,445 | |
| | | |
Long/Short Alternative Fund | | | – | | | | 1,000 | | | | 1,000 | |
| | | | |
| | | |
Total | | $ | – | | | $ | 186,886 | | | $ | 186,886 | |
| | | | |
International Swaps and Derivatives Association, Inc. Master Agreements and Credit Support Annexes (“ISDA Master Agreements”) govern OTC financial derivative transactions entered into by a Fund and select counterparties. ISDA Master Agreements maintain provisions for general obligations, representations, agreements, collateral and events of default or termination. Events of termination include conditions that may entitle counterparties to elect to terminate early and cause settlement of all outstanding transactions under the applicable ISDA Master Agreement. Any election to terminate early could be material to the financial statements. In limited circumstances, the ISDA Master Agreement may contain additional provisions that add additional counterparty protection beyond coverage of existing daily exposure if the counterparty has a decline in credit quality below a predefined level. These amounts, if any, may be segregated with a third party custodian.
The following is a summary by counterparty of the market value of OTC financial derivative instruments and collateral (received)/pledged as of March 31, 2019 ($ Thousands):
| | | | | | | | | | | | | | | | | | | | | | | | | | | | | | | | | | | | | | | | | | | | | | | | | | | | | | | | |
| | | Financial Derivative Assets | | | | | | Financial Derivative Liabilities | | | | | | | | | | | | | |
Global Managed Volatility Fund | | Forward
Foreign
Currency
Contracts | | | Purchased
Options
and
Swaptions | | | Swap
Agreements | | | Total
Over
the
Counter | | | | | | Forward
Foreign
Currency
Contracts | | | Written
Options
and
Swaptions | | | Swap
Agreements | | | Reverse
Repurchase
Agreements | | | Total
Over the
Counter | | | | | | Net Market
Value of
OTC
Derivatives | | | Collateral
(Received)
Pledged | | | Net
Exposures(1) | |
| | | | | | | | | | | | | | |
Brown Brothers Harriman | | | $ 1,163 | | | | $ — | | | | $ — | | | | $ 1,163 | | | | | | | $ | (637) | | | | $ — | | | | $ — | | | | $ — | | | $ | (637) | | | | | | | | $ 526 | | | | $ — | | | | $ 526 | |
| | | | | | | | | | | | | | | | | | | | | | | | | | | | |
| | | | | | | | | | | | | | |
Total Over the Counter | | | $ 1,163 | | | | $ — | | | | $ — | | | | $ 1,163 | | | | | | | $ | (637) | | | | $ — | | | | $ — | | | | $ — | | | $ | (637) | | | | | | | | | | | | | | | | | |
| | |
SEI Institutional Managed Trust / Semi-Annual Report / March 31, 2019 | | 309 |
Notes to Financial Statements/Consolidated Notes to Financial Statements (Unaudited) (Continued)
March 31, 2019
| | | | | | | | | | | | | | | | | | | | | | | | | | | | | | | | | | | | | | | | | | | | | | | | | | | | | | | | |
| | | Financial Derivative Assets | | | | | | Financial Derivative Liabilities | | | | | | | | | | | | | |
| Core Fixed Income Fund | | Forward
Foreign
Currency
Contracts | | | Purchased
Options
and
Swaptions | | | Swap
Agreements | | | Total Over
the Counter | | | | | | Forward
Foreign
Currency
Contracts | | | Written
Options
and
Swaptions | | | Swap
Agreements | | | Reverse
Repurchase
Agreements | | | Total Over the
Counter | | | | | | Net Market
Value of
OTC
Derivatives | | | Collateral
(Received)
Pledged | | | Net
Exposures(1) | |
| | | | | | | | | | | | | | |
| | | | | | | | | | | | | | | | | | | | | | | | | | | | | | | | | | | | | | | | | | | | | | | | | | | | | | | | |
| | | | | | | | | | | | | | |
Citigroup | | | $ 788 | | | | $ 37 | | | | $ 325 | | | | $ 1,150 | | | | | | | | $ (1,988) | | | | $ — | | | | $ — | | | | $ — | | | | $ (1,988) | | | | | | | | $ (838) | | | | $ — | | | | $ (838) | |
| | | | | | | | | | | | | | |
Deutsche Bank | | | 8 | | | | — | | | | — | | | | 8 | | | | | | | | (10) | | | | — | | | | — | | | | — | | | | (10) | | | | | | | | (2) | | | | — | | | | (2) | |
| | | | | | | | | | | | | | |
Goldman Sachs | | | 85 | | | | 34 | | | | — | | | | 119 | | | | | | | | (40) | | | | — | | | | — | | | | — | | | | (40) | | | | | | | | 79 | | | | — | | | | 79 | |
| | | | | | | | | | | | | | | | | | | | | | | | | | | | |
| | | | | | | | | | | | | | |
| | | | | | | | | | | | | | | | | | | | | | | | | | | | | | | | | | | | | | | | | | | | | | | | | | | | | | | | |
| | | | | | | | | | | | | | |
Total Over the Counter | | | $ 881 | | | | $ 71 | | | | $ 325 | | | | $ 1,277 | | | | | | | | $ (2,038) | | | | $ — | | | | $ — | | | | $ — | | | | $(2,038) | | | | | | | | | | | | | | | | | |
| | | | | | | |
| | | Financial Derivative Assets | | | | | | Financial Derivative Liabilities | | | | | | | | | | | | | |
| High Yield Bond Fund | | Forward
Foreign
Currency
Contracts | | | Purchased
Options
and
Swaptions | | | Swap
Agreements | | | Total Over
the Counter | | | | | | Forward
Foreign
Currency
Contracts | | | Written
Options
and
Swaptions | | | Swap
Agreements | | | Reverse
Repurchase
Agreements | | | Total Over the
Counter | | | | | | Net Market
Value of
OTC
Derivatives | | | Collateral
(Received)
Pledged | | | Net
Exposures(1) | |
| | | | | | | | | | | | | | |
Bank of America | | | $ — | | | | $ — | | | | $ — | | | | $ — | | | | | | | | $ — | | | | $ — | | | | $ (187) | | | | $ — | | | | $ (187) | | | | | | | | $ (187) | | | | $ — | | | | $ (187) | |
| | | | | | | | | | | | | | |
JPMorgan Chase Bank | | | — | | | | — | | | | — | | | | — | | | | | | | | — | | | | — | | | | (189) | | | | — | | | | (189) | | | | | | | | (189) | | | | — | | | | (189) | |
| | | | | | | | | | | | | | | | | | | | | | | | | | | | |
| | | | | | | | | | | | | | |
Total Over the Counter | | | $ — | | | | $ — | | | | $ — | | | | $ — | | | | | | | | $ — | | | | $ — | | | | $ (376) | | | | $ — | | | | $ (376) | | | | | | | | | | | | | | | | | |
| | | | | | | |
| | | Financial Derivative Assets | | | | | | Financial Derivative Liabilities | | | | | | | | | | | | | |
Dynamic Asset Allocation
Fund | | Forward
Foreign
Currency
Contracts | | | Purchased
Options
and
Swaptions | | | Swap
Agreements | | | Total Over
the Counter | | | | | | Forward
Foreign
Currency
Contracts | | | Written
Options
and
Swaptions | | | Swap
Agreements | | | Reverse
Repurchase
Agreements | | | Total Over the
Counter | | | | | | Net Market
Value of
OTC
Derivatives | | | Collateral
(Received)
Pledged | | | Net
Exposures(1) | |
| | | | | | | | | | | | | | |
Bank of America | | | $ — | | | | $ 2,720 | | | | $ — | | | | $ 2,720 | | | | | | | | $ (85) | | | | $ — | | | | $ — | | | | $ — | | | | $ (85) | | | | | | | | $ 2,635 | | | | $ — | | | | $ 2,635 | |
| | | | | | | | | | | | | | |
Bank of Montreal | | | — | | | | 155 | | | | — | | | | 155 | | | | | | | | — | | | | — | | | | — | | | | — | | | | — | | | | | | | | 155 | | | | — | | | | 155 | |
| | | | | | | | | | | | | | |
Barclays PLC | | | — | | | | — | | | | — | | | | — | | | | | | | | (2,497) | | | | — | | | | — | | | | — | | | | (2,497) | | | | | | | | (2,497) | | | | — | | | | (2,497) | |
| | | | | | | | | | | | | | |
BNP Paribas | | | 667 | | | | — | | | | 1,295 | | | | 1,962 | | | | | | | | — | | | | — | | | | — | | | | — | | | | — | | | | | | | | 1,962 | | | | — | | | | 1,962 | |
| | | | | | | | | | | | | | |
Goldman Sachs | | | — | | | | — | | | | — | | | | — | | | | | | | | (136) | | | | — | | | | — | | | | — | | | | (136) | | | | | | | | (136) | | | | — | | | | (136) | |
| | | | | | | | | | | | | | |
HSBC | | | — | | | | — | | | | 2,291 | | | | 2,291 | | | | | | | | — | | | | — | | | | (4,050) | | | | — | | | | (4,050) | | | | | | | | (1,759) | | | | — | | | | (1,759) | |
| | | | | | | | | | | | | | |
JPMorgan Chase Bank | | | 1,562 | | | | — | | | | — | | | | 1,562 | | | | | | | | — | | | | — | | | | — | | | | — | | | | — | | | | | | | | 1,562 | | | | — | | | | 1,562 | |
| | | | | | | | | | | | | | |
Morgan Stanley | | | — | | | | — | | | | — | | | | — | | | | | | | | — | | | | — | | | | (1,322) | | | | — | | | | (1,322) | | | | | | | | (1,322) | | | | — | | | | (1,322) | |
| | | | | | | | | | | | | | |
RBC | | | — | | | | — | | | | — | | | | — | | | | | | | | (9) | | | | — | | | | — | | | | — | | | | (9) | | | | | | | | (9) | | | | — | | | | (9) | |
| | | | | | | | | | | | | | | | | | | | | | | | | | | | |
| | | | | | | | | | | | | | |
| | | | | | | | | | | | | | | | | | | | | | | | | | | | | | | | | | | | | | | | | | | | | | | | | | | | | | | | |
| | | | | | | | | | | | | | |
Total Over the Counter | | | $ 2,229 | | | | $ 2,875 | | | | $ 3,586 | | | | $ 8,690 | | | | | | | | $ (2,727) | | | | $ — | | | | $ (5,372) | | | | $ — | | | | $(8,099) | | | | | | | | | | | | | | | | | |
| | | | | | | |
| | | Financial Derivative Assets | | | | | | Financial Derivative Liabilities | | | | | | | | | | | | | |
Multi-Strategy Alternative
Fund | | Forward
Foreign
Currency
Contracts | | | Purchased
Options
and
Swaptions | | | Swap
Agreements | | | Total Over
the Counter | | | | | | Forward
Foreign
Currency
Contracts | | | Written
Options
and
Swaptions | | | Swap
Agreements | | | Reverse
Repurchase
Agreements | | | Total Over the
Counter | | | | | | Net Market
Value of
OTC
Derivatives | | | Collateral
(Received)
Pledged | | | Net
Exposures(1) | |
| | | | | | | | | | | | | | |
Bank of America | | | $ — | | | | $ — | | | | $ — | | | | $ — | | | | | | | | $ — | | | | $ — | | | | $ (16) | | | | $ — | | | | $ (16) | | | | | | | | $ (16) | | | | $ — | | | | $ (16) | |
| | | | | | | | | | | | | | |
Barclays PLC | | | 144 | | | | — | | | | — | | | | 144 | | | | | | | | (192) | | | | — | | | | — | | | | — | | | | (192) | | | | | | | | (48) | | | | — | | | | (48) | |
| | | | | | | | | | | | | | |
Deutsche Bank | | | 25 | | | | — | | | | 531 | | | | 556 | | | | | | | | (45) | | | | — | | | | — | | | | — | | | | (45) | | | | | | | | 511 | | | | — | | | | 511 | |
| | | | | | | | | | | | | | |
JPMorgan Chase Bank | | | — | | | | — | | | | — | | | | — | | | | | | | | — | | | | — | | | | (32) | | | | — | | | | (32) | | | | | | | | (32) | | | | — | | | | (32) | |
| | | | | | | | | | | | | | |
Merrill Lynch | | | 2 | | | | — | | | | — | | | | 2 | | | | | | | | (3) | | | | — | | | | — | | | | — | | | | (3) | | | | | | | | (1) | | | | — | | | | (1) | |
| | | | | | | | | | | | | | |
Morgan Stanley | | | — | | | | — | | | | 15 | | | | 15 | | | | | | | | (10) | | | | — | | | | (261) | | | | — | | | | (271) | | | | | | | | (256) | | | | — | | | | (256) | |
| | | | | | | | | | | | | | | | | | | | | | | | | | | | |
| | | | | | | | | | | | | | |
Total Over the Counter | | | $ 171 | | | | $ — | | | | $ 546 | | | | $ 717 | | | | | | | | $ (250) | | | | $ — | | | | $ (309) | | | | $ — | | | | $ (559) | | | | | | | | | | | | | | | | | |
| | | | | | | |
| | | Financial Derivative Assets | | | | | | Financial Derivative Liabilities | | | | | | | | | | | | | |
Multi-Asset Accumulation
Fund | | Forward
Foreign
Currency
Contracts | | | Purchased
Options
and
Swaptions | | | Swap
Agreements | | | Total Over
the
Counter | | | | | | Forward
Foreign
Currency
Contracts | | | Written
Options
and
Swaptions | | | Swap
Agreements | | | Reverse
Repurchase
Agreements | | | Total
Over the
Counter | | | | | | Net Market
Value of
OTC
Derivatives | | | Collateral
(Received)
Pledged | | | Net
Exposures(1) | |
| | | | | | | | | | | | | | |
Bank of America | | | $ — | | | | $ — | | | | $ 1,288 | | | | $ 1,288 | | | | | | | | $ — | | | | $ — | | | | $ (139) | | | | $— | | | | $ (139) | | | | | | | | $ 1,149 | | | | $ — | | | | $ 1,149 | |
| | | | | | | | | | | | | | |
BNP Paribas | | | 6 | | | | — | | | | — | | | | 6 | | | | | | | | (13) | | | | — | | | | — | | | | — | | | | (13) | | | | | | | | (7) | | | | — | | | | (7) | |
| | | | | | | | | | | | | | |
Citigroup | | | 3,013 | | | | — | | | | 6 | | | | 3,019 | | | | | | | | (2,316) | | | | — | | | | (224) | | | | — | | | | (2,540) | | | | | | | | 479 | | | | — | | | | 479 | |
| | | | | | | | | | | | | | |
JPMorgan Chase Bank | | | 3,012 | | | | — | | | | 320 | | | | 3,332 | | | | | | | | (2,326) | | | | — | | | | — | | | | — | | | | (2,326) | | | | | | | | 1,006 | | | | 6,507 | | | | 7,513 | |
| | | | | | | | | | | | | | |
Merrill Lynch | | | — | | | | — | | | | 94 | | | | 94 | | | | | | | | — | | | | — | | | | (26) | | | | — | | | | (26) | | | | | | | | 68 | | | | — | | | | 68 | |
| | | | | | | | | | | | | | |
State Street | | | 2,322 | | | | — | | | | — | | | | 2,322 | | | | | | | | — | | | | — | | | | — | | | | — | | | | — | | | | | | | | 2,322 | | | | — | | | | 2,322 | |
| | | | | | | | | | | | | | | | | | | | | | | | | | | | |
| | |
310 | | SEI Institutional Managed Trust / Semi-Annual Report / March 31, 2019 |
| | | | | | | | | | | | | | | | | | | | | | | | | | | | | | | | | | | | | | | | | | | | | | | | | | | | | | | | |
| | | Financial Derivative Assets | | | | | | Financial Derivative Liabilities | | | | | | | | | | | | | |
Multi-
Asset
Accumulation
Fund | | Forward
Foreign
Currency
Contracts | | | Purchased
Options
and
Swaptions | | | Swap
Agreements | | | Total Over
the
Counter | | | | | | Forward
Foreign
Currency
Contracts | | | Written
Options
and
Swaptions | | | Swap
Agreements | | | Reverse
Repurchase
Agreements | | | Total Over the Counter | | | | | | Net Market
Value of
OTC
Derivatives | | | Collateral
(Received)
Pledged | | | Net
Exposures(1) | |
| | | | | | | | | | | | | | |
Total Over the Counter | | | $ 8,353 | | | | $ — | | | | $ 1,708 | | | | $ 10,061 | | | | | | | | $ (4,655) | | | | $ — | | | | $ (389) | | | | $ — | | | | $ (5,044) | | | | | | | | | | | | | | | | | |
| | | | | | | |
| | | Financial Derivative Assets | | | | | | Financial Derivative Liabilities | | | | | | | | | | | | | |
Multi-
Asset
Income
Fund | | Forward Foreign Currency
Contracts | | | Purchased Options and
Swaptions | | | Swap
Agreements | | | Total Over the
Counter | | | | | | Forward Foreign Currency
Contracts | | | Written Options and
Swaptions | | | Swap
Agreements | | | Reverse Repurchase
Agreements | | | Total Over the
Counter | | | | | | Net Market Value of OTC
Derivatives | | | Collateral (Received)
Pledged | | | Net
Exposures(1) | |
| | | | | | | | | | | | | | |
Barclays PLC | | | $ 274 | | | | $ — | | | | $ — | | | | $ 274 | | | | | | | | $ (38) | | | | $ — | | | | $ — | | | | $ — | | | | $ (38) | | | | | | | | $ 236 | | | | $ — | | | | $ 236 | |
| | | | | | | | | | | | | | |
Citigroup | | | 249 | | | | — | | | | — | | | | 249 | | | | | | | | (261) | | | | — | | | | — | | | | — | | | | (261) | | | | | | | | (12) | | | | — | | | | (12) | |
| | | | | | | | | | | | | | |
Goldman Sachs | | | 385 | | | | — | | | | — | | | | 385 | | | | | | | | — | | | | — | | | | — | | | | — | | | | — | | | | | | | | 386 | | | | — | | | | 386 | |
| | | | | | | | | | | | | | |
JPMorgan Chase Bank | | | 323 | | | | 65 | | | | — | | | | 388 | | | | | | | | (36) | | | | — | | | | — | | | | — | | | | (36) | | | | | | | | 351 | | | | — | | | | 351 | |
| | | | | | | | | | | | | | |
Standard Bank | | | — | | | | — | | | | — | | | | — | | | | | | | | (3) | | | | — | | | | — | | | | — | | | | (3) | | | | | | | | (3) | | | | — | | | | (3) | |
| | | | | | | | | | | | | | | | | | | | | | | | | | | | |
| | | | | | | | | | | | | | |
Total Over the Counter | | | $ 1,231 | | | | $ 65 | | | | $ — | | | | $ 1,296 | | | | | | | | $ (338) | | | | $ — | | | | $ — | | | | $ — | | | | $ (338) | | | | | | | | | | | | | | | | | |
| | | | | | | |
| | | Financial Derivative Assets | | | | | | Financial Derivative Liabilities | | | | | | | | | | | | | |
Multi-
Asset
Inflation
Managed
Fund | | Forward
Foreign
Currency
Contracts | | | Purchased
Options
and
Swaptions | | | Swap
Agreements | | | Total Over the
Counter | | | | | | Forward
Foreign
Currency
Contracts | | | Written
Options
and
Swaptions | | | Swap
Agreements | | | Reverse
Repurchase
Agreements | | | Total
Over the
Counter | | | | | | Net Market
Value of
OTC
Derivatives | | | Collateral
(Received)
Pledged | | | Net
Exposures(1) | |
| | | | | | | | | | | | | | |
ANZ | | | $ 3 | | | | $ — | | | | $ — | | | | $ 3 | | | | | | | | $ — | | | | $ — | | | | $ — | | | | $ — | | | | $ — | | | | | | | | $ 3 | | | | $ — | | | | $ 3 | |
| | | | | | | | | | | | | | |
BNP Paribas | | | 4 | | | | — | | | | — | | | | 4 | | | | | | | | — | | | | — | | | | — | | | | — | | | | — | | | | | | | | 4 | | | | — | | | | 4 | |
| | | | | | | | | | | | | | |
Brown Brothers Harriman | | | 11 | | | | — | | | | — | | | | 11 | | | | | | | | (10) | | | | — | | | | — | | | | — | | | | (10) | | | | | | | | 1 | | | | — | | | | 1 | |
| | | | | | | | | | | | | | |
CGG | | | — | | | | — | | | | 2 | | | | 2 | | | | | | | | — | | | | — | | | | — | | | | — | | | | — | | | | | | | | 2 | | | | — | | | | 2 | |
| | | | | | | | | | | | | | |
Chase Securities | | | — | | | | — | | | | — | | | | — | | | | | | | | — | | | | — | | | | — | | | | (200,337) | | | | (200,337) | | | | | | | | (200,337) | | | | — | | | | (200,337) | |
| | | | | | | | | | | | | | |
Citibank | | | — | | | | — | | | | 3 | | | | 3 | | | | | | | | — | | | | — | | | | (26) | | | | — | | | | (26) | | | | | | | | (23) | | | | — | | | | (23) | |
| | | | | | | | | | | | | | |
Citigroup | | | 21 | | | | — | | | | 9 | | | | 30 | | | | | | | | (3) | | | | — | | | | (154) | | | | — | | | | (157) | | | | | | | | (127) | | | | — | | | | (127) | |
| | | | | | | | | | | | | | |
Credit Suisse | | | 6 | | | | — | | | | 2 | | | | 8 | | | | | | | | — | | | | — | | | | (121) | | | | — | | | | (121) | | | | | | | | (113) | | | | — | | | | (113) | |
| | | | | | | | | | | | | | |
Deutsche Bank | | | 28 | | | | — | | | | 1 | | | | 29 | | | | | | | | (11) | | | | — | | | | (205) | | | | — | | | | (216) | | | | | | | | (187) | | | | — | | | | (187) | |
| | | | | | | | | | | | | | |
Goldman Sachs | | | — | | | | — | | | | 27 | | | | 27 | | | | | | | | — | | | | — | | | | (274) | | | | (42,922) | | | | (43,196) | | | | | | | | (43,169) | | | | — | | | | (43,169) | |
| | | | | | | | | | | | | | |
HSBC | | | — | | | | — | | | | — | | | | — | | | | | | | | (12) | | | | — | | | | — | | | | — | | | | (12) | | | | | | | | (12) | | | | — | | | | (12) | |
| | | | | | | | | | | | | | |
JPMorgan Chase Bank | | | 2 | | | | — | | | | — | | | | 2 | | | | | | | | (75) | | | | — | | | | (1) | | | | — | | | | (76) | | | | | | | | (74) | | | | — | | | | (74) | |
| | | | | | | | | | | | | | |
Macquarie Bank Limited | | | — | | | | — | | | | 35 | | | | 35 | | | | | | | | — | | | | — | | | | (224) | | | | — | | | | (224) | | | | | | | | (189) | | | | — | | | | (189) | |
| | | | | | | | | | | | | | |
Merrill Lynch | | | — | | | | — | | | | — | | | | — | | | | | | | | — | | | | — | | | | (234) | | | | — | | | | (234) | | | | | | | | (234) | | | | — | | | | (234) | |
| | | | | | | | | | | | | | |
Morgan Stanley | | | 12 | | | | — | | | | — | | | | 12 | | | | | | | | — | | | | — | | | | — | | | | — | | | | — | | | | | | | | 12 | | | | — | | | | 12 | |
| | | | | | | | | | | | | | |
RBS | | | 14 | | | | — | | | | — | | | | 14 | | | | | | | | (22) | | | | — | | | | — | | | | — | | | | (22) | | | | | | | | (8) | | | | — | | | | (8) | |
| | | | | | | | | | | | | | |
Societe Generale | | | — | | | | — | | | | 13 | | | | 13 | | | | | | | | — | | | | — | | | | (150) | | | | — | | | | (150) | | | | | | | | (137) | | | | — | | | | (137) | |
| | | | | | | | | | | | | | |
Standard Bank | | | 6 | | | | — | | | | — | | | | 6 | | | | | | | | (46) | | | | — | | | | — | | | | — | | | | (46) | | | | | | | | (40) | | | | — | | | | (40) | |
| | | | | | | | | | | | | | |
UBS | | | 42 | | | | — | | | | — | | | | 42 | | | | | | | | (1) | | | | — | | | | — | | | | — | | | | (1) | | | | | | | | 41 | | | | — | | | | 41 | |
| | | | | | | | | | | | | | | | | | | | | | | | | | | | |
| | | | | | | | | | | | | | |
| | | | | | | | | | | | | | | | | | | | | | | | | | | | | | | | | | | | | | | $ | | | | | | | | | | | | | | | | | |
| | | | | | | | | | | | | | |
Total Over the Counter | | | $ 149 | | | | $ — | | | | $ 92 | | | | $ 241 | | | | | | | | $ (180) | | | | $ — | | | | $ (1,389) | | | | $ (243,259) | | | | (244,828) | | | | | | | | | | | | | | | | | |
| | |
SEI Institutional Managed Trust / Semi-Annual Report / March 31, 2019 | | 311 |
Notes to Financial Statements/Consolidated Notes to Financial Statements (Unaudited) (Continued)
March 31, 2019
| | | | | | | | | | | | | | | | | | | | | | | | | | | | | | | | | | | | | | | | | | | | | | | | | | | | | | | | |
| | | Financial Derivative Assets | | | | | | Financial Derivative Liabilities | | | | | | | | | | | | | |
Multi-Asset Capital
Stability Fund | | Forward
Foreign
Currency
Contracts | | | Purchased
Options
and
Swaptions | | | Swap
Agreements | | | Total Over
the
Counter | | | | | | Forward
Foreign
Currency
Contracts | | | Written
Options
and
Swaptions | | | Swap
Agreements | | | Reverse
Repurchase
Agreements | | | Total
Over the
Counter | | | | | | Net Market
Value of
OTC
Derivatives | | | Collateral
(Received)
Pledged | | | Net
Exposures(1) | |
| | | | | | | | | | | | | | |
ANZ | | | $ — | | | | $ — | | | | $ — | | | | $ — | | | | | | | $ | (11) | | | $ | — | | | $ | — | | | $ | — | | | $ | (11) | | | | | | | $ | (11) | | | $ | — | | | $ | (11) | |
| | | | | | | | | | | | | | |
Bank of America | | | — | | | | — | | | | — | | | | — | | | | | | | | (1) | | | | (82) | | | | — | | | | — | | | | (83) | | | | | | | | (83) | | | | — | | | | (83) | |
| | | | | | | | | | | | | | |
Barclays PLC | | | 31 | | | | — | | | | — | | | | 31 | | | | | | | | (74) | | | | — | | | | — | | | | — | | | | (74) | | | | | | | | (43) | | | | — | | | | (43) | |
| | | | | | | | | | | | | | |
BNP Paribas | | | 25 | | | | — | | | | — | | | | 25 | | | | | | | | (23) | | | | — | | | | — | | | | — | | | | (23) | | | | | | | | 2 | | | | — | | | | 2 | |
| | | | | | | | | | | | | | |
Brown Brothers Harriman | | | 67 | | | | — | | | | — | | | | 67 | | | | | | | | (64) | | | | — | | | | — | | | | — | | | | (64) | | | | | | | | 3 | | | | — | | | | 3 | |
| | | | | | | | | | | | | | |
Citigroup | | | 24 | | | | — | | | | — | | | | 24 | | | | | | | | (266) | | | | — | | | | — | | | | — | | | | (266) | | | | | | | | (242) | | | | — | | | | (242) | |
| | | | | | | | | | | | | | |
Credit Suisse | | | 19 | | | | — | | | | — | | | | 19 | | | | | | | | — | | | | — | | | | — | | | | — | | | | — | | | | | | | | 19 | | | | — | | | | 19 | |
| | | | | | | | | | | | | | |
Deutsche Bank | | | 4 | | | | — | | | | — | | | | 4 | | | | | | | | — | | | | — | | | | — | | | | — | | | | — | | | | | | | | 4 | | | | — | | | | 4 | |
| | | | | | | | | | | | | | |
Goldman Sachs | | | 1,019 | | | | — | | | | — | | | | 1,019 | | | | | | | | (22) | | | | — | | | | — | | | | — | | | | (22) | | | | | | | | (997) | | | | — | | | | (997) | |
| | | | | | | | | | | | | | |
JPMorgan Chase Bank | | | 9 | | | | — | | | | — | | | | 9 | | | | | | | | (68) | | | | (246) | | | | — | | | | — | | | | (314) | | | | | | | | (305) | | | | — | | | | (305) | |
| | | | | | | | | | | | | | |
Morgan Stanley | | | 24 | | | | — | | | | — | | | | 24 | | | | | | | | (95) | | | | (1) | | | | — | | | | — | | | | (96) | | | | | | | | (72) | | | | — | | | | (72) | |
| | | | | | | | | | | | | | |
RBS | | | 8 | | | | — | | | | — | | | | 8 | | | | | | | | (10) | | | | — | | | | — | | | | — | | | | (10) | | | | | | | | (2) | | | | — | | | | (2) | |
| | | | | | | | | | | | | | |
Standard Bank | | | 27 | | | | — | | | | — | | | | 27 | | | | | | | | (55) | | | | — | | | | — | | | | — | | | | (55) | | | | | | | | (28) | | | | — | | | | (28) | |
| | | | | | | | | | | | | | |
UBS | | | 6 | | | | — | | | | — | | | | 6 | | | | | | | | — | | | | — | | | | — | | | | — | | | | — | | | | | | | | 6 | | | | — | | | | 6 | |
| | | | | | | | | | | | | | | | | | | | | | | | | | | | |
| | | | | | | | | | | | | | |
Total Over the Counter | | | $ 1,263 | | | | $ — | | | | $ — | | | $ | 1,263 | | | | | | | $ | (689) | | | $ | (329) | | | | $ — | | | | $ — | | | $ | (1,018) | | | | | | | | | | | | | | | | | |
| (1) | Net Exposures represents the net receivable/(payable) that would be due from /to the counterparty in the event of default. Exposure from OTC financial derivative instruments can only be netted across transactions governed under the same master agreement with the same legal entity. |
Securities with an aggregate market value of $154 ($ Thousands) have been pledged as collateral for financial derivative instruments as governed by International Swaps and Derivatives Association, Inc. master agreements as of March 31, 2019.
5. BASIS FOR CONSOLIDATION FOR THE MULTI-ASSET ACCUMULATION FUND AND MULTI-ASSET INFLATION MANAGED FUND
The Consolidated Schedules of Investments, Consolidated Statements of Assets and Liabilities, Consolidated Statements of Operations, Consolidated Statements of Changes in Net Assets, Consolidated Statement of Cash Flows, and the Consolidated Financial Highlights of the Multi-Asset Accumulation Fund and Multi-Asset Inflation Managed Fund include the accounts of their respective Subsidiaries. All intercompany accounts and transactions have been eliminated in consolidation for the Funds. Each of the
Subsidiaries has a fiscal year end of September 30th for financial statement consolidation purposes and a nonconforming tax year end of August 31.
The Subsidiaries are classified as controlled foreign corporations under the Internal Revenue Code of 1986 (“IRC”). Each Subsidiary’s taxable income is included in the calculation of the relevant Fund’s taxable income. Net losses of the Subsidiaries are not deductible by the Funds either in the current period or carried forward to future periods.
The Multi-Asset Accumulation Fund and Multi-Asset Inflation Managed Fund may each invest up to 25% of their total assets in its respective Subsidiary.
A summary of the Funds’ investments in the Subsidiaries are as follows:
| | | | | | | | | | | | | | | | |
| | | Inception Date of Subsidiary | | | | | Subsidiary Net Assets at
March 31, 2019
($ Thousands) | | | | | % of Total Net Assets at
March 31, 2019 | |
Dynamic Commodity Strategy Subsidiary, Ltd. | | | March 28, 2018 | | | | | | $ 35,160 | | | | | | 4.4 | % |
Accumulation Commodity Strategy Subsidiary, Ltd. | | | April 9, 2012 | | | | | | 459,870 | | | | | | 16.4 | % |
Inflation Commodity Strategy Subsidiary Ltd. | | | April 9, 2012 | | | | | | 161,223 | | | | | | 18.1 | % |
| | |
312 | | SEI Institutional Managed Trust / Semi-Annual Report / March 31, 2019 |
Gains and losses attributed to the Funds’ investments in Subsidiaries are as follows:
| | | | | | | | | | | | |
| | | Dynamic
Commodity
Strategy
Subsidiary, Ltd.
($Thousands) | | | Accumulation
Commodity
Strategy, Ltd.
($Thousands) | | | Inflation
Commodity
Strategy
Subsidiary, Ltd.
($Thousands) | |
Investment Income: | | | | | | | | | | | | |
Investment Income | | $ | 194 | | | $ | 4,626 | | | $ | 1,949 | |
Net Realized Gain (Loss) on: | | | | | | | | | | | | |
Investments | | | (523) | | | | (782) | | | | (77) | |
Futures Contracts | | | — | | | | (53,637) | | | | (12,460) | |
Swap Contracts | | | (4,266) | | | | 9,802 | | | | (2,201) | |
Options | | | — | | | | — | | | | (442) | |
Net Change in Unrealized Appreciation (Depreciation) on: | | | | | | | | | | | | |
Investments | | | (520) | | | | 2,764 | | | | 48 | |
Futures Contracts | | | — | | | | (501) | | | | 3,383 | |
Swap Contracts | | | 453 | | | | (163) | | | | (615) | |
Options | | | — | | | | — | | | | (85) | |
Foreign Currency and Translation of Other Assets and Liabilities Denominated in Foreign Currency | | | — | | | | — | | | | — | |
| | | | | | | | | | | | |
Total gains and losses attributed to the Funds’ investment in Subsidiaries | | $ | (4,662) | | | $ | (37,891) | | | $ | (10,500) | |
| | | | | | | | | | | | |
6. INVESTMENT ADVISORY, ADMINISTRATION AND DISTRIBUTION AGREEMENTS, INVESTMENT SUBADVISORY AGREEMENTS AND OTHER TRANSACTIONS WITH AFFILIATES
Investment Advisory, Administration and Distribution Agreements— SIMC serves as investment adviser (the “Adviser”) to each Fund. In connection with serving as Adviser, SIMC is entitled to a fee, which is calculated daily and paid monthly, based on the average daily net assets of each Fund.
SEI Investments Global Funds Services (the “Administrator”) provides administrative and transfer agency services to the Funds for annual fees, based on the average daily net assets of each Fund.
SEI Investments Distribution Co. (“ the Distributor”) is the Distributor of the shares of the Funds. The Funds have adopted a shareholder services plan and agreement (the “Service Plan”) with respect to Class F and Class I Shares that allows such shares to pay service providers a fee, based on average daily net assets of each respective Class of Shares, in connection with the ongoing servicing of shareholder accounts owning such shares. The Funds have also adopted an administrative services
plan and agreement (the “Administrative Service Plan”) with respect to Class I Shares that allows such Shares to pay service providers a fee, based on average daily net assets of the Class I Shares, in connection with ongoing administrative services for shareholder accounts owning such Shares.
The Service Plan and Administrative Service Plan provide that shareholder service fees and administrative service fees, respectively, on Class F and Class I Shares will be paid to the Distributor, which may then be used by the Distributor to compensate financial intermediaries for providing shareholder services and administrative services, as applicable, with respect to the Shares.
The Adviser, Administrator and/or Distributor have voluntarily agreed to waive a portion of their fees in order to keep total direct operating expenses (exclusive of interest from borrowings, brokerage commissions, taxes, Trustee fees, proxy fees, prime broker fees, interest and dividend expenses related to short sales and extraordinary expenses not incurred in the ordinary course of the Funds’ business) at a specified level. The voluntary waivers by the Funds’ Adviser, Administrator and/or Distributor are limited to the Funds’ direct operating expenses and, therefore, do not apply to indirect expenses incurred by the Funds, such as acquired fund fees and expenses. The waivers are voluntarily and the Funds’ Adviser, Administrator and/or Distributor may discontinue all or part of any of these waivers at any time. In addition, some Funds may participate in a commission recapture program where the Funds’ trades may be executed through the Funds’ distributor, and a portion of the commissions paid on those trades are then used to pay the Funds’ expenses.
| | |
SEI Institutional Managed Trust / Semi-Annual Report / March 31, 2019 | | 313 |
Notes to Financial Statements/Consolidated Notes to Financial Statements (Unaudited) (Continued)
March 31, 2019
The following is a summary of annual fees payable to the Adviser and Distributor and the contractual and voluntary expense limitations for each fund:
| | | | | | | | | | | | | | | | |
| | | Advisory
Fees | | | Shareholder
Servicing
Fee | | | Administrative
Servicing
Fee | | | Voluntary
Expense
Limitation | |
Large Cap Fund | | | | | | | | | | | | | | | | |
Class F | | | 0.3900% | | | | 0.25% | | | | – | | | | 0.89% | |
Class Y | | | 0.3900% | | | | – | | | | – | | | | 0.64% | |
Large Cap Value Fund | | | | | | | | | | | | | | | | |
Class F | | | 0.3500% | | | | 0.25% | | | | – | | | | 0.89% | |
Class I | | | 0.3500% | | | | 0.25% | | | | 0.25% | | | | 1.11% | |
Class Y | | | 0.3500% | | | | – | | | | – | | | | 0.64% | |
Large Cap Growth Fund | | | | | | | | | | | | | | | | |
Class F | | | 0.4000% | | | | 0.25% | | | | – | | | | 0.89% | |
Class I | | | 0.4000% | | | | 0.25% | | | | 0.25% | | | | 1.11% | |
Class Y | | | 0.4000% | | | | – | | | | – | | | | 0.64% | |
Large Cap Index Fund | | | | | | | | | | | | | | | | |
Class F | | | 0.0500% | | | | 0.25% | | | | – | | | | 0.25% | |
Tax-Managed Large Cap Fund | | | | | | | | | | | | | | | | |
Class F | | | 0.4000% | | | | 0.25% | | | | – | | | | 0.89% | |
Class Y | | | 0.4000% | | | | – | | | | – | | | | 0.64% | |
S&P 500 Index Fund | | | | | | | | | | | | | | | | |
Class I | | | 0.0300% | | | | 0.25% | | | | 0.25% | | | | 0.65% | |
Small Cap Fund | | | | | | | | | | | | | | | | |
Class F | | | 0.6500% | | | | 0.25% | | | | – | | | | 1.14% | |
Class Y | | | 0.6500% | | | | – | | | | – | | | | 0.89% | |
Small Cap Value Fund | | | | | | | | | | | | | | | | |
Class F | | | 0.6500% | | | | 0.25% | | | | – | | | | 1.14% | |
Class I | | | 0.6500% | | | | 0.25% | | | | 0.25% | | | | 1.36% | |
Class Y | | | 0.6500% | | | | – | | | | – | | | | 0.89% | |
Small Cap Growth Fund | | | | | | | | | | | | | | | | |
Class F | | | 0.6500% | | | | 0.25% | | | | – | | | | 1.11% | |
Class I | | | 0.6500% | | | | 0.25% | | | | 0.25% | | | | 1.36% | |
Class Y | | | 0.6500% | | | | – | | | | – | | | | 0.86% | |
Tax-Managed Small/Mid Cap Fund | | | | | | | | | | | | | | | | |
Class F | | | 0.6500% | | | | 0.25% | | | | – | | | | 1.11% | |
Class Y | | | 0.6500% | | | | – | | | | – | | | | 0.89% | |
Mid-Cap Fund | | | | | | | | | | | | | | | | |
Class F | | | 0.4000% | | | | 0.25% | | | | – | | | | 0.98% | |
Class I | | | 0.4000% | | | | 0.25% | | | | 0.25% | | | | 1.20% | |
Class Y | | | 0.4000% | | | | – | | | | – | | | | 0.73% | |
U.S. Managed Volatility Fund | | | | | | | | | | | | | | | | |
Class F | | | 0.6500% | | | | 0.25% | | | | – | | | | 0.95% | |
Class I | | | 0.6500% | | | | 0.25% | | | | 0.25% | | | | 1.20% | |
Class Y | | | 0.6500% | | | | – | | | | – | | | | 0.70% | |
Global Managed Volatility Fund | | | | | | | | | | | | | | | | |
Class F | | | 0.6500% | | | | 0.25% | | | | – | | | | 1.11% | |
Class I | | | 0.6500% | | | | 0.25% | | | | 0.25% | | | | 1.36% | |
Class Y | | | 0.6500% | | | | – | | | | – | | | | 0.86% | |
Tax-Managed Managed Volatility Fund | | | | | | | | | | | | | | | | |
Class F | | | 0.6500% | | | | 0.25% | | | | – | | | | 1.00% | |
Class Y | | | 0.6500% | | | | – | | | | – | | | | 0.75% | |
Tax-Managed International Managed Volatility Fund | | | | | | | | | | | | | | | | |
Class F | | | 0.6500% | | | | 0.25% | | | | – | | | | 1.11% | |
Class Y | | | 0.6500% | | | | – | | | | – | | | | 0.86% | |
Real Estate Fund | | | | | | | | | | | | | | | | |
Class F | | | 0.6500% | | | | 0.25% | | | | – | | | | 1.14% | |
Class I | | | 0.6500% | | | | 0.25% | | | | 0.25% | | | | 1.36% | |
Class Y | | | 0.6500% | | | | – | | | | – | | | | 0.89% | |
| | |
314 | | SEI Institutional Managed Trust / Semi-Annual Report / March 31, 2019 |
| | | | | | | | | | | | | | | | |
| | | Advisory
Fees | | | Shareholder
Servicing
Fee | | | Administrative
Servicing
Fee | | | Voluntary
Expense
Limitation | |
Enhanced Income Fund | | | | | | | | | | | | | | | | |
Class F | | | 0.4000% | | | | 0.25% | | | | — | | | | 0.60% | |
Class I | | | 0.4000% | | | | 0.25% | | | | 0.25% | | | | 0.85% | |
Class Y | | | 0.4000% | | | | — | | | | — | | | | 0.46% | |
Core Fixed Income Fund | | | | | | | | | | | | | | | | |
Class F | | | 0.2750% | | | | 0.25% | | | | — | | | | 0.66% | |
Class I | | | 0.2750% | | | | 0.25% | | | | 0.25% | | | | 0.88% | |
Class Y | | | 0.2750% | | | | — | | | | — | | | | 0.41% | |
High Yield Bond Fund | | | | | | | | | | | | | | | | |
Class F | | | 0.4875% | | | | 0.25% | | | | — | | | | 0.89% | |
Class I | | | 0.4875% | | | | 0.25% | | | | 0.25% | | | | 1.11% | |
Class Y | | | 0.4875% | | | | — | | | | — | | | | 0.64% | |
Conservative Income Fund | | | | | | | | | | | | | | | | |
Class F | | | 0.1000% | | | | 0.25% | | | | — | | | | 0.30% | |
Class Y | | | 0.1000% | | | | — | | | | — | | | | 0.20% | |
Tax-Free Conservative Income Fund | | | | | | | | | | | | | | | | |
Class F | | | 0.1000% | | | | 0.25% | | | | — | | | | 0.30% | |
Class Y | | | 0.1000% | | | | — | | | | — | | | | 0.20% | |
Real Return Fund | | | | | | | | | | | | | | | | |
Class F | | | 0.2200% | | | | 0.25% | | | | — | | | | 0.45% | |
Class Y | | | 0.2200% | | | | — | | | | — | | | | 0.35% | |
Dynamic Asset Allocation Fund | | | | | | | | | | | | | | | | |
Class F | | | 0.6000% | | | | 0.25% | | | | — | | | | 0.75% | |
Class Y | | | 0.6000% | | | | — | | | | — | | | | 0.50% | |
Multi-Strategy Alternative Fund | | | | | | | | | | | | | | | | |
Class F | | | 1.5000% | | | | 0.25% | | | | — | | | | 1.09% | |
Class Y | | | 1.5000% | | | | — | | | | — | | | | 0.84% | |
Multi-Asset Accumulation Fund | | | | | | | | | | | | | | | | |
Class F | | | 0.7500% | | | | 0.25% | | | | — | | | | 1.17% | |
Class Y | | | 0.7500% | | | | — | | | | — | | | | 0.92% | |
Multi-Asset Income Fund | | | | | | | | | | | | | | | | |
Class F | | | 0.6000% | | | | 0.25% | | | | — | | | | 0.80% | |
Class Y | | | 0.6000% | | | | — | | | | — | | | | 0.70% | |
Multi-Asset Inflation Managed Fund | | | | | | | | | | | | | | | | |
Class F | | | 0.5500% | | | | 0.25% | | | | — | | | | 0.90% | |
Class Y | | | 0.5500% | | | | — | | | | — | | | | 0.65% | |
Multi-Asset Capital Stability Fund | | | | | | | | | | | | | | | | |
Class F | | | 0.4000% | | | | 0.25% | | | | — | | | | 0.62% | |
Class Y | | | 0.4000% | | | | — | | | | — | | | | 0.52% | |
Long/Short Alternative Fund | | | | | | | | | | | | | | | | |
Class F | | | 0.8000% | | | | 0.25% | | | | — | | | | 1.15% | |
Class Y | | | 0.8000% | | | | — | | | | — | | | | 0.90% | |
The following is a summary of annual fees payable to the Administrator:
| | | | | | | | | | | | | | | | | | | | |
| | | First $1.5 Billion | | | Next $500 Million | | | Next $500 Million | | | Next $500 Million | | | Over $3 Billion | |
Large Cap Fund | | | 0.300 | % | | | 0.2550 | % | | | 0.2100 | % | | | 0.1650 | % | | | 0.120% | |
Large Cap Value Fund | | | 0.300 | % | | | 0.2550 | % | | | 0.2100 | % | | | 0.1650 | % | | | 0.120% | |
Large Cap Growth Fund | | | 0.300 | % | | | 0.2550 | % | | | 0.2100 | % | | | 0.1650 | % | | | 0.120% | |
Large Cap Index Fund | | | 0.300 | % | | | 0.2550 | % | | | 0.2100 | % | | | 0.1650 | % | | | 0.120% | |
Tax-Managed Large Cap Fund | | | 0.300 | % | | | 0.2550 | % | | | 0.2100 | % | | | 0.1650 | % | | | 0.120% | |
Small Cap Fund | | | 0.300 | % | | | 0.2550 | % | | | 0.2100 | % | | | 0.1650 | % | | | 0.120% | |
Small Cap Value Fund | | | 0.300 | % | | | 0.2550 | % | | | 0.2100 | % | | | 0.1650 | % | | | 0.120% | |
Small Cap Growth Fund | | | 0.300 | % | | | 0.2550 | % | | | 0.2100 | % | | | 0.1650 | % | | | 0.120% | |
Tax-Managed Small/Mid Cap Fund | | | 0.300 | % | | | 0.2550 | % | | | 0.2100 | % | | | 0.1650 | % | | | 0.120% | |
Mid-Cap Fund | | | 0.300 | % | | | 0.2550 | % | | | 0.2100 | % | | | 0.1650 | % | | | 0.120% | |
U.S. Managed Volatility Fund | | | 0.300 | % | | | 0.2550 | % | | | 0.2100 | % | | | 0.1650 | % | | | 0.120% | |
Global Managed Volatility Fund | | | 0.300 | % | | | 0.2550 | % | | | 0.2100 | % | | | 0.1650 | % | | | 0.120% | |
Tax-Managed Managed Volatility Fund | | | 0.300 | % | | | 0.2550 | % | | | 0.2100 | % | | | 0.1650 | % | | | 0.120% | |
Tax-Managed International Managed Volatility Fund | | | 0.450 | % | | | 0.3700 | % | | | 0.2900 | % | | | 0.2100 | % | | | 0.130% | |
| | |
SEI Institutional Managed Trust / Semi-Annual Report / March 31, 2019 | | 315 |
Notes to Financial Statements/Consolidated Notes to Financial Statements (Unaudited) (Continued)
March 31, 2019
| | | | | | | | | | | | | | | | | | | | |
| | | First $1.5 Billion | | | Next $500 Million | | | Next $500 Million | | | Next $500 Million | | | Over $3 Billion | |
Real Estate Fund | | | 0.300 | % | | | 0.2550 | % | | | 0.2100 | % | | | 0.1650 | % | | | 0.120 | % |
Enhanced Income Fund | | | 0.200 | % | | | 0.1775 | % | | | 0.1550 | % | | | 0.1325 | % | | | 0.110 | % |
Core Fixed Income Fund | | | 0.200 | % | | | 0.1775 | % | | | 0.1550 | % | | | 0.1325 | % | | | 0.110 | % |
High Yield Bond Fund | | | 0.200 | % | | | 0.1775 | % | | | 0.1550 | % | | | 0.1325 | % | | | 0.110 | % |
Conservative Income Fund | | | 0.200 | % | | | 0.1775 | % | | | 0.1550 | % | | | 0.1325 | % | | | 0.110 | % |
Tax-Free Conservative Income Fund | | | 0.200 | % | | | 0.1775 | % | | | 0.1550 | % | | | 0.1325 | % | | | 0.110 | % |
Real Return Fund | | | 0.200 | % | | | 0.1775 | % | | | 0.1550 | % | | | 0.1325 | % | | | 0.110 | % |
Dynamic Asset Allocation Fund | | | 0.300 | % | | | 0.2550 | % | | | 0.2100 | % | | | 0.1650 | % | | | 0.120 | % |
Multi-Strategy Alternative Fund | | | 0.300 | % | | | 0.2550 | % | | | 0.2100 | % | | | 0.1650 | % | | | 0.120 | % |
Multi-Asset Accumulation Fund | | | 0.300 | % | | | 0.2550 | % | | | 0.2100 | % | | | 0.1650 | % | | | 0.120 | % |
Multi-Asset Income Fund | | | 0.300 | % | | | 0.2550 | % | | | 0.2100 | % | | | 0.1650 | % | | | 0.120 | % |
Multi-Asset Inflation Managed Fund | | | 0.300 | % | | | 0.2550 | % | | | 0.2100 | % | | | 0.1650 | % | | | 0.120 | % |
Multi-Asset Capital Stability Fund | | | 0.300 | % | | | 0.2550 | % | | | 0.2100 | % | | | 0.1650 | % | | | 0.120 | % |
Long/Short Alternative Fund | | | 0.300 | % | | | 0.2550 | % | | | 0.2100 | % | | | 0.1650 | % | | | 0.120 | % |
| | | | | |
| | | First $2 Billion | | | Next $500 Million | | | Next $500 Million | | | Over $3 Billion | | | | |
S&P 500 Index Fund | | | 0.220 | % | | | 0.2100 | % | | | 0.1650 | % | | | 0.120 | % |
As of March 31, 2019, SIMC has entered into investmentsub-advisory agreements with the following affiliated and unaffiliated parties:
Large Cap Fund
Brandywine Global Investment Management, LLC
Ceredex Value Advisors, LLC
Coho Partners, Ltd.
Fred Alger Management, Inc.
LSV Asset Management*
MarVista Investment Partners, LLC
Parametric Portfolio Associates LLC
Large Cap Value Fund
AQR Capital Management, LLC
Brandywine Global Investment Management, LLC
LSV Asset Management*
Parametric Portfolio Associates LLC
Shafer Cullen Capital Management Inc.
Large Cap Growth Fund
Fiera Capital Inc.
Fred Alger Management, Inc.
McKinley Capital Management, LLC
Parametric Portfolio Associates LLC
Large Cap Index Fund
SSGA Funds Management, Inc.
Tax-Managed Large Cap Fund
Brandywine Global Investment Management, LLC
Coho Partners, Ltd.
Fiera Capital Inc.
LSV Asset Management*
MarVista Investment Partners, LLC
Parametric Portfolio Associates LLC
Shafer Cullen Capital Management
S&P 500 Index Fund
SSGA Funds Management, Inc.
Small Cap Fund
Copeland Capital Management, LLC
EAM Investors, LLC
Falcon Point Capital, LLC
LMCG Investments, LLC
Parametric Portfolio Associates LLC
Rice Hall James & Associates
Snow Capital Management L.P.
Small Cap Value Fund
Cardinal Capital Management, L.L.C.
LSV Asset Management*
Parametric Portfolio Associates LLC
Snow Capital Management, L.P.
Small Cap Growth Fund
361 Capital, LLC
ArrowMark Colorado Holding LLC
EAM Investors LLC
FalconPoint Capital, LLC
Parametric Portfolio Associates LLC
Tax-Managed Small/Mid Cap Fund
Cardinal Capital Management, L.L.C.
Hillsdale Investment Management Inc.
Martingale Asset Management, LLC
Parametric Portfolio Associates LLC
Rice Hall James & Associates LLC
Snow Capital Management L.P.
Mid-Cap Fund
Quantitative Management Associates LLC
U.S. Managed Volatility Fund
LSV Asset Management*
Wells Capital Management, Inc.
Global Managed Volatility Fund
Acadian Asset Management LLC
Wells Capital Management, Inc.
Tax-Managed Managed Volatility Fund
LSV Asset Management*
Parametric Portfolio Associates LLC
Wells Capital Management, Inc.
Tax-Managed International Managed Volatility Fund
Acadian Asset Management LLC
| | |
316 | | SEI Institutional Managed Trust / Semi-Annual Report / March 31, 2019 |
LSV Asset Management*
Parametric Portfolio Associates LLC
Wells Capital Management, Inc.
Real Estate Fund
CenterSquare Investment Management LLC
Enhanced Income Fund
Ares Management LLC
Wellington Management Company, LLP
Core Fixed Income Fund
Jennison Associates LLC
Logan Circle Partners, LP
Metropolitan West Asset Management, LLC
Wells Capital Management Incorporated
Western Asset Management Company
Western Asset Management Company Limited
High Yield Bond Fund
Ares Management LLC
Benefit Street Partners, LLC
Brigade Capital Management, LLC
J.P. Morgan Investment Management, Inc.
T. Rowe Price Associates, Inc.
Conservative Income Fund
BlackRock Advisors, LLC
Tax-Free Conservative Income Fund
BlackRock Advisors, LLC
Dynamic Asset Allocation Fund
SSGA Funds Management, Inc.
Multi-Strategy Alternative Fund
Brigade Capital Management, LLC
Caerus Investors LLC
Emso Partners Limited Management, LLC
Kettle Hill Capital Management LLC
Mountaineer Partners Management, LLC
Ramius Advisors, LLC
Multi-Asset Accumulation Fund
AQR Capital Management, LLC
PanAgora Asset Management Inc.
Multi-Asset Income Fund
Goldman Sachs Asset Management, LP
SSGA Funds Management Inc.
Western Asset Management Company
Western Asset Management Company Limited
Multi-Asset Inflation Managed Fund
AllianceBernstein, L.P.
Columbia Management Investments
Credit Suisse Asset Management, LLC
QS Investors, LLC
Multi-Asset Capital Stability Fund
AllianceBernstein, L.P.
Janus Capital Management, LLC
Long/Short Alternative Fund
Dynamic Beta Investments, LLC
Under the investmentsub-advisory agreements, eachsub-adviser receives a fee paid by SIMC.
Brokerage Commissions Paid to Affiliates— The Distribution Agreement between the Distributor and the Trust provides that the Distributor may receive compensation on fund transactions effected for the Trust in accordance with the rules of the Securities and Exchange Commission (“SEC”). Accordingly, it is expected that fund transactions may result in brokerage commissions being paid to the Distributor. SEC rules require that such commissions not exceed usual and customary commissions.
Such commissions for the six month period ended March 31, 2019 were as follows ($ Thousands):
Payments to/from Affiliates— Certain officers and/or trustees of the Trust are also officers and/or Directors of the Administrator, Adviser and/or Distributor. The Trust pays each unaffiliated Trustee an annual fee for attendance at quarterly, interim and committee meetings. Compensation of officers and affiliated Trustees of the Trust is paid by the Administrator or Distributor.
A portion of the services provided by the Chief Compliance Officer (“CCO”) and his staff, whom are employees of the Administrator, are paid for by the Trust as incurred.
LSV Asset Management (a partially owned indirect subsidiary of SEI Investment Co.) serves as thesub-adviser to the Large Cap, Large Cap Value,Tax-Managed Large Cap, Small Cap Value, U.S. Managed Volatility,Tax-Managed Managed Volatility andTax-Managed International Managed Volatility Funds. For this service LSV Asset Management is entitled to receive a fee from SIMC. Such fees for the six month period ended March 31, 2019 were as follows ($ Thousands):
| | | | |
Large Cap Fund | | $ | 278 | |
Large Cap Value Fund | | | 160 | |
Tax-Managed Large Cap Fund | | | 335 | |
Small Cap Value Fund | | | 323 | |
U.S. Managed Volatility Fund | | | 953 | |
Tax-Managed Managed Volatility Fund | | | 860 | |
Tax-Managed International Managed Volatility Fund | | | 212 | |
| | | | |
| | $ | 3,121 | |
| | | | |
On April 20, 2018, SIMC made a capital contribution to the SIMT Large Cap Index Fund in the amount of $330,025. The capital contribution offset the Fund’s performance deviation from its benchmark that resulted from an unusually large unanticipated cash flow that came into the Fund shortly after launch.
| | |
SEI Institutional Managed Trust / Semi-Annual Report / March 31, 2019 | | 317 |
Notes to Financial Statements/Consolidated Notes to Financial Statements (Unaudited) (Continued)
March 31, 2019
Fees Paid Indirectly— The Funds may direct certain fund trades to the Distributor who pays a portion of the Funds’ expenses. Accordingly, the expenses reduced, which were used to pay third party expenses, and the effect on the Funds’ expense ratio, as a percentage of the Funds’ average daily net assets for the period ended March 31, 2019, can be found on the Statements of Operations or Consolidated Statements of Operations and Financial Highlights or Consolidated Financial Highlights, respectively.
Investment in Affiliated Security— The Funds may invest in the SEI Daily Income Trust Government Fund an affiliated money market fund to manage excess cash or to serve as margin or collateral for derivative positions. Additionally, the Funds may invest the cash collateral from the securities lending program in the SEI Liquidity Fund, L.P.
Interfund Lending— The SEC has granted an exemption that permits the Trust to participate in an interfund lending program (“the Program”) with existing or future investment companies registered under the 1940 Act that are advised by SIMC (the “SEI Funds”). The Program allows the SEI Funds to lend money to and borrow
money from each other for temporary or emergency purposes. Participation in the Program is voluntary for both borrowing and lending funds.
Interfund loans may be made only when the rate of interest to be charged is more favorable to the lending fund than an investment in overnight repurchase agreements (“Repo Rate”), and more favorable to the borrowing fund than the rate of interest that would be charged by a bank for short-term borrowings (“Bank Loan Rate”). The Bank Loan Rate will be determined using a formula annually reviewed by the Board. The interest rate imposed on interfund loans is the average of the Repo Rate and the Bank Loan Rate.
During the period ended March 31, 2019, the following Funds borrowed funds from the SEI Multi-Asset Accumulation Fund. The amount borrowed, interest paid on the borrowing and the corresponding interest rate were as follows ($ Thousands):
| | | | | | | | | | | | | | | | | | | | |
| | | Borrowing
Date | | | Maturity
Date | | | Amount
Borrowed | | | Interest
Paid | | | Interest
Rate | |
Enhanced Income Fund | | | 01/04/19 | | | | 01/07/19 | | | $ | 6,000 | | | $ | 2 | | | | 3.54 | % |
World Select Equity Fund | | | 10/03/18 | | | | 10/05/18 | | | | 9,000 | | | | 2 | | | | 3.24 | % |
7. CAPITAL SHARE TRANSACTIONS
Capital share transactions for the Funds were as follows (Thousands):
For the period ended March 31, 2019 (Unaudited) and the year ended September 30, 2018.
| | | | | | | | | | | | | | | | | | | | | | | | | | | | | | | | |
| | | Large Cap Fund | | | Large Cap Value Fund | | | Large Cap Growth Fund | | | Large Cap Index Fund(1) | |
| | | | | | | | |
| | | 10/1/2018 to 3/31/2019
(Unaudited) | | | 2018 | | | 10/1/2018 to 3/31/2019
(Unaudited) | | | 2018 | | | 10/1/2018 to 3/31/2019
(Unaudited) | | | 2018 | | | 10/1/2018 to 3/31/2019 (Unaudited) | | | 2018
| |
Class F: | | | | | | | | | | | | | | | | | | | | | | | | | | | | | | | | |
| | | | | | | | |
Shares Issued | | | 14,022 | | | | 29,633 | | | | 4,548 | | | | 5,041 | | | | 3,518 | | | | 4,121 | | | | 11,435 | | | | 24,944 | |
| | | | | | | | |
Shares Issued in Lieu of Dividends and Distributions | | | 20,833 | | | | 11,197 | | | | 4,850 | | | | 2,397 | | | | 4,683 | | | | 3,119 | | | | 278 | | | | 124 | |
| | | | | | | | |
Shares Redeemed | | | (23,093 | ) | | | (48,868 | ) | | | (6,356 | ) | | | (9,447 | ) | | | (5,307 | ) | | | (11,018 | ) | | | (3,502 | ) | | | (2,515 | ) |
| | | | | | | | |
Total Increase (Decrease) in Net Assets Derived from Class F Transactions | | | 11,762 | | | | (8,038 | ) | | | 3,042 | | | | (2,009 | ) | | | 2,894 | | | | (3,778 | ) | | | 8,211 | | | | 22,553 | |
Class I: | | | | | | | | | | | | | | | | | | | | | | | | | | | | | | | | |
| | | | | | | | |
Shares Issued | | | – | | | | – | | | | 14 | | | | 14 | | | | 5 | | | | 15 | | | | – | | | | – | |
| | | | | | | | |
Shares Issued in Lieu of Dividends and Distributions | | | – | | | | – | | | | 14 | | | | 7 | | | | 11 | | | | 7 | | | | – | | | | – | |
| | | | | | | | |
Shares Redeemed | | | – | | | | – | | | | (22 | ) | | | (41 | ) | | | (13 | ) | | | (29 | ) | | | – | | | | – | |
| | | | | | | | |
Total Increase (Decrease) in Net Assets Derived from Class I Transactions | | | – | | | | – | | | | 6 | | | | (20 | ) | | | 3 | | | | (7 | ) | | | – | | | | – | |
Class Y: | | | | | | | | | | | | | | | | | | | | | | | | | | | | | | | | |
| | | | | | | | |
Shares Issued | | | 1,709 | | | | 809 | | | | 1,061 | | | | 905 | | | | 717 | | | | 400 | | | | – | | | | – | |
| | | | | | | | |
Shares Issued in Lieu of Dividends and Distributions | | | 1,223 | | | | 737 | | | | 535 | | | | 245 | | | | 456 | | | | 277 | | | | – | | | | – | |
| | | | | | | | |
Shares Redeemed | | | (1,718 | ) | | | (3,603 | ) | | | (388 | ) | | | (616 | ) | | | (271 | ) | | | (740 | ) | | | – | | | | – | |
| | | | | | | | |
Total Increase (Decrease) in Net Assets Derived from Class Y Transactions | | | 1,214 | | | | (2,057 | ) | | | 1,208 | | | | 534 | | | | 902 | | | | (63 | ) | | | – | | | | – | |
Increase (Decrease) in Capital Shares | | | 12,976 | | | | (10,095 | ) | | | 4,256 | | | | (1,495 | ) | | | 3,799 | | | | (3,848 | ) | | | 8,211 | | | | 22,553 | |
| | | | | | | | | | | | | | | | | | | | | | | | | | | | | | | | |
| | | | |
| | | Tax-Managed
Large Cap Fund | | | S&P 500 Index Fund(2) | | | Small Cap Fund | | | Small Cap Value Fund | |
| | | | | | | | |
| | | 10/1/2018 to 3/31/2019
(Unaudited) | | | 2018 | | | 10/1/2018 to 3/31/2019
(Unaudited) | | | 2018 | | | 10/1/2018 to 3/31/2019
(Unaudited) | | | 2018 | | | 10/1/2018 to 3/31/2019 (Unaudited) | | | 2018 | |
Class E: | | | | | | | | | | | | | | | | | | | | | | | | | | | | | | | | |
| | | | | | | | |
Shares Issued | | | – | | | | – | | | | – | | | | 345 | | | | – | | | | – | | | | – | | | | – | |
| | |
318 | | SEI Institutional Managed Trust / Semi-Annual Report / March 31, 2019 |
| | | | | | | | | | | | | | | | | | | | | | | | | | | | | | | | |
| | | | |
| | | Tax-Managed Large Cap Fund | | | S&P 500 Index Fund(2) | | | Small Cap Fund | | | Small Cap Value Fund | |
| | | | | | | | |
| | | 10/1/2018 to 3/31/2019 (Unaudited) | | | 2018 | | | 10/1/2018 to
3/31/2019 (Unaudited) | | | 2018 | | | 10/1/2018 to
3/31/2019 (Unaudited) | | | 2018 | | | 10/1/2018 to
3/31/2019 (Unaudited) | | | 2018 | |
| | | | | | | | |
Shares Issued in Lieu of Dividends and Distributions | | | – | | | | – | | | | — | | | | 105 | | | | – | | | | – | | | | – | | | | – | |
| | | | | | | | |
Shares Redeemed | | | – | | | | – | | | | — | | | | (5,783 | ) | | | – | | | | – | | | | – | | | | – | |
| | | | | | | | | |
Total Decrease in Net Assets Derived from Class E Transactions | | | – | | | | – | | | | — | | | | (5,333 | ) | | | – | | | | – | | | | – | | | | – | |
Class F: | | | | | | | | | | | | | | | | | | | | | | | | | | | | | | | | |
| | | | | | | | |
Shares Issued | | | 7,861 | | | | 17,428 | | | | 1,200 | | | | 8,507 | | | | 5,195 | | | | 9,853 | | | | 1,256 | | | | 2,866 | |
| | | | | | | | |
Shares Issued in Lieu of Dividends and Distributions | | | 1,572 | | | | 2,483 | | | | 357 | | | | 200 | | | | 6,784 | | | | 3,016 | | | | 1,338 | | | | 1,112 | |
| | | | | | | | |
Shares Redeemed | | | (14,318 | ) | | | (23,839 | ) | | | (2,164 | ) | | | (2,512 | ) | | | (7,569 | ) | | | (8,925 | ) | | | (2,180 | ) | | | (4,162 | ) |
| | | | | | | | | |
Total Increase (Decrease) in Net Assets Derived from Class F Transactions | | | (4,885 | ) | | | (3,928 | ) | | | (607 | ) | | | 6,195 | | | | 4,410 | | | | 3,944 | | | | 414 | | | | (184 | ) |
Class I: | | | | | | | | | | | | | | | | | | | | | | | | | | | | | | | | |
| | | | | | | | |
Shares Issued | | | – | | | | – | | | | 10 | | | | 15 | | | | – | | | | – | | | | 9 | | | | 9 | |
| | | | | | | | |
Shares Issued in Lieu of Dividends and Distributions | | | – | | | | – | | | | 2 | | | | 2 | | | | – | | | | – | | | | 9 | | | | 8 | |
| | | | | | | | |
Shares Redeemed | | | – | | | | – | | | | (16 | ) | | | (29 | ) | | | – | | | | – | | | | (10 | ) | | | (19 | ) |
| | | | | | | | | |
Total Increase (Decrease) in Net Assets Derived from Class I Transactions | | | – | | | | – | | | | (4 | ) | | | (12 | ) | | | – | | | | – | | | | 8 | | | | (2 | ) |
Class Y: | | | | | | | | | | | | | | | | | | | | | | | | | | | | | | | | |
| | | | | | | | |
Shares Issued | | | 3,794 | | | | 1,885 | | | | — | | | | 126 | | | | 781 | | | | 277 | | | | 405 | | | | 180 | |
| | | | | | | | |
Shares Issued in Lieu of Dividends and Distributions | | | 178 | | | | 272 | | | | — | | | | 15 | | | | 371 | | | | 198 | | | | 168 | | | | 122 | |
| | | | | | | | |
Shares Redeemed | | | (988 | ) | | | (1,896 | ) | | | — | | | | (855 | ) | | | (492 | ) | | | (883 | ) | | | (139 | ) | | | (105 | ) |
| | | | | | | | | |
Total Increase (Decrease) in Net Assets Derived from Class Y Transactions | | | 2,984 | | | | 261 | | | | — | | | | (714 | ) | | | 660 | | | | (408 | ) | | | 434 | | | | 197 | |
| | | | | | | | |
Increase (Decrease) in Capital Shares | | | (1,901 | ) | | | (3,667 | ) | | | (611 | ) | | | 136 | | | | 5,070 | | | | 3,536 | | | | 856 | | | | 11 | |
| | | | |
| | | Small Cap Growth Fund | | | Tax-Managed Small/
Mid Cap Fund | | | Mid-Cap Fund | | | U.S. Managed Volatility Fund | |
| | | | | | | | |
| | | 10/1/2018 to
3/31/2019
(Unaudited) | | | 2018 | | | 10/1/2018 to
3/31/2019
(Unaudited) | | | 2018 | | | 10/1/2018 to
3/31/2019 (Unaudited) | | | 2018 | | | 10/1/2018 to
3/31/2019 (Unaudited) | | | 2018 | |
Class F: | | | | | | | | | | | | | | | | | | | | | | | | | | | | | | | | |
| | | | | | | | |
Shares Issued | | | 801 | | | | 1,683 | | | | 2,869 | | | | 5,753 | | | | 641 | | | | 1,117 | | | | 6,590 | | | | 8,805 | |
| | | | | | | | |
Shares Issued in Lieu of Dividends and Distributions | | | 1,256 | | | | 29 | | | | 2,798 | | | | 594 | | | | 450 | | | | 277 | | | | 5,277 | | | | 4,331 | |
| | | | | | | | |
Shares Redeemed | | | (1,933 | ) | | | (1,813 | ) | | | (4,740 | ) | | | (5,504 | ) | | | (1,333 | ) | | | (916 | ) | | | (8,865 | ) | | | (17,592 | ) |
| | | | | | | | | |
Total Increase (Decrease) in Net Assets Derived from Class F Transactions | | | 124 | | | | (101 | ) | | | 927 | | | | 843 | | | | (242 | ) | | | 478 | | | | 3,002 | | | | (4,456 | ) |
Class I: | | | | | | | | | | | | | | | | | | | | | | | | | | | | | | | | |
| | | | | | | | |
Shares Issued | | | 4 | | | | 8 | | | | – | | | | – | | | | 2 | | | | 6 | | | | 5 | | | | 5 | |
| | | | | | | | |
Shares Issued in Lieu of Dividends and Distributions | | | 8 | | | | — | | | | – | | | | – | | | | 4 | | | | 2 | | | | 8 | | | | 7 | |
| | | | | | | | |
Shares Redeemed | | | (5 | ) | | | (19 | ) | | | – | | | | – | | | | (3 | ) | | | (11 | ) | | | (1 | ) | | | (27 | ) |
| | | | | | | | | |
Total Increase (Decrease) in Net Assets Derived from Class I Transactions | | | 7 | | | | (11 | ) | | | – | | | | – | | | | 3 | | | | (3 | ) | | | 12 | | | | (15 | ) |
Class Y: | | | | | | | | | | | | | | | | | | | | | | | | | | | | | | | | |
| | | | | | | | |
Shares Issued | | | 202 | | | | 73 | | | | 1,111 | | | | 524 | | | | 15 | | | | 31 | | | | 17,702 | | | | 30,172 | |
| | | | | | | | |
Shares Issued in Lieu of Dividends and Distributions | | | 113 | | | | 3 | | | | 298 | | | | 64 | | | | 13 | | | | 7 | | | | 4,334 | | | | 3,975 | |
| | | | | | | | |
Shares Redeemed | | | (63 | ) | | | (111 | ) | | | (298 | ) | | | (443 | ) | | | (16 | ) | | | (17 | ) | | | (5,643 | ) | | | (29,733 | ) |
| | | | | | | | | |
Total Increase (Decrease) in Net Assets Derived from Class Y Transactions | | | 252 | | | | (35 | ) | | | 1,111 | | | | 145 | | | | 12 | | | | 21 | | | | 16,393 | | | | 4,414 | |
| | | | | | | | |
Increase (Decrease) in Capital Shares | | | 383 | | | | (147 | ) | | | 2,038 | | | | 988 | | | | (227 | ) | | | 496 | | | | 19,407 | | | | (57 | ) |
| | | | |
| | | Global Managed Volatility
Fund | | | Tax-Managed Managed
Volatility Fund | | | Tax-Managed International
Managed Volatility Fund | | | Real Estate Fund | |
| | | | | | | | |
| | | 10/1/2018 to
3/31/2019
(Unaudited) | | | 2018 | | | 10/1/2018 to
3/31/2019
(Unaudited) | | | 2018 | | | 10/1/2018 to
3/31/2019 (Unaudited) | | | 2018 | | | 10/1/2018 to
3/31/2019 (Unaudited) | | | 2018 | |
Class F: | | | | | | | | | | | | | | | | | | | | | | | | | | | | | | | | |
| | | | | | | | |
Shares Issued | | | 11,481 | | | | 20,682 | | | | 5,570 | | | | 10,661 | | | | 4,505 | | | | 10,005 | | | | 828 | | | | 1,545 | |
| | | | | | | | |
Shares Issued in Lieu of Dividends and Distributions | | | 8,609 | | | | 6,370 | | | | 2,063 | | | | 2,187 | | | | 728 | | | | 649 | | | | 455 | | | | 665 | |
| | | | | | | | |
Shares Redeemed | | | (18,104 | ) | | | (32,841 | ) | | | (9,085 | ) | | | (15,284 | ) | | | (5,896 | ) | | | (8,562 | ) | | | (944 | ) | | | (4,352 | ) |
| | | | | | | | | |
Total Increase (Decrease) in Net Assets Derived from Class F Transactions | | | 1,986 | | | | (5,789 | ) | | | (1,452 | ) | | | (2,436 | ) | | | (663 | ) | | | 2,092 | | | | 339 | | | | (2,142 | ) |
Class I: | | | | | | | | | | | | | | | | | | | | | | | | | | | | | | | | |
| | |
SEI Institutional Managed Trust / Semi-Annual Report / March 31, 2019 | | 319 |
Notes to Financial Statements/Consolidated Notes to Financial Statements (Unaudited) (Continued)
March 31, 2019
| | | | | | | | | | | | | | | | | | | | | | | | | | | | | | | | |
| | | | |
| | | Global Managed Volatility
Fund | | | Tax-Managed Managed
Volatility Fund | | | Tax-Managed International
Managed Volatility Fund | | | Real Estate Fund | |
| | | | | | | | |
| | | 10/1/2018 to 3/31/2019
(Unaudited) | | | 2018 | | | 10/1/2018 to 3/31/2019 (Unaudited) | | | 2018 | | | 10/1/2018 to 3/31/2019 (Unaudited) | | | 2018 | | | 10/1/2018 to 3/31/2019
(Unaudited) | | | 2018 | |
| | | | | | | | |
Shares Issued | | | 2 | | | | 22 | | | | – | | | | – | | | | – | | | | – | | | | 1 | | | | 1 | |
| | | | | | | | |
Shares Issued in Lieu of Dividends and Distributions | | | 10 | | | | 9 | | | | – | | | | – | | | | – | | | | – | | | | 2 | | | | 3 | |
| | | | | | | | |
Shares Redeemed | | | (4 | ) | | | (61 | ) | | | – | | | | – | | | | – | | | | – | | | | – | | | | (7 | ) |
| | | | | | | | | |
Total Increase (Decrease) in Net Assets Derived from Class I Transactions | | | 8 | | | | (30 | ) | | | – | | | | – | | | | – | | | | – | | | | 3 | | | | (3 | ) |
Class Y: | | | | | | | | | | | | | | | | | | | | | | | | | | | | | | | | |
| | | | | | | | |
Shares Issued | | | 2,824 | | | | 6,681 | | | | 1,249 | | | | 1,309 | | | | 1,865 | | | | 1,162 | | | | 146 | | | | 294 | |
| | | | | | | | |
Shares Issued in Lieu of Dividends and Distributions | | | 1,906 | | | | 1,276 | | | | 161 | | | | 142 | | | | 67 | | | | 31 | | | | 184 | | | | 247 | |
| | | | | | | | |
Shares Redeemed | | | (4,973 | ) | | | (6,463 | ) | | | (832 | ) | | | (760 | ) | | | (617 | ) | | | (104 | ) | | | (311 | ) | | | (439 | ) |
| | | | | | | | | |
Total Increase (Decrease) in Net Assets Derived from Class Y Transactions | | | (243 | ) | | | 1,494 | | | | 578 | | | | 691 | | | | 1,315 | | | | 1,089 | | | | 19 | | | | 102 | |
| | | | | | | | |
Increase (Decrease) in Capital Shares | | | 1,751 | | | | (4,325 | ) | | | (874 | ) | | | (1,745 | ) | | | 652 | | | | 3,181 | | | | 361 | | | | (2,043 | ) |
| | | | |
| | | | | | Enhanced Income Fund | | | Core Fixed Income Fund | | | High Yield Bond Fund | |
| | | | | | | | |
| | | | | | | | | 10/1/2018 to 3/31/2019 (Unaudited) | | | 2018 | | | 10/1/2018 to 3/31/2019 (Unaudited) | | | 2018 | | | 10/1/2018 to 3/31/2019
(Unaudited) | | | 2018 | |
Class F: | | | | | | | | | | | | | | | | | | | | | | | | | | | | | | | | |
| | | | | | | | |
Shares Issued | | | | | | | | | | | 1,376 | | | | 3,585 | | | | 30,667 | | | | 42,581 | | | | 26,163 | | | | 52,420 | |
| | | | | | | | |
Shares Issued in Lieu of Dividends and Distributions | | | | | | | | | | | 156 | | | | 221 | | | | 4,430 | | | | 4,573 | | | | 8,277 | | | | 12,167 | |
| | | | | | | | |
Shares Redeemed | | | | | | | | | | | (3,836 | ) | | | (2,854 | ) | | | (46,851 | ) | | | (35,171 | ) | | | (34,862 | ) | | | (57,037 | ) |
| | | | | | | | |
Merger(3) | | | | | | | | | | | — | | | | — | | | | — | | | | 155,566 | | | | — | | | | — | |
| | | | | | | | | |
Total Increase (Decrease) in Net Assets Derived from Class F Transactions | | | | | | | | | | | (2,304 | ) | | | 952 | | | | (11,754 | ) | | | 167,549 | | | | (422 | ) | | | 7,550 | |
Class I: | | | | | | | | | | | | | | | | | | | | | | | | | | | | | | | | |
| | | | | | | | |
Shares Issued | | | | | | | | | | | 1 | | | | 1 | | | | 216 | | | | 424 | | | | 5,898 | | | | 10 | |
| | | | | | | | |
Shares Issued in Lieu of Dividends and Distributions | | | | | | | | | | | — | | | | 1 | | | | 4 | | | | 7 | | | | 4 | | | | 6 | |
| | | | | | | | |
Shares Redeemed | | | | | | | | | | | (1 | ) | | | (12 | ) | | | (363 | ) | | | (383 | ) | | | (4,179 | ) | | | (99 | ) |
| | | | | | | | | |
Total Increase (Decrease) in Net Assets Derived from Class I Transactions | | | | | | | | | | | — | | | | (10 | ) | | | (143 | ) | | | 48 | | | | 1,723 | | | | (83 | ) |
Class Y: | | | | | | | | | | | | | | | | | | | | | | | | | | | | | | | | |
| | | | | | | | |
Shares Issued | | | | | | | | | | | 120 | | | | 467 | | | | 5,771 | | | | 6,623 | | | | 3,483 | | | | 3,711 | |
| | | | | | | | |
Shares Issued in Lieu of Dividends and Distributions | | | | | | | | | | | 15 | | | | 21 | | | | 562 | | | | 640 | | | | 1,097 | | | | 1,653 | |
| | | | | | | | |
Shares Redeemed | | | | | | | | | | | (122 | ) | | | (315 | ) | | | (4,961 | ) | | | (4,383 | ) | | | (3,637 | ) | | | (5,996 | ) |
| | | | | | | | |
Merger(3) | | | | | | | | | | | — | | | | — | | | | — | | | | 13,372 | | | | — | | | | — | |
| | | | | | | | | |
Total Increase (Decrease) in Net Assets Derived from Class Y Transactions | | | | | | | | | | | 13 | | | | 173 | | | | 1,372 | | | | 16,252 | | | | 943 | | | | (632 | ) |
| | | | | | | | |
Increase (Decrease) in Capital Shares | | | | | | | | | | | (2,291 | ) | | | 1,115 | | | | (10,525 | ) | | | 183,849 | | | | 2,244 | | | | 6,835 | |
| | |
320 | | SEI Institutional Managed Trust / Semi-Annual Report / March 31, 2019 |
| | | | | | | | | | | | | | | | | | | | | | | | | | | | | | | | |
| | | Conservative Income Fund | | | Tax-Free Conservative
Income Fund | | | Real Return Fund | | | Dynamic Asset Allocation
Fund | |
| | | | | | | | |
| | | 10/1/2018 to 3/31/2019
(Unaudited) | | | 2018 | | | 10/1/2018 to 3/31/2019
(Unaudited) | | | 2018 | | | 10/1/2018 to 3/31/2019 (Unaudited) | | | 2018 | | | 10/1/2018 to 3/31/2019 (Unaudited) | | | 2018 | |
Class F: | | | | | | | | | | | | | | | | | | | | | | | | | | | | | | | | |
| | | | | | | | |
Shares Issued | | | 12,408 | | | | 11,140 | | | | 2,798 | | | | 6,355 | | | | 2,629 | | | | 5,006 | | | | 4,912 | | | | 14,245 | |
| | | | | | | | |
Shares Issued in Lieu of Dividends and Distributions | | | 200 | | | | 227 | | | | 86 | | | | 124 | | | | 224 | | | | 289 | | | | 1,119 | | | | 840 | |
| | | | | | | | |
Shares Redeemed | | | (10,556 | ) | | | (9,427 | ) | | | (3,199 | ) | | | (6,568 | ) | | | (3,939 | ) | | | (6,357 | ) | | | (9,497 | ) | | | (12,142 | ) |
| | | | | | | | | |
Total Increase (Decrease) in Net Assets Derived from Class F Transactions | | | 2,052 | | | | 1,940 | | | | (315 | ) | | | (89 | ) | | | (1,086 | ) | | | (1,062 | ) | | | (3,466 | ) | | | 2,943 | |
Class Y: | | | | | | | | | | | | | | | | | | | | | | | | | | | | | | | | |
| | | | | | | | |
Shares Issued | | | 834 | | | | 2,603 | | | | 2,230 | | | | 1,165 | | | | 606 | | | | 248 | | | | 856 | | | | 1,922 | |
| | | | | | | | |
Shares Issued in Lieu of Dividends and Distributions | | | 30 | | | | 36 | | | | 11 | | | | 5 | | | | 19 | | | | 24 | | | | 132 | | | | 116 | |
| | | | | | | | |
Shares Redeemed | | | (1,092 | ) | | | (1,887 | ) | | | (718 | ) | | | (436 | ) | | | (364 | ) | | | (404 | ) | | | (1,231 | ) | | | (2,165 | ) |
| | | | | | | | | |
Total Increase (Decrease) in Net Assets Derived from Class Y Transactions | | | (228 | ) | | | 752 | | | | 1,523 | | | | 734 | | | | 261 | | | | (132 | ) | | | (243 | ) | | | (127 | ) |
| | | | | | | | |
Increase (Decrease) in Capital Shares | | | 1,824 | | | | 2,692 | | | | 1,208 | | | | 645 | | | | (825 | ) | | | (1,194 | ) | | | (3,709 | ) | | | 2,816 | |
| | | | |
| | | | | | Multi-Strategy Alternative
Fund | | | Multi-Asset Accumulation Fund | | | Multi-Asset Income Fund | |
| | | | | | | | |
| | | | | | | | | 10/1/2018 to 3/31/2019
(Unaudited) | | | 2018 | | | 10/1/2018 to 3/31/2019 (Unaudited) | | | 2018 | | | 10/1/2018 to 3/31/2019 (Unaudited) | | | 2018 | |
Class F: | | | | | | | | | | | | | | | | | | | | | | | | | | | | | | | | |
| | | | | | | | |
Shares Issued | | | | | | | | | | | 4,341 | | | | 9,584 | | | | 19,152 | | | | 57,354 | | | | 7,217 | | | | 20,107 | |
| | | | | | | | |
Shares Issued in Lieu of Dividends and Distributions | | | | | | | | | | | 2,184 | | | | 1,003 | | | | 8,007 | | | | 11,460 | | | | 1,121 | | | | 2,607 | |
| | | | | | | | |
Shares Redeemed | | | | | | | | | | | (6,973 | ) | | | (10,382 | ) | | | (36,115 | ) | | | (44,664 | ) | | | (12,279 | ) | | | (20,693 | ) |
| | | | | | | | | |
Total Increase (Decrease) in Net Assets Derived from Class F Transactions | | | | | | | | | | | (448 | ) | | | 205 | | | | (8,956 | ) | | | 24,150 | | | | (3,941 | ) | | | 2,021 | |
Class Y: | | | | | | | | | | | | | | | | | | | | | | | | | | | | | | | | |
| | | | | | | | |
Shares Issued | | | | | | | | | | | 565 | | | | 190 | | | | 3,264 | | | | 2,082 | | | | 1,457 | | | | 3,725 | |
| | | | | | | | |
Shares Issued in Lieu of Dividends and Distributions | | | | | | | | | | | 27 | | | | 12 | | | | 757 | | | | 1,155 | | | | 278 | | | | 665 | |
| | | | | | | | |
Shares Redeemed | | | | | | | | | | | (135 | ) | | | (92 | ) | | | (4,297 | ) | | | (3,772 | ) | | | (3,552 | ) | | | (3,203 | ) |
| | | | | | | | | |
Total Increase (Decrease) in Net Assets Derived from Class Y Transactions | | | | | | | | | | | 457 | | | | 110 | | | | (276 | ) | | | (535 | ) | | | (1,817 | ) | | | 1,187 | |
| | | | | | | | |
Increase (Decrease) in Capital Shares | | | | | | | | | | | 9 | | | | 315 | | | | (9,232 | ) | | | 23,615 | | | | (5,758 | ) | | | 3,208 | |
| | | | |
| | | | | | Multi-Asset Inflation Managed Fund | | | Multi-Asset Capital Stability
Fund | | | Long/Short Alternative Fund | |
| | | | | | | | |
| | | | | | | | | 10/1/2018 to 3/31/2019
(Unaudited) | | | 2018 | | | 10/1/2018 to 3/31/2019 (Unaudited) | | | 2018 | | | 10/1/2018 to 3/31/2019 (Unaudited) | | | 2018 | |
Class F: | | | | | | | | | | | | | | | | | | | | | | | | | | | | | | | | |
| | | | | | | | |
Shares Issued | | | | | | | | | | | 7,811 | | | | 23,139 | | | | 8,137 | | | | 16,159 | | | | 625 | | | | 413 | |
| | | | | | | | |
Shares Issued in Lieu of Dividends and Distributions | | | | | | | | | | | 1,707 | | | | 1,249 | | | | 287 | | | | 1,987 | | | | 16 | | | | — | |
| | | | | | | | |
Shares Redeemed | | | | | | | | | | | (13,565 | ) | | | (19,420 | ) | | | (10,535 | ) | | | (17,923 | ) | | | (725 | ) | | | (11 | ) |
| | | | | | | | | |
Total Increase (Decrease) in Net Assets Derived from Class F Transactions | | | | | | | | | | | (4,047 | ) | | | 4,968 | | | | (2,111 | ) | | | 223 | | | | (84 | ) | | | 402 | |
Class Y: | | | | | | | | | | | | | | | | | | | | | | | | | | | | | | | | |
| | | | | | | | |
Shares Issued | | | | | | | | | | | 1,294 | | | | 693 | | | | 936 | | | | 486 | | | | — | | | | — | |
| | | | | | | | |
Shares Issued in Lieu of Dividends and Distributions | | | | | | | | | | | 146 | | | | 127 | | | | 27 | | | | 182 | | | | — | | | | — | |
| | | | | | | | |
Shares Redeemed | | | | | | | | | | | (1,056 | ) | | | (1,375 | ) | | | (544 | ) | | | (1,134 | ) | | | (151 | ) | | | — | |
| | | | | | | | | |
Total Increase (Decrease) in Net Assets Derived from Class Y Transactions | | | | | | | | | | | 384 | | | | (555 | ) | | | 419 | | | | (466 | ) | | | (151 | ) | | | — | |
| | | | | | | | |
Increase (Decrease) in Capital Shares | | | | | | | | | | | (3,663 | ) | | | 4,413 | | | | (1,692 | ) | | | (243 | ) | | | (235 | ) | | | 402 | |
| (1) | Commenced operations on January 31, 2018. |
| (2) | On April 20, 2018, the Class Y shares and Class E shares were converted to Class F shares. |
| (3) | See Note 13 in the Notes to Financial Statements. |
N/A — Not applicable. Shares currently not offered.
Amounts designated as “—” are zero or have been rounded to zero.
| | |
SEI Institutional Managed Trust / Semi-Annual Report / March 31, 2019 | | 321 |
Notes to Financial Statements/Consolidated Notes to Financial Statements (Unaudited) (Continued)
March 31, 2019
8. INVESTMENT TRANSACTIONS
The cost of security purchases and proceeds from the sale of securities, other than temporary cash investments and futures, during the six month period ended March 31, 2019, were as follows:
| | | | | | | | | | | | |
| | | U.S. Gov’t
($ Thousands) | | | Other
($ Thousands) | | | Total ($ Thousands) | |
Large Cap Fund | |
Purchases | | $ | – | | | $ | 1,029,259 | | | $ | 1,029,259 | |
Sales | | | – | | | | 1,180,071 | | | | 1,180,071 | |
Large Cap Value Fund | |
Purchases | | | – | | | | 311,764 | | | | 311,764 | |
Sales | | | – | | | | 324,734 | | | | 324,734 | |
Large Cap Growth Fund | |
Purchases | | | – | | | | 694,530 | | | | 694,530 | |
Sales | | | – | | | | 730,399 | | | | 730,399 | |
Large Cap Index Fund | |
Purchases | | | – | | | | 89,637 | | | | 89,637 | |
Sales | | | – | | | | 12,019 | | | | 12,019 | |
Tax-Managed Large Cap Fund | |
Purchases | | | – | | | | 1,258,473 | | | | 1,258,473 | |
Sales | | | – | | | | 1,353,254 | | | | 1,353,254 | |
S&P 500 Index Fund | |
Purchases | | | – | | | | 48,268 | | | | 48,268 | |
Sales | | | – | | | | 98,736 | | | | 98,736 | |
Small Cap Fund | |
Purchases | | | – | | | | 451,157 | | | | 451,157 | |
Sales | | | – | | | | 506,140 | | | | 506,140 | |
Small Cap Value Fund | |
Purchases | | | – | | | | 148,057 | | | | 148,057 | |
Sales | | | – | | | | 221,144 | | | | 221,144 | |
Small Cap Growth Fund | |
Purchases | | | – | | | | 356,614 | | | | 356,614 | |
Sales | | | – | | | | 390,567 | | | | 390,567 | |
Tax-Managed Small/Mid Cap Fund | |
Purchases | | | – | | | | 690,217 | | | | 690,217 | |
Sales | | | – | | | | 792,494 | | | | 792,494 | |
Mid-Cap Fund | |
Purchases | | | – | | | | 57,739 | | | | 57,739 | |
Sales | | | – | | | | 75,057 | | | | 75,057 | |
U.S. Managed Volatility Fund | |
Purchases | | | – | | | | 544,976 | | | | 544,976 | |
Sales | | | – | | | | 407,900 | | | | 407,900 | |
Global Managed Volatility Fund | |
Purchases | | | – | | | | 446,689 | | | | 446,689 | |
Sales | | | – | | | | 540,701 | | | | 540,701 | |
Tax-Managed Managed Volatility Fund | |
Purchases | | | – | | | | 188,206 | | | | 188,206 | |
Sales | | | – | | | | 239,129 | | | | 239,129 | |
Tax-Managed International Managed Volatility Fund | |
Purchases | | | – | | | | 106,810 | | | | 106,810 | |
Sales | | | – | | | | 113,656 | | | | 113,656 | |
Real Estate Fund | |
Purchases | | | – | | | | 49,238 | | | | 49,238 | |
Sales | | | – | | | | 52,677 | | | | 52,677 | |
Enhanced Income Fund | |
Purchases | | | – | | | | 4,686 | | | | 4,686 | |
Sales | | | 224 | | | | 16,988 | | | | 17,212 | |
| | | | | | | | | | | | |
| | | U.S. Gov’t
($ Thousands) | | | Other ($ Thousands) | | | Total ($ Thousands) | |
Core Fixed Income Fund | |
Purchases | | | 6,772,145 | | | | 1,408,506 | | | | 8,180,651 | |
Sales | | | 6,759,978 | | | | 1,474,632 | | | | 8,234,610 | |
High Yield Bond Fund | |
Purchases | | | – | | | | 431,170 | | | | 431,170 | |
Sales | | | – | | | | 480,104 | | | | 480,104 | |
Conservative Income Fund | |
Purchases | | | – | | | | – | | | | – | |
Sales | | | – | | | | – | | | | – | |
Tax-Free Conservative Income Fund | |
Purchases | | | – | | | | – | | | | – | |
Sales | | | – | | | | – | | | | – | |
Real Return Fund | |
Purchases | | | 27,725 | | | | – | | | | 27,725 | |
Sales | | | 40,072 | | | | – | | | | 40,072 | |
Dynamic Asset Allocation Fund | |
Purchases | | | – | | | | 21,211 | | | | 21,211 | |
Sales | | | – | | | | 95,107 | | | | 95,107 | |
Multi-Strategy Alternative Fund | |
Purchases | | | 1,481 | | | | 534,388 | | | | 535,869 | |
Sales | | | 213 | | | | 574,770 | | | | 574,983 | |
Multi-Asset Accumulation Fund | |
Purchases | | | 203,592 | | | | 191,636 | | | | 395,228 | |
Sales | | | 264,802 | | | | 167,873 | | | | 432,675 | |
Multi-Asset Income Fund | |
Purchases | | | 15,395 | | | | 198,382 | | | | 213,777 | |
Sales | | | 25,135 | | | | 197,835 | | | | 222,970 | |
Multi-Asset Inflation Managed Fund | |
Purchases | | | 63,686 | | | | 259,774 | | | | 323,460 | |
Sales | | | 81,127 | | | | 281,871 | | | | 362,998 | |
Multi-Asset Capital Stability Fund | |
Purchases | | | 126,715 | | | | 29,108 | | | | 155,823 | |
Sales | | | 57,551 | | | | 30,912 | | | | 88,463 | |
Long/Short Alternative Fund | |
Purchases | | | – | | | | 1,490 | | | | 1,490 | |
Sales | | | – | | | | 41 | | | | 41 | |
9. FEDERAL TAX INFORMATION
It is each Fund’s intention to continue to qualify as a regulated investment company under Subchapter M of The Internal Revenue Code and distribute all of its taxable income (including net capital gains). Accordingly, no provision for Federal income taxes is required.
The Multi-Asset Accumulation and Multi-Asset Inflation Managed Funds have each requested private letter rulings from the Internal Revenue Service (“IRS”) concluding that the income generated from their investment in their respective Subsidiaries, each of which invests in commodity-linked derivatives, will be “qualifying income” for regulated investment company (“RIC”) qualification purposes, regardless of whether actual distributions are made to the Funds by the respective Subsidiary.
In July 2011, the IRS suspended the issuance of private letter rulings regarding the investment by RICs into controlled foreign corporations which principally invest
| | |
322 | | SEI Institutional Managed Trust / Semi-Annual Report / March 31, 2019 |
in commodities, such as the Subsidiaries, indicating that it was reconsidering its policies surrounding the issuance of these rulings. The IRS subsequently stated that it intends to issue public guidance regarding the use of controlled foreign corporations by RICs to indirectly invest in commodities. It is unclear whether this guidance will continue to permit or somehow restrict the distributions from controlled foreign corporations to be treated as “qualifying income” for purposes of the RIC qualification rules. As a result, there can be no assurance that the IRS will grant the private letter ruling requested by the Funds. The IRS, however, has informally indicated that any guidance regarding the treatment of distributions from controlled foreign corporations will be prospective in application and provide for transition periods for affected RICs. While the private letter ruling request is pending with the IRS, the Multi-Asset Accumulation and Multi-Asset Inflation Managed Funds have secured an opinion of counsel based on customary representations that actual distributions made to the Funds should be treated as “qualifying income.” If the IRS does issue public guidance that results in an adverse determination relating to the treatment of income and gain to the Funds from controlled foreign corporations such as the Subsidiaries, the Funds would likely need to significantly change their investment strategies, which could adversely affect such Funds.
The Real Estate Fund has a tax year that ends on December 31. The following tax disclosures are representative as of September 30, 2018, except for the permanent reclassification and tax character of distributions, which are as of December 31, 2017. Accordingly, the disclosures are for informational use by shareholders and are subject to change attributable to activity through the end of the tax year-ending December 31, 2018.
Dividends from net investment income and distributions from net realized capital gains are determined in accordance with U.S. Federal income tax regulations, which may differ from those amounts determined under U.S. GAAP. These book/tax differences are either temporary or permanent in nature. To the extent these differences are permanent, they are charged or credited topaid-in capital, undistributed net investment income or accumulated net realized gain, as appropriate, in the period that the differences arise.
The tax character of dividends and distributions paid during the fiscal years or periods ended September 30, 2018 or September 30, 2017 (unless otherwise indicated) was as follows:
| | | | | | | | | | | | | | | | | | | | | | |
| | | | | Ordinary
Income ($ Thousands) | | | Long-term
Capital Gain ($ Thousands) | | | Return of Capital ($ Thousands) | | | Tax Exempt Income
($ Thousands) | | | Total ($ Thousands) | |
Large Cap Fund | | | | | | | | | | | | | | | | | | | | | | |
| | 2018 | | $ | 24,161 | | | $ | 163,013 | | | $ | – | | | $ | – | | | $ | 187,174 | |
| | 2017 | | | 21,285 | | | | – | | | | – | | | | – | | | | 21,285 | |
Large Cap Value Fund | | | | | | | | | | | | | | | | | | | | | | |
| | 2018 | | | 22,219 | | | | 48,679 | | | | – | | | | – | | | | 70,898 | |
| | 2017 | | | 19,081 | | | | – | | | | – | | | | – | | | | 19,081 | |
Large Cap Growth Fund | | | | | | | | | | | | | | | | | | | | | | |
| | 2018 | | | 4,438 | | | | 118,351 | | | | – | | | | – | | | | 122,789 | |
| | 2017 | | | 1,999 | | | | – | | | | – | | | | – | | | | 1,999 | |
Large Cap Index Fund | | | | | | | | | | | | | | | | | | | | | | |
| | 2018 | | | 1,229 | | | | – | | | | – | | | | – | | | | 1,229 | |
Tax-Managed Large Cap Fund | | | | | | | | | | | | | | | | | | | | | | |
| | 2018 | | | 31,067 | | | | 46,098 | | | | – | | | | – | | | | 77,165 | |
| | 2017 | | | 28,591 | | | | – | | | | – | | | | – | | | | 28,591 | |
S&P 500 Index Fund | | | | | | | | | | | | | | | | | | | | | | |
| | 2018 | | | 17,056 | | | | 5,078 | | | | – | | | | – | | | | 22,134 | |
| | 2017 | | | 13,125 | | | | 19,199 | | | | – | | | | – | | | | 32,324 | |
Small Cap Fund | | | | | | | | | | | | | | | | | | | | | | |
| | 2018 | | | 5,565 | | | | 38,028 | | | | – | | | | – | | | | 43,593 | |
| | 2017 | | | 886 | | | | – | | | | – | | | | – | | | | 886 | |
Small Cap Value Fund | | | | | | | | | | | | | | | | | | | | | | |
| | 2018 | | | 3,700 | | | | 29,488 | | | | – | | | | – | | | | 33,188 | |
| | 2017 | | | 2,158 | | | | – | | | | – | | | | – | | | | 2,158 | |
Small Cap Growth Fund | | | | | | | | | | | | | | | | | | | | | | |
| | |
SEI Institutional Managed Trust / Semi-Annual Report / March 31, 2019 | | 323 |
Notes to Financial Statements/Consolidated Notes to Financial Statements (Unaudited) (Continued)
March 31, 2019
| | | | | | | | | | | | | | | | | | | | | | | | |
| | | | | | Ordinary
Income
($ Thousands) | | | Long-term
Capital Gain
($ Thousands) | | | Return of Capital
($ Thousands) | | | Tax Exempt Income
($ Thousands) | | | Total
($ Thousands) | |
| | | 2018 | | | $ | – | | | $ | 1,186 | | | $ | – | | | $ | – | | | $ | 1,186 | |
Tax-Managed Small/Mid Cap Fund | | | | | | | | | | | | | | | | | | | | | | | | |
| | | 2018 | | | | 724 | | | | 16,005 | | | | – | | | | – | | | | 16,729 | |
| | | 2017 | | | | 2,538 | | | | 547 | | | | – | | | | – | | | | 3,085 | |
Mid-Cap Fund | | | | | | | | | | | | | | | | | | | | | | | | |
| | | 2018 | | | | 4,862 | | | | 4,552 | | | | – | | | | – | | | | 9,414 | |
| | | 2017 | | | | 1,020 | | | | 358 | | | | – | | | | – | | | | 1,378 | |
U.S. Managed Volatility Fund | | | | | | | | | | | | | | | | | | | | | | | | |
| | | 2018 | | | | 47,998 | | | | 111,818 | | | | – | | | | – | | | | 159,816 | |
| | | 2017 | | | | 25,245 | | | | 45,837 | | | | – | | | | – | | | | 71,082 | |
Global Managed Volatility Fund | | | | | | | | | | | | | | | | | | | | | | | | |
| | | 2018 | | | | 26,382 | | | | 76,034 | | | | – | | | | – | | | | 102,416 | |
| | | 2017 | | | | 50,137 | | | | 63,082 | | | | – | | | | – | | | | 113,219 | |
Tax-Managed Managed Volatility Fund | | | | | | | | | | | | | | | | | | | | | | | | |
| | | 2018 | | | | 15,125 | | | | 28,360 | | | | – | | | | – | | | | 43,485 | |
| | | 2017 | | | | 16,338 | | | | 26,042 | | | | – | | | | – | | | | 42,380 | |
Tax-Managed International Managed Volatility Fund | | | | | | | | | | | | | | | | | | | | | |
| | | 2018 | | | | 9,141 | | | | – | | | | – | | | | – | | | | 9,141 | |
| | | 2017 | | | | 77 | | | | 28 | | | | – | | | | – | | | | 105 | |
Real Estate Fund | | | | | | | | | | | | | | | | | | | | | | | | |
| | | 2018 | | | | 2,513 | | | | 13,955 | | | | – | | | | – | | | | 16,468 | |
| | | 2017 | | | | 7,755 | | | | 13,759 | | | | – | | | | – | | | | 21,514 | |
Enhanced Income Fund | | | | | | | | | | | | | | | | | | | | | | | | |
| | | 2018 | | | | 1,936 | | | | – | | | | – | | | | – | | | | 1,936 | |
| | | 2017 | | | | 2,547 | | | | – | | | | – | | | | – | | | | 2,547 | |
Core Fixed Income Fund | | | | | | | | | | | | | | | | | | | | | | | | |
| | | 2018 | | | | 62,547 | | | | – | | | | – | | | | – | | | | 62,547 | |
| | | 2017 | | | | 81,841 | | | | 7,985 | | | | – | | | | – | | | | 89,826 | |
High Yield Bond Fund | | | | | | | | | | | | | | | | | | | | | | | | |
| | | 2018 | | | | 108,348 | | | | – | | | | – | | | | – | | | | 108,348 | |
| | | 2017 | | | | 118,605 | | | | – | | | | – | | | | – | | | | 118,605 | |
Conservative Income Fund | | | | | | | | | | | | | | | | | | | | | | | | |
| | | 2018 | | | | 3,625 | | | | – | | | | – | | | | – | | | | 3,625 | |
| | | 2017 | | | | 1,777 | | | | – | | | | – | | | | – | | | | 1,777 | |
Tax-Free Conservative Income Fund | | | | | | | | | | | | | | | | | | | | | | | | |
| | | 2018 | | | | 1,660 | | | | – | | | | – | | | | – | | | | 1,660 | |
| | | 2017 | | | | 1 | | | | – | | | | – | | | | 767 | | | | 768 | |
Real Return Fund | | | | | | | | | | | | | | | | | | | | | | | | |
| | | 2018 | | | | 3,769 | | | | – | | | | – | | | | – | | | | 3,769 | |
| | | 2017 | | | | 2,688 | | | | – | | | | 406 | | | | – | | | | 3,094 | |
Dynamic Asset Allocation Fund | | | | | | | | | | | | | | | | | | | | | | | | |
| | | 2018 | | | | 12,839 | | | | – | | | | – | | | | – | | | | 12,839 | |
| | | 2017 | | | | 5,476 | | | | – | | | | – | | | | – | | | | 5,476 | |
Multi-Strategy Alternative Fund | | | | | | | | | | | | | | | | | | | | | | | | |
| | | 2018 | | | | 11,213 | | | | – | | | | – | | | | – | | | | 11,213 | |
| | | 2017 | | | | 366 | | | | – | | | | – | | | | – | | | | 366 | |
Multi-Asset Accumulation Fund | | | | | | | | | | | | | | | | | | | | | | | | |
| | | 2018 | | | | 55,747 | | | | 79,460 | | | | – | | | | – | | | | 135,207 | |
| | | 2017 | | | | 104,451 | | | | 61,492 | | | | – | | | | – | | | | 165,943 | |
Multi-Asset Income Fund | | | | | | | | | | | | | | | | | | | | | | | | |
| | | 2018 | | | | 35,157 | | | | 2,671 | | | | 2,095 | | | | – | | | | 39,923 | |
| | | 2017 | | | | 31,837 | | | | – | | | | – | | | | – | | | | 31,837 | |
Multi-Asset Inflation Managed Fund | | | | | | | | | | | | | | | | | | | | | | | | |
| | | 2018 | | | | 12,654 | | | | – | | | | – | | | | – | | | | 12,654 | |
| | | 2017 | | | | 10,449 | | | | – | | | | – | | | | – | | | | 10,449 | |
| | |
324 | | SEI Institutional Managed Trust / Semi-Annual Report / March 31, 2019 |
| | | | | | | | | | | | | | | | | | | | | | | | |
| | | | | | Ordinary
Income
($ Thousands) | | | Long-term
Capital Gain
($ Thousands) | | | Return of Capital
($ Thousands) | | | Tax Exempt Income
($ Thousands) | | | Total
($ Thousands) | |
Multi-Asset Capital Stability Fund | | | | | | | | | | | | | | | | | | | | | | | | |
| | | 2018 | | | $ | 21,764 | | | $ | 5,775 | | | $ | – | | | $ | – | | | $ | 27,539 | |
| | | 2017 | | | | 3,419 | | | | 1,622 | | | | – | | | | – | | | | 5,041 | |
Long/Short Alternative Fund | | | | | | | | | | | | | | | | | | | | | | | | |
| | | 2018 | | | | 1,328 | | | | 1,971 | | | | – | | | | – | | | | 3,299 | |
| | | 2017 | | | | – | | | | – | | | | 1 | | | | – | | | | 1 | |
As of March 31, 2019, the components of Distributable Earnings/(Accumulated Losses) were as follows:
| | | | | | | | | | | | | | | | | | | | | | | | | | | | | | | | | | | | |
| |
| | | Undistributed
Ordinary
Income
($ Thousands) | | | Undistributed
Long-Term
Capital Gain
($ Thousands) | | | Undistributed
Tax-Exempt
Income
($ Thousands) | | | Capital
Loss
Carryforwards
($ Thousands) | | | Post-
October
Losses
($ Thousands) | | | Late Year
Ordinary
Losses
($ Thousands) | | | Unrealized
Appreciation
(Depreciation)
($ Thousands) | | | Other
Temporary
Differences
($ Thousands) | | | Total
Distributable
Earnings
(Accumulated
Losses)
($ Thousands) | |
| |
Large Cap Fund | | $ | 38,183 | | | $ | 234,194 | | | $ | – | | | $ | – | | | $ | – | | | $ | – | | | $ | 623,910 | | | $ | (6 | ) | | | $896,281 | |
Large Cap Value Fund | | | 21,152 | | | | 99,940 | | | | – | | | | – | | | | – | | | | – | | | | 282,237 | | | | (3 | ) | | | 403,326 | |
Large Cap Growth Fund | | | 23,939 | | | | 143,029 | | | | – | | | | – | | | | – | | | | – | | | | 526,186 | | | | (2 | ) | | | 693,152 | |
Large Cap Index Fund | | | 1,094 | | | | 224 | | | | – | | | | – | | | | – | | | | – | | | | 11,701 | | | | – | | | | 13,019 | |
Tax-Managed Large Cap Fund | | | 10,665 | | | | 26,999 | | | | – | | | | – | | | | – | | | | – | | | | 2,107,375 | | | | 3 | | | | 2,145,042 | |
S&P 500 Index Fund | | | 4,942 | | | | 14,401 | | | | – | | | | – | | | | – | | | | – | | | | 522,333 | | | | (2 | ) | | | 541,674 | |
Small Cap Fund | | | 27,359 | | | | 51,099 | | | | – | | | | – | | | | – | | | | (11 | ) | | | 92,805 | | | | (1 | ) | | | 171,251 | |
Small Cap Value Fund | | | 7,045 | | | | 22,925 | | | | – | | | | – | | | | – | | | | – | | | | 52,796 | | | | (4 | ) | | | 82,762 | |
Small Cap Growth Fund | | | 9,410 | | | | 33,975 | | | | – | | | | – | | | | – | | | | – | | | | 83,419 | | | | 1 | | | | 126,805 | |
Tax-Managed Small/Mid Cap Fund | | | 175 | | | | 61,266 | | | | – | | | | – | | | | – | | | | – | | | | 364,846 | | | | 1 | | | | 426,288 | |
Mid-Cap Fund | | | 4,198 | | | | 8,115 | | | | – | | | | – | | | | – | | | | – | | | | 15,186 | | | | 2 | | | | 27,501 | |
U.S. Managed Volatility Fund | | | 19,492 | | | | 130,853 | | | | – | | | | – | | | | – | | | | – | | | | 247,690 | | | | – | | | | 398,035 | |
Global Managed Volatility Fund | | | 22,508 | | | | 78,860 | | | | – | | | | – | | | | – | | | | – | | | | 191,376 | | | | (1 | ) | | | 292,743 | |
Tax-Managed Managed Volatility Fund | | | 3,419 | | | | 30,667 | | | | – | | | | – | | | | – | | | | – | | | | 397,313 | | | | – | | | | 431,399 | |
Tax-Managed International Managed Volatility Fund | | | 8,921 | | | | – | | | | – | | | | (5,055 | ) | | | (5,283 | ) | | | – | | | | 40,302 | | | | 1 | | | | 38,886 | |
Real Estate Fund | | | – | | | | 11,864 | | | | – | | | | – | | | | – | | | | – | | | | 14,208 | | | | (3 | ) | | | 26,069 | |
Enhanced Income Fund | | | 658 | | | | – | | | | – | | | | (31,418 | ) | | | (410 | ) | | | – | | | | (703 | ) | | | 7 | | | | (31,866 | ) |
Core Fixed Income Fund | | | 5,813 | | | | – | | | | – | | | | (62,687 | ) | | | (35,906 | ) | | | – | | | | (56,019 | ) | | | (10,228 | ) | | | (159,027 | ) |
High Yield Bond Fund | | | 23,818 | | | | – | | | | – | | | | (53,071 | ) | | | – | | | | – | | | | (100,943 | ) | | | (7,580 | ) | | | (137,776 | ) |
Conservative Income Fund | | | 99 | | | | – | | | | – | | | | – | | | | – | | | | – | | | | 9 | | | | (97 | ) | | | 11 | |
Tax-Free Conservative Income Fund | | | 37 | | | | 6 | | | | – | | | | – | | | | – | | | | – | | | | (4 | ) | | | (37 | ) | | | 2 | |
Real Return Fund | | | 2,870 | | | | – | | | | – | | | | (3,388 | ) | | | (1,829 | ) | | | – | | | | (4,823 | ) | | | 3 | | | | (7,167 | ) |
Dynamic Asset Allocation Fund | | | 3,148 | | | | – | | | | – | | | | (1,958 | ) | | | (19,945 | ) | | | – | | | | 238,987 | | | | – | | | | 220,232 | |
Multi-Strategy Alternative Fund | | | 4,165 | | | | 14,047 | | | | – | | | | – | | | | – | | | | – | | | | (7,555 | ) | | | (1,457 | ) | | | 9,200 | |
Multi-Asset Accumulation Fund | | | 44,804 | | | | 7,015 | | | | – | | | | – | | | | – | | | | – | | | | (133,715 | ) | | | (6,885 | ) | | | (88,781 | ) |
Multi-Asset Income Fund | | | – | | | | – | | | | – | | | | (2,608 | ) | | | (10,818 | ) | | | – | | | | 17,141 | | | | (2,346 | ) | | | 1,369 | |
Multi-Asset Inflation Managed Fund | | | 13,373 | | | | – | | | | – | | | | (26,606 | ) | | | (6,066 | ) | | | – | | | | (102,081 | ) | | | (27 | ) | | | (121,407 | ) |
Multi-Asset Capital Stability Fund | | | 3,085 | | | | – | | | | – | | | | – | | | | (1,037 | ) | | | – | | | | (2,712 | ) | | | (229 | ) | | | (893 | ) |
Long/Short Alternative Fund | | | 506 | | | | 596 | | | | – | | | | – | | | | – | | | | – | | | | (4 | ) | | | – | | | | 1,098 | |
Post October losses represent losses realized on investment transactions from November 1, 2017 through September 30, 2018 that, in accordance with Federal income tax regulations, the Funds may defer and treat as having arisen in the following fiscal year. Deferred Late-Year Losses represent ordinary losses realized on investment transactions from January 1, 2018 through September 30, 2018 and specified losses realized on
investment transactions from November 1, 2017 through September 30, 2018, that, in accordance with Federal income tax regulations, the Fund defers and treats as having arisen in the following fiscal year.
| | |
SEI Institutional Managed Trust / Semi-Annual Report / March 31, 2019 | | 325 |
Notes to Financial Statements/Consolidated Notes to Financial Statements (Unaudited) (Continued)
March 31, 2019
For Federal income tax purposes, capital loss carryforwards may be carried forward and applied against future capital gains as follows:
| | | | | | | | | | | | | | | | | | | | | | | | |
| |
| | | Expires 2020
($ Thousands) | | | Expires 2019
($ Thousands) | | | Expires 2018
($ Thousands) | | | Expires 2017
($ Thousands) | | | Expires 2016
($ Thousands) | | | Total Capital
Loss Carryforwards
($ Thousands) | |
| |
Enhanced Income Fund | | $ | – | | | | 26,775 | | | | – | | | | – | | | | – | | | | 26,775 | |
Under the Regulated Investment Company Modernization Act of 2010, Funds will be permitted to carry forward capital losses incurred in taxable years beginning after December 22, 2010 for an unlimited period. However, any losses incurred during those future taxable years are required to be utilized prior to the losses incurred inpre-enactment taxable years. As a result of this ordering rule,pre-enactment capital loss carryforwards are more likely to expire unused. Additionally, post-enactment capital losses that are carried forward will retain their character as either short-term or long-term capital losses rather than being considered all short-term as under previous law. Losses carried forward under these new provisions are as follows:
| | | | | | | | | | | | |
| |
| | | Short-Term
Loss
($ Thousands) | | | Long-Term
Loss
($ Thousands) | | | Total *
($ Thousands) | |
| |
Tax-Managed International Managed Volatility Fund | | $ | 5,055 | | | $ | – | | | $ | 5,055 | |
Enhanced Income Fund | | | – | | | | 4,643 | | | | 4,643 | |
Core Fixed Income Fund | | | 19,813 | | | | 42,874 | | | | 62,687 | |
High Yield Bond Fund | | | – | | | | 53,071 | | | | 53,071 | |
Real Return Fund | | | 644 | | | | 2,744 | | | | 3,388 | |
Dynamic Asset Allocation Fund | | | 226 | | | | 1,732 | | | | 1,958 | |
Multi-Asset Income Fund | | | 1,652 | | | | 956 | | | | 2,608 | |
Multi-Asset Inflation Managed Fund | | | 25,975 | | | | 631 | | | | 26,606 | |
| * | This table should be used in conjunction with the capital loss carryforwards table. |
During the fiscal year ended September 30, 2018, the following Funds utilized capital loss carryforward to offset capital gains:
| | | | |
| |
| | | Amount Utilized
($ Thousands) | |
| |
Small Cap Growth | | $ | 2,742 | |
High Yield Bond Fund | | | 11,410 | |
The Enhanced Income Fund and High Yield Bond Fund had expired capital lass in the amount of $61,656 and $3,086 ($Thousands) for the year ended September 30, 2018.
For Federal income tax purposes, the cost of investments owned at September 30, 2018, and the net realized gains or losses on investments sold for the period, were different from amounts reported for financial reporting purposes primarily due to investments in partnerships that captures losses from other securities, and wash sales which cannot be used
for Federal income tax purposes in the current year and have been deferred for use in future years. The Federal tax cost and aggregate gross unrealized appreciation and depreciation on total investments held by the Funds at March 31, 2019, were as follows:
| | | | | | | | | | | | | | | | |
| |
| | | Federal Tax
Cost
($ Thousands) | | | Appreciated
Securities
($ Thousands) | | | Depreciated
Securities
($ Thousands) | | | Net
Unrealized
Appreciation
(Depreciation)
($ Thousands) | |
| |
Large Cap Fund | | $ | 1,927,631 | | | $ | 492,169 | | | $ | (58,411 | ) | | $ | 433,758 | |
Large Cap Value Fund | | | 1,120,269 | | | | 270,139 | | | | (40,466 | ) | | | 229,673 | |
Large Cap Growth Fund | | | 1,025,627 | | | | 467,737 | | | | (5,987 | ) | | | 461,750 | |
Large Cap Index Fund | | | 301,056 | | | | 23,256 | | | | (14,129 | ) | | | 9,127 | |
Tax-Managed Large Cap Fund | | | 2,214,918 | | | | 1,732,802 | | | | (4,749 | ) | | | 1,728,053 | |
S&P 500 Index Fund | | | 342,733 | | | | 535,075 | | | | (50,455 | ) | | | 484,620 | |
Small Cap Fund | | | 596,801 | | | | 79,020 | | | | (33,148 | ) | | | 45,872 | |
Small Cap Value Fund | | | 316,562 | | | | 44,361 | | | | (22,673 | ) | | | 21,688 | |
Small Cap Growth Fund | | | 325,792 | | | | 52,290 | | | | (20,342 | ) | | | 31,948 | |
Tax-Managed Small/Mid Cap Fund | | | 725,407 | | | | 230,639 | | | | (6,015 | ) | | | 224,624 | |
Mid-Cap Fund | | | 104,114 | | | | 12,654 | | | | (5,465 | ) | | | 7,189 | |
U.S. Managed Volatility Fund | | | 1,543,697 | | | | 276,374 | | | | (36,910 | ) | | | 239,464 | |
Global Managed Volatility Fund | | | 1,130,268 | | | | 182,823 | | | | (39,605 | ) | | | 143,218 | |
Tax-Managed Managed Volatility Fund | | | 675,514 | | | | 382,747 | | | | (5,039 | ) | | | 377,708 | |
Tax-Managed International Managed Volatility Fund | | | 322,483 | | | | 43,276 | | | | (7,729 | ) | | | 35,547 | |
Real Estate Fund | | | 111,518 | | | | 25,098 | | | | (697 | ) | | | 24,401 | |
Enhanced Income Fund | | | 64,744 | | | | 93 | | | | (634 | ) | | | (541 | ) |
Core Fixed Income Fund | | | 4,338,676 | | | | 79,684 | | | | (38,931 | ) | | | 40,753 | |
High Yield Bond Fund | | | 1,634,352 | | | | 52,491 | | | | (75,308 | ) | | | (22,817 | ) |
Conservative Income Fund | | | 256,096 | | | | 67 | | | | (18 | ) | | | 49 | |
Tax-Free Conservative Income Fund | | | 185,192 | | | | 22 | | | | 1 | | | | 21 | |
Real Return Fund | | | 248,128 | | | | 943 | | | | (1,231 | ) | | | (288 | ) |
Dynamic Asset Allocation Fund | | | 557,863 | | | | 238,192 | | | | (26,224 | ) | | | 211,968 | |
Multi-Strategy Alternative Fund | | | 389,762 | | | | 8,172 | | | | (16,163 | ) | | | (7,991 | ) |
Multi-Asset Accumulation Fund | | | 2,001,457 | | | | 63,447 | | | | (14,102 | ) | | | 49,345 | |
Multi-Asset Income Fund | | | 868,617 | | | | 49,508 | | | | (26,359 | ) | | | 23,149 | |
Multi-Asset Inflation Managed Fund | | | 1,005,163 | | | | 64,787 | | | | (33,696 | ) | | | 31,091 | |
Multi-Asset Capital Stability Fund | | | 690,574 | | | | 4,724 | | | | (2,236 | ) | | | 2,488 | |
| | |
326 | | SEI Institutional Managed Trust / Semi-Annual Report / March 31, 2019 |
| | | | | | | | | | | | | | | | |
| | | Federal Tax Cost
($ Thousands) | | | Appreciated
Securities
($ Thousands) | | | Depreciated
Securities
($ Thousands) | | | Net Unrealized
Appreciation
(Depreciation)
($ Thousands) | |
Long/Short Alternative Fund | | $ | 29,421 | | | $ | 20 | | | $ | (3 | ) | | $ | 17 | |
Management has analyzed the Funds’ tax positions taken on federal income tax returns for all open tax years and has concluded that as of March 31, 2019, no provision for income tax would be required in the Funds’ financial statements. The Funds’ federal and state income and federal excise tax returns for tax years for which the applicable statutes of limitations have not expired are subject to examination by the Internal Revenue Service and state departments of revenue.
10. SECURITIES LENDING
Each Fund may lend portfolio securities to brokers, dealers and other financial organizations that meet capital and other credit requirements or other criteria established by the Board. These loans may not exceed 33 1/3% of the total asset value of the Fund (including the loan collateral). No Fund will lend portfolio securities to its Adviser,sub-adviser or their affiliates unless it has applied for and received specific authority to do so from the SEC. Loans of portfolio securities will be fully collateralized by cash, letters of credit or U.S. Government securities. Collateral will be maintained in an amount equal to at least 100% of the current market value of the loaned securities by marking to market daily, although the borrower will be required to deliver collateral between 102% and 105% of the market value of borrowed securities for domestic and foreign securities, respectively. However, due to market fluctuations during the day, the value of securities loaned on a particular day may, during the course of the day, exceed the value of collateral. On each business day, the amount of collateral is adjusted based on the prior day’s market fluctuations and the current day’s lending activity. Income from lending activity is determined by the amount of interest earned on collateral, less any amounts payable to the borrowers of the securities and the lending agent. Lending securities involves certain risks, including the risk that the Fund may be delayed or restricted from recovering the loomed securities or disposing of the collateral for the loan, which could give rise to loss because at adverse market actions expenses and/ or delays in connection with the disposition of the underlying securities.
Cash collateral received in connection with securities lending is invested in eligible securities by the lending agent. These investments may include the SEI Liquidity Fund L.P. (“Liquidity Fund”), and the Fund bears its pro rate portion of the Liquidity Fund’s expenses and is subject to the risk of loss in the underlying investments
of the Liquidity Fund. There is no guarantee that these investments will not lose value.
The following is a summary of securities lending agreements held by certain Funds which would be subject to offset as of March 31, 2019 ($ Thousands):
| | | | | | | | | | | | |
| |
| | | Securities
Loaned
at Value | | | Cash
Collateral
Received (1) | | | Net
Amount | |
| |
Large Cap Fund | | | $14,761 | | | | $14,761 | | | | $– | |
Large Cap Value Fund | | | 4,377 | | | | 4,377 | | | | – | |
Large Cap Growth Fund | | | 11,014 | | | | 11,014 | | | | – | |
Tax-Managed Large Cap Fund | | | 36,153 | | | | 36,153 | | | | – | |
Small Cap Fund | | | 22,756 | | | | 22,756 | | | | – | |
Small Cap Value Fund | | | 11,176 | | | | 11,176 | | | | – | |
Small Cap Growth Fund | | | 19,784 | | | | 19,784 | | | | – | |
Tax-Managed Small/Mid Cap Fund | | | 86,388 | | | | 86,388 | | | | – | |
Core Fixed Income Fund | | | 118,052 | | | | 118,052 | | | | – | |
| (1) | Excess collateral received in connection with the above securities lending transactions is not shown for financial reporting purposes. See each Fund’s Summary Schedule of Investments or Schedule of Investments for the total collateral received. |
11. CONCENTRATION/RISKS
In the normal course of business, the Trust enters into contracts that provide general indemnifications by the Trust to the counterparty to the contract. The Trust’s maximum exposure under these arrangements is dependent on future claims that may be made against the Trust and, therefore, cannot be estimated; however, Management believes that, based on experience, the risk of loss from such claims is considered remote.
The following descriptions provide additional information about some of the risks of investing in the Funds:
Arbitrage Strategies Risk— Arbitrage strategies involve engaging in transactions that attempt to exploit price differences of identical, related or similar securities on different markets or in different forms. The Fund may realize losses or a reduced rate of return if underlying relationships among securities in which it takes investment positions change in an adverse manner or if a transaction is unexpectedly terminated or delayed. Trading to seek short-term capital appreciation can be expected to cause the Fund’s portfolio turnover rate to be substantially higher than that of the average equity-oriented investment company.
Asset-Backed Securities Risk— Payment of principal and interest on asset-backed securities is dependent largely on the cash flows generated by the assets backing the securities. Securitization trusts generally do not have any assets or sources of funds other than the receivables and related property they own, and asset-backed securities are generally not insured or guaranteed by the related sponsor or any other entity. Asset-backed securities may be more illiquid than more
| | |
SEI Institutional Managed Trust / Semi-Annual Report / March 31, 2019 | | 327 |
Notes to Financial Statements/Consolidated Notes to Financial Statements (Unaudited) (Continued)
March 31, 2019
conventional types of fixed income securities that the Fund may acquire.
Bank Loans Risk— With respect to bank loans, the Fund will assume the credit risk of both the borrower and the lender that is selling the participation in the loan. The Fund may also have difficulty disposing of bank loans because, in certain cases, the market for such instruments is not highly liquid.
Below Investment Grade Securities (Junk Bonds) Risk— Fixed income securities rated below investment grade ( junk bonds) involve greater risks of default or downgrade and are generally more volatile than investment grade securities because the prospect for repayment of principal and interest of many of these securities is speculative. Because these securities typically offer a higher rate of return to compensate investors for these risks, they are sometimes referred to as “high yield bonds,” but there is no guarantee that an investment in these securities will result in a high rate of return.
Call Risk— Issuers of callable bonds may call (redeem) securities with higher coupons or interest rates before their maturity dates. The Fund may be forced to reinvest the unanticipated proceeds at lower interest rates, resulting in a decline in the Fund’s income. Bonds may be called due to falling interest rates ornon-economical circumstances.
Collateralized Debt Obligations (CDOs) and
Collateralized Loan Obligations (CLOs) Risk— CDOs and CLOs are securities backed by an underlying portfolio of debt and loan obligations, respectively. CDOs and CLOs issue classes or “tranches” that vary in risk and yield and may experience substantial losses due to actual defaults, decrease in market value due to collateral defaults and removal of subordinate tranches, market anticipation of defaults and investor aversion to CDO and CLO securities as a class. The risks of investing in CDOs and CLOs depend largely on the tranche invested in and the type of the underlying debts and loans in the tranche of the CDO or CLO, respectively, in which the Fund invests. CDOs and CLOs also carry risks including, but not limited to, interest rate risk and credit risk, which are described below. For example, a liquidity crisis in the global credit markets could cause substantial fluctuations in prices for leveraged loans and high-yield debt securities and limited liquidity for such instruments. When the Fund invests in CDOs or CLOs, in addition to directly bearing the expenses associated with its own operations, it may bear a pro rata portion of the CDO’s or CLO’s expenses.
Commercial Paper Risk— Commercial paper is a short-term obligation with a maturity generally ranging from one to 270 days and is issued by U.S. or foreign
companies or other entities in order to finance their current operations. Such investments are unsecured and usually discounted from their value at maturity. The value of commercial paper may be affected by changes in the credit rating or financial condition of the issuing entities and will tend to fall when interest rates rise and rise when interest rates fall. Asset-backed commercial paper may be issued by structured investment vehicles or other conduits that are organized to issue the commercial paper and to purchase trade receivables or other financial assets. The repayment of asset-backed commercial paper depends primarily on the cash collections received from such issuer’s underlying asset portfolio and the issuer’s ability to issue new asset-backed commercial paper.
Commodity Investments and Derivatives Risk— Commodity investments and derivatives may be more volatile and less liquid than direct investments in the underlying commodities themselves. Commodity related equity returns can also be affected by the issuer’s financial structure or the performance of unrelated businesses. The value of a commodity investment or a derivative investment in commodities is typically based upon the price movements of a physical commodity, a commodity futures contract or commodity index or some other readily measurable economic variable that is dependent upon changes in the value of commodities or the commodities markets. The value of these securities will rise or fall in response to changes in the underlying commodity or related benchmark or investment, changes in interest rates or factors affecting a particular industry or commodity, such as natural disasters, weather and U.S. and international economic, political and regulatory developments.
Commodity-Linked Securities Risk— Investments in commodity-linked securities may be more volatile and less liquid than direct investments in the underlying commodities themselves. Commodity-related equity returns can also be affected by the issuer’s financial structure or the performance of unrelated businesses.
Concentration Risk— A downturn in the financial services industry would impact the Fund more than a portfolio that does not concentrate in securities issued by companies in the financial services industry.
Convertible and Preferred Securities Risk—
Convertible and preferred securities have many of the same characteristics as stocks, including many of the same risks. In addition, convertible securities may be more sensitive to changes in interest rates than stocks. Convertible securities may also have credit ratings below investment grade, meaning that they carry a
| | |
328 | | SEI Institutional Managed Trust / Semi-Annual Report / March 31, 2019 |
higher risk of failure by the issuer to pay principal and/or interest when due.
Corporate Fixed Income Securities Risk— Corporate fixed income securities respond to economic developments, especially changes in interest rates, as well as perceptions of the creditworthiness and business prospects of individual issuers.
Credit Risk— The risk that the issuer of a security or the counterparty to a contract will default or otherwise become unable to honor a financial obligation.
Currency Risk— As a result of the Fund’s investments in securities or other investments denominated in, and/ or receiving revenues in, foreign currencies, the Fund will be subject to currency risk. Currency risk is the risk that foreign currencies will decline in value relative to the U.S. dollar or, in the case of hedging positions, that the U.S. dollar will decline in value relative to the currency hedged. In either event, the dollar value of an investment in the Fund would be adversely affected. Currency exchange rates may fluctuate in response to, among other things, changes in interest rates, intervention (or failure to intervene) by U.S. or foreign governments, central banks or supranational entities, or by the imposition of currency controls or other political developments in the United States or abroad.
Depositary Receipts Risk— Depositary receipts, such as ADRs, are certificates evidencing ownership of shares of a foreign issuer that are issued by depositary banks and generally trade on an established market. Depositary receipts are subject to many of the risks associated with investing directly in foreign securities, including, among other things, political, social and economic developments abroad, currency movements and different legal, regulatory and tax environments.
Derivatives Risk — The Fund’s use of futures contracts is subject to leverage risk, correlation risk, liquidity risk and market risk. Leverage risk and liquidity risk are described below. Market risk is the risk that the market value of an investment may move up and down, sometimes rapidly and unpredictably. Correlation risk is the risk that changes in the value of the derivative may not correlate perfectly with the underlying asset, rate or index. Each of these risks could cause the Fund to lose more than the principal amount invested in a derivative instrument. The Fund’s use of derivatives may also increase the amount of taxes payable by shareholders. The Fund’s use of derivatives may also increase the amount of taxes payable by shareholders. Both U.S. andnon-U.S. regulators are in the process of adopting and implementing regulations governing derivatives markets, the ultimate impact of which remains unclear.
Directional or Tactical Strategies Risk — Directional or tactical strategies usually use long and short positions,
which entail predicting the direction that particular securities or sectors or the overall market might move. Directional or tactical strategies may utilize leverage and hedging. There may be a significant risk of loss if the Fund’s judgment is incorrect as to the direction, timing or extent of expected movements of particular securities or sectors or the market as a whole.
Distressed Securities Risk— Distressed securities frequently do not produce income while they are outstanding and may require the Fund to bear certain extraordinary expenses in order to protect and recover its investment. Distressed securities are at high risk for default.
Duration Risk— The longer-term securities in which the Fund may invest tend to be more volatile than shorter-term securities. A portfolio with a longer average portfolio duration is more sensitive to changes in interest rates than a portfolio with a shorter average portfolio duration.
Equity Market Risk— The risk that stock prices will fall over short or extended periods of time.
Event-Driven Strategies Risk— Event-driven strategies involve making evaluations and predictions about both the likelihood that a particular event in the life of a company will occur and the impact such an event will have on the value of the company’s securities. The transaction in which such a company is involved may be unsuccessful, take considerable time (or longer than anticipated) or may result in a distribution of cash or a new security, the value of which may be less than the purchase price of the company’s security. If an anticipated transaction does not occur, the Fund may be required to sell its securities at a loss.
Exchange-Traded Funds (ETFs) Risk— The risks of owning shares of an ETF generally reflect the risks of owning the underlying securities the ETF is designed to track, although lack of liquidity in an ETF could result in its value being more volatile than the underlying portfolio securities. When the Fund invests in an ETF, in addition to directly bearing the expenses associated with its own operations, it will bear a pro rata portion of the ETF’s expenses.
Exchange-Traded Notes (ETNs) Risk— The value of an ETN is subject to the credit risk of the issuer.
There may not be an active trading market available for some ETNs. Additionally, trading of ETNs may be halted or the ETN may be delisted by the listing exchange.
| | |
SEI Institutional Managed Trust / Semi-Annual Report / March 31, 2019 | | 329 |
Notes to Financial Statements/Consolidated Notes to Financial Statements (Unaudited) (Continued)
March 31, 2019
Extension Risk— The risk that rising interest rates may extend the duration of a fixed income security, typically reducing the security’s value.
Financial Services Industry Risk— The Fund’s portfolio is concentrated in investments in securities issued by companies in the financial services industry. The financial services industry is subject to extensive government regulation. Profitability is largely dependent on the availability and cost of capital, and can fluctuate significantly when interest rates change. Financial services companies are highly dependent on short-term interest rates and typically will be adversely affected by economic downturns or changes in banking regulations.
Fixed Income Market Risk— The prices of the Fund’s fixed income securities respond to economic developments, particularly interest rate changes, as well as to perceptions about the creditworthiness of individual issuers, including governments and their agencies. Generally, the Fund’s fixed income securities will decrease in value if interest rates rise and vice versa. In a low interest rate environment, risks associated with rising rates are heightened. Declines in dealer market-making capacity as a result of structural or regulatory changes could decrease liquidity and/or increase volatility in the fixed income markets. In the case of foreign securities, price fluctuations will reflect international economic and political events, as well as changes in currency valuations relative to the U.S. dollar. In response to these events, the Fund’s value may fluctuate and/or the Fund may experience increased redemptions from shareholders, which may impact the Fund’s liquidity or force the Fund to sell securities into a declining or illiquid market.
Foreign Investment/Emerging Markets Risk— The risk thatnon-U.S. securities may be subject to additional risks due to, among other things, political, social and economic developments abroad, currency movements and different legal, regulatory and tax environments. These additional risks may be heightened with respect to emerging market countries because political turmoil and rapid changes in economic conditions are more likely to occur in these countries.
Foreign Sovereign Debt Securities Risk— The risks that: (i) the governmental entity that controls the repayment of sovereign debt may not be willing or able to repay the principal and/or interest when it becomes due because of factors such as debt service burden, political constraints, cash flow problems and other national economic factors; (ii) governments may default on their debt securities, which may require holders of such securities to participate in debt rescheduling or additional lending to defaulting governments; and (iii)
there is no bankruptcy proceeding by which defaulted sovereign debt may be collected in whole or in part.
Income Risk— An investment in the Fund is subject to income risk, which is the possibility that the Fund’s yield will decline due to falling interest rates.
Inflation Protected Securities Risk— The value of inflation protected securities, including TIPS, generally will fluctuate in response to changes in “real” interest rates, generally decreasing when real interest rates rise and increasing when real interest rates fall. Real interest rates represent nominal (or stated) interest rates reduced by the expected impact of inflation. In addition, interest payments on inflation indexed securities will generally vary up or down along with the rate of inflation.
Interest Rate Risk— The risk that a rise in interest rates will cause a fall in the value of fixed income securities, including U.S. Government securities, in which the Fund invests. Although U.S. Government securities are considered to be among the safest investments, they are not guaranteed against price movements due to changing interest rates. A low interest rate environment may present greater interest rate risk because there may be a greater likelihood of rates increasing and rates may increase more rapidly.
Investment Company and Exchange-Traded Funds (ETFs) Risk— When the Fund invests in an investment company, in addition to directly bearing the expenses associated with its own operations, it will bear a pro rata portion of the investment company’s expenses. In addition, while the risks of owning shares of an investment company generally reflect the risks of owning the underlying investments of the investment company, the Fund may be subject to additional or different risks than if the Fund had invested directly in the underlying investments. For example, the lack of liquidity in an ETF could result in its value being more volatile than the underlying portfolio securities.Closed-end investment companies issue a fixed number of shares that trade on a stock exchange orover-the-counter at a premium or a discount to their net asset value. As a result, aclosed-end fund’s share price fluctuates based on what another investor is willing to pay rather than on the market value of the securities in the fund.
Investment in the Subsidiary Risk— A Subsidiary is not registered under the Investment Company Act of 1940 (the 1940 Act) and, unless otherwise noted in this prospectus, is not subject to all of the investor protections of the 1940 Act. Thus, the Fund, as an investor in a Subsidiary, will not have all of the protections offered to investors in registered investment companies. In addition, changes in the laws of the United States and/or the Cayman Islands, under which
| | |
330 | | SEI Institutional Managed Trust / Semi-Annual Report / March 31, 2019 |
the Fund and a Subsidiary, respectively, are organized, could result in the inability of the Fund and/or a Subsidiary to operate as intended and could negatively affect the Fund and its shareholders.
Investment Style Risk— The risk that large capitalization securities may underperform other segments of the equity markets or the equity markets as a whole.
Large Capitalization Risk— The risk that larger, more established companies may be unable to respond quickly to new competitive challenges such as changes in technology and consumer tastes. Larger companies also may not be able to attain the high growth rates of successful smaller companies.
Leverage Risk— The Fund’s use of derivatives may result in the Fund’s total investment exposure substantially exceeding the value of its portfolio securities and the Fund’s investment returns depending substantially on the performance of securities that the Fund may not directly own. The use of leverage can amplify the effects of market volatility on the Fund’s share price and may also cause the Fund to liquidate portfolio positions when it would not be advantageous to do so in order to satisfy its obligations. The Fund’s use of leverage may result in a heightened risk of investment loss.
Liquidity Risk— The risk that certain securities may be difficult or impossible to sell at the time and the price that the Fund would like. The Fund may have to lower the price of the security, sell other securities instead or forego an investment opportunity, any of which could have a negative effect on Fund management or performance.
Market Risk— The risk that the market value of a security may move up and down, sometimes rapidly and unpredictably. The Fund’s net asset value per share will fluctuate with the market prices of its portfolio securities. Market risk may affect a single issuer, an industry, a sector or the equity or bond market as a whole. Although the Fund may have an investment portfolio of short-term debt securities that is similar to the investment portfolios of many money market funds, the Fund is not a money market fund, does not seek to maintain a stable net asset value per share, and does not provide investors with the same regulatory protections as a money market fund. Under normal conditions, the Fund’s investments may be more susceptible than a money market fund to interest rate risk, valuation risk, credit risk and other risks relevant to the Fund’s investments. Certain of the Fund’s investments may not be permitted investments of a money market fund.
Master Limited Partnership (MLP) Risk— Investments in units of MLPs involve risks that differ from an
investment in common stock. Holders of the units of MLPs have more limited control and limited rights to vote on matters affecting the partnership. There are also certain tax risks associated with an investment in units of MLPs. In addition, conflicts of interest may exist between common unit holders, subordinated unit holders and the general partner of an MLP, including a conflict arising as a result of incentive distribution payments. The benefit the Fund derives from investment in MLP units is largely dependent on the MLPs being treated as partnerships and not as corporations for federal income tax purposes. If an MLP were classified as a corporation for federal income tax purposes, there would be a reduction in theafter-tax return to the Fund of distributions from the MLP, likely causing a reduction in the value of the Fund’s shares. MLP entities are typically focused in the energy, natural resources and real estate sectors of the economy. A downturn in the energy, natural resources or real estate sectors of the economy could have an adverse impact on the Fund. At times, the performance of securities of companies in the energy, natural resources and real estate sectors of the economy may lag the performance of other sectors or the broader market as a whole. The Internal Revenue Code of 1986, as amended, provides that the Fund is permitted to invest up to 25% of its assets in one or more qualified publicly traded partnerships (QPTPs), which will include certain MLPs, and treat the income allocated by such QPTPs as qualifying income for purposes of the regulated investment company annual qualifying income requirements described in “Taxes” below.
Mortgage Dollar Rolls Risk— Mortgage dollar rolls are transactions in which the Fund sells securities (usually mortgage-backed securities) and simultaneously contracts to repurchase substantially similar, but not identical, securities on a specified future date. If the broker-dealer to whom the Fund sells the security becomes insolvent, the Fund’s right to repurchase the security may be restricted. Other risks involved in entering into mortgage dollar rolls include the risk that the value of the security may change adversely over the term of the mortgage dollar roll and that the security the Fund is required to repurchase may be worth less than the security that the Fund originally held.
Mortgage-Backed Securities Risk— Mortgage-backed securities are affected significantly by the rate of prepayments and modifications of the mortgage loans backing those securities, as well as by other factors such as borrower defaults, delinquencies, realized or liquidation losses and other shortfalls. Mortgage backed securities are particularly sensitive to prepayment risk, which is described below, given that the term to maturity for mortgage loans is generally substantially longer than the expected lives of those securities;
| | |
SEI Institutional Managed Trust / Semi-Annual Report / March 31, 2019 | | 331 |
Notes to Financial Statements/Consolidated Notes to Financial Statements (Unaudited) (Continued)
March 31, 2019
however, the timing and amount of prepayments cannot be accurately predicted. The timing of changes in the rate of prepayments of the mortgage loans may significantly affect the Fund’s actual yield to maturity on any mortgage-backed securities, even if the average rate of principal payments is consistent with the Fund’s expectation. Along with prepayment risk, mortgage-backed securities are significantly affected by interest rate risk, which is described above. In a low interest rate environment, mortgage loan prepayments would generally be expected to increase due to factors such as refinancings and loan modifications at lower interest rates. In contrast, if prevailing interest rates rise, prepayments of mortgage loans would generally be expected to decline and therefore extend the weighted average lives of mortgage-backed securities held or acquired by the Fund.
Municipal Securities Risk— Municipal securities, like other fixed income securities, rise and fall in value in response to economic and market factors, primarily changes in interest rates, and actual or perceived credit quality. Rising interest rates will generally cause municipal securities to decline in value. Longerterm securities usually respond more sharply to interest rate changes than do shorter-term securities. A municipal security will also lose value if, due to rating downgrades or other factors, there are concerns about the issuer’s current or future ability to make principal or interest payments. State and local governments rely on taxes and, to some extent, revenues from private projects financed by municipal securities, to pay interest and principal on municipal debt. Poor statewide or local economic results or changing political sentiments may reduce tax revenues and increase the expenses of municipal issuers, making it more difficult for them to meet their obligations. Actual or perceived erosion of the creditworthiness of municipal issuers may reduce the value of the Fund’s holdings. As a result, the Fund will be more susceptible to factors that adversely affect issuers of municipal obligations than a mutual fund that does not have as great a concentration in municipal obligations. Municipal obligations may be underwritten or guaranteed by a relatively small number of financial services firms, so changes in the municipal securities market that affect those firms may decrease the availability of municipal instruments in the market, thereby making it difficult for theSub-Adviser to identify and obtain appropriate investments for the Fund’s portfolio. Also, there may be economic or political changes that impact the ability of issuers of municipal securities to repay principal and to make interest payments on securities owned by the Fund. Any changes in the financial condition of municipal
issuers may also adversely affect the value of the Fund’s securities.
Non-Diversified Risk— The Fund isnon-diversified, which means that it may invest in the securities of relatively few issuers. As a result, the Fund may be more susceptible to a single adverse economic or political occurrence affecting one or more of these issuers and may experience increased volatility due to its investments in those securities.
Opportunity Risk— The risk of missing out on an investment opportunity because the assets necessary to take advantage of it are tied up in other investments.
Portfolio Turnover Risk— Due to its investment strategy, the Fund may buy and sell securities frequently.
This may result in higher transaction costs and additional capital gains tax liabilities, which may affect the Fund’s performance.
Prepayment Risk— The risk that, in a declining interest rate environment, fixed income securities with stated interest rates may have the principal paid earlier than expected, requiring the Fund to invest the proceeds at generally lower interest rates.
Private Placements Risk— Investment in privately placed securities may be less liquid than in publicly traded securities. Although these securities may be resold in privately negotiated transactions, the prices realized from these sales could be less than those originally paid by the Fund or less than what may be considered the fair value of such securities. Further, companies whose securities are not publicly traded may not be subject to the disclosure and other investor protection requirements that might be applicable if their securities were publicly traded.
Real Estate Industry Risk— Securities of companies principally engaged in the real estate industry may be subject to the risks associated with the direct ownership of real estate. Risks commonly associated with the direct ownership of real estate include fluctuations in the value of underlying properties, defaults by borrowers or tenants, changes in interest rates and risks related to general or local economic conditions. The Fund’s investments are concentrated in issuers conducting business in the real estate industry, and therefore the Fund is subject to risks associated with legislative or regulatory changes, adverse market conditions and/or increased competition affecting that industry.
Real Estate Investment Trusts (REITs) Risk— REITs are trusts that invest primarily in commercial real estate or real estate-related loans. The Fund’s investments in REITs will be subject to the risks associated with the direct ownership of real estate. Risks commonly associated with the direct ownership of real estate
| | |
332 | | SEI Institutional Managed Trust / Semi-Annual Report / March 31, 2019 |
include fluctuations in the value of underlying properties, defaults by borrowers or tenants, changes in interest rates and risks related to general or local economic conditions. Some REITs may have limited diversification and may be subject to risks inherent in financing a limited number of properties.
Repurchase Agreement Risk— Although repurchase agreement transactions must be fully collateralized at all times, they generally create leverage and involve some counterparty risk to the Fund whereby a defaulting counterparty could delay or prevent the Fund’s recovery of collateral.
Short Sales Risk— A short sale involves the sale of a security that the Fund does not own in the expectation of purchasing the same security (or a security exchangeable therefore) at a later date at a lower price. Short sales expose the Fund to the risk that it will be required to buy the security sold short (also known as “covering” the short position) at a time when the security has appreciated in value, thus resulting in a loss to the Fund. Investment in short sales may also cause the Fund to incur expenses related to borrowing securities. Reinvesting proceeds received from short selling may create leverage, which can amplify the effects of market volatility on the Fund’s share price. In addition, shorting a future contract may require posting only a margin that may amount to less than the notional exposure of the contract. Such a practice may exacerbate the loss in a case of adverse price action.
Small and Medium Capitalization Companies Risk— The risk that small and medium capitalization companies in which the Fund may invest may be more vulnerable to adverse business or economic events than larger, more established companies. In particular, small and medium capitalization companies may have limited product lines, markets and financial resources and may depend upon a relatively small management group. Therefore, small capitalization and medium capitalization stocks may be more volatile than those of larger companies. Small capitalization and medium capitalization stocks may be tradedover-the-counter or listed on an exchange.
Tax Risk— The Fund may gain most of its exposure to the commodities markets through its investment in a Subsidiary, which invests in commodity investments and derivative instruments. To the extent the Fund invests in such instruments directly, it will seek to restrict its income from commodity-linked derivative instruments that do not generate qualifying income, such as commodity-linked swaps, to a maximum of 10% of its gross income (when combined with its other investments that produce nonqualifying income) to comply with certain qualifying income tests necessary for the Fund to qualify as a regulated investment
company (RIC) under Subchapter M of the Internal Revenue Code of 1986, as amended. The tax treatment of certain commodity-linked derivative instruments may be affected by future regulatory or legislative changes that could affect the character, timing and/or amount of the Fund’s taxable income or gains and distributions. The Fund intends to hold certain commodity-related investments indirectly through a Subsidiary. The Fund believes that income from the Subsidiary will be qualifying income because it expects that the Subsidiary will make annual distributions of its earnings and profits. The Fund intends to secure an opinion of counsel based on customary representations that actual distributions made to the Fund from its Subsidiary should be treated as “qualifying income.” If the Fund did not qualify as a RIC for any taxable year and certain relief provisions were not available, the Fund’s taxable income would be subject to tax at the Fund level and to a further tax at the shareholder level when such income is distributed. Failure to comply with the requirements for qualification as a RIC would have significant negative tax consequences to Fund shareholders.
Taxation Risk— The Fund is managed to minimize tax consequences to investors, but will likely earn taxable income and gains from time to time.
Tracking Error Risk— The risk that the Fund’s performance may vary substantially from the performance of the benchmark index it tracks as a result of cash flows, Fund expenses, imperfect correlation between the Fund’s investments and the index’s components and other factors.
U.S. Government Securities Risk— Although U.S. Government securities are considered to be among the safest investments, they are not guaranteed against price movements due to changing interest rates. Obligations issued by some U.S. Government agencies are backed by the U.S. Treasury, while others are backed solely by the ability of the agency to borrow from the U.S. Treasury or by the agency’s own resources.
Warrants Risk— Warrants are instruments that entitle the holder to buy an equity security at a specific price for a specific period of time. Warrants may be more speculative than other types of investments. The price of a warrant may be more volatile than the price of its underlying security, and a warrant may offer greater potential for capital appreciation as well as capital loss. A warrant ceases to have value if it is not exercised prior to its expiration date.
The foregoing is not intended to be a complete discussion of the risks associated with investing in a Fund. Please review each Fund’s current prospectus for additional disclosures regarding the principal risks associated with investing in a Fund.
| | |
SEI Institutional Managed Trust / Semi-Annual Report / March 31, 2019 | | 333 |
Notes to Financial Statements/Consolidated Notes to Financial Statements (Unaudited) (Continued)
March 31, 2019
12. CONCENTRATION OF SHAREHOLDERS
SEI Private Trust Company (“SPTC”) and SIMC are subsidiaries of SEI Investments Company. As of March 31, 2019, SPTC held of record the following percentage of outstanding shares of each Fund:
| | | | | | | | |
| | |
| Fund | | % Held | |
Large Cap Fund | | | | | | | | |
| | |
Class F | | | 98.13 | % | | | | |
| | |
Class Y | | | 20.33 | | | | | |
| | |
Large Cap Value Fund | | | | | | | | |
| | |
Class F | | | 93.37 | % | | | | |
| | |
Class I | | | 14.25 | | | | | |
| | |
Class Y | | | 94.59 | | | | | |
| | |
Large Cap Growth Fund | | | | | | | | |
| | |
Class F | | | 92.89 | % | | | | |
| | |
Class I | | | 17.45 | | | | | |
| | |
Class Y | | | 98.97 | | | | | |
| | |
Large Cap Index Fund | | | | | | | | |
| | |
Class F | | | 99.96 | % | | | | |
| | |
Tax-Managed Large Cap Fund | | | | | | | | |
| | |
Class F | | | 87.92 | % | | | | |
| | |
Class Y | | | 54.96 | | | | | |
| | |
S&P 500 Index Fund | | | | | | | | |
| | |
Class F | | | 51.21 | % | | | | |
| | |
Class I | | | 39.63 | | | | | |
| | |
Small Cap Fund | | | | | | | | |
| | |
Class F | | | 98.45 | % | | | | |
| | |
Class Y | | | 29.57 | | | | | |
| | |
Small Cap Value Fund | | | | | | | | |
| | |
Class F | | | 87.78 | % | | | | |
| | |
Class I | | | 8.02 | | | | | |
| | |
Class Y | | | 98.87 | | | | | |
| | |
Small Cap Growth Fund | | | | | | | | |
| | |
Class F | | | 90.55 | % | | | | |
| | |
Class I | | | 9.64 | | | | | |
| | |
Class Y | | | 97.75 | | | | | |
| | |
Tax-Managed Small/Mid Cap Fund | | | | | | | | |
| | |
Class F | | | 92.19 | % | | | | |
| | |
Class Y | | | 55.78 | | | | | |
| | |
Mid-Cap Fund | | | | | | | | |
| | |
Class F | | | 84.91 | % | | | | |
| | |
Class I | | | 0.00 | | | | | |
| | |
Class Y | | | 59.39 | | | | | |
| | |
U.S. Managed Volatility Fund | | | | | | | | |
| | |
Class F | | | 89.54 | % | | | | |
| | |
Class I | | | 0.00 | | | | | |
| | |
Class Y | | | 7.70 | | | | | |
| | |
Global Managed Volatility Fund | | | | | | | | |
| | |
Class F | | | 94.37 | % | | | | |
| | |
Class I | | | 0.00 | | | | | |
| | |
Class Y | | | 34.93 | | | | | |
| | |
Tax-Managed Managed Volatility Fund | | | | | | | | |
| | |
Class F | | | 87.60 | % | | | | |
| | |
Class Y | | | 69.88 | | | | | |
| | | | | | | | |
| | |
| Fund | | % Held | |
Tax-Managed International Managed Volatility Fund | | | | | | | | |
| | |
Class F | | | 97.28 | % | | | | |
| | |
Class Y | | | 80.17 | | | | | |
| | |
Real Estate Fund | | | | | | | | |
| | |
Class F | | | 83.54 | % | | | | |
| | |
Class I | | | 0.00 | | | | | |
| | |
Class Y | | | 49.53 | | | | | |
| | |
Enhanced Income Fund | | | | | | | | |
| | |
Class F | | | 95.90 | % | | | | |
| | |
Class I | | | 0.00 | | | | | |
| | |
Class Y | | | 94.86 | | | | | |
| | |
Core Fixed Income Fund | | | | | | | | |
| | |
Class F | | | 96.91 | % | | | | |
| | |
Class I | | | 35.74 | | | | | |
| | |
Class Y | | | 46.33 | | | | | |
| | |
High Yield Bond Fund | | | | | | | | |
| | |
Class F | | | 96.10 | % | | | | |
| | |
Class I | | | 95.95 | | | | | |
| | |
Class Y | | | 49.74 | | | | | |
| | |
Conservative Income Fund | | | | | | | | |
| | |
Class F | | | 98.74 | % | | | | |
| | |
Class Y | | | 40.73 | | | | | |
| | |
Tax-Free Conservative Income Fund | | | | | | | | |
| | |
Class F | | | 98.88 | % | | | | |
| | |
Class Y | | | 94.86 | | | | | |
| | |
Real Return Fund | | | | | | | | |
| | |
Class F | | | 98.55 | % | | | | |
| | |
Class Y | | | 31.98 | | | | | |
| | |
Dynamic Asset Allocation Fund | | | | | | | | |
| | |
Class F | | | 97.89 | % | | | | |
| | |
Class Y | | | 8.77 | | | | | |
| | |
Multi-Strategy Alternative Fund | | | | | | | | |
| | |
Class F | | | 98.19 | % | | | | |
| | |
Class Y | | | 63.58 | | | | | |
| | |
Multi-Asset Accumulation Fund | | | | | | | | |
| | |
Class F | | | 98.73 | % | | | | |
| | |
Class Y | | | 12.46 | | | | | |
| | |
Multi-Asset Income Fund | | | | | | | | |
| | |
Class F | | | 93.23 | % | | | | |
| | |
Class Y | | | 49.95 | | | | | |
| | |
Multi-Asset Inflation Managed Fund | | | | | | | | |
| | |
Class F | | | 98.68 | % | | | | |
| | |
Class Y | | | 25.09 | | | | | |
| | |
Multi-Asset Capital Stability Fund | | | | | | | | |
| | |
Class F | | | 98.91 | % | | | | |
| | |
Class Y | | | 17.34 | | | | | |
| | |
Long/Short Alternative Fund | | | | | | | | |
| | |
Class F | | | 96.74 | % | | | | |
| | |
Class Y | | | 0.00 | | | | | |
SPTC is not a direct service provider to the SEI Funds. However, SPTC performs a role in the comprehensive investment solution that SEI provides to investors. SPTC
| | |
334 | | SEI Institutional Managed Trust / Semi-Annual Report / March 31, 2019 |
holds shares in the Funds as custodian for shareholders that are clients of independent registered investment advisers, financial planners, bank trust departments and other financial advisers. SPTC maintains omnibus accounts at the Fund’s transfer agent.
13. FUND MERGER
At a meeting held on December 4, 2017, the Board determined that it was in the best interest of the U.S. Fixed Income Fund and its shareholders to reorganize the U.S. Fixed Income Fund into the Core Fixed Income Fund (each a “Fund” and together, the “Funds”), also a series of the Trust. The investment objective of the Funds was the same, which is to seek current income consistent with the preservation of capital. Also, the principal investment strategies of the two Funds were substantially similar. Accordingly, the Board approved
an Agreement and Plan of Reorganization (the “Plan of Reorganization”) that provided for the reorganization of the U.S. Fixed Income Fund (“Acquired Fund”) into the Core Fixed Income Fund (“Surviving Fund”). The transaction wastax-free, meaning that the U.S. Fixed Income Fund’s shareholders became shareholders of the Core Fixed Income Fund without realizing any gain or loss for federal income tax purposes.
The Reorganization occurred as of the close of business on August 10, 2018, whereby all of the assets of the Acquired Fund were transferred to the corresponding Surviving Fund and shareholders of Class F Shares and Class Y Shares of the Acquired Fund received shares of Class F Shares and Class Y shares of the Surviving Fund, respectively, in exchange for their shares as follows ($ Thousands).
| | | | | | | | | | | | | | | | | | | | |
| Acquired Fund | | Net Assets
($ Thousands) | | | Shares | | | Net
Investment Income
($ Thousands) | | | Net
Realized Loss on
Investments ($ Thousands) | | | Unrealized
Depreciation on
Investments ($ Thousands) | |
U.S. Fixed Income Fund | | | $1,853,263 | | | | 186,914 | | | | $(1) | | | | $(44,750) | | | | $(14,284) | |
| | | | | | | | | | | | | | | | | | | | | |
| Surviving Fund | | | | | | | | Shares Issues | | | Net Assets Prior to Merger
($ Thousands) | | | Net Assets After
Merger ($ Thousands) | |
Core Fixed Income Fund | | | | | | | | | | | 168,938 | | | | $2,161,422 | | | | $4,014,685 | |
Because the combined investment portfolios have been managed as a single integrated portfolio since the Reorganization was completed, it is not practicable to separate the amounts of revenue and earnings of the U.S. Fixed Income Fund that have been included in the Surviving Fund’s Statement of Operations since August 10, 2018.
Assuming the Reorganization had been completed on October 1, 2017, the beginning of the annual reporting period the Acquired Fund pro forma results of operations for the period ended September 30, 2018 are as follows ($ Thousands):
| | | | | | | | | | | | |
| Acquired Fund | | Net
Investment Income
($ Thousands) | | | Net Realized
Loss on Investments
($ Thousands) | | | Unrealized
Depreciation on
Investments ($ Thousands) | |
U.S. Fixed Income Fund | | | $96,476 | | | | $(57,786) | | | | $(96,373) | |
Because the combined investment portfolios have been managed as a single integrated portfolio since the acquisition was completed, it is not practicable to separate the amounts of revenue and earnings of U.S. Fixed Income Fund that have been included in the Fund’s Statement of Operations since August 10, 2018.
For financial reporting purposes, assets received and shares issued by the Fund were recorded at fair value; however, the cost basis of the investments received
from U.S. Fixed Income Fund, in the amount of $1976,180 (000), was carried forward to align ongoing reporting of the Fund’s realized and unrealized gains and losses with amounts distributable to shareholders for tax purposes. The Fund acquired capital loss carryovers are as follows
($ Thousands):
| | | | | | | | | | | | |
| | | Short-Term
Loss
($ Thousands) | | | Long-Term
Loss
($ Thousands) | | | Total
($ Thousands) | |
U.S. Fixed Income Fund | | $ | 13,163 | | | $ | 25,699 | | | $ | 38,862 | |
14. NEW ACCOUNTING PRONOUNCEMENT
In August 2018, the FASB issued Accounting Standards Update2018-13, Fair Value Measurement (Topic 820). The new guidance includes additions and modifications to disclosures requirements for fair value measurements. For public entities, the amendments are effective for financial statements issued for fiscal years beginning after December 15, 2019, and interim periods within those fiscal years. At this time, management is currently evaluating the impact of this new guidance on the financial statements and disclosures.
15. REGULATORY MATTERS
On August 17, 2018, the SEC adopted amendments to RegulationS-X. These changes are effective for periods after November 5, 2018. The updates to Registered Investment Companies were mainly focused on
| | |
SEI Institutional Managed Trust / Semi-Annual Report / March 31, 2019 | | 335 |
Notes to Financial Statements/Consolidated Notes to Financial Statements (Unaudited) (Concluded)
March 31, 2019
simplifying the presentation of distributable earnings by eliminating the need to present the components of distributable earnings on a book basis in the Statements of Assets and Liabilities/Consolidated Statements of Assets and Liabilities. The update also impacted the presentation of undistributed net investment income and distribution to shareholders on the Statements of Changes in Net Assets/. The amounts presented in the current Statements of Changes in Net Assets/ Consolidated Statements of Changes in Net Assets represent the aggregated total distributions of net investment income and realized capital gains, except for distributions classified as return of capital which are still presented separately. The disaggregated amounts from the prior fiscal year are broken out below if there were both distributions from net investment income and realized capital gains. Otherwise, the amount on the current Statement of Changes for the prior fiscal year end represents distributions of net investment income.
| | | | | | | | | | | | |
| | | Net Investment
Income | | | Net Realized
Gains | | | Total | |
| | | |
Large Cap Fund | | | | | | | | | | | | |
Class F | | | $20,429 | | | | $155,771 | | | | $176,200 | |
Class Y | | | 1,590 | | | | 9,384 | | | | 10,974 | |
Large Cap Value Fund | | | | | | | | | |
Class F | | | 18,678 | | | | 45,218 | | | | 63,896 | |
Class I | | | 55 | | | | 164 | | | | 219 | |
Class Y | | | 2,246 | | | | 4,537 | | | | 6,783 | |
Large Cap Growth Fund | | | | | | | | | |
Class F | | | 2,022 | | | | 109,987 | | | | 112,009 | |
Class I | | | 1 | | | | 286 | | | | 287 | |
Class Y | | | 422 | | | | 10,071 | | | | 10,493 | |
Tax-Managed Large Cap Fund | | | | | | | | | |
Class F | | | 27,609 | | | | 42,173 | | | | 69,782 | |
Class Y | | | 3,458 | | | | 3,925 | | | | 7,383 | |
S&P 500 Index Fund | | | | | | | | | | | | |
Class E | | | 4,249 | | | | 2,887 | | | | 7,136 | |
Class F | | | 10,057 | | | | 3,776 | | | | 13,833 | |
Class I | | | 90 | | | | 55 | | | | 145 | |
Class Y | | | 609 | | | | 411 | | | | 1,020 | |
Small Cap Fund | | | | | | | | | | | | |
Class F | | | – | | | | 41,012 | | | | 41,012 | |
Class Y | | | 11 | | | | 2,570 | | | | 2,581 | |
Small Cap Value Fund | | | | | | | | | |
Class F | | | 2,304 | | | | 27,242 | | | | 29,546 | |
Class I | | | 11 | | | | 200 | | | | 211 | |
Class Y | | | 357 | | | | 3,074 | | | | 3,431 | |
Small Cap Growth Fund | | | | | | | | | |
Class F | | | – | | | | 1,080 | | | | 1,080 | |
Class I | | | – | | | | 7 | | | | 7 | |
Class Y | | | – | | | | 99 | | | | 99 | |
Tax-Managed Small/Mid Cap Fund | | | | | | | | | |
Class F | | | 546 | | | | 14,622 | | | | 15,168 | |
Class Y | | | 179 | | | | 1,382 | | | | 1,561 | |
Mid-Cap Fund | | | | | | | | | | | | |
Class F | | | 892 | | | | 8,262 | | | | 9,154 | |
Class I | | | 4 | | | | 61 | | | | 65 | |
Class Y | | | 25 | | | | 170 | | | | 195 | |
U.S. Managed Volatility Fund | | | | | | | | | |
Class F | | | 14,288 | | | | 73,695 | | | | 87,983 | |
Class I | | | 17 | | | | 104 | | | | 121 | |
Class Y | | | 12,038 | | | | 59,674 | | | | 71,712 | |
Global Managed Volatility Fund | | | | | | | | | |
Class F | | | 18,701 | | | | 67,396 | | | | 86,097 | |
Class I | | | 21 | | | | 86 | | | | 107 | |
Class Y | | | 4,329 | | | | 11,883 | | | | 16,212 | |
Tax-Managed Managed Volatility Fund | | | | | | | | | |
Class F | | | 14,038 | | | | 26,713 | | | | 40,751 | |
Class Y | | | 1,087 | | | | 1,647 | | | | 2,734 | |
Real Estate Fund | | | | | | | | | | | | |
Class F | | | 1,561 | | | | 10,611 | | | | 12,172 | |
Class I | | | 6 | | | | 45 | | | | 51 | |
Class Y | | | 573 | | | | 3,672 | | | | 4,245 | |
High Yield Bond Fund | | | | | | | | | |
Class F | | | 77,103 | | | | 18,986 | | | | 96,089 | |
Class I | | | 33 | | | | 11 | | | | 44 | |
Class Y | | | 9,850 | | | | 2,365 | | | | 12,215 | |
Conservative Income Fund | | | | | | | | | |
Class F | | | 3,259 | | | | 2 | | | | 3,261 | |
Class Y | | | 364 | | | | – | | | | 364 | |
Dynamic Asset Allocation Fund | | | | | | | | | |
| | |
336 | | SEI Institutional Managed Trust / Semi-Annual Report / March 31, 2019 |
| | | | | | | | | | | | |
| | | Net Investment
Income | | | Net Realized
Gains | | | Total | |
| | | |
Class F | | | 10,480 | | | | 884 | | | | 11,364 | |
Class Y | | | 1,383 | | | | 92 | | | | 1,475 | |
Multi-Strategy Alternative Fund | | | | | | | | | | | | |
Class F | | | 1,267 | | | | 9,825 | | | | 11,092 | |
Class Y | | | 27 | | | | 94 | | | | 121 | |
Multi-Asset Accumulation Fund | | | | | | | | | | | | |
Class F | | | – | | | | 123,715 | | | | 123,715 | |
Class Y | | | – | | | | 11,492 | | | | 11,492 | |
Multi-Asset Income Fund | | | | | | | | | | | | |
Class F | | | 24,006 | | | | 6,954 | | | | 30,960 | |
Class Y | | | 5,369 | | | | 1,499 | | | | 6,868 | |
Multi-Asset Capital Stability Fund | | | | | | | | | | | | |
Class F | | | 13,747 | | | | 11,949 | | | | 25,696 | |
Class Y | | | 1,008 | | | | 835 | | | | 1,843 | |
Long/Short Alternative Fund | | | | | | | | | | | | |
Class F | | | – | | | | 2 | | | | 2 | |
Class Y | | | 129 | | | | 3,168 | | | | 3,297 | |
16. SUBSEQUENT EVENTS
Management evaluated the need for disclosures and/or adjustments resulting from subsequent events through the date the financial statements were issued.
At a meeting of the Board of Trustees (the “Board”) of SEI Institutional Managed Trust (the “Trust”) held on April 2, 2019, the Board approved the liquidation of the Enhanced Income Fund, a series of the Trust. The decision to liquidate was based on declining asset levels in the Fund, with no expectation of future asset growth, which has impaired the viability of the Fund. Each shareholder received its pro rata portion of the Fund’s liquidation proceeds on May 13, 2019.
| | |
SEI Institutional Managed Trust / Semi-Annual Report / March 31, 2019 | | 337 |
Disclosure of Fund Expenses (Unaudited)
March 31, 2019
All mutual funds have operating expenses. As a shareholder of a fund, your investment is affected by these ongoing costs, which include (among others) costs for portfolio management, administrative services, and shareholder reports like this one. It is important for you to understand the impact of these costs on your investment returns.
Operating expenses such as these are deducted from the fund’s gross income and directly reduce your final investment return. These expenses are expressed as a percentage of the fund’s average net assets; this percentage is known as the fund’s expense ratio.
The following examples use the expense ratio and are intended to help you understand the ongoing costs (in dollars) of investing in your fund and to compare these costs with those of other mutual funds. The examples are based on an investment of $1,000 made at the beginning of the period shown and held for the entire period.
The table on this page illustrates your fund’s costs in two ways:
•Actual fund return. This section helps you to estimate the actual expenses after fee waivers that your Fund incurred over the period. The “Expenses Paid During Period” column shows the actual dollar expense cost incurred by a $1,000 investment in the Fund, and the “Ending Account Value” number is derived from deducting that expense cost from the Fund’s gross investment return.
You can use this information, together with the actual amount you invested in the Fund, to estimate the expenses you paid over that period. Simply divide your actual account value by $1,000 to arrive at a ratio (for example, an $8,600 account value divided by $1,000 = 8.6), then multiply that ratio by the number shown for your Fund under “Expenses Paid During Period.”
•Hypothetical 5% return. This section helps you compare your Fund’s costs with those of other mutual funds. It assumes that the fund had an annual 5% return before expenses during the year, but that the expense ratio (Column 3) for the period is unchanged. This example is useful in making comparisons because the Securities and Exchange Commission requires all mutual funds to make this 5% calculation. You can assess your Fund’s comparative cost by comparing the hypothetical result for your Fund in the “Expense Paid During Period” column with those that appear in the same charts in the shareholder reports for other funds.
NOTE: Because the return is set at 5% for comparison purposes — NOT your Fund’s actual return — the account values shown may not apply to your specific investment.
| | | | | | | | | | | | | | | | |
| | | Beginning
Account
Value
10/1/18 | | | Ending
Account
Value
3/31/19 | | | Annualized
Expense
Ratios | | | Expenses
Paid
During
Period * | |
Large Cap Fund | |
Actual Fund Return | | | | | |
Class F Shares | | $ | 1,000.00 | | | $ | 969.60 | | | | 0.89 | % | | $ | 4.37 | |
Class Y Shares | | | 1,000.00 | | | | 971.00 | | | | 0.64 | | | | 3.14 | |
Hypothetical 5% Return | | | | | |
Class F Shares | | $ | 1,000.00 | | | $ | 1,020.50 | | | | 0.89 | % | | $ | 4.48 | |
Class Y Shares | | | 1,000.00 | | | | 1,021.70 | | | | 0.64 | | | | 3.23 | |
Large Cap Value Fund | |
Actual Fund Return | | | | | |
Class F Shares | | $ | 1,000.00 | | | $ | 965.70 | | | | 0.89 | % | | $ | 4.36 | |
Class I Shares | | | 1,000.00 | | | | 964.70 | | | | 1.11 | | | | 5.44 | |
Class Y Shares | | | 1,000.00 | | | | 967.40 | | | | 0.64 | | | | 3.14 | |
Hypothetical 5% Return | | | | | |
Class F Shares | | $ | 1,000.00 | | | $ | 1,020.50 | | | | 0.89 | % | | $ | 4.48 | |
Class I Shares | | | 1,000.00 | | | | 1,019.40 | | | | 1.11 | | | | 5.59 | |
Class Y Shares | | | 1,000.00 | | | | 1,021.70 | | | | 0.64 | | | | 3.23 | |
| | | | | | | | | | | | | | | | |
| | | Beginning
Account
Value
10/1/18 | | | Ending
Account
Value
3/31/19 | | | Annualized
Expense
Ratios | | | Expenses
Paid
During
Period * | |
Large Cap Growth Fund | |
Actual Fund Return | | | | | |
Class F Shares | | $ | 1,000.00 | | | $ | 987.10 | | | | 0.89 | % | | $ | 4.41 | |
Class I Shares | | | 1,000.00 | | | | 986.00 | | | | 1.11 | | | | 5.50 | |
Class Y Shares | | | 1,000.00 | | | | 988.20 | | | | 0.64 | | | | 3.17 | |
Hypothetical 5% Return | | | | | |
Class F Shares | | $ | 1,000.00 | | | $ | 1,020.50 | | | | 0.89 | % | | $ | 4.48 | |
Class I Shares | | | 1,000.00 | | | | 1,019.40 | | | | 1.11 | | | | 5.59 | |
Class Y Shares | | | 1,000.00 | | | | 1,021.70 | | | | 0.64 | | | | 3.23 | |
Large Cap Index Fund | |
Actual Fund Return | |
Class F Shares | | $ | 1,000.00 | | | $ | 981.20 | | | | 0.25 | % | | $ | 1.23 | |
Hypothetical 5% Return | |
Class F Shares | | $ | 1,000.00 | | | $ | 1,023.70 | | | | 0.25 | % | | $ | 1.26 | |
| | |
338 | | SEI Institutional Managed Trust / Semi-Annual Report / March 31, 2019 |
| | | | | | | | | | | | | | | | |
| | | Beginning
Account
Value
10/1/18 | | | Ending
Account
Value
3/31/19 | | | Annualized
Expense
Ratios | | | Expenses
Paid
During
Period * | |
Tax-Managed Large Cap Fund | |
Actual Fund Return | | | | | | | | | | | | | | | | |
| | | | |
Class F Shares | | $ | 1,000.00 | | | $ | 967.50 | | | | 0.89% | | | | $ 4.37 | |
Class Y Shares | | | 1,000.00 | | | | 968.80 | | | | 0.64 | | | | 3.14 | |
Hypothetical 5% Return | | | | | | | | | | | | | | | | |
| | | | |
Class F Shares | | $ | 1,000.00 | | | $ | 1,020.50 | | | | 0.89% | | | | $ 4.48 | |
Class Y Shares | | | 1,000.00 | | | | 1,021.70 | | | | 0.64 | | | | 3.23 | |
S&P 500 Index Fund | |
Actual Fund Return | | | | | | | | | | | | | | | | |
| | | | |
Class F Shares | | $ | 1,000.00 | | | $ | 982.00 | | | | 0.25% | | | | $ 1.24 | |
Class I Shares | | | 1,000.00 | | | | 980.20 | | | | 0.65 | | | | 3.21 | |
Hypothetical 5% Return | | | | | | | | | | | | | | | | |
| | | | |
Class F Shares | | $ | 1,000.00 | | | $ | 1,023.70 | | | | 0.25% | | | | $ 1.26 | |
Class I Shares | | | 1,000.00 | | | | 1,021.69 | | | | 0.65 | | | | 3.28 | |
Small Cap Fund | |
Actual Fund Return | | | | | | | | | | | | | | | | |
| | | | |
Class F Shares | | $ | 1,000.00 | | | $ | 892.70 | | | | 1.14% | | | | $ 5.38 | |
Class Y Shares | | | 1,000.00 | | | | 894.30 | | | | 0.89 | | | | 4.20 | |
Hypothetical 5% Return | | | | | | | | | | | | | | | | |
| | | | |
Class F Shares | | $ | 1,000.00 | | | $ | 1,019.20 | | | | 1.14% | | | | $ 5.74 | |
Class Y Shares | | | 1,000.00 | | | | 1,020.50 | | | | 0.89 | | | | 4.48 | |
Small Cap Value Fund | |
Actual Fund Return | | | | | | | | | | | | | | | | |
| | | | |
Class F Shares | | $ | 1,000.00 | | | $ | 908.70 | | | | 1.14% | | | | $ 5.42 | |
Class I Shares | | | 1,000.00 | | | | 907.70 | | | | 1.36 | | | | 6.47 | |
Class Y Shares | | | 1,000.00 | | | | 910.00 | | | | 0.89 | | | | 4.24 | |
Hypothetical 5% Return | | | | | | | | | | | | | | | | |
| | | | |
Class F Shares | | $ | 1,000.00 | | | $ | 1,019.20 | | | | 1.14% | | | | $ 5.74 | |
Class I Shares | | | 1,000.00 | | | | 1,018.20 | | | | 1.36 | | | | 6.84 | |
Class Y Shares | | | 1,000.00 | | | | 1,020.50 | | | | 0.89 | | | | 4.48 | |
Small Cap Growth Fund | |
Actual Fund Return | | | | | | | | | | | | | | | | |
| | | | |
Class F Shares | | $ | 1,000.00 | | | $ | 891.00 | | | | 1.11% | | | | $ 5.23 | |
Class I Shares | | | 1,000.00 | | | | 890.20 | | | | 1.36 | | | | 6.41 | |
Class Y Shares | | | 1,000.00 | | | | 892.40 | | | | 0.86 | | | | 4.06 | |
Hypothetical 5% Return | | | | | | | | | | | | | | | | |
| | | | |
Class F Shares | | $ | 1,000.00 | | | $ | 1,019.40 | | | | 1.11% | | | | $ 5.59 | |
Class I Shares | | | 1,000.00 | | | | 1,018.20 | | | | 1.36 | | | | 6.84 | |
Class Y Shares | | | 1,000.00 | | | | 1,020.60 | | | | 0.86 | | | | 4.33 | |
Tax-Managed Small/Mid Cap Fund | |
Actual Fund Return | | | | | | | | | | | | | | | | |
| | | | |
Class F Shares | | $ | 1,000.00 | | | $ | 898.60 | | | | 1.11% | | | | $ 5.25 | |
Class Y Shares | | | 1,000.00 | | | | 899.50 | | | | 0.89 | | | | 4.21 | |
Hypothetical 5% Return | | | | | | | | | | | | | | | | |
| | | | |
Class F Shares | | $ | 1,000.00 | | | $ | 1,019.40 | | | | 1.11% | | | | $ 5.59 | |
Class Y Shares | | | 1,000.00 | | | | 1,020.50 | | | | 0.89 | | | | 4.48 | |
| | | | | | | | | | | | | | | | |
| | | Beginning
Account
Value
10/1/18 | | | Ending
Account
Value
3/31/19 | | | Annualized
Expense
Ratios | | | Expenses
Paid
During
Period * | |
Mid-Cap Fund | |
Actual Fund Return | | | | | | | | | | | | | | | | |
| | | | |
Class F Shares | | $ | 1,000.00 | | | $ | 957.50 | | | | 0.98% | | | | $ 4.78 | |
Class I Shares | | | 1,000.00 | | | | 956.40 | | | | 1.20 | | | | 5.85 | |
Class Y Shares | | | 1,000.00 | | | | 958.70 | | | | 0.73 | | | | 3.56 | |
Hypothetical 5% Return | | | | | | | | | | | | | | | | |
| | | | |
Class F Shares | | $ | 1,000.00 | | | $ | 1,020.00 | | | | 0.98% | | | | $ 4.94 | |
Class I Shares | | | 1,000.00 | | | | 1,018.90 | | | | 1.20 | | | | 6.04 | |
Class Y Shares | | | 1,000.00 | | | | 1,021.30 | | | | 0.73 | | | | 3.68 | |
U.S. Managed Volatility Fund | |
Actual Fund Return | | | | | | | | | | | | | | | | |
| | | | |
Class F Shares | | $ | 1,000.00 | | | $ | 1,015.50 | | | | 0.95% | | | | $ 4.77 | |
Class I Shares | | | 1,000.00 | | | | 1,014.20 | | | | 1.20 | | | | 6.03 | |
Class Y Shares | | | 1,000.00 | | | | 1,016.80 | | | | 0.70 | | | | 3.52 | |
Hypothetical 5% Return | | | | | | | | | | | | | | | | |
| | | | |
Class F Shares | | $ | 1,000.00 | | | $ | 1,020.20 | | | | 0.95% | | | | $ 4.78 | |
Class I Shares | | | 1,000.00 | | | | 1,018.90 | | | | 1.20 | | | | 6.04 | |
Class Y Shares | | | 1,000.00 | | | | 1,021.40 | | | | 0.70 | | | | 3.53 | |
Global Managed Volatility Fund | |
Actual Fund Return | | | | | | | | | | | | | | | | |
| | | | |
Class F Shares | | $ | 1,000.00 | | | $ | 989.00 | | | | 1.11% | | | | $ 5.50 | |
Class I Shares | | | 1,000.00 | | | | 986.70 | | | | 1.36 | | | | 6.74 | |
Class Y Shares | | | 1,000.00 | | | | 989.20 | | | | 0.86 | | | | 4.27 | |
Hypothetical 5% Return | | | | | | | | | | | | | | | | |
| | | | |
Class F Shares | | $ | 1,000.00 | | | $ | 1,019.40 | | | | 1.11% | | | | $ 5.59 | |
Class I Shares | | | 1,000.00 | | | | 1,018.20 | | | | 1.36 | | | | 6.84 | |
Class Y Shares | | | 1,000.00 | | | | 1,020.60 | | | | 0.86 | | | | 4.33 | |
Tax-Managed Managed Volatility Fund | |
Actual Fund Return | | | | | | | | | | | | | | | | |
| | | | |
Class F Shares | | $ | 1,000.00 | | | $ | 1,003.40 | | | | 1.00% | | | | $ 4.99 | |
Class Y Shares | | | 1,000.00 | | | | 1,004.10 | | | | 0.75 | | | | 3.75 | |
Hypothetical 5% Return | | | | | | | | | | | | | | | | |
| | | | |
Class F Shares | | $ | 1,000.00 | | | $ | 1,019.90 | | | | 1.00% | | | | $ 5.04 | |
Class Y Shares | | | 1,000.00 | | | | 1,021.20 | | | | 0.75 | | | | 3.78 | |
Tax-Managed International Managed Volatility Fund | |
Actual Fund Return | | | | | | | | | | | | | | | | |
| | | | |
Class F Shares | | $ | 1,000.00 | | | $ | 965.20 | | | | 1.11% | | | | $ 5.44 | |
Class Y Shares | | | 1,000.00 | | | | 966.30 | | | | 0.86 | | | | 4.22 | |
Hypothetical 5% Return | | | | | | | | | | | | | | | | |
| | | | |
Class F Shares | | $ | 1,000.00 | | | $ | 1,019.40 | | | | 1.11% | | | | $ 5.59 | |
Class Y Shares | | | 1,000.00 | | | | 1,020.60 | | | | 0.86 | | | | 4.33 | |
Real Estate Fund | |
Actual Fund Return | | | | | | | | | | | | | | | | |
| | | | |
Class F Shares | | $ | 1,000.00 | | | $ | 1,069.20 | | | | 1.14% | | | | $ 5.88 | |
Class I Shares | | | 1,000.00 | | | | 1,068.20 | | | | 1.36 | | | | 7.01 | |
Class Y Shares | | | 1,000.00 | | | | 1,070.60 | | | | 0.89 | | | | 4.59 | |
Hypothetical 5% Return | | | | | | | | | | | | | | | | |
| | | | |
Class F Shares | | $ | 1,000.00 | | | $ | 1,019.20 | | | | 1.14% | | | | $ 5.74 | |
Class I Shares | | | 1,000.00 | | | | 1,018.20 | | | | 1.36 | | | | 6.84 | |
Class Y Shares | | | 1,000.00 | | | | 1,020.50 | | | | 0.89 | | | | 4.48 | |
| | |
SEI Institutional Managed Trust / Semi-Annual Report / March 31, 2019 | | 339 |
Disclosure of Fund Expenses (Unaudited) (Concluded)
March 31, 2019
| | | | | | | | | | | | | | |
| | | Beginning
Account
Value
10/1/18 | | | Ending
Account
Value
3/31/19 | | | Annualized
Expense
Ratios | | Expenses
Paid
During
Period * | |
Enhanced Income Fund | | | | |
Actual Fund Return | | | | |
| | | | |
Class F Shares | | $ | 1,000.00 | | | $ | 1,009.60 | | | 0.60% | | | $3.01 | |
Class I Shares | | | 1,000.00 | | | | 1,009.50 | | | 0.85 | | | 4.26 | |
Class Y Shares | | | 1,000.00 | | | | 1,011.60 | | | 0.46 | | | 2.31 | |
Hypothetical 5% Return | | | | |
Class F Shares | | $ | 1,000.00 | | | $ | 1,021.94 | | | 0.60% | | | $3.02 | |
| | | | |
Class I Shares | | | 1,000.00 | | | | 1,020.64 | | | 0.85 | | | 4.28 | |
Class Y Shares | | | 1,000.00 | | | | 1,022.64 | | | 0.46 | | | 2.32 | |
Core Fixed Income Fund | | | | |
Actual Fund Return | | | | |
| | | | |
Class F Shares | | $ | 1,000.00 | | | $ | 1,046.90 | | | 0.66% | | | $3.37 | |
Class I Shares | | | 1,000.00 | | | | 1,044.80 | | | 0.88 | | | 4.49 | |
Class Y Shares | | | 1,000.00 | | | | 1,047.20 | | | 0.41 | | | 2.09 | |
Hypothetical 5% Return | | | | |
Class F Shares | | $ | 1,000.00 | | | $ | 1,021.60 | | | 0.66% | | | $3.33 | |
Class I Shares | | | 1,000.00 | | | | 1,020.50 | | | 0.88 | | | 4.43 | |
Class Y Shares | | | 1,000.00 | | | | 1,022.90 | | | 0.41 | | | 2.07 | |
High Yield Bond Fund | | | | |
Actual Fund Return | | | | |
Class F Shares | | $ | 1,000.00 | | | $ | 1,008.30 | | | 0.89% | | | $4.46 | |
Class I Shares | | | 1,000.00 | | | | 1,004.70 | | | 1.11 | | | 5.60 | |
Class Y Shares | | | 1,000.00 | | | | 1,008.10 | | | 0.64 | | | 3.20 | |
Hypothetical 5% Return | | | | |
Class F Shares | | $ | 1,000.00 | | | $ | 1,020.50 | | | 0.89% | | | $4.48 | |
Class I Shares | | | 1,000.00 | | | | 1,019.40 | | | 1.11 | | | 5.64 | |
Class Y Shares | | | 1,000.00 | | | | 1,021.70 | | | 0.64 | | | 3.23 | |
Conservative Income Fund | | | | |
Actual Fund Return | | | | |
Class F Shares | | $ | 1,000.00 | | | $ | 1,011.50 | | | 0.30% | | | $1.50 | |
Class Y Shares | | | 1,000.00 | | | | 1,012.00 | | | 0.20 | | | 1.00 | |
Hypothetical 5% Return | | | | |
Class F Shares | | $ | 1,000.00 | | | $ | 1,023.40 | | | 0.30% | | | $1.51 | |
Class Y Shares | | | 1,000.00 | | | | 1,023.90 | | | 0.20 | | | 1.01 | |
Tax-Free Conservative Income Fund | | | | |
Actual Fund Return | | | | |
Class F Shares | | $ | 1,000.00 | | | $ | 1,006.80 | | | 0.30% | | | $1.50 | |
Class Y Shares | | | 1,000.00 | | | | 1,007.30 | | | 0.20 | | | 1.00 | |
Hypothetical 5% Return | | | | |
Class F Shares | | $ | 1,000.00 | | | $ | 1,023.40 | | | 0.30% | | | $1.51 | |
Class Y Shares | | | 1,000.00 | | | | 1,023.90 | | | 0.20 | | | 1.01 | |
Real Return Fund | | | | |
Actual Fund Return | | | | |
Class F Shares | | $ | 1,000.00 | | | $ | 1,013.60 | | | 0.45% | | | $2.26 | |
Class Y Shares | | | 1,000.00 | | | | 1,014.10 | | | 0.35 | | | 1.76 | |
Hypothetical 5% Return | | | | |
Class F Shares | | $ | 1,000.00 | | | $ | 1,022.70 | | | 0.45% | | | $2.27 | |
Class Y Shares | | | 1,000.00 | | | | 1,023.20 | | | 0.35 | | | 1.77 | |
| | | | | | | | | | | | | | |
| | | Beginning
Account
Value
10/1/18 | | | Ending
Account
Value
3/31/19 | | | Annualized
Expense
Ratios | | Expenses
Paid
During
Period * | |
Dynamic Asset Allocation Fund | | | | |
Actual Fund Return | | | | |
Class F Shares | | $ | 1,000.00 | | | $ | 978.90 | | | 0.75% | | | $3.70 | |
Class Y Shares | | | 1,000.00 | | | | 980.30 | | | 0.50 | | | 2.47 | |
Hypothetical 5% Return | | | | |
Class F Shares | | $ | 1,000.00 | | | $ | 1,021.20 | | | 0.75% | | | $3.78 | |
Class Y Shares | | | 1,000.00 | | | | 1,022.40 | | | 0.50 | | | 2.52 | |
Multi-Strategy Alternative Fund | | | | |
Actual Fund Return | | | | |
Class F Shares | | $ | 1,000.00 | | | $ | 978.50 | | | 1.33% | | | $6.56 | |
Class Y Shares | | | 1,000.00 | | | | 979.10 | | | 1.09 | | | 5.38 | |
Hypothetical 5% Return | | | | |
Class F Shares | | $ | 1,000.00 | | | $ | 1,018.30 | | | 1.33% | | | $6.69 | |
Class Y Shares | | | 1,000.00 | | | | 1,019.50 | | | 1.09 | | | 5.49 | |
Multi-Asset Accumulation Fund | | | | |
Actual Fund Return | | | | |
Class F Shares | | $ | 1,000.00 | | | $ | 1,003.10 | | | 1.17% | | | $5.88 | |
Class Y Shares | | | 1,000.00 | | | | 1,004.10 | | | 0.92 | | | 4.62 | |
Hypothetical 5% Return | | | | |
Class F Shares | | $ | 1,000.00 | | | $ | 1,019.20 | | | 1.17% | | | $5.92 | |
Class Y Shares | | | 1,000.00 | | | | 1,020.46 | | | 0.92 | | | 4.66 | |
Multi-Asset Income Fund | | | | |
Actual Fund Return | | | | |
Class F Shares | | $ | 1,000.00 | | | $ | 1,036.20 | | | 0.80% | | | $4.06 | |
Class Y Shares | | | 1,000.00 | | | | 1,036.60 | | | 0.70 | | | 3.55 | |
Hypothetical 5% Return | | | | |
Class F Shares | | $ | 1,000.00 | | | $ | 1,020.94 | | | 0.80% | | | $4.03 | |
Class Y Shares | | | 1,000.00 | | | | 1,021.44 | | | 0.70 | | | 3.53 | |
Multi-Asset Inflation Managed Fund | | | | |
Actual Fund Return | | | | |
Class F Shares | | $ | 1,000.00 | | | $ | 993.80 | | | 1.82% | | | $9.05 | |
Class Y Shares | | | 1,000.00 | | | | 995.30 | | | 1.57 | | | 7.81 | |
Hypothetical 5% Return | | | | |
Class F Shares | | $ | 1,000.00 | | | $ | 1,015.86 | | | 1.82% | | | $9.15 | |
Class Y Shares | | | 1,000.00 | | | | 1,017.10 | | | 1.57 | | | 7.90 | |
Multi-Asset Capital Stability Fund | | | | |
Actual Fund Return | | | | |
Class F Shares | | $ | 1,000.00 | | | $ | 1,014.40 | | | 0.62% | | | $3.11 | |
Class Y Shares | | | 1,000.00 | | | | 1,014.40 | | | 0.52 | | | 2.61 | |
Hypothetical 5% Return | | | | |
Class F Shares | | $ | 1,000.00 | | | $ | 1,021.80 | | | 0.62% | | | $3.13 | |
Class Y Shares | | | 1,000.00 | | | | 1,022.30 | | | 0.52 | | | 2.62 | |
Long/Short Alternative Fund | | | | |
Actual Fund Return | | | | |
Class F Shares | | $ | 1,000.00 | | | $ | 962.30 | | | 1.15% | | | $5.63 | |
Class Y Shares | | | 1,000.00 | | | | 963.10 | | | 0.90 | | | 4.40 | |
Hypothetical 5% Return | | | | |
Class F Shares | | $ | 1,000.00 | | | $ | 1,019.20 | | | 1.15% | | | $5.79 | |
Class Y Shares | | | 1,000.00 | | | | 1,020.44 | | | 0.90 | | | 4.53 | |
* Expenses are equal to the Fund’s annualized expense ratio multiplied by the average account value over the period, multiplied by 182/365 (to reflect theone-half year period shown).
| | |
340 | | SEI Institutional Managed Trust / Semi-Annual Report / March 31, 2019 |
(This page intentionally left blank)
Board of Trustees Considerations in Approving the Advisory andSub-Advisory Agreements (Unaudited)
SEI Institutional Managed Trust (the “Trust”) and SEI Investments Management Corporation (“SIMC”) have entered into an investment advisory agreement (the “Advisory Agreement”). Pursuant to the Advisory Agreement, SIMC is responsible for the investment advisory services provided to the series of the Trust (the “Funds”). Pursuant to separatesub-advisory agreements with SIMC (the“Sub-Advisory Agreements” and, together with the Advisory Agreement, the “Investment Advisory Agreements”), and under the supervision of SIMC and the Trust’s Board of Trustees (the “Board”), thesub-advisers (each, a“Sub-Adviser” and collectively, the“Sub-Advisers”) provide security selection and certain other advisory services with respect to all or a discrete portion of the assets of the Funds. TheSub-Advisers are also responsible for managing their employees who provide services to the Funds. TheSub-Advisers are selected based primarily upon the research and recommendations of SIMC, which evaluates quantitatively and qualitatively theSub-Advisers’ skills and investment results in managing assets for specific asset classes, investment styles and strategies.
The Investment Company Act of 1940, as amended (the “1940 Act”), requires that the initial approval of, as well as the continuation of, the Funds’ Investment Advisory Agreements be specifically approved: (i) by the vote of the Board or by a vote of the shareholders of the Funds; and (ii) by the vote of a majority of the Trustees who are not parties to the Investment Advisory Agreements or “interested persons” of any party (the “Independent Trustees”), cast in person at a meeting called for the purpose of voting on such approval(s). In connection with their consideration of such approval(s), the Funds’ Trustees must request and evaluate, and SIMC and theSub-Advisers are required to furnish, such information as may be reasonably necessary to evaluate the terms of the Investment Advisory Agreements. In addition, the Securities and Exchange Commission takes the position that, as part of their fiduciary duties with respect to a mutual fund’s fees, mutual fund boards are required to evaluate the material factors applicable to a decision to approve an investment advisory agreement.
Consistent with these responsibilities, the Board calls and holds meetings each year to consider whether to approve new and/or renew existing Investment Advisory Agreements between the Trust and SIMC and SIMC and theSub-Advisers with respect to the Funds of the Trust. In preparation for these meetings, the Board requests and reviews a wide variety of materials provided by SIMC and theSub-Advisers, including information about SIMC’s and theSub-Advisers’ affiliates, personnel and operations and the services provided pursuant to the Investment Advisory Agreements. The Board also receives data from third parties. This information is provided in addition to the detailed information about the Funds that the Board reviews during the course of each year, including information that relates to Fund operations and Fund performance. The Trustees also receive a memorandum from counsel regarding the responsibilities of Trustees in connection with their consideration of whether to approve the Trust’s Investment Advisory Agreements. Finally, the Independent Trustees receive advice from independent counsel to the Independent Trustees, meet in executive sessions outside the presence of Fund management and participate in question and answer sessions with representatives of SIMC and theSub-Advisers.
Specifically, during the first half of the Trust’s fiscal year, the Board requested and received written materials from SIMC and certain of theSub-Advisers regarding: (i) the quality of SIMC’s and theSub-Advisers’ investment management and other services; (ii) SIMC’s and theSub-Advisers’ investment management personnel; (iii) SIMC’s and theSub-Advisers’ operations and financial condition; (iv) SIMC’s and theSub-Advisers’ brokerage practices (including any soft dollar arrangements) and investment strategies; (v) the level of the advisory fees that SIMC charges the Funds and the level of thesub-advisory fees that SIMC pays theSub-Advisers, compared with fees each charge to comparable accounts; (vi) the advisory fees charged by SIMC and the Funds’ overall fees and operating expenses compared with peer groups of mutual funds prepared by Broadridge, an independent provider of investment company data; (vii) the level of SIMC’s and theSub-Advisers’ profitability from their Fund-related operations; (viii) SIMC’s and theSub-Advisers’ compliance program, including a description of material compliance matters and material compliance violations; (ix) SIMC’s potential economies of scale; (x) SIMC’s and theSub-Advisers’ policies on and compliance procedures for personal securities transactions; (xi) SIMC’s and theSub-Advisers’ expertise and resources in domestic and/or international financial markets; and (xii) the Funds’ performance over various periods of time compared with peer groups of mutual funds prepared by Broadridge and the Funds’ benchmark indexes.
At the December4-5, 2018 meeting of the Board, certainSub-Advisory Agreements were either initially approved or, if theSub-Advisory Agreement was already in effect (unless operating under an initialtwo-year term), renewed by the Trustees, including a majority of the Independent Trustees. In addition, the Board approved a brief extension of the Advisory Agreement and certainSub-Advisory Agreements already in effect (unless operating under an initial
| | |
342 | | SEI Institutional Managed Trust / Semi-Annual Report / March 31, 2019 |
two-year term) to accommodate a revised Spring meeting schedule. Typically, the Trustees renew the Advisory Agreement and certainSub-Advisory Agreements at the first quarterlyin-person meeting of the calendar year in March. Agreements regularly renewed at the March meeting expire on April 1 of the following year. Because the first quarterlyin-person meeting of the Board in calendar year 2019 was held on April2-3, the Advisory Agreement and certainSub-Advisory Agreements would have expired prior to the meeting, without the extension. Accordingly, the Board votedin-person at the December4-5, 2018 meeting to extend the Advisory Agreement and certainSub-Advisory Agreements until the April2-3, 2019 meeting. In evaluating whether to approve the extension of the Advisory Agreement and certainSub-Advisory Agreements, the Board considered the information made available to it throughout the course of the year by representatives of the SEI investment and compliance teams. At the April2-3, 2019 meeting, the Board evaluated the Advisory Agreement and the applicableSub-Advisory Agreements in accordance with the renewal process that it typically applies during the annual contract renewal each Spring. Although outside the scope of the period covered by this report, the Board’s renewal of the Advisory Agreement and the applicableSub-Advisory Agreements at the April2-3, 2019 meeting of the Board is discussed herein, consistent with prior shareholder reports of the Funds. The Board’s approvals were based on its consideration and evaluation of the factors described above, as discussed at the meeting and at prior meetings, such as the December4-5, 2018 meeting. The following discusses some, but not all, of the factors that were considered by the Board in connection with its assessment of the Advisory Agreement and the applicableSub-Advisory Agreements.
Nature, Extent and Quality of Services.The Board considered the nature, extent and quality of the services provided by SIMC and theSub-Advisers to the Funds and the resources of SIMC and theSub-Advisers and their affiliates dedicated to the Funds. In this regard, the Trustees evaluated, among other things, SIMC’s and eachSub-Adviser’s personnel, experience, track record and compliance program. Following evaluation, the Board concluded that, within the context of its full deliberations, the nature, extent and quality of services provided by SIMC and theSub-Advisers to the Funds and the resources of SIMC and theSub-Advisers and their affiliates dedicated to the Funds were sufficient to support the renewal of the Investment Advisory Agreements. In addition to advisory services, the Board considered the nature and quality of certain administrative, transfer agency and othernon-investment advisory services provided to the Funds by SIMC and/or its affiliates.
Performance.In determining whether to renew SIMC’s Advisory Agreement, the Trustees considered the Funds’ performance relative to their peer groups and appropriate indexes/benchmarks. The Trustees reviewed performance information for each Fund, noting that they receive performance reports that permit them to monitor each Fund’s performance at board meetings throughout the year. As part of this review, the Trustees considered the composition of each peer group and selection criteria. In assessing Fund performance, the Trustees considered a report compiled by Broadridge, an independent third-party that was engaged to prepare an assessment of the Funds in connection with the renewal of the Advisory Agreement (the “Broadridge Report”). The Broadridge Report included metrics on risk analysis, volatility versus total return, net total return and performance consistency for the Funds (except when such metric was not available due to a limited operating history) and a universe of comparable funds. Based on the materials considered and discussed at the meetings, the Trustees found Fund performance satisfactory, or, where performance was materially below the benchmark and/or peer group, the Trustees were satisfied with the reasons provided to explain such performance. In connection with the approval or renewal ofSub-Advisory Agreements, the Board considered the performance of theSub-Adviser relative to appropriate indexes/benchmarks. Following evaluation, the Board concluded that, within the context of its full deliberations, the performance of the Funds was sufficient to support renewal of SIMC’s Advisory Agreement, and the performance of eachSub-Adviser was sufficient to support approval or renewal of theSub-Advisory Agreement.
Fees. With respect to the Funds’ expenses under the Investment Advisory Agreements, the Trustees considered the rate of compensation called for by the Investment Advisory Agreements and the Funds’ net operating expense ratio in comparison to those of the Funds’ respective peer groups. In assessing Fund expenses, the Trustees considered the information in the Broadridge Report, which included various metrics related to fund expenses, including, but not limited to, contractual management fees at various asset levels, actual management fees (including transfer agent expenses), and actual total expenses (including, solely with respect to the Multi-Strategy Alternative Fund, underlying fund expenses) for the Funds and a universe of comparable funds. Based on the materials considered and discussion at the meetings, the Trustees further determined that fees were either shown to be below the peer average in the comparative fee analysis, or that there was a reasonable basis for the fee level. The Trustees also considered the effects of SIMC’s contractual waiver of its management fee with respect to the S&P 500 Index Fund and the Core Fixed Income Fund and its voluntary waiver of management and other fees to prevent total Fund
| | |
SEI Institutional Managed Trust / Semi-Annual Report / March 31, 2019 | | 343 |
Board of Trustees Considerations in Approving the Advisory and Sub-Advisory Agreements (Unaudited) (Concluded)
operating expenses from exceeding a specified cap and concluded that SIMC, through waivers, has maintained the Funds’ net operating expenses at competitive levels for its distribution channels. In determining the appropriateness of fees, the Board also took into consideration the impact of fees incurred indirectly by the Funds as a result of investments into underlying funds, including funds from which SIMC or its affiliates earn fees. The Board also took into consideration compensation earned from the Funds by SIMC or its affiliates fornon-advisory services, such as administration, transfer agency, shareholder services or brokerage, and considered whether SIMC and its affiliates may have realized other benefits from their relationship with the Funds, such as any research and brokerage services received under soft dollar arrangements. When considering fees paid toSub-Advisers, the Board took into account the fact that theSub-Advisers are compensated by SIMC and not by the Funds directly, and that such compensation with respect to any unaffiliatedSub-Adviser reflects an arms-length negotiation between theSub-Adviser and SIMC. Following evaluation, the Board concluded that, within the context of its full deliberations, the expenses of the Funds are reasonable and supported renewal of the Investment Advisory Agreements. The Board also considered whether theSub-Advisers and their affiliates may have realized other benefits from their relationship with the Funds, such as any research and brokerage services received under soft dollar arrangements.
Profitability.With regard to profitability, the Trustees considered compensation flowing to SIMC and theSub-Advisers and their affiliates, directly or indirectly. The Trustees considered whether the levels of compensation and profitability were reasonable. As with the fee levels, when considering the profitability of theSub-Advisers, the Board took into account the fact that compensation with respect to any unaffiliatedSub-Adviser reflects an arms-length negotiation between theSub-Adviser and SIMC. In connection with the approval or renewal of eachSub-Advisory Agreement, the Board also took into consideration the impact that the fees paid to theSub-Adviser have on SIMC’s advisory fee margin and profitability. Based on this evaluation, the Board concluded that, within the context of its full deliberations, the profitability of each of SIMC and theSub-Advisers is reasonable and supported renewal of the Investment Advisory Agreements.
Economies of Scale.With respect to the Advisory Agreement, the Trustees considered whether any economies of scale were being realized by SIMC and its affiliates and, if so, whether the benefits of such economies of scale were passed along to the Funds’ shareholders through a graduated investment advisory fee schedule or other means, including any fee waivers by SIMC and its affiliates. The Trustees recognized that economies of scale are difficult to identify and quantify and are rarely identifiable on afund-by-fund basis. Based on this evaluation, the Board determined that the fees were reasonable in light of the information that was provided by SIMC with respect to economies of scale.
Based on the Trustees’ deliberation and their evaluation of the information described above, the Board, including all of the Independent Trustees, with the assistance of Fund counsel and Independent Trustees’ counsel, unanimously approved the approval or renewal, as applicable, of the Investment Advisory Agreements and concluded that the compensation under the Investment Advisory Agreements is fair and reasonable in light of such services and expenses and such other matters as the Trustees considered to be relevant in the exercise of their reasonable judgment. In the course of its deliberations, the Board did not identify any particular factor (or conclusion with respect thereto) or single piece of information that wasall-important, controlling or determinative of its decision, but considered all of the factors together, and each Trustee may have attributed different weights to the various factors (and conclusions with respect thereto) and information.
| | |
344 | | SEI Institutional Managed Trust / Semi-Annual Report / March 31, 2019 |
SEI Institutional Managed Trust / Semi-Annual Report / March 31, 2019
Robert A. Nesher,Chairman
Trustees
William M. Doran
George J. Sullivan, Jr.
Nina Lesavoy
James M. Williams
Mitchell A. Johnson
Hubert L. Harris, Jr.
Susan C. Cote
James B. Taylor
Officers
Robert A. Nesher
President and Chief Executive Officer
James J. Hoffmayer
Controller and Chief Financial Officer
Glenn Kurdziel
Assistant Controller
Russell Emery
Chief Compliance Officer
Timothy D. Barto
Vice President, Secretary
Aaron Buser
Vice President, Assistant Secretary
David F. McCann
Vice President, Assistant Secretary
Stephen G. MacRae
Vice President
Bridget E. Sudall
Anti-Money Laundering Compliance Officer
Privacy Officer
Investment Adviser
SEI Investments Management Corporation
Administrator
SEI Investments Global Funds Services
Distributor
SEI Investments Distribution Co.
Legal Counsel
Morgan, Lewis & Bockius LLP
Independent Registered Public Accounting Firm
KPMG LLP
This report and the financial statements contained herein are submitted for the general information of the shareholders of the Trust and must be preceded or accompanied by a current prospectus. Shares of the Funds are not deposits or obligations of, or guaranteed or endorsed by, any bank. The shares are not federally insured by the Federal Deposit Insurance Corporation (FDIC), the Federal Reserve Board, or any other government agency. Investment in the shares involves risk, including the possible loss of principal.
For more information call
1 800 DIAL SEI
(1 800 342 5734)

SEI-F-092 (3/19)
Not applicable for semi-annual report.
| Item 3. | Audit Committee Financial Expert. |
Not applicable for semi-annual report.
| Item 4. | Principal Accountant Fees and Services. |
Not applicable for semi-annual report.
| Item 5. | Audit Committee of Listed Registrants. |
Not applicable.
| Item 6. | Schedule of Investments. |
The Schedules of Investments in securities of unaffiliated issuers as of the close of the reporting period for the Large Cap Fund, Large Cap Value Fund, Large Cap Growth Fund, Large Cap Index Fund,Tax-Managed Large Cap Fund, S&P 500 Index Fund, Small Cap Fund, Small Cap Value Fund, Small Cap Growth Fund,Tax-Managed Small/Mid Cap Fund,Mid-Cap Fund, U.S. Managed Volatility Fund, Global Managed Volatility Fund,Tax-Managed Managed Volatility Fund,Tax-Managed International Managed Volatility Fund, and Dynamic Asset Allocation Fund are listed below. The Schedule of Investments in securities of unaffiliated issuers as of the close of the reporting period for the Real Estate Fund, Enhanced Income Fund, Core Fixed Income Fund, High Yield Bond Fund, Conservative Income Fund,Tax-Free Conservative Income Fund, Real Return Fund, Multi-Strategy Alternative Fund, Multi-Asset Accumulation Fund, Multi-Asset Income Fund, Multi-Asset Inflation Managed Fund, Multi-Asset Capital Stability Fund and Long/Short Alternative Fund is included as part of the report to shareholders filed under Item 1 of this form.
SCHEDULE OF INVESTMENTS (Unaudited)
March 31, 2019
Large Cap Fund(Continued)
| | | | | | | | |
| | | |
| Description | | Shares | | Market Value ($ Thousands) |
| | |
COMMON STOCK — 97.9% | | | | | | | | |
| | |
Communication Services — 7.1% | | | | | | | | |
Alphabet Inc, Cl A * | | | 24,804 | | | $ | 29,192 | |
Alphabet Inc, Cl C * | | | 2,151 | | | | 2,524 | |
AT&T Inc | | | 501,527 | | | | 15,728 | |
Charter Communications Inc, Cl A * | | | 8,513 | | | | 2,953 | |
DISH Network Corp, Cl A * | | | 73,243 | | | | 2,321 | |
Facebook Inc, Cl A * | | | 176,696 | | | | 29,453 | |
IAC/InterActiveCorp * | | | 4,684 | | | | 984 | |
Interpublic Group of Cos Inc/The | | | 22,205 | | | | 466 | |
Live Nation Entertainment Inc * | | | 67,265 | | | | 4,274 | |
Madison Square Garden Co/The * | | | 13,860 | | | | 4,063 | |
Match Group Inc | | | 8,301 | | | | 470 | |
Netflix Inc * | | | 14,330 | | | | 5,109 | |
Omnicom Group Inc | | | 211,517 | | | | 15,439 | |
Take-Two Interactive Software Inc, Cl A * | | | 20,416 | | | | 1,927 | |
TEGNA Inc | | | 209,294 | | | | 2,951 | |
T-Mobile US Inc * | | | 58,171 | | | | 4,020 | |
Tribune Media Co, Cl A | | | 13,694 | | | | 632 | |
TripAdvisor Inc * | | | 24,452 | | | | 1,258 | |
Twitter Inc * | | | 92,830 | | | | 3,052 | |
Verizon Communications Inc | | | 451,877 | | | | 26,719 | |
Viacom Inc, Cl B | | | 102,749 | | | | 2,884 | |
Walt Disney Co/The | | | 91,703 | | | | 10,182 | |
| | |
| | | | | | | 166,601 | |
| | |
Consumer Discretionary — 10.0% | | | | | | | | |
Alibaba Group Holding Ltd ADR * | | | 51,859 | | | | 9,462 | |
Amazon.com Inc, Cl A * | | | 30,715 | | | | 54,696 | |
Best Buy Co Inc | | | 43,112 | | | | 3,063 | |
Booking Holdings Inc * | | | 3,238 | | | | 5,650 | |
BorgWarner Inc | | | 28,785 | | | | 1,106 | |
Brinker International Inc | | | 43,929 | | | | 1,949 | |
CarMax Inc * | | | 100,971 | | | | 7,048 | |
Delphi Automotive PLC * | | | 12,125 | | | | 964 | |
Dick’s Sporting Goods Inc | | | 54,230 | | | | 1,996 | |
Dillard’s Inc, Cl A (A) | | | 17,881 | | | | 1,288 | |
Dollar General Corp | | | 142,657 | | | | 17,019 | |
Dollar Tree Inc * | | | 10,447 | | | | 1,097 | |
DR Horton Inc | | | 107,192 | | | | 4,436 | |
eBay Inc | | | 52,967 | | | | 1,967 | |
Etsy Inc * | | | 6,472 | | | | 435 | |
Ford Motor Co | | | 215,383 | | | | 1,891 | |
Garmin Ltd | | | 5,297 | | | | 457 | |
General Motors Co | | | 331,071 | | | | 12,283 | |
Goodyear Tire & Rubber Co/The | | | 109,735 | | | | 1,992 | |
Harley-Davidson Inc, Cl A | | | 53,538 | | | | 1,909 | |
Home Depot Inc/The | | | 35,082 | | | | 6,732 | |
Kohl’s Corp | | | 73,406 | | | | 5,048 | |
Lear Corp | | | 27,328 | | | | 3,709 | |
Lowe’s Cos Inc | | | 139,789 | | | | 15,303 | |
Lululemon Athletica Inc * | | | 15,089 | | | | 2,473 | |
Macy’s Inc | | | 74,067 | | | | 1,780 | |
| | | | | | | | |
| | | |
| Description | | Shares | | Market Value ($ Thousands) |
| | |
COMMON STOCK (continued) | | | | | | | | |
Magna International Inc, Cl A | | | 108,712 | | | $ | 5,293 | |
Mohawk Industries Inc * | | | 24,444 | | | | 3,084 | |
Norwegian Cruise Line Holdings Ltd * | | | 75,465 | | | | 4,147 | |
O’Reilly Automotive Inc * | | | 29,819 | | | | 11,579 | |
PulteGroup Inc | | | 235,972 | | | | 6,598 | |
Ross Stores Inc | | | 192,997 | | | | 17,968 | |
Royal Caribbean Cruises Ltd | | | 49,105 | | | | 5,628 | |
Tapestry Inc | | | 143,000 | | | | 4,646 | |
Target Corp, Cl A | | | 50,332 | | | | 4,040 | |
Vail Resorts Inc | | | 15,520 | | | | 3,372 | |
Whirlpool Corp | | | 18,237 | | | | 2,423 | |
| | |
| | | | | | | 234,531 | |
| | |
Consumer Staples — 6.9% | | | | | | | | |
Altria Group Inc | | | 182,864 | | | | 10,502 | |
Archer-Daniels-Midland Co | | | 146,548 | | | | 6,321 | |
Colgate-Palmolive Co | | | 100,898 | | | | 6,915 | |
Conagra Brands Inc | | | 310,496 | | | | 8,613 | |
Estee Lauder Cos Inc/The, Cl A | | | 9,377 | | | | 1,552 | |
Herbalife Nutrition Ltd * | | | 8,121 | | | | 430 | |
Ingredion Inc | | | 47,359 | | | | 4,484 | |
JM Smucker Co/The | | | 139,997 | | | | 16,310 | |
Kellogg Co | | | 198,013 | | | | 11,362 | |
Kroger Co/The | | | 641,242 | | | | 15,775 | |
Molson Coors Brewing Co, Cl B | | | 142,461 | | | | 8,498 | |
PepsiCo Inc | | | 96,546 | | | | 11,832 | |
Philip Morris International Inc | | | 222,296 | | | | 19,649 | |
Pilgrim’s Pride Corp * | | | 105,209 | | | | 2,345 | |
Procter & Gamble Co/The | | | 32,988 | | | | 3,432 | |
Sysco Corp, Cl A | | | 13,131 | | | | 877 | |
Tyson Foods Inc, Cl A | | | 122,646 | | | | 8,515 | |
Unilever NV | | | 257,120 | | | | 14,987 | |
Walgreens Boots Alliance Inc | | | 137,264 | | | | 8,685 | |
| | |
| | | | | | | 161,084 | |
| | |
Energy — 6.3% | | | | | | | | |
BP PLC ADR | | | 180,571 | | | | 7,895 | |
Cabot Oil & Gas Corp | | | 50,609 | | | | 1,321 | |
Canadian Natural Resources Ltd | | | 323,345 | | | | 8,892 | |
Carrizo Oil & Gas Inc * | | | 115,706 | | | | 1,443 | |
Chevron Corp | | | 267,288 | | | | 32,924 | |
ConocoPhillips | | | 103,555 | | | | 6,911 | |
Core Laboratories NV (A) | | | 74,551 | | | | 5,139 | |
Diamondback Energy Inc, Cl A | | | 53,744 | | | | 5,457 | |
Exxon Mobil Corp | | | 62,550 | | | | 5,054 | |
Halliburton Co | | | 59,501 | | | | 1,743 | |
Kinder Morgan Inc/DE | | | 87,840 | | | | 1,758 | |
Laredo Petroleum Inc * | | | 322,581 | | | | 997 | |
Marathon Petroleum Corp | | | 330,584 | | | | 19,785 | |
Occidental Petroleum Corp | | | 192,067 | | | | 12,715 | |
Phillips 66 | | | 32,125 | | | | 3,057 | |
Royal Dutch Shell PLC ADR, Cl A | | | 175,362 | | | | 10,976 | |
| | | | |
SEI Institutional Managed Trust / Semi-Annual Report / March 31, 2019 | | | 1 | |
SCHEDULE OF INVESTMENTS (Unaudited)
March 31, 2019
Large Cap Fund(Continued)
| | | | | | | | |
| | | |
| Description | | Shares | | Market Value ($ Thousands) |
| | |
COMMON STOCK (continued) | | | | | | | | |
Schlumberger Ltd, Cl A | | | 401,281 | | | $ | 17,484 | |
Valero Energy Corp | | | 59,378 | | | | 5,037 | |
| | |
| | | | | | | 148,588 | |
| | |
Financials — 16.5% | | | | | | | | |
Aflac Inc | | | 348,811 | | | | 17,441 | |
Allstate Corp/The | | | 77,966 | | | | 7,343 | |
American International Group Inc | | | 220,049 | | | | 9,475 | |
Ameriprise Financial Inc | | | 38,551 | | | | 4,938 | |
Annaly Capital Management Inc | | | 275,527 | | | | 2,753 | |
Banco Santander SA ADR (A) | | | 535,887 | | | | 2,481 | |
Bank of America Corp | | | 981,805 | | | | 27,088 | |
Bank of New York Mellon Corp/The | | | 40,826 | | | | 2,059 | |
BB&T Corp | | | 60,224 | | | | 2,802 | |
Berkshire Hathaway Inc, Cl B * | | | 126,314 | | | | 25,375 | |
Blackstone Group LP/The (B) | | | 215,564 | | | | 7,538 | |
Capital One Financial Corp | | | 61,434 | | | | 5,019 | |
CIT Group Inc | | | 132,056 | | | | 6,335 | |
Citigroup Inc | | | 513,200 | | | | 31,931 | |
Discover Financial Services | | | 53,937 | | | | 3,838 | |
E*TRADE Financial Corp | | | 72,599 | | | | 3,371 | |
Everest Re Group Ltd | | | 18,830 | | | | 4,067 | |
Fifth Third Bancorp | | | 365,348 | | | | 9,214 | |
First Republic Bank/CA | | | 118,119 | | | | 11,866 | |
Hartford Financial Services Group Inc/The | | | 42,704 | | | | 2,123 | |
Invesco Ltd | | | 146,607 | | | | 2,831 | |
JPMorgan Chase & Co | | | 301,012 | | | | 30,471 | |
KeyCorp | | | 155,139 | | | | 2,443 | |
KKR & Co Inc | | | 338,871 | | | | 7,960 | |
Lincoln National Corp | | | 89,065 | | | | 5,228 | |
Markel Corp * | | | 17,107 | | | | 17,043 | |
Marsh & McLennan Cos Inc | | | 130,535 | | | | 12,257 | |
MetLife Inc | | | 62,379 | | | | 2,656 | |
MFA Financial Inc | | | 143,982 | | | | 1,047 | |
Moody’s Corp | | | 74,861 | | | | 13,557 | |
Morgan Stanley | | | 48,930 | | | | 2,065 | |
PNC Financial Services Group Inc/The | | | 15,930 | | | | 1,954 | |
Progressive Corp/The | | | 173,660 | | | | 12,519 | |
Prudential Financial Inc | | | 38,952 | | | | 3,579 | |
Radian Group Inc | | | 122,321 | | | | 2,537 | |
Regions Financial Corp | | | 350,441 | | | | 4,959 | |
Reinsurance Group of America Inc, Cl A | | | 24,960 | | | | 3,544 | |
S&P Global Inc | | | 41,688 | | | | 8,777 | |
SLM Corp | | | 335,704 | | | | 3,327 | |
Starwood Property Trust Inc | | | 50,735 | | | | 1,134 | |
State Street Corp | | | 205,088 | | | | 13,497 | |
SunTrust Banks Inc | | | 107,702 | | | | 6,381 | |
Synchrony Financial | | | 15,209 | | | | 485 | |
Two Harbors Investment Corp | | | 71,276 | | | | 964 | |
Unum Group | | | 44,371 | | | | 1,501 | |
US Bancorp | | | 280,419 | | | | 13,513 | |
Voya Financial Inc | | | 90,831 | | | | 4,538 | |
| | | | | | | | |
| | | |
| Description | | Shares | | Market Value ($ Thousands) |
| | |
COMMON STOCK (continued) | | | | | | | | |
Wells Fargo & Co | | | 248,463 | | | $ | 12,006 | |
Zions Bancorp NA | | | 153,205 | | | | 6,957 | |
| | |
| | | | | | | 386,787 | |
| | |
Health Care — 14.9% | | | | | | | | |
Abbott Laboratories | | | 424,218 | | | | 33,912 | |
AbbVie Inc | | | 57,474 | | | | 4,632 | |
ABIOMED Inc * | | | 2,570 | | | | 734 | |
Allergan PLC | | | 23,004 | | | | 3,368 | |
Alnylam Pharmaceuticals Inc * | | | 5,206 | | | | 486 | |
AmerisourceBergen Corp, Cl A | | | 243,656 | | | | 19,375 | |
Amgen Inc, Cl A | | | 108,639 | | | | 20,639 | |
Biogen Inc * | | | 28,909 | | | | 6,833 | |
Boston Scientific Corp * | | | 159,473 | | | | 6,121 | |
Bristol-Myers Squibb Co | | | 73,582 | | | | 3,511 | |
Cardinal Health Inc | | | 17,886 | | | | 861 | |
Cigna Corp (C) | | | 66,908 | | | | 10,760 | |
CVS Health Corp | | | 282,416 | | | | 15,231 | |
Danaher Corp, Cl A | | | 40,427 | | | | 5,337 | |
DexCom Inc * | | | 11,888 | | | | 1,416 | |
Eli Lilly & Co | | | 36,699 | | | | 4,762 | |
Gilead Sciences Inc | | | 94,467 | | | | 6,141 | |
HCA Healthcare Inc | | | 43,190 | | | | 5,631 | |
Horizon Pharma Plc * | | | 91,285 | | | | 2,413 | |
Humana Inc | | | 55,343 | | | | 14,721 | |
Illumina Inc * | | | 11,567 | | | | 3,594 | |
Jazz Pharmaceuticals PLC * | | | 13,254 | | | | 1,895 | |
Johnson & Johnson | | | 276,269 | | | | 38,620 | |
Merck & Co Inc | | | 367,900 | | | | 30,598 | |
Mettler-Toledo International Inc * | | | 18,439 | | | | 13,331 | |
Mylan NV * | | | 56,768 | | | | 1,609 | |
Pfizer Inc | | | 404,922 | | | | 17,197 | |
Sarepta Therapeutics Inc * | | | 17,552 | | | | 2,092 | |
Teleflex Inc | | | 46,383 | | | | 14,015 | |
Thermo Fisher Scientific Inc | | | 4,198 | | | | 1,149 | |
UnitedHealth Group Inc | | | 135,344 | | | | 33,465 | |
Veeva Systems Inc, Cl A * | | | 4,374 | | | | 555 | |
Vertex Pharmaceuticals Inc * | | | 46,041 | | | | 8,469 | |
WellCare Health Plans Inc * | | | 3,229 | | | | 871 | |
Zimmer Biomet Holdings Inc | | | 112,033 | | | | 14,307 | |
Zoetis Inc, Cl A | | | 27,074 | | | | 2,726 | |
| | |
| | | | | | | 351,377 | |
| | |
Industrials — 10.0% | | | | | | | | |
3M Co | | | 41,027 | | | | 8,525 | |
AerCap Holdings NV * | | | 69,739 | | | | 3,246 | |
AGCO Corp | | | 67,440 | | | | 4,691 | |
Allison Transmission Holdings Inc | | | 104,943 | | | | 4,714 | |
American Airlines Group Inc | | | 212,480 | | | | 6,748 | |
AO Smith Corp | | | 134,094 | | | | 7,150 | |
Boeing Co/The | | | 30,621 | | | | 11,680 | |
Cintas Corp | | | 41,613 | | | | 8,410 | |
| | |
| 2 | | SEI Institutional Managed Trust / Semi-Annual Report / March 31, 2019 |
SCHEDULE OF INVESTMENTS (Unaudited)
March 31, 2019
Large Cap Fund(Continued)
| | | | | | | | |
| | | |
| Description | | Shares | | Market Value ($ Thousands) |
| | |
COMMON STOCK (continued) | | | | | | | | |
Cummins Inc | | | 63,418 | | | $ | 10,012 | |
Delta Air Lines Inc, Cl A | | | 122,858 | | | | 6,346 | |
Eaton Corp PLC | | | 28,193 | | | | 2,271 | |
Emerson Electric Co | | | 134,437 | | | | 9,205 | |
Expeditors International of Washington Inc | | | 23,350 | | | | 1,772 | |
FedEx Corp | | | 34,255 | | | | 6,214 | |
Fortive Corp | | | 151,227 | | | | 12,686 | |
General Dynamics Corp | | | 22,783 | | | | 3,857 | |
Harris Corp | | | 31,064 | | | | 4,961 | |
Honeywell International Inc | | | 217,424 | | | | 34,553 | |
Huntington Ingalls Industries Inc, Cl A | | | 13,945 | | | | 2,889 | |
Illinois Tool Works Inc | | | 70,307 | | | | 10,091 | |
ManpowerGroup Inc | | | 11,765 | | | | 973 | |
Roper Technologies Inc | | | 47,516 | | | | 16,249 | |
RR Donnelley & Sons Co | | | 154,714 | | | | 730 | |
Sensata Technologies Holding PLC * | | | 215,630 | | | | 9,708 | |
Spirit AeroSystems Holdings Inc, Cl A | | | 41,152 | | | | 3,767 | |
TransDigm Group Inc * | | | 23,901 | | | | 10,851 | |
Union Pacific Corp | | | 16,834 | | | | 2,815 | |
United Continental Holdings Inc * | | | 87,721 | | | | 6,998 | |
United Technologies Corp | | | 54,722 | | | | 7,053 | |
WW Grainger Inc | | | 56,546 | | | | 17,016 | |
| | |
| | | | | | | 236,181 | |
| | |
Information Technology — 18.0% | | | | | | | | |
Adobe Inc * | | | 105,389 | | | | 28,085 | |
Analog Devices Inc | | | 63,887 | | | | 6,725 | |
Apple Inc | | | 122,748 | | | | 23,316 | |
Applied Materials Inc | | | 126,797 | | | | 5,029 | |
Automatic Data Processing Inc | | | 78,962 | | | | 12,613 | |
Avalara Inc * | | | 39,869 | | | | 2,224 | |
Broadcom Inc | | | 14,147 | | | | 4,254 | |
Cadence Design Systems Inc * | | | 7,308 | | | | 464 | |
Cisco Systems Inc | | | 321,695 | | | | 17,368 | |
Citrix Systems Inc | | | 4,593 | | | | 458 | |
Corning Inc, Cl B | | | 159,303 | | | | 5,273 | |
Dell Technologies Inc, Cl C * | | | 16,525 | | | | 970 | |
DXC Technology Co | | | 81,413 | | | | 5,236 | |
EPAM Systems Inc * | | | 26,576 | | | | 4,495 | |
Fidelity National Information Services Inc, Cl B | | | 58,904 | | | | 6,662 | |
Global Payments Inc | | | 82,437 | | | | 11,254 | |
Hewlett Packard Enterprise Co | | | 376,685 | | | | 5,812 | |
HP Inc | | | 326,252 | | | | 6,339 | |
Intel Corp | | | 345,841 | | | | 18,572 | |
International Business Machines Corp | | | 54,647 | | | | 7,711 | |
Intuit Inc | | | 97,447 | | | | 25,474 | |
IPG Photonics Corp * | | | 26,151 | | | | 3,969 | |
Juniper Networks Inc | | | 181,896 | | | | 4,815 | |
Lam Research Corp | | | 51,223 | | | | 9,170 | |
Marvell Technology Group Ltd | | | 74,632 | | | | 1,485 | |
Microchip Technology Inc (A) | | | 308,253 | | | | 25,573 | |
| | | | | | | | |
| | | |
| Description | | Shares | | Market Value ($ Thousands) |
| | |
COMMON STOCK (continued) | | | | | | | | |
Micron Technology Inc * | | | 110,435 | | | $ | 4,564 | |
Microsoft Corp | | | 370,704 | | | | 43,721 | |
Motorola Solutions Inc | | | 84,383 | | | | 11,849 | |
NetApp Inc | | | 44,116 | | | | 3,059 | |
NVIDIA Corp | | | 6,471 | | | | 1,162 | |
ON Semiconductor Corp * | | | 135,982 | | | | 2,797 | |
Oracle Corp, Cl B | | | 282,015 | | | | 15,147 | |
PayPal Holdings Inc * | | | 83,563 | | | | 8,677 | |
RealPage Inc * | | | 54,494 | | | | 3,307 | |
Red Hat Inc * | | | 22,152 | | | | 4,047 | |
salesforce.com * | | | 123,745 | | | | 19,598 | |
Seagate Technology PLC | | | 77,003 | | | | 3,688 | |
Skyworks Solutions Inc | | | 34,456 | | | | 2,842 | |
Tech Data Corp * | | | 48,241 | | | | 4,940 | |
VeriSign Inc * | | | 22,600 | | | | 4,103 | |
Visa Inc, Cl A | | | 182,351 | | | | 28,481 | |
Vishay Intertechnology Inc | | | 103,407 | | | | 1,910 | |
Western Digital Corp | | | 41,757 | | | | 2,007 | |
Worldpay Inc, Cl A * | | | 55,500 | | | | 6,299 | |
Xerox Corp | | | 81,708 | | | | 2,613 | |
Xilinx Inc | | | 34,973 | | | | 4,434 | |
| | |
| | | | | | | 422,591 | |
| | |
Materials — 3.6% | | | | | | | | |
Air Products & Chemicals Inc | | | 17,944 | | | | 3,427 | |
Cabot Corp | | | 21,482 | | | | 894 | |
Celanese Corp, Cl A | | | 30,515 | | | | 3,009 | |
Crown Holdings Inc * | | | 92,433 | | | | 5,044 | |
Domtar Corp | | | 41,040 | | | | 2,038 | |
DowDuPont Inc | | | 258,426 | | | | 13,777 | |
Eastman Chemical Co | | | 97,406 | | | | 7,391 | |
Ecolab Inc | | | 69,652 | | | | 12,296 | |
Freeport-McMoRan Inc, Cl B | | | 123,862 | | | | 1,597 | |
Huntsman Corp | | | 126,618 | | | | 2,848 | |
International Paper Co | | | 21,612 | | | | 1,000 | |
Linde PLC | | | 58,347 | | | | 10,265 | |
LyondellBasell Industries NV, Cl A | | | 31,428 | | | | 2,642 | |
Newmont Mining Corp | | | 46,079 | | | | 1,648 | |
Owens-Illinois Inc | | | 55,338 | | | | 1,050 | |
Packaging Corp of America | | | 20,059 | | | | 1,993 | |
Sherwin-Williams Co/The, Cl A | | | 11,517 | | | | 4,961 | |
Vulcan Materials Co | | | 67,058 | | | | 7,940 | |
| | |
| | | | | | | 83,820 | |
| | |
Real Estate — 2.9% | | | | | | | | |
American Tower Corp, Cl A | | | 132,231 | | | | 26,057 | |
Crown Castle International Corp | | | 108,136 | | | | 13,841 | |
Gaming and Leisure Properties Inc | | | 94,459 | | | | 3,643 | |
Hospitality Properties Trust | | | 81,476 | | | | 2,144 | |
Host Hotels & Resorts Inc | | | 270,955 | | | | 5,121 | |
Mid-America Apartment Communities Inc | | | 78,323 | | | | 8,563 | |
Omega Healthcare Investors Inc | | | 81,674 | | | | 3,116 | |
| | | | |
SEI Institutional Managed Trust / Semi-Annual Report / March 31, 2019 | | | 3 | |
SCHEDULE OF INVESTMENTS (Unaudited)
March 31, 2019
Large Cap Fund(Continued)
| | | | | | | | |
| | | |
| Description | | Shares | | Market Value
($ Thousands) |
| | |
COMMON STOCK (continued) | | | | | | | | |
Senior Housing Properties Trust | | | 175,773 | | | $ | 2,071 | |
VEREIT Inc | | | 491,703 | | | | 4,116 | |
| | | | | | | | |
| | |
| | | | | | | 68,672 | |
| | | | | | | | |
| | |
Utilities — 1.7% | | | | | | | | |
Entergy Corp | | | 71,427 | | | | 6,831 | |
Exelon Corp | | | 108,817 | | | | 5,455 | |
FirstEnergy Corp | | | 218,071 | | | | 9,074 | |
NextEra Energy Inc | | | 62,276 | | | | 12,039 | |
NRG Energy Inc | | | 28,954 | | | | 1,230 | |
Public Service Enterprise Group Inc | | | 93,854 | | | | 5,576 | |
| | | | | | | | |
| | |
| | | | | | | 40,205 | |
| | | | | | | | |
| |
Total Common Stock
(Cost $1,866,690) ($ Thousands) | | | | 2,300,437 | |
| | | | | | | | |
| | | | | | | | |
| | | |
| Description | | Shares | | Market Value
($ Thousands) |
| |
AFFILIATED PARTNERSHIP — 0.6% | | | | | |
SEI Liquidity Fund, L.P. 2.480% **†(C) | | | 14,869,849 | | | $ | 14,878 | |
| | | | | | | | |
| |
Total Affiliated Partnership
(Cost $14,867) ($ Thousands) | | | | 14,878 | |
| | | | | | | | |
| | |
CASH EQUIVALENT ��� 2.0% | | | | | | | | |
SEI Daily Income Trust, Government Fund, Cl F | | | | | | | | |
2.220% **† | | | 46,074,280 | | | | 46,074 | |
| | | | | | | | |
| |
Total Cash Equivalent
(Cost $46,074) ($ Thousands) | | | | 46,074 | |
| | | | | | | | |
| |
Total Investments – 100.5%
(Cost $1,927,631) ($ Thousands) | | | $ | 2,361,389 | |
| | | | | | | | |
A list of the open futures contracts held at March 31, 2019 is as follows:
| | | | | | | | | | | | | | | | | | | | |
Type of Contract | | Number of
Contracts
Long/(Short) | | | Expiration
Date | | | Notional Amount
(Thousands) | | | Value
(Thousands) | | | Unrealized
Appreciation
(Depreciation)
(Thousands) | |
S&P 500 IndexE-MINI | | | 182 | | | | Jun-2019 | | | $ | 25,401 | | | $ | 25,824 | | | $ | 423 | |
| | | | | |
S&P Mid Cap 400 IndexE-MINI | | | 12 | | | | Jun-2019 | | | | 2,259 | | | | 2,280 | | | | 21 | |
| | | | | | | | | | | | |
| | | | | |
| | | | | | | | | | $ | 27,660 | | | $ | 28,104 | | | $ | 444 | |
| | | | | | | | | | | | |
| | Percentages are based on Net Assets of $2,349,301 ($ Thousands). |
| * | Non-income producing security. |
| ** | Rate shown is the7-day effective yield as of March 31, 2019. |
| ‡ | Real Estate Investment Trust. |
| † | Investment in Affiliated Security (see Note 6). |
| (A) | Certain securities or partial positions of certain securities are on loan at March 31, 2019 (see Note 10). The total market value of securities on loan at March 31, 2019 was $14,761 ($ Thousands). |
| (B) | Security is a Master Limited Partnership. At March 31, 2019, such securities amounted to $7,538 ($ Thousands), or 0.3 % of the net assets of the Fund (See Note 2). |
| (C) | This security was purchased with cash collateral held from securities on loan (see Note 10). The total market value of such securities as of March 31, 2019 was $14,878 ($ Thousands). |
Cl — Class
L.P. — Limited Partnership
Ltd. — Limited
S&P— Standard & Poor’s
| | |
| 4 | | SEI Institutional Managed Trust / Semi-Annual Report / March 31, 2019 |
SCHEDULE OF INVESTMENTS (Unaudited)
March 31, 2019
Large Cap Fund(Continued)
The following is a list of the level of inputs used as of March 31, 2019, in valuing the Fund’s investments carried at value ($ Thousands):
| | | | | | | | | | | | | | | | |
Investments in
Securities | | Level 1 | | | Level 2 | | | Level 3 | | | Total | |
Common Stock | | $ | 2,300,437 | | | $ | – | | | $ | – | | | $ | 2,300,437 | |
Affiliated Partnership | | | – | | | | 14,878 | | | | – | | | | 14,878 | |
Cash Equivalent | | | 46,074 | | | | – | | | | – | | | | 46,074 | |
| | | | | | | | | | | | | | | | |
Total Investments in Securities | | $ | 2,346,511 | | | $ | 14,878 | | | $ | – | | | $ | 2,361,389 | |
| | | | | | | | | | | | | | | | |
| | | | | | | | | | | | | |
Other Financial
Instruments | | Level 1 | | | Level 2 | | | Level 3 | | | Total | |
Futures Contracts* | | | | | | | | | | | | | | | | |
Unrealized Appreciation | | $ | 444 | | | $ | – | | | $ | – | | | $ | 444 | |
| | | | | | | | | | | | | | | | |
Total Other Financial Instruments | | $ | 444 | | | $ | – | | | $ | – | | | $ | 444 | |
| | | | | | | | | | | | | | | | |
For the period ended March 31, 2019, there were no transfers between Level 1 and Level 2 assets and liabilities.
For the period ended March 31, 2019, there were no transfers between Level 2 and Level 3 assets and liabilities.
For more information on valuation inputs, see Note 2 – Significant Accounting Policies in Notes to Financial Statements.
Amounts designated as “—” are either $0 or have been rounded to $0.
The following is a summary of the Fund’s transactions with affiliates for the period ended March 31, 2019 ($ Thousands):
| | | | | | | | | | | | | | |
|
| Security Description | | Value at 9/30/18 | | Purchases at
Cost | | Proceeds from
Sales | | Realized Gain | | Change in
Unrealized
Depreciation | | Value 3/31/19 | | Income |
|
SEI Daily Income Trust, Government Fund, Cl F | | $57,680 | | $316,891 | | $ (328,497) | | $— | | $— | | $46,074 | | $551 |
SEI Liquidity Fund, L.P. | | 52,638 | | 125,593 | | (163,358) | | 5 | | — | | 14,878 | | 52 |
| | | | | | | | | | | | | | |
Totals | | $110,318 | | $442,484 | | $ (491,855) | | $5 | | $— | | $60,952 | | $603 |
| | | | | | | | | | | | | | |
Amounts designated as “—” are either $0 or have been rounded to $0.
The accompanying notes are an integral part of the financial statements.
| | | | |
SEI Institutional Managed Trust / Semi-Annual Report / March 31, 2019 | | | 5 | |
SCHEDULE OF INVESTMENTS (Unaudited)
March 31, 2019
Large Cap Value Fund(Continued)
| | | | | | | | |
| Description | | Shares | | | Market Value
($ Thousands) |
| | |
COMMON STOCK — 97.5% | | | | | | | | |
Communication Services — 6.3% | | | | | |
AT&T Inc | | | 1,025,830 | | | $ | 32,170 | |
BCE Inc | | | 219,735 | | | | 9,754 | |
Comcast Corp, Cl A | | | 153,009 | | | | 6,117 | |
DISH Network Corp, Cl A * | | | 22,888 | | | | 725 | |
Facebook Inc, Cl A * | | | 41,397 | | | | 6,901 | |
Fox Corp * | | | 25,780 | | | | 925 | |
Omnicom Group Inc | | | 18,311 | | | | 1,337 | |
TEGNA Inc | | | 133,195 | | | | 1,878 | |
Telephone & Data Systems Inc | | | 106,380 | | | | 3,269 | |
United States Cellular Corp * | | | 48,626 | | | | 2,232 | |
Verizon Communications Inc | | | 237,848 | | | | 14,064 | |
Viacom Inc, Cl B | | | 119,643 | | | | 3,358 | |
Walt Disney Co/The | | | 25,740 | | | | 2,858 | |
| | | | | | | | |
| | |
| | | | | | | 85,588 | |
| | | | | | | | |
| |
Consumer Discretionary — 7.6% | | | | | |
Best Buy Co Inc | | | 73,919 | | | | 5,253 | |
BorgWarner Inc | | | 35,125 | | | | 1,349 | |
Brinker International Inc (A) | | | 12,302 | | | | 546 | |
Capri Holdings Ltd * | | | 46,293 | | | | 2,118 | |
Carnival Corp | | | 39,846 | | | | 2,021 | |
Columbia Sportswear Co | | | 26,415 | | | | 2,752 | |
Dick’s Sporting Goods Inc | | | 29,143 | | | | 1,073 | |
Dillard’s Inc, Cl A (A) | | | 12,443 | | | | 896 | |
DR Horton Inc | | | 136,160 | | | | 5,634 | |
eBay Inc | | | 27,214 | | | | 1,011 | |
Foot Locker Inc, Cl A | | | 90,185 | | | | 5,465 | |
Ford Motor Co | | | 157,740 | | | | 1,385 | |
GameStop Corp, Cl A (A) | | | 17,836 | | | | 181 | |
Gap Inc/The | | | 78,161 | | | | 2,046 | |
General Motors Co | | | 367,789 | | | | 13,645 | |
Genuine Parts Co | | | 109,513 | | | | 12,269 | |
Goodyear Tire & Rubber Co/The | | | 118,457 | | | | 2,150 | |
Graham Holdings Co, Cl B | | | 394 | | | | 269 | |
Harley-Davidson Inc, Cl A | | | 25,543 | | | | 911 | |
Kohl’s Corp | | | 81,094 | | | | 5,577 | |
Lear Corp | | | 24,338 | | | | 3,303 | |
Macy’s Inc | | | 145,959 | | | | 3,508 | |
Magna International Inc, Cl A | | | 78,699 | | | | 3,832 | |
Michaels Cos Inc/The * | | | 47,401 | | | | 541 | |
Mohawk Industries Inc * | | | 20,342 | | | | 2,566 | |
Norwegian Cruise Line Holdings Ltd * | | | 63,278 | | | | 3,478 | |
PulteGroup Inc | | | 84,284 | | | | 2,357 | |
Ralph Lauren Corp, Cl A | | | 27,084 | | | | 3,512 | |
Royal Caribbean Cruises Ltd | | | 2,192 | | | | 251 | |
Skechers U.S.A. Inc, Cl A * | | | 62,719 | | | | 2,108 | |
Target Corp, Cl A | | | 105,907 | | | | 8,500 | |
Whirlpool Corp | | | 12,733 | | | | 1,692 | |
Wyndham Destinations Inc | | | 18,506 | | | | 749 | |
| | | | | | | | |
| | |
| | | | | | | 102,948 | |
| | | | | | | | |
| | | | | | | | |
| Description | | Shares | | | Market Value
($ Thousands) |
| | |
COMMON STOCK (continued) | | | | | | | | |
Consumer Staples — 8.2% | | | | | | | | |
Altria Group Inc | | | 132,361 | | | $ | 7,601 | |
Archer-Daniels-Midland Co | | | 75,616 | | | | 3,261 | |
Diageo PLC ADR | | | 61,169 | | | | 10,008 | |
Ingredion Inc | | | 37,745 | | | | 3,574 | |
JM Smucker Co/The | | | 36,241 | | | | 4,222 | |
Kimberly-Clark Corp | | | 88,522 | | | | 10,968 | |
Kroger Co/The | | | 270,077 | | | | 6,644 | |
Molson Coors Brewing Co, Cl B | | | 77,819 | | | | 4,642 | |
Philip Morris International Inc | | | 156,750 | | | | 13,855 | |
Pilgrim’s Pride Corp * | | | 54,440 | | | | 1,213 | |
Procter & Gamble Co/The | | | 39,228 | | | | 4,082 | |
Tyson Foods Inc, Cl A | | | 107,097 | | | | 7,436 | |
Unilever NV | | | 140,802 | | | | 8,207 | |
Walgreens Boots Alliance Inc | | | 178,672 | | | | 11,305 | |
Walmart Inc | | | 135,544 | | | | 13,220 | |
| | | | | | | | |
| | |
| | | | | | | 110,238 | |
| | | | | | | | |
| | |
Energy — 11.0% | | | | | | | | |
Anadarko Petroleum Corp, Cl A | | | 58,242 | | | | 2,649 | |
BP PLC ADR | | | 151,476 | | | | 6,623 | |
Canadian Natural Resources Ltd | | | 253,935 | | | | 6,983 | |
Carrizo Oil & Gas Inc * | | | 58,378 | | | | 728 | |
Chevron Corp | | | 235,172 | | | | 28,969 | |
ConocoPhillips | | | 345,296 | | | | 23,045 | |
Devon Energy Corp | | | 145,337 | | | | 4,587 | |
Diamondback Energy Inc, Cl A | | | 6,673 | | | | 678 | |
Exxon Mobil Corp | | | 316,864 | | | | 25,603 | |
Halliburton Co | | | 48,787 | | | | 1,429 | |
HollyFrontier Corp | | | 87,412 | | | | 4,307 | |
Kinder Morgan Inc/DE | | | 53,733 | | | | 1,075 | |
Laredo Petroleum Inc * | | | 69,375 | | | | 214 | |
Marathon Petroleum Corp | | | 153,825 | | | | 9,206 | |
Occidental Petroleum Corp | | | 40,460 | | | | 2,678 | |
PBF Energy Inc, Cl A | | | 25,974 | | | | 809 | |
Phillips 66 | | | 58,480 | | | | 5,566 | |
Pioneer Natural Resources Co | | | 4,098 | | | | 624 | |
Royal Dutch Shell PLC ADR, Cl A | | | 139,866 | | | | 8,754 | |
Schlumberger Ltd, Cl A | | | 126,608 | | | | 5,516 | |
Valero Energy Corp | | | 104,174 | | | | 8,837 | |
| | | | | | | | |
| | |
| | | | | | | 148,880 | |
| | | | | | | | |
| | |
Financials — 19.9% | | | | | | | | |
Aflac Inc | | | 149,859 | | | | 7,493 | |
AGNC Investment Corp ‡ | | | 14,913 | | | | 268 | |
Allstate Corp/The | | | 78,965 | | | | 7,437 | |
Ameriprise Financial Inc | | | 23,966 | | | | 3,070 | |
Annaly Capital Management Inc ‡ | | | 128,342 | | | | 1,282 | |
Arthur J Gallagher & Co | | | 3,311 | | | | 259 | |
Assured Guaranty Ltd | | | 28,419 | | | | 1,263 | |
Athene Holding Ltd, Cl A * | | | 7,120 | | | | 291 | |
Banco Santander SA ADR | | | 536,092 | | | | 2,482 | |
| | | | |
SEI Institutional Managed Trust / Semi-Annual Report / March 31, 2019 | | | 1 | |
SCHEDULE OF INVESTMENTS (Unaudited)
March 31, 2019
Large Cap Value Fund(Continued)
| | | | | | | | |
| | | |
| Description | | Shares | | | Market Value
($ Thousands) |
| |
COMMON STOCK (continued) | | | | | |
Bank of America Corp | | | 591,845 | | | $ | 16,329 | |
Bank of New York Mellon Corp/The | | | 32,486 | | | | 1,638 | |
BB&T Corp | | | 26,657 | | | | 1,240 | |
Berkshire Hathaway Inc, Cl B * | | | 82,741 | | | | 16,622 | |
Blackstone Group LP/The (B) | | | 166,341 | | | | 5,817 | |
Capital One Financial Corp | | | 66,427 | | | | 5,426 | |
Chubb Ltd | | | 73,483 | | | | 10,294 | |
CIT Group Inc | | | 27,607 | | | | 1,324 | |
Citigroup Inc | | | 323,897 | | | | 20,153 | |
Discover Financial Services | | | 45,825 | | | | 3,261 | |
E*TRADE Financial Corp | | | 25,887 | | | | 1,202 | |
Erie Indemnity Co, Cl A | | | 7,137 | | | | 1,274 | |
Everest Re Group Ltd | | | 20,651 | | | | 4,460 | |
Fidelity National Financial Inc | | | 75,438 | | | | 2,757 | |
Fifth Third Bancorp | | | 196,391 | | | | 4,953 | |
First American Financial Corp | | | 5,189 | | | | 267 | |
Franklin Resources Inc | | | 9,651 | | | | 320 | |
Goldman Sachs Group Inc/The | | | 6,945 | | | | 1,333 | |
Hartford Financial Services Group Inc/The | | | 32,534 | | | | 1,618 | |
HSBC Holdings PLC ADR (A) | | | 159,040 | | | | 6,454 | |
Invesco Ltd | | | 136,599 | | | | 2,638 | |
JPMorgan Chase & Co | | | 384,576 | | | | 38,931 | |
KeyCorp | | | 115,584 | | | | 1,820 | |
KKR & Co Inc | | | 321,877 | | | | 7,561 | |
Lincoln National Corp | | | 32,614 | | | | 1,914 | |
MetLife Inc | | | 55,848 | | | | 2,377 | |
MFA Financial Inc ‡ | | | 41,144 | | | | 299 | |
Morgan Stanley | | | 32,111 | | | | 1,355 | |
Old Republic International Corp | | | 12,663 | | | | 265 | |
PNC Financial Services Group Inc/The | | | 34,045 | | | | 4,176 | |
Popular Inc | | | 45,227 | | | | 2,358 | |
Prudential Financial Inc | | | 54,813 | | | | 5,036 | |
Radian Group Inc | | | 38,271 | | | | 794 | |
Regions Financial Corp | | | 211,042 | | | | 2,986 | |
Reinsurance Group of America Inc, Cl A | | | 28,599 | | | | 4,061 | |
SLM Corp | | | 133,095 | | | | 1,319 | |
Starwood Property Trust Inc ‡ | | | 95,177 | | | | 2,127 | |
State Street Corp | | | 15,313 | | | | 1,008 | |
SunTrust Banks Inc | | | 234,504 | | | | 13,894 | |
Synchrony Financial | | | 162,848 | | | | 5,195 | |
T Rowe Price Group Inc | | | 16,997 | | | | 1,702 | |
TCF Financial Corp | | | 11,222 | | | | 232 | |
Travelers Cos Inc/The | | | 97,005 | | | | 13,305 | |
Two Harbors Investment Corp ‡ | | | 19,808 | | | | 268 | |
Unum Group | | | 87,057 | | | | 2,945 | |
Voya Financial Inc | | | 50,782 | | | | 2,537 | |
Wells Fargo & Co | | | 312,120 | | | | 15,082 | |
Zions Bancorp NA | | | 19,200 | | | | 872 | |
| | |
| | | | | | | 267,644 | |
| | |
Health Care — 14.2% | | | | | | | | |
Abbott Laboratories | | | 22,205 | | | | 1,775 | |
| | | | | | | | |
| | | |
| Description | | Shares | | | Market Value
($ Thousands) |
| | |
COMMON STOCK (continued) | | | | | | | | |
AbbVie Inc | | | 41,325 | | | $ | 3,330 | |
Agilent Technologies Inc | | | 3,373 | | | | 271 | |
Amgen Inc, Cl A | | | 23,681 | | | | 4,499 | |
Anthem Inc | | | 15,091 | | | | 4,331 | |
Baxter International Inc | | | 3,575 | | | | 291 | |
Biogen Inc * | | | 7,585 | | | | 1,793 | |
Bristol-Myers Squibb Co | | | 176,482 | | | | 8,420 | |
Bruker Corp | | | 7,094 | | | | 273 | |
Cardinal Health Inc | | | 15,707 | | | | 756 | |
Centene Corp * | | | 64,502 | | | | 3,425 | |
Cigna Corp (C) | | | 28,571 | | | | 4,595 | |
CVS Health Corp | | | 103,377 | | | | 5,575 | |
Eli Lilly & Co | | | 107,835 | | | | 13,993 | |
Gilead Sciences Inc | | | 78,772 | | | | 5,121 | |
HCA Healthcare Inc | | | 51,703 | | | | 6,741 | |
Horizon Pharma Plc * | | | 88,843 | | | | 2,348 | |
Humana Inc | | | 14,403 | | | | 3,831 | |
Jazz Pharmaceuticals PLC * | | | 7,873 | | | | 1,125 | |
Johnson & Johnson | | | 229,920 | | | | 32,141 | |
McKesson Corp | | | 46,809 | | | | 5,479 | |
Medtronic PLC | | | 2,846 | | | | 259 | |
Merck & Co Inc | | | 327,493 | | | | 27,238 | |
Mylan NV * | | | 108,207 | | | | 3,067 | |
Novartis AG ADR | | | 109,770 | | | | 10,553 | |
Pfizer Inc | | | 859,268 | | | | 36,493 | |
Varian Medical Systems Inc * | | | 1,997 | | | | 283 | |
Waters Corp * | | | 1,074 | | | | 270 | |
Zimmer Biomet Holdings Inc | | | 19,774 | | | | 2,525 | |
| | |
| | | | | | | 190,801 | |
| | |
Industrials — 7.2% | | | | | | | | |
3M Co | | | 40,786 | | | | 8,475 | |
AerCap Holdings NV * | | | 72,735 | | | | 3,385 | |
AGCO Corp | | | 37,676 | | | | 2,620 | |
Allison Transmission Holdings Inc | | | 24,790 | | | | 1,114 | |
American Airlines Group Inc | | | 142,321 | | | | 4,520 | |
Boeing Co/The | | | 15,100 | | | | 5,759 | |
Cummins Inc | | | 21,255 | | | | 3,356 | |
Delta Air Lines Inc, Cl A | | | 152,815 | | | | 7,893 | |
Eaton Corp PLC | | | 11,560 | | | | 931 | |
FedEx Corp | | | 11,227 | | | | 2,037 | |
GrafTech International Ltd | | | 43,255 | | | | 553 | |
Huntington Ingalls Industries Inc, Cl A | | | 9,609 | | | | 1,991 | |
Ingersoll-Rand PLC | | | 2,509 | | | | 271 | |
JetBlue Airways Corp * | | | 23,835 | | | | 390 | |
Johnson Controls International plc | | | 242,079 | | | | 8,942 | |
L3 Technologies Inc | | | 7,973 | | | | 1,645 | |
Lockheed Martin Corp | | | 4,158 | | | | 1,248 | |
ManpowerGroup Inc | | | 67,688 | | | | 5,597 | |
Norfolk Southern Corp | | | 8,383 | | | | 1,567 | |
PACCAR Inc | | | 8,534 | | | | 581 | |
Raytheon Co | | | 54,023 | | | | 9,837 | |
| | |
| 2 | | SEI Institutional Managed Trust / Semi-Annual Report / March 31, 2019 |
SCHEDULE OF INVESTMENTS (Unaudited)
March 31, 2019
Large Cap Value Fund (Continued)
| | | | | | | | |
| | | |
| Description | | Shares | | | Market Value
($ Thousands) |
| | |
COMMON STOCK (continued) | | | | | | | | |
RR Donnelley & Sons Co | | | 49,345 | | | $ | 233 | |
Siemens AG ADR | | | 130,264 | | | | 7,002 | |
Southwest Airlines Co, Cl A | | | 70,172 | | | | 3,643 | |
Spirit AeroSystems Holdings Inc, Cl A | | | 36,890 | | | | 3,377 | |
Teledyne Technologies Inc * | | | 1,123 | | | | 266 | |
United Continental Holdings Inc * | | | 55,180 | | | | 4,402 | |
United Technologies Corp | | | 16,739 | | | | 2,157 | |
USG Corp | | | 6,128 | | | | 265 | |
Waste Management Inc | | | 23,373 | | | | 2,429 | |
| | |
| | | | | | | 96,486 | |
| | |
Information Technology — 11.2% | | | | | | | | |
Akamai Technologies Inc * | | | 17,095 | | | | 1,226 | |
Applied Materials Inc | | | 47,118 | | | | 1,869 | |
Avnet Inc | | | 6,016 | | | | 261 | |
Cisco Systems Inc | | | 617,328 | | | | 33,330 | |
Cognizant Technology Solutions Corp, Cl A | | | 31,064 | | | | 2,251 | |
Conduent Inc * | | | 17,329 | | | | 240 | |
Corning Inc, Cl B | | | 386,238 | | | | 12,784 | |
DXC Technology Co | | | 35,513 | | | | 2,284 | |
Hewlett Packard Enterprise Co | | | 163,962 | | | | 2,530 | |
HP Inc | | | 362,964 | | | | 7,052 | |
Intel Corp | | | 584,123 | | | | 31,367 | |
International Business Machines Corp | | | 40,675 | | | | 5,739 | |
IPG Photonics Corp * | | | 15,960 | | | | 2,422 | |
Jabil Inc | | | 9,274 | | | | 247 | |
Juniper Networks Inc | | | 104,785 | | | | 2,774 | |
Keysight Technologies Inc * | | | 27,298 | �� | | | 2,380 | |
Lam Research Corp | | | 11,624 | | | | 2,081 | |
Marvell Technology Group Ltd | | | 19,915 | | | | 396 | |
Micron Technology Inc * | | | 148,877 | | | | 6,153 | |
Microsoft Corp | | | 135,407 | | | | 15,970 | |
NVIDIA Corp | | | 5,801 | | | | 1,042 | |
ON Semiconductor Corp * | | | 45,784 | | | | 942 | |
Oracle Corp, Cl B | | | 74,995 | | | | 4,028 | |
Seagate Technology PLC | | | 29,578 | | | | 1,416 | |
Skyworks Solutions Inc | | | 20,654 | | | | 1,704 | |
Symantec Corp, Cl A | | | 11,792 | | | | 271 | |
Tech Data Corp * | | | 14,228 | | | | 1,457 | |
Vishay Intertechnology Inc | | | 41,121 | | | | 759 | |
Western Digital Corp | | | 62,175 | | | | 2,988 | |
Xerox Corp | | | 94,500 | | | | 3,022 | |
| | |
| | | | | | | 150,985 | |
| | |
Materials — 3.9% | | | | | | | | |
Cabot Corp | | | 24,552 | | | | 1,022 | |
Celanese Corp, Cl A | | | 12,537 | | | | 1,236 | |
Crown Holdings Inc * | | | 68,051 | | | | 3,714 | |
Domtar Corp | | | 25,252 | | | | 1,254 | |
DowDuPont Inc | | | 258,229 | | | | 13,766 | |
Eastman Chemical Co | | | 67,278 | | | | 5,105 | |
Freeport-McMoRan Inc, Cl B | | | 180,084 | | | | 2,321 | |
| | | | | | | | |
| | | |
| Description | | Shares | | | Market Value
($ Thousands) |
| | |
COMMON STOCK (continued) | | | | | | | | |
Huntsman Corp | | | 123,041 | | | $ | 2,767 | |
International Paper Co | | | 43,552 | | | | 2,015 | |
LyondellBasell Industries NV, Cl A | | | 64,376 | | | | 5,413 | |
Newmont Mining Corp | | | 61,638 | | | | 2,205 | |
Owens-Illinois Inc | | | 59,035 | | | | 1,120 | |
Packaging Corp of America | | | 11,025 | | | | 1,096 | |
Reliance Steel & Aluminum Co | | | 42,072 | | | | 3,797 | |
Steel Dynamics Inc | | | 130,842 | | | | 4,615 | |
Westrock Co | | | 27,193 | | | | 1,043 | |
| | |
| | | | | | | 52,489 | |
| | |
Real Estate — 3.4% | | | | | | | | |
Brixmor Property Group Inc ‡ | | | 54,720 | | | | 1,005 | |
Camden Property Trust ‡ | | | 2,746 | | | | 279 | |
Equity Commonwealth ‡ | | | 7,874 | | | | 257 | |
Gaming and Leisure Properties Inc ‡ | | | 6,921 | | | | 267 | |
HCP Inc ‡ | | | 284,637 | | | | 8,909 | |
Hospitality Properties Trust ‡ | | | 84,305 | | | | 2,218 | |
Host Hotels & Resorts Inc ‡ | | | 167,334 | | | | 3,163 | |
Howard Hughes Corp/The * | | | 7,500 | | | | 825 | |
Jones Lang LaSalle Inc | | | 1,625 | | | | 251 | |
Medical Properties Trust Inc ‡ | | | 286,392 | | | | 5,301 | |
Omega Healthcare Investors Inc ‡ | | | 33,721 | | | | 1,286 | |
Outfront Media Inc ‡ | | | 14,564 | | | | 341 | |
Realogy Holdings Corp (A) | | | 42,499 | | | | 484 | |
Retail Properties of America Inc, Cl A ‡ | | | 111,265 | | | | 1,356 | |
Senior Housing Properties Trust ‡ | | | 140,808 | | | | 1,659 | |
Ventas Inc ‡ | | | 4,240 | | | | 271 | |
VEREIT Inc ‡ | | | 278,716 | | | | 2,333 | |
Welltower Inc ‡ | | | 200,627 | | | | 15,569 | |
| | |
| | | | | | | 45,774 | |
| | |
Utilities — 4.6% | | | | | | | | |
AES Corp/VA | | | 237,088 | | | | 4,287 | |
Ameren Corp | | | 4,419 | | | | 325 | |
CenterPoint Energy Inc | | | 109,383 | | | | 3,358 | |
Consolidated Edison Inc | | | 67,882 | | | | 5,757 | |
DTE Energy Co | | | 18,650 | | | | 2,326 | |
Edison International | | | 36,971 | | | | 2,289 | |
Entergy Corp | | | 39,729 | | | | 3,799 | |
Exelon Corp | | | 248,451 | | | | 12,455 | |
FirstEnergy Corp | | | 80,582 | | | | 3,353 | |
NextEra Energy Inc | | | 91,339 | | | | 17,658 | |
NRG Energy Inc | | | 36,894 | | | | 1,567 | |
Pinnacle West Capital Corp | | | 2,739 | | | | 262 | |
Public Service Enterprise Group Inc | | | 4,680 | | | | 278 | |
Vistra Energy Corp | | | 165,021 | | | | 4,296 | |
| | |
| | | | | | | 62,010 | |
| | |
Total Common Stock
(Cost $1,084,172) ($ Thousands) | | | | | | | 1,313,843 | |
| | | | |
SEI Institutional Managed Trust / Semi-Annual Report / March 31, 2019 | | | 3 | |
SCHEDULE OF INVESTMENTS (Unaudited)
March 31, 2019
Large Cap Value Fund(Continued)
| | | | | | | | |
| | | |
| Description | | Shares | | | Market Value
($ Thousands) |
| |
AFFILIATED PARTNERSHIP — 0.3% | | | | | |
SEI Liquidity Fund, L.P.
2.480% **†(D) | | | 4,536,876 | | | $ | 4,538 | |
| | | | | | | | |
| | |
Total Affiliated Partnership
(Cost $4,536) ($ Thousands) | | | | | | | 4,538 | |
| | | | | | | | |
| | | |
| Description | | Shares | | | Market Value
($ Thousands) |
| | |
CASH EQUIVALENT — 2.3% | | | | | | | | |
SEI Daily Income Trust, Government Fund,Cl F | | | | | | | | |
2.220%**† | | | 31,561,067 | | | $ | 31,561 | |
| | | | | | | | |
Total Cash Equivalent
(Cost $31,561) ($ Thousands) | | | | | | | 31,561 | |
| | | | | | | | |
| |
Total Investments in Securities – 100.1% | | | | | |
(Cost $1,120,269) ($ Thousands) | | | $ | 1,349,942 | |
| | | | | | | | |
A list of the open futures contracts held at March 31, 2019 is as follows:
| | | | | | | | | | | | | | | | | | | | |
Type of Contract | | Number of
Contracts
Long | | Expiration
Date | | Notional Amount
(Thousands) | | Value
(Thousands) | | | Unrealized
Appreciation
(Thousands) | |
S&P 500 IndexE-MINI | | | 71 | | | | Jun-2019 | | | $ | 9,804 | | | $ | 10,074 | | | $ | 270 | |
| | | | | |
S&P Mid Cap 400 IndexE-MINI | | | 41 | | | | Jun-2019 | | | | 7,672 | | | | 7,794 | | | | 122 | |
| | | | | | | | | | | | |
| | | | | | | | | | $ | 17,476 | | | $ | 17,868 | | | $ | 392 | |
| | | | | | | | | | | | |
| | Percentages are based on Net Assets of $1,348,144 ($ Thousands). |
| * | Non-income producing security. |
| ** | Rate shown is the7-day effective yield as of March 31, 2019. |
| ‡ | Real Estate Investment Trust. |
| † | Investment in Affiliated Security (see Note 6). |
| (A) | Certain securities or partial positions of certain securities are on loan at March 31, 2019 (see Note 10). The total market value of securities on loan at March 31, 2019 was $4,377 ($ Thousands). |
| (B) | Security is a Master Limited Partnership. At March 31, 2019, such securities amounted to $5,817 ($ Thousands), or 0.4% of the net assets of the Fund (see Note 2). |
| (C) | Securities considered illiquid. The total value of such securities as of March 31, 2019 was $4,595 ($ Thousands) and represented 0.3% of the Net Assets of the Fund. |
| (D) | This security was purchased with cash collateral held from securities on loan (see Note 10). The total market value of such securities as of March 31, 2019 was $4,538 ($ Thousands). |
ADR — American Depositary Receipt
Cl — Class
L.P. — Limited Partnership
Ltd. — Limited
PLC — Public Limited Company
S&P— Standard & Poor’s
The following is a list of the level of inputs used as of March 31, 2019, in valuing the Fund’s investments and other financial instruments carried at value ($ Thousands):
| | | | | | | | | | | | | | | | |
| | | | | |
Investments in
Securities | | Level 1 | | | Level 2 | | Level 3 | | Total | |
Common Stock | | $ | 1,313,843 | | | $ | – | | | $ | – | | | $ | 1,313,843 | |
Affiliated Partnership | | | – | | | | 4,538 | | | | – | | | | 4,538 | |
Cash Equivalent | | | 31,561 | | | | – | | | | – | | | | 31,561 | |
| | | | | | | | | | | | | | | | |
Total Investments in Securities | | $ | 1,345,404 | | | $ | 4,538 | | | $ | – | | | $ | 1,349,942 | |
| | | | | | | | | | | | | | | | |
| | | | | | | | | | | | | | | | |
Other Financial
Instruments | | Level 1 | | | Level 2 | | Level 3 | | Total | |
Futures Contracts * | | | | | | | | | | | | | | | | |
Unrealized Appreciation | | $ | 392 | | | $ | – | | | $ | – | | | $ | 392 | |
| | | | | | | | | | | | | | | | |
Total Other Financial Instruments | | $ | 392 | | | $ | – | | | $ | – | | | $ | 392 | |
| | | | | | | | | | | | | | | | |
* Futures contracts are valued at the unrealized appreciation on the instrument.
For the period ended March 31, 2019, there were no transfers between Level 1 and Level 2 assets and liabilities.
For the period ended March 31, 2019, there were no transfers between Level 2 and Level 3 assets and liabilities.
For more information on valuation inputs, see Note 2 – Significant Accounting Policies in Notes to Financial Statements.
The following is a summary of the Fund’s transactions with affiliates for the period ended March 31, 2019 ($ Thousands):
| | | | | | | | | | | | | | | | | | | | | | | | | | | | |
| Security Description | | Value 9/30/18 | | Purchases at
Cost | | Proceeds from Sales | | Realized Gain | | Change in Unrealized
Appreciation | | Value 3/31/19 | | Income |
SEI Liquidity Fund, L.P. | | | $ 10,516 | | | | $ 93,706 | | | | $ (99,688) | | | | $ 3 | | | | $ 1 | | | | $ 4,538 | | | | $ 24 | |
SEI Daily Income Trust, Government Fund, Cl F | | | 42,653 | | | | 101,670 | | | | (112,762) | | | | – | | | | – | | | | 31,561 | | | | 369 | |
| | | | | | | | | | | | | | | | | | | | | | | | | | | | |
Totals | | | $ 53,169 | | | | $ 195,376 | | | | $ (212,450) | | | | $ 3 | | | | $ 1 | | | | $ 36,099 | | | | $ 393 | |
| | | | | | | | | | | | | | | | | | | | | | | | | | | | |
Amounts designated as “—” are either $0 or have been rounded to $0.
The accompanying notes are an integral part of the financial statements.
| | |
| 4 | | SEI Institutional Managed Trust / Semi-Annual Report / March 31, 2019 |
SCHEDULE OF INVESTMENTS (Unaudited)
March 31, 2019
Large Cap Growth Fund(Continued)
| | | | | | | | |
| | | |
| Description | | Shares | | Market Value
($ Thousands) |
| | |
COMMON STOCK — 98.2% | | | | | | | | |
| | |
Communication Services — 10.2% | | | | | | | | |
Alphabet Inc, Cl A * | | | 47,240 | | | $ | 55,596 | |
Alphabet Inc, Cl C * | | | 10,824 | | | | 12,700 | |
Charter Communications Inc, Cl A * | | | 9,279 | | | | 3,219 | |
Facebook Inc, Cl A * | | | 198,862 | | | | 33,148 | |
IAC/InterActiveCorp * | | | 6,922 | | | | 1,454 | |
Live Nation Entertainment Inc * | | | 80,740 | | | | 5,130 | |
Madison Square Garden Co/The * | | | 10,620 | | | | 3,113 | |
Match Group Inc *(A) | | | 4,951 | | | | 280 | |
Netflix Inc * | | | 24,960 | | | | 8,900 | |
Take-Two Interactive Software Inc, Cl A * | | | 42,476 | | | | 4,008 | |
Telephone & Data Systems Inc | | | 14,899 | | | | 458 | |
T-Mobile US Inc * | | | 147,591 | | | | 10,199 | |
Tribune Media Co, Cl A | | | 7,080 | | | | 327 | |
TripAdvisor Inc * | | | 4,996 | | | | 257 | |
Twitter Inc * | | | 80,264 | | | | 2,639 | |
Walt Disney Co/The | | | 82,659 | | | | 9,178 | |
| | |
| | | | | | | 150,606 | |
| | |
Consumer Discretionary — 15.6% | | | | | | | | |
Alibaba Group Holding Ltd ADR * | | | 88,263 | | | | 16,104 | |
Amazon.com Inc, Cl A * | | | 44,429 | | | | 79,117 | |
AutoZone Inc * | | | 22,155 | | | | 22,689 | |
Darden Restaurants Inc | | | 2,532 | | | | 308 | |
Delphi Automotive PLC * | | | 40,517 | | | | 3,221 | |
Dollar Tree Inc * | | | 23,358 | | | | 2,453 | |
Domino’s Pizza Inc | | | 1,007 | | | | 260 | |
Etsy Inc * | | | 14,615 | | | | 982 | |
Foot Locker Inc, Cl A | | | 64,234 | | | | 3,893 | |
General Motors Co | | | 7,261 | | | | 269 | |
H&R Block Inc | | | 11,779 | | | | 282 | |
Hilton Worldwide Holdings Inc | | | 30,354 | | | | 2,523 | |
Home Depot Inc/The | | | 39,504 | | | | 7,580 | |
Lowe’s Cos Inc | | | 102,559 | | | | 11,227 | |
Lululemon Athletica Inc * | | | 63,993 | | | | 10,486 | |
NIKE Inc, Cl B | | | 172,922 | | | | 14,562 | |
Ross Stores Inc | | | 4,377 | | | | 407 | |
Royal Caribbean Cruises Ltd | | | 51,930 | | | | 5,952 | |
Starbucks Corp | | | 70,862 | | | | 5,268 | |
Tiffany & Co | | | 69,425 | | | | 7,328 | |
TJX Cos Inc/The | | | 339,896 | | | | 18,086 | |
Tractor Supply Co | | | 67,314 | | | | 6,581 | |
Vail Resorts Inc | | | 25,103 | | | | 5,455 | |
Yum China Holdings Inc | | | 143,165 | | | | 6,430 | |
| | |
| | | | | | | 231,463 | |
| | |
Consumer Staples — 4.2% | | | | | | | | |
Clorox Co/The | | | 2,074 | | | | 333 | |
Colgate-Palmolive Co | | | 184,478 | | | | 12,644 | |
Estee Lauder Cos Inc/The, Cl A | | | 12,050 | | | | 1,995 | |
Herbalife Nutrition Ltd * | | | 89,152 | | | | 4,724 | |
Hershey Co/The | | | 92,045 | | | | 10,569 | |
| | | | | | | | |
| | | |
| Description | | Shares | | Market Value
($ Thousands) |
| | |
COMMON STOCK (continued) | | | | | | | | |
Monster Beverage Corp * | | | 9,583 | | | $ | 523 | |
PepsiCo Inc | | | 157,598 | | | | 19,314 | |
Procter & Gamble Co/The | | | 94,332 | | | | 9,815 | |
Sysco Corp, Cl A | | | 22,162 | | | | 1,480 | |
| | |
| | | | | | | 61,397 | |
| | |
Energy — 0.3% | | | | | | | | |
Cabot Oil & Gas Corp | | | 162,501 | | | | 4,241 | |
| | |
Financials — 7.8% | | | | | | | | |
Aflac Inc | | | 107,953 | | | | 5,398 | |
Citigroup Inc | | | 69,560 | | | | 4,328 | |
CME Group Inc | | | 72,684 | | | | 11,962 | |
FactSet Research Systems Inc | | | 31,327 | | | | 7,778 | |
First Hawaiian Inc | | | 10,969 | | | | 286 | |
LPL Financial Holdings Inc | | | 3,860 | | | | 269 | |
Moody’s Corp | | | 129,490 | | | | 23,449 | |
Morgan Stanley | | | 19,180 | | | | 809 | |
MSCI Inc, Cl A | | | 78,786 | | | | 15,666 | |
Popular Inc | | | 5,333 | | | | 278 | |
Progressive Corp/The | | | 319,594 | | | | 23,040 | |
S&P Global Inc | | | 43,307 | | | | 9,118 | |
US Bancorp | | | 273,464 | | | | 13,178 | |
Zions Bancorp NA | | | 6,899 | | | | 313 | |
| | |
| | | | | | | 115,872 | |
| | |
Health Care — 15.5% | | | | | | | | |
Abbott Laboratories | | | 205,567 | | | | 16,433 | |
ABIOMED Inc * | | | 1,025 | | | | 293 | |
Alnylam Pharmaceuticals Inc * | | | 13,312 | | | | 1,244 | |
Becton Dickinson and Co | | | 81,942 | | | | 20,463 | |
Biogen Inc * | | | 4,655 | | | | 1,100 | |
Boston Scientific Corp * | | | 221,574 | | | | 8,504 | |
Cigna Corp (B) | | | 34,675 | | | | 5,577 | |
Danaher Corp, Cl A | | | 89,177 | | | | 11,773 | |
DexCom Inc * | | | 5,352 | | | | 637 | |
Exelixis Inc * | | | 11,949 | | | | 284 | |
HCA Healthcare Inc | | | 40,097 | | | | 5,228 | |
Humana Inc | | | 37,831 | | | | 10,063 | |
Illumina Inc * | | | 17,070 | | | | 5,304 | |
Johnson & Johnson | | | 150,630 | | | | 21,057 | |
Merck & Co Inc | | | 109,651 | | | | 9,120 | |
Mettler-Toledo International Inc * | | | 21,426 | | | | 15,491 | |
Regeneron Pharmaceuticals Inc * | | | 26,257 | | | | 10,782 | |
Sarepta Therapeutics Inc * | | | 26,517 | | | | 3,161 | |
Stryker Corp | | | 22,620 | | | | 4,468 | |
Thermo Fisher Scientific Inc | | | 11,414 | | | | 3,124 | |
UnitedHealth Group Inc | | | 207,463 | | | | 51,297 | |
Varian Medical Systems Inc * | | | 74,409 | | | | 10,545 | |
Veeva Systems Inc, Cl A * | | | 11,156 | | | | 1,415 | |
Vertex Pharmaceuticals Inc * | | | 63,443 | | | | 11,670 | |
| | | | |
SEI Institutional Managed Trust / Semi-Annual Report / March 31, 2019 | | | 1 | |
SCHEDULE OF INVESTMENTS (Unaudited)
March 31, 2019
Large Cap Growth Fund(Continued)
| | | | | | | | |
| | | |
| Description | | Shares | | | Market Value ($ Thousands) | |
| |
COMMON STOCK (continued) | | | | | |
Zoetis Inc, Cl A | | | 11,081 | | | $ | 1,116 | |
| | |
| | | | | | | 230,149 | |
| |
Industrials — 10.3% | | | | | |
3M Co | | | 70,234 | | | | 14,593 | |
Allison Transmission Holdings Inc | | | 9,498 | | | | 427 | |
Boeing Co/The | | | 67,507 | | | | 25,749 | |
Cintas Corp | | | 75,177 | | | | 15,194 | |
Copart Inc * | | | 5,254 | | | | 318 | |
CSX Corp | | | 114,932 | | | | 8,599 | |
Delta Air Lines Inc, Cl A | | | 123,994 | | | | 6,404 | |
Expeditors International of Washington Inc | | | 5,131 | | | | 390 | |
Graco Inc | | | 300,933 | | | | 14,902 | |
HD Supply Holdings Inc * | | | 10,173 | | | | 441 | |
Honeywell International Inc | | | 40,350 | | | | 6,412 | |
Middleby Corp/The * | | | 87,227 | | | | 11,342 | |
Robert Half International Inc | | | 157,721 | | | | 10,277 | |
Spirit AeroSystems Holdings Inc, Cl A | | | 80,802 | | | | 7,396 | |
Union Pacific Corp | | | 97,386 | | | | 16,283 | |
United Technologies Corp | | | 106,872 | | | | 13,775 | |
WW Grainger Inc | | | 2,194 | | | | 660 | |
| | |
| | | | | | | 153,162 | |
| |
Information Technology — 29.5% | | | | | |
Adobe Inc * | | | 116,876 | | | | 31,146 | |
Advanced Micro Devices Inc * | | | 22,810 | | | | 582 | |
Analog Devices Inc | | | 147,089 | | | | 15,484 | |
Apple Inc | | | 214,018 | | | | 40,653 | |
Arista Networks Inc * | | | 22,586 | | | | 7,102 | |
Aspen Technology Inc * | | | 8,375 | | | | 873 | |
Avalara Inc * | | | 62,259 | | | | 3,473 | |
Booz Allen Hamilton Holding Corp, Cl A | | | 5,214 | | | | 303 | |
Broadcom Inc | | | 62,672 | | | | 18,846 | |
Cadence Design Systems Inc * | | | 22,196 | | | | 1,410 | |
CDW Corp/DE | | | 14,556 | | | | 1,403 | |
Citrix Systems Inc | | | 2,901 | | | | 289 | |
Dell Technologies Inc, Cl C * | | | 15,378 | | | | 903 | |
EPAM Systems Inc * | | | 9,445 | | | | 1,597 | |
Euronet Worldwide Inc * | | | 8,403 | | | | 1,198 | |
F5 Networks Inc, Cl A * | | | 14,224 | | | | 2,232 | |
Fortinet Inc * | | | 43,100 | | | | 3,619 | |
GoDaddy Inc, Cl A * | | | 4,000 | | | | 301 | |
Intel Corp | | | 5,715 | | | | 307 | |
Intuit Inc | | | 9,784 | | | | 2,558 | |
Keysight Technologies Inc * | | | 3,334 | | | | 291 | |
KLA-Tencor Corp | | | 2,639 | | | | 315 | |
Lam Research Corp | | | 53,100 | | | | 9,505 | |
Mastercard Inc, Cl A | | | 171,148 | | | | 40,297 | |
Microsoft Corp | | | 731,873 | | | | 86,317 | |
National Instruments Corp | | | 17,003 | | | | 754 | |
NetApp Inc | | | 60,438 | | | | 4,191 | |
Oracle Corp, Cl B | | | 274,986 | | | | 14,770 | |
| | | | | | | | |
| | | |
| Description | | Shares | | Market Value
($ Thousands) |
| |
COMMON STOCK (continued) | | | | | |
Palo Alto Networks Inc * | | | 15,490 | | | $ | 3,762 | |
Paychex Inc | | | 4,190 | | | | 336 | |
Paycom Software Inc * | | | 37,490 | | | | 7,090 | |
PayPal Holdings Inc * | | | 104,842 | | | | 10,887 | |
RealPage Inc * | | | 85,873 | | | | 5,212 | |
Red Hat Inc * | | | 22,924 | | | | 4,188 | |
salesforce.com * | | | 137,437 | | | | 21,766 | |
ServiceNow Inc * | | | 10,487 | | | | 2,585 | |
Tableau Software Inc, Cl A * | | | 6,615 | | | | 842 | |
Ubiquiti Networks Inc (A) | | | 63,166 | | | | 9,457 | |
VeriSign Inc * | | | 12,618 | | | | 2,291 | |
Visa Inc, Cl A | | | 283,381 | | | | 44,261 | |
VMware Inc, Cl A * | | | 59,886 | | | | 10,810 | |
Worldpay Inc, Cl A * | | | 77,423 | | | | 8,788 | |
Xilinx Inc | | | 32,253 | | | | 4,089 | |
Zebra Technologies Corp, Cl A * | | | 49,225 | | | | 10,314 | |
| | |
| | | | | | | 437,397 | |
| | |
Materials — 3.1% | | | | | | | | |
Air Products & Chemicals Inc | | | 13,673 | | | | 2,611 | |
Ecolab Inc | | | 34,700 | | | | 6,126 | |
Linde PLC | | | 64,004 | | | | 11,260 | |
Sherwin-Williams Co/The, Cl A | | | 51,845 | | | | 22,330 | |
Vulcan Materials Co | | | 24,865 | | | | 2,944 | |
| | |
| | | | | | | 45,271 | |
| | |
Real Estate — 1.3% | | | | | | | | |
CBRE Group Inc, Cl A *‡ | | | 52,608 | | | | 2,602 | |
Crown Castle International Corp ‡ | | | 37,899 | | | | 4,851 | |
EPR Properties, Cl A ‡ | | | 142,436 | | | | 10,953 | |
Equity Commonwealth *‡ | | | 8,659 | | | | 283 | |
Medical Properties Trust Inc ‡ | | | 15,536 | | | | 288 | |
| | |
| | | | | | | 18,977 | |
| | |
Utilities — 0.4% | | | | | | | | |
CenterPoint Energy Inc | | | 212,071 | | | | 6,511 | |
| | |
Total Common Stock
(Cost $993,297) ($ Thousands) | | | | | | | 1,455,046 | |
| |
AFFILIATED PARTNERSHIP — 0.8% | | | | | |
SEI Liquidity Fund, L.P. | | | | | | | | |
2.480% **†(C) | | | 11,088,940 | | | | 11,089 | |
| | |
Total Affiliated Partnership
(Cost $11,088) ($ Thousands) | | | | | | | 11,089 | |
| | |
| 2 | | SEI Institutional Managed Trust / Semi-Annual Report / March 31, 2019 |
SCHEDULE OF INVESTMENTS (Unaudited)
March 31, 2019
Large Cap Growth Fund(Continued)
| | | | | | | | |
| | | |
| Description | | Shares | | Market Value
($ Thousands) |
| |
CASH EQUIVALENT — 1.4% | | | | | |
SEI Daily Income Trust, Government Fund, Cl F | | | | | | | | |
2.220%**† | | | 21,242,105 | | | $ | 21,242 | |
| | | | | | | | |
| | | |
| Description | | Shares | | Market Value
($ Thousands) |
| |
CASH EQUIVALENT (continued) | | | | | |
Total Cash Equivalent
(Cost $21,242) ($ Thousands) | | | | | | $ | 21,242 | |
| | |
Total Investments in Securities — 100.4%
(Cost $1,025,627) ($ Thousands) | | | | | | $ | 1,487,377 | |
| | | | | | | | |
A list of the open futures held by the Fund at March 31, 2019, is as follows:
| | | | | | | | | | | | | | | | | | | | |
Type of Contract | | Number of
Contracts
Long/(Short) | | | Expiration
Date | | | Notional Amount
(Thousands) | | Value
(Thousands) | | Unrealized
Appreciation
(Thousands) |
| | | | | |
S&P 500 IndexE-MINI | | | 110 | | | | Jun-2019 | | | $ | 15,305 | | | $ | 15,608 | | | $ | 303 | |
| | | | | | | | | | | | |
| | | | | | | | | | $ | 15,305 | | | $ | 15,608 | | | $ | 303 | |
| | | | | | | | | | | | |
| | Percentages are based on Net Assets of $1,481,763 ($ Thousands). |
| * | Non-income producing security. |
| ** | Rate shown is the7-day effective yield as of March 31, 2019. |
| † | Investment in Affiliated Security (see Note 6). |
| ‡ | Real Estate Investment Trust. |
| (A) | Certain securities or partial positions of certain securities are on loan at March 31, 2019 (see Note 10). The total market value of securities on loan at March 31, 2019 was $11,014 ($ Thousands). |
| (B) | Securities considered illiquid. The total value of such securities as of March 31, 2019 was $5,576 ($ Thousands) and represented 0.4% of the Net Assets of the Fund. |
| (C) | This security was purchased with cash collateral held from securities on loan (see Note 10). The total market value of such securities as of March 31, 2019 was $11,089 ($ Thousands). |
ADR — American Depositary Receipt
Cl — Class
L.P. — Limited Partnership
Ltd. — Limited
MSCI — Morgan Stanley Capital International
PLC — Public Limited Company
The following is a list of the level of inputs used as of March 31, 2019, in valuing the Fund’s investments and other financial instruments carried at value ($ Thousands):
| | | | | | | | | | | | | | | | |
Investments in
Securities | | Level 1 | | Level 2 | | Level 3 | | Total |
Common Stock | | $ | 1,455,046 | | | $ | – | | | $ | – | | | $ | 1,455,046 | |
Affiliated Partnership | | | – | | | | 11,089 | | | | – | | | | 11,089 | |
Cash Equivalent | | | 21,242 | | | | – | | | | – | | | | 21,242 | |
| | | | | | | | | | | | | | | | |
Total Investments in Securities | | $ | 1,476,288 | | | $ | 11,089 | | | $ | – | | | $ | 1,487,377 | |
| | | | | | | | | | | | | | | | |
| | | | | | | | | |
Other Financial
Instruments | | Level 1 | | Level 2 | | Level 3 | | Total |
Futures Contracts * | | | | | | | | | | | | | | | | |
Unrealized Appreciation | | $ | 303 | | | $ | — | | | $ | — | | | $ | 303 | |
| | | | | | | | | | | | | | | | |
Total Other Financial Instruments | | $ | 303 | | | $ | — | | | $ | — | | | $ | 303 | |
| | | | | | | | | | | | | | | | |
* Futures contracts are valued at the unrealized Appreciation on the instrument.
For the period ended March 31, 2019, there were no transfers between Level 1 and Level 2 assets and liabilities.
For the period ended March 31, 2019, there were no transfers between Level 2 and Level 3 assets and liabilities.
For more information on valuation inputs, see Note 2 — Significant Accounting Policies in Notes to Financial Statements.
The following is a summary of the Fund’s transactions with affiliates for the period ended March 31, 2019 ($ Thousands):
| | | | | | | | | | | | | | |
| Security Description | | Value at 9/30/18 | | Purchases at
Cost | | Proceeds from
Sales | | Realized Gain | | Change in
Unrealized
Appreciation | | Value 3/31/19 | | Income |
SEI Daily Income Trust, Government Fund, Cl F | | $ 46,852 | | $152,380 | | $ (177,990) | | $ — | | $ — | | $ 21,242 | | $ 392 |
SEI Liquidity Fund, L.P. | | 18,951 | | 70,563 | | (78,427) | | — | | 2 | | 11,089 | | 187 |
| | | | | | | | | | | | | | |
Totals | | $ 65,803 | | $222,943 | | $ (256,417) | | $ — | | $ 2 | | $ 32,331 | | $ 579 |
| | | | | | | | | | | | | | |
Amounts designated as “—” are either $0 or have been rounded to $0.
The accompanying notes are an integral part of the financial statements.
| | | | |
SEI Institutional Managed Trust / Semi-Annual Report / March 31, 2019 | | | 3 | |
SCHEDULE OF INVESTMENTS (Unaudited)
March 31, 2019
Large Cap Index Fund(Continued)
| | | | | | | | |
| | | |
| Description | | Shares | | Market Value
($ Thousands) |
| |
COMMON STOCK — 97.9% | | | | | |
| |
Communication Services — 9.3% | | | | | |
Activision Blizzard Inc | | | 8,608 | | | $ | 392 | |
Alphabet Inc, Cl A * | | | 3,425 | | | | 4,031 | |
Alphabet Inc, Cl C * | | | 3,491 | | | | 4,096 | |
AMC Networks Inc, Cl A * | | | 400 | | | | 23 | |
AT&T Inc | | | 83,521 | | | | 2,619 | |
Cable One Inc | | | 37 | | | | 36 | |
CBS Corp, Cl B | | | 3,615 | | | | 172 | |
CenturyLink Inc | | | 10,712 | | | | 128 | |
Charter Communications Inc, Cl A * | | | 1,954 | | | | 678 | |
Cinemark Holdings Inc | | | 1,200 | | | | 48 | |
Comcast Corp, Cl A | | | 51,701 | | | | 2,067 | |
Discovery Inc, Cl A * | | | 1,600 | | | | 43 | |
Discovery Inc, Cl C * | | | 3,917 | | | | 100 | |
DISH Network Corp, Cl A * | | | 2,600 | | | | 82 | |
Electronic Arts Inc * | | | 3,369 | | | | 342 | |
Facebook Inc, Cl A * | | | 27,345 | | | | 4,558 | |
Fox Corp * | | | 5,631 | | | | 205 | |
GCI Liberty Inc * | | | 1,100 | | | | 61 | |
IAC/InterActiveCorp * | | | 920 | | | | 193 | |
Interpublic Group of Cos Inc/The | | | 4,200 | | | | 88 | |
John Wiley & Sons Inc, Cl A | | | 400 | | | | 18 | |
Liberty Broadband Corp, Cl A * | | | 300 | | | | 27 | |
Liberty Broadband Corp, Cl C * | | | 1,187 | | | | 109 | |
Liberty Media Corp-Liberty Formula One, Cl A * | | | 500 | | | | 17 | |
Liberty Media Corp-Liberty Formula One, Cl C * | | | 2,400 | | | | 84 | |
Liberty Media Corp-Liberty SiriusXM * | | | 3,000 | | | | 115 | |
Lions Gate Entertainment Corp, Cl A | | | 300 | | | | 5 | |
Lions Gate Entertainment Corp, Cl B | | | 900 | | | | 14 | |
Live Nation Entertainment Inc * | | | 1,590 | | | | 101 | |
Madison Square Garden Co/The * | | | 269 | | | | 79 | |
Match Group Inc * | | | 500 | | | | 28 | |
Netflix Inc * | | | 4,828 | | | | 1,721 | |
News Corp, Cl A | | | 3,900 | | | | 48 | |
News Corp, Cl B | | | 1,200 | | | | 15 | |
Omnicom Group Inc | | | 2,626 | | | | 192 | |
Sirius XM Holdings Inc | | | 18,818 | | | | 107 | |
Sprint Corp * | | | 7,200 | | | | 41 | |
Take-Two Interactive Software Inc, Cl A * | | | 1,300 | | | | 123 | |
Telephone & Data Systems Inc | | | 1,200 | | | | 37 | |
T-Mobile US Inc * | | | 3,510 | | | | 243 | |
Tribune Media Co, Cl A | | | 900 | | | | 41 | |
TripAdvisor Inc * | | | 1,200 | | | | 62 | |
Twitter Inc * | | | 8,280 | | | | 272 | |
United States Cellular Corp * | | | 45 | | | | 2 | |
Verizon Communications Inc | | | 47,515 | | | | 2,810 | |
Viacom Inc, Cl A | | | 32 | | | | 1 | |
Viacom Inc, Cl B | | | 4,200 | | | | 118 | |
Walt Disney Co/The | | | 20,167 | | | | 2,239 | |
Zayo Group Holdings Inc * | | | 2,390 | | | | 68 | |
| | | | | | | | |
| | | |
| Description | | Shares | | Market Value
($ Thousands) |
| | |
COMMON STOCK (continued) | | | | | | | | |
Zillow Group Inc, Cl A * | | | 500 | | | $ | 17 | |
Zillow Group Inc, Cl C * | | | 1,400 | | | | 49 | |
Zynga Inc, Cl A * | | | 9,300 | | | | 50 | |
| | |
| | | | | | | 28,815 | |
| |
Consumer Discretionary — 10.0% | | | | | |
Adient PLC | | | 740 | | | | 10 | |
Advance Auto Parts Inc | | | 775 | | | | 132 | |
Amazon.com Inc, Cl A * | | | 4,718 | | | | 8,402 | |
Aramark | | | 2,800 | | | | 83 | |
AutoNation Inc * | | | 500 | | | | 18 | |
AutoZone Inc * | | | 299 | | | | 306 | |
Best Buy Co Inc | | | 2,700 | | | | 192 | |
Booking Holdings Inc * | | | 517 | | | | 902 | |
BorgWarner Inc | | | 2,400 | | | | 92 | |
Bright Horizons Family Solutions Inc * | | | 700 | | | | 89 | |
Brunswick Corp/DE | | | 900 | | | | 45 | |
Burlington Stores Inc * | | | 753 | | | | 118 | |
Caesars Entertainment Corp * | | | 6,407 | | | | 56 | |
Capri Holdings Ltd * | | | 1,500 | | | | 69 | |
CarMax Inc * | | | 1,900 | | | | 133 | |
Carnival Corp | | | 4,627 | | | | 235 | |
Carter’s Inc | | | 500 | | | | 50 | |
Chipotle Mexican Grill Inc, Cl A * | | | 273 | | | | 194 | |
Choice Hotels International | | | 400 | | | | 31 | |
Columbia Sportswear Co | | | 300 | | | | 31 | |
Darden Restaurants Inc | | | 1,383 | | | | 168 | |
Delphi Automotive PLC * | | | 2,914 | | | | 232 | |
Dick’s Sporting Goods Inc | | | 700 | | | | 26 | |
Dollar General Corp | | | 3,059 | | | | 365 | |
Dollar Tree Inc * | | | 2,730 | | | | 287 | |
Domino’s Pizza Inc | | | 512 | | | | 132 | |
DR Horton Inc | | | 4,000 | | | | 165 | |
Dunkin’ Brands Group Inc | | | 1,014 | | | | 76 | |
eBay Inc | | | 9,906 | | | | 368 | |
Expedia Group Inc | | | 1,343 | | | | 160 | |
Extended Stay America Inc | | | 2,300 | | | | 41 | |
Floor & Decor Holdings Inc, Cl A * | | | 800 | | | | 33 | |
Foot Locker Inc, Cl A | | | 1,200 | | | | 73 | |
Ford Motor Co | | | 44,685 | | | | 392 | |
Frontdoor Inc * | | | 900 | | | | 31 | |
Gap Inc/The | | | 2,300 | | | | 60 | |
Garmin Ltd | | | 1,300 | | | | 112 | |
Garrett Motion Inc * | | | 617 | | | | 9 | |
General Motors Co | | | 14,881 | | | | 552 | |
Gentex Corp | | | 2,935 | | | | 61 | |
Genuine Parts Co | | | 1,676 | | | | 188 | |
Goodyear Tire & Rubber Co/The | | | 2,400 | | | | 44 | |
Graham Holdings Co, Cl B | | | 54 | | | | 37 | |
Grand Canyon Education Inc * | | | 500 | | | | 57 | |
GrubHub Inc * | | | 1,100 | | | | 76 | |
H&R Block Inc | | | 2,200 | | | | 53 | |
| | | | |
SEI Institutional Managed Trust / Semi-Annual Report / March 31, 2019 | | | 1 | |
SCHEDULE OF INVESTMENTS (Unaudited)
March 31, 2019
Large Cap Index Fund(Continued)
| | | | | | | | |
| | | |
| Description | | Shares | | Market Value
($ Thousands) |
| | |
COMMON STOCK (continued) | | | | | | | | |
Hanesbrands Inc | | | 3,900 | | | $ | 70 | |
Harley-Davidson Inc, Cl A | | | 1,800 | | | | 64 | |
Hasbro Inc | | | 1,300 | | | | 111 | |
Hilton Grand Vacations Inc * | | | 1,018 | | | | 31 | |
Hilton Worldwide Holdings Inc | | | 3,149 | | | | 262 | |
Home Depot Inc/The | | | 13,014 | | | | 2,497 | |
Hyatt Hotels Corp, Cl A | | | 400 | | | | 29 | |
International Game Technology | | | 1,100 | | | | 14 | |
Kohl’s Corp | | | 1,825 | | | | 125 | |
L Brands Inc | | | 2,500 | | | | 69 | |
Las Vegas Sands Corp | | | 4,144 | | | | 253 | |
Lear Corp | | | 750 | | | | 102 | |
Leggett & Platt Inc | | | 1,600 | | | | 68 | |
Lennar Corp, Cl A | | | 3,228 | | | | 158 | |
Lennar Corp, Cl B | | | 50 | | | | 2 | |
LKQ Corp * | | | 3,589 | | | | 102 | |
Lowe’s Cos Inc | | | 9,257 | | | | 1,013 | |
Lululemon Athletica Inc * | | | 1,093 | | | | 179 | |
Macy’s Inc | | | 3,500 | | | | 84 | |
Marriott International Inc/MD, Cl A | | | 3,290 | | | | 412 | |
Mattel Inc * | | | 3,500 | | | | 45 | |
McDonald’s Corp | | | 8,936 | | | | 1,697 | |
MGM Resorts International | | | 5,853 | | | | 150 | |
Michaels Cos Inc/The * | | | 1,100 | | | | 13 | |
Mohawk Industries Inc * | | | 759 | | | | 96 | |
Newell Brands Inc, Cl B | | | 5,070 | | | | 78 | |
NIKE Inc, Cl B | | | 14,167 | | | | 1,193 | |
Nordstrom Inc | | | 1,400 | | | | 62 | |
Norwegian Cruise Line Holdings Ltd * | | | 2,500 | | | | 137 | |
NVR Inc * | | | 37 | | | | 102 | |
O’Reilly Automotive Inc * | | | 919 | | | | 357 | |
Penske Automotive Group Inc, Cl A | | | 400 | | | | 18 | |
Polaris Industries Inc | | | 656 | | | | 55 | |
Pool Corp | | | 467 | | | | 77 | |
PulteGroup Inc | | | 2,700 | | | | 75 | |
PVH Corp | | | 849 | | | | 104 | |
Qurate Retail Inc * | | | 5,165 | | | | 83 | |
Ralph Lauren Corp, Cl A | | | 636 | | | | 82 | |
Ross Stores Inc | | | 4,262 | | | | 397 | |
Royal Caribbean Cruises Ltd | | | 1,949 | | | | 223 | |
Service Corp International/US | | | 1,900 | | | | 76 | |
ServiceMaster Global Holdings Inc * | | | 1,500 | | | | 70 | |
Six Flags Entertainment Corp | | | 700 | | | | 35 | |
Skechers U.S.A. Inc, Cl A * | | | 1,400 | | | | 47 | |
Starbucks Corp | | | 13,823 | | | | 1,028 | |
Tapestry Inc | | | 3,508 | | | | 114 | |
Target Corp, Cl A | | | 6,096 | | | | 489 | |
Tempur Sealy International Inc * | | | 600 | | | | 35 | |
Tesla Inc * | | | 1,559 | | | | 436 | |
Thor Industries Inc | | | 600 | | | | 37 | |
Tiffany & Co | | | 1,382 | | | | 146 | |
TJX Cos Inc/The | | | 14,263 | | | | 759 | |
| | | | | | | | |
| | | |
| Description | | Shares | | Market Value
($ Thousands) |
| | |
COMMON STOCK (continued) | | | | | | | | |
Toll Brothers Inc | | | 1,400 | | | $ | 51 | |
Tractor Supply Co | | | 1,400 | | | | 137 | |
Ulta Beauty Inc * | | | 638 | | | | 222 | |
Under Armour Inc, Cl A * | | | 2,000 | | | | 42 | |
Under Armour Inc, Cl C * | | | 2,300 | | | | 43 | |
Urban Outfitters Inc * | | | 700 | | | | 21 | |
Vail Resorts Inc | | | 500 | | | | 109 | |
VF Corp | | | 3,744 | | | | 325 | |
Visteon Corp * | | | 300 | | | | 20 | |
Wayfair Inc, Cl A * | | | 675 | | | | 100 | |
Wendy’s Co/The | | | 2,300 | | | | 41 | |
Whirlpool Corp | | | 738 | | | | 98 | |
Williams-Sonoma Inc | | | 900 | | | | 51 | |
Wyndham Destinations Inc | | | 1,163 | | | | 47 | |
Wyndham Hotels & Resorts Inc | | | 1,263 | | | | 63 | |
Wynn Resorts Ltd | | | 1,215 | | | | 145 | |
Yum China Holdings Inc | | | 4,185 | | | | 188 | |
Yum! Brands Inc | | | 3,535 | | | | 353 | |
| | |
| | | | | | | 31,003 | |
| | |
Consumer Staples — 6.7% | | | | | | | | |
Altria Group Inc | | | 21,662 | | | | 1,244 | |
Archer-Daniels-Midland Co | | | 6,459 | | | | 278 | |
Brown-Forman Corp, Cl A | | | 500 | | | | 25 | |
Brown-Forman Corp, Cl B | | | 3,122 | | | | 165 | |
Bunge Ltd | | | 1,600 | | | | 85 | |
Campbell Soup Co | | | 1,900 | | | | 72 | |
Casey’s General Stores Inc | | | 433 | | | | 56 | |
Church & Dwight Co Inc | | | 2,910 | | | | 207 | |
Clorox Co/The | | | 1,471 | | | | 236 | |
Coca-Cola Co/The | | | 43,980 | | | | 2,061 | |
Colgate-Palmolive Co | | | 9,726 | | | | 667 | |
Conagra Brands Inc | | | 5,649 | | | | 157 | |
Constellation Brands Inc, Cl A | | | 1,772 | | | | 311 | |
Costco Wholesale Corp | | | 5,008 | | | | 1,213 | |
Coty Inc, Cl A | | | 5,300 | | | | 61 | |
Energizer Holdings Inc | | | 800 | | | | 36 | |
Estee Lauder Cos Inc/The, Cl A | | | 2,438 | | | | 404 | |
Flowers Foods Inc | | | 2,000 | | | | 43 | |
General Mills Inc | | | 6,882 | | | | 356 | |
Hain Celestial Group Inc/The * | | | 1,000 | | | | 23 | |
Herbalife Nutrition Ltd * | | | 1,174 | | | | 62 | |
Hershey Co/The | | | 1,640 | | | | 188 | |
Hormel Foods Corp | | | 3,237 | | | | 145 | |
Ingredion Inc | | | 810 | | | | 77 | |
JM Smucker Co/The | | | 1,254 | | | | 146 | |
Kellogg Co | | | 2,785 | | | | 160 | |
Keurig Dr Pepper Inc | | | 2,246 | | | | 63 | |
Kimberly-Clark Corp | | | 3,970 | | | | 492 | |
Kraft Heinz Co/The | | | 7,049 | | | | 230 | |
Kroger Co/The | | | 9,288 | | | | 228 | |
Lamb Weston Holdings Inc | | | 1,600 | | | | 120 | |
| | |
| 2 | | SEI Institutional Managed Trust / Semi-Annual Report / March 31, 2019 |
SCHEDULE OF INVESTMENTS (Unaudited)
March 31, 2019
Large Cap Index Fund(Continued)
| | | | | | | | |
| | | |
| Description | | Shares | | Market Value
($ Thousands) |
| | |
COMMON STOCK (continued) | | | | | | | | |
McCormick & Co Inc/MD | | | 1,441 | | | $ | 217 | |
Molson Coors Brewing Co, Cl B | | | 1,895 | | | | 113 | |
Mondelez International Inc, Cl A | | | 16,512 | | | | 824 | |
Monster Beverage Corp * | | | 4,577 | | | | 250 | |
Nu Skin Enterprises Inc, Cl A | | | 700 | | | | 33 | |
PepsiCo Inc | | | 16,235 | | | | 1,989 | |
Philip Morris International Inc | | | 17,950 | | | | 1,587 | |
Pilgrim’s Pride Corp * | | | 900 | | | | 20 | |
Post Holdings Inc * | | | 740 | | | | 81 | |
Procter & Gamble Co/The | | | 28,579 | | | | 2,974 | |
Seaboard Corp | | | 4 | | | | 17 | |
Spectrum Brands Holdings Inc | | | 547 | | | | 30 | |
Sprouts Farmers Market Inc * | | | 1,200 | | | | 26 | |
Sysco Corp, Cl A | | | 5,463 | | | | 365 | |
TreeHouse Foods Inc * | | | 700 | | | | 45 | |
Tyson Foods Inc, Cl A | | | 3,276 | | | | 227 | |
US Foods Holding Corp * | | | 2,600 | | | | 91 | |
Walgreens Boots Alliance Inc | | | 9,369 | | | | 593 | |
Walmart Inc | | | 16,110 | | | | 1,571 | |
| | |
| | | | | | | 20,664 | |
| | |
Energy — 5.1% | | | | | | | | |
Anadarko Petroleum Corp, Cl A | | | 5,935 | | | | 270 | |
Antero Resources Corp * | | | 3,200 | | | | 28 | |
Apache Corp | | | 4,300 | | | | 149 | |
Apergy Corp * | | | 1,032 | | | | 42 | |
Baker Hughes a GE Co, Cl A | | | 5,902 | | | | 164 | |
Cabot Oil & Gas Corp | | | 4,800 | | | | 125 | |
Centennial Resource Development Inc/ DE, Cl A * | | | 1,500 | | | | 13 | |
Cheniere Energy Inc * | | | 2,600 | | | | 178 | |
Chesapeake Energy Corp * | | | 14,900 | | | | 46 | |
Chevron Corp | | | 21,928 | | | | 2,701 | |
Cimarex Energy Co | | | 1,144 | | | | 80 | |
CNX Resources Corp * | | | 1,800 | | | | 19 | |
Concho Resources Inc | | | 2,230 | | | | 247 | |
ConocoPhillips | | | 13,026 | | | | 869 | |
Continental Resources Inc/OK, Cl A * | | | 900 | | | | 40 | |
Devon Energy Corp | | | 5,400 | | | | 170 | |
Diamondback Energy Inc, Cl A | | | 1,838 | | | | 187 | |
EOG Resources Inc | | | 6,627 | | | | 631 | |
EQT Corp | | | 2,800 | | | | 58 | |
Equitrans Midstream Corp | | | 2,160 | | | | 47 | |
Extraction Oil & Gas Inc * | | | 700 | | | | 3 | |
Exxon Mobil Corp | | | 48,657 | | | | 3,931 | |
Halliburton Co | | | 9,961 | | | | 292 | |
Helmerich & Payne Inc | | | 1,200 | | | | 67 | |
Hess Corp | | | 2,900 | | | | 175 | |
HollyFrontier Corp | | | 1,800 | | | | 89 | |
Kinder Morgan Inc/DE | | | 22,465 | | | | 449 | |
Kosmos Energy Ltd | | | 2,400 | | | | 15 | |
Marathon Oil Corp | | | 9,592 | | | | 160 | |
| | | | | | | | |
| | | |
| Description | | Shares | | Market Value
($ Thousands) |
| | |
COMMON STOCK (continued) | | | | | | | | |
Marathon Petroleum Corp | | | 7,770 | | | $ | 465 | |
Murphy Oil Corp | | | 1,700 | | | | 50 | |
Nabors Industries Ltd | | | 3,400 | | | | 12 | |
National Oilwell Varco Inc, Cl A | | | 4,600 | | | | 123 | |
Noble Energy Inc | | | 5,743 | | | | 142 | |
Occidental Petroleum Corp | | | 8,693 | | | | 575 | |
ONEOK Inc | | | 4,761 | | | | 332 | |
Parsley Energy Inc, Cl A * | | | 2,900 | | | | 56 | |
Patterson-UTI Energy Inc | | | 2,800 | | | | 39 | |
PBF Energy Inc, Cl A | | | 1,500 | | | | 47 | |
Phillips 66 | | | 4,675 | | | | 445 | |
Pioneer Natural Resources Co | | | 1,994 | | | | 304 | |
QEP Resources Inc * | | | 2,400 | | | | 19 | |
Range Resources Corp | | | 2,600 | | | | 29 | |
RPC Inc | | | 400 | | | | 5 | |
Schlumberger Ltd, Cl A | | | 15,898 | | | | 693 | |
SM Energy Co | | | 1,000 | | | | 17 | |
Targa Resources Corp | | | 2,500 | | | | 104 | |
Transocean Ltd * | | | 5,400 | | | | 47 | |
Valero Energy Corp | | | 4,922 | | | | 418 | |
Weatherford International PLC * | | | 8,600 | | | | 6 | |
Whiting Petroleum Corp * | | | 1,100 | | | | 29 | |
Williams Cos Inc/The | | | 13,773 | | | | 396 | |
WPX Energy Inc * | | | 4,500 | | | | 59 | |
| | |
| | | | | | | 15,657 | |
| | |
Financials — 12.6% | | | | | | | | |
Affiliated Managers Group Inc | | | 633 | | | | 68 | |
Aflac Inc | | | 8,482 | | | | 424 | |
AGNC Investment Corp | | | 5,828 | | | | 105 | |
Alleghany * | | | 183 | | | | 112 | |
Allstate Corp/The | | | 3,823 | | | | 360 | |
Ally Financial Inc | | | 4,800 | | | | 132 | |
American Express Co | | | 8,001 | | | | 875 | |
American Financial Group Inc/OH | | | 843 | | | | 81 | |
American International Group Inc | | | 10,103 | | | | 435 | |
American National Insurance Co | | | 124 | | | | 15 | |
Ameriprise Financial Inc | | | 1,532 | | | | 196 | |
Annaly Capital Management Inc | | | 16,174 | | | | 162 | |
Aon PLC | | | 2,786 | | | | 476 | |
Arch Capital Group Ltd * | | | 4,589 | | | | 148 | |
Arthur J Gallagher & Co | | | 2,066 | | | | 161 | |
Associated Banc-Corp | | | 1,800 | | | | 38 | |
Assurant Inc | | | 700 | | | | 66 | |
Assured Guaranty Ltd | | | 1,300 | | | | 58 | |
Athene Holding Ltd, Cl A * | | | 1,900 | | | | 78 | |
AXA Equitable Holdings Inc | | | 3,000 | | | | 60 | |
Axis Capital Holdings Ltd | | | 900 | | | | 49 | |
Bank of America Corp | | | 103,564 | | | | 2,857 | |
Bank of Hawaii Corp | | | 448 | | | | 35 | |
Bank of New York Mellon Corp/The | | | 10,085 | | | | 509 | |
Bank OZK | | | 1,500 | | | | 43 | |
| | | | |
SEI Institutional Managed Trust / Semi-Annual Report / March 31, 2019 | | | 3 | |
SCHEDULE OF INVESTMENTS (Unaudited)
March 31, 2019
Large Cap Index Fund(Continued)
| | | | | | | | |
| | | |
| Description | | Shares | | Market Value
($ Thousands) |
| | |
COMMON STOCK (continued) | | | | | | | | |
BankUnited Inc | | | 1,200 | | | $ | 40 | |
BB&T Corp | | | 8,762 | | | | 408 | |
Berkshire Hathaway Inc, Cl B * | | | 22,309 | | | | 4,482 | |
BGC Partners Inc, Cl A | | | 2,300 | | | | 12 | |
BlackRock Inc | | | 1,363 | | | | 583 | |
BOK Financial Corp | | | 400 | | | | 33 | |
Brighthouse Financial Inc * | | | 1,300 | | | | 47 | |
Brown & Brown Inc | | | 2,500 | | | | 74 | |
Capital One Financial Corp | | | 5,441 | | | | 444 | |
Cboe Global Markets Inc | | | 1,300 | | | | 124 | |
Charles Schwab Corp/The | | | 13,842 | | | | 592 | |
Chimera Investment Corp | | | 2,200 | | | | 41 | |
Chubb Ltd | | | 5,294 | | | | 742 | |
Cincinnati Financial Corp | | | 1,700 | | | | 146 | |
CIT Group Inc | | | 1,146 | | | | 55 | |
Citigroup Inc | | | 27,322 | | | | 1,700 | |
Citizens Financial Group Inc | | | 5,347 | | | | 174 | |
CME Group Inc | | | 4,063 | | | | 669 | |
CNA Financial Corp | | | 200 | | | | 9 | |
Comerica Inc | | | 1,853 | | | | 136 | |
Commerce Bancshares Inc/MO | | | 1,040 | | | | 60 | |
Credit Acceptance Corp, Cl A * | | | 128 | | | | 58 | |
Cullen/Frost Bankers Inc | | | 640 | | | | 62 | |
Discover Financial Services | | | 3,827 | | | | 272 | |
E*TRADE Financial Corp | | | 2,813 | | | | 131 | |
East West Bancorp Inc | | | 1,600 | | | | 77 | |
Eaton Vance Corp | | | 1,400 | | | | 56 | |
Erie Indemnity Co, Cl A | | | 300 | | | | 54 | |
Evercore Inc, Cl A | | | 400 | | | | 36 | |
Everest Re Group Ltd | | | 445 | | | | 96 | |
FactSet Research Systems Inc | | | 472 | | | | 117 | |
Fidelity National Financial Inc | | | 3,010 | | | | 110 | |
Fifth Third Bancorp | | | 8,700 | | | | 219 | |
First American Financial Corp | | | 1,200 | | | | 62 | |
First Citizens BancShares Inc/NC, Cl A | | | 68 | | | | 28 | |
First Hawaiian Inc | | | 1,500 | | | | 39 | |
First Horizon National Corp | | | 3,600 | | | | 50 | |
First Republic Bank/CA | | | 1,880 | | | | 189 | |
FNB Corp/PA | | | 3,400 | | | | 36 | |
Franklin Resources Inc | | | 3,600 | | | | 119 | |
Goldman Sachs Group Inc/The | | | 4,007 | | | | 769 | |
Hanover Insurance Group Inc/The, Cl A | | | 489 | | | | 56 | |
Hartford Financial Services Group Inc/The | | | 4,100 | | | | 204 | |
Huntington Bancshares Inc/OH | | | 11,892 | | | | 151 | |
Interactive Brokers Group Inc, Cl A | | | 821 | | | | 43 | |
Intercontinental Exchange Inc | | | 6,412 | | | | 488 | |
Invesco Ltd | | | 4,700 | | | | 91 | |
Jefferies Financial Group Inc | | | 3,100 | | | | 58 | |
JPMorgan Chase & Co | | | 38,087 | | | | 3,856 | |
KeyCorp | | | 11,388 | | | | 179 | |
Lazard Ltd, Cl A (A) | | | 1,200 | | | | 43 | |
Legg Mason Inc | | | 800 | | | | 22 | |
| | | | | | | | |
| | | |
| Description | | Shares | | Market Value
($ Thousands) |
| | |
COMMON STOCK (continued) | | | | | | | | |
Lincoln National Corp | | | 2,477 | | | $ | 145 | |
Loews Corp | | | 3,189 | | | | 153 | |
LPL Financial Holdings Inc | | | 900 | | | | 63 | |
M&T Bank Corp | | | 1,566 | | | | 246 | |
Markel Corp * | | | 150 | | | | 149 | |
MarketAxess Holdings Inc | | | 468 | | | | 115 | |
Marsh & McLennan Cos Inc | | | 5,821 | | | | 547 | |
Mercury General Corp | | | 200 | | | | 10 | |
MetLife Inc | | | 9,330 | | | | 397 | |
MFA Financial Inc | | | 4,600 | | | | 33 | |
Moody’s Corp | | | 1,909 | | | | 346 | |
Morgan Stanley | | | 13,915 | | | | 587 | |
Morningstar Inc, Cl A | | | 200 | | | | 25 | |
MSCI Inc, Cl A | | | 952 | | | | 189 | |
Nasdaq Inc, Cl A | | | 1,300 | | | | 114 | |
Navient Corp | | | 3,300 | | | | 38 | |
New Residential Investment Corp | | | 4,540 | | | | 77 | |
New York Community Bancorp Inc | | | 5,000 | | | | 58 | |
Northern Trust Corp | | | 2,262 | | | | 205 | |
Old Republic International Corp | | | 3,000 | | | | 63 | |
OneMain Holdings Inc, Cl A | | | 981 | | | | 31 | |
PacWest Bancorp | | | 1,300 | | | | 49 | |
People’s United Financial Inc | | | 4,400 | | | | 72 | |
Pinnacle Financial Partners Inc | | | 800 | | | | 44 | |
PNC Financial Services Group Inc/The | | | 5,198 | | | | 638 | |
Popular Inc | | | 1,200 | | | | 63 | |
Principal Financial Group Inc, Cl A | | | 3,300 | | | | 166 | |
Progressive Corp/The | | | 6,609 | | | | 476 | |
Prosperity Bancshares | | | 800 | | | | 55 | |
Prudential Financial Inc | | | 4,718 | | | | 433 | |
Raymond James Financial Inc | | | 1,570 | | | | 126 | |
Regions Financial Corp | | | 12,312 | | | | 174 | |
Reinsurance Group of America Inc, Cl A | | | 768 | | | | 109 | |
RenaissanceRe Holdings Ltd | | | 475 | | | | 68 | |
S&P Global Inc | | | 2,838 | | | | 598 | |
Santander Consumer USA Holdings Inc | | | 1,200 | | | | 25 | |
SEI Investments Co † | | | 1,500 | | | | 78 | |
Signature Bank/New York NY, Cl B | | | 578 | | | | 74 | |
SLM Corp | | | 5,600 | | | | 55 | |
Starwood Property Trust Inc | | | 3,300 | | | | 74 | |
State Street Corp | | | 4,233 | | | | 279 | |
Sterling Bancorp/DE | | | 2,300 | | | | 43 | |
SunTrust Banks Inc | | | 5,160 | | | | 306 | |
SVB Financial Group, Cl B * | | | 584 | | | | 130 | |
Synchrony Financial | | | 8,256 | | | | 263 | |
Synovus Financial Corp | | | 1,700 | | | | 58 | |
T Rowe Price Group Inc | | | 2,671 | | | | 267 | |
TCF Financial Corp | | | 1,700 | | | | 35 | |
TD Ameritrade Holding Corp | | | 3,111 | | | | 156 | |
Texas Capital Bancshares Inc * | | | 600 | | | | 33 | |
TFS Financial Corp | | | 200 | | | | 3 | |
Torchmark Corp, Cl A | | | 1,300 | | | | 107 | |
| | |
| 4 | | SEI Institutional Managed Trust / Semi-Annual Report / March 31, 2019 |
SCHEDULE OF INVESTMENTS (Unaudited)
March 31, 2019
Large Cap Index Fund(Continued)
| | | | | | | | |
| | | |
| Description | | Shares | | Market Value
($ Thousands) |
| | |
COMMON STOCK (continued) | | | | | | | | |
Travelers Cos Inc/The | | | 3,024 | | | $ | 415 | |
Two Harbors Investment Corp | | | 3,000 | | | | 41 | |
Umpqua Holdings Corp | | | 2,500 | | | | 41 | |
Unum Group | | | 2,400 | | | | 81 | |
US Bancorp | | | 17,426 | | | | 840 | |
Virtu Financial Inc, Cl A | | | 600 | | | | 14 | |
Voya Financial Inc | | | 1,800 | | | | 90 | |
Webster Financial Corp | | | 995 | | | | 50 | |
Wells Fargo & Co | | | 47,610 | | | | 2,301 | |
Western Alliance Bancorp * | | | 1,000 | | | | 41 | |
White Mountains Insurance Group Ltd | | | 28 | | | | 26 | |
Willis Towers Watson PLC | | | 1,486 | | | | 261 | |
Wintrust Financial Corp | | | 700 | | | | 47 | |
WR Berkley Corp | | | 1,200 | | | | 102 | |
Zions Bancorp NA | | | 2,200 | | | | 100 | |
| | |
| | | | | | | 38,983 | |
| | |
Health Care — 13.9% | | | | | | | | |
Abbott Laboratories | | | 19,636 | | | | 1,570 | |
AbbVie Inc | | | 17,504 | | | | 1,411 | |
ABIOMED Inc * | | | 520 | | | | 148 | |
Acadia Healthcare Co Inc, Cl A * | | | 1,100 | | | | 32 | |
Agilent Technologies Inc | | | 3,779 | | | | 304 | |
Agios Pharmaceuticals Inc * | | | 600 | | | | 40 | |
Alexion Pharmaceuticals Inc * | | | 2,417 | | | | 327 | |
Align Technology Inc * | | | 889 | | | | 253 | |
Alkermes PLC * | | | 1,800 | | | | 66 | |
Allergan PLC | | | 3,886 | | | | 569 | |
Alnylam Pharmaceuticals Inc * | | | 1,074 | | | | 100 | |
AmerisourceBergen Corp, Cl A | | | 1,788 | | | | 142 | |
Amgen Inc, Cl A | | | 7,308 | | | | 1,388 | |
Anthem Inc | | | 3,061 | | | | 878 | |
Baxter International Inc | | | 5,692 | | | | 463 | |
Becton Dickinson and Co | | | 3,031 | | | | 757 | |
Biogen Inc * | | | 2,298 | | | | 543 | |
BioMarin Pharmaceutical Inc * | | | 2,037 | | | | 181 | |
Bio-Rad Laboratories Inc, Cl A * | | | 300 | | | | 92 | |
Bio-Techne Corp | | | 418 | | | | 83 | |
Bluebird Bio Inc * | | | 600 | | | | 94 | |
Boston Scientific Corp * | | | 15,996 | | | | 614 | |
Bristol-Myers Squibb Co | | | 18,798 | | | | 897 | |
Bruker Corp | | | 1,000 | | | | 38 | |
Cantel Medical Corp | | | 400 | | | | 27 | |
Cardinal Health Inc | | | 3,300 | | | | 159 | |
Catalent Inc * | | | 1,623 | | | | 66 | |
Celgene Corp, Cl A * | | | 8,118 | | | | 766 | |
Centene Corp * | | | 4,624 | | | | 246 | |
Cerner Corp * | | | 3,600 | | | | 206 | |
Charles River Laboratories International Inc * | | | 500 | | | | 73 | |
Chemed Corp | | | 180 | | | | 58 | |
Cigna Corp (B) | | | 4,272 | | | | 687 | |
| | | | | | | | |
| | | |
| Description | | Shares | | Market Value
($ Thousands) |
| | |
COMMON STOCK (continued) | | | | | | | | |
Cooper Cos Inc/The, Cl A | | | 529 | | | $ | 157 | |
Covetrus Inc * | | | 619 | | | | 20 | |
CVS Health Corp | | | 14,794 | | | | 798 | |
Danaher Corp, Cl A | | | 7,173 | | | | 947 | |
DaVita Inc * | | | 1,500 | | | | 81 | |
DENTSPLY SIRONA Inc | | | 2,400 | | | | 119 | |
DexCom Inc * | | | 1,000 | | | | 119 | |
Edwards Lifesciences Corp, Cl A * | | | 2,415 | | | | 462 | |
Elanco Animal Health Inc * | | | 4,177 | | | | 134 | |
Eli Lilly & Co | | | 10,116 | | | | 1,313 | |
Encompass Health Corp | | | 1,200 | | | | 70 | |
Exact Sciences Corp * | | | 1,300 | | | | 113 | |
Exelixis Inc * | | | 3,100 | | | | 74 | |
Gilead Sciences Inc | | | 14,605 | | | | 949 | |
HCA Healthcare Inc | | | 3,125 | | | | 407 | |
Henry Schein Inc * | | | 1,747 | | | | 105 | |
Hill-Rom Holdings Inc | | | 750 | | | | 79 | |
Hologic Inc * | | | 3,100 | | | | 150 | |
Humana Inc | | | 1,578 | | | | 420 | |
ICU Medical Inc * | | | 159 | | | | 38 | |
IDEXX Laboratories Inc * | | | 976 | | | | 218 | |
Illumina Inc * | | | 1,664 | | | | 517 | |
Incyte Corp * | | | 1,984 | | | | 171 | |
Insulet Corp * | | | 700 | | | | 67 | |
Integra LifeSciences Holdings Corp * | | | 800 | | | | 45 | |
Intuitive Surgical Inc * | | | 1,277 | | | | 729 | |
Ionis Pharmaceuticals Inc * | | | 1,400 | | | | 114 | |
IQVIA Holdings Inc * | | | 2,040 | | | | 293 | |
Jazz Pharmaceuticals PLC * | | | 643 | | | | 92 | |
Johnson & Johnson | | | 30,900 | | | | 4,319 | |
Laboratory Corp of America Holdings * | | | 1,140 | | | | 174 | |
Masimo Corp * | | | 500 | | | | 69 | |
McKesson Corp | | | 2,169 | | | | 254 | |
MEDNAX Inc * | | | 1,000 | | | | 27 | |
Medtronic PLC | | | 15,659 | | | | 1,426 | |
Merck & Co Inc | | | 29,910 | | | | 2,488 | |
Mettler-Toledo International Inc * | | | 294 | | | | 213 | |
Moderna * | | | 600 | | | | 12 | |
Molina Healthcare Inc * | | | 700 | | | | 99 | |
Mylan NV * | | | 5,700 | | | | 162 | |
Nektar Therapeutics, Cl A * | | | 1,600 | | | | 54 | |
Neurocrine Biosciences Inc * | | | 1,100 | | | | 97 | |
Penumbra Inc * | | | 400 | | | | 59 | |
PerkinElmer Inc | | | 1,200 | | | | 116 | |
Perrigo Co PLC | | | 1,583 | | | | 76 | |
Pfizer Inc | | | 66,089 | | | | 2,807 | |
PRA Health Sciences Inc * | | | 700 | | | | 77 | |
Premier Inc, Cl A * | | | 500 | | | | 17 | |
QIAGEN NV * | | | 2,500 | | | | 102 | |
Quest Diagnostics Inc | | | 1,500 | | | | 135 | |
Regeneron Pharmaceuticals Inc * | | | 922 | | | | 379 | |
ResMed Inc | | | 1,553 | | | | 161 | |
| | | | |
SEI Institutional Managed Trust / Semi-Annual Report / March 31, 2019 | | | 5 | |
SCHEDULE OF INVESTMENTS (Unaudited)
March 31, 2019
Large Cap Index Fund(Continued)
| | | | | | | | |
| | | |
| Description | | Shares | | Market Value
($ Thousands) |
| | |
COMMON STOCK (continued) | | | | | | | | |
Sage Therapeutics Inc * | | | 600 | | | $ | 95 | |
Sarepta Therapeutics Inc * | | | 800 | | | | 95 | |
Seattle Genetics Inc * | | | 1,261 | | | | 92 | |
STERIS PLC | | | 1,000 | | | | 128 | |
Stryker Corp | | | 3,949 | | | | 780 | |
Teleflex Inc | | | 509 | | | | 154 | |
Thermo Fisher Scientific Inc | | | 4,664 | | | | 1,277 | |
United Therapeutics Corp * | | | 532 | | | | 62 | |
UnitedHealth Group Inc | | | 10,975 | | | | 2,714 | |
Universal Health Services Inc, Cl B | | | 942 | | | | 126 | |
Varian Medical Systems Inc * | | | 1,036 | | | | 147 | |
Veeva Systems Inc, Cl A * | | | 1,430 | | | | 181 | |
Vertex Pharmaceuticals Inc * | | | 2,922 | | | | 537 | |
Waters Corp * | | | 919 | | | | 231 | |
WellCare Health Plans Inc * | | | 631 | | | | 170 | |
West Pharmaceutical Services Inc | | | 844 | | | | 93 | |
Zimmer Biomet Holdings Inc | | | 2,322 | | | | 297 | |
Zoetis Inc, Cl A | | | 5,508 | | | | 554 | |
| | |
| | | | | | | 43,135 | |
| | |
Industrials — 9.6% | | | | | | | | |
3M Co | | | 6,410 | | | | 1,332 | |
Acuity Brands Inc | | | 478 | | | | 57 | |
ADT Inc | | | 400 | | | | 3 | |
AECOM * | | | 1,800 | | | | 53 | |
AGCO Corp | | | 800 | | | | 56 | |
Air Lease Corp, Cl A | | | 1,100 | | | | 38 | |
Alaska Air Group Inc | | | 1,400 | | | | 79 | |
Allegion PLC | | | 1,050 | | | | 95 | |
Allison Transmission Holdings Inc | | | 1,200 | | | | 54 | |
AMERCO | | | 63 | | | | 23 | |
American Airlines Group Inc | | | 4,572 | | | | 145 | |
AMETEK Inc | | | 2,583 | | | | 214 | |
AO Smith Corp | | | 1,600 | | | | 85 | |
Arconic Inc | | | 4,800 | | | | 92 | |
Arcosa Inc | | | 433 | | | | 13 | |
Armstrong World Industries Inc | | | 500 | | | | 40 | |
Boeing Co/The | | | 6,138 | | | | 2,341 | |
BWX Technologies Inc, Cl W | | | 1,300 | | | | 64 | |
Carlisle Cos Inc | | | 624 | | | | 76 | |
Caterpillar Inc, Cl A | | | 6,633 | | | | 899 | |
CH Robinson Worldwide Inc | | | 1,500 | | | | 130 | |
Cintas Corp | | | 970 | | | | 196 | |
Clean Harbors Inc * | | | 600 | | | | 43 | |
Colfax Corp * | | | 900 | | | | 27 | |
Copa Holdings SA, Cl A | | | 333 | | | | 27 | |
Copart Inc * | | | 2,400 | | | | 145 | |
CoStar Group Inc * | | | 395 | | | | 184 | |
Crane Co, Cl A | | | 500 | | | | 42 | |
CSX Corp | | | 8,874 | | | | 664 | |
Cummins Inc | | | 1,715 | | | | 271 | |
Curtiss-Wright Corp | | | 500 | | | | 57 | |
| | | | | | | | |
| | | |
| Description | | Shares | | Market Value
($ Thousands) |
| | |
COMMON STOCK (continued) | | | | | | | | |
Deere & Co | | | 3,732 | | | $ | 596 | |
Delta Air Lines Inc, Cl A | | | 7,506 | | | | 388 | |
Donaldson Co Inc, Cl A | | | 1,600 | | | | 80 | |
Dover Corp | | | 1,605 | | | | 151 | |
Eaton Corp PLC | | | 4,993 | | | | 402 | |
Emerson Electric Co | | | 7,043 | | | | 482 | |
Equifax Inc | | | 1,335 | | | | 158 | |
Expeditors International of Washington Inc | | | 1,900 | | | | 144 | |
Fastenal Co, Cl A | | | 3,300 | | | | 212 | |
FedEx Corp | | | 2,864 | | | | 520 | |
Flowserve Corp | | | 1,600 | | | | 72 | |
Fluor Corp | | | 1,600 | | | | 59 | |
Fortive Corp | | | 3,361 | | | | 282 | |
Fortune Brands Home & Security Inc | | | 1,500 | | | | 71 | |
Gardner Denver Holdings Inc * | | | 1,500 | | | | 42 | |
Gates Industrial Corp PLC * | | | 200 | | | | 3 | |
General Dynamics Corp | | | 2,910 | | | | 493 | |
General Electric Co | | | 98,770 | | | | 987 | |
Genesee & Wyoming Inc, Cl A * | | | 600 | | | | 52 | |
Graco Inc | | | 2,000 | | | | 99 | |
GrafTech International Ltd | | | 261 | | | | 3 | |
Harris Corp | | | 1,329 | | | | 212 | |
HD Supply Holdings Inc * | | | 2,200 | | | | 95 | |
HEICO, Cl A | | | 800 | | | | 67 | |
HEICO Corp | | | 450 | | | | 43 | |
Hexcel Corp, Cl A | | | 900 | | | | 62 | |
Honeywell International Inc | | | 8,379 | | | | 1,332 | |
Hubbell Inc, Cl B | | | 605 | | | | 71 | |
Huntington Ingalls Industries Inc, Cl A | | | 493 | | | | 102 | |
IDEX Corp | | | 852 | | | | 129 | |
IHS Markit Ltd * | | | 4,466 | | | | 243 | |
Illinois Tool Works Inc | | | 3,809 | | | | 547 | |
Ingersoll-Rand PLC | | | 2,807 | | | | 303 | |
ITT Inc | | | 1,048 | | | | 61 | |
Jacobs Engineering Group Inc | | | 1,500 | | | | 113 | |
JB Hunt Transport Services Inc | | | 969 | | | | 98 | |
JetBlue Airways Corp * | | | 3,400 | | | | 56 | |
Johnson Controls International plc | | | 10,364 | | | | 383 | |
Kansas City Southern | | | 1,180 | | | | 137 | |
KAR Auction Services Inc | | | 1,600 | | | | 82 | |
Kirby Corp * | | | 600 | | | | 45 | |
Knight-Swift Transportation Holdings Inc, Cl A | | | 1,400 | | | | 46 | |
L3 Technologies Inc | | | 952 | | | | 196 | |
Landstar System Inc | | | 446 | | | | 49 | |
Lennox International | | | 465 | | | | 123 | |
Lincoln Electric Holdings Inc | | | 700 | | | | 59 | |
Lockheed Martin Corp | | | 2,794 | | | | 839 | |
Macquarie Infrastructure Corp | | | 900 | | | | 37 | |
ManpowerGroup Inc | | | 688 | | | | 57 | |
Masco Corp | | | 3,300 | | | | 130 | |
Middleby Corp/The * | | | 635 | | | | 83 | |
| | |
| 6 | | SEI Institutional Managed Trust / Semi-Annual Report / March 31, 2019 |
SCHEDULE OF INVESTMENTS (Unaudited)
March 31, 2019
Large Cap Index Fund(Continued)
| | | | | | | | |
| | | |
| Description | | Shares | | Market Value
($ Thousands) |
| | |
COMMON STOCK (continued) | | | | | | | | |
MSC Industrial Direct Co Inc, Cl A | | | 479 | | | $ | 40 | |
Nielsen Holdings PLC | | | 4,000 | | | | 95 | |
Nordson | | | 643 | | | | 85 | |
Norfolk Southern Corp | | | 3,063 | | | | 572 | |
Northrop Grumman Corp | | | 1,815 | | | | 489 | |
nVent Electric PLC | | | 1,800 | | | | 49 | |
Old Dominion Freight Line Inc, Cl A | | | 715 | | | | 103 | |
Oshkosh Corp | | | 800 | | | | 60 | |
Owens Corning | | | 1,400 | | | | 66 | |
PACCAR Inc | | | 3,955 | | | | 269 | |
Parker-Hannifin Corp, Cl A | | | 1,484 | | | | 255 | |
Pentair PLC | | | 1,700 | | | | 76 | |
Quanta Services Inc | | | 1,700 | | | | 64 | |
Raytheon Co | | | 3,279 | | | | 597 | |
Regal Beloit Corp | | | 600 | | | | 49 | |
Republic Services Inc | | | 2,600 | | | | 209 | |
Resideo Technologies Inc * | | | 1,486 | | | | 29 | |
Robert Half International Inc | | | 1,400 | | | | 91 | |
Rockwell Automation Inc | | | 1,400 | | | | 246 | |
Rollins Inc | | | 1,700 | | | | 71 | |
Roper Technologies Inc | | | 1,152 | | | | 394 | |
Ryder System Inc | | | 600 | | | | 37 | |
Schneider National Inc, Cl B | | | 300 | | | | 6 | |
Sensata Technologies Holding PLC * | | | 1,900 | | | | 86 | |
Snap-on Inc | | | 619 | | | | 97 | |
Southwest Airlines Co, Cl A | | | 5,944 | | | | 309 | |
Spirit AeroSystems Holdings Inc, Cl A | | | 1,200 | | | | 110 | |
Stanley Black & Decker Inc | | | 1,767 | | | | 241 | |
Stericycle Inc, Cl A * | | | 1,100 | | | | 60 | |
Teledyne Technologies Inc * | | | 452 | | | | 107 | |
Terex Corp | | | 700 | | | | 22 | |
Textron Inc | | | 2,738 | | | | 139 | |
Timken Co/The | | | 700 | | | | 30 | |
Toro Co/The | | | 1,100 | | | | 76 | |
TransDigm Group Inc * | | | 530 | | | | 241 | |
TransUnion | | | 2,200 | | | | 147 | |
Trinity Industries Inc | | | 1,800 | | | | 39 | |
Union Pacific Corp | | | 8,340 | | | | 1,394 | |
United Continental Holdings Inc * | | | 2,773 | | | | 221 | |
United Parcel Service Inc, Cl B | | | 7,924 | | | | 885 | |
United Rentals Inc * | | | 903 | | | | 103 | |
United Technologies Corp | | | 9,268 | | | | 1,195 | |
Univar Inc * | | | 1,600 | | | | 35 | |
USG Corp * | | | 800 | | | | 35 | |
Valmont Industries Inc | | | 200 | | | | 26 | |
Verisk Analytics Inc, Cl A | | | 1,797 | | | | 239 | |
WABCO Holdings Inc * | | | 600 | | | | 79 | |
Wabtec Corp | | | 1,466 | | | | 108 | |
Waste Management Inc | | | 4,931 | | | | 512 | |
Watsco Inc | | | 377 | | | | 54 | |
Welbilt Inc * | | | 1,200 | | | | 20 | |
WESCO International Inc * | | | 600 | | | | 32 | |
| | | | | | | | |
| | | |
| Description | | Shares | | Market Value
($ Thousands) |
| |
COMMON STOCK (continued) | | | | | |
WW Grainger Inc | | | 511 | | | $ | 154 | |
XPO Logistics Inc * | | | 1,333 | | | | 72 | |
Xylem Inc/NY | | | 2,038 | | | | 161 | |
| | | | | | | | |
| | |
| | | | | | | 29,622 | |
| | | | | | | | |
| |
Information Technology — 21.1% | | | | | |
2U Inc * | | | 600 | | | | 42 | |
Accenture PLC, Cl A | | | 7,437 | | | | 1,309 | |
Adobe Inc * | | | 5,641 | | | | 1,503 | |
Advanced Micro Devices Inc * | | | 10,747 | | | | 274 | |
Akamai Technologies Inc * | | | 1,800 | | | | 129 | |
Alliance Data Systems Corp | | | 576 | | | | 101 | |
Amdocs Ltd | | | 1,600 | | | | 87 | |
Amphenol Corp, Cl A | | | 3,416 | | | | 323 | |
Analog Devices Inc | | | 4,256 | | | | 448 | |
ANSYS Inc * | | | 1,006 | | | | 184 | |
Apple Inc | | | 54,666 | | | | 10,384 | |
Applied Materials Inc | | | 11,017 | | | | 437 | |
Arista Networks Inc * | | | 645 | | | | 203 | |
ARRIS International PLC * | | | 1,900 | | | | 60 | |
Arrow Electronics Inc, Cl A * | | | 900 | | | | 69 | |
Aspen Technology Inc * | | | 800 | | | | 83 | |
Atlassian Corp PLC, Cl A * | | | 1,100 | | | | 124 | |
Autodesk Inc, Cl A * | | | 2,507 | | | | 391 | |
Automatic Data Processing Inc | | | 4,979 | | | | 795 | |
Avnet Inc | | | 1,300 | | | | 56 | |
Black Knight Inc * | | | 1,700 | | | | 93 | |
Booz Allen Hamilton Holding Corp, Cl A | | | 1,600 | | | | 93 | |
Broadcom Inc | | | 4,732 | | | | 1,423 | |
Broadridge Financial Solutions Inc | | | 1,328 | | | | 138 | |
Cadence Design Systems Inc * | | | 3,300 | | | | 210 | |
CDK Global Inc | | | 1,476 | | | | 87 | |
CDW Corp/DE | | | 1,700 | | | | 164 | |
Ceridian HCM Holding Inc * | | | 606 | | | | 31 | |
Cisco Systems Inc | | | 52,076 | | | | 2,812 | |
Citrix Systems Inc | | | 1,502 | | | | 150 | |
Cognex Corp | | | 1,900 | | | | 97 | |
Cognizant Technology Solutions Corp, Cl A | | | 6,640 | | | | 481 | |
Coherent Inc * | | | 243 | | | | 34 | |
CommScope Holding Co Inc * | | | 1,900 | | | | 41 | |
Conduent Inc * | | | 2,600 | | | | 36 | |
CoreLogic Inc/United States * | | | 1,000 | | | | 37 | |
Corning Inc, Cl B | | | 9,014 | | | | 298 | |
Cypress Semiconductor Corp | | | 3,700 | | | | 55 | |
Dell Technologies Inc, Cl C * | | | 1,727 | | | | 101 | |
DocuSign Inc, Cl A * | | | 820 | | | | 42 | |
Dolby Laboratories Inc, Cl A | | | 700 | | | | 44 | |
DXC Technology Co | | | 3,081 | | | | 198 | |
EchoStar Corp, Cl A * | | | 500 | | | | 18 | |
Elastic NV * | | | 100 | | | | 8 | |
EPAM Systems Inc * | | | 600 | | | | 101 | |
Euronet Worldwide Inc * | | | 600 | | | | 86 | |
| | | | |
SEI Institutional Managed Trust / Semi-Annual Report / March 31, 2019 | | | 7 | |
SCHEDULE OF INVESTMENTS (Unaudited)
March 31, 2019
Large Cap Index Fund(Continued)
| | | | | | | | |
| | | |
| Description | | Shares | | Market Value
($ Thousands) |
| | |
COMMON STOCK (continued) | | | | | | | | |
F5 Networks Inc, Cl A * | | | 691 | | | $ | 108 | |
Fair Isaac Corp * | | | 369 | | | | 100 | |
Fidelity National Information Services Inc, Cl B | | | 3,781 | | | | 428 | |
FireEye Inc * | | | 2,400 | | | | 40 | |
First Data Corp, Cl A * | | | 6,234 | | | | 164 | |
First Solar Inc * | | | 1,000 | | | | 53 | |
Fiserv Inc, Cl A * | | | 4,592 | | | | 405 | |
FleetCor Technologies Inc * | | | 967 | | | | 238 | |
FLIR Systems Inc | | | 1,500 | | | | 71 | |
Fortinet Inc * | | | 1,700 | | | | 143 | |
Gartner Inc * | | | 1,066 | | | | 162 | |
Genpact Ltd | | | 1,700 | | | | 60 | |
Global Payments Inc | | | 1,817 | | | | 248 | |
GoDaddy Inc, Cl A * | | | 2,025 | | | | 152 | |
Guidewire Software Inc, Cl Z * | | | 900 | | | | 87 | |
Hewlett Packard Enterprise Co | | | 16,307 | | | | 252 | |
HP Inc | | | 17,565 | | | | 341 | |
Intel Corp | | | 51,850 | | | | 2,784 | |
International Business Machines Corp | | | 10,595 | | | | 1,495 | |
Intuit Inc | | | 2,827 | | | | 739 | |
IPG Photonics Corp * | | | 433 | | | | 66 | |
Jabil Inc | | | 1,800 | | | | 48 | |
Jack Henry & Associates Inc | | | 854 | | | | 118 | |
Juniper Networks Inc | | | 3,700 | | | | 98 | |
Keysight Technologies Inc * | | | 2,100 | | | | 183 | |
KLA-Tencor Corp | | | 1,899 | | | | 227 | |
Lam Research Corp | | | 1,758 | | | | 315 | |
Leidos Holdings Inc | | | 1,600 | | | | 103 | |
Littelfuse Inc | | | 300 | | | | 55 | |
LogMeIn Inc | | | 700 | | | | 56 | |
Manhattan Associates Inc * | | | 700 | | | | 39 | |
Marvell Technology Group Ltd | | | 6,672 | | | | 133 | |
Mastercard Inc, Cl A | | | 10,494 | | | | 2,471 | |
Maxim Integrated Products Inc | | | 3,200 | | | | 170 | |
Microchip Technology Inc | | | 2,726 | | | | 226 | |
Micron Technology Inc * | | | 12,968 | | | | 536 | |
Microsoft Corp | | | 87,225 | | | | 10,287 | |
MKS Instruments Inc | | | 600 | | | | 56 | |
Monolithic Power Systems Inc | | | 500 | | | | 68 | |
Motorola Solutions Inc | | | 1,836 | | | | 258 | |
National Instruments Corp | | | 1,400 | | | | 62 | |
NCR Corp * | | | 1,223 | | | | 33 | |
NetApp Inc | | | 2,900 | | | | 201 | |
Nuance Communications * | | | 3,000 | | | | 51 | |
Nutanix Inc, Cl A * | | | 1,459 | | | | 55 | |
NVIDIA Corp | | | 6,694 | | | | 1,202 | |
NXP Semiconductors NV | | | 3,830 | | | | 339 | |
Okta Inc, Cl A * | | | 1,000 | | | | 83 | |
ON Semiconductor Corp * | | | 4,800 | | | | 99 | |
Oracle Corp, Cl B | | | 27,738 | | | | 1,490 | |
Palo Alto Networks Inc * | | | 1,061 | | | | 258 | |
| | | | | | | | |
| | | |
| Description | | Shares | | Market Value
($ Thousands) |
| | |
COMMON STOCK (continued) | | | | | | | | |
Paychex Inc | | | 3,638 | | | $ | 292 | |
Paycom Software Inc * | | | 536 | | | | 101 | |
PayPal Holdings Inc * | | | 13,436 | | | | 1,395 | |
Pegasystems Inc | | | 400 | | | | 26 | |
Pluralsight, Cl A * | | | 800 | | | | 25 | |
Proofpoint Inc * | | | 600 | | | | 73 | |
PTC Inc * | | | 1,365 | | | | 126 | |
Pure Storage Inc, Cl A * | | | 2,000 | | | | 44 | |
Qorvo Inc * | | | 1,468 | | | | 105 | |
QUALCOMM Inc | | | 13,864 | | | | 791 | |
RealPage Inc * | | | 800 | | | | 49 | |
Red Hat Inc * | | | 2,060 | | | | 376 | |
RingCentral Inc, Cl A * | | | 800 | | | | 86 | |
Sabre Corp | | | 3,400 | | | | 73 | |
salesforce.com Inc * | | | 8,329 | | | | 1,319 | |
ServiceNow Inc * | | | 2,022 | | | | 498 | |
Skyworks Solutions Inc | | | 1,972 | | | | 163 | |
SolarWinds Corp * | | | 200 | | | | 4 | |
Splunk Inc * | | | 1,681 | | | | 209 | |
Square Inc, Cl A * | | | 3,300 | | | | 247 | |
SS&C Technologies Holdings Inc | | | 2,400 | | | | 153 | |
Switch Inc, Cl A | | | 100 | | | | 1 | |
Symantec Corp, Cl A | | | 7,201 | | | | 166 | |
Synopsys Inc * | | | 1,731 | | | | 199 | |
Tableau Software Inc, Cl A * | | | 806 | | | | 103 | |
Teradata Corp * | | | 1,397 | | | | 61 | |
Teradyne Inc | | | 1,954 | | | | 78 | |
Texas Instruments Inc | | | 11,043 | | | | 1,171 | |
Total System Services Inc | | | 2,074 | | | | 197 | |
Trimble Inc * | | | 3,000 | | | | 121 | |
Twilio Inc, Cl A * | | | 1,000 | | | | 129 | |
Tyler Technologies Inc * | | | 425 | | | | 87 | |
Ubiquiti Networks Inc | | | 200 | | | | 30 | |
Ultimate Software Group Inc/The * | | | 380 | | | | 125 | |
Universal Display Corp | | | 542 | | | | 83 | |
VeriSign Inc * | | | 1,208 | | | | 219 | |
Versum Materials Inc | | | 1,406 | | | | 71 | |
Visa Inc, Cl A | | | 20,270 | | | | 3,166 | |
VMware Inc, Cl A * | | | 794 | | | | 143 | |
Western Digital Corp | | | 3,392 | | | | 163 | |
Western Union Co/The | | | 5,200 | | | | 96 | |
WEX Inc * | | | 442 | | | | 85 | |
Workday Inc, Cl A * | | | 1,700 | | | | 328 | |
Worldpay Inc, Cl A * | | | 3,423 | | | | 388 | |
Xerox Corp | | | 2,200 | | | | 70 | |
Xilinx Inc | | | 2,907 | | | | 369 | |
Zebra Technologies Corp, Cl A * | | | 600 | | | | 126 | |
Zendesk Inc * | | | 1,314 | | | | 112 | |
| | | | | | | | |
| | |
| | | | | | | 65,378 | |
| | | | | | | | |
| | |
Materials — 2.8% | | | | | | | | |
Air Products & Chemicals Inc | | | 2,570 | | | | 491 | |
| | |
| 8 | | SEI Institutional Managed Trust / Semi-Annual Report / March 31, 2019 |
SCHEDULE OF INVESTMENTS (Unaudited)
March 31, 2019
Large Cap Index Fund(Continued)
| | | | | | | | |
| | | |
| Description | | Shares | | Market Value
($ Thousands) |
| | |
COMMON STOCK (continued) | | | | | | | | |
Albemarle Corp | | | 1,156 | | | $ | 95 | |
Alcoa Corp * | | | 2,300 | | | | 65 | |
AptarGroup Inc | | | 700 | | | | 74 | |
Ardagh Group SA, Cl A | | | 100 | | | | 1 | |
Ashland Global Holdings Inc | | | 800 | | | | 62 | |
Avery Dennison Corp | | | 1,023 | | | | 116 | |
Axalta Coating Systems Ltd * | | | 2,200 | | | | 55 | |
Ball Corp | | | 3,735 | | | | 216 | |
Bemis Co Inc | | | 1,000 | | | | 55 | |
Berry Global Group Inc * | | | 1,577 | | | | 85 | |
Cabot Corp | | | 700 | | | | 29 | |
Celanese Corp, Cl A | | | 1,500 | | | | 148 | |
CF Industries Holdings Inc | | | 2,637 | | | | 108 | |
Chemours Co/The | | | 1,900 | | | | 71 | |
Crown Holdings Inc * | | | 1,500 | | | | 82 | |
Domtar Corp | | | 600 | | | | 30 | |
DowDuPont Inc | | | 26,019 | | | | 1,387 | |
Eagle Materials Inc | | | 459 | | | | 39 | |
Eastman Chemical Co | | | 1,632 | | | | 124 | |
Ecolab Inc | | | 2,919 | | | | 515 | |
Element Solutions * | | | 2,100 | | | | 21 | |
FMC Corp | | | 1,600 | | | | 123 | |
Freeport-McMoRan Inc, Cl B | | | 16,723 | | | | 216 | |
Graphic Packaging Holding Co | | | 3,300 | | | | 42 | |
Huntsman Corp | | | 2,300 | | | | 52 | |
International Flavors & Fragrances Inc | | | 1,160 | | | | 149 | |
International Paper Co | | | 4,691 | | | | 217 | |
Linde PLC | | | 6,374 | | | | 1,121 | |
LyondellBasell Industries NV, Cl A | | | 3,511 | | | | 295 | |
Martin Marietta Materials Inc, Cl A | | | 705 | | | | 142 | |
Mosaic Co/The | | | 4,200 | | | | 115 | |
NewMarket Corp | | | 70 | | | | 30 | |
Newmont Mining Corp | | | 6,100 | | | | 218 | |
Nucor Corp | | | 3,500 | | | | 204 | |
Olin Corp | | | 1,800 | | | | 42 | |
Owens-Illinois Inc | | | 2,000 | | | | 38 | |
Packaging Corp of America | | | 1,027 | | | | 102 | |
PPG Industries Inc | | | 2,779 | | | | 314 | |
Reliance Steel & Aluminum Co | | | 746 | | | | 67 | |
Royal Gold Inc, Cl A | | | 747 | | | | 68 | |
RPM International Inc | | | 1,500 | | | | 87 | |
Scotts Miracle-Gro Co/The, Cl A | | | 577 | | | | 45 | |
Sealed Air Corp | | | 1,800 | | | | 83 | |
Sherwin-Williams Co/The, Cl A | | | 961 | | | | 414 | |
Silgan Holdings Inc | | | 800 | | | | 24 | |
Sonoco Products Co | | | 1,200 | | | | 74 | |
Southern Copper Corp | | | 800 | | | | 32 | |
Steel Dynamics Inc | | | 2,500 | | | | 88 | |
United States Steel Corp | | | 1,900 | | | | 37 | |
Valvoline Inc | | | 2,100 | | | | 39 | |
Vulcan Materials Co | | | 1,480 | | | | 175 | |
Westlake Chemical Corp | | | 332 | | | | 23 | |
| | | | | | | | |
| | | |
| Description | | Shares | | Market Value
($ Thousands) |
| | |
COMMON STOCK (continued) | | | | | | | | |
Westrock Co | | | 2,800 | | | $ | 107 | |
WR Grace & Co | | | 800 | | | | 62 | |
| | | | | | | | |
| | |
| | | | | | | 8,714 | |
| | | | | | | | |
| | |
Real Estate — 3.7% | | | | | | | | |
Alexandria Real Estate Equities Inc | | | 1,237 | | | | 176 | |
American Campus Communities Inc | | | 1,700 | | | | 81 | |
American Homes 4 Rent, Cl A | | | 2,800 | | | | 64 | |
American Tower Corp, Cl A | | | 5,027 | | | | 991 | |
Apartment Investment & Management Co, Cl A | | | 1,900 | | | | 96 | |
Apple Hospitality Inc | | | 2,400 | | | | 39 | |
AvalonBay Communities Inc | | | 1,600 | | | | 321 | |
Boston Properties Inc | | | 1,762 | | | | 236 | |
Brandywine Realty Trust | | | 2,000 | | | | 32 | |
Brixmor Property Group Inc | | | 3,300 | | | | 61 | |
Brookfield Property Inc, Cl A | | | 1,227 | | | | 25 | |
Camden Property Trust | | | 1,000 | | | | 102 | |
CBRE Group Inc, Cl A * | | | 3,600 | | | | 178 | |
Colony Capital Inc | | | 4,700 | | | | 25 | |
Columbia Property Trust Inc | | | 1,100 | | | | 25 | |
CoreSite Realty Corp | | | 400 | | | | 43 | |
Corporate Office Properties Trust | | | 1,400 | | | | 38 | |
Crown Castle International Corp | | | 4,751 | | | | 608 | |
CubeSmart | | | 2,100 | | | | 67 | |
CyrusOne Inc | | | 1,200 | | | | 63 | |
Digital Realty Trust Inc, Cl A | | | 2,404 | | | | 286 | |
Douglas Emmett Inc | | | 1,800 | | | | 73 | |
Duke Realty Corp | | | 3,900 | | | | 119 | |
Empire State Realty Trust Inc, Cl A | | | 1,400 | | | | 22 | |
EPR Properties, Cl A | | | 800 | | | | 62 | |
Equinix Inc | | | 954 | | | | 432 | |
Equity Commonwealth * | | | 1,300 | | | | 42 | |
Equity LifeStyle Properties Inc | | | 1,000 | | | | 114 | |
Equity Residential | | | 4,083 | | | | 308 | |
Essex Property Trust Inc | | | 729 | | | | 211 | |
Extra Space Storage Inc | | | 1,400 | | | | 143 | |
Federal Realty Investment Trust | | | 846 | | | | 117 | |
Gaming and Leisure Properties Inc | | | 2,355 | | | | 91 | |
HCP Inc | | | 5,670 | | | | 177 | |
Healthcare Trust of America Inc, Cl A | | | 2,600 | | | | 74 | |
Highwoods Properties Inc | | | 1,100 | | | | 51 | |
Hospitality Properties Trust | | | 1,700 | | | | 45 | |
Host Hotels & Resorts Inc | | | 8,402 | | | | 159 | |
Howard Hughes Corp/The * | | | 463 | | | | 51 | |
Hudson Pacific Properties Inc | | | 1,600 | | | | 55 | |
Invitation Homes Inc | | | 4,100 | | | | 100 | |
Iron Mountain Inc | | | 3,200 | | | | 113 | |
JBG SMITH Properties | | | 1,100 | | | | 45 | |
Jones Lang LaSalle Inc | | | 543 | | | | 84 | |
Kilroy Realty Corp | | | 1,200 | | | | 91 | |
Kimco Realty Corp | | | 4,400 | | | | 81 | |
| | | | |
SEI Institutional Managed Trust / Semi-Annual Report / March 31, 2019 | | | 9 | |
SCHEDULE OF INVESTMENTS (Unaudited)
March 31, 2019
Large Cap Index Fund(Continued)
| | | | | | | | |
| | | |
| Description | | Shares | | Market Value
($ Thousands) |
| |
COMMON STOCK (continued) | | | | | |
Lamar Advertising Co, Cl A | | | 1,000 | | | $ | 79 | |
Liberty Property Trust | | | 1,800 | | | | 87 | |
Life Storage Inc | | | 500 | | | | 49 | |
Macerich Co/The | | | 1,700 | | | | 74 | |
Medical Properties Trust Inc | | | 4,300 | | | | 80 | |
Mid-America Apartment Communities Inc | | | 1,300 | | | | 142 | |
National Retail Properties Inc | | | 1,800 | | | | 100 | |
Omega Healthcare Investors Inc | | | 2,354 | | | | 90 | |
Outfront Media Inc | | | 1,700 | | | | 40 | |
Paramount Group Inc | | | 2,300 | | | | 33 | |
Park Hotels & Resorts Inc | | | 2,400 | | | | 75 | |
Prologis Inc | | | 7,231 | | | | 520 | |
Public Storage | | | 1,688 | | | | 368 | |
Rayonier Inc | | | 1,400 | | | | 44 | |
Realogy Holdings Corp | | | 1,399 | | | | 16 | |
Realty Income Corp | | | 3,363 | | | | 247 | |
Regency Centers Corp | | | 1,800 | | | | 121 | |
Retail Properties of America Inc, Cl A | | | 2,100 | | | | 26 | |
Retail Value Inc | | | 92 | | | | 3 | |
SBA Communications Corp, Cl A * | | | 1,296 | | | | 259 | |
Senior Housing Properties Trust | | | 2,700 | | | | 32 | |
Simon Property Group Inc | | | 3,557 | | | | 648 | |
SITE Centers Corp | | | 1,500 | | | | 20 | |
SL Green Realty Corp | | | 935 | | | | 84 | |
Spirit Realty Capital Inc | | | 1,078 | | | | 43 | |
STORE Capital Corp | | | 2,100 | | | | 70 | |
Sun Communities Inc | | | 1,000 | | | | 119 | |
Taubman Centers Inc | | | 700 | | | | 37 | |
UDR Inc | | | 3,200 | | | | 145 | |
Uniti Group Inc | | | 1,900 | | | | 21 | |
Ventas Inc | | | 4,090 | | | | 261 | |
VEREIT Inc | | | 11,100 | | | | 93 | |
VICI Properties Inc (B) | | | 4,500 | | | | 98 | |
Vornado Realty Trust | | | 1,900 | | | | 128 | |
Weingarten Realty Investors | | | 1,400 | | | | 41 | |
Welltower Inc | | | 4,200 | | | | 326 | |
Weyerhaeuser Co | | | 8,597 | | | | 226 | |
WP Carey Inc | | | 1,790 | | | | 140 | |
| | |
| | | | | | | 11,402 | |
| | |
Utilities — 3.1% | | | | | | | | |
AES Corp/VA | | | 7,900 | | | | 143 | |
Alliant Energy Corp | | | 2,600 | | | | 123 | |
Ameren Corp | | | 2,825 | | | | 208 | |
American Electric Power Co Inc | | | 5,609 | | | | 470 | |
American Water Works Co Inc | | | 2,027 | | | | 211 | |
Aqua America Inc | | | 1,900 | | | | 69 | |
Atmos Energy Corp | | | 1,266 | | | | 130 | |
Avangrid Inc | | | 800 | | | | 40 | |
CenterPoint Energy Inc | | | 5,855 | | | | 180 | |
CMS Energy Corp | | | 3,310 | | | | 184 | |
Consolidated Edison Inc | | | 3,539 | | | | 300 | |
| | | | | | | | |
| | | |
| Description | | Shares | | Market Value
($ Thousands) |
| | |
COMMON STOCK (continued) | | | | | | | | |
Dominion Energy Inc | | | 8,802 | | | $ | 675 | |
DTE Energy Co | | | 2,113 | | | | 264 | |
Duke Energy Corp | | | 8,306 | | | | 748 | |
Edison International | | | 3,635 | | | | 225 | |
Entergy Corp | | | 2,035 | | | | 195 | |
Evergy Inc | | | 3,017 | | | | 175 | |
Eversource Energy | | | 3,598 | | | | 255 | |
Exelon Corp | | | 11,239 | | | | 563 | |
FirstEnergy Corp | | | 5,700 | | | | 237 | |
Hawaiian Electric Industries Inc | | | 1,100 | | | | 45 | |
MDU Resources Group Inc | | | 2,300 | | | | 59 | |
National Fuel Gas Co | | | 900 | | | | 55 | |
NextEra Energy Inc | | | 5,527 | | | | 1,068 | |
NiSource Inc | | | 4,100 | | | | 118 | |
NRG Energy Inc | | | 3,300 | | | | 140 | |
OGE Energy Corp | | | 2,300 | | | | 99 | |
PG&E Corp * | | | 5,706 | | | | 102 | |
Pinnacle West Capital Corp | | | 1,300 | | | | 124 | |
PPL Corp | | | 8,234 | | | | 261 | |
Public Service Enterprise Group Inc | | | 5,743 | | | | 341 | |
Sempra Energy | | | 3,149 | | | | 396 | |
Southern Co/The | | | 11,815 | | | | 611 | |
UGI Corp | | | 1,930 | | | | 107 | |
Vistra Energy Corp | | | 4,469 | | | | 116 | |
WEC Energy Group Inc | | | 3,585 | | | | 284 | |
Xcel Energy Inc | | | 5,790 | | | | 325 | |
| | |
| | | | | | | 9,646 | |
| | |
Total Common Stock (Cost $293,892) ($ Thousands) | | | | | | | 303,019 | |
| |
AFFILIATED PARTNERSHIP — 0.0% | | | | | |
SEI Liquidity Fund, L.P.
| | | | | | | | |
2.480% **† (B) | | | 867 | | | | 1 | |
| | |
Total Affiliated Partnership (Cost $1) ($ Thousands) | | | | | | | 1 | |
| | |
CASH EQUIVALENT — 2.3% | | | | | | | | |
SEI Daily Income Trust, Government Fund, Cl F | | | | | | | | |
2.220% **† | | | 7,163,345 | | | | 7,163 | |
| | |
Total Cash Equivalent (Cost $7,163) ($ Thousands) | | | | | | | 7,163 | |
| |
Total Investments — 100.2%
(Cost $301,056) ($ Thousands) | | | $ | 310,183 | |
| | | | | | | | |
| | |
| 10 | | SEI Institutional Managed Trust / Semi-Annual Report / March 31, 2019 |
SCHEDULE OF INVESTMENTS (Unaudited)
March 31, 2019
Large Cap Index Fund(Continued)
A list of the open futures contracts held by the Fund at March 31, 2019 is as follows:
| | | | | | | | | | | | | | | | | | | | |
| | | Number of | | | | | | | | | | | | Unrealized | |
| Type of | | Contracts | | | Expiration | | | Notional Amount | | | Value | | | Appreciation | |
| Contract | | Long | | | Date | | | (Thousands) | | | (Thousands) | | | (Thousands) | |
S&P 500 IndexE-MINI | | | 40 | | | | Jun-2019 | | | $ | 5,539 | | | $ | 5,676 | | | $ | 137 | |
S&P Mid Cap 400 IndexE-MINI | | | 3 | | | | Jun-2019 | | | | 563 | | | | 570 | | | | 7 | |
| | | | | |
| | | | | | | | | | $ | 6,102 | | | $ | 6,246 | | | $ | 144 | |
| | | | | | | | | | | | |
| | Percentages are based on Net Assets of $309,517 ($ Thousands). |
| * | Non-income producing security. |
| ** | Rate shown is the7-day effective yield as of March 31, 2019. |
| ‡ | Real Estate Investment Trust. |
| † | Investment in Affiliated Security (see Note 6). |
| (A) | Security is a Master Limited Partnership. At March 31, 2019, such securities amounted to $43 ($ Thousands), or 0.0 of the Net Assets of the Fund (See Note 2). |
| (B) | This security was purchased with cash collateral held from securities on loan (see Note 10). The total market value of such securities as of March 31, 2019 was $1 ($ Thousands). |
Cl – Class
L.P. – Limited Partnership
PLC – Public Limited Company
S&P – Standard & Poor’s
The following is a list of the level of inputs used as of March 31, 2019, in valuing the Fund’s investments carried at value ($ Thousands):
| | | | | | | | | | | | | | | | |
| Investments in Securities | | Level 1 | | Level 2 | | Level 3 | | Total |
Common Stock | | $ | 303,019 | | | $ | – | | | $ | – | | | $ | 303,019 | |
Affiliated Partnership | | | – | | | | 1 | | | | – | | | | 1 | |
| | | | | | | | | | | | | | | | |
| | | | | |
| Investments in Securities | | Level 1 | | Level 2 | | Level 3 | | Total |
Cash Equivalent | | $ | 7,163 | | | $ | – | | | $ | – | | | $ | 7,163 | |
Total Investments in Securities | | $ | 310,182 | | | $ | 1 | | | $ | – | | | $ | 310,183 | |
| | | | | | | | | | | | | | | | |
| | | | | | | | | |
| Other Financial Instruments | | Level 1 | | Level 2 | | Level 3 | | Total |
Futures Contracts*
Unrealized Appreciation | | $ | 144 | | | $ | – | | | $ | – | | | $ | 144 | |
| | | | | | | | | | | | | | | | |
Total Other Financial Instruments | | $ | 144 | | | $ | – | | | $ | – | | | $ | 144 | |
| | | | | | | | | | | | | | | | |
* Futures contracts are valued at the unrealized appreciation on the instrument.
For the period ended March 31, 2019, there were no transfers between Level 1 and Level 2 assets and liabilities.
For the period ended March 31, 2019, there were no transfers between Level 2 and Level 3 assets and liabilities.
For more information on valuation inputs, see Note 2 – Significant Accounting Policies in Notes to Financial Statements.
Amounts designated as “—” are either $0 or have been rounded to $0.
The following is a summary of the Fund’s transactions with affiliates for the period ended March 31, 2019 ($ Thousands):
| | | | | | | | | | | | | | | | | | | | | | | | | | |
| Security Description | | Value
9/30/18 | | | Purchases at
Cost | | | Proceeds from
Sales | | | Realized Gain | | | Change in Unrealized
Depreciation | | | Value
3/31/19 | | | Income |
SEI Investment Co | | | $ 73 | | | | $ 16 | | | | $ — | | | | $— | | | | $ (11) | | | | $ 78 | | | $ — |
SEI Daily Income Trust, Government | | | 4,849 | | | | 49,660 | | | | (47,346) | | | | — | | | | — | | | | 7,163 | | | 59 |
Fund, Cl F | | | | | | | | | | | | | | | | | | | | | | | | | | |
SEI Liquidity Fund, L.P. | | | 173 | | | | 1,629 | | | | (1,801) | | | | — | | | | — | | | | 1 | | | 3 |
| | | | | | | | | | | | | | | | | | | | | | | | | | |
Totals | | | $ 5,095 | | | | $ 51,305 | | | | $ (49,147) | | | | $— | | | | $ (11) | | | | $7,242 | | | $ 62 |
| | | | | | | | | | | | | | | | | | | | | | | | | | |
Amounts designated as “—” are either $0 or have been rounded to $0.
The accompanying notes are an integral part of the financial statements.
| | | | |
SEI Institutional Managed Trust / Semi-Annual Report / March 31, 2019 | | | 11 | |
SCHEDULE OF INVESTMENTS (Unaudited)
March 31, 2019
Tax-Managed Large Cap Fund(Continued)
| | | | | | | | |
| | | |
| Description | | Shares | | Market Value
($ Thousands) |
| |
COMMON STOCK — 99.0% | | | | | |
Communication Services — 4.5% | | | | | |
Alphabet Inc, Cl A * | | | 26,214 | | | $ | 30,851 | |
Alphabet Inc, Cl C * | | | 26,751 | | | | 31,387 | |
AT&T Inc | | | 755,611 | | | | 23,696 | |
BCE Inc | | | 210,755 | | | | 9,355 | |
Cars.com Inc * | | | 17,535 | | | | 400 | |
Charter Communications Inc, Cl A * | | | 14,857 | | | | 5,154 | |
Comcast Corp, Cl A | | | 121,805 | | | | 4,870 | |
Electronic Arts Inc * | | | 48,975 | | | | 4,977 | |
Facebook Inc, Cl A * | | | 173,490 | | | | 28,919 | |
Netflix Inc * | | | 12,384 | | | | 4,416 | |
Omnicom Group Inc | | | 111,965 | | | | 8,172 | |
TEGNA Inc | | | 153,973 | | | | 2,171 | |
TripAdvisor Inc * | | | 104,329 | | | | 5,368 | |
Verizon Communications Inc | | | 185,200 | | | | 10,951 | |
Viacom Inc, Cl B | | | 93,199 | | | | 2,616 | |
Walt Disney Co/The | | | 39,402 | | | | 4,375 | |
| | |
| | | | | | | 177,678 | |
| |
Consumer Discretionary — 10.7% | | | | | |
Amazon.com Inc, Cl A * | | | 43,128 | | | | 76,800 | |
AutoZone Inc * | | | 16,513 | | | | 16,911 | |
Best Buy Co Inc | | | 186,465 | | | | 13,250 | |
Booking Holdings Inc * | | | 2,537 | | | | 4,427 | |
Darden Restaurants Inc | | | 3,127 | | | | 380 | |
Dollar General Corp | | | 420,873 | | | | 50,210 | |
Domino’s Pizza Inc | | | 16,892 | | | | 4,360 | |
eBay Inc | | | 127,055 | | | | 4,719 | |
General Motors Co | | | 94,123 | | | | 3,492 | |
Genuine Parts Co | | | 183,424 | | | | 20,549 | |
Graham Holdings Co, Cl B | | | 809 | | | | 553 | |
Harley-Davidson Inc, Cl A | | | 48,308 | | | | 1,723 | |
Home Depot Inc/The | | | 118,848 | | | | 22,806 | |
Kohl’s Corp | | | 46,716 | | | | 3,213 | |
Lear Corp | | | 115,549 | | | | 15,681 | |
Lowe’s Cos Inc | | | 461,327 | | | | 50,501 | |
Macy’s Inc | | | 115,047 | | | | 2,765 | |
Magna International Inc, Cl A | | | 129,268 | | | | 6,294 | |
NIKE Inc, Cl B | | | 389,570 | | | | 32,806 | |
Norwegian Cruise Line Holdings Ltd * | | | 285,518 | | | | 15,692 | |
PulteGroup Inc | | | 125,000 | | | | 3,495 | |
Ross Stores Inc | | | 243,090 | | | | 22,632 | |
Starbucks Corp | | | 68,046 | | | | 5,058 | |
Target Corp, Cl A | | | 54,025 | | | | 4,336 | |
Tiffany & Co | | | 39,063 | | | | 4,123 | |
TJX Cos Inc/The | | | 374,562 | | | | 19,930 | |
TopBuild Corp * | | | 51,618 | | | | 3,346 | |
Whirlpool Corp | | | 65,517 | | | | 8,706 | |
Wyndham Destinations Inc | | | 15,527 | | | | 629 | |
| | |
| | | | | | | 419,387 | |
| | | | | | | | |
| | | |
| Description | | Shares | | Market Value
($ Thousands) |
| |
COMMON STOCK (continued) | | | | | |
Consumer Staples — 8.6% | | | | | |
Altria Group Inc | | | 256,561 | | | $ | 14,734 | |
Archer-Daniels-Midland Co | | | 146,608 | | | | 6,323 | |
Clorox Co/The | | | 40,884 | | | | 6,560 | |
Coca-Cola Co/The | | | 83,088 | | | | 3,894 | |
Conagra Brands Inc | | | 49,133 | | | | 1,363 | |
Constellation Brands Inc, Cl A | | | 10,975 | | | | 1,924 | |
Costco Wholesale Corp | | | 20,685 | | | | 5,009 | |
Diageo PLC ADR | | | 156,683 | | | | 25,635 | |
Estee Lauder Cos Inc/The, Cl A | | | 35,000 | | | | 5,794 | |
Herbalife Nutrition Ltd * | | | 48,825 | | | | 2,587 | |
Hershey Co/The | | | 129,273 | | | | 14,844 | |
Ingredion Inc | | | 22,400 | | | | 2,121 | |
JM Smucker Co/The | | | 188,990 | | | | 22,017 | |
Kimberly-Clark Corp | | | 122,901 | | | | 15,228 | |
Kraft Heinz Co/The | | | 5,643 | | | | 184 | |
Kroger Co/The | | | 864,549 | | | | 21,268 | |
Lamb Weston Holdings Inc | | | 16,377 | | | | 1,227 | |
Molson Coors Brewing Co, Cl B | | | 138,000 | | | | 8,232 | |
Mondelez International Inc, Cl A | | | 99,290 | | | | 4,957 | |
PepsiCo Inc | | | 208,706 | | | | 25,577 | |
Philip Morris International Inc | | | 438,408 | | | | 38,751 | |
Procter & Gamble Co/The | | | 233,806 | | | | 24,328 | |
Sysco Corp, Cl A | | | 102,270 | | | | 6,828 | |
Tyson Foods Inc, Cl A | | | 281,181 | | | | 19,522 | |
Unilever NV | | | 408,590 | | | | 23,817 | |
Walgreens Boots Alliance Inc | | | 184,087 | | | | 11,647 | |
Walmart Inc | | | 222,560 | | | | 21,706 | |
| | |
| | | | | | | 336,077 | |
| |
Energy — 6.2% | | | | | |
BP PLC ADR | | | 265,989 | | | | 11,629 | |
Cabot Oil & Gas Corp | | | 215,115 | | | | 5,614 | |
Canadian Natural Resources Ltd | | | 438,313 | | | | 12,054 | |
Chevron Corp | | | 357,036 | | | | 43,980 | |
ConocoPhillips | | | 314,897 | | | | 21,016 | |
Devon Energy Corp | | | 153,000 | | | | 4,829 | |
Encana Corp | | | 320,628 | | | | 2,321 | |
Exxon Mobil Corp | | | 287,776 | | | | 23,252 | |
Halliburton Co | | | 85,000 | | | | 2,490 | |
HollyFrontier Corp | | | 140,000 | | | | 6,898 | |
Kinder Morgan Inc/DE | | | 656,377 | | | | 13,134 | |
Marathon Oil Corp | | | 265,093 | | | | 4,430 | |
Marathon Petroleum Corp | | | 288,248 | | | | 17,252 | |
Occidental Petroleum Corp | | | 339,288 | | | | 22,461 | |
Phillips 66 | | | 113,325 | | | | 10,785 | |
Royal Dutch Shell PLC ADR, Cl A | | | 182,043 | | | | 11,394 | |
Schlumberger Ltd, Cl A | | | 210,000 | | | | 9,150 | |
Valero Energy Corp | | | 211,817 | | | | 17,968 | |
| | |
| | | | | | | 240,657 | |
| | | | |
SEI Institutional Managed Trust / Semi-Annual Report / March 31, 2019 | | | 1 | |
SCHEDULE OF INVESTMENTS (Unaudited)
March 31, 2019
Tax-Managed Large Cap Fund(Continued)
| | | | | | | | |
| | | |
| Description | | Shares | | Market Value ($ Thousands) |
| | |
COMMON STOCK (continued) | | | | | | | | |
| | |
Financials — 16.7% | | | | | | | | |
Aflac Inc | | | 525,317 | | | $ | 26,266 | |
Allstate Corp/The | | | 59,438 | | | | 5,598 | |
American Financial Group Inc/OH | | | 39,790 | | | | 3,828 | |
Ameriprise Financial Inc | | | 82,444 | | | | 10,561 | |
Annaly Capital Management Inc ‡ | | | 1,133,538 | | | | 11,324 | |
Assurant Inc | | | 47,000 | | | | 4,461 | |
Bank of America Corp | | | 1,550,747 | | | | 42,785 | |
BB&T Corp | | | 41,703 | | | | 1,940 | |
Berkshire Hathaway Inc, Cl B * | | | 93,247 | | | | 18,732 | |
Blackstone Group LP/The (A) | | | 44,695 | | | | 1,563 | |
Capital One Financial Corp | | | 113,167 | | | | 9,245 | |
Chubb Ltd | | | 68,000 | | | | 9,525 | |
CIT Group Inc | | | 69,886 | | | | 3,352 | |
Citigroup Inc | | | 379,987 | | | | 23,643 | |
CME Group Inc | | | 117,119 | | | | 19,275 | |
Commerce Bancshares Inc/MO | | | 25,055 | | | | 1,455 | |
Discover Financial Services | | | 241,586 | | | | 17,191 | |
Everest Re Group Ltd | | | 57,218 | | | | 12,357 | |
FactSet Research Systems Inc | | | 11,209 | | | | 2,783 | |
Fifth Third Bancorp | | | 478,279 | | | | 12,062 | |
First Republic Bank/CA | | | 60,000 | | | | 6,028 | |
Goldman Sachs Group Inc/The | | | 21,644 | | | | 4,155 | |
Hartford Financial Services Group Inc/The | | | 101,910 | | | | 5,067 | |
HSBC Holdings PLC ADR (A) | | | 335,925 | | | | 13,632 | |
Huntington Bancshares Inc/OH | | | 321,477 | | | | 4,076 | |
Intercontinental Exchange Inc | | | 58,438 | | | | 4,449 | |
JPMorgan Chase & Co | | | 478,943 | | | | 48,483 | |
KeyCorp | | | 816,571 | | | | 12,861 | |
KKR & Co Inc | | | 266,561 | | | | 6,262 | |
Lincoln National Corp | | | 182,558 | | | | 10,716 | |
Markel Corp * | | | 14,683 | | | | 14,628 | |
Marsh & McLennan Cos Inc | | | 138,328 | | | | 12,989 | |
MFA Financial Inc ‡ | | | 1,453,576 | | | | 10,567 | |
Moody’s Corp | | | 288,575 | | | | 52,258 | |
Morgan Stanley | | | 311,935 | | | | 13,164 | |
MSCI Inc, Cl A | | | 225,501 | | | | 44,839 | |
PNC Financial Services Group Inc/The | | | 46,966 | | | | 5,761 | |
Progressive Corp/The | | | 44,272 | | | | 3,192 | |
Prudential Financial Inc | | | 112,425 | | | | 10,330 | |
Regions Financial Corp | | | 507,300 | | | | 7,178 | |
Reinsurance Group of America Inc, Cl A | | | 61,098 | | | | 8,675 | |
S&P Global Inc | | | 18,482 | | | | 3,891 | |
Santander Consumer USA Holdings Inc | | | 152,330 | | | | 3,219 | |
State Street Corp | | | 165,424 | | | | 10,887 | |
SunTrust Banks Inc | | | 207,324 | | | | 12,284 | |
T Rowe Price Group Inc | | | 24,474 | | | | 2,450 | |
TCF Financial Corp | | | 35,327 | | | | 731 | |
Travelers Cos Inc/The | | | 120,419 | | | | 16,517 | |
Unum Group | | | 111,116 | | | | 3,759 | |
US Bancorp | | | 529,468 | | | | 25,515 | |
Voya Financial Inc | | | 294,050 | | | | 14,691 | |
| | | | | | | | |
| | | |
| Description | | Shares | | Market Value ($ Thousands) |
| | |
COMMON STOCK (continued) | | | | | | | | |
Wells Fargo & Co | | | 368,253 | | | $ | 17,794 | |
Zions Bancorp NA | | | 65,000 | | | | 2,952 | |
| | |
| | | | | | | 651,946 | |
| | |
Health Care — 16.5% | | | | | | | | |
Abbott Laboratories | | | 274,129 | | | | 21,914 | |
AbbVie Inc | | | 92,048 | | | | 7,418 | |
Allergan PLC | | | 21,656 | | | | 3,171 | |
AmerisourceBergen Corp, Cl A | | | 92,635 | | | | 7,366 | |
Amgen Inc, Cl A | | | 145,948 | | | | 27,727 | |
Anthem Inc | | | 16,702 | | | | 4,793 | |
Baxter International Inc | | | 63,282 | | | | 5,145 | |
Becton Dickinson and Co | | | 250,061 | | | | 62,448 | |
Biogen Inc * | | | 59,530 | | | | 14,072 | |
Bristol-Myers Squibb Co | | | 30,000 | | | | 1,431 | |
Cardinal Health Inc | | | 72,515 | | | | 3,492 | |
Celgene Corp, Cl A * | | | 50,515 | | | | 4,766 | |
Centene Corp * | | | 69,834 | | | | 3,708 | |
Cigna Corp (C) | | | 27,340 | | | | 4,397 | |
CVS Health Corp | | | 335,650 | | | | 18,102 | |
Edwards Lifesciences Corp, Cl A * | | | 20,638 | | | | 3,949 | |
Eli Lilly & Co | | | 209,143 | | | | 27,138 | |
Gilead Sciences Inc | | | 134,443 | | | | 8,740 | |
HCA Healthcare Inc | | | 109,165 | | | | 14,233 | |
Horizon Pharma Plc * | | | 139,419 | | | | 3,685 | |
Humana Inc | | | 44,504 | | | | 11,838 | |
IDEXX Laboratories Inc * | | | 72,356 | | | | 16,179 | |
Intuitive Surgical Inc * | | | 7,669 | | | | 4,376 | |
Jazz Pharmaceuticals PLC * | | | 30,000 | | | | 4,288 | |
Johnson & Johnson | | | 707,789 | | | | 98,942 | |
McKesson Corp | | | 4,926 | | | | 577 | |
Merck & Co Inc | | | 866,971 | | | | 72,106 | |
Mettler-Toledo International Inc * | | | 28,371 | | | | 20,512 | |
Novartis AG ADR | | | 125,000 | | | | 12,017 | |
Novo Nordisk A/S ADR | | | 86,039 | | | | 4,501 | |
Pfizer Inc | | | 861,349 | | | | 36,581 | |
Teleflex Inc | | | 36,000 | | | | 10,878 | |
United Therapeutics Corp * | | | 38,304 | | | | 4,496 | |
UnitedHealth Group Inc | | | 343,376 | | | | 84,903 | |
Varian Medical Systems Inc * | | | 44,957 | | | | 6,371 | |
Vertex Pharmaceuticals Inc * | | | 9,535 | | | | 1,754 | |
Zoetis Inc, Cl A | | | 63,768 | | | | 6,419 | |
| | |
| | | | | | | 644,433 | |
| | |
Industrials — 10.3% | | | | | | | | |
3M Co | | | 157,724 | | | | 32,772 | |
AerCap Holdings NV * | | | 175,578 | | | | 8,171 | |
AGCO Corp | | | 52,600 | | | | 3,658 | |
Alaska Air Group Inc | | | 67,899 | | | | 3,810 | |
Allison Transmission Holdings Inc | | | 135,000 | | | | 6,064 | |
Boeing Co/The | | | 43,817 | | | | 16,713 | |
Caterpillar Inc, Cl A | | | 32,511 | | | | 4,405 | |
| | |
| 2 | | SEI Institutional Managed Trust / Semi-Annual Report / March 31, 2019 |
SCHEDULE OF INVESTMENTS (Unaudited)
March 31, 2019
Tax-Managed Large Cap Fund(Continued)
| | | | | | | | |
| | | |
| Description | | Shares | | Market Value ($ Thousands) |
| | |
COMMON STOCK (continued) | | | | | | | | |
Cummins Inc | | | 8,214 | | | $ | 1,297 | |
Deere & Co | | | 27,326 | | | | 4,368 | |
Delta Air Lines Inc, Cl A | | | 360,509 | | | | 18,620 | |
Eaton Corp PLC | | | 178,693 | | | | 14,396 | |
Emerson Electric Co | | | 191,793 | | | | 13,132 | |
Expeditors International of Washington Inc | | | 158,200 | | | | 12,007 | |
FedEx Corp | | | 20,626 | | | | 3,742 | |
Graco Inc | | | 568,764 | | | | 28,165 | |
Harris Corp | | | 25,220 | | | | 4,028 | |
HD Supply Holdings Inc * | | | 278,564 | | | | 12,076 | |
Honeywell International Inc | | | 84,277 | | | | 13,393 | |
Huntington Ingalls Industries Inc, Cl A | | | 41,706 | | | | 8,641 | |
Illinois Tool Works Inc | | | 143,062 | | | | 20,534 | |
Johnson Controls International plc | | | 155,000 | | | | 5,726 | |
Lockheed Martin Corp | | | 15,688 | | | | 4,709 | |
ManpowerGroup Inc | | | 18,167 | | | | 1,502 | |
Middleby Corp/The * | | | 198,419 | | | | 25,800 | |
Northrop Grumman Corp | | | 16,563 | | | | 4,465 | |
Oshkosh Corp | | | 61,954 | | | | 4,655 | |
PACCAR Inc | | | 43,000 | | | | 2,930 | |
Raytheon Co | | | 106,117 | | | | 19,322 | |
Robert Half International Inc | | | 69,290 | | | | 4,515 | |
Roper Technologies Inc | | | 67,713 | | | | 23,156 | |
RR Donnelley & Sons Co | | | 445,233 | | | | 2,102 | |
Sensata Technologies Holding PLC * | | | 30,000 | | | | 1,351 | |
Siemens AG ADR | | | 92,094 | | | | 4,950 | |
Southwest Airlines Co, Cl A | | | 86,460 | | | | 4,488 | |
SPX Corp * | | | 148,826 | | | | 5,178 | |
TransDigm Group Inc * | | | 26,436 | | | | 12,002 | |
United Continental Holdings Inc * | | | 134,548 | | | | 10,734 | |
United Technologies Corp | | | 81,889 | | | | 10,555 | |
USG Corp | | | 41,806 | | | | 1,810 | |
Waste Management Inc | | | 18,232 | | | | 1,894 | |
WW Grainger Inc | | | 72,613 | | | | 21,851 | |
| | |
| | | | | | | 403,687 | |
| | |
Information Technology — 16.5% | | | | | | | | |
Adobe Inc * | | | 137,412 | | | | 36,619 | |
Analog Devices Inc | | | 82,993 | | | | 8,737 | |
Apple Inc | | | 266,564 | | | | 50,634 | |
Applied Materials Inc | | | 507,844 | | | | 20,141 | |
ASML Holding NV, Cl G | | | 27,764 | | | | 5,221 | |
Automatic Data Processing Inc | | | 130,577 | | | | 20,858 | |
Broadcom Inc | | | 17,131 | | | | 5,151 | |
Cisco Systems Inc | | | 569,792 | | | | 30,763 | |
Citrix Systems Inc | | | 44,716 | | | | 4,456 | |
Cognizant Technology Solutions Corp, Cl A | | | 90,285 | | | | 6,541 | |
Corning Inc, Cl B | | | 234,159 | | | | 7,751 | |
DXC Technology Co | | | 38,661 | | | | 2,486 | |
Hewlett Packard Enterprise Co | | | 307,307 | | | | 4,742 | |
HP Inc | | | 480,394 | | | | 9,334 | |
Intel Corp | | | 571,741 | | | | 30,702 | |
| | | | | | | | |
| | | |
| Description | | Shares | | Market Value ($ Thousands) |
| | |
COMMON STOCK (continued) | | | | | | | | |
International Business Machines Corp | | | 20,181 | | | $ | 2,848 | |
Intuit Inc | | | 156,005 | | | | 40,781 | |
Juniper Networks Inc | | | 66,060 | | | | 1,749 | |
Keysight Technologies Inc * | | | 148,082 | | | | 12,913 | |
Lam Research Corp | | | 22,006 | | | | 3,939 | |
Marvell Technology Group Ltd | | | 264,770 | | | | 5,266 | |
Mastercard Inc, Cl A | | | 286,090 | | | | 67,360 | |
Microchip Technology Inc (A) | | | 304,799 | | | | 25,286 | |
Micron Technology Inc * | | | 446,316 | | | | 18,446 | |
Microsoft Corp | | | 592,146 | | | | 69,838 | |
Motorola Solutions Inc | | | 22,111 | | | | 3,105 | |
Oracle Corp, Cl B | | | 512,747 | | | | 27,540 | |
QUALCOMM Inc | | | 79,861 | | | | 4,554 | |
Red Hat Inc * | | | 16,812 | | | | 3,072 | |
salesforce.com Inc * | | | 15,984 | | | | 2,531 | |
Seagate Technology PLC | | | 112,151 | | | | 5,371 | |
ServiceNow Inc * | | | 18,268 | | | | 4,503 | |
Tech Data Corp * | | | 22,300 | | | | 2,284 | |
Texas Instruments Inc | | | 44,297 | | | | 4,699 | |
VeriSign Inc * | | | 91,384 | | | | 16,592 | |
Visa Inc, Cl A | | | 358,604 | | | | 56,010 | |
Vishay Intertechnology Inc | | | 88,686 | | | | 1,638 | |
Western Digital Corp | | | 72,366 | | | | 3,478 | |
Xilinx Inc | | | 82,000 | | | | 10,397 | |
Zendesk Inc * | | | 63,012 | | | | 5,356 | |
| | |
| | | | | | | 643,692 | |
| | |
Materials — 4.0% | | | | | | | | |
Cabot Corp | | | 99,097 | | | | 4,125 | |
Celanese Corp, Cl A | | | 28,298 | | | | 2,790 | |
DowDuPont Inc | | | 242,015 | | | | 12,902 | |
Eastman Chemical Co | | | 109,370 | | | | 8,299 | |
Ecolab Inc | | | 134,113 | | | | 23,676 | |
Huntsman Corp | | | 312,058 | | | | 7,018 | |
Ingevity Corp * | | | 14,131 | | | | 1,492 | |
International Paper Co | | | 367,473 | | | | 17,003 | |
Linde PLC | | | 123,959 | | | | 21,808 | |
LyondellBasell Industries NV, Cl A | | | 132,110 | | | | 11,108 | |
Owens-Illinois Inc | | | 225,590 | | | | 4,282 | |
Sherwin-Williams Co/The, Cl A | | | 89,695 | | | | 38,633 | |
Westrock Co | | | 84,787 | | | | 3,252 | |
| | |
| | | | | | | 156,388 | |
| | |
Real Estate — 2.9% | | | | | | | | |
American Tower Corp, Cl A ‡ | | | 132,020 | | | | 26,016 | |
Brandywine Realty Trust ‡ | | | 24,300 | | | | 385 | |
CBRE Group Inc, Cl A *‡ | | | 41,173 | | | | 2,036 | |
Crown Castle International Corp ‡ | | | 40,644 | | | | 5,202 | |
Equinix Inc ‡ | | | 1,986 | | | | 900 | |
Equity Commonwealth ‡ | | | 237,285 | | | | 7,757 | |
HCP Inc ‡ | | | 775,087 | | | | 24,260 | |
Hospitality Properties Trust ‡ | | | 97,540 | | | | 2,566 | |
| | | | |
SEI Institutional Managed Trust / Semi-Annual Report / March 31, 2019 | | | 3 | |
SCHEDULE OF INVESTMENTS (Unaudited)
March 31, 2019
Tax-Managed Large Cap Fund(Continued)
| | | | | | | | |
| | | |
| Description | | Shares | | Market Value ($ Thousands) |
| | |
COMMON STOCK (continued) | | | | | | | | |
Host Hotels & Resorts Inc ‡ | | | 141,505 | | | $ | 2,675 | |
Omega Healthcare Investors Inc ‡ | | | 255,670 | | | | 9,754 | |
Public Storage ‡ | | | 4,106 | | | | 894 | |
SBA Communications Corp, Cl A *‡ | | | 25,216 | | | | 5,035 | |
Simon Property Group Inc ‡ | | | 6,723 | | | | 1,225 | |
VEREIT Inc ‡ | | | 1,613,897 | | | | 13,508 | |
Welltower Inc ‡ | | | 161,568 | | | | 12,538 | |
| | |
| | | | | | | 114,751 | |
| | |
Utilities — 2.1% | | | | | | | | |
Ameren Corp | | | 65,226 | | | | 4,798 | |
American Electric Power Co Inc | | | 57,553 | | | | 4,820 | |
Edison International | | | 58,113 | | | | 3,598 | |
Entergy Corp | | | 170,852 | | | | 16,339 | |
Exelon Corp | | | 317,795 | | | | 15,931 | |
FirstEnergy Corp | | | 511,649 | | | | 21,290 | |
NextEra Energy Inc | | | 26,217 | | | | 5,068 | |
OGE Energy Corp | | | 213,728 | | | | 9,216 | |
| | |
| | | | | | | 81,060 | |
| | | | | | | | |
| | | |
| Description | | Shares | | Market Value ($ Thousands) |
| | |
COMMON STOCK (continued) | | | | | | | | |
Total Common Stock
(Cost $2,141,705) ($ Thousands) | | | | | | $ | 3,869,756 | |
| |
AFFILIATED PARTNERSHIP — 0.9% | | | | | |
SEI Liquidity Fund, L.P. | | | | | | | | |
2.480% **† (D) | | | 36,664,327 | | | | 36,664 | |
| | |
Total Affiliated Partnership
(Cost $36,662) ($ Thousands) | | | | | | | 36,664 | |
| | |
CASH EQUIVALENT — 0.9% | | | | | | | | |
SEI Daily Income Trust, Government Fund, Cl F | | | | | | | | |
2.220%**† | | | 36,551,380 | | | | 36,551 | |
Total Cash Equivalent
(Cost $36,551) ($ Thousands) | | | | | | | 36,551 | |
| |
Total Investments in Securities — 100.8%
(Cost $2,214,918) ($ Thousands) | | | $ | 3,942,971 | |
| | | | | | | | |
A list of the open futures contracts held at March 31, 2019 is as follows:
| | | | | | | | | | | | | | | | | | | | |
| |
Type of
Contract | | Number of
Contracts
Long/(Short) | | | Expiration
Date | | | Notional Amount
(Thousands) | | | Value
(Thousands) | | | Unrealized
Appreciation
(Depreciation)
(Thousands) | |
| |
S&P 500 IndexE-MINI | | | 180 | | | | Jun-2019 | | | $ | 25,019 | | | $ | 25,540 | | | $ | 521 | |
S&P Mid Cap 400 IndexE-MINI | | | 11 | | | | Jun-2019 | | | | 2,058 | | | | 2,091 | | | | 33 | |
| | | | | |
| | | | | | | | | | $ | 27,077 | | | $ | 27,631 | | | $ | 554 | |
| | | | | | | | | | | | |
| | Percentages are based on a Net Assets of $3,909,752 ($ Thousands). |
| * | Non-income producing security. |
| ** | Rate shown is the7-day effective yield as of March 31, 2019. |
| † | Investment in Affiliated Security (see Note 6). |
| ‡ | Real Estate Investment Trust. |
| (A) | Certain securities or partial positions of certain securities are on loan at March 31, 2019 (see Note 10). The total market value of securities on loan at March 31, 2019 was $36,153 ($ Thousands). |
| (B) | Security is a Master Limited Partnership. At March 31, 2019, such securities amounted to $1,563 ($ Thousands), or 0.0% of Net Assets (See Note 2). |
| (C) | Securities considered illiquid. The total value of such securities as of March 31, 2019 was $4,397 ($ Thousands) and represented 0.1% of the Net Assets of the Fund. |
| (D) | This security was purchased with cash collateral held from securities on loan (see Note 10). The total market value of such securities as of March 31, 2019 was $36,664 ($ Thousands). |
| | Percentages are based on Net Assets of $36,664 ($ Thousands). |
ADR — American Depositary Receipt
Cl — Class
L.P. — Limited Partnership
PLC — Public Limited Company
S&P— Standard & Poor’s
| | |
| 4 | | SEI Institutional Managed Trust / Semi-Annual Report / March 31, 2019 |
SCHEDULE OF INVESTMENTS (Unaudited)
March 31, 2019
Tax-Managed Large Cap Fund(Continued)
The following is a list of the level of inputs used as of March 31, 2019, in valuing the Fund’s investments carried at value ($ Thousands):
| | | | | | | | | | | | | | | | |
Investments in
Securities | | Level 1 | | Level 2 | | Level 3 | | Total |
Common Stock | | $ | 3,869,756 | | | $ | – | | | $ | – | | | $ | 3,869,756 | |
Affiliated Partnership | | | – | | | | 36,664 | | | | – | | | | 36,664 | |
Cash Equivalent | | | 36,551 | | | | – | | | | – | | | | 36,551 | |
| | | | | | | | | | | | | | | | |
Total Investments in Securities | | $ | 3,906,307 | | | $ | 36,664 | | | $ | – | | | $ | 3,942,971 | |
| | | | | | | | | | | | | | | | |
| | | | | | | | | | | | | | | | |
| Other Financial Instruments | | Level 1 | | Level 2 | | Level 3 | | Total |
Futures Contracts* | | | | | | | | | | | | | | | | |
Unrealized Appreciation | | $ | 554 | | | $ | – | | | $ | – | | | $ | 554 | |
| | | | | | | | | | | | | | | | |
Total Other Financial Instruments | | $ | 554 | | | $ | – | | | $ | – | | | $ | 554 | |
| | | | | | | | | | | | | | | | |
* Futures contracts are valued at the unrealized appreciation on the instrument.
For the period ended March 31, 2019, there were no transfers between Level 1 and Level 2 assets and liabilities.
For the period ended March 31, 2019, there were no transfers between Level 2 and Level 3 assets and liabilities.
For more information on valuation inputs, see Note 2 – Significant Accounting Policies in Notes to Financial Statements.
Amounts designated as “—” are either $0 or have been rounded to $0.
The following is a summary of the Fund’s transactions with affiliates for the period ended March 31, 2019 ($ Thousands):
| | | | | | | | | | | | | | | | | | | | | | | | | | |
| Security Description | | Value 9/30/18 | | Purchases at
Cost | | Proceeds from
Sales | | Realized Gain | | Change in
Unrealized
Appreciation | | | Value 3/31/19 | | Income |
SEI Liquidity Fund, L.P. | | $ 37,560 | | | $ 178,454 | | | | $ (179,362) | | | | $10 | | | | $ 2 | | | | $ 36,664 | | | | $ 44 | |
SEI Daily Income Trust, Government Fund, Cl F | | 14,303 | | | 294,577 | | | | (272,329) | | | | — | | | | — | | | | 36,551 | | | | 500 | |
| | | | | | | | | | | | | | | | | | | | | | | | | | |
Totals | | $ 51,863 | | | $ 473,031 | | | | $ (451,691) | | | | $10 | | | | $ 2 | | | | $ 73,215 | | | | $ 544 | |
| | | | | | | | | | | | | | | | | | | | | | | | | | |
Amounts designated as “—” are either $0 or have been rounded to $0.
The accompanying notes are an integral part of the financial statements.
| | | | |
SEI Institutional Managed Trust / Semi-Annual Report / March 31, 2019 | | | 5 | |
SCHEDULE OF INVESTMENTS (Unaudited)
March 31, 2019
S&P 500 Index Fund(Continued)
| | | | | | | | |
| | | |
| Description | | Shares | | Market Value ($ Thousands) |
| | |
COMMON STOCK — 98.5% | | | | | | | | |
| | |
Communication Services — 9.9% | | | | | | | | |
Activision Blizzard Inc | | | 26,600 | | | $ | 1,211 | |
Alphabet Inc, Cl A * | | | 10,300 | | | | 12,122 | |
Alphabet Inc, Cl C * | | | 10,612 | | | | 12,451 | |
AT&T Inc | | | 251,293 | | | | 7,880 | |
CBS Corp, Cl B | | | 12,226 | | | | 581 | |
CenturyLink Inc | | | 32,370 | | | | 388 | |
Charter Communications Inc, Cl A * | | | 6,000 | | | | 2,081 | |
Comcast Corp, Cl A | | | 155,896 | | | | 6,233 | |
Discovery Inc, Cl A * | | | 5,600 | | | | 151 | |
Discovery Inc, Cl C * | | | 11,904 | | | | 303 | |
DISH Network Corp, Cl A * | | | 8,100 | | | | 257 | |
Electronic Arts Inc * | | | 10,378 | | | | 1,055 | |
Facebook Inc, Cl A * | | | 82,309 | | | | 13,720 | |
Fox Corp * | | | 17,620 | | | | 642 | |
Interpublic Group of Cos Inc/The | | | 13,301 | | | | 279 | |
Netflix Inc * | | | 15,100 | | | | 5,384 | |
News Corp, Cl A | | | 13,975 | | | | 174 | |
News Corp, Cl B | | | 4,000 | | | | 50 | |
Omnicom Group Inc | | | 7,604 | | | | 555 | |
Take-Two Interactive Software Inc, Cl A * | | | 3,800 | | | | 359 | |
TripAdvisor Inc * | | | 3,455 | | | | 178 | |
Twitter Inc * | | | 24,600 | | | | 809 | |
Verizon Communications Inc | | | 142,596 | | | | 8,432 | |
Viacom Inc, Cl B | | | 11,901 | | | | 334 | |
Walt Disney Co/The | | | 60,194 | | | | 6,683 | |
| | |
| | | | | | | 82,312 | |
| | |
Consumer Discretionary — 10.0% | | | | | | | | |
Advance Auto Parts Inc | | | 2,500 | | | | 426 | |
Amazon.com Inc, Cl A * | | | 14,252 | | | | 25,379 | |
AutoZone Inc * | | | 894 | | | | 916 | |
Best Buy Co Inc | | | 8,054 | | | | 572 | |
Booking Holdings Inc * | | | 1,565 | | | | 2,731 | |
BorgWarner Inc | | | 7,200 | | | | 277 | |
Capri Holdings Ltd * | | | 4,900 | | | | 224 | |
CarMax Inc * | | | 5,900 | | | | 412 | |
Carnival Corp | | | 13,684 | | | | 694 | |
Chipotle Mexican Grill Inc, Cl A * | | | 804 | | | | 571 | |
Darden Restaurants Inc | | | 4,218 | | | | 512 | |
Delphi Automotive PLC * | | | 9,000 | | | | 715 | |
Dollar General Corp | | | 9,281 | | | | 1,107 | |
Dollar Tree Inc * | | | 8,254 | | | | 867 | |
DR Horton Inc | | | 11,558 | | | | 478 | |
eBay Inc | | | 29,449 | | | | 1,094 | |
Expedia Group Inc | | | 4,055 | | | | 483 | |
Foot Locker Inc, Cl A | | | 4,000 | | | | 242 | |
Ford Motor Co | | | 135,737 | | | | 1,192 | |
Gap Inc/The | | | 6,931 | | | | 181 | |
Garmin Ltd | | | 4,005 | | | | 346 | |
General Motors Co | | | 45,413 | | | | 1,685 | |
Genuine Parts Co | | | 5,136 | | | | 575 | |
| | | | | | | | |
| | | |
| Description | | Shares | | Market Value ($ Thousands) |
| | |
COMMON STOCK (continued) | | | | | | | | |
H&R Block Inc | | | 6,813 | | | $ | 163 | |
Hanesbrands Inc | | | 11,700 | | | | 209 | |
Harley-Davidson Inc, Cl A | | | 5,408 | | | | 193 | |
Hasbro Inc | | | 3,896 | | | | 331 | |
Hilton Worldwide Holdings Inc | | | 10,100 | | | | 839 | |
Home Depot Inc/The | | | 39,045 | | | | 7,492 | |
Kohl’s Corp | | | 5,656 | | | | 389 | |
L Brands Inc | | | 8,027 | | | | 221 | |
Leggett & Platt Inc | | | 4,259 | | | | 180 | |
Lennar Corp, Cl A | | | 9,716 | | | | 477 | |
LKQ Corp * | | | 10,600 | | | | 301 | |
Lowe’s Cos Inc | | | 27,649 | | | | 3,027 | |
Macy’s Inc | | | 10,864 | | | | 261 | |
Marriott International Inc/MD, Cl A | | | 9,824 | | | | 1,229 | |
Mattel Inc * | | | 11,131 | | | | 145 | |
McDonald’s Corp | | | 26,517 | | | | 5,036 | |
MGM Resorts International | | | 16,900 | | | | 434 | |
Mohawk Industries Inc * | | | 2,100 | | | | 265 | |
Newell Brands Inc, Cl B | | | 14,155 | | | | 217 | |
NIKE Inc, Cl B | | | 43,794 | | | | 3,688 | |
Nordstrom Inc | | | 3,907 | | | | 173 | |
Norwegian Cruise Line Holdings Ltd * | | | 7,500 | | | | 412 | |
O’Reilly Automotive Inc * | | | 2,700 | | | | 1,048 | |
PulteGroup Inc | | | 8,799 | | | | 246 | |
PVH Corp | | | 2,559 | | | | 312 | |
Ralph Lauren Corp, Cl A | | | 1,805 | | | | 234 | |
Ross Stores Inc | | | 12,936 | | | | 1,204 | |
Royal Caribbean Cruises Ltd | | | 6,000 | | | | 688 | |
Starbucks Corp | | | 43,334 | | | | 3,221 | |
Tapestry Inc | | | 10,019 | | | | 326 | |
Target Corp, Cl A | | | 18,128 | | | | 1,455 | |
Tiffany & Co | | | 3,778 | | | | 399 | |
TJX Cos Inc/The | | | 42,686 | | | | 2,271 | |
Tractor Supply Co | | | 4,200 | | | | 411 | |
Ulta Beauty Inc * | | | 1,900 | | | | 663 | |
Under Armour Inc, Cl A * | | | 6,005 | | | | 127 | |
Under Armour Inc, Cl C * | | | 6,449 | | | | 122 | |
VF Corp | | | 11,365 | | | | 988 | |
Whirlpool Corp | | | 2,105 | | | | 280 | |
Wynn Resorts Ltd | | | 3,300 | | | | 394 | |
Yum! Brands Inc | | | 10,470 | | | | 1,045 | |
| | |
| | | | | | | 82,795 | |
| | |
Consumer Staples — 7.2% | | | | | | | | |
Altria Group Inc | | | 64,673 | | | | 3,714 | |
Archer-Daniels-Midland Co | | | 19,575 | | | | 844 | |
Brown-Forman Corp, Cl B | | | 5,865 | | | | 310 | |
Campbell Soup Co | | | 6,784 | | | | 259 | |
Church & Dwight Co Inc | | | 8,400 | | | | 598 | |
Clorox Co/The | | | 4,342 | | | | 697 | |
Coca-Cola Co/The | | | 133,549 | | | | 6,258 | |
Colgate-Palmolive Co | | | 29,995 | | | | 2,056 | |
| | | | |
SEI Institutional Managed Trust / Semi-Annual Report / March 31, 2019 | | | 1 | |
SCHEDULE OF INVESTMENTS (Unaudited)
March 31, 2019
S&P 500 Index Fund(Continued)
| | | | | | | | |
| | | |
| Description | | Shares | | Market Value ($ Thousands) |
| | |
COMMON STOCK (continued) | | | | | | | | |
Conagra Brands Inc | | | 16,365 | | | $ | 454 | |
Constellation Brands Inc, Cl A | | | 5,913 | | | | 1,037 | |
Costco Wholesale Corp | | | 15,218 | | | | 3,685 | |
Coty Inc, Cl A | | | 14,414 | | | | 166 | |
Estee Lauder Cos Inc/The, Cl A | | | 7,700 | | | | 1,275 | |
General Mills Inc | | | 20,386 | | | | 1,055 | |
Hershey Co/The | | | 4,812 | | | | 553 | |
Hormel Foods Corp | | | 9,008 | | | | 403 | |
JM Smucker Co/The | | | 3,953 | | | | 460 | |
Kellogg Co | | | 8,467 | | | | 486 | |
Kimberly-Clark Corp | | | 12,003 | | | | 1,487 | |
Kraft Heinz Co/The | | | 22,008 | | | | 719 | |
Kroger Co/The | | | 27,236 | | | | 670 | |
Lamb Weston Holdings Inc | | | 4,900 | | | | 367 | |
McCormick & Co Inc/MD | | | 4,166 | | | | 627 | |
Molson Coors Brewing Co, Cl B | | | 6,351 | | | | 379 | |
Mondelez International Inc, Cl A | | | 50,120 | | | | 2,502 | |
Monster Beverage Corp * | | | 13,354 | | | | 729 | |
PepsiCo Inc | | | 48,515 | | | | 5,945 | |
Philip Morris International Inc | | | 53,787 | | | | 4,754 | |
Procter & Gamble Co/The | | | 86,308 | | | | 8,980 | |
Sysco Corp, Cl A | | | 16,620 | | | | 1,110 | |
Tyson Foods Inc, Cl A | | | 10,103 | | | | 701 | |
Walgreens Boots Alliance Inc | | | 27,757 | | | | 1,756 | |
Walmart Inc | | | 49,461 | | | | 4,824 | |
| | |
| | | | | | | 59,860 | |
| | |
Energy — 5.4% | | | | | | | | |
Anadarko Petroleum Corp, Cl A | | | 17,185 | | | | 782 | |
Apache Corp | | | 12,600 | | | | 437 | |
Baker Hughes a GE Co, Cl A | | | 17,749 | | | | 492 | |
Cabot Oil & Gas Corp | | | 14,813 | | | | 387 | |
Chevron Corp | | | 65,623 | | | | 8,083 | |
Cimarex Energy Co | | | 3,604 | | | | 252 | |
Concho Resources Inc | | | 7,000 | | | | 777 | |
ConocoPhillips | | | 39,660 | | | | 2,647 | |
Devon Energy Corp | | | 15,513 | | | | 490 | |
Diamondback Energy Inc, Cl A | | | 5,400 | | | | 548 | |
EOG Resources Inc | | | 19,997 | | | | 1,903 | |
Exxon Mobil Corp | | | 146,446 | | | | 11,833 | |
Halliburton Co | | | 30,442 | | | | 892 | |
Helmerich & Payne Inc | | | 3,905 | | | | 217 | |
Hess Corp | | | 8,975 | | | | 541 | |
HollyFrontier Corp | | | 5,400 | | | | 266 | |
Kinder Morgan Inc/DE | | | 67,682 | | | | 1,354 | |
Marathon Oil Corp | | | 28,156 | | | | 470 | |
Marathon Petroleum Corp | | | 23,160 | | | | 1,386 | |
National Oilwell Varco Inc, Cl A | | | 12,968 | | | | 345 | |
Noble Energy Inc | | | 15,900 | | | | 393 | |
Occidental Petroleum Corp | | | 26,064 | | | | 1,725 | |
ONEOK Inc | | | 14,009 | | | | 978 | |
Phillips 66 | | | 14,675 | | | | 1,397 | |
| | | | | | | | |
| | | |
| Description | | Shares | | Market Value ($ Thousands) |
| | |
COMMON STOCK (continued) | | | | | | | | |
Pioneer Natural Resources Co | | | 5,804 | | | $ | 884 | |
Schlumberger Ltd, Cl A | | | 47,800 | | | | 2,083 | |
TechnipFMC PLC | | | 14,200 | | | | 334 | |
Valero Energy Corp | | | 14,708 | | | | 1,248 | |
Williams Cos Inc/The | | | 42,069 | | | | 1,208 | |
| | |
| | | | | | | 44,352 | |
| | |
Financials — 12.5% | | | | | | | | |
Affiliated Managers Group Inc | | | 1,800 | | | | 193 | |
Aflac Inc | | | 26,434 | | | | 1,322 | |
Allstate Corp/The | | | 11,559 | | | | 1,089 | |
American Express Co | | | 24,128 | | | | 2,637 | |
American International Group Inc | | | 30,630 | | | | 1,319 | |
Ameriprise Financial Inc | | | 4,684 | | | | 600 | |
Aon PLC | | | 8,329 | | | | 1,422 | |
Arthur J Gallagher & Co | | | 6,100 | | | | 476 | |
Assurant Inc | | | 2,205 | | | | 209 | |
Bank of America Corp | | | 309,945 | | | | 8,551 | |
Bank of New York Mellon Corp/The | | | 30,199 | | | | 1,523 | |
BB&T Corp | | | 26,706 | | | | 1,243 | |
Berkshire Hathaway Inc, Cl B * | | | 67,117 | | | | 13,483 | |
BlackRock Inc | | | 4,261 | | | | 1,821 | |
Brighthouse Financial Inc * | | | 3,803 | | | | 138 | |
Capital One Financial Corp | | | 16,466 | | | | 1,345 | |
Cboe Global Markets Inc | | | 3,900 | | | | 372 | |
Charles Schwab Corp/The | | | 41,536 | | | | 1,776 | |
Chubb Ltd | | | 15,934 | | | | 2,232 | |
Cincinnati Financial Corp | | | 5,483 | | | | 471 | |
Citigroup Inc | | | 81,651 | | | | 5,080 | |
Citizens Financial Group Inc | | | 15,800 | | | | 513 | |
CME Group Inc | | | 12,340 | | | | 2,031 | |
Comerica Inc | | | 5,592 | | | | 410 | |
Discover Financial Services | | | 11,230 | | | | 799 | |
E*TRADE Financial Corp | | | 8,752 | | | | 406 | |
Everest Re Group Ltd | | | 1,400 | | | | 302 | |
Fifth Third Bancorp | | | 22,311 | | | | 563 | |
First Republic Bank/CA | | | 5,500 | | | | 553 | |
Franklin Resources Inc | | | 10,050 | | | | 333 | |
Goldman Sachs Group Inc/The | | | 11,965 | | | | 2,297 | |
Hartford Financial Services Group Inc/The | | | 12,186 | | | | 606 | |
Huntington Bancshares Inc/OH | | | 35,214 | | | | 446 | |
Intercontinental Exchange Inc | | | 19,705 | | | | 1,500 | |
Invesco Ltd | | | 14,200 | | | | 274 | |
Jefferies Financial Group Inc | | | 8,613 | | | | 162 | |
JPMorgan Chase & Co | | | 113,000 | | | | 11,439 | |
KeyCorp | | | 34,483 | | | | 543 | |
Lincoln National Corp | | | 7,098 | | | | 417 | |
Loews Corp | | | 9,362 | | | | 449 | |
M&T Bank Corp | | | 4,725 | | | | 742 | |
Marsh & McLennan Cos Inc | | | 17,459 | | | | 1,639 | |
MetLife Inc | | | 32,839 | | | | 1,398 | |
Moody’s Corp | | | 5,808 | | | | 1,052 | |
| | |
| 2 | | SEI Institutional Managed Trust / Semi-Annual Report / March 31, 2019 |
SCHEDULE OF INVESTMENTS (Unaudited)
March 31, 2019
S&P 500 Index Fund(Continued)
| | | | | | | | |
| | | |
| Description | | Shares | | Market Value
($ Thousands) |
| | |
COMMON STOCK (continued) | | | | | | | | |
Morgan Stanley | | | 45,161 | | | $ | 1,906 | |
MSCI Inc, Cl A | | | 3,000 | | | | 597 | |
Nasdaq Inc, Cl A | | | 4,000 | | | | 350 | |
Northern Trust Corp | | | 7,509 | | | | 679 | |
People’s United Financial Inc | | | 12,300 | | | | 202 | |
PNC Financial Services Group Inc/The | | | 15,684 | | | | 1,924 | |
Principal Financial Group Inc, Cl A | | | 8,757 | | | | 440 | |
Progressive Corp/The | | | 20,185 | | | | 1,455 | |
Prudential Financial Inc | | | 14,266 | | | | 1,311 | |
Raymond James Financial Inc | | | 4,500 | | | | 362 | |
Regions Financial Corp | | | 34,463 | | | | 488 | |
S&P Global Inc | | | 8,521 | | | | 1,794 | |
State Street Corp | | | 13,191 | | | | 868 | |
SunTrust Banks Inc | | | 15,296 | | | | 906 | |
SVB Financial Group, Cl B * | | | 1,800 | | | | 400 | |
Synchrony Financial | | | 22,063 | | | | 704 | |
T Rowe Price Group Inc | | | 8,208 | | | | 822 | |
Torchmark Corp, Cl A | | | 3,539 | | | | 290 | |
Travelers Cos Inc/The | | | 9,056 | | | | 1,242 | |
Unum Group | | | 7,261 | | | | 246 | |
US Bancorp | | | 51,723 | | | | 2,493 | |
Wells Fargo & Co | | | 141,215 | | | | 6,823 | |
Willis Towers Watson PLC | | | 4,421 | | | | 777 | |
Zions Bancorp NA | | | 6,460 | | | | 293 | |
| | |
| | | | | | | 103,548 | |
| | |
Health Care — 14.4% | | | | | | | | |
Abbott Laboratories | | | 60,719 | | | | 4,854 | |
AbbVie Inc | | | 50,868 | | | | 4,099 | |
ABIOMED Inc * | | | 1,500 | | | | 428 | |
Agilent Technologies Inc | | | 10,915 | | | | 877 | |
Alexion Pharmaceuticals Inc * | | | 7,600 | | | | 1,027 | |
Align Technology Inc * | | | 2,459 | | | | 699 | |
Allergan PLC | | | 10,953 | | | | 1,604 | |
AmerisourceBergen Corp, Cl A | | | 5,296 | | | | 421 | |
Amgen Inc, Cl A | | | 21,629 | | | | 4,109 | |
Anthem Inc | | | 8,802 | | | | 2,526 | |
Baxter International Inc | | | 16,335 | | | | 1,328 | |
Becton Dickinson and Co | | | 9,271 | | | | 2,315 | |
Biogen Inc * | | | 6,800 | | | | 1,607 | |
Boston Scientific Corp * | | | 47,812 | | | | 1,835 | |
Bristol-Myers Squibb Co | | | 56,192 | | | | 2,681 | |
Cardinal Health Inc | | | 10,159 | | | | 489 | |
Celgene Corp, Cl A * | | | 24,205 | | | | 2,284 | |
Centene Corp * | | | 14,000 | | | | 743 | |
Cerner Corp * | | | 11,200 | | | | 641 | |
Cigna Corp | | | 13,207 | | | | 2,124 | |
Cooper Cos Inc/The, Cl A | | | 1,700 | | | | 503 | |
CVS Health Corp | | | 44,576 | | | | 2,404 | |
Danaher Corp, Cl A | | | 21,696 | | | | 2,864 | |
DaVita Inc * | | | 4,105 | | | | 223 | |
DENTSPLY SIRONA Inc | | | 7,309 | | | | 362 | |
| | | | | | | | |
| | | |
| Description | | Shares | | Market Value
($ Thousands) |
| | |
COMMON STOCK (continued) | | | | | | | | |
Edwards Lifesciences Corp, Cl A * | | | 7,300 | | | $ | 1,397 | |
Eli Lilly & Co | | | 29,906 | | | | 3,881 | |
Gilead Sciences Inc | | | 43,966 | | | | 2,858 | |
HCA Healthcare Inc | | | 9,305 | | | | 1,213 | |
Henry Schein Inc * | | | 5,300 | | | | 319 | |
Hologic Inc * | | | 9,100 | | | | 440 | |
Humana Inc | | | 4,801 | | | | 1,277 | |
IDEXX Laboratories Inc * | | | 2,900 | | | | 648 | |
Illumina Inc * | | | 5,100 | | | | 1,585 | |
Incyte Corp * | | | 5,900 | | | | 507 | |
Intuitive Surgical Inc * | | | 3,960 | | | | 2,260 | |
IQVIA Holdings Inc * | | | 5,600 | | | | 806 | |
Johnson & Johnson | | | 91,954 | | | | 12,854 | |
Laboratory Corp of America Holdings * | | | 3,363 | | | | 514 | |
McKesson Corp | | | 6,569 | | | | 769 | |
Medtronic PLC | | | 46,572 | | | | 4,242 | |
Merck & Co Inc | | | 89,274 | | | | 7,425 | |
Mettler-Toledo International Inc * | | | 900 | | | | 651 | |
Mylan NV * | | | 17,415 | | | | 494 | |
Nektar Therapeutics, Cl A * | | | 5,800 | | | | 195 | |
PerkinElmer Inc | | | 3,640 | | | | 351 | |
Perrigo Co PLC | | | 4,404 | | | | 212 | |
Pfizer Inc | | | 191,556 | | | | 8,135 | |
Quest Diagnostics Inc | | | 4,624 | | | | 416 | |
Regeneron Pharmaceuticals Inc * | | | 2,700 | | | | 1,109 | |
ResMed Inc | | | 5,000 | | | | 520 | |
Stryker Corp | | | 10,746 | | | | 2,123 | |
Teleflex Inc | | | 1,600 | | | | 483 | |
Thermo Fisher Scientific Inc | | | 13,952 | | | | 3,819 | |
UnitedHealth Group Inc | | | 33,128 | | | | 8,191 | |
Universal Health Services Inc, Cl B | | | 2,900 | | | | 388 | |
Varian Medical Systems Inc * | | | 3,105 | | | | 440 | |
Vertex Pharmaceuticals Inc * | | | 8,800 | | | | 1,619 | |
Waters Corp * | | | 2,597 | | | | 654 | |
WellCare Health Plans Inc * | | | 1,700 | | | | 459 | |
Zimmer Biomet Holdings Inc | | | 6,960 | | | | 889 | |
Zoetis Inc, Cl A | | | 16,646 | | | | 1,676 | |
| | |
| | | | | | | 118,866 | |
| | |
Industrials — 9.3% | | | | | | | | |
3M Co | | | 20,001 | | | | 4,156 | |
Alaska Air Group Inc | | | 4,000 | | | | 224 | |
Allegion PLC | | | 3,170 | | | | 288 | |
American Airlines Group Inc | | | 13,909 | | | | 442 | |
AMETEK Inc | | | 7,700 | | | | 639 | |
AO Smith Corp | | | 4,800 | | | | 256 | |
Arconic Inc | | | 14,078 | | | | 269 | |
Boeing Co/The | | | 18,141 | | | | 6,919 | |
Caterpillar Inc, Cl A | | | 19,806 | | | | 2,683 | |
CH Robinson Worldwide Inc | | | 4,605 | | | | 401 | |
Cintas Corp | | | 2,912 | | | | 588 | |
Copart Inc * | | | 7,100 | | | | 430 | |
| | | | |
SEI Institutional Managed Trust / Semi-Annual Report / March 31, 2019 | | | 3 | |
SCHEDULE OF INVESTMENTS (Unaudited)
March 31, 2019
S&P 500 Index Fund(Continued)
| | | | | | | | |
| | | |
| Description | | Shares | | Market Value
($ Thousands) |
| | |
COMMON STOCK (continued) | | | | | | | | |
CSX Corp | | | 26,672 | | | $ | 1,996 | |
Cummins Inc | | | 5,044 | | | | 796 | |
Deere & Co | | | 11,106 | | | | 1,775 | |
Delta Air Lines Inc, Cl A | | | 21,713 | | | | 1,121 | |
Dover Corp | | | 4,937 | | | | 463 | |
Eaton Corp PLC | | | 15,015 | | | | 1,210 | |
Emerson Electric Co | | | 21,115 | | | | 1,446 | |
Equifax Inc | | | 4,030 | | | | 478 | |
Expeditors International of Washington Inc | | | 5,909 | | | | 448 | |
Fastenal Co, Cl A | | | 9,609 | | | | 618 | |
FedEx Corp | | | 8,305 | | | | 1,507 | |
Flowserve Corp | | | 4,300 | | | | 194 | |
Fluor Corp | | | 4,944 | | | | 182 | |
Fortive Corp | | | 10,287 | | | | 863 | |
Fortune Brands Home & Security Inc | | | 5,000 | | | | 238 | |
General Dynamics Corp | | | 9,530 | | | | 1,613 | |
General Electric Co | | | 300,109 | | | | 2,998 | |
Harris Corp | | | 4,000 | | | | 639 | |
Honeywell International Inc | | | 25,151 | | | | 3,997 | |
Huntington Ingalls Industries Inc, Cl A | | | 1,500 | | | | 311 | |
IHS Markit Ltd * | | | 12,700 | | | | 691 | |
Illinois Tool Works Inc | | | 10,429 | | | | 1,497 | |
Ingersoll-Rand PLC | | | 8,204 | | | | 886 | |
Jacobs Engineering Group Inc | | | 4,004 | | | | 301 | |
JB Hunt Transport Services Inc | | | 2,951 | | | | 299 | |
Johnson Controls International PLC | | | 32,109 | | | | 1,186 | |
Kansas City Southern | | | 3,400 | | | | 394 | |
L3 Technologies Inc | | | 2,823 | | | | 583 | |
Lockheed Martin Corp | | | 8,536 | | | | 2,562 | |
Masco Corp | | | 10,268 | | | | 404 | |
Nielsen Holdings PLC | | | 12,400 | | | | 293 | |
Norfolk Southern Corp | | | 9,330 | | | | 1,744 | |
Northrop Grumman Corp | | | 5,923 | | | | 1,597 | |
PACCAR Inc | | | 11,891 | | | | 810 | |
Parker-Hannifin Corp, Cl A | | | 4,471 | | | | 767 | |
Pentair PLC | | | 5,266 | | | | 234 | |
Quanta Services Inc | | | 4,800 | | | | 181 | |
Raytheon Co | | | 9,873 | | | | 1,798 | |
Republic Services Inc | | | 7,383 | | | | 593 | |
Robert Half International Inc | | | 4,032 | | | | 263 | |
Rockwell Automation Inc | | | 4,130 | | | | 725 | |
Rollins Inc | | | 4,900 | | | | 204 | |
Roper Technologies Inc | | | 3,600 | | | | 1,231 | |
Snap-on Inc | | | 1,953 | | | | 306 | |
Southwest Airlines Co, Cl A | | | 17,262 | | | | 896 | |
Stanley Black & Decker Inc | | | 5,140 | | | | 700 | |
Textron Inc | | | 8,207 | | | | 416 | |
TransDigm Group Inc * | | | 1,700 | | | | 772 | |
Union Pacific Corp | | | 24,893 | | | | 4,162 | |
United Continental Holdings Inc * | | | 7,800 | | | | 622 | |
United Parcel Service Inc, Cl B | | | 23,924 | | | | 2,673 | |
United Rentals Inc * | | | 2,800 | | | | 320 | |
| | | | | | | | |
| | | |
| Description | | Shares | | Market Value
($ Thousands) |
| | |
COMMON STOCK (continued) | | | | | | | | |
United Technologies Corp | | | 27,944 | | | $ | 3,602 | |
Verisk Analytics Inc, Cl A | | | 5,600 | | | | 745 | |
Wabtec Corp | | | 4,490 | | | | 331 | |
Waste Management Inc | | | 13,428 | | | | 1,395 | |
WW Grainger Inc | | | 1,565 | | | | 471 | |
Xylem Inc/NY | | | 6,100 | | | | 482 | |
| | |
| | | | | | | 77,324 | |
| | |
Information Technology — 20.9% | | | | | | | | |
Accenture PLC, Cl A | | | 22,204 | | | | 3,908 | |
Adobe Inc * | | | 16,841 | | | | 4,488 | |
Advanced Micro Devices Inc * | | | 30,000 | | | | 766 | |
Akamai Technologies Inc * | | | 5,504 | | | | 395 | |
Alliance Data Systems Corp | | | 1,600 | | | | 280 | |
Amphenol Corp, Cl A | | | 10,109 | | | | 955 | |
Analog Devices Inc | | | 12,671 | | | | 1,334 | |
ANSYS Inc * | | | 2,800 | | | | 512 | |
Apple Inc | | | 154,682 | | | | 29,382 | |
Applied Materials Inc | | | 32,550 | | | | 1,291 | |
Arista Networks Inc * | | | 1,800 | | | | 566 | |
Autodesk Inc, Cl A * | | | 7,517 | | | | 1,171 | |
Automatic Data Processing Inc | | | 15,059 | | | | 2,405 | |
Broadcom Inc | | | 13,646 | | | | 4,103 | |
Broadridge Financial Solutions Inc | | | 3,944 | | | | 409 | |
Cadence Design Systems Inc * | | | 9,400 | | | | 597 | |
Cisco Systems Inc | | | 151,861 | | | | 8,199 | |
Citrix Systems Inc | | | 4,342 | | | | 433 | |
Cognizant Technology Solutions Corp, Cl A | | | 20,005 | | | | 1,449 | |
Corning Inc, Cl B | | | 27,208 | | | | 901 | |
DXC Technology Co | | | 9,530 | | | | 613 | |
F5 Networks Inc, Cl A * | | | 2,100 | | | | 330 | |
Fidelity National Information Services Inc, Cl B | | | 11,365 | | | | 1,285 | |
Fiserv Inc, Cl A * | | | 13,720 | | | | 1,211 | |
FleetCor Technologies Inc * | | | 3,000 | | | | 740 | |
FLIR Systems Inc | | | 4,900 | | | | 233 | |
Fortinet Inc * | | | 4,900 | | | | 411 | |
Gartner Inc * | | | 3,100 | | | | 470 | |
Global Payments Inc | | | 5,300 | | | | 724 | |
Hewlett Packard Enterprise Co | | | 47,591 | | | | 734 | |
HP Inc | | | 53,091 | | | | 1,032 | |
Intel Corp | | | 155,163 | | | | 8,332 | |
International Business Machines Corp | | | 30,933 | | | | 4,365 | |
Intuit Inc | | | 8,986 | | | | 2,349 | |
IPG Photonics Corp * | | | 1,300 | | | | 197 | |
Jack Henry & Associates Inc | | | 2,700 | | | | 375 | |
Juniper Networks Inc | | | 11,600 | | | | 307 | |
Keysight Technologies Inc * | | | 6,600 | | | | 575 | |
KLA-Tencor Corp | | | 5,671 | | | | 677 | |
Lam Research Corp | | | 5,222 | | | | 935 | |
Mastercard Inc, Cl A | | | 31,217 | | | | 7,350 | |
Maxim Integrated Products Inc | | | 9,400 | | | | 500 | |
| | |
| 4 | | SEI Institutional Managed Trust / Semi-Annual Report / March 31, 2019 |
SCHEDULE OF INVESTMENTS (Unaudited)
March 31, 2019
S&P 500 Index Fund(Continued)
| | | | | | | | |
| | | |
| Description | | Shares | | Market Value
($ Thousands) |
| | |
COMMON STOCK (continued) | | | | | | | | |
Microchip Technology Inc | | | 8,304 | | | $ | 689 | |
Micron Technology Inc * | | | 38,769 | | | | 1,602 | |
Microsoft Corp | | | 264,889 | | | | 31,241 | |
Motorola Solutions Inc | | | 5,689 | | | | 799 | |
NetApp Inc | | | 8,385 | | | | 581 | |
NVIDIA Corp | | | 20,965 | | | | 3,764 | |
Oracle Corp, Cl B | | | 88,523 | | | | 4,755 | |
Paychex Inc | | | 10,869 | | | | 872 | |
PayPal Holdings Inc * | | | 40,549 | | | | 4,211 | |
Qorvo Inc * | | | 4,200 | | | | 301 | |
QUALCOMM Inc | | | 41,854 | | | | 2,387 | |
Red Hat Inc * | | | 6,100 | | | | 1,114 | |
salesforce.com Inc * | | | 26,609 | | | | 4,214 | |
Seagate Technology PLC | | | 8,600 | | | | 412 | |
Skyworks Solutions Inc | | | 6,004 | | | | 495 | |
Symantec Corp, Cl A | | | 21,647 | | | | 498 | |
Synopsys Inc * | | | 5,000 | | | | 576 | |
TE Connectivity Ltd | | | 11,709 | | | | 945 | |
Texas Instruments Inc | | | 32,366 | | | | 3,433 | |
Total System Services Inc | | | 5,789 | | | | 550 | |
VeriSign Inc * | | | 3,700 | | | | 672 | |
Visa Inc, Cl A | | | 60,418 | | | | 9,437 | |
Western Digital Corp | | | 10,374 | | | | 499 | |
Western Union Co/The | | | 14,534 | | | | 268 | |
Xerox Corp | | | 6,676 | | | | 213 | |
Xilinx Inc | | | 8,609 | | | | 1,092 | |
| | |
| | | | | | | 172,909 | |
| | |
Materials — 2.6% | | | | | | | | |
Air Products & Chemicals Inc | | | 7,526 | | | | 1,437 | |
Albemarle Corp | | | 3,600 | | | | 295 | |
Avery Dennison Corp | | | 3,015 | | | | 341 | |
Ball Corp | | | 11,572 | | | | 670 | |
Celanese Corp, Cl A | | | 4,700 | | | | 464 | |
CF Industries Holdings Inc | | | 7,750 | | | | 317 | |
DowDuPont Inc | | | 77,721 | | | | 4,143 | |
Eastman Chemical Co | | | 4,820 | | | | 366 | |
Ecolab Inc | | | 8,834 | | | | 1,560 | |
FMC Corp | | | 4,500 | | | | 346 | |
Freeport-McMoRan Inc, Cl B | | | 49,036 | | | | 632 | |
International Flavors & Fragrances Inc | | | 3,494 | | | | 450 | |
International Paper Co | | | 13,474 | | | | 623 | |
Linde PLC | | | 19,220 | | | | 3,381 | |
LyondellBasell Industries NV, Cl A | | | 10,404 | | | | 875 | |
Martin Marietta Materials Inc, Cl A | | | 2,119 | | | | 426 | |
Mosaic Co/The | | | 11,909 | | | | 325 | |
Newmont Mining Corp | | | 18,125 | | | | 648 | |
Nucor Corp | | | 10,495 | | | | 612 | |
Packaging Corp of America | | | 3,200 | | | | 318 | |
PPG Industries Inc | | | 8,190 | | | | 924 | |
Sealed Air Corp | | | 5,328 | | | | 245 | |
Sherwin-Williams Co/The, Cl A | | | 2,816 | | | | 1,213 | |
| | | | | | | | |
| | | |
| Description | | Shares | | Market Value
($ Thousands) |
| | |
COMMON STOCK (continued) | | | | | | | | |
Vulcan Materials Co | | | 4,449 | | | $ | 527 | |
Westrock Co | | | 8,784 | | | | 337 | |
| | |
| | | | | | | 21,475 | |
| | |
Real Estate — 3.0% | | | | | | | | |
Alexandria Real Estate Equities Inc ‡ | | | 3,900 | | | | 556 | |
American Tower Corp, Cl A ‡ | | | 15,200 | | | | 2,995 | |
Apartment Investment & Management Co, Cl A ‡ | | | 5,141 | | | | 259 | |
AvalonBay Communities Inc ‡ | | | 4,708 | | | | 945 | |
Boston Properties Inc ‡ | | | 5,200 | | | | 696 | |
CBRE Group Inc, Cl A *‡ | | | 10,509 | | | | 520 | |
Crown Castle International Corp ‡ | | | 14,404 | | | | 1,844 | |
Digital Realty Trust Inc, Cl A ‡ | | | 7,269 | | | | 865 | |
Duke Realty Corp ‡ | | | 11,800 | | | | 361 | |
Equinix Inc ‡ | | | 2,916 | | | | 1,321 | |
Equity Residential ‡ | | | 12,844 | | | | 967 | |
Essex Property Trust Inc ‡ | | | 2,200 | | | | 636 | |
Extra Space Storage Inc ‡ | | | 4,200 | | | | 428 | |
Federal Realty Investment Trust ‡ | | | 2,600 | | | | 358 | |
HCP Inc ‡ | | | 16,300 | | | | 510 | |
Host Hotels & Resorts Inc ‡ | | | 25,174 | | | | 476 | |
Iron Mountain Inc ‡ | | | 9,638 | | | | 342 | |
Kimco Realty Corp ‡ | | | 14,013 | | | | 259 | |
Macerich Co/The ‡ | | | 3,504 | | | | 152 | |
Mid-America Apartment Communities Inc ‡ | | | 3,900 | | | | 426 | |
Prologis Inc ‡ | | | 21,799 | | | | 1,569 | |
Public Storage ‡ | | | 5,266 | | | | 1,147 | |
Realty Income Corp ‡ | | | 10,500 | | | | 772 | |
Regency Centers Corp ‡ | | | 5,899 | | | | 398 | |
SBA Communications Corp, Cl A *‡ | | | 3,800 | | | | 759 | |
Simon Property Group Inc ‡ | | | 10,706 | | | | 1,951 | |
SL Green Realty Corp ‡ | | | 3,000 | | | | 270 | |
UDR Inc ‡ | | | 9,500 | | | | 432 | |
Ventas Inc ‡ | | | 12,132 | | | | 774 | |
Vornado Realty Trust ‡ | | | 6,077 | | | | 410 | |
Welltower Inc ‡ | | | 13,300 | | | | 1,032 | |
Weyerhaeuser Co ‡ | | | 25,361 | | | | 668 | |
| | |
| | | | | | | 25,098 | |
| | |
Utilities — 3.3% | | | | | | | | |
AES Corp/VA | | | 22,990 | | | | 416 | |
Alliant Energy Corp | | | 7,900 | | | | 372 | |
Ameren Corp | | | 8,353 | | | | 614 | |
American Electric Power Co Inc | | | 16,815 | | | | 1,408 | |
American Water Works Co Inc | | | 6,300 | | | | 657 | |
Atmos Energy Corp | | | 3,900 | | | | 401 | |
CenterPoint Energy Inc | | | 17,185 | | | | 528 | |
CMS Energy Corp | | | 10,101 | | | | 561 | |
Consolidated Edison Inc | | | 11,033 | | | | 936 | |
Dominion Energy Inc | | | 27,587 | | | | 2,115 | |
DTE Energy Co | | | 6,245 | | | | 779 | |
| | | | |
SEI Institutional Managed Trust / Semi-Annual Report / March 31, 2019 | �� | | 5 | |
SCHEDULE OF INVESTMENTS (Unaudited)
March 31, 2019
S&P 500 Index Fund(Continued)
| | | | | | | | |
| | | |
| Description | | Shares | | | Market Value
($ Thousands) |
| | |
COMMON STOCK (continued) | | | | | | | | |
Duke Energy Corp | | | 25,016 | | | $ | 2,251 | |
Edison International | | | 11,157 | | | | 691 | |
Entergy Corp | | | 6,564 | | | | 628 | |
Evergy Inc | | | 8,999 | | | | 522 | |
Eversource Energy | | | 11,035 | | | | 783 | |
Exelon Corp | | | 33,455 | | | | 1,677 | |
FirstEnergy Corp | | | 17,323 | | | | 721 | |
NextEra Energy Inc | | | 16,620 | | | | 3,213 | |
NiSource Inc | | | 12,592 | | | | 361 | |
NRG Energy Inc | | | 10,013 | | | | 425 | |
Pinnacle West Capital Corp | | | 3,949 | | | | 378 | |
PPL Corp | | | 24,571 | | | | 780 | |
Public Service Enterprise Group Inc | | | 17,630 | | | | 1,047 | |
Sempra Energy | | | 9,545 | | | | 1,201 | |
Southern Co/The | | | 35,535 | | | | 1,837 | |
WEC Energy Group Inc | | | 11,019 | | | | 871 | |
Xcel Energy Inc | | | 17,536 | | | | 986 | |
| | |
| | | | | | | 27,159 | |
Total Common Stock (Cost $331,078) ($ Thousands) | | | | | | | 815,698 | |
| | | | | | | | |
| | | |
| Description | | Face Amount
(Thousands) | | | Market Value
($ Thousands) |
| |
U.S. TREASURY OBLIGATION — 0.1% | | | | | |
U.S. Treasury Bills
2.315%, 06/20/2019 (A)(B) | | $ | 800 | | | $ | 796 | |
| |
Total U.S. Treasury Obligation
(Cost $796) ($ Thousands) | | | | 796 | |
| | |
| | | Shares | | | |
| |
AFFILIATED PARTNERSHIP — 0.0% | | | | | |
SEI Liquidity Fund, L.P. | | | | | | | | |
2.480% **†(C) | | | 2,074 | | | | 2 | |
| | |
Total Affiliated Partnership (Cost $2) ($ Thousands) | | | | | | | 2 | |
| | |
CASH EQUIVALENT — 1.3% | | | | | | | | |
SEI Daily Income Trust, Government Fund, Cl F | | | | | | | | |
2.220%**† | | | 10,857,162 | | | | 10,857 | |
| | |
Total Cash Equivalent
(Cost $10,857) ($ Thousands) | | | | | | | 10,857 | |
| |
Total Investments in Securities — 99.9%
(Cost $342,733) ($ Thousands) | | | $ | 827,353 | |
| | | | | | | | |
A list of the open futures contracts held by the Fund at March 31, 2019, is as follows:
| | | | | | | | | | | | | | | | | | |
Type of Contract | | Number of
Contracts
Long | | Expiration
Date | | Notional Amount
(Thousands) | | Value
(Thousands) | | | Unrealized
Appreciation
(Thousands) |
S&P 500 IndexE-MINI | | | 88 | | | | Jun-2019 | | | $ | 12,186 | | | $ | 12,486 | | | $ 300 |
| | | | | |
| | | | | | | | | | $ | 12,186 | | | $ | 12,486 | | | $ 300 |
| | | | | | | | | | | |
Percentages are based on Net Assets of $828,017 ($ Thousands).
| * | Non-income producing security. |
| ** | Rate shown is the7-day effective yield as of March 31, 2019. |
| ‡ | Real Estate Investment Trust. |
| † | Investment in Affiliated Security (see Note 6). |
| (A) | Security, or portion thereof, has been pledged as collateral on open futures contracts. |
| (B) | Zero coupon security. The rate shown on the Schedule of Investments is the security’s effective yield at the time of purchase. |
| (C) | This security was purchased with cash collateral held from securities on loan. The total market value of such securities as of March 31, 2019 was $2 ($ Thousands). |
Cl — Class
L.P. — Limited Partnership
PLC — Public Limited Company
S&P— Standard & Poor’s
The following is a list of the level of inputs used as of March 31, 2019, in valuing the Fund’s investments and other financial instruments carried at value ($ Thousands):
| | | | | | | | | | | | | | | | |
| | | | | |
| Investments in Securities | | Level 1 | | Level 2 | | Level 3 | | Total |
Common Stock | | $ | 815,698 | | | $ | – | | | $ | – | | | $ | 815,698 | |
U.S. Treasury Obligation | | | – | | | | 796 | | | | – | | | | 796 | |
Affiliated Partnership | | | – | | | | 2 | | | | – | | | | 2 | |
Cash Equivalent | | | 10,857 | | | | – | | | | – | | | | 10,857 | |
| | | | | | | | | | | | | | | | |
Total Investments in Securities | | $ | 826,555 | | | $ | 798 | | | $ | – | | | $ | 827,353 | |
| | | | | | | | | | | | | | | | |
| | | | | | | | | | | | | | | | |
| Other Financial Instruments | | Level 1 | | Level 2 | | Level 3 | | Total |
Futures Contracts*
Unrealized Appreciation | | $ | 300 | | | $ | – | | | $ | – | | | $ | 300 | |
| | | | | | | | | | | | | | | | |
Total Other Financial Instruments | | $ | 300 | | | $ | – | | | $ | – | | | $ | 300 | |
| | | | | | | | | | | | | | | | |
|
* Futures contracts are valued at the unrealized appreciation on the instrument. | |
For the period ended March 31, 2019, there were no transfers between Level 1 and Level 2 assets and liabilities.
| | |
| 6 | | SEI Institutional Managed Trust / Semi-Annual Report / March 31, 2019 |
SCHEDULE OF INVESTMENTS (Unaudited)
March 31, 2019
S&P 500 Index Fund(Continued)
For the period ended March 31, 2019, there were no transfers between Level 2 and Level 3 assets and liabilities.
The following is a summary of the Fund’s transactions with affiliates for the period ended March 31, 2019 ($ Thousands):
For more information on valuation inputs, see Note 2 – Significant Accounting Policies in Notes to Financial Statements.
| | | | | | | | | | | | | | | | | | | | | | | | | | | | |
| Security Description | | Value
9/30/18 | | Purchases at Cost | | Proceeds from
Sales | | Realized Gain | | Change in Unrealized
Depreciation | | Value
3/31/19 | | Income |
SEI Liquidity Fund, L.P. | | | $ 1,791 | | | | $ 6,940 | | | | $(8,729) | | | | $— | | | | $— | | | | $ 2 | | | | $ 6 | |
SEI Daily Income Trust, Government Fund, ClF | | | 18,431 | | | | 61,940 | | | | (69,514) | | | | — | | | | — | | | | 10,857 | | | | 112 | |
| | | | | | | | | | | | | | | | | | | | | | | | | | | | |
Totals | | | $20,222 | | | | $68,880 | | | | $(78,243) | | | | $ - | | | | $ - | | | | $10,859 | | | | $118 | |
| | | | | | | | | | | | | | | | | | | | | | | | | | | | |
Amounts designated as “—” are either $0 or have been rounded to $0.
The accompanying notes are an integral part of the financial statements.
| | | | |
SEI Institutional Managed Trust / Semi-Annual Report / March 31, 2019 | | | 7 | |
SCHEDULE OF INVESTMENTS (Unaudited)
March 31, 2019
Small Cap Fund(Continued)
| | | | | | |
| | | |
| Description | | Shares | | Market Value
($ Thousands) | |
| | |
COMMON STOCK — 97.3% | | | | | | |
| | |
Communication Services — 3.2% | | | | | | |
Bandwidth Inc, Cl A * | | 10,445 | | $ | 699 | |
Boingo Wireless Inc * | | 70,420 | | | 1,639 | |
Cable One Inc | | 2,531 | | | 2,484 | |
Care.com Inc * | | 3,501 | | | 69 | |
Cargurus Inc, Cl A * | | 13,899 | | | 557 | |
Cogent Communications Holdings Inc | | 52,086 | | | 2,826 | |
Criteo SA ADR * | | 38,284 | | | 767 | |
Meet Group Inc/The * | | 19,012 | | | 96 | |
National CineMedia Inc | | 13,247 | | | 93 | |
New York Times Co/The, Cl A (A) | | 17,658 | | | 580 | |
Nexstar Media Group Inc, Cl A | | 31,330 | | | 3,395 | |
Pareteum Corp *(A) | | 123,000 | | | 560 | |
QuinStreet Inc * | | 3,727 | | | 50 | |
Rosetta Stone Inc * | | 29,000 | | | 634 | |
Shenandoah Telecommunications Co | | 22,218 | | | 986 | |
TechTarget Inc * | | 6,568 | | | 107 | |
Tribune Media Co, Cl A | | 29,289 | | | 1,351 | |
Vonage Holdings Corp * | | 116,092 | | | 1,166 | |
WideOpenWest Inc * | | 8,261 | | | 75 | |
World Wrestling Entertainment Inc, Cl A | | 9,499 | | | 824 | |
Zynga Inc, Cl A * | | 144,000 | | | 767 | |
| | |
| | | | | 19,725 | |
| | |
Consumer Discretionary — 12.8% | | | | | | |
Advance Auto Parts Inc | | 6,467 | | | 1,103 | |
American Eagle Outfitters Inc | | 18,571 | | | 412 | |
Asbury Automotive Group Inc * | | 7,967 | | | 553 | |
Big Lots Inc | | 126,909 | | | 4,825 | |
Bloomin’ Brands Inc | | 98,125 | | | 2,007 | |
Boot Barn Holdings Inc * | | 489 | | | 14 | |
Bright Horizons Family Solutions Inc * | | 5,730 | | | 728 | |
Brinker International Inc (A) | | 7,557 | | | 335 | |
Callaway Golf Co | | 10,686 | | | 170 | |
Carter’s Inc | | 13,187 | | | 1,329 | |
Cheesecake Factory Inc/The (A) | | 39,658 | | | 1,940 | |
Chegg Inc * | | 24,031 | | | 916 | |
Clarus Corp | | 6,226 | | | 80 | |
Columbia Sportswear Co | | 5,800 | | | 604 | |
Conn’s Inc * | | 49,664 | | | 1,135 | |
Cooper Tire & Rubber Co | | 46,074 | | | 1,377 | |
Core-Mark Holding Co Inc, Cl A | | 43,772 | | | 1,625 | |
Crocs Inc * | | 47,196 | | | 1,215 | |
Dave & Buster’s Entertainment Inc | | 22,669 | | | 1,131 | |
Deckers Outdoor Corp * | | 8,480 | | | 1,246 | |
Del Frisco’s Restaurant Group Inc * | | 72,228 | | | 463 | |
Denny’s Corp, Cl A * | | 34,000 | | | 624 | |
Dine Brands Global Inc | | 6,218 | | | 568 | |
Domino’s Pizza Inc | | 7,987 | | | 2,061 | |
DSW Inc, Cl A | | 861 | | | 19 | |
Eldorado Resorts Inc * | | 47,944 | | | 2,239 | |
Etsy Inc * | | 25,831 | | | 1,736 | |
| | | | | | |
| | | |
| Description | | Shares | | Market Value
($ Thousands) | |
| | |
COMMON STOCK (continued) | | | | | | |
Expedia Group Inc | | 1,270 | | $ | 151 | |
Five Below Inc * | | 5,531 | | | 687 | |
Fox Factory Holding Corp * | | 3,309 | | | 231 | |
Gentherm Inc * | | 17,769 | | | 655 | |
Grand Canyon Education Inc * | | 3,119 | | | 357 | |
Gray Television Inc * | | 9,036 | | | 193 | |
GrubHub Inc * | | 7,588 | | | 527 | |
Haverty Furniture Cos Inc | | 5,051 | | | 111 | |
iRobot Corp *(A) | | 11,940 | | | 1,405 | |
Jack in the Box Inc | | 24,361 | | | 1,975 | |
K12 Inc * | | 36,677 | | | 1,252 | |
La-Z-Boy Inc, Cl Z | | 2,086 | | | 69 | |
LCI Industries | | 12,453 | | | 957 | |
LKQ Corp * | | 43,929 | | | 1,247 | |
Malibu Boats Inc, Cl A * | | 6,371 | | | 252 | |
Marine Products Corp | | 4,155 | | | 56 | |
MasterCraft Boat Holdings Inc * | | 6,834 | | | 154 | |
Matthews International Corp, Cl A | | 21,906 | | | 809 | |
Michaels Cos Inc/The * | | 49,905 | | | 570 | |
Modine Manufacturing Co * | | 227,034 | | | 3,149 | |
Monro Inc | | 7,699 | | | 666 | |
Movado Group Inc | | 6,952 | | | 253 | |
Murphy USA Inc * | | 25,628 | | | 2,194 | |
Oxford Industries Inc, Cl A | | 11,819 | | | 890 | |
Planet Fitness Inc, Cl A * | | 18,450 | | | 1,268 | |
PlayAGS Inc * | | 53,007 | | | 1,268 | |
Polaris Industries Inc | | 6,199 | | | 523 | |
Pool Corp | | 18,001 | | | 2,970 | |
Rent-A-Center Inc/TX * | | 18,634 | | | 389 | |
RH * | | 1,632 | | | 168 | |
Rocky Brands Inc | | 1,022 | | | 25 | |
RTW RetailWinds Inc * | | 33,754 | | | 81 | |
Ruth’s Hospitality Group Inc | | 8,049 | | | 206 | |
Sally Beauty Holdings Inc * | | 12,925 | | | 238 | |
Service Corp International/US | | 47,046 | | | 1,889 | |
ServiceMaster Global Holdings Inc * | | 13,931 | | | 651 | |
Shoe Carnival Inc (A) | | 4,716 | | | 161 | |
Shutterfly Inc * | | 18,400 | | | 748 | |
Shutterstock Inc * | | 11,299 | | | 527 | |
Six Flags Entertainment Corp | | 18,653 | | | 921 | |
Skechers U.S.A. Inc, Cl A * | | 138,228 | | | 4,646 | |
Skyline Champion Corp * | | 748 | | | 14 | |
Sleep Number Corp * | | 18,539 | | | 871 | |
Stamps.com Inc * | | 3,730 | | | 304 | |
Steven Madden Ltd | | 21,642 | | | 732 | |
Strategic Education Inc | | 17,872 | | | 2,347 | |
Thor Industries Inc | | 15,036 | | | 938 | |
Town Sports International Holdings Inc * | | 10,084 | | | 48 | |
Tractor Supply Co | | 26,898 | | | 2,630 | |
Turtle Beach Corp *(A) | | 5,026 | | | 57 | |
Urban Outfitters Inc * | | 26,232 | | | 778 | |
Vail Resorts Inc | | 4,590 | | | 997 | |
| | | | |
SEI Institutional Managed Trust / Semi-Annual Report / March 31, 2019 | | | 1 | |
SCHEDULE OF INVESTMENTS (Unaudited)
March 31, 2019
Small Cap Fund(Continued)
| | | | | | | | |
| | | |
| Description | | Shares | | | Market Value
($ Thousands) |
| | |
COMMON STOCK (continued) | | | | | | | | |
Vera Bradley Inc * | | | 10,291 | | | $ | 136 | |
Vista Outdoor Inc * | | | 56,654 | | | | 454 | |
Wingstop Inc, Cl A | | | 9,121 | | | | 693 | |
Wyndham Hotels & Resorts Inc | | | 34,615 | | | | 1,730 | |
YETI Holdings Inc *(A) | | | 28,000 | | | | 847 | |
| | |
| | | | | | | 79,520 | |
| | |
Consumer Staples — 5.2% | | | | | | | | |
Andersons Inc/The | | | 29,786 | | | | 960 | |
Boston Beer Co Inc/The, Cl A * | | | 129 | | | | 38 | |
Calavo Growers Inc | | | 24,511 | | | | 2,055 | |
Casey’s General Stores Inc | | | 12,122 | | | | 1,561 | |
Central Garden & Pet Co, Cl A * | | | 44,062 | | | | 1,024 | |
Chefs’ Warehouse Inc/The * | | | 5,365 | | | | 167 | |
Church & Dwight Co Inc | | | 33,935 | | | | 2,417 | |
Darling Ingredients Inc * | | | 96,108 | | | | 2,081 | |
Freshpet Inc * | | | 13,239 | | | | 560 | |
Hain Celestial Group Inc/The * | | | 232,099 | | | | 5,366 | |
Hostess Brands Inc, Cl A * | | | 107,849 | | | | 1,348 | |
J&J Snack Foods Corp | | | 13,035 | | | | 2,070 | |
Medifast Inc | | | 5,296 | | | | 676 | |
Natural Grocers by Vitamin Cottage Inc * | | | 3,649 | | | | 44 | |
Performance Food Group Co * | | | 39,659 | | | | 1,572 | |
Pilgrim’s Pride Corp * | | | 196,859 | | | | 4,388 | |
Sanderson Farms Inc | | | 7,883 | | | | 1,039 | |
Simply Good Foods Co/The * | | | 52,603 | | | | 1,083 | |
Spectrum Brands Holdings Inc | | | 15,992 | | | | 876 | |
TreeHouse Foods Inc * | | | 43,996 | | | | 2,840 | |
USANA Health Sciences Inc * | | | 3,154 | | | | 265 | |
Village Super Market Inc, Cl A | | | 2,514 | | | | 69 | |
| | | | | | |
| | |
| | | | | | | 32,499 | |
| | |
Energy — 3.1% | | | | | | | | |
Adams Resources & Energy Inc | | | 1,843 | | | | 72 | |
Antero Midstream Corp | | | 130,000 | | | | 1,791 | |
Arch Coal Inc | | | 212 | | | | 19 | |
Cabot Oil & Gas Corp | | | 69,881 | | | | 1,824 | |
Callon Petroleum Co * | | | 147,982 | | | | 1,117 | |
Carrizo Oil & Gas Inc * | | | 103,336 | | | | 1,289 | |
DMC Global Inc | | | 14,000 | | | | 695 | |
Energy Fuels Inc/Canada *(A) | | | 47,145 | | | | 157 | |
Evolution Petroleum Corp | | | 16,448 | | | | 111 | |
GasLog Ltd | | | 14,856 | | | | 259 | |
Gulfport Energy Corp * | | | 377,859 | | | | 3,031 | |
Helix Energy Solutions Group Inc * | | | 37,378 | | | | 296 | |
PBF Energy Inc, Cl A | | | 40,614 | | | | 1,265 | |
Phillips 66 Partners LP (B) | | | 29,707 | | | | 1,555 | |
ProPetro Holding Corp * | | | 60,620 | | | | 1,366 | |
Range Resources Corp | | | 252,291 | | | | 2,836 | |
Renewable Energy Group Inc * | | | 2,362 | | | | 52 | |
Select Energy Services Inc, Cl A * | | | 50,015 | | | | 601 | |
SRC Energy Inc * | | | 76,847 | | | | 394 | |
| | | | | | | | |
| | | |
| Description | | Shares | | | Market Value
($ Thousands) |
| | |
COMMON STOCK (continued) | | | | | | | | |
W&T Offshore Inc * | | | 47,149 | | | $ | 325 | |
| | |
| | | | | | | 19,055 | |
| | |
Financials — 16.1% | | | | | | | | |
Affiliated Managers Group Inc | | | 27,509 | | | | 2,947 | |
American Equity Investment Life Holding Co | | | 165,173 | | | | 4,463 | |
American National Bankshares Inc | | | 1,963 | | | | 69 | |
Arbor Realty Trust Inc (A) | | | 25,985 | | | | 337 | |
Atlantic Capital Bancshares Inc * | | | 11,299 | | | | 201 | |
Axos Financial Inc * | | | 26,771 | | | | 775 | |
Banc of California Inc | | | 47,627 | | | | 659 | |
Bancorp Inc/The * | | | 96,764 | | | | 782 | |
Bank of Commerce Holdings | | | 7,000 | | | | 74 | |
Bank of Marin Bancorp | | | 2,622 | | | | 107 | |
Bank of NT Butterfield & Son Ltd/The | | | 47,772 | | | | 1,714 | |
Bank OZK | | | 93,895 | | | | 2,721 | |
BankUnited Inc | | | 197,240 | | | | 6,588 | |
Baycom Corp * | | | 5,801 | | | | 131 | |
Blackstone Mortgage Trust Inc, Cl A | | | 65,686 | | | | 2,270 | |
Bridge Bancorp Inc | | | 6,962 | | | | 204 | |
Bridgewater Bancshares Inc * | | | 5,439 | | | | 56 | |
Cannae Holdings Inc * | | | 28,935 | | | | 702 | |
Capstar Financial Holdings Inc | | | 6,167 | | | | 89 | |
Caretrust | | | 61,599 | | | | 1,445 | |
CBTX Inc | | | 7,857 | | | | 255 | |
Central Pacific Financial Corp | | | 9,825 | | | | 283 | |
Century Bancorp Inc/MA, Cl A | | | 773 | | | | 56 | |
Chemical Financial Corp | | | 18,257 | | | | 751 | |
CNO Financial Group Inc | | | 277,492 | | | | 4,490 | |
Cohen & Steers Inc | | | 39,963 | | | | 1,689 | |
Cowen Inc, Cl A * | | | 102,390 | | | | 1,484 | |
Dynex Capital Inc | | | 5,098 | | | | 31 | |
Eagle Bancorp Inc * | | | 21,781 | | | | 1,093 | |
eHealth Inc * | | | 12,823 | | | | 799 | |
Enova International Inc * | | | 15,082 | | | | 344 | |
Enterprise Financial Services Corp | | | 4,368 | | | | 178 | |
Essent Group Ltd * | | | 9,003 | | | | 391 | |
Evercore Inc, Cl A | | | 17,015 | | | | 1,548 | |
FactSet Research Systems Inc | | | 8,167 | | | | 2,028 | |
Federal Agricultural Mortgage Corp, Cl C | | | 2,003 | | | | 145 | |
Federated Investors Inc, Cl B | | | 15,082 | | | | 442 | |
Fifth Third Bancorp | | | 53,134 | | | | 1,340 | |
First American Financial Corp | | | 32,801 | | | | 1,689 | |
First BanCorp/Puerto Rico | | | 90,123 | | | | 1,033 | |
First Citizens BancShares Inc/NC, Cl A | | | 1,066 | | | | 434 | |
First Commonwealth Financial Corp | | | 284,206 | | | | 3,581 | |
First Financial Corp/IN | | | 4,991 | | | | 210 | |
First Horizon National Corp | | | 95,191 | | | | 1,331 | |
First Northwest Bancorp | | | 6,681 | | | | 104 | |
FNB Corp/PA | | | 620,026 | | | | 6,572 | |
Franklin Financial Network Inc | | | 2,252 | | | | 65 | |
| | |
| 2 | | SEI Institutional Managed Trust / Semi-Annual Report / March 31, 2019 |
SCHEDULE OF INVESTMENTS (Unaudited)
March 31, 2019
Small Cap Fund(Continued)
| | | | | | | | |
| | | |
| Description | | Shares | | Market Value
($ Thousands) |
| |
COMMON STOCK (continued) | | | | | |
Genworth Financial Inc, Cl A * | | | 17,686 | | | $ | 68 | |
Great Southern Bancorp Inc | | | 2,897 | | | | 150 | |
Great Western Bancorp Inc | | | 105,024 | | | | 3,318 | |
Green Dot Corp, Cl A * | | | 12,994 | | | | 788 | |
Greenhill & Co Inc | | | 7,824 | | | | 168 | |
Hamilton Lane Inc, Cl A | | | 7,199 | | | | 314 | |
Hanover Insurance Group Inc/The, Cl A | | | 5,395 | | | | 616 | |
Health Insurance Innovations Inc, Cl A *(A) | | | 31,154 | | | | 836 | |
Hercules Capital Inc, Cl A (A) | | | 135,864 | | | | 1,720 | |
Heritage Commerce Corp | | | 8,256 | | | | 100 | |
Home BancShares Inc/AR | | | 117,288 | | | | 2,061 | |
IBERIABANK Corp | | | 29,491 | | | | 2,115 | |
Independent Bank Corp/MI | | | 5,173 | | | | 111 | |
INTL. FCStone Inc * | | | 5,121 | | | | 199 | �� |
Kemper Corp, Cl A | | | 1,388 | | | | 106 | |
LegacyTexas Financial Group Inc | | | 10,790 | | | | 403 | |
LPL Financial Holdings Inc | | | 8,200 | | | | 571 | |
MarketAxess Holdings Inc | | | 10,279 | | | | 2,529 | |
Metropolitan Bank Holding Corp * | | | 2,340 | | | | 81 | |
MSCI Inc, Cl A | | | 12,477 | | | | 2,481 | |
National General Holdings Corp | | | 204,145 | | | | 4,844 | |
NMI Holdings Inc, Cl A * | | | 25,440 | | | | 658 | |
OFG Bancorp | | | 62,319 | | | | 1,233 | |
Old Second Bancorp Inc | | | 7,999 | | | | 101 | |
On Deck Capital Inc * | | | 25,678 | | | | 139 | |
Oritani Financial Corp | | | 16,925 | | | | 281 | |
Pacific Mercantile Bancorp * | | | 10,527 | | | | 80 | |
Parke Bancorp Inc | | | 2,859 | | | | 60 | |
PCSB Financial Corp | | | 7,646 | | | | 150 | |
PennyMac Financial Services Inc * | | | 6,660 | | | | 148 | |
PennyMac Mortgage Investment Trust | | | 12,994 | | | | 269 | |
Primerica Inc | | | 1,267 | | | | 155 | |
Prosperity Bancshares Inc | | | 28,091 | | | | 1,940 | |
Radian Group Inc | | | 18,261 | | | | 379 | |
Republic Bancorp Inc/KY, Cl A | | | 4,781 | | | | 214 | |
Sterling Bancorp/DE | | | 121,826 | | | | 2,270 | |
Stock Yards Bancorp Inc | | | 2,935 | | | | 99 | |
TriState Capital Holdings Inc * | | | 10,307 | | | | 211 | |
Umpqua Holdings Corp | | | 288,953 | | | | 4,768 | |
United Bankshares Inc/WV | | | 39,169 | | | | 1,420 | |
Unity Bancorp Inc | | | 3,176 | | | | 60 | |
Univest Financial Corp | | | 55,291 | | | | 1,352 | |
Waddell & Reed Financial Inc, Cl A (A) | | | 23,162 | | | | 401 | |
Walker & Dunlop Inc | | | 1,724 | | | | 88 | |
Wintrust Financial Corp | | | 12,920 | | | | 870 | |
| | |
| | | | | | | 99,625 | |
| | |
Health Care — 12.6% | | | | | | | | |
Aclaris Therapeutics Inc * | | | 17,876 | | | | 107 | |
Aerie Pharmaceuticals Inc * | | | 12,393 | | | | 589 | |
Aimmune Therapeutics Inc * | | | 12,233 | | | | 273 | |
Akebia Therapeutics Inc * | | | 40,516 | | | | 332 | |
| | | | | | | | |
| | | |
| Description | | Shares | | Market Value
($ Thousands) |
| | |
COMMON STOCK (continued) | | | | | | | | |
Amedisys Inc * | | | 3,114 | | | $ | 384 | |
Antares Pharma Inc * | | | 62,742 | | | | 190 | |
Array BioPharma Inc * | | | 39,943 | | | | 974 | |
Axsome Therapeutics Inc *(A) | | | 52,726 | | | | 750 | |
BioCryst Pharmaceuticals Inc * | | | 61,369 | | | | 500 | |
BioDelivery Sciences International Inc * | | | 115,000 | | | | 609 | |
Biohaven Pharmaceutical Holding Co Ltd * | | | 12,000 | | | | 618 | |
BioMarin Pharmaceutical Inc * | | | 7,658 | | | | 680 | |
BioSpecifics Technologies Corp * | | | 2,347 | | | | 146 | |
BioTelemetry Inc * | | | 26,867 | | | | 1,682 | |
Cantel Medical Corp | | | 19,743 | | | | 1,321 | |
Cardiovascular Systems Inc * | | | 46,413 | | | | 1,794 | |
Catalyst Pharmaceuticals Inc * | | | 118,000 | | | | 602 | |
Charles River Laboratories International Inc * | | | 9,377 | | | | 1,362 | |
Chemed Corp | | | 6,467 | | | | 2,070 | |
Clovis Oncology Inc * | | | 7,709 | | | | 191 | |
Codexis Inc * | | | 27,701 | | | | 569 | |
Collegium Pharmaceutical Inc * | | | 22,142 | | | | 335 | |
Corcept Therapeutics Inc * | | | 6,500 | | | | 76 | |
CorVel Corp * | | | 2,996 | | | | 195 | |
Dermira Inc * | | | 44,000 | | | | 596 | |
Eagle Pharmaceuticals Inc/DE * | | | 4,664 | | | | 235 | |
Emergent BioSolutions Inc * | | | 30,715 | | | | 1,552 | |
Encompass Health Corp | | | 31,982 | | | | 1,868 | |
Endo International PLC * | | | 18,748 | | | | 151 | |
Ensign Group Inc/The | | | 67,723 | | | | 3,467 | |
Evolus Inc *(A) | | | 18,500 | | | | 418 | |
Fluidigm Corp * | | | 68,419 | | | | 909 | |
Genomic Health Inc * | | | 15,684 | | | | 1,099 | |
Glaukos Corp * | | | 10,200 | | | | 799 | |
Guardant Health Inc *(A) | | | 7,728 | | | | 593 | |
Halozyme Therapeutics Inc * | | | 3,842 | | | | 62 | |
Hill-Rom Holdings Inc | | | 6,100 | | | | 646 | |
HMS Holdings Corp * | | | 5,430 | | | | 161 | |
Horizon Pharma Plc * | | | 31,633 | | | | 836 | |
Immune Design Corp * | | | 15,000 | | | | 88 | |
Immunomedics Inc * | | | 13,500 | | | | 259 | |
Innoviva Inc * | | | 11,681 | | | | 164 | |
Inogen Inc * | | | 2,442 | | | | 233 | |
Insmed Inc * | | | 11,867 | | | | 345 | |
Inspire Medical Systems Inc * | | | 11,636 | | | | 661 | |
Integer Holdings Corp * | | | 6,295 | | | | 475 | |
Integra LifeSciences Holdings Corp * | | | 30,297 | | | | 1,688 | |
Invitae Corp * | | | 29,500 | | | | 691 | |
iRadimed Corp * | | | 2,933 | | | | 82 | |
Jazz Pharmaceuticals PLC * | | | 3,156 | | | | 451 | |
LHC Group Inc * | | | 7,469 | | | | 828 | |
Ligand Pharmaceuticals Inc * | | | 23,725 | | | | 2,982 | |
Magellan Health Inc * | | | 70,639 | | | | 4,657 | |
Masimo Corp * | | | 9,390 | | | | 1,298 | |
Medidata Solutions Inc * | | | 9,224 | | | | 676 | |
| | | | |
SEI Institutional Managed Trust / Semi-Annual Report / March 31, 2019 | | | 3 | |
SCHEDULE OF INVESTMENTS (Unaudited)
March 31, 2019
Small Cap Fund(Continued)
| | | | | | | | |
| | | |
| Description | | Shares | | | Market Value
($ Thousands) |
| |
COMMON STOCK (continued) | | | | | |
| | |
Medpace Holdings Inc * | | | 7,532 | | | $ | 444 | |
Meridian Bioscience Inc | | | 11,313 | | | | 199 | |
Merit Medical Systems Inc * | | | 22,599 | | | | 1,397 | |
Mirati Therapeutics Inc * | | | 7,200 | | | | 528 | |
Myriad Genetics Inc * | | | 27,876 | | | | 925 | |
NanoString Technologies Inc * | | | 29,000 | | | | 694 | |
Nektar Therapeutics, Cl A * | | | 19,236 | | | | 646 | |
NeoGenomics Inc * | | | 112,363 | | | | 2,299 | |
Neurocrine Biosciences Inc * | | | 4,824 | | | | 425 | |
NextGen Healthcare Inc * | | | 14,467 | | | | 243 | |
Novocure Ltd * | | | 14,719 | | | | 709 | |
Nuvectra Corp * | | | 35,883 | | | | 395 | |
Omnicell Inc * | | | 21,166 | | | | 1,711 | |
Optinose Inc *(A) | | | 21,886 | | | | 225 | |
Pacira Pharmaceuticals Inc/DE * | | | 15,858 | | | | 604 | |
Patterson Cos Inc | | | 38,067 | | | | 832 | |
PDL BioPharma Inc * | | | 63,471 | | | | 236 | |
Premier Inc, Cl A * | | | 38,008 | | | | 1,311 | |
Prestige Consumer Healthcare Inc, Cl A * | | | 62,053 | | | | 1,856 | |
Progenics Pharmaceuticals Inc * | | | 28,875 | | | | 134 | |
Puma Biotechnology Inc * | | | 14,386 | | | | 558 | |
Quest Diagnostics Inc | | | 14,725 | | | | 1,324 | |
Quidel Corp * | | | 1,262 | | | | 83 | |
Ra Pharmaceuticals Inc * | | | 20,697 | | | | 464 | |
Reata Pharmaceuticals Inc, Cl A * | | | 10,805 | | | | 923 | |
ResMed Inc | | | 18,579 | | | | 1,932 | |
Retrophin Inc * | | | 22,889 | | | | 518 | |
SeaSpine Holdings Corp * | | | 67,094 | | | | 1,012 | |
SIGA Technologies Inc * | | | 12,034 | | | | 72 | |
STERIS PLC | | | 19,822 | | | | 2,538 | |
Supernus Pharmaceuticals Inc * | | | 35,053 | | | | 1,228 | |
Tandem Diabetes Care Inc * | | | 11,242 | | | | 714 | |
Teleflex Inc | | | 5,173 | | | | 1,563 | |
Tivity Health Inc * | | | 19,904 | | | | 350 | |
Vanda Pharmaceuticals Inc * | | | 15,236 | | | | 280 | |
Veracyte Inc * | | | 53,471 | | | | 1,338 | |
Vericel Corp * | | | 56,709 | | | | 993 | |
Viking Therapeutics Inc *(A) | | | 30,898 | | | | 307 | |
Wright Medical Group NV * | | | 25,017 | | | | 787 | |
| | |
| | | | | | | 78,116 | |
| |
Industrials — 15.8% | | | | | |
ACCO Brands Corp | | | 123,638 | | | | 1,058 | |
Actuant Corp, Cl A | | | 35,967 | | | | 876 | |
ADT Inc (A) | | | 232,413 | | | | 1,485 | |
AECOM * | | | 99,526 | | | | 2,953 | |
Aerovironment Inc * | | | 3,342 | | | | 229 | |
Altra Industrial Motion Corp | | | 33,126 | | | | 1,028 | |
American Superconductor Corp *(A) | | | 51,894 | | | | 667 | |
Apogee Enterprises Inc | | | 127,895 | | | | 4,795 | |
ArcBest Corp | | | 7,203 | | | | 222 | |
Armstrong World Industries Inc | | | 8,700 | | | | 691 | |
| | | | | | | | |
| | | |
| Description | | Shares | | | Market Value
($ Thousands) |
| |
COMMON STOCK (continued) | | | | | |
| | |
ASGN Inc * | | | 24,704 | | | $ | 1,568 | |
Astec Industries Inc | | | 33,182 | | | | 1,253 | |
Atkore International Group Inc * | | | 17,930 | | | | 386 | |
Atlas Air Worldwide Holdings Inc * | | | 95,014 | | | | 4,804 | |
Axon Enterprise Inc * | | | 1,160 | | | | 63 | |
Badger Meter Inc | | | 49,771 | | | | 2,769 | |
Barrett Business Services Inc | | | 939 | | | | 73 | |
BMC Stock Holdings Inc * | | | 6,318 | | | | 112 | |
Brady Corp, Cl A | | | 16,745 | | | | 777 | |
Brink’s Co/The | | | 17,508 | | | | 1,320 | |
BWX Technologies Inc, Cl W | | | 61,980 | | | | 3,073 | |
Casella Waste Systems Inc, Cl A * | | | 18,035 | | | | 641 | |
Chart Industries Inc * | | | 8,741 | | | | 791 | |
Cimpress NV * | | | 9,209 | | | | 738 | |
CIRCOR International Inc * | | | 16,034 | | | | 523 | |
Clean Harbors Inc * | | | 20,671 | | | | 1,479 | |
Comfort Systems USA Inc | | | 3,219 | | | | 169 | |
Commercial Vehicle Group Inc * | | | 6,080 | | | | 47 | |
Continental Building Products Inc * | | | 8,404 | | | | 208 | |
CoStar Group Inc * | | | 1,910 | | | | 891 | |
DXP Enterprises Inc/TX * | | | 1,788 | | | | 70 | |
Dycom Industries Inc * | | | 11,662 | | | | 536 | |
EMCOR Group Inc | | | 19,637 | | | | 1,435 | |
Energy Recovery Inc *(A) | | | 21,298 | | | | 186 | |
Ennis Inc | | | 10,306 | | | | 214 | |
Enphase Energy Inc *(A) | | | 73,000 | | | | 674 | |
EnPro Industries Inc | | | 19,526 | | | | 1,258 | |
Fortress Transportation & Infrastructure Investors LLC (B) | | | 99,282 | | | | 1,699 | |
FTI Consulting Inc * | | | 9,305 | | | | 715 | |
Generac Holdings Inc * | | | 26,034 | | | | 1,334 | |
Global Brass & Copper Holdings Inc | | | 4,852 | | | | 167 | |
Graham Corp, Cl A | | | 3,344 | | | | 66 | |
Great Lakes Dredge & Dock Corp * | | | 20,827 | | | | 186 | |
Harris Corp | | | 12,457 | | | | 1,989 | |
Harsco Corp * | | | 14,077 | | | | 284 | |
Healthcare Services Group Inc | | | 31,259 | | | | 1,031 | |
HEICO Corp | | | 20,423 | | | | 1,937 | |
Herman Miller Inc | | | 2,733 | | | | 96 | |
Hexcel Corp, Cl A | | | 21,517 | | | | 1,488 | |
Hillenbrand Inc | | | 8,279 | | | | 344 | |
Huron Consulting Group Inc * | | | 29,501 | | | | 1,393 | |
ICF International Inc, Cl A | | | 14,392 | | | | 1,095 | |
Insperity Inc, Cl A | | | 11,758 | | | | 1,454 | |
ITT Inc | | | 29,123 | | | | 1,689 | |
JetBlue Airways Corp * | | | 31,000 | | | | 507 | |
KAR Auction Services Inc | | | 53,585 | | | | 2,749 | |
Kelly Services Inc, Cl A | | | 33,219 | | | | 733 | |
Kennametal Inc | | | 22,596 | | | | 830 | |
Kforce Inc | | | 7,968 | | | | 280 | |
Korn Ferry | | | 31,269 | | | | 1,400 | |
Kratos Defense & Security Solutions Inc * | | | 34,458 | | | | 539 | |
| | |
| 4 | | SEI Institutional Managed Trust / Semi-Annual Report / March 31, 2019 |
SCHEDULE OF INVESTMENTS (Unaudited)
March 31, 2019
Small Cap Fund(Continued)
| | | | | | | | |
| | | |
| Description | | Shares | | | Market Value
($ Thousands) |
| | |
COMMON STOCK (continued) | | | | | | | | |
LB Foster Co, Cl A *(C) | | | 30,452 | | | $ | 573 | |
Lydall Inc * | | | 51,397 | | | | 1,206 | |
Masonite International Corp * | | | 27,471 | | | | 1,370 | |
MasTec Inc * | | | 30,064 | | | | 1,446 | |
Mercury Systems Inc * | | | 10,200 | | | | 654 | |
Meritor Inc * | | | 3,091 | | | | 63 | |
Milacron Holdings Corp * | | | 96,730 | | | | 1,095 | |
MSC Industrial Direct Co Inc, Cl A | | | 6,650 | | | | 550 | |
Mueller Industries Inc | | | 3,381 | | | | 106 | |
Nordson Corp | | | 14,719 | | | | 1,950 | |
Omega Flex Inc | | | 1,091 | | | | 83 | |
Park-Ohio Holdings Corp | | | 1,528 | | | | 49 | |
Regal Beloit | | | 16,698 | | | | 1,367 | |
REV Group Inc (A) | | | 154,868 | | | | 1,696 | |
Rush Enterprises Inc, Cl A | | | 10,294 | | | | 430 | |
Ryder System Inc | | | 34,188 | | | | 2,119 | |
Saia Inc * | | | 11,725 | | | | 716 | |
SkyWest Inc | | | 7,921 | | | | 430 | |
Snap-on Inc | | | 9,664 | | | | 1,513 | |
SPX FLOW Inc * | | | 14,009 | | | | 447 | |
Standex International Corp | | | 17,437 | | | | 1,280 | |
Steelcase Inc, Cl A | | | 28,750 | | | | 418 | |
Team Inc * | | | 97,872 | | | | 1,713 | |
Tetra Tech Inc | | | 37,614 | | | | 2,241 | |
Titan Machinery Inc * | | | 7,968 | | | | 124 | |
Toro Co/The | | | 24,243 | | | | 1,669 | |
Trex Co Inc * | | | 531 | | | | 33 | |
TriMas Corp * | | | 48,427 | | | | 1,464 | |
TriNet Group Inc * | | | 17,104 | | | | 1,022 | |
Universal Logistics Holdings Inc | | | 3,404 | | | | 67 | |
Vicor Corp * | | | 8,312 | | | | 258 | |
WageWorks Inc * | | | 35,453 | | | | 1,339 | |
Watts Water Technologies Inc, Cl A | | | 11,330 | | | | 916 | |
WillScot Corp, Cl A * | | | 75,214 | | | | 834 | |
Woodward Inc | | | 9,125 | | | | 866 | |
XPO Logistics Inc *(A) | | | 29,030 | | | | 1,560 | |
| | |
| | | | | | | 97,734 | |
| | | | | | | | |
| | |
Information Technology — 17.7% | | | | | | | | |
A10 Networks Inc * | | | 17,422 | | | | 124 | |
Acacia Communications Inc * | | | 11,600 | | | | 665 | |
ACI Worldwide Inc * | | | 51,147 | | | | 1,681 | |
Alarm.com Holdings Inc *(A) | | | 13,168 | | | | 855 | |
Alteryx Inc, Cl A * | | | 10,418 | | | | 874 | |
Anaplan Inc *(A) | | | 17,500 | | | | 689 | |
Appfolio Inc, Cl A * | | | 4,143 | | | | 329 | |
Aspen Technology Inc * | | | 5,094 | | | | 531 | |
Avalara Inc * | | | 12,000 | | | | 669 | |
AVX Corp | | | 22,228 | | | | 385 | |
Belden Inc | | | 14,714 | | | | 790 | |
Booz Allen Hamilton Holding Corp, Cl A | | | 10,814 | | | | 629 | |
Box Inc, Cl A * | | | 57,742 | | | | 1,115 | |
| | | | | | | | |
| | | |
| Description | | Shares | | | Market Value
($ Thousands) |
| | |
COMMON STOCK (continued) | | | | | | | | |
Broadridge Financial Solutions Inc | | | 17,590 | | | $ | 1,824 | |
Cabot Microelectronics Corp | | | 17,146 | | | | 1,920 | |
CACI International Inc, Cl A * | | | 12,359 | | | | 2,250 | |
CalAmp Corp * | | | 81,189 | | | | 1,021 | |
ChannelAdvisor Corp * | | | 10,834 | | | | 132 | |
Ciena Corp * | | | 36,287 | | | | 1,355 | |
Cognex Corp | | | 37,477 | | | | 1,906 | |
Conduent Inc * | | | 66,254 | | | | 916 | |
Control4 Corp * | | | 8,085 | | | | 137 | |
Cornerstone OnDemand Inc * | | | 25,037 | | | | 1,372 | |
Coupa Software Inc * | | | 9,105 | | | | 828 | |
Cree Inc * | | | 12,300 | | | | 704 | |
CSG Systems International Inc | | | 2,509 | | | | 106 | |
Cypress Semiconductor Corp | | | 126,051 | | | | 1,881 | |
Diodes Inc * | | | 26,262 | | | | 911 | |
Echo Global Logistics Inc * | | | 24,184 | | | | 599 | |
Envestnet Inc * | | | 11,591 | | | | 758 | |
Euronet Worldwide Inc * | | | 18,940 | | | | 2,701 | |
Everbridge Inc * | | | 21,251 | | | | 1,594 | |
Everi Holdings Inc * | | | 87,688 | | | | 922 | |
EVERTEC Inc | | | 20,237 | | | | 563 | |
ExlService Holdings Inc * | | | 18,358 | | | | 1,102 | |
Fabrinet * | | | 27,247 | | | | 1,427 | |
Fair Isaac Corp * | | | 2,550 | | | | 693 | |
FireEye Inc * | | | 150,099 | | | | 2,520 | |
Five9 Inc *(A) | | | 39,249 | | | | 2,074 | |
ForeScout Technologies Inc * | | | 15,400 | | | | 645 | |
Glu Mobile Inc * | | | 74,118 | | | | 811 | |
HubSpot Inc * | | | 3,675 | | | | 611 | |
Insight Enterprises Inc * | | | 11,401 | | | | 628 | |
j2 Global Inc | | | 40,014 | | | | 3,465 | |
Jack Henry & Associates Inc | | | 12,221 | | | | 1,696 | |
KEMET Corp | | | 22,573 | | | | 383 | |
Lattice Semiconductor Corp * | | | 66,500 | | | | 793 | |
Limelight Networks Inc * | | | 260,530 | | | | 842 | |
Littelfuse Inc | | | 10,093 | | | | 1,842 | |
LivePerson Inc * | | | 22,500 | | | | 653 | |
LiveRamp Holdings Inc * | | | 9,970 | | | | 544 | |
LogMeIn Inc | | | 17,500 | | | | 1,402 | |
MACOM Technology Solutions Holdings Inc * | | | 161,371 | | | | 2,696 | |
ManTech International Corp/VA, Cl A | | | 25,619 | | | | 1,384 | |
MAXIMUS Inc | | | 26,928 | | | | 1,911 | |
MKS Instruments Inc | | | 7,200 | | | | 670 | |
MobileIron Inc * | | | 37,405 | | | | 205 | |
MongoDB Inc, Cl A *(A) | | | 4,079 | | | | 600 | |
Nanometrics Inc * | | | 7,972 | | | | 246 | |
Napco Security Technologies Inc * | | | 4,937 | | | | 102 | |
NCR Corp * | | | 95,181 | | | | 2,597 | |
NeoPhotonics Corp * | | | 15,000 | | | | 94 | |
New Relic Inc * | | | 3,396 | | | | 335 | |
Novanta Inc * | | | 6,836 | | | | 579 | |
| | | | |
SEI Institutional Managed Trust / Semi-Annual Report / March 31, 2019 | | | 5 | |
SCHEDULE OF INVESTMENTS (Unaudited)
March 31, 2019
Small Cap Fund(Continued)
| | | | | | | | |
| | | |
| Description | | Shares | | | Market Value
($ Thousands) |
| | |
COMMON STOCK (continued) | | | | | | | | |
ON Semiconductor Corp * | | | 111,252 | | | $ | 2,288 | |
Paylocity Holding Corp * | | | 9,116 | | | | 813 | |
Perficient Inc * | | | 43,363 | | | | 1,188 | |
Photronics Inc * | | | 13,890 | | | | 131 | |
Power Integrations Inc | | | 27,926 | | | | 1,953 | |
Proofpoint Inc * | | | 16,883 | | | | 2,050 | |
PROS Holdings Inc * | | | 15,500 | | | | 655 | |
Q2 Holdings Inc * | | | 9,800 | | | | 679 | |
Quantenna Communications Inc * | | | 14,266 | | | | 347 | |
Rapid7 Inc * | | | 12,289 | | | | 622 | |
RingCentral Inc, Cl A * | | | 7,454 | | | | 804 | |
Rogers Corp * | | | 3,919 | | | | 623 | |
Rubicon Project Inc/The * | | | 94,000 | | | | 572 | |
SailPoint Technologies Holding Inc * | | | 7,634 | | | | 219 | |
Sanmina Corp * | | | 20,700 | | | | 597 | |
SecureWorks Corp, Cl A * | | | 3,500 | | | | 64 | |
Semtech Corp * | | | 46,727 | | | | 2,379 | |
SolarWinds Corp * | | | 24,276 | | | | 474 | |
SPS Commerce Inc * | | | 11,011 | | | | 1,168 | |
Super Micro Computer Inc *(C) | | | 265,590 | | | | 5,611 | |
SVMK Inc * | | | 37,000 | | | | 674 | |
Switch Inc, Cl A (A) | | | 71,704 | | | | 739 | |
Sykes Enterprises Inc * | | | 9,684 | | | | 274 | |
SYNNEX Corp | | | 21,068 | | | | 2,010 | |
Tech Data Corp * | | | 2,878 | | | | 295 | |
Telaria Inc * | | | 113,000 | | | | 716 | |
Teradata Corp * | | | 14,500 | | | | 633 | |
Trade Desk Inc/The, Cl A * | | | 14,586 | | | | 2,887 | |
Twilio Inc, Cl A * | | | 3,558 | | | | 460 | |
Unisys Corp *(A) | | | 14,080 | | | | 164 | |
Universal Display Corp | | | 4,300 | | | | 657 | |
Upland Software Inc * | | | 15,500 | | | | 657 | |
Varonis Systems Inc * | | | 548 | | | | 33 | |
Verint Systems Inc * | | | 11,400 | | | | 682 | |
Viavi Solutions Inc * | | | 184,484 | | | | 2,284 | |
Vishay Precision Group Inc * | | | 2,710 | | | | 93 | |
Wix.com Ltd * | | | 14,709 | | | | 1,777 | |
WNS Holdings Ltd ADR * | | | 16,674 | | | | 888 | |
Workiva Inc, Cl A * | | | 17,027 | | | | 863 | |
Xperi Corp | | | 30,313 | | | | 709 | |
Zendesk Inc * | | | 10,735 | | | | 912 | |
Zscaler Inc * | | | 15,087 | | | | 1,070 | |
| | |
| | | | | | | 110,000 | |
| | | | | | |
| | |
Materials — 5.2% | | | | | | | | |
Allegheny Technologies Inc * | | | 52,960 | | | | 1,354 | |
B2Gold Corp * | | | 247,610 | | | | 696 | |
Century Aluminum Co * | | | 84,529 | | | | 751 | |
Commercial Metals Co, Cl A | | | 193,282 | | | | 3,301 | |
Ferroglobe Representation * | | | 56,257 | | | | — | |
FutureFuel Corp | | | 13,620 | | | | 182 | |
HB Fuller Co | | | 20,789 | | | | 1,011 | |
| | | | | | | | |
| | | |
| Description | | Shares | | | Market Value
($ Thousands) |
| | |
COMMON STOCK (continued) | | | | | | | | |
Ingevity Corp * | | | 19,843 | | | $ | 2,096 | |
International Flavors & Fragrances Inc | | | 14,660 | | | | 1,888 | |
Livent Corp *(A) | | | 150,701 | | | | 1,851 | |
Louisiana-Pacific Corp | | | 10,486 | | | | 256 | |
Olin Corp | | | 56,562 | | | | 1,309 | |
Owens-Illinois Inc | | | 276,467 | | | | 5,247 | |
Quaker Chemical Corp | | | 8,714 | | | | 1,746 | |
Sensient Technologies Corp | | | 25,726 | | | | 1,744 | |
Silgan Holdings Inc | | | 31,968 | | | | 947 | |
Sonoco Products Co | | | 9,301 | | | | 572 | |
SunCoke Energy Inc * | | | 15,332 | | | | 130 | |
United States Steel Corp | | | 132,028 | | | | 2,573 | |
Valvoline Inc | | | 80,777 | | | | 1,499 | |
Venator Materials PLC * | | | 171,623 | | | | 965 | |
Warrior Met Coal Inc | | | 15,815 | | | | 481 | |
WR Grace & Co | | | 20,757 | | | | 1,620 | |
| | |
| | | | | | | 32,219 | |
| | |
Real Estate — 3.5% | | | | | | | | |
Agree Realty Corp | | | 9,127 | | | | 633 | |
Alexandria Real Estate Equities Inc | | | 14,583 | | | | 2,079 | |
Americold Realty Trust | | | 59,379 | | | | 1,812 | |
Chesapeake Lodging Trust | | | 13,266 | | | | 369 | |
Clipper Realty Inc | | | 5,243 | | | | 70 | |
Columbia Property Trust Inc | | | 66,824 | | | | 1,504 | |
CoreSite Realty Corp | | | 16,736 | | | | 1,791 | |
Corporate Office Properties Trust | | | 49,932 | | | | 1,363 | |
Cushman & Wakefield PLC * | | | 17,058 | | | | 304 | |
First Industrial Realty Trust Inc | | | 597 | | | | 21 | |
Franklin Street Properties Corp | | | 27,615 | | | | 198 | |
Gladstone Commercial Corp | | | 12,452 | | | | 259 | |
Hannon Armstrong Sustainable Infrastructure Capital Inc | | | 8,676 | | | | 222 | |
Kennedy-Wilson Holdings Inc | | | 73,110 | | | | 1,564 | |
Lexington Realty Trust | | | 111,590 | | | | 1,011 | |
Marcus & Millichap Inc * | | | 9,187 | | | | 374 | |
Medical Properties Trust Inc | | | 95,582 | | | | 1,769 | |
NexPoint Residential Trust Inc | | | 19,845 | | | | 761 | |
NorthStar Realty Europe Corp | | | 12,107 | | | | 210 | |
Retail Opportunity Investments Corp | | | 77,579 | | | | 1,345 | |
RMR Group Inc/The | | | 4,099 | | | | 250 | |
Ryman Hospitality Properties Inc | | | 24,117 | | | | 1,983 | |
Safehold Inc | | | 4,936 | | | | 108 | |
STAG Industrial Inc | | | 11,033 | | | | 327 | |
Terreno Realty Corp | | | 15,000 | | | | 631 | |
Tier Inc | | | 22,212 | | | | 637 | |
Xenia Hotels & Resorts Inc | | | 14,314 | | | | 314 | |
| | |
| | | | | | | 21,909 | |
| | |
Utilities — 2.1% | | | | | | | | |
Algonquin Power & Utilities Corp | | | 177,868 | | | | 2,004 | |
American States Water Co | | | 35,874 | | | | 2,558 | |
| | |
| 6 | | SEI Institutional Managed Trust / Semi-Annual Report / March 31, 2019 |
SCHEDULE OF INVESTMENTS (Unaudited)
March 31, 2019
Small Cap Fund(Continued)
| | | | | | | | |
| | | |
| Description | | Shares | | | Market Value
($ Thousands) |
| | |
COMMON STOCK (continued) | | | | | | | | |
American Water Works Co Inc | | | 18,244 | | | $ | 1,902 | |
AquaVenture Holdings Ltd * | | | 6,167 | | | | 119 | |
Atlantic Power Corp *(A) | | | 28,897 | | | | 73 | |
Black Hills Corp, Cl A | | | 14,752 | | | | 1,093 | |
Hawaiian Electric Industries Inc | | | 25,209 | | | | 1,028 | |
IDACORP Inc, Cl A | | | 11,985 | | | | 1,193 | |
Portland General Electric Co | | | 51,351 | | | | 2,662 | |
Pure Cycle Corp * | | | 8,100 | | | | 80 | |
Vivint Solar Inc *(A) | | | 15,066 | | | | 75 | |
| | | | | | | | |
| | |
| | | | | | | 12,787 | |
| | | | | | | | |
| | |
Total Common Stock
(Cost $557,214) ($ Thousands) | | | | | | | 603,189 | |
| | | | | | | | |
| | |
EXCHANGE TRADED FUND — 0.2% | | | | | | | | |
| | |
Financials — 0.2% | | | | | | | | |
iShares Russell 2000 Value ETF (A) | | | 11,706 | | | | 1,404 | |
| | | | | | | | |
| | |
Total Exchange Traded Fund
(Cost $1,505) ($ Thousands) | | | | | | | 1,404 | |
| | | | | | | | |
| | |
AFFILIATED PARTNERSHIP — 3.8% | | | | | | | | |
SEI Liquidity Fund, L.P. | | | | | | | | |
2.480% **† (D) | | | 23,189,100 | | | | 23,186 | |
| | | | | | | | |
| | |
Total Affiliated Partnership (Cost $23,188) ($ Thousands) | | | | | | | 23,186 | |
| | | | | | | | |
| | |
CASH EQUIVALENT — 2.4% | | | | | | | | |
SEI Daily Income Trust, Government Fund, Cl F | | | | | | | | |
2.220% **† | | | 14,894,231 | | | | 14,894 | |
| | | | | | | | |
| | |
Total Cash Equivalent
(Cost $14,894) ($ Thousands) | | | | | | | 14,894 | |
| | | | | | | | |
| | |
Total Investments — 103.7%
(Cost $596,801) ($ Thousands) | | | | | | $ | 642,673 | |
| | | | | | | | |
For more information on valuation inputs, see Note 2 – Significant Accounting Policies in Notes to Financial Statements.
| | Percentages are based on Net Assets of $619,789 ($ Thousands). |
| * | Non-income producing security. |
| ** | Rate shown is the 7-day effective yield as of March 31, 2019. |
| ‡ | Real Estate Investment Trust. |
| † | Investment in Affiliated Security (see Note 6). |
| (A) | Certain securities or partial positions of certain securities are on loan at March 31, 2019 (see Note 10). The total market value of securities on loan at March 31, 2019 was $22,756 ($ Thousands). |
| (B) | Security is a Master Limited Partnership. At March 31, 2019, such securities amounted to $3,254 ($ Thousands), or 0.5% of the net assets of the Fund (See Note 2). |
| (C) | Securities considered illiquid. The total value of such securities as of March 31, 2019 was $6,184 ($ Thousands) and represented 1.0% of the Net Assets of the Fund. |
| (D) | This security was purchased with cash collateral held from securities on loan (see Note 10). The total market value of such securities as of March 31, 2019 was $23,186 ($ Thousands). |
ADR — American Depositary Receipt
Cl — Class
ETF — Exchange-Traded Fund
LLC — Limited Liability Company
L.P. — Limited Partnership
Ltd. — Limited
PLC — Public Limited Company
The following is a list of the level of inputs used as of March 31, 2019, in valuing the Fund’s investments and other financial instruments carried at value ($ Thousands):
| | | | | | | | | | | | | | | | |
| | | | | |
Investments in
Securities | | Level 1 | | | Level 2 | | | Level 3 | | | Total | |
Common Stock | | $ | 603,189 | | | $ | – | | | $ | – | | | $ | 603,189 | |
Exchange Traded Fund | | | 1,404 | | | | – | | | | – | | | | 1,404 | |
Affiliated Partnership | | | – | | | | 23,186 | | | | – | | | | 23,186 | |
Cash Equivalent | | | 14,894 | | | | – | | | | – | | | | 14,894 | |
| | | | | | | | | | | | | | | | |
Total Investments in Securities | | $ | 619,487 | | | $ | 23,186 | | | $ | – | | | $ | 642,673 | |
| | | | | | | | | | | | | | | | |
For the period ended March 31, 2019, there were no transfers between Level 1 and Level 2 assets and liabilities.
For the period ended March 31, 2019, there were no transfers between Level 2 and Level 3 assets and liabilities.
| | | | |
SEI Institutional Managed Trust / Semi-Annual Report / March 31, 2019 | | | 7 | |
SCHEDULE OF INVESTMENTS (Unaudited)
March 31, 2019
Small Cap Fund(Continued)
The following is a summary of the Fund’s transactions with affiliates for the period ended March 31, 2019 ($ Thousands):
| | | | | | | | | | | | | | | | | | | | | | | | | | |
| Security Description | | Value 9/30/2018 | | | Purchases at
Cost | | | Proceeds from
Sales | | | Realized
Gain
(Loss) | | | Change in
Unrealized
Appreciation
(Depreciation) | | Value
3/31/2019 | | | Income | |
SEI Liquidity Fund, L.P. | | $ | 50,875 | | | $ | 68,728 | | | $ | (96,420) | | | $ | — | | | $3 | | $ | 23,186 | | | $ | 97 | |
SEI Daily Income Trust, Government Fund, CI F | | | 16,607 | | | | 66,474 | | | | (68,187) | | | | — | | | — | | | 14,894 | | | | 127 | |
| | | | | | | | | | | | | | | | | | | | | | | | | | |
Totals | | $ | 67,482 | | | $ | 135,202 | | | $ | (164,607) | | | $ | - | | | $3 | | $ | 38,080 | | | $ | 224 | |
| | | | | | | | | | | | | | | | | | | | | | | | | | |
Amounts designated as “—” are either $0 or have been rounded to $0.
The accompanying notes are an integral part of the financial statements.
| | |
| 8 | | SEI Institutional Managed Trust / Semi-Annual Report / March 31, 2019 |
SCHEDULE OF INVESTMENTS (Unaudited)
March 31, 2019
Small Cap Value Fund(Continued)
| | | | | | | | |
| | | |
| Description | | Shares | | Market Value ($ Thousands) |
| | |
COMMON STOCK — 92.6% | | | | | | | | |
| | |
Communication Services — 2.5% | | | | | | | | |
AMC Networks Inc, Cl A * | | | 19,587 | | | $ | 1,112 | |
Entercom Communications Corp | | | 74,808 | | | | 393 | |
Entravision Communications Corp, Cl A | | | 17,834 | | | | 58 | |
EW Scripps Co/The, Cl A | | | 11,534 | | | | 242 | |
Gannett Co Inc | | | 27,713 | | | | 292 | |
IAC/InterActiveCorp * | | | 20,159 | | | | 4,236 | |
Liberty TripAdvisor Holdings Inc, Cl A * | | | 18,500 | | | | 262 | |
Nexstar Media Group Inc, Cl A | | | 7,536 | | | | 817 | |
Sinclair Broadcast Group Inc, Cl A | | | 22,149 | | | | 852 | |
Tribune Publishing Co * | | | 3,320 | | | | 39 | |
Yelp Inc, Cl A * | | | 1,942 | | | | 67 | |
| | |
| | | | | | | 8,370 | |
| | |
Consumer Discretionary — 12.3% | | | | | | | | |
Aaron’s Inc | | | 19,597 | | | | 1,031 | |
Abercrombie & Fitch Co, Cl A | | | 6,081 | | | | 167 | |
American Axle & Manufacturing Holdings Inc * | | | 48,409 | | | | 693 | |
American Eagle Outfitters Inc | | | 7,315 | | | | 162 | |
American Public Education Inc * | | | 3,837 | | | | 116 | |
Bassett Furniture Industries Inc | | | 3,512 | | | | 58 | |
Beazer Homes USA Inc, Cl A * | | | 41,050 | | | | 472 | |
Bed Bath & Beyond Inc (A) | | | 32,398 | | | | 550 | |
Big Lots Inc | | | 81,080 | | | | 3,083 | |
Bloomin’ Brands Inc | | | 48,780 | | | | 997 | |
Brinker International Inc | | | 10,631 | | | | 472 | |
Buckle Inc/The (A) | | | 3,436 | | | | 64 | |
Cheesecake Factory Inc/The (A) | | | 18,682 | | | | 914 | |
Chico’s FAS Inc | | | 9,091 | | | | 39 | |
Children’s Place Inc/The | | | 3,916 | | | | 381 | |
Cooper Tire & Rubber Co | | | 22,859 | | | | 683 | |
Cooper-Standard Holdings Inc * | | | 16,247 | | | | 763 | |
CSS Industries Inc | | | 30,142 | | | | 180 | |
Dana Inc | | | 60,695 | | | | 1,077 | |
Deckers Outdoor Corp * | | | 8,518 | | | | 1,252 | |
Dick’s Sporting Goods Inc | | | 30,309 | | | | 1,116 | |
Ethan Allen Interiors Inc | | | 10,798 | | | | 207 | |
Express Inc * | | | 73,091 | | | | 313 | |
Extended Stay America Inc | | | 96,511 | | | | 1,732 | |
GameStop Corp, Cl A (A) | | | 17,604 | | | | 179 | |
Genesco Inc * | | | 11,220 | | | | 511 | |
Gentherm Inc * | | | 9,007 | | | | 332 | |
Group 1 Automotive Inc | | | 9,394 | | | | 608 | |
Haverty Furniture Cos Inc | | | 29,371 | | | | 643 | |
Hibbett Sports Inc * | | | 8,723 | | | | 199 | |
K12 Inc * | | | 9,558 | | | | 326 | |
KB Home | | | 11,801 | | | | 285 | |
La-Z-Boy Inc, Cl Z | | | 25,210 | | | | 832 | |
Liberty Expedia Holdings Inc, Cl A * | | | 13,255 | | | | 567 | |
Lithia Motors Inc, Cl A | | | 20,345 | | | | 1,887 | |
MDC Holdings Inc | | | 24,792 | | | | 720 | |
| | | | | | | | |
| | | |
| Description | | Shares | | Market Value ($ Thousands) |
| |
COMMON STOCK (continued) | | | | | |
Meritage Homes Corp * | | | 18,062 | | | $ | 807 | |
Modine Manufacturing Co * | | | 162,134 | | | | 2,249 | |
Murphy USA Inc * | | | 4,762 | | | | 408 | |
Office Depot Inc | | | 343,182 | | | | 1,246 | |
PetMed Express Inc (A) | | | 18,646 | | | | 425 | |
Potbelly Corp * | | | 7,888 | | | | 67 | |
Red Robin Gourmet Burgers Inc * | | | 3,219 | | | | 93 | |
Sally Beauty Holdings Inc * | | | 39,190 | | | | 721 | |
Shutterstock Inc | | | 1,285 | | | | 60 | |
Six Flags Entertainment Corp | | | 48,732 | | | | 2,405 | |
Skechers U.S.A. Inc, Cl A * | | | 74,115 | | | | 2,491 | |
Sonic Automotive Inc, Cl A | | | 30,073 | | | | 445 | |
Speedway Motorsports Inc | | | 4,474 | | | | 65 | |
Stoneridge Inc * | | | 32,839 | | | | 948 | |
Sturm Ruger & Co Inc | | | 3,232 | | | | 171 | |
Taylor Morrison Home Corp, Cl A * | | | 13,504 | | | | 240 | |
Tenneco Inc, Cl A | | | 15,823 | | | | 351 | |
Tower International Inc | | | 8,666 | | | | 182 | |
Urban Outfitters Inc * | | | 14,182 | | | | 420 | |
Wendy’s Co/The | | | 105,507 | | | | 1,887 | |
Williams-Sonoma Inc (A) | | | 16,854 | | | | 948 | |
| | |
| | | | | | | 40,240 | |
| |
Consumer Staples — 3.9% | | | | | |
Andersons Inc/The | | | 16,802 | | | | 542 | |
B&G Foods Inc, Cl A (A) | | | 64,678 | | | | 1,579 | |
Hain Celestial Group Inc/The * | | | 98,747 | | | | 2,283 | |
Hostess Brands Inc, Cl A * | | | 149,767 | | | | 1,872 | |
Ingles Markets Inc, Cl A | | | 14,167 | | | | 391 | |
Nature’s Sunshine Products Inc * | | | 1,153 | | | | 11 | |
Pilgrim’s Pride Corp * | | | 105,616 | | | | 2,354 | |
SpartanNash Co | | | 43,313 | | | | 687 | |
Spectrum Brands Holdings Inc (A) | | | 30,699 | | | | 1,682 | |
Universal Corp/VA | | | 12,310 | | | | 709 | |
USANA Health Sciences Inc * | | | 1,627 | | | | 137 | |
Village Super Market Inc, Cl A | | | 15,841 | | | | 433 | |
Weis Markets Inc | | | 2,858 | | | | 117 | |
| | |
| | | | | | | 12,797 | |
| |
Energy — 4.3% | | | | | |
Adams Resources & Energy Inc | | | 553 | | | | 22 | |
Arch Coal Inc | | | 9,387 | | | | 857 | |
Callon Petroleum Co * | | | 102,707 | | | | 775 | |
Carrizo Oil & Gas Inc * | | | 38,955 | | | | 486 | |
Delek US Holdings Inc | | | 21,084 | | | | 768 | |
Denbury Resources Inc * | | | 187,616 | | | | 385 | |
Gulfport Energy Corp * | | | 269,372 | | | | 2,160 | |
Laredo Petroleum Inc * | | | 88,768 | | | | 274 | |
Mammoth Energy Services Inc | | | 2,693 | | | | 45 | |
Midstates Petroleum Co Inc * | | | 4,175 | | | | 41 | |
Par Pacific Holdings Inc * | | | 10,160 | | | | 181 | |
Parsley Energy Inc, Cl A * | | | 72,479 | | | | 1,399 | |
| | | | |
SEI Institutional Managed Trust / Semi-Annual Report / March 31, 2019 | | | 1 | |
SCHEDULE OF INVESTMENTS (Unaudited)
March 31, 2019
Small Cap Value Fund(Continued)
| | | | | | | | |
| | | |
| Description | | Shares | | Market Value ($ Thousands) |
| |
COMMON STOCK (continued) | | | | | |
PBF Energy Inc, Cl A | | | 51,988 | | | $ | 1,619 | |
Peabody Energy Corp | | | 17,684 | | | | 501 | |
ProPetro Holding Corp * | | | 4,318 | | | | 97 | |
Range Resources Corp | | | 135,449 | | | | 1,522 | |
Renewable Energy Group Inc * | | | 34,855 | | | | 765 | |
SEACOR Holdings Inc, Cl A * | | | 4,148 | | | | 175 | |
Southwestern Energy Co * | | | 163,144 | | | | 765 | |
SRC Energy Inc * | | | 70,663 | | | | 362 | |
Viper Energy Partners LP (B) | | | 32,198 | | | | 1,068 | |
| | |
| | | | | | | 14,267 | |
| | | | | |
| | |
Financials — 24.5% | | | | | | | | |
Affiliated Managers Group Inc | | | 14,740 | | | | 1,579 | |
AG Mortgage Investment Trust Inc | | | 23,551 | | | | 397 | |
American Equity Investment Life Holding Co | | | 92,081 | | | | 2,488 | |
Apollo Commercial Real Estate Finance Inc | | | 27,313 | | | | 497 | |
Arbor Realty Trust Inc (A) | | | 72,815 | | | | 944 | |
ARMOUR Residential Inc | | | 26,550 | | | | 519 | |
Artisan Partners Asset Management Inc, Cl A | | | 8,800 | | | | 221 | |
Associated Banc-Corp | | | 48,210 | | | | 1,029 | |
Banco Latinoamericano de Comercio Exterior SA, Cl E | |
|
40,605 |
| | | 809 | |
Bancorp Inc/The * | | | 76,453 | | | | 618 | |
BankUnited Inc | | | 120,163 | | | | 4,013 | |
Berkshire Hills Bancorp Inc | | | 28,239 | | | | 769 | |
BGC Partners Inc, Cl A | | | 354,191 | | | | 1,881 | |
BlackRock Capital Investment Corp | | | 75,056 | | | | 450 | |
Bridge Bancorp Inc | | | 3,818 | | | | 112 | |
C&F Financial Corp | | | 1,901 | | | | 96 | |
Camden National Corp | | | 21,686 | | | | 905 | |
Cathay General Bancorp | | | 21,589 | | | | 732 | |
Central Pacific Financial Corp | | | 21,176 | | | | 611 | |
Central Valley Community Bancorp | | | 1,085 | | | | 21 | |
Century Bancorp Inc/MA, Cl A | | | 568 | | | | 41 | |
CIT Group Inc | | | 24,356 | | | | 1,168 | |
CNO Financial Group Inc | | | 228,963 | | | | 3,705 | |
Codorus Valley Bancorp Inc | | | 2,300 | | | | 49 | |
Columbia Banking System Inc | | | 80,757 | | | | 2,640 | |
Community Trust Bancorp Inc | | | 15,141 | | | | 622 | |
Cowen Inc, Cl A * | | | 61,671 | | | | 894 | |
Crawford & Co, Cl B | | | 5,551 | | | | 51 | |
Customers Bancorp Inc * | | | 12,199 | | | | 223 | |
Dynex Capital Inc ‡ | | | 55,919 | | | | 341 | |
Enova International Inc * | | | 7,596 | | | | 173 | |
EZCORP Inc, Cl A * | | | 11,390 | | | | 106 | |
Federal Agricultural Mortgage Corp, Cl C | | | 18,235 | | | | 1,321 | |
FGL Holdings | | | 26,477 | | | | 208 | |
Financial Institutions Inc | | | 3,662 | | | | 100 | |
First Busey Corp | | | 14,021 | | | | 342 | |
First Business Financial Services Inc | | | 1,838 | | | | 37 | |
First Citizens BancShares Inc/NC, Cl A | | | 297 | | | | 121 | |
First Commonwealth Financial Corp | | | 221,075 | | | | 2,786 | |
| | | | | | | | |
| | | |
| Description | | Shares | | Market Value ($ Thousands) |
| |
COMMON STOCK (continued) | | | | | |
First Community Bankshares Inc | | | 24,184 | | | $ | 801 | |
First Financial Corp/IN | | | 3,000 | | | | 126 | |
First Internet Bancorp | | | 1,818 | | | | 35 | |
First Interstate BancSystem Inc, Cl A | | | 9,642 | | | | 384 | |
First Merchants Corp | | | 41,471 | | | | 1,528 | |
First Northwest Bancorp | | | 3,455 | | | | 54 | |
Flagstar Bancorp Inc | | | 28,979 | | | | 954 | |
Flushing Financial Corp | | | 41,550 | | | | 911 | |
FNB Corp/PA | | | 298,350 | | | | 3,162 | |
Fulton Financial Corp | | | 65,372 | | | | 1,012 | |
Genworth Financial Inc, Cl A * | | | 81,448 | | | | 312 | |
Granite Point Mortgage Trust Inc | | | 7,303 | | | | 136 | |
Great Southern Bancorp Inc | | | 7,275 | | | | 378 | |
Great Western Bancorp Inc | | | 56,311 | | | | 1,779 | |
Greenlight Capital Re Ltd, Cl A * | | | 9,297 | | | | 101 | |
Hancock Whitney Corp, Cl A | | | 32,818 | | | | 1,326 | |
Hanmi Financial Corp | | | 22,349 | | | | 475 | |
HCI Group Inc | | | 8,328 | | | | 356 | |
Hercules Capital Inc, Cl A (A) | | | 34,116 | | | | 432 | |
Hilltop Holdings Inc | | | 17,167 | | | | 313 | |
HomeStreet Inc * | | | 6,770 | | | | 178 | |
Hope Bancorp Inc | | | 72,870 | | | | 953 | |
IBERIABANK Corp | | | 9,736 | | | | 698 | |
Invesco Mortgage Capital Inc | | | 34,916 | | | | 552 | |
Ladder Capital Corp, Cl A | | | 43,249 | | | | 736 | |
Legg Mason Inc | | | 28,410 | | | | 778 | |
Luther Burbank Corp | | | 4,600 | | | | 46 | |
Marlin Business Services Corp | | | 3,006 | | | | 65 | |
Meta Financial Group Inc | | | 6,255 | | | | 123 | |
Metropolitan Bank Holding Corp * | | | 1,600 | | | | 56 | |
MFA Financial Inc ‡ | | | 103,933 | | | | 756 | |
MGIC Investment Corp * | | | 109,333 | | | | 1,442 | |
National General Holdings Corp | | | 104,332 | | | | 2,476 | |
Nelnet Inc, Cl A | | | 17,322 | | | | 954 | |
New Mountain Finance Corp | | | 37,291 | | | | 506 | |
OFG Bancorp | | | 86,492 | | | | 1,712 | |
Old National Bancorp/IN, Cl A | | | 41,682 | | | | 684 | |
Oppenheimer Holdings Inc, Cl A | | | 4,744 | | | | 123 | |
Orrstown Financial Services Inc | | | 1,625 | | | | 30 | |
Pacific City Financial Corp | | | 2,911 | | | | 51 | |
PacWest Bancorp | | | 114,937 | | | | 4,323 | |
PennantPark Investment Corp | | | 64,382 | | | | 445 | |
PennyMac Mortgage Investment Trust ‡ | | | 35,976 | | | | 745 | |
Peoples Bancorp Inc/OH | | | 17,670 | | | | 547 | |
Popular Inc | | | 19,429 | | | | 1,013 | |
Radian Group Inc | | | 48,994 | | | | 1,016 | |
Republic Bancorp Inc/KY, Cl A | | | 27,592 | | | | 1,234 | |
Starwood Property Trust Inc ‡ | | | 113,711 | | | | 2,541 | |
Stewart Information Services Corp | | | 1,299 | | | | 55 | |
TCF Financial Corp | | | 64,970 | | | | 1,344 | |
Tiptree Inc | | | 10,141 | | | | 64 | |
TriState Capital Holdings Inc * | | | 6,000 | | | | 123 | |
| | |
| 2 | | SEI Institutional Managed Trust / Semi-Annual Report / March 31, 2019 |
SCHEDULE OF INVESTMENTS (Unaudited)
March 31, 2019
Small Cap Value Fund(Continued)
| | | | | | | | |
| | | |
| Description | | Shares | | Market Value ($ Thousands) |
| |
COMMON STOCK (continued) | | | | | |
Two Harbors Investment Corp ‡ | | | 44,275 | | | $ | 599 | |
Umpqua Holdings Corp | | | 149,720 | | | | 2,470 | |
Union Bankshares Corp | | | 17,904 | | | | 579 | |
United Bankshares Inc/WV | | | 19,403 | | | | 703 | |
Unity Bancorp Inc | | | 2,301 | | | | 43 | |
Universal Insurance Holdings Inc | | | 17,309 | | | | 537 | |
Waddell & Reed Financial Inc, Cl A | | | 19,155 | | | | 331 | |
Western Asset Mortgage Capital Corp | | | 27,156 | | | | 278 | |
World Acceptance Corp * | | | 2,137 | | | | 250 | |
| | |
| | | | | | | 80,353 | |
| | |
Health Care — 4.6% | | | | | | | | |
Acorda Therapeutics Inc * | | | 10,787 | | | | 143 | |
AMAG Pharmaceuticals Inc * | | | 9,827 | | | | 127 | |
Anika Therapeutics Inc * | | | 1,987 | | | | 60 | |
Collegium Pharmaceutical Inc * | | | 1,682 | | | | 25 | |
Eagle Pharmaceuticals Inc/DE * | | | 13,146 | | | | 664 | |
Emergent BioSolutions * | | | 6,471 | | | | 327 | |
Ensign Group Inc/The | | | 2,460 | | | | 126 | |
FONAR Corp * | | | 1,435 | | | | 29 | |
Genomic Health Inc * | | | 4,776 | | | | 335 | |
Globus Medical Inc, Cl A * | | | 880 | | | | 43 | |
Haemonetics Corp * | | | 3,424 | | | | 300 | |
Halozyme Therapeutics Inc * | | | 2,795 | | | | 45 | |
HealthStream Inc * | | | 4,564 | | | | 128 | |
Innoviva Inc * | | | 67,426 | | | | 946 | |
Integer Holdings Corp * | | | 449 | | | | 34 | |
Lannett Co Inc *(A) | | | 29,164 | | | | 230 | |
Ligand Pharmaceuticals Inc *(A) | | | 23,421 | | | | 2,944 | |
Luminex Corp | | | 5,956 | | | | 137 | |
Magellan Health Inc * | | | 40,330 | | | | 2,659 | |
Mallinckrodt PLC * | | | 29,688 | | | | 645 | |
Medidata Solutions Inc * | | | 547 | | | | 40 | |
Medpace Holdings Inc * | | | 1,725 | | | | 102 | |
Meridian Bioscience Inc | | | 10,222 | | | | 180 | |
Myriad Genetics Inc * | | | 2,835 | | | | 94 | |
NextGen Healthcare Inc * | | | 9,964 | | | | 168 | |
Orthofix Medical Inc * | | | 4,175 | | | | 235 | |
Owens & Minor Inc | | | 26,615 | | | | 109 | |
Patterson Cos Inc | | | 28,779 | | | | 629 | |
PDL BioPharma Inc * | | | 74,236 | | | | 276 | |
Quidel Corp * | | | 2,822 | | | | 185 | |
SIGA Technologies Inc * | | | 11,582 | | | | 70 | |
Syneos Health Inc, Cl A * | | | 51,297 | | | | 2,655 | |
Tivity Health Inc * | | | 10,500 | | | | 184 | |
Triple-S Management Corp, Cl B * | | | 5,145 | | | | 117 | |
Utah Medical Products Inc | | | 115 | | | | 10 | |
Vanda Pharmaceuticals Inc * | | | 4,705 | | | | 87 | |
| | |
| | | | | | | 15,088 | |
| | |
Industrials — 13.6% | | | | | | | | |
ACCO Brands Corp | | | 171,268 | | | | 1,466 | |
| | | | | | | | |
| | | |
| Description | | Shares | | Market Value ($ Thousands) |
| |
COMMON STOCK (continued) | | | | | |
AECOM * | | | 53,318 | | | $ | 1,582 | |
Aircastle Ltd | | | 29,842 | | | | 604 | |
Apogee Enterprises Inc | | | 69,561 | | | | 2,608 | |
ArcBest Corp | | | 18,285 | | | | 563 | |
ASGN Inc * | | | 5,307 | | | | 337 | |
Astec Industries Inc | | | 18,652 | | | | 704 | |
Atlas Air Worldwide Holdings Inc * | | | 65,374 | | | | 3,305 | |
BMC Stock Holdings Inc * | | | 16,338 | | | | 289 | |
Briggs & Stratton Corp | | | 26,143 | | | | 309 | |
Builders FirstSource Inc * | | | 33,017 | | | | 440 | |
Columbus McKinnon Corp/NY | | | 2,300 | | | | 79 | |
Commercial Vehicle Group Inc * | | | 6,548 | | | | 50 | |
Costamare Inc | | | 11,635 | | | | 61 | |
Deluxe Corp | | | 14,076 | | | | 615 | |
EMCOR Group Inc | | | 4,761 | | | | 348 | |
Ennis Inc | | | 14,698 | | | | 305 | |
EnPro Industries Inc | | | 4,266 | | | | 275 | |
Genesee & Wyoming Inc, Cl A * | | | 30,063 | | | | 2,620 | |
Global Brass & Copper Holdings Inc | | | 10,977 | | | | 378 | |
Greenbrier Cos Inc/The | | | 25,748 | | | | 830 | |
Hawaiian Holdings Inc | | | 27,816 | | | | 730 | |
Herman Miller Inc | | | 24,747 | | | | 871 | |
Hurco Cos Inc | | | 1,486 | | | | 60 | |
Hyster-Yale Materials Handling Inc | | | 7,261 | | | | 453 | |
JetBlue Airways Corp * | | | 44,184 | | | | 723 | |
Kaman Corp, Cl A | | | 21,022 | | | | 1,229 | |
KAR Auction Services Inc | | | 81,411 | | | | 4,177 | |
Kelly Services Inc, Cl A | | | 16,319 | | | | 360 | |
Kennametal Inc | | | 11,518 | | | | 423 | |
Kimball International Inc, Cl B | | | 7,600 | | | | 108 | |
LB Foster Co, Cl A *(C) | | | 14,576 | | | | 274 | |
LSC Communications Inc | | | 5,632 | | | | 37 | |
Lydall Inc * | | | 28,456 | | | | 668 | |
Matson Inc | | | 15,175 | | | | 548 | |
Meritor Inc * | | | 56,313 | | | | 1,146 | |
Miller Industries Inc/TN | | | 2,667 | | | | 82 | |
Moog Inc, Cl A | | | 13,249 | | | | 1,152 | |
National Presto Industries Inc | | | 350 | | | | 38 | |
Navigant Consulting Inc | | | 10,113 | | | | 197 | |
NCI Building Systems Inc * | | | 4,509 | | | | 28 | |
Park-Ohio Holdings Corp | | | 10,866 | | | | 352 | |
Preformed Line Products Co | | | 1,138 | | | | 60 | |
Quad/Graphics Inc | | | 2,626 | | | | 31 | |
Regal Beloit Corp | | | 12,961 | | | | 1,061 | |
Resideo Technologies Inc * | | | 44,591 | | | | 860 | |
REV Group Inc (A) | | | 84,078 | | | | 921 | |
RR Donnelley & Sons Co | | | 11,848 | | | | 56 | |
SkyWest Inc | | | 27,635 | | | | 1,500 | |
Steelcase Inc, Cl A | | | 58,785 | | | | 855 | |
Sterling Construction Co Inc * | | | 10,585 | | | | 133 | |
Teledyne Technologies Inc * | | | 10,824 | | | | 2,565 | |
Terex Corp | | | 25,962 | | | | 834 | |
| | | | |
SEI Institutional Managed Trust / Semi-Annual Report / March 31, 2019 | | | 3 | |
SCHEDULE OF INVESTMENTS (Unaudited)
March 31, 2019
Small Cap Value Fund(Continued)
| | | | | | | | |
| | | |
| Description | | Shares | | Market Value ($ Thousands) |
| | |
COMMON STOCK (continued) | | | | | | | | |
Timken Co/The | | | 16,530 | | | $ | 721 | |
Trinity Industries Inc | | | 66,448 | | | | 1,444 | |
Triton International Ltd/Bermuda | | | 20,132 | | | | 626 | |
TrueBlue Inc * | | | 12,625 | | | | 298 | |
Universal Forest Products Inc | | | 4,272 | | | | 128 | |
Vectrus Inc * | | | 4,843 | | | | 129 | |
Wabash National Corp | | | 69,150 | | | | 937 | |
YRC Worldwide Inc * | | | 5,738 | | | | 38 | |
| | |
| | | | | | | 44,621 | |
| | |
Information Technology — 10.4% | | | | | | | | |
ACI Worldwide Inc * | | | 126,549 | | | | 4,160 | |
Advanced Energy Industries Inc * | | | 8,391 | | | | 417 | |
Amkor Technology Inc * | | | 109,665 | | | | 937 | |
Anixter International Inc * | | | 2,055 | | | | 115 | |
Avaya Holdings Corp * | | | 19,946 | | | | 336 | |
Axcelis Technologies Inc * | | | 27,466 | | | | 553 | |
Belden Inc | | | 14,450 | | | | 776 | |
Benchmark Electronics Inc | | | 37,478 | | | | 984 | |
Ciena Corp * | | | 23,155 | | | | 865 | |
Cirrus Logic Inc * | | | 15,277 | | | | 643 | |
CommVault Systems Inc * | | | 5,240 | | | | 339 | |
CSG Systems International Inc | | | 25,704 | | | | 1,087 | |
Cypress Semiconductor Corp | | | 88,506 | | | | 1,320 | |
Diodes Inc * | | | 21,000 | | | | 729 | |
Immersion Corp * | | | 10,008 | | | | 84 | |
Insight Enterprises Inc * | | | 34,330 | | | | 1,890 | |
InterDigital Inc | | | 4,321 | | | | 285 | |
Itron Inc * | | | 14,206 | | | | 663 | |
j2 Global Inc | | | 24,330 | | | | 2,107 | |
Jabil Inc | | | 33,167 | | | | 882 | |
Kulicke & Soffa Industries Inc | | | 42,104 | | | | 931 | |
MKS Instruments Inc | | | 623 | | | | 58 | |
MoneyGram International Inc * | | | 16,876 | | | | 34 | |
Nanometrics Inc * | | | 5,245 | | | | 162 | |
NCR Corp * | | | 51,096 | | | | 1,394 | |
NetScout Systems Inc * | | | 1,645 | | | | 46 | |
NIC Inc | | | 15,007 | | | | 256 | |
PC Connection Inc | | | 2,171 | | | | 80 | |
Perficient Inc * | | | 3,962 | | | | 108 | |
Photronics Inc * | | | 17,284 | | | | 163 | |
Progress Software Corp | | | 10,808 | | | | 480 | |
Sanmina Corp * | | | 45,681 | | | | 1,318 | |
ScanSource Inc * | | | 16,099 | | | | 577 | |
Silicon Motion Technology Corp ADR | | | 27,609 | | | | 1,094 | |
SMART Global Holdings Inc * | | | 1,639 | | | | 31 | |
Super Micro Computer Inc *(C) | | | 142,131 | | | | 3,003 | |
Sykes Enterprises Inc * | | | 39,443 | | | | 1,115 | |
SYNNEX Corp | | | 9,813 | | | | 936 | |
Tech Data Corp * | | | 21,929 | | | | 2,246 | |
TTM Technologies Inc * | | | 40,127 | | | | 471 | |
Unisys Corp * | | | 13,958 | | | | 163 | |
| | | | | | | | |
| | | |
| Description | | Shares | | Market Value ($ Thousands) |
| | |
COMMON STOCK (continued) | | | | | | | | |
Verint Systems Inc * | | | 1,300 | | | $ | 78 | |
Vishay Intertechnology Inc | | | 3,300 | | | | 61 | |
Zix Corp * | | | 16,402 | | | | 113 | |
| | |
| | | | | | | 34,090 | |
| | |
Materials — 8.4% | | | | | | | | |
Ashland Global Holdings Inc | | | 21,090 | | | | 1,648 | |
B2Gold Corp * | | | 120,186 | | | | 338 | |
Boise Cascade Co | | | 8,999 | | | | 241 | |
Cabot Corp | | | 20,876 | | | | 869 | |
Century Aluminum Co * | | | 38,553 | | | | 342 | |
Chemours Co/The | | | 21,769 | | | | 809 | |
Clearwater Paper Corp * | | | 13,273 | | | | 259 | |
Commercial Metals Co, Cl A | | | 106,715 | | | | 1,823 | |
Domtar Corp | | | 14,370 | | | | 713 | |
Ferroglobe Representation *(D) | | | 53,302 | | | | – | |
FMC Corp | | | 55,002 | | | | 4,225 | |
FutureFuel Corp | | | 6,403 | | | | 86 | |
Greif Inc, Cl A | | | 13,113 | | | | 541 | |
Huntsman Corp | | | 31,261 | | | | 703 | |
Kraton Corp * | | | 19,007 | | | | 612 | |
Kronos Worldwide Inc | | | 33,621 | | | | 471 | |
Livent Corp *(A) | | | 130,141 | | | | 1,598 | |
Louisiana-Pacific Corp | | | 21,703 | | | | 529 | |
Owens-Illinois Inc | | | 164,855 | | | | 3,129 | |
Rayonier Advanced Materials Inc | | | 50,683 | | | | 687 | |
Schnitzer Steel Industries Inc, Cl A | | | 19,257 | | | | 462 | |
Schweitzer-Mauduit International Inc | | | 15,024 | | | | 582 | |
Silgan Holdings Inc | | | 82,066 | | | | 2,432 | |
Stepan Co | | | 1,522 | | | | 133 | |
Trinseo SA | | | 18,458 | | | | 836 | |
United States Steel Corp | | | 70,914 | | | | 1,382 | |
Valvoline Inc | | | 65,314 | | | | 1,212 | |
Venator Materials PLC * | | | 93,333 | | | | 525 | |
Warrior Met Coal Inc | | | 12,008 | | | | 365 | |
| | |
| | | | | | | 27,552 | |
| | |
Real Estate — 7.2% | | | | | | | | |
Ashford Hospitality Trust Inc ‡ | | | 70,941 | | | | 337 | |
Braemar Hotels & Resorts Inc | | | 9,613 | | | | 117 | |
CBL & Associates Properties Inc ‡(A) | | | 51,264 | | | | 79 | |
Chatham Lodging Trust ‡ | | | 35,907 | | | | 691 | |
Chesapeake Lodging Trust ‡ | | | 6,399 | | | | 178 | |
CorEnergy Infrastructure Trust Inc | | | 4,974 | | | | 183 | |
DiamondRock Hospitality Co ‡ | | | 69,186 | | | | 749 | |
Franklin Street Properties Corp ‡ | | | 51,167 | | | | 368 | |
Gaming and Leisure Properties Inc ‡ | | | 80,438 | | | | 3,102 | |
Getty Realty Corp ‡ | | | 16,159 | | | | 518 | |
Hersha Hospitality Trust, Cl A | | | 40,163 | | | | 688 | |
Hospitality Properties Trust ‡ | | | 27,288 | | | | 718 | |
Howard Hughes Corp/The * | | | 11,841 | | | | 1,303 | |
Industrial Logistics Properties Trust | | | 28,621 | | | | 577 | |
| | |
| 4 | | SEI Institutional Managed Trust / Semi-Annual Report / March 31, 2019 |
SCHEDULE OF INVESTMENTS (Unaudited)
March 31, 2019
Small Cap Value Fund(Continued)
| | | | | | | | |
| | | |
| Description | | Shares | | Market Value ($ Thousands) |
| | |
COMMON STOCK (continued) | | | | | | | | |
InfraREIT Inc | | | 8,645 | | | $ | 181 | |
Invitation Homes Inc ‡ | | | 53,384 | | | | 1,299 | |
Kite Realty Group Trust | | | 43,656 | | | | 698 | |
Lexington Realty Trust ‡ | | | 68,235 | | | | 618 | |
Medical Properties Trust Inc ‡ | | | 219,644 | | | | 4,066 | |
Newmark Group Inc, Cl A | | | 69,166 | | | | 577 | |
Office Properties Income Trust | | | 14,860 | | | | 411 | |
Outfront Media Inc ‡ | | | 24,486 | | | | 573 | |
Pebblebrook Hotel Trust ‡ | | | 4,476 | | | | 139 | |
Piedmont Office Realty Trust Inc, Cl A ‡ | | | 33,910 | | | | 707 | |
RLJ Lodging Trust ‡ | | | 6,252 | | | | 110 | |
RMR Group Inc/The | | | 2,071 | | | | 126 | |
Sabra Health Care Inc ‡ | | | 37,239 | | | | 725 | |
Senior Housing Properties Trust ‡ | | | 41,568 | | | | 490 | |
SITE Centers Corp ‡ | | | 35,205 | | | | 479 | |
Spirit Realty Capital Inc ‡ | | | 20,981 | | | | 834 | |
Summit Hotel Properties Inc ‡ | | | 37,321 | | | | 426 | |
Washington Prime Group Inc ‡(A) | | | 107,960 | | | | 610 | |
Xenia Hotels & Resorts Inc ‡ | | | 41,221 | | | | 903 | |
| | |
| | | | | | | 23,580 | |
| | |
Utilities — 0.9% | | | | | | | | |
NorthWestern Corp | | | 12,686 | | | | 893 | |
| | | | | | | | |
| | | |
| Description | | Shares | | Market Value ($ Thousands) |
| | |
COMMON STOCK (continued) | | | | | | | | |
Portland General Electric Co | | | 38,970 | | | $ | 2,020 | |
| | |
| | | | | | | 2,913 | |
| |
Total Common Stock
(Cost $282,185) ($ Thousands) | | | | 303,871 | |
| |
AFFILIATED PARTNERSHIP — 3.5% | | | | | |
SEI Liquidity Fund, L.P. | | | | | | | | |
2.480% **†(D) | | | 11,385,010 | | | | 11,386 | |
| |
Total Affiliated Partnership
(Cost $11,384) ($ Thousands) | | | | 11,386 | |
| |
CASH EQUIVALENT — 7.0% | | | | | |
SEI Daily Income Trust, Government Fund, Cl F | | | | | | | | |
2.220%**† | | | 22,993,085 | | | | 22,993 | |
| |
Total Cash Equivalent
(Cost $22,993) ($ Thousands) | | | | 22,993 | |
| |
Total Investments in Securities — 103.1%
(Cost $316,562) ($ Thousands) | | | $ | 338,250 | |
| | | | | | | | |
A list of the open futures contracts held at March 31, 2019 is as follows:
| | | | | | | | | | | | | | | | | | | | |
Type of Contract | | Number of Contracts Long | | Expiration
Date | | Notional Amount
(Thousands) | | Value
(Thousands) | | | Unrealized
Appreciation
(Thousands) | |
| | | | | |
Russell 2000 IndexE-MINI | | | 154 | | | | Jun-2019 | | | $ | 11,754 | | | $ | 11,887 | | | $ | 133 | |
| | | | | | | | | | | | |
| | Percentages are based on Net Assets of $328,005 ($ Thousands). |
| * | Non-income producing security. |
| ** | Rate shown is the7-day effective yield as of March 31, 2019. |
| ‡ | Real Estate Investment Trust. |
| † | Investment in Affiliated Security (see Note 6). |
| (A) | Certain securities or partial positions of certain securities are on loan at March 31, 2019 (see Note 10). The total market value of securities on loan at March 31, 2019 was $11,176 ($ Thousands). |
| (B) | Security is a Master Limited Partnership. At March 31, 2019, such securities amounted to $1,068 ($ Thousands), or 0.3% of the net assets of the Fund (see Note 2). |
| (C) | Securities considered illiquid. The total value of such securities as of March 31, 2019 was $3,277 ($ Thousands) and represented 1.0% of the Net Assets of the Fund. |
| (D) | This security was purchased with cash collateral held from securities on loan (see Note 10). The total market value of such securities as of March 31, 2019 was $11,386 ($ Thousands). |
ADR — American Depositary Receipt
Cl — Class
L.P. — Limited Partnership
Ltd. — Limited
PLC — Public Limited Company
The following is a list of the level of inputs used as of March 31, 2019, in valuing the Fund’s investments and other financial instruments carried at value ($ Thousands):
| | | | | | | | | | | | | | | | |
| Investments in Securities | | Level 1 | | | Level 2 | | Level 3 | | Total | |
Common Stock | | $ | 303,871 | | | $ | – | | | $ | – | | | $ | 303,871 | |
Affiliated Partnership | | | – | | | | 11,386 | | | | – | | | | 11,386 | |
Cash Equivalent | | | 22,993 | | | | – | | | | – | | | | 22,993 | |
| | | | | | | | | | | | | | | | |
Total Investments in Securities | | $ | 326,864 | | | $ | 11,386 | | | $ | – | | | $ | 338,250 | |
| | | | | | | | | | | | | | | | |
| | | | | | | | | | | | | | | | |
| Other Financial Instruments | | Level 1 | | | Level 2 | | Level 3 | | Total | |
Futures Contracts * | | | | | | | | | | | | | | | | |
Unrealized Appreciation | | $ | 133 | | | $ | — | | | $ | — | | | $ | 133 | |
| | | | | | | | | | | | | | | | |
Total Other Financial Instruments | | $ | 133 | | | $ | — | | | $ | — | | | $ | 133 | |
| | | | | | | | | | | | | | | | |
*Futures contracts are valued at the unrealized appreciation on the instrument.
For the period ended March 31, 2019, there were no transfers between Level 1 and Level 2 assets and liabilities.
For the period ended March 31, 2019, there were no transfers between Level 2 and Level 3 assets and liabilities.
For more information on valuation inputs, see Note 2 — Significant Accounting Policies in Notes to Financial Statements.
| | | | |
SEI Institutional Managed Trust / Semi-Annual Report / March 31, 2019 | | | 5 | |
SCHEDULE OF INVESTMENTS (Unaudited)
March 31, 2019
Small Cap Value Fund(Continued)
The following is a summary of the Fund’s transactions with affiliates for the period ended March 31, 2019 ($ Thousands):
| | | | | | | | | | | | | | | | | | | | | | | | | | | | |
| Security Description | | Value 9/30/18 | | Purchases at
Cost | | Proceeds from
Sales | | Realized Gain | | Change in Unrealized Depreciation | | Value 3/31/19 | | Income |
SEI Liquidity Fund, L.P. | | | $ 57,595 | | | | $ 31,480 | | | | $ (77,717) | | | | $ 23 | | | | $ 5 | | | | $ 11,386 | | | | $ 113 | |
SEI Daily Income Trust, Government Fund, Cl F | | | 10,473 | | | | 50,203 | | | | (37,683) | | | | — | | | | — | | | | 22,993 | | | | 94 | |
| | | | | | | | | | | | | | | | | | | | | | | | | | | | |
Totals | | | $ 68,068 | | | | $ 81,683 | | | | $ (115,400) | | | | $ 23 | | | | $ 5 | | | | $ 34,379 | | | | $ 207 | |
| | | | | | | | | | | | | | | | | | | | | | | | | | | | |
Amounts designated as “—” are either $0 or have been rounded to $0.
The accompanying notes are an integral part of the financial statements.
| | |
| 6 | | SEI Institutional Managed Trust / Semi-Annual Report / March 31, 2019 |
SCHEDULE OF INVESTMENTS (Unaudited)
March 31, 2019
Small Cap Growth Fund(Continued)
| | | | | | | | |
| | | |
| Description | | Shares | | | Market Value
($ Thousands) | |
| | |
COMMON STOCK — 97.6% | | | | | | | | |
| |
Communication Services — 3.6% | | | | | |
Bandwidth Inc, Cl A * | | | 5,872 | | | $ | 393 | |
Boingo Wireless Inc * | | | 50,632 | | | | 1,179 | |
Care.com Inc * | | | 1,733 | | | | 34 | |
Cargurus Inc, Cl A * | | | 22,907 | | | | 918 | |
Cinemark Holdings Inc | | | 29,633 | | | | 1,185 | |
Eventbrite Inc, Cl A * | | | 13,323 | | | | 255 | |
Meet Group Inc/The * | | | 107,662 | | | | 541 | |
National CineMedia Inc | | | 116,459 | | | | 821 | |
New York Times Co/The, Cl A | | | 10,083 | | | | 331 | |
Nexstar Media Group Inc, Cl A | | | 4,900 | | | | 531 | |
Ooma Inc * | | | 2,126 | | | | 28 | |
Pareteum Corp * | | | 71,339 | | | | 325 | |
QuinStreet Inc * | | | 4,347 | | | | 58 | |
Rosetta Stone Inc * | | | 16,800 | | | | 367 | |
Shenandoah Telecommunications Co | | | 13,496 | | | | 599 | |
Sinclair Broadcast Group Inc, Cl A | | | 14,924 | | | | 574 | |
TechTarget Inc * | | | 48,534 | | | | 790 | |
Travelzoo * | | | 2,849 | | | | 38 | |
TrueCar Inc * | | | 58,743 | | | | 390 | |
Vonage Holdings Corp * | | | 131,394 | | | | 1,319 | |
WideOpenWest Inc * | | | 5,795 | | | | 53 | |
World Wrestling Entertainment Inc, Cl A | | | 4,570 | | | | 397 | |
Yelp Inc, Cl A * | | | 15,433 | | | | 532 | |
Zynga Inc, Cl A * | | | 87,000 | | | | 464 | |
| | |
| | | | | | | 12,122 | |
| |
Consumer Discretionary — 14.3% | | | | | |
Abercrombie & Fitch Co, Cl A | | | 20,473 | | | | 561 | |
American Eagle Outfitters Inc | | | 9,225 | | | | 204 | |
Asbury Automotive Group Inc * | | | 12,542 | | | | 870 | |
Boot Barn Holdings Inc * | | | 22,706 | | | | 668 | |
Bright Horizons Family Solutions Inc * | | | 3,120 | | | | 397 | |
Brinker International Inc (A) | | | 16,873 | | | | 749 | |
Callaway Golf Co | | | 5,537 | | | | 88 | |
Carter’s Inc | | | 13,896 | | | | 1,401 | |
Chegg Inc * | | | 27,342 | | | | 1,042 | |
Chuy’s Holdings Inc * | | | 28,218 | | | | 643 | |
Clarus Corp | | | 44,441 | | | | 569 | |
Columbia Sportswear Co | | | 3,600 | | | | 375 | |
Conn’s Inc *(A) | | | 53,161 | | | | 1,215 | |
Cooper-Standard Holdings Inc * | | | 10,410 | | | | 489 | |
Crocs Inc * | | | 41,862 | | | | 1,078 | |
Dana Inc | | | 32,867 | | | | 583 | |
Deckers Outdoor Corp * | | | 4,718 | | | | 693 | |
Denny’s Corp, Cl A * | | | 21,356 | | | | 392 | |
Dine Brands Global Inc | | | 9,923 | | | | 906 | |
DSW Inc, Cl A | | | 440 | | | | 10 | |
Eldorado Resorts Inc * | | | 53,272 | | | | 2,487 | |
Etsy Inc * | | | 13,163 | | | | 885 | |
Five Below Inc * | | | 2,885 | | | | 358 | |
Fox Factory Holding Corp * | | | 10,585 | | | | 740 | |
| | | | | | | | |
| | | |
| Description | | Shares | | | Market Value
($ Thousands) | |
| | |
COMMON STOCK (continued) | | | | | | | | |
Funko Inc, Cl A * | | | 27,836 | | | $ | 605 | |
Grand Canyon Education Inc * | | | 28,933 | | | | 3,313 | |
Gray Television Inc * | | | 35,145 | | | | 751 | |
Haverty Furniture Cos Inc | | | 2,936 | | | | 64 | |
Installed Building Products Inc * | | | 12,605 | | | | 611 | |
iRobot Corp *(A) | | | 6,599 | | | | 777 | |
Jack in the Box Inc | | | 25,675 | | | | 2,081 | |
K12 Inc * | | | 38,290 | | | | 1,307 | |
La-Z-Boy Inc, Cl Z | | | 18,918 | | | | 624 | |
Malibu Boats Inc, Cl A * | | | 27,042 | | | | 1,070 | |
Marine Products Corp (A) | | | 1,832 | | | | 25 | |
MasterCraft Boat Holdings Inc * | | | 3,136 | | | | 71 | |
Monro Inc (A) | | | 3,867 | | | | 335 | |
Movado Group Inc | | | 3,657 | | | | 133 | |
Planet Fitness Inc, Cl A * | | | 10,674 | | | | 733 | |
Playa Hotels & Resorts NV * | | | 114,570 | | | | 874 | |
PlayAGS Inc * | | | 150,505 | | | | 3,602 | |
Rent-A-Center Inc/TX * | | | 10,816 | | | | 226 | |
RH *(A) | | | 735 | | | | 76 | |
Rocky Brands Inc | | | 1,588 | | | | 38 | |
RTW RetailWinds Inc * | | | 9,937 | | | | 24 | |
Ruth’s Hospitality Group Inc | | | 3,900 | | | | 100 | |
Sally Beauty Holdings Inc *(A) | | | 123,589 | | | | 2,275 | |
SeaWorld Entertainment Inc * | | | 22,044 | | | | 568 | |
ServiceMaster Global Holdings Inc * | | | 7,840 | | | | 366 | |
Shoe Carnival Inc (A) | | | 18,253 | | | | 621 | |
Shutterstock Inc * | | | 33,943 | | | | 1,583 | |
Skechers U.S.A. Inc, Cl A * | | | 98,110 | | | | 3,297 | |
Skyline Champion Corp * | | | 1,711 | | | | 32 | |
Sleep Number Corp * | | | 23,554 | | | | 1,107 | |
Strategic Education Inc | | | 12,732 | | | | 1,672 | |
Town Sports International Holdings Inc * | | | 3,148 | | | | 15 | |
Turtle Beach Corp *(A) | | | 1,727 | | | | 20 | |
Vera Bradley Inc * | | | 8,331 | | | | 110 | |
Wingstop Inc, Cl A | | | 5,800 | | | | 441 | |
Wolverine World Wide Inc | | | 22,042 | | | | 788 | |
YETI Holdings Inc *(A) | | | 17,500 | | | | 529 | |
| | |
| | | | | | | 48,267 | |
| | |
Consumer Staples — 1.7% | | | | | | | | |
BJ’s Wholesale Club Holdings Inc * | | | 24,261 | | | | 665 | |
Boston Beer Co Inc/The, Cl A * | | | 1,940 | | | | 572 | |
Central Garden & Pet Co, Cl A * | | | 47,320 | | | | 1,100 | |
Chefs’ Warehouse Inc/The * | | | 2,720 | | | | 85 | |
Freshpet Inc * | | | 8,473 | | | | 358 | |
Lancaster Colony Corp | | | 236 | | | | 37 | |
Medifast Inc | | | 5,405 | | | | 689 | |
Natural Grocers by Vitamin Cottage Inc * | | | 4,343 | | | | 52 | |
Performance Food Group Co * | | | 14,959 | | | | 593 | |
Simply Good Foods Co/The * | | | 54,533 | | | | 1,123 | |
TreeHouse Foods Inc * | | | 6,300 | | | | 407 | |
USANA Health Sciences Inc *(A) | | | 1,612 | | | | 135 | |
| | | | |
SEI Institutional Managed Trust / Semi-Annual Report / March 31, 2019 | | | 1 | |
SCHEDULE OF INVESTMENTS (Unaudited)
March 31, 2019
Small Cap Growth Fund(Continued)
| | | | | | | | |
| | | |
| Description | | Shares | | | Market Value
($ Thousands) | |
| | |
COMMON STOCK (continued) | | | | | | | | |
Village Super Market Inc, Cl A | | | 1,919 | | | $ | 52 | |
WD-40 Co (A) | | | – | | | | — | |
| | |
| | | | | | | 5,868 | |
| | |
Energy — 1.9% | | | | | | | | |
Adams Resources & Energy Inc | | | 764 | | | | 30 | |
Arch Coal Inc | | | 473 | | | | 43 | |
Archrock Inc | | | 56,759 | | | | 555 | |
C&J Energy Services Inc * | | | 35,399 | | | | 549 | |
Carrizo Oil & Gas Inc * | | | 48,093 | | | | 600 | |
DMC Global Inc | | | 8,100 | | | | 402 | |
Energy Fuels Inc/Canada * | | | 21,919 | | | | 73 | |
Evolution Petroleum Corp | | | 50,369 | | | | 340 | |
GasLog Ltd | | | 37,461 | | | | 654 | |
Gulfport Energy Corp * | | | 8,282 | | | | 66 | |
Helix Energy Solutions Group Inc * | | | 22,953 | | | | 182 | |
McDermott International Inc * | | | 67,539 | | | | 503 | |
NCS Multistage Holdings Inc *(A) | | | 89,855 | | | | 465 | |
ProPetro Holding Corp * | | | 61,379 | | | | 1,384 | |
Renewable Energy Group Inc * | | | 1,123 | | | | 25 | |
RigNet Inc, Cl A * | | | 32,151 | | | | 314 | |
W&T Offshore Inc * | | | 26,108 | | | | 180 | |
| | |
| | | | | | | 6,365 | |
| | |
Financials — 9.0% | | | | | | | | |
American Equity Investment Life Holding Co | | | 19,170 | | | | 518 | |
American National Bankshares Inc | | | 1,164 | | | | 41 | |
Arbor Realty Trust Inc (A) | | | 14,171 | | | | 184 | |
Argo Group International Holdings Ltd | | | 8,487 | | | | 600 | |
Atlantic Capital Bancshares Inc * | | | 5,908 | | | | 105 | |
Bank of Commerce Holdings | | | 6,142 | | | | 65 | |
Bank of Marin Bancorp | | | 1,462 | | | | 60 | |
Baycom Corp * | | | 2,942 | | | | 67 | |
Bridge Bancorp Inc | | | 3,559 | | | | 104 | |
Bridgewater Bancshares Inc * | | | 1,926 | | | | 20 | |
Brookline Bancorp Inc, Cl A | | | 37,888 | | | | 546 | |
Cambridge Bancorp | | | 425 | | | | 35 | |
Cannae Holdings Inc * | | | 14,792 | | | | 359 | |
Capstar Financial Holdings Inc | | | 2,787 | | | | 40 | |
Capstead Mortgage Corp ‡ | | | 69,285 | | | | 595 | |
CBTX Inc | | | 4,016 | | | | 130 | |
Central Pacific Financial Corp | | | 5,023 | | | | 145 | |
Century Bancorp Inc/MA, Cl A | | | 808 | | | | 59 | |
CNO Financial Group Inc | | | 1,177 | | | | 19 | |
CVB Financial Corp | | | 26,314 | | | | 554 | |
Dynex Capital Inc ‡ | | | 3,000 | | | | 18 | |
eHealth Inc * | | | 6,273 | | | | 391 | |
Enova International Inc * | | | 31,085 | | | | 709 | |
Enterprise Financial Services Corp | | | 15,530 | | | | 633 | |
Essent Group Ltd * | | | 19,570 | | | | 850 | |
Evercore Inc, Cl A | | | 6,489 | | | | 591 | |
EZCORP Inc, Cl A * | | | 57,000 | | | | 531 | |
| | | | | | | | |
| | | |
| Description | | Shares | | | Market Value
($ Thousands) | |
| | |
COMMON STOCK (continued) | | | | | | | | |
Federal Agricultural Mortgage Corp, Cl C | | | 1,193 | | | $ | 86 | |
FGL Holdings | | | 65,364 | | | | 515 | |
First BanCorp/Puerto Rico | | | 96,695 | | | | 1,108 | |
First Citizens BancShares Inc/NC, Cl A | | | 568 | | | | 231 | |
First Financial Corp/IN | | | 3,135 | | | | 132 | |
First Midwest Bancorp Inc/IL | | | 26,700 | | | | 546 | |
First Northwest Bancorp | | | 2,973 | | | | 46 | |
Franklin Financial Network Inc | | | 1,735 | | | | 50 | |
Genworth Financial Inc, Cl A * | | | 5,784 | | | | 22 | |
Great Southern Bancorp Inc | | | 1,470 | | | | 76 | |
Great Western Bancorp Inc | | | 15,292 | | | | 483 | |
Green Dot Corp, Cl A * | | | 14,014 | | | | 850 | |
Greenhill & Co Inc (A) | | | 3,929 | | | | 85 | |
GS Acquisition Holdings Corp *(B) | | | 97,986 | | | | 1,028 | |
Hamilton Lane Inc, Cl A | | | 4,152 | | | | 181 | |
Health Insurance Innovations Inc, Cl A *(A) | | | 48,964 | | | | 1,313 | |
Heritage Commerce Corp | | | 3,995 | | | | 48 | |
Home BancShares Inc/AR | | | 48,072 | | | | 845 | |
IBERIABANK Corp | | | 8,110 | | | | 582 | |
Independent Bank Corp/MI | | | 2,784 | | | | 60 | |
INTL. FCStone Inc * | | | 2,169 | | | | 84 | |
Investors Bancorp Inc | | | 50,312 | | | | 596 | |
Kemper Corp, Cl A | | | 801 | | | | 61 | |
LegacyTexas Financial Group Inc | | | 5,418 | | | | 203 | |
LPL Financial Holdings Inc | | | 5,258 | | | | 366 | |
Metropolitan Bank Holding Corp * | | | 1,866 | | | | 65 | |
MGIC Investment Corp * | | | 49,109 | | | | 648 | |
Moelis & Co, Cl A | | | 12,700 | | | | 529 | |
National General Holdings Corp | | | 5,475 | | | | 130 | |
NMI Holdings Inc, Cl A * | | | 15,505 | | | | 401 | |
Oak Valley Bancorp | | | 2,225 | | | | 39 | |
OFG Bancorp | | | 42,502 | | | | 841 | |
Old Second Bancorp Inc | | | 3,597 | | | | 45 | |
On Deck Capital Inc * | | | 11,862 | | | | 64 | |
One Madison Corp *(B) | | | 97,686 | | | | 1,042 | |
Oritani Financial Corp | | | 8,652 | | | | 144 | |
Pacific Mercantile Bancorp * | | | 4,935 | | | | 38 | |
Parke Bancorp Inc | | | 2,638 | | | | 55 | |
PCSB Financial Corp | | | 5,206 | | | | 102 | |
PennantPark Investment Corp (A) | | | 97,395 | | | | 673 | |
PennyMac Financial Services Inc * | | | 3,276 | | | | 73 | |
PennyMac Mortgage Investment Trust ‡ | | | 6,777 | | | | 140 | |
Primerica Inc | | | 584 | | | | 71 | |
Provident Financial Services Inc | | | 21,836 | | | | 565 | |
Radian Group Inc | | | 41,778 | | | | 867 | |
Republic Bancorp Inc/KY, Cl A | | | 2,618 | | | | 117 | |
Spirit of Texas Bancshares Inc * | | | 959 | | | | 20 | |
Sterling Bancorp/DE | | | 30,700 | | | | 572 | |
Stock Yards Bancorp Inc | | | 2,203 | | | | 75 | |
TPG Pace Holdings Corp *(B) | | | 91,116 | | | | 971 | |
TriState Capital Holdings Inc * | | | 5,946 | | | | 122 | |
Trupanion Inc *(A) | | | 21,668 | | | | 709 | |
| | |
| 2 | | SEI Institutional Managed Trust / Semi-Annual Report / March 31, 2019 |
SCHEDULE OF INVESTMENTS (Unaudited)
March 31, 2019
Small Cap Growth Fund(Continued)
| | | | | | | | |
| | | |
| Description | | Shares | | | Market Value
($ Thousands) | |
| | |
COMMON STOCK (continued) | | | | | | | | |
United Community Banks Inc/GA | | | 21,000 | | | $ | 524 | |
Unity Bancorp Inc | | | 2,300 | | | | 44 | |
Value Creation *(C)(D)(E) | | | 145,600 | | | | 57 | |
Veritex Holdings Inc | | | 21,026 | | | | 509 | |
Waddell & Reed Financial Inc, Cl A (A) | | | 11,404 | | | | 197 | |
Walker & Dunlop Inc | | | 11,690 | | | | 595 | |
Wintrust Financial Corp | | | 13,594 | | | | 915 | |
WisdomTree Investments Inc | | | 141,841 | | | | 1,001 | |
| | |
| | | | | | | 30,526 | |
| | |
Health Care — 19.5% | | | | | | | | |
Accelerate Diagnostics Inc *(A) | | | 27,848 | | | | 585 | |
Albireo Pharma Inc * | | | 22,494 | | | | 725 | |
Amedisys Inc * | | | 5,988 | | | | 738 | |
Antares Pharma Inc * | | | 41,193 | | | | 125 | |
Argenx SE ADR * | | | 5,198 | | | | 649 | |
Array BioPharma Inc * | | | 23,000 | | | | 561 | |
Arrowhead Pharmaceuticals Inc *(A) | | | 33,392 | | | | 613 | |
Axogen Inc * | | | 43,711 | | | | 921 | |
Axsome Therapeutics Inc *(A) | | | 26,809 | | | | 381 | |
BioCryst Pharmaceuticals Inc * | | | 36,329 | | | | 296 | |
BioDelivery Sciences International Inc * | | | 71,000 | | | | 376 | |
Biohaven Pharmaceutical Holding Co Ltd * | | | 7,767 | | | | 400 | |
BioSpecifics Technologies Corp * | | | 1,585 | | | | 99 | |
BioTelemetry Inc * | | | 36,323 | | | | 2,275 | |
Cardiovascular Systems Inc * | | | 48,137 | | | | 1,861 | |
CareDx Inc * | | | 25,340 | | | | 799 | |
Castlight Health Inc, Cl B * | | | 5,551 | | | | 21 | |
Catalyst Pharmaceuticals Inc * | | | 68,708 | | | | 350 | |
Chemed Corp | | | 1,696 | | | | 543 | |
ChemoCentryx Inc * | | | 45,141 | | | | 627 | |
Chimerix Inc * | | | 212,615 | | | | 446 | |
Codexis Inc * | | | 16,033 | | | | 329 | |
Collegium Pharmaceutical Inc * | | | 1,069 | | | | 16 | |
CONMED Corp | | | 8,775 | | | | 730 | |
Corcept Therapeutics Inc *(A) | | | 4,174 | | | | 49 | |
CorVel Corp * | | | 1,384 | | | | 90 | |
CryoLife Inc * | | | 18,891 | | | | 551 | |
DBV Technologies SA ADR * | | | 51,940 | | | | 400 | |
Deciphera Pharmaceuticals Inc * | | | 21,689 | | | | 503 | |
Dermira Inc * | | | 25,500 | | | | 346 | |
Eagle Pharmaceuticals Inc/DE *(A) | | | 2,453 | | | | 124 | |
Editas Medicine Inc *(A) | | | 21,212 | | | | 519 | |
Emergent BioSolutions * | | | 16,340 | | | | 825 | |
Endo International PLC * | | | 10,934 | | | | 88 | |
Endologix Inc *(A) | | | 18,342 | | | | 121 | |
Ensign Group Inc/The | | | 20,670 | | | | 1,058 | |
Evolus Inc *(A) | | | 11,500 | | | | 260 | |
Fluidigm Corp * | | | 39,000 | | | | 518 | |
Genomic Health Inc * | | | 15,650 | | | | 1,096 | |
Glaukos Corp *(A) | | | 5,900 | | | | 462 | |
Guardant Health Inc *(A) | | | 3,929 | | | | 301 | |
| | | | | | | | |
| | | |
| Description | | Shares | | | Market Value
($ Thousands) | |
| | |
COMMON STOCK (continued) | | | | | | | | |
Halozyme Therapeutics Inc * | | | 37,193 | | | $ | 599 | |
HealthEquity Inc * | | | 7,664 | | | | 567 | |
Heron Therapeutics Inc *(A) | | | 24,568 | | | | 600 | |
Hill-Rom Holdings Inc | | | 3,700 | | | | 392 | |
HMS Holdings Corp * | | | 18,777 | | | | 556 | |
Horizon Pharma Plc * | | | 17,560 | | | | 464 | |
Immune Design Corp * | | | 7,171 | | | | 42 | |
ImmunoGen Inc * | | | 104,646 | | | | 284 | |
Immunomedics Inc *(A) | | | 35,302 | | | | 678 | |
Innoviva Inc * | | | 6,087 | | | | 85 | |
Inogen Inc * | | | 1,261 | | | | 120 | |
Inspire Medical Systems Inc * | | | 6,736 | | | | 382 | |
Insulet Corp * | | | 6,386 | | | | 607 | |
Integer Holdings Corp * | | | 10,055 | | | | 758 | |
Integra LifeSciences Holdings Corp * | | | 31,928 | | | | 1,779 | |
Invitae Corp * | | | 18,321 | | | | 429 | |
iRadimed Corp * | | | 1,278 | | | | 36 | |
Kiniksa Pharmaceuticals Ltd, Cl A *(A) | | | 26,328 | | | | 475 | |
Kodiak Sciences Inc * | | | 74,437 | | | | 486 | |
LHC Group Inc * | | | 3,646 | | | | 404 | |
Ligand Pharmaceuticals Inc *(A) | | | 17,707 | | | | 2,226 | |
Liquidia Technologies Inc * | | | 47,067 | | | | 536 | |
MacroGenics Inc * | | | 27,019 | | | | 486 | |
Mallinckrodt PLC * | | | 26,000 | | | | 565 | |
Masimo Corp * | | | 5,402 | | | | 747 | |
Medidata Solutions Inc * | | | 13,282 | | | | 973 | |
Medpace Holdings Inc *(A) | | | 3,826 | | | | 226 | |
Meridian Bioscience Inc | | | 6,066 | | | | 107 | |
Merit Medical Systems Inc * | | | 45,746 | | | | 2,828 | |
Mersana Therapeutics Inc *(A) | | | 110,949 | | | | 584 | |
Mirati Therapeutics Inc * | | | 4,188 | | | | 307 | |
Myriad Genetics Inc * | | | 2,329 | | | | 77 | |
NanoString Technologies Inc * | | | 18,064 | | | | 432 | |
NeoGenomics Inc * | | | 94,313 | | | | 1,930 | |
Neon Therapeutics Inc * | | | 34,969 | | | | 226 | |
Nevro Corp * | | | 20,460 | | | | 1,279 | |
NextGen Healthcare Inc * | | | 7,722 | | | | 130 | |
Novocure Ltd * | | | 9,002 | | | | 434 | |
Nuvectra Corp * | | | 41,231 | | | | 454 | |
Omnicell Inc * | | | 18,890 | | | | 1,527 | |
Orchard Therapeutics plc ADR *(A) | | | 34,776 | | | | 622 | |
Pacific Biosciences of California Inc * | | | 93,193 | | | | 674 | |
Pacira Pharmaceuticals Inc/DE * | | | 883 | | | | 34 | |
PDL BioPharma Inc * | | | 33,194 | | | | 123 | |
Precision BioSciences Inc * | | | 12,400 | | | | 223 | |
Prestige Consumer Healthcare Inc, Cl A * | | | 34,456 | | | | 1,031 | |
Quidel Corp * | | | 12,922 | | | | 846 | |
R1 RCM Inc * | | | 68,873 | | | | 666 | |
Ra Pharmaceuticals Inc * | | | 13,116 | | | | 294 | |
Reata Pharmaceuticals Inc, Cl A *(A) | | | 5,039 | | | | 431 | |
REGENXBIO Inc * | | | 9,861 | | | | 565 | |
Retrophin Inc * | | | 26,292 | | | | 595 | |
| | | | |
SEI Institutional Managed Trust / Semi-Annual Report / March 31, 2019 | | | 3 | |
SCHEDULE OF INVESTMENTS (Unaudited)
March 31, 2019
Small Cap Growth Fund(Continued)
| | | | | | | | |
| | | |
| Description | | Shares | | Market Value ($ Thousands) |
| | |
COMMON STOCK (continued) | | | | | | | | |
Revance Therapeutics Inc * | | | 32,289 | | | $ | 509 | |
Rhythm Pharmaceuticals Inc *(A) | | | 21,233 | | | | 582 | |
SeaSpine Holdings Corp * | | | 72,521 | | | | 1,094 | |
SIGA Technologies Inc *(A) | | | 8,560 | | | | 51 | |
STAAR Surgical Co * | | | 927 | | | | 32 | |
Supernus Pharmaceuticals Inc * | | | 3,208 | | | | 112 | |
Syneos Health Inc, Cl A * | | | 26,292 | | | | 1,361 | |
Tandem Diabetes Care Inc * | | | 6,861 | | | | 436 | |
TCR2 Therapeutics Inc * | | | 28,372 | | | | 495 | |
Tenet Healthcare Corp * | | | 20,991 | | | | 605 | |
US Physical Therapy Inc | | | 5,875 | | | | 617 | |
Vanda Pharmaceuticals Inc * | | | 8,233 | | | | 151 | |
Veracyte Inc * | | | 56,800 | | | | 1,421 | |
Vericel Corp * | | | 62,205 | | | | 1,089 | |
Viking Therapeutics Inc *(A) | | | 101,544 | | | | 1,009 | |
WaVe Life Sciences Ltd * | | | 16,518 | | | | 642 | |
Wright Medical Group NV * | | | 14,139 | | | | 445 | |
Xencor Inc * | | | 32,067 | | | | 996 | |
Xeris Pharmaceuticals Inc * | | | 52,705 | | | | 529 | |
| | |
| | | | | | | 65,874 | |
Industrials — 19.4% | | | | | | | | |
ABM Industries Inc | | | 41,424 | | | | 1,506 | |
Aerovironment Inc * | | | 1,703 | | | | 117 | |
Allegiant Travel Co, Cl A | | | 4,347 | | | | 563 | |
American Superconductor Corp * | | | 27,379 | | | | 352 | |
Apogee Enterprises Inc | | | 27,893 | | | | 1,046 | |
ArcBest Corp | | | 3,323 | | | | 102 | |
Armstrong World Industries Inc | | | 5,494 | | | | 436 | |
ASGN Inc * | | | 23,883 | | | | 1,516 | |
Atkore International Group Inc * | | | 39,627 | | | | 853 | |
Atlas Air Worldwide Holdings Inc * | | | 9,441 | | | | 477 | |
Axon Enterprise Inc * | | | 1,009 | | | | 55 | |
Badger Meter Inc | | | 6,700 | | | | 373 | |
Barrett Business Services Inc | | | 342 | | | | 26 | |
BMC Stock Holdings Inc * | | | 3,406 | | | | 60 | |
Brady Corp, Cl A | | | 8,409 | | | | 390 | |
Brink’s Co/The | | | 18,455 | | | | 1,392 | |
Casella Waste Systems Inc, Cl A * | | | 11,482 | | | | 408 | |
Chart Industries Inc * | | | 12,187 | | | | 1,103 | |
Cimpress NV * | | | 8,061 | | | | 646 | |
Clean Harbors Inc * | | | 36,900 | | | | 2,639 | |
Comfort Systems USA Inc | | | 1,403 | | | | 74 | |
Commercial Vehicle Group Inc * | | | 4,683 | | | | 36 | |
CompX International Inc | | | 2,624 | | | | 38 | |
Construction Partners Inc, Cl A * | | | 82,303 | | | | 1,051 | |
Continental Building Products Inc * | | | 4,296 | | | | 106 | |
DXP Enterprises Inc/TX * | | | 1,297 | | | | 50 | |
Dycom Industries Inc * | | | 13,378 | | | | 615 | |
EMCOR Group Inc | | | 11,945 | | | | 873 | |
Energy Recovery Inc *(A) | | | 10,255 | | | | 90 | |
Ennis Inc | | | 6,156 | | | | 128 | |
| | | | | | | | |
| | | |
| Description | | Shares | | Market Value ($ Thousands) |
| | |
COMMON STOCK (continued) | | | | | | | | |
Enphase Energy Inc * | | | 42,500 | | | $ | 392 | |
Federal Signal Corp | | | 24,844 | | | | 646 | |
Forrester Research Inc * | | | 24,276 | | | | 1,174 | |
Fortress Transportation & Infrastructure | | | | | | | | |
Investors LLC (F) | | | 104,624 | | | | 1,790 | |
Forward Air Corp | | | 18,961 | | | | 1,227 | |
FTI Consulting Inc * | | | 5,089 | | | | 391 | |
Generac Holdings Inc * | | | 12,564 | | | | 644 | |
Global Brass & Copper Holdings Inc | | | 2,514 | | | | 87 | |
Gorman-Rupp Co/The | | | 1,026 | | | | 35 | |
Graham Corp, Cl A | | | 31,263 | | | | 614 | |
Great Lakes Dredge & Dock Corp * | | | 12,887 | | | | 115 | |
H&E Equipment Services Inc | | | 19,698 | | | | 495 | |
Harsco Corp * | | | 6,768 | | | | 136 | |
Heartland Express Inc | | | 68,691 | | | | 1,324 | |
Heidrick & Struggles International Inc | | | 17,463 | | | | 669 | |
Herc Holdings Inc * | | | 13,500 | | | | 526 | |
Heritage-Crystal Clean Inc * | | | 87,988 | | | | 2,415 | |
Herman Miller Inc | | | 1,593 | | | | 56 | |
Hillenbrand Inc | | | 4,653 | | | | 193 | |
Hudson Technologies Inc *(A) | | | 187,525 | | | | 362 | |
ICF International Inc, Cl A | | | 15,609 | | | | 1,188 | |
InnerWorkings Inc * | | | 343,089 | | | | 1,242 | |
Insperity Inc, Cl A | | | 6,720 | | | | 831 | |
John Bean Technologies Corp, Cl A | | | 20,861 | | | | 1,917 | |
KBR Inc | | | 28,857 | | | | 551 | |
Kennametal Inc | | | 40,646 | | | | 1,494 | |
Kforce Inc | | | 3,328 | | | | 117 | |
Kirby Corp * | | | 27,176 | | | | 2,041 | |
Korn Ferry | | | 11,446 | | | | 513 | |
Kratos Defense & Security Solutions Inc * | | | 19,918 | | | | 311 | |
MasTec Inc * | | | 43,208 | | | | 2,078 | |
Matson Inc | | | 42,691 | | | | 1,541 | |
McGrath RentCorp | | | 11,499 | | | | 650 | |
Mercury Systems Inc * | | | 15,400 | | | | 987 | |
Meritor Inc * | | | 28,055 | | | | 571 | |
Moog Inc, Cl A | | | 7,095 | | | | 617 | |
MSC Industrial Direct Co Inc, Cl A | | | 15,021 | | | | 1,242 | |
Mueller Industries Inc | | | 2,506 | | | | 79 | |
Multi-Color Corp | | | 21,870 | | | | 1,091 | |
NOW Inc * | | | 3,469 | | | | 48 | |
Omega Flex Inc | | | 872 | | | | 66 | |
Park-Ohio Holdings Corp | | | 971 | | | | 31 | |
Proto Labs Inc * | | | 4,681 | | | | 492 | |
Rexnord Corp * | | | 21,700 | | | | 546 | |
Ritchie Bros Auctioneers Inc | | | 20,589 | | | | 700 | |
Rush Enterprises Inc, Cl A | | | 19,415 | | | | 812 | |
Saia Inc * | | | 12,755 | | | | 779 | |
SkyWest Inc | | | 4,180 | | | | 227 | |
SP Plus Corp * | | | 38,363 | | | | 1,309 | |
Spirit Airlines Inc * | | | 9,492 | | | | 502 | |
Steelcase Inc, Cl A | | | 13,240 | | | | 193 | |
| | |
| 4 | | SEI Institutional Managed Trust / Semi-Annual Report / March 31, 2019 |
SCHEDULE OF INVESTMENTS (Unaudited)
March 31, 2019
Small Cap Growth Fund(Continued)
| | | | | | | | |
| | | |
| Description | | Shares | | Market Value ($ Thousands) |
| | |
COMMON STOCK (continued) | | | | | | | | |
Tennant Co | | | 22,745 | | | $ | 1,412 | |
Tetra Tech Inc | | | 10,601 | | | | 632 | |
Titan Machinery Inc * | | | 4,873 | | | | 76 | |
Trex Co Inc * | | | 823 | | | | 51 | |
TriNet Group Inc * | | | 35,688 | | | | 2,132 | |
TrueBlue Inc * | | | 75,659 | | | | 1,789 | |
Universal Logistics Holdings Inc | | | 1,992 | | | | 39 | |
Vicor Corp * | | | 3,876 | | | | 120 | |
WageWorks Inc * | | | 38,240 | | | | 1,444 | |
Watts Water Technologies Inc, Cl A | | | 12,247 | | | | 990 | |
WillScot Corp, Cl A *(A) | | | 81,540 | | | | 904 | |
Woodward Inc | | | 5,300 | | | | 503 | |
| | |
| | | | | | | 65,270 | |
| | |
Information Technology — 21.5% | | | | | | | | |
2U Inc * | | | 28,503 | | | | 2,020 | |
3D Systems Corp *(A) | | | 50,170 | | | | 540 | |
A10 Networks Inc * | | | 11,606 | | | | 82 | |
Acacia Communications Inc * | | | 7,200 | | | | 413 | |
ACI Worldwide Inc * | | | 13,612 | | | | 448 | |
Actua Corp *(B)(C)(D) | | | 105,055 | | | | 67 | |
Alarm.com Holdings Inc * | | | 6,827 | | | | 443 | |
Alteryx Inc, Cl A * | | | 6,324 | | | | 530 | |
American Software Inc/GA, Cl A | | | 44,879 | | | | 536 | |
Anaplan Inc *(A) | | | 10,700 | | | | 421 | |
Appfolio Inc, Cl A * | | | 2,411 | | | | 192 | |
Aspen Technology Inc * | | | 2,755 | | | | 287 | |
Asure Software Inc *(A) | | | 82,434 | | | | 504 | |
Avalara Inc * | | | 7,500 | | | | 419 | |
AVX Corp | | | 12,041 | | | | 209 | |
Benefitfocus Inc *(A) | | | 11,618 | | | | 575 | |
Booz Allen Hamilton Holding Corp, Cl A | | | 6,350 | | | | 369 | |
Box Inc, Cl A * | | | 60,702 | | | | 1,172 | |
Cabot Microelectronics Corp | | | 8,284 | | | | 928 | |
CACI International Inc, Cl A * | | | 4,073 | | | | 741 | |
CalAmp Corp * | | | 71,448 | | | | 899 | |
Carbonite Inc * | | | 81,044 | | | | 2,011 | |
ChannelAdvisor Corp * | | | 44,548 | | | | 543 | |
Ciena Corp * | | | 16,985 | | | | 634 | |
CommVault Systems * | | | 8,606 | | | | 557 | |
Control4 Corp * | | | 4,918 | | | | 83 | |
Cornerstone OnDemand Inc * | | | 40,655 | | | | 2,227 | |
Coupa Software Inc * | | | 4,715 | | | | 429 | |
Cree Inc *(A) | | | 19,142 | | | | 1,095 | |
CSG Systems International Inc | | | 17,229 | | | | 729 | |
CTS Corp | | | 19,538 | | | | 574 | |
CyberArk Software Ltd * | | | 6,131 | | | | 730 | |
Diodes Inc * | | | 15,096 | | | | 524 | |
Domo Inc, Cl B * | | | 14,012 | | | | 565 | |
Echo Global Logistics Inc * | | | 5,754 | | | | 143 | |
Envestnet Inc * | | | 15,368 | | | | 1,005 | |
| | | | | | | | |
| | | |
| Description | | Shares | | Market Value ($ Thousands) |
| | |
COMMON STOCK (continued) | | | | | | | | |
Euronet Worldwide Inc * | | | 9,935 | | | $ | 1,417 | |
Everbridge Inc * | | | 27,496 | | | | 2,063 | |
Everi Holdings Inc * | | | 49,098 | | | | 517 | |
EVERTEC Inc | | | 10,318 | | | | 287 | |
Fabrinet * | | | 27,096 | | | | 1,419 | |
Fair Isaac Corp * | | | 1,470 | | | | 399 | |
FireEye Inc * | | | 160,592 | | | | 2,696 | |
Five9 Inc * | | | 48,007 | | | | 2,536 | |
ForeScout Technologies Inc * | | | 9,672 | | | | 405 | |
Glu Mobile Inc * | | | 46,010 | | | | 503 | |
HubSpot Inc * | | | 1,552 | | | | 258 | |
Insight Enterprises Inc * | | | 6,636 | | | | 365 | |
KEMET Corp | | | 11,103 | | | | 188 | |
Lattice Semiconductor Corp * | | | 41,618 | | | | 497 | |
Limelight Networks Inc * | | | 294,612 | | | | 952 | |
LivePerson Inc * | | | 39,644 | | | | 1,151 | |
LiveRamp Holdings Inc * | | | 6,172 | | | | 337 | |
LogMeIn Inc | | | 38,853 | | | | 3,112 | |
MAXIMUS Inc | | | 20,929 | | | | 1,486 | |
MKS Instruments Inc | | | 4,200 | | | | 391 | |
MobileIron Inc * | | | 22,167 | | | | 121 | |
Model N Inc * | | | 41,226 | | | | 723 | |
MongoDB Inc, Cl A * | | | 1,810 | | | | 266 | |
Nanometrics Inc * | | | 4,193 | | | | 130 | |
Napco Security Technologies Inc * | | | 4,070 | | | | 84 | |
NeoPhotonics Corp *(A) | | | 9,429 | | | | 59 | |
New Relic Inc * | | | 1,837 | | | | 181 | |
NIC Inc | | | 33,600 | | | | 574 | |
Novanta Inc * | | | 12,021 | | | | 1,019 | |
Paylocity Holding Corp * | | | 5,190 | | | | 463 | |
Perficient Inc * | | | 61,124 | | | | 1,674 | |
Photronics Inc * | | | 5,597 | | | | 53 | |
Plantronics Inc | | | 14,596 | | | | 673 | |
Presidio Inc | | | 93,410 | | | | 1,383 | |
Proofpoint Inc * | | | 18,232 | | | | 2,214 | |
PROS Holdings Inc * | | | 23,071 | | | | 975 | |
Q2 Holdings Inc * | | | 6,197 | | | | 429 | |
QAD Inc, Cl A | | | 13,817 | | | | 595 | |
Quantenna Communications Inc * | | | 7,326 | | | | 178 | |
Rambus Inc * | | | 57,984 | | | | 606 | |
Rapid7 Inc * | | | 6,778 | | | | 343 | |
RingCentral Inc, Cl A * | | | 3,951 | | | | 426 | |
Rogers Corp * | | | 2,430 | | | | 386 | |
Rubicon Project Inc/The * | | | 54,000 | | | | 328 | |
SailPoint Technologies Holding Inc * | | | 26,442 | | | | 759 | |
Sanmina Corp * | | | 29,858 | | | | 861 | |
SecureWorks Corp, Cl A *(A) | | | 2,302 | | | | 42 | |
SolarWinds Corp *(A) | | | 14,043 | | | | 274 | |
SPS Commerce Inc * | | | 11,714 | | | | 1,242 | |
SVMK Inc * | | | 51,005 | | | | 929 | |
Switch Inc, Cl A | | | 82,556 | | | | 851 | |
Sykes Enterprises Inc * | | | 5,173 | | | | 146 | |
| | | | |
SEI Institutional Managed Trust / Semi-Annual Report / March 31, 2019 | | | 5 | |
SCHEDULE OF INVESTMENTS (Unaudited)
March 31, 2019
Small Cap Growth Fund(Continued)
| | | | | | | | |
| | | |
| Description | | Shares | | Market Value ($ Thousands) |
| | |
COMMON STOCK (continued) | | | | | | | | |
SYNNEX Corp | | | 5,598 | | | $ | 534 | |
Tech Data Corp * | | | 7,702 | | | | 789 | |
Telaria Inc * | | | 65,000 | | | | 412 | |
Teradata Corp * | | | 5,734 | | | | 250 | |
Trade Desk Inc/The, Cl A *(A) | | | 2,584 | | | | 512 | |
Twilio Inc, Cl A * | | | 2,378 | | | | 307 | |
Unisys Corp *(A) | | | 54,382 | | | | 635 | |
Universal Display Corp (A) | | | 2,660 | | | | 407 | |
Upland Software Inc * | | | 22,453 | | | | 951 | |
Varonis Systems Inc * | | | 711 | | | | 42 | |
Verint Systems Inc * | | | 6,600 | | | | 395 | |
Viavi Solutions Inc * | | | 75,720 | | | | 937 | |
Vishay Intertechnology Inc | | | 170 | | | | 3 | |
Vishay Precision Group Inc * | | | 1,465 | | | | 50 | |
Workiva Inc, Cl A * | | | 10,157 | | | | 515 | |
Xperi Corp | | | 44,629 | | | | 1,044 | |
Zendesk Inc * | | | 5,576 | | | | 474 | |
Zix Corp * | | | 5,409 | | | | 37 | |
Zscaler Inc * | | | 8,207 | | | | 582 | |
| | |
| | | | | | | 72,486 | |
| | |
Materials — 1.2% | | | | | | | | |
Advanced Emissions Solutions Inc | | | 2,978 | | | | 34 | |
Balchem Corp | | | 5,900 | | | | 547 | |
Cleveland-Cliffs Inc (A) | | | 52,487 | | | | 524 | |
FutureFuel Corp | | | 7,061 | | | | 95 | |
Greif Inc, Cl A | | | 13,672 | | | | 564 | |
Ingevity Corp * | | | 7,638 | | | | 807 | |
Intrepid Potash Inc * | | | 3,352 | | | | 13 | |
Kraton Corp * | | | 16,024 | | | | 516 | |
Louisiana-Pacific Corp | | | 2,710 | | | | 66 | |
Materion Corp | | | 10,200 | | | | 582 | |
SunCoke Energy Inc * | | | 6,339 | | | | 54 | |
Warrior Met Coal Inc (A) | | | 7,802 | | | | 237 | |
| | |
| | | | | | | 4,039 | |
| | |
Real Estate — 4.3% | | | | | | | | |
Agree Realty Corp ‡ | | | 5,605 | | | | 389 | |
American Assets Trust Inc ‡ | | | 12,514 | | | | 574 | |
Americold Realty Trust ‡ | | | 34,418 | | | | 1,050 | |
CareTrust Inc ‡ | | | 33,502 | | | | 786 | |
Chesapeake Lodging Trust ‡ | | | 6,767 | | | | 188 | |
Clipper Realty Inc | | | 3,615 | | | | 48 | |
CoreCivic Inc ‡ | | | 28,381 | | | | 552 | |
Cousins Properties Inc, Cl A ‡ | | | 68,902 | | | | 666 | |
Cushman & Wakefield PLC *(A) | | | 8,567 | | | | 152 | |
EastGroup Properties Inc ‡ | | | 6,456 | | | | 721 | |
First Industrial Realty Trust Inc ‡ | | | 1,140 | | | | 40 | |
Franklin Street Properties Corp ‡ | | | 18,038 | | | | 130 | |
Gladstone Commercial Corp ‡ | | | 6,500 | | | | 135 | |
Hannon Armstrong Sustainable Infrastructure Capital Inc ‡(A) | | | 27,560 | | | | 707 | |
| | | | | | | | |
| | | |
| Description | | Shares | | Market Value ($ Thousands) |
| | |
COMMON STOCK (continued) | | | | | | | | |
Jernigan Capital Inc ‡ | | | 29,647 | | | $ | 624 | |
Lexington Realty Trust ‡ | | | 17,832 | | | | 162 | |
Marcus & Millichap Inc * | | | 19,074 | | | | 777 | |
Medical Properties Trust Inc ‡ | | | 86,325 | | | | 1,598 | |
National Storage Affiliates Trust ‡ | | | 17,732 | | | | 506 | |
NexPoint Residential Trust Inc ‡ | | | 11,375 | | | | 436 | |
NorthStar Realty Europe Corp ‡ | | | 5,988 | | | | 104 | |
Rexford Industrial Realty Inc ‡ | | | 16,930 | | | | 606 | |
RMR Group Inc/The | | | 2,185 | | | | 133 | |
Ryman Hospitality Properties Inc ‡ | | | 8,405 | | | | 691 | |
Safehold Inc | | | 2,992 | | | | 65 | |
STAG Industrial Inc ‡ | | | 6,302 | | | | 187 | |
Terreno Realty Corp ‡ | | | 24,053 | | | | 1,011 | |
Tier Inc ‡ | | | 39,232 | | | | 1,124 | |
Whitestone REIT, Cl B ‡ | | | 2,628 | | | | 32 | |
Xenia Hotels & Resorts Inc ‡ | | | 8,739 | | | | 191 | |
| | |
| | | | | | | 14,385 | |
| | |
Utilities — 1.2% | | | | | | | | |
AquaVenture Holdings Ltd * | | | 3,824 | | | | 74 | |
Atlantic Power Corp * | | | 12,173 | | | | 31 | |
Black Hills Corp, Cl A | | | 7,669 | | | | 568 | |
NorthWestern Corp | | | 8,398 | | | | 591 | |
ONE Gas Inc | | | 6,360 | | | | 566 | |
Pattern Energy Group Inc, Cl A | | | 24,624 | | | | 542 | |
PNM Resources Inc | | | 12,468 | | | | 590 | |
Portland General Electric Co | | | 5,904 | | | | 306 | |
Pure Cycle Corp * | | | 4,013 | | | | 40 | |
Spire Inc | | | 7,200 | | | | 592 | |
Vivint Solar Inc *(A) | | | 6,519 | | | | 33 | |
| | |
| | | | | | | 3,933 | |
| | |
Total Common Stock
(Cost $297,215) ($ Thousands) | | | | | | | 329,135 | |
| | |
| | | Number of
Warrants | | |
| |
WARRANTS — 0.0% | | | | | |
Magnolia Oil & Gas Corp, Expires 08/03/2023 | | | | | | | | |
Strike Price * | | | 31,731 | | | | 108 | |
| | |
Total Warrants
(Cost $79) ($ Thousands) | | | | | | | 108 | |
| | |
| 6 | | SEI Institutional Managed Trust / Semi-Annual Report / March 31, 2019 |
SCHEDULE OF INVESTMENTS (Unaudited)
March 31, 2019
Small Cap Growth Fund(Continued)
| | | | | | | | |
| | | |
| Description | | Shares | | Market Value ($ Thousands) |
| |
AFFILIATED PARTNERSHIP — 6.0% | | | | | |
SEI Liquidity Fund, L.P.
| | | | | | | | |
2.480% **†(G) | | | 20,173,837 | | | $ | 20,172 | |
| | |
Total Affiliated Partnership (Cost $20,173) ($ Thousands) | | | | | | | 20,172 | |
| | |
CASH EQUIVALENT — 2.5% | | | | | | | | |
SEI Daily Income Trust, Government Fund, Cl F | | | | | | | | |
2.220%**† | | | 8,325,467 | | | | 8,325 | |
Total Cash Equivalent (Cost $8,325) ($ Thousands) | | | | | | | 8,325 | |
| |
Total Investments in Securities — 106.1%
(Cost $325,792) ($ Thousands) | | | $ | 357,740 | |
| | | | | | | | |
| | Percentages are based on Net Assets of $337,109 ($ Thousands). |
| * | Non-income producing security. |
| ** | Rate shown is the7-day effective yield as of March 31, 2019. |
| ‡ | Real Estate Investment Trust. |
| † | Investment in Affiliated Security (see Note –). |
| (A) | Certain securities or partial positions of certain securities are on loan at March 31, 2019. The total market value of securities on loan at March 31, 2019 was $19,784 ($ Thousands). |
| (B) | Securities considered illiquid. The total value of such securities as of March 31, 2019 was $3,108 ($ Thousands) and represented 0.9% of the Net Assets of the Fund. |
| (C) | Security fair valued using methods determined in good faith by the Valuation Committee of the Board of Trustees. The total market value of such securities as of March 31, 2019 was $124 ($ Thousands) and represented 0.0% of the Net Assets of the Fund. |
| (D) | Level 3 security in accordance with fair value hierarchy. |
| (E) | Securities considered restricted. The total market value of such securities as of March 31, 2019 was $57 ($ Thousands) and represented 0.0% of the Net Assets of the Fund. |
| (F) | Security is a Master Limited Partnership. At March 31, 2019, such securities amounted to $1,790 ($ Thousands), or 0.5% of the net assets of the Fund. |
| (G) | This security was purchased with cash collateral held from securities on loan. The total market value of such securities as of March 31, 2019 was $20,172 ($ Thousands). |
ADR — American Depositary Receipt
Cl — Class
LLC — Limited Liability Company
L.P. — Limited Partnership
Ltd. — Limited
PLC — Public Limited Company
The following is a list of the level of inputs used as of March 31, 2019, in valuing the Fund’s investments and other financial instruments carried at value ($ Thousands):
| | | | | | | | | | | | | | | | |
| | | | | |
Investments in
Securities | | Level 1 | | Level 2 | | Level 3(1) | | Total |
Common Stock | | $ | 329,011 | | | $ | – | | | $ | 124 | | | $ | 329,135 | |
Warrants | | | 108 | | | | – | | | | – | | | | 108 | |
Affiliated Partnership | | | – | | | | 20,172 | | | | – | | | | 20,172 | |
Cash Equivalent | | | 8,325 | | | | – | | | | – | | | | 8,325 | |
| | | | | | | | | | | | | | | | |
Total Investments in Securities | | $ | 337,444 | | | $ | 20,172 | | | $ | 124 | | | $ | 357,740 | |
| | | | | | | | | | | | | | | | |
(1) A reconciliation of Level 3 investments is presented when the Fund has a significant amount of Level 3 investments at the beginning and/or end of the period in relation to net assets. Management has concluded that Level 3 investments are not material in relation to net assets.
For the period ended March 31, 2019, there were no transfers between Level 1 and Level 2 assets and liabilities.
For the period ended March 31, 2019, there were no transfers between Level 2 and Level 3 assets and liabilities.
For more information on valuation inputs, see Note 2 – Significant Accounting Policies in Notes to Financial Statements.
| | | | |
SEI Institutional Managed Trust / Semi-Annual Report / March 31, 2019 | | | 7 | |
SCHEDULE OF INVESTMENTS (Unaudited)
March 31, 2019
Small Cap Growth Fund(Continued)
The following is a summary of the Fund’s transactions with affiliates for the period ended March 31, 2019 ($ Thousands):
| | | | | | | | | | | | | | | | | | | | | | | | | | | | |
| Security Description | | Value
9/30/2018 | | Purchases at
Cost | | Proceeds from
Sales | | Realized Gain
(Loss) | | Change in
Unrealized
Appreciation
(Depreciation) | | | Value
3/31/2019 | | Income |
SEI Liquidity Fund, L.P. | | | $25,165 | | | | $57,683 | | | | $ (62,682) | | | | $5 | | | | $1 | | | | $20,172 | | | | $92 | |
SEI Daily Income Trust, Government Fund, CI F | | | 17,517 | | | | 59,948 | | | | (69,140) | | | | — | | | | — | | | | 8,325 | | | | 91 | |
| | | | | | | | | | | | | | | | | | | | | | | | | | | | |
Totals | | | $42,682 | | | | $117,631 | | | | $ (131,822) | | | | $5 | | | | $1 | | | | $28,497 | | | | $183 | |
| | | | | | | | | | | | | | | | | | | | | | | | | | | | |
Amounts designated as “—” are either $0 or have been rounded to $0.
The accompanying notes are an integral part of the financial statements.
| | |
| 8 | | SEI Institutional Managed Trust / Semi-Annual Report / March 31, 2019 |
SCHEDULE OF INVESTMENTS (Unaudited)
March 31, 2019
Tax-Managed Small/Mid Cap Fund(Continued)
| | | | | | | | |
| | | |
| Description | | Shares | | Market Value ($ Thousands) |
| | |
COMMON STOCK — 97.2% | | | | | | | | |
| | |
Communication Services — 3.7% | | | | | | | | |
AMC Networks Inc, Cl A *(A) | | | 7,465 | | | $ | 424 | |
Boingo Wireless Inc * | | | 49,670 | | | | 1,156 | |
Cable One Inc | | | 1,150 | | | | 1,129 | |
Cargurus Inc, Cl A * | | | 9,039 | | | | 362 | |
Cinemark Holdings Inc | | | 14,699 | | | | 588 | |
Cogent Communications Holdings Inc | | | 12,431 | | | | 674 | |
Criteo SA ADR * | | | 38,065 | | | | 762 | |
Electronic Arts Inc * | | | 6,830 | | | | 694 | |
EW Scripps Co/The, Cl A | | | 96,241 | | | | 2,021 | |
Gray Television Inc * | | | 27,368 | | | | 585 | |
Hemisphere Media Group Inc, Cl A * | | | 11,405 | | | | 161 | |
IAC/InterActiveCorp * | | | 56,249 | | | | 11,818 | |
IMAX * | | | 14,106 | | | | 320 | |
Interpublic Group of Cos Inc/The | | | 32,406 | | | | 681 | |
Liberty TripAdvisor Holdings Inc, Cl A * | | | 23,813 | | | | 338 | |
National CineMedia Inc | | | 68,393 | | | | 482 | |
Nexstar Media Group Inc, Cl A (A) | | | 47,039 | | | | 5,098 | |
Ooma Inc * | | | 37,532 | | | | 497 | |
Shenandoah Telecommunications Co | | | 26,011 | | | | 1,154 | |
Take-Two Interactive Software Inc, Cl A * | | | 5,083 | | | | 480 | |
TEGNA Inc | | | 13,762 | | | | 194 | |
Telephone & Data Systems Inc | | | 13,410 | | | | 412 | |
Vonage Holdings Corp * | | | 188,736 | | | | 1,895 | |
| | |
| | | | | | | 31,925 | |
| | |
Consumer Discretionary — 12.3% | | | | | | | | |
1-800-Flowers.com Inc, Cl A * | | | 42,193 | | | | 769 | |
Aaron’s Inc (A) | | | 15,577 | | | | 819 | |
Advance Auto Parts Inc | | | 14,346 | | | | 2,446 | |
American Public Education Inc * | | | 27,594 | | | | 831 | |
America’sCar-Mart Inc/TX * | | | 9,789 | | | | 894 | |
Asbury Automotive Group Inc * | | | 4,381 | | | | 304 | |
Autoliv Inc (A) | | | 2,900 | | | | 213 | |
Big Lots Inc | | | 136,893 | | | | 5,205 | |
BJ’s Restaurants Inc | | | 16,225 | | | | 767 | |
Bloomin’ Brands Inc | | | 143,909 | | | | 2,943 | |
Bright Horizons Family Solutions Inc * | | | 16,432 | | | | 2,089 | |
Brinker International Inc (A) | | | 36,526 | | | | 1,621 | |
Burlington Stores Inc * | | | 10,030 | | | | 1,571 | |
Carriage Services Inc | | | 10,488 | | | | 202 | |
Carrols Restaurant Group Inc * | | | 46,890 | | | | 467 | |
Cato Corp/The, Cl A | | | 11,995 | | | | 180 | |
Cheesecake Factory Inc/The (A) | | | 90,237 | | | | 4,414 | |
Chuy’s Holdings Inc * | | | 23,855 | | | | 543 | |
Cooper Tire & Rubber Co | | | 46,425 | | | | 1,388 | |
Core-Mark Holding Co Inc, Cl A | | | 19,584 | | | | 727 | |
Cracker Barrel Old Country Store Inc (A) | | | 595 | | | | 96 | |
Crocs Inc * | | | 3,698 | | | | 95 | |
Dave & Buster’s Entertainment Inc | | | 56,809 | | | | 2,833 | |
Del Taco Restaurants Inc * | | | 31,000 | | | | 312 | |
Denny’s Corp, Cl A * | | | 9,756 | | | | 179 | |
| | | | | | | | |
| | | |
| Description | | Shares | | Market Value ($ Thousands) |
| | |
COMMON STOCK (continued) | | | | | | | | |
Dick’s Sporting Goods Inc | | | 11,194 | | | $ | 412 | |
Dillard’s Inc, Cl A | | | 2,522 | | | | 182 | |
Dine Brands Global Inc (A) | | | 21,298 | | | | 1,944 | |
Domino’s Pizza Inc | | | 2,231 | | | | 576 | |
El Pollo Loco Holdings Inc * | | | 53,107 | | | | 691 | |
Etsy Inc * | | | 33,739 | | | | 2,268 | |
Extended Stay America Inc | | | 149,853 | | | | 2,690 | |
Fiesta Restaurant Group Inc * | | | 36,879 | | | | 483 | |
Five Below Inc * | | | 7,055 | | | | 877 | |
Foot Locker Inc, Cl A | | | 15,332 | | | | 929 | |
Gentherm Inc * | | | 44,944 | | | | 1,657 | |
Graham Holdings Co, Cl B | | | 1,200 | | | | 820 | |
Grand Canyon Education Inc * | | | 20,065 | | | | 2,298 | |
GrubHub Inc *(A) | | | 23,204 | | | | 1,612 | |
H&R Block Inc | | | 15,315 | | | | 367 | |
Hasbro Inc (A) | | | 7,072 | | | | 601 | |
Haverty Furniture Cos Inc | | | 26,391 | | | | 577 | |
K12 Inc * | | | 58,405 | | | | 1,993 | |
Laureate Education Inc, Cl A * | | | 17,337 | | | | 260 | |
LCI Industries | | | 24,809 | | | | 1,906 | |
Lear Corp | | | 6,085 | | | | 826 | |
Liberty Expedia Holdings Inc, Cl A * | | | 8,771 | | | | 375 | |
Lithia Motors Inc, Cl A (A) | | | 56,842 | | | | 5,272 | |
LKQ Corp * | | | 57,078 | | | | 1,620 | |
Modine Manufacturing Co * | | | 234,106 | | | | 3,247 | |
Movado Group Inc | | | 6,061 | | | | 220 | |
Office Depot Inc | | | 299,304 | | | | 1,086 | |
Ollie’s Bargain Outlet Holdings Inc * | | | 19,518 | | | | 1,665 | |
Oxford Industries Inc, Cl A (A) | | | 14,808 | | | | 1,114 | |
Penske Automotive Group Inc, Cl A | | | 9,286 | | | | 415 | |
Planet Fitness Inc, Cl A * | | | 45,731 | | | | 3,143 | |
Polaris Industries Inc | | | 9,333 | | | | 788 | |
Pool Corp | | | 24,064 | | | | 3,970 | |
Rent-A-Center Inc/TX * | | | 11,441 | | | | 239 | |
Ruth’s Hospitality Group Inc | | | 11,577 | | | | 296 | |
Shutterfly Inc * | | | 42,583 | | | | 1,731 | |
Six Flags Entertainment Corp | | | 126,299 | | | | 6,233 | |
Skechers U.S.A. Inc, Cl A * | | | 184,516 | | | | 6,202 | |
Standard Motor Products Inc | | | 2,012 | | | | 99 | |
Strategic Education Inc | | | 14,806 | | | | 1,944 | |
Sturm Ruger & Co Inc | | | 5,788 | | | | 307 | |
Texas Roadhouse Inc, Cl A | | | 17,057 | | | | 1,061 | |
Tractor Supply Co | | | 12,316 | | | | 1,204 | |
Ulta Beauty Inc * | | | 3,283 | | | | 1,145 | |
Vail Resorts Inc | | | 10,571 | | | | 2,297 | |
Veoneer Inc *(A) | | | 7,000 | | | | 160 | |
Wendy’s Co/The | | | 220,433 | | | | 3,944 | |
Whirlpool Corp | | | 5,200 | | | | 691 | |
| | |
| | | | | | | 106,345 | |
| | |
Consumer Staples — 5.1% | | | | | | | | |
Andersons Inc/The | | | 58,260 | | | | 1,878 | |
| | | | |
SEI Institutional Managed Trust / Semi-Annual Report / March 31, 2019 | | | 1 | |
SCHEDULE OF INVESTMENTS (Unaudited)
March 31, 2019
Tax-Managed Small/Mid Cap Fund(Continued)
| | | | | | | | |
| | | |
| Description | | Shares | | Market Value ($ Thousands) |
| | |
COMMON STOCK (continued) | | | | | | | | |
B&G Foods Inc, Cl A (A) | | | 140,633 | | | $ | 3,434 | |
Boston Beer Co Inc/The, Cl A * | | | 2,433 | | | | 717 | |
Cal-Maine Foods Inc (A) | | | 5,753 | | | | 257 | |
Central Garden & Pet Co, Cl A * | | | 25,607 | | | | 595 | |
Chefs’ Warehouse Inc/The * | | | 20,954 | | | | 651 | |
Coca-Cola Consolidated Inc | | | 2,500 | | | | 720 | |
Energizer Holdings Inc | | | 5,200 | | | | 234 | |
Flowers Foods Inc (A) | | | 83,104 | | | | 1,772 | |
Freshpet Inc * | | | 40,259 | | | | 1,702 | |
Hain Celestial Group Inc/The * | | | 178,101 | | | | 4,118 | |
Hostess Brands Inc, Cl A * | | | 455,006 | | | | 5,688 | |
Ingredion Inc | | | 7,843 | | | | 743 | |
J&J Snack Foods Corp | | | 7,030 | | | | 1,117 | |
John B Sanfilippo & Son Inc | | | 10,125 | | | | 728 | |
Kroger Co/The (A) | | | 19,039 | | | | 468 | |
Lamb Weston Holdings Inc | | | 34,188 | | | | 2,562 | |
Landec Corp * | | | 13,916 | | | | 171 | |
Performance Food Group Co * | | | 44,666 | | | | 1,770 | |
Pilgrim’s Pride Corp * | | | 215,356 | | | | 4,800 | |
Post Holdings Inc * | | | 8,519 | | | | 932 | |
Primo Water Corp * | | | 7,305 | | | | 113 | |
Seaboard Corp | | | 100 | | | | 428 | |
Spectrum Brands Holdings Inc (A) | | | 63,363 | | | | 3,471 | |
Tootsie Roll Industries Inc (A) | | | 25,993 | | | | 968 | |
TreeHouse Foods Inc * | | | 24,098 | | | | 1,555 | |
Universal Corp/VA | | | 2,729 | | | | 157 | |
US Foods Holding Corp * | | | 15,000 | | | | 524 | |
USANA Health Sciences Inc * | | | 4,731 | | | | 397 | |
WD-40 Co (A) | | | 6,900 | | �� | | 1,169 | |
Weis Markets Inc | | | 7,975 | | | | 325 | |
| | |
| | | | | | | 44,164 | |
| | |
Energy – 2.0% | | | | | | | | |
Arch Coal Inc | | | 4,232 | | | | 386 | |
Callon Petroleum Co *(A) | | | 332,281 | | | | 2,509 | |
Diamondback Energy Inc, Cl A (A) | | | 5,222 | | | | 530 | |
Frontline Ltd/Bermuda *(A) | | | 111,445 | | | | 720 | |
GasLog Ltd | | | 12,393 | | | | 216 | |
Gulfport Energy Corp * | | | 320,608 | | | | 2,571 | |
Marathon Petroleum Corp | | | 23,446 | | | | 1,403 | |
Par Pacific Holdings Inc * | | | 14,578 | | | | 260 | |
Parsley Energy Inc, Cl A * | | | 97,078 | | | | 1,874 | |
PBF Energy Inc, Cl A | | | 68,781 | | | | 2,142 | |
Pioneer Natural Resources Co | | | 2,474 | | | | 377 | |
Range Resources Corp (A) | | | 259,415 | | | | 2,916 | |
World Fuel Services Corp | | | 35,000 | | | | 1,011 | |
| | |
| | | | | | | 16,915 | |
| | |
Financials – 17.8% | | | | | | | | |
Affiliated Managers Group Inc | | | 31,446 | | | | 3,368 | |
AG Mortgage Investment Trust Inc | | | 14,512 | | | | 244 | |
Alleghany Corp * | | | 1,200 | | | | 735 | |
| | | | | | | | |
| | | |
| Description | | Shares | | Market Value ($ Thousands) |
| | |
COMMON STOCK (continued) | | | | | | | | |
Allstate Corp/The | | | 7,797 | | | $ | 734 | |
American Equity Investment Life Holding Co | | | 203,817 | | | | 5,507 | |
American Financial Group Inc | | | 14,643 | | | | 1,409 | |
American National Insurance Co | | | 8,233 | | | | 995 | |
Ameriprise Financial Inc | | | 4,701 | | | | 602 | |
AMERISAFE Inc | | | 11,659 | | | | 693 | |
Anworth Mortgage Asset Corp ‡ | | | 142,960 | | | | 578 | |
Arch Capital Group Ltd * | | | 10,008 | | | | 323 | |
Ares Commercial Real Estate Corp ‡ | | | 75,996 | | | | 1,154 | |
Argo Group International Holdings Ltd | | | 6,242 | | | | 441 | |
Assured Guaranty Ltd | | | 13,356 | | | | 593 | |
Atlantic Capital Bancshares Inc * | | | 33,171 | | | | 591 | |
Axis Capital Holdings Ltd | | | 13,323 | | | | 730 | |
Axos Financial Inc * | | | 57,790 | | | | 1,674 | |
BancFirst Corp | | | 13,798 | | | | 720 | |
Bancorp Inc/The * | | | 129,901 | | | | 1,050 | |
Bank of Marin Bancorp | | | 13,834 | | | | 563 | |
Bank OZK (A) | | | 97,587 | | | | 2,828 | |
BankUnited Inc | | | 179,461 | | | | 5,994 | |
Banner Corp | | | 2,218 | | | | 120 | |
BGC Partners Inc, Cl A | | | 672,412 | | | | 3,571 | |
Canadian Imperial Bank of Commerce | | | 3,321 | | | | 263 | |
Central Pacific Financial Corp | | | 41,371 | | | | 1,193 | |
CNO Financial Group Inc | | | 210,192 | | | | 3,401 | |
Columbia Banking System Inc (A) | | | 196,637 | | | | 6,428 | |
Community Trust Bancorp Inc | | | 20,468 | | | | 840 | |
Cowen Inc, Cl A * | | | 180,570 | | | | 2,616 | |
Dynex Capital Inc ‡ | | | 81,650 | | | | 497 | |
E*TRADE Financial Corp | | | 11,727 | | | | 544 | |
Eagle Bancorp Inc * | | | 29,167 | | | | 1,464 | |
East West Bancorp Inc | | | 21,214 | | | | 1,018 | |
Employers Holdings Inc | | | 17,888 | | | | 717 | |
Enterprise Financial Services Corp | | | 22,224 | | | | 906 | |
Erie Indemnity Co, Cl A | | | 5,000 | | | | 893 | |
Essent Group Ltd * | | | 30,000 | | | | 1,303 | |
Everest Re Group Ltd | | | 6,060 | | | | 1,309 | |
Exantas Capital Corp ‡ | | | 114,868 | | | | 1,221 | |
FBL Financial Group Inc, Cl A | | | 2,500 | | | | 157 | |
Fidelity Southern Corp | | | 20,478 | | | | 561 | |
Fifth Third Bancorp | | | 3,480 | | | | 88 | |
Financial Institutions Inc | | | 30,077 | | | | 817 | |
First American Financial Corp | | | 23,494 | | | | 1,210 | |
First BanCorp/Puerto Rico | | | 59,830 | | | | 686 | |
First Busey Corp | | | 37,603 | | | | 918 | |
First Citizens BancShares Inc/NC, Cl A | | | 1,150 | | | | 468 | |
First Commonwealth Financial Corp | | | 239,369 | | | | 3,016 | |
First Defiance Financial Corp | | | 36,128 | | | | 1,038 | |
First Interstate BancSystem Inc, Cl A | | | 19,006 | | | | 757 | |
First Merchants Corp | | | 92,308 | | | | 3,402 | |
FNB Corp/PA (A) | | | 315,391 | | | | 3,343 | |
Great Southern Bancorp Inc | | | 9,644 | | | | 501 | |
Great Western Bancorp Inc | | | 96,737 | | | | 3,056 | |
| | |
| 2 | | SEI Institutional Managed Trust / Semi-Annual Report / March 31, 2019 |
SCHEDULE OF INVESTMENTS (Unaudited)
March 31, 2019
Tax-Managed Small/Mid Cap Fund(Continued)
| | | | | | | | |
| | | |
| Description | | Shares | | Market Value ($ Thousands) |
| | |
COMMON STOCK (continued) | | | | | | | | |
Green Dot Corp, Cl A * | | | 25,420 | | | $ | 1,542 | |
Hanover Insurance Group Inc/The, Cl A | | | 25,705 | | | | 2,935 | |
HCI Group Inc | | | 7,712 | | | | 330 | |
HomeTrust Bancshares Inc | | | 3,694 | | | | 93 | |
Horace Mann Educators Corp, Cl A | | | 21,962 | | | | 773 | |
Horizon Bancorp Inc/IN | | | 9,767 | | | | 157 | |
Huntington Bancshares Inc | | | 97,198 | | | | 1,232 | |
Independent Bank Corp/MI | | | 30,442 | | | | 654 | |
Invesco Mortgage Capital Inc | | | 44,341 | | | | 701 | |
James River Group Holdings Ltd | | | 3,101 | | | | 124 | |
Kemper Corp, Cl A | | | 12,000 | | | | 914 | |
KKR Real Estate Finance Trust Inc ‡(A) | | | 56,183 | | | | 1,125 | |
Ladder Capital Corp, Cl A | | | 58,285 | | | | 992 | |
MarketAxess Holdings Inc (A) | | | 3,601 | | | | 886 | |
Mercantile Bank Corp | | | 2,955 | | | | 97 | |
Mercury General Corp | | | 9,712 | | | | 486 | |
Meridian Bancorp Inc | | | 27,019 | | | | 424 | |
National General Holdings Corp | | | 257,621 | | | | 6,113 | |
NBT Bancorp Inc | | | 22,329 | | | | 804 | |
NMI Holdings Inc, Cl A * | | | 37,080 | | | | 959 | |
Northwest Bancshares Inc | | | 72,630 | | | | 1,233 | |
OceanFirst Financial Corp | | | 37,999 | | | | 914 | |
OFG Bancorp | | | 219,022 | | | | 4,334 | |
Old Republic International Corp | | | 50,500 | | | | 1,056 | |
PacWest Bancorp | | | 280,427 | | | | 10,547 | |
PCSB Financial Corp | | | 9,084 | | | | 178 | |
PennyMac Mortgage Investment Trust ‡ | | | 10,214 | | | | 212 | |
Peoples Bancorp Inc/OH | | | 8,234 | | | | 255 | |
People’s United Financial Inc | | | 73,000 | | | | 1,200 | |
Popular Inc | | | 47,861 | | | | 2,495 | |
Provident Financial Services Inc | | | 54,717 | | | | 1,417 | |
Reinsurance Group of America Inc, Cl A | | | 13,096 | | | | 1,859 | |
RenaissanceRe Holdings Ltd | | | 8,320 | | | | 1,194 | |
Safety Insurance Group Inc | | | 8,465 | | | | 738 | |
Sandy Spring Bancorp Inc | | | 23,023 | | | | 720 | |
Selective Insurance Group Inc | | | 19,688 | | | | 1,246 | |
Signature Bank/New York NY, Cl B | | | 6,100 | | | | 781 | |
Starwood Property Trust Inc ‡ | | | 240,140 | | | | 5,367 | |
State Auto Financial Corp | | | 11,452 | | | | 377 | |
SVB Financial Group, Cl B * | | | 6,773 | | | | 1,506 | |
Synovus Financial Corp | | | 3,100 | | | | 107 | |
TCF Financial Corp | | | 55,027 | | | | 1,139 | |
Towne Bank/Portsmouth VA | | | 17,590 | | | | 435 | |
TPG RE Finance Trust Inc ‡ | | | 64,242 | | | | 1,259 | |
TriCo Bancshares | | | 11,381 | | | | 447 | |
Two Harbors Investment Corp ‡ | | | 7,503 | | | | 102 | |
UMH Properties ‡ | | | 31,140 | | | | 438 | |
Umpqua Holdings Corp | | | 294,810 | | | | 4,864 | |
United Bankshares Inc/WV | | | 49,000 | | | | 1,776 | |
United Financial Bancorp Inc | | | 42,740 | | | | 613 | |
Univest Financial Corp | | | 28,995 | | | | 709 | |
Walker & Dunlop Inc | | | 12,464 | | | | 635 | |
| | | | | | | | |
| | | |
| Description | | Shares | | Market Value ($ Thousands) |
| | |
COMMON STOCK (continued) | | | | | | | | |
Washington Trust Bancorp Inc | | | 18,370 | | | $ | 885 | |
Waterstone Financial Inc | | | 18,820 | | | | 310 | |
Webster Financial Corp (A) | | | 3,768 | | | | 191 | |
Western Asset Mortgage Capital Corp | | | 114,682 | | | | 1,173 | |
Westwood Holdings Group Inc | | | 13,100 | | | | 462 | |
WSFS Financial Corp | | | 1,200 | | | | 46 | |
| | |
| | | | | | | 154,409 | |
| | |
Health Care – 11.1% | | | | | | | | |
ABIOMED Inc * | | | 967 | | | | 276 | |
Aerie Pharmaceuticals Inc * | | | 28,346 | | | | 1,346 | |
Aimmune Therapeutics Inc *(A) | | | 17,031 | | | | 381 | |
Akebia Therapeutics Inc *(A) | | | 57,181 | | | | 468 | |
AmerisourceBergen Corp, Cl A | | | 6,015 | | | | 478 | |
Amphastar Pharmaceuticals Inc * | | | 35,355 | | | | 722 | |
AngioDynamics Inc * | | | 4,492 | | | | 103 | |
ANI Pharmaceuticals Inc * | | | 4,710 | | | | 332 | |
Atrion Corp | | | 124 | | | | 109 | |
BioMarin Pharmaceutical Inc * | | | 12,720 | | | | 1,130 | |
BioSpecifics Technologies Corp * | | | 13,104 | | | | 817 | |
BioTelemetry Inc * | | | 10,534 | | | | 660 | |
CareDx Inc * | | | 15,651 | | | | 493 | |
Catalent Inc * | | | 16,500 | | | | 670 | |
Charles River Laboratories International Inc * | | | 7,525 | | | | 1,093 | |
Chemed Corp | | | 8,200 | | | | 2,625 | |
Clovis Oncology Inc * | | | 20,404 | | | | 506 | |
Collegium Pharmaceutical Inc *(A) | | | 43,020 | | | | 651 | |
Computer Programs & Systems Inc | | | 23,271 | | | | 691 | |
Cooper Cos Inc/The, Cl A | | | 1,973 | | | | 584 | |
DexCom Inc * | | | 9,343 | | | | 1,113 | |
Emergent BioSolutions Inc * | | | 61,329 | | | | 3,098 | |
Encompass Health Corp | | | 19,928 | | | | 1,164 | |
Ensign Group Inc/The | | | 22,232 | | | | 1,138 | |
Exelixis Inc * | | | 13,139 | | | | 313 | |
GW Pharmaceuticals PLC ADR *(A) | | | 3,127 | | | | 527 | |
Haemonetics Corp * | | | 29,432 | | | | 2,575 | |
HealthStream Inc * | | | 20,596 | | | | 578 | |
Hill-Rom Holdings Inc | | | 5,000 | | | | 529 | |
HMS Holdings Corp * | | | 4,419 | | | | 131 | |
Horizon Pharma PLC * | | | 36,713 | | | | 970 | |
Humana Inc | | | 5,500 | | | | 1,463 | |
ICON * | | | 11,790 | | | | 1,610 | |
ICU Medical Inc * | | | 5,669 | | | | 1,357 | |
IDEXX Laboratories Inc * | | | 6,675 | | | | 1,493 | |
Incyte Corp * | | | 3,300 | | | | 284 | |
Insmed Inc *(A) | | | 29,783 | | | | 866 | |
Integer Holdings Corp * | | | 20,775 | | | | 1,567 | |
iRhythm Technologies Inc * | | | 7,092 | | | | 532 | |
Jazz Pharmaceuticals PLC * | | | 16,502 | | | | 2,359 | |
Lantheus Holdings Inc * | | | 12,394 | | | | 303 | |
LHC Group Inc * | | | 8,754 | | | | 970 | |
| | | | |
SEI Institutional Managed Trust / Semi-Annual Report / March 31, 2019 | | | 3 | |
SCHEDULE OF INVESTMENTS (Unaudited)
March 31, 2019
Tax-Managed Small/Mid Cap Fund(Continued)
| | | | | | | | |
| | | |
| Description | | Shares | | Market Value ($ Thousands) |
| | |
COMMON STOCK (continued) | | | | | | | | |
Ligand Pharmaceuticals Inc *(A) | | | 75,013 | | | $ | 9,430 | |
LivaNova PLC * | | | 9,469 | | | | 921 | |
Luminex Corp | | | 45,103 | | | | 1,038 | |
Magellan Health Inc * | | | 63,448 | | | | 4,183 | |
Masimo Corp * | | | 15,397 | | | | 2,129 | |
Medidata Solutions Inc * | | | 9,005 | | | | 660 | |
Medpace Holdings Inc *(A) | | | 8,816 | | | | 520 | |
Meridian Bioscience Inc | | | 97,749 | | | | 1,721 | |
Merit Medical Systems Inc * | | | 17,000 | | | | 1,051 | |
Mettler-Toledo International Inc * | | | 411 | | | | 297 | |
Molina Healthcare Inc * | | | 3,601 | | | | 511 | |
Myriad Genetics Inc * | | | 54,464 | | | | 1,808 | |
National HealthCare Corp | | | 19,293 | | | | 1,464 | |
National Research Corp, Cl A | | | 5,713 | | | | 221 | |
Natus Medical Inc * | | | 9,007 | | | | 229 | |
Nektar Therapeutics, Cl A *(A) | | | 29,446 | | | | 989 | |
NeoGenomics Inc *(A) | | | 23,942 | | | | 490 | |
NextGen Healthcare Inc * | | | 83,596 | | | | 1,407 | |
Novocure Ltd * | | | 11,889 | | | | 573 | |
Optinose Inc * | | | 70,360 | | | | 725 | |
Oxford Immunotec Global PLC * | | | 23,295 | | | | 401 | |
Pacira Pharmaceuticals Inc/DE * | | | 54,439 | | | | 2,072 | |
Penumbra Inc *(A) | | | 10,162 | | | | 1,494 | |
PerkinElmer Inc (A) | | | 12,707 | | | | 1,224 | |
Phibro Animal Health Corp, Cl A | | | 3,474 | | | | 115 | |
Premier Inc, Cl A * | | | 100,268 | | | | 3,458 | |
Prestige Consumer Healthcare Inc, Cl A * | | | 25,851 | | | | 773 | |
Progenics Pharmaceuticals Inc * | | | 55,862 | | | | 259 | |
Puma Biotechnology Inc * | | | 36,274 | | | | 1,407 | |
QIAGEN NV * | | | 3,422 | | | | 139 | |
Reata Pharmaceuticals Inc, Cl A *(A) | | | 3,083 | | | | 264 | |
Sage Therapeutics Inc *(A) | | | 3,171 | | | | 504 | |
Sarepta Therapeutics Inc *(A) | | | 1,971 | | | | 235 | |
Supernus Pharmaceuticals Inc * | | | 54,109 | | | | 1,896 | |
Syneos Health Inc, Cl A *(A) | | | 108,524 | | | | 5,617 | |
Teleflex Inc | | | 8,291 | | | | 2,505 | |
Tivity Health Inc * | | | 5,546 | | | | 97 | |
United Therapeutics Corp * | | | 8,314 | | | | 976 | |
Veracyte Inc * | | | 31,103 | | | | 778 | |
WellCare Health Plans Inc * | | | 3,172 | | | | 856 | |
West Pharmaceutical Services Inc | | | 11,500 | | | | 1,267 | |
Wright Medical Group NV * | | | 3,400 | | | | 107 | |
| | |
| | | | | | | 95,886 | |
Industrials — 14.2% | | | | | | | | |
ACCO Brands Corp | | | 243,092 | | | | 2,081 | |
Acuity Brands Inc | | | 2,631 | | | | 316 | |
Advanced Disposal Services Inc * | | | 20,915 | | | | 586 | |
Advanced Drainage Systems Inc | | | 14,578 | | | | 376 | |
AECOM * | | | 62,700 | | | | 1,860 | |
Air Transport Services Group Inc * | | | 30,092 | | | | 694 | |
Alaska Air Group Inc | | | 3,200 | | | | 180 | |
| | | | | | | | |
| | | |
| Description | | Shares | | Market Value ($ Thousands) |
| | |
COMMON STOCK (continued) | | | | | | | | |
AO Smith Corp (A) | | | 28,088 | | | $ | 1,498 | |
Apogee Enterprises Inc | | | 86,752 | | | | 3,252 | |
ArcBest Corp | | | 9,290 | | | | 286 | |
Arcosa Inc | | | 5,154 | | | | 157 | |
ASGN Inc * | | | 8,718 | | | | 554 | |
Astec Industries Inc | | | 42,367 | | | | 1,600 | |
Atlas Air Worldwide Holdings Inc * | | | 99,124 | | | | 5,012 | |
AZZ Inc | | | 30,554 | | | | 1,251 | |
Badger Meter Inc | | | 2,009 | | | | 112 | |
Barrett Business Services Inc | | | 2,383 | | | | 184 | |
Carlisle Cos Inc | | | 9,043 | | | | 1,109 | |
Cimpress NV * | | | 14,550 | | | | 1,166 | |
Cintas Corp | | | 7,937 | | | | 1,604 | |
Clean Harbors Inc * | | | 7,022 | | | | 502 | |
Comfort Systems USA Inc | | | 2,089 | | | | 109 | |
CoStar Group Inc * | | | 9,928 | | | | 4,631 | |
Covanta Holding Corp | | | 87,516 | | | | 1,515 | |
CRA International Inc | | | 1,925 | | | | 97 | |
Crane Co, Cl A | | | 600 | | | | 51 | |
CSW Industrials Inc * | | | 1,824 | | | | 104 | |
Curtiss-Wright Corp | | | 15,306 | | | | 1,735 | |
Deluxe Corp | | | 11,400 | | | | 498 | |
Ducommun Inc * | | | 12,544 | | | | 546 | |
DXP Enterprises Inc/TX * | | | 12,853 | | | | 500 | |
Dycom Industries Inc * | | | 15,943 | | | | 732 | |
EMCOR Group Inc | | | 24,206 | | | | 1,769 | |
Encore Wire Corp | | | 11,419 | | | | 653 | |
Ennis Inc | | | 22,760 | | | | 472 | |
Exponent Inc | | | 30,000 | | | | 1,732 | |
Forrester Research Inc * | | | 2,218 | | | | 107 | |
Genesee & Wyoming Inc, Cl A * | | | 87,615 | | | | 7,635 | |
Global Brass & Copper Holdings Inc | | | 8,105 | | | | 279 | |
Gorman-Rupp Co/The | | | 10,483 | | | | 356 | |
Great Lakes Dredge & Dock Corp * | | | 100,393 | | | | 894 | |
Harsco Corp * | | | 17,249 | | | | 348 | |
Hawaiian Holdings Inc (A) | | | 26,352 | | | | 692 | |
HD Supply Holdings Inc * | | | 26,744 | | | | 1,159 | |
Heartland Express Inc | | | 16,190 | | | | 312 | |
Heidrick & Struggles International Inc | | | 27,504 | | | | 1,054 | |
Heritage-Crystal Clean Inc * | | | 4,102 | | | | 113 | |
Hexcel Corp, Cl A | | | 23,064 | | | | 1,595 | |
HNI Corp | | | 1,400 | | | | 51 | |
Hub Group Inc, Cl A * | | | 34,424 | | | | 1,406 | |
Huntington Ingalls Industries Inc, Cl A | | | 6,945 | | | | 1,439 | |
Huron Consulting Group Inc * | | | 25,000 | | | | 1,180 | |
ICF International Inc, Cl A | | | 4,655 | | | | 354 | |
IDEX Corp | | | 10,820 | | | | 1,642 | |
Insperity Inc, Cl A | | | 8,458 | | | | 1,046 | |
JetBlue Airways Corp * | | | 1,486 | | | | 24 | |
John Bean Technologies Corp, Cl A (A) | | | 1,377 | | | | 127 | |
Kadant Inc | | | 21,160 | | | | 1,861 | |
Kaman Corp, Cl A | | | 54,466 | | | | 3,183 | |
| | |
| 4 | | SEI Institutional Managed Trust / Semi-Annual Report / March 31, 2019 |
SCHEDULE OF INVESTMENTS (Unaudited)
March 31, 2019
Tax-Managed Small/Mid Cap Fund (Continued)
| | | | | | | | |
| | | |
| Description | | Shares | | | Market Value
($ Thousands) |
| |
COMMON STOCK (continued) | | | | | |
KAR Auction Services Inc | | | 226,271 | | | $ | 11,610 | |
Kelly Services Inc, Cl A | | | 29,385 | | | | 648 | |
Kforce Inc | | | 10,057 | | | | 353 | |
Kratos Defense & Security Solutions Inc *(A) | | | 37,042 | | | | 579 | |
L3 Technologies Inc | | | 7,300 | | | | 1,506 | |
LB Foster Co, Cl A *(B) | | | 54,099 | | | | 1,018 | |
Lincoln Electric Holdings Inc | | | 646 | | | | 54 | |
Lydall Inc * | | | 85,500 | | | | 2,006 | |
Macquarie Infrastructure Corp | | | 14,970 | | | | 617 | |
Masonite International Corp * | | | 25,400 | | | | 1,267 | |
Matson Inc | | | 24,542 | | | | 886 | |
McGrath RentCorp | | | 2,022 | | | | 114 | |
Meritor Inc * | | | 72,117 | | | | 1,468 | |
Middleby Corp/The *(A) | | | 11,520 | | | | 1,498 | |
MSA Safety Inc | | | 10,698 | | | | 1,106 | |
MSC Industrial Direct Co Inc, Cl A | | | 15,500 | | | | 1,282 | |
MYR Group Inc * | | | 14,422 | | | | 499 | |
Old Dominion Freight Line Inc, Cl A | | | 11,337 | | | | 1,637 | |
Radiant Logistics Inc * | | | 175,811 | | | | 1,108 | |
RBC Bearings Inc * | | | 11,061 | | | | 1,407 | |
Resideo Technologies Inc * | | | 123,688 | | | | 2,386 | |
Resources Connection Inc | | | 79,067 | | | | 1,308 | |
REV Group Inc (A) | | | 134,487 | | | | 1,473 | |
Robert Half International Inc | | | 13,313 | | | | 867 | |
Rush Enterprises Inc, Cl A | | | 5,443 | | | | 228 | |
Ryder System Inc | | | 8,900 | | | | 552 | |
SkyWest Inc | | | 17,047 | | | | 925 | |
SP Plus Corp * | | | 9,711 | | | | 331 | |
Spirit AeroSystems Holdings Inc, Cl A | | | 12,076 | | | | 1,105 | |
Spirit Airlines Inc * | | | 3,326 | | | | 176 | |
Steelcase Inc, Cl A | | | 62,215 | | | | 905 | |
Teledyne Technologies Inc * | | | 27,753 | | | | 6,578 | |
Tetra Tech Inc | | | 27,739 | | | | 1,653 | |
Toro Co/The | | | 2,800 | | | | 193 | |
TransDigm Group Inc * | | | 500 | | | | 227 | |
TriMas Corp * | | | 19,941 | | | | 603 | |
Trinity Industries Inc | | | 134,263 | | | | 2,918 | |
TrueBlue Inc * | | | 30,324 | | | | 717 | |
United Rentals Inc * | | | 7,561 | | | | 864 | |
US Ecology Inc | | | 3,168 | | | | 177 | |
Wabtec Corp (A) | | | 3,600 | | | | 265 | |
Watsco Inc (A) | | | 600 | | | | 86 | |
XPO Logistics Inc *(A) | | | 22,266 | | | | 1,197 | |
| | |
| | | | | | | 122,778 | |
| |
Information Technology — 15.4% | | | | | |
Acacia Communications Inc * | | | 14,275 | | | | 819 | |
ACI Worldwide Inc * | | | 428,876 | | | | 14,097 | |
Agilysys Inc * | | | 22,396 | | | | 474 | |
Airgain Inc * | | | 85,000 | | | | 1,091 | |
Alteryx Inc, Cl A * | | | 14,250 | | | | 1,195 | |
American Software Inc/GA, Cl A | | | 30,440 | | | | 364 | |
| | | | | | | | |
| | | |
| Description | | Shares | | | Market Value
($ Thousands) |
| |
COMMON STOCK (continued) | | | | | |
ANSYS Inc * | | | 2,600 | | | $ | 475 | |
Arista Networks Inc * | | | 2,488 | | | | 782 | |
Aspen Technology Inc * | | | 27,648 | | | | 2,883 | |
Avnet Inc | | | 7,600 | | | | 330 | |
AVX Corp | | | 54,000 | | | | 936 | |
Belden Inc (A) | | | 5,121 | | | | 275 | |
Black Knight Inc * | | | 10,000 | | | | 545 | |
Broadcom Inc | | | 374 | | | | 112 | |
Broadridge Financial Solutions Inc | | | 1,700 | | | | 176 | |
Cadence Design Systems Inc * | | | 54,862 | | | | 3,484 | |
CalAmp Corp * | | | 29,007 | | | | 365 | |
CDW Corp | | | 10,820 | | | | 1,043 | |
ChannelAdvisor Corp * | | | 8,137 | | | | 99 | |
Coherent Inc *(A) | | | 1,510 | | | | 214 | |
CommVault Systems Inc * | | | 13,903 | | | | 900 | |
Cornerstone OnDemand Inc * | | | 15,000 | | | | 822 | |
CSG Systems International Inc | | | 16,700 | | | | 706 | |
Cypress Semiconductor Corp | | | 345,310 | | | | 5,152 | |
Dolby Laboratories Inc, Cl A | | | 15,200 | | | | 957 | |
Echo Global Logistics Inc * | | | 28,325 | | | | 702 | |
Entegris Inc | | | 26,270 | | | | 938 | |
EPAM Systems Inc * | | | 5,383 | | | | 910 | |
Euronet Worldwide Inc * | | | 23,000 | | | | 3,280 | |
EVERTEC Inc | | | 113,185 | | | | 3,148 | |
Fabrinet * | | | 12,859 | | | | 673 | |
Fair Isaac Corp * | | | 2,500 | | | | 679 | |
Fidelity National Information Services Inc, Cl B | | | 10,569 | | | | 1,195 | |
Gartner Inc *(A) | | | 1,518 | | | | 230 | |
Global Payments Inc | | | 5,841 | | | | 797 | |
Glu Mobile Inc * | | | 57,682 | | | | 631 | |
Guidewire Software Inc, Cl Z * | | | 12,033 | | | | 1,169 | |
Hackett Group Inc/The | | | 19,093 | | | | 302 | |
IEC Electronics Corp * | | | 60,000 | | | | 411 | |
Inphi Corp * | | | 24,989 | | | | 1,093 | |
Insight Enterprises Inc * | | | 21,641 | | | | 1,192 | |
Integrated Device Technology Inc * | | | 67,087 | | | | 3,287 | |
InterDigital Inc | | | 1,288 | | | | 85 | |
j2 Global Inc (A) | | | 95,339 | | | | 8,256 | |
Keysight Technologies Inc * | | | 29,653 | | | | 2,586 | |
KLA-Tencor Corp | | | 4,819 | | | | 575 | |
Leidos Holdings Inc | | | 24,667 | | | | 1,581 | |
Littelfuse Inc | | | 800 | | | | 146 | |
Lumentum Holdings Inc *(A) | | | 4,818 | | | | 272 | |
Manhattan Associates Inc *(A) | | | 10,280 | | | | 567 | |
ManTech International Corp/VA, Cl A | | | 12,383 | | | | 669 | |
MAXIMUS Inc | | | 53,612 | | | | 3,805 | |
Microchip Technology Inc | | | 7,324 | | | | 608 | |
Model N Inc * | | | 18,083 | | | | 317 | |
Monolithic Power Systems Inc | | | 6,335 | | | | 858 | |
Monotype Imaging Holdings Inc | | | 62,542 | | | | 1,244 | |
MTS Systems Corp, Cl A | | | 12,851 | | | | 700 | |
| | | | |
SEI Institutional Managed Trust / Semi-Annual Report / March 31, 2019 | | | 5 | |
SCHEDULE OF INVESTMENTS (Unaudited)
March 31, 2019
Tax-Managed Small/Mid Cap Fund(Continued)
| | | | | | | | |
| | | |
| Description | | Shares | | | Market Value
($ Thousands) |
| |
COMMON STOCK (continued) | | | | | |
Napco Security Technologies Inc * | | | 4,938 | | | $ | 102 | |
National Instruments Corp | | | 26,750 | | | | 1,187 | |
NCR Corp * | | | 91,133 | | | | 2,487 | |
NeoPhotonics Corp *(A) | | | 67,889 | | | | 427 | |
NIC Inc | | | 86,499 | | | | 1,478 | |
Novanta Inc * | | | 13,800 | | | | 1,169 | |
ON Semiconductor Corp * | | | 178,810 | | | | 3,678 | |
Palo Alto Networks Inc * | | | 4,182 | | | | 1,016 | |
Perficient Inc * | | | 12,505 | | | | 343 | |
QAD Inc, Cl A | | | 2,281 | | | | 98 | |
Qorvo Inc * | | | 10,870 | | | | 780 | |
RingCentral Inc, Cl A * | | | 15,306 | | | | 1,650 | |
Rubicon Project Inc/The * | | | 138,252 | | | | 841 | |
SailPoint Technologies Holding Inc * | | | 6,659 | | | | 191 | |
Sanmina Corp * | | | 12,000 | | | | 346 | |
ScanSource Inc * | | | 29,806 | | | | 1,068 | |
Science Applications International Corp | | | 11,276 | | | | 868 | |
Semtech Corp * | | | 88,152 | | | | 4,488 | |
Shutterstock Inc * | | | 23,805 | | | | 1,110 | |
Silicon Motion Technology Corp ADR | | | 53,792 | | | | 2,132 | |
SPS Commerce Inc * | | | 10,244 | | | | 1,086 | |
SS&C Technologies Holdings Inc | | | 3,924 | | | | 250 | |
Super Micro Computer Inc *(B) | | | 350,560 | | | | 7,406 | |
Sykes Enterprises Inc *(A) | | | 9,712 | | | | 275 | |
Synopsys Inc * | | | 15,383 | | | | 1,771 | |
Tech Data Corp * | | | 8,900 | | | | 911 | |
Teradyne Inc | | | 18,928 | | | | 754 | |
Trade Desk Inc/The, Cl A *(A) | | | 25,821 | | | | 5,111 | |
Tyler Technologies Inc * | | | 4,765 | | | | 974 | |
Verint Systems Inc * | | | 25,000 | | | | 1,497 | |
Wix.com Ltd * | | | 36,039 | | | | 4,355 | |
WNS Holdings Ltd ADR * | | | 13,983 | | | | 745 | |
Workiva Inc, Cl A * | | | 10,983 | | | | 557 | |
Zebra Technologies Corp, Cl A * | | | 6,251 | | | | 1,310 | |
| | |
| | | | | | | 133,663 | |
| |
Materials — 5.9% | | | | | |
Albemarle Corp (A) | | | 4,500 | | | | 369 | |
Ashland Global Holdings Inc | | | 48,756 | | | | 3,809 | |
Avery Dennison Corp | | | 2,472 | | | | 279 | |
B2Gold Corp * | | | 656,468 | | | | 1,845 | |
Balchem Corp | | | 11,353 | | | | 1,054 | |
Berry Global Group Inc * | | | 14,891 | | | | 802 | |
Century Aluminum Co * | | | 122,680 | | | | 1,089 | |
Commercial Metals Co, Cl A | | | 77,136 | | | | 1,317 | |
Crown Holdings Inc * | | | 4,800 | | | | 262 | |
FMC Corp | | | 141,171 | | | | 10,845 | |
Hawkins Inc | | | 10,682 | | | | 393 | |
Ingevity Corp * | | | 31,964 | | | | 3,376 | |
Livent Corp *(A) | | | 250,825 | | | | 3,080 | |
Materion Corp | | | 12,245 | | | | 699 | |
Owens-Illinois Inc | | | 248,936 | | | | 4,725 | |
| | | | | | | | |
| | | |
| Description | | Shares | | | Market Value
($ Thousands) |
| |
COMMON STOCK (continued) | | | | | |
Packaging Corp of America | | | 2,600 | | | $ | 258 | |
Royal Gold Inc, Cl A | | | 12,000 | | | | 1,091 | |
Schnitzer Steel Industries Inc, Cl A | | | 20,451 | | | | 491 | |
Silgan Holdings Inc | | | 207,309 | | | | 6,143 | |
Stepan Co | | | 6,908 | | | | 605 | |
Tredegar Corp | | | 5,814 | | | | 94 | |
United States Steel Corp | | | 178,732 | | | | 3,483 | |
Valvoline Inc (A) | | | 216,872 | | | | 4,025 | |
Venator Materials PLC * | | | 190,882 | | | | 1,073 | |
| | |
| | | | | | | 51,207 | |
| |
Real Estate — 6.4% | | | | | |
Alexander’s Inc ‡ | | | 2,215 | | | | 833 | |
American Assets Trust Inc ‡ | | | 7,234 | | | | 332 | |
Apartment Investment & Management Co, Cl A ‡ | | | 10,004 | | | | 503 | |
Armada Hoffler Properties Inc ‡ | | | 153,483 | | | | 2,393 | |
Braemar Hotels & Resorts Inc | | | 40,496 | | | | 495 | |
Camden Property Trust ‡ | | | 14,750 | | | | 1,497 | |
CareTrust Inc ‡ | | | 42,500 | | | | 997 | |
Chatham Lodging Trust ‡ | | | 79,229 | | | | 1,524 | |
City Office Inc ‡ | | | 58,828 | | | | 665 | |
CorEnergy Infrastructure Trust Inc | | | 18,108 | | | | 666 | |
Cousins Properties Inc, Cl A ‡ | | | 50,000 | | | | 483 | |
EastGroup Properties Inc ‡ | | | 14,800 | | | | 1,652 | |
EPR Properties, Cl A ‡ | | | 7,000 | | | | 538 | |
Equity LifeStyle Properties ‡ | | | 12,600 | | | | 1,440 | |
Gaming and Leisure Properties Inc ‡ | | | 179,643 | | | | 6,929 | |
Getty Realty Corp ‡ | | | 49,817 | | | | 1,596 | |
Gladstone Commercial Corp ‡ | | | 37,688 | | | | 783 | |
Global Net Lease Inc ‡ | | | 20,000 | | | | 378 | |
Highwoods Properties Inc ‡ | | | 10,000 | | | | 468 | |
Howard Hughes Corp/The * | | | 31,604 | | | | 3,476 | |
Independence Realty Trust Inc | | | 113,415 | | | | 1,224 | |
Innovative Industrial Properties Inc, Cl A ‡(A) | | | 9,304 | | | | 760 | |
Investors Real Estate Trust | | | 28,192 | | | | 1,689 | |
Invitation Homes Inc ‡ | | | 88,917 | | | | 2,163 | |
Lexington Realty Trust ‡ | | | 109,000 | | | | 988 | |
LTC Properties Inc ‡ | | | 9,000 | | | | 412 | |
Medical Properties Trust Inc ‡(A) | | | 428,546 | | | | 7,932 | |
Mid-America Apartment Communities Inc ‡ | | | 5,599 | | | | 612 | |
Monmouth Real Estate Investment Corp, Cl A ‡ | | | 23,494 | | | | 310 | |
Newmark Group Inc, Cl A | | | 176,823 | | | | 1,475 | |
PS Business Parks Inc ‡ | | | 12,200 | | | | 1,913 | |
Regency Centers Corp ‡ | | | 5,413 | | | | 365 | |
Retail Properties of America Inc, Cl A ‡ | | | 54,793 | | | | 668 | |
Rexford Industrial Realty Inc ‡ | | | 27,000 | | | | 967 | |
RLJ Lodging Trust ‡ | | | 53,080 | | | | 933 | |
Saul Centers Inc ‡ | | | 14,723 | | | | 756 | |
Sun Communities Inc ‡ | | | 12,903 | | | | 1,529 | |
Tier Inc ‡ | | | 43,035 | | | | 1,233 | |
| | |
| 6 | | SEI Institutional Managed Trust / Semi-Annual Report / March 31, 2019 |
SCHEDULE OF INVESTMENTS (Unaudited)
March 31, 2019
Tax-Managed Small/Mid Cap Fund(Continued)
| | | | | | | | |
| | | |
| Description | | Shares | | | Market Value
($ Thousands) |
| |
COMMON STOCK (continued) | | | | | |
Universal Health Realty Income Trust ‡ | | | 1,794 | | | $ | 136 | |
Urstadt Biddle Properties Inc, Cl A ‡ | | | 58,312 | | | | 1,204 | |
| | |
| | | | | | | 54,917 | |
| | |
Utilities — 3.3% | | | | | | | | |
ALLETE Inc | | | 7,500 | | | | 617 | |
American States Water Co | | | 21,500 | | | | 1,533 | |
Atmos Energy Corp | | | 20,484 | | | | 2,108 | |
Avista Corp | | | 13,200 | | | | 536 | |
Black Hills Corp, Cl A | | | 9,201 | | | | 682 | |
Chesapeake Utilities Corp | | | 6,037 | | | | 551 | |
CMS Energy Corp | | | 10,600 | | | | 589 | |
Dominion Energy Inc | | | 5,179 | | | | 397 | |
Evergy Inc | | | 21,057 | | | | 1,222 | |
IDACORP Inc, Cl A | | | 10,909 | | | | 1,086 | |
MDU Resources Group Inc | | | 49,882 | | | | 1,288 | |
Middlesex Water Co | | | 24,460 | | | | 1,369 | |
New Jersey Resources Corp | | | 12,500 | | | | 622 | |
NorthWestern Corp | | | 16,618 | | | | 1,170 | |
NRG Energy Inc | | | 31,000 | | | | 1,317 | |
OGE Energy Corp | | | 31,500 | | | | 1,358 | |
ONE Gas Inc | | | 13,750 | | | | 1,224 | |
Otter Tail Corp | | | 7,293 | | | | 363 | |
Pinnacle West Capital Corp | | | 15,400 | | | | 1,472 | |
PNM Resources Inc | | | 25,500 | | | | 1,207 | |
Portland General Electric Co | | | 43,378 | | | | 2,249 | |
Southwest Gas Holdings Inc | | | 10,221 | | | | 841 | |
Spire Inc | | | 14,200 | | | | 1,169 | |
UGI Corp | | | 35,168 | | | | 1,949 | |
Unitil Corp | | | 30,419 | | | | 1,648 | |
York Water Co/The | | | 4,806 | | | | 165 | |
| | |
| | | | | | | 28,732 | |
| |
Total Common Stock
(Cost $616,414) ($ Thousands) | | | | 840,941 | |
| | | | | | | | |
| | |
| | | Number of
Rights | | | |
| | |
RIGHTS — 0.0% | | | | | | | | |
Schulman‡‡ | | | 51,428 | | | | 103 | |
| | | | | | | | |
| | |
Total Rights
(Cost $—) ($ Thousands) | | | | | | | 103 | |
| | | | | | | | |
| | | | | | | | |
| | | |
| Description | | Shares | | | Market Value
($ Thousands) |
| |
AFFILIATED PARTNERSHIP — 10.2% | | | | | |
SEI Liquidity Fund, L.P. | | | | | | | | |
2.480% **†(C) | | | 88,103,789 | | | $ | 88,097 | |
| | | | | | | | |
| | |
Total Affiliated Partnership (Cost $88,103) ($ Thousands) | | | | | | | 88,097 | |
| | | | | | | | |
| | |
CASH EQUIVALENT — 2.4% | | | | | | | | |
SEI Daily Income Trust, Government Fund,Cl F | | | | | | | | |
2.220%**† | | | 20,889,500 | | | | 20,890 | |
| | | | | | | | |
| | |
Total Cash Equivalent (Cost $20,890) ($ Thousands) | | | | | | | 20,890 | |
| | | | | | | | |
| | |
Total Investments in Securities — 109.8% (Cost $725,407) ($ Thousands) | | | | | | $ | 950,031 | |
| | | | | | | | |
| | Percentages are based on Net Assets of $865,349 ($ Thousands). |
| * | Non-income producing security. |
| ** | Rate shown is the7-day effective yield as of March 31, 2019. |
| ‡ | Real Estate Investment Trust. |
| ‡‡ | Expiration date not available. |
| † | Investment in Affiliated Security (see Note 6). |
| (A) | Certain securities or partial positions of certain securities are on loan at March 31, 2019 (see Note 10). The total market value of securities on loan at March 31, 2019 was $86,388 ($ Thousands). |
| (B) | Securities considered illiquid. The total value of such securities as of March 31, 2019 was $8,424 ($ Thousands) and represented 1.0% of the Net Assets of the Fund. |
| (C) | This security was purchased with cash collateral held from securities on loan (see Note 10). The total market value of such securities as of March 31, 2019 was $88,097 ($ Thousands). |
ADR — American Depositary Receipt
Cl — Class
L.P. — Limited Partnership
Ltd — Limited
PLC — Public Limited Company
The following is a list of the level of inputs used as of March 31, 2019, in valuing the Fund’s investments carried at value ($ Thousands):
| | | | | | | | | | | | | | | | |
| | | | | |
| Investments in Securities | | Level 1 | | | Level 2 | | | Level 3 | | | Total | |
Common Stock | | $ | 840,941 | | | $ | – | | | $ | – | | | $ | 840,941 | |
Rights | | | 103 | | | | – | | | | – | | | | 103 | |
Affiliated Partnership | | | – | | | | 88,097 | | | | – | | | | 88,097 | |
Cash Equivalent | | | 20,890 | | | | – | | | | – | | | | 20,890 | |
| | | | | | | | | | | | | | | | |
Total Investments in Securities | | $ | 861,934 | | | $ | 88,097 | | | $ | – | | | $ | 950,031 | |
| | | | | | | | | | | | | | | | |
For the period ended March 31, 2019, there were no transfers between Level 1 and Level 2 assets and liabilities.
For the period ended March 31, 2019, there were no transfers between Level 2 and Level 3 assets and liabilities.
For more information on valuation inputs, see Note 2 – Significant Accounting Policies in Notes to
Financial Statements.
| | | | |
SEI Institutional Managed Trust / Semi-Annual Report / March 31, 2019 | | | 7 | |
SCHEDULE OF INVESTMENTS (Unaudited)
March 31, 2019
Tax-Managed Small/Mid Cap Fund(Continued)
The following is a summary of the Fund’s transactions with affiliates for the period ended March 31, 2019 ($ Thousands):
| | | | | | | | | | | | | | | | | | | | | | | | | | |
| Security Description | | Value 9/30/2018 | | Purchases at
Cost | | Proceeds
from Sales | | Realized Gain
(Loss) | | Change in
Unrealized
Appreciation | | Value
3/31/2019 | | Income |
SEI Liquidity Fund, L.P. | | | $ 173,797 | | | | $ 81,421 | | | | $ (167,184 | ) | | $ 54 | | | $ 9 | | | | $ 88,097 | | | | $ 251 | |
SEI Daily Income Trust, Government Fund, CI F | | | 32,302 | | | | 70,814 | | | | (82,226 | ) | | - | | | - | | | | 20,890 | | | | 229 | |
| | | | | | | | | | | | | | | | | | | | | | | | | | |
Total | | | $ 206,099 | | | | $ 152,235 | | | | $ (249,410 | ) | | $ 54 | | | $ 9 | | | | $ 108,987 | | | | $ 480 | |
| | | | | | | | | | | | | | | | | | | | | | | | | | |
Amounts designated as “—” are either $0 or have been rounded to $0.
The accompanying notes are an integral part of the financial statements.
| | |
| 8 | | SEI Institutional Managed Trust / Semi-Annual Report / March 31, 2019 |
SCHEDULE OF INVESTMENTS (Unaudited)
March 31, 2019
Mid-Cap Fund(Continued)
| | | | | | | | |
| | | |
| Description | | Shares | | Market Value
($ Thousands) |
| |
COMMON STOCK — 95.8% | | | | | |
Communication Services — 2.0% | | | | | |
CBS Corp, Cl B | | | 5,200 | | | $ | 247 | |
CenturyLink Inc | | | 56,600 | | | | 679 | |
Marcus Corp/The | | | 2,600 | | | | 104 | |
Shenandoah Telecommunications Co | | | 1,500 | | | | 66 | |
Sirius XM Holdings Inc | | | 7,400 | | | | 42 | |
TEGNA Inc | | | 6,000 | | | | 85 | |
TripAdvisor Inc * | | | 4,100 | | | | 211 | |
Viacom Inc, Cl B | | | 25,000 | | | | 702 | |
| | |
| | | | | | | 2,136 | |
| |
Consumer Discretionary — 12.2% | | | | | |
Aramark | | | 19,900 | | | | 588 | |
Asbury Automotive Group Inc * | | | 600 | | | | 42 | |
AutoNation Inc * | | | 4,900 | | | | 175 | |
Big Lots Inc | | | 5,600 | | | | 213 | |
Bloomin’ Brands Inc | | | 9,900 | | | | 202 | |
CarMax Inc * | | | 7,200 | | | | 503 | |
Core-Mark Holding Co Inc, Cl A | | | 1,800 | | | | 67 | |
Dollar General Corp | | | 3,100 | | | | 370 | |
Expedia Group Inc | | | 6,000 | | | | 714 | |
Extended Stay America Inc | | | 30,400 | | | | 546 | |
Foot Locker Inc, Cl A | | | 4,300 | | | | 261 | |
Genuine Parts Co | | | 7,000 | | | | 784 | |
Hilton Worldwide Holdings Inc | | | 6,700 | | | | 557 | |
Johnson Outdoors Inc, Cl A | | | 900 | | | | 64 | |
Kohl’s Corp | | | 11,783 | | | | 810 | |
LKQ Corp * | | | 12,800 | | | | 363 | |
Lululemon Athletica Inc * | | | 300 | | | | 49 | |
Macy’s Inc | | | 25,200 | | | | 606 | |
Michaels Cos Inc/The * | | | 21,400 | | | | 244 | |
Norwegian Cruise Line Holdings Ltd * | | | 13,700 | | | | 753 | |
NVR Inc * | | | 160 | | | | 443 | |
PVH Corp | | | 5,700 | | | | 695 | |
Qurate Retail Inc * | | | 36,500 | | | | 583 | |
Ross Stores Inc | | | 9,400 | | | | 875 | |
Royal Caribbean Cruises Ltd | | | 7,100 | | | | 814 | |
Tapestry Inc | | | 17,400 | | | | 565 | |
Ulta Beauty Inc * | | | 1,500 | | | | 523 | |
Yum China Holdings Inc | | | 19,600 | | | | 880 | |
| | |
| | | | | | | 13,289 | |
| |
Consumer Staples — 5.4% | | | | | |
Archer-Daniels-Midland Co | | | 21,100 | | | | 910 | |
Campbell Soup Co | | | 16,500 | | | | 629 | |
Clorox Co/The | | | 2,300 | | | | 369 | |
Energizer Holdings Inc | | | 1,100 | | | | 49 | |
JM Smucker Co/The | | | 6,400 | | | | 746 | |
Kellogg Co | | | 12,500 | | | | 717 | |
Keurig Dr. Pepper Inc | | | 22,600 | | | | 632 | |
Kroger Co/The | | | 20,700 | | | | 509 | |
Nu Skin Enterprises Inc, Cl A | | | 4,300 | | | | 206 | |
| | | | | | | | |
| | | |
| Description | | Shares | | Market Value
($ Thousands) |
| |
COMMON STOCK (continued) | | | | | |
Pilgrim’s Pride Corp * | | | 10,600 | | | $ | 236 | |
Tyson Foods Inc, Cl A | | | 13,200 | | | | 917 | |
| | |
| | | | | | | 5,920 | |
| |
Energy — 3.5% | | | | | |
Cheniere Energy Inc * | | | 9,300 | | | | 636 | |
CONSOL Energy Inc * | | | 8,700 | | | | 298 | |
Continental Resources Inc, Cl A * | | | 12,700 | | | | 569 | |
Devon Energy Corp | | | 11,900 | | | | 376 | |
HollyFrontier Corp | | | 9,900 | | | | 488 | |
Marathon Oil Corp | | | 42,600 | | | | 712 | |
Matrix Service Co * | | | 3,800 | | | | 74 | |
ONEOK Inc | | | 5,400 | | | | 377 | |
PBF Energy Inc, Cl A | | | 4,600 | | | | 143 | |
Superior Energy Services Inc * | | | 11,600 | | | | 54 | |
TechnipFMC PLC | | | 2,100 | | | | 49 | |
Unit Corp * | | | 2,400 | | | | 34 | |
| | |
| | | | | | | 3,810 | |
| |
Financials — 11.0% | | | | | |
Affiliated Managers Group Inc | | | 2,800 | | | | 300 | |
American Financial Group Inc | | | 1,500 | | | | 144 | |
Ameriprise Financial Inc | | | 6,600 | | | | 845 | |
AXA Equitable Holdings Inc | | | 19,000 | | | | 383 | |
BGC Partners Inc, Cl A | | | 21,200 | | | | 113 | |
Citizens Financial Group Inc | | | 23,100 | | | | 751 | |
CNA Financial Corp | | | 11,200 | | | | 486 | |
Discover Financial Services | | | 9,000 | | | | 640 | |
East West Bancorp Inc | | | 8,300 | | | | 398 | |
Fifth Third Bancorp | | | 30,500 | | | | 769 | |
Huntington Bancshares Inc | | | 41,500 | | | | 526 | |
Invesco Ltd | | | 20,300 | | | | 392 | |
KeyCorp | | | 44,600 | | | | 702 | |
Lincoln National Corp | | | 12,200 | | | | 716 | |
LPL Financial Holdings Inc | | | 4,800 | | | | 334 | |
M&T Bank Corp | | | 1,500 | | | | 236 | |
National General Holdings Corp | | | 500 | | | | 12 | |
Navient Corp | | | 39,900 | | | | 462 | |
OneMain Holdings Inc, Cl A | | | 20,900 | | | | 664 | |
Popular Inc | | | 3,600 | | | | 188 | |
Radian Group Inc | | | 14,000 | | | | 290 | |
Reinsurance Group of America Inc, Cl A | | | 4,600 | | | | 653 | |
Synchrony Financial | | | 20,200 | | | | 644 | |
T Rowe Price Group Inc | | | 5,100 | | | | 511 | |
Two Harbors Investment Corp ‡ | | | 14,400 | | | | 195 | |
Unum Group | | | 19,100 | | | | 646 | |
Western Asset Mortgage Capital Corp | | | 7,300 | | | | 75 | |
| | |
| | | | | | | 12,075 | |
| |
Health Care — 11.2% | | | | | |
Agilent Technologies Inc | | | 13,600 | | | | 1,093 | |
Alexion Pharmaceuticals Inc * | | | 1,100 | | | | 149 | |
| | | | |
SEI Institutional Managed Trust / Semi-Annual Report / March 31, 2019 | | | 1 | |
SCHEDULE OF INVESTMENTS (Unaudited)
March 31, 2019
Mid-Cap Fund(Continued)
| | | | | | | | |
| | | |
| Description | | Shares | | Market Value
($ Thousands) |
| | |
COMMON STOCK (continued) | | | | | | | | |
Centene Corp * | | | 16,100 | | | $ | 855 | |
Cerner Corp * | | | 3,600 | | | | 206 | |
Charles River Laboratories International Inc * | | | 3,400 | | | | 494 | |
Cooper Cos Inc/The, Cl A | | | 1,800 | | | | 533 | |
Danaher Corp, Cl A | | | 3,400 | | | | 449 | |
Edwards Lifesciences Corp, Cl A * | | | 4,600 | | | | 880 | |
Hologic Inc * | | | 14,600 | | | | 707 | |
IDEXX Laboratories Inc * | | | 1,500 | | | | 335 | |
Incyte Corp * | | | 11,000 | | | | 946 | |
IQVIA Holdings Inc * | | | 6,100 | | | | 877 | |
Jazz Pharmaceuticals PLC * | | | 1,000 | | | | 143 | |
MEDNAX Inc * | | | 12,000 | | | | 326 | |
Mettler-Toledo International Inc * | | | 560 | | | | 405 | |
Molina Healthcare Inc * | | | 600 | | | | 85 | |
Mylan * | | | 8,000 | | | | 227 | |
Perrigo Co PLC | | | 2,400 | | | | 116 | |
PRA Health Sciences Inc * | | | 6,100 | | | | 673 | |
ResMed Inc | | | 3,900 | | | | 405 | |
STERIS PLC | | | 5,500 | | | | 704 | |
Universal Health Services Inc, Cl B | | | 2,200 | | | | 294 | |
Veeva Systems Inc, Cl A * | | | 400 | | | | 51 | |
West Pharmaceutical Services Inc | | | 3,300 | | | | 364 | |
Zimmer Biomet Holdings Inc | | | 7,500 | | | | 958 | |
| | |
| | | | | | | 12,275 | |
| |
Industrials — 12.0% | | | | | |
AMETEK Inc | | | 10,900 | | | | 904 | |
Arconic Inc | | | 33,500 | | | | 640 | |
Armstrong World Industries Inc | | | 5,100 | | | | 405 | |
Atkore International Group Inc * | | | 26,700 | | | | 575 | |
BMC Stock Holdings Inc * | | | 9,000 | | | | 159 | |
CH Robinson Worldwide Inc | | | 600 | | | | 52 | |
Colfax Corp * | | | 9,000 | | | | 267 | |
Continental Building Products Inc * | | | 8,600 | | | | 213 | |
Cummins Inc | | | 6,600 | | | | 1,042 | |
EMCOR Group Inc | | | 5,100 | | | | 373 | |
Encore Wire Corp | | | 4,900 | | | | 280 | |
Fluor Corp | | | 1,100 | | | | 41 | |
Global Brass & Copper Holdings Inc | | | 3,400 | | | | 117 | |
Heidrick & Struggles International Inc | | | 2,800 | | | | 107 | |
Huntington Ingalls Industries Inc, Cl A | | | 3,100 | | | | 642 | |
Ingersoll-Rand PLC | | | 3,100 | | | | 335 | |
Insperity Inc, Cl A | | | 200 | | | | 25 | |
Korn Ferry | | | 5,700 | | | | 255 | |
Macquarie Infrastructure Corp | | | 12,400 | | | | 511 | |
NCI Building Systems Inc * | | | 6,200 | | | | 38 | |
Old Dominion Freight Line Inc, Cl A | | | 5,100 | | | | 736 | |
Oshkosh Corp | | | 8,100 | | | | 609 | |
PACCAR Inc | | | 14,500 | | | | 988 | |
Pentair PLC | | | 4,800 | | | | 214 | |
Regal Beloit | | | 3,100 | | | | 254 | |
| | | | | | | | |
| | | |
| Description | | Shares | | Market Value
($ Thousands) |
| | |
COMMON STOCK (continued) | | | | | | | | |
Resideo Technologies Inc * | | | 3,300 | | | $ | 64 | |
Spirit AeroSystems Holdings Inc, Cl A | | | 7,200 | | | | 659 | |
Textron Inc | | | 13,400 | | | | 679 | |
Timken Co/The | | | 9,200 | | | | 401 | |
United Continental Holdings Inc * | | | 2,500 | | | | 200 | |
United Rentals Inc * | | | 5,200 | | | | 594 | |
Vectrus Inc * | | | 4,400 | | | | 117 | |
WESCO International Inc * | | | 11,300 | | | | 599 | |
| | |
| | | | | | | 13,095 | |
| |
Information Technology — 19.8% | | | | | |
Analog Devices Inc | | | 10,300 | | | | 1,084 | |
Anixter International Inc * | | | 1,300 | | | | 73 | |
ANSYS Inc * | | | 1,400 | | | | 256 | |
Arista Networks Inc * | | | 3,200 | | | | 1,006 | |
Autodesk Inc, Cl A * | | | 6,700 | | | | 1,044 | |
Avnet Inc | | | 1,500 | | | | 65 | |
Booz Allen Hamilton Holding Corp, Cl A | | | 11,500 | | | | 669 | |
Cadence Design Systems Inc * | | | 16,300 | | | | 1,035 | |
CDK Global Inc | | | 4,700 | | | | 276 | |
CDW Corp | | | 9,800 | | | | 944 | |
Citrix Systems Inc | | | 4,600 | | | | 458 | |
Cognizant Technology Solutions Corp, Cl A | | | 600 | | | | 44 | |
CommScope Holding Co Inc * | | | 31,800 | | | | 691 | |
Conduent Inc * | | | 9,400 | | | | 130 | |
Corning Inc, Cl B | | | 1,000 | | | | 33 | |
Dell Technologies Inc, Cl C * | | | 11,526 | | | | 676 | |
DXC Technology Co | | | 12,100 | | | | 778 | |
EPAM Systems Inc * | | | 600 | | | | 102 | |
Euronet Worldwide Inc * | | | 400 | | | | 57 | |
F5 Networks Inc, Cl A * | | | 3,700 | | | | 581 | |
Fidelity National Information Services Inc, Cl B | | | 9,500 | | | | 1,074 | |
FleetCor Technologies Inc * | | | 1,700 | | | | 419 | |
Fortinet Inc * | | | 10,800 | | | | 907 | |
Genpact Ltd | | | 12,500 | | | | 440 | |
Hewlett Packard Enterprise Co | | | 31,300 | | | | 483 | |
Jabil Inc | | | 3,400 | | | | 90 | |
Keysight Technologies Inc * | | | 2,600 | | | | 227 | |
Leidos Holdings Inc | | | 10,700 | | | | 686 | |
LogMeIn Inc | | | 1,100 | | | | 88 | |
Manhattan Associates Inc * | | | 1,300 | | | | 72 | |
Nuance Communications Inc * | | | 20,800 | | | | 352 | |
Presidio Inc | | | 11,400 | | | | 169 | |
Progress Software Corp | | | 5,400 | | | | 240 | |
Qorvo Inc * | | | 10,100 | | | | 725 | |
Splunk Inc * | | | 700 | | | | 87 | |
SPS Commerce Inc * | | | 3,900 | | | | 414 | |
SS&C Technologies Holdings Inc | | | 13,600 | | | | 866 | |
Symantec Corp, Cl A | | | 31,700 | | | | 729 | |
Synopsys Inc * | | | 9,000 | | | | 1,036 | |
Versum Materials Inc | | | 11,100 | | | | 558 | |
| | |
| 2 | | SEI Institutional Managed Trust / Semi-Annual Report / March 31, 2019 |
SCHEDULE OF INVESTMENTS (Unaudited)
March 31, 2019
Mid-Cap Fund(Continued)
| | | | | | | | |
| | | |
| Description | | Shares | | Market Value
($ Thousands) |
| |
COMMON STOCK (continued) | | | | | |
Xilinx Inc | | | 9,000 | | | $ | 1,141 | |
Zebra Technologies Corp, Cl A * | | | 4,300 | | | | 901 | |
| | |
| | | | | | | 21,706 | |
| |
Materials — 4.6% | | | | | |
Alcoa Corp * | | | 14,600 | | | | 411 | |
Freeport-McMoRan Inc, Cl B | | | 9,200 | | | | 119 | |
Huntsman Corp | | | 13,800 | | | | 310 | |
LyondellBasell Industries, Cl A | | | 400 | | | | 34 | |
Mosaic Co/The | | | 20,600 | | | | 562 | |
Nucor Corp | | | 13,400 | | | | 782 | |
Packaging Corp of America | | | 6,800 | | | | 676 | |
Steel Dynamics Inc | | | 18,800 | | | | 663 | |
Vulcan Materials Co | | | 3,700 | | | | 438 | |
Westlake Chemical Corp | | | 6,100 | | | | 414 | |
Westrock Co | | | 15,300 | | | | 587 | |
| | |
| | | | | | | 4,996 | |
| |
Real Estate — 8.2% | | | | | |
Apple Hospitality Inc ‡ | | | 36,100 | | | | 588 | |
Armada Hoffler Properties Inc ‡ | | | 4,700 | | | | 73 | |
CBRE Group Inc, Cl A *‡ | | | 19,600 | | | | 969 | |
CoreCivic Inc ‡ | | | 25,300 | | | | 492 | |
Empire State Realty Trust Inc, Cl A ‡ | | | 11,400 | | | | 180 | |
Equity Residential ‡ | | | 13,300 | | | | 1,002 | |
Franklin Street Properties Corp ‡ | | | 14,500 | | | | 104 | |
Gaming and Leisure Properties Inc ‡ | | | 10,200 | | | | 393 | |
GEO Group Inc/The ‡ | | | 28,450 | | | | 546 | |
Host Hotels & Resorts Inc ‡ | | | 38,700 | | | | 731 | |
Jones Lang LaSalle Inc | | | 1,100 | | | | 170 | |
Newmark Group Inc, Cl A | | | 2,451 | | | | 21 | |
Outfront Media Inc ‡ | | | 1,900 | | | | 45 | |
Park Hotels & Resorts Inc ‡ | | | 7,300 | | | | 227 | |
Ryman Hospitality Properties Inc ‡ | | | 6,400 | | | | 526 | |
SBA Communications Corp, Cl A *‡ | | | 4,300 | | | | 859 | |
SITE Centers Corp ‡ | | | 4,100 | | | | 56 | |
Spirit Realty Capital Inc ‡ | | | 15,320 | | | | 609 | |
Ventas Inc ‡ | | | 600 | | | | 38 | |
VEREIT Inc ‡ | | | 83,000 | | | | 695 | |
Welltower Inc ‡ | | | 2,000 | | | | 155 | |
Xenia Hotels & Resorts Inc ‡ | | | 23,700 | | | | 519 | |
| | |
| | | | | | | 8,998 | |
| |
Utilities — 5.9% | | | | | |
AES Corp | | | 51,600 | | | | 933 | |
Ameren Corp | | | 2,900 | | | | 213 | |
American Water Works Co Inc | | | 600 | | | | 62 | |
CenterPoint Energy Inc | | | 25,900 | | | | 795 | |
Eversource Energy | | | 10,200 | | | | 724 | |
FirstEnergy Corp | | | 11,100 | | | | 462 | |
MDU Resources Group Inc | | | 15,900 | | | | 411 | |
NRG Energy Inc | | | 20,800 | | | | 884 | |
| | | | | | | | |
| | | |
| Description | | Shares | | Market Value
($ Thousands) |
| |
COMMON STOCK (continued) | | | | | |
PPL Corp | | | 10,000 | | | $ | 317 | |
Public Service Enterprise Group Inc | | | 14,600 | | | | 867 | |
UGI Corp | | | 14,900 | | | | 826 | |
| | |
| | | | | | | 6,494 | |
| | |
Total Common Stock
(Cost $97,605) ($ Thousands) | | | | | | | 104,794 | |
| |
CASH EQUIVALENT — 5.9% | | | | | |
SEI Daily Income Trust, Government Fund, Cl F | | | | | | | | |
2.220%**† | | | 6,508,656 | | | | 6,509 | |
| | |
Total Cash Equivalent
(Cost $6,509) ($ Thousands) | | | | | | | 6,509 | |
| |
Total Investments in Securities — 101.7% | | | | | |
(Cost $104,114) ($ Thousands) | | | $ | 111,303 | |
| | | | | | | | |
| | Percentages are based on Net Assets of $109,389 ($ Thousands). |
| * | Non-income producing security. |
| ** | Rate shown is the7-day effective yield as of March 31, 2019. |
| ‡ | Real Estate Investment Trust. |
| † | Investment in Affiliated Security (see Note 6). |
Cl — Class
Ltd. — Limited
PLC — Public Limited Company
| | | | |
SEI Institutional Managed Trust / Semi-Annual Report / March 31, 2019 | | | 3 | |
SCHEDULE OF INVESTMENTS (Unaudited)
March 31, 2019
Mid-Cap Fund(Continued)
As of March 31, 2019, all of the Fund’s investments were considered Level 1, in accordance with the authoritative guidance on fair value measurements and disclosure under U.S. GAAP.
For the period ended March 31, 2019, there were no transfers between Level 1 and Level 2 assets and liabilities.
For the period ended March 31, 2019, there were no transfers between Level 2 and Level 3 assets and liabilities.
For more information on valuation inputs, see Note 2 – Significant Accounting Policies in Notes to
Financial Statements.
The following is a summary of the Fund’s transactions with affiliates for the period ended March 31, 2019 ($ Thousands):
| | | | | | | | | | | | | | | | | | | | |
| Security Description | | Value 9/30/2018 | | Purchases at
Cost | | Proceeds from
Sales | | Realized Gain
(Loss) | | Change in
Unrealized
Appreciation
(Depreciation) | | Value 3/31/2019 | | Income |
SEI Liquidity Fund, L.P. | | $ — | | $ 993 | | $ (993) | | | $— | | | | $— | | | | $ — | | | $ 4 |
SEI Daily Income Trust, Government Fund, CI F | | 5,737 | | 30,850 | | (30,078) | | | — | | | | — | | | | 6,509 | | | 43 |
| | | | | | | | | | | | | | | | | | | | |
Totals | | $5,737 | | $31,843 | | $ (31,071) | | | $ - | | | | $ - | | | | $ 6,509 | | | $ 47 |
| | | | | | | | | | | | | | | | | | | | |
Amounts designated as “—” are either $0 or have been rounded to $0.
The accompanying notes are an integral part of the financial statements.
| | |
| 4 | | SEI Institutional Managed Trust / Semi-Annual Report / March 31, 2019 |
SCHEDULE OF INVESTMENTS (Unaudited)
March 31, 2019
U.S. Managed Volatility Fund(Continued)
| | | | | | | | |
| | | |
| Description | | Shares | | Market Value
($ Thousands) |
| | |
COMMON STOCK — 97.1% | | | | | | | | |
| |
Communication Services — 7.5% | | | | | |
AT&T Inc | | | 560,800 | | | $ | 17,587 | |
BCE Inc | | | 82,400 | | | | 3,660 | |
Boston Omaha Corp, Cl A * | | | 1,645 | | | | 41 | |
Cable One Inc | | | 6,611 | | | | 6,488 | |
Cars.com Inc * | | | 20,259 | | | | 462 | |
China Mobile ADR | | | 75,300 | | | | 3,840 | |
Cinemark Holdings Inc | | | 192,449 | | | | 7,696 | |
Comcast Corp, Cl A | | | 370,900 | | | | 14,829 | |
Emerald Expositions Events | | | 44,683 | | | | 567 | |
Fluent Inc * | | | 19,373 | | | | 109 | |
Liberty Latin America Ltd, Cl A * | | | 13,661 | | | | 264 | |
Liberty Latin America Ltd, Cl C * | | | 2,082 | | | | 40 | |
Madison Square Garden Co/The * | | | 28,995 | | | | 8,499 | |
MSG Networks * | | | 38,014 | | | | 827 | |
NTT DOCOMO Inc ADR | | | 184,500 | | | | 4,102 | |
Omnicom Group Inc | | | 162,121 | | | | 11,833 | |
SK Telecom Co Ltd ADR | | | 191,000 | | | | 4,678 | |
TELUS | | | 201,700 | | | | 7,467 | |
Verizon Communications | | | 537,900 | | | | 31,806 | |
Walt Disney Co | | | 66,500 | | | | 7,384 | |
World Wrestling Entertainment Inc, Cl A | | | 8,799 | | | | 764 | |
Zynga Inc, Cl A * | | | 315,779 | | | | 1,683 | |
| | |
| | | | | | | 134,626 | |
| | |
Consumer Discretionary — 6.6% | | | | | | | | |
AutoZone Inc * | | | 19,300 | | | | 19,766 | |
Bassett Furniture Industries Inc | | | 2,057 | | | | 34 | |
Bed Bath & Beyond Inc | | | 67,000 | | | | 1,138 | |
Booking Holdings Inc * | | | 4,672 | | | | 8,152 | |
Bright Horizons Family Solutions Inc * | | | 7,804 | | | | 992 | |
Callaway Golf Co | | | 27,943 | | | | 445 | |
Canadian Tire Corp Ltd, Cl A | | | 45,600 | | | | 4,915 | |
Career Education Corp * | | | 10,920 | | | | 180 | |
Cavco Industries Inc * | | | 2,080 | | | | 244 | |
Cheesecake Factory | | | 22,611 | | | | 1,106 | |
Churchill Downs Inc | | | 12,588 | | | | 1,136 | |
Chuy’s Holdings Inc * | | | 5,186 | | | | 118 | |
Cracker Barrel Old Country Store Inc | | | 7,770 | | | | 1,256 | |
Darden Restaurants Inc | | | 2 | | | | — | |
Del Taco Restaurants Inc * | | | 26,530 | | | | 267 | |
eBay Inc | | | 271,722 | | | | 10,092 | |
Expedia Group Inc | | | 2,059 | | | | 245 | |
Graham Holdings Co, Cl B | | | 1,557 | | | | 1,064 | |
H&R Block Inc | | | 259,589 | | | | 6,215 | |
Hilton Grand Vacations Inc * | | | 140,375 | | | | 4,331 | |
K12 Inc * | | | 8,966 | | | | 306 | |
Kohl’s Corp | | | 89,800 | | | | 6,176 | |
Murphy USA Inc * | | | 30,600 | | | | 2,620 | |
NVR Inc * | | | 2,389 | | | | 6,610 | |
PetMed Express Inc | | | 27,124 | | | | 618 | |
Potbelly Corp * | | | 3,440 | | | | 29 | |
| | | | | | | | |
| | | |
| Description | | Shares | | Market Value
($ Thousands) |
| | |
COMMON STOCK (continued) | | | | | | | | |
Sally Beauty Holdings Inc * | | | 142,800 | | | $ | 2,629 | |
Target Corp, Cl A | | | 320,200 | | | | 25,699 | |
Tenneco Inc, Cl A | | | 8,493 | | | | 188 | |
Toyota Motor Corp ADR | | | 57,700 | | | | 6,810 | |
Tupperware Brands Corp | | | 15,049 | | | | 385 | |
Ulta Beauty Inc * | | | 10,435 | | | | 3,639 | |
Wingstop Inc, Cl A | | | 9,667 | | | | 735 | |
| | |
| | | | | | | 118,140 | |
| | |
Consumer Staples — 14.1% | | | | | | | | |
Altria Group Inc | | | 370,054 | | | | 21,252 | |
Calavo Growers Inc | | | 11,888 | | | | 997 | |
Cal-Maine Foods Inc | | | 27,729 | | | | 1,238 | |
Clorox Co/The | | | 55,472 | | | | 8,901 | |
Coca-Cola Co/The | | | 264,548 | | | | 12,397 | |
Colgate-Palmolive Co | | | 116,990 | | | | 8,019 | |
Costco Wholesale Corp | | | 46,980 | | | | 11,376 | |
Flowers Foods Inc | | | 157,708 | | | | 3,362 | |
Fresh Del Monte Produce Inc | | | 300 | | | | 8 | |
Freshpet Inc * | | | 3,669 | | | | 155 | |
Hershey Co/The | | | 98,982 | | | | 11,366 | |
Hostess Brands Inc, Cl A * | | | 45,482 | | | | 569 | |
Ingredion Inc | | | 59,042 | | | | 5,591 | |
J&J Snack Foods Corp | | | 5,929 | | | | 942 | |
JM Smucker Co/The | | | 96,000 | | | | 11,184 | |
John B Sanfilippo & Son | | | 2,192 | | | | 158 | |
Kellogg Co | | | 70,100 | | | | 4,022 | |
Keurig Dr Pepper Inc | | | 274,338 | | | | 7,673 | |
Kimberly-Clark Corp | | | 36,210 | | | | 4,486 | |
Kroger Co/The | | | 524,000 | | | | 12,890 | |
Lamb Weston Holdings Inc | | | 101,568 | | | | 7,612 | |
Lancaster Colony Corp | | | 9,286 | | | | 1,455 | |
MGP Ingredients Inc | | | 7,326 | | | | 565 | |
National Beverage Corp, Cl A | | | 7,099 | | | | 410 | |
PepsiCo Inc | | | 103,777 | | | | 12,718 | |
Performance Food Group * | | | 28,406 | | | | 1,126 | |
Philip Morris International Inc | | | 91,512 | | | | 8,089 | |
Procter & Gamble Co/The | | | 120,821 | | | | 12,571 | |
Simply Good Foods Co/The * | | | 3,784 | | | | 78 | |
Sysco Corp, Cl A | | | 167,386 | | | | 11,175 | |
Tootsie Roll Industries Inc | | | 7,356 | | | | 274 | |
Tyson Foods Inc, Cl A | | | 342,897 | | | | 23,807 | |
Universal Corp/VA | | | 14,233 | | | | 820 | |
USANA Health Sciences Inc * | | | 5,484 | | | | 460 | |
Vector Group Ltd | | | 46,844 | | | | 505 | |
Walgreens Boots Alliance Inc | | | 371,300 | | | | 23,492 | |
Walmart Inc | | | 219,400 | | | | 21,398 | |
| | |
| | | | | | | 253,141 | |
| | |
Energy — 2.6% | | | | | | | | |
Arch Coal Inc | | | 9,519 | | | | 869 | |
Baker Hughes a GE Co, Cl A | | | 63,347 | | | | 1,756 | |
| | | | |
SEI Institutional Managed Trust / Semi-Annual Report / March 31, 2019 | | | 1 | |
SCHEDULE OF INVESTMENTS (Unaudited)
March 31, 2019
U.S. Managed Volatility Fund(Continued)
| | | | | | | | |
| | | |
| Description | | Shares | | Market Value
($ Thousands) |
| |
COMMON STOCK (continued) | | | | | |
Chevron Corp | | | 97,600 | | | $ | 12,022 | |
ConocoPhillips | | | 9,766 | | | | 652 | |
Dorian LPG Ltd * | | | 36,173 | | | | 232 | |
Evolution Petroleum Corp | | | 5,652 | | | | 38 | |
Exxon Mobil Corp | | | 133,300 | | | | 10,771 | |
Par Pacific Holdings Inc * | | | 52,627 | | | | 937 | |
Phillips 66 | | | 122,600 | | | | 11,668 | |
REX American Resources Corp * | | | 863 | | | | 69 | |
SilverBow Resources Inc * | | | 594 | | | | 14 | |
Valero Energy Corp | | | 96,200 | | | | 8,161 | |
| | |
| | | | | | | 47,189 | |
| | |
Financials — 15.7% | | | | | | | | |
ACNB Corp | | | 966 | | | | 36 | |
Aflac Inc | | | 402,300 | | | | 20,115 | |
AGNC Investment Corp ‡ | | | 235,405 | | | | 4,237 | |
Allstate Corp/The | | | 253,100 | | | | 23,837 | |
American Financial Group Inc/OH | | | 177,246 | | | | 17,053 | |
American National Insurance Co | | | 34,863 | | | | 4,212 | |
Annaly Capital Management Inc ‡ | | | 1,635,604 | | | | 16,340 | |
Anworth Mortgage Asset Corp ‡ | | | 20,918 | | | | 85 | |
Aon PLC | | | 5,497 | | | | 938 | |
Apollo Commercial Real Estate Finance Inc | | | 230,444 | | | | 4,194 | |
Arch Capital Group Ltd * | | | 331,488 | | | | 10,714 | |
Ares Commercial Real Estate Corp ‡ | | | 3,513 | | | | 53 | |
ARMOUR Residential Inc | | | 39,034 | | | | 762 | |
Axis Capital Holdings Ltd | | | 4,211 | | | | 231 | |
B. Riley Financial Inc | | | 16,804 | | | | 281 | |
Bank of NT Butterfield & Son Ltd/The | | | 31,682 | | | | 1,137 | |
Baycom Corp * | | | 9,604 | | | | 217 | |
BB&T Corp | | | 151,500 | | | | 7,049 | |
BCB Bancorp Inc | | | 10,338 | | | | 139 | |
Berkshire Hathaway Inc, Cl B * | | | 112,100 | | | | 22,520 | |
Blackstone Mortgage Trust Inc, Cl A | | | 34,234 | | | | 1,183 | |
Brown & Brown Inc | | | 10,119 | | | | 299 | |
Cambridge Bancorp | | | 1,356 | | | | 112 | |
Capitol Federal Financial Inc | | | 35,726 | | | | 477 | |
Cboe Global Markets Inc | | | 94,984 | | | | 9,065 | |
Century Bancorp Inc/MA, Cl A | | | 1,374 | | | | 100 | |
Chimera Investment Corp ‡ | | | 134,520 | | | | 2,521 | |
Citizens Financial Group Inc | | | 25,226 | | | | 820 | |
Civista Bancshares Inc | | | 4,479 | | | | 98 | |
CME Group Inc | | | 62,495 | | | | 10,285 | |
CNA Financial Corp | | | 79,700 | | | | 3,455 | |
Codorus Valley Bancorp Inc | | | 593 | | | | 13 | |
Community Bankers Trust Corp | | | 17,908 | | | | 131 | |
Community Financial | | | 206 | | | | 6 | |
Dynex Capital Inc ‡ | | | 42,923 | | | | 261 | |
Eagle Bancorp Inc * | | | 13,818 | | | | 694 | |
Employers Holdings Inc | | | 2,258 | | | | 91 | |
Enstar Group Ltd * | | | 1,710 | | | | 298 | |
Essent Group Ltd * | | | 28,053 | | | | 1,219 | |
| | | | | | | | |
| | | |
| Description | | Shares | | Market Value
($ Thousands) |
| | |
COMMON STOCK (continued) | | | | | | | | |
Evans Bancorp Inc | | | 2,900 | | | $ | 103 | |
Exantas Capital Corp ‡ | | | 18,438 | | | | 196 | |
FactSet Research Systems Inc | | | 11,795 | | | | 2,928 | |
FBL Financial Group Inc, Cl A | | | 3,491 | | | | 219 | |
FGL Holdings | | | 72,325 | | | | 569 | |
Fifth Third Bancorp | | | 158,300 | | | | 3,992 | |
First American Financial Corp | | | 76,300 | | | | 3,930 | |
First Bancshares Inc/The | | | 1,681 | | | | 52 | |
First Business Financial Services Inc | | | 2,957 | | | | 59 | |
First Northwest Bancorp | | | 4,769 | | | | 74 | |
Genworth MI Canada Inc | | | 71,000 | | | | 2,152 | |
Global Indemnity Ltd | | | 1,290 | | | | 39 | |
Great Ajax Corp ‡ | | | 6,210 | | | | 85 | |
Guaranty Bancshares Inc | | | 1,457 | | | | 43 | |
Hingham Institution for Savings | | | 265 | | | | 46 | |
HomeTrust Bancshares Inc | | | 3,124 | | | | 79 | |
Houlihan Lokey Inc, Cl A | | | 14,726 | | | | 675 | |
Independent Bank Corp/MI | | | 1,552 | | | | 33 | |
INTL. FCStone Inc * | | | 2,675 | | | | 104 | |
Invesco Mortgage Capital Inc | | | 25,452 | | | | 402 | |
Investar Holding Corp | | | 965 | | | | 22 | |
Kemper Corp, Cl A | | | 4,949 | | | | 377 | |
Kingstone Cos Inc | | | 12,092 | | | | 178 | |
Kinsale Capital Group Inc | | | 717 | | | | 49 | |
Loblaw Cos Ltd | | | 110,700 | | | | 5,462 | |
MarketAxess Holdings Inc | | | 31,213 | | | | 7,681 | |
Mercury General Corp | | | 14,114 | | | | 707 | |
Meta Financial Group Inc | | | 23,515 | | | | 463 | |
MFA Financial Inc ‡ | | | 1,495,594 | | | | 10,873 | |
Moelis & Co, Cl A | | | 17,293 | | | | 720 | |
Morningstar Inc, Cl A | | | 16,417 | | | | 2,068 | |
Mr Cooper Group Inc * | | | 56,714 | | | | 544 | |
National Bank of Canada | | | 145,500 | | | | 6,568 | |
National General Holdings Corp | | | 3,563 | | | | 85 | |
Nicolet Bankshares Inc * | | | 6,867 | | | | 409 | |
Northeast Bancorp | | | 26,067 | | | | 539 | |
Norwood Financial Corp | | | 450 | | | | 14 | |
Ohio Valley Banc Corp | | | 1,779 | | | | 64 | |
Old Line Bancshares Inc | | | 20,661 | | | | 515 | |
Old Republic International Corp | | | 25,909 | | | | 542 | |
Old Second Bancorp Inc | | | 8,516 | | | | 107 | |
Orrstown Financial Services Inc | | | 5,497 | | | | 102 | |
Parke Bancorp Inc | | | 3,024 | | | | 63 | |
PCSB Financial Corp | | | 20,853 | | | | 408 | |
Peoples Bancorp of North Carolina | | | 595 | | | | 16 | |
PNC Financial Services Group Inc/The | | | 34,500 | | | | 4,232 | |
Popular Inc | | | 14,176 | | | | 739 | |
Premier Financial Bancorp Inc | | | 9,395 | | | | 148 | |
Progressive Corp/The | | | 172,924 | | | | 12,466 | |
Protective Insurance Corp | | | 2,940 | | | | 54 | |
Ready Capital Corp ‡ | | | 31,292 | | | | 459 | |
Reinsurance Group of America Inc, Cl A | | | 23,900 | | | | 3,393 | |
| | |
| 2 | | SEI Institutional Managed Trust / Semi-Annual Report / March 31, 2019 |
SCHEDULE OF INVESTMENTS (Unaudited)
March 31, 2019
U.S. Managed Volatility Fund(Continued)
| | | | | | | | |
| | | |
| Description | | Shares | | Market Value
($ Thousands) |
| |
COMMON STOCK (continued) | | | | | |
Riverview Bancorp Inc | | | 15,930 | | | $ | 116 | |
Safety Insurance Group Inc | | | 6,911 | | | | 602 | |
SmartFinancial Inc * | | | 1,537 | | | | 29 | |
Southern National Bancorp of Virginia Inc | | | 21,017 | | | | 308 | |
Starwood Property Trust Inc ‡ | | | 343,145 | | | | 7,669 | |
TFS Financial Corp | | | 19,348 | | | | 319 | |
Third Point Reinsurance Ltd * | | | 79,355 | | | | 824 | |
Timberland Bancorp Inc/WA | | | 15,155 | | | | 424 | |
TPG RE Finance Trust Inc ‡ | | | 15,308 | | | | 300 | |
Travelers Cos Inc/The | | | 67,900 | | | | 9,313 | |
TriCo Bancshares | | | 1,247 | | | | 49 | |
Two Harbors Investment Corp ‡ | | | 819,851 | | | | 11,093 | |
United Security Bancshares/Fresno CA | | | 938 | | | | 10 | |
Unity Bancorp | | | 2,310 | | | | 44 | |
US Bancorp | | | 172,500 | | | | 8,313 | |
Virtu Financial Inc, Cl A | | | 6,658 | | | | 158 | |
Waterstone Financial Inc | | | 7,851 | | | | 129 | |
| | |
| | | | | | | 280,825 | |
| | |
Health Care — 10.2% | | | | | | | | |
AbbVie Inc | | | 100,800 | | | | 8,123 | |
Accuray Inc * | | | 18,824 | | | | 90 | |
Amgen Inc, Cl A | | | 39,400 | | | | 7,485 | |
Amphastar Pharmaceuticals Inc * | | | 22,745 | | | | 465 | |
Baxter International Inc | | | 36,434 | | | | 2,962 | |
Bio-Rad Laboratories Inc, Cl A * | | | 31,782 | | | | 9,715 | |
Cambrex Corp * | | | 3,554 | | | | 138 | |
CareDx Inc * | | | 7,487 | | | | 236 | |
Codexis Inc * | | | 3,660 | | | | 75 | |
Computer Programs & Systems Inc | | | 2,127 | | | | 63 | |
Dova Pharmaceuticals Inc * | | | 20,156 | | | | 179 | |
Eli Lilly & Co | | | 132,000 | | | | 17,128 | |
Emergent BioSolutions Inc * | | | 7,254 | | | | 367 | |
Enzo Biochem Inc * | | | 71,099 | | | | 194 | |
Gilead Sciences Inc | | | 59,000 | | | | 3,836 | |
Haemonetics Corp * | | | 9,251 | | | | 809 | |
HCA Healthcare Inc | | | 94,000 | | | | 12,256 | |
Humana Inc | | | 28,477 | | | | 7,575 | |
ICU Medical Inc * | | | 956 | | | | 229 | |
Intersect ENT Inc * | | | 5,454 | | | | 175 | |
Johnson & Johnson | | | 223,100 | | | | 31,187 | |
Kindred Biosciences Inc * | | | 2,894 | | | | 27 | |
LeMaitre Vascular Inc | | | 30,755 | | | | 953 | |
Luminex Corp | | | 5,334 | | | | 123 | |
Merck & Co Inc | | | 489,157 | | | | 40,683 | |
Myriad Genetics Inc * | | | 13,690 | | | | 455 | |
Pfizer Inc | | | 754,300 | | | | 32,035 | |
Phibro Animal Health Corp, Cl A | | | 10,473 | | | | 346 | |
Prestige Consumer Healthcare Inc, Cl A * | | | 12,857 | | | | 385 | |
Sanofi ADR | | | 61,600 | | | | 2,728 | |
Tactile Systems Technology Inc * | | | 10,857 | | | | 572 | |
US Physical Therapy Inc | | | 2,467 | | | | 259 | |
| | | | | | | | |
| | | |
| Description | | Shares | | Market Value
($ Thousands) |
| | |
COMMON STOCK (continued) | | | | | | | | |
Utah Medical Products Inc | | | 3,129 | | | $ | 276 | |
| | |
| | | | | | | 182,129 | |
| | |
Industrials — 9.1% | | | | | | | | |
ADT Inc | | | 152,457 | | | | 974 | |
Advanced Disposal Services Inc * | | | 34,765 | | | | 973 | |
Aerovironment Inc * | | | 3,388 | | | | 232 | |
Allison Transmission Holdings Inc | | | 215,300 | | | | 9,671 | |
BWX Technologies Inc, Cl W | | | 105,931 | | | | 5,252 | |
Carlisle Cos Inc | | | 34,954 | | | | 4,286 | |
Cummins Inc | | | 31,600 | | | | 4,989 | |
Eaton Corp PLC | | | 137,400 | | | | 11,069 | |
Expeditors International of Washington Inc | | | 31,601 | | | | 2,398 | |
FedEx Corp | | | 8,700 | | | | 1,578 | |
Forrester Research Inc | | | 5,899 | | | | 285 | |
Honeywell International Inc | | | 28,402 | | | | 4,514 | |
Huntington Ingalls Industries Inc, Cl A | | | 36,220 | | | | 7,505 | |
Lawson Products Inc/DE * | | | 1,300 | | | | 41 | |
Lockheed Martin Corp | | | 30,025 | | | | 9,012 | |
National Presto Industries | | | 4,966 | | | | 539 | |
Northrop Grumman Corp | | | 682 | | | | 184 | |
Omega Flex Inc | | | 2,851 | | | | 216 | |
Raytheon Co | | | 119,671 | | | | 21,790 | |
Republic Services Inc | | | 392,738 | | | | 31,568 | |
Schneider National Inc, Cl B | | | 88,685 | | | | 1,867 | |
Toro Co/The | | | 55,116 | | | | 3,794 | |
United Technologies Corp | | | 66,500 | | | | 8,571 | |
Vectrus Inc * | | | 18,156 | | | | 483 | |
Waste Management Inc | | | 305,558 | | | | 31,751 | |
| | |
| | | | | | | 163,542 | |
| |
Information Technology — 14.6% | | | | | |
Alpha & Omega Semiconductor Ltd * | | | 4,188 | | | | 48 | |
Amdocs Ltd | | | 540,205 | | | | 29,230 | |
Appfolio Inc, Cl A * | | | 1,355 | | | | 108 | |
Apple Inc | | | 62,100 | | | | 11,796 | |
Aspen Technology Inc * | | | 11,868 | | | | 1,237 | |
Automatic Data Processing Inc | | | 58,196 | | | | 9,296 | |
Avnet Inc | | | 87,000 | | | | 3,773 | |
Booz Allen Hamilton Holding Corp, Cl A | | | 183,269 | | | | 10,655 | |
CACI International Inc, Cl A * | | | 1,386 | | | | 252 | |
Cadence Design Systems Inc * | | | 67,429 | | | | 4,282 | |
Calix Inc * | | | 9,889 | | | | 76 | |
Canon Inc ADR | | | 130,800 | | | | 3,798 | |
CDK Global Inc | | | 128,496 | | | | 7,558 | |
CDW Corp/DE | | | 19,104 | | | | 1,841 | |
Cisco Systems Inc | | | 537,800 | | | | 29,036 | |
Cision Ltd * | | | 4,969 | | | | 68 | |
CommVault Systems Inc * | | | 1,104 | | | | 71 | |
Corning Inc, Cl B | | | 120,900 | | | | 4,002 | |
CSG Systems International Inc | | | 6,102 | | | | 258 | |
Diodes Inc * | | | 4,562 | | | | 158 | |
| | | | |
SEI Institutional Managed Trust / Semi-Annual Report / March 31, 2019 | | | 3 | |
SCHEDULE OF INVESTMENTS (Unaudited)
March 31, 2019
U.S. Managed Volatility Fund(Continued)
| | | | | | | | |
| | | |
| Description | | Shares | | Market Value ($ Thousands) |
| | |
COMMON STOCK (continued) | | | | | | | | |
Ebix Inc | | | 11,598 | | | $ | 573 | |
F5 Networks Inc, Cl A * | | | 41,500 | | | | 6,513 | |
Fidelity National Information Services Inc, Cl B | | | 15,418 | | | | 1,744 | |
FLIR Systems Inc | | | 22,604 | | | | 1,076 | |
Genpact Ltd | | | 151,768 | | | | 5,339 | |
Intel Corp | | | 440,000 | | | | 23,628 | |
International Business Machines Corp | | | 90,300 | | | | 12,741 | |
Jack Henry & Associates Inc | | | 8,332 | | | | 1,156 | |
KLA-Tencor Corp | | | 57,400 | | | | 6,854 | |
Maxim Integrated Products Inc | | | 59,609 | | | | 3,169 | |
Motorola Solutions Inc | | | 119,339 | | | | 16,758 | |
MTS Systems Corp, Cl A | | | 6,845 | | | | 373 | |
National Instruments Corp | | | 159,262 | | | | 7,065 | |
NVE Corp | | | 1,951 | | | | 191 | |
Oracle Corp, Cl B | | | 351,500 | | | | 18,879 | |
Paychex Inc | | | 54,187 | | | | 4,346 | |
PRGX Global Inc * | | | 2,210 | | | | 18 | |
QUALCOMM Inc | | | 30,241 | | | | 1,725 | |
Ribbon Communications Inc * | | | 10,849 | | | | 56 | |
Science Applications International Corp | | | 14,109 | | | | 1,086 | |
SecureWorks Corp, Cl A * | | | 13,087 | | | | 241 | |
Sykes Enterprises Inc * | | | 5,752 | | | | 163 | |
Symantec Corp, Cl A | | | 282,306 | | | | 6,490 | |
SYNNEX Corp | | | 8,285 | | | | 790 | |
Synopsys Inc * | | | 67,256 | | | | 7,745 | |
Teradata Corp * | | | 28,542 | | | | 1,246 | |
TTEC Holdings Inc | | | 5,995 | | | | 217 | |
Western Union Co/The | | | 715,900 | | | | 13,223 | |
| | |
| | | | | | | 260,948 | |
| | |
Materials — 2.7% | | | | | | | | |
Ardagh Group SA, Cl A | | | 49,594 | | | | 645 | |
Eastman Chemical Co | | | 71,600 | | | | 5,433 | |
Gold Resource Corp | | | 113,281 | | | | 445 | |
Hawkins Inc | | | 3,939 | | | | 145 | |
Materion Corp | | | 2,815 | | | | 161 | |
NewMarket Corp | | | 169 | | | | 73 | |
Newmont Mining Corp | | | 162,748 | | | | 5,821 | |
Royal Gold Inc, Cl A | | | 73,720 | | | | 6,703 | |
Sealed Air Corp | | | 165,200 | | | | 7,609 | |
Silgan Holdings Inc | | | 165,800 | | | | 4,913 | |
Sonoco Products Co | | | 212,380 | | | | 13,068 | |
Valvoline Inc | | | 166,658 | | | | 3,093 | |
| | |
| | | | | | | 48,109 | |
| | |
Real Estate — 3.9% | | | | | | | | |
Apple Hospitality Inc ‡ | | | 332,602 | | | | 5,421 | |
Brixmor Property Group Inc ‡ | | | 246,300 | | | | 4,524 | |
Consolidated-Tomoka Land Co | | | 3,492 | | | | 206 | |
CoreCivic Inc ‡ | | | 48,641 | | | | 946 | |
CorePoint Lodging Inc ‡ | | | 12,997 | | | | 145 | |
| | | | | | | | |
| | | |
| Description | | Shares | | Market Value ($ Thousands) |
| | |
COMMON STOCK (continued) | | | | | | | | |
Cousins Properties Inc, Cl A ‡ | | | 58,350 | | | $ | 564 | |
Easterly Government Properties Inc ‡ | | | 8,224 | | | | 148 | |
Equity Commonwealth ‡ | | | 11,120 | | | | 363 | |
Gaming and Leisure Properties Inc ‡ | | | 239,900 | | | | 9,253 | |
Getty Realty Corp ‡ | | | 102,400 | | | | 3,280 | |
Gladstone Commercial Corp ‡ | | | 7,089 | | | | 147 | |
Kennedy-Wilson Holdings Inc | | | 1,382 | | | | 30 | |
National Health Investors Inc ‡ | | | 62,456 | | | | 4,906 | |
Newmark Group Inc, Cl A | | | 3,090 | | | | 26 | |
Omega Healthcare Investors Inc ‡ | | | 144,000 | | | | 5,494 | |
Piedmont Office Realty Trust, Cl A ‡ | | | 273,000 | | | | 5,692 | |
PS Business Parks Inc ‡ | | | 11,580 | | | | 1,816 | |
Retail Properties of America Inc, Cl A ‡ | | | 413,000 | | | | 5,034 | |
RMR Group Inc/The | | | 12,756 | | | | 778 | |
Ryman Hospitality Properties Inc ‡ | | | 8,128 | | | | 668 | |
Senior Housing Properties Trust ‡ | | | 221,100 | | | | 2,605 | |
Terreno Realty Corp ‡ | | | 29,249 | | | | 1,230 | |
VEREIT Inc ‡ | | | 655,900 | | | | 5,490 | |
VICI Properties Inc ‡(A) | | | 448,026 | | | | 9,803 | |
Xenia Hotels & Resorts Inc ‡ | | | 10,388 | | | | 228 | |
| | |
| | | | | | | 68,797 | |
| | |
Utilities — 10.1% | | | | | | | | |
ALLETE | | | 14,408 | | | | 1,185 | |
Ameren Corp | | | 310,564 | | | | 22,842 | |
American Electric Power Co Inc | | | 172,521 | | | | 14,449 | |
Atlantic Power Corp * | | | 113,294 | | | | 286 | |
Avangrid Inc | | | 26,042 | | | | 1,311 | |
Avista Corp | | | 21,867 | | | | 888 | |
CenterPoint Energy Inc | | | 40,112 | | | | 1,231 | |
Chesapeake Utilities Corp | | | 11,351 | | | | 1,035 | |
CMS Energy Corp | | | 168,002 | | | | 9,331 | |
DTE Energy Co | | | 56,494 | | | | 7,047 | |
Edison International | | | 89,800 | | | | 5,560 | |
El Paso Electric Co, Cl A | | | 20,304 | | | | 1,194 | |
Entergy Corp | | | 261,300 | | | | 24,988 | |
Exelon Corp | | | 496,900 | | | | 24,910 | |
FirstEnergy Corp | | | 246,500 | | | | 10,257 | |
Hawaiian Electric Industries Inc | | | 107,565 | | | | 4,385 | |
IDACORP Inc, Cl A | | | 14,400 | | | | 1,433 | |
MGE Energy Inc | | | 19,153 | | | | 1,302 | |
New Jersey Resources Corp | | | 1,105 | | | | 55 | |
NextEra Energy Inc | | | 70,715 | | | | 13,671 | |
Northwest Natural Holding Co | | | 17,621 | | | | 1,156 | |
NorthWestern Corp | | | 20,694 | | | | 1,457 | |
Pinnacle West Capital Corp | | | 111,998 | | | | 10,705 | |
PNM Resources Inc | | | 21,327 | | | | 1,010 | |
Portland General Electric Co | | | 21,770 | | | | 1,129 | |
PPL Corp | | | 38,547 | | | | 1,223 | |
Public Service Enterprise Group Inc | | | 132,200 | | | | 7,854 | |
Southwest Gas Holdings Inc | | | 10,738 | | | | 883 | |
Spire | | | 17,848 | | | | 1,469 | |
| | |
| 4 | | SEI Institutional Managed Trust / Semi-Annual Report / March 31, 2019 |
SCHEDULE OF INVESTMENTS (Unaudited)
March 31, 2019
U.S. Managed Volatility Fund(Continued)
| | | | | | | | |
| | | |
| Description | | Shares | | Market Value ($ Thousands) |
| | |
COMMON STOCK (continued) | | | | | | | | |
UGI Corp | | | 25,385 | | | $ | 1,407 | |
Unitil Corp | | | 22,335 | | | | 1,210 | |
Xcel Energy Inc | | | 73,619 | | | | 4,138 | |
| | |
| | | | | | | 181,001 | |
| | |
Total Common Stock
(Cost $1,498,983) ($ Thousands) | | | | | | | 1,738,447 | |
| | |
CASH EQUIVALENT — 2.5% | | | | | | | | |
SEI Daily Income Trust, Government Fund, Cl F | | | | | | | | |
2.220%**† | | | 44,714,082 | | | | 44,714 | |
Total Cash Equivalent
(Cost $44,714) ($ Thousands) | | | | | | | 44,714 | |
| |
Total Investments in Securities — 99.6%
(Cost $1,543,697) ($ Thousands) | | | $ | 1,783,161 | |
| | | | | | | | |
A list of the open futures contracts held by the Fund at March 31, 2019, is as follows:
| | | | | | | | | | | | | | | | | | | | |
Type of Contract | | Number of
Contracts
Long | | | Expiration
Date | | | Notional Amount
(Thousands) | | Value
(Thousands) | | Unrealized
Appreciation
(Thousands) |
S&P 500 IndexE-MINI | | | 190 | | | | Jun-2019 | | | $ | 26,202 | | | $ | 26,959 | | | $ | 757 | |
| | | | | | | | | | | | |
| | Percentages are based on Net Assets of $1,789,829 ($ Thousands). |
| * | Non-income producing security. |
| ** | Rate shown is the7-day effective yield as of March 31, 2019. |
| ‡ | Real Estate Investment Trust. |
| † | Investment in Affiliated Security (see Note 6). |
| (A) | Securities considered illiquid. The total value of such securities as of March 31, 2019 was $9,803 ($ Thousands) and represented 0.5% of the Net Assets of the Fund. |
ADR — American Depositary Receipt
Cl — Class
Ltd— Limited
S&P— Standard & Poor’s
The following is a list of the level of inputs used as of March 31, 2019, in valuing the Fund’s investments and other financial instruments carried at value ($ Thousands):
| | | | | | | | | | | | | | | | |
| Investments in Securities | | Level 1 | | Level 2 | | Level 3 | | Total |
Common Stock | | $ | 1,738,447 | | | $ | – | | | $ | – | | | $ | 1,738,447 | |
Cash Equivalent | | | 44,714 | | | | – | | | | – | | | | 44,714 | |
| | | | | | | | | | | | | | | | |
| | | | |
Total Investments in Securities | | $ | 1,783,161 | | | $ | – | | | $ | – | | | $ | 1,783,161 | |
| | | | | | | | | | | | | | | | |
| | | | | | | | | | | | | | | | |
| Other Financial Instruments | | Level 1 | | Level 2 | | Level 3 | | Total |
Futures Contracts * | | | | | | | | | | | | | | | | |
| | | | |
Unrealized Appreciation | | $ | 757 | | | $ | — | | | $ | — | | | $ | 757 | |
| | | | | | | | | | | | | | | | |
| | | | |
Total Other Financial Instruments | | $ | 757 | | | $ | — | | | $ | — | | | $ | 757 | |
| | | | | | | | | | | | | | | | |
* Futures contracts are valued at the unrealized appreciation on the instrument.
For the period ended March 31, 2019, there were no transfers between Level 1 and Level 2 assets and liabilities.
For the period ended March 31, 2019, there were no transfers between Level 2 and Level 3 assets and liabilities.
For more information on valuation inputs, see Note 2 – Significant Accounting Policies in Notes to Financial Statements.
The following is a summary of the Fund’s transactions with affiliates for the period ended March 31, 2019 ($ Thousands):
| | | | | | | | | | | | | | | | | | | | |
| Security Description | | Value 9/30/18 | | Purchases at Cost | | Proceeds from
Sales | | Value 3/31/19 | | Income |
SEI Daily Income Trust, Government Fund, Cl F | | | $28,046 | | | | $403,501 | | | | $ (386,833) | | | | $44,714 | | | | $425 | |
| | | | | | | | | | | | | | | | | | | | |
| | | | |
SEI Institutional Managed Trust / Semi-Annual Report / March 31, 2019 | | | 5 | |
SCHEDULE OF INVESTMENTS (Unaudited)
March 31, 2019
U.S. Managed Volatility Fund(Continued)
Amounts designated as “—” are either $0 or have been rounded to $0.
The accompanying notes are an integral part of the financial statements.
| | |
| 6 | | SEI Institutional Managed Trust / Semi-Annual Report / March 31, 2019 |
SCHEDULE OF INVESTMENTS (Unaudited)
March 31, 2019
Global Managed Volatility Fund(Continued)
| | | | | | | | |
| | | |
| Description | | Shares | | | Market Value
($ Thousands) | |
| | |
COMMON STOCK — 96.7% | | | | | | | | |
| | |
Australia — 3.3% | | | | | | | | |
Aurizon Holdings Ltd | | | 473,942 | | | $ | 1,532 | |
AusNet Services | | | 11,283 | | | | 14 | |
Caltex Australia Ltd | | | 77,775 | | | | 1,448 | |
Coca-Cola Amatil Ltd | | | 278,583 | | | | 1,712 | |
Cochlear Ltd | | | 16,327 | | | | 2,010 | |
Coles Group Ltd * | | | 107,124 | | | | 902 | |
Computershare Ltd | | | 107,994 | | | | 1,310 | |
Crown Resorts Ltd | | | 120,119 | | | | 982 | |
CSL Ltd | | | 45,149 | | | | 6,252 | |
Evolution Mining Ltd | | | 377,195 | | | | 981 | |
Flight Centre Travel Group Ltd | | | 59,467 | | | | 1,776 | |
Insurance Australia Group Ltd | | | 84,457 | | | | 461 | |
Newcrest Mining Ltd | | | 321,519 | | | | 5,826 | |
QBE Insurance Group Ltd | | | 36,639 | | | | 320 | |
Regis Resources Ltd | | | 112,019 | | | | 422 | |
Rio Tinto Ltd | | | 140,374 | | | | 9,763 | |
South32 Ltd | | | 95,621 | | | | 253 | |
Stockland‡ | | | 90,625 | | | | 248 | |
Telstra Corp Ltd, Cl B | | | 1,193,734 | | | | 2,815 | |
Wesfarmers Ltd | | | 113,931 | | | | 2,804 | |
Woolworths Group Ltd | | | 26,115 | | | | 564 | |
| | | | | | | | |
| | | | | | | 42,395 | |
| | | | | | | | |
| | |
Austria — 0.5% | | | | | | | | |
Agrana Beteiligungs AG | | | 21,344 | | | | 429 | |
Erste Group Bank AG | | | 12,175 | | | | 448 | |
EVN AG | | | 17,488 | | | | 255 | |
Oberbank AG | | | 594 | | | | 63 | |
Oesterreichische Post AG | | | 69,674 | | | | 2,949 | |
Telekom Austria AG, Cl A | | | 44,848 | | | | 326 | |
Verbund AG | | | 8,272 | | | | 397 | |
voestalpine AG | | | 55,307 | | | | 1,681 | |
| | | | | | | | |
| | | | | | | 6,548 | |
| | | | | | | | |
| | |
Belgium — 0.4% | | | | | | | | |
Ageas | | | 4,137 | | | | 200 | |
Colruyt SA | | | 25,293 | | | | 1,871 | |
Proximus SADP | | | 67,419 | | | | 1,946 | |
Sipef NV | | | 871 | | | | 49 | |
UCB SA, Cl A | | | 7,558 | | | | 650 | |
| | | | | | | | |
| | | | | | | 4,716 | |
| | | | | | | | |
| | |
Canada — 7.2% | | | | | | | | |
Agnico Eagle Mines Ltd | | | 30,400 | | | | 1,322 | |
Alacer Gold Corp * | | | 31,600 | | | | 86 | |
Argonaut Gold Inc * | | | 46,600 | | | | 66 | |
Atco Ltd/Canada, Cl I | | | 90,477 | | | | 3,048 | |
B2Gold Corp * | | | 147,900 | | | | 414 | |
Bank of Montreal | | | 86,217 | | | | 6,453 | |
BCE Inc | | | 220,026 | | | | 9,767 | |
Canadian Imperial Bank of Commerce | | | 58,568 | | | | 4,630 | |
Canadian Tire Corp Ltd, Cl A | | | 10,700 | | | | 1,153 | |
Canadian Utilities Ltd, Cl A | | | 113,786 | | | | 3,107 | |
| | | | | | | | |
| | | |
| Description | | Shares | | | Market Value
($ Thousands) | |
| | |
COMMON STOCK (continued) | | | | | | | | |
Centerra Gold Inc * | | | 59,000 | | | | $ 310 | |
CGI Inc, Cl A * | | | 24,900 | | | | 1,712 | |
Constellation Software Inc/Canada | | | 3,500 | | | | 2,967 | |
Detour Gold Corp * | | | 134,000 | | | | 1,258 | |
Dundee Precious Metals Inc * | | | 43,600 | | | | 145 | |
Empire Co Ltd, Cl A | | | 41,200 | | | | 892 | |
Fairfax Financial Holdings Ltd | | | 5,900 | | | | 2,734 | |
George Weston Ltd | | | 9,155 | | | | 659 | |
Great-West Lifeco Inc | | | 9,900 | | | | 240 | |
Guyana Goldfields Inc * | | | 121,600 | | | | 98 | |
H&R Real Estate Investment Trust | | | 122,600 | | | | 2,148 | |
Hydro One Ltd | | | 27,000 | | | | 420 | |
iA Financial Corp Inc | | | 6,500 | | | | 240 | |
IGM Financial Inc | | | 2,000 | | | | 51 | |
Kinross Gold Corp * | | | 204,700 | | | | 705 | |
Loblaw Cos Ltd | | | 55,600 | | | | 2,743 | |
Metro Inc, Cl A | | | 38,400 | | | | 1,414 | |
Morguard Real Estate Investment Trust | | | 5,637 | | | | 53 | |
National Bank of Canada | | | 141,100 | | | | 6,370 | |
OceanaGold Corp | | | 215,800 | | | | 678 | |
Open Text Corp | | | 99,800 | | | | 3,833 | |
Osisko Gold Royalties Ltd | | | 117,700 | | | | 1,322 | |
Power Corp of Canada | | | 41,300 | | | | 963 | |
Power Financial Corp | | | 56,000 | | | | 1,309 | |
RioCan Real Estate Investment Trust | | | 130,700 | | | | 2,590 | |
Rogers Communications Inc, Cl B | | | 274,000 | | | | 14,740 | |
Royal Bank of Canada | | | 34,000 | | | | 2,566 | |
SmartCentres Real Estate Investment Trust | | | 33,400 | | | | 875 | |
SSR Mining Inc * | | | 51,880 | | | | 656 | |
Sun Life Financial Inc | | | 20,100 | | | | 772 | |
TELUS Corp | | | 3,400 | | | | 126 | |
Torex Gold Resources Inc * | | | 58,300 | | | | 734 | �� |
Toronto-Dominion Bank/The | | | 125,492 | | | | 6,812 | |
| | | | | | | | |
| | | | | | | 93,181 | |
| | | | | | | | |
| | |
Denmark — 0.8% | | | | | | | | |
Carlsberg A/S, Cl B | | | 60,035 | | | | 7,505 | |
Demant A/S * | | | 44,717 | | | | 1,324 | |
DSV A/S | | | 11,926 | | | | 987 | |
H Lundbeck A/S, Cl H | | | 2 | | | | – | |
| | | | | | | | |
| | | | | | | 9,816 | |
| | | | | | | | |
| | |
Finland — 0.1% | | | | | | | | |
Orion Oyj, Cl B | | | 21,674 | | | | 813 | |
| | | | | | | | |
| | |
France — 1.2% | | | | | | | | |
Aeroports de Paris, Cl A | | | 1,247 | | | | 241 | |
AXA SA | | | 41,811 | | | | 1,053 | |
Boiron SA | | | 654 | | | | 39 | |
Caisse Regionale de Credit Agricole Mutuel Nord de France | | | 453 | | | | 12 | |
Dassault Aviation SA | | | 482 | | | | 712 | |
Engie SA | | | 298,470 | | | | 4,451 | |
Eutelsat Communications SA | | | 60,189 | | | | 1,054 | |
| | | | |
SEI Institutional Managed Trust / Semi-Annual Report / March 31, 2019 | | | 1 | |
SCHEDULE OF INVESTMENTS (Unaudited)
March 31, 2019
Global Managed Volatility Fund(Continued)
| | | | | | | | |
| | | |
| Description | | Shares | | | Market Value
($ Thousands) | |
| | |
COMMON STOCK (continued) | | | | | | | | |
Orange SA | | | 80,612 | | | | $ 1,312 | |
Publicis Groupe SA | | | 7,841 | | | | 420 | |
Societe Generale SA | | | 5,092 | | | | 147 | |
Veolia Environnement SA | | | 278,331 | | | | 6,229 | |
| | | | | | | | |
| | | | | | | 15,670 | |
| | | | | | | | |
| | |
Germany — 1.8% | | | | | | | | |
Aareal Bank AG | | | 74,006 | | | | 2,283 | |
adidas AG | | | 17,389 | | | | 4,229 | |
Allianz SE | | | 2,226 | | | | 496 | |
Deutsche Lufthansa AG | | | 230,632 | | | | 5,067 | |
Deutsche Telekom AG | | | 215,944 | | | | 3,587 | |
Fraport AG Frankfurt Airport Services Worldwide | | | 1,094 | | | | 84 | |
McKesson Europe AG | | | 3,971 | | | | 117 | |
METRO AG | | | 308,898 | | | | 5,130 | |
MVV Energie AG | | | 2,427 | | | | 71 | |
RHOEN-KLINIKUM AG | | | 29,874 | | | | 861 | |
RTL Group SA | | | 16,494 | | | | 902 | |
Uniper SE | | | 1,293 | | | | 39 | |
Wuestenrot & Wuerttembergische AG | | | 1,365 | | | | 26 | |
| | | | | | | | |
| | | | | | | 22,892 | |
| | | | | | | | |
| | |
Guernsey — 0.1% | | | | | | | | |
Amdocs Ltd | | | 24,999 | | | | 1,353 | |
| | | | | | | | |
| | |
Hong Kong — 4.8% | | | | | | | | |
ASM Pacific Technology Ltd | | | 102,300 | | | | 1,141 | |
BOC Hong Kong Holdings Ltd | | | 522,500 | | | | 2,163 | |
CK Hutchison Holdings Ltd | | | 20,500 | | | | 215 | |
CK Infrastructure Holdings Ltd | | | 567,000 | | | | 4,655 | |
CLP Holdings Ltd, Cl B | | | 1,656,656 | | | | 19,205 | |
First Pacific Co Ltd | | | 860,000 | | | | 313 | |
Hang Seng Bank Ltd | | | 120,000 | | | | 2,961 | |
HK Electric Investments & HK Electric Investments Ltd | | | 2,022,500 | | | | 2,066 | |
HKT Trust & HKT Ltd | | | 3,767,000 | | | | 6,056 | |
Hong Kong & China Gas Co Ltd | | | 552,000 | | | | 1,324 | |
Kerry Properties Ltd | | | 408,500 | | | | 1,824 | |
Langham Hospitality Investments and Langham Hospitality Investments Ltd | | | 425,500 | | | | 172 | |
Li & Fung Ltd | | | 3,742,000 | | | | 672 | |
Link REIT | | | 710,000 | | | | 8,303 | |
Miramar Hotel & Investment | | | 49,000 | | | | 106 | |
MTR Corp Ltd | | | 659,000 | | | | 4,080 | |
NWS Holdings Ltd | | | 26,000 | | | | 57 | |
PCCW Ltd | | | 1,766,000 | | | | 1,098 | |
Power Assets Holdings Ltd | | | 283,500 | | | | 1,967 | |
Regal Hotels International Holdings Ltd | | | 378,000 | | | | 237 | |
Swire Pacific Ltd, Cl A | | | 29,000 | | | | 373 | |
WH Group Ltd | | | 1,118,500 | | | | 1,197 | |
Yue Yuen Industrial Holdings Ltd | | | 641,500 | | | | 2,207 | |
| | | | | | | | |
| | | | | | | 62,392 | |
| | | | | | | | |
| | | | | | | | |
| | | |
| Description | | Shares | | | Market Value
($ Thousands) | |
| | |
COMMON STOCK (continued) | | | | | | | | |
| | |
Ireland — 0.1% | | | | | | | | |
Jazz Pharmaceuticals PLC * | | | 11,545 | | | | $ 1,650 | |
| | | | | | | | |
| | |
Israel — 1.7% | | | | | | | | |
Bank Hapoalim BM | | | 1,179,985 | | | | 7,824 | |
Bank LeumiLe-Israel BM | | | 1,523,061 | | | | 9,948 | |
FIBI Holdings Ltd | | | 1,678 | | | | 47 | |
Israel Discount Bank Ltd, Cl A | | | 1,058,914 | | | | 3,661 | |
Mediterranean Towers Ltd | | | 39,638 | | | | 71 | |
Paz Oil Co Ltd * | | | 1,031 | | | | 154 | |
Rami Levy Chain Stores Hashikma Marketing 2006 Ltd | | | 624 | | | | 32 | |
| | | | | | | | |
| | | | | | | 21,737 | |
| | | | | | | | |
| | |
Italy — 0.4% | | | | | | | | |
A2A SpA | | | 231,648 | | | | 423 | |
Avio SpA | | | 1,959 | | | | 27 | |
Hera SpA | | | 610,398 | | | | 2,210 | |
Iren SpA | | | 775,065 | | | | 1,979 | |
Orsero SpA | | | 4,900 | | | | 41 | |
| | | | | | | | |
| | | | | | | 4,680 | |
| | | | | | | | |
| | |
Japan — 10.0% | | | | | | | | |
ABC-Mart Inc, Cl H | | | 11,100 | | | | 661 | |
Aeon Co Ltd, Cl H | | | 17,100 | | | | 358 | |
Aeon Hokkaido Corp | | | 41,700 | | | | 284 | |
AEON REIT Investment Corp | | | 400 | | | | 472 | |
Ahjikan Co Ltd | | | 2,500 | | | | 23 | |
Ajinomoto Co Inc | | | 41,300 | | | | 660 | |
Alpen Co Ltd | | | 26,769 | | | | 414 | |
Amiyaki Tei Co Ltd | | | 2,300 | | | | 73 | |
Aohata Corp | | | 2,900 | | | | 61 | |
Araya Industrial Co Ltd | | | 2,600 | | | | 37 | |
Arcland Sakamoto Co Ltd | | | 3,768 | | | | 51 | |
Arcs Co Ltd | | | 3,500 | | | | 77 | |
Astellas Pharma Inc | | | 324,400 | | | | 4,861 | |
Atsugi Co Ltd | | | 11,750 | | | | 102 | |
Bandai Namco Holdings Inc | | | 4,800 | | | | 225 | |
Benesse Holdings Inc, Cl A | | | 4,700 | | | | 122 | |
Can Do Co Ltd | | | 2,300 | | | | 35 | |
Canon Inc | | | 190,900 | | | | 5,542 | |
C’BON COSMETICS Co Ltd | | | 1,100 | | | | 25 | |
Chubu Electric Power Co Inc | | | 93,600 | | | | 1,462 | |
Chugoku Electric Power Co Inc/The | | | 27,400 | | | | 342 | |
Computer Institute of Japan Ltd | | | 22,200 | | | | 168 | |
Create Medic Co Ltd | | | 6,200 | | | | 53 | |
Daiichikosho Co Ltd | | | 1,300 | | | | 66 | |
Daiwa House REIT Investment Corp | | | 119 | | | | 264 | |
Daiwa Office Investment Corp‡ | | | 11 | | | | 78 | |
DCM Holdings Co Ltd | | | 19,000 | | | | 177 | |
DyDo Group Holdings Inc | | | 36,590 | | | | 1,650 | |
EDION Corp | | | 19,900 | | | | 174 | |
FALCO HOLDINGS Co Ltd | | | 3,400 | | | | 42 | |
Frontier Real Estate Investment Corp | | | 166 | | | | 697 | |
| | |
| 2 | | SEI Institutional Managed Trust / Semi-Annual Report / March 31, 2019 |
SCHEDULE OF INVESTMENTS (Unaudited)
March 31, 2019
Global Managed Volatility Fund(Continued)
| | | | | | | | |
| | | |
| Description | | Shares | | | Market Value
($ Thousands) | |
| | |
COMMON STOCK (continued) | | | | | | | | |
Fujiya Co Ltd | | | 19,300 | | | | $ 380 | |
G-7 Holdings Inc, Cl 7 | | | 8,864 | | | | 187 | |
Hakudo Co Ltd | | | 2,400 | | | | 34 | |
Hitachi Ltd | | | 9,241 | | | | 299 | |
Hokkaido Electric Power Co Inc | | | 31,100 | | | | 179 | |
Hokkaido Gas Co Ltd | | | 5,200 | | | | 68 | |
Hokuriku Electric Power Co | | | 5,400 | | | | 42 | |
Hoya Corp | | | 63,300 | | | | 4,180 | |
Itochu-Shokuhin Co Ltd | | | 2,003 | | | | 86 | |
Japan Excellent Inc‡ | | | 568 | | | | 826 | |
Japan Logistics Fund Inc | | | 88 | | | | 187 | |
Japan Meat Co Ltd | | | 1,300 | | | | 23 | |
Japan Oil Transportation Co Ltd | | | 2,100 | | | | 54 | |
Japan Post Bank Co Ltd | | | 57,100 | | | | 624 | |
Japan Post Holdings Co Ltd | | | 759,200 | | | | 8,889 | |
Japan Prime Realty Investment Corp, Cl A‡ | | | 131 | | | | 540 | |
Japan Rental Housing Investments Inc‡ | | | 888 | | | | 708 | |
Japan Tobacco Inc | | | 181,300 | | | | 4,496 | |
J-Oil Mills Inc | | | 700 | | | | 26 | |
JXTG Holdings Inc | | | 27,300 | | | | 125 | |
Kadoya Sesame Mills Inc | | | 1,000 | | | | 47 | |
Kakaku.com Inc | | | 54,600 | | | | 1,049 | |
Kaken Pharmaceutical Co Ltd | | | 800 | | | | 36 | |
Kakiyasu Honten Co Ltd | | | 9,700 | | | | 189 | |
Kato Sangyo Co Ltd | | | 29,100 | | | | 960 | |
KDDI Corp | | | 209,400 | | | | 4,512 | |
Keiyo Co Ltd | | | 7,852 | | | | 35 | |
Kenedix Retail REIT Corp | | | 351 | | | | 857 | |
Kewpie Corp | | | 2,700 | | | | 65 | |
King Jim Co Ltd | | | 14,000 | | | | 109 | |
Kohnan Shoji Co Ltd | | | 45,146 | | | | 1,120 | |
Kohsoku Corp | | | 2,600 | | | | 29 | |
Komeri Co Ltd | | | 9,500 | | | | 233 | |
Konica Minolta Inc | | | 91,600 | | | | 901 | |
Kurimoto Ltd | | | 10,600 | | | | 139 | |
Kyokuyo Co Ltd | | | 11,500 | | | | 295 | |
KYORIN Holdings Inc | | | 109,700 | | | | 2,142 | |
Kyushu Electric Power Co Inc | | | 88,300 | | | | 1,043 | |
Kyushu Railway Co | | | 83,100 | | | | 2,733 | |
Marubeni Corp | | | 641,900 | | | | 4,436 | |
McDonald’s Holdings Co Japan Ltd | | | 37,600 | | | | 1,739 | |
Medipal Holdings Corp | | | 150,000 | | | | 3,564 | |
Megmilk Snow Brand Co Ltd | | | 11,900 | | | | 290 | |
MEIJI Holdings Co Ltd | | | 3,500 | | | | 284 | |
Michinoku Bank Ltd/The | | | 2,100 | | | | 31 | |
Mitsubishi Gas Chemical Co Inc | | | 41,200 | | | | 588 | |
Mitsubishi Tanabe Pharma Corp | | | 104,200 | | | | 1,392 | |
Mitsui & Co Ltd | | | 98,700 | | | | 1,532 | |
Miyoshi Oil & Fat Co Ltd | | | 16,300 | | | | 165 | |
Mizuho Financial Group Inc | | | 3,964,800 | | | | 6,136 | |
Mochida Pharmaceutical Co Ltd | | | 8,600 | | | | 441 | |
Mori Trust Sogo Reit Inc | | | 681 | | | | 1,059 | |
| | | | | | | | |
| | | |
| Description | | Shares | | | Market Value
($ Thousands) | |
| | |
COMMON STOCK (continued) | | | | | | | | |
Morito Co Ltd | | | 6,400 | | | | $ 49 | |
Morozoff Ltd | | | 1,100 | | | | 49 | |
Musashi Co Ltd | | | 2,400 | | | | 50 | |
Nagoya Railroad Co Ltd | | | 8,900 | | | | 246 | |
Nakayama Steel Works Ltd | | | 6,300 | | | | 29 | |
Nichia Steel Works Ltd | | | 8,300 | | | | 26 | |
Nichi-iko Pharmaceutical Co Ltd | | | 11,500 | | | | 153 | |
Nihon Kohden Corp | | | 5,300 | | | | 158 | |
Nippon Accommodations Fund Inc | | | 10 | | | | 51 | |
Nippon Building Fund Inc | | | 105 | | | | 711 | |
Nippon Express Co Ltd | | | 8,800 | | | | 490 | |
Nippon Flour Mills Co Ltd | | | 73,334 | | | | 1,259 | |
Nippon Prologis REIT Inc‡ | | | 76 | | | | 162 | |
Nippon Telegraph & Telephone Corp | | | 136,400 | | | | 5,796 | |
Nippon Television Holdings Inc | | | 6,700 | | | | 100 | |
Nisshin Oillio Group Ltd/The | | | 21,352 | | | | 631 | |
NJS Co Ltd | | | 2,600 | | | | 34 | |
NTT DOCOMO Inc | | | 377,500 | | | | 8,361 | |
Ohsho Food Service Corp | | | 10,900 | | | | 690 | |
Okinawa Cellular Telephone Co | | | 800 | | | | 25 | |
Okinawa Electric Power Co Inc/The | | | 78,912 | | | | 1,344 | |
One REIT Inc | | | 115 | | | | 294 | |
Oracle Corp Japan | | | 56,500 | | | | 3,793 | |
Orix JREIT Inc | | | 132 | | | | 227 | |
Osaka Gas Co Ltd | | | 36,600 | | | | 722 | |
Otsuka Corp | | | 19,200 | | | | 717 | |
OUG Holdings Inc (A) | | | 3,000 | | | | 70 | |
Premier Investment Corp | | | 261 | | | | 329 | |
Rhythm Watch Co Ltd | | | 1,900 | | | | 23 | |
Ricoh Co Ltd | | | 96,400 | | | | 1,008 | |
San Holdings Inc | | | 1,900 | | | | 43 | |
Sankyo Co Ltd | | | 14,600 | | | | 557 | |
Sawai Pharmaceutical Co Ltd | | | 4,000 | | | | 232 | |
Secom Co Ltd | | | 1,800 | | | | 154 | |
Seven & i Holdings Co Ltd | | | 179,500 | | | | 6,772 | |
SG Holdings Co Ltd | | | 69,100 | | | | 2,013 | |
Shidax Corp | | | 10,800 | | | | 31 | |
Shimamura Co Ltd | | | 2,600 | | | | 220 | |
Shionogi & Co Ltd | | | 6,800 | | | | 421 | |
Shofu Inc | | | 6,400 | | | | 74 | |
Showa Sangyo Co Ltd | | | 3,200 | | | | 87 | |
SKY Perfect JSAT Holdings Inc | | | 20,400 | | | | 85 | |
SRS Holdings Co Ltd | | | 3,400 | | | | 30 | |
St Marc Holdings Co Ltd | | | 3,200 | | | | 72 | |
Starts Proceed Investment Corp, Cl A | | | 264 | | | | 436 | |
Step Co Ltd | | | 4,400 | | | | 59 | |
Suntory Beverage & Food Ltd | | | 10,100 | | | | 474 | |
Suzuken Co Ltd/Aichi Japan | | | 3,600 | | | | 208 | |
Taiko Pharmaceutical Co Ltd | | | 20,100 | | | | 341 | |
Ten Allied Co Ltd * | | | 5,900 | | | | 22 | |
Toho Holdings Co Ltd | | | 53,700 | | | | 1,340 | |
Tohoku Electric Power Co Inc | | | 76,700 | | | | 978 | |
| | | | |
SEI Institutional Managed Trust / Semi-Annual Report / March 31, 2019 | | | 3 | |
SCHEDULE OF INVESTMENTS (Unaudited)
March 31, 2019
Global Managed Volatility Fund(Continued)
| | | | | | | | |
| | | |
| Description | | Shares | | Market Value ($ Thousands) |
| | |
COMMON STOCK (continued) | | | | | | | | |
Tokai Corp/Gifu | | | 1,310 | | | $ | 32 | |
Tokyo Electric Power Co Holdings Inc * | | | 669,800 | | | | 4,236 | |
Tokyo Gas Co Ltd | | | 13,500 | | | | 365 | |
Tokyo Theatres Co Inc | | | 2,100 | | | | 25 | |
Tokyu Recreation Co Ltd | | | 800 | | | | 36 | |
Tokyu REIT Inc | | | 163 | | | | 264 | |
Toyo Suisan Kaisha Ltd | | | 9,500 | | | | 362 | |
Tsumura & Co | | | 4,400 | | | | 134 | |
Unicafe Inc | | | 6,400 | | | | 58 | |
Valor Holdings Co Ltd | | | 6,900 | | | | 167 | |
Vital KSK Holdings Inc | | | 59,400 | | | | 586 | |
West Japan Railway Co | | | 1,100 | | | | 83 | |
Yamada Denki Co Ltd | | | 188,300 | | | | 929 | |
Yashima Denki Co Ltd | | | 4,500 | | | | 34 | |
Yellow Hat Ltd | | | 7,000 | | | | 92 | |
| | | | | | | 129,009 | |
| | |
Netherlands — 0.4% | | | | | | | | |
ABN AMRO Group NV | | | 28,181 | | | | 636 | |
Coca-Cola European Partners PLC | | | 5,674 | | | | 293 | |
ForFarmers NV | | | 21,521 | | | | 177 | |
Koninklijke Ahold Delhaize NV | | | 94,198 | | | | 2,509 | |
NN Group NV | | | 25,369 | | | | 1,055 | |
Sligro Food Group NV | | | 1,081 | | | | 39 | |
| | | | | | | 4,709 | |
| | |
New Zealand — 1.8% | | | | | | | | |
Abano Healthcare Group Ltd | | | 3,951 | | | | 10 | |
Argosy Property Ltd | | | 303,971 | | | | 265 | |
Arvida Group Ltd | | | 28,483 | | | | 25 | |
Auckland International Airport Ltd | | | 119,975 | | | | 666 | |
Chorus Ltd | | | 16,875 | | | | 68 | |
Contact Energy Ltd | | | 865,027 | | | | 4,094 | |
EBOS Group Ltd | | | 9,652 | | | | 145 | |
Fisher & Paykel Healthcare Corp Ltd | | | 664,248 | | | | 7,112 | |
Fletcher Building Ltd | | | 354,357 | | | | 1,196 | |
Goodman Property Trust | | | 835,750 | | | | 986 | |
Kathmandu Holdings Ltd | | | 27,874 | | | | 43 | |
Kiwi Property Group Ltd | | | 807,099 | | | | 817 | |
Mainfreight Ltd | | | 3,460 | | | | 85 | |
Mercury NZ Ltd | | | 432,485 | | | | 1,150 | |
Meridian Energy Ltd | | | 129,503 | | | | 370 | |
Metlifecare Ltd | | | 87,150 | | | | 297 | |
Property for Industry Ltd | | | 83,533 | | | | 111 | |
Restaurant Brands New Zealand Ltd | | | 32,005 | | | | 191 | |
Ryman Healthcare Ltd | | | 137,400 | | | | 1,148 | |
Sanford Ltd/NZ | | | 10,470 | | | | 50 | |
Spark New Zealand Ltd | | | 1,590,534 | | | | 4,122 | |
Stride Property Group | | | 75,455 | | | | 104 | |
Summerset Group Holdings Ltd | | | 48,624 | | | | 219 | |
Synlait Milk Ltd * | | | 25,247 | | | | 183 | |
Trustpower Ltd | | | 30,153 | | | | 136 | |
Vector Ltd | | | 94,500 | | | | 231 | |
| | | | | | | | |
| | | |
| Description | | Shares | | Market Value ($ Thousands) |
| | |
COMMON STOCK (continued) | | | | | | | | |
Warehouse Group Ltd/The (A) | | | 38,887 | | | $ | 58 | |
Z Energy Ltd | | | 19,005 | | | | 81 | |
| | | | | | | 23,963 | |
| | |
Norway — 1.5% | | | | | | | | |
Mowi ASA | | | 37,130 | | | | 830 | |
Olav Thon Eiendomsselskap ASA | | | 1,713 | | | | 30 | |
Orkla ASA | | | 1,121,458 | | | | 8,621 | |
Telenor ASA | | | 522,333 | | | | 10,475 | |
| | | | | | | 19,956 | |
| | |
Panama — 0.1% | | | | | | | | |
Carnival Corp | | | 28,085 | | | | 1,425 | |
| | |
Portugal — 0.1% | | | | | | | | |
REN - Redes Energeticas Nacionais SGPS SA | | | 426,813 | | | | 1,218 | |
| | |
Singapore — 1.5% | | | | | | | | |
Ascendas Real Estate Investment Trust | | | 1,650,000 | | | | 3,545 | |
CapitaLand Commercial Trust | | | 1,868,000 | | | | 2,676 | |
CapitaLand Mall Trust‡ | | | 2,202,500 | | | | 3,870 | |
ComfortDelGro Corp Ltd | | | 731,100 | | | | 1,387 | |
Fraser and Neave Ltd | | | 20,400 | | | | 27 | |
Genting Singapore Ltd | | | 771,900 | | | | 593 | |
Hongkong Land Holdings Ltd | | | 10,400 | | | | 74 | |
Hutchison Port Holdings Trust, Cl U | | | 1,403,000 | | | | 330 | |
IREIT Global | | | 88,100 | | | | 48 | |
Jardine Matheson Holdings Ltd | | | 3,900 | | | | 243 | |
SATS Ltd | | | 341,000 | | | | 1,286 | |
Sheng Siong Group Ltd | | | 1,009,986 | | | | 776 | |
Singapore Airlines Ltd | | | 64,800 | | | | 462 | |
Singapore Press Holdings Ltd | | | 429,500 | | | | 764 | |
Singapore Technologies Engineering Ltd | | | 412,700 | | | | 1,140 | |
SPH REIT‡ | | | 752,577 | | | | 583 | |
StarHub Ltd | | | 757,700 | | | | 834 | |
Suntec Real Estate Investment Trust | | | 146,100 | | | | 210 | |
Yangzijiang Shipbuilding Holdings Ltd | | | 446,200 | | | | 494 | |
| | | | | | | 19,342 | |
| | |
Sweden — 1.9% | | | | | | | | |
Axfood AB | | | 324,180 | | | | 6,047 | |
ICA Gruppen AB | | | 278,598 | | | | 11,204 | |
Industrivarden AB, Cl C | | | 2,915 | | | | 61 | |
Swedish Match AB | | | 153,240 | | | | 7,829 | |
| | | | | | | 25,141 | |
| | |
Switzerland — 5.4% | | | | | | | | |
Allreal Holding AG, Cl A | | | 16,970 | | | | 2,888 | |
Alpiq Holding AG | | | 1,275 | | | | 82 | |
Barry Callebaut AG | | | 449 | | | | 811 | |
Berner Kantonalbank AG | | | 232 | | | | 56 | |
BKW AG | | | 15,320 | | | | 1,045 | |
Chocoladefabriken Lindt & Spruengli AG | | | 475 | | | | 3,586 | |
Emmi AG | | | 202 | | | | 178 | |
Intershop Holding AG | | | 112 | | | | 57 | |
| | |
| 4 | | SEI Institutional Managed Trust / Semi-Annual Report / March 31, 2019 |
SCHEDULE OF INVESTMENTS (Unaudited)
March 31, 2019
Global Managed Volatility Fund(Continued)
| | | | | | | | |
| | | |
| Description | | Shares | | Market Value ($ Thousands) |
|
COMMON STOCK (continued) | |
Lastminute.com NV * | | | 1,582 | | | $ | 33 | |
Nestle SA | | | 100,371 | | | | 9,564 | |
Novartis AG | | | 98,011 | | | | 9,426 | |
Plazza AG | | | 133 | | | | 32 | |
PSP Swiss Property AG | | | 345 | | | | 38 | |
Roche Holding AG | | | 50,791 | | | | 13,992 | |
Schindler Holding AG | | | 11,480 | | | | 2,379 | |
Sonova Holding AG | | | 21,509 | | | | 4,255 | |
Swiss Life Holding AG | | | 7,852 | | | | 3,457 | |
Swiss Prime Site AG | | | 42,062 | | | | 3,685 | |
Swisscom AG | | | 22,788 | | | | 11,143 | |
Tamedia AG | | | 491 | | | | 50 | |
Valora Holding AG | | | 9,104 | | | | 2,509 | |
| | | | | | | 69,266 | |
|
United Kingdom — 2.7% | |
AG Barr PLC | | | 6,564 | | | | 69 | |
Britvic PLC | | | 516,162 | | | | 6,406 | |
Carnival PLC | | | 8,403 | | | | 412 | |
Centrica PLC | | | 1,110,510 | | | | 1,653 | |
Coca-Cola HBC AG | | | 13,510 | | | | 460 | |
Cranswick PLC | | | 15,084 | | | | 535 | |
Diageo PLC | | | 114,712 | | | | 4,691 | |
easyJet PLC | | | 7,406 | | | | 108 | |
F&C UK Real Estate Investment Ltd | | | 61,099 | | | | 70 | |
Focusrite PLC | | | 6,827 | | | | 43 | |
Greggs PLC | | | 114,267 | | | | 2,738 | |
Imperial Brands PLC | | | 39,928 | | | | 1,365 | |
Legal & General Group PLC | | | 57,866 | | | | 208 | |
Marks & Spencer Group PLC | | | 48,666 | | | | 177 | |
National Grid PLC | | | 334,868 | | | | 3,712 | |
Next PLC, Cl A | | | 49,482 | | | | 3,598 | |
Royal Mail PLC | | | 339,426 | | | | 1,054 | |
Secure Income REIT Plc‡ | | | 19,676 | | | | 105 | |
SSE PLC | | | 153,655 | | | | 2,377 | |
Tate & Lyle PLC | | | 12,919 | | | | 122 | |
TUI AG | | | 21,182 | | | | 203 | |
Wm Morrison Supermarkets PLC | | | 1,432,336 | | | | 4,247 | |
| | | | | | | 34,353 | |
|
United States — 48.9% | |
|
Communication Services — 2.2% | |
ATN International Inc | | | 4,720 | | | | 266 | |
Interpublic Group of Cos Inc/The | | | 30,257 | | | | 636 | |
John Wiley & Sons Inc, Cl A | | | 43,993 | | | | 1,945 | |
Liberty Media Corp-Liberty Braves * | | | 3,847 | | | | 107 | |
Marchex Inc, Cl B * | | | 10,578 | | | | 50 | |
Marcus Corp/The | | | 24,447 | | | | 979 | |
MSG Networks Inc * | | | 28,002 | | | | 609 | |
New Media Investment Group Inc | | | 111,488 | | | | 1,171 | |
News Corp, Cl A | | | 134,577 | | | | 1,674 | |
Reading International Inc, Cl A * | | | 9,570 | | | | 153 | |
Scholastic Corp, Cl B | | | 48,880 | | | | 1,943 | |
| | | | | | | | |
| | | |
| Description | | Shares | | Market Value ($ Thousands) |
|
COMMON STOCK (continued) | |
Telephone & Data Systems Inc | | | 88,955 | | | $ | 2,734 | |
United States Cellular Corp * | | | 5,544 | | | | 255 | |
Verizon Communications Inc | | | 142,568 | | | | 8,430 | |
Walt Disney Co/The | | | 62,532 | | | | 6,943 | |
| | |
| | | | | | | 27,895 | |
|
Consumer Discretionary — 7.8% | |
Acushnet Holdings Corp | | | 13,164 | | | | 305 | |
America’sCar-Mart Inc/TX * | | | 4,894 | | | | 447 | |
Booking Holdings Inc * | | | 2,194 | | | | 3,828 | |
Churchill Downs Inc | | | 23,396 | | | | 2,112 | |
Columbia Sportswear Co | | | 62,011 | | | | 6,460 | |
Darden Restaurants Inc | | | 78,887 | | | | 9,582 | |
Deckers Outdoor Corp * | | | 9,141 | | | | 1,344 | |
Denny’s Corp, Cl A * | | | 27,377 | | | | 502 | |
Dollar General Corp | | | 25,236 | | | | 3,011 | |
eBay Inc | | | 142,616 | | | | 5,297 | |
Gap Inc/The | | | 182,660 | | | | 4,782 | |
Genuine Parts Co | | | 42,117 | | | | 4,718 | |
Graham Holdings Co, Cl B | | | 2,832 | | | | 1,935 | |
Home Depot Inc/The | | | 62,784 | | | | 12,048 | |
International Speedway Corp, Cl A | | | 9,526 | | | | 416 | |
K12 Inc * | | | 31,709 | | | | 1,082 | |
Kohl’s Corp | | | 5,997 | | | | 412 | |
Lululemon Athletica Inc * | | | 31,936 | | | | 5,233 | |
McDonald’s Corp | | | 30,485 | | | | 5,789 | |
Regis Corp * | | | 4,110 | | | | 81 | |
Ross Stores Inc | | | 31,662 | | | | 2,948 | |
Service Corp International/US | | | 112,578 | | | | 4,520 | |
Steven Madden Ltd | | | 27,771 | | | | 940 | |
Target Corp, Cl A | | | 25,688 | | | | 2,062 | |
TJX Cos Inc/The | | | 174,474 | | | | 9,284 | |
Ulta Beauty Inc * | | | 5,100 | | | | 1,779 | |
Yum! Brands Inc | | | 104,707 | | | | 10,451 | |
| | |
| | | | | | | 101,368 | |
|
Consumer Staples — 10.6% | |
Archer-Daniels-Midland Co | | | 29,351 | | | | 1,266 | |
Brown-Forman Corp, Cl B | | | 1,655 | | | | 87 | |
Church & Dwight Co Inc | | | 6,032 | | | | 430 | |
Clorox Co/The | | | 38,128 | | | | 6,118 | |
Coca-Cola Co/The | | | 260,355 | | | | 12,200 | |
Coca-Cola European Partners PLC | | | 209,619 | | | | 10,846 | |
Colgate-Palmolive Co | | | 127,114 | | | | 8,712 | |
Costco Wholesale Corp | | | 38,004 | | | | 9,202 | |
Estee Lauder Cos Inc/The, Cl A | | | 98,019 | | | | 16,227 | |
Herbalife Nutrition Ltd * | | | 26,722 | | | | 1,416 | |
Hershey Co/The | | | 20,761 | | | | 2,384 | |
Ingredion Inc | | | 13,430 | | | | 1,272 | |
Inter Parfums Inc | | | 2,427 | | | | 184 | |
J&J Snack Foods Corp | | | 19,712 | | | | 3,131 | |
John B Sanfilippo & Son Inc | | | 2,763 | | | | 199 | |
Kimberly-Clark Corp | | | 7,619 | | | | 944 | |
| | | | |
SEI Institutional Managed Trust / Semi-Annual Report / March 31, 2019 | | | 5 | |
SCHEDULE OF INVESTMENTS (Unaudited)
March 31, 2019
Global Managed Volatility Fund(Continued)
| | | | | | | | |
| | | |
| Description | | Shares | | Market Value ($ Thousands) |
|
COMMON STOCK (continued) | |
Lancaster Colony Corp | | | 21,609 | | | $ | 3,386 | |
Medifast Inc | | | 14,403 | | | | 1,837 | |
Nu Skin Enterprises Inc, Cl A | | | 16,078 | | | | 769 | |
Oil-Dri Corp of America | | | 859 | | | | 27 | |
PepsiCo Inc | | | 154,668 | | | | 18,955 | |
Procter & Gamble Co/The | | | 177,532 | | | | 18,472 | |
Simply Good Foods Co/The * | | | 17,787 | | | | 366 | |
Sysco Corp, Cl A | | | 94,576 | | | | 6,314 | |
Tyson Foods Inc, Cl A | | | 72,407 | | | | 5,027 | |
USANA Health Sciences Inc * | | | 44,468 | | | | 3,730 | |
WD-40 Co | | | 16,210 | | | | 2,747 | |
| | |
| | | | | | | 136,248 | |
|
Energy — 0.0% | |
Riviera Resources Inc/Linn * | | | 2,113 | | | | 30 | |
|
Financials — 9.1% | |
Aflac Inc | | | 90,081 | | | | 4,504 | |
AGNC Investment Corp ‡ | | | 547,865 | | | | 9,862 | |
American Business Bank * | | | 1,245 | | | | 44 | |
American Equity Investment Life Holding Co | | | 26,865 | | | | 726 | |
American Financial Group Inc/OH | | | 17,417 | | | | 1,676 | |
Annaly Capital Management Inc ‡ | | | 665,773 | | | | 6,651 | |
Anworth Mortgage Asset Corp ‡ | | | 41,707 | | | | 168 | |
Apollo Commercial Real Estate Finance Inc | | | 25,795 | | | | 469 | |
Ares Commercial Real Estate Corp ‡ | | | 61,081 | | | | 928 | |
Associated Banc-Corp | | | 31,986 | | | | 683 | |
Athene Holding Ltd, Cl A * | | | 9,759 | | | | 398 | |
BancFirst Corp | | | 975 | | | | 51 | |
Bancorp Inc/The * | | | 8,909 | | | | 72 | |
Bank of America Corp | | | 55,363 | | | | 1,527 | |
Bank of Hawaii Corp | | | 5,867 | | | | 463 | |
BankFinancial Corp | | | 9,880 | | | | 147 | |
Banner Corp | | | 14,815 | | | | 803 | |
BB&T Corp | | | 6,625 | | | | 308 | |
Berkshire Hathaway Inc, Cl B * | | | 37,787 | | | | 7,591 | |
BlackRock TCP Capital Corp | | | 128,497 | | | | 1,822 | |
Boston Private Financial Holdings Inc | | | 16,005 | | | | 175 | |
Brookline Bancorp Inc, Cl A | | | 5,727 | | | | 82 | |
Capitol Federal Financial Inc | | | 9,149 | | | | 122 | |
Capstead Mortgage Corp ‡ | | | 52,946 | | | | 455 | |
Cathay General Bancorp | | | 9,868 | | | | 335 | |
CBTX Inc | | | 6,107 | | | | 198 | |
Central Pacific Financial Corp | | | 17,765 | | | | 512 | |
Cherry Hill Mortgage Investment Corp ‡ | | | 19,559 | | | | 337 | |
Chimera Investment Corp ‡ | | | 1,349 | | | | 25 | |
Cincinnati Financial Corp | | | 7,095 | | | | 609 | |
CIT Group Inc | | | 12,802 | | | | 614 | |
Citizens Financial Group Inc | | | 78,082 | | | | 2,538 | |
CNA Financial Corp | | | 2,890 | | | | 125 | |
Columbia Financial Inc * | | | 17,903 | | | | 281 | |
Comerica Inc | | | 16,357 | | | | 1,199 | |
Commerce Bancshares Inc/MO | | | 23,100 | | | | 1,341 | |
| | | | | | | | |
| | | |
| Description | | Shares | | Market Value ($ Thousands) |
|
COMMON STOCK (continued) | |
CVB Financial Corp | | | 4,508 | | | $ | 95 | |
Dime Community Bancshares Inc | | | 7,076 | | | | 133 | |
Dynex Capital Inc ‡ | | | 9,074 | | | | 55 | |
East West Bancorp Inc | | | 12,000 | | | | 576 | |
Employers Holdings Inc | | | 3,896 | | | | 156 | |
Enterprise Financial Services Corp | | | 3,842 | | | | 157 | |
ESSA Bancorp Inc | | | 1,559 | | | | 24 | |
Exantas Capital Corp ‡ | | | 15,007 | | | | 160 | |
Fidus Investment Corp | | | 2,543 | | | | 39 | |
Fifth Third Bancorp | | | 83,066 | | | | 2,095 | |
First Bancorp/Southern Pines NC | | | 3,292 | | | | 114 | |
First Defiance Financial Corp | | | 2,577 | | | | 74 | |
First Hawaiian Inc | | | 4,572 | | | | 119 | |
First Merchants Corp | | | 2,939 | | | | 108 | |
First Northwest Bancorp | | | 5,208 | | | | 81 | |
Flagstar Bancorp Inc | | | 7,999 | | | | 263 | |
Fulton Financial Corp | | | 14,681 | | | | 227 | |
Garrison Capital Inc | | | 4,773 | | | | 34 | |
Granite Point Mortgage Trust Inc | | | 16,647 | | | | 309 | |
Great Southern Bancorp Inc | | | 1,400 | | | | 73 | |
Great Western Bancorp Inc | | | 3,822 | | | | 121 | |
Hartford Financial Services Group Inc/The | | | 36,849 | | | | 1,832 | |
Hilltop Holdings Inc | | | 8,807 | | | | 161 | |
HomeTrust Bancshares Inc | | | 4,179 | | | | 105 | |
IBERIABANK Corp | | | 6,605 | | | | 474 | |
Independent Bank Corp/MI | | | 5,057 | | | | 109 | |
Investors Bancorp Inc | | | 34,973 | | | | 414 | |
JPMorgan Chase & Co | | | 234 | | | | 24 | |
Kearny Financial Corp/MD | | | 85,986 | | | | 1,107 | |
KKR Real Estate Finance Trust Inc ‡ | | | 30,519 | | | | 611 | |
Ladder Capital Corp, Cl A | | | 43,407 | | | | 739 | |
Lakeland Bancorp Inc | | | 4,469 | | | | 67 | |
Lakeland Financial Corp | | | 3,190 | | | | 144 | |
Lincoln National Corp | | | 134,150 | | | | 7,875 | |
M&T Bank Corp | | | 4,017 | | | | 631 | |
Meridian Bancorp Inc | | | 13,871 | | | | 218 | |
MetLife Inc | | | 30,051 | | | | 1,279 | |
MGIC Investment Corp * | | | 44,829 | | | | 591 | |
National Western Life Group Inc, Cl A | | | 1,518 | | | | 398 | |
Northfield Bancorp Inc | | | 2,543 | | | | 35 | |
Northwest Bancshares Inc | | | 146,581 | | | | 2,487 | |
Oaktree Strategic Income Corp | | | 7,492 | | | | 61 | |
Oritani Financial Corp | | | 23,788 | | | | 396 | |
Pacific City Financial Corp | | | 1,707 | | | | 30 | |
PCSB Financial Corp | | | 3,568 | | | | 70 | |
PennyMac Mortgage Investment Trust ‡ | | | 52,665 | | | | 1,091 | |
Peoples Bancorp Inc/OH | | | 1,506 | | | | 47 | |
People’s United Financial Inc | | | 209,203 | | | | 3,439 | |
Principal Financial Group Inc, Cl A | | | 2,985 | | | | 150 | |
Provident Financial Services Inc | | | 29,315 | | | | 759 | |
Prudential Financial Inc | | | 82,948 | | | | 7,621 | |
Radian Group Inc | | | 15,118 | | | | 314 | |
| | |
| 6 | | SEI Institutional Managed Trust / Semi-Annual Report / March 31, 2019 |
SCHEDULE OF INVESTMENTS (Unaudited)
March 31, 2019
Global Managed Volatility Fund(Continued)
| | | | | | | | |
| | | |
| Description | | Shares | | Market Value ($ Thousands) |
| | |
COMMON STOCK (continued) | | | | | | | | |
Ready Capital Corp ‡ | | | 3,477 | | | $ | 51 | |
Reinsurance Group of America Inc, Cl A | | | 21,058 | | | | 2,990 | |
Solar Capital Ltd | | | 3,953 | | | | 82 | |
Starwood Property Trust Inc ‡ | | | 350,822 | | | | 7,841 | |
Stock Yards Bancorp Inc | | | 2,155 | | | | 73 | |
TCG BDC Inc | | | 11,941 | | | | 173 | |
Territorial Bancorp Inc | | | 1,783 | | | | 48 | |
Torchmark Corp, Cl A | | | 80,212 | | | | 6,573 | |
TPG Specialty Lending Inc | | | 6,608 | | | | 132 | |
TrustCo Bank Corp NY | | | 8,661 | | | | 67 | |
Trustmark Corp | | | 20,430 | | | | 687 | |
Umpqua Holdings Corp | | | 21,683 | | | | 358 | |
United Community Banks Inc/GA | | | 18,320 | | | | 457 | |
United Community Financial Corp/OH | | | 4,734 | | | | 44 | |
United Financial Bancorp Inc | | | 18,758 | | | | 269 | |
Univest Financial Corp | | | 2,271 | | | | 56 | |
US Bancorp | | | 25,766 | | | | 1,242 | |
Voya Financial Inc | | | 110,391 | | | | 5,515 | |
Washington Federal Inc | | | 35,047 | | | | 1,012 | |
Washington Trust Bancorp Inc | | | 1,200 | | | | 58 | |
Waterstone Financial Inc | | | 29,492 | | | | 485 | |
WesBanco Inc | | | 1,385 | | | | 55 | |
Western Alliance Bancorp * | | | 18,432 | | | | 756 | |
Wintrust Financial Corp | | | 4,791 | | | | 323 | |
Zions Bancorp NA | | | 31,830 | | | | 1,445 | |
| | |
| | | | | | | 116,925 | |
| | |
Health Care — 9.8% | | | | | | | | |
Anthem Inc | | | 34,447 | | | | 9,886 | |
Baxter International Inc | | | 3,731 | | | | 303 | |
Bio-Rad Laboratories Inc, Cl A * | | | 2,438 | | | | 745 | |
BioSpecifics Technologies Corp * | | | 1,926 | | | | 120 | |
Bruker Corp | | | 1,863 | | | | 72 | |
Centene Corp * | | | 25,242 | | | | 1,340 | |
Chemed Corp | | | 34,253 | | | | 10,963 | |
Cigna Corp (A) | | | 34,742 | | | | 5,587 | |
Computer Programs & Systems Inc | | | 5,177 | | | | 154 | |
Danaher Corp, Cl A | | | 71,638 | | | | 9,458 | |
Encompass Health Corp | | | 127,627 | | | | 7,453 | |
Genomic Health Inc * | | | 17,279 | | | | 1,210 | |
Gilead Sciences Inc | | | 34,648 | | | | 2,252 | |
Haemonetics Corp * | | | 3,435 | | | | 300 | |
Hanger Inc * | | | 1,892 | | | | 36 | |
HCA Healthcare Inc | | | 42,734 | | | | 5,572 | |
HealthStream Inc * | | | 964 | | | | 27 | |
Humana Inc | | | 34,960 | | | | 9,299 | |
Innoviva Inc * | | | 25,225 | | | | 354 | |
Johnson & Johnson | | | 3,345 | | | | 468 | |
Masimo Corp * | | | 14,845 | | | | 2,053 | |
Medtronic PLC | | | 25,419 | | | | 2,315 | |
Merck & Co Inc | | | 44,952 | | | | 3,739 | |
Mettler-Toledo International Inc * | | | 5,488 | | | | 3,968 | |
Molina Healthcare Inc * | | | 3,356 | | | | 476 | |
| | | | | | | | |
| | | |
| Description | | Shares | | Market Value ($ Thousands) |
| | |
COMMON STOCK (continued) | | | | | | | | |
National HealthCare Corp | | | 12,906 | | | $ | 979 | |
Orthofix Medical Inc * | | | 22,432 | | | | 1,265 | |
Pfizer Inc | | | 161,899 | | | | 6,876 | |
Phibro Animal Health Corp, Cl A | | | 3,365 | | | | 111 | |
Prestige Consumer Healthcare Inc, Cl A * | | | 54,592 | | | | 1,633 | |
Quest Diagnostics Inc | | | 47,184 | | | | 4,243 | |
STERIS PLC | | | 9,024 | | | | 1,155 | |
United Therapeutics Corp * | | | 37,165 | | | | 4,362 | |
UnitedHealth Group Inc | | | 36,206 | | | | 8,952 | |
Universal Health Services Inc, Cl B | | | 61,528 | | | | 8,231 | |
US Physical Therapy Inc | | | 3,070 | | | | 322 | |
WellCare Health Plans Inc * | | | 8,609 | | | | 2,322 | |
Zoetis Inc, Cl A | | | 78,822 | | | | 7,935 | |
| | |
| | | | | | | 126,536 | |
| | |
Industrials — 2.1% | | | | | | | | |
Brady Corp, Cl A | | | 25,445 | | | | 1,181 | |
CBIZ Inc * | | | 11,896 | | | | 241 | |
CH Robinson Worldwide Inc | | | 16,295 | | | | 1,417 | |
Infrastructure and Energy Alternatives Inc * | | | 2,874 | | | | 15 | |
Lockheed Martin Corp | | | 21,735 | | | | 6,524 | |
ManpowerGroup Inc | | | 10,123 | | | | 837 | |
McGrath RentCorp | | | 6,620 | | | | 374 | |
Raytheon Co | | | 34,477 | | | | 6,278 | |
Republic Services Inc | | | 8,820 | | | | 709 | |
Robert Half International Inc | | | 6,997 | | | | 456 | |
United Continental Holdings Inc * | | | 8,459 | | | | 675 | |
Waste Management Inc | | | 75,811 | | | | 7,878 | |
| | |
| | | | | | | 26,585 | |
| | |
Information Technology — 2.5% | | | | | | | | |
Agilysys Inc * | | | 5,251 | | | | 111 | |
Booz Allen Hamilton Holding Corp, Cl A | | | 62,617 | | | | 3,641 | |
Broadridge Financial Solutions Inc | | | 6,657 | | | | 690 | |
CACI International Inc, Cl A * | | | 7,825 | | | | 1,424 | |
Cisco Systems Inc | | | 90,095 | | | | 4,864 | |
Citrix Systems Inc | | | 81,465 | | | | 8,119 | |
CSG Systems International Inc | | | 4,597 | | | | 194 | |
F5 Networks Inc, Cl A * | | | 18,392 | | | | 2,886 | |
Juniper Networks Inc | | | 42,890 | | | | 1,135 | |
MAXIMUS Inc | | | 6,568 | | | | 466 | |
MicroStrategy Inc, Cl A * | | | 1,873 | | | | 270 | |
Motorola Solutions Inc | | | 51,314 | | | | 7,206 | |
Progress Software Corp | | | 5,951 | | | | 264 | |
SPS Commerce Inc * | | | 4,467 | | | | 474 | |
Sykes Enterprises Inc * | | | 18,734 | | | | 530 | |
| | |
| | | | | | | 32,274 | |
| | |
Materials — 1.1% | | | | | | | | |
Kaiser Aluminum Corp | | | 21,361 | | | | 2,237 | |
Materion Corp | | | 41,209 | | | | 2,351 | |
Newmont Mining Corp | | | 78,385 | | | | 2,804 | |
Reliance Steel & Aluminum Co | | | 60,358 | | | | 5,448 | |
| | | | |
SEI Institutional Managed Trust / Semi-Annual Report / March 31, 2019 | | | 7 | |
SCHEDULE OF INVESTMENTS (Unaudited)
March 31, 2019
Global Managed Volatility Fund(Continued)
| | | | | | | | |
| | | |
| Description | | Shares | | Market Value ($ Thousands) |
| | |
COMMON STOCK (continued) | | | | | | | | |
Royal Gold Inc, Cl A | | | 7,990 | | | $ | 727 | |
| | |
| | | | | | | 13,567 | |
| | |
Utilities — 3.8% | | | | | | | | |
American Electric Power Co Inc | | | 37,983 | | | | 3,181 | |
Avista Corp | | | 18,007 | | | | 731 | |
Black Hills Corp, Cl A | | | 8,769 | | | | 650 | |
CenterPoint Energy Inc | | | 326,669 | | | | 10,029 | |
Consolidated Edison Inc | | | 29,376 | | | | 2,491 | |
DTE Energy Co | | | 56,193 | | | | 7,010 | |
El Paso Electric Co, Cl A | | | 3,955 | | | | 233 | |
Evergy Inc | | | 40,250 | | | | 2,337 | |
Exelon Corp | | | 200,301 | | | | 10,041 | |
Hawaiian Electric Industries Inc | | | 120,764 | | | | 4,924 | |
IDACORP Inc, Cl A | | | 2,642 | | | | 263 | |
MDU Resources Group Inc | | | 67,994 | | | | 1,756 | |
NextEra Energy Inc | | | 4,766 | | | | 921 | |
Pinnacle West Capital Corp | | | 3,631 | | | | 347 | |
Portland General Electric Co | | | 10,568 | | | | 548 | |
Public Service Enterprise Group Inc | | | 8,134 | | | | 483 | |
Southern Co/The | | | 47,429 | | | | 2,451 | |
UGI Corp | | | 19,639 | | | | 1,088 | |
| | |
| | | | | | | 49,484 | |
| | | | | | | 630,912 | |
| | | | | | | | |
| | | |
| Description | | Shares | | Market Value ($ Thousands) |
| | |
COMMON STOCK (continued) | | | | | | | | |
Total Common Stock
(Cost $1,103,705) ($ Thousands) | | | | | | $ | 1,247,137 | |
| | |
PREFERRED STOCK — 0.1% | | | | | | | | |
| | |
Germany — 0.1% | | | | | | | | |
Bayerische Motoren Werke AG (B) | | | 13,514 | | | | 890 | |
| | |
Sweden — 0.0% | | | | | | | | |
Akelius Residential Property AB (B) | | | 9,103 | | | | 339 | |
| | |
Total Preferred Stock
(Cost $1,443) ($ Thousands) | | | | | | | 1,229 | |
| | |
CASH EQUIVALENT — 1.9% | | | | | | | | |
SEI Daily Income Trust, Government Fund, Cl F | | | | | | | | |
2.220%**† | | | 25,120,070 | | | | 25,120 | |
Total Cash Equivalent
(Cost $25,120) ($ Thousands) | | | | | | | 25,120 | |
| |
Total Investments in Securities — 98.8%
(Cost $1,130,268) ($ Thousands) | | | $ | 1,273,486 | |
| | | | | | | | |
A list of the open futures contracts held by the Fund at March 31, 2019, is as follows:
| | | | | | | | | | | | | | | | | | | | |
| Type of Contract | | Number of
Contracts
Long (Short) | | | Expiration
Date | | | Notional Amount
(Thousands) | | | Value
(Thousands) | | | Unrealized
Appreciation/ (Depreciation) (Thousands) | |
DJ Euro Stoxx 50 Index | | | 69 | | | | Jun-2019 | | | $ | 2,506 | | | $ | 2,535 | | | $ | 35 | |
FTSE 100 Index | | | 16 | | | | Jun-2019 | | | | 1,493 | | | | 1,504 | | | | 22 | |
Hang Seng Index | | | 3 | | | | Apr-2019 | | | | 547 | | | | 556 | | | | 9 | |
S&P 500 IndexE-MINI | | | 80 | | | | Jun-2019 | | | | 11,103 | | | | 11,351 | | | | 248 | |
SPI 200 Index | | | 6 | | | | Jun-2019 | | | | 658 | | | | 658 | | | | – | |
TOPIX Index | | | 13 | | | | Jun-2019 | | | | 1,859 | | | | 1,870 | | | | 1 | |
| | | | | | | | | | | | | | | | | | | | |
| | | | | | | | | | $ | 18,166 | | | $ | 18,474 | | | $ | 315 | |
| | | | | | | | | | | | | | | | | | | | |
A list of the open forward foreign currency contracts held by the Fund at March 31, 2019, is as follows:
| | | | | | | | | | | | | | | | | | | | |
| Counterparty | | Settlement Date | | | | Currency to Deliver
(Thousands) | | | | Currency to Receive (Thousands) | | | Unrealized
Appreciation
(Depreciation)
(Thousands) |
Brown Brothers Harriman | | | 04/25/19 | | | USD | | | 92 | | | DKK | | | 604 | | | $ | (1 | ) |
Brown Brothers Harriman | | | 04/25/19 | | | USD | | | 17 | | | SGD | | | 23 | | | | – | |
Brown Brothers Harriman | | | 04/25/19 | | | USD | | | 224 | | | SGD | | | 302 | | | | (1 | ) |
Brown Brothers Harriman | | | 04/25/19 | | | USD | | | 284 | | | GBP | | | 215 | | | | (4 | ) |
Brown Brothers Harriman | | | 04/25/19 | | | USD | | | 2 | | | NOK | | | 13 | | | | – | |
Brown Brothers Harriman | | | 04/25/19 | | | USD | | | 355 | | | NOK | | | 3,020 | | | | (4 | ) |
Brown Brothers Harriman | | | 04/25/19 | | | USD | | | 433 | | | SEK | | | 3,983 | | | | (3 | ) |
Brown Brothers Harriman | | | 04/25/19 | | | USD | | | 718 | | | HKD | | | 5,633 | | | | – | |
| | |
| 8 | | SEI Institutional Managed Trust / Semi-Annual Report / March 31, 2019 |
SCHEDULE OF INVESTMENTS (Unaudited)
March 31, 2019
Global Managed Volatility Fund(Continued)
| | | | | | | | | | | | | | | | | | | | |
| Counterparty | | Settlement Date | | | | | Currency to Deliver
(Thousands) | | | | | Currency to Receive (Thousands) | | | Unrealized
Appreciation
(Depreciation)
(Thousands) |
Brown Brothers Harriman | | | 04/25/19 | | | USD | | | 174 | | | CHF | | | 173 | | | $ | — | |
Brown Brothers Harriman | | | 04/25/19 | | | USD | | | 832 | | | CHF | | | 823 | | | | (3 | ) |
Brown Brothers Harriman | | | 04/25/19 | | | USD | | | 1,058 | | | EUR | | | 931 | | | | (11 | ) |
Brown Brothers Harriman | | | 04/25/19 | | | USD | | | 891 | | | CAD | | | 1,194 | | | | 3 | |
Brown Brothers Harriman | | | 04/25/19 | | | USD | | | 191 | | | CAD | | | 255 | | | | — | |
Brown Brothers Harriman | | | 04/25/19 | | | USD | | | 923 | | | JPY | | | 102,150 | | | | 2 | |
Brown Brothers Harriman | | | 04/25/19 | | | USD | | | 636 | | | JPY | | | 69,821 | | | | (4 | ) |
Brown Brothers Harriman | | | 04/25/19 | | | SGD | | | 13,413 | | | USD | | | 9,937 | | | | 28 | |
Brown Brothers Harriman | | | 04/25/19 | | | SGD | | | 131 | | | USD | | | 97 | | | | — | |
Brown Brothers Harriman | | | 04/25/19 | | | GBP | | | 13,802 | | | USD | | | 18,225 | | | | 223 | |
Brown Brothers Harriman | | | 04/25/19 | | | DKK | | | 25,750 | | | USD | | | 3,925 | | | | 44 | |
Brown Brothers Harriman | | | 04/25/19 | | | CHF | | | 565 | | | USD | | | 569 | | | | 1 | |
Brown Brothers Harriman | | | 04/25/19 | | | CHF | | | 34,744 | | | USD | | | 34,910 | | | | (60 | ) |
Brown Brothers Harriman | | | 04/25/19 | | | EUR | | | 39,763 | | | USD | | | 45,238 | | | | 508 | |
Brown Brothers Harriman | | | 04/25/19 | | | CAD | | | 58,057 | | | USD | | | 43,583 | | | | 97 | |
Brown Brothers Harriman | | | 04/25/19 | | | CAD | | | 1,192 | | | USD | | | 889 | | | | (4 | ) |
Brown Brothers Harriman | | | 04/25/19 | | | NOK | | | 87,698 | | | USD | | | 10,277 | | | | 81 | |
Brown Brothers Harriman | | | 04/25/19 | | | NOK | | | 1,621 | | | USD | | | 188 | | | | (1 | ) |
Brown Brothers Harriman | | | 04/25/19 | | | SEK | | | 121,304 | | | USD | | | 13,233 | | | | 130 | |
Brown Brothers Harriman | | | 04/25/19 | | | SEK | | | 3,964 | | | USD | | | 427 | | | | (1 | ) |
Brown Brothers Harriman | | | 04/25/19 | | | HKD | | | 3,420 | | | USD | | | 436 | | | | — | |
Brown Brothers Harriman | | | 04/25/19 | | | HKD | | | 261,179 | | | USD | | | 33,287 | | | | (11 | ) |
Brown Brothers Harriman | | | 04/25/19 | | | JPY | | | 48,552 | | | USD | | | 441 | | | | 1 | |
Brown Brothers Harriman | | | 04/25/19 | | | JPY | | | 7,605,103 | | | USD | | | 68,391 | | | | (470 | ) |
Brown Brothers Harriman | | | 04/26/19 | | | USD | | | 28 | | | NZD | | | 42 | | | | — | |
Brown Brothers Harriman | | | 04/26/19 | | | USD | | | 354 | | | NZD | | | 513 | | | | (4 | ) |
Brown Brothers Harriman | | | 04/26/19 | | | USD | | | 61 | | | AUD | | | 87 | | | | — | |
Brown Brothers Harriman | | | 04/26/19 | | | USD | | | 658 | | | AUD | | | 924 | | | | (1 | ) |
Brown Brothers Harriman | | | 04/26/19 | | | NZD | | | 16,822 | | | USD | | | 11,520 | | | | 45 | |
Brown Brothers Harriman | | | 04/26/19 | | | NZD | | | 418 | | | USD | | | 284 | | | | (1 | ) |
Brown Brothers Harriman | | | 04/26/19 | | | AUD | | | 31,435 | | | USD | | | 22,284 | | | | (53 | ) |
| | | | | | | | | | | | | | | | | | | | |
| | | | | | | | | | | | | | | | | | $ | 526 | |
| | | | | | | | | | | | | | | | | | | | |
| | Percentages are based on Net Assets of $1,289,481 ($ Thousands). |
| * | Non-income producing security. |
| ** | Rate shown is the7-day effective yield as of March 31, 2019. |
| ‡ | Real Estate Investment Trust. |
| † | Investment in Affiliated Security (see Note 6). |
| (A) | Securities considered illiquid. The total value of such securities as of March 31, 2019 was $5,715 ($ Thousands) and represented 0.4% of the Net Assets of the Fund. |
| (B) | There is currently no rate available. |
AUD — Australian Dollar
CAD — Canadian Dollar
CHF — Swiss Franc
Cl — Class
DJ — Dow Jones
DKK — Danish Krone
EUR — Euro
FTSE— Financial Times and the London Stock Exchange
GBP — British Pound Sterling
HKD — Hong Kong Dollar
JPY — Japanese Yen
Ltd — Limited
NOK — Norwegian Krone
NZD — New Zealand Dollar
S&P— Standard & Poor’s
SEK — Swedish Krona
SGD — Singapore Dollar
SPI — Share Price Index
TOPIX — Tokyo Price Index
USD — United States Dollar
| | | | |
SEI Institutional Managed Trust / Semi-Annual Report / March 31, 2019 | | | 9 | |
SCHEDULE OF INVESTMENTS (Unaudited)
March 31, 2019
Global Managed Volatility Fund(Continued)
The following is a list of the level of inputs used as of March 31, 2019, in valuing the Fund’s investments and other financial instruments carried at value ($ Thousands):
| | | | | | | | | | | | | | | | |
Investments in
Securities | | Level 1 | | | Level 2 | | Level 3 | | | Total |
Common Stock | | $ | 1,247,137 | | | $ | – | | | $ | – | | | $ | 1,247,137 | |
Preferred Stock | | | 1,229 | | | | – | | | | – | | | | 1,229 | |
Cash Equivalent | | | 25,120 | | | | – | | | | – | | | | 25,120 | |
| | | | | | | | | | | | | | | | |
Total Investments in Securities | | $ | 1,273,486 | | | $ | – | | | $ | – | | | $ | 1,273,486 | |
| | | | | | | | | | | | | | | | |
| | | | | | | | | | | | | | | | |
Other
Financial
Instruments | | Level 1 | | | Level 2 | | Level 3 | | | Total |
Futures Contracts* | | | | | | | | | | | | | | | | |
Unrealized Appreciation | | $ | 315 | | | $ | – | | | $ | – | | | $ | 315 | |
Forwards Contracts* | | | | | | | | | | | | | | | | |
Unrealized Appreciation | | | – | | | | 1,163 | | | | – | | | | 1,163 | |
Unrealized Depreciation | | | – | | | | (637 | ) | | | – | | | | (637 | ) |
| | | | | | | | | | | | | | | | |
Total Other Financial Instruments | | $ | 315 | | | $ | 526 | | | $ | – | | | $ | 841 | |
| | | | | | | | | | | | | | | | |
For the period ended March 31, 2019, there were no transfers between Level 1 and Level 2 assets and liabilities.
For the period ended March 31, 2019, there were no transfers between Level 2 and Level 3 assets and liabilities.
For more information on valuation inputs, see Note 2 – Significant Accounting Policies in Notes to Financial Statements.
* Futures contracts and forward contracts are valued at the unrealized appreciation/(depreciation) on the instrument.
The following is a summary of the Fund’s transactions with affiliates for the period ended March 31, 2019 ($ Thousands):
| | | | | | | | | | | | | | | | | | | | |
| Security Description | | Value 9/30/2018 | | Purchases at Cost | | Proceeds from
Sales | | Value 3/31/2019 | | | Income | |
SEI Daily Income Trust, Government Fund, Cl F | | | $ 26,205 | | | | $ 125,128 | | | | $ | (126,213) | | | $ 25,120 | | | | $ 139 | |
| | | | | | | | | | | | | | | | | | | | |
Amounts designated as “—” are either $0 or have been rounded to $0.
The accompanying notes are an integral part of the financial statements.
| | |
| 10 | | SEI Institutional Managed Trust / Semi-Annual Report / March 31, 2019 |
SCHEDULE OF INVESTMENTS (Unaudited)
March 31, 2019
Tax-Managed Managed Volatility Fund(Continued)
| | | | | | | | |
| | | |
| Description | | Shares | | Market Value
($ Thousands) |
| |
COMMON STOCK — 97.8% | | | | | |
| |
Communication Services — 5.1% | | | | | |
AT&T Inc | | | 75,970 | | | $ | 2,382 | |
Lions Gate Entertainment Corp, Cl B | | | 35,000 | | | | 528 | |
Madison Square Garden Co/The * | | | 21,211 | | | | 6,218 | |
NTT DOCOMO Inc ADR | | | 130,100 | | | | 2,893 | |
Omnicom Group Inc | | | 67,600 | | | | 4,934 | |
SK Telecom Co Ltd ADR | | | 129,800 | | | | 3,179 | |
Take-Two Interactive Software Inc, Cl A * | | | 9,560 | | | | 902 | |
TELUS Corp | | | 115,600 | | | | 4,280 | |
Verizon Communications Inc | | | 307,339 | | | | 18,173 | |
Walt Disney Co/The | | | 93,498 | | | | 10,381 | |
| | |
| | | | | | | 53,870 | |
| |
Consumer Discretionary — 4.8% | | | | | |
AutoZone Inc * | | | 6,300 | | | | 6,452 | |
Best Buy Co Inc | | | 10,994 | | | | 781 | |
Canadian Tire Corp Ltd, Cl A | | | 59,500 | | | | 6,413 | |
Darden Restaurants Inc | | | 65,500 | | | | 7,956 | |
Deckers Outdoor Corp * | | | 3,645 | | | | 536 | |
Dick’s Sporting Goods Inc | | | 43,505 | | | | 1,601 | |
Dollar General Corp | | | 13,022 | | | | 1,553 | |
Dunkin’ Brands Group Inc | | | 9,462 | | | | 711 | |
Fiat Chrysler Automobiles NV | | | 24,564 | | | | 365 | |
Gap Inc/The | | | 84,865 | | | | 2,222 | |
Graham Holdings Co, Cl B | | | 1,110 | | | | 758 | |
Lowe’s Cos Inc | | | 34,400 | | | | 3,766 | |
McDonald’s Corp | | | 37,607 | | | | 7,142 | |
NVR Inc * | | | 432 | | | | 1,195 | |
Toyota Motor Corp ADR | | | 38,500 | | | | 4,544 | |
Ulta Beauty Inc * | | | 14,203 | | | | 4,953 | |
| | |
| | | | | | | 50,948 | |
| |
Consumer Staples — 15.0% | | | | | |
Altria Group Inc | | | 217,281 | | | | 12,478 | |
Archer-Daniels-Midland Co | | | 45,200 | | | | 1,949 | |
Bunge Ltd | | | 3,948 | | | | 210 | |
Church & Dwight Co Inc | | | 102,803 | | | | 7,323 | |
Clorox Co/The | | | 46,743 | | | | 7,500 | |
Coca-Cola Co/The | | | 90,300 | | | | 4,231 | |
Coca-Cola European Partners PLC | | | 49,400 | | | | 2,556 | |
Colgate-Palmolive Co | | | 64,144 | | | | 4,396 | |
Costco Wholesale Corp | | | 36,346 | | | | 8,801 | |
Herbalife Nutrition Ltd * | | | 4,997 | | | | 265 | |
Hershey Co/The | | | 44,177 | | | | 5,073 | |
Ingredion Inc | | | 10,845 | | | | 1,027 | |
JM Smucker Co/The | | | 20,949 | | | | 2,441 | |
Kimberly-Clark Corp | | | 43,214 | | | | 5,354 | |
Kroger Co/The | | | 124,000 | | | | 3,050 | |
Lamb Weston Holdings Inc | | | 41,191 | | | | 3,087 | |
McCormick & Co Inc/MD | | | 55,408 | | | | 8,346 | |
Metro Inc, Cl A | | | 58,400 | | | | 2,151 | |
Nu Skin Enterprises Inc, Cl A | | | 18,077 | | | | 865 | |
| | | | | | | | |
| | | |
| Description | | Shares | | Market Value
($ Thousands) |
| |
COMMON STOCK (continued) | | | | | |
PepsiCo Inc | | | 64,572 | | | $ | 7,913 | |
Philip Morris International Inc | | | 34,312 | | | | 3,033 | |
Procter & Gamble Co/The | | | 48,347 | | | | 5,031 | |
Sanderson Farms Inc | | | 28,200 | | | | 3,718 | |
Sysco Corp, Cl A | | | 96,035 | | | | 6,411 | |
Tyson Foods Inc, Cl A | | | 183,000 | | | | 12,706 | |
Walgreens Boots Alliance Inc | | | 233,800 | | | | 14,793 | |
Walmart Inc | | | 247,524 | | | | 24,141 | |
| | |
| | | | | | | 158,849 | |
| |
Energy — 2.7% | | | | | |
Chevron Corp | | | 46,500 | | | | 5,728 | |
Concho Resources Inc | | | 3,205 | | | | 356 | |
EOG Resources Inc | | | 36,122 | | | | 3,438 | |
Exxon Mobil Corp | | | 71,100 | | | | 5,745 | |
Marathon Petroleum Corp | | | 19,233 | | | | 1,151 | |
Schlumberger Ltd, Cl A | | | 16,417 | | | | 715 | |
Valero Energy Corp | | | 95,870 | | | | 8,133 | |
Williams Cos Inc/The | | | 110,432 | | | | 3,171 | |
| | |
| | | | | | | 28,437 | |
| |
Financials — 15.7% | | | | | |
Aflac Inc | | | 112,800 | | | | 5,640 | |
AGNC Investment Corp ‡ | | | 130,419 | | | | 2,348 | |
Allstate Corp/The | | | 65,446 | | | | 6,164 | |
American Financial Group Inc | | | 41,500 | | | | 3,993 | |
Arbor Realty Trust Inc | | | 257,845 | | | | 3,344 | |
Arch Capital Group Ltd * | | | 193,014 | | | | 6,238 | |
Assurant Inc | | | 10,566 | | | | 1,003 | |
Assured Guaranty Ltd | | | 34,028 | | | | 1,512 | |
Axis Capital Holdings Ltd | | | 50,100 | | | | 2,744 | |
Bank of America Corp | | | 21,231 | | | | 586 | |
Bank of Hawaii Corp | | | 28,052 | | | | 2,212 | |
Bank of Nova Scotia/The, Cl C | | | 52,600 | | | | 2,801 | |
BankUnited Inc | | | 15,934 | | | | 532 | |
Berkshire Hathaway Inc, Cl B * | | | 59,100 | | | | 11,873 | |
BOK Financial Corp | | | 52,300 | | | | 4,265 | |
Cboe Global Markets Inc | | | 80,058 | | | | 7,641 | |
Chimera Investment Corp ‡ | | | 148,500 | | | | 2,783 | |
Chubb Ltd | | | 12,399 | | | | 1,737 | |
CME Group Inc | | | 28,880 | | | | 4,753 | |
Cullen/Frost Bankers Inc | | | 27,019 | | | | 2,623 | |
Everest Re Group Ltd | | | 43,466 | | | | 9,387 | |
Genworth MI Canada Inc | | | 23,900 | | | | 724 | |
Hanover Insurance Group Inc/The, Cl A | | | 19,700 | | | | 2,249 | |
Ladder Capital Corp, Cl A | | | 171,200 | | | | 2,914 | |
LPL Financial Holdings Inc | | | 53,707 | | | | 3,741 | |
MarketAxess Holdings Inc | | | 18,920 | | | | 4,656 | |
MFA Financial Inc ‡ | | | 501,709 | | | | 3,647 | |
Morningstar Inc, Cl A | | | 54,552 | | | | 6,873 | |
National Bank of Canada | | | 54,700 | | | | 2,469 | |
Popular Inc | | | 90,817 | | | | 4,734 | |
| | | | |
SEI Institutional Managed Trust / Semi-Annual Report / March 31, 2019 | | | 1 | |
SCHEDULE OF INVESTMENTS (Unaudited)
March 31, 2019
Tax-Managed Managed Volatility Fund(Continued)
| | | | | | | | |
| | | |
| Description | | Shares | | Market Value
($ Thousands) |
| |
COMMON STOCK (continued) | | | | | |
Progressive Corp/The | | | 115,800 | | | $ | 8,348 | |
Regions Financial Corp | | | 186,377 | | | | 2,637 | |
Reinsurance Group of America Inc, Cl A | | | 9,329 | | | | 1,324 | |
RenaissanceRe Holdings Ltd | | | 83,889 | | | | 12,038 | |
TFS Financial Corp | | | 211,099 | | | | 3,477 | |
Travelers Cos Inc/The | | | 83,472 | | | | 11,449 | |
Two Harbors Investment Corp ‡ | | | 294,700 | | | | 3,987 | |
US Bancorp | | | 31,411 | | | | 1,514 | |
Voya Financial Inc | | | 13,223 | | | | 661 | |
White Mountains Insurance Group Ltd | | | 4,776 | | | | 4,420 | |
| | |
| | | | | | | 166,041 | |
| |
Health Care — 17.0% | | | | | |
AbbVie Inc | | | 53,300 | | | | 4,295 | |
AmerisourceBergen Corp, Cl A | | | 60,764 | | | | 4,832 | |
Amgen Inc, Cl A | | | 16,800 | | | | 3,192 | |
Anthem Inc | | | 44,047 | | | | 12,641 | |
AstraZeneca ADR | | | 107,200 | | | | 4,334 | |
Bausch Health Cos Inc * | | | 3,933 | | | | 97 | |
Baxter International Inc | | | 87,932 | | | | 7,150 | |
Biogen Inc * | | | 3,955 | | | | 935 | |
Bio-Rad Laboratories Inc, Cl A * | | | 8,793 | | | | 2,688 | |
Chemed Corp | | | 1,680 | | | | 538 | |
Cigna Corp (A) | | | 29,317 | | | | 4,715 | |
CVS Health Corp | | | 31,417 | | | | 1,694 | |
Edwards Lifesciences Corp, Cl A * | | | 2,235 | | | | 428 | |
Eli Lilly & Co | | | 156,104 | | | | 20,256 | |
Haemonetics Corp * | | | 2,567 | | | | 224 | |
Hill-Rom Holdings Inc | | | 7,580 | | | | 802 | |
Hologic Inc * | | | 32,197 | | | | 1,558 | |
Humana Inc | | | 38,120 | | | | 10,140 | |
ICON * | | | 9,514 | | | | 1,299 | |
Johnson & Johnson | | | 195,171 | | | | 27,283 | |
Laboratory Corp of America Holdings * | | | 18,602 | | | | 2,846 | |
Masimo Corp * | | | 11,105 | | | | 1,536 | |
McKesson Corp | | | 8,957 | | | | 1,048 | |
Merck & Co Inc | | | 271,437 | | | | 22,575 | |
Pfizer Inc | | | 600,276 | | | | 25,494 | |
Premier Inc, Cl A * | | | 18,980 | | | | 655 | |
Quest Diagnostics Inc | | | 50,752 | | | | 4,564 | |
UnitedHealth Group Inc | | | 35,650 | | | | 8,815 | |
Varian Medical Systems Inc * | | | 2,133 | | | | 302 | |
WellCare Health Plans Inc * | | | 1,176 | | | | 317 | |
Zoetis Inc, Cl A | | | 18,364 | | | | 1,849 | |
| | |
| | | | | | | 179,102 | |
| |
Industrials — 9.2% | | | | | |
Boeing Co/The | | | 32,700 | | | | 12,472 | |
BWX Technologies Inc, Cl W | | | 20,728 | | | | 1,028 | |
EMCOR Group Inc | | | 13,365 | | | | 977 | |
Expeditors International of Washington Inc | | | 14,206 | | | | 1,078 | |
General Dynamics Corp | | | 8,600 | | | | 1,456 | |
| | | | | | | | |
| | | |
| Description | | Shares | | Market Value
($ Thousands) |
| |
COMMON STOCK (continued) | | | | | |
Huntington Ingalls Industries Inc, Cl A | | | 5,798 | | | $ | 1,201 | |
Kaman Corp, Cl A | | | 32,900 | | | | 1,923 | |
L3 Technologies Inc | | | 20,542 | | | | 4,239 | |
Landstar System Inc | | | 11,414 | | | | 1,248 | |
Lockheed Martin Corp | | | 25,675 | | | | 7,707 | |
Northrop Grumman Corp | | | 45,529 | | | | 12,275 | |
Quanta Services Inc | | | 37,697 | | | | 1,423 | |
Raytheon Co | | | 80,261 | | | | 14,614 | |
Republic Services Inc | | | 146,100 | | | | 11,743 | |
Southwest Airlines Co, Cl A | | | 23,251 | | | | 1,207 | |
Spirit AeroSystems Holdings Inc, Cl A | | | 12,040 | | | | 1,102 | |
United Continental Holdings Inc * | | | 9,555 | | | | 762 | |
United Technologies Corp | | | 50,700 | | | | 6,535 | |
Waste Management Inc | | | 133,069 | | | | 13,827 | |
| | |
| | | | | | | 96,817 | |
| |
Information Technology — 11.8% | | | | | |
Amdocs Ltd | | | 171,424 | | | | 9,276 | |
Apple Inc | | | 75,762 | | | | 14,391 | |
Aspen Technology Inc * | | | 14,158 | | | | 1,476 | |
Automatic Data Processing Inc | | | 18,753 | | | | 2,996 | |
Broadridge Financial Solutions Inc | | | 13,234 | | | | 1,372 | |
Cadence Design Systems Inc * | | | 8,968 | | | | 570 | |
Cisco Systems Inc | | | 306,400 | | | | 16,543 | |
Citrix Systems Inc | | | 14,298 | | | | 1,425 | |
CSG Systems International Inc | | | 37,600 | | | | 1,590 | |
Intel Corp | | | 307,300 | | | | 16,502 | |
Intuit Inc | | | 7,373 | | | | 1,927 | |
Jack Henry & Associates Inc | | | 10,939 | | | | 1,518 | |
Juniper Networks Inc | | | 135,400 | | | | 3,584 | |
Mastercard Inc, Cl A | | | 1,331 | | | | 313 | |
Microsoft Corp | | | 85,745 | | | | 10,113 | |
Motorola Solutions Inc | | | 89,937 | | | | 12,629 | |
NetApp Inc | | | 9,091 | | | | 630 | |
Oracle Corp, Cl B | | | 176,000 | | | | 9,453 | |
Science Applications International Corp | | | 14,671 | | | | 1,129 | |
Symantec Corp, Cl A | | | 173,514 | | | | 3,989 | |
Synopsys Inc * | | | 74,285 | | | | 8,554 | |
Tech Data Corp * | | | 22,200 | | | | 2,274 | |
Teradyne Inc | | | 15,297 | | | | 609 | |
VeriSign Inc * | | | 10,747 | | | | 1,951 | |
| | |
| | | | | | | 124,814 | |
| |
Materials — 2.3% | | | | | |
AptarGroup Inc | | | 6,262 | | | | 666 | |
Avery Dennison Corp | | | 31,600 | | | | 3,571 | |
Axalta Coating Systems Ltd * | | | 78,998 | | | | 1,992 | |
Bemis Co Inc | | | 44,400 | | | | 2,463 | |
Kaiser Aluminum Corp | | | 33,600 | | | | 3,519 | |
LyondellBasell Industries, Cl A | | | 7,082 | | | | 595 | |
Newmont Mining Corp | | | 36,922 | | | | 1,321 | |
Silgan Holdings Inc | | | 110,800 | | | | 3,283 | |
| | |
| 2 | | SEI Institutional Managed Trust / Semi-Annual Report / March 31, 2019 |
SCHEDULE OF INVESTMENTS (Unaudited)
March 31, 2019
Tax-Managed Managed Volatility Fund(Continued)
| | | | | | | | |
| | | |
| Description | | Shares | | Market Value
($ Thousands) |
| |
COMMON STOCK (continued) | | | | | |
Sonoco Products Co | | | 98,300 | | | $ | 6,048 | |
Trinseo SA | | | 15,714 | | | | 712 | |
| | |
| | | | | | | 24,170 | |
| |
Real Estate — 2.3% | | | | | |
Equity LifeStyle Properties Inc ‡ | | | 14,695 | | | | 1,680 | |
Medical Properties Trust Inc ‡ | | | 197,100 | | | | 3,648 | |
National Health Investors Inc ‡ | | | 41,200 | | | | 3,236 | |
Omega Healthcare Investors Inc ‡ | | | 128,000 | | | | 4,883 | |
Rayonier Inc ‡ | | | 23,223 | | | | 732 | |
SBA Communications Corp, Cl A *‡ | | | 8,218 | | | | 1,641 | |
Tanger Factory Outlet Centers Inc ‡ | | | 190,700 | | | | 4,001 | |
VEREIT Inc ‡ | | | 523,800 | | | | 4,384 | |
| | |
| | | | | | | 24,205 | |
| |
Utilities — 11.9% | | | | | |
Alliant Energy Corp | | | 9,988 | | | | 471 | |
Ameren Corp | | | 74,283 | | | | 5,464 | |
American Electric Power Co Inc | | | 126,917 | | | | 10,629 | |
Consolidated Edison Inc | | | 160,960 | | | | 13,651 | |
DTE Energy Co | | | 45,217 | | | | 5,640 | |
Duke Energy Corp | | | 55,583 | | | | 5,002 | |
Edison International | | | 120,856 | | | | 7,483 | |
Entergy Corp | | | 119,200 | | | | 11,399 | |
Eversource Energy | | | 113,201 | | | | 8,032 | |
Exelon Corp | | | 227,300 | | | | 11,395 | |
FirstEnergy Corp | | | 87,500 | | | | 3,641 | |
NextEra Energy Inc | | | 33,372 | | | | 6,452 | |
Pinnacle West Capital Corp | | | 48,930 | | | | 4,677 | |
Portland General Electric Co | | | 73,374 | | | | 3,804 | |
Public Service Enterprise Group Inc | | | 183,544 | | | | 10,904 | |
Southern Co/The | | | 92,901 | | | | 4,801 | |
Southwest Gas Holdings Inc | | | 10,242 | | | | 843 | |
UGI Corp | | | 27,722 | | | | 1,536 | |
WEC Energy Group Inc | | | 117,465 | | | | 9,289 | |
| | |
| | | | | | | 125,113 | |
| | |
Total Common Stock
(Cost $654,658) ($ Thousands) | | | | | | | 1,032,366 | |
| | |
CASH EQUIVALENT — 2.0% | | | | | | | | |
SEI Daily Income Trust, Government Fund, Cl F | | | | | | | | |
2.220%** | | | 20,855,746 | | | | 20,856 | |
Total Cash Equivalent
(Cost $20,856) ($ Thousands) | | | | | | | 20,856 | |
| |
Total Investments in Securities — 99.8%
(Cost $675,514) ($ Thousands) | | | $ | 1,053,222 | |
| | | | | | | | |
| | | | |
SEI Institutional Managed Trust / Semi-Annual Report / March 31, 2019 | | | 3 | |
SCHEDULE OF INVESTMENTS (Unaudited)
March 31, 2019
Tax-Managed Managed Volatility Fund(Continued)
A list of the open futures contracts held by the Fund at March 31, 2019, is as follows:
| | | | | | | | | | | | | | | | | | | | |
| | | | | | |
| Type of Contract | | Number
of Contracts | | | Expiration
Date | | Notional Amount
(Thousands) | | Value
(Thousands) | | | Unrealized
Appreciation | |
| | | | | |
S&P 500 IndexE-MINI | | | 67 | | | | Jun-2019 | | | $ | 9,229 | | | $ | 9,507 | | | $ | 278 | |
| | | | | | | | | | | | |
| | | | | | | | | | $ | 9,229 | | | $ | 9,507 | | | $ | 278 | |
| | | | | | | | | | | | |
Percentages are based on Net Assets of $1,055,211 ($ Thousands).
| * | Non-income producing security. |
| ** | Rate shown is the7-day effective yield as of March 31, 2019. |
| † | Investment in Affiliated Security (see Note 10). |
| ‡ | Real Estate Investment Trust. |
| (A) | Securities considered illiquid. The total value of such securities as of March 31, 2019 was $4,715 ($ Thousands) and represented 0.4% of the Net Assets of the Fund. |
Cl — Class
L.P. — Limited Partnership
Ltd. — Limited
The following is a list of the level of inputs used as of March 31, 2019, in valuing the Fund’s investments and other financial instruments carried at value ($ Thousands):
| | | | | | | | | | | | | | | | |
| | | | | |
Investments in
Securities | | Level 1 | | Level 2 | | Level 3 | | Total |
| | | | |
Common Stock | | $ | 1,032,366 | | | $ | – | | | $ | – | | | $ | 1,032,366 | |
Cash Equivalent | | | 20,856 | | | | – | | | | – | | | | 20,856 | |
| | | | | | | | | | | | | | | | |
Total Investments in Securities | | $ | 1,053,222 | | | $ | – | | | $ | – | | | $ | 1,053,222 | |
| | | | | | | | | | | | | | | | |
| | | | | | | | | | | | | | | | |
| | | | | |
| Other Financial Instruments | | Level 1 | | Level 2 | | Level 3 | | Total |
Futures Contracts * | | | | | | | | | | | | | | | | |
Unrealized Appreciation | | $ | 278 | | | $ | — | | | $ | — | | | $ | 278 | |
| | | | | | | | | | | | | | | | |
Total Other Financial Instruments | | $ | 278 | | | $ | — | | | $ | — | | | $ | 278 | |
| | | | | | | | | | | | | | | | |
* Futures contracts are valued at the unrealized appreciation on the instrument.
For the period ended March 31, 2019, there were no transfers between Level 1 and Level 2 assets and liabilities.
For the period ended March��31, 2019, there were no transfers between Level 2 and Level 3 assets and liabilities.
For more information on valuation inputs, see Note 2 – Significant Accounting Policies in Notes to Financial Statements.
Amounts designated as “—” are either $0 or have been rounded to $0.
The following is a summary of the Fund’s transactions with affiliates for the period ended March 31, 2019 ($ Thousands):
| | | | | | | | | | | | | | | | | | | | | | | | | | | | |
| Security Description | | Value 9/30/18 | | Purchases at
Cost | | Proceeds
from Sales | | Realized Gain
(Loss) | | Change in
Unrealized
Appreciation
(Depreciation) | | Value 3/31/19 | | Income |
SEI Daily Income Trust, Government Fund, Cl F | | $ | 17,479 | | | $ | 137,335 | | | $ | (133,958) | | | $ | - | | | $ | - | | | $ | 20,856 | | | $ | 273 | |
| | | | | | | | | | | | | | | | | | | | | | | | | | | | |
Total | | $ | 17,479 | | | $ | 137,335 | | | $ | (133,958) | | | $ | - | | | $ | - | | | $ | 20,856 | | | $ | 273 | |
| | | | | | | | | | | | | | | | | | | | | | | | | | | | |
The accompanying notes are an integral part of the financial statements.
| | |
| 4 | | SEI Institutional Managed Trust / Semi-Annual Report / March 31, 2019 |
SCHEDULE OF INVESTMENTS (Unaudited)
March 31, 2019
Tax-Managed International Managed Volatility Fund(Continued)
| | | | | | | | |
| | | |
| Description | | Shares | | Market Value
($ Thousands) |
| | |
COMMON STOCK — 94.6% | | | | | | | | |
| | |
Australia — 7.8% | | | | | | | | |
Abacus Property Group | | | 264,458 | | | $ | 699 | |
AGL Energy Ltd | | | 185,423 | | | | 2,867 | |
ASX Ltd | | | 42,439 | | | | 2,105 | |
Aurizon Holdings Ltd | | | 454,449 | | | | 1,469 | |
BHP Group Ltd | | | 6,201 | | | | 170 | |
Brickworks Ltd | | | 70,947 | | | | 873 | |
Coca-Cola Amatil Ltd | | | 324,187 | | | | 1,992 | |
Crown Resorts Ltd | | | 109,603 | | | | 896 | |
CSL Ltd | | | 10,005 | | | | 1,385 | |
Evolution Mining Ltd | | | 42,178 | | | | 110 | |
Flight Centre Travel Group Ltd | | | 25,121 | | | | 750 | |
Harvey Norman Holdings Ltd | | | 506,941 | | | | 1,448 | |
Inghams Group Ltd | | | 383,880 | | | | 1,192 | |
Lendlease Group | | | 53,706 | | | | 472 | |
Macquarie Group Ltd | | | 22,760 | | | | 2,092 | |
Mirvac Group | | | 364,912 | | | | 713 | |
Newcrest Mining Ltd | | | 13,198 | | | | 239 | |
Rio Tinto Ltd | | | 42,230 | | | | 2,937 | |
Sonic Healthcare Ltd | | | 14,936 | | | | 261 | |
South32 Ltd | | | 157,673 | | | | 418 | |
Stockland | | | 165,692 | | | | 453 | |
Telstra Corp Ltd, Cl B | | | 712,585 | | | | 1,680 | |
Wesfarmers Ltd | | | 45,049 | | | | 1,109 | |
Woolworths Group Ltd | | | 104,549 | | | | 2,258 | |
| | | | | | | 28,588 | |
| | |
Austria — 1.2% | | | | | | | | |
CA Immobilien Anlagen AG | | | 7,835 | | | | 283 | |
Erste Group Bank AG | | | 8,303 | | | | 306 | |
Oesterreichische Post AG | | | 15,373 | | | | 651 | |
OMV AG | | | 8,528 | | | | 463 | |
Raiffeisen Bank International AG | | | 6,989 | | | | 157 | |
S IMMO AG | | | 9,548 | | | | 195 | |
Telekom Austria AG, Cl A | | | 81,520 | | | | 593 | |
UNIQA Insurance Group AG | | | 35,314 | | | | 352 | |
Verbund AG | | | 12,388 | | | | 595 | |
voestalpine AG | | | 21,703 | | | | 660 | |
| | | | | | | 4,255 | |
| | |
Belgium — 1.7% | | | | | | | | |
Ageas | | | 2,043 | | | | 98 | |
Colruyt SA | | | 41,376 | | | | 3,062 | |
D’ieteren SA/NV | | | 9,167 | | | | 363 | |
Proximus SADP | | | 31,937 | | | | 922 | |
Sipef NV | | | 1,175 | | | | 66 | |
UCB SA, Cl A | | | 12,608 | | | | 1,084 | |
Umicore SA | | | 17,180 | | | | 764 | |
| | | | | | | 6,359 | |
| | |
Canada — 2.3% | | | | | | | | |
Bank of Nova Scotia/The, Cl C | | | 8,884 | | | | 473 | |
Canadian Imperial Bank of Commerce | | | 8,964 | | | | 709 | |
Canadian Tire Corp Ltd, Cl A | | | 11,347 | | | | 1,223 | |
| | | | | | | | |
| | | |
| Description | | Shares | | Market Value
($ Thousands) |
| | |
COMMON STOCK (continued) | | | | | | | | |
George Weston Ltd | | | 2,159 | | | $ | 155 | |
Loblaw Cos Ltd | | | 14,065 | | | | 694 | |
TELUS Corp | | | 70,718 | | | | 2,618 | |
Toronto-Dominion Bank/The | | | 48,192 | | | | 2,616 | |
| | | | | | | 8,488 | |
| | |
Denmark — 2.1% | | | | | | | | |
Carlsberg A/S, Cl B | | | 10,243 | | | | 1,281 | |
Coloplast A/S, Cl B | | | 15,341 | | | | 1,685 | |
Danske Bank A/S | | | 72,884 | | | | 1,280 | |
Demant A/S * | | | 5,208 | | | | 154 | |
DSV A/S | | | 1,251 | | | | 104 | |
H Lundbeck A/S, Cl H | | | 5,809 | | | | 252 | |
Jyske Bank A/S | | | 16,014 | | | | 619 | |
Matas A/S | | | 15,078 | | | | 149 | |
Novo Nordisk A/S, Cl B | | | 7,621 | | | | 399 | |
Royal Unibrew A/S | | | 7,711 | | | | 569 | |
Scandinavian Tobacco Group A/S | | | 49,655 | | | | 620 | |
Sydbank A/S | | | 18,313 | | | | 380 | |
United International Enterprises | | | 564 | | | | 112 | |
| | | | | | | 7,604 | |
| | |
Finland — 1.1% | | | | | | | | |
Elisa OYJ | | | 9,000 | | | | 406 | |
Fortum OYJ | | | 47,674 | | | | 976 | |
Kesko OYJ, Cl B | | | 18,076 | | | | 1,101 | |
Orion Oyj, Cl B | | | 19,059 | | | | 715 | |
Tieto OYJ | | | 21,996 | | | | 672 | |
| | | | | | | 3,870 | |
| | |
France — 6.3% | | | | | | | | |
Accor SA | | | 1,616 | | | | 65 | |
Aeroports de Paris, Cl A | | | 1,070 | | | | 207 | |
AXA SA | | | 21,925 | | | | 552 | |
Baikowski SAS *(A) | | | 2,092 | | | | 34 | |
Bastide le Confort Medical | | | 2,603 | | | | 101 | |
BNP Paribas SA | | | 10,388 | | | | 497 | |
Caisse Regionale de Credit Agricole Mutuel de Paris etd’Ile-de-France | | | 985 | | | | 109 | |
Caisse Regionale De Credit Agricole Mutuel Toulouse 31 (A) | | | 779 | | | | 111 | |
Cie Generale des Etablissements Michelin SCA | | | 16,319 | | | | 1,931 | |
Credit Agricole SA | | | 53,678 | | | | 649 | |
Credit Regionale de Credit Agricole Mutuel Sud Rhone Alpes (A) | | | 459 | | | | 112 | |
Danone SA | | | 8,176 | | | | 631 | |
Dassault Aviation SA | | | 545 | | | | 805 | |
Engie SA | | | 126,141 | | | | 1,881 | |
Eutelsat Communications SA | | | 7,231 | | | | 127 | |
Fnac Darty SA * | | | 1,602 | | | | 120 | |
Kaufman & Broad SA | | | 10,510 | | | | 430 | |
LNA Sante SA | | | 2,819 | | | | 148 | |
Metropole Television SA | | | 34,396 | | | | 635 | |
| | | | |
SEI Institutional Managed Trust / Semi-Annual Report / March 31, 2019 | | | 1 | |
SCHEDULE OF INVESTMENTS (Unaudited)
March 31, 2019
Tax-Managed International Managed Volatility Fund(Continued)
| | | | | | | | |
| | | |
| Description | | Shares | | Market Value
($ Thousands) |
| | |
COMMON STOCK (continued) | | | | | | | | |
Orange SA | | | 146,678 | | | $ | 2,388 | |
Peugeot SA | | | 16,000 | | | | 390 | |
PSB Industries SA | | | 2,092 | | | | 77 | |
Renault SA | | | 5,850 | | | | 387 | |
Rubis SCA | | | 2,506 | | | | 137 | |
Sanofi | | | 56,743 | | | | 5,017 | |
SCOR SE | | | 2,972 | | | | 127 | |
Societe BIC SA | | | 16,100 | | | | 1,436 | |
Societe Generale SA | | | 14,980 | | | | 433 | |
Thales SA, Cl A | | | 652 | | | | 78 | |
TOTAL SA | | | 42,611 | | | | 2,369 | |
Veolia Environnement SA | | | 36,492 | | | | 817 | |
| | | | | | | 22,801 | |
| | |
Germany — 5.5% | | | | | | | | |
Aareal Bank AG | | | 32,422 | | | | 1,000 | |
adidas AG | | | 1,170 | | | | 285 | |
Allianz SE | | | 1,989 | | | | 443 | |
Beiersdorf AG | | | 2,968 | | | | 309 | |
Covestro AG | | | 16,142 | | | | 889 | |
Daimler AG | | | 10,923 | | | | 641 | |
Deutsche Lufthansa AG | | | 39,440 | | | | 867 | |
Deutsche Telekom AG | | | 131,358 | | | | 2,182 | |
Evonik Industries AG | | | 28,804 | | | | 785 | |
Fraport AG Frankfurt Airport Services Worldwide | | | 4,634 | | | | 355 | |
Freenet AG | | | 5,102 | | | | 110 | |
Hannover Rueck SE | | | 12,686 | | | | 1,823 | |
Hornbach Holding AG & Co KGaA | | | 12,334 | | | | 619 | |
McKesson Europe AG | | | 3,753 | | | | 110 | |
Merck KGaA | | | 25,871 | | | | 2,953 | |
METRO AG | | | 112,029 | | | | 1,861 | |
MTU Aero Engines AG | | | 1,151 | | | | 261 | |
Muenchener Rueckversicherungs- | | | | | | | | |
Gesellschaft AG in Muenchen | | | 12,870 | | | | 3,049 | |
Salzgitter AG | | | 19,737 | | | | 571 | |
SAP SE | | | 1,022 | | | | 118 | |
Siemens AG | | | 3,158 | | | | 340 | |
Siltronic AG | | | 1,382 | | | | 122 | |
Sirius Real Estate Ltd | | | 87,389 | | | | 72 | |
Uniper SE | | | 5,125 | | | | 155 | |
Vonovia SE | | | 5,398 | | | | 280 | |
| | | | | | | 20,200 | |
| | |
Hong Kong — 5.9% | | | | | | | | |
China Motor Bus Co Ltd (A) | | | 16,800 | | | | 227 | |
CK Infrastructure Holdings Ltd | | | 82,000 | | | | 673 | |
CLP Holdings Ltd, Cl B | | | 368,500 | | | | 4,272 | |
Dah Sing Banking Group Ltd | | | 336,000 | | | | 631 | |
Hang Lung Group Ltd | | | 128,000 | | | | 411 | |
Hang Seng Bank Ltd | | | 19,000 | | | | 469 | |
HK Electric Investments & HK Electric Investments Ltd | | | 1,500,500 | | | | 1,533 | |
| | | | | | | | |
| | | |
| Description | | Shares | | Market Value
($ Thousands) |
| | |
COMMON STOCK (continued) | | | | | | | | |
HKT Trust & HKT Ltd | | | 633,000 | | | $ | 1,018 | |
Hong Kong & China Gas Co Ltd | | | 390,390 | | | | 936 | |
Hongkong & Shanghai Hotels Ltd/The | | | 154,000 | | | | 222 | |
Hutchison Telecommunications Hong Kong Holdings | | | 254,000 | | | | 108 | |
Hysan Development Co Ltd | | | 19,000 | | | | 102 | |
Johnson Electric Holdings Ltd | | | 115,500 | | | | 267 | |
Kerry Properties Ltd | | | 480,000 | | | | 2,143 | |
Lee & Man Paper Manufacturing Ltd | | | 716,000 | | | | 610 | |
Link REIT | | | 10,000 | | | | 117 | |
MTR Corp Ltd | | | 184,000 | | | | 1,139 | |
New World Development Co Ltd | | | 94,000 | | | | 156 | |
NWS Holdings Ltd | | | 383,000 | | | | 837 | |
Pacific Textile Holdings | | | 491,000 | | | | 442 | |
Paliburg Holdings Ltd (A) | | | 328,000 | | | | 140 | |
PCCW Ltd | | | 657,000 | | | | 408 | |
Power Assets Holdings Ltd | | | 92,000 | | | | 638 | |
Regal Hotels International Holdings Ltd | | | 160,000 | | | | 100 | |
Regal Real Estate Investment Trust | | | 259,000 | | | | 80 | |
Shangri-La Asia Ltd | | | 54,000 | | | | 77 | |
Sunlight Real Estate Investment Trust | | | 145,000 | | | | 109 | |
Swire Pacific Ltd, Cl A | | | 27,000 | | | | 347 | |
Tian An China Investment Co Ltd | | | 170,000 | | | | 92 | |
WH Group Ltd | | | 2,423,000 | | | | 2,593 | |
Wharf Real Estate Investment Co Ltd | | | 59,000 | | | | 439 | |
Wheelock & Co Ltd | | | 24,000 | | | | 176 | |
| | | | | | | 21,512 | |
| | |
Ireland — 0.2% | | | | | | | | |
Irish Residential Properties REIT PLC | | | 343,231 | | | | 613 | |
| | |
Israel — 1.6% | | | | | | | | |
Bank Hapoalim BM | | | 410,265 | | | | 2,720 | |
Bank LeumiLe-Israel BM | | | 57,265 | | | | 374 | |
Fattal Holdings 1998 Ltd * | | | 851 | | | | 96 | |
FIBI Holdings Ltd | | | 3,995 | | | | 112 | |
Isras Investment Co Ltd | | | 1,037 | | | | 145 | |
Kerur Holdings Ltd | | | 4,093 | | | | 101 | |
Mizrahi Tefahot Bank Ltd | | | 48,726 | | | | 1,003 | |
Oil Refineries Ltd * | | | 1,712,187 | | | | 838 | |
Paz Oil Co Ltd * | | | 2,001 | | | | 299 | |
Shufersal Ltd | | | 26,493 | | | | 171 | |
| | | | | | | 5,859 | |
| | |
Italy — 1.1% | | | | | | | | |
A2A SpA | | | 452,940 | | | | 827 | |
Assicurazioni Generali SpA | | | 9,000 | | | | 167 | |
Atlantia SpA | | | 9,488 | | | | 246 | |
Enel SpA | | | 143,512 | | | | 919 | |
Hera SpA | | | 337,822 | | | | 1,223 | |
Intesa Sanpaolo SpA | | | 42,682 | | | | 104 | |
Terna Rete Elettrica Nazionale SpA | | | 53,518 | | | | 339 | |
| | | | | | | 3,825 | |
| | |
| 2 | | SEI Institutional Managed Trust / Semi-Annual Report / March 31, 2019 |
SCHEDULE OF INVESTMENTS (Unaudited)
March 31, 2019
Tax-Managed International Managed Volatility Fund(Continued)
| | | | | | | | |
| | | |
| Description | | Shares | | Market Value
($ Thousands) |
| | |
COMMON STOCK (continued) | | | | | | | | |
| | |
Japan — 21.1% | | | | | | | | |
ABC-Mart Inc, Cl H | | | 9,600 | | | $ | 572 | |
Aeon Co Ltd, Cl H | | | 34,200 | | | | 716 | |
AEON REIT Investment Corp | | | 798 | | | | 942 | |
AGC Inc/Japan | | | 15,100 | | | | 529 | |
Ainavo Holdings | | | 12,200 | | | | 100 | |
Aisin Seiki Co Ltd | | | 24,800 | | | | 886 | |
Alfresa Holdings Corp | | | 26,400 | | | | 751 | |
Alpen Co Ltd | | | 6,400 | | | | 99 | |
Alps Logistics | | | 13,400 | | | | 98 | |
ANA Holdings Inc | | | 19,700 | | | | 722 | |
Aozora Bank Ltd | | | 33,200 | | | | 821 | |
Arcs Co Ltd | | | 47,700 | | | | 1,049 | |
Asahi Group Holdings Ltd | | | 6,100 | | | | 272 | |
Asahi Kasei Corp | | | 18,000 | | | | 186 | |
Astellas Pharma Inc | | | 201,500 | | | | 3,019 | |
Bandai Namco Holdings Inc | | | 10,200 | | | | 478 | |
Canon Inc | | | 45,200 | | | | 1,312 | |
Choushimaru Co Ltd | | | 10,500 | | | | 107 | |
Chubu Electric Power Co Inc | | | 15,500 | | | | 242 | |
COMSYS Holdings Corp | | | 9,900 | | | | 270 | |
Daiichi Kensetsu Corp | | | 7,200 | | | | 107 | |
Daiichi Sankyo Co Ltd | | | 4,600 | | | | 212 | |
Daiki Aluminium Industry Co Ltd | | | 26,000 | | | | 156 | |
Daiohs Corp | | | 3,400 | | | | 42 | |
Dairei | | | 6,300 | | | | 102 | |
DCM Holdings Co Ltd | | | 109,400 | | | | 1,020 | |
Ebara Foods Industry Inc | | | 4,700 | | | | 92 | |
EDION Corp | | | 20,600 | | | | 180 | |
FJ Next Co Ltd | | | 16,100 | | | | 124 | |
FUJIFILM Holdings Corp | | | 24,700 | | | | 1,123 | |
Gakkyusha Co Ltd | | | 8,400 | | | | 99 | |
Gourmet Kineya Co Ltd | | | 10,000 | | | | 105 | |
Hakudo Co Ltd | | | 6,800 | | | | 95 | |
Heiwa Corp | | | 6,400 | | | | 128 | |
Hiroshima Gas Co Ltd | | | 31,400 | | | | 98 | |
Hokkaido Gas Co Ltd | | | 9,800 | | | | 127 | |
Honda Motor Co Ltd | | | 33,000 | | | | 893 | |
Hoya Corp | | | 1,500 | | | | 99 | |
Inaba Denki Sangyo Co Ltd | | | 20,600 | | | | 797 | |
ITOCHU Corp | | | 90,100 | | | | 1,630 | |
Itochu Enex Co Ltd | | | 41,300 | | | | 333 | |
Japan Airlines Co Ltd | | | 51,800 | | | | 1,825 | |
Japan Post Bank Co Ltd | | | 83,000 | | | | 907 | |
Japan Post Holdings Co Ltd | | | 108,400 | | | | 1,269 | |
Japan Prime Realty Investment Corp, Cl A‡ | | | 189 | | | | 779 | |
Japan Tobacco Inc | | | 64,900 | | | | 1,610 | |
Joshin Denki Co Ltd | | | 6,000 | | | | 138 | |
JXTG Holdings Inc | | | 249,000 | | | | 1,139 | |
Kadoya Sesame Mills Inc | | | 2,200 | | | | 103 | |
Kamigumi Co Ltd | | | 61,100 | | | | 1,415 | |
Kaneka Corp | | | 11,600 | | | | 434 | |
| | | | | | | | |
| | | |
| Description | | Shares | | Market Value
($ Thousands) |
| | |
COMMON STOCK (continued) | | | | | | | | |
Kato Sangyo Co Ltd | | | 8,700 | | | $ | 287 | |
KDDI Corp | | | 115,200 | | | | 2,482 | |
Keihanshin Building Co Ltd | | | 19,000 | | | | 186 | |
Keiyo Co Ltd | | | 73,200 | | | | 327 | |
Kinden Corp | | | 18,800 | | | | 312 | |
Kirin Holdings Co Ltd | | | 4,600 | | | | 110 | |
Kohnan Shoji Co Ltd | | | 4,500 | | | | 112 | |
Komeri Co Ltd | | | 12,700 | | | | 311 | |
K’s Holdings Corp | | | 7,500 | | | | 67 | |
Kuraray Co Ltd | | | 73,500 | | | | 935 | |
Kurimoto Ltd | | | 10,700 | | | | 141 | |
Kyokuyo Co Ltd | | | 11,300 | | | | 290 | |
KYORIN Holdings Inc | | | 19,000 | | | | 371 | |
Kyowa Exeo Corp | | | 33,300 | | | | 919 | |
Kyushu Railway Co | | | 3,300 | | | | 109 | |
LIXIL VIVA Corp | | | 15,100 | | | | 192 | |
Marvelous | | | 13,900 | | | | 108 | |
Matsumotokiyoshi Holdings Co Ltd | | | 2,900 | | | | 97 | |
McDonald’s Holdings Co Japan Ltd | | | 16,100 | | | | 745 | |
Mebuki Financial Group Inc | | | 135,900 | | | | 347 | |
Medipal Holdings Corp | | | 44,900 | | | | 1,067 | |
Mitsubishi Corp | | | 6,900 | | | | 192 | |
Mitsubishi Gas Chemical Co Inc | | | 15,200 | | | | 217 | |
Mitsubishi Shokuhin Co Ltd | | | 27,200 | | | | 712 | |
Mitsubishi Tanabe Pharma Corp | | | 37,600 | | | | 502 | |
Mitsui & Co Ltd | | | 75,400 | | | | 1,171 | |
Miyoshi Oil & Fat Co Ltd | | | 10,200 | | | | 103 | |
Mizuho Financial Group Inc | | | 2,085,300 | | | | 3,227 | |
Mochida Pharmaceutical Co Ltd | | | 1,800 | | | | 92 | |
NHK Spring Co Ltd | | | 50,200 | | | | 451 | |
Nippo Corp | | | 49,900 | | | | 931 | |
Nippon Building Fund Inc | | | 103 | | | | 698 | |
Nippon Express Co Ltd | | | 13,700 | | | | 762 | |
Nippon Flour Mills Co Ltd | | | 55,300 | | | | 949 | |
Nippon Telegraph & Telephone Corp | | | 102,000 | | | | 4,334 | |
Nissan Motor Co Ltd | | | 225,200 | | | | 1,848 | |
Nisshin Oillio Group Ltd/The | | | 26,900 | | | | 795 | |
Nitto Fuji Flour Milling Co Ltd (A) | | | 4,000 | | | | 222 | |
NTT DOCOMO Inc | | | 122,100 | | | | 2,704 | |
Okinawa Electric Power Co Inc/The | | | 11,287 | | | | 192 | |
Ootoya Holdings Co Ltd (A) | | | 11,000 | | | | 223 | |
Osaka Gas Co Ltd | | | 39,900 | | | | 787 | |
Otsuka Corp | | | 14,600 | | | | 545 | |
OUG Holdings Inc (A) | | | 8,700 | | | | 202 | |
Proto Corp | | | 6,100 | | | | 110 | |
Sankyo Co Ltd | | | 29,000 | | | | 1,106 | |
Seiko Epson | | | 33,200 | | | | 508 | |
Senshu Ikeda Holdings Inc | | | 114,800 | | | | 295 | |
Seven & i Holdings Co Ltd | | | 21,000 | | | | 792 | |
SG Holdings Co Ltd | | | 8,800 | | | | 256 | |
Shibusawa Warehouse Co Ltd/The | | | 7,200 | | | | 109 | |
Shidax Corp | | | 31,700 | | | | 92 | |
| | | | |
SEI Institutional Managed Trust / Semi-Annual Report / March 31, 2019 | | | 3 | |
SCHEDULE OF INVESTMENTS (Unaudited)
March 31, 2019
Tax-Managed International Managed Volatility Fund(Continued)
| | | | | | | | |
| | | |
| Description | | Shares | | Market Value ($ Thousands) |
| |
COMMON STOCK (continued) | | | | | |
Shimachu Co Ltd | | | 7,600 | | | $ | 198 | |
Shionogi & Co Ltd | | | 12,400 | | | | 768 | |
Softbank | | | 8,300 | | | | 94 | |
SoftBank Group Corp | | | 1,200 | | | | 116 | |
SPK Corp | | | 4,500 | | | | 98 | |
Sumitomo Bakelite Co Ltd | | | 3,200 | | | | 115 | |
Sumitomo Dainippon Pharma Co Ltd | | | 2,100 | | | | 52 | |
Sumitomo Mitsui Financial Group Inc | | | 8,400 | | | | 294 | |
Sumitomo Osaka Cement Co Ltd | | | 25,300 | | | | 997 | |
Suzuken Co Ltd/Aichi Japan | | | 23,500 | | | | 1,361 | |
Taisho Pharmaceutical Holdings Co Ltd | | | 7,900 | | | | 753 | |
TAKEBISHI CORP | | | 1,900 | | | | 24 | |
Teijin Ltd | | | 72,500 | | | | 1,196 | |
Toho Holdings Co Ltd | | | 3,500 | | | | 87 | |
Tokio Marine Holdings | | | 7,900 | | | | 383 | |
Tokyo Electric Power Co Holdings Inc * | | | 69,800 | | | | 441 | |
Tokyo Gas Co Ltd | | | 28,900 | | | | 782 | |
Toshiba Plant Systems & Services Corp | | | 7,200 | | | | 128 | |
Toyota Motor Corp | | | 17,600 | | | | 1,031 | |
Tsumura & Co | | | 11,000 | | | | 334 | |
Valor Holdings Co Ltd | | | 5,000 | | | | 121 | |
West Japan Railway Co | | | 23,300 | | | | 1,755 | |
Yaizu Suisankagaku Industry Co Ltd | | | 10,500 | | | | 106 | |
Yamada Denki Co Ltd | | | 32,300 | | | | 159 | |
Yasuda Logistics Corp | | | 19,800 | | | | 165 | |
Yellow Hat Ltd | | | 11,200 | | | | 147 | |
Yomeishu Seizo Co Ltd | | | 6,000 | | | | 116 | |
Yuasa Funashoku Co Ltd (A) | | | 4,560 | | | | 151 | |
Zaoh | | | 8,700 | | | | 104 | |
| | | | | | | 77,070 | |
| | |
Netherlands — 2.6% | | | | | | | | |
ABN AMRO Group | | | 79,449 | | | | 1,793 | |
ASR Nederland NV | | | 10,035 | | | | 418 | |
Corbion NV | | | 3,042 | | | | 91 | |
Heineken NV | | | 3,040 | | | | 321 | |
Koninklijke Ahold Delhaize NV | | | 126,640 | | | | 3,374 | |
NN Group NV | | | 68,275 | | | | 2,839 | |
Randstad NV | | | 2,260 | | | | 110 | |
Signify NV | | | 15,116 | | | | 405 | |
| | | | | | | 9,351 | |
| | |
New Zealand — 2.0% | | | | | | | | |
Auckland International Airport Ltd | | | 105,544 | | | | 586 | |
Chorus Ltd | | | 57,800 | | | | 233 | |
Contact Energy Ltd | | | 114,148 | | | | 540 | |
Fisher & Paykel Healthcare Corp Ltd | | | 184,452 | | | | 1,975 | |
Fletcher Building Ltd | | | 29,864 | | | | 101 | |
Freightways Ltd | | | 32,367 | | | | 182 | |
Goodman Property Trust | | | 149,541 | | | | 176 | |
Mercury NZ Ltd | | | 234,122 | | | | 623 | |
Meridian Energy Ltd | | | 176,978 | | | | 505 | |
PGG Wrightson | | | 303,672 | | | | 102 | |
| | | | | | | | |
| | | |
| Description | | Shares | | Market Value ($ Thousands) |
| |
COMMON STOCK (continued) | | | | | |
Ryman Healthcare Ltd | | | 42,791 | | | $ | 358 | |
Spark New Zealand Ltd | | | 176,255 | | | | 457 | |
Summerset Group Holdings Ltd | | | 57,029 | | | | 257 | |
Tourism Holdings Ltd | | | 55,789 | | | | 180 | |
Warehouse Group Ltd/The (A) | | | 97,101 | | | | 144 | |
Z Energy Ltd | | | 198,449 | | | | 847 | |
| | | | | | | 7,266 | |
| | |
Norway — 1.3% | | | | | | | | |
Austevoll Seafood ASA | | | 51,946 | | | | 615 | |
DNB ASA, Cl A | | | 29,374 | | | | 542 | |
Mowi ASA | | | 46,066 | | | | 1,030 | |
Olav Thon Eiendomsselskap ASA | | | 6,036 | | | | 106 | |
Orkla ASA | | | 93,828 | | | | 721 | |
Sparebank 1 Oestlandet | | | 10,088 | | | | 97 | |
Sparebanken Sor | | | 9,196 | | | | 96 | |
Telenor ASA | | | 64,166 | | | | 1,287 | |
Yara International ASA | | | 3,093 | | | | 127 | |
| | | | | | | 4,621 | |
| | |
Portugal — 0.1% | | | | | | | | |
REN - Redes Energeticas Nacionais SGPS SA | | | 122,631 | | | | 350 | |
Sonae SGPS SA | | | 104,822 | | | | 109 | |
| | | | | | | 459 | |
| | |
Singapore — 3.7% | | | | | | | | |
CapitaLand Commercial Trust | | | 422,500 | | | | 605 | |
CapitaLand Mall Trust‡ | | | 1,336,100 | | | | 2,348 | |
ComfortDelGro Corp Ltd | | | 330,900 | | | | 628 | |
DBS Group Holdings Ltd | | | 167,700 | | | | 3,124 | |
Mapletree Industrial Trust | | | 103,900 | | | | 161 | |
Mapletree Logistics Trust | | | 224,370 | | | | 242 | |
Olam International Ltd | | | 78,000 | | | | 114 | |
Oversea-Chinese Banking Corp Ltd | | | 116,200 | | | | 948 | |
SATS Ltd | | | 279,900 | | | | 1,056 | |
Sheng Siong Group Ltd | | | 365,100 | | | | 280 | |
Singapore Airlines Ltd | | | 32,600 | | | | 232 | |
Singapore Press Holdings Ltd | | | 210,200 | | | | 374 | |
Singapore Technologies Engineering Ltd | | | 450,200 | | | | 1,243 | |
SPH REIT‡ | | | 284,000 | | | | 220 | |
United Industrial Corp Ltd (A) | | | 50,700 | | | | 109 | |
United Overseas Bank Ltd | | | 44,200 | | | | 822 | |
UOL Group Ltd | | | 26,200 | | | | 134 | |
Venture Corp Ltd | | | 8,100 | | | | 107 | |
Wilmar International Ltd | | | 255,300 | | | | 624 | |
| | | | | | | 13,371 | |
| | |
Spain — 1.9% | | | | | | | | |
Ebro Foods SA | | | 26,169 | | | | 560 | |
Enagas SA | | | 5,521 | | | | 161 | |
Endesa SA | | | 130,857 | | | | 3,341 | |
Grifols SA | | | 16,305 | | | | 457 | |
Iberdrola SA | | | 210,398 | | | | 1,849 | |
International Consolidated Airlines Group SA | | | 51,138 | | | | 341 | |
| | |
| 4 | | SEI Institutional Managed Trust / Semi-Annual Report / March 31, 2019 |
SCHEDULE OF INVESTMENTS (Unaudited)
March 31, 2019
Tax-Managed International Managed Volatility Fund(Continued)
| | | | | | | | |
| | | |
| Description | | Shares | | Market Value ($ Thousands) |
| |
COMMON STOCK (continued) | | | | | |
Red Electrica Corp SA | | | 13,129 | | | $ | 280 | |
| | | | | | | 6,989 | |
| |
Sweden — 2.6% | | | | | |
Axfood AB | | | 54,195 | | | | 1,011 | |
Epiroc AB, Cl B * | | | 21,754 | | | | 209 | |
Essity AB, Cl B | | | 12,605 | | | | 364 | |
Hemfosa Fastigheter AB | | | 18,745 | | | | 165 | |
ICA Gruppen AB | | | 77,256 | | | | 3,107 | |
JM AB | | | 18,508 | | | | 332 | |
KNOW IT AB | | | 10,862 | | | | 233 | |
Nyfosa AB * | | | 18,745 | | | | 112 | |
Resurs Holding AB | | | 116,084 | | | | 721 | |
Scandic Hotels Group AB | | | 56,783 | | | | 508 | |
Svenska Cellulosa AB SCA, Cl B | | | 21,139 | | | | 184 | |
Swedbank AB, Cl A | | | 21,238 | | | | 301 | |
Swedish Match AB | | | 32,122 | | | | 1,641 | |
Telia Co AB | | | 168,432 | | | | 762 | |
| | | | | | | 9,650 | |
| |
Switzerland — 9.4% | | | | | |
Allreal Holding AG, Cl A | | | 688 | | | | 117 | |
ALSO Holding AG | | | 1,128 | | | | 146 | |
Baloise Holding AG | | | 8,737 | | | | 1,443 | |
Barry Callebaut AG | | | 566 | | | | 1,022 | |
Basellandschaftliche Kantonalbank | | | 213 | | | | 195 | |
Basler Kantonalbank, Cl H | | | 1,334 | | | | 102 | |
Berner Kantonalbank AG | | | 473 | | | | 115 | |
BKW AG | | | 15,516 | | | | 1,058 | |
Chocoladefabriken Lindt & Spruengli AG | | | 207 | | | | 1,407 | |
Emmi AG | | | 117 | | | | 103 | |
Idorsia Ltd * | | | 3,040 | | | | 53 | |
Intershop Holding AG | | | 203 | | | | 104 | |
Nestle SA | | | 13,549 | | | | 1,291 | |
Novartis AG | | | 16,871 | | | | 1,623 | |
Orior AG | | | 2,561 | | | | 205 | |
Pargesa Holding SA | | | 8,903 | | | | 697 | |
PSP Swiss Property AG | | | 4,712 | | | | 512 | |
Roche Holding AG | | | 24,986 | | | | 6,883 | |
Romande Energie Holding SA | | | 76 | | | | 86 | |
Schindler Holding AG | | | 6,813 | | | | 1,412 | |
SGS SA, Cl B | | | 202 | | | | 503 | |
Sika AG | | | 2,966 | | | | 414 | |
Sonova Holding AG | | | 10,159 | | | | 2,010 | |
St Galler Kantonalbank AG | | | 263 | | | | 121 | |
Swiss Life Holding AG | | | 10,494 | | | | 4,621 | |
Swiss Prime Site AG | | | 11,158 | | | | 977 | |
Swiss Re AG | | | 17,857 | | | | 1,744 | |
Swisscom AG | | | 2,292 | | | | 1,121 | |
Tamedia AG | | | 1,368 | | | | 139 | |
Valiant Holding AG | | | 6,581 | | | | 756 | |
Valora Holding AG | | | 946 | | | | 261 | |
| | | | | | | | |
| | | |
| Description | | Shares | | Market Value
($ Thousands) |
| |
COMMON STOCK (continued) | | | | | |
Zurich Insurance Group AG | | | 9,498 | | | $ | 3,143 | |
| | | | | | | 34,384 | |
| |
United Kingdom — 12.1% | | | | | |
AstraZeneca PLC | | | 3,479 | | | | 278 | |
Auto Trader Group PLC | | | 65,351 | | | | 444 | |
B&M European Value Retail SA | | | 108,426 | | | | 528 | |
BAE Systems PLC | | | 296,852 | | | | 1,866 | |
Berkeley Group Holdings PLC | | | 13,401 | | | | 644 | |
BP PLC | | | 345,444 | | | | 2,514 | |
BP PLC ADR | | | 5,855 | | | | 256 | |
Britvic PLC | | | 108,231 | | | | 1,343 | |
Carnival PLC | | | 31,964 | | | | 1,568 | |
Cello Health PLC | | | 77,483 | | | | 127 | |
Central Asia Metals PLC | | | 116,605 | | | | 360 | |
Centrica PLC | | | 229,042 | | | | 341 | |
Coca-Cola HBC AG | | | 37,198 | | | | 1,268 | |
Computacenter PLC | | | 28,017 | | | | 404 | |
Craneware PLC | | | 7,808 | | | | 247 | |
Diageo PLC | | | 43,913 | | | | 1,796 | |
easyJet PLC | | | 14,746 | | | | 215 | |
F&C UK Real Estate Investment Ltd | | | 30,456 | | | | 35 | |
GlaxoSmithKline PLC | | | 190,001 | | | | 3,953 | |
Greggs PLC | | | 7,203 | | | | 173 | |
Halfords Group PLC | | | 53,733 | | | | 162 | |
HSBC Holdings PLC | | | 215,732 | | | | 1,752 | |
Imperial Brands PLC | | | 89,525 | | | | 3,062 | |
Inchcape PLC | | | 152,238 | | | | 1,133 | |
J D Wetherspoon PLC | | | 37,692 | | | | 643 | |
J Sainsbury PLC | | | 359,981 | | | | 1,106 | |
Kingfisher PLC | | | 207,367 | | | | 634 | |
Legal & General Group PLC | | | 454,925 | | | | 1,632 | |
Lloyds Banking Group PLC | | | 668,205 | | | | 541 | |
Marks & Spencer Group PLC | | | 218,253 | | | | 793 | |
Mondi PLC | | | 20,021 | | | | 443 | |
National Express Group PLC | | | 116,554 | | | | 617 | |
National Grid PLC | | | 6,395 | | | | 71 | |
Next PLC, Cl A | | | 9,675 | | | | 703 | |
Paragon Banking Group PLC | | | 19,079 | | | | 108 | |
Persimmon PLC | | | 13,991 | | | | 396 | |
QinetiQ Group PLC | | | 414,692 | | | | 1,628 | |
Reckitt Benckiser Group PLC | | | 8,245 | | | | 686 | |
Rio Tinto PLC | | | 14,852 | | | | 863 | |
Royal Mail PLC | | | 178,458 | | | | 554 | |
ScS Group PLC | | | 36,908 | | | | 114 | |
Secure Income REIT Plc‡ | | | 25,660 | | | | 137 | |
Smith & Nephew PLC | | | 19,840 | | | | 394 | |
Sports Direct International PLC * | | | 37,485 | | | | 143 | |
SSE PLC | | | 106,289 | | | | 1,644 | |
Tate & Lyle PLC | | | 215,499 | | | | 2,038 | |
Tesco PLC | | | 90,373 | | | | 273 | |
Total Produce PLC | | | 87,508 | | | | 167 | |
Unilever PLC | | | 15,429 | | | | 884 | |
| | | | |
SEI Institutional Managed Trust / Semi-Annual Report / March 31, 2019 | | | 5 | |
SCHEDULE OF INVESTMENTS (Unaudited)
March 31, 2019
Tax-Managed International Managed Volatility Fund(Continued)
| | | | | | |
| | | |
| Description | | Shares | | Market Value
($ Thousands) | |
| |
COMMON STOCK (continued) | | | | |
Vodafone Group PLC | | 327,528 | | $ | 597 | |
WH Smith PLC | | 29,626 | | | 819 | |
Wm Morrison Supermarkets PLC | | 318,093 | | | 943 | |
| | | | | 44,040 | |
| | |
United States — 1.0% | | | | | | |
Atlantica Yield PLC | | 26,990 | | | 525 | |
Coca-Cola European Partners PLC | | 43,981 | | | 2,276 | |
Hudson Ltd, Cl A * | | 22,483 | | | 309 | |
KLA-Tencor Corp | | 435 | | | 52 | |
QIAGEN NV * | | 11,104 | | | 452 | |
Taro Pharmaceutical Industries Ltd | | 963 | | | 104 | |
| | | | | 3,718 | |
| | |
Total Common Stock
(Cost $309,286) ($ Thousands) | | | | | 344,893 | |
| | |
PREFERRED STOCK — 0.2% | | | | | | |
Germany — 0.2% | | | | | | |
Bayerische Motoren Werke AG (B) | | 1,362 | | | 90 | |
Henkel AG & Co KGaA (B) | | 7,150 | | | 730 | |
| | | | | 820 | |
| | |
Total Preferred Stock
(Cost $880) ($ Thousands) | | | | | 820 | |
| | |
CASH EQUIVALENT — 3.4% | | | | | | |
SEI Daily Income Trust, Government Fund, Cl F | | | | | | |
2.220%**† | | 12,316,988 | | | 12,317 | |
| | |
Total Cash Equivalent
(Cost $12,317) ($ Thousands) | | | | | 12,317 | |
| |
Total Investments in Securities — 98.2%
(Cost $322,483) ($ Thousands) | | $ | 358,030 | |
| | | | | | |
A list of the open futures contracts held by the Fund at March 31, 2019, is as follows:
| | | | | | | | | | | | | | | | | | |
| Type of Contract | | Number of
Contracts
Long (Short) | | | Expiration
Date | | Notional Amount
(Thousands) | | Value
(Thousands) | | Unrealized
Appreciation/
(Depreciation)
(Thousands) |
DJ Euro Stoxx 50 Index | | | 95 | | | Jun-2019 | | $ | 3,430 | | | $ | 3,490 | | | $ | 60 | |
FTSE 100 Index | | | 22 | | | Jun-2019 | | | 2,032 | | | | 2,067 | | | | 46 | |
Hang Seng Index | | | 1 | | | Apr-2019 | | | 183 | | | | 185 | | | | 2 | |
SPI 200 Index | | | 8 | | | Jun-2019 | | | 879 | | | | 877 | | | | (3 | ) |
TOPIX Index | | | 17 | | | Jun-2019 | | | 2,429 | | | | 2,445 | | | | (3 | ) |
| | | | | | | | | | | | | | | | | | |
| | | | | | | | $ | 8,953 | | | $ | 9,064 | | | $ | 102 | |
| | | | | | | | | | | | | | | | | | |
| | |
| 6 | | SEI Institutional Managed Trust / Semi-Annual Report / March 31, 2019 |
SCHEDULE OF INVESTMENTS (Unaudited)
March 31, 2019
Tax-Managed International Managed Volatility Fund(Continued)
Percentages are based on Net Assets of $364,622 ($ Thousands).
| * | Non-income producing security. |
| ** | Rate shown is the7-day effective yield as of March 31, 2019. |
| ‡ | Real Estate Investment Trust. |
| † | Investment in Affiliated Security (see Note 6). |
| (A) | Securities considered illiquid. The total value of such securities as of March 31, 2019 was $1,675 ($ Thousands) and represented 0.5% of the Net Assets of the Fund. |
| (B) | There is currently no rate available. |
ADR — American Depositary Receipt
Cl — Class
DJ — Dow Jones
FTSE— Financial Times and Stock Exchange
Ltd. — Limited
PLC — Public Limited Company
REIT — Real Estate investment Trust
SPI — Share Price Index
TOPIX — Tokyo Stock Price Index
The following is a list of the level of inputs used as of March 31, 2019, in valuing the Fund’s investments and other financial instruments carried at value ($ Thousands):
| | | | | | | | | | | | | | | | |
| | | | | |
Investments in
Securities | | Level 1 | | | Level 2 | | | Level 3 | | | Total | |
Common Stock | | $ | 344,893 | | | $ | — | | | $ | — | | | $ | 344,893 | |
Preferred Stock | | | 820 | | | | — | | | | — | | | | 820 | |
Cash Equivalent | | | 12,317 | | | | — | | | | — | | | | 12,317 | |
| | | | | | | | | | | | | | | | |
Total Investments in Securities | | $ | 358,030 | | | $ | — | | | $ | — | | | $ | 358,030 | |
| | | | | | | | | | | | | | | | |
| | | | | | | | | | | | | | | | |
| | | | | |
Other Financial
Instruments | | Level 1 | | | Level 2 | | | Level 3 | | | Total | |
Futures Contracts * | | | | | | | | | | | | | | | | |
Unrealized Appreciation | | $ | 108 | | | $ | — | | | $ | — | | | $ | 108 | |
Unrealized Depreciation | | | (6) | | | | — | | | | — | | | | (6) | |
| | | | | | | | | | | | | | | | |
Total Other Financial Instruments | | $ | 102 | | | $ | — | | | $ | — | | | $ | 102 | |
| | | | | | | | | | | | | | | | |
* Futures contracts are valued at the unrealized appreciation/(depreciation) on the instrument.
For the period ended March 31, 2019, there were no transfers between Level 1 and Level 2 assets and liabilities.
For the period ended March 31, 2019, there were no transfers between Level 2 and Level 3 assets and liabilities.
For more information on valuation inputs, see Note 2 — Significant Accounting Policies in Notes to Financial Statements.
Amounts designated as “—” are either $0 or have been rounded to $0.
The following is a summary of the Fund’s transactions with affiliates for the period ended March 31, 2019 ($ Thousands):
| | | | | | | | | | | | | | |
| Security Description | | Value 9/30/2018 | | Purchases at
Cost | | Proceeds from
Sales | | Realized Gain
(Loss) | | Change in
Unrealized
Appreciation
(Depreciation) | | Value 3/31/2019 | | Income |
SEI Daily Income Trust, Government Fund, CI F | | $ 6,054 | | $ 30,025 | | $ (23,762) | | $ — | | $ — | | $ 12,317 | | $ 83 |
| | | | | | | | | | | | | | |
Totals | | $ 6,054 | | $ 30,025 | | $ (23,762) | | $ — | | $ — | | $ 12,317 | | $ 83 |
| | | | | | | | | | | | | | |
The accompanying notes are an integral part of the financial statements.
| | | | |
SEI Institutional Managed Trust / Semi-Annual Report / March 31, 2019 | | | 7 | |
CONSOLIDATED SCHEDULE OF INVESTMENTS (Unaudited)
March 31, 2019
Dynamic Asset Allocation Fund(Continued)
| | | | | | | | |
| | | |
| Description | | Shares | | | Market Value
($ Thousands) |
| | |
COMMON STOCK — 92.9% | | | | | | | | |
| |
Communication Services — 9.4% | | | | | |
Activision Blizzard Inc | | | 23,800 | | | $ | 1,084 | |
Alphabet Inc, Cl A * | | | 9,369 | | | | 11,026 | |
Alphabet Inc, Cl C * | | | 9,593 | | | | 11,256 | |
AT&T Inc | | | 227,703 | | | | 7,141 | |
CBS Corp, Cl B | | | 10,782 | | | | 512 | |
CenturyLink Inc | | | 30,657 | | | | 368 | |
Charter Communications Inc, Cl A * | | | 5,400 | | | | 1,873 | |
Comcast Corp, Cl A | | | 141,080 | | | | 5,640 | |
Discovery Inc, Cl A * | | | 5,229 | | | | 141 | |
Discovery Inc, Cl C * | | | 11,385 | | | | 289 | |
DISH Network Corp, Cl A * | | | 6,900 | | | | 219 | |
Electronic Arts Inc * | | | 9,428 | | | | 958 | |
Facebook Inc, Cl A * | | | 74,671 | | | | 12,447 | |
Fox Corp * | | | 16,253 | | | | 592 | |
Interpublic Group of Cos Inc/The | | | 12,697 | | | | 267 | |
Netflix Inc * | | | 13,620 | | | | 4,856 | |
News Corp, Cl A | | | 12,630 | | | | 157 | |
News Corp, Cl B | | | 4,100 | | | | 51 | |
Omnicom Group Inc | | | 6,969 | | | | 509 | |
Take-Two Interactive Software Inc, Cl A * | | | 3,500 | | | | 330 | |
TripAdvisor Inc * | | | 3,297 | | | | 170 | |
Twitter Inc * | | | 22,600 | | | | 743 | |
Verizon Communications Inc | | | 129,198 | | | | 7,640 | |
Viacom Inc, Cl B | | | 11,530 | | | | 324 | |
Walt Disney Co/The | | | 54,550 | | | | 6,057 | |
| | |
| | | | | | | 74,650 | |
| | |
Consumer Discretionary — 9.5% | | | | | | | | |
Advance Auto Parts Inc | | | 2,294 | | | | 391 | |
Amazon.com Inc, Cl A * | | | 12,936 | | | | 23,036 | |
AutoZone Inc * | | | 725 | | | | 742 | |
Best Buy Co Inc | | | 7,178 | | | | 510 | |
Booking Holdings Inc * | | | 1,409 | | | | 2,459 | |
BorgWarner Inc | | | 6,501 | | | | 250 | |
Capri Holdings Ltd * | | | 4,928 | | | | 225 | |
CarMax Inc * | | | 5,556 | | | | 388 | |
Carnival Corp | | | 12,780 | | | | 648 | |
Chipotle Mexican Grill Inc, Cl A * | | | 723 | | | | 514 | |
Darden Restaurants Inc | | | 3,934 | | | | 478 | |
Delphi Automotive PLC * | | | 8,141 | | | | 647 | |
Dollar General Corp | | | 8,273 | | | | 987 | |
Dollar Tree Inc * | | | 7,485 | | | | 786 | |
DR Horton Inc | | | 10,686 | | | | 442 | |
eBay Inc | | | 27,047 | | | | 1,005 | |
Expedia Group Inc | | | 3,715 | | | | 442 | |
Foot Locker Inc, Cl A | | | 3,800 | | | | 230 | |
Ford Motor Co | | | 122,676 | | | | 1,077 | |
Gap Inc/The | | | 7,198 | | | | 188 | |
Garmin Ltd | | | 3,704 | | | | 320 | |
General Motors Co | | | 40,977 | | | | 1,520 | |
Genuine Parts Co | | | 4,604 | | | | 516 | |
| | | | | | | | |
| | | |
| Description | | Shares | | | Market Value
($ Thousands) |
| | |
COMMON STOCK (continued) | | | | | | | | |
H&R Block Inc | | | 6,510 | | | $ | 156 | |
Hanesbrands Inc | | | 10,867 | | | | 194 | |
Harley-Davidson Inc, Cl A | | | 4,655 | | | | 166 | |
Hasbro Inc | | | 3,798 | | | | 323 | |
Hilton Worldwide Holdings Inc | | | 9,300 | | | | 773 | |
Home Depot Inc/The | | | 35,382 | | | | 6,789 | |
Kohl’s Corp | | | 5,227 | | | | 359 | |
L Brands Inc | | | 7,208 | | | | 199 | |
Leggett & Platt Inc | | | 4,065 | | | | 172 | |
Lennar Corp, Cl A | | | 9,074 | | | | 445 | |
LKQ Corp * | | | 10,200 | | | | 289 | |
Lowe’s Cos Inc | | | 24,945 | | | | 2,731 | |
Macy’s Inc | | | 10,230 | | | | 246 | |
Marriott International Inc/MD, Cl A | | | 8,851 | | | | 1,107 | |
Mattel Inc * | | | 11,299 | | | | 147 | |
McDonald’s Corp | | | 23,907 | | | | 4,540 | |
MGM Resorts International | | | 16,200 | | | | 416 | |
Mohawk Industries Inc * | | | 1,858 | | | | 234 | |
Newell Brands Inc, Cl B | | | 11,313 | | | | 174 | |
NIKE Inc, Cl B | | | 39,238 | | | | 3,304 | |
Nordstrom Inc | | | 3,566 | | | | 158 | |
Norwegian Cruise Line Holdings Ltd * | | | 7,100 | | | | 390 | |
O’Reilly Automotive Inc * | | | 2,412 | | | | 937 | |
PulteGroup Inc | | | 8,443 | | | | 236 | |
PVH Corp | | | 2,320 | | | | 283 | |
Ralph Lauren Corp, Cl A | | | 1,760 | | | | 228 | |
Ross Stores Inc | | | 11,549 | | | | 1,075 | |
Royal Caribbean Cruises Ltd | | | 5,410 | | | | 620 | |
Starbucks Corp | | | 39,057 | | | | 2,904 | |
Tapestry Inc | | | 8,934 | | | | 290 | |
Target Corp, Cl A | | | 16,484 | | | | 1,323 | |
Tiffany & Co | | | 3,398 | | | | 359 | |
TJX Cos Inc/The | | | 38,876 | | | | 2,069 | |
Tractor Supply Co | | | 3,746 | | | | 366 | |
Ulta Beauty Inc * | | | 1,800 | | | | 628 | |
Under Armour Inc, Cl A * | | | 5,846 | | | | 124 | |
Under Armour Inc, Cl C * | | | 6,681 | | | | 126 | |
VF Corp | | | 10,240 | | | | 890 | |
Whirlpool Corp | | | 2,109 | | | | 280 | |
Wynn Resorts Ltd | | | 3,117 | | | | 372 | |
Yum! Brands Inc | | | 9,597 | | | | 958 | |
| | |
| | | | | | | 75,181 | |
| | |
Consumer Staples — 6.8% | | | | | | | | |
Altria Group Inc | | | 58,869 | | | | 3,381 | |
Archer-Daniels-Midland Co | | | 17,441 | | | | 752 | |
Brown-Forman Corp, Cl B | | | 5,485 | | | | 289 | |
Campbell Soup Co | | | 6,172 | | | | 235 | |
Church & Dwight Co Inc | | | 7,600 | | | | 541 | |
Clorox Co/The | | | 3,922 | | | | 629 | |
Coca-Cola Co/The | | | 120,782 | | | | 5,660 | |
Colgate-Palmolive Co | | | 27,048 | | | | 1,854 | |
| | | | |
SEI Institutional Managed Trust / Semi-Annual Report / March 31, 2019 | | | 1 | |
CONSOLIDATED SCHEDULE OF INVESTMENTS (Unaudited)
March 31, 2019
Dynamic Asset Allocation Fund(Continued)
| | | | | | | | |
| | | |
| Description | | Shares | | | Market Value
($ Thousands) |
| | |
COMMON STOCK (continued) | | | | | | | | |
Conagra Brands Inc | | | 14,892 | | | $ | 413 | |
Constellation Brands Inc, Cl A | | | 5,170 | | | | 906 | |
Costco Wholesale Corp | | | 13,776 | | | | 3,336 | |
Coty Inc, Cl A | | | 14,849 | | | | 171 | |
Estee Lauder Cos Inc/The, Cl A | | | 6,744 | | | | 1,116 | |
General Mills Inc | | | 18,641 | | | | 965 | |
Hershey Co/The | | | 4,386 | | | | 504 | |
Hormel Foods Corp | | | 8,316 | | | | 372 | |
JM Smucker Co/The | | | 3,404 | | | | 397 | |
Kellogg Co | | | 7,794 | | | | 447 | |
Kimberly-Clark Corp | | | 10,777 | | | | 1,335 | |
Kraft Heinz Co/The | | | 19,500 | | | | 637 | |
Kroger Co/The | | | 25,048 | | | | 616 | |
Lamb Weston Holdings Inc | | | 4,800 | | | | 360 | |
McCormick & Co Inc/MD | | | 3,914 | | | | 590 | |
Molson Coors Brewing Co, Cl B | | | 6,124 | | | | 365 | |
Mondelez International Inc, Cl A | | | 44,953 | | | | 2,244 | |
Monster Beverage Corp * | | | 12,065 | | | | 659 | |
PepsiCo Inc | | | 43,840 | | | | 5,373 | |
Philip Morris International Inc | | | 48,837 | | | | 4,317 | |
Procter & Gamble Co/The | | | 78,409 | | | | 8,158 | |
Sysco Corp, Cl A | | | 14,743 | | | | 984 | |
Tyson Foods Inc, Cl A | | | 9,275 | | | | 644 | |
Walgreens Boots Alliance Inc | | | 25,107 | | | | 1,589 | |
Walmart Inc | | | 44,476 | | | | 4,338 | |
| | |
| | | | | | | 54,177 | |
| | |
Energy — 5.0% | | | | | | | | |
Anadarko Petroleum Corp, Cl A | | | 15,893 | | | | 723 | |
Apache Corp | | | 11,801 | | | | 409 | |
Baker Hughes a GE Co, Cl A | | | 16,315 | | | | 452 | |
Cabot Oil & Gas Corp | | | 12,898 | | | | 337 | |
Chevron Corp | | | 59,426 | | | | 7,320 | |
Cimarex Energy Co | | | 3,149 | | | | 220 | |
Concho Resources Inc | | | 6,300 | | | | 699 | |
ConocoPhillips | | | 35,586 | | | | 2,375 | |
Devon Energy Corp | | | 13,526 | | | | 427 | |
Diamondback Energy Inc, Cl A | | | 4,700 | | | | 477 | |
EOG Resources Inc | | | 18,327 | | | | 1,744 | |
Exxon Mobil Corp | | | 132,500 | | | | 10,706 | |
Halliburton Co | | | 27,242 | | | | 798 | |
Helmerich & Payne Inc | | | 3,443 | | | | 191 | |
Hess Corp | | | 7,874 | | | | 474 | |
HollyFrontier Corp | | | 4,800 | | | | 236 | |
Kinder Morgan Inc/DE | | | 60,114 | | | | 1,203 | |
Marathon Oil Corp | | | 25,292 | | | | 423 | |
Marathon Petroleum Corp | | | 21,250 | | | | 1,272 | |
National Oilwell Varco Inc, Cl A | | | 12,530 | | | | 334 | |
Noble Energy Inc | | | 15,437 | | | | 382 | |
Occidental Petroleum Corp | | | 23,500 | | | | 1,556 | |
ONEOK Inc | | | 12,954 | | | | 905 | |
Phillips 66 | | | 13,299 | | | | 1,266 | |
| | | | | | | | |
| | | |
| Description | | Shares | | | Market Value
($ Thousands) |
| | |
COMMON STOCK (continued) | | | | | | | | |
Pioneer Natural Resources Co | | | 5,192 | | | $ | 791 | |
Schlumberger Ltd, Cl A | | | 43,437 | | | | 1,892 | |
TechnipFMC PLC | | | 13,613 | | | | 320 | |
Valero Energy Corp | | | 12,997 | | | | 1,102 | |
Williams Cos Inc/The | | | 38,046 | | | | 1,093 | |
| | |
| | | | | | | 40,127 | |
| | |
Financials — 11.7% | | | | | | | | |
Affiliated Managers Group Inc | | | 1,729 | | | | 185 | |
Aflac Inc | | | 23,518 | | | | 1,176 | |
Allstate Corp/The | | | 10,412 | | | | 981 | |
American Express Co | | | 21,713 | | | | 2,373 | |
American International Group Inc | | | 27,105 | | | | 1,167 | |
Ameriprise Financial Inc | | | 4,317 | | | | 553 | |
Aon PLC | | | 7,609 | | | | 1,299 | |
Arthur J Gallagher & Co | | | 5,800 | | | | 453 | |
Assurant Inc | | | 1,782 | | | | 169 | |
Bank of America Corp | | | 281,645 | | | | 7,771 | |
Bank of New York Mellon Corp/The | | | 27,743 | | | | 1,399 | |
BB&T Corp | | | 24,256 | | | | 1,129 | |
Berkshire Hathaway Inc, Cl B * | | | 60,830 | | | | 12,220 | |
BlackRock Inc | | | 3,815 | | | | 1,630 | |
Brighthouse Financial Inc * | | | 3,292 | | | | 120 | |
Capital One Financial Corp | | | 14,615 | | | | 1,194 | |
Cboe Global Markets Inc | | | 3,400 | | | | 325 | |
Charles Schwab Corp/The | | | 37,135 | | | | 1,588 | |
Chubb Ltd | | | 14,466 | | | | 2,026 | |
Cincinnati Financial Corp | | | 4,693 | | | | 403 | |
Citigroup Inc | | | 73,445 | | | | 4,570 | |
Citizens Financial Group Inc | | | 14,300 | | | | 465 | |
CME Group Inc | | | 11,248 | | | | 1,851 | |
Comerica Inc | | | 4,873 | | | | 357 | |
Discover Financial Services | | | 10,146 | | | | 722 | |
E*TRADE Financial Corp | | | 7,570 | | | | 352 | |
Everest Re Group Ltd | | | 1,300 | | | | 281 | |
Fifth Third Bancorp | | | 20,851 | | | | 526 | |
First Republic Bank/CA | | | 5,100 | | | | 512 | |
Franklin Resources Inc | | | 9,536 | | | | 316 | |
Goldman Sachs Group Inc/The | | | 10,721 | | | | 2,058 | |
Hartford Financial Services Group Inc/The | | | 11,461 | | | | 570 | |
Huntington Bancshares Inc | | | 32,047 | | | | 406 | |
Intercontinental Exchange Inc | | | 17,680 | | | | 1,346 | |
Invesco Ltd | | | 11,812 | | | | 228 | |
Jefferies Financial Group Inc | | | 8,140 | | | | 153 | |
JPMorgan Chase & Co | | | 102,417 | | | | 10,368 | |
KeyCorp | | | 31,052 | | | | 489 | |
Lincoln National Corp | | | 6,209 | | | | 365 | |
Loews Corp | | | 8,789 | | | | 421 | |
M&T Bank Corp | | | 4,308 | | | | 676 | |
Marsh & McLennan Cos Inc | | | 15,617 | | | | 1,466 | |
MetLife Inc | | | 30,212 | | | | 1,286 | |
Moody’s Corp | | | 5,104 | | | | 924 | |
| | |
| 2 | | SEI Institutional Managed Trust / Semi-Annual Report / March 31, 2019 |
CONSOLIDATED SCHEDULE OF INVESTMENTS (Unaudited)
March 31, 2019
Dynamic Asset Allocation Fund(Continued)
| | | | | | | | |
| | | |
| Description | | Shares | | | Market Value
($ Thousands) |
| | |
COMMON STOCK (continued) | | | | | | | | |
Morgan Stanley | | | 40,717 | | | $ | 1,718 | |
MSCI Inc, Cl A | | | 2,700 | | | | 537 | |
Nasdaq Inc, Cl A | | | 3,687 | | | | 323 | |
Northern Trust Corp | | | 6,871 | | | | 621 | |
People’s United Financial Inc | | | 11,889 | | | | 195 | |
PNC Financial Services Group Inc/The | | | 14,197 | | | | 1,741 | |
Principal Financial Group Inc, Cl A | | | 8,033 | | | | 403 | |
Progressive Corp/The | | | 18,421 | | | | 1,328 | |
Prudential Financial Inc | | | 12,777 | | | | 1,174 | |
Raymond James Financial Inc | | | 4,100 | | | | 330 | |
Regions Financial Corp | | | 32,060 | | | | 454 | |
S&P Global Inc | | | 7,678 | | | | 1,617 | |
SunTrust Banks Inc | | | 14,139 | | | | 838 | |
SVB Financial Group, Cl B * | | | 1,700 | | | | 378 | |
Synchrony Financial | | | 20,601 | | | | 657 | |
T Rowe Price Group Inc | | | 7,340 | | | | 735 | |
Torchmark Corp, Cl A | | | 3,335 | | | | 273 | |
Travelers Cos Inc/The | | | 8,352 | | | | 1,146 | |
Unum Group | | | 6,563 | | | | 222 | |
US Bancorp | | | 47,202 | | | | 2,275 | |
Wells Fargo & Co | | | 128,333 | | | | 6,201 | |
Willis Towers Watson PLC | | | 4,047 | | | | 711 | |
Zions Bancorp NA | | | 5,537 | | | | 251 | |
| | |
| | | | | | | 92,997 | |
| | |
Health Care — 13.6% | | | | | | | | |
Abbott Laboratories | | | 54,824 | | | | 4,383 | |
AbbVie Inc | | | 46,325 | | | | 3,733 | |
ABIOMED Inc * | | | 1,400 | | | | 400 | |
Agilent Technologies Inc | | | 10,085 | | | | 811 | |
Alexion Pharmaceuticals Inc * | | | 7,008 | | | | 947 | |
Align Technology Inc * | | | 2,300 | | | | 654 | |
Allergan PLC | | | 9,780 | | | | 1,432 | |
AmerisourceBergen Corp, Cl A | | | 5,054 | | | | 402 | |
Amgen Inc, Cl A | | | 19,563 | | | | 3,717 | |
Anthem Inc | | | 8,038 | | | | 2,307 | |
Baxter International Inc | | | 14,992 | | | | 1,219 | |
Becton Dickinson and Co | | | 8,419 | | | | 2,102 | |
Biogen Inc * | | | 6,150 | | | | 1,454 | |
Boston Scientific Corp * | | | 43,192 | | | | 1,658 | |
Bristol-Myers Squibb Co | | | 51,338 | | | | 2,449 | |
Cardinal Health Inc | | | 9,603 | | | | 462 | |
Celgene Corp, Cl A * | | | 21,794 | | | | 2,056 | |
Centene Corp * | | | 13,000 | | | | 690 | |
Cerner Corp * | | | 10,112 | | | | 578 | |
Cigna Corp (A) | | | 11,920 | | | | 1,917 | |
Cooper Cos Inc/The, Cl A | | | 1,500 | | | | 444 | |
Covetrus Inc * | | | 1 | | | | — | |
CVS Health Corp | | | 40,660 | | | | 2,193 | |
Danaher Corp, Cl A | | | 19,591 | | | | 2,586 | |
DaVita Inc * | | | 4,157 | | | | 226 | |
DENTSPLY SIRONA Inc | | | 6,871 | | | | 341 | |
| | | | | | | | |
| | | |
| Description | | Shares | | | Market Value
($ Thousands) |
| | |
COMMON STOCK (continued) | | | | | | | | |
Edwards Lifesciences Corp, Cl A * | | | 6,572 | | | $ | 1,257 | |
Eli Lilly & Co | | | 27,066 | | | | 3,512 | |
Gilead Sciences Inc | | | 40,113 | | | | 2,608 | |
HCA Healthcare Inc | | | 8,343 | | | | 1,088 | |
Henry Schein Inc * | | | 4,844 | | | | 291 | |
Hologic Inc * | | | 8,300 | | | | 402 | |
Humana Inc | | | 4,290 | | | | 1,141 | |
IDEXX Laboratories Inc * | | | 2,700 | | | | 604 | |
Illumina Inc * | | | 4,600 | | | | 1,429 | |
Incyte Corp * | | | 5,500 | | | | 473 | |
Intuitive Surgical Inc * | | | 3,538 | | | | 2,019 | |
IQVIA Holdings Inc * | | | 4,900 | | | | 705 | |
Johnson & Johnson | | | 83,344 | | | | 11,651 | |
Laboratory Corp of America Holdings * | | | 3,017 | | | | 462 | |
McKesson Corp | | | 6,137 | | | | 718 | |
Medtronic PLC | | | 42,141 | | | | 3,838 | |
Merck & Co Inc | | | 80,966 | | | | 6,734 | |
Mettler-Toledo International Inc * | | | 800 | | | | 578 | |
Mylan * | | | 15,926 | | | | 451 | |
Nektar Therapeutics, Cl A * | | | 5,700 | | | | 192 | |
PerkinElmer Inc | | | 3,369 | | | | 325 | |
Perrigo Co PLC | | | 4,076 | | | | 196 | |
Pfizer Inc | | | 173,557 | | | | 7,371 | |
Quest Diagnostics Inc | | | 4,378 | | | | 394 | |
Regeneron Pharmaceuticals Inc * | | | 2,415 | | | | 992 | |
ResMed Inc | | | 4,400 | | | | 457 | |
Stryker Corp | | | 9,676 | | | | 1,911 | |
Teleflex Inc | | | 1,400 | | | | 423 | |
Thermo Fisher Scientific Inc | | | 12,611 | | | | 3,452 | |
UnitedHealth Group Inc | | | 30,111 | | | | 7,445 | |
Universal Health Services Inc, Cl B | | | 2,642 | | | | 353 | |
Varian Medical Systems Inc * | | | 2,765 | | | | 392 | |
Vertex Pharmaceuticals Inc * | | | 8,058 | | | | 1,482 | |
Waters Corp * | | | 2,220 | | | | 559 | |
WellCare Health Plans Inc * | | | 1,600 | | | | 432 | |
Zimmer Biomet Holdings Inc | | | 6,353 | | | | 811 | |
Zoetis Inc, Cl A | | | 14,873 | | | | 1,497 | |
| | |
| | | | | | | 107,806 | |
| | |
Industrials — 8.8% | | | | | | | | |
3M Co | | | 17,926 | | | | 3,725 | |
Alaska Air Group Inc | | | 3,900 | | | | 219 | |
Allegion PLC | | | 3,094 | | | | 281 | |
American Airlines Group Inc | | | 12,725 | | | | 404 | |
AMETEK Inc | | | 7,064 | | | | 586 | |
AO Smith Corp | | | 4,700 | | | | 251 | |
Arconic Inc | | | 13,592 | | | | 260 | |
Boeing Co/The | | | 16,409 | | | | 6,259 | |
Caterpillar Inc, Cl A | | | 18,045 | | | | 2,445 | |
CH Robinson Worldwide Inc | | | 4,387 | | | | 382 | |
Cintas Corp | | | 2,652 | | | | 536 | |
Copart Inc * | | | 6,200 | | | | 376 | |
| | | | |
SEI Institutional Managed Trust / Semi-Annual Report / March 31, 2019 | | | 3 | |
CONSOLIDATED SCHEDULE OF INVESTMENTS (Unaudited)
March 31, 2019
Dynamic Asset Allocation Fund(Continued)
| | | | | | | | |
| | | |
| Description | | Shares | | Market Value
($ Thousands) |
| | |
COMMON STOCK (continued) | | | | | | | | |
CSX Corp | | | 24,088 | | | $ | 1,802 | |
Cummins Inc | | | 4,563 | | | | 720 | |
Deere & Co | | | 9,913 | | | | 1,585 | |
Delta Air Lines Inc, Cl A | | | 19,622 | | | | 1,013 | |
Dover Corp | | | 4,546 | | | | 426 | |
Eaton Corp PLC | | | 13,239 | | | | 1,067 | |
Emerson Electric Co | | | 19,226 | | | | 1,316 | |
Equifax Inc | | | 3,876 | | | | 459 | |
Expeditors International of Washington Inc | | | 5,408 | | | | 410 | |
Fastenal Co, Cl A | | | 9,022 | | | | 580 | |
FedEx Corp | | | 7,569 | | | | 1,373 | |
Flowserve Corp | | | 4,154 | | | | 188 | |
Fluor Corp | | | 4,492 | | | | 165 | |
Fortive Corp | | | 9,254 | | | | 776 | |
Fortune Brands Home & Security Inc | | | 4,700 | | | | 224 | |
General Dynamics Corp | | | 8,465 | | | | 1,433 | |
General Electric Co | | | 273,693 | | | | 2,734 | |
Harris Corp | | | 3,627 | | | | 579 | |
Honeywell International Inc | | | 22,752 | | | | 3,616 | |
Huntington Ingalls Industries Inc, Cl A | | | 1,300 | | | | 269 | |
IHS Markit Ltd * | | | 11,300 | | | | 615 | |
Illinois Tool Works Inc | | | 9,431 | | | | 1,354 | |
Ingersoll-Rand PLC | | | 7,703 | | | | 832 | |
Jacobs Engineering Group Inc | | | 3,621 | | | | 272 | |
JB Hunt Transport Services Inc | | | 2,845 | | | | 288 | |
Johnson Controls International PLC | | | 28,138 | | | | 1,039 | |
Kansas City Southern | | | 3,263 | | | | 378 | |
L3 Technologies Inc | | | 2,519 | | | | 520 | |
Lockheed Martin Corp | | | 7,693 | | | | 2,309 | |
Masco Corp | | | 9,623 | | | | 378 | |
Nielsen Holdings PLC | | | 11,380 | | | | 269 | |
Norfolk Southern Corp | | | 8,402 | | | | 1,570 | |
Northrop Grumman Corp | | | 5,261 | | | | 1,418 | |
PACCAR Inc | | | 10,819 | | | | 737 | |
Parker-Hannifin Corp, Cl A | | | 3,952 | | | | 678 | |
Pentair PLC | | | 5,277 | | | | 235 | |
Quanta Services Inc | | | 4,282 | | | | 162 | |
Raytheon Co | | | 8,799 | | | | 1,602 | |
Republic Services Inc | | | 6,762 | | | | 544 | |
Robert Half International Inc | | | 3,959 | | | | 258 | |
Rockwell Automation Inc | | | 3,835 | | | | 673 | |
Rollins Inc | | | 4,950 | | | | 206 | |
Roper Technologies Inc | | | 3,214 | | | | 1,099 | |
Snap-on Inc | | | 1,655 | | | | 259 | |
Southwest Airlines Co, Cl A | | | 15,433 | | | | 801 | |
Stanley Black & Decker Inc | | | 4,711 | | | | 642 | |
Textron Inc | | | 7,537 | | | | 382 | |
TransDigm Group Inc * | | | 1,500 | | | | 681 | |
Union Pacific Corp | | | 22,719 | | | | 3,799 | |
United Continental Holdings Inc * | | | 6,900 | | | | 551 | |
United Parcel Service Inc, Cl B | | | 21,811 | | | | 2,437 | |
United Rentals Inc * | | | 2,599 | | | | 297 | |
| | | | | | | | |
| | | |
| Description | | Shares | | Market Value
($ Thousands) |
| | |
COMMON STOCK (continued) | | | | | | | | |
United Technologies Corp | | | 25,507 | | | $ | 3,288 | |
Verisk Analytics Inc, Cl A | | | 5,100 | | | | 678 | |
Wabtec Corp | | | 4,290 | | | | 316 | |
Waste Management Inc | | | 12,082 | | | | 1,255 | |
WW Grainger Inc | | | 1,447 | | | | 435 | |
Xylem Inc/NY | | | 5,548 | | | | 439 | |
| | |
| | | | | | | 70,155 | |
| | |
Information Technology — 19.7% | | | | | | | | |
Accenture PLC, Cl A | | | 20,048 | | | | 3,529 | |
Adobe Inc * | | | 15,264 | | | | 4,068 | |
Advanced Micro Devices Inc * | | | 27,600 | | | | 704 | |
Akamai Technologies Inc * | | | 5,274 | | | | 378 | |
Alliance Data Systems Corp | | | 1,346 | | | | 236 | |
Amphenol Corp, Cl A | | | 9,420 | | | | 890 | |
Analog Devices Inc | | | 11,392 | | | | 1,199 | |
ANSYS Inc * | | | 2,700 | | | | 493 | |
Apple Inc | | | 140,230 | | | | 26,637 | |
Applied Materials Inc | | | 29,871 | | | | 1,185 | |
Arista Networks Inc * | | | 1,600 | | | | 503 | |
Autodesk Inc, Cl A * | | | 6,905 | | | | 1,076 | |
Automatic Data Processing Inc | | | 13,742 | | | | 2,195 | |
Broadcom Inc | | | 12,375 | | | | 3,721 | |
Broadridge Financial Solutions Inc | | | 3,700 | | | | 384 | |
Cadence Design Systems Inc * | | | 8,800 | | | | 559 | |
Cisco Systems Inc | | | 138,072 | | | | 7,455 | |
Citrix Systems Inc | | | 4,026 | | | | 401 | |
Cognizant Technology Solutions Corp, Cl A | | | 17,877 | | | | 1,295 | |
Corning Inc, Cl B | | | 24,571 | | | | 813 | |
DXC Technology Co | | | 8,276 | | | | 532 | |
F5 Networks Inc, Cl A * | | | 1,791 | | | | 281 | |
Fidelity National Information Services Inc, Cl B | | | 10,253 | | | | 1,160 | |
Fiserv Inc, Cl A * | | | 12,264 | | | | 1,083 | |
FleetCor Technologies Inc * | | | 2,700 | | | | 666 | |
FLIR Systems Inc | | | 3,992 | | | | 190 | |
Fortinet Inc * | | | 4,600 | | | | 386 | |
Gartner Inc * | | | 2,800 | | | | 425 | |
Global Payments Inc | | | 5,047 | | | | 689 | |
Hewlett Packard Enterprise Co | | | 42,910 | | | | 662 | |
HP Inc | | | 47,710 | | | | 927 | |
Intel Corp | | | 140,997 | | | | 7,572 | |
International Business Machines Corp | | | 27,968 | | | | 3,946 | |
Intuit Inc | | | 8,085 | | | | 2,114 | |
IPG Photonics Corp * | | | 1,200 | | | | 182 | |
Jack Henry & Associates Inc | | | 2,500 | | | | 347 | |
Juniper Networks Inc | | | 11,433 | | | | 303 | |
Keysight Technologies Inc * | | | 6,000 | | | | 523 | |
KLA-Tencor Corp | | | 4,849 | | | | 579 | |
Lam Research Corp | | | 4,820 | | | | 863 | |
Mastercard Inc, Cl A | | | 28,182 | | | | 6,635 | |
Maxim Integrated Products Inc | | | 8,800 | | | | 468 | |
| | |
| 4 | | SEI Institutional Managed Trust / Semi-Annual Report / March 31, 2019 |
CONSOLIDATED SCHEDULE OF INVESTMENTS (Unaudited)
March 31, 2019
Dynamic Asset Allocation Fund(Continued)
| | | | | | | | |
| | | |
| Description | | Shares | | Market Value
($ Thousands) |
| | |
COMMON STOCK (continued) | | | | | | | | |
Microchip Technology Inc | | | 7,437 | | | $ | 617 | |
Micron Technology Inc * | | | 34,771 | | | | 1,437 | |
Microsoft Corp | | | 240,196 | | | | 28,329 | |
Motorola Solutions Inc | | | 5,102 | | | | 716 | |
NetApp Inc | | | 7,628 | | | | 529 | |
NVIDIA Corp | | | 19,048 | | | | 3,420 | |
Oracle Corp, Cl B | | | 79,533 | | | | 4,272 | |
Paychex Inc | | | 10,100 | | | | 810 | |
PayPal Holdings Inc * | | | 36,885 | | | | 3,830 | |
Qorvo Inc * | | | 3,905 | | | | 280 | |
QUALCOMM Inc | | | 38,068 | | | | 2,171 | |
Red Hat Inc * | | | 5,560 | | | | 1,016 | |
salesforce.com Inc * | | | 23,972 | | | | 3,796 | |
Seagate Technology PLC | | | 8,043 | | | | 385 | |
Skyworks Solutions Inc | | | 5,607 | | | | 462 | |
Symantec Corp, Cl A | | | 20,408 | | | | 469 | |
Synopsys Inc * | | | 4,600 | | | | 530 | |
TE Connectivity Ltd | | | 10,803 | | | | 872 | |
Texas Instruments Inc | | | 29,511 | | | | 3,130 | |
Total System Services Inc | | | 5,067 | | | | 481 | |
VeriSign Inc * | | | 3,378 | | | | 613 | |
Visa Inc, Cl A | | | 54,732 | | | | 8,549 | |
Western Digital Corp | | | 9,238 | | | | 444 | |
Western Union Co/The | | | 13,277 | | | | 245 | |
Xerox Corp | | | 6,089 | | | | 195 | |
Xilinx Inc | | | 7,987 | | | | 1,013 | |
| | |
| | | | | | | 156,865 | |
| | |
Materials — 2.4% | | | | | | | | |
Air Products & Chemicals Inc | | | 6,961 | | | | 1,329 | |
Albemarle Corp | | | 3,400 | | | | 279 | |
Avery Dennison Corp | | | 2,576 | | | | 291 | |
Ball Corp | | | 10,412 | | | | 603 | |
Celanese Corp, Cl A | | | 4,100 | | | | 404 | |
CF Industries Holdings Inc | | | 6,737 | | | | 275 | |
DowDuPont Inc | | | 70,875 | | | | 3,778 | |
Eastman Chemical Co | | | 4,498 | | | | 341 | |
Ecolab Inc | | | 7,854 | | | | 1,387 | |
FMC Corp | | | 4,149 | | | | 319 | |
Freeport-McMoRan Inc, Cl B | | | 45,762 | | | | 590 | |
International Flavors & Fragrances Inc | | | 3,115 | | | | 401 | |
International Paper Co | | | 12,473 | | | | 577 | |
Linde PLC | | | 17,182 | | | | 3,023 | |
Livent Corp * | | | 1 | | | | — | |
LyondellBasell Industries, Cl A | | | 9,543 | | | | 802 | |
Martin Marietta Materials Inc, Cl A | | | 1,965 | | | | 395 | |
Mosaic Co/The | | | 10,810 | | | | 295 | |
Newmont Mining Corp | | | 16,604 | | | | 594 | |
Nucor Corp | | | 9,348 | | | | 546 | |
Packaging Corp of America | | | 3,000 | | | | 298 | |
PPG Industries Inc | | | 7,270 | | | | 821 | |
Sealed Air Corp | | | 5,158 | | | | 238 | |
| | | | | | | | |
| | | |
| Description | | Shares | | Market Value
($ Thousands) |
| | |
COMMON STOCK (continued) | | | | | | | | |
Sherwin-Williams Co/The, Cl A | | | 2,513 | | | $ | 1,082 | |
Vulcan Materials Co | | | 4,130 | | | | 489 | |
Westrock Co | | | 8,092 | | | | 310 | |
| | |
| | | | | | | 19,467 | |
| | |
Real Estate — 2.9% | | | | | | | | |
Alexandria Real Estate Equities Inc ‡ | | | 3,400 | | | | 485 | |
American Tower Corp, Cl A ‡ | | | 13,816 | | | | 2,723 | |
Apartment Investment & Management Co, Cl A ‡ | | | 4,944 | | | | 249 | |
AvalonBay Communities Inc ‡ | | | 4,322 | | | | 868 | |
Boston Properties Inc ‡ | | | 4,908 | | | | 657 | |
CBRE Group Inc, Cl A *‡ | | | 9,525 | | | | 471 | |
Crown Castle International Corp ‡ | | | 13,128 | | | | 1,680 | |
Digital Realty Trust Inc, Cl A ‡ | | | 6,600 | | | | 785 | |
Duke Realty Corp ‡ | | | 11,700 | | | | 358 | |
Equinix Inc ‡ | | | 2,559 | | | | 1,160 | |
Equity Residential ‡ | | | 11,533 | | | | 869 | |
Essex Property Trust Inc ‡ | | | 2,060 | | | | 596 | |
Extra Space Storage Inc ‡ | | | 3,900 | | | | 397 | |
Federal Realty Investment Trust ‡ | | | 2,400 | | | | 331 | |
HCP Inc ‡ | | | 15,430 | | | | 483 | |
Host Hotels & Resorts Inc ‡ | | | 23,612 | | | | 446 | |
Iron Mountain Inc ‡ | | | 9,376 | | | | 332 | |
Kimco Realty Corp ‡ | | | 13,396 | | | | 248 | |
Macerich Co/The ‡ | | | 3,465 | | | | 150 | |
Mid-America Apartment Communities Inc ‡ | | | 3,600 | | | | 394 | |
Prologis Inc ‡ | | | 19,570 | | | | 1,408 | |
Public Storage ‡ | | | 4,700 | | | | 1,024 | |
Realty Income Corp ‡ | | | 9,218 | | | | 678 | |
Regency Centers Corp ‡ | | | 5,200 | | | | 351 | |
SBA Communications Corp, Cl A *‡ | | | 3,600 | | | | 719 | |
Simon Property Group Inc ‡ | | | 9,758 | | | | 1,778 | |
SL Green Realty Corp ‡ | | | 2,515 | | | | 226 | |
UDR Inc ‡ | | | 8,700 | | | | 395 | |
Ventas Inc ‡ | | | 11,110 | | | | 709 | |
Vornado Realty Trust ‡ | | | 5,331 | | | | 359 | |
Welltower Inc ‡ | | | 11,807 | | | | 916 | |
Weyerhaeuser Co ‡ | | | 23,960 | | | | 631 | |
| | |
| | | | | | | 22,876 | |
| | |
Utilities — 3.1% | | | | | | | | |
AES Corp | | | 20,412 | | | | 369 | |
Alliant Energy Corp | | | 7,700 | | | | 363 | |
Ameren Corp | | | 7,644 | | | | 562 | |
American Electric Power Co Inc | | | 15,629 | | | | 1,309 | |
American Water Works Co Inc | | | 5,800 | | | | 605 | |
Atmos Energy Corp | | | 3,800 | | | | 391 | |
CenterPoint Energy Inc | | | 16,217 | | | | 498 | |
CMS Energy Corp | | | 9,013 | | | | 501 | |
Consolidated Edison Inc | | | 9,778 | | | | 829 | |
Dominion Energy Inc | | | 24,868 | | | | 1,906 | |
| | | | |
SEI Institutional Managed Trust / Semi-Annual Report / March 31, 2019 | | | 5 | |
CONSOLIDATED SCHEDULE OF INVESTMENTS (Unaudited)
March 31, 2019
Dynamic Asset Allocation Fund(Continued)
| | | | | | | | |
| | | |
| Description | | Shares | | | Market Value
($ Thousands) |
| |
COMMON STOCK (continued) | | | | | |
DTE Energy Co | | | 5,741 | | | $ | 716 | |
Duke Energy Corp | | | 22,398 | | | | 2,016 | |
Edison International | | | 10,390 | | | | 643 | |
Entergy Corp | | | 5,677 | | | | 543 | |
Evergy Inc | | | 7,800 | | | | 453 | |
Eversource Energy | | | 9,944 | | | | 706 | |
Exelon Corp | | | 30,490 | | | | 1,528 | |
FirstEnergy Corp | | | 15,521 | | | | 646 | |
NextEra Energy Inc | | | 14,998 | | | | 2,899 | |
NiSource Inc | | | 11,613 | | | | 333 | |
NRG Energy Inc | | | 8,664 | | | | 368 | |
Pinnacle West Capital Corp | | | 3,594 | | | | 344 | |
PPL Corp | | | 22,339 | | | | 709 | |
Public Service Enterprise Group Inc | | | 15,757 | | | | 936 | |
Sempra Energy | | | 8,568 | | | | 1,078 | |
Southern Co/The | | | 32,682 | | | | 1,689 | |
WEC Energy Group Inc | | | 9,837 | | | | 778 | |
Xcel Energy Inc | | | 16,046 | | | | 902 | |
| | |
| | | | | | | 24,620 | |
| | |
Total Common Stock (Cost $528,650) ($ Thousands) | | | | | | | 738,921 | |
| | | | | | | | |
| | | |
| Description | | Shares | | | Market Value
($ Thousands) |
| |
EXCHANGE TRADED FUND — 3.9% | | | | | |
SPDR S&P 500 ETF Trust (B) | | | 109,425 | | | $ | 30,910 | |
| | |
Total Exchange Traded Fund (Cost $29,213) ($ Thousands) | | | | | | | 30,910 | |
| |
Total Investments in Securities — 96.8%
(Cost $557,863) ($ Thousands) | | | $ | 769,831 | |
| | | | | | | | |
| | |
| | | Contracts | | | |
| |
PURCHASED OPTION (C) — 0.0% | | | | | |
| | |
Total Purchased Option (Cost $468) ($ Thousands) | | | 185,586,452 | | | $ | 155 | |
| | | | | | | | |
| |
PURCHASED SWAPTION (D) — 0.3% | | | | | |
| | |
Total Purchased Swaption (Cost $2,357) ($ Thousands) | | | 864,868,000 | | | $ | 2,720 | |
| | | | | | | | |
A list of the OTC option contracts held by the Fund at March 31, 2019, is as follows:
| | | | | | | | | | | | | | | | | | | | | | |
| Description | | Counterparty | | Number of Contracts | | | Notional Amount
(Thousands) | | | Exercise Price | | | Expiration Date | | | Value
(Thousands) |
| | | | | |
PURCHASED OPTION — 0.0% | | | | | | | | | | | | | | | | | | | | |
| | | | | |
Put Options | | | | | | | | | | | | | | | | | | | | |
| | | | | | |
April 2019, EUR Put USD Call* | | Bank of Montreal | | | 185,586,452 | | | $ | 208,154 | | | | $1.10 | | | | 04/20/19 | | | $ | 155 | |
| | | | | | | | | | | | | | | | | | | | | | |
Total Purchased Options | | | | | | | | $ | 208,154 | | | | | | | | | | | $ | 155 | |
| | | | | | | | | | | | | | | | | | | | | | |
A list of the open OTC swaption contracts held by the Fund at March 31, 2019, is as follows:
| | | | | | | | | | | | | | | | |
| Description | | Counterparty | | Number of Contracts/
Notional Amount | | | Exercise Price | | | Expiration Date | | Value
(Thousands) |
| | | | |
PURCHASED SWAPTION — 0.3% | | | | | | | | | | | | | | |
| | | | | |
Call Swaptions — 0.3% | | | | | | | | | | | | | | | | |
CMS One Look* | | Bank of America Merrill Lynch | | | 864,868,000 | | | | $0.14 | | | 07/17/21 | | $ | 2,720 | |
| | | | | | | | | | | | | | | | |
Total Purchased Swaption (Cost $2,357) ($ Thousands) | | | | | | | | | | | | | | $ | 2,720 | |
| | | | | | | | | | | | | | | | |
A list of the open futures contracts held by the Fund at March 31, 2019, is as follows:
| | | | | | | | | | | | | | | | | | |
Type of
Contract | | Number of
Contracts
Long/(Short) | | Expiration
Date | | | Notional Amount
(Thousands) | | Value
(Thousands) | | Unrealized Appreciation
(Depreciation)
(Thousands) |
Amsterdam Index | | (65) | | | Apr-2019 | | | $ | (7,782 | ) | | $ | (7,998 | ) | | $ | (214 | ) |
CAC40 10 Euro Index | | (133) | | | Apr-2019 | | | | (7,829 | ) | | | (7,979 | ) | | | (147 | ) |
| | |
| 6 | | SEI Institutional Managed Trust / Semi-Annual Report / March 31, 2019 |
CONSOLIDATED SCHEDULE OF INVESTMENTS (Unaudited)
March 31, 2019
Dynamic Asset Allocation Fund(Continued)
| | | | | | | | | | | | | | | | | | | | |
Type of Contract | | Number of
Contracts
Long/(Short) | | | Expiration Date | | | Notional Amount
(Thousands) | | | Value
(Thousands) | | | Unrealized
Appreciation
(Depreciation)
(Thousands) | |
DAX Index | | | (25) | | | | Jun-2019 | | | $ | (8,066) | | | $ | (8,095) | | | $ | (25) | |
FTSE MIB Index | | | (66) | | | | Jun-2019 | | | | (7,434) | | | | (7,685) | | | | (251) | |
IBEX | | | (77) | | | | Apr-2019 | | | | (7,855) | | | | (7,944) | | | | (87) | |
MSCI EAFE IndexE-MINI | | | (338) | | | | Jun-2019 | | | | (31,160) | | | | (31,542) | | | | (382) | |
MSCI Emerging Markets | | | 2,274 | | | | Jun-2019 | | | | 119,811 | | | | 120,226 | | | | 415 | |
S&P 500 IndexE-MINI | | | (185) | | | | Jun-2019 | | | | (25,559) | | | | (26,250) | | | | (691) | |
| | | | | | | | | | | | |
| | | | | | | | | | $ | 24,126 | | | $ | 22,733 | | | $ | (1,382) | |
| | | | | | | | | | | | |
A list of the open forward foreign currency contracts held by the Fund at March 31, 2019, is as follows:
| | | | | | | | | | | | | | | | | | | | | | | | |
| Counterparty | | Settlement Date | | | | | | Currency to Deliver
(Thousands) | | | | | | Currency to Receive
(Thousands) | | | Unrealized
Appreciation
(Depreciation)
(Thousands) | |
Bank of America | | | 01/09/20 | | | | USD | | | | 894 | | | | SAR | | | | 3,355 | | | $ | — | |
Bank of America | | | 01/09/20 | | | | SAR | | | | 152,334 | | | | USD | | | | 40,507 | | | | (85) | |
Barclays PLC | | | 04/09/19 | | | | USD | | | | 1,476 | | | | EUR | | | | 1,313 | | | | — | |
Barclays PLC | | | 04/09/19 | | | | USD | | | | 74,878 | | | | JPY | | | | 8,004,844 | | | | (2,495) | |
Barclays PLC | | | 04/09/19 | | | | JPY | | | | 223,304 | | | | USD | | | | 2,018 | | | | (2) | |
BNP Paribas | | | 04/09/19 | | | | EUR | | | | 38,458 | | | | USD | | | | 43,881 | | | | 667 | |
Goldman Sachs | | | 04/09/19 | | | | USD | | | | 5,799 | | | | JPY | | | | 626,187 | | | | (136) | |
JPMorgan Chase Bank | | | 04/09/19 | | | | EUR | | | | 68,928 | | | | USD | | | | 79,013 | | | | 1,562 | |
RBC | | | 04/09/19 | | | | USD | | | | 3,406 | | | | JPY | | | | 375,744 | | | | (9) | |
| | | | | | | | | | | | | | | | | | | | | | | | |
| | | | | | | | | | | | | | | | | | | | | | $ | (498) | |
| | | | | | | | | | | | | | | | | | | | | | | | |
A list of the open OTC swap agreements held by the Fund at March 31, 2019, is as follows:
| | | | | | | | | | | | | | | | | | | | | | | | | | | | |
| Total Return Swaps | |
| Counterparty | | Reference Entity/
Obligation | | Fund Pays | | Fund Receives | | Payment
Frequency | | Termination
Date | | Currency | | Notional
Amount
(Thousands) | | | Value
(Thousands) | | | Upfront
Payments/
Receipts
(Thousands) | | | Net Unrealized
Appreciation
(Depreciation)
(Thousands) | |
BNP Paribas(B) | | Bloomberg Commodity Index Total Return | | USD T-BILL
AUCTION HIGH
RATE + 11 BPS | | INDEX RETURN | | Quarterly | | 05/10/2019 | | USD | | | (73,205 | ) | | $ | 1,295 | | | $ | – | | | $ | 1,295 | |
HSBC | | Russell 1000 Growth Total Return | | INDEX
RETURN | | 3-MONTH USD
- LIBOR PLUS
16 BPS | | Quarterly | | 04/23/2019 | | USD | | | 41,873 | | | | (4,050 | ) | | | – | | | | (4,050) | |
HSBC | | Russell 1000 Value Index Total Return | | 3-MONTH USD
- LIBOR PLUS
20 BPS | | INDEX RETURN | | Quarterly | | 04/23/2019 | | USD | | | (41,002 | ) | | | 2,291 | | | | – | | | | 2,291 | |
Morgan Stanley | | Russell 1000 Growth Total Return | | INDEX
RETURN | | 3-MONTH USD
- LIBOR PLUS
20 BPS | | Quarterly | | 09/19/2019 | | USD | | | 85,959 | | | | (621 | ) | | | – | | | | (621) | |
Morgan Stanley | | Russell 1000 Value Index Total Return | | 3-MONTH USD
- LIBOR PLUS
24 BPS | | INDEX RETURN | | Quarterly | | 09/19/2019 | | USD | | | (86,911 | ) | | | (701 | ) | | | – | | | | (701) | |
| | | | | | | | | | | | | | | | | | | | |
| | | | | | | | | | | | | | | | | | $ | (1,786 | ) | | $ | – | | | $ | (1,786) | |
| | | | | | | | | | | | | | | | | | | | |
| | Percentages are based on Net Assets of $795,513 ($ Thousands). |
| * | Non-income producing security. |
| ‡ | Real Estate Investment Trust. |
| (A) | Securities considered illiquid. The total value of such securities as of March 31, 2019 was $1,917 ($ Thousands) and represented 0.2% of the Net Assets of the Fund. |
| (B) | Security is held by the Dynamic Commodity Strategy Subsidiary Ltd. as of March 31, 2019. |
| (C) | Refer to table below for details on Options Contracts. |
| (D) | Refer to table below for details on Swaption Contracts. |
BPS — Basis Point
Cl — Class
CMS — Constant Maturity Swap
DAX — German Stock Index
EAFE — Europe, Australasia and Far East
ETF — Exchange-Traded Fund
EUR — Euro
FTSE— Financial Times and Stock Exchange
IBEX — Spanish Exchange Index
| | | | |
SEI Institutional Managed Trust / Semi-Annual Report / March 31, 2019 | | | 7 | |
CONSOLIDATED SCHEDULE OF INVESTMENTS (Unaudited)
March 31, 2019
Dynamic Asset Allocation Fund(Continued)
JPY — Japanese Yen
LIBOR — London Interbank Offered Rate
Ltd — Limited
MIB — Milano Indice di Borsa
MSCI — Morgan Stanley Capital International
OTC —Over-The-Counter
PLC — Public Limited Company
S&P— Standard & Poor’s
SAR — Saudi Riyal
SPDR — Standard & Poor’s Depositary Receipt
USD — United States Dollar
The following is a list of the level of inputs used as of March 31, 2019, in valuing the Fund’s investments and other financial instruments carried at value ($ Thousands):
| | | | | | | | | | | | | | | | |
| | | | | |
Investments in
Securities | | Level 1 | | | Level 2 | | | Level 3 | | | Total | |
Common Stock | | $ | 738,921 | | | $ | — | | | $ | — | | | $ | 738,921 | |
Exchange Traded Fund | | | 30,910 | | | | — | | | | — | | | | 30,910 | |
| | | | | | | | | | | | | | | | |
Total Investments in Securities | | $ | 769,831 | | | $ | — | | | $ | — | | | $ | 769,831 | |
| | | | | | | | | | | | | | | | |
| | | | | | | | | | | | | | | | |
| | | | | |
Other Financial
Instruments | | Level 1 | | | Level 2 | | | Level 3 | | | Total | |
Purchased Option | | $ | 155 | | | $ | — | | | $ | — | | | $ | 155 | |
Purchased Swaption | | | — | | | | 2,720 | | | | — | | | | 2,720 | |
Futures Contracts * | | | | | | | | | | | | | | | | |
Unrealized Appreciation | | | 415 | | | | — | | | | — | | | | 415 | |
Unrealized Depreciation | | | (1,797) | | | | — | | | | — | | | | (1,797) | |
Forwards Contracts * | | | | | | | | | | | | | | | | |
Unrealized Appreciation | | | — | | | | 2,229 | | | | — | | | | 2,229 | |
Unrealized Depreciation | | | — | | | | (2,727) | | | | — | | | | (2,727) | |
OTC Swaps | | | | | | | | | | | | | | | | |
Total Return Swaps * | | | | | | | | | | | | | | | | |
Unrealized Appreciation | | | — | | | | 3,586 | | | | — | | | | 3,586 | |
Unrealized Depreciation | | | — | | | | (5,372) | | | | — | | | | (5,372) | |
| | | | | | | | | | | | | | | | |
Total Other Financial Instruments | | $ | (1,227) | | | $ | 436 | | | $ | — | | | $ | (791) | |
| | | | | | | | | | | | | | | | |
* Futures contracts, forward contracts and swap contracts are valued at the unrealized appreciation (depreciation) on the instruments.
For the period ended March 31, 2019, there were no transfers between Level 1 and Level 2 assets and liabilities.
For the period ended March 31, 2019, there were no transfers between Level 2 and Level 3 assets and liabilities.
For more information on valuation inputs, see Note 2 – Significant Accounting Policies in Notes to Financial Statements.
Amounts designated as “—” are either $0 or have been rounded to $0.
The accompanying notes are an integral part of the financial statements.
| | |
| 8 | | SEI Institutional Managed Trust / Semi-Annual Report / March 31, 2019 |
| Item 7. | Disclosure of Proxy Voting Policies and Procedures forClosed-End Management Investment Companies. |
Not applicable.
| Item 8. | Portfolio Managers ofClosed-End Management Investment Companies. |
Not applicable.
| Item 9. | Purchases of Equity Securities byClosed-End Management Company and Affiliated Purchasers. |
Not applicable.
| Item 10. | Submission of Matters to a Vote of Security Holders. |
There have been no material changes to the procedures by which shareholders may recommend nominees to the Registrant’s Board of Trustees (the “Board”). The Registrant has a standing Governance Committee (the “Committee”) currently consisting of the Independent Trustees. The Committee is responsible for evaluating and recommending nominees for election to the Board. Pursuant to the Committee’s Charter, adopted on June 18, 2004, as amended, the Committee will review all shareholder recommendations for nominations to fill vacancies on the Board if such recommendations are submitted in writing and addressed to the Committee at the Registrant’s office.
| Item 11. | Controls and Procedures. |
(a) The Registrant’s principal executive and principal financial officers, or persons performing similar functions, have concluded that the Registrant’s disclosure controls and procedures (as defined in Rule30a-3(c) under the Act (17 CFR270.30a-3(c))) are effective, based on the evaluation of these controls and procedures required by Rule30a-3(b) under the Act(270.30a-3(b)) and Rules13a-15(b) or15d-15(b) under the Exchange Act (17 CFR240.13a-15(b) or240.15d-15(b)) as of a date within 90 days of the filing date of this report.
(b) There were no changes in the Registrant’s internal control over financial reporting (as defined in Rule30a-3(d) under the Act(17 CFR270.30a-3(d)) that occurred during the period covered by this report that have materially affected, or are reasonably likely to materially affect, the Registrant’s internal control over financial reporting.
| Items 12. | Disclosure of Securities Lending Activities forClosed-End Management Investment Companies. |
Not applicable.
(a)(1) Not applicable for semi-annual report.
(a)(2) A separate certification for the principal executive officer and the principal financial officer of the Registrant as required by Rule30a-2(a) under the Investment Company Act of 1940 are filed herewith.
(b) Officer certifications as required by Rule30a-2(b) under the Investment Company Act of 1940, as amended, also accompany this filing as exhibits.
SIGNATURES
Pursuant to the requirements of the Securities Exchange Act of 1934 and the Investment Company Act of 1940, the registrant has duly caused this report to be signed on its behalf by the undersigned, thereunto duly authorized.
| | | | | | |
| | | | | | SEI Institutional Managed Trust |
| | | |
| By | | | | | | /s/ Robert A. Nesher |
| | | | | | Robert A. Nesher, |
| | | | | | President & CEO |
Date: June 7, 2019
Pursuant to the requirements of the Securities Exchange Act of 1934 and the Investment Company Act of 1940, this report has been signed below by the following persons on behalf of the registrant and in the capacities and on the dates indicated.
| | | | | | |
| By | | | | | | /s/ Robert A. Nesher |
| | | | | | Robert A. Nesher, |
| | | | | | President & CEO |
| | | |
| Date: June 7, 2019 | | | | | | |
| | | |
| By | | | | | | /s/ James J. Hoffmayer |
| | | | | | James J. Hoffmayer, |
| | | | | | Controller & CFO |
| | | |
| Date: June 7, 2019 | | | | | | |