- PG Dashboard
- Financials
- Filings
-
Holdings
- Transcripts
- ETFs
- Insider
- Institutional
- Shorts
-
8-K Filing
The Procter & Gamble Company (PG) 8-KRegulation FD Disclosure
Filed: 27 Jan 12, 12:00am



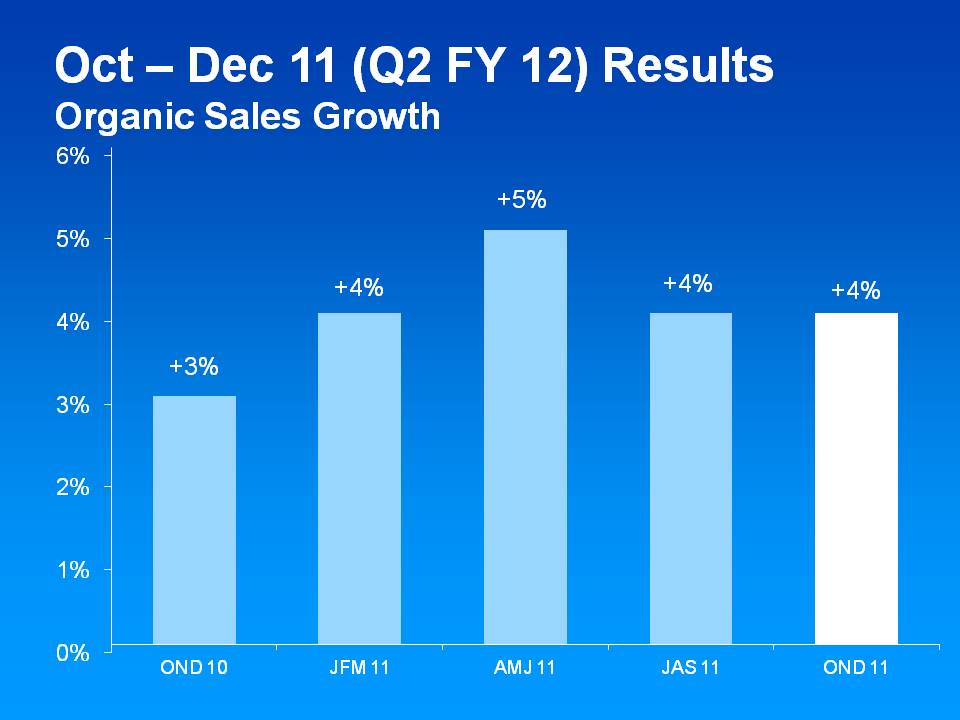

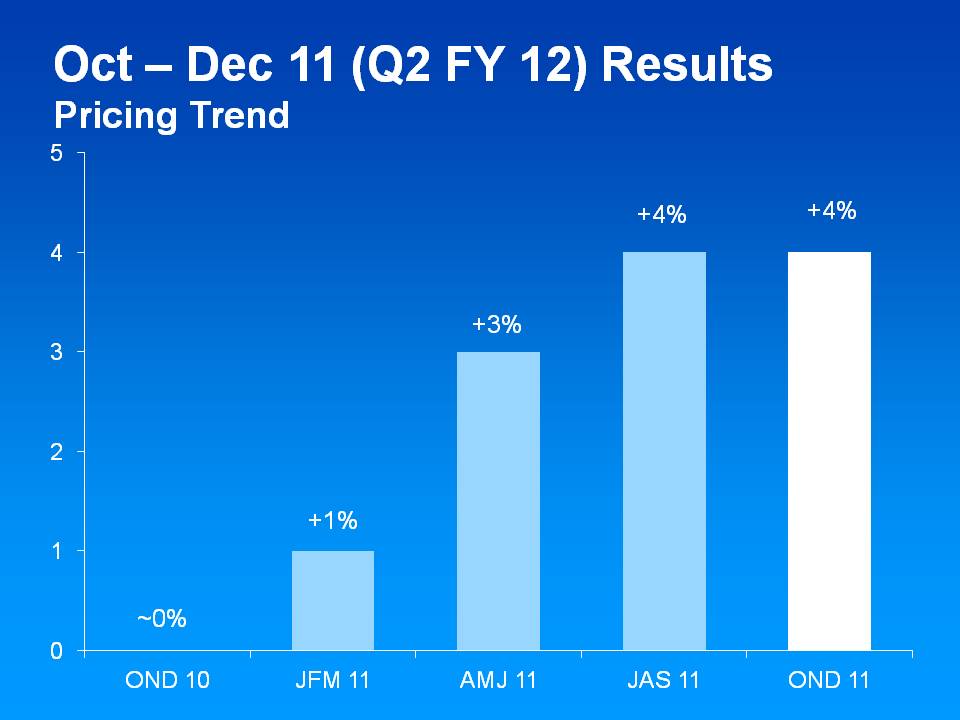
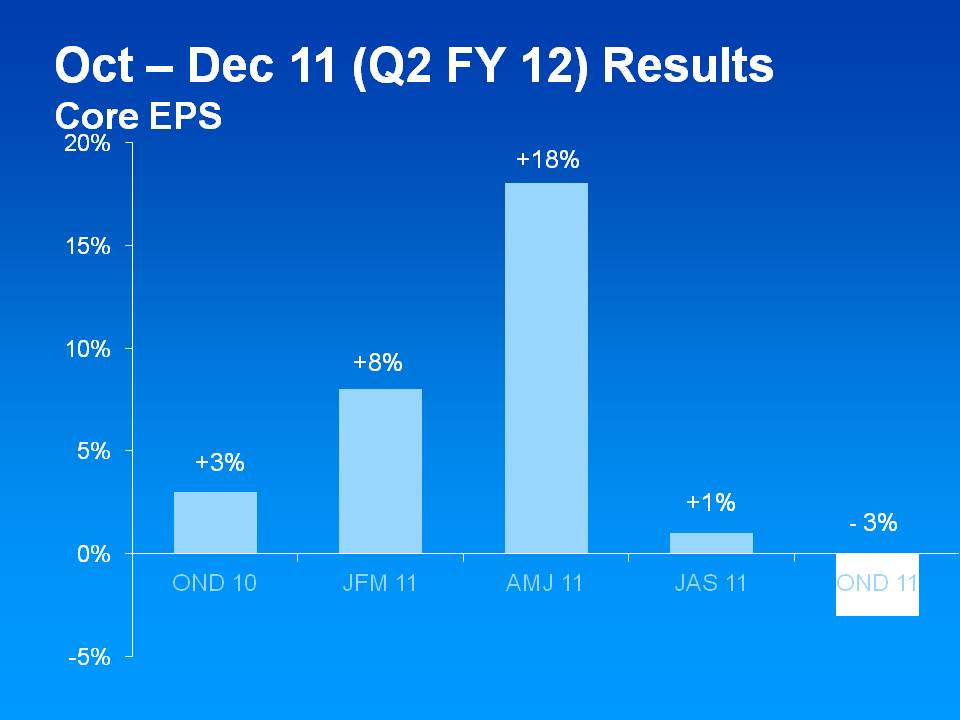


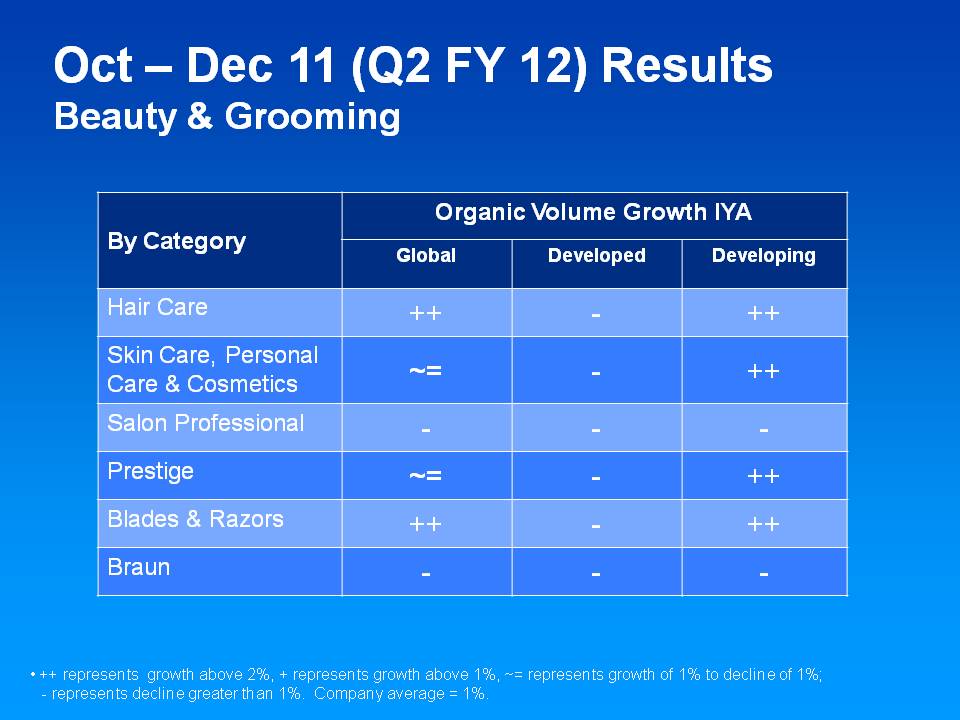









| 1. | Organic Sales Growth – pages 1 and 2 |
| 2. | Core EPS – pages 2 through 4 |
| 3. | Core Operating Margin – pages 4 and 5 |
| 4. | Core Operating Profit Growth – pages 5 and 6 |
| 5. | Core Effective Tax Rate – page 6 |
| 6. | Free Cash Flow – page 6 |
| Total P&G | Net Sales Growth | Foreign Exchange Impact | Acquisition/ Divestiture Impact* | Organic Sales Growth | |||||||||||
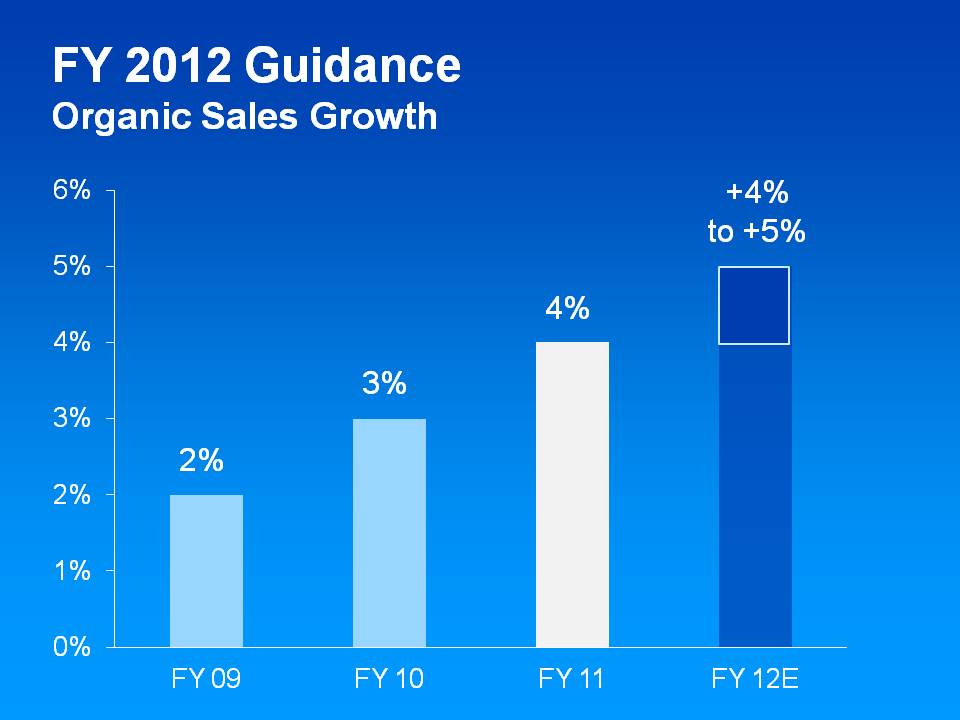
| OND 09 | 6% | -2% | 1% | 5% | |||||||||||
| JFM 10 | 7% | -3% | 0% | 4% | |||||||||||
| AMJ 10 | 5% | -1% | 0% | 4% | |||||||||||
| JAS 10 | 2% | 3% | -1% | 4% | |||||||||||
| OND 10 | 2% | 2% | -1% | 3% | |||||||||||
| JFM 11 | 5% | -1% | 0% | 4% | |||||||||||
| AMJ 11 | 10% | -5% | 0% | 5% | |||||||||||
| JAS 11 | 9% | -5% | 0% | 4% | |||||||||||
| OND 11 | 4% | 0% | 0% | 4% | |||||||||||
| Average–OND 09-OND 11 | 5% | -1% | 0% | 4% | |||||||||||
| JFM 12 (Estimate) | 0% to 2% | 3% | 0% | 3% to 5% | |||||||||||
| AMJ 12 (Estimate) | -1% to 2% | 5% to 4% | 0% | 4% to 6% | |||||||||||
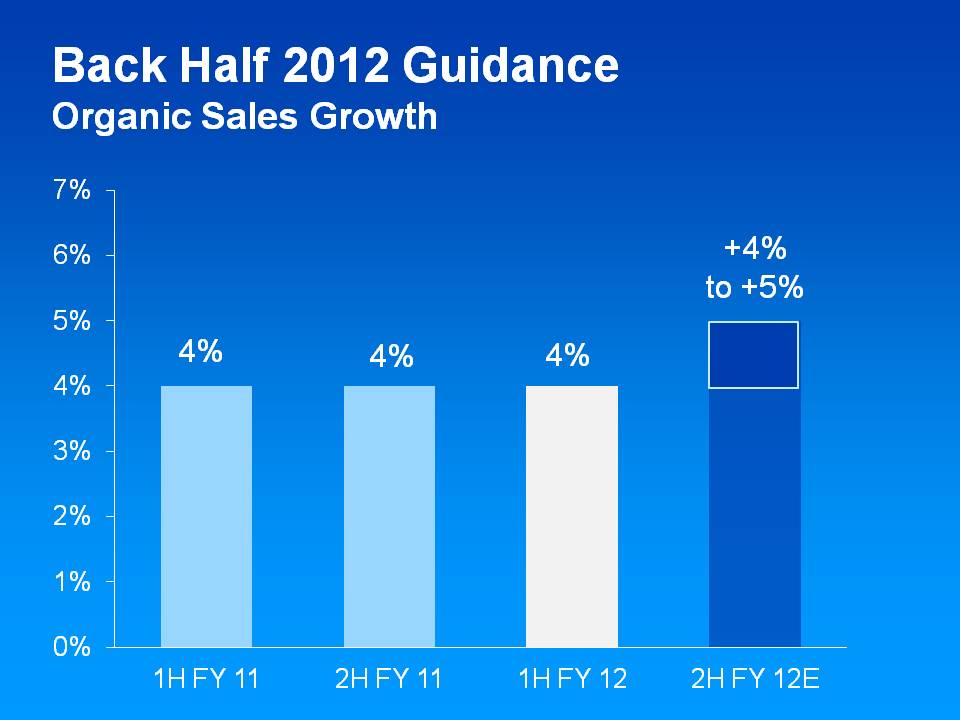
| 1H FY 2011 | 2% | 2% | 0% | 4% | |||||||||||
| 2H FY 2011 | 7% | -3% | 0% | 4% | |||||||||||
| 1H FY 2012 | 6% | -3% | 1% | 4% | |||||||||||
| 2H FY 2012 (Estimate) | 0% to 2% | 4% to 3% | 0% | 4% to 5% | |||||||||||
| FY 2009 | -3% | 4% | 1% | 2% | |||||||||||
| FY 2010 | 3% | 1% | -1% | 3% | |||||||||||
| FY 2011 | 5% | 0% | -1% | 4% | |||||||||||
| FY 2012 (Estimate) | 3% to 4% | 1% | 0% | 4% to 5% | |||||||||||
| OND 2011 | Net Sales Growth | Foreign Exchange Impact | Acquisition/ Divestiture Impact* | Organic Sales Growth | |||||||||||
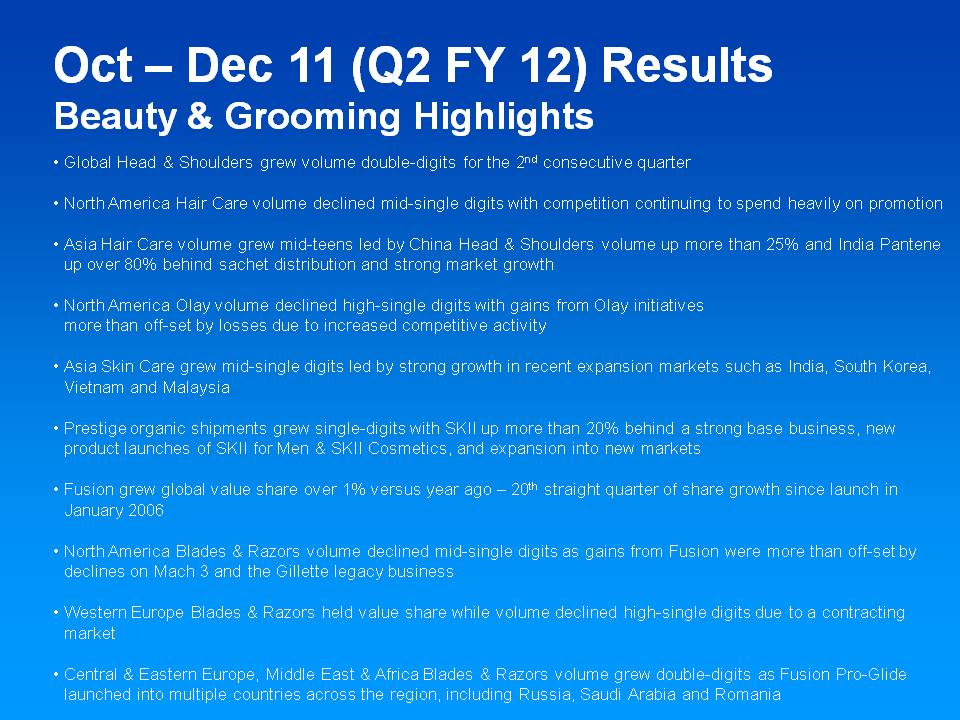
| Beauty | 1% | -1% | 2% | 2% | |||||||||||
| Grooming | 1% | 0% | 1% | 2% | |||||||||||
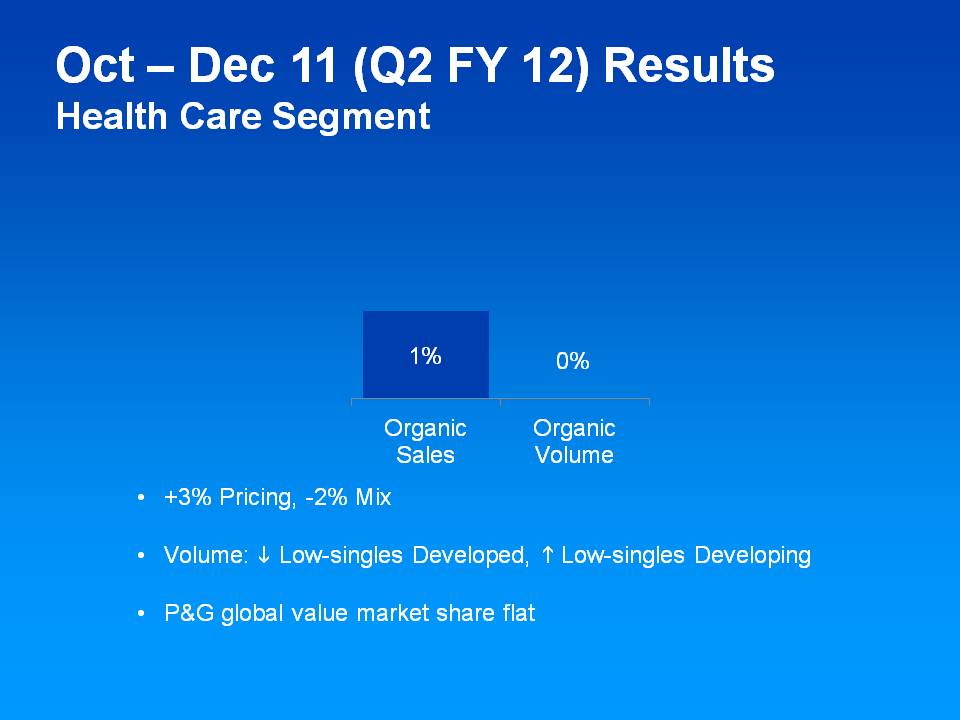
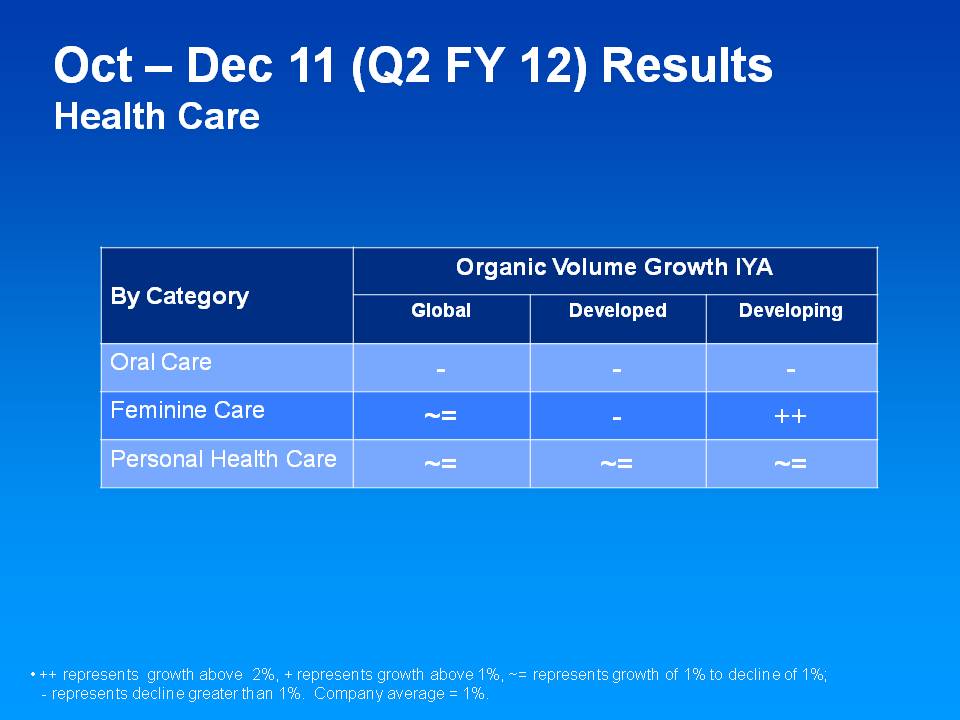
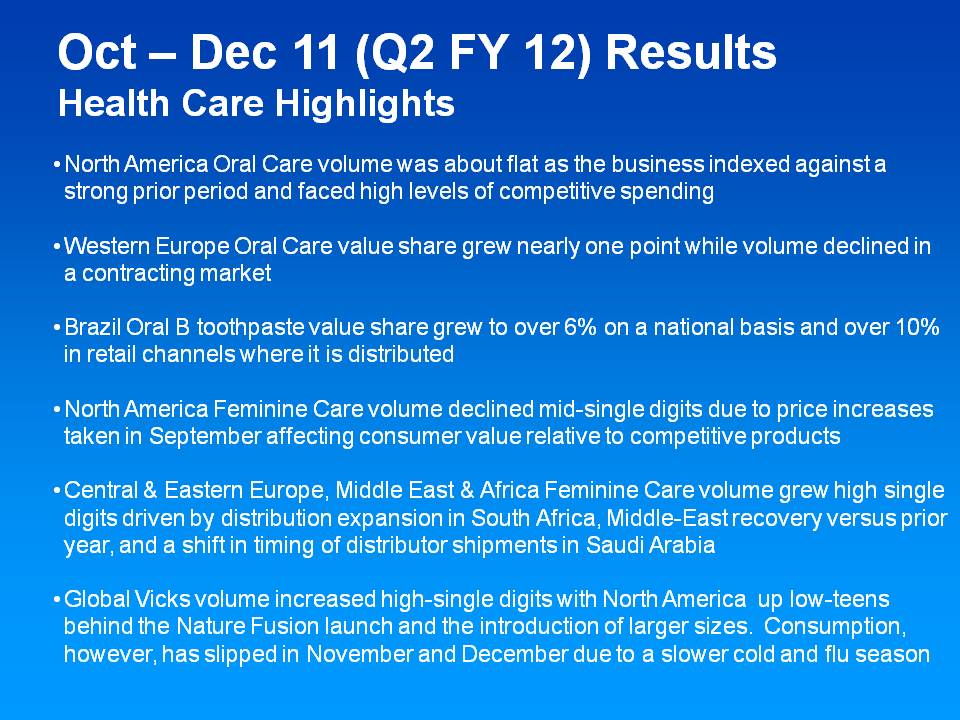
| Health Care | 1% | 0% | 0% | 1% | |||||||||||
| Snacks and Pet Care | 3% | 0% | 0% | 3% | |||||||||||
| Fabric Care and Home Care | 5% | 0% | 0% | 5% | |||||||||||
| Baby Care and Family Care | 6% | 0% | 0% | 6% | |||||||||||
| Total P&G | 4% | 0% | 0% | 4% | |||||||||||
| Fiscal Year Data: | FY 2011 | FY 2010 | FY 2009 | FY 2008 | |||||||
| Diluted Net Earnings Per Share - Continuing Operations | $3.93 | $3.53 | $3.39 | $3.40 | |||||||
| Settlement from U.S. Tax Litigation | ($0.08) | - | - | - | |||||||
| Charges for European Legal Matters | $0.10 | $0.09 | - | - | |||||||
| Charge for Taxation of Retiree Healthcare Subsidy | - | $0.05 | - | - | |||||||
| Incremental Folgers-related Restructuring Charges | - | - | $0.09 | - | |||||||
| Significant Adjustments to Tax Reserves | - | - | - | ($0.14) | |||||||
| Rounding Impacts | ($0.01) | - | |||||||||
Core EPS | $3.95 | $3.67 | $3.47 | $3.26 | |||||||
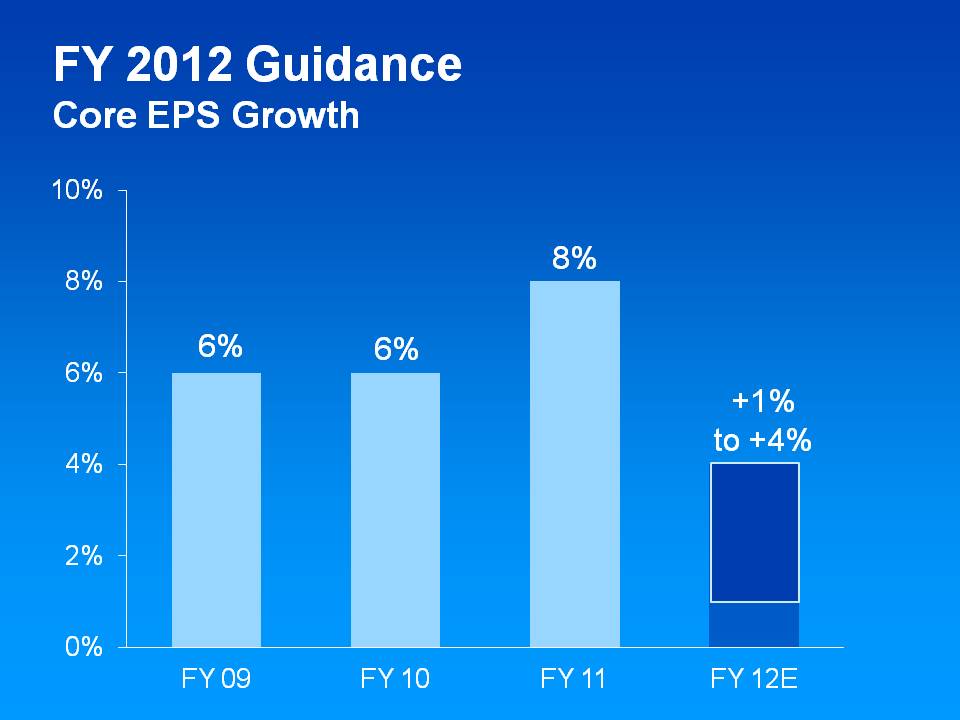
| Core EPS Growth | 8% | 6% | 6% | ||||||||
| Quarter / Period Data: | OND 11 | OND 10 | OND 09 | ||||||||
| Diluted Net Earnings Per Share-Continuing Operations | |||||||||||
| $0.57 | $1.11 | $1.01 | |||||||||
| Impairment charges | $0.50 | - | - | ||||||||
| Charges for European legal matters | $0.02 | $0.10 | $0.09 | ||||||||
| Settlement from U.S. tax litigation | - | ($0.08) | - | ||||||||
| Incremental restructuring | $0.01 | - | - | ||||||||
| Core EPS | $1.10 | $1.13 | $1.10 | ||||||||
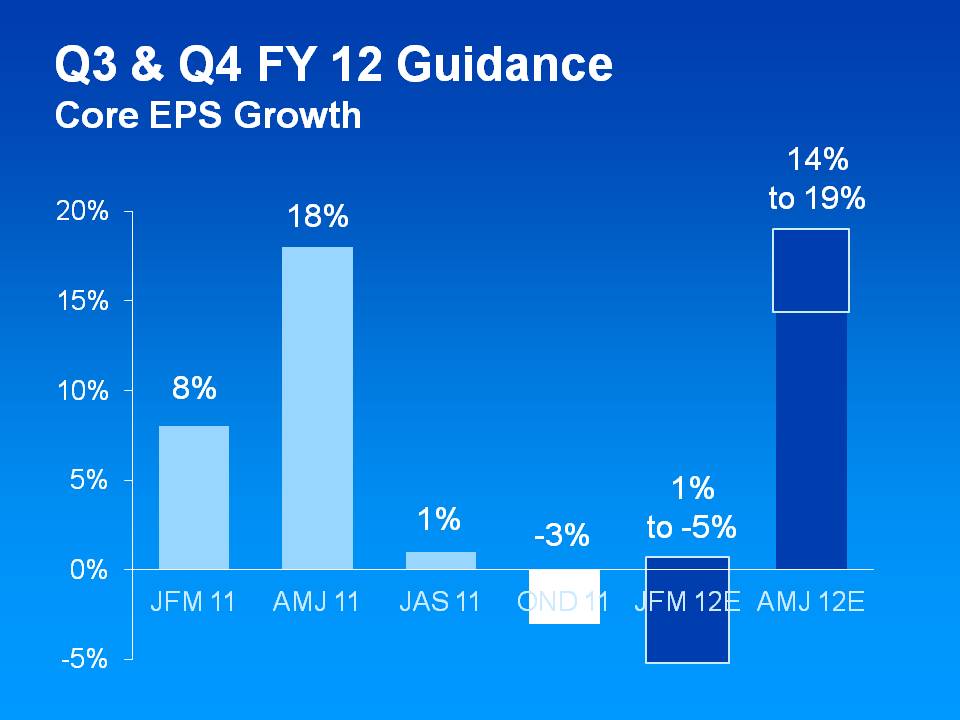
| Core EPS Growth | -3% | 3% | |||||||||
JFM 11 | JFM 10 | ||||||||||
| Diluted Net Earnings Per Share – Continuing Operations | $0.96 | $0.83 | |||||||||
| Charge for Taxation of Retiree Healthcare Subsidy | - | $0.05 | |||||||||
| Rounding Impacts | - | $0.01 | |||||||||
| Core EPS | $0.96 | $0.89 | |||||||||
| Core EPS Growth | 8% | ||||||||||
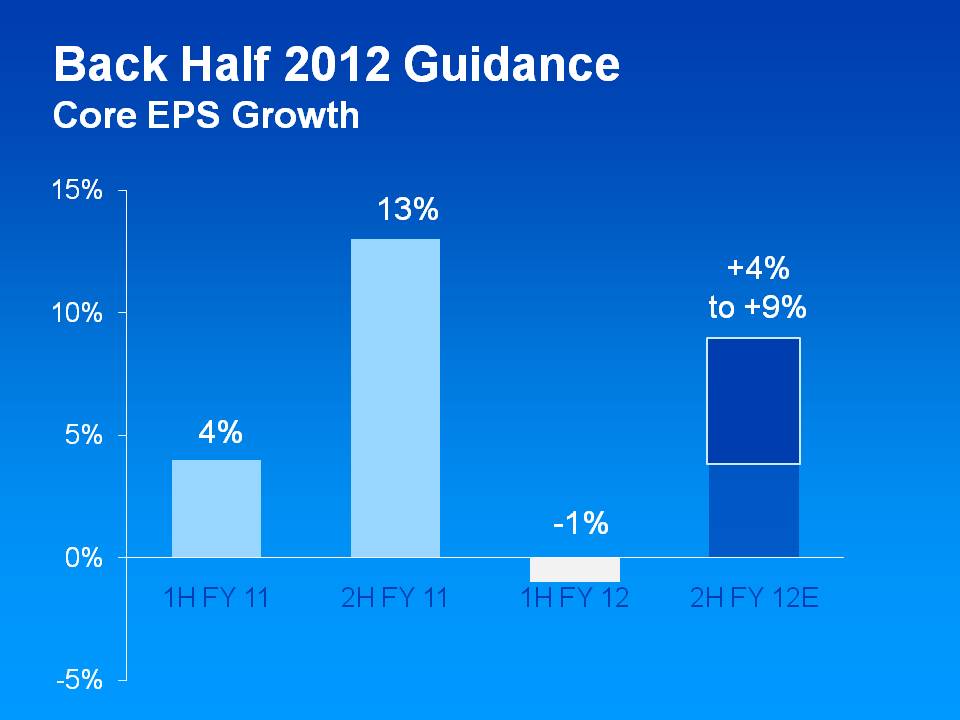
1H FY 2012 | 1H FY 2011 | 1H FY 2010 | |||
| Diluted Net Earnings Per Share-Continuing Operations | $1.60 | $2.13 | $1.98 | ||
| Impairment charges | $0.50 | - | - | ||
| Charges for European legal matters | $0.02 | $0.10 | $0.09 | ||
| Settlement for U.S. Tax litigation | - | ($0.08) | - | ||
| Incremental restructuring | $0.01 | - | - | ||
| Core EPS | $2.13 | $2.15 | $2.07 | ||
| Core EPS Growth | -1% | 4% |
| JFM 12 (Est.) | JFM 11 | ||
| Diluted Net Earnings Per Share | $0.81 to $0.87 | $0.96 | |
Incremental Restructuring | $0.10 | - | |
| Core EPS | $0.91 to $0.97 | $0.96 | |
| Core EPS Growth | -5% to 1% |
| AMJ 12 (Est.) | AMJ 11 | |||
| Diluted Net Earnings Per Share | $1.44 to $1.61 | $0.84 | ||
One-time gain from snacks divestiture | ($0.55) to ($0.65) | - | ||
Incremental restructuring | $0.07 to $0.04 | - | ||
| Core EPS | $0.96 to $1.00 | $0.84 | ||
| Core EPS Growth | 14% to 19% |
| 2H FY 2012 (Estimate) | 2H FY 2011 | 2H FY 2010 | |||
| Diluted Net Earnings Per Share-Continuing Operations | $2.25 to $2.48 | $1.80 | $1.54 | ||
| One-time gain from snacks divestiture | ($0.55) to ($0.65) | - | - | ||
| Charge for taxation of retiree healthcare subsidy | - | - | $0.05 | ||
| Incremental restructuring | $0.17 to $0.14 | - | - | ||
| Rounding impacts | - | - | $0.01 | ||
| Core EPS | $1.87 to $1.97 | $1.80 | $1.60 | ||
| Core EPS Growth | 4% to 9% | 13% |
| FY 2012 (Est.) | FY 2011 | |||
| Diluted Net Earnings Per Share | $3.85 to $4.08 | $3.93 | ||
One-time gain from snacks divestiture | ($0.55) to ($0.65) | |||
Impairment charges | $0.50 | - | ||
Charges for European legal matters | $0.02 | $0.10 | ||
Settlement from U.S. tax litigation | - | ($0.08) | ||
Incremental restructuring | $0.18 to $0.15 | - | ||
| Core EPS | $4.00 to $4.10 | $3.95 | ||
| Core EPS Growth | 1% to 4% |
| OND 11 | OND 10 | ||
| Operating Margin | 12.4% | 20.0% | |
| Impairment charges | 7.0% | - | |
| Charges for European legal matters | 0.3% | 1.4% | |
| Incremental restructuring | 0.1% | - | |
| Core Operating Margin | 19.8% | 21.4% | |
| Basis point change | -160 bps | ||
| 2H FY 2012 (Estimate) | 2H FY 2011 | ||
| Operating Margin | 17.0% to 18.3% | 17.2% | |
| Charges for European legal matters | - | 0.0% | |
| Incremental restructuring | 1.7% to 1.4% | - | |
| Core Operating Margin | 18.7% to 19.7% | 17.2% | |
| Basis point change | 150 to 250 |
| OND 11 | JAS 11 | AMJ 11 | JFM 11 | ||||
| Operating Profit Growth | -36% | -4% | 11% | -5% | |||
| Impairment charges | 36% | - | - | - | |||
| Charges for European legal matters | -6% | - | - | - | |||
| Incremental restructuring | 1% | - | - | - | |||
| Rounding | 1% | - | - | - | |||
| Core Operating Profit Growth | -4% | -4% | 11% | -5% | |||
| 2H FY 2012 (Est.) | 1H FY 2012 | 2H FY 2011 | 1H FY 2011 | ||||
| Operating Profit Growth | 0% to 7% | -19% | 2% | -4% | |||
| Impairment charges | - | 18% | - | - | |||
| Charges for European legal matters | - | -3% | - | - | |||
| Incremental restructuring | 10% to 8% | - | - | - | |||
| Rounding | - | - | - | 1% | |||
| Core Operating Profit Growth | 10% to 15% | -4% | 2% | -3% | |||
AMJ 12 (Estimate) | JFM 12 (Estimate) | ||
| Operating Profit Growth | 11% to 19% | -8% to -2% | |
| Impairment charges | - | - | |
| Charges for European legal matters | - | - | |
| Incremental restructuring | 8% to 5% | 10% | |
| Core Operating Profit Growth | 19% to 24% | 2% to 8% |
| OND 2011 | ||||
| Effective Tax Rate | 36.7% | |||
| Tax impact of impairment charges | (11.7%) | |||
| Tax impact of European legal matters | (0.4%) | |||
| Tax impact of incremental restructuring | 0.2% | |||
| Rounding | 0.1% | |||
Core Effective Tax Rate | 24.9% |
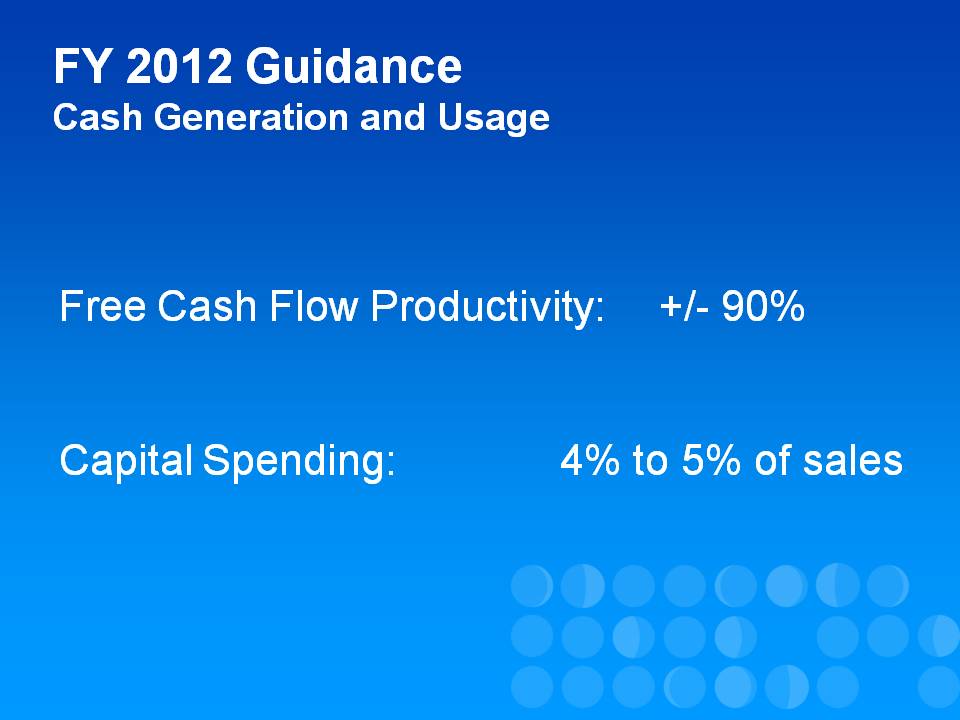
| Operating Cash Flow | Capital Spending | Free Cash Flow | |
| Oct-Dec ‘11 | $3,328 | ($947) | $2,381 |