Management's Discussion and Analysis
The purpose of this discussion is to provide an understanding of P&G's financial results and condition by focusing on changes in certain key measures from year to year. Management's Discussion and Analysis (MD&A) is organized in the following sections:
| • | Overview |
| • | Summary of 2011 Results |
| • | Forward-Looking Statements |
| • | Results of Operations |
| • | Segment Results |
| • | Financial Condition |
| • | Significant Accounting Policies and Estimates |
| • | Other Information |
Throughout MD&A, we refer to measures used by management to evaluate performance, including unit volume growth, net sales and net earnings. We also refer to a number of financial measures that are not defined under accounting principles generally accepted in the United States of America (U.S. GAAP), including organic sales growth, core earnings per share (Core EPS), free cash flow and free cash flow productivity. Organic sales growth is net sales growth excluding the impacts of foreign exchange, acquisitions and divestitures. Core EPS is diluted net earnings per share from continuing operations excluding certain specified charges. Free cash flow is operating cash flow less capital spending. Free cash flow productivity is the ratio of free cash flow to net earnings. We believe these measures provide investors with important information that is useful in understanding our business results and trends. The explanation at the end of MD&A provides more details on the use and the derivation of these measures.
Management also uses certain market share and market consumption estimates to evaluate performance relative to competition despite some limitations on the availability and comparability of share and consumption information. References to market share and market consumption in MD&A are based on a combination of vendor-reported consumption and market size data, as well as internal estimates. All market share references represent the percentage of sales in dollar terms on a constant currency basis of our products, relative to all product sales in the category. In certain situations, we discuss volume share, which is the percentage of unit volume of our products relative to all products sold in the category.
Recent Business Developments
Effective during the quarter ending December 31, 2011, we implemented a number of changes to our organization structure within the Beauty & Grooming Global Business Unit (GBU), which resulted in changes to the components of the Beauty reportable segment and the Grooming reportable segment. These two segments transitioned from consumer-oriented to product-oriented. As a result female blades and razors transitioned from Beauty to Grooming, while male personal care products such as Old Spice and Gillette, moved from Grooming to Beauty. These changes have been reflected in our segment reporting beginning in the second quarter of fiscal 2012. Our historical segment reporting for the years ending June 30, 2011, 2010, and 2009 have been recasted to reflect the new structure. The GBU and segment discussions in the MD&A and accompanying Consolidated Financial Statements have been revised to reflect the new organizational structure implemented during the quarter ending December 31, 2011.
Effective February 2011, the Company consolidated the three GBUs into two: Beauty & Grooming and Household Care. As a result, the Health Care segment largely became part of P&G's Beauty and Grooming GBU, while the Snacks and Pet Care segment became part of P&G's Household Care GBU.
In October 2009, we sold our global pharmaceuticals business to Warner Chilcott plc (Warner Chilcott) for $2.8 billion, net of assumed and transferred liabilities. Under the terms of the agreement, Warner Chilcott acquired our portfolio of branded pharmaceuticals products, our prescription drug product pipeline and our manufacturing facilities in Puerto Rico and Germany. The pharmaceuticals business had historically been part of the Health Care reportable segment. In accordance with the applicable accounting guidance for the disposal of long-lived assets, the results of our pharmaceuticals business are presented as discontinued operations and, as such, have been excluded from continuing operations and from segment results for all periods presented.
In November 2008, we completed the divestiture of our coffee business through the merger of our Folgers coffee subsidiary
into The J.M. Smucker Company (Smucker) in an all-stock Reverse Morris Trust transaction. In connection with the merger, 38.7 million shares of P&G common stock were tendered by our shareholders and exchanged for all shares of Folgers common stock. Pursuant to the merger, a Smucker subsidiary merged with and into Folgers and Folgers became a wholly-owned subsidiary of Smucker.
The coffee business had historically been part of the Company's Snacks, Coffee and Pet Care reportable segment, as well as the coffee portion of the away-from-home business which was included in the Fabric Care and Home Care reportable segment. In accordance with the applicable accounting guidance for the disposal of long-lived assets, the results of our coffee business are presented as discontinued operations and, as such, have been excluded from continuing operations and from segment results for all periods presented. The Snacks, Coffee and Pet Care reportable segment was renamed Snacks and Pet Care to reflect this change.
OVERVIEW
The purpose of our business is to provide branded consumer packaged goods of superior quality and value to our consumers around the world. This will enable us to execute our Purpose-inspired growth strategy: to touch and improve more consumers' lives, in more parts of the world, more completely. We believe this will result in leadership sales, earnings and value creation, allowing employees, shareholders and the communities in which we operate to prosper.
Our products are sold in more than 180 countries primarily through mass merchandisers, grocery stores, membership club stores, drug stores and high-frequency stores, the neighborhood stores which serve many consumers in developing markets. We continue to expand our presence in other channels, including department stores, perfumeries, pharmacies, salons and e-commerce. We have on-the-ground operations in approximately 80 countries.
Our market environment is highly competitive with global, regional and local competitors. In many of the markets and industry segments in which we sell our products, we compete against other branded products as well as retailers' private-label brands. Additionally, many of the product segments in which we compete are differentiated by price (referred to as super-premium, premium, mid-tier and value-tier products). We are well positioned in the industry segments and markets in which we operate-often holding a leadership or significant market share position.
Organizational Structure
Our organizational structure is comprised of two Global Business Units (GBUs), Global Operations, Global Business Services (GBS) and Corporate Functions (CF).
GLOBAL BUSINESS UNITS
The businesses are managed under two GBUs, Beauty & Grooming and Household Care. The primary responsibility of the GBUs is to develop the overall strategy for our brands. They identify common consumer needs, develop new product innovations and upgrades and build our brands through effective commercial innovations and marketing plans.
Under U.S. GAAP, the business units comprising the GBUs are aggregated into six reportable segments: Beauty; Grooming; Health Care; Snacks and Pet Care; Fabric Care and Home Care; and Baby Care and Family Care. The following provides additional detail on our reportable segments, businesses and the key product and brand composition within each.
| Reportable Segment | % of Net Sales* | % of Net Earnings* | Categories | Billion Dollar Brands | ||
| Beauty | 23 | % | 22 | % | Antiperspirant and Deodorant, Cosmetics, Hair Care, Hair Color, Hair Styling, Personal Cleansing, Prestige Products, Salon Professional, Skin Care | Head & Shoulders, Olay, Pantene, Wella |
| Grooming | 10 | % | 16 | % | Blades and Razors, Electronic Hair Removal Devices, Shave Products, Home Small Appliances | Braun, Fusion, Gillette, Mach3 |
| Health Care | 14 | % | 16 | % | Feminine Care, Gastrointestinal, Incontinence, Rapid Diagnostics, Respiratory, Toothbrush, Toothpaste, Water Filtration, Other Oral Care | Always, Crest, Oral-B |
| Snacks and Pet Care | 4 | % | 2 | % | Pet Care, Snacks | Iams, Pringles |
| Fabric Care and Home Care | 30 | % | 27 | % | Laundry Additives, Air Care, Batteries, Dish Care, Fabric Enhancers, Laundry Detergents, Surface Care | Ace, Ariel, Dawn, Downy, Duracell, Gain, Tide, Febreze |
| Baby Care and Family Care | 19 | % | 17 | % | Baby Wipes, Diapers, Paper Towels, Tissues, Toilet Paper | Bounty, Charmin, Pampers |
* Percent of net sales and net earnings from continuing operations for the year ended June 30, 2011 (excluding results held in Corporate).
Beauty: We are a global market leader in the beauty category. Most of the beauty markets in which we compete are highly fragmented with a large number of global and local competitors. In skin, cosmetics, and personal care we compete with a wide variety of products, ranging from deodorants to cosmetics to skin care, such as the Olay brand, which is the top facial skin care brand in the world with approximately 10% of the global market share. In hair care, we compete in both the retail and salon professional channels. We are the global market leader in the retail hair care market with over 20% of the global market share behind Pantene and Head & Shoulders. In the prestige channel, we compete primarily with prestige fragrances and the SK-II brand. We are one of the global market leaders in prestige fragrances, primarily behind the Dolce & Gabbana, Gucci and Hugo Boss fragrance brands.
Grooming: We hold leadership market share in the blades and razors market on a global basis and in nearly all of the geographies in which we compete. Our global blades and razors market share is approximately 70%, primarily behind the Gillette franchise including Fusion and Mach3. Our electronic hair removal devices and small home appliances are sold under the Braun brand in a number of markets around the world, where we compete against both global and regional competitors. Our primary focus in this area is electric hair removal devices, such as electric razors and epilators, where we hold approximately 30% of the male shavers market and 50% of the female epilators market.
Health Care: We compete in oral care, feminine care and personal health. In oral care, there are several global competitors in the market, and we have the number two market share position with over 20% of the global market. We are the global market leader in the feminine care category with over 30% of the global market share. In personal health, we are the market leader in nonprescription heartburn medications behind Prilosec OTC and in respiratory treatments behind Vicks.
Snacks and Pet Care: In snacks, we compete against both global and local competitors and have a global market share of almost 10% in the potato chips market behind our Pringles brand. In pet care, we compete in several markets around the globe in the premium pet care segment, with the Iams and Eukanuba brands. The vast majority of our pet care business is in North America, where we have almost a 10% share of the market.
Fabric Care and Home Care: This segment is comprised of a variety of fabric care products, including laundry detergents, additives and fabric enhancers; home care products, including dishwashing liquids and detergents, surface cleaners and air fresheners; and batteries. In fabric care, we generally have the number one or number two share position in the markets in which we compete and are the global market leader, with about 30% of the global market share. Our global home care market share is over 15% across the categories in which we compete. In batteries, we compete primarily behind the Duracell brand and have over 25% of the global battery market share.
Baby Care and Family Care: In baby care, we compete mainly in diapers and baby wipes, with approximately 35% of the global market share. We are the number one or number two baby care competitor in most of the key markets in which we compete, primarily behind Pampers, the Company's largest brand, with annual net sales of approximately $9 billion. Our family care business is predominantly a North American business comprised largely of the Bounty paper towel and Charmin toilet paper brands. U.S. market shares are approximately 45% for Bounty and over 25% for Charmin.
GLOBAL OPERATIONS
Global Operations is comprised of our Market Development Organization (MDO), which is responsible for developing go-to-market plans at the local level. The MDO includes dedicated retail customer, trade channel and country-specific teams. It is organized along five geographic units: North America, Western Europe, Central & Eastern Europe/Middle East/Africa (CEEMEA), Latin America and Asia, which is comprised of Japan, Greater China and ASEAN/Australia/India/Korea (AAIK). Throughout MD&A, we reference business results in developing markets, which we define as the aggregate of CEEMEA, Latin America, AAIK and Greater China, and developed markets, which are comprised of North America, Western Europe and Japan.
GLOBAL BUSINESS SERVICES
GBS provides technology, processes and standard data tools to enable the GBUs and the MDO to better understand the business and better serve consumers and customers. The GBS organization is responsible for providing world-class solutions at a low cost and with minimal capital investment.
CORPORATE FUNCTIONS
CF provides Company-level strategy and portfolio analysis, corporate accounting, treasury, external relations, governance, human resources and legal, as well as other centralized functional support.
Strategic Focus
We are focused on strategies that we believe are right for the long-term health of the Company and will deliver total shareholder return in the top one-third of our peer group. The Company's long-term financial targets are:
| • | Grow organic sales 1% to 2% faster than market growth in the categories and geographies in which we compete, |
| • | Deliver Core EPS growth of high single digits to low double digits, and |
| • | Generate free cash flow productivity of 90% or greater. |
In order to achieve these targets, we have created one over-arching strategy, inspired by our Purpose. At the heart of this strategy is innovating to win by touching and improving the lives of:
| • | More Consumers. We are improving more consumers' lives by innovating and expanding our product portfolio vertically, up and down value tiers. We continue to successfully develop and launch premium innovations focused on improving consumer value through enhanced performance. We are also serving consumers who are more price conscious through lower-priced offerings with superior performance versus other mid-tier and value-tier alternatives. |
| • | In More Parts of the World. We are improving lives in more parts of the world by innovating and expanding our existing product portfolio geographically into new markets. We are increasing our presence in developing markets and increasing the amount of sales from these markets by focusing on affordability, accessibility and awareness of our brands. |
| • | More Completely. We are improving lives more completely by innovating to improve existing products, creating or entering adjacent categories and expanding into new channels to reach consumers where they shop. We are driving regimen use that broadens the occasions for which our brands can serve the needs of each consumer. By attracting new consumers into our existing brand franchises and broadening the products used by our current consumers, we are able to build scale, reduce costs and profitably grow market share. |
We will leverage P&G's five core strengths that create competitive advantages and are critical to winning in the consumer products industry: consumer knowledge; innovation; brand-building; go-to-market capabilities and scale. We are coordinating our activities across categories and markets, acting more intentionally as one Company. We are placing particular emphasis on execution, simplification and scale as key improvement areas that will enable P&G to create the greatest value and competitive advantage. Finally, we are strengthening the depth, breadth and quality of leadership at all levels of the Company to make P&G a more demand-driven, real-time, future-focused organization.
SUMMARY OF 2011 RESULTS
| • | Net sales increased 5% to $82.6 billion. |
| ◦ | Organic sales increased 4%. |
| ◦ | Unit volume increased 6% versus the prior year, behind double-digit growth in developing regions and low single-digit growth in developed regions. |
| • | Net earnings from continuing operations increased 8% to $11.9 billion behind sales growth and a lower effective tax rate, partially offset by operating margin contraction. |
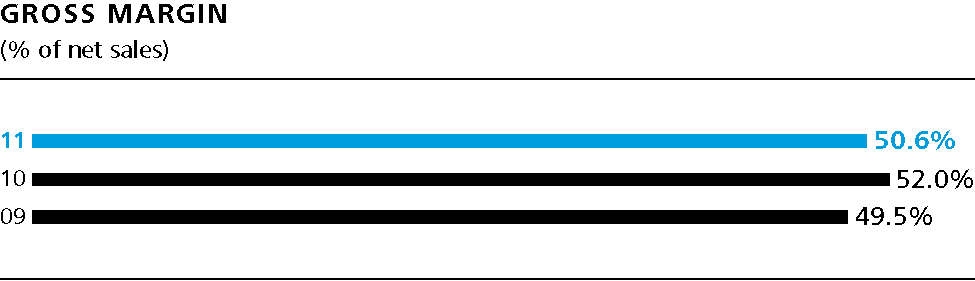
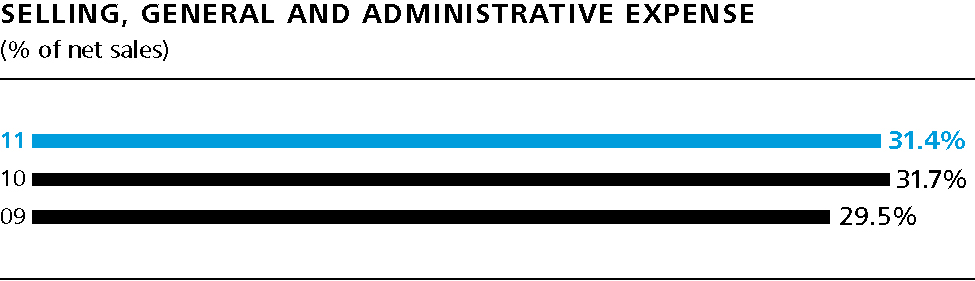
| ◦ | Operating margin declined 110 basis points behind a reduction in gross margin, partially offset by a reduction in selling, general and administrative expenses (SG&A) as a percentage of net sales. Gross margin declined behind higher commodity costs, partially offset by manufacturing cost savings. SG&A as a percentage of net sales declined due to reduced foreign currency exchange costs and a reduction in overhead spending as a percentage of net sales due to productivity improvements, partially offset by increased marketing investments. |
| • | Net earnings attributable to Procter & Gamble decreased 7% to $11.8 billion. |
| ◦ | Net earnings from discontinued operations declined $1.8 billion due to the gains on the sale of the pharmaceutical business in the prior year. |
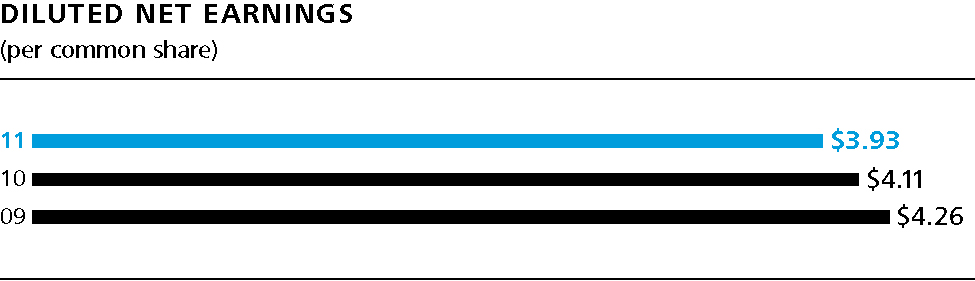
| • | Diluted net earnings per share from continuing operations increased 11% to $3.93. |
| ◦ | Diluted net earnings per share declined 4% to $3.93, including a decline in discontinued operations of $0.58. |
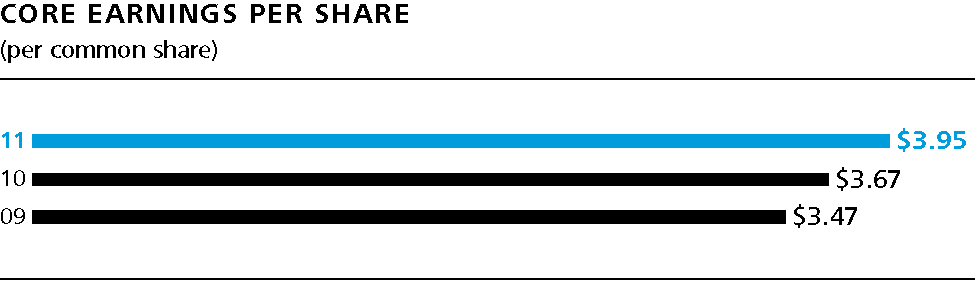
| ◦ | Core EPS grew 8% to $3.95. |
| • | Cash flow from operating activities was $13.3 billion. |
| ◦ | Free cash flow was $10.0 billion. |
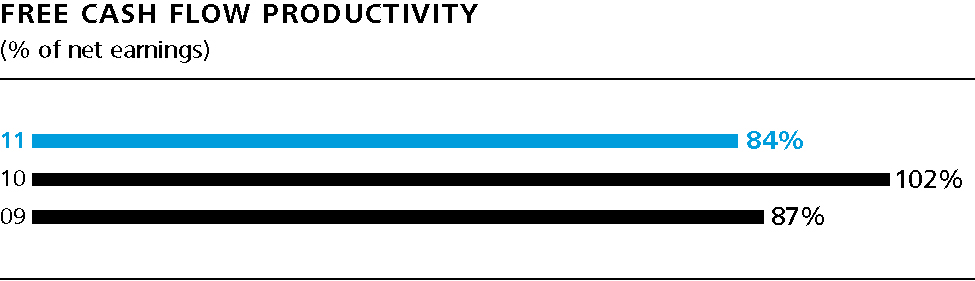
| ◦ | Free cash flow productivity was 84%. |
FORWARD-LOOKING STATEMENTS
We discuss expectations regarding future performance, events and outcomes, such as our business outlook and objectives, in annual and quarterly reports, press releases and other written and oral communications. All such statements, except for historical and present factual information, are "forward-looking statements," and are based on financial data and our business plans available only as of the time the statements are made, which may become out-of-date or incomplete. We assume no obligation to update any forward-looking statements as a result of new information, future events or other factors. Forward-looking statements are inherently uncertain and investors must recognize that events could be significantly different from our expectations. For more information on risks that could impact our results, refer to Item 1A Risk Factors in our most recent 10-Q, 10-K and 8-K filings.
Ability to Achieve Business Plans. We are a consumer products company and rely on continued demand for our brands and products. To achieve business goals, we must develop and sell products that appeal to consumers and retail trade customers. Our continued success is dependent on leading-edge innovation with respect to both products and operations, on the continued positive reputations of our brands and our ability to successfully maintain trademark protection. This means we must be able to obtain patents and trademarks, and respond to technological advances and patents granted to competition. Our success is also dependent on effective sales, advertising and marketing programs. Our ability to innovate and execute in these areas will determine the extent to which we are able to grow existing sales and volume profitably, especially with respect to the product categories and geographic markets (including developing markets) in which we have chosen to focus. There are high levels of competitive activity in the environments in which we operate. To address these challenges, we must respond to competitive factors, including pricing, promotional incentives, trade terms and product initiatives. We must manage each of these factors, as well as maintain mutually beneficial relationships with our key customers, in order to effectively compete and achieve our business plans. As a company that manages a portfolio of consumer brands, our ongoing business model involves a certain level of ongoing acquisition and divestiture activities. We must be able to successfully manage the impacts of these activities, while at the same time delivering against base business objectives. Daily conduct of our business also depends on our ability to maintain key information technology systems, including systems operated by third-party suppliers.
Cost Pressures. Our costs are subject to fluctuations, particularly due to changes in commodity prices, raw materials, labor costs, foreign exchange and interest rates. Therefore, our success is dependent, in part, on our continued ability to manage these fluctuations through pricing actions, cost savings projects, sourcing decisions and certain hedging transactions. We also must manage our debt and currency exposure, especially in certain countries with currency exchange controls, such as Venezuela, China and India. We need to maintain key manufacturing and supply arrangements, including sole supplier and sole manufacturing plant arrangements, and successfully manage any disruptions at Company manufacturing sites. We must implement, achieve and sustain cost improvement plans, including our outsourcing projects and those related to general overhead and workforce optimization. Successfully managing these changes, including identifying, developing and retaining key employees, is critical to our success.
Global Economic Conditions. Economic changes, terrorist activity, political unrest and natural disasters, such as the civil unrest in the Middle East and the impacts of the Japan earthquake and tsunami, may result in business interruption, inflation, deflation or decreased demand for our products. Our success will depend, in part, on our ability to manage continued global political and/or economic uncertainty, especially in our significant geographic markets, due to terrorist and other hostile activities or natural disasters. We could also be negatively impacted by a global, regional or national economic crisis, including
sovereign risk in the event of a deterioration in the credit worthiness of or a default by local governments, resulting in a disruption of credit markets. Such events could negatively impact our ability to collect receipts due from governments, including refunds of value added taxes, create significant credit risks relative to our local customers and depository institutions, and/or negatively impact our overall liquidity.
Regulatory Environment. Changes in laws, regulations and the related interpretations may alter the environment in which we do business. This includes changes in environmental, competitive and product-related laws, as well as changes in accounting standards and taxation requirements. Our ability to manage regulatory, tax and legal matters (including product liability, patent, intellectual property, competition law matters and tax policy) and to resolve pending legal matters within current estimates may impact our results.
RESULTS OF OPERATIONS
Net Sales
Net sales increased 5% in 2011 to $82.6 billion on a 6% increase in unit volume. Volume grew behind market and share growth. Global market growth, in categories that we compete, grew 3% on a constant currency basis. Volume increased low single digits in developed regions and double digits in developing regions. All geographic regions contributed to volume growth, led by double-digit growth in Asia, high single-digit growth in Latin America and mid-single-digit growth in CEEMEA and Western Europe. All six of the business segments contributed to volume growth with high single-digit growth in the Baby Care and Family Care and Fabric Care and Home Care segments, mid-single-digit growth in the Beauty and Health Care segments, and a low single-digit growth in the Grooming and Snacks and Pet Care segments. Organic volume, which excludes acquisitions and divestitures, was up 5%. Mix reduced net sales by 2% due mainly to disproportionate growth in developing regions and mid-tier products, both of which have lower than Company average selling prices, and declines in the premium-priced professional salon and prestige categories. Pricing added 1% to net sales behind price increases to offset higher commodity costs and foreign exchange. Organic sales were up 4%, led by high single-digit growth in the Baby and Family Care segment, as well as mid-single-digit growth across the Grooming and Health Care segments.
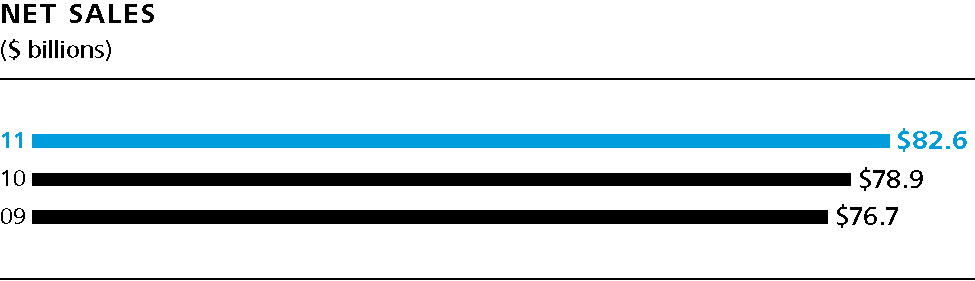

Net sales increased 3% in 2010 to $78.9 billion on a 4% increase in unit volume. Volume increased low single digits in developed regions and mid-single digits in developing regions. All geographic regions contributed to volume growth, led by high single-digit growth in Asia and CEEMEA. Volume growth for the reportable segments was mixed, with low single-digit increases in the Beauty, Grooming and Health Care segments, a mid-single-digit increase in the Fabric Care and Home Care segment and a high single-digit increase in the Baby Care and Family Care segment, partially offset by a low single-digit decline in the Snacks and Pet Care segment. Price increases added 1% to net sales as increases taken primarily in developing regions to offset local currency devaluations were partially offset by price reductions to improve consumer value. Mix reduced net sales by 1% behind disproportionate growth in developing regions, which have lower than Company average selling prices, and relatively weaker shipments of Salon Professional, Prestige, Personal Health Care and Pet Care, which have higher than Company average selling prices. Organic sales were up 3%, led by mid-single-digit growth across the Fabric Care and Home Care and the Baby Care and Family Care segments. Unfavorable foreign exchange reduced net sales growth by 1% as the U.S. dollar strengthened versus key foreign currencies.
Operating Costs
| Comparisons as a percentage of net sales; Years ended June 30 | 2011 | Basis Point Change | 2010 | Basis Point Change | 2009 | |||||||||
| Gross margin | 50.6 | % | (140 | ) | 52.0 | % | 250 | 49.5 | % | |||||
| Selling, general and administrative expense | 31.4 | % | (30 | ) | 31.7 | % | 220 | 29.5 | % | |||||
| Operating margin | 19.2 | % | (110 | ) | 20.3 | % | 30 | 20.0 | % | |||||
| Earnings from continuing operations before income taxes | 18.6 | % | (80 | ) | 19.2 | % | 30 | 18.9 | % | |||||
| Net earnings from continuing operations | 14.4 | % | 40 | 14.0 | % | 0 | 14.0 | % | ||||||
| Net earnings attributable to Procter & Gamble | 14.3 | % | (180 | ) | 16.1 | % | (140 | ) | 17.5 | % | ||||
Gross margin contracted 140 basis points in 2011 to 50.6% of net sales. The reduction in gross margin was driven mainly by a 225-basis point increase in commodity and energy costs, along with negative product mix from disproportionate growth in developing regions and mid-tier products. These impacts were partially offset by manufacturing cost savings and the favorable impact of volume scale leverage.
Gross margin expanded 250 basis points in 2010 to 52.0% of net sales. Manufacturing and logistics cost savings projects and lower commodity and energy costs positively impacted gross margin by about 280 basis points. Volume scale leverage and price increases also contributed to gross margin expansion. These impacts were partially offset by unfavorable foreign exchange and product mix impacts.
Total selling, general and administrative expenses (SG&A) increased 4% to $26.0 billion in 2011 behind higher marketing and overhead spending, which was partially offset by the impact of lower foreign currency exchange costs. SG&A as a percentage of net sales decreased 30 basis points to 31.4% due to a reduction in overhead and other operating expenses as a percentage of net sales, partially offset by increased marketing investments. Marketing spending as a percentage of net sales increased 60 basis points due to additional marketing investments to support innovation and expansion plans. Overhead spending as a percentage of net sales decreased 50 basis points due to sales leverage, partially offset by added spending to support growth. Other operating expenses as a percentage of net sales decreased 40 basis points mainly due to a decrease in Venezuela-related foreign currency exchange costs of $548 million (see further discussion in the following paragraphs). Charges for competition law fines increased nominally to $303 million versus the prior year charge of $283 million.
SG&A increased 10% to $25.0 billion in 2010 behind higher marketing, overhead and other operating expenses. SG&A as a percentage of net sales increased 220 basis points to 31.7% due to higher marketing and other operating expenses as a percentage of net sales, while overhead spending as a percentage of sales was in line with the prior year. Marketing spending as a percentage of net sales was up 150 basis points as additional marketing investments, primarily to increase media impressions, and the impact of reduced spending in the fourth quarter of 2009 were partially offset by media rate savings. Advertising spending as a percentage of net sales was up 110 basis points versus 2009 behind investments to support initiatives and business growth. Overhead spending as a percentage of net sales was consistent with the prior year as additional spending to support business growth was offset by productivity improvements and lower restructuring charges. Other operating expenses as a percentage of net sales increased 70 basis points mainly due to an increase in Venezuela-related foreign currency exchange costs of $492 million (see further discussion in the following paragraph) and charges for competition law fines of $283 million.
Because of currency restrictions in Venezuela, payments for certain imported goods and services have historically been satisfied by exchanging Bolivares Fuertes for U.S. dollars through securities transactions in the parallel market rather than at the more favorable official exchange rate. At the discretion of management, these securities transactions can be utilized to manage exposure to currency movements on local cash balances. A reduction in the availability of foreign currency at the official exchange rate and an increased spread between the official and parallel exchange rates during most of fiscal 2010 resulted in increased costs for exchange transactions executed using securities transactions in the parallel market during 2010. There were minimal parallel market exchange transactions executed during 2011 due to a very restrictive parallel market exchange mechanism. For a more detailed discussion of the impacts of and recent events in Venezuela, see the section entitled "Venezuela Currency Impacts" at the end of this Results of Operations section.
We fund a number of restructuring-type activities, primarily related to manufacturing and workforce optimization efforts, to maintain a competitive cost structure and to integrate acquired businesses. Within our results of continuing operations, after-tax charges to fund restructuring-type activities declined approximately $200 million in 2011, and were slightly below our ongoing funding level of $300 million to $400 million, after tax.
Non-Operating Items
Interest expense decreased 12% in 2011 to $831 million due primarily to a reduction in interest rates on floating rate debt partially offset by an increase in debt outstanding. In 2010, interest expense decreased 30% to $946 million due to a reduction in interest rates on floating rate debt and a reduction in debt outstanding.
Other non-operating income/(expense) primarily includes divestiture gains, interest and investment income. Other non-operating income/(expense) was a net benefit of $332 million in 2011 versus $82 million in 2010. This $250 million change was primarily due to the impact of gains on divestitures in the current year (Zest brand in North America and Infasil brand in Western Europe) and incremental costs in the prior year period associated with exercising the call option on an outstanding bond, partially offset by a gain due to the acquisition of MDVIP in the prior year period. Other non-operating income/(expense) declined $401 million in 2010 to $82 million mainly due to divestiture gains in fiscal 2009, which included gains on the sale of Thermacare, Noxzema, Infusium and other minor brands, and incremental costs associated with exercising the call option on an outstanding bond in 2010.
Income Taxes
The effective tax rate on continuing operations decreased 500 basis points to 22.1%. This was primarily driven by net favorable discrete adjustments (primarily driven by favorable audit and litigation settlements for uncertain tax positions in multiple jurisdictions relating to prior periods), which drove 410 basis points of the effective tax rate difference. Net adjustments to tax balances for uncertain tax positions in a number of jurisdictions resulted in a benefit of approximately $535 million in the current year, including a $252 million benefit from the settlement of U.S. tax litigation primarily related to the valuation of technology donations. In 2010, net discrete adjustments resulted in a charge of $86 million, including a $152 million charge for legislation which changed the taxation of certain future retiree prescription drug subsidy payments in the United States. While there will likely be some level of benefits from discrete adjustments on an ongoing basis, we do not expect the magnitude of the adjustments experienced in fiscal 2011 to be sustainable. The current year tax rate also benefited from the geographic mix of current year sales and earnings, which drove a 50-basis point reduction as an increased proportion of earnings were generated in foreign markets with lower tax rates versus the U.S.
In 2010, the effective tax rate on continuing operations increased 140 basis points to 27.1%. This was primarily due to a $152 million charge for legislation which changed the taxation of certain future retiree prescription drug subsidy payments in the United States, the non-deductibility of a $283 million charge for competition law fines and a lower level of net favorable adjustments to reserves for previously existing uncertain tax positions and foreign tax credits, partially offset by a more favorable geographic mix of earnings. During 2010, net adjustments to prior-year reserves balances for uncertain tax positions benefited the effective tax rate by 40 basis points versus a 130-basis point benefit in 2009.
Net Earnings
Net earnings from continuing operations were $11.9 billion in 2011, an increase of 8% versus the prior year due mainly to net sales growth and a lower effective tax rate, partially offset by operating margin contraction. Operating margin decreased 110 basis points due to a decrease in gross margin, partially offset by a decrease in SG&A spending as a percentage of net sales. Gross margin declined behind higher commodity costs, partially offset by manufacturing cost savings. SG&A as a percentage of net sales declined due to reduced foreign currency exchange costs and a reduction in overhead spending as a percentage of net sales due to productivity improvements, partially offset by increased marketing investments. Net earnings from continuing operations were $11.1 billion in 2010, an increase of 3% versus the prior year due mainly to net sales growth and operating margin expansion, partially offset by a higher effective tax rate. Operating margin was up 30 basis points due to an increase in gross margin, mostly offset by an increase in SG&A as a percentage of net sales.
Net earnings from discontinued operations decreased $1.8 billion in 2011 mainly due to the impact of the gain on the
divestiture of the global pharmaceuticals business in the prior year. In 2010, net earnings from discontinued operations, declined $1.0 billion to $1.8 billion due to the loss of contribution from the pharmaceuticals business divested in October 2009 and coffee business divested in November 2008 and lower gains on the sale of discontinued operations. The gains on the sale of the global pharmaceuticals business in fiscal 2010 were $1.6 billion versus a $2.0 billion gain on the sale of the coffee business in fiscal 2009.
Diluted net earnings per share from continuing operations in 2011 increased 11% to $3.93 behind higher net earnings from continuing operations and the reduction in shares outstanding. Diluted net earnings per share from discontinued operations declined $0.58. Diluted net earnings per share declined 4% to $3.93 driven by lower net earnings from discontinued operations, partially offset by higher net earnings from continuing operations and a reduction in weighted average shares outstanding resulting from share repurchase activity. The reduction in the number of shares outstanding was driven by treasury share repurchases of $7.0 billion, nearly all of which were made under our publicly announced share repurchase program.
Diluted net earnings per share from continuing operations in 2010 increased 4% to $3.53 behind higher net earnings from continuing operations and the reduction in shares outstanding. Diluted net earnings per share from discontinued operations declined $0.29 to $0.58. Diluted net earnings per share declined 4% to $4.11 driven by lower net earnings from discontinued operations, partially offset by higher net earnings from continuing operations and a reduction in weighted average shares outstanding. The reduction in the number of shares outstanding was driven by treasury share repurchases of $6.0 billion, nearly all of which were made under our publicly announced share repurchase program.
Core EPS increased 8% to $3.95 in 2011. Core EPS represents diluted net earnings per share from continuing operations excluding a current-year benefit from the settlement of U.S. tax litigation primarily related to the valuation of technology donations, charges in both 2011 and 2010 for competition law fines and charges in 2010 for legislation which changed the taxation of certain future retiree prescription drug subsidy payments in the United States. Core EPS grew 6% in 2010 to $3.67.
Venezuela Currency Impacts
Venezuela was determined to be a highly inflationary economy under U.S. GAAP during fiscal 2010. As a result, the U.S. dollar is now the functional currency for our subsidiaries in Venezuela. Any currency remeasurement adjustments for non-dollar denominated monetary assets and liabilities held by these subsidiaries and other transactional foreign exchange gains and losses are reflected in earnings. Also during fiscal 2010, the Venezuelan government devalued the Bolivar Fuerte relative to the U.S. dollar. The remeasurement of our local balance sheets in fiscal 2010 did not materially impact our results. This was due to the relatively small non-dollar denominated net monetary asset position in Venezuela.
The Venezuelan government introduced a number of currency controls for companies operating in Venezuela. During calendar year 2010, there were two official exchange rates for imported goods. Those goods classified as essential, such as food, medicine and capital investments, had an exchange rate of 2.6 bolivars to the U.S. dollar, while payments for other non-essential goods had an exchange rate of 4.3. Many of our imported products fell into the essential classification and qualified for the 2.6 rate. In January 2011, the Venezuelan government announced the elimination of the 2.6 exchange rate on essential goods, resulting in the application of the 4.3 rate to all qualifying goods. Our overall results in Venezuela are reflected in our Consolidated Financial Statements at the 4.3 rate, which is also expected to be applicable to dividend repatriations.
There are also exchange controls over securities transactions in what was the parallel market, which has historically been used to pay for imported goods and services that do not qualify for exchange in the official market and is now controlled by
authorities. The Central Bank of Venezuela is now the only legal intermediary to execute foreign exchange transactions outside of CADIVI (4.3 rate) through the SITME rate which was approximately 5.3 as of June 30, 2011. The notional amount of transactions that run through this foreign exchange rate for non-essential goods is restrictive, which for us has essentially eliminated our ability to access any foreign exchange rate other than the CADIVI (4.3) rate to pay for imported goods and/or manage our local monetary asset balances.
As of June 30, 2011, we had net monetary assets denominated in local currency of approximately $798 million. Approximately $347 million of this balance has been remeasured using the parallel rate because we plan to use that amount of the net assets (largely cash) to satisfy U.S. dollar denominated liabilities that do not qualify for official rate dollars. The availability of the parallel market to settle these transactions is uncertain. The remaining net monetary asset balances are currently reflected within our Consolidated Financial Statements at the 4.3 official exchange rate. Depending on the future availability of U.S. dollars at the official rate, our local U.S. dollar needs, our overall repatriation plans and the creditworthiness of the local depository institutions and other creditors, we have exposure for our local monetary assets. We also have devaluation exposure for the differential between the current and potential future official and parallel exchange rates on the portion of our local monetary assets reflected at the 4.3 official exchange rate.
Our ability to effectively manage sales and profit levels in Venezuela will be impacted by several factors, including the Company's ability to mitigate the effect of any potential future devaluation, further actions of the Venezuelan government, economic conditions in Venezuela, such as inflation and consumer spending, the availability of raw materials, utilities and energy and the future state of exchange controls in Venezuela including the availability of U.S. dollars at the official foreign exchange rate.
SEGMENT RESULTS
Results for the segments reflect information on the same basis we use for internal management reporting and performance evaluation. The results of these reportable business segments do not include certain non-business unit specific costs such as interest expense, investing activities and certain restructuring costs. These costs are reported in our Corporate segment and are included as part of our Corporate segment discussion. Additionally, as described in Note 11 to the Consolidated Financial Statements, we have investments in certain companies over which we exert significant influence, but do not control the financial and operating decisions and, therefore, do not consolidate these companies for U.S. GAAP purposes ("unconsolidated entities"). Given that certain of these investments are managed as integral parts of the Company's business units, they are accounted for as if they were consolidated subsidiaries for management and segment reporting purposes. This means pre-tax earnings in the business units include 100% of each pre-tax income statement component. In determining after-tax earnings in the business units, we eliminate the share of earnings applicable to other ownership interests, in a manner similar to noncontrolling interest, and apply the statutory tax rates. Eliminations to adjust each line item to U.S. GAAP are included in our Corporate segment. All references to net earnings throughout the discussion of segment results refer to net earnings from continuing operations attributable to Procter & Gamble.
| Net Sales Change Drivers vs. Year Ago (2011 vs. 2010) | Volume with Acquisitions & Divestitures | Volume Excluding Acquisitions & Divestitures | Foreign Exchange | Price | Mix/Other | Net Sales Growth | |||||||||||
| Beauty | 4 | % | 5 | % | 1 | % | 1 | % | -2 | % | 4 | % | |||||
| Grooming | 3 | % | 3 | % | 0 | % | 2 | % | 0 | % | 5 | % | |||||
| Health Care | 5 | % | 5 | % | 0 | % | 0 | % | 0 | % | 5 | % | |||||
| Snacks and Pet Care | 1 | % | -2 | % | 1 | % | -1 | % | 0 | % | 1 | % | |||||
| Fabric Care and Home Care | 7 | % | 5 | % | -1 | % | 0 | % | -2 | % | 4 | % | |||||
| Baby Care and Family Care | 8 | % | 8 | % | -1 | % | 1 | % | -2 | % | 6 | % | |||||
| TOTAL COMPANY | 6 | % | 5 | % | 0 | % | 1 | % | -2 | % | 5 | % | |||||
Net sales percentage changes are approximations based on quantitative formulas that are consistently applied.
BEAUTY
| ($ millions) | 2011 | Change vs. Prior Year | 2010 | Change vs. Prior Year | |||||||||
| Volume | n/a | +4 | % | n/a | +3 | % | |||||||
| Net sales | $ | 19,937 | +4 | % | $ | 19,258 | +3 | % | |||||
| Net earnings | $ | 2,542 | -1 | % | $ | 2,568 | +2 | % | |||||
Beauty net sales increased 4% to $19.9 billion on unit volume growth of 4%. Organic sales grew 3% on organic volume of 5%. Mix negatively impacted net sales by 2% behind disproportionate growth in developing regions, which have lower than segment average selling prices, and declines in the premium-priced Prestige Products and Salon Professional categories. Favorable foreign exchange positively impacted net sales growth by 1%. Volume in developing regions increased double digits, while volume in developed regions declined low single digits. Volume in Retail Hair Care grew mid-single digits behind growth in all regions except North America. Developing regions grew double digits behind initiative activity on Pantene, Head & Shoulders and Rejoice, distribution expansions and market growth, which were partially offset by a mid-single-digit decline in North America due to competitive activity. Global market share of the hair care category was up slightly. Volume in Skin, Cosmetics and Personal Care was up mid single digits primarily due to higher shipments of Olay and Safeguard behind initiative activity, and distribution expansion and market growth in developing markets. Volume in Salon Professional was down high single digits mainly due to the planned exit of non-strategic businesses and market size contractions in developed regions. Volume in Prestige Products declined low single digits primarily due to the divestiture of minor brands and lower shipments in Western Europe. Excluding the minor brand divestitures, volume increased low single digits due to growth of Dolce & Gabanna and Gucci fragrance brands behind initiative activity.
Net earnings decreased 1% in 2011 to $2.5 billion, as higher net sales were more than offset by a 60-basis point decrease in net earnings margin. Net earnings margin decreased due to gross margin contraction and higher SG&A as a percentage of net sales. Gross margin decreased primarily due to an increase in commodity costs, partially offset by manufacturing cost savings and pricing. SG&A as a percentage of net sales increased due to higher marketing spending, partially offset by lower overhead spending as a percentage of net sales and reduced foreign currency exchange costs.
Net sales increased 3% in 2010 to $19.3 billion on unit volume growth of 3%. Price increases added 1% to net sales growth as earlier price increases taken in developing regions to offset currency devaluations more than offset price reductions in Hair Care. Unfavorable geographic mix reduced net sales 1% due to disproportionate growth in developing regions, which have lower than segment average selling prices. Organic sales were up 3%. Volume growth was driven by high single-digit growth in developing regions, with a low-single-digit decrease in developed regions. Hair Care volume grew mid-single digits behind growth of Pantene, Head & Shoulders and Rejoice primarily in Asia and Latin America. Global share of the hair care market was in line with 2009. Skin, Cosmetics and Personal Care volume was up low single digits as higher shipments of skin care and personal cleansing products in developing regions were partially offset by the discontinuation of Max Factor in North America, the fiscal 2009 divestiture of Noxzema and volume share losses on non-strategic personal cleansing brands in developed regions. Salon Professional volume was down double digits mainly due to the exit of non-strategic businesses and continued market contractions. Prestige volume declined low single digits due to continued contraction of the fragrance market.
Net earnings increased 2% in 2010 to $2.6 billion driven by net sales growth, partially offset by a 10-basis point reduction in net earnings margin. Net earnings margin declined due to higher SG&A as a percentage of net sales, the impact of divestiture gains in the prior year and a higher tax rate, partially offset by gross margin expansion. SG&A as a percentage of net sales was up due to increased marketing spending and higher foreign currency exchange costs. The tax rate increase was due to a shift in the geographic mix of earnings to countries with higher statutory tax rates. Gross margin expansion was driven primarily by price increases and manufacturing costs savings.
GROOMING
| ($ millions) | 2011 | Change vs. Prior Year | 2010 | Change vs. Prior Year | |||||||||
| Volume | n/a | +3 | % | n/a | +1 | % | |||||||
| Net sales | $ | 8,245 | +5 | % | $ | 7,864 | +4 | % | |||||
| Net earnings | $ | 1,775 | +10 | % | $ | 1,621 | +8 | % | |||||
Grooming net sales increased 5% to $8.2 billion on volume growth of 3%. Organic sales were up 5%. Price increases, taken primarily across blades and razors in Latin America and developed regions, contributed 2% to net sales growth. Volume grew high single digits in developing regions and decreased low single digits in developed regions. Volume for blades and razors was up low single digits due to market growth in developing regions, partially offset by reduced volume in the developed regions.
Gillette Fusion and Venus shipments increased double digits behind distribution expansion and initiative activity; while Mach3 shipments increased low single digits due to growth in developing regions, partially offset by decreases in developed markets. Global market share of the blades and razors category was down about half a point. Volume in Appliances decreased low single digits due to competitive activity and a shift from low-tier, high volume products to higher-tier product offerings. Global market share of the dry shave category was down half a point.
Net earnings increased 10% to $1.8 billion behind higher net sales and a 90-basis point increase in net earnings margin. Net earnings margin increased due to gross margin expansion, a lower effective tax rate and a decrease in SG&A as a percentage of net sales. Gross margin increased due to price increases, the favorable impact of volume scale leverage and manufacturing cost savings. The tax rate decrease was due to a shift in the geographic mix of earnings to countries with lower statutory tax rates. SG&A as a percentage of net sales was down due to lower foreign currency exchange costs and lower overhead spending as a percentage of net sales due to sales leverage, partially offset by higher marketing spending.
Net sales increased 4% to $7.9 billion in 2010 on a 1% increase in unit volume. Price increases, taken primarily in developing regions to offset currency devaluations and across blades and razors, added 4% to net sales. Product mix had a negative 1% impact on net sales due mainly to disproportionate growth in developing regions and of disposable razors, both of which have lower than segment average selling prices. Organic sales grew 4%. Volume in developing regions increased low single digits, while volume in developed regions was in line with the prior year. Volume for blades and razors was up low single digits mainly due to growth of disposable razors in developing regions. Mach3 shipments declined high single digits, while Gillette Fusion shipments increased double digits behind the launch of the new Fusion ProGlide. Global market share of the blades and razors category was down about half a point versus the prior year. Volume in Appliances was down low single digits behind a mid-single-digit decline in developing regions, due mostly to market contractions and volume share losses in home and hair care appliances. Global value share of the dry shaving market was up half a point.
Net earnings increased 8% to $1.6 billion in 2010 behind sales growth and net earnings margin expansion. Net earnings margin increased 80-basis points driven by gross margin expansion and a lower tax rate, partially offset by higher SG&A as a percentage of net sales. Gross margin increased mainly due to price increases and manufacturing cost savings. The reduction in the tax rate was mainly due to a shift in the geographic mix of earnings to developing regions which generally have lower statutory tax rates. The increase in SG&A as a percentage of net sales was driven by higher marketing spending and incremental foreign currency exchange costs, partially offset by lower overhead spending as a percentage of net sales.
HEALTH CARE
| ($ millions) | 2011 | Change vs. Prior Year | 2010 | Change vs. Prior Year | |||||||||
| Volume | n/a | +5 | % | n/a | +3 | % | |||||||
| Net sales | $ | 12,033 | +5 | % | $ | 11,493 | +2 | % | |||||
| Net earnings | $ | 1,796 | -3 | % | $ | 1,860 | +1 | % | |||||
Health Care net sales increased 5% to $12.0 billion on 5% growth in unit volume. Organic sales were up 5%. Volume increased high single digits in developing regions and low single digits in developed regions. Volume in Oral Care grew mid-single digits behind initiative activity and incremental merchandising support of Crest and Oral-B. Global market share of the oral care category was up over half a point. Volume in Personal Health Care grew low single digits behind higher shipments of Vicks in North America and the developing regions, partially offset by continuing decline of Prilosec OTC in North America due to competitive activity. All-outlet value share of the U.S. personal health care market increased about half a point. Volume in Feminine Care was up mid-single digits mainly due to higher shipments of Naturella, behind expansion into developing regions, and Always, behind initiative activity in developing regions. Global market share of the feminine care category was down less than half a point.
Net earnings decreased 3% to $1.8 billion as higher net sales were more than offset by a 130-basis point decrease in net earnings margin. Net earnings margin decreased due to lower gross margin, higher SG&A as a percentage of net sales and a higher effective tax rate. Gross margin declined due to higher commodity costs and unfavorable mix due to disproportionate growth in developing regions, partially offset by manufacturing cost savings. SG&A as a percentage of net sales increased behind higher marketing spending to support growth, partially offset by lower foreign currency exchange costs. The tax rate increase was due to a shift in the geographic mix of earnings to countries with higher statutory tax rates.
In July 2011, P&G and Teva Pharmaceutical Industries Ltd. reached a definitive agreement to create a partnership in consumer health care by bringing together both companies' existing over-the-counter medicine businesses and complementary
capabilities. The partnership is expected to have over $1.0 billion in annual sales, only a portion of which will be incremental to our Consolidated Financial Statements. The Company expects the transaction to close by the end of the 2011 calendar year, pending necessary regulatory approvals.
Net sales increased 2% in 2010 to $11.5 billion on unit volume growth of 3%. Price increases, taken mainly in developing regions to offset currency devaluations, added 1% to net sales. Unfavorable mix reduced net sales by 2% mainly due to disproportionate growth in developing regions, which have lower than segment average selling prices. Organic sales increased 2%. Volume grew mid-single digits in developing regions and low single digits in developed regions. Oral Care volume grew mid-single digits behind initiative activity in Western Europe, Latin America and Asia. Personal Health Care volume was up low single digits behind higher shipments of Vicks and diagnostic products, partially offset by a continuing decline of Prilosec OTC in North America due to increased competitive activity. All-outlet value share of the U.S. personal health care market declined 1-share point, led by a 5-share point decline of Prilosec OTC's share of the upper stomach remedies segment. Feminine Care volume increased low single digits behind initiative-driven growth of Always and expansion of Naturella into China. Global market share of the feminine care category was down about half a point.
Net earnings increased 1% to $1.9 billion for 2010 on higher net sales, partially offset by a 10-basis point reduction in net earnings margin. Net earnings margin contracted due to higher SG&A as a percentage of net sales, partially offset by higher gross margin. SG&A as a percentage of net sales increased due to higher marketing and overhead spending and incremental foreign currency exchange costs. Gross margin grew behind price increases, lower commodity costs and manufacturing cost savings.
SNACKS AND PET CARE
| ($ millions) | 2011 | Change vs. Prior Year | 2010 | Change vs. Prior Year | |||||||||
| Volume | n/a | +1 | % | n/a | -2 | % | |||||||
| Net sales | $ | 3,156 | +1 | % | $ | 3,135 | +1 | % | |||||
| Net earnings | $ | 241 | -26 | % | $ | 326 | +39 | % | |||||
Snacks and Pet Care net sales increased 1% to $3.2 billion on a 1% increase in unit volume. Organic sales, which exclude the impacts of foreign exchange and the Natura acquisition, were down 5% on a 2% decline in organic volume. Price decreases, through higher promotional spending, reduced net sales growth by 1%. Favorable foreign exchange positively impacted net sales growth by 1%. Snacks volume increased high single digits mainly due to increased distribution in CEEMEA and Latin America, as well as initiatives and incremental merchandising activity. Global market share of the snacks category was up slightly. Pet Care volume was down mid-single digits mainly due to the impacts of the recall of select dry pet food products and the supply constraints resulting from restructuring the supply chain following the recalls, partially offset by the impact of the Natura acquisition in June 2010. Excluding the Natura acquisition, Pet Care volume decreased double digits. Global market share of the pet care category was down half a point.
Net earnings decreased 26% to $241 million as sales growth was more than offset by a 280-basis point decrease in net earnings margin. Net earnings margin decreased due to operating margin contraction partially offset by a lower effective tax rate. The operating margin reduction was driven by lower gross margin and increased SG&A as a percentage of net sales. Gross margin declined behind incremental costs and reduced scale leverage related to the pet food recall and supply chain restructuring efforts. SG&A as a percentage of net sales increased due to costs related to the select dry pet food products recall. The tax rate decrease was due to a shift in the geographic mix of earnings to countries with lower statutory tax rates.
In April 2011, we announced plans to divest the Company's Snacks business through a merger with Diamond Foods, Inc. in an all-stock Reverse Morris Trust transaction. The Snacks business had net sales of approximately $1.5 billion and operating income of approximately $200 million in fiscal 2011. The Company expects the transaction to close by the end of the 2011 calendar year, pending necessary regulatory approvals.
Net sales increased 1% in 2010 to $3.1 billion on a 2% decline in unit volume. Price increases, taken primarily to offset prior-year commodity cost increases, added 3% to net sales. Favorable foreign exchange added 1% to net sales. Mix reduced net sales by 1% due to the discontinuation of certain premium snack products, which have higher than segment average selling prices, and higher shipments of large size pet products, which have lower than segment average selling prices. Organic sales were in line with the prior year. Volume in Snacks was down mid-single digits behind volume share losses driven by lower merchandising activity in North America and the discontinuation of certain premium snack products. Global market share of the snacks category was down half a point versus the prior year. Volume in Pet Care was up low single digits behind the continued success of product initiatives, increased marketing support and incremental merchandising activity.
Net earnings increased 39% to $326 million in 2010 driven by higher net sales and a 290-basis point increase in net earnings margin. Net earnings margin expanded due to higher gross margin and a lower tax rate, partially offset by higher SG&A as a percentage of net sales. Gross margin expanded behind price increases, commodity cost declines and manufacturing cost savings. The tax rate declined due to a shift in the geographic mix of earnings to countries with lower statutory tax rates. SG&A as a percentage of net sales increased due to higher marketing and overhead spending.
FABRIC CARE AND HOME CARE
| ($ millions) | 2011 | Change vs. Prior Year | 2010 | Change vs. Prior Year | |||||||||
| Volume | n/a | +7 | % | n/a | +6 | % | |||||||
| Net sales | $ | 24,837 | +4 | % | $ | 23,805 | +3 | % | |||||
| Net earnings | $ | 3,009 | -10 | % | $ | 3,339 | +10 | % | |||||
Fabric Care and Home Care net sales increased 4% to $24.8 billion on a 7% increase in unit volume. Organic sales were up 3%. Organic volume, which excludes the impact of the Ambi Pur acquisition, increased 5%. Mix negatively impacted net sales growth by 2% due to disproportionate growth of mid-tier product lines and powdered laundry detergents, which have lower than segment average selling prices. Unfavorable foreign exchange reduced net sales by 1%. Volume in developing regions was up high single digits, while volume in developed regions grew mid-single digits. Fabric Care volume increased mid-single digits, led by high single-digit growth in developing regions behind initiative activity, increased distribution and market growth. Global market share of the fabric care category increased slightly. Home Care volume increased double digits due, in part, to the Ambi Pur acquisition. Organic volume in Home Care was up high single digits driven mainly by initiative activity, including launches of Gain hand dishwashing liquid and Febreze Set & Refresh in North America, and geographic expansion of dish and air care product lines. Global market share of the home care category was up nearly 1 point. Batteries volume grew mid-single digits primarily due to price reductions executed through pack count increases in North America, which were implemented in January 2010, initiative activity in Western Europe and market growth and distribution expansion in Asia. Global market share of the batteries category increased more than half a point.
Net earnings decreased 10% to $3.0 billion as net sales growth was more than offset by a 190-basis point decrease in net earnings margin. Net earnings margin decreased mainly due to gross margin contraction. SG&A as a percentage of net sales and the effective tax rate also increased. Gross margin decreased mainly due to higher commodity costs and unfavorable product mix behind disproportionate growth of developing regions and mid-tier products, partially offset by manufacturing cost savings. SG&A as a percentage of net sales increased behind higher overhead spending to support growth. The tax rate increased due to a shift in the geographic mix of earnings to countries with higher statutory tax rates.
Net sales increased 3% to $23.8 billion in 2010 on a 6% increase in unit volume. Pricing reduced net sales by 1% as the impact of price reductions to improve consumer value were partially offset by price increases taken primarily in developing regions to offset currency devaluations. Mix lowered net sales by 1% due mainly to unfavorable geographic mix and a shift toward larger size products, which have lower than segment average selling prices. Unfavorable foreign exchange reduced net sales by 1%. Organic sales grew 4%. Volume increased mid-single digits in both developed and developing regions. Fabric Care volume grew mid-single digits behind new product launches, price reductions and incremental merchandising activity. Global market share of the fabric care category was down about half a point. Home Care volume was up high single digits mainly due to new product launches, media spending increases and market size expansion. Global market share of the home care category was up about half a point versus 2009. Batteries volume increased mid-single digits primarily due to growth in Greater China, price reductions to improve consumer value in North America and higher demand from business customers.
Net earnings increased 10% to $3.3 billion in 2010 due to higher net sales and a 90-basis point increase in net earnings margin. Net earnings margin increased due to higher gross margin and a lower tax rate, partially offset by an increase in SG&A as a percentage of net sales. Gross margin increased mainly due to lower commodity costs and manufacturing cost savings, while SG&A as a percentage of net sales increased due to higher marketing spending. The tax rate declined due to a shift in the geographic mix of earnings to countries with lower statutory tax rates.
BABY CARE AND FAMILY CARE
| ($ millions) | 2011 | Change vs. Prior Year | 2010 | Change vs. Prior Year | |||||||||
| Volume | n/a | +8 | % | n/a | +7 | % | |||||||
| Net sales | $ | 15,606 | +6 | % | $ | 14,736 | +4 | % | |||||
| Net earnings | $ | 1,978 | -3 | % | $ | 2,049 | +16 | % | |||||
Baby Care and Family Care net sales increased 6% to $15.6 billion on 8% volume growth. Organic sales were up 7%. Mix reduced net sales by 2% driven mainly by disproportionate growth of mid-tier product lines, larger package sizes and developing regions, all of which have lower than segment average selling prices. Pricing added 1% to net sales growth primarily due to price increases executed in Baby Care to offset higher commodity costs and foreign exchange. Unfavorable foreign exchange negatively impacted net sales by 1%. Volume grew double digits in developing regions and mid-single digits in developed regions. Volume in Baby Care was up high single digits primarily due to double-digit growth in developing regions behind initiative activity, market size growth and distribution expansion. Global market share of the baby care category increased over 1 point. Volume in Family Care increased high single digits driven by the continued impact of initiatives launched in prior periods, with high single-digit growth in North America. In the U.S., all-outlet share of the family care category increased half a point.
Net earnings decreased 3% to $2.0 billion as sales growth was more than offset by a 120-basis point reduction in net earnings margin. Net earnings margin declined mainly due to a lower gross margin, partially offset by a decrease in SG&A as a percentage of net sales. The reduction in gross margin was driven by higher commodity costs and unfavorable product mix, behind disproportionate growth of mid-tier product lines, larger package sizes and developing regions, which were only partially offset by the favorable impact of volume scale leverage and manufacturing cost savings. SG&A as a percentage of net sales declined due to lower foreign currency exchange costs.
Net sales grew 4% to $14.7 billion in 2010 on 7% volume growth. Pricing was in line with the prior year as the impact of price increases primarily taken in developing regions to offset local currency devaluations were offset by price reductions to improve consumer value. Negative mix reduced net sales by 2% driven mainly by disproportionate growth of mid-tier product lines, large count packs and developing regions, all of which have lower than segment average selling prices. Unfavorable foreign exchange reduced net sales by 1%. Organic sales increased 5%. Volume grew double digits in developing regions and mid-single digits in developed regions. Volume in Baby Care increased high single digits behind incremental initiative activity, market size expansion and price reductions to improve consumer value, primarily in CEEMEA. Global share of the baby care market was up over half a point. Volume in Family Care grew high single digits due to increased merchandising and initiative activity, market growth and price reductions to improve consumer value.
Net earnings increased 16% to $2.0 billion in 2010 behind net sales growth and 140 basis points of net earnings margin expansion driven by higher gross margin, partially offset by higher SG&A as a percentage of net sales. Gross margin increased mainly due to lower commodity costs and manufacturing cost savings. SG&A as a percentage of net sales increased primarily behind incremental marketing investments and higher foreign currency exchange costs.
Corporate
Corporate includes certain operating and non-operating activities not allocated to specific business units. These include: the incidental businesses managed at the corporate level; financing and investing activities; other general corporate items; the historical results of certain divested brands and categories; and certain restructuring-type activities to maintain a competitive cost structure, including manufacturing and workforce optimization. Corporate also includes reconciling items to adjust the accounting policies used in the segments to U.S. GAAP. The most significant reconciling items include income taxes (to adjust from statutory rates that are reflected in the segments to the overall Company effective tax rate), adjustments for unconsolidated entities (to eliminate net sales, cost of products sold and SG&A for entities that are consolidated in the segments but accounted for using the equity method for U.S. GAAP) and noncontrolling interest adjustments for subsidiaries where we do not have 100% ownership. Since certain unconsolidated entities and less than 100%-owned subsidiaries are managed as integral parts of the Company, they are accounted for similar to a wholly-owned subsidiary for management and segment purposes. This means our segment results recognize 100% of each income statement component through before-tax earnings in the segments, with eliminations for unconsolidated entities and noncontrolling interests in Corporate. In determining segment net earnings, we apply the statutory tax rates (with adjustments to arrive at the Company's effective tax rate in Corporate) and eliminate the share of earnings applicable to other ownership interests, in a manner similar to noncontrolling interest.
Corporate net sales primarily reflect the adjustment to eliminate the sales of unconsolidated entities included in business segment results. Accordingly, Corporate net sales are generally a negative balance. In 2011, negative net sales in Corporate were down $98 million due to adjustments required to eliminate sales of unconsolidated entities. Net income from continuing operations increased $1.3 billion to $586 million. The increase was due to current-period net discrete adjustments to reverse reserves for uncertain tax positions, prior-period charges for the taxation of certain future retiree prescription drug subsidy payments in the U.S., lower current-period interest expense, a reduction in restructuring-type charges and current-year divestiture gains. Additional discussion of the items impacting net income in Corporate are included in the Results of Operations section.
In 2010, negative net sales in Corporate were up 2% mainly due to adjustments required to eliminate sales of unconsolidated
entities. Net expenses from continuing operations increased $579 million to $707 million. The increase was primarily due to 2010 charges for competition law fines and for enacted legislation impacting the taxation of certain future retiree prescription drug subsidy payments in the U.S. and the impact of higher prior-period divestiture gains and tax audit settlements. These impacts were partially offset by lower interest expense and restructuring charges in 2010.
FINANCIAL CONDITION
We believe our financial condition continues to be of high quality, as evidenced by our ability to generate substantial cash from operations and ready access to capital markets at competitive rates.
Operating cash flow provides the primary source of funds to finance operating needs and capital expenditures. Excess operating cash is used first to fund shareholder dividends. Other discretionary uses include share repurchases and tack-on acquisitions to complement our portfolio of brands and geographies. As necessary, we may supplement operating cash flow with debt to fund these activities. The overall cash position of the Company reflects our strong business results and a global cash management strategy that takes into account liquidity management, economic factors and tax considerations.
Operating Activities
Operating cash flow was $13.3 billion in 2011, an 17% decrease versus the prior year. Operating cash flow resulted primarily from net earnings adjusted for non-cash items (depreciation and amortization, stock-based compensation, deferred income taxes and gain on the sale of businesses), partially offset by an increase in working capital. The net of accounts receivable, inventory and accounts payable consumed $569 million of operating cash flow in 2011 mainly due to increases in inventories and accounts receivables. Inventory consumed $501 million driven by higher commodity costs, business growth and increased stock levels in advance of initiatives and sourcing changes. Inventory days on hand increased by five days due to the impact of foreign exchange, higher commodity costs and increased safety stock levels. Accounts receivable used $426 million primarily to support business growth. Accounts receivable days sales outstanding were up three days due to timing of sales and the impact of foreign exchange. Inventory and accounts receivable increases were partially offset by accounts payable, accrued and other liabilities, which increased to support business growth. Other operating assets and liabilities were also a significant use of operating cash flow due primarily to net reductions in reserves for uncertain tax positions and an increase in the amount of value added taxes due from various governmental authorities. In the prior year, working capital was a net source of cash.
Operating cash flow was $16.1 billion in 2010, an 8% increase versus the prior year. Operating cash flow resulted primarily from net earnings adjusted for non-cash items (depreciation and amortization, stock-based compensation, deferred income taxes and gain on the sale of businesses) and a reduction in working capital. The increase in operating cash flow versus 2009 was primarily due to the 2010 reduction in working capital balances, partially offset by a decline in earnings versus 2009. The net of accounts receivable, inventory, and accounts payable contributed $2.5 billion to operating cash flow in 2010 mainly due to an increase in accounts payable, accrued and other liabilities. Accounts payable, accrued and other liabilities increased primarily due to increased expenditures to support business growth, primarily related to the increased marketing investments. Accounts receivable days were down year over year due mainly to the global pharmaceuticals divestiture and improved collection efforts. Inventory contributed to operating cash flow despite growth in the business from a reduction in days on hand primarily due to inventory management improvement efforts. Cash flow from discontinued operations contributed $285 million to operating cash flow.
Free Cash Flow. We view free cash flow as an important measure because it is one factor impacting the amount of cash available for dividends and discretionary investment. It is defined as operating cash flow less capital expenditures and is one of the measures used to evaluate senior management and determine their at-risk compensation. Free cash flow was $10.0 billion in 2011, a decrease of 23% versus the prior year. Free cash flow decreased due to lower operating cash flow and higher capital spending. Free cash flow productivity, defined as the ratio of free cash flow to net earnings, was 84% in 2011.
In 2010, free cash flow was $13.1 billion an increase of 11% versus the prior year. Free cash flow increased due to higher operating cash flow and lower capital spending. Free cash flow productivity was 102% in 2010. This included a negative 23% impact resulting from the global pharmaceuticals divestiture, which increased net earnings and lowered operating cash flow due to tax payments on the divestiture gain.
Investing Activities
Net investing activities consumed $3.5 billion of cash in 2011 and $597 million in 2010 mainly due to capital spending and acquisitions, partially offset by proceeds from asset sales, including $3.0 billion in cash received from the sale of our global pharmaceuticals business in 2010.
Capital Spending. We view capital spending efficiency as a critical component of our overall cash management strategy. We manage capital spending to support our business growth plans and have cost controls to deliver our cash generation targets. Capital expenditures, primarily to support capacity expansion, innovation and cost savings, were $3.3 billion in 2011 and $3.1 billion in 2010. The increase in capital spending resulted primarily from capacity expansions. Capital spending as a percentage of net sales increased 10 basis points to 4.0% in 2011. Capital spending as a percentage of net sales decreased 30 basis points to 3.9% in 2010 behind the scale leverage of net sales growth and a reduction in capital spending.
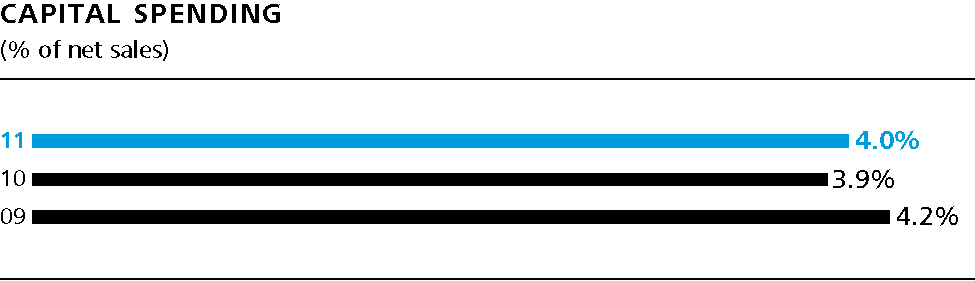
Acquisitions. Acquisitions used $474 million of cash in 2011 primarily for the acquisition of Ambi Pur, an air freshener business. In 2010, acquisitions used $425 million of cash primarily for the acquisition of Natura, a leading producer and distributor of branded premium natural pet foods.
Proceeds from Asset Sales. Proceeds from asset sales contributed $225 million to cash in 2011 mainly due to the sale of our Infasil brand in Western Europe and Zest brand in North America. In 2010, proceeds from asset sales contributed $3.1 billion to cash mainly due to the sale of our global pharmaceuticals business.
Financing Activities
Dividend Payments. Our first discretionary use of cash is dividend payments. Dividends per common share increased 9% to $1.97 per share in 2011. Total dividend payments to common and preferred shareholders were $5.8 billion in 2011 and $5.5 billion in 2010. The increase in dividend payments resulted from increases in our quarterly dividends per share, partially offset by a reduction in the number of shares outstanding. In April 2011, the Board of Directors declared an increase in our quarterly dividend from $0.4818 to $0.525 per share on Common Stock and Series A and B ESOP Convertible Class A Preferred Stock. This represents a 9% increase compared to the prior quarterly dividend and is the 55th consecutive year that our dividend has increased. We have paid a dividend in every year since our incorporation in 1890.
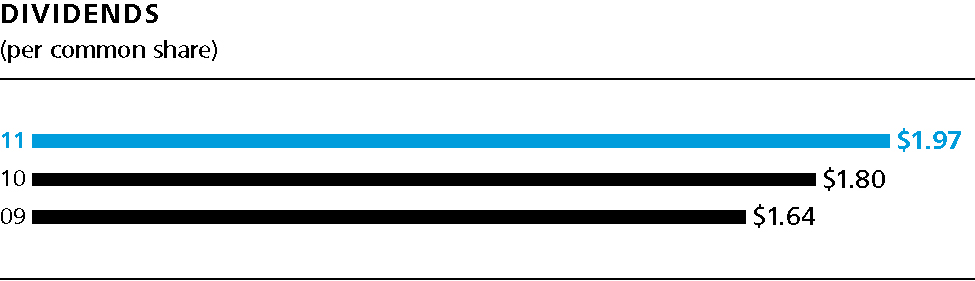
Long-Term and Short-Term Debt. We maintain debt levels we consider appropriate after evaluating a number of factors, including cash flow expectations, cash requirements for ongoing operations, investment and financing plans (including acquisitions and share repurchase activities) and the overall cost of capital. Total debt was $32.0 billion in 2011 and $29.8 billion in 2010. Our total debt increased in 2011 mainly due to net debt issuances to fund general corporate purposes.
Treasury Purchases. Total share repurchases were $7.0 billion in 2011 and $6.0 billion in 2010.
Liquidity
Our current liabilities exceeded current assets by $5.3 billion, largely due to our commercial paper program. We anticipate being able to support our short-term liquidity and operating needs largely through cash generated from operations. We utilize short- and long-term debt to fund discretionary items such as acquisitions and share repurchases. We have strong short- and long-term debt ratings which have enabled and should continue to enable us to refinance our debt as it becomes due at favorable rates in commercial paper and bond markets. In addition, we have agreements with a diverse group of financial institutions that, if needed, should provide sufficient credit funding to meet short-term financing requirements.
On June 30, 2011, our short-term credit ratings were P-1 (Moody's) and A-1+ (Standard & Poor's), while our long-term credit
ratings are Aa3 (Moody's) and AA- (Standard & Poor's), both with a stable outlook.
We maintain bank credit facilities to support our ongoing commercial paper program. These facilities can be extended for certain periods of time as specified in, and in accordance with, the terms of each credit agreement. The current facility is an $11.0 billion facility split between a $7.0 billion 5-year facility and a $4.0 billion 364-day facility, which expire in August 2016 and August 2012, respectively. We anticipate that these facilities will remain largely undrawn for the foreseeable future. These credit facilities do not have cross-default or ratings triggers, nor do they have material adverse events clauses, except at the time of signing. In addition to these credit facilities, we have an automatically effective registration statement on Form S-3 filed with the SEC that is available for registered offerings of short- or long-term debt securities.
Guarantees and Other Off-Balance Sheet Arrangements
We do not have guarantees or other off-balance sheet financing arrangements, including variable interest entities, which we believe could have a material impact on financial condition or liquidity.
Contractual Commitments
The following table provides information on the amount and payable date of our contractual commitments as of June 30, 2011.
| ($ millions) | Total | Less Than 1 Year | 1-3 Years | 3-5 Years | After 5 Years | ||||||||||||||
| RECORDED LIABILITIES | |||||||||||||||||||
| Total debt | $ | 31,494 | $ | 9,933 | $ | 5,959 | $ | 5,095 | $ | 10,507 | |||||||||
| Capital leases | 407 | 46 | 89 | 75 | 197 | ||||||||||||||
Uncertain tax positions(1) | 77 | 77 | — | — | — | ||||||||||||||
| OTHER | |||||||||||||||||||
| Interest payments relating to long-term debt | 9,897 | 1,002 | 1,744 | 1,313 | 5,838 | ||||||||||||||
Operating leases(2) | 1,499 | 264 | 416 | 314 | 505 | ||||||||||||||
Minimum pension funding(3) | 1,070 | 391 | 679 | — | — | ||||||||||||||
Purchase obligations(4) | 3,012 | 1,351 | 1,130 | 258 | 273 | ||||||||||||||
| TOTAL CONTRACTUAL COMMITMENTS | 47,456 | 13,064 | 10,017 | 7,055 | 17,320 | ||||||||||||||
| (1) | As of June 30, 2011, the Company's Consolidated Balance Sheet reflects a liability for uncertain tax positions of $2.4 billion, including $555 million of interest and penalties. Due to the high degree of uncertainty regarding the timing of future cash outflows of liabilities for uncertain tax positions beyond one year, a reasonable estimate of the period of cash settlement beyond twelve months from the balance sheet date of June 30, 2011 cannot be made. |
| (2) | Operating lease obligations are shown net of guaranteed sublease income. |
| (3) | Represents future pension payments to comply with local funding requirements. The projected payments beyond fiscal year 2014 are not currently determinable. |
| (4) | Primarily reflects future contractual payments under various take-or-pay arrangements entered into as part of the normal course of business. Commitments made under take-or-pay obligations represent future purchases in line with expected usage to obtain favorable pricing. Approximately 26% relates to service contracts for information technology, human resources management and facilities management activities that have been outsourced. While the amounts listed represent contractual obligations, we do not believe it is likely that the full contractual amount would be paid if the underlying contracts were canceled prior to maturity. In such cases, we generally are able to negotiate new contracts or cancellation penalties, resulting in a reduced payment. The amounts do not include obligations related to other contractual purchase obligations that are not take-or-pay arrangements. Such contractual purchase obligations are primarily purchase orders at fair value that are part of normal operations and are reflected in historical operating cash flow trends. We do not believe such purchase obligations will adversely affect our liquidity position. |
SIGNIFICANT ACCOUNTING POLICIES AND ESTIMATES
In preparing our financial statements in accordance with U.S. GAAP, there are certain accounting policies that may require a choice between acceptable accounting methods or may require substantial judgment or estimation in their application. These include income taxes, certain employee benefits and acquisitions, goodwill and intangible assets. We believe these accounting policies, and others set forth in Note 1 to the Consolidated Financial Statements, should be reviewed as they are integral to understanding the results of operations and financial condition of the Company.
The Company has discussed the selection of significant accounting policies and the effect of estimates with the Audit
Committee of the Company's Board of Directors.
Income Taxes
Our annual tax rate is determined based on our income, statutory tax rates and the tax impacts of items treated differently for tax purposes than for financial reporting purposes. Tax law requires certain items be included in the tax return at different times than the items are reflected in the financial statements. Some of these differences are permanent, such as expenses that are not deductible in our tax return, and some differences are temporary, reversing over time, such as depreciation expense. These temporary differences create deferred tax assets and liabilities.
Deferred tax assets generally represent the tax effect of items that can be used as a tax deduction or credit in future years for which we have already recorded the tax benefit in our income statement. Deferred tax liabilities generally represent tax expense recognized in our financial statements for which payment has been deferred, the tax effect of expenditures for which a deduction has already been taken in our tax return but has not yet been recognized in our financial statements or assets recorded at fair value in business combinations for which there was no corresponding tax basis adjustment.
Inherent in determining our annual tax rate are judgments regarding business plans, planning opportunities and expectations about future outcomes. Realization of certain deferred tax assets is dependent upon generating sufficient taxable income in the appropriate jurisdiction prior to the expiration of the carryforward periods. Although realization is not assured, management believes it is more likely than not that our deferred tax assets, net of valuation allowances, will be realized.
We operate in multiple jurisdictions with complex tax policy and regulatory environments. In certain of these jurisdictions, we may take tax positions that management believes are supportable, but are potentially subject to successful challenge by the applicable taxing authority. These interpretational differences with the respective governmental taxing authorities can be impacted by the local economic and fiscal environment. We evaluate our tax positions and establish liabilities in accordance with the applicable accounting guidance on uncertainty in income taxes. We review these tax uncertainties in light of changing facts and circumstances, such as the progress of tax audits, and adjust them accordingly. We have a number of audits in process in various jurisdictions. Although the resolution of these tax positions is uncertain, based on currently available information, we believe that the ultimate outcomes will not have a material adverse effect on our financial position, results of operations or cash flows.
Because there are a number of estimates and assumptions inherent in calculating the various components of our tax provision, certain changes or future events such as changes in tax legislation, geographic mix of earnings, completion of tax audits or earnings repatriation plans could have an impact on those estimates and our effective tax rate.
Employee Benefits
We sponsor various post-employment benefits throughout the world. These include pension plans, both defined contribution plans and defined benefit plans, and other post-employment benefit (OPEB) plans, consisting primarily of health care and life insurance for retirees. For accounting purposes, the defined benefit pension and OPEB plans require assumptions to estimate the projected and accumulated benefit obligations, including the following variables: discount rate; expected salary increases; certain employee-related factors, such as turnover, retirement age and mortality; expected return on assets and health care cost trend rates. These and other assumptions affect the annual expense and obligations recognized for the underlying plans. Our assumptions reflect our historical experiences and management's best judgment regarding future expectations. As permitted by U.S. GAAP, the net amount by which actual results differ from our assumptions is deferred. If this net deferred amount exceeds 10% of the greater of plan assets or liabilities, a portion of the deferred amount is included in expense for the following year. The cost or benefit of plan changes, such as increasing or decreasing benefits for prior employee service (prior service cost), is deferred and included in expense on a straight-line basis over the average remaining service period of the employees expected to receive benefits.
The expected return on plan assets assumption impacts our defined benefit expense, since many of our defined benefit pension plans and our primary OPEB plan are funded. The process for setting the expected rates of return is described in Note 8 to the Consolidated Financial Statements. For 2011, the average return on assets assumptions for pension plan assets and OPEB assets were 7.0% and 9.2%, respectively. A change in the rate of return of 50 basis points for both pension and OPEB assets would impact annual after-tax benefit expense by less than $50 million.
Since pension and OPEB liabilities are measured on a discounted basis, the discount rate impacts our plan obligations and expenses. Discount rates used for our U.S. defined benefit pension and OPEB plans are based on a yield curve constructed from a portfolio of high quality bonds for which the timing and amount of cash outflows approximate the estimated payouts of the plan. For our international plans, the discount rates are set by benchmarking against investment grade corporate bonds rated AA or better. The average discount rate on the defined benefit pension plans of 5.3% represents a weighted average of local rates in
countries where such plans exist. A 50 basis point change in the discount rate would impact annual after-tax defined benefit pension expense by less than $60 million. The average discount rate on the OPEB plan of 5.7% reflects the higher interest rates generally applicable in the U.S., which is where a majority of the plan participants receive benefits. A 50 basis point change in the discount rate would impact annual after-tax OPEB expense by less than $35 million.
Acquisitions, Goodwill and Intangible Assets
We account for acquired businesses using the purchase method of accounting. Under the purchase method, our Consolidated Financial Statements reflect the operations of an acquired business starting from the completion of the acquisition. In addition, the assets acquired and liabilities assumed must be recorded at the date of acquisition at their respective estimated fair values, with any excess of the purchase price over the estimated fair values of the net assets acquired recorded as goodwill.
Significant judgment is required in estimating the fair value of intangible assets and in assigning their respective useful lives. Accordingly, we typically obtain the assistance of third-party valuation specialists for significant items. The fair value estimates are based on available historical information and on future expectations and assumptions deemed reasonable by management, but are inherently uncertain.
We typically use an income method to estimate the fair value of intangible assets, which is based on forecasts of the expected future cash flows attributable to the respective assets. Significant estimates and assumptions inherent in the valuations reflect a consideration of other marketplace participants, and include the amount and timing of future cash flows (including expected growth rates and profitability), the underlying product or technology life cycles, economic barriers to entry, a brand's relative market position and the discount rate applied to the cash flows. Unanticipated market or macroeconomic events and circumstances may occur, which could affect the accuracy or validity of the estimates and assumptions.
Determining the useful life of an intangible asset also requires judgment. Certain brand intangibles are expected to have indefinite lives based on their history and our plans to continue to support and build the acquired brands. Other acquired intangible assets (e.g., certain trademarks or brands, customer relationships, patents and technologies) are expected to have determinable useful lives. Our assessment as to brands that have an indefinite life and those that have a determinable life is based on a number of factors including competitive environment, market share, brand history, underlying product life cycles, operating plans and the macroeconomic environment of the countries in which the brands are sold. Our estimates of the useful lives of determinable-lived intangibles are primarily based on these same factors. All of our acquired technology and customer-related intangibles are expected to have determinable useful lives.
The costs of determinable-lived intangibles are amortized to expense over their estimated life. The value of indefinite-lived intangible assets and residual goodwill is not amortized, but is tested at least annually for impairment. Our impairment testing for goodwill is performed separately from our impairment testing of indefinite-lived intangibles. We test goodwill for impairment by reviewing the book value compared to the fair value at the reportable unit level. We test individual indefinite-lived intangibles by reviewing the individual book values compared to the fair value. We determine the fair value of our reporting units and indefinite-lived intangible assets based on the income approach. Under the income approach, we calculate the fair value of our reporting units and indefinite-lived intangible assets based on the present value of estimated future cash flows. Considerable management judgment is necessary to evaluate the impact of operating and macroeconomic changes and to estimate future cash flows to measure fair value. Assumptions used in our impairment evaluations, such as forecasted growth rates and cost of capital, are consistent with internal projections and operating plans. We believe such assumptions and estimates are also comparable to those that would be used by other marketplace participants. When certain events or changes in operating conditions occur, indefinite-lived intangible assets may be reclassified to a determinable life asset and an additional impairment assessment may be performed. We did not recognize any material impairment charges for goodwill or intangible assets during the years presented.
Our annual impairment testing for both goodwill and indefinite-lived intangible assets indicated that all reporting unit and indefinite-lived intangible asset fair values exceeded their respective recorded values. However, future changes in the judgments, assumptions and estimates that are used in our impairment testing for goodwill and indefinite-lived intangible assets, including discount and tax rates or future cash flow projections, could result in significantly different estimates of the fair values. A significant reduction in the estimated fair values could result in impairment charges that could materially affect the financial statements in any given year. The recorded value of goodwill and intangible assets from recently acquired businesses are derived from more recent business operating plans and macroeconomic environmental conditions and therefore are more susceptible to an adverse change that could require an impairment charge.
For example, the Gillette intangible and goodwill amounts represent values as of a relatively more recent acquisition date, and as such, the amounts are more susceptible to an impairment risk if business operating results or macroeconomic conditions deteriorate. Gillette indefinite-lived intangible assets represent approximately 88% of the $27.8 billion of indefinite-lived
intangible assets at June 30, 2011. Goodwill allocated to stand-alone reporting units consisting primarily of businesses purchased as part of the Gillette acquisition represents 42% of the $57.6 billion of goodwill at June 30, 2011. This includes the Male Grooming and Appliance businesses, which are components of the Grooming segment, and the Batteries business, which is part of the Fabric Care and Home Care segment.
With the exception of our Appliances and Salon Professional businesses, all of our other reporting units have fair values that significantly exceed recorded values. As noted above, the Appliances business was acquired as part of the Gillette acquisition and is a stand-alone goodwill reporting unit. The Salon Professional business, which consists primarily of operations acquired in the Wella acquisition, became a new stand-alone goodwill reporting unit as of July 1, 2009. These businesses represent some of our more discretionary consumer spending categories. The Appliances business has goodwill of $1.6 billion, while the Salon Professional business has goodwill of $885 million. The estimated fair values of our Appliances and Salon Professional businesses exceed their carrying values by approximately 10% and 30%, respectively. Because purchases in these categories are more discretionary in nature, their operations and underlying fair values were disproportionately impacted by the economic downturn that began in fiscal 2009, which led to a reduction in home and personal grooming appliance purchases and in visits to hair salons. Our valuation of the Appliances and Salon Professional businesses has them returning to sales and earnings growth rates consistent with our long-term business plans. Failure to achieve these business plans or a further deterioration of the macroeconomic conditions could result in a valuation that would trigger an impairment of the goodwill and intangible assets of these businesses.
New Accounting Pronouncements
There were no new accounting pronouncements issued or effective during the fiscal year which have had or are expected to have a material impact on the Consolidated Financial Statements. For a discussion of new accounting pronouncements, see Note 1 to our Consolidated Financial Statements.
OTHER INFORMATION
Hedging and Derivative Financial Instruments
As a multinational company with diverse product offerings, we are exposed to market risks, such as changes in interest rates, currency exchange rates and commodity prices. We evaluate exposures on a centralized basis to take advantage of natural exposure correlation and netting. Except within financing operations, we leverage the Company's broadly diversified portfolio of exposures as a natural hedge and prioritize operational hedging activities over financial market instruments. To the extent we choose to further manage volatility associated with the net exposures, we enter into various financial transactions which we account for using the applicable accounting guidance for derivative instruments and hedging activities. These financial transactions are governed by our policies covering acceptable counterparty exposure, instrument types and other hedging practices. Note 5 to the Consolidated Financial Statements includes a detailed discussion of our accounting policies for financial instruments.
Derivative positions can be monitored using techniques including market valuation, sensitivity analysis and value-at-risk modeling. The tests for interest rate, currency rate and commodity derivative positions discussed below are based on the CorporateManager™ value-at-risk model using a one-year horizon and a 95% confidence level. The model incorporates the impact of correlation (the degree to which exposures move together over time) and diversification (from holding multiple currency, commodity and interest rate instruments) and assumes that financial returns are normally distributed. Estimates of volatility and correlations of market factors are drawn from the RiskMetrics™ dataset as of June 30, 2011. In cases where data is unavailable in RiskMetrics™, a reasonable proxy is included.
Our market risk exposures relative to interest rates, currency rates and commodity prices, as discussed below, have not changed materially versus the previous reporting period. In addition, we are not aware of any facts or circumstances that would significantly impact such exposures in the near term.
Interest Rate Exposure on Financial Instruments. Interest rate swaps are used to hedge exposures to interest rate movement on underlying debt obligations. Certain interest rate swaps denominated in foreign currencies are designated to hedge exposures to currency exchange rate movements on our investments in foreign operations. These currency interest rate swaps are designated as hedges of the Company's foreign net investments.
Based on our overall interest rate exposure as of and during the year ended June 30, 2011, including derivative and other instruments sensitive to interest rates, we believe a near-term change in interest rates, at a 95% confidence level based on historical interest rate movements, would not materially affect our financial statements.
Currency Rate Exposure on Financial Instruments. Because we manufacture and sell products and finance operations in a number of countries throughout the world, we are exposed to the impact on revenue and expenses of movements in currency
exchange rates. The primary purpose of our currency hedging activities is to manage the volatility associated with short-term changes in exchange rates. Corporate policy prescribes the range of allowable hedging activity. We primarily use forward contracts with maturities of less than 18 months. In addition, we enter into certain currency swaps with maturities of up to five years to hedge our exposure to exchange rate movements on intercompany financing transactions.
Based on our overall currency rate exposure as of and during the year ended June 30, 2011, we believe, at a 95% confidence level based on historical currency rate movements, the impact of a near-term change in currency rates on derivative and other instruments would not materially affect our financial statements.
Commodity Price Exposure on Financial Instruments. We use raw materials that are subject to price volatility caused by weather, supply conditions, political and economic variables and other unpredictable factors. In addition to fixed price contracts, we may use futures, options and swap contracts to manage the volatility related to the above exposures.
Based on our overall commodity price exposure as of and during the year ended June 30, 2011, we believe, at a 95% confidence level based on historical commodity price movements, the impact of a near-term change in commodity prices on derivative and other instruments would not materially affect our financial statements.
Measures Not Defined By U.S. GAAP
Our discussion of financial results includes several "non-GAAP" financial measures. We believe these measures provide our investors with additional information about our underlying results and trends, as well as insight to some of the metrics used to evaluate management. When used in MD&A, we have provided the comparable GAAP measure in the discussion. These measures include:
Organic Sales Growth. Organic sales growth is a non-GAAP measure of sales growth excluding the impacts of acquisitions, divestitures and foreign exchange from year-over-year comparisons. We believe this provides investors with a more complete understanding of underlying sales trends by providing sales growth on a consistent basis. Organic sales is also one of the measures used to evaluate senior management and is a factor in determining their at-risk compensation.
The following tables provide a numerical reconciliation of organic sales growth to reported net sales growth:
| Year ended June 30, 2011 | Net Sales Growth | Foreign Exchange Impact | Acquisition/ Divestiture Impact* | Organic Sales Growth | |||||||
| Beauty | 4 | % | -1 | % | 0 | % | 3 | % | |||
| Grooming | 5 | % | 0 | % | 0 | % | 5 | % | |||
| Health Care | 5 | % | 0 | % | 0 | % | 5 | % | |||
| Snacks and Pet Care | 1 | % | -1 | % | -5 | % | -5 | % | |||
| Fabric Care and Home Care | 4 | % | 1 | % | -2 | % | 3 | % | |||
| Baby Care and Family Care | 6 | % | 1 | % | 0 | % | 7 | % | |||
| TOTAL P&G | 5 | % | 0 | % | -1 | % | 4 | % | |||
| Year ended June 30, 2010 | Net Sales Growth | Foreign Exchange Impact | Acquisition/ Divestiture Impact* | Organic Sales Growth | |||||||
| Beauty | 3 | % | 0 | % | 0 | % | 3 | % | |||
| Grooming | 4 | % | 0 | % | 0 | % | 4 | % | |||
| Health Care | 2 | % | 0 | % | 0 | % | 2 | % | |||
| Snacks and Pet Care | 1 | % | -1 | % | 0 | % | 0 | % | |||
| Fabric Care and Home Care | 3 | % | 1 | % | 0 | % | 4 | % | |||
| Baby Care and Family Care | 4 | % | 1 | % | 0 | % | 5 | % | |||
| TOTAL P&G | 3 | % | 1 | % | -1 | % | 3 | % | |||
* Acquisition/Divestiture Impact includes rounding impacts necessary to reconcile net sales to organic sales.
Core EPS. This is a measure of the Company's diluted net earnings per share from continuing operations excluding certain items that are not judged to be part of the Company's sustainable results or trends. This includes a significant benefit in 2011 from the settlement of U.S. tax litigation primarily related to the valuation of technology donations, charges in both 2011 and 2010 related to pending European legal matters, a 2010 charge related to a tax provision for retiree healthcare subsidy payments
in the U.S. healthcare reform legislation, and incremental restructuring charges in 2009 to offset dilution caused by the Folgers divestiture. We do not view these items to be part of our sustainable results. We believe the Core EPS measure provides an important perspective of underlying business trends and results and provides a more comparable measure of year-on-year earnings per share growth. Core EPS is also one of the measures used to evaluate senior management and is a factor in determining their at-risk compensation. The table below provides a reconciliation of reported diluted net earnings per share from continuing operations to Core EPS:
| Years ended June 30 | 2011 | 2010 | 2009 | ||||||||
| Diluted Net Earnings Per Share - Continuing Operations | $ | 3.93 | $ | 3.53 | $ | 3.39 | |||||
| Settlement from U.S. Tax Litigation | (0.08 | ) | — | — | |||||||
| Charges for Pending European Legal Matters | 0.10 | 0.09 | — | ||||||||
| Charge for Taxation of Retiree Healthcare Subsidy | — | 0.05 | — | ||||||||
| Incremental Folgers-related Restructuring Charges | — | — | 0.09 | ||||||||
| Rounding Impacts | — | — | (0.01 | ) | |||||||
| CORE EPS | 3.95 | 3.67 | 3.47 | ||||||||
| Core EPS Growth | 8 | % | 6 | % | |||||||
Note - All reconciling items are presented net of tax. Tax effects are calculated consistent with the nature of the underlying transaction. The significant adjustment to an income tax reserve was tax expense. There was no tax impact on EPS due to the charges for pending European legal matters.
Free Cash Flow. Free cash flow is defined as operating cash flow less capital spending. We view free cash flow as an important measure because it is one factor in determining the amount of cash available for dividends and discretionary investment. Free cash flow is also one of the measures used to evaluate senior management and is a factor in determining their at-risk compensation.
Free Cash Flow Productivity. Free cash flow productivity is defined as the ratio of free cash flow to net earnings. Free cash flow productivity is also one of the measures used to evaluate senior management and is a factor in determining their at-risk compensation.
The following table provides a numerical reconciliation of free cash flow and free cash flow productivity:
| ($ millions) | Operating Cash Flow | Capital Spending | Free Cash Flow | Net Earnings | Free Cash Flow Productivity | |||||||||||||
| 2011 | $ | 13,330 | $ | (3,306 | ) | $ | 10,024 | $ | 11,927 | 84 | % | |||||||
| 2010 | 16,131 | (3,067 | ) | 13,064 | 12,846 | 102 | % | |||||||||||
| 2009 | 14,983 | (3,238 | ) | 11,745 | 13,522 | 87 | % | |||||||||||