UNITED STATES
SECURITIES AND EXCHANGE COMMISSION
Washington D.C. 20549
______________________________________________________
FORM 10-K
______________________________________________________
(Mark One)
| ý | ANNUAL REPORT PURSUANT TO SECTION 13 OR 15(d) OF THE SECURITIES EXCHANGE ACT OF 1934 |
For the fiscal year ended October 31, 2014
OR
| ¨ | TRANSITION REPORT PURSUANT TO SECTION 13 OR 15(d) OF THE SECURITIES EXCHANGE ACT OF 1934 |
Commission file number 1-14229
______________________________________________________
QUIKSILVER, INC.
(Exact name of registrant as specified in its charter)
______________________________________________________
| Delaware | 33-0199426 |
| (State or other jurisdiction of | (I.R.S. Employer |
| incorporation or organization) | Identification Number) |
15202 Graham Street
Huntington Beach, California
92649
(Address of principal executive offices)
(Zip Code)
(714) 889-2200
(Registrant’s telephone number, including area code)
Securities registered pursuant to Section 12(b) of the Act:
| Title of each class | Name of each exchange on which registered |
| Common Stock | New York Stock Exchange |
Securities registered pursuant to Section 12(g) of the Act: None
___________________________________________________
Indicate by check mark if the Registrant is a well-known seasoned issuer, as defined in Rule 405 of the Securities Act. Yes ¨ No ý
Indicate by check mark if the Registrant is not required to file reports pursuant to Section 13 or Section 15(d) of the Act. Yes ¨ No ý
Indicate by check mark whether the Registrant (1) has filed all reports required to be filed by Section 13 or 15(d) of the Securities Exchange Act of 1934 during the preceding 12 months (or for such shorter period that the Registrant was required to file such reports), and (2) has been subject to such filing requirements for the past 90 days. Yes ý No ¨
Indicate by check mark whether the Registrant has submitted electronically and posted on its corporate Web site, if any, every Interactive Data File required to be submitted and posted pursuant to Rule 405 of Regulation S-T during the preceding 12 months (or for such shorter period that the Registrant was required to submit and post such files). Yes ý No ¨
Indicate by check mark if disclosure of delinquent filers pursuant to Item 405 of Regulation S-K is not contained herein, and will not be contained, to the best of Registrant’s knowledge, in definitive proxy or information statements incorporated by reference in Part III of this Form 10-K or any amendment to this Form 10-K. ý
Indicate by check mark whether the Registrant is a large accelerated filer, an accelerated filer, a non-accelerated filer or a smaller reporting company. See the definitions of “large accelerated filer,” “accelerated filer” and “smaller reporting company” in Rule 12b-2 of the Exchange Act (Check one).
| Large accelerated filer | x | Accelerated filer | ¨ | |
| Non-accelerated filer | ¨ | (Do not check if a smaller reporting company) | Smaller reporting company | ¨ |
Indicate by check mark whether the Registrant is a shell company (as defined in Rule 12b-2 of the Act). Yes ¨ No ý
The aggregate market value of the Registrant’s Common Stock held by non-affiliates of the Registrant was approximately $875 million as of April 30, 2014, the last business day of Registrant’s most recently completed second fiscal quarter.
As of December 3, 2014, there were 174,057,410 shares of the Registrant’s Common Stock issued and outstanding.
DOCUMENTS INCORPORATED BY REFERENCE
Portions of the Registrant’s Proxy Statement for the Annual Meeting of Stockholders to be held March 17, 2015 are incorporated by reference into Part III of this Form 10-K.
1
TABLE OF CONTENTS
| Page | ||
| Item 1. | ||
| Item 1A. | ||
| Item 1B. | ||
| Item 2. | ||
| Item 3. | ||
| Item 4. | ||
| Item 5. | ||
| Item 6. | ||
| Item 7. | ||
| Item 7A. | ||
| Item 8. | ||
| Item 9. | ||
| Item 9A. | ||
| Item 9B. | ||
| Item 10. | ||
| Item 11. | ||
| Item 12. | ||
| Item 13. | ||
| Item 14. | ||
| Item 15. | ||
2
PART I
| Item 1. | BUSINESS |
Introduction
Quiksilver, Inc. (together with its subsidiaries, the “Company,” “we,” “us,” or “our”) is one of the world’s leading outdoor sports lifestyle companies. We design, develop and distribute branded apparel, footwear, accessories and related products. Our brands, inspired by the passion for outdoor action sports, represent a casual lifestyle for young-minded people who connect with our boardriding culture and heritage. Our three core brands, Quiksilver, Roxy, and DC, are synonymous with the heritage and culture of surfing, skateboarding and snowboarding. Our products combine decades of brand heritage, authenticity and design experience with the latest technical performance innovations available in the marketplace.
Quiksilver, Inc., a Delaware corporation, was incorporated in 1976 and became a publicly-traded company in 1986 (NYSE: ZQK). Our products are sold in over 115 countries through a wide range of distribution channels, including wholesale accounts (surf shops, skate shops, snow shops, sporting goods stores, discount centers, specialty stores, online retailers, and select department stores), 935 owned or licensed Company retail stores, and via our e-commerce websites. In fiscal 2014, 65% of our revenue was generated outside of the United States. Our global headquarters is in Huntington Beach, California. Our fiscal year ends on October 31 (i.e., “fiscal 2014” refers to the year ended October 31, 2014).
Our Mission and Strategies
Our mission is to build authentic, active brands into significant, sustainable successes.
In our efforts to increase shareholder value, we have adopted three fundamental strategies: 1) strengthening our brands; 2) growing sales; and 3) driving operational efficiencies. Under each of these strategies, we are pursuing specific initiatives as outlined below:
Strengthening our brands: improving our product offerings, ensuring a consistent global brand presentation, investing in social media and our website properties, migrating marketing spend closer to the point of customer contact, and increasing brand exposure in emerging markets.
Growing sales: improving our product offerings and brand segmentation, offering channel specific product collections, extending our wholesale distribution, expanding and improving our e-commerce platform, investing in emerging markets, and increasing our network of retail stores.
Driving operational efficiencies: redesigning core processes to eliminate redundant activities, establishing global controls and monitoring over core processes, improving supply chain effectiveness, centralizing key activities into global centers of excellence, reducing global headcount in accordance with redesigned processes and global centers of excellence, implementing global IT systems and improving aggregation of data to support global processes.
The goal of these strategies is to allow us to increase operating income as a percentage of sales. However, there can be no guarantee that the efforts contemplated by these strategies will improve our operating results. For a description of significant risks and uncertainties that could hinder our strategic efforts, please refer to “Item 1A. Risk Factors”.
Brands
Our three core brands target the action sports lifestyle and broader outdoor market. Quiksilver and Roxy are leading brands rooted in surfing and are also prominent in snow sports. DC’s reputation is based in skateboarding but it is also popular in BMX, motocross and snowboarding.
Net revenues by brand, as a percentage of total net revenues from continuing operations, for each of the last three fiscal years were as follows:
| 2014 | 2013 | 2012 | |||||||
| Quiksilver | 40 | % | 40 | % | 40 | % | |||
| Roxy | 31 | % | 28 | % | 27 | % | |||
| DC | 27 | % | 30 | % | 31 | % | |||
| Other brands | 2 | % | 2 | % | 2 | % | |||
| Total | 100 | % | 100 | % | 100 | % | |||
1
Quiksilver
We have grown our Quiksilver brand from its origins in 1976 as a line of boardshorts to include a full range of apparel and accessories for men and boys inspired by surfing and boardriding sports.
Roxy
Our Roxy brand, introduced in 1991, includes a full range of apparel, footwear and accessories for young women and girls inspired by surfing, beach and boardriding sports.
DC
We have grown our DC brand, which we acquired in 2004, from its origins as a line of technical skateboarding shoes to include a full range of apparel, footwear and accessories for men, women and children inspired by skateboarding, motocross, BMX, rally car and snowboarding.
Distribution Channels
We sell our products in over 115 countries around the world through wholesale customers, our own retail stores and via e-commerce. Net revenues by distribution channel, as a percentage of total net revenues from continuing operations, for each of the last three fiscal years were as follows:
| 2014 | 2013 | 2012 | |||||||
| Wholesale | 67 | % | 71 | % | 74 | % | |||
| Retail | 28 | % | 25 | % | 23 | % | |||
| E-commerce | 5 | % | 4 | % | 3 | % | |||
| Total | 100 | % | 100 | % | 100 | % | |||
Our wholesale revenues are spread over a large and diversified customer base. During fiscal 2014, approximately 15% of our consolidated revenues from continuing operations were from our ten largest customers, and our largest customer accounted for approximately 3% of such revenues. In the wholesale channel, our products are sold in major markets by over 300 independent sales representatives in addition to our employee sales staff. In smaller markets, we use over 150 local distributors. Our independent sales representatives are generally compensated on a commission basis. We employ retail merchandise coordinators who travel between specified retail locations of our wholesale customers to further improve the presentation of our product and build our brand image at the retail level.
We believe that the integrity and success of our brands is dependent, in part, upon our careful selection of appropriate retailers to support our brands in the wholesale sales channel. A foundation of our business is the distribution of our products through surf shops, skateboard shops, snowboard shops, sporting goods stores, and our own proprietary retail concept stores, where the environment communicates our brand and culture. Our distribution channels serve as a base of legitimacy and long-term loyalty for our brands.
Our products are also distributed through active lifestyle specialty chains. This category includes chains in the United States such as Zumiez, Tilly’s, Famous Footwear, and Journeys, chains in Europe such as Go Sport, Intersport and Sport 2000, and chains in the Asia/Pacific region such as City Beach and Murasaki Sports. Limited collections of our products are distributed through department stores, including Macy’s in the United States, Galeries Lafayette in France, and El Corte Ingles in Spain.
For a discussion regarding our retail distribution channel, please see “Retail Concepts” below.
We also operate several e-commerce websites that sell our products throughout the world and provide online content for our customers regarding our brands, athletes, events and the lifestyle associated with our brands.
We have licensed the right to produce and sell products using our trademarks for certain specific product categories. We may continue to license additional product categories that we believe are peripheral to our core businesses, or where we believe that a licensee would have better expertise, wider product distribution capabilities, superior supply chain capabilities, or where we believe that licensing is a better operating structure for us. For further discussion, please see "Licensing" below.
Segment Information and Geographical Sales
Our sales are globally diversified. We have four operating segments consisting of the Americas, EMEA and APAC, each of which sells a full range of our products, as well as Corporate Operations. Our Americas segment, consisting of North, South, and Central America, includes net revenues generated primarily from the United States, Canada, Brazil, and Mexico. Net
2
revenues in our Europe, Middle East and Africa segment (“EMEA”) are primarily generated from continental Europe, the United Kingdom, Russia and South Africa. Net revenues from our Asia/Pacific segment (“APAC”) are primarily generated from Australia, Japan, New Zealand, South Korea, Taiwan, and Indonesia. Net revenues in our emerging markets include Brazil, Russia, Indonesia, Mexico, South Korea, Taiwan and China. These markets are reported within their respective regional segments noted above. Royalties earned from various licensees in other international territories are categorized in Corporate Operations, along with revenues from sourcing services to our licensees. For information regarding the revenues, operating income/(loss), and identifiable assets from continuing operations attributable to our operating segments, see Note 2, "Segment and Geographic Information", to our consolidated financial statements.
The following table summarizes our net revenues by country, as a percentage of total net revenues from continuing operations (excluding revenues from licensees), for each of the last three fiscal years:
| 2014 | 2013 | 2012 | |||||||
| United States | 35 | % | 38 | % | 39 | % | |||
| France | 12 | % | 12 | % | 11 | % | |||
| Australia/New Zealand | 7 | % | 7 | % | 8 | % | |||
| Spain | 6 | % | 5 | % | 6 | % | |||
| Canada | 5 | % | 6 | % | 6 | % | |||
| Japan | 5 | % | 5 | % | 5 | % | |||
| Brazil | 4 | % | 3 | % | 3 | % | |||
| Russia | 3 | % | 2 | % | 2 | % | |||
| Germany | 3 | % | 3 | % | 3 | % | |||
| All other countries | 20 | % | 19 | % | 17 | % | |||
| Total | 100 | % | 100 | % | 100 | % | |||
We generally sell our apparel, footwear, accessories and related products to wholesale customers on a net-30 to net-90 day basis in the Americas and EMEA and on a net-10 to net-120 day or 30 day end of month basis in APAC depending on the country, product category, and whether we sell directly to retailers in the country or to a distributor. Some customers are required to pay for product upon delivery. We generally do not reimburse our customers for marketing expenses or guarantee margins to our customers. We offer consignment terms to certain accounts.
Product Categories
We offer apparel, footwear, accessories and related products within each of our core brands. Net revenues by major product group, as a percentage of total net revenues from continuing operations, for each of the last three fiscal years were as follows:
| 2014 | 2013 | 2012 | |||||||
| Apparel and accessories | 75 | % | 75 | % | 73 | % | |||
| Footwear | 25 | % | 25 | % | 27 | % | |||
| Total | 100 | % | 100 | % | 100 | % | |||
Typical retail selling prices of some of our primary products on a segment basis, in the segment's currencies, are as follows:
Americas (USD) | EMEA (Euros) | APAC (AUD) | |||||||
| T-shirt | 25 | 23 | 27 | ||||||
| Walking short | 53 | 47 | 54 | ||||||
| Snowboard jacket | 243 | 156 | 155 | ||||||
| Skate shoe | 54 | 57 | 67 | ||||||
Licensing Agreements
We have licensed the right to produce and sell products bearing our trademarks for certain specific product categories. We may continue to license additional product categories that we believe are peripheral to our core business, or where we believe that a licensee would have better expertise, wider product distribution capabilities, superior supply chain capabilities, or where we
3
believe that licensing is a better operating structure for us. During fiscal 2014, we executed several licensing agreements for peripheral product categories. Pursuant to these agreements, wholesale sales for these categories either already have transitioned, or will transition, to our licensees during fiscal 2015. We plan to purchase products in these categories from our licensee for sales in our retail stores and in our own e-commerce business. In the aggregate, these licensing agreements cover product categories that generated approximately $51 million in wholesale net revenues during fiscal 2014. Royalty revenues from licensing are not expected to fully replace the wholesale net revenues we have historically generated from these product categories. However, over time, royalty revenues are anticipated to result in improved operating margins versus those achieved from producing and distributing these categories internally.
Seasonality
Our products are generally available throughout the year. Demand for certain product categories changes in different seasons of the year. Sales of shorts, short-sleeve shirts, t-shirts and swimwear are higher during the spring and summer seasons. Sales of pants, long-sleeve shirts, fleece, jackets, sweaters and technical outerwear are higher during the fall and holiday seasons. Our fiscal fourth quarter has historically been our largest in terms of net revenues due to the wholesale channel impact of our shipments to retailers in advance of the Christmas/holiday season. Net revenues from continuing operations by quarter, and the associated percentage of full fiscal year net revenues for each of the last three fiscal years, were as follows:
| 2014 | 2013 | 2012 | |||||||||||||||||||
| In millions | % of Net Revenues | % of Net Revenues | % of Net Revenues | ||||||||||||||||||
1st Quarter ended January 31 | $ | 393 | 25 | % | $ | 412 | 23 | % | $ | 435 | 22 | % | |||||||||
2nd Quarter ended April 30 | 397 | 25 | % | 447 | 25 | % | 483 | 25 | % | ||||||||||||
3rd Quarter ended July 31 | 380 | 24 | % | 475 | 26 | % | 495 | 26 | % | ||||||||||||
4th Quarter ended October 31 | 400 | 26 | % | 476 | 26 | % | 529 | 27 | % | ||||||||||||
| Total | $ | 1,570 | 100 | % | $ | 1,811 | 100 | % | $ | 1,942 | 100 | % | |||||||||
Retail Concepts
We believe retail stores are an important component of our overall global growth strategy. We operate a combination of our proprietary, multi-brand Boardriders stores as well as Quiksilver, Roxy and DC brand stores that feature a broad selection of products from our core brands and, at times, a limited selection of products from other brands. The proprietary design of our stores demonstrates our history, authenticity and commitment to surfing and other boardriding sports. In addition to our core brand stores, we operate 147 factory outlet stores in which we offer specifically designed products for this channel as well as prior season products. In various territories, we also operate Quiksilver and Roxy shops primarily within larger department stores. These “shop-in-shops” require a much smaller initial investment and are typically smaller than a traditional retail store while having many of the same operational characteristics.
Total Company-owned retail stores are detailed below, by format and segment, at the end of each of the last three fiscal years:
| Company Owned Stores by Format | 2014 | 2013 | 2012 | |||
| Full-price stores | 266 | 276 | 291 | |||
| Shop-in-shops | 270 | 225 | 194 | |||
| Factory outlets | 147 | 130 | 120 | |||
| Total | 683 | 631 | 605 | |||
| Company Owned Stores by Segment | 2014 | 2013 | 2012 | ||||||
| EMEA | 296 | 268 | 271 | ||||||
| APAC | 287 | 263 | 224 | ||||||
| Americas | 100 | 100 | 110 | ||||||
| Total | 683 | 631 | 605 | ||||||
In addition to the Company-owned stores noted above, we also had 252 stores licensed to independent third parties in various countries as of October 31, 2014.
4
Future Season Orders
At the end of October 2014, our backlog totaled $365 million compared to $421 million the year before. Our backlog depends upon a number of factors and fluctuates based upon the timing of trade shows, sales meetings, the length and timing of various international selling seasons, changes in foreign currency exchange rates, decisions regarding brand distribution and product samples, market conditions, wholesale pricing, product quality, customer acceptance of the product line, and other factors. The timing of shipments also fluctuates from year to year based upon the production of goods, our ability to distribute our products in a timely manner, holidays and events, and customer requests for timing of product delivery. As a consequence, a comparison of backlog from season to season or year to year is not necessarily meaningful and may not be indicative of eventual shipments or forecasted revenues.
Product Design and Development
Our apparel, footwear, accessories and related products are designed to support the positioning of our brands. Creative design, innovative fabrics and quality of workmanship are emphasized. Our design and merchandising teams create seasonal product ranges for each of our brands. These design groups constantly monitor local, regional, and global fashion trends. Our global design centers in Huntington Beach, California and St. Jean de Luz, France each develop specific product categories for each of our brands globally. These global design centers share inspiration, design concepts, merchandising themes, graphics and style viewpoints that are globally consistent while reflecting local adaptations for differences in geography, culture and taste.
Production and Raw Materials
Our apparel, footwear, accessories and related products are generally sourced from a variety of suppliers principally in China, South Korea, Indonesia, India, Vietnam and other parts of the Far East and, to a lesser extent, in Mexico, Turkey, Portugal and other foreign countries. After being imported, some of these products require embellishments such as screen printing, dyeing, washing or embroidery.
During fiscal 2014, no single supplier of finished goods accounted for more than 7% of our consolidated production. Our largest raw material supplier accounted for 72% of our expenditures for raw materials during fiscal 2014, however, our raw materials expenditures comprised less than 1% of our consolidated production costs. We believe that numerous finished goods and raw materials suppliers are available to provide additional capacity on an as-needed basis and that we enjoy favorable on-going relationships with these suppliers. However, shortages of raw materials or labor pricing pressures can result in delays in deliveries of our products by our suppliers or in increased costs to us.
In addition to our direct sourcing model, we retain independent buying agents, primarily in China and Vietnam, to assist us in selecting and overseeing the majority of our independent third party manufacturing and sourcing of finished goods, fabrics, blanks and other products. These agents monitor duties and other trade regulations and perform some of our quality control functions.
We also employ staff in China, Vietnam, Indonesia, India and other countries that are involved in sourcing and quality control functions to assist us in monitoring and coordinating our overseas production. By having employees in regions where we source our products, we enhance our ability to monitor factories to ensure their compliance with our standards of manufacturing practices. Our policies require every factory to comply with a code of conduct relating to factory working conditions and the treatment of workers involved in the manufacture of products.
We continue to explore new sourcing opportunities for finished goods and raw materials, and we believe we have established solid working relationships over many years with vendors who are financially stable and reputable, and who understand our product quality and delivery standards. However, in the event of any unanticipated substantial disruption of our relationships with, or performance by, key existing suppliers and/or contractors, there could be a short-term adverse effect on our operations.
A portion of our finished goods and raw materials must be committed to and purchased prior to the receipt of customer orders. If we overestimate the demand for a particular product, excess production can generally be distributed in our factory outlet stores or through secondary wholesale distribution channels, although this may be at reduced margins. If we overestimate the purchase of a particular raw material, it can generally be used in garments for subsequent seasons or in garments for distribution through our factory outlet stores or secondary wholesale distribution channels, although this may also be at reduced margins.
Imports and Import Restrictions
We import finished goods and raw materials for our domestic operations under multilateral and bilateral trade agreements between the U.S. and a number of foreign countries, including China and India. These agreements impose duties on the products that are imported into the U.S. from the affected countries. In Europe, we operate in the European Union (“EU”)
5
within which there are few trade barriers. We also operate under constraints imposed on imports of finished goods and raw materials from outside the EU, including quotas and duty charges.
Promotion and Advertising
The strength of our brands is based upon our history of developing excellent products and our active involvement in surf, skate and snow sports. We sponsor athletes who use our products in outdoor sports, such as surfing, skateboarding, snowboarding, skiing, and motocross, and produce or sponsor events that showcase these sports. Our brands have become closely identified with the lifestyle that is associated with those who are active in these sports. Accordingly, our advertising efforts are focused on presenting our products in the context of these sports and the lifestyle represented by participants in these sports.
We have relationships with leading athletes worldwide. These include Rob Dyrdek, Torah Bright, Dane Reynolds, Jeremy Flores, Nyjah Huston, and Stephanie Gilmore, among many others. Along with these athletes, many of whom have achieved world champion status in their individual sports, we sponsor up-and-coming professionals and amateurs. We believe that these athletes validate the quality and performance of our products, maintain an authentic connection with the core users of our products and create a general aspiration to the lifestyle that these athletes represent.
We have, and may continue to, sponsor certain surf, snow and skateboard events, and our sponsored athletes may participate in certain events and promotions. These events have included world-class boardriding events, such as the Quiksilver Pro (in France and Australia), and the Quiksilver In Memory of Eddie Aikau, which we believe is the most prestigious event among surfers. Some of our Quiksilver, DC and Roxy athletes participate in the Summer and Winter X-Games as well as the Olympics.
Our brand messages are communicated through advertising, public relations, social media, editorial content and other programming in both core and mainstream media. Through various entertainment initiatives, we bring our lifestyle message to an even broader audience through television, films, social media, online video, books and co-sponsored events and products.
Trademarks and Patents
Trademarks
We own the “Quiksilver” and “Roxy” trademarks and the related "mountain and wave" and "heart" logos in virtually every country in the world in apparel, footwear and related accessory product classifications. For our DC brand, we own the trademarks “DC Shoes,” “DCSHOECOUSA,” and the related “DC Star” logo in many countries in apparel, footwear and related accessory product classifications. In addition, we maintain a portfolio of other trademarks related to both our core and non-core brands.
We apply for and register our trademarks throughout the world, mainly for use on apparel, footwear, accessories and related products, as well as for retail services. We believe our trademarks and our other intellectual property are crucial to the successful marketing and sale of our products, and we attempt to vigorously prosecute and defend our rights throughout the world. Because of the success of our trademarks, we also maintain global anti-counterfeiting programs to protect our brands.
Patents
Our patent portfolio contains patents and applications primarily related to wetsuits, skate shoes, watches, boardshorts and snowboard boots.
Competition
We face competition from many global lifestyle brands and companies such as Nike, VF Corp., Kering, Vans, Reebok, North Face, Billabong, Hurley, Rip Curl, Volcom, Etnies, O'Neil, and Tom’s Shoes, as well as other regional and local brands that compete with us for market share and floor space with our wholesale customers.
In addition to brand competition, we face distribution channel competition. Our retail stores compete with multi-brand wholesale accounts, as well as vertical retail brands such as Hollister, Gap, and Abercrombie & Fitch, and retail stores of our brand competitors such as Nike stores, Billabong stores, and Vans stores, among others. We also face competition from non-branded retailers such as H&M, Zara and Forever 21.
Our retail stores and e-commerce websites also compete with the e-commerce websites of our wholesale accounts, competitive brands, and online-only competitors such as Amazon and e-Bay, globally, Zappos in the Americas, Zalando in EMEA and TaoBao in China.
Some of our competitors are significantly larger than we are and may have substantially greater resources than we have.
6
We compete primarily on the basis of successful brand management, product design, product quality, pricing, service and delivery. To remain competitive, we must:
| • | maintain our reputation for authenticity in the core outdoor sports lifestyle markets; |
| • | continue to develop and respond to global fashion and lifestyle trends in our markets; |
| • | create innovative, high quality and stylish products at appropriate price points; |
| • | convey our outdoor sports lifestyle messages to consumers worldwide; and |
| • | source and deliver products on time to our wholesale customers. |
Employees
At October 31, 2014, we had approximately 6,100 full-time equivalent employees, consisting of approximately 2,400 in the Americas, approximately 2,300 in EMEA and approximately 1,400 in APAC. None of these employees are represented by trade unions. Certain French employees are represented by workers' councils who negotiate with management on behalf of the employees. Management is generally required to share its plans with the workers’ councils, to the extent that these plans affect the represented employees. We have never experienced a work stoppage and consider our working relationships with our employees and the workers’ councils to be good.
Environmental Matters
Some of our facilities and operations have been or are subject to various federal, state and local environmental laws and regulations which govern, among other things, the use and storage of hazardous materials, the storage and disposal of solid and hazardous wastes, the discharge of pollutants into the air, water and land, and the cleanup of contamination. Some of our third party manufacturing partners use, among other things, inks and dyes, and produce related by-products and wastes. We have acquired businesses and properties in the past, and may do so again in the future. In the event we or our predecessors fail or have failed to comply with environmental laws, or cause or have caused a release of hazardous substances or other environmental damage, whether at our sites or elsewhere, we could incur fines, penalties or other liabilities arising out of such noncompliance, releases or environmental damage. Compliance with and liabilities under environmental laws and regulations did not have a significant impact on our capital expenditures, results of operations or competitive position during the last three fiscal years.
Discontinued Operations
We have divested or exited certain non-core businesses in order to improve our focus on our three flagship brands. In November 2013, we completed the sale of Mervin Manufacturing, Inc. (“Mervin”), a manufacturer of snowboards and related products under the Lib Technologies and GNU brands, for $58 million. In January 2014, we completed the sale of substantially all of the assets of Hawk Designs, Inc. (“Hawk”), our subsidiary that owned and operated our Hawk brand, for $19 million. Both the Mervin and Hawk businesses had been classified as "held for sale" as of October 31, 2013.
Our equity interest in Surfdome Shop, Ltd. (“Surfdome”), a multi-brand e-commerce retailer, has been classified as "held for sale" as of October 31, 2014 and 2013. In December 2014, we sold our 51% ownership stake in Surfdome. At the completion of the sale, we received net proceeds of approximately $16 million, which included payments to us for all outstanding loans and trade receivables.
The results of operations of these three businesses are reflected in discontinued operations for the period presented herein. See Note 18, "Discontinued Operations" to our consolidated financial statements for further discussion of the operating results of our discontinued operations.
For additional information related to the sale of these businesses, see Item 7. "Management's Discussion and Analysis — Discontinued Operations".
Available Information
We file our annual report on Form 10-K, quarterly reports on Form 10-Q, current reports on Form 8-K, proxy statements and registration statements, and any amendments thereto, with the Securities and Exchange Commission (SEC). All such filings are available online through the SEC’s website at http://www.sec.gov or on our corporate website at http://www.quiksilverinc.com. We make available free of charge, on or through our corporate website, our annual, quarterly and current reports, and any amendments to those reports, as soon as reasonably practicable after electronically filing such reports with the SEC. In addition, copies of the written charters for the committees of our board of directors, our Corporate Governance Guidelines, our Code of Ethics for Senior Financial Officers and our Code of Business Conduct and Ethics are also available on our website,
7
and can be found under the Investor Relations-Corporate Governance links. Copies are also available in print, free of charge, by writing to Investor Relations, Quiksilver, Inc., 15202 Graham Street, Huntington Beach, California 92649. We may post amendments or waivers of our Code of Ethics for Senior Financial Officers and Code of Business Conduct and Ethics, if any, on our website. This website address is intended to be an inactive textual reference only, and none of the information contained on our website is part of this report or is incorporated in this report by reference.
| Item 1A. | RISK FACTORS |
Cautionary Note Regarding Forward-Looking Statements
This report on Form 10-K contains “forward-looking statements” within the meaning of the safe harbor provisions of the U.S. Private Securities Litigation Reform Act of 1995. Forward-looking statements are often, but not always, identified by words such as: “anticipate,” “intend,” “plan,” “goal,” “seek,” “believe,” “project,” “estimate,” “expect,” “outlook,” “strategy,” “future,” “likely,” “may,” “should,” “could,” “will” and similar references to future periods. Examples of forward-looking statements include, but are not limited to, statements we make regarding:
| • | current or future volatility in certain economies, credit markets and future market conditions; and |
| • | our belief that we have sufficient liquidity to fund our business operations during the next twelve months; and |
| • | our expectations regarding our level of capital expenditures in fiscal 2015; and |
| • | our expectations regarding the future performance of our business. |
Forward-looking statements are neither historical facts nor assurances of future performance. Instead, they are based only on our current beliefs, expectations and assumptions regarding the future of our business, future plans and strategies, projections, anticipated events and trends, the economy and other future conditions. Because forward-looking statements relate to the future, they are subject to inherent uncertainties, risks and changes in circumstances that are difficult to predict and many of which are outside of our control. Our actual results and financial condition may differ materially from those indicated in the forward-looking statements. Therefore, you should not rely on any of these forward-looking statements. Important factors that could cause our actual results and financial condition to differ materially from those indicated in the forward-looking statements include, among others, the following:
| • | our ability to execute our mission and strategies; |
| • | our ability to achieve the financial results that we anticipate; |
| • | our ability to improve our business performance; |
| • | our ability to effectively transition our supply chain and certain other business processes to global scope; |
| • | future expenditures for capital projects; |
| • | increases in production costs and raw materials and disruptions in the supply chains for these materials; |
| • | deterioration of global economic conditions and credit and capital markets; |
| • | potential non-cash asset impairment charges for goodwill, intangible assets or other fixed assets; |
| • | our ability to continue to maintain our brand image and reputation; |
| • | foreign currency exchange rate and interest rate fluctuations; |
| • | our ability to remain compliant with our debt covenants; |
| • | payments due on contractual commitments and other debt obligations; |
| • | our ability to finance our operations; |
| • | changes in political, social and economic conditions and local regulations, particularly in Europe and Asia; |
| • | the occurrence of hostilities or catastrophic events; |
| • | changes in customer demand; and |
8
| • | disruptions to or breaches of our computer systems and software, as well as natural events such as severe weather, fires, floods and earthquakes or man-made or other disruptions of our operating systems, structures or equipment. |
Any forward-looking statement made by us in this report is based only on information currently available to us and speaks only as of the date on which it is made. We undertake no obligation to publicly update any forward-looking statement, whether written or oral, that may be made from time to time, whether as a result of new information, future developments or otherwise.
Our business faces numerous risks, many of which are beyond our control. The impact of these risks, as well as other unforeseen risks, could have a material negative impact on our business, financial condition or results of operations. The trading price of our common stock or our senior notes could decline as a result. You should consider these risks before deciding to invest in, or maintain your investment in, our common stock or senior notes.
We may not be successful in improving our results of operations or financial condition.
We have recently made significant changes in our strategic focus, senior management, operational processes, organizational structure, location of key business functions, expense structure, brand portfolio, marketing allocation, and product pricing in order to improve our performance. There can be no guarantee that these changes will result in improved operating results. Additionally, as we work to globalize certain business processes, changes in existing processes may result in unforeseen issues and complications that could have a material adverse effect on our results of operations and financial condition.
We may be unable to continue to reduce SG&A at the same pace.
We have recently undertaken various restructuring activities, including staff reductions, discontinuation of certain product categories or brands, exiting facilities, and other expense reductions. We believe these activities have contributed to reducing overall SG&A levels on a go-forward basis. However, if we do not undertake additional restructuring activities, or decrease the pace of such restructuring activities, we will be unable to sustain further SG&A reductions in future periods, which could be perceived negatively and, as a result, our stock price could decline.
Financial and competitive difficulties of our wholesale customers (independent retailers) may negatively impact our revenues and profitability.
Our wholesale business has been negatively impacted in some areas due to financial and competitive difficulties experienced by some of our independent wholesale customers. Our business may continue to be adversely impacted in the future as a result of such difficulties. Any continuation of financial and competitive difficulties for, or deterioration in the financial health of, our current or prospective wholesale customers could result in decreased sales, uncollectible receivables, increased product returns, decreased margins, or an inability to generate new business. Also, any consolidation of retail accounts, or concentration of market share in a specific area, could significantly increase our credit risk. Any or all of these factors could have a material adverse effect on our business, financial condition, and results of operations.
Additionally, as consumers become more confident shopping online, our wholesale channel customers face increased competition from online competitors, including, but not limited to, Amazon in the Americas, Zalando in EMEA, and Taobao in China. These online competitors may have lower cost structures, higher sales volumes, wider product assortments, and faster marketing response times than some of our traditional wholesale channel customers. In addition, our smaller independent wholesale accounts may face competitive challenges from large multi-location accounts that benefit from better pricing and terms due to higher purchasing volume, larger marketing investments, higher levels of support from suppliers, and superior financial condition. Also, we have made, and plan to make, changes to our wholesale sales force structure whereby wholesale accounts generating less than a minimum annual order volume will not be serviced by a salesperson, but will instead be provided a self-service website from which they may order our products. Lastly, our plans to reduce the size of our product assortment available to wholesale customers could have the effect of reducing wholesale revenues. We have experienced, and expect to continue to experience, difficulties in expanding or maintaining our wholesale channel revenues due to these and other factors. Such difficulties in our wholesale channel could have a material adverse impact on our operating results, financial condition and stock price.
Unfavorable economic conditions could have a material adverse effect on our business, results of operations and financial condition.
Our financial performance has been, and may continue to be, negatively affected by unfavorable economic conditions. Continued or further recessionary economic conditions, or other macro economic factors, may have an adverse impact on our sales volumes, pricing levels and profitability. As domestic and international economic conditions change, trends in discretionary consumer spending become unpredictable and subject to reductions due to uncertainties about the future. When consumers reduce discretionary spending, purchases of specialty apparel and footwear, like our products, tend to decline which may result in reduced orders from retailers for our products, order cancellations, and/or unanticipated discounts. A continuation
9
of the general reduction in consumer discretionary spending in the domestic and international economies, as well as the impact of tight credit markets on us, our suppliers, other vendors or customers, could have a material adverse effect on our results of operations and financial condition.
The apparel, footwear and accessories industries are each highly competitive, and if we fail to compete effectively, we could lose our market position.
The apparel, footwear and accessories industries are each highly competitive. We compete against a number of domestic and international brands, manufacturers, retailers and distributors of apparel, footwear and accessories. In order to compete effectively, we must: (1) maintain the image of our brands and our reputation for authenticity in our core markets; (2) be flexible and innovative in responding to rapidly changing market demands; and (3) offer consumers a wide variety of high quality products at competitive prices.
The purchasing decisions of consumers are highly subjective and can be influenced by many factors, such as brand image, marketing programs and product design. Several of our global competitors enjoy substantial competitive advantages, including greater financial resources for competitive activities, such as sales, marketing, strategic acquisitions and athlete endorsements. The number of our direct competitors and the intensity of competition may increase as we expand into other product lines or as other companies expand into our product categories. Our competitors may enter into business combinations or alliances that strengthen their competitive positions or prevent us from taking advantage of such combinations or alliances. Our competitors also may be able to respond more quickly and effectively than we can to new or changing opportunities, standards or consumer preferences. Our competitors may offers sales terms and conditions that we are unwilling or unable to match. If we fail to retain our competitive position, our sales could decline significantly which would have a material adverse effect on our results of operations, financial condition and liquidity.
If we are unable to develop innovative and stylish products in response to rapid changes in consumer demands and fashion trends, we may suffer a decline in our revenues and market share.
The apparel, footwear and accessories industries are subject to rapidly changing consumer demands based on fashion trends and performance features. Our success depends, in part, on our ability to anticipate, gauge and respond to these changing consumer preferences in a timely manner while preserving the authenticity and image of our brands and the quality of our products.
As is typical with new products, market acceptance of new designs and products we may introduce is subject to uncertainty. In addition, we generally make decisions regarding product designs months in advance of the time when consumer acceptance can be measured. If trends shift away from our products, or if we misjudge the market for our product lines, we may be faced with significant amounts of unsold inventory or other conditions which could have a material adverse effect on our results of operations and financial condition.
The failure of new product designs or new product lines to gain market acceptance could also adversely affect our business and the image of our brands. Achieving market acceptance for new products may also require substantial marketing efforts and expenditures to expand consumer demand. These requirements could strain our management, financial and operational resources. If we do not continue to develop stylish and innovative products that provide better design and performance attributes than the products of our competitors, or if our future product lines misjudge consumer demands, we may lose consumer loyalty, which could result in a decline in our revenues and market share.
Our business could be harmed if we fail to maintain proper inventory levels.
We maintain an inventory of selected products that we anticipate will be in demand. We may be unable to sell the products we have ordered in advance from manufacturers or that we have in our inventory. Inventory levels in excess of customer demand may result in inventory write-downs or the sale of excess inventory at discounted or closeout prices. These events could significantly harm our operating results and impair the image of our brands. Conversely, if we underestimate consumer demand for our products or if our manufacturers fail to supply quality products in a timely manner, we may experience inventory shortages, which might result in unfilled orders, negatively impact customer relationships, diminish brand loyalty and result in lost revenues, any of which could harm our business.
10
Our business could be harmed if we fail to execute our internal plans to transition our supply chain and certain other business processes to global scope.
We are in the process of transitioning our footwear and apparel supply chains, as well as certain other business processes, to global scope. If our globalization efforts fail to produce planned efficiencies, or the transition is not managed effectively, we may experience excess inventories, inventory shortage, late deliveries, lost revenues, or increased costs. Any business disruption arising from our globalization efforts, or our failure to effectively execute our internal plans for globalization, could adversely impact our results of operations and financial condition.
Our business could be harmed if we are unable to accurately forecast demand for our products.
To ensure adequate inventory supply, we forecast inventory needs and place orders with our manufacturers before firm orders are placed by our customers. If we fail to accurately forecast customer demand, we may experience excess inventory levels or a shortage of product to deliver to our customers.
Inventory levels in excess of customer demand may result in inventory write-downs or write-offs and the sale of excess inventory at discounted prices, which would have an adverse effect on gross margin. In addition, if we underestimate the demand for our products, our manufacturers may not be able to produce products to meet our customer requirements, and this could result in delays in the shipment of our products and our ability to satisfy customer demand, as well as damage to our reputation and customer relationships. A failure to accurately predict the level of demand for our products could cause a decline in revenue and adversely impact our results of operations and financial condition.
The demand for our products is seasonal and is dependent upon several unpredictable factors.
Consumer demand for our products can fluctuate significantly from quarter to quarter and year to year. Consumer demand is dependent on many factors, including customer acceptance of our product designs, fashion trends, economic conditions, changes in consumer spending, weather patterns during peak selling periods, and numerous other factors beyond our control. The seasonality of our business and/or misjudgment in anticipating consumer demands could have a material adverse effect on our financial condition and results of operations.
Our industry is subject to pricing pressures that may adversely impact our financial performance.
We source many of our products offshore because manufacturing costs, particularly labor costs, are generally less than in the U.S. Many of our competitors also source their products offshore, possibly at lower costs than ours, and they may use these cost savings to reduce prices. To remain competitive, we may be forced to adjust our prices from time to time in response to these pricing pressures. As a result, our financial performance may be negatively affected if we are forced to reduce our prices while we are unable to reduce production costs or our production costs increase and we are unable to proportionately increase our prices. Any inability on our part to effectively respond to changing prices and sourcing costs could have a material adverse effect on our results of operations, financial condition and liquidity.
Our wholesale pricing strategies may adversely impact our financial performance.
We have recently made, and may continue to make, adjustments to our wholesale prices. We believe these reductions in our wholesale pricing will result in improved in-season sell through of our products by our wholesale customers, reduced product markdowns, and reduced product returns. We believe these reductions in wholesale prices, when combined with related reductions in markdowns and returns, will not be detrimental to our gross margin. If these reductions in our wholesale prices do not result in reductions in markdowns and returns, this could have a material adverse effect on our gross margin, results of operations, financial condition and liquidity.
Fluctuations in the cost and availability of raw materials, labor, and transportation could cause manufacturing delays and increase our costs.
The prices of the fabrics used to manufacture our products depend largely on the market prices for the raw materials used to produce them, particularly cotton. The price and availability of such raw materials may fluctuate significantly, depending on many factors, including crop yields and weather patterns. In addition, the cost of labor at many of our third party manufacturers has been increasing significantly. The cost of logistics and transportation fluctuates in large part due to the price of oil. Any fluctuations in the cost and availability of any of our raw materials or other sourcing costs could have a material adverse effect on our gross margins and our ability to meet consumer demands.
Factors affecting international commerce and our international operations may seriously harm our financial condition.
We generate the majority of our revenues from outside of the United States, and we anticipate that revenue from our international operations could account for an increasingly larger portion of our revenue in the future. Our international
11
operations are directly related to, and dependent on, the volume of international trade and foreign market conditions. International commerce and our international operations are subject to many risks, including:
| • | recessions in foreign economies; |
| • | fluctuations in foreign currency exchange rates; |
| • | the adoption and expansion of trade restrictions; |
| • | limitations on repatriation of earnings; |
| • | difficulties in protecting our intellectual property or enforcing our intellectual property rights under the laws of other countries; |
| • | longer receivables collection periods and greater difficulty in collecting accounts receivable; |
| • | social, political and economic instability or hostilities; |
| • | unexpected changes in regulatory requirements; |
| • | fluctuations in foreign tax rates; |
| • | tariffs, sanctions and other trade barriers; and |
| • | U.S. government licensing requirements for exports. |
The occurrence or consequences of any of these risks may restrict our ability to operate in the affected regions and decrease the profitability of our international operations, which may harm our financial condition.
We have established, and may continue to establish, joint ventures in various foreign territories with independent third party business partners to distribute and sell Quiksilver, Roxy, DC and other branded products in such territories. In addition, we may decide to acquire the remaining portion of existing joint ventures that we do not own. These joint ventures are subject to substantial risks and liabilities associated with their operations, as well as the risk that our relationships with our joint venture partners do not succeed in the manner that we anticipate. If our joint venture operations, or our relationships with our joint venture partners, are not successful, we could face litigation or legal costs in connection with exiting the relationship or delays in making planned changes to our operations in the applicable territories. These costs, delays, and/or investments could adversely impact our our financial condition and/or the market price of our common stock.
We have operations in certain emerging markets and developing countries where the risk of asset misappropriation, civil unrest or social instability, theft, other crimes, or frivolous claims is higher than in more developed countries. Likewise, there is less protection for intellectual property rights of foreign companies in these jurisdictions. These risks can significantly increase the cost of operations in such markets.
In addition, as we continue to expand our overseas operations, we are subject to certain anti-corruption laws, including the U.S. Foreign Corrupt Practices Act, in addition to the laws of the foreign countries in which we operate. We must use all commercially reasonable efforts to ensure our employees and agents comply with these laws. If any of our overseas operations, or our employees or agents, violates such laws, we could become subject to sanctions or other penalties that could negatively affect our reputation, business and operating results.
Uncertainty of changing international trade regulations and quotas on imports of textiles and apparel may adversely affect our business.
Quotas, duties or tariffs may have a material adverse effect on our business, financial condition and results of operations. We currently import raw materials and/or finished garments into the majority of countries in which we sell our products. Substantially all of our import operations are subject to customs duties.
In addition, the countries in which our products are manufactured or into which they are imported may, from time to time, impose new quotas, duties, tariffs, requirements as to where raw materials must be purchased, new workplace regulations or other restrictions on our imports, or otherwise adversely modify existing restrictions. Adverse changes in these costs and restrictions could harm our business.
12
We rely on third party manufacturers and problems with, or loss of, our suppliers or raw materials could harm our business and results of operations.
Substantially all of our products are produced by independent manufacturers. We face the risk that these third party manufacturers with whom we contract to produce our products may not produce and deliver our products on a timely basis, or at all. We also may be subject to credit reductions and other changes in our business relationships with our suppliers, vendors and customers if they perceive that we would be unable to pay our debts to them in a timely manner. We cannot be certain that we will not experience operational difficulties with our manufacturers, such as reductions in the availability of production capacity, errors in complying with product specifications and regulatory and customer requirements, insufficient quality control, failures to meet production deadlines, increases in materials and manufacturing costs or other business interruptions or failures due to deteriorating economies. The failure or unwillingness of any manufacturer to perform to our expectations could result in supply shortages or delays for certain products and harm our business. Our business may also be harmed by material increases to our cost of goods as a result of increasing labor costs, which manufacturers have recently faced.
If our independent manufacturers fail to comply with appropriate laws, regulations, safety codes, employment practices, human rights, quality standards, environmental standards, production practices, or other obligations and norms, our reputation and brand image could be negatively impacted and we could be exposed to litigation and additional costs which would adversely affect our operational efficiency and results of operations.
The capacity of our manufacturers to manufacture our products also is dependent, in part, upon the availability of raw materials. Our manufacturers may experience shortages of raw materials, which could result in delays in deliveries of our products by our manufacturers or increased costs to us. Any shortage of raw materials or inability of a manufacturer to manufacture or ship our products in a timely manner, or at all, could impair our ability to ship orders of our products in a cost-efficient, timely manner and could cause us to miss the delivery requirements of our customers. As a result, we could experience cancellations of orders, refusals to accept deliveries, or reductions in our prices and margins, any of which could harm our financial performance and results of operations.
Labor disruptions at our suppliers, manufacturers, common carriers or ports may adversely affect our business.
Our business depends on our ability to source and distribute products in a timely manner. As a result, we rely on the timely and free flow of goods through open and operational ports worldwide and on a consistent basis from our suppliers and manufacturers. Labor disputes or disruptions at various ports, our common carriers, or at our suppliers or manufacturers create significant risks for our business, particularly if these disputes result in work slowdowns, lockouts, strikes or other disruptions during our peak importing or manufacturing seasons, and could have an adverse effect on our business, potentially resulting in canceled orders by customers, unanticipated inventory accumulation or shortages, and an adverse impact on our results of operations and financial condition.
Our business could suffer if we lose key management or are unable to attract and retain the talent required for our business.
Our performance is significantly impacted by the efforts and abilities of our senior management team. If we lose the services of one or more of our key executives, we may not be able to successfully manage our business or achieve our business objectives. If we are unable to recruit and retain qualified management personnel in a timely manner, our results of operations and financial condition could suffer.
We have granted performance-based equity compensation to our senior management team that have the potential to generate compensation that could be substantial to them as individuals. Certain of these grants vest upon achievement of specified common stock price thresholds and completion of the required service period. Others vest upon the achievement of specified financial targets. In some cases, there is no required post-vesting service period for the grantees. If the shares underlying such equity compensation ultimately vest, the risk of senior management turnover would be heightened and a departure of any portion of the senior management team could have an adverse impact on our operations and financial condition.
Our debt obligations expose us to certain risks.
Our levels of debt and leverage may have negative consequences to us, including the following:
| • | we may have difficulty satisfying our obligations with respect to our indebtedness, and, if we fail to comply with these requirements, an event of default could result; |
| • | we may be required to dedicate a substantial portion of our cash flow from operations to required interest and, where applicable, principal payments on indebtedness, thereby reducing the availability of cash flow for working capital, capital expenditures and other general corporate activities; |
13
| • | covenants relating to our indebtedness may limit our ability to obtain additional financing for working capital, capital expenditures and other general corporate activities; |
| • | we may be subject to credit reductions and other changes in our business relationships with our suppliers, vendors and customers if they perceive that we would be unable to pay our debts to them in a timely manner; |
| • | we have debt agreements with cross default provisions, wherein a default in certain agreements could result in a default in other agreements; |
| • | we have credit facilities that are subject to periodic review and renewal, and we may be unable to extend these facilities at terms favorable to us, requiring the use of cash on hand or reducing our available credit; |
| • | we have unsecured short term credit facilities, and agreements to provide letters of credit, in which the related banks may elect not to continue the facility which could reduce our available borrowing capacity; and |
| • | we may be placed at a competitive disadvantage against less leveraged competitors. |
The agreements governing our debt obligations contain various covenants that impose restrictions on us that may affect our ability to operate our business.
The agreements, including indentures, governing our indebtedness impose, and future financing agreements are likely to impose, operating and financial restrictions on our activities. These restrictions require us to comply with or maintain certain financial tests and ratios. In addition, the agreements limit or prohibit our ability to, among other things:
| • | incur additional debt and guarantees; |
| • | pay distributions or dividends and repurchase stock; |
| • | make other restricted payments, including without limitation, certain restricted investments; |
| • | create liens; |
| • | enter into agreements that restrict dividends from subsidiaries; |
| • | engage in transactions with affiliates; and |
| • | enter into mergers, consolidations or sales of substantially all of our assets, including restrictions on the use of proceeds from sales of certain asset groups. |
These restrictions on our ability to operate our business could seriously harm our business by, among other things, limiting our ability to take advantage of financing, merger and acquisition, and other corporate opportunities.
Various risks, uncertainties and events beyond our control could affect our ability to comply with these covenants. Failure to comply with any of the covenants in our existing or future financing agreements could result in a default under those agreements and under other agreements containing cross-default provisions. A default would permit lenders to accelerate the maturity of the debt under these agreements and to foreclose upon any collateral securing the debt. Under these circumstances, we might not have sufficient funds or other resources to satisfy all of our obligations. In addition, the limitations imposed by financing agreements on our ability to incur additional debt and to take other actions might significantly impair our ability to obtain other financing. We cannot assure you that we will be granted waivers or amendments to these agreements if, for any reason, we are unable to comply with these agreements or that we will be able to refinance our debt on terms acceptable to us, or at all.
We lease retail stores, office space, and distribution center facilities under operating leases, and if we terminate such leases prior to their contractual expiration, we could be liable for substantial payments for remaining lease liabilities.
We operate 683 retail stores, as well as various offices, showrooms, distribution centers and equipment, under non-cancelable operating leases. We have, at times, closed certain under-performing stores prior to the termination of their related lease agreements. As a result, we have incurred mutually negotiated lease termination costs with landlords. We may close additional under-performing stores, or other leased facilities, prior to the termination of their related lease agreements in the future. This could require payment to the landlord or lease holder of an early lease termination fee, or require us to continue to make lease payments through the end of the lease while we are not using the related facility. Consequently, we may incur substantial lease termination payments or facility exit expenses that could decrease our profitability, reduce our cash balances or amounts available under credit facilities, and thereby have an adverse effect on our business, financial condition, and results of operations.
14
Our success is dependent on our ability to protect our worldwide intellectual property rights, and our inability to enforce these rights could harm our business.
Our success depends to a significant degree upon our ability to protect and preserve our intellectual property, including copyrights, trademarks, patents, service marks, trade dress, trade secrets and similar intellectual property. We rely on the intellectual property, patent, trademark and copyright laws of the United States and other countries to protect our proprietary rights. However, we may be unable to prevent third parties from using our intellectual property without our authorization, particularly in those countries where the laws do not protect our proprietary rights as fully as in the United States. The use of our intellectual property or similar intellectual property by others could reduce or eliminate any competitive advantage we have developed, causing us to lose sales or otherwise harm our business. From time to time, we resort to litigation to protect these rights, and these proceedings can be burdensome and costly and we may not prevail.
We have obtained some U.S. and foreign trademarks, patents and service mark registrations, and have applied for additional ones, but cannot guarantee that any of our pending applications will be approved by the applicable governmental authorities. The loss of trademarks, patents and service marks, or the loss of the exclusive use of our trademarks, patents and service marks, could have a material adverse effect on our business, financial condition and results of operations. Accordingly, we devote substantial resources to the establishment and protection of our trademarks, patents and service marks on a worldwide basis and continue to evaluate the registration of additional trademarks, patents and service marks, as appropriate. There can be no assurance that our actions taken to establish and protect our trademarks, patents and service marks will be adequate to prevent imitation of our products by others or to prevent others from seeking to block sales of our products as violations of their trademark, patent or other proprietary rights.
We may be subject to claims that our products have infringed upon the intellectual property rights of others, which may cause us to incur unexpected costs or prevent us from selling our products.
We cannot be certain that our products do not and will not infringe the intellectual property rights of others. We may be subject to legal proceedings and claims in the ordinary course of our business, including claims of alleged infringement of the intellectual property rights of third parties by us or our customers in connection with their use of our products. Any such claims, whether or not meritorious, could result in costly litigation and divert the efforts of our personnel. Moreover, should we be found liable for infringement, we may be required to enter into licensing agreements (if available on acceptable terms or at all) or to pay damages and cease making or selling certain products. Moreover, we may need to redesign, discontinue or rename some of our products to avoid future infringement liability. Any of the foregoing could cause us to incur significant costs and prevent us from manufacturing or selling our products.
If we are unable to maintain our endorsements by professional athletes, our ability to market and sell our products may be harmed.
A valuable element of our marketing strategy has been to obtain endorsements from prominent athletes, which contribute to the authenticity and image of our brands. We believe that this strategy has been an effective means of gaining brand exposure worldwide and creating broad appeal for our products. We cannot be certain that we will be able to maintain our existing relationships with these individuals in the future or that we will be able to attract new athletes to endorse our products. We also are subject to risks related to the selection of athletes whom we choose to endorse our products. We may select athletes who are unable to perform at expected levels or who are not sufficiently marketable. In addition, negative publicity concerning any of our athletes could harm our brand and adversely impact our business. If we are unable in the future to secure prominent athletes and arrange athlete endorsements of our products on terms we deem to be reasonable, we may be required to modify our marketing platform and to rely more heavily on other forms of marketing and promotion, which may not prove to be effective. Our inability to obtain endorsements from professional athletes could adversely affect our ability to market and sell our products, resulting in loss of revenues and a loss of profitability.
In some cases, we sign multi-year contracts with sponsored athletes. If we should later wish to terminate the contract prior to the expiration date, we could be required to pay an early termination penalty, or negotiated release payment, which could have an adverse effect on our business and results of operations.
Difficulties in implementing our new global Enterprise Resource Planning system and other technologies could impact our ability to design, produce and ship our products on a timely basis.
We are in the process of implementing the SAP Apparel and Footwear Solution in addition to certain peripheral technologies as our core operational and financial system (together, “ERP”). The ongoing implementation of the ERP is a key part of our continuing efforts to manage our business more effectively by eliminating redundancies and improving our overall cost structure and margin performance. Difficulties in implementing our ERP and integrating peripheral technologies into it, including the costs of customizing and updating our ERP, could impact our ability to design, produce and ship our products on a timely basis, and thereby have an adverse effect on our business, financial condition and results of operations.
15
We rely significantly on information technology and any failure, inadequacy, interruption or security lapse of that technology could harm our ability to effectively operate our business.
Our ability to effectively manage and maintain our supply chain, ship products to customers, and invoice customers on a timely basis depends significantly on several key information systems. The failure of these systems to operate effectively or to integrate with other systems, or a breach in security of any of these systems, could cause delays in product fulfillment and reduced efficiency of our operations, and it could require significant capital investments to remediate any such failure, problem or breach.
In addition, hackers and data thieves are increasingly sophisticated and operate large scale and complex automated attacks. Despite security measures that we and our third party vendors have in place, any breach of our or our third party service providers’ networks may result in the loss of valuable business data, our customers’ or employees’ personal information, or a disruption of our business, which could give rise to unwanted media attention, damage our customer relationships and reputation, and result in lost sales, fines or lawsuits. In addition, we must comply with increasingly complex regulatory standards enacted to protect this business and personal data. Any inability to maintain compliance with these regulatory standards could expose us to risks of litigation and liability, and adversely impact our results of operations and financial condition.
Changes in foreign currency exchange rates could affect our reported revenues and costs.
We are exposed to gains and losses resulting from fluctuations in foreign currency exchange rates relating to certain sales, royalty income, and product purchases of our international subsidiaries that are denominated in currencies other than their functional currencies. We are also exposed to foreign currency gains and losses resulting from U.S. transactions that are not denominated in U.S. dollars. If we are unsuccessful in hedging these potential losses, our operating results could be negatively impacted and our cash flows could be significantly reduced. In some cases, as part of our risk management strategies, we may choose not to hedge such risks. If we misjudge these risks, there could be a material adverse effect on our operating results and financial position. We may use foreign currency exchange contracts, or other derivatives, to hedge certain currency exchange risks. Such derivatives may expose us to counterparty risks and there can be no guarantee that such derivatives will be effective as hedges.
Furthermore, we are exposed to gains and losses resulting from the effect that fluctuations in foreign currency exchange rates have on the reported results in our consolidated financial statements due to the translation of the statements of operations and balance sheets of our international subsidiaries into U.S. dollars. We may (but generally do not) use foreign currency exchange contracts to hedge the profit and loss effects of this translation effect because such exposures are generally non-cash in nature and because accounting rules would require us to mark these contracts to fair value in the statement of operations at the end of each financial reporting period. We translate our revenues and expenses at average exchange rates during the period. As a result, the reported revenues and expenses of our international subsidiaries would decrease if the U.S. dollar increased in value in relation to other currencies, including but not limited to the euro, Australian dollar, Japanese yen, Brazilian real, or Russian ruble.
Future sales of our common stock, or the issuance of other equity securities, may adversely affect the market price of our common stock and the value of our senior notes.
Sales of a substantial number of shares of our common stock or other equity-related securities could depress the market price of our common stock, senior notes, or both. We cannot predict the effect that future sales of our common stock or other equity-related securities, including the exercise and/or sale of the equity securities held by entities affiliated with Rhône Capital LLC, would have on the market price of our common stock or the value of our senior notes.
Actions by our licensee partners could adversely impact our brand reputation and business.
We have licensed certain product categories to third party licensees which have the right to design, source, and sell certain products bearing our trademarks. We anticipate that the product royalties from these licensing agreements could improve the profitability of these categories relative to operating these categories ourselves, as we believe that our licensee partners have better expertise, wider product distribution capabilities, or superior supply chain capabilities. Failure of our licensees to source quality products, execute business plans, or comply with laws, regulations, or other standards could harm the reputation of our brands and result in a failure to achieve expected royalty income and related profitability and thereby have an adverse effect on our business, financial condition, and results of operations.
Employment related matters may affect our profitability.
As of October 31, 2014, we had no unionized employees, but certain French employees are represented by workers’ councils. As we have little control over union activities, we could face difficulties in the future should our workforce become unionized.
16
There can be no assurance that we will not experience work stoppages or other labor problems in the future with our non-unionized employees or employees represented by workers’ councils.
We employ staff in jurisdictions where regulations or business practices dictate that we provide employees with offer notification periods or severance payments in connection with the termination of their employment with us which are significantly in excess of those traditionally provided in the United States. Consequently, our costs to terminate employees may be greater than the costs of other companies that do not employ significant numbers of employees in these jurisdictions.
The effects of war, acts of terrorism, natural disasters or other unforeseen wide-scale events could have a material adverse effect on our operating results and financial condition.
The continued threat of terrorism, and associated heightened security measures and military actions in response to acts of terrorism, has disrupted commerce and has intensified uncertainties in the U.S. and international economies. Any further acts of terrorism, escalated hostilities, a future war, or a widespread natural or other disaster may disrupt commerce, undermine consumer confidence and lead to a further downturn in the U.S. or international economies, which could negatively impact our revenues. Furthermore, an act of terrorism, war or the implementation of trade sanctions, or the threat thereof, or any natural or other disaster that results in unforeseen interruptions of commerce could negatively impact our business by interfering with our ability to obtain products from our manufacturers.
Failure to maintain adequate financial and management processes and controls could lead to errors in our financial reporting and could adversely affect our business.
We are required to document and test our internal controls over financial reporting pursuant to Section 404 of the Sarbanes-Oxley Act of 2002 (“SOX 404”). As a result, we have incurred and expect to continue to incur substantial expenses to comply with SOX 404 requirements. If, for any reason, our SOX 404 compliance efforts fail to result in an unqualified opinion regarding the effectiveness of our internal controls, we could be subject to regulatory scrutiny and a loss of public confidence, which could have a material adverse effect on our business, stock price and ability to attract credit. In addition, if we do not maintain adequate financial and management personnel, processes and controls, we may not be able to: (1) accurately report our financial performance on a timely basis, which could cause a decline in our stock price and adversely affect our ability to raise capital, our results of operations, and our financial condition; and (2) appropriately manage or control our operations, which could adversely impact our results of operations.
If our goodwill, other intangible assets, or other fixed assets become impaired, we may be required to record significant non-cash charges to our earnings.
We may be required to record impairments of goodwill to the extent the fair value of any of our reporting units becomes less than its carrying value. Our estimates of fair value are based on assumptions about future cash flows of each reporting unit, discount rates applied to these cash flows and current market estimates of value. Based on the uncertainty of future revenue growth rates, gross profit performance, and other assumptions used to estimate goodwill recoverability, future reductions in our expected cash flows could cause a material non-cash impairment charge of goodwill, which could have a material adverse effect on our results of operations and financial condition.
We also have certain other intangible assets including, but not limited to, intellectual property and deferred tax assets, as well as fixed assets in our Company-owned retail stores, which could be at risk of impairment or may require valuation reserves based upon anticipated future benefits to be derived from such assets. Any change in the valuation of such assets could have a material effect on our profitability.
| Item 1B. | UNRESOLVED STAFF COMMENTS |
None.
17
| Item 2. | PROPERTIES |
As of October 31, 2014, our principal facilities in excess of 40,000 square feet were as follows:
| Location | Principal Use | Square Footage | Lease Expiration | |||||
| Huntington Beach, CA | Offices | 223,000 | 2034 | * | ||||
| Huntington Beach, CA | Offices | 120,000 | 2024 | |||||
| Mira Loma, CA | Distribution center | 683,000 | 2027 | * | ||||
| Huntington Beach, CA | Offices | 102,000 | 2024 | |||||
| St. Jean de Luz, France | Offices | 151,000 | N/A | ** | ||||
| St. Jean de Luz, France | Distribution center | 127,000 | N/A | ** | ||||
| St. Jean de Luz, France | Offices | 67,000 | 2021 | * | ||||
| Rives, France | Distribution center | 206,000 | 2016 | |||||
| Torquay, Australia | Offices | 54,000 | 2024 | * | ||||
| Geelong, Australia | Distribution center | 81,000 | 2038 | * | ||||
| Geelong, Australia | Distribution center | 134,000 | 2039 | * | ||||
| * | Includes extension periods exercisable at our option. |
| ** | These locations are owned. |
As of October 31, 2014, we operated 100 retail stores in the Americas, 296 retail stores in EMEA, and 287 retail stores in APAC on leased premises. The leases for our facilities, including retail stores, required aggregate annual rentals of approximately $119 million in fiscal 2014. We anticipate that we will be able to extend those leases that expire in the near future on terms satisfactory to us, or, if necessary, locate substitute facilities on acceptable terms. We believe that our corporate, distribution and retail leased facilities are suitable and adequate to meet our current needs.
| Item 3. | LEGAL PROCEEDINGS |
As part of our global operations, we may be involved in legal claims involving trademarks, intellectual property, licensing, employment matters, compliance, contracts and other matters incidental to our business. We believe the resolution of any such matter currently threatened or pending will not have a material adverse effect on our financial condition, results of operations or liquidity.
| Item 4. | MINE SAFETY DISCLOSURES |
Not applicable.
18
PART II
Item 5. MARKET FOR REGISTRANT’S COMMON EQUITY, RELATED STOCKHOLDER MATTERS AND ISSUER PURCHASES OF EQUITY SECURITIES
Our common stock trades on the New York Stock Exchange (“NYSE”) under the symbol “ZQK.” The high and low sales prices of our common stock, as reported by the NYSE for the two most recent fiscal years, are set forth below.
| 2014 | 2013 | |||||||||||||||
| High | Low | High | Low | |||||||||||||
| 4th Quarter ended October 31 | $ | 3.35 | $ | 1.40 | $ | 8.55 | $ | 4.81 | ||||||||
| 3rd Quarter ended July 31 | 6.89 | 2.89 | 8.13 | 5.74 | ||||||||||||
| 2nd Quarter ended April 30 | 8.27 | 6.14 | 6.83 | 5.65 | ||||||||||||
| 1st Quarter ended January 31 | 9.28 | 6.90 | 6.67 | 3.20 | ||||||||||||
We have historically reinvested our earnings in our business and have never paid a cash dividend. No change in this practice is currently being considered. Any payment of cash dividends in the future will be determined by our Board of Directors, considering conditions existing at that time, including our earnings, financial requirements and condition, opportunities for reinvesting earnings, business conditions and other factors. In addition, under the indentures related to our senior notes and under our other debt agreements, we must obtain prior consent to pay dividends to our stockholders above a pre-determined amount.
On December 3, 2014, there were 859 holders of record of our common stock and an estimated 35,314 beneficial stockholders.
Performance Graph
The following graph compares from November 1, 2009 to October 31, 2014 the yearly percentage change in Quiksilver Inc.'s cumulative total stockholder return on its common stock with the cumulative total return of (i) the NYSE Market Index and (ii) a group of peer companies that in our judgment manufacture and sell products similar to those that we manufacture and sell. The yearly percentage change has been measured by dividing (i) the sum of (A) the cumulative amount of dividends for the measurement period, assuming dividend reinvestment, and (B) the difference between the price of the stock at the end and the beginning of the measurement period; by (ii) the stock price at the beginning of the measurement period. The historical stock performance shown on the graph is not intended to, and may not be, indicative of future stock performance.
The performance graph below is being furnished solely to accompany this Annual Report on Form 10-K pursuant to Item 201 (e) of Regulation S-K, and is not being filed for the purposes of Section 18 of the Securities Exchange Act of 1934, as amended, and is not to be incorporated by reference into any of our filings, whether made before or after the date hereof, regardless of any general incorporation language in such filing.
19
Comparison of 5-Year Cumulative Total Return
Among Quiksilver, Inc.,
NYSE Market Index & Peer Group Index
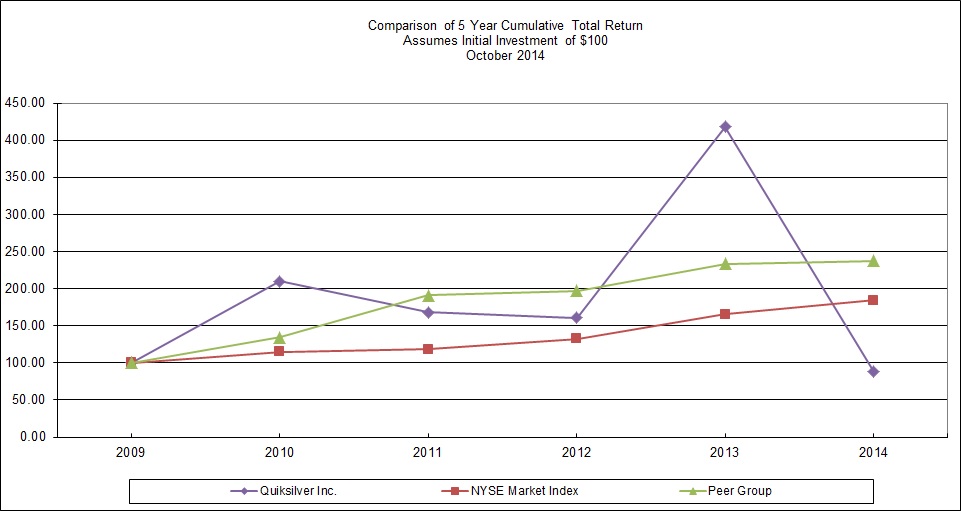
Assumes $100 invested on November 1, 2009
Assumes Dividends Reinvested
Fiscal Year Ended October 31, 2014
| 2009 | 2010 | 2011 | 2012 | 2013 | 2014 | |||||||
| Quiksilver Inc. | $100.00 | $209.55 | $168.35 | $160.81 | $418.10 | $87.94 | ||||||
| NYSE Market Index | $100.00 | $114.54 | $118.38 | $132.41 | $165.64 | $183.99 | ||||||
| Peer Group Index | $100.00 | $134.52 | $190.73 | $197.24 | $233.44 | $237.29 | ||||||
The following public companies were used in the graph above to represent the Peer Group:
Coach, Inc.
Columbia Sportswear Co
Guess, Inc.
Hampshire Group Ltd
Jones Group, Inc
Fifth & Pacific Companies, Inc
Oxford Industries, Inc
Phillips-Van Heusen Corp
Polo Ralph Lauren Corp
VF Corp
20
| Item 6. | SELECTED FINANCIAL DATA |
The statements of operations and balance sheet data shown below were derived from our audited consolidated financial statements for the periods presented. See Note 18, “Discontinued Operations”, to our consolidated financial statements for a discussion of the operating results of our discontinued businesses. This selected financial data should be read together with our consolidated financial statements and related notes, as well as the discussion under the caption “Management’s Discussion and Analysis of Financial Condition and Results of Operations” in Item 7.
| Year Ended October 31, | ||||||||||||||||||||
| Amounts in thousands, except ratios and per share data | 2014 (1) (2) | 2013 (1) (2) | 2012 (1) (2) | 2011 (1) (2) | 2010 (1) (2) | |||||||||||||||
| Statements of Operations Data | ||||||||||||||||||||
| Revenues, net | $ | 1,570,399 | $ | 1,810,570 | $ | 1,941,849 | $ | 1,916,327 | $ | 1,806,315 | ||||||||||
| (Loss)/income before provision for income taxes | (332,120 | ) | (73,191 | ) | (13,341 | ) | (42,501 | ) | 5,489 | |||||||||||
Loss from continuing operations(3) | (327,434 | ) | (238,766 | ) | (18,019 | ) | (27,421 | ) | (17,489 | ) | ||||||||||
Income from discontinued operations(3) | 18,057 | 6,201 | 7,263 | 6,163 | 7,805 | |||||||||||||||
Net loss(3) | (309,377 | ) | (232,565 | ) | (10,756 | ) | (21,258 | ) | (9,684 | ) | ||||||||||
Loss per share from continuing operations(3) | (1.92 | ) | (1.43 | ) | (0.11 | ) | (0.17 | ) | (0.13 | ) | ||||||||||
Income per share from discontinued operations(3) | 0.11 | 0.04 | 0.04 | 0.04 | 0.06 | |||||||||||||||
Net loss per share(3) | (1.81 | ) | (1.39 | ) | (0.07 | ) | (0.13 | ) | (0.07 | ) | ||||||||||
Loss per share from continuing operations, assuming dilution(3) | (1.92 | ) | (1.43 | ) | (0.11 | ) | (0.17 | ) | (0.13 | ) | ||||||||||
Income per share from discontinued operations, assuming dilution(3) | 0.11 | 0.04 | 0.04 | 0.04 | 0.06 | |||||||||||||||
Net loss per share, assuming dilution(3) | (1.81 | ) | (1.39 | ) | (0.07 | ) | (0.13 | ) | (0.07 | ) | ||||||||||
Weighted average common shares outstanding(4) | 170,492 | 167,255 | 164,245 | 162,430 | 135,334 | |||||||||||||||
Weighted average common shares outstanding, assuming dilution(4) | 170,492 | 167,255 | 164,245 | 162,430 | 135,334 | |||||||||||||||
| Balance Sheet Data | ||||||||||||||||||||
| Total assets | $ | 1,256,664 | $ | 1,620,470 | $ | 1,718,240 | $ | 1,764,223 | $ | 1,696,121 | ||||||||||
| Working capital | 394,296 | 548,216 | 549,253 | 581,361 | 537,439 | |||||||||||||||
| Lines of credit | 32,929 | — | 18,147 | 18,335 | 22,586 | |||||||||||||||
| Long-term debt | 795,661 | 831,300 | 739,822 | 729,351 | 706,187 | |||||||||||||||
Stockholders’ equity(3) | 56,030 | 369,706 | 583,310 | 610,098 | 610,368 | |||||||||||||||
| (1) | Fiscal 2014, 2013, 2012, 2011 and 2010 include asset impairments of $11 million, $12 million, $7 million, $12 million, and $12 million, respectively. Fiscal 2014 and 2011 also include goodwill impairments of $178 million in EMEA and $74 million in APAC, respectively. |
| (2) | All fiscal years reflect the operations of Mervin and Hawk as discontinued operations. Fiscal 2010 also reflects the operations of Rossignol and Cleveland Golf as discontinued operations. Fiscal 2014, 2013 and 2012 reflect the operations of Surfdome as discontinued operations. |
| (3) | Attributable to Quiksilver, Inc. |
| (4) | The significant increase in weighted average common shares outstanding and weighted average common shares outstanding, assuming dilution from fiscal 2010 to fiscal 2011 is primarily due to the debt-for-equity exchange that occurred in August 2010, in which we exchanged $140 million of outstanding debt for 31.1 million shares, which represents an exchange price of $4.50 per share. |
21
Item 7. MANAGEMENT’S DISCUSSION AND ANALYSIS OF FINANCIAL CONDITION AND RESULTS OF OPERATIONS
The following Management’s Discussion and Analysis of Financial Condition and Results of Operations (“MD&A”) should be read in conjunction with our Consolidated Financial Statements and Notes thereto included elsewhere in this Annual Report on Form 10-K. The MD&A contains forward-looking statements that involve risks and uncertainties. Our actual results could differ materially from those anticipated in these forward-looking statements as a result of certain factors, including those set forth under “Risk Factors” within Item 1A.
Overview
We began operations in 1976 as a California company making boardshorts for surfers in the United States under a license agreement with the Quiksilver brand founders in Australia. We reincorporated in Delaware and went public in 1986 and, in subsequent years, acquired the worldwide licenses and trademarks that created the global company that we are today. Our business is rooted in the strong heritage and authenticity of our core brands, Quiksilver, Roxy and DC, each of which caters to the casual, outdoor lifestyle associated with surfing, skateboarding, snowboarding, BMX and motocross, among other activities. Today, our products are sold in over 115 countries through a wide range of distribution points, including wholesale accounts (surf shops, skate shops, snow shops, sporting goods stores, discount centers, specialty stores, select department stores, and licensed stores), 683 Company-owned retail stores, and via our e-commerce websites. We operate in the outdoor market of the sporting goods industry in which we design, develop and distribute branded apparel, footwear, accessories and related products. We have four operating segments consisting of the Americas, EMEA and APAC, each of which sells a full range of our products, as well as Corporate Operations. Our Americas segment, consisting of North, South, and Central America, includes revenues primarily from the United States, Canada, Brazil, and Mexico. Our EMEA segment, consisting of Europe, the Middle East, and Africa, includes revenues primarily from continental Europe, the United Kingdom, Russia and South Africa. Our APAC segment, consisting of Australia, New Zealand, and Pacific Rim markets, includes revenues primarily from Australia, Japan, New Zealand, South Korea, Taiwan, and Indonesia. Royalties earned from various licensees in other international territories are categorized in Corporate Operations along with revenues from sourcing services for our licensees. For information regarding the operating income and identifiable assets attributed to our operating segments, see Note 2, "Segment and Geographic Information", to our consolidated financial statements.
Discontinued Operations
In order to improve our focus on the operations and development of our three core brands (Quiksilver, Roxy and DC), we have divested certain non-core businesses. In November 2013, we completed the sale of our Mervin business for $58 million. In January 2014, we completed the sale of substantially all of the assets of our Hawk business for $19 million. The sale of these businesses generated a net after-tax gain of approximately $30 million, which is included in income from discontinued operations for fiscal 2014. In December 2014, we sold our 51% ownership stake in Surfdome. At the completion of the sale, we received net proceeds of approximately $16 million, which included payments to us from Surfdome for all outstanding loans and trade receivables. During fiscal 2014, we recorded non-cash impairment charges totaling $21 million in discontinued operations to write-down Surfdome goodwill, intangible assets and other long-term assets to their estimated fair market value. Our sale of the Mervin and Hawk businesses generated income tax expense of approximately $19 million during fiscal 2014. However, as we do not expect to pay income tax on these sales after application of available loss carry-forwards, an offsetting income tax benefit was recognized within continuing operations. The operations of Surfdome generated a tax benefit of approximately $3 million.
The Mervin, Hawk and Surfdome businesses are presented as discontinued operations in our consolidated financial statements for all periods presented. See Note 7 to our consolidated financial statements, "Intangible Assets and Goodwill", for further discussion on the impairment charges. See Note 18, “Discontinued Operations”, to our consolidated financial statements for further discussion of the operating results of our discontinued businesses.
22
Results of Operations
The following table sets forth selected statement of operations data and other data from continuing operations expressed as a percentage of net revenues for the fiscal years indicated. The discussion of our operating results from continuing operations that follows should be read in conjunction with the table.
| Year Ended October 31, | |||||||||
| 2014 | 2013 | 2012 | |||||||
| Statements of Operations Data | |||||||||
| Revenues, net | 100.0 | % | 100.0 | % | 100.0 | % | |||
| Gross profit | 48.6 | % | 48.2 | % | 48.5 | % | |||
| Selling, general and administrative expense | 52.7 | % | 47.4 | % | 45.7 | % | |||
| Goodwill impairment | 11.3 | % | — | % | — | % | |||
| Asset impairments | 0.7 | % | 0.7 | % | 0.4 | % | |||
| Operating (loss)/income | (16.1 | )% | 0.1 | % | 2.4 | % | |||
| Interest expense, net | 4.8 | % | 3.9 | % | 3.1 | % | |||
| Foreign currency loss/(gain) | 0.2 | % | 0.3 | % | (0.1 | )% | |||
| Loss before (benefit)/provision for income taxes | (21.1 | )% | (4.0 | )% | (0.7 | )% | |||
Fiscal 2014 Compared to Fiscal 2013
Revenues, net
Reconciliation of GAAP Results to Non-GAAP Measures
In order to provide additional information regarding comparable growth rates in our regional operating segments, brands, distribution channels and product groups, we make reference to net revenues on a "constant currency continuing category" basis, which is a non-GAAP measure. Our use of this non-GAAP measure is not intended to be a replacement of net revenues reported on a GAAP basis and readers should not ignore our GAAP-based net revenue results. We believe constant currency continuing category reporting provides additional perspective into the changes in our net revenues, as it adjusts for the effect of changing foreign currency exchange rates from period to period and the net revenue impact from product categories that have been transitioned to a third-party licensing model. Constant currency is calculated by taking the average foreign currency exchange rate for the current period and applying that same rate to the comparable prior year period. Continuing category impacts are determined by removing the comparable prior period wholesale channel net revenues generated from product categories which are now licensed, as well as the current period licensing net revenues generated from those same product categories. Because there was no net revenue impact from transitioning product categories to a third-party licensing model in fiscal 2013, our net revenue comparisons of fiscal 2013 to fiscal 2012 include only constant currency non-GAAP measures.
The following tables present net revenues from continuing operations by segment, brand, channel and product group on an as reported (GAAP) basis, and on a constant currency continuing category (non-GAAP) basis, for the fiscal years ended October 31, 2014 and 2013:
23
Revenues, net by Segment
Net revenues by segment, in both historical and on a constant currency continuing category basis, for fiscal 2014 and 2013 were as follows:
| In $millions | Americas | EMEA | APAC | Corporate | Total | |||||||||||||||
| Fiscal 2014 | ||||||||||||||||||||
| Net revenues as reported | $ | 723 | $ | 584 | $ | 262 | $ | 1 | $ | 1,570 | ||||||||||
| Less licensing revenue from licensed product categories | (5 | ) | — | — | — | (5 | ) | |||||||||||||
| Constant currency continuing category net revenues | $ | 718 | $ | 584 | $ | 262 | $ | 1 | $ | 1,565 | ||||||||||
| Fiscal 2013 | ||||||||||||||||||||
| Net revenues as reported | $ | 893 | $ | 632 | $ | 282 | $ | 4 | $ | 1,811 | ||||||||||
| Impact of fiscal 2014 foreign exchange rates | (13 | ) | 5 | (21 | ) | — | (29 | ) | ||||||||||||
| Less wholesale net revenues from licensed product categories | (27 | ) | — | — | — | (27 | ) | |||||||||||||
| Constant currency continuing category net revenues | $ | 853 | $ | 637 | $ | 261 | $ | 4 | $ | 1,754 | ||||||||||
| Change in net revenues as reported ($) | $ | (170 | ) | $ | (48 | ) | $ | (20 | ) | $ | (3 | ) | $ | (241 | ) | |||||
| Change in net revenues as reported (%) | (19 | )% | (8 | )% | (7 | )% | (77 | )% | (13 | )% | ||||||||||
| Change in constant currency continuing category net revenues ($) | $ | (135 | ) | $ | (53 | ) | $ | 1 | $ | (3 | ) | $ | (189 | ) | ||||||
| Change in constant currency continuing category net revenues (%) | (16 | )% | (8 | )% | 1 | % | (77 | )% | (11 | )% | ||||||||||
Net revenues in our Americas segment decreased $170 million, or 19%, on an as reported basis in fiscal 2014 versus the prior year. Changes in foreign currency exchange rates contributed $13 million of this decrease. In addition, our licensing of peripheral product categories contributed $27 million of this decrease. Net revenues on a constant currency continuing category basis decreased by $135 million, or 16%, primarily due to a decrease of $126 million in the wholesale channel, most significantly in the DC brand, with our Quiksilver and Roxy brands also generating decreased sales. These declines were focused in North America. On a constant currency continuing category basis, net revenues in the emerging markets of Brazil and Mexico increased by a combined 6% on an as reported basis (13% in constant currency).
Net revenues in our EMEA segment decreased $48 million, or 8%, on an as reported basis in fiscal 2014 versus the prior year. Changes in foreign currency exchange rates contributed $5 million of this decrease. Our licensing of peripheral product categories did not affect the EMEA region. Net revenues on a constant currency continuing category basis decreased by $53 million, or 8%, primarily due to a decrease of $57 million in the wholesale channel, primarily in the Quiksilver and DC brands, with our Roxy brand also generating decreased sales. On a constant currency continuing category basis, net revenues decreased most significantly in Germany and France where net revenues declined 23% and 7%, respectively, on an as reported basis. These declines were partially offset by growth of 5% in Russia (18% in constant currency).
Net revenues in our APAC segment decreased $20 million, or 7%, on an as reported basis in fiscal 2014 versus the prior year. Changes in foreign currency exchange rates contributed $21 million of this decrease. Our licensing of peripheral product categories did not affect the APAC region. Net revenues on a constant currency continuing category basis increased by $2 million, or 1%, due to increased sales in the retail ($10 million) and e-commerce ($4 million) channels, partially offset by a decrease of $12 million in the wholesale channel across all three brands. Net revenues decreased 12% in Australia on an as reported basis (6% in constant currency), but net revenues in our APAC emerging markets, which include Indonesia, South Korea, Taiwan and China, grew 5% collectively (14% in constant currency).
Net revenues in our emerging markets as a whole, which include Brazil, Russia, Indonesia, Mexico, South Korea, Taiwan and China increased 5% during fiscal 2014 compared to fiscal 2013 (14% on a constant currency continuing category basis). These markets are reported within their respective regional segments above.
24
Revenues, net By Brand
Net revenues by brand, in both historical and on a constant currency continuing category basis, for fiscal 2014 and 2013 were as follows:
| In $millions | Quiksilver | Roxy | DC | Other | Total | |||||||||||||||
| Fiscal 2014 | ||||||||||||||||||||
| Net revenues as reported | $ | 628 | $ | 480 | $ | 427 | $ | 35 | $ | 1,570 | ||||||||||
| Less licensing revenue from licensed product categories | (3 | ) | — | (2 | ) | — | (5 | ) | ||||||||||||
| Constant currency continuing category net revenues | $ | 625 | $ | 480 | $ | 425 | $ | 35 | $ | 1,565 | ||||||||||
| Fiscal 2013 | ||||||||||||||||||||
| Net revenues as reported | $ | 721 | $ | 511 | $ | 542 | $ | 36 | $ | 1,811 | ||||||||||
| Impact of fiscal 2014 foreign exchange rates | (12 | ) | (9 | ) | (8 | ) | — | (29 | ) | |||||||||||
| Less wholesale net revenues from licensed product categories | (16 | ) | — | (11 | ) | — | (27 | ) | ||||||||||||
| Constant currency continuing category net revenues | $ | 693 | $ | 502 | $ | 523 | $ | 36 | $ | 1,754 | ||||||||||
| Change in net revenues as reported ($) | $ | (93 | ) | $ | (31 | ) | $ | (115 | ) | $ | (1 | ) | $ | (241 | ) | |||||
| Change in net revenues as reported (%) | (13 | )% | (6 | )% | (21 | )% | (2 | )% | (13 | )% | ||||||||||
| Change in constant currency continuing category net revenues ($) | $ | (68 | ) | $ | (22 | ) | $ | (98 | ) | $ | (1 | ) | $ | (189 | ) | |||||
| Change in constant currency continuing category net revenues (%) | (10 | )% | (4 | )% | (19 | )% | (1 | )% | (11 | )% | ||||||||||
Quiksilver brand net revenues decreased $93 million, or 13%, on an as reported basis in fiscal 2014 versus the prior year. Changes in foreign currency exchange rates contributed $12 million of this decrease. Our licensing of peripheral product categories contributed $17 million of this decrease. Net revenues on a constant currency continuing category basis decreased by $68 million, or 10%, primarily due to lower net revenues in the EMEA and Americas wholesale channels of $34 million and $25 million, respectively. Wholesale channel net revenues in both the EMEA and Americas segments decreased primarily due to lower customer orders driven by poor prior seasons' sell through, and less effective order fulfillment compared to the prior year.
Roxy brand net revenues decreased $31 million, or 6%, on an as reported basis in fiscal 2014 versus the prior year. Changes in foreign currency exchange rates contributed $9 million of this decrease. Our licensing of peripheral product categories did not affect the Roxy brand. Net revenues on a constant currency continuing category basis decreased $22 million, or 4%, primarily due to lower net revenues in the Americas and EMEA wholesale channels of $16 million and $6 million, respectively. Wholesale channel net revenues in both the Americas and EMEA segments decreased primarily due to lower customer orders driven by poor prior seasons' sell through, and less effective order fulfillment compared to the prior year. The decrease in wholesale channel net revenues was partially offset by increased net revenues from our retail and e-commerce channels.
DC brand net revenues decreased $115 million, or 21%, on an as reported basis in fiscal 2014 versus the prior year. Changes in foreign currency exchange rates contributed $8 million of this decrease. Our licensing of peripheral product categories contributed $10 million of this decrease. Net revenues on a constant currency continuing category basis decreased $98 million, or 19%, primarily due to a $85 million decline in the Americas wholesale channel driven by decreased clearance sales, narrowed product distribution to mid-tier wholesale customers, and lower customer orders driven by poor prior seasons' sell through.
25
Revenues, net By Channel
Net revenues by channel, in both historical and on a constant currency continuing category basis, for fiscal 2014 and 2013 were as follows:
| In $millions | Wholesale | Retail | E-com | Licensing | Total | |||||||||||||||
| Fiscal 2014 | ||||||||||||||||||||
| Net revenues as reported | $ | 1,038 | $ | 445 | $ | 77 | $ | 10 | $ | 1,570 | ||||||||||
| Less licensing revenue from licensed product categories | — | — | — | (5 | ) | (5 | ) | |||||||||||||
| Constant currency continuing category net revenues | $ | 1,038 | $ | 445 | $ | 77 | $ | 5 | $ | 1,565 | ||||||||||
| Fiscal 2013 | ||||||||||||||||||||
| Net revenues as reported | $ | 1,286 | $ | 447 | $ | 69 | $ | 8 | $ | 1,811 | ||||||||||
| Impact of fiscal 2014 foreign exchange rates | (22 | ) | (7 | ) | — | — | (29 | ) | ||||||||||||
| Less wholesale net revenues from licensed product categories | (27 | ) | — | — | — | (27 | ) | |||||||||||||
| Constant currency continuing category net revenues | $ | 1,237 | $ | 440 | $ | 69 | $ | 8 | $ | 1,754 | ||||||||||
| Change in net revenues as reported ($) | $ | (248 | ) | $ | (2 | ) | $ | 8 | $ | 2 | $ | (241 | ) | |||||||
| Change in net revenues as reported (%) | (19 | )% | — | % | (12 | )% | 29 | % | (13 | )% | ||||||||||
| Change in constant currency continuing category net revenues ($) | $ | (199 | ) | $ | 5 | $ | 8 | $ | (3 | ) | $ | (189 | ) | |||||||
| Change in constant currency continuing category net revenues (%) | (16 | )% | 1 | % | 12 | % | (42 | )% | (11 | )% | ||||||||||
Wholesale net revenues decreased $248 million, or 19%, on an as reported basis in fiscal 2014 versus the prior year. Changes in foreign currency exchange rates contributed $22 million of this decrease. Our licensing of peripheral product categories contributed $27 million to this decrease. On a constant currency continuing category basis, wholesale net revenues decreased $199 million, or 16%, primarily due to lower net revenues in our Americas and EMEA segments of $126 million and $57 million, respectively, of which $85 million was from our DC brand, $25 million was from our Quiksilver brand, and $16 million was from our Roxy brand. Both the Americas and EMEA wholesale channels were unfavorably impacted by lower customer orders driven by poor prior season’s sell through, and less effective order fulfillment compared to the prior year.
Retail net revenues decreased $2 million, or less than 1%, on as reported basis in fiscal 2014 versus the prior year. Changes in foreign currency exchange rates contributed $7 million towards this decrease. Our licensing of peripheral product categories did not affect the retail channel. On a constant currency continuing category basis, retail net revenues increased $5 million, or 1%. Global retail same-store sales were flat for fiscal 2014. We ended fiscal 2014 with 683 total retail stores compared to 631 at the end of fiscal 2013.
E-commerce net revenues increased $8 million, or 12%, on both an as reported basis and a constant currency basis during fiscal 2014 versus the prior year. Our licensing of peripheral product categories did not affect the e-commerce channel. E-commerce net revenues increased in our EMEA and APAC segments by $6 million and $3 million, respectively, as we expanded our online business across all three core brands.
26
Revenues, net By Product Group
Net revenues by product group, in both historical and on a constant currency continuing category basis, for fiscal 2014 and 2013 were as follows:
| Apparel and Accessories | ||||||||||||
| In $millions | Footwear | Total | ||||||||||
| Fiscal 2014 | ||||||||||||
| Net revenues as reported | $ | 1,173 | $ | 397 | $ | 1,570 | ||||||
| Less licensing revenue from licensed product categories | (5 | ) | — | (5 | ) | |||||||
| Constant currency continuing category net revenues | $ | 1,168 | $ | 397 | $ | 1,565 | ||||||
| Fiscal 2013 | ||||||||||||
| Net revenues as reported | $ | 1,354 | $ | 457 | $ | 1,811 | ||||||
| Impact of fiscal 2014 foreign exchange rates | (24 | ) | (5 | ) | (29 | ) | ||||||
| Less wholesale net revenues from licensed product categories | (27 | ) | — | (27 | ) | |||||||
| Constant currency continuing category net revenues | $ | 1,303 | $ | 452 | $ | 1,754 | ||||||
| Change in net revenues as reported ($) | $ | (181 | ) | $ | (60 | ) | $ | (241 | ) | |||
| Change in net revenues as reported (%) | (13 | )% | (13 | )% | (13 | )% | ||||||
| Change in constant currency continuing category net revenues ($) | (135 | ) | (55 | ) | (189 | ) | ||||||
| Change in constant currency continuing category net revenues (%) | (10 | )% | (12 | )% | (11 | )% | ||||||
Apparel and accessories net revenues decreased $181 million, or 13%, on an as reported basis in fiscal 2014 versus the prior year. Changes in foreign currency exchange rates contributed $24 million of this decrease. Our licensing of peripheral product categories contributed $27 million of this decrease. On a constant currency continuing category basis, net revenues decreased $134 million, or 10%, primarily due to net revenue declines in the wholesale channel and DC brand.
Footwear net revenues decreased $60 million, or 13%, on an as reported basis in fiscal 2014 versus the prior year. Changes in foreign currency exchange rates contributed $5 million of this decrease. Our licensing of peripheral product categories did not affect our footwear product group. On a constant currency continuing category basis, net revenues decreased $55 million, or 12%, primarily due to net revenue declines in the DC brand and wholesale channel.
Gross Profit
Gross profit decreased to $763 million in fiscal 2014 from $872 million in fiscal 2013. Gross margin, or gross profit as a percentage of net revenues, increased to 48.6% in fiscal 2014 from 48.2% in the prior fiscal year. This 40 basis point improvement in gross margin was primarily due to the segment and channel net revenue shifts toward our higher margin EMEA and APAC segments, and retail and e-commerce channels versus our Americas segment and wholesale channel.
Gross margin by segment for fiscal 2014 and 2013 was as follows:
Basis Point Change Increase (Decrease) | ||||||||
| Year Ended October 31, | ||||||||
| 2014 | 2013 | |||||||
| Americas | 41.3 | % | 41.5 | % | (20) bp | |||
| EMEA | 55.6 | % | 56.7 | % | (110) bp | |||
| APAC | 54.6 | % | 51.0 | % | 360 bp | |||
| Consolidated | 48.6 | % | 48.2 | % | 40 bp | |||
Selling, General and Administrative Expense ("SG&A")
SG&A from continuing operations decreased $30 million, or 4%, to $827 million in fiscal 2014 from $858 million in fiscal 2013. This $30 million decrease was primarily attributable to reductions in employee compensation of $18 million (including a
27
$13 million reduction in ongoing employee compensation), athlete and event sponsorship of $15 million, facility expenses of $10 million, and reduced consulting expenses of $6 million. These decreases were partially offset by increased bad debt expense of $15 million within the Americas segment due to increased reserves for doubtful accounts regarding certain independent distributor accounts.
SG&A by segment as reported for fiscal 2014 and 2013 was as follows:
| Year Ended October 31, | $ Change Increase (Decrease) | Basis Point Change Increase (Decrease) | ||||||||||||||||||
| 2014 | 2013 | |||||||||||||||||||
| In millions | % of Net Revenues | % of Net Revenues | ||||||||||||||||||
| Americas | $ | 318 | 44.0 | % | $ | 320 | 35.8 | % | $ | (2 | ) | 820 bp | ||||||||
| EMEA | 311 | 53.3 | % | 324 | 51.4 | % | (13 | ) | 190 bp | |||||||||||
| APAC | 156 | 59.2 | % | 146 | 51.9 | % | 9 | 730 bp | ||||||||||||
| Corporate Operations | 43 | 67 | (24 | ) | ||||||||||||||||
| Consolidated | $ | 827 | 52.7 | % | $ | 858 | 47.3 | % | $ | (30 | ) | 540 bp | ||||||||
SG&A within Corporate Operations decreased $24 million primarily due to organizational changes that transitioned responsibility for certain costs to our other segments. The decrease in Americas and EMEA segment SG&A was primarily due to reductions in employee compensation, athlete and event sponsorship, and facilities expenses, partially offset by increased bad debt expense in the Americas segment. The increase in APAC segment SG&A was primarily due to the allocation of costs associated with the Company's centralization of certain global business functions, including merchandising and design, marketing and supply chain, among others.
Asset Impairments
Asset impairment charges were $189 million in fiscal 2014 compared to $12 million in fiscal 2013. Impairment charges in fiscal 2014 were due to: 1) the impairment of goodwill associated with our EMEA reporting unit of $178 million; 2) impairments associated with planned restructuring of our e-commerce and other information technology systems of $7 million; and 3) impairments of certain under-performing retail stores of $4 million. Impairment charges in fiscal 2013 were primarily related to certain under-performing retail stores, discontinued brands, and trademarks associated with those brands.
Non-operating Expenses
Interest expense was $76 million in fiscal 2014 compared to $71 million in fiscal 2013. This increase was primarily due to higher average net borrowings, due to annualizing the refinancing of our U.S. senior notes in July 2013, and higher interest rates associated with that debt.
Our foreign currency loss was $3 million in fiscal 2014 compared to $5 million in fiscal 2013. The reduction in currency translation loss resulted primarily from the foreign currency exchange effect of certain non-euro denominated assets of our European subsidiaries.
Our income tax benefit for fiscal 2014 was $4 million compared to income tax expense of $166 million in fiscal 2013. Income tax expense for fiscal 2013 includes a $157 million non-cash valuation allowance recorded against deferred tax assets primarily in our EMEA segment. Our sale of the Mervin and Hawk businesses resulted in aggregate income tax expense of approximately $19 million during fiscal 2014. However, as we do not expect to pay income tax on these sales after application of available loss carry-forwards, an offsetting income tax benefit was recognized within continuing operations. The operations of Surfdome generated a tax benefit of approximately $3 million. Excluding this income tax benefit, we generated income tax expense in both fiscal 2014 and 2013 as we recorded tax expense in certain tax jurisdictions but were unable to record tax benefits against the losses in those jurisdictions where we have previously recorded valuation allowances.
Net Loss from Continuing Operations Attributable to Quiksilver, Inc.
Our net loss from continuing operations attributable to Quiksilver, Inc. in fiscal 2014 was $327 million, or $1.92 per share, compared to $239 million, or $1.43 per share, for fiscal 2013. The increased net loss was primarily attributable to the lower gross profit in fiscal 2014 as noted above.
28
Fiscal 2013 Compared to Fiscal 2012
Revenues, net
Revenues, net By Segment
The following tables present consolidated net revenues by segment, in both historical currency and constant currency, for fiscal 2013 and 2012:
In millions Historical Currency (as reported) | Year Ended October 31, | $ Change Increase (Decrease) | % Change Increase (Decrease) | ||||||||||||
| 2013 | 2012 | ||||||||||||||
| Americas | $ | 893 | $ | 961 | $ | (68 | ) | (7 | )% | ||||||
| EMEA | 632 | 672 | (40 | ) | (6 | )% | |||||||||
| APAC | 282 | 306 | (24 | ) | (8 | )% | |||||||||
| Corporate | 4 | 4 | — | ||||||||||||
| Total | $ | 1,811 | $ | 1,942 | $ | (131 | ) | (7 | )% | ||||||
In millions Constant Currency (current year exchange rates) | Year Ended October 31, | $ Change Increase (Decrease) | % Change Increase (Decrease) | ||||||||||||
| 2013 | 2012 | ||||||||||||||
| Americas | $ | 893 | $ | 954 | $ | (61 | ) | (6 | )% | ||||||
| EMEA | 632 | 681 | (49 | ) | (7 | )% | |||||||||
| APAC | 282 | 283 | (1 | ) | 0 | % | |||||||||
| Corporate | 4 | 4 | — | ||||||||||||
| Total | $ | 1,811 | $ | 1,921 | $ | (110 | ) | (6 | )% | ||||||
Our net revenues for fiscal 2013 were $1.81 billion, a decrease of $131 million, or 7%, from $1.94 billion in fiscal 2012. Net revenues in fiscal 2013 declined by a single-digit percentage across all three regional segments with Americas segment net revenues down $68 million, EMEA segment net revenues down $40 million and APAC segment net revenues down $24 million. The decline in net revenues in our APAC segment in fiscal 2013 was almost entirely due to unfavorable changes in foreign currency exchange rates between fiscal 2013 and fiscal 2012. Absent changes in foreign currency exchange rates, APAC net revenues in fiscal 2013 were flat compared to fiscal 2012. A more detailed discussion of net revenue changes by segment, brand and channel as adjusted for changes in foreign currency exchange rates (i.e., in constant currency) is set forth below.
In constant currency, net revenues in the Americas segment decreased 6% versus the prior year due to a 13% decline in DC brand net revenues and a 5% decline in Quiksilver brand net revenues, partially offset by a 3% increase in Roxy brand net revenues. By distribution channel, Americas net revenues declined by 7% in the wholesale channel, 5% in the retail channel, and were flat in the e-commerce channel. Americas net revenues declined by nearly 10% in the United States, partially offset by growth outside of the U.S., particularly in the emerging markets of Brazil and Mexico.
In constant currency, net revenues in the EMEA segment decreased 7% versus the prior year primarily due to a 12% decline in the wholesale distribution channel partially offset by substantial growth in the e-commerce channel and modest growth in the retail channel. EMEA net revenues declined across all three core brands. Net revenues declined most prominently in Spain (17%) and France (3%) due, in part, to the negative economic circumstances in those countries. These declines were partially offset by net revenue growth in Russia and Germany.
In constant currency, net revenues in the APAC segment were flat to last year with 16% growth in DC brand net revenues offset by declines of 4% in Quiksilver brand net revenues and 5% in Roxy brand net revenues. By distribution channel, APAC net revenues grew in excess of 100% in the e-commerce channel as we expanded the perimeter of our online business in this region, and grew by 2% in the retail channel. This growth was offset by a 6% net revenue decline in the wholesale channel. Net revenue growth in APAC emerging markets, particularly South Korea and Indonesia, as well as Japan was offset by a net revenue decrease in Australia/New Zealand due to continuing economic challenges in those countries.
29
Revenues, net By Brand
Net revenues by brand, in both historical and constant currency, for fiscal 2013 and 2012 were as follows:
In millions Historical Currency (as reported) | Year Ended October 31, | $ Change Increase (Decrease) | % Change Increase (Decrease) | ||||||||||||
| 2013 | 2012 | ||||||||||||||
| Quiksilver | $ | 721 | $ | 784 | $ | (63 | ) | (8 | )% | ||||||
| Roxy | 511 | 530 | (19 | ) | (4 | )% | |||||||||
| DC | 542 | 593 | (51 | ) | (9 | )% | |||||||||
| Other | 36 | 35 | 1 | ||||||||||||
| Total | $ | 1,811 | $ | 1,942 | $ | (131 | ) | (7 | )% | ||||||
In millions Constant Currency (current year exchange rates) | Year Ended October 31, | $ Change Increase (Decrease) | % Change Increase (Decrease) | ||||||||||||
| 2013 | 2012 | ||||||||||||||
| Quiksilver | $ | 721 | $ | 775 | $ | (54 | ) | (7 | )% | ||||||
| Roxy | 511 | 522 | (11 | ) | (2 | )% | |||||||||
| DC | 542 | 588 | (46 | ) | (8 | )% | |||||||||
| Other | 36 | 35 | 1 | ||||||||||||
| Total | $ | 1,811 | $ | 1,921 | $ | (110 | ) | (6 | )% | ||||||
Quiksilver brand net revenues decreased 8% on an as reported basis with single-digit percentage decreases across all three regional segments. By channel, Quiksilver net revenues decreased in both the wholesale and retail channels across all three regional segments but grew within the e-commerce channel in all regional segments.
Roxy brand net revenues decreased 4% on an as reported basis due to net revenue declines of 13% and 6% in the APAC and EMEA segments, respectively, partially offset by 6% net revenue growth in the Americas wholesale channel. By channel, Roxy brand net revenues declined in each of the wholesale and retail channels, partially offset by e-commerce growth within the EMEA and APAC regional segments.
DC brand net revenues decreased 9% on an as reported basis due to a 15% decline in the Americas wholesale channel and 9% and 5% declines in the EMEA and APAC wholesale channels, respectively. DC brand net revenues grew in the retail and e-commerce channels across all three regional segments.
Revenues, net By Channel
Net revenues by channel, in both historical and constant currency, for fiscal 2013 and 2012 were as follows:
In millions Historical Currency (as reported) | Year Ended October 31, | $ Change Increase (Decrease) | % Change Increase (Decrease) | ||||||||||||
| 2013 | 2012 | ||||||||||||||
| Wholesale | $ | 1,294 | $ | 1,430 | $ | (136 | ) | (10 | )% | ||||||
| Retail | 447 | 457 | (10 | ) | (2 | )% | |||||||||
| E-commerce | 69 | 55 | 14 | 25 | % | ||||||||||
| Total | $ | 1,811 | $ | 1,942 | $ | (132 | ) | (7 | )% | ||||||
30
In millions Constant Currency (current year exchange rates) | Year Ended October 31, | $ Change Increase (Decrease) | % Change Increase (Decrease) | ||||||||||||
| 2013 | 2012 | ||||||||||||||
| Wholesale | $ | 1,294 | $ | 1,414 | $ | (120 | ) | (9 | )% | ||||||
| Retail | 447 | 451 | (4 | ) | (1 | )% | |||||||||
| E-commerce | 69 | 55 | 14 | 25 | % | ||||||||||
| Total | $ | 1,811 | $ | 1,921 | $ | (110 | ) | (6 | )% | ||||||
Wholesale net revenues decreased 10% on an as reported basis across all three regional segments and all three core brands, most significantly in the DC and Quiksilver brands and the EMEA and Americas regional segments. Significant economic difficulties in Europe continued to result in the loss of many small accounts in our EMEA segment. Retail net revenues decreased 2% on an as reported basis primarily due to 5% declines in both the Americas and APAC segments, partially offset by 2% growth in the EMEA segment. By brand, Quiksilver and Roxy brand retail net revenues declined by 5% and 7%, respectively, partially offset by 22% growth in DC brand net revenues primarily in the EMEA and APAC segments as we expanded the availability of DC brand products within these segments. E-commerce net revenues increased 25% on an as reported basis versus the prior year due to significant growth within the EMEA and APAC segments.
Gross Profit
Gross profit decreased to $872 million in fiscal 2013 from $941 million in fiscal 2012. Gross margin, or gross profit as a percentage of net revenues, decreased 30 basis points to 48.2% in fiscal 2013 from 48.5% in the prior year, primarily due to increased discounting associated with DC brand net revenues within our wholesale channel. We entered fiscal 2013 with a higher level of DC inventory in the wholesale channel than we planned, which resulted in higher discounting to clear this product.
Gross margin by regional segment for fiscal 2013 and 2012 was as follows:
| Basis Point (bp) Change Increase (Decrease) | ||||||||
| Year Ended October 31, | ||||||||
| 2013 | 2012 | |||||||
| Americas | 41.5 | % | 42.5 | % | (100) bp | |||
| EMEA | 56.7 | % | 56.1 | % | 60 bp | |||
| APAC | 51.0 | % | 51.2 | % | (20) bp | |||
| Consolidated | 48.2 | % | 48.5 | % | (30) bp | |||
Gross margin in the Americas and APAC segments declined versus the prior year primarily due to increased discounting associated with the DC brand within the wholesale channel. These decreases were partially offset by improved wholesale gross margins in our EMEA segment as a result of reduced discounting versus the prior year and the benefit of aged inventory liquidation, which left us with less aged inventory than the prior year. As of October 31, 2013, aged inventory was approximately 6% of total inventory, a reduction of 100 basis points versus October 31, 2012.
Selling, General and Administrative Expense ("SG&A")
SG&A decreased $31 million, or 3%, to $858 million in fiscal 2013 compared to $888 million in fiscal 2012. The decrease in SG&A was primarily due to reduced employee compensation expenses and event-related marketing expenses, partially offset by higher severance and early lease termination costs as well as increased e-commerce expenses associated with the expansion of our online business. Severance expenses were approximately $26 million in fiscal 2013 compared to approximately $13 million in fiscal 2012. SG&A by segment for fiscal 2013 and 2012 was as follows:
31
| Year Ended October 31, | $ Change Increase (Decrease) | Basis Point (bp) Change Increase (Decrease) | |||||||||||||||||||
| 2013 | 2012 | ||||||||||||||||||||
| In millions | % of Net Revenues | % of Net Revenues | |||||||||||||||||||
| Americas | $ | 320 | 35.8 | % | $ | 349 | 36.4 | % | $ | (29 | ) | (60) bp | |||||||||
| EMEA | 324 | 51.4 | % | 323 | 48.0 | % | 1 | 340 bp | |||||||||||||
| APAC | 146 | 51.9 | % | 157 | 51.3 | % | (11 | ) | 60 bp | ||||||||||||
| Corporate Operations | 67 | 59 | 8 | ||||||||||||||||||
| Consolidated | $ | 857 | 47.3 | % | $ | 888 | 45.7 | % | $ | (31 | ) | 160 | bp | ||||||||
As a percentage of net revenues, SG&A increased 160 basis points to 47.3% in fiscal 2013 compared to 45.7% in fiscal 2012, primarily due to the net revenue decline in fiscal 2013. SG&A increased as a percentage of net revenues in each of the EMEA and APAC segments primarily due to net revenue declines outpacing any SG&A reductions in fiscal 2013. SG&A improved 60 basis points in the Americas segment as the 8% reduction in SG&A expense was less than the 7% decrease in net revenues.
Asset Impairments
Asset impairment charges were $12 million in fiscal 2013 compared to $7 million in fiscal 2012. Impairment charges in fiscal 2013 were primarily related to our decision to close certain under-performing retail stores, discontinuation of certain brands and trademarks associated with those brands.
Non-operating Expenses
Net interest expense was $71 million in fiscal 2013 compared to $61 million in fiscal 2012. Interest expense in fiscal 2013 includes a $3 million write-off of debt issuance costs related to our senior notes due April 2015 that were redeemed in August 2013 (see Note 8, "Debt", to the consolidated financial statements). The remaining increase in interest expense was primarily due to the higher interest rates associated with our recently issued senior notes due 2018 and 2020 compared to the senior notes which were redeemed.
Our foreign currency loss amounted to $5 million in fiscal 2013 compared to a foreign currency gain of $2 million in fiscal 2012. The fiscal 2013 year loss resulted primarily from the foreign currency exchange effect of certain U.S. dollar denominated liabilities of our foreign subsidiaries.
Our income tax expense was $166 million in fiscal 2013 compared to $4 million in fiscal 2012. Income tax expense for fiscal 2013 includes a $157 million non-cash valuation allowance recorded during the fourth quarter against deferred tax assets primarily in our EMEA segment. Although we incurred a net loss during each of fiscal 2013 and 2012, we incurred income tax expense as we were unable to benefit from the losses in certain jurisdictions where we have recorded valuation allowances.
Net Loss Attributable to Quiksilver, Inc.
Our net loss from continuing operations attributable to Quiksilver, Inc. in fiscal 2013 was $239 million, or $1.43 per share, compared to $18 million, or $0.11 per share, for fiscal 2012. The increased net loss was primarily attributable to the $157 million non-cash deferred tax valuation allowance and lower gross profit in fiscal 2013 as noted above.
Financial Position, Capital Resources and Liquidity
The following table shows our cash, working capital and total indebtedness at October 31, 2014 and 2013:
| In millions | October 31 | $ Change Increase (Decrease) | % Change Increase (Decrease) | ||||||||||||
| 2014 | 2013 | ||||||||||||||
| Cash and cash equivalents | $ | 47 | $ | 57 | $ | (10 | ) | (18 | )% | ||||||
Restricted cash(1) | 21 | — | 21 | ||||||||||||
| Working capital | 394 | 548 | (154 | ) | (28 | )% | |||||||||
| Total indebtedness | 829 | 831 | (2 | ) | |||||||||||
| (1) | Certain of our debt agreements contain restrictions on the usage of funds received from the sale of assets. These restrictions generally require such cash to be used for either repayment of indebtedness, capital expenditures, or other investments in our business. Restricted cash at October 31, 2014 primarily consists of the remaining proceeds of $16 million from the sale of our Mervin and Hawk businesses in the first quarter of 2014, which is subject to these restrictions. |
32
At October 31, 2014, we had $47 million of cash on hand, $21 million in restricted cash, $74 million available on our credit facilities, and $21 million available for additional letters of credit in EMEA. Taken together, this represents cash and credit facility availability of $162 million at October 31, 2014. Our primary credit facilities mature in October 2016 and May 2018. We have no principal payments due on our 2017, 2018 or 2020 Notes before December 2017. Although we have experienced significant operating losses and cash flow volatility in recent years, we believe we have adequate liquidity to continue executing our plans to drive net revenue growth and operating efficiencies, as well as to provide adequate liquidity to each of our segments. We believe our cash flows from operations, cash on hand, and restricted cash, together with our existing credit facilities, will be adequate to fund our capital requirements for at least the next twelve months from the date of the filing of our consolidated financial statements for the fiscal year ended October 31, 2014.
See “Debt Structure” below for a description of the various debt agreements comprising our total indebtedness.
Cash Flows
Cash Flows from Operating Activities
Net cash used in operating activities was $27 million in fiscal 2014, a decrease in cash provided of $53 million compared to the prior year. The following table summarizes the major categories of changes in cash flows from operations between fiscal 2014 and 2013:
| In millions | Fiscal 2014 | Fiscal 2013 | Change $ | |||||||||
| Net loss | $ | (320 | ) | $ | (234 | ) | $ | (86 | ) | |||
| Net effect of non-cash reconciling adjustments | 266 | 249 | 17 | |||||||||
| Cash provided by operating assets and liabilities | 47 | 10 | 37 | |||||||||
| Cash (used in)/provided by operating activities of continuing operations | (7 | ) | 25 | (32 | ) | |||||||
| Cash (used in)/provided by operating activities of discontinued operations | (19 | ) | 2 | (21 | ) | |||||||
| Net cash (used in)/provided by operating activities | $ | (26 | ) | $ | 27 | $ | (53 | ) | ||||
Net cash used in operating activities of continuing operations was $9 million in fiscal 2014, a decrease in cash provided of $33 million compared to the prior year. Our net loss was $320 million in fiscal 2014, a decline in year-over-year operating results of $86 million versus the prior year. This decline in operating performance was primarily attributable to the net income impact of the $248 million decrease in wholesale channel net revenues in fiscal 2014 versus the prior year, partially offset by a $30 million reduction in SG&A and a 40 basis point improvement in gross margin in fiscal 2014 versus the prior year. Cash provided by operating assets and liabilities was $47 million in fiscal 2014, an increase of $37 million versus the prior year. This increase was primarily attributable to: i) reductions in accounts receivable as a result of decreased wholesale net revenues and a 4-day improvement in days sales outstanding; and ii) reductions in inventories as a result of managing inventory levels relative to the net revenue decline in our wholesale channel, which generated a 4-day improvement in inventory days on hand. These improvements were partially offset by decreased accounts payable as a result of supply chain decisions to pay vendors more promptly.
Cash Flows from Investing Activities
Net cash provided by investing activities was $6 million in fiscal 2014, an increase of $60 million compared to cash used of $54 million in the prior year. This increase was primarily attributable to the $77 million in cash proceeds received from the sale of our Mervin and Hawk businesses during the first quarter of fiscal 2014. The remaining proceeds from these transactions of $16 million are restricted by certain of our credit agreements to the repayment of indebtedness and for capital expenditures. Capital expenditures were $53 million in fiscal 2014, an increase of $1 million compared to the prior year. These investments were primarily focused on our ongoing enterprise-wide reporting system (SAP) and investments in company-owned retail stores. We expect capital expenditures in fiscal 2015 to be approximately $25 million, primarily for the construction of new retail stores. We intend to fund these expenditures from cash on hand, restricted cash, operating cash flows, availability on our credit facilities, and the $16 million of net proceeds received from our divestiture of Surfdome during December 2014.
Cash Flows from Financing Activities
Net cash provided by financing activities was $14 million in fiscal 2014, a decrease of $36 million compared to the prior year. This decrease in cash provided was primarily attributable to: i) reduced new borrowing needs due to the divestiture of our Mervin and Hawk businesses; and ii) the prior year increase in long-term debt arising from the refinancing of our U.S. Senior Notes (see "Debt Structure" below).
33
Working Capital - Trade Accounts Receivable and Inventories
Two of the primary components of our working capital and near-term sources of cash at any point in time are trade accounts receivable and inventories. A comparison of the balances of these items as of October 31, 2014 and 2013 is as follows:
| October 31 | Change ($/Days) | |||||||||||
| 2014 | 2013 | |||||||||||
| Trade accounts receivable | $ | 320 | $ | 412 | $ | (92 | ) | |||||
Average days sales outstanding(1) | 93 | 97 | (4 | ) | ||||||||
| Inventories | $ | 279 | $ | 338 | $ | (59 | ) | |||||
Inventory days on hand(2) | 118 | 122 | (4 | ) | ||||||||
| (1) | Computed as net accounts receivable as of the balance sheet date, excluding value added taxes, divided by the result obtained by dividing fiscal 2014 and fiscal 2013 fourth quarter net wholesale revenues by 90 days. |
| (2) | Computed as net inventory as of the balance sheet date divided by the result obtained by dividing fiscal 2014 and fiscal 2013 fourth quarter cost of goods sold by 90 days. |
Days sales outstanding (“DSO”) improved by 4 days as of October 31, 2014 compared to October 31, 2013. The decrease in DSO was primarily due to improved collections and credit management. Total net inventory decreased by $59 million as of October 31, 2014 compared to October 31, 2013 and inventory days on hand decreased by 4 days year over year as a result.
Debt Structure
We generally finance our working capital needs and capital investments with cash on hand, operating cash flows and bank revolving credit facilities. Multiple banks in the United States, Europe and Australia make these credit facilities available to us. We have used term debt to supplement these credit facilities, and it has typically been used to finance long-term assets and our operations. Our debt outstanding at October 31, 2014 includes short-term and long-term debt as follows:
| In millions | Maturity Date | U.S. Dollar | Non-U.S. Dollar | Total | ||||||||||
| Lines of credit - 0.8% Floating | October 31, 2016 | $ | — | $ | 32,929 | 32,929 | ||||||||
| 2017 Notes - 8.875% Fixed | December 15, 2017 | — | 252,188 | 252,188 | ||||||||||
| ABL Credit Facility - 2.1% to 5.6% Floating | May 24, 2018 | 21,000 | 14,933 | 35,933 | ||||||||||
| 2018 Notes - 7.875% Fixed | August 1, 2018 | 278,834 | — | 278,834 | ||||||||||
| 2020 Notes - 10.000% Fixed | August 1, 2020 | 222,582 | — | 222,582 | ||||||||||
| Capital lease obligations and other borrowings - Various % | Various | 2,257 | 3,867 | 6,124 | ||||||||||
| Total Indebtedness | $ | 524,673 | $ | 303,917 | $ | 828,590 | ||||||||
As of October 31, 2014, our credit facilities allowed for total cash borrowings and letters of credit of $187 million. The actual availability and maximum borrowings possible under certain credit facilities fluctuates with the amount of eligible assets comprising the "borrowing base." At October 31, 2014, we had a total of $69 million of direct borrowings and $24 million in letters of credit outstanding. The amount of availability for borrowings remaining as of October 31, 2014 was $74 million, $59 million of which could also be used for letters of credit in the United States and APAC. In addition to the $74 million of availability for borrowings, we also had $21 million in additional capacity for letters of credit in EMEA as of October 31, 2014.
A limited amount of our outstanding debt bears interest based on London Inter-Bank Offer Rate ("LIBOR"), Tokyo Inter-Bank Offer Rate ("TIBOR") or Euro Inter-Bank Offer Rate ("EURIBOR") plus a credit spread. Our effective interest rates, therefore, will move up or down depending on market conditions. The credit spreads are subject to change based on our financial performance and market conditions.
EMEA lines of credit
On October 31, 2013, certain European subsidiaries of the Company entered into a credit facility with a commercial bank. The facility has an initial term of three years and borrowings are limited to €60 million. Borrowing availability under this facility is based on eligible EMEA trade accounts receivable. The facility does not contain any financial covenants.
34
We also maintain various credit facilities with several banks in Europe. These facilities are all unsecured, short-term facilities used to support the day-to-day working capital needs of our EMEA segment. See Note 8 to our consolidated financial statements, "Debt", for further information on the EMEA Credit Facilities.
The 2017 Notes
In December 2010, Boardriders S.A., our wholly-owned subsidiary, issued €200 million aggregate principal amount of its senior notes, which bear a coupon interest rate of 8.875% and are due December 15, 2017 (the “2017 Notes”). The 2017 Notes are general senior obligations and are fully and unconditionally guaranteed, jointly and severally, on a senior unsecured basis by Quiksilver, Inc. and certain of its current and future U.S. and non-U.S. subsidiaries, subject to certain exceptions. We may redeem some or all of the 2017 Notes at fixed redemption prices as set forth in the indenture related to such 2017 Notes. For the year following December 15, 2014, the 2017 Notes can be redeemed at 104.4%. The 2017 Notes indenture includes covenants that limit our ability to, among other things: incur additional debt; pay dividends on our capital stock or repurchase our capital stock; make certain investments; enter into certain types of transactions with affiliates; impose limitations on the ability of our restricted subsidiaries to pay dividends or make other payments to Quiksilver, Inc.; use assets as security in other transactions; and sell certain assets or merge with or into other companies. As of October 31, 2014, we were in compliance with these covenants. See Note 8 to our consolidated financial statements, "Debt", for further information on the 2017 Notes.
ABL Credit Facility
On May 24, 2013, we entered into an Amended and Restated Credit Agreement with Bank of America, N.A., and the lenders and other agents party thereto (the “ABL Credit Facility”). The ABL Credit Facility has a term of five years. The ABL Credit Facility encompasses certain entities within both our Americas and APAC segments. Under the ABL Credit Facility, our borrowings are limited to the lesser of (i) $230 million in aggregate, with sublimits for specific subsidiaries (with an option to expand the aggregate commitments by up to an additional $125 million on certain conditions) and (ii) a borrowing base calculated upon designated percentages of eligible accounts receivable, eligible inventory and, in the case of U.S. and Canadian borrowers, certain eligible credit card receivables. The ABL Credit Facility includes a $145 million total sublimit for letters of credit, with smaller sublimits applicable to specific subsidiaries. The ABL Credit Facility is guaranteed by Quiksilver, Inc. and our domestic, Canadian, Australian and Japanese subsidiaries (other than immaterial subsidiaries), except that our Canadian, Australian and Japanese subsidiaries do not guarantee the obligations of the domestic loan parties. The obligations under the ABL Credit Facility are, subject to certain exceptions, generally secured by (i) a first priority security interest in our domestic, Canadian, Australian and Japanese inventory and accounts receivable, (ii) a security interest in substantially all of our other domestic, Canadian, Australian and Japanese personal property (which security interest is a second priority security interest in the case of the domestic loan parties) and (iii) a pledge of the shares of certain of our subsidiaries, except that the assets of our Canadian, Australian and Japanese subsidiaries do not secure the obligations of the domestic loan parties.
The ABL Credit Facility contains customary default provisions and provides that, upon the occurrence of an event of default relating to the bankruptcy or insolvency of the borrower or other subsidiaries, the unpaid balance of the principal and accrued interest under the ABL Credit Facility and all other obligations of the borrower under the loan documents will become immediately due and payable without any action under the ABL Credit Facility. Upon the occurrence of any other event of default (which would include a default under other material indebtedness), the agent of the lenders may, by written notice, declare the unpaid balance of the principal and accrued interest under the ABL Credit Facility and all other obligations under the loan documents immediately due and payable without any further action.
The ABL Credit Facility also includes certain representations and warranties and restrictive covenants usual for facilities of this type. The ABL Credit Facility does not have a financial maintenance covenant, other than a minimum fixed charge coverage ratio of 1.0 to 1.0, which does not apply unless remaining borrowing availability was to fall below the greater of (a) $15 million and (b) 10% of the total borrowing base available. See Note 8 to our consolidated financial statements, "Debt", for further information on the ABL Credit Facility.
The 2018 Notes and 2020 Notes
On July 16, 2013, Quiksilver, Inc. and its wholly-owned subsidiary, QS Wholesale, Inc. issued (i) $280 million aggregate principal amount in 7.875% Senior Secured Notes due 2018 (the “2018 Notes”), and (ii) $225 million aggregate principal amount in 10.000% Senior Notes due 2020 (the “Original 2020 Notes”). In November, 2013, the Original 2020 Notes were exchanged for publicly registered notes with identical terms (the “2020 Notes”). The 2018 Notes and 2020 Notes are general senior obligations of Quiksilver Inc., and its wholly-owned subsidiary, QS Wholesale, Inc. (the "Issuers") and are fully and unconditionally guaranteed, jointly and severally, on a senior basis by certain of our current and future U.S. subsidiaries. The 2018 Notes and the related guarantees are secured by (1) a second-priority security interest in the current assets of the Issuers and the subsidiary guarantors, together with all related general intangibles (excluding intellectual property rights) and other property related to such assets, including the proceeds thereof, which assets secure our ABL Credit Facility on a first-priority
35
basis; and (2) a first-priority security interest in substantially all other property (including intellectual property rights) of the Issuers and the guarantors and a first-priority pledge of 100% of the equity interests of certain subsidiaries directly owned by the Issuers and the guarantors (but excluding equity interests of applicable foreign subsidiaries of the Issuers and the guarantors possessing more than 65% of the total combined voting power of all classes of equity interests of such applicable foreign subsidiaries entitled to vote) and the proceeds of the foregoing. The 2020 Notes are not secured.
We may redeem some or all of the 2018 Notes and 2020 Notes at fixed redemption prices as set forth in the indenture related to such notes.
The 2018 Notes and 2020 Notes indentures include covenants that limit our ability to, among other things: incur additional debt; issue certain preferred shares; pay dividends on our capital stock or repurchase capital stock; make certain investments; enter into certain types of transactions with affiliates; impose limitations on the ability of our restricted subsidiaries to pay dividends or make certain other payments to us; use assets as security in other transactions; and sell certain assets or merge with or into other companies. As of October 31, 2014, we were in compliance with these covenants. See Note 8 to our consolidated financial statements, "Debt", for further information on the 2018 Notes and 2020 Notes.
Other
For information regarding our contractual payment obligations on our outstanding indebtedness, see Contractual Obligations and Commitments below.
Contractual Obligations and Commitments
We lease certain land and buildings under non-cancelable operating leases. The leases expire at various dates through 2024, excluding renewals at our option, and contain various provisions for rental adjustments including, in certain cases, adjustments based on increases in the Consumer Price Index. The leases generally contain renewal provisions for varying periods of time.
Our significant contractual obligations and commitments as of October 31, 2014 are summarized in the following table:
| Payments Due by Period | ||||||||||||||||||||
| In millions | One Year | Two to Three Years | Four to Five Years | After Five Years | Total | |||||||||||||||
| Operating lease obligations | $ | 88 | $ | 130 | $ | 83 | $ | 96 | $ | 397 | ||||||||||
Long-term debt obligations(1) | 2 | 3 | 567 | 223 | 796 | |||||||||||||||
Professional athlete sponsorships(2) | 19 | 20 | 4 | — | 43 | |||||||||||||||
Certain other obligations(3) | 26 | 3 | — | — | 29 | |||||||||||||||
| Total | $ | 135 | $ | 156 | $ | 654 | $ | 319 | $ | 1,265 | ||||||||||
| (1) | Represents all long-term debt obligations, including capital leases and other borrowings of $6 million. Excludes required interest payments. See Note 8, "Debt", to our consolidated financial statements for interest terms. |
| (2) | We establish relationships with professional athletes in order to promote our products and brands. We have entered into endorsement agreements with professional athletes in sports such as surfing, skateboarding, snowboarding, BMX and motocross. Many of these contracts provide incentives for magazine exposure and competitive victories while wearing or using our products. It is not possible to determine the amounts we may be required to pay under these agreements as they are subject to many variables. The amounts listed are the approximate amounts of minimum obligations required to be paid under these contracts. The estimated maximum amount that could be paid under existing contracts is approximately $57 million and would assume that all bonuses, victories, etc. are achieved during a five-year period. The actual amounts paid under these agreements may be higher or lower than the amounts listed as a result of the variable nature of these obligations. |
| (3) | Certain other obligations include approximately $24 million of contractual letters of credit with maturity dates of primarily less than one year (see Note 8, "Debt", to our consolidated financial statements for additional details) and approximately $5 million related to our French profit sharing plan (see Note 14, "Employee Benefit Plans", to our consolidated financial statements for additional details). We also enter into unconditional purchase obligations with various suppliers of goods and services in the normal course of operations through purchase orders or other documentation. Such unconditional purchase obligations are generally outstanding for periods of less than a year and are settled by cash payments upon delivery of goods and services and are not reflected in this line item. We have approximately $19 million of tax contingencies related to uncertain tax positions, which is excluded from the table based on the uncertainty of the timing of |
36
the cash flows of these contingencies See Note 13, "Income Taxes", to our consolidated financial statements for additional information on our income taxes.
Off Balance Sheet Arrangements
Other than certain obligations and commitments described in the table above, we did not have any material off balance sheet arrangements as of October 31, 2014.
Inflation
Inflation has been modest during the fiscal years covered by this report, resulting in an insignificant impact on our sales and profits.
New Accounting Pronouncements
For further information on new accounting pronouncements affecting the Company, see Note 1, "Significant Accounting Policies—New Accounting Pronouncements", to our consolidated financial statements.
Critical Accounting Policies
Our consolidated financial statements have been prepared in accordance with accounting principles generally accepted in the United States of America. To prepare these financial statements, we must make estimates and assumptions that affect the reported amounts of assets and liabilities. These estimates also affect our reported revenues and expenses. Judgments must also be made about the disclosure of contingent liabilities. Actual results could be significantly different from these estimates. We believe that the following discussion addresses the accounting policies that are necessary to understand and evaluate our reported financial results.
Revenue Recognition
Revenues are recognized when the risk of ownership and title passes to our customers, which is generally at the time of shipment in the wholesale channel and at the point of purchase in the retail and e-commerce channels. Generally, we extend credit to our customers and do not require collateral. Our sales agreements with our customers do not provide for any rights of return. However, we do approve returns on a case-by-case basis at our sole discretion to protect our brands and our image. We provide allowances for estimated returns as reductions to revenues when revenues are recorded. Related losses have historically been within our expectations, but there can be no assurance that we will continue to experience the same loss rates. If actual or expected future returns were significantly greater or lower than the allowances we have established, we would record a reduction or increase to net revenues in the period when such determination is known.
Accounts Receivable
Throughout the year, we perform credit evaluations of our customers, and we adjust credit limits based on payment history and the customer’s current creditworthiness. We continuously monitor our collections and maintain a reserve for estimated credit losses based on our historical experience and any specific customer collection issues that have been identified. We also use insurance on certain classes of receivables in our EMEA segment. Historically, our losses have been consistent with our estimates, but there can be no assurance that we will continue to experience the same credit loss rates that we have experienced in the past. It is not uncommon for some of our customers to have financial difficulties from time to time. This is normal given the wide variety of our account base, which includes small surf shops, medium-sized retail chains, and some large department store chains. Upon determination that a significantly greater or lower reserve is necessary, we record a charge or credit to selling, general and administrative expenses in the period when such determination is known.
Inventories
We value inventories at the cost to purchase and/or manufacture the product or the current estimated market value of the inventory, whichever is lower. We regularly review our inventory quantities on hand, and adjust inventory values with a charge to cost of sales in the period in which such determination is known for excess and obsolete inventory based primarily on estimated forecasts of product demand and market value.
Long-Lived Assets
We acquire tangible and intangible assets in the normal course of our business. We evaluate the recovery of non-amortizing intangible assets in conjunction with our goodwill evaluation. We evaluate the recoverability of the carrying amount of other long-lived assets (including fixed assets, trademarks, licenses and other amortizable intangibles) whenever events or changes in circumstances indicate that the carrying value of an asset may not be recoverable. Impairment indicators include, but are not limited to, cost factors, financial performance, adverse legal or regulatory developments, industry and market conditions and
37
general economic conditions. An impairment loss is recognized when the carrying value exceeds the undiscounted future cash flows estimated to result from the use and eventual disposition of the asset. Impairments are recognized in operating earnings in the period in which such determination is known. We use our best judgment based on the most current facts and circumstances regarding our business when applying these impairment rules to determine the timing of the impairment tests, the undiscounted cash flows used to assess impairments, and the fair value of a potentially impaired asset. The estimates we have used are consistent with the plans and estimates that we use to manage our business. It is possible, however, that the plans may change and estimates used may prove to be inaccurate. If our actual results, or the plans and estimates used in future impairment analyses, are lower than the original estimates used to assess the recoverability of these assets, we could incur future impairment charges.
Goodwill
Our business acquisitions have resulted in the recognition of goodwill. Goodwill is not amortized but is subject to annual impairment tests (in the fourth fiscal quarter for us) and between annual tests, if events indicate it is more likely than not that the fair value of a reporting unit is less than its carrying value. Significant judgment is involved in determining if an indicator of impairment has occurred. Such indicators may include deterioration in general economic conditions, negative developments in equity and credit markets, adverse changes in the markets in which we operate, increases in costs that have a negative effect on earnings and cash flows, or a trend of negative or declining cash flows over multiple periods, among others.
Goodwill is allocated at the reporting unit level, which is defined as an operating segment or one level below an operating segment. We have two reporting units under which we evaluate goodwill for impairment; the Americas and APAC. The application of the goodwill impairment test requires significant judgment, including the identification of the reporting units, and the determination of both the carrying value and the fair value of the reporting units. The carrying value of each reporting unit is determined by assigning the assets and liabilities, including existing goodwill, to those reporting units. The determination of the fair value of each reporting unit requires significant judgment, including our estimation of future cash flows, which is dependent upon internal forecasts, estimation of the long-term rate of growth of our businesses, estimation of the useful lives of the assets which will generate the cash flows, determination of our weighted-average cost of capital and other factors. In determining the appropriate discount rate, we considered the weighted average cost of capital for each reporting unit which, among other factors, considers the cost of common equity capital and the marginal cost of debt.
The estimates and assumptions used to calculate the fair value of a reporting unit may change from period to period based upon actual operating results, market conditions and our view of future trends, and are subject to a high degree of uncertainty. The estimates we have used are consistent with the plans and estimates that we use to manage our business. It is possible, however, that the plans may change and estimates used may prove to be inaccurate. The estimated fair value of a reporting unit could change materially if different assumptions and estimates were used. If our actual results, or the plans and estimates used in future impairment analyses, are lower than the original estimates used to assess the recoverability of these assets, we could incur future impairment charges.
We test goodwill for impairment using the two-step method. When performing the two-step impairment test, we use a combination of an income approach, which estimates fair value of the reporting unit based upon future discounted cash flows, and a market approach, which estimates fair value using market multiples for transactions in a set of comparable companies. If the carrying value of the reporting unit exceeds its fair value, we then perform the second step of the impairment test to measure the amount of the impairment loss, if any. The second step requires fair valuation of all the reporting unit’s assets and liabilities in a manner similar to a purchase price allocation, with any residual fair value being allocated to goodwill. This residual fair value of goodwill is then compared to the carrying value to determine impairment. An impairment charge will be recognized only when the estimated fair value of a reporting unit, including goodwill, is less than its carrying value.
During the second and third quarters of fiscal 2014, we recorded non-cash goodwill impairment charges totaling $178 million in continuing operations to fully impair goodwill associated with our EMEA reporting unit due to the significant decline in our stock price, further net revenue deterioration in the EMEA wholesale channel and impairment related to our Surfdome business. We conducted our annual goodwill impairment test on October 31, 2014, and concluded goodwill for the Americas and APAC reporting units was not impaired. As of October 31, 2014, the fair value of each of our reporting units substantially exceeded their respective carrying values. Goodwill amounted to $74 million for the Americas, and $6 million for APAC as of October 31, 2014.
Income Taxes
We are subject to income taxes in both domestic and foreign tax jurisdictions. The calculation of income tax expense involves significant judgment in the application of global, complex tax laws and regulations. The provision for income taxes is determined using the applicable statutory tax rates in the relevant jurisdictions, which may be more or less than the U.S. federal statutory rate. Current income tax expense is the amount of income taxes expected to be payable for the current year. A deferred income tax asset or liability is established for the expected future consequences of temporary differences in the financial
38
reporting and tax bases of assets and liabilities. We consider future taxable income and ongoing prudent and feasible tax planning strategies in assessing the value of our deferred tax assets. If we determine that it is more likely than not that these assets will not be realized, we would reduce the value of these assets to their expected realizable value by recording a valuation allowance, thereby decreasing net income. Evaluating the value of these assets is necessarily based on our judgment. Realization of deferred tax assets related to operating loss and credit carry-forwards is dependent upon future taxable income in specific jurisdictions, the amount and timing of which is uncertain. If we subsequently determine that the deferred tax assets for which a valuation allowance had been recorded would, in our judgment, be realized in the future, the valuation allowance would be reduced, thereby increasing net income in the period when that determination was made.
We do not provide for withholding and U.S. taxes for certain unremitted earnings of non-U.S. subsidiaries because we intend to permanently reinvest these earnings in these foreign operations. Income tax expense could be incurred if these earnings were remitted to the United States. It is not practicable to estimate the amount of the deferred tax liability on such unremitted earnings.
We recognize a tax benefit from an uncertain tax position when, in our judgment, it is more likely than not that the position will be sustained upon examination, including resolutions of any related appeals or litigation processes, based on the technical merits of the tax position. Judgment is also used in determining that a tax position will be settled and the possible settlement outcomes. We recognize accrued interest and penalties related to unrecognized tax benefits as a component of our provision for income taxes. The application of this guidance can create significant variability in our tax rate from period to period based upon changes in or adjustments to our uncertain tax positions.
Stock-Based Compensation Expense
We recognize compensation expense for all stock-based payments net of an estimated forfeiture rate and only recognize compensation cost for those shares expected to vest using the graded vested method over the requisite service period of the award. For option valuation, we determine the fair value at the grant date using the Black-Scholes option-pricing model which requires the input of certain assumptions, including the expected life of the stock-based payment awards, stock price volatility and interest rates. For performance based equity awards with stock price contingencies, we determine the fair value using a Monte-Carlo simulation, which creates a normal distribution of future stock prices, which is then used to value the awards based on their individual terms.
Foreign Currency Translation
A significant portion of our revenues are generated in Europe, where we operate with the euro as our primary functional currency, and a smaller portion of our revenues are generated in APAC, where we operate with the Australian dollar and Japanese yen as our primary functional currencies. Our European revenues in the United Kingdom are denominated in British pounds, and substantial portions of our EMEA and APAC product is sourced in U.S. dollars, both of which result in exposure to gains and losses that could occur from fluctuations in foreign currency exchange rates. Revenues and expenses that are denominated in foreign currencies are translated using the average exchange rate for the period. Assets and liabilities are translated at the rate of exchange on the balance sheet date. Gains and losses from assets and liabilities denominated in a currency other than the functional currency of the entity on which they reside are generally recognized currently in our statement of operations. Gains and losses from translation of foreign subsidiary financial statements into U.S. dollars are included in accumulated other comprehensive income or loss.
As part of our overall strategy to manage our level of exposure to the risk of fluctuations in foreign currency exchange rates, we enter into foreign currency exchange contracts generally in the form of forward contracts. For all contracts that qualify as cash flow hedges, we record the changes in the fair value of the derivative contracts in other comprehensive income or loss.
| Item 7A. | QUANTITATIVE AND QUALITATIVE DISCLOSURES ABOUT MARKET RISK |
We are exposed to a variety of risks. Two of these risks are foreign currency exchange rate fluctuations and changes in interest rates that affect interest expense. See also Note 15, "Derivative Financial Instruments", to our consolidated financial statements.
Foreign Currency and Derivatives
We are exposed to gains and losses resulting from fluctuations in foreign currency exchange rates relating to certain sales, royalty income and product purchases of our international subsidiaries that are denominated in currencies other than their functional currencies. We are also exposed to foreign currency gains and losses resulting from domestic transactions that are not denominated in U.S. dollars, and to fluctuations in interest rates related to our variable rate debt. Furthermore, we are exposed to gains and losses resulting from the effect that fluctuations in foreign currency exchange rates have on the reported results in our consolidated financial statements due to the translation of the operating results and financial position of our
39
international subsidiaries. We use foreign currency exchange contracts and intercompany loans as part of our overall strategy to manage the level of exposure to the risk of fluctuations in foreign currency exchange rates.
On the date we enter into a derivative contract, we designate the derivative as a hedge of the identified exposure. Before entering into various hedge transactions, we formally document all relationships between hedging instruments and hedged items, as well as the risk-management objective and strategy. In this documentation, we identify the asset, liability, firm commitment, or forecasted transaction that has been designated as a hedged item and indicate how the hedging instrument is expected to hedge the risks related to the hedged item. We formally measure effectiveness of our hedging relationships both at the hedge inception and on an ongoing basis in accordance with our risk management policy. We will discontinue hedge accounting prospectively:
| • | if we determine that the derivative is no longer effective in offsetting changes in the cash flows of a hedged item; |
| • | when the derivative expires or is sold, terminated or exercised; |
| • | if it becomes probable that the forecasted transaction being hedged by the derivative will not occur; |
| • | if a hedged firm commitment no longer meets the definition of a firm commitment; or |
| • | if we determine that designation of the derivative as a hedge instrument is no longer appropriate. |
Derivatives that do not qualify or are no longer deemed effective to qualify for hedge accounting but are used by management to mitigate exposure to currency risks are marked to fair value with corresponding gains or losses recorded in earnings. For all qualifying cash flow hedges, the changes in the fair value of the derivatives are recorded in other comprehensive income. As of October 31, 2014, we were hedging a significant portion of forecasted transactions expected to occur through October 2015. Assuming exchange rates at October 31, 2014 remain constant, $4 million of gains, net of tax, related to hedges of these transactions are expected to be reclassified into earnings over the next 12 months.
We enter into forward exchange and other derivative contracts with major banks and are exposed to foreign currency losses in the event of nonperformance by these banks. We anticipate, however, that these banks will be able to fully satisfy their obligations under the contracts. Accordingly, we do not obtain collateral or other security to support the contracts.
Translation of Results of International Subsidiaries
As discussed above, we are exposed to financial statement gains and losses as a result of translating the operating results and financial position of our international subsidiaries. We translate the local currency statements of operations of our foreign subsidiaries into U.S. dollars using the average exchange rate during the reporting period. Changes in foreign currency exchange rates affect our reported results and distort comparisons from period to period. We generally do not use foreign currency exchange contracts to hedge the profit and loss effects of such exposure as accounting rules do not allow such types of contracts to qualify for hedge accounting.
By way of example, when the U.S. dollar strengthens compared to the euro, there is a negative effect on our reported results for EMEA because it takes more profits in euros to generate the same amount of profits in stronger U.S. dollars. The opposite is also true. That is, when the U.S. dollar weakens there is a positive effect on the translation of our reported results from EMEA. In addition, the statements of operations of APAC are translated from Australian dollars and Japanese yen into U.S. dollars, and there is a negative effect on our reported results for APAC when the U.S. dollar is stronger in comparison to the Australian dollar or Japanese yen.
EMEA revenues decreased 8% in U.S. dollars during fiscal 2014 compared to fiscal 2013 as reported in our consolidated financial statements, as well as in constant currency.
APAC revenues decreased 7% in U.S. dollars during fiscal 2014 compared to fiscal 2013 as reported in our consolidated financial statements. In constant currency, APAC revenues increased 1% primarily as a result of a stronger U.S. dollar versus various currencies in APAC in comparison to the prior fiscal year.
40
Interest Rates
A limited amount of our outstanding debt bears interest based on London Inter-Bank Offer Rate ("LIBOR"), Tokyo Inter-Bank Offer Rate ("TIBOR") or Euro Inter-Bank Offer Rate ("EURIBOR") plus a credit spread. Our effective interest rates, therefore, will move up or down depending on market conditions. The credit spreads are subject to change based on financial performance and market conditions. Interest expense also includes financing fees and related costs and can be affected by foreign currency exchange rate movements upon translating non-U.S. dollar denominated interest expense into U.S. dollars for reporting purposes. The approximate amount of our variable rate debt was $42 million at October 31, 2014, and the weighted average effective interest rate at that time was 2.3%. If interest rates or credit spreads were to increase by 10% (i.e., to approximately 2.6%), our annual loss before tax would be increased by approximately $0.2 million based on the borrowing levels at the end of fiscal 2014.
| Item 8. | FINANCIAL STATEMENTS AND SUPPLEMENTARY DATA |
The financial statements and supplementary data together with the report thereon of Deloitte & Touche LLP listed in the index at Item 15(a)1 and 15(a)2 are included herein by reference.
| Item 9. | CHANGES IN AND DISAGREEMENTS WITH ACCOUNTANTS ON ACCOUNTING AND FINANCIAL DISCLOSURE |
None.
| Item 9A. | CONTROLS AND PROCEDURES |
We maintain disclosure controls and procedures (as defined in Rules 13a-15(e) and 15d-15(e) under the Securities Exchange Act of 1934, as amended (the “Exchange Act”)) that are designed to ensure that information required to be disclosed in our reports filed under the Exchange Act, is recorded, processed, summarized and reported within the time periods specified in the SEC’s rules and forms, and that such information is accumulated and communicated to our management, including our Chief Executive Officer and Chief Financial Officer, as appropriate, to allow timely decisions regarding required disclosure. In designing and evaluating the disclosure controls and procedures, management recognized that any controls and procedures, no matter how well designed and operated, can provide only reasonable assurance of achieving the desired control objectives, and management necessarily was required to apply its judgment in evaluating the cost-benefit relationship of possible controls and procedures. Our disclosure controls and procedures are designed to provide a reasonable level of assurance of reaching our desired disclosure control objectives.
We carried out an evaluation under the supervision and with the participation of management, including our Chief Executive Officer and Chief Financial Officer, of the effectiveness of the design and operation of our disclosure controls and procedures as of October 31, 2014, the end of the period covered by this report. Based on that evaluation, our Chief Executive Officer and Chief Financial Officer concluded that our disclosure controls and procedures were effective, and were operating at the reasonable assurance level as of October 31, 2014.
There have been no changes in our internal control over financial reporting (as defined in Rules 13a-15(f) and 15d-15(f) under the Exchange Act) during the quarter ended October 31, 2014 that materially affected, or are reasonably likely to materially affect, our internal control over financial reporting.
Management’s Annual Report on Internal Control Over Financial Reporting
Internal control over financial reporting refers to the process designed by, or under the supervision of, our Chief Executive Officer and Chief Financial Officer, and effected by our Board of Directors, management and other personnel, to provide reasonable assurance regarding the reliability of financial reporting and the preparation of financial statements for external purposes in accordance with generally accepted accounting principles, and includes those policies and procedures that:
| • | pertain to the maintenance of records that, in reasonable detail, accurately and fairly reflect the transactions and dispositions of our assets; |
| • | provide reasonable assurance that transactions are recorded as necessary to permit preparation of financial statements in accordance with generally accepted accounting principles, and that our receipts and expenditures are being made only in accordance with authorizations of our management and directors; and |
41
| • | provide reasonable assurance regarding prevention or timely detection of unauthorized acquisition, use or disposition of our assets that could have a material effect on the consolidated financial statements. |
Internal control over financial reporting cannot provide absolute assurance of achieving financial reporting objectives because of its inherent limitations. Internal control over financial reporting is a process that involves human diligence and compliance and is subject to lapses in judgment and breakdowns resulting from human failures. Internal control over financial reporting also can be circumvented by collusion or improper management override. Because of such limitations, there is a risk that material misstatements may not be prevented or detected on a timely basis by internal control over financial reporting. However, these inherent limitations are known features of the financial reporting process. Therefore, it is possible to design into the process safeguards to reduce, though not eliminate, this risk. Management is responsible for establishing and maintaining adequate internal control over our financial reporting.
Management has used the framework set forth in the report entitled “Internal Control—Integrated Framework” published by the Committee of Sponsoring Organizations (“COSO”) of the Treadway Commission (1992 Framework) to evaluate the effectiveness of its internal control over financial reporting. Management has concluded that its internal control over financial reporting was effective as of the end of the most recent fiscal year. Deloitte & Touche LLP has issued an attestation report (see below) on our internal control over financial reporting.
The foregoing has been approved by our management, including our Chief Executive Officer and Chief Financial Officer, who have been involved with the assessment and analysis of our internal controls over financial reporting.
42
REPORT OF INDEPENDENT REGISTERED PUBLIC ACCOUNTING FIRM
To the Board of Directors and Stockholders of
Quiksilver, Inc.
Huntington Beach, California
We have audited the internal control over financial reporting of Quiksilver, Inc. and subsidiaries (the “Company”) as of October 31, 2014, based on criteria established in Internal Control—Integrated Framework (1992) issued by the Committee of Sponsoring Organizations of the Treadway Commission. The Company’s management is responsible for maintaining effective internal control over financial reporting and for its assessment of the effectiveness of internal control over financial reporting, included in the accompanying Management’s Annual Report on Internal Control Over Financial Reporting. Our responsibility is to express an opinion on the Company’s internal control over financial reporting based on our audit.
We conducted our audit in accordance with the standards of the Public Company Accounting Oversight Board (United States). Those standards require that we plan and perform the audit to obtain reasonable assurance about whether effective internal control over financial reporting was maintained in all material respects. Our audit included obtaining an understanding of internal control over financial reporting, assessing the risk that a material weakness exists, testing and evaluating the design and operating effectiveness of internal control based on the assessed risk, and performing such other procedures as we considered necessary in the circumstances. We believe that our audit provides a reasonable basis for our opinion.
A company’s internal control over financial reporting is a process designed by, or under the supervision of, the company’s principal executive and principal financial officers, or persons performing similar functions, and effected by the company’s board of directors, management, and other personnel to provide reasonable assurance regarding the reliability of financial reporting and the preparation of financial statements for external purposes in accordance with accounting principles generally accepted in the United States of America. A company’s internal control over financial reporting includes those policies and procedures that (1) pertain to the maintenance of records that, in reasonable detail, accurately and fairly reflect the transactions and dispositions of the assets of the company; (2) provide reasonable assurance that transactions are recorded as necessary to permit preparation of financial statements in accordance with accounting principles generally accepted in the United States of America, and that receipts and expenditures of the company are being made only in accordance with authorizations of management and directors of the company; and (3) provide reasonable assurance regarding prevention or timely detection of unauthorized acquisition, use, or disposition of the company’s assets that could have a material effect on the financial statements.
Because of the inherent limitations of internal control over financial reporting, including the possibility of collusion or improper management override of controls, material misstatements due to error or fraud may not be prevented or detected on a timely basis. Also, projections of any evaluation of the effectiveness of the internal control over financial reporting to future periods are subject to the risk that the controls may become inadequate because of changes in conditions, or that the degree of compliance with the policies or procedures may deteriorate.
In our opinion, the Company maintained, in all material respects, effective internal control over financial reporting as of October 31, 2014, based on the criteria established in Internal Control — Integrated Framework (1992) issued by the Committee of Sponsoring Organizations of the Treadway Commission.
We have also audited, in accordance with the standards of the Public Company Accounting Oversight Board (United States), the consolidated financial statements as of and for the year ended October 31, 2014, of the Company and our report dated December 22, 2014, expressed an unqualified opinion on those financial statements.
/s/ Deloitte & Touche LLP
Costa Mesa, California
December 22, 2014
43
| Item 9B. | OTHER INFORMATION |
None.
PART III
| Item 10. | DIRECTORS, EXECUTIVE OFFICERS AND CORPORATE GOVERNANCE |
The information required to be included by this item will be included under the headings “Election of Directors,” “Executive Compensation and Other Information,” and “Corporate Governance” in our proxy statement for the 2015 Annual Meeting of Stockholders. Such information is incorporated herein by reference to our proxy statement, which will be filed with the Securities and Exchange Commission within 120 days of our fiscal year ended October 31, 2014.
We have adopted a Code of Ethics for Senior Financial Officers in compliance with applicable rules of the Securities and Exchange Commission that applies to all of our senior executive, financial and accounting officers, including our principal executive officer, our principal financial officer and our principal accounting officer or controller, or persons performing similar functions. We have posted a copy of this Code of Ethics on our website, at http://www.quiksilverinc.com. We intend to disclose any amendments to, or waivers from, any provision of this Code of Ethics by posting such information on such website.
| Item 11. | EXECUTIVE COMPENSATION |
The information required to be included by this item will be included under the heading “Executive Compensation and Other Information” in our proxy statement for the 2015 Annual Meeting of Stockholders. Such information is incorporated herein by reference to our proxy statement, which will be filed with the Securities and Exchange Commission within 120 days of our fiscal year ended October 31, 2014.
| Item 12. | SECURITY OWNERSHIP OF CERTAIN BENEFICIAL OWNERS AND MANAGEMENT AND RELATED STOCKHOLDER MATTERS |
The information required to be included by this item will be included under the heading “Ownership of Securities” in our proxy statement for the 2015 Annual Meeting of Stockholders. Such information is incorporated herein by reference to our proxy statement, which will be filed with the Securities and Exchange Commission within 120 days of our fiscal year ended October 31, 2014.
| Item 13. | CERTAIN RELATIONSHIPS AND RELATED TRANSACTIONS, AND DIRECTOR INDEPENDENCE |
The information required to be included by this item will be included under the headings “Certain Relationships and Related Transactions” and “Corporate Governance” in our proxy statement for the 2015 Annual Meeting of Stockholders. Such information is incorporated herein by reference to our proxy statement, which will be filed with the Securities and Exchange Commission within 120 days of our fiscal year ended October 31, 2014.
| Item 14. | PRINCIPAL ACCOUNTANT FEES AND SERVICES |
The information required to be included by this item will be included under the heading “Independent Registered Public Accounting Firm” in our proxy statement for the 2015 Annual Meeting of Stockholders. Such information is incorporated herein by reference to our proxy statement, which will be filed with the Securities and Exchange Commission within 120 days of our fiscal year ended October 31, 2014.
44
PART IV
| Item 15. | EXHIBITS AND FINANCIAL STATEMENT SCHEDULES |
The following financial statements of Quiksilver Inc. are incorporated by reference in Item 8 of this Annual Report on Form 10-K.
(a)
| 1. | Consolidated Financial Statements |
| Page | |
| Audited consolidated financial statements of Quiksilver, Inc. as of October 31, 2014 and 2013 and for each of the three years in the period ended October 31, 2014: | |
| Report of Independent Public Accounting Firm | |
| Consolidated Statements of Operations Years Ended October 31, 2014, 2013 and 2012 | |
| Consolidated Statements of Comprehensive Loss Years Ended October 31, 2014, 2013 and 2012 | |
| Consolidated Balance Sheets October 31, 2014 and 2013 | |
| Consolidated Statements of Changes in Equity Years Ended October 31, 2014, 2013 and 2012 | |
| Consolidated Statements of Cash Flows Years Ended October 31, 2014, 2013 and 2012 | |
| Notes to Consolidated Financial Statements | |
| 2. | Financial Statement Schedules |
All schedules have been omitted for the reason that the required information is presented in the financial statements or notes thereto, the amounts are not significant or the schedules are not applicable.
| 3. | Exhibits |
The Exhibits listed in the Exhibit Index, which appears immediately following the signature page and is incorporated herein by reference, are filed as part of this Annual Report on Form 10-K.
45
REPORT OF INDEPENDENT REGISTERED PUBLIC ACCOUNTING FIRM
To the Board of Directors and Stockholders of
Quiksilver, Inc.
Huntington Beach, California
We have audited the accompanying consolidated balance sheets of Quiksilver, Inc. and subsidiaries (the “Company”) as of October 31, 2014 and 2013, and the related consolidated statements of operations, comprehensive loss, changes in equity, and cash flows for each of the three years in the period ended October 31, 2014. These consolidated financial statements are the responsibility of the Company’s management. Our responsibility is to express an opinion on these consolidated financial statements based on our audits.
We conducted our audits in accordance with the standards of the Public Company Accounting Oversight Board (United States). Those standards require that we plan and perform the audit to obtain reasonable assurance about whether the consolidated financial statements are free of material misstatement. An audit includes examining, on a test basis, evidence supporting the amounts and disclosures in the consolidated financial statements. An audit also includes assessing the accounting principles used and significant estimates made by management, as well as evaluating the overall consolidated financial statement presentation. We believe that our audits provide a reasonable basis for our opinion.
In our opinion, such consolidated financial statements present fairly, in all material respects, the financial position of the Company as of October 31, 2014 and 2013, and the results of its operations and its cash flows for each of the three years in the period ended October 31, 2014, in conformity with accounting principles generally accepted in the United States of America.
We have also audited, in accordance with the standards of the Public Company Accounting Oversight Board (United States), the Company’s internal control over financial reporting as of October 31, 2014, based on the criteria established in Internal Control — Integrated Framework (1992) issued by the Committee of Sponsoring Organizations of the Treadway Commission and our report dated December 22, 2014, expressed an unqualified opinion on the Company’s internal control over financial reporting.
/s/ Deloitte & Touche LLP
Costa Mesa, California
December 22, 2014
QUIKSILVER, INC.
CONSOLIDATED STATEMENTS OF OPERATIONS
Years Ended October 31, 2014, 2013 and 2012
| In thousands, except per share amounts | 2014 | 2013 | 2012 | |||||||||
| Revenues, net | $ | 1,570,399 | $ | 1,810,570 | $ | 1,941,849 | ||||||
| Cost of goods sold | 807,558 | 938,139 | 1,000,530 | |||||||||
| Gross profit | 762,841 | 872,431 | 941,319 | |||||||||
| Selling, general and administrative expense | 827,181 | 857,557 | 888,250 | |||||||||
| Goodwill impairments | 178,197 | — | — | |||||||||
| Asset impairments | 10,934 | 12,327 | 7,234 | |||||||||
| Operating (loss)/income | (253,471 | ) | 2,547 | 45,835 | ||||||||
| Interest expense, net | 75,991 | 71,049 | 60,885 | |||||||||
| Foreign currency loss/(gain) | 2,658 | 4,689 | (1,709 | ) | ||||||||
| Loss before (benefit)/provision for income taxes | (332,120 | ) | (73,191 | ) | (13,341 | ) | ||||||
| (Benefit)/provision for income taxes | (4,325 | ) | 166,220 | 3,904 | ||||||||
| Loss from continuing operations | (327,795 | ) | (239,411 | ) | (17,245 | ) | ||||||
| Income from discontinued operations, net of tax (includes net gain on sale of $29,742 for the year ended October 31, 2014) | 7,649 | 5,886 | 7,502 | |||||||||
| Net loss | (320,146 | ) | (233,525 | ) | (9,743 | ) | ||||||
| Less: net loss/(income) attributable to non-controlling interest | 10,769 | 960 | (1,013 | ) | ||||||||
| Net loss attributable to Quiksilver, Inc. | $ | (309,377 | ) | $ | (232,565 | ) | $ | (10,756 | ) | |||
| Loss per share from continuing operations attributable to Quiksilver, Inc. | $ | (1.92 | ) | $ | (1.43 | ) | $ | (0.11 | ) | |||
| Income per share from discontinued operations attributable to Quiksilver, Inc. | $ | 0.11 | $ | 0.04 | $ | 0.04 | ||||||
| Net loss per share attributable to Quiksilver, Inc. | $ | (1.81 | ) | $ | (1.39 | ) | $ | (0.07 | ) | |||
| Loss per share from continuing operations attributable to Quiksilver, Inc., assuming dilution | $ | (1.92 | ) | $ | (1.43 | ) | $ | (0.11 | ) | |||
| Income per share from discontinued operations attributable to Quiksilver, Inc., assuming dilution | $ | 0.11 | $ | 0.04 | $ | 0.04 | ||||||
| Net loss per share attributable to Quiksilver, Inc., assuming dilution | $ | (1.81 | ) | $ | (1.39 | ) | $ | (0.07 | ) | |||
| Weighted average common shares outstanding, basic | 170,492 | 167,255 | 164,245 | |||||||||
| Weighted average common shares outstanding, diluted | 170,492 | 167,255 | 164,245 | |||||||||
| Amounts attributable to Quiksilver, Inc.: | ||||||||||||
| Loss from continuing operations | $ | (327,434 | ) | $ | (238,766 | ) | $ | (18,019 | ) | |||
| Income from discontinued operations, net of tax | 18,057 | 6,201 | 7,263 | |||||||||
| Net loss | $ | (309,377 | ) | $ | (232,565 | ) | $ | (10,756 | ) | |||
See Notes to Consolidated Financial Statements.
47
QUIKSILVER, INC.
CONSOLIDATED STATEMENTS OF COMPREHENSIVE LOSS
Years Ended October 31, 2014, 2013 and 2012
| In thousands | 2014 | 2013 | 2012 | |||||||||
| Net loss | $ | (320,146 | ) | $ | (233,525 | ) | $ | (9,743 | ) | |||
| Other comprehensive loss: | ||||||||||||
| Foreign currency translation adjustment | (25,304 | ) | (2,147 | ) | (43,574 | ) | ||||||
| Reclassification adjustment for realized (loss)/gain on derivative instruments transferred to earnings, net of tax provision/(benefit) of $(748) (2014), $0 (2013), and $564 (2012) | (597 | ) | (8,137 | ) | (365 | ) | ||||||
| Reclassification adjustment for realized foreign currency gain/(loss) transferred to earnings, net of tax benefit of $0 (2014), $0 (2013), and $(373) (2012) | — | (343 | ) | 929 | ||||||||
| Net unrealized gain/(loss) on derivative instruments, net of tax provision of $1,232 (2014), $0 (2013), and $6,244 (2012) | 9,281 | (1,867 | ) | 13,295 | ||||||||
| Comprehensive loss | (336,766 | ) | (246,019 | ) | (39,458 | ) | ||||||
| Comprehensive loss/(income) attributable to non-controlling interest | 10,769 | 960 | (1,013 | ) | ||||||||
| Comprehensive loss attributable to Quiksilver, Inc. | $ | (325,997 | ) | $ | (245,059 | ) | $ | (40,471 | ) | |||
See Notes to Consolidated Financial Statements.
48
QUIKSILVER, INC.
CONSOLIDATED BALANCE SHEETS
October 31, 2014 and 2013
| In thousands, except share and per share amounts | 2014 | 2013 | ||||||
| ASSETS | ||||||||
| Current assets: | ||||||||
| Cash and cash equivalents | $ | 46,664 | $ | 57,280 | ||||
| Restricted cash | 4,687 | — | ||||||
| Trade accounts receivable, net | 319,840 | 411,638 | ||||||
| Other receivables | 40,847 | 23,306 | ||||||
| Inventories | 278,780 | 337,715 | ||||||
| Deferred income taxes-current | 4,926 | 9,997 | ||||||
| Prepaid expenses and other current assets | 28,080 | 24,124 | ||||||
| Current portion of assets held for sale | 20,265 | 51,196 | ||||||
| Total current assets | 744,089 | 915,256 | ||||||
| Restricted cash | 16,514 | — | ||||||
| Fixed assets, net | 213,768 | 231,261 | ||||||
| Intangible assets, net | 135,510 | 134,596 | ||||||
| Goodwill | 80,622 | 261,625 | ||||||
| Other assets | 47,086 | 53,287 | ||||||
| Deferred income taxes long-term | 16,088 | — | ||||||
| Assets held for sale, net of current portion | 2,987 | 24,445 | ||||||
| Total assets | $ | 1,256,664 | $ | 1,620,470 | ||||
| LIABILITIES AND EQUITY | ||||||||
| Current liabilities: | ||||||||
| Lines of credit | $ | 32,929 | $ | — | ||||
| Accounts payable | 168,307 | 201,675 | ||||||
| Accrued liabilities | 112,701 | 121,545 | ||||||
| Current portion of long-term debt | 2,432 | 23,488 | ||||||
| Income taxes payable | 1,156 | 3,912 | ||||||
| Deferred income taxes-current | 19,628 | — | ||||||
| Current portion of assets held for sale | 12,640 | 16,420 | ||||||
| Total current liabilities | 349,793 | 367,040 | ||||||
| Long-term debt, net of current portion | 793,229 | 807,812 | ||||||
| Other long-term liabilities | 39,342 | 36,345 | ||||||
| Deferred income taxes long-term | 16,790 | 19,896 | ||||||
| Assets held for sale, net of current portion | — | 1,719 | ||||||
| Total liabilities | 1,199,154 | 1,232,812 | ||||||
| Commitments and contingencies – Note 10 | ||||||||
| Equity: | ||||||||
| Preferred stock, $0.01 par value, authorized shares - 5,000,000; issued and outstanding shares – none | — | — | ||||||
| Common stock, $0.01 par value, authorized shares - 285,000,000; issued shares – 174,057,410 (2014) and 172,579,182 (2013) | 1,741 | 1,726 | ||||||
| Additional paid-in capital | 589,032 | 576,726 | ||||||
| Treasury stock, 2,885,200 shares | (6,778 | ) | (6,778 | ) | ||||
| Accumulated deficit | (585,263 | ) | (275,886 | ) | ||||
| Accumulated other comprehensive income | 57,298 | 73,918 | ||||||
| Total Quiksilver, Inc. stockholders’ equity | 56,030 | 369,706 | ||||||
| Non-controlling interest | 1,480 | 17,952 | ||||||
| Total equity | 57,510 | 387,658 | ||||||
| Total liabilities and equity | $ | 1,256,664 | $ | 1,620,470 | ||||
See Notes to Consolidated Financial Statements.
49
QUIKSILVER, INC.
CONSOLIDATED STATEMENTS OF CHANGES IN EQUITY
Years Ended October 31, 2014, 2013 and 2012
| In thousands | Common Stock | Additional Paid-in Capital | Treasury Stock | Accumulated Deficit | Accumulated Other Comprehensive Income | Non- Controlling Interest | Total Equity | ||||||||||||||||||||||||
| Shares | Amounts | ||||||||||||||||||||||||||||||
| Balance, October 31, 2011 | 168,054 | $ | 1,681 | $ | 531,633 | $ | (6,778 | ) | $ | (32,565 | ) | $ | 116,127 | $ | 12,524 | $ | 622,622 | ||||||||||||||
| Exercise of stock options | 506 | 5 | 1,122 | — | — | — | — | 1,127 | |||||||||||||||||||||||
| Stock compensation expense | — | — | 22,552 | — | — | — | — | 22,552 | |||||||||||||||||||||||
| Restricted stock | 45 | — | — | — | — | — | — | ||||||||||||||||||||||||
| Employee stock purchase plan | 461 | 5 | 1,109 | — | — | — | — | 1,114 | |||||||||||||||||||||||
| Transactions with non-controlling interest holders | — | — | (11,110 | ) | — | — | — | (6,475 | ) | (17,585 | ) | ||||||||||||||||||||
| Business acquisitions | — | — | — | — | — | — | 11,864 | 11,864 | |||||||||||||||||||||||
| Net loss and other comprehensive income | — | — | — | — | (10,756 | ) | (29,715 | ) | 1,013 | (39,458 | ) | ||||||||||||||||||||
| Balance, October 31, 2012 | 169,066 | $ | 1,691 | $ | 545,306 | $ | (6,778 | ) | $ | (43,321 | ) | $ | 86,412 | $ | 18,926 | $ | 602,236 | ||||||||||||||
| Exercise of stock options | 2,986 | 30 | 8,739 | — | — | — | — | 8,769 | |||||||||||||||||||||||
| Stock compensation expense | — | — | 21,556 | — | — | — | — | 21,556 | |||||||||||||||||||||||
| Restricted stock | 78 | 1 | (1 | ) | — | — | — | — | — | ||||||||||||||||||||||
| Employee stock purchase plan | 449 | 4 | 1,171 | — | — | — | — | 1,175 | |||||||||||||||||||||||
| Transactions with non-controlling interest holders | — | — | (45 | ) | — | — | — | (14 | ) | (59 | ) | ||||||||||||||||||||
| Net loss and other comprehensive (loss)/income | — | — | — | — | (232,565 | ) | (12,494 | ) | (960 | ) | (246,019 | ) | |||||||||||||||||||
| Balance, October 31, 2013 | 172,579 | $ | 1,726 | $ | 576,726 | $ | (6,778 | ) | $ | (275,886 | ) | $ | 73,918 | $ | 17,952 | $ | 387,658 | ||||||||||||||
| Exercise of stock options | 1,070 | 11 | 4,569 | — | — | — | — | 4,580 | |||||||||||||||||||||||
| Stock compensation expense | — | — | 17,260 | — | — | — | — | 17,260 | |||||||||||||||||||||||
| Restricted stock | 75 | 1 | (1 | ) | — | — | — | — | — | ||||||||||||||||||||||
| Employee stock purchase plan | 333 | 3 | 1,318 | — | — | — | — | 1,321 | |||||||||||||||||||||||
| Transactions with non-controlling interest holders | — | — | (10,840 | ) | — | — | — | (5,703 | ) | (16,543 | ) | ||||||||||||||||||||
| Net loss and other comprehensive loss | — | — | — | — | (309,377 | ) | (16,620 | ) | (10,769 | ) | (336,766 | ) | |||||||||||||||||||
| Balance, October 31, 2014 | 174,057 | $ | 1,741 | $ | 589,032 | $ | (6,778 | ) | $ | (585,263 | ) | $ | 57,298 | $ | 1,480 | $ | 57,510 | ||||||||||||||
See Notes to Consolidated Financial Statements.
50
QUIKSILVER, INC.
CONSOLIDATED STATEMENTS OF CASH FLOWS
Years Ended October 31, 2014, 2013 and 2012
| In thousands | 2014 | 2013 | 2012 | |||||||||
| Cash flows from operating activities: | ||||||||||||
| Net loss | $ | (320,146 | ) | $ | (233,525 | ) | $ | (9,743 | ) | |||
| Adjustments to reconcile net loss to net cash (used in)/provided by operating activities: | ||||||||||||
| Income from discontinued operations | (7,649 | ) | (5,886 | ) | (7,502 | ) | ||||||
| Depreciation and amortization | 51,938 | 49,958 | 52,418 | |||||||||
| Stock-based compensation | 17,260 | 21,556 | 22,552 | |||||||||
| Provision for doubtful accounts | 21,856 | 5,729 | 4,030 | |||||||||
| (Gain)/loss on disposal of fixed assets | (5,056 | ) | 218 | (6,366 | ) | |||||||
| Unrealized foreign currency gain | (1,464 | ) | (1,600 | ) | (155 | ) | ||||||
| Asset impairments | 189,131 | 12,327 | 7,234 | |||||||||
| Non-cash interest expense | 3,469 | 6,795 | 3,685 | |||||||||
| Equity in earnings | 228 | 613 | 282 | |||||||||
| Deferred income taxes | (4,823 | ) | 159,097 | (8,621 | ) | |||||||
| Subtotal of non-cash reconciling adjustments | 264,890 | 248,807 | 67,557 | |||||||||
| Changes in operating assets and liabilities: | ||||||||||||
| Trade accounts receivable | 50,607 | (1,220 | ) | (50,750 | ) | |||||||
| Other receivables | (6,267 | ) | (759 | ) | (89 | ) | ||||||
| Inventories | 37,097 | (11,860 | ) | 7,183 | ||||||||
| Prepaid expenses and other current assets | (7,776 | ) | (1,176 | ) | (5,018 | ) | ||||||
| Other assets | 1,073 | 3,798 | 2,146 | |||||||||
| Accounts payable | (29,524 | ) | 7,750 | (6,087 | ) | |||||||
| Accrued liabilities and other long-term liabilities | 6,768 | 9,258 | (4,677 | ) | ||||||||
| Income taxes payable | (5,243 | ) | 3,815 | (15,094 | ) | |||||||
| Subtotal of changes in operating assets and liabilities | 46,735 | 9,606 | (72,386 | ) | ||||||||
| Cash (used in)/provided by operating activities of continuing operations | (8,521 | ) | 24,888 | (14,572 | ) | |||||||
| Cash (used in)/provided by operating activities of discontinued operations | (18,414 | ) | 2,304 | 1,033 | ||||||||
| Net cash (used in)/provided by operating activities | (26,935 | ) | 27,192 | (13,539 | ) | |||||||
| Cash flows from investing activities: | ||||||||||||
| Capital expenditures | (53,415 | ) | (52,182 | ) | (63,343 | ) | ||||||
| Changes in restricted cash | (21,201 | ) | — | — | ||||||||
| Proceeds from the sale of properties and equipment | 5,650 | 859 | 8,198 | |||||||||
| Cash used in investing activities of continuing operations | (68,966 | ) | (51,323 | ) | (55,145 | ) | ||||||
| Cash provided by/(used in) investing activities of discontinued operations | 75,114 | (2,570 | ) | (11,855 | ) | |||||||
| Net cash provided by/(used in) investing activities | 6,148 | (53,893 | ) | (67,000 | ) | |||||||
| Cash flows from financing activities: | ||||||||||||
| Borrowings on lines of credit | 57,413 | 6,157 | 15,139 | |||||||||
| Payments on lines of credit | (24,485 | ) | (22,561 | ) | (12,641 | ) | ||||||
| Borrowings on long-term debt | 197,086 | 652,915 | 140,035 | |||||||||
| Payments on long-term debt | (222,172 | ) | (582,456 | ) | (112,841 | ) | ||||||
| Stock option exercises and employee stock purchases | 5,902 | 9,944 | 2,241 | |||||||||
| Purchase of non-controlling interest | — | (58 | ) | (11,000 | ) | |||||||
| Payments of debt and equity issuance costs | (123 | ) | (14,277 | ) | — | |||||||
| Cash provided by financing activities of continuing operations | 13,621 | 49,664 | 20,933 | |||||||||
| Net cash provided by financing activities | 13,621 | 49,664 | 20,933 | |||||||||
| Effect of exchange rate changes on cash | (3,450 | ) | (7,506 | ) | (8,324 | ) | ||||||
| Net (decrease)/increase in cash and cash equivalents | (10,616 | ) | 15,457 | (67,930 | ) | |||||||
| Cash and cash equivalents, beginning of year | 57,280 | 41,823 | 109,753 | |||||||||
| Cash and cash equivalents, end of year | $ | 46,664 | $ | 57,280 | $ | 41,823 | ||||||
| Supplementary cash flow information: | ||||||||||||
| Cash paid during the period for: | ||||||||||||
| Interest | $ | 73,772 | $ | 52,115 | $ | 54,788 | ||||||
| Income taxes | $ | 17,056 | $ | 11,799 | $ | 25,733 | ||||||
| Summary of significant non-cash transactions: | ||||||||||||
| Capital expenditures accrued at year-end (investing activities) | $ | 10,556 | $ | 5,432 | $ | 6,026 | ||||||
| Debt issued for purchase of non-controlling interest (financing activities) | $ | 17,388 | $ | — | $ | — | ||||||
51
QUIKSILVER, INC.
NOTES TO CONSOLIDATED FINANCIAL STATEMENTS
Years Ended October 31, 2014, 2013 and 2012
Note 1 — Significant Accounting Policies
Company Business
Quiksilver, Inc. and its subsidiaries (the “Company”) design, develop and distribute branded apparel, footwear, accessories and related products. The Company’s apparel and footwear brands represent a casual lifestyle for young-minded people that connect with its boardriding culture and heritage. The Company’s Quiksilver, Roxy, and DC brands are synonymous with the heritage and culture of surfing, skateboarding and snowboarding. The Company’s products are sold in over 115 countries in a wide range of distribution points, including surf shops, skate shops, snow shops, its proprietary concept stores, other specialty stores and select department stores. Distribution is primarily in the United States, Europe and Australia.
The Company currently operates in four segments: the Americas, EMEA, APAC, each of which sells a full range of the Company's products, as well as Corporate Operations. See Note 2, "Segments and Geographic Information" for further discussion.
Principles of Consolidation
The consolidated financial statements include the accounts of Quiksilver, Inc. and its subsidiaries, (the "Company"). All intercompany transactions and balances have been eliminated.
The Company completed the sale of Mervin Manufacturing, Inc. ("Mervin") and substantially all of the assets of Hawk Designs, Inc. ("Hawk") during the first quarter ended January 31, 2014. In December 2014, the Company sold its majority stake in its Surfdome Shop, Ltd. ("Surfdome") for net proceeds of approximately $16 million. As a result, the Company reports the operating results of Mervin, Hawk and Surfdome in "Income from discontinued operations, net of tax" in the consolidated statements of operations for all periods presented. In addition, the assets and liabilities associated with these businesses are reported as discontinued operations in the consolidated balance sheets (see Note 18, "Discontinued Operations"). Unless otherwise indicated, the disclosures accompanying the consolidated financial statements reflect the Company's continuing operations.
Basis of Presentation
The accompanying consolidated financial statements have been prepared in accordance with accounting principles generally accepted in the United States of America, ("GAAP"). References to any particular fiscal year refer to the year ended October 31 of that year (for example, “fiscal 2014” refers to the year ended October 31, 2014).
Use of Estimates
The preparation of financial statements in conformity with GAAP requires management to make estimates and assumptions. Such estimates and assumptions affect the reported amounts of assets and liabilities and the disclosure of contingent assets and liabilities at the date of the financial statements, and the reported amounts of revenues and expenses during the reporting period. Actual results could differ from those estimates.
Cash Equivalents
Cash equivalents represent cash and short-term, highly liquid investments, including commercial paper, U.S. Treasury, U.S. Agency, and corporate debt securities with original maturities of three months or less at the date of purchase. Cash equivalents represent Level 1 fair value investments. See the Fair Value Measurements section below for further details.
Restricted Cash
Restricted cash represents cash that is designated for specific uses according to the terms and conditions of certain of the Company's credit facilities. The nature of the permitted usage of restricted cash determines its classification on the Company's balance sheet. Amounts reported within current assets are available for use in current operations within certain parameters. Amounts reported within long-term assets can only be used for capital expenditures, acquisitions or other long-term investment needs. The Company expects that all restricted cash will be utilized during fiscal 2015.
52
Inventories
Inventories are valued at the lower of cost (first-in, first-out and moving average, depending on entity) or market. Management regularly reviews the inventory quantities on hand and adjusts inventory values for excess and obsolete inventory based primarily on estimated forecasts of product demand and market value.
Fixed Assets, net
Furniture and other equipment, computer equipment and buildings are recorded at cost and depreciated on a straight-line basis over their estimated useful lives, which generally range from two to twenty years. Leasehold improvements are recorded at cost and amortized over their estimated useful lives or related lease term, whichever is shorter. Land use rights for certain leased retail locations are amortized to estimated residual value and are tested for impairment when the store subject to the land use right has an indicator of impairment. Depreciation and amortization of all assets are recorded in selling, general and administrative expense ("SG&A").
Long-lived Assets
The Company accounts for the impairment and disposition of long-lived assets in accordance with Accounting Standards Codification (“ASC”) 360, “Property, Plant, and Equipment.” In accordance with ASC 360, management assesses potential impairments of its long-lived assets whenever events or changes in circumstances indicate that the carrying value of an asset may not be recoverable. An impairment loss is recognized when the carrying value exceeds the undiscounted future cash flows estimated to result from the use and eventual disposition of the asset. The Company recorded approximately $11 million in fixed asset impairments primarily related to its retail stores during fiscal 2014, $12 million in fiscal 2013 and $7 million in fiscal 2012 to write-down the carrying value to their estimated fair values. Fair value is determined using a discounted cash flow model which requires “Level 3” inputs, as defined in ASC 820, “Fair Value Measurements and Disclosures.” See the Fair Value Measurements section below. On an individual retail store basis, these inputs typically include annual revenue growth assumptions ranging from (15)% to 20% per year depending upon the location, life cycle and current economics of a specific store, as well as modest gross margin and expense improvement assumptions. The impairment charges reduced the carrying amounts of the respective long-lived assets as follows:
| Year Ended October 31, | ||||||||||||
| In thousands | 2014 | 2013 | 2012 | |||||||||
| Carrying value of long-lived assets | $ | 10,934 | $ | 10,181 | $ | 7,933 | ||||||
| Less: impairment charges | (10,934 | ) | (10,181 | ) | (7,234 | ) | ||||||
| Fair value of long-lived assets | $ | — | $ | — | $ | 699 | ||||||
Goodwill and Intangible Assets
The Company accounts for goodwill and intangible assets in accordance with ASC 350, “Intangibles - Goodwill and Other.” Under ASC 350, goodwill and intangible assets with indefinite lives are not amortized but are tested for impairment annually and also in the event of an impairment indicator. The annual impairment test is a fair value test as prescribed by ASC 350 which includes assumptions for each reporting unit. The assumptions for the Company include projected annual revenue growth ranging from (14)% to 17% per year, annual gross margin improvements ranging from (10) to 250 basis points per year, and SG&A improvements ranging from (50) to 1,290 basis points per year as a percentage of net revenues, and discount rates.
In fiscal 2014, the Company recorded goodwill impairment charges of approximately $178 million to fully impair goodwill associated with its EMEA reporting segment. No goodwill impairments were recorded in fiscal 2013 or fiscal 2012.
As of October 31, 2014, the fair values of each of the Company’s reporting units substantially exceeded their carrying values. Goodwill amounted to $74 million for the Americas and $6 million for APAC as of October 31, 2014. Based on the uncertainty of future revenue growth rates, gross profit and expense performance, and other assumptions used to estimate goodwill recoverability in the Company’s reporting units, future reductions in the Company’s expected cash flows for a reporting unit as a result of any variation between projected and actual results could cause an impairment of goodwill.
See Note 7, "Intangible Assets and Goodwill," for further details regarding the goodwill impairments that were recorded in fiscal 2014.
Fair Value Measurements
ASC 820 defines fair value as the exchange price that would be received for an asset or paid to transfer a liability (an exit price) in the principal or most advantageous market for the asset or liability in an orderly transaction between market participants on the measurement date. ASC 820 requires that valuation techniques maximize the use of observable inputs and minimize the use
53
of unobservable inputs. ASC 820 also establishes a fair value hierarchy which prioritizes the valuation inputs into three broad levels. Based on the underlying inputs, each fair value measurement in its entirety is reported in one of the three levels. These levels are:
The Company measures certain financial assets and liabilities at fair value on a recurring basis, including derivatives. Fair value is the price the Company would receive to sell an asset or pay to transfer a liability in an orderly transaction with a market participant at the measurement date. The Company uses a three-level hierarchy established in ASC 820 that prioritizes fair value measurements based on the types of inputs used for the various valuation techniques (market approach, income approach, and cost approach).
The levels of hierarchy are described below:
| • | Level 1 – Valuation is based upon quoted prices for identical instruments traded in active markets. Level 1 assets and liabilities include debt and equity securities traded in an active exchange market, as well as U.S. Treasury securities. |
| • | Level 2 – Valuation is based upon quoted prices for similar instruments in active markets, quoted prices for identical or similar instruments in markets that are not active, and model based valuation techniques for which all significant assumptions are observable in the market or can be corroborated by observable market data for substantially the full term of the assets or liabilities. |
| • | Level 3 – Valuation is determined using model-based techniques with significant assumptions not observable in the market. These unobservable assumptions reflect the Company’s own estimates of assumptions that market participants would use in pricing the asset or liability. Valuation techniques include the use of third party pricing services, option- pricing models, discounted cash flow models and similar techniques. |
The Company’s assessment of the significance of a particular input to the fair value measurement in its entirety requires judgment and considers factors specific to the asset or liability. Financial assets and liabilities are classified in their entirety based on the most conservative level of input that is significant to the fair value measurement.
Pricing vendors are utilized for certain Level 1 and Level 2 investments. These vendors either provide a quoted market price in an active market or use observable inputs without applying significant adjustments in their pricing. Observable inputs include broker quotes, interest rates and yield curves observable at commonly quoted intervals, volatilities and credit risks. The Company’s fair value processes include controls that are designed to ensure appropriate fair values are recorded. These controls include an analysis of period-over-period fluctuations and comparison to another independent pricing vendor.
For fair value disclosures related to the Company’s cash, long-lived assets and debt, see the sections above entitled, “Cash Equivalents”, “Long-lived Assets”, and Note 8, "Debt", respectively.
Assets Held for Sale/Discontinued Operations
The Company applies the guidance set forth in ASC 360, “Property, Plant and Equipment” and ASC 205, “Presentation of Financial Statements” to determine when certain asset groups should be classified as “held for sale” and reported as discontinued operations in its consolidated financial statements. As a result of the application of this guidance, the Company has classified certain asset groups as “held for sale” as of October 31, 2014. See Note 18, “Discontinued Operations”, for further details regarding the operating results of the Company’s discontinued operations.
Revenue Recognition
Revenues are recognized upon the transfer of title and risk of ownership to customers. For wholesale customers, transfer is based on the terms of sale, typically at the shipping point. For retail and e-commerce customers, transfer occurs at the time of sale. Allowances for estimated returns and doubtful accounts, non-merchandise credits, and certain co-op advertising arrangements are provided when revenues are recorded. Returns and allowances are reported as reductions in revenues, whereas allowances for bad debts are reported as a component of SG&A expense. Royalty and license income is recorded as earned. The Company performs ongoing credit evaluations of its customers and generally does not require collateral.
Revenues in the consolidated statements of operations include the following:
| Year Ended October 31, | ||||||||||||
| In thousands | 2014 | 2013 | 2012 | |||||||||
| Product sales, net | $ | 1,559,174 | $ | 1,801,355 | $ | 1,929,086 | ||||||
| Royalty and licensing income | 11,225 | 9,215 | 12,763 | |||||||||
| Total | $ | 1,570,399 | $ | 1,810,570 | $ | 1,941,849 | ||||||
54
Promotion and Advertising
The Company’s promotion and advertising efforts include magazine advertisements, retail signage, athlete sponsorships, boardriding contests, websites, television programs, co-branded products, social media and other events. For fiscal 2014, 2013 and 2012, these expenses totaled $78 million, $93 million and $118 million, respectively. Advertising costs are expensed when incurred.
Rent Expense
The Company enters into non-cancelable operating leases for retail stores, distribution facilities, equipment, and office space. Most leases have fixed rentals, with many of the real estate leases requiring normal and customary additional payments for real estate taxes and occupancy-related costs. Rent expense for leases having rent holidays, landlord incentives or scheduled rent increases is recorded on a straight-line basis over the lease term, generally beginning with the lease commencement date. Differences between straight-line rent expense and actual rent payments are recorded in other assets or other liabilities as an adjustment to rent expense over the lease term.
Income Taxes
The Company accounts for income taxes using the asset and liability approach as promulgated by the authoritative guidance included in ASC 740, “Income Taxes.” Deferred income tax assets and liabilities are established for temporary differences between the financial reporting bases and the tax bases of the Company’s assets and liabilities at tax rates expected to be in effect when such assets or liabilities are realized or settled. Deferred income tax assets are reduced by a valuation allowance if, in the judgment of the Company’s management, it is more likely than not that such assets will not be realized. The Company evaluated the recoverability of its deferred tax assets at the end of fiscal 2014 in accordance with ASC 740.
ASC 740 also clarifies the accounting for uncertainty in income taxes recognized in the financial statements. This guidance provides that a tax benefit from an uncertain tax position may be recognized when it is more likely than not that the position will be sustained upon examination, including resolutions of any related appeals or litigation processes, based on the technical merits of the tax position. The Company recognizes accrued interest and penalties related to unrecognized tax benefits as a component of its provision for income taxes. The application of this guidance can create significant variability in the effective tax rate from period to period based upon changes in or adjustments to the Company’s uncertain tax positions.
Stock-based Compensation Expense
The Company recognizes compensation expense for all stock-based payments net of an estimated forfeiture rate and only recognizes compensation cost for those shares expected to vest using the graded vested method over the requisite service period of the award. For option valuations, the Company determines the fair value at the grant date using the Black-Scholes option-pricing model which requires the input of certain assumptions, including the expected life of the stock-based payment awards, stock price volatility and interest rates. For performance based equity awards with stock price contingencies, the Company determines the fair value using a Monte-Carlo simulation, which creates a normal distribution of future stock prices, which is then used to value the awards based on their individual terms.
Net Loss per Share
The Company reports basic and diluted earnings per share (“EPS”). Basic EPS is based on the weighted average number of shares outstanding during the period, while diluted EPS additionally includes the dilutive effect of the Company’s outstanding stock options, warrants and shares of restricted stock computed using the treasury stock method.
The table below sets forth the reconciliation of the denominator of each net loss per share calculation:
| Year Ended October 31, | |||||||||
| In thousands | 2014 | 2013 | 2012 | ||||||
| Shares used in computing basic net loss per share | 170,492 | 167,255 | 164,245 | ||||||
Dilutive effect of stock options and restricted stock(1) | — | — | — | ||||||
Dilutive effect of stock warrants(1) | — | — | — | ||||||
| Shares used in computing diluted net loss per share | 170,492 | 167,255 | 164,245 | ||||||
| (1) | For fiscal 2014, 2013 and 2012, the shares used in computing diluted net loss per share do not include 2,145,000, 3,862,000, and 3,103,000 dilutive stock options and shares of restricted stock, respectively, nor 17,024,000, 17,792,000, and 11,559,000 dilutive warrant shares, respectively, as the effect is anti-dilutive given the Company’s loss. For fiscal 2014, 2013 and 2012, additional stock options outstanding of 4,856,000, 5,409,000, and 10,559,000, respectively, and |
55
additional warrant shares outstanding of 8,630,000, 7,862,000, and 14,095,000, respectively, were excluded from the calculation of diluted net loss per share, as their effect would have been anti-dilutive based on the application of the treasury stock method.
Foreign Currency Translation and Foreign Currency Transactions
The Company's reporting currency is the U.S dollar. The functional currencies of the Company's subsidiaries within its EMEA and APAC segments are primarily the Euro, and the Australian dollar and the Japanese yen, respectively. The functional currency of the Company's subsidiaries within its Americas segment is primarily the U.S. dollar. Adjustments resulting from translating foreign functional currency financial statements into U.S. dollars are included in the foreign currency translation adjustment, a component of accumulated other comprehensive income in shareholders’ equity.
The Company’s global subsidiaries have various assets and liabilities, primarily receivables and payables, which are denominated in currencies other than their functional currency. These balance sheet items are subject to remeasurement, the impact of which is recorded in "Foreign currency loss/(gain)" within the consolidated statements of operations.
Derivatives
Derivative financial instruments are recognized as either assets or liabilities on the balance sheet and are measured at fair value. The accounting for changes in the fair value of a derivative depends on the use and type of the derivative. The Company’s derivative financial instruments principally consist of foreign currency exchange rate contracts, which the Company uses to manage its exposure to the risk of changes in foreign currency exchange rates. The Company’s objectives are to reduce the volatility of earnings and cash flows associated with changes in foreign currency exchange rates. The Company does not enter into derivative financial instruments for speculative or trading purposes.
Comprehensive Income or Loss
Comprehensive income or loss includes all changes in stockholders’ equity except those resulting from investments by, and distributions to, stockholders. Accordingly, the Company’s consolidated statements of comprehensive loss include its net loss, the fair value gains and losses on certain derivative instruments and adjustments resulting from translating foreign functional currency financial statements into U.S. dollars for the Company's subsidiaries within the EMEA and APAC segments and the foreign entities within the Americas segment. See Note 2 "Segment and Geographic Information" for further detail on the Company's segments.
New Accounting Pronouncements
In April 2014, the FASB issued Accounting Standards Update ("ASU") 2014-08 Presentation of Financial Statements (Topic 205) and Property Plant and Equipment (Topic 360), Reporting Discontinued Operations and Disclosures of Disposals of Components of an Entity which provides amended guidance on the presentation of financial statements and reporting discontinued operations and disclosures of disposals of components of an entity within property, plant and equipment. ASU 2014-08 amends the definition of a discontinued operation and requires entities to disclose additional information about disposal transactions that do not meet the discontinued operations criteria. The effective date of ASU 2014-08 is for disposals that occur in annual periods (and interim periods therein) beginning on or after December 15, 2014, with early adoption permitted. The Company is currently evaluating the impact, if any, that this amended guidance may have on its consolidated financial statements and related disclosures.
In May 2014, the FASB issued ASU 2014-09, Revenue from Contracts with Customers, which provides a single, comprehensive framework for all entities in all industries to apply in the determination of when to recognize revenue, and, therefore, supersedes virtually all existing revenue recognition requirements and guidance. This framework is expected to result in less complex guidance in application while providing a consistent and comparable methodology for revenue recognition. The core principle of the guidance is that an entity should apply the following steps: (i) identify the contract(s) with a customer, (ii) identify the performance obligations in the contract(s), (iii) determine the transaction price, (iv) allocate the transaction price to the performance obligations in the contract(s), and (v) recognize revenue when, or as, the entity satisfies a performance obligation. ASU 2014-09 is effective for annual periods (and interim periods therein) beginning on or after December 15, 2016. Early adoption is not permitted. The Company is currently in the process of evaluating the impact that this amended guidance will have on its consolidated financial statements and related disclosures.
In June 2014, the FASB issued ASU 2014-12, Compensation - Stock Compensation, which clarifies accounting for share-based payments for which the terms of an award provide that a performance target could be achieved after the requisite service period. That is the case when an employee is eligible to retire or otherwise terminate employment before the end of the period in which a performance target could be achieved and still be eligible to vest in the award if and when the performance target is achieved. The updated guidance clarifies that such a term should be treated as a performance condition that affects vesting. As such, the performance target should not be reflected in estimating the grant-date fair value of the award. Compensation cost
56
should be recognized in the period in which it becomes probable that the performance target will be achieved and should represent the compensation cost attributable to the periods for which the requisite service has already been rendered. The guidance will be effective for the Company beginning with fiscal year 2016, and may be applied either prospectively or retrospectively. The Company does not anticipate that this guidance will materially impact its consolidated financial statements and related disclosures.
In August 2014, the FASB issued ASU 2014-15, Presentation of Financial Statements – Going Concern, which will require an entity’s management to assess, for each annual and interim period, whether there is substantial doubt about the entity’s ability to continue as a going concern within one year of the financial statement issuance date. The definition of substantial doubt within the new standard incorporates a likelihood threshold of “probable” similar to the use of that term under current GAAP for loss contingencies. Certain disclosures will be required if conditions give rise to substantial doubt. The guidance will be effective for the Company beginning with fiscal year 2017. Early adoption is permitted. The Company is currently evaluating the impact that this amended guidance will have on its consolidated financial statements and related disclosures.
Note 2 — Segment and Geographic Information
Operating segments are defined as components of an enterprise about which separate financial information is available that is evaluated regularly by the Company’s chief operating decision maker in deciding how to allocate resources and in assessing performance. The Company currently operates in four segments: the Americas, EMEA, APAC, each of which sells a full range of the Company's products, as well as Corporate Operations. The Americas segment, consisting of North, South and Central America, includes revenues primarily from the United States, Canada, Brazil and Mexico. The EMEA segment, consisting of Europe, the Middle East and Africa, includes revenues primarily from continental Europe, the United Kingdom, Russia and South Africa. The APAC segment, consisting of Asia and the Pacific Rim, includes revenues primarily from Australia, Japan, New Zealand, South Korea, Taiwan and Indonesia. Costs that support all segments, including trademark protection, trademark maintenance and licensing functions, are part of Corporate Operations. Corporate Operations also includes sourcing income and gross profits earned from the Company's licensees.
57
Information related to the Company’s operating segments, all from continuing operations, is as follows:
| Year Ended October 31, | ||||||||||||
| In thousands | 2014 | 2013 | 2012 | |||||||||
| Revenues, net: | ||||||||||||
| Americas | $ | 723,427 | $ | 893,333 | $ | 960,719 | ||||||
| EMEA | 583,650 | 631,546 | 671,991 | |||||||||
| APAC | 262,494 | 282,070 | 305,518 | |||||||||
| Corporate operations | 828 | 3,621 | 3,621 | |||||||||
| Total | $ | 1,570,399 | $ | 1,810,570 | $ | 1,941,849 | ||||||
| Gross profit/(loss): | ||||||||||||
| Americas | $ | 298,910 | $ | 370,288 | $ | 408,361 | ||||||
| EMEA | 324,542 | 358,175 | 376,929 | |||||||||
| APAC | 143,452 | 143,874 | 156,328 | |||||||||
| Corporate operations | (4,063 | ) | 94 | (299 | ) | |||||||
| Total | $ | 762,841 | $ | 872,431 | $ | 941,319 | ||||||
| SG&A expense: | ||||||||||||
| Americas | $ | 317,749 | $ | 319,736 | $ | 349,350 | ||||||
| EMEA | 310,861 | 324,346 | 322,715 | |||||||||
| APAC | 155,540 | 146,389 | 157,145 | |||||||||
| Corporate operations | 43,031 | 67,086 | 59,040 | |||||||||
| Total | $ | 827,181 | $ | 857,557 | $ | 888,250 | ||||||
| Asset impairments: | ||||||||||||
| Americas | $ | 6,672 | $ | 9,211 | $ | 5,267 | ||||||
| EMEA | 179,608 | 3,004 | 560 | |||||||||
| APAC | 808 | 112 | 1,407 | |||||||||
| Corporate operations | 2,043 | — | — | |||||||||
| Total | $ | 189,131 | $ | 12,327 | $ | 7,234 | ||||||
| Operating (loss)/income: | ||||||||||||
| Americas | $ | (25,511 | ) | $ | 41,341 | $ | 53,744 | |||||
| EMEA | (165,927 | ) | 30,825 | 53,654 | ||||||||
| APAC | (12,896 | ) | (2,627 | ) | (2,224 | ) | ||||||
| Corporate operations | (49,137 | ) | (66,992 | ) | (59,339 | ) | ||||||
| Total | $ | (253,471 | ) | $ | 2,547 | $ | 45,835 | |||||
| Identifiable assets: | ||||||||||||
| Americas | $ | 467,920 | $ | 581,021 | $ | 576,179 | ||||||
| EMEA | 510,896 | 744,936 | 718,537 | |||||||||
| APAC | 202,225 | 222,542 | 224,149 | |||||||||
| Corporate operations | 75,623 | 71,971 | 199,375 | |||||||||
| Total | $ | 1,256,664 | $ | 1,620,470 | $ | 1,718,240 | ||||||
Net revenues from the United States accounted for 35%, 38%, and 39% of consolidated net revenues from continuing operations for fiscal 2014, 2013 and 2012, respectively. Net revenues from France accounted for 12%, 12%, and 11% of consolidated net revenues from continuing operations for fiscal 2014, 2013 and 2012, respectively. No other individual country accounted for more than 7% of consolidated net revenues from continuing operations for the periods presented. Net revenues from all foreign countries combined accounted for 65%, 62% and 61% of consolidated net revenues from continuing operations for fiscal 2014, 2013 and 2012, respectively. Identifiable assets in the United States totaled $462 million as of October 31, 2014.
58
During fiscal 2014, the Company made various organizational changes toward global centralization of certain business functions, including merchandising and design, marketing, and supply chain, among others. As a result, certain of these costs were allocated across the regional segments commensurate with the proportionate benefits received from those business functions. Consequently, year-over-year segment SG&A expense may not be directly comparable. Please refer to MD&A for a discussion of SG&A expense on a consolidated basis as well as by segment.
The Company sells a full range of its products within each geographical segment. The percentages of net revenues from continuing operations attributable to each of the Company’s product groups are as follows:
| Year Ended October 31, | |||||||||
| 2014 | 2013 | 2012 | |||||||
| Apparel and accessories | 75 | % | 75 | % | 73 | % | |||
| Footwear | 25 | % | 25 | % | 27 | % | |||
| Total | 100 | % | 100 | % | 100 | % | |||
The Company’s largest customer accounted for approximately 3% of the Company’s net revenues for fiscal 2014, 2013 and 2012.
Note 3 — Restricted Cash
The Company's restricted cash balance as of October 31, 2014 was $21 million. Certain of our debt agreements contain restrictions on the usage of funds received from the sale of assets. These restrictions generally require such cash to be used for either repayment of indebtedness, capital expenditures, or other investments in the business. Restricted cash at October 31, 2014 primarily consists of the remaining proceeds of $16 million from the sale of the Mervin and Hawk businesses in the first quarter of 2014, which is subject to these restrictions and, consequently, reflected as a long-term asset. The Company expects to utilize the remaining proceeds from the sale of the Mervin and Hawk businesses in fiscal 2015.
Note 4 — Allowance for Doubtful Accounts
The allowance for doubtful accounts, which includes bad debts as well as sales returns and allowances, consisted of the following as of the dates indicated:
| Year Ended October 31, | ||||||||||||
| In thousands | 2014 | 2013 | 2012 | |||||||||
| Balance, beginning of year | $ | 60,912 | $ | 57,563 | $ | 61,341 | ||||||
| Provision for doubtful accounts | 21,856 | 5,729 | 4,030 | |||||||||
| Deductions | (18,777 | ) | (2,380 | ) | (7,808 | ) | ||||||
| Balance, end of year | $ | 63,991 | $ | 60,912 | $ | 57,563 | ||||||
The provision for doubtful accounts represents charges to SG&A for estimated bad debts, whereas the provision for sales returns and allowances is reported as a reduction of revenues. In certain jurisdictions, the Company is precluded from writing off uncollectable invoices against our allowance for doubtful accounts until our wholesale customer has completed certain administrative processes.
Note 5 — Inventories
Inventories consisted of the following as of the dates indicated:
| October 31, | ||||||||
| In thousands | 2014 | 2013 | ||||||
| Raw materials | $ | 3,524 | $ | 4,725 | ||||
| Work in process | 467 | 681 | ||||||
| Finished goods | 274,789 | 332,309 | ||||||
| Total | $ | 278,780 | $ | 337,715 | ||||
59
Note 6 — Fixed Assets, net
Fixed assets consisted of the following as of the dates indicated:
| October 31, | ||||||||
| In thousands | 2014 | 2013 | ||||||
| Furniture and other equipment | $ | 103,554 | $ | 128,409 | ||||
| Leasehold improvements | 163,894 | 175,698 | ||||||
| Computer software and equipment | 106,238 | 110,651 | ||||||
| Land use rights | 37,409 | 39,678 | ||||||
| Land and buildings | 10,626 | 11,482 | ||||||
| Construction in progress | 12,935 | 14,203 | ||||||
| Total fixed assets, gross | 434,656 | 480,121 | ||||||
| Accumulated depreciation and amortization | (220,888 | ) | (248,860 | ) | ||||
| Total fixed assets, net | $ | 213,768 | $ | 231,261 | ||||
During fiscal 2014, 2013 and 2012, the Company recorded approximately $49 million, $47 million, and $49 million, respectively, in depreciation expense and approximately $11 million, $12 million, and $7 million, respectively, in fixed asset impairments, primarily related to under-performing retail stores. These stores were generating negative cash flows and were not expected to become profitable in the future. As a result, the Company has already closed certain of these stores and is working to close the remaining under-performing stores as soon as practicable. Any charges associated with future rent commitments, net of expected sublease income, will be charged to future earnings upon store closure.
Note 7 — Intangible Assets and Goodwill
Intangible Assets
Intangible assets consisted of the following as of the dates indicated:
| October 31, | ||||||||||||||||||||||||
| 2014 | 2013 | |||||||||||||||||||||||
| In thousands | Gross Amount | Amortization | Net Book Value | Gross Amount | Amortization | Net Book Value | ||||||||||||||||||
| Non-amortizable trademarks | $ | 124,121 | $ | — | $ | 124,121 | $ | 124,099 | $ | — | $ | 124,099 | ||||||||||||
| Amortizable trademarks | 21,858 | (12,508 | ) | 9,350 | 19,810 | (11,534 | ) | 8,276 | ||||||||||||||||
| Amortizable licenses | 11,817 | (11,817 | ) | — | 12,749 | (12,749 | ) | — | ||||||||||||||||
| Other amortizable intangibles | 8,406 | (6,367 | ) | 2,039 | 8,185 | (5,964 | ) | 2,221 | ||||||||||||||||
| Total | $ | 166,202 | $ | (30,692 | ) | $ | 135,510 | $ | 164,843 | $ | (30,247 | ) | $ | 134,596 | ||||||||||
The change in non-amortizable trademarks is due primarily to foreign currency exchange fluctuations. Other amortizable intangibles primarily include non-compete agreements, patents and customer relationships and are amortized on a straight-line basis over their estimated useful lives of 5 to 18 years. Certain trademarks and licenses will continue to be amortized using estimated useful lives of 10 to 25 years with no residual values. Intangible amortization expense was approximately $2 million in fiscal 2014, $2 million for fiscal 2013 and $3 million for fiscal 2012 and is charged to SG&A. Based on the Company’s amortizable intangible assets as of October 31, 2014, annual amortization expense is estimated to be approximately $2 million in fiscal 2015 and fiscal 2016 and $1 million in fiscal 2017 through fiscal 2019.
60
Goodwill
Goodwill by segment and in total, and changes in the carrying amounts, as of the dates indicated are as follows:
| In thousands | Americas | EMEA | APAC | Consolidated | ||||||||||||
| Gross goodwill | $ | 76,048 | $ | 186,334 | $ | 135,752 | $ | 398,134 | ||||||||
| Accumulated impairment losses | — | — | (129,545 | ) | (129,545 | ) | ||||||||||
| Net goodwill at October 31, 2011 | $ | 76,048 | $ | 186,334 | $ | 6,207 | $ | 268,589 | ||||||||
| Acquisitions | — | 174 | — | 174 | ||||||||||||
| Foreign currency translation and other | (74 | ) | (11,639 | ) | — | (11,713 | ) | |||||||||
| Gross goodwill | 75,974 | 174,869 | 135,752 | 386,595 | ||||||||||||
| Accumulated impairment losses | — | — | (129,545 | ) | (129,545 | ) | ||||||||||
| Net goodwill at October 31, 2012 | $ | 75,974 | $ | 174,869 | $ | 6,207 | $ | 257,050 | ||||||||
| Foreign currency translation and other | (1,031 | ) | 5,606 | — | 4,575 | |||||||||||
| Gross goodwill | 74,943 | 180,475 | 135,752 | 391,170 | ||||||||||||
| Accumulated impairment losses | — | — | (129,545 | ) | (129,545 | ) | ||||||||||
| Net goodwill at October 31, 2013 | $ | 74,943 | $ | 180,475 | $ | 6,207 | $ | 261,625 | ||||||||
| Impairments | — | (178,197 | ) | (178,197 | ) | |||||||||||
| Foreign currency translation and other | (528 | ) | (2,278 | ) | — | (2,806 | ) | |||||||||
| Gross goodwill | 74,415 | 178,197 | 135,752 | 388,364 | ||||||||||||
| Accumulated impairment losses | — | (178,197 | ) | (129,545 | ) | (307,742 | ) | |||||||||
| Net goodwill at October 31, 2014 | $ | 74,415 | $ | — | $ | 6,207 | $ | 80,622 | ||||||||
The Company performs its annual goodwill impairment test during the fourth fiscal quarter. As of October 31, 2014, the fair value of each of its reporting units substantially exceeded their respective carrying values. However, certain factors may result in the need to perform an impairment test prior to the fourth fiscal quarter, including significant under-performance of the Company’s business relative to expected operating results, significant adverse economic and industry trends, a significant decline in the Company’s market capitalization for an extended period of time relative to net book value, or a decision to divest an individual business within a reporting unit.
Based upon the Company’s assessment of these factors in connection with the preparation of the Company’s condensed consolidated financial statements for the second quarter of fiscal 2014, given the sales decline in the Company’s EMEA reporting unit for the six months ended April 30, 2014, the Company performed an interim impairment test for the EMEA reporting unit using a discounted cash flow analysis and evaluated whether any adverse economic or industry trends would negatively affect the conclusions drawn from the prior period annual impairment test. The results of the Company’s interim impairment evaluation indicated that the fair value of the EMEA reporting unit exceeded its carrying value by 9%. As a result, the Company concluded that the EMEA reporting unit’s goodwill was not impaired based on the interim impairment evaluation.
During the third quarter of fiscal 2014, the Company performed an additional interim impairment test for the EMEA reporting unit due to the significant decline in the Company's stock price and further net revenue deterioration in the EMEA wholesale channel. The results of this impairment evaluation resulted in a non-cash charge of $178 million to fully impair goodwill associated with the EMEA reporting unit.
61
Note 8 — Debt
A summary of borrowings under lines of credit and long-term debt as of the dates indicated is as follows:
| October 31, | ||||||||||
| In thousands | Maturity | 2014 | 2013 | |||||||
| Lines of credit - 0.8% Floating | October 31, 2016 | $ | 32,929 | $ | — | |||||
| EMEA credit facilities | — | 21,594 | ||||||||
| 2017 Notes - 8.875% Fixed | December 15, 2017 | 252,188 | 274,952 | |||||||
| ABL Credit Facility - 2.1% to 5.6% Floating | May 24, 2018 | 35,933 | 27,408 | |||||||
| 2018 Notes - 7.875% Fixed | August 1, 2018 | 278,834 | 278,612 | |||||||
| 2020 Notes - 10.000% Fixed | August 1, 2020 | 222,582 | 222,285 | |||||||
| Capital lease obligations and other borrowings - Various % | Various | 6,124 | 6,449 | |||||||
| Total debt | 828,590 | 831,300 | ||||||||
| Less current portion | (35,361 | ) | (23,488 | ) | ||||||
| Long-term debt, net of current portion | $ | 793,229 | $ | 807,812 | ||||||
As of October 31, 2014, the Company’s credit facilities allowed for total cash borrowings and letters of credit of $187 million. The total maximum borrowings and actual availability fluctuate with the amount of assets comprising the borrowing base under certain of the credit facilities. At October 31, 2014, the Company had a total of $69 million of direct borrowings and $24 million in letters of credit outstanding. The effective availability for borrowings remaining as of October 31, 2014 was $74 million, $59 million of which could also be used for letters of credit in the United States and APAC. In addition to the $74 million of availability for borrowings, the Company also had $21 million in additional capacity for letters of credit in EMEA as of October 31, 2014.
A description of each of the Company’s major credit arrangements in the table above follows:
EMEA lines of credit
On October 31, 2013, certain European subsidiaries of the Company entered into a line of credit facility with a commercial bank. The facility has an initial term of three years and borrowings are limited to €60 million. Borrowing availability under this facility is based on eligible EMEA trade accounts receivable. The facility does not contain any financial covenants.
The Company also maintains various credit facilities with several banks in Europe. These facilities are all unsecured, short-term facilities used to support day-to-day working capital needs of the EMEA segment. At October 31, 2014, there were no direct borrowings outstanding and $5 million in letters of credit outstanding under these credit facilities.
2017 Notes
In December 2010, Boardriders S.A., the Company’s wholly-owned subsidiary, issued €200 million aggregate principal amount of its senior notes, which bear a coupon interest rate of 8.875% and are due December 15, 2017 (the “2017 Notes”). For the year following December 15, 2014, the 2017 Notes can be redeemed at 104.4%. The 2017 Notes were issued at par value in a private offering that was exempt from the registration requirements of the Securities Act of 1933, as amended (the “Securities Act”). The 2017 Notes were offered within the United States only to qualified institutional buyers in accordance with Rule 144A under the Securities Act and outside the United States only to non-U.S. investors in accordance with Regulation S under the Securities Act. The 2017 Notes will not be registered under the Securities Act or the securities laws of any other jurisdiction.
The 2017 Notes are general senior obligations and are fully and unconditionally guaranteed, jointly and severally, on a senior unsecured basis by Quiksilver, Inc. and certain of its current and future U.S. and non-U.S. subsidiaries, subject to certain exceptions. These subsidiary guarantors include entities with ownership of the Company's Quiksilver, Roxy, and DC trademarks worldwide.
The Company may redeem some or all of the 2017 Notes at fixed redemption prices as set forth in the indenture related to such 2017 Notes. The 2017 Notes indenture includes covenants that limit the Company’s ability to, among other things: incur additional debt; pay dividends on its capital stock or repurchase its capital stock; make certain investments; enter into certain types of transactions with affiliates; impose limitations on the ability of its restricted subsidiaries to pay dividends or make other payments to Quiksilver, Inc.; use assets as security in other transactions; and sell certain assets or merge with or into other companies. As of October 31, 2014, the Company was in compliance with these covenants.
62
The Company capitalized approximately $6 million of debt issuance costs associated with the issuance of the 2017 Notes, which are being amortized into interest expense over the seven-year term of the 2017 Notes.
ABL Credit Facility
On May 24, 2013, Quiksilver, Inc., as a guarantor, QS Wholesale, Inc., as lead borrower, and certain other U.S., Canadian, Australian and Japanese subsidiaries of Quiksilver, Inc., as borrowers (collectively, the “Borrower”) and/or as guarantors, entered into an amended and restated asset-based credit facility with Bank of America, N.A. and a syndicate of lenders, which amended and restated the existing asset-based credit facility for Quiksilver, Inc.’s Americas operations (the “ABL Credit Facility”). The ABL Credit Facility has a term of five years. On July 16, 2013, the Company entered into an amendment to the ABL Credit Facility to provide for certain mechanical changes required in connection with the issuance of the 2018 Notes and 2020 Notes.
Under the ABL Credit Facility, borrowings are limited to the lesser of (i) $230 million in aggregate, with sublimits for specific subsidiaries (with an option to expand the aggregate commitments by up to an additional $125 million on certain conditions) and (ii) a borrowing base calculated upon designated percentages of eligible accounts receivable, eligible inventory and, in the case of U.S. and Canadian borrowers, certain eligible credit card receivables. The ABL Credit Facility includes a $145 million total sublimit for letters of credit, with smaller sublimits applicable to specific subsidiaries. The interest rate on borrowings under the ABL Credit Facility is determined, at the Borrower’s option, as either: (i) an adjusted London Inter-Bank Offer (“LIBO”) rate plus a spread of 1.75% to 2.25%; or (ii) a Base Rate (as defined for each of the U.S., Canadian, Australian and Japanese borrowers) plus a spread of 0.75% to 1.75%. The ABL Credit Facility is guaranteed by Quiksilver, Inc. and certain domestic, Canadian, Australian and Japanese subsidiaries, except that the Canadian, Australian and Japanese subsidiaries do not guarantee the obligations of the Company’s domestic loan parties. The obligations under the ABL Credit Facility are, subject to certain exceptions, generally secured by (i) a first priority security interest in the domestic, Canadian, Australian and Japanese borrowers’ inventory and accounts receivable, (ii) a security interest in substantially all of the Company’s other domestic, Canadian, Australian and Japanese borrowers’ personal property (which security interest is a second priority security interest in the case of the domestic loan parties) and (iii) a pledge of the shares of certain of our subsidiaries, except that the assets of our Canadian, Australian and Japanese subsidiaries do not secure the obligations of the domestic loan parties.
The ABL Credit Facility contains customary default provisions and provides that, upon the occurrence of an event of default relating to the bankruptcy or insolvency of the Borrower or other subsidiaries, the unpaid balance of the principal and accrued interest under the ABL Credit Facility and all other obligations of the Borrower under the loan documents will become immediately due and payable without any action under the ABL Credit Facility. Upon the occurrence of any other event of default (which would include a default under other material indebtedness), the Agent may, by written notice, declare the unpaid balance of the principal and accrued interest under the ABL Credit Facility and all other obligations under the loan documents immediately due and payable without any further action.
The ABL Credit Facility also includes certain representations and warranties and restrictive covenants usual for facilities and transactions of this type. The ABL Credit Facility does not have a financial maintenance covenant, other than a minimum fixed charge coverage ratio of 1.0 to 1.0 that would only apply if aggregate excess availability under the ABL Credit Facility is less than the greater of (a) $15 million and (b) 10% of the lesser of the borrowing base and the aggregate ABL Credit Facility commitments at such time; provided that, for such purposes Australian excess availability and Japanese excess availability shall not account for more than 40% of aggregate excess availability. The Borrower paid customary agency, arrangement and upfront fees in connection with the ABL Credit Facility
2018 Notes and 2020 Notes
On July 16, 2013, Quiksilver, Inc. and its wholly-owned subsidiary, QS Wholesale, Inc. issued (i) $280 million aggregate principal amount in 7.875% Senior Secured Notes due 2018 (the “2018 Notes”), and (ii) $225 million aggregate principal amount in 10.000% Senior Notes due 2020 (the “Original 2020 Notes”). These notes were issued in a private offering that was exempt from the registration requirements of the Securities Act. They were offered within the United States only to qualified institutional buyers in accordance with Rule 144A under the Securities Act, and outside of the United States only to non-U.S. investors in accordance with Regulation S under the Securities Act. In November, 2013, the Original 2020 Notes were exchanged for publicly registered notes with identical terms (the “2020 Notes”).
The issuers received net proceeds from the offering of the 2018 Notes and the 2020 Notes of approximately $493 million after deducting initial purchaser discounts, but before offering expenses. The Company used a portion of the net proceeds to redeem their former 2015 Notes on August 15, 2013. The Company also used portions of the net proceeds to repay in full and terminate its former Americas term loan, to pay down a portion of the then outstanding amounts under the ABL Credit Facility and to pay related fees and expenses. As a result of the repayments of the former 2015 Notes and the Americas term loan, the Company recorded non-cash interest expense of approximately $3 million to write-off the deferred debt issuance cost related to such debt
63
during the fiscal year ended October 31, 2013. The Company has approximately $9 million in unamortized debt issuance costs related to the 2018 Notes and 2020 Notes included in prepaid expenses and other assets as of October 31, 2014.
The 2018 Notes will mature on August 1, 2018 and bear interest at the rate of 7.875% per annum. The offering price of the 2018 Notes was 99.483% of the principal amount. The 2018 Notes are general senior obligations of the issuers and are fully and unconditionally guaranteed, jointly and severally, on a senior secured basis by certain of the Company’s current and future U.S. subsidiaries. The 2018 Notes are secured by (1) a second-priority security interest in the current assets of the issuers and the subsidiary guarantors, together with all related general intangibles (excluding intellectual property rights) and other property related to such assets, including the proceeds thereof, which assets secure the Company’s ABL Credit Facility on a first-priority basis; and (2) a first-priority security interest in substantially all other property (including intellectual property rights, which primarily consist of the Company's Quiksilver and Roxy trademarks in the United States and Mexico, and the Company's DC trademarks worldwide) of the issuers and the guarantors and a first-priority pledge of 100% of the equity interests of certain subsidiaries directly owned by the issuers and the guarantors (but excluding equity interests of applicable foreign subsidiaries of the issuers and the guarantors possessing more than 65% of the total combined voting power of all classes of equity interests of such applicable foreign subsidiaries entitled to vote) and the proceeds of the foregoing.
The 2020 Notes will mature on August 1, 2020 and bear interest at the rate of 10.000% per annum. The offering price of the 2020 Notes was 98.757% of the principal amount. The 2020 Notes are general senior obligations of the issuers and are fully and unconditionally guaranteed, jointly and severally, on a senior unsecured basis by certain of the Company’s current and future U.S. subsidiaries. The issuers and subsidiary guarantors include entities with ownership of the Company's Quiksilver and Roxy trademarks in the United States and Mexico, and the Company's DC trademarks worldwide.
The Company may redeem some or all of the 2018 Notes and 2020 Notes at fixed redemption prices as set forth in the indenture related to such Notes.
The 2018 Notes and 2020 Notes indentures include covenants that limit the Company’s ability to, among other things: incur additional debt; issue certain preferred shares; pay dividends on its capital stock or repurchase capital stock; make certain investments; enter into certain types of transactions with affiliates; impose limitations on the ability of its restricted subsidiaries to pay dividends or make certain other payments to the Company; use assets as security in other transactions; and sell certain assets or merge with or into other companies. As of October 31, 2014, the Company was in compliance with these covenants.
Capital lease obligations and other borrowings
The Company also had approximately $6 million in capital leases and other borrowings as of October 31, 2014.
During the second quarter of fiscal 2014, the Company paid approximately $15 million of other borrowings to the former minority interest owners of the Company's Brazil subsidiary, related to the Company's acquisition of the remaining minority interest in this subsidiary in November 2013.
Principal payments on all long-term debt obligations as of the date indicated, including capital leases, are due by fiscal year according to the table below.
| In thousands | October 31, 2014 | |||
| 2015 | $ | 2,432 | ||
| 2016 | 1,655 | |||
| 2017 | 1,508 | |||
| 2018 | 567,484 | |||
| 2019 | — | |||
| Thereafter | 222,582 | |||
| Total | $ | 795,661 | ||
The estimated fair value of the Company’s debt as of October 31, 2014 was $688 million, compared to a carrying value of $829 million. The fair value of the Company’s debt is calculated based on the market price of the Company’s publicly traded 2020 Notes, the trading price of the Company’s 2018 Notes and 2017 Notes, (all Level 1 fair value inputs), and the carrying values of the Company’s other debt obligations due to the variable rate nature of those debt obligations.
64
Note 9 — Accrued Liabilities
Accrued liabilities consisted of the following as of the dates indicated:
| October 31, | ||||||||
| In thousands | 2014 | 2013 | ||||||
| Accrued employee compensation and benefits | $ | 40,461 | $ | 41,229 | ||||
| Accrued sales and payroll taxes | 19,471 | 14,738 | ||||||
| Accrued interest | 19,673 | 22,289 | ||||||
Other liabilities(1) | 33,096 | 43,289 | ||||||
| Total | $ | 112,701 | $ | 121,545 | ||||
(1) Other liabilities consists of various accrued expenses with no individual item accounting for more than 5% of total accrued liabilities.
Note 10 — Commitments and Contingencies
Operating Leases
The Company leases certain land and buildings under long-term operating lease agreements. The following is a schedule of future minimum lease payments by fiscal year required under such leases as of the date indicated:
| In thousands | October 31, 2014 | |||
| 2015 | $ | 87,883 | ||
| 2016 | 72,893 | |||
| 2017 | 57,355 | |||
| 2018 | 45,991 | |||
| 2019 | 36,934 | |||
| Thereafter | 95,954 | |||
| Total | $ | 397,010 | ||
Total rent expense was approximately $119 million, $123 million and $134 million, in fiscal 2014, 2013 and 2012, respectively, and was charged to SG&A.
Professional Athlete Sponsorships
The Company establishes relationships with professional athletes in order to promote its products and brands. The Company has entered into endorsement agreements with professional athletes in sports such as surfing, skateboarding, snowboarding, BMX and motocross. Many of these contracts provide incentives for magazine exposure and competitive victories while wearing or using the Company’s products. Such expenses are an ordinary part of the Company’s operations and are expensed to SG&A as incurred. The following is a schedule of future estimated minimum payments required under such endorsement agreements as of the date indicated:
| In thousands | October 31, 2014 | |||
| 2015 | $ | 18,957 | ||
| 2016 | 11,917 | |||
| 2017 | 8,322 | |||
| 2018 | 3,377 | |||
| 2019 | 319 | |||
| Thereafter | 110 | |||
| Total | $ | 43,002 | ||
65
Litigation
As part of its global operations, the Company may be involved in legal claims involving trademarks, intellectual property, licensing, employment matters, compliance, contracts and other matters incidental to its business. The Company believes the resolution of any such matter currently threatened or pending will not have a material adverse effect on its financial condition, results of operations or liquidity.
Indemnities and Guarantees
During its normal course of business, the Company has made certain indemnities, commitments and guarantees under which it may be required to make payments in relation to certain transactions. These include (i) intellectual property indemnities to the Company’s customers and licensees in connection with the use, sale and/or license of Company products, (ii) indemnities to various lessors in connection with facility leases for certain claims arising from such facilities or leases, (iii) indemnities to vendors and service providers pertaining to claims based on the negligence or willful misconduct of the Company, and (iv) indemnities involving the accuracy of representations and warranties in certain contracts. The duration of these indemnities, commitments and guarantees varies and, in certain cases, may be indefinite. The majority of these indemnities, commitments and guarantees do not provide for any limitation of the maximum potential for future payments the Company could be obligated to make. The Company has not recorded any liability for these indemnities, commitments and guarantees in the accompanying consolidated balance sheets.
Note 11 — Stockholders’ Equity
In March 2013, the Company’s stockholders approved the Company’s 2013 Performance Incentive Plan (the “2013 Plan”), which generally replaced the Company’s 2000 Stock Incentive Plan (the “2000 Plan”). Under the 2013 Plan, 7,224,657 shares are reserved for issuance over its term, consisting of 2,764,657 shares previously authorized under the 2000 Plan, and not subject to outstanding awards under such plan, plus an additional 4,460,000 shares. In March 2014, the Company’s stockholders approved an amendment to the 2013 Plan increasing the number of shares of common stock reserved for issuance under the 2013 Plan by 5,500,000 shares. At the time the 2013 Plan was approved, there were 20,080,029 shares subject to outstanding awards under the 2000 Plan. These shares remain reserved for issuance pursuant to their original terms and, if they expire, are canceled, or otherwise terminate, will also be available for issuance under the 2013 Plan. No additional awards may be granted under the 2000 Plan. Under the 2013 Plan, stock options may be granted to officers and employees selected by the plan’s administrative committee at an exercise price not less than the fair market value of the underlying shares on the date of grant. Options vest over a period of time, generally three years, as designated by the committee and are subject to such other terms and conditions as the committee determines. The Company issues new shares for stock option exercises and restricted stock grants.
For non-performance based options, the Company uses the Black-Scholes option-pricing model to value stock-based compensation expense. Forfeitures are estimated at the date of grant based on historical rates and reduce the compensation expense recognized. The expected term of options granted is derived from historical data on employee exercises. The risk-free interest rate is based on the U.S. Treasury yield curve in effect at the date of grant. Expected volatility is based on the historical volatility of the Company’s stock. The fair value of each option grant was estimated as of the grant date using the Black-Scholes option-pricing model for each of fiscal 2014, 2013 and 2012, assuming risk-free interest rates of 2.2%, 1.7%, and 1.1%, respectively; volatility of 80.7%, 78.3%, and 76.5%, respectively; zero dividend yield; and expected lives of 6.7 years, 7.1 years, and 7.1 years, respectively. The weighted average fair value of options granted was $5.82, $4.81, and $2.58 for fiscal 2014, 2013, and 2012, respectively. The Company records stock-based compensation expense using the graded vested method over the vesting period, which is generally three years. As of October 31, 2014, the Company had approximately $2 million of unrecognized compensation expense, for non-performance based options, expected to be recognized over a weighted average period of approximately 1.8 years. Compensation expense was included in SG&A for fiscal 2014, 2013 and 2012.
66
Changes in shares under option, excluding performance based options, are summarized as follows:
| Year Ended October 31, | |||||||||||||||||||||
| 2014 | 2013 | 2012 | |||||||||||||||||||
| In thousands | Shares | Weighted Average Price | Shares | Weighted Average Price | Shares | Weighted Average Price | |||||||||||||||
| Outstanding, beginning of year | 8,829,618 | $ | 4.83 | 12,325,499 | $ | 4.49 | 13,399,381 | $ | 4.40 | ||||||||||||
| Granted | 275,000 | 8.05 | 1,045,000 | 6.68 | 375,000 | 3.66 | |||||||||||||||
| Exercised | (1,058,416 | ) | 4.27 | (2,985,792 | ) | 2.94 | (506,329 | ) | 2.23 | ||||||||||||
| Canceled/Forfeited | (1,228,593 | ) | 7.67 | (1,555,089 | ) | 7.02 | (942,553 | ) | 4.08 | ||||||||||||
| Outstanding, end of year | 6,817,609 | 4.52 | 8,829,618 | 4.83 | 12,325,499 | 4.49 | |||||||||||||||
| Exercisable, end of year | 5,696,273 | 4.24 | 6,044,792 | 4.72 | 7,903,327 | 4.94 | |||||||||||||||
The aggregate intrinsic value of options exercised during the year ended October 31, 2014 was $4 million. The aggregate intrinsic value of options outstanding and exercisable as of October 31, 2014 is $18 million. The weighted average life of options outstanding and exercisable as of October 31, 2014 is 5.0 years and 4.5 years, respectively.
Outstanding stock options, excluding performance based options, at October 31, 2014 consist of the following:
| Options Outstanding | Options Exercisable | |||||||||||||||
| Range of Exercise Prices | Shares | Weighted Average Remaining Life (Years) | Weighted Average Exercise Price | Shares | Weighted Average Exercise Price | |||||||||||
| $1.04 - $2.34 | 1,731,417 | 4.6 | $ | 2.08 | 1,731,417 | $ | 2.08 | |||||||||
| $2.35 - $4.60 | 1,631,750 | 5.2 | 3.24 | 1,565,082 | 3.25 | |||||||||||
| $4.61 - $6.64 | 2,379,942 | 4.8 | 5.35 | 1,758,608 | 5.32 | |||||||||||
| $6.65 - $8.70 | 725,000 | 8.0 | 7.31 | 291,666 | 7.57 | |||||||||||
| $8.71 - $10.75 | 206,500 | 3.1 | 9.03 | 206,500 | 9.03 | |||||||||||
| $10.76 - $16.36 | 143,000 | 1.1 | 14.49 | 143,000 | 14.49 | |||||||||||
| Total | 6,817,609 | 5.0 | $ | 4.52 | 5,696,273 | $ | 4.24 | |||||||||
Changes in non-vested shares under option, excluding performance based options, for the year ended October 31, 2014 were as follows:
| Shares | Weighted Average Grant Date Fair Value | ||||||
| Non-vested, beginning of year | 2,784,826 | $ | 2.95 | ||||
| Granted | 275,000 | 5.82 | |||||
| Vested | (1,733,490 | ) | 2.37 | ||||
| Canceled | (205,000 | ) | 4.75 | ||||
| Non-vested, end of year | 1,121,336 | $ | 4.18 | ||||
Of the 1.1 million non-vested shares under option as of October 31, 2014, all are expected to vest over their respective lives.
As of October 31, 2014, there were 11,542,572 shares of common stock that were available for future grant. Of these shares, 9,658,829 were available for issuance of restricted stock.
The Company grants performance based options and performance based restricted stock units to certain key employees and executives. Vesting of these awards is contingent upon a required service period and the Company’s achievement of specified common stock price thresholds or performance goals. In addition, the vesting of a portion of the options can be accelerated based upon the Company’s achievement of specified annual performance targets. The Company believes that the granting of these awards serves to further align the interests of its employees and executives with those of its stockholders. Based on the
67
vesting contingencies in the awards, the Company used a Monte-Carlo simulation in order to determine the grant date fair values of the awards.
The assumptions used in the Monte-Carlo simulation for the 2014 restricted stock units included a risk free interest rate of 0.6%, volatility of 57.7%, and zero dividend yield. The weighted average fair value of all restricted stock units granted during 2014 was $5.16. The assumptions used for the 2013 restricted stock units included a risk-free interest rate ranging from 0.5% to 0.8%, volatility of 56.4% to 88.6%, and a zero dividend yield. The weighted average fair value of all restricted stock units granted during 2013 was $4.21.
Activity related to performance based options and performance based restricted stock units for the fiscal year ended October 31, 2014 is as follows:
Performance Options | Performance Restricted Stock Units | |||||
| Non-vested, October 31, 2013 | 688,000 | 11,675,782 | ||||
| Granted | — | 300,000 | ||||
| Exercised | (12,000 | ) | — | |||
| Canceled | (36,000 | ) | (1,757,274 | ) | ||
| Non-vested, October 31, 2014 | 640,000 | 10,218,508 | ||||
As of October 31, 2014, the Company had approximately $0.4 million and $0.4 million of unrecognized compensation expense, net of estimated forfeitures, related to the performance options and the performance restricted stock units, respectively. This unrecognized compensation expense is expected to be recognized over a weighted average period of approximately 1.4 years and 0.3 years, respectively.
The Company may also grant restricted stock and restricted stock units under its 2013 Plan. Prior to March 2013, the Company issued restricted stock and restricted stock units under its 2000 Plan. Restricted stock issued under both plans generally vests in three years, while restricted stock units generally vest upon the Company’s achievement of a specified common stock price threshold.
Changes in restricted stock are as follows:
| Year Ended October 31, | |||||||||
| 2014 | 2013 | 2012 | |||||||
| Outstanding restricted stock, beginning of year | 195,000 | 801,667 | 1,911,669 | ||||||
| Granted | 105,000 | 105,000 | 105,000 | ||||||
| Vested | (95,000 | ) | (685,000 | ) | (1,155,002 | ) | |||
| Forfeited | (30,000 | ) | (26,667 | ) | (60,000 | ) | |||
| Outstanding restricted stock, end of year | 175,000 | 195,000 | 801,667 | ||||||
Compensation expense for restricted stock is determined using the intrinsic value method and forfeitures are estimated at the date of grant based on historical rates and reduce the compensation expense recognized. The Company monitors the probability of meeting the restricted stock performance criteria, if any, and will adjust the amortization period as appropriate. As of October 31, 2014, there had been no acceleration of the amortization period. As of October 31, 2014, the Company had approximately $0.5 million of unrecognized compensation expense expected to be recognized over a weighted average period of approximately 1.4 years.
The Company began the Quiksilver Employee Stock Purchase Plan (the “ESPP”) in fiscal 2001, which provides a method for employees of the Company to purchase common stock at a 15% discount from fair market value as of the beginning or end of each purchasing period of six months, whichever is lower. The ESPP covers substantially all full-time domestic and Australian employees. Since the adoption of guidance within ASC 718, “Stock Compensation,” compensation expense has been recognized for shares issued under the ESPP. During fiscal 2014, 2013 and 2012, 332,812, 448,896, and 461,088 shares of stock, respectively, were issued under the plan with proceeds to the Company of approximately $1 million per year.
During fiscal 2014, 2013 and 2012, the Company recognized total compensation expense related to options, restricted stock, performance based options, performance based restricted stock units and ESPP shares of approximately $17 million, $22 million, and $23 million, respectively.
68
In addition to the equity instruments noted above, certain affiliates of Rhône Capital LLC hold common stock warrants that entitle such affiliates to purchase approximately 25.7 million shares of the Company’s common stock at an exercise price of $1.86 per share.
Note 12 — Accumulated Other Comprehensive Income
The components of accumulated other comprehensive income include changes in fair value of derivative instruments qualifying as cash flow hedges and foreign currency translation adjustments. The components of accumulated other comprehensive income, net of tax, are as follows:
| In thousands | Derivative Instruments | Foreign Currency Adjustments | Total | |||||||||
| Balance, October 31, 2011 | $ | (8,103 | ) | $ | 124,230 | $ | 116,127 | |||||
| Net gains reclassified to Cost of Goods Sold ("COGS") | (365 | ) | — | (365 | ) | |||||||
| Net losses reclassified to foreign currency gain | 929 | — | 929 | |||||||||
| Changes in fair value, net of tax | 13,295 | (43,574 | ) | (30,279 | ) | |||||||
| Balance, October 31, 2012 | $ | 5,756 | $ | 80,656 | $ | 86,412 | ||||||
| Net gains reclassified to COGS | (8,137 | ) | — | (8,137 | ) | |||||||
| Net gains reclassified to foreign currency loss | (343 | ) | — | (343 | ) | |||||||
| Changes in fair value, net of tax | (1,867 | ) | (2,147 | ) | (4,014 | ) | ||||||
| Balance, October 31, 2013 | $ | (4,591 | ) | $ | 78,509 | $ | 73,918 | |||||
| Net gains reclassified to COGS | (597 | ) | — | (597 | ) | |||||||
| Changes in fair value, net of tax | 9,281 | (25,304 | ) | (16,023 | ) | |||||||
| Balance, October 31, 2014 | $ | 4,093 | $ | 53,205 | $ | 57,298 | ||||||
69
Note 13 — Income Taxes
A summary of the (benefit)/provision for income taxes from continuing operations is as follows:
| Year Ended October 31, | ||||||||||||
| In thousands | 2014 | 2013 | 2012 | |||||||||
| Current: | ||||||||||||
| United States: | ||||||||||||
| Federal | $ | (14,320 | ) | $ | (1,921 | ) | $ | (2,322 | ) | |||
| State | (2,676 | ) | (60 | ) | (105 | ) | ||||||
| Foreign | 18,783 | 13,719 | 15,574 | |||||||||
| 1,787 | 11,738 | 13,147 | ||||||||||
| Deferred: | ||||||||||||
| United States: | ||||||||||||
| Federal | $ | 134 | $ | (1,490 | ) | $ | 152 | |||||
| State | 34 | (259 | ) | 322 | ||||||||
| Foreign | (6,280 | ) | 156,231 | (9,717 | ) | |||||||
| (6,112 | ) | 154,482 | (9,243 | ) | ||||||||
| (Benefit)/provision for income taxes | $ | (4,325 | ) | $ | 166,220 | $ | 3,904 | |||||
A reconciliation of the effective income tax rate to a computed “expected” statutory federal income tax rate is as follows:
| Year Ended October 31, | |||||||||
| 2014 | 2013 | 2012 | |||||||
| Computed “expected” statutory federal income tax rate | 35.0 | % | 35.0 | % | 35.0 | % | |||
| State income taxes, net of federal income tax benefit | 0.8 | % | 0.1 | % | 0.8 | % | |||
| Foreign tax rate differential | (0.8 | )% | (9.2 | )% | (11.2 | )% | |||
| Goodwill impairment | (18.7 | )% | — | % | — | % | |||
| Stock-based compensation | (0.3 | )% | (2.2 | )% | (24.9 | )% | |||
| Uncertain tax positions | (0.2 | )% | 1.2 | % | 12.5 | % | |||
| Valuation allowance | (13.6 | )% | (250.8 | )% | (88.0 | )% | |||
| Foreign tax exempt income | — | % | — | % | 36.8 | % | |||
| Other | (0.9 | )% | (1.2 | )% | 9.7 | % | |||
| Effective income tax rate | 1.3 | % | (227.1 | )% | (29.3 | )% | |||
70
The components of net deferred income tax assets/(liabilities) are as follows:
| October 31, | ||||||||
| In thousands | 2014 | 2013 | ||||||
| Deferred income tax assets: | ||||||||
| Allowance for doubtful accounts | $ | 6,748 | $ | 8,082 | ||||
| Unrealized gains and losses | 9,351 | 15,342 | ||||||
| Tax loss carry forwards | 419,584 | 385,375 | ||||||
| Accruals and other | 80,028 | 82,768 | ||||||
| Subtotal of deferred income tax assets | 515,711 | 491,567 | ||||||
| Deferred income tax liabilities: | ||||||||
| Depreciation and amortization | (8,411 | ) | (15,155 | ) | ||||
| Intangibles | (26,766 | ) | (27,244 | ) | ||||
| Subtotal of deferred income tax liabilities | (35,177 | ) | (42,399 | ) | ||||
| Deferred income tax assets, net | 480,534 | 449,168 | ||||||
| Valuation allowance | (495,938 | ) | (459,068 | ) | ||||
| Net deferred income tax liabilities | $ | (15,404 | ) | $ | (9,900 | ) | ||
Income(loss) before provision/(benefit) for income taxes from continuing operations includes ($151) million, ($5) million, and $32 million of (loss)/income from foreign jurisdictions for the fiscal years ended October 31, 2014, 2013 and 2012, respectively. The Company's sale of the Mervin and Hawk businesses generated income tax of approximately $19 million within discontinued operations during fiscal 2014. However, as the Company does not expect to pay income tax on these sales after application of available loss carry-forwards, an offsetting income tax benefit was recognized within continuing operations. Before this tax benefit, the Company generated income tax expense of $12 million in fiscal 2014 due to being unable to record tax benefits against the losses in certain jurisdictions where we have previously recorded valuation allowances. The Company does not provide for the U.S. federal, state or additional foreign income tax effects on certain foreign earnings that management intends to permanently reinvest. Determination of the amount of any unrecognized deferred income tax liability on this temporary difference is not practicable.
As of October 31, 2014, the Company has federal net operating loss carry forwards of approximately $330 million and state net operating loss carry forwards of approximately $391 million, which will expire on various dates through 2034. The company has recorded a valuation allowance against the entire amount of these tax loss carry forwards. In addition, the Company has foreign tax loss carry forwards of approximately $923 million as of October 31, 2014. Approximately $870 million will be carried forward until fully utilized, with the remaining $53 million expiring on various dates through 2034. The Company has recorded a valuation allowance against $884 million of the foreign tax loss carry forwards.
Each reporting period, the Company evaluates the realizability of all of its deferred tax assets in each tax jurisdiction. In the fiscal year ended October 31, 2013, the Company concluded that based on all available information and proper weighting of objective and subjective evidence, including a cumulative loss that had been sustained over a three-year period, it is more likely than not that its deferred tax assets primarily in the EMEA segment will not be realized and a full valuation allowance of $157 million was established. Due to sustained tax losses, the Company maintains a previously recorded valuation allowance against its net deferred tax assets in certain jurisdictions in the Americas, APAC, and Corporate Operations segments.
The following table summarizes the activity related to the Company’s unrecognized tax benefits (excluding interest and penalties and related tax carry forwards):
| Year Ended October 31, | ||||||||
| In thousands | 2014 | 2013 | ||||||
| Balance, beginning of year | $ | 11,002 | $ | 10,787 | ||||
| Gross increases related to current year tax positions | 1,352 | 1,255 | ||||||
| Gross increases related to prior period tax positions | 645 | — | ||||||
| Lapse in statute of limitation | (437 | ) | (866 | ) | ||||
| Foreign exchange and other | (71 | ) | (174 | ) | ||||
| Balance, end of year | $ | 12,491 | $ | 11,002 | ||||
71
If the Company’s positions are sustained by the relevant taxing authority, approximately $11 million (excluding interest and penalties) of uncertain tax position liabilities as of October 31, 2014 would favorably impact the Company’s effective tax rate in future periods.
The Company includes interest and penalties related to unrecognized tax benefits in its provision for income taxes in the accompanying consolidated statements of operations, which is included in current tax expense in the summary of income tax provision table shown above. As of October 31, 2014, the Company had recognized a liability for interest and penalties of $7 million.
During the next 12 months, it is reasonably possible that the Company’s liability for uncertain tax positions may change by a significant amount as a result of the resolution or payment of uncertain tax positions related to intercompany transactions between foreign affiliates and certain foreign withholding tax exposures. Conclusion of these matters could result in settlement for different amounts than the Company has accrued as uncertain tax benefits. If a position that the Company concluded was more likely than not is subsequently reversed, the Company would need to accrue and ultimately pay an additional amount. Conversely, the Company could settle positions with the tax authorities for amounts lower than have been accrued or extinguish a position through payment. The Company believes the outcomes which are reasonably possible within the next 12 months range from a reduction of the liability for unrecognized tax benefits of $10 million to an increase of the liability of $4 million, excluding penalties and interest for its existing tax positions. There were no settlements in fiscal 2014 or 2013.
The Company conducts business globally and files income tax returns in the United States and its significant foreign tax jurisdictions, including France, Australia, and Canada. The Company is subject to examination in the United States for fiscal 2011 and thereafter, in France for fiscal 2010 and thereafter, in Australia for fiscal 2010 and thereafter, and in Canada for fiscal 2011 and thereafter. Certain subsidiaries currently are under tax audit in France for years ranging from fiscal 2010 through fiscal 2013.
Note 14 — Employee Benefit Plans
The Company maintains the Quiksilver 401(k) Employee Savings Plan and Trust (the “401(k) Plan”). This plan is generally available to all U.S. employees with six months of service and is funded by employee contributions and periodic discretionary contributions from the Company, which are approved by the Company’s Board of Directors. The Company did not make any contributions to the 401(k) Plan in fiscal 2014, 2013, and 2012.
Employees of the Company’s French subsidiary, Na Pali SAS, with three months of service are covered under the French Profit Sharing Plan (the “French Profit Sharing Plan”), which is mandated by law.
Compensation is earned under the French Profit Sharing Plan based on statutory computations with an additional discretionary component. Funds are maintained by the Company and become fully vested with the employees after five years, although earlier disbursement is optional if certain personal events occur or upon the termination of employment. Compensation expense of $0.3 million, $0.5 million, and $0.4 million was recognized related to the French Profit Sharing Plan for the fiscal years ended October 31, 2014, 2013 and 2012, respectively.
Note 15 — Derivative Financial Instruments
The Company is exposed to gains and losses resulting from fluctuations in foreign currency exchange rates relating to certain sales, royalty income and product purchases of its international subsidiaries that are denominated in currencies other than their functional currencies. The Company is also exposed to foreign currency gains and losses resulting from domestic transactions that are not denominated in U.S. dollars. Furthermore, the Company is exposed to gains and losses resulting from the effect that fluctuations in foreign currency exchange rates have on the reported results in the Company’s consolidated financial statements due to the translation of the operating results and financial position of the Company’s international subsidiaries. As part of its overall strategy to manage the level of exposure to the risk of fluctuations in foreign currency exchange rates, the Company uses various foreign currency exchange contracts and intercompany loans.
The Company accounts for all of its cash flow hedges under ASC 815, “Derivatives and Hedging,” which requires companies to recognize all derivative instruments as either assets or liabilities at fair value in the consolidated balance sheet. In accordance with ASC 815, the Company designates forward contracts as cash flow hedges of forecasted purchases of commodities.
For derivative instruments that are designated and qualify as cash flow hedges, the effective portion of the gain or loss on the derivative is reported as a component of other comprehensive income (“OCI”) and reclassified into earnings in the same period or periods during which the hedged transaction affects earnings. Gains and losses on the derivative representing either hedge ineffectiveness or hedge components excluded from the assessment of effectiveness are recognized in current earnings. As of October 31, 2014, the Company was hedging a portion of forecasted transactions expected to occur through October 2015.
72
Assuming October 31, 2014 exchange rates remain constant, $4 million of gains, net of tax, related to hedges of these transactions are expected to be reclassified into earnings over the next 12 months.
On the date the Company enters into a derivative contract, management designates the derivative as a hedge of the identified exposure. Before entering into various hedge transactions, the Company formally documents all relationships between hedging instruments and hedged items, as well as the risk management objective and strategy. In this documentation, the Company identifies the asset, liability, firm commitment, or forecasted transaction that has been designated as a hedged item and indicates how the hedging instrument is expected to hedge the risks related to the hedged item. The Company formally measures effectiveness of its hedging relationships both at the hedge inception and on an ongoing basis in accordance with its risk management policy. The Company would discontinue hedge accounting prospectively (i) if management determines that the derivative is no longer effective in offsetting changes in the cash flows of a hedged item, (ii) when the derivative expires or is sold, terminated, or exercised, (iii) if it becomes probable that the forecasted transaction being hedged by the derivative will not occur, (iv) if a hedged firm commitment no longer meets the definition of a firm commitment, or (v) if management determines that designation of the derivative as a hedge instrument is no longer appropriate. As a result of the expiration, sale, termination, or exercise of derivative contracts, the Company reclassified into earnings net gains/(losses) of $1 million, $8 million and ($1) million for the fiscal year ended October 31, 2014, 2013 and 2012, respectively.
The Company enters into forward exchange and other derivative contracts with major banks and is exposed to exchange rate losses in the event of nonperformance by these banks. The Company anticipates, however, that these banks will be able to fully satisfy their obligations under the contracts. Accordingly, the Company does not require collateral or other security to support the contracts.
As of October 31, 2014, the Company had the following outstanding derivative contracts that were entered into to hedge forecasted purchases:
| In thousands | Commodity | Notional Amount | Maturity | Fair Value | ||||||||
| United States dollar | Inventory | $ | 243,904 | Nov 2014 – Oct 2015 | $ | 16,681 | ||||||
The Company’s derivative assets and liabilities include foreign exchange derivatives that are measured at fair value using observable market inputs such as forward rates, interest rates, the Company’s credit risk and the Company’s counterparties’ credit risks. Based on these inputs, the Company’s derivative assets and liabilities are classified within Level 2 of the valuation hierarchy.
The following tables reflect the fair values of assets and liabilities measured and recognized at fair value on a recurring basis on the accompanying consolidated balance sheet as of the dates indicated:
| Fair Value Measurements Using | Assets (Liabilities) | |||||||||||||||
| In thousands | Level 1 | Level 2 | Level 3 | at Fair Value | ||||||||||||
| October 31, 2014: | ||||||||||||||||
| Derivative assets: | ||||||||||||||||
| Other receivables | $ | — | $ | 16,683 | $ | — | $ | 16,683 | ||||||||
| Derivative liabilities: | ||||||||||||||||
| Accrued liabilities | — | (2 | ) | — | (2 | ) | ||||||||||
| Total fair value | $ | — | $ | 16,681 | $ | — | $ | 16,681 | ||||||||
| October 31, 2013: | ||||||||||||||||
| Derivative assets: | ||||||||||||||||
| Other receivables | $ | — | $ | 2,026 | $ | — | $ | 2,026 | ||||||||
| Other assets | — | 382 | — | 382 | ||||||||||||
| Derivative liabilities: | ||||||||||||||||
| Accrued liabilities | — | (3,313 | ) | — | (3,313 | ) | ||||||||||
| Total fair value | $ | — | $ | (905 | ) | $ | — | $ | (905 | ) | ||||||
73
Note 16 — Quarterly Financial Data (Unaudited)
A summary of quarterly financial data (unaudited) is as follows:
| Year Ended October 31, 2014 | ||||||||||||||||
| Quarter Ended | ||||||||||||||||
| In thousands, except per share amounts | January 31 | April 30 | July 31 | October 31 | ||||||||||||
| Revenues, net | $ | 392,612 | $ | 397,121 | $ | 380,016 | $ | 400,650 | ||||||||
| Gross profit | 199,836 | 194,354 | 181,700 | 186,951 | ||||||||||||
(Loss)/income from continuing operations attributable to Quiksilver, Inc.(1) | (22,333 | ) | (37,817 | ) | (217,802 | ) | (49,482 | ) | ||||||||
Income/(loss) from discontinued operations attributable to Quiksilver, Inc.(2) | 37,720 | (15,245 | ) | (2,282 | ) | (2,136 | ) | |||||||||
Net income/(loss) attributable to Quiksilver, Inc.(1) | 15,387 | (53,062 | ) | (220,084 | ) | (51,618 | ) | |||||||||
| (Loss)/income per share from continuing operations attributable to Quiksilver, Inc., assuming dilution | (0.13 | ) | (0.22 | ) | (1.28 | ) | (0.29 | ) | ||||||||
| Income/(loss) per share from discontinued operations attributable to Quiksilver, Inc., assuming dilution | 0.22 | (0.09 | ) | (0.01 | ) | (0.01 | ) | |||||||||
| Net income/(loss) per share attributable to Quiksilver, Inc., assuming dilution | 0.09 | (0.31 | ) | (1.29 | ) | (0.30 | ) | |||||||||
| Trade accounts receivable, net | 338,723 | 351,530 | 317,658 | 319,840 | ||||||||||||
| Inventories, net | 360,146 | 304,539 | 330,959 | 278,780 | ||||||||||||
| Year Ended October 31, 2013 | ||||||||||||||||
| Quarter Ended | ||||||||||||||||
| In thousands, except per share amounts | January 31 | April 30 | July 31 | October 31 | ||||||||||||
| Revenues, net | $ | 412,189 | $ | 447,304 | $ | 475,164 | $ | 475,913 | ||||||||
| Gross profit | 209,773 | 205,454 | 233,532 | 223,672 | ||||||||||||
(Loss)/income from continuing operations attributable to Quiksilver, Inc.(3) | (31,568 | ) | (32,474 | ) | 35 | (174,759 | ) | |||||||||
Income/(loss) from discontinued operations attributable to Quiksilver, Inc.(2) | 439 | 79 | 2,036 | 3,647 | ||||||||||||
Net (loss)/income attributable to Quiksilver, Inc.(3) | (31,129 | ) | (32,395 | ) | 2,071 | (171,112 | ) | |||||||||
(Loss)/income per share from continuing operations attributable to Quiksilver, Inc., assuming dilution(3) | (0.19 | ) | (0.19 | ) | — | (1.04 | ) | |||||||||
| (Loss)/income per share from discontinued operations attributable to Quiksilver, Inc., assuming dilution | — | — | 0.01 | 0.02 | ||||||||||||
Net (loss)/income per share attributable to Quiksilver, Inc., assuming dilution(3) | (0.19 | ) | (0.19 | ) | 0.01 | (1.01 | ) | |||||||||
| Trade accounts receivable, net | 331,193 | 372,056 | 410,593 | 411,638 | ||||||||||||
| Inventories, net | 403,883 | 345,766 | 379,684 | 337,715 | ||||||||||||
| (1) | The fiscal quarter ended July 31, 2014 included goodwill impairment charge of $178 million for the EMEA segment. |
| (2) | The fiscal quarters ended April 30, 2014, July 31, 2014, and October 31, 2014 include impairment charges of $15 million, $4 million, and $2 million, respectively, related to the Surfdome business. |
| (3) | The fiscal quarter ended October 31, 2013 included income tax provision of $157 million for a full valuation allowance against deferred tax assets primarily in the EMEA segment. |
Note 17 — Restructuring Charges
In connection with the globalization of its organizational structure and core processes, as well as its overall cost reduction efforts, the Company developed and approved a multi-year profit improvement plan in 2013 ("the 2013 Plan"). This plan covers the global operations of the Company, and as the Company continues to evaluate its structure, processes and costs,
74
additional charges may be incurred in the future under the plan that are not yet determined. The 2013 Plan is, in many respects, a continuation and acceleration of the Company's Fiscal 2011 Cost Reduction Plan (the “2011 Plan”). The Company will no longer incur any new charges under the 2011 Plan, but will continue to make cash payments on amounts previously accrued under the 2011 Plan. Amounts charged to expense under the 2013 Plan and 2011 Plan were primarily recorded in SG&A, with a small portion recorded in COGS in the Company’s consolidated statements of operations.
Activity and liability balances recorded as part of the 2013 Plan and 2011 Plan were as follows:
| In thousands | Workforce | Facility & Other | Total | |||||||||
| Balance, October 31, 2011 | $ | 1,076 | $ | 6,232 | $ | 7,308 | ||||||
| Charged to expense | 9,721 | 3,881 | 13,602 | |||||||||
| Cash payments | (5,462 | ) | (3,257 | ) | (8,719 | ) | ||||||
| Balance, October 31, 2012 | $ | 5,335 | $ | 6,856 | $ | 12,191 | ||||||
| Charged to expense | 22,671 | 5,838 | 28,509 | |||||||||
| Cash payments | (15,847 | ) | (5,163 | ) | (21,010 | ) | ||||||
| Adjustments | — | (592 | ) | (592 | ) | |||||||
| Balance, October 31, 2013 | $ | 12,159 | $ | 6,939 | $ | 19,098 | ||||||
| Charged to expense | 19,350 | 15,295 | 34,645 | |||||||||
| Cash payments | (19,999 | ) | (9,943 | ) | (29,942 | ) | ||||||
| Balance, October 31, 2014 | $ | 11,510 | $ | 12,291 | $ | 23,801 | ||||||
Of the amounts charged to expense during fiscal 2014, approximately $25 million, $7 million, $1 million and $2 million were related to the Americas segment, EMEA segment, APAC segment and Corporate Operations segment, respectively.
In addition to the restructuring charges noted above, the Company also recorded approximately $4 million of additional inventory write downs within cost of goods sold and approximately $2 million of additional expenses within SG&A during fiscal 2013 related to certain non-core brands and peripheral product categories that have been discontinued, which are not reflected in the table above. Additionally, the Company recorded severance charges of approximately $3 million within SG&A during fiscal 2013 which were unrelated to the 2013 Plan or the 2011 Plan.
Note 18 — Discontinued Operations
One of the elements of the Company’s strategy to improve profitability involves divesting or exiting certain non-core businesses. In November 2013, the Company completed the sale of Mervin Manufacturing, Inc., a manufacturer of snowboards and related products under the “Lib-Technologies” and “GNU” brands, (“Mervin”) for $58 million. In January 2014, the Company completed the sale of substantially all of the assets of Hawk Designs, Inc. ("Hawk") for $19 million. These transactions resulted in an after-tax gain of approximately $30 million during fiscal 2014, which is included in income from discontinued operations in the table below. In December 2014, the Company sold its majority stake in U.K.-based Surfdome Shop, Ltd., a multi-brand e-commerce retailer, (“Surfdome”) for net proceeds of approximately $16 million, which included payments from Surfdome for all outstanding loans and trade receivables. Accordingly, each of the Company’s Mervin, Hawk and Surfdome businesses were classified as “held for sale” as of October 31, 2014 and are presented as discontinued operations in the accompanying consolidated financial statements for all periods presented. The Company’s sale of the Mervin and Hawk businesses generated income tax expense of approximately $19 million during fiscal 2014. However, as the Company does not expect to pay income tax on these sales after application of available loss carry-forwards, an offsetting income tax benefit was recognized within continuing operations. The operations of Surfdome generated a tax benefit of $3 million. During fiscal 2014, the Company recorded non-cash impairment charges totaling $21 million in discontinued operations to write-down Surfdome goodwill, intangible assets and other long-term assets to their estimated fair market value. The operating results of discontinued operations were as follows:
75
| Year Ended October 31, | ||||||||||||
| In thousands | 2014 | 2013 | 2012 | |||||||||
| Revenues, net | $ | 60,605 | $ | 83,209 | $ | 71,390 | ||||||
| Income before income taxes | 23,564 | 9,766 | 11,155 | |||||||||
| Provision for income taxes | 15,915 | 3,880 | 3,653 | |||||||||
| Income from discontinued operations | 7,649 | 5,886 | 7,502 | |||||||||
| Less: net loss/(income) attributable to non-controlling interest | 10,408 | 315 | (239 | ) | ||||||||
| Income from discontinued operations attributable to Quiksilver, Inc. | $ | 18,057 | $ | 6,201 | $ | 7,263 | ||||||
The components of major assets and liabilities held for sale at October 31, 2014 and 2013 were as follows:
| Year Ended October 31, | ||||||||
| In thousands | 2014 | 2013 | ||||||
| Assets: | ||||||||
| Receivables, net | $ | — | $ | 24,229 | ||||
| Inventories, net | 19,659 | 25,915 | ||||||
| Goodwill | — | 16,109 | ||||||
| Other | 3,593 | 9,388 | ||||||
| Total assets | $ | 23,252 | $ | 75,641 | ||||
| Liabilities: | ||||||||
| Accounts payable | $ | 12,520 | $ | 13,039 | ||||
| Accrued liabilities | 120 | 3,381 | ||||||
| Other | — | 1,719 | ||||||
| Total liabilities | $ | 12,640 | $ | 18,139 | ||||
Total assets held for sale as of October 31, 2014 and 2013 by geographical segment were as follows:
| October 31, | ||||||||
| In thousands | 2014 | 2013 | ||||||
| Americas | $ | 28 | $ | 27,398 | ||||
| EMEA | 23,224 | 47,588 | ||||||
| APAC | — | 655 | ||||||
| Total assets | $ | 23,252 | $ | 75,641 | ||||
Note 19 — Condensed Consolidating Financial Information
In July 2013, the Company issued $225 million aggregate principal amount of its 2020 Notes. These notes were issued in a private offering that was exempt from the registration requirements of the Securities Act of 1933, as amended (the “Securities Act”). They were offered within the United States only to qualified institutional buyers in accordance with Rule 144A under the Securities Act, and outside of the United States only to non-U.S. investors in accordance with Regulation S under the Securities Act. In November, 2013, these notes were exchanged for publicly registered notes with identical terms. Obligations under the Company’s 2020 Notes are fully and unconditionally guaranteed, jointly and severally, on a senior unsecured basis by certain of its 100% owned domestic subsidiaries.
The Company presents condensed consolidating financial information for Quiksilver, Inc. and its domestic subsidiaries within the notes to the consolidated financial statements in accordance with the criteria established for parent companies in the SEC’s Regulation S-X, Rule 3-10(f). The following condensed consolidating financial information presents the results of operations, financial position and cash flows of Quiksilver, Inc., QS Wholesale, Inc., the 100% owned guarantor subsidiaries, the non-guarantor subsidiaries and the eliminations necessary to arrive at the information for the Company on a consolidated basis as of October 31, 2014 and October 31, 2013 and for each of fiscal 2014, 2013 and 2012. The principal elimination entries eliminate investments in subsidiaries and intercompany balances and transactions.
76
Condensed Consolidating Statement of Operations
Year Ended October 31, 2014
| In thousands | Quiksilver, Inc. | QS Wholesale, Inc. | Guarantor Subsidiaries | Non-Guarantor Subsidiaries | Eliminations | Consolidated | |||||||||||||||||
| Revenues, net | $ | 465 | $ | 339,886 | $ | 361,715 | $ | 1,026,090 | $ | (157,757 | ) | $ | 1,570,399 | ||||||||||
| Cost of goods sold | 193 | 213,824 | 257,752 | 487,316 | (151,527 | ) | 807,558 | ||||||||||||||||
| Gross profit | 272 | 126,062 | 103,963 | 538,774 | (6,230 | ) | 762,841 | ||||||||||||||||
| Selling, general and administrative expense | 36,514 | 113,530 | 160,695 | 522,649 | (6,207 | ) | 827,181 | ||||||||||||||||
| Asset impairments | 2,043 | 40,430 | 4,267 | 142,391 | — | 189,131 | |||||||||||||||||
| Operating loss | (38,285 | ) | (27,898 | ) | (60,999 | ) | (126,266 | ) | (23 | ) | (253,471 | ) | |||||||||||
| Interest expense, net | 46,464 | 2,917 | (5 | ) | 26,615 | — | 75,991 | ||||||||||||||||
| Foreign currency (gain)/(loss) | (216 | ) | (269 | ) | 66 | 3,077 | — | 2,658 | |||||||||||||||
| Equity in earnings | 224,726 | 4,509 | — | — | (229,235 | ) | — | ||||||||||||||||
| Loss before provision/(benefit) for income taxes | (309,259 | ) | (35,055 | ) | (61,060 | ) | (155,958 | ) | 229,212 | (332,120 | ) | ||||||||||||
| Provision/(benefit) for income taxes | 119 | 584 | (17,531 | ) | 12,503 | — | (4,325 | ) | |||||||||||||||
| Loss from continuing operations | (309,378 | ) | (35,639 | ) | (43,529 | ) | (168,461 | ) | 229,212 | (327,795 | ) | ||||||||||||
| Income/(loss) from discontinued operations | — | — | 29,244 | (21,595 | ) | — | 7,649 | ||||||||||||||||
| Net loss | (309,378 | ) | (35,639 | ) | (14,285 | ) | (190,056 | ) | 229,212 | (320,146 | ) | ||||||||||||
| Net loss attributable to non-controlling interest | — | — | — | 10,769 | — | 10,769 | |||||||||||||||||
| Net loss attributable to Quiksilver, Inc. | (309,378 | ) | (35,639 | ) | (14,285 | ) | (179,287 | ) | 229,212 | (309,377 | ) | ||||||||||||
| Other comprehensive loss | (16,620 | ) | — | — | (16,620 | ) | 16,620 | (16,620 | ) | ||||||||||||||
| Comprehensive loss attributable to Quiksilver, Inc. | $ | (325,998 | ) | $ | (35,639 | ) | $ | (14,285 | ) | $ | (195,907 | ) | $ | 245,832 | $ | (325,997 | ) | ||||||
77
Condensed Consolidating Statement of Operations
Year Ended October 31, 2013
| In thousands | Quiksilver, Inc. | QS Wholesale, Inc. | Guarantor Subsidiaries | Non-Guarantor Subsidiaries | Eliminations | Consolidated | |||||||||||||||||
| Revenues, net | $ | 464 | $ | 422,210 | $ | 472,864 | $ | 1,158,281 | $ | (243,249 | ) | $ | 1,810,570 | ||||||||||
| Cost of goods sold | — | 252,103 | 330,655 | 548,582 | (193,201 | ) | 938,139 | ||||||||||||||||
| Gross profit | 464 | 170,107 | 142,209 | 609,699 | (50,048 | ) | 872,431 | ||||||||||||||||
| Selling, general and administrative expense | 54,002 | 131,560 | 137,148 | 559,152 | (24,305 | ) | 857,557 | ||||||||||||||||
| Asset impairments | — | 1,646 | 5,939 | 4,742 | — | 12,327 | |||||||||||||||||
| Operating (loss)/income | (53,538 | ) | 36,901 | (878 | ) | 45,805 | (25,743 | ) | 2,547 | ||||||||||||||
| Interest expense, net | 39,487 | 4,359 | 1 | 27,202 | — | 71,049 | |||||||||||||||||
| Foreign currency (gain)/loss | 318 | 56 | (4 | ) | 4,319 | — | 4,689 | ||||||||||||||||
| Equity in earnings | 138,111 | 2,739 | — | — | (140,850 | ) | — | ||||||||||||||||
| (Loss)/income before provision/(benefit) for income taxes | (231,454 | ) | 29,747 | (875 | ) | 14,284 | 115,107 | (73,191 | ) | ||||||||||||||
| Provision/(benefit) for income taxes | 422 | (665 | ) | (3,488 | ) | 169,951 | — | 166,220 | |||||||||||||||
| (Loss)/income from continuing operations | (231,876 | ) | 30,412 | 2,613 | (155,667 | ) | 115,107 | (239,411 | ) | ||||||||||||||
| Income from discontinued operations | (689 | ) | — | 5,211 | 1,353 | 11 | 5,886 | ||||||||||||||||
| Net (loss)/income | (232,565 | ) | 30,412 | 7,824 | (154,314 | ) | 115,118 | (233,525 | ) | ||||||||||||||
| Net income attributable to non-controlling interest | — | — | — | 960 | — | 960 | |||||||||||||||||
| Net (loss)/income attributable to Quiksilver, Inc. | (232,565 | ) | 30,412 | 7,824 | (153,354 | ) | 115,118 | (232,565 | ) | ||||||||||||||
| Other comprehensive loss | (12,494 | ) | — | — | (12,494 | ) | 12,494 | (12,494 | ) | ||||||||||||||
| Comprehensive (loss)/income attributable to Quiksilver, Inc. | $ | (245,059 | ) | $ | 30,412 | $ | 7,824 | $ | (165,848 | ) | $ | 127,612 | $ | (245,059 | ) | ||||||||
78
Condensed Consolidating Statement of Operations
Year Ended October 31, 2012
| In thousands | Quiksilver, Inc. | QS Wholesale, Inc. | Guarantor Subsidiaries | Non-Guarantor Subsidiaries | Eliminations | Consolidated | |||||||||||||||||
| Revenues, net | $ | 469 | $ | 453,532 | $ | 537,295 | $ | 1,222,273 | $ | (271,720 | ) | $ | 1,941,849 | ||||||||||
| Cost of goods sold | — | 275,179 | 358,290 | 579,152 | (212,091 | ) | 1,000,530 | ||||||||||||||||
| Gross profit | 469 | 178,353 | 179,005 | 643,121 | (59,629 | ) | 941,319 | ||||||||||||||||
| Selling, general and administrative expense | 56,983 | 147,684 | 151,230 | 562,946 | (30,593 | ) | 888,250 | ||||||||||||||||
| Asset impairments | — | 11 | 5,151 | 2,072 | — | 7,234 | |||||||||||||||||
| Operating (loss)/income | (56,514 | ) | 30,658 | 22,624 | 78,103 | (29,036 | ) | 45,835 | |||||||||||||||
| Interest expense, net | 28,987 | 5,352 | 1 | 26,545 | — | 60,885 | |||||||||||||||||
| Foreign currency loss/(gain) | (173 | ) | (148 | ) | 96 | (1,484 | ) | — | (1,709 | ) | |||||||||||||
| Equity in earnings | (74,572 | ) | 4,674 | — | — | 69,898 | — | ||||||||||||||||
| (Loss)/income before provision/(benefit) for income taxes | (10,756 | ) | 20,780 | 22,527 | 53,042 | (98,934 | ) | (13,341 | ) | ||||||||||||||
| Provision/(benefit) for income taxes | — | 1,144 | (3,097 | ) | 5,857 | — | 3,904 | ||||||||||||||||
| (Loss)/income from continuing operations | (10,756 | ) | 19,636 | 25,624 | 47,185 | (98,934 | ) | (17,245 | ) | ||||||||||||||
| Income from discontinued operations | — | — | 5,721 | 2,080 | (299 | ) | 7,502 | ||||||||||||||||
| Net (loss)/income | (10,756 | ) | 19,636 | 31,345 | 49,265 | (99,233 | ) | (9,743 | ) | ||||||||||||||
| Net income attributable to non-controlling interest | — | — | — | (1,013 | ) | — | (1,013 | ) | |||||||||||||||
| Net (loss)/income attributable to Quiksilver, Inc. | (10,756 | ) | 19,636 | 31,345 | 48,252 | (99,233 | ) | (10,756 | ) | ||||||||||||||
| Other comprehensive income | (29,715 | ) | — | — | (29,715 | ) | 29,715 | (29,715 | ) | ||||||||||||||
| Comprehensive (loss)/income attributable to Quiksilver, Inc. | $ | (40,471 | ) | $ | 19,636 | $ | 31,345 | $ | 18,537 | $ | (69,518 | ) | $ | (40,471 | ) | ||||||||
79
Condensed Consolidating Balance Sheet
October 31, 2014
| In thousands | Quiksilver, Inc. | QS Wholesale, Inc. | Guarantor Subsidiaries | Non-Guarantor Subsidiaries | Eliminations | Consolidated | |||||||||||||||||
| ASSETS | |||||||||||||||||||||||
| Current assets: | |||||||||||||||||||||||
| Cash and cash equivalents | $ | 158 | $ | 2,867 | $ | (2,701 | ) | $ | 46,340 | $ | — | $ | 46,664 | ||||||||||
| Restricted cash | — | — | — | 4,687 | — | 4,687 | |||||||||||||||||
| Trade accounts receivable, net | — | 57,317 | 37,606 | 224,917 | — | 319,840 | |||||||||||||||||
| Other receivables | 10 | 3,402 | 1,071 | 36,644 | (280 | ) | 40,847 | ||||||||||||||||
| Inventories | — | 22,006 | 70,923 | 203,305 | (17,454 | ) | 278,780 | ||||||||||||||||
| Deferred income taxes | — | 21,554 | — | 4,926 | (21,554 | ) | 4,926 | ||||||||||||||||
| Prepaid expenses and other current assets | 1,579 | 6,209 | 2,941 | 17,351 | — | 28,080 | |||||||||||||||||
| Intercompany balances | — | 258,808 | — | — | (258,808 | ) | — | ||||||||||||||||
| Current portion of assets held for sale | — | — | 28 | 20,237 | — | 20,265 | |||||||||||||||||
| Total current assets | 1,747 | 372,163 | 109,868 | 558,407 | (298,096 | ) | 744,089 | ||||||||||||||||
| Restricted cash | — | 16,514 | — | — | — | 16,514 | |||||||||||||||||
| Fixed assets, net | 20,381 | 34,408 | 21,259 | 137,720 | — | 213,768 | |||||||||||||||||
| Intangible assets, net | 6,674 | 43,815 | 1,150 | 83,871 | — | 135,510 | |||||||||||||||||
| Goodwill | — | 61,982 | 11,089 | 7,551 | — | 80,622 | |||||||||||||||||
| Other assets | 7,097 | 5,160 | 1,255 | 33,574 | — | 47,086 | |||||||||||||||||
| Deferred income taxes long-term | 30,807 | — | 2,052 | 16,088 | (32,859 | ) | 16,088 | ||||||||||||||||
| Investment in subsidiaries | 725,088 | 1,525 | — | — | (726,613 | ) | — | ||||||||||||||||
| Assets held for sale, net of current portion | — | — | — | 2,987 | — | 2,987 | |||||||||||||||||
| Total assets | $ | 791,794 | $ | 535,567 | $ | 146,673 | $ | 840,198 | $ | (1,057,568 | ) | $ | 1,256,664 | ||||||||||
| LIABILITIES AND EQUITY | |||||||||||||||||||||||
| Current liabilities: | |||||||||||||||||||||||
| Lines of credit | $ | — | $ | — | $ | — | $ | 32,929 | $ | — | $ | 32,929 | |||||||||||
| Accounts payable | 4,582 | 40,942 | 22,008 | 100,775 | — | 168,307 | |||||||||||||||||
| Accrued liabilities | 17,887 | 15,092 | 7,230 | 72,492 | — | 112,701 | |||||||||||||||||
| Current portion of long-term debt | — | 600 | — | 1,832 | — | 2,432 | |||||||||||||||||
| Income taxes payable | — | — | — | 1,436 | (280 | ) | 1,156 | ||||||||||||||||
| Deferred income taxes | 31,450 | — | 4,925 | 4,807 | (21,554 | ) | 19,628 | ||||||||||||||||
| Intercompany balances | 179,251 | — | 39,265 | 40,292 | (258,808 | ) | — | ||||||||||||||||
| Current portion of assets held for sale | — | — | 6 | 12,634 | — | 12,640 | |||||||||||||||||
| Total current liabilities | 233,170 | 56,634 | 73,434 | 267,197 | (280,642 | ) | 349,793 | ||||||||||||||||
| Long-term debt | 501,416 | 22,657 | — | 269,156 | — | 793,229 | |||||||||||||||||
| Deferred income taxes long-term | — | 38,052 | — | 11,597 | (32,859 | ) | 16,790 | ||||||||||||||||
| Other long-term liabilities | 1,179 | 9,800 | 7,420 | 20,943 | — | 39,342 | |||||||||||||||||
| Total liabilities | 735,765 | 127,143 | 80,854 | 568,893 | (313,501 | ) | 1,199,154 | ||||||||||||||||
| Stockholders’/invested equity | 56,029 | 408,424 | 65,819 | 269,825 | (744,067 | ) | 56,030 | ||||||||||||||||
| Non-controlling interest | — | — | — | 1,480 | — | 1,480 | |||||||||||||||||
| Total liabilities and equity | $ | 791,794 | $ | 535,567 | $ | 146,673 | $ | 840,198 | $ | (1,057,568 | ) | $ | 1,256,664 | ||||||||||
80
Condensed Consolidating Balance Sheet
October 31, 2013
| In thousands | Quiksilver, Inc. | QS Wholesale, Inc. | Guarantor Subsidiaries | Non-Guarantor Subsidiaries | Eliminations | Consolidated | |||||||||||||||||
| ASSETS | |||||||||||||||||||||||
| Current assets: | |||||||||||||||||||||||
| Cash and cash equivalents | $ | 35 | $ | 3,733 | $ | 296 | $ | 53,216 | $ | — | $ | 57,280 | |||||||||||
| Trade accounts receivable, net | — | 83,991 | 48,230 | 279,417 | — | 411,638 | |||||||||||||||||
| Other receivables | 19 | 5,613 | 2,007 | 15,667 | — | 23,306 | |||||||||||||||||
| Income taxes receivable | — | — | — | — | — | — | |||||||||||||||||
| Inventories | — | 43,405 | 93,074 | 224,695 | (23,459 | ) | 337,715 | ||||||||||||||||
| Deferred income taxes | — | 24,624 | — | 6,482 | (21,109 | ) | 9,997 | ||||||||||||||||
| Prepaid expenses and other current assets | 3,372 | 3,271 | 3,752 | 13,729 | — | 24,124 | |||||||||||||||||
| Intercompany balances | — | 173,547 | — | — | (173,547 | ) | — | ||||||||||||||||
| Current portion of assets held for sale | — | — | 26,051 | 25,475 | (330 | ) | 51,196 | ||||||||||||||||
| Total current assets | 3,426 | 338,184 | 173,410 | 618,681 | (218,445 | ) | 915,256 | ||||||||||||||||
| Fixed assets, net | 21,378 | 35,152 | 21,816 | 152,915 | — | 231,261 | |||||||||||||||||
| Intangible assets, net | 4,487 | 44,596 | 1,154 | 84,359 | — | 134,596 | |||||||||||||||||
| Goodwill | — | 103,880 | 7,675 | 150,070 | — | 261,625 | |||||||||||||||||
| Other assets | 8,025 | 5,654 | 1,096 | 38,512 | — | 53,287 | |||||||||||||||||
| Deferred income taxes long-term | 21,085 | — | — | 2,111 | (23,196 | ) | — | ||||||||||||||||
| Investment in subsidiaries | 949,814 | 8,795 | — | — | (958,609 | ) | — | ||||||||||||||||
| Assets held for sale, net of current portion | — | — | 1,676 | 22,769 | — | 24,445 | |||||||||||||||||
| Total assets | $ | 1,008,215 | $ | 536,261 | $ | 206,827 | $ | 1,069,417 | $ | (1,200,250 | ) | $ | 1,620,470 | ||||||||||
| LIABILITIES AND EQUITY | |||||||||||||||||||||||
| Current liabilities: | |||||||||||||||||||||||
| Lines of credit | $ | — | $ | — | $ | — | $ | — | $ | — | $ | — | |||||||||||
| Accounts payable | 4,222 | 51,283 | 35,910 | 110,260 | — | 201,675 | |||||||||||||||||
| Accrued liabilities | 17,900 | 9,921 | 6,929 | 86,795 | — | 121,545 | |||||||||||||||||
| Current portion of long-term debt | — | — | — | 23,488 | — | 23,488 | |||||||||||||||||
| Income taxes payable | — | 121 | — | 3,791 | — | 3,912 | |||||||||||||||||
| Deferred income taxes | 20,365 | — | 744 | — | (21,109 | ) | — | ||||||||||||||||
| Intercompany balances | 92,815 | — | 47,424 | 33,308 | (173,547 | ) | — | ||||||||||||||||
| Current portion of assets held for sale | 689 | — | 3,773 | 11,958 | — | 16,420 | |||||||||||||||||
| Total current liabilities | 135,991 | 61,325 | 94,780 | 269,600 | (194,656 | ) | 367,040 | ||||||||||||||||
| Long-term debt | 500,896 | — | — | 306,916 | — | 807,812 | |||||||||||||||||
| Deferred income taxes long-term | — | 41,039 | 2,053 | — | (23,196 | ) | 19,896 | ||||||||||||||||
| Other long-term liabilities | 1,622 | 6,012 | 8,946 | 19,765 | — | 36,345 | |||||||||||||||||
| Assets held for sale, net of current portion | — | — | 187 | 1,532 | — | 1,719 | |||||||||||||||||
| Total liabilities | 638,509 | 108,376 | 105,966 | 597,813 | (217,852 | ) | 1,232,812 | ||||||||||||||||
| Stockholders’/invested equity | 369,706 | 427,885 | 100,861 | 453,652 | (982,398 | ) | 369,706 | ||||||||||||||||
| Non-controlling interest | — | — | — | 17,952 | — | 17,952 | |||||||||||||||||
| Total liabilities and equity | $ | 1,008,215 | $ | 536,261 | $ | 206,827 | $ | 1,069,417 | $ | (1,200,250 | ) | $ | 1,620,470 | ||||||||||
81
Condensed Consolidating Statement of Cash Flows
Year Ended October 31, 2014
| In thousands | Quiksilver, Inc. | QS Wholesale, Inc. | Guarantor Subsidiaries | Non-Guarantor Subsidiaries | Eliminations | Consolidated | |||||||||||||||||
| Cash flows from operating activities: | |||||||||||||||||||||||
| Net loss | $ | (309,378 | ) | $ | (35,639 | ) | $ | (14,285 | ) | $ | (190,056 | ) | $ | 229,212 | $ | (320,146 | ) | ||||||
| Adjustments to reconcile net loss to net cash (used in)/provided by operating activities: | |||||||||||||||||||||||
| Income from discontinued operations | — | — | (29,244 | ) | 21,595 | — | (7,649 | ) | |||||||||||||||
| Depreciation and amortization | 2,696 | 10,712 | 9,752 | 28,778 | — | 51,938 | |||||||||||||||||
| Stock-based compensation | 17,260 | — | — | — | — | 17,260 | |||||||||||||||||
| Provision for doubtful accounts | — | 15,515 | 437 | 5,904 | — | 21,856 | |||||||||||||||||
| Asset impairments | 2,043 | 40,430 | 4,267 | 142,391 | — | 189,131 | |||||||||||||||||
| Equity in earnings | 224,726 | 4,509 | — | 228 | (229,235 | ) | 228 | ||||||||||||||||
| Non-cash interest expense | 1,911 | 1,016 | — | 542 | — | 3,469 | |||||||||||||||||
| Deferred income taxes | — | 1,467 | — | (6,290 | ) | — | (4,823 | ) | |||||||||||||||
| Other adjustments to reconcile net loss | (375 | ) | (295 | ) | (306 | ) | (5,544 | ) | — | (6,520 | ) | ||||||||||||
| Changes in operating assets and liabilities: | |||||||||||||||||||||||
| Trade accounts receivable | — | 11,120 | 10,317 | 29,170 | — | 50,607 | |||||||||||||||||
| Inventories | — | 21,131 | 21,039 | (5,096 | ) | 23 | 37,097 | ||||||||||||||||
| Intercompany | 132,629 | (45,566 | ) | (128,989 | ) | 41,926 | — | — | |||||||||||||||
| Other operating assets and liabilities | (16,870 | ) | 5,948 | (18,527 | ) | (11,520 | ) | — | (40,969 | ) | |||||||||||||
| Cash provided by/(used by) operating activities of continuing operations | 54,642 | 30,348 | (145,539 | ) | 52,028 | — | (8,521 | ) | |||||||||||||||
| Cash (used by)/provided by operating activities of discontinued operations | — | (18,791 | ) | 16,805 | (16,428 | ) | — | (18,414 | ) | ||||||||||||||
| Net cash provided by/(used in) operating activities | 54,642 | 11,557 | (128,734 | ) | 35,600 | — | (26,935 | ) | |||||||||||||||
| Cash flows from investing activities: | |||||||||||||||||||||||
| Proceeds from sale of fixed assets | 174 | 94 | 532 | 4,850 | — | 5,650 | |||||||||||||||||
| Capital expenditures | (6,480 | ) | (12,365 | ) | (10,569 | ) | (24,001 | ) | — | (53,415 | ) | ||||||||||||
| Changes in restricted cash | — | (16,514 | ) | — | (4,687 | ) | — | (21,201 | ) | ||||||||||||||
| Cash used in investing activities of continuing operations | (6,306 | ) | (28,785 | ) | (10,037 | ) | (23,838 | ) | — | (68,966 | ) | ||||||||||||
| Cash provided by/(used by) investing activities of discontinued operations | — | 19,000 | 58,052 | (1,938 | ) | — | 75,114 | ||||||||||||||||
| Net cash (used in)/provided by investing activities | (6,306 | ) | (9,785 | ) | 48,015 | (25,776 | ) | — | 6,148 | ||||||||||||||
| Cash flows from financing activities: | |||||||||||||||||||||||
| Borrowings on lines of credit | — | — | — | 57,413 | — | 57,413 | |||||||||||||||||
| Payments on lines of credit | — | — | — | (24,485 | ) | — | (24,485 | ) | |||||||||||||||
| Borrowings on long-term debt | — | 117,068 | — | 80,018 | — | 197,086 | |||||||||||||||||
| Payments on long-term debt | — | (95,976 | ) | — | (126,196 | ) | — | (222,172 | ) | ||||||||||||||
| Payments of debt issuance costs | (160 | ) | 37 | — | — | — | (123 | ) | |||||||||||||||
| Stock option exercises and employee stock purchases | 5,902 | — | — | — | — | 5,902 | |||||||||||||||||
| Intercompany | (53,955 | ) | (22,801 | ) | 76,756 | — | — | — | |||||||||||||||
| Cash (used in)/provided by financing activities of continuing operations | (48,213 | ) | (1,672 | ) | 76,756 | (13,250 | ) | — | 13,621 | ||||||||||||||
| Cash (used in)/provided by intercompany financing operations of discontinued operations | — | (966 | ) | 966 | — | — | — | ||||||||||||||||
| Net cash provided by/(used in) financing activities | (48,213 | ) | (2,638 | ) | 77,722 | (13,250 | ) | — | 13,621 | ||||||||||||||
| Effect of exchange rate changes on cash | — | — | — | (3,450 | ) | — | (3,450 | ) | |||||||||||||||
| Net increase/(decrease) in cash and cash equivalents | 123 | (866 | ) | (2,997 | ) | (6,876 | ) | — | (10,616 | ) | |||||||||||||
| Cash and cash equivalents, beginning of period | 35 | 3,733 | 296 | 53,216 | — | 57,280 | |||||||||||||||||
| Cash and cash equivalents, end of period | $ | 158 | $ | 2,867 | $ | (2,701 | ) | $ | 46,340 | $ | — | $ | 46,664 | ||||||||||
82
Condensed Consolidating Statement of Cash Flows
Year Ended October 31, 2013
| In thousands | Quiksilver, Inc. | QS Wholesale, Inc. | Guarantor Subsidiaries | Non-Guarantor Subsidiaries | Eliminations | Consolidated | |||||||||||||||||
| Cash flows from operating activities: | |||||||||||||||||||||||
| Net (loss)/income | $ | (232,565 | ) | $ | 30,412 | $ | 7,824 | $ | (154,314 | ) | $ | 115,118 | $ | (233,525 | ) | ||||||||
| Adjustments to reconcile net (loss)/income to net cash (used in)/provided by operating activities: | |||||||||||||||||||||||
| Income from discontinued operations | 689 | — | (5,211 | ) | (1,353 | ) | (11 | ) | (5,886 | ) | |||||||||||||
| Depreciation and Amortization | 2,218 | 11,556 | 6,031 | 30,153 | — | 49,958 | |||||||||||||||||
| Stock based compensation | 21,556 | — | — | — | — | 21,556 | |||||||||||||||||
| Provision for doubtful accounts | — | (129 | ) | (1,823 | ) | 7,681 | — | 5,729 | |||||||||||||||
| Asset impairments | — | 1,646 | 5,939 | 4,742 | — | 12,327 | |||||||||||||||||
| Equity in earnings | 138,111 | 2,739 | — | 613 | (140,850 | ) | 613 | ||||||||||||||||
| Non-cash interest expense | 4,702 | 1,312 | — | 781 | 6,795 | ||||||||||||||||||
| Deferred income taxes | — | (1,750 | ) | — | 160,847 | — | 159,097 | ||||||||||||||||
| Other adjustments to reconcile net (loss)/income | 316 | 27 | (196 | ) | (1,529 | ) | — | (1,382 | ) | ||||||||||||||
| Changes in operating assets and liabilities: | |||||||||||||||||||||||
| Trade accounts receivable | — | (3,339 | ) | 36,610 | (34,491 | ) | — | (1,220 | ) | ||||||||||||||
| Inventories | — | (11,182 | ) | 3,830 | (30,251 | ) | 25,743 | (11,860 | ) | ||||||||||||||
| Other operating assets and liabilities | 8,327 | 3,080 | (20,748 | ) | 32,027 | — | 22,686 | ||||||||||||||||
| Cash (used in)/provided by operating activities of continuing operations | (56,646 | ) | 34,372 | 32,256 | 14,906 | — | 24,888 | ||||||||||||||||
| Cash provided by operating activities of discontinued operations | — | — | 1,515 | 789 | — | 2,304 | |||||||||||||||||
| Net cash (used in)/provided by operating activities | (56,646 | ) | 34,372 | 33,771 | 15,695 | — | 27,192 | ||||||||||||||||
| Cash flows from investing activities: | |||||||||||||||||||||||
| Proceeds from sale of fixed assets | 55 | — | 12 | 792 | — | 859 | |||||||||||||||||
| Capital expenditures | (7,347 | ) | (6,606 | ) | (7,965 | ) | (30,264 | ) | — | (52,182 | ) | ||||||||||||
| Cash used in investing activities of continuing operations | (7,292 | ) | (6,606 | ) | (7,953 | ) | (29,472 | ) | — | (51,323 | ) | ||||||||||||
| Cash used in investing activities of discontinued operations | — | — | (268 | ) | (2,302 | ) | — | (2,570 | ) | ||||||||||||||
| Net cash used in investing activities | (7,292 | ) | (6,606 | ) | (8,221 | ) | (31,774 | ) | — | (53,893 | ) | ||||||||||||
| Cash flows from financing activities: | |||||||||||||||||||||||
| Transactions with non-controlling interest owners | — | (58 | ) | — | — | — | (58 | ) | |||||||||||||||
| Borrowings on lines of credit | — | — | — | 6,157 | — | 6,157 | |||||||||||||||||
| Payments on lines of credit | — | — | — | (22,561 | ) | — | (22,561 | ) | |||||||||||||||
| Borrowings on long-term debt | 500,776 | 59,829 | — | 92,310 | — | 652,915 | |||||||||||||||||
| Payments on long-term debt | (400,000 | ) | (129,123 | ) | — | (53,333 | ) | — | (582,456 | ) | |||||||||||||
| Payments of debt issuance costs | (9,965 | ) | (4,312 | ) | — | — | — | (14,277 | ) | ||||||||||||||
| Stock option exercises and employee stock purchases | 9,944 | — | — | — | — | 9,944 | |||||||||||||||||
| Intercompany | (37,106 | ) | 47,665 | (23,423 | ) | 12,864 | — | — | |||||||||||||||
| Cash provided by/(used in) financing activities of continuing operations | 63,649 | (25,999 | ) | (23,423 | ) | 35,437 | — | 49,664 | |||||||||||||||
| Cash provided by financing activities of discontinued operations | — | — | — | — | — | — | |||||||||||||||||
| Net cash provided by/(used in) financing activities | 63,649 | (25,999 | ) | (23,423 | ) | 35,437 | — | 49,664 | |||||||||||||||
| Effect of exchange rate changes on cash | — | — | — | (7,506 | ) | — | (7,506 | ) | |||||||||||||||
| Net increase/(decrease) in cash and cash equivalents | (289 | ) | 1,767 | 2,127 | 11,852 | — | 15,457 | ||||||||||||||||
| Cash and cash equivalents, beginning of period | 324 | 1,966 | (1,831 | ) | 41,364 | — | 41,823 | ||||||||||||||||
| Cash and cash equivalents, end of period | $ | 35 | $ | 3,733 | $ | 296 | $ | 53,216 | $ | — | $ | 57,280 | |||||||||||
83
Condensed Consolidating Statement of Cash Flows
Year Ended October 31, 2012
| In thousands | Quiksilver, Inc. | QS Wholesale, Inc. | Guarantor Subsidiaries | Non-Guarantor Subsidiaries | Eliminations | Consolidated | |||||||||||||||||
| Cash flows from operating activities: | |||||||||||||||||||||||
| Net (loss)/income | $ | (10,756 | ) | $ | 19,636 | $ | 31,345 | $ | 49,265 | $ | (99,233 | ) | $ | (9,743 | ) | ||||||||
| Adjustments to reconcile net (loss)/income to net cash (used in)/provided by operating activities: | |||||||||||||||||||||||
| Income from discontinued operations | — | — | (5,721 | ) | (2,080 | ) | 299 | (7,502 | ) | ||||||||||||||
| Depreciation and Amortization | 2,088 | 11,314 | 6,483 | 32,533 | — | 52,418 | |||||||||||||||||
| Stock based compensation | 22,552 | — | — | — | — | 22,552 | |||||||||||||||||
| Provision for doubtful accounts | — | (763 | ) | (1,307 | ) | 6,100 | — | 4,030 | |||||||||||||||
| Asset impairments | — | 11 | 5,151 | 2,072 | — | 7,234 | |||||||||||||||||
| Equity in earnings | (74,572 | ) | 4,674 | — | 282 | 69,898 | 282 | ||||||||||||||||
| Non-cash interest expense | 1,490 | 1,506 | — | 689 | — | 3,685 | |||||||||||||||||
| Deferred income taxes | — | 474 | — | (9,095 | ) | — | (8,621 | ) | |||||||||||||||
| Other adjustments to reconcile net (loss)/income | (443 | ) | (94 | ) | 130 | (6,114 | ) | — | (6,521 | ) | |||||||||||||
| Changes in operating assets and liabilities: | |||||||||||||||||||||||
| Trade accounts receivable | — | (7,227 | ) | (19,368 | ) | (24,155 | ) | — | (50,750 | ) | |||||||||||||
| Inventories | — | 23,444 | (41,966 | ) | (3,331 | ) | 29,036 | 7,183 | |||||||||||||||
| Other operating assets and liabilities | 5,918 | (9,589 | ) | 16,996 | (42,144 | ) | — | (28,819 | ) | ||||||||||||||
| Cash (used in)/provided by operating activities of continuing operations | (53,723 | ) | 43,386 | (8,257 | ) | 4,022 | — | (14,572 | ) | ||||||||||||||
| Cash provided by/(used in) operating activities of discontinued operations | — | — | (1,521 | ) | 2,554 | — | 1,033 | ||||||||||||||||
| Net cash (used in)/provided by operating activities | (53,723 | ) | 43,386 | (9,778 | ) | 6,576 | — | (13,539 | ) | ||||||||||||||
| Cash flows from investing activities: | |||||||||||||||||||||||
| Proceeds from sale of fixed assets | — | 43 | 2 | 8,153 | — | 8,198 | |||||||||||||||||
| Capital expenditures | (4,388 | ) | (13,744 | ) | (8,527 | ) | (36,684 | ) | — | (63,343 | ) | ||||||||||||
| Payment for purchases of companies | — | — | — | — | — | — | |||||||||||||||||
| Cash used in investing activities of continuing operations | (4,388 | ) | (13,701 | ) | (8,525 | ) | (28,531 | ) | — | (55,145 | ) | ||||||||||||
| Cash used in investing activities of discontinued operations | — | — | (309 | ) | (11,546 | ) | — | (11,855 | ) | ||||||||||||||
| Net cash used in investing activities | (4,388 | ) | (13,701 | ) | (8,834 | ) | (40,077 | ) | — | (67,000 | ) | ||||||||||||
| Cash flows from financing activities: | |||||||||||||||||||||||
| Transactions with non-controlling interest owners | — | (11,000 | ) | — | — | — | (11,000 | ) | |||||||||||||||
| Borrowings on lines of credit | — | — | — | 15,139 | — | 15,139 | |||||||||||||||||
| Payments on lines of credit | — | — | — | (12,641 | ) | — | (12,641 | ) | |||||||||||||||
| Borrowings on long-term debt | — | 93,500 | — | 46,535 | — | 140,035 | |||||||||||||||||
| Payments on long term debt | — | (70,800 | ) | — | (42,041 | ) | — | (112,841 | ) | ||||||||||||||
| Payments of Debt and Equity Issuance Costs | — | — | — | — | — | — | |||||||||||||||||
| Stock option exercises and employee stock purchases | 2,241 | — | — | — | — | 2,241 | |||||||||||||||||
| Intercompany | 56,177 | (44,391 | ) | 20,422 | (32,208 | ) | — | — | |||||||||||||||
| Cash provided by/(used in) financing activities of continuing operations | 58,418 | (32,691 | ) | 20,422 | (25,216 | ) | — | 20,933 | |||||||||||||||
| Cash provided by financing activities of discontinued operations | — | — | — | — | — | — | |||||||||||||||||
| Net cash provided by/(used in) financing activities | 58,418 | (32,691 | ) | 20,422 | (25,216 | ) | — | 20,933 | |||||||||||||||
| Effect of exchange rate changes on cash | — | — | — | (8,324 | ) | — | (8,324 | ) | |||||||||||||||
| Net (decrease)/increase in cash and cash equivalents | 307 | (3,006 | ) | 1,810 | (67,041 | ) | — | (67,930 | ) | ||||||||||||||
| Cash and cash equivalents, beginning of period | 17 | 4,972 | (3,641 | ) | 108,405 | — | 109,753 | ||||||||||||||||
| Cash and cash equivalents, end of period | $ | 324 | $ | 1,966 | $ | (1,831 | ) | $ | 41,364 | $ | — | $ | 41,823 | ||||||||||
84
SIGNATURES
Pursuant to the requirements of Section 13 or 15(d) of the Securities Exchange Act of 1934, the Registrant has duly caused this report to be signed on its behalf by the undersigned, thereunto duly authorized.
Date: December 22, 2014
| QUIKSILVER, INC. | ||||
| (Registrant) | ||||
| By: | /s/ Andrew P. Mooney | By: | /s/ Richard Shields | |
| Andrew P. Mooney | Richard Shields | |||
| Chief Executive Officer and Chairman of the Board | Chief Financial Officer | |||
| (Principal Executive Officer) | (Principal Financial and Accounting Officer) | |||
KNOW ALL PERSONS BY THESE PRESENTS, that each of the persons whose signature appears below hereby constitutes and appoints Andrew P. Mooney and Richard Shields, each of them acting individually, as his attorney-in-fact, each with the full power of substitution, for him in any and all capacities, to sign any and all amendments to this Annual Report on Form 10-K, and to file the same, with all exhibits thereto and other documents in connection therewith, with the Securities and Exchange Commission, granting unto said attorneys-in-fact, and each of them, full power and authority to do and perform each and every act and thing requisite and necessary to be done in and about the premises as fully to all intents and purposes as he might or could do in person, hereby ratifying and confirming our signatures as they may be signed by our said attorney-in-fact and any and all amendments to this Annual Report on Form 10-K.
Pursuant to the requirements of the Securities Exchange Act of 1934, this report has been signed below by the following persons on behalf of the Registrant and in the capacities and on the dates indicated:
| Signatures | Title | Date Signed | ||
| /s/ Andrew P. Mooney | Chief Executive Officer and Chairman of the Board (Principal Executive Officer) | December 22, 2014 | ||
| Andrew P. Mooney | ||||
| /s/ Richard Shields | Chief Financial Officer (Principal Financial and Accounting Officer) | December 22, 2014 | ||
| Richard Shields | ||||
| /s/ William M. Barnum, Jr. | Director | December 22, 2014 | ||
| William M. Barnum, Jr. | ||||
| /s/ Joseph F. Berardino | Director | December 22, 2014 | ||
| Joseph F. Berardino | ||||
| /s/ Bernd Beetz | Director | December 22, 2014 | ||
| Bernd Beetz | ||||
| /s/ Michael A. Clarke | Director | December 22, 2014 | ||
| Michael A. Clarke | ||||
| /s/ Elizabeth Dolan | Director | December 22, 2014 | ||
| Elizabeth Dolan | ||||
| /s/ M. Steven Langman | Director | December 22, 2014 | ||
| M. Steven Langman | ||||
| /s/ Robert B. McKnight, Jr. | Director | December 22, 2014 | ||
| Robert B. McKnight, Jr. | ||||
| /s/ Andrew W. Sweet | Director | December 22, 2014 | ||
| Andrew W. Sweet | ||||
85
EXHIBIT INDEX
| Exhibit # | Description of Exhibit | |
| 2.1 | Stock Purchase Agreement dated November 12, 2008, by and among Quiksilver, Inc., Pilot S.A.S., Meribel S.A.S., Quiksilver Americas, Inc., Chartreuse et Mont Blanc LLC, Chartreuse et Mont Blanc SAS, Chartreuse et Mont Blanc Global Holdings S.C.A., Macquarie Asset Finance Limited and Mavilia SAS (incorporated by reference to Exhibit 2.1 of the Company’s Current Report on Form 8-K filed on November 18, 2008). | |
| 3.1 | Restated Certificate of Incorporation of Quiksilver, Inc., as amended (incorporated by reference to Exhibit 3.1 of the Company’s Annual Report on Form 10-K for the year ended October 31, 2004). | |
| 3.2 | Certificate of Amendment of Restated Certificate of Incorporation of Quiksilver, Inc. (incorporated by reference to Exhibit 10.1 of the Company’s Quarterly Report on Form 10-Q for the quarter ended April 30, 2005). | |
| 3.3 | Certificate of Designation of the Series A Convertible Preferred Stock of Quiksilver, Inc. (incorporated by reference to Exhibit 3.1 of the Company’s Current Report on Form 8-K filed on August 4, 2009). | |
| 3.4 | Certificate of Amendment of Restated Certificate of Incorporation of Quiksilver, Inc. (incorporated by reference to Exhibit 3.1 of the Company’s Current Report on Form 8-K filed on April 1, 2010). | |
| 3.5 | Amended and Restated Bylaws of Quiksilver, Inc. (incorporated by reference to Exhibit 3.1 of the Company’s Current Report on Form 8-K filed on January 3, 2013). | |
| 4.1 | Indenture for the 6 7/8% Senior Notes due 2015 dated July 22, 2005, among Quiksilver, Inc., the subsidiary guarantors set forth therein and Wilmington Trust Company, as trustee, including the form of Global Note attached thereto (incorporated by reference to Exhibit 4.1 of the Company’s Current Report on Form 8-K filed July 25, 2005). | |
| 4.2 | Indenture, dated as of December 10, 2010, by and among Boardriders S.A., Quiksilver, Inc., as guarantor, the subsidiary guarantor parties thereto, and Deutsche Trustee Company Limited, as trustee, Deutsche Bank Luxembourg S.A., as registrar and transfer agent, and Deutsche Bank AG, London Branch, as principal paying agent and common depositary (incorporated by reference to Exhibit 4.1 of the Company’s Current Report on Form 8-K filed December 13, 2010). | |
| 4.3 | Indenture, dated as of July 16, 2013, related to the $280,000,000 aggregate principal amount 7.875% Senior Secured Notes due 2018, by and among Quiksilver, Inc., QS Wholesale, Inc., the subsidiary guarantor parties thereto, and Wells Fargo Bank, National Association, as trustee and collateral agent, including the Form of Note attached thereto (incorporated by reference to Exhibit 4.1 of the Company’s Current Report on Form 8-K filed July 16, 2013). | |
| 10.1 | Warrant and Registration Rights Agreement by and among Quiksilver, Inc., Rhône Capital III L.P. and Romolo Holdings C.V., Triton SPV L.P., Triton Onshore SPV L.P., Triton Offshore SPV L.P. and Triton Coinvestment SPV L.P., as the initial warrant holders, dated July 31, 2009 (incorporated by reference to Exhibit 10.4 of the Company’s Quarterly Report on Form 10-Q filed on June 9, 2010). | |
| 10.2 | Exchange Letter Agreement by and among Quiksilver, Inc., Quiksilver Americas, Inc., Mountain & Wave S.a.r.l., Rhône Group L.L.C., Romolo Holdings C.V., Triton SPV L.P., Triton Onshore SPV L.P., Triton Offshore SPV L.P. and Triton Coinvestment SPV L.P. dated June 14, 2010 (incorporated by reference to Exhibit 10.1 of the Company’s Current Report on Form 8-K filed June 15, 2010). | |
| 10.3 | Exchange Agreement by and among Quiksilver, Inc., Quiksilver Americas, Inc., Mountain & Wave S.a.r.l., Rhône Group L.L.C., Romolo Holdings C.V., Triton SPV L.P., Triton Onshore SPV L.P., Triton Offshore SPV L.P. and Triton Coinvestment SPV L.P. dated June 24, 2010 (incorporated by reference to Exhibit 10.1 of the Company’s Current Report on Form 8-K filed June 25, 2010). | |
| 10.4 | Stockholders Agreement by and among Quiksilver, Inc., Rhône Capital III, L.P., Romolo Holdings C.V., Triton SPV L.P., Triton Onshore SPV L.P., Triton Offshore SPV L.P. and Triton Coinvestment SPV L.P. dated August 9, 2010 (incorporated by reference to Exhibit 10.1 of the Company’s Current Report on Form 8-K filed August 9, 2010). | |
| 10.5 | Amended and Restated Credit Agreement, dated as of May 24, 2013, among Quiksilver, Inc., as a guarantor, QS Wholesale, Inc., as lead borrower, the other borrowers and guarantors party thereto, Bank of America, N.A., as administrative agent, and the lenders and other agents party thereto (incorporated by reference to Exhibit 10.1 of the Company’s Current Report on Form 8-K filed on May 29, 2013). | |
| 10.6 | First Amendment, dated as of July 16, 2013, to Amended and Restated Credit Agreement, dated as of May 24, 2013, by and among Quiksilver Inc., as a guarantor, QS Wholesale, Inc., as lead borrower, the other borrowers and guarantors party thereto, Bank of America, N.A., as administrative agent, and the lenders and other agents party thereto (incorporated by reference to Exhibit 10.2 of the Company’s Current Report on Form 8-K filed July 16, 2013). | |
86
| 10.7 | English Translation of Agreement, dated as of October 31, 2013, by and among Na Pali S.A.S., Emerald Coast S.A.S., Kauai GmBH, Lanai Ltd., Sumbawa SL and Eurofactor (incorporated by reference to Exhibit 10.1 of the Company’s Current Report on Form 8-K filed on November 6, 2013). | |
| 10.8 | Form of Indemnity Agreement between Quiksilver, Inc. and individual directors and officers of Quiksilver, Inc. (incorporated by reference to Exhibit 10.8 of the Company’s Annual Report on Form 10-K for the year ended October 31, 2006). (1) | |
| 10.9 | Quiksilver, Inc. 2000 Stock Incentive Plan, as amended and restated, together with form Stock Option and Restricted Stock Agreements (incorporated by reference to Exhibit 10.1 of the Company’s Current Report on Form 8-K filed on March 23, 2011). (1) | |
| 10.10 | Amendment to Quiksilver, Inc. 2000 Stock Incentive Plan (incorporated by reference to Exhibit 10.1 of the Company’s Current Report on Form 8-K filed on November 13, 2012). (1) | |
| 10.11 | Standard Form of Restricted Stock Unit Agreement under the Quiksilver, Inc. 2000 Stock Incentive Plan, as amended and restated (incorporated by reference to Exhibit 10.4 of the Company’s Quarterly Report on Form 10-Q for the quarter ended April 30, 2011). (1) | |
| 10.12 | Form of Letter Agreement for the Surrender, Cancellation and Amendment of Restricted Stock Unit Award (incorporated by reference to Exhibit 10.2 of the Company’s Current Report on Form 8-K filed on November 13, 2012). (1) | |
| 10.13 | Letter Agreement for the Surrender, Cancellation and Amendment of Restricted Stock Unit Award between Robert B. McKnight, Jr. and Quiksilver, Inc. dated January 22, 2013 (incorporated by reference to Exhibit 10.5 to the Company’s Quarterly Report on Form 10-Q for the quarter ended January 31, 2013). (1) | |
| 10.14 | Form of Restricted Stock Unit Agreement for November 2012 Grants (incorporated by reference to Exhibit 10.3 of the Company’s Current Report on Form 8-K filed on November 13, 2012). (1) | |
| 10.15 | Restricted Stock Unit Agreement between Andrew P. Mooney and Quiksilver, Inc. dated January 11, 2013 (incorporated by reference to Exhibit 10.4 to the Company’s Quarterly Report on Form 10-Q for the quarter ended January 31, 2013). (1) | |
| 10.16 | Restricted Stock Unit Agreement between Andrew P. Mooney and Quiksilver, Inc. dated March 19, 2013 (incorporated by reference to Exhibit 10.3 of the Company’s Current Report on Form 8-K filed on March 20, 2013). (1) | |
| 10.17 | Quiksilver, Inc. 2000 Employee Stock Purchase Plan (incorporated by reference to Exhibit 10.4 of the Company’s Quarterly Report on Form 10-Q for the quarter ended April 30, 2009). (1) | |
| 10.18 | Quiksilver, Inc. Employee Stock Purchase Plan, as amended and restated (incorporated by reference to Exhibit 10.2 of the Company’s Current Report on Form 8-K filed on March 20, 2013). (1) | |
| 10.19 | Quiksilver, Inc. Non-Employee Director Compensation Policy. (1) | |
| 10.20 | Quiksilver, Inc. Long Term Incentive Plan (incorporated by reference to Exhibit 10.20 of the Company’s Annual Report on Form 10-K for the year ended October 31, 2004). (1) | |
| 10.21 | Quiksilver, Inc. Incentive Compensation Plan (incorporated by reference to Exhibit 10.1 of the Company’s Current Report on Form 8-K filed on February 9, 2011). (1) | |
| 10.22 | Quiksilver, Inc. 2013 Performance Incentive Plan, together with form Stock Option, Restricted Stock and Restricted Stock Unit Agreements (incorporated by reference to Exhibit 10.1 of the Company’s Current Report on Form 8-K filed on March 20, 2013). (1) | |
| 10.23 | Form of Performance Restricted Stock Unit Agreement under Quiksilver, Inc. 2013 Performance Incentive Plan. (1) | |
| 10.24 | Amended and Restated Employment Agreement between Robert B. McKnight, Jr. and Quiksilver, Inc. dated January 3, 2013 (incorporated by reference to Exhibit 10.1 of the Company’s Current Report on Form 8-K filed on January 3, 2013). (1) | |
| 10.25 | Retirement Agreement between Robert B. McKnight, Jr. and Quiksilver, Inc. dated October 31, 2014 (incorporated by reference to Exhibit 10.1 of the Company’s Current Report on Form 8-K filed on November 5, 2014). (1) | |
| 10.26 | Employment Agreement between Andrew P. Mooney and Quiksilver, Inc. dated January 3, 2013 (incorporated by reference to Exhibit 10.2 of the Company’s Current Report on Form 8-K filed on January 3, 2013). (1) | |
87
| 10.27 | Amendment to Employment Agreement between Andrew P. Mooney and Quiksilver, Inc. dated November 3, 2014, including Restricted Stock Unit Agreement between Andrew P. Mooney and Quiksilver, Inc. dated November 3, 2014 as Exhibit A (incorporated by reference to Exhibit 10.3 of the Company’s Current Report on Form 8-K filed on November 5, 2014). (1) | |
| 10.28 | Employment Agreement between Charles S. Exon and Quiksilver, Inc. dated January 5, 2012 (incorporated by reference to Exhibit 10.2 of the Company’s Current Report on Form 8-K filed on January 6, 2012). (1) | |
| 10.29 | Retirement Agreement between Charles S. Exon and Quiksilver, Inc. dated October 31, 2014 (incorporated by reference to Exhibit 10.2 of the Company’s Current Report on Form 8-K filed on November 5, 2014). (1) | |
| 10.40 | Transitional Employment Agreement between Joseph Scirocco and Quiksilver, Inc. dated January 5, 2012 (incorporated by reference to Exhibit 10.3 of the Company’s Current Report on Form 8-K filed on January 6, 2012). (1) | |
| 10.30 | English translation of Employment Agreement between Pierre Agnes and Pilot SAS effective July 1, 2013 (incorporated by reference to Exhibit 10.1 of the Company’s Current Report on Form 8-K filed October 4, 2013). (1) | |
| 10.31 | English translation of Corporate Mandate between Pierre Agnes and Pilot SAS Quiksilver, Inc. effective July 1, 2013 (incorporated by reference to Exhibit 10.2 of the Company’s Current Report on Form 8-K filed October 4, 2013). (1) | |
| 10.32 | Deed of Separation between Craig Stevenson and Ug Manufacturing Co. Pty Ltd dated February 22, 2013 (incorporated by reference to Exhibit 10.1 of the Company’s Current Report on Form 8-K filed on February 22, 2013). (1) | |
| 10.33 | Employment Agreement between Richard Shields and Quiksilver, Inc. dated April 12, 2012 (incorporated by reference to Exhibit 10.1 of the Company’s Current Report on Form 8-K filed April 27, 2012). (1) | |
| 10.34 | Employment Agreement between Alan Vickers and Quiksilver, Inc., dated February 13, 2014 (1) | |
| 10.35 | Indemnity Agreement by and between Quiksilver, Inc. and Andrew Sweet dated July 31, 2009 (incorporated by reference to Exhibit 10.16 of the Company’s Quarterly Report on Form 10-Q for the quarter ended July 31, 2009). (1) | |
| 10.36 | Indemnity Agreement by and between Quiksilver, Inc. and M. Steven Langman dated July 31, 2009 (incorporated by reference to Exhibit 10.17 of the Company’s Quarterly Report on Form 10-Q for the quarter ended July 31, 2009). (1) | |
| 21.10 | Subsidiaries of Quiksilver, Inc. | |
| 23.10 | Consent of Deloitte & Touche LLP | |
| 24.10 | Power of Attorney (included on signature page). | |
| 31.10 | Rule 13a-14(a)/15d-14(a) Certifications – Principal Executive Officer | |
| 31.20 | Rule 13a-14(a)/15d-14(a) Certifications – Principal Financial Officer | |
| 32.10 | Certification Pursuant to 18 U.S.C. Section 1350, As Adopted Pursuant to Section 906 of The Sarbanes-Oxley Act of 2002 – Chief Executive Officer | |
| 32.20 | Certification Pursuant to 18 U.S.C. Section 1350, As Adopted Pursuant to Section 906 of The Sarbanes-Oxley Act of 2002 – Chief Financial Officer | |
| (1) | Management contract or compensatory plan. |
| 101.INS | XBRL Instance Document | |
| 101.SCH | XBRL Taxonomy Extension Schema Document | |
| 101.CAL | XBRL Taxonomy Extension Calculation Linkbase Document | |
| 101.DEF | XBRL Taxonomy Extension Definition Linkbase Document | |
| 101.LAB | XBRL Taxonomy Extension Label Linkbase Document | |
| 101.PRE | XBRL Taxonomy Extension Presentation Linkbase Document | |
88