UNITED STATES
SECURITIES AND EXCHANGE COMMISSION
Washington, D.C. 20549
FORMN-CSR
CERTIFIED SHAREHOLDER REPORT OF REGISTERED
MANAGEMENT INVESTMENT COMPANIES
Investment Company Act file number811-04894
Franklin Managed Trust
(Exact name of registrant as specified in charter)
One Franklin Parkway, San Mateo, CA 94403-1906
(Address of principal executive offices) (Zip code)
Craig S. Tyle, One Franklin Parkway, San Mateo, CA 94403-1906
(Name and address of agent for service)
Registrant’s telephone number, including area code: 650312-2000
Date of fiscal year end: 9/30
Date of reporting period: 9/30/19
Item 1. Reports to Stockholders.
Sign up for electronic delivery at franklintempleton.com/edelivery
Internet Delivery of Fund Reports Unless You Request Paper Copies: Effective January 1, 2021, as permitted by the SEC, paper copies of the Fund’s shareholder reports will no longer be sent by mail, unless you specifically request them from the Fund or your financial intermediary. Instead, the reports will be made available on a website, and you will be notified by mail each time a report is posted and provided with a website link to access the report.
If you already elected to receive shareholder reports electronically, you will not be affected by this change and you need not take any action. If you have not signed up for electronic delivery, we would encourage you to join fellow shareholders who have. You may elect to receive shareholder reports and other communications electronically from the Fund by calling (800)632-2301 or by contacting your financial intermediary.
You may elect to continue to receive paper copies of all your future shareholder reports free of charge by contacting your financial intermediary or, if you invest directly with a Fund, calling (800)632-2301 to let the Fund know of your request. Your election to receive reports in paper will apply to all funds held in your account.
SHAREHOLDER LETTER
Dear Shareholder:
During the 12 months ended September 30, 2019, the U.S. economy continued to grow, but at a more moderate pace due to concerns about trade and geopolitical stress. The U.S. Federal Reserve (Fed) raised its federal funds rate by 0.25% at its December 2018 meeting, bringing the rate from 2.25% to 2.50%, but lowered it by 0.25% at both its July and September 2019 meetings, resulting in a rate of 2.00% byperiod-end. The Fed cited muted inflation pressures and the potential effects of global trade tensions on economic growth as rationale for easing the rate. The10-year U.S. Treasury yield began the period at 3.05% and decreased to 1.68% atperiod-end. In this environment, U.S. stocks, as measured by the Standard & Poor’s® 500 Index, posted a +4.25% return.1
After the reporting period, in a further effort to sustain economic expansion, while fostering a strong labor market and stable inflation, the Fed lowered the federal funds rate by 0.25%, to 1.75% at its October meeting.
We are committed to our long-term perspective and disciplined investment approach as we conduct a rigorous, fundamental analysis of securities with a regular emphasis on investment risk management.
The enclosed annual report for Franklin Rising Dividends Fund includes more detail about prevailing conditions during the period and a discussion about investment decisions. We
encourage you to discuss your investment goals with your financial advisor, who can review your overall portfolio, reassess your goals and help you stay focused on the long term. Please remember all securities markets fluctuate, as do mutual fund prices.
We are grateful for the trust you have placed in Franklin Rising Dividends Fund and look forward to continuing to serve your investment needs.
Sincerely,

Donald G. Taylor, CPA
President and Chief Investment Officer
Franklin Managed Trust
This letter reflects our analysis and opinions as of September 30, 2019, unless otherwise indicated. The information is not a complete analysis of every aspect of any market, country, industry, security or fund. Statements of fact are from sources considered reliable.
1. Source: Morningstar.
The index is unmanaged and includes reinvestment of any income or distributions.
See www.franklintempletondatasources.com for additional data provider information.
|
Not FDIC Insured | May Lose Value | No Bank Guarantee |
| | | | |
| | | |
| franklintempleton.com | | Not part of the annual report | | 1 |
Contents
|
| Visitfranklintempleton.comfor fund updates, to access your account, or to find helpful financial planning tools. |
| | | | |
| | | |
2 | | Annual Report | | franklintempleton.com |
ANNUAL REPORT
Franklin Rising Dividends Fund
This annual report for Franklin Rising Dividends Fund covers the fiscal year ended September 30, 2019.
Your Fund’s Goal and Main Investments
The Fund seeks long-term capital appreciation. Preservation of capital, while not a goal, is also an important consideration. Under normal market conditions, the Fund invests at least 80% of its net assets in companies that have paid consistently rising dividends. The Fund invests predominantly in equity securities, primarily common stock. Companies that have paid consistently rising dividends per share include those companies that currently pay dividends on their common stocks and have maintained or increased their dividend rate during the last four consecutive years. The Fund may invest up to 25% of its total assets in foreign securities.
Performance Overview
For the 12 months under review, the Fund’s Class A shares posted a +7.55% cumulative total return. In comparison, the Fund’s benchmark, the Standard & Poor’s® 500 Index (S&P 500®), which is a broad measure of U.S. stock performance, posted a +4.25% total return.1 You can find more of the Fund’s performance data in the Performance Summary beginning on page 6.
Performance data represent past performance, which does not guarantee future results. Investment return and principal value will fluctuate, and you may have a gain or loss when you sell your shares. Current performance may differ from figures shown. For most recentmonth-end performance, go tofranklintempleton.comor call(800)342-5236.
Economic and Market Overview
The U.S. economy expanded during the 12 months ended September 30, 2019. After moderating for two consecutive quarters, the economy grew significantly faster in 2019’s first quarter. However, the economy moderated in the second and third quarters, due partly to weakness in inventory and business investment. The manufacturing sector expanded
during most of the period, but contracted in August and September 2019. The services sector continued to expand throughout the period, although the rate of expansion slowed in September. The unemployment rate decreased from 3.7% in September 2018 to 3.5% atperiod-end.2 The annual inflation rate, as measured by the Consumer Price Index, decreased from 2.3% in September 2018 to 1.7% atperiod-end.2
The U.S. Federal Reserve (Fed) raised its target range for the federal funds rate by 0.25% at its December 2018 meeting, to 2.25%–2.50%. However, at its July 2019 meeting, the Fed lowered the federal funds target rate range for the first time since December 2008, to 2.00%–2.25%, citing muted inflation pressures and the potential effects of global trade tensions on economic growth. Furthermore, the Fed ended its balance sheet normalization program earlier than previously indicated. In September, the Fed further lowered the federal funds target rate range to 1.75%–2.00%, reiterating the rationale cited at the July meeting.
U.S. equity markets overall rose during the period, benefiting from upbeat economic data and U.S. corporate earnings, the Fed’s rate cuts and investor optimism about further monetary easing. However, markets reflected concerns about tighter regulation of technology companies, the Fed’s 2018 interest-rate path, political uncertainties in the U.S. (including the impeachment inquiry into President Donald Trump), geopolitical tensions in certain regions, and the impact of U.S. trade disputes with China and other trading partners on global growth and corporate earnings. These concerns were partly alleviated at certain points during the period by easing trade tensions and optimism about a potential U.S.-China trade deal. The broad U.S. stock market, as measured by the Standard & Poor’s® 500 Index (S&P 500®), sold off sharply in 2018’s fourth quarter, but generally trended higher in 2019’s first seven months, reaching a newall-time high in July. Stocks retreated in August, due to escalating trade tensions and heightened concerns about U.S. and global economic growth, but recovered in September amid easing trade tensions and investor optimism about the upcoming
1. Source: Morningstar.
The index is unmanaged and includes reinvestment of any income or distributions. It does not reflect any fees, expenses or sales charges. One cannot invest directly in an index, and an index is not representative of the Fund’s portfolio.
2. Source: Bureau of Labor Statistics.
See www.franklintempletondatasources.com for additional data provider information.
The dollar value, number of shares or principal amount, and names of all portfolio holdings are listed in the Fund’s Statement of Investments (SOI).
The SOI begins on page 15.
| | | | |
| | | |
| franklintempleton.com | | Annual Report | | 3 |
FRANKLIN RISING DIVIDENDS FUND
U.S.-China trade negotiations in October 2019. Overall, the S&P 500 posted a +4.25% total return for the12-month period.1
Investment Strategy
We base our investment strategy on our belief that companies with consistently rising dividends should, over time, also experience stock price appreciation. We select portfolio securities based on several criteria. To be eligible for purchase, stocks generally will pass certain screening criteria, such as consistent and substantial dividend increases, reinvested earnings, and long-term debt that is no more than 50% of total capitalization or senior debt that has been rated investment grade by at least one of the major bond rating organizations. We seek fundamentally sound companies that meet our standards and attempt to acquire them at what we believe are attractive prices.
Manager’s Discussion
During the 12 months under review, holdings that positively contributed to Fund performance included Roper Technologies, Air Products and Chemicals and Stryker.
Roper Technologies, a diversified industrial company, enjoyed solid stock price performance during the period. The company continued to post strong revenue and earnings growth, as well as robust cash flow generation. Roper expects to continue achieving strong operating results in 2019, with moderate organic revenue growth and continued strong profitability. The company has increased its dividend for 26 consecutive years.
Shares of industrial gases company Air Products and Chemicals rose based on strong fundamentals. We believe the outlook for the industrial gases industry looks robust. The industry has consolidated, competitive pressures are abating, pricing power has improved and project backlogs look to be increasing. Moreover, we believe Air Products has a significant long-term opportunity in converting coal and natural gas into a synthetic gas used for power generation and chemicals production. The company has increased its dividend for 36 consecutive years.
Stryker, a developer of surgical and medical products, was a contributor as the stock continued to rise following another strong earnings report which showed solid growth across its business. We believe the company’s topline growth trajectory looks robust based on a steady cadence of new product launches, international expansion and ongoing growth from MAKO, Stryker’srobotic-arm assisted technology. The company has increased its dividend for 26 consecutive years.
Portfolio Composition
Based on Total Net Assets as of 9/30/19

Detractors from Fund performance included Albemarle, Occidental Petroleum and EOG Resources.
Shares of Albemarle, a specialty chemicals producer, declined despite the company’s ongoing strong fundamental performance. In response to concerns about lithium oversupply and pricing implications, Albemarle has announced steps to curtail capital expenditures to moderate supply growth over the next few years. Management confirmed that the company’s long-term contracts andlow-cost position could provide insulation from spot price fluctuations, and that its strong resource base provides solid
| | | | |
| | | |
4 | | Annual Report | | franklintempleton.com |
FRANKLIN RISING DIVIDENDS FUND
growth prospects as demand continues to accelerate. The company has increased its dividend for 25 consecutive years.
Top 10 Holdings
9/30/19
| | | | |
Company Sector/Industry | | % of Total Net Assets |
| |
Microsoft Corp. Software & Services | | | 6.8% | |
| |
Roper Technologies Inc. Industrial Conglomerates | | | 6.0% | |
| |
Stryker Corp. Health Care Equipment & Services | | | 4.2% | |
| |
Accenture PLC Software & Services | | | 3.7% | |
| |
Honeywell International Inc. Industrial Conglomerates | | | 3.6% | |
| |
Linde PLC (United Kingdom) Materials | | | 3.6% | |
| |
Texas Instruments Inc. Semiconductors & Semiconductor Equipment | | | 3.5% | |
| |
Air Products and Chemicals Inc. Materials | | | 3.4% | |
| |
Becton, Dickinson and Co. Health Care Equipment & Services | | | 3.4% | |
| |
Medtronic PLC Health Care Equipment & Services | | | 3.2% | |
Occidental Petroleum acquired oil and gas exploration and production firm Anadarko Petroleum (not a Fund holding) during the period. Although the deal gives Occidental Petroleum a greater presence in the U.S. shale producing Permian Basin and allows it to cut costs, investor concerns about the financing needed to complete the deal weighed on Occidental’s stock price. The company has increased its dividend for 17 consecutive years.
Oil and gas exploration company EOG Resources hurt returns during the period as the broader industry environment has remained challenging despite a recent spike in oil prices following heightened Middle East tensions. EOG has continued to post strong financial results, with solid free cash flow. Furthermore, we view the company as one of the highest-quality names in the energy exploration and production industry. The company has increased its dividend for two consecutive years.
Thank you for your participation in Franklin Rising Dividends Fund. We look forward to continuing to serve your investment needs.
| | |
 | |  |
| | Nicolas Getaz, CFA® |
| | Co-Lead Portfolio Manager |
| |

| | 
Matthew Quinlan Co-Lead Portfolio Manager Amritha Kasturirangan Portfolio Manager Nayan Sheth Portfolio Manager |
|
|
|
|
|
| |
| | | |
The foregoing information reflects our analysis, opinions and portfolio holdings as of September 30, 2019, the end of the reporting period. The way we implement our main investment strategies and the resulting portfolio holdings may change depending on factors such as market and economic conditions. These opinions may not be relied upon as investment advice or an offer for a particular security. The information is not a complete analysis of every aspect of any market, country, industry, security or the Fund. Statements of fact are from sources considered reliable, but the investment manager makes no representation or warranty as to their completeness or accuracy. Although historical performance is no guarantee of future results, these insights may help you understand our investment management philosophy.
CFA® is a trademark owned by CFA Institute.
| | | | |
| | | |
| franklintempleton.com | | Annual Report | | 5 |
FRANKLIN RISING DIVIDENDS FUND
Performance Summary as of September 30, 2019
The performance table and graphs do not reflect any taxes that a shareholder would pay on Fund dividends, capital gain distributions, if any, or any realized gains on the sale of Fund shares. Total return reflects reinvestment of the Fund’s dividends and capital gain distributions, if any, and any unrealized gains or losses. Your dividend income will vary depending on dividends or interest paid by securities in the Fund’s portfolio, adjusted for operating expenses of each class. Capital gain distributions are net profits realized from the sale of portfolio securities.
Performance as of 9/30/19
Cumulative total return excludes sales charges. Average annual total return includes maximum sales charges. Sales charges will vary depending on the size of the investment and the class of share purchased. The maximum is 5.50% and the minimum is 0%.Class A:5.50% maximum initial sales charge;Advisor Class:no sales charges. For other share classes, visitfranklintempleton.com.
| | | | | | |
| Share Class | | Cumulative Total Return1
| | Average Annual Total Return2 | |
| | |
A3 | | | | | | |
1-Year | | +7.55% | | | +1.64% | |
| | |
5-Year | | +64.47% | | | +9.22% | |
| | |
10-Year | | +224.62% | | | +11.86% | |
| | |
Advisor | | | | | | |
1-Year | | +7.82% | | | +7.82% | |
| | |
5-Year | | +66.56% | | | +10.74% | |
| | |
10-Year | | +233.00% | | | +12.78% | |
Performance data represent past performance, which does not guarantee future results. Investment return and principal value will fluctuate, and you may have a gain or loss when you sell your shares. Current performance may differ from figures shown. For most recentmonth-end performance, go tofranklintempleton.comor call(800)342-5236.
See page 8 for Performance Summary footnotes.
| | | | |
| | | |
6 | | Annual Report | | franklintempleton.com |
FRANKLIN RISING DIVIDENDS FUND
PERFORMANCE SUMMARY
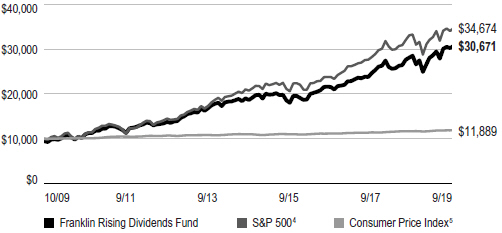
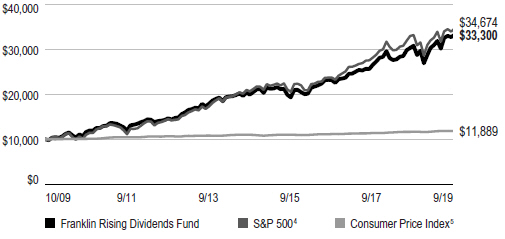
Total Return Index Comparison for a Hypothetical $10,000 Investment
Total return represents the change in value of an investment over the periods shown. It includes any applicable maximum sales charge, Fund expenses, account fees and reinvested distributions. The unmanaged indexes include reinvestment of any income or distributions. They differ from the Fund in composition and do not pay management fees or expenses. One cannot invest directly in an index.
Class A(10/1/09–9/30/19)
Advisor Class(10/1/09–9/30/19)
See page 8 for Performance Summary footnotes.
| | | | |
| | | |
| franklintempleton.com | | Annual Report | | 7 |
FRANKLIN RISING DIVIDENDS FUND
PERFORMANCE SUMMARY
Distributions(10/1/18–9/30/19)
| | | | | | | | | | | | |
| Share Class | | Net Investment Income | | | Long-Term Capital Gain | | | Total | |
| A | | | $0.7469 | | | | $2.1614 | | | | $2.9083 | |
| C | | | $0.2741 | | | | $2.1614 | | | | $2.4355 | |
| R | | | $0.5887 | | | | $2.1614 | | | | $2.7501 | |
| R6 | | | $0.9387 | | | | $2.1614 | | | | $3.1001 | |
| Advisor | | | $0.9042 | | | | $2.1614 | | | | $3.0656 | |
|
| Total Annual Operating Expenses5 | |
| | | |
| Share Class | | | | | | | | | |
| A | | | 0.88 | % | | | | | | | | |
| Advisor | | | 0.63 | % | | | | | | | | |
Each class of shares is available to certain eligible investors and has different annual fees and expenses, as described in the prospectus.
All investments involve risks, including possible loss of principal. Value securities may not increase in price as anticipated or may decline further in value. For stocks paying dividends, dividends are not guaranteed, and can increase, decrease or be totally eliminated without notice. While smaller and midsize companies may offer substantial opportunities for capital growth, they also involve heightened risks and should be considered speculative. Historically, smaller andmidsize-company securities have been more volatile in price than larger company securities, especially over the short term. The Fund is actively managed but there is no guarantee that the manager’s investment decisions will produce the desired results. The Fund’s prospectus also includes a description of the main investment risks.
1. Cumulative total return represents the change in value of an investment over the periods indicated.
2. Average annual total return represents the average annual change in value of an investment over the periods indicated. Return for less than one year, if any, has not been annualized.
3. Prior to 9/10/18, these shares were offered at a higher initial sales charge of 5.75%, thus actual returns (with sales charges) would have differed. Average annual total returns (with sales charges) have been restated to reflect the current maximum initial sales charge of 5.50%.
4. Source: Morningstar. The S&P 500 is a market capitalization-weighted index of 500 stocks designed to measure total U.S. equity market performance. 5. Source: Bureau of Labor Statistics, bls.gov/cpi. The Consumer Price Index (CPI) is a commonly used measure of the inflation rate.
6. Figures are as stated in the Fund’s current prospectus and may differ from the expense ratios disclosed in the Your Fund’s Expenses and Financial Highlights sections in this report. In periods of market volatility, assets may decline significantly, causing total annual Fund operating expenses to become higher than the figures shown.
See www.franklintempletondatasources.com for additional data provider information.
| | | | |
| | | |
8 | | Annual Report | | franklintempleton.com |
FRANKLIN RISING DIVIDENDS FUND
Your Fund’s Expenses
As a Fund shareholder, you can incur two types of costs: (1) transaction costs, including sales charges (loads) on Fund purchases and redemptions; and (2) ongoing Fund costs, including management fees, distribution and service(12b-1) fees, and other Fund expenses. All mutual funds have ongoing costs, sometimes referred to as operating expenses. The table below shows ongoing costs of investing in the Fund and can help you understand these costs and compare them with those of other mutual funds. The table assumes a $1,000 investment held for the six months indicated.
Actual Fund Expenses
The table below provides information about actual account values and actual expenses in the columns under the heading “Actual.” In these columns the Fund’s actual return, which includes the effect of Fund expenses, is used to calculate the “Ending Account Value” for each class of shares. You can estimate the expenses you paid during the period by following these steps (ofcourse, your account value and expenses will differ from those in this illustration):Divide your account value by $1,000 (ifyour account had an $8,600 value, then $8,600÷ $1,000 = 8.6). Then multiply the result by the number in the row for your class of shares under the headings “Actual” and “Expenses Paid During Period” (ifActual Expenses Paid During Period were $7.50, then 8.6 x $7.50 = $64.50). In this illustration, the actual expenses paid this period are $64.50.
Hypothetical Example for Comparison with Other Funds
Under the heading “Hypothetical” in the table, information is provided about hypothetical account values and hypothetical expenses based on the Fund’s actual expense ratio and an assumed rate of return of 5% per year before expenses, which is not the Fund’s actual return. This information may not be used to estimate the actual ending account balance or expenses you paid for the period, but it can help you compare ongoing costs of investing in the Fund with those of other funds. To do so, compare this 5% hypothetical example for the class of shares you hold with the 5% hypothetical examples that appear in the shareholder reports of other funds.
Please note that expenses shown in the table are meant to highlight ongoing costs and do not reflect any transactional costs. Therefore, information under the heading “Hypothetical” is useful in comparing ongoing costs only, and will not help you compare total costs of owning different funds. In addition, if transactional costs were included, your total costs would have been higher.
| | | | | | | | | | | | |
| | | | | Actual (actual return after expenses) | | Hypothetical (5% annual return before expenses) | | |
| | | | | | | | |
Share
Class | | Beginning
Account
Value 4/1/19 | | Ending
Account
Value 9/30/19 | | Expenses Paid During Period 4/1/19–9/30/191, 2 | | Ending
Account
Value 9/30/19 | | Expenses Paid During Period 4/1/19–9/30/191, 2 | | Net
Annualized
Expense
Ratio2 |
| | | | | | |
A | | $1,000 | | $1,071.60 | | $4.52 | | $1,020.71 | | $4.41 | | 0.87% |
C | | $1,000 | | $1,067.60 | | $8.40 | | $1,016.95 | | $8.19 | | 1.62% |
R | | $1,000 | | $1,070.20 | | $5.81 | | $1,019.45 | | $5.67 | | 1.12% |
R6 | | $1,000 | | $1,073.50 | | $2.75 | | $1,022.41 | | $2.69 | | 0.53% |
Advisor | | $1,000 | | $1,072.90 | | $3.22 | | $1,021.96 | | $3.14 | | 0.62% |
1. Expenses are equal to the annualized expense ratio for thesix-month period as indicated above—in the far right column—multiplied by the simple average account value over the period indicated, and then multiplied by 183/365 to reflect theone-half year period.
2. Reflects expenses after fee waivers and expense reimbursements. Does not include acquired fund fees and expenses.
| | | | |
| | | |
| franklintempleton.com | | Annual Report | | 9 |
FRANKLIN MANAGED TRUST
Financial Highlights
Franklin Rising Dividends Fund
| | | | | | | | | | | | | | | | | | | | |
| | | Year Ended September 30, |
| | | 2019 | | 2018 | | 2017 | | 2016 | | 2015 |
| | | | | |
Class A | | | | | | | | | | | | | | | | | | | | |
| | | | | |
Per share operating performance | | | | | | | | | | | | | | | | | | | | |
(for a share outstanding throughout the year) | | | | | | | | | | | | | | | | | | | | |
| | | | | |
Net asset value, beginning of year | | | $66.02 | | | | $58.98 | | | | $53.47 | | | | $47.01 | | | | $49.72 | |
| | | | | |
Income from investment operationsa: | | | | | | | | | | | | | | | | | | | | |
| | | | | |
Net investment incomeb | | | 0.73 | | | | 0.70 | | | | 0.69 | | | | 0.69 | | | | 0.64 | |
| | | | | |
Net realized and unrealized gains (losses) | | | 3.97 | | | | 8.40 | | | | 6.75 | | | | 8.26 | | | | (2.22 | ) |
| | | | | |
Total from investment operations | | | 4.70 | | | | 9.10 | | | | 7.44 | | | | 8.95 | | | | (1.58 | ) |
| | | | | |
Less distributions from: | | | | | | | | | | | | | | | | | | | | |
| | | | | |
Net investment income | | | (0.75 | ) | | | (0.66 | ) | | | (0.82 | ) | | | (0.58 | ) | | | (0.63 | ) |
| | | | | |
Net realized gains | | | (2.16 | ) | | | (1.40 | ) | | | (1.11 | ) | | | (1.91 | ) | | | (0.50 | ) |
| | | | | |
Total distributions | | | (2.91 | ) | | | (2.06 | ) | | | (1.93 | ) | | | (2.49 | ) | | | (1.13 | ) |
| | | | | |
Net asset value, end of year | | | $67.81 | | | | $66.02 | | | | $58.98 | | | | $53.47 | | | | $47.01 | |
| | | | | |
Total returnc | | | 7.55% | | | | 15.77% | | | | 14.36% | | | | 19.51% | | | | (3.35)% | |
| | | | | |
Ratios to average net assets | | | | | | | | | | | | | | | | | | | | |
| | | | | |
Expensesd | | | 0.87% | | | | 0.87% | | | | 0.91% | | | | 0.91% | | | | 0.92% | |
| | | | | |
Net investment income | | | 1.16% | | | | 1.14% | | | | 1.25% | | | | 1.38% | | | | 1.25% | |
| | | | | |
Supplemental data | | | | | | | | | | | | | | | | | | | | |
| | | | | |
Net assets, end of year (000’s) | | | $13,214,451 | | | | $12,295,189 | | | | $11,626,959 | | | | $11,662,059 | | | | $10,220,847 | |
| | | | | |
Portfolio turnover rate | | | 2.65% | | | | 1.63% | | | | 3.09% | | | | 1.74% | | | | 8.51% | |
aThe amount shown for a share outstanding throughout the period may not correlate with the Statement of Operations for the period due to the timing of sales and repurchases of the Fund’s shares in relation to income earned and/or fluctuating fair value of the investments of the Fund.
bBased on average daily shares outstanding.
cTotal return does not reflect sales commissions or contingent deferred sales charges, if applicable.
dBenefit of waiver and payments by affiliates and expense reduction rounds to less than 0.01%.
| | | | |
| | | |
10 | | Annual Report | The accompanying notes are an integral part of these financial statements. | | franklintempleton.com |
FRANKLIN MANAGED TRUST
FINANCIAL HIGHLIGHTS
Franklin Rising Dividends Fund(continued)
| | | | | | | | | | | | | | | | | | | | |
| | | | | | Year Ended September 30, | | | |
| | | 2019 | | | 2018 | | | 2017 | | | 2016 | | | 2015 |
| | | | | |
Class C | | | | | | | | | | | | | | | | | | | | |
| | | | | |
Per share operating performance | | | | | | | | | | | | | | | | | | | | |
(for a share outstanding throughout the year) | | | | | | | | | | | | | | | | | | | | |
| | | | | |
Net asset value, beginning of year | | | $64.73 | | | | $57.86 | | | | $52.50 | | | | $46.26 | | | | $48.94 | |
| | | | | |
Income from investment operationsa: | | | | | | | | | | | | | | | | | | | | |
| | | | | |
Net investment incomeb | | | 0.25 | | | | 0.24 | | | | 0.28 | | | | 0.31 | | | | 0.25 | |
| | | | | |
Net realized and unrealized gains (losses) | | | 3.88 | | | | 8.25 | | | | 6.62 | | | | 8.12 | | | | (2.18 | ) |
| | | | | |
Total from investment operations | | | 4.13 | | | | 8.49 | | | | 6.90 | | | | 8.43 | | | | (1.93 | ) |
| | | | | |
Less distributions from: | | | | | | | | | | | | | | | | | | | | |
| | | | | |
Net investment income | | | (0.27 | ) | | | (0.22 | ) | | | (0.43 | ) | | | (0.28 | ) | | | (0.25 | ) |
| | | | | |
Net realized gains | | | (2.16 | ) | | | (1.40 | ) | | | (1.11 | ) | | | (1.91 | ) | | | (0.50 | ) |
| | | | | |
Total distributions | | | (2.43 | ) | | | (1.62 | ) | | | (1.54 | ) | | | (2.19 | ) | | | (0.75 | ) |
| | | | | |
Net asset value, end of year | | | $66.43 | | | | $64.73 | | | | $57.86 | | | | $52.50 | | | | $46.26 | |
| | | | | |
Total returnc | | | 6.75% | | | | 14.92% | | | | 13.49% | | | | 18.62% | | | | (4.07)% | |
| | | | | |
Ratios to average net assets | | | | | | | | | | | | | | | | | | | | |
| | | | | |
Expensesd | | | 1.62% | | | | 1.62% | | | | 1.66% | | | | 1.66% | | | | 1.67% | |
| | | | | |
Net investment income | | | 0.41% | | | | 0.39% | | | | 0.50% | | | | 0.63% | | | | 0.50% | |
| | | | | |
Supplemental data | | | | | | | | | | | | | | | | | | | | |
| | | | | |
Net assets, end of year (000’s) | | | $2,375,567 | | | | $2,980,374 | | | | $2,907,500 | | | | $2,956,171 | | | | $2,644,955 | |
| | | | | |
Portfolio turnover rate | | | 2.65% | | | | 1.63% | | | | 3.09% | | | | 1.74% | | | | 8.51% | |
aThe amount shown for a share outstanding throughout the period may not correlate with the Statement of Operations for the period due to the timing of sales and repurchases of the Fund’s shares in relation to income earned and/or fluctuating fair value of the investments of the Fund.
bBased on average daily shares outstanding.
cTotal return does not reflect sales commissions or contingent deferred sales charges, if applicable.
dBenefit of waiver and payments by affiliates and expense reduction rounds to less than 0.01%.
| | | | |
| | | |
| franklintempleton.com | | The accompanying notes are an integral part of these financial statements. | Annual Report | | 11 |
FRANKLIN MANAGED TRUST
FINANCIAL HIGHLIGHTS
Franklin Rising Dividends Fund(continued)
| | | | | | | | | | | | | | | | | | | | |
| | | | | | Year Ended September 30, | | | | |
| | | 2019 | | | 2018 | | | 2017 | | | 2016 | | | 2015 | |
| | | | | |
Class R | | | | | | | | | | | | | | | | | | | | |
| | | | | |
Per share operating performance | | | | | | | | | | | | | | | | | | | | |
(for a share outstanding throughout the year) | | | | | | | | | | | | | | | | | | | | |
| | | | | |
Net asset value, beginning of year | | | $65.78 | | | | $58.76 | | | | $53.28 | | | | $46.87 | | | | $49.56 | |
| | | | | |
Income from investment operationsa: | | | | | | | | | | | | | | | | | | | | |
| | | | | |
Net investment incomeb | | | 0.57 | | | | 0.55 | | | | 0.57 | | | | 0.57 | | | | 0.51 | |
| | | | | |
Net realized and unrealized gains (losses) | | | 3.96 | | | | 8.37 | | | | 6.71 | | | | 8.22 | | | | (2.20 | ) |
| | | | | |
Total from investment operations | | | 4.53 | | | | 8.92 | | | | 7.28 | | | | 8.79 | | | | (1.69 | ) |
| | | | | |
Less distributions from: | | | | | | | | | | | | | | | | | | | | |
| | | | | |
Net investment income | | | (0.59 | ) | | | (0.50 | ) | | | (0.69 | ) | | | (0.47 | ) | | | (0.50 | ) |
| | | | | |
Net realized gains | | | (2.16 | ) | | | (1.40 | ) | | | (1.11 | ) | | | (1.91 | ) | | | (0.50 | ) |
| | | | | |
Total distributions | | | (2.75 | ) | | | (1.90 | ) | | | (1.80 | ) | | | (2.38 | ) | | | (1.00 | ) |
| | | | | |
Net asset value, end of year | | | $67.56 | | | | $65.78 | | | | $58.76 | | | | $53.28 | | | | $46.87 | |
| | | | | |
Total return | | | 7.28% | | | | 15.50% | | | | 14.07% | | | | 19.20% | | | | (3.58)% | |
| | | | | |
Ratios to average net assets | | | | | | | | | | | | | | | | | | | | |
| | | | | |
Expensesc | | | 1.12% | | | | 1.12% | | | | 1.16% | | | | 1.16% | | | | 1.17% | |
| | | | | |
Net investment income | | | 0.91% | | | | 0.89% | | | | 1.00% | | | | 1.13% | | | | 1.00% | |
| | | | | |
Supplemental data | | | | | | | | | | | | | | | | | | | | |
| | | | | |
Net assets, end of year (000’s) | | | $194,827 | | | | $203,792 | | | | $227,179 | | | | $247,961 | | | | $243,597 | |
| | | | | |
Portfolio turnover rate | | | 2.65% | | | | 1.63% | | | | 3.09% | | | | 1.74% | | | | 8.51% | |
aThe amount shown for a share outstanding throughout the period may not correlate with the Statement of Operations for the period due to the timing of sales and repurchases of the Fund’s shares in relation to income earned and/or fluctuating fair value of the investments of the Fund.
bBased on average daily shares outstanding.
cBenefit of waiver and payments by affiliates and expense reduction rounds to less than 0.01%.
| | | | |
| | | |
12 | | Annual Report | The accompanying notes are an integral part of these financial statements. | | franklintempleton.com |
FRANKLIN MANAGED TRUST
FINANCIAL HIGHLIGHTS
Franklin Rising Dividends Fund(continued)
| | | | | | | | | | | | | | | | | | | | |
| | | Year Ended September 30, | |
| | | 2019 | | | 2018 | | | 2017 | | | 2016 | | | 2015 | |
| | | | | |
Class R6 | | | | | | | | | | | | | | | | | | | | |
| | | | | |
Per share operating performance | | | | | | | | | | | | | | | | | | | | |
(for a share outstanding throughout the year) | | | | | | | | | | | | | | | | | | | | |
| | | | | |
Net asset value, beginning of year | | | $65.97 | | | | $58.97 | | | | $53.46 | | | | $46.98 | | | | $49.67 | |
| | | | | |
Income from investment operationsa: | | | | | | | | | | | | | | | | | | | | |
| | | | | |
Net investment incomeb | | | 0.94 | | | | 0.83 | | | | 0.92 | | | | 0.90 | | | | 0.84 | |
| | | | | |
Net realized and unrealized gains (losses) | | | 3.98 | | | | 8.47 | | | | 6.73 | | | | 8.24 | | | | (2.20 | ) |
| | | | | |
Total from investment operations | | | 4.92 | | | | 9.30 | | | | 7.65 | | | | 9.14 | | | | (1.36 | ) |
| | | | | |
Less distributions from: | | | | | | | | | | | | | | | | | | | | |
| | | | | |
Net investment income | | | (0.94 | ) | | | (0.90 | ) | | | (1.03 | ) | | | (0.75 | ) | | | (0.83 | ) |
| | | | | |
Net realized gains | | | (2.16 | ) | | | (1.40 | ) | | | (1.11 | ) | | | (1.91 | ) | | | (0.50 | ) |
| | | | | |
Total distributions | | | (3.10 | ) | | | (2.30 | ) | | | (2.14 | ) | | | (2.66 | ) | | | (1.33 | ) |
| | | | | |
Net asset value, end of year | | | $67.79 | | | | $65.97 | | | | $58.97 | | | | $53.46 | | | | $46.98 | |
| | | | | |
Total return | | | 7.91% | | | | 16.18% | | | | 14.80% | | | | 19.97% | | | | (2.93)% | |
| | | | | |
Ratios to average net assets | | | | | | | | | | | | | | | | | | | | |
| | | | | |
Expensesc | | | 0.53% | | | | 0.53% | | | | 0.52% | | | | 0.52% | | | | 0.52% | |
| | | | | |
Net investment income | | | 1.50% | | | | 1.48% | | | | 1.64% | | | | 1.77% | | | | 1.65% | |
| | | | | |
Supplemental data | | | | | | | | | | | | | | | | | | | | |
| | | | | |
Net assets, end of year (000’s) | | | $1,852,106 | | | | $1,743,486 | | | | $523,985 | | | | $586,747 | | | | $553,301 | |
| | | | | |
Portfolio turnover rate | | | 2.65% | | | | 1.63% | | | | 3.09% | | | | 1.74% | | | | 8.51% | |
aThe amount shown for a share outstanding throughout the period may not correlate with the Statement of Operations for the period due to the timing of sales and repurchases of the Fund’s shares in relation to income earned and/or fluctuating fair value of the investments of the Fund.
bBased on average daily shares outstanding.
cBenefit of waiver and payments by affiliates and expense reduction rounds to less than 0.01%.
| | | | |
| | | |
| franklintempleton.com | | The accompanying notes are an integral part of these financial statements. | Annual Report | | 13 |
FRANKLIN MANAGED TRUST
FINANCIAL HIGHLIGHTS
Franklin Rising Dividends Fund(continued)
| | | | | | | | | | | | | | | | | | | | |
| | | | | | Year Ended September 30, | | | | |
| | | 2019 | | | 2018 | | | 2017 | | | 2016 | | | 2015 | |
| | | | | |
Advisor Class | | | | | | | | | | | | | | | | | | | | |
| | | | | |
Per share operating performance | | | | | | | | | | | | | | | | | | | | |
(for a share outstanding throughout the year) | | | | | | | | | | | | | | | | | | | | |
| | | | | |
Net asset value, beginning of year | | | $65.98 | | | | $58.95 | | | | $53.45 | | | | $46.97 | | | | $49.68 | |
| | | | | |
Income from investment operationsa: | | | | | | | | | | | | | | | | | | | | |
| | | | | |
Net investment incomeb | | | 0.89 | | | | 0.90 | | | | 0.78 | | | | 0.81 | | | | 0.77 | |
| | | | | |
Net realized and unrealized gains (losses) | | | 3.97 | | | | 8.34 | | | | 6.79 | | | | 8.26 | | | | (2.22 | ) |
| | | | | |
Total from investment operations | | | 4.86 | | | | 9.24 | | | | 7.57 | | | | 9.07 | | | | (1.45 | ) |
| | | | | |
Less distributions from: | | | | | | | | | | | | | | | | | | | | |
| | | | | |
Net investment income | | | (0.90 | ) | | | (0.81 | ) | | | (0.96 | ) | | | (0.68 | ) | | | (0.76 | ) |
| | | | | |
Net realized gains | | | (2.16 | ) | | | (1.40 | ) | | | (1.11 | ) | | | (1.91 | ) | | | (0.50 | ) |
| | | | | |
Total distributions | | | (3.06 | ) | | | (2.21 | ) | | | (2.07 | ) | | | (2.59 | ) | | | (1.26 | ) |
| | | | | |
Net asset value, end of year | | | $67.78 | | | | $65.98 | | | | $58.95 | | | | $53.45 | | | | $46.97 | |
| | | | | |
Total return | | | 7.82% | | | | 16.07% | | | | 14.65% | | | | 19.81% | | | | (3.11)% | |
| | | | | |
Ratios to average net assets | | | | | | | | | | | | | | | | | | | | |
| | | | | |
Expensesc | | | 0.62% | | | | 0.62% | | | | 0.66% | | | | 0.66% | | | | 0.67% | |
| | | | | |
Net investment income | | | 1.41% | | | | 1.39% | | | | 1.50% | | | | 1.63% | | | | 1.50% | |
| | | | | |
Supplemental data | | | | | | | | | | | | | | | | | | | | |
| | | | | |
Net assets, end of year (000’s) | | | $3,282,003 | | | | $2,883,129 | | | | $3,292,740 | | | | $2,105,241 | | | | $1,671,632 | |
| | | | | |
Portfolio turnover rate | | | 2.65% | | | | 1.63% | | | | 3.09% | | | | 1.74% | | | | 8.51% | |
aThe amount shown for a share outstanding throughout the period may not correlate with the Statement of Operations for the period due to the timing of sales and repurchases of the Fund’s shares in relation to income earned and/or fluctuating fair value of the investments of the Fund.
bBased on average daily shares outstanding.
cBenefit of waiver and payments by affiliates and expense reduction rounds to less than 0.01%.
| | | | |
| | | |
14 | | Annual Report | The accompanying notes are an integral part of these financial statements. | | franklintempleton.com |
FRANKLIN MANAGED TRUST
Statement of Investments, September 30, 2019
Franklin Rising Dividends Fund
| | | | | | | | |
| | | Shares | | | Value | |
Common Stocks 98.9% | | | | | | | | |
Aerospace & Defense 5.9% | | | | | | | | |
The Boeing Co. | | | 645,318 | | | $ | 245,524,139 | |
General Dynamics Corp. | | | 2,209,190 | | | | 403,685,289 | |
Raytheon Co. | | | 771,100 | | | | 151,282,109 | |
United Technologies Corp. | | | 3,110,536 | | | | 424,650,375 | |
| | | | | | | | |
| | |
| | | | | | | 1,225,141,912 | |
| | | | | | | | |
Building Products 1.7% | | | | | | | | |
Johnson Controls International PLC | | | 7,861,949 | | | | 345,060,942 | |
aResideo Technologies Inc. | | | 741,266 | | | | 10,637,167 | |
| | | | | | | | |
| | |
| | | | | | | 355,698,109 | |
| | | | | | | | |
Commercial & Professional Services 2.5% | | | | | | | | |
ABM Industries Inc. | | | 979,149 | | | | 35,562,692 | |
Cintas Corp. | | | 1,476,400 | | | | 395,822,840 | |
bMatthews International Corp., A | | | 2,538,911 | | | | 89,852,060 | |
| | | | | | | | |
| | |
| | | | | | | 521,237,592 | |
| | | | | | | | |
Consumer Durables & Apparel 2.0% | | | | | | | | |
NIKE Inc., B | | | 4,570,700 | | | | 429,280,144 | |
| | | | | | | | |
| | |
Consumer Services 1.9% | | | | | | | | |
McDonald’s Corp. | | | 1,898,754 | | | | 407,681,471 | |
| | | | | | | | |
| | |
Diversified Financials 0.1% | | | | | | | | |
State Street Corp. | | | 469,000 | | | | 27,760,110 | |
| | | | | | | | |
| | |
Electrical Equipment 0.6% | | | | | | | | |
nVent Electric PLC | | | 5,297,468 | | | | 116,756,195 | |
| | | | | | | | |
| | |
Energy 4.8% | | | | | | | | |
aApergy Corp. | | | 2,481,950 | | | | 67,136,747 | |
Chevron Corp. | | | 2,421,000 | | | | 287,130,600 | |
EOG Resources Inc. | | | 1,846,000 | | | | 137,010,120 | |
Exxon Mobil Corp. | | | 2,323,500 | | | | 164,062,335 | |
Occidental Petroleum Corp. | | | 3,874,900 | | | | 172,316,803 | |
Schlumberger Ltd. | | | 4,900,529 | | | | 167,451,076 | |
| | | | | | | | |
| | |
| | | | | | | 995,107,681 | |
| | | | | | | | |
Food & Staples Retailing 1.8% | | | | | | | | |
Walgreens Boots Alliance Inc. | | | 1,114,947 | | | | 61,667,719 | |
Walmart Inc. | | | 2,732,764 | | | | 324,324,431 | |
| | | | | | | | |
| | |
| | | | | | | 385,992,150 | |
| | | | | | | | |
Food, Beverage & Tobacco 4.5% | | | | | | | | |
Bunge Ltd. | | | 4,111,980 | | | | 232,820,307 | |
McCormick & Co. Inc. | | | 2,162,100 | | | | 337,936,230 | |
PepsiCo Inc. | | | 2,682,077 | | | | 367,712,757 | |
| | | | | | | | |
| | |
| | | | | | | 938,469,294 | |
| | | | | | | | |
| | | | |
| | | |
| franklintempleton.com | | Annual Report | | 15 |
FRANKLIN MANAGED TRUST
STATEMENT OF INVESTMENTS
Franklin Rising Dividends Fund(continued)
| | | | | | | | |
| | | Shares | | | Value | |
Common Stocks(continued) | | | | | | | | |
Health Care Equipment & Services 15.6% | | | | | | | | |
Abbott Laboratories | | | 4,121,500 | | | $ | 344,845,905 | |
Becton, Dickinson and Co. | | | 2,808,756 | | | | 710,502,918 | |
CVS Health Corp. | | | 2,357,300 | | | | 148,674,911 | |
DENTSPLY SIRONA Inc. | | | 1,755,000 | | | | 93,559,050 | |
Medtronic PLC | | | 6,067,400 | | | | 659,040,988 | |
Stryker Corp. | | | 4,030,218 | | | | 871,736,153 | |
West Pharmaceutical Services Inc. | | | 3,100,400 | | | | 439,698,728 | |
| | | | | | | | |
| | |
| | | | | | | 3,268,058,653 | |
| | | | | | | | |
Household & Personal Products 3.2% | | | | | | | | |
Colgate-Palmolive Co. | | | 3,874,610 | | | | 284,822,581 | |
The Procter & Gamble Co. | | | 3,108,588 | | | | 386,646,175 | |
| | | | | | | | |
| | |
| | | | | | | 671,468,756 | |
| | | | | | | | |
Industrial Conglomerates 9.8% | | | | | | | | |
Carlisle Cos. Inc. | | | 322,529 | | | | 46,940,871 | |
Honeywell International Inc. | | | 4,447,600 | | | | 752,533,920 | |
Roper Technologies Inc. | | | 3,495,802 | | | | 1,246,602,993 | |
| | | | | | | | |
| | |
| | | | | | | 2,046,077,784 | |
| | | | | | | | |
Insurance 1.7% | | | | | | | | |
Aflac Inc. | | | 3,129,420 | | | | 163,731,255 | |
Erie Indemnity Co., A | | | 1,064,722 | | | | 197,665,639 | |
| | | | | | | | |
| | |
| | | | | | | 361,396,894 | |
| | | | | | | | |
Machinery 3.2% | | | | | | | | |
Donaldson Co. Inc. | | | 2,883,204 | | | | 150,157,264 | |
Dover Corp. | | | 3,291,800 | | | | 327,731,608 | |
Pentair PLC | | | 4,816,668 | | | | 182,070,051 | |
| | | | | | | | |
| | |
| | | | | | | 659,958,923 | |
| | | | | | | | |
Materials 11.2% | | | | | | | | |
Air Products and Chemicals Inc. | | | 3,217,458 | | | | 713,825,232 | |
bAlbemarle Corp. | | | 7,328,965 | | | | 509,509,647 | |
Ecolab Inc. | | | 1,410,072 | | | | 279,250,659 | |
Linde PLC (United Kingdom) | | | 3,854,035 | | | | 746,603,660 | |
Nucor Corp. | | | 1,825,400 | | | | 92,931,114 | |
| | | | | | | | |
| | |
| | | | | | | 2,342,120,312 | |
| | | | | | | | |
Media & Entertainment 0.2% | | | | | | | | |
John Wiley & Sons Inc., A | | | 746,318 | | | | 32,793,213 | |
| | | | | | | | |
| | |
Pharmaceuticals, Biotechnology & Life Sciences 3.6% | | | | | | | | |
AbbVie Inc. | | | 1,918,900 | | | | 145,299,108 | |
Johnson & Johnson | | | 3,103,800 | | | | 401,569,644 | |
Perrigo Co. PLC | | | 1,711,600 | | | | 95,661,324 | |
Pfizer Inc. | | | 3,046,100 | | | | 109,446,373 | |
| | | | | | | | |
| | |
| | | | | | | 751,976,449 | |
| | | | | | | | |
| | | | |
| | | |
16 | | Annual Report | | franklintempleton.com |
FRANKLIN MANAGED TRUST
STATEMENT OF INVESTMENTS
Franklin Rising Dividends Fund(continued)
| | | | | | | | |
| | | Shares | | | Value | |
Common Stocks(continued) | | | | | | | | |
Retailing 4.3% | | | | | | | | |
The Gap Inc. | | | 2,369,700 | | | $ | 41,137,992 | |
Lowe’s Cos. Inc. | | | 204,800 | | | | 22,519,808 | |
Ross Stores Inc. | | | 4,259,150 | | | | 467,867,628 | |
Target Corp. | | | 1,837,391 | | | | 196,435,472 | |
Tiffany & Co. | | | 1,915,091 | | | | 177,394,879 | |
| | | | | | | | |
| | |
| | | | | | | 905,355,779 | |
| | | | | | | | |
Semiconductors & Semiconductor Equipment 6.4% | | | | | | | | |
Analog Devices Inc. | | | 5,126,519 | | | | 572,785,968 | |
Texas Instruments Inc. | | | 5,589,400 | | | | 722,374,056 | |
Versum Materials Inc. | | | 882,629 | | | | 46,717,553 | |
| | | | | | | | |
| | |
| | | | | | | 1,341,877,577 | |
| | | | | | | | |
Software & Services 11.6% | | | | | | | | |
Accenture PLC, A | | | 4,013,700 | | | | 772,035,195 | |
Microsoft Corp. | | | 10,312,100 | | | | 1,433,691,263 | |
Visa Inc., A | | | 1,318,600 | | | | 226,812,386 | |
| | | | | | | | |
| | |
| | | | | | | 2,432,538,844 | |
| | | | | | | | |
Trading Companies & Distributors 0.8% | | | | | | | | |
W.W. Grainger Inc. | | | 539,100 | | | | 160,193,565 | |
| | | | | | | | |
| | |
Transportation 1.5% | | | | | | | | |
Norfolk Southern Corp. | | | 356,653 | | | | 64,076,278 | |
United Parcel Service Inc., B | | | 2,036,700 | | | | 244,037,394 | |
| | | | | | | | |
| | |
| | | | | | | 308,113,672 | |
| | | | | | | | |
| | |
Total Common Stocks (Cost $10,723,598,802) | | | | | | | 20,685,055,079 | |
| | | | | | | | |
| | |
Short Term Investments (Cost $250,577,007) 1.2% | | | | | | | | |
| | |
Money Market Funds 1.2% | | | | | | | | |
c,dInstitutional Fiduciary Trust Money Market Portfolio, 1.71% | | | 250,577,007 | | | | 250,577,007 | |
| | | | | | | | |
| | |
Total Investments (Cost $10,974,175,809) 100.1% | | | | | | | 20,935,632,086 | |
Other Assets, less Liabilities (0.1)% | | | | | | | (16,677,413 | ) |
| | | | | | | | |
| | |
Net Assets 100.0% | | | | | | $ | 20,918,954,673 | |
| | | | | | | | |
aNon-income producing.
bSee Note 7 regarding holdings of 5% voting securities.
cSee Note 3(f) regarding investments in affiliated management investment companies.
dThe rate shown is the annualizedseven-day effective yield at period end.
| | | | |
| | | |
| franklintempleton.com | | The accompanying notes are an integral part of these financial statements. | Annual Report | | 17 |
FRANKLIN MANAGED TRUST
FINANCIAL STATEMENTS
Statement of Assets and Liabilities
September 30, 2019
Franklin Rising Dividends Fund
| | | | |
Assets: | | | | |
Investments in securities: | | | | |
Cost - Unaffiliated issuers | | $ | 10,211,324,519 | |
Cost -Non-controlled affiliates (Note 3f and 7) | | | 762,851,290 | |
| | | | |
| |
Value - Unaffiliated issuers | | $ | 20,085,693,372 | |
Value -Non-controlled affiliates (Note 3f and 7) | | | 849,938,714 | |
Cash | | | 65,882 | |
Receivables: | | | | |
Capital shares sold | | | 18,577,298 | |
Dividends | | | 23,202,502 | |
Other assets | | | 7,685 | |
| | | | |
| |
Total assets | | | 20,977,485,453 | |
| | | | |
Liabilities: | | | | |
Payables: | | | | |
Investment securities purchased | | | 12,073,576 | |
Capital shares redeemed | | | 23,933,534 | |
Management fees | | | 8,438,688 | |
Distribution fees | | | 9,642,890 | |
Transfer agent fees | | | 3,579,563 | |
Accrued expenses and other liabilities | | | 862,529 | |
| | | | |
Total liabilities | | | 58,530,780 | |
| | | | |
| |
Net assets, at value | | $ | 20,918,954,673 | |
| | | | |
Net assets consist of: | | | | |
Paid-in capital | | $ | 10,559,263,305 | |
Total distributable earnings (loss) | | | 10,359,691,368 | |
| | | | |
| |
Net assets, at value | | $ | 20,918,954,673 | |
| | | | |
Class A: | | | | |
Net assets, at value | | $ | 13,214,451,463 | |
| | | | |
Shares outstanding | | | 194,863,254 | |
| | | | |
Net asset value per sharea | | $ | 67.81 | |
| | | | |
Maximum offering price per share (net asset value per share ÷ 94.50%) | | $ | 71.76 | |
| | | | |
Class C: | | | | |
Net assets, at value | | $ | 2,375,567,322 | |
| | | | |
Shares outstanding | | | 35,759,268 | |
| | | | |
Net asset value and maximum offering price per sharea | | $ | 66.43 | |
| | | | |
Class R: | | | | |
Net assets, at value | | $ | 194,827,496 | |
| | | | |
Shares outstanding | | | 2,883,771 | |
| | | | |
Net asset value and maximum offering price per share | | $ | 67.56 | |
| | | | |
Class R6: | | | | |
Net assets, at value | | $ | 1,852,105,879 | |
| | | | |
Shares outstanding | | | 27,322,301 | |
| | | | |
Net asset value and maximum offering price per share | | $ | 67.79 | |
| | | | |
Advisor Class: | | | | |
Net assets, at value | | $ | 3,282,002,513 | |
| | | | |
Shares outstanding | | | 48,421,364 | |
| | | | |
Net asset value and maximum offering price per share | | | $67.78 | |
| | | | |
aRedemption price is equal to net asset value less contingent deferred sales charges, if applicable.
| | | | |
| | | |
18 | | Annual Report | The accompanying notes are an integral part of these financial statements. | | franklintempleton.com |
FRANKLIN MANAGED TRUST
FINANCIAL STATEMENTS
Statement of Operations
for the year ended September 30, 2019
Franklin Rising Dividends Fund
| | | | |
Investment income: | | | | |
Dividends: | | | | |
Unaffiliated issuers | | $ | 380,095,013 | |
Non-controlled affiliates (Note 3f and 7) | | | 16,117,174 | |
| | | | |
| |
Total investment income | | | 396,212,187 | |
| | | | |
Expenses: | | | | |
Management fees (Note 3a) | | | 97,337,313 | |
Distribution fees: (Note 3c) | | | | |
Class A | | | 30,700,730 | |
Class C | | | 24,382,632 | |
Class R | | | 949,380 | |
Transfer agent fees: (Note 3e) | | | | |
Class A | | | 13,398,211 | |
Class C | | | 2,662,418 | |
Class R | | | 207,999 | |
Class R6 | | | 424,476 | |
Advisor Class | | | 3,225,105 | |
Custodian fees (Note 4) | | | 178,056 | |
Reports to shareholders | | | 1,270,162 | |
Registration and filing fees | | | 339,064 | |
Professional fees | | | 112,672 | |
Trustees’ fees and expenses | | | 211,630 | |
Other | | | 295,757 | |
| | | | |
| |
Total expenses | | | 175,695,605 | |
Expense reductions (Note 4) | | | (6,295 | ) |
Expenses waived/paid by affiliates (Note 3f) | | | (648,347 | ) |
| | | | |
| |
Net expenses | | | 175,040,963 | |
| | | | |
| |
Net investment income | | | 221,171,224 | |
| | | | |
Realized and unrealized gains (losses): | | | | |
Net realized gain (loss) from: | | | | |
Investments: | | | | |
Unaffiliated issuers | | | 707,507,765 | |
| | | | |
Net change in unrealized appreciation (depreciation) on: | | | | |
Investments: | | | | |
Unaffiliated issuers | | | 789,857,601 | |
Non-controlled affiliates (Note 3f and 7) | | | (254,769,928 | ) |
| | | | |
| |
Net change in unrealized appreciation (depreciation) | | | 535,087,673 | |
| | | | |
| |
Net realized and unrealized gain (loss) | | | 1,242,595,438 | |
| | | | |
| |
Net increase (decrease) in net assets resulting from operations | | $ | 1,463,766,662 | |
| | | | |
| | | | |
| | | |
| franklintempleton.com | | The accompanying notes are an integral part of these financial statements. | Annual Report | | 19 |
FRANKLIN MANAGED TRUST
FINANCIAL STATEMENTS
Statements of Changes in Net Assets
Franklin Rising Dividends Fund
| | | | | | | | |
| | | Year Ended September 30, | |
| | | | |
| | | 2019 | | | 2018 | |
| |
Increase (decrease) in net assets: | | | | | | | | |
Operations: | | | | | | | | |
Net investment income | | | $ 221,171,224 | | | | $ 208,408,121 | |
Net realized gain (loss) | | | 707,507,765 | | | | 433,342,583 | |
Net change in unrealized appreciation (depreciation) | | | 535,087,673 | | | | 2,169,741,941 | |
| | | | |
| | |
Net increase (decrease) in net assets resulting from operations | | | 1,463,766,662 | | | | 2,811,492,645 | |
| | | | |
Distributions to shareholders: | | | | | | | | |
Class A | | | (556,211,379 | ) | | | (398,280,274 | ) |
Class C | | | (97,026,206 | ) | | | (79,151,118 | ) |
Class R | | | (8,500,824 | ) | | | (7,035,147 | ) |
Class R6 | | | (83,190,016 | ) | | | (52,273,566 | ) |
Advisor Class | | | (137,066,020 | ) | | | (93,524,891 | ) |
| | | | |
| | |
Total distributions to shareholders | | | (881,994,445 | ) | | | (630,264,996 | ) |
| | | | |
Capital share transactions: (Note 2) | | | | | | | | |
Class A | | | 537,873,957 | | | | (678,802,613 | ) |
Class C | | | (640,012,448 | ) | | | (256,671,681 | ) |
Class R | | | (13,215,686 | ) | | | (47,107,968 | ) |
Class R6 | | | 55,614,611 | | | | 1,056,881,995 | |
Advisor Class | | | 290,951,288 | | | | (727,919,166 | ) |
| | | | |
| | |
Total capital share transactions | | | 231,211,722 | | | | (653,619,433 | ) |
| | | | |
| | |
Net increase (decrease) in net assets | | | 812,983,939 | | | | 1,527,608,216 | |
Net assets: | | | | | | | | |
Beginning of year | | | 20,105,970,734 | | | | 18,578,362,518 | |
| | | | |
| | |
End of year | | | $20,918,954,673 | | | | $20,105,970,734 | |
| | | | |
| | | | |
| | | |
20 | | Annual Report | The accompanying notes are an integral part of these financial statements. | | franklintempleton.com |
FRANKLIN MANAGED TRUST
Notes to Financial Statements
Franklin Rising Dividends Fund
1. Organization and Significant Accounting Policies
Franklin Managed Trust (Trust) is registered under the Investment Company Act of 1940 (1940 Act) as anopen-end management investment company, consisting of one fund, Franklin Rising Dividends Fund (Fund) and applies the specialized accounting and reporting guidance in U.S. Generally Accepted Accounting Principles (U.S. GAAP). The Fund offers five classes of shares: Class A, Class C, Class R, Class R6 and Advisor Class. Beginning on October 19, 2018, Class C shares automatically convert to Class A shares after they have been held for 10 years. Each class of shares may differ by its initial sales load, contingent deferred sales charges, voting rights on matters affecting a single class, its exchange privilege and fees due to differing arrangements for distribution and transfer agent fees.
The following summarizes the Fund’s significant accounting policies.
a. Financial Instrument Valuation
The Fund’s investments in financial instruments are carried at fair value daily. Fair value is the price that would be received to sell an asset or paid to transfer a liability in an orderly transaction between market participants on the measurement date. The Fund calculates the net asset value (NAV) per share each business day as of 4 p.m. Eastern time or the regularly scheduled close of the New York Stock Exchange (NYSE), whichever is earlier. Under compliance policies and procedures approved by the Fund’s Board of Trustees (the Board), the Fund’s administrator has responsibility for oversight of valuation, including leading the cross-functional Valuation Committee (VC). The Fund may utilize independent pricing services, quotations from securities and financial instrument dealers, and other market sources to determine fair value.
Equity securities listed on an exchange or on the NASDAQ National Market System are valued at the last quoted sale price or the official closing price of the day, respectively. Foreign equity securities are valued as of the close of trading on the foreign stock exchange on which the security is primarily traded, or as of 4 p.m. Eastern time. The value is then converted into its U.S. dollar equivalent at the foreign exchange rate in effect at 4 p.m. Eastern time on the day that the value of the security is determined.Over-the-counter (OTC) securities are valued within the range of the most recent quoted bid and ask prices. Securities that trade in multiple markets or on multiple exchanges are valued
according to the broadest and most representative market. Certain equity securities are valued based upon fundamental characteristics or relationships to similar securities.
Investments inopen-end mutual funds are valued at the closing NAV.
The Fund has procedures to determine the fair value of financial instruments for which market prices are not reliable or readily available. Under these procedures, the Fund primarily employs a market-based approach which may use related or comparable assets or liabilities, recent transactions, market multiples, book values, and other relevant information for the investment to determine the fair value of the investment. An income-based valuation approach may also be used in which the anticipated future cash flows of the investment are discounted to calculate fair value. Discounts may also be applied due to the nature or duration of any restrictions on the disposition of the investments. Due to the inherent uncertainty of valuations of such investments, the fair values may differ significantly from the values that would have been used had an active market existed.
Trading in securities on foreign securities stock exchanges and OTC markets may be completed before 4 p.m. Eastern time. In addition, trading in certain foreign markets may not take place on every Fund’s business day. Occasionally, events occur between the time at which trading in a foreign security is completed and 4 p.m. Eastern time that might call into question the reliability of the value of a portfolio security held by the Fund. As a result, differences may arise between the value of the Fund’s portfolio securities as determined at the foreign market close and the latest indications of value at 4 p.m. Eastern time. In order to minimize the potential for these differences, the VC monitors price movements following the close of trading in foreign stock markets through a series of country specific market proxies (such as baskets of American Depositary Receipts, futures contracts and exchange traded funds). These price movements are measured against established trigger thresholds for each specific market proxy to assist in determining if an event has occurred that may call into question the reliability of the values of the foreign securities held by the Fund. If such an event occurs, the securities may be valued using fair value procedures, which may include the use of independent pricing services.
| | | | |
| | | |
| franklintempleton.com | | Annual Report | | 21 |
FRANKLIN MANAGED TRUST
NOTES TO FINANCIAL STATEMENTS
Franklin Rising Dividends Fund(continued)
1. Organization and Significant Accounting
Policies(continued)
a. Financial Instrument Valuation(continued)
When the last day of the reporting period is anon-business day, certain foreign markets may be open on those days that the Fund’s NAV is not calculated, which could result in differences between the value of the Fund’s portfolio securities on the last business day and the last calendar day of the reporting period. Any significant security valuation changes due to an open foreign market are adjusted and reflected by the Fund for financial reporting purposes.
b. Foreign Currency Translation
Portfolio securities and other assets and liabilities denominated in foreign currencies are translated into U.S. dollars based on the exchange rate of such currencies against U.S. dollars on the date of valuation. The Fund may enter into foreign currency exchange contracts to facilitate transactions denominated in a foreign currency. Purchases and sales of securities, income and expense items denominated in foreign currencies are translated into U.S. dollars at the exchange rate in effect on the transaction date. Portfolio securities and assets and liabilities denominated in foreign currencies contain risks that those currencies will decline in value relative to the U.S. dollar. Occasionally, events may impact the availability or reliability of foreign exchange rates used to convert the U.S. dollar equivalent value. If such an event occurs, the foreign exchange rate will be valued at fair value using procedures established and approved by the Board.
The Fund does not separately report the effect of changes in foreign exchange rates from changes in market prices on securities held. Such changes are included in net realized and unrealized gain or loss from investments in the Statement of Operations.
Realized foreign exchange gains or losses arise from sales of foreign currencies, currency gains or losses realized between the trade and settlement dates on securities transactions and the difference between the recorded amounts of dividends, interest, and foreign withholding taxes and the U.S. dollar equivalent of the amounts actually received or paid. Net unrealized foreign exchange gains and losses arise from changes in foreign exchange rates on foreign denominated assets and liabilities other than investments in securities held at the end of the reporting period.
c. Income and Deferred Taxes
It is the Fund’s policy to qualify as a regulated investment company under the Internal Revenue Code. The Fund intends to distribute to shareholders substantially all of its taxable income and net realized gains to relieve it from federal income and excise taxes. As a result, no provision for U.S. federal income taxes is required.
The Fund may be subject to foreign taxation related to income received, capital gains on the sale of securities and certain foreign currency transactions in the foreign jurisdictions in which it invests. Foreign taxes, if any, are recorded based on the tax regulations and rates that exist in the foreign markets in which the Fund invests. When a capital gain tax is determined to apply, the Fund records an estimated deferred tax liability in an amount that would be payable if the securities were disposed of on the valuation date.
The Fund may recognize an income tax liability related to its uncertain tax positions under U.S. GAAP when the uncertain tax position has a less than 50% probability that it will be sustained upon examination by the tax authorities based on its technical merits. As of September 30, 2019, the Fund has determined that no tax liability is required in its financial statements related to uncertain tax positions for any open tax years (or expected to be taken in future tax years). Open tax years are those that remain subject to examination and are based on the statute of limitations in each jurisdiction in which the Fund invests.
d. Security Transactions, Investment Income, Expenses and Distributions
Security transactions are accounted for on trade date. Realized gains and losses on security transactions are determined on a specific identification basis. Estimated expenses are accrued daily. Dividend income is recorded on theex-dividend date except for certain dividends from securities where the dividend rate is not available. In such cases, the dividend is recorded as soon as the information is received by the Fund. Distributions to shareholders are recorded on theex-dividend date. Distributable earnings are determined according to income tax regulations (tax basis) and may differ from earnings recorded in accordance with U.S. GAAP. These differences may be permanent or temporary. Permanent differences are reclassified among capital accounts to reflect their tax character. These
| | | | |
| | | |
22 | | Annual Report | | franklintempleton.com |
FRANKLIN MANAGED TRUST
NOTES TO FINANCIAL STATEMENTS
Franklin Rising Dividends Fund(continued)
reclassifications have no impact on net assets or the results of operations. Temporary differences are not reclassified, as they may reverse in subsequent periods.
Realized and unrealized gains and losses and net investment income, excluding class specific expenses, are allocated daily to each class of shares based upon the relative proportion of net assets of each class. Differences in per share distributions by class are generally due to differences in class specific expenses.
e. Accounting Estimates
The preparation of financial statements in accordance with U.S. GAAP requires management to make estimates and assumptions that affect the reported amounts of assets and liabilities at the date of the financial statements and the amounts of income and expenses during the reporting period. Actual results could differ from those estimates.
f. Guarantees and Indemnifications
Under the Fund’s organizational documents, its officers and trustees are indemnified by the Fund against certain liabilities arising out of the performance of their duties to the Fund. Additionally, in the normal course of business, the Fund enters into contracts with service providers that contain general indemnification clauses. The Fund’s maximum exposure under these arrangements is unknown as this would involve future claims that may be made against the Fund that have not yet occurred. Currently, the Fund expects the risk of loss to be remote.
2. Shares of Beneficial Interest
At September 30, 2019, there were an unlimited number of shares authorized (without par value). Transactions in the Fund’s shares were as follows:
| | | | | | | | | | | | | | | | |
| | | Year Ended September 30, | |
| | | 2019 | | | 2018 | |
| | | Shares | | | Amount | | | Shares | | | Amount | |
Class A Shares: | | | | | | | | | | | | | | | | |
| | | | |
Shares solda | | | 28,898,162 | | | $ | 1,814,790,163 | | | | 18,808,403 | | | $ | 1,161,605,875 | |
Shares issued in reinvestment of distributions | | | 8,546,829 | | | | 532,972,074 | | | | 6,321,101 | | | | 380,073,730 | |
Shares redeemed | | | (28,830,030 | ) | | | (1,809,888,280 | ) | | | (36,031,200 | ) | | | (2,220,482,218 | ) |
| | | | |
Net increase (decrease) | | | 8,614,961 | | | $ | 537,873,957 | | | | (10,901,696 | ) | | $ | (678,802,613 | ) |
| | | | |
Class C Shares: | | | | | | | | | | | | | | | | |
Shares sold | | | 4,375,914 | | | $ | 267,309,828 | | | | 4,472,054 | | | $ | 271,543,395 | |
Shares issued in reinvestment of distributions | | | 1,489,574 | | | | 90,625,119 | | | | 1,251,893 | | | | 74,169,651 | |
Shares redeemeda | | | (16,149,596 | ) | | | (997,947,395 | ) | | | (9,930,838 | ) | | | (602,384,727 | ) |
| | | | |
Net increase (decrease) | | | (10,284,108 | ) | | $ | (640,012,448 | ) | | | (4,206,891 | ) | | $ | (256,671,681 | ) |
| | | | |
Class R Shares: | | | | | | | | | | | | | | | | |
| | | | |
Shares sold | | | 588,478 | | | $ | 36,918,338 | | | | 601,475 | | | $ | 37,034,012 | |
Shares issued in reinvestment of distributions | | | 125,116 | | | | 7,762,164 | | | | 104,447 | | | | 6,266,855 | |
Shares redeemed | | | (927,897 | ) | | | (57,896,188 | ) | | | (1,473,997 | ) | | | (90,408,835 | ) |
| | | | |
Net increase (decrease) | | | (214,303 | ) | | $ | (13,215,686 | ) | | | (768,075 | ) | | $ | (47,107,968 | ) |
| | | | |
| | | |
| franklintempleton.com | | Annual Report | | 23 |
FRANKLIN MANAGED TRUST
NOTES TO FINANCIAL STATEMENTS
Franklin Rising Dividends Fund(continued)
2. Shares of Beneficial Interest(continued)
| | | | | | | | | | | | | | | | |
| | | Year Ended September 30, | |
| | | 2019 | | | 2018 | |
| | | Shares | | | Amount | | | Shares | | | Amount | |
Class R6 Shares: | | | | | | | | | | | | | | | | |
| | | | |
Shares soldb | | | 6,524,045 | | | $ | 408,198,694 | | | | 21,976,032 | | | $ | 1,333,219,973 | |
Shares issued in reinvestment of distributions | | | 1,255,823 | | | | 78,349,767 | | | | 816,532 | | | | 49,038,863 | |
Shares redeemed | | | (6,886,545 | ) | | | (430,933,850 | ) | | | (5,249,456 | ) | | | (325,376,841 | ) |
| | | | |
Net increase (decrease) | | | 893,323 | | | $ | 55,614,611 | | | | 17,543,108 | | | $ | 1,056,881,995 | |
| | | | |
Advisor Class Shares: | | | | | | | | | | | | | | | | |
Shares sold | | | 13,526,867 | | | $ | 842,087,025 | | | | 10,750,124 | | | $ | 664,749,442 | |
Shares issued in reinvestment of distributions | | | 1,980,058 | | | | 123,585,579 | | | | 1,396,205 | | | | 83,752,170 | |
Shares redeemedb | | | (10,781,721 | ) | | | (674,721,316 | ) | | | (24,307,052 | ) | | | (1,476,420,778 | ) |
| | | | |
Net increase (decrease) | | | 4,725,204 | | | $ | 290,951,288 | | | | (12,160,723 | ) | | $ | (727,919,166 | ) |
aMay include a portion of Class C shares that were automatically converted to Class A.
bEffective October 25, 2017, a portion of Advisor Class shares were exchanged into Class R6.
3. Transactions with Affiliates
Franklin Resources, Inc. is the holding company for various subsidiaries that together are referred to as Franklin Templeton. Certain officers and trustees of the Fund are also officers and/or directors of the following subsidiaries:
| | | | |
| Subsidiary | | Affiliation | | |
| | |
| Franklin Advisers, Inc. (Advisers) | | Investment manager | | |
| | |
| Franklin Templeton Services, LLC (FT Services) | | Administrative manager | | |
| | |
| Franklin Templeton Distributors, Inc. (Distributors) | | Principal underwriter | | |
| | |
| Franklin Templeton Investor Services, LLC (Investor Services) | | Transfer agent | | |
a. Management Fees
The Fund pays an investment management fee to Advisers based on the average daily net assets of the Fund as follows:
| | | | |
| Annualized Fee Rate | | Net Assets | | |
| | |
| 0.750% | | Up to and including $500 million | | |
| | |
| 0.625% | | Over $500 million, up to and including $1 billion | | |
| | |
| 0.500% | | Over $1 billion, up to and including $5 billion | | |
| | |
| 0.490% | | Over $5 billion, up to and including $10 billion | | |
| | |
| 0.480% | | Over $10 billion, up to and including $20 billion | | |
| | |
| 0.470% | | In excess of $20 billion | | |
For the year ended September 30, 2019, the gross effective investment management fee rate was 0.497% of the Fund’s average daily net assets.
| | | | |
| | | |
24 | | Annual Report | | franklintempleton.com |
FRANKLIN MANAGED TRUST
NOTES TO FINANCIAL STATEMENTS
Franklin Rising Dividends Fund(continued)
b. Administrative Fees
Under an agreement with Advisers, FT Services provides administrative services to the Fund. The fee is paid by Advisers based on the Fund’s average daily net assets, and is not an additional expense of the Fund.
c. Distribution Fees
The Board has adopted distribution plans for each share class, with the exception of Class R6 and Advisor Class shares, pursuant to Rule12b-1 under the 1940 Act. Under the Fund’s Class A reimbursement distribution plan, the Fund reimburses Distributors for costs incurred in connection with the servicing, sale and distribution of the Fund’s shares up to the maximum annual plan rate. Under the Class A reimbursement distribution plan, costs exceeding the maximum for the current plan year cannot be reimbursed in subsequent periods. In addition, under the Fund’s Class C and R compensation distribution plans, the Fund pays Distributors for costs incurred in connection with the servicing, sale and distribution of the Fund’s shares up to the maximum annual plan rate for each class. The plan year, for purposes of monitoring compliance with the maximum annual plan rates, is February 1 through January 31.
The maximum annual plan rates, based on the average daily net assets, for each class, are as follows:
| | | | |
Class A | | | 0.25 | % |
Class C | | | 1.00 | % |
Class R | | | 0.50 | % |
d. Sales Charges/Underwriting Agreements
Front-end sales charges and contingent deferred sales charges (CDSC) do not represent expenses of the Fund. These charges are deducted from the proceeds of sales of Fund shares prior to investment or from redemption proceeds prior to remittance, as applicable. Distributors has advised the Fund of the following commission transactions related to the sales and redemptions of the Fund’s shares for the year:
| | | | |
Sales charges retained net of commissions paid to unaffiliated brokers/dealers | | $ | 2,029,883 | |
CDSC retained | | $ | 113,655 | |
e. Transfer Agent Fees
Each class of shares pays transfer agent fees to Investor Services for its performance of shareholder servicing obligations. The fees are based on an annualized asset based fee of 0.02% plus a transaction based fee. In addition, each class reimburses Investor Services for out of pocket expenses incurred and, except for Class R6, reimburses shareholder servicing fees paid to third parties. These fees are allocated daily based upon their relative proportion of such classes’ aggregate net assets. Class R6 pays Investor Services transfer agent fees specific to that class.
For the year ended September 30, 2019, the Fund paid transfer agent fees of $19,918,209, of which $8,118,759 was retained by Investor Services.
| | | | |
| | | |
| franklintempleton.com | | Annual Report | | 25 |
FRANKLIN MANAGED TRUST
NOTES TO FINANCIAL STATEMENTS
Franklin Rising Dividends Fund(continued)
3. Transactions with Affiliates(continued)
f. Investments in Affiliated Management Investment Companies
The Fund invests in one or more affiliated management investment companies for purposes other than exercising a controlling influence over the management or policies. Management fees paid by the Fund are waived on assets invested in the affiliated management investment companies, as noted in the Statement of Operations, in an amount not to exceed the management and administrative fees paid directly or indirectly by each affiliate. During the year ended September 30, 2019, the Fund held investments in affiliated management investment companies as follows:
| | | | | | | | | | | | | | | | | | | | | | | | | | | | | | | | |
| | | Value at
Beginning
of Year | | | Purchases | | | Sales | | | Realized
Gain (Loss) | | | Net Change in
Unrealized
Appreciation
(Depreciation) | | | Value at End of Year | | | Number of
Shares
Held at End
of Year | | | Dividend
Income | |
Non-Controlled Affiliates | | | | | | | | | | | | | | | | | | | | | | | | | | | | | | | | |
| | | | | | | | |
Institutional Fiduciary Trust Money Market Portfolio, 1.71% | | $ | 222,499,729 | | | $ | 807,552,514 | | | $ | (779,475,236 | ) | | | $ — | | | | $ — | | | $ | 250,577,007 | | | | 250,577,007 | | | | $3,608,534 | |
g. Waiver and Expense Reimbursements
Investor Services has contractually agreed in advance to waive or limit its fees so that the Class R6 transfer agent fees do not exceed 0.03% based on the average net assets of the class until January 31, 2020.
Prior to February 1, 2019, the Class R6 transfer agent fees were limited to 0.02% based on the average net assets of the class.
4. Expense Offset Arrangement
The Fund has entered into an arrangement with its custodian whereby credits realized as a result of uninvested cash balances are used to reduce a portion of the Fund’s custodian expenses. During the year ended September 30, 2019, the custodian fees were reduced as noted in the Statement of Operations.
5. Income Taxes
The tax character of distributions paid during the years ended September 30, 2019 and 2018, was as follows:
| | | | | | | | |
| | | 2019 | | | 2018 |
| | | | |
Distributions paid from: | | | | | | | | |
| | |
Ordinary income | | $ | 222,578,976 | | | $ | 220,379,087 | |
| | |
Long term capital gain | | | 659,415,469 | | | | 409,885,909 | |
| | | | |
| | |
| | $ | 881,994,445 | | | $ | 630,264,996 | |
| | | | |
| | | | |
| | | |
26 | | Annual Report | | franklintempleton.com |
FRANKLIN MANAGED TRUST
NOTES TO FINANCIAL STATEMENTS
Franklin Rising Dividends Fund(continued)
At September 30, 2019, the cost of investments, net unrealized appreciation (depreciation), undistributed ordinary income and undistributed long term capital gains for income tax purposes were as follows:
| | | | |
Cost of investments | | $ | 11,014,338,519 | |
| |
Unrealized appreciation | | $ | 10,727,007,244 | |
| |
Unrealized depreciation | | | (805,713,677 | ) |
| |
Net unrealized appreciation (depreciation) | | $ | 9,921,293,567 | |
| |
Distributable earnings: | | | | |
| |
Undistributed ordinary income | | $ | 56,487,853 | |
| |
Undistributed long term capital gains | | | 381,909,944 | |
| |
Total distributable earnings | | $ | 438,397,797 | |
Differences between income and/or capital gains as determined on a book basis and a tax basis are primarily due to differing treatment of corporate actions.
The Fund utilized a tax accounting practice to treat a portion of the proceeds from capital shares redeemed as a distribution from realized capital gains.
6. Investment Transactions
Purchases and sales of investments (excluding short term securities) for the year ended September 30, 2019, aggregated $517,671,862 and $965,033,358, respectively.
7. Holdings of 5% Voting Securities of Portfolio Companies
The 1940 Act defines “affiliated companies” to include investments in portfolio companies in which a fund owns 5% or more of the outstanding voting securities. During the year ended September 30, 2019, investments in “affiliated companies” were as follows:
| | | | | | | | | | | | | | | | | | | | | | | | | | | | | | | | |
| Name of Issuer | | Value at
Beginning
of Year | | | Purchases | | | Sales | | | Realized
Gain (Loss) | | | Net Change in
Unrealized
Appreciation
(Depreciation) | | | Value at End of Year | | | Number of
Shares
Held at End of Year | | | Dividend
Income | |
Non-Controlled Affiliates | | | | | | | | | | | | | | | | | | | | | |
Albemarle Corp. | | $ | 705,175,194 | | | $ | 21,630,054 | | | | $ — | | | | $ — | | | $ | (217,295,601 | ) | | $ | 509,509,647 | | | | 7,328,965 | | | $ | 10,477,511 | |
Matthews International Corp., A | | | 127,326,387 | | | | — | | | | — | | | | — | | | | (37,474,327 | ) | | | 89,852,060 | | | | 2,538,911 | | | | 2,031,129 | |
| | | | | | | | |
Total Affiliated Securities(Value is 2.9% of Net Assets) | | $ | 832,501,581 | | | $ | 21,630,054 | | | | $ — | | | | $ — | | | $ | (254,769,928 | ) | | $ | 599,361,707 | | | | | | | $ | 12,508,640 | |
8. Credit Facility
The Fund, together with other U.S. registered and foreign investment funds (collectively, Borrowers), managed by Franklin Templeton, are borrowers in a joint syndicated senior unsecured credit facility totaling $2 billion (Global Credit Facility) which matures on February 7, 2020. This Global Credit Facility provides a source of funds to the Borrowers for temporary and emergency purposes, including the ability to meet future unanticipated or unusually large redemption requests.
| | | | |
| | | |
| franklintempleton.com | | Annual Report | | 27 |
FRANKLIN MANAGED TRUST
NOTES TO FINANCIAL STATEMENTS
Franklin Rising Dividends Fund(continued)
8. Credit Facility(continued)
Under the terms of the Global Credit Facility, the Fund shall, in addition to interest charged on any borrowings made by the Fund and other costs incurred by the Fund, pay its share of fees and expenses incurred in connection with the implementation and maintenance of the Global Credit Facility, based upon its relative share of the aggregate net assets of all of the Borrowers, including an annual commitment fee of 0.15% based upon the unused portion of the Global Credit Facility. These fees are reflected in other expenses in the Statement of Operations. During the year ended September 30, 2019, the Fund did not use the Global Credit Facility.
9. Fair Value Measurements
The Fund follows a fair value hierarchy that distinguishes between market data obtained from independent sources (observable inputs) and the Fund’s own market assumptions (unobservable inputs). These inputs are used in determining the value of the Fund’s financial instruments and are summarized in the following fair value hierarchy:
| | • | | Level 1 – quoted prices in active markets for identical financial instruments |
| | • | | Level 2 – other significant observable inputs (including quoted prices for similar financial instruments, interest rates, prepayment speed, credit risk, etc.) |
| | • | | Level 3 – significant unobservable inputs (including the Fund’s own assumptions in determining the fair value of financial instruments) |
The input levels are not necessarily an indication of the risk or liquidity associated with financial instruments at that level.
At September 30, 2019, all of the Fund’s investments in financial instruments carried at fair value were valued using Level 1 inputs. For detailed categories, see the accompanying Statement of Investments.
10. Subsequent Events
The Fund has evaluated subsequent events through the issuance of the financial statements and determined that no events have occurred that require disclosure.
| | | | |
| | | |
28 | | Annual Report | | franklintempleton.com |
FRANKLIN MANAGED TRUST
Report of Independent Registered Public Accounting Firm
To the Board of Trustees of Franklin Managed Trust and Shareholders of Franklin Rising Dividends Fund
Opinion on the Financial Statements
We have audited the accompanying statement of assets and liabilities, including the statement of investments, of Franklin Rising Dividends Fund (the “Fund”) as of September 30, 2019, the related statement of operations for the year ended September 30, 2019, the statement of changes in net assets for each of the two years in the period ended September 30, 2019, including the related notes, and the financial highlights for each of the four years in the period ended September 30, 2019 (collectively referred to as the “financial statements”). In our opinion, the financial statements present fairly, in all material respects, the financial position of the Fund as of September 30, 2019, the results of its operations for the year then ended, the changes in its net assets for each of the two years in the period ended September 30, 2019 and the financial highlights for each of the four years in the period ended September 30, 2019 in conformity with accounting principles generally accepted in the United States of America.
The financial statements of the Fund as of and for the year ended September 30, 2015, and the financial highlights for each of the periods ended on or prior to September 30, 2015 (not presented herein, other than the financial highlights) were audited by other auditors whose report dated November 16, 2015 expressed an unqualified opinion on those financial statements and financial highlights.
Basis for Opinion
These financial statements are the responsibility of the Fund’s management. Our responsibility is to express an opinion on the Fund’s financial statements based on our audits. We are a public accounting firm registered with the Public Company Accounting Oversight Board (United States) (PCAOB) and are required to be independent with respect to the Fund in accordance with the U.S. federal securities laws and the applicable rules and regulations of the Securities and Exchange Commission and the PCAOB.
We conducted our audits of these financial statements in accordance with the standards of the PCAOB. Those standards require that we plan and perform the audit to obtain reasonable assurance about whether the financial statements are free of material misstatement, whether due to error or fraud.
Our audits included performing procedures to assess the risks of material misstatement of the financial statements, whether due to error or fraud, and performing procedures that respond to those risks. Such procedures included examining, on a test basis, evidence regarding the amounts and disclosures in the financial statements. Our audits also included evaluating the accounting principles used and significant estimates made by management, as well as evaluating the overall presentation of the financial statements. Our procedures included confirmation of securities owned as of September 30, 2019 by correspondence with the custodian, transfer agent, and brokers; when replies were not received from brokers, we performed other auditing procedures. We believe that our audits provide a reasonable basis for our opinion.
PricewaterhouseCoopers LLP
San Francisco, California
November 14, 2019
We have served as the auditor of one or more investment companies in the Franklin Templeton Group of Funds since 1948.
| | | | |
| | | |
| franklintempleton.com | | Annual Report | | 29 |
FRANKLIN MANAGED TRUST
Franklin Rising Dividends Fund
Tax Information (unaudited)
Under Section 852(b)(3)(C) of the Internal Revenue Code, the Fund hereby reports the maximum amount allowable but no less than $678,425,537 as a long term capital gain dividend for the fiscal year ended September 30, 2019.
Under Section 854(b)(1)(A) of the Internal Revenue Code, the Fund hereby reports 100% of the ordinary income dividends as income qualifying for the dividends received deduction for the fiscal year ended September 30, 2019.
Under Section 854(b)(1)(B) of the Internal Revenue Code, the Fund hereby reports the maximum amount allowable but no less than $376,378,943 as qualified dividends for purposes of the maximum rate under Section 1(h)(11) of the Internal Revenue Code for the fiscal year ended September 30, 2019. Distributions, including qualified dividend income, paid during calendar year 2019 will be reported to shareholders on Form1099-DIV bymid-February 2020. Shareholders are advised to check with their tax advisors for information on the treatment of these amounts on their individual income tax returns.
| | | | |
| | | |
30 | | Annual Report | | franklintempleton.com |
FRANKLIN MANAGED TRUST
Board Members and Officers
The name, year of birth and address of the officers and board members, as well as their affiliations, positions held with the Fund, principal occupations during at least the past five years and number of U.S. registered portfolios overseen in the Franklin Templeton fund complex, are shown below. Generally, each board member serves until that person’s successor is elected and qualified.
Independent Board Members
| | | | | | | | |
Name, Year of Birth and Address | | Position | | Length of
Time Served | | Number of Portfolios in
Fund Complex Overseen
by Board Member* | | Other Directorships Held
During at Least the Past 5 Years |
| | | | |
Harris J. Ashton (1932) One Franklin Parkway San Mateo, CA 94403-1906 | | Trustee | | Since 2017 | | 135 | | Bar-S Foods (meat packing company) (1981-2010). |
|
Principal Occupation During at Least the Past 5 Years: Director of various companies; andformerly, Director, RBC Holdings, Inc. (bank holding company) (until 2002); and President, Chief Executive Officer and Chairman of the Board, General Host Corporation (nursery and craft centers) (until 1998). |
| | | | |
Terrence J. Checki (1945) One Franklin Parkway San Mateo, CA 94403-1906 | | Trustee | | Since 2017 | | 114 | | Hess Corporation (exploration of oil and gas) (2014-present). |
|
Principal Occupation During at Least the Past 5 Years: Member of the Council on Foreign Relations (1996-present); Member of the National Committee on U.S.-China Relations (1999-present); member of the Board of Trustees of the Economic Club of New York (2013-present); member of the Board of Trustees of the Foreign Policy Association (2005-present) and member of various other boards of trustees and advisory boards; andformerly, Executive Vice President of the Federal Reserve Bank of New York and Head of its Emerging Markets and Internal Affairs Group and Member of Management Committee (1995-2014); and Visiting Fellow at the Council on Foreign Relations (2014). |
| | | | |
Mary C. Choksi (1950) One Franklin Parkway San Mateo, CA94403-1906 | | Trustee | | Since 2017 | | 135 | | Avis Budget Group Inc. (car rental) (2007-present), Omnicom Group Inc. (advertising and marketing communications services)
(2011-present) and White Mountains Insurance Group, Ltd. (holding company) (2017-present). |
|
Principal Occupation During at Least the Past 5 Years: Director of various companies; andformerly, Founder and Senior Advisor, Strategic Investment Group (investment management group) (2015-2017); Founding Partner and Senior Managing Director, Strategic Investment Group (1987-2015); Founding Partner and Managing Director, Emerging Markets Management LLC (investment management firm) (1987-2011); and Loan Officer/Senior Loan Officer/Senior Pension Investment Officer, World Bank Group (international financial institution) (1977-1987). |
| | | | |
Edith E. Holiday (1952) One Franklin Parkway San Mateo, CA94403-1906 | | Lead
Independent
Trustee | | Trustee
since 2017
and Lead
Independent
Trustee
since March
2019 | | 135 | | Hess Corporation (exploration of oil and gas) (1993-present), Canadian National Railway (railroad)
(2001-present), White Mountains Insurance Group, Ltd. (holding company) (2004-present), Santander Consumer USA Holdings, Inc. (consumer finance) (2016-present), RTI International Metals, Inc. (manufacture and distribution of titanium) (1999-2015) and H.J. Heinz Company (processed foods and allied products) (1994-2013). |
|
Principal Occupation During at Least the Past 5 Years: Director or Trustee of various companies and trusts; andformerly, Assistant to the President of the United States and Secretary of the Cabinet
(1990-1993); General Counsel to the United States Treasury Department (1989-1990); and Counselor to the Secretary and Assistant Secretary for Public Affairs and Public Liaison-United States Treasury Department (1988-1989). |
| | | | |
| | | |
| franklintempleton.com | | Annual Report | | 31 |
FRANKLIN MANAGED TRUST
Independent Board Members(continued)
| | | | | | | | |
Name, Year of Birth and Address | | Position | | Length of
Time Served | | Number of Portfolios in
Fund Complex Overseen
by Board Member* | | Other Directorships Held
During at Least the Past 5 Years |
| | | | |
J. Michael Luttig (1954) One Franklin Parkway San Mateo, CA94403-1906 | | Trustee | | Since 2017 | | 135 | | Boeing Capital Corporation (aircraft financing) (2006-2013). |
|
Principal Occupation During at Least the Past 5 Years: Executive Vice President, Counselor and Senior Advisor to Boeing Chairman and Board of Directors, The Boeing Company (aerospace company) (May 2019); andformerly, General Counsel and member of the Executive Council, The Boeing Company (2006-2019) and Federal Appeals Court Judge, U.S. Court of Appeals for the Fourth Circuit (1991-2006). |
| | | | |
Larry D. Thompson (1945) One Franklin Parkway San Mateo, CA 94403-1906 | | Trustee | | Since 2017 | | 135 | | The Southern Company (energy company) (2014-present; previously 2010-2012), Graham Holdings Company (education and media organization) (2011-present) and Cbeyond, Inc. (business communications provider) (2010-2012). |
|
Principal Occupation During at Least the Past 5 Years: Director of various companies; Counsel, Finch McCranie, LLP (law firm) (2015-present); Independent Compliance Monitor and Auditor, Volkswagen AG (manufacturer of automobiles and commercial vehicles) (2017-present); John A. Sibley Professor of Corporate and Business Law, University of Georgia School of Law (2015-present; previously 2011-2012); andformerly, Executive Vice President - Government Affairs, General Counsel and Corporate Secretary, PepsiCo, Inc. (consumer products) (2012-2014); Senior Vice President - Government Affairs, General Counsel and Secretary, PepsiCo, Inc. (2004-2011); Senior Fellow of The Brookings Institution (2003-2004); Visiting Professor, University of Georgia School of Law (2004); and Deputy Attorney General, U.S. Department of Justice (2001-2003). |
|
| Interested Board Members and Officers |
| | | | |
Name, Year of Birth and Address | | Position | | Length of
Time Served | | Number of Portfolios in
Fund Complex Overseen
by Board Member* | | Other Directorships Held
During at Least the Past 5 Years |
**Gregory E. Johnson (1961) One Franklin Parkway San Mateo, CA 94403-1906 | | Trustee | | Since 2015 | | 147 | | None |
|
Principal Occupation During at Least the Past 5 Years: Chairman of the Board, Member - Office of the Chairman, Director and Chief Executive Officer, Franklin Resources, Inc.; officer and/or director or trustee, as the case may be, of some of the other subsidiaries of Franklin Resources, Inc. and of 42 of the investment companies in Franklin Templeton; Vice Chairman, Investment Company Institute; andformerly, President, Franklin Resources, Inc. (1994-2015). |
| | | | |
**Rupert H. Johnson, Jr. (1940) One Franklin Parkway San Mateo, CA 94403-1906 | | Chairman of
the Board,
Trustee and
Vice President | | Chairman of the
Board, Trustee
since 2017 and
Vice President
since 1991 | | 135 | | None |
|
Principal Occupation During at Least the Past 5 Years: Vice Chairman, Member - Office of the Chairman and Director, Franklin Resources, Inc.; Director, Franklin Advisers, Inc.; and officer and/or director or trustee, as the case may be, of some of the other subsidiaries of Franklin Resources, Inc. and of 40 of the investment companies in Franklin Templeton. |
| | | | |
| | | |
32 | | Annual Report | | franklintempleton.com |
FRANKLIN MANAGED TRUST
Interested Board Members and Officers(continued)
| | | | | | | | |
Name, Year of Birth and Address | | Position | | Length of
Time Served | | Number of Portfolios in
Fund Complex Overseen
by Board Member* | | Other Directorships Held
During at Least the Past 5 Years |
| | | | |
Alison E. Baur (1964) One Franklin Parkway San Mateo, CA 94403-1906 | | Vice President | | Since 2012 | | Not Applicable | | Not Applicable |
|
Principal Occupation During at Least the Past 5 Years: Deputy General Counsel, Franklin Templeton; and officer of some of the other subsidiaries of Franklin Resources, Inc. and of 44 of the investment companies in Franklin Templeton. |
| | | | |
Gaston Gardey (1967) One Franklin Parkway San Mateo, CA 94403-1906 | | Treasurer, Chief Financial Officer and Chief Accounting Officer | | Since 2017 | | Not Applicable | | Not Applicable |
|
Principal Occupation During at Least the Past 5 Years: Treasurer, U.S. Fund Administration & Reporting and officer of 26 of the investment companies in Franklin Templeton. |
| | | | |
Aliya S. Gordon (1973) One Franklin Parkway San Mateo, CA 94403-1906 | | Vice President | | Since 2009 | | Not Applicable | | Not Applicable |
|
Principal Occupation During at Least the Past 5 Years: Senior Associate General Counsel, Franklin Templeton; Vice President and Secretary, Franklin Resources, Inc.; and officer of 44 of the investment companies in Franklin Templeton. |
| | | | |
Steven J. Gray (1955) One Franklin Parkway San Mateo, CA 94403-1906 | | Vice President and Co- Secretary | | Vice President
since 2009 and
Co-Secretary
January 2019 | | Not Applicable | | Not Applicable |
|
Principal Occupation During at Least the Past 5 Years: Senior Associate General Counsel, Franklin Templeton; Vice President, Franklin Templeton Distributors, Inc. and FASA, LLC; and officer of 44 of the investment companies in Franklin Templeton. |
| | | | |
Matthew T. Hinkle (1971) One Franklin Parkway San Mateo, CA 94403-1906 | | Chief Executive Officer – Finance and Administration | | Since 2017 | | Not Applicable | | Not Applicable |
|
Principal Occupation During at Least the Past 5 Years: Senior Vice President, Franklin Templeton Services, LLC; officer of 44 of the investment companies in Franklin Templeton; andformerly, Vice President, Global Tax (2012-April 2017) and Treasurer/Assistant Treasurer, Franklin Templeton (2009-2017). |
| | | | |
Robert Lim (1948) One Franklin Parkway San Mateo, CA 94403-1906 | | Vice President – AML Compliance | | Since 2016 | | Not Applicable | | Not Applicable |
|
Principal Occupation During at Least the Past 5 Years: Vice President, Franklin Templeton Companies, LLC; Chief Compliance Officer, Franklin Templeton Distributors, Inc. and Franklin Templeton Investor Services, LLC; and officer of 44 of the investment companies in Franklin Templeton. |
| | | | |
Kimberly H. Novotny (1972) 300 S.E. 2nd Street Fort Lauderdale, FL 33301-1923 | | Vice President | | Since 2013 | | Not Applicable | | Not Applicable |
|
Principal Occupation During at Least the Past 5 Years: Senior Associate General Counsel, Franklin Templeton; Vice President and Corporate Secretary, Fiduciary Trust International of the South; Vice President, Templeton Investment Counsel, LLC; Assistant Secretary, Franklin Resources, Inc.; and officer of 44 of the investment companies in Franklin Templeton. |
| | | | |
| | | |
| franklintempleton.com | | Annual Report | | 33 |
FRANKLIN MANAGED TRUST
Interested Board Members and Officers(continued)
| | | | | | | | |
Name, Year of Birth and Address | | Position | | Length of
Time Served | | Number of Portfolios in
Fund Complex Overseen
by Board Member* | | Other Directorships Held
During at Least the Past 5 Years |
| | | | |
Robert C. Rosselot (1960) 300 S.E. 2nd Street Fort Lauderdale, FL33301-1923 | | Chief Compliance Officer | | Since 2013 | | Not Applicable | | Not Applicable |
|
Principal Occupation During at Least the Past 5 Years: Director, Global Compliance, Franklin Templeton; Vice President, Franklin Templeton Companies, LLC; officer of 44 of the investment companies in Franklin Templeton; andformerly, Senior Associate General Counsel, Franklin Templeton (2007-2013); and Secretary and Vice President, Templeton Group of Funds (2004-2013). |
| | | | |
Donald G. Taylor (1954) 280 Park Avenue New York, NY 10017 | | President and Chief Executive Officer- Investment Management | | Since 2014 | | Not Applicable | | Not Applicable |
|
Principal Occupation During at Least the Past 5 Years: Officer of one of the investment companies in Franklin Templeton; andformerly, President and Chief Investment Officer, Franklin Advisory Services, LLC (1999-2017). |
| | | | |
Navid J. Tofigh (1972) One Franklin Parkway San Mateo, CA 94403-1906 | | Vice President | | Since 2015 | | Not Applicable | | Not Applicable |
|
Principal Occupation During at Least the Past 5 Years: Associate General Counsel and officer of 44 of the investment companies in Franklin Templeton. |
| | | | |
Craig S. Tyle (1960) One Franklin Parkway San Mateo, CA 94403-1906 | | Vice President | | Since 2005 | | Not Applicable | | Not Applicable |
|
Principal Occupation During at Least the Past 5 Years: General Counsel and Executive Vice President, Franklin Resources, Inc.; and officer of some of the other subsidiaries of Franklin Resources, Inc. and of 44 of the investment companies in Franklin Templeton. |
| | | | |
Lori A. Weber (1964) 300 S.E. 2nd Street Fort Lauderdale, FL33301-1923 | | Vice President and Co- Secretary | | Vice President
since2011 and Co-
Secretary since
January 2019 | | Not Applicable | | Not Applicable |
|
Principal Occupation During at Least the Past 5 Years: Senior Associate General Counsel, Franklin Templeton; Assistant Secretary, Franklin Resources, Inc.; Vice President and Secretary, Templeton Investment Counsel, LLC; and officer of 44 of the investment companies in Franklin Templeton. |
| | | | |
| | | |
34 | | Annual Report | | franklintempleton.com |
FRANKLIN MANAGED TRUST
*We base the number of portfolios on each separate series of the U.S. registered investment companies within the Franklin Templeton fund complex. These portfolios have a common investment manager or affiliated investment managers.
**Gregory E. Johnson is considered to be an interested person of the Fund under the federal securities laws due to his position as an officer and director of Franklin Resources, Inc. (Resources), which is the parent company of the Fund’s investment manager and distributor. Rupert H. Johnson, Jr. is considered to be an interested person of the Fund under the federal securities laws due to his position as an officer and director and major shareholder of Resources.
Note 1: Rupert H. Johnson, Jr. is the uncle of Gregory E. Johnson.
Note 2: Effective March 12, 2019, John B. Wilson ceased to be a trustee of the Trust.
Note 3: Officer information is current as of the date of this report. It is possible that after this date, information about officers may change.
The Sarbanes-Oxley Act of 2002 and Rules adopted by the Securities and Exchange Commission require the Fund to disclose whether the Fund’s Audit Committee includes at least one member who is an audit committee financial expert within the meaning of such Act and Rules. The Fund’s Board has determined that there is at least one such financial expert on the Audit Committee and has designated Mary C. Choksi as its audit committee financial expert. The Board believes that Ms. Choksi qualifies as such an expert in view of her extensive business background and experience. She currently serves as a director of Avis Budget Group, Inc. (2007-present) and formerly, Founder and Senior Advisor, Strategic Investment Group (1987 to 2017). Ms. Choksi has been a Member of the Fund’s Audit Committee since 2017. As a result of such background and experience, the Board believes that Ms. Choksi has acquired an understanding of generally accepted accounting principles and financial statements, the general application of such principles in connection with the accounting estimates, accruals and reserves, and analyzing and evaluating financial statements that present a breadth and level of complexity of accounting issues generally comparable to those of the Fund, as well as an understanding of internal controls and procedures for financial reporting and an understanding of audit committee functions. Ms. Choksi is an independent Board member as that term is defined under the relevant Securities and Exchange Commission Rules and Releases.
The Statement of Additional Information (SAI) includes additional information about the board members and is available, without charge, upon request. Shareholders may call (800) DIALBEN/342-5236 to request the SAI.
| | | | |
| | | |
| franklintempleton.com | | Annual Report | | 35 |
FRANKLIN MANAGED TRUST
FRANKLIN RISING DIVIDENDS FUND
Shareholder Information
Board Review of Investment
Management Agreements
FRANKLIN MANAGED TRUST
Franklin Rising Dividends Fund
(Fund)
At anin-person meeting held on April 16, 2019 (Meeting), the Board of Trustees (Board) of Franklin Managed Trust (Trust), including a majority of the trustees who are not “interested persons” as defined in the Investment Company Act of 1940 (Independent Trustees), reviewed and approved the continuance of the investment management agreement between Franklin Advisers, Inc. (Manager) and the Trust, on behalf of the Fund (Management Agreement) for an additionalone-year period. The Independent Trustees received advice from and met separately with Independent Trustee counsel in considering whether to approve the continuation of the Management Agreement.
In considering the continuation of the Management Agreement, the Board reviewed and considered information provided by the Manager at the Meeting and throughout the year at meetings of the Board and its committees. The Board also reviewed and considered information provided in response to a detailed set of requests for information submitted to the Manager by Independent Trustee counsel on behalf of the Independent Trustees in connection with the annual contract renewal process. In addition, prior to the Meeting, the Independent Trustees held a telephonic contract renewal meeting at which the Independent Trustees conferred amongst themselves and Independent Trustee counsel about contract renewal matters. The Board reviewed and considered all of the factors it deemed relevant in approving the continuance of the Management Agreement, including, but not limited to: (i) the nature, extent and quality of the services provided by the Manager; (ii) the investment performance of the Fund; (iii) the costs of the services provided and profits realized by the Manager and its affiliates from the relationship with the Fund; (iv) the extent to which economies of scale are realized as the Fund grows; and (v) whether fee levels reflect these economies of scale for the benefit of Fund investors.
In approving the continuance of the Management Agreement, the Board, including a majority of the Independent Trustees, determined that the terms of the Management Agreement are fair and reasonable and that the continuance of such Management Agreement is in the interests of the Fund and its shareholders. While attention
was given to all information furnished, the following discusses some primary factors relevant to the Board’s determination.
Nature, Extent and Quality of Services
The Board reviewed and considered information regarding the nature, extent and quality of investment management services provided by the Manager and its affiliates to the Fund and its shareholders. This information included, among other things, the qualifications, background and experience of the senior management and investment personnel of the Manager; the structure of investment personnel compensation; oversight of third-party service providers; investment performance reports and related financial information for the Fund; reports on expenses, shareholder services, marketing support payments made to financial intermediaries and third party servicing arrangements; legal and compliance matters; risk controls; pricing and other services provided by the Manager and its affiliates; and management fees charged by the Manager and its affiliates to US funds and other accounts, including management’s explanation of differences among accounts where relevant. The Board also reviewed and considered an annual report on payments made by Franklin Templeton Investments (FTI) or the Fund to financial intermediaries, as well as a memorandum relating to third-party servicing arrangements in response to a guidance update in 2016 from the US Securities and Exchange Commission (SEC) relating to mutual fund distribution andsub-accounting fees. The Board noted management’s continuing efforts and expenditures in establishing effective business continuity plans and developing strategies to address areas of heightened concern in the mutual fund industry, such as cybersecurity and liquidity risk management. The Board also recognized management’s commitment to facilitating Board oversight of liquidity through the designation of a liquidity/risk administrator and the development of reports that highlight the amount of illiquid investments for the Fund.
The Board also reviewed and considered the benefits provided to Fund shareholders of investing in a fund that is part of the Franklin Templeton family of funds. The Board noted the financial position of Franklin Resources, Inc. (FRI), the Manager’s parent, and its commitment to the mutual fund business as evidenced by its continued introduction of new funds, reassessment of the fund offerings in response to the market environment and project initiatives and capital investments relating to the services provided to the Fund by the FTI organization.
| | | | |
| | | |
36 | | Annual Report | | franklintempleton.com |
FRANKLIN MANAGED TRUST
FRANKLIN RISING DIVIDENDS FUND
SHAREHOLDER INFORMATION
Following consideration of such information, the Board was satisfied with the nature, extent and quality of services provided by the Manager and its affiliates to the Fund and its shareholders.
Fund Performance
The Board reviewed and considered the performance results of the Fund over various time periods ended December 31, 2018. The Board considered the performance returns for the Fund in comparison to the performance returns of mutual funds deemed comparable to the Fund included in a universe (Performance Universe) selected by Broadridge Financial Solutions, Inc. (Broadridge), an independent provider of investment company data. The Board received a description of the methodology used by Broadridge to select the mutual funds included in a Performance Universe. The Board also reviewed and considered Fund performance reports provided and discussions that occurred with portfolio managers at Board meetings throughout the year. A summary of the Fund’s performance results is below.
The Performance Universe for the Fund included the Fund and all retail and institutionalmulti-cap core funds. The Board noted that the Fund’s annualized total return for the10-year period was below the median of its Performance Universe, but for theone-, three- and five-year periods was above the median of its Performance Universe. The Board concluded that the Fund’s performance was satisfactory.
Comparative Fees and Expenses
The Board reviewed and considered information regarding the Fund’s actual total expense ratio and its various components, including, as applicable, management fees; transfer agent expenses; underlying fund expenses; Rule12b-1 andnon-Rule12b-1 service fees; and othernon-management fees. The Board also noted the quarterly and annual reports it receives on all marketing support payments made by FTI to financial intermediaries. The Board considered the actual total expense ratio and, separately, the contractual management fee rate, without the effect of fee waivers, if any (Management Rate) of the Fund in comparison to the median expense ratio and median Management Rate, respectively, of other mutual funds deemed comparable to and with a similar expense structure to the Fund selected by Broadridge (Expense Group). Broadridge fee and expense data is based upon information taken from each fund’s most recent annual report, which reflects historical asset levels that may be quite different from those currently existing, particularly in a period of market volatility. While recognizing such inherent limitation
and the fact that expense ratios and Management Rates generally increase as assets decline and decrease as assets grow, the Board believed the independent analysis conducted by Broadridge to be an appropriate measure of comparative fees and expenses. The Broadridge Management Rate includes administrative charges, and the actual total expense ratio, for comparative consistency, was shown for Class A shares for funds with multiple classes of shares. The Board received a description of the methodology used by Broadridge to select the mutual funds included in an Expense Group.
The Expense Group for the Fund included the Fund and 10 othermulti-cap core funds. The Board noted that the Management Rate and actual total expense ratio for the Fund were below the medians and in the first quintile (least expensive) of its Expense Group. The Board concluded that the Management Rate charged to the Fund is reasonable.
Profitability
The Board reviewed and considered information regarding the profits realized by the Manager and its affiliates in connection with the operation of the Fund. In this respect, the Board considered the Fund profitability analysis provided by the Manager that addresses the overall profitability of FTI’s US fund business, as well as its profits in providing investment management and other services to each of the individual funds during the12-month period ended September 30, 2018, being the most recent fiscalyear-end for FRI. The Board noted that although management continually makes refinements to its methodologies used in calculating profitability in response to organizational and product related changes, the overall methodology has remained consistent with that used in the Fund’s profitability report presentations from prior years. Additionally, PricewaterhouseCoopers LLP, auditor to FRI and certain Franklin Templeton funds, has been engaged by the Manager to periodically review and assess the allocation methodologies to be used solely by the Fund’s Board with respect to the profitability analysis.
The Board noted management’s belief that costs incurred in establishing the infrastructure necessary for the type of mutual fund operations conducted by the Manager and its affiliates may not be fully reflected in the expenses allocated to the Fund in determining its profitability, as well as the fact that the level of profits, to a certain extent, reflected operational cost savings and efficiencies initiated by management. The Board also noted management’s expenditures in improving shareholder services provided to
| | | | |
| | | |
| franklintempleton.com | | Annual Report | | 37 |
FRANKLIN MANAGED TRUST
FRANKLIN RISING DIVIDENDS FUND
SHAREHOLDER INFORMATION
the Fund, as well as the need to implement systems and meet additional regulatory and compliance requirements resulting from recent SEC and other regulatory requirements.
The Board also considered the extent to which the Manager and its affiliates might derive ancillary benefits from fund operations, including revenues generated from transfer agent services, potential benefits resulting from personnel and systems enhancements necessitated by fund growth, as well as increased leverage with service providers and counterparties. Based upon its consideration of all these factors, the Board concluded that the level of profits realized by the Manager and its affiliates from providing services to the Fund was not excessive in view of the nature, extent and quality of services provided to the Fund.
Economies of Scale
The Board reviewed and considered the extent to which the Manager may realize economies of scale, if any, as the Fund grows larger and whether the Fund’s management fee structure reflects any economies of scale for the benefit of shareholders. With respect to possible economies of scale, the Board noted the existence of management fee breakpoints, which operate generally to share any economies of scale with the Fund’s shareholders by reducing the Fund’s effective management fees as the Fund grows in size. The Board considered the Manager’s view that any analyses of potential economies of scale in managing a particular fund are inherently limited in light of the joint and common costs and investments the Manager incurs across the Franklin Templeton family of funds as a whole. The Board concluded that to the extent economies of scale may be realized by the Manager and its affiliates, the Fund’s management fee structure provided a sharing of benefits with the Fund and its shareholders as the Fund grows.
Conclusion
Based on its review, consideration and evaluation of all factors it believed relevant, including the above-described factors and conclusions, the Board unanimously approved the continuation of the Management Agreement for an additionalone-year period.
Proxy Voting Policies and Procedures
The Fund’s investment manager has established Proxy Voting Policies and Procedures (Policies) that the Fund uses to determine how to vote proxies relating to portfolio securities. Shareholders may view the Fund’s complete
Policies online at franklintempleton.com. Alternatively, shareholders may request copies of the Policies free of charge by calling the Proxy Group collect at (954)527-7678 or by sending a written request to: Franklin Templeton Companies, LLC, 300 S.E. 2nd Street, Fort Lauderdale, FL 33301, Attention: Proxy Group. Copies of the Fund’s proxy voting records are also made available online at franklintempleton.com and posted on the U.S. Securities and Exchange Commission’s website at sec.gov and reflect the most recent12-month period ended June 30.
Quarterly Statement of Investments
The Trust, on behalf of the Fund, files a complete statement of investments with the U.S. Securities and Exchange Commission for the first and third quarters for each fiscal year as an exhibit to its report on FormN-PORT. Shareholders may view the filed FormN-PORT by visiting the Commission’s website at sec.gov. The filed form may also be viewed and copied at the Commission’s Public Reference Room in Washington, DC. Information regarding the operations of the Public Reference Room may be obtained by calling(800) SEC-0330.
Householding of Reports and Prospectuses
You will receive the Fund’s financial reports every six months as well as an annual updated summary prospectus (prospectus available upon request). To reduce Fund expenses, we try to identify related shareholders in a household and send only one copy of the financial reports and summary prospectus. This process, called “householding,” will continue indefinitely unless you instruct us otherwise. If you prefer not to have these documents householded, please call us at (800)632-2301. At any time you may view current prospectuses/summary prospectuses and financial reports on our website. If you choose, you may receive these documents through electronic delivery.
| | | | |
| | | |
38 | | Annual Report | | franklintempleton.com |
This page intentionally left blank.
This page intentionally left blank.
Authorized for distribution only when accompanied or preceded by a summary prospectus and/or prospectus. Investors should carefully consider a fund’s investment goals, risks, charges and expenses before investing. A prospectus contains this and other information; please read it carefully before investing.
To help ensure we provide you with quality service, all calls to and from our service areas are monitored and/or recorded.
| | | | | | |
 | | Annual Report and Shareholder Letter |
| | Franklin Rising Dividends Fund |
| | Investment Manager | | Distributor | | Shareholder Services |
| | Franklin Advisers, Inc. | | Franklin Templeton Distributors, Inc. | | (800)632-2301 |
| | | | (800) DIAL BEN®/342-5236 | | |
| | | | franklintempleton.com | | |
| | |
| © 2019 Franklin Templeton Investments. All rights reserved. | | 158 A 11/19 |
Item 2. Code of Ethics.
(a) The Registrant has adopted a code of ethics that applies to its principal executive officers and principal financial and accounting officer.
(c) N/A
(d) N/A
(f) Pursuant to Item 13(a)(1), the Registrant is attaching as an exhibit a copy of its code of ethics that applies to its principal executive officers and principal financial and accounting officer.
Item 3. Audit Committee Financial Expert.
(a)(1) The Registrant has an audit committee financial expert serving on its audit committee.
(2) The audit committee financial expert is Mary C. Choksi and she is “independent” as defined under the relevant Securities and Exchange Commission Rules and Releases.
Item 4. Principal Accountant Fees and Services.
(a) Audit Fees
The aggregate fees paid to the principal accountant for professional services rendered by the principal accountant for the audit of the registrant’s annual financial statements or for services that are normally provided by the principal accountant in connection with statutory and regulatory filings or engagements were $101,158 for the fiscal year ended September 30, 2019 and $116,060 for the fiscal year ended September 30, 2018.
(b) Audit-Related Fees
The aggregate fees paid to the principal accountant for assurance and related services rendered by the principal accountant to the registrant that are reasonably related to the performance of the audit of the registrant’s financial statements and are not reported under paragraph (a) of Item 4 were $3,133 for the fiscal year ended September 30, 2019 and $3,102 for the fiscal year ended September 30, 2018. The services for which these fees were paid included attestation services.
There were no fees paid to the principal accountant for assurance and related services rendered by the principal accountant to the registrant’s investment adviser and any entity controlling, controlled by or under common control with the investment adviser that provides ongoing services to the registrant that are reasonably related to the performance of the audit of their financial statements.
(c) Tax Fees
There were no fees paid to the principal accountant for professional services rendered by the principal accountant to the registrant for tax compliance, tax advice and tax planning.
The aggregate fees paid to the principal accountant for professional services rendered by the principal accountant to the registrant’s investment adviser and any entity controlling, controlled by or under common control with the investment adviser that provides ongoing services to the registrant for tax compliance, tax advice and tax planning were $20,000 for the fiscal year ended September 30, 2019 and $5,000 for the fiscal year ended September 30, 2018. The services for which these fees were paid included professional fees in connection with tax treatment of equipment lease transactions, professional fees in connection with an Indonesia withholding tax refund claim and tax consulting services related to the operating agreement and term sheet for the launch of a new fund.
(d) All Other Fees
The aggregate fees paid to the principal accountant for products and services rendered by the principal accountant to the registrant not reported in paragraphs (a)-(c) of Item 4 were $0 for the fiscal year ended September 30, 2019 and $6,539 for the fiscal year ended September 30, 2018. The services for which these fees were paid included review of materials provided to the fund Board in connection with the investment management contract renewal process.
The aggregate fees paid to the principal accountant for products and services rendered by the principal accountant to the registrant’s investment adviser and any entity controlling, controlled by or under common control with the investment adviser that provides ongoing services to the registrant not reported in paragraphs (a)-(c) of Item 4 were $114,908 for the fiscal year ended September 30, 2019 and $27,500 for the fiscal year ended September 30, 2018. The services for which these fees were paid included valuation services related to fair value engagement, the issuance of an Auditor’s Certificate for South Korean regulatory shareholders disclosures, benchmarking services in connection with the ICI TA Survey and assets under management certification.
(e) (1) The registrant’s audit committee is directly responsible for approving the services to be provided by the auditors, including:
(i)pre-approval of all audit and audit related services;
(ii)pre-approval of allnon-audit related services to be provided to the Fund by the auditors;
(iii)pre-approval of allnon-audit related services to be provided to the registrant by the auditors to the registrant’s investment adviser or to any entity that controls, is controlled by or is under common control with the registrant’s investment adviser and that provides ongoing services to the registrant where thenon-audit services relate directly to the operations or financial reporting of the registrant; and
(iv) establishment by the audit committee, if deemed necessary or appropriate, as an alternative to committeepre-approval of services to be provided by the auditors, as required by paragraphs (ii) and (iii) above, of policies and procedures to permit such services to bepre-approved by other means, such as through establishment of guidelines or by action of a designated member or members of the
committee; provided the policies and procedures are detailed as to the particular service and the committee is informed of each service and such policies and procedures do not include delegation of audit committee responsibilities, as contemplated under the Securities Exchange Act of 1934, to management; subject, in the case of (ii) through (iv), to any waivers, exceptions or exemptions that may be available under applicable law or rules.
(e) (2) None of the services provided to the registrant described in paragraphs (b)-(d) of Item 4 were approved by the audit committee pursuant to paragraph (c)(7)(i)(C) of Rule2-01 of regulationS-X.
(f) No disclosures are required by this Item 4(f).
(g) The aggregatenon-audit fees paid to the principal accountant for services rendered by the principal accountant to the registrant and the registrant’s investment adviser and any entity controlling, controlled by or under common control with the investment adviser that provides ongoing services to the registrant were $138,041 for the fiscal year ended September 30, 2019 and $42,141 for the fiscal year ended September 30, 2018.
(h) The registrant’s audit committee of the board has considered whether the provision ofnon-audit services that were rendered to the registrant’s investment adviser (not including anysub-adviser whose role is primarily portfolio management and is subcontracted with or overseen by another investment adviser), and any entity controlling, controlled by, or under common control with the investment adviser that provides ongoing services to the registrant that were notpre-approved pursuant to paragraph (c)(7)(ii) of Rule2-01 of RegulationS-X is compatible with maintaining the principal accountant’s independence.
Item 5. Audit Committee of Listed Registrants. N/A
Item 6. Schedule of Investments. N/A
Item 7. Disclosure of Proxy Voting Policies and Procedures forClosed-End Management Investment Companies. N/A
Item 8. Portfolio Managers ofClosed-End Management Investment Companies. N/A
Item 9. Purchases of Equity Securities byClosed-End Management Investment Company and Affiliated Purchasers. N/A
Item 10. Submission of Matters to a Vote of Security Holders.
There have been no changes to the procedures by which shareholders may recommend nominees to the Registrant’s Board of Trustees that would require disclosure herein.
Item 11. Controls and Procedures.
(a)Evaluation of Disclosure Controls and Procedures. The Registrant maintains disclosure controls and procedures that are designed to provide reasonable assurance that information required to be disclosed in the Registrant’s filings under the Securities Exchange Act of 1934, as amended, and the Investment Company Act of 1940 is recorded, processed, summarized and reported within the periods specified in the rules and forms of the Securities and Exchange Commission. Such information is accumulated and communicated to the Registrant’s management, including its principal executive officer and principal financial officer, as appropriate, to allow timely decisions regarding required disclosure. The Registrant’s management, including the principal executive officer and the principal financial officer, recognizes that any set of controls and procedures, no matter how well designed and operated, can provide only reasonable assurance of achieving the desired control objectives.
Within 90 days prior to the filing date of this Shareholder Report on FormN-CSR, the Registrant had carried out an evaluation, under the supervision and with the participation of the Registrant’s management, including the Registrant’s principal executive officer and the Registrant’s principal financial officer, of the effectiveness of the design and operation of the Registrant’s disclosure controls and procedures. Based on such evaluation, the Registrant’s principal executive officer and principal financial officer concluded that the Registrant’s disclosure controls and procedures are effective.
(b)Changes in Internal Controls. There have been no changes in the Registrant’s internal control over financial reporting that occurred during the period covered by this report that has materially affected, or is reasonably likely to materially affect the internal control over financial reporting.
Item 12. Disclosure of Securities Lending Activities forClosed-End Management Investment Company. N/A
Item 13. Exhibits.
(a) (1) Code of Ethics
(a) (2) Certifications pursuant to Section 302 of the Sarbanes-Oxley Act of 2002 of Matthew T. Hinkle, Chief Executive Officer – Finance and Administration, and Gaston Gardey, Chief Financial Officer and Chief Accounting Officer
(b) Certifications pursuant to Section 906 of the Sarbanes-Oxley Act of 2002 of Matthew T. Hinkle, Chief Executive Officer – Finance and Administration, and Gaston Gardey, Chief Financial Officer and Chief Accounting Officer
SIGNATURES
Pursuant to the requirements of the Securities Exchange Act of 1934 and the Investment Company Act of 1940, the registrant has duly caused this report to be signed on its behalf by the undersigned, thereunto duly authorized.
| | |
| FRANKLIN MANAGED TRUST |
| |
| By | | /S/ MATTHEW T. HINKLE |
| | Matthew T. Hinkle |
| | Chief Executive Officer – Finance and Administration |
| Date November 29, 2019 |
Pursuant to the requirements of the Securities Exchange Act of 1934 and the Investment Company Act of 1940, this report has been signed below by the following persons on behalf of the registrant and in the capacities and on the dates indicated.
| | |
| By | | /S/ MATTHEW T. HINKLE |
| | Matthew T. Hinkle |
| | Chief Executive Officer – Finance and Administration |
| Date November 29, 2019 |
| | |
| By | | /S/ GASTON GARDEY |
| | Gaston Gardey |
| | Chief Financial Officer and Chief Accounting Officer |
| Date November 29, 2019 |