UNITED STATES
SECURITIES AND EXCHANGE COMMISSION
Washington, D.C. 20549
FORM N-CSR
CERTIFIED SHAREHOLDER REPORT OF REGISTERED MANAGEMENT INVESTMENT
COMPANIES
Investment Company Act file number_811-04894
__Franklin Managed Trust
(Exact name of registrant as specified in charter)
One Franklin Parkway, San Mateo, CA 94403-1906
(Address of principal executive offices)(Zip code)
Craig S. Tyle, One Franklin Parkway, San Mateo, CA 94403-1906
(Name and address of agent for service)
Registrant's telephone number, including area code: _650 312-2000
Date of fiscal year end: 9/30
Date of reporting period: _9/30/16
Item 1. Reports to Stockholders.

| |
| Contents | |
| |
| Annual Report | |
| Franklin Rising Dividends Fund | 3 |
| Performance Summary | 7 |
| Your Fund’s Expenses | 10 |
| Financial Highlights and Statement of Investments | 11 |
| FinancialStatements | 20 |
| Notes to Financial Statements | 24 |
| Report of Independent Registered | |
| Public Accounting Firm . | 33 |
| Tax Information . | 34 |
| Board Members and Officers | 35 |
| Shareholder Information | 40 |
Visit franklintempleton.com for fund updates, to access your account, or to find helpful financial planning tools.
2 Annual Report
franklintempleton.com
Annual Report
Franklin Rising Dividends Fund
We are pleased to bring you Franklin Rising Dividends Fund’s annual report for the fiscal year ended September 30, 2016. We welcome the former shareholders of Franklin Large Cap Value Fund that now own shares of Franklin Rising Dividends Fund as a result of Franklin Large Cap Value Fund’s reorganization that took effect on May 20, 2016.
Your Fund’s Goal and Main Investments
The Fund seeks long-term capital appreciation. Preservation of capital, while not a goal, is also an important consideration. Under normal market conditions, the Fund invests at least 80% of its net assets in companies that have paid consistently rising dividends. The Fund invests predominantly in equity securities, primarily common stock. Companies that have paid consistently rising dividends include those companies that currently pay dividends on their common stocks and have maintained or increased their dividend rate during the last four consecutive years.
Performance Overview
For the 12 months under review, the Fund’s Class A shares delivered a +19.51% cumulative total return. In comparison, the Fund’s benchmark, the Standard & Poor’s 500 Index (S&P 500®), which is a broad measure of U.S. stock performance, generated a +15.43% total return.1 You can find the Fund’s long-term performance data in the Performance Summary beginning on page 7.
Performance data represent past performance, which does not guarantee future results. Investment return and principal value will fluctuate, and you may have a gain or loss when you sell your shares. Current performance may differ from figures shown. For most recent month-end performance, go to franklintempleton.com or call (800) 342-5236.
Economic and Market Overview
The U.S. economy grew modestly during the first three quarters of the 12 months ended September 30, 2016, despite a general decline in private inventory, nonresidential fixed investments and exports. However, personal consumption expenditures remained strong throughout the period, contributing to faster growth in 2016’s third quarter as nonresidential fixed investments and exports grew. Manufacturing conditions generally contracted during the first half of the period, but generally expanded in the second half. The services sector, although volatile, continued to grow throughout the period. Growth in services contributed to new jobs, and the unemployment rate decreased slightly from 5.1% in September 2015 to 5.0% at period-end.2 Home sales and prices rose amid relatively low mortgage rates. Monthly retail sales grew for most of the review period, and rose to the highest level in April in more than a year, due to a broad-based increase across most retail categories. After declining in August, retail sales rose in September, driven largely by sales in auto and auto components dealers, gasoline stations and and grocery stores. Inflation, as measured by the Consumer Price Index (CPI), rose slightly in September due to an increase in shelter and gasoline costs. The CPI reported its highest monthly reading over the past three years in April as energy prices rose.
After maintaining a near-zero interest rate for seven years to support the U.S. economy’s recovery, the U.S. Federal Reserve (Fed) raised its target range for the federal funds rate to 0.25%–0.50% at its December 2015 meeting and maintained the rate through the period-end. In July, the Fed Chair signaled the possibility of a near-term increase in interest rates citing strengthening labor market conditions and the Fed’s optimism about future economic growth. However, following lower-than-expected job growth in August, the Fed kept interest rates unchanged at its September meeting and lowered its forecast for 2016 U.S. economic growth.
U.S. stock markets rose during the period, as investors remained confident after the European Central Bank expanded its quantitative easing measures and cut its benchmark interest rate to zero, the People’s Bank of China introduced further easing measures, and the Bank of Japan adopted a negative
1. Source: Morningstar.
The index is unmanaged and includes reinvestment of any income or distributions. It does not reflect any fees, expenses or sales charges. One cannot invest directly in an
index, and an index is not representative of the Fund’s portfolio.
2. Source: Bureau of Labor Statistics.
See www.franklintempletondatasources.com for additional data provider information.
The dollar value, number of shares or principal amount, and names of all portfolio holdings are listed in the Fund’s Statement of Investments (SOI).
The SOI begins on page 16.
franklintempleton.com
Annual Report
3
FRANKLIN RISING DIVIDENDS FUND
interest rate policy. However, the U.K.’s historic referendum to leave the European Union (also known as the “Brexit”) and global growth concerns weighed on market sentiment. Toward period-end, the rally in crude oil prices and the Fed’s decision to keep interest rates unchanged further boosted investor confidence. The broad U.S. stock market ended the 12-month period with a +15.43% total return, as measured by the S&P 500.1
Investment Strategy
We base our investment strategy on our belief that companies with consistently rising dividends should, over time, also experience stock price appreciation. We select portfolio securities based on several criteria. To be eligible for purchase, stocks generally will pass certain screening criteria, such as consistent and substantial dividend increases, strong balance sheets, and relatively low price/earnings ratios. We seek fundamentally sound companies that meet our standards and attempt to acquire them at what we believe are attractive prices, often when they are out of favor with other investors.
Manager’s Discussion
During the 12 months under review, holdings that helped Fund performance included Albemarle; Becton, Dickinson and Co.; and Microsoft.
Albemarle, a specialty chemicals producer, continued to perform well, as earlier momentum from improved performance and heightened expectations surrounding its lithium business continued to propel the stock. Over the past year, the company has continued to report better-than-expected financial results driven by solid sales and core business growth. Albemarle also benefited recently from the announcements of its acquisition of lithium conversion assets that should reduce its costs as well as the acquisition of rights to explore and acquire lithium resources in Argentina. The company has 22 consecutive years of dividend increases.
The stock of Becton, Dickinson and Co., a global medical technology company that manufactures medical devices and instrument systems, rose throughout the year due to a series of generally positive earnings reports. In our analysis, the company’s long-term growth trajectory remains solid, given likely revenue and cost synergies from the integration of its CareFusion acquisition. In developed markets, Becton, Dickinson is positioning itself as a broad supplier with a focus on medication management, while in developing markets, the company is filing for approval of CareFusion’s products that include equipment and dispensing systems for infusions and IV treatments. We believe the company’s business model
continues to deliver steady growth. The company has raised its dividend for 44 consecutive years.
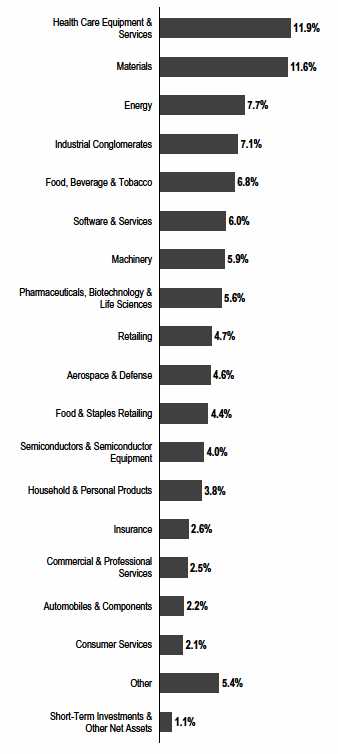
Portfolio Breakdown
Based on Total Net Assets as of 9/30/16
Shares of Microsoft, a software and information technology (IT) services company, appreciated as the company’s
4 Annual Report
franklintempleton.com
FRANKLIN RISING DIVIDENDS FUND
cloud-based initiatives continued to deliver strong results, led by Office 365 subscriber growth and Azure revenue growth. Additionally, prudent expense management led to better operating results and earnings per share growth exceeded expectations. The company has raised its dividend for 13 consecutive years.
Detractors from Fund performance included Bunge, Perrigo and Nike.
The share price of Bunge, a global agribusiness and food production company, experienced volatility surrounding challenging crop conditions in the Americas and the likely impact on the company’s food processing business. Recent earnings results exceeded expectations due to improving performance in Brazil, and we believe that the second half of 2016 looks promising based on reports of a large North American harvest. The company has 16 consecutive years of dividend increases.
Perrigo, a healthcare supplier and pharmaceuticals company, was adversely affected by the abrupt departure of its chief executive officer, a reduction in earnings guidance, and concerns about diminishing pricing power in its prescriptions business. New management focused on resetting the company’s guidance to more realistic levels and on improving profitability at its underperforming European subsidiary. We agree with management’s actions and regard many of the problems as rectifiable or one-time in nature. We also believe that Perrigo’s over the counter franchise remains a solid driver of long-term value. The company has 14 consecutive years of dividend increases.
Shares of Nike, an athletic footwear, apparel and equipment company, declined over the past 12 months resulting largely from concerns about market share erosion in the U.S. to competitors, including Adidas and Under Armour, and an inventory buildup, which it is addressing. Although Nike continues to operate in a highly competitive market, we regard the company as having built an enduring franchise, which remains well-aligned with consumer trends. We believe that Nike has multiple sources of growth and leverage, including innovation, continued overseas expansion and increased automation, and continues to be well-positioned for the long term. The company has 14 consecutive years of dividend increases.
We did not initiate any new positions in the Fund during the period. We added to existing holdings including Linear Technology, a manufacturer and distributor of analog integrated circuits (24 consecutive years of dividend increases); and the aforementioned Perrigo and Microsoft. We exited our positions in California Resources, which we received from a spinoff of Occidental Petroleum; Knowles, which we received from a spinoff of Dover; Teleflex; Discover Financial; and Western Digital. We reduced our holdings in several positions including McDonald’s, Johnson & Johnson, and Chevron, among others.
Top 10 Holdings
9/30/16
| | |
| Company | % of Total | |
| Sector/Industry | Net Assets | |
| Roper Technologies Inc. | 3.8 | % |
| Industrial Conglomerates | | |
| Microsoft Corp. | 3.4 | % |
| Software & Services | | |
| Albemarle Corp. | 3.4 | % |
| Materials | | |
| Honeywell International Inc. | 3.1 | % |
| Industrial Conglomerates | | |
| Air Products and Chemicals Inc. | 3.1 | % |
| Materials | | |
| Becton, Dickinson and Co. | 3.0 | % |
| Health Care Equipment & Services | | |
| Medtronic PLC | 3.0 | % |
| Health Care Equipment & Services | | |
| Praxair Inc. | 3.0 | % |
| Materials | | |
| Stryker Corp. | 2.9 | % |
| Health Care Equipment & Services | | |
| Pentair PLC (United Kingdom) | 2.7 | % |
| Machinery | | |
Our 10 largest positions on September 30, 2016, represented 31.4% of the Fund’s total net assets. It is interesting to note how these 10 companies fit the Fund’s screening criteria. On average, they have raised their dividends 27 years in a row and by 338% over the past 10 years. Their most recent year-over-year dividend increases averaged 9.9% with a dividend yield of 1.9% on September 30, 2016, and a dividend payout ratio of 38.2%, based on estimates of calendar year 2016 operating earnings. Their average price/earnings ratio was 21.0 times 2016 estimates versus 18.4 for that of the unmanaged S&P 500.
franklintempleton.com
Annual Report
5
FRANKLIN RISING DIVIDENDS FUND
Thank you for your participation in Franklin Rising Dividends Fund. We look forward to continuing to serve your investment needs.


Donald G. Taylor, CPA
Lead Portfolio Manager
Nicolas Getaz, CFA
Bruce C. Baughman, CPA
Portfolio Management Team
CFA® is a trademark owned by CFA Institute.
The foregoing information reflects our analysis, opinions and portfolio holdings as of September 30, 2016, the end of the reporting period. The way we implement our main investment strategies and the resulting portfolio holdings may change depending on factors such as market and economic conditions. These opinions may not be relied upon as investment advice or an offer for a particular security. The information is not a complete analysis of every aspect of any market, country, industry, security or the Fund. Statements of fact are from sources considered reliable, but the investment manager makes no representation or warranty as to their completeness or accuracy. Although historical performance is no guarantee of future results, these insights may help you understand our investment management philosophy.
6 Annual Report
franklintempleton.com
FRANKLIN RISING DIVIDENDS FUND
Performance Summary as of September 30, 2016
The performance table and graphs do not reflect any taxes that a shareholder would pay on Fund dividends, capital gain distributions, if any, or any realized gains on the sale of Fund shares. Total return reflects reinvestment of the Fund’s dividends and capital gain distributions, if any, and any unrealized gains or losses.
Performance as of 9/30/161
Cumulative total return excludes sales charges. Average annual total return includes maximum sales charges. Sales charges will vary depending on the size of the investment and the class of share purchased. The maximum is 5.75% and the minimum is 0%. Class A: 5.75% maximum initial sales charge; Advisor Class: no sales charges. For other share classes, visit franklintempleton.com.
| | | | | | |
| | Cumulative | | Average Annual | | Total Annual | |
| Share Class | Total Return2 | | Total Return3 | | Operating Expenses4 | |
| A | | | | | 0.92 | % |
| 1-Year | +19.51 | % | +12.63 | % | | |
| 5-Year | +90.91 | % | +12.46 | % | | |
| 10-Year | +88.32 | % | +5.91 | % | | |
| Advisor | | | | | 0.67 | % |
| 1-Year | +19.81 | % | +19.81 | % | | |
| 5-Year | +93.34 | % | +14.09 | % | | |
| 10-Year | +93.19 | % | +6.81 | % | | |
Performance data represent past performance, which does not guarantee future results. Investment return and principal value will fluctuate, and you may have a gain or loss when you sell your shares. Current performance may differ from figures shown. For most recent month-end performance, go to franklintempleton.com or call (800) 342-5236.
See page 9 for Performance Summary footnotes.
franklintempleton.com
Annual Report
7
FRANKLIN RISING DIVIDENDS FUND
PERFORMANCE SUMMARY
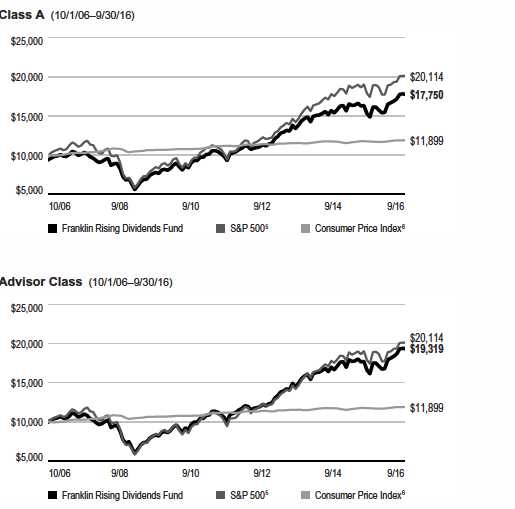
Total Return Index Comparison for a Hypothetical $10,000 Investment1
Total return represents the change in value of an investment over the periods shown. It includes any applicable maximum sales charge, Fund expenses, account fees and reinvested distributions. The unmanaged indexes include reinvestment of any income or distributions. They differ from the Fund in composition and do not pay management fees or expenses. One cannot invest directly in an index.
See page 9 for Performance Summary footnotes.
8 Annual Report
franklintempleton.com
FRANKLIN RISING DIVIDENDS FUND
PERFORMANCE SUMMARY
Each class of shares is available to certain eligible investors and has different annual fees and expenses, as described in the prospectus.
All investments involve risks, including possible loss of principal. Value securities may not increase in price as anticipated or may decline further in value. For stocks paying dividends, dividends are not guaranteed, and can increase, decrease or be totally eliminated without notice. While smaller and midsize companies may offer substantial opportunities for capital growth, they also involve heightened risks and should be considered speculative. Historically, smaller and midsize-company securities have been more volatile in price than larger company securities, especially over the short term. The Fund is actively managed but there is no guarantee that the manager’s investment decisions will produce the desired results. The Fund’s prospectus also includes a description of the main investment risks.
1. The Fund has a fee waiver associated with any investment it makes in a Franklin Templeton money fund and/or other Franklin Templeton fund, contractually guaranteed through its current fiscal year-end. Fund investment results reflect the fee waiver; without this waiver, the results would have been lower.
2. Cumulative total return represents the change in value of an investment over the periods indicated.
3. Average annual total return represents the average annual change in value of an investment over the periods indicated. Return for less than one year, ifany,hasnotbeen annualized.
4. Figures are as stated in the Fund’s current prospectus and may differ from the expense ratios disclosed in the Financial Highlights in this report. In periods of market volatility, assets may decline significantly, causing total annual Fund operating expenses to become higher than the figures shown.
5. Source: Morningstar. The S&P 500 is a market capitalization-weighted index of 500 stocks designed to measure total U.S. equity market performance. 6. Source: Bureau of Labor Statistics, bls.gov/cpi. The Consumer Price Index (CPI) is a commonly used measure of the inflation rate.
See www.franklintempletondatasources.com for additional data provider information.
franklintempleton.com
Annual Report
9
FRANKLIN RISING DIVIDENDS FUND
Your Fund’s Expenses
As a Fund shareholder, you can incur two types of costs: (1) transaction costs, including sales charges (loads) on Fund purchases and redemptions; and (2) ongoing Fund costs, including management fees, distribution and service (12b-1) fees, and other Fund expenses. All mutual funds have ongoing costs, sometimes referred to as operating expenses. The table below shows ongoing costs of investing in the Fund and can help you understand these costs and compare them with those of other mutual funds. The table assumes a $1,000 investment held for the six months indicated.
Actual Fund Expenses
The table below provides information about actual account values and actual expenses in the columns under the heading “Actual.” In these columns the Fund’s actual return, which includes the effect of Fund expenses, is used to calculate the “Ending Account Value” for each class of shares. You can estimate the expenses you paid during the period by following these steps (of course, your account value and expenses will differ from those in this illustration): Divide your account value by $1,000 (if your account had an $8,600 value, then $8,600 ÷ $1,000 = 8.6). Then multiply the result by the number in the row for your class of shares under the headings “Actual” and “Expenses Paid During Period” (if Actual Expenses Paid During Period were $7.50, then 8.6 x $7.50 = $64.50). In this illustration, the actual expenses paid this period are $64.50.
Hypothetical Example for Comparison with Other Funds
Under the heading “Hypothetical” in the table, information is provided about hypothetical account values and hypothetical expenses based on the Fund’s actual expense ratio and an assumed rate of return of 5% per year before expenses, which is not the Fund’s actual return. This information may not be used to estimate the actual ending account balance or expenses you paid for the period, but it can help you compare ongoing costs of investing in the Fund with those of other funds. To do so, compare this 5% hypothetical example for the class of shares you hold with the 5% hypothetical examples that appear in the shareholder reports of other funds.
Please note that expenses shown in the table are meant to highlight ongoing costs and do not reflect any transactional costs. Therefore, information under the heading “Hypothetical” is useful in comparing ongoing costs only, and will not help you compare total costs of owning different funds. In addition, if transactional costs were included, your total costs would have been higher.
| | | | | | | | | | | | |
| | | | | | | Actual | | Hypothetical | | |
| | | | | (actual return after expenses) | | (5% annual return before expenses) | | |
| | | | | | | Expenses | | | | Expenses | Net | |
| | | Beginning | | Ending | | Paid During | | Ending | | Paid During | Annualized | |
| Share | | Account | | Account | | Period | | Account | | Period | Expense | |
| Class | | Value 4/1/16 | | Value 9/30/16 | | 4/1/16–9/30/161,2 | | Value 9/30/16 | | 4/1/16–9/30/161,2 | Ratio2 | |
| A | $ | 1,000 | $ | 1,077.20 | $ | 4.67 | $ | 1,020.50 | $ | 4.55 | 0.90 | % |
| C | $ | 1,000 | $ | 1,073.20 | $ | 8.55 | $ | 1,016.75 | $ | 8.32 | 1.65 | % |
| R | $ | 1,000 | $ | 1,075.70 | $ | 5.97 | $ | 1,019.25 | $ | 5.81 | 1.15 | % |
| R6 | $ | 1,000 | $ | 1,079.20 | $ | 2.70 | $ | 1,022.40 | $ | 2.63 | 0.52 | % |
| Advisor | $ | 1,000 | $ | 1,078.50 | $ | 3.38 | $ | 1,021.75 | $ | 3.29 | 0.65 | % |
1. Expenses are equal to the annualized expense ratio for the six-month period as indicated above–in the far right column–multiplied by the simple average account value
over the period indicated, and then multiplied by 183/366 to reflect the one-half year period.
2. Reflects expenses after fee waivers and expense reimbursements. Does not include acquired fund fees and expenses.
10 Annual Report
franklintempleton.com
| | | | | | | | | | | | | | | |
| | | | | | | | | FRANKLIN MANAGED TRUST | |
| |
| |
| |
| Financial Highlights | | | | | | | | | | | | | | | |
| Franklin Rising Dividends Fund | | | | | | | | | | | | | | | |
| | | | | | Year Ended September 30, | | | | |
| | | 2016 | | | 2015 | | | 2014 | | | 2013 | | | 2012 | |
| Class A | | | | | | | | | | | | | | | |
| Per share operating performance | | | | | | | | | | | | | | | |
| (for a share outstanding throughout the year) | | | | | | | | | | | | | | | |
| Net asset value, beginning of year | $ | 47.01 | | $ | 49.72 | | $ | 45.46 | | $ | 37.86 | | $ | 31.39 | |
| Income from investment operationsa: | | | | | | | | | | | | | | | |
| Net investment incomeb | | 0.69 | | | 0.64 | | | 0.55 | | | 0.54 | | | 0.52 | |
| Net realized and unrealized gains (losses) | | 8.26 | | | (2.22 | ) | | 4.50 | | | 7.61 | | | 6.36 | |
| Total from investment operations | | 8.95 | | | (1.58 | ) | | 5.05 | | | 8.15 | | | 6.88 | |
| Less distributions from: | | | | | | | | | | | | | | | |
| Net investment income | | (0.58 | ) | | (0.63 | ) | | (0.79 | ) | | (0.55 | ) | | (0.41 | ) |
| Net realized gains | | (1.91 | ) | | (0.50 | ) | | — | | | — | | | — | |
| Total distributions | | (2.49 | ) | | (1.13 | ) | | (0.79 | ) | | (0.55 | ) | | (0.41 | ) |
| Net asset value, end of year. | $ | 53.47 | | $ | 47.01 | | $ | 49.72 | | $ | 45.46 | | $ | 37.86 | |
| |
| Total returnc | | 19.51 | % | | (3.35 | )% | | 11.16 | % | | 21.86 | % | | 22.02 | % |
| |
| Ratios to average net assets | | | | | | | | | | | | | | | |
| Expenses | | 0.91 | %d | | 0.92 | %d | | 0.91 | %d | | 0.93 | % | | 0.96 | % |
| Net investment income | | 1.38 | % | | 1.25 | % | | 1.12 | % | | 1.30 | % | | 1.44 | % |
| |
| Supplemental data | | | | | | | | | | | | | | | |
| Net assets, end of year (000’s) | $ | 11,662,059 | | $ | 10,220,847 | | $ | 10,615,668 | | $ | 8,795,238 | | $ | 5,777,197 | |
| Portfolio turnover rate | | 1.74 | % | | 8.51 | % | | 4.42 | % | | 0.70 | % | | 2.77 | % |
aThe amount shown for a share outstanding throughout the period may not correlate with the Statement of Operations for the period due to the timing of sales and
repurchases of the Fund’s shares in relation to income earned and/or fluctuating fair value of the investments of the Fund.
bBased on average daily shares outstanding.
cTotal return does not reflect sales commissions or contingent deferred sales charges, if applicable.
dBenefit of waiver and payments by affiliates and expense reduction rounds to less than 0.01%.
franklintempleton.com
The accompanying notes are an integral part of these financial statements. | Annual Report 11
| | | | | | | | | | | | | | | |
| FRANKLIN MANAGED TRUST | | | | | | | | | | | | | | | |
| FINANCIAL HIGHLIGHTS | | | | | | | | | | | | | | | |
| |
| |
| Franklin Rising Dividends Fund (continued) | | | | | | | | | | | | | | | |
| | | | | | Year Ended September 30, | | | | |
| | | 2016 | | | 2015 | | | 2014 | | | 2013 | | | 2012 | |
| Class C | | | | | | | | | | | | | | | |
| Per share operating performance | | | | | | | | | | | | | | | |
| (for a share outstanding throughout the year) | | | | | | | | | | | | | | | |
| Net asset value, beginning of year | $ | 46.26 | | $ | 48.94 | | $ | 44.62 | | $ | 37.20 | | $ | 30.87 | |
| Income from investment operationsa: | | | | | | | | | | | | | | | |
| Net investment incomeb | | 0.31 | | | 0.25 | | | 0.18 | | | 0.23 | | | 0.24 | |
| Net realized and unrealized gains (losses) | | 8.12 | | | (2.18 | ) | | 4.42 | | | 7.49 | | | 6.28 | |
| Total from investment operations | | 8.43 | | | (1.93 | ) | | 4.60 | | | 7.72 | | | 6.52 | |
| Less distributions from: | | | | | | | | | | | | | | | |
| Net investment income | | (0.28 | ) | | (0.25 | ) | | (0.28 | ) | | (0.30 | ) | | (0.19 | ) |
| Net realized gains | | (1.91 | ) | | (0.50 | ) | | — | | | — | | | — | |
| Total distributions | | (2.19 | ) | | (0.75 | ) | | (0.28 | ) | | (0.30 | ) | | (0.19 | ) |
| Net asset value, end of year. | $ | 52.50 | | $ | 46.26 | | $ | 48.94 | | $ | 44.62 | | $ | 37.20 | |
| |
| Total returnc | | 18.62 | % | | (4.07 | )% | | 10.32 | % | | 20.93 | % | | 21.13 | % |
| |
| Ratios to average net assets | | | | | | | | | | | | | | | |
| Expenses | | 1.66 | %d | | 1.67 | %d | | 1.66 | %d | | 1.68 | % | | 1.71 | % |
| Net investment income | | 0.63 | % | | 0.50 | % | | 0.37 | % | | 0.55 | % | | 0.69 | % |
| |
| Supplemental data | | | | | | | | | | | | | | | |
| Net assets, end of year (000’s) | $ | 2,956,171 | | $ | 2,644,955 | | $ | 2,775,137 | | $ | 2,261,420 | | $ | 1,410,361 | |
| Portfolio turnover rate | | 1.74 | % | | 8.51 | % | | 4.42 | % | | 0.70 | % | | 2.77 | % |
aThe amount shown for a share outstanding throughout the period may not correlate with the Statement of Operations for the period due to the timing of sales and
repurchases of the Fund’s shares in relation to income earned and/or fluctuating fair value of the investments of the Fund.
bBased on average daily shares outstanding.
cTotal return does not reflect sales commissions or contingent deferred sales charges, if applicable.
dBenefit of waiver and payments by affiliates and expense reduction rounds to less than 0.01%.
12 Annual Report | The accompanying notes are an integral part of these financial statements.
franklintempleton.com
| | | | | | | | | | | | | | | |
| | | | | | | | | FRANKLIN MANAGED TRUST | |
| | | | | | | | | FINANCIAL HIGHLIGHTS | |
| |
| |
| Franklin Rising Dividends Fund (continued) | | | | | | | | | | | | | | | |
| | | | | | Year Ended September 30, | | | | |
| | | 2016 | | | 2015 | | | 2014 | | | 2013 | | | 2012 | |
| Class R | | | | | | | | | | | | | | | |
| Per share operating performance | | | | | | | | | | | | | | | |
| (for a share outstanding throughout the year) | | | | | | | | | | | | | | | |
| Net asset value, beginning of year | $ | 46.87 | | $ | 49.56 | | $ | 45.26 | | $ | 37.72 | | $ | 31.29 | |
| Income from investment operationsa: | | | | | | | | | | | | | | | |
| Net investment incomeb | | 0.57 | | | 0.51 | | | 0.42 | | | 0.44 | | | 0.43 | |
| Net realized and unrealized gains (losses) | | 8.22 | | | (2.20 | ) | | 4.48 | | | 7.58 | | | 6.34 | |
| Total from investment operations | | 8.79 | | | (1.69 | ) | | 4.90 | | | 8.02 | | | 6.77 | |
| Less distributions from: | | | | | | | | | | | | | | | |
| Net investment income | | (0.47 | ) | | (0.50 | ) | | (0.60 | ) | | (0.48 | ) | | (0.34 | ) |
| Net realized gains | | (1.91 | ) | | (0.50 | ) | | — | | | — | | | — | |
| Total distributions | | (2.38 | ) | | (1.00 | ) | | (0.60 | ) | | (0.48 | ) | | (0.34 | ) |
| Net asset value, end of year. | $ | 53.28 | | $ | 46.87 | | $ | 49.56 | | $ | 45.26 | | $ | 37.72 | |
| |
| Total return | | 19.20 | % | | (3.58 | )% | | 10.86 | % | | 21.55 | % | | 21.74 | % |
| |
| Ratios to average net assets | | | | | | | | | | | | | | | |
| Expenses | | 1.16 | %c | | 1.17 | %c | | 1.16 | %c | | 1.18 | % | | 1.21 | % |
| Net investment income | | 1.13 | % | | 1.00 | % | | 0.87 | % | | 1.05 | % | | 1.19 | % |
| |
| Supplemental data | | | | | | | | | | | | | | | |
| Net assets, end of year (000’s) | $ | 247,961 | | $ | 243,597 | | $ | 332,943 | | $ | 277,758 | | $ | 179,509 | |
| Portfolio turnover rate | | 1.74 | % | | 8.51 | % | | 4.42 | % | | 0.70 | % | | 2.77 | % |
aThe amount shown for a share outstanding throughout the period may not correlate with the Statement of Operations for the period due to the timing of sales and
repurchases of the Fund’s shares in relation to income earned and/or fluctuating fair value of the investments of the Fund.
bBased on average daily shares outstanding.
cBenefit of waiver and payments by affiliates and expense reduction rounds to less than 0.01%.
franklintempleton.com
The accompanying notes are an integral part of these financial statements. | Annual Report 13
| | | | | | | | | | | | |
| FRANKLIN MANAGED TRUST | | | | | | | | | | | | |
| FINANCIAL HIGHLIGHTS | | | | | | | | | | | | |
| |
| |
| Franklin Rising Dividends Fund (continued) | | | | | | | | | | | | |
| | | Year Ended September 30, | | | | |
| | | 2016 | | | 2015 | | | 2014 | | | 2013 | a |
| Class R6 | | | | | | | | | | | | |
| Per share operating performance | | | | | | | | | | | | |
| (for a share outstanding throughout the year) | | | | | | | | | | | | |
| Net asset value, beginning of year | $ | 46.98 | | $ | 49.67 | | $ | 45.50 | | $ | 42.07 | |
| Income from investment operationsb: | | | | | | | | | | | | |
| Net investment incomec | | 0.90 | | | 0.84 | | | 0.74 | | | 0.30 | |
| Net realized and unrealized gains (losses) | | 8.24 | | | (2.20 | ) | | 4.50 | | | 3.13 | |
| Total from investment operations | | 9.14 | | | (1.36 | ) | | 5.24 | | | 3.43 | |
| Less distributions from: | | | | | | | | | | | | |
| Net investment income. | | (0.75 | ) | | (0.83 | ) | | (1.07 | ) | | — | |
| Net realized gains | | (1.91 | ) | | (0.50 | ) | | — | | | — | |
| Total distributions | | (2.66 | ) | | (1.33 | ) | | (1.07 | ) | | — | |
| Net asset value, end of year | $ | 53.46 | | $ | 46.98 | | $ | 49.67 | | $ | 45.50 | |
| |
| Total returnd | | 19.97 | % | | (2.93 | )% | | 11.59 | % | | 8.15 | % |
| |
| Ratios to average net assetse | | | | | | | | | | | | |
| Expenses | | 0.52 | %f | | 0.52 | %f | | 0.52 | %f | | 0.53 | % |
| Net investment income | | 1.77 | % | | 1.65 | % | | 1.51 | % | | 1.70 | % |
| |
| Supplemental data | | | | | | | | | | | | |
| Net assets, end of year (000’s) | $ | 586,747 | | $ | 553,301 | | $ | 597,859 | | $ | 497,875 | |
| Portfolio turnover rate | | 1.74 | % | | 8.51 | % | | 4.42 | % | | 0.70 | % |
aFor the period May 1, 2013 (effective date) to September 30, 2013.
bThe amount shown for a share outstanding throughout the period may not correlate with the Statement of Operations for the period due to the timing of sales and
repurchases of the Fund’s shares in relation to income earned and/or fluctuating fair value of the investments of the Fund.
cBased on average daily shares outstanding.
dTotal return is not annualized for periods less than one year.
eRatios are annualized for periods less than one year.
fBenefit of waiver and payments by affiliates and expense reduction rounds to less than 0.01%.
14 Annual Report | The accompanying notes are an integral part of these financial statements.
franklintempleton.com
| | | | | | | | | | | | | | | |
| | | | | | | | | FRANKLIN MANAGED TRUST | |
| | | | | | | | | FINANCIAL HIGHLIGHTS | |
| |
| |
| Franklin Rising Dividends Fund (continued) | | | | | | | | | | | | | | | |
| | | | | | Year Ended September 30, | | | | |
| | | 2016 | | | 2015 | | | 2014 | | | 2013 | | | 2012 | |
| Advisor Class | | | | | | | | | | | | | | | |
| Per share operating performance | | | | | | | | | | | | | | | |
| (for a share outstanding throughout the year) | | | | | | | | | | | | | | | |
| Net asset value, beginning of year | $ | 46.97 | | $ | 49.68 | | $ | 45.48 | | $ | 37.87 | | $ | 31.39 | |
| Income from investment operationsa: | | | | | | | | | | | | | | | |
| Net investment incomeb | | 0.81 | | | 0.77 | | | 0.67 | | | 0.65 | | | 0.61 | |
| Net realized and unrealized gains (losses) | | 8.26 | | | (2.22 | ) | | 4.50 | | | 7.60 | | | 6.35 | |
| Total from investment operations | | 9.07 | | | (1.45 | ) | | 5.17 | | | 8.25 | | | 6.96 | |
| Less distributions from: | | | | | | | | | | | | | | | |
| Net investment income | | (0.68 | ) | | (0.76 | ) | | (0.97 | ) | | (0.64 | ) | | (0.48 | ) |
| Net realized gains | | (1.91 | ) | | (0.50 | ) | | — | | | — | | | — | |
| Total distributions | | (2.59 | ) | | (1.26 | ) | | (0.97 | ) | | (0.64 | ) | | (0.48 | ) |
| Net asset value, end of year. | $ | 53.45 | | $ | 46.97 | | $ | 49.68 | | $ | 45.48 | | $ | 37.87 | |
| |
| Total return | | 19.81 | % | | (3.11 | )% | | 11.43 | % | | 22.16 | % | | 22.36 | % |
| |
| Ratios to average net assets | | | | | | | | | | | | | | | |
| Expenses | | 0.66 | %c | | 0.67 | %c | | 0.66 | %c | | 0.68 | % | | 0.71 | % |
| Net investment income | | 1.63 | % | | 1.50 | % | | 1.37 | % | | 1.55 | % | | 1.69 | % |
| |
| Supplemental data | | | | | | | | | | | | | | | |
| Net assets, end of year (000’s) | $ | 2,105,241 | | $ | 1,671,632 | | $ | 1,900,482 | | $ | 1,292,847 | | $ | 1,233,135 | |
| Portfolio turnover rate | | 1.74 | % | | 8.51 | % | | 4.42 | % | | 0.70 | % | | 2.77 | % |
aThe amount shown for a share outstanding throughout the period may not correlate with the Statement of Operations for the period due to the timing of sales and
repurchases of the Fund’s shares in relation to income earned and/or fluctuating fair value of the investments of the Fund.
bBased on average daily shares outstanding.
cBenefit of waiver and payments by affiliates and expense reduction rounds to less than 0.01%.
franklintempleton.com
The accompanying notes are an integral part of these financial statements. | Annual Report 15
| | | |
| FRANKLIN MANAGED TRUST | | | |
| |
| |
| |
| |
| Statement of Investments, September 30, 2016 | | | |
| Franklin Rising Dividends Fund | | | |
| | Shares/ | | |
| | Units | | Value |
| |
| Common Stocks and Other Equity Interests 98.9% | | | |
| Aerospace & Defense 4.6% | | | |
| General Dynamics Corp | 2,209,190 | $ | 342,777,920 |
| United Technologies Corp | 4,513,136 | | 458,534,618 |
| | | | 801,312,538 |
| Automobiles & Components 2.2% | | | |
| Johnson Controls International PLC | 8,353,749 | | 388,699,941 |
| Banks 0.1% | | | |
| BB&T Corp | 69,000 | | 2,602,680 |
| Citigroup Inc | 68,000 | | 3,211,640 |
| KeyCorp | 246,000 | | 2,993,820 |
| U.S. Bancorp | 71,000 | | 3,045,190 |
| | | | 11,853,330 |
| Commercial & Professional Services 2.5% | | | |
| ABM Industries Inc | 1,145,249 | | 45,466,385 |
| Brady Corp., A | 2,119,725 | | 73,363,682 |
| Cintas Corp | 1,484,100 | | 167,109,660 |
| a Matthews International Corp., A | 2,663,292 | | 161,821,622 |
| | | | 447,761,349 |
| Consumer Durables & Apparel 1.7% | | | |
| Leggett & Platt Inc | 1,097,590 | | 50,028,152 |
| NIKE Inc., B | 4,610,400 | | 242,737,560 |
| | | | 292,765,712 |
| Consumer Services 2.1% | | | |
| McDonald’s Corp | 2,156,954 | | 248,826,213 |
| Yum! Brands Inc | 1,255,000 | | 113,966,550 |
| | | | 362,792,763 |
| Diversified Financials 0.2% | | | |
| b Berkshire Hathaway Inc., A | 8 | | 1,729,760 |
| KKR & Co., LP | 135,000 | | 1,925,100 |
| Northern Trust Corp | 14,000 | | 951,860 |
| State Street Corp | 469,000 | | 32,656,470 |
| | | | 37,263,190 |
| Electrical Equipment 0.0%† | | | |
| Eaton Corp. PLC | 55,000 | | 3,614,050 |
| Rockwell Automation Inc | 15,000 | | 1,835,100 |
| | | | 5,449,150 |
| Energy 7.7% | | | |
| Chevron Corp | 3,062,600 | | 315,202,792 |
| EOG Resources Inc | 870,300 | | 84,166,713 |
| Exxon Mobil Corp | 3,419,700 | | 298,471,416 |
| Occidental Petroleum Corp | 3,742,600 | | 272,910,392 |
| Schlumberger Ltd | 4,975,529 | | 391,275,601 |
| | | | 1,362,026,914 |
| Food & Staples Retailing 4.4% | | | |
| CVS Health Corp | 2,573,200 | | 228,989,068 |
| Walgreens Boots Alliance Inc | 3,550,847 | | 286,269,285 |
| Wal-Mart Stores Inc | 3,557,264 | | 256,549,880 |
| | | | 771,808,233 |
16 Annual Report
franklintempleton.com
FRANKLIN MANAGED TRUST
STATEMENT OF INVESTMENTS
| | | |
| Franklin Rising Dividends Fund (continued) | | | |
| | Shares/ | | |
| | Units | | Value |
| |
| Common Stocks and Other Equity Interests (continued) | | | |
| Food, Beverage & Tobacco 6.8% | | | |
| Archer-Daniels-Midland Co | 7,864,100 | $ | 331,629,097 |
| Bunge Ltd | 4,924,122 | | 291,655,746 |
| McCormick & Co. Inc | 2,276,400 | | 227,457,888 |
| PepsiCo Inc | 3,230,677 | | 351,400,737 |
| | | | 1,202,143,468 |
| Health Care Equipment & Services 11.9% | | | |
| Abbott Laboratories | 4,121,500 | | 174,298,235 |
| Becton, Dickinson and Co | 2,959,116 | | 531,841,919 |
| DENTSPLY SIRONA Inc | 1,755,000 | | 104,299,650 |
| Medtronic PLC | 6,114,500 | | 528,292,800 |
| Stryker Corp | 4,396,818 | | 511,833,583 |
| West Pharmaceutical Services Inc | 3,141,600 | | 234,049,200 |
| | | | 2,084,615,387 |
| Household & Personal Products 3.8% | | | |
| Colgate-Palmolive Co | 3,829,210 | | 283,897,629 |
| The Procter & Gamble Co | 4,236,288 | | 380,206,848 |
| | | | 664,104,477 |
| Industrial Conglomerates 7.1% | | | |
| Carlisle Cos. Inc | 322,529 | | 33,081,800 |
| General Electric Co | 83,500 | | 2,473,270 |
| Honeywell International Inc | 4,629,700 | | 539,776,723 |
| Roper Technologies Inc | 3,642,302 | | 664,610,846 |
| | | | 1,239,942,639 |
| Insurance 2.6% | | | |
| Aflac Inc | 1,564,710 | | 112,455,708 |
| The Allstate Corp | 57,000 | | 3,943,260 |
| Arthur J. Gallagher & Co | 874,700 | | 44,495,989 |
| Erie Indemnity Co., A | 1,733,082 | | 176,895,680 |
| MetLife Inc | 20,000 | | 888,600 |
| Old Republic International Corp | 4,380,950 | | 77,192,339 |
| Prudential Financial Inc | 20,000 | | 1,633,000 |
| RLI Corp | 437,718 | | 29,922,402 |
| The Travelers Cos. Inc | 17,000 | | 1,947,350 |
| | | | 449,374,328 |
| Machinery 5.9% | | | |
| Donaldson Co. Inc | 3,007,604 | | 112,273,857 |
| Dover Corp | 5,428,800 | | 399,776,832 |
| Hillenbrand Inc | 1,366,700 | | 43,242,388 |
| Illinois Tool Works Inc | 28,000 | | 3,355,520 |
| Parker-Hannifin Corp | 27,000 | | 3,389,310 |
| Pentair PLC (United Kingdom) | 7,288,368 | | 468,204,761 |
| Stanley Black & Decker Inc | 22,000 | | 2,705,560 |
| | | | 1,032,948,228 |
| Materials 11.6% | | | |
| Air Products and Chemicals Inc | 3,568,458 | | 536,481,976 |
| a Albemarle Corp | 6,998,000 | | 598,259,020 |
| Bemis Co. Inc | 1,516,389 | | 77,351,003 |
| Ecolab Inc | 1,668,372 | | 203,074,240 |
franklintempleton.com
Annual Report
17
FRANKLIN MANAGED TRUST
STATEMENT OF INVESTMENTS
| | | |
| Franklin Rising Dividends Fund (continued) | | | |
| | Shares/ | | |
| | Units | | Value |
| |
| Common Stocks and Other Equity Interests (continued) | | | |
| Materials (continued) | | | |
| FMC Corp | 20,000 | $ | 966,800 |
| Nucor Corp | 1,825,400 | | 90,266,030 |
| Praxair Inc | 4,327,535 | | 522,896,054 |
| | | | 2,029,295,123 |
| Media 1.3% | | | |
| a John Wiley & Sons Inc., A | 4,412,048 | | 227,705,797 |
| Pharmaceuticals, Biotechnology & Life Sciences 5.6% | | | |
| AbbVie Inc | 2,775,100 | | 175,025,557 |
| Johnson & Johnson | 3,935,400 | | 464,888,802 |
| Merck & Co. Inc | 64,000 | | 3,994,240 |
| Perrigo Co. PLC | 1,711,600 | | 158,032,028 |
| Pfizer Inc | 3,178,800 | | 107,665,956 |
| Roche Holding AG, ADR (Switzerland) | 2,057,000 | | 63,705,290 |
| Sanofi, ADR (France) | 65,000 | | 2,482,350 |
| | | | 975,794,223 |
| Retailing 4.7% | | | |
| The Gap Inc | 4,700,900 | | 104,548,016 |
| The Home Depot Inc | 21,500 | | 2,766,620 |
| Nordstrom Inc | 39,000 | | 2,023,320 |
| Ross Stores Inc | 5,226,650 | | 336,073,595 |
| Target Corp | 4,015,891 | | 275,811,394 |
| Tiffany & Co | 1,560,200 | | 113,317,326 |
| | | | 834,540,271 |
| Semiconductors & Semiconductor Equipment 4.0% | | | |
| Linear Technology Corp | 2,714,000 | | 160,913,060 |
| Microchip Technology Inc | 45,000 | | 2,796,300 |
| QUALCOMM Inc | 2,430,600 | | 166,496,100 |
| Texas Instruments Inc | 5,291,000 | | 371,322,380 |
| | | | 701,527,840 |
| Software & Services 6.0% | | | |
| Accenture PLC, A | 3,693,800 | | 451,271,546 |
| Microsoft Corp | 10,482,500 | | 603,792,000 |
| | | | 1,055,063,546 |
| Technology Hardware & Equipment 0.0%† | | | |
| Cisco Systems Inc | 70,000 | | 2,220,400 |
| Corning Inc | 195,000 | | 4,611,750 |
| TE Connectivity Ltd | 23,600 | | 1,519,368 |
| | | | 8,351,518 |
| Trading Companies & Distributors 0.7% | | | |
| W.W. Grainger Inc | 574,300 | | 129,125,612 |
| Transportation 1.4% | | | |
| Norfolk Southern Corp | 11,000 | | 1,067,660 |
| United Parcel Service Inc., B | 2,182,300 | | 238,656,328 |
| | | | 239,723,988 |
| Total Common Stocks and Other Equity Interests (Cost $11,858,349,847) | | | 17,355,989,565 |
18 Annual Report
franklintempleton.com
FRANKLIN MANAGED TRUST
STATEMENT OF INVESTMENTS
| | | | |
| Franklin Rising Dividends Fund (continued) | | | | |
| | Shares | | Value | |
| Short Term Investments (Cost $216,224,906) 1.2% | | | | |
| Money Market Funds 1.2% | | | | |
| b,c Institutional Fiduciary Trust Money Market Portfolio | 216,224,906 | $ | 216,224,906 | |
| Total Investments (Cost $12,074,574,753) 100.1% | | | 17,572,214,471 | |
| Other Assets, less Liabilities (0.1)% | | | (14,036,271 | ) |
| Net Assets 100.0% | | $ | 17,558,178,200 | |
See Abbreviations on page 32.
†Rounds to less than 0.1% of net assets.
aSee Note 7 regarding holdings of 5% voting securities.
bNon-income producing.
cSee Note 3(f) regarding investments in affiliated management investment companies.
franklintempleton.com
The accompanying notes are an integral part of these financial statements. | Annual Report 19
| | |
| FRANKLIN MANAGED TRUST | | |
| |
| |
| |
| |
| Financial Statements | | |
| |
| |
| Statement of Assets and Liabilities | | |
| September 30, 2016 | | |
| |
| Franklin Rising Dividends Fund | | |
| |
| Assets: | | |
| Investments in securities: | | |
| Cost - Unaffiliated issuers | $ | 11,172,009,138 |
| Cost - Non-controlled affiliates (Note 3f and 7) | | 902,565,615 |
| Total cost of investments | $ | 12,074,574,753 |
| Value - Unaffiliated issuers | $ | 16,368,203,126 |
| Value - Non-controlled affiliates (Note 3f and 7) | | 1,204,011,345 |
| Total value of investments | | 17,572,214,471 |
| Receivables: | | |
| Investment securities sold | | 8,223,910 |
| Capital shares sold | | 34,594,874 |
| Dividends | | 17,054,062 |
| Other assets | | 4,394 |
| Total assets | | 17,632,091,711 |
| Liabilities: | | |
| Payables: | | |
| Capital shares redeemed | | 51,749,608 |
| Management fees | | 7,080,321 |
| Distribution fees | | 10,073,943 |
| Transfer agent fees | | 4,147,079 |
| Accrued expenses and other liabilities | | 862,560 |
| Total liabilities | | 73,913,511 |
| Net assets, at value | $ | 17,558,178,200 |
| Net assets consist of: | | |
| Paid-in capital | $ | 11,665,826,282 |
| Undistributed net investment income | | 48,128,261 |
| Net unrealized appreciation (depreciation) | | 5,458,245,885 |
| Accumulated net realized gain (loss) | | 385,977,772 |
| Net assets, at value | $ | 17,558,178,200 |
20 Annual Report | The accompanying notes are an integral part of these financial statements.
franklintempleton.com
FRANKLIN MANAGED TRUST
FINANCIAL STATEMENTS
Statement of Assets and Liabilities (continued)
September 30, 2016
| | |
| Franklin Rising Dividends Fund | | |
| |
| Class A: | | |
| Net assets, at value | $ | 11,662,058,865 |
| Shares outstanding | | 218,092,269 |
| Net asset value per sharea | $ | 53.47 |
| Maximum offering price per share (net asset value per share ÷ 94.25%) | $ | 56.73 |
| Class C: | | |
| Net assets, at value | $ | 2,956,170,555 |
| Shares outstanding | | 56,311,356 |
| Net asset value and maximum offering price per sharea | $ | 52.50 |
| Class R: | | |
| Net assets, at value | $ | 247,960,527 |
| Shares outstanding | | 4,653,664 |
| Net asset value and maximum offering price per share | $ | 53.28 |
| Class R6: | | |
| Net assets, at value | $ | 586,747,159 |
| Shares outstanding | | 10,975,659 |
| Net asset value and maximum offering price per share | $ | 53.46 |
| Advisor Class: | | |
| Net assets, at value | $ | 2,105,241,094 |
| Shares outstanding | | 39,383,774 |
| Net asset value and maximum offering price per share | $ | 53.45 |
aRedemption price is equal to net asset value less contingent deferred sales charges, if applicable.
franklintempleton.com
The accompanying notes are an integral part of these financial statements. | Annual Report 21
|
| FRANKLIN MANAGED TRUST |
| FINANCIAL STATEMENTS |
Statement of Operations
for the year ended September 30, 2016
| | | |
| Franklin Rising Dividends Fund | | | |
| |
| Investment income: | | | |
| Dividends: | | | |
| Unaffiliated issuers | $ | 361,204,762 | |
| Non-controlled affiliates (Note 7) | | 16,711,888 | |
| Total investment income. | | 377,916,650 | |
| Expenses: | | | |
| Management fees (Note 3a) | | 82,616,627 | |
| Distribution fees: (Note 3c) | | | |
| Class A | | 27,782,699 | |
| Class C | | 28,053,403 | |
| Class R | | 1,215,213 | |
| Transfer agent fees: (Note 3e) | | | |
| Class A | | 15,180,279 | |
| Class C | | 3,842,445 | |
| Class R | | 331,961 | |
| Class R6 | | 2,155 | |
| Advisor Class | | 2,431,776 | |
| Custodian fees (Note 4) | | 181,696 | |
| Reports to shareholders | | 1,691,134 | |
| Registration and filing fees | | 510,416 | |
| Professional fees | | 211,814 | |
| Trustees’ fees and expenses | | 688,611 | |
| Other. | | 255,340 | |
| Total expenses | | 164,995,569 | |
| Expense reductions (Note 4) | | (96 | ) |
| Expenses waived/paid by affiliates (Note 3f) | | (446,363 | ) |
| Net expenses | | 164,549,110 | |
| Net investment income | | 213,367,540 | |
| Realized and unrealized gains (losses): | | | |
| Net realized gain (loss) from: | | | |
| Investments | | 395,241,655 | |
| Foreign currency transactions | | (16,076 | ) |
| Net realized gain (loss) | | 395,225,579 | |
| Net change in unrealized appreciation (depreciation) on investments | | 2,295,332,464 | |
| Net realized and unrealized gain (loss) | | 2,690,558,043 | |
| Net increase (decrease) in net assets resulting from operations | $ | 2,903,925,583 | |
22 Annual Report | The accompanying notes are an integral part of these financial statements.
franklintempleton.com
| | | | | | |
| | | FRANKLIN MANAGED TRUST | |
| | | FINANCIAL STATEMENTS | |
| |
| |
| Statements of Changes in Net Assets | | | | | | |
| |
| Franklin Rising Dividends Fund | | | | | | |
| |
| | | Year Ended September 30, | |
| | | 2016 | | | 2015 | |
| Increase (decrease) in net assets: | | | | | | |
| Operations: | | | | | | |
| Net investment income | $ | 213,367,540 | | $ | 197,365,168 | |
| Net realized gain (loss) | | 395,225,579 | | | 618,141,290 | |
| Net change in unrealized appreciation (depreciation) | | 2,295,332,464 | | | (1,350,007,553 | ) |
| Net increase (decrease) in net assets resulting from operations | | 2,903,925,583 | | | (534,501,095 | ) |
| Distributions to shareholders from: | | | | | | |
| Net investment income: | | | | | | |
| Class A | | (127,610,709 | ) | | (137,566,769 | ) |
| Class C | | (15,877,260 | ) | | (14,665,982 | ) |
| Class R | | (2,284,958 | ) | | (2,976,663 | ) |
| Class R6 | | (8,617,327 | ) | | (10,085,356 | ) |
| Advisor Class | | (23,728,849 | ) | | (28,389,858 | ) |
| Net realized gains: | | | | | | |
| Class A | | (413,062,860 | ) | | (106,307,434 | ) |
| Class C | | (107,524,199 | ) | | (28,159,254 | ) |
| Class R | | (9,531,669 | ) | | (3,267,663 | ) |
| Class R6 | | (21,866,423 | ) | | (5,872,904 | ) |
| Advisor Class | | (67,142,436 | ) | | (18,856,271 | ) |
| Total distributions to shareholders | | (797,246,690 | ) | | (356,148,154 | ) |
| Capital share transactions: (Note 2) | | | | | | |
| Class A | | 16,788,033 | | | 204,062,954 | |
| Class C | | (41,557,923 | ) | | 26,363,619 | |
| Class R | | (26,375,961 | ) | | (78,456,446 | ) |
| Class R6 | | (42,046,098 | ) | | (14,412,368 | ) |
| Advisor Class | | 210,358,970 | | | (134,665,006 | ) |
| Total capital share transactions | | 117,167,021 | | | 2,892,753 | |
| Net increase (decrease) in net assets | | 2,223,845,914 | | | (887,756,496 | ) |
| Net assets: | | | | | | |
| Beginning of year | | 15,334,332,286 | | | 16,222,088,782 | |
| End of year. | $ | 17,558,178,200 | | $ | 15,334,332,286 | |
| Undistributed net investment income included in net assets: | | | | | | |
| End of year. | $ | 48,128,261 | | $ | 12,906,246 | |
franklintempleton.com
The accompanying notes are an integral part of these financial statements. | Annual Report 23
FRANKLIN MANAGED TRUST
Notes to Financial Statements
Franklin Rising Dividends Fund
1. Organization and Significant Accounting Policies
Franklin Managed Trust (Trust) is registered under the Investment Company Act of 1940 (1940 Act) as an open-end management investment company, consisting of one fund, Franklin Rising Dividends Fund (Fund) and applies the specialized accounting and reporting guidance in U.S. Generally Accepted Accounting Principles (U.S. GAAP). The Fund offers five classes of shares: Class A, Class C, Class R, Class R6 and Advisor Class. Each class of shares differs by its initial sales load, contingent deferred sales charges, voting rights on matters affecting a single class, its exchange privilege and fees primarily due to differing arrangements for distribution and transfer agent fees.
The following summarizes the Fund’s significant accounting policies.
a. Financial Instrument Valuation
The Fund’s investments in financial instruments are carried at fair value daily. Fair value is the price that would be received to sell an asset or paid to transfer a liability in an orderly transaction between market participants on the measurement date. The Fund calculates the net asset value (NAV) per share as of 4 p.m. Eastern time each day the New York Stock Exchange (NYSE) is open for trading. Under compliance policies and procedures approved by the Fund’s Board of Trustees (the Board), the Fund’s administrator has responsibility for oversight of valuation, including leading the cross-functional Valuation Committee (VC). The VC provides administration and oversight of the Fund’s valuation policies and procedures, which are approved annually by the Board. Among other things, these procedures allow the Fund to utilize independent pricing services, quotations from securities and financial instrument dealers, and other market sources to determine fair value.
Equity securities listed on an exchange or on the NASDAQ National Market System are valued at the last quoted sale price or the official closing price of the day, respectively. Foreign equity securities are valued as of the close of trading on the foreign stock exchange on which the security is primarily traded or as of 4 p.m. Eastern time, whichever is earlier. The value is then converted into its U.S. dollar equivalent at the foreign exchange rate in effect at 4 p.m. Eastern time on the day that the value of the security is determined. Over-the-counter (OTC) securities are valued within the range of the most recent quoted bid and ask prices. Securities that trade in multiple markets or on multiple exchanges are valued according to the broadest and most representative market. Certain equity securities are valued based upon fundamental characteristics or relationships to similar securities.
Investments in open-end mutual funds are valued at the closing NAV.
The Fund has procedures to determine the fair value of financial instruments for which market prices are not reliable or readily available. Under these procedures, the VC convenes on a regular basis to review such financial instruments and considers a number of factors, including significant unobservable valuation inputs, when arriving at fair value. The VC primarily employs a market-based approach which may use related or comparable assets or liabilities, recent transactions, market multiples, book values, and other relevant information for the investment to determine the fair value of the investment. An income-based valuation approach may also be used in which the anticipated future cash flows of the investment are discounted to calculate fair value. Discounts may also be applied due to the nature or duration of any restrictions on the disposition of the investments. Due to the inherent uncertainty of valuations of such investments, the fair values may differ significantly from the values that would have been used had an active market existed. The VC employs various methods for calibrating these valuation approaches including a regular review of key inputs and assumptions, transactional back-testing or disposition analysis, and reviews of any related market activity.
Trading in securities on foreign securities stock exchanges and OTC markets may be completed before 4 p.m. Eastern time. In addition, trading in certain foreign markets may not take place on every NYSE business day. Occasionally, events occur between the time at which trading in a foreign security is completed and the close of the NYSE that might call into question the reliability of the value of a portfolio security held by the Fund. As a result, differences may arise between the value of the Fund’s portfolio securities as determined at the foreign market close and the latest indications of value at the close of the NYSE. In order to minimize the potential for these differences, the VC monitors price movements following the close of trading in foreign stock markets through a series of country specific market proxies (such as baskets of American Depositary Receipts, futures contracts and exchange traded funds). These price movements are measured against established trigger thresholds for each specific market proxy to
24 Annual Report
franklintempleton.com
FRANKLIN MANAGED TRUST
NOTES TO FINANCIAL STATEMENTS
Franklin Rising Dividends Fund (continued)
assist in determining if an event has occurred that may call into question the reliability of the values of the foreign securities held by the Fund. If such an event occurs, the securities may be valued using fair value procedures, which may include the use of independent pricing services.
When the last day of the reporting period is a non-business day, certain foreign markets may be open on those days that the NYSE is closed, which could result in differences between the value of the Fund’s portfolio securities on the last business day and the last calendar day of the reporting period. Any significant security valuation changes due to an open foreign market are adjusted and reflected by the Fund for financial reporting purposes.
b. Foreign Currency Translation
Portfolio securities and other assets and liabilities denominated in foreign currencies are translated into U.S. dollars based on the exchange rate of such currencies against U.S. dollars on the date of valuation. The Fund may enter into foreign currency exchange contracts to facilitate transactions denominated in a foreign currency. Purchases and sales of securities, income and expense items denominated in foreign currencies are translated into U.S. dollars at the exchange rate in effect on the transaction date. Portfolio securities and assets and liabilities denominated in foreign currencies contain risks that those currencies will decline in value relative to the U.S. dollar. Occasionally, events may impact the availability or reliability of foreign exchange rates used to convert the U.S. dollar equivalent value. If such an event occurs, the foreign exchange rate will be valued at fair value using procedures established and approved by the Board.
The Fund does not separately report the effect of changes in foreign exchange rates from changes in market prices on securities held. Such changes are included in net realized and unrealized gain or loss from investments in the Statement of Operations.
Realized foreign exchange gains or losses arise from sales of foreign currencies, currency gains or losses realized between the trade and settlement dates on securities transactions and the difference between the recorded amounts of dividends, interest, and foreign withholding taxes and the U.S. dollar equivalent of the amounts actually received or paid. Net unrealized foreign exchange gains and losses arise from changes in foreign exchange rates on foreign denominated assets and liabilities other than investments in securities held at the end of the reporting period.
c. Income and Deferred Taxes
It is the Fund’s policy to qualify as a regulated investment company under the Internal Revenue Code. The Fund intends to distribute to shareholders substantially all of its taxable income and net realized gains to relieve it from federal income and excise taxes. As a result, no provision for U.S. federal income taxes is required.
The Fund may be subject to foreign taxation related to income received, capital gains on the sale of securities and certain foreign currency transactions in the foreign jurisdictions in which it invests. Foreign taxes, if any, are recorded based on the tax regulations and rates that exist in the foreign markets in which the Fund invests. When a capital gain tax is determined to apply, the Fund records an estimated deferred tax liability in an amount that would be payable if the securities were disposed of on the valuation date.
The Fund may recognize an income tax liability related to its uncertain tax positions under U.S. GAAP when the uncertain tax position has a less than 50% probability that it will be sustained upon examination by the tax authorities based on its technical merits. As of September 30, 2016, the Fund has determined that no tax liability is required in its financial statements related to uncertain tax positions for any open tax years (or expected to be taken in future tax years). Open tax years are those that remain subject to examination and are based on each tax jurisdiction’s statute of limitation.
d. Security Transactions, Investment Income, Expenses and Distributions
Security transactions are accounted for on trade date. Realized gains and losses on security transactions are determined on a specific identification basis. Estimated expenses are accrued daily. Dividend income is recorded on the ex-dividend date except for certain dividends from securities where the dividend rate is not available. In such cases, the dividend is recorded as soon as the information is received by the Fund. Distributions to shareholders are recorded on the ex-dividend date and are determined according to income tax regulations (tax basis). Distributable earnings determined on a tax basis may differ from earnings recorded in accordance with U.S. GAAP. These differences may be permanent or temporary. Permanent
franklintempleton.com
Annual Report
25
FRANKLIN MANAGED TRUST
NOTES TO FINANCIAL STATEMENTS
Franklin Rising Dividends Fund (continued)
1. Organization and Significant Accounting
Policies (continued)
d. Security Transactions, Investment Income, Expenses and Distributions (continued)
differences are reclassified among capital accounts to reflect their tax character. These reclassifications have no impact on net assets or the results of operations. Temporary differences are not reclassified, as they may reverse in subsequent periods.
Realized and unrealized gains and losses and net investment income, not including class specific expenses, are allocated daily to each class of shares based upon the relative proportion of net assets of each class. Differences in per share distributions, by class, are generally due to differences in class specific expenses.
e. Accounting Estimates
The preparation of financial statements in accordance with U.S. GAAP requires management to make estimates and assumptions that affect the reported amounts of assets and
liabilities at the date of the financial statements and the amounts of income and expenses during the reporting period. Actual results could differ from those estimates.
f. Guarantees and Indemnifications
Under the Trust’s organizational documents, its officers and trustees are indemnified by the Trust against certain liabilities arising out of the performance of their duties to the Trust. Additionally, in the normal course of business, the Trust, on behalf of the Fund, enters into contracts with service providers that contain general indemnification clauses. The Trust’s maximum exposure under these arrangements is unknown as this would involve future claims that may be made against the Trust that have not yet occurred. Currently, the Trust expects the risk of loss to be remote.
2. Shares of Beneficial Interest
At September 30, 2016, there were an unlimited number of shares authorized (without par value). Transactions in the Fund’s shares
were as follows:
| | | | | | | | | | |
| | | | | Year Ended September 30, | | | | |
| | | | | 2016 | | | | | 2015 | |
| | Shares | | | Amount | | Shares | | | Amount | |
| Class A Shares: | | | | | | | | | | |
| Shares sold | 33,828,312 | | $ | 1,719,581,671 | | 38,499,980 | | $ | 1,973,293,037 | |
| Shares issued in reinvestment of distributions | 10,414,790 | | | 515,015,113 | | 4,479,831 | | | 229,113,788 | |
| Shares issued on reorganization (Note 8) | 2,575,554 | | | 99,849,935 | | — | | | — | |
| Shares redeemed | (46,142,408 | ) | | (2,317,658,686 | ) | (39,088,763 | ) | | (1,998,343,871 | ) |
| Net increase (decrease) | 676,248 | | $ | 16,788,033 | | 3,891,048 | | $ | 204,062,954 | |
| Class C Shares: | | | | | | | | | | |
| Shares sold | 8,199,537 | | $ | 410,254,613 | | 10,098,859 | | $ | 510,023,884 | |
| Shares issued in reinvestment of distributions | 2,279,688 | | | 110,737,680 | | 746,497 | | | 37,722,860 | |
| Shares issued on reorganization (Note 8) | 639,687 | | | 24,370,881 | | — | | | — | |
| Shares redeemed | (11,986,483 | ) | | (586,921,097 | ) | (10,372,575 | ) | | (521,383,125 | ) |
| Net increase (decrease) | (867,571 | ) | $ | (41,557,923 | ) | 472,781 | | $ | 26,363,619 | |
| Class R Shares: | | | | | | | | | | |
| Shares sold | 1,040,088 | | $ | 52,860,243 | | 1,238,091 | | $ | 63,147,445 | |
| Shares issued in reinvestment of distributions | 218,216 | | | 10,751,479 | | 113,274 | | | 5,792,953 | |
| Shares issued on reorganization (Note 8) | 78,433 | | | 3,030,450 | | — | | | — | |
| Shares redeemed | (1,880,603 | ) | | (93,018,133 | ) | (2,871,445 | ) | | (147,396,844 | ) |
| Net increase (decrease) | (543,866 | ) | $ | (26,375,961 | ) | (1,520,080 | ) | $ | (78,456,446 | ) |
26 Annual Report
franklintempleton.com
| | | | | | | | | | |
| | | | | | | FRANKLIN MANAGED TRUST | |
| | | | | NOTES TO FINANCIAL STATEMENTS | |
| |
| |
| |
| |
| Franklin Rising Dividends Fund (continued) | | | | | | | | | | |
| |
| | | | | Year Ended September 30, | | | | |
| | | | 2016 | | | | | 2015 | | |
| | Shares | | | Amount | | Shares | | | Amount | |
| Class R6 Shares: | | | | | | | | | | |
| Shares sold | 1,090,567 | | $ | 55,523,821 | | 1,024,522 | | $ | 52,361,224 | |
| Shares issued in reinvestment of distributions | 556,116 | | | 27,477,953 | | 282,913 | | | 14,446,269 | |
| Shares redeemed | (2,449,170 | ) | | (125,047,872 | ) | (1,564,916 | ) | | (81,219,861 | ) |
| Net increase (decrease) | (802,487 | ) | $ | (42,046,098 | ) | (257,481 | ) | $ | (14,412,368 | ) |
| Advisor Class Shares: | | | | | | | | | | |
| Shares sold | 13,762,237 | | $ | 710,165,890 | | 7,658,976 | | $ | 391,825,067 | |
| Shares issued in reinvestment of distributions | 1,656,248 | | | 81,839,593 | | 823,330 | | | 42,060,063 | |
| Shares issued on reorganization (Note 8) | 119,079 | | | 4,612,835 | | — | | | — | |
| Shares redeemed | (11,740,996 | ) | | (586,259,348 | ) | (11,151,010 | ) | | (568,550,136 | ) |
| Net increase (decrease) | 3,796,568 | | $ | 210,358,970 | | (2,668,704 | ) | $ | (134,665,006 | ) |
3. Transactions with Affiliates
Franklin Resources, Inc. is the holding company for various subsidiaries that together are referred to as Franklin Templeton Investments. Certain officers and trustees of the Fund are also officers and/or directors of the following subsidiaries:
| |
| Subsidiary | Affiliation |
| Franklin Advisory Services, LLC (Advisory Services) | Investment manager |
| Franklin Templeton Services, LLC (FT Services) | Administrative manager |
| Franklin Templeton Distributors, Inc. (Distributors) | Principal underwriter |
| Franklin Templeton Investor Services, LLC (Investor Services) | Transfer agent |
| |
| a. Management Fees | |
The Fund pays an investment management fee to Advisory Services based on the average daily net assets of the Fund as follows:
| | |
| Annualized Fee Rate | | Net Assets |
| 0.750% | | Up to and including $500 million |
| 0.625% | | Over $500 million, up to and including $1 billion |
| 0.500% | | Over $1 billion, up to and including $5 billion |
| 0.490% | | Over $5 billion, up to and including $10 billion |
| 0.480% | | Over $10 billion, up to and including $20 billion |
| 0.470% | | In excess of $20 billion |
For the year ended September 30, 2016, the effective investment management fee rate was 0.500% of the Fund’s average daily net assets.
b. Administrative Fees
Under an agreement with Advisory Services, FT Services provides administrative services to the Fund. The fee is paid by Advisory Services based on the Fund’s average daily net assets, and is not an additional expense of the Fund.
franklintempleton.com
Annual Report
27
FRANKLIN MANAGED TRUST
NOTES TO FINANCIAL STATEMENTS
Franklin Rising Dividends Fund (continued)
| 3. | Transactions with Affiliates (continued) |
| c. | Distribution Fees |
The Board has adopted distribution plans for each share class, with the exception of Class R6 and Advisor Class shares, pursuant to Rule 12b-1 under the 1940 Act. Under the Fund’s Class A reimbursement distribution plan, the Fund reimburses Distributors for costs incurred in connection with the servicing, sale and distribution of the Fund’s shares up to the maximum annual plan rate. Under the Class A reimbursement distribution plan, costs exceeding the maximum for the current plan year cannot be reimbursed in subsequent periods. In addition, under the Fund’s Class C and R compensation distribution plans, the Fund pays Distributors for costs incurred in connection with the servicing, sale and distribution of the Fund’s shares up to the maximum annual plan rate for each class. The plan year, for purposes of monitoring compliance with the maximum annual plan rates, is February 1 through January 31.
The maximum annual plan rates, based on the average daily net assets, for each class, are as follows:
| | |
| Class A | 0.25 | % |
| Class C | 1.00 | % |
| Class R | 0.50 | % |
| |
| d. Sales Charges/Underwriting Agreements | | |
Front-end sales charges and contingent deferred sales charges (CDSC) do not represent expenses of the Fund. These charges are deducted from the proceeds of sales of Fund shares prior to investment or from redemption proceeds prior to remittance, as applicable. Distributors has advised the Fund of the following commission transactions related to the sales and redemptions of the Fund’s shares for the year:
| | |
| Sales charges retained net of commissions paid to | | |
| unaffiliated brokers/dealers | $ | 4,882,974 |
| CDSC retained | $ | 268,401 |
| |
| e. Transfer Agent Fees | | |
Each class of shares, except for Class R6, pays transfer agent fees to Investor Services for its performance of shareholder servicing obligations and reimburses Investor Services for out of pocket expenses incurred, including shareholder servicing fees paid to third parties. These fees are allocated daily based upon their relative proportion of such classes’ aggregate net assets. Class R6 pays Investor Services transfer agent fees specific to that class.
For the year ended September 30, 2016, the Fund paid transfer agent fees of $21,788,616, of which $8,117,876 was retained by Investor Services.
28 Annual Report
franklintempleton.com
FRANKLIN MANAGED TRUST
NOTES TO FINANCIAL STATEMENTS
Franklin Rising Dividends Fund (continued)
f. Investments in Affiliated Management Investment Companies
The Fund invests in one or more affiliated management investment companies for purposes other than exercising a controlling influence over the management or policies. Management fees paid by the Fund are waived on assets invested in the affiliated management investment companies, as noted in the Statement of Operations, in an amount not to exceed the management and administrative fees paid directly or indirectly by each affiliate. Prior to October 1, 2013, the waiver was accounted for as a reduction to management fees. During the year ended September 30, 2016, the Fund held investments in affiliated management investment companies as follows:
| | | | | | | | | | | |
| | | | | | | | | | | % of | |
| | | | | | | | | | | Affiliated | |
| | Number of | | | | Number of | | | | | Fund Shares | |
| | Shares Held | | | | Shares | | Value | | | Outstanding | |
| | at Beginning | Gross | Gross | | Held at End | | at End | Investment | Realized | Held at End | |
| | of Year | Additions | Reductions | | of Year | | of Year | Income | Gain (Loss) | of Year | |
| |
| Non-Controlled Affiliates | | | | | | | | | | | |
| Institutional Fiduciary Trust Money | | | | | | | | | | | |
| Market Portfolio | 131,132,658 | 888,654,104 | (803,561,856 | ) | 216,224,906 | $ | 216,224,906 | $ – | $ – | 1.4 | % |
| |
| |
| g. Waiver and Expense Reimbursements | | | | | | | | | | |
Investor Services has contractually agreed in advance to waive or limit its fees so that the Class R6 transfer agent fees do not exceed 0.01% until January 31, 2017. There were no Class R6 transfer agent fees waived during the year ended September 30, 2016.
4. Expense Offset Arrangement
The Fund has entered into an arrangement with its custodian whereby credits realized as a result of uninvested cash balances are used to reduce a portion of the Fund’s custodian expenses. During the year ended September 30, 2016, the custodian fees were reduced as noted in the Statement of Operations.
5. Income Taxes
For tax purposes, capital losses may be carried over to offset future capital gains, if any. At September 30, 2016, the Fund had short-term capital loss carryforwards of $1,076,222 and long-term capital loss carryforwards of $4,586,450, which were from the merged Franklin Large Cap Value Fund and may be carried over to offset future capital gains, subject to certain limitations.
During the year ended September 30, 2016, the Fund utilized $1,568,397 of capital loss carryforwards.
The tax character of distributions paid during the years ended September 30, 2016 and 2015, was as follows:
| | | | |
| | | 2016 | | 2015 |
| Distributions paid from: | | | | |
| Ordinary income | $ | 178,605,098 | $ | 195,486,299 |
| Long term capital gain | | 618,641,592 | | 160,661,855 |
| | $ | 797,246,690 | $ | 356,148,154 |
franklintempleton.com
Annual Report
29
FRANKLIN MANAGED TRUST
NOTES TO FINANCIAL STATEMENTS
Franklin Rising Dividends Fund (continued)
5. Income Taxes (continued)
At September 30, 2016, the cost of investments, net unrealized appreciation (depreciation), undistributed ordinary income and undistributed long term capital gains for income tax purposes were as follows:
| | | |
| Cost of investments | $ | 12,074,706,613 | |
| |
| Unrealized appreciation | $ | 5,851,688,622 | |
| Unrealized depreciation | | (354,180,764 | ) |
| Net unrealized appreciation (depreciation) | $ | 5,497,507,858 | |
| |
| Undistributed ordinary income. | $ | 52,899,510 | |
| Undistributed long term capital gains | | 387,001,053 | |
| Distributable earnings | $ | 439,900,563 | |
Differences between income and/or capital gains as determined on a book basis and a tax basis are primarily due to differing treatment of wash sales.
6. Investment Transactions
Purchases and sales of investments (excluding short term securities) for the year ended September 30, 2016, aggregated $285,350,552 and $990,754,003, respectively.
7. Holdings of 5% Voting Securities of Portfolio Companies
The 1940 Act defines "affiliated companies" to include investments in portfolio companies in which a fund owns 5% or more of the outstanding voting securities. During the year ended September 30, 2016, the Fund held investments in “affiliated companies” as follows:
| | | | | | | | | | |
| | Number of | | | Number of | | | | | | |
| | Shares Held | | | Shares Held | | Value | | | | Realized |
| | at Beginning | Gross | Gross | at End | | at End | | Investment | | Gain |
| Name of Issuer | of Year | Additions | Reductions | of Year | | of Year | | Income | | (Loss) |
| |
| Non-Controlled Affiliates | | | | | | | | | | |
| Albemarle Corp | 6,956,000 | 42,000 | — | 6,998,000 | $ | 598,259,020 | $ | 8,407,600 | $ | — |
| John Wiley & Sons Inc., A | 4,412,048 | — | — | 4,412,048 | | 227,705,797 | | 6,706,313 | | — |
| Matthews International Corp., A. | 2,663,292 | — | — | 2,663,292 | | 161,821,622 | | 1,597,975 | | — |
| Total Affiliated Securities (Value is 5.6% of Net Assets) | | | $ | 987,786,439 | $ | 16,711,888 | $ | — |
8. Reorganization
On May 20, 2016, Franklin Rising Dividends Fund (Surviving Fund), pursuant to a plan of reorganization approved on April 29, 2016 by shareholders of Franklin Large Cap Value Fund (Acquired Fund), a series of Franklin Value Investors Trust, acquired 100% of the Acquired Fund’s net assets, primarily made up of investment securities, which included $39,393,833 of unrealized appreciation, through a tax-free exchange of 3,412,753 shares of the Surviving Fund (valued at $131,864,101). Immediately after the completion of the reorganization, the combined net assets of the Surviving Fund were $16,713,037,978.
30 Annual Report
franklintempleton.com
FRANKLIN MANAGED TRUST
NOTES TO FINANCIAL STATEMENTS
Franklin Rising Dividends Fund (continued)
The primary reasons for the reorganization were to combine the Acquired Fund with a larger fund that had lower annual fund operating expense ratios, better overall historical performance, closely aligned investment goals and generally similar principal investment strategies/risks. The estimated cost of the reorganization was $176,450 of which the Surviving Fund and the Acquired Fund each paid 25% and Advisory Services paid 50%. The allocated portion of the Surviving Fund’s reorganization expenses are included with professional fees and reports to shareholders expenses in the Statement of Operations.
Assuming the reorganization had been completed on October 1, 2015, the Surviving Fund’s pro forma results of operations, would have been as follows:
| | | | | | |
| | | | | | | Net Increase |
| | | | | Net Realized and | | (Decrease) in Net |
| | | | | Unrealized Gain | | Assets from |
| Period | | Net Investment Income | | (Loss) | | Operations |
| |
| For the period October 1, 2015, through September 30, 2016 | $ | 214,464,893 | $ | 2,692,615,366 | $ | 2,907,080,259 |
Subsequent to the reorganization, the Fund has been managed as a single entity. Accordingly, it is impracticable to identify the amount of net investment income attributable to the Acquired Fund’s assets after the completion of the reorganization.
9. Credit Facility
The Fund, together with other U.S. registered and foreign investment funds (collectively, Borrowers), managed by Franklin Templeton Investments, are borrowers in a joint syndicated senior unsecured credit facility totaling $2 billion (Global Credit Facility) which matures on February 10, 2017. This Global Credit Facility provides a source of funds to the Borrowers for temporary and emergency purposes, including the ability to meet future unanticipated or unusually large redemption requests.
Under the terms of the Global Credit Facility, the Fund shall, in addition to interest charged on any borrowings made by the Fund and other costs incurred by the Fund, pay its share of fees and expenses incurred in connection with the implementation and maintenance of the Global Credit Facility, based upon its relative share of the aggregate net assets of all of the Borrowers, including an annual commitment fee of 0.07% based upon the unused portion of the Global Credit Facility. Effective February 12, 2016, the annual commitment fee is 0.15%. These fees are reflected in other expenses in the Statement of Operations. During the year ended September 30, 2016, the Fund did not use the Global Credit Facility.
10. Fair Value Measurements
The Fund follows a fair value hierarchy that distinguishes between market data obtained from independent sources (observable inputs) and the Fund’s own market assumptions (unobservable inputs). These inputs are used in determining the value of the Fund’s financial instruments and are summarized in the following fair value hierarchy:
- Level 1 – quoted prices in active markets for identical financial instruments
- Level 2 – other significant observable inputs (including quoted prices for similar financial instruments, interest rates, prepayment speed, credit risk, etc.)
- Level 3 – significant unobservable inputs (including the Fund’s own assumptions in determining the fair value of financial instruments)
The input levels are not necessarily an indication of the risk or liquidity associated with financial instruments at that level.
For movements between the levels within the fair value hierarchy, the Fund has adopted a policy of recognizing the transfers as of the date of the underlying event which caused the movement.
franklintempleton.com
Annual Report
31
FRANKLIN MANAGED TRUST
NOTES TO FINANCIAL STATEMENTS
Franklin Rising Dividends Fund (continued)
10. Fair Value Measurements (continued)
At September 30, 2016, all of the Fund’s investments in financial instruments carried at fair value were valued using Level 1 inputs.
For detailed categories, see the accompanying Statement of Investments.
11. Change of Independent Registered Public Accounting Firm
On December 4, 2015, upon recommendation from the Audit Committee, the Board replaced Tait, Weller & Baker LLP (TWB) with PricewaterhouseCoopers LLP (PwC) to serve as the Fund’s independent registered public accounting firm for the fiscal year ending September 30, 2016.
TWB’s reports on the Fund’s financial statements for the prior two fiscal years contained no adverse opinion or disclaimer of opinion nor were they qualified or modified as to uncertainty, audit scope, or accounting principles. During such fiscal years, (i) there were no disagreements with TWB on any matter of accounting principles or practices, financial statement disclosure, or audit scope or procedure, which disagreements, if not resolved to the satisfaction of TWB, would have caused them to make reference to the subject matter of the disagreements in connection with their reports on the Fund’s financial statements for such years, (ii) there were no reportable events, and (iii) prior to December 4, 2015 PwC was not consulted regarding the application of accounting principles associated with any financial matter during the Fund’s prior two fiscal years.
12. Subsequent Events
The Fund has evaluated subsequent events through the issuance of the financial statements and determined that no events have occurred that require disclosure.
Abbreviations
Selected Portfolio
ADR American Depositary Receipt
32 Annual Report
franklintempleton.com
FRANKLIN MANAGED TRUST
Report of Independent Registered Public Accounting Firm
To the Board of Trustees and Shareholders of Franklin Rising Dividends Fund
In our opinion, the accompanying statement of assets and liabilities, including the statement of investments, and the related statements of operations and of changes in net assets and the financial highlights present fairly, in all material respects, the financial position of the Franklin Rising Dividends Fund (the “Fund”) at September 30, 2016, and the results of its operations, the changes in its net assets and the financial highlights for the year then ended, in conformity with accounting principles generally accepted in the United States of America. These financial statements and financial highlights (hereafter referred to as “financial statements”) are the responsibility of the Fund’s management. Our responsibility is to express an opinion on these financial statements based on our audit. We conducted our audit of these financial statements in accordance with the standards of the Public Company Accounting Oversight Board (United States). Those standards require that we plan and perform the audit to obtain reasonable assurance about whether the financial statements are free of material misstatement. An audit includes examining, on a test basis, evidence supporting the amounts and disclosures in the financial statements, assessing the accounting principles used and significant estimates made by management, and evaluating the overall financial statement presentation. We believe that our audit, which included confirmation of securities at September 30, 2016 by correspondence with the custodian, transfer agent and brokers, provide a reasonable basis for our opinion. The statement of changes in net assets and the financial highlights of the Fund for the periods ended September 30, 2015 and prior were audited by another independent registered public accounting firm whose report dated November 16, 2015 expressed an unqualified opinion on those statements and highlights.
PricewaterhouseCoopers LLP
San Francisco, California
November 16, 2016
franklintempleton.com
Annual Report
33
FRANKLIN MANAGED TRUST
Tax Information (unaudited)
Under Section 852(b)(3)(C) of the Internal Revenue Code (Code), the Fund hereby reports the maximum amount allowable but no less than $618,641,592 as a long term capital gain dividend for the fiscal year ended September 30, 2016.
Under Section 871(k)(2)(C) of the Code, the Fund hereby reports the maximum amount allowable but no less than $485,995 as a short term capital gain dividend for purposes of the tax imposed under Section 871(a)(1)(A) of the Code for the fiscal year ended September 30, 2016.
Under Section 854(b)(1)(A) of the Code, the Fund hereby reports 100% of the ordinary income dividends as income qualifying for the dividends received deduction for the fiscal year ended September 30, 2016.
Under Section 854(b)(1)(B) of the Code, the Fund hereby reports the maximum amount allowable but no less than $361,717,270 as qualified dividends for purposes of the maximum rate under Section 1(h)(11) of the Code for the fiscal year ended September 30, 2016. Distributions, including qualified dividend income, paid during calendar year 2016 will be reported to shareholders on Form 1099-DIV by mid-February 2017. Shareholders are advised to check with their tax advisors for information on the treatment of these amounts on their individual income tax returns.
34 Annual Report
franklintempleton.com
FRANKLIN MANAGED TRUST
| | | | |
| Board Members and Officers | | |
| |
| |
| The name, year of birth and address of the officers and board members, as well as their affiliations, positions held with the Fund, |
| principal occupations during at least the past five years and number of U.S. registered portfolios overseen in the Franklin Templeton |
| Investments fund complex, are shown below. Generally, each board member serves until that person’s successor is elected and |
| qualified. | | | | |
| |
| |
| Independent Board Members | | | |
| |
| | | | Number of Portfolios in | |
| Name, Year of Birth | | Length of | Fund Complex Overseen | Other Directorships Held |
| and Address | Position | Time Served | by Board Member* | During at Least the Past 5 Years |
| |
| Edward I. Altman, Ph.D. (1941) | Trustee | Since 2015 | 16 | None |
| One Franklin Parkway | | | | |
| San Mateo, CA 94403-1906 | | | | |
| Principal Occupation During at Least the Past 5 Years: | | |
| Max L. Heine Professor of Finance, Emeritus and Director of The Credit and Debt Markets Research Program, Salomon Center, Stern School |
| of Business, New York University; editor and author of numerous financial publications; financial consultant; an adviser to numerous financial |
| and publishing organizations; and formerly, Vice Director, Salomon Center, Stern School of Business, New York University. |
| |
| Ann Torre Bates (1958) | Trustee | Since 2015 | 42 | Ares Capital Corporation (specialty |
| One Franklin Parkway | | | | finance company) (2010-present), |
| San Mateo, CA 94403-1906 | | | | United Natural Foods, Inc. (distributor |
| | | | | of natural, organic and specialty foods) |
| | | | | (2013-present), Allied Capital |
| | | | | Corporation (financial services) |
| | | | | (2003-2010), SLM Corporation (Sallie |
| | | | | Mae) (1997-2014) and Navient |
| | | | | Corporation (loan management, |
| | | | | servicing and asset recovery) |
| | | | | (2014-2016). |
| Principal Occupation During at Least the Past 5 Years: | | |
| Director of various companies; and formerly, Executive Vice President and Chief Financial Officer, NHP Incorporated (manager of multifamily |
| housing) (1995-1997); and Vice President and Treasurer, US Airways, Inc. (until 1995). | |
| |
| Burton J. Greenwald (1929) | Trustee and | Trustee since | 16 | Franklin Templeton Emerging Markets |
| One Franklin Parkway | Vice | 2001 and Vice | | Debt Opportunities Fund PLC and |
| San Mateo, CA 94403-1906 | Chairmanof the Chairman of | | Fiduciary International Ireland Limited |
| | Board | the Board | | (1999-2015). |
| | | since 2015 | | |
| Principal Occupation During at Least the Past 5 Years: | | |
| Managing Director, B.J. Greenwald Associates (management consultants to the financial services industry); and formerly, Chairman, Fiduciary |
| Trust International Funds; Executive Vice President, L.F. Rothschild Fund Management, Inc.; President and Director, Merit Mutual Funds; |
| President, Underwriting Division and Director, National Securities & Research Corporation; Governor, Investment Company Institute; and |
| Chairman, ICI Public Information Committee. | | | |
| |
| Keith E. Mitchell (1954) | Trustee | Since 2015 | 16 | None |
| One Franklin Parkway | | | | |
| San Mateo, CA 94403-1906 | | | | |
| Principal Occupation During at Least the Past 5 Years: | | |
| Director of various boards of asset management firms; and formerly, Managing Member, Mitchell, Hartley & Bechtel Advisers, LLC (formerly, |
| Mitchell Advisers, LLC) (advisory firm) (2003-2015) and Managing Director, Putman Lovell NBF. | |
| |
| David W. Niemiec (1949) | Trustee | Since 2011 | 42 | Emeritus Corporation (assisted living) |
| One Franklin Parkway | | | | (1999-2010) and OSI Pharmaceuticals, |
| San Mateo, CA 94403-1906 | | | | Inc. (pharmaceutical products) |
| | | | | (2006-2010). |
| Principal Occupation During at Least the Past 5 Years: | | |
| Advisor, Saratoga Partners (private equity fund); and formerly, Managing Director, Saratoga Partners (1998-2001) and SBC Warburg Dillon |
| Read (investment banking) (1997-1998); Vice Chairman, Dillon, Read & Co. Inc. (investment banking) (1991-1997); and Chief Financial Officer, |
| Dillon, Read & Co. Inc. (1982-1997). | | | |
franklintempleton.com
Annual Report
35
FRANKLIN MANAGED TRUST
| | | | |
| Independent Board Members (continued) | | |
| |
| |
| |
| | | | Number of Portfolios in | |
| Name, Year of Birth | | Length of | Fund Complex Overseen | Other Directorships Held |
| and Address | Position | Time Served | by Board Member* | During at Least the Past 5 Years |
| |
| Charles Rubens II (1930) | Trustee | Since 1986 | 16 | None |
| One Franklin Parkway | | | | |
| San Mateo, CA 94403-1906 | | | | |
| Principal Occupation During at Least the Past 5 Years: | | |
| Private investor and president of non-profit organizations; and formerly, an executive of Time, Inc.; and Trustee of Colorado College. |
| |
| Jan Hopkins Trachtman (1947) | Trustee | Since 2015 | 16 | None |
| One Franklin Parkway | | | | |
| San Mateo, CA 94403-1906 | | | | |
| Principal Occupation During at Least the Past 5 Years: | | |
| President and Founder, The Jan Hopkins Group (communications consulting firm); serves on Advisory Board of Knight Bagehot Fellowship; |
| and formerly, President, Economic Club of New York (2007-2015); Anchor/Correspondent, CNN Financial News (until 2003); Managing |
| Director and Head of Client Communications, Citigroup Private Bank (until 2005); Off-Air Reporter, ABC News’ World News Tonight; and Editor, |
| CBS Network News. | | | | |
| |
| Robert E. Wade (1946) | Trustee and | Trustee | 42 | El Oro Ltd (investments) |
| One Franklin Parkway | Chairman of | since 2004 | | (2003-present). |
| San Mateo, CA 94403-1906 | the Board | and Chairman | | |
| | | of the Board | | |
| | | since 2015 | | |
| Principal Occupation During at Least the Past 5 Years: | | |
| Attorney at law engaged in private practice (1972-2008) and member of various boards. | |
| |
| Gregory H. Williams (1943) | Trustee | Since 2008 | 16 | None |
| One Franklin Parkway | | | | |
| San Mateo, CA 94403-1906 | | | | |
| Principal Occupation During at Least the Past 5 Years: | | |
| Private investor; Consultant; and formerly, President, University of Cincinnati (2009-2012); President, The City College of New York |
| (2001-2009); Dean, College of Law, Ohio State University (1993-2001); and Associate Vice President, Academic Affairs and Professor of Law, |
| University of Iowa (1977-1993). | | | | |
| |
| |
| Interested Board Members and Officers | | |
| |
| | | | Number of Portfolios in | |
| Name, Year of Birth | | Length of | Fund Complex Overseen | Other Directorships Held |
| and Address | Position | Time Served | by Board Member* | During at Least the Past 5 Years |
| |
| **Gregory E. Johnson (1961) | Trustee | Since 2015 | 159 | None |
| One Franklin Parkway | | | | |
| San Mateo, CA 94403-1906 | | | | |
| Principal Occupation During at Least the Past 5 Years: | | |
| Chairman of the Board, Member - Office of the Chairman, Director and Chief Executive Officer, Franklin Resources, Inc.; officer and/or director |
| or trustee, as the case may be, of some of the other subsidiaries of Franklin Resources, Inc. and of 44 of the investment companies in Franklin |
| Templeton Investments; Vice Chairman, Investment Company Institute; and formerly, President, Franklin Resources, Inc. (1994-2015). |
| |
| **Jennifer M. Johnson (1964) | Trustee | Since 2015 | 15 | None |
| One Franklin Parkway | | | | |
| San Mateo, CA 94403-1906 | | | | |
| Principal Occupation During at Least the Past 5 Years: | | |
| Co-President, Franklin Resources, Inc.; officer and/or director or trustee, as the case may be, of some of the other subsidiaries of Franklin |
| Resources, Inc. and of four of the investment companies in Franklin Templeton Investments; and formerly, Chief Operating Officer and |
| Executive Vice President, Franklin Resources, Inc. (1994-2015); Executive Vice President of Operations and Technology, Franklin Resources, |
| Inc. (2005-2010); Senior Vice President, Franklin Resources, Inc. (2003-2005). | |
36 Annual Report
franklintempleton.com
FRANKLIN MANAGED TRUST
| | | | |
| Interested Board Members and Officers (continued) | |
| |
| |
| |
| | | | Number of Portfolios in | |
| Name, Year of Birth | | Length of | Fund Complex Overseen | Other Directorships Held |
| and Address | Position | Time Served | by Board Member* | During at Least the Past 5 Years |
| |
| Alison E. Baur (1964) | Vice President | Since 2012 | Not Applicable | Not Applicable |
| One Franklin Parkway | | | | |
| San Mateo, CA 94403-1906 | | | | |
| Principal Occupation During at Least the Past 5 Years: | | |
| Deputy General Counsel, Franklin Templeton Investments; and officer of some of the other subsidiaries of Franklin Resources, Inc. and of 45 |
| of the investment companies in Franklin Templeton Investments. | | |
| |
| Laura F. Fergerson (1962) | Chief Executive Since 2009 | Not Applicable | Not Applicable |
| One Franklin Parkway | Officer- | | | |
| San Mateo, CA 94403-1906 | Finance and | | | |
| | Administration | | | |
| Principal Occupation During at Least the Past 5 Years: | | |
| Senior Vice President, Franklin Templeton Services, LLC; Vice President, Franklin Advisers, Inc. and Franklin Templeton Institutional, LLC; and |
| officer of 45 of the investment companies in Franklin Templeton Investments. | |
| |
| Aliya S. Gordon (1973) | Vice President | Since 2009 | Not Applicable | Not Applicable |
| One Franklin Parkway | | | | |
| San Mateo, CA 94403-1906 | | | | |
| Principal Occupation During at Least the Past 5 Years: | | |
| Senior Associate General Counsel, Franklin Templeton Investments; and officer of 45 of the investment companies in Franklin Templeton |
| Investments. | | | | |
| |
| Steven J. Gray (1955) | Secretary | Secretary since | Not Applicable | Not Applicable |
| One Franklin Parkway | and Vice | 2005 and Vice | | |
| San Mateo, CA 94403-1906 | President | President | | |
| | | since 2009 | | |
| Principal Occupation During at Least the Past 5 Years: | | |
| Senior Associate General Counsel, Franklin Templeton Investments; Vice President, Franklin Templeton Distributors, Inc. and Franklin |
| Alternative Strategies Advisers, LLC; and officer of 45 of the investment companies in Franklin Templeton Investments. |
| |
| Rupert H. Johnson, Jr. (1940) | Vice President | Since 1991 | Not Applicable | Not Applicable |
| One Franklin Parkway | | | | |
| San Mateo, CA 94403-1906 | | | | |
| Principal Occupation During at Least the Past 5 Years: | | |
| Vice Chairman, Member - Office of the Chairman and Director, Franklin Resources, Inc.; Director, Franklin Advisers, Inc.; Senior Vice |
| President, Franklin Advisory Services, LLC; and officer and/or director or trustee, as the case may be, of some of the other subsidiaries of |
| Franklin Resources, Inc. and of 42 of the investment companies in Franklin Templeton Investments. | |
| |
| Robert G. Kubilis (1973) | Treasurer, | Since 2012 | Not Applicable | Not Applicable |
| 300 S.E. 2nd Street | Chief | | | |
| Fort Lauderdale, FL 33301-1923 | Financial | | | |
| | Officer and | | | |
| | Chief | | | |
| | Accounting | | | |
| | Officer | | | |
| Principal Occupation During at Least the Past 5 Years: | | |
| Treasurer, U.S. Fund Administration & Reporting, Franklin Templeton Investments; and officer of four of the investment companies in Franklin |
| Templeton Investments. | | | | |
| |
| Robert Lim (1948) | Vice President | Since May 2016 | Not Applicable | Not Applicable |
| One Franklin Parkway | – AML | | | |
| San Mateo, CA 94403-1906 | Compliance | | | |
| Principal Occupation During at Least the Past 5 Years: | | |
| Vice President, Franklin Templeton Companies, LLC; Chief Compliance Officer, Franklin Templeton Distributors, Inc. and Franklin Templeton |
| Investor Services, LLC; and officer of 45 of the investment companies in Franklin Templeton Investments. |
franklintempleton.com
Annual Report
37
FRANKLIN MANAGED TRUST
| | | | |
| Interested Board Members and Officers (continued) | |
| |
| |
| |
| | | | Number of Portfolios in | |
| Name, Year of Birth | | Length of | Fund Complex Overseen | Other Directorships Held |
| and Address | Position | Time Served | by Board Member* | During at Least the Past 5 Years |
| |
| Kimberly H. Novotny (1972) | Vice President | Since 2013 | Not Applicable | Not Applicable |
| 300 S.E. 2nd Street | | | | |
| Fort Lauderdale, FL 33301-1923 | | | | |
| Principal Occupation During at Least the Past 5 Years: | | |
| Associate General Counsel, Franklin Templeton Investments; Vice President and Corporate Secretary, Fiduciary Trust International of the |
| South; Vice President, Templeton Investment Counsel, LLC; Assistant Secretary, Franklin Resources, Inc.; and officer of 45 of the investment |
| companies in Franklin Templeton Investments. | | | |
| |
| Robert C. Rosselot (1960) | Chief | Since 2013 | Not Applicable | Not Applicable |
| 300 S.E. 2nd Street | Compliance | | | |
| Fort Lauderdale, FL 33301-1923 | Officer | | | |
| Principal Occupation During at Least the Past 5 Years: | | |
| Director, Global Compliance, Franklin Templeton Investments; Vice President, Franklin Templeton Companies, LLC; officer of 45 of the |
| investment companies in Franklin Templeton Investments; and formerly, Senior Associate General Counsel, Franklin Templeton Investments |
| (2007-2013); and Secretary and Vice President, Templeton Group of Funds (2004-2013). | |
| |
| Karen L. Skidmore (1952) | Vice President | Since 2006 | Not Applicable | Not Applicable |
| One Franklin Parkway | | | | |
| San Mateo, CA 94403-1906 | | | | |
| Principal Occupation During at Least the Past 5 Years: | | |
| Senior Associate General Counsel, Franklin Templeton Investments; and officer of 45 of the investment companies in Franklin Templeton |
| Investments. | | | | |
| |
| Donald G. Taylor (1954) | President and | Since 2014 | Not Applicable | Not Applicable |
| 55 Challenger Road, Suite 501 | Chief Executive | | | |
| Ridgefield, NJ 07660 | Officer- | | | |
| | Investment | | | |
| | Management | | | |
| Principal Occupation During at Least the Past 5 Years: | | |
| President and Chief Investment Officer, Franklin Advisory Services, LLC; and officer of two of the investment companies in Franklin Templeton |
| Investments. | | | | |
| |
| Navid J. Tofigh (1972) | Vice President | Since 2015 | Not Applicable | Not Applicable |
| One Franklin Parkway | | | | |
| San Mateo, CA 94403-1906 | | | | |
| Principal Occupation During at Least the Past 5 Years: | | |
| Associate General Counsel, Franklin Templeton Investments; and officer of 45 of the investment companies in Franklin Templeton Investments. |
| |
| Craig S. Tyle (1960) | Vice President | Since 2005 | Not Applicable | Not Applicable |
| One Franklin Parkway | | | | |
| San Mateo, CA 94403-1906 | | | | |
| Principal Occupation During at Least the Past 5 Years: | | |
| General Counsel and Executive Vice President, Franklin Resources, Inc.; and officer of some of the other subsidiaries of Franklin Resources, |
| Inc. and of 45 of the investment companies in Franklin Templeton Investments. | |
| |
| Lori A. Weber (1964) | Vice President | Since 2011 | Not Applicable | Not Applicable |
| 300 S.E. 2nd Street | | | | |
| Fort Lauderdale, FL 33301-1923 | | | | |
| Principal Occupation During at Least the Past 5 Years: | | |
| Senior Associate General Counsel, Franklin Templeton Investments; Assistant Secretary, Franklin Resources, Inc.; Vice President and |
| Secretary, Templeton Investment Counsel, LLC; and officer of 45 of the investment companies in Franklin Templeton Investments. |
| |
| We base the number of portfolios on each separate series of the U.S. registered investment companies within the Franklin Templeton Investments fund complex. These |
| portfolios have a common investment manager or affiliated investment managers. | | |
| **Gregory E. Johnson is considered to be an interested person of the Fund under the federal securities laws due to his position as an officer and director of Franklin |
| Resources, Inc. (Resources), which is the parent company of the Fund’s investment manager and distributor. Jennifer M. Johnson is considered to be an interested person of |
| the Fund under the federal securities laws due to her position as officer and director of Resources. | |
38 Annual Report
franklintempleton.com
FRANKLIN MANAGED TRUST
Interested Board Members and Officers (continued)
Note 1: Rupert H. Johnson, Jr. is the uncle of Gregory E. Johnson and Jennifer M. Johnson. Gregory E. Johnson and Jennifer M. Johnson are siblings.
Note 2: Officer information is current as of the date of this report. It is possible that after this date, information about officers may change.
Note 3: Effective September 30, 2016, William J. Lippman ceased to be a trustee of the Trust.
The Sarbanes-Oxley Act of 2002 and Rules adopted by the U.S. Securities and Exchange Commission require the Fund to disclose whether the Fund’s Audit
Committee includes at least one member who is an audit committee financial expert within the meaning of such Act and Rules. The Fund’s Board has determined
that there is at least one such financial expert on the Audit Committee and has designated David W. Niemiec as an audit committee financial expert. The Board
believes that Mr. Niemiec qualifies as such an expert in view of his extensive business background and experience. Mr. Niemiec has served as a member of the
Fund Audit Committee since 2013, currently serves as an Advisor to Saratoga Partners and was formerly its Managing Director from 1998 to 2001. Mr. Niemiec
was formerly a director of Emeritus Corporation from 1999 to 2010 and OSI Pharmaceuticals, Inc. from 2006 to 2010, Managing Director of SBC Warburg Dillon
Read from 1997 to 1998, and was Vice Chairman from 1991 to 1997 and Chief Financial Officer from 1982 to 1997 of Dillon, Read & Co. Inc. As a result of such
background and experience, the Board believes that Mr. Niemiec has acquired an understanding of generally accepted accounting principles and financial
statements, the general application of such principles in connection with the accounting estimates, accruals and reserves, and analyzing and evaluating financial
statements that present a breadth and level of complexity of accounting issues generally comparable to those of the Fund, as well as an understanding of
internal controls and procedures for financial reporting and an understanding of audit committee functions. Mr. Niemiec is an independent Board member as that
term is defined under the applicable U.S. Securities and Exchange Commission Rules and Releases.
The Statement of Additional Information (SAI) includes additional information about the board members and is available, without charge, upon request.
Shareholders may call (800) DIAL BEN/342-5236 to request the SAI.
franklintempleton.com
Annual Report
39
FRANKLIN MANAGED TRUST FRANKLIN RISING DIVIDENDS FUND
Shareholder Information
Proxy Voting Policies and Procedures
The Fund’s investment manager has established Proxy Voting Policies and Procedures (Policies) that the Fund uses to determine how to vote proxies relating to portfolio securities. Shareholders may view the Fund’s complete Policies online at franklintempleton.com. Alternatively, shareholders may request copies of the Policies free of charge by calling the Proxy Group collect at (954) 527-7678 or by sending a written request to: Franklin Templeton Companies, LLC, 300 S.E. 2nd Street, Fort Lauderdale, FL 33301, Attention: Proxy Group. Copies of the Fund’s proxy voting records are also made available online at franklintempleton.com and posted on the U.S. Securities and Exchange Commission’s website at sec.gov and reflect the most recent 12-month period ended June 30.
Quarterly Statement of Investments
The Trust, on behalf of the Fund, files a complete statement of investments with the U.S. Securities and Exchange Commission for the first and third quarters for each fiscal year on Form N-Q. Shareholders may view the filed Form N-Q by visiting the Commission’s website at sec.gov. The filed form may also be viewed and copied at the Commission’s Public Reference Room in Washington, DC. Information regarding the operations of the Public Reference Room may be obtained by calling (800) SEC-0330.
Householding of Reports and Prospectuses
You will receive the Fund’s financial reports every six months as well as an annual updated summary prospectus (prospectus available upon request). To reduce Fund expenses, we try to identify related shareholders in a household and send only one copy of the financial reports and summary prospectus. This process, called “householding,” will continue indefinitely unless you instruct us otherwise. If you prefer not to have these documents householded, please call us at (800) 632-2301. At any time you may view current prospectuses/summary prospectuses and financial reports on our website. If you choose, you may receive these documents through electronic delivery.
40 Annual Report
franklintempleton.com

Item 2. Code of Ethics.
(a) The Registrant has adopted a code of ethics that applies to its principal executive officers and principal financial and accounting officer.
(c) N/A
(d) N/A
(f) Pursuant to Item 12(a)(1), the Registrant is attaching as an exhibit a copy of its code of ethics that applies to its principal executive officers and principal financial and accounting officer.
Item 3. Audit Committee Financial Expert.
(a)(1) The Registrant has an audit committee financial expert serving on its audit committee.
(2) The audit committee financial expert is David W. Niemiec and he is "independent" as defined under the relevant Securities and Exchange Commission Rules and Releases.
Item 4. Principal Accountant Fees and Services.
(a) Audit Fees
The aggregate fees paid to the principal accountant for professional services rendered by the principal accountant for the audit of the registrant’s annual financial statements or for services that are normally provided by the principal accountant in connection with statutory and regulatory filings or engagements were $41,695 for the fiscal year ended September 30, 2016 and $30,300 for the fiscal year ended September 30, 2015.
(b) Audit-Related Fees
The aggregate fees paid to the principal accountant for assurance and related services rendered by the principal accountant to the registrant that are reasonably related to the performance of the audit of the registrant's financial statements and are not reported under paragraph (a) of Item 4 were $3,011 for the fiscal year ended September 30, 2016 and $0 for the fiscal year ended September 30, 2015. The services for which these fees were paid included attestation services.
There were no fees paid to the principal accountant for assurance and related services rendered by the principal accountant to the registrant's investment adviser and any entity controlling, controlled by or under common control with the investment adviser that provides ongoing services to the registrant that are reasonably related to the performance of the audit of their financial statements.
(c) Tax Fees
There were no fees paid to the principal accountant for professional services rendered by the principal accountant to the registrant for tax compliance, tax advice and tax planning.
There were no fees paid to the principal accountant for professional services rendered by the principal accountant to the registrant’s investment adviser and any entity controlling, controlled by or under common control with the investment adviser that provides ongoing services to the registrant for tax compliance, tax advice and tax planning.
(d) All Other Fees
There were no fees paid to the principal accountant for products and services rendered by the principal accountant to the registrant not reported in paragraphs (a)-(c) of Item 4.
There were no fees paid to the principal accountant for products and services rendered by the principal accountant to the registrant’s investment adviser and any entity controlling, controlled by or under common control with the investment adviser that provides ongoing services to the registrant other than services reported in paragraphs (a)-(c) of Item 4.
(e) (1) The registrant’s audit committee is directly responsible for approving the services to be provided by the auditors, including:
(i) pre-approval of all audit and audit related services;
(ii) pre-approval of all non-audit related services to be provided to the Fund by the auditors;
(iii) pre-approval of all non-audit related services to be provided to the registrant by the auditors to the registrant’s investment adviser or to any entity that controls, is controlled by or is under common control with the registrant’s investment adviser and that provides ongoing services to the registrant where the non-audit services relate directly to the operations or financial reporting of the registrant; and
(iv) establishment by the audit committee, if deemed necessary or appropriate, as an alternative to committee pre-approval of services to be provided by the auditors, as required by paragraphs (ii) and (iii) above, of policies and procedures to permit such services to be pre-approved by other means, such as through establishment of guidelines or by action of a designated member or members of the committee; provided the policies and procedures are detailed as to the particular service and the committee is informed of each service and such policies and procedures do not include delegation of audit committee responsibilities, as contemplated under the Securities Exchange Act of 1934, to management; subject, in the case of (ii) through (iv), to any waivers, exceptions or exemptions that may be available under applicable law or rules.
(e) (2) None of the services provided to the registrant described in paragraphs (b)-(d) of Item 4 were approved by the audit committee pursuant to paragraph (c)(7)(i)(C) of Rule 2-01 of regulation S-X.
(f) No disclosures are required by this Item 4(f).
(g) The aggregate non-audit fees paid to the principal accountant for services rendered by the principal accountant to the registrant and the registrant’s investment adviser and any entity controlling, controlled by or under common control with the investment adviser that provides ongoing services to the registrant were $3,011 for the fiscal year ended September 30, 2016 and $0 for the fiscal year ended September 30, 2015.
(h) The registrant’s audit committee of the board has considered whether the provision of non-audit services that were rendered to the registrant’s investment adviser (not including any sub-adviser whose role is primarily portfolio management and is subcontracted with or overseen by another investment adviser), and any entity controlling, controlled by, or under common control with the investment adviser that provides ongoing services to the registrant that were not pre-approved pursuant to paragraph (c)(7)(ii) of Rule 2-01 of Regulation S-X is compatible with maintaining the principal accountant’s independence.
Item 5. Audit Committee of Listed Registrants. N/A
Item 6. Schedule of Investments. N/A
Item 7. Disclosure of Proxy Voting Policies and Procedures for Closed-End Management Investment Companies. N/A
Item 8. Portfolio Managers of Closed-End Management Investment Companies. N/A
Item 9. Purchases of Equity Securities by Closed-End Management Investment Company and Affiliated Purchasers. N/A
Item 10. Submission of Matters to a Vote of Security Holders.
There have been no changes to the procedures by which shareholders may recommend nominees to the Registrant's Board of Trustees that would require disclosure herein.
Item 11. Controls and Procedures.
(a) Evaluation of Disclosure Controls and Procedures. The Registrant maintains disclosure controls and procedures that are designed to ensure that information required to be disclosed in the Registrant’s filings under the Securities Exchange Act of 1934 and the Investment Company Act of 1940 is recorded, processed, summarized and reported within the periods specified in the rules and forms of the Securities and Exchange Commission. Such information is accumulated and communicated to the Registrant’s management, including its principal executive officer and principal financial officer, as appropriate, to allow timely decisions regarding required disclosure. The Registrant’s management, including the principal executive officer and the principal financial officer, recognizes that any set of controls and procedures, no matter how well designed and operated, can provide only reasonable assurance of achieving the desired control objectives.
Within 90 days prior to the filing date of this Shareholder Report on Form N-CSR, the Registrant had carried out an evaluation, under the supervision and with the participation of the Registrant’s management, including the Registrant’s principal executive officer and the Registrant’s principal financial officer, of the effectiveness of the design and operation of the Registrant’s disclosure controls and procedures. Based on such evaluation, the Registrant’s principal executive officer and principal financial officer concluded that the Registrant’s disclosure controls and procedures are effective.
(b) Changes in Internal Controls. There have been no changes in the Registrant’s internal controls or in other factors that could materially affect the internal controls over financial reporting subsequent to the date of their evaluation in connection with the preparation of this Shareholder Report on Form N-CSR.
Item 12. Exhibits.
(a) (1) Code of Ethics
(a) (2) Certifications pursuant to Section 302 of the Sarbanes-Oxley Act of 2002 of Laura F. Fergerson, Chief Executive Officer - Finance and Administration, and Robert G. Kubilis, Chief Financial Officer and Chief Accounting Officer
(b) Certifications pursuant to Section 906 of the Sarbanes-Oxley Act of 2002 of Laura F. Fergerson, Chief Executive Officer - Finance and Administration, and Robert G. Kubilis, Chief Financial Officer and Chief Accounting Officer
SIGNATURES
Pursuant to the requirements of the Securities Exchange Act of 1934 and the Investment Company Act of 1940, the registrant has duly caused this report to be signed on its behalf by the undersigned, thereunto duly authorized.
FRANKLIN MANAGED TRUST
By /s/ Laura F. Fergerson
Laura F. Fergerson
Chief Executive Officer –
Finance and Administration
Date November 25, 2016
Pursuant to the requirements of the Securities Exchange Act of 1934 and the Investment Company Act of 1940, this report has been signed below by the following persons on behalf of the registrant and in the capacities and on the dates indicated.
By /s/ Laura F. Fergerson
Laura F. Fergerson
Chief Executive Officer –
Finance and Administration
Date November 25, 2016
By /s/ Robert G. Kubilis
Robert G. Kubilis
Chief Financial Officer and
Chief Accounting Officer
Date November 25, 2016