UNITED STATES
SECURITIES AND EXCHANGE COMMISSION
Washington, D.C. 20549
FORM N-CSR
CERTIFIED SHAREHOLDER REPORT OF REGISTERED MANAGEMENT INVESTMENT COMPANIES
Investment Company Act file number_811-04894
__Franklin Managed Trust
(Exact name of registrant as specified in charter)
One Franklin Parkway, San Mateo, CA 94403-1906
(Address of principal executive offices)(Zip code)
Craig S. Tyle, One Franklin Parkway, San Mateo, CA 94403-1906
(Name and address of agent for service)
Registrant's telephone number, including area code: _650 312-2000
Date of fiscal year end: 9/30
Date of reporting period: _9/30/14
Item 1. Reports to Stockholders.
Franklin Templeton Investments
Gain From Our Perspective®
At Franklin Templeton Investments, we’re dedicated to one goal: delivering exceptional asset management for our clients. By bringing together multiple, world-class investment teams in a single firm, we’re able to offer specialized expertise across styles and asset classes, all supported by the strength and resources of one of the world’s largest asset managers. This has helped us to become a trusted partner to individual and institutional investors across the globe.
Focus on Investment Excellence
At the core of our firm, you’ll find multiple independent investment teams—each with a focused area of expertise—from traditional to alternative strategies and multi-asset solutions. And because our portfolio groups operate autonomously, their strategies can be combined to deliver true style and asset class diversification.
All of our investment teams share a common commitment to excellence grounded in rigorous, fundamental research and robust, disciplined risk management. Decade after decade, our consistent, research-driven processes have helped Franklin Templeton earn an impressive record of strong, long-term results.
1. As of 12/31/13. Clients are represented by the total number of shareholder accounts.
Global Perspective Shaped by Local Expertise
In today’s complex and interconnected world, smart investing demands a global perspective. Franklin Templeton pioneered international investing over 60 years ago, and our expertise in emerging markets spans more than a quarter of a century. Today, our investment professionals are on the ground across the globe, spotting investment ideas and potential risks firsthand. These locally based teams bring in-depth understanding of local companies, economies and cultural nuances, and share their best thinking across our global research network.
Strength and Experience
Franklin Templeton is a global leader in asset management serving clients in over 150 countries.1 We run our business with the same prudence we apply to asset management, staying focused on delivering relevant investment solutions, strong long-term results and reliable, personal service. This approach, focused on putting clients first, has helped us to become one of the most trusted names in financial services.
Not FDIC Insured | May Lose Value | No Bank Guarantee
| |
| Contents | |
| |
| Shareholder Letter | 1 |
| Annual Report | |
| Franklin Rising Dividends Fund | 3 |
| Performance Summary | 7 |
| Your Fund’s Expenses | 12 |
| Financial Highlights and | |
| Statement of Investments | 14 |
| Financial Statements | 22 |
| Notes to Financial Statements | 26 |
| Report of Independent Registered | |
| Public Accounting Firm | 33 |
| Tax Information | 34 |
| Board Members and Officers | 35 |
| Shareholder Information | 39 |
Annual Report
Franklin Rising Dividends Fund
This annual report for Franklin Rising Dividends Fund covers the fiscal year ended September 30, 2014.
Your Fund’s Goal and Main Investments
The Fund seeks long-term capital appreciation. Preservation of capital, while not a goal, is also an important consideration. Under normal market conditions, the Fund invests at least 80% of its net assets in companies that have paid consistently rising dividends.
Performance Overview
For the 12 months under review, the Fund’s Class A shares delivered a cumulative total return of +11.16%. In comparison, the Fund’s benchmark, the Standard & Poor’s 500 Index (S&P 500®), which is a broad measure of U.S. stock performance, generated a +19.73% total return.1 While we are disappointed with the recent performance of the Fund, we remain committed to the Fund’s goal of seeking long-term capital appreciation through investment in the securities of companies that have paid consistently rising dividends. You can find the Fund’s long-term performance data in the Performance Summary beginning on page 7.
Performance data represent past performance, which does not guarantee future results. Investment return and principal value will fluctuate, and you may have a gain or loss when you sell your shares. Current performance may differ from figures shown. Please visit franklintempleton.com or call (800) 342-5236 for most recent month-end performance.
Economic and Market Overview
The U.S. economy continued to show signs of recovery during the 12-month period ended September 30, 2014, underpinned
by manufacturing activity, consumer and business spending and rising inventories. Economic activity rebounded strongly in the second quarter of 2014 after severe weather conditions and a slowdown in health care spending led to a contraction in the first quarter. Except for a sharp rebound in March, retail sales rose at a modest pace that missed consensus expectations for most of the period. In the housing market, home sales experienced some weather-related weakness early in 2014 but ticked up in May, and home prices remained higher than a year earlier. The unemployment rate declined to 5.9% in September 2014 from 7.2% in September 2013.2 Inflation, as measured by the Consumer Price Index, was subdued for the period.
U.S. economic growth trends were generally encouraging during the period. In January 2014, the U.S. Federal Reserve Board (Fed) began reducing its bond purchases $10 billion a month, based on largely positive economic and employment data in late 2013. The Fed continued to taper its asset purchases during the year. In September 2014, the Fed indicated it planned to maintain its near-zero interest rate policy for a “considerable time” after its bond-buying program likely ends in October. The Fed also noted that inflation remained below its unofficial 2% target. Fed actions to normalize monetary policy remained dependent on economic performance, and the Fed lowered its U.S. economic growth projections in September.
Investors’ confidence grew as corporate profits rose and generally favorable economic data indicated continued recovery despite brief sell-offs when many investors reacted to the Fed’s statements, political instability in certain emerging markets, crises in Ukraine and the Middle East, weakness in Europe and moderating economic data in China. U.S. stocks rose for the 12 months under review as the S&P 500 and Dow Jones Industrial Average reached all-time highs.
1. Source: Morningstar.
The index is unmanaged and includes reinvested dividends. One cannot invest directly in an index, and an index is not representative of the Fund’s portfolio.
See www.franklintempletondatasources.com for additional data provider information.
2. Source: Bureau of Labor Statistics.
The dollar value, number of shares or principal amount, and names of all portfolio holdings are listed in the Fund’s Statement of Investments (SOI).
The SOI begins on page 19.
franklintempleton.com
Annual Report
| 3
FRANKLIN RISING DIVIDENDS FUND
Portfolio Breakdown
Based on Total Net Assets as of 9/30/14

Investment Strategy
We base our investment strategy on our belief that companies with consistently rising dividends should, over time, also experience stock price appreciation. We select portfolio securities based on several criteria. To be eligible for purchase, stocks generally will pass certain screens, such as consistent and substantial dividend increases, strong balance sheets, and relatively
low price/earnings ratios. We seek fundamentally sound companies that meet our standards and attempt to acquire them at what we believe are attractive prices, often when they are out of favor with other investors.
Manager’s Discussion
During the 12 months under review, three holdings that helped absolute Fund performance were Johnson & Johnson, Archer-Daniels-Midland, and Air Products and Chemicals. Johnson & Johnson, a health care products manufacturer, reported solid results from its pharmaceuticals division and was helped by the commercial launch of a number of relatively new drugs. These included Olysio for hepatitis C, Invokana for diabetes, Xarelto to reduce risk of stroke and blood clots, and Imbruvica for cancer. Resuming sales of a number of the company’s over-the-counter products that were previously recalled also boosted sales growth. Overall, we believe Johnson & Johnson enjoyed a period of exceptionally good growth. The company has 52 years of rising dividends. Archer-Daniels-Midland, an agribusi-ness services provider, reported relatively solid results and was particularly aided by strong ethanol demand domestically and in export markets. We believed the company could likely benefit from a bumper U.S. harvest in 2014. Company management announced an increased focus on return on invested capital, which was well received by investors. In July 2014, Archer announced the acquisition of Wild Flavors, a natural flavor provider for the beverage industry, indicating a potential interest in moving into other, higher-margin businesses, in our view. The company also proposed selling its underperforming chocolate business to Cargill in September 2014. Archer has raised its dividend for the past 39 years. Shares of Air Products and Chemicals, an industrial gas producer, rallied as a result of improved financial performance over the year and positive sentiment surrounding the ongoing involvement of an activist shareholder. The share price rose sharply in June after the appointment of new chief executive officer (CEO) Seifi Ghasemi and again in September when he announced his reorganization plan. The company has a 32-year history of increasing dividends.
Detractors from absolute Fund performance included Brady, Albemarle and Knowles. Brady, a manufacturer of industrial identification solutions, struggled to gain traction in a difficult operating environment, and the divestiture of its Asian die cut business hindered earnings. The company also incurred higher expenses from restructuring to concentrate on its identification solutions and workplace safety businesses. Michael Nauman was appointed CEO in August and was early in the process of
4 | Annual Report
franklintempleton.com
FRANKLIN RISING DIVIDENDS FUND
| | |
| Top 10 Equity Holdings | | |
| 9/30/14 | | |
| Company | % of Total | |
| Sector/Industry | Net Assets | |
| Johnson & Johnson | 3.9 | % |
| Pharmaceuticals, Biotechnology & Life Sciences | | |
| Roper Industries Inc. | 3.3 | % |
| Industrial Conglomerates | | |
| Pentair PLC | 3.1 | % |
| Machinery | | |
| United Technologies Corp. | 3.0 | % |
| Aerospace & Defense | | |
| Chevron Corp. | 2.9 | % |
| Energy | | |
| Praxair Inc. | 2.9 | % |
| Materials | | |
| Air Products and Chemicals Inc. | 2.9 | % |
| Materials | | |
| Bunge Ltd. | 2.8 | % |
| Food, Beverage & Tobacco | | |
| Medtronic Inc. | 2.8 | % |
| Health Care Equipment & Services | | |
| Archer-Daniels-Midland Co. | 2.8 | % |
| Food, Beverage & Tobacco | | |
refocusing the company strategy. Brady has 29 years of dividend increases. Albemarle, a specialty chemicals producer, had a challenging year as disappointing 2014 guidance erased early share price strength. The decline was likely due to technical selling surrounding Albemarle’s announced acquisition of Rockwood Holdings, a specialty chemicals company. The company’s stock recovered as financial performance improved over the course of the year, only to decline significantly in July in response to further downward revision in 2014 guidance. The stock continued to struggle in response to concerns over global growth headwinds. Albemarle has 20 years of dividend increases. In early 2014, Knowles, a manufacturer of advanced acoustic components, was spun off from Dover, a long-time Fund holding, and the stock of the new company was volatile as it established a trading range. Despite solid financial performance since the spin-off, shares of Knowles declined sharply in September as concerns emerged surrounding potential risks to the company’s role as a microphone supplier for the new iPhone 6. Knowles currently does not pay a dividend.
We initiated new positions in Schlumberger, an oilfield services company; DENTSPLY International, a dental health care products manufacturer; and United Parcel Service, the world’s largest package delivery company; all of which have long histories of dividend increases; as well as Microsoft, a global software and services provider; and Texas Instruments, a designer and manufacturer of semiconductors and related products, each of which has 10 years of consecutive dividend increases. We also established new holdings in Accenture, a management, technology and outsourcing consulting firm (9 years of dividend increases); CVS Health, an integrated pharmacy health care provider (11 years); Yum! Brands (10 years), a quick-service restaurants company; and Perrigo (8 years), a pharmaceutical and nutritional products manufacturer. We made additions to Ross Stores (20 years), a discount apparel and home accessories retailer; Bunge (13 years), a global agribusiness and food company; Target (42 years), a mass-market discount retailer; Honeywell International (10 years), a diversified technology manufacturer; and United Technologies (20 years), a building systems and aerospace products and services provider; among others. We liquidated some positions including Family Dollar Stores, Hill-Rom Holdings and Mercury General. We reduced our holdings in International Business Machines and Air Products and Chemicals, and made smaller reductions to two other positions.
Our 10 largest positions on September 30, 2014, represented 30.4% of the Fund’s total net assets. It is interesting to note how these 10 companies would, in aggregate, respond to the Fund’s screening criteria based on a simple average of statistical measures. On average, these 10 companies have raised their dividends 30 years in a row and by 218% over the past 10 years. Their most recent year-over-year dividend increases averaged 13.0% with a dividend yield of 2.1% on September 30, 2014, and a dividend payout ratio of 34.6%, based on estimates of calendar year 2014 operating earnings. Their average price/earnings ratio was 17.5 times 2014 estimates versus 16.4 for that of the unmanaged S&P 500.
franklintempleton.com
Annual Report
| 5
FRANKLIN RISING DIVIDENDS FUND
Thank you for your continued participation in Franklin Rising Dividends Fund. We look forward to continuing to serve your investment needs.

The foregoing information reflects our analysis, opinions and portfolio holdings as of September 30, 2014, the end of the reporting period. The way we implement our main investment strategies and the resulting portfolio holdings may change depending on factors such as market and economic conditions. These opinions may not be relied upon as investment advice or an offer for a particular security. The information is not a complete analysis of every aspect of any market, country, industry, security or the Fund. Statements of fact are from sources considered reliable, but the investment manager makes no representation or warranty as to their completeness or accuracy. Although historical performance is no guarantee of future results, these insights may help you understand our investment management philosophy.
CFA® is a trademark owned by CFA Institute.
6 | Annual Report
franklintempleton.com
FRANKLIN RISING DIVIDENDS FUND
Performance Summary as of September 30, 2014
Your dividend income will vary depending on dividends or interest paid by securities in the Fund’s portfolio, adjusted for operating expenses of each class. Capital gain distributions are net profits realized from the sale of portfolio securities. The performance table and graphs do not reflect any taxes that a shareholder would pay on Fund dividends, capital gain distributions, if any, or any realized gains on the sale of Fund shares. Total return reflects reinvestment of the Fund’s dividends and capital gain distributions, if any, and any unrealized gains or losses.
| | | | | | |
| Net Asset Value | | | | | | |
| Share Class (Symbol) | | 9/30/14 | | 9/30/13 | | Change |
| A (FRDPX) | $ | 49.72 | $ | 45.46 | +$ | 4.26 |
| C (FRDTX) | $ | 48.94 | $ | 44.62 | +$ | 4.32 |
| R (FRDRX) | $ | 49.56 | $ | 45.26 | +$ | 4.30 |
| R6 (FRISX) | $ | 49.67 | $ | 45.50 | +$ | 4.17 |
| Advisor (FRDAX) | $ | 49.68 | $ | 45.48 | +$ | 4.20 |
| |
| |
| Distributions (10/1/13–9/30/14) | | | | | | |
| Dividend |
| Share Class | | Income | | | | |
| A | $ | 0.7915 | | | | |
| C | $ | 0.2767 | | | | |
| R | $ | 0.6014 | | | | |
| R6 | $ | 1.0711 | | | | |
| Advisor | $ | 0.9693 | | | | |
franklintempleton.com
Annual Report
| 7
FRANKLIN RISING DIVIDENDS FUND
PERFORMANCE SUMMARY
Performance as of 9/30/141
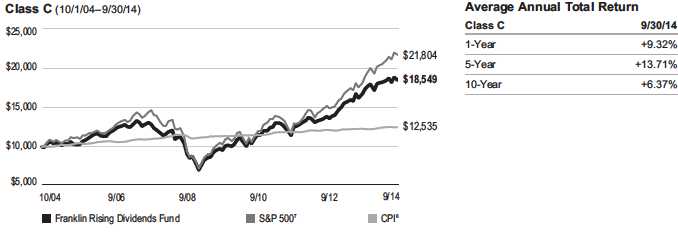
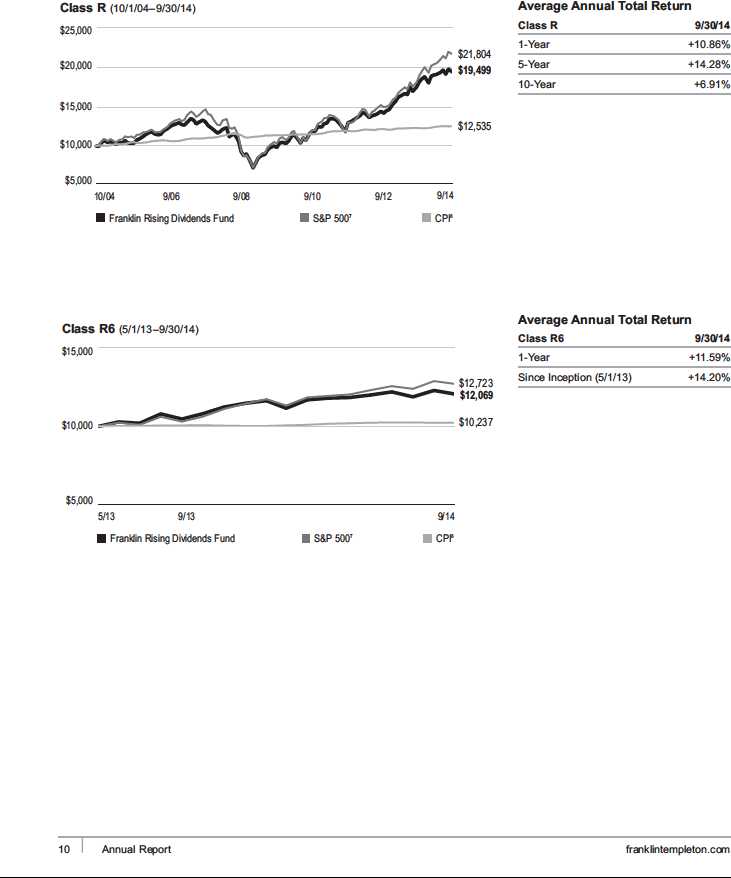
Cumulative total return excludes sales charges. Average annual total return and value of $10,000 investment include maximum sales charges. Class A: 5.75% maximum initial sales charge; Class C: 1% contingent deferred sales charge in first year only;
Class R/R6/Advisor Class: no sales charges.
| | | | | | | | | | | | |
| | | Cumulative | | | Average Annual | | | Value of | Total Annual Operating Expenses5 | |
| Share Class | | Total Return2 | | | Total Return3 | | $ | 10,000 Investment4 | (with waiver) | | (without waiver) | |
| A | | | | | | | | | 0.94 | % | 0.95 | % |
| 1-Year | + | 11.16 | % | + | 4.78 | % | $ | 10,478 | | | | |
| 5-Year | + | 97.37 | % | + | 13.22 | % | $ | 18,602 | | | | |
| 10-Year | + | 99.77 | % | + | 6.53 | % | $ | 18,826 | | | | |
| C | | | | | | | | | 1.69 | % | 1.70 | % |
| 1-Year | + | 10.32 | % | + | 9.32 | % | $ | 10,932 | | | | |
| 5-Year | + | 90.08 | % | + | 13.71 | % | $ | 19,008 | | | | |
| 10-Year | + | 85.49 | % | + | 6.37 | % | $ | 18,549 | | | | |
| R | | | | | | | | | 1.19 | % | 1.20 | % |
| 1-Year | + | 10.86 | % | + | 10.86 | % | $ | 11,086 | | | | |
| 5-Year | + | 94.95 | % | + | 14.28 | % | $ | 19,495 | | | | |
| 10-Year | + | 94.99 | % | + | 6.91 | % | $ | 19,499 | | | | |
| R6 | | | | | | | | | 0.54 | % | 0.55 | % |
| 1-Year | + | 11.59 | % | + | 11.59 | % | $ | 11,159 | | | | |
| Since Inception (5/1/13) | + | 20.69 | % | + | 14.20 | % | $ | 12,069 | | | | |
| Advisor6 | | | | | | | | | 0.69 | % | 0.70 | % |
| 1-Year | + | 11.43 | % | + | 11.43 | % | $ | 11,143 | | | | |
| 5-Year | + | 99.93 | % | + | 14.86 | % | $ | 19,993 | | | | |
| 10-Year | + | 104.37 | % | + | 7.41 | % | $ | 20,437 | | | | |
Performance data represent past performance, which does not guarantee future results. Investment return and principal value will fluctuate, and you may have a gain or loss when you sell your shares. Current performance may differ from figures shown. For most recent month-end performance, go to franklintempleton.com or call (800) 342-5236.
8 | Annual Report
franklintempleton.com
FRANKLIN RISING DIVIDENDS FUND
PERFORMANCE SUMMARY
Total Return Index Comparison for a Hypothetical $10,000 Investment1
Total return represents the change in value of an investment over the periods shown. It includes any applicable, maximum sales charge, Fund expenses, account fees and reinvested distributions. The unmanaged index includes reinvestment of any income or distributions. It differs from the Fund in composition and does not pay management fees or expenses. One cannot invest directly in an index.

franklintempleton.com
Annual Report
| 9
FRANKLIN RISING DIVIDENDS FUND
PERFORMANCE SUMMARY
Total Return Index Comparison for a Hypothetical $10,000 Investment1 (continued)
FRANKLIN RISING DIVIDENDS FUND
PERFORMANCE SUMMARY
Total Return Index Comparison for a Hypothetical $10,000 Investment1 (continued)

| | | | | |
| All investments involve risks, including possible loss of principal. Value securities may not increase in price as anticipated or may decline further in value. While | |
| smaller and midsize companies may offer substantial opportunities for capital growth, they also involve heightened risks and should be considered speculative. | |
| Historically, smaller and midsize company securities have been more volatile in price than larger company securities, especially over the short term. The Fund | |
| is actively managed but there is no guarantee that the manager’s investment decisions will produce the desired results. The Fund’s prospectus also includes a | |
| description of the main investment risks. | | | | |
| |
| Class C: | These shares have higher annual fees and expenses than Class A shares. | | | | |
| Class R: | Shares are available to certain eligible investors as described in the prospectus. These shares have higher annual fees and expenses than Class A shares. | |
| Class R6: | Shares are available to certain eligible investors as described in the prospectus. | | | | |
| Advisor Class: | Shares are available to certain eligible investors as described in the prospectus. | | | | |
| |
| 1. The Fund has a fee waiver associated with its investments in a Franklin Templeton money fund, contractually guaranteed through at least its current fiscal year-end. | |
| Fund investment results reflect the fee waiver, to the extent applicable; without this reduction, the results would have been lower. | | | | |
| 2. Cumulative total return represents the change in value of an investment over the periods indicated. | | | | |
| 3. Average annual total return represents the average annual change in value of an investment over the periods indicated. | | | | |
| 4. These figures represent the value of a hypothetical $10,000 investment in the Fund over the periods indicated. | | | | |
| 5. Figures are as stated in the Fund’s current prospectus. In periods of market volatility, assets may decline significantly, causing total annual Fund operating expenses to | |
| become higher than the figures shown. | | | | |
| 6. Effective 10/3/05, the Fund began offering Advisor Class shares, which do not have sales charges or a Rule 12b-1 plan. Performance quotations for this class reflect the | |
| following methods of calculation: (a) For periods prior to 10/3/05, a restated figure is used based upon the Fund’s Class A performance, excluding the effect of Class A’s | |
| maximum initial sales charge, but reflecting the effect of the Class A Rule 12b-1 fees; and (b) for periods after 10/3/05, actual Advisor Class performance is used reflecting | |
| all charges and fees applicable to that class. Since 10/3/05 (commencement of sales), the cumulative and average annual total returns of Advisor Class shares were | |
| +97.39% and +7.86%. | | | | |
| 7. Source: Morningstar. The S&P 500 is a market capitalization-weighted index of 500 stocks designed to measure total U.S. equity market performance. | | | |
| 8. Source: Bureau of Labor Statistics, bls.gov/cpi. The Consumer Price Index (CPI) is a commonly used measure of the inflation rate. | | | | |
| See www.franklintempletondatasources.com for additional data provider information. | | | | |
| |
| |
| |
| |
| franklintempleton.com | Annual Report | | | 11 | |
FRANKLIN RISING DIVIDENDS FUND
Your Fund’s Expenses
As a Fund shareholder, you can incur two types of costs:
- Transaction costs, including sales charges (loads) on Fund purchases; and
- Ongoing Fund costs, including management fees, distribu- tion and service (12b-1) fees, and other Fund expenses. All mutual funds have ongoing costs, sometimes referred to as operating expenses.
The following table shows ongoing costs of investing in the Fund and can help you understand these costs and compare them with those of other mutual funds. The table assumes a $1,000 investment held for the six months indicated.
Actual Fund Expenses
The first line (Actual) for each share class listed in the table provides actual account values and expenses. The “Ending Account Value” is derived from the Fund’s actual return, which includes the effect of Fund expenses.
You can estimate the expenses you paid during the period by following these steps. Of course, your account value and expenses will differ from those in this illustration:
| 1. | Divide your account value by $1,000. |
| | If an account had an $8,600 value, then $8,600 �� $1,000 = 8.6. |
| 2. | Multiply the result by the number under the heading “Expenses Paid During Period.” |
| | If Expenses Paid During Period were $7.50, then 8.6 x $7.50 = $64.50. |
In this illustration, the estimated expenses paid this period are $64.50.
Hypothetical Example for Comparison with Other Funds
Information in the second line (Hypothetical) for each class in the table can help you compare ongoing costs of investing in the Fund with those of other mutual funds. This information may not be used to estimate the actual ending account balance or expenses you paid during the period. The hypothetical “Ending Account Value” is based on the actual expense ratio for each class and an assumed 5% annual rate of return before expenses, which does not represent the Fund’s actual return. The figure under the heading “Expenses Paid During Period” shows the hypothetical expenses your account would have incurred under this scenario. You can compare this figure with the 5% hypothetical examples that appear in shareholder reports of other funds.
Please note that expenses shown in the table are meant to highlight ongoing costs and do not reflect any transaction costs, such as sales charges. Therefore, the second line for each class is useful in comparing ongoing costs only, and will not help you compare total costs of owning different funds. In addition, if transaction costs were included, your total costs would have been higher. Please refer to the Fund prospectus for additional information on operating expenses.
12 | Annual Report
franklintempleton.com
FRANKLIN RISING DIVIDENDS FUND
YOUR FUND’S EXPENSES
| | | | | | |
| | | Beginning Account | | Ending Account | | Expenses Paid During |
| Share Class | | Value 4/1/14 | | Value 9/30/14 | | Period* 4/1/14–9/30/14 |
| A | | | | | | |
| Actual | $ | 1,000 | $ | 1,020.20 | $ | 4.66 |
| Hypothetical (5% return before expenses) | $ | 1,000 | $ | 1,020.46 | $ | 4.66 |
| C | | | | | | |
| Actual | $ | 1,000 | $ | 1,016.40 | $ | 8.44 |
| Hypothetical (5% return before expenses) | $ | 1,000 | $ | 1,016.70 | $ | 8.44 |
| R | | | | | | |
| Actual | $ | 1,000 | $ | 1,018.80 | $ | 5.92 |
| Hypothetical (5% return before expenses) | $ | 1,000 | $ | 1,019.20 | $ | 5.92 |
| R6 | | | | | | |
| Actual | $ | 1,000 | $ | 1,022.00 | $ | 2.64 |
| Hypothetical (5% return before expenses) | $ | 1,000 | $ | 1,022.46 | $ | 2.64 |
| Advisor | | | | | | |
| Actual | $ | 1,000 | $ | 1,021.60 | $ | 3.40 |
| Hypothetical (5% return before expenses) | $ | 1,000 | $ | 1,021.71 | $ | 3.40 |
*Expenses are calculated using the most recent six-month expense ratio, net of expense waivers, annualized for each class (A: 0.92%; C: 1.67%; R: 1.17%; R6: 0.52%; and Advisor: 0.67%), multiplied by the average account value over the period, multiplied by 183/365 to reflect the one-half year period.
franklintempleton.com
Annual Report
| 13
| | | | | | | | | | | | | | | |
| FRANKLIN MANAGED TRUST | | | | | | | | | | | | | | | |
| |
| |
| |
| Financial Highlights | | | | | | | | | | | | | | | |
| Franklin Rising Dividends Fund | | | | | | | | | | | | | | | |
| | | | | | Year Ended September 30, | | | | |
| | | 2014 | | | 2013 | | | 2012 | | | 2011 | | | 2010 | |
| Class A | | | | | | | | | | | | | | | |
| Per share operating performance | | | | | | | | | | | | | | | |
| (for a share outstanding throughout the year) | | | | | | | | | | | | | | | |
| Net asset value, beginning of year | $ | 45.46 | | $ | 37.86 | | $ | 31.39 | | $ | 30.92 | | $ | 26.72 | |
| Income from investment operationsa: | | | | | | | | | | | | | | | |
| Net investment incomeb | | 0.55 | | | 0.54 | | | 0.52 | | | 0.48 | | | 0.38 | |
| Net realized and unrealized gains (losses) | | 4.50 | | | 7.61 | | | 6.36 | | | 0.36 | | | 3.94 | |
| Total from investment operations | | 5.05 | | | 8.15 | | | 6.88 | | | 0.84 | | | 4.32 | |
| Less distributions from net investment income | | (0.79 | ) | | (0.55 | ) | | (0.41 | ) | | (0.37 | ) | | (0.12 | ) |
| Net asset value, end of year | $ | 49.72 | | $ | 45.46 | | $ | 37.86 | | $ | 31.39 | | $ | 30.92 | |
| |
| Total returnc | | 11.16 | % | | 21.86 | % | | 22.02 | % | | 2.74 | % | | 16.23 | % |
| |
| Ratios to average net assets | | | | | | | | | | | | | | | |
| Expenses | | 0.91 | %d | | 0.93 | % | | 0.96 | % | | 0.99 | % | | 1.05 | % |
| Net investment income | | 1.12 | % | | 1.30 | % | | 1.44 | % | | 1.42 | % | | 1.32 | % |
| |
| Supplemental data | | | | | | | | | | | | | | | |
| Net assets, end of year (000’s) | $ | 10,615,668 | | $ | 8,795,238 | | $ | 5,777,197 | | $ | 3,386,930 | | $ | 2,043,971 | |
| Portfolio turnover rate | | 4.42 | % | | 0.70 | % | | 2.77 | % | | 4.04 | % | | 5.65 | % |
aThe amount shown for a share outstanding throughout the period may not correlate with the Statement of Operations for the period due to the timing of sales and
repurchases of the Fund shares in relation to income earned and/or fluctuating fair value of the investments of the Fund.
bBased on average daily shares outstanding.
cTotal return does not reflect sales commissions or contingent deferred sales charges, if applicable.
dBenefit of waiver and payments by affiliates and expense reduction rounds to less than 0.01%.
14 | Annual Report | The accompanying notes are an integral part of these financial statements.
franklintempleton.com
| | | | | | | | | | | | | | | |
| | | | | | | | | FRANKLIN MANAGED TRUST | |
| | | | | | | | | FINANCIAL HIGHLIGHTS | |
| |
| |
| |
| Franklin Rising Dividends Fund (continued) | | | | | | | | | | | | | | | |
| | | | | | Year Ended September 30, | | | | |
| | | 2014 | | | 2013 | | | 2012 | | | 2011 | | | 2010 | |
| Class C | | | | | | | | | | | | | | | |
| Per share operating performance | | | | | | | | | | | | | | | |
| (for a share outstanding throughout the year) | | | | | | | | | | | | | | | |
| Net asset value, beginning of year | $ | 44.62 | | $ | 37.20 | | $ | 30.87 | | $ | 30.46 | | $ | 26.41 | |
| Income from investment operationsa: | | | | | | | | | | | | | | | |
| Net investment incomeb | | 0.18 | | | 0.23 | | | 0.24 | | | 0.22 | | | 0.16 | |
| Net realized and unrealized gains (losses) | | 4.42 | | | 7.49 | | | 6.28 | | | 0.38 | | | 3.89 | |
| Total from investment operations | | 4.60 | | | 7.72 | | | 6.52 | | | 0.60 | | | 4.05 | |
| Less distributions from net investment income | | (0.28 | ) | | (0.30 | ) | | (0.19 | ) | | (0.19 | ) | | — | |
| Net asset value, end of year | $ | 48.94 | | $ | 44.62 | | $ | 37.20 | | $ | 30.87 | | $ | 30.46 | |
| |
| Total returnc | | 10.32 | % | | 20.93 | % | | 21.13 | % | | 1.98 | % | | 15.34 | % |
| |
| Ratios to average net assets | | | | | | | | | | | | | | | |
| Expenses | | 1.66 | %d | | 1.68 | % | | 1.71 | % | | 1.74 | % | | 1.80 | % |
| Net investment income | | 0.37 | % | | 0.55 | % | | 0.69 | % | | 0.67 | % | | 0.57 | % |
| |
| Supplemental data | | | | | | | | | | | | | | | |
| Net assets, end of year (000’s) | $ | 2,775,137 | | $ | 2,261,420 | | $ | 1,410,361 | | $ | 806,172 | | $ | 471,028 | |
| Portfolio turnover rate | | 4.42 | % | | 0.70 | % | | 2.77 | % | | 4.04 | % | | 5.65 | % |
aThe amount shown for a share outstanding throughout the period may not correlate with the Statement of Operations for the period due to the timing of sales and
repurchases of the Fund shares in relation to income earned and/or fluctuating fair value of the investments of the Fund.
bBased on average daily shares outstanding.
cTotal return does not reflect sales commissions or contingent deferred sales charges, if applicable.
dBenefit of waiver and payments by affiliates and expense reduction rounds to less than 0.01%.
franklintempleton.com
The accompanying notes are an integral part of these financial statements. | Annual Report | 15
| | | | | | | | | | | | | | | |
| FRANKLIN MANAGED TRUST | | | | | | | | | | | | | | | |
| FINANCIAL HIGHLIGHTS | | | | | | | | | | | | | | | |
| |
| |
| |
| Franklin Rising Dividends Fund (continued) | | | | | | | | | | | | | | | |
| | | | | | Year Ended September 30, | | | | |
| | | 2014 | | | 2013 | | | 2012 | | | 2011 | | | 2010 | |
| Class R | | | | | | | | | | | | | | | |
| Per share operating performance | | | | | | | | | | | | | | | |
| (for a share outstanding throughout the year) | | | | | | | | | | | | | | | |
| Net asset value, beginning of year | $ | 45.26 | | $ | 37.72 | | $ | 31.29 | | $ | 30.82 | | $ | 26.64 | |
| Income from investment operationsa: | | | | | | | | | | | | | | | |
| Net investment incomeb | | 0.42 | | | 0.44 | | | 0.43 | | | 0.39 | | | 0.31 | |
| Net realized and unrealized gains (losses) | | 4.48 | | | 7.58 | | | 6.34 | | | 0.38 | | | 3.94 | |
| Total from investment operations | | 4.90 | | | 8.02 | | | 6.77 | | | 0.77 | | | 4.25 | |
| Less distributions from net investment income | | (0.60 | ) | | (0.48 | ) | | (0.34 | ) | | (0.30 | ) | | (0.07 | ) |
| Net asset value, end of year | $ | 49.56 | | $ | 45.26 | | $ | 37.72 | | $ | 31.29 | | $ | 30.82 | |
| |
| Total return | | 10.86 | % | | 21.55 | % | | 21.74 | % | | 2.47 | % | | 15.97 | % |
| |
| Ratios to average net assets | | | | | | | | | | | | | | | |
| Expenses | | 1.16 | %c | | 1.18 | % | | 1.21 | % | | 1.24 | % | | 1.30 | % |
| Net investment income | | 0.87 | % | | 1.05 | % | | 1.19 | % | | 1.17 | % | | 1.07 | % |
| |
| Supplemental data | | | | | | | | | | | | | | | |
| Net assets, end of year (000’s) | $ | 332,943 | | $ | 277,758 | | $ | 179,509 | | $ | 80,959 | | $ | 45,876 | |
| Portfolio turnover rate | | 4.42 | % | | 0.70 | % | | 2.77 | % | | 4.04 | % | | 5.65 | % |
aThe amount shown for a share outstanding throughout the period may not correlate with the Statement of Operations for the period due to the timing of sales and
repurchases of the Fund shares in relation to income earned and/or fluctuating fair value of the investments of the Fund.
bBased on average daily shares outstanding.
cBenefit of waiver and payments by affiliates and expense reduction rounds to less than 0.01%.
16 | Annual Report | The accompanying notes are an integral part of these financial statements.
franklintempleton.com
| | | | | | |
| | | FRANKLIN MANAGED TRUST | |
| | | FINANCIAL HIGHLIGHTS | |
| |
| |
| |
| Franklin Rising Dividends Fund (continued) | | | | | | |
| | | Year Ended September 30, | |
| | | 2014 | | | 2013 | a |
| Class R6 | | | | | | |
| Per share operating performance | | | | | | |
| (for a share outstanding throughout the year) | | | | | | |
| Net asset value, beginning of year | $ | 45.50 | | $ | 42.07 | |
| Income from investment operationsb: | | | | | | |
| Net investment incomec | | 0.74 | | | 0.30 | |
| Net realized and unrealized gains (losses) | | 4.50 | | | 3.13 | |
| Total from investment operations | | 5.24 | | | 3.43 | |
| Less distributions from net investment income | | (1.07 | ) | | — | |
| Net asset value, end of year | $ | 49.67 | | $ | 45.50 | |
| |
| Total returnd | | 11.59 | % | | 8.15 | % |
| |
| Ratios to average net assetse | | | | | | |
| Expenses | | 0.52%f | | | 0.53 | % |
| Net investment income | | 1.51 | % | | 1.70 | % |
| |
| Supplemental data | | | | | | |
| Net assets, end of year (000’s) | $ | 597,859 | | $ | 497,875 | |
| Portfolio turnover rate | | 4.42 | % | | 0.70 | % |
aFor the period May 1, 2013 (effective date) to September 30, 2013.
bThe amount shown for a share outstanding throughout the period may not correlate with the Statement of Operations for the period due to the timing of sales and
repurchases of the Fund shares in relation to income earned and/or fluctuating fair value of the investments of the Fund.
cBased on average daily shares outstanding.
dTotal return is not annualized for periods less than one year.
eRatios are annualized for periods less than one year.
fBenefit of waiver and payments by affiliates and expense reduction rounds to less than 0.01%.
franklintempleton.com
The accompanying notes are an integral part of these financial statements. | Annual Report | 17
| | | | | | | | | | | | | | | |
| FRANKLIN MANAGED TRUST | | | | | | | | | | | | | | | |
| FINANCIAL HIGHLIGHTS | | | | | | | | | | | | | | | |
| |
| |
| |
| Franklin Rising Dividends Fund (continued) | | | | | | | | | | | | | | | |
| | | | | | Year Ended September 30, | | | | |
| | | 2014 | | | 2013 | | | 2012 | | | 2011 | | | 2010 | |
| Advisor Class | | | | | | | | | | | | | | | |
| Per share operating performance | | | | | | | | | | | | | | | |
| (for a share outstanding throughout the year) | | | | | | | | | | | | | | | |
| Net asset value, beginning of year | $ | 45.48 | | $ | 37.87 | | $ | 31.39 | | $ | 30.89 | | $ | 26.68 | |
| Income from investment operationsa: | | | | | | | | | | | | | | | |
| Net investment incomeb | | 0.67 | | | 0.65 | | | 0.61 | | | 0.55 | | | 0.45 | |
| Net realized and unrealized gains (losses) | | 4.50 | | | 7.60 | | | 6.35 | | | 0.38 | | | 3.94 | |
| Total from investment operations | | 5.17 | | | 8.25 | | | 6.96 | | | 0.93 | | | 4.39 | |
| Less distributions from net investment income | | (0.97 | ) | | (0.64 | ) | | (0.48 | ) | | (0.43 | ) | | (0.18 | ) |
| Net asset value, end of year | $ | 49.68 | | $ | 45.48 | | $ | 37.87 | | $ | 31.39 | | $ | 30.89 | |
| |
| Total return | | 11.43 | % | | 22.16 | % | | 22.36 | % | | 2.97 | % | | 16.57 | % |
| |
| Ratios to average net assets | | | | | | | | | | | | | | | |
| Expenses | | 0.66 | %c | | 0.68 | % | | 0.71 | % | | 0.74 | % | | 0.80 | % |
| Net investment income | | 1.37 | % | | 1.55 | % | | 1.69 | % | | 1.67 | % | | 1.57 | % |
| |
| Supplemental data | | | | | | | | | | | | | | | |
| Net assets, end of year (000’s) | $ | 1,900,482 | | $ | 1,292,847 | | $ | 1,233,135 | | $ | 571,399 | | $ | 137,549 | |
| Portfolio turnover rate | | 4.42 | % | | 0.70 | % | | 2.77 | % | | 4.04 | % | | 5.65 | % |
aThe amount shown for a share outstanding throughout the period may not correlate with the Statement of Operations for the period due to the timing of sales and
repurchases of the Fund shares in relation to income earned and/or fluctuating fair value of the investments of the Fund.
bBased on average daily shares outstanding.
cBenefit of waiver and payments by affiliates and expense reduction rounds to less than 0.01%.
18 | Annual Report | The accompanying notes are an integral part of these financial statements.
franklintempleton.com
| | | |
| | FRANKLIN MANAGED TRUST |
| |
| |
| |
| |
| Statement of Investments, September 30, 2014 | | | |
| |
| Franklin Rising Dividends Fund | | | |
| | Shares | | Value |
| Common Stocks 98.2% | | | |
| Aerospace & Defense 7.0% | | | |
| General Dynamics Corp. | 1,702,000 | $ | 216,307,180 |
| Honeywell International Inc. | 4,599,700 | | 428,324,064 |
| United Technologies Corp. | 4,580,174 | | 483,666,374 |
| | | | 1,128,297,618 |
| Automobiles & Components 2.5% | | | |
| Johnson Controls Inc. | 9,151,111 | | 402,648,884 |
| Commercial & Professional Services 1.2% | | | |
| ABM Industries Inc. | 1,145,249 | | 29,421,447 |
| Brady Corp., A | 2,534,825 | | 56,881,473 |
| Cintas Corp. | 1,484,100 | | 104,762,619 |
| | | | 191,065,539 |
| Consumer Durables & Apparel 1.6% | | | |
| Leggett & Platt Inc. | 1,097,590 | | 38,327,843 |
| NIKE Inc., B | 2,369,000 | | 211,314,800 |
| Superior Uniform Group Inc. | 149,600 | | 3,238,840 |
| | | | 252,881,483 |
| Consumer Services 3.1% | | | |
| aMatthews International Corp., A | 2,463,292 | | 108,113,886 |
| McDonald’s Corp. | 3,334,654 | | 316,158,546 |
| Yum! Brands Inc. | 1,145,780 | | 82,473,244 |
| | | | 506,745,676 |
| Diversified Financials 0.2% | | | |
| State Street Corp. | 424,000 | | 31,210,640 |
| Energy 9.5% | | | |
| Chevron Corp. | 4,014,100 | | 478,962,412 |
| Exxon Mobil Corp. | 3,390,700 | | 318,895,335 |
| Occidental Petroleum Corp. | 3,572,000 | | 343,447,800 |
| Schlumberger Ltd. | 3,927,655 | | 399,403,237 |
| | | | 1,540,708,784 |
| Food & Staples Retailing 5.4% | | | |
| CVS Health Corp. | 2,543,200 | | 202,413,288 |
| Wal-Mart Stores Inc. | 4,492,864 | | 343,569,310 |
| Walgreen Co. | 5,679,447 | | 336,620,823 |
| | | | 882,603,421 |
| Food, Beverage & Tobacco 8.9% | | | |
| Archer-Daniels-Midland Co. | 8,738,400 | | 446,532,240 |
| Bunge Ltd. | 5,397,722 | | 454,650,124 |
| McCormick & Co. Inc. | 2,276,400 | | 152,291,160 |
| PepsiCo Inc. | 4,148,300 | | 386,165,247 |
| | | | 1,439,638,771 |
| Health Care Equipment & Services 10.5% | | | |
| Abbott Laboratories | 3,883,000 | | 161,493,970 |
| Becton, Dickinson and Co. | 3,163,516 | | 360,039,756 |
| DENTSPLY International Inc. | 1,755,000 | | 80,028,000 |
franklintempleton.com
Annual Report
| 19
FRANKLIN MANAGED TRUST
STATEMENT OF INVESTMENTS
| | | |
| Franklin Rising Dividends Fund (continued) | | | |
| | Shares | | Value |
| Common Stocks (continued) | | | |
| Health Care Equipment & Services (continued) | | | |
| Medtronic Inc. | 7,291,000 | $ | 451,677,450 |
| Stryker Corp. | 4,804,727 | | 387,981,705 |
| Teleflex Inc. | 1,188,653 | | 124,856,111 |
| West Pharmaceutical Services Inc. | 3,141,600 | | 140,618,016 |
| | | | 1,706,695,008 |
| Household & Personal Products 4.0% | | | |
| Colgate-Palmolive Co. | 3,829,210 | | 249,741,076 |
| The Procter & Gamble Co. | 4,678,888 | | 391,810,081 |
| | | | 641,551,157 |
| Industrial Conglomerates 3.4% | | | |
| Carlisle Cos. Inc. | 322,529 | | 25,924,881 |
| Roper Industries Inc. | 3,645,509 | | 533,301,512 |
| | | | 559,226,393 |
| Insurance 2.4% | | | |
| Aflac Inc. | 1,253,410 | | 73,011,133 |
| Arthur J. Gallagher & Co. | 874,700 | | 39,676,392 |
| The Chubb Corp. | 430,000 | | 39,164,400 |
| Erie Indemnity Co., A | 1,733,082 | | 131,384,946 |
| Old Republic International Corp. | 4,380,950 | | 62,559,966 |
| RLI Corp. | 852,718 | | 36,914,162 |
| | | | 382,710,999 |
| Machinery 6.2% | | | |
| Donaldson Co. Inc. | 1,055,473 | | 42,883,868 |
| Dover Corp. | 5,258,800 | | 422,439,404 |
| Hillenbrand Inc. | 1,366,700 | | 42,217,363 |
| Pentair PLC (United Kingdom) | 7,712,000 | | 505,058,880 |
| | | | 1,012,599,515 |
| Materials 9.6% | | | |
| Air Products and Chemicals Inc. | 3,622,058 | | 471,519,510 |
| aAlbemarle Corp. | 6,007,525 | | 353,843,223 |
| Bemis Co. Inc. | 1,516,389 | | 57,653,110 |
| Ecolab Inc. | 1,323,172 | | 151,939,841 |
| Nucor Corp. | 958,400 | | 52,021,952 |
| Praxair Inc. | 3,680,935 | | 474,840,615 |
| | | | 1,561,818,251 |
| Media 1.4% | | | |
| aJohn Wiley & Sons Inc., A | 3,970,548 | | 222,787,448 |
| Pharmaceuticals, Biotechnology & Life Sciences 5.8% | | | |
| AbbVie Inc. | 2,916,000 | | 168,428,160 |
| Johnson & Johnson | 5,939,800 | | 633,123,282 |
| Perrigo Co. PLC | 333,500 | | 50,088,365 |
| Pfizer Inc. | 3,083,800 | | 91,187,966 |
| | | | 942,827,773 |
20 | Annual Report
franklintempleton.com
FRANKLIN MANAGED TRUST
STATEMENT OF INVESTMENTS
| | | | |
| Franklin Rising Dividends Fund (continued) | | | | |
| | Shares | | Value | |
| Common Stocks (continued) | | | | |
| Retailing 4.2% | | | | |
| Ross Stores Inc. | 4,244,200 | $ | 320,776,636 | |
| Target Corp. | 5,706,920 | | 357,709,746 | |
| | | | 678,486,382 | |
| Semiconductors & Semiconductor Equipment 0.9% | | | | |
| Texas Instruments Inc. | 3,109,800 | | 148,306,362 | |
| Software & Services 6.3% | | | | |
| Accenture PLC, A | 3,619,613 | | 294,346,929 | |
| International Business Machines Corp. | 1,927,000 | | 365,802,410 | |
| Microsoft Corp. | 7,793,200 | | 361,292,752 | |
| | | | 1,021,442,091 | |
| Technology Hardware & Equipment 2.9% | | | | |
| bKnowles Corp. | 2,524,400 | | 66,896,600 | |
| QUALCOMM Inc. | 5,430,600 | | 406,045,962 | |
| | | | 472,942,562 | |
| Trading Companies & Distributors 0.0%† | | | | |
| W.W. Grainger Inc. | 22,500 | | 5,662,125 | |
| Transportation 1.2% | | | | |
| United Parcel Service Inc., B | 2,007,800 | | 197,346,662 | |
| Total Common Stocks (Cost $11,417,282,570) | | | 15,930,203,544 | |
| Short Term Investments (Cost $334,618,162) 2.1% | | | | |
| Money Market Funds 2.1% | | | | |
| b,cInstitutional Fiduciary Trust Money Market Portfolio | 334,618,162 | | 334,618,162 | |
| Total Investments (Cost $11,751,900,732) 100.3% | | | 16,264,821,706 | |
| Other Assets, less Liabilities (0.3)% | | | (42,732,924 | ) |
| Net Assets 100.0% | | $ | 16,222,088,782 | |
†Rounds to less than 0.1% of net assets.
aSee Note 7 regarding holdings of 5% voting securities.
bNon-income producing.
cSee Note 3(f) regarding investments in Institutional Fiduciary Trust Money Market Portfolio.
franklintempleton.com
The accompanying notes are an integral part of these financial statements. | Annual Report | 21
| | |
| FRANKLIN MANAGED TRUST | | |
| |
| |
| |
| |
| Financial Statements | | |
| |
| Statement of Assets and Liabilities | | |
| September 30, 2014 | | |
| |
| Franklin Rising Dividends Fund | | |
| |
| Assets: | | |
| Investments in securities: | | |
| Cost - Unaffiliated issuers | $ | 10,825,530,212 |
| Cost - Non-controlled affiliated issuers (Note 7) | | 591,752,358 |
| Cost - Sweep Money Fund (Note 3f) | | 334,618,162 |
| Total cost of investments | $ | 11,751,900,732 |
| Value - Unaffiliated issuers | $ | 15,245,458,987 |
| Value - Non-controlled affiliated issuers (Note 7) | | 684,744,557 |
| Value - Sweep Money Fund (Note 3f) | | 334,618,162 |
| Total value of investments | | 16,264,821,706 |
| Receivables: | | |
| Investment securities sold | | 86,134 |
| Capital shares sold | | 25,958,730 |
| Dividends | | 16,327,484 |
| Other assets | | 4,056 |
| Total assets | | 16,307,198,110 |
| Liabilities: | | |
| Payables: | | |
| Investment securities purchased | | 28,578,893 |
| Capital shares redeemed | | 36,332,570 |
| Management fees | | 6,760,148 |
| Distribution fees | | 9,457,309 |
| Transfer agent fees | | 3,343,585 |
| Accrued expenses and other liabilities | | 636,823 |
| Total liabilities | | 85,109,328 |
| Net assets, at value | $ | 16,222,088,782 |
| Net assets consist of: | | |
| Paid-in capital | $ | 11,538,613,216 |
| Undistributed net investment income | | 9,361,646 |
| Net unrealized appreciation (depreciation) | | 4,512,920,974 |
| Accumulated net realized gain (loss) | | 161,192,946 |
| Net assets, at value | $ | 16,222,088,782 |
22 | Annual Report | The accompanying notes are an integral part of these financial statements.
franklintempleton.com
| | |
| | | FRANKLIN MANAGED TRUST |
| | | FINANCIAL STATEMENTS |
| |
| |
| Statement of Assets and Liabilities (continued) | | |
| September 30, 2014 | | |
| |
| Franklin Rising Dividends Fund | | |
| |
| Class A: | | |
| Net assets, at value | $ | 10,615,668,318 |
| Shares outstanding | | 213,524,973 |
| Net asset value per sharea | $ | 49.72 |
| Maximum offering price per share (net asset value per share ÷ 94.25%) | $ | 52.75 |
| Class C: | | |
| Net assets, at value | $ | 2,775,136,662 |
| Shares outstanding | | 56,706,146 |
| Net asset value and maximum offering price per sharea | $ | 48.94 |
| Class R: | | |
| Net assets, at value | $ | 332,942,772 |
| Shares outstanding | | 6,717,610 |
| Net asset value and maximum offering price per share | $ | 49.56 |
| Class R6: | | |
| Net assets, at value | $ | 597,858,971 |
| Shares outstanding | | 12,035,627 |
| Net asset value and maximum offering price per share | $ | 49.67 |
| Advisor Class: | | |
| Net assets, at value | $ | 1,900,482,059 |
| Shares outstanding | | 38,255,910 |
| Net asset value and maximum offering price per share | $ | 49.68 |
| | | |
| aRedemption price is equal to net asset value less contingent deferred sales charges, if applicable. | | |
| franklintempleton.com | The accompanying notes are an integral part of these financial statements. | Annual Report | | | 23 |
|
| FRANKLIN MANAGED TRUST |
| FINANCIAL STATEMENTS |
Statement of Operations
for the year ended September 30, 2014
| | | |
| Franklin Rising Dividends Fund | | | |
| |
| Investment income: | | | |
| Dividends: | | | |
| Unaffiliated issuers | $ | 301,771,931 | |
| Non-controlled affiliated issuers (Note 7) | | 11,008,645 | |
| Total investment income | | 312,780,576 | |
| Expenses: | | | |
| Management fees (Note 3a) | | 77,665,782 | |
| Distribution fees: (Note 3c) | | | |
| Class A | | 25,579,392 | |
| Class C | | 26,462,076 | |
| Class R | | 1,618,316 | |
| Transfer agent fees: (Note 3e) | | | |
| Class A | | 14,155,813 | |
| Class C | | 3,660,003 | |
| Class R | | 447,864 | |
| Class R6 | | 885 | |
| Advisor Class | | 2,309,560 | |
| Custodian fees (Note 4) | | 132,816 | |
| Reports to shareholders | | 1,275,480 | |
| Registration and filing fees | | 769,252 | |
| Professional fees | | 151,544 | |
| Trustees’ fees and expenses | | 425,030 | |
| Other | | 188,928 | |
| Total expenses | | 154,842,741 | |
| Expense reductions (Note 4) | | (27 | ) |
| Expenses waived/paid by affiliates (Note 3f and 3g) | | (689,132 | ) |
| Net expenses | | 154,153,582 | |
| Net investment income | | 158,626,994 | |
| Realized and unrealized gains (losses): | | | |
| Net realized gain (loss) from investments | | 177,366,191 | |
| Net change in unrealized appreciation (depreciation) on investments | | 1,200,159,972 | |
| Net realized and unrealized gain (loss) | | 1,377,526,163 | |
| Net increase (decrease) in net assets resulting from operations | $ | 1,536,153,157 | |
24 | Annual Report | The accompanying notes are an integral part of these financial statements.
franklintempleton.com
| | | | | | |
| | | FRANKLIN MANAGED TRUST | |
| | | FINANCIAL STATEMENTS | |
| |
| |
| Statements of Changes in Net Assets | | | | | | |
| |
| Franklin Rising Dividends Fund | | | | | | |
| |
| | | Year Ended September 30, | |
| | | 2014 | | | 2013 | |
| Increase (decrease) in net assets: | | | | | | |
| Operations: | | | | | | |
| Net investment income | $ | 158,626,994 | | $ | 126,449,412 | |
| Net realized gain (loss) from investments | | 177,366,191 | | | 14,324,507 | |
| Net change in unrealized appreciation (depreciation) on investments | | 1,200,159,972 | | | 1,875,807,110 | |
| Net increase (decrease) in net assets resulting from operations | | 1,536,153,157 | | | 2,016,581,029 | |
| Distributions to shareholders from: | | | | | | |
| Net investment income: | | | | | | |
| Class A | | (164,179,512 | ) | | (85,230,833 | ) |
| Class C | | (15,088,950 | ) | | (11,527,327 | ) |
| Class R | | (3,937,165 | ) | | (2,383,593 | ) |
| Class R6 | | (12,368,352 | ) | | — | |
| Advisor Class | | (32,617,726 | ) | | (20,785,888 | ) |
| Total distributions to shareholders | | (228,191,705 | ) | | (119,927,641 | ) |
| Capital share transactions: (Note 2) | | | | | | |
| Class A | | 949,385,444 | | | 1,740,016,368 | |
| Class B | | — | | | (13,161,217 | ) |
| Class C | | 282,762,651 | | | 539,811,291 | |
| Class R | | 27,411,213 | | | 56,208,067 | |
| Class R6 | | 52,630,051 | | | 460,272,727 | |
| Advisor Class | | 476,798,468 | | | (167,677,646 | ) |
| Total capital share transactions | | 1,788,987,827 | | | 2,615,469,590 | |
| Net increase (decrease) in net assets | | 3,096,949,279 | | | 4,512,122,978 | |
| Net assets: | | | | | | |
| Beginning of year | | 13,125,139,503 | | | 8,613,016,525 | |
| End of year | $ | 16,222,088,782 | | $ | 13,125,139,503 | |
| Undistributed net investment income included in net assets: | | | | | | |
| End of year | $ | 9,361,646 | | $ | 78,926,357 | |
franklintempleton.com
The accompanying notes are an integral part of these financial statements. | Annual Report | 25
FRANKLIN MANAGED TRUST
Notes to Financial Statements
Franklin Rising Dividends Fund
1. Organization and Significant Accounting Policies
Franklin Managed Trust (Trust) is registered under the Investment Company Act of 1940, as amended, (1940 Act) as an open-end management investment company, consisting of one fund, Franklin Rising Dividends Fund (Fund). The Fund offers five classes of shares: Class A, Class C, Class R, Class R6, and Advisor Class. Each class of shares differs by its initial sales load, contingent deferred sales charges, voting rights on matters affecting a single class, its exchange privilege and fees primarily due to differing arrangements for distribution and transfer agent fees.
The following summarizes the Fund’s significant accounting policies.
a. Financial Instrument Valuation
The Fund’s investments in financial instruments are carried at fair value daily. Fair value is the price that would be received to sell an asset or paid to transfer a liability in an orderly transaction between market participants on the measurement date. The Fund calculates the net asset value (NAV) per share at the close of the New York Stock Exchange (NYSE), generally at 4 p.m. Eastern time (NYSE close) on each day the NYSE is open for trading. Under compliance policies and procedures approved by the Fund’s Board of Trustees (the Board), the Fund’s administrator has responsibility for oversight of valuation, including leading the cross-functional Valuation and Liquidity Oversight Committee (VLOC). The VLOC provides administration and oversight of the Fund’s valuation policies and procedures, which are approved annually by the Board. Among other things, these procedures allow the Fund to utilize independent pricing services, quotations from securities and financial instrument dealers, and other market sources to determine fair value.
Equity securities listed on an exchange or on the NASDAQ National Market System are valued at the last quoted sale price or the official closing price of the day, respectively. Over-the-counter securities are valued within the range of the most recent quoted bid and ask prices. Securities that trade in multiple markets or on multiple exchanges are valued according to the broadest and most representative market. Certain equity securities are valued based upon fundamental characteristics or
relationships to similar securities. Investments in open-end mutual funds are valued at the closing net asset value.
The Fund has procedures to determine the fair value of financial instruments for which market prices are not reliable or readily available. Under these procedures, the VLOC convenes on a regular basis to review such financial instruments and considers a number of factors, including significant unobservable valuation inputs, when arriving at fair value. The VLOC primarily employs a market-based approach which may use related or comparable assets or liabilities, recent transactions, market multiples, book values, and other relevant information for the investment to determine the fair value of the investment. An income-based valuation approach may also be used in which the anticipated future cash flows of the investment are discounted to calculate fair value. Discounts may also be applied due to the nature or duration of any restrictions on the disposition of the investments. Due to the inherent uncertainty of valuations of such investments, the fair values may differ significantly from the values that would have been used had an active market existed. The VLOC employs various methods for calibrating these valuation approaches including a regular review of key inputs and assumptions, transactional back-testing or disposition analysis, and reviews of any related market activity.
b. Income Taxes
It is the Fund’s policy to qualify as a regulated investment company under the Internal Revenue Code. The Fund intends to distribute to shareholders substantially all of its taxable income and net realized gains to relieve it from federal income and excise taxes. As a result, no provision for U.S. federal income taxes is required.
The Fund recognizes the tax benefits of uncertain tax positions only when the position is “more likely than not” to be sustained upon examination by the tax authorities based on the technical merits of the tax position. As of September 30, 2014, and for all open tax years, the Fund has determined that no liability for unrecognized tax benefits is required in the Fund’s financial statements related to uncertain tax positions taken on a tax return (or expected to be taken on future tax returns). Open tax years are those that remain subject to examination and are based on each tax jurisdiction statute of limitation.
26 | Annual Report
franklintempleton.com
Franklin Rising Dividends Fund (continued)
c. Security Transactions, Investment Income, Expenses and Distributions
Security transactions are accounted for on trade date. Realized gains and losses on security transactions are determined on a specific identification basis. Estimated expenses are accrued daily. Dividend income is recorded on the ex-dividend date. Distributions to shareholders are recorded on the ex-dividend date and are determined according to income tax regulations (tax basis). Distributable earnings determined on a tax basis may differ from earnings recorded in accordance with accounting principles generally accepted in the United States of America. These differences may be permanent or temporary. Permanent differences are reclassified among capital accounts to reflect their tax character. These reclassifications have no impact on net assets or the results of operations. Temporary differences are not reclassified, as they may reverse in subsequent periods.
Realized and unrealized gains and losses and net investment income, not including class specific expenses, are allocated daily to each class of shares based upon the relative proportion of net assets of each class. Differences in per share distributions, by class, are generally due to differences in class specific expenses.
FRANKLIN MANAGED TRUST
NOTES TO FINANCIAL STATEMENTS
d. Accounting Estimates
The preparation of financial statements in accordance with accounting principles generally accepted in the United States of America requires management to make estimates and assumptions that affect the reported amounts of assets and liabilities at the date of the financial statements and the amounts of income and expenses during the reporting period. Actual results could differ from those estimates.
e. Guarantees and Indemnifications
Under the Trust’s organizational documents, its officers and trustees are indemnified by the Trust against certain liabilities arising out of the performance of their duties to the Trust. Additionally, in the normal course of business, the Trust, on behalf of the Fund, enters into contracts with service providers that contain general indemnification clauses. The Trust’s maximum exposure under these arrangements is unknown as this would involve future claims that may be made against the Trust that have not yet occurred. Currently, the Trust expects the risk of loss to be remote.
2. Shares of Beneficial Interest
At September 30, 2014, there were an unlimited number of shares authorized (without par value). Transactions in the Fund’s shares were as follows:
| | | | | | | | | | | |
| | | | | Year Ended September 30, | | | | | |
| | | | | 2014 | | | | | 2013 | |
| | Shares | | | Amount | | Shares | | | | Amount | |
| Class A Shares: | | | | | | | | | | | |
| Shares sold | 54,274,939 | | $ | 2,623,736,117 | | 68,106,182 | | $ | 2,864,407,432 | |
| Shares issued in reinvestment of distributions | 3,136,758 | | | 152,510,709 | | 2,152,713 | | | | 80,188,575 | |
| Shares redeemed | (37,359,342 | ) | | (1,826,861,382 | ) | (29,365,694 | ) | | | (1,204,579,639 | ) |
| Net increase (decrease) | 20,052,355 | | $ | 949,385,444 | | 40,893,201 | | $ | 1,740,016,368 | |
| Class B Sharesa: | | | | | | | | | | | |
| Shares sold | | | | | | 3,603 | | | $ | 136,674 | |
| Shares redeemed | | | | | | (343,671 | ) | | | (13,297,891 | ) |
| Net increase (decrease) | | | | | | (340,068 | ) | | $ | (13,161,217 | ) |
| Class C Shares: | | | | | | | | | | | |
| Shares sold | 13,652,743 | | $ | 649,203,690 | | 19,163,359 | | | $ | 799,333,025 | |
| Shares issued in reinvestment of distributions | 273,799 | | | 13,139,102 | | 270,064 | | | | 9,935,656 | |
| Shares redeemed | (7,905,384 | ) | | (379,580,141 | ) | (6,664,332 | ) | | | (269,457,390 | ) |
| Net increase (decrease) | 6,021,158 | | $ | 282,762,651 | | 12,769,091 | | | $ | 539,811,291 | |
| |
| |
| franklintempleton.com | | | | | | Annual Report | 27 | |
FRANKLIN MANAGED TRUST
NOTES TO FINANCIAL STATEMENTS
| | | | | | | | | | |
| Franklin Rising Dividends Fund (continued) | | | | | | | | | | |
| |
| 2. Shares of Beneficial Interest (continued) | | | | | | | | | | |
| | | | | Year Ended September 30, | | | | |
| | | | | 2014 | | | | | 2013 | |
| | Shares | | | Amount | | Shares | | | Amount | |
| Class R Shares: | | | | | | | | | | |
| Shares sold | 2,376,189 | | $ | 114,752,696 | | 2,994,298 | | $ | 123,054,455 | |
| Shares issued in reinvestment of distributions | 75,881 | | | 3,681,854 | | 60,674 | | | 2,254,636 | |
| Shares redeemed | (1,871,695 | ) | | (91,023,337 | ) | (1,676,388 | ) | | (69,101,024 | ) |
| Net increase (decrease) | 580,375 | | $ | 27,411,213 | | 1,378,584 | | $ | 56,208,067 | |
| Class R6 Sharesb: | | | | | | | | | | |
| Shares soldc | 1,879,292 | | $ | 91,630,704 | | 11,146,010 | | $ | 469,383,916 | |
| Shares issued in reinvestment of distributions | 250,063 | | | 12,136,881 | | — | | | — | |
| Shares redeemed | (1,034,866 | ) | | (51,137,534 | ) | (204,872 | ) | | (9,111,189 | ) |
| Net increase (decrease) | 1,094,489 | | $ | 52,630,051 | | 10,941,138 | | $ | 460,272,727 | |
| Advisor Class Shares: | | | | | | | | | | |
| Shares sold | 18,144,499 | | $ | 881,378,289 | | 13,181,564 | | $ | 552,595,742 | |
| Shares issued in reinvestment of distributions | 583,206 | | | 28,359,342 | | 506,692 | | | 18,843,870 | |
| Shares redeemedc | (8,900,621 | ) | | (432,939,163 | ) | (17,823,004 | ) | | (739,117,258 | ) |
| Net increase (decrease) | 9,827,084 | | $ | 476,798,468 | | (4,134,748 | ) | $ | (167,677,646 | ) |
aEffective March 21, 2013, all Class B shares were converted to Class A.
bFor the period May 1, 2013 (effective date) to September 30, 2013.
cEffective May 1, 2013, a portion of Advisor Class shares exchanged into Class R6.
3. Transactions with Affiliates
Franklin Resources, Inc. is the holding company for various subsidiaries that together are referred to as Franklin Templeton Investments. Certain officers and trustees of the Fund are also officers and/or directors of the following subsidiaries:
| |
| Subsidiary | Affiliation |
| Franklin Advisory Services, LLC (Advisory Services) | Investment manager |
| Franklin Templeton Services, LLC (FT Services) | Administrative manager |
| Franklin Templeton Distributors, Inc. (Distributors) | Principal underwriter |
| Franklin Templeton Investor Services, LLC (Investor Services) | Transfer agent |
a. Management Fees
The Fund pays an investment management fee to Advisory Services based on the average daily net assets of the Fund as follows:
| | |
| Annualized Fee Rate | | Net Assets |
| 0.750 | % | Up to and including $500 million |
| 0.625 | % | Over $500 million, up to and including $1 billion |
| 0.500 | % | Over $1 billion, up to and including $5 billion |
| 0.490 | % | Over $5 billion, up to and including $10 billion |
| 0.480 | % | In excess of $10 billion |
28 | Annual Report
franklintempleton.com
FRANKLIN MANAGED TRUST
NOTES TO FINANCIAL STATEMENTS
Franklin Rising Dividends Fund (continued)
b. Administrative Fees
Under an agreement with Advisory Services, FT Services provides administrative services to the Fund. The fee is paid by Advisory Services based on the Fund’s average daily net assets, and is not an additional expense of the Fund.
c. Distribution Fees
The Board has adopted distribution plans for each share class, with the exception of Class R6 and Advisor Class shares, pursuant to Rule 12b-1 under the 1940 Act. Distribution fees are not charged on shares held by affiliates. Under the Fund’s Class A reimbursement distribution plan, the Fund reimburses Distributors for costs incurred in connection with the servicing, sale and distribution of the Fund’s shares up to the maximum annual plan rate. Under the Class A reimbursement distribution plan, costs exceeding the maximum for the current plan year cannot be reimbursed in subsequent periods. In addition, under the Fund’s Class C and R compensation distribution plans, the Fund pays Distributors for costs incurred in connection with the servicing, sale and distribution of the Fund’s shares up to the maximum annual plan rate for each class. The plan year, for purposes of monitoring compliance with the maximum annual plan rates, is February 1 through January 31.
The maximum annual plan rates, based on the average daily net assets, for each class, are as follows:
| | |
| Class A | 0.25 | % |
| Class C | 1.00 | % |
| Class R | 0.50 | % |
d. Sales Charges/Underwriting Agreements
Front-end sales charges and contingent deferred sales charges (CDSC) do not represent expenses of the Fund. These charges are deducted from the proceeds of sales of Fund shares prior to investment or from redemption proceeds prior to remittance, as applicable. Distributors has advised the Fund of the following commission transactions related to the sales and redemptions of the Fund’s shares for the year:
| | |
| Sales charges retained net of commissions paid to unaffiliated | | |
| broker/dealers | $ | 8,291,986 |
| CDSC retained | $ | 387,849 |
e. Transfer Agent Fees
Each class of shares, except for Class R6, pays transfer agent fees to Investor Services for its performance of shareholder servicing obligations and reimburses Investor Services for out of pocket expenses incurred, including shareholding servicing fees paid to third parties. These fees are allocated daily based upon their relative proportion of such classes’ aggregate net assets. Class R6 pays Investor Services transfer agent fees specific to that class.
For the year ended September 30, 2014, the Fund paid transfer agent fees of $20,574,125 of which $7,701,053 was retained by Investor Services.
f. Investments in Institutional Fiduciary Trust Money Market Portfolio
The Fund invests in Institutional Fiduciary Trust Money Market Portfolio (Sweep Money Fund), an affiliated open-end management investment company. Management fees paid by the Fund are waived on assets invested in the Sweep Money Fund, as noted on the Statement of Operations, in an amount not to exceed the management and administrative fees paid directly or indirectly by the Sweep Money Fund.
franklintempleton.com
Annual Report
| 29
FRANKLIN MANAGED TRUST
NOTES TO FINANCIAL STATEMENTS
Franklin Rising Dividends Fund (continued)
3. Transactions with Affiliates (continued)
g. Waiver and Expense Reimbursements
Investor Services has contractually agreed in advance to waive or limit its fees so that the Class R6 transfer agent fees do not exceed 0.01% until January 31, 2015. There were no Class R6 transfer agent fees waived during the year ended September 30, 2014.
4. Expense Offset Arrangement
The Fund has entered into an arrangement with its custodian whereby credits realized as a result of uninvested cash balances are used to reduce a portion of the Fund’s custodian expenses. During the year ended September 30, 2014, the custodian fees were reduced as noted in the Statement of Operations.
5. Income Taxes
For tax purposes, capital losses may be carried over to offset future capital gains. Capital loss carryforwards with no expiration, if any, must be fully utilized before those losses with expiration dates.
During the year ended September 30, 2014, the Fund utilized $16,007,007 of capital loss carryforwards.
The tax character of distributions paid during the years ended September 30, 2014 and 2013 was as follows:
| | | | |
| | | 2014 | | 2013 |
| Distributions paid from ordinary income | $ | 228,191,705 | $ | 119,927,641 |
At September 30, 2014, the cost of investments, net unrealized appreciation (depreciation), undistributed ordinary income and undistributed long term capital gains for income tax purposes were as follows:
| | | |
| Cost of investments | $ | 11,752,066,971 | |
| |
| Unrealized appreciation | $ | 4,566,277,564 | |
| Unrealized depreciation | | (53,522,829 | ) |
| Net unrealized appreciation (depreciation) | $ | 4,512,754,735 | |
| |
| Undistributed ordinary income | $ | 11,160,027 | |
| Undistributed long term capital gains | | 159,560,804 | |
| Distributable earnings | $ | 170,720,831 | |
Differences between income and/or capital gains as determined on a book basis and a tax basis are primarily due to differing treatment of wash sales.
6. Investment Transactions
Purchases and sales of investments (excluding short term securities) for the year ended September 30, 2014, aggregated $2,967,425,928 and $642,830,966, respectively.
30 | Annual Report
franklintempleton.com
FRANKLIN MANAGED TRUST
NOTES TO FINANCIAL STATEMENTS
Franklin Rising Dividends Fund (continued)
7. Holdings of 5% Voting Securities of Portfolio Companies
The 1940 Act defines “affiliated companies” to include investments in portfolio companies in which a fund owns 5% or more of the outstanding voting securities. Investments in “affiliated companies” for the Fund for the year ended September 30, 2014, were as shown below.
| | | | | | | | | | |
| | Number of | | | Number of | | | | | | |
| | Shares Held | | | Shares Held | | | | | | |
| | at Beginning | Gross | Gross | at End | | Value at End | | Investment | | Realized |
| Name of Issuer | of Year | Additions | Reductions | of Year | | of Year | | Income | | Gain (Loss) |
| Non-Controlled Affiliates | | | | | | | | | | |
| Albemarle Corp. | 5,283,025 | 724,500 | — | 6,007,525 | $ | 353,843,223 | $ | 6,057,004 | $ | — |
| John Wiley & Sons Inc., A | 3,387,309 | 583,239 | — | 3,970,548 | | 222,787,448 | | 4,035,721 | | — |
| Matthews International | | | | | | | | | | |
| Corp., A | 1,680,602 | 782,690 | — | 2,463,292 | | 108,113,886 | | 915,920 | | — |
| Total Affiliated Securities (Value is 4.22% of Net Assets) | | | $ | 684,744,557 | $ | 11,008,645 | $ | — |
8. Credit Facility
The Fund, together with other U.S. registered and foreign investment funds (collectively, Borrowers), managed by Franklin Templeton Investments, are borrowers in a joint syndicated senior unsecured credit facility totaling $1.5 billion (Global Credit Facility) which matures on February 13, 2015. This Global Credit Facility provides a source of funds to the Borrowers for temporary and emergency purposes, including the ability to meet future unanticipated or unusually large redemption requests.
Under the terms of the Global Credit Facility, the Fund shall, in addition to interest charged on any borrowings made by the Fund and other costs incurred by the Fund, pay its share of fees and expenses incurred in connection with the implementation and maintenance of the Global Credit Facility, based upon its relative share of the aggregate net assets of all of the Borrowers, including an annual commitment fee of 0.07% based upon the unused portion of the Global Credit Facility. These fees are reflected in other expenses on the Statement of Operations. During the year ended September 30, 2014, the Fund did not use the Global Credit Facility.
9. Fair Value Measurements
The Fund follows a fair value hierarchy that distinguishes between market data obtained from independent sources (observable inputs) and the Fund’s own market assumptions (unobservable inputs). These inputs are used in determining the value of the Fund’s financial instruments and are summarized in the following fair value hierarchy:
- Level 1 – quoted prices in active markets for identical financial instruments
- Level 2 – other significant observable inputs (including quoted prices for similar financial instruments, interest rates, prepayment speed, credit risk, etc.)
- Level 3 – significant unobservable inputs (including the Fund’s own assumptions in determining the fair value of financial instruments)
The input levels are not necessarily an indication of the risk or liquidity associated with financial instruments at that level.
For movements between the levels within the fair value hierarchy, the Fund has adopted a policy of recognizing the transfers as of the date of the underlying event which caused the movement.
At September 30, 2014, all of the Fund’s investments in financial instruments carried at fair value were valued using Level 1 inputs.
For detailed categories, see the accompanying Statement of Investments.
franklintempleton.com
Annual Report
| 31
FRANKLIN MANAGED TRUST
NOTES TO FINANCIAL STATEMENTS
Franklin Rising Dividends Fund (continued)
10. New Accounting Pronouncements
In June 2013, the Financial Accounting Standards Board (FASB) issued Accounting Standards Update (ASU) No. 2013-08, Investment Companies (Topic 946): Amendments to the Scope, Measurement, and Disclosure Requirements. The ASU modifies the criteria used in defining an investment company under U.S. Generally Accepted Accounting Principles and also sets forth certain measurement and disclosure requirements. Under the ASU, an entity that is registered under the 1940 Act automatically qualifies as an investment company. The ASU is effective for interim and annual reporting periods beginning after December 15, 2013. Management has reviewed the requirements and believes the adoption of this ASU will not have a material impact on the financial statements.
In June 2014, FASB issued ASU No. 2014-11, Transfers and Servicing (Topic 860), Repurchase-to-Maturity Transactions, Repurchase Financings, and Disclosures. The ASU changes the accounting for certain repurchase agreements and expands disclosure requirements related to repurchase agreements, securities lending, repurchase-to-maturity and similar transactions. The ASU is effective for interim and annual reporting periods beginning after December 15, 2014. Management is currently evaluating the impact, if any, of applying this provision.
11. Subsequent Events
The Fund has evaluated subsequent events through the issuance of the financial statements and determined that no events have occurred that require disclosure.
32 | Annual Report
franklintempleton.com
FRANKLIN MANAGED TRUST
FRANKLIN RISING DIVIDENDS FUND
Report of Independent Registered Public Accounting Firm
Franklin Rising Dividends Fund
To the Shareholders and Board of Trustees of Franklin Managed Trust
We have audited the accompanying statement of assets and liabilities of the Franklin Rising Dividends Fund, a series of shares of Franklin Managed Trust, including the statement of investments, as of September 30, 2014, and the related statement of operations for the year then ended, the statements of changes in net assets for each of the two years in the period then ended, and the financial highlights for each of the periods indicated thereon. These financial statements and financial highlights are the responsibility of the Trust’s management. Our responsibility is to express an opinion on these financial statements and financial highlights based on our audits.
We conducted our audits in accordance with the standards of the Public Company Accounting Oversight Board (United States). Those standards require that we plan and perform the audit to obtain reasonable assurance about whether the financial statements and financial highlights are free of material misstatement. The Trust is not required to have, nor were we engaged to perform an audit of the Trust’s internal control over financial reporting. Our audits included consideration of internal control over financial reporting as a basis for designing audit procedures that are appropriate in the circumstances, but not for the purpose of expressing an opinion on the effectiveness of the Trust’s internal control over financial reporting. Accordingly, we express no such opinion. An audit includes examining, on a test basis, evidence supporting the amounts and disclosures in the financial statements. Our procedures included confirmation of securities owned as of September 30, 2014, by correspondence with the custodian and brokers. An audit also includes assessing the accounting principles used and significant estimates made by management, as well as evaluating the overall financial statement presentation. We believe that our audits provide a reasonable basis for our opinion.
In our opinion, the financial statements and financial highlights referred to above present fairly, in all material respects, the financial position of Franklin Rising Dividends Fund at September 30, 2014, the results of its operations for the year then ended, the changes in its net assets for each of the two years in the period then ended, and the financial highlights for each of the periods presented, in conformity with accounting principles generally accepted in the United States of America.
Tait, Weller & Baker LLP
Philadelphia, Pennsylvania
November 13, 2014
franklintempleton.com
Annual Report
| 33
FRANKLIN MANAGED TRUST
Tax Information (unaudited)
Franklin Rising Dividends Fund
Under Section 854(b)(1)(A) of the Internal Revenue Code (Code), the Fund hereby reports 100% of the ordinary income dividends as income qualifying for the dividends received deduction for the fiscal year ended September 30, 2014.
Under Section 854(b)(1)(B) of the Code, the Fund hereby reports the maximum amount allowable but no less than $310,466,976 as qualified dividends for purposes of the maximum rate under Section 1(h)(11) of the Code for the fiscal year ended September 30, 2014. Distributions, including qualified dividend income, paid during calendar year 2014 will be reported to shareholders on Form 1099-DIV by mid-February 2015. Shareholders are advised to check with their tax advisors for information on the treatment of these amounts on their individual income tax returns.
34 | Annual Report
franklintempleton.com
| | | | |
| | | | FRANKLIN RISING DIVIDENDS FUND |
| |
| |
| |
| Board Members and Officers | | |
| |
| The name, year of birth and address of the officers and board members, as well as their affiliations, positions held with the Trust, |
| principal occupations during at least the past five years and number of portfolios overseen in the Franklin Templeton Investments |
| fund complex are shown below. Generally, each board member serves until that person’s successor is elected and qualified. |
| |
| |
| Independent Board Members | | | |
| |
| | | | Number of Portfolios in | |
| Name, Year of Birth | | Length of | Fund Complex Overseen | Other Directorships Held |
| and Address | Position | Time Served | by Board Member* | During at Least the Past 5 Years |
| |
| Burton J. Greenwald (1929) | Trustee | Since 2001 | 17 | Franklin Templeton Emerging Markets |
| One Franklin Parkway | | | | Debt Opportunities Fund PLC and |
| San Mateo, CA 94403-1906 | | | | Fiduciary International Ireland Limited. |
| Principal Occupation During at Least the Past 5 Years: | | |
| Managing Director, B.J. Greenwald Associates (management consultants to the financial services industry); and formerly, Chairman, |
| Fiduciary Trust International Funds; Executive Vice President, L.F. Rothschild Fund Management, Inc.; President and Director, Merit Mutual |
| Funds; President, Underwriting Division and Director, National Securities & Research Corporation; Governor, Investment Company Institute |
| and Chairman, ICI Public Information Committee. | | | |
| |
| David W. Niemiec (1949) | Trustee | Since 2011 | 33 | Emeritus Corporation (assisted living) |
| One Franklin Parkway | | | | (1999-2010) and OSI Pharmaceuticals, |
| San Mateo, CA 94403-1906 | | | | Inc. (pharmaceutical products) |
| | | | | (2006-2010). |
| |
| Principal Occupation During at Least the Past 5 Years: | | |
| Advisor, Saratoga Partners (private equity fund); and formerly, Managing Director, Saratoga Partners (1998-2001) and SBC Warburg Dillon |
| Read (investment banking) (1997-1998); Vice Chairman, Dillon, Read & Co. Inc. (investment banking) (1991-1997); and Chief Financial |
| Officer, Dillon, Read & Co. Inc. (1982-1997). | | | |
| |
| Charles Rubens II (1930) | Trustee | Since 1986 | 17 | None |
| One Franklin Parkway | | | | |
| San Mateo, CA 94403-1906 | | | | |
| Principal Occupation During at Least the Past 5 Years: | | |
| Private investor and president of non-profit organizations; and formerly, an executive of Time, Inc.; and Trustee of Colorado College. |
| |
| Robert E. Wade (1946) | Trustee | Since 2004 | 43 | El Oro Ltd (investments). |
| One Franklin Parkway | | | | |
| San Mateo, CA 94403-1906 | | | | |
| Principal Occupation During at Least the Past 5 Years: | | |
| Attorney at law engaged in private practice (1972-2008) and member of various boards. | |
| |
| Gregory H. Williams (1943) | Trustee | Since 2008 | 7 | None |
| One Franklin Parkway | | | | |
| San Mateo, CA 94403-1906 | | | | |
| Principal Occupation During at Least the Past 5 Years: | | |
| Private investor; Consultant; and formerly, President, University of Cincinnati (2009-2012); President, The City College of New York |
| (2001-2009); Dean, College of Law, Ohio State University (1993-2001); and Associate Vice President, Academic Affairs and Professor of |
| Law, University of Iowa (1977-1993). | | | |
franklintempleton.com
Annual Report
| 35
| | | | |
| FRANKLIN RISING DIVIDENDS FUND | | | |
| |
| |
| |
| |
| Interested Board Members and Officers | | |
| |
| | | | Number of Portfolios in | |
| Name, Year of Birth | | Length of | Fund Complex Overseen | Other Directorships Held |
| and Address | Position | Time Served | by Board Member* | During at Least the Past 5 Years |
| |
| William J. Lippman (1925) | Trustee | Since 1986 | 7 | None |
| One Parker Plaza, 9th Floor | | | | |
| |
| Principal Occupation During at Least the Past 5 Years: | | |
| Officer and/or director or trustee, as the case may be, of two of the investment companies in Franklin Templeton Investments; and formerly, |
| President, Franklin Advisory Services, LLC (1999-2014); and Director, Templeton Worldwide, Inc. (1994-2014). |
| |
| Alison E. Baur (1964) | Vice President | Since 2012 | Not Applicable | Not Applicable |
| One Franklin Parkway | | | | |
| San Mateo, CA 94403-1906 | | | | |
| Principal Occupation During at Least the Past 5 Years: | | |
| Deputy General Counsel, Franklin Templeton Investments; and officer of some of the other subsidiaries of Franklin Resources, Inc. and of |
| 46 of the investment companies in Franklin Templeton Investments. | | |
| |
| Laura F. Fergerson (1962) | Chief Executive Since 2009 | Not Applicable | Not Applicable |
| One Franklin Parkway | Officer – | | | |
| San Mateo, CA 94403-1906 | Finance and | | | |
| | Administration | | | |
| |
| Principal Occupation During at Least the Past 5 Years: | | |
| Senior Vice President, Franklin Templeton Services, LLC; and officer of 46 of the investment companies in Franklin Templeton Investments. |
| |
| Aliya S. Gordon (1973) | Vice President | Since 2009 | Not Applicable | Not Applicable |
| One Franklin Parkway | | | | |
| San Mateo, CA 94403-1906 | | | | |
| Principal Occupation During at Least the Past 5 Years: | | |
| Senior Associate General Counsel, Franklin Templeton Investments; officer of 46 of the investment companies in Franklin Templeton |
| Investments; and formerly, Litigation Associate, Steefel, Levitt & Weiss, LLP (2000-2004). | |
| |
| Steven J. Gray (1955) | Secretary and | Secretary since | Not Applicable | Not Applicable |
| One Franklin Parkway | Vice President | 2005 and Vice | | |
| San Mateo, CA 94403-1906 | | President since | | |
| | | 2009 | | |
| |
| Principal Occupation During at Least the Past 5 Years: | | |
| Senior Associate General Counsel, Franklin Templeton Investments; Vice President, Franklin Templeton Distributors, Inc. and Franklin |
| Alternative Strategies Advisers, LLC; and officer of 46 of the investment companies in Franklin Templeton Investments. |
| |
| Selena L. Holmes (1965) | Vice President | Since 2012 | Not Applicable | Not Applicable |
| 100 Fountain Parkway | – AML | | | |
| St. Petersburg, FL 33716-1205 | Compliance | | | |
| |
| Principal Occupation During at Least the Past 5 Years: | | |
| Director, Global Compliance Monitoring; Chief Compliance Officer, Franklin Alternative Strategies Advisers, LLC; Vice President, Franklin |
| Templeton Companies, LLC; and officer of 46 of the investment companies in Franklin Templeton Investments. |
36 | Annual Report
franklintempleton.com
FRANKLIN RISING DIVIDENDS FUND
| | | | |
| Interested Board Members and Officers (continued) | |
| |
| | | | Number of Portfolios in | |
| Name, Year of Birth | | Length of | Fund Complex Overseen | Other Directorships Held |
| and Address | Position | Time Served | by Board Member* | During at Least the Past 5 Years |
| |
| Rupert H. Johnson, Jr. (1940) | Vice President | Since 1991 | Not Applicable | Not Applicable |
| One Franklin Parkway | | | | |
| San Mateo, CA 94403-1906 | | | | |
| Principal Occupation During at Least the Past 5 Years: | | |
| Vice Chairman, Member – Office of the Chairman and Director, Franklin Resources, Inc.; Director, Franklin Advisers, Inc.; Senior Vice |
| President, Franklin Advisory Services, LLC; and officer and/or director or trustee, as the case may be, of some of the other subsidiaries of |
| Franklin Resources, Inc. and of 41 of the investment companies in Franklin Templeton Investments. | |
| |
| Robert G. Kubilis (1973) | Treasurer, | Since 2012 | Not Applicable | Not Applicable |
| 300 S.E. 2nd Street | Chief Financial | | | |
| Fort Lauderdale, FL 33301-1923 | Officer and | | | |
| | Chief | | | |
| | Accounting | | | |
| | Officer | | | |
| |
| Principal Occupation During at Least the Past 5 Years: | | |
| Assistant Treasurer, Fund Accounting, Franklin Templeton Investments; and officer of five of the investment companies in Franklin Templeton |
| Investments. | | | | |
| |
| Kimberly H. Novotny (1972) | Vice President | Since 2013 | Not Applicable | Not Applicable |
| 300 S.E. 2nd Street | | | | |
| Fort Lauderdale, FL 33301-1923 | | | | |
| Principal Occupation During at Least the Past 5 Years: | | |
| Associate General Counsel, Franklin Templeton Investments; Vice President and Secretary, Fiduciary Trust International of the South; Vice |
| President, Templeton Investment Counsel, LLC; Assistant Secretary, Franklin Resources, Inc.; and officer of 46 of the investment companies |
| in Franklin Templeton Investments. | | | |
| |
| Robert C. Rosselot (1960) | Chief | Since 2013 | Not Applicable | Not Applicable |
| 300 S.E. 2nd Street | Compliance | | | |
| Fort Lauderdale, FL 33301-1923 | Officer | | | |
| Principal Occupation During at Least the Past 5 Years: | | |
| Director, Global Compliance, Franklin Templeton Investments; Vice President, Franklin Templeton Companies, LLC; officer of 46 of the |
| investment companies in Franklin Templeton Investments; and formerly, Senior Associate General Counsel, Franklin Templeton Investments |
| (2007-2013); and Secretary and Vice President, Templeton Group of Funds (2004-2013). | |
| |
| Karen L. Skidmore (1952) | Vice President | Since 2006 | Not Applicable | Not Applicable |
| One Franklin Parkway | | | | |
| San Mateo, CA 94403-1906 | | | | |
| Principal Occupation During at Least the Past 5 Years: | | |
| Senior Associate General Counsel, Franklin Templeton Investments; and officer of 46 of the investment companies in Franklin Templeton |
| Investments. | | | | |
franklintempleton.com
Annual Report
| 37
| | | | |
| FRANKLIN RISING DIVIDENDS FUND | | | |
| |
| |
| |
| |
| Interested Board Members and Officers (continued) | |
| |
| | | | Number of Portfolios in | |
| Name, Year of Birth | | Length of | Fund Complex Overseen | Other Directorships Held |
| and Address | Position | Time Served | by Board Member* | During at Least the Past 5 Years |
| |
| **Donald G. Taylor (1954) | President and | Since | Not Applicable | Not Applicable |
| One Parker Plaza, 9th Floor | Chief Executive October 2014 | | |
| Fort Lee, NJ 07024-2920 | Officer – | | | |
| | Investment | | | |
| | Management | | | |
| |
| Principal Occupation During at Least the Past 5 Years: | | |
| President and Chief Investment Officer, Franklin Advisory Services, LLC; Director, officer of two of the investment companies in Franklin |
| Templeton Investments. | | | | |
| |
| Craig S. Tyle (1960) | Vice President | Since 2005 | Not Applicable | Not Applicable |
| One Franklin Parkway | | | | |
| San Mateo, CA 94403-1906 | | | | |
| Principal Occupation During at Least the Past 5 Years: | | |
| General Counsel and Executive Vice President, Franklin Resources, Inc.; and officer of some of the other subsidiaries of Franklin Resources, |
| Inc. and of 46 of the investment companies in Franklin Templeton Investments. | |
| |
| Lori A. Weber (1964) | Vice President | Since 2011 | Not Applicable | Not Applicable |
| 300 S.E. 2nd Street | | | | |
| Fort Lauderdale, FL 33301-1923 | | | | |
| Principal Occupation During at Least the Past 5 Years: | | |
| Senior Associate General Counsel, Franklin Templeton Investments; Assistant Secretary, Franklin Resources, Inc.; Vice President and |
| Secretary, Templeton Investment Counsel, LLC; Vice President, Fiduciary Trust International of the South; and officer of 46 of the investment |
| companies in Franklin Templeton Investments. | | | |
| |
| |
| *We base the number of portfolios on each separate series of the U.S. registered investment companies within the Franklin Templeton Investments fund complex. These |
| portfolios have a common investment manager or affiliated investment managers. | | |
| **Donald G. Taylor is considered to be an interested person of the Fund under the federal securities laws due to his position as an officer of some of the subsidiaries of |
| Franklin Resources, Inc., which is the parent company of the Fund’s investment manager and distributor. | |
| Note 1: Officer information is current as of the date of this report. It is possible that after this date, information about officers may change. |
| |
| The Sarbanes-Oxley Act of 2002 and Rules adopted by the Securities and Exchange Commission require the Fund to disclose whether the Fund’s Audit Committee |
| includes at least one member who is an audit committee financial expert within the meaning of such Act and Rules. The Fund’s Board has determined that there is |
| at least one such financial expert on the Audit Committee and has designated David W. Niemiec as an audit committee financial expert. The Board believes that |
| Mr. Niemiec qualifies as such an expert in view of his extensive business background and experience. Mr. Niemiec has served as a member of the Fund Audit |
| Committee since 2013, currently serves as an Advisor to Saratoga Partners and was formerly its Managing Director from 1998 to 2001. Mr. Niemiec was formerly |
| a director of Emeritus Corporation from 1999 to 2010 and OSI Pharmaceuticals, Inc. from 2006 to 2010, Managing Director of SBC Warburg Dillon Read from 1997 |
| to 1998, and was Vice Chairman from 1991 to 1997 and Chief Financial Officer from 1982 to 1997 of Dillon, Read & Co. Inc. As a result of such background and |
| experience, the Board believes that Mr. Niemiec has acquired an understanding of generally accepted accounting principles and financial statements, the general |
| application of such principles in connection with the accounting estimates, accruals and reserves, and analyzing and evaluating financial statements that present a |
| breadth and level of complexity of accounting issues generally comparable to those of the Fund, as well as an understanding of internal controls and procedures |
| for financial reporting and an understanding of audit committee functions. Mr. Niemiec is an independent Board member as that term is defined under the appli- |
| cable U.S. Securities and Exchange Commission Rules and Releases. | | |
| |
| The Statement of Additional Information (SAI) includes additional information about the board members and is available, without charge, upon request. |
| Shareholders may call (800) DIAL BEN/342-5236 to request the SAI. | | |
| |
| |
| |
| |
| 38 | Annual Report | | | | franklintempleton.com |
FRANKLIN MANAGED TRUST
FRANKLIN RISING DIVIDENDS FUND
Shareholder Information
Proxy Voting Policies and Procedures
The Trust’s investment manager has established Proxy Voting Policies and Procedures (Policies) that the Trust uses to determine how to vote proxies relating to portfolio securities. Shareholders may view the Trust’s complete Policies online at franklintempleton.com. Alternatively, shareholders may request copies of the Policies free of charge by calling the Proxy Group collect at (954) 527-7678 or by sending a written request to: Franklin Templeton Companies, LLC, 300 S.E. 2nd Street, Fort Lauderdale, FL 33301, Attention: Proxy Group. Copies of the Trust’s proxy voting records are also made available online at franklintempleton.com and posted on the U.S. Securities and Exchange Commission’s website at sec.gov and reflect the most recent 12-month period ended June 30.
Quarterly Statement of Investments
The Trust files a complete statement of investments with the U.S. Securities and Exchange Commission for the first and third quarters for each fiscal year on Form N-Q. Shareholders may view the filed Form N-Q by visiting the Commission’s website at sec.gov. The filed form may also be viewed and copied at the Commission’s Public Reference Room in Washington, DC. Information regarding the operations of the Public Reference Room may be obtained by calling (800) SEC-0330.
Householding of Reports and Prospectuses
You will receive the Fund’s financial reports every six months as well as an annual updated summary prospectus (prospectus available upon request). To reduce Fund expenses, we try to identify related shareholders in a household and send only one copy of the financial reports and summary prospectus. This process, called “householding,” will continue indefinitely unless you instruct us otherwise. If you prefer not to have these documents householded, please call us at (800) 632-2301. At any time you may view current prospectuses/summary prospectuses and financial reports on our website. If you choose, you may receive these documents through electronic delivery.
franklintempleton.com
Annual Report
| 39
This page intentionally left blank.
Item 2. Code of Ethics.
(a) The Registrant has adopted a code of ethics that applies to its principal executive officers and principal financial and accounting officer.
(c) N/A
(d) N/A
(f) Pursuant to Item 12(a)(1), the Registrant is attaching as an exhibit a copy of its code of ethics that applies to its principal executive officers and principal financial and accounting officer.
Item 3. Audit Committee Financial Expert.
(a)(1) The Registrant has an audit committee financial expert serving on its audit committee.
(2) The audit committee financial expert is David W. Niemiec and he is "independent" as defined under the relevant Securities and Exchange Commission Rules and Releases.
Item 4. Principal Accountant Fees and Services.
(a) Audit Fees
The aggregate fees paid to the principal accountant for professional services rendered by the principal accountant for the audit of the registrant’s annual financial statements or for services that are normally provided by the principal accountant in connection with statutory and regulatory filings or engagements were $29,500 for the fiscal year ended September 30, 2014 and $28,600 for the fiscal year ended September 30, 2013.
(b) Audit-Related Fees
There were no fees paid to the principal accountant for assurance and related services rendered by the principal accountant to the registrant that are reasonably related to the performance of the audit of the registrant's financial statements and are not reported under paragraph (a) of Item 4.
There were no fees paid to the principal accountant for assurance and related services rendered by the principal accountant to the registrant's investment adviser and any entity controlling, controlled by or under common control with the investment adviser that provides ongoing services to the registrant that are reasonably related to the performance of the audit of their financial statements.
(c) Tax Fees
There were no fees paid to the principal accountant for professional services rendered by the principal accountant to the registrant for tax compliance, tax advice and tax planning.
There were no fees paid to the principal accountant for professional services rendered by the principal accountant to the registrant’s investment adviser and any entity controlling, controlled by or under common control with the investment adviser that provides ongoing services to the registrant for tax compliance, tax advice and tax planning.
(d) All Other Fees
There were no fees paid to the principal accountant for products and services rendered by the principal accountant to the registrant not reported in paragraphs (a)-(c) of Item 4.
There were no fees paid to the principal accountant for products and services rendered by the principal accountant to the registrant’s investment adviser and any entity controlling, controlled by or under common control with the investment adviser that provides ongoing services to the registrant other than services reported in paragraphs (a)-(c) of Item 4.
(e) (1) The registrant’s audit committee is directly responsible for approving the services to be provided by the auditors, including:
(i) pre-approval of all audit and audit related services;
(ii) pre-approval of all non-audit related services to be provided to the Fund by the auditors;
(iii) pre-approval of all non-audit related services to be provided to the registrant by the auditors to the registrant’s investment adviser or to any entity that controls, is controlled by or is under common control with the registrant’s investment adviser and that provides ongoing services to the registrant where the non-audit services relate directly to the operations or financial reporting of the registrant; and
(iv) establishment by the audit committee, if deemed necessary or appropriate, as an alternative to committee pre-approval of services to be provided by the auditors, as required by paragraphs (ii) and (iii) above, of policies and procedures to permit such services to be pre-approved by other means, such as through establishment of guidelines or by action of a designated member or members of the committee; provided the policies and procedures are detailed as to the particular service and the committee is informed of each service and such policies and procedures do not include delegation of audit committee responsibilities, as contemplated under the Securities Exchange Act of 1934, to management; subject, in the case of (ii) through (iv), to any waivers, exceptions or exemptions that may be available under applicable law or rules.
(e) (2) None of the services provided to the registrant described in paragraphs (b)-(d) of Item 4 were approved by the audit committee pursuant to paragraph (c)(7)(i)(C) of Rule 2-01 of regulation S-X.
(f) No disclosures are required by this Item 4(f).
(g) There were no non-audit fees paid to the principal accountant for services rendered by the principal accountant to the registrant and the registrant’s investment adviser and any entity controlling, controlled by or under common control with the investment adviser that provides ongoing services to the registrant.
(h) The registrant’s audit committee of the board has considered whether the provision of non-audit services that were rendered to the registrant’s investment adviser (not including any sub-adviser whose role is primarily portfolio management and is subcontracted with or overseen by another investment adviser), and any entity controlling, controlled by, or under common control with the investment adviser that provides ongoing services to the registrant that were not pre-approved pursuant to paragraph (c)(7)(ii) of Rule 2-01 of Regulation S-X is compatible with maintaining the principal accountant’s independence.
Item 5. Audit Committee of Listed Registrants. N/A
Item 6. Schedule of Investments. N/A
Item 7. Disclosure of Proxy Voting Policies and Procedures for Closed-End Management Investment Companies. N/A
Item 8. Portfolio Managers of Closed-End Management Investment Companies. N/A
Item 9. Purchases of Equity Securities by Closed-End Management Investment Company and Affiliated Purchasers. N/A
Item 10. Submission of Matters to a Vote of Security Holders.
There have been no changes to the procedures by which shareholders may recommend nominees to the Registrant's Board of Trustees that would require disclosure herein.
Item 11. Controls and Procedures.
(a) Evaluation of Disclosure Controls and Procedures. The Registrant maintains disclosure controls and procedures that are designed to ensure that information required to be disclosed in the Registrant’s filings under the Securities Exchange Act of 1934 and the Investment Company Act of 1940 is recorded, processed, summarized and reported within the periods specified in the rules and forms of the Securities and Exchange Commission. Such information is accumulated and communicated to the Registrant’s management, including its principal executive officer and principal financial officer, as appropriate, to allow timely decisions regarding required disclosure. The Registrant’s management, including the principal executive officer and the principal financial officer, recognizes that any set of controls and procedures, no matter how well designed and operated, can provide only reasonable assurance of achieving the desired control objectives.
Within 90 days prior to the filing date of this Shareholder Report on Form N-CSR, the Registrant had carried out an evaluation, under the supervision and with the participation of the Registrant’s management, including the Registrant’s principal executive officer and the Registrant’s principal financial officer, of the effectiveness of the design and operation of the Registrant’s disclosure controls and procedures. Based on such evaluation, the Registrant’s principal executive officer and principal financial officer concluded that the Registrant’s disclosure controls and procedures are effective.
(b) Changes in Internal Controls. There have been no changes in the Registrant’s internal controls or in other factors that could materially affect the internal controls over financial reporting subsequent to the date of their evaluation in connection with the preparation of this Shareholder Report on Form N-CSR.
Item 12. Exhibits.
(a) (1) Code of Ethics
(a) (2) Certifications pursuant to Section 302 of the Sarbanes-Oxley Act of 2002 of Laura F. Fergerson, Chief Executive Officer - Finance and Administration, and Robert G. Kubilis, Chief Financial Officer and Chief Accounting Officer
(b) Certifications pursuant to Section 906 of the Sarbanes-Oxley Act of 2002 of Laura F. Fergerson, Chief Executive Officer - Finance and Administration, and Robert G. Kubilis, Chief Financial Officer and Chief Accounting Officer
SIGNATURES
Pursuant to the requirements of the Securities Exchange Act of 1934 and the Investment Company Act of 1940, the registrant has duly caused this report to be signed on its behalf by the undersigned, thereunto duly authorized.
FRANKLIN MANAGED TRUST
By /s/ Laura F. Fergerson
Laura F. Fergerson
Chief Executive Officer - Finance and Administration
Date November 25, 2014
Pursuant to the requirements of the Securities Exchange Act of 1934 and the Investment Company Act of 1940, this report has been signed below by the following persons on behalf of the registrant and in the capacities and on the dates indicated.
By /s/ Laura F. Fergerson
Laura F. Fergerson
Chief Executive Officer - Finance and Administration
Date November 25, 2014
By /s/ Robert G. Kubilis
Robert G. Kubilis
Chief Financial Officer and
Chief Accounting Officer
Date November 25, 2014