
Annual Report
Franklin Rising Dividends Fund
Your Fund’s Goal and Main Investments: Franklin Rising Dividends Fund seeks long-term capital appreciation. Preservation of capital, while not a goal, is also an important consideration. Under normal market conditions, the Fund invests at least 80% of its net assets in companies that have paid consistently rising dividends.


Manager’s Discussion
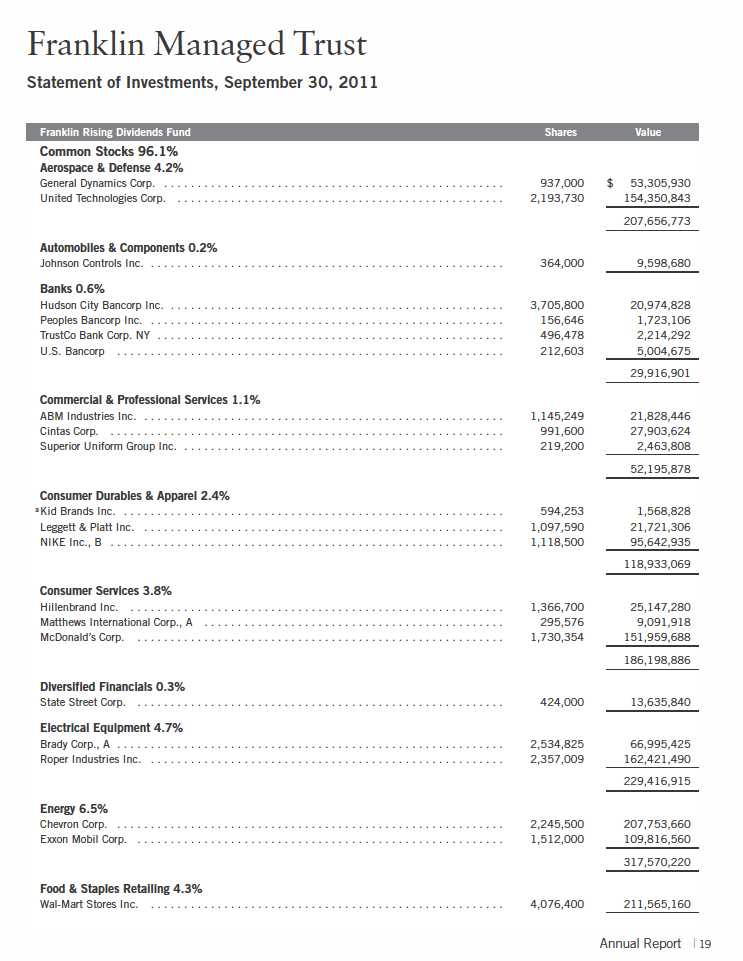
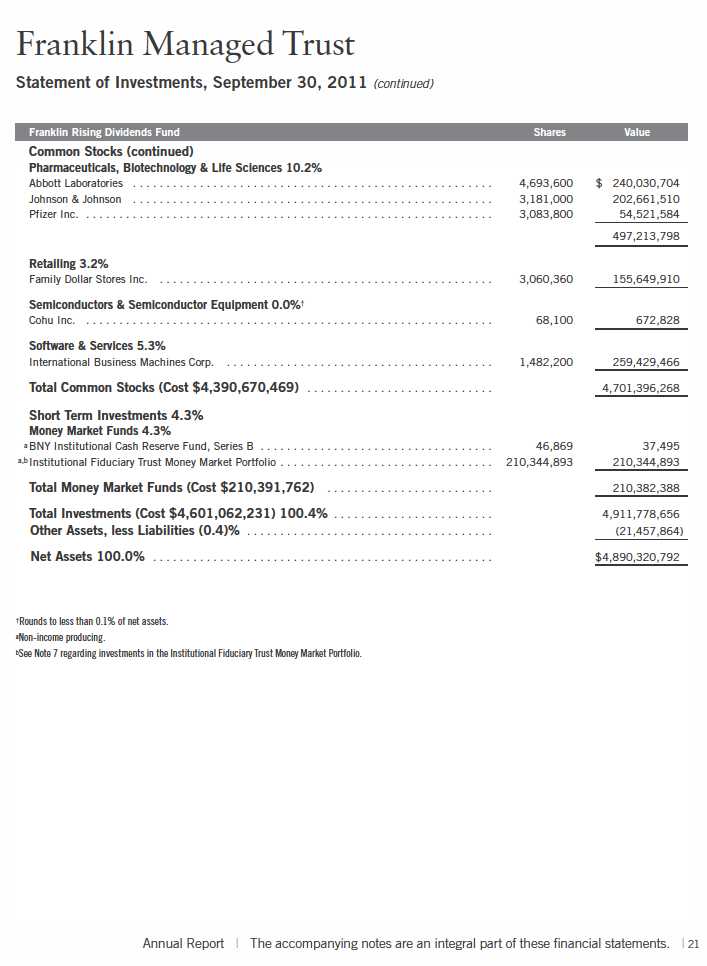
During the 12 months under review, three holdings that helped Fund performance were International Business Machines (IBM), Family Dollar Stores and Erie Indemnity. Information technology software and services provider IBM generates significant recurring revenues from its software and services businesses, thus making the company less vulnerable to economic weakness than many other technology companies, in our view. The company has 16 consecutive years of dividend increases. Discount retailer Family Dollar Stores announced a significant new share repurchase program early in the period. In addition, the company reported record quarterly earnings and increased its dividend for the 35th consecutive year during the period. Erie Indemnity, a management company for a property and casualty insurer, increased in value largely due to its very strong capital position, which enabled its shares to perform better than most other financial stocks. Erie has 31 consecutive years of dividend increases.
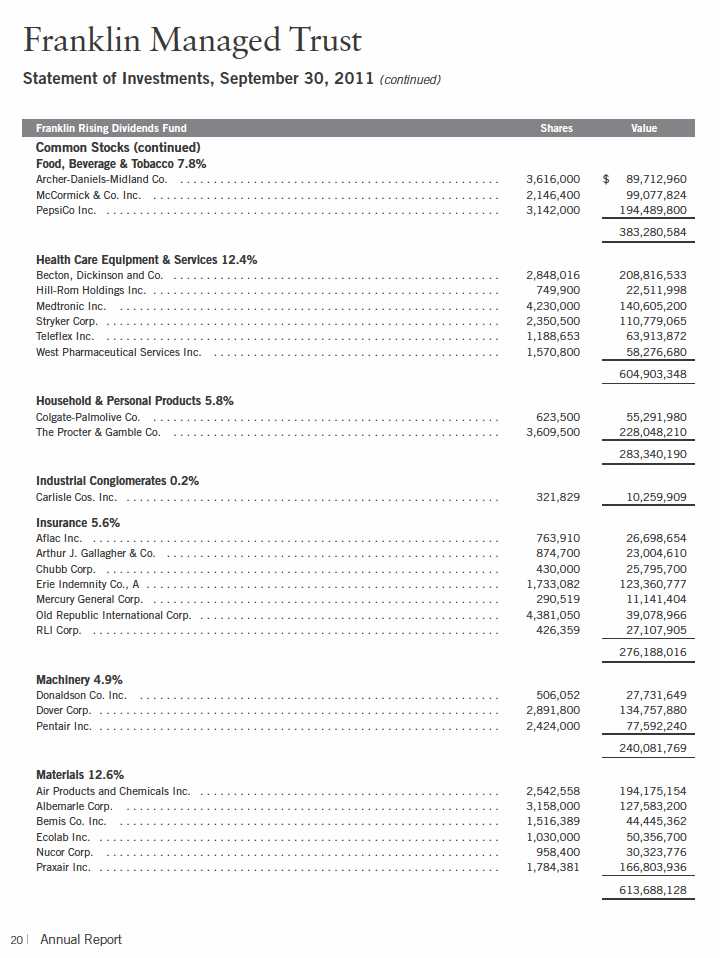
Detractors from performance included Albemarle, Hudson City Bancorp and Old Republic International. Shares of specialty chemicals manufacturer Albemarle, a new holding, suffered as investors seemed to fear the company’s sales growth rate could decline if some of its more cyclical markets slow. Hudson City disclosed declining net interest margin would cause it to restructure its balance sheet. During the period, the company completed a restructuring of its balance sheet that reduced higher cost structured borrowings and allowed for increased net interest income. Losses in Old Republic’s mortgage guaranty business remained high as the housing market has failed to recover significantly.
In addition to purchasing shares in Albemarle, we initiated 10 other positions: large integrated energy company Chevron (23 years of dividend increases), insurer Chubb (46 years), consumer products manufacturer and marketer Colgate-Palmolive (48 years); cleaning products and services provider Ecolab (19 years), integrated energy company Exxon Mobil (29 years), memorialization and related products manufacturer Matthews International (16 years), restaurant operator McDonald’s (35 years), global athletic footwear and apparel maker Nike (9 years), and industrial manufacturer Pentair (35 years). We also initiated a position in Johnson Controls, a global automotive and building efficiency systems and services provider, which has a solid history of dividend increases. We made significant additions to holdings of global snacks and beverages manufacturer PepsiCo, therapeutic and diagnostic products manufacturer Medtronic, and industrial gases company Air Products and Chemicals. We liquidated our positions in Beckman Coulter, Nordson and Sally Beauty Holdings, and we reduced our holdings in Carlisle Cos. and Family Dollar Stores. In addition, Unilever completed its cash acquisition of long-time Fund holding Alberto-Culver during the period.
| | | |
| Top 10 Equity Holdings | | | |
| 9/30/11 | | | |
| |
| Company | % of Total | |
| Sector/Industry | Net Assets | |
| International Business Machines Corp. | 5.3 | % |
| Software & Services | | | |
| Abbott Laboratories | | 4.9 | % |
| Pharmaceuticals, Biotechnology & | | | |
| Life Sciences | | | |
| The Procter & Gamble Co. | | 4.7 | % |
| Household & Personal Products | | | |
| Wal-Mart Stores Inc. | | 4.3 | % |
| Food & Staples Retailing | | | |
| Becton, Dickinson and Co. | | 4.3 | % |
| Health Care Equipment & Services | | | |
| Chevron Corp. | | 4.3 | % |
| Energy | | | |
| Johnson & Johnson | | 4.1 | % |
| Pharmaceuticals, Biotechnology & | | | |
| Life Sciences | | | |
| PepsiCo Inc. | | 4.0 | % |
| Food, Beverage & Tobacco | | | |
| Air Products and Chemicals Inc. | | 4.0 | % |
| Materials | | | |
| Praxair Inc. | | 3.4 | % |
| Materials | | | |
Annual Report | 5
Our 10 largest positions on September 30, 2011, represented 43.3% of the Fund’s total net assets. It is interesting to note how these 10 companies would, in aggregate, respond to the Fund’s screening criteria based on a simple average of statistical measures. On average, these 10 companies have raised their dividends 34 years in a row and by 278% over the past 10 years. Their most recent year-over-year dividend increases averaged 11.6% with a dividend yield of 2.9% on September 30, 2011, and a dividend payout ratio of 36.9%, based on estimates of calendar year 2011 operating earnings. Their average price/earnings ratio was 12.8 times 2011 estimates versus 11.7 for that of the unmanaged S&P 500.
Thank you for your continued participation in Franklin Rising Dividends Fund.
We look forward to serving your future investment needs.


Donald G. Taylor, CPA
Lead Portfolio Manager
William J. Lippman
Margaret McGee
Bruce C. Baughman, CPA
Portfolio Management Team
Franklin Rising Dividends Fund
The foregoing information reflects our analysis, opinions and portfolio holdings as of September 30, 2011, the end of the reporting period. The way we implement our main investment strategies and the resulting portfolio holdings may change depending on factors such as market and economic conditions. These opinions may not be relied upon as investment advice or an offer for a particular security. The information is not a complete analysis of every aspect of any market, country, industry, security or the Fund. Statements of fact are from sources considered reliable, but the investment manager makes no representation or warranty as to their completeness or accuracy. Although historical performance is no guarantee of future results, these insights may help you understand our investment management philosophy.
6 | Annual Report
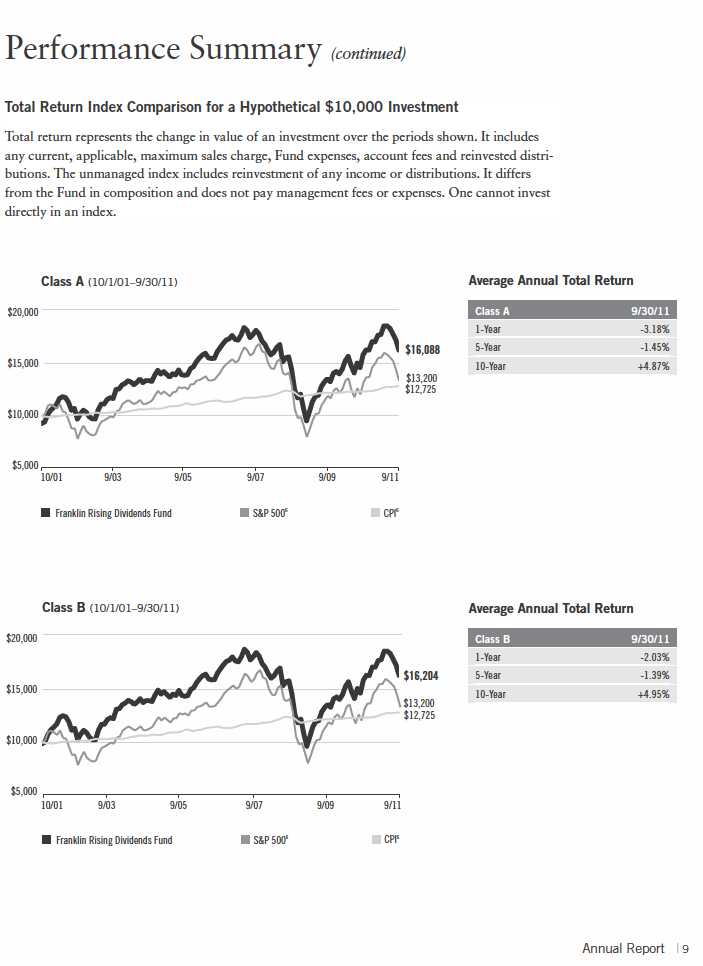
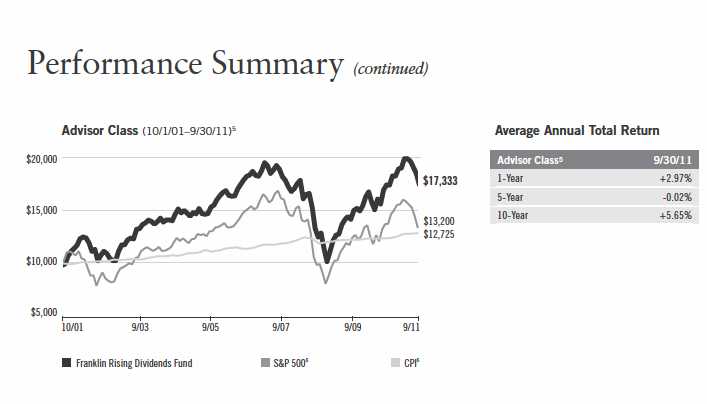
Performance Summary as of 9/30/11
Your dividend income will vary depending on dividends or interest paid by securities in the Fund’s portfolio, adjusted for operating expenses of each class. Capital gain distributions are net profits realized from the sale of portfolio securities. The performance table and graphs do not reflect any taxes that a shareholder would pay on Fund dividends, capital gain distributions, if any, or any realized gains on the sale of Fund shares. Total return reflects reinvestment of the Fund’s dividends and capital gain distributions, if any, and any unrealized gains or losses.
| | | | | | | | |
| Price and Distribution Information | | | | | | |
| |
| Class A (Symbol: FRDPX) | | | | Change | | 9/30/11 | | 9/30/10 |
| Net Asset Value (NAV) | | | +$ | 0.47 | $ | 31.39 | $ | 30.92 |
| Distributions (10/1/10–9/30/11) | | | | | | | | |
| Dividend Income | $ | 0.3730 | | | | | | |
| Class B (Symbol: FRDBX) | | | | Change | | 9/30/11 | | 9/30/10 |
| Net Asset Value (NAV) | | | +$ | 0.53 | $ | 31.11 | $ | 30.58 |
| Distributions (10/1/10–9/30/11) | | | | | | | | |
| Dividend Income | $ | 0.0740 | | | | | | |
| Class C (Symbol: FRDTX) | | | | Change | | 9/30/11 | | 9/30/10 |
| Net Asset Value (NAV) | | | +$ | 0.41 | $ | 30.87 | $ | 30.46 |
| Distributions (10/1/10–9/30/11) | | | | | | | | |
| Dividend Income | $ | 0.1884 | | | | | | |
| Class R (Symbol: FRDRX) | | | | Change | | 9/30/11 | | 9/30/10 |
| Net Asset Value (NAV) | | | +$ | 0.47 | $ | 31.29 | $ | 30.82 |
| Distributions (10/1/10–9/30/11) | | | | | | | | |
| Dividend Income | $ | 0.2981 | | | | | | |
| Advisor Class (Symbol: FRDAX) | | | | Change | | 9/30/11 | | 9/30/10 |
| Net Asset Value (NAV) | | | +$ | 0.50 | $ | 31.39 | $ | 30.89 |
| Distributions (10/1/10–9/30/11) | | | | | | | | |
| Dividend Income | $ | 0.4347 | | | | | | |
Annual Report | 7
Performance Summary (continued)
Performance
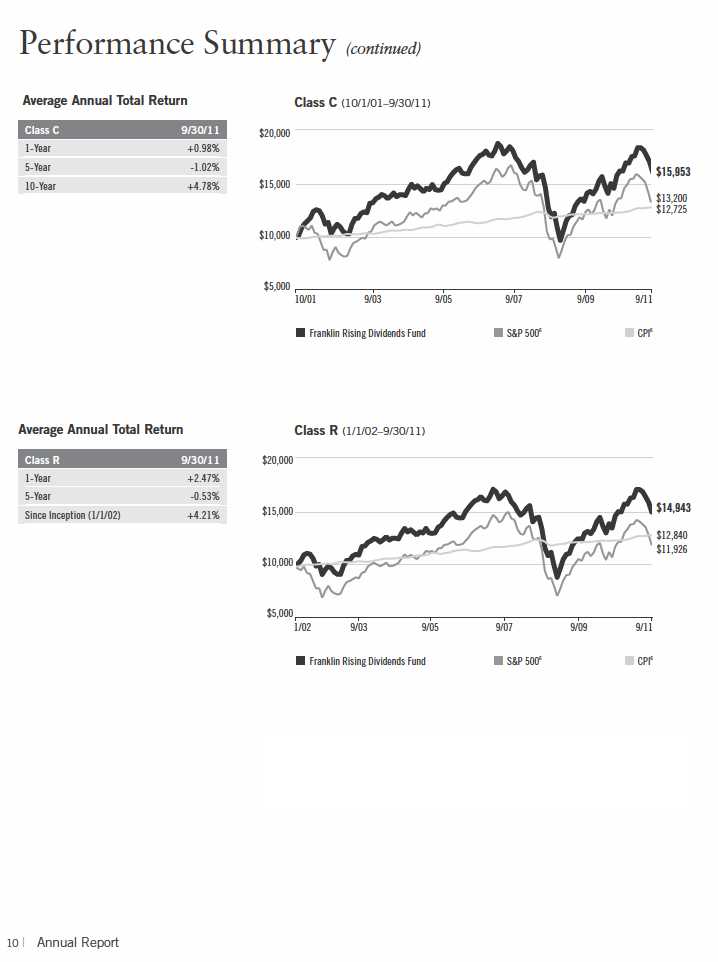
Cumulative total return excludes sales charges. Average annual total return and value of $10,000 investment include maximum sales charges. Class A: 5.75% maximum initial sales charge; Class B: contingent deferred sales charge (CDSC) declining from 4% to 1% over six years, and eliminated thereafter; Class C: 1% CDSC in first year only;
Class R/Advisor Class: no sales charges.
| | | | | | | | | | | |
| Class A | | | | 1-Year | | | 5-Year | | | 10-Year | |
| Cumulative Total Return1 | | | + | 2.74 | % | | -1.35 | % | + | 70.73 | % |
| Average Annual Total Return2 | | | | -3.18 | % | | -1.45 | % | + | 4.87 | % |
| Value of $10,000 Investment3 | | | $ | 9,682 | | $ | 9,298 | | $ | 16,088 | |
| Total Annual Operating Expenses4 | 1.08 | % | | | | | | | | | |
| Class B | | | | 1-Year | | | 5-Year | | | 10-Year | |
| Cumulative Total Return1 | | | + | 1.97 | % | | -5.00 | % | + | 62.04 | % |
| Average Annual Total Return2 | | | | -2.03 | % | | -1.39 | % | + | 4.95 | % |
| Value of $10,000 Investment3 | | | $ | 9,797 | | $ | 9,326 | | $ | 16,204 | |
| Total Annual Operating Expenses4 | 1.82 | % | | | | | | | | | |
| Class C | | | | 1-Year | | | 5-Year | | | 10-Year | |
| Cumulative Total Return1 | | | + | 1.98 | % | | -4.98 | % | + | 59.53 | % |
| Average Annual Total Return2 | | | + | 0.98 | % | | -1.02 | % | + | 4.78 | % |
| Value of $10,000 Investment3 | | | $ | 10,098 | | $ | 9,502 | | $ | 15,953 | |
| Total Annual Operating Expenses4 | 1.83 | % | | | | | | | | | |
| Class R | | | | 1-Year | | | 5-Year | | | Inception (1/1/02) | |
| Cumulative Total Return1 | | | + | 2.47 | % | | -2.62 | % | + | 49.43 | % |
| Average Annual Total Return2 | | | + | 2.47 | % | | -0.53 | % | + | 4.21 | % |
| Value of $10,000 Investment3 | | | $ | 10,247 | | $ | 9,738 | | $ | 14,943 | |
| Total Annual Operating Expenses4 | 1.33 | % | | | | | | | | | |
| Advisor Class5 | | | | 1-Year | | | 5-Year | | | 10-Year | |
| Cumulative Total Return1 | | | + | 2.97 | % | | -0.08 | % | + | 73.33 | % |
| Average Annual Total Return2 | | | + | 2.97 | % | | -0.02 | % | + | 5.65 | % |
| Value of $10,000 Investment3 | | | $ | 10,297 | | $ | 9,992 | | $ | 17,333 | |
| Total Annual Operating Expenses4 | 0.83 | % | | | | | | | | | |
Performance data represent past performance, which does not guarantee future results. Investment return and principal value will fluctuate, and you may have a gain or loss when you sell your shares. Current performance may differ from figures shown. For most recent month-end performance, go to franklintempleton.com or call (800) 342-5236.
8 | Annual Report
| | | | |
| Endnotes | | | | |
| |
| Value securities may not increase in price as anticipated or may decline further in value. While smaller and midsize | | | |
| companies may offer substantial opportunities for capital growth, they also involve heightened risks and should be | | | |
| considered speculative. Historically, smaller and midsize company securities have been more volatile in price than | | | |
| larger company securities, especially over the short term. The Fund is actively managed but there is no guarantee | | | |
| that the manager’s investment decisions will produce the desired results. The Fund’s prospectus also includes a | | | |
| description of the main investment risks. | | | |
| |
| Class B: | These shares have higher annual fees and expenses than Class A shares. | | | |
| |
| Class C: | Prior to 1/1/04, these shares were offered with an initial sales charge; thus actual total returns would | | | |
| | have differed. These shares have higher annual fees and expenses than Class A shares. | | | |
| |
| Class R: | Shares are available to certain eligible investors as described in the prospectus. These shares have | | | |
| | higher annual fees and expenses than Class A shares. | | | |
| |
| Advisor Class: | Shares are available to certain eligible investors as described in the prospectus. | | | |
| |
| 1. Cumulative total return represents the change in value of an investment over the periods indicated. | | | |
| 2. Average annual total return represents the average annual change in value of an investment over the periods | | | |
| indicated. | | | | |
| 3. These figures represent the value of a hypothetical $10,000 investment in the Fund over the periods indicated. | | | |
| 4. Figures are as stated in the Fund’s prospectus current as of the date of this report. In periods of market volatility, | | | |
| assets may decline significantly, causing total annual Fund operating expenses to become higher than the figures | | | |
| shown. | | | | |
| 5. Effective 10/3/05, the Fund began offering Advisor Class shares, which do not have sales charges or a Rule 12b-1 | | | |
| plan. Performance quotations for this class reflect the following methods of calculation: (a) For periods prior to 10/3/05, | | | |
| a restated figure is used based upon the Fund’s Class A performance, excluding the effect of Class A’s maximum initial | | | |
| sales charge, but reflecting the effect of the Class A Rule 12b-1 fees; and (b) for periods after 10/3/05, actual Advisor | | | |
| Class performance is used reflecting all charges and fees applicable to that class. Since 10/3/05 (commencement of | | | |
| sales), the cumulative and average annual total returns of Advisor Class shares were +18.51% and +2.88%. | | | |
| 6. Source: © 2011 Morningstar. The S&P 500 is a market capitalization-weighted index of 500 stocks designed to | | | |
| measure total U.S. equity market performance. The Consumer Price Index (CPI), calculated by the U.S. Bureau of Labor | | | |
| Statistics, is a commonly used measure of the inflation rate. | | | |
| |
| |
| |
| | | Annual Report | | | 11 |
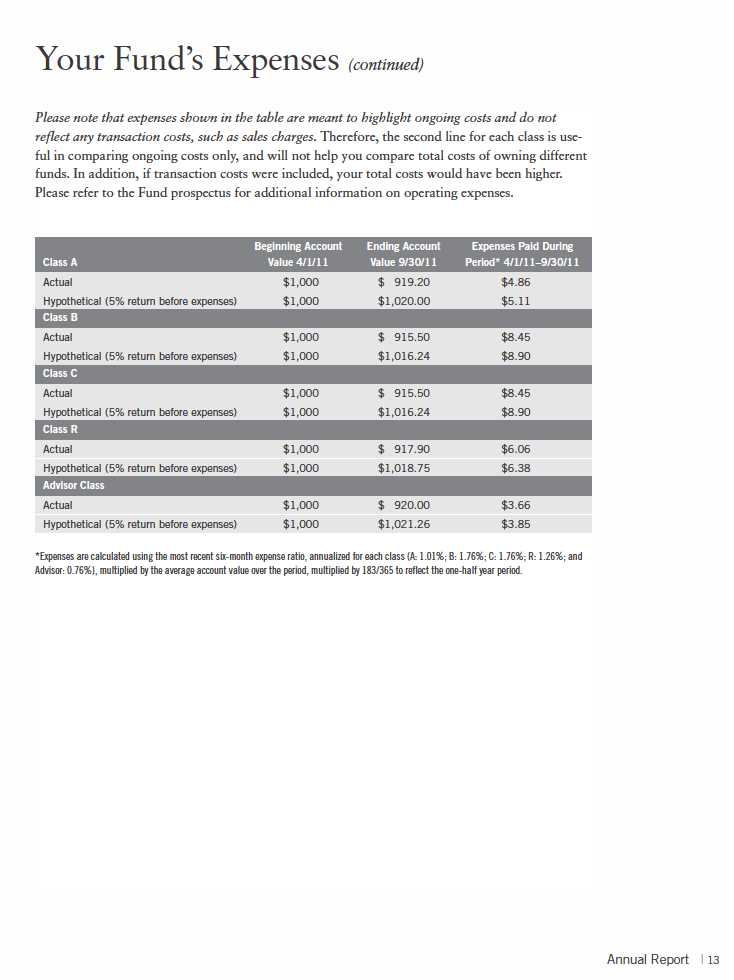
Your Fund’s Expenses
As a Fund shareholder, you can incur two types of costs:
- Transaction costs, including sales charges (loads) on Fund purchases; and
- Ongoing Fund costs, including management fees, distribution and service (12b-1) fees, and other Fund expenses. All mutual funds have ongoing costs, sometimes referred to as operating expenses.
The following table shows ongoing costs of investing in the Fund and can help you understand these costs and compare them with those of other mutual funds. The table assumes a $1,000 investment held for the six months indicated.
Actual Fund Expenses
The first line (Actual) for each share class listed in the table provides actual account values and expenses. The “Ending Account Value” is derived from the Fund’s actual return, which includes the effect of Fund expenses.
You can estimate the expenses you paid during the period by following these steps. Of course, your account value and expenses will differ from those in this illustration:
| 1. | Divide your account value by $1,000. |
| | If an account had an $8,600 value, then $8,600 ÷ $1,000 = 8.6. |
| 2. | Multiply the result by the number under the heading “Expenses Paid During Period.” |
| | If Expenses Paid During Period were $7.50, then 8.6 x $7.50 = $64.50. |
In this illustration, the estimated expenses paid this period are $64.50.
Hypothetical Example for Comparison with Other Funds
Information in the second line (Hypothetical) for each class in the table can help you compare ongoing costs of investing in the Fund with those of other mutual funds. This information may not be used to estimate the actual ending account balance or expenses you paid during the period. The hypothetical “Ending Account Value” is based on the actual expense ratio for each class and an assumed 5% annual rate of return before expenses, which does not represent the Fund’s actual return. The figure under the heading “Expenses Paid During Period” shows the hypothetical expenses your account would have incurred under this scenario. You can compare this figure with the 5% hypothetical examples that appear in shareholder reports of other funds.
12 | Annual Report


Franklin Managed Trust
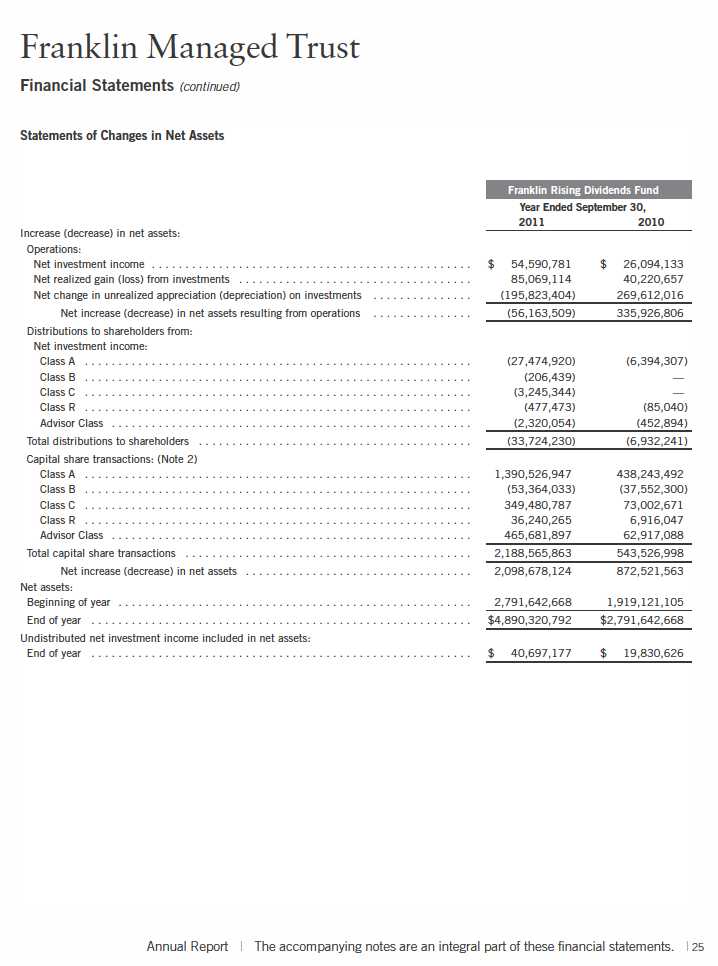
Financial Statements (continued)
Statement of Operations
for the year ended September 30, 2011
| | | |
| | | Franklin Rising | |
| | | Dividends Fund | |
| Investment income: | | | |
| Dividends | $ | 101,553,017 | |
| Expenses: | | | |
| Management fees (Note 3a) | | 22,567,807 | |
| Distribution fees: (Note 3c) | | | |
| Class A | | 7,555,673 | |
| Class B | | 742,877 | |
| Class C | | 7,246,956 | |
| Class R | | 350,462 | |
| Transfer agent fees (Note 3e) | | 7,225,449 | |
| Special servicing agreement fees (Note 8) | | 105,247 | |
| Accounting fees (Note 3b) | | 40,000 | |
| Custodian fees (Note 4) | | 58,672 | |
| Reports to shareholders | | 447,669 | |
| Registration and filing fees | | 329,980 | |
| Professional fees | | 54,802 | |
| Trustees’ fees and expenses | | 175,089 | |
| Other | | 61,553 | |
| Total expenses | | 46,962,236 | |
| Net investment income | | 54,590,781 | |
| Realized and unrealized gains (losses): | | | |
| Net realized gain (loss) from investments | | 85,069,114 | |
| Net change in unrealized appreciation (depreciation) on investments | | (195,823,404 | ) |
| Net realized and unrealized gain (loss) | | (110,754,290 | ) |
| Net increase (decrease) in net assets resulting from operations | $ | (56,163,509 | ) |
24 | The accompanying notes are an integral part of these financial statements. | Annual Report
Franklin Managed Trust
Notes to Financial Statements
Franklin Rising Dividends Fund
1. ORGANIZATION AND SIGNIFICANT ACCOUNTING POLICIES
Franklin Managed Trust (Trust) is registered under the Investment Company Act of 1940, as amended, (1940 Act) as an open-end investment company, consisting of one fund, the Franklin Rising Dividends Fund (Fund). The Fund offers five classes of shares: Class A, Class B, Class C, Class R, and Advisor Class. Each class of shares differs by its initial sales load, contingent deferred sales charges, distribution fees, voting rights on matters affecting a single class and its exchange privilege.
The following summarizes the Fund’s significant accounting policies.
a. Financial Instrument Valuation
The Fund’s investments in securities and other financial instruments are carried at fair value daily. Fair value is the price that would be received to sell an asset or paid to transfer a liability in an orderly transaction between market participants on the measurement date. Under procedures approved by the Fund’s Board of Trustees, the Fund may utilize independent pricing services, quotations from securities and financial instrument dealers, and other market sources to determine fair value.
Equity securities listed on an exchange or on the NASDAQ National Market System are valued at the last quoted sale price or the official closing price of the day, respectively. Over-the-counter securities are valued within the range of the most recent quoted bid and ask prices. Securities that trade in multiple markets or on multiple exchanges are valued according to the broadest and most representative market. Certain equity securities are valued based upon fundamental characteristics or relationships to similar securities. Investments in open-end mutual funds are valued at the closing net asset value.
The Fund has procedures to determine the fair value of securities and other financial instruments for which market prices are not readily available or which may not be reliably priced. Under these procedures, the Fund primarily employs a market-based approach which may use related or comparable assets or liabilities, recent transactions, market multiples, book values, and other relevant information for the investment to determine the fair value of the investment. The Fund may also use an income-based valuation approach in which the anticipated future cash flows of the investment are discounted to calculate fair value. Discounts may also be applied due to the nature or duration of any restrictions on the disposition of the investments. Due to the inherent uncertainty of valuations of such investments, the fair values may differ significantly from the values that would have been used had an active market existed.
b. Securities Lending
The Fund participates in a principal based security lending program. The Fund receives cash collateral against the loaned securities in an amount equal to at least 102% of the market value of the loaned securities. Collateral is maintained over the life of the loan in an amount not less
26 | Annual Report
Franklin Managed Trust
Notes to Financial Statements (continued)
Franklin Rising Dividends Fund
| 1. | ORGANIZATION AND SIGNIFICANT ACCOUNTING POLICIES (continued) |
| b. | Securities Lending (continued) |
than 100% of the market value of loaned securities, as determined at the close of Fund business each day; any additional collateral required due to changes in security values is delivered to the Fund on the next business day. The collateral is invested in repurchase agreements and in a non-registered money fund managed by the Fund’s custodian on the Fund’s behalf. The Fund receives income from the investment of cash collateral, in addition to lending fees and rebates paid by the borrower. The Fund bears the market risk with respect to the collateral investment, securities loaned, and the risk that the principal may default on its obligations to the Fund. At September 30, 2011, the Fund had no securities on loan.
c. Income Taxes
It is the Fund’s policy to qualify as a regulated investment company under the Internal Revenue Code. The Fund intends to distribute to shareholders substantially all of its taxable income and net realized gains to relieve it from federal income and excise taxes. As a result, no provision for U.S. federal income taxes is required. The Fund files U.S. income tax returns as well as tax returns in certain other jurisdictions. The Fund records a provision for taxes in its financial statements including penalties and interest, if any, for a tax position taken on a tax return (or expected to be taken) when it fails to meet the more likely than not (a greater than 50% probability) threshold and based on the technical merits, the tax position may not be sustained upon examination by the tax authorities. As of September 30, 2011, and for all open tax years, the Fund has determined that no provision for income tax is required in the Fund’s financial statements. Open tax years are those that remain subject to examination and are based on each tax jurisdiction statute of limitation.
d. Security Transactions, Investment Income, Expenses and Distributions
Security transactions are accounted for on trade date. Realized gains and losses on security transactions are determined on a specific identification basis. Estimated expenses are accrued daily. Dividend income is recorded on the ex-dividend date. Distributions to shareholders are recorded on the ex-dividend date and are determined according to income tax regulations (tax basis). Distributable earnings determined on a tax basis may differ from earnings recorded in accordance with accounting principles generally accepted in the United States of America. These differences may be permanent or temporary. Permanent differences are reclassified among capital accounts to reflect their tax character. These reclassifications have no impact on net assets or the results of operations. Temporary differences are not reclassified, as they may reverse in subsequent periods.
Realized and unrealized gains and losses and net investment income, not including class specific expenses, are allocated daily to each class of shares based upon the relative proportion of net assets of each class. Differences in per share distributions, by class, are generally due to differences in class specific expenses.
Annual Report | 27
Franklin Managed Trust
Notes to Financial Statements (continued)
Franklin Rising Dividends Fund
1. ORGANIZATION AND SIGNIFICANT ACCOUNTING POLICIES (continued) e. Accounting Estimates
The preparation of financial statements in accordance with accounting principles generally accepted in the United States of America requires management to make estimates and assumptions that affect the reported amounts of assets and liabilities at the date of the financial statements and the amounts of income and expenses during the reporting period. Actual results could differ from those estimates.
f. Guarantees and Indemnifications
Under the Trust’s organizational documents, its officers and trustees are indemnified by the Trust against certain liabilities arising out of the performance of their duties to the Trust. Additionally, in the normal course of business, the Trust, on behalf of the Fund, enters into contracts with service providers that contain general indemnification clauses. The Trust’s maximum exposure under these arrangements is unknown as this would involve future claims that may be made against the Trust that have not yet occurred. Currently, the Trust expects the risk of loss to be remote.
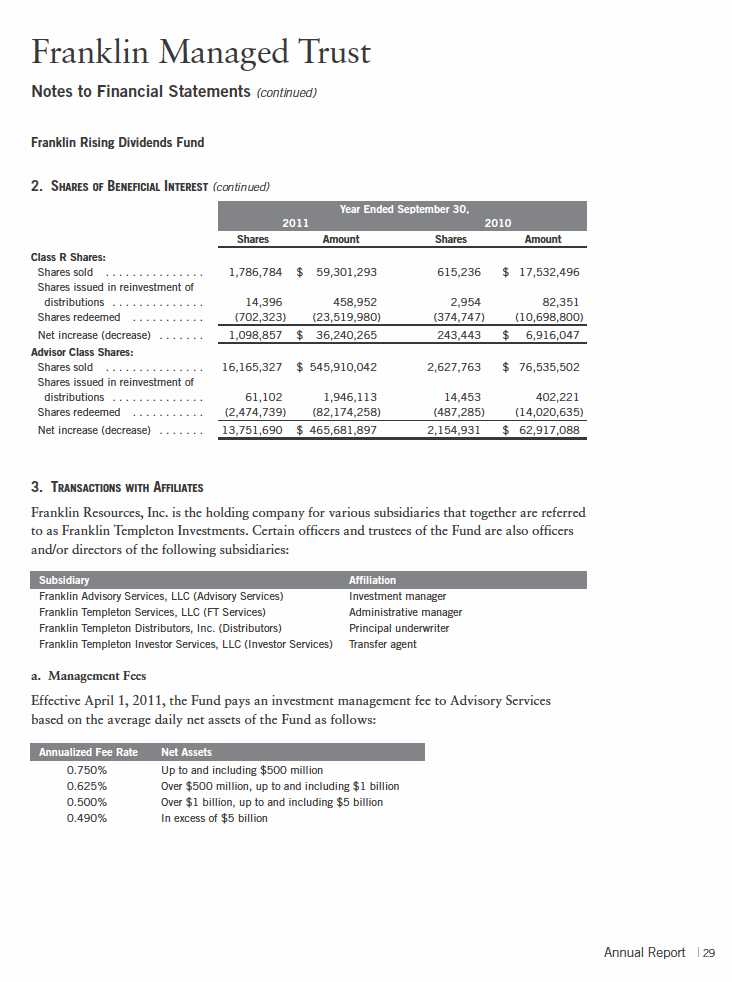
2. SHARES OF BENEFICIAL INTEREST
At September 30, 2011, there were an unlimited number of shares authorized (without par value). Transactions in the Fund’s shares were as follows:

Franklin Managed Trust
Notes to Financial Statements (continued)
Franklin Rising Dividends Fund
| 3. | TRANSACTIONS WITH AFFILIATES (continued) |
| a. | Management Fees (continued) |
Prior to April 1, 2011, the Fund paid fees to Advisory Services based on the average daily net assets of the Fund as follows:
| | |
| Annualized Fee Rate | | Net Assets |
| 0.750 | % | Up to and including $500 million |
| 0.625 | % | Over $500 million, up to and including $1 billion |
| 0.500 | % | In excess of $1 billion |
b. Administrative Fees
Under an agreement with Advisory Services, FT Services provides administrative services to the Fund. The fee is paid by Advisory Services based on average daily net assets, and is not an additional expense of the Fund.
The Fund also pays accounting fees to Advisory Services as noted in the Statement of Operations.
c. Distribution Fees
The Trust’s Board of Trustees has adopted distribution plans for each share class, with the exception of Advisor Class shares, pursuant to Rule 12b-1 under the 1940 Act. Under the Fund’s Class A reimbursement distribution plan, the Fund reimburses Distributors for costs incurred in connection with the servicing, sale and distribution of the Fund’s shares up to the maximum annual plan rate. Under the Class A reimbursement distribution plan, costs exceeding the maximum for the current plan year cannot be reimbursed in subsequent periods.
In addition, under the Fund’s Class B, C, and R compensation distribution plans, the Fund pays Distributors for costs incurred in connection with the servicing, sale and distribution of the Fund’s shares up to the maximum annual plan rate for each class.
The maximum annual plan rates, based on the average daily net assets, for each class, are as follows:
| | |
| Class A | 0.25 | % |
| Class B | 1.00 | % |
| Class C | 1.00 | % |
| Class R | 0.50 | % |
d. Sales Charges/Underwriting Agreements
Front-end sales charges and contingent deferred sales charges (CDSC) do not represent expenses of the Fund. These charges are deducted from the proceeds of sales of Fund shares prior to
30 | Annual Report
Franklin Managed Trust
Notes to Financial Statements (continued)
Franklin Rising Dividends Fund
| 3. | TRANSACTIONS WITH AFFILIATES (continued) |
| d. | Sales Charges/Underwriting Agreements (continued) |
investment or from redemption proceeds prior to remittance, as applicable. Distributors has advised the Fund of the following commission transactions related to the sales and redemptions of the Fund’s shares for the year:
| | |
| Sales charges retained net of commissions paid to | | |
| unaffiliated broker/dealers | $ | 5,905,022 |
| CDSC retained | $ | 199,638 |
e. Transfer Agent Fees
For the year ended September 30, 2011, the Fund paid transfer agent fees of $7,225,449, of which $3,111,267 was retained by Investor Services.
4. EXPENSE OFFSET ARRANGEMENT
The Fund has entered into an arrangement with its custodian whereby credits realized as a result of uninvested cash balances are used to reduce a portion of the Fund’s custodian expenses. During the year ended September 30, 2011, there were no credits earned.
5. INCOME TAXES
For tax purposes, capital losses may be carried over to offset future capital gains, if any. At September 30, 2011, the Fund had capital loss carryforwards of $31,009,000 expiring in 2017. During the year ended September 30, 2011, the Fund utilized $84,855,649 of capital loss carry-forwards.
Under the Regulated Investment Company Modernization Act of 2010, the Fund will be permitted to carry forward capital losses incurred in taxable years beginning after December 22, 2010 for an unlimited period. Post-enactment capital loss carryforwards will retain their character as either short-term or long-term capital losses rather than being considered short-term as under previous law. Any post-enactment capital losses generated will be required to be utilized prior to the losses incurred in pre-enactment tax years.
The tax character of distributions paid during the years ended September 30, 2011 and 2010, was as follows:
| | | | |
| | | 2011 | | 2010 |
| Distributions paid from - ordinary income | $ | 33,724,230 | $ | 6,932,241 |
Annual Report | 31
Franklin Managed Trust
Notes to Financial Statements (continued)
Franklin Rising Dividends Fund
5. INCOME TAXES (continued)
At September 30, 2011, the cost of investments, net unrealized appreciation (depreciation) and undistributed ordinary income for income tax purposes were as follows:
| | | |
| Cost of investments | $ | 4,601,228,469 | |
| |
| Unrealized appreciation | $ | 618,757,659 | |
| Unrealized depreciation | | (308,207,472 | ) |
| Net unrealized appreciation (depreciation) | $ | 310,550,187 | |
| |
| Distributable earnings - undistributed ordinary income | $ | 40,697,177 | |
Differences between income and/or capital gains as determined on a book basis and a tax basis are primarily due to differing treatment of wash sales.
6. INVESTMENT TRANSACTIONS
Purchases and sales of investments (excluding short term securities) for the year ended September 30, 2011, aggregated $2,386,900,510 and $160,701,630, respectively.
7. INVESTMENTS IN INSTITUTIONAL FIDUCIARY TRUST MONEY MARKET PORTFOLIO
The Fund invests in the Institutional Fiduciary Trust Money Market Portfolio (Sweep Money Fund), an open-end investment company managed by Franklin Advisers, Inc. (an affiliate of the investment manager). Management fees paid by the Fund are reduced on assets invested in the Sweep Money Fund, in an amount not to exceed the management and administrative fees paid by the Sweep Money Fund.
8. SPECIAL SERVICING AGREEMENT
The Fund, which is an eligible underlying investment of one or more of the Franklin Templeton Fund Allocator Series Funds (Allocator Funds), participates in a Special Servicing Agreement (SSA) with the Allocator Funds and certain service providers of the Fund and the Allocator Funds. Under the SSA, the Fund may pay a portion of the Allocator Funds’ expenses (other than any asset allocation, administrative, and distribution fees) to the extent such payments are less than the amount of the benefits realized or expected to be realized by the Fund (e.g., due to reduced costs associated with servicing accounts) from the investment in the Fund by the Allocator Funds. The Allocator Funds are either managed by Franklin Advisers, Inc. or administered by FT Services, affiliates of Advisory Services. For the year ended September 30, 2011, the Fund was held by one or more of the Allocator Funds and the amount of expenses borne by the Fund is noted in the Statement of Operations. At September 30, 2011, 4.87% of the Fund’s outstanding shares was held by one or more of the Allocator Funds.
32 | Annual Report
Franklin Managed Trust
Notes to Financial Statements (continued)
Franklin Rising Dividends Fund
9. CREDIT FACILITY
The Fund, together with other U.S. registered and foreign investment funds (collectively, Borrowers), managed by Franklin Templeton Investments, are borrowers in a joint syndicated senior unsecured credit facility totaling $750 million (Global Credit Facility) which matures on January 20, 2012. This Global Credit Facility provides a source of funds to the Borrowers for temporary and emergency purposes, including the ability to meet future unanticipated or unusually large redemption requests.
Under the terms of the Global Credit Facility, the Fund shall, in addition to interest charged on any borrowings made by the Fund and other costs incurred by the Fund, pay its share of fees and expenses incurred in connection with the implementation and maintenance of the Global Credit Facility, based upon its relative share of the aggregate net assets of all of the Borrowers, including an annual commitment fee of 0.08% based upon the unused portion of the Global Credit Facility, which is reflected in other expenses on the Statement of Operations. During the year ended September 30, 2011, the Fund did not use the Global Credit Facility.
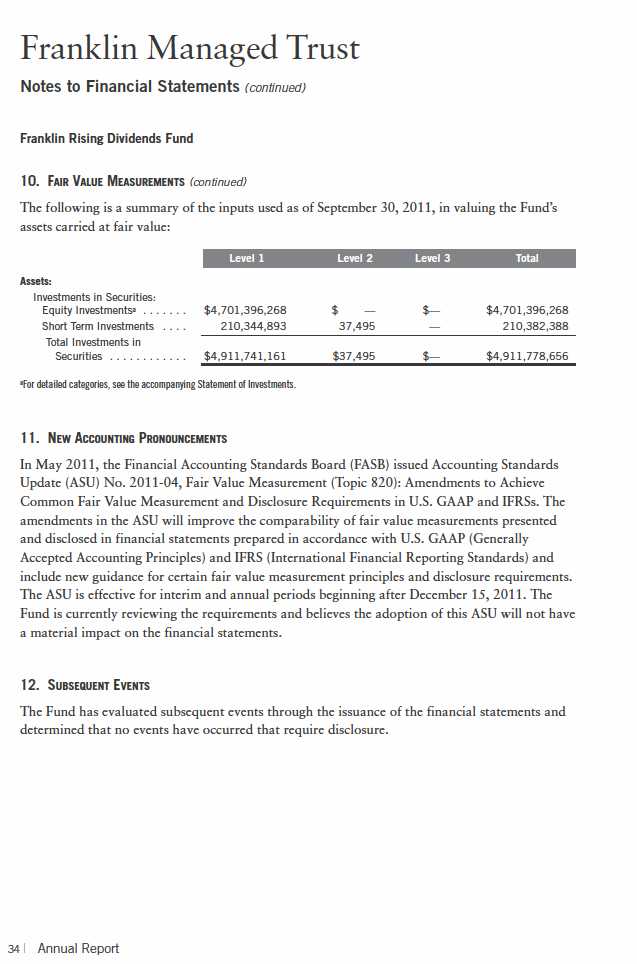
10. FAIR VALUE MEASUREMENTS
The Fund follows a fair value hierarchy that distinguishes between market data obtained from independent sources (observable inputs) and the Fund’s own market assumptions (unobservable inputs). These inputs are used in determining the value of the Fund’s investments and are summarized in the following fair value hierarchy:
- Level 1 – quoted prices in active markets for identical securities
- Level 2 – other significant observable inputs (including quoted prices for similar securities, interest rates, prepayment speed, credit risk, etc.)
- Level 3 – significant unobservable inputs (including the Fund’s own assumptions in determining the fair value of investments)
The inputs or methodology used for valuing securities are not an indication of the risk associated with investing in those securities.
For movements between the levels within the fair value hierarchy, the Fund has adopted a policy of recognizing the transfers as of the date of the underlying event which caused the movement.
Annual Report | 33
Franklin Managed Trust
Report of Independent Registered Public Accounting Firm
Franklin Rising Dividends Fund
To the Shareholders and Board of Trustees of Franklin Managed Trust
We have audited the accompanying statement of assets and liabilities of the Franklin Rising Dividends Fund, a series of shares of Franklin Managed Trust, including the statement of investments, as of September 30, 2011, and the related statement of operations for the year then ended, the statements of changes in net assets for each of the two years in the period then ended, and the financial highlights for each of the five years in the period then ended. These financial statements and financial highlights are the responsibility of the Trust’s management. Our responsibility is to express an opinion on these financial statements and financial highlights based on our audits.
We conducted our audits in accordance with the standards of the Public Company Accounting Oversight Board (United States). Those standards require that we plan and perform the audit to obtain reasonable assurance about whether the financial statements and financial highlights are free of material misstatement. The Trust is not required to have, nor were we engaged to perform an audit of the Trust’s internal control over financial reporting. Our audits included consideration of internal control over financial reporting as a basis for designing audit procedures that are appropriate in the circumstances, but not for the purpose of expressing an opinion on the effectiveness of the Trust’s internal control over financial reporting. Accordingly, we express no such opinion. An audit includes examining, on a test basis, evidence supporting the amounts and disclosures in the financial statements. Our procedures included confirmation of securities owned as of September 30, 2011, by correspondence with the custodian and brokers. An audit also includes assessing the accounting principles used and significant estimates made by management, as well as evaluating the overall financial statement presentation. We believe that our audits provide a reasonable basis for our opinion.
In our opinion, the financial statements and financial highlights referred to above present fairly, in all material respects, the financial position of Franklin Rising Dividends Fund at September 30, 2011, the results of its operations for the year then ended, the changes in its net assets for each of the two years in the period then ended, and the financial highlights for each of the five years in the period then ended, in conformity with accounting principles generally accepted in the United States of America.
Tait, Weller & Baker LLP
Philadelphia, Pennsylvania
November 14, 2011
Annual Report | 35
Franklin Managed Trust
Tax Designation (unaudited)
Franklin Rising Dividends Fund
Under Section 854(b)(2) of the Internal Revenue Code (Code), the Fund designates 100% of the ordinary income dividends as income qualifying for the dividends received deduction for the fiscal year ended September 30, 2011.
Under Section 854(b)(2) of the Code, the Fund designates the maximum amount allowable but no less than $101,552,400 as qualified dividends for purposes of the maximum rate under Section 1(h)(11) of the Code for the fiscal year ended September 30, 2011. Distributions, including qualified dividend income, paid during calendar year 2011 will be reported to shareholders on Form 1099-DIV in January 2012. Shareholders are advised to check with their tax advisors for information on the treatment of these amounts on their individual income tax returns.
36 | Annual Report

Franklin Managed Trust
Shareholder Information
Franklin Rising Dividends Fund
Proxy Voting Policies and Procedures
The Trust’s investment manager has established Proxy Voting Policies and Procedures (Policies) that the Trust uses to determine how to vote proxies relating to portfolio securities. Shareholders may view the Trust’s complete Policies online at franklintempleton.com. Alternatively, shareholders may request copies of the Policies free of charge by calling the Proxy Group collect at (954) 527-7678 or by sending a written request to: Franklin Templeton Companies, LLC, 300 S.E. 2nd Street, Fort Lauderdale, FL 33301, Attention: Proxy Group. Copies of the Trust’s proxy voting records are also made available online at franklintempleton.com and posted on the U.S. Securities and Exchange Commission’s website at sec.gov and reflect the most recent 12-month period ended June 30.
Quarterly Statement of Investments
The Trust files a complete statement of investments with the U.S. Securities and Exchange Commission for the first and third quarters for each fiscal year on Form N-Q. Shareholders may view the filed Form N-Q by visiting the Commission’s website at sec.gov. The filed form may also be viewed and copied at the Commission’s Public Reference Room in Washington, DC. Information regarding the operations of the Public Reference Room may be obtained by calling (800) SEC-0330.
HouseholdingofReportsandProspectuses
You will receive the Fund’s financial reports every six months as well as an annual updated summary prospectus (prospectus available upon request). To reduce Fund expenses, we try to identify related shareholders in a household and send only one copy of the financial reports and summary prospectus. This process, called “householding,” will continue indefinitely unless you instruct us otherwise. If you prefer not to have these documents householded, please call us at (800) 632-2301. At any time you may view current prospectuses/summary prospectuses and financial reports on our website. If you choose, you may receive these documents through electronic delivery.
Annual Report | 41
This page intentionally left blank.
This page intentionally left blank.
This page intentionally left blank.
Item 2. Code of Ethics.
(a) The Registrant has adopted a code of ethics that applies to its principal executive officers and principal financial and accounting officer.
| (c) | N/A |
| (d) | N/A |
| (f) | Pursuant to Item 12(a)(1), the Registrant is attaching as an |
exhibit a copy of its code of ethics that applies to its principal executive officers and principal financial and accounting officer.
Item 3. Audit Committee Financial Expert.
(a)(1) The Registrant has an audit committee financial expert serving on its audit committee.
(2) The audit committee financial expert is Frank T. Crohn and he is "independent" as defined under the relevant Securities and Exchange Commission Rules and Releases.
Item 4. Principal Accountant Fees and Services.
(a) Audit Fees
The aggregate fees paid to the principal accountant for professional services rendered by the principal accountant for the audit of the registrant’s annual financial statements or for services that are normally provided by the principal accountant in connection with statutory and regulatory filings or engagements were $27,000 for the fiscal year ended September 30, 2011 and $26,400 for the fiscal year ended September 30, 2010.
(b) Audit-Related Fees
There were no fees paid to the principal accountant for assurance and related services rendered by the principal accountant to the registrant that are reasonably related to the performance of the audit of the registrant's financial statements and are not reported under paragraph (a) of Item 4.
There were no fees paid to the principal accountant for assurance and related services rendered by the principal accountant to the registrant's investment adviser and any entity controlling, controlled by or under common control with the investment adviser that provides ongoing services to the registrant that are reasonably related to the performance of the audit of their financial statements.
(c) Tax Fees
There were no fees paid to the principal accountant for professional services rendered by the principal accountant to the registrant for tax compliance, tax advice and tax planning.
There were no fees paid to the principal accountant for professional services rendered by the principal accountant to the registrant’s investment adviser and any entity controlling, controlled by or under common control with the investment adviser that provides ongoing services to the registrant for tax compliance, tax advice and tax planning.
(d) All Other Fees
There were no fees paid to the principal accountant for products and services rendered by the principal accountant to the registrant not reported in paragraphs (a)-(c) of Item 4.
There were no fees paid to the principal accountant for products and services rendered by the principal accountant to the registrant’s investment adviser and any entity controlling, controlled by or under common control with the investment adviser that provides ongoing services to the registrant other than services reported in paragraphs
| (a) | -(c) of Item 4. |
| (e) | (1) The registrant’s audit committee is directly responsible for |
approving the services to be provided by the auditors, including:
| (i) | pre-approval of all audit and audit related services; |
| (ii) | pre-approval of all non-audit related services to be |
provided to the Fund by the auditors;
(iii) pre-approval of all non-audit related services to be provided to the registrant by the auditors to the registrant’s investment adviser or to any entity that controls, is controlled by or is under common control with the registrant’s investment adviser and that provides ongoing services to the registrant where the non-audit services relate directly to the operations or financial reporting of the registrant; and
(iv) establishment by the audit committee, if deemed necessary or appropriate, as an alternative to committee pre-approval of services to be provided by the auditors, as required by paragraphs (ii) and (iii) above, of policies and procedures to permit such services to be pre-approved by other means, such as through establishment of guidelines or by action of a designated member or members of the committee; provided the policies and procedures are detailed as to the particular service and the committee is informed of each service and such policies and procedures do not include delegation of audit committee responsibilities, as contemplated under the Securities Exchange Act of 1934, to management; subject, in the case of (ii) through (iv), to any waivers, exceptions or exemptions that may be available under applicable law or rules.
(e) (2) None of the services provided to the registrant described in paragraphs (b)-(d) of Item 4 were approved by the audit committee pursuant to paragraph (c)(7)(i)(C) of Rule 2-01 of regulation S-X.
| (f) | No disclosures are required by this Item 4(f). |
| (g) | There were no non-audit fees paid to the principal accountant for |
services rendered by the principal accountant to the registrant and the registrant’s investment adviser and any entity controlling, controlled by or under common control with the investment adviser that provides ongoing services to the registrant.
(h) The registrant’s audit committee of the board has considered whether the provision of non-audit services that were rendered to the registrant’s investment adviser (not including any sub-adviser whose role is primarily portfolio management and is subcontracted with or overseen by another investment adviser), and any entity controlling, controlled by, or under common control with the investment adviser that provides ongoing services to the registrant that were not pre-approved pursuant to paragraph (c)(7)(ii) of Rule 2-01 of Regulation S-X is compatible with maintaining the principal accountant’s independence.
| |
Item 5. Audit Committee of Listed Registrants. Item 6. Schedule of Investments. | N/A N/A |
Item 7. Disclosure of Proxy Voting Policies and Procedures for Closed-
| |
| End Management Investment Companies. | N/A |
| |
| |
| Item 8. Portfolio Managers of Closed-End Management Investment | |
| Companies. | N/A |
| |
| |
| Item 9. Purchases of Equity Securities by Closed-End Management | |
| Investment Company and Affiliated Purchasers. | N/A |
Item 10. Submission of Matters to a Vote of Security Holders.
There have been no changes to the procedures by which shareholders may recommend nominees to the Registrant's Board of Trustees that would require disclosure herein.
Item 11. Controls and Procedures.
(a) Evaluation of Disclosure Controls and Procedures. The Registrant maintains disclosure controls and procedures that are designed to ensure that information required to be disclosed in the Registrant’s filings under the Securities Exchange Act of 1934 and the Investment Company Act of 1940 is recorded, processed, summarized and reported within the periods specified in the rules and forms of the Securities and Exchange Commission. Such information is accumulated and communicated to the Registrant’s management, including its principal executive officer and principal financial officer, as appropriate, to allow timely decisions regarding required disclosure. The Registrant’s management, including the principal executive officer and the principal financial officer, recognizes that any set of controls and procedures, no matter how well designed and operated, can provide only reasonable assurance of achieving the desired control objectives.
Within 90 days prior to the filing date of this Shareholder Report on Form N-CSR, the Registrant had carried out an evaluation, under the supervision and with the participation of the Registrant’s management, including the Registrant’s principal executive officer and the Registrant’s principal financial officer, of the effectiveness of the design and operation of the Registrant’s disclosure controls and procedures. Based on such evaluation, the Registrant’s principal executive officer and principal financial officer concluded that the Registrant’s disclosure controls and procedures are effective.
(b) Changes in Internal Controls.
There have been no significant
changes in the Registrant’s internal controls or in other factors that could significantly affect the internal controls subsequent to the date of their evaluation in connection with the preparation of this Shareholder Report on Form N-CSR.
Item 12. Exhibits.
