UNITED STATES
SECURITIES AND EXCHANGE COMMISSION
Washington, D.C. 20549
FORM N-CSR
CERTIFIED SHAREHOLDER REPORT OF REGISTERED MANAGEMENT INVESTMENT COMPANIES
Investment Company Act file number_811-04894
__Franklin Managed Trust
(Exact name of registrant as specified in charter)
One Franklin Parkway, San Mateo, CA 94403-1906
(Address of principal executive offices) (Zip code)
Craig S. Tyle, One Franklin Parkway, San Mateo, CA 94403-1906
(Name and address of agent for service)
Registrant's telephone number, including area code:_650 312-2000
Date of fiscal year end: 9/30
Date of reporting period:_9/30/10
Item 1. Reports to Stockholders.

Annual Report
Franklin Rising Dividends Fund
Your Fund’s Goal and Main Investments: Franklin Rising Dividends Fund seeks long-
term capital appreciation. Preservation of capital, while not a goal, is also an important consideration.
The Fund invests at least 80% of its net assets in companies that have paid consistently rising dividends.
Performance data represent past performance, which does not guarantee future results. Investment return and principal value will fluctuate, and you may have a gain or loss when you sell your shares. Current performance may differ from figures shown. Please visit franklintempleton.com or call (800) 342-5236 for most recent month-end performance.
We are pleased to bring you Franklin Rising Dividends Fund’s annual report for the fiscal year ended September 30, 2010.
Performance Overview
For the 12 months under review, Franklin Rising Dividends Fund – Class A delivered a +16.23% cumulative total return. The Fund outperformed its benchmark, the Standard & Poor’s 500 Index (S&P 500), which rose 10.16% for the same period.1 You can find the Fund’s long-term performance data in the Performance Summary beginning on page 8.
Economic and Market Overview
During the 12-month period ended September 30, 2010, the U.S. economy recovered unevenly from the recession, supported by a combination of fundamental improvement in business conditions and government intervention and stimulus. Economic activity as measured by gross domestic product (GDP) expanded at a 5.0% annualized rate in 2009’s fourth quarter. As the effects of temporary stimulus measures faded, construction, industrial production and exports cooled somewhat. As a result, GDP growth slowed to an annualized 3.7% pace in 2010’s first quarter, and then downshifted further to 1.7% annualized in the second quarter and an estimated annualized 2.0% pace in the third quarter.
Challenges such as mixed economic data, elevated debt concerns surrounding the U.S. budget deficit and a growing lack of job prospects for the
1. Source: © 2010 Morningstar. All Rights Reserved. The information contained herein: (1) is proprietary to Morningstar and/or its content providers; (2) may not be copied or distributed; and (3) is not warranted to be accurate, complete or timely. Neither Morningstar nor its content providers are responsible for any damages or losses arising from any use of this information. The S&P 500 is a market capitalization-weighted index of 500 stocks designed to measure total U.S. equity market performance. STANDARD & POOR’S®, S&P® and S&P 500® are registered trademarks of Standard & Poor’s Financial Services LLC. Standard & Poor’s does not sponsor, endorse, sell or promote any S&P index-based product.
The index is unmanaged and includes reinvested dividends. One cannot invest directly in an index, and an index is not representative of the Fund’s portfolio.
The dollar value, number of shares or principal amount, and names of all portfolio holdings are listed in the Fund’s Statement of Investments (SOI). The SOI begins on page 20.
Annual Report | 3
unemployed also hindered consumer confidence and the economy’s advance. During much of the period, home prices rose in many regions due to low interest rates, a first-time homebuyer tax credit program, and prices dipping to levels that lured buyers. Later in the period, home sales stalled as the homebuyer tax credit program ended, foreclosures mounted and the housing sector overall remained weak.
Amid signs of a demand-led recovery, crude oil prices rose from $71 per barrel at the end of September 2009 to a 17-month high of $87 in early April. But as doubts surfaced about the recovery’s sustainability, oil prices drifted down as low as $66 in late May. Despite an abundant oil supply, a falling U.S. dollar and speculative buying pushed prices to $80 per barrel by the end of September. The September 2010 inflation rate was an annualized 1.1%.2 Core inflation, which excludes volatile food and energy costs, rose at a 0.8% annualized rate, and toward period-end reached a 44-year low level.2 Despite a lack of significant job gains, the unempl oyment rate, which had risen from 9.8% at the beginning of the period to a 26-year high of 10.1% in October 2009, was 9.6% in September 2010 as the labor force participation rate fell.2
Given few inflationary pressures and uncertainty surrounding the economic recovery, the Federal Open Market Committee (FOMC) made no major changes to its monetary policy. It repeatedly stated it will keep the federal funds target rate in the exceptionally low 0% to 0.25% range “for an extended period” and eventually shifted its focus to its outlook and the status of its current holdings. In September, the FOMC revealed concerns about the subdued recovery and said inflation was below the pace “consistent with its mandate.” Having already lowered interest rates effectively to zero, the FOMC appeared ready to buy government debt to stimulate the economy and promote a low level of inflation consistent with healthy economic growth.
Investor confidence shifted with each release of encouraging or discouraging economic, regulatory or political news, stoking considerable volatility among equities. Ultimately, stock market gains made in the first half of the fiscal year gave way to a directionless, nearly flat trend during the latter half as many investors sought the relative safety of precious metals and U.S. Treasury securities. Overall, for the year ended September 30, 2010, the Dow Jones Industrial Average, S&P 500 and NASDAQ Composite Index rose 14.12%, 10.16% and 12.61%, respectively.3 Performance among the major sectors
2. Source: Bureau of Labor Statistics.
3. Source: © 2010 Morningstar. The Dow Jones Industrial Average is price weighted based on the average market price of 30 blue chip stocks of companies that are generally industry leaders. See footnote 1 for a description of the S&P 500. The NASDAQ Composite Index is a broad-based, market capitalization-weighted index designed to measure all NASDAQ domestic and international based common type stocks listed on The NASDAQ Stock Market.
4 | Annual Report
varied widely, with consumer discretionary, industrials and telecommunication services posting solid gains, while financials had a loss and energy and health care underperformed.
Investment Strategy
We base our investment strategy on our belief that companies with consistently rising dividends should, over time, also realize stock price appreciation. We select portfolio securities based on several criteria. To be eligible for purchase, stocks generally will pass certain screens, requiring consistent and substantial dividend increases, strong balance sheets, and relatively low price/earnings ratios. We seek fundamentally sound companies that meet our standards and attempt to acquire them at what we believe are attractive prices, often when they are out of favor with other investors.
Manager’s Discussion
During the 12 months under review, three holdings that helped Fund performance were Family Dollar Stores, Erie Indemnity and Dover. Family Dollar Stores, a discount retailer, benefited from the disclosure that a well-known activist investor had established a large position in the company. Family Dollar has increased its dividend for 34 consecutive years. Shares of Erie Indemnity, a property and casualty insurer, increased as investors became less concerned about the company’s investment portfolio. Erie has increased its dividend for 30 years. Earnings estimates for industrial products and equipment manufacturer Dover rose sharply after the company reported better-than-expected operating results in recent quarters. The company has 55 years of dividend increases.
Most of the Fund’s holdings helped the Fund’s return during the period; however, there were some positions that hindered results. Detractors from performance included West Pharmaceutical Services, Nucor and State Street. Shares of West Pharmaceutical, a manufacturer of drug delivery systems and components, declined in value as the company lowered its earnings estimates. Steel company Nucor experienced a decline in quarterly earnings largely due to higher scrap metal costs. State Street, a provider of services to institutional investors, reported disappointing earnings as fee income was lower and certain expenses were higher than expected.
| | | |
| Top 10 Equity Holdings | | | |
| 9/30/10 | | | |
| |
| Company | % of Total | |
| Sector/Industry | Net Assets | |
| Family Dollar Stores Inc. | | 5.1 | % |
| Retailing | | | |
| Praxair Inc. | | 5.0 | % |
| Materials | | | |
| International Business Machines Corp. | 4.8 | % |
| Software & Services | | | |
| Abbott Laboratories | | 4.7 | % |
| Pharmaceuticals, Biotechnology & | | | |
| Life Sciences | | | |
| Roper Industries Inc. | | 4.7 | % |
| Electrical Equipment | | | |
| Wal-Mart Stores Inc. | | 4.7 | % |
| Food & Staples Retailing | | | |
| United Technologies Corp. | | 4.7 | % |
| Aerospace & Defense | | | |
| Becton, Dickinson and Co. | | 4.6 | % |
| Health Care Equipment & Services | | | |
| The Procter & Gamble Co. | | 4.5 | % |
| Household & Personal Products | | | |
| Dover Corp. | | 3.9 | % |
| Machinery | | | |
Annual Report | 5
During the Fund’s fiscal year, we initiated seven new positions: Archer-Daniels Midland, a processor of agricultural products with 35 years of dividend increases; Beckman Coulter, a manufacturer of medical diagnostic instruments with 16 years of dividend increases; General Dynamics, a diversified aerospace and defense company with 18 years of dividend increases; Hudson City Bancorp, a large savings bank that has consistently increased its dividend since becoming a public company 10 years ago; Johnson & Johnson, a large diversified manufacturer of health care products with 48 years of dividend increases; Medtronic, a manufacturer of therapeutic and diagnostic medical products with 33 years of dividend increases; and PepsiCo, a global manufacturer of snacks and beverages with 38 years of dividend increases. We made significant additions to holdings in health care products manufacturer Abbott Laboratories, industrial gases company Air Products & Chemicals, and information technology services and software provider International Business Machines (IBM). Abbott Laboratories has raised its dividend for 38 years, while Air Products & Chemicals and IBM have raised their dividends for 28 and 15 years. We made smaller additions to 11 other positions.
We eliminated the Fund’s position in Graco after appreciation in its stock price discounted a strong recovery in the company’s earnings power. Significant reductions to the portfolio included Aflac, Carlisle Companies and Family Dollar. Some deterioration in Aflac’s investment portfolio stressed the company’s capital ratios and could impact future dividend decisions. Carlisle, which has exposure to the difficult commercial real estate market, no longer had a dividend that had doubled in the past 10 years. We sold shares of Family Dollar as price appreciation caused the position to become greater than our target level. We made smaller reductions to six other positions.
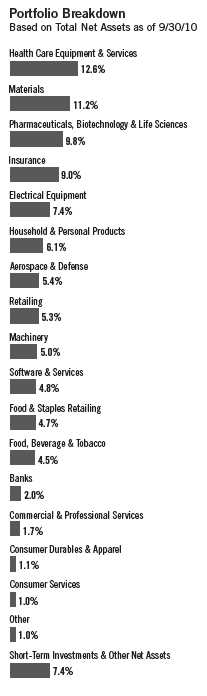
Our 10 largest positions on September 30, 2010, represented 46.7% of the Fund’s total net assets. It is interesting to note how these 10 companies would, in aggregate, respond to the Fund’s screening criteria based on a simple average of statistical measures. On average, these 10 companies have raised their dividends 32 years in a row and by 272% over the past 10 years. Their most recent year-over-year dividend increases averaged 11.9% with a dividend yield of 2.1% on September 30, 2010, and a dividend payout ratio of 32%, based on estimates of calendar year 2010 operating earnings. Their average price/earnings ratio was 15.5 times 2010 estimates versus 14.3 for that of the unmanaged S&P 500.
6 | Annual Report
Thank you for your continued participation in Franklin Rising Dividends Fund. We look forward to serving your future investment needs.


Donald G. Taylor, CPA
Lead Portfolio Manager
William J. Lippman
Margaret McGee
Bruce C. Baughman, CPA
Portfolio Management Team
Franklin Rising Dividends Fund
The foregoing information reflects our analysis, opinions and portfolio holdings as of September 30, 2010, the end of the reporting period. The way we implement our main investment strategies and the resulting portfolio holdings may change depending on factors such as market and economic conditions. These opinions may not be relied upon as investment advice or an offer for a particular security. The information is not a complete analysis of every aspect of any market, country, industry, security or the Fund. Statements of fact are from sources considered reliable, but the investment manager makes no representation or warranty as to their completeness or accuracy. Although historical performance is no guarantee of future results, these insights may help you understand our investment management philosophy.
Annual Report | 7
Performance Summary as of 9/30/10
Your dividend income will vary depending on dividends or interest paid by securities in the Fund’s portfolio, adjusted for operating expenses of each class. Capital gain distributions are net profits realized from the sale of portfolio securities. The performance table and graphs do not reflect any taxes that a shareholder would pay on Fund dividends, capital gain distributions, if any, or any realized gains on the sale of Fund shares. Total return reflects reinvestment of the Fund’s dividends and capital gain distributions, if any, and any unrealized gains or losses.
| | | | | | | | |
| Price and Distribution Information | | | | | | |
| |
| Class A (Symbol: FRDPX) | | | | Change | | 9/30/10 | | 9/30/09 |
| Net Asset Value (NAV) | | | +$ | 4.20 | $ | 30.92 | $ | 26.72 |
| Distributions (10/1/09–9/30/10) | | | | | | | | |
| Dividend Income | $ | 0.1231 | | | | | | |
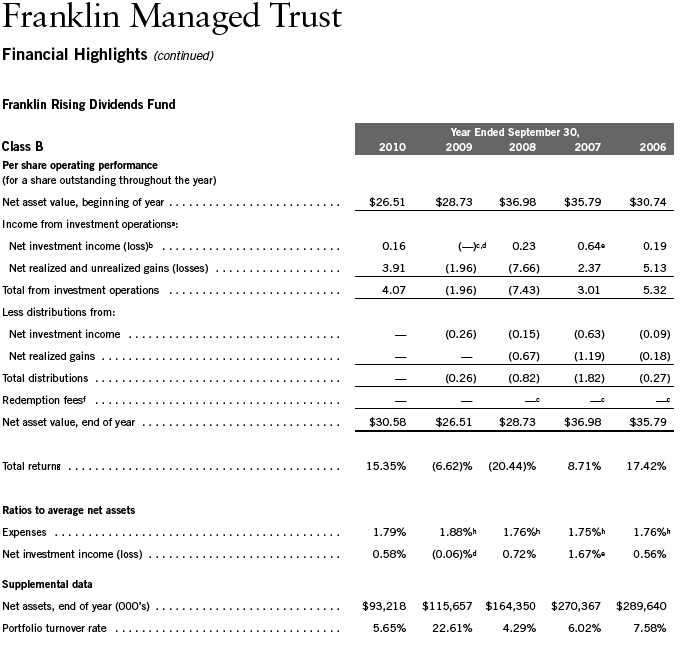
| Class B (Symbol: FRDBX) | | | | Change | | 9/30/10 | | 9/30/09 |
| Net Asset Value (NAV) | | | +$ | 4.07 | $ | 30.58 | $ | 26.51 |
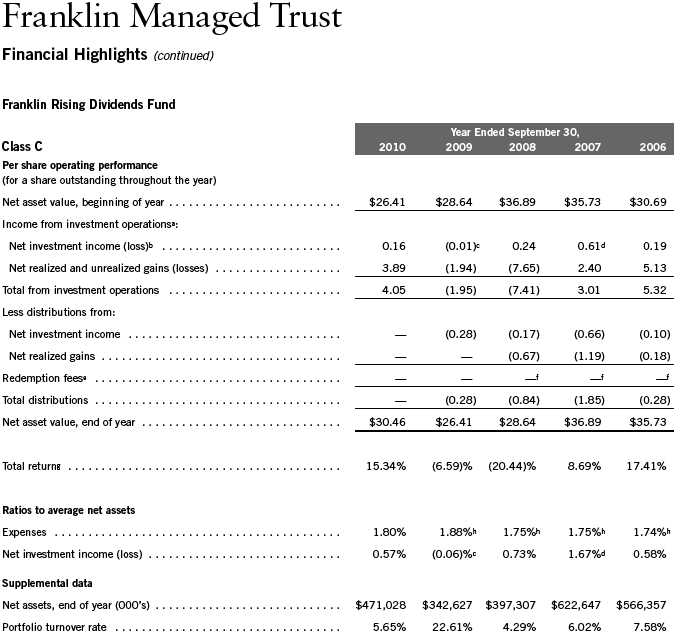
| Class C (Symbol: FRDTX) | | | | Change | | 9/30/10 | | 9/30/09 |
| Net Asset Value (NAV) | | | +$ | 4.05 | $ | 30.46 | $ | 26.41 |
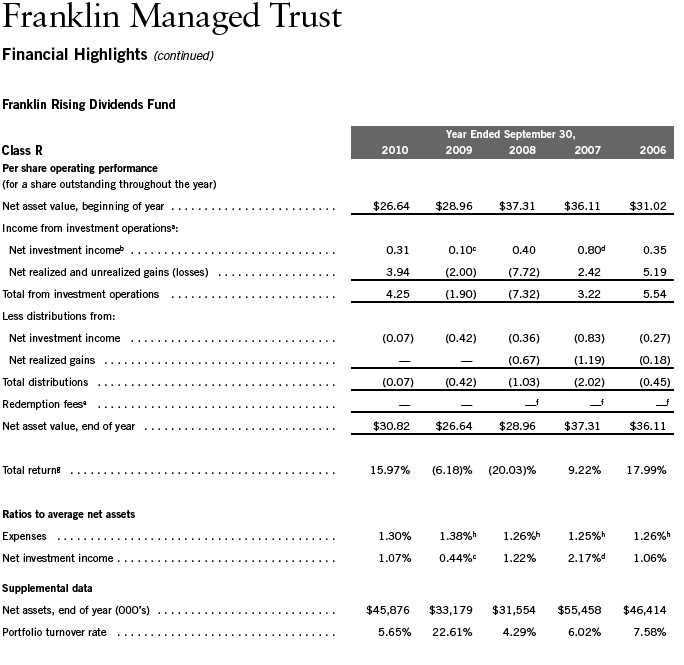
| Class R (Symbol: FRDRX) | | | | Change | | 9/30/10 | | 9/30/09 |
| Net Asset Value (NAV) | | | +$ | 4.18 | $ | 30.82 | $ | 26.64 |
| Distributions (10/1/09–9/30/10) | | | | | | | | |
| Dividend Income | $ | 0.0668 | | | | | | |
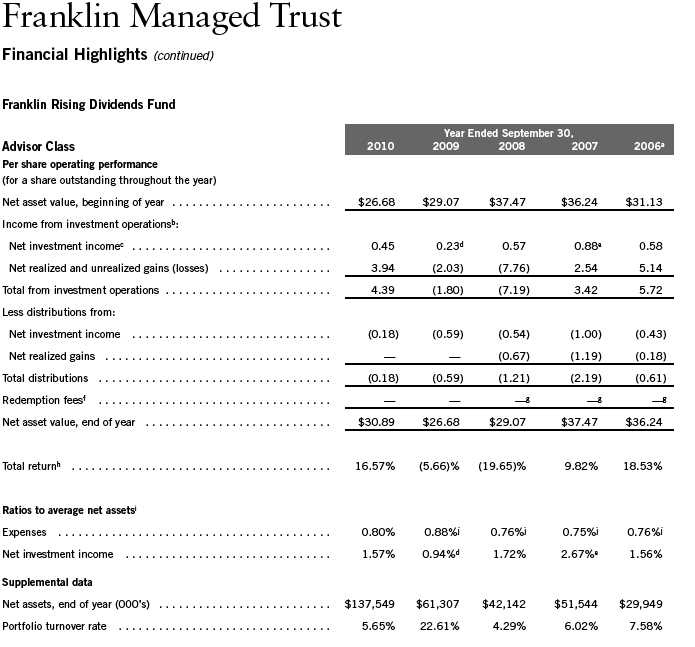
| Advisor Class (Symbol: FRDAX) | | | | Change | | 9/30/10 | | 9/30/09 |
| Net Asset Value (NAV) | | | +$ | 4.21 | $ | 30.89 | $ | 26.68 |
| Distributions (10/1/09–9/30/10) | | | | | | | | |
| Dividend Income | $ | 0.1819 | | | | | | |
8 | Annual Report
Performance Summary (continued)
Performance
Cumulative total return excludes sales charges. Average annual total return and value of $10,000 investment include maximum sales charges. Class A: 5.75% maximum initial sales charge; Class B: contingent deferred sales charge (CDSC) declining from 4% to 1% over six years, and eliminated thereafter; Class C: 1% CDSC in first year only; Class R/Advisor Class: no sales charges.
| | | | | | | | | | | |
| Class A | | | | 1-Year | | | 5-Year | | | 10-Year | |
| Cumulative Total Return1 | | | + | 16.23 | % | + | 13.55 | % | + | 90.11 | % |
| Average Annual Total Return2 | | | + | 9.55 | % | + | 1.37 | % | + | 6.01 | % |
| Value of $10,000 Investment3 | | | $ | 10,955 | | $ | 10,702 | | $ | 17,919 | |
| Total Annual Operating Expenses4 | 1.17 | % | | | | | | | | | |
| Class B | | | | 1-Year | | | 5-Year | | | 10-Year | |
| Cumulative Total Return1 | | | + | 15.35 | % | + | 9.39 | % | + | 80.83 | % |
| Average Annual Total Return2 | | | + | 11.35 | % | + | 1.44 | % | + | 6.10 | % |
| Value of $10,000 Investment3 | | | $ | 11,135 | | $ | 10,740 | | $ | 18,083 | |
| Total Annual Operating Expenses4 | 1.92 | % | | | | | | | | | |
| Class C | | | | 1-Year | | | 5-Year | | | 10-Year | |
| Cumulative Total Return1 | | | + | 15.34 | % | + | 9.40 | % | + | 77.98 | % |
| Average Annual Total Return2 | | | + | 14.34 | % | + | 1.81 | % | + | 5.93 | % |
| Value of $10,000 Investment3 | | | $ | 11,434 | | $ | 10,940 | | $ | 17,798 | |
| Total Annual Operating Expenses4 | 1.92 | % | | | | | | | | | |
| Class R | | | | 1-Year | | | 5-Year | | | Inception (1/1/02) | |
| Cumulative Total Return1 | | | + | 15.97 | % | + | 12.12 | % | + | 45.83 | % |
| Average Annual Total Return2 | | | + | 15.97 | % | + | 2.31 | % | + | 4.41 | % |
| Value of $10,000 Investment3 | | | $ | 11,597 | | $ | 11,212 | | $ | 14,583 | |
| Total Annual Operating Expenses4 | 1.42 | % | | | | | | | | | |
| Advisor Class5 | | | | 1-Year | | | 5-Year | | | 10-Year | |
| Cumulative Total Return1 | | | + | 16.57 | % | + | 15.02 | % | + | 92.56 | % |
| Average Annual Total Return2 | | | + | 16.57 | % | + | 2.84 | % | + | 6.77 | % |
| Value of $10,000 Investment3 | | | $ | 11,657 | | $ | 11,502 | | $ | 19,256 | |
| Total Annual Operating Expenses4 | | | | 0.92 | % | | | | | | |
Performance data represent past performance, which does not guarantee future results. Investment return and principal value will fluctuate, and you may have a gain or loss when you sell your shares. Current performance may differ from figures shown. For most recent month-end performance, go to franklintempleton.com or call (800) 342-5236.
Annual Report | 9
Performance Summary (continued)
Total Return Index Comparison for a Hypothetical $10,000 Investment
Total return represents the change in value of an investment over the periods shown. It includes any current, applicable, maximum sales charge, Fund expenses, account fees and reinvested distributions. The unmanaged index includes reinvestment of any income or distributions. It differs from the Fund in composition and does not pay management fees or expenses. One cannot invest directly in an index.

10 | Annual Report

| | | | | |
| 1/02 9/02 | 9/04 | 9/06 | | 9/08 | 9/10 |
| Franklin Rising Dividends Fund | | S&P 5006 | | CPI6 |
Annual Report | 11

Endnotes
Value securities may not increase in price as anticipated or may decline further in value. While smaller and mid-size companies may offer substantial opportunities for capital growth, they also involve heightened risks and should be considered speculative. Historically, smaller and midsize company securities have been more volatile in price than larger company securities, especially over the short term. The Fund’s prospectus also includes a description of the main investment risks.
| | |
| | Class B: | These shares have higher annual fees and expenses than Class A shares. |
| | Class C: | Prior to 1/1/04, these shares were offered with an initial sales charge; thus actual total returns |
| | | would have differed. These shares have higher annual fees and expenses than Class A shares. |
| | Class R: | Shares are available to certain eligible investors as described in the prospectus. These shares have |
| | | higher annual fees and expenses than Class A shares. |
| | Advisor Class: | Shares are available to certain eligible investors as described in the prospectus. |
1. Cumulative total return represents the change in value of an investment over the periods indicated.
2. Average annual total return represents the average annual change in value of an investment over the periods indicated.
3. These figures represent the value of a hypothetical $10,000 investment in the Fund over the periods indicated.
4. Figures are as stated in the Fund’s prospectus current as of the date of this report. In periods of market volatility, assets may decline significantly, causing total annual Fund operating expenses to become higher than the figures shown.
5. Effective 10/3/05, the Fund began offering Advisor Class shares, which do not have sales charges or a Rule 12b-1 plan. Performance quotations for this class reflect the following methods of calculation: (a) For periods prior to 10/3/05, a restated figure is used based upon the Fund’s Class A performance, excluding the effect of Class A’s maximum initial sales charge, but reflecting the effect of the Class A Rule 12b-1 fees; and (b) for periods after 10/2/05, actual Advisor Class performance is used reflecting all charges and fees applicable to that class. Since 10/3/05 (commencement of sales), the cumulative and average annual total returns of Advisor Class shares were +15.09% and +2.86%.
6. Source: © 2010 Morningstar. The S&P 500 is a market capitalization-weighted index of 500 stocks designed to measure total U.S. equity market performance. The Consumer Price Index (CPI), calculated by the U.S. Bureau of Labor Statistics, is a commonly used measure of the inflation rate.
12 | Annual Report
Your Fund’s Expenses
As a Fund shareholder, you can incur two types of costs:
- Transaction costs, including sales charges (loads) on Fund purchases; and
- Ongoing Fund costs, including management fees, distribution and service (12b-1) fees, and other Fund expenses. All mutual funds have ongoing costs, sometimes referred to as operating expenses.
The following table shows ongoing costs of investing in the Fund and can help you understand these costs and compare them with those of other mutual funds. The table assumes a $1,000 investment held for the six months indicated.
Actual Fund Expenses
The first line (Actual) for each share class listed in the table provides actual account values and expenses. The “Ending Account Value” is derived from the Fund’s actual return, which includes the effect of Fund expenses.
You can estimate the expenses you paid during the period by following these steps. Of course, your account value and expenses will differ from those in this illustration:
| 1. | Divide your account value by $1,000. |
| | If an account had an $8,600 value, then $8,600 ÷ $1,000 = 8.6. |
| 2. | Multiply the result by the number under the heading “Expenses Paid During Period.” |
| | If Expenses Paid During Period were $7.50, then 8.6 x $7.50 = $64.50. |
In this illustration, the estimated expenses paid this period are $64.50.
Hypothetical Example for Comparison with Other Funds
Information in the second line (Hypothetical) for each class in the table can help you compare ongoing costs of investing in the Fund with those of other mutual funds. This information may not be used to estimate the actual ending account balance or expenses you paid during the period. The hypothetical “Ending Account Value” is based on the actual expense ratio for each class and an assumed 5% annual rate of return before expenses, which does not represent the Fund’s actual return. The figure under the heading “Expenses Paid During Period” shows the hypothetical expenses your account would have incurred under this scenario. You can compare this figure with the 5% hypothetical examples that appear in shareholder reports of other funds.
Annual Report | 13
Your Fund’s Expenses (continued)
Please note that expenses shown in the table are meant to highlight ongoing costs and do not reflect any transaction costs, such as sales charges. Therefore, the second line for each class is useful in comparing ongoing costs only, and will not help you compare total costs of owning different funds. In addition, if transaction costs were included, your total costs would have been higher. Please refer to the Fund prospectus for additional information on operating expenses.
| | | | | | |
| | | Beginning Account | | Ending Account | | Expenses Paid During |
| Class A | | Value 4/1/10 | | Value 9/30/10 | | Period* 4/1/10–9/30/10 |
| Actual | $ | 1,000 | $ | 1,036.50 | $ | 5.31 |
| Hypothetical (5% return before expenses) | $ | 1,000 | $ | 1,019.85 | $ | 5.27 |
| Class B | | | | | | |
| Actual | $ | 1,000 | $ | 1,032.80 | $ | 9.12 |
| Hypothetical (5% return before expenses) | $ | 1,000 | $ | 1,016.09 | $ | 9.05 |
| Class C | | | | | | |
| Actual | $ | 1,000 | $ | 1,032.50 | $ | 9.12 |
| Hypothetical (5% return before expenses) | $ | 1,000 | $ | 1,016.09 | $ | 9.05 |
| Class R | | | | | | |
| Actual | $ | 1,000 | $ | 1,035.30 | $ | 6.58 |
| Hypothetical (5% return before expenses) | $ | 1,000 | $ | 1,018.60 | $ | 6.53 |
| Advisor Class | | | | | | |
| Actual | $ | 1,000 | $ | 1,038.00 | $ | 4.04 |
| Hypothetical (5% return before expenses) | $ | 1,000 | $ | 1,021.11 | $ | 4.00 |
*Expenses are calculated using the most recent six-month expense ratio, annualized for each class (A: 1.04%; B: 1.79%; C: 1.79%; R: 1.29%; and Advisor: 0.79%), multiplied by the average account value over the period, multiplied by 183/365 to reflect the one-half year period.
14 | Annual Report
| | | | | | | | | | | | | | | |
| Franklin Managed Trust | | | | | | | | | | | | | |
| |
| Financial Highlights | | | | | | | | | | | | | | | |
| |
| Franklin Rising Dividends Fund | | | | | | | | | | | | | | | |
| | | | | | Year Ended September 30, | | | | |
| Class A | | 2010 | | | 2009 | | | 2008 | | | 2007 | | | 2006 | |
| Per share operating performance | | | | | | | | | | | | | | | |
| (for a share outstanding throughout the year) | | | | | | | | | | | | | | | |
| Net asset value, beginning of year | $ | 26.72 | | $ | 29.08 | | $ | 37.47 | | $ | 36.25 | | $ | 31.14 | |
| Income from investment operationsa: | | | | | | | | | | | | | | | |
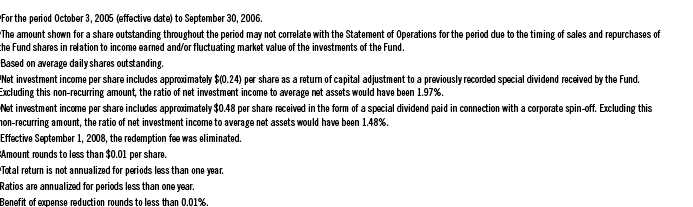
| Net investment incomeb | | 0.38 | | | 0.16 | c | | 0.48 | | | 0.89 | d | | 0.44 | |
| Net realized and unrealized gains (losses) | | 3.94 | | | (2.01 | ) | | (7.75 | ) | | 2.43 | | | 5.20 | |
| Total from investment operations | | 4.32 | | | (1.85 | ) | | (7.27 | ) | | 3.32 | | | 5.64 | |
| Less distributions from: | | | | | | | | | | | | | | | |
| Net investment income | | (0.12 | ) | | (0.51 | ) | | (0.45 | ) | | (0.91 | ) | | (0.35 | ) |
| Net realized gains | | — | | | — | | | (0.67 | ) | | (1.19 | ) | | (0.18 | ) |
| Total distributions | | (0.12 | ) | | (0.51 | ) | | (1.12 | ) | | (2.10 | ) | | (0.53 | ) |
| Redemption feese | | — | | | — | | | —f | | | —f | | | —f | |
| Net asset value, end of year | $ | 30.92 | | $ | 26.72 | | $ | 29.08 | | $ | 37.47 | | $ | 36.25 | |
| |
| Total returng | | 16.23 | % | | (5.90 | )% | | (19.85 | )% | | 9.53 | % | | 18.26 | % |
| |
| Ratios to average net assets | | | | | | | | | | | | | | | |
| Expenses | | 1.05 | % | | 1.13 | %h | | 1.01 | %h | | 1.00 | %h | | 1.00 | %h |
| Net investment income | | 1.32 | % | | 0.69 | %c | | 1.47 | % | | 2.42 | %d | | 1.32 | % |
| Supplemental data | | | | | | | | | | | | | | | |
| Net assets, end of year (000’s) | $ | 2,043,971 | | $ | 1,366,352 | | $ | 1,383,212 | | $ | 2,061,210 | | $ | 1,741,181 | |
| Portfolio turnover rate | | 5.65 | % | | 22.61 | % | | 4.29 | % | | 6.02 | % | | 7.58 | % |

Annual Report | The accompanying notes are an integral part of these financial statements. | 15
16 | The accompanying notes are an integral part of these financial statements. | Annual Report

Annual Report | The accompanying notes are an integral part of these financial statements. | 17
18 | The accompanying notes are an integral part of these financial statements. | Annual Report
Annual Report | The accompanying notes are an integral part of these financial statements. | 19
| | | |
| Franklin Managed Trust | | | |
| |
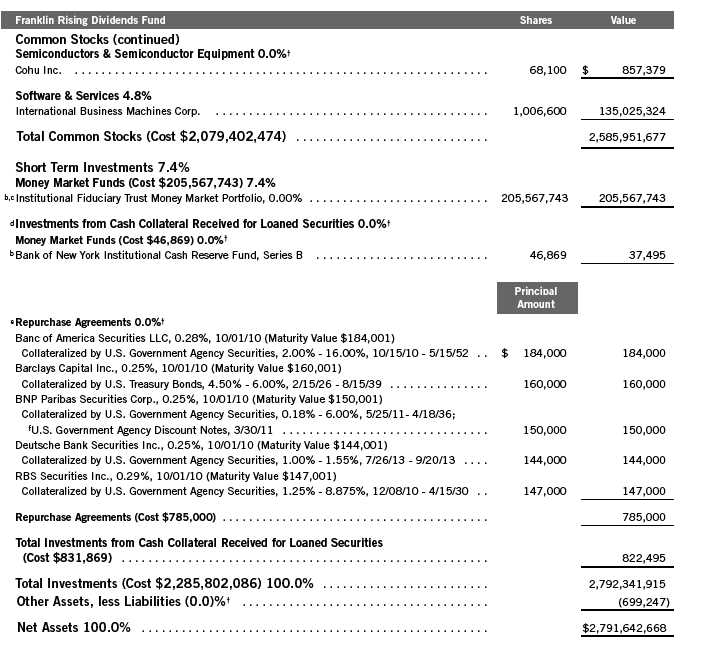
| Statement of Investments, September 30, 2010 | | | |
| |
| |
| Franklin Rising Dividends Fund | Shares | | Value |
| Common Stocks 92.6% | | | |
| Aerospace & Defense 5.4% | | | |
| General Dynamics Corp. | 342,000 | $ | 21,481,020 |
| United Technologies Corp. | 1,825,730 | | 130,046,748 |
| | | | 151,527,768 |
| |
| Banks 2.0% | | | |
| Hudson City Bancorp Inc. | 3,705,800 | | 45,433,108 |
| Peoples Bancorp Inc. | 156,646 | | 1,937,711 |
| aTrustCo Bank Corp. NY | 496,478 | | 2,760,417 |
| U.S. Bancorp | 212,603 | | 4,596,477 |
| | | | 54,727,713 |
| |
| Commercial & Professional Services 1.7% | | | |
| ABM Industries Inc. | 1,145,249 | | 24,725,926 |
| Cintas Corp. | 758,600 | | 20,899,430 |
| Superior Uniform Group Inc. | 219,200 | | 2,027,600 |
| | | | 47,652,956 |
| |
| Consumer Durables & Apparel 1.1% | | | |
| bKid Brands Inc. | 594,253 | | 5,110,576 |
| Leggett & Platt Inc. | 1,097,590 | | 24,981,148 |
| | | | 30,091,724 |
| |
| Consumer Services 1.0% | | | |
| Hillenbrand Inc. | 1,366,700 | | 29,397,717 |
| |
| Diversified Financials 0.6% | | | |
| State Street Corp. | 424,000 | | 15,967,840 |
| |
| Electrical Equipment 7.4% | | | |
| Brady Corp., A | 2,534,825 | | 73,940,845 |
| Roper Industries Inc. | 2,031,009 | | 132,381,167 |
| | | | 206,322,012 |
| |
| Food & Staples Retailing 4.7% | | | |
| Wal-Mart Stores Inc. | 2,450,400 | | 131,145,408 |
| |
| Food, Beverage & Tobacco 4.5% | | | |
| Archer-Daniels-Midland Co. | 673,500 | | 21,498,120 |
| McCormick & Co. Inc. | 2,146,400 | | 90,234,656 |
| PepsiCo Inc. | 208,000 | | 13,819,520 |
| | | | 125,552,296 |
| |
| Health Care Equipment & Services 12.6% | | | |
| Beckman Coulter Inc. | 159,200 | | 7,767,368 |
| Becton, Dickinson and Co. | 1,730,516 | | 128,231,236 |
| Hill-Rom Holdings Inc. | 749,900 | | 26,913,911 |
| Medtronic Inc. | 790,000 | | 26,528,200 |
20 | Annual Report
| | | |
| Franklin Managed Trust | | | |
| |
| Statement of Investments, September 30, 2010 (continued) | | | |
| |
| |
| Franklin Rising Dividends Fund | Shares | | Value |
| Common Stocks (continued) | | | |
| Health Care Equipment & Services (continued) | | | |
| Stryker Corp. | 1,029,800 | $ | 51,541,490 |
| Teleflex Inc. | 986,653 | | 56,022,157 |
| West Pharmaceutical Services Inc. | 1,570,800 | | 53,894,148 |
| | | | 350,898,510 |
| |
| Household & Personal Products 6.1% | | | |
| Alberto-Culver Co. | 1,135,550 | | 42,753,458 |
| The Procter & Gamble Co. | 2,111,000 | | 126,596,670 |
| | | | 169,350,128 |
| |
| Industrial Conglomerates 0.4% | | | |
| Carlisle Cos. Inc. | 406,829 | | 12,184,528 |
| |
| Insurance 9.0% | | | |
| Aflac Inc. | 656,910 | | 33,968,816 |
| Arthur J. Gallagher & Co. | 874,700 | | 23,065,839 |
| Erie Indemnity Co., A | 1,733,082 | | 97,156,577 |
| Mercury General Corp. | 290,519 | | 11,873,512 |
| Old Republic International Corp. | 4,381,050 | | 60,677,542 |
| RLI Corp. | 426,359 | | 24,140,447 |
| | | | 250,882,733 |
| |
| Machinery 5.0% | | | |
| Donaldson Co. Inc. | 506,052 | | 23,850,231 |
| Dover Corp. | 2,087,500 | | 108,988,375 |
| Nordson Corp. | 102,049 | | 7,519,991 |
| | | | 140,358,597 |
| |
| Materials 11.2% | | | |
| Air Products and Chemicals Inc. | 1,076,900 | | 89,188,858 |
| Bemis Co. Inc. | 1,516,389 | | 48,145,351 |
| Nucor Corp. | 958,400 | | 36,610,880 |
| Praxair Inc. | 1,540,881 | | 139,079,919 |
| | | | 313,025,008 |
| |
| Pharmaceuticals, Biotechnology & Life Sciences 9.8% | | | |
| Abbott Laboratories | 2,537,600 | | 132,564,224 |
| Johnson & Johnson | 1,425,500 | | 88,323,980 |
| Pfizer Inc. | 3,083,800 | | 52,948,846 |
| | | | 273,837,050 |
| |
| Retailing 5.3% | | | |
| Family Dollar Stores Inc. | 3,221,160 | | 142,246,426 |
| bSally Beauty Holdings Inc. | 437,550 | | 4,900,560 |
| | | | 147,146,986 |
Annual Report | 21
Franklin Managed Trust
Statement of Investments, September 30, 2010 (continued)

| | | |
| Franklin Managed Trust | | | |
| |
| Financial Statements | | | |
| |
| |
| Statement of Assets and Liabilities | | | |
| September 30, 2010 | | | |
| |
| | | Franklin Rising | |
| | | Dividends Fund | |
| Assets: | | | |
| Investments in securities: | | | |
| Cost - Unaffiliated issuers | $ | 2,079,449,343 | |
| Cost - Sweep Money Fund (Note 7) | | 205,567,743 | |
| Cost - Repurchase agreements | | 785,000 | |
| Total cost of investments | $ | 2,285,802,086 | |
| Value - Unaffiliated issuers | $ | 2,585,989,172 | |
| Value - Sweep Money Fund (Note 7) | | 205,567,743 | |
| Value - Repurchase agreements | | 785,000 | |
| Total value of investments (includes securities loaned in the amount of $803,976) | | 2,792,341,915 | |
| Receivables: | | | |
| Investment securities sold | | 1,882,059 | |
| Capital shares sold | | 23,499,092 | |
| Dividends | | 2,301,092 | |
| Other assets | | 1,964 | |
| Total assets | | 2,820,026,122 | |
| Liabilities: | | | |
| Payables: | | | |
| Investment securities purchased | | 16,827,179 | |
| Capital shares redeemed | | 6,948,403 | |
| Affiliates | | 3,101,260 | |
| Payable upon return of securities loaned | | 831,869 | |
| Accrued expenses and other liabilities | | 674,743 | |
| Total liabilities | | 28,383,454 | |
| Net assets, at value | $ | 2,791,642,668 | |
| Net assets consist of: | | | |
| Paid-in capital | $ | 2,381,516,564 | |
| Undistributed net investment income | | 19,830,626 | |
| Net unrealized appreciation (depreciation) | | 506,539,829 | |
| Accumulated net realized gain (loss) | | (116,244,351 | ) |
| Net assets, at value | $ | 2,791,642,668 | |
Annual Report | The accompanying notes are an integral part of these financial statements. | 23
| | | |
| Franklin Managed Trust | | | |
| |
| Financial Statements (continued) | | | |
| |
| |
| Statement of Assets and Liabilities (continued) | | | |
| September 30, 2010 | | | |
| |
| | | | Franklin Rising |
| | | | Dividends Fund |
| Class A: | | | |
| Net assets, at value | $ | | 2,043,971,458 |
| Shares outstanding | | | 66,112,649 |
| Net asset value per sharea | | $ | 30.92 |
| Maximum offering price per share (net asset value per share ÷ 94.25%) | | $ | 32.81 |
| Class B: | | | |
| Net assets, at value | $ | | 93,217,978 |
| Shares outstanding | | | 3,048,529 |
| Net asset value and maximum offering price per sharea | | $ | 30.58 |
| Class C: | | | |
| Net assets, at value | $ | | 471,028,067 |
| Shares outstanding | | | 15,463,579 |
| Net asset value and maximum offering price per sharea | | $ | 30.46 |
| Class R: | | | |
| Net assets, at value | $ | | 45,876,046 |
| Shares outstanding | | | 1,488,733 |
| Net asset value and maximum offering price per share | | $ | 30.82 |
| Advisor Class: | | | |
| Net assets, at value | $ | | 137,549,119 |
| Shares outstanding | | | 4,452,376 |
| Net asset value and maximum offering price per share | | $ | 30.89 |
aRedemption price is equal to net asset value less contingent deferred sales charges, if applicable.
24 | The accompanying notes are an integral part of these financial statements. | Annual Report
Franklin Managed Trust
Financial Statements (continued)
Statement of Operations
for the year ended September 30, 2010
| | |
| | | Franklin Rising |
| | | Dividends Fund |
| Investment income: | | |
| Dividends | $ | 53,334,600 |
| Expenses: | | |
| Management fees (Note 3a) | | 12,857,203 |
| Distribution fees: (Note 3c) | | |
| Class A | | 4,063,402 |
| Class B | | 1,058,503 |
| Class C | | 3,859,290 |
| Class R | | 200,856 |
| Transfer agent fees (Note 3e) | | 4,368,897 |
| Accounting fees (Note 3b) | | 40,000 |
| Custodian fees (Note 4) | | 30,102 |
| Reports to shareholders | | 369,706 |
| Registration and filing fees | | 135,784 |
| Professional fees | | 65,409 |
| Trustees’ fees and expenses | | 124,746 |
| Other | | 66,569 |
| Total expenses | | 27,240,467 |
| Net investment income | | 26,094,133 |
| Realized and unrealized gains (losses): | | |
| Net realized gain (loss) from investments | | 40,220,657 |
| Net change in unrealized appreciation (depreciation) on investments | | 269,612,016 |
| Net realized and unrealized gain (loss) | | 309,832,673 |
| Net increase (decrease) in net assets resulting from operations | $ | 335,926,806 |
Annual Report | The accompanying notes are an integral part of these financial statements. | 25
| | | | | | | |
| Franklin Managed Trust | | | | | | | |
| |
| Financial Statements (continued) | | | | | | | |
| |
| |
| Statements of Changes in Net Assets | | | | | | | |
| | | Franklin Rising Dividends Fund | |
| | | Year Ended September 30, | |
| | | 2010 | | | | 2009 | |
| Increase (decrease) in net assets: | | | | | | | |
| Operations: | | | | | | | |
| Net investment income | $ | 26,094,133 | | $ | 8,199,744 | |
| Net realized gain (loss) from investments | | 40,220,657 | | | | 35,778,170 | |
| Net change in unrealized appreciation (depreciation) on investments | | 269,612,016 | | | | (171,534,364 | ) |
| Net increase (decrease) in net assets resulting from operations | | 335,926,806 | | | | (127,556,450 | ) |
| Distributions to shareholders from: | | | | | | | |
| Net investment income: | | | | | | | |
| Class A | | (6,394,307 | ) | | | (23,819,218 | ) |
| Class B | | — | | | | (1,371,541 | ) |
| Class C | | — | | | | (3,700,932 | ) |
| Class R | | (85,040 | ) | | | (463,098 | ) |
| Advisor Class | | (452,894 | ) | | | (1,285,315 | ) |
| Total distributions to shareholders | | (6,932,241 | ) | | | (30,640,104 | ) |
| Capital share transactions: (Note 2) | | | | | | | |
| Class A | | 438,243,492 | | | | 83,063,560 | |
| Class B | | (37,552,300 | ) | | | (31,189,930 | ) |
| Class C | | 73,002,671 | | | | (19,557,483 | ) |
| Class R | | 6,916,047 | | | | 3,660,394 | |
| Advisor Class | | 62,917,088 | | | | 22,775,992 | |
| Total capital share transactions | | 543,526,998 | | | | 58,752,533 | |
| |
| Net increase (decrease) in net assets | | 872,521,563 | | | | (99,444,021 | ) |
| |
| Net assets: | | | | | | | |
| Beginning of year | | 1,919,121,105 | | | | 2,018,565,126 | |
| End of year | $ | 2,791,642,668 | | $ | 1,919,121,105 | |
| Undistributed net investment income included in net assets: | | | | | | | |
| End of year | $ | 19,830,626 | | | $ | 668,734 | |
26 | The accompanying notes are an integral part of these financial statements. | Annual Report
Franklin Managed Trust
Notes to Financial Statements
Franklin Rising Dividends Fund
1. ORGANIZATION AND SIGNIFICANT ACCOUNTING POLICIES
Franklin Managed Trust (Trust) is registered under the Investment Company Act of 1940, as amended, (1940 Act) as an open-end investment company, consisting of one fund, the Franklin Rising Dividends Fund (Fund). The Fund offers five classes of shares: Class A, Class B, Class C, Class R, and Advisor Class. Each class of shares differs by its initial sales load, contingent deferred sales charges, distribution fees, voting rights on matters affecting a single class and its exchange privilege.
The following summarizes the Fund’s significant accounting policies.
a. Financial Instrument Valuation
The Fund values its investments in securities and other assets and liabilities carried at fair value daily. Fair value is the price that would be received to sell an asset or paid to transfer a liability in an orderly transaction between market participants on the measurement date. Under procedures approved by the Fund’s Board of Trustees, the Fund may utilize independent pricing services, quotations from securities and financial instrument dealers, and other market sources to determine fair value.
Equity securities listed on an exchange or on the NASDAQ National Market System are valued at the last quoted sale price or the official closing price of the day, respectively. Over-the-counter securities are valued within the range of the most recent quoted bid and ask prices. Securities that trade in multiple markets or on multiple exchanges are valued according to the broadest and most representative market. Certain equity securities are valued based upon fundamental characteristics or relationships to similar securities. Investments in open-end mutual funds are valued at the closing net asset value. Repurchase agreements are valued at cost, which approximates market value.
The Fund has procedures to determine the fair value of securities and other financial instruments for which market prices are not readily available or which may not be reliably priced. Under these procedures, the Fund primarily employs a market-based approach which may use related or comparable assets or liabilities, recent transactions, market multiples, book values, and other relevant information for the investment to determine the fair value of the investment. The Fund may also use an income-based valuation approach in which the anticipated future cash flows of the investment are discounted to calculate fair value. Discounts may also be applied due to the nature or duration of any restrictions on the disposition of the investments. Due to the inherent uncertainty of valuations of such investments, the fair values may differ significantly from the values that would have been used had an active market existed.
Annual Report | 27
Franklin Managed Trust
Notes to Financial Statements (continued)
Franklin Rising Dividends Fund
| 1. | ORGANIZATION AND SIGNIFICANT ACCOUNTING POLICIES (continued) |
| b. | Repurchase Agreements |
The Fund may enter into repurchase agreements, which are accounted for as a loan by the Fund to the seller, collateralized by securities which are delivered to the Fund’s custodian. The market value, including accrued interest, of the initial collateralization is required to be at least 102% of the dollar amount invested by the Fund, with the value of the underlying securities marked to market daily to maintain coverage of at least 100%. All repurchase agreements held by the Fund at year end had been entered into on September 30, 2010.
c. Securities Lending
The Fund participates in a principal based security lending program. The Fund receives cash collateral against the loaned securities in an amount equal to at least 102% of the market value of the loaned securities. Collateral is maintained over the life of the loan in an amount not less than 100% of the market value of loaned securities, as determined at the close of Fund business each day; any additional collateral required due to changes in security values is delivered to the Fund on the next business day. The collateral is invested in repurchase agreements or in a non-registered money fund managed by the Fund’s custodian on the Fund’s behalf. The Fund receives income from the investment of cash collateral, in addition to lending fees and rebates paid by the borrower. The Fund bears the market risk with respect to the collateral investment, securities loaned, and the risk that the principal may default on its obligations to the Fund.
d. Income Taxes
It is the Fund’s policy to qualify as a regulated investment company under the Internal Revenue Code and to distribute to shareholders substantially all of its taxable income and net realized gains. As a result, no provision for U.S. federal income taxes is required. The Fund files U.S. income tax returns as well as tax returns in certain other jurisdictions. The Fund recognizes in its financial statements the effects including penalties and interest, if any, of a tax position taken on tax return (or expected to be taken) when it’s more likely than not (a greater than 50% probability), based on the technical merits, that the tax position will be sustained upon examination by the tax authorities. As of September 30, 2010, and for all open tax years, the Fund has determined that no provision for income tax is required in the Fund’s financial statements. Open tax years are those that remain subject to examination and are based on each ta x jurisdiction statute of limitation. The Fund is not aware of any tax position for which it is reasonably possible that the total amounts of unrecognized tax effects will significantly change in the next twelve months.
e. Security Transactions, Investment Income, Expenses and Distributions
Security transactions are accounted for on trade date. Realized gains and losses on security transactions are determined on a specific identification basis. Estimated expenses are accrued daily. Dividend income is recorded on the ex-dividend date. Distributions to shareholders are recorded
28 | Annual Report
Franklin Managed Trust
Notes to Financial Statements (continued)
Franklin Rising Dividends Fund
| 1. | ORGANIZATION AND SIGNIFICANT ACCOUNTING POLICIES (continued) |
| e. | Security Transactions, Investment Income, Expenses and Distributions (continued) |
on the ex-dividend date and are determined according to income tax regulations (tax basis). Distributable earnings determined on a tax basis may differ from earnings recorded in accordance with accounting principles generally accepted in the United States of America. These differences may be permanent or temporary. Permanent differences are reclassified among capital accounts to reflect their tax character. These reclassifications have no impact on net assets or the results of operations. Temporary differences are not reclassified, as they may reverse in subsequent periods.
Realized and unrealized gains and losses and net investment income, not including class specific expenses, are allocated daily to each class of shares based upon the relative proportion of net assets of each class. Differences in per share distributions, by class, are generally due to differences in class specific expenses.
Distributions received by the Fund from certain securities may be a return of capital (ROC). Such distributions reduce the cost basis of the securities, and any distributions in excess of the cost basis are recognized as capital gains.
f. Accounting Estimates
The preparation of financial statements in accordance with accounting principles generally accepted in the United States of America requires management to make estimates and assumptions that affect the reported amounts of assets and liabilities at the date of the financial statements and the amounts of income and expenses during the reporting period. Actual results could differ from those estimates.
g. Guarantees and Indemnifications
Under the Trust’s organizational documents, its officers and trustees are indemnified by the Trust against certain liabilities arising out of the performance of their duties to the Trust. Additionally, in the normal course of business, the Trust, on behalf of the Fund, enters into contracts with service providers that contain general indemnification clauses. The Trust’s maximum exposure under these arrangements is unknown as this would involve future claims that may be made against the Trust that have not yet occurred. Currently, the Trust expects the risk of loss to be remote.
Annual Report | 29
Franklin Managed Trust
Notes to Financial Statements (continued)
Franklin Rising Dividends Fund
2. SHARES OF BENEFICIAL INTEREST
At September 30, 2010, there were an unlimited number of shares authorized (without par value). Transactions in the Fund’s shares were as follows:
| | | | | | | | | | | | |
| | | | | | Year Ended September 30, | | | | | |
| | 2010 | | | 2009 | | |
| | Shares | | | | Amount | | Shares | | | | Amount | |
| Class A Shares: | | | | | | | | | | | | |
| Shares sold | 26,422,951 | | $ | 766,721,973 | | 17,782,305 | | $ | 412,485,420 | |
| Shares issued in reinvestment of | | | | | | | | | | | | |
| distributions | 209,107 | | | | 5,836,183 | | 987,590 | | | | 21,085,041 | |
| Shares redeemed | (11,659,516 | ) | | (334,314,664 | ) | (15,190,191 | ) | | (350,506,901 | ) |
| Net increase (decrease) | 14,972,542 | | $ | 438,243,492 | | 3,579,704 | | | $ | 83,063,560 | |
| Class B Shares: | | | | | | | | | | | | |
| Shares sold | 105,129 | | | $ | 3,034,209 | | 204,677 | | | $ | 4,704,284 | |
| Shares issued in reinvestment of | | | | | | | | | | | | |
| distributions | — | | | | — | | 54,199 | | | | 1,154,987 | |
| Shares redeemed | (1,420,165 | ) | | | (40,586,509 | ) | (1,616,744 | ) | | | (37,049,201 | ) |
| Net increase (decrease) | (1,315,036 | ) | $ | (37,552,300 | ) | (1,357,868 | ) | $ | (31,189,930 | ) |
| Class C Shares: | | | | | | | | | | | | |
| Shares sold | 5,435,524 | | $ | 156,435,257 | | 3,364,297 | | | $ | 77,359,913 | |
| Shares issued in reinvestment of | | | | | | | | | | | | |
| distributions | — | | | | — | | 149,272 | | | | 3,169,049 | |
| Shares redeemed | (2,947,529 | ) | | | (83,432,586 | ) | (4,408,499 | ) | | (100,086,445 | ) |
| Net increase (decrease) | 2,487,995 | | | $ | 73,002,671 | | (894,930 | ) | $ | (19,557,483 | ) |
| Class R Shares: | | | | | | | | | | | | |
| Shares sold | 615,236 | | | $ | 17,532,496 | | 567,360 | | | $ | 13,192,735 | |
| Shares issued in reinvestment of | | | | | | | | | | | | |
| distributions | 2,954 | | | | 82,351 | | 21,047 | | | | 449,134 | |
| Shares redeemed | (374,747 | ) | | | (10,698,800 | ) | (432,648 | ) | | | (9,981,475 | ) |
| Net increase (decrease) | 243,443 | | | $ | 6,916,047 | | 155,759 | | | $ | 3,660,394 | |
| Advisor Class Shares: | | | | | | | | | | | | |
| Shares sold | 2,627,763 | | | $ | 76,535,502 | | 1,656,141 | | | $ | 39,307,240 | |
| Shares issued in reinvestment of | | | | | | | | | | | | |
| distributions | 14,453 | | | | 402,221 | | 59,255 | | | | 1,260,948 | |
| Shares redeemed | (487,285 | ) | | | (14,020,635 | ) | (867,386 | ) | | | (17,792,196 | ) |
| Net increase (decrease) | 2,154,931 | | | $ | 62,917,088 | | 848,010 | | | $ | 22,775,992 | |
30 | Annual Report
Franklin Managed Trust
Notes to Financial Statements (continued)
Franklin Rising Dividends Fund
3. TRANSACTIONS WITH AFFILIATES
Franklin Resources, Inc. is the holding company for various subsidiaries that together are referred to as Franklin Templeton Investments. Certain officers and trustees of the Trust are also officers and/or directors of the following subsidiaries:
| |
Subsidiary Franklin Advisory Services, LLC (Advisory Services) Franklin Templeton Services, LLC (FT Services) Franklin Templeton Distributors, Inc. (Distributors) Franklin Templeton Investor Services, LLC (Investor Services) | Affiliation Investment manager Administrative manager Principal underwriter Transfer agent |
a. Management Fees
The Fund pays an investment management fee to Advisory Services based on the average daily net assets of the Fund as follows:
| | |
| Annualized Fee Rate | | Net Assets |
| 0.750 | % | Up to and including $500 million |
| 0.625 | % | Over $500 million, up to and including $1 billion |
| 0.500 | % | In excess of $1 billion |
b. Administrative Fees
Under an agreement with Advisory Services, FT Services provides administrative services to the Fund. The fee is paid by Advisory Services based on average daily net assets, and is not an additional expense of the Fund.
The Fund also pays accounting fees to Advisory Services as noted in the Statement of Operations.
c. Distribution Fees
The Trust’s Board of Trustees has adopted distribution plans for each share class, with the exception of Advisor Class shares, pursuant to Rule 12b-1 under the 1940 Act. Under the Fund’s Class A reimbursement distribution plan, the Fund reimburses Distributors for costs incurred in connection with the servicing, sale and distribution of the Fund’s shares up to the maximum annual plan rate. Under the Class A reimbursement distribution plan, costs exceeding the maximum for the current plan year cannot be reimbursed in subsequent periods.
In addition, under the Fund’s Class B, C, and R compensation distribution plans, the Fund pays Distributors for costs incurred in connection with the servicing, sale and distribution of the Fund’s shares up to the maximum annual plan rate for each class.
Annual Report | 31
Franklin Managed Trust
Notes to Financial Statements (continued)
Franklin Rising Dividends Fund
| 3. | TRANSACTIONS WITH AFFILIATES (continued) |
| c. | Distribution Fees (continued) |
The maximum annual plan rates, based on the average daily net assets, for each class, are as follows:
| | |
| Class A | 0.25 | % |
| Class B | 1.00 | % |
| Class C | 1.00 | % |
| Class R | 0.50 | % |
d. Sales Charges/Underwriting Agreements
Distributors has advised the Fund of the following commission transactions related to the sales and redemptions of the Fund’s shares for the year:
| | |
| Sales charges retained net of commissions paid to | | |
| unaffiliated broker/dealers | $ | 2,880,202 |
| Contingent deferred sales charges retained | $ | 90,240 |
e. Transfer Agent Fees
For the year ended September 30, 2010, the Fund paid transfer agent fees of $4,368,897, of which $2,299,980 was retained by Investor Services.
4. EXPENSE OFFSET ARRANGEMENT
The Fund has entered into an arrangement with its custodian whereby credits realized as a result of uninvested cash balances are used to reduce a portion of the Fund’s custodian expenses. During the year ended September 30, 2010, there were no credits earned.
5. INCOME TAXES
For tax purposes, capital losses may be carried over to offset future capital gains, if any. At September 30, 2010, the Fund had tax basis capital losses of $115,864,649 expiring in 2017. During the year ended September 30, 2010, the Fund utilized $30,313,386 of capital loss carryforwards.
The tax character of distributions paid during the years ended September 30, 2010 and 2009, was as follows:
| | | | |
| | | 2010 | | 2009 |
| Distributions paid from - ordinary income | $ | 6,932,241 | $ | 30,640,104 |
32 | Annual Report
Franklin Managed Trust
Notes to Financial Statements (continued)
Franklin Rising Dividends Fund
5. INCOME TAXES (continued)
At September 30, 2010, the cost of investments, net unrealized appreciation (depreciation) and undistributed ordinary income for income tax purposes were as follows:
| | | |
| Cost of investments | $ | 2,286,181,789 | |
| |
| Unrealized appreciation | $ | 610,171,873 | |
| Unrealized depreciation | | (104,011,747 | ) |
| Net unrealized appreciation (depreciation) | $ | 506,160,126 | |
| |
| Distributable earnings - undistributed ordinary income | $ | 19,830,626 | |
Net realized gains (losses) differ for financial statement and tax purposes primarily due to differing treatment of wash sales.
6. INVESTMENT TRANSACTIONS
Purchases and sales of investments (excluding short term securities) for the year ended September 30, 2010, aggregated $584,891,875 and $119,281,155, respectively.
7. INVESTMENTS IN INSTITUTIONAL FIDUCIARY TRUST MONEY MARKET PORTFOLIO
The Fund may invest in the Institutional Fiduciary Trust Money Market Portfolio (Sweep Money Fund), an open-end investment company managed by Franklin Advisers, Inc. (an affiliate of the investment manager). Pursuant to a SEC exemptive order specific to the Fund’s investment in the Sweep Money Fund, management fees paid by the Fund are reduced on assets invested in the Sweep Money Fund, in an amount not to exceed the management and administrative fees paid by the Sweep Money Fund.
8. CREDIT FACILITY
The Fund, together with other U.S. registered and foreign investment funds (collectively “Borrowers”), managed by Franklin Templeton Investments, are borrowers in a joint syndicated senior unsecured credit facility totaling $750 million (Global Credit Facility) which matures on January 21, 2011. This Global Credit Facility provides a source of funds to the Borrowers for temporary and emergency purposes, including the ability to meet future unanticipated or unusually large redemption requests.
Under the terms of the Global Credit Facility, the Fund shall, in addition to interest charged on any borrowings made by the Fund and other costs incurred by the Fund, pay its share of fees and expenses incurred in connection with the implementation and maintenance of the Global Credit Facility, based upon its relative share of the aggregate net assets of all of the Borrowers,
Annual Report | 33
Franklin Managed Trust
Notes to Financial Statements (continued)
Franklin Rising Dividends Fund
8. CREDIT FACILITY (continued)
including an annual commitment fee of 0.10% based upon the unused portion of the Global Credit Facility, which is reflected in other expenses on the Statement of Operations. During the year ended September 30, 2010, the Fund did not use the Global Credit Facility.
9. FAIR VALUE MEASUREMENTS
The Fund follows a fair value hierarchy that distinguishes between market data obtained from independent sources (observable inputs) and the Fund’s own market assumptions (unobservable inputs). These inputs are used in determining the value of the Fund’s investments and are summarized in the following fair value hierarchy:
- Level 1 – quoted prices in active markets for identical securities
- Level 2 – other significant observable inputs (including quoted prices for similar securities, interest rates, prepayment speed, credit risk, etc.)
- Level 3 – significant unobservable inputs (including the Fund’s own assumptions in determining the fair value of investments)
The inputs or methodology used for valuing securities are not an indication of the risk associated with investing in those securities.
For movements between the levels within the fair value hierarchy, the Fund has adopted a policy of recognizing the transfers as of the date of the underlying event which caused the movement.
The following is a summary of the inputs used as of September 30, 2010, in valuing the Fund’s assets carried at fair value:
| | | | | | | | | |
| | | Level 1 | | | Level 2 | | Level 3 | | Total |
| Assets: | | | | | | | | | |
| Investments in Securities: | | | | | | | | | |
| Equity Investmentsa | $ | 2,585,951,677 | | $ | — | $ | — | $ | 2,585,951,677 |
| Short Term Investments | | 205,567,743 | | 822,495 | | — | | 206,390,238 |
| Total Investments in | | | | | | | | | |
| Securities | $ | 2,791,519,420 | $ | 822,495 | $ | — | $ | 2,792,341,915 |
| |
| aFor detailed industry descriptions, see the accompanying Statement of Investments. | | | | | |
34 | Annual Report
Franklin Managed Trust
Notes to Financial Statements (continued)
Franklin Rising Dividends Fund
10. SUBSEQUENT EVENTS
The Fund has evaluated subsequent events through the issuance of the financial statements and determined that no events have occurred that require disclosure.
Annual Report | 35
Franklin Managed Trust
Report of Independent Registered Public Accounting Firm
Franklin Rising Dividends Fund
To the Shareholders and Board of Trustees of Franklin Managed Trust
We have audited the accompanying statement of assets and liabilities of the Franklin Rising Dividends Fund, a series of shares of Franklin Managed Trust, including the statement of investments, as of September 30, 2010, and the related statement of operations for the year then ended, the statements of changes in net assets for each of the two years in the period then ended, and the financial highlights for each of the periods indicated thereon. These financial statements and financial highlights are the responsibility of the Trust’s management. Our responsibility is to express an opinion on these financial statements and financial highlights based on our audits.
We conducted our audits in accordance with the standards of the Public Company Accounting Oversight Board (United States). Those standards require that we plan and perform the audit to obtain reasonable assurance about whether the financial statements and financial highlights are free of material misstatement. We were not engaged to perform an audit of the Trust’s internal control over financial reporting. Our audits included consideration of internal control over financial reporting as a basis for designing audit procedures that are appropriate in the circumstances, but not for the purpose of expressing an opinion on the effectiveness of the Trust’s internal control over financial reporting. Accordingly, we express no such opinion. An audit includes examining, on a test basis, evidence supporting the amounts and disclosures in the financial statements. Our procedures included confirmation of securities owned as of September 30, 2010, by c orrespondence with the custodian and brokers or through other appropriate auditing procedures where replies from brokers were not received. An audit also includes assessing the accounting principles used and significant estimates made by management, as well as evaluating the overall financial statement presentation. We believe that our audits provide a reasonable basis for our opinion.
In our opinion, the financial statements and financial highlights referred to above present fairly, in all material respects, the financial position of Franklin Rising Dividends Fund at September 30, 2010, the results of its operations for the year then ended, the changes in its net assets for each of the two years in the period then ended, and the financial highlights for each of the periods presented, in conformity with accounting principles generally accepted in the United States of America.
Tait, Weller & Baker LLP
Philadelphia, Pennsylvania
November 12, 2010
36 | Annual Report
Franklin Managed Trust
Tax Designation (unaudited)
Franklin Rising Dividends Fund
Under Section 854(b)(2) of the Internal Revenue Code (Code), the Fund designates 100% of the ordinary income dividends as income qualifying for the dividends received deduction for the fiscal year ended September 30, 2010.
Under Section 854(b)(2) of the Code, the Fund designates the maximum amount allowable but no less than $53,334,063 as qualified dividends for purposes of the maximum rate under Section 1(h)(11) of the Code for the fiscal year ended September 30, 2010. Distributions, including qualified dividend income, paid during calendar year 2010 will be reported to shareholders on Form 1099-DIV in January 2011. Shareholders are advised to check with their tax advisors for information on the treatment of these amounts on their individual income tax returns.
Annual Report | 37
Franklin Managed Trust
Board Members and Officers
The name, year of birth and address of the officers and board members, as well as their affiliations, positions held with the Trust, principal occupations during the past five years and number of portfolios overseen in the Franklin Templeton Investments fund complex are shown below. Generally, each board member serves until that person’s successor is elected and qualified.
| | | | |
| Independent Board Members | | | |
| |
| | | | Number of Portfolios in | |
| Name, Year of Birth | | Length of | Fund Complex Overseen | |
| and Address | Position | Time Served | by Board Member* | Other Directorships Held |
| Frank T. Crohn (1924) | Trustee | Since 1986 | 7 | None |
| One Franklin Parkway | | | | |
| San Mateo, CA 94403-1906 | | | | |
Principal Occupation During Past 5 Years:
Chairman, Eastport Lobster & Fish Company; and formerly, Director, Unity Mutual Life Insurance Company (until 2006); Chief Executive Officer and Chairman, Financial Benefit Life Insurance Company (insurance and annuities) (until 1996); Chief Executive Officer, National Benefit Life Insurance Co. (insurance) (1963-1982); and Director, AmVestors Financial Corporation (until 1997).
| | | | |
| Burton J. Greenwald (1929) | Lead | Trustee since | 15 | Franklin Templeton Emerging Markets |
| One Franklin Parkway | Independent | 2001 and Lead | | Debt Opportunities Fund PLC and |
| San Mateo, CA 94403-1906 | Trustee | Independent | | Fiduciary International Ireland |
| | | Trustee since | | Limited. |
| | | 2007 | | |
Principal Occupation During Past 5 Years:
Managing Director, B.J. Greenwald Associates (management consultants to the financial services industry); and formerly, Chairman, Fiduciary Trust International Funds; Executive Vice President, L.F. Rothschild Fund Management, Inc.; President and Director, Merit Mutual Funds; President, Underwriting Division and Director, National Securities & Research Corporation; Governor, Investment Company Institute and Chairman, ICI Public Information Committee.
| | | | |
| Charles Rubens II (1930) | Trustee | Since 1986 | 15 | None |
| One Franklin Parkway | | | | |
| San Mateo, CA 94403-1906 | | | | |
| Principal Occupation During Past 5 Years: | | | |
| Private investor. | | | | |
| Robert E. Wade (1946) | Trustee | Since 2004 | 38 | El Oro Ltd. (investments). |
| One Franklin Parkway | | | | |
| San Mateo, CA 94403-1906 | | | | |
| Principal Occupation During Past 5 Years: | | | |
| Attorney at law engaged in private practice (1973-2009) and member of various boards. | |
| Gregory H. Williams (1943) | Trustee | Since 2008 | 7 | None |
| One Franklin Parkway | | | | |
| San Mateo, CA 94403-1906 | | | | |
Principal Occupation During Past 5 Years:
President, University of Cincinnati (since November 2009); and formerly, President, The City College of New York (2001-2009); Dean of The Ohio State University College of Law (1993-2001); and Associate Vice President for Academic Affairs and Professor of Law, University of Iowa (1977-1993).
38 | Annual Report
| | | | |
| Interested Board Members and Officers | | |
| |
| | | | Number of Portfolios in | |
| Name, Year of Birth | | Length of | Fund Complex Overseen | |
| and Address | Position | Time Served | by Board Member* | Other Directorships Held |
| **William J. Lippman (1925) | Trustee, | Trustee and | 7 | None |
| One Parker Plaza, 9th Floor | President and | President since | | |
| Fort Lee, NJ 07024 | Chief Executive | 1986 and Chief | | |
| | Officer – | Executive Officer – | | |
| | Investment | Investment | | |
| | Management | Management | | |
| | | since 2002 | | |
Principal Occupation During Past 5 Years:
President, Franklin Advisory Services, LLC; Director, Templeton Worldwide, Inc.; and officer and/or director or trustee, as the case may be, of four of the investment companies in Franklin Templeton Investments.
| | | | |
| James M. Davis (1952) | Chief | Chief Compliance | Not Applicable | Not Applicable |
| One Franklin Parkway | Compliance | Officer since 2004 | | |
| San Mateo, CA 94403-1906 | Officer and | and Vice President | | |
| | Vice President | – AML Compliance | | |
| | – AML | since 2006 | | |
| | Compliance | | | |
Principal Occupation During Past 5 Years:
Director, Global Compliance, Franklin Resources, Inc.; officer of some of the other subsidiaries of Franklin Resources, Inc. and of 45 of the investment companies in Franklin Templeton Investments; and formerly, Director of Compliance, Franklin Resources, Inc. (1994-2001).
| | | | |
| Laura F. Fergerson (1962) | Chief Executive | Since 2009 | Not Applicable | Not Applicable |
| One Franklin Parkway | Officer – | | | |
| San Mateo, CA 94403-1906 | Finance and | | | |
| | Administration | | | |
Principal Occupation During Past 5 Years:
Vice President, Franklin Templeton Services, LLC; officer of 45 of the investment companies in Franklin Templeton Investments; and formerly, Director and member of Audit and Valuation Committees, Runkel Funds, Inc. (2003-2004); Assistant Treasurer of most of the investment companies in Franklin Templeton Investments (1997-2003); and Vice President, Franklin Templeton Services, LLC (1997-2003).
| | | | |
| Aliya S. Gordon (1973) | Vice President | Since 2009 | Not Applicable | Not Applicable |
| One Franklin Parkway | | | | |
| San Mateo, CA 94403-1906 | | | | |
Principal Occupation During Past 5 Years:
Associate General Counsel, Franklin Templeton Investments; officer of 45 of the investment companies in Franklin Templeton Investments; and formerly, Litigation Associate, Steefel, Levitt & Weiss, LLP (2000-2004).
| | | | |
| David P. Goss (1947) | Vice President | Since 2000 | Not Applicable | Not Applicable |
| One Franklin Parkway | | | | |
| San Mateo, CA 94403-1906 | | | | |
Principal Occupation During Past 5 Years:
Senior Associate General Counsel, Franklin Templeton Investments; and officer and/or director, as the case may be, of some of the other subsidiaries of Franklin Resources, Inc. and of 45 of the investment companies in Franklin Templeton Investments.
Annual Report | 39
| | | | |
| | | | Number of Portfolios in | |
| Name, Year of Birth | | Length of | Fund Complex Overseen | |
| and Address | Position | Time Served | by Board Member* | Other Directorships Held |
| Steven J. Gray (1955) | Secretary and | Secretary since | Not Applicable | Not Applicable |
| One Franklin Parkway | Vice President | 2005 and Vice | | |
| San Mateo, CA 94403-1906 | | President since | | |
| | | 2009 | | |
Principal Occupation During Past 5 Years:
Senior Associate General Counsel, Franklin Templeton Investments; Vice President, Franklin Templeton Distributors, Inc.; and officer of 45 of the investment companies in Franklin Templeton Investments.
| | | | |
| Matthew T. Hinkle (1971) | Treasurer, | Since 2009 | Not Applicable | Not Applicable |
| One Franklin Parkway | Chief Financial | | | |
| San Mateo, CA 94403-1906 | Officer and | | | |
| | Chief | | | |
| | Accounting | | | |
| | Officer | | | |
Principal Occupation During Past 5 Years:
Director, Fund Accounting, Franklin Templeton Investments; and officer of four of the investment companies in Franklin Templeton Investments.
| | | | |
| Rupert H. Johnson, Jr. (1940) | Vice President | Since 1991 | Not Applicable | Not Applicable |
| One Franklin Parkway | | | | |
| San Mateo, CA 94403-1906 | | | | |
Principal Occupation During Past 5 Years:
Vice Chairman, Member – Office of the Chairman and Director, Franklin Resources, Inc.; Director, Franklin Advisers, Inc.; Senior Vice President, Franklin Advisory Services, LLC; and officer and/or director or trustee, as the case may be, of some of the other subsidiaries of Franklin Resources, Inc. and of 25 of the investment companies in Franklin Templeton Investments.
| | | | |
| Robert C. Rosselot (1960) | Vice President | Since 2009 | Not Applicable | Not Applicable |
| 500 East Broward Blvd. | | | | |
| Suite 2100 | | | | |
| Fort Lauderdale, FL 33394-3091 | | | | |
Principal Occupation During Past 5 Years:
Senior Associate General Counsel, Franklin Templeton Investments; Assistant Secretary, Franklin Resources, Inc.; Vice President and Secretary, Templeton Investment Counsel, LLC; Vice President, Secretary and Trust Officer, Fiduciary Trust International of the South; and officer of 45 of the investment companies in Franklin Templeton Investments.
| | | | |
| Karen L. Skidmore (1952) | Vice President | Since 2006 | Not Applicable | Not Applicable |
| One Franklin Parkway | | | | |
| San Mateo, CA 94403-1906 | | | | |
Principal Occupation During Past 5 Years:
Senior Associate General Counsel, Franklin Templeton Investments; and officer of 45 of the investment companies in Franklin Templeton Investments.
40 | Annual Report
| | | | |
| | | | Number of Portfolios in | |
| Name, Year of Birth | | Length of | Fund Complex Overseen | |
| and Address | Position | Time Served | by Board Member* | Other Directorships Held |
| Craig S. Tyle (1960) | Vice President | Since 2005 | Not Applicable | Not Applicable |
| One Franklin Parkway | | | | |
| San Mateo, CA 94403-1906 | | | | |
Principal Occupation During Past 5 Years:
General Counsel and Executive Vice President, Franklin Resources, Inc.; officer of some of the other subsidiaries of Franklin Resources, Inc. and of 45 of the investment companies in Franklin Templeton Investments; and formerly, Partner, Shearman & Sterling, LLP (2004-2005); and General Counsel, Investment Company Institute (ICI) (1997-2004).
* We base the number of portfolios on each separate series of the U.S. registered investment companies within the Franklin Templeton Investments fund complex. These portfolios have a common investment manager or affiliated investment managers.
**William J. Lippman is considered to be an interested person of the Fund under the federal securities laws due to his position as an officer of some of the subsidiaries of Franklin Resources, Inc., which is the parent company of the Fund’s investment manager and distributor.
Note 1: Officer information is current as of the date of this report. It is possible that after this date, information about officers may change.
The Sarbanes-Oxley Act of 2002 and Rules adopted by the Securities and Exchange Commission require the Fund to disclose whether the Fund’s Audit Committee includes at least one member who is an audit committee financial expert within the meaning of such Act and Rules. The Fund’s Board has determined that there is at least one such financial expert on the Audit Committee and has designated Frank T. Crohn as its audit committee financial expert. The Board believes that Mr. Crohn, who currently is a director of various companies and Chairs the Fund’s Audit Committee, qualifies as such an expert in view of his business background and experience, which includes service as Chief Executive Officer of National Benefit Life Insurance Company (1963-1982), Chief Executive Officer of Financial Benefit Life Insurance Company (1982-1996), and service as a Director of Amvestors Financial Corporation until 1997. As a result of such b ackground and experience, the Board of Trustees believes that Mr. Crohn has acquired an understanding of generally accepted accounting principles and financial statements, the general application of such principles in connection with the accounting estimates, accruals and reserves, and analyzing and evaluating financial statements that present a breadth and level of complexity of accounting issues generally comparable to those of the Fund, as well as an understanding of internal controls and procedures for financial reporting and an understanding of audit committee functions. Mr. Crohn is an independent Board member as defined under the relevant Securities and Exchange Commission Rules and Releases.
The Statement of Additional Information (SAI) includes additional information about the board members and is available, without charge, upon request. Shareholders may call (800) DIAL BEN/(800) 342-5236 to request the SAI.
Annual Report | 41
Franklin Managed Trust
Shareholder Information
Franklin Rising Dividends Fund
Proxy Voting Policies and Procedures
The Trust’s investment manager has established Proxy Voting Policies and Procedures (Policies) that the Trust uses to determine how to vote proxies relating to portfolio securities. Shareholders may view the Trust’s complete Policies online at franklintempleton.com. Alternatively, shareholders may request copies of the Policies free of charge by calling the Proxy Group collect at (954) 527-7678 or by sending a written request to: Franklin Templeton Companies, LLC, 500 East Broward Boulevard, Suite 1500, Fort Lauderdale, FL 33394, Attention: Proxy Group. Copies of the Trust’s proxy voting records are also made available online at franklintempleton.com and posted on the U.S. Securities and Exchange Commission’s website at sec.gov and reflect the most recent 12-month period ended June 30.
Quarterly Statement of Investments
The Trust files a complete statement of investments with the U.S. Securities and Exchange Commission for the first and third quarters for each fiscal year on Form N-Q. Shareholders may view the filed Form N-Q by visiting the Commission’s website at sec.gov. The filed form may also be viewed and copied at the Commission’s Public Reference Room in Washington, DC. Information regarding the operations of the Public Reference Room may be obtained by calling (800) SEC-0330.
Householding of Reports and Prospectuses
You will receive the Fund’s financial reports every six months as well as an annual updated summary prospectus (prospectus available upon request). To reduce Fund expenses, we try to identify related shareholders in a household and send only one copy of the financial reports and summary prospectus. This process, called “householding,” will continue indefinitely unless you instruct us otherwise. If you prefer not to have these documents householded, please call us at (800) 632-2301. At any time you may view current prospectuses/summary prospectuses and financial reports on our website. If you choose, you may receive these documents through electronic delivery.
42 | Annual Report

Sign up for electronic delivery
on franklintempleton. com
Annual Report and Shareholder Letter
FRANKLIN RISING DIVIDENDS FUND
Investment Manager
Franklin Advisory Services, LLC
Distributor
Franklin Templeton Distributors, Inc.
(800) DIAL BEN®
franklintempleton. com
Shareholder Services
(800) 632-2301
Authorized for distribution only when accompanied or preceded by a summary prospectus and/or prospectus. Investors should carefully consider a fund’s investment goals, risks, charges and expenses before investing. A prospectus contains this and other information; please read it carefully before investing.
To ensure the highest quality of service, telephone calls to or from our service departments may be monitored, recorded and accessed. These calls can be identified by the presence of a regular beeping tone.
- 2010 Franklin Templeton Investments. All rights reserved.
- A 11/10
Item 2. Code of Ethics.
(a) The Registrant has adopted a code of ethics that applies to its principal executive officers and principal financial and accounting officer.
(c) N/A
(d) N/A
(f) Pursuant to Item 12(a)(1), the Registrant is attaching as an exhibit a copy of its code of ethics that applies to its principal executive officers and principal financial and accounting officer.
Item 3. Audit Committee Financial Expert.
(a)(1) The Registrant has an audit committee financial expert serving on its audit committee.
(2) The audit committee financial expert is Frank T. Crohn and he is "independent" as defined under the relevant Securities and Exchange Commission Rules and Releases.
Item 4. Principal Accountant Fees and Services.
(a) Audit Fees
The aggregate fees paid to the principal accountant for professional services rendered by the principal accountant for the audit of the registrant’s annual financial statements or for services that are normally provided by the principal accountant in connection with statutory and regulatory filings or engagements were $26,400 for the fiscal year ended September 30, 2010 and $25,200 for the fiscal year ended September 30, 2009.
(b) Audit-Related Fees
There were no fees paid to the principal accountant for assurance and related services rendered by the principal accountant to the registrant that are reasonably related to the performance of the audit of the registrant's financial statements and are not reported under paragraph (a) of Item 4.
There were no fees paid to the principal accountant for assurance and related services rendered by the principal accountant to the registrant's investment adviser and any entity controlling, controlled by or under common control with the investment adviser that provides ongoing services to the registrant that are reasonably related to the performance of the audit of their financial statements.
(c) Tax Fees
There were no fees paid to the principal accountant for professional services rendered by the principal accountant to the registrant for tax compliance, tax advice and tax planning.
There were no fees paid to the principal accountant for professional services rendered by the principal accountant to the registrant’s investment adviser and any entity controlling, controlled by or under common control with the investment adviser that provides ongoing services to the registrant for tax compliance, tax advice and tax planning.
(d) All Other Fees
There were no fees paid to the principal accountant for products and services rendered by the principal accountant to the registrant not reported in paragraphs (a)-(c) of Item 4.
There were no fees paid to the principal accountant for products and services rendered by the principal accountant to the registrant’s investment adviser and any entity controlling, controlled by or under common control with the investment adviser that provides ongoing services to the registrant other than services reported in paragraphs (a)-(c) of Item 4.
(e) (1) The registrant’s audit committee is directly responsible for approving the services to be provided by the auditors, including:
(i) pre-approval of all audit and audit related services;
(ii) pre-approval of all non-audit related services to be provided to the Fund by the auditors;
(iii) pre-approval of all non-audit related services to be provided to the registrant by the auditors to the registrant’s investment adviser or to any entity that controls, is controlled by or is under common control with the registrant’s investment adviser and that provides ongoing services to the registrant where the non-audit services relate directly to the operations or financial reporting of the registrant; and
(iv) establishment by the audit committee, if deemed necessary or appropriate, as an alternative to committee pre-approval of services to be provided by the auditors, as required by paragraphs (ii) and (iii) above, of policies and procedures to permit such services to be pre-approved by other means, such as through establishment of guidelines or by action of a designated member or members of the committee; provided the policies and procedures are detailed as to the particular service and the committee is informed of each service and such policies and procedures do not include delegation of audit committee responsibilities, as contemplated under the Securities Exchange Act of 1934, to management; subject, in the case of (ii) through (iv), to any waivers, exceptions or exemptions that may be available under applicable law or rules.
(e) (2) None of the services provided to the registrant described in paragraphs (b)-(d) of Item 4 were approved by the audit committee pursuant to paragraph (c)(7)(i)(C) of Rule 2-01 of regulation S-X.
(f) No disclosures are required by this Item 4(f).
(g) There were no non-audit fees paid to the principal accountant for services rendered by the principal accountant to the registrant and the registrant’s investment adviser and any entity controlling, controlled by or under common control with the investment adviser that provides ongoing services to the registrant.
(h) The registrant’s audit committee of the board has considered whether the provision of non-audit services that were rendered to the registrant’s investment adviser (not including any sub-adviser whose role is primarily portfolio management and is subcontracted with or overseen by another investment adviser), and any entity controlling, controlled by, or under common control with the investment adviser that provides ongoing services to the registrant that were not pre-approved pur suant to paragraph (c)(7)(ii) of Rule 2-01 of Regulation S-X is compatible with maintaining the principal accountant’s independence.
Item 5. Audit Committee of Listed Registrants. N/A
Item 6. Schedule of Investments. N/A
Item 7. Disclosure of Proxy Voting Policies and Procedures for Closed-End Management Investment Companies. N/A
Item 8. Portfolio Managers of Closed-End Management Investment Companies. N/A
Item 9. Purchases of Equity Securities by Closed-End Management Investment Company and Affiliated Purchasers. N/A
Item 10. Submission of Matters to a Vote of Security Holders.
There have been no changes to the procedures by which shareholders may recommend nominees to the Registrant's Board of Trustees that would require disclosure herein.
Item 11. Controls and Procedures.
(a) Evaluation of Disclosure Controls and Procedures. The Registrant maintains disclosure controls and procedures that are designed to ensure that information required to be disclosed in the Registrant’s filings under the Securities Exchange Act of 1934 and the Investment Company Act of 1940 is recorded, processed, summarized and reported within the periods specified in the rules and forms of the Securities and Exchange Commission. Such information is accumulated and communicated to the Registrant’s management, including its principal executive officer and principal financial officer, as appropriate, to allow timely decisions regarding required disclosure. The Registrant’s management, including the principal executive officer and the principal financial officer, recognizes that any set of controls and procedures, no matter how well designed and operated, can provide only reasonable assurance of achieving the desired control objectives.
Within 90 days prior to the filing date of this Shareholder Report on Form N-CSR, the Registrant had carried out an evaluation, under the supervision and with the participation of the Registrant’s management, including the Registrant’s principal executive officer and the Registrant’s principal financial officer, of the effectiveness of the design and operation of the Registrant’s disclosure controls and procedures. Based on such evaluation, the Registrant’s principal executive officer and principal financial officer concluded that the Registrant’s disclosure controls and procedures are effective.
(b) Changes in Internal Controls. There have been no significant changes in the Registrant’s internal controls or in other factors that could significantly affect the internal controls subsequent to the date of their evaluation in connection with the preparation of this Shareholder Report on Form N-CSR.
Item 12. Exhibits.
(a) (1) Code of Ethics
(a) (2) Certifications pursuant to Section 302 of the Sarbanes-Oxley Act of 2002 of Laura F. Fergerson, Chief Executive Officer - Finance and Administration, and Matthew T. Hinkle, Chief Financial Officer and Chief Accounting Officer
(b) Certifications pursuant to Section 906 of the Sarbanes-Oxley Act of 2002 of Laura F. Fergerson, Chief Executive Officer - Finance and Administration, and Matthew T. Hinkle, Chief Financial Officer and Chief Accounting Officer
SIGNATURES
Pursuant to the requirements of the Securities Exchange Act of 1934 and the Investment Company Act of 1940, the registrant has duly caused this report to be signed on its behalf by the undersigned, thereunto duly authorized.
FRANKLIN MANAGED TRUST
By /s/LAURA F. FERGERSON
Laura F. Fergerson
Chief Executive Officer - Finance and Administration
Date November 24, 2010
Pursuant to the requirements of the Securities Exchange Act of 1934 and the Investment Company Act of 1940, this report has been signed below by the following persons on behalf of the registrant and in the capacities and on the dates indicated.
By /s/LAURA F. FERGERSON
Laura F. Fergerson
Chief Executive Officer - Finance and Administration
Date November 24, 2010
By /s/MATTHEW T. HINKLE
Matthew T. Hinkle
Chief Financial Officer and
Chief Accounting Officer
Date November 24, 2010