UNITED STATES
SECURITIES AND EXCHANGE COMMISSION
Washington, D.C. 20549
FORM N-CSR
CERTIFIED SHAREHOLDER REPORT OF REGISTERED
MANAGEMENT INVESTMENT COMPANIES
Investment Company Act file number_811-04894
__Franklin Managed Trust
(Exact name of registrant as specified in charter)
One Franklin Parkway, San Mateo, CA 94403-1906
(Address of principal executive offices)(Zip code)
Craig S. Tyle, One Franklin Parkway, San Mateo, CA 94403-1906
(Name and address of agent for service)
Registrant's telephone number, including area code: _650 312-2000
Date of fiscal year end: 9/30
Date of reporting period: _9/30/13
Item 1. Reports to Stockholders.
| 1
Annual Report
Franklin Rising Dividends Fund
Your Fund’s Goal and Main Investments: Franklin Rising Dividends Fund seeks long-
term capital appreciation. Preservation of capital, while not a goal, is also an important consideration.
Under normal market conditions, the Fund invests at least 80% of its net assets in companies that have
paid consistently rising dividends.
Performance data represent past performance, which does not guarantee future results. Investment return and principal value will fluctuate, and you may have a gain or loss when you sell your shares. Current performance may differ from figures shown. Please visit franklintempleton.com or call (800) 342-5236 for most recent month-end performance.
We are pleased to bring you Franklin Rising Dividends Fund’s annual report for the fiscal year ended September 30, 2013.
Performance Overview
For the 12 months under review, Franklin Rising Dividends Fund – Class A delivered a +21.86% cumulative total return. In comparison, the Fund’s benchmark, the Standard & Poor’s 500 Index (S&P 500®), which is a broad measure of U.S. stock performance, generated a +19.34% total return.1 You can find the Fund’s long-term performance data in the Performance Summary beginning on page 7.
Economic and Market Overview
The U.S. economy, as measured by gross domestic product, grew modestly during the 12-month period ended September 30, 2013. Despite a large decline in federal government spending during the fourth quarter of 2012, economic growth improved in 2013, supported by investment and consumer spending. Accelerating new and existing home sales accompanied historically low mortgage rates, rising but affordable housing prices, low inventories and the lowest level of U.S. foreclosures in nearly eight years. Manufacturing, a mainstay of economic productivity, expanded for most of the period, and the unemployment rate fell to 7.2% in September 2013 from 7.8% a year earlier.2
1. Source: © 2013 Morningstar. All Rights Reserved. The information contained herein: (1) is proprietary to Morningstar and/or its content providers; (2) may not be copied or distributed; and (3) is not warranted to be accurate, complete or timely. Neither Morningstar nor its content providers are responsible for any damages or losses arising from any use of this information. The index is unmanaged and includes reinvested dividends. One cannot invest directly in an index, and an index is not representative of the Fund’s portfolio.
2. Source: Bureau of Labor Statistics.
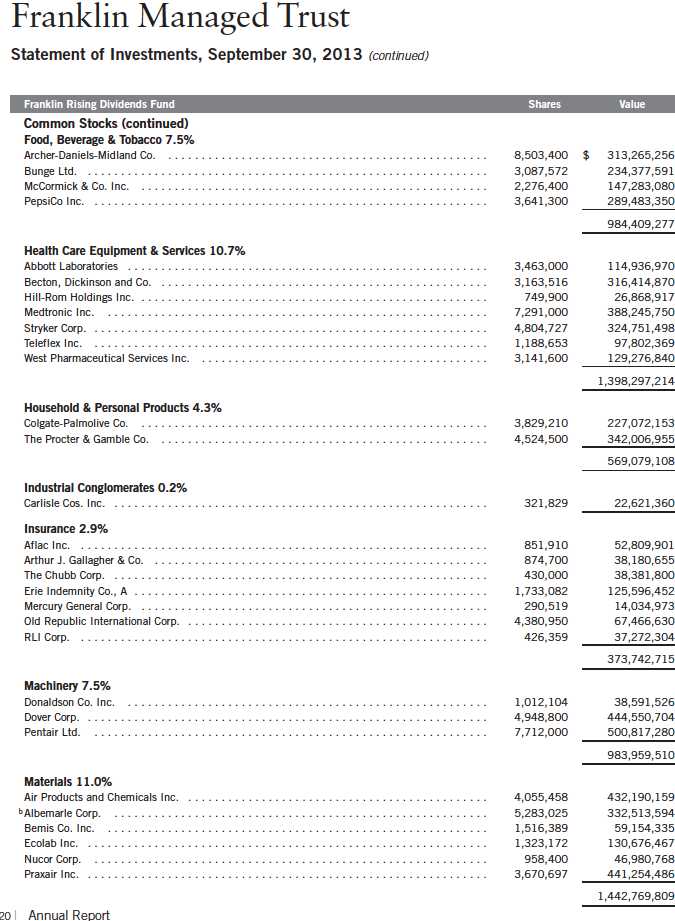
The dollar value, number of shares or principal amount, and names of all portfolio holdings are listed in the Fund’s Statement of Investments (SOI). The SOI begins on page 19.
Annual Report | 3

In the fourth quarter of 2012, financial markets reflected uncertainty surrounding the outcome of the national election and whether Congress would avert automatic federal budget cuts and income tax increases scheduled for the beginning of 2013. Congress passed a budget bill on January 1, 2013, that preserved lower income tax rates for most U.S. households, but Washington’s lack of consensus on proposed expenditure reductions resulted in further across-the-board federal spending cuts starting in March. After indicating in May that the Federal Reserve Board (Fed) might reduce monthly purchases of mortgage-backed securities and Treasuries, assuming ongoing U.S. recovery, Fed Chairman Ben Bernanke announced in September that any tapering of its purchases would be postponed until U.S. economic growth strengthened. At period-end, because of partisan disagreement about a new health care law, Congress did not authorize some routine federal funding, resulting in a temporary shutdown of non-essential U.S. government services beginning on October 1. Unless prolonged, the shutdown was not expected to hinder long-term economic growth, but the political impasse added to concerns about congressional ability to successfully navigate federal debt ceiling negotiations in October.
The Fed’s potential tapering and the impending U.S. government shutdown sparked some market sell-offs. Rising corporate profits and generally favorable economic data bolstered investor confidence, however, and U.S. stocks generated strong 12-month returns as the S&P 500 and Dow Jones Industrial Average reached all-time highs during the period.
Investment Strategy
We base our investment strategy on our belief that companies with consistently rising dividends should, over time, also experience stock price appreciation. We select portfolio securities based on several criteria. To be eligible for purchase, stocks generally will pass certain screens, such as consistent and substantial dividend increases, strong balance sheets, and relatively low price/earnings ratios. We seek fundamentally sound companies that meet our standards and attempt to acquire them at what we believe are attractive prices, often when they are out of favor with other investors.
Manager’s Discussion
During the 12 months under review, three of the holdings that helped Fund performance were Pentair, Dover and Johnson Controls. Shares of Pentair, a manufacturer of water pumps and filtration products, rebounded after stronger second-quarter year-over-year sales and earnings. The company also benefited from increased earnings guidance and growing optimism about its
4 | Annual Report
2012 merger with Tyco’s flow-control business. Pentair has had 37 consecutive years of dividend increases. Dover, a manufacturer of equipment and industrial products, experienced strength in its businesses serving the consumer electronics and refrigeration markets that led to stronger-than-expected sales and earnings growth. The company also announced its intention to spin off several businesses in its communication technologies segment. The company has had 58 consecutive years of dividend increases. Johnson Controls, a leading global manufacturer of auto batteries and interior systems as well as building efficiency controls, reported higher third-quarter earnings resulting from its stabilizing automotive business in Europe as well as increased auto sales in Asia and the U.S. Although demand for the company’s building products softened, the company benefited from its strong service business as well as pricing and cost reduction efforts. Johnson Controls also announced an agreement to divest its automotive electronics business.
Detractors from Fund performance included International Business Machines (IBM), Exxon Mobil and Target. IBM, a leading global provider of information technology software, services and hardware, reported increased net income and earnings in the fourth quarter of 2012. In subsequent quarters, however, IBM’s shares underperformed as the company, as well as some of its competitors, reported poor sales growth. In particular, revenue from IBM’s services and hardware segments declined. Exxon Mobil is a large integrated energy company operating throughout the world. Although oil prices rose during the period and the firm’s year-over-year fiscal 2012 results were favorable, its shares suffered during the period resulting from decreased earnings and production levels. The company’s stock price also marginally decreased, as did prices of other energy stocks, which reflected easing Middle East geopolitical tensions as well as concerns about the impending U.S. government shutdown and debt ceiling deadline. Target’s share price weakness provided us the opportunity to initiate a position in what we believe is an attractive rising dividend company.
We initiated new positions in Honeywell International, a diversified industrial company, which has raised its dividend in eight out of the past 10 years; Qualcomm (11 years of consecutive dividend increases), a manufacturer of digital wireless communications equipment; Target (46 years), a mass-market discount retailer; Bunge (13 years), a global agribusiness producer; Ross Stores (19 years), a discount retail apparel and home accessories store operator; and W.W. Grainger (42 years), a maintenance and operating supply distributor. We also made additions to Occidental Petroleum (11 years), an oil and gas exploration and production company; Praxair (20 years), an industrial gas manufacturer; Roper Industries (20 years), an engineered product and technology solutions provider; and Colgate-Palmolive (51 years), a household
Annual Report | 5
products manufacturer and marketer, and we made smaller additions to existing holdings. Although no positions were liquidated during the period, we did reduce our holdings in Abbott Laboratories and its recent spin-off, AbbVie, Wal-Mart Stores and Becton, Dickinson.
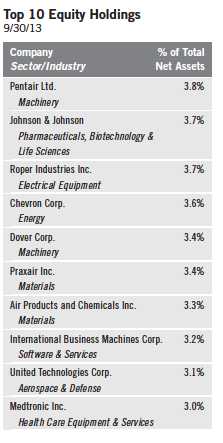
Our 10 largest positions on September 30, 2013, represented 34.2% of the Fund’s total net assets. It is interesting to note how these 10 companies would, in aggregate, respond to the Fund’s screening criteria based on a simple average of statistical measures. On average, these 10 companies have raised their dividends 32 years in a row and by 266% over the past 10 years. Their most recent year-over-year dividend increases averaged 10.0% with a dividend yield of 2.1% on September 30, 2013, and a dividend payout ratio of 32.9%, based on estimates of calendar year 2013 operating earnings. Their average price/ earnings ratio was 16.7 times 2013 estimates versus 15.3 for that of the unmanaged S&P 500.
Thank you for your continued participation in Franklin Rising Dividends Fund.
We look forward to continuing to serve your investment needs.
6 | Annual Report
Performance Summary as of 9/30/13
Your dividend income will vary depending on dividends or interest paid by securities in the Fund’s portfolio, adjusted for operating expenses of each class. Capital gain distributions are net profits realized from the sale of portfolio securities. The performance table and graphs do not reflect any taxes that a shareholder would pay on Fund dividends, capital gain distributions, if any, or any realized gains on the sale of Fund shares. Total return reflects reinvestment of the Fund’s dividends and capital gain distributions, if any, and any unrealized gains or losses.

Annual Report | 7
Performance Summary (continued)
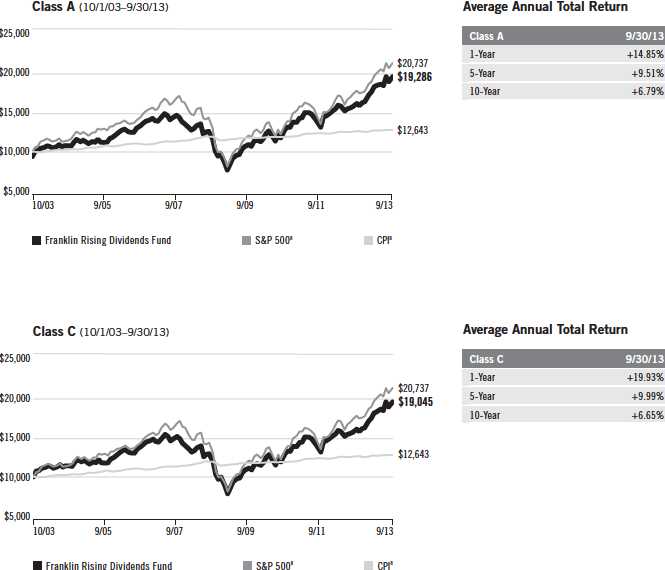
Performance1
Cumulative total return excludes sales charges. Aggregate and average annual total returns and value of $10,000 investment include maximum sales charges. Class A: 5.75% maximum initial sales charge; Class C: 1% contingent deferred sales charge in first year only; Class R/R6/Advisor Class: no sales charges.

Performance data represent past performance, which does not guarantee future results. Investment return and principal value will fluctuate, and you may have a gain or loss when you sell your shares. Current performance may differ from figures shown. For most recent month-end performance, go to franklintempleton.com or call (800) 342-5236.
8 | Annual Report
Performance Summary (continued)
Total Return Index Comparison for a Hypothetical $10,000 Investment1
Total return represents the change in value of an investment over the periods shown. It includes any current, applicable, maximum sales charge, Fund expenses, account fees and reinvested distributions. The unmanaged index includes reinvestment of any income or distributions. It differs from the Fund in composition and does not pay management fees or expenses. One cannot invest directly in an index.
Annual Report | 9

10 | Annual Report
Performance Summary (continued)
Endnotes
All investments involve risks, including possible loss of principal. Value securities may not increase in price as anticipated or may decline further in value. While smaller and midsize companies may offer substantial opportunities for capital growth, they also involve heightened risks and should be considered speculative. Historically, smaller and midsize company securities have been more volatile in price than larger company securities, especially over the short term. The Fund is actively managed but there is no guarantee that the manager’s investment decisions will produce the desired results. The Fund’s prospectus also includes a description of the main investment risks.
Class C: Prior to 1/1/04, these shares were offered with an initial sales charge; thus actual total returns would have differed. These shares
have higher annual fees and expenses than Class A shares.
Class R: Shares are available to certain eligible investors as described in the prospectus. These shares have higher annual fees and
expenses than Class A shares.
Class R6: Shares are available to certain eligible investors as described in the prospectus.
Advisor Class: Shares are available to certain eligible investors as described in the prospectus.
1. The Fund has a fee waiver associated with its investments in a Franklin Templeton money fund, contractually guaranteed through at least its current fiscal year end. Fund investment results reflect the fee waiver, to the extent applicable; without these reductions, the results would have been lower.
2. Cumulative total return represents the change in value of an investment over the periods indicated.
3. Average annual total return represents the average annual change in value of an investment over the periods indicated. 4. These figures represent the value of a hypothetical $10,000 investment in the Fund over the periods indicated.
5. Figures are as stated in the Fund’s current prospectus. In periods of market volatility, assets may decline significantly, causing total annual Fund operating expenses to become higher than the figures shown.
6. Aggregate total return represents the change in value of an investment for the period indicated. Since Class R6 shares have existed for less than one year, average annual total return is not available.
7. Effective 10/3/05, the Fund began offering Advisor Class shares, which do not have sales charges or a Rule 12b-1 plan. Performance quotations for this class reflect the following methods of calculation: (a) For periods prior to 10/3/05, a restated figure is used based upon the Fund’s Class A performance, excluding the effect of Class A’s maximum initial sales charge, but reflecting the effect of the Class A Rule 12b-1 fees; and (b) for periods after 10/3/05, actual Advisor Class performance is used reflecting all charges and fees applicable to that class. Since 10/3/05 (commencement of sales), the cumulative and average annual total returns of Advisor Class shares were +77.14% and +7.42%.
8. Source: © 2013 Morningstar. The S&P 500 is a market capitalization-weighted index of 500 stocks designed to measure total U.S. equity market performance. The Consumer Price Index (CPI), calculated by the Bureau of Labor Statistics, is a commonly used measure of the inflation rate.
Annual Report | 11
Your Fund’s Expenses
As a Fund shareholder, you can incur two types of costs:
- Transaction costs, including sales charges (loads) on Fund purchases; and
- Ongoing Fund costs, including management fees, distribution and service (12b-1) fees, and other Fund expenses. All mutual funds have ongoing costs, sometimes referred to as operating expenses.
The following table shows ongoing costs of investing in the Fund and can help you understand these costs and compare them with those of other mutual funds. The table assumes a $1,000 investment held for the six months indicated.
Actual Fund Expenses
The first line (Actual) for each share class listed in the table provides actual account values and expenses. The “Ending Account Value” is derived from the Fund’s actual return, which includes the effect of Fund expenses.
You can estimate the expenses you paid during the period by following these steps. Of course, your account value and expenses will differ from those in this illustration:
| 1. | Divide your account value by $1,000. |
| | If an account had an $8,600 value, then $8,600 ÷ $1,000 = 8.6. |
| 2. | Multiply the result by the number under the heading “Expenses Paid During Period.” |
| | If Expenses Paid During Period were $7.50, then 8.6 x $7.50 = $64.50. |
In this illustration, the estimated expenses paid this period are $64.50.
Hypothetical Example for Comparison with Other Funds
Information in the second line (Hypothetical) for each class in the table can help you compare ongoing costs of investing in the Fund with those of other mutual funds. This information may not be used to estimate the actual ending account balance or expenses you paid during the period. The hypothetical “Ending Account Value” is based on the actual expense ratio for each class and an assumed 5% annual rate of return before expenses, which does not represent the Fund’s actual return. The figure under the heading “Expenses Paid During Period” shows the hypothetical expenses your account would have incurred under this scenario. You can compare this figure with the 5% hypothetical examples that appear in shareholder reports of other funds.
12 | Annual Report
Your Fund’s Expenses (continued)
Please note that expenses shown in the table are meant to highlight ongoing costs and do not reflect any transaction costs, such as sales charges. Therefore, the second line for each class is useful in comparing ongoing costs only, and will not help you compare total costs of owning different funds. In addition, if transaction costs were included, your total costs would have been higher. Please refer to the Fund prospectus for additional information on operating expenses.
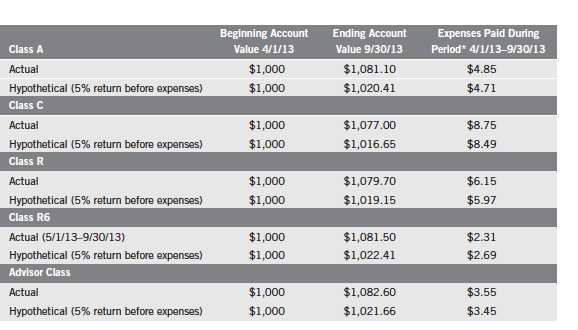
*Expenses are calculated using the most recent six-month expense ratio, annualized for each class (A: 0.93%; C: 1.68%; R: 1.18%; R6: 0.53%; and Advisor: 0.68%), multiplied by the average account value over the period, multiplied by 183/365 to reflect the one-half year period for Class R6 Hypothetical expenses and Actual and Hypothetical expenses for Classes A, C, R and Advisor. The multiplier is 153/365 for Actual Class R6 expenses to reflect the number of days since inception.
Annual Report | 13
14 | The accompanying notes are an integral part of these financial statements. | Annual Report

Annual Report | The accompanying notes are an integral part of these financial statements. | 15

16 | The accompanying notes are an integral part of these financial statements. | Annual Report
Annual Report | The accompanying notes are an integral part of these financial statements. | 17

18 | The accompanying notes are an integral part of these financial statements. | Annual Report

Annual Report | 19
Franklin Managed Trust
Statement of Investments, September 30, 2013 (continued)

Annual Report | The accompanying notes are an integral part of these financial statements. | 21

22 | The accompanying notes are an integral part of these financial statements. | Annual Report
Annual Report | The accompanying notes are an integral part of these financial statements. | 23

24 | The accompanying notes are an integral part of these financial statements. | Annual Report

Annual Report | The accompanying notes are an integral part of these financial statements. | 25
Franklin Managed Trust
Notes to Financial Statements
Franklin Rising Dividends Fund
1. ORGANIZATION AND SIGNIFICANT ACCOUNTING POLICIES
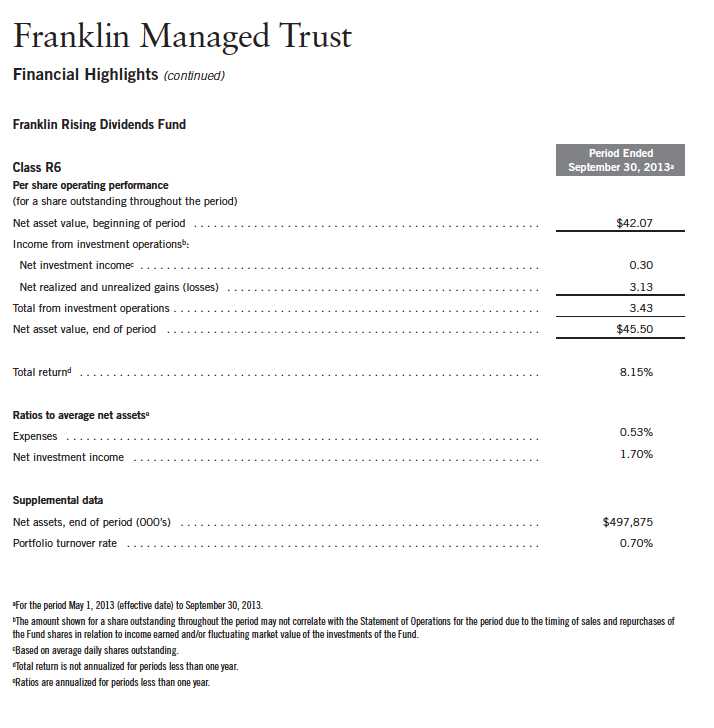
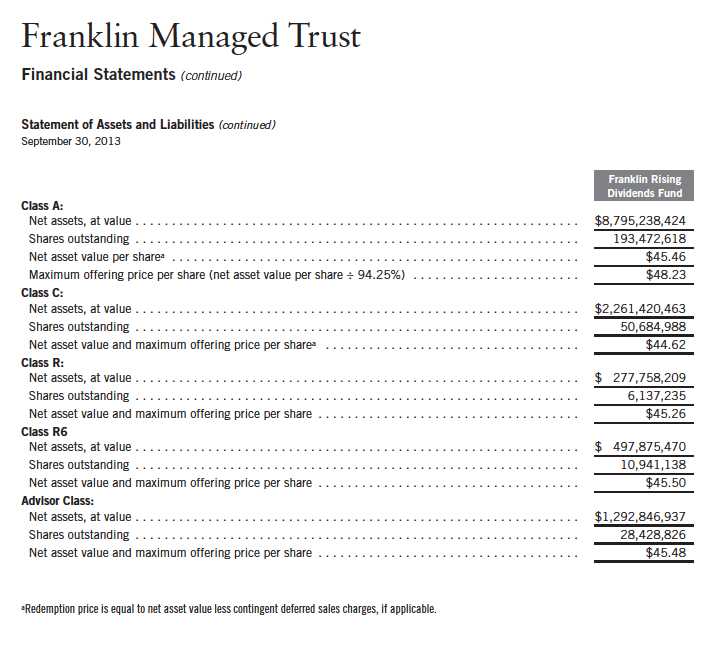
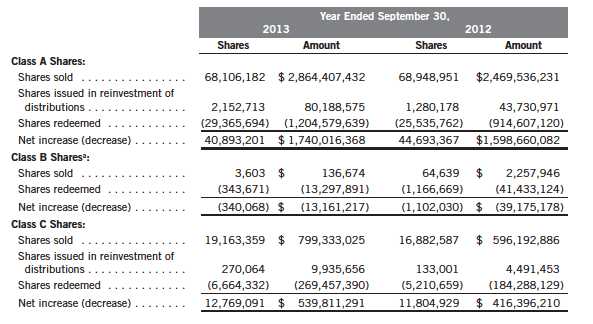
Franklin Managed Trust (Trust) is registered under the Investment Company Act of 1940, as amended, (1940 Act) as an open-end investment company, consisting of one fund, the Franklin Rising Dividends Fund (Fund). The Fund offers five classes of shares: Class A, Class C, Class R, Class R6, and Advisor Class. Effective May 1, 2013, the Fund began offering a new class of shares, Class R6. Effective March 21, 2013, all Class B shares were converted to Class A. Each class of shares differs by its initial sales load, contingent deferred sales charges, voting rights on matters affecting a single class, its exchange privilege and fees primarily due to differing arrangements for distribution and transfer agent fees.
The following summarizes the Fund’s significant accounting policies.
a. Financial Instrument Valuation
The Fund’s investments in financial instruments are carried at fair value daily. Fair value is the price that would be received to sell an asset or paid to transfer a liability in an orderly transaction between market participants on the measurement date. Under procedures approved by the Fund’s Board of Trustees (the Board), the Fund’s administrator, investment manager and other affiliates have formed the Valuation and Liquidity Oversight Committee (VLOC). The VLOC provides administration and oversight of the Fund’s valuation policies and procedures, which are approved annually by the Board. Among other things, these procedures allow the Fund to utilize independent pricing services, quotations from securities and financial instrument dealers, and other market sources to determine fair value.
Equity securities listed on an exchange or on the NASDAQ National Market System are valued at the last quoted sale price or the official closing price of the day, respectively. Over-the-counter securities are valued within the range of the most recent quoted bid and ask prices. Securities that trade in multiple markets or on multiple exchanges are valued according to the broadest and most representative market. Certain equity securities are valued based upon fundamental characteristics or relationships to similar securities. Investments in open-end mutual funds are valued at the closing net asset value.
The Fund has procedures to determine the fair value of financial instruments for which market prices are not reliable or readily available. Under these procedures, the VLOC convenes on a regular basis to review such financial instruments and considers a number of factors, including significant unobservable valuation inputs, when arriving at fair value. The VLOC primarily employs a market-based approach which may use related or comparable assets or liabilities, recent transactions, market multiples, book values, and other relevant information for the investment to determine the fair value of the investment. An income-based valuation approach may also be used in which the anticipated future cash flows of the investment are discounted to calculate fair value. Discounts may also be applied due to the nature or duration of any restrictions on the disposition
26 | Annual Report
Franklin Managed Trust
Notes to Financial Statements (continued)
Franklin Rising Dividends Fund
| 1. | ORGANIZATION AND SIGNIFICANT ACCOUNTING POLICIES (continued) |
| a. | Financial Instrument Valuation (continued) |
of the investments. Due to the inherent uncertainty of valuations of such investments, the fair values may differ significantly from the values that would have been used had an active market existed. The VLOC employs various methods for calibrating these valuation approaches including a regular review of key inputs and assumptions, transactional back-testing or disposition analysis, and reviews of any related market activity.
b. Income Taxes
It is the Fund’s policy to qualify as a regulated investment company under the Internal Revenue Code. The Fund intends to distribute to shareholders substantially all of its taxable income and net realized gains to relieve it from federal income and excise taxes. As a result, no provision for U.S. federal income taxes is required.
The Fund recognizes the tax benefits of uncertain tax positions only when the position is “more likely than not” to be sustained upon examination by the tax authorities based on the technical merits of the tax position. As of September 30, 2013, and for all open tax years, the Fund has determined that no liability for unrecognized tax benefits is required in the Fund’s financial statements related to uncertain tax positions taken on a tax return (or expected to be taken on future tax returns). Open tax years are those that remain subject to examination and are based on each tax jurisdiction statute of limitation.
c. Security Transactions, Investment Income, Expenses and Distributions
Security transactions are accounted for on trade date. Realized gains and losses on security transactions are determined on a specific identification basis. Estimated expenses are accrued daily. Dividend income is recorded on the ex-dividend date. Distributions to shareholders are recorded on the ex-dividend date and are determined according to income tax regulations (tax basis). Distributable earnings determined on a tax basis may differ from earnings recorded in accordance with accounting principles generally accepted in the United States of America. These differences may be permanent or temporary. Permanent differences are reclassified among capital accounts to reflect their tax character. These reclassifications have no impact on net assets or the results of operations. Temporary differences are not reclassified, as they may reverse in subsequent periods.
Realized and unrealized gains and losses and net investment income, not including class specific expenses, are allocated daily to each class of shares based upon the relative proportion of net assets of each class. Differences in per share distributions, by class, are generally due to differences in class specific expenses.
Annual Report | 27
Franklin Managed Trust
Notes to Financial Statements (continued)
Franklin Rising Dividends Fund
| 1. | ORGANIZATION AND SIGNIFICANT ACCOUNTING POLICIES (continued) |
| d. | Accounting Estimates |
The preparation of financial statements in accordance with accounting principles generally accepted in the United States of America requires management to make estimates and assumptions that affect the reported amounts of assets and liabilities at the date of the financial statements and the amounts of income and expenses during the reporting period. Actual results could differ from those estimates.
e. Guarantees and Indemnifications
Under the Trust’s organizational documents, its officers and trustees are indemnified by the Trust against certain liabilities arising out of the performance of their duties to the Trust. Additionally, in the normal course of business, the Trust, on behalf of the Fund, enters into contracts with service providers that contain general indemnification clauses. The Trust’s maximum exposure under these arrangements is unknown as this would involve future claims that may be made against the Trust that have not yet occurred. Currently, the Trust expects the risk of loss to be remote.
2. SHARES OF BENEFICIAL INTEREST
At September 30, 2013, there were an unlimited number of shares authorized (without par value). Transactions in the Fund’s shares were as follows:
28 | Annual Report

Annual Report | 29
Franklin Managed Trust
Notes to Financial Statements (continued)
Franklin Rising Dividends Fund
| 3. | TRANSACTIONS WITH AFFILIATES (continued) |
| b. | Administrative Fees |
Under an agreement with Advisory Services, FT Services provides administrative services to the Fund. The fee is paid by Advisory Services based on the Fund’s average daily net assets, and is not an additional expense of the Fund.
The Fund also pays accounting fees to Advisory Services as noted in the Statement of Operations.
c. Distribution Fees
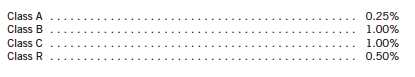
The Board has adopted distribution plans for each share class, with the exception of Class R6 and Advisor Class shares, pursuant to Rule 12b-1 under the 1940 Act. Distribution fees are not charged on shares held by affiliates. Under the Fund’s Class A reimbursement distribution plan, the Fund reimburses Distributors for costs incurred in connection with the servicing, sale and distribution of the Fund’s shares up to the maximum annual plan rate. Under the Class A reimbursement distribution plan, costs exceeding the maximum for the current plan year cannot be reimbursed in subsequent periods. In addition, under the Fund’s Class B, C, and R compensation distribution plans, the Fund pays Distributors for costs incurred in connection with the servicing, sale and distribution of the Fund’s shares up to the maximum annual plan rate for each class. The plan year, for purposes of monitoring compliance with the maximum annual plan rates, is February 1 through January 31.
The maximum annual plan rates, based on the average daily net assets, for each class, are as follows:
d. Sales Charges/Underwriting Agreements
Front-end sales charges and contingent deferred sales charges (CDSC) do not represent expenses of the Fund. These charges are deducted from the proceeds of sales of Fund shares prior to investment or from redemption proceeds prior to remittance, as applicable. Distributors has advised the Fund of the following commission transactions related to the sales and redemptions of the Fund’s shares for the year:

30 | Annual Report
Franklin Managed Trust
Notes to Financial Statements (continued)
Franklin Rising Dividends Fund
| 3. | TRANSACTIONS WITH AFFILIATES (continued) |
| e. | Transfer Agent Fees |
Each class of shares, except for Class R6, pays transfer agent fees to Investor Services for its performance of shareholder servicing obligations and reimburses Investor Services for out of pocket expenses incurred, including shareholding servicing fees paid to third parties. These fees are allocated daily based upon their relative proportion of such classes’ aggregate net assets. Class R6 pays Investor Services transfer agent fees specific to that class.
For the year ended September 30, 2013, the Fund paid transfer agent fees of $15,023,715, of which $5,553,579 was retained by Investor Services.
f. Waiver and Expense Reimbursements
Investor Services has contractually agreed in advance to waive or limit its fees so that the Class R6 transfer agent fees do not exceed 0.01% until January 31, 2015. There were no expenses waived during the year ended September 30, 2013.
4. EXPENSE OFFSET ARRANGEMENT
The Fund has entered into an arrangement with its custodian whereby credits realized as a result of uninvested cash balances are used to reduce a portion of the Fund’s custodian expenses. During the year ended September 30, 2013, there were no credits earned.
5. INCOME TAXES
For tax purposes, capital losses may be carried over to offset future capital gains. Capital loss carryforwards with no expiration, if any, must be fully utilized before those losses with expiration dates.
At September 30, 2013, the Fund had capital loss carryforwards of $16,007,007 expiring in 2017.
During the year ended September 30, 2013, the Fund utilized $6,979,859 of capital loss carry-forwards.
The tax character of distributions paid during the years ended September 30, 2013 and 2012 was as follows:

Annual Report | 31
Franklin Managed Trust
Notes to Financial Statements (continued)
Franklin Rising Dividends Fund
5. INCOME TAXES (continued)
At September 30, 2013, the cost of investments, net unrealized appreciation (depreciation) and undistributed ordinary income for income tax purposes were as follows:
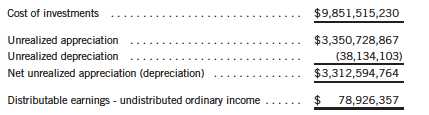
Differences between income and/or capital gains as determined on a book basis and a tax basis are primarily due to differing treatment of wash sales.
6. INVESTMENT TRANSACTIONS
Purchases and sales of investments (excluding short term securities) for the year ended September 30, 2013, aggregated $2,212,517,015 and $67,952,941, respectively.
7. INVESTMENTS IN INSTITUTIONAL FIDUCIARY TRUST MONEY MARKET PORTFOLIO
The Fund invests in the Institutional Fiduciary Trust Money Market Portfolio (Sweep Money Fund), an open-end investment company managed by Franklin Advisers, Inc. (an affiliate of the investment manager). Management fees paid by the Fund are reduced on assets invested in the Sweep Money Fund, in an amount not to exceed the management and administrative fees paid by the Sweep Money Fund.
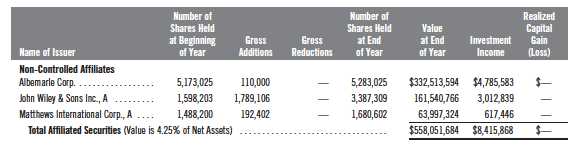
8. HOLDINGS OF 5% VOTING SECURITIES OF PORTFOLIO COMPANIES
The 1940 Act defines “affiliated companies” to include investments in portfolio companies in which a fund owns 5% or more of the outstanding voting securities. Investments in “affiliated companies” for the Fund for the year ended September 30, 2013, were as shown below.
32 | Annual Report
Franklin Managed Trust
Notes to Financial Statements (continued)
Franklin Rising Dividends Fund
9. SPECIAL SERVICING AGREEMENT
The Fund, which is an eligible underlying investment of one or more of the Franklin Templeton Fund Allocator Series Funds (Allocator Funds), participated in a Special Servicing Agreement (SSA) with the Allocator Funds and certain service providers of the Fund and the Allocator Funds. Under the SSA, the Fund may pay a portion of the Allocator Funds’ expenses (other than any asset allocation, administrative, and distribution fees) to the extent such payments are less than the amount of the benefits realized or expected to be realized by the Fund (e.g., due to reduced costs associated with servicing accounts) from the investment in the Fund by the Allocator Funds. The Allocator Funds are either managed by Franklin Advisers, Inc. or administered by FT Services, affiliates of Advisory Services. For the year ended September 30, 2013, the Fund was held by one or more of the Allocator Funds and the amount of expenses borne by the Fund is noted in the Statement of Operations. At September 30, 2013, 3.78% of the Fund’s outstanding shares were held by one or more of the Allocator Funds. Effective May 1, 2013, the SSA was discontinued until further notice.
10. CREDIT FACILITY
The Fund, together with other U.S. registered and foreign investment funds (collectively, Borrowers), managed by Franklin Templeton Investments, are borrowers in a joint syndicated senior unsecured credit facility totaling $1.5 billion (Global Credit Facility) which matures on January 17, 2014. This Global Credit Facility provides a source of funds to the Borrowers for temporary and emergency purposes, including the ability to meet future unanticipated or unusually large redemption requests.
Under the terms of the Global Credit Facility, the Fund shall, in addition to interest charged on any borrowings made by the Fund and other costs incurred by the Fund, pay its share of fees and expenses incurred in connection with the implementation and maintenance of the Global Credit Facility, based upon its relative share of the aggregate net assets of all of the Borrowers, including an annual commitment fee of 0.07% based upon the unused portion of the Global Credit Facility. These fees are reflected in other expenses on the Statement of Operations. During the year ended September 30, 2013, the Fund did not use the Global Credit Facility.
11. FAIR VALUE MEASUREMENTS
The Fund follows a fair value hierarchy that distinguishes between market data obtained from independent sources (observable inputs) and the Fund’s own market assumptions (unobservable
Annual Report | 33
Franklin Managed Trust
Notes to Financial Statements (continued)
Franklin Rising Dividends Fund
11. FAIR VALUE MEASUREMENTS (continued)
inputs). These inputs are used in determining the value of the Fund’s financial instruments and are summarized in the following fair value hierarchy:
- Level 1 – quoted prices in active markets for identical financial instruments
- Level 2 – other significant observable inputs (including quoted prices for similar financial instruments, interest rates, prepayment speed, credit risk, etc.)
- Level 3 – significant unobservable inputs (including the Fund’s own assumptions in deter- mining the fair value of financial instruments)
The inputs or methodology used for valuing financial instruments are not an indication of the risk associated with investing in those financial instruments.
For movements between the levels within the fair value hierarchy, the Fund has adopted a policy of recognizing the transfers as of the date of the underlying event which caused the movement.
At September 30, 2013, all of the Fund’s investments in financial instruments carried at fair value were valued using Level 1 inputs. For detailed categories, see the accompanying Statement of Investments.
12. NEW ACCOUNTING PRONOUNCEMENTS
In December 2011, the Financial Accounting Standards Board (FASB) issued Accounting Standards Update (ASU) No. 2011-11, Balance Sheet (Topic 210): Disclosures about Offsetting Assets and Liabilities. The amendments in the ASU enhance disclosures about offsetting of financial assets and liabilities to enable investors to understand the effect of these arrangements on a fund’s financial position. In January 2013, FASB issued ASU No. 2013-01, Balance Sheet (Topic 210): Clarifying the Scope of Disclosures about Offsetting Assets and Liabilities. The amendments in ASU No. 2013-01 clarify the intended scope of disclosures required by ASU
No. 2011-11. These ASUs are effective for interim and annual reporting periods beginning on or after January 1, 2013. The Fund believes the adoption of these ASUs will not have a material impact on its financial statements.
In June 2013, FASB issued ASU No. 2013-08, Investment Companies (Topic 946): Amendments to the Scope, Measurement, and Disclosure Requirements. The ASU modifies the criteria used in defining an investment company under U.S. Generally Accepted Accounting Principles and also sets forth certain measurement and disclosure requirements. Under the ASU, an entity that is registered under the 1940 Act automatically qualifies as an investment company. The ASU is
34 | Annual Report
Franklin Managed Trust
Notes to Financial Statements (continued)
Franklin Rising Dividends Fund
12. NEW ACCOUNTING PRONOUNCEMENTS (continued)
effective for interim and annual reporting periods beginning after December 15, 2013. The Fund is currently reviewing the requirements and believes the adoption of this ASU will not have a material impact on its financial statements.
13. SUBSEQUENT EVENTS
The Fund has evaluated subsequent events through the issuance of the financial statements and determined that no events have occurred that require disclosure.
Annual Report | 35
Franklin Managed Trust
Report of Independent Registered Public Accounting Firm
Franklin Rising Dividends Fund
To the Shareholders and Board of Trustees of Franklin Managed Trust
We have audited the accompanying statement of assets and liabilities of the Franklin Rising Dividends Fund, a series of shares of Franklin Managed Trust, including the statement of investments, as of September 30, 2013, and the related statement of operations for the year then ended, the statements of changes in net assets for each of the two years in the period then ended, and the financial highlights for each of the periods indicated thereon. These financial statements and financial highlights are the responsibility of the Trust’s management. Our responsibility is to express an opinion on these financial statements and financial highlights based on our audits.
We conducted our audits in accordance with the standards of the Public Company Accounting Oversight Board (United States). Those standards require that we plan and perform the audit to obtain reasonable assurance about whether the financial statements and financial highlights are free of material misstatement. The Trust is not required to have, nor were we engaged to perform an audit of the Trust’s internal control over financial reporting. Our audits included consideration of internal control over financial reporting as a basis for designing audit procedures that are appropriate in the circumstances, but not for the purpose of expressing an opinion on the effectiveness of the Trust’s internal control over financial reporting. Accordingly, we express no such opinion. An audit includes examining, on a test basis, evidence supporting the amounts and disclosures in the financial statements. Our procedures included confirmation of securities owned as of September 30, 2013, by correspondence with the custodian and brokers. An audit also includes assessing the accounting principles used and significant estimates made by management, as well as evaluating the overall financial statement presentation. We believe that our audits provide a reasonable basis for our opinion.
In our opinion, the financial statements and financial highlights referred to above present fairly, in all material respects, the financial position of Franklin Rising Dividends Fund at September 30, 2013, the results of its operations for the year then ended, the changes in its net assets for each of the two years in the period then ended, and the financial highlights for each of the periods presented, in conformity with accounting principles generally accepted in the United States of America.
Tait, Weller & Baker LLP
Philadelphia, Pennsylvania
November 14, 2013
36 | Annual Report
Franklin Managed Trust
Tax Information (unaudited)
Franklin Rising Dividends Fund
Under Section 854(b)(1)(A) of the Internal Revenue Code (Code), the Fund hereby reports 100% of the ordinary income dividends as income qualifying for the dividends received deduction for the fiscal year ended September 30, 2013.
Under Section 854(b)(1)(B) of the Code, the Fund hereby reports the maximum amount allowable but no less than $233,369,686 as qualified dividends for purposes of the maximum rate under Section 1(h)(11) of the Code for the fiscal year ended September 30, 2013. Distributions, including qualified dividend income, paid during calendar year 2013 will be reported to shareholders on Form 1099-DIV by mid-February 2014. Shareholders are advised to check with their tax advisors for information on the treatment of these amounts on their individual income tax returns.
Annual Report | 37
Franklin Managed Trust
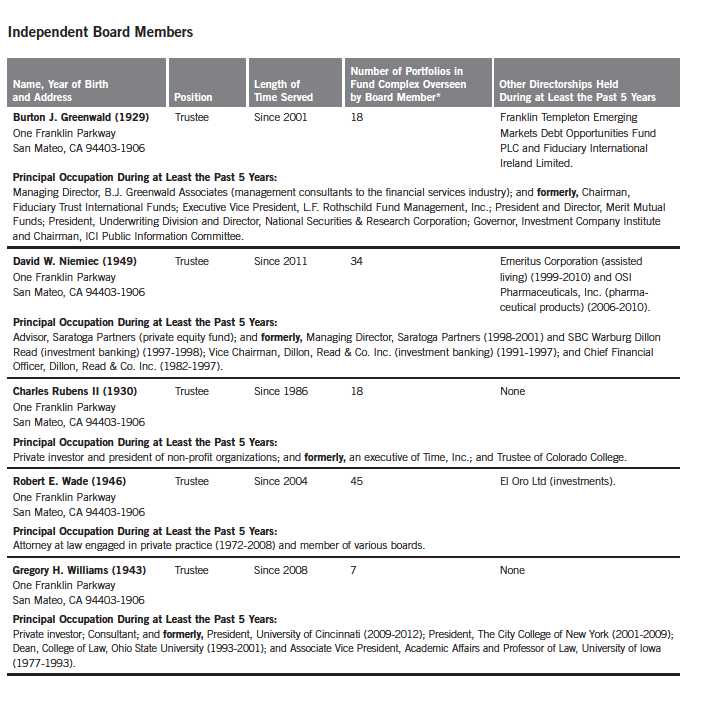
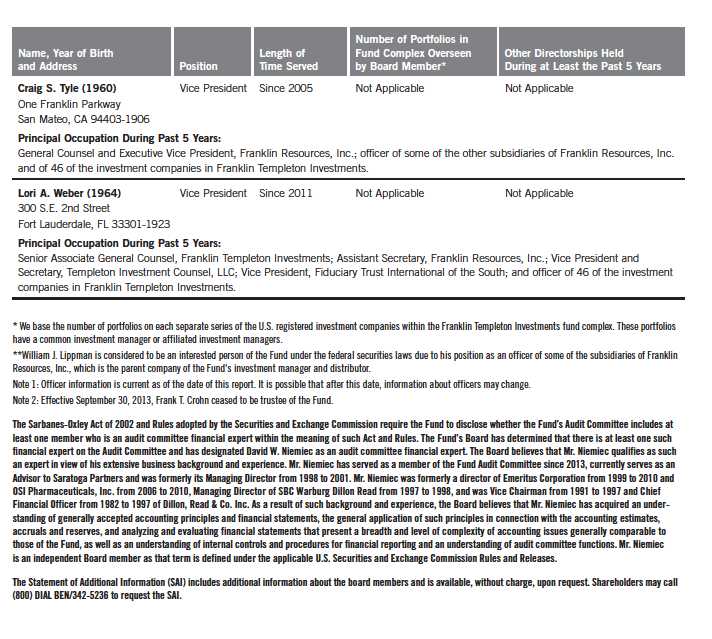
Board Members and Officers
The name, year of birth and address of the officers and board members, as well as their affiliations, positions held with the Trust, principal occupations during at least the past five years and number of portfolios overseen in the Franklin Templeton Investments fund complex are shown below. Generally, each board member serves until that person’s successor is elected and qualified.
38 | Annual Report

Annual Report | 39

40 | Annual Report
Annual Report | 41
Franklin Managed Trust
Shareholder Information
Franklin Rising Dividends Fund
Proxy Voting Policies and Procedures
The Trust’s investment manager has established Proxy Voting Policies and Procedures (Policies) that the Trust uses to determine how to vote proxies relating to portfolio securities. Shareholders may view the Trust’s complete Policies online at franklintempleton.com. Alternatively, shareholders may request copies of the Policies free of charge by calling the Proxy Group collect at (954) 527-7678 or by sending a written request to: Franklin Templeton Companies, LLC, 300 S.E. 2nd Street, Fort Lauderdale, FL 33301, Attention: Proxy Group. Copies of the Trust’s proxy voting records are also made available online at franklintempleton.com and posted on the U.S. Securities and Exchange Commission’s website at sec.gov and reflect the most recent 12-month period ended June 30.
Quarterly Statement of Investments
The Trust files a complete statement of investments with the U.S. Securities and Exchange Commission for the first and third quarters for each fiscal year on Form N-Q. Shareholders may view the filed Form N-Q by visiting the Commission’s website at sec.gov. The filed form may also be viewed and copied at the Commission’s Public Reference Room in Washington, DC. Information regarding the operations of the Public Reference Room may be obtained by calling (800) SEC-0330.
Householding of Reports and Prospectuses
You will receive the Fund’s financial reports every six months as well as an annual updated summary prospectus (prospectus available upon request). To reduce Fund expenses, we try to identify related shareholders in a household and send only one copy of the financial reports and summary prospectus. This process, called “householding,” will continue indefinitely unless you instruct us otherwise. If you prefer not to have these documents householded, please call us at (800) 632-2301. At any time you may view current prospectuses/summary prospectuses and financial reports on our website. If you choose, you may receive these documents through electronic delivery.
42 | Annual Report
This page intentionally left blank.
This page intentionally left blank.

Item 2. Code of Ethics.
(a) The Registrant has adopted a code of ethics that applies to its principal executive officers and principal financial and accounting officer.
(c) N/A
(d) N/A
(f) Pursuant to Item 12(a)(1), the Registrant is attaching as an exhibit a copy of its code of ethics that applies to its principal executive officers and principal financial and accounting officer.
Item 3. Audit Committee Financial Expert.
(a)(1) The Registrant has an audit committee financial expert serving on its audit committee.
(2) The audit committee financial expert is Frank T. Crohn and he is "independent" as defined under the relevant Securities and Exchange Commission Rules and Releases.
Item 4. Principal Accountant Fees and Services.
(a) Audit Fees
The aggregate fees paid to the principal accountant for professional services rendered by the principal accountant for the audit of the registrant’s annual financial statements or for services that are normally provided by the principal accountant in connection with statutory and regulatory filings or engagements were $27,800 for the fiscal year ended September 30, 2013 and $27,800 for the fiscal year ended September 30, 2012.
(b) Audit-Related Fees
There were no fees paid to the principal accountant for assurance and related services rendered by the principal accountant to the registrant that are reasonably related to the performance of the audit of the registrant's financial statements and are not reported under paragraph (a) of Item 4.
There were no fees paid to the principal accountant for assurance and related services rendered by the principal accountant to the registrant's investment adviser and any entity controlling, controlled by or under common control with the investment adviser that provides ongoing services to the registrant that are reasonably related to the performance of the audit of their financial statements.
(c) Tax Fees
There were no fees paid to the principal accountant for professional services rendered by the principal accountant to the registrant for tax compliance, tax advice and tax planning.
There were no fees paid to the principal accountant for professional services rendered by the principal accountant to the registrant’s investment adviser and any entity controlling, controlled by or under common control with the investment adviser that provides ongoing services to the registrant for tax compliance, tax advice and tax planning.
(d) All Other Fees
There were no fees paid to the principal accountant for products and services rendered by the principal accountant to the registrant not reported in paragraphs (a)-(c) of Item 4.
There were no fees paid to the principal accountant for products and services rendered by the principal accountant to the registrant’s investment adviser and any entity controlling, controlled by or under common control with the investment adviser that provides ongoing services to the registrant other than services reported in paragraphs (a)-(c) of Item 4.
(e) (1) The registrant’s audit committee is directly responsible for approving the services to be provided by the auditors, including:
(i) pre-approval of all audit and audit related services;
(ii) pre-approval of all non-audit related services to be provided to the Fund by the auditors;
(iii) pre-approval of all non-audit related services to be provided to the registrant by the auditors to the registrant’s investment adviser or to any entity that controls, is controlled by or is under common control with the registrant’s investment adviser and that provides ongoing services to the registrant where the non-audit services relate directly to the operations or financial reporting of the registrant; and
(iv) establishment by the audit committee, if deemed necessary or appropriate, as an alternative to committee pre-approval of services to be provided by the auditors, as required by paragraphs (ii) and (iii) above, of policies and procedures to permit such services to be pre-approved by other means, such as through establishment of guidelines or by action of a designated member or members of the committee; provided the policies and procedures are detailed as to the particular service and the committee is informed of each service and such policies and procedures do not include delegation of audit committee responsibilities, as contemplated under the Securities Exchange Act of 1934, to management; subject, in the case of (ii) through (iv), to any waivers, exceptions or exemptions that may be available under applicable law or rules.
(e) (2) None of the services provided to the registrant described in paragraphs (b)-(d) of Item 4 were approved by the audit committee pursuant to paragraph (c)(7)(i)(C) of Rule 2-01 of regulation S-X.
(f) No disclosures are required by this Item 4(f).
(g) There were no non-audit fees paid to the principal accountant for services rendered by the principal accountant to the registrant and the registrant’s investment adviser and any entity controlling, controlled by or under common control with the investment adviser that provides ongoing services to the registrant.
(h) The registrant’s audit committee of the board has considered whether the provision of non-audit services that were rendered to the registrant’s investment adviser (not including any sub-adviser whose role is primarily portfolio management and is subcontracted with or overseen by another investment adviser), and any entity controlling, controlled by, or under common control with the investment adviser that provides ongoing services to the registrant that were not pre-approved pursuant to paragraph (c)(7)(ii) of Rule 2-01 of Regulation S-X is compatible with maintaining the principal accountant’s independence.
Item 5. Audit Committee of Listed Registrants. N/A
Item 6. Schedule of Investments. N/A
Item 7. Disclosure of Proxy Voting Policies and Procedures for Closed-End Management Investment Companies. N/A
Item 8. Portfolio Managers of Closed-End Management Investment Companies. N/A
Item 9. Purchases of Equity Securities by Closed-End Management Investment Company and Affiliated Purchasers. N/A
Item 10. Submission of Matters to a Vote of Security Holders.
There have been no changes to the procedures by which shareholders may recommend nominees to the Registrant's Board of Trustees that would require disclosure herein.
Item 11. Controls and Procedures.
(a) Evaluation of Disclosure Controls and Procedures. The Registrant maintains disclosure controls and procedures that are designed to ensure that information required to be disclosed in the Registrant’s filings under the Securities Exchange Act of 1934 and the Investment Company Act of 1940 is recorded, processed, summarized and reported within the periods specified in the rules and forms of the Securities and Exchange Commission. Such information is accumulated and communicated to the Registrant’s management, including its principal executive officer and principal financial officer, as appropriate, to allow timely decisions regarding required disclosure. The Registrant’s management, including the principal executive officer and the principal financial officer, recognizes that any set of controls and procedures, no matter how well designed and operated, can provide only reasonable assurance of achieving the desired control objectives.
Within 90 days prior to the filing date of this Shareholder Report on Form N-CSR, the Registrant had carried out an evaluation, under the supervision and with the participation of the Registrant’s management, including the Registrant’s principal executive officer and the Registrant’s principal financial officer, of the effectiveness of the design and operation of the Registrant’s disclosure controls and procedures. Based on such evaluation, the Registrant’s principal executive officer and principal financial officer concluded that the Registrant’s disclosure controls and procedures are effective.
(b) Changes in Internal Controls. There have been no changes in the Registrant’s internal controls or in other factors that could materially affect the internal controls over financial reporting subsequent to the date of their evaluation in connection with the preparation of this Shareholder Report on Form N-CSR.
Item 12. Exhibits.
(a) (1) Code of Ethics
(a) (2) Certifications pursuant to Section 302 of the Sarbanes-Oxley Act of 2002 of Laura F. Fergerson, Chief Executive Officer - Finance and Administration, and Robert G. Kubilis, Chief Financial Officer and Chief Accounting Officer
(b) Certifications pursuant to Section 906 of the Sarbanes-Oxley Act of 2002 of Laura F. Fergerson, Chief Executive Officer - Finance and Administration, and Robert G. Kubilis, Chief Financial Officer and Chief Accounting Officer
SIGNATURES
Pursuant to the requirements of the Securities Exchange Act of 1934 and the Investment Company Act of 1940, the registrant has duly caused this report to be signed on its behalf by the undersigned, thereunto duly authorized.
FRANKLIN MANAGED TRUST
By /s/LAURA F. FERGERSON
Laura F. Fergerson
Chief Executive Officer - Finance and Administration
Date November 26, 2013
Pursuant to the requirements of the Securities Exchange Act of 1934 and the Investment Company Act of 1940, this report has been signed below by the following persons on behalf of the registrant and in the capacities and on the dates indicated.
By /s/LAURA F. FERGERSON
Laura F. Fergerson
Chief Executive Officer - Finance and Administration
Date November 26, 2013
By /s/ROBERT G. KUBILIS
Robert G. Kubilis
Chief Financial Officer and
Chief Accounting Officer
Date November 26, 2013