UNITED STATES
SECURITIES AND EXCHANGE COMMISSION
Washington, D.C. 20549
FORM N-CSRS
CERTIFIED SHAREHOLDER REPORT OF REGISTERED MANAGEMENT INVESTMENT COMPANIES
Investment Company Act file number 811-04892
Templeton Growth Fund, Inc.
(Exact name of registrant as specified in charter)
![]()
Registrant's telephone number, including area code: (954) 527-7500_
Date of fiscal year end: _8/31__
Date of reporting period: 2/29/12
Item 1. Reports to Stockholders.
Semiannual Report
Templeton Growth Fund, Inc.
Your Fund’s Goal and Main Investments: Templeton Growth Fund seeks long-term
capital growth. Under normal market conditions, the Fund invests primarily in equity securities of
companies located anywhere in the world, including emerging markets.
We are pleased to bring you Templeton Growth Fund’s semiannual report for
the period ended February 29, 2012.
Performance Overview
Templeton Growth Fund – Class A delivered a cumulative total return of
+8.71% for the six months under review. The Fund’s Class A shares per-
formed comparably to the +8.54% total return of the benchmark, the MSCI
World Index, which measures stock performance in global developed mar-
kets.1 The Fund’s long-term relative results are shown in the Performance
Summary beginning on page 11. For the 10-year period ended February 29,
2012, Templeton Growth Fund – Class A generated a cumulative total return
of +57.27%, compared with the MSCI World Index’s +72.21% cumulative
total return for the same period.1 Please note index performance information
is provided for reference and we do not attempt to track the index but rather
undertake investments on the basis of fundamental research. You can find
more performance data in the Performance Summary.
Economic and Market Overview
Global stocks, as measured by the MSCI World Index, rose from their lowest
levels in over a year to deliver solid gains for the six months under review,
despite persistent concerns surrounding Europe’s fiscal crisis and a global eco-
nomic slowdown. The period began amid elevated volatility as sovereign bond
yields in Europe spiked to record levels and policymakers scrambled to contain
the gathering debt crisis. Greek and Italian debt came under intense pressure,
1. Source: © 2012 Morningstar. All Rights Reserved. The information contained herein: (1) is proprietary to Morningstar
and/or its content providers; (2) may not be copied or distributed; and (3) is not warranted to be accurate, complete or
timely. Neither Morningstar nor its content providers are responsible for any damages or losses arising from any use of
this information. As of 2/29/12, the Fund’s Class A 10-year average annual total return not including the maximum sales
charge was +4.63%, compared with the MSCI World Index’s 10-year average annual total return of +5.59%. The index is
unmanaged and includes reinvested dividends. One cannot invest directly in an index, and an index is not representative
of the Fund’s portfolio.
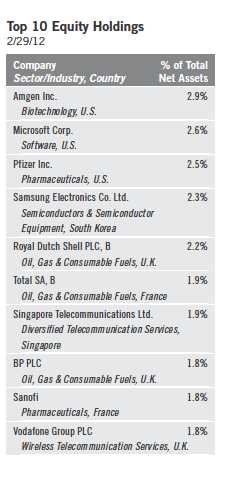
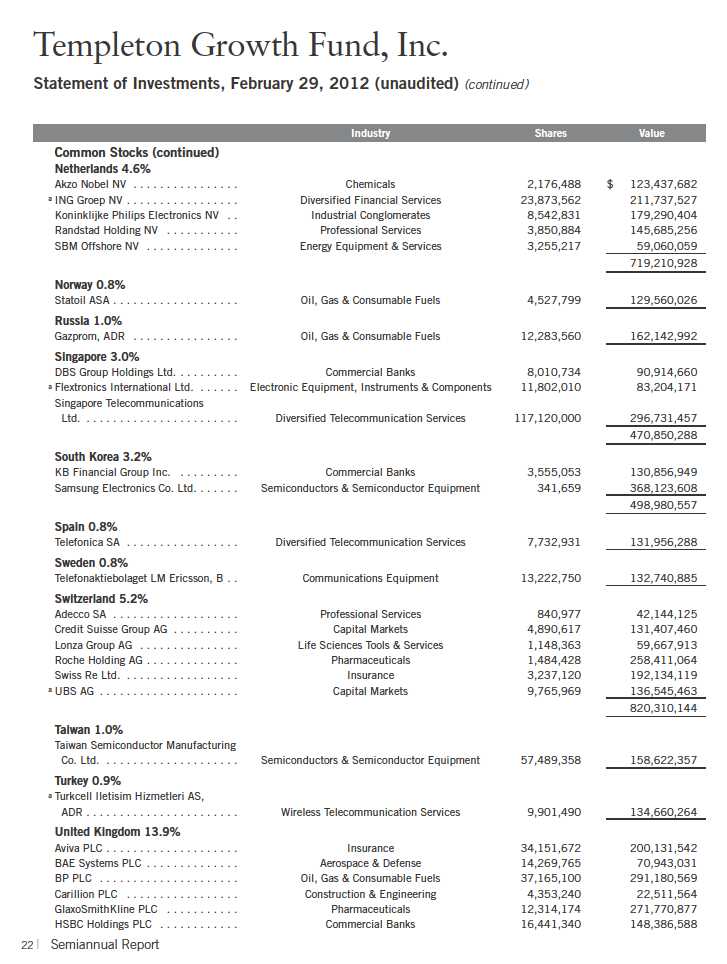
The dollar value, number of shares or principal amount, and names of all portfolio holdings are listed in the
Fund’s Statement of Investments (SOI). The SOI begins on page 21.
Semiannual Report | 3
forcing the dissolution of their respective governments and installment of technocrat-led coalitions to oversee restructuring and austerity programs. Realizing the severity of the situation, many policymakers resumed their vigilance. The European Central Bank cut interest rates and expanded lending facilities through the introduction of its Long-Term Refinancing Operation, which provided more than 1 trillion euros (US$1.3 trillion) of low-cost capital to regional lenders in two separate auctions. Greece received its second bailout toward period-end, along with the painful provision of debt restructuring and austerity programs. Policymakers elsewhere also came to Europe’s aid, with the International Monetary Fund revamping its credit line and six global central banks agreeing to lower funding costs for Europe’s distressed lenders. In the U.S., the Federal Reserve Board initiated “Operation Twist,” a program that used the proceeds of short-dated bond sales to fund the purchase of longer dated issues in an effort to drive down key borrowing costs. In emerging markets, China and India encouraged loan growth by reducing the amount of capital banks are required to keep on hand, while Brazil cut interest rates three times during the review period.
The cumulative effect of these decisive policy moves was a period of stabilization that supported broad equity market gains. Resilient corporate earnings and generally improving economic data also fueled the rally, particularly in the U.S., where fourth quarter 2011 growth domestic product (GDP) grew at a better-than-expected 3% annualized rate. Indicators ranging from home sales to unemployment claims to consumer confidence all improved toward period-end. Economic news elsewhere was mostly mixed. Fourth quarter GDP growth of 8.9% in China and 6.1% in India, while still robust in absolute terms, disappointed investor expectations and constituted the weakest economic advances since 2009 for the world’s two most populous countries.2 In the eurozone, fourth quarter GDP contracted for the first time since 2009, registering -0.3% from the previous quarter.3 Such growth concerns generally pressured commodity prices, with the exception of oil, which approached record highs due to fears geopolitical developments in the Middle East could strangle supply. Meanwhile, a relatively better near-term growth outlook in the U.S. helped flatten the Treasury yield curve and supported the dollar’s rally against the euro and yen.
2. Sources: National Bureau of Statistics (China); India Central Statistical Organization.
3. Source: Eurostat.
4 | Semiannual Report
Investment Strategy
Our investment strategy employs a bottom-up, value-oriented, long-term
approach. We focus on the market price of a company’s securities relative to
our evaluation of the company’s long-term earnings, asset value and cash flow
potential. As we look worldwide, we consider specific companies, rather than
sectors or countries, while doing in-depth research to construct a bargain list
from which we buy. Before we make a purchase, we look at the company’s
price/earnings ratio, price/cash flow ratio, profit margins and liquidation value.
Manager’s Discussion
The six months ended February 29, 2012, spanned a period of tenuous stabi-
lization following a tumultuous summer marked by Europe’s deepening debt
crisis and signs of a global economic slowdown. Central bankers who had
begun incrementally tightening policy amid a gathering global recovery
reversed course at the beginning of the reporting period as volatility resur-
faced. In Europe, policymakers appeared to stabilize sovereign bond markets
and allay bank funding concerns while their counterparts in China and the
U.S. also redoubled stabilization efforts. Generally resilient corporate earnings
also supported equities. In this bullish environment, economically sensitive sec-
tors mostly led market returns, while defensive sectors mostly lagged.
Templeton Growth Fund – Class A delivered a positive absolute return dur-
ing the reporting period in line with that of its benchmark, the MSCI World
Index. Encouragingly, stock selection was a bigger contributor than sector
allocation, a sign Templeton’s bottom-up fundamental investment process
added value in an uncertain market environment. We have previously writ-
ten about the global financial crisis and subsequent attempts to support asset
values through increased liquidity that resulted in what we considered to be
periods of indiscriminate trading in which stock prices were more indicative
of investor sentiment than underlying business values. These periods can
challenge fundamental investors from a performance perspective, though
such significant dislocations may also create compelling long-term invest-
ment opportunities. We found what we considered to be many attractive
opportunities in recent years as high-quality companies with durable and
diversified business operations traded at severely depressed valuations.
One sector where we found attractive investment opportunities amid the pes-
simism accompanying the global financial crisis was information technology,
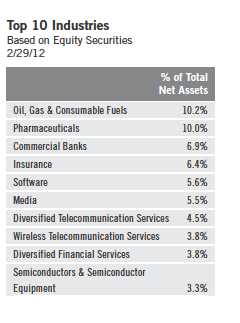
Semiannual Report | 5
the Fund’s biggest sector contributor to relative performance.4 We began increasing technology exposure in the mid-2000s after surviving the technology, media and telecommunications bubble with only a nominal weighting in what we viewed as an overpriced sector. Once the bubble burst and valuations compressed, we began building positions. Investors again sold technology stocks in the 2008 financial crisis fearing a global economic slowdown would reduce consumer and business appetite for technology investment. However, we believed the increasingly essential nature of consumer technology and the productivity-enhancing capabilities of enterprise technology could help preserve industry revenues. Based on our analysis, we identified a number of technology businesses with strong balance sheets, prodigious cash flows and sustainable competitive advantages trading at levels well below our estimation of their long-term intrinsic value.
U.S. software bellwether Microsoft is a long-standing Fund holding. Like many other technology stocks, Microsoft suffered steep losses in the “dot-com” bubble burst, with shares losing roughly two-thirds of their value and the company going from the largest ever to not even the largest in the technology sector. However, unlike many other dot-com stocks, immense value remained as Microsoft maintained its near-monopoly in computer operating systems (Windows) and applications software (Office). The stock ultimately transitioned from “growth” to “value” after years of compounding cash flows and contracting multiples, and we initiated a position in 2006. Although the market has been slow to recognize Microsoft’s underlying value, recent performance has been more encouraging. Shares rallied strongly since last fall as revenues weathered Europe’s latest fiscal scare, and we reduced our position size and realized long-term gains.
The global media industry underwent a similar experience as the technology sector after the dot-com bubble burst, with weaker competitors edged out and surviving players consolidating market share and business value through prolific cash flow generation and astute capital investments. U.S. cable operator Comcast exemplified this trend, growing into the country’s largest cable and Internet services provider. With its ability to offer voice, data and video packages, Comcast effectively controls a large portion of America’s access to content and communication portals, a powerful competitive position we believe is not fully reflected in recent modest valuations. Investors seemingly began to acknowledge this unique advantage during the reporting period as
4. The information technology sector comprises communications equipment; computers and peripherals; electronic equipment, instruments and components; office electronics; semiconductors and semiconductor equipment; and software in the SOI.
6 | Semiannual Report
shares rallied and Comcast became a top contributor, helping the Fund’s overweighted consumer discretionary sector outperform that of the index.5
Health care, another overweighted sector in the Fund, also outperformed during the period.6 Stock selection again led Fund outperformance, even more so than in the technology and consumer discretionary sectors, since our health care overweighting was a headwind to relative performance. Similar to the technology sector, where we felt macro-level uncertainty kept investors from recognizing stock-level values, uncertainty in the pharmaceuticals industry obscured an abundance of what we perceived to be bottom-up value. Fears of revenue declines stemming from generic competition, unfavorable regulation and diminishing pipeline productivity beset many of the world’s leading drug-makers. However, we believe such fears are being proactively addressed by managements restructuring their research and development processes and diversifying away from patent dependent products. Current valuations are more reflective of investor skepticism, in our view, than the value potential inherent in some of the industry’s most innovative pharmaceuticals firms.
This situation provided what we saw as a number of compelling opportunities at the security level. Consider U.S.-based Amgen, the world’s largest biopharmaceutical company and a top contributor during the period. We first identified the stock as undervalued in 2007/2008, when industry-wide fears of slowing top-line growth led investors to overlook Amgen’s impressive ability to generate cash and develop new products. Since then, Amgen has successfully managed its maturing product portfolio while effectively developing a pipeline of new drugs with the potential to materially enhance future revenues. Our patience was rewarded by a rising stock price and management’s commitment to convert the company’s prodigious cash flow into shareholder value by pledging most of net income to dividends and share buybacks. We believe a similar opportunity unfolded at Pfizer, the world’s largest traditional pharmaceuticals firm and another top contributor during the period. Management is returning roughly $8 billion per annum to shareholders through dividends and share buybacks, and the company has several potential blockbuster drugs in its pipeline, but investors seemed focused on looming patent expirations and potential regulatory headwinds. This led to a situation where, by our analysis, Pfizer’s share price assigned no value to its promising pipeline portfolio, while also allowing little credit for its operational diversification and ongoing restructuring potential.
5. The consumer discretionary sector comprises auto components, automobiles, media, multi-line retail and specialty retail in the SOI.
6. The health care sector comprises biotechnology, health care equipment and supplies, life sciences tools and services, and pharmaceuticals in the SOI.
Semiannual Report | 7
Another sector we believe offers potentially outsized long-term investment returns is telecommunication services.7 However, our overweighted position in the defensive sector and isolated weakness at the stock level weighed on performance during the period. Specifically, U.S. wireless operator Sprint Nextel was a major laggard, declining during the six months in review due to liquidity concerns. Sprint’s capital-intensive decisions to offer Apple’s iPhone and accelerate its 4G network build-out put pressure on near-term cash flows, raising concerns shares could be diluted if the company taps equity markets for financing. In our analysis, Sprint’s aggressive growth strategy was necessary to remain competitive over the long term, and its capital issues were addressable through debt markets or potential vendor financing arrangements. Although risks remain, so do considerable rewards if Sprint executes successfully, a scenario for which the recent share price assigned too low a probability in our assessment. Elsewhere in the sector, we found companies with attractive international growth exposure trading at modest valuation levels and offering, on average, dividend yields in excess of 6% at period-end, compelling value propositions in our view.
In our view, the financials sector also presented deep value opportunities to us, though stock-specific weakness also resulted in underperformance during the period.8 Credit Agricole, France’s largest lender, was the biggest detractor in the sector, declining after the bank wrote down its Greek exposure, cancelled its 2011 dividend, and scrapped its long-term earnings forecast. However, we believe the restructurings helped Credit Agricole achieve its Basel III-mandated capital ratio, and operating profits at the company’s core retail/commercial banking business, which composes 80% of earnings, will likely remain largely intact. Across the global financials sector, banks were building capital buffers and policymakers were ensuring the smooth operation of funding markets, a considerably more stable situation than 2008 that was not reflected in historically low industry valuations.
The only other sector hurting relative performance during the period was industrials, where, in particular, losses at German airline Deutsche Lufthansa negatively affected returns.9 Shares of Europe’s second biggest airline fell after rising oil prices and economic weakness pressured travel bookings, leading to a larger-than-expected earnings decline. The stock recently approached all-time valuation lows at 0.5 times book value, a multiple we believe ignores the
7. The telecommunication services sector comprises diversified telecommunication services and wireless telecommunication services in the SOI.
8. The financials sector comprises capital markets, commercial banks, consumer finance, diversified financial services, insurance, and real estate management and development in the SOI.
9. The industrials sector comprises aerospace and defense, air freight and logistics, airlines, commercial services and supplies, construction and engineering, electrical equipment, industrial conglomerates and professional services in the SOI.
8 | Semiannual Report
firm’s strong balance sheet, proactive capacity reductions and realizable value potential in the vacated sale of wholly owned subsidiary BMI. While we found attractive values in various parts of the industrials sector in general, we found fewer opportunities in materials, another highly cyclical market segment.10 We largely avoided the overpriced metals and mining firms trading near peak valuations in recent years, and our limited materials weighting comprised primarily chemicals and building aggregate companies. This value discipline was positive for the Fund during the reporting period as commodity prices declined due to global growth uncertainty, and the Fund’s select holdings elsewhere in the sector performed well.
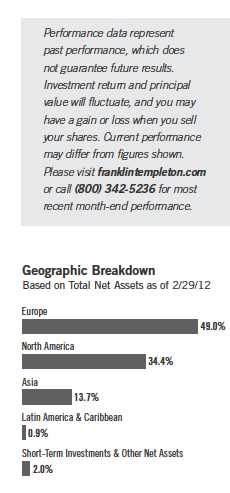
From a regional perspective, stock selection overcame a detractive underweighting in the U.S. and a detractive overweighting in Asia. However, the Fund’s overweighting in Europe hurt relative performance. Uncertainty in Europe and the entire global economy continued to unnerve investors even as stocks performed well in the recent market rally.
It is important to recognize the effect of currency movements on the Fund’s performance. In general, if the value of the U.S. dollar goes up compared with a foreign currency, an investment traded in that foreign currency will go down in value because it will be worth fewer U.S. dollars. This can have a negative effect on Fund performance. Conversely, when the U.S. dollar weakens in relation to a foreign currency, an investment traded in that foreign currency will increase in value, which can contribute to Fund performance. For the six months ended February 29, 2012, the U.S. dollar rose in value relative to most currencies. As a result, the Fund’s performance was negatively affected by the portfolio’s substantial investment in securities with non-U.S. currency exposure.
Although we do not pretend to know which way markets are headed in the future, we remain positive about the Fund. As Sir John Templeton said, “I never ask if the market is going to go up or down, because I don’t know, and besides it doesn’t matter. I search nation after nation for stocks, asking: ‘Where is the one that is the lowest priced in relation to what I believe it’s worth?’” We continue to search for high-quality companies around the world, priced at levels far below what we believe they are ultimately worth, a situation that gives us confidence over our long-term investment horizon.
10. The materials sector comprises chemicals, construction materials, and metals and mining in the SOI.
Semiannual Report | 9
The foregoing information reflects our analysis, opinions and portfolio holdings as of February 29, 2012, the end of
the reporting period. The way we implement our main investment strategies and the resulting portfolio holdings
may change depending on factors such as market and economic conditions. These opinions may not be relied upon
as investment advice or an offer for a particular security. The information is not a complete analysis of every
aspect of any market, country, industry, security or the Fund. Statements of fact are from sources considered reli-
able, but the investment manager makes no representation or warranty as to their completeness or accuracy.
Although historical performance is no guarantee of future results, these insights may help you understand our
investment management philosophy.
10 | Semiannual Report
Performance Summary as of 2/29/12
Your dividend income will vary depending on dividends or interest paid by securities in the Fund’s
portfolio, adjusted for operating expenses of each class. Capital gain distributions are net profits
realized from the sale of portfolio securities. The performance table does not reflect any taxes that
a shareholder would pay on Fund dividends, capital gain distributions, if any, or any realized gains
on the sale of Fund shares. Total return reflects reinvestment of the Fund’s dividends and capital
gain distributions, if any, and any unrealized gains or losses.
Semiannual Report | 11
Performance Summary (continued)
Performance
Cumulative total return excludes sales charges. Average annual total returns and value of $10,000 investment include
maximum sales charges. Class A: 5.75% maximum initial sales charge; Class B: contingent deferred sales charge (CDSC)
declining from 4% to 1% over six years, and eliminated thereafter; Class C: 1% CDSC in first year only; Class R/Advisor
Class: no sales charges.
Performance data represent past performance, which does not guarantee future results. Investment return and principal
value will fluctuate, and you may have a gain or loss when you sell your shares. Current performance may differ from
figures shown. For most recent month-end performance, go to franklintempleton.com or call (800) 342-5236.
12 | Semiannual Report
Performance Summary (continued)
Endnotes
All investments involve risks, including possible loss of principal. Special risks are associated with foreign investing, including currency fluctu-
ations, economic instability and political developments. Investments in developing markets involve heightened risks related to the same
factors, in addition to those associated with these markets’ smaller size and lesser liquidity. The Fund is actively managed but there is no guar-
antee that the manager’s investment decisions will produce the desired results. The Fund’s prospectus also includes a description of the main
investment risks.
1. Cumulative total return represents the change in value of an investment over the periods indicated.
2. Average annual total return represents the average annual change in value of an investment over the periods indicated. Six-month return has not
been annualized.
3. These figures represent the value of a hypothetical $10,000 investment in the Fund over the periods indicated.
4. In accordance with SEC rules, we provide standardized average annual total return information through the latest calendar quarter.
5. Figures are as stated in the Fund’s prospectus current as of the date of this report. In periods of market volatility, assets may decline significantly,
causing total annual Fund operating expenses to become higher than the figures shown.
Semiannual Report | 13
Your Fund’s Expenses
As a Fund shareholder, you can incur two types of costs:
- Transaction costs, including sales charges (loads) on Fund purchases; and
- Ongoing Fund costs, including management fees, distribution and service (12b-1) fees, and other Fund expenses. All mutual funds have ongoing costs, sometimes referred to as operating expenses.
The following table shows ongoing costs of investing in the Fund and can help you understand these costs and compare them with those of other mutual funds. The table assumes a $1,000 investment held for the six months indicated.
Actual Fund Expenses
The first line (Actual) for each share class listed in the table provides actual account values and expenses. The “Ending Account Value” is derived from the Fund’s actual return, which includes the effect of Fund expenses.
You can estimate the expenses you paid during the period by following these steps. Of course, your account value and expenses will differ from those in this illustration:
| 1. | Divide your account value by $1,000. |
| If an account had an $8,600 value, then $8,600 ÷ $1,000 = 8.6. | |
| 2. | Multiply the result by the number under the heading “Expenses Paid During Period.” |
| If Expenses Paid During Period were $7.50, then 8.6 x $7.50 = $64.50. |
In this illustration, the estimated expenses paid this period are $64.50.
Hypothetical Example for Comparison with Other Funds
Information in the second line (Hypothetical) for each class in the table can help you compare ongoing costs of investing in the Fund with those of other mutual funds. This information may not be used to estimate the actual ending account balance or expenses you paid during the period. The hypothetical “Ending Account Value” is based on the actual expense ratio for each class and an assumed 5% annual rate of return before expenses, which does not represent the Fund’s actual return. The figure under the heading “Expenses Paid During Period” shows the hypothetical expenses your account would have incurred under this scenario. You can compare this figure with the 5% hypothetical examples that appear in shareholder reports of other funds.
14 | Semiannual Report
Your Fund’s Expenses (continued)
Please note that expenses shown in the table are meant to highlight ongoing costs and do not
reflect any transaction costs, such as sales charges. Therefore, the second line for each class is use-
ful in comparing ongoing costs only, and will not help you compare total costs of owning different
funds. In addition, if transaction costs were included, your total costs would have been higher.
Please refer to the Fund prospectus for additional information on operating expenses.
*Expenses are calculated using the most recent six-month expense ratio, annualized for each class (A: 1.11%; B: 1.86%; C: 1.86%; R: 1.36%; and
Advisor: 0.86%), multiplied by the average account value over the period, multiplied by 182/366 to reflect the one-half year period.
Semiannual Report | 15
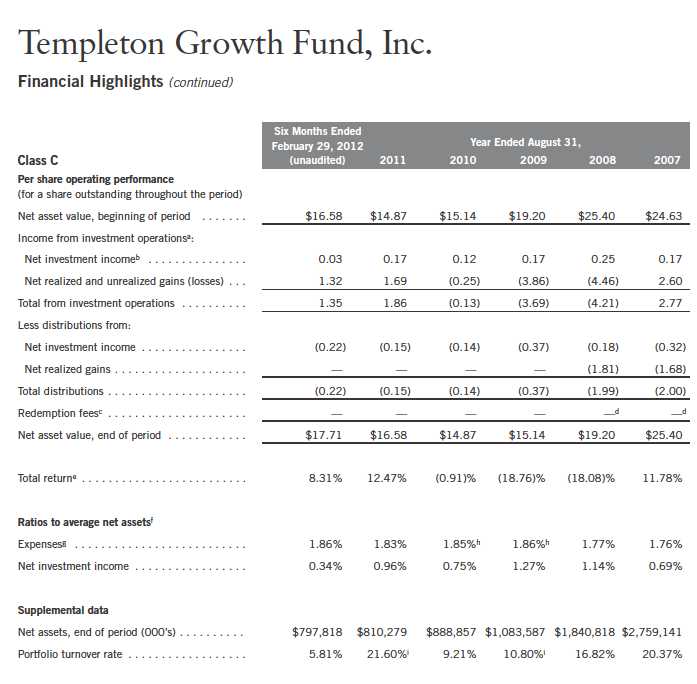
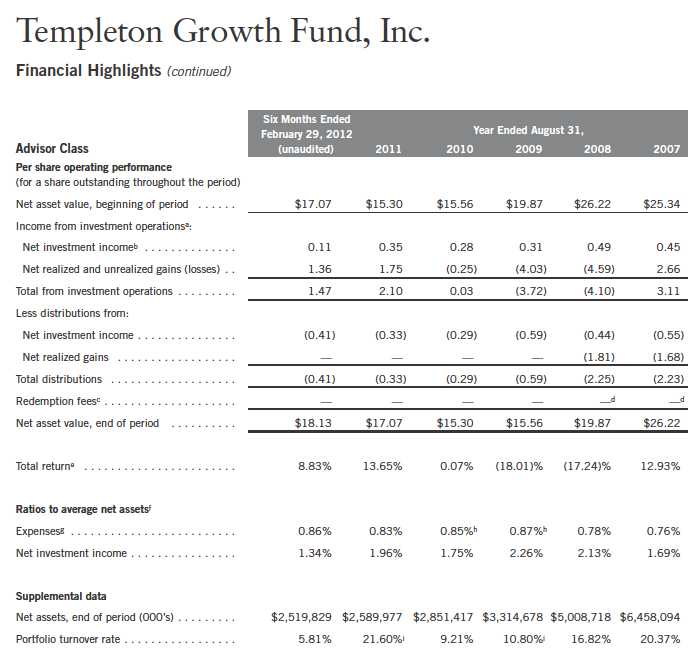
Templeton Growth Fund, Inc.
Financial Highlights
aThe amount shown for a share outstanding throughout the period may not correlate with the Statement of Operations for the period due to the timing of sales and repurchases of
the Fund shares in relation to income earned and/or fluctuating market value of the investments of the Fund.
bBased on average daily shares outstanding.
cEffective September 1, 2008, the redemption fee was eliminated.
dAmount rounds to less than $0.01 per share.
eTotal return does not reflect sales commissions or contingent deferred sales charges, if applicable, and is not annualized for periods less than one year.
fRatios are annualized for periods less than one year.
gBenefit of expense reduction rounds to less than 0.01%.
hBenefit of waiver and payment by affiliate rounds to less than 0.01%.
iExcludes the value of portfolio securities delivered as a result of redemptions in-kind.
16 | The accompanying notes are an integral part of these financial statements. | Semiannual Report
aThe amount shown for a share outstanding throughout the period may not correlate with the Statement of Operations for the period due to the timing of sales and repurchases of
the Fund shares in relation to income earned and/or fluctuating market value of the investments of the Fund.
bBased on average daily shares outstanding.
cEffective September 1, 2008, the redemption fee was eliminated.
dAmount rounds to less than $0.01 per share.
eTotal return does not reflect sales commissions or contingent deferred sales charges, if applicable, and is not annualized for periods less than one year.
fRatios are annualized for periods less than one year.
gBenefit of expense reduction rounds to less than 0.01%.
hBenefit of waiver and payment by affiliate rounds to less than 0.01%.
iExcludes the value of portfolio securities delivered as a result of redemptions in-kind.
Semiannual Report | The accompanying notes are an integral part of these financial statements. | 17
aThe amount shown for a share outstanding throughout the period may not correlate with the Statement of Operations for the period due to the timing of sales and repurchases of
the Fund shares in relation to income earned and/or fluctuating market value of the investments of the Fund.
bBased on average daily shares outstanding.
cEffective September 1, 2008, the redemption fee was eliminated.
dAmount rounds to less than $0.01 per share.
eTotal return does not reflect sales commissions or contingent deferred sales charges, if applicable, and is not annualized for periods less than one year.
fRatios are annualized for periods less than one year.
gBenefit of expense reduction rounds to less than 0.01%.
hBenefit of waiver and payment by affiliate rounds to less than 0.01%.
iExcludes the value of portfolio securities delivered as a result of redemptions in-kind.
18 | The accompanying notes are an integral part of these financial statements. | Semiannual Report
aThe amount shown for a share outstanding throughout the period may not correlate with the Statement of Operations for the period due to the timing of sales and repurchases of
the Fund shares in relation to income earned and/or fluctuating market value of the investments of the Fund.
bBased on average daily shares outstanding.
cEffective September 1, 2008, the redemption fee was eliminated.
dAmount rounds to less than $0.01 per share.
eTotal return does not reflect sales commissions or contingent deferred sales charges, if applicable, and is not annualized for periods less than one year.
fRatios are annualized for periods less than one year.
gBenefit of expense reduction rounds to less than 0.01%.
hBenefit of waiver and payment by affiliate rounds to less than 0.01%.
iExcludes the value of portfolio securities delivered as a result of redemptions in-kind.
Semiannual Report | The accompanying notes are an integral part of these financial statements. | 19
aThe amount shown for a share outstanding throughout the period may not correlate with the Statement of Operations for the period due to the timing of sales and repurchases of
the Fund shares in relation to income earned and/or fluctuating market value of the investments of the Fund.
bBased on average daily shares outstanding.
cEffective September 1, 2008, the redemption fee was eliminated.
dAmount rounds to less than $0.01 per share.
eTotal return is not annualized for periods less than one year.
fRatios are annualized for periods less than one year.
gBenefit of expense reduction rounds to less than 0.01%.
hBenefit of waiver and payment by affiliate rounds to less than 0.01%.
iExcludes the value of portfolio securities delivered as a result of redemptions in-kind.
20 | The accompanying notes are an integral part of these financial statements. | Semiannual Report
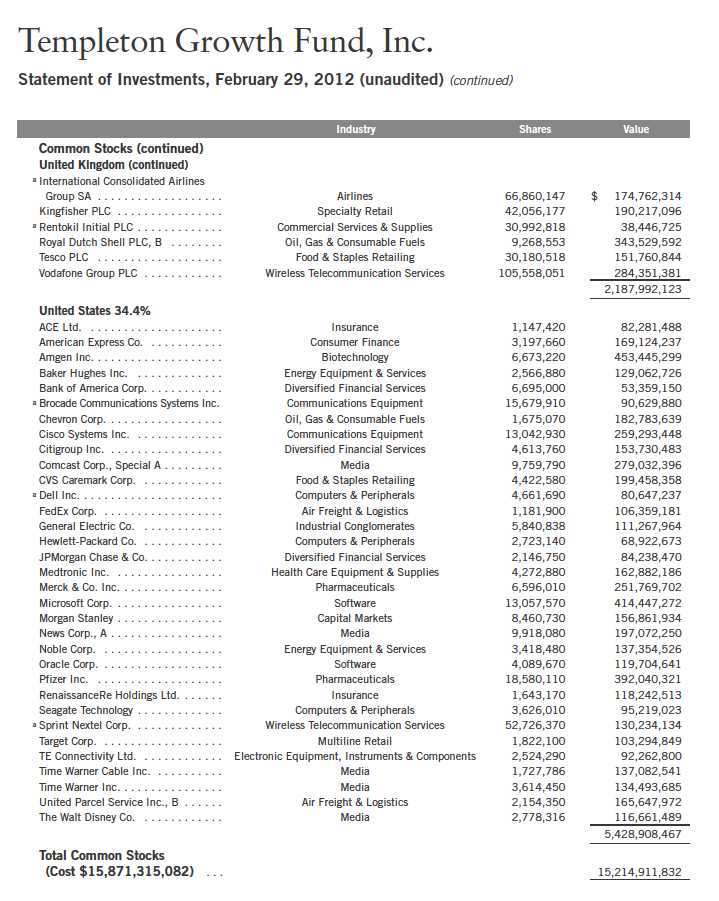
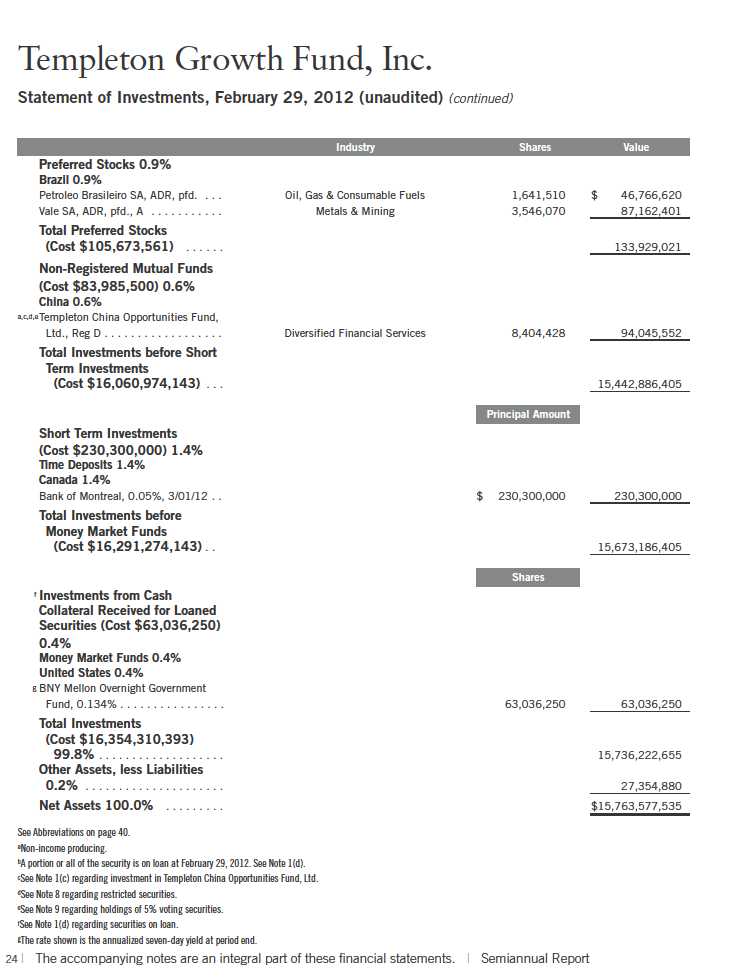
Templeton Growth Fund, Inc.
Statement of Investments, February 29, 2012 (unaudited)
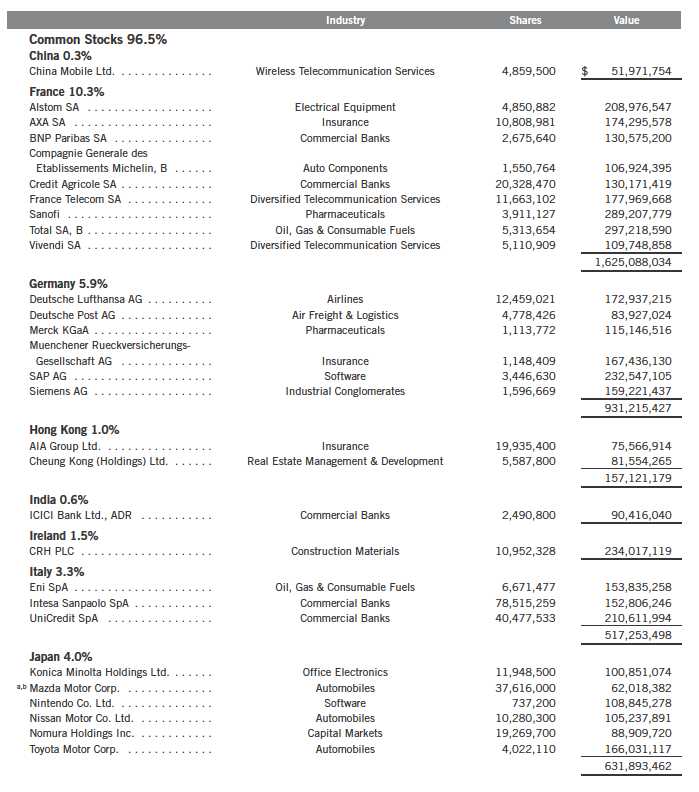
Semiannual Report | 21
Semiannual Report | 23
Semiannual Report | The accompanying notes are an integral part of these financial statements. | 25
26 | The accompanying notes are an integral part of these financial statements. | Semiannual Report
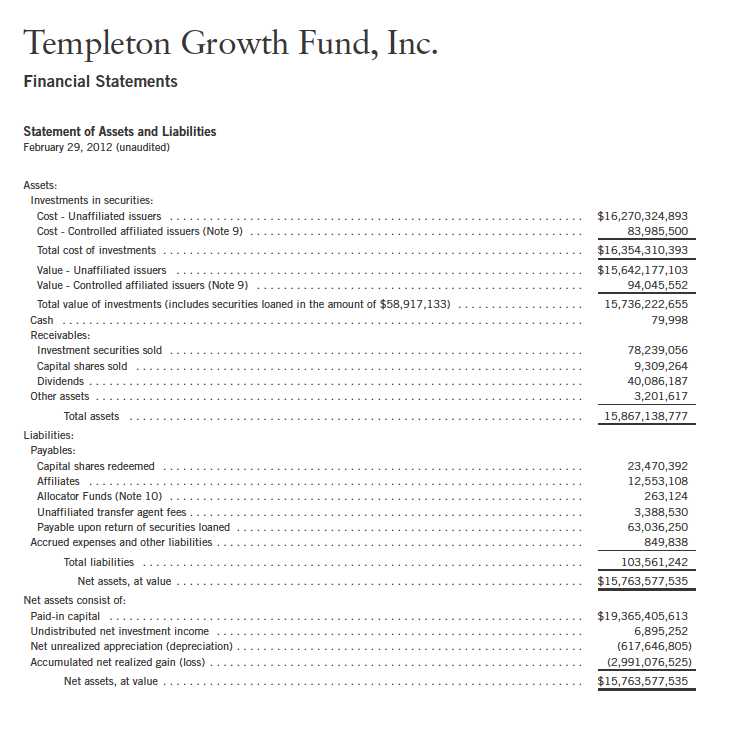
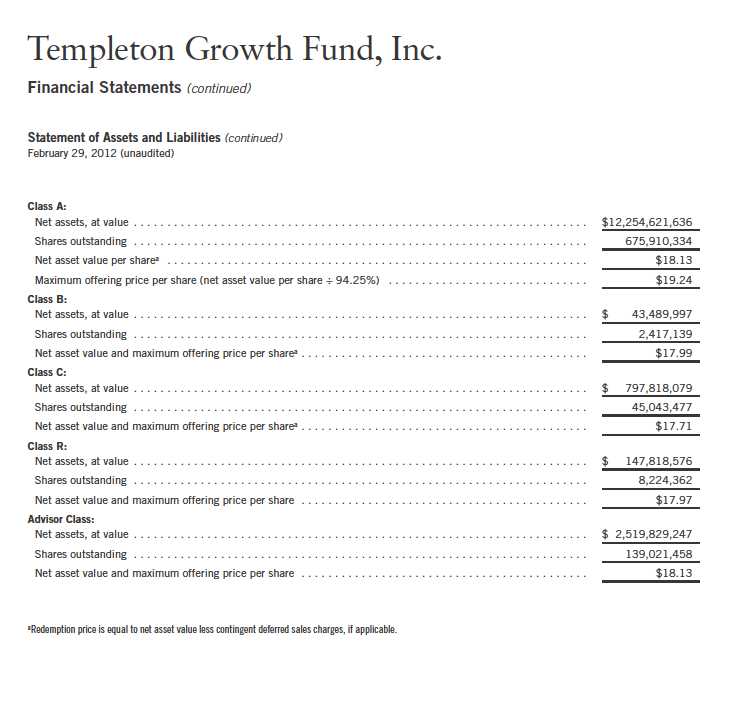
Templeton Growth Fund, Inc.
Financial Statements (continued)
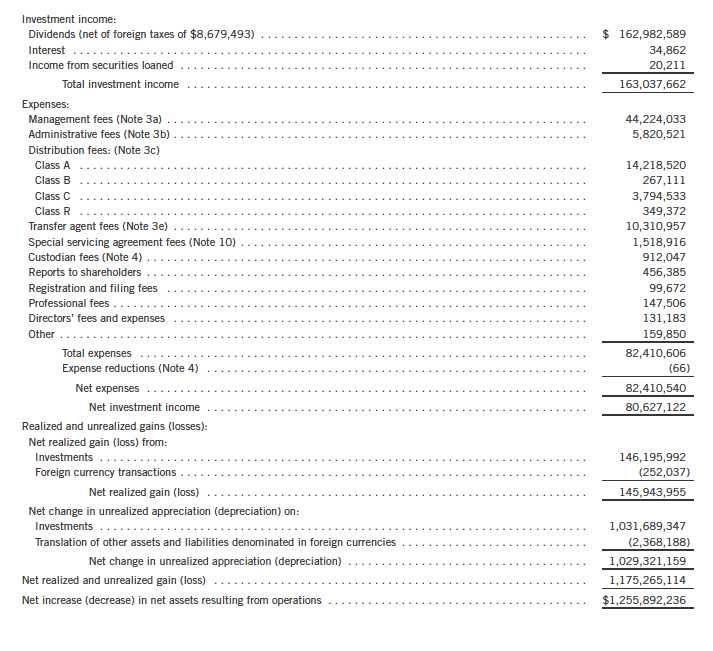
Statement of Operations
for the six months ended February 29, 2012 (unaudited)
Semiannual Report | The accompanying notes are an integral part of these financial statements. | 27
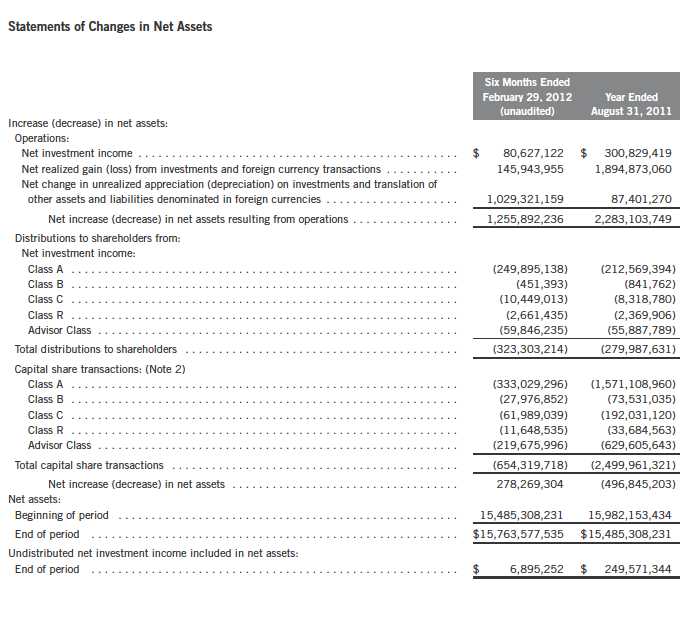
Templeton Growth Fund, Inc.
Financial Statements (continued)
28 | The accompanying notes are an integral part of these financial statements. | Semiannual Report
Templeton Growth Fund, Inc.
Notes to Financial Statements (unaudited)
1. ORGANIZATION AND SIGNIFICANT ACCOUNTING POLICIES
Templeton Growth Fund, Inc. (Fund) is registered under the Investment Company Act of 1940, as amended, (1940 Act) as an open-end investment company. The Fund offers five classes of shares: Class A, Class B, Class C, Class R, and Advisor Class. Each class of shares differs by its initial sales load, contingent deferred sales charges, distribution fees, voting rights on matters affecting a single class and its exchange privilege.
The following summarizes the Fund’s significant accounting policies.
a. Financial Instrument Valuation
The Fund’s investments in securities and other financial instruments are carried at fair value daily. Fair value is the price that would be received to sell an asset or paid to transfer a liability in an orderly transaction between market participants on the measurement date. Under procedures approved by the Fund’s Board of Directors, the Fund may utilize independent pricing services, quotations from securities and financial instrument dealers, and other market sources to determine fair value.
Equity securities listed on an exchange or on the NASDAQ National Market System are valued at the last quoted sale price or the official closing price of the day, respectively. Foreign equity securities are valued as of the close of trading on the foreign stock exchange on which the security is primarily traded, or the NYSE, whichever is earlier. The value is then converted into its U.S. dollar equivalent at the foreign exchange rate in effect at the close of the NYSE on the day that the value of the security is determined. Over-the-counter securities are valued within the range of the most recent quoted bid and ask prices. Securities that trade in multiple markets or on multiple exchanges are valued according to the broadest and most representative market. Certain equity securities are valued based upon fundamental characteristics or relationships to similar securities. Investments in non-registered money market funds are valued at the closing net asset value. Time deposits are valued at cost, which approximates market value.
The Fund has procedures to determine the fair value of securities and other financial instruments for which market prices are not readily available or which may not be reliably priced. Under these procedures, the Fund primarily employs a market-based approach which may use related or comparable assets or liabilities, recent transactions, market multiples, book values, and other relevant information for the investment to determine the fair value of the investment. The Fund may also use an income-based valuation approach in which the anticipated future cash flows of the investment are discounted to calculate fair value. Discounts may also be applied due to the nature or duration of any restrictions on the disposition of the investments. Due to the inherent uncertainty of valuations of such investments, the fair values may differ significantly from the values that would have been used had an active market existed.
Trading in securities on foreign securities stock exchanges and over-the-counter markets may be completed before the daily close of business on the NYSE. Occasionally, events occur between the time at which trading in a foreign security is completed and the close of the NYSE that
Semiannual Report | 29
Templeton Growth Fund, Inc.
Notes to Financial Statements (unaudited) (continued)
| 1. | ORGANIZATION AND SIGNIFICANT ACCOUNTING POLICIES (continued) |
| a. | Financial Instrument Valuation (continued) |
might call into question the reliability of the value of a portfolio security held by the Fund. As a result, differences may arise between the value of the Fund’s portfolio securities as determined at the foreign market close and the latest indications of value at the close of the NYSE. In order to minimize the potential for these differences, the investment manager monitors price movements following the close of trading in foreign stock markets through a series of country specific market proxies (such as baskets of American Depositary Receipts, futures contracts and exchange traded funds). These price movements are measured against established trigger thresholds for each specific market proxy to assist in determining if an event has occurred that may call into question the reliability of the values of the foreign securities held by the Fund. If such an event occurs, the securities may be valued using fair value procedures, which may include the use of independent pricing services.
b. Foreign Currency Translation
Portfolio securities and other assets and liabilities denominated in foreign currencies are translated into U.S. dollars based on the exchange rate of such currencies against U.S. dollars on the date of valuation. The Fund may enter into foreign currency exchange contracts to facilitate transactions denominated in a foreign currency. Purchases and sales of securities, income and expense items denominated in foreign currencies are translated into U.S. dollars at the exchange rate in effect on the transaction date. Portfolio securities and assets and liabilities denominated in foreign currencies contain risks that those currencies will decline in value relative to the U.S. dollar. Occasionally, events may impact the availability or reliability of foreign exchange rates used to convert the U.S. dollar equivalent value. If such an event occurs, the foreign exchange rate will be valued at fair value using procedures established and approved by the Fund’s Board of Directors.
The Fund does not separately report the effect of changes in foreign exchange rates from changes in market prices on securities held. Such changes are included in net realized and unrealized gain or loss from investments on the Statement of Operations.
Realized foreign exchange gains or losses arise from sales of foreign currencies, currency gains or losses realized between the trade and settlement dates on securities transactions and the difference between the recorded amounts of dividends, interest, and foreign withholding taxes and the U.S. dollar equivalent of the amounts actually received or paid. Net unrealized foreign exchange gains and losses arise from changes in foreign exchange rates on foreign denominated assets and liabilities other than investments in securities held at the end of the reporting period.
30 | Semiannual Report
Templeton Growth Fund, Inc.
Notes to Financial Statements (unaudited) (continued)
| 1. | ORGANIZATION AND SIGNIFICANT ACCOUNTING POLICIES (continued) |
| c. | Investment in Templeton China Opportunities Fund, Ltd. |
The Fund invests in Templeton China Opportunities Fund, Ltd. (China Fund), a private offering of unregistered shares in a Cayman Islands Exempt Company. The China Fund investment objective is to seek capital growth primarily through investments in A-shares of Chinese companies listed on the Shanghai and Shenzhen stock exchanges. Chinese A-shares are traded in Chinese Renminbi and are only available as an investment to domestic (Chinese) investors and holders of a Qualified Foreign Institutional Investors license. The China Fund is managed by Templeton Investment Counsel, LLC (an affiliate of the investment manager). No additional management or administrative fees are incurred on assets invested in the China Fund.
The China Fund may be subject to certain restrictions and administrative processes relating to its ability to repatriate cash balances, investment proceeds and earnings associated with its investment, as such activities are subject to approval by agencies of the Chinese government and thus the Fund may incur delays in redeeming its investment in the China Fund. The Fund’s investment in the China Fund is valued based upon the fair value of the China Fund’s portfolio securities and other assets and liabilities.
d. Securities Lending
The Fund participates in a principal based securities lending program. The Fund receives cash collateral against the loaned securities in an amount equal to at least 102% of the market value of the loaned securities. Collateral is maintained over the life of the loan in an amount not less than 100% of the market value of loaned securities, as determined at the close of fund business each day; any additional collateral required due to changes in security values is delivered to the Fund on the next business day. The collateral is invested in a non-registered money fund as indicated on the Statement of Investments. The Fund receives income from the investment of cash collateral, in addition to lending fees and rebates paid by the borrower. The Fund bears the market risk with respect to the collateral investment, securities loaned, and the risk that the principal may default on its obligations to the Fund.
e. Income Taxes
It is the Fund’s policy to qualify as a regulated investment company under the Internal Revenue Code. The Fund intends to distribute to shareholders substantially all of its taxable income and net realized gains to relieve it from federal income and excise taxes. As a result, no provision for U.S. federal income taxes is required.
The Fund may be subject to foreign taxation related to income received, capital gains on the sale of securities and certain foreign currency transactions in the foreign jurisdictions in which it invests. Foreign taxes, if any, are recorded based on the tax regulations and rates that exist in the foreign markets in which the Fund invests. When a capital gain tax is determined to apply the Fund records an estimated deferred tax liability in an amount that would be payable if the securities were disposed of on the valuation date.
Semiannual Report | 31
Templeton Growth Fund, Inc.
Notes to Financial Statements (unaudited) (continued)
| 1. | ORGANIZATION AND SIGNIFICANT ACCOUNTING POLICIES (continued) |
| e. | Income Taxes (continued) |
The Fund recognizes the tax benefits of uncertain tax positions only when the position is “more likely than not” to be sustained upon examination by the tax authorities based on the technical merits of the tax position. As of February 29, 2012, and for all open tax years, the Fund has determined that no liability for unrecognized tax benefits is required in the Fund’s financial statements related to uncertain tax positions taken on a tax return (or expected to be taken on future tax returns). Open tax years are those that remain subject to examination and are based on each tax jurisdiction statute of limitation.
f. Security Transactions, Investment Income, Expenses and Distributions
Security transactions are accounted for on trade date. Realized gains and losses on security transactions are determined on a specific identification basis. Interest income and estimated expenses are accrued daily. Amortization of premium and accretion of discount on debt securities are included in interest income. Dividend income is recorded on the ex-dividend date except that certain dividends from foreign securities are recognized as soon as the Fund is notified of the ex-dividend date. Distributions to shareholders are recorded on the ex-dividend date and are determined according to income tax regulations (tax basis). Distributable earnings determined on a tax basis may differ from earnings recorded in accordance with accounting principles generally accepted in the United States of America. These differences may be permanent or temporary. Permanent differences are reclassified among capital accounts to reflect their tax character. These reclassifications have no impact on net assets or the results of operations. Temporary differences are not reclassified, as they may reverse in subsequent periods.
Realized and unrealized gains and losses and net investment income, not including class specific expenses, are allocated daily to each class of shares based upon the relative proportion of net assets of each class. Differences in per share distributions, by class, are generally due to differences in class specific expenses.
g. Accounting Estimates
The preparation of financial statements in accordance with accounting principles generally accepted in the United States of America requires management to make estimates and assumptions that affect the reported amounts of assets and liabilities at the date of the financial statements and the amounts of income and expenses during the reporting period. Actual results could differ from those estimates.
h. Guarantees and Indemnifications
Under the Fund’s organizational documents, its officers and directors are indemnified by the Fund against certain liabilities arising out of the performance of their duties to the Fund. Additionally, in the normal course of business, the Fund enters into contracts with service providers that contain general indemnification clauses. The Fund’s maximum exposure under these arrangements is unknown as this would involve future claims that may be made against the Fund that have not yet occurred. Currently, the Fund expects the risk of loss to be remote.
32 | Semiannual Report
Templeton Growth Fund, Inc.
Notes to Financial Statements (unaudited) (continued)
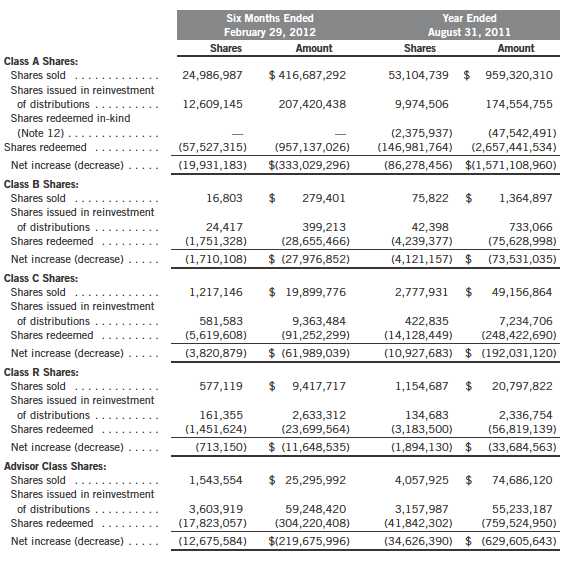
2. CAPITAL STOCK
At February 29, 2012, there were 2.4 billion shares authorized ($0.01 par value). Transactions
in the Fund’s shares were as follows:
Semiannual Report | 33
Templeton Growth Fund, Inc.
Notes to Financial Statements (unaudited) (continued)
3. TRANSACTIONS WITH AFFILIATES
Franklin Resources, Inc. is the holding company for various subsidiaries that together are
referred to as Franklin Templeton Investments. Certain officers and directors of the Fund are
also officers and/or directors of the following subsidiaries:
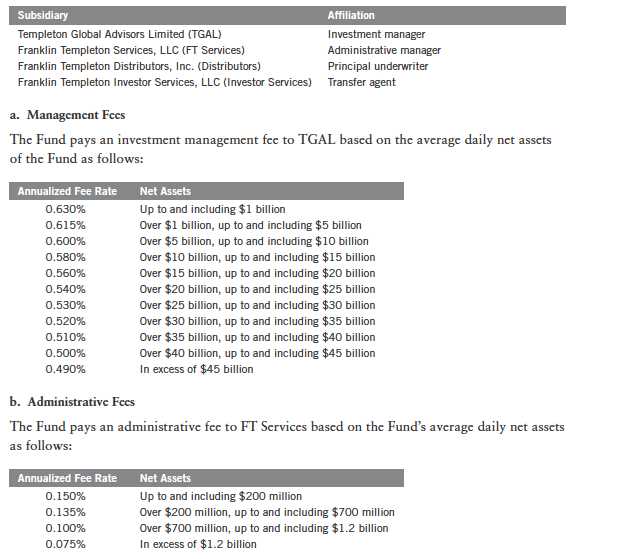
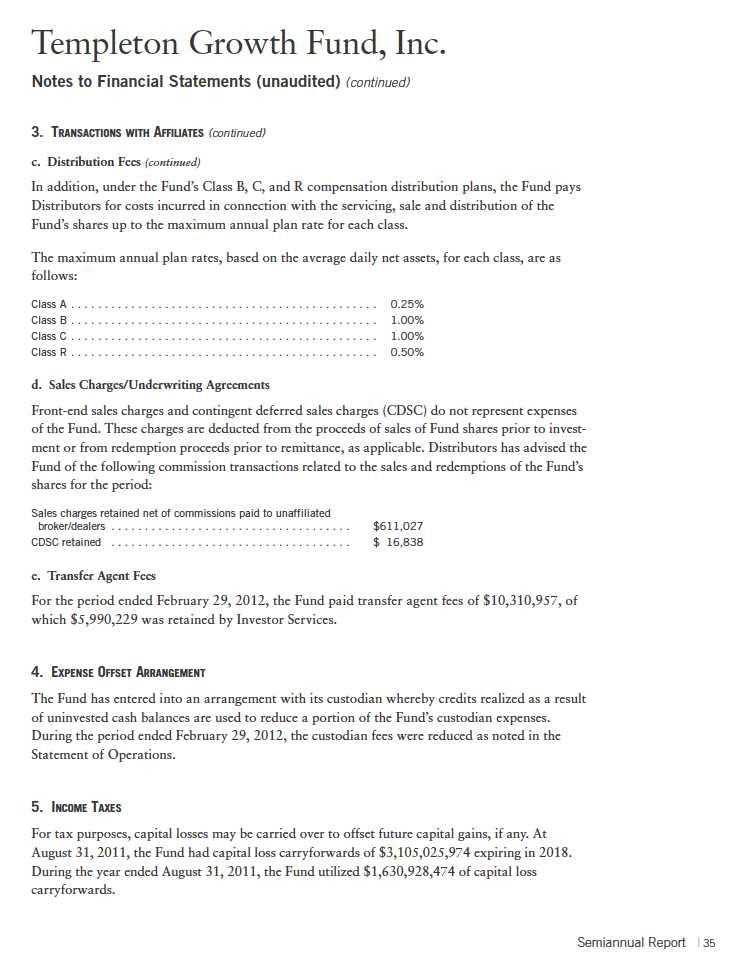
c. Distribution Fees
The Fund’s Board of Directors has adopted distribution plans for each share class, with the
exception of Advisor Class shares, pursuant to Rule 12b-1 under the 1940 Act. Under the
Fund’s Class A reimbursement distribution plan, the Fund reimburses Distributors for costs
incurred in connection with the servicing, sale and distribution of the Fund’s shares up to the
maximum annual plan rate. Under the Class A reimbursement distribution plan, costs exceeding
the maximum for the current plan year cannot be reimbursed in subsequent periods.
34 | Semiannual Report
Templeton Growth Fund, Inc.
Notes to Financial Statements (unaudited) (continued)
5. INCOME TAXES (continued)
Under the Regulated Investment Company Modernization Act of 2010, the Fund will be permitted to carry forward capital losses incurred in taxable years beginning after December 22, 2010 for an unlimited period. Post-enactment capital loss carryforwards will retain their character as either short-term or long-term capital losses rather than being considered short-term as under previous law. Any post-enactment capital losses generated will be required to be utilized prior to the losses incurred in pre-enactment tax years.
At February 29, 2012, the cost of investments, net unrealized appreciation (depreciation), for income tax purposes were as follows:
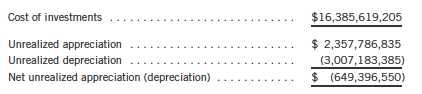
Differences between income and/or capital gains as determined on a book basis and a tax basis are primarily due to differing treatments of foreign currency transactions, pass-through entity income, regulatory settlements, wash sales, and gains realized on in-kind shareholder redemptions.
6. INVESTMENT TRANSACTIONS
Purchases and sales of investments (excluding short term securities) for the period ended February 29, 2012, aggregated $861,041,021 and $1,864,374,229, respectively.
7. CONCENTRATION OF RISK
Investing in foreign securities may include certain risks and considerations not typically associated with investing in U.S. securities, such as fluctuating currency values and changing local and regional economic, political and social conditions, which may result in greater market volatility. In addition, certain foreign securities may not be as liquid as U.S. securities.
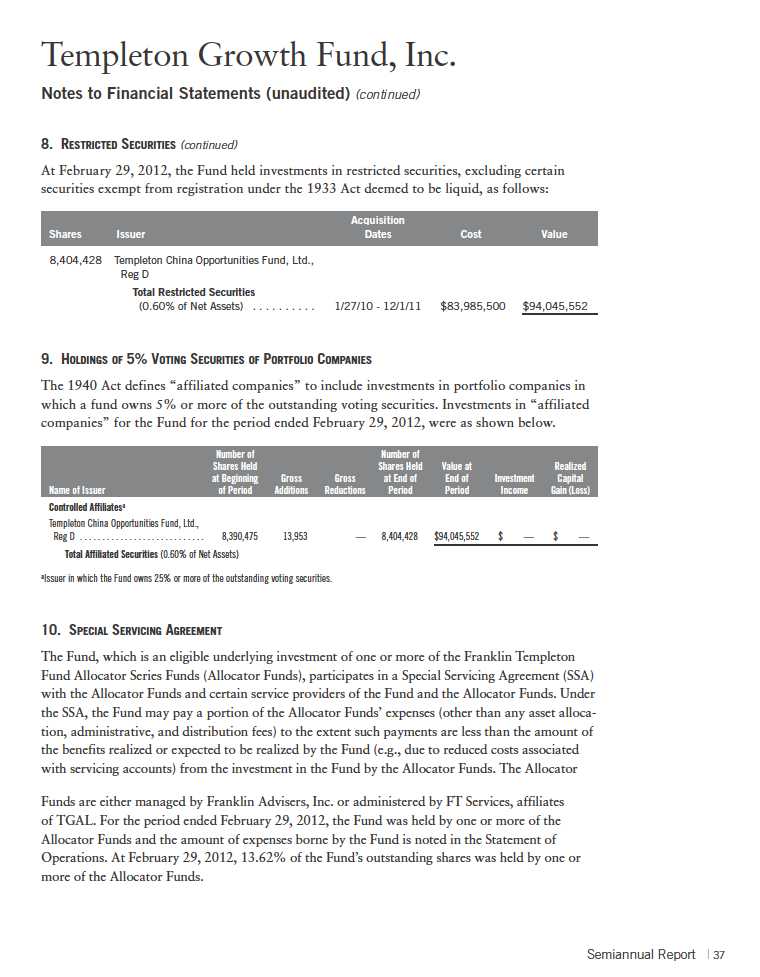
8. RESTRICTED SECURITIES
The Fund invests in securities that are restricted under the Securities Act of 1933 (1933 Act) or which are subject to legal, contractual, or other agreed upon restrictions on resale. Restricted securities are often purchased in private placement transactions, and cannot be sold without prior registration unless the sale is pursuant to an exemption under the 1933 Act. Disposal of these securities may require greater effort and expense, and prompt sale at an acceptable price may be difficult. The Fund may have registration rights for restricted securities. The issuer generally incurs all registration costs.
36 | Semiannual Report
Templeton Growth Fund, Inc.
Notes to Financial Statements (unaudited) (continued)
11. CREDIT FACILITY
The Fund, together with other U.S. registered and foreign investment funds (collectively, Borrowers), managed by Franklin Templeton Investments, are borrowers in a joint syndicated senior unsecured credit facility totaling $1.5 billion (Global Credit Facility) which matures on January 18, 2013. This Global Credit Facility provides a source of funds to the Borrowers for temporary and emergency purposes, including the ability to meet future unanticipated or unusually large redemption requests.
Under the terms of the Global Credit Facility, the Fund shall, in addition to interest charged on any borrowings made by the Fund and other costs incurred by the Fund, pay its share of fees and expenses incurred in connection with the implementation and maintenance of the Global Credit Facility, based upon its relative share of the aggregate net assets of all of the Borrowers, including an annual commitment fee of 0.08% based upon the unused portion of the Global Credit Facility, which is reflected in other expenses on the Statement of Operations. During the period ended February 29, 2012, the Fund did not use the Global Credit Facility.
12. REDEMPTION IN-KIND
During the year ended August 31, 2011, the Fund realized $4,961,497 of net gains resulting from a redemption in-kind in which a shareholder redeemed fund shares for securities held by the Fund rather than for cash. Because such gains are not taxable to the Fund, and are not distributed to remaining shareholders, they have been reclassified from accumulated net realized gains to paid-in capital.
13. FAIR VALUE MEASUREMENTS
The Fund follows a fair value hierarchy that distinguishes between market data obtained from independent sources (observable inputs) and the Fund’s own market assumptions (unobservable inputs). These inputs are used in determining the value of the Fund’s investments and are summarized in the following fair value hierarchy:
- Level 1 – quoted prices in active markets for identical securities
- Level 2 – other significant observable inputs (including quoted prices for similar securities, interest rates, prepayment speed, credit risk, etc.)
- Level 3 – significant unobservable inputs (including the Fund’s own assumptions in determining the fair value of investments)
The inputs or methodology used for valuing securities are not an indication of the risk associated with investing in those securities.
For movements between the levels within the fair value hierarchy, the Fund has adopted a policy of recognizing the transfers as of the date of the underlying event which caused the movement.
38 | Semiannual Report
Templeton Growth Fund, Inc.
Notes to Financial Statements (unaudited) (continued)
15. SUBSEQUENT EVENTS
The Fund has evaluated subsequent events through the issuance of the financial statements and
determined that no events have occurred that require disclosure.
ABBREVIATIONS
Selected Portfolio
ADR - American Depositary Receipt
40 | Semiannual Report
Templeton Growth Fund, Inc.
Shareholder Information
Proxy Voting Policies and Procedures
The Fund’s investment manager has established Proxy Voting Policies and Procedures (Policies) that the Fund uses to determine how to vote proxies relating to portfolio securities. Shareholders may view the Fund’s complete Policies online at franklintempleton.com. Alternatively, shareholders may request copies of the Policies free of charge by calling the Proxy Group collect at (954) 527-7678 or by sending a written request to: Franklin Templeton Companies, LLC, 300 S.E. 2nd Street, Fort Lauderdale, FL 33301, Attention: Proxy Group. Copies of the Fund’s proxy voting records are also made available online at franklintempleton.com and posted on the U.S. Securities and Exchange Commission’s website at sec.gov and reflect the most recent 12-month period ended June 30.
Quarterly Statement of Investments
The Fund files a complete statement of investments with the U.S. Securities and Exchange Commission for the first and third quarters for each fiscal year on Form N-Q. Shareholders may view the filed Form N-Q by visiting the Commission’s website at sec.gov. The filed form may also be viewed and copied at the Commission’s Public Reference Room in Washington, DC. Information regarding the operations of the Public Reference Room may be obtained by calling (800) SEC-0330.
Semiannual Report | 41
This page intentionally left blank.
This page intentionally left blank.
This page intentionally left blank.
Item 2. Code of Ethics.
| (a) | The Registrant has adopted a code of ethics that applies to its principal executive officers and principal financial and accounting officer. |
| (c) | N/A |
| (d) | N/A |
| (f) | Pursuant to Item 12(a)(1), the Registrant is attaching as an exhibit a copy of its code of ethics that applies to its principal executive officers and principal financial and accounting officer. |
Item 3. Audit Committee Financial Expert.
(a)(1) The Registrant has an audit committee financial expert serving on its audit committee.
(2) The audit committee financial expert is David W. Niemiec and he is "independent" as defined under the relevant Securities and Exchange Commission Rules and Releases.

Item 6. Schedule of Investments. N/A
Item 7. Disclosure of Proxy Voting Policies and Procedures for Closed-End Management Investment Companies. N/A
Item 8. Portfolio Managers of Closed-End Management Investment Companies. N/A
Item 9. Purchases of Equity Securities by Closed-End Management Investment Company and Affiliated Purchasers. N/A
Item 10. Submission of Matters to a Vote of Security Holders.
There have been no changes to the procedures by which shareholders may recommend nominees to the Registrant's Board of Directors that would require disclosure herein.
Item 11. Controls and Procedures.
(a) Evaluation of Disclosure Controls and Procedures. The Registrant maintains disclosure controls and procedures that are designed to ensure that information required to be disclosed in the Registrant’s filings under the Securities Exchange Act of 1934 and the Investment Company Act of 1940 is recorded,
processed, summarized and reported within the periods specified in the rules and forms of the Securities and Exchange Commission. Such information is accumulated and communicated to the Registrant’s management, including its principal executive officer and principal financial officer, as appropriate, to allow timely decisions regarding required disclosure. The Registrant’s management, including the principal executive officer and the principal financial officer, recognizes that any set of controls and procedures, no matter how well designed and operated, can provide only reasonable assurance of achieving the desired control objectives.
Within 90 days prior to the filing date of this Shareholder Report on Form N-CSR, the Registrant had carried out an evaluation, under the supervision and with the participation of the Registrant’s management, including the Registrant’s principal executive officer and the Registrant’s principal financial officer, of the effectiveness of the design and operation of the Registrant’s disclosure controls and procedures. Based on such evaluation, the Registrant’s principal executive officer and principal financial officer concluded that the Registrant’s disclosure controls and procedures are effective.
(b) Changes in Internal Controls.
There have been no significant changes in
the Registrant’s internal controls or in other factors that could significantly affect the internal controls subsequent to the date of their evaluation in connection with the preparation of this Shareholder Report on Form N-CSR.
Item 12. Exhibits.
(a)(1) Code of Ethics
(a)(2) Certifications pursuant to Section 302 of the Sarbanes-Oxley Act of 2002 of Laura F. Fergerson, Chief Executive Officer - Finance and Administration, and Mark H. Otani, Chief Financial Officer and Chief Accounting Officer
(b) Certifications pursuant to Section 906 of the Sarbanes-Oxley Act of 2002 of Laura F. Fergerson, Chief Executive Officer - Finance and Administration, and Mark H. Otani, Chief Financial Officer and Chief Accounting Officer