TEMPLETON GROWTH FUND, INC.
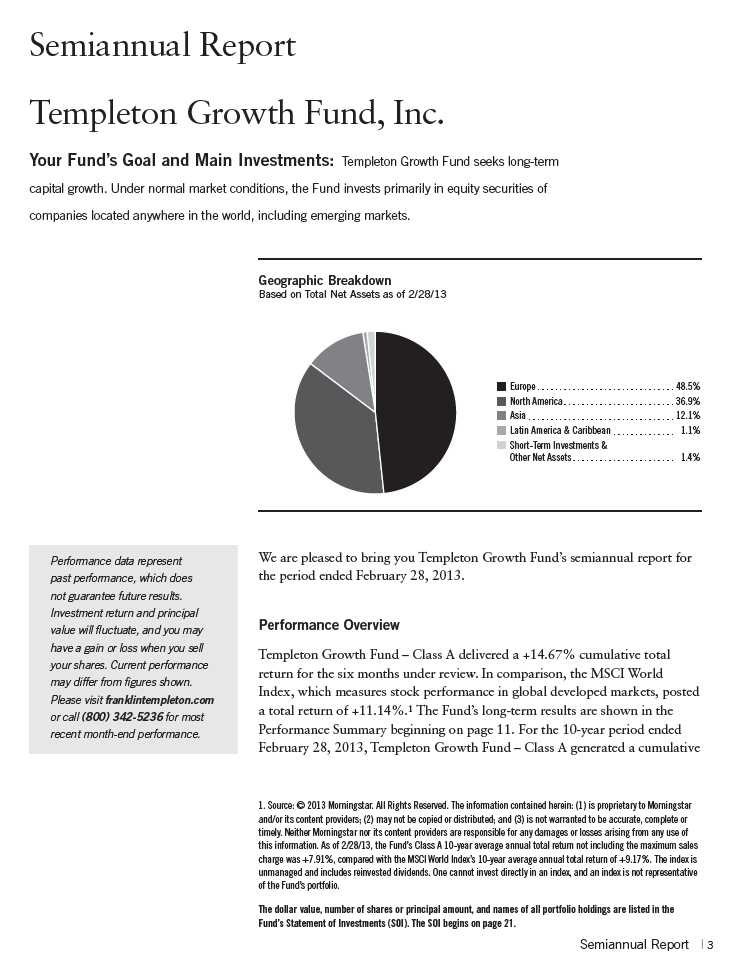
total return of +108.93%, compared with the MSCI World Index’s +140.48% cumulative total return for the same period.1 Please note index performance information is provided for reference and we do not attempt to track the index but rather undertake investments on the basis of fundamental research. You can find more performance data in the Performance Summary.
Economic and Market Overview
Global developed country stocks, as measured by the MSCI World Index, advanced during the six-month review period as continued policy support and improving investor sentiment overcame the negative effects of mixed economic data and growing political distractions. Stocks entered the period with positive momentum as central banks in all major regions loosened policy. The U.S. Federal Reserve Board announced a third and unlimited round of quantitative easing, China announced a fiscal stimulus package to fund infrastructure projects and Germany’s top constitutional court allowed that country to conditionally ratify the European Stability Mechanism. Investor attention turned to politics as many major countries prepared to elect or appoint new leaders. The U.S. and China began new political cycles in November, resulting in the re-election of incumbent U.S. president Barack Obama and the appointment of Xi Jinping, a close ally of China’s former president, to lead that country’s top decision-making body. The markets initially reacted negatively to these events, but after a brief dip, stocks quickly recovered and rallied to post-crisis highs by the end of the review period.
As the period progressed, headline economic data painted a picture of nuanced and inconsistent global growth trends. China’s growth remained above the 7% benchmark associated with an economic “hard landing,” and the People’s Bank of China differed from other central banks by tightening monetary policy to discourage asset bubble formation. Developed world growth remained mostly anemic, however, and policy conditions supportive. In the U.S., fourth-quarter 2012 growth was roughly flat, mainly because of public spending cuts and inventory drawdowns, although private demand actually accelerated. Europe’s economic weakness persisted, and even Germany succumbed to growth pressures in the fourth quarter. Political developments in both regions threatened to derail stocks — U.S. politicians failed to reach a basic budget compromise, and inconclusive Italian elections were interpreted as a vote against pro-European reforms. But market momentum remained positive and stock funds began experiencing investment inflows for the first time since the beginning of 2011.
Japan was particularly notable for its strength after the Liberal Democratic Party won elections and immediately appointed a central bank governor who vowed to defeat deflation. The yen consequently plummeted, resulting in calls
4 | Semiannual Report
from developed world leaders to prevent exchange rate targeting and competitive devaluation. Yet, traditional hedges against currency instability failed to reflect concern, and gold extended its longest run of monthly losses since 1997. Commodities in general weakened owing to a muted global growth outlook, yet rising bond yields in safe-haven government securities and subdued volatility readings in stock markets suggested that investors remained mostly sanguine about future growth prospects.
Investment Strategy
Our investment strategy employs a bottom-up, value-oriented, long-term approach. We focus on the market price of a company’s securities relative to our evaluation of the company’s long-term earnings, asset value and cash flow potential. As we look worldwide, we consider specific companies, rather than sectors or countries, while doing in-depth research to construct a bargain list from which we buy. Before we make a purchase, we look at the company’s price/earnings ratio, price/cash flow ratio, profit margins and liquidation value.
Manager’s Discussion
Templeton Growth Fund delivered solid gains and outperformed the benchmark MSCI World Index during the six-month period under review. All major regions and sectors contributed to performance. Stock selection notably drove relative performance, suggesting that our bottom-up, fundamental approach added value. Not surprising to us, improving Fund performance coincided with a weakening of market conditions that we have previously identified as being adverse to our investment style. Stock correlations (the tendency of stocks to move in unison) declined from what were, by some measures, their highest levels since the Great Depression, rewarding our efforts to identify stocks with what we saw as differentiated value. Consequently, during the period the performance of value-oriented stocks improved, and January 2013 marked the first time in three years the MSCI World Value Index outperformed the MSCI World Growth Index over a rolling 12-month horizon. Fund investment flow data suggested to us a nascent change in risk tolerance as equity funds experienced net inflows for the first time in two years. The leadership of the market’s more cyclical sectors — financials, industrials and consumer discretionary — also suggested to us that investors were becoming more confident in the stock market’s rally. Although economic data remained mixed and global politics fractious, central bank policies stayed generally accommodative and improving sentiment supported stock market gains.
We believe these positive developments benefited the Fund by vindicating some of our firmest contrarian convictions. We have long held that certain stocks looked cheap in absolute terms and relative to other asset classes.
Semiannual Report | 5
The difference between the yield on a stock and a U.S. Treasury bond is the “equity risk premium” — the premium that investors receive for assuming the uncertainty of owning equities. For much of the past four decades this premium was negative; during the period under review it was nearly six percentage points. In our view, rarely have investors owned stocks on such advantageous terms. This has created an attractive margin of safety, in our opinion, strengthened by a 2.6% average dividend yield for the MSCI World Index, which is roughly 75% higher than the average yield of a diversified portfolio of minimal risk government bonds (including 10-year U.S. Treasuries, Japanese government bonds, U.K. gilts and German bunds).2 Meanwhile, global stocks generally traded roughly 20% below their historical earnings multiple average and our analysis showed pockets of extreme undervaluation persisted during the period.3
We have commented in past reports that the global financial crisis forced companies to undergo important fundamental repairs, and highlighted what we viewed as the attractive prospects for capital preservation, appreciation and income implicit in equity valuations. Companies that survived the crisis have generally strengthened their balance sheets, improved capital efficiency and refined strategic goals to compete in a sluggish global economic growth environment. As a result, corporate earnings per share largely recovered to pre-crisis levels by 2011, and many excess cash flows have since helped pay down debt and buy back stock. A one-third average increase in book value per share of global stocks over the past four years shows how such measures compounded shareholder value. However, stock funds continued to experience outflows because investors, chastened by 2008 losses and skeptical about the ongoing economic recovery, also doubted the sustainability of the market rally. Although the Fund captured many of the gains that investors on the sidelines missed, the tendency of stocks to move uniformly in reaction to economic and political headlines had limited the relative value of our bottom-up strategy in the crisis recovery. For this reason, the willingness of investors to discriminate between stock valuations and fundamentals during the review period was particularly encouraging to us and significantly benefited our portfolio of stocks we consider undervalued.
Encouraging to us, the Fund’s relative performance during the review period was attributable to stock selection rather than sector or country allocations. This suggested that our bottom-up, fundamental approach to stock investing
2. Sources: FactSet; Bloomberg LP. © 2013 FactSet Research Systems Inc. All Rights Reserved. The information contained herein: (1) is proprietary to FactSet Research Systems Inc. and/or its content providers; (2) may not be copied or distributed; and (3) is not warranted to be accurate, complete or timely. Neither FactSet Research Systems Inc. nor its content providers are responsible for any damages or losses arising from any use of this information. Past performance is no guarantee of future results.
3. Source: FactSet, MSCI. MSCI makes no express or implied warranties or representations and shall have no liability whatsoever with respect to any MSCI data contained herein. The MSCI data may not be further redistributed or used as a basis for other indices or any securities or financial products. This report is not approved, reviewed or produced by MSCI.
6 | Semiannual Report
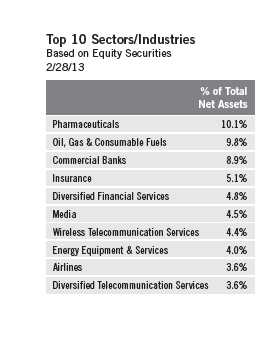
added significant value for shareholders. This benefit was especially evident in financials, the Fund’s top contributing sector in absolute and relative terms.4 Although our sector overweighting aided returns, the contribution from stock picking was far greater, and financials comprised many of the Fund’s top performers for the period. Most of those positions are from Europe, where we selectively increased exposure in recent years as the region’s unpopularity created bargain opportunities, in our view. Even after such stocks’ recent gains, we continued to see significant upside potential in certain European financials that have restructured, recapitalized and now enjoy the implicit backstop of the European Central Bank (ECB). Although the sector’s risk profile in the intermediate term remained elevated given ongoing global economic risks and industry reorganization, we believe tangible book values may gradually increase over time and investors could recognize the value of our financials holdings as banks revert to more normalized valuation levels.
Industrials is another cyclical sector where the Fund benefited from investing in low-valued firms undergoing restructuring initiatives.5 Two airlines were among top Fund contributors — Deutsche Lufthansa (Germany) and off-benchmark, U.K.-based International Consolidated Airlines Group (IAG), the parent company of British Airways. Shares rallied during the review period after the firms implemented aggressive cost cuts and capacity reductions and benefited from improving air traffic volumes. We acquired the two stocks at valuations we considered very low amid uncertainty surrounding global economic growth, competitive pressures and rising pension deficits. We were encouraged to see management at both companies taking steps to address such challenges head-on in an effort to enhance profitability and shareholder value.
Similar dynamics helped support the Fund’s consumer discretionary holdings, notably among Japanese auto manufacturers recovering from earthquake-related production disruptions and a diplomatic row with China that dented sales in the world’s largest car market.6 Toyota Motor was a top contributor, generating robust gains after lifting profit forecasts and regaining its status as the world’s largest car maker. Smaller Japanese rival Mazda Motor did even better, surging after demand for new models improved and the company shuttered loss-making production facilities. The developments were amplified by the longest stretch of yen weakness since 2008, which significantly improved sales prospects for companies that sell many of their vehicles abroad.
4. The financials sector comprises capital markets, commercial banks, consumer finance, diversified financial services, insurance, and real estate management and development in the SOI.
5. The industrials sector comprises aerospace and defense; air freight and logistics; construction and engineering; construction materials; electrical equipment; electronic equipment, instruments and components; industrial conglomerates; and machinery in the SOI.
6. The consumer discretionary sector comprises auto components, automobiles, media, multiline retail and specialty retail in the SOI.
Semiannual Report | 7
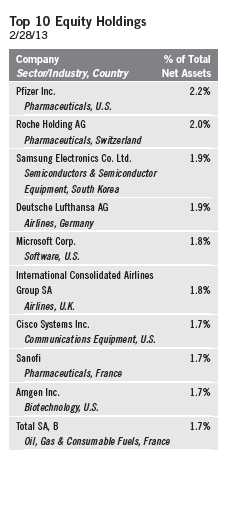
Stock selection greatly benefited the Fund’s information technology sector performance, as our dynamic holdings sheltered the Fund from an otherwise weak period for technology stocks.7 Off-benchmark, South Korean consumer electronics and semiconductor manufacturer Samsung Electronics was a notable performer. Even after gaining more than 800% since coming on the Fund’s bargain list over a decade ago, Samsung continues to impress us with its technological innovation and managerial savvy. The company holds the number-one position in smartphone sales globally and in the fourth quarter of 2012 doubled its share of the lucrative tablet computer market.
Other leading sector performers included Hewlett-Packard (HP) and Dell, two storied technology firms that in recent years navigated a confluence of self-inflicted wounds and low-cost competition from companies in emerging markets (a Chinese competitor surpassed HP in 2012 as the world’s largest PC maker). In our opinion, the companies made mistakes in their multi-year efforts to diversify away from low-margin personal computers into higher growth technology segments, and a series of managerial changes did little to restore investor confidence. At various points, the stocks traded at historically low valuations, and although our investments have not been profitable yet, we believe positive signs emerged during the period. Dell announced a buyout led by founder and CEO Michael Dell, which boosted shares and could unlock value, while HP’s announcement of better-than-expected earnings signaled to us that its turnaround strategy was gaining traction. Although distinct challenges confront Dell and HP, we remain encouraged by recent developments.
The only sector detractors from relative performance were energy and telecommunication services.8 In the energy sector, stock-specific weakness and an unfavorable overweighting during a period of declining oil prices resulted in underperformance. Canadian oil and gas producer Talisman Energy was a notable sector detractor, declining amid weak North American gas prices and falling output from its North Sea projects. Nonetheless, the company appeared to take the necessary steps to shift its focus to more economical international projects, and depressed valuations suggested to us considerable long-term upside potential should it succeed. Overall, the energy sector looks broadly undervalued to us after stumbling over the past decade as production growth slowed and capital expenditures accelerated. We have become increasingly focused on energy companies we believe are positioned for stronger production growth and feature high dividend yields as a way of mitigating our reliance on sector optimism or a “stronger for longer” oil price environment. The Fund’s
7. The information technology sector comprises communications equipment, computers and peripherals, office electronics, semiconductors and semiconductor equipment, and software in the SOI.
8. The energy sector comprises energy equipment and services; and oil, gas and consumable fuels in the SOI. The telecommunication services sector comprises diversified telecommunication services and wireless telecommunication services in the SOI.
8 | Semiannual Report
overweighted telecommunication services holdings also hurt performance, primarily France Telecom (France) and Vodafone Group (U.K.), two of the world’s largest mobile operators. Although concerns persisted about top-line growth and regulatory and competitive pressures, most telecommunications companies in the Fund remained highly profitable enterprises trading at what we saw as depressed valuations and paying healthy dividend yields.
From a geographic standpoint, all major regions performed well, with a strong contribution from stock selection among our overweighted eurozone and underweighted U.S. holdings. Despite leading market returns in 2012, developed Europe was still home to eight of the world’s 10 cheapest markets as of January 1, 2013, based on cyclically adjusted price-to-earnings ratios. We believe significant potential for earnings improvement remained, with European companies overall recently earning less than their U.S. counterparts by the biggest gap on record. The region’s dramatic policy progress has also made European stocks more attractive to us, with the ECB seeking to neutralize tail risks with unconventional monetary tools and peripheral nations working to repair balance sheets using fiscal austerity and to enact structural reforms to regain competitiveness. Although concerns about economic growth persist in Europe and elsewhere, we think investors should keep in mind that stock returns have historically been only loosely correlated with economic growth. Indeed, U.S. stocks represented by the Standard & Poor’s 500 Index delivered about the same total return (more than 100%) since March 2009, a period some consider the “Great Recession,” as it did from 1996 through 2000, a period many consider one of history’s greatest bull markets.9 Relative to the benchmark, our allocations to the U.K., Spain and Singapore and off-benchmark exposure to Brazil modestly hurt performance.
We believe much of global stocks’ recent strength was attributable to sustained central bank intervention, which has admittedly been more favorable to asset prices than the real economy. Regardless of the immediate efficacy of monetary policy in achieving its primary economic objectives, globally coordinated stimulus could continue to provide the stability necessary for further market appreciation as the world economy recovers. Policy errors remain a key challenge in this environment, and the economic imbalances represented by the strained fiscal positions of developed world governments are not likely sustainable for the long term. In our opinion, the expectation of open-ended policy support is no long-term panacea, and we were far more encouraged by the attractive valuations and fundamentals of our holdings. At period-end, the Fund continued to trade well below its benchmark based on most valuation metrics and offered its investors a dividend yield in excess of the 10-year U.S. Treasury coupon. Although economic concerns will likely persist and volatility
9. Source: Bloomberg, LP. STANDARD & POOR’S®, S&P® and S&P 500® are registered trademarks of Standard & Poor’s Financial Services LLC.
Semiannual Report | 9
may return, we believe compelling, bottom-up opportunities remain for value-
oriented investors.
Thank you for your continued participation in Templeton Growth Fund.
We look forward to serving your future investment needs.

The foregoing information reflects our analysis, opinions and portfolio holdings as of February 28, 2013, the end of
the reporting period. The way we implement our main investment strategies and the resulting portfolio holdings
may change depending on factors such as market and economic conditions. These opinions may not be relied upon
as investment advice or an offer for a particular security. The information is not a complete analysis of every
aspect of any market, country, industry, security or the Fund. Statements of fact are from sources considered reli-
able, but the investment manager makes no representation or warranty as to their completeness or accuracy.
Although historical performance is no guarantee of future results, these insights may help you understand our
investment management philosophy.
10 | Semiannual Report
Performance Summary as of 2/28/13
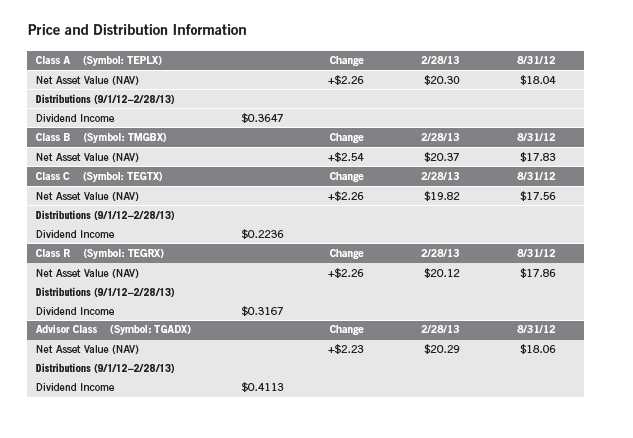
Your dividend income will vary depending on dividends or interest paid by securities in the Fund’s
portfolio, adjusted for operating expenses of each class. Capital gain distributions are net profits
realized from the sale of portfolio securities. The performance table does not reflect any taxes that
a shareholder would pay on Fund dividends, capital gain distributions, if any, or any realized gains
on the sale of Fund shares. Total return reflects reinvestment of the Fund’s dividends and capital
gain distributions, if any, and any unrealized gains or losses.
Semiannual Report | 11
Performance Summary (continued)
Performance
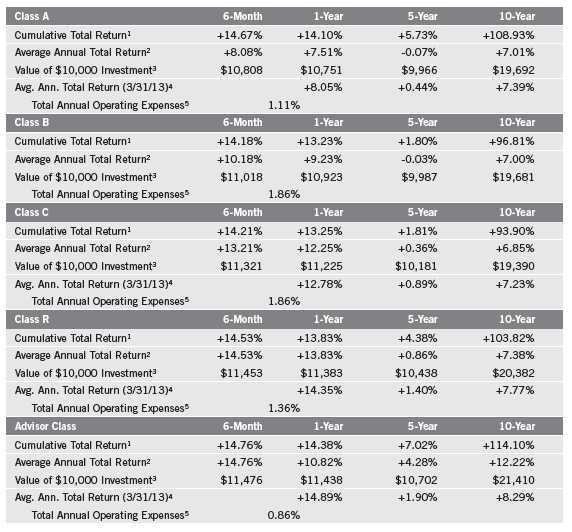
Cumulative total return excludes sales charges. Average annual total returns and value of $10,000 investment include
maximum sales charges. Class A: 5.75% maximum initial sales charge; Class B: contingent deferred sales charge (CDSC)
declining from 4% to 1% over six years, and eliminated thereafter; Class C: 1% CDSC in first year only; Class R/Advisor
Class: no sales charges.
Performance data represent past performance, which does not guarantee future results. Investment return and principal
value will fluctuate, and you may have a gain or loss when you sell your shares. Current performance may differ from
figures shown. For most recent month-end performance, go to franklintempleton.com or call (800) 342-5236.
12 | Semiannual Report
Performance Summary (continued)
Endnotes
All investments involve risks, including possible loss of principal. Special risks are associated with foreign investing, including currency fluctu-
ations, economic instability and political developments; investments in emerging markets involve heightened risks related to the same factors.
To the extent the Fund focuses on particular countries, regions, industries, sectors or types of investment from time to time, it may be subject
to greater risks of adverse developments in such areas of focus than a fund that invests in a wider variety of countries, regions, industries,
sectors or investments. Current political uncertainty surrounding the European Union (EU) and its membership may increase market volatility.
The financial instability of some countries in the EU, including Greece, Italy and Spain, together with the risk of that impacting other more sta-
ble countries, may increase the economic risk of investing in companies in Europe. The Fund is actively managed but there is no guarantee
that the manager’s investment decisions will produce the desired results. The Fund’s prospectus also includes a description of the main invest-
ment risks.
1. Cumulative total return represents the change in value of an investment over the periods indicated.
2. Average annual total return represents the average annual change in value of an investment over the periods indicated. Six-month return has not
been annualized.
3. These figures represent the value of a hypothetical $10,000 investment in the Fund over the periods indicated.
4. In accordance with SEC rules, we provide standardized average annual total return information through the latest calendar quarter. For Class B
shares, 3/31/13 performance data are not available – all class B shares were converted to Class A shares before the end of the quarter.
5. Figures are as stated in the Fund’s prospectus current as of the date of this report. In periods of market volatility, assets may decline significantly,
causing total annual Fund operating expenses to become higher than the figures shown.
Semiannual Report | 13
Your Fund’s Expenses
As a Fund shareholder, you can incur two types of costs:
- Transaction costs, including sales charges (loads) on Fund purchases; and
- Ongoing Fund costs, including management fees, distribution and service (12b-1) fees, and other Fund expenses. All mutual funds have ongoing costs, sometimes referred to as operating expenses.
The following table shows ongoing costs of investing in the Fund and can help you understand these costs and compare them with those of other mutual funds. The table assumes a $1,000 investment held for the six months indicated.
Actual Fund Expenses
The first line (Actual) for each share class listed in the table provides actual account values and expenses. The “Ending Account Value” is derived from the Fund’s actual return, which includes the effect of Fund expenses.
You can estimate the expenses you paid during the period by following these steps. Of course, your account value and expenses will differ from those in this illustration:
| 1. | Divide your account value by $1,000. |
| If an account had an $8,600 value, then $8,600 ÷ $1,000 = 8.6. | |
| 2. | Multiply the result by the number under the heading “Expenses Paid During Period.” |
| If Expenses Paid During Period were $7.50, then 8.6 x $7.50 = $64.50. |
In this illustration, the estimated expenses paid this period are $64.50.
Hypothetical Example for Comparison with Other Funds
Information in the second line (Hypothetical) for each class in the table can help you compare ongoing costs of investing in the Fund with those of other mutual funds. This information may not be used to estimate the actual ending account balance or expenses you paid during the period. The hypothetical “Ending Account Value” is based on the actual expense ratio for each class and an assumed 5% annual rate of return before expenses, which does not represent the Fund’s actual return. The figure under the heading “Expenses Paid During Period” shows the hypothetical expenses your account would have incurred under this scenario. You can compare this figure with the 5% hypothetical examples that appear in shareholder reports of other funds.
14 | Semiannual Report
Your Fund’s Expenses (continued)
Please note that expenses shown in the table are meant to highlight ongoing costs and do not reflect
any transaction costs, such as sales charges. Therefore, the second line for each class is useful in
comparing ongoing costs only, and will not help you compare total costs of owning different funds.
In addition, if transaction costs were included, your total costs would have been higher. Please refer
to the Fund prospectus for additional information on operating expenses.
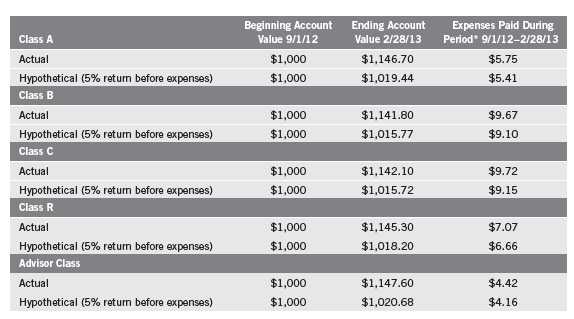
*Expenses are calculated using the most recent six-month expense ratio, annualized for each class (A: 1.08%; B: 1.82%; C: 1.83%; R: 1.33%; and
Advisor: 0.83%), multiplied by the average account value over the period, multiplied by 181/365 to reflect the one-half year period.
Semiannual Report | 15
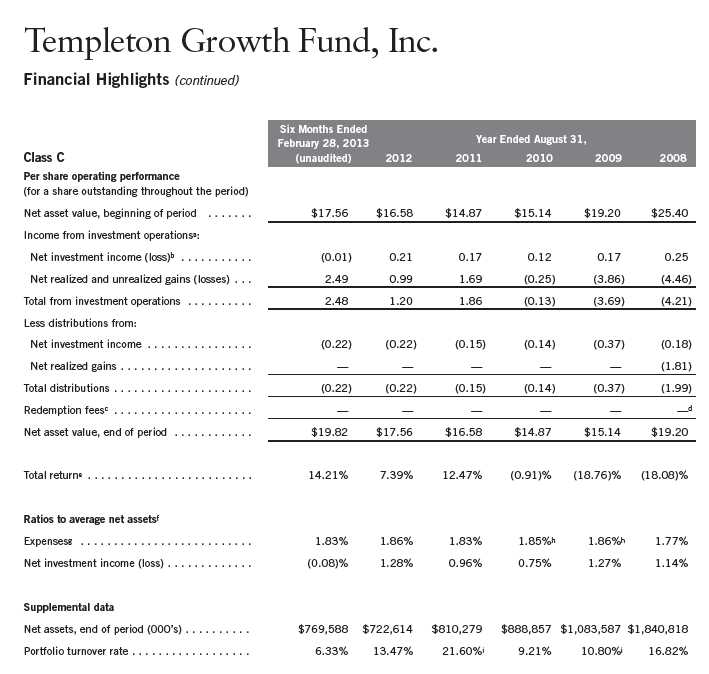
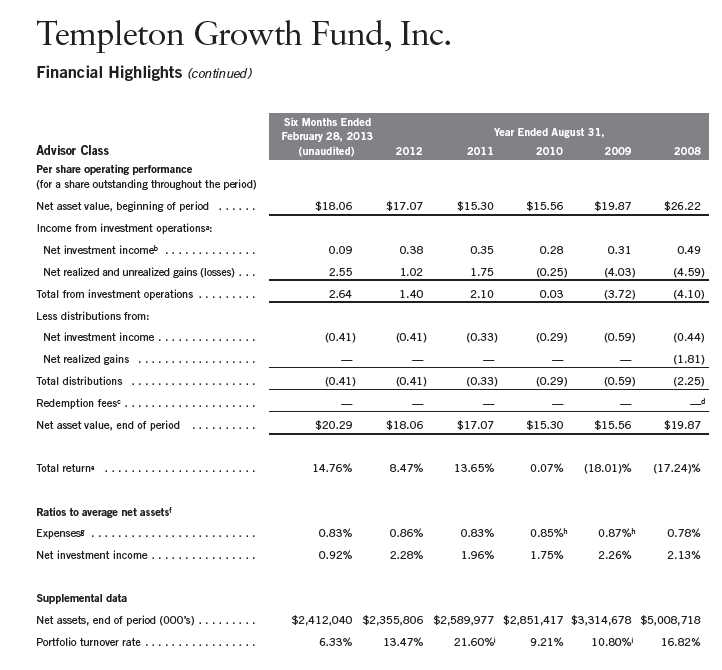
Templeton Growth Fund, Inc.
Financial Highlights

aThe amount shown for a share outstanding throughout the period may not correlate with the Statement of Operations for the period due to the timing of sales and repurchases of
the Fund shares in relation to income earned and/or fluctuating market value of the investments of the Fund.
bBased on average daily shares outstanding.
cEffective September 1, 2008, the redemption fee was eliminated.
dAmount rounds to less than $0.01 per share.
eTotal return does not reflect sales commissions or contingent deferred sales charges, if applicable, and is not annualized for periods less than one year.
fRatios are annualized for periods less than one year.
gBenefit of expense reduction rounds to less than 0.01%.
hBenefit of waiver and payment by affiliate rounds to less than 0.01%.
iExcludes the value of portfolio securities delivered as a result of redemptions in-kind.
16 | The accompanying notes are an integral part of these financial statements. | Semiannual Report

aThe amount shown for a share outstanding throughout the period may not correlate with the Statement of Operations for the period due to the timing of sales and repurchases of
the Fund shares in relation to income earned and/or fluctuating market value of the investments of the Fund.
bBased on average daily shares outstanding.
cAmount rounds to less than $0.01 per share.
dEffective September 1, 2008, the redemption fee was eliminated.
eTotal return does not reflect sales commissions or contingent deferred sales charges, if applicable, and is not annualized for periods less than one year.
fRatios are annualized for periods less than one year.
gBenefit of expense reduction rounds to less than 0.01%.
hBenefit of waiver and payment by affiliate rounds to less than 0.01%.
iExcludes the value of portfolio securities delivered as a result of redemptions in-kind.
Semiannual Report | The accompanying notes are an integral part of these financial statements. | 17
aThe amount shown for a share outstanding throughout the period may not correlate with the Statement of Operations for the period due to the timing of sales and repurchases of
the Fund shares in relation to income earned and/or fluctuating market value of the investments of the Fund.
bBased on average daily shares outstanding.
cEffective September 1, 2008, the redemption fee was eliminated.
dAmount rounds to less than $0.01 per share.
eTotal return does not reflect sales commissions or contingent deferred sales charges, if applicable, and is not annualized for periods less than one year.
fRatios are annualized for periods less than one year.
gBenefit of expense reduction rounds to less than 0.01%.
hBenefit of waiver and payment by affiliate rounds to less than 0.01%.
iExcludes the value of portfolio securities delivered as a result of redemptions in-kind.
18 | The accompanying notes are an integral part of these financial statements. | Semiannual Report
aThe amount shown for a share outstanding throughout the period may not correlate with the Statement of Operations for the period due to the timing of sales and repurchases of
the Fund shares in relation to income earned and/or fluctuating market value of the investments of the Fund.
bBased on average daily shares outstanding.
cEffective September 1, 2008, the redemption fee was eliminated.
dAmount rounds to less than $0.01 per share.
eTotal return does not reflect sales commissions or contingent deferred sales charges, if applicable, and is not annualized for periods less than one year.
fRatios are annualized for periods less than one year.
gBenefit of expense reduction rounds to less than 0.01%.
hBenefit of waiver and payment by affiliate rounds to less than 0.01%.
iExcludes the value of portfolio securities delivered as a result of redemptions in-kind.
Semiannual Report | The accompanying notes are an integral part of these financial statements. | 19
aThe amount shown for a share outstanding throughout the period may not correlate with the Statement of Operations for the period due to the timing of sales and repurchases of
the Fund shares in relation to income earned and/or fluctuating market value of the investments of the Fund.
bBased on average daily shares outstanding.
cEffective September 1, 2008, the redemption fee was eliminated.
dAmount rounds to less than $0.01 per share.
eTotal return is not annualized for periods less than one year.
fRatios are annualized for periods less than one year.
gBenefit of expense reduction rounds to less than 0.01%.
hBenefit of waiver and payment by affiliate rounds to less than 0.01%.
iExcludes the value of portfolio securities delivered as a result of redemptions in-kind.
20 | The accompanying notes are an integral part of these financial statements. | Semiannual Report
Templeton Growth Fund, Inc.
Statement of Investments, February 28, 2013 (unaudited)
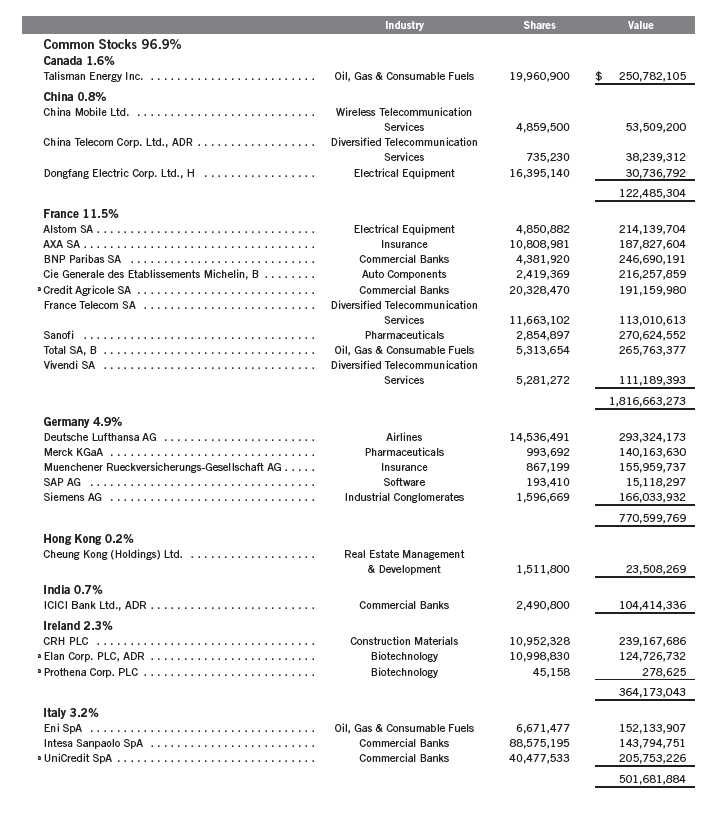
Semiannual Report | 21
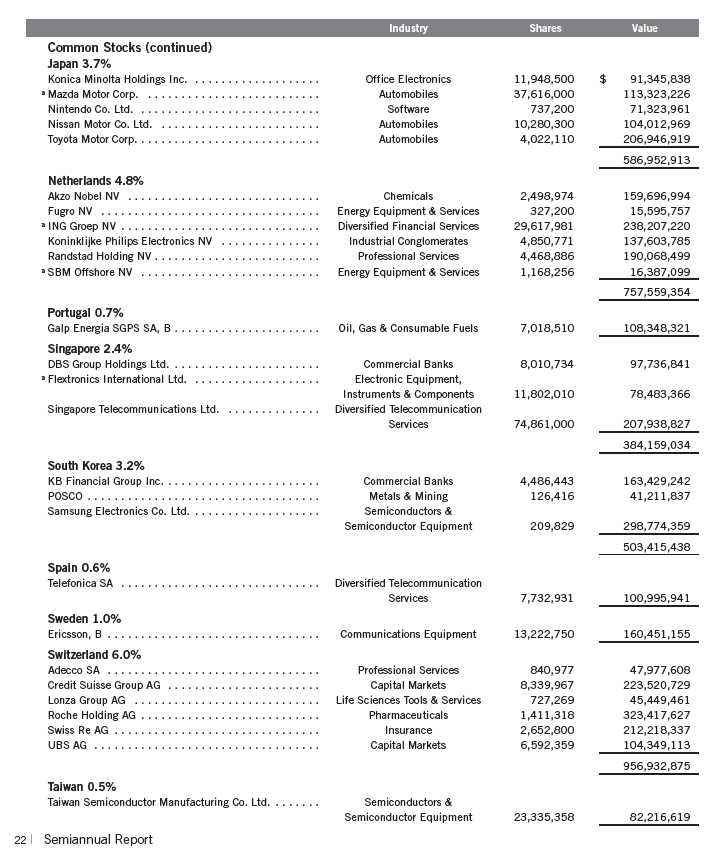
Templeton Growth Fund, Inc.
Statement of Investments, February 28, 2013 (unaudited) (continued)
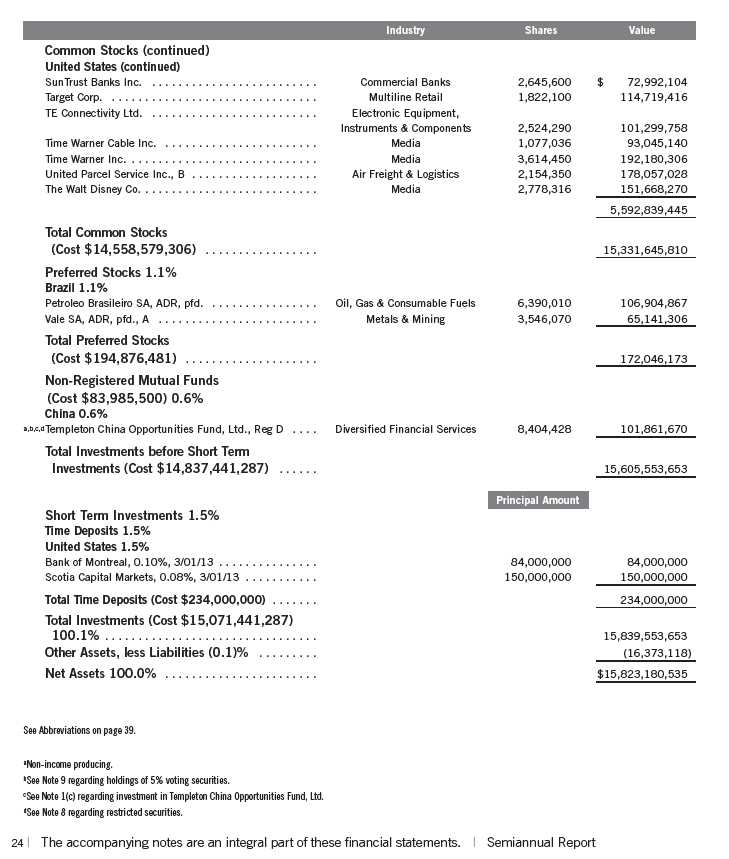
Templeton Growth Fund, Inc.
Statement of Investments, February 28, 2013 (unaudited) (continued)

Semiannual Report | 23
Templeton Growth Fund, Inc.
Statement of Investments, February 28, 2013 (unaudited) (continued)
Semiannual Report | The accompanying notes are an integral part of these financial statements. | 25
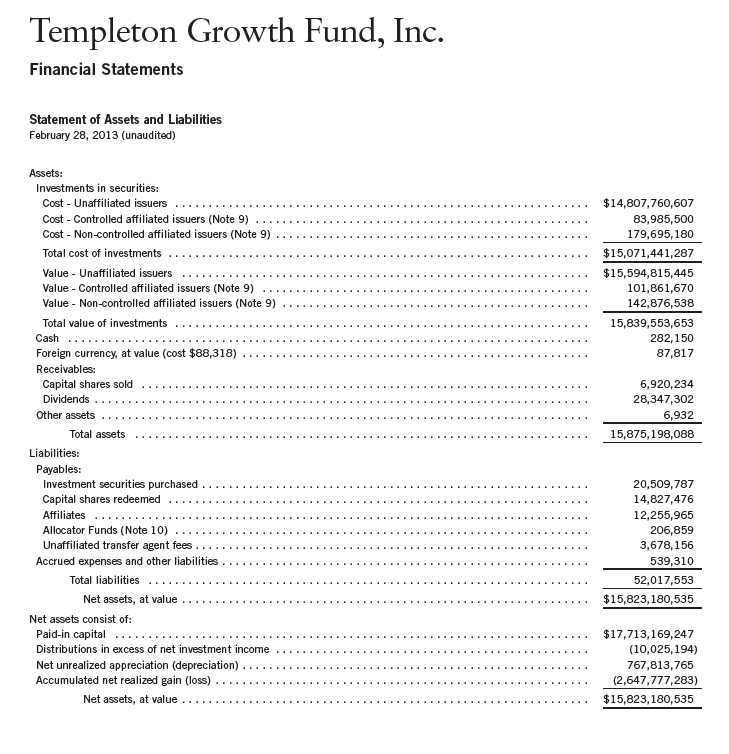
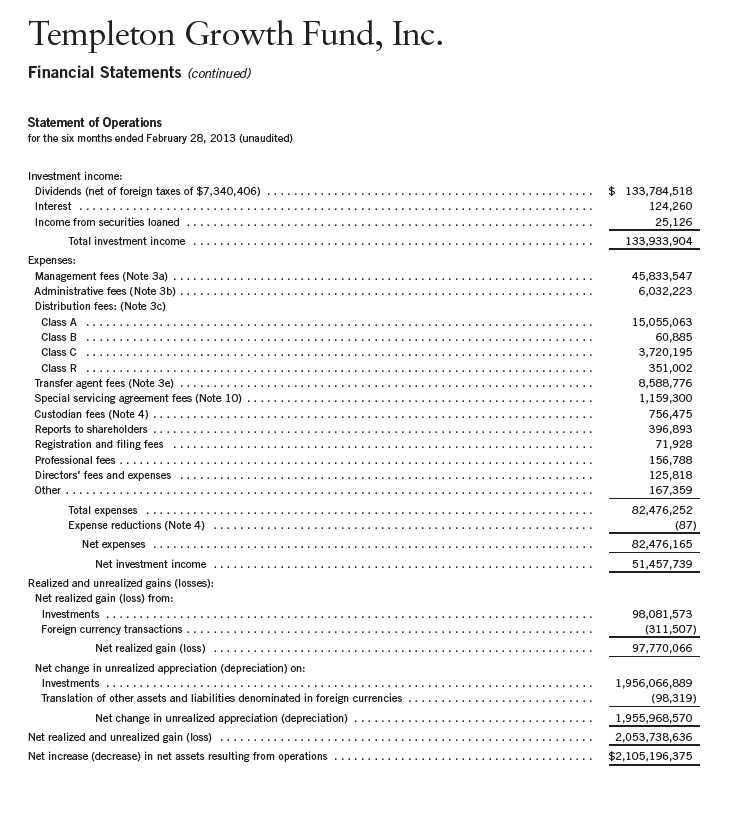
Templeton Growth Fund, Inc.
Financial Statements (continued)
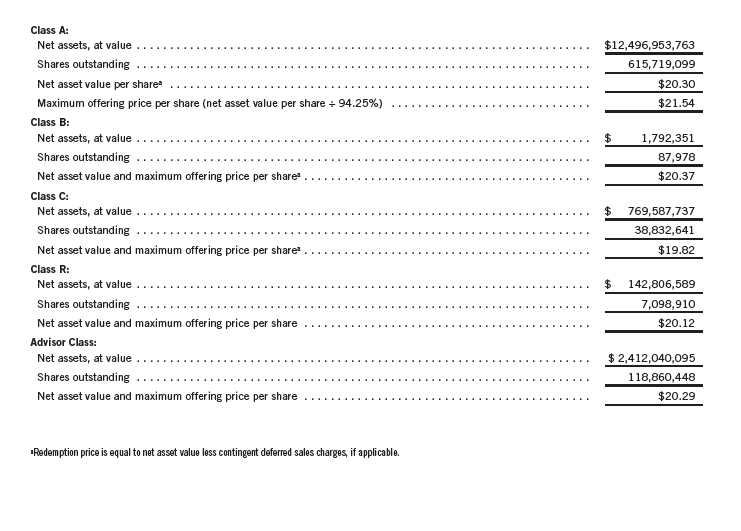
Statement of Assets and Liabilities (continued)
February 28, 2013 (unaudited)
26 | The accompanying notes are an integral part of these financial statements. | Semiannual Report
Semiannual Report | The accompanying notes are an integral part of these financial statements. | 27
Templeton Growth Fund, Inc.
Financial Statements (continued)
28 | The accompanying notes are an integral part of these financial statements. | Semiannual Report
Templeton Growth Fund, Inc.
Notes to Financial Statements (unaudited)
1. ORGANIZATION AND SIGNIFICANT ACCOUNTING POLICIES
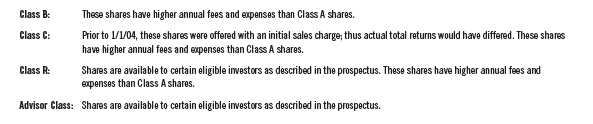
Templeton Growth Fund, Inc. (Fund) is registered under the Investment Company Act of 1940, as amended, (1940 Act) as an open-end investment company. The Fund offers five classes of shares: Class A, Class B, Class C, Class R, and Advisor Class. Effective March 1, 2005, the Fund no longer offered Class B shares for purchase. As disclosed in the fund prospectus, Class B shares convert to Class A shares after eight years of investment; therefore all Class B shares will convert to Class A by March 2013. Each class of shares differs by its initial sales load, contingent deferred sales charges, distribution fees, voting rights on matters affecting a single class and its exchange privilege.
The following summarizes the Fund’s significant accounting policies.
a. Financial Instrument Valuation
The Fund’s investments in financial instruments are carried at fair value daily. Fair value is the price that would be received to sell an asset or paid to transfer a liability in an orderly transaction between market participants on the measurement date. Under procedures approved by the Fund’s Board of Directors (the Board), the Fund’s administrator, investment manager and other affiliates have formed the Valuation and Liquidity Oversight Committee (VLOC). The VLOC provides administration and oversight of the Fund’s valuation policies and procedures, which are approved annually by the Board. Among other things, these procedures allow the Fund to utilize independent pricing services, quotations from securities and financial instrument dealers, and other market sources to determine fair value.
Equity securities listed on an exchange or on the NASDAQ National Market System are valued at the last quoted sale price or the official closing price of the day, respectively. Foreign equity securities are valued as of the close of trading on the foreign stock exchange on which the security is primarily traded, or the NYSE, whichever is earlier. The value is then converted into its U.S. dollar equivalent at the foreign exchange rate in effect at the close of the NYSE on the day that the value of the security is determined. Over-the-counter (OTC) securities are valued within the range of the most recent quoted bid and ask prices. Securities that trade in multiple markets or on multiple exchanges are valued according to the broadest and most representative market. Certain equity securities are valued based upon fundamental characteristics or relationships to similar securities. Time deposits are valued at cost, which approximates market value.
The Fund has procedures to determine the fair value of financial instruments for which market prices are not reliable or readily available. Under these procedures, the VLOC convenes on a regular basis to review such financial instruments and considers a number of factors, including significant unobservable valuation inputs, when arriving at fair value. The VLOC primarily employs a market-based approach which may use related or comparable assets or liabilities, recent transactions, market multiples, book values, and other relevant information for the investment to determine the fair value of the investment. An income-based valuation approach may also be used in which the anticipated future cash flows of the investment are discounted to calculate fair value. Discounts may also be applied due to the nature or duration of any restrictions
Semiannual Report | 29
Templeton Growth Fund, Inc.
Notes to Financial Statements (unaudited) (continued)
| 1. | ORGANIZATION AND SIGNIFICANT ACCOUNTING POLICIES (continued) |
| a. | Financial Instrument Valuation (continued) |
on the disposition of the investments. Due to the inherent uncertainty of valuations of such investments, the fair values may differ significantly from the values that would have been used had an active market existed. The VLOC employs various methods for calibrating these valuation approaches including a regular review of key inputs and assumptions, transactional back-testing or disposition analysis, and reviews of any related market activity.
Trading in securities on foreign securities stock exchanges and OTC markets may be completed before the daily close of business on the NYSE. Occasionally, events occur between the time at which trading in a foreign security is completed and the close of the NYSE that might call into question the reliability of the value of a portfolio security held by the Fund. As a result, differences may arise between the value of the Fund’s portfolio securities as determined at the foreign market close and the latest indications of value at the close of the NYSE. In order to minimize the potential for these differences, the VLOC monitors price movements following the close of trading in foreign stock markets through a series of country specific market proxies (such as baskets of American Depositary Receipts, futures contracts and exchange traded funds). These price movements are measured against established trigger thresholds for each specific market proxy to assist in determining if an event has occurred that may call into question the reliability of the values of the foreign securities held by the Fund. If such an event occurs, the securities may be valued using fair value procedures, which may include the use of independent pricing services.
b. Foreign Currency Translation
Portfolio securities and other assets and liabilities denominated in foreign currencies are translated into U.S. dollars based on the exchange rate of such currencies against U.S. dollars on the date of valuation. The Fund may enter into foreign currency exchange contracts to facilitate transactions denominated in a foreign currency. Purchases and sales of securities, income and expense items denominated in foreign currencies are translated into U.S. dollars at the exchange rate in effect on the transaction date. Portfolio securities and assets and liabilities denominated in foreign currencies contain risks that those currencies will decline in value relative to the U.S. dollar. Occasionally, events may impact the availability or reliability of foreign exchange rates used to convert the U.S. dollar equivalent value. If such an event occurs, the foreign exchange rate will be valued at fair value using procedures established and approved by the Board.
The Fund does not separately report the effect of changes in foreign exchange rates from changes in market prices on securities held. Such changes are included in net realized and unrealized gain or loss from investments on the Statement of Operations.
Realized foreign exchange gains or losses arise from sales of foreign currencies, currency gains or losses realized between the trade and settlement dates on securities transactions and the difference between the recorded amounts of dividends, interest, and foreign withholding taxes and the

Templeton Growth Fund, Inc.
Notes to Financial Statements (unaudited) (continued)
| 1. | ORGANIZATION AND SIGNIFICANT ACCOUNTING POLICIES (continued) |
| b. | Foreign Currency Translation (continued) |
gains and losses arise from changes in foreign exchange rates on foreign denominated assets and liabilities other than investments in securities held at the end of the reporting period.
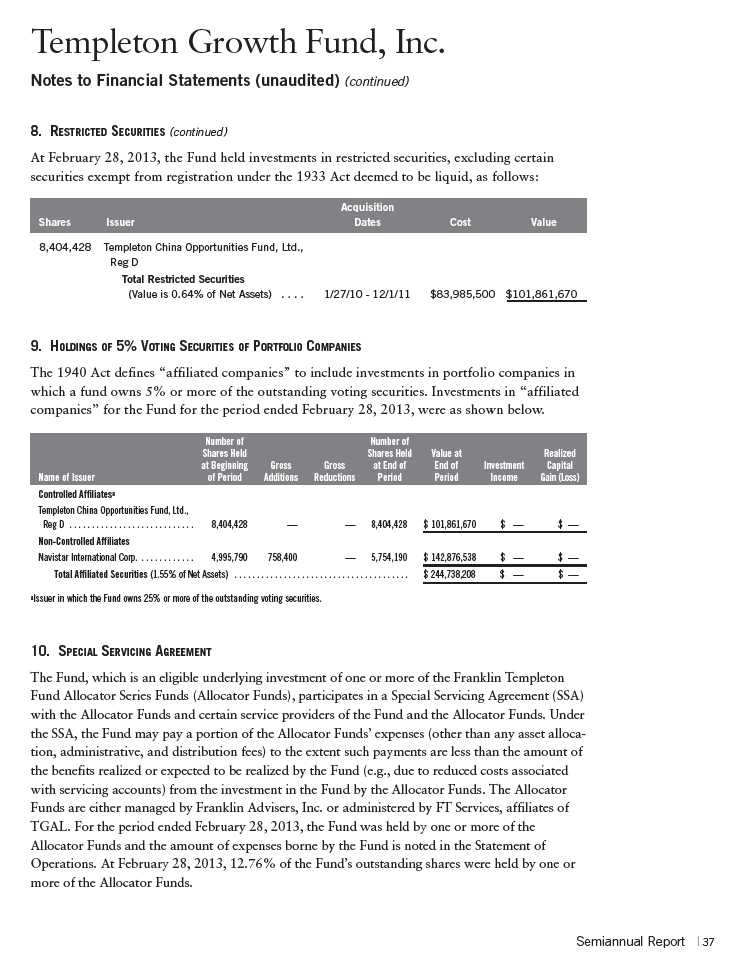
c. Investment in Templeton China Opportunities Fund, Ltd.
The Fund invests in Templeton China Opportunities Fund, Ltd. (China Fund), a private offering of unregistered shares in a Cayman Islands Exempt Company. The China Fund investment objective is to seek capital growth primarily through investments in A-shares of Chinese companies listed on the Shanghai and Shenzhen stock exchanges. Chinese A-shares are traded in Chinese Renminbi and are only available as an investment to domestic (Chinese) investors and holders of a Qualified Foreign Institutional Investors license. The China Fund is managed by Templeton Investment Counsel, LLC (an affiliate of the investment manager). No additional management or administrative fees are incurred on assets invested in the China Fund.
The China Fund may be subject to certain restrictions and administrative processes relating to its ability to repatriate cash balances, investment proceeds and earnings associated with its investment, as such activities are subject to approval by agencies of the Chinese government and thus the Fund may incur delays in redeeming its investment in the China Fund. The Fund’s investments in the China Fund is valued based upon the fair value of the China Fund’s portfolio securities and other assets and liabilities.
d. Income and Deferred Taxes
It is the Fund’s policy to qualify as a regulated investment company under the Internal Revenue Code. The Fund intends to distribute to shareholders substantially all of its taxable income and net realized gains to relieve it from federal income and excise taxes. As a result, no provision for U.S. federal income taxes is required.
The Fund may be subject to foreign taxation related to income received, capital gains on the sale of securities and certain foreign currency transactions in the foreign jurisdictions in which it invests. Foreign taxes, if any, are recorded based on the tax regulations and rates that exist in the foreign markets in which the Fund invests. When a capital gain tax is determined to apply the Fund records an estimated deferred tax liability in an amount that would be payable if the securities were disposed of on the valuation date.
The Fund recognizes the tax benefits of uncertain tax positions only when the position is “more likely than not” to be sustained upon examination by the tax authorities based on the technical merits of the tax position. As of February 28, 2013, and for all open years, the Fund has determined that no liability for unrecognized tax benefits is required in the Fund’s financial statements related to uncertain tax positions taken on a tax return (or expected to be taken on future tax returns). Open tax years are those that remain subject to examination and are based on each tax jurisdiction statue of limitation.
Semiannual Report | 31
Templeton Growth Fund, Inc.
Notes to Financial Statements (unaudited) (continued)
| 1. | ORGANIZATION AND SIGNIFICANT ACCOUNTING POLICIES (continued) |
| e. | Security Transactions, Investment Income, Expenses and Distributions |
Security transactions are accounted for on trade date. Realized gains and losses on security transactions are determined on a specific identification basis. Interest income and estimated expenses are accrued daily. Amortization of premium and accretion of discount on debt securities are included in interest income. Dividend income is recorded on the ex-dividend date except that certain dividends from foreign securities are recognized as soon as the Fund is notified of the ex-dividend date. Distributions to shareholders are recorded on the ex-dividend date and are determined according to income tax regulations (tax basis). Distributable earnings determined on a tax basis may differ from earnings recorded in accordance with accounting principles generally accepted in the United States of America. These differences may be permanent or temporary. Permanent differences are reclassified among capital accounts to reflect their tax character. These reclassifications have no impact on net assets or the results of operations. Temporary differences are not reclassified, as they may reverse in subsequent periods.
Realized and unrealized gains and losses and net investment income, not including class specific expenses, are allocated daily to each class of shares based upon the relative proportion of net assets of each class. Differences in per share distributions, by class, are generally due to differences in class specific expenses.
f. Accounting Estimates
The preparation of financial statements in accordance with accounting principles generally accepted in the United States of America requires management to make estimates and assumptions that affect the reported amounts of assets and liabilities at the date of the financial statements and the amounts of income and expenses during the reporting period. Actual results could differ from those estimates.
g. Guarantees and Indemnifications
Under the Fund’s organizational documents, its officers and directors are indemnified by the Fund against certain liabilities arising out of the performance of their duties to the Fund. Additionally, in the normal course of business, the Fund enters into contracts with service providers that contain general indemnification clauses. The Fund’s maximum exposure under these arrangements is unknown as this would involve future claims that may be made against the Fund that have not yet occurred. Currently, the Fund expects the risk of loss to be remote.
32 | Semiannual Report
Templeton Growth Fund, Inc.
Notes to Financial Statements (unaudited) (continued)
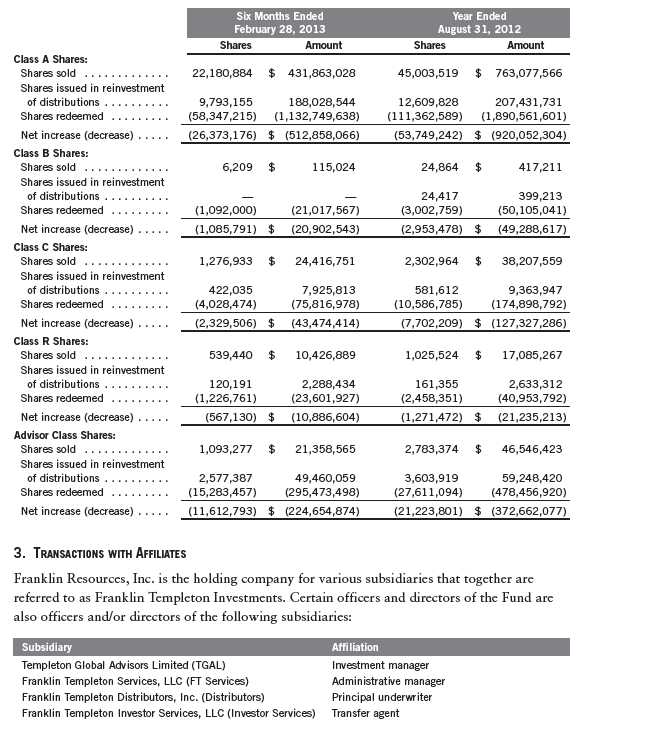
2. CAPITAL STOCK
At February 28, 2013, there were 2.4 billion shares authorized ($0.01 par value). Transactions
in the Fund’s shares were as follows:
Semiannual Report | 33
Templeton Growth Fund, Inc.
Notes to Financial Statements (unaudited) (continued)
3. TRANSACTIONS WITH AFFILIATES (continued)
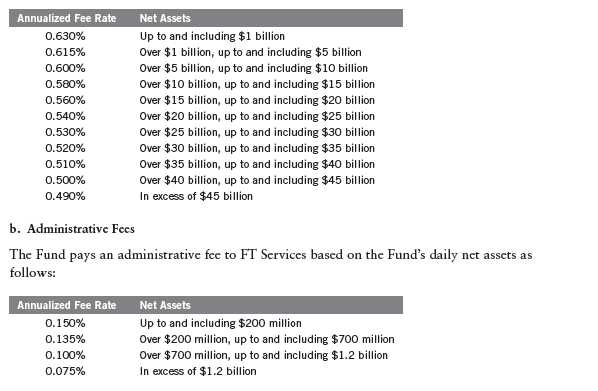
a. Management Fees
The Fund pays an investment management fee to TGAL based on the average daily net assets
of the Fund as follows:
c. Distribution Fees
The Board has adopted distribution plans for each share class, with the exception of Advisor
Class shares, pursuant to Rule 12b-1 under the 1940 Act. Distribution fees are not charged on
shares held by affiliates. Under the Fund’s Class A reimbursement distribution plan, the Fund
reimburses Distributors for costs incurred in connection with the servicing, sale and distribution
of the Fund’s shares up to the maximum annual plan rate. Under the Class A reimbursement dis-
tribution plan, costs exceeding the maximum for the current plan year cannot be reimbursed in
subsequent periods. In addition, under the Fund’s Class B, C, and R compensation distribution
plan, the Fund pays Distributors for costs incurred in connection with the servicing, sale and
distribution of the Fund’s shares up to the maximum annual plan rate for each class.
34 | Semiannual Report
Templeton Growth Fund, Inc.
Notes to Financial Statements (unaudited) (continued)
| 3. | TRANSACTIONS WITH AFFILIATES (continued) |
| c. | Distribution Fees (continued) |
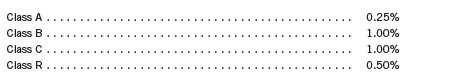
The maximum annual plan rates, based on the average daily net assets, for each class, are as
follows:
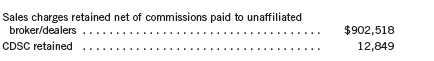
d. Sales Charges/Underwriting Agreements
Front-end sales charges and contingent deferred sales charges (CDSC) do not represent expenses
of the Fund. These charges are deducted from the proceeds of sales of Fund shares prior to invest-
ment or from redemption proceeds prior to remittance, as applicable. Distributors has advised the
Fund of the following commission transactions related to the sales and redemptions of the Fund’s
shares for the period:
e. Transfer Agent Fees
For the period ended February 28, 2013, the Fund paid transfer agent fees of $8,588,776, of
which $5,249,380 was retained by Investor Services.
4. EXPENSE OFFSET ARRANGEMENT
The Fund has entered into an arrangement with its custodian whereby credits realized as a result
of uninvested cash balances are used to reduce a portion of the Fund’s custodian expenses.
During the period ended February 28, 2013, the custodian fees were reduced as noted in the
Statement of Operations.
5. INCOME TAXES
For tax purposes, capital losses may be carried over to offset future capital gains, if any. Capital
loss carry forwards with no expiration, if any, must be fully utilized before those losses with
expiration dates.
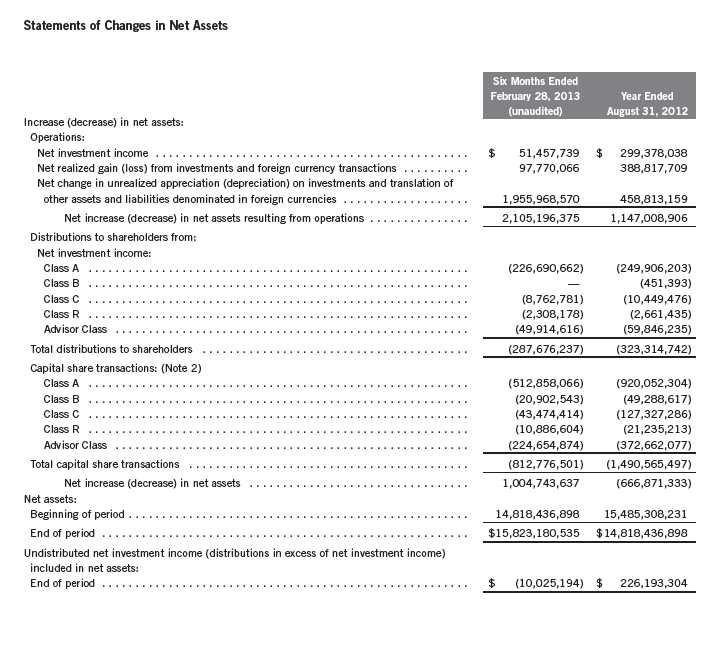
At August 31, 2012, the Fund had capital loss carryforward of $2,716,953,863 expiring
in 2018.
Semiannual Report | 35
Templeton Growth Fund, Inc.
Notes to Financial Statements (unaudited) (continued)
5. INCOME TAXES (continued)
At February 28, 2013, the cost of investments, net unrealized appreciation (depreciation), for
income tax purposes were as follows:
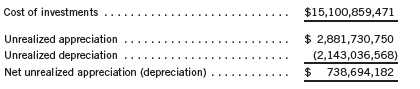
Differences between income and/or capital gains as determined on a book basis and a tax basis are
primarily due to differing treatments of regulatory settlements.
6. INVESTMENT TRANSACTIONS
Purchases and sales of investments (excluding short term securities) for the period ended
February 28, 2013, aggregated $957,419,394 and $2,032,176,301, respectively.
7. CONCENTRATION OF RISK
Investing in foreign securities may include certain risks and considerations not typically asso-
ciated with investing in U.S. securities, such as fluctuating currency values and changing local
and regional economic, political and social conditions, which may result in greater market
volatility. In addition, certain foreign securities may not be as liquid as U.S. securities.
8. RESTRICTED SECURITIES
The Fund invests in securities that are restricted under the Securities Act of 1933 (1933 Act) or
which are subject to legal, contractual, or other agreed upon restrictions on resale. Restricted
securities are often purchased in private placement transactions, and cannot be sold without
prior registration unless the sale is pursuant to an exemption under the 1933 Act. Disposal of
these securities may require greater effort and expense, and prompt sale at an acceptable price
may be difficult. The Fund may have registration rights for restricted securities. The issuer gen-
erally incurs all registration costs.
36 | Semiannual Report
Templeton Growth Fund, Inc.
Notes to Financial Statements (unaudited) (continued)
11. CREDIT FACILITY
The Fund, together with other U.S. registered and foreign investment funds (collectively, Borrowers), managed by Franklin Templeton Investments, are borrowers in a joint syndicated senior unsecured credit facility totaling $1.5 billion (Global Credit Facility) which matures on January 17, 2014. This Global Credit Facility provides a source of funds to the Borrowers for temporary and emergency purposes, including the ability to meet future unanticipated or unusually large redemption requests.
Under the terms of the Global Credit Facility, the Fund shall, in addition to interest charged on any borrowings made by the Fund and other costs incurred by the Fund, pay its share of fees and expenses incurred in connection with the implementation and maintenance of the Global Credit Facility, based upon its relative share of the aggregate net assets of all of the Borrowers, including an annual commitment fee of 0.07% based upon the unused portion of the Global Credit Facility. These fees are reflected in other expenses on the Statement of Operations. During the period ended February 28, 2013, the Fund did not use the Global Credit Facility.
12. FAIR VALUE MEASUREMENTS
The Fund follows a fair value hierarchy that distinguishes between market data obtained from independent sources (observable inputs) and the Fund’s own market assumptions (unobservable inputs). These inputs are used in determining the value of the Fund’s financial instruments and are summarized in the following fair value hierarchy:
- Level 1 – quoted prices in active markets for identical financial instruments
- Level 2 – other significant observable inputs (including quoted prices for similar financial instruments, interest rates, prepayment speed, credit risk, etc.)
- Level 3 – significant unobservable inputs (including the Fund’s own assumptions in determining the fair value of financial instruments)
The inputs or methodology used for valuing financial instruments are not an indication of the risk associated with investing in those financial instruments.
For movements between the levels within the fair value hierarchy, the Fund has adopted a policy of recognizing the transfers as of the date of the underlying event which caused the movement.
38 | Semiannual Report
Templeton Growth Fund, Inc.
Notes to Financial Statements (unaudited) (continued)
12. FAIR VALUE MEASUREMENTS (continued)
A summary of inputs used as of February 28, 2013, in valuing the Fund’s assets carried at fair
value, is as follows:
13. NEW ACCOUNTING PRONOUNCEMENTS
In December 2011, the Financial Accounting Standards Board (FASB) issued Accounting Standards Update (ASU) No. 2011-11, Balance Sheet (Topic 210): Disclosures about Offsetting Assets and Liabilities. The amendments in the ASU enhance disclosures about offsetting of financial assets and liabilities to enable investors to understand the effect of these arrangements on a fund’s financial position. In January 2013, FASB issued ASU No. 2013-01, Balance Sheet (Topic 210): Clarifying the Scope of Disclosures about Offsetting Assets and Liabilities. The amendments in ASU No. 2013-01 clarify the intended scope of disclosures required by ASU No. 2011-11. These ASUs are effective for interim and annual reporting periods beginning on or after January 1, 2013. The Fund believes the adoption of these ASUs will not have a material impact on its financial statements.
14. SUBSEQUENT EVENTS
The Fund evaluated subsequent events through the issuance of the financial statements and determined that no events have occurred that require disclosure.
ABBREVIATIONS
Selected Portfolio
ADR - American Depositary Receipt
Semiannual Report | 39
Templeton Growth Fund, Inc.
Shareholder Information
Proxy Voting Policies and Procedures
The Fund’s investment manager has established Proxy Voting Policies and Procedures (Policies) that the Fund uses to determine how to vote proxies relating to portfolio securities. Shareholders may view the Fund’s complete Policies online at franklintempleton.com. Alternatively, shareholders may request copies of the Policies free of charge by calling the Proxy Group collect at (954) 527-7678 or by sending a written request to: Franklin Templeton Companies, LLC, 300 S.E. 2nd Street, Fort Lauderdale, FL 33301, Attention: Proxy Group. Copies of the Fund’s proxy voting records are also made available online at franklintempleton.com and posted on the U.S. Securities and Exchange Commission’s website at sec.gov and reflect the most recent 12-month period ended June 30.
Quarterly Statement of Investments
The Fund files a complete statement of investments with the U.S. Securities and Exchange Commission for the first and third quarters for each fiscal year on Form N-Q. Shareholders may view the filed Form N-Q by visiting the Commission’s website at sec.gov. The filed form may also be viewed and copied at the Commission’s Public Reference Room in Washington, DC. Information regarding the operations of the Public Reference Room may be obtained by calling (800) SEC-0330.
40 | Semiannual Report
and forms of the Securities and Exchange Commission. Such information is
accumulated and communicated to the Registrant’s management, including its
principal executive officer and principal financial officer, as appropriate, to
allow timely decisions regarding required disclosure. The Registrant’s
management, including the principal executive officer and the principal
financial officer, recognizes that any set of controls and procedures, no
matter how well designed and operated, can provide only reasonable assurance of
achieving the desired control objectives.
Within 90 days prior to the filing date of this Shareholder Report on Form N-
CSR, the Registrant had carried out an evaluation, under the supervision and
with the participation of the Registrant’s management, including the
Registrant’s principal executive officer and the Registrant’s principal
financial officer, of the effectiveness of the design and operation of the
Registrant’s disclosure controls and procedures. Based on such evaluation, the
Registrant’s principal executive officer and principal financial officer
concluded that the Registrant’s disclosure controls and procedures are
effective.
(b) Changes in Internal Controls.
There have been no changes in the
Registrant’s internal controls or in other factors that could materially affect
the internal controls over financial reporting subsequent to the date of their
evaluation in connection with the preparation of this Shareholder Report on
Form N-CSR.
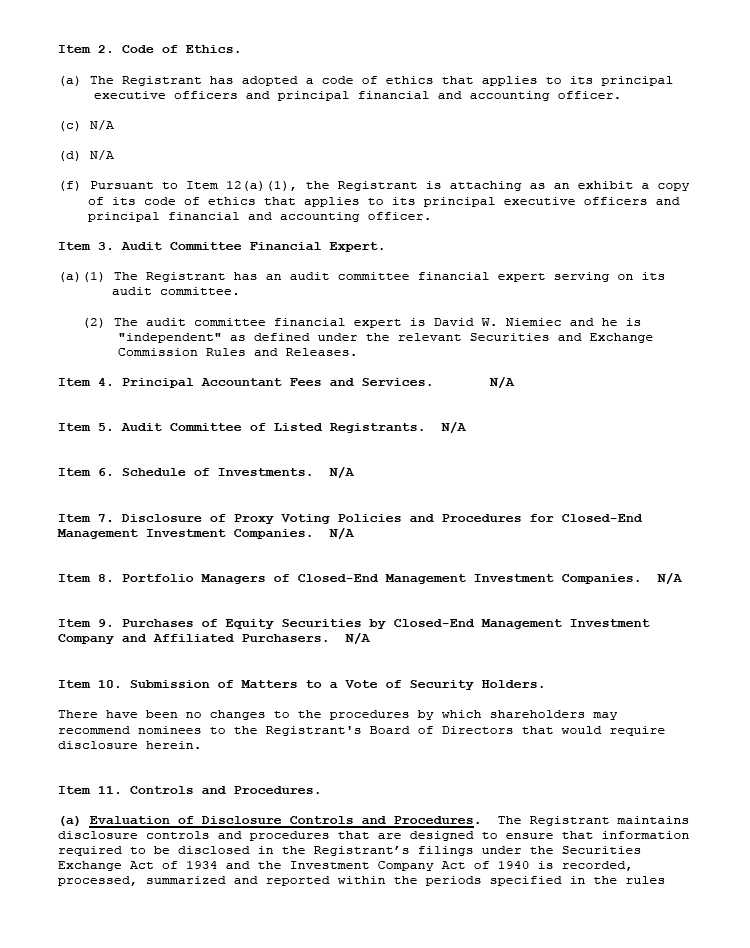
Item 12. Exhibits.
(a)(1) Code of Ethics
(a)(2) Certifications pursuant to Section 302 of the Sarbanes-Oxley Act of 2002
of Laura F. Fergerson, Chief Executive Officer - Finance and Administration, and
Mark H. Otani, Chief Financial Officer and Chief Accounting Officer
(b) Certifications pursuant to Section 906 of the Sarbanes-Oxley Act of 2002 of
Laura F. Fergerson, Chief Executive Officer - Finance and Administration, and
Mark H. Otani, Chief Financial Officer and Chief Accounting Officer