Exhibit 13
MANAGEMENT'S DISCUSSION AND ANALYSIS
Management's discussion and analysis addresses the financial condition and results of operations for Park National Corporation and our subsidiaries (unless the context otherwise requires, collectively, "Park" or the "Corporation"). This discussion should be read in conjunction with the consolidated financial statements and related notes and the five-year summary of selected financial data. Management’s discussion and analysis contains forward-looking statements that are provided to assist in the understanding of anticipated future financial performance. Forward-looking statements provide current expectations or forecasts of future events and are not guarantees of future performance. The forward-looking statements are based on management’s expectations and are subject to a number of risks and uncertainties. Although management believes that the expectations reflected in such forward-looking statements are reasonable, actual results may differ materially from those expressed or implied in such statements. Risks and uncertainties that could cause actual results to differ materially include, without limitation: Park's ability to execute our business plan successfully and within the expected timeframe; general economic and financial market conditions, and the uneven spread of positive impacts of the recovery on the economy, specifically in the real estate markets and the credit markets, either nationally or in the states in which Park and our subsidiaries do business, may be worse or slower than expected which could adversely impact the demand for loan, deposit and other financial services as well as loan delinquencies and defaults; changes in interest rates and prices may adversely impact the value of securities, loans, deposits and other financial instruments and the interest rate sensitivity of our consolidated balance sheet; changes in consumer spending, borrowing and saving habits; changes in unemployment; changes in customers', suppliers' and other counterparties' performance and creditworthiness; asset/liability repricing risks and liquidity risks; our liquidity requirements could be adversely affected by changes to regulations governing bank capital and liquidity standards as well as by changes in our assets and liabilities; competitive factors among financial services organizations could increase significantly, including product and pricing pressures, changes to third-party relationships and our ability to attract, develop and retain qualified bank professionals; clients could pursue alternatives to bank deposits, causing us to lose a relatively inexpensive source of funding; the nature, timing and effect of changes in banking regulations or other regulatory or legislative requirements affecting the respective businesses of Park and our subsidiaries, including changes in laws and regulations concerning taxes, accounting, banking, securities and other aspects of the financial services industry, specifically the Dodd-Frank Wall Street Reform and Consumer Protection Act of 2010 (the “Dodd-Frank Act”), as well as future regulations which will be adopted by the relevant regulatory agencies, including the Consumer Financial Protection Bureau, to implement the Dodd-Frank Act's provisions, the Budget Control Act of 2011, the American Taxpayer Relief Act of 2012 and the Basel III regulatory capital reforms; the effect of changes in accounting policies and practices, as may be adopted by the Financial Accounting Standards Board, the Securities and Exchange Commission (the "SEC"), the Public Company Accounting Oversight Board and other regulatory agencies, and the accuracy of our assumptions and estimates used to prepare our financial statements; the effect of trade, monetary, fiscal and other governmental policies of the U.S. federal government, including interest rate policies of the Federal Reserve; disruption in the liquidity and other functioning of U.S. financial markets; the impact on financial markets and the economy of any changes in the credit ratings of the U.S. Treasury obligations and other U.S. government-backed debt, as well as issues surrounding the levels of U.S. and European government debt and concerns regarding the creditworthiness of certain sovereign governments, supranationals and financial institutions in Europe; unfavorable resolution of legal proceedings or other claims and regulatory and other governmental examinations or other inquiries; the adequacy of our risk management program; a failure in or breach of our operational or security systems or infrastructure, or those of our third-party vendors and other service providers, including as a result of cyber attacks; demand for loans in the respective market areas served by Park and our subsidiaries; and other risk factors relating to the banking industry as detailed from time to time in Park's reports filed with the SEC including those described in "Item 1A. Risk Factors" of Part I of Park's Annual Report on Form 10-K for the fiscal year ended December 31, 2014. Park does not undertake, and specifically disclaims any obligation, to publicly release the results of any revisions that may be made to update any forward-looking statement to reflect the events or circumstances after the date on which the forward-looking statement was made, or reflect the occurrence of unanticipated events, except to the extent required by law.
OVERVIEW
Financial Results by segment
The table below reflects the net income (loss) by segment for the fiscal years ended December 31, 2014, 2013, and 2012. Park's operating segments include The Park National Bank ("PNB"), Guardian Financial Services Company (“GFSC”), SE Property Holdings, LLC ("SEPH"). Additionally, our parent company is presented below.
|
| | | | | | | | | | | |
| Table 1 - Net income (loss) by segment | | | | | |
| (In thousands) | | 2014 | | 2013 | 2012 |
| PNB | | $ | 83,040 |
| | $ | 75,594 |
| $ | 87,106 |
|
| GFSC | | 1,175 |
| | 2,888 |
| 3,550 |
|
| Parent Company | | (5,050 | ) | | (1,397 | ) | 195 |
|
| Ongoing operations | | $ | 79,165 |
| | $ | 77,085 |
| $ | 90,851 |
|
| SEPH | | 4,925 |
| | 142 |
| (12,221 | ) |
| Total Park | | $ | 84,090 |
| | $ | 77,227 |
| $ | 78,630 |
|
| Preferred dividends and accretion | | — |
| | — |
| 3,425 |
|
| Net income available to common shareholders | | $ | 84,090 |
| | $ | 77,227 |
| $ | 75,205 |
|
The category “Parent Company” above excludes the results for SEPH, an entity which is winding down commensurate with the disposition of its problem assets. Management considers the “Ongoing operations” results, which excludes the results of SEPH, to be reflective of the business of Park and our subsidiaries on a going forward basis. The discussion below provides some additional information regarding the segments that make up the “Ongoing operations”, followed by additional information regarding SEPH.
The Park National Bank (PNB)
The table below reflects PNB's net income for the fiscal years ended December 31, 2014, 2013 and 2012.
|
| | | | | | | | | | |
| Table 2 - PNB - Summary Income Statement | | | | |
| (In thousands) | | 2014 | 2013 | 2012 |
| Net interest income | | $ | 218,641 |
| $ | 210,781 |
| $ | 221,758 |
|
| Provision for loan losses | | 3,517 |
| 14,039 |
| 16,678 |
|
| Other income | | 69,384 |
| 70,841 |
| 70,739 |
|
| Other expense | | 171,365 |
| 165,665 |
| 156,516 |
|
| Income before income taxes | | $ | 113,143 |
| $ | 101,918 |
| $ | 119,303 |
|
| Federal income taxes | | 30,103 |
| 26,324 |
| 32,197 |
|
| Net income | | $ | 83,040 |
| $ | 75,594 |
| $ | 87,106 |
|
PNB's results for the fiscal year ended December 31, 2014 included income and expense related to participations in legacy Vision Bank ("Vision") assets. For the fiscal year ended December 31, 2014, there were net recoveries of $6.2 million, gains with respect to the sale of other real estate owned ("OREO") of $1.2 million, and expenses of $2.0 million related to participations in legacy Vision assets. For the fiscal year ended December 31, 2013, there were net recoveries of $0.6 million, and expenses of $1.6 million related to participations in legacy Vision assets. For the fiscal year ended December 31, 2012, there were net charge-offs of $3.5 million related to participations in legacy Vision assets.
The table below provides certain balance sheet information and financial ratios for PNB as of and for the fiscal years ended December 31, 2014 and December 31, 2013.
|
| | | | | | | | | |
| Table 3 - PNB - Balance Sheet Information | | | | |
| (In thousands) | December 31, 2014 | December 31, 2013 | | % change from 12/31/13 |
| Loans | $ | 4,781,761 |
| $ | 4,559,406 |
| | 4.88 | % |
| Allowance for loan losses | 52,000 |
| 56,888 |
| | (8.59 | )% |
| Net loans | 4,729,761 |
| 4,502,518 |
| | 5.05 | % |
| Investment securities | 1,498,444 |
| 1,421,937 |
| | 5.38 | % |
| Total assets | 6,912,443 |
| 6,524,098 |
| | 5.95 | % |
| Average assets | 6,792,672 |
| 6,576,420 |
| | 3.29 | % |
| Return on average assets | 1.22 | % | 1.15 | % | | 6.09 | % |
Loans outstanding at December 31, 2014 of $4.78 billion represented an increase of $222 million, or 4.88%, compared to the loans outstanding of $4.56 billion at December 31, 2013. The $222 million increase in loans experienced at PNB in 2014 was related to growth in PNB's retained residential mortgage loan portfolio of approximately $48 million, in the consumer loan portfolio of approximately $167 million, and in the commercial loan portfolio of approximately $7 million, which was net of $12.7 million of commercial loans sold in the fourth quarter of 2014.
PNB's allowance for loan losses decreased by $4.9 million, or 8.59%, to $52.0 million at December 31, 2014, compared to $56.9 million at December 31, 2013. Net charge-offs were $8.4 million, or charge-offs of 0.18% of total average loans, for the fiscal year ended December 31, 2014. Refer to the “CREDIT EXPERIENCE--(Recovery of) Provision for Loan Losses” section for additional information regarding the credit metrics of PNB's loan portfolio.
Guardian Financial Services Company (GFSC)
The table below reflects GFSC's net income for the fiscal years ended December 31, 2014, 2013, and 2012.
|
| | | | | | | | | | |
| Table 4 - GFSC- Summary Income Statement | | | | |
| (In thousands) | | 2014 | 2013 | 2012 |
| Net interest income | | $ | 7,457 |
| $ | 8,741 |
| $ | 9,156 |
|
| Provision for loan losses | | 1,544 |
| 1,175 |
| 859 |
|
| Other income (loss) | | (1 | ) | 11 |
| — |
|
| Other expense | | 4,103 |
| 3,133 |
| 2,835 |
|
| Income before income taxes | | $ | 1,809 |
| $ | 4,444 |
| $ | 5,462 |
|
| Federal income taxes | | 634 |
| 1,556 |
| 1,912 |
|
| Net income | | $ | 1,175 |
| $ | 2,888 |
| $ | 3,550 |
|
The table below provides certain balance sheet information and financial ratios for GFSC as of and for the fiscal years ended December 31, 2014 and December 31, 2013.
|
| | | | | | | | | |
| Table 5 - GFSC- Balance Sheet Information | | | | |
| (In thousands) | December 31, 2014 | December 31, 2013 | | % change from 12/31/13 |
| Loans | $ | 40,645 |
| $ | 47,228 |
| | (13.94 | )% |
| Allowance for loan losses | 2,352 |
| 2,581 |
| | (8.87 | )% |
| Net loans | 38,293 |
| 44,647 |
| | (14.23 | )% |
| Total assets | 40,308 |
| 47,115 |
| | (14.45 | )% |
| Average assets | 43,038 |
| 49,481 |
| | (13.02 | )% |
| Return on average assets | 2.73 | % | 5.84 | % | | (53.25 | )% |
Park Parent Company
The table below reflects the Park Parent Company net income (loss) for the fiscal years ended December 31, 2014, 2013, and 2012.
|
| | | | | | | | | | |
| Table 6 - Park Parent Company Income Statement | | | | |
| (In thousands) | | 2014 | 2013 | 2012 |
| Net interest income (expense) | | $ | (2,012 | ) | $ | 2,828 |
| $ | 4,742 |
|
| Provision for loan losses | | — |
| — |
| — |
|
| Other income | | 175 |
| 469 |
| 233 |
|
| Other expense | | 8,000 |
| 7,520 |
| 6,585 |
|
| Loss before income taxes | | $ | (9,837 | ) | $ | (4,223 | ) | $ | (1,610 | ) |
| Federal income tax benefit | | (4,787 | ) | (2,826 | ) | (1,805 | ) |
| Net income (loss) | | $ | (5,050 | ) | $ | (1,397 | ) | $ | 195 |
|
The net interest income (expense) for Park's parent company includes interest income on loans to SEPH and on subordinated debt investments in PNB, which are eliminated in the consolidated Park National Corporation totals. Additionally, net interest income (expense) includes interest expense related to the $35.25 million and $30.00 million of subordinated notes issued by Park to accredited investors on December 23, 2009 and April 20, 2012, respectively. Park paid in full the $35.25 million outstanding principal amount of the 10% Subordinated Notes due December 23, 2019, plus accrued interest, on December 24, 2014, the earliest redemption date allowable under the related note purchase agreement dated December 23, 2009.
SEPH
The table below reflects SEPH's net income (loss) for the fiscal years ended December 31, 2014, 2013 and 2012. SEPH holds the remaining assets and liabilities of those retained by Vision subsequent to the sale of the Vision business on February 16, 2012. Prior to holding the remaining Vision assets, SEPH held OREO assets that had been transferred from Vision to SEPH. This segment represents a run-off portfolio of the legacy Vision assets.
|
| | | | | | | | | | |
| Table 7 - SEPH Summary Income Statement | | | | |
| (In thousands) | | 2014 | 2013 | 2012 |
| Net interest income (expense) | | $ | 958 |
| $ | (1,325 | ) | $ | (341 | ) |
| (Recovery of) provision for loan losses | | (12,394 | ) | (11,799 | ) | 17,882 |
|
| Other income (loss) | | 5,991 |
| 1,956 |
| (736 | ) |
| Gain on sale of Vision business | | — |
| — |
| 22,167 |
|
| Other expense | | 11,766 |
| 12,211 |
| 22,032 |
|
| Income (loss) before income taxes | | $ | 7,577 |
| $ | 219 |
| $ | (18,824 | ) |
| Federal income taxes (benefit) | | 2,652 |
| 77 |
| (6,603 | ) |
| Net income (loss) | | $ | 4,925 |
| $ | 142 |
| $ | (12,221 | ) |
| Net income (loss) excluding gain on sale of Vision business | | $ | 4,925 |
| $ | 142 |
| $ | (26,630 | ) |
SEPH's financial results for the fiscal year ended December 31, 2014 included net recoveries of $12.4 million. The net recoveries during 2014 consisted of charge-offs of $1.1 million, offset by recoveries of $13.5 million. Other income for the fiscal year ended December 31, 2014 at SEPH of $6.0 million was largely related to net gains on the sale of OREO of $3.3 million and non-yield loan fee income of $1.3 million, offset by OREO devaluations of $831,000. Additionally, other income for the fiscal year ended December 31, 2014 included a $2.2 million gain on the sale of SEPH loans held for sale in the fourth quarter of 2014. SEPH sold $5.8 million of commercial loans which had been moved to held for sale as of September 30, 2014.
On February 16, 2012, when Vision merged with and into SEPH, the loans then held by Vision were transferred to SEPH by operation of law at their fair value and no allowance for loan loss is carried at SEPH. The loans included in both the performing and nonperforming portfolios have been charged down to their fair value. The table below provides additional information for SEPH regarding charge-offs as a percentage of the unpaid principal balance, as of December 31, 2014.
|
| | | | | | | | | | | | |
| Table 8 - SEPH - Retained Vision Loan Portfolio |
| | | | | | |
| (In thousands) | | Unpaid Principal Balance | Aggregate Charge-Offs | Net Book Balance | Charge-off Percentage |
| Nonperforming loans | | $ | 43,901 |
| $ | 20,888 |
| $ | 23,013 |
| 47.58 | % |
| Performing loans - retained by SEPH | | 1,035 |
| 92 |
| 943 |
| 8.89 | % |
| Total SEPH loan exposure | | $ | 44,936 |
| $ | 20,980 |
| $ | 23,956 |
| 46.69 | % |
The table below provides an overview of SEPH loans and OREO, representing the legacy Vision assets. This information is provided as of December 31, 2014, 2013, and 2012, showing the decline in legacy Vision assets at SEPH over the last two years.
|
| | | | | | | | | | | | | | | | |
| Table 9 - SEPH Legacy Assets | | | | | | |
| (In thousands) | | SEPH 12/31/14 | SEPH 12/31/13 | SEPH 12/31/12 | Change from 12/31/13 | Change from 12/31/12 |
| Nonperforming loans | | $ | 23,013 |
| $ | 36,108 |
| $ | 55,292 |
| $ | (13,095 | ) | $ | (32,279 | ) |
| OREO | | 11,918 |
| 23,224 |
| 21,003 |
| (11,306 | ) | (9,085 | ) |
| Total nonperforming assets | | $ | 34,931 |
| $ | 59,332 |
| $ | 76,295 |
| $ | (24,401 | ) | $ | (41,364 | ) |
| Performing loans | | $ | 943 |
| $ | 1,907 |
| $ | 3,886 |
| $ | (964 | ) | $ | (2,943 | ) |
| Total SEPH - Legacy Vision assets | | $ | 35,874 |
| $ | 61,239 |
| $ | 80,181 |
| $ | (25,365 | ) | $ | (44,307 | ) |
In addition to the SEPH assets listed above, PNB participations in legacy Vision assets totaled $11.5 million, $12.3 million and $19.2 million at December 31, 2014, 2013 and 2012, respectively.
Park National Corporation
The table below reflects Park's net income for the fiscal years ended December 31, 2014, 2013 and 2012.
|
| | | | | | | | | | |
| Table 10 - Park Summary Income Statement | | | | |
| (In thousands) | | 2014 | 2013 | 2012 |
| Net interest income | | $ | 225,044 |
| $ | 221,025 |
| $ | 235,315 |
|
| (Recovery of) provision for loan losses | | (7,333 | ) | 3,415 |
| 35,419 |
|
| Other income | | 75,549 |
| 73,277 |
| 70,236 |
|
| Gain on sale of Vision business | | — |
| — |
| 22,167 |
|
| Other expense | | 195,234 |
| 188,529 |
| 187,968 |
|
| Income before income taxes | | $ | 112,692 |
| $ | 102,358 |
| $ | 104,331 |
|
| Federal income taxes | | 28,602 |
| 25,131 |
| 25,701 |
|
| Net income | | $ | 84,090 |
| $ | 77,227 |
| $ | 78,630 |
|
| Net income excluding the gain on sale of Vision business | | $ | 84,090 |
| $ | 77,227 |
| $ | 64,221 |
|
ISSUANCE OF PREFERRED SHARES AND EMERGENCY ECONOMIC STABILIZATION ACT
On October 3, 2008, Congress passed the Emergency Economic Stabilization Act of 2008 (“EESA”), which created the Troubled Asset Relief Program (“TARP”) and provided the Secretary of the Treasury with broad authority to implement certain actions to help restore stability and liquidity to U.S. markets. The Capital Purchase Program (the “CPP”) was announced by the U.S. Department of the Treasury (the “U.S. Treasury”) on October 14, 2008 as part of TARP.
On December 23, 2008, as part of Park's participation in the CPP, Park completed the sale to the U.S. Treasury of (i) 100,000 of Park’s Fixed Rate Cumulative Perpetual Preferred Shares, Series A, each without par value and having a liquidation preference of $1,000 per share (the “Series A Preferred Shares”), and (ii) a warrant (the “Warrant”) to purchase 227,376 Park common shares at an exercise price of $65.97 per share, for an aggregate purchase price of $100 million. All of the proceeds from the sale of the Series A Preferred Shares and the Warrant by Park to the U.S. Treasury qualified as Tier 1 capital for regulatory purposes.
On April 25, 2012, Park repurchased the 100,000 Series A Preferred Shares for total consideration of $101.0 million, including accrued and unpaid dividends of $1.0 million. In addition to the accrued and unpaid dividends of $1.0 million, the charge to retained earnings, resulting from the repurchase of the Series A Preferred Shares, was $1.6 million on April 25, 2012.
On May 2, 2012, Park repurchased the Warrant from the U.S. Treasury for consideration of $2.8 million, or $12.50 per Park common share.
The dividends and accretion on the Series A Preferred Shares totaled $3.4 million for 2012. The accretion of the discount was $1.9 million in 2012. Income available to common shareholders is net income minus the preferred share dividends and accretion. Income available to common shareholders was $84.1 million for 2014, $77.2 million for 2013, and $75.2 million for 2012.
DIVIDENDS ON COMMON SHARES
Cash dividends declared on common shares were $3.76 in 2014, 2013 and 2012. The quarterly cash dividend on common shares was $0.94 per share for each quarter of 2014, 2013 and 2012.
CRITICAL ACCOUNTING POLICIES
The significant accounting policies used in the development and presentation of Park’s consolidated financial statements are listed in Note 1 of the Notes to Consolidated Financial Statements. The accounting and reporting policies of Park conform with U.S. generally accepted accounting principles ("GAAP") and general practices within the financial services industry. The preparation of financial statements in conformity with GAAP requires management to make estimates and assumptions that affect the amounts reported in the financial statements and the accompanying notes. Actual results could differ from those estimates.
Allowance for Loan and Lease Losses ("ALLL") - The determination of the ALLL involves a higher degree of judgment and complexity than Park's other significant accounting policies. The ALLL is calculated with the objective of maintaining a reserve level believed by management to be sufficient to absorb probable, incurred credit losses in the loan portfolio. Management’s determination of the adequacy of the ALLL is based on periodic evaluations of the loan portfolio and of current economic conditions. However, this evaluation is inherently subjective as it requires material estimates, including expected default probabilities, the loss given default, the amounts and timing of expected future cash flows on impaired loans, and estimated losses based on historical loss experience and current economic conditions. All of these factors may be susceptible to significant change. To the extent that actual results differ from management estimates, additional loan loss provisions may be required that would adversely impact earnings for future periods. Refer to the “CREDIT EXPERIENCE - (Recovery of) Provision for Loan Losses” section for additional discussion.
Other Real Estate Owned ("OREO") - OREO, property acquired through foreclosure, is recorded at estimated fair value less anticipated selling costs (net realizable value). If the net realizable value is below the carrying value of the loan on the date of transfer of the OREO, the difference is charged off against the ALLL. Subsequent declines in value (OREO devaluations) are reported as adjustments to the carrying amount of OREO and are expensed within other income. Gains or losses not previously recognized, resulting from the sale of OREO, are recognized within other income on the date of sale. At December 31, 2014, OREO totaled $22.6 million, a decrease of 34.7%, compared to $34.6 million at December 31, 2013.
Fair Value - In accordance with GAAP, management utilizes the fair value hierarchy, which has the objective of maximizing the use of observable market inputs. The accounting guidance also requires disclosures regarding the inputs used to calculate fair value. These inputs are classified as Level 1, 2, and 3. Level 3 inputs are those with significant unobservable inputs that reflect a company’s own assumptions about the market for a particular instrument. Some of the inputs could be based on internal models and/or cash flow analyses. The large majority of Park’s financial assets valued using Level 2 inputs consists of available-for-sale (“AFS”) securities. The fair value of these AFS securities is obtained largely by the use of matrix pricing, which is a mathematical technique widely used in the financial services industry to value debt securities without relying exclusively on quoted market prices for the specific securities but rather by relying on the securities’ relationship to other benchmark quoted securities.
Goodwill and Other Intangible Assets - The accounting for goodwill and other intangible assets also involves a higher degree of judgment than most other significant accounting policies. GAAP establishes standards for the amortization of acquired intangible assets and the impairment assessment of goodwill. Goodwill arising from business combinations represents the value attributable to unidentifiable intangible assets in the business acquired. Park’s goodwill relates to the value inherent in the banking industry and that value is dependent upon the ability of PNB, Park’s bank subsidiary, to provide quality, cost-effective banking services in a competitive marketplace. The goodwill value is supported by revenue that is in part driven by the volume of business transacted. A decrease in earnings resulting from a decline in the customer base, the inability to deliver cost-effective services over sustained periods or significant credit problems can lead to impairment of goodwill that could adversely impact earnings in future periods. Under GAAP, goodwill is no longer amortized but is subject to an annual evaluation for impairment, or more frequently if events or changes in circumstances indicate that the asset might be impaired by assessing qualitative factors to determine whether it is more likely than not that the fair value of a reporting unit is less than its carrying amount. If after assessing these events or circumstances, it is concluded that it is more likely than not that the fair value of a reporting unit is less than its carrying amount, then the performance of the second step of the impairment test is required. If the carrying amount of the goodwill exceeds the fair value, an impairment charge must be recorded in an amount equal to the excess. At December 31, 2014, on a consolidated basis, Park had $72.3 million of goodwill.
Pension Plan - The determination of pension plan obligations and related expenses requires the use of assumptions to estimate the amount of benefits that employees earn while working, as well as the present value of those benefits. Annual pension expense is principally based on four components: (1) the value of benefits earned by employees for working during the year (service cost), (2) the increase in the liability due to the passage of time (interest cost), and (3) other gains and losses, reduced by (4) the expected return on plan assets for our pension plan.
Significant assumptions used to measure our annual pension expense include:
| |
| • | the interest rate used to determine the present value of liabilities (discount rate); |
| |
| • | certain employee-related factors, such as turnover, retirement age and mortality; |
| |
| • | the expected return on assets in our funded plans; and |
| |
| • | for pension expense, the rate of salary increases for plans where benefits are based on earnings |
Our assumptions reflect our historical experience and management’s best judgment regarding future expectations. Due to the significant management judgment involved, our assumptions could have a material impact on the measurement of our pension plan expense and obligation.
ABOUT OUR BUSINESS
Through our Ohio-based banking divisions, Park is engaged in the commercial banking and trust business, generally in small to medium population Ohio communities. Management believes there is a significant number of consumers and businesses which seek long-term relationships with community-based financial institutions of quality and strength. While not engaging in activities such as foreign lending, nationally syndicated loans or investment banking, Park attempts to meet the needs of our customers for commercial, real estate and consumer loans, and investment, fiduciary and deposit services.
Park’s subsidiaries compete for deposits and loans with other banks, savings associations, credit unions and other types of financial institutions. At December 31, 2014, Park operated 124 financial service offices (including those of PNB, Scope Aircraft, Park Title Agency, GFSC and SEPH) and a network of 141 automated teller machines in 28 Ohio counties.
A summary of financial data, average loans and average deposits, for Park’s bank subsidiaries and their divisions for 2014, 2013 and 2012 is shown in Table 11. See Note 25 of the Notes to Consolidated Financial Statements for additional financial information for the Corporation’s operating segments. Please note that the financial statements for the divisions of PNB are not prepared on a separate basis and, therefore, net income is not included in the summary financial data below.
|
| | | | | | | | | | | | | | | | | | | | | | | | |
| Table 11 - Park Affiliate Financial Data |
| | | 2014 | | 2013 | | 2012 |
| (In thousands) | | Average Loans | | Average Deposits | | Average
Loans | | Average Deposits | | Average
Loans | | Average Deposits |
| Park National Bank: | | | | | | | | | | | | |
| Park National Bank Division | | $ | 1,383,686 |
| | $ | 1,426,645 |
| | $ | 1,348,466 |
| | $ | 1,355,805 |
| | $ | 1,286,751 |
| | $ | 1,354,196 |
|
| Security National Bank Division | | 454,680 |
| | 774,716 |
| | 432,259 |
| | 780,525 |
| | 412,388 |
| | 767,560 |
|
| First-Knox National Bank Division | | 571,519 |
| | 563,275 |
| | 540,452 |
| | 538,142 |
| | 513,976 |
| | 507,237 |
|
| Century National Bank Division | | 638,314 |
| | 493,449 |
| | 618,144 |
| | 482,002 |
| | 604,382 |
| | 480,536 |
|
| Richland Bank Division | | 242,788 |
| | 451,304 |
| | 240,692 |
| | 444,364 |
| | 248,421 |
| | 439,420 |
|
| Fairfield National Bank Division | | 255,280 |
| | 401,255 |
| | 251,567 |
| | 398,260 |
| | 245,064 |
| | 394,239 |
|
| Second National Bank Division | | 355,379 |
| | 317,208 |
| | 323,880 |
| | 308,970 |
| | 302,185 |
| | 290,870 |
|
| Park National SW & N KY Bank Division | | 363,735 |
| | 208,784 |
| | 324,386 |
| | 216,134 |
| | 291,297 |
| | 218,407 |
|
| United Bank, N.A. Division | | 92,427 |
| | 190,082 |
| | 85,761 |
| | 193,823 |
| | 92,258 |
| | 196,841 |
|
| Unity National Bank Division | | 174,950 |
| | 162,074 |
| | 160,123 |
| | 153,814 |
| | 147,956 |
| | 149,537 |
|
| Farmers Bank Division | | 108,397 |
| | 89,328 |
| | 100,189 |
| | 84,802 |
| | 95,661 |
| | 75,684 |
|
| Scope Aircraft Finance | | 178,194 |
| | 8 |
| | 182,794 |
| | 7 |
| | 175,019 |
| | 9 |
|
| SEPH/Vision Bank | | 31,836 |
| | — |
| | 47,625 |
| | 18 |
| | 133,306 |
| | 67,737 |
|
| GFSC | | 43,165 |
| | 6,610 |
| | 49,687 |
| | 8,172 |
| | 48,987 |
| | 8,524 |
|
| Parent Company, other | | (177,053 | ) | | (67,185 | ) | | (191,244 | ) | | (105,098 | ) | | (186,990 | ) | | (115,400 | ) |
| Consolidated Totals | | $ | 4,717,297 |
| | $ | 5,017,553 |
| | $ | 4,514,781 |
| | $ | 4,859,740 |
| | $ | 4,410,661 |
| | $ | 4,835,397 |
|
SOURCE OF FUNDS
Deposits: Park’s major source of funds is deposits from individuals, businesses and local government entities. These deposits consist of non-interest bearing and interest bearing deposits.
Average total deposits were $5,018 million in 2014, compared to $4,860 million in 2013, and $4,835 million in 2012. Table 12 provides a summary of deposit balances as of December 31, 2014 and 2013, along with the change over the past year.
|
| | | | | | | | | | | | |
| Table 12 - Year-End Deposits | | | | | | |
| December 31, | | | | | | |
| (In thousands) | | 2014 | | 2013 | | Change |
| Non-interest bearing checking | | $ | 1,269,296 |
| | $ | 1,193,553 |
| | $ | 75,743 |
|
| Interest bearing transaction accounts | | 1,122,079 |
| | 1,145,525 |
| | (23,446 | ) |
| Savings | | 1,325,445 |
| | 1,124,994 |
| | 200,451 |
|
| All other time deposits | | 1,409,911 |
| | 1,324,659 |
| | 85,252 |
|
| Other | | 1,269 |
| | 1,263 |
| | 6 |
|
| Total | | $ | 5,128,000 |
| | $ | 4,789,994 |
| | $ | 338,006 |
|
The average interest rate paid on interest bearing deposits was 0.29% in 2014, compared to 0.35% in 2013, and 0.49% in 2012. The average cost of interest bearing deposits for each quarter of 2014 was 0.32% for the fourth quarter, 0.27% for the third quarter, 0.27% for the second quarter and 0.29% for the first quarter. The increase to 0.32% in the fourth quarter was largely due to the addition of $200 million of brokered deposits which settled in September 2014 and have an effective rate of 1.77%.
Short-Term Borrowings: Short-term borrowings consist of securities sold under agreements to repurchase, Federal Home Loan Bank advances, federal funds purchased and other borrowings. These funds are used to manage the Corporation’s liquidity needs and interest rate sensitivity risk. The average rate paid on short-term borrowings generally moves closely with changes in market interest rates for short-term investments. The average rate paid on short-term borrowings was 0.20% in 2014, compared to 0.22% in 2013, and 0.26% in 2012. The year-end balance for short-term borrowings was $277 million at December 31, 2014, compared to $242 million at December 31, 2013, and $344 million at December 31, 2012.
Long-Term Debt: Long-term debt primarily consists of borrowings from the Federal Home Loan Bank and repurchase agreements with investment banking firms. The average balance of long-term debt and the average cost of long-term debt include the subordinated notes discussed in the following section. In 2014, average long-term debt was $868 million, compared to $871 million in 2013, and $908 million in 2012. Average total debt (long-term and short-term) was $1,131 million in 2014, compared to $1,124 million in 2013, and $1,166 million in 2012. Average total debt increased by $7 million or 0.6% in 2014 compared to 2013, and decreased by $42 million or 3.6% in 2013 compared to 2012. Average long-term debt was 77% of average total debt in 2014 and 2013, compared to 78% in 2012.
On November 30, 2012, Park's bank subsidiary, PNB, restructured $300 million of fixed rate repurchase agreement borrowings with a third-party investment banking firm. The restructuring reduced the weighted-average interest rate paid on the debt from 4.04% to 1.75% and extended the weighted-average maturity from 4.4 years to 5.0 years. A $25 million prepayment penalty was paid by PNB to the third-party investment banking firm as part of the restructuring which will be amortized over the five-year remaining term of the restructured borrowing. The effective rate on the restructured borrowing is 3.40%, including the impact of the prepayment penalty amortization.
The average interest rate paid on long-term debt was 3.29% for 2014, compared to 3.26% for 2013, and 3.45% for 2012.
Subordinated Notes: Park assumed, with the 2007 acquisition of Vision's parent holding company, $15.5 million of floating rate junior subordinated notes. The $15.5 million of junior subordinated notes were purchased by Vision Bancshares Trust I ("Trust I") following the issuance of Trust I's $15.0 million of floating rate preferred securities. The interest rate on these junior subordinated notes adjusts every quarter at 148 basis points above the three-month LIBOR interest rate. The maturity date for the junior subordinated notes is December 30, 2035 and the junior subordinated notes may be prepaid after December 30, 2010. These junior subordinated notes qualify as Tier 1 capital under current Federal Reserve Board guidelines.
On December 23, 2009, Park issued an aggregate principal amount of $35.25 million of subordinated notes to 38 purchasers. These subordinated notes had a fixed annual interest rate of 10% with quarterly interest payments. The maturity date of these subordinated notes was December 23, 2019 and the subordinated notes were eligible to be prepaid after December 23, 2014. The subordinated notes qualifed as Tier 2 capital under applicable Federal Reserve Board guidelines. Each subordinated note was purchased at a purchase price of 100% of the principal amount by an accredited investor. Park paid in full the $35.25 million outstanding principal amount, plus accrued interest, on December 24, 2014, the earliest redemption date allowable under the related note purchase agreement.
On April 20, 2012, Park issued an aggregate principal amount of $30.0 million of subordinated notes to 56 purchasers. These subordinated notes have a fixed annual interest rate of 7% with quarterly interest payments. The maturity date of these subordinated notes is April 20, 2022 and the subordinated notes are eligible to be prepaid after April 20, 2017. The subordinated notes qualify as Tier 2 capital under applicable Federal Reserve Board guidelines. Each subordinated note was purchased at a purchase price of 100% of the principal amount by an accredited investor.
See Note 14 of the Notes to Consolidated Financial Statements for additional information about the subordinated notes.
Shareholders' Equity: The ratio of tangible shareholders’ equity [shareholders’ equity ($698.6 million) less goodwill ($72.3 million)] to tangible assets [total assets ($7,003 million) less goodwill ($72.3 million)] was 9.04% at December 31, 2014, compared to 8.82% at December 31, 2013, and 8.79% at December 31, 2012.
In accordance with GAAP, Park reflects any unrealized holding gain or loss on AFS securities, change in the funded status of Park's pension plan or unrealized net holding gain/loss on cash flow hedge, net of income taxes, as accumulated other comprehensive income (loss) which is part of Park’s shareholders’ equity.
The unrealized net holding gain, net of income taxes, on AFS securities was $1.3 million at year-end 2014, compared to the unrealized net holding loss, net of income taxes, of $29.8 million at year-end 2013, and unrealized net holding gain, net of income taxes, of $9.6 million at year-end 2012. The unrealized net holding gain at December 31, 2014 was the result of decreases in long-term interest rates during the year.
In accordance with GAAP, Park adjusts accumulated other comprehensive income (loss) to recognize the net actuarial gain or loss reflected in the funding status of Park’s pension plan. See Note 16 of the Notes to Consolidated Financial Statements for information on the accounting for Park’s pension plan.
Pertaining to the funding status of the pension plan, Park recognized a net comprehensive loss of $9.3 million in 2014, net comprehensive income of $21.5 million in 2013 and a net comprehensive loss of $6.2 million in 2012. The net comprehensive loss in 2014 was due to changes in actuarial assumptions, primarily a decrease in the discount rate from 5.30% at December 31, 2013 to 4.42% at December 31, 2014. The actuarial loss more than offset the positive investment returns with respect to the pension plan's assets in 2014. The net comprehensive income in 2013 was due to positive investment returns in 2013 and changes in actuarial assumptions, primarily an increase in the discount rate from 4.47% at December 31, 2012 to 5.30% at December 31, 2013. The net comprehensive loss in 2012 was due to changes in actuarial assumptions, primarily a change in the discount rate. The actuarial loss more than offset the positive investment returns with respect to the pension plan's assets in 2012. At year-end 2014, the balance in accumulated other comprehensive loss pertaining to the pension plan was $(14.9) million, compared to $(5.6) million at December 31, 2013, and $(27.1) million at December 31, 2012.
Park also recognized net comprehensive income with respect to the unrealized net holding gain of $0.6 million for the year ended December 31, 2012, due to the mark-to-market of the $25 million (notional amount) cash flow hedge that expired on December 28, 2012.
INVESTMENT OF FUNDS
Loans: Average loans were $4,717 million in 2014, compared to $4,515 million in 2013, and $4,411 million in 2012. The average yield on loans was 4.84% in 2014, compared to 5.02% in 2013, and 5.35% in 2012. The average prime lending rate was 3.25% in each of 2014, 2013 and 2012. Approximately 50% of Park’s loan balances mature or reprice within one year (see Table 34). The yield on average loan balances for each quarter of 2014 was 4.83% for the fourth quarter, 4.80% for the third quarter, 4.91% for the second quarter and 4.84% for the first quarter.
At December 31, 2014, loan balances were $4,830 million, compared to $4,621 million at year-end 2013, an increase of $209 million or 4.5%. The loan growth of $209 million in 2014 was largely due to increases in loans of $222 million at PNB, offset by declines at GFSC and SEPH.
Year-end residential real estate loans were $1,851 million, $1,800 million, and $1,713 million in 2014, 2013, and 2012, respectively. Residential real estate loans increased by $51 million or 2.8% in 2014, and $87 million or 5.1% in 2013. The increases in 2013 and 2014 were primarily due to management's decision to continue to retain certain of the 15-year, fixed-rate mortgage loans originated during each year. The balance of 15-year, fixed-rate mortgage loans was $471 million at December 31, 2012, and had a weighted-average interest rate of 3.62%. At December 31, 2013, the 15-year, fixed-rate mortgage loan portfolio increased by $141 million to $612 million and had a weighted-average interest rate of 3.50%. At December 31, 2014, the 15-year, fixed-rate mortgage loan portfolio increased by $27 million to $639 million and had a weighted-average interest rate of 3.50%.
The long-term, fixed-rate residential mortgage loans that Park originates are generally sold in the secondary market and Park typically retains servicing on these loans. During 2010, Park began to retain on our balance sheet certain of the 15-year, fixed-rate residential mortgage loans that it originated. The balance of sold fixed-rate residential mortgage loans, in which Park has maintained the servicing rights, was $1,264 million at year-end 2014, compared to $1,326 million at year-end 2013 and $1,311 million at year-end 2012.
Year-end consumer loans were $893 million, $724 million, and $652 million in 2014, 2013 and 2012, respectively. Consumer loans increased by $169 million or 23.3% in 2014 and increased by $72 million or 11.0% in 2013. The increase in consumer loans in 2014 and 2013 was primarily due to an increase in automobile lending in Ohio.
On a combined basis, year-end commercial, financial and agricultural loans, construction real estate loans and commercial real estate loans totaled $2,082 million, $2,094 million, and $2,082 million for 2014, 2013 and 2012, respectively. These combined loan totals decreased by $12 million or 0.6% in 2014 and increased by $12 million or 0.6% in 2013. The decrease in 2014 was primarily due to the fact that the increase in commercial, financial and agricultural loans of $31.1 million, was more than offset by decreases in construction real estate and commercial real estate of $312,000 and $42.6 million, respectively. The increase in 2013 was primarily due to increases in commercial real estate loans of $20.2 million and commercial, financial and agricultural loans of $1.5 million, partially offset by a decline in construction real estate loans of $9.4 million.
Table 13 reports year-end loan balances by type of loan for the past five years.
|
| | | | | | | | | | | | | | | | | | | | |
| Table 13 - Loans by Type | | | | | | | | | | |
| December 31, | | | | | | | | | | |
| (In thousands) | | 2014 | | 2013 | | 2012 | | 2011 | | 2010 |
| Commercial, financial and agricultural | | $ | 856,535 |
| | $ | 825,432 |
| | $ | 823,927 |
| | $ | 743,797 |
| | $ | 737,902 |
|
| Construction real estate | | 155,804 |
| | 156,116 |
| | 165,528 |
| | 217,546 |
| | 406,480 |
|
| Residential real estate | | 1,851,375 |
| | 1,799,547 |
| | 1,713,645 |
| | 1,628,618 |
| | 1,692,209 |
|
| Commercial real estate | | 1,069,637 |
| | 1,112,273 |
| | 1,092,164 |
| | 1,108,574 |
| | 1,226,616 |
|
| Consumer | | 893,160 |
| | 723,733 |
| | 651,930 |
| | 616,505 |
| | 666,871 |
|
| Leases | | 3,171 |
| | 3,404 |
| | 3,128 |
| | 2,059 |
| | 2,607 |
|
| Total Loans | | $ | 4,829,682 |
| | $ | 4,620,505 |
| | $ | 4,450,322 |
| | $ | 4,317,099 |
| | $ | 4,732,685 |
|
|
| | | | | | | | | | | | | | | | |
| Table 14 - Selected Loan Maturity Distribution | | | | | | |
| | | One Year or Less (1) | | Over One Through Five Years | | Over Five Years | | Total |
| December 31, 2014 | | | | |
| (In thousands) | | | | |
| Commercial, financial and agricultural | | $ | 363,707 |
| | $ | 347,979 |
| | $ | 144,849 |
| | $ | 856,535 |
|
| Construction real estate | | 50,558 |
| | 18,256 |
| | 86,990 |
| | 155,804 |
|
| Commercial real estate | | 54,437 |
| | 106,911 |
| | 908,289 |
| | 1,069,637 |
|
| Total | | $ | 468,702 |
| | $ | 473,146 |
| | $ | 1,140,128 |
| | $ | 2,081,976 |
|
| Total of these selected loans due | | | | | | | | |
| after one year with: | | | | | | | | |
| Fixed interest rate | | | | $ | 306,931 |
| | $ | 167,379 |
| | $ | 474,310 |
|
| Floating interest rate | | | | 166,215 |
| | 972,749 |
| | 1,138,964 |
|
| |
| (1) | Nonaccrual loans of $47.4 million are included within the one year or less classification above. |
Investment Securities: Park’s investment securities portfolio is structured to minimize credit risk, provide liquidity and contribute to earnings. As conditions change over time, Park’s overall interest rate risk, liquidity needs and potential return on the investment portfolio will change. Management regularly evaluates the securities in the investment portfolio as circumstances evolve. Circumstances that could result in the sale of a security include: to better manage interest rate risk; to meet liquidity needs; or to improve the overall yield in the investment portfolio.
Park classifies the majority of our securities as AFS (see Note 6 of the Notes to Consolidated Financial Statements). These securities are carried on the books at their estimated fair value with the unrealized holding gain or loss, net of federal taxes, accounted for as accumulated other comprehensive income (loss). The securities that are classified as AFS are free to be sold in future periods in carrying out Park’s investment strategies.
Park classifies certain types of U.S. Government sponsored entity collateralized mortgage obligations (“CMOs”) that we purchase as held-to-maturity. A classification of held-to-maturity means that Park has the positive intent and the ability to hold these securities until maturity. These CMOs are classified as held-to-maturity because they are generally not as liquid as the other U.S. Government sponsored entities' asset-backed securities that Park classifies as AFS. At year-end 2014, Park’s held-to-maturity securities portfolio was $141 million, compared to $182 million at year-end 2013, and $401 million at year-end 2012. All of the CMOs, mortgage-backed securities, and callable notes in Park’s investment portfolio were issued by a U.S. Government sponsored entity.
Average taxable investment securities were $1,433 million in 2014, compared to $1,377 million in 2013 and $1,610 million in 2012. The average yield on taxable investment securities was 2.58% in 2014, compared to 2.67% in 2013 and 3.14% in 2012. Average tax-exempt investment securities were $65,000 in 2014, compared to $1.0 million in 2013 and $3.1 million in 2012. The average tax-equivalent yield on tax-exempt investment securities was 6.97% in 2014, compared to 7.07% in 2013 and 7.03% in 2012.
Total investment securities (at amortized cost) were $1,499 million at December 31, 2014, compared to $1,470 million and $1,567 million at December 31, 2013 and December 31, 2012, respectively. Management purchased investment securities totaling $352 million in 2014, $583 million in 2013 and $1,227 million in 2012. Proceeds from repayments and maturities of investment securities were $140 million in 2014, $605 million in 2013 and $1,348 million in 2012.
Proceeds from sales of investment securities were $173.1 million in 2014. Park sold investment securities with a book value of $187,000 for a gain of $22,000. Additionally, investment securities with a book value of $174.1 million were sold at a loss of $1.2 million. Proceeds from sales of investment securities were $75 million in 2013. These securities were sold at book value; thus, there was no gain or loss recognized. There were no sales of investment securities in 2012.
At year-end 2014, 2013 and 2012, the average tax-equivalent yield on the total investment portfolio was 2.47%, 2.53%, and 2.76%, respectively. The weighted average remaining maturity of the total investment portfolio was 5.2 years at December 31, 2014, 6.5 years at December 31, 2013, and 2.1 years at December 31, 2012. Obligations of the U.S. Treasury and other U.S. Government sponsored entities and U.S. Government sponsored entities' asset-backed securities were approximately 96.0% of the total investment portfolio at year-end 2014, approximately 95.2% of the total investment portfolio at year-end 2013, and approximately 95.7% of the total investment portfolio at year-end 2012.
The average maturity of the investment portfolio would lengthen if long-term interest rates were to increase as the principal repayments from mortgage-backed securities and CMOs would be reduced and callable U.S. Government sponsored entity notes would extend to their maturity dates. At year-end 2014, management estimated that the average maturity of the investment portfolio would lengthen to 5.7 years with a 100 basis point increase in long-term interest rates and to 5.8 years with a 200 basis point increase in long-term interest rates. Likewise, the average maturity of the investment portfolio would shorten if long-term interest rates were to decrease as the principal repayments from mortgage-backed securities and CMOs would increase as borrowers would refinance their mortgage loans and the callable U.S. Government sponsored entity notes would shorten to their call dates. At year-end 2014, management estimated that the average maturity of the investment portfolio would decrease to 1.8 years with a 100 basis point decrease in long-term interest rates and to 1.5 years with a 200 basis point decrease in long-term interest rates.
Table 15 sets forth the carrying value of investment securities, as well as the percentage held within each category at year-end 2014, 2013 and 2012:
|
| | | | | | | | | | | | |
| Table 15 - Investment Securities | | | | | | |
| December 31, | | | | | | |
| (In thousands) | | 2014 | | 2013 | | 2012 |
| Obligations of U.S. Treasury and other U.S. Government sponsored entities | | $ | 538,064 |
| | $ | 525,136 |
| | $ | 695,727 |
|
| Obligations of states and political subdivisions | | — |
| | 240 |
| | 1,573 |
|
| U.S. Government asset-backed securities | | 901,715 |
| | 830,292 |
| | 816,322 |
|
| Federal Home Loan Bank stock | | 50,086 |
| | 59,031 |
| | 59,031 |
|
| Federal Reserve Bank stock | | 8,225 |
| | 6,876 |
| | 6,876 |
|
| Equities | | 2,698 |
| | 2,659 |
| | 2,222 |
|
| Total | | $ | 1,500,788 |
| | $ | 1,424,234 |
| | $ | 1,581,751 |
|
| Investments by category as a percentage of total investment securities | | | | | | |
| Obligations of U.S. Treasury and other U.S. Government sponsored entities | | 35.9 | % | | 36.9 | % | | 44.0 | % |
| Obligations of states and political subdivisions | | — | % | | N.M. |
| | 0.1 | % |
| U.S. Government asset-backed securities | | 60.1 | % | | 58.3 | % | | 51.7 | % |
| Federal Home Loan Bank stock | | 3.3 | % | | 4.1 | % | | 3.7 | % |
| Federal Reserve Bank stock | | 0.5 | % | | 0.5 | % | | 0.4 | % |
| Equities | | 0.2 | % | | 0.2 | % | | 0.1 | % |
| Total | | 100.0 | % | | 100.0 | % | | 100.0 | % |
N.M. - Not meaningful
ANALYSIS OF EARNINGS
Park’s principal source of earnings is net interest income, the difference between total interest income and total interest expense. Net interest income results from average balances outstanding for interest earning assets and interest bearing liabilities in conjunction with the average rates earned and paid on them. (See Table 16 for three years of history on the average balances of the balance sheet categories as well as the average rates earned on interest earning assets and the average rates paid on interest bearing liabilities.)
Net interest income increased by $4.0 million, or 1.8%, to $225.0 million for 2014, compared to a decrease of $14.3 million, or 6.1%, to $221.0 million for 2013. The tax equivalent net yield on interest earning assets (net interest margin) was 3.55% for 2014, compared to 3.61% for 2013 and 3.83% for 2012. The net interest rate spread (the difference between rates received for interest earning assets and the rates paid for interest bearing liabilities) was 3.38% for 2014, compared to 3.43% for 2013 and 3.62% for 2012. The increase in net interest income in 2014 was primarily due to the increase in average interest earning assets of $189 million, to $6,355 million, or 3.1%. The decrease in net interest income in 2013 was due to the decline in the net interest spread to 3.43%, while total interest earning assets only declined by approximately $25 million.
The average yield on interest earning assets was 4.19% in 2014, compared to 4.29% in 2013 and 4.64% in 2012. On a quarterly basis for 2014, the average yield on interest earning assets was 4.11% for the fourth quarter, 4.17% for the third quarter, 4.28% for the second quarter, and 4.20% for the first quarter.
The average rate paid on interest bearing liabilities was 0.81% in 2014, compared to 0.86% in 2013 and 1.02% in 2012. On a quarterly basis for 2014, the average rate paid on interest bearing liabilities was 0.82% for the fourth quarter, 0.79% for the third quarter, 0.81% for the second quarter, and 0.82% for the first quarter.
|
| | | | | | | | | | | | | | | | | | | | | | | | |
| Table 16 - Distribution of Assets, Liabilities and Shareholders' Equity |
| December 31, | 2014 | 2013 | 2012 |
| (In thousands) | Daily Average | Interest | Average Rate | Daily
Average | Interest | Average
Rate | Daily
Average | Interest | Average
Rate |
| ASSETS | | | | | | | | | |
| Interest earning assets: | | | | | | | | | |
| Loans (1) (2) | $ | 4,717,297 |
| $ | 228,487 |
| 4.84 | % | $ | 4,514,781 |
| $ | 226,816 |
| 5.02 | % | $ | 4,410,661 |
| $ | 236,184 |
| 5.35 | % |
Taxable investment securities | 1,432,627 |
| 36,981 |
| 2.58 | % | 1,376,913 |
| 36,686 |
| 2.66 | % | 1,610,044 |
| 50,549 |
| 3.14 | % |
| Tax-exempt investment securities (3) | 65 |
| 5 |
| 6.97 | % | 974 |
| 69 |
| 7.07 | % | 3,087 |
| 217 |
| 7.03 | % |
| Money market instruments | 204,874 |
| 515 |
| 0.25 | % | 272,851 |
| 678 |
| 0.25 | % | 166,319 |
| 408 |
| 0.25 | % |
| Total interest earning assets | 6,354,863 |
| 265,988 |
| 4.19 | % | 6,165,519 |
| 264,249 |
| 4.29 | % | 6,190,111 |
| 287,358 |
| 4.64 | % |
| Non-interest earning assets: | | | | | | | | | |
| Allowance for loan losses | (58,917 | ) | | | (56,860 | ) | | | (61,995 | ) | | |
| Cash and due from banks | 112,113 |
| | | 110,796 |
| | | 119,410 |
| | |
| Premises and equipment, net | 55,407 |
| | | 56,303 |
| | | 54,917 |
| | |
| Other assets | 431,842 |
| | | 427,215 |
| | | 464,363 |
| | |
| TOTAL | $ | 6,895,308 |
| | | $ | 6,702,973 |
| | | $ | 6,766,806 |
| | |
| | | | | | | | | | |
| LIABILITIES AND SHAREHOLDERS' EQUITY | | | | | | |
| Interest bearing liabilities: | | | | | | | | | |
| Transaction accounts | $ | 1,291,310 |
| $ | 825 |
| 0.06 | % | $ | 1,251,305 |
| $ | 927 |
| 0.07 | % | $ | 1,239,417 |
| $ | 1,411 |
| 0.11 | % |
| Savings deposits | 1,216,750 |
| 852 |
| 0.07 | % | 1,098,860 |
| 846 |
| 0.08 | % | 1,006,321 |
| 1,072 |
| 0.11 | % |
| Time deposits | 1,312,868 |
| 9,323 |
| 0.71 | % | 1,392,196 |
| 11,235 |
| 0.81 | % | 1,540,863 |
| 15,921 |
| 1.03 | % |
| Total interest bearing deposits | 3,820,928 |
| 11,000 |
| 0.29 | % | 3,742,361 |
| 13,008 |
| 0.35 | % | 3,786,601 |
| 18,404 |
| 0.49 | % |
| Short-term borrowings | 263,270 |
| 517 |
| 0.20 | % | 253,123 |
| 544 |
| 0.22 | % | 258,661 |
| 678 |
| 0.26 | % |
| Long-term debt (4) | 867,615 |
| 28,582 |
| 3.29 | % | 870,538 |
| 28,370 |
| 3.26 | % | 907,704 |
| 31,338 |
| 3.45 | % |
| Total interest bearing liabilities | 4,951,813 |
| 40,099 |
| 0.81 | % | 4,866,022 |
| 41,922 |
| 0.86 | % | 4,952,966 |
| 50,420 |
| 1.02 | % |
| Table 16 - Continued |
| | | | | | | | | | | | | | | | | | | | | | | | |
| Non-interest bearing liabilities: | | | | | | | | | |
| Demand deposits | 1,196,625 |
| | | 1,117,379 |
| | | 1,048,796 |
| | |
| Other | 64,415 |
| | | 74,039 |
| | | 75,312 |
| | |
| Total non-interest bearing liabilities | 1,261,040 |
| | | 1,191,418 |
| | | 1,124,108 |
| | |
| Shareholders' equity | 682,455 |
| | | 645,533 |
| | | 689,732 |
| | |
| TOTAL | $ | 6,895,308 |
| | | $ | 6,702,973 |
| | | $ | 6,766,806 |
| | |
| Tax equivalent net interest income | | $ | 225,889 |
| | | $ | 222,327 |
| | | $ | 236,938 |
| |
| Net interest spread | | | 3.38 | % | | | 3.43 | % | | | 3.62 | % |
| Net yield on interest earning assets (net interest margin) | | | 3.55 | % | | | 3.61 | % | | | 3.83 | % |
| |
| (1) | Loan income includes loan related fee income of $1.3 million in 2014, $1.9 million in 2013, and $3.1 million in 2012. Loan income also includes the effects of taxable equivalent adjustments using a 35% tax rate in 2014, 2013 and 2012. The taxable equivalent adjustment was $ 843,000 in 2014, $1.3 million in 2013, and $1.5 million in 2012. |
| |
| (2) | For the purpose of the computation, nonaccrual loans are included in the daily average loans outstanding. |
| |
| (3) | Interest income on tax-exempt investment securities includes the effects of taxable equivalent adjustments using a 35% tax rate in 2014, 2013 and 2012. The taxable equivalent adjustments were $2,000 in 2014, $24,000 in 2013, and $77,000 in 2012. |
| |
| (4) | Includes subordinated notes. |
The following table displays (for each quarter of 2014) the average balance of interest earning assets, the net interest income and the tax equivalent net interest income and net interest margin.
|
| | | | | | | | | | | | | | |
| Table 17 - Quarterly Net Interest Margin |
| (In thousands) | | Average Interest Earning Assets | | Net Interest Income | | Tax Equivalent Net Interest Income | | Tax Equivalent Net Interest Margin |
| First Quarter | | $ | 6,238,321 |
| | $ | 54,480 |
| | 54,703 |
| | 3.56 | % |
| Second Quarter | | 6,244,100 |
| | 56,561 |
| | 56,783 |
| | 3.65 | % |
| Third Quarter | | 6,360,829 |
| | 56,709 |
| | 56,918 |
| | 3.55 | % |
| Fourth Quarter | | 6,572,463 |
| | 57,294 |
| | 57,485 |
| | 3.47 | % |
| 2014 | | $ | 6,354,863 |
| | $ | 225,044 |
| | 225,889 |
| | 3.55 | % |
In the following table, the change in tax equivalent interest due to both volume and rate has been allocated to volume and rate changes in proportion to the relationship of the absolute dollar amounts of the change in each.
|
| | | | | | | | | | | | | | | | | | | | | | | | |
| Table 18 - Volume/Rate Variance Analysis | | |
| | | Change from 2013 to 2014 | | Change from 2012 to 2013 |
| (In thousands) | | Volume | | Rate | | Total | | Volume | | Rate | | Total |
| Increase (decrease) in: | | | | | | | | | | | | |
| Interest income: | | | | | | | | | | | | |
| Total loans | | $ | 9,961 |
| | $ | (8,290 | ) | | $ | 1,671 |
| | $ | 5,464 |
| | $ | (14,832 | ) | | $ | (9,368 | ) |
| Taxable investments | | 1,433 |
| | (1,138 | ) | | 295 |
| | (6,744 | ) | | (7,119 | ) | | (13,863 | ) |
| Tax-exempt investments | | (63 | ) | | (1 | ) | | (64 | ) | | (149 | ) | | 1 |
| | (148 | ) |
| Money market instruments | | (163 | ) | | — |
| | (163 | ) | | 270 |
| | — |
| | 270 |
|
| Total interest income | | 11,168 |
| | (9,429 | ) | | 1,739 |
| | (1,159 | ) | | (21,950 | ) | | (23,109 | ) |
| Interest expense: | | | | | | | | | | | | |
| Transaction accounts | | $ | 27 |
| | $ | (129 | ) | | $ | (102 | ) | | $ | 13 |
| | $ | (497 | ) | | $ | (484 | ) |
| Savings accounts | | 104 |
| | (98 | ) | | 6 |
| | 95 |
| | (321 | ) | | (226 | ) |
| Time deposits | | (604 | ) | | (1,308 | ) | | (1,912 | ) | | (1,458 | ) | | (3,228 | ) | | (4,686 | ) |
| Short-term borrowings | | 23 |
| | (50 | ) | | (27 | ) | | (16 | ) | | (118 | ) | | (134 | ) |
| Long-term debt | | (83 | ) | | 295 |
| | 212 |
| | (1,266 | ) | | (1,702 | ) | | (2,968 | ) |
| Total interest expense | | (533 | ) | | (1,290 | ) | | (1,823 | ) | | (2,632 | ) | | (5,866 | ) | | (8,498 | ) |
| Net variance | | $ | 11,701 |
| | $ | (8,139 | ) | | $ | 3,562 |
| | $ | 1,473 |
| | $ | (16,084 | ) | | $ | (14,611 | ) |
Other Income: Other income was $75.5 million in 2014, compared to $73.3 million in 2013, and $92.4 million in 2012. Other income in 2012 included $22.2 million related to the gain on sale of the Vision business. Excluding this gain, other income was $70.2 million in 2012. The $2.2 million increase in other income to $75.5 million in 2014, compared to $73.3 million in 2013 was primarily due to a $2.0 million increase in income from fiduciary activities, a $2.4 million increase in the gain on the sale of OREO, net, and $1.9 million of income from the gain on the sale of commercial loans held for sale, offset by a $2.5 million decrease in other service income, a $1.2 million loss on sale of investment securities, and an $893,000 decrease in service charges on deposits. The increase in other income to $73.3 million in 2013, compared to $70.2 million excluding the gain on the sale of the Vision business in 2012 was primarily due to a $1.2 million increase in income from fiduciary activities and a $3.7 million decline in OREO devaluations, offset by a $1.3 million decline in the gain on the sale of OREO, net.
The following table displays total other income for Park in 2014, 2013 and 2012.
|
| | | | | | | | | | | | |
| Table 19 - Other Income |
| Year Ended December 31, | | |
| (In thousands) | | 2014 | | 2013 | | 2012 |
| Income from fiduciary activities | | $ | 19,150 |
| | $ | 17,133 |
| | $ | 15,947 |
|
| Service charges on deposits | | 15,423 |
| | 16,316 |
| | 16,704 |
|
| Gain on sale of Vision business | | — |
| | — |
| | 22,167 |
|
| Other service income | | 10,459 |
| | 12,913 |
| | 13,631 |
|
| Checkcard fee income | | 13,570 |
| | 12,955 |
| | 12,541 |
|
| Bank owned life insurance income | | 4,861 |
| | 5,041 |
| | 4,754 |
|
| ATM fees | | 2,467 |
| | 2,632 |
| | 2,359 |
|
| Gain on the sale of OREO, net | | 5,503 |
| | 3,110 |
| | 4,414 |
|
| OREO devaluations | | (2,406 | ) | | (3,180 | ) | | (6,872 | ) |
| Gain on the sale of commercial loans held for sale | | 1,867 |
| | — |
| | — |
|
| Loss on sale of investment securities | | (1,158 | ) | | — |
| | — |
|
| Miscellaneous | | 5,813 |
| | 6,357 |
| | 6,758 |
|
| Total other income | | $ | 75,549 |
| | $ | 73,277 |
| | $ | 92,403 |
|
The following table breaks out the change in total other income for the year ended December 31, 2014, compared to the year ended December 31, 2013, and for the year ended December 31, 2013 compared to the year ended December 31, 2012 between Park's Ohio-based operations and SEPH.
|
| | | | | | | | | | | | | | | | | | | | | | | | |
| Table 20 - Other Income Breakout |
| | | Change from 2013 to 2014 | | Change from 2012 to 2013 |
| (In thousands) | | Ohio-based operations | | SEPH | | Total | | Ohio-based operations | | SEPH | | Total |
| Income from fiduciary activities | | $ | 2,017 |
| | $ | — |
| | $ | 2,017 |
| | $ | 1,189 |
| | $ | (3 | ) | | $ | 1,186 |
|
| Service charges on deposits | | (893 | ) | | — |
| | (893 | ) | | (234 | ) | | (154 | ) | | (388 | ) |
| Gain on sale of Vision business | | — |
| | — |
| | — |
| | — |
| | (22,167 | ) | | (22,167 | ) |
| Other service income | | (3,726 | ) | | 1,272 |
| | (2,454 | ) | | (620 | ) | | (98 | ) | | (718 | ) |
| Checkcard fee income | | 615 |
| | — |
| | 615 |
| | 532 |
| | (118 | ) | | 414 |
|
| Bank owned life insurance income | | (180 | ) | | — |
| | (180 | ) | | 305 |
| | (18 | ) | | 287 |
|
| ATM fees | | (165 | ) | | — |
| | (165 | ) | | 282 |
| | (9 | ) | | 273 |
|
| Gain on the sale of OREO, net | | 1,642 |
| | 751 |
| | 2,393 |
| | (655 | ) | | (649 | ) | | (1,304 | ) |
| OREO devaluations | | 1,011 |
| | (237 | ) | | 774 |
| | (1,282 | ) | | 4,974 |
| | 3,692 |
|
| (Loss) gain on sale of commercial loans held for sale | | (329 | ) | | 2,196 |
| | 1,867 |
| | — |
| | — |
| | — |
|
| Loss on sale of investment securities | | (1,158 | ) | | — |
| | (1,158 | ) | | — |
| | — |
| | — |
|
| Miscellaneous | | (597 | ) | | 53 |
| | (544 | ) | | 832 |
| | (1,233 | ) | | (401 | ) |
| Total other income | | $ | (1,763 | ) | | $ | 4,035 |
| | $ | 2,272 |
| | $ | 349 |
| | $ | (19,475 | ) | | $ | (19,126 | ) |
Income from fiduciary activities increased by $2.0 million, or 11.8%, to $19.2 million in 2014, compared to an increase of $1.2 million, or 7.4%, to $17.1 million in 2013. The increases in fiduciary fee income in 2014 and 2013 were primarily due to improvements in the equity markets and also due to an increase in the total account balances serviced by PNB’s Trust Department. PNB charges fiduciary fees largely based on the market value of the assets being managed. The average market value of the trust assets that PNB managed was $4.26 billion at December 31, 2014, compared to $3.86 billion at December 31, 2013, and $3.52 billion at December 31, 2012.
Service charges on deposit accounts decreased by $893,000, or 5.5%, to $15.4 million in 2014, compared to a decrease of $388,000, or 2.3%, to $16.3 million in 2013. The declines in 2014 and 2013 were related to declines in service charges on deposits within Park's Ohio-based operations, largely as a result of a decrease in fee income from overdraft charges and other non-sufficient funds (NSF) charges. Park’s customers did not use our courtesy overdraft program as frequently in 2013 and 2014.
As previously discussed, on February 16, 2012, Park completed the sale of the Vision business for a purchase price of $27.9 million. As a result of the transaction, Park recorded a pre-tax gain of $22.2 million (after actual expenses directly related to the transaction). This gain on sale was recognized at Vision prior to the merger of Vision (as constituted after the sale) with and into SEPH.
Fee income earned from origination and sale into the secondary market of long-term, fixed-rate mortgage loans is included within other non-yield related fees in the subcategory “Other service income”. Other service income decreased $2.5 million, or 19%, to $10.5 million in 2014, and decreased $718,000, or 5.3%, to $12.9 million in 2013. The decrease during 2014 consisted of a $3.7 million decrease at PNB offset by a $1.2 million increase at SEPH due to the recovery of fees and expenses. The decrease in other service income in 2014 and 2013 at PNB was primarily due to a corresponding decrease in the amount of mortgage loans originated.
Checkcard fee income, which is generated from debit card transactions, increased $615,000, or 4.7%, to $13.6 million in 2014, compared to $13.0 million in 2013, and $12.5 million in 2012. The increases in 2014 and 2013 were attributable to continued increases in the volume of debit card transactions.
Gain on the sale of OREO, net, totaled $5.5 million in 2014, an increase of $2.4 million, compared to $3.1 million in 2013. The table below provides details on the OREO sales at PNB and SEPH in 2014 and 2013.
|
| | | | | | | | | | |
| Table 21 - Sales of OREO |
| (In thousands) | OREO Properties Sold | Book Balance of OREO Sold | Net Proceeds of OREO Sold | Gain on Sale (1) |
| 2014: | | | | |
| PNB | 90 | $ | 7,271 |
| $ | 8,191 |
| $ | 920 |
|
| PNB Participations in Vision assets | 1 | 1,826 |
| 3,085 |
| 1,259 |
|
| SEPH | 114 | 13,258 |
| 16,522 |
| 3,264 |
|
| Total | 205 | $ | 22,355 |
| $ | 27,798 |
| $ | 5,443 |
|
| 2013: | | | | |
| PNB | 111 | $ | 9,527 |
| $ | 10,161 |
| $ | 634 |
|
| PNB Participations in Vision assets | — | — |
| — |
| — |
|
| SEPH | 104 | 10,369 |
| 12,882 |
| 2,513 |
|
| Total | 215 | $ | 19,896 |
| $ | 23,043 |
| $ | 3,147 |
|
(1) The gain on sale amounts above excludes any deferred gains on sale.
OREO devaluations, which result from declines in the fair value (less anticipated selling costs) of property acquired through foreclosure, totaled $2.4 million in 2014, a decrease of $774,000, or 24.3%, compared to $3.2 million in 2013. Of the $2.4 million in OREO devaluations in 2014, $1.6 million were related to devaluations at PNB.
Gain on sale of commercial loans held for sale was $1.9 million in 2014. PNB sold $12.7 million of commercial loans held for sale, which resulted in a $328,000 loss on sale. SEPH sold $6.4 million of commercial loans held for sale, which resulted in a $2.2 million gain on sale.
Other Expense: Other expense was $195.2 million in 2014, compared to $188.5 million in 2013, and $188.0 million in 2012. Other expense increased by $6.7 million, or 3.6% in 2014, and increased by $561,000, or 0.3%, in 2013. The following table displays total other expense for Park for 2014, 2013 and 2012.
|
| | | | | | | | | | | |
| Table 22 - Other Expense |
| Year Ended December 31, | |
| (In thousands) | 2014 | | 2013 | | 2012 |
| Salaries and employee benefits | $ | 101,968 |
| | $ | 100,298 |
| | $ | 95,977 |
|
| Data processing fees | 4,712 |
| | 4,174 |
| | 3,916 |
|
| Professional fees and services | 29,580 |
| | 27,865 |
| | 24,267 |
|
| Net occupancy expense of bank premises | 10,006 |
| | 9,804 |
| | 9,444 |
|
| Furniture and equipment expense | 11,571 |
| | 11,249 |
| | 10,788 |
|
| Insurance | 5,723 |
| | 5,205 |
| | 5,780 |
|
| Marketing | 4,371 |
| | 3,790 |
| | 3,474 |
|
| Postage and telephone | 5,268 |
| | 5,790 |
| | 5,983 |
|
| Intangible amortization expense | — |
| | 337 |
| | 2,172 |
|
| State taxes | 2,290 |
| | 3,702 |
| | 3,786 |
|
| Loan put provision | — |
| | — |
| | 3,299 |
|
| OREO expense | 2,063 |
| | 2,731 |
| | 4,011 |
|
| Amortization of investment in qualified affordable housing projects | 7,724 |
| | 7,014 |
| | 6,841 |
|
| Miscellaneous | 9,958 |
| | 6,570 |
| | 8,230 |
|
| Total other expense | $ | 195,234 |
| | $ | 188,529 |
| | $ | 187,968 |
|
| Full-time equivalent employees | 1,801 |
| | 1,836 |
| | 1,826 |
|
The following table breaks out the change in other expense for the year ended December 31, 2014, compared to the year ended December 31, 2013, and for the year ended December 31, 2013 compared to the year ended December 31, 2012 in each of Park's Ohio-based operations and SEPH.
|
| | | | | | | | | | | | | | | | | | | | | | | | |
| Table 23 - Other Expense Breakout |
| | | Change from 2013 to 2014 | | Change from 2012 to 2013 |
| (In thousands) | | Ohio-based operations | | SEPH | | Total | | Ohio-based operations | | SEPH | | Total |
| Salaries and employee benefits | | $ | 1,625 |
| | $ | 45 |
| | $ | 1,670 |
| | $ | 6,710 |
| | $ | (2,389 | ) | | $ | 4,321 |
|
| Data processing fees | | 538 |
| | — |
| | 538 |
| | 500 |
| | (242 | ) | | 258 |
|
| Professional fees and services | | 598 |
| | 1,117 |
| | 1,715 |
| | 5,027 |
| | (1,429 | ) | | 3,598 |
|
| Net occupancy expense of bank premises | | 206 |
| | (4 | ) | | 202 |
| | 676 |
| | (316 | ) | | 360 |
|
| Furniture and equipment expense | | 334 |
| | (12 | ) | | 322 |
| | 529 |
| | (68 | ) | | 461 |
|
| Insurance | | 508 |
| | 10 |
| | 518 |
| | (433 | ) | | (142 | ) | | (575 | ) |
| Marketing | | 581 |
| | — |
| | 581 |
| | 338 |
| | (22 | ) | | 316 |
|
| Postage and telephone | | (521 | ) | | (1 | ) | | (522 | ) | | (57 | ) | | (136 | ) | | (193 | ) |
| Intangible amortization expense | | (337 | ) | | — |
| | (337 | ) | | (220 | ) | | (1,615 | ) | | (1,835 | ) |
| State taxes | | (1,451 | ) | | 39 |
| | (1,412 | ) | | (36 | ) | | (48 | ) | | (84 | ) |
| Loan put provision | | — |
| | — |
| | — |
| | — |
| | (3,299 | ) | | (3,299 | ) |
| OREO expense | | (684 | ) | | 16 |
| | (668 | ) | | (409 | ) | | (871 | ) | | (1,280 | ) |
| Amortization of investment in qualified affordable housing projects | | 710 |
| | — |
| | 710 |
| | 173 |
| | — |
| | 173 |
|
| Miscellaneous | | 5,043 |
| | (1,655 | ) | | 3,388 |
| | (2,415 | ) | | 755 |
| | (1,660 | ) |
| Total other expense | | $ | 7,150 |
| | $ | (445 | ) | | $ | 6,705 |
| | $ | 10,383 |
| | $ | (9,822 | ) | | $ | 561 |
|
Salaries and employee benefits expense increased $1.7 million, or 1.7%, to $102.0 million in 2014 and increased by $4.3 million, or 4.5%, to $100.3 million in 2013. The increase in 2014 was primarily due to increases of $992,000 in salary expense, $3.4 million in group medical insurance, and $1.2 million in other employee benefits, offset by a $4.1 million decrease in retirement benefit expense. The increase in 2013 was primarily due to increases of $2.6 million in salary expense, $1.5 million in group medical insurance, and $831,000 in retirement benefit expense. Park had 1,801 full-time equivalent employees at year-end 2014, compared to 1,836 full-time equivalent employees at year-end 2013, and 1,826 at year-end 2012.
Professional fees and services increased $1.7 million, or 6.2%, to $29.6 million in 2014, and increased by $3.6 million, or 14.8%, to $27.9 million in 2013. This subcategory of total other expense includes legal fees, management consulting fees, director fees, audit fees, regulatory examination fees and memberships in industry associations. The increase in professional fees and services expense in each of 2013 and 2014 was primarily due to increases in legal and consulting fees at both PNB and SEPH, although SEPH realized a modest decline in 2013 from the level in 2012.
State taxes decreased by $1.4 million, or 38.1%, to $2.3 million in 2014, compared to $3.7 million in 2013. The decrease was due to the reversal of an accrual previously established for the 2012 and 2013 state tax years which are now concluded.
As part of the transaction between Vision and Centennial, Park agreed to allow Centennial to “put back” up to $7.5 million aggregate principal amount of loans, which were originally included within the loans sold in the transaction. The loan put option expired on August 16, 2012, 180 days after the closing of the transaction. In total, Centennial put back 44 loans, totaling approximately $7.5 million. Upon repurchase, Park was required to charge each of the repurchased loans down to its then current fair value. Park recognized $3.3 million of loan put provision expense in 2012 to establish a liability account that was utilized to cover write downs on the 44 loans repurchased from Centennial.
The subcategory "Miscellaneous" other expense includes expenses for supplies, travel, charitable contributions, and other miscellaneous expense. The subcategory miscellaneous other expense increased by $3.4 million, or 51.6%, to $10.0 million in 2014, and decreased by $1.7 million, or 20.2%, to $6.6 million in 2013. The $3.4 million increase in 2014 was primarily due to a charitable contribution and a contract termination fee. The $1.7 million decline in 2013 was largely due to the reversal of a
$1.5 million liability for potential credit loss exposure related to certain off-balance sheet arrangements in the Ohio-based operations, which had previously been established in 2012.
Income Taxes: Federal income tax expense was $28.6 million in 2014, compared to $25.1 million in 2013, and $25.7 million in 2012. Federal income tax expense as a percentage of income before taxes was 25.4% in 2014, 24.6% in 2013, and 24.6% in 2012. The difference between the statutory federal income tax rate of 35% and Park’s effective tax rate reflects the permanent tax differences, primarily consisting of tax-exempt interest income from municipal investments and loans, low income housing tax credits, bank owned life insurance income, and dividends paid on common shares held within Park’s salary deferral plan. Park's permanent tax differences for 2014 were approximately $10.6 million.
CREDIT EXPERIENCE
(Recovery of) Provision for Loan Losses: The (recovery of) provision for loan losses is the amount added to the allowance for loan losses to ensure the allowance is sufficient to absorb probable, incurred credit losses. The amount of the (recovery of) provision for loan losses is determined by management after reviewing the risk characteristics of the loan portfolio, historic and current loan loss experience and current economic conditions.
The (recovery of) provision for loan losses for Park was ($7.3) million in 2014, $3.4 million in 2013 and $35.4 million in 2012. Net loan (recoveries) charge-offs were ($2.2) million in 2014, ($516,000) in 2013, and $48.3 million in 2012. Net loan charge-offs for the year ended December 31, 2012 included the charge-off of $12.1 million related to the retained Vision loans to bring the retained Vision loan portfolio to fair value prior to the merger of Vision with and into SEPH on February 16, 2012. The ratio of net loan (recoveries) charge-offs to average loans was (0.05%) in 2014, (0.01%) in 2013, and 1.10% in 2012.
Park's Ohio-based subsidiaries, PNB and GFSC, are the only subsidiaries that carry an ALLL balance. The table below provides additional information on the provision for loan losses and the ALLL for Park’s Ohio-based subsidiaries for 2014, 2013 and 2012.
|
| | | | | | | | | |
| Table 24 - ALLL Information - Park's Ohio-Based Subsidiaries | | | |
| (In thousands) | 2014 | 2013 | 2012 |
| ALLL, beginning balance | $ | 59,468 |
| $ | 55,537 |
| $ | 57,706 |
|
| Charge-offs: | | | |
| Ohio-based subsidiaries loans | 22,988 |
| 16,809 |
| 21,786 |
|
| PNB participations in Vision loans | 667 |
| 131 |
| 3,549 |
|
| Total charge-offs | 23,655 |
| 16,940 |
| 25,335 |
|
| Recoveries: | | | |
| Ohio-based subsidiaries loans | (6,613 | ) | (4,942 | ) | (5,618 | ) |
| PNB participations in Vision loans | (6,865 | ) | (715 | ) | (10 | ) |
| Total recoveries | (13,478 | ) | (5,657 | ) | (5,628 | ) |
| Net charge-offs | 10,177 |
| 11,283 |
| 19,707 |
|
| Provision for (recovery of) loan losses: | | | |
| Ohio-based subsidiaries loans | 11,259 |
| 16,095 |
| 14,170 |
|
| PNB participations in Vision loans | (6,198 | ) | (881 | ) | 3,368 |
|
| Total provision for loan losses | 5,061 |
| 15,214 |
| 17,538 |
|
| ALLL, ending balance | $ | 54,352 |
| $ | 59,468 |
| $ | 55,537 |
|
| Average loans, Ohio-based subsidiaries | $ | 4,685,461 |
| $ | 4,467,156 |
| $ | 4,277,355 |
|
| Total net charge-offs as a percentage of average loans | 0.22 | % | 0.25 | % | 0.46 | % |
| Total net charge-offs as a percentage of average loans - excluding PNB participations in Vision loans | 0.35 | % | 0.25 | % | 0.38 | % |
SEPH, as a non-bank subsidiary of Park, does not carry an ALLL balance, but recognizes a provision for loan losses when a charge-off is taken and recognizes a recovery of loan losses when a recovery is received. The (recovery of) provision for loan losses for SEPH was ($12.4) million for 2014 and ($11.8) million for 2013. The provision for loan losses, including those provisions recorded at Vision prior to the February 16, 2012 merger of Vision with and into SEPH, was $17.9 million in 2012.
The net recoveries in 2014 consisted of charge-offs of $1.1 million and recoveries of $13.5 million, and the net recoveries in 2013 consisted of charge-offs of $2.2 million and recoveries of $14.0 million.
On February 16, 2012, when Vision merged with and into SEPH, the loans which had been retained by Vision were transferred by operation of law at their fair value and no allowance for loan loss has been or will be carried at SEPH. The table below provides additional information regarding charge-offs as a percentage of unpaid principal balance, as of December 31, 2014.
|
| | | | | | | | | | | |
| Table 25 - SEPH - Retained Vision Loan Portfolio Charge-offs as a percentage of unpaid principal balance |
| December 31, 2014 (In thousands) | Unpaid Principal Balance | Charge-Offs | Net Book Balance | Charge-off Percentage |
| Nonperforming loans - retained by SEPH | $ | 43,901 |
| $ | 20,888 |
| $ | 23,013 |
| 47.58 | % |
| Performing loans - retained by SEPH | 1,035 |
| 92 |
| 943 |
| 8.89 | % |
| Total SEPH loan exposure | $ | 44,936 |
| $ | 20,980 |
| $ | 23,956 |
| 46.69 | % |
Generally, management obtains updated appraisal information for nonperforming loans annually. As new appraisal information is received, management performs an evaluation of the appraisal and applies a discount for anticipated disposition costs to determine the net realizable value of the collateral, which is compared to the outstanding principal balance to determine if additional write-downs are necessary.
At year-end 2014, the allowance for loan losses was $54.4 million, or 1.13% of total loans outstanding, compared to $59.5 million, or 1.29% of total loans outstanding, at year-end 2013, and $55.5 million, or 1.25% of total loans outstanding, at year-end 2012. The table below provides additional information related to specific reserves on impaired commercial loans and general reserves for all other loans in Park’s portfolio at December 31, 2014, 2013 and 2012.
|
| | | | | | | | | | | | |
Table 26 - General Reserve Trends - Park | | | | | | |
| | | Year Ended December 31, |
| (In thousands) | | 2014 | | 2013 | | 2012 |
| Allowance for loan losses, end of period | | $ | 54,352 |
| | $ | 59,468 |
| | $ | 55,537 |
|
| Specific reserves | | 3,660 |
| | 10,451 |
| | 8,276 |
|
| General reserves | | $ | 50,692 |
| | $ | 49,017 |
| | $ | 47,261 |
|
| Total loans | | $ | 4,829,682 |
| | $ | 4,620,505 |
| | $ | 4,450,322 |
|
| Impaired commercial loans | | 73,676 |
| | 112,304 |
| | 137,238 |
|
| Non-impaired loans | | $ | 4,756,006 |
| | $ | 4,508,201 |
| | $ | 4,313,084 |
|
| Allowance for loan losses as a percentage of year-end loans | | 1.13 | % | | 1.29 | % | | 1.25 | % |
| General reserves as a percentage of non-impaired loans | | 1.07 | % | | 1.09 | % | | 1.10 | % |
General reserves increased $1.7 million, or 3.4%, to $50.7 million at December 31, 2014, compared to $49.0 million at December 31, 2013. The increase in general reserves was primarily due to a $3.9 million increase in general reserves in the consumer loan portfolio, as this portfolio of loans experienced significant growth in 2014. Offsetting the general reserve increase in the consumer loan portfolio was a $2.2 million decline in general reserves in the commercial loan portfolio due to the improving credit trends for Park’s Ohio-based operations (PNB and GFSC) commercial loan portfolio. The following table shows the improving credit trends in Park’s Ohio-based operations commercial loan portfolio.
|
| | | | | | | | | |
| Table 27 - Park Ohio - Commercial Credit Trends | | | |
| Commercial loans * (In thousands) | December 31, 2014 | December 31, 2013 | December 31, 2012 |
| Pass rated | $ | 2,360,689 |
| $ | 2,311,914 |
| $ | 2,225,702 |
|
| Special Mention | 15,946 |
| 26,361 |
| 49,275 |
|
| Substandard | 3,553 |
| 2,687 |
| 16,843 |
|
| Impaired | 51,323 |
| 77,038 |
| 89,365 |
|
| Total | $ | 2,431,511 |
| $ | 2,418,000 |
| $ | 2,381,185 |
|
* Commercial loans include: (1) Commercial, financial and agricultural loans, (2) Commercial real estate loans, (3) Commercial related loans in the construction real estate portfolio and (4) Commercial related loans in the residential real estate portfolio.
Delinquent and accruing loan trends for Park's Ohio-based operations have also improved over the past 24 months. Delinquent and accruing loans were $33.0 million, or 0.69% of total loans at December 31, 2014, compared to $32.0 million, or 0.70% of total loans at December 31, 2013, and $39.6 million, or 0.90% of total loans at December 31, 2012.
Impaired commercial loans for Park's Ohio-based operations were $51.3 million as of December 31, 2014, a reduction from the balances of impaired commercial loans of $77.0 million and $89.4 million at December 31, 2013 and 2012, respectively. The $51.3 million of impaired commercial loans at December 31, 2014 included $3.6 million of loans modified in a troubled debt restructuring which are currently on accrual status and performing in accordance with the restructured terms. Impaired commercial loans are individually evaluated for impairment and specific reserves are established to cover any probable, incurred losses for those loans that have not been charged down to the net realizable value of the underlying collateral or to the net present value of expected cash flows.
Management believes that the allowance for loan losses at year-end 2014 is adequate to absorb probable, incurred credit losses in the loan portfolio. See Note 1 of the Notes to Consolidated Financial Statements and the discussion under the heading “CRITICAL ACCOUNTING POLICIES” earlier in this Management's Discussion and Analysis for additional information on management’s evaluation of the adequacy of the allowance for loan losses.
The table below provides a summary of Park's loan loss experience over the past five years:
|
| | | | | | | | | | | | | | | | | | | | |
| Table 28 - Summary of Loan Loss Experience | | | | | | | | |
| (In thousands) | | 2014 | | 2013 | | 2012 | | 2011 | | 2010 |
| | | | | | | | | | | |
| Average loans (net of unearned interest) | | $ | 4,717,297 |
| | $ | 4,514,781 |
| | $ | 4,410,661 |
| | $ | 4,713,511 |
| | $ | 4,642,478 |
|
| Allowance for loan losses: | | | | | | | | | | |
| Beginning balance | | 59,468 |
| | 55,537 |
| | 68,444 |
| | 143,575 |
| | 116,717 |
|
| Charge-offs: | | | | | | | | | | |
| Commercial, financial | | | | | | | | | | |
| and agricultural | | 3,779 |
| | 6,160 |
| | 26,847 |
| | 18,350 |
| | 8,484 |
|
| Real estate - construction | | 1,316 |
| | 1,791 |
| | 9,985 |
| | 64,166 |
| | 23,308 |
|
| Real estate - residential | | 3,944 |
| | 3,207 |
| | 8,607 |
| | 20,691 |
| | 18,401 |
|
| Real estate - commercial | | 8,003 |
| | 1,832 |
| | 10,454 |
| | 23,063 |
| | 7,748 |
|
| Consumer | | 7,738 |
| | 6,163 |
| | 5,375 |
| | 7,612 |
| | 8,373 |
|
| Leases | | — |
| | — |
| | — |
| | — |
| | — |
|
| Total charge-offs | | $ | 24,780 |
| | $ | 19,153 |
| | $ | 61,268 |
| | $ | 133,882 |
| | $ | 66,314 |
|
| Recoveries: | | | | | | | | | | |
| Commercial, financial | | | | | | | | | | |
| and agricultural | | $ | 1,003 |
| | $ | 1,314 |
| | $ | 1,066 |
| | $ | 1,402 |
| | $ | 1,237 |
|
| Real estate - construction | | 12,572 |
| | 9,378 |
| | 2,979 |
| | 1,463 |
| | 813 |
|
| Real estate - residential | | 2,985 |
| | 6,000 |
| | 5,559 |
| | 1,719 |
| | 1,429 |
|
| Real estate - commercial | | 7,759 |
| | 726 |
| | 783 |
| | 1,825 |
| | 850 |
|
| Consumer | | 2,671 |
| | 2,249 |
| | 2,555 |
| | 2,385 |
| | 1,763 |
|
| Leases | | 7 |
| | 2 |
| | — |
| | 4 |
| | — |
|
| Total recoveries | | $ | 26,997 |
| | $ | 19,669 |
| | $ | 12,942 |
| | $ | 8,798 |
| | $ | 6,092 |
|
| Net (recoveries) charge-offs | | $ | (2,217 | ) | | $ | (516 | ) | | $ | 48,326 |
| | $ | 125,084 |
| | $ | 60,222 |
|
| (Recovery) provision included in earnings | | (7,333 | ) | | 3,415 |
| | 35,419 |
| | 63,272 |
| | 87,080 |
|
| Transfer of loans at fair value | | — |
| | — |
| | — |
| | (219 | ) | | — |
|
Allowance for loan losses acquired (transferred) related to Vision | | — |
| | — |
| | — |
| | (13,100 | ) | | — |
|
| Ending balance | | $ | 54,352 |
| | $ | 59,468 |
| | $ | 55,537 |
| | $ | 68,444 |
| | $ | 143,575 |
|
| Ratio of net (recoveries) charge-offs to average loans | | (0.05 | )% | | (0.01 | )% | | 1.10 | % | | 2.65 | % | | 1.30 | % |
| Ratio of allowance for loan losses | | | | | | | | | | |
| to end of year loans | | 1.13 | % | | 1.29 | % | | 1.25 | % | | 1.59 | % | | 3.03 | % |
The following table summarizes Park's allocation of the allowance for loan losses for the past five years:
|
| | | | | | | | | | | | | | | | | | | | | | | | | |
| Table 29 - Allocation of Allowance for Loan Losses | | |
| December 31, | 2014 | 2013 | 2012 | 2011 | 2010 |
| (In thousands) | Allowance | Percent of Loans Per Category | Allowance | Percent of Loans Per Category | Allowance | Percent of Loans Per Category | Allowance | Percent of Loans Per Category | Allowance | Percent of Loans Per Category |
| Commercial, financial, and agricultural | $ | 10,719 |
| 17.73 | % | $ | 14,218 |
| 17.87 | % | $ | 15,635 |
| 18.51 | % | $ | 16,950 |
| 17.23 | % | $ | 11,555 |
| 15.59 | % |
Real estate - construction | 8,652 |
| 3.23 | % | 6,855 |
| 3.38 | % | 6,841 |
| 3.72 | % | 14,433 |
| 5.04 | % | 70,462 |
| 8.59 | % |
Real estate - residential | 14,772 |
| 38.33 | % | 14,251 |
| 38.95 | % | 14,759 |
| 38.51 | % | 15,692 |
| 37.72 | % | 30,259 |
| 35.75 | % |
Real estate - commercial | 8,808 |
| 22.15 | % | 15,899 |
| 24.07 | % | 11,736 |
| 24.54 | % | 15,539 |
| 25.68 | % | 24,369 |
| 25.92 | % |
| Consumer | 11,401 |
| 18.49 | % | 8,245 |
| 15.66 | % | 6,566 |
| 14.65 | % | 5,830 |
| 14.28 | % | 6,925 |
| 14.09 | % |
| Leases | — |
| 0.07 | % | — |
| 0.07 | % | — |
| 0.07 | % | — |
| 0.05 | % | 5 |
| 0.06 | % |
| Total | $ | 54,352 |
| 100.00 | % | $ | 59,468 |
| 100.00 | % | $ | 55,537 |
| 100.00 | % | $ | 68,444 |
| 100.00 | % | $ | 143,575 |
| 100.00 | % |
As of December 31, 2014, Park had no significant concentrations of loans to borrowers engaged in the same or similar industries nor did Park have any loans to foreign governments.
Nonperforming Assets: Nonperforming loans include: 1) loans whose interest is accounted for on a nonaccrual basis; 2) troubled debt restructurings (TDRs) on accrual status; and 3) loans which are contractually past due 90 days or more as to principal or interest payments, where interest continues to accrue. Prior to Park’s adoption of Accounting Standards Update (ASU) 2011-02, Park classified all TDRs as nonaccrual loans. With the adoption of ASU 2011-02, management determined it was appropriate to return certain TDRs to accrual status. Specifically, if the restructured note has been current for a period of at least six months and management expects the borrower will remain current throughout the renegotiated contract, the loan may be returned to accrual status. OREO results from taking possession of property that served as collateral for a defaulted loan.
The following is a summary of Park’s nonaccrual loans, accruing TDRs, loans past due 90 days or more and still accruing and OREO for the last five years:
|
| | | | | | | | | | | | | | | | | | | | |
| Table 30 - Park - Nonperforming Assets | | | | | | | | | | |
| | | December 31, |
| (In thousands) | | 2014 | | 2013 | | 2012 | | 2011 | | 2010 |
| Nonaccrual loans | | $ | 100,393 |
| | $ | 135,216 |
| | $ | 155,536 |
| | $ | 195,106 |
| | $ | 289,268 |
|
| Accruing TDRs | | 16,254 |
| | 18,747 |
| | 29,800 |
| | 28,607 |
| | — |
|
| Loans past due 90 days or more and accruing | | 2,641 |
| | 1,677 |
| | 2,970 |
| | 3,489 |
| | 3,590 |
|
| Total nonperforming loans | | $ | 119,288 |
| | $ | 155,640 |
| | $ | 188,306 |
| | $ | 227,202 |
| | $ | 292,858 |
|
| OREO – PNB | | 10,687 |
| | 11,412 |
| | 14,715 |
| | 13,240 |
| | 8,385 |
|
| OREO – Vision | | — |
| | — |
| | — |
| | — |
| | 33,324 |
|
| OREO – SEPH | | 11,918 |
| | 23,224 |
| | 21,003 |
| | 29,032 |
| | — |
|
| Total nonperforming assets | | $ | 141,893 |
| | $ | 190,276 |
| | $ | 224,024 |
| | $ | 269,474 |
| | $ | 334,567 |
|
| Percentage of nonperforming loans to total loans | | 2.47 | % | | 3.37 | % | | 4.23 | % | | 5.26 | % | | 6.19 | % |
| Percentage of nonperforming assets to total loans | | 2.94 | % | | 4.12 | % | | 5.03 | % | | 6.24 | % | | 7.07 | % |
| Percentage of nonperforming assets to total assets | | 2.03 | % | | 2.87 | % | | 3.37 | % | | 3.86 | % | | 4.59 | % |
SEPH and Vision nonperforming assets for the last five years were as follows:
|
| | | | | | | | | | | | | | | | | | | | |
| Table 31 - SEPH/Vision - Nonperforming Assets | | | | | | | | |
| | | December 31, |
| (In thousands) | | 2014 | | 2013 | | 2012 | | 2011 | | 2010 |
| Nonaccrual loans | | $ | 22,916 |
| | $ | 36,108 |
| | $ | 55,292 |
| | $ | 98,993 |
| | $ | 171,453 |
|
| Accruing TDRs | | 97 |
| | — |
| | — |
| | 2,265 |
| | — |
|
| Loans past due 90 days or more and accruing | | — |
| | — |
| | — |
| | 122 |
| | 364 |
|
| Total nonperforming loans | | $ | 23,013 |
| | $ | 36,108 |
| | $ | 55,292 |
| | $ | 101,380 |
| | $ | 171,817 |
|
| OREO - SEPH | | 11,918 |
| | 23,224 |
| | 21,003 |
| | 29,032 |
| | — |
|
| OREO - Vision | | — |
| | — |
| | — |
| | — |
| | 33,324 |
|
| Total nonperforming assets | | $ | 34,931 |
| | $ | 59,332 |
| | $ | 76,295 |
| | $ | 130,412 |
| | $ | 205,141 |
|
| Percentage of nonperforming loans to total loans | | N.M. |
| | N.M. |
| | N.M. |
| | N.M. |
| | 26.82 | % |
| Percentage of nonperforming assets to total loans | | N.M. |
| | N.M. |
| | N.M. |
| | N.M. |
| | 32.02 | % |
| Percentage of nonperforming assets to total assets | | N.M. |
| | N.M. |
| | N.M. |
| | N.M. |
| | 25.90 | % |
N.M.- Not meaningful
Nonperforming assets for Park, excluding SEPH/Vision, for the last five years were as follows:
|
| | | | | | | | | | | | | | | | | | | | |
| Table 32 - Park excluding SEPH/Vision - Nonperforming Assets | | | | | | |
| | | December 31, |
| (In thousands) | | 2014 | | 2013 | | 2012 | | 2011 | | 2010 |
| Nonaccrual loans | | $ | 77,477 |
| | $ | 99,108 |
| | $ | 100,244 |
| | $ | 96,113 |
| | $ | 117,815 |
|
| Accruing TDRs | | 16,157 |
| | 18,747 |
| | 29,800 |
| | 26,342 |
| | - |
|
| Loans past due 90 days or more and accruing | | 2,641 |
| | 1,677 |
| | 2,970 |
| | 3,367 |
| | 3,226 |
|
| Total nonperforming loans | | $ | 96,275 |
| | $ | 119,532 |
| | $ | 133,014 |
| | $ | 125,822 |
| | $ | 121,041 |
|
| OREO – PNB | | 10,687 |
| | 11,412 |
| | 14,715 |
| | 13,240 |
| | 8,385 |
|
| Total nonperforming assets | | $ | 106,962 |
| | $ | 130,944 |
| | $ | 147,729 |
| | $ | 139,062 |
| | $ | 129,426 |
|
| Percentage of nonperforming loans to total loans | | 2.00 | % | | 2.61 | % | | 3.03 | % | | 3.00 | % | | 2.96 | % |
| Percentage of nonperforming assets to total loans | | 2.23 | % | | 2.86 | % | | 3.36 | % | | 3.32 | % | | 3.16 | % |
| Percentage of nonperforming assets to total assets | | 1.55 | % | | 2.00 | % | | 2.26 | % | | 2.21 | % | | 1.99 | % |
Park had $19.5 million of commercial loans included on the watch list at December 31, 2014, compared to $29.0 million of commercial loans at year-end 2013 and $68.3 million of commercial loans at year-end 2012. Commercial loans include: (1) commercial, financial and agricultural loans; (2) commercial real estate loans; (3) certain real estate construction loans; and (4) certain residential real estate loans. Park’s watch list includes all criticized and classified commercial loans, defined by Park as loans rated special mention or worse, less those commercial loans currently considered to be impaired. As a percentage of year-end total commercial loans, Park’s watch list of potential problem commercial loans was 0.8% in 2014, 1.2% in 2013, and 2.8% in 2012. The existing conditions of these loans do not warrant classification as nonaccrual. However, these loans have shown some weakness and management performs additional analyses regarding a borrower’s ability to comply with payment terms for watch list loans.
Park’s allowance for loan losses includes an allocation for loans specifically identified as impaired under GAAP. At December 31, 2014, loans considered to be impaired consisted substantially of commercial loans graded as "substandard" or “doubtful” and placed on non-accrual status. Specific reserves on impaired commercial loans are typically based on management’s best estimate of the fair value of collateral securing these loans. The amount ultimately charged off for these loans may be different from the specific reserve as the ultimate liquidation of the collateral may be for amounts different from management’s estimates.
When determining the quarterly and annual loan loss provision, Park reviews the grades of commercial loans. These loans are graded from 1 to 8. A grade of 1 indicates little or no credit risk and a grade of 8 is considered a loss. Commercial loans that are pass-rated are considered to be of acceptable credit risk. Commercial loans graded a 5 (special mention) are considered to be watch list credits and a higher loan loss reserve percentage is allocated to these loans. Commercial loans graded 6 (substandard), also considered watch list credits, are considered to represent higher credit risk and, as a result, a higher loan loss reserve percentage is allocated to these loans. Generally, commercial loans that are graded a 6 are considered for partial charge-off or have been charged down to the net realizable value of the underlying collateral. Commercial loans that are graded a 7 (doubtful) are shown as nonperforming and Park charges these loans down to their fair value by taking a partial charge-off or recording a specific reserve. Any commercial loan graded an 8 (loss) is completely charged off.
As of December 31, 2014, management had taken partial charge-offs of approximately $32.5 million related to the $73.7 million of commercial loans considered to be impaired, compared to charge-offs of approximately $63.3 million related to the $112.3 million of impaired commercial loans at December 31, 2013. The table below provides additional information related to Park's impaired commercial loans at December 31, 2014, including those impaired commercial loans at PNB, PNB participations in impaired Vision loans and those impaired Vision commercial loans retained at SEPH.
|
| | | | | | | | | | | | | | | | | | | | | | | |
| Table 33 - Park Impaired Commercial Loans | | |
| December 31, 2014 | | | | | | | | | | | | |
| (In thousands) | | Unpaid principal balance (UPB) | | Prior charge- offs | | Total impaired loans | | Specific reserve | | Carrying balance | | Carrying balance as a % of UPB |
| PNB | | $ | 48,399 |
| | $ | 5,435 |
| | $ | 42,964 |
| | $ | 3,660 |
| | $ | 39,304 |
| | 81.21 | % |
| PNB Participations in Vision loans | | $ | 15,054 |
| | $ | 6,695 |
| | $ | 8,359 |
| | $ | — |
| | $ | 8,359 |
| | 55.53 | % |
| SEPH | | 42,703 |
| | 20,350 |
| | 22,353 |
| | — |
| | 22,353 |
| | 52.35 | % |
| Total Park | | $ | 106,156 |
| | $ | 32,480 |
| | $ | 73,676 |
| | $ | 3,660 |
| | $ | 70,016 |
| | 65.96 | % |
A significant portion of Park’s allowance for loan losses is allocated to commercial loans. “Special mention” loans are loans that have potential weaknesses that may result in loss exposure to Park. “Substandard” loans are those that exhibit a well-defined weakness, jeopardizing repayment of the loans, resulting in a higher probability that Park will suffer a loss on the loans unless the weakness is corrected. Park’s annualized 72-month loss experience, defined as charge-offs plus changes in specific reserves, within the commercial loan portfolio has been 0.60% of the principal balance of these loans. This annualized 72-month loss experience includes only the performance of the PNB loan portfolio and excludes the impact of PNB participations in Vision loans. The allowance for loan losses related to performing commercial loans was $29.3 million or 1.23% of the outstanding principal balance of other accruing commercial loans at December 31, 2014.
The overall reserve of 1.23% for other accruing commercial loans breaks down as follows: pass-rated commercial loans are reserved at 1.18%; special mention commercial loans are reserved at 5.83%; and substandard commercial loans are reserved at 10.60%. The reserve levels for pass-rated, special mention and substandard commercial loans in excess of the annualized 72-month loss experience of 0.60% are due to the following factors which management reviews on a quarterly or annual basis:
| |
| • | Loss Emergence Period Factor: Annually during the fourth quarter, management calculates the loss emergence period for each commercial loan segment. This loss emergence period is calculated based upon the average period of time it takes a credit to move from pass-rated to nonaccrual. If the loss emergence period for any commercial loan segment is greater than one year, management applies additional general reserves to all performing loans within that segment of the commercial loan portfolio. |
| |
| • | Loss Migration Factor: Park’s commercial loans are individually risk graded. If loan downgrades occur, the probability of default increases, and accordingly, management allocates a higher percentage reserve to those accruing commercial loans graded special mention and substandard. Annually, management calculates a loss migration factor for each commercial loan segment for special mention and substandard credits based on a review of losses over the period of time a loan takes to migrate from pass to nonaccrual. |
| |
| • | Environmental Loss Factor: Management has identified certain macroeconomic factors that trend in accordance with losses in Park’s commercial loan portfolio. These macroeconomic factors are reviewed quarterly and the adjustments made to the environmental loss factor impacting each segment in the performing commercial loan portfolio correlate to changes in the macroeconomic environment. |
Generally, consumer loans are not individually graded. Consumer loans include: (1) mortgage and installment loans included in the construction real estate segment of the loan portfolio; (2) mortgage, home equity lines of credit (HELOC), and installment loans included in the residential real estate segment of the loan portfolio; and (3) all loans included in the consumer segment of the loan portfolio. The amount of loan loss reserve assigned to these loans is based on historical loss experience over the past 72 months. Management generally considers a one-year coverage period (the “Historical Loss Factor”) appropriate because the probable loss on any given loan in the consumer loan pool should ordinarily become apparent in that time frame. However, management may incorporate adjustments to the Historical Loss Factor as circumstances warrant additional reserves (e.g., increased loan delinquencies, improving or deteriorating economic conditions, changes in lending management and underwriting standards, etc.). At December 31, 2014, the coverage level within the consumer portfolio was approximately 1.98 years.
The judgmental increases discussed above incorporate management’s evaluation of the impact of environmental qualitative factors which pose additional risks and assignment of a component of the allowance for loan losses in consideration of these factors. Such environmental factors include: national and local economic trends and conditions; experience, ability and depth of lending management and staff; effects of any changes in lending policies and procedures; and levels of, and trends in, consumer bankruptcies, delinquencies, impaired loans and charge-offs and recoveries. The determination of this component of the allowance for loan losses requires considerable management judgment. Management is working to address weaknesses in those loans that may result in future loss. Actual loss experience may be more or less than the amount allocated.
CAPITAL RESOURCES
Liquidity and Interest Rate Sensitivity Management: Park’s objective in managing our liquidity is to maintain the ability to continuously meet the cash flow needs of customers, such as borrowings or deposit withdrawals, while at the same time seeking higher yields from longer-term lending and investing activities.
Cash and cash equivalents increased by $90.7 million during 2014 to $237.7 million at year-end. Cash provided by operating activities was $122.7 million in 2014, $145.8 million in 2013, and $138.8 million in 2012. Net income was the primary source of cash from operating activities during each year.
Cash used in investing activities was $280.6 million in 2014, $137.1 million in 2013 and $228.3 million in 2012. Investment security transactions are the major use or source of cash in investing activities. Proceeds from the sale, repayment or maturity of securities provide cash and purchases of securities use cash. Net security transactions used cash of $29.7 million in 2014, provided cash of $96.9 million in 2013, and provided cash of $122.3 million in 2012. Another major use or source of cash in investing activities is the net increase or decrease in the loan portfolio. Cash used by the net increase in the loan portfolio was $ 234.0 million in 2014, $212.3 million in 2013, and $186.7 million in 2012.
Cash provided by financing activities was $248.5 million in 2014, cash used in financing activities was $62.9 million in 2013, and cash provided by financing activities was $133.4 million in 2012. A major source of cash for financing activities is the net change in deposits. Deposits increased and provided $338.0 million of cash in 2014, $74.0 million of cash in 2013 and $250.9 million of cash in 2012. Of the $338.0 million deposit increase in 2014, $200 million was related to the settlement of brokered deposits in September 2014. Another major source of cash for financing activities is short-term borrowings and long-term debt. In 2014, net short-term borrowings increased and provided $35.0 million in cash, and net long-term borrowings decreased and used $64.2 million in cash. In 2013, net short-term borrowings decreased and used $102.1 million in cash, and net long-term borrowings increased and provided $24.0 million in cash. In 2012, net short-term borrowings increased and provided $80.6 million in cash, and net long-term borrowings decreased and used $65.1 million in cash. Additionally, in 2012, cash declined by $100.0 million from the repurchase of the Series A Preferred Shares and $2.8 million from the repurchase of the Warrant, both from the U.S. Treasury. Finally, cash declined by $57.9 million in 2014 and 2013, and $60.2 million in 2012, from the payment of cash dividends.
Funds are available from a number of sources, including the capital markets, the investment securities portfolio, the core deposit base, Federal Home Loan Bank borrowings and the capability to securitize or package loans for sale. In the opinion of Park's management, the present funding sources provide more than adequate liquidity for Park to meet our cash flow needs.
The following table shows interest rate sensitivity data for five different time intervals as of December 31, 2014:
|
| | | | | | | | | | | | | | | | | | | | | | | | |
| Table 34 - Interest Rate Sensitivity | | | | | | | | | | |
| | | 0-3 | | 3-12 | | 1-3 | | 3-5 | | Over 5 | | |
| (In thousands) | | Months | | Months | | Years | | Years | | Years | | Total |
| Interest earning assets: | | | | | | | | | | | | |
| Investment securities (1) | | $ | 87,326 |
| | $ | 103,929 |
| | $ | 214,806 |
| | $ | 165,405 |
| | $ | 927,387 |
| | $ | 1,498,853 |
|
| Money market instruments | | 104,188 |
| | — |
| | — |
| | — |
| | — |
| | 104,188 |
|
| Loans (1) | | 1,226,840 |
| | 1,167,698 |
| | 1,518,430 |
| | 640,904 |
| | 275,810 |
| | 4,829,682 |
|
| Total interest earning assets | | 1,418,354 |
| | 1,271,627 |
| | 1,733,236 |
| | 806,309 |
| | 1,203,197 |
| | 6,432,723 |
|
| Interest bearing liabilities: | | | | | | | | | | | | |
| Interest bearing transaction accounts (2) | | $ | 584,271 |
| | $ | — |
| | $ | 537,808 |
| | $ | — |
| | $ | — |
| | $ | 1,122,079 |
|
| Savings accounts (2) | | 398,755 |
| | — |
| | 926,690 |
| | — |
| | — |
| | 1,325,445 |
|
| Time deposits | | 344,236 |
| | 480,146 |
| | 398,757 |
| | 186,270 |
| | 502 |
| | 1,409,911 |
|
| Other | | — |
| | 1,269 |
| | — |
| | — |
| | — |
| | 1,269 |
|
| Total deposits | | 1,327,262 |
| | 481,415 |
| | 1,863,255 |
| | 186,270 |
| | 502 |
| | 3,858,704 |
|
| Short-term borrowings | | 276,980 |
| | — |
| | — |
| | — |
| | — |
| | 276,980 |
|
| Long-term debt | | 23,503 |
| | 21,449 |
| | 365,106 |
| | 200,383 |
| | 176,161 |
| | 786,602 |
|
| Subordinated notes | | 15,000 |
| | — |
| | 30,000 |
| | — |
| | — |
| | 45,000 |
|
| Total interest bearing liabilities | | 1,642,745 |
| | 502,864 |
| | 2,258,361 |
| | 386,653 |
| | 176,663 |
| | 4,967,286 |
|
| Interest rate sensitivity gap | | (224,391 | ) | | 768,763 |
| | (525,125 | ) | | 419,656 |
| | 1,026,534 |
| | 1,465,437 |
|
| Cumulative rate sensitivity gap | | (224,391 | ) | | 544,372 |
| | 19,247 |
| | 438,903 |
| | 1,465,437 |
| | |
| Cumulative gap as a | | | | | | | | | | | | |
| percentage of total | | | | | | | | | | | | |
| interest earning assets | | (3.49 | )% | | 8.46 | % | | 0.30 | % | | 6.82 | % | | 22.78 | % | | |
| |
| (1) | Investment securities and loans that are subject to prepayment are shown in the table by the earlier of their re-pricing date or their expected repayment date and not by their contractual maturity date. Nonaccrual loans of $100.4 million are included within the three to twelve month maturity category. |
| |
| (2) | Management considers interest bearing transaction accounts and savings accounts to be core deposits and, therefore, not as rate sensitive as other deposit accounts and borrowed money. Accordingly, only 52% of interest bearing transaction accounts and 30% of savings accounts are considered to re-price within one year. If all of the interest bearing transaction accounts and savings accounts were considered to re-price within one year, the one-year cumulative gap would change from a positive 8.46% to a negative 14.30%. |
The interest rate sensitivity gap analysis provides an overall picture of Park’s static interest rate risk position. At December 31, 2014, the cumulative interest earning assets maturing or repricing within twelve months were $2,690 million compared to the cumulative interest bearing liabilities maturing or repricing within twelve months of $2,146 million. For the twelve-month cumulative gap position, rate sensitive assets exceeded rate sensitive liabilities by $544 million or 8.46% of interest earning assets.
A positive twelve-month cumulative rate sensitivity gap (assets exceed liabilities) would suggest that Park’s net interest margin would increase if interest rates were to increase. Conversely, a negative twelve-month cumulative rate sensitivity gap would suggest that Park’s net interest margin would decrease if interest rates were to increase. However, the usefulness of the interest rate sensitivity gap analysis as a forecasting tool in projecting net interest income is limited. The gap analysis does not consider the magnitude, timing or frequency by which assets or liabilities will reprice during a period and also contains assumptions as to the repricing of transaction and savings accounts that may not prove to be correct.
The cumulative twelve-month interest rate sensitivity gap position at year-end 2013 was a positive $367 million or 6.05% of total interest earning assets. The percentage of interest earning assets maturing or repricing within one year was 41.8% at year-end 2014, compared to 41.5% at year-end 2013. The percentage of interest bearing liabilities maturing or repricing within one year was 43.2% at year-end 2014, compared to 45.4% at year-end 2013.
Management supplements the interest rate sensitivity gap analysis with periodic simulations of balance sheet sensitivity under various interest rate and what-if scenarios to better forecast and manage the net interest margin. Park’s management uses an earnings simulation model to analyze net interest income sensitivity to movements in interest rates. This model is based on actual cash flows and repricing characteristics for balance sheet instruments and incorporates market-based assumptions regarding the impact of changing interest rates on the prepayment rate of certain assets and liabilities. This model also includes management’s projections for activity levels of various balance sheet instruments and non-interest fee income and operating expense. Assumptions based on the historical behavior of deposit rates and balances in relation to changes in interest rates are also incorporated into this earnings simulation model. These assumptions are inherently uncertain and, as a result, the model cannot precisely measure net interest income and net income. Actual results will differ from simulated results due to the timing, magnitude and frequency of interest rate changes as well as changes in market conditions and management strategies.
Management uses a 50 basis point change in market interest rates per quarter for a total of 200 basis points per year in evaluating the impact of changing interest rates on net interest income and net income over a twelve-month horizon. At December 31, 2014, the earnings simulation model projected that net income would increase by 1.3% using a rising interest rate scenario and decrease by 7.1% using a declining interest rate scenario over the next year. At December 31, 2013, the earnings simulation model projected that net income would decrease by 1.4% using a rising interest rate scenario and decrease by 10.3% using a declining interest rate scenario over the following year. At December 31, 2012, the earnings simulation model projected that net income would increase by 1.1% using a rising interest rate scenario and decrease by 6.6% using a declining interest rate scenario over the following year. Consistently, over the past several years, Park’s earnings simulation model has projected that changes in interest rates would have only a small impact on net income and the net interest margin. Park’s net interest margin was 3.55% in 2014, 3.61% in 2013 and 3.83% in 2012. A major goal of Park’s asset/liability committee is to maintain a relatively stable net interest margin regardless of the level of interest rates.
CONTRACTUAL OBLIGATIONS
In the ordinary course of operations, Park enters into certain contractual obligations. Such obligations include the funding of operations through debt issuances as well as leases for premises. The following table summarizes Park’s significant and determinable obligations by payment date at December 31, 2014.
Further discussion of the nature of each specified obligation is included in the referenced Note to the Consolidated Financial Statements.
|
| | | | | | | | | | | | | | | | | | | | | | | |
| Table 35 - Contractual Obligations |
| December 31, 2014 | | Payments Due In |
| | | | | 0-1 | | 1-3 | | 3-5 | | Over 5 | | |
| (In thousands) | | Note | | Years | | Years | | Years | | Years | | Total |
| Deposits without stated maturity | | 11 |
| | $ | 3,718,088 |
| | $ | — |
| | $ | — |
| | $ | — |
| | $ | 3,718,088 |
|
| Certificates of deposit | | 11 |
| | 823,230 |
| | 399,886 |
| | 186,293 |
| | 502 |
| | 1,409,911 |
|
| Short-term borrowings | | 12 |
| | 276,980 |
| | — |
| | — |
| | — |
| | 276,980 |
|
| Long-term debt | | 13 |
| | 51,000 |
| | 377,000 |
| | 200,382 |
| | 176,161 |
| | 804,543 |
|
| Subordinated notes | | 14 |
| | — |
| | — |
| | — |
| | 45,000 |
| | 45,000 |
|
| Operating leases | | 10 |
| | 1,143 |
| | 1,314 |
| | 815 |
| | 252 |
| | 3,524 |
|
| Defined benefit pension plan | | 16 |
| | 6,282 |
| | 13,138 |
| | 14,880 |
| | 46,850 |
| | 81,150 |
|
| Purchase obligations | | | | 3,884 |
| | — |
| | — |
| | — |
| | 3,884 |
|
| Total contractual obligations | | | | $ | 4,880,607 |
| | $ | 791,338 |
| | $ | 402,370 |
| | $ | 268,765 |
| | $ | 6,343,080 |
|
The Corporation’s operating lease obligations represent short-term and long-term lease and rental payments for facilities and equipment. Purchase obligations represent obligations under agreements to purchase goods or services that are enforceable and legally binding on the Corporation.
Commitments, Contingent Liabilities, and Off-Balance Sheet Arrangements: In order to meet the financing needs of our customers, the Corporation issues loan commitments and standby letters of credit. At December 31, 2014, the Corporation had $885.1 million of loan commitments for commercial, commercial real estate, and residential real estate loans and had $12.5 million of standby letters of credit. At December 31, 2013, the Corporation had $821.8 million of loan commitments for commercial, commercial real estate, and residential real estate loans and had $20.6 million of standby letters of credit.
Commitments to extend credit under loan commitments and standby letters of credit do not necessarily represent future cash requirements. These commitments often expire without being drawn upon. However, all of the loan commitments and standby letters of credit were permitted to be drawn upon in 2014. See Note 21 of the Notes to Consolidated Financial Statements for additional information on loan commitments and standby letters of credit.
The Corporation did not have any unrecorded significant contingent liabilities at December 31, 2014.
Capital: Park’s primary means of maintaining capital adequacy is through retained earnings. At December 31, 2014, the Corporation’s total shareholders’ equity was $698.6 million, compared to $651.7 million at December 31, 2013. Total shareholders’ equity at December 31, 2014 was 9.98% of total assets, compared to 9.82% of total assets at December 31, 2013.
Tangible shareholders’ equity [total shareholders’ equity ($698.6 million) less goodwill and other intangible assets ($72.3 million)] was $626.3 million at December 31, 2014 and was $579.4 million at December 31, 2013. At December 31, 2014, tangible shareholders’ equity was 9.04% of total tangible assets [total assets ($7,003 million) less goodwill and other intangible assets ($72.3 million)], compared to 8.82% at December 31, 2013.
Net income was $84.1 million in 2014, $77.2 million in 2013 and $78.6 million in 2012.
Preferred share dividends paid as a result of Park’s participation in the CPP were $1.6 million in 2012. Accretion of the discount on the Series A Preferred Shares was $1,854,000 in 2012. As mentioned previously, Park repurchased the Series A Preferred Shares on April 25, 2012. Income available to common shareholders is net income less the preferred share dividends and accretion. Income available to common shareholders was $84.1 million in 2014, $77.2 million in 2013, and $75.2 million in 2012.
Cash dividends declared for common shares were $57.9 million in each of 2014, 2013, and 2012. On a per share basis, the cash dividends declared were $3.76 per share in each of 2014, 2013 and 2012.
Park repurchased 29,700 common shares for treasury in 2014, repurchased 10,550 common shares for treasury in 2013, and did not purchase any treasury shares during 2012. Common shares held in treasury had a balance of $77.4 million at December 31, 2014, $76.1 million at December 31, 2013, and $76.4 million at December 31, 2012. During 2014, the value of common shares held in treasury was reduced by $1.0 million as a result of the issuance of an aggregate of 10,200 common shares to directors of Park and to the directors of Park's bank subsidiary PNB (and its divisions), and increased by $2.4 million due to the repurchase of 29,700 common shares for treasury. During 2013, the value of common shares held in treasury was reduced by $1.1 million as a result of the issuance of an aggregate of 10,550 common shares to directors of Park and to the directors of Park's bank subsidiary PNB (and its divisions), and increased by $0.8 million due to the repurchase of 10,550 common shares held in treasury. During 2012, the value of common shares held in treasury was reduced by $632,000 as a result of the issuance of an aggregate of 6,120 common shares to directors of Park and to the directors of Park's bank subsidiary PNB (and its divisions).
Park did not issue any new common shares, that it had not already held as treasury shares, in any of 2014, 2013 or 2012. Common shares had a balance of $303.1 million at December 31, 2014, and $302.7 million at each of December 31, 2013 and 2012.
Accumulated other comprehensive loss (net) was $13.6 million at December 31, 2014, compared to $35.4 million at December 31, 2013, and $17.5 million at December 31, 2012. During the 2012 year, the change in net unrealized holding gain (loss) on securities available for sale, net of tax, was a loss of $3.1 million and Park did not realize any after-tax gains, resulting in an unrealized gain on securities available for sale of $9.6 million at December 31, 2012. During the 2013 year, the change in net unrealized holding gain (loss) on securities available for sale, net of tax, was a loss of $39.4 million and Park did not realize any after-tax gains, resulting in an unrealized loss on securities available for sale of $29.8 million at December 31, 2013. During the 2014 year, the change in net unrealized holding gain (loss) on securities available for sale, net of tax, was a gain of $31.1 million. In addition, Park recognized other comprehensive gain of $0.6 million in 2012 due to the mark-to-market of a cash flow hedge at December 31, 2012. Finally, Park recognized other comprehensive loss of $9.3 million, net of tax, related to the change in pension plan assets and benefit obligations in 2014, compared to a gain of $21.5 million, net of tax, in 2013, and a loss of $6.2 million, net of tax, in 2012.
Financial institution regulators have established guidelines for minimum capital ratios for banks, thrifts and bank holding companies. Park’s accumulated other comprehensive income (loss) is not included in computing regulatory capital. The minimum leverage capital ratio (defined as shareholders’ equity less intangible assets divided by tangible assets) at December 31, 2014 was 4%. Park’s leverage capital ratio was 9.25% at December 31, 2014 and exceeded the minimum capital required by $371 million. The minimum Tier 1 risk-based capital ratio (defined as leverage capital divided by risk-adjusted assets) at December 31, 2014 was 4%. Park’s Tier 1 risk-based capital ratio was 13.39% at December 31, 2014 and exceeded the minimum capital required by $459 million. The minimum total risk-based capital ratio (defined as leverage capital plus supplemental capital divided by risk-adjusted assets) at December 31, 2014 was 8%. Park’s total risk-based capital ratio was 15.14% at December 31, 2014 and exceeded the minimum capital required by $349 million.
PNB, the only financial institution subsidiary of Park, met the well capitalized ratio guidelines at December 31, 2014. See Note 24 of the Notes to Consolidated Financial Statements for the capital ratios for Park and PNB.
Effects of Inflation: Balance sheets of financial institutions typically contain assets and liabilities that are monetary in nature and, therefore, differ greatly from most commercial and industrial companies which have significant investments in premises, equipment and inventory. During periods of inflation, financial institutions that are in a net positive monetary position will experience a decline in purchasing power, which does have an impact on growth. Another significant effect on internal equity growth is other expenses, which tend to rise during periods of inflation.
Management believes the most significant impact on financial results is the Corporation's ability to align our asset/liability management program to react to changes in interest rates.
SELECTED FINANCIAL DATA
|
| | | | | | | | | | | | | | | | | | | | |
| Table 36 - Consolidated Five-Year Selected Financial Data | | | | | | | | |
| December 31, (Dollars in thousands, except per share data) | | 2014 | | 2013 | | 2012 | | 2011 | | 2010 |
| Results of Operations: | | | | | | | | | | |
| Interest income | | $ | 265,143 |
| | $ | 262,947 |
| | $ | 285,735 |
| | $ | 331,880 |
| | $ | 345,517 |
|
| Interest expense | | 40,099 |
| | 41,922 |
| | 50,420 |
| | 58,646 |
| | 71,473 |
|
| Net interest income | | 225,044 |
| | 221,025 |
| | 235,315 |
| | 273,234 |
| | 274,044 |
|
| (Recovery of) provision for loan losses | | (7,333 | ) | | 3,415 |
| | 35,419 |
| | 63,272 |
| | 87,080 |
|
| Net interest income after (recovery of) provision for loan losses | | 232,377 |
| | 217,610 |
| | 199,896 |
| | 209,962 |
| | 186,964 |
|
| Gain on sale of the Vision business (1) | | — |
| | — |
| | 22,167 |
| | — |
| | — |
|
| Non-interest income | | 75,549 |
| | 73,277 |
| | 70,236 |
| | 94,910 |
| | 74,880 |
|
| Non-interest expense | | 195,234 |
| | 188,529 |
| | 187,968 |
| | 188,317 |
| | 187,107 |
|
| Net income | | 84,090 |
| | 77,227 |
| | 78,630 |
| | 82,140 |
| | 58,101 |
|
| Net income available to common shareholders | | 84,090 |
| | 77,227 |
| | 75,205 |
| | 76,284 |
| | 52,294 |
|
| Per common share: | | | | | | | | | | |
| Net income per common share - basic | | $ | 5.46 |
| | $ | 5.01 |
| | $ | 4.88 |
| | $ | 4.95 |
| | $ | 3.45 |
|
| Net income per common share - diluted | | 5.46 |
| | 5.01 |
| | 4.88 |
| | 4.95 |
| | 3.45 |
|
| Cash dividends declared | | 3.76 |
| | 3.76 |
| | 3.76 |
| | 3.76 |
| | 3.76 |
|
| Average Balances: | | | | | | | | | | |
| Loans | | $ | 4,717,297 |
| | $ | 4,514,781 |
| | $ | 4,410,661 |
| | $ | 4,713,511 |
| | $ | 4,642,478 |
|
| Investment securities | | 1,432,692 |
| | 1,377,887 |
| | 1,613,131 |
| | 1,848,880 |
| | 1,746,356 |
|
| Money market instruments and other | | 204,874 |
| | 272,851 |
| | 166,319 |
| | 78,593 |
| | 93,009 |
|
| Total earning assets | | 6,354,863 |
| | 6,165,519 |
| | 6,190,111 |
| | 6,640,984 |
| | 6,481,843 |
|
| Non-interest bearing deposits | | 1,196,625 |
| | 1,117,379 |
| | 1,048,796 |
| | 999,085 |
| | 907,514 |
|
| Interest bearing deposits | | 3,820,928 |
| | 3,742,361 |
| | 3,786,601 |
| | 4,193,404 |
| | 4,274,501 |
|
| Total deposits | | 5,017,553 |
| | 4,859,740 |
| | 4,835,397 |
| | 5,192,489 |
| | 5,182,015 |
|
| Short-term borrowings | | $ | 263,270 |
| | $ | 253,123 |
| | $ | 258,661 |
| | $ | 297,537 |
| | $ | 300,939 |
|
| Long-term debt | | 867,615 |
| | 870,538 |
| | 907,704 |
| | 881,921 |
| | 725,356 |
|
| Shareholders' equity | | 682,455 |
| | 645,533 |
| | 689,732 |
| | 743,873 |
| | 746,510 |
|
| Common shareholders' equity | | 682,455 |
| | 645,533 |
| | 658,855 |
| | 646,169 |
| | 649,637 |
|
| Total assets | | 6,895,308 |
| | 6,702,973 |
| | 6,766,806 |
| | 7,206,171 |
| | 7,042,705 |
|
|
| | | | | | | | | | | | | | | |
| Ratios: | | | | | | | | | | |
| Return on average assets (x) | | 1.22 | % | | 1.15 | % | | 1.11 | % | | 1.06 | % | | 0.74 | % |
| Return on average common equity (x) | | 12.32 | % | | 11.96 | % | | 11.41 | % | | 11.81 | % | | 8.05 | % |
| Net interest margin (2) | | 3.55 | % | | 3.61 | % | | 3.83 | % | | 4.14 | % | | 4.26 | % |
| Efficiency ratio (2) | | 64.77 | % | | 63.78 | % | | 57.07 | % | | 55.18 | % | | 55.18 | % |
| Dividend payout ratio (3) | | 68.91 | % | | 75.04 | % | | 73.68 | % | | 70.50 | % | | 109.14 | % |
| Average shareholders' equity to average total assets | | 9.90 | % | | 9.63 | % | | 10.19 | % | | 10.32 | % | | 10.60 | % |
| Leverage capital | | 9.25 | % | | 9.48 | % | | 9.17 | % | | 9.81 | % | | 9.54 | % |
| Tier 1 capital | | 13.39 | % | | 13.27 | % | | 13.12 | % | | 14.15 | % | | 13.24 | % |
| Risk-based capital | | 15.14 | % | | 15.91 | % | | 15.77 | % | | 16.65 | % | | 15.71 | % |
| (1) The Vision business was sold on February 16, 2012 for a gain on sale of $22.2 million. |
| (2) Computed on a fully taxable equivalent basis. |
| (3) Cash dividends paid divided by net income. |
| (x) Reported measure uses net income available to common shareholders. |
The following table is a summary of selected quarterly results of operations for the years ended December 31, 2014 and 2013.
|
| | | | | | | | | | | | | | | | |
| Table 37 - Quarterly Financial Data | | | | | | | | |
| | | Three Months Ended |
| (Dollars in thousands, except share data) | | March 31 | | June 30 | | Sept. 30 | | Dec. 31 |
| 2014: | | | | | | | | |
| Interest income | | $ | 64,342 |
| | $ | 66,363 |
| | $ | 66,622 |
| | $ | 67,816 |
|
| Interest expense | | 9,862 |
| | 9,802 |
| | 9,913 |
| | 10,522 |
|
| Net interest income | | 54,480 |
| | 56,561 |
| | 56,709 |
| | 57,294 |
|
| (Recovery of) provision for loan losses | | (2,225 | ) | | (1,260 | ) | | 4,501 |
| | (8,349 | ) |
| Income before income taxes | | 25,655 |
| | 29,296 |
| | 24,701 |
| | 33,040 |
|
| Net income | | 19,619 |
| | 21,827 |
| | 18,303 |
| | 24,341 |
|
| Per common share data: | | | | | | | | |
| Net income per common share - basic | | 1.27 |
| | 1.42 |
| | 1.19 |
| | 1.58 |
|
| Net income per common share - diluted | | 1.27 |
| | 1.42 |
| | 1.19 |
| | 1.58 |
|
| Weighted-average common shares outstanding - basic | | 15,401,105 |
| | 15,392,435 |
| | 15,392,421 |
| | 15,393,924 |
|
| Weighted-average common shares equivalent - diluted | | 15,414,897 |
| | 15,412,167 |
| | 15,413,664 |
| | 15,414,433 |
|
| 2013: | | | | | | | | |
| Interest income | | $ | 66,192 |
| | $ | 65,279 |
| | $ | 65,410 |
| | $ | 66,066 |
|
| Interest expense | | 10,739 |
| | 10,567 |
| | 10,450 |
| | 10,166 |
|
| Net interest income | | 55,453 |
| | 54,712 |
| | 54,960 |
| | 55,900 |
|
| Provision for (recovery of) loan losses | | 329 |
| | 673 |
| | 2,498 |
| | (85 | ) |
| Income before income taxes | | 27,831 |
| | 26,767 |
| | 25,143 |
| | 22,617 |
|
| Net income | | 20,710 |
| | 20,034 |
| | 19,029 |
| | 17,454 |
|
| Per common share data: | | | | | | | | |
| Net income per common share - basic | | 1.34 |
| | 1.30 |
| | 1.23 |
| | 1.13 |
|
| Net income per common share - diluted | | 1.34 |
| | 1.30 |
| | 1.23 |
| | 1.13 |
|
| Weighted-average common shares outstanding - basic | | 15,411,990 |
| | 15,411,981 |
| | 15,411,972 |
| | 15,413,517 |
|
| Weighted-average common shares equivalent - diluted | | 15,411,990 |
| | 15,411,981 |
| | 15,411,972 |
| | 15,413,517 |
|
The Corporation's common shares (symbol: PRK) are traded on NYSE MKT LLC. At December 31, 2014, the Corporation had 3,922 shareholders of record. The following table sets forth the high, low and closing sale prices of, and dividends declared on the common shares for each quarterly period for the years ended December 31, 2014 and 2013, as reported by NYSE MKT LLC.
|
| | | | | | | | | | | | | | | | |
| Table 38 - Market and Dividend Information | | | | | | | | |
| | | High | | Low | | Last Price | | Cash Dividend Declared Per Share |
| 2014: | | | | | | | | |
| First Quarter | | $ | 86.78 |
| | $ | 75.06 |
| | $ | 76.89 |
| | $ | 0.94 |
|
| Second Quarter | | 83.32 |
| | 70.51 |
| | 77.20 |
| | 0.94 |
|
| Third Quarter | | 79.77 |
| | 72.87 |
| | 75.42 |
| | 0.94 |
|
| Fourth Quarter | | 89.84 |
| | 74.00 |
| | 88.48 |
| | 0.94 |
|
| 2013: | | | | | | | | |
| First Quarter | | $ | 70.31 |
| | $ | 64.79 |
| | $ | 69.79 |
| | $ | 0.94 |
|
| Second Quarter | | 72.00 |
| | 66.00 |
| | 68.79 |
| | 0.94 |
|
| Third Quarter | | 81.49 |
| | 68.89 |
| | 79.08 |
| | 0.94 |
|
| Fourth Quarter | | 86.00 |
| | 76.53 |
| | 85.07 |
| | 0.94 |
|
PERFORMANCE GRAPH
Table 39 compares the total return performance for Park common shares with the NYSE MKT Composite Index, the NASDAQ Bank Stocks Index and the SNL Financial Bank and Thrift Index for the five-year period from December 31, 2009 to December 31, 2014. The NYSE MKT Composite Index is a market capitalization-weighted index of the stocks listed on NYSE MKT. The NASDAQ Bank Stocks Index is comprised of all depository institutions, holding companies and other investment companies that are traded on The NASDAQ Global Select and Global Markets. Park considers a number of bank holding companies traded on The NASDAQ Global Select Market to be within our peer group. The SNL Financial Bank and Thrift Index is comprised of all publicly-traded bank and thrift stocks researched by SNL Financial.
The NYSE MKT Financial Stocks Index includes the stocks of banks, thrifts, finance companies and securities broker-dealers. Park believes that the NASDAQ Bank Stocks Index and the SNL Financial Bank and Thrift Index are more appropriate industry indices for Park to use for the five-year total return performance comparison.
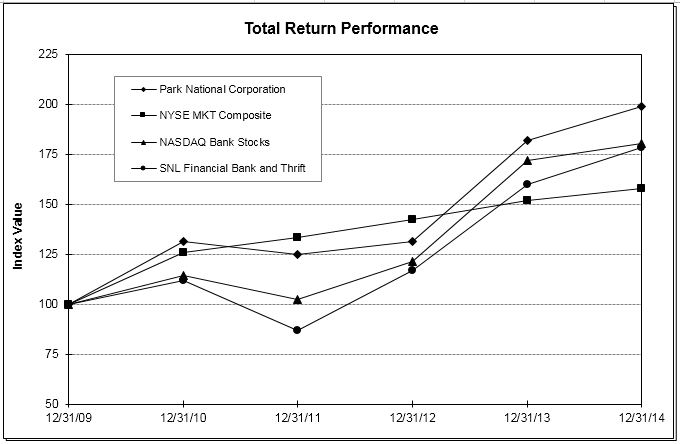
|
| | | | | | | | | | | | | | | | | | |
| Table 39 – Total Return Performance |
| | | Period Ending |
| Index | | 12/31/09 | | 12/31/10 | | 12/31/11 | | 12/31/12 | | 12/31/13 | | 12/31/14 |
| Park National Corporation | | 100.00 |
| | 131.05 |
| | 124.99 |
| | 131.31 |
| | 181.78 |
| | 198.55 |
|
| NYSE MKT Composite | | 100.00 |
| | 125.60 |
| | 133.49 |
| | 142.32 |
| | 151.80 |
| | 157.50 |
|
| NASDAQ Bank Stocks | | 100.00 |
| | 114.16 |
| | 102.17 |
| | 121.26 |
| | 171.86 |
| | 180.31 |
|
| SNL Financial Bank and Thrift | | 100.00 |
| | 111.64 |
| | 86.81 |
| | 116.57 |
| | 159.61 |
| | 178.18 |
|
The total return for Park’s common shares has outperformed the total return of the NASDAQ Bank Stocks Index and the SNL Financial Bank and Thrift Index for the five-year period indicated in Table 39. The annual compound total return on Park’s common shares for the past five years was a positive 14.7%. By comparison, the annual compound total returns for the past five years on the NYSE MKT Composite Index, the NASDAQ Bank Stocks Index and the SNL Financial Bank and Thrift Index were a positive 9.5%, a positive 12.5% and a positive 12.2%, respectively.
Management’s Report on Internal Control Over Financial Reporting
To the Board of Directors and Shareholders
Park National Corporation
The management of Park National Corporation (the “Corporation”) is responsible for establishing and maintaining adequate internal control over financial reporting as defined in Rules 13a-15(f) and 15d-15(f) under the Securities Exchange Act of 1934. The Corporation’s internal control over financial reporting is designed to provide reasonable assurance regarding the reliability of financial reporting and the preparation of financial statements for external purposes in accordance with U.S. generally accepted accounting principles. The Corporation’s internal control over financial reporting includes those policies and procedures that:
| |
| a) | pertain to the maintenance of records that, in reasonable detail, accurately and fairly reflect the transactions and dispositions of the assets of the Corporation and its consolidated subsidiaries; |
| |
| b) | provide reasonable assurance that transactions are recorded as necessary to permit preparation of financial statements in accordance with U.S. generally accepted accounting principles, and that receipts and expenditures of the Corporation and its consolidated subsidiaries are being made only in accordance with authorizations of management and directors of the Corporation; and |
| |
| c) | provide reasonable assurance regarding prevention or timely detection of unauthorized acquisition, use or disposition of the assets of the Corporation and its consolidated subsidiaries that could have a material effect on the financial statements. |
The Corporation’s internal control over financial reporting as it relates to the consolidated financial statements is evaluated for effectiveness by management and tested for reliability through a program of internal audits. Actions are taken to correct potential deficiencies as they are identified.
Because of its inherent limitations, internal control over financial reporting may not prevent or detect misstatements. Also, projections of any evaluations of effectiveness to future periods are subject to the risk that controls may become inadequate because of changes in conditions, or that the degree of compliance with the policies or procedures may deteriorate. Accordingly, even an effective system of internal control over financial reporting will provide only reasonable assurance with respect to financial statement preparation.
With the participation of our Chairman of the Board, our Chief Executive Officer and President and our Chief Financial
Officer, management evaluated the effectiveness of the Corporation’s internal control over financial reporting as of December 31, 2014, the end of the Corporation’s fiscal year. In making this assessment, management used the criteria set forth for effective internal control over financial reporting by the Committee of Sponsoring Organizations of the Treadway Commission's (COSO) 1992 Internal Control-Integrated Framework.
Based on our assessment under the criteria described in the preceding paragraph, management concluded that the
Corporation maintained effective internal control over financial reporting as of December 31, 2014.
The Corporation’s independent registered public accounting firm, Crowe Horwath LLP, has audited the Corporation’s 2014 and 2013 consolidated financial statements included in this Annual Report and the Corporation’s internal control over financial reporting as of December 31, 2014, and has issued their Report of Independent Registered Public Accounting Firm, which appears in this Annual Report.
|
| | | | |
| /s/ C. Daniel DeLawder | | /s/ David L. Trautman | | /s/ Brady T. Burt |
| C. Daniel DeLawder | | David L. Trautman | | Brady T. Burt |
| Chairman of the Board | | Chief Executive Officer and President | | Chief Financial Officer, Secretary and Treasurer |
| | | | | |
| February 24, 2015 | | | | |
REPORT OF INDEPENDENT REGISTERED PUBLIC ACCOUNTING FIRM
To the Board of Directors and Shareholders
Park National Corporation
Newark, Ohio
We have audited the accompanying consolidated balance sheets of Park National Corporation as of December 31, 2014 and 2013 and the related consolidated statements of income, comprehensive income, changes in shareholders’ equity and cash flows for each of the three years in the period ended December 31, 2014. We also have audited Park National Corporation’s internal control over financial reporting as of December 31, 2014, based on criteria established in the 1992 Internal Control – Integrated
Framework issued by the Committee of Sponsoring Organizations of the Treadway Commission (COSO). Park National Corporation’s management is responsible for these financial statements, for maintaining effective internal control over financial reporting, and for its assessment of the effectiveness of internal control over financial reporting, included in the accompanying Management’s Report on Internal Control over Financial Reporting. Our responsibility is to express an opinion on these financial statements and an opinion on the company's internal control over financial reporting based on our audits.
We conducted our audits in accordance with the standards of the Public Company Accounting Oversight Board (United States). Those standards require that we plan and perform the audits to obtain reasonable assurance about whether the financial statements are free of material misstatement and whether effective internal control over financial reporting was maintained in all material respects. Our audits of the financial statements included examining, on a test basis, evidence supporting the amounts and disclosures in the financial statements, assessing the accounting principles used and significant estimates made by
management, and evaluating the overall financial statement presentation. Our audit of internal control over financial reporting included obtaining an understanding of internal control over financial reporting, assessing the risk that a material weakness exists, and testing and evaluating the design and operating effectiveness of internal control based on the assessed risk. Our audits also included performing such other procedures as we considered necessary in the circumstances. We believe that our audits provide a reasonable basis for our opinions.
A company's internal control over financial reporting is a process designed to provide reasonable assurance regarding the reliability of financial reporting and the preparation of financial statements for external purposes in accordance with generally accepted accounting principles. A company's internal control over financial reporting includes those policies and procedures that (1) pertain to the maintenance of records that, in reasonable detail, accurately and fairly reflect the transactions and dispositions of the assets of the company; (2) provide reasonable assurance that transactions are recorded as necessary to permit
preparation of financial statements in accordance with generally accepted accounting principles, and that receipts and expenditures of the company are being made only in accordance with authorizations of management and directors of the company; and (3) provide reasonable assurance regarding prevention or timely detection of unauthorized acquisition, use, or disposition of the company's assets that could have a material effect on the financial statements.
Because of its inherent limitations, internal control over financial reporting may not prevent or detect misstatements. Also, projections of any evaluation of effectiveness to future periods are subject to the risk that controls may become inadequate because of changes in conditions, or that the degree of compliance with the policies or procedures may deteriorate.
In our opinion, the consolidated financial statements referred to above present fairly, in all material respects, the financial position of Park National Corporation as of December 31, 2014 and 2013, and the results of its operations and its cash flows for each of the three years in the period ended December 31, 2014, in conformity with accounting principles generally accepted in the United States of America. Also in our opinion, Park National Corporation maintained, in all material respects, effective internal control over financial reporting as of December 31, 2014, based on criteria established in the 1992 Internal Control –
Integrated Framework issued by the COSO.
Crowe Horwath LLP
Columbus, Ohio
February 24, 2015
Park National Corporation and Subsidiaries
Consolidated Balance Sheets
at December 31, 2014 and 2013
|
| | | | | | | | |
| (In thousands, except share and per share data) | | 2014 | | 2013 |
| | | | | |
| Assets | | | | |
| Cash and due from banks | | $ | 133,511 |
| | $ | 129,078 |
|
| Money market instruments | | 104,188 |
| | 17,952 |
|
| Cash and cash equivalents | | 237,699 |
| | 147,030 |
|
| | | | | |
| Investment securities: | | | | |
| Securities available-for-sale, at fair value (amortized cost of $1,299,980 and $1,222,143 at December 31, 2014 and 2013, respectively) | | 1,301,915 |
| | 1,176,266 |
|
| Securities held-to-maturity, at amortized cost (fair value of $143,490 and $187,402 at December 31, 2014 and 2013, respectively) | | 140,562 |
| | 182,061 |
|
| Other investment securities | | 58,311 |
| | 65,907 |
|
| Total investment securities | | 1,500,788 |
| | 1,424,234 |
|
| | | | | |
| Total loans | | 4,829,682 |
| | 4,620,505 |
|
| Allowance for loan losses | | (54,352 | ) | | (59,468 | ) |
| Net loans | | 4,775,330 |
| | 4,561,037 |
|
| | | | | |
| Other assets: | | | | |
| Bank owned life insurance | | 171,928 |
| | 169,284 |
|
| Goodwill | | 72,334 |
| | 72,334 |
|
| Premises and equipment, net | | 55,479 |
| | 55,278 |
|
| Accrued interest receivable | | 17,677 |
| | 18,335 |
|
| Other real estate owned | | 22,605 |
| | 34,636 |
|
| Mortgage loan servicing rights | | 8,613 |
| | 9,013 |
|
| Other | | 140,803 |
| | 147,166 |
|
| Total other assets | | 489,439 |
| | 506,046 |
|
| | | | | |
| Total assets | | $ | 7,003,256 |
| | $ | 6,638,347 |
|
The accompanying notes are an integral part of the consolidated financial statements.
Park National Corporation and Subsidiaries
Consolidated Balance Sheets
at December 31, 2014 and 2013
|
| | | | | | |
| (In thousands, except share and per share data) | | 2014 | | 2013 |
| | | | | |
| Liabilities and shareholders’ equity | | | | |
| | | | | |
| Deposits: | | | | |
| Non-interest bearing | | 1,269,296 |
| | 1,193,553 |
|
| Interest bearing | | 3,858,704 |
| | 3,596,441 |
|
| Total deposits | | 5,128,000 |
| | 4,789,994 |
|
| | | | | |
| Short-term borrowings | | 276,980 |
| | 242,029 |
|
| Long-term debt | | 786,602 |
| | 810,541 |
|
| Subordinated notes | | 45,000 |
| | 80,250 |
|
| Total borrowings | | 1,108,582 |
| | 1,132,820 |
|
| | | | | |
| Other liabilities: | | | | |
| Accrued interest payable | | 2,551 |
| | 2,901 |
|
| Other | | 65,525 |
| | 60,885 |
|
| Total other liabilities | | 68,076 |
| | 63,786 |
|
| | | | | |
| Total liabilities | | 6,304,658 |
| | 5,986,600 |
|
| | | | | |
| Commitments and Contingencies | |
|
| |
|
|
| | | | | |
| Shareholders’ equity: | | | | |
| | | | | |
| Preferred shares (200,000 shares authorized; no shares outstanding at December 31, 2014 and 2013) | | — |
| | — |
|
| Common shares, no par value (20,000,000 shares authorized; 16,150,888 and 16,150,941 shares issued at December 31, 2014 and 2013, respectively) | | 303,104 |
| | 302,651 |
|
| Accumulated other comprehensive loss, net | | (13,608 | ) | | (35,419 | ) |
| Retained earnings | | 486,541 |
| | 460,643 |
|
| Less: Treasury shares (758,489 and 738,989 shares at December 31, 2014 and 2013, respectively) | | (77,439 | ) | | (76,128 | ) |
| Total shareholders’ equity | | 698,598 |
| | 651,747 |
|
| Total liabilities and shareholders’ equity | | 7,003,256 |
| | 6,638,347 |
|
The accompanying notes are an integral part of the consolidated financial statements.
Park National Corporation and Subsidiaries
Consolidated Statements of Income
for years ended December 31, 2014, 2013 and 2012
|
| | | | | | | | | | | | |
| (In thousands, except per share data) | | 2014 | | 2013 | | 2012 |
| | | | | | | |
| Interest and dividend income: | | | | | | |
| Interest and fees on loans | | $ | 227,644 |
| | $ | 225,538 |
| | $ | 234,638 |
|
| Interest and dividends on: | | | | | | |
| Obligations of U.S. Government, its agencies and other securities | | 36,981 |
| | 36,686 |
| | 50,549 |
|
| Obligations of states and political subdivisions | | 3 |
| | 45 |
| | 140 |
|
| Other interest income | | 515 |
| | 678 |
| | 408 |
|
| Total interest and dividend income | | 265,143 |
| | 262,947 |
| | 285,735 |
|
| | | | | | | |
| Interest expense: | | | | | | |
| Interest on deposits: | | | | | | |
| Demand and savings deposits | | 1,677 |
| | 1,773 |
| | 2,483 |
|
| Time deposits | | 9,323 |
| | 11,235 |
| | 15,921 |
|
| Interest on short-term borrowings | | 517 |
| | 544 |
| | 678 |
|
| Interest on long-term debt | | 28,582 |
| | 28,370 |
| | 31,338 |
|
| Total interest expense | | 40,099 |
| | 41,922 |
| | 50,420 |
|
| Net interest income | | 225,044 |
| | 221,025 |
| | 235,315 |
|
| | | | | | | |
| (Recovery of) provision for loan losses | | (7,333 | ) | | 3,415 |
| | 35,419 |
|
| Net interest income after (recovery of) provision for loan losses | | 232,377 |
| | 217,610 |
| | 199,896 |
|
| | | | | | | |
| Other income: | | | | | | |
| Income from fiduciary activities | | 19,150 |
| | 17,133 |
| | 15,947 |
|
| Service charges on deposit accounts | | 15,423 |
| | 16,316 |
| | 16,704 |
|
| Other service income | | 10,459 |
| | 12,913 |
| | 13,631 |
|
| Checkcard fee income | | 13,570 |
| | 12,955 |
| | 12,541 |
|
| Bank owned life insurance income | | 4,861 |
| | 5,041 |
| | 4,754 |
|
| ATM fees | | 2,467 |
| | 2,632 |
| | 2,359 |
|
| Gain on sale of OREO, net | | 5,503 |
| | 3,110 |
| | 4,414 |
|
| OREO devaluations | | (2,406 | ) | | (3,180 | ) | | (6,872 | ) |
| Gain on sale of loans held for sale | | 1,867 |
| | — |
| | — |
|
| Gain on sale of Vision Bank business | | — |
| | — |
| | 22,167 |
|
| Loss on sale of investment securities | | (1,158 | ) | | — |
| | — |
|
| Miscellaneous | | 5,813 |
| | 6,357 |
| | 6,758 |
|
| Total other income | | $ | 75,549 |
| | $ | 73,277 |
| | $ | 92,403 |
|
| | | | | | | |
| | | | | | | |
The accompanying notes are an integral part of the consolidated financial statements.
Park National Corporation and Subsidiaries
Consolidated Statements of Income
for years ended December 31, 2014, 2013 and 2012
|
| | | | | | | | | | | | |
| (In thousands, except per share data) | | 2014 | | 2013 | | 2012 |
| | | | | | | |
| Other expense: | | | | | | |
| Salaries and employee benefits | | $ | 101,968 |
| | $ | 100,298 |
| | $ | 95,977 |
|
| Data processing fees | | 4,712 |
| | 4,174 |
| | 3,916 |
|
| Professional fees and services | | 29,580 |
| | 27,865 |
| | 24,267 |
|
| Net occupancy expense of bank premises | | 10,006 |
| | 9,804 |
| | 9,444 |
|
| Amortization of intangibles | | — |
| | 337 |
| | 2,172 |
|
| Furniture and equipment expense | | 11,571 |
| | 11,249 |
| | 10,788 |
|
| Insurance | | 5,723 |
| | 5,205 |
| | 5,780 |
|
| Marketing | | 4,371 |
| | 3,790 |
| | 3,474 |
|
| Postage and telephone | | 5,268 |
| | 5,790 |
| | 5,983 |
|
| State taxes | | 2,290 |
| | 3,702 |
| | 3,786 |
|
| Loan put provision | | — |
| | — |
| | 3,299 |
|
| OREO expense | | 2,063 |
| | 2,731 |
| | 4,011 |
|
| Amortization of investment in qualified affordable housing projects | | 7,724 |
| | 7,014 |
| | 6,841 |
|
| Miscellaneous | | 9,958 |
| | 6,570 |
| | 8,230 |
|
| Total other expense | | 195,234 |
| | 188,529 |
| | 187,968 |
|
| | | | | | | |
| Income before income taxes | | 112,692 |
| | 102,358 |
| | 104,331 |
|
| | | | | | | |
| Federal income taxes | | 28,602 |
| | 25,131 |
| | 25,701 |
|
| | | | | | | |
| Net income | | $ | 84,090 |
| | $ | 77,227 |
| | $ | 78,630 |
|
| | | | | | | |
| Preferred share dividends and accretion | | — |
| | — |
| | 3,425 |
|
| | | | | | | |
| Income available to common shareholders | | $ | 84,090 |
| | $ | 77,227 |
| | $ | 75,205 |
|
| | | | | | | |
| Earnings per common share: | | | | | | |
| Basic | | $ | 5.46 |
| | $ | 5.01 |
| | $ | 4.88 |
|
| Diluted | | $ | 5.46 |
| | $ | 5.01 |
| | $ | 4.88 |
|
The accompanying notes are an integral part of the consolidated financial statements.
PARK NATIONAL CORPORATION
Consolidated Statements of Comprehensive Income
for years ended December 31, 2014, 2013 and 2012
|
| | | | | | | | | | | |
| | |
| (In thousands) | 2014 | | 2013 | | 2012 |
| | | | | | |
| Net income | $ | 84,090 |
| | $ | 77,227 |
| | $ | 78,630 |
|
| | | | | | |
| Other comprehensive income (loss), net of tax: | | | | | |
| Defined benefit pension plan: | | | | | |
| Amortization of net loss and prior service costs, net of income taxes of $7, $953 and $605 for the years ended December 31, 2014, 2013, and 2012, respectively | 12 |
| | 1,770 |
| | 1,123 |
|
| Unrealized net actuarial (loss) gain, net of income taxes of ($4,997), $10,643 and ($3,933) for the years ended December 31, 2014, 2013, and 2012, respectively. | (9,279 | ) | | 19,766 |
| | (7,303 | ) |
| Change in funded status of pension plan, net of income taxes | (9,267 | ) | | 21,536 |
| | (6,180 | ) |
| | | | | | |
| Unrealized net holding gain on cash flow hedge, net of income taxes of $296 for the year ended December 31, 2012 | — |
| | — |
| | 550 |
|
| | | | | | |
| Securities available-for-sale: | | | | | |
| Net loss realized on sale of securities, net of income taxes of $405 for the year ended December 31, 2014 | 753 |
| | — |
| | — |
|
| Other than temporary impairment realized on securities, net of income taxes of $6 and $19 for the years ended December 31, 2013 and 2012, respectively | — |
| | 11 |
| | 35 |
|
| Change in unrealized securities holding gain (loss), net of income taxes of $16,329, ($21,242) and ($1,664) for the years ended December 31, 2014, 2013, and 2012, respectively | 30,325 |
| | (39,448 | ) | | (3,092 | ) |
| Unrealized net holding (loss) on securities available-for-sale, net of income taxes | 31,078 |
| | (39,437 | ) | | (3,057 | ) |
| | | | | | |
| Other comprehensive income (loss) | $ | 21,811 |
| | $ | (17,901 | ) | | $ | (8,687 | ) |
| | | | | | |
| Comprehensive income | $ | 105,901 |
| | $ | 59,326 |
| | $ | 69,943 |
|
The accompanying notes are an integral part of the consolidated financial statements.
Park National Corporation and Subsidiaries
Consolidated Statements of Changes in Shareholders’ Equity
for the years ended December 31, 2014, 2013 and 2012
|
| | | | | | | | | | | | | | | | | | | | | | | | | | | | | | |
| | | Preferred Shares | | Common Shares | | Retained Earnings | | Treasury Shares | | Accumulated Other Comprehensive Income (Loss) | | Total |
| (In thousands, except share and per share data) | | Shares Outstanding | | Amount | | Shares Outstanding | | Amount | | | | |
| | | | | | | | | | | | | | | | | |
| Balance, January 1, 2012 | | 100,000 |
| | $ | 98,146 |
| | 15,405,912 |
| | $ | 305,499 |
| | $ | 424,557 |
| | $ | (77,007 | ) | | $ | (8,831 | ) | | $ | 742,364 |
|
| Net income | | | | | | | | | | 78,630 |
| | | | | | 78,630 |
|
| Other comprehensive loss, net of tax | | | | | | | | | | | | | | (8,687 | ) | | (8,687 | ) |
| Cash dividends, $3.76 per share | | | | | | | | | | (57,932 | ) | | | | | | (57,932 | ) |
| Cash payment for fractional shares in dividend reinvestment plan | | | | | | (34 | ) | | (2 | ) | | | | | | | | (2 | ) |
| Common share warrants redeemed | | | | | | | | (2,843 | ) | | | | | | | | (2,843 | ) |
| Preferred shares redeemed | | (100,000 | ) | | (100,000 | ) | | | | | | | | | | | | (100,000 | ) |
| Accretion of discount on preferred shares | | | | 1,854 |
| | | | | | (1,854 | ) | | | | | | — |
|
| Preferred share dividends | | | | | | | | | | (1,571 | ) | | | | | | (1,571 | ) |
| Treasury shares reissued for director grants | | | | | | 6,120 |
| | | | (225 | ) | | 632 |
| | | | 407 |
|
| Balance, December 31, 2012 | | — |
| | $ | — |
| | 15,411,998 |
| | $ | 302,654 |
| | $ | 441,605 |
| | $ | (76,375 | ) | | $ | (17,518 | ) | | $ | 650,366 |
|
| Net income | | | | | | | | | | 77,227 |
| | | | | | 77,227 |
|
| Other comprehensive loss, net of tax | | | | | | | | | | | | | | (17,901 | ) | | (17,901 | ) |
| Cash dividends, $3.76 per share | | | | | | | | | | (57,949 | ) | | | | | | (57,949 | ) |
| Cash payment for fractional shares in dividend reinvestment plan | | | | | | (46 | ) | | (3 | ) | | | | | | | | (3 | ) |
| Treasury shares repurchased | | | | | | (10,550 | ) | | | | | | (843 | ) | | | | (843 | ) |
| Treasury shares reissued for director grants | | | | | | 10,550 |
| | | | (240 | ) | | 1,090 |
| | | | 850 |
|
| Balance, December 31, 2013 | | — |
| | $ | — |
| | 15,411,952 |
| | $ | 302,651 |
| | $ | 460,643 |
| | $ | (76,128 | ) | | $ | (35,419 | ) | | $ | 651,747 |
|
| Net income | | | | | | | | | | 84,090 |
| | | | | | 84,090 |
|
| Other comprehensive income, net of tax | | | | | | | | | | | | | | 21,811 |
| | 21,811 |
|
| Cash dividends, $3.76 per share | | | | | | | | | | (57,949 | ) | | | | | | (57,949 | ) |
| Cash payment for fractional shares in dividend reinvestment plan | | | | | | (53 | ) | | (5 | ) | | | | | | | | (5 | ) |
| Share based compensation expense | | | | | | | | 458 |
| | | | | | | | 458 |
|
| Treasury shares repurchased | | | | | | (29,700 | ) | | | | | | (2,355 | ) | | | | (2,355 | ) |
| Treasury shares reissued for director grants | | | | | | 10,200 |
| | | | (243 | ) | | 1,044 |
| | | | 801 |
|
| Balance, December 31, 2014 | | — |
| | $ | — |
| | 15,392,399 |
| | $ | 303,104 |
| | $ | 486,541 |
| | $ | (77,439 | ) | | $ | (13,608 | ) | | $ | 698,598 |
|
The accompanying notes are an integral part of the consolidated financial statements.
Park National Corporation and Subsidiaries
Consolidated Statements of Cash Flows
for the years ended December 31, 2014, 2013 and 2012
|
| | | | | | | | | | | | |
| (In thousands) | | 2014 | | 2013 | | 2012 |
| | | | | | | |
| Operating activities: | | | | | | |
| Net income | | $ | 84,090 |
| | $ | 77,227 |
| | $ | 78,630 |
|
| Adjustments to reconcile net income to net cash provided by operating activities: | | | | | | |
| (Recovery of) provision for loan losses | | (7,333 | ) | | 3,415 |
| | 35,419 |
|
| Loan put provision | | — |
| | — |
| | 3,299 |
|
| Amortization of loan fees and costs, net | | 4,160 |
| | 3,611 |
| | 2,119 |
|
| Provision for depreciation | | 7,243 |
| | 7,315 |
| | 6,954 |
|
| Other than temporary impairment on investment securities | | — |
| | 17 |
| | 54 |
|
| Amortization of intangible assets | | — |
| | 337 |
| | 2,172 |
|
| Accretion of investment securities | | (213 | ) | | (33 | ) | | (239 | ) |
| Amortization of prepayment penalty on long-term debt | | 5,031 |
| | 4,835 |
| | — |
|
| Deferred income tax | | 1,563 |
| | (2,456 | ) | | 12,717 |
|
| Realized net investment security losses | | 1,158 |
| | — |
| | — |
|
| Share-based compensation expense | | 1,259 |
| | 850 |
| | 407 |
|
| Loan originations to be sold in secondary market | | (136,125 | ) | | (317,534 | ) | | (442,890 | ) |
| Proceeds from sale of loans in secondary market | | 135,209 |
| | 345,704 |
| | 434,489 |
|
| Gain on sale of loans in secondary market | | (2,682 | ) | | (4,093 | ) | | (5,807 | ) |
| Proceeds from sale of loans held for sale | | 20,966 |
| | — |
| | — |
|
| Gain on sale of loans held for sale | | (1,867 | ) | | — |
| | — |
|
| OREO devaluations | | 2,406 |
| | 3,180 |
| | 6,872 |
|
| Gain on sale of OREO, net | | (5,503 | ) | | (3,110 | ) | | (4,414 | ) |
| Proceeds from the sale of OREO | | 27,798 |
| | 23,043 |
| | 26,988 |
|
| Bank owned life insurance income | | (4,861 | ) | | (5,041 | ) | | (4,754 | ) |
| Changes in assets and liabilities: | | | | | | |
| (Increase) Decrease in other assets | | (23,200 | ) | | 6,818 |
| | (14,171 | ) |
| Decrease in other liabilities | | 13,629 |
| | 1,676 |
| | 954 |
|
| Net cash provided by operating activities | | 122,728 |
| | 145,761 |
| | 138,799 |
|
| | | | | | | |
| Investing activities: | | | | | | |
| Proceeds from redemption of Federal Home Loan Bank stock | | 8,946 |
| | — |
| | — |
|
| Proceeds from sales of securities | | 173,123 |
| | 75,000 |
| | — |
|
| Proceeds from calls and maturities of securities: | | | | | | |
| Held-to-maturity | | 41,436 |
| | 219,329 |
| | 681,513 |
|
| Available-for-sale | | 99,092 |
| | 385,259 |
| | 666,431 |
|
| Purchase of securities: | | | | | | |
| Held-to-maturity | | — |
| | — |
| | (262,679 | ) |
| Available-for-sale | | (350,934 | ) | | (582,728 | ) | | (964,704 | ) |
| Net (increase) decrease in other investments | | (1,350 | ) | | — |
| | 1,697 |
|
| Net loan originations, portfolio loans | | (234,017 | ) | | (212,311 | ) | | (186,740 | ) |
| Sales of assets/liabilities related to Vision Bank | | — |
| | — |
| | (144,436 | ) |
| Investment in qualified affordable housing projects | | (9,417 | ) | | (8,222 | ) | | (9,964 | ) |
|
| | | | | | | | | | | | |
| (In thousands) | | 2014 | | 2013 | | 2012 |
| | | | | | | |
| Purchases of bank owned life insurance, net | | — |
| | (4,600 | ) | | (2,500 | ) |
| Purchases of premises and equipment, net | | (7,444 | ) | | (8,842 | ) | | (6,964 | ) |
| Net cash used in investing activities | | (280,565 | ) |
| (137,115 | ) |
| (228,346 | ) |
| | | | | | | |
| Financing activities | | | | | | |
| Net increase in deposits | | 338,006 |
| | 73,962 |
| | 250,918 |
|
| Net increase (decrease) in short-term borrowings | | 34,951 |
| | (102,139 | ) | | 80,574 |
|
| Proceeds from issuance of subordinated notes | | — |
| | — |
| | 30,000 |
|
| Proceeds from long-term debt | | 125,000 |
| | 75,000 |
| | 300,000 |
|
| Repayment of subordinated notes | | (35,250 | ) | | — |
| | (25,000 | ) |
| Repayment of long-term debt | | (153,970 | ) | | (50,952 | ) | | (340,129 | ) |
| Cash payment for repurchase of common share warrant from U.S. Treasury | | — |
| | — |
| | (2,843 | ) |
| Repurchase of preferred shares from U.S. Treasury | | — |
| | — |
| | (100,000 | ) |
| Repurchase of treasury shares | | (2,355 | ) | | (843 | ) | | — |
|
| Cash dividends paid | | (57,876 | ) | | (57,949 | ) | | (60,154 | ) |
| Net cash provided by (used in) financing activities | | 248,506 |
| | (62,921 | ) | | 133,366 |
|
| Increase (decrease) in cash and cash equivalents | | 90,669 |
| | (54,275 | ) | | 43,819 |
|
| | | | | | | |
| Cash and cash equivalents at beginning of year | | 147,030 |
| | 201,305 |
| | 157,486 |
|
| Cash and cash equivalents at end of year | | $ | 237,699 |
| | $ | 147,030 |
| | $ | 201,305 |
|
| | | | | | | |
| Cash paid for: | | | | | | |
| Interest | | $ | 40,449 |
| | $ | 42,481 |
| | $ | 51,877 |
|
| | | | | | | |
| Income taxes | | $ | 27,810 |
| | $ | 20,000 |
| | $ | 7,000 |
|
| | | | | | | |
| Non cash items: | | | | | | |
| Loans transferred to OREO | | $ | 12,780 |
| | $ | 22,144 |
| | $ | 23,634 |
|
| | | | | | | |
| Loans transferred to held for sale | | $ | 21,985 |
| | $ | — |
| | $ | — |
|
The accompanying notes are an integral part of the consolidated financial statements.
Notes to Consolidated Financial Statements
1. Summary of Significant Accounting Policies
The following is a summary of significant accounting policies followed in the preparation of the consolidated financial statements:
Principles of Consolidation
The consolidated financial statements include the accounts of Park National Corporation and its subsidiaries (“Park”, the “Company” or the “Corporation”). Material intercompany accounts and transactions have been eliminated.
Use of Estimates
The preparation of financial statements in conformity with U.S. generally accepted accounting principles ("GAAP") requires management to make estimates and assumptions that affect the amounts reported in the consolidated financial statements and accompanying notes. Actual results could differ from those estimates. Management has identified the allowance for loan losses, accounting for Other Real Estate Owned (“OREO”), fair value accounting, accounting for goodwill and accounting for pension plan and other post retirement benefits as significant estimates.
Reclassifications
Certain prior year amounts have been reclassified to conform with the current year presentation. Reclassifications had no effect on prior year net income or shareholders' equity.
Restrictions on Cash and Due from Banks
The Corporation’s national bank subsidiary is required to maintain average reserve balances with the Federal Reserve Bank. The average required reserve balance was approximately $40.3 million at December 31, 2014 and $48.0 million at December 31, 2013. No other compensating balance arrangements were in existence at December 31, 2014.
Investment Securities
Investment securities are classified upon acquisition into one of three categories: held-to-maturity (HTM), available-for-sale (AFS), or trading (see Note 6 of these Notes to Consolidated Financial Statements).
HTM securities are those securities that the Corporation has the positive intent and ability to hold to maturity and are recorded at amortized cost. AFS securities are those securities that would be available to be sold in the future in response to the Corporation’s liquidity needs, changes in market interest rates, and asset-liability management strategies, among other reasons. AFS securities are reported at fair value, with unrealized holding gains and losses excluded from earnings but included in other comprehensive income, net of applicable taxes. The Corporation did not hold any trading securities during any period presented.
AFS and HTM securities are evaluated quarterly for potential other-than-temporary impairment. Management considers the facts related to each security including the nature of the security, the amount and duration of the loss, the credit quality of the issuer, the expectations for that security’s performance and whether Park intends to sell, or it is more likely than not that Park will be required to sell, a security in an unrealized loss position before recovery of its amortized cost basis. Declines in the value of equity securities that are considered to be other-than-temporary are recorded as a charge to earnings in the Consolidated Statements of Income. Declines in the value of debt securities that are considered to be other-than-temporary are separated into (1) the amount of the total impairment related to credit loss and (2) the amount of the total impairment related to all other factors. The amount of the total other-than-temporary impairment related to the credit loss is recognized in earnings. The amount of the total other-than-temporary impairment related to all other factors is recognized in other comprehensive income.
Interest income from investment securities includes amortization of purchase premium or discount. Premiums and discounts on securities are amortized on the level-yield method without anticipating prepayments, except for mortgage-backed securities where prepayments are anticipated.
Gains and losses realized on the sale of investment securities are recorded on the trade date and determined using the specific identification basis.
Notes to Consolidated Financial Statements
Federal Home Loan Bank (FHLB) and Federal Reserve Bank (FRB) Stock
Park’s national bank subsidiary, The Park National Bank (PNB) is a member of the FHLB. Additionally, PNB is a member of the FRB. Members are required to own a certain amount of stock based on their level of borrowings and other factors and may invest in additional amounts. FHLB stock and FRB stock are classified as restricted securities and are carried at their redemption value within other investment securities on the Consolidated Balance Sheets. Both cash and stock dividends are reported as income.
Bank Owned Life Insurance
Park has purchased insurance policies on the lives of directors and certain key officers. Bank owned life insurance is recorded at its cash surrender value (or the amount that can be realized).
Loans Held for Sale
Generally, loans held for sale are carried at the lower of cost or fair value. Park has elected the fair value option for mortgage loans held for sale, which are carried at their fair value.
Mortgage Banking Derivatives
Commitments to fund mortgage loans (interest rate locks) to be sold into the secondary market and forward commitments for the future delivery of these mortgage loans are accounted for as free standing derivatives. The fair values of these mortgage derivatives are estimated based on changes in mortgage interest rates from the date the interest rate on the loan is locked. The Company enters into forward commitments for the future delivery of mortgage loans when interest rate locks are entered into, in order to hedge the change in interest rates resulting from its commitments to fund the loans. Changes in the fair values of these derivatives are included in net gains on sale of loans.
Loans
Loans that management has the intent and ability to hold for the foreseeable future or until maturity or payoff, are reported at their outstanding principal balances adjusted for any charge-offs, any deferred fees or costs on originated loans, and any unamortized premiums or discounts on purchased loans. Interest income is reported on the interest method and includes amortization of net deferred loan origination fees and costs over the loan term. Commercial loans include: (1) commercial, financial and agricultural loans; (2) commercial real estate loans; (3) those commercial loans in the real estate construction loan segment; and (4) those commercial loans in the residential real estate loan segment. Consumer loans include: (1) mortgage and installment loans included in the real estate construction segment; (2) mortgage, home equity lines of credit (HELOC), and installment loans included in the residential real estate segment; and (3) all loans included in the consumer segment.
Generally, commercial loans are placed on nonaccrual status at 90 days past due and consumer and residential mortgage loans are placed on nonaccrual status at 120 days past due. Accrued interest on these loans is considered a loss, unless the loan is well-secured and in the process of collection. Commercial loans placed on nonaccrual status are considered impaired (see Note 7 of these Notes to Consolidated Financial Statements). For loans which are on nonaccrual status, it is Park’s policy to reverse interest previously accrued on the loans against interest income. Interest on such loans may be recorded on a cash basis and be included in earnings only when cash is actually received. Park’s charge-off policy for commercial loans requires management to establish a specific reserve or record a charge-off as soon as it is apparent that the borrower is troubled and there is, or likely will be, a collateral shortfall related to the estimated value of the collateral securing the loan. The Company’s charge-off policy for consumer loans is dependent on the class of the loan. Residential mortgage loans, HELOCs, and consumer loans secured by residential real estate are typically charged down to the value of the collateral, less estimated selling costs, at 180 days past due. The charge-off policy for other consumer loans, primarily installment loans, requires a monthly review of delinquent loans and a complete charge-off for any account that reaches 120 days past due.
The delinquency status of a loan is based on contractual terms and not on how recently payments have been received. Loans may be removed from nonaccrual status when loan payments have been received to cure the delinquency status, the borrower has demonstrated the ability to maintain current payment status in accordance with the loan agreement and the loan is deemed to be well-secured by management.
A description of each segment of the loan portfolio, along with the risk characteristics of each segment, is included below:
Commercial, financial and agricultural: Commercial, financial and agricultural loans are made for a wide variety of general corporate purposes, including financing for commercial and industrial businesses, financing for equipment, inventories and accounts receivable, acquisition financing and commercial leasing. The term of each commercial loan varies by its purpose. Repayment terms are structured such that commercial loans will be repaid within the economic useful life of the underlying asset. The commercial loan portfolio includes loans to a wide variety of corporations and businesses across many industrial classifications
Notes to Consolidated Financial Statements
in the 28 Ohio counties where PNB operates. The primary industries represented by these customers include manufacturing, retail trade, health care and other services.
Commercial real estate: Commercial real estate (“CRE”) loans include mortgage loans to developers and owners of commercial real estate. The lending policy for CRE loans is designed to address the unique risk attributes of CRE lending. The collateral for these CRE loans is the underlying commercial real estate.
Construction real estate: The Company defines construction loans as both commercial construction loans and residential construction loans where the loan proceeds are used exclusively for the improvement of real estate as to which the Company holds a mortgage. Construction loans may be in the form of a permanent loan or short-term construction loan, depending on the needs of the individual borrower. Construction financing is generally considered to involve a higher degree of risk of loss than long-term financing on improved, occupied real estate. Risk of loss on a construction loan depends largely upon the accuracy of the initial estimate of the property’s value at completion of construction and the estimated cost (including interest) of construction. If the estimate of construction cost proves to be inaccurate, the PNB division making the loan may be required to advance funds beyond the amount originally committed to permit completion of the project. If the estimate of value proves inaccurate, the PNB division may be confronted, at or prior to the maturity of the loan, with a project having a value insufficient to assure full repayment, should the borrower default. In the event that a default on a construction loan occurs and foreclosure follows, the PNB division must take control of the project and attempt to either arrange for completion of construction or dispose of the unfinished project. Additional risk exists with respect to loans made to developers who do not have a buyer for the property, as the developer may lack funds to pay the loan if the property is not sold upon completion. PNB and its divisions attempt to reduce such risks on loans to developers by requiring personal guarantees and reviewing current personal financial statements and tax returns as well as other projects undertaken by the developer.
Residential real estate: The Company defines residential real estate loans as first mortgages on individuals’ primary residences or second mortgages of individuals’ primary residences in the form of HELOCs or installment loans. Credit approval for residential real estate loans requires demonstration of sufficient income to repay the principal and interest and the real estate taxes and insurance, stability of employment, an established credit record and an appraised value of the real estate securing the loan.
Consumer: The Company originates direct and indirect consumer loans, primarily automobile loans and home equity based credit cards to customers in its primary market areas. Credit approval for consumer loans requires income sufficient to repay principal and interest due, stability of employment, an established credit record and sufficient collateral for secured loans. Consumer loans typically have shorter terms and lower balances with higher yields as compared to real estate mortgage loans, but generally carry higher risks of default. Consumer loan collections are dependent on the borrower’s financial stability, and thus are more likely to be affected by adverse personal circumstances.
Allowance for Loan Losses
The allowance for loan losses is that amount believed adequate to absorb probable incurred credit losses in the loan portfolio based on management’s evaluation of various factors. The determination of the allowance requires significant estimates, including the timing and amounts of expected cash flows on impaired loans, consideration of current economic conditions, and historical loss experience pertaining to pools of homogeneous loans, all of which may be susceptible to change. The allowance is increased through a provision for loan losses that is charged to earnings based on management’s quarterly evaluation of the factors previously mentioned and is reduced by charge-offs, net of recoveries.
The allowance for loan losses includes both (1) an estimate of loss based on historical loss experience within both commercial and consumer loan categories with similar characteristics (“statistical allocation”) and (2) an estimate of loss based on an impairment analysis of each commercial loan that is considered to be impaired (“specific allocation”).
In calculating the allowance for loan losses, management believes it is appropriate to utilize historical loss rates that are comparable to the current period being analyzed, giving consideration to losses experienced over a full cycle. For the historical loss factor at December 31, 2014, the Company utilized an annual loss rate (“historical loss experience”), calculated based on an average of the net charge-offs and the annual change in specific reserves for impaired commercial loans, experienced during 2009 through 2014 within the individual segments of the commercial and consumer loan categories. Management believes the 72-month historical loss experience methodology is appropriate in the current economic environment, as it captures loss rates consistent with current expectations based on current economic conditions. The loss factor applied to Park’s consumer portfolio as of December 31, 2014 was based on the historical loss experience over the past 72 months, plus an additional judgmental reserve, increasing the total allowance for loan loss coverage in the consumer portfolio to approximately 1.98 years of historical loss. The consumer loan portfolio loss coverage ratio was 1.68 years at December 31, 2013. The loss factor applied to Park’s commercial portfolio as of December 31, 2014 was based on the historical loss experience over the past 72 months, plus
Notes to Consolidated Financial Statements
additional reserves for consideration of (1) a loss emergence period factor, (2) a loss migration factor and (3) a judgmental or environmental loss factor. These additional reserves increased the total allowance for loan loss coverage in the commercial portfolio to approximately 2.28 years of historical loss at December 31, 2014. The commercial loan portfolio loss coverage ratio was 2.42 years at December 31, 2013. Park’s commercial loans are individually risk graded. If loan downgrades occur, the probability of default increases and accordingly management allocates a higher percentage reserve to those accruing commercial loans graded special mention and substandard.
The judgmental increases discussed above incorporate management’s evaluation of the impact of environmental qualitative factors which pose additional risks and assign a component of the allowance for loan losses in consideration of these factors. Such environmental factors include: national and local economic trends and conditions; experience, ability and depth of lending management and staff; effects of any changes in lending policies and procedures; and levels of, and trends in, consumer bankruptcies, delinquencies, impaired loans and charge-offs and recoveries.
GAAP requires a specific allocation to be established as a component of the allowance for loan losses for certain loans when it is probable that all amounts due pursuant to the contractual terms of the loans will not be collected, and the recorded investment in the loans exceeds their measure of impairment. Management considers the following related to commercial loans when determining if a loan should be considered impaired: (1) current debt service coverage levels of the borrowing entity; (2) payment history over the most recent 12-month period; (3) other signs of deterioration in the borrower’s financial situation, such as changes in credit scores; and (4) consideration of global cash flows of financially sound guarantors that have previously supported loan payments. The recorded investment is the carrying balance of the loan, plus accrued interest receivable, both as of the end of the year. Impairment is measured using either the present value of expected future cash flows based upon the initial effective interest rate on the loan, the observable market price of the loan, or the fair value of the collateral. If a loan is considered to be collateral dependent, the fair value of collateral, less estimated selling costs, is used to measure impairment.
Troubled Debt Restructuring (TDRs)
Management classifies loans as TDRs when a borrower is experiencing financial difficulty and Park has granted a concession. In order to determine whether a borrower is experiencing financial difficulty, an evaluation is performed of the probability that the borrower will be in payment default on any of the borrower's debt in the foreseeable future without the modification. This evaluation is performed under the Company’s internal underwriting policy. Management’s policy is to modify loans by extending the term or by granting a temporary or permanent contractual interest rate below the market rate, not by forgiving debt. TDRs are separately identified for impairment disclosures and are measured at the present value of estimated future cash flows using the loan’s effective rate at inception. If a TDR is considered to be a collateral dependent loan, the loan is reported, net, at the fair value of the collateral.
Income Recognition
Income earned by the Corporation and its subsidiaries is recognized on the accrual basis of accounting, except for nonaccrual loans as previously discussed, and late charges on loans which are recognized as income when they are collected.
Premises and Equipment
Land is carried at cost and is not subject to depreciation. Premises and equipment are stated at cost, less accumulated depreciation and amortization. Depreciation is generally provided on the straight-line method over the estimated useful lives of the related assets. Leasehold improvements are amortized over the shorter of the remaining lease period or the estimated useful lives of the improvements. Upon the sale or other disposal of an asset, the cost and related accumulated depreciation are removed from the accounts and the resulting gain or loss is recognized. Maintenance and repairs are charged to expense as incurred while renewals and improvements that extend the useful life of an asset are capitalized. Premises and equipment are evaluated for impairment whenever events or changes in circumstances indicate that the carrying amount of a particular asset may not be recoverable.
The range of depreciable lives over which premises and equipment are being depreciated are:
|
| |
| Buildings | 30 Years |
| Equipment, furniture and fixtures | 3 to 12 Years |
| Leasehold improvements | 1 to 10 Years |
Notes to Consolidated Financial Statements
Other Real Estate Owned (OREO)
OREO is initially recorded at fair value less anticipated selling costs (net realizable value), establishing a new cost basis, and consists of property acquired through foreclosure and real estate held for sale. If the net realizable value is below the carrying value of the loan at the date of transfer, the difference is charged to the allowance for loan losses. These assets are subsequently accounted for at the lower of cost or fair value less costs to sell. Subsequent changes in the value of real estate are classified as OREO valuation adjustments, are reported as adjustments to the carrying amount of OREO and are recorded within “Other income”. In certain circumstances where management believes the devaluation may not be permanent in nature, Park utilizes a valuation allowance to record OREO devaluations, which is also expensed through “Other income”. Costs relating to development and improvement of such properties are capitalized (not in excess of fair value less estimated costs to sell) and costs relating to holding the properties are charged to "Other expense".
Mortgage Servicing Rights (MSR)
When Park sells mortgage loans with servicing rights retained, servicing rights are recorded at an amount not to exceed fair value with the income statement effect recorded in "Other service income." Capitalized servicing rights are amortized in proportion to and over the period of the estimated future servicing income of the underlying loan and is included within “Other service income”.
Mortgage servicing rights are assessed for impairment periodically, based on fair value, with any impairment recognized through a valuation allowance. The fair value of mortgage servicing rights is determined by discounting estimated future cash flows from the servicing assets, using market discount rates and expected future prepayment rates. In order to calculate fair value, the sold loan portfolio is stratified into homogeneous pools of like categories. (See Note 22 of these Notes to Consolidated Financial Statements.)
Fees received for servicing mortgage loans owned by investors are based on a percentage of the outstanding monthly principal balance of such loans and are included in income as loan payments are received. The cost of servicing loans is charged to expense as incurred.
Goodwill and Other Intangible Assets
Goodwill represents the excess of the purchase price over net identifiable tangible and intangible assets acquired in a purchase business combination. Other intangible assets represent purchased assets that have no physical property but represent some future economic benefit to their owner and are capable of being sold or exchanged on their own or in combination with a related asset or liability.
Goodwill and indefinite-lived intangible assets are not amortized to expense, but are subject to impairment tests annually, or more frequently if events or changes in circumstances indicate that the asset might be impaired. Intangible assets with definitive useful lives (such as core deposit intangibles) are amortized to expense over their estimated useful lives.
Management considers several factors when performing the annual impairment tests on goodwill. The factors considered include the operating results for the particular Park segment for the past year and the operating results budgeted for the current year (including multi-year projections), the deposit and loan totals of the Park segment and the economic conditions in the markets served by the Park segment. At December 31, 2014, the goodwill remaining on Park's Consolidated Balance Sheet consisted entirely of goodwill at PNB. (See Note 25 of these Notes to Consolidated Financial Statements for operating segment results.)
GAAP requires a company to perform an impairment test on goodwill annually, or more frequently if events or changes in circumstances indicate that the asset might be impaired, by assessing qualitative factors to determine whether the existence of events or circumstances leads to a determination that it is more likely than not that the fair value of a reporting unit is less than its carrying amount. If after assessing these events or circumstances, it is concluded that it is not more likely than not that the fair value of a reporting unit is less than its carrying amount, then performing the two-step impairment test is unnecessary. If the carrying amount of the goodwill exceeds the fair value, an impairment charge must be recorded in an amount equal to the excess.
Park evaluates goodwill for impairment on April 1 of each year, with financial data as of March 31. Based on the analysis performed as of April 1, 2014, the Company determined that goodwill for Park’s national bank subsidiary (PNB) was not impaired. There have been no subsequent circumstances or events triggering an additional evaluation.
Consolidated Statement of Cash Flows
Cash and cash equivalents include cash and cash items, amounts due from banks and money market instruments. Generally, money market instruments are purchased and sold for one-day periods.
Notes to Consolidated Financial Statements
Loss Contingencies and Guarantees
Loss contingencies, including claims and legal actions arising in the ordinary course of business, are recorded as liabilities when the likelihood of loss is probable and an amount or range of loss can be reasonably estimated.
Income Taxes
The Corporation accounts for income taxes using the asset and liability approach. Under this method, deferred tax assets and liabilities are determined based on differences between financial reporting and tax bases of assets and liabilities and are measured using the enacted tax rates and laws that will be in effect when the differences are expected to reverse. To the extent that Park does not consider it more likely than not that a deferred tax asset will be recovered, a valuation allowance is recorded. All positive and negative evidence is reviewed when determining how much of a valuation allowance is recognized on a quarterly basis. A valuation allowance, if needed, reduces deferred tax assets to the amount expected to be realized.
An uncertain tax position is recognized as a benefit only if it is “more-likely-than-not” that the tax position would be sustained in a tax examination being presumed to occur. The benefit recognized for a tax position that meets the “more-likely-than-not” criteria is measured based on the largest benefit that is more than 50 percent likely to be realized, taking into consideration the amounts and probabilities of the outcome upon settlement. For tax positions not meeting the “more-likely-than-not” test, no tax benefit is recorded. Park recognizes any interest and penalties related to income tax matters in income tax expense.
Treasury Shares
The purchase of Park’s common shares is recorded at cost. At the date of retirement or subsequent reissuance, the treasury shares account is reduced by the weighted average cost of the common shares retired or reissued.
Comprehensive Income
Comprehensive income consists of net income and other comprehensive income (loss). Other comprehensive income (loss) includes unrealized gains and losses on securities available for sale, changes in the funded status of the Company’s Defined Benefit Pension Plan, and the unrealized net holding gains and losses on the cash flow hedge that matured on December 28, 2012, which are also recognized as separate components of equity.
Share-Based Compensation
Compensation cost is recognized for restricted stock units and stock awards issued to employees and directors, based on the fair value of these awards at the date of grant. The market price of Park’s common shares at the date of grant is used to estimate the fair value of restricted stock units and stock awards. Compensation cost is recognized over the required service period, generally defined as the vesting period. (See Note 15 of these Notes to Consolidated Financial Statements.)
Loan Commitments and Related Financial Instruments
Financial instruments include off‑balance sheet credit instruments, such as commitments to make loans and commercial letters of credit, issued to meet customer financing needs. The face amount for these items represents the exposure to loss, before considering customer collateral or ability to repay. Such financial instruments are recorded when they are funded.
Derivative Instruments
At the inception of a derivative contract, the Company designates the derivative as one of three types based on the Company’s intentions and belief as to the derivative's likely effectiveness as a hedge. These three types are: (1) a hedge of the fair value of a recognized asset or liability or of an unrecognized firm commitment (“fair value hedge”); (2) a hedge of a forecasted transaction or the variability of cash flows to be received or paid related to a recognized asset or liability (“cash flow hedge”); or (3) an instrument with no hedging designation (“stand-alone derivative”). For a fair value hedge, the gain or loss on the derivative, as well as the offsetting loss or gain on the hedged item, are recognized in current earnings as fair values change. For a cash flow hedge, the gain or loss on the derivative is reported in other comprehensive income and is reclassified into earnings in the same periods during which the hedged transaction affects earnings. For both types of hedges, changes in the fair value of derivatives that are not highly effective in hedging the changes in fair value or expected cash flows of the hedged item are recognized immediately in current earnings. Changes in the fair value of derivatives that do not qualify for hedge accounting are reported currently in earnings, as non-interest income.
The Company formally documents the relationship between derivatives and hedged items, as well as the risk-management objective and the strategy for undertaking hedge transactions at the inception of the hedging relationship. This documentation includes linking fair value or cash flow hedges to specific assets and liabilities on the Consolidated Balance Sheets or to specific firm commitments or forecasted transactions. The Company also formally assesses, both at the hedge’s inception and on an ongoing basis, whether the derivative instruments that are used are highly effective in offsetting changes in fair values or cash flows of the hedged items. The Company discontinues hedge accounting when it determines that the derivative is no
Notes to Consolidated Financial Statements
longer effective in offsetting changes in the fair value or cash flows of the hedged item, the derivative is settled or terminates, a hedged forecasted transaction is no longer probable, a hedged firm commitment is no longer firm, or treatment of the derivative as a hedge is no longer appropriate or intended.
When hedge accounting is discontinued, subsequent changes in fair value of the derivative are recorded as non-interest income. When a fair value hedge is discontinued, the hedged asset or liability is no longer adjusted for changes in fair value and the existing basis adjustment is amortized or accreted over the remaining life of the asset or liability. When a cash flow hedge is discontinued but the hedged cash flows or forecasted transactions are still expected to occur, gains or losses that were accumulated in other comprehensive income are amortized into earnings over the same periods in which the hedged transactions will affect earnings.
Fair Value Measurement
Fair values of financial instruments are estimated using relevant market information and other assumptions, as more fully disclosed in Note 23 of these Notes to Consolidated Financial Statements. Fair value estimates involve uncertainties and matters of significant judgment regarding interest rates, credit risk, prepayments, and other factors, especially in the absence of broad markets for particular items. Changes in assumptions or in market conditions could significantly affect the estimates.
Transfers of Financial Assets
Transfers of financial assets are accounted for as sales, when control over the assets has been relinquished. Control over transferred assets is deemed to be surrendered when the assets have been isolated from the Company, the transferee obtains the right (free of conditions that constrain it from taking advantage of that right) to pledge or exchange the transferred assets, and the Company does not maintain effective control over the transferred assets through an agreement to repurchase them before their maturity.
Retirement Plans
Pension expense is the net of service and interest cost, return on plan assets and amortization of gains and losses not immediately recognized. Employee 401(k) plan expense is the amount of matching contributions. Deferred compensation and supplemental retirement plan expense allocates the benefits over years of service.
Earnings Per Common Share
Basic earnings per common share is net income available to common shareholders divided by the weighted average number of common shares outstanding during the period. Diluted earnings per common share includes the dilutive effect of additional potential common shares issuable under stock awards, stock options, warrants and convertible securities. Earnings and dividends per common share are restated for any stock splits and stock dividends through the date of issuance of the consolidated financial statements.
Operating Segments
The Corporation is a financial holding company headquartered in Newark, Ohio. The operating segments for the Corporation are its chartered national bank subsidiary, The Park National Bank ("PNB") (headquartered in Newark, Ohio), SE Property Holdings, LLC ("SEPH"), and Guardian Financial Services Company ("GFSC").
2. Adoption of New Accounting Pronouncements
ASU 2013-11- Income Taxes (Topic 740): Presentation of an Unrecognized Tax Benefit When a Net Operating Loss Carryforward, a Similar Tax Loss, or a Tax Credit Carryforward Exists: The ASU requires that an unrecognized tax benefit, or a portion of an unrecognized tax benefit, be presented in the financial statements as a reduction to a deferred tax asset for a net operating loss carryforward, a similar tax loss, or a tax credit carryforward. However, if a net operating loss carryforward, a similar tax loss, or a tax credit carryforward is not available at the reporting date under the tax law of the applicable jurisdiction to settle any additional income taxes that would result from the disallowance of a tax position or the tax law of the applicable jurisdiction does not require the entity to use, and the entity does not intend to use, the deferred tax asset for such purpose, the unrecognized tax benefit should be presented in the financial statements as a liability and should not be combined with deferred tax assets. The amendments are effective for fiscal years, and interim periods within those years, beginning after December 15, 2013. The adoption of this guidance effective January 1, 2014 did not have an impact on Park's consolidated statements.
ASU 2014-01- Investments—Equity Method and Joint Ventures (Topic 323): Accounting for Investments in Qualified Affordable Housing Projects (a consensus of the FASB Emerging Issues Task Force): In January 2014, FASB issued Accounting Standards Update 2014-01, Equity Method and Joint Ventures (Topic 323): Accounting for Investments in Qualified Affordable Housing Projects (a consensus of the FASB Emerging Issues Task Force). The ASU permits reporting entities to
Notes to Consolidated Financial Statements
make an accounting policy election to account for their investments in qualified affordable housing projects using the proportional amortization method if certain conditions are met. Under the proportional amortization method, an entity amortizes the initial cost of the investment in proportion to the tax credits and other tax benefits received and recognizes the net investment performance in the income statement as a component of income tax expense. Additionally, a reporting entity should disclose information that enables users of its financial statement to understand the nature of its investments in qualified affordable housing projects, and the effect of the measurement of its investments in qualified affordable housing projects and the related tax credits on its financial position and results of operations. The new guidance is effective for annual periods, and interim reporting periods within those annual periods, beginning after December 15, 2014. The adoption of this guidance will not have a material impact on Park's consolidated financial statements, but may impact the presentation of Park's investments in qualified affordable housing projects. Finally, the adoption of this guidance will require additional disclosures.
ASU 2014-04 - Receivables—Troubled Debt Restructurings by Creditors (Subtopic 310-40): Reclassification of Residential Real Estate Collateralized Consumer Mortgage Loans upon Foreclosure (a consensus of the FASB Emerging Issues Task Force): In January 2014, FASB issued Accounting Standards Update 2014-04, Receivables—Troubled Debt Restructurings by Creditors (Subtopic 310-40): Reclassification of Residential Real Estate Collateralized Consumer Mortgage Loans upon Foreclosure (a consensus of the FASB Emerging Issues Task Force). The ASU clarifies when an in substance repossession or foreclosure occurs and a creditor is considered to have received physical possession of real estate property collateralizing a consumer mortgage loan. Specifically, the new ASU requires a creditor to reclassify a collateralized consumer mortgage loan to real estate property upon obtaining legal title to the real estate collateral, or the borrower voluntarily conveying all interest in the real estate property to the lender to satisfy the loan through a deed in lieu of foreclosure or similar legal agreement. Additional disclosures are required detailing the amount of foreclosed residential real estate property held by the creditor and the recorded investment in consumer mortgages collateralized by real estate property that are in the process of foreclosure. The new guidance is effective for annual periods, and interim reporting periods within those annual periods, beginning after December 15, 2014. The adoption of this guidance will not have a material impact on Park's consolidated financial statements, but will result in additional disclosures.
ASU 2014-09 - Revenue from Contracts with Customers (Topic 606): In May 2014, FASB issued Accounting Standards Update 2014-09, Revenue from Contracts with Customers (Topic 606). The ASU creates a new topic, Topic 606, to provide guidance on revenue recognition for entities that enter into contracts with customers to transfer goods or services or enter into contracts for the transfer of nonfinancial assets. The core principle of the guidance is that an entity should recognize revenue to depict the transfer of promised goods or services to customers in an amount that reflects the consideration to which the entity expects to be entitled in exchange for those goods or services. Additional disclosures are required to provide quantitative and qualitative information regarding the nature, amount, timing, and uncertainty of revenue and cash flows arising from contracts with customers. The new guidance is effective for annual reporting periods, and interim reporting periods within those annual periods, beginning after December 15, 2016. Early adoption is not permitted. Management is currently evaluating the impact of the adoption of this guidance on Park's consolidated financial statements.
ASU 2014-11 - Transfers and Servicing (Topic 860): Repurchase-to-Maturity Transactions, Repurchase Financings, and Disclosures: In June 2014, FASB issued Accounting Standards Update 2014-11, Transfers and Servicing (Topic 860): Repurchase-to-Maturity Transactions, Repurchase Financings, and Disclosures. The amendments in this ASU change the accounting for repurchase-to-maturity transactions and linked repurchase financings to secured borrowing accounting, which is consistent with the accounting for other repurchase agreements. The amendments also require two new disclosures. The first disclosure requires an entity to disclose information on transfers accounted for as sales in transactions that are economically similar to repurchase agreements. The second disclosure provides increased transparency about the types of collateral pledged in repurchase agreements and similar transactions accounted for as secured borrowings. The accounting changes are effective for annual periods, and interim reporting periods within those annual periods, beginning after December 15, 2014. The disclosure for certain transactions accounted for as a sale is required to be presented for interim and annual periods beginning after December 15, 2014, with all other disclosure requirements required to be presented for annual periods beginning after December 15, 2014, and for interim periods beginning after March 15, 2015. The adoption of this guidance will not have a material impact on Park's consolidated financial statements, but will result in additional disclosures.
Notes to Consolidated Financial Statements
3. Organization
Park National Corporation is a financial holding company headquartered in Newark, Ohio. Through its national bank subsidiary, PNB, Park is engaged in a general commercial banking and trust business, primarily in Ohio. PNB operates through eleven banking divisions with the Park National Bank Division headquartered in Newark, Ohio, the Fairfield National Bank Division headquartered in Lancaster, Ohio, The Park National Bank of Southwest Ohio & Northern Kentucky Division headquartered in Cincinnati, Ohio, the First-Knox National Bank Division headquartered in Mount Vernon, Ohio, the Farmers Bank Division headquartered in Loudonville, Ohio, the Security National Bank Division headquartered in Springfield, Ohio, the Unity National Bank Division headquartered in Piqua, Ohio, the Richland Bank Division headquartered in Mansfield, Ohio, the Century National Bank Division headquartered in Zanesville, Ohio, the United Bank, N.A. Division headquartered in Bucyrus, Ohio and the Second National Bank Division headquartered in Greenville, Ohio. A wholly-owned subsidiary of Park, Guardian Financial Services Company ("GFSC") is a consumer finance company located in Central Ohio.
Through February 16, 2012, Park operated a second banking subsidiary, Vision Bank ("Vision"), which was engaged in a general commercial banking business, primarily in Baldwin County, Alabama and the panhandle of Florida. Vision operated through two banking divisions with the Vision Bank Florida Division headquartered in Panama City, Florida and the Vision Bank Alabama Division headquartered in Gulf Shores, Alabama. Promptly following the sale of the Vision business to Centennial, Vision surrendered its Florida banking charter to the Florida Office of Financial Regulation and became a non-bank Florida corporation. The Florida Corporation merged with and into a wholly-owned, non-bank subsidiary of Park, SEPH, with SEPH being the surviving entity. SEPH holds the remaining assets and liabilities retained by Vision subsequent to the sale. SEPH also holds OREO that had previously been transferred to SEPH from Vision. SEPH's assets consist primarily of performing and nonperforming loans and OREO. This segment represents a run off portfolio of the legacy Vision assets.
All of the Ohio-based banking divisions provide the following principal services: the acceptance of deposits for demand, savings and time accounts; commercial, industrial, consumer and real estate lending, including installment loans, credit cards, home equity lines of credit; trust services; cash management; safe deposit operations; electronic funds transfers and a variety of additional banking-related services. Vision, with its two banking divisions, through February 16, 2012, provided the services mentioned above. See Note 25 of these Notes to Consolidated Financial Statements for financial information on the Corporation’s operating segments.
4. Sale of Vision Bank Business
On February 16, 2012, Park and its wholly-owned subsidiary, Vision, completed their sale of substantially all of the performing loans, operating assets and liabilities associated with Vision to Centennial Bank (“Centennial”), an Arkansas state-chartered bank which is a wholly-owned subsidiary of Home BancShares, Inc. (“Home”), an Arkansas corporation, as contemplated by the previously announced Purchase and Assumption Agreement by and between Park, Vision, Home and Centennial, dated as of November 16, 2011, as amended by the First Amendment to Purchase and Assumption Agreement, dated as of January 25, 2012, and the Second Amendment to Purchase and Assumption Agreement, dated as of April 30, 2012 (collectively, the "Vision Purchase Agreement") for a purchase price of $27.9 million.
Subsequent to the transactions contemplated by the Vision Purchase Agreement, Vision was left with approximately $22 million of performing loans (including mortgage loans held for sale) and non-performing loans with a fair value of $88 million. Park recorded a pre-tax gain, net of expenses directly related to the sale, of approximately $22.2 million, resulting from the transactions contemplated by the Vision Purchase Agreement. The pre-tax gain, net of expense is summarized in the table below:
|
| | | |
| (In thousands) | |
| Premium paid | $ | 27,913 |
|
| One-time gains | 298 |
|
| Loss on sale of fixed assets | (2,434 | ) |
| Employment and severance agreements | (1,610 | ) |
| Other one-time charges, including estimates | (2,000 | ) |
| Pre-tax gain | $ | 22,167 |
|
As part of the transaction between Vision and Centennial, Park agreed to allow Centennial to “put back” up to $7.5 million aggregate principal amount of loans, which were originally included within the loans sold in the transaction. The loan put option expired on August 16, 2012, 180 days after the closing of the transaction, which was February 16, 2012. Prior to August 16, 2012, Centennial notified Park of Centennial's intent to put back approximately $7.5 million aggregate principal amount of
Notes to Consolidated Financial Statements
loans. During 2012, Centennial put back 44 loans, totaling approximately $7.5 million. These 44 loans were recorded on the books at a fair value of $4.2 million. The difference of $3.3 million was written off against the loan put liability that had previously been established in the first half of 2012.
5. Goodwill
The following table reflects the activity in goodwill and other intangible assets for the years ended December 31, 2014, 2013 and 2012.
|
| | | | | | | | | | | | |
| (In thousands) | | Goodwill | | Core Deposit Intangibles | | Total |
| January 1, 2012 | | $ | 72,334 |
| | $ | 2,509 |
| | $ | 74,843 |
|
| Amortization | | — |
| | (2,172 | ) | | (2,172 | ) |
| December 31, 2012 | | $ | 72,334 |
| | $ | 337 |
| | $ | 72,671 |
|
| Amortization | | — |
| | (337 | ) | | (337 | ) |
| December 31, 2013 | | $ | 72,334 |
| | $ | — |
| | $ | 72,334 |
|
| Amortization | | — |
| | — |
| | — |
|
| December 31, 2014 | | $ | 72,334 |
| | $ | — |
| | $ | 72,334 |
|
The core deposit intangibles were amortized to expense principally on the straight-line method, over a period of six years. The amortization period for the core deposit intangibles related to Vision Bank was accelerated in the first quarter of 2012 due to the pending sale of the Vision Bank business to Centennial Bank. Core deposit intangibles were fully amortized at December 31, 2013, and thus there was no amortization expense in 2014. Core deposit intangible amortization expense was $337,000 in 2013 and $2.2 million in 2012.
6. Investment Securities
The amortized cost and fair value of investment securities are shown in the following table. Management performs a quarterly evaluation of investment securities for any other-than-temporary impairment. During 2014, there were no investment securities deemed to be other-than-temporarily impaired. During 2013 and 2012, Park recognized other-than-temporary impairment charges of $17,000 and $54,000, respectively, related to an equity investment in a financial institution.
Investment securities at December 31, 2014 and December 31, 2013 were as follows:
|
| | | | | | | | | | | | | | | | |
| (In thousands) |
| Amortized Cost |
| Gross Unrealized/Unrecognized Holding Gains |
| Gross Unrealized/Unrecognized Holding Losses |
| Estimated Fair Value |
| 2014: |
|
|
|
|
|
|
|
|
|
|
|
|
| Securities Available-for-Sale |
|
|
|
|
|
|
|
|
|
|
|
|
| Obligations of U.S. Treasury and other U.S. Government sponsored entities |
| $ | 546,886 |
|
| $ | 11 |
|
| $ | 8,833 |
|
| $ | 538,064 |
|
| U.S. Government sponsored entities’ asset-backed securities |
| 751,974 |
|
| 13,421 |
|
| 4,242 |
|
| 761,153 |
|
| Other equity securities |
| 1,120 |
|
| 1,578 |
|
| — |
|
| 2,698 |
|
| Total |
| $ | 1,299,980 |
| | $ | 15,010 |
| | $ | 13,075 |
| | $ | 1,301,915 |
|
| 2014: |
|
|
|
|
|
|
|
|
|
|
|
|
| Securities Held-to-Maturity |
|
|
|
|
|
|
|
|
|
|
|
|
| U.S. Government sponsored entities’ asset-backed securities |
| $ | 140,562 |
|
| $ | 3,088 |
|
| $ | 160 |
|
| $ | 143,490 |
|
| Total |
| $ | 140,562 |
| | $ | 3,088 |
| | $ | 160 |
| | $ | 143,490 |
|
Notes to Consolidated Financial Statements
|
| | | | | | | | | | | | | | | | |
| (In thousands) | | Amortized Cost | | Gross Unrealized/Unrecognized Holding Gains | | Gross Unrealized/Unrecognized Holding Losses | | Estimated Fair Value |
| 2013: | | | | | | | | |
| Securities Available-for-Sale | | | | | | | | |
| Obligations of U.S. Treasury and other U.S. Government sponsored entities | | $ | 570,632 |
| | $ | — |
| | $ | 45,496 |
| | $ | 525,136 |
|
| U.S. Government sponsored entities’ asset-backed securities | | 650,391 |
| | 8,070 |
| | 9,990 |
| | 648,471 |
|
| Other equity securities | | 1,120 |
| | 1,539 |
| | — |
| | 2,659 |
|
| Total | | $ | 1,222,143 |
| | $ | 9,609 |
| | $ | 55,486 |
| | $ | 1,176,266 |
|
| 2013: | | | | | | | | |
| Securities Held-to-Maturity | | | | | | | | |
| Obligations of states and political subdivisions | | $ | 240 |
| | $ | 1 |
| | $ | — |
| | $ | 241 |
|
| U.S. Government sponsored entities’ asset-backed securities | | 181,821 |
| | 5,382 |
| | 42 |
| | 187,161 |
|
| Total | | $ | 182,061 |
| | $ | 5,383 |
| | $ | 42 |
| | $ | 187,402 |
|
Park’s U.S. Government sponsored entities' asset-backed securities consisted of 15-year mortgage-backed securities and collateralized mortgage obligations (CMOs). At December 31, 2014, the amortized cost of Park’s available-for-sale mortgage-backed securities was $387.1 million and there were no held-to-maturity mortgage-backed securities within Park's investment portfolio. At December 31, 2014, the amortized cost of Park's available-for-sale and held-to-maturity CMOs was $364.9 million and $140.6 million, respectively.
The following table provides detail on investment securities with unrealized losses aggregated by investment category and length of time the individual securities had been in a continuous loss position at December 31, 2014 and December 31, 2013:
|
| | | | | | | | | | | | | | | | | | | | | | | | |
| | | Less than 12 Months | | 12 Months or Longer | | Total |
| (In thousands) | | Fair Value | | Unrealized Losses | | Fair Value | | Unrealized Losses | | Fair Value | | Unrealized Losses |
| 2014: | | | | | | | | | | | | |
| Securities Available-for-Sale | | | | | | | | | | | | |
| Obligations of U.S. Treasury and other U.S. Government sponsored entities | | $ | 119,913 |
| | $ | 87 |
| | $ | 388,140 |
| | $ | 8,746 |
| | $ | 508,053 |
| | $ | 8,833 |
|
| U.S. Government sponsored entities' asset-backed securities | | 73,276 |
| | 136 |
| | 170,430 |
| | 4,106 |
| | 243,706 |
| | 4,242 |
|
| Total | | $ | 193,189 |
| | $ | 223 |
| | $ | 558,570 |
| | $ | 12,852 |
| | $ | 751,759 |
| | $ | 13,075 |
|
| 2014: | | | | | | | | | | | | |
| Securities Held-to-Maturity | | | | | | | | | | | | |
| U.S. Government sponsored entities’ asset-backed securities | | $ | 8,032 |
| | $ | 148 |
| | $ | 2,714 |
| | $ | 12 |
| | $ | 10,746 |
| | $ | 160 |
|
Notes to Consolidated Financial Statements
|
| | | | | | | | | | | | | | | | | | | | | | | | |
| | | Less than 12 Months | | 12 Months or Longer | | Total |
| (In thousands) | | Fair Value | | Unrealized Losses | | Fair Value | | Unrealized Losses | | Fair Value | | Unrealized Losses |
| 2013: | | | | | | | | | | | | |
| Securities Available-for-Sale | | | | | | | | | | | | |
| Obligations of U.S. Treasury and other U.S. Government sponsored entities | | $ | 377,626 |
| | $ | 29,256 |
| | $ | 147,510 |
| | $ | 16,240 |
| | $ | 525,136 |
| | 45,496 |
|
| U.S. Government sponsored entities' asset-backed securities | | 404,035 |
| | 8,917 |
| | 21,572 |
| | 1,073 |
| | 425,607 |
| | 9,990 |
|
| Total | | $ | 781,661 |
| | $ | 38,173 |
| | $ | 169,082 |
| | $ | 17,313 |
| | $ | 950,743 |
| | $ | 55,486 |
|
| 2013: | | | | | | | | | | | | |
| Securities Held-to-Maturity | | | | | | | | | | | | |
| U.S. Government sponsored entities' asset-backed securities | | $ | 5,781 |
| | $ | 42 |
| | $ | — |
| | $ | — |
| | $ | 5,781 |
| | $ | 42 |
|
Management does not believe any individual unrealized loss as of December 31, 2014 or 2013 represented an other-than-temporary impairment. The unrealized losses on debt securities are primarily the result of interest rate changes. These conditions will not prohibit Park from receiving its contractual principal and interest payments on these debt securities. The fair value of these debt securities is expected to recover as payments are received on these securities and they approach maturity. Should the impairment of any of these securities become other-than-temporary, the cost basis of the investment will be reduced and the resulting loss recognized in net income in the period the other-than-temporary impairment is identified.
Other investment securities (as shown on the Consolidated Balance Sheets) consist of stock investments in the FHLB and the FRB. These restricted stock investments are carried at their redemption value. Park owned $50.1 million and $59.0 million of FHLB stock and $8.2 million and $6.9 million of FRB stock at December 31, 2014 and December 31, 2013, respectively.
During 2014, the FHLB elected to redeem 89,460 shares of FHLB stock for $8.9 million. There was no gain or loss resulting from this transaction. Additionally, during 2014, Park purchased 27,000 shares of FRB stock in order to maintain required stock levels. The FRB stock was purchased for a $1.4 million subscription price.
The amortized cost and estimated fair value of investments in debt securities at December 31, 2014, are shown in the following table by contractual maturity or the expected call date, except for asset-backed securities, which are shown as a single total, due to the unpredictability of the timing in principal repayments.
|
| | | | | | | | | | | |
| (In thousands) | | Amortized Cost | | Estimated Fair Value | | Weighted Average Yield |
| Securities Available-for-Sale | | | | | | |
| U.S. Treasury and other U.S. Government sponsored entities’ notes: | | | | | | |
| Due one through five years | | 30,000 |
| | 30,011 |
| | 2.10 | % |
| Due five through ten years | | 516,886 |
| | 508,053 |
| | 2.35 | % |
| Total | | $ | 546,886 |
| | $ | 538,064 |
| | 2.34 | % |
| | | | | | | |
U.S. Government sponsored entities’ asset-backed securities
| | $ | 751,974 |
| | $ | 761,153 |
| | 2.36 | % |
| | | | | | | |
| Securities Held-to-Maturity | | | | | | |
| U.S. Government sponsored entities’ asset-backed securities | | $ | 140,562 |
| | $ | 143,490 |
| | 3.58 | % |
Approximately $546.9 million of Park’s securities shown in the above table as U.S. Treasury and other U.S. Government sponsored entities' notes are callable notes. These callable securities have a final maturity of 5 to 8 years. Of the $546.9 million reported at December 31, 2014, $30.0 million were expected to be called and are shown in the table at their expected call date.
Notes to Consolidated Financial Statements
Investment securities having an amortized cost of $1,205 million and $1,321 million at December 31, 2014 and 2013, respectively, were pledged to collateralize government and trust department deposits in accordance with federal and state requirements, to secure repurchase agreements sold and as collateral for FHLB advance borrowings.
At December 31, 2014, $513 million was pledged for government and trust department deposits, $664 million was pledged to secure repurchase agreements and $28 million was pledged as collateral for FHLB advance borrowings. At December 31, 2013, $639 million was pledged for government and trust department deposits, $648 million was pledged to secure repurchase agreements and $34 million was pledged as collateral for FHLB advance borrowings.
At December 31, 2014, there were no holdings of securities of any one issuer, other than the U.S. Government and its agencies, in an amount greater than 10% of shareholders’ equity.
During 2014, Park sold investment securities with a book value of $187,000 at a gain of $22,000. Additionally, Park sold investment securities with a book value of $174.1 million at a loss of $1.2 million. During 2013, Park sold $75.0 million of securities at book value for no gain. During 2012, Park had no sales of investment securities.
7. Loans
The composition of the loan portfolio, by class of loan, as of December 31, 2014 and December 31, 2013 was as follows:
|
| | | | | | | | | | | | | | | | | | | | | | | | | |
| | | 12/31/2014 | | | 12/31/2013 |
| (In thousands) | | Loan Balance | | Accrued Interest Receivable | | Recorded Investment | | | Loan Balance | | Accrued Interest Receivable | | Recorded Investment |
| | | | | | | | | | | | | | |
| Commercial, financial and agricultural * | | $ | 856,535 |
| | $ | 3,218 |
| | $ | 859,753 |
| | | $ | 825,432 |
| | $ | 3,079 |
| | $ | 828,511 |
|
| Commercial real estate * | | 1,069,637 |
| | 3,546 |
| | 1,073,183 |
| | | 1,112,273 |
| | 3,765 |
| | 1,116,038 |
|
| Construction real estate: | | | | | | | | | | | | | |
| SEPH commercial land and development * | | 2,195 |
| | — |
| | 2,195 |
| | | 5,846 |
| | 2 |
| | 5,848 |
|
| Remaining commercial | | 115,139 |
| | 300 |
| | 115,439 |
| | | 110,842 |
| | 263 |
| | 111,105 |
|
| Mortgage | | 31,148 |
| | 72 |
| | 31,220 |
| | | 31,882 |
| | 96 |
| | 31,978 |
|
| Installment | | 7,322 |
| | 23 |
| | 7,345 |
| | | 7,546 |
| | 26 |
| | 7,572 |
|
| Residential real estate: | | | | | | | | | | | | | |
| Commercial | | 417,612 |
| | 1,038 |
| | 418,650 |
| | | 407,387 |
| | 904 |
| | 408,291 |
|
| Mortgage | | 1,189,709 |
| | 1,548 |
| | 1,191,257 |
| | | 1,144,754 |
| | 1,559 |
| | 1,146,313 |
|
| HELOC | | 216,915 |
| | 803 |
| | 217,718 |
| | | 213,565 |
| | 870 |
| | 214,435 |
|
| Installment | | 27,139 |
| | 97 |
| | 27,236 |
| | | 33,841 |
| | 132 |
| | 33,973 |
|
| Consumer | | 893,160 |
| | 2,967 |
| | 896,127 |
| | | 723,733 |
| | 2,775 |
| | 726,508 |
|
| Leases | | 3,171 |
| | 17 |
| | 3,188 |
| | | 3,404 |
| | 23 |
| | 3,427 |
|
| Total loans | | $ | 4,829,682 |
| | $ | 13,629 |
| | $ | 4,843,311 |
| | | $ | 4,620,505 |
| | $ | 13,494 |
| | $ | 4,633,999 |
|
* Included within commercial, financial and agricultural loans, commercial real estate loans, and SEPH commercial land and development loans were an immaterial amount of consumer loans that were not broken out by class.
Loans are shown net of deferred origination fees, costs and unearned income of $9.4 million at December 31, 2014 and $7.3 million at December 31, 2013, which represented a net deferred income position in both years.
Overdrawn deposit accounts of $2.3 million and $3.3 million have been reclassified to loans at December 31, 2014 and 2013, respectively.
Notes to Consolidated Financial Statements
Credit Quality
The following table presents the recorded investment in nonaccrual loans, accruing troubled debt restructurings, and loans past due 90 days or more and still accruing by class of loan as of December 31, 2014 and December 31, 2013:
|
| | | | | | | | | | | | | | | | |
|
| 12/31/2014 |
| (In thousands) |
| Nonaccrual Loans |
| Accruing Troubled Debt Restructurings |
| Loans Past Due 90 Days or More and Accruing |
| Total Nonperforming Loans |
| Commercial, financial and agricultural |
| $ | 18,826 |
|
| $ | 297 |
|
| $ | 229 |
|
| $ | 19,352 |
|
| Commercial real estate |
| 19,299 |
|
| 2,690 |
|
| — |
|
| 21,989 |
|
| Construction real estate: |
|
|
|
|
|
|
|
|
|
|
|
|
| SEPH commercial land and development |
| 2,078 |
|
| — |
|
| — |
|
| 2,078 |
|
| Remaining commercial |
| 5,558 |
|
| 51 |
|
| — |
|
| 5,609 |
|
| Mortgage |
| 59 |
|
| 94 |
|
| 9 |
|
| 162 |
|
| Installment |
| 115 |
|
| 125 |
|
| — |
|
| 240 |
|
| Residential real estate: |
|
|
|
|
|
|
|
|
|
|
|
|
| Commercial |
| 24,336 |
|
| 594 |
|
| — |
|
| 24,930 |
|
| Mortgage |
| 21,869 |
|
| 10,349 |
|
| 1,329 |
|
| 33,547 |
|
| HELOC |
| 1,879 |
|
| 630 |
|
| 9 |
|
| 2,518 |
|
| Installment |
| 1,743 |
|
| 779 |
|
| — |
|
| 2,522 |
|
| Consumer |
| 4,631 |
|
| 723 |
|
| 1,133 |
|
| 6,487 |
|
| Total loans |
| $ | 100,393 |
|
| $ | 16,332 |
|
| $ | 2,709 |
|
| $ | 119,434 |
|
|
| | | | | | | | | | | | | | | | |
| | | 12/31/2013 |
| (In thousands) | | Nonaccrual Loans | | Accruing Troubled Debt Restructurings | | Loans Past Due 90 Days or More and Accruing | | Total Nonperforming Loans |
| Commercial, financial and agricultural | | $ | 20,633 |
| | $ | 107 |
| | $ | 80 |
| | $ | 20,820 |
|
| Commercial real estate | | 39,588 |
| | 2,234 |
| | 2 |
| | 41,824 |
|
| Construction real estate: | | | | | | | | |
| SEPH commercial land and development | | 4,777 |
| | — |
| | — |
| | 4,777 |
|
| Remaining commercial | | 10,476 |
| | 306 |
| | — |
| | 10,782 |
|
| Mortgage | | 87 |
| | 97 |
| | — |
| | 184 |
|
| Installment | | 39 |
| | 192 |
| | — |
| | 231 |
|
| Residential real estate: | | | | | | | | |
| Commercial | | 32,495 |
| | 913 |
| | — |
| | 33,408 |
|
| Mortgage | | 20,564 |
| | 11,708 |
| | 549 |
| | 32,821 |
|
| HELOC | | 2,129 |
| | 751 |
| | — |
| | 2,880 |
|
| Installment | | 965 |
| | 885 |
| | 80 |
| | 1,930 |
|
| Consumer | | 3,463 |
| | 1,616 |
| | 1,016 |
| | 6,095 |
|
| Total loans | | $ | 135,216 |
| | $ | 18,809 |
| | $ | 1,727 |
| | $ | 155,752 |
|
Notes to Consolidated Financial Statements
The following table provides additional information regarding those nonaccrual and accruing troubled debt restructured loans that are individually evaluated for impairment and those collectively evaluated for impairment as of December 31, 2014 and December 31, 2013.
|
| | | | | | | | | | | | | | | | | | | | | | | | | |
| | | 12/31/2014 | | | 12/31/2013 |
(In thousands) | | Nonaccrual and accruing troubled debt restructurings | | Loans individually evaluated for impairment | | Loans collectively evaluated for impairment | | | Nonaccrual and accruing troubled debt restructurings | | Loans individually evaluated for impairment | | Loans collectively evaluated for impairment |
| Commercial, financial and agricultural | | $ | 19,123 |
| | $ | 19,106 |
| | $ | 17 |
| | | $ | 20,740 |
| | $ | 20,727 |
| | $ | 13 |
|
| Commercial real estate | | 21,989 |
| | 21,989 |
| | — |
| | | 41,822 |
| | 41,822 |
| | — |
|
| Construction real estate: | | | | | | | | | | | | | |
| SEPH commercial land and development | | 2,078 |
| | 2,078 |
| | — |
| | | 4,777 |
| | 4,777 |
| | — |
|
| Remaining commercial | | 5,609 |
| | 5,609 |
| | — |
| | | 10,782 |
| | 10,782 |
| | — |
|
| Mortgage | | 153 |
| | — |
| | 153 |
| | | 184 |
| | — |
| | 184 |
|
| Installment | | 240 |
| | — |
| | 240 |
| | | 231 |
| | — |
| | 231 |
|
| Residential real estate: | | | | | | | | | | | | | |
| Commercial | | 24,930 |
| | 24,930 |
| | — |
| | | 33,408 |
| | 33,408 |
| | — |
|
| Mortgage | | 32,218 |
| | — |
| | 32,218 |
| | | 32,272 |
| | — |
| | 32,272 |
|
| HELOC | | 2,509 |
| | — |
| | 2,509 |
| | | 2,880 |
| | — |
| | 2,880 |
|
| Installment | | 2,522 |
| | — |
| | 2,522 |
| | | 1,850 |
| | — |
| | 1,850 |
|
| Consumer | | 5,354 |
| | — |
| | 5,354 |
| | | 5,079 |
| | 799 |
| | 4,280 |
|
| Total loans | | $ | 116,725 |
| | $ | 73,712 |
| | $ | 43,013 |
| | | $ | 154,025 |
| | $ | 112,315 |
| | $ | 41,710 |
|
All of the loans individually evaluated for impairment were evaluated using the fair value of the collateral or the present value of expected future cash flows as the measurement method.
Notes to Consolidated Financial Statements
The following table presents loans individually evaluated for impairment by class of loan as of December 31, 2014 and December 31, 2013.
|
| | | | | | | | | | | | | | | | | | | | | | | | | |
|
| 12/31/2014 | |
| 12/31/2013 |
| (In thousands) |
| Unpaid principal balance |
| Recorded investment |
| Allowance for loan losses allocated | |
| Unpaid principal balance |
| Recorded investment |
| Allowance for loan losses allocated |
| With no related allowance recorded | | | | | | | | | | | |
| Commercial, financial and agricultural |
| $ | 30,601 |
|
| $ | 17,883 |
|
| $ | — |
| |
| $ | 22,429 |
|
| $ | 12,885 |
|
| $ | — |
|
| Commercial real estate |
| 27,923 |
|
| 20,696 |
|
| — |
| |
| 56,870 |
|
| 34,149 |
|
| — |
|
| Construction real estate: |
|
|
|
|
|
|
|
|
| |
| | | | | |
| SEPH commercial land and development |
| 11,026 |
|
| 2,078 |
|
| — |
| |
| 23,722 |
|
| 4,777 |
|
| — |
|
| Remaining commercial |
| 1,427 |
| | 391 |
| | — |
| |
| 8,429 |
|
| 6,872 |
|
| — |
|
| Residential real estate: |
|
|
| |
|
| |
|
| |
| | | | | |
| Commercial |
| 25,822 |
| | 23,352 |
| | — |
| |
| 36,709 |
|
| 31,461 |
|
| — |
|
| Consumer |
| — |
| | — |
| | — |
| |
| 799 |
|
| 799 |
|
| — |
|
| With an allowance recorded |
| | | | | | |
| | | | | |
| Commercial, financial and agricultural |
| 1,251 |
| | 1,223 |
| | 981 |
| |
| 12,616 |
|
| 7,842 |
|
| 3,268 |
|
| Commercial real estate |
| 1,310 |
| | 1,293 |
| | 262 |
| |
| 7,966 |
|
| 7,673 |
|
| 5,496 |
|
| Construction real estate: |
| | | | | | |
| | | | | |
| Remaining commercial |
| 5,218 |
| | 5,218 |
| | 1,812 |
| |
| 3,909 |
|
| 3,910 |
|
| 1,132 |
|
| Residential real estate: |
| | | | | | |
| | | | | |
| Commercial |
| 1,578 |
| | 1,578 |
| | 605 |
| |
| 2,129 |
|
| 1,947 |
|
| 555 |
|
| Consumer |
| — |
| | — |
| | — |
| |
| — |
|
| — |
|
| — |
|
| Total |
| $ | 106,156 |
|
| $ | 73,712 |
|
| $ | 3,660 |
| |
| $ | 175,578 |
|
| $ | 112,315 |
|
| $ | 10,451 |
|
Management’s general practice is to proactively charge down loans individually evaluated for impairment to the fair value of the underlying collateral. At December 31, 2014 and December 31, 2013, there were $32.4 million and $58.1 million, respectively, of partial charge-offs on loans individually evaluated for impairment with no related allowance recorded and $45,000 and $5.2 million, respectively, of partial charge-offs on loans individually evaluated for impairment that also had a specific reserve allocated.
The allowance for loan losses included specific reserves related to loans individually evaluated for impairment at December 31, 2014 and 2013, of $3.7 million and $10.5 million, respectively. These loans with specific reserves had a recorded investment of $9.3 million and $21.4 million as of December 31, 2014 and 2013, respectively.
Notes to Consolidated Financial Statements
Interest income on loans individually evaluated for impairment is recognized on a cash basis only when Park expects to receive the entire recorded investment of the loan. The following tables present the average recorded investment and interest income recognized subsequent to impairment on loans individually evaluated for impairment as of and for the years ended December 31, 2014, 2013, and 2012:
|
| | | | | | | | | | | | |
| | | | | Year ended December 31, 2014 |
| (In thousands) | | Recorded Investment as of December 31, 2014 | | Average recorded investment | | Interest income recognized |
| Commercial, financial and agricultural | | $ | 19,106 |
| | $ | 19,518 |
| | $ | 360 |
|
| Commercial real estate | | 21,989 |
| | 31,945 |
| | 1,027 |
|
| Construction real estate: | | | | | | |
| SEPH commercial land and development | | 2,078 |
| | 3,658 |
| | 146 |
|
| Remaining commercial | | 5,609 |
| | 8,784 |
| | 61 |
|
| Residential real estate: | | | | | | |
| Commercial | | 24,930 |
| | 28,306 |
| | 1,084 |
|
| Consumer | | — |
| | 403 |
| | — |
|
| Total | | $ | 73,712 |
| | $ | 92,614 |
| | $ | 2,678 |
|
|
| | | | | | | | | | | | |
| | | | | Year ended December 31, 2013 |
| (In thousands) | | Recorded Investment as of December 31, 2013 | | Average recorded investment | | Interest income recognized |
| Commercial, financial and agricultural | | $ | 20,727 |
| | $ | 20,523 |
| | $ | 412 |
|
| Commercial real estate | | 41,822 |
| | 41,426 |
| | 1,151 |
|
| Construction real estate: | | | | | | |
| SEPH commercial land and development | | 4,777 |
| | 8,723 |
| | — |
|
| Remaining commercial | | 10,782 |
| | 17,829 |
| | 616 |
|
| Residential real estate: | | | | | | |
| Commercial | | 33,408 |
| | 34,972 |
| | 461 |
|
| Consumer | | 799 |
| | 616 |
| | — |
|
| Total | | $ | 112,315 |
| | $ | 124,089 |
| | $ | 2,640 |
|
Notes to Consolidated Financial Statements
|
| | | | | | | | | | | | |
| | | | | Year ended December 31, 2012 |
| (In thousands) | | Recorded Investment as of December 31, 2012 | | Average recorded investment | | Interest income recognized |
| Commercial, financial and agricultural | | $ | 22,587 |
| | $ | 35,305 |
| | $ | 529 |
|
| Commercial real estate | | 44,278 |
| | 44,541 |
| | 968 |
|
| Construction real estate: | | | | | | |
| SEPH commercial land and development | | 13,260 |
| | 17,277 |
| | — |
|
| Remaining commercial | | 21,574 |
| | 27,774 |
| | 818 |
|
| Residential real estate: | | | | | | |
| Commercial | | 35,622 |
| | 39,248 |
| | 497 |
|
| Consumer | | 18 |
| | 19 |
| | 1 |
|
| Total | | $ | 137,339 |
| | $ | 164,164 |
| | $ | 2,813 |
|
The following tables present the aging of the recorded investment in past due loans as of December 31, 2014 and December 31, 2013 by class of loan.
|
| | | | | | | | | | | | | | | | | | | | |
| | | 12/31/2014 |
| (In thousands) | | Accruing loans past due 30-89 days | | Past due nonaccrual loans and loans past due 90 days or more and accruing * | | Total past due | | Total current | | Total recorded investment |
| Commercial, financial and agricultural | | $ | 6,482 |
| | $ | 7,508 |
| | $ | 13,990 |
| | $ | 845,763 |
| | $ | 859,753 |
|
| Commercial real estate | | 808 |
| | 8,288 |
| | 9,096 |
| | 1,064,087 |
| | 1,073,183 |
|
| Construction real estate: | | | | | | | | | | |
| SEPH commercial land and development | | — |
| | 2,068 |
| | 2,068 |
| | 127 |
| | 2,195 |
|
| Remaining commercial | | 166 |
| | 77 |
| | 243 |
| | 115,196 |
| | 115,439 |
|
| Mortgage | | 39 |
| | 68 |
| | 107 |
| | 31,113 |
| | 31,220 |
|
| Installment | | 21 |
| | 25 |
| | 46 |
| | 7,299 |
| | 7,345 |
|
| Residential real estate: | | | | | | | | | | |
| Commercial | | 250 |
| | 19,592 |
| | 19,842 |
| | 398,808 |
| | 418,650 |
|
| Mortgage | | 11,146 |
| | 10,637 |
| | 21,783 |
| | 1,169,474 |
| | 1,191,257 |
|
| HELOC | | 262 |
| | 387 |
| | 649 |
| | 217,069 |
| | 217,718 |
|
| Installment | | 596 |
| | 464 |
| | 1,060 |
| | 26,176 |
| | 27,236 |
|
| Consumer | | 11,304 |
| | 3,818 |
| | 15,122 |
| | 881,005 |
| | 896,127 |
|
| Leases | | — |
| | — |
| | — |
| | 3,188 |
| | 3,188 |
|
| Total loans | | $ | 31,074 |
| | $ | 52,932 |
| | $ | 84,006 |
| | $ | 4,759,305 |
| | $ | 4,843,311 |
|
* Includes $2.7 million of loans past due 90 days or more and accruing. The remaining are past due, nonaccrual loans.
Notes to Consolidated Financial Statements
|
| | | | | | | | | | | | | | | | | | | | |
| | | 12/31/2013 |
| (In thousands) | | Accruing loans past due 30-89 days | | Past due nonaccrual loans and loans past due 90 days or more and accruing * | | Total past due | | Total current | | Total recorded investment |
| | | | | | | | | | | |
| Commercial, financial and agricultural | | $ | 1,233 |
| | $ | 13,275 |
| | $ | 14,508 |
| | $ | 814,003 |
| | $ | 828,511 |
|
| Commercial real estate | | 2,168 |
| | 18,274 |
| | 20,442 |
| | 1,095,596 |
| | 1,116,038 |
|
| Construction real estate: | | | | | | | | | | |
| SEPH commercial land and development | | — |
| | 4,242 |
| | 4,242 |
| | 1,606 |
| | 5,848 |
|
| Remaining commercial | | — |
| | 3,463 |
| | 3,463 |
| | 107,642 |
| | 111,105 |
|
| Mortgage | | 264 |
| | 75 |
| | 339 |
| | 31,639 |
| | 31,978 |
|
| Installment | | 207 |
| | 14 |
| | 221 |
| | 7,351 |
| | 7,572 |
|
| Residential real estate: | | | | | | | | | | |
| Commercial | | 900 |
| | 5,659 |
| | 6,559 |
| | 401,732 |
| | 408,291 |
|
| Mortgage | | 13,633 |
| | 11,829 |
| | 25,462 |
| | 1,120,851 |
| | 1,146,313 |
|
| HELOC | | 571 |
| | 402 |
| | 973 |
| | 213,462 |
| | 214,435 |
|
| Installment | | 696 |
| | 436 |
| | 1,132 |
| | 32,841 |
| | 33,973 |
|
| Consumer | | 12,143 |
| | 3,941 |
| | 16,084 |
| | 710,424 |
| | 726,508 |
|
| Leases | | — |
| | — |
| | — |
| | 3,427 |
| | 3,427 |
|
| Total loans | | $ | 31,815 |
| | $ | 61,610 |
| | $ | 93,425 |
| | $ | 4,540,574 |
| | $ | 4,633,999 |
|
* Includes $1.7 million of loans past due 90 days or more and accruing. The remaining are past due, nonaccrual loans.
Credit Quality Indicators
Management utilizes past due information as a credit quality indicator across the loan portfolio. Past due information as of December 31, 2014 and 2013 is included in the tables above. The past due information is the primary credit quality indicator within the following classes of loans: (1) mortgage loans and installment loans in the construction real estate segment; (2) mortgage loans, HELOC and installment loans in the residential real estate segment; and (3) consumer loans. The primary credit indicator for commercial loans is based on an internal grading system that grades all commercial loans on a scale from 1 to 8. Credit grades are continuously monitored by the responsible loan officer and adjustments are made when appropriate. A grade of 1 indicates little or no credit risk and a grade of 8 is considered a loss. Commercial loans that are pass-rated are considered to be of acceptable credit risk. Commercial loans graded a 5 (special mention) are considered to be watch list credits and a higher loan loss reserve percentage is allocated to these loans. Loans classified as special mention have potential weaknesses that require management’s close attention. If left uncorrected, these potential weaknesses may result in deterioration of the repayment prospects for the loan or of the institution’s credit position at some future date. Commercial loans graded 6 (substandard), also considered watch list credits, are considered to represent higher credit risk and, as a result, a higher loan loss reserve percentage is allocated to these loans. Loans classified as substandard are inadequately protected by the current sound worth and paying capacity of the obligor or the value of the collateral pledged, if any. Loans so classified have a well defined weakness or weaknesses that jeopardize the liquidation of the debt. They are characterized by the distinct possibility that Park will sustain some loss if the deficiencies are not corrected. Commercial loans that are graded a 7 (doubtful) are shown as nonaccrual and Park generally charges these loans down to their fair value by taking a partial charge-off or recording a specific reserve. Loans classified as doubtful have all the weaknesses inherent in those classified as substandard with the added characteristic that the weaknesses make collection or liquidation in full, on the basis of currently existing facts, conditions, and values, highly questionable and improbable. Certain 6-rated loans and all 7-rated loans are included within the impaired category. A loan is deemed impaired when management determines the borrower's ability to perform in accordance with the contractual loan agreement is in doubt. Any commercial loan graded an 8 (loss) is completely charged off.
Notes to Consolidated Financial Statements
The tables below present the recorded investment by loan grade at December 31, 2014 and December 31, 2013 for all commercial loans:
|
| | | | | | | | | | | | | | | | | | | | |
| | | 12/31/2014 |
| (In thousands) | | 5 Rated | | 6 Rated | | Impaired | | Pass Rated | | Recorded Investment |
| Commercial, financial and agricultural* | | $ | 1,874 |
| | $ | 1,201 |
| | $ | 19,123 |
| | $ | 837,555 |
| | $ | 859,753 |
|
| Commercial real estate* | | 8,448 |
| | 1,712 |
| | 21,989 |
| | 1,041,034 |
| | 1,073,183 |
|
| Construction real estate: | | | | | | | | | | |
| SEPH commercial land and development* | | — |
| | — |
| | 2,078 |
| | 117 |
| | 2,195 |
|
| Remaining commercial | | 3,349 |
| | 57 |
| | 5,609 |
| | 106,424 |
| | 115,439 |
|
| Residential real estate: | | | | | | | | | | |
| Commercial | | 2,581 |
| | 598 |
| | 24,930 |
| | 390,541 |
| | 418,650 |
|
| Leases | | — |
| | — |
| | — |
| | 3,188 |
| | 3,188 |
|
| Total Commercial Loans | | $ | 16,252 |
| | $ | 3,568 |
| | $ | 73,729 |
| | $ | 2,378,859 |
| | $ | 2,472,408 |
|
* Included within commercial, financial and agricultural loans, commercial real estate loans, and SEPH commercial land and development loans was an immaterial amount of consumer loans that were not broken out by class.
|
| | | | | | | | | | | | | | | | | | | | |
| | | 12/31/2013 |
| (In thousands) | | 5 Rated | | 6 Rated | | Impaired | | Pass Rated | | Recorded Investment |
| Commercial, financial and agricultural* | | $ | 6,055 |
| | $ | 532 |
| | $ | 20,740 |
| | $ | 801,184 |
| | $ | 828,511 |
|
| Commercial real estate* | | 11,591 |
| | 1,525 |
| | 41,822 |
| | 1,061,100 |
| | 1,116,038 |
|
| Construction real estate: | | | | | | | | | | |
| SEPH commercial land and development* | | 354 |
| | — |
| | 4,777 |
| | 717 |
| | 5,848 |
|
| Remaining commercial | | 6,858 |
| | 244 |
| | 10,782 |
| | 93,221 |
| | 111,105 |
|
| Residential real estate: | | | | | | | | | | |
| Commercial | | 5,033 |
| | 397 |
| | 33,408 |
| | 369,453 |
| | 408,291 |
|
| Leases | | — |
| | — |
| | — |
| | 3,427 |
| | 3,427 |
|
| Total Commercial Loans | | $ | 29,891 |
| | $ | 2,698 |
| | $ | 111,529 |
| | $ | 2,329,102 |
| | $ | 2,473,220 |
|
* Included within commercial, financial and agricultural loans, commercial real estate loans, and SEPH commercial land and development loans was an immaterial amount of consumer loans that were not broken out by class.
Troubled Debt Restructuring (TDRs)
Management classifies loans as TDRs when a borrower is experiencing financial difficulties and Park has granted a concession to the borrower as part of a modification or in the loan renewal process. In order to determine whether a borrower is experiencing financial difficulty, an evaluation is performed of the probability that the borrower will be in payment default on any of the borrower's debt in the foreseeable future without the modification. This evaluation is performed in accordance with the Company’s internal underwriting policy. Management’s policy is to modify loans by extending the term or by granting a temporary or permanent contractual interest rate below the market rate, not by forgiving debt. Certain loans which were modified during the years ended December 31, 2014 and December 31, 2013 did not meet the definition of a TDR as the modification was a delay in a payment that was considered to be insignificant. Management considers a forbearance period of up to three months or a delay in payment of up to 30 days to be insignificant. TDRs may be classified as accruing if the borrower has been current for a period of at least six months with respect to loan payments and management expects that the borrower will be able to continue to make payments in accordance with the terms of the restructured note. Management reviews all accruing TDRs quarterly to ensure payments continue to be made in accordance with the modified terms.
Management reviews renewals/modifications of loans previously identified as TDRs to consider if it is appropriate to remove the TDR classification. If the borrower is no longer experiencing financial difficulty and the renewal/modification does not contain a concessionary interest rate or other concessionary terms, management considers the potential removal of the TDR classification. If deemed appropriate, the TDR classification is removed as the borrower has complied with the terms of the loan at the date of the renewal/modification and there was a reasonable expectation that the borrower would continue to comply with
Notes to Consolidated Financial Statements
the terms of the loan subsequent to the date of the renewal/modification. The majority of these TDRs were originally considered restructurings in a prior year as a result of a renewal/modification with an interest rate that was not commensurate with the risk of the underlying loan at the time of the renewal/modification. During the years ended December 31, 2014 and 2013, Park removed the TDR classification on $2.5 million and $7.7 million, respectively, of loans that met the requirements discussed above.
At December 31, 2014 and 2013, there were $47.5 million and $76.3 million, respectively, of TDRs included in the nonaccrual loan totals. At December 31, 2014 and 2013, $15.7 million and $50.6 million of these nonaccrual TDRs were performing in accordance with the terms of the restructured note. As of December 31, 2014 and 2013, there were $16.3 million and $18.8 million, respectively, of TDRs included in accruing loan totals. Management will continue to review the restructured loans and may determine it appropriate to move certain nonaccrual TDRs to accrual status in the future.
At December 31, 2014 and 2013, Park had commitments to lend $1.4 million and $4.0 million, respectively, of additional funds to borrowers whose outstanding loan terms had been modified in a TDR.
The specific reserve related to TDRs at December 31, 2014 and 2013 was $2.4 million and $7.5 million, respectively. Modifications made in 2013 and 2014 were largely the result of renewals, extending the maturity date of the loan, at terms consistent with the original note. These modifications were deemed to be TDRs primarily due to Park’s conclusion that the borrower would likely not have qualified for similar terms through another lender. Many of the modifications deemed to be TDRs were previously identified as impaired loans, and thus were also previously evaluated for impairment under ASC 310. Additional specific reserves of $0.7 million were recorded during the year ended December 31, 2014, as a result of TDRs identified in the 2014 year. Additional specific reserves of $1.1 million were recorded during the year ended December 31, 2013 as a result of TDRs identified in the 2013 year.
The terms of certain other loans were modified during the years ended December 31, 2014 and 2013 that did not meet the definition of a TDR. Modified/renewed substandard commercial loans which did not meet the definition of a TDR had a total recorded investment as of December 31, 2014 and 2013 of $987,000 and $878,000, respectively. The renewal/modification of these loans: (1) involved a renewal/modification of the terms of a loan to a borrower who was not experiencing financial difficulties, (2) resulted in a delay in a payment that was considered to be insignificant, or (3) resulted in Park obtaining additional collateral or guarantees that improved the likelihood of the ultimate collection of the loan such that the modification was deemed to be at market terms. Modified consumer loans which did not meet the definition of a TDR had a total recorded investment as of December 31, 2014 and 2013 of $19.9 million and $24.2 million, respectively. Many of these loans were to borrowers who were not experiencing financial difficulties but who were looking to reduce their cost of funds.
Notes to Consolidated Financial Statements
The following tables detail the number of contracts modified as TDRs during the years ended December 31, 2014 and 2013 as well as the recorded investment of these contracts at December 31, 2014 and 2013. The recorded investment pre- and post-modification is generally the same due to the fact that Park does not typically provide for forgiveness of principal.
|
| | | | | | | | | | | | | | | |
| | | Year ended December 31, 2014 |
| (In thousands) | | Number of Contracts | | Accruing | | Nonaccrual | | Recorded Investment |
| Commercial, financial and agricultural | | 30 |
| | $ | 292 |
| | $ | 431 |
| | $ | 723 |
|
| Commercial real estate | | 11 |
| | 1,184 |
| | 1,254 |
| | 2,438 |
|
| Construction real estate: | | | | | | | | |
| SEPH commercial land and development | | — |
| | — |
| | — |
| | — |
|
| Remaining commercial | | 2 |
| | — |
| | 206 |
| | 206 |
|
| Mortgage | | — |
| | — |
| | — |
| | — |
|
| Installment | | 2 |
| | — |
| | 56 |
| | 56 |
|
| Residential real estate: | | | | | | | | |
| Commercial | | 9 |
| | — |
| | 866 |
| | 866 |
|
| Mortgage | | 46 |
| | 32 |
| | 2,325 |
| | 2,357 |
|
| HELOC | | 10 |
| | 85 |
| | 241 |
| | 326 |
|
| Installment | | 10 |
| | 109 |
| | 12 |
| | 121 |
|
| Consumer | | 330 |
| | 244 |
| | 1,058 |
| | 1,302 |
|
| Total loans | | 450 |
| | $ | 1,946 |
| | $ | 6,449 |
| | $ | 8,395 |
|
|
| | | | | | | | | | | | | | | |
| | | Year ended December 31, 2013 |
| (In thousands) | | Number of Contracts | | Accruing | | Nonaccrual | | Recorded Investment |
| Commercial, financial and agricultural | | 34 |
| | $ | 7 |
| | $ | 1,334 |
| | $ | 1,341 |
|
| Commercial real estate | | 22 |
| | — |
| | 8,563 |
| | 8,563 |
|
| Construction real estate: | | | | | | | | |
| SEPH commercial land and development | | — |
| | — |
| | — |
| | — |
|
| Remaining commercial | | 3 |
| | — |
| | 98 |
| | 98 |
|
| Mortgage | | — |
| | — |
| | — |
| | — |
|
| Installment | | 4 |
| | 26 |
| | 25 |
| | 51 |
|
| Residential real estate: | | | | | | | | |
| Commercial | | 15 |
| | — |
| | 2,552 |
| | 2,552 |
|
| Mortgage | | 62 |
| | 1,967 |
| | 2,278 |
| | 4,245 |
|
| HELOC | | 16 |
| | 175 |
| | — |
| | 175 |
|
| Installment | | 13 |
| | 113 |
| | 179 |
| | 292 |
|
| Consumer | | 327 |
| | 805 |
| | 345 |
| | 1,150 |
|
| Total loans | | 496 |
| | $ | 3,093 |
| | $ | 15,374 |
| | $ | 18,467 |
|
Of those loans which were modified and determined to be a TDR during the year ended December 31, 2014, $0.7 million were on nonaccrual status as of December 31, 2013. Of those loans which were modified and determined to be a TDR during the year ended December 31, 2013, $5.5 million were on nonaccrual status as of December 31, 2012.
Notes to Consolidated Financial Statements
The following table presents the recorded investment in financing receivables which were modified as TDRs within the previous 12 months and for which there was a payment default during the year ended December 31, 2014 and December 31, 2013. For this table, a loan is considered to be in default when it becomes 30 days contractually past due under modified terms. The additional allowance for loan loss resulting from the defaults on TDR loans was immaterial.
|
| | | | | | | | | | | | | | | |
| | | Year ended December 31, 2014 | | Year ended December 31, 2013 |
| (In thousands) | | Number of Contracts | | Recorded Investment | | Number of Contracts | | Recorded Investment |
| Commercial, financial and agricultural | | 4 |
| | $ | 206 |
| | 11 |
| | $ | 771 |
|
| Commercial real estate | | 1 |
| | 302 |
| | 11 |
| | 2,839 |
|
| Construction real estate: | | | | | | | | |
| SEPH commercial land and development | | — |
| | — |
| | — |
| | — |
|
| Remaining commercial | | — |
| | — |
| | — |
| | — |
|
| Mortgage | | — |
| | — |
| | — |
| | — |
|
| Installment | | — |
| | — |
| | 1 |
| | 10 |
|
| Residential real estate: | | | | | | | | |
| Commercial | | 1 |
| | 3 |
| | 4 |
| | 1,683 |
|
| Mortgage | | 14 |
| | 810 |
| | 26 |
| | 1,533 |
|
| HELOC | | 2 |
| | 160 |
| | — |
| | — |
|
| Installment | | 2 |
| | 12 |
| | 5 |
| | 72 |
|
| Consumer | | 62 |
| | 516 |
| | 74 |
| | 471 |
|
| Leases | | — |
| | — |
| | — |
| | — |
|
| Total loans | | 86 |
| | $ | 2,009 |
| | $ | 132 |
| | $ | 7,379 |
|
Of the $2.0 million in modified TDRs which defaulted during the year ended December 31, 2014, $314,000 were accruing loans and $1.7 million were nonaccrual loans. Of the $7.4 million in modified TDRs which defaulted during the year ended December 31, 2013, $397,000 were accruing loans and $7.0 million were nonaccrual loans.
Management transfers a loan to OREO at the time that Park takes deed/title of the asset. At December 31, 2014 and 2013, Park had $22.6 million and $34.6 million, respectively, of OREO.
Certain of the Corporation’s executive officers, directors and related entities of directors are loan customers of PNB. As of December 31, 2014 and 2013, credit exposure aggregating approximately $45.7 million and $49.7 million, respectively, was outstanding to such parties. Of this total exposure, approximately $36.0 million and $37.7 million were outstanding at December 31, 2014 and 2013, respectively, with the remaining balance representing available credit. During 2014, new loans and advances on existing loans were made to these executive officers, directors and related entities totaling $6.0 million and $6.4 million, respectively. These extensions of credit were offset by payments of $14.1 million. During 2013, new loans and advances on existing loans were $547,000 and $11.9 million, respectively. These extensions of credit were offset by payments of $10.0 million.
8. Allowance for Loan Losses
The allowance for loan losses is that amount management believes is adequate to absorb probable incurred credit losses in the loan portfolio based on management’s evaluation of various factors including overall growth in the loan portfolio, an analysis of individual loans, prior and current loss experience, and current economic conditions. A provision for loan losses is charged to operations based on management’s periodic evaluation of these and other pertinent factors as discussed within Note 1 of these Notes to Consolidated Financial Statements.
Management updates historical losses annually in the fourth quarter, or more frequently as deemed appropriate.
With the inclusion of 2013 net charge-off information, management concluded that it was no longer appropriate to calculate the historical loss average with an even allocation across the five-year period. Rather than apply a 20% allocation to each year in the calculation of the historical annualized loss factor, management determined that it was appropriate to more heavily weight those years with higher losses in the historical loss calculation, given the continued uncertainty in the current economic
Notes to Consolidated Financial Statements
environment. Specifically, rather than applying equal percentages to each year in the historical loss calculation, management applied more weight to the 2009 through 2011 period compared to the 2012 and 2013 periods.
With the inclusion of 2014 net charge-off information in the fourth quarter of 2014, management extended the historical loss period to six years. Due to the same factors that management considered in 2013, management applied more weight to the 2009 through 2011 periods compared to the 2012 through 2014 periods.
The activity in the allowance for loan losses for the years ended December 31, 2014, 2013, and 2012 is summarized in the following tables.
|
| | | | | | | | | | | | | | | | | | | | | | | | | | | | |
| | | Year ended December 31, 2014 |
| (In thousands) | | Commercial, financial and agricultural | | Commercial real estate | | Construction real estate | | Residential real estate | | Consumer | | Leases | | Total |
| Allowance for credit losses: | | | | | | | | | | | | |
| Beginning balance | | $ | 14,218 |
| | $ | 15,899 |
| | $ | 6,855 |
| | $ | 14,251 |
| | $ | 8,245 |
| | $ | — |
| | $ | 59,468 |
|
| Charge-offs | | 3,779 |
| | 8,003 |
| | 1,316 |
| | 3,944 |
| | 7,738 |
| | — |
| | 24,780 |
|
| Recoveries | | (1,003 | ) | | (7,759 | ) | | (12,572 | ) | | (2,985 | ) | | (2,671 | ) | | (7 | ) | | (26,997 | ) |
| Net charge-offs (recoveries) | | 2,776 |
| | 244 |
| | (11,256 | ) | | 959 |
| | 5,067 |
| | (7 | ) | | (2,217 | ) |
| (Recovery) Provision | | $ | (723 | ) | | (6,847 | ) | | (9,459 | ) | | 1,480 |
| | 8,223 |
| | (7 | ) | | (7,333 | ) |
| Ending balance | | $ | 10,719 |
| | $ | 8,808 |
| | $ | 8,652 |
| | $ | 14,772 |
| | $ | 11,401 |
| | — |
| | $ | 54,352 |
|
|
| | | | | | | | | | | | | | | | | | | | | | | | | | | | |
| | | Year ended December 31, 2013 |
| (In thousands) | | Commercial, financial and agricultural | | Commercial real estate | | Construction real estate | | Residential real estate | | Consumer | | Leases | | Total |
| Allowance for credit losses: | | | | | | | | | | | | |
| Beginning balance | | $ | 15,635 |
| | $ | 11,736 |
| | $ | 6,841 |
| | $ | 14,759 |
| | $ | 6,566 |
| | $ | — |
| | $ | 55,537 |
|
| Charge-offs | | 6,160 |
| | 1,832 |
| | 1,791 |
| | 3,207 |
| | 6,163 |
| | — |
| | 19,153 |
|
| Recoveries | | (1,314 | ) | | (726 | ) | | (9,378 | ) | | (6,000 | ) | | (2,249 | ) | | (2 | ) | | (19,669 | ) |
| Net charge-offs (recoveries) | | 4,846 |
| | 1,106 |
| | (7,587 | ) | | (2,793 | ) | | 3,914 |
| | (2 | ) | | (516 | ) |
| Provision (Recovery) | | 3,429 |
| | 5,269 |
| | (7,573 | ) | | (3,301 | ) | | 5,593 |
| | (2 | ) | | 3,415 |
|
| Ending balance | | $ | 14,218 |
| | $ | 15,899 |
| | $ | 6,855 |
| | $ | 14,251 |
| | $ | 8,245 |
| | — |
| | $ | 59,468 |
|
|
| | | | | | | | | | | | | | | | | | | | | | | | | | | | |
| | | Year ended December 31, 2012 |
| (In thousands) | | Commercial, financial and agricultural | | Commercial real estate | | Construction real estate | | Residential real estate | | Consumer | | Leases | | Total |
| Allowance for credit losses: | | | | | | | | | | | | |
| Beginning balance | | $ | 16,950 |
| | $ | 15,539 |
| | $ | 14,433 |
| | $ | 15,692 |
| | $ | 5,830 |
| | $ | — |
| | $ | 68,444 |
|
| Charge-offs | | 26,847 |
| | 10,454 |
| | 9,985 |
| | 8,607 |
| | 5,375 |
| | — |
| | 61,268 |
|
| Recoveries | | (1,066 | ) | | (783 | ) | | (2,979 | ) | | (5,559 | ) | | (2,555 | ) | | — |
| | (12,942 | ) |
| Net charge-offs | | 25,781 |
| | 9,671 |
| | 7,006 |
| | 3,048 |
| | 2,820 |
| | — |
| | 48,326 |
|
| Provision (Recovery) | | 24,466 |
| | 5,868 |
| | (586 | ) | | 2,115 |
| | 3,556 |
| | — |
| | 35,419 |
|
| Ending balance | | $ | 15,635 |
| | $ | 11,736 |
| | $ | 6,841 |
| | $ | 14,759 |
| | $ | 6,566 |
| | — |
| | $ | 55,537 |
|
Notes to Consolidated Financial Statements
Loans collectively evaluated for impairment in the following tables include all performing loans at December 31, 2014 and 2013, as well as nonperforming loans internally classified as consumer loans. Nonperforming consumer loans are not typically individually evaluated for impairment, but receive a portion of the statistical allocation of the allowance for loan losses. Loans individually evaluated for impairment include all impaired loans internally classified as commercial loans at December 31, 2014 and 2013, which are evaluated for impairment in accordance with GAAP (see Note 1 of these Notes to Consolidated Financial Statements).
The composition of the allowance for loan losses at December 31, 2014 and 2013 was as follows:
|
| | | | | | | | | | | | | | | | | | | | | | | | | | | | |
| | | December 31, 2014 |
| (In thousands) | | Commercial, financial, and agricultural | | Commercial real estate | | Construction real estate | | Residential real estate | | Consumer | | Leases | | Total |
| Allowance for loan losses: | | | | | | | | | | | | |
| Ending allowance balance attributed to loans | | | | | | | | | | | | | | |
| Individually evaluated for impairment | | $ | 981 |
| | $ | 262 |
| | $ | 1,812 |
| | $ | 605 |
| | $ | — |
| | $ | — |
| | $ | 3,660 |
|
| Collectively evaluated for impairment | | 9,738 |
| | 8,546 |
| | 6,840 |
| | 14,167 |
| | 11,401 |
| | — |
| | 50,692 |
|
| Total ending allowance balance | | $ | 10,719 |
| | $ | 8,808 |
| | $ | 8,652 |
| | $ | 14,772 |
| | $ | 11,401 |
| | $ | — |
| | $ | 54,352 |
|
| Loan Balance: | | | | | | | | | | | | | | |
| Loans individually evaluated for impairment | | $ | 19,103 |
| | $ | 21,978 |
| | $ | 7,690 |
| | $ | 24,905 |
| | $ | — |
| | $ | — |
| | $ | 73,676 |
|
| Loans collectively evaluated for impairment | | 837,432 |
| | 1,047,659 |
| | 148,114 |
| | 1,826,470 |
| | 893,160 |
| | 3,171 |
| | 4,756,006 |
|
| Total ending loan balance | | $ | 856,535 |
| | $ | 1,069,637 |
| | $ | 155,804 |
| | $ | 1,851,375 |
| | $ | 893,160 |
| | $ | 3,171 |
| | $ | 4,829,682 |
|
| Allowance for loan losses as a percentage of loan balance: | | | | | | | | |
| Loans individually evaluated for impairment | | 5.14 | % | | 1.19 | % | | 23.56 | % | | 2.43 | % | | — | % | | — | % | | 4.97 | % |
| Loans collectively evaluated for impairment | | 1.16 | % | | 0.82 | % | | 4.62 | % | | 0.78 | % | | 1.28 | % | | — | % | | 1.07 | % |
| Total | | 1.25 | % | | 0.82 | % | | 5.55 | % | | 0.80 | % | | 1.28 | % | | — | % | | 1.13 | % |
| Recorded Investment: | | | | | | | | | | | | |
| Loans individually evaluated for impairment | | $ | 19,106 |
| | $ | 21,989 |
| | $ | 7,687 |
| | $ | 24,930 |
| | $ | — |
| | $ | — |
| | $ | 73,712 |
|
| Loans collectively evaluated for impairment | | 840,647 |
| | 1,051,194 |
| | 148,512 |
| | 1,829,931 |
| | 896,127 |
| | 3,188 |
| | 4,769,599 |
|
| Total ending recorded investment | | $ | 859,753 |
| | $ | 1,073,183 |
| | $ | 156,199 |
| | $ | 1,854,861 |
| | $ | 896,127 |
| | $ | 3,188 |
| | $ | 4,843,311 |
|
Notes to Consolidated Financial Statements
|
| | | | | | | | | | | | | | | | | | | | | | | | | | | | |
| | | December 31, 2013 |
| (In thousands) | | Commercial, financial, and agricultural | | Commercial real estate | | Construction real estate | | Residential real estate | | Consumer | | Leases | | Total |
| Allowance for loan losses: | | | | | | | | | | | | |
| Ending allowance balance attributed to loans | | | | | | | | | | | | | | |
| Individually evaluated for impairment | | $ | 3,268 |
| | $ | 5,496 |
| | $ | 1,132 |
| | $ | 555 |
| | $ | — |
| | $ | — |
| | $ | 10,451 |
|
| Collectively evaluated for impairment | | 10,950 |
| | 10,403 |
| | 5,723 |
| | 13,696 |
| | 8,245 |
| | — |
| | 49,017 |
|
| Total ending allowance balance | | $ | 14,218 |
| | $ | 15,899 |
| | $ | 6,855 |
| | $ | 14,251 |
| | $ | 8,245 |
| | $ | — |
| | $ | 59,468 |
|
| Loan Balance: | | | | | | | | | | | | | | |
| Loans individually evaluated for impairment | | $ | 20,724 |
| | $ | 41,816 |
| | $ | 15,559 |
| | $ | 33,406 |
| | $ | 799 |
| | $ | — |
| | $ | 112,304 |
|
| Loans collectively evaluated for impairment | | 804,708 |
| | 1,070,457 |
| | 140,557 |
| | 1,766,141 |
| | 722,934 |
| | 3,404 |
| | 4,508,201 |
|
| Total ending loan balance | | $ | 825,432 |
| | $ | 1,112,273 |
| | $ | 156,116 |
| | $ | 1,799,547 |
| | $ | 723,733 |
| | $ | 3,404 |
| | $ | 4,620,505 |
|
| Allowance for loan losses as a percentage of loan balance: | | | | | | | | |
| Loans individually evaluated for impairment | | 15.77 | % | | 13.14 | % | | 7.28 | % | | 1.66 | % | | — | % | | — | % | | 9.31 | % |
| Loans collectively evaluated for impairment | | 1.36 | % | | 0.97 | % | | 4.07 | % | | 0.78 | % | | 1.14 | % | | — | % | | 1.09 | % |
| Total | | 1.72 | % | | 1.43 | % | | 4.39 | % | | 0.79 | % | | 1.14 | % | | — | % | | 1.29 | % |
| Recorded Investment: | | | | | | | | | | | | |
| Loans individually evaluated for impairment | | $ | 20,727 |
| | $ | 41,822 |
| | $ | 15,559 |
| | $ | 33,408 |
| | $ | 799 |
| | $ | — |
| | $ | 112,315 |
|
| Loans collectively evaluated for impairment | | 807,784 |
| | 1,074,216 |
| | 140,944 |
| | 1,769,604 |
| | 725,709 |
| | 3,427 |
| | 4,521,684 |
|
| Total recorded investment | | $ | 828,511 |
| | $ | 1,116,038 |
| | $ | 156,503 |
| | $ | 1,803,012 |
| | $ | 726,508 |
| | $ | 3,427 |
| | $ | 4,633,999 |
|
9. Loans Held for Sale
Mortgage loans held for sale are carried at their fair value. Mortgage loans held for sale were $5.3 million and $1.7 million at December 31, 2014 and 2013, respectively. These amounts are included in loans on the Consolidated Balance Sheets and in the residential real estate loan segments in Note 7 and Note 8. The contractual balance was $5.2 million and $1.6 million at December 31, 2014 and 2013, respectively. The gain expected upon sale was $80,000 and $28,000 at December 31, 2014 and 2013, respectively. None of these loans were 90 days or more past due or on nonaccrual status as of December 31, 2014 or 2013.
During 2014, Park transferred certain commercial loans held for investment, with a book balance of $22.0 million, to the loans held for sale portfolio, and subsequently completed the sale of these commercial loans held for sale, recognizing a net gain on sale of $1.9 million.
Notes to Consolidated Financial Statements
10. Premises and Equipment
The major categories of premises and equipment and accumulated depreciation are summarized as follows:
|
| | | | | | | | |
| December 31 (In thousands) | | 2014 | | 2013 |
| Land | | $ | 17,836 |
| | $ | 17,657 |
|
| Buildings | | 71,002 |
| | 70,183 |
|
| Equipment, furniture and fixtures | | 42,139 |
| | 36,937 |
|
| Leasehold improvements | | 3,439 |
| | 3,903 |
|
| Total | | $ | 134,416 |
| | $ | 128,680 |
|
| Less accumulated depreciation | | (78,937 | ) | | (73,402 | ) |
| Premises and equipment, net | | $ | 55,479 |
| | $ | 55,278 |
|
Depreciation expense amounted to $7.2 million, $7.3 million and $7.0 million for the years ended December 31, 2014, 2013 and 2012, respectively.
The Corporation leases certain premises and equipment accounted for as operating leases. The following is a schedule of the future minimum rental payments required for the next five years under such leases with initial terms in excess of one year:
|
| | | | |
| (In thousands) | | |
| 2015 | | 1,143 |
|
| 2016 | | 755 |
|
| 2017 | | 559 |
|
| 2018 | | 448 |
|
| 2019 | | 367 |
|
| Thereafter | | 252 |
|
| Total | | $ | 3,524 |
|
Rent expense for Park was $1.7 million, $1.8 million and $1.9 million, for the years ended December 31, 2014, 2013 and 2012, respectively.
11. Deposits
At December 31, 2014 and 2013, non-interest bearing and interest bearing deposits were as follows:
|
| | | | | | | | |
| December 31 (In thousands) | | 2014 | | 2013 |
| Non-interest bearing | | $ | 1,269,296 |
| | $ | 1,193,553 |
|
| Interest bearing | | 3,858,704 |
| | 3,596,441 |
|
| Total | | $ | 5,128,000 |
| | $ | 4,789,994 |
|
At December 31, 2014, the maturities of time deposits were as follows:
|
| | | | |
| (In thousands) | | |
| 2015 | | $ | 823,230 |
|
| 2016 | | 254,565 |
|
| 2017 | | 145,321 |
|
| 2018 | | 42,160 |
|
| 2019 | | 144,133 |
|
| After 5 years | | 502 |
|
| Total | | $ | 1,409,911 |
|
Notes to Consolidated Financial Statements
At December 31, 2014 and 2013, respectively, Park had approximately $21.9 million and $18.4 million of deposits received from executive officers, directors and their related entities.
Maturities of time deposits over $100,000 and $250,000 as of December 31, 2014 were:
|
| | | | | | | |
| December 31 (In thousands) | | Over $100,000 | Over $250,000 |
| 3 months or less | | $ | 210,386 |
| $ | 18,927 |
|
| Over 3 months through 6 months | | 93,168 |
| 11,954 |
|
| Over 6 months through 12 months | | 132,344 |
| 10,470 |
|
| Over 12 months | | 323,295 |
| 223,892 |
|
| Total | | $ | 759,193 |
| $ | 265,243 |
|
12. Short-Term Borrowings
Short-term borrowings were as follows:
|
| | | | | | | | |
| December 31 (In thousands) | | 2014 | | 2013 |
| Securities sold under agreements to repurchase and federal funds purchased | | $ | 276,980 |
| | $ | 242,029 |
|
| FHLB advances | | — |
| | — |
|
| Total short-term borrowings | | $ | 276,980 |
| | $ | 242,029 |
|
The outstanding balances for all short-term borrowings as of December 31, 2014 and 2013 and the weighted-average interest rates as of and paid during each of the years then ended were as follows:
|
| | | | | | | | |
| (In thousands) | | Repurchase agreements and Federal Funds Purchased | | FHLB Advances |
| 2014 | | | | |
| Ending balance | | $ | 276,980 |
| | $ | — |
|
| Highest month-end balance | | 307,025 |
| | — |
|
| Average daily balance | | 262,709 |
| | 561 |
|
| Weighted-average interest rate: | | | | |
| As of year-end | | 0.18 | % | | — | % |
| Paid during the year | | 0.19 | % | | 0.10 | % |
| 2013 | | | | |
| Ending balance | | $ | 242,029 |
| | $ | — |
|
| Highest month-end balance | | 280,863 |
| | — |
|
| Average daily balance | | 251,868 |
| | 1,255 |
|
| Weighted-average interest rate: | | | | |
| As of year-end | | 0.19 | % | | — | % |
| Paid during the year | | 0.21 | % | | 0.41 | % |
During 2013 and 2014, outstanding FHLB advances were collateralized by investment securities owned by the Corporation’s bank subsidiary and by various loans pledged under a blanket agreement by the Corporation’s bank subsidiary.
See Note 6 of these Notes to Consolidated Financial Statements for the amount of investment securities that are pledged. At December 31, 2014 and 2013, $2,038 million and $2,072 million, respectively, of commercial real estate and residential mortgage loans were pledged under a blanket agreement to the FHLB by Park’s bank subsidiary.
Note 6 states that $664 million and $648 million of securities were pledged to secure repurchase agreements as of December 31, 2014 and 2013, respectively. Park’s repurchase agreements in short-term borrowings consist of customer
Notes to Consolidated Financial Statements
accounts and securities which are pledged on an individual security basis. Park’s repurchase agreements with a third-party financial institution are classified as long-term debt. See Note 13 of these Notes to Consolidated Financial Statements.
13. Long-Term Debt
Long-term debt is listed below:
|
| | | | | | | | | | | | | | |
| December 31, | | 2014 | | 2013 |
| (In thousands) | | Outstanding Balance | | Average Rate | | Outstanding Balance | | Average Rate |
| Total Federal Home Loan Bank advances by year of maturity: | | | | | | | | |
| 2014 | | — |
| | — | % | | 100,500 |
| | 1.51 | % |
| 2015 | | 51,000 |
| | 2.00 | % | | 51,000 |
| | 2.00 | % |
| 2016 | | 26,000 |
| | 0.92 | % | | 26,000 |
| | 0.92 | % |
| 2017 | | 51,000 |
| | 1.28 | % | | 51,000 |
| | 3.37 | % |
| 2018 | | 125,049 |
| | 2.11 | % | | 125,062 |
| | 2.11 | % |
| 2019 | | 75,333 |
| | 1.97 | % | | 25,415 |
| | 1.94 | % |
| Thereafter | | 176,161 |
| | 3.16 | % | | 151,330 |
| | 3.33 | % |
| Total | | $ | 504,543 |
| | 2.30 | % | | 530,307 |
| | 2.39 | % |
| Total broker repurchase agreements by year of maturity: | | | | | | | | |
| 2017 | | 300,000 |
| | 1.75 | % | | 300,000 |
| | 1.75 | % |
| Total | | $ | 300,000 |
| | 1.75 | % | | $ | 300,000 |
| | 1.75 | % |
| Total combined long-term debt by year of maturity: | | | | | | | | |
| 2014 | | — |
| | — | % | | 100,500 |
| | 1.51 | % |
| 2015 | | 51,000 |
| | 2.00 | % | | 51,000 |
| | 2.00 | % |
| 2016 | | 26,000 |
| | 0.92 | % | | 26,000 |
| | 0.92 | % |
| 2017 | | 351,000 |
| | 1.68 | % | | 351,000 |
| | 1.99 | % |
| 2018 | | 125,049 |
| | 2.11 | % | | 125,062 |
| | 2.11 | % |
| 2019 | | 75,333 |
| | 1.97 | % | | 25,415 |
| | 1.94 | % |
| Thereafter | | 176,161 |
| | 3.16 | % | | 151,330 |
| | 3.33 | % |
| Total | | $ | 804,543 |
| | 2.09 | % | | $ | 830,307 |
| | 2.16 | % |
| Prepayment penalty | | (17,941 | ) | | — |
| | (19,766 | ) | | — |
|
| Total long-term debt | | $ | 786,602 |
| | 2.89 | % | | $ | 810,541 |
| | 2.79 | % |
On November 30, 2012, Park restructured $300 million in repurchase agreements at a rate of 1.75%. As part of this restructuring, Park paid a prepayment penalty of $25 million. The penalty is being amortized as an adjustment to interest expense over the remaining term of the repurchase agreements using the effective interest method, resulting in an effective interest rate of 3.55%. Of the $25 million prepayment penalty, $14.8 million remained to be amortized as of December 31, 2014. The remaining amortization will be $5.0 million in 2015, $5.1 million in 2016 and $4.7 million in 2017.
On November 21, 2014, Park restructured $50 million in FHLB advances at a rate of 1.25%. As part of this restructuring, Park paid a prepayment penalty of $3.2 million. The penalty is being amortized as an adjustment to interest expense over the remaining term of the advances using the effective interest method, resulting in an effective interest rate of 3.52%. Of the $3.2 million prepayment penalty, $3.1 million remained to be amortized as of December 31, 2014. The remaining amortization will be $1.0 million in 2015, $1.1 million in 2016, and $1.0 million in 2017.
Park had approximately $176.2 million of long-term debt at December 31, 2014 with a contractual maturity longer than five years. However, approximately $150 million of this debt is callable by the issuer in 2015.
At December 31, 2014 and 2013, FHLB advances were collateralized by investment securities owned by PNB’s banking divisions and by various loans pledged under a blanket agreement by PNB's banking divisions.
Notes to Consolidated Financial Statements
See Note 6 of these Notes to Consolidated Financial Statements for the amount of investment securities that were pledged. See Note 12 of these Notes to Consolidated Financial Statements for the amount of commercial real estate and residential mortgage loans that were pledged to the FHLB at December 31, 2014 and December 31, 2013.
14. Subordinated Notes
As part of the acquisition of Vision's parent bank holding company ("Vision Parent") on March 9, 2007, Park became the successor to Vision Parent under (i) the Amended and Restated Trust Agreement of Vision Bancshares Trust I (the “Trust”), dated as of December 5, 2005, (ii) the Junior Subordinated Indenture, dated as of December 5, 2005, and (iii) the Guarantee Agreement, also dated as of December 5, 2005.
On December 1, 2005, Vision Parent formed a wholly-owned Delaware statutory business trust, Vision Bancshares Trust I (“Trust I”), which issued $15.0 million of Trust I's floating rate preferred securities (the “Trust Preferred Securities”) to institutional investors. These Trust Preferred Securities qualify as Tier I capital under FRB guidelines. All of the common securities of Trust I are owned by Park. The proceeds from the issuance of the common securities and the Trust Preferred Securities were used by Trust I to purchase $15.5 million of junior subordinated notes, which carry a floating rate based on a three-month LIBOR plus 148 basis points. The debentures represent the sole asset of Trust I. The Trust Preferred Securities accrue and pay distributions at a floating rate of three-month LIBOR plus 148 basis points per annum. The Trust Preferred Securities are mandatorily redeemable upon maturity of the notes in December 2035, or upon earlier redemption as provided in the notes. Park has the right to redeem the notes purchased by Trust I in whole or in part, on or after December 30, 2010. As specified in the indenture, if the notes are redeemed prior to maturity, the redemption price will be the principal amount, plus any unpaid accrued interest. In accordance with GAAP, Trust I is not consolidated with Park’s financial statements, but rather the subordinated notes are reflected as a liability.
On December 23, 2009, Park entered into a Note Purchase Agreement, dated December 23, 2009, with 38 purchasers (the “2009 Purchasers”). Under the terms of the Note Purchase Agreement, the 2009 Purchasers purchased from Park an aggregate principal amount of $35.25 million of 10% Subordinated Notes due December 23, 2019 (the “2009 Notes”). The 2009 Notes were intended to qualify as Tier 2 capital under applicable rules and regulations of the FRB. The 2009 Notes could not be prepaid in any amount prior to December 23, 2014; however, subsequent to that date, Park could prepay, without penalty, all or a portion of the principal amount outstanding. Of the $35.25 million in 2009 Notes, $14.05 million were purchased by related parties. The 2009 Notes were prepaid in full on December 24, 2014.
On April 20, 2012, Park entered into a Note Purchase Agreement, dated April 20, 2012 (the “2012 Purchase Agreement”), with 56 purchasers (the "2012 Purchasers"). Under the terms of the 2012 Purchase Agreement, the 2012 Purchasers purchased from Park an aggregate principal amount of $30 million of 7% Subordinated Notes due April 20, 2022 (the "2012 Notes"). The 2012 Notes are intended to qualify as Tier 2 capital under applicable rules and regulations of the FRB. Each 2012 Note was purchased at a purchase price of 100% of the principal amount thereof. The 2012 Notes may not be prepaid by Park prior to April 20, 2017. From and after April 20, 2017, Park may prepay all, or from time to time, any part of the 2012 Notes at 100% of the principal amount (plus accrued interest) without penalty, subject to any requirement under FRB regulations to obtain prior approval from the FRB before making any prepayment.
15. Share-Based Compensation
The Park National Corporation 2005 Incentive Stock Option Plan (the “2005 Plan”) was adopted by the Board of Directors of Park on January 18, 2005, and was approved by Park's shareholders at the Annual Meeting of Shareholders on April 18, 2005. Under the 2005 Plan, 1,500,000 common shares were authorized for delivery upon the exercise of incentive stock options. All of the common shares delivered upon the exercise of incentive stock options granted under the 2005 Plan were to be treasury shares. The 2005 Plan was terminated on April 22, 2013 and no common shares were delivered thereunder.
The Park National Corporation 2013 Long-Term Incentive Plan (the "2013 Incentive Plan") was adopted by the Board of Directors of Park on January 28, 2013 and was approved by Park's shareholders at the Annual Meeting of Shareholders on April 22, 2013. The 2013 Incentive Plan replaces the 2005 Plan and Park's Stock Plan for Non-Employee Directors of Park National Corporation and Subsidiaries (the "Directors' Stock Plan") which were terminated immediately following the approval of the 2013 Incentive Plan. The 2013 Incentive Plan makes equity-based awards and cash-based awards available for grant to participants in the form of incentive stock options, nonqualified stock options, stock appreciations rights, restricted common shares, restricted stock awards that may be settled in common shares, cash or a combination of the two, unrestricted common shares and cash-based awards. Under the 2013 Incentive Plan, 600,000 common shares are authorized to be granted. The common shares to be issued and delivered under the 2013 Incentive Plan may consist of either common shares currently held or common shares subsequently acquired by Park as treasury shares, including common shares purchased in the open market or in
Notes to Consolidated Financial Statements
private transactions. No awards may be made under the 2013 Incentive Plan after April 22, 2023. At December 31, 2014, 557,275 common shares were available for future grants under the 2013 Incentive Plan.
During 2014 and 2013, Park granted 10,200 and 10,550 common shares, respectively, to directors under the 2013 Incentive Plan. The common shares granted to directors were not subjected to a vesting period and resulted in expense of $801,000 and $850,000 in 2014 and 2013, respectively, which is included in Professional fees and services on the Consolidated Income Statement.
On January 24, 2014, the Compensation Committee of the Board of Directors of Park granted awards of 21,975 performance-based restricted stock units (“PBRSUs”) to certain employees of Park, which grants were effective on January 24, 2014. The number of PBRSUs earned or settled will depend on certain performance conditions and are also subject to service-based vesting. Share-based compensation expense of $458,000 was recognized in 2014 related to awards to employees. Park expects to recognize additional share-based compensation expense of approximately $1.2 million through the first quarter of 2018 related to these PBRSUs. No share-based compensation expense was recognized in 2013 or 2012 as there were no outstanding awards held by employees.
16. Benefit Plans
The Corporation has a noncontributory Defined Benefit Pension Plan (the “Pension Plan”) covering substantially all of the employees of the Corporation and its subsidiaries. The Pension Plan provides benefits based on an employee’s years of service and compensation.
The Corporation generally contributes annually an amount that can be deducted for federal income tax purposes using a different actuarial cost method and different assumptions from those used for financial reporting purposes. In January 2013, management contributed $12.6 million, of which $11.0 million was deductible on the 2012 tax return and $1.6 million was deductible on the 2013 tax return. See Note 17 of these Notes to Consolidated Financial Statements. There was no pension contribution in 2014 and there is no contribution expected in 2015.
Using an accrual measurement date of December 31, 2014 and 2013, plan assets and benefit obligation activity for the Pension Plan are listed below:
|
| | | | | | | | |
| (In thousands) | | 2014 | | 2013 |
| Change in fair value of plan assets | | | | |
| Fair value at beginning of measurement period | | $ | 152,739 |
| | $ | 117,768 |
|
| Actual return on plan assets | | 15,511 |
| | 31,518 |
|
| Company contributions | | — |
| | 12,638 |
|
| Benefits paid | | (7,652 | ) | | (9,185 | ) |
| Fair value at end of measurement period | | $ | 160,598 |
| | $ | 152,739 |
|
| Change in benefit obligation | | | | |
| Projected benefit obligation at beginning of measurement period | | $ | 89,179 |
| | $ | 97,653 |
|
| Service cost | | 4,331 |
| | 4,817 |
|
| Interest cost | | 4,577 |
| | 4,223 |
|
| Actuarial (gains) loss | | 18,893 |
| | (8,329 | ) |
| Benefits paid | | (7,652 | ) | | (9,185 | ) |
| Projected benefit obligation at the end of measurement period | | $ | 109,328 |
| | $ | 89,179 |
|
| Funded status at end of year (fair value of plan assets less benefit obligation) | | $ | 51,270 |
| | $ | 63,560 |
|
Notes to Consolidated Financial Statements
The asset allocation for the Pension Plan as of each measurement date, by asset category, was as follows:
|
| | | | | | | | |
| | | | | Percentage of Plan Assets |
| Asset category | | Target Allocation | | 2014 | | 2013 |
| Equity securities | | 50% - 100% | | 85 | % | | 83 | % |
| Fixed income and cash equivalents | | remaining balance | | 15 | % | | 17 | % |
| Total | | | | 100 | % | | 100 | % |
The investment policy, as established by the Retirement Plan Committee, is to invest assets according to the target allocation stated above. Assets will be reallocated periodically based on the investment strategy of the Retirement Plan Committee. The investment policy is reviewed periodically.
The expected long-term rate of return on plan assets used to measure the benefit obligation was 7.25% as of December 31, 2014 and 2013. This return was based on the expected return of each of the asset categories, weighted based on the median of the target allocation for each class.
The accumulated benefit obligation for the Pension Plan was $92.0 million and $75.9 million at December 31, 2014 and 2013, respectively.
On November 17, 2009, the Park Pension Plan completed the purchase of 115,800 common shares of Park for $7.0 million or $60.45 per share. At December 31, 2014 and 2013, the fair value of the 115,800 common shares held by the Pension Plan was $10.2 million, or $88.48 per share and $9.9 million, or $85.07 per share, respectively.
The weighted average assumptions used to determine benefit obligations at December 31, 2014, 2013 and 2012 were as follows:
|
| | | | | | | | | |
| | | 2014 | | 2013 | | 2012 |
| Discount rate | | 4.42 | % | | 5.30 | % | | 4.47 | % |
| Rate of compensation increase | | | |
|
| | 3.00 | % |
| Under age 30 | | 10.00 | % | | 10.00 | % | | |
| Ages 30-39 | | 6.00 | % | | 6.00 | % | | |
| Ages 40 and over | | 3.00 | % | | 3.00 | % | | |
The estimated future pension benefit payments reflecting expected future service for the next ten years are shown below (in thousands):
|
| | | |
| 2015 | $ | 6,282 |
|
| 2016 | 6,236 |
|
| 2017 | 6,902 |
|
| 2018 | 7,081 |
|
| 2019 | 7,799 |
|
| 2020-2024 | 46,850 |
|
| Total | $ | 81,150 |
|
Notes to Consolidated Financial Statements
The following table shows ending balances of accumulated other comprehensive loss at December 31, 2014 and 2013.
|
| | | | | | | | |
| (In thousands) | | 2014 | | 2013 |
| Prior service cost | | $ | (15 | ) | | $ | (34 | ) |
| Net actuarial loss | | (22,855 | ) | | (8,579 | ) |
| Total | | (22,870 | ) | | (8,613 | ) |
| Deferred taxes | | 8,005 |
| | 3,015 |
|
| Accumulated other comprehensive loss | | $ | (14,865 | ) | | $ | (5,598 | ) |
Using an actuarial measurement date of December 31 for 2014, 2013 and 2012, components of net periodic benefit cost and other amounts recognized in other comprehensive (loss) income were as follows:
|
| | | | | | | | | | | | |
| (In thousands) | | 2014 | | 2013 | | 2012 |
| Components of net periodic benefit cost and other amounts recognized in other comprehensive (loss) income | | | | | | |
| Service cost | | $ | (4,331 | ) | | $ | (4,817 | ) | | $ | (4,271 | ) |
| Interest cost | | (4,577 | ) | | (4,223 | ) | | (4,048 | ) |
| Expected return on plan assets | | 10,869 |
| | 9,536 |
| | 8,742 |
|
| Amortization of prior service cost | | (19 | ) | | (20 | ) | | (20 | ) |
| Recognized net actuarial loss | | ��� |
| | (2,703 | ) | | (1,708 | ) |
| Net periodic benefit income (cost) | | $ | 1,942 |
| | $ | (2,227 | ) | | $ | (1,305 | ) |
| Change to net actuarial (loss) gain for the period | | $ | (14,276 | ) | | $ | 30,409 |
| | $ | (11,236 | ) |
| Amortization of prior service cost | | 19 |
| | 20 |
| | 20 |
|
| Amortization of net loss | | — |
| | 2,703 |
| | 1,708 |
|
| Total recognized in other comprehensive (loss) income | | (14,257 | ) | | 33,132 |
| | (9,508 | ) |
| Total recognized in net benefit cost and other comprehensive (loss) income | | $ | (12,315 | ) | | $ | 30,905 |
| | $ | (10,813 | ) |
The estimated prior service costs for the Pension Plan that will be amortized from accumulated other comprehensive loss into net periodic benefit cost over the next fiscal year is $15,000. The estimated net actuarial loss expected to be recognized in the next fiscal year is $637,000.
The weighted average assumptions used to determine net periodic benefit cost for the years ended December 31, 2014, 2013 and 2012 are listed below:
|
| | | | | | | | | |
| | | 2014 | | 2013 | | 2012 |
| Discount Rate | | 5.30 | % | | 4.47 | % | | 5.18 | % |
| Rate of compensation increase | |
|
| |
|
| | 3.00 | % |
| Under age 30 | | 10.00 | % | | 10.00 | % | | |
| Ages 30-39 | | 6.00 | % | | 6.00 | % | | |
| Ages 40 and over | | 3.00 | % | | 3.00 | % | | |
| Expected long-term return on plan assets | | 7.25 | % | | 7.50 | % | | 7.75 | % |
The Pension Plan maintains cash in a PNB savings account. The Pension Plan cash balance was $1.9 million at December 31, 2014.
GAAP defines fair value as the price that would be received by Park for an asset or paid by Park to transfer a liability (an exit price) in an orderly transaction between market participants on the measurement date, using the most advantageous market for the asset or liability. The fair values of equity securities, consisting of mutual fund investments and common stock (U.S. large cap) held by the Pension Plan and the fixed income and cash equivalents, are determined by obtaining quoted prices on nationally
Notes to Consolidated Financial Statements
recognized securities exchanges (Level 1 inputs). The fair value of Pension Plan assets at December 31, 2014 was $160.6 million. At December 31, 2014, $141.1 million of equity investments and cash in the Pension Plan were categorized as Level 1 inputs; $19.5 million of plan investments in corporate (U.S. large cap) and U.S. Government sponsored entity bonds were categorized as Level 2 inputs, as fair value was based on quoted market prices of comparable instruments; and no investments were categorized as Level 3 inputs. The fair value of Pension Plan assets was $152.7 million at December 31, 2013. At December 31, 2013, $128.7 million of investments in the Pension Plan were categorized as Level 1 inputs; $24.0 million were categorized as Level 2; and no investments were categorized as Level 3.
The Corporation has a voluntary salary deferral plan covering substantially all of the employees of the Corporation and its subsidiaries. Eligible employees may contribute a portion of their compensation subject to a maximum statutory limitation. The Corporation provides a matching contribution established annually by the Corporation. Contribution expense for the Corporation was $1.1 million, $1.1 million, and $1.0 million for 2014, 2013 and 2012, respectively.
The Corporation has a Supplemental Executive Retirement Plan (SERP) covering certain key officers of the Corporation and its subsidiaries with defined pension benefits in excess of limits imposed by federal tax law. The accrued benefit cost for the SERP totaled $7.6 million and $6.8 million for 2014 and 2013, respectively. The expense for the Corporation was $0.2 million for 2014, $0.2 million for 2013 and $0.3 million for 2012.
17. Income Taxes
Deferred income taxes reflect the net tax effects of temporary differences between the carrying amounts of assets and liabilities for financial reporting purposes and the amounts used for income tax purposes. Significant components of the Corporation’s deferred tax assets and liabilities are as follows:
|
| | | | | | | | |
| December 31 (In thousands) | | 2014 | | 2013 |
| Deferred tax assets: | | |
| Allowance for loan losses | | $ | 19,023 |
| | $ | 20,814 |
|
| Accumulated other comprehensive loss – Pension Plan | | 8,005 |
| | 3,015 |
|
| Accumulated other comprehensive loss – Unrealized losses on securities | | — |
| | 16,057 |
|
| Intangible assets | | 543 |
| | 673 |
|
| Deferred compensation | | 3,820 |
| | 3,611 |
|
| OREO devaluations | | 3,984 |
| | 5,287 |
|
| Partnership adjustments | | 4,725 |
| | 3,793 |
|
| Net deferred loan fees | | 933 |
| | 282 |
|
| Other | | 3,795 |
| | 3,423 |
|
| Total deferred tax assets | | $ | 44,828 |
| | $ | 56,955 |
|
| Deferred tax liabilities: | | | | |
| Accumulated other comprehensive income – Unrealized gains on securities | | 677 |
| | — |
|
| Deferred investment income | | 10,199 |
| | 10,199 |
|
| Pension Plan | | 25,949 |
| | 25,261 |
|
| Mortgage servicing rights | | 3,015 |
| | 3,154 |
|
| Other | | 804 |
| | 850 |
|
| Total deferred tax liabilities | | $ | 40,644 |
| | $ | 39,464 |
|
| Net deferred tax assets | | $ | 4,184 |
| | $ | 17,491 |
|
Park performs an analysis to determine if a valuation allowance against deferred tax assets is required in accordance with GAAP. Management has determined that it is not required to establish a valuation allowance against the December 31, 2014 or 2013 deferred tax assets in accordance with GAAP since it is more likely than not that the deferred tax assets will be fully utilized in future periods.
Notes to Consolidated Financial Statements
The components of the provision for federal income taxes are shown below:
|
| | | | | | | | | | | | |
| December 31, (In thousands) | | 2014 | | 2013 | | 2012 |
| Currently payable | | | | | | |
| Federal | | $ | 27,039 |
| | $ | 27,587 |
| | $ | 12,984 |
|
| | | | | | | |
| Deferred | | | | | | |
| Federal | | 1,563 |
| | (2,456 | ) | | 12,717 |
|
| Total | | 28,602 |
| | 25,131 |
| | 25,701 |
|
The following is a reconciliation of income tax expense to the amount computed at the statutory rate of 35% for the years ended December 31, 2014, 2013 and 2012.
|
| | | | | | | | | |
| | | 2014 | | 2013 | | 2012 |
| | | | | | | |
| Statutory federal corporate tax rate | | 35.0 | % | | 35.0 | % | | 35.0 | % |
| Changes in rates resulting from: | | | | | | |
| Tax exempt interest income, net of disallowed interest | | (0.5 | )% | | (0.8 | )% | | (0.9 | )% |
| Bank owned life insurance | | (1.5 | )% | | (1.7 | )% | | (1.6 | )% |
| Tax credits (low income housing) | | (6.3 | )% | | (6.6 | )% | | (6.1 | )% |
| Other | | (1.3 | )% | | (1.3 | )% | | (1.8 | )% |
| Effective tax rate | | 25.4 | % | | 24.6 | % | | 24.6 | % |
Park and its subsidiaries do not pay state income tax to the state of Ohio, but pay a franchise tax based on equity. The franchise tax expense is included in the state tax expense and is shown in “State taxes” on Park’s Consolidated Statements of Income.
Unrecognized Tax Benefits
The following is a reconciliation of the beginning and ending amount of unrecognized tax benefits.
|
| | | | | | | | | | | | |
| (In thousands) | | 2014 | | 2013 | | 2012 |
| January 1 Balance | | $ | 518 |
| | $ | 517 |
| | $ | 485 |
|
| Additions based on tax positions related to the current year | | 76 |
| | 74 |
| | 74 |
|
| Additions for tax positions of prior years | | 14 |
| | 4 |
| | 25 |
|
| Reductions for tax positions of prior years | | — |
| | — |
| | — |
|
| Reductions due to statute of limitations | | (76 | ) | | (77 | ) | | (67 | ) |
| December 31 Balance | | $ | 532 |
| | $ | 518 |
| | $ | 517 |
|
The amount of unrecognized tax benefits that, if recognized, would favorably affect the effective income tax rate in the future periods at December 31, 2014, 2013 and 2012 was $413,000, $403,000 and $404,000, respectively. Park does not expect the total amount of unrecognized tax benefits to significantly increase or decrease during the next year.
The (income)/expense related to interest and penalties recorded on unrecognized tax benefits in the Consolidated Statements of Income for the years ended December 31, 2013 and 2012 was $(500) and $4,500, respectively. There was no expense related to interest and penalties for the year ending 2014. The amount accrued for interest and penalties at December 31, 2014, 2013 and 2012 was $67,000, $67,000 and $67,500, respectively.
Park and its subsidiaries are subject to U.S. federal income tax and income tax in various state jurisdictions. The Corporation is subject to routine audits of tax returns by the Internal Revenue Service and states in which we conduct business. No material adjustments have been made on closed federal and state tax audits. All tax years ending prior to December 31, 2011 are closed to examination by the federal and state taxing authorities.
Notes to Consolidated Financial Statements
18. Other Comprehensive Income (Loss)
Other comprehensive income (loss) components, net of tax, are shown in the following table for the years ended December 31, 2014, 2013 and 2012.
|
| | | | | | | | | | | | | | | | | |
Year ended December 31, (in thousands) | | Changes in Pension Plan assets and benefit obligations | | Unrealized gains and losses on available-for-sale securities | | Unrealized net holding loss on cash flow hedge | | Total |
| Beginning balance at December 31, 2013 | | $ | (5,598 | ) | | $ | (29,821 | ) | | $ | — |
| | $ | (35,419 | ) |
| | Other comprehensive gain (loss) before reclassifications | | (9,279 | ) | | 30,325 |
| | — |
| | $ | 21,046 |
|
| | Amounts reclassified from accumulated other comprehensive income | | 12 |
| | 753 |
| | — |
| | $ | 765 |
|
| Net current period other comprehensive income (loss) | | (9,267 | ) | | 31,078 |
| | — |
| | $ | 21,811 |
|
| Ending balance at December 31, 2014 | | $ | (14,865 | ) | | $ | 1,257 |
| | $ | — |
| | $ | (13,608 | ) |
| | | | | | | | | | |
| Beginning balance at December 31, 2012 | | $ | (27,134 | ) | | $ | 9,616 |
| | $ | — |
| | $ | (17,518 | ) |
| | Other comprehensive gain (loss) before reclassifications | | 19,766 |
| | (39,448 | ) | | — |
| | $ | (19,682 | ) |
| | Amounts reclassified from accumulated other comprehensive income | | 1,770 |
| | 11 |
| | — |
| | $ | 1,781 |
|
| Net current period other comprehensive income (loss) | | 21,536 |
| | (39,437 | ) | | — |
| | $ | (17,901 | ) |
| Ending balance at December 31, 2013 | | $ | (5,598 | ) | | $ | (29,821 | ) | | $ | — |
| | $ | (35,419 | ) |
| | | | | | | | | | |
| Beginning balance at December 31, 2011 | | $ | (20,954 | ) | | $ | 12,673 |
| | $ | (550 | ) | | $ | (8,831 | ) |
| | Net current period other comprehensive income (loss) | | (6,180 | ) | | (3,057 | ) | | 550 |
| | $ | (8,687 | ) |
| Ending balance at December 31, 2012 | | $ | (27,134 | ) | | $ | 9,616 |
| | $ | — |
| | $ | (17,518 | ) |
Notes to Consolidated Financial Statements
The following table provides information concerning amounts reclassified out of accumulated other comprehensive income (loss) for the years ended December 31, 2014 and 2013:
|
| | | | | | | | | | |
| | Amount Reclassified from Accumulated Other Comprehensive Income (Loss) | | Affected Line Item in the Consolidated Statement of Income |
| (in thousands) | | 2014 | 2013 | | |
| Amortization of defined benefit pension items | | | | | |
| | Amortization of prior service cost | | $ | 19 |
| $ | 20 |
| | Salaries and employee benefits |
| | Amortization of net loss | | — |
| 2,703 |
| | Salaries and employee benefits |
| Total income before income taxes | | 19 |
| 2,723 |
| | Total income before income taxes |
| | Federal income taxes | | 7 |
| 953 |
| | Federal income taxes |
| | Net of tax | | $ | 12 |
| $ | 1,770 |
| | Net of tax |
| | | | | | | |
| Unrealized gains & losses on available for sale securities | | | | | |
| | Loss on sale of investment securities | | $ | 1,158 |
| $ | — |
| | Loss on sale of investment securities |
| | Other than temporary impairment | | — |
| 17 |
| | Miscellaneous expense |
| Total income before income taxes | | 1,158 |
| 17 |
| | Total income before income taxes |
| | Federal income taxes | | 405 |
| 6 |
| | Federal income taxes |
| | Net of tax | | $ | 753 |
| $ | 11 |
| | Net of tax |
19. Earnings Per Common Share
GAAP requires the reporting of basic and diluted earnings per common share. Basic earnings per common share excludes any dilutive effects of restricted stock units, warrants and convertible securities.
The following table sets forth the computation of basic and diluted earnings per common share:
|
| | | | | | | | | | | | |
Year ended December 31
(In thousands, except share data) | | 2014 | | 2013 | | 2012 |
| Numerator: | | | | | | |
| Net income available to common shareholders | | $ | 84,090 |
| | $ | 77,227 |
| | $ | 75,205 |
|
| Denominator: | | | | | | |
| Basic earnings per common share: | | | | | | |
| Weighted-average shares | | 15,394,971 |
| | 15,412,365 |
| | 15,407,078 |
|
| Effect of dilutive securities – restricted stock units and warrants | | 18,861 |
| | — |
| | 1,063 |
|
| Diluted earnings per common share: | | | | | | |
| Adjusted weighted-average shares and assumed conversions | | 15,413,832 |
| | 15,412,365 |
| | 15,408,141 |
|
| Earnings per common share: | | | | | | |
| Basic earnings per common share | | $ | 5.46 |
| | $ | 5.01 |
| | $ | 4.88 |
|
| Diluted earnings per common share | | $ | 5.46 |
| | $ | 5.01 |
| | $ | 4.88 |
|
On January 24, 2014, Park awarded 21,975 performance-based restricted stock units ("PBRSUs") to certain employees. The PBRSUs vest based on service and performance conditions. The dilutive effect of the PBRSUs was the addition of 18,861 common shares for the year ended December 31, 2014.
A warrant to purchase 227,376 common shares was outstanding at December 31, 2011 as a result of Park’s participation in the U.S. Treasury Capital Purchase Program ("CPP"). Park repurchased the CPP warrant on May 2, 2012. The warrant to purchase 227,376 common shares issued under the CPP were included in the computation of diluted earnings per common share for the year ended December 31, 2012 as the dilutive effect of this warrant was 1,063 common shares for the twelve month period ended December 31, 2012. The exercise price of the CPP warrant to purchase 227,376 common shares was $65.97.
Notes to Consolidated Financial Statements
All options under Park's 2005 Plan had expired by December 31, 2012. The common shares represented by the options for the twelve months ended December 31, 2012, totaling 63,308, were not included in the computation of diluted earnings per common share because the exercise price exceeded the fair value of the underlying common shares such that their inclusion would have had an anti-dilutive effect.
20. Dividend Restrictions
Bank regulators limit the amount of dividends a subsidiary bank can declare in any calendar year without obtaining prior approval. At December 31, 2014, approximately $86.7 million of the total shareholders’ equity of PNB was available for the payment of dividends to the Corporation, without approval by the applicable regulatory authorities.
21. Financial Instruments with Off-Balance Sheet Risk and Financial Instruments with Concentrations of Credit Risk
The Corporation is party to financial instruments with off-balance sheet risk in the normal course of business to meet the financing needs of its customers. These financial instruments include loan commitments and standby letters of credit. The instruments involve, to varying degrees, elements of credit and interest rate risk in excess of the amount recognized in the consolidated financial statements.
The Corporation’s exposure to credit loss in the event of nonperformance by the other party to the financial instrument for loan commitments and standby letters of credit is represented by the contractual amount of those instruments. The Corporation uses the same credit policies in making commitments and conditional obligations as it does for on-balance sheet instruments. Since many of the loan commitments may expire without being drawn upon, the total commitment amount does not necessarily represent future cash requirements. The credit risk involved in issuing letters of credit is essentially the same as that involved in extending loan commitments to customers.
The total amounts of off-balance sheet financial instruments with credit risk were as follows:
|
| | | | | | | | |
| December 31 (In thousands) | | 2014 | | 2013 |
| Loan commitments | | $ | 885,052 |
| | $ | 821,795 |
|
| Standby letters of credit | | 12,473 |
| | 20,590 |
|
The loan commitments are generally for variable rates of interest.
The Corporation grants retail, commercial and commercial real estate loans to customers primarily located in Ohio. The Corporation evaluates each customer’s creditworthiness on a case-by-case basis. The amount of collateral obtained, if deemed necessary by the Corporation upon extension of credit, is based on management’s credit evaluation of the customer. Collateral held varies but may include accounts receivable, inventory, property, plant and equipment, and income-producing commercial properties.
Although the Corporation has a diversified loan portfolio, a substantial portion of the borrowers’ ability to honor their contracts is dependent upon the economic conditions in each borrower’s geographic location and industry.
22. Loan Servicing
Park serviced sold mortgage loans of $1,265 million at December 31, 2014, compared to $1,326 million at December 31, 2013 and $1,311 million at December 31, 2012. At December 31, 2014, $7.0 million of the sold mortgage loans were sold with recourse compared to $10.7 million at December 31, 2013. Management closely monitors the delinquency rates on the mortgage loans sold with recourse. As of December 31, 2014 and 2013, management had established a reserve of $379,000 and $1.0 million, respectively, to account for future loan repurchases.
The amortization of mortgage loan servicing rights is included within “Other service income”. Generally, mortgage servicing rights are capitalized and amortized on an individual sold loan basis. When a sold mortgage loan is paid off, the related mortgage servicing rights are fully amortized.
Notes to Consolidated Financial Statements
Activity for mortgage servicing rights and the related valuation allowance follows:
|
| | | | | | | | | | | | |
| December 31 (In thousands) | | 2014 | | 2013 | | 2012 |
| Mortgage servicing rights: | | | | | | |
| Carrying amount, net, beginning of year | | $ | 9,013 |
| | $ | 7,763 |
| | $ | 9,301 |
|
| Additions | | 1,026 |
| | 2,436 |
| | 3,399 |
|
| Amortization | | (1,631 | ) | | (2,479 | ) | | (3,634 | ) |
| Change in valuation allowance | | 205 |
| | 1,293 |
| | (1,303 | ) |
| Carrying amount, net, end of year | | $ | 8,613 |
| | $ | 9,013 |
| | $ | 7,763 |
|
| Valuation allowance: | | | | | | |
| Beginning of year | | $ | 1,031 |
| | $ | 2,324 |
| | $ | 1,021 |
|
| Change in valuation allowance | | (205 | ) | | (1,293 | ) | | 1,303 |
|
| End of year | | $ | 826 |
| | $ | 1,031 |
| | $ | 2,324 |
|
The fair value of mortgage servicing rights was $9.1 million and $9.5 million at December 31, 2014 and 2013, respectively. The fair value of mortgage servicing rights at December 31, 2014 was established using a discount rate of 10% and constant prepayment speeds ranging from 5.7% to 22.3%. The fair value of mortgage servicing rights at December 31, 2013 was established using a discount rate of 10% and constant prepayment speeds ranging from 6.6% to 22.5%.
Servicing fees included in other service income were $3.5 million, $3.6 million and $3.6 million for the years ended December 31, 2014, 2013 and 2012, respectively.
23. Fair Value
The fair value hierarchy requires an entity to maximize the use of observable inputs and minimize the use of unobservable inputs when measuring fair value. The three levels of inputs that Park uses to measure fair value are as follows:
| |
| • | Level 1: Quoted prices (unadjusted) for identical assets or liabilities in active markets that Park has the ability to access as of the measurement date. |
| |
| • | Level 2: Level 1 inputs for assets or liabilities that are not actively traded. Also consists of an observable market price for a similar asset or liability. This includes the use of “matrix pricing” to value debt securities absent the exclusive use of quoted prices. |
| |
| • | Level 3: Consists of unobservable inputs that are used to measure fair value when observable market inputs are not available. This could include the use of internally developed models, financial forecasting and similar inputs. |
Fair value is defined as the price that would be received to sell an asset or paid to transfer a liability between market participants at the balance sheet date. When possible, the Company looks to active and observable markets to price identical assets or liabilities. When identical assets and liabilities are not traded in active markets, the Company looks to observable market data for similar assets and liabilities. However, certain assets and liabilities are not traded in observable markets and Park must use other valuation methods to develop a fair value. The fair value of impaired loans is typically based on the fair value of the underlying collateral, which is estimated through third-party appraisals or internal estimates of collateral values in accordance with Park's valuation requirements per its commercial and real estate loan policies.
Notes to Consolidated Financial Statements
Assets and Liabilities Measured at Fair Value on a Recurring Basis:
The following table presents assets and liabilities measured at fair value on a recurring basis:
|
| | | | | | | | | | | | | | | | |
| Fair Value Measurements at December 31, 2014 using: |
| (In thousands) | | Level 1 | | Level 2 | | Level 3 | | Balance at December 31, 2014 |
| Assets | | |
| | |
| | |
| | |
|
| Investment securities: | | |
| | |
| | |
| | |
|
| Obligations of U.S. Treasury and other U.S. Government sponsored entities | | $ | — |
| | $ | 538,064 |
| | $ | — |
| | $ | 538,064 |
|
| U.S. Government sponsored entities’ asset-backed securities | | — |
| | 761,153 |
| | — |
| | 761,153 |
|
| Equity securities | | 1,922 |
| | — |
| | 776 |
| | 2,698 |
|
| Mortgage loans held for sale | | — |
| | 5,264 |
| | — |
| | 5,264 |
|
| Mortgage IRLCs | | — |
| | 70 |
| | — |
| | 70 |
|
| | | | | | | | | |
| Liabilities | | |
| | |
| | |
| | |
|
| Fair value swap | | $ | — |
| | $ | — |
| | $ | 226 |
| | $ | 226 |
|
|
| | | | | | | | | | | | | | | | |
| Fair Value Measurements at December 31, 2013 using: |
| (In thousands) | | Level 1 | | Level 2 | | Level 3 | | Balance at December 31, 2013 |
| Assets | | |
| | |
| | |
| | |
|
| Investment securities: | | |
| | |
| | |
| | |
|
| Obligations of U.S. Treasury and other U.S. Government sponsored entities | | $ | — |
| | $ | 525,136 |
| | $ | — |
| | $ | 525,136 |
|
| U.S. Government sponsored entities’ asset-backed securities | | — |
| | 648,471 |
| | — |
| | 648,471 |
|
| Equity securities | | 1,900 |
| | — |
| | 759 |
| | 2,659 |
|
| Mortgage loans held for sale | | — |
| | 1,666 |
| | — |
| | 1,666 |
|
| Mortgage IRLCs | | — |
| | 61 |
| | — |
| | 61 |
|
| | | | | | | | | |
| Liabilities | | |
| | |
| | |
| | |
|
| Fair value swap | | $ | — |
| | $ | — |
| | $ | 135 |
| | $ | 135 |
|
There were no transfers between Level 1 and Level 2 during 2014 or 2013. Management’s policy is to transfer assets or liabilities from one level to another when the methodology to obtain the fair value changes such that there are more or fewer unobservable inputs as of the end of the reporting period.
The following methods and assumptions were used by the Company in determining fair value of the financial assets and liabilities discussed above:
Investment securities: Fair values for investment securities are based on quoted market prices, where available. If quoted market prices are not available, fair values are based on quoted market prices of comparable instruments. The Fair Value Measurements tables exclude Park’s FHLB stock and FRB stock. These assets are carried at their respective redemption values, as it is not practicable to calculate their fair values. For securities where quoted prices or market prices of similar securities are not available, which include municipal securities, fair values are calculated using discounted cash flows.
Fair value swap: The fair value of the swap agreement entered into with the purchaser of the Visa Class B shares represents an internally developed estimate of the exposure based upon probability-weighted potential Visa litigation losses.
Notes to Consolidated Financial Statements
Mortgage Interest Rate Lock Commitments (IRLCs): IRLCs are based on current secondary market pricing and are classified as Level 2.
Mortgage loans held for sale: Mortgage loans held for sale are carried at their fair value. Mortgage loans held for sale are estimated using security prices for similar product types and, therefore, are classified in Level 2.
The table below is a reconciliation of the beginning and ending balances of the Level 3 inputs for the years ended December 31, 2014 and 2013, for financial instruments measured on a recurring basis and classified as Level 3:
|
| | | | | | | | |
| Level 3 Fair Value Measurements |
| (In thousands) | | Equity Securities | | Fair Value Swap |
| Balance at January 1, 2014 | | $ | 759 |
| | $ | (135 | ) |
| Total Gains (Losses) | | | | |
| Included in earnings - realized | | — |
| | — |
|
| Included in earnings - unrealized | | — |
| | — |
|
| Included in other comprehensive income | | 17 |
| | — |
|
| Purchases, sales, issuances and settlements, other, net | | — |
| | — |
|
| Re-evaluation of fair value swap | | — |
| | (91 | ) |
| Balance at December 31, 2014 | | $ | 776 |
| | $ | (226 | ) |
| Balance at January 1, 2013 | | $ | 780 |
| | $ | (135 | ) |
| Total Gains (Losses) | | | | |
| Included in earnings - realized | | (17 | ) | | — |
|
| Included in earnings - unrealized | | — |
| | — |
|
| Included in other comprehensive income | | (4 | ) | | — |
|
| Purchases, sales, issuances and settlements, other, net | | — |
| | — |
|
| Re-evaluation of fair value swap | | — |
| | — |
|
| Balance at December 31, 2013 | | $ | 759 |
| | $ | (135 | ) |
Assets and liabilities measured at fair value on a nonrecurring basis:
The following methods and assumptions were used by the Company in determining the fair value of assets and liabilities measured at fair value on a nonrecurring basis described below:
Impaired Loans: At the time a loan is considered impaired, it is valued at the lower of cost or fair value. Impaired loans carried at fair value have been partially charged-off or receive specific allocations of the allowance for loan losses. For collateral dependent loans, fair value is generally based on real estate appraisals. These appraisals may utilize a single valuation approach or a combination of approaches including comparable sales and the income approach. Adjustments are routinely made in the appraisal process by the independent appraisers to adjust for differences between the comparable sales and income data available. Such adjustments result in a Level 3 classification of the inputs for determining fair value. Collateral is then adjusted or discounted based on management’s historical knowledge, changes in market conditions from the time of the valuation, and management’s expertise and knowledge of the client and client’s business, resulting in a Level 3 fair value classification. Impaired loans are evaluated on a quarterly basis for additional impairment and adjusted accordingly. Additionally, updated valuations are obtained annually for all impaired loans in accordance with Company policy.
Other Real Estate Owned (OREO): Assets acquired through or in lieu of loan foreclosure are initially recorded at fair value less costs to sell when acquired. The carrying value of OREO is not re-measured to fair value on a recurring basis, but is subject to fair value adjustments when the carrying value exceeds the fair value, less estimated selling costs. Fair value is based on recent real estate appraisals and is updated at least annually. These appraisals may utilize a single valuation approach or a combination of approaches including the comparable sales approach and the income approach. Adjustments are routinely made in the appraisal process by the independent appraisers to adjust for differences between the comparable sales and income data available. Such adjustments result in a Level 3 classification of the inputs for determining fair value.
Notes to Consolidated Financial Statements
Appraisals for both collateral dependent impaired loans and OREO are performed by licensed appraisers. Appraisals are generally obtained to support the fair value of collateral. In general, there are three types of appraisals, real estate appraisals, income approach appraisals and lot development loan appraisals, received by the Company. These are discussed below:
| |
| • | Real estate appraisals typically incorporate measures such as recent sales prices for comparable properties. Appraisers may make adjustments to the sales prices of the comparable properties as deemed appropriate based on the age, condition or general characteristics of the subject property. Management generally applies a 15% discount to real estate appraised values which management expects will cover all disposition costs (including selling costs). This 15% is based on historical discounts to appraised values on sold OREO properties. |
| |
| • | Income approach appraisals typically incorporate the annual net operating income of the business divided by an appropriate capitalization rate, as determined by the appraiser. Management generally applies a 15% discount to income approach appraised values which management expects will cover all disposition costs (including selling costs). |
| |
| • | Lot development loan appraisals are typically performed using a discounted cash flow analysis. Appraisers determine an anticipated absorption period and a discount rate that takes into account an investor’s required rate of return based on recent comparable sales. Management generally applies a 6% discount to lot development appraised values, which is an additional discount above the net present value calculation included in the appraisal, to account for selling costs. |
MSRs: MSRs are carried at the lower of cost or fair value. MSRs do not trade in active, open markets with readily observable prices. For example, sales of MSRs do occur, but precise terms and conditions typically are not readily available. As such, management, with the assistance of a third-party specialist, determines fair value based on the discounted value of the future cash flows estimated to be received. Significant inputs include the discount rate and assumed prepayment speeds utilized. The calculated fair value is then compared to market values where possible to ascertain the reasonableness of the valuation in relation to current market expectations for similar products. Accordingly, MSRs are classified as Level 2.
The following tables present assets and liabilities measured at fair value on a nonrecurring basis. Collateral dependent impaired loans are carried at fair value if they have been charged down to fair value or if a specific valuation allowance has been established. A new cost basis is established at the time a property is initially recorded in OREO. OREO properties are carried at fair value if a devaluation has been taken to the property's value subsequent to the initial measurement.
The following table presents assets and liabilities measured at fair value on a nonrecurring basis:
|
| | | | | | | | | | | | | | | | |
| Fair Value Measurements at December 31, 2014 Using: |
| (In thousands) | | Level 1 | | Level 2 | | Level 3 | | Balance at December 31, 2014 |
| Impaired Loans: | | | | | | | | |
| Commercial real estate | | $ | — |
| | $ | — |
| | $ | 8,481 |
| | $ | 8,481 |
|
| Construction real estate: | | | | | | | | |
| SEPH commercial land and development | | — |
| | — |
| | 2,078 |
| | 2,078 |
|
| Remaining commercial | | — |
| | — |
| | 3,483 |
| | 3,483 |
|
| Residential real estate | | — |
| | — |
| | 2,921 |
| | 2,921 |
|
| Total impaired loans | | $ | — |
| | $ | — |
| | $ | 16,963 |
| | $ | 16,963 |
|
| Mortgage Servicing Rights | | $ | — |
| | $ | 2,928 |
| | $ | — |
| | $ | 2,928 |
|
| Other Real Estate Owned: | | | | | | | | |
| Commercial real estate | | — |
| | — |
| | 1,470 |
| | 1,470 |
|
| Construction real estate | | — |
| | — |
| | 6,473 |
| | 6,473 |
|
| Residential real estate | | — |
| | — |
| | 2,369 |
| | 2,369 |
|
| Total Other Real Estate Owned | | $ | — |
| | $ | — |
| | $ | 10,312 |
| | $ | 10,312 |
|
Notes to Consolidated Financial Statements
|
| | | | | | | | | | | | | | | | |
| Fair Value Measurements at December 31, 2013 Using: |
| (In thousands) | | Level 1 | | Level 2 | | Level 3 | | Balance at December 31, 2013 |
| Impaired Loans: | | | | | | | | |
| Commercial real estate | | $ | — |
| | $ | — |
| | $ | 21,100 |
| | $ | 21,100 |
|
| Construction real estate: | | | | | | | | |
| SEPH commercial land and development | | — |
| | — |
| | 4,777 |
| | 4,777 |
|
| Remaining commercial | | — |
| | — |
| | 3,788 |
| | 3,788 |
|
| Residential real estate | | — |
| | — |
| | 4,154 |
| | 4,154 |
|
| Total impaired loans | | $ | — |
| | $ | — |
| | $ | 33,819 |
| | $ | 33,819 |
|
| Mortgage Servicing Rights | | $ | — |
| | $ | 2,259 |
| | $ | — |
| | $ | 2,259 |
|
| Other Real Estate Owned: | | | | | | | | |
| Commercial real estate | | — |
| | — |
| | 4,119 |
| | 4,119 |
|
| Construction real estate | | — |
| | — |
| | 11,041 |
| | 11,041 |
|
| Residential real estate | | — |
| | — |
| | 3,366 |
| | 3,366 |
|
| Total Other Real Estate Owned | | $ | — |
| | $ | — |
| | $ | 18,526 |
| | $ | 18,526 |
|
The table below provides additional detail on those impaired loans which are recorded at fair value as well as the remaining impaired loan portfolio not included above. The remaining impaired loans consist of loans which are not collateral dependent as well as loans carried at cost as the fair value of the underlying collateral or the present value of expected future cash flows on each of the loans exceeded the book value for each respective credit.
|
| | | | | | | | | | | | | | | | |
| | | December 31, 2014 |
| (In thousands) | | Recorded Investment | | Prior Charge-Offs | | Specific Valuation Allowance | | Carrying Balance |
| Impaired loans recorded at fair value | | $ | 19,643 |
| | $ | 19,731 |
| | $ | 2,680 |
| | $ | 16,963 |
|
| Remaining impaired loans | | 54,069 |
| | 12,749 |
| | 980 |
| | 53,089 |
|
| Total impaired loans | | $ | 73,712 |
| | $ | 32,480 |
| | $ | 3,660 |
| | $ | 70,052 |
|
|
| | | | | | | | | | | | | | | | |
| | | December 31, 2013 |
| (In thousands) | | Recorded Investment | | Prior Charge-Offs | | Specific Valuation Allowance | | Carrying Balance |
| Impaired loans recorded at fair value | | $ | 41,002 |
| | $ | 48,952 |
| | $ | 7,183 |
| | $ | 33,819 |
|
| Remaining impaired loans | | 71,313 |
| | 14,320 |
| | 3,268 |
| | 68,045 |
|
| Total impaired loans | | $ | 112,315 |
| | $ | 63,272 |
| | $ | 10,451 |
| | $ | 101,864 |
|
The expense of credit adjustments related to impaired loans carried at fair value for the years ended December 31, 2014, 2013 and 2012 was $3.0 million, $8.1 million, and $16.0 million, respectively.
MSRs totaled $8.6 million at December 31, 2014. Of this $8.6 million MSR carrying balance, $2.9 million was recorded at fair value and included a valuation allowance of $0.8 million. The remaining $5.7 million was recorded at cost, as the fair value exceeded cost at December 31, 2014. At December 31, 2013, MSRs totaled $9.0 million. Of this $9.0 million MSR carrying balance, $2.3 million was recorded at fair value and included a valuation allowance of $1.0 million. The remaining $6.7 million was recorded at cost, as the fair value exceeded cost at December 31, 2013. Income (Expense) related to MSRs carried at fair value for the years ended December 31, 2014, 2013 and 2012 was $0.2 million, $1.3 million and $(1.3) million, respectively.
Notes to Consolidated Financial Statements
Total OREO held by Park at December 31, 2014 and 2013 was $22.6 million and $34.6 million, respectively. Approximately 46% and 53% of OREO held by Park at December 31, 2014 and 2013, respectively, was carried at fair value due to fair value adjustments made subsequent to the initial OREO measurement. At December 31, 2014 and 2013, OREO held at fair value, less estimated selling costs, amounted to $10.3 million and $18.5 million, respectively. The net expense related to OREO fair value adjustments was $2.4 million, $3.2 million and $6.9 million for the years ended December 31, 2014, 2013 and 2012, respectively.
The following tables present qualitative information about Level 3 fair value measurements for financial instruments measured at fair value on a non-recurring basis at December 31, 2014 and December 31, 2013:
|
| | | | | | | | | | |
| December 31, 2014 |
| (In thousands) | | Fair Value | | Valuation Technique | | Unobservable Input(s) | | Range (Weighted Average) |
| Impaired loans: | | |
| | | | | | |
| Commercial real estate | | $ | 8,481 |
| | Sales comparison approach | | Adj to comparables | | 0.0% - 84.0% (38.8%) |
| | | | | Income approach | | Capitalization rate | | 8.0% - 9.5% (9.4%) |
| | | | | Cost approach | | Accumulated depreciation | | 23.0% (23.0%) |
| | | | | | | | | |
| Construction real estate: | | |
| | | | | | |
| SEPH commercial land and development | | $ | 2,078 |
| | Sales comparison approach | | Adj to comparables | | 5.0% - 35.0% (17.5%) |
| | | | | Bulk sale approach | | Discount rate | | 10.8% (10.8%) |
| | | | | | | | | |
| Remaining commercial | | $ | 3,483 |
| | Sales comparison approach | | Adj to comparables | | 0.2% - 76.0% (45.4%) |
| | | | | Bulk sale approach | | Discount rate | | 10.0% - 22.0% (16.5%) |
| | | | | | | | | |
| Residential real estate | | $ | 2,921 |
| | Sales comparison approach | | Adj to comparables | | 0.0% - 120.6% (11.1%) |
| | | | | Income approach | | Capitalization rate | | 7.9% - 10.0% (8.0%) |
| | | | | | | | | |
| Other real estate owned: | | | | | | | | |
| Commercial real estate | | $ | 1,470 |
| | Sales comparison approach | | Adj to comparables | | 0.0% - 87.0% (30.5%) |
| | | | | Income approach | | Capitalization rate | | 8.4% - 10.0% (9.4%) |
| | | | | Cost approach | | Accumulated depreciation | | 60.0% - 95.0% (77.5%) |
| | | | | | | | | |
| Construction real estate | | $ | 6,473 |
| | Sales comparison approach | | Adj to comparables | | 0.0% - 82.9% (27.1%) |
| | | | | Bulk sale approach | | Discount rate | | 15.0% (15.0%) |
| | | | | | | | | |
| Residential real estate | | $ | 2,369 |
| | Sales comparison approach | | Adj to comparables | | 0.0% - 38.3% (10.1%) |
| | | | | Income approach | | Capitalization rate | | 6.8% - 7.8% (7.6%) |
Notes to Consolidated Financial Statements
|
| | | | | | | | | | |
| December 31, 2013 |
| (In thousands) | | Fair Value | | Valuation Technique | | Unobservable Input(s) | | Range (Weighted Average) |
| Impaired loans: | | |
| | | | | | |
| Commercial real estate | | $ | 21,100 |
| | Sales comparison approach | | Adj to comparables | | 0.0% - 109.0% (22.8%) |
| | | | | Income approach | | Capitalization rate | | 8.0% - 12.5% (9.1%) |
| | | | | Cost approach | | Accumulated depreciation | | 11.7% - 65.0% (37.1%) |
| | | | | | | | | |
| Construction real estate: | | |
| | | | | | |
| SEPH commercial land and development | | $ | 4,777 |
| | Sales comparison approach | | Adj to comparables | | 0.0% - 96.0% (13.9%) |
| | | | | Bulk sale approach | | Discount rate | | 11.0% - 20.0% (14.9%) |
| | | | | | | | | |
| Remaining commercial | | $ | 3,788 |
| | Sales comparison approach | | Adj to comparables | | 0.0% - 40.0% (22.4%) |
| | | | | Bulk sale approach | | Discount rate | | 11.0% - 20.0% (18.0%) |
| | | | | | | | | |
| Residential real estate | | $ | 4,154 |
| | Sales comparison approach | | Adj to comparables | | 0.0% - 121.8% (14.9%) |
| | | | | Income approach | | Capitalization rate | | 7.8% - 10.0% (8.4%) |
| | | | | | | | | |
| Other real estate owned: | | | | | | | | |
| Commercial real estate | | $ | 4,119 |
| | Sales comparison approach | | Adj to comparables | | 0.0% - 140.0% (17.7%) |
| | | | | Income approach | | Capitalization rate | | 8.0% - 11.5% (9.6%) |
| | | | | Cost approach | | Accumulated depreciation | | 60.0% - 95.0% (80.0%) |
| | | | | | | | | |
| Construction real estate | | $ | 11,041 |
| | Sales comparison approach | | Adj to comparables | | 0.0% - 484.0% (36.2%) |
| | | | | Bulk sale approach | | Discount rate | | 13.0% - 14.0% (13.6%) |
| | | | | | | | | |
| Residential real estate | | $ | 3,366 |
| | Sales comparison approach | | Adj to comparables | | 0.0% - 273.0% (19.2%) |
| | | | | Income approach | | Capitalization rate | | 5.4% - 7.8% (7.4%) |
Notes to Consolidated Financial Statements
The following methods and assumptions were used by the Corporation in estimating its fair value disclosures for assets and liabilities not discussed above:
Cash and cash equivalents: The carrying amounts reported in the Consolidated Balance Sheets for cash and short-term instruments approximate those assets’ fair values.
Loans receivable: For variable-rate loans that reprice frequently and with no significant change in credit risk, fair values are based on carrying values. The fair values for certain mortgage loans (e.g., one-to-four family residential) are based on quoted market prices of similar loans sold in conjunction with securitization transactions, adjusted for differences in loan characteristics. The fair values for other loans are estimated using discounted cash flow analyses, based upon interest rates currently being offered for loans with similar terms to borrowers of similar credit quality. The methods utilized to estimate fair value do not necessarily represent an exit price.
Off-balance sheet instruments: Fair values for the Corporation’s loan commitments and standby letters of credit are based on the fees currently charged to enter into similar agreements, taking into account the remaining terms of the agreements and the counterparties’ credit standing. The carrying amount and fair value are not material.
Deposit liabilities: The fair values disclosed for demand deposits (e.g., interest and non-interest checking, savings, and money market accounts) are, by definition, equal to the amount payable on demand at the reporting date (i.e., their carrying amounts). The carrying amounts for variable-rate, fixed-term certificates of deposit approximate their fair values at the reporting date. Fair values for fixed-rate certificates of deposit are estimated using a discounted cash flow calculation that applies interest rates currently being offered on certificates to a schedule of aggregated expected monthly maturities of time deposits.
Short-term borrowings: The carrying amounts of federal funds purchased, borrowings under repurchase agreements and other short-term borrowings approximate their fair values.
Long-term debt: Fair values for long-term debt are estimated using a discounted cash flow calculation that applies interest rates currently being offered on long-term debt to a schedule of monthly maturities.
Subordinated notes: Fair values for subordinated notes are estimated using a discounted cash flow calculation that applies interest rate spreads currently being offered on similar debt structures to a schedule of monthly maturities.
Notes to Consolidated Financial Statements
The fair value of financial instruments at December 31, 2014 and December 31, 2013, was as follows:
|
| | | | | | | | | | | | | | | | | | | | |
| | | December 31, 2014 |
| | | | | Fair Value Measurements |
| (In thousands) | | Carrying value | | Level 1 | | Level 2 | | Level 3 | | Total fair value |
| Financial assets: | | | | | | | | | | |
| Cash and money market instruments | | $ | 237,699 |
| | $ | 237,699 |
| | $ | — |
| | $ | — |
| | $ | 237,699 |
|
| Investment securities | | 1,442,477 |
| | 1,922 |
| | 1,442,708 |
| | 775 |
| | 1,445,405 |
|
| Accrued interest receivable - securities | | 4,048 |
| | — |
| | 4,048 |
| | — |
| | 4,048 |
|
| Accrued interest receivable - loans | | 13,629 |
| | — |
| | — |
| | 13,629 |
| | 13,629 |
|
| | | | | | | | | | | |
| Mortgage loans held for sale | | 5,264 |
| | — |
| | 5,264 |
| | — |
| | 5,264 |
|
| Impaired loans carried at fair value | | 16,963 |
| | — |
| | — |
| | 16,963 |
| | 16,963 |
|
| Mortgage IRLCs | | 70 |
| | — |
| | 70 |
| | — |
| | 70 |
|
| Other loans | | 4,753,033 |
| | — |
| | — |
| | 4,757,461 |
| | 4,757,461 |
|
| Loans receivable, net | | $ | 4,775,330 |
| | $ | — |
| | $ | 5,334 |
| | $ | 4,774,424 |
| | $ | 4,779,758 |
|
| | | | | | | | | | | |
| Financial liabilities: | | |
| | |
| | |
| | |
| | |
|
| Non-interest bearing checking accounts | | $ | 1,269,296 |
| | $ | 1,269,296 |
| | $ | — |
| | $ | — |
| | $ | 1,269,296 |
|
| Interest bearing transaction accounts | | 1,122,079 |
| | 1,122,079 |
| | — |
| | — |
| | 1,122,079 |
|
| Savings accounts | | 1,325,445 |
| | 1,325,445 |
| | — |
| | — |
| | 1,325,445 |
|
| Time deposits | | 1,409,911 |
| | — |
| | 1,422,885 |
| | — |
| | 1,422,885 |
|
| Other | | 1,269 |
| | 1,269 |
| | — |
| | — |
| | 1,269 |
|
| Total deposits | | $ | 5,128,000 |
| | $ | 3,718,089 |
| | $ | 1,422,885 |
| | $ | — |
| | $ | 5,140,974 |
|
| | | | | | | | | | | |
| Short-term borrowings | | $ | 276,980 |
| | $ | — |
| | $ | 276,980 |
| | $ | — |
| | $ | 276,980 |
|
| Long-term debt | | 786,602 |
| | — |
| | 827,500 |
| | — |
| | 827,500 |
|
| Subordinated notes | | 45,000 |
| | — |
| | 42,995 |
| | — |
| | 42,995 |
|
| Accrued interest payable – deposits | | 1,125 |
| | 14 |
| | 1,111 |
| | — |
| | 1,125 |
|
| Accrued interest payable – debt/borrowings | | 1,426 |
| | 3 |
| | 1,423 |
| | — |
| | 1,426 |
|
| | | | | | | | | | | |
| Derivative financial instruments: | | |
| | |
| | |
| | | | |
|
| Fair value swap | | $ | 226 |
| | $ | — |
| | $ | — |
| | $ | 226 |
| | $ | 226 |
|
Notes to Consolidated Financial Statements
|
| | | | | | | | | | | | | | | | | | | | |
| | | December 31, 2013 |
| | | | | Fair Value Measurements |
| (In thousands) | | Carrying value | | Level 1 | | Level 2 | | Level 3 | | Total fair value |
| Financial assets: | | | | | | | | | | |
| Cash and money market instruments | | $ | 147,030 |
| | $ | 147,030 |
| | $ | — |
| | $ | — |
| | $ | 147,030 |
|
| Investment securities | | 1,358,327 |
| | 1,900 |
| | 1,361,009 |
| | 759 |
| | 1,363,668 |
|
| Accrued interest receivable - securities | | 4,840 |
| | — |
| | 4,840 |
| | — |
| | 4,840 |
|
| Accrued interest receivable - loans | | 13,495 |
| | — |
| | — |
| | 13,495 |
| | 13,495 |
|
| | | | | | | | | | | |
| Mortgage loans held for sale | | 1,666 |
| | — |
| | 1,666 |
| | — |
| | 1,666 |
|
| Impaired loans carried at fair value | | 33,819 |
| | — |
| | — |
| | 33,819 |
| | 33,819 |
|
| Mortgage IRLCs | | 61 |
| | — |
| | 61 |
| | — |
| | 61 |
|
| Other loans | | 4,525,491 |
| | — |
| | — |
| | 4,531,680 |
| | 4,531,680 |
|
| Loans receivable, net | | $ | 4,561,037 |
| | $ | — |
| | $ | 1,727 |
| | $ | 4,565,499 |
| | $ | 4,567,226 |
|
| | | | | | | | | | | |
| Financial liabilities: | | |
| | |
| | |
| | |
| | |
|
| Non-interest bearing checking accounts | | $ | 1,193,553 |
| | $ | 1,193,553 |
| | $ | — |
| | — |
| | $ | 1,193,553 |
|
| Interest bearing transaction accounts | | 1,145,525 |
| | 1,145,525 |
| | — |
| | — |
| | 1,145,525 |
|
| Savings accounts | | 1,124,994 |
| | 1,124,994 |
| | — |
| | — |
| | 1,124,994 |
|
| Time deposits | | 1,324,659 |
| | — |
| | 1,331,129 |
| | — |
| | 1,331,129 |
|
| Other | | 1,263 |
| | 1,263 |
| | — |
| | — |
| | 1,263 |
|
| Total deposits | | $ | 4,789,994 |
| | $ | 3,465,335 |
| | $ | 1,331,129 |
| | $ | — |
| | $ | 4,796,464 |
|
| | | | | | | | | | | |
| Short-term borrowings | | $ | 242,029 |
| | $ | — |
| | $ | 242,029 |
| | $ | — |
| | $ | 242,029 |
|
| Long-term debt | | 810,541 |
| | — |
| | 860,963 |
| | — |
| | 860,963 |
|
| Subordinated notes | | 80,250 |
| | — |
| | 83,140 |
| | — |
| | 83,140 |
|
| Accrued interest payable – deposits | | 1,366 |
| | 16 |
| | 1,350 |
| | — |
| | 1,366 |
|
| Accrued interest payable – debt/borrowings | | 1,535 |
| | 4 |
| | 1,531 |
| | — |
| | 1,535 |
|
| | | | | | | | | | | |
| Derivative financial instruments: | | |
| | |
| | |
| | |
| | |
|
| Fair value swap | | $ | 135 |
| | $ | — |
| | $ | — |
| | $ | 135 |
| | $ | 135 |
|
24. Capital Ratios
At December 31, 2014 and 2013, the Corporation and PNB had Tier 1, total risk-based capital and leverage ratios which were well above the required minimum levels of 4.00%, 8.00% and 4.00%.
The following table indicates the capital ratios for Park and PNB at December 31, 2014 and December 31, 2013.
|
| | | | | | | | | | | | | | | | | | |
| | | 2014 | | 2013 |
| | | Tier 1 Risk-Based | | Total Risk-Based | | Leverage | | Tier 1 Risk-Based | | Total Risk-Based | | Leverage |
| Park National Bank | | 10.13 | % | | 11.74 | % | | 6.96 | % | | 10.01 | % | | 11.78 | % | | 7.10 | % |
| Park | | 13.39 | % | | 15.14 | % | | 9.25 | % | | 13.27 | % | | 15.91 | % | | 9.48 | % |
Notes to Consolidated Financial Statements
Failure to meet the minimum requirements above could cause the FRB to take action. PNB is also subject to the capital requirements of its primary regulator, the OCC. As of December 31, 2014 and 2013, Park and PNB were well-capitalized and met all capital requirements to which each was then subject. There are no conditions or events since PNB's most recent regulatory report filings, that management believes have changed the risk categories for PNB.
The following table reflects various measures of capital for Park and PNB:
|
| | | | | | | | | | | | | | | | | | | | | |
| | | | | | | To Be Adequately Capitalized | | To Be Well Capitalized |
| (In thousands) | | Actual Amount | | Ratio | | Amount | | Ratio | | Amount | | Ratio |
| At December 31, 2014 | | | | | | | | | | | | |
Total Risk-Based Capital
(to risk-weighted assets) | | | | | | | | | | | | |
| PNB | | $ | 563,188 |
| | 11.74 | % | | $ | 383,634 |
| | 8.00 | % | | $ | 479,542 |
| | 10.00 | % |
| Park | | 739,517 |
| | 15.14 | % | | 390,822 |
| | 8.00 | % | | N/A |
| | N/A |
|
Tier 1 Risk-Based Capital
(to risk-weighted assets) | | | | | | | | | | | | |
| PNB | | $ | 485,943 |
| | 10.13 | % | | $ | 191,817 |
| | 4.00 | % | | $ | 287,725 |
| | 6.00 | % |
| Park | | 654,339 |
| | 13.39 | % | | 195,411 |
| | 4.00 | % | | N/A |
| | N/A |
|
Leverage Ratio
(to average total assets) | | | | | | | | | | | | |
| PNB | | $ | 485,943 |
| | 6.96 | % | | $ | 279,210 |
| | 4.00 | % | | $ | 349,013 |
| | 5.00 | % |
| Park | | 654,339 |
| | 9.25 | % | | 282,992 |
| | 4.00 | % | | N/A |
| | N/A |
|
| | | | | | | | | | | | | |
| At December 31, 2013 | | | | | | | | | | | | |
Total Risk-Based Capital
(to risk-weighted assets) | | | | | | | | | | | | |
| PNB | | $ | 545,144 |
| | 11.78 | % | | $ | 370,198 |
| | 8.00 | % | | $ | 462,747 |
| | 10.00 | % |
| Park | | 754,605 |
| | 15.91 | % | | 379,446 |
| | 8.00 | % | | N/A |
| | N/A |
|
Tier 1 Risk-Based Capital
(to risk-weighted assets) | | | | | | | | | | | | |
| PNB | | $ | 463,015 |
| | 10.01 | % | | $ | 185,099 |
| | 4.00 | % | | $ | 277,648 |
| | 6.00 | % |
| Park | | 629,410 |
| | 13.27 | % | | 189,723 |
| | 4.00 | % | | N/A |
| | N/A |
|
Leverage Ratio
(to average total assets) | | | | | | | | | | | | |
| PNB | | $ | 463,015 |
| | 7.10 | % | | $ | 261,025 |
| | 4.00 | % | | $ | 326,281 |
| | 5.00 | % |
| Park | | 629,410 |
| | 9.48 | % | | 265,633 |
| | 4.00 | % | | N/A |
| | N/A |
|
25. Segment Information
The Corporation is a financial holding company headquartered in Newark, Ohio. The operating segments for the Corporation are its chartered national bank subsidiary, PNB (headquartered in Newark, Ohio), SEPH and GFSC.
GAAP requires management to disclose information about the different types of business activities in which a company engages and also information on the different economic environments in which a company operates, so that the users of the financial statements can better understand a company’s performance, better understand the potential for future cash flows, and make more informed judgments about the company as a whole. Park’s current operating segments are in line with GAAP as: (i) discrete financial information is available for each operating segment and (ii) the segments are aligned with internal reporting to Park’s Chief Executive Officer and President, who is the chief operating decision maker.
Notes to Consolidated Financial Statements
|
| | | | | | | | | | | | | | | | | | | | | |
| Operating results for the year ended December 31, 2014 (In thousands) |
| | | PNB | | | GFSC | | SEPH | | All Other | | Total |
| Net interest income (loss) | | $ | 218,641 |
| | | $ | 7,457 |
| | $ | 958 |
| | $ | (2,012 | ) | | $ | 225,044 |
|
| Provision for (recovery of) loan losses | | 3,517 |
| | | 1,544 |
| | (12,394 | ) | | — |
| | (7,333 | ) |
| Other income (loss) | | 69,384 |
| | | (1 | ) | | 5,991 |
| | 175 |
| | 75,549 |
|
| Other expense | | 171,365 |
| | | 4,103 |
| | 11,766 |
| | 8,000 |
| | 195,234 |
|
| Income (loss) before taxes | | 113,143 |
| | | 1,809 |
| | 7,577 |
| | (9,837 | ) | | 112,692 |
|
| Income taxes (benefit) | | 30,103 |
| | | 634 |
| | 2,652 |
| | (4,787 | ) | | 28,602 |
|
| Net income (loss) | | $ | 83,040 |
| | | $ | 1,175 |
| | $ | 4,925 |
| | $ | (5,050 | ) | | $ | 84,090 |
|
| Balances at December 31, 2014 |
| Assets | | $ | 6,912,443 |
| | | $ | 40,308 |
| | $ | 43,762 |
| | $ | 6,743 |
| | $ | 7,003,256 |
|
| Loans | | 4,781,761 |
| | | 40,645 |
| | 23,956 |
| | (16,680 | ) | | 4,829,682 |
|
| Deposits | | 5,222,766 |
| | | 5,883 |
| | — |
| | (100,649 | ) | | 5,128,000 |
|
|
| | | | | | | | | | | | | | | | | | | | | |
| Operating results for the year ended December 31, 2013 (In thousands) |
| | | PNB | | | GFSC | | SEPH | | All Other | | Total |
| Net interest income (loss) | | $ | 210,781 |
| | | $ | 8,741 |
| | $ | (1,325 | ) | | $ | 2,828 |
| | $ | 221,025 |
|
| Provision for (recovery of) loan losses | | 14,039 |
| | | 1,175 |
| | (11,799 | ) | | — |
| | 3,415 |
|
| Other income | | 70,841 |
| | | 11 |
| | 1,956 |
| | 469 |
| | 73,277 |
|
| Other expense | | 165,665 |
| | | 3,133 |
| | 12,211 |
| | 7,520 |
| | 188,529 |
|
| Income (loss) before taxes | | 101,918 |
| | | 4,444 |
| | 219 |
| | (4,223 | ) | | 102,358 |
|
| Income taxes (benefit) | | 26,324 |
| | | 1,556 |
| | 77 |
| | (2,826 | ) | | 25,131 |
|
| Net income (loss) | | $ | 75,594 |
| | | $ | 2,888 |
| | $ | 142 |
| | $ | (1,397 | ) | | $ | 77,227 |
|
| Balances at December 31, 2013 |
| Assets | | $ | 6,524,098 |
| | | $ | 47,115 |
| | $ | 72,781 |
| | $ | (5,647 | ) | | $ | 6,638,347 |
|
| Loans | | 4,559,406 |
| | | 47,228 |
| | 38,014 |
| | (24,143 | ) | | 4,620,505 |
|
| Deposits | | 4,896,405 |
| | | 7,159 |
| | — |
| | (113,570 | ) | | 4,789,994 |
|
|
| | | | | | | | | | | | | | | | | | | | | |
| Operating results for the year ended December 31, 2012 (In thousands) |
| | | PNB | | | GFSC | | SEPH | | All Other | | Total |
| Net interest income (loss) | | $ | 221,758 |
| | | $ | 9,156 |
| | $ | (341 | ) | | $ | 4,742 |
| | $ | 235,315 |
|
| Provision for loan losses | | 16,678 |
| | | 859 |
| | 17,882 |
| | — |
| | 35,419 |
|
| Other income | | 70,739 |
| | | — |
| | 21,431 |
| | 233 |
| | 92,403 |
|
| Other expense | | 156,516 |
| | | 2,835 |
| | 22,032 |
| | 6,585 |
| | 187,968 |
|
| Income (loss) before taxes | | 119,303 |
| | | 5,462 |
| | (18,824 | ) | | (1,610 | ) | | 104,331 |
|
| Income taxes (benefit) | | 32,197 |
| | | 1,912 |
| | (6,603 | ) | | (1,805 | ) | | 25,701 |
|
| Net income (loss) | | $ | 87,106 |
| | | $ | 3,550 |
| | $ | (12,221 | ) | | $ | 195 |
| | $ | 78,630 |
|
| Balances at December 31, 2012 | | | | | | | | | | | |
| Assets | | $ | 6,502,579 |
| | | $ | 49,926 |
| | $ | 104,428 |
| | $ | (14,130 | ) | | $ | 6,642,803 |
|
| Loans | | 4,369,173 |
| | | 50,082 |
| | 59,178 |
| | (28,111 | ) | | 4,450,322 |
|
| Deposits | | 4,814,107 |
| | | 8,358 |
| | — |
| | (106,433 | ) | | 4,716,032 |
|
Notes to Consolidated Financial Statements
The following is a reconciliation of financial information for the reportable segments to the Corporation’s consolidated totals:
|
| | | | | | | | | | | | | | | | | | | | | | | | |
| | | 2014 |
| (In thousands) | | Net Interest Income | | Depreciation Expense | | Other Expense | | Income Taxes | | Assets | | Deposits |
| Totals for reportable segments | | $ | 227,056 |
| | $ | 7,243 |
| | $ | 179,991 |
| | $ | 33,389 |
| | $ | 6,996,513 |
| | $ | 5,228,649 |
|
| Elimination of intersegment items | | 3,708 |
| | — |
| | — |
| | — |
| | (18,556 | ) | | (100,649 | ) |
| Parent Co. totals - not eliminated | | (5,720 | ) | | — |
| | 8,000 |
| | (4,787 | ) | | 25,299 |
| | — |
|
| Totals | | $ | 225,044 |
| | $ | 7,243 |
| | $ | 187,991 |
| | $ | 28,602 |
| | $ | 7,003,256 |
| | $ | 5,128,000 |
|
|
| | | | | | | | | | | | | | | | | | | | | | | | |
| | | 2013 |
| (In thousands) | | Net Interest Income | | Depreciation Expense | | Other Expense | | Income Taxes | | Assets | | Deposits |
| Totals for reportable segments | | $ | 218,197 |
| | $ | 7,315 |
| | $ | 173,694 |
| | $ | 27,957 |
| | $ | 6,643,994 |
| | $ | 4,903,564 |
|
| Elimination of intersegment items | | 8,659 |
| | — |
| | — |
| | — |
| | (30,369 | ) | | (113,570 | ) |
| Parent Co. totals - not eliminated | | (5,831 | ) | | — |
| | 7,520 |
| | (2,826 | ) | | 24,722 |
| | — |
|
| Totals | | $ | 221,025 |
| | $ | 7,315 |
| | $ | 181,214 |
| | $ | 25,131 |
| | $ | 6,638,347 |
| | $ | 4,789,994 |
|
|
| | | | | | | | | | | | | | | | | | | | | | | | |
| | | 2012 |
| (In thousands) | | Net Interest Income | | Depreciation Expense | | Other Expense | | Income Taxes | | Assets | | Deposits |
| Totals for reportable segments | | $ | 230,573 |
| | $ | 6,954 |
| | $ | 174,429 |
| | $ | 27,506 |
| | $ | 6,656,933 |
| | $ | 4,822,465 |
|
| Elimination of intersegment items | | 8,558 |
| | — |
| | — |
| | — |
| | (35,639 | ) | | (106,433 | ) |
| Parent Co. totals - not eliminated | | (3,816 | ) | | — |
| | 6,585 |
| | (1,805 | ) | | 21,509 |
| | — |
|
| Totals | | $ | 235,315 |
| | $ | 6,954 |
| | $ | 181,014 |
| | $ | 25,701 |
| | $ | 6,642,803 |
| | $ | 4,716,032 |
|
26. Parent Company Statements
The Parent Company statements should be read in conjunction with the consolidated financial statements and the information set forth below. Investments in subsidiaries are accounted for using the equity method of accounting. The effective tax rate for the Parent Company is substantially less than the statutory rate due principally to tax-exempt dividends from subsidiaries.
Cash represents non-interest bearing deposits with PNB. Net cash provided by operating activities reflects cash payments (received from subsidiaries) for income taxes of $5.81 million, $2.54 million and $4.54 million in 2014, 2013 and 2012, respectively.
At December 31, 2014 and 2013, shareholders’ equity reflected in the Parent Company balance sheet includes $197.9 million and $196.0 million, respectively, of undistributed earnings of the Corporation’s subsidiaries which are restricted from transfer as dividends to the Corporation.
Notes to Consolidated Financial Statements
|
| | | | | | | | |
| Balance Sheets |
| December 31, 2014 and 2013 |
| (In thousands) | | 2014 | | 2013 |
| Assets: | | | | |
| Cash | | $ | 98,671 |
| | $ | 106,942 |
|
| Investment in subsidiaries | | 601,912 |
| | 582,992 |
|
| Debentures receivable from PNB | | 25,000 |
| | 25,000 |
|
| Other investments | | 2,344 |
| | 2,297 |
|
| Other assets | | 23,260 |
| | 21,984 |
|
| Total assets | | $ | 751,187 |
| | $ | 739,215 |
|
| Liabilities: | | | | |
| Subordinated notes | | 45,000 |
| | 80,250 |
|
| Other liabilities | | 7,589 |
| | 7,218 |
|
| Total liabilities | | 52,589 |
| | 87,468 |
|
| Total shareholders’ equity | | 698,598 |
| | 651,747 |
|
| Total liabilities and shareholders’ equity | | $ | 751,187 |
| | $ | 739,215 |
|
|
| | | | | | | | | | | | |
| Statements of Income |
| for the years ended December 31, 2014, 2013 and 2012 |
| (In thousands) | | 2014 | | 2013 | | 2012 |
| Income: | | | | | | |
| Dividends from subsidiaries | | $ | 60,000 |
| | $ | 15,000 |
| | $ | 197,000 |
|
| Interest and dividends | | 3,708 |
| | 8,659 |
| | 10,027 |
|
| Other | | 262 |
| | 531 |
| | 232 |
|
| Total income | | 63,970 |
| | 24,190 |
| | 207,259 |
|
| Expense: | | | | | | |
| Other, net | | 13,807 |
| | 13,413 |
| | 11,869 |
|
| Total expense | | 13,807 |
| | 13,413 |
| | 11,869 |
|
| Income before federal taxes and equity in undistributed income (losses) of subsidiaries | | 50,163 |
| | 10,777 |
| | 195,390 |
|
| Federal income tax benefit | | 4,787 |
| | 2,826 |
| | 1,806 |
|
| Income before equity in undistributed income (losses) of subsidiaries | | 54,950 |
| | 13,603 |
| | 197,196 |
|
| Equity in undistributed income (losses) of subsidiaries | | 29,140 |
| | 63,624 |
| | (118,566 | ) |
| Net income | | $ | 84,090 |
| | $ | 77,227 |
| | $ | 78,630 |
|
| Other comprehensive income (loss) (1) | | 21,811 |
| | (17,901 | ) | | (8,687 | ) |
| Comprehensive income | | 105,901 |
|
| 59,326 |
| | 69,943 |
|
(1) See Consolidated Statements of Comprehensive Income for other comprehensive income detail
Notes to Consolidated Financial Statements
|
| | | | | | | | | | | | |
| Statements of Cash Flows |
| for the years ended December 31, 2014, 2013 and 2012 |
| (In thousands) | | 2014 | | 2013 | | 2012 |
| Operating activities: | | | | | | |
| Net income | | $ | 84,090 |
| | $ | 77,227 |
| | $ | 78,630 |
|
| Adjustments to reconcile net income to net cash provided by operating activities: | | | | | | |
| Undistributed (income) losses of subsidiaries | | (29,140 | ) | | (63,624 | ) | | 118,566 |
|
| Compensation expense for issuance of treasury stock to directors | | 801 |
| | 850 |
| | 407 |
|
| Share-based compensation expense | | 458 |
| | — |
| | — |
|
| (Decrease) increase in other assets | | (1,292 | ) | | (2,215 | ) | | 5,748 |
|
| Increase (decrease) in other liabilities | | 298 |
| | (2,187 | ) | | 1,724 |
|
| Net cash provided by operating activities | | 55,215 |
| | 10,051 |
| | 205,075 |
|
| Investing activities: | | | | | | |
| Capital contribution in subsidiary | | — |
| | (45,000 | ) | | (45,000 | ) |
| Purchase of debentures receivable from subsidiaries | | — |
| | — |
| | (115,000 | ) |
| Repayment of investments in and advances to subsidiaries | | 32,000 |
| | 101,960 |
| | 52,000 |
|
| Net cash provided by (used in) investing activities | | 32,000 |
| | 56,960 |
| | (108,000 | ) |
| Financing activities: | | | | | | |
| Cash dividends paid | | (57,876 | ) | | (57,949 | ) | | (60,154 | ) |
| Payment to repurchase warrants | | — |
| | — |
| | (2,843 | ) |
| Payment to repurchase preferred shares | | — |
| | — |
| | (100,000 | ) |
| Repayment of subordinated notes | | (35,250 | ) | | — |
| | — |
|
| Repurchase of treasury shares | | (2,355 | ) | | (843 | ) | | — |
|
| Proceeds from issuance of subordinated notes | | — |
| | — |
| | 30,000 |
|
| Cash payment for fractional shares | | (5 | ) | | (3 | ) | | (2 | ) |
| Net cash used in financing activities | | (95,486 | ) | | (58,795 | ) | | (132,999 | ) |
| (Decrease) increase in cash | | (8,271 | ) | | 8,216 |
| | (35,924 | ) |
| Cash at beginning of year | | 106,942 |
| | 98,726 |
| | 134,650 |
|
| Cash at end of year | | $ | 98,671 |
| | $ | 106,942 |
| | $ | 98,726 |
|
27. Participation in the U.S. Treasury Capital Purchase Program (CPP)
On December 23, 2008, Park issued $100 million of Fixed Rate Cumulative Perpetual Preferred Shares, Series A, with a liquidation preference of $1,000 per share (the “Series A Preferred Shares”), associated with Park's participation in the CPP. As part of its participation in the CPP, Park also issued a warrant to the U.S. Treasury to purchase 227,376 common shares (the “Warrant”).
On April 25, 2012, Park entered into a Letter Agreement with the U.S. Treasury pursuant to which Park repurchased the 100,000 Series A Preferred Shares for a purchase price of $100 million plus a pro rata accrued and unpaid dividend. Total consideration of $101.0 million included accrued and unpaid dividends of $1.0 million. In addition to the accrued and unpaid dividends of $1.0 million, the charge to retained earnings, resulting from the repurchase of the Series A Preferred Shares, was $1.6 million on April 25, 2012.
On May 2, 2012, Park entered into a Letter Agreement pursuant to which Park repurchased from the U.S. Treasury the Warrant to purchase 227,376 Park common shares in full for consideration of $2.8 million, or $12.50 per Park common share.