UNITED STATES
SECURITIES AND EXCHANGE COMMISSION
Washington, D.C. 20549
FORM N-CSR
CERTIFIED SHAREHOLDER REPORT OF REGISTERED
MANAGEMENT INVESTMENT COMPANIES
Investment Company Act file number: 811-4920
WASATCH FUNDS, INC.
(Exact name of registrant as specified in charter)
150 Social Hall Avenue
4th Floor
Salt Lake City, Utah 84111
(Address of principal executive offices) (Zip code)
| | |
| (Name and Address of Agent for Service) | | Copy to: |
| |
Samuel S. Stewart, Jr. Wasatch Funds, Inc. 150 Social Hall Avenue, 4th Floor Salt Lake City, Utah 84111 | | Eric F. Fess, Esq. Chapman & Cutler LLP 111 West Monroe Street Chicago, IL 60603 |
Registrant’s telephone number, including area code: (801) 533-0777
Date of fiscal year end: September 30
Date of reporting period: March 31, 2007
| Item 1: | Report to Shareholders. |
| | |
 | | Semi-Annual Report |
| |
| MARCH 31, 2007 | | WASATCH CORE GROWTH FUND® |
| |
| | WASATCH GLOBAL SCIENCE & TECHNOLOGY FUND® |
| |
| | WASATCHHERITAGE GROWTH FUND® |
| |
| | WASATCH INTERNATIONAL GROWTH FUND® |
| |
| | WASATCH INTERNATIONAL OPPORTUNITIES FUND™ |
| |
| | WASATCH MICRO CAP FUND® |
| |
| | WASATCH MICRO CAP VALUE FUND® |
| |
| | WASATCH SMALL CAP GROWTH FUND® |
| |
| | WASATCH SMALL CAP VALUE FUND® |
| |
| | WASATCH STRATEGIC INCOME FUND™ |
| |
| | WASATCH ULTRA GROWTH FUND® |
| |
| | WASATCH-HOISINGTON U.S. TREASURY FUND® |
Wasatch Funds, Inc.
P.O. Box 2172
Milwaukee, WI 53201-2172
www.wasatchfunds.com
800.551.1700
This material must be accompanied or preceded by a prospectus.
Please read the prospectus carefully before you invest.
Wasatch Funds are distributed by ALPS Distributors, Inc.
1
| | |

Samuel S. Stewart, Jr., PhD, CFA President of
Wasatch Funds | | FELLOW SHAREHOLDERS: Back in the 1950s, there was a game show called The $64,000 Question. Each week, contestants would take the stage, step into the “isolation booth,” and try to win ever-larger prizes with ever-tougher questions. As time ticked away, the drama mounted. The contestants’ financial destiny was on the line with every right or wrong answer. Some investors today might feel a little like those contestants as they try to figure out where the economy is headed next. Overall, things look pretty good. Employment remains strong. Inflation is tame. Corporate earnings are solid. The markets are moving upward. On the other hand, the once-robust housing market has stagnated, the subprime mortgage sector has been hit hard, energy prices remain volatile, and we still see plenty of political instability around the world. That brings us to the $64,000 question: Will the equity markets and the economy be able to continue the growth of the past six months? Although we at Wasatch don’t focus on macroeconomic factors as the basis for our investment decisions, we do recognize that the overall health of the economy may have an impact on our funds over the short term. |
The recent troubles in the subprime mortgage sector are clearly a cause for concern. When housing prices were soaring, some lenders wrote mortgages for borrowers who couldn’t qualify for traditional financing. Both borrowers and lenders counted on continuing escalation of home values. Now that prices are flat or even slightly down, a lot of people are finding it hard to meet their payments, and an increasing number are facing foreclosure — a bad scenario for borrowers and lenders alike.
Whether this situation will turn out to be just a bump in the road, or one that reverberates more broadly through the economy, is not clear yet. There are ways the subprime issue could cause broader problems. One would be if it compounded the general slowdown in the housing market to cause a significant loss of jobs in the homebuilding industry and related areas like materials and consumer durables.
Another would be if it ultimately put the brakes on consumer spending. Over the past several years, homeowners have been able to use their homes, through refinancing and equity loans, as a ready source of extra cash. That’s helped to fuel all kinds of spending — from sensible home improvements to exotic travel and luxury automobiles. As many industries have benefited from this resource, the same would be hurt if it dried up in the wake of tighter borrowing guidelines.
We can’t ignore the potential impact from this tightening in the mortgage and housing sectors. What is important to remember, though, is that while the subprime meltdown could have broader implications, it doesn’t signal a crisis in our financial system. It’s clearly a situation we will continue to watch in the coming months, but at this point I view it as another cloud on the horizon — we should keep an eye on it, but I’m not ready to cancel the picnic.
PERFORMANCE
It was this very difficulty in trying to predict what the economy would do that led us in our early days to focus our efforts elsewhere — on fundamental due diligence to find strong companies. We saw that even the highest-paid, best-trained economists in this country struggled to figure out the macroeconomic landscape. It seemed pointless for us to get into that guessing game and then make our investment decisions based on such predictions. We felt much more comfortable identifying strong companies — those that can sail ahead even when the winds aren’t favorable — from the bottom up, and then owning them for the long-term.
O’Reilly Automotive is a great example of the type of company we want to own. O’Reilly is a U.S. automotive supplies retailer. It’s in a business that’s relatively immune to economic cycles. Automobiles constantly need maintenance and repair, and demand can actually accelerate when times are tough and people delay new car purchases. O’Reilly also has the tailwind of an aging U.S. auto fleet, the ability to expand geographically and a management team that has an excellent track record of growing the business. We first purchased O’Reilly in 1992 at around $3 per share and over the last 15 years have owned it in multiple funds. Of course its stock price hasn’t gone up every period, but with a great long-term business model O’Reilly has shown sustainable growth and its stock now trades at roughly $36.
A strong market like we’ve seen the past six months — the S&P 500® was up 7.38% — historically is not the kind of market in which tried-and-true companies such as O’Reilly lead, but I am encouraged by Wasatch’s overall performance during this recent period. Not all of our funds beat their respective benchmarks, but we began to feel traction again in most of our styles, delivered generally solid returns, and had some funds outperform their benchmarks by a wide margin, with particularly strong international returns.
As I’ve discussed before, international investing is an area of increasing interest and focus at Wasatch. We’ve broadened and deepened our international investment team, and committed more resources to global research. Why? There’s no place for an ‘isolation booth’ on today’s global investment stage. Our increased focus on international companies represents a long-term strategy, not a temporary shift. That’s why you’ll find international holdings not just in our global and international funds, but also at varying levels in every one of our domestic funds.
Our interest in international investing heightened several years ago. At that time, most foreign markets were depressed relative to the U.S., so valuations were attractive. Not only that, but better global communication was making it easier to conduct thorough research of international companies to determine which ones truly offered opportunity. And unlike our early days — when purchasing an international stock was a hard, if not infeasible, process — there is now an investment infrastructure that makes buying a foreign equity quite manageable. In short, it’s become easier to identify strong international prospects and to take action.
2
Researching international companies clearly helps us evaluate the prospects of U.S. based firms as they compete on a more global scale every day. Similarly, our domestic knowledge helps us evaluate companies elsewhere in the world. For example, Super Cheap Auto Group out of Australia looks surprisingly similar to how O’Reilly looked several years ago. Super Cheap’s primary business is a chain of roughly 200 auto parts stores in Australia and New Zealand. Our intimate knowledge of O’Reilly helped us get comfortable with the business model of this overseas peer much more quickly, thus allowing the funds that held Super Cheap to benefit from the dramatic 77% increase in its stock price over the last six months.
Obviously, we’re not the only people tuned into the investment potential of global markets. A lot of money is being directed at foreign countries. As a result, there are fewer inexpensive stocks — particularly in some smaller markets where even a modest influx of investor dollars can drive prices up quickly.
Three markets that particularly excite us are, not coincidentally, some of the world’s most populous: China, India, and Brazil. These countries have economies that are growing much faster than the United States.’ It’s not just that they have a lot of people — they have an expanding consumer class that demands more and better products and services. This has paved the way for a variety of companies, from consumer discretionary to financials, to grow rapidly by addressing these consumers’ appetites. As these companies grow, many are realizing that not only do they have huge local markets but that a global orientation creates numerous opportunities from which to choose.
With the U.S. and other established markets looking at only modest projections for growth, markets like these are drawing escalating interest from investors — including ourselves. That makes our expanded research capabilities all the more important in finding reasonably valued companies with the fundamental qualities to grow and thrive in the global economy. To learn as much as we can about each company, we travel extensively to see and hear about companies first hand and then compare notes with each other. Our Multiple Eyes™ research approach is about more than just sharing these investment ideas — it’s also about helping to identify possible pitfalls. In an increasingly competitive international investing landscape, there’s little room for guesswork.
OUTLOOK
Returning to the domestic front, it’s important to keep the market activity of recent months in context. There were certainly moments of high volatility and steep one-day declines. But they came as part of a remarkable run. From last June through the end of March, the U.S. equity markets experienced an almost uninterrupted nine-month upturn and finished by reaching all-time highs.
With such strength, the market almost inevitably will find a reason to correct. Recently, worries about the subprime mortgage situation and concern about a pullback in the Shanghai stock market were enough to provoke triple-digit single-day losses. But, in both instances the U.S. market quickly regained its footing and kept moving upward. Does that mean there’s nothing to worry about? Hardly. Investors ignore risk at their own peril. The market has shown real resilience and determination, but at the same time I don’t see enough overwhelmingly good news on the horizon for the market to keep up its recent pace.
Fortunately, the performance of Wasatch Funds doesn’t depend on the answer to the single question: Is the economy going to go up or down? Rather, we deal with dozens of questions every day. Is a company undervalued? Does it have unique advantages? Is it serving a market that can grow and expand even in a challenging environment? Does its management have the talent and vision to stay ahead of its competitors? The answers to these questions won’t help us win a one-time jackpot. But they provide something much more valuable. They help us build portfolios that can serve as a foundation for a long-term financial plan.
We appreciate the continued trust you have placed in us.
Sincerely,

Samuel S. Stewart, Jr.
President of Wasatch Funds
WASATCH-HOISINGTON U.S. TREASURY FUND
For information about the performance and outlook of the Fund, please see the management discussion and portfolio summary on pages 26 and 27. The views expressed in the management discussion are those of Hoisington Investment Management Company, sub-advisor to the Fund, and may differ from the views of Wasatch Advisors, investment advisor to Wasatch Funds.
Information in this shareholder report regarding market or economic trends or the factors influencing the Funds’ historical or future performance reflects the opinions of Fund management as of the date of this report. These statements should not be relied upon for any other purpose. Past performance is no guarantee of future results, and there is no guarantee that the market forecasts discussed will be realized.
3
| | |
| WASATCH CORE GROWTH FUND (WGROX) — Management Discussion | | MARCH 31, 2007 |
|
| |
| |
The Wasatch Core Growth Fund is managed by a team of Wasatch portfolio managers, led by JB Taylor and Paul Lambert.
| | | | |

JB Taylor
Portfolio Manager | | 
Paul Lambert
Portfolio Manager | | OVERVIEW The Wasatch Core Growth Fund gained 10.77% in the six months ended March 31, 2007, while the Russell 2000 Index returned 11.02% over the same period. Although the Fund slightly |
underperformed the Index, it was able to post a strong return for this period. The six months began with generally stable conditions, but as the period progressed, the environment became increasingly choppy. The markets experienced some steep single-day declines in late February and early March. The volatility was seemingly triggered by concerns over the implications of a slowing U.S. economy, weakness in international equity markets, and worries about the potential impact of recent difficulties among subprime mortgage lenders.
Because we focus on individual company selection, not macroeconomic positioning or top-down sector allocation, our strategy typically has been to avoid companies that depend on effusive levels of consumer confidence and spending. Instead, our research tends to lead us to favor companies that can grow their earnings in both robust and weak economic environments.
That said, the top-contributing sectors for the Fund during the period were health care, financial services, and consumer discretionary. Virtually all sectors in which we were invested made positive contributions to performance over the six months.
DETAILSOFTHE PERIOD
The health care sector was home to two of the Fund’s strongest contributors for the six-month period, Sunrise Senior Living and Pediatrix Medical Group. Sunrise Senior Living, the largest operator of assisted-living facilities in the country, is capitalizing on the strong demand for high-quality, trusted senior care. The company is addressing these strong demographic trends by maintaining a premium position in the marketplace and by staying diversified geographically. A further boost to the stock came in the first quarter of 2007 when an affiliate REIT of the company was sold, giving investors greater insight into the parent company’s intrinsic value. Pediatrix was also particularly strong in the first quarter of 2007, as the provider of pediatric health services posted impressive fourth quarter top-line results.
Our focus on moving more assets into our highest quality names served us well, as we nicely increased our stake in both companies prior to the run up. This strategy had a positive impact on performance for the six months, and we believe it will continue to do so over the longer term.
UTI Bank, which is benefiting from the economic expansion and demand for more sophisticated financial services in the Indian market, was a top performer for the Fund and led our strong showing in the financials sector. This investment reflects our Multiple Eyes™ approach to investing, which includes working closely with our international investment team as we seek opportunities around the globe.
Several post-secondary education providers within the consumer discretionary sector produced solid performance during the period: Laureate Education, Strayer Education, and Universal Technical Institute. We believe these companies are positioned to thrive as both domestic and international workers seek to enhance their professional skill-sets and earn higher incomes. Laureate received a further boost from an announced buy-out led by a private equity firm and management.
Pool Corp., a provider of pool maintenance supplies and the Fund’s largest holding, was the biggest detractor in the consumer discretionary sector. Pool’s stock price languished primarily because many observers are associating its prospects with the slowdown in the housing market. However, because the company’s growth prospects over the next 10 years appear strong, we believe that sentiment is overdone. Pool’s valuation is now compelling, and we used the price declines to add to our position.
OUTLOOK
We remain pleased with the quality and value of the companies held in the Core Growth Fund. Over the past six months, we have focused on finding companies that have the potential to offer stable to accelerating earnings growth in a variety of economic climates, including an economy that may be softening. We expect the companies in the Fund to provide earnings growth rates in the mid- to high teens. We are taking special care to ensure that we are not being overly optimistic about their business models. We also believe that at 22x trailing earnings for our portfolio holdings, we are paying a reasonable price for earnings growth.
While we expect problems in the subprime mortgage market to have some ramifications for the broader economy, at this point the nature and dimensions of the potential disruption remain unclear. There are forecasts of record foreclosures, but we haven’t yet seen what the ultimate impact on the consumer will be. Further, it’s not yet clear what impact the slower housing market will have on employment levels. Rather than attempting to discern trends that are difficult to predict accurately, we are maintaining our focus on company-by-company research. In today’s somewhat uncertain environment, we are beginning to see the market turn toward higher-quality companies. These companies have strong management teams, generate higher returns on capital and have sustainable competitive advantages — exactly the types of companies we strive to own.
Thank you for the opportunity to manage your assets.
4
| | |
| WASATCH CORE GROWTH FUND (WGROX) — Portfolio Summary | | MARCH 31, 2007 |
|
| |
| |
AVERAGE ANNUAL TOTAL RETURNS
| | | | | | | | |
| | | SIX MONTHS* | | 1 YEAR | | 5 YEARS | | 10 YEARS |
Wasatch Core Growth Fund | | 10.77% | | 2.58% | | 6.33% | | 15.31% |
Russell 2000 Index | | 11.02% | | 5.91% | | 10.95% | | 10.23% |
Performance data quoted represents past performance. Past performance is not indicative of future performance and current performance may be lower or higher than the performance quoted. Wasatch Funds will deduct a fee of 2% from redemption proceeds on Fund shares held two months or less. Performance data does not reflect the deduction of this fee which, if charged, would reduce the performance quoted. The table above does not reflect the deduction of taxes that you would pay on fund distributions or the redemption of fund shares.
The total annual fund operating expenses for the Wasatch Core Growth Fund are 1.17% and are based on Fund expenses before any expense reimbursements by the Advisor. The net expenses for the Core Growth Fund are 1.17% and are based on Fund expenses, net of waivers and reimbursements. The Advisor has contractually agreed to reimburse the Fund for total annual fund operating expenses in excess of 1.50% until at least 1/31/08 (excluding interest, taxes, brokerage commissions, other investment related costs and extraordinary expenses in excess of such limitations). See the prospectus for additional information regarding Fund expenses.
To obtain the most recent month-end performance, please visit www.wasatchfunds.com or call 800.551.1700. Investment returns and principal value will fluctuate and shares, when redeemed, may be worth more or less than their original cost. The Advisor has absorbed, in the past, certain Fund expenses, without which total returns would have been lower.
Investments in small cap funds will be more volatile and loss of principal could be greater than investing in large cap or more diversified funds.
TOP 10 EQUITY HOLDINGS*
| | | | |
| Ticker | | Company | | % of Fund |
| POOL | | Pool Corp. Swimming pool supplies distributor. | | 5.11% |
| CPRT | | Copart, Inc. Vehicle salvage services. | | 4.81% |
| ORLY | | O’Reilly Automotive, Inc. Automotive parts retailer/distributor. | | 4.21% |
| PDX | | Pediatrix Medical Group, Inc. National network of neonatalogists. | | 4.04% |
| SRZ | | Sunrise Senior Living, Inc. Assisted living centers. | | 3.64% |
| | | | |
| Ticker | | Company | | % of Fund |
| STRA | | Strayer Education, Inc. Post-secondary education. | | 3.07% |
| MSM | | MSC Industrial Direct Co., Inc., Class A Industrial products distributor. | | 3.04% |
| GISX | | Global Imaging Systems, Inc. Office imaging equipment sales and service | | 3.00% |
| CBH | | Commerce Bancorp, Inc. Commercial banking, corporate trust and insurance brokerage services. | | 2.98% |
| GTRC | | Guitar Center, Inc. Music stores. | | 2.95% |
| * | | As of March 31, 2007, the Fund had 36.85% invested in the Top 10 equity holdings and there were 69 long-term holdings in the Fund. Portfolio holdings are subject to change at any time. References to specific securities should not be construed as recommendations by the Funds or their Advisor. |
SECTOR BREAKDOWN**
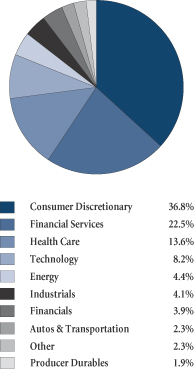
| ** | | Excludes short-term investments, securities sold short and written options, if any. |
GROWTHOFA $10,000 INVESTMENT
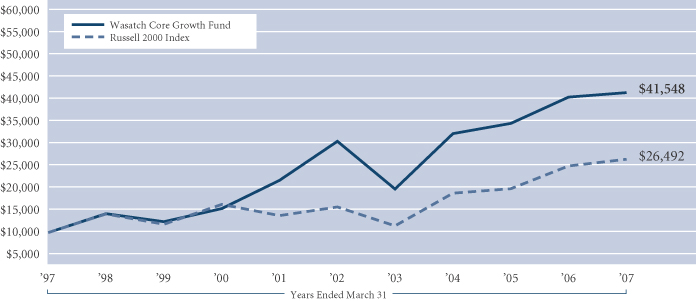
The Russell 2000 Index is an unmanaged total return index of the smallest 2,000 companies in the Russell 3000 Index, as ranked by total market capitalization. The Russell 2000 Index is widely regarded in the industry as accurately capturing the universe of small company stocks. You cannot invest directly in the Index.
5
| | |
| WASATCH GLOBAL SCIENCE & TECHNOLOGY FUND (WAGTX) — Management Discussion | | MARCH 31, 2007 |
|
| |
| |
The Wasatch Global Science & Technology Fund is managed by a team of Wasatch portfolio managers, led by Noor Kamruddin and James S. Gulbrandsen.
| | | | |

Noor Kamruddin Portfolio Manager | | 
James S. Gulbrandsen Portfolio Manager | | OVERVIEW The Wasatch Global Science & Technology Fund gained 12.96% in the six-month period ended March 31, 2007, easily outpacing the 7.48% return of the Lipper Science & Technology Index. In a |
volatile market, the Fund performed well in absolute and relative terms.
Fundamental bottom-up stock selection was the key to the Fund’s performance, although sector allocation helped as well. International holdings, particularly a handful of Brazilian companies, played a major role in propelling outperformance of the benchmark. Trips to Brazil yielded valuable insights, which helped as the Fund benefited from our companies located there, including Submarino, an online retailer, NII Holdings, a Latin American wireless service company, and Weg, a Brazilian manufacturer of customized, highly engineered motors and electronic control systems.
Our thorough approach to research, including in-person visits and our Multiple Eyes™ approach of sharing insights with fellow Wasatch managers helped us identify and gain insight on firms that fit what we look for — rationally valued, high-quality global science and technology companies with strong potential for increasing earnings momentum. Although it is becoming more challenging to outperform the global technology market because global markets are becoming more highly correlated, we believe that our research efforts are paying off.
DETAILSOFTHE PERIOD
By far, the Fund’s largest contributor was MMI Holdings, a Singapore-based manufacturer of electro-mechanical components and equipment. The company’s stock shot up when it announced that it was in talks with Kohlberg Kravis Roberts & Co. for a potential leveraged buyout at a substantial premium.
Among our Brazilian holdings, Submarino was the leading contributor to performance, and the second largest positive contributor overall. Both Submarino and MMI stock gained more than 70% during the period. Submarino, a major online retailer, is the Amazon.com* of Brazil. During the period, Submarino agreed to a merger with its primary online competitor, Americanas.com.* As a result, we believe Submarino solidified its position as the online commerce powerhouse of Brazil. The transaction was shareholder-friendly, and it appears Submarino’s management team will continue largely intact in the new company.
We believe Weg is another very strong company. A far cry from a typical manufacturing company, in our opinion this firm is a leading edge, high-end, custom design shop. We expect it to benefit from various economic trends, including
high global demand for capital goods, infrastructure build-out, energy efficiency, and the company’s potential to grow its market share in many areas. Weg’s vertical integration gives it additional flexibility and a more competitive cost structure. It also has an excellent and highly diversified book of business of customers in different regions and industries. This is a company that we hope and expect to profit from for a long time.
One of the more interesting Brazilian trips involved several days visiting the management of NII Holdings, a provider of digital wireless communication services primarily to business customers in Latin America. We believe NII has a best-in-breed wireless model in an under-penetrated market and its performance exceeded our expectations during the period. Although it’s a relatively new position, NII is already one of the Fund’s 10 largest holdings because of the confidence we gained from our in-depth research.
We like the business model of TGS-NOPEC, a Norwegian geophysical company that has a powerful and lucrative database of two-dimensional and three-dimensional seismic surveys for oil and gas exploration.
RaySearch Laboratories also added to performance. This Swedish medical technology company develops imaging software to help radiation treat cancer more effectively.
Among our disappointing holdings, Amgen and Advanced Micro Devices stood out. Amgen, a leading global biotechnology firm, faced a steady stream of bad news including safety concerns surrounding two of its bread-and-butter products, anemia-fighting drugs Epogen and Aranesp. The future of Amgen’s market share was threatened by a competitor’s drug. Further bad news about another drug in Amgen’s pipeline contributed to erosion in the company’s stock price. Despite this negative news, we remain enthusiastic about owning this company right now because of its current valuation and long history of successful growth.
AMD, which for years had been taking microprocessor market share from Intel,* its major competitor, woke the sleeping giant. AMD was hurt by Intel’s newly aggressive marketing approaches, which included substantially underpricing AMD in a number of markets. AMD is a small position in the Fund, and we’re holding onto it for now because of its current valuation and in the hope that it will begin to regain some market share from Intel soon.
OUTLOOK
Despite our concern that the capital markets are going through a trying time, we see opportunities to take advantage of attractive prices and we’re building positions in higher-conviction names. We are confident that recent research trips will yield some profitable results. We see plenty of promise, particularly in Brazil, and we think we’re uncovering a great deal of potential with our Multiple Eyes approach. The more we learn about our holdings in Brazil and elsewhere, the more assured we become that we’re following a smart strategy. More generally, we are increasingly focused on international tech opportunities.
Thank you for the opportunity to manage your assets.
| * | | As of March 31, 2007, none of the Wasatch Funds held Amazon.com, Americanas.com or Intel Corp. |
6
| | |
| WASATCH GLOBAL SCIENCE & TECHNOLOGY FUND (WAGTX) — Portfolio Summary | | MARCH 31, 2007 |
|
| |
| |
AVERAGE ANNUAL TOTAL RETURNS
| | | | | | | | |
| | | SIX MONTHS* | | 1 YEAR | | 5 YEARS | | SINCE INCEPTION
12/19/00 |
Wasatch Global Science & Technology Fund | | 12.96% | | 5.13% | | 8.31% | | 8.22% |
Lipper Science & Technology Index | | 7.48% | | 1.16% | | 2.55% | | -7.01% |
Russell 2000 Technology Index | | 11.78% | | -0.69% | | 1.53% | | -4.95% |
Nasdaq Composite Index | | 7.62% | | 4.23% | | 6.23% | | -0.73% |
Performance data quoted represents past performance. Past performance is not indicative of future performance and current performance may be lower or higher than the performance quoted. Wasatch Funds will deduct a fee of 2% from redemption proceeds on Fund shares held two months or less. Performance data does not reflect the deduction of this fee which, if charged, would reduce the performance quoted. The table above does not reflect the deduction of taxes that you would pay on fund distributions or the redemption of fund shares.
The total annual fund operating expenses for the Wasatch Global Science & Technology Fund are 1.94% and are based on Fund expenses before any expense reimbursements by the Advisor. The net expenses for the Global Science & Technology Fund are 1.94% and are based on Fund expenses, net of waivers and reimbursements. The Advisor has contractually agreed to reimburse the Fund for total annual fund operating expenses in excess of 1.95% until at least 1/31/08 (excluding interest, taxes, brokerage commissions, other investment related costs and extraordinary expenses in excess of such limitations). See the prospectus for additional information regarding Fund expenses.
To obtain the most recent month-end performance, please visit www.wasatchfunds.com or call 800.551.1700. Investment returns and principal value will fluctuate and shares, when redeemed, may be worth more or less than their original cost. The Advisor has absorbed, in the past, certain Fund expenses, without which total returns would have been lower.
Investments in concentrated funds will be more volatile and loss of principal could be greater than investing in more diversified funds. Investing in foreign securities entails special risks, such as currency fluctuations and political uncertainties, which are described in more detail in the prospectus.
TOP 10 EQUITY HOLDINGS*
| | | | |
| Ticker | | Company | | % of Fund |
| NIHD | | NII Holdings, Inc. Wireless communications provider. | | 3.32% |
| AMXL MM | | America Movil S.A. de C.V., Series L (Mexico) Wireless telecommunication services. | | 2.93% |
| NSM | | National Semiconductor Corp. Semiconductors. | | 2.59% |
| INFO IN | | Infosys Technologies Ltd. (India) Business and information technology consulting. | | 2.52% |
| TGS NO | | TGS-NOPEC Geophysical Co. ASA (Norway) Geoscience data for energy exploration. | | 2.52% |
| | | | |
| Ticker | | Company | | % of Fund |
| MCHP | | Microchip Technology, Inc. Semiconductors. | | 2.45% |
| WEGE4 BZ | | Weg S.A. Pfd. (Brazil) Electric motors and components. | | 2.33% |
| TXN | | Texas Instruments, Inc. Semiconductors and electronic components. | | 2.25% |
| LMA SP | | LMA International N.V. (Singapore) Devices for airway support during surgery. | | 2.18% |
| MMI SP | | MMI Holdings Ltd. (Singapore) Electro-mechanical components and equipment. | | 2.08% |
| * | | As of March 31, 2007, the Fund had 25.17% invested in the Top 10 equity holdings and there were 111 long-term holdings in the Fund. Portfolio holdings are subject to change at any time. References to specific securities should not be construed as recommendations by the Funds or their Advisor. |
SECTOR BREAKDOWN**
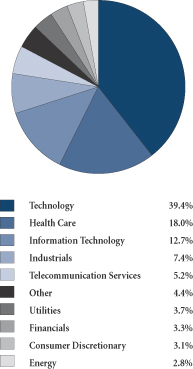
| | ** | | Excludes short-term investments, securities sold short and written options, if any. |
GROWTHOFA $10,000 INVESTMENT
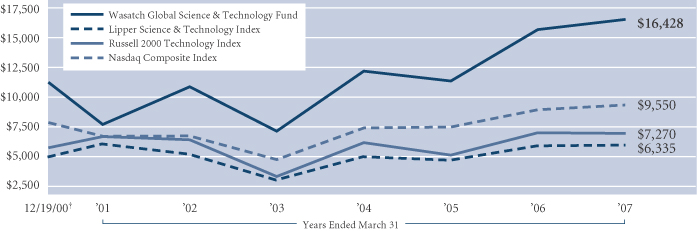
†Inception: December 19, 2000. The Lipper Science & Technology Index is a composite of mutual funds that invest in science and technology companies and have investment objectives similar to those of the Fund. The Russell 2000 Technology Index is a capitalization-weighted index of companies that serve the electronics and computer industries or that manufacture products based on the latest applied science. The Russell 2000 Index is an unmanaged total return index of the smallest 2,000 companies in the Russell 3000 Index, as ranked by total market capitalization. The Russell 2000 Index is widely regarded in the industry as accurately capturing the universe of small company stocks. The Nasdaq Composite Index is unmanaged and measures all Nasdaq domestic and non-U.S. based common stocks listed on The Nasdaq Stock Market. The Index is market-value weighted. This means each company’s security affects the Index in proportion to its market value. The market value, the last sale price multiplied by total shares outstanding, is calculated throughout the trading day, and is related to the total value of the Index. Due to their number and size, technology stocks tend to dominate the direction of the Index. You cannot invest directly in these indexes.
7
| | |
| WASATCH HERITAGE GROWTH FUND (WAHGX) — Management Discussion | | MARCH 31, 2007 |
|
| |
| |
The Wasatch Heritage Growth Fund is managed by a team of Wasatch portfolio managers, led by Chris Bowen and Ryan Snow.
| | | | |

Chris Bowen Portfolio Manager | | 
Ryan Snow Portfolio Manager | | OVERVIEW The Wasatch Heritage Growth Fund returned 7.35% for the six-month period ended March 31, 2007. It was a mixed period for the Fund compared to its benchmarks. While we slightly |
outperformed the 7.19% return of the larger market capitalization Russell 1000 Index, we significantly underperformed the 11.18% return posted by the Fund’s primary benchmark, the Russell Midcap Growth Index (the “Index”).
From a sector perspective, the highlight of the period was the performance of the Fund’s technology holdings, which, in aggregate contributed just over 2% of the overall return and gained more than 1% on the Index.
Our underperformance was primarily driven by two sectors — energy, and materials and processing. As has been the case for the past several quarters, these sectors generally have been strong, while the Fund has had limited exposure to them. We have had some success finding companies in these sectors that meet our investment criteria, but we remain underweight versus the Index, especially in materials.
Overall, the Fund received a positive contribution from every sector in which it had a meaningful weight.
DETAILSOFTHE PERIOD
Although the market delivered strong performance during the period, the one constant was that volatility reigned. We witnessed the Dow’s largest one-day drop since 2001, but the Dow also experienced multiple sessions of 100-plus point gains. The market headlines were dominated by troubles in the subprime mortgage lending market, substantially lower homebuilding growth and speculation concerning the Fed’s next interest rate move.
While roller coaster markets can be unsettling, we believe volatility provides opportunity for long-term investors like Wasatch. Most stocks have a relatively wide spread between their high and low prices during any given year. Provided that nothing has fundamentally changed about a company’s earnings prospects, we view volatility on the downside as a chance to selectively purchase companies “on sale.”
Coach, Inc. is an ideal illustration. Coach sets the standard in the “affordable luxury” market for handbags, briefcases and other accessories. Last summer, the stock price dropped and we were able to add to our existing position at an attractive price. Subsequently, over the past six months, Coach was the Fund’s top contributor, returning over 45%. Although the stock carries an above-average price-to-earnings (P/E) ratio* compared to the market, our thesis remains that this is a well-run company that will continue to grow its earnings as worldwide consumer spending remains robust.
Unfortunately, the Fund’s biggest detractor also came from consumer discretionary, a sector that underperformed the Index for the period. Apollo Group, a for-profit provider of higher education programs, subtracted 0.65% from the Fund’s overall return. In October, the stock fell nearly 23% after Apollo Group posted disappointing earnings results and announced concerns about its then ongoing stock option review. Although we trimmed some of our exposure, we continue to be cautiously optimistic about the stock and felt that the market was too severe in its hastiness to sell it. By March 30, the stock had regained 17%.
The technology sector was led by the Fund’s largest holding, Infosys Technologies. This global information technology services firm based in India has been a steady performer that continues to execute its business plan. It has benefited the Fund due to our Multiple Eyes™ culture. Wasatch got to know Infosys when it was a much smaller company held in a variety of our small cap funds. As it grew, it became an attractive option for the Fund.
Zimmer Holdings, a provider of orthopedic implants, led our health care companies, which had an overall contribution in line with the Index. In contrast, our selection of financial services companies underperformed the Index.
In light of ongoing concerns for the homebuilding industry, it is perhaps surprising that NVR was our third best contributor, delivering a return of over 24% in the producer durables sector. Although NVR’s fundamentals are still somewhat weak, in our opinion, this was another case of a stock being oversold and then coming back to more reasonable levels.
OUTLOOK
Clearly, we prefer to outperform the Index by which we’re measured, but we believe the Fund’s potential to do well over the long term remains intact. We remain committed to Wasatch’s proven investment methodology, and we have solidified that belief by investing the majority of our personal investing assets in Heritage and other Funds in the Wasatch family.
We continue to look globally for reasonably priced companies that are growing their earnings at least 15% annually. We think we have several success-generating factors working in our favor. First, our Multiple Eyes culture essentially provides us with a company-wide research team that aides us in both uncovering new ideas and testing our investment rationale. Next, from a fundamental standpoint, we are pleased with our companies’ performance. On average, they’re growing earnings at our target rate, have solid returns on assets (ROA) and are priced attractively. Finally, we feel that our discipline is a key strength. We won’t arbitrarily forego our investing principles to chase the market’s hot sectors.
Although we can’t predict how the market will perform, we can and will continue striving to assemble a portfolio of quality companies that meet our investment criteria. In that light, we feel assured that the market will appreciate our holdings at some point.
Thank you for the opportunity to manage your assets.
| * | | Price-to-earnings multiple or P/E is the price of a company’s stock divided by its earnings per share (EPS). |
8
| | |
| WASATCH HERITAGE GROWTH FUND (WAHGX) — Portfolio Summary | | MARCH 31, 2007 |
|
| |
| |
AVERAGE ANNUAL TOTAL RETURNS
| | | | | | | | |
| | | SIX MONTHS* | | 1 YEAR | | 5 YEARS | | SINCE INCEPTION
6/18/04 |
Wasatch Heritage Growth Fund | | 7.35% | | 4.60% | | N/A | | 8.57% |
Russell Midcap Growth Index | | 11.18% | | 6.90% | | N/A | | 13.83% |
Russell 1000 Growth Index | | 7.19% | | 7.06% | | N/A | | 7.05% |
Performance data quoted represents past performance. Past performance is not indicative of future performance and current performance may be lower or higher than the performance quoted. Wasatch Funds will deduct a fee of 2% from redemption proceeds on Fund shares held two months or less. Performance data does not reflect the deduction of this fee which, if charged, would reduce the performance quoted. The table above does not reflect the deduction of taxes that you would pay on fund distributions or the redemption of fund shares.
The total annual fund operating expenses for the Wasatch Heritage Growth Fund are 0.95% and are based on Fund expenses before any expense reimbursements by the Advisor. The net expenses for the Heritage Growth Fund are 0.95% and are based on Fund expenses, net of waivers and reimbursements. The Advisor has contractually agreed to reimburse the Fund for total annual fund operating expenses in excess of 0.95% until at least 1/31/08 (excluding interest, taxes, brokerage commissions, other investment related costs and extraordinary expenses in excess of such limitations). See the prospectus for additional information regarding Fund expenses.
To obtain the most recent month-end performance, please visit www.wasatchfunds.com or call 800.551.1700. Investment returns and principal value will fluctuate and shares, when redeemed, may be worth more or less than their original cost. The Advisor has absorbed, in the past, certain Fund expenses, without which total returns would have been lower.
Investing in mid cap funds will be more volatile and loss of principal could be greater than investing in large cap funds. Equity investing involves risks, including potential loss of the principal amount invested. Being non-diversified, the Fund can invest a larger portion of its assets in the stocks of a limited number of companies than a diversified fund. Non-diversification increases the risk of loss to the Fund if the values of these securities decline.
*Not annualized.
TOP 10 EQUITY HOLDINGS*
| | | | |
| Ticker | | Company | | % of Fund |
| INFO IN | | Infosys Technologies Ltd. Business and information technology consulting. | | 3.56% |
| WLP | | WellPoint, Inc. Health maintenance organization. | | 3.41% |
| ZMH | | Zimmer Holdings, Inc. Orthopedic implants. | | 2.84% |
| APH | | Amphenol Corp., Class A Interconnect products manufacturer. | | 2.83% |
| COH | | Coach, Inc. Handbags and accessories. | | 2.64% |
| | | | |
| Ticker | | Company | | % of Fund |
| NVR | | NVR, Inc. Homebuilder. | | 2.37% |
| APOL | | Apollo Group, Inc., Class A Higher education for working adults. | | 2.32% |
| DVA | | DaVita, Inc. Kidney dialysis centers. | | 2.21% |
| LLL | | L-3 Communications Holdings, Inc. Defense contractor. | | 2.19% |
| CVD | | Covance, Inc. Drug development services. | | 2.12% |
| * | | As of March 31, 2007, the Fund had 26.49% invested in the Top 10 equity holdings and there were 72 long-term holdings in the Fund. Portfolio holdings are subject to change at any time. References to specific securities should not be construed as recommendations by the Funds or their Advisor. |
SECTOR BREAKDOWN**
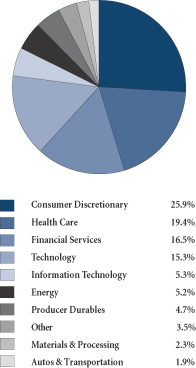
| ** | | Excludes short-term investments, securities sold short and written options, if any. |
GROWTHOFA $10,000 INVESTMENT
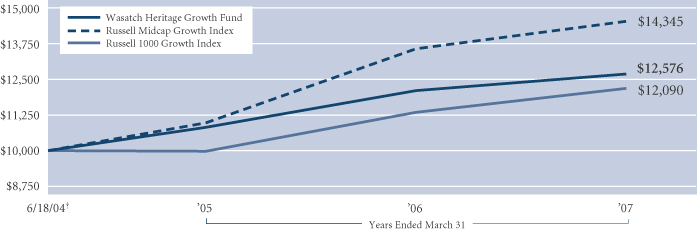
| | † | | Inception: June 18, 2004. The Russell Midcap Growth Index measures the performance of those Russell Midcap Index companies with higher price-to-book ratios and higher forecasted growth values. The Russell Midcap Index is an unmanaged total return index of the 800 smallest companies in the Russell 1000 Index, as ranked by total market capitalization. The stocks in the Russell Midcap Growth Index are also members of the Russell 1000 Growth Index. The Russell 1000 Growth Index measures the performance of those Russell 1000 Index companies with higher price-to-book ratios and higher forecasted growth values. You cannot invest directly in these indexes. |
9
| | |
| WASATCH INTERNATIONAL GROWTH FUND (WAIGX) — Management Discussion | | MARCH 31, 2007 |
|
| |
| |
The Wasatch International Growth Fund is managed by a team of Wasatch portfolio managers, led by Roger D. Edgley and Laura G. Hoffman.
| | | | |

Roger D. Edgley, CFA Portfolio Manager | | 
Laura G. Hoffman, CFA Portfolio Manager | | OVERVIEW The Wasatch International Growth Fund gained 23.48% in the past six months and outperformed the MSCI World Ex-U.S.A. Small Cap Index, which gained 19.78%. In an environment |
of strong global growth fueled by emerging market infrastructure development, the Fund’s performance was broad based across countries and economic sectors. In Continental Europe, industrials companies were among the top contributors. In Asia, our retail holdings did especially well. We like the opportunities we are seeing in Brazil and adding to our weight in the period proved to be a good move. Stock exchanges and Scandinavian investment firms drove the return of the Fund’s financials sector, and a couple of our Scandinavian energy companies also posted strong results. In Japan, being underweight relative to the Index was a plus.
Although few areas in the Fund were weak, the impact of some bears mentioning. The United Kingdom was the largest contributor to the Index’s performance, but we had fewer holdings than the Index and they lagged in performance. The Fund had no exposure to utilities and was underweight in telecommunication services and materials, two sectors that were strong outperformers for the Index. We sold several holdings whose results were disappointing.
All in all, we are pleased with the way the Fund performed in the last six months and feel it remains well positioned for the future.
DETAILSOFTHE PERIOD
Strong economic growth in many emerging markets is helping fuel economic growth throughout the world. This trend led us to identify several interesting investment themes and some attractive opportunities.
Infrastructure spending in emerging markets has spurred the worldwide growth of the industrials and materials sectors. This has been beneficial for Europe where economies are largely based on industrials, and we have been rewarded for increasing our exposure to European industrials. We like companies that offer not only engineering or manufacturing expertise but also have a high service component to their revenues and a strong global presence. Services generally have higher margins and the revenue is typically steadier, which helps smooth out some of the cyclicality of the sector. An example is Demag Cranes based in Germany. Demag, a supplier of industrial cranes and port automation technology, has been able to improve margins by growing its maintenance and refurbishment services division.
One of our biggest missed opportunities over the past year was not adding enough to the materials sector. We are working hard to remedy this and initiated small positions in several companies late in 2006 and expect to continue increasing our exposure to the materials sector in 2007.
Retail companies throughout Asia have been benefiting from a powerful demographic trend — an emerging middle class with growing discretionary income. We look for companies that are building strong franchises and we want to invest in them when they are relatively undiscovered so we can buy them at reasonable valuations. One example is China Hongxing Sports, a shoe manufacturer that sells its products mainly in China. We own other shoe and apparel companies and discovered this company when it was trading at a discount to the rest of the sector. We have captured significant upside as management has continued to improve margins and expand the company’s retail network.
Stock exchanges — JSE Ltd. in South Africa and Osaka Securities Exchange in Japan were among the top performers in the financials sector. These companies are seeing increased volume and the scalability of their business models allows them to run that volume through their relatively fixed cost base, resulting in improvement in margins and profits.
In some European and Scandinavian countries, government and pension benefits for retirees are expected to decrease substantially in the years ahead. Companies like Acta Holdings in Norway are helping people begin saving for retirement and the Fund has benefited from investments in such companies.
Energy continues to command attention as the world struggles to find ways to meet the growing energy needs of its citizens. Energy exploration and oil and gas development has helped drive economic growth in Scandinavia where the Fund has invested in several energy companies that have done well. A notable example is TGS-NOPEC, a Norwegian company that provides seismic and geoscience data for energy exploration and was the Fund’s top contributor over the past six months.
While we continue to like Japanese real estate companies and see growth potential in some industrials companies, we are concerned by the downturn in consumer sentiment and feel that the current administration is not focusing enough on the economy. These concerns are behind our decision to remain substantially underweight versus the Index in Japan.
OUTLOOK
We see broad strength in economies around the world, although there is some concern that the U.S. economy could slow more than anticipated. European economies are expected to continue to benefit from emerging markets’ strong demand for industrials. Spending by the world’s emerging middle class should continue to support the results of our consumer-focused companies. We continue to monitor consumer sentiment in Japan, hoping that the administration will focus more on the economy and eventually provide a clear direction on interest rates.
Overall, we are pleased with the Fund’s results so far this year. We will continue to focus on investing in companies that we believe can deliver strong results, improve their core products and services, and maintain a global presence.
Thank you for the opportunity to manage your assets.
10
| | |
| WASATCH INTERNATIONAL GROWTH FUND (WAIGX) — Portfolio Summary | | MARCH 31, 2007 |
|
| |
| |
AVERAGE ANNUAL TOTAL RETURNS
| | | | | | | | |
| | | SIX MONTHS* | | 1 YEAR | | 5 YEARS | | SINCE INCEPTION
6/28/02 |
Wasatch International Growth Fund | | 23.48% | | 20.72% | | N/A | | 23.22% |
MSCI World Ex-U.S.A. Small Cap Index | | 19.78% | | 15.70% | | N/A | | 24.71% |
Performance data quoted represents past performance. Past performance is not indicative of future performance and current performance may be lower or higher than the performance quoted. Wasatch Funds will deduct a fee of 2% from redemption proceeds on Fund shares held two months or less. Performance data does not reflect the deduction of this fee which, if charged, would reduce the performance quoted. The table above does not reflect the deduction of taxes that you would pay on fund distributions or the redemption of fund shares.
The total annual fund operating expenses for the Wasatch International Growth Fund are 1.78% and are based on Fund expenses before any expense reimbursements by the Advisor. The net expenses for the International Growth Fund are 1.78% and are based on Fund expenses, net of waivers and reimbursements. The Advisor has contractually agreed to reimburse the Fund for total annual fund operating expenses in excess of 1.95% until at least 1/31/08 (excluding interest, taxes, brokerage commissions, other investment related costs and extraordinary expenses in excess of such limitations). See the prospectus for additional information regarding Fund expenses.
To obtain the most recent month-end performance, please visit www.wasatchfunds.com or call 800.551.1700. Investment returns and principal value will fluctuate and shares, when redeemed, may be worth more or less than their original cost. The Advisor has absorbed, in the past, certain Fund expenses, without which total returns would have been lower.
Investing in foreign securities entails special risks, such as currency fluctuations and political uncertainties, which are described in more detail in the prospectus. Investments in small cap funds will be more volatile and loss of principal could be greater than investing in large cap or more diversified funds.
*Not annualized.
TOP 10 EQUITY HOLDINGS*
| | | | |
| Ticker | | Company | | % of Fund |
| T3C GR | | Thielert AG (Germany) High performance engine and
component manufacturer. | | 2.19% |
| TGS NO | | TGS-NOPEC Geophysical Co. ASA (Norway) Geoscience data for energy exploration. | | 2.12% |
| CHHS SP | | China Hongxing Sports Ltd. (China) Athletic wear retailer. | | 2.02% |
| AWD GR | | AWD Holding AG (Germany) Financial services. | | 1.94% |
| NTB BH | | The Bank of N.T. Butterfield &
Son Ltd. (Bermuda) Wealth management and financial services. | | 1.77% |
| | | | |
| Ticker | | Company | | % of Fund |
| ACTA NO | | Acta Holdings ASA (Norway) Financial advisory services. | | 1.68% |
| 48 HK | | EganaGoldpfeil (Holdings) Ltd. (Hong Kong) Luxury fashion accessories brand manager. | | 1.67% |
| 8874 JP | | Joint Corp. (Japan) Residential condominium developer. | | 1.67% |
| JSE SJ | | JSE Ltd. (South Africa) Securities exchange. | | 1.62% |
| HEMX SS | | Hemtex AB (Sweden) Home furnishing products. | | 1.59% |
| * | | As of March 31, 2007, the Fund had 18.27% invested in the Top 10 equity holdings and there were 125 long-term holdings in the Fund. Portfolio holdings are subject to change at any time. References to specific securities should not be construed as recommendations by the Funds or their Advisor. |
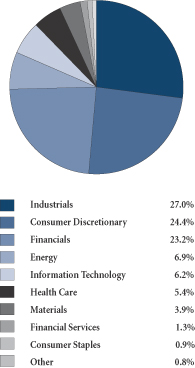
SECTOR BREAKDOWN**
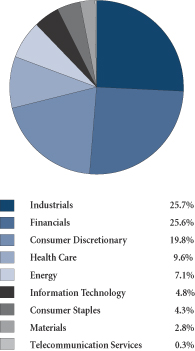
| ** | | Excludes short-term investments, securities sold short and written options, if any. |
GROWTHOFA $10,000 INVESTMENT
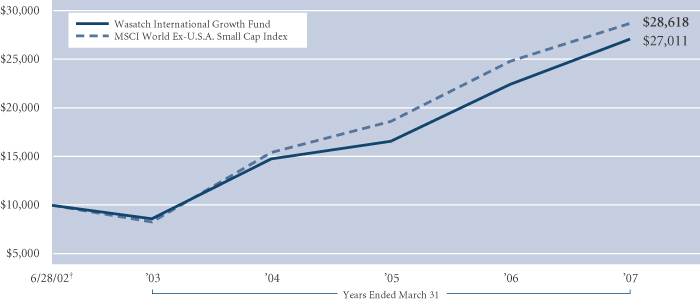
| | † | Inception: June 28, 2002. The MSCI World Ex-U.S.A. Small Cap Index is an unmanaged index that measures the performance of stocks with market capitalizations between U.S. $200 million and $1.5 billion across 22 developed markets, excluding the United States. You cannot invest directly in the Index. |
11
| | |
| WASATCH INTERNATIONAL OPPORTUNITIES FUND (WAIOX) — Management Discussion | | MARCH 31, 2007 |
|
| |
| |
The Wasatch International Opportunities Fund is managed by a team of Wasatch portfolio managers, led by Roger D. Edgley and Blake H. Walker.
| | | | |
Roger D. Edgley, CFA Portfolio Manager | | 
Blake H. Walker Portfolio Manager | | OVERVIEW The Wasatch International Opportunities Fund gained 30.96% in the six months ended March 31, 2007, outperforming the MSCI World Ex-U.S.A. Small Cap Index, which gained 19.78%. |
The Fund and the global markets were able to outperform their U.S. counterparts at a time when there were significant uncertainties on the macroeconomic front. Among the areas of concern were fears that a slowing housing market and difficulties among U.S. subprime mortgage lenders and borrowers would reverberate throughout global economies.
No single theme, trend, or industry was dominant during the period, though the growing power of the international consumer was felt throughout many sectors and companies. Holdings in the consumer discretionary and financials sectors were the driving forces in the Fund’s performance over the six months.
The consumer discretionary sector, which is substantially overweight in the Fund, made the greatest positive contribution to the Fund’s performance for the period. The rise of the global consumer remains an enormous force in international markets; stocks of companies that serve their needs and that benefit from their expanding buying power were among the strongest performers for the period. In many cases, strong performers even from non-consumer sectors have businesses that are driven in large part by these consumer forces.
In the financials sector, our performance benefited from holdings in a variety of international markets. Because the financial services and securities industries are still in relatively nascent stages in many international markets, they can offer far greater room for expansion than is available from their counterparts in the U.S.
Although economic concerns may be on the horizon in the U.S., at this point their ultimate impact there is unclear. More relevant for this Fund, thus far they haven’t had notable negative impact on international markets. This is a strong indication that global markets are becoming increasingly self-sustaining, and no longer take all of their cues from the U.S. In an uncertain domestic environment, this could be a positive trend for global investors.
DETAILSOFTHE PERIOD
The three strongest sectors for the Fund over the period were consumer discretionary, financials, and industrials. In the consumer discretionary sector, athletic shoe and apparel maker China Hongxing Sports produced a triple-digit return
and contributed just over 3% to performance. The company is benefiting from booming demand for its products in China, boosted in large part by excitement over the upcoming 2008 Olympics in Beijing. Given the size of that nation’s population and the rapid expansion of its consumer class, we have a firm conviction that the company is well-positioned for growth long after the games are over. Other holdings directly benefiting from Asian consumer spending included luxury-goods seller EganaGoldpfeil and fashion retailer Ports Design.
The rising sophistication and financial activity of international consumers — seeking not just material goods but also the opportunity to save and invest — played an important role in the performance of our holdings among financial stocks. Among our top performers in this sector were Acta Holdings, a Norwegian asset manager, Japan’s Osaka Securities Exchange, and South African securities exchange JSE Ltd. The exchanges also offer broad-based exposure to growth in their respective home markets.
An emerging area of interest for us in the financial sector is Japanese real estate. While we ultimately chose to trim most of our Japanese positions after a rebound failed to materialize, Japanese real estate is an area we believe offers a number of exciting opportunities. Among the strong factors underlying this segment of the market are a scarcity of real property and the availability of relatively cheap long-term debt. While our holdings in this area of the market, such as Babcock & Brown Japan Property Trust and Takara Leben did not contribute positively to returns over this period, we believe they have strong potential going forward.
Energy remained an important sector for the Fund. Over the six months, our holdings in this area (in which the Fund was overweight) underperformed their sector benchmark. Our Canadian holdings were hit hard by an unfavorable change in the taxation of energy trusts, compounded by lower commodity prices. There were some healthy performers among our holdings such as Singapore-traded Ezra Holdings, which provides offshore support and marine services to the oil and gas industry, and APL, a Norwegian company providing the industry with specialized technologies. We anticipate maintaining our overweight position in the sector going forward.
OUTLOOK
Many foreign markets no longer follow the lead of the U.S., having grown to the point that they set their own pace. Nonetheless, the level of uncertainty surrounding the U.S. is somewhat disquieting. Although many global markets may have developed their own capacity for broad and sustained growth, were a severe credit crunch to afflict the U.S., its impact could eventually be felt elsewhere in the world. Also, performance in Singapore, a market that is heavily represented in the portfolio, is still closely tied to that of the U.S.
We continue to have great confidence in the power of consumers in emerging markets. Encouraging factors include both the size of the markets involved in rising discretionary consumer spending — such as China, India, and Brazil — and the significant gap that remains between the standards of living for consumers in these markets and those in more mature economies.
Thank you for the opportunity to manage your assets.
12
| | |
| WASATCH INTERNATIONAL OPPORTUNITIES FUND (WAIOX) — Portfolio Summary | | MARCH 31, 2007 |
|
| |
| |
AVERAGE ANNUAL TOTAL RETURNS
| | | | | | | | |
| | | SIX MONTHS* | | 1 YEAR | | 5 YEARS | | SINCE INCEPTION
1/27/05 |
Wasatch International Opportunities Fund | | 30.96% | | 28.13% | | N/A | | 30.17% |
MSCI World Ex-U.S.A. Small Cap Index | | 19.78% | | 15.70% | | N/A | | 23.57% |
Performance data quoted represents past performance. Past performance is not indicative of future performance and current performance may be lower or higher than the performance quoted. Wasatch Funds will deduct a fee of 2% from redemption proceeds on Fund shares held two months or less. Performance data does not reflect the deduction of this fee which, if charged, would reduce the performance quoted. The table above does not reflect the deduction of taxes that you would pay on fund distributions or the redemption of fund shares.
The total annual fund operating expenses for the Wasatch International Opportunities Fund are 2.63% and are based on Fund expenses before any expense reimbursements by the Advisor. The net expenses for the International Opportunities Fund are 2.26% and are based on Fund expenses, net of waivers and reimbursements. The Advisor has contractually agreed to reimburse the Fund for total annual fund operating expenses in excess of 2.25% until at least 1/31/08 (excluding interest, taxes, brokerage commissions, other investment related costs and extraordinary expenses in excess of such limitations). See the prospectus for additional information regarding Fund expenses.
To obtain the most recent month-end performance, please visit www.wasatchfunds.com or call 800.551.1700. Investment returns and principal value will fluctuate and shares, when redeemed, may be worth more or less than their original cost. The Advisor has absorbed, currently or in the past, certain Fund expenses, without which total returns would have been lower.
Investing in foreign securities entails special risks, such as currency fluctuations and political uncertainties, which are described in more detail in the prospectus. Investments in small cap funds will be more volatile and loss of principal could be greater than investing in large cap or more diversified funds.
*Not annualized.
TOP 10 EQUITY HOLDINGS*
| | | | |
| Ticker | | Company | | % of Fund |
| ACTA NO | | Acta Holdings ASA (Norway) Financial advisory services. | | 3.58% |
| CHHS SP | | China Hongxing Sports Ltd. (China) Athletic wear retailer. | | 3.56% |
| 48 HK | | EganaGoldpfeil (Holdings) Ltd. (Hong Kong) Luxury fashion accessories brand manager. | | 2.62% |
| MMI SP | | MMI Holdings Ltd. (Singapore) Electro-mechanical components and equipment. | | 2.15% |
| EZRA SP | | Ezra Holdings Ltd. (Singapore) Marine services support. | | 2.14% |
| | | | |
| Ticker | | Company | | % of Fund |
| 072870 KS | | MegaStudy Co. Ltd. (Korea) Online education provider. | | 2.07% |
| JSE SJ | | JSE Ltd. (South Africa) Securities exchange. | | 2.04% |
| RAYB SS | | RaySearch Laboratories AB (Sweden) Dosage software for radiology. | | 2.01% |
| HEMX SS | | Hemtex AB (Sweden) Home furnishing products. | | 1.61% |
| AQR GR | | Arques Industries AG (Germany) Industrial turnaround specialist. | | 1.55% |
| * | | As of March 31, 2007, the Fund had 23.33% invested in the Top 10 equity holdings and there were 131 long-term holdings in the Fund. Portfolio holdings are subject to change at any time. References to specific securities should not be construed as recommendations by the Funds or their Advisor. |
SECTOR BREAKDOWN**
| ** | | Excludes short-term investments, securities sold short and written options, if any. |
GROWTHOFA $10,000 INVESTMENT
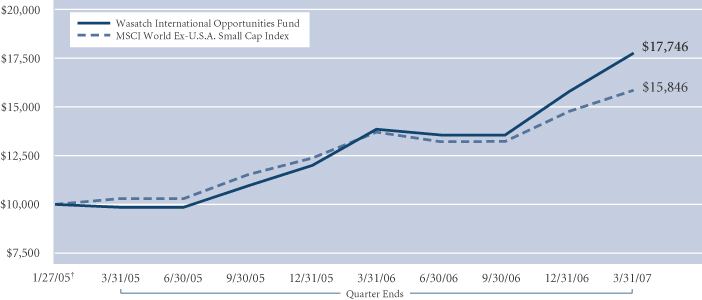
| | † | | Inception: January 27, 2005. The MSCI World Ex-U.S.A. Small Cap Index is an unmanaged index that measures the performance of stocks with market capitalizations between U.S. $200 million and $1.5 billion across 22 developed markets, excluding the United States. You cannot invest directly in the Index. |
13
| | |
| WASATCH MICRO CAP FUND (WMICX) — Management Discussion | | MARCH 31, 2007 |
|
| |
| |
The Wasatch Micro Cap Fund is managed by a team of Wasatch portfolio managers, led by Daniel Chace.
| | |

Daniel Chace, CFA Portfolio Manager | | OVERVIEW The Wasatch Micro Cap Fund gained 12.94% during the six months ended March 31, 2007. The Russell 2000 Index (the “Index”) advanced 11.02% and the Russell Microcap Index rose 11.29% over the same time period. The Fund’s investments in international companies continued to do well, outpacing our domestic holdings and contributing to outperformance of the Index. Another key area of strength was the health care sector, which generated |
a significant increase and positively impacted relative returns. While the Fund’s performance was strong overall, a number of individual investments turned in disappointing results, including a business services company that missed earnings estimates.
Looking forward, there are some challenges facing small cap equities, including an apparent slowdown in corporate earnings growth and the potential for problems in the subprime mortgage market to spill over into other areas of the economy. Despite these big-picture risks, we believe that the Fund remains well-positioned for the long term given our focus on investing in companies exhibiting an attractive combination of quality, value and earnings growth.
DETAILSOFTHE PERIOD
Wasatch looks for opportunities around the world, and nearly 20% of the Fund’s total market value was invested in foreign-listed stocks* this period. Our international holdings generated a strong gain and added value relative to the Index, with companies domiciled in China and Singapore doing especially well. One of the Fund’s best-performing stocks was China Hongxing Sports (China), an athletic shoe and apparel retailer. The company is benefiting from several positive trends in China, including rising disposable incomes and the increasing popularity of sports, and reported significant earnings growth and margin expansion.
Raffles Education (Singapore), a provider of training and design courses, was another top-performing name in the Fund. Raffles Education is also experiencing good growth and margin improvement, driven by favorable enrollment trends and higher tuition fees, among other factors. Adhering to our valuation discipline, we have been trimming our position on price strength. We decided to maintain a small weight in the stock after a March meeting in Singapore with the company’s Chief Executive Officer, who made a compelling case for further margin expansion. The meeting was part of a trip made by several members of our research team representing different Wasatch funds, consistent with our belief that subjecting companies to the scrutiny of multiple sets of eyes leads to better investment decisions.
The Fund traditionally has been heavily weighted in health care stocks, because this is an area where our bottom-up, fundamental research typically finds many companies exhibiting strong growth prospects. Overall, our health care
investments produced a significant gain this period and favorably impacted results versus the Index. CorVel, a provider of medical cost containment services and a long-term holding, was one of the best-performing names in the portfolio. The stock had been weak for the better part of 2004 and 2005, mainly due to sluggish volumes of workers’ compensation insurance claims. We decided to stay the course, however, since our ongoing dialogue with management gave us confidence that CorVel’s business was poised to turn the corner. We were rewarded for our patience in 2006, when the company’s earnings growth started to accelerate, driven by cost controls and productivity enhancements that boosted margins. And although CorVel was a top 10 contributor to performance in the second, third and fourth quarters of 2006, we sold our position near the end of last year, because we felt the stock was becoming richly valued.
LECG Corp., a U.S.-based provider of expert services such as independent testimony, is an example of a stock that we ultimately did lose patience with after owning it in the Fund since late 2005. LECG Corp. was one of the biggest detractors this period, declining sharply after the company preannounced a substantial earnings shortfall. The earnings miss was just one in a series of disappointments and exacerbated our concerns that LECG Corp. would continue to struggle to grow its business and expand margins at the same time. As a result, we have lowered our weight in the stock.
OUTLOOK
2006 marked the fourth consecutive year of gains from U.S. small cap equities, and valuations aren’t as reasonable as they once were following such a strong run. In addition, earnings growth across the equity market appears to have peaked, and weakness in the housing and subprime mortgage sectors is clouding the outlook for the U.S. economy as a whole.
Despite these challenges facing the broad small cap market, we believe in the Fund’s ability to produce strong results over time. The aggregate earnings growth rate reported by our companies during the first quarter of 2007 was somewhat lower than we had anticipated, but our bottom-up earnings models suggest that portfolio earnings growth is likely to accelerate. We believe we have invested in a good selection of high-quality companies and continue to adhere to our valuation discipline, which should provide downside protection in a weaker environment. Lastly, the Fund had minimal direct exposure to the subprime mortgage market as of March 31, and we are closely monitoring the situation’s potential ripple effect on companies in other sectors of the economy.
Thank you for the opportunity to manage your assets.
| * | | These holdings excluded American Depositary Receipts (ADRs — receipts issued by domestic banks for shares of foreign-based corporations that trade on U.S. stock exchanges) and companies incorporated in other countries but whose shares trade on U.S. stock exchanges. |
14
| | |
| WASATCH MICRO CAP FUND (WMICX) — Portfolio Summary | | MARCH 31, 2007 |
|
| |
| |
AVERAGE ANNUAL TOTAL RETURNS
| | | | | | | | |
| | | SIX MONTHS* | | 1 YEAR | | 5 YEARS | | 10 YEARS |
Wasatch Micro Cap Fund | | 12.94% | | 7.25% | | 13.77% | | 24.80% |
Russell 2000 Index | | 11.02% | | 5.91% | | 10.95% | | 10.23% |
Russell Microcap Index | | 11.29% | | 3.05% | | 13.09% | | N/A |
Performance data quoted represents past performance. Past performance is not indicative of future performance and current performance may be lower or higher than the performance quoted. Wasatch Funds will deduct a fee of 2% from redemption proceeds on Fund shares held two months or less. Performance data does not reflect the deduction of this fee which, if charged, would reduce the performance quoted. The table above does not reflect the deduction of taxes that you would pay on fund distributions or the redemption of fund shares.
The total annual fund operating expenses for the Wasatch Micro Cap Fund are 2.15% and are based on Fund expenses before any expense reimbursements by the Advisor. The net expenses for the Micro Cap Fund are 2.15% and are based on Fund expenses, net of waivers and reimbursements. The Advisor has contractually agreed to reimburse the Fund for total annual fund operating expenses in excess of 2.50% until at least 1/31/08 (excluding interest, taxes, brokerage commissions, other investment related costs and extraordinary expenses in excess of such limitations). See the prospectus for additional information regarding Fund expenses.
To obtain the most recent month-end performance, please visit www.wasatchfunds.com or call 800.551.1700. Investment returns and principal value will fluctuate and shares, when redeemed, may be worth more or less than their original cost. The Advisor has absorbed, in the past, certain Fund expenses, without which total returns would have been lower.
Investments in micro cap funds will be more volatile and loss of principal could be greater than investing in large cap or more diversified funds. Investing in foreign securities entails special risks, such as currency fluctuations and political uncertainties, which are described in more detail in the prospectus.
*Not annualized.
TOP 10 EQUITY HOLDINGS*
| | | | |
| Ticker | | Company | | % of Fund |
| BGFV | | Big 5 Sporting Goods Corp. Sporting goods retailer. | | 2.35% |
| CHHS SP | | China Hongxing Sports Ltd. (China) Athletic wear retailer. | | 2.22% |
| AMSG | | AmSurg Corp. Ambulatory surgery centers. | | 2.03% |
| OIIM | | O2Micro International Ltd. ADR (Cayman Islands) Semiconductors. | | 1.97% |
| POWI | | Power Integrations, Inc. Semiconductors. | | 1.86% |
| | | | |
| Ticker | | Company | | % of Fund |
| PRSC | | Providence Service Corp. (The) Management of U.S. government-sponsored social services. | | 1.86% |
| GTRC | | Guitar Center, Inc. Music stores. | | 1.80% |
| WINS | | SM&A Competition management services. | | 1.64% |
| MCRL | | Micrel, Inc. Semiconductors. | | 1.64% |
| ABAX | | Abaxis, Inc. Portable blood analysis systems. | | 1.60% |
| * | | As of March 31, 2007, the Fund had 18.97% invested in the Top 10 equity holdings and there were 144 long-term holdings in the Fund. Portfolio holdings are subject to change at any time. References to specific securities should not be construed as recommendations by the Funds or their Advisor. |
SECTOR BREAKDOWN**
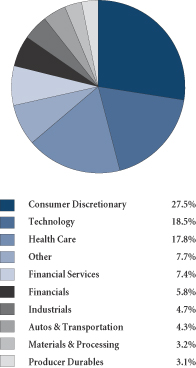
| ** | | Excludes short-term investments, securities sold short and written options, if any. |
GROWTHOFA $10,000 INVESTMENT
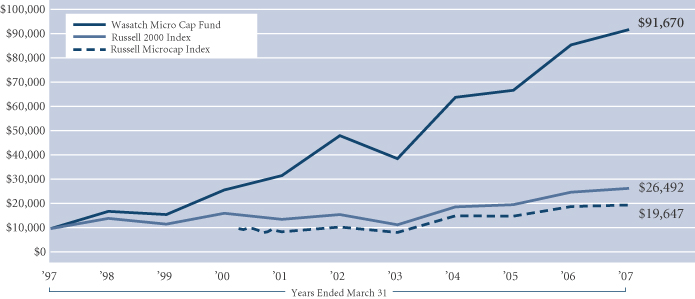
The Russell 2000 Index is an unmanaged total return index of the smallest 2,000 companies in the Russell 3000 Index, as ranked by total market capitalization. The Russell 2000 Index is widely regarded in the industry as accurately capturing the universe of small company stocks. The Russell Microcap Index is an unmanaged total return index of the smallest 1,000 securities in the small cap Russell 2000 Index along with the next smallest 1,000 companies, based on a ranking of all U.S. equities by market capitalization. No data was available for the Index prior to 6/30/00. Data for the Index from 6/30/00 until its official start date of July 1, 2005 was from a paper portfolio. You cannot invest directly in these indexes.
15
| | |
| WASATCH MICRO CAP VALUE FUND (WAMVX) — Management Discussion | | MARCH 31, 2007 |
|
| |
| |
The Wasatch Micro Cap Value Fund is managed by a team of Wasatch portfolio managers, led by John Malooly and Brian Bythrow.
| | | | |

John Malooly, CFA Portfolio Manager | | 
Brian Bythrow, CFA Portfolio Manager | | OVERVIEW The Wasatch Micro Cap Value Fund gained 16.65% for the six months ended March 31, 2007 and outperformed the Russell 2000 Index, which gained 11.02%. The market environment was |
generally positive in the last three months of 2006. In the first quarter of 2007, however, uncertainty began to permeate the market, with increased volatility due to concerns about the overall strength of the U.S. economy, weakness in the Chinese market, and the potential impact of difficulties among subprime mortgage lenders and borrowers.
Small cap stocks continued to outperform large caps — not the usual trend when concerns about the economy are rising. However, in the second half of the period, returns for micro cap stocks lagged small caps, offering some indication of investors’ diminishing appetite for risk. Such a trend is typical of the later stages of an economic cycle. We were pleased that our carefully selected portfolio was able to outperform the small cap index despite this headwind for micro caps.
The consumer discretionary sector, in which the Fund is underweight, made the greatest contribution to performance. Our strategy in this area has been to be underexposed to the U.S. consumer, and overexposed to the consumer from emerging economies. The health care and technology sectors also made substantial contributions to performance. Many companies in these areas offer defensive characteristics, which can be helpful in times of economic uncertainty.
We have been able to outperform during a challenging market in large part because we have identified what we believe are strong companies with above-average growth potential and more moderate levels of risk. We believe these companies have the potential to do well over the long term, even if economic growth slows.
DETAILSOFTHE PERIOD
After years of vigorous spending, it appears that the U.S. consumer may be tapped out. And while the ultimate impact of falling real estate values and the subprime mortgage crunch is not yet clear, it could prove to be another factor weighing on disposable income. We are sidestepping this issue by seeking out companies that play on the consumer in emerging markets, many of which are experiencing rapid growth and appear unfazed by problems in the U.S.
In line with this strategy, China Hongxing Sports was the single largest contributor to the Fund’s performance over the past six months, just as it was for all of 2006. The company, which produces and sells branded athletic shoes and
apparel mainly in China, has been a true undiscovered growth story. When we first identified it as an investment, it was trading at a single-digit price-to-earnings multiple.* It now trades near 20 times earnings with 40% earnings growth. We believe it could be a strong performer for an extended period of time.
Although our top-contributing health care holding, VNUS Medical Technologies, is not part of our emerging consumer trend, it exemplifies our effort to identify companies that combine defensive characteristics — such as being involved in an industry with a favorable demographic backdrop — with the potential to outperform in stronger economic times as well, because of its innovative products and exceptional leadership. VNUS Medical benefited when it received a favorable ruling in a patent case against several rival companies in November. This positive development is far from the company’s only strength and we believe it has the potential to gain additional market share as it launches a new product in coming months.
Our technology holdings outperformed their benchmark for the period, led by Interactive Intelligence, a developer of business communications software. We like this company for its strong product lineup, top-notch customer base, and high levels of inside ownership. It has been able to post strong numbers due in part to the growing demand for cost-efficient communications systems. Although the company’s share price fell a bit in the first quarter of 2007, we continue to have strong conviction about the company’s prospects, and are even adding to our position as opportunities arise.
Interactive Intelligence is positioned to capitalize on businesses’ need to optimize productivity in a tight labor market. We believe this theme will play a meaningful role in the markets and the economy for years to come. While such companies certainly benefit from a healthy economy, they’re attractive in that they don’t necessarily depend on a particularly strong economic environment to succeed — a characteristic we believe many of our holdings share.
OUTLOOK
We anticipate considerable uncertainty in the market during the months ahead, and believe we have structured the Fund well for such an environment. While some companies — such as China Hongxing Sports — represent larger positions in the Fund due to our conviction in them as long-term holdings, in most cases we find that taking smaller positions in a number of stocks is a sensible approach.
We expect to keep our international holdings close to 30% of assets. This seems an appropriate stance, given the somewhat muted outlook for the U.S. economy and the stronger growth prospects elsewhere around the globe.
One area we are concerned about for the months ahead is the risk that investors may become increasingly wary of volatility in an uncertain market, and move away from micro cap stocks and toward larger cap names. To help manage this risk, we will continue to seek out companies with modest valuations and undiscovered growth potential.
Thank you for the opportunity to manage your assets.
| * | | Price-to-earnings multiple or P/E is the price of a company’s stock divided by its earnings per share (EPS). |
16
| | |
| WASATCH MICRO CAP VALUE FUND (WAMVX) — Portfolio Summary | | MARCH 31, 2007 |
|
| |
| |
AVERAGE ANNUAL TOTAL RETURNS
| | | | | | | | |
| | | SIX MONTHS* | | 1 YEAR | | 5 YEARS | | SINCE INCEPTION
7/28/03 |
Wasatch Micro Cap Value Fund | | 16.65% | | 13.93% | | N/A | | 22.95% |
Russell 2000 Index | | 11.02% | | 5.91% | | N/A | | 16.67% |
Performance data quoted represents past performance. Past performance is not indicative of future performance and current performance may be lower or higher than the performance quoted. Wasatch Funds will deduct a fee of 2% from redemption proceeds on Fund shares held two months or less. Performance data does not reflect the deduction of this fee which, if charged, would reduce the performance quoted. The table above does not reflect the deduction of taxes that you would pay on fund distributions or the redemption of fund shares.
The total annual fund operating expenses for the Wasatch Micro Cap Value Fund are 2.33% and are based on Fund expenses before any expense reimbursements by the Advisor. The net expenses for the Micro Cap Value Fund are 2.25% and are based on Fund expenses, net of waivers and reimbursements. The Advisor has contractually agreed to reimburse the Fund for total annual fund operating expenses in excess of 2.25% until at least 1/31/08 (excluding interest, taxes, brokerage commissions, other investment related costs and extraordinary expenses in excess of such limitations). See the prospectus for additional information regarding Fund expenses.
To obtain the most recent month-end performance, please visit www.wasatchfunds.com or call 800.551.1700. Investment returns and principal value will fluctuate and shares, when redeemed, may be worth more or less than their original cost. The Advisor has absorbed, currently or in the past, certain Fund expenses, without which total returns would have been lower.
Investments in micro cap funds will be more volatile and loss of principal could be greater than investing in large cap or more diversified funds. Investing in foreign securities entails special risks, such as currency fluctuations and political uncertainties, which are described in more detail in the prospectus.
TOP 10 EQUITY HOLDINGS*
| | | | |
| Ticker | | Company | | % of Fund |
| VNUS | | VNUS Medical Technologies, Inc. Minimally invasive varicose vein treatment. | | 2.02% |
| CHHS SP | | China Hongxing Sports Ltd. (China) Athletic wear retailer. | | 1.43% |
| LHCG | | LHC Group, Inc. Health care services to Medicare recipients. | | 1.40% |
| MPP | | MTS Medication Technologies, Inc. Medication dispensing systems. | | 1.39% |
| PLXT | | PLX Technology, Inc. Semiconductors. | | 1.38% |
| | | | |
| Ticker | | Company | | % of Fund |
| 48 HK | | EganaGoldpfeil (Holdings) Ltd. (Hong Kong) Luxury fashion accessories brand manager. | | 1.30% |
| 538 HK | | Ajisen China Holdings Ltd. (Hong Kong) Japanese noodle chain in China. | | 1.29% |
| MRE CN | | Martinrea International, Inc. (Canada) Metal forming and fluid management products. | | 1.26% |
| 072870 KS | | MegaStudy Co. Ltd. (Korea) Online education provider. | | 1.24% |
| ACTA NO | | Acta Holdings ASA (Norway) Financial advisory services. | | 1.23% |
| | * | | As of March 31, 2007, the Fund had 13.94% invested in the Top 10 equity holdings and there were 154 long-term holdings in the Fund. Portfolio holdings are subject to change at any time. References to specific securities should not be construed as recommendations by the Funds or their Advisor. |
SECTOR BREAKDOWN**
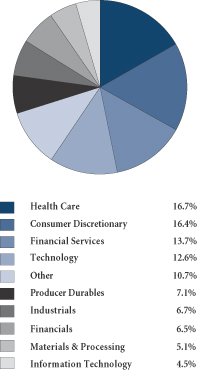
| ** | | Excludes short-term investments, securities sold short and written options, if any. |
GROWTHOFA $10,000 INVESTMENT
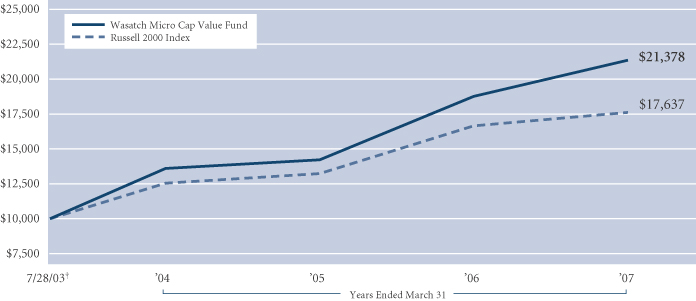
| | †Inception: | | July 28, 2003. The Russell 2000 Index is an unmanaged total return index of the smallest 2,000 companies in the Russell 3000 Index, as ranked by total market capitalization. The Russell 2000 Index is widely regarded in the industry as accurately capturing the universe of small company stocks. You cannot invest directly in the Index. |
17
| | |
| WASATCH SMALL CAP GROWTH FUND (WAAEX) — Management Discussion | | MARCH 31, 2007 |
|
| |
| |
The Wasatch Small Cap Growth Fund is managed by a team of Wasatch portfolio managers, led by Jeff Cardon.
| | |

Jeff Cardon, CFA Portfolio Manager | | OVERVIEW The Wasatch Small Cap Growth Fund gained 8.95% in the six months ended March 31, 2007. During the same time, the Russell 2000 Growth Index advanced 11.46% and the Russell 2000 Index rose 11.02%. We were pleased that the Fund generated such a substantial gain this period. That said, in typical fashion, we had a difficult time keeping up with the small cap indexes in such a strong market. We tend to lag in very strong |
markets due to our focus on investing in “steady-eddy” quality growth companies, which can look unexciting to investors when the market is hot.
Looking ahead, earnings growth is expected to decelerate across the equity market. As the slowdown unfolds, the healthy growth rates we expect from our portfolio companies should stand out relative to other small companies.
DETAILSOFTHE PERIOD
The Wasatch Small Cap Growth Fund posted a strong gain during the six-month period, supported by a favorable backdrop for equities and generally positive operating results from our portfolio companies. On a weighted-average basis, our companies reported third and fourth quarter earnings growth that was comfortably above our 15% target. It is important to note that the majority of earnings growth was driven by strong sales growth and little margin expansion. This kind of fundamental performance is markedly different from that of companies in cyclical, commodity-oriented sectors where margin expansion is fueling much of the earnings growth.
FactSet Research Systems made the largest positive contribution to return and is a good example of a name that is experiencing strong sales growth. FactSet is a provider of database services to the investment industry that we know from both an investor and customer perspective. The company has grown its revenues more than 20% in each of the past two years, as it continues to capitalize on the increasing sophistication and globalization of the equity markets. A characteristic of FactSet that we find particularly appealing is the recurring revenue stream that comes from its subscription-based business model.
Pediatrix Medical Group and United Surgical Partners were also top contributors this period and a big reason why our health services investments turned in such strong results overall. Pediatrix, a provider of physician management services to neonatal pediatricians, benefited from several positive catalysts on the horizon, including the company’s plans to expand into the anesthesia market via acquisition. United Surgical Partners, an operator of ambulatory surgery centers, announced in January that it was being acquired by a private equity firm at a premium of more than 13%. The transaction is scheduled to close in the second quarter, and we
sold our position because we expect the stock to trade near the buyout price until then.
Our retail investments delivered only a modest gain for the Fund, and one of the largest detractors in the portfolio was Cache, a women’s fashion apparel retailer. The company’s stock price was negatively impacted by broad weakness in the fashion apparel market. Despite this period’s decline, we remain confident that Cache has the potential to transform itself from a good company into a great company. We have identified several positive factors that should benefit the stock over the long run, including a shift from sourcing through domestic third parties to sourcing directly from international manufacturers, which is a less expensive approach.
SRA International, a provider of information technology services to the federal government, was another notable detractor from performance. The company is facing some obstacles that we consider to be short-term in nature, including the challenge of recruiting enough qualified technical personnel. We continue to believe the stock is a good, long-term investment given the tailwinds of an aging federal workforce and expectations for steady growth in the federal budget, among other factors.
OUTLOOK
The outlook for corporate earnings growth has dimmed in response to concerns about the economy, a lull in productivity gains and rising input and financing costs. In addition, there is uncertainty about how losses in the subprime mortgage market will impact other sectors of the economy. Wall Street analysts are expecting first quarter earnings growth of less than 5% for S&P 500® companies on the heels of double-digit growth in the fourth quarter. First quarter earnings growth for smaller companies is also expected to be in the single digits, as it was in the fourth quarter. Across the capitalization spectrum, some of the lowest first quarter estimates are for cyclical, commodity-driven sectors, including energy and basic materials.
The earnings growth rate of the Fund will likely decelerate along with the market. However, because we focus on investing in what we believe are higher-quality, less cyclical companies, our portfolio companies appear on track to continue growing their revenues and earnings at a healthy pace. As a result, we think that the operating performance of our companies will shine relative to the typical small company in a slower growth environment. We feel confident that the earnings gap that we expect between our holdings and the broader market makes the Fund well-positioned for the months ahead.
Thank you for the opportunity to manage your assets.
18
| | |
| WASATCH SMALL CAP GROWTH FUND (WAAEX) — Portfolio Summary | | MARCH 31, 2007 |
|
| |
| |
AVERAGE ANNUAL TOTAL RETURNS
| | | | | | | | |
| | | SIX MONTHS* | | 1 YEAR | | 5 YEARS | | 10 YEARS |
Wasatch Small Cap Growth Fund | | 8.95% | | 0.93% | | 7.50% | | 14.90% |
Russell 2000 Growth Index | | 11.46% | | 1.56% | | 7.88% | | 6.31% |
Russell 2000 Index | | 11.02% | | 5.91% | | 10.95% | | 10.23% |
Performance data quoted represents past performance. Past performance is not indicative of future performance and current performance may be lower or higher than the performance quoted. Wasatch Funds will deduct a fee of 2% from redemption proceeds on Fund shares held two months or less. Performance data does not reflect the deduction of this fee which, if charged, would reduce the performance quoted. The table above does not reflect the deduction of taxes that you would pay on fund distributions or the redemption of fund shares.
The total annual fund operating expenses for the Wasatch Small Cap Growth Fund are 1.18% and are based on Fund expenses before any expense reimbursements by the Advisor. The net expenses for the Small Cap Growth Fund are 1.18% and are based on Fund expenses, net of waivers and reimbursements. The Advisor has contractually agreed to reimburse the Fund for total annual fund operating expenses in excess of 1.50% until at least 1/31/08 (excluding interest, taxes, brokerage commissions, other investment related costs and extraordinary expenses in excess of such limitations). See the prospectus for additional information regarding Fund expenses.
To obtain the most recent month-end performance, please visit www.wasatchfunds.com or call 800.551.1700. Investment returns and principal value will fluctuate and shares, when redeemed, may be worth more or less than their original cost. The Advisor has absorbed, in the past, certain Fund expenses, without which total returns would have been lower.
Investments in small cap funds will be more volatile and loss of principal could be greater than investing in large cap or more diversified funds.
TOP 10 EQUITY HOLDINGS*
| | | | |
| Ticker | | Company | | % of Fund |
| ORLY | | O’Reilly Automotive, Inc. Automotive parts retailer/distributor. | | 5.41% |
| KNX | | Knight Transportation, Inc. Long haul trucking and logistic services. | | 3.93% |
| TECH | | Techne Corp. Complex, disposable research kits for biotech. | | 2.93% |
| RECN | | Resources Connection, Inc. Outsourcing of professional business services. | | 2.60% |
| FDS | | FactSet Research Systems, Inc. Financial and economic information for investment managers. | | 2.50% |
| | | | |
| Ticker | | Company | | % of Fund |
| HWAY | | Healthways, Inc. Disease management services. | | 2.44% |
| GTRC | | Guitar Center, Inc. Music stores. | | 2.38% |
| CPRT | | Copart, Inc. Vehicle salvage services. | | 2.24% |
| PDX | | Pediatrix Medical Group, Inc. National network of neonatalogists. | | 2.22% |
| HDB | | HDFC Bank Ltd. ADR Consumer bank. | | 2.14% |
| * | | As of March 31, 2007, the Fund had 28.79% invested in the Top 10 equity holdings and there were 111 long-term holdings in the Fund. Portfolio holdings are subject to change at any time. References to specific securities should not be construed as recommendations by the Funds or their Advisor. |
SECTOR BREAKDOWN**
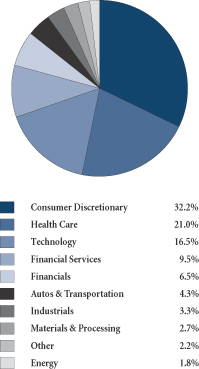
| ** | | Excludes short-term investments, securities sold short and written options, if any. |
GROWTHOFA $10,000 INVESTMENT
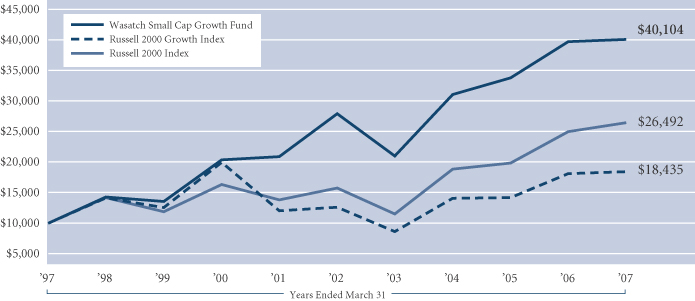
The Russell 2000 Growth Index is an unmanaged total return index that measures the performance of those Russell 2000 Index companies with higher price-to-book ratios and higher forecasted growth values. The Russell 2000 Index is an unmanaged total return index of the smallest 2,000 companies in the Russell 3000 Index, as ranked by total market capitalization. The Russell 2000 Index is widely regarded in the industry as accurately capturing the universe of small company stocks. The Fund has changed its primary market index from the Russell 2000 Index to the Russell 2000 Growth Index, which the Advisor believes better represents the types of companies in which the Fund typically invests. You cannot invest directly in these indexes.
19
| | |
| WASATCH SMALL CAP VALUE FUND (WMCVX) — Management Discussion | | MARCH 31, 2007 |
|
| |
| |
The Wasatch Small Cap Value Fund is managed by a team of Wasatch portfolio managers, led by Jim Larkins and John Mazanec.
| | | | |

Jim Larkins, MBA Portfolio Manager | | 
John Mazanec, MBA Portfolio Manager | | OVERVIEW The Wasatch Small Cap Value Fund gained 13.54% in the six-month period ended March 31, 2007, outpacing the 10.62% return of the Russell 2000 Value Index. The Fund’s solid half-year results |
were achieved mainly from stock picking, and the biggest contributor was the financial services sector. Stock selection also propelled the Fund forward with significant gains in consumer discretionary, health care, and technology. The Fund’s top contributor was ON Semiconductor, a chip maker focused on power management applications. Despite strong stock picking in the producer durables, utilities and consumer staples sectors, our performance versus the Index was held back by our substantial underweight in these areas.
DETAILSOFTHE PERIOD
The Fund benefited from our focus on investing in fallen angels, hidden opportunities and undiscovered gems.* A key theme that boosted returns was the large number of acquisitions that took place — in the market overall and among companies we own. A couple of factors are driving this trend. First, private equity funds continue to raise a tremendous amount of capital, and are putting it to work by buying undervalued public companies. Also, in our current heavily regulated environment, a byproduct of the Enron/WorldCom era of malfeasance, many small companies have found it more expensive and cumbersome to remain public. As a result, some firms have chosen to go private or sell out.
Molecular Devices, a maker of high-throughput screening instruments used in drug discovery, was the Fund’s top acquisition-related contributor. When we bought this company late last year, we believed it was attractive, and were proven right very quickly, as it was acquired at close to a 50% premium. Two of our financial companies also agreed to be acquired — Placer Sierra, a regional California bank, and Hub International, an insurance broker.
In some cases, making a relatively quick profit when a company is acquired at a premium is bittersweet. While it’s nice to have our assessment of a company’s worth confirmed, we’d often prefer to reap the longer-term benefit of owning a great company for a number of years, especially when we believe a takeout premium is too low.
Performance was strong for many financial holdings during the period, and we did well by selling on increased valuations. We also lowered our weightings in real estate investment trusts (REITs) and business development companies, and reduced our mortgage exposure as we grew concerned about the high-risk loan portfolios some of our
companies held. We should have more aggressively trimmed our position in HomeBanc Corp., a residential mortgage REIT and the biggest detractor for the period. HomeBanc suffered from being a high-cost lender in the economically weak Southeast states, particularly Florida. Making matters worse, the firm’s Chief Executive Officer, who was the heart and soul of the company, departed. We sold our position because of these challenges and uncertainties.
In contrast, we expect good things from Redwood Trust, a company that focuses on the less risky, super-prime jumbo mortgage market. It’s in a good position to take advantage of the dislocation that currently exists between subprime and prime residential mortgages. The company has excess capital and a long history of being an intelligent buyer, remaining calm when there’s panic in the street.
Performance in the Fund’s materials and processing sector was disappointing, especially in comparison to its red-hot Index performance. The biggest detractor was Beacon Roofing Supply, a long-term holding that has been hurt by exposure to the residential market. However, we remain committed to Beacon, which gets much of its business from re-roofing, rather than new construction. In contrast to Beacon, we had strong returns from a new steel holding, Wheeling-Pittsburgh, which received a boost from a new management team and an infusion of capital.
In consumer discretionary, we really like Fossil, a maker of fashion watches and accessories. It’s a great fallen-angel story. We bought Fossil at a price we thought was below its intrinsic value and now earnings have begun to reaccelerate. We recently added to our position because we see improving fundamentals and management executing as planned.
In health care, our weighting reached its highest level in a couple of years because of opportunities we’ve uncovered. One example is LHC Group, a provider of in-home health care. We think LHC Group is a great company in a high-growth area, and we hope to hold it for a long time.
OUTLOOK
We are pleased with the Fund’s return for the six-month period. We experienced higher than usual trading activity and have sold a number of successful names, resulting in fewer holdings overall. At the same time, we have taken larger positions in newer names, a sign that we like the opportunities the market is providing to us.
The current portfolio includes promising new prospects that we’re watching closely to see which ones will become more prominent players on our roster. We believe that a handful of these companies will prove to be the types of long-term holdings we strive to own.
Thank you for the opportunity to manage your assets.
| * | | Fallen angels are defined as companies with a solid long-term growth history and outlook whose current earnings have gotten off track. Hidden opportunities include companies that in our opinion are not being priced correctly given their book value or cash flow, special situations where we determine that a company is being misvalued by the market, companies that have hidden assets that we believe are not reflected in their current stock price, and spin-offs that we believe are underpriced. Undiscovered gems are companies that may be undervalued because they currently receive little coverage from Wall Street analysts. |
20
| | |
| WASATCH SMALL CAP VALUE FUND (WMCVX) — Portfolio Summary | | MARCH 31, 2007 |
|
| |
| |
AVERAGE ANNUAL TOTAL RETURNS
| | | | | | | | |
| | | SIX MONTHS* | | 1 YEAR | | 5 YEARS | | SINCE INCEPTION
12/17/97 |
Wasatch Small Cap Value Fund | | 13.54% | | 7.64% | | 11.53% | | 18.27% |
Russell 2000 Value Index | | 10.62% | | 10.38% | | 13.61% | | 11.44% |
Performance data quoted represents past performance. Past performance is not indicative of future performance and current performance may be lower or higher than the performance quoted. Wasatch Funds will deduct a fee of 2% from redemption proceeds on Fund shares held two months or less. Performance data does not reflect the deduction of this fee which, if charged, would reduce the performance quoted. The table above does not reflect the deduction of taxes that you would pay on fund distributions or the redemption of fund shares.
The total annual fund operating expenses for the Wasatch Small Cap Value Fund are 1.98% and are based on Fund expenses before any expense reimbursements by the Advisor. The net expenses for the Small Cap Value Fund are 1.98% and are based on Fund expenses, net of waivers and reimbursements. The Advisor has contractually agreed to reimburse the Fund for total annual fund operating expenses in excess of 1.95% until at least 1/31/08 (excluding interest, taxes, brokerage commissions, other investment related costs and extraordinary expenses in excess of such limitations). See the prospectus for additional information regarding Fund expenses.
To obtain the most recent month-end performance, please visit www.wasatchfunds.com or call 800.551.1700. Investment returns and principal value will fluctuate and shares, when redeemed, may be worth more or less than their original cost. The Advisor has absorbed, currently or in the past, certain Fund expenses, without which total returns would have been lower.
Investments in small cap funds will be more volatile and loss of principal could be greater than investing in large cap or more diversified funds.
* Not annualized.
TOP 10 EQUITY HOLDINGS*
| | | | |
| Ticker | | Company | | % of Fund |
| RWT | | Redwood Trust, Inc. Jumbo ARM mortgage REIT. | | 2.85% |
| MSM | | MSC Industrial Direct Co., Inc., Class A Industrial products distributor. | | 2.68% |
| BECN | | Beacon Roofing Supply, Inc. Roofing supplies distributor. | | 2.52% |
| INT | | World Fuel Services Corp. Marine, aviation and land fuel products and services. | | 2.25% |
| ESCH | | Eschelon Telecom, Inc. Telecommunication services for businesses. | | 2.24% |
| | | | |
| Ticker | | Company | | % of Fund |
| VEH | | Valero GP Holdings, LLC Petroleum product terminals and liquids pipelines operator. | | 2.16% |
| UPL | | Ultra Petroleum Corp. Oil and gas developer. | | 2.08% |
| TTI | | TETRA Technologies, Inc. Oil and gas industry services. | | 2.05% |
| FOSL | | Fossil, Inc. Fashion watches and accessories. | | 1.97% |
| VTNC | | Vitran Corp., Inc. Trucking company. | | 1.92% |
| * | | As of March 31, 2007, the Fund had 22.72% invested in the Top 10 equity holdings and there were 94 long-term holdings in the Fund. Portfolio holdings are subject to change at any time. References to specific securities should not be construed as recommendations by the Funds or their Advisor. |
SECTOR BREAKDOWN**
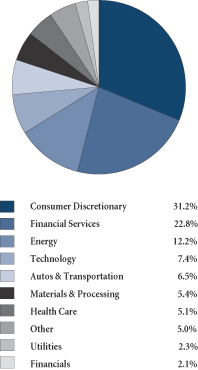
| ** | | Excludes short-term investments, securities sold short and written options, if any. |
GROWTHOFA $10,000 INVESTMENT
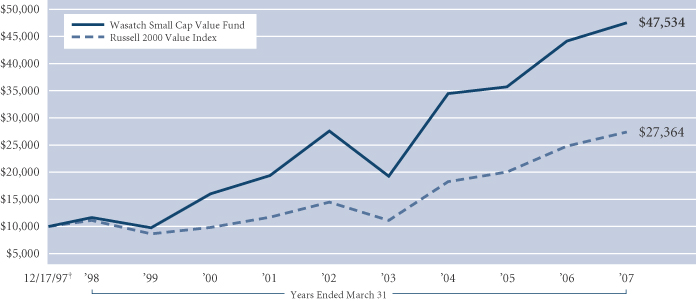
| | † | | Inception: December 17, 1997. The Russell 2000 Value Index measures the performance of those Russell 2000 Index companies with lower price-to-book ratios and lower forecasted growth values. The Russell 2000 Index is an unmanaged total return index of the smallest 2,000 companies in the Russell 3000 Index, as ranked by total market capitalization. The Russell 2000 Index is widely regarded in the industry as accurately capturing the universe of small company stocks. You cannot invest directly in the Index. |
21
| | |
| WASATCH STRATEGIC INCOME FUND (WASIX) — Management Discussion | | MARCH 31, 2007 |
|
| |
| |
The Wasatch Strategic Income Fund is managed by a team of Wasatch portfolio managers, led by Sam Stewart.
| | |
Sam Stewart, PhD, CFA Portfolio Manager | | OVERVIEW The Strategic Income Fund’s goal is to deliver reasonably consistent annualized returns that fall somewhere between bond and equity returns over the long term. The Fund got off to an unexpectedly strong start, passing the one-year mark and posting a 17.72% return for the 12 months ended March 31, 2007. We are certainly pleased with this performance, but realistically expect more modest annual returns for the Fund. |
During the past six months the stock market experienced one of its most volatile periods in recent memory, including a 416 point one-day loss — its largest since 2001. However, the market was still up nicely for the period, with the Fund’s equity benchmark, the S&P 500® Index, posting a 7.38% increase.
The Strategic Income Fund outpaced the S&P 500 by delivering an 11.39% return for the six months ended March 31. This was also well ahead of the 2.76% return of the Lehman Brothers Aggregate Bond Index. We felt good about the Fund’s performance, but were equally as pleased to see the Fund’s resilience during recent market turbulence.
The Fund benefited during the period from investments in undervalued real estate investment trusts (REITS), international holdings, and companies paying a meaningful dividend. Companies that detracted from performance tended to have some level of real or perceived exposure to the weak housing market.
DETAILSOFTHE PERIOD
The Fund entered the period with a significant weighting in finance-related companies. As you probably heard over the last few months, the financial sector has been taking a bit of a beating due to subprime mortgage woes. For the Fund’s financial holdings to have posted more than a 12% gain during the six month period gives us increased confidence in the Fund’s composition and potential to achieve its absolute return target.
Despite being heavily weighted in the financial sector, the Fund’s holdings are actually comprised of very different kinds of companies — Blue Chip, Dividend Growth, and Value. We believe this diversity creates a less correlated portfolio that may provide protection in an unstable market. We also feel good about the downside buffer provided by our dividend yield.
We did lighten up on our financial weightings during the period, as we expect the financial turbulence is not over yet. However, we continue to believe that a growing financial sector will be an important feature of globalization and therefore a good long-term area in which to carry a significant portfolio weighting.
Another standout this period was our group of international holdings, returning more than 24%. We continue to find international equities attractive for their typically higher dividend yields, as well as their growth potential. Weg S.A. is a holding that fits these criteria nicely, and whose price has increased over 68% in the last six months. This decidedly prosaic Brazilian company produces electric motors and is a classic Multiple Eyes™ example of how we leverage the work of other Wasatch analysts. A portfolio manager on another Wasatch Fund brought Weg to our attention.
We believe that Weg is an appealing play on the increasing demand for capital goods in Latin America and globally. While Weg gets 60% of its revenue from Brazil and is the market leader there, it only has a 4% market share of motors worldwide, which gives it plenty of headroom for growth. The company’s numbers support our growth thesis, with five-year compounding revenue growth of 25% and operating margins of 20%. We found Weg attractive at a price-to-earnings (P/E) multiple* of just 15 and dividend yield of 2.3%.
Unfortunately, it’s nearly impossible to enjoy the roses without getting pricked by a few thorns. HomeBanc Corp., a mortgage loan originator, has been a thorn in our side as we have seen its market value slide. Notwithstanding our cautiously optimistic view of HomeBanc in the third quarter of 2006, we cut our losses in the fourth quarter and sold the stock. Our decision was partly made following the company’s announcement that rising interest rates had caused a wider-than-expected loss in the third quarter. We see HomeBanc as a possible takeover target, but ultimately decided the quality of its investments was not worth continuing to hold the company for that sole prospect. In hindsight, with burgeoning competition from Wall Street firms in the residential mortgage arena, we should have sold more aggressively than we did.
OUTLOOK
Going forward, we look to further increase our international focus and add positions as we find attractively valued companies. We would also love to grow our overall Blue Chip weighting when buying opportunities present themselves. On the flip side, we will likely continue trimming financial holdings over the near-term, but expect to keep financials meaningfully overweighted for the long-term as we believe this is one of the key sectors of globalization.
Over our years of managing mutual funds, we have learned that constructing an ideal portfolio of investments is an ongoing process. With just over a year now under our belts on the Strategic Income Fund, we feel better than ever about the Fund’s composition and believe it is well positioned to achieve its investment objectives.
Thank you for the opportunity to manage your assets.
| * | | Price-to-earnings multiple or P/E is the price of a company’s stock divided by its earnings per share (EPS). |
22
| | |
| WASATCH STRATEGIC INCOME FUND (WASIX) — Portfolio Summary | | MARCH 31, 2007 |
|
| |
| |
AVERAGE ANNUAL TOTAL RETURNS
| | | | | | | | |
| | | SIX MONTHS* | | 1 YEAR | | 5 YEARS | | SINCE INCEPTION
2/1/06 |
Wasatch Strategic Income Fund | | 11.39% | | 17.72% | | N/A | | 16.85% |
Lehman Brothers Aggregate Bond Index | | 2.76% | | 6.59% | | N/A | | 5.05% |
S&P 500 Index | | 7.38% | | 11.83% | | N/A | | 11.54% |
Performance data quoted represents past performance. Past performance is not indicative of future performance and current performance may be lower or higher than the performance quoted. Wasatch Funds will deduct a fee of 2% from redemption proceeds on Fund shares held two months or less. Performance data does not reflect the deduction of this fee which, if charged, would reduce the performance quoted. The table above does not reflect the deduction of taxes that you would pay on fund distributions or the redemption of fund shares.
The total annual fund operating expenses for the Wasatch Strategic Income Fund are 2.95% and are based on Fund expenses before any expense reimbursements by the Advisor. The net expenses for the Strategic Income Fund are 1.24% and are based on Fund expenses, net of waivers and reimbursements. The Advisor has contractually agreed to reimburse the Fund for total annual fund operating expenses in excess of 0.95% until at least 1/31/08 (excluding interest, taxes, brokerage commissions, other investment related costs and extraordinary expenses in excess of such limitations). See the prospectus for additional information regarding Fund expenses.
To obtain the most recent month-end performance, please visit www.wasatchfunds.com or call 800.551.1700. Investment returns and principal value will fluctuate and shares, when redeemed, may be worth more or less than their original cost. The Advisor has absorbed, currently or in the past, certain Fund expenses, without which total returns would have been lower.
With respect to the Fund’s assets invested in fixed income securities, you are subject, but not limited to, the same interest rate, inflation and credit risk associated with the underlying fixed-income securities owned by the Fund. Return of principal is not guaranteed. Equity investing involves risks, including potential loss of the principal amount invested. Being non-diversified, the Fund can invest a larger portion of its assets in the securities of a limited number of companies than a diversified fund. Non-diversification increases the risk of loss to the Fund if the values of these securities decline. Investing in foreign securities entails special risks, such as currency fluctuations and political uncertainties, which are described in more detail in the prospectus.
TOP 10 EQUITY HOLDINGS*
| | | | |
| Ticker | | Company | | % of Fund |
| POOL | | Pool Corp. Swimming pool supplies distributor. | | 4.75% |
| COF | | Capital One Financial Corp. Credit cards and financial services. | | 4.50% |
| RWT | | Redwood Trust, Inc. Jumbo ARM mortgage REIT. | | 3.60% |
| CSE | | CapitalSource, Inc. Financial services to businesses. | | 3.05% |
| KFN | | KKR Financial Corp. Mortgage REIT. | | 2.93% |
| | | | |
| Ticker | | Company | | % of Fund |
| SFI | | iStar Financial, Inc. REIT. | | 2.66% |
| MGRC | | McGrath RentCorp Modular building rentals. | | 2.66% |
| MCHP | | Microchip Technology, Inc. Semiconductors. | | 2.51% |
| AHR | | Anthracite Capital, Inc. Mortgage lender. | | 2.37% |
| NTB BH | | The Bank of N.T. Butterfield & Son Ltd. (Bermuda) Wealth management and financial services. | | 2.11% |
| * | | As of March 31, 2007, the Fund had 31.14% invested in the Top 10 equity holdings and there were 80 long-term holdings in the Fund. Portfolio holdings are subject to change at any time. References to specific securities should not be construed as recommendations by the Funds or their Advisor. |
SECTOR BREAKDOWN**
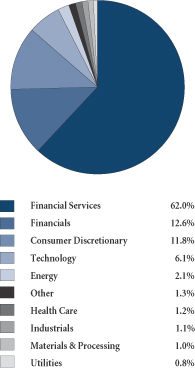
** | | Excludes short-term investments, securities sold short and written options, if any. |
GROWTHOFA $10,000 INVESTMENT
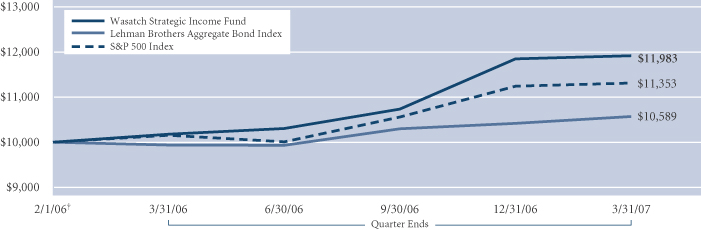
†Inception: February 1, 2006. The Lehman Brothers Aggregate Bond Index covers the U.S. investment grade fixed rate bond market, including government and corporate securities, agency mortgage pass-through securities, and asset-backed securities. To be included in the index the security must meet the following criteria: must have at least one year to final maturity, regardless of call features; must have at least $100 million par amount outstanding; must be rated investment grade or better by Moody’s Investors Service, Standard & Poor’s, or Fitch Investor’s Service; must be fixed rate, although it can carry a coupon that steps up or changes to a predetermined schedule; must be dollar-denominated and must be nonconvertible. All corporate and asset-backed securities must be registered with the SEC; and must be publicly issued. The S&P 500 Index includes 500 of the United States’ largest stocks from a broad variety of industries. The Index is unmanaged but is a commonly used measure of common stock total return performance. You cannot invest directly in these indexes.
23
| | |
| WASATCH ULTRA GROWTH FUND (WAMCX) — Management Discussion | | MARCH 31, 2007 |
|
| |
| |
The Wasatch Ultra Growth Fund is managed by a team of Wasatch portfolio managers, led by Ajay Krishnan and Neal Dihora.
| | | | |

Ajay Krishnan, CFA Portfolio Manager | | 
Neal Dihora, CFA Portfolio Manager | | OVERVIEW During the six months ended March 31, 2007 the Wasatch Ultra Growth Fund gained 8.29% and the Russell 2000 Growth Index rose 11.46%. Market conditions were frothy throughout much of the peri- |
od, with the Index climbing nearly 15% from the beginning of October through late February. Prices of small cap growth stocks subsequently retreated, only to rally later in March amid robust merger activity and rising hopes that the Federal Reserve might still cut rates in 2007.
We were pleased that the Fund generated such a strong gain in this environment. That said, we were disappointed that results trailed the Index. We typically do not keep up with the benchmark in unusually strong markets, and this period was no exception. The challenge of outperforming in such a buoyant market was accentuated by declines in several of our investments.
Looking forward, we expect the 12-month earnings growth rate of the portfolio to remain above our 20% target. We believe that this earnings growth profile, combined with our attention to valuation, makes the Fund well positioned for the months ahead.
DETAILSOFTHE PERIOD
The Ultra Growth Fund participated in this period’s strong stock market advance, with many of our investments posting substantial gains. Two names that did particularly well were health care companies United Surgical Partners, an operator of ambulatory surgery centers, and Intuitive Surgical, a manufacturer of robotic-assisted, minimally invasive surgical systems. United Surgical Partners, which was our largest holding at the start of the period, announced in January that it was being acquired by a private equity firm at a premium of more than 13%. We sold our position in the stock, since we thought it would continue to trade near the buyout price until the transaction’s scheduled second-quarter close. Shares of Intuitive Surgical were weak in the fourth quarter but rebounded to finish the period with a strong gain after the company reported sales and earnings growth that surpassed Wall Street’s expectations.
One of our best-performing holdings this period was Raffles Education (Singapore), a provider of post-secondary educational courses targeting the Asia Pacific region. Raffles has been benefiting from the rising affluence throughout emerging Asia Pacific countries that is fueling demand for post-secondary education. We believe that the company’s growth prospects remain bright but sold the stock in March
because we thought it was becoming richly valued. And while we no longer own Raffles, it is still a good example of our Multiple Eyes™ approach to investing, which includes working closely with our international research team as we seek opportunities around the globe.
We also sold one of the largest detractors from performance: Shuffle Master, a manufacturer of technology-based products for the gaming industry whose stock was weak during the period after the company preannounced disappointing quarterly earnings. We did not sell Shuffle Master in response to just one quarter’s sub-par results but because we did not see an end to the integration problems the company was having with an acquisition it made in early 2006. As concerns related to the acquisition continued to surface, we met with management last fall and came away feeling comfortable that the issues would soon be resolved. However, further due diligence on the company — underscored by recent operating results — confirmed that this was not the case. We decided that the acquisition would be a drag on earnings for awhile and that it was best to step to the sidelines and revisit Shuffle Master in the future when there would be greater visibility into the ramifications of the deal.
ArthroCare, a supplier of a proprietary technology that enables minimally invasive surgical procedures, was another stock that underperformed. One of ArthroCare’s competitors has been temporarily allowing doctors to sample its tonsillectomy product for free, causing weakness in ArthroCare’s ear, nose and throat business. Based on some additional research we conducted, including speaking directly with a number of physicians, we concluded that the sampling program would not have a lasting effect on ArthroCare’s growth. We continue to view the company as a good, long-term investment given the many uses of its proven, patented technology — intellectual property that has been strengthened through legal victories and licensing agreements. Health technology stocks like ArthroCare can be volatile from one quarter to the next, reinforcing our belief in taking a long-term perspective on companies. We were rewarded for being patient with Intuitive Surgical this period in the face of a difficult fourth quarter for the stock, and we are confident in ArthroCare’s long-term potential as well.
OUTLOOK
Wasatch continues to expand its research team, and we are constantly trying to leverage this growing analytical talent for the benefit of the Fund’s shareholders. Recently, we have invested in several reasonably priced companies in non-traditional growth sectors — companies whose price-to-earnings (P/E) multiples* have contracted in sympathy with an anticipated economic slowdown but whose prospects should be solid regardless of the economic cycle. We believe these types of investments will help keep the Fund’s earnings growth rate above our 20% target over the next 12 months, while maintaining our sensitivity to valuation.
Thank you for the opportunity to manage your assets.
| * | | Price-to-earnings multiple or P/E is the price of a company’s stock divided by its earnings per share (EPS). |
24
| | |
| WASATCH ULTRA GROWTH FUND (WAMCX) — Portfolio Summary | | MARCH 31, 2007 |
|
| |
| |
AVERAGE ANNUAL TOTAL RETURNS
| | | | | | | | |
| | | SIX MONTHS* | | 1 YEAR | | 5 YEARS | | 10 YEARS |
Wasatch Ultra Growth Fund | | 8.29% | | -2.15% | | 5.82% | | 12.95% |
Russell 2000 Growth Index | | 11.46% | | 1.56% | | 7.88% | | 6.31% |
Performance data quoted represents past performance. Past performance is not indicative of future performance and current performance may be lower or higher than the performance quoted. Wasatch Funds will deduct a fee of 2% from redemption proceeds on Fund shares held two months or less. Performance data does not reflect the deduction of this fee which, if charged, would reduce the performance quoted. The table above does not reflect the deduction of taxes that you would pay on fund distributions or the redemption of fund shares.
The total annual fund operating expenses for the Wasatch Ultra Growth Fund are 1.48% and are based on Fund expenses before any expense reimbursements by the Advisor. The net expenses for the Ultra Growth Fund are 1.48% and are based on Fund expenses, net of waivers and reimbursements. The Advisor has contractually agreed to reimburse the Fund for total annual fund operating expenses in excess of 1.75% until at least 1/31/08 (excluding interest, taxes, brokerage commissions, other investment related costs and extraordinary expenses in excess of such limitations). See the prospectus for additional information regarding Fund expenses.
To obtain the most recent month-end performance, please visit www.wasatchfunds.com or call 800.551.1700. Investment returns and principal value will fluctuate and shares, when redeemed, may be worth more or less than their original cost. The Advisor has absorbed, in the past, certain Fund expenses, without which total returns would have been lower.
Investments in small cap funds will be more volatile and loss of principal could be greater than investing in large cap or more diversified funds.
* Not annualized.
TOP 10 EQUITY HOLDINGS*
| | | | |
| Ticker | | Company | | % of Fund |
| HWAY | | Healthways, Inc. Disease management services. | | 4.38% |
| PDX | | Pediatrix Medical Group, Inc. National network of neonatalogists. | | 3.70% |
| ORLY | | O’Reilly Automotive, Inc. Automotive parts retailer/distributor. | | 3.15% |
| SLAB | | Silicon Laboratories, Inc. Analog and mixed signal integrated circuits. | | 2.90% |
| CTSH | | Cognizant Technology Solutions Corp., Class A Professional technology services. | | 2.76% |
| | | | |
| Ticker | | Company | | % of Fund |
| KYPH | | Kyphon, Inc. Medical devices for spine treatments. | | 2.71% |
| SIRF | | SiRF Technology Holdings, Inc. Semiconductors and software for global positioning systems. | | 2.66% |
| ARTC | | ArthroCare Corp. Disposable devices for minimally invasive surgery. | | 2.59% |
| PSYS | | Psychiatric Solutions, Inc. Inpatient behavioral health care services. | | 2.45% |
| PRSC | | Providence Service Corp. (The) Management of U.S. government-sponsored social services. | | 2.43% |
| * | | As of March 31, 2007, the Fund had 29.73% invested in the Top 10 equity holdings and there were 102 long-term holdings in the Fund. Portfolio holdings are subject to change at any time. References to specific securities should not be construed as recommendations by the Funds or their Advisor. |
SECTOR BREAKDOWN**
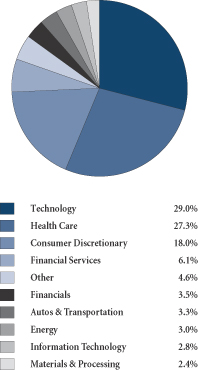
| ** | | Excludes short-term investments, securities sold short and written options, if any. |
GROWTHOFA $10,000 INVESTMENT
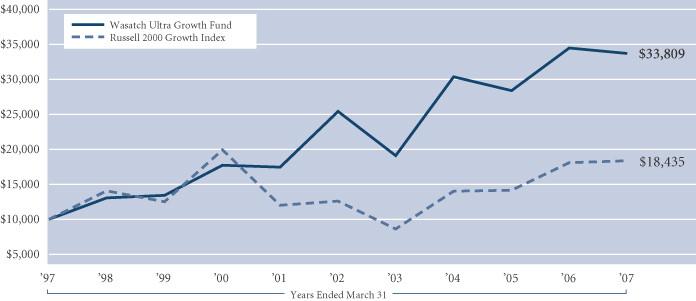
The Russell 2000 Growth Index measures the performance of those Russell 2000 Index companies with higher price-to-book ratios and higher forecasted growth values. The Russell 2000 Index is an unmanaged total return index of the smallest 2,000 companies in the Russell 3000 Index, as ranked by total market capitalization. The Russell 2000 Index is widely regarded in the industry as accurately capturing the universe of small company stocks. You cannot invest directly in these indexes.
25
| | |
| WASATCH- HOISINGTON U.S. TREASURY FUND (WHOSX) — Management Discussion | | MARCH 31, 2007 |
|
| |
| |
| | |

Van R. Hoisington Portfolio Manager | | OVERVIEW The U.S. Treasury Fund seeks to provide a rate of return that exceeds the rate of inflation over a business cycle by investing in U.S. Treasury securities, with an emphasis on both income and capital appreciation. The Fund returned 6.26% in the 12 months ended March 2007, versus 6.59% for the Lehman Brother’s Aggregate Bond Index. For the past six months, the Fund returned 0.33%, versus 2.76% for the Lehman. |
DETAILSOFTHE PERIOD
At the end of the first quarter, the 30-year Treasury bond yielded 4.84%, or slightly below the year earlier level of 4.89%, but above the 4.76% level of six months ago. The rise in bond yields held the Fund to a nearly flat return for the six-month period. However, a decline in yields over the past 12 months allowed bond prices to rise and enhance the return of the Fund.
The Federal funds rate was 5.25% at the end of March compared with 4.75% a year earlier and a low of 1% in the spring of 2004 when the Fed moved to restrict monetary conditions. The Fed funds rate is nearly 0.5% higher than the yield on the 10-year note, creating an inverted yield curve, a condition that has lasted nearly 10 months.
Responding to monetary restraint, economic activity slowed, as the housing, automotive and capital goods industries slumped. Real gross domestic product (GDP) in the first quarter does not appear to have improved from the 2.4% rate of growth registered over three prior quarters. In the four quarters ended in March 2006, real GDP rose by 3.7%.
The weaker rise in real economic activity was reflected in the labor markets. In the 12 months ended March 2007, private nonfarm employment rose 1.5%, down from a 2.4% gain a year earlier. The unemployment rate, however, eased to a six year low in March, as growth in the labor force moderated. The Fed’s preferred inflation measure rose more than desired, although broader indicators moderated.
OUTLOOK
Real GDP should expand about 1.5% this year. This relatively sanguine view nevertheless reflects the slowest nominal growth in almost a half century and disguises a serious deterioration of underlying economic fundamentals that make future growth problematic and a recession likely late this year or in 2008.
Monetary policy works with long and variable lags. For instance, the economy appeared to be unaffected by the increases in the Fed funds rate that began in 2004 and ended in June 2006. Based on this experience, the lag between monetary execution and economic impact would appear to be about two years. As such, the 1% rise in the funds rate in the first half of 2006 may negatively affect economic growth through the first half of 2008.
Historically, credit worthiness issues have increased dramatically during prior periods of monetary restraint. This well-known pattern has emerged once again. The problems in the subprime and Alt-A mortgage sectors, the two lowest credit categories of homeowner debt, have been given widespread publicity. Less recognized are the increasing delinquencies and foreclosures that have occurred for prime mortgages and credit cards.
In the past, such credit ripples have caused financial institutions to tighten credit standards for all types of loans, a process often referred to as “credit contagion.” The failure of the Penn Central railroad in 1970 was one of several notable examples. A tightening credit policy by the financial community will either extend the downturn or delay a normal economic recovery.
A housing drag will persist many months. With inventories of unsold homes in February at a 16-year high and completions far above starts, substantial further production cuts must occur. Housing will feed back into consumption through reduced cash takeouts from home equity and reductions in output and employment in construction.
Faltering capital spending will reduce employment and output materially since these outlays have large multiplier effects on the rest of the economy. A sharp deceleration in key indicators of capital spending strongly suggests that the capital goods sector has either entered, or is about to enter a recession.
In the first quarter, the Leading Economic Index (LEI)* fell 0.6% below the year earlier level. The current four-quarter decline is only the eleventh instance since the Korean War. Nine recessions and one slowdown followed the previous 10 episodes.
If a recession is to be avoided, the Fed will need to take their approach in 1966 - 67 and again in 1995. In both of those circumstances, inflation was running above desirable levels, but the Fed quickly and substantially eased monetary conditions, yield curve inversions quickly reversed, money/credit growth re-accelerated and recessions were narrowly averted.
Whether the Fed reverses direction quickly or stands firm, the bond market outlook appears favorable. Given the deep-seated and complex problems facing the economy, we believe economic conditions will deteriorate and inflation will trend lower, paving the way for bond prices to appreciate. The Fund appears well positioned for such an event with investments in long-term U.S. Treasury bonds.
Thank you for the opportunity to manage your assets.
| * | | Leading Economic Index (LEI) was developed by the Conference Board and is comprised of 10 components that lead changes in overall economic activity. |
26
| | |
| WASATCH-HOISINGTON U.S. TREASURY FUND (WHOSX) — Portfolio Summary | | MARCH 31, 2007 |
|
| |
| |
AVERAGE ANNUAL TOTAL RETURNS
| | | | | | | | |
| | | SIX MONTHS* | | 1 YEAR | | 5 YEARS | | 10 YEARS |
Wasatch-Hoisington U.S. Treasury Fund | | 0.33% | | 6.26% | | 8.21% | | 8.16% |
Lehman Brothers Aggregate Bond Index | | 2.76% | | 6.59% | | 5.35% | | 6.46% |
Performance data quoted represents past performance. Past performance is not indicative of future performance and current performance may be lower or higher than the performance quoted. Wasatch Funds will deduct a fee of 2% from redemption proceeds on Fund shares held two months or less. Performance data does not reflect the deduction of this fee which, if charged, would reduce the performance quoted. The table above does not reflect the deduction of taxes that you would pay on fund distributions or the redemption of fund shares.
The total annual fund operating expenses for the Wasatch-Hoisington U.S. Treasury Fund are 0.72% and are based on Fund expenses before any expense reimbursements by the Advisor. The net expenses for the U.S. Treasury Fund are 0.72% and are based on Fund expenses, net of waivers and reimbursements. The Advisor has contractually agreed to reimburse the Fund for total annual fund operating expenses in excess of 0.75% until at least 1/31/08 (excluding interest, taxes, brokerage commissions, other investment related costs and extraordinary expenses in excess of such limitations). See the prospectus for additional information regarding Fund expenses.
To obtain the most recent month-end performance, please visit www.wasatchfunds.com or call 800.551.1700. Investment returns and principal value will fluctuate and shares, when redeemed, may be worth more or less than their original cost. The Advisor has absorbed, in the past, certain Fund expenses, without which total returns would have been lower.
Investments in fixed income funds are subject to the same interest rate, inflation, credit and other risks associated with the underlying bonds. Return of principal is not guaranteed.
TOP 10 HOLDINGS*
| | | | | |
| Holding | | Maturity
Date | | % of
Fund | |
| U.S. Treasury Strip, principal only | | 11/15/27 | | 32.16 | % |
| U.S. Treasury Bond, 5.25% | | 2/15/29 | | 16.02 | % |
| U.S. Treasury Strip, principal only | | 8/15/25 | | 14.07 | % |
| U.S. Treasury Bond, 5.25% | | 11/15/28 | | 5.98 | % |
| U.S. Treasury Bond, 5.50% | | 8/15/28 | | 5.84 | % |
| | | | | |
| Holding | | Maturity
Date | | % of
Fund | |
| U.S. Treasury Bond, 6.125% | | 11/15/27 | | 3.95 | % |
| U.S. Treasury Bond, 6.75% | | 8/15/26 | | 3.48 | % |
| U.S. Treasury Strip, principal only | | 11/15/21 | | 3.46 | % |
| U.S. Treasury Bond, 7.50% | | 11/15/24 | | 3.22 | % |
| U.S. Treasury Bond, 5.375% | | 2/15/31 | | 3.21 | % |
| * | | As of March 31, 2007, the Fund had 91.39% invested in the Top 10 holdings and there were 13 long-term holdings in the Fund. Portfolio holdings are subject to change at any time. References to specific securities should not be construed as recommendations by the Funds or their Advisor. |
INVESTMENTS & CASH
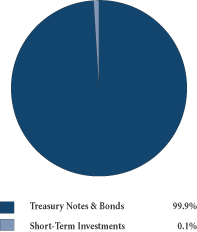
GROWTHOFA $10,000 INVESTMENT
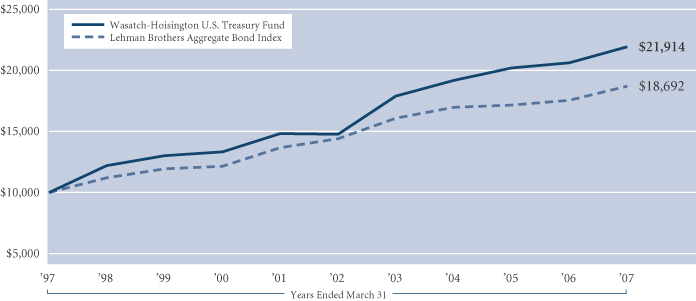
The Lehman Brothers Aggregate Bond Index covers the U.S. investment grade fixed rate bond market, including government and corporate securities, agency mortgage pass-through securities, and asset-backed securities. To be included in the index the security must meet the following criteria: must have at least one year to final maturity, regardless of call features; must have at least $100 million par amount outstanding; must be rated investment grade or better by Moody’s Investors Service, Standard & Poor’s, or Fitch Investor’s Service; must be fixed rate, although it can carry a coupon that steps up or changes to a predetermined schedule; must be dollar-denominated and must be nonconvertible. All corporate and asset-backed securities must be registered with the SEC; and must be publicly issued. You cannot invest directly in the Index.
27
| | |
| WASATCH FUNDS — Operating Expenses | | |
|
| |
| |
EXPENSE EXAMPLE
As a shareholder of Wasatch Funds, you incur two types of costs: (1) transaction costs, including redemption fees and (2) ongoing costs, including management fees and other fund expenses. This example is intended to help you understand your ongoing costs (in dollars) of investing in a Wasatch Fund and to compare these costs with the ongoing costs of investing in other mutual funds.
The example is based on an investment of $1,000.00 invested at the beginning of the period and held for the entire six month period ended March 31, 2007.
ACTUAL EXPENSES
The first line of the following table provides information about actual account values and actual expenses, based upon the actual total return of the fund during the most recent six month period ended March 31. You may use the information in this line, together with the amount you invested, to estimate the expenses you paid over the period. Simply divide your account value by $1,000.00 (for example, an $8,600.00 account value divided by $1,000.00 = 8.6), then multiply the result by the number in the first line under the heading entitled “Expenses Paid During Period” to estimate the expenses you paid on your account during this period.
In addition, the Funds charge a $15.00 IRA distribution fee, a $12.50 IRA annual maintenance fee and a $10.00 fee for redemptions paid by wire. To the extent these fees apply to your account, your expenses paid during the period would be higher and your ending account value would be lower than the amounts shown in the following table.
HYPOTHETICAL EXAMPLEFOR COMPARISON PURPOSES
The second line of the following table provides information about hypothetical account values and hypothetical expenses based on a fund’s actual expense ratio and an assumed rate of return of 5% per year before expenses, which is not the fund’s actual return. The hypothetical account values and expenses may not be used to estimate the actual ending account balance or expenses you paid for the period. You may use this information to compare the ongoing costs of investing in a Wasatch Fund and other funds. To do so, compare this 5% hypothetical example with the 5% hypothetical examples that appear in the shareholder reports of other funds.
In addition, the Funds charge a $15.00 IRA distribution fee, a $12.50 IRA annual maintenance fee and a $10.00 fee for redemptions paid by wire. To the extent these fees apply to your account, your expenses paid during the period would be higher and your ending account value would be lower than the amounts shown in the following table. If another fund’s fees differ from those listed above, your expenses paid and your ending account value could be higher or lower than those of other funds.
Please note that the expenses shown in the table are meant to highlight your ongoing costs only and do not reflect any transactional costs, such as redemption fees. Therefore, the second line of the table is useful in comparing ongoing costs only, and will not help you determine the relative total costs of owning different funds. In addition, if these transactional costs were included, your costs would have been higher.
28
| | |
| | MARCH 31, 2007 (UNAUDITED) |
|
| |
| |
| | | | | | | | |
| | | Account Value | | Expenses
Paid
During Period* | | Annualized
Expense
Ratio* |
| | | Beginning of Period
October 1, 2006 | | End of Period
March 31, 2007 | | |
Core Growth Fund | | | | | | | | |
Actual | | $1,000.00 | | $1,107.70 | | $6.31 | | 1.20% |
Hypothetical (5% before expenses) | | $1,000.00 | | $1,018.95 | | $6.04 | | 1.20% |
|
| |
Global Science & Technology Fund | | | | | | | | |
Actual | | $1,000.00 | | $1,129.60 | | $10.09 | | 1.90% |
Hypothetical (5% before expenses) | | $1,000.00 | | $1,015.46 | | $9.55 | | 1.90% |
|
| |
Heritage Growth Fund | | | | | | | | |
Actual | | $1,000.00 | | $1,073.50 | | $4.91 | | 0.95% |
Hypothetical (5% before expenses) | | $1,000.00 | | $1,020.19 | | $4.78 | | 0.95% |
|
| |
International Growth Fund | | | | | | | | |
Actual | | $1,000.00 | | $1,234.80 | | $9.81 | | 1.76% |
Hypothetical (5% before expenses) | | $1,000.00 | | $1,016.16 | | $8.85 | | 1.76% |
|
| |
International Opportunities Fund | | | | | | | | |
Actual | | $1,000.00 | | $1,309.60 | | $12.96 | | 2.25% |
Hypothetical (5% before expenses) | | $1,000.00 | | $1,013.71 | | $11.30 | | 2.25% |
|
| |
Micro Cap Fund | | | | | | | | |
Actual | | $1,000.00 | | $1,129.40 | | $11.36 | | 2.14% |
Hypothetical (5% before expenses) | | $1,000.00 | | $1,014.26 | | $10.75 | | 2.14% |
|
| |
Micro Cap Value Fund |
Actual | | $1,000.00 | | $1,166.50 | | $12.15 | | 2.25% |
Hypothetical (5% before expenses) | | $1,000.00 | | $1,013.71 | | $11.30 | | 2.25% |
|
| |
Small Cap Growth Fund | | | | | | | | |
Actual | | $1,000.00 | | $1,089.50 | | $6.20 | | 1.19% |
Hypothetical (5% before expenses) | | $1,000.00 | | $1,019.00 | | $5.99 | | 1.19% |
|
| |
Small Cap Value Fund | | | | | | | | |
Actual | | $1,000.00 | | $1,135.40 | | $8.94 | | 1.68% |
Hypothetical (5% before expenses) | | $1,000.00 | | $1,016.55 | | $8.45 | | 1.68% |
|
| |
Strategic Income Fund1 | | | | | | | | |
Actual | | $1,000.00 | | $1,113.90 | | $6.11 | | 1.15% |
Hypothetical (5% before expenses) | | $1,000.00 | | $1,019.15 | | $5.84 | | 1.15% |
|
| |
Ultra Growth Fund | | | | | | | | |
Actual | | $1,000.00 | | $1,082.90 | | $7.79 | | 1.50% |
Hypothetical (5% before expenses) | | $1,000.00 | | $1,017.45 | | $7.54 | | 1.50% |
|
| |
U.S. Treasury Fund | | | | | | | | |
Actual | | $1,000.00 | | $1,003.30 | | $3.50 | | 0.70% |
Hypothetical (5% before expenses) | | $1,000.00 | | $1,021.44 | | $3.53 | | 0.70% |
|
| |
*Expenses are equal to the Funds’ annualized expense ratio as indicated above multiplied by the average account value over the period, multiplied by the number of days in the most recent fiscal half-year divided by the number of days in the full fiscal year (182/365).
1The annualized expense ratio includes dividend payments for securities sold short. Excluding these items the annualized expense ratio would have been 0.95%. Dividend payments for securities sold short are not a reimbursable expense under the contractual agreement between the Fund and the Advisor.
29
| | |
| WASATCH CORE GROWTH FUND (WGROX) — Schedule of Investments | | |
|
| |
| |
| | | | | |
| Shares | | | | Value |
| | | | | |
| | COMMON STOCKS 96.9% | | | |
| | |
| | Aerospace 0.4% | | | |
| 691,180 | | DataPath, Inc.* *** † | | $ | 5,252,968 |
| | | | | |
| | |
| | Banks 8.2% | | | |
| 1,178,100 | | Commerce Bancorp, Inc. | | | 39,324,978 |
| 390,567 | | First Community Bancorp, Inc. | | | 22,082,658 |
| 590,755 | | HDFC Bank Ltd. | | | 12,961,811 |
| 1,031,653 | | UCBH Holding, Inc. | | | 19,209,379 |
| 1,255,201 | | UTI Bank Ltd. | | | 14,394,641 |
| | | | | |
| | | | | 107,973,467 |
| | | | | |
| | |
| | Building Products 0.5% | | | |
| 100,360 | | Demag Cranes AG | | | 6,548,906 |
| | | | | |
| | |
| | Commercial Services and Supplies 7.8% | | | |
| 2,261,055 | | Copart, Inc.* | | | 63,332,150 |
| 276,745 | | CRA International, Inc.* | | | 14,440,554 |
| 727,600 | | Liquidity Services, Inc.* | | | 12,325,544 |
| 440,488 | | Waste Connections, Inc.* | | | 13,188,211 |
| | | | | |
| | | | | 103,286,459 |
| | | | | |
| | |
| | Computer Services Software and Systems 3.3% | | | |
| 409,740 | | American Reprographics Co.* | | | 12,615,895 |
| 195,050 | | Covansys Corp.* | | | 4,813,834 |
| 312,435 | | Quality Systems, Inc. | | | 12,497,400 |
| 559,130 | | SRA International, Inc., Class A* | | | 13,620,407 |
| | | | | |
| | | | | 43,547,536 |
| | | | | |
| | |
| | Diversified Financial Services 1.9% | | | |
| 475,271 | | Euronet Worldwide, Inc.* | | | 12,765,779 |
| 336,315 | | Housing Development Finance Corp. Ltd. | | | 11,817,042 |
| | | | | |
| | | | | 24,582,821 |
| | | | | |
| | |
| | Education Services 4.0% | | | |
| 323,976 | | Strayer Education, Inc. | | | 40,497,000 |
| 530,609 | | Universal Technical Institute, Inc.* | | | 12,246,456 |
| | | | | |
| | | | | 52,743,456 |
| | | | | |
| | |
| | Electronics — Medical Systems 1.1% | | | |
| 296,171 | | Haemonetics Corp.* | | | 13,845,994 |
| | | | | |
| | |
| | Electronics — Semiconductors/ Components 4.7% | | | |
| 1,048,587 | | ASE Test Ltd.* | | | 11,932,920 |
| 116,365 | | Hittite Microwave Corp.* | | | 4,674,382 |
| 1,274,194 | | Micrel, Inc.* | | | 14,041,618 |
| 609,310 | | National Semiconductor Corp. | | | 14,708,744 |
| 304,248 | | Silicon Laboratories, Inc.* | | | 9,103,100 |
| 276,637 | | SiRF Technology Holdings, Inc.* | | | 7,679,443 |
| | | | | |
| | | | | 62,140,207 |
| | | | | |
| | |
| | Energy Equipment and Services 1.3% | | | |
| 718,815 | | TGS-NOPEC Geophysical Co. ASA* | | | 16,648,562 |
| | | | | |
| | |
| | Energy — Miscellaneous 0.8% | | | |
| 432,000 | | TETRA Technologies, Inc.* | | | 10,674,720 |
| | | | | |
| | |
| | Engineering and Contracting
Services 1.5% | | | |
| 466,153 | | URS Corp.* | | | 19,853,456 |
| | | | | |
| | |
| | Finance Companies 1.7% | | | |
| 501,564 | | Dollar Financial Corp.* | | | 12,689,569 |
| 722,367 | | United PanAm Financial Corp.* | | | 9,029,588 |
| | | | | |
| | | | | 21,719,157 |
| | | | | |
| | | | | |
| Shares | | | | Value |
| | | | | |
| | |
| | Finance — Small Loan 0.9% | | | |
| 519,934 | | AmeriCredit Corp.* | | $ | 11,885,691 |
| | | | | |
| | |
| | Financial Data Processing Services and Systems 1.1% | | | |
| 320,358 | | Fidelity Information Services, Inc. | | | 14,563,475 |
| | | | | |
| | |
| | Financial Information Services 0.9% | | | |
| 193,072 | | FactSet Research Systems, Inc. | | | 12,134,575 |
| | | | | |
| | |
| | Financial — Miscellaneous 2.0% | | | |
| 562,603 | | Fidelity National Title Group, Inc., Class A | | | 13,508,098 |
| 249,685 | | First American Corp. | | | 12,664,023 |
| | | | | |
| | | | | 26,172,121 |
| | | | | |
| | |
| | Health Care Facilities 5.9% | | | |
| 311,360 | | Healthways, Inc.* | | | 14,556,080 |
| 444,579 | | Pharmaceutical Product Development, Inc. | | | 14,977,867 |
| 1,212,497 | | Sunrise Senior Living, Inc.* | | | 47,917,881 |
| | | | | |
| | | | | 77,451,828 |
| | | | | |
| | |
| | Health Care Management Services 4.0% | | | |
| 933,064 | | Pediatrix Medical Group, Inc.* | | | 53,240,632 |
| | | | | |
| | |
| | Home Building 1.4% | | | |
| 126,056 | | M.D.C. Holdings, Inc. | | | 6,059,512 |
| 19,523 | | NVR, Inc.* | | | 12,982,795 |
| | | | | |
| | | | | 19,042,307 |
| | | | | |
| | |
| | Household Products 0.3% | | | |
| 791,157 | | Emami Ltd. | | | 3,577,820 |
| | | | | |
| | |
| | Investment Management Companies 4.3% | | | |
| 600 | | Brantley Mezzanine Finance, LLC* ** *** † | | | — |
| 272,365 | | National Financial Partners Corp. | | | 12,776,642 |
| 517,602 | | SEI Investments Co. | | | 31,175,169 |
| 880,060 | | Solar Capital, LLC* *** † | | | 13,200,900 |
| | | | | |
| | | | | 57,152,711 |
| | | | | |
| | |
| | Leisure Time 6.7% | | | |
| 412,664 | | Life Time Fitness, Inc.* | | | 21,215,056 |
| 1,880,810 | | Pool Corp. | | | 67,332,998 |
| | | | | |
| | | | | 88,548,054 |
| | | | | |
| | |
| | Machinery 0.1% | | | |
| 9,514 | | Burckhardt Compression Holding AG* | | | 1,565,332 |
| | | | | |
| | |
| | Medical and Dental Instruments and Supplies 2.3% | | | |
| 1,406,852 | | PSS World Medical, Inc.* | | | 29,740,851 |
| | | | | |
| | |
| | Multi-Sector Companies 0.7% | | | |
| 341,255 | | Raven Industries, Inc. | | | 9,572,203 |
| | | | | |
| | |
| | Oil and Gas 2.2% | | | |
| 548,700 | | Ultra Petroleum Corp.* | | | 29,152,431 |
| | | | | |
| | |
| | Real Estate 0.9% | | | |
| 1,126,615 | | LPS Brasil Consultoria de Imoveis S.A.* | | | 11,501,660 |
| | | | | |
| | |
| | Real Estate Investment Trusts (REIT) 3.4% | | | |
| 945,605 | | Annaly Mortgage Management, Inc. | | | 14,637,965 |
| 1,224,830 | | HomeBanc Corp. | | | 4,274,657 |
| 490,793 | | Redwood Trust, Inc. | | | 25,609,579 |
| | | | | |
| | | | | 44,522,201 |
| | | | | |
30
| | |
| | MARCH 31, 2007 (UNAUDITED) |
|
| |
| |
| | | | | |
Shares | | | | Value |
| | | | | |
| | Rental and Leasing Services — Consumer 1.3% | | | |
| 639,460 | | Aaron Rents, Inc. | | $ | 16,907,322 |
| | | | | |
| | |
| | Retail 15.2% | | | |
| 57,885 | | Bijou Brigitte AG | | | 13,471,548 |
| 2,028,759 | | Global Imaging Systems, Inc.* | | | 39,560,801 |
| 862,264 | | Guitar Center, Inc.* | | | 38,905,352 |
| 856,912 | | MSC Industrial Direct Co., Inc., Class A | | | 40,000,652 |
| 1,676,954 | | O’Reilly Automotive, Inc.* | | | 55,507,177 |
| 457,475 | | Sonic Automotive, Inc. | | | 13,038,038 |
| | | | | |
| | | | | 200,483,568 |
| | | | | |
| | |
| | Road and Rail 2.7% | | | |
| 1,174,475 | | Localiza Rent A Car S.A. | | | 35,999,343 |
| | | | | |
| | |
| | Securities Brokerage and Services 0.6% | | | |
| 122,098 | | GFI Group, Inc.* | | | 8,299,001 |
| | | | | |
| | |
| | Textiles, Apparel and Luxury Goods 0.6% | | | |
| 2,761,000 | | Ports Design Ltd. | | | 7,367,472 |
| | | | | |
| | |
| | Truckers 2.2% | | | |
| 1,637,589 | | Knight Transportation, Inc. | | | 29,181,836 |
| | | | | |
| | |
| | Total Common Stocks
(cost $987,437,838) | | | 1,276,880,143 |
| | | | | |
| | |
| | PREFERRED STOCKS 0.6% | | | |
| | |
| | Machinery 0.6% | | | |
| 1,086,890 | | Weg S.A. Pfd. | | | 8,189,983 |
| | | | | |
| | |
| | Total Preferred Stocks (cost $4,221,267) | | | 8,189,983 |
| | | | | |
| | | | | | |
Principal Amount | | | | Value | |
| | | | | | |
| | SHORT-TERM INVESTMENTS 3.3% | | | | |
| | |
| | Repurchase Agreement 3.3% | | | | |
| $43,059,000 | | Repurchase Agreement dated 3/30/07, 4.30% due 4/2/07 with State Street Bank and Trust Co. collateralized by $33,530,000 of United States Treasury Bonds 7.875% due 2/15/21; value: $43,924,300; repurchase proceeds: $43,074,429 (cost $43,059,000) | | $ | 43,059,000 | |
| | | | | | |
| | |
| | Total Short-Term Investments
(cost $43,059,000) | | | 43,059,000 | |
| | | | | | |
| | |
| | Total Investments
(cost $1,034,718,105) 100.8% | | | 1,328,129,126 | |
| | |
| | Liabilities less Other Assets (0.8)% | | | (10,390,469 | ) |
| | | | | | |
| | |
| | NET ASSETS 100.0% | | $ | 1,317,738,657 | |
| | | | | | |
| |
| | *Non-income producing. **Common units. ***Security was fair valued under procedures adopted by the Board of Directors (see Note 2). †Security purchased in a private placement transaction or under Rule 144A of the Securities Act of 1933 (see Note 9). See notes to financial statements. | |
31
| | |
| WASATCH GLOBAL SCIENCE & TECHNOLOGY FUND (WAGTX) — Schedule of Investments |
|
| |
| |
| | | | | |
| Shares | | | | Value |
| | | | | |
| | COMMON STOCKS 94.3% | | | |
| | |
| | Banks 1.3% | | | |
| 84,225 | | HDFC Bank Ltd. (India) | | $ | 1,847,989 |
| | | | | |
| | Biotechnology Research and Production 2.2% | | | |
| 40,805 | | ArthroCare Corp.* | | | 1,470,612 |
| 20,185 | | Celgene Corp.* | | | 1,058,905 |
| 33,375 | | Neurochem, Inc.* | | | 503,295 |
| | | | | |
| | | | | 3,032,812 |
| | | | | |
| | Communications Technology 2.2% | | | |
| 54,125 | | Cisco Systems, Inc.* | | | 1,381,811 |
| 39,905 | | QUALCOMM, Inc. | | | 1,702,348 |
| | | | | |
| | | | | 3,084,159 |
| | | | | |
| | Computer Services Software and Systems 8.9% | | | |
| 30,385 | | Adobe Systems, Inc.* | | | 1,267,054 |
| 54,440 | | Autodesk, Inc.* | | | 2,046,944 |
| 21,105 | | Cognizant Technology Solutions Corp., Class A* | | | 1,862,938 |
| 13,445 | | Digital River, Inc.* | | | 742,836 |
| 9,510 | | F5 Networks, Inc.* | | | 634,127 |
| 1,585 | | Google, Inc., Class A* | | | 726,184 |
| 478,135 | | Kana Software, Inc.* | | | 1,769,100 |
| 27,190 | | NeuStar, Inc., Class A* | | | 773,284 |
| 68,395 | | Opnet Technologies, Inc.* | | | 924,016 |
| 49,415 | | QLogic Corp.* | | | 840,055 |
| 8,140 | | Sourcefire, Inc.* | | | 143,508 |
| 65,450 | | Tier Technologies, Inc., Class B* | | | 575,960 |
| | | | | |
| | | | | 12,306,006 |
| | | | | |
| | Computer Technology 3.4% | | | |
| 29,220 | | Apple Computer, Inc.* | | | 2,714,830 |
| 7,500 | | Isilon Systems, Inc.* | | | 121,275 |
| 115,385 | | Western Digital Corp.* | | | 1,939,622 |
| | | | | |
| | | | | 4,775,727 |
| | | | | |
| | Computers and Peripherals 1.7% | | | |
| 118,439 | | Catcher Technology Co. Ltd. (Taiwan) | | | 930,618 |
| 102,100 | | Positivo Informatica S.A.* (Brazil) | | | 1,424,536 |
| | | | | |
| | | | | 2,355,154 |
| | | | | |
| | Diversified Financial Services 0.8% | | | |
| 30,170 | | Housing Development Finance Corp. Ltd. (India) | | | 1,060,078 |
| | | | | |
| | Diversified Telecommunication Services 1.0% | | | |
| 67,300 | | GVT Holding S.A.* (Brazil) | | | 778,678 |
| 35,255 | | Option N.V.* (Belgium) | | | 644,564 |
| | | | | |
| | | | | 1,423,242 |
| | | | | |
| | Drugs and Pharmaceuticals 2.1% | | | |
| 40,730 | | Amgen, Inc.* | | | 2,275,992 |
| 26,065 | | Pharmion Corp.* | | | 685,249 |
| | | | | |
| | | | | 2,961,241 |
| | | | | |
| | Electrical and Electronics 1.4% | | | |
| 46,635 | | Power Integrations, Inc.* | | | 1,056,283 |
| 87,430 | | TTM Technologies, Inc.* | | | 834,082 |
| | | | | |
| | | | | 1,890,365 |
| | | | | |
| | Electrical Equipment 0.8% | | | |
| 606,140 | | Unisteel Technology Ltd. (Singapore) | | | 1,174,798 |
| | | | | |
| | Electronic Equipment and Instruments 1.3% | | | |
| 1,891,690 | | QRSciences Holdings Ltd. (Australia) | | | 582,586 |
| 4,060 | | Samsung Electronics Co. Ltd. GDR (Korea) | | | 1,235,255 |
| | | | | |
| | | | | 1,817,841 |
| | | | | |
| | | | | |
| Shares | | | | Value |
| | | | | |
| | Electronics 1.4% | | | |
| 182,715 | | Nu Horizons Electronics Corp.* | | $ | 1,923,989 |
| | | | | |
| | Electronics — Medical Systems 3.2% | | | |
| 12,215 | | Intuitive Surgical, Inc.* | | | 1,484,978 |
| 43,375 | | Medtronic, Inc. | | | 2,127,977 |
| 34,215 | | NXStage Medical, Inc.* | | | 455,744 |
| 20,710 | | Somanetics Corp.* | | | 412,957 |
| | | | | |
| | | | | 4,481,656 |
| | | | | |
| | Electronics — Semiconductors/ Components 21.4% | | | |
| 48,570 | | Advanced Micro Devices, Inc.* | | | 634,324 |
| 88,170 | | ASE Test Ltd.* | | | 1,003,375 |
| 101,840 | | Aviza Technology, Inc.* | | | 734,266 |
| 19,925 | | Broadcom Corp., Class A* | | | 638,995 |
| 54,105 | | Marvell Technology Group Ltd.* | | | 909,505 |
| 44,415 | | Maxim Integrated Products, Inc.††† | | | 1,305,801 |
| 179,720 | | Micrel, Inc.* | | | 1,980,514 |
| 95,755 | | Microchip Technology, Inc. | | | 3,402,175 |
| 35,385 | | Microsemi Corp.* | | | 736,362 |
| 75,495 | | MIPS Technologies, Inc.* | | | 674,170 |
| 149,170 | | National Semiconductor Corp. | | | 3,600,964 |
| 71,080 | | Netlogic Microsystems, Inc.* | | | 1,892,150 |
| 70,630 | | ON Semiconductor Corp.* | | | 630,020 |
| 218,160 | | PLX Technology, Inc.* | | | 2,124,878 |
| 94,300 | | PMC-Sierra, Inc.* | | | 661,043 |
| 88,490 | | Silicon Laboratories, Inc.* | | | 2,647,621 |
| 58,453 | | SiRF Technology Holdings, Inc.* | | | 1,622,655 |
| 58,505 | | Techwell, Inc.* | | | 729,557 |
| 16,870 | | Tessera Technologies, Inc.* | | | 670,414 |
| 103,790 | | Texas Instruments, Inc. | | | 3,124,079 |
| | | | | |
| | | | | 29,722,868 |
| | | | | |
| | Energy Equipment and Services 2.8% | | | |
| 1,872,010 | | Advanced Holdings Ltd. (Singapore) | | | 345,549 |
| 151,140 | | TGS-NOPEC Geophysical Co. ASA* (Norway) | | | 3,500,572 |
| | | | | |
| | | | | 3,846,121 |
| | | | | |
| | Entertainment 0.8% | | | |
| 105,085 | | Outdoor Channel Holdings, Inc.* | | | 1,073,969 |
| | | | | |
| | Food and Drug Retailing 0.7% | | | |
| 47,200 | | Sugi Pharmacy Co. Ltd. (Japan) | | | 957,245 |
| | | | | |
| | Health Care Equipment and Supplies 4.2% | | | |
| 7,853,270 | | LMA International N.V.* (Singapore) | | | 3,028,652 |
| 112,455 | | RaySearch Laboratories AB* (Sweden) | | | 2,850,142 |
| | | | | |
| | | | | 5,878,794 |
| | | | | |
| | Health Care Providers and Services 1.5% | | | |
| 102,595 | | OdontoPrev S.A.* (Brazil) | | | 2,044,917 |
| | | | | |
| | Internet and Catalog Retail 1.7% | | | |
| 71,515 | | Submarino S.A. (Brazil) | | | 2,412,806 |
| | | | | |
| | Leisure Equipment and Products 0.5% | | | |
| 49,350 | | Largan Precision Co. Ltd. (Taiwan) | | | 718,103 |
| | | | | |
| | Machinery 4.1% | | | |
| 1,873,793 | | Innovalues Precision Ltd. (Singapore) | | | 1,655,272 |
| 2,630,950 | | MMI Holdings Ltd. (Singapore) | | | 2,896,491 |
| 95,400 | | Pason Systems, Inc. (Canada) | | | 1,184,898 |
| | | | | |
| | | | | 5,736,661 |
| | | | | |
32
| | |
| | MARCH 31, 2007 (UNAUDITED) |
|
| |
| |
| | | | | |
| Shares | | | | Value |
| | | | | |
| | Medical and Dental Instruments
and Supplies 3.1% | | | |
| 77,795 | | Abaxis, Inc.* | | $ | 1,895,864 |
| 19,790 | | Cyberonics, Inc.* | | | 371,656 |
| 84,130 | | Dexcom, Inc.* | | | 661,262 |
| 56,535 | | Enpath Medical, Inc.* | | | 565,350 |
| 13,030 | | Techne Corp.* | | | 744,013 |
| | | | | |
| | | | | 4,238,145 |
| | | | | |
| | Medical Services 1.5% | | | |
| 34,780 | | Covance, Inc.* | | | 2,063,845 |
| | | | | |
| | Miscellaneous Materials and Commodities 0.6% | | | |
| 50,085 | | Symyx Technologies, Inc.* | | | 887,506 |
| | | | | |
| | Production Technology Equipment 2.5% | | | |
| 45,080 | | Eagle Test Systems, Inc.* | | | 750,131 |
| 147,430 | | inTEST Corp.* | | | 663,435 |
| 42,850 | | Intevac, Inc.* | | | 1,129,955 |
| 25,000 | | Nanometrics, Inc.* | | | 167,500 |
| 43,955 | | Rudolph Technologies, Inc.* | | | 766,575 |
| | | | | |
| | | | | 3,477,596 |
| | | | | |
| | Real Estate 1.2% | | | |
| 158,015 | | LPS Brasil Consultoria de Imoveis S.A.* (Brazil) | | | 1,613,182 |
| | | | | |
| | Road and Rail 1.2% | | | |
| 54,025 | | Localiza Rent A Car S.A. (Brazil) | | | 1,655,944 |
| | | | | |
| | Semiconductor Equipment and Products 3.0% | | | |
| 11,345 | | austriamicrosystems AG* (Austria) | | | 666,170 |
| 338,056 | | O2Micro International Ltd. ADR* (Cayman Islands) | | | 2,670,642 |
| 58,595 | | PSi Technologies Holdings, Inc. ADR* | | | 89,064 |
| 119,880 | | Wolfson Microelectronics plc* (United Kingdom) | | | 698,672 |
| | | | | |
| | | | | 4,124,548 |
| | | | | |
| | Software 5.3% | | | |
| 43,920 | | Belzberg Technologies, Inc.* (Canada) | | | 314,272 |
| 61,540 | | Duzon Digital Ware Co. Ltd. (Korea) | | | 1,416,179 |
| 75,015 | | Infosys Technologies Ltd. (India) | | | 3,507,195 |
| 1,460,000 | | Kingdee International Software Group Co. Ltd. (Hong Kong) | | | 1,098,692 |
| 2,287,000 | | Silverlake Axis Ltd. (Singapore) | | | 1,085,530 |
| | | | | |
| | | | | 7,421,868 |
| | | | | |
| | Utilities — Telecommunications 3.6% | | | |
| 35,000 | | Allot Communications Ltd.* | | | 320,250 |
| 62,290 | | NII Holdings, Inc.* | | | 4,620,672 |
| | | | | |
| | | | | 4,940,922 |
| | | | | |
| | Wireless Telecommunication Services 2.9% | | | |
| 1,700,130 | | America Movil S.A. de C.V., Series L (Mexico) | | | 4,078,342 |
| | | | | |
| | |
| | Total Common Stocks
(cost $114,379,252) | | | 131,028,439 |
| | | | | |
| | | | | |
| Shares | | | | Value |
| | | | | |
| | |
| | PREFERRED STOCKS 4.0% | | | |
| | |
| | Communications Technology 0.0% | | | |
| 30,265 | | Incipient, Inc., Series D Pfd.* *** † | | $ | 43,884 |
| 6,528 | | Xtera Communications, Inc., Series A-1 Pfd.* *** † | | | 7,076 |
| | | | | |
| | | | | 50,960 |
| | | | | |
| | Computer Technology 0.3% | | | |
| 78,502 | | BlueArc Corp., Series DD Pfd.* *** † | | | 366,605 |
| | | | | |
| | Diversified Telecommunication Services 1.2% | | | |
| 121,300 | | Tele Norte Leste Participacoes S.A. Pfd. (Brazil) | | | 1,683,576 |
| | | | | |
| | Drugs and Pharmaceuticals 0.1% | | | |
| 283,018 | | Point Biomedical Corp., Series F Pfd.* *** † | | | 105,000 |
| | | | | |
| | Machinery 2.3% | | | |
| 430,405 | | Weg S.A. Pfd. (Brazil) | | | 3,243,207 |
| | | | | |
| | Media 0.0% | | | |
| 1,091 | | Net Servicos de Comunicacao S.A., Series 4 Pfd.* (Brazil) | | | 14,784 |
| | | | | |
| | Utilities — Telecommunications 0.1% | | | |
| 17,684 | | Neutral Tandem, Inc., Series C Pfd.* *** † | | | 111,107 |
| | | | | |
| | |
| | Total Preferred Stocks
(cost $5,369,722) | | | 5,575,239 |
| | | | | |
| | |
| | LIMITED PARTNERSHIP INTEREST 0.2% | | | |
| | |
| | Other 0.2% | | | |
| | Montagu Newhall Global Partners II-B, L.P.* *** † | | | 214,213 |
| | | | | |
| | |
| | Total Limited Partnership Interest
(cost $237,144) | | | 214,213 |
| | | | | |
| | |
| | WARRANTS 0.3% | | | |
| | |
| | Drugs and Pharmaceuticals 0.0% | | | |
| 3,832 | | Acusphere, Inc. expiring 8/2/08* *** † | | | — |
| 768 | | Acusphere, Inc. expiring 10/20/08* *** † | | | — |
| 84,905 | | Point Biomedical Corp. expiring 2/16/12* *** † | | | — |
| | | | | |
| | | | | — |
| | | | | |
| | Electronic Equipment and Instruments 0.0% | | | |
| 945,845 | | QRSciences Holdings Ltd. expiring 2/15/08* *** † (Australia) | | | — |
| | | | | |
| | Transportation Infrastructure 0.3% | | | |
| 1,697,000 | | Goodpack Ltd. expiring 4/13/07* (Singapore) | | | 453,085 |
| | | | | |
| | |
| | Total Warrants
(cost $819,273) | | | 453,085 |
| | | | | |
| | |
Number of
Contracts | | | | Value |
| | PUT OPTIONS PURCHASED 0.0% | | | |
| | |
| 150 | | Apple, Inc. expiring 7/21/07 exercise price $75 | | $ | 15,000 |
| | | | | |
| | |
| | Total Put Options Purchased (premium $54,375) | | | 15,000 |
| | | | | |
33
| | |
WASATCH GLOBAL SCIENCE & TECHNOLOGY FUND (WAGTX) — Schedule of Investments (continued) |
|
| |
| |
| | | | | |
Principal
Amount | | | | Value |
| | | | | |
| | SHORT-TERM INVESTMENTS 0.6% | | | |
| | |
| | Repurchase Agreement 0.6% | | | |
| $822,000 | | Repurchase Agreement dated 3/30/07, 4.30% due 4/2/07 with State Street Bank and Trust Co. collateralized by $610,000 of United States Treasury Bonds 8.875% due 2/15/19; value: $841,178; repurchase proceeds: $822,295††† (cost $822,000) | | $ | 822,000 |
| | | | | |
| | |
| | Total Short-Term Investments
(cost $822,000) | | | 822,000 |
| | | | | |
| | |
| | Total Investments
(cost $121,681,766) 99.4% | | | 138,107,976 |
| | |
| | Other Assets less Liabilities 0.6% | | | 882,734 |
| | | | | |
| | |
| | NET ASSETS 100.0% | | $ | 138,990,710 |
| | | | | |
| | |
Number of
Contracts | | | | Value |
| | CALL OPTIONS WRITTEN | | | |
| | |
| 150 | | Apple, Inc. expiring 7/21/07 exercise price $115 | | $ | 20,250 |
| | | | | |
| | |
| | Total Call Options Written
(premium $18,374) | | | 20,250 |
| | | | | |
| |
| | *Non-income producing. |
| | ***Security was fair valued under procedures adopted by the Board of Directors (see Note 2). |
| | †Security purchased in a private placement transaction or under
Rule 144A of the Securities Act of 1933 (see Note 9). |
| | †††All or a portion of this security has been designated as collateral for written options or purchase commitments (see Note 10). ADR American Depositary Receipts. GDR Global Depositary Receipts. See notes to financial statements. |
At March 31, 2007, Wasatch Global Science & Technology Fund’s investments, excluding short-term investments and written options, were in the following countries:
| | | |
| Country | | % | |
Australia | | 0.4 | |
Austria | | 0.5 | |
Belgium | | 0.5 | |
Brazil | | 10.8 | |
Canada | | 1.1 | |
Cayman Islands | | 1.9 | |
Hong Kong | | 0.8 | |
India | | 4.7 | |
Japan | | 0.7 | |
Korea | | 1.9 | |
Mexico | | 3.0 | |
Norway | | 2.6 | |
Singapore | | 7.7 | |
Sweden | | 2.1 | |
Taiwan | | 1.2 | |
United Kingdom | | 0.5 | |
United States | | 59.6 | |
| | | |
TOTAL | | 100.0 | % |
| | | |
34
| | |
| WASATCH HERITAGE GROWTH FUND (WAHGX) — Schedule of Investments | | MARCH 31, 2007 (UNAUDITED) |
|
| |
| |
| | | | | |
| Shares | | | | Value |
| | | | | |
| | |
| | COMMON STOCKS 97.1% | | | |
| | |
| | Airlines 0.6% | | | |
| 44,565 | | Gol Linhas Aereas Inteligentes S.A. ADR | | $ | 1,356,113 |
| | | | | |
| | Banks 2.9% | | | |
| 128,760 | | Commerce Bancorp, Inc. | | | 4,298,009 |
| 97,905 | | TCF Financial Corp. | | | 2,580,776 |
| | | | | |
| | | | | 6,878,785 |
| | | | | |
| | Chemicals 1.2% | | | |
| 59,865 | | Cabot Corp. | | | 2,857,356 |
| | | | | |
| | Commercial Services and Supplies 2.5% | | | |
| 43,050 | | Corporate Executive Board Co. | | | 3,270,078 |
| 76,810 | | eBay, Inc.* | | | 2,546,251 |
| | | | | |
| | | | | 5,816,329 |
| | | | | |
| | Communications Technology 3.6% | | | |
| 129,130 | | Cisco Systems, Inc.* | | | 3,296,689 |
| 58,815 | | L-3 Communications Holdings, Inc. | | | 5,144,548 |
| | | | | |
| | | | | 8,441,237 |
| | | | | |
| | Computer Services Software and Systems 2.9% | | | |
| 26,045 | | Cognizant Technology Solutions Corp., Class A* | | | 2,298,992 |
| 29,885 | | F5 Networks, Inc.* | | | 1,992,732 |
| 151,895 | | QLogic Corp.* | | | 2,582,215 |
| | | | | |
| | | | | 6,873,939 |
| | | | | |
| | Diversified Financial Services 1.9% | | | |
| 64,640 | | Countrywide Financial Corp. | | | 2,174,489 |
| 65,600 | | Housing Development Finance Corp. Ltd. | | | 2,304,976 |
| | | | | |
| | | | | 4,479,465 |
| | | | | |
| | Drugs and Pharmaceuticals 3.3% | | | |
| 71,595 | | Endo Pharmaceuticals Holdings, Inc.* | | | 2,104,893 |
| 48,455 | | Forest Laboratories, Inc.* | | | 2,492,525 |
| 86,500 | | Teva Pharmaceutical Industries Ltd. ADR | | | 3,237,695 |
| | | | | |
| | | | | 7,835,113 |
| | | | | |
| | Education Services 2.3% | | | |
| 124,105 | | Apollo Group, Inc., Class A* | | | 5,448,210 |
| | | | | |
| | Electronics 2.8% | | | |
| 103,170 | | Amphenol Corp., Class A | | | 6,661,687 |
| | | | | |
| | Electronics — Semiconductors/ Components 5.5% | | | |
| 138,750 | | Linear Technology Corp. | | | 4,383,113 |
| 160,460 | | Maxim Integrated Products, Inc. | | | 4,717,524 |
| 75,780 | | Microchip Technology, Inc. | | | 2,692,463 |
| 120,725 | | ON Semiconductor Corp.* | | | 1,076,867 |
| | | | | |
| | | | | 12,869,967 |
| | | | | |
| | Energy — Miscellaneous 1.6% | | | |
| 122,250 | | Chesapeake Energy Corp. | | | 3,775,080 |
| | | | | |
| | Finance Companies 1.5% | | | |
| 46,671 | | Capital One Financial Corp. | | | 3,521,794 |
| | | | | |
| | Finance — Small Loan 1.0% | | | |
| 98,475 | | AmeriCredit Corp.* | | | 2,251,138 |
| | | | | |
| | Financial Data Processing Services
and Systems 3.4% | | | |
| 67,440 | | Alliance Data Systems Corp.* | | | 4,155,653 |
| 70,635 | | Fiserv, Inc.* | | | 3,747,893 |
| | | | | |
| | | | | 7,903,546 |
| | | | | |
| | | | | |
| Shares | | | | Value |
| | | | | |
| | Financial Information Services 1.0% | | | |
| 37,930 | | Moody’s Corp. | | $ | 2,353,936 |
| | | | | |
| | Health Care Facilities 2.8% | | | |
| 97,615 | | DaVita, Inc.* | | | 5,204,832 |
| 26,055 | | Quest Diagnostics, Inc. | | | 1,299,363 |
| | | | | |
| | | | | 6,504,195 |
| | | | | |
| | Health Care Management Services 4.4% | | | |
| 44,500 | | UnitedHealth Group, Inc. | | | 2,357,165 |
| 99,000 | | WellPoint, Inc.* | | | 8,028,900 |
| | | | | |
| | | | | 10,386,065 |
| | | | | |
| | Health Care Services 2.4% | | | |
| 28,630 | | Express Scripts, Inc.* | | | 2,311,014 |
| 91,022 | | Lincare Holdings, Inc.* | | | 3,335,956 |
| | | | | |
| | | | | 5,646,970 |
| | | | | |
| | Home Building 2.4% | | | |
| 8,377 | | NVR, Inc.* | | | 5,570,705 |
| | | | | |
| | Hotels, Restaurants and Leisure 0.5% | | | |
| 445,230 | | Shangri-La Asia Ltd. | | | 1,099,734 |
| | | | | |
| | Investment Management Companies 2.1% | | | |
| 40,210 | | SEI Investments Co. | | | 2,421,848 |
| 53,225 | | T. Rowe Price Group, Inc. | | | 2,511,688 |
| | | | | |
| | | | | 4,933,536 |
| | | | | |
| | Leisure Time 0.9% | | | |
| 58,960 | | Pool Corp. | | | 2,110,768 |
| | | | | |
| | Medical and Dental Instruments
and Supplies 3.9% | | | |
| 62,875 | | St. Jude Medical, Inc.* | | | 2,364,729 |
| 78,370 | | Zimmer Holdings, Inc.* | | | 6,693,581 |
| | | | | |
| | | | | 9,058,310 |
| | | | | |
| | Medical Services 2.1% | | | |
| 84,045 | | Covance, Inc.* | | | 4,987,230 |
| | | | | |
| | Office Furniture and Business Equipments 1.0% | | | |
| 103,435 | | Knoll, Inc. | | | 2,464,856 |
| | | | | |
| | Oil and Gas 3.4% | | | |
| 67,635 | | BJ Services Co. | | | 1,887,016 |
| 69,750 | | Ultra Petroleum Corp.* | | | 3,705,818 |
| 86,135 | | W&T Offshore, Inc. | | | 2,491,886 |
| | | | | |
| | | | | 8,084,720 |
| | | | | |
| | Production Technology Equipment 1.1% | | | |
| 49,050 | | KLA-Tencor Corp. | | | 2,615,346 |
| | | | | |
| | Real Estate 1.0% | | | |
| 67,415 | | CB Richard Ellis Group, Inc., Class A* | | | 2,304,245 |
| | | | | |
| | Real Estate Investment Trusts (REIT) 2.3% | | | |
| 86,255 | | Annaly Mortgage Management, Inc. | | | 1,335,228 |
| 105,070 | | CapitalSource, Inc. | | | 2,640,409 |
| 30,745 | | iStar Financial, Inc. | | | 1,439,788 |
| | | | | |
| | | | | 5,415,425 |
| | | | | |
35
| | |
WASATCH HERITAGE GROWTH FUND (WAHGX) — Schedule of Investments (continued) |
|
| |
| |
| | | | | |
Shares | | | | Value |
| | | | | |
| | Retail 16.4% | | | |
| 53,385 | | Advance Auto Parts, Inc. | | $ | 2,057,992 |
| 100,365 | | Aeropostale, Inc.* | | | 4,037,684 |
| 38,482 | | American Eagle Outfitters, Inc. | | | 1,154,075 |
| 78,072 | | Bed Bath & Beyond, Inc.* | | | 3,136,152 |
| 64,662 | | Best Buy Co., Inc. | | | 3,150,333 |
| 60,970 | | CDW Corp. | | | 3,745,387 |
| 86,425 | | Dollar Tree Stores, Inc.* | | | 3,304,892 |
| 358,535 | | Esprit Holdings Ltd. | | | 4,189,367 |
| 59,020 | | Fastenal Co. | | | 2,068,651 |
| 61,000 | | Home Depot, Inc. | | | 2,241,140 |
| 40,290 | | Kohl’s Corp.* | | | 3,086,617 |
| 115,225 | | Lowe’s Companies, Inc. | | | 3,628,435 |
| 83,500 | | O’Reilly Automotive, Inc.* | | | 2,763,850 |
| | | | | |
| | | | | 38,564,575 |
| | | | | |
| | Securities Brokerage and Services 1.0% | | | |
| 19,165 | | Intercontinentalexchange, Inc.* | | | 2,342,155 |
| | | | | |
| | Semiconductor Equipment and Products 1.6% | | | |
| 349,139 | | Taiwan Semiconductor Manufacturing Co. Ltd. ADR | | | 3,753,244 |
| | | | | |
| | Software 3.6% | | | |
| 179,450 | | Infosys Technologies Ltd. | | | 8,389,870 |
| | | | | |
| | Textiles, Apparel and Luxury Goods 2.6% | | | |
| 123,975 | | Coach, Inc.* | | | 6,204,949 |
| | | | | |
| | Transportation — Miscellaneous 1.1% | | | |
| 56,210 | | C.H. Robinson Worldwide, Inc. | | | 2,684,028 |
| | | | | |
| | Truckers 0.7% | | | |
| 64,175 | | J.B. Hunt Transport Services, Inc. | | | 1,683,952 |
| | | | | |
| | Utilities — Telecommunications 0.9% | | | |
| 29,280 | | NII Holdings, Inc.* | | | 2,171,990 |
| | | | | |
| | Wireless Telecommunication Services 0.9% | | | |
| 874,220 | | America Movil S.A. de C.V., Series L | | | 2,097,115 |
| | | | | |
| | |
| | Total Common Stocks
(cost $198,857,759) | | | 228,397,678 |
| | | | | |
| | | | | | |
Principal
Amount | | | | Value | |
| | | | | | |
| | |
| | SHORT-TERM INVESTMENTS 3.1% | | | | |
| | |
| | Repurchase Agreement 3.1% | | | | |
| $7,362,000 | | Repurchase Agreement dated 3/30/07,
4.30% due 4/2/07 with State Street Bank and Trust Co. collateralized by $5,450,000 of United States Treasury Bonds 8.875% due 2/15/19; value: $7,515,441; repurchase
proceeds: $7,364,638††† (cost $7,362,000) | | $ | 7,362,000 | |
| | | | | | |
| | |
| | Total Short-Term Investments
(cost $7,362,000) | | | 7,362,000 | |
| | | | | | |
| | |
| | Total Investments
(cost $206,219,759) 100.2% | | | 235,759,678 | |
| | |
| | Liabilities less Other Assets (0.2)% | | | (428,987 | ) |
| | | | | | |
| | |
| | NET ASSETS 100.0% | | $ | 235,330,691 | |
| | | | | | |
| | |
Number of
Contracts | | | | Value | |
| | |
| | PUT OPTIONS WRITTEN | | | | |
| | |
| 50 | | F5 Networks, Inc. expiring 4/21/07
exercise price $60 | | $ | 2,150 | |
| 50 | | F5 Networks, Inc. expiring 4/21/07
exercise price $65 | | | 8,000 | |
| | | | | | |
| | | | | 10,150 | |
| | | | | | |
| | |
| | Total Put Options Written
(premium $7,750) | | | 10,150 | |
| | | | | | |
| |
| | *Non-income producing. †††All or a portion of this security has been designated as collateral for written options. ADR American Depositary Receipts. See notes to financial statements. | |
36
| | |
| WASATCH INTERNATIONAL GROWTH FUND (WAIGX) — Schedule of Investments | | MARCH 31, 2007 (UNAUDITED) |
|
| |
| |
| | | | | |
| Shares | | | | Value |
| | | | | |
| | COMMON STOCKS 98.6% | | | |
| | |
| | Aerospace and Defense 2.2% | | | |
| 323,253 | | Thielert AG* (Germany) | | $ | 10,047,452 |
| | | | | |
| | Airlines 0.6% | | | |
| 92,430 | | Gol Linhas Aereas Inteligentes S.A. ADR (Brazil) | | | 2,812,645 |
| | | | | |
| | Auto Components 0.4% | | | |
| 73,800 | | Keihin Corp. (Japan) | | | 1,678,699 |
| | | | | |
| | Banks 4.6% | | | |
| 148,440 | | Canadian Western Bank (Canada) | | | 3,271,487 |
| 207,140 | | HDFC Bank Ltd. (India) | | | 4,544,878 |
| 149,320 | | Proton Bank S.A. (Greece) | | | 2,148,857 |
| 136,013 | | The Bank of N.T. Butterfield & Son Ltd. (Bermuda) | | | 8,105,825 |
| 249,555 | | UTI Bank Ltd. (India) | | | 2,861,896 |
| | | | | |
| | | | | 20,932,943 |
| | | | | |
| | Biotechnology Research and Production 1.5% | | | |
| 1,396,565 | | Ark Therapeutics Group plc* (United Kingdom) | | | 3,492,203 |
| 200,435 | | QIAGEN N.V.* (Netherlands) | | | 3,443,473 |
| | | | | |
| | | | | 6,935,676 |
| | | | | |
| | Building Products 1.5% | | | |
| 103,759 | | Demag Cranes AG (Germany) | | | 6,770,705 |
| | | | | |
| | Commercial Services and Supplies 3.9% | | | |
| 117,620 | | Anhanguera Educacional Participacoes S.A.* ** (Brazil) | | | 1,275,122 |
| 444,355 | | Bloomsbury Publishing plc (United Kingdom) | | | 1,732,327 |
| 62,740 | | Campbell Brothers Ltd. (Australia) | | | 1,123,733 |
| 471,562 | | Datamonitor plc (United Kingdom) | | | 5,482,685 |
| 649,100 | | Michael Page International plc (United Kingdom) | | | 6,843,932 |
| 1,375 | | Schulthess Group AG (Switzerland) | | | 1,583,028 |
| | | | | |
| | | | | 18,040,827 |
| | | | | |
| | Computers and Peripherals 0.5% | | | |
| 74,935 | | Logitech International S.A.* (Switzerland) | | | 2,085,734 |
| | | | | |
| | Construction and Engineering 2.0% | | | |
| 734,715 | | Even Construtora e Incorporadora S.A.* (Brazil) | | | 4,107,546 |
| 66,415 | | Outokumpu Technology* (Finland) | | | 2,476,488 |
| 87,870 | | Stantec, Inc.* (Canada) | | | 2,419,769 |
| | | | | |
| | | | | 9,003,803 |
| | | | | |
| | Diversified Financial Services 13.4% | | | |
| 1,383,845 | | Acta Holdings ASA (Norway) | | | 7,710,587 |
| 643,395 | | African Bank Investments Ltd. (South Africa) | | | 2,673,826 |
| 152,595 | | Arques Industries AG (Germany) | | | 3,706,239 |
| 187,630 | | AWD Holding AG (Germany) | | | 8,896,021 |
| 690 | | Bank Sarasin & Cie AG, Class B (Switzerland) | | | 2,498,124 |
| 192,450 | | D. Carnegie & Co. AB (Sweden) | | | 4,002,658 |
| 167,495 | | Hellenic Exchanges Holding S.A. (Greece) | | | 3,848,595 |
| 154,280 | | Home Capital Group, Inc. (Canada) | | | 4,700,860 |
| 1,857,970 | | Infrastructure Development Finance Co. Ltd. (India) | | | 3,597,878 |
| 762,480 | | JSE Ltd. (South Africa) | | | 7,419,827 |
| 4,758,000 | | Macquarie International Infrastructure Fund Ltd. (Singapore) | | | 3,481,693 |
| 459,671 | | Numis Corp. plc (United Kingdom) | | | 2,805,714 |
| 1,095 | | Osaka Securities Exchange Co. Ltd. (Japan) | | | 6,322,321 |
| | | | | |
| | | | | 61,664,343 |
| | | | | |
| | | | | |
| Shares | | | | Value |
| | | | | |
| | Diversified Telecommunication Services 0.3% | | | |
| 122,400 | | GVT Holding S.A.* (Brazil) | | $ | 1,416,198 |
| | | | | |
| | Drugs and Pharmaceuticals 1.1% | | | |
| 355,155 | | Hikma Pharmaceuticals plc (United Kingdom) | | | 2,706,222 |
| 1,202,233 | | Sigma Pharmaceuticals Ltd. (Australia) | | | 2,445,619 |
| | | | | |
| | | | | 5,151,841 |
| | | | | |
| | Electrical Equipment 2.9% | | | |
| 77,570 | | Conergy AG (Germany) | | | 5,602,280 |
| 29,120 | | Solarworld AG (Germany) | | | 2,263,961 |
| 2,728,387 | | Unisteel Technology Ltd. (Singapore) | | | 5,288,060 |
| | | | | |
| | | | | 13,154,301 |
| | | | | |
| | Electronic Equipment and Instruments 1.3% | | | |
| 356,654 | | Rotork plc (United Kingdom) | | | 5,951,431 |
| | | | | |
| | Energy Equipment and Services 3.9% | | | |
| 419,315 | | TGS-NOPEC Geophysical Co. ASA* (Norway) | | | 9,711,806 |
| 172,380 | | Trican Well Service Ltd. (Canada) | | | 3,416,352 |
| 294,110 | | Wavefield Inseis ASA* (Norway) | | | 2,399,928 |
| 105,595 | | WorleyParsons Ltd. (Australia) | | | 2,378,254 |
| | | | | |
| | | | | 17,906,340 |
| | | | | |
| | Food and Drug Retailing 0.7% | | | |
| 168,460 | | Sugi Pharmacy Co. Ltd. (Japan) | | | 3,416,472 |
| | | | | |
| | Food Products 2.4% | | | |
| 137,025 | | Cosan S.A. Industria e Comercio* (Brazil) | | | 2,484,702 |
| 321,200 | | PPB Oil Palms Berhad (Malaysia) | | | 1,207,693 |
| 94,100 | | Sao Martinho S.A.* (Brazil) | | | 1,219,595 |
| 68,700 | | Unicharm PetCare Corp. (Japan) | | | 2,395,153 |
| 1,967,160 | | Wilmar International Ltd. (Singapore) | | | 3,566,280 |
| | | | | |
| | | | | 10,873,423 |
| | | | | |
| | Health Care Equipment and Supplies 3.9% | | | |
| 233,040 | | Elekta AB, Class B (Sweden) | | | 4,196,168 |
| 5,419,210 | | LMA International N.V.* (Singapore) | | | 2,089,945 |
| 2,016,000 | | Moulin International Holdings Ltd.* *** (Hong Kong) | | | 2,580 |
| 17,710 | | Nakanishi, Inc. (Japan) | | | 2,070,685 |
| 127,230 | | RaySearch Laboratories AB* (Sweden) | | | 3,224,610 |
| 21,378 | | Straumann Holding AG (Switzerland) | | | 6,144,269 |
| | | | | |
| | | | | 17,728,257 |
| | | | | |
| | Health Care Providers and Services 3.1% | | | |
| 52,653 | | Eurofins Scientific* (France) | | | 4,730,159 |
| 81,020 | | Icon plc ADR* (Ireland) | | | 3,451,452 |
| 63,193 | | Orpea* (France) | | | 6,169,772 |
| | | | | |
| | | | | 14,351,383 |
| | | | | |
| | Hotels, Restaurants and Leisure 1.3% | | | |
| 1,906,295 | | FU JI Food & Catering Services Holdings Ltd. | | | 5,989,460 |
| | | | | |
| | Household Durables 4.8% | | | |
| 158,970 | | Fourlis Holdings S.A. (Greece) | | | 3,720,750 |
| 86,856 | | Gafisa S.A. ADR* (Brazil) | | | 2,214,828 |
| 123,200 | | Japan General Estate Co. Ltd. (The) (Japan) | | | 3,174,286 |
| 201,090 | | Joint Corp. (Japan) | | | 7,660,571 |
| 1,699,410 | | Nien Made Enterprise Co. Ltd. (Taiwan) | | | 1,586,938 |
| 902,235 | | Urbi Desarrollos Urbanos S.A. de C.V.* (Mexico) | | | 3,793,683 |
| | | | | |
| | | | | 22,151,056 |
| | | | | |
| | Internet and Catalog Retail 0.5% | | | |
| 33,145 | | Submarino S.A. GDR*** (Brazil) | | | 2,236,522 |
| | | | | |
37
| | |
| WASATCH INTERNATIONAL GROWTH FUND (WAIGX) — Schedule of Investments (continued) |
|
| |
| |
| | | | | |
| Shares | | | | Value |
| | | | | |
| | Machinery 9.6% | | | |
| 314,000 | | Aichi Corp. (Japan) | | $ | 2,950,425 |
| 232,365 | | Bharat Forge Ltd. (India) | | | 1,693,700 |
| 154,160 | | Biesse S.p.A. (Italy) | | | 4,558,665 |
| 38,818 | | Burckhardt Compression Holding AG* (Switzerland) | | | 6,386,698 |
| 1,378,520 | | Emeco Holdings Ltd. (Australia) | | | 1,983,069 |
| 173,880 | | Frigoglass S.A. (Greece) | | | 4,116,235 |
| 62,865 | | Haulotte Group (France) | | | 2,017,049 |
| 86,310 | | Konecranes Oyj (Finland) | | | 2,897,424 |
| 5,727,050 | | MMI Holdings Ltd. (Singapore) | | | 6,305,079 |
| 32,832 | | Palfinger AG (Austria) | | | 5,093,691 |
| 198,355 | | Pason Systems, Inc. (Canada) | | | 2,463,631 |
| 88,470 | | Takeuchi Manufacturing Co. Ltd. (Japan) | | | 3,693,773 |
| | | | | |
| | | | | 44,159,439 |
| | | | | |
| | Metals and Mining 2.8% | | | |
| 79,290 | | Aber Diamond Corp. (Canada) | | | 2,960,609 |
| 210,780 | | Lundin Mining Corp.* (Canada) | | | 2,349,211 |
| 380,370 | | Pacific Metals Co., Ltd. (Japan) | | | 5,320,652 |
| 774,016 | | Perilya Ltd. (Australia) | | | 2,270,832 |
| | | | | |
| | | | | 12,901,304 |
| | | | | |
| | Office Electronics 0.5% | | | |
| 16,320 | | Neopost S.A. (France) | | | 2,335,507 |
| | | | | |
| | Oil and Gas 3.1% | | | |
| 869,080 | | Det Norske Oljeselskap (DNO) ASA* (Norway) | | | 1,565,897 |
| 563,007 | | JKX Oil and Gas plc (United Kingdom) | | | 3,364,396 |
| 88,095 | | Premier Oil plc* (United Kingdom) | | | 2,190,732 |
| 434,400 | | Seabird Exploration Ltd.* (Norway) | | | 2,613,761 |
| 153,165 | | Soco International plc* (United Kingdom) | | | 4,716,620 |
| | | | | |
| | | | | 14,451,406 |
| | | | | |
| | Real Estate 8.7% | | | |
| 9,600 | | ARDEPRO Co. Ltd. (Japan) | | | 3,453,061 |
| 1,067,840 | | Babcock & Brown Japan Property Trust (Australia) | | | 1,661,628 |
| 66,023 | | Babis Vovos Int’l. Construction S.A. (Greece) | | | 2,472,467 |
| 2,985,695 | | Charter Hall Group (Australia) | | | 6,726,925 |
| 580 | | Creed Corp. (Japan) | | | 1,884,014 |
| 267,379 | | DTZ Holdings plc (United Kingdom) | | | 3,485,137 |
| 160,255 | | Great Portland Estates plc (United Kingdom) | | | 2,448,544 |
| 817,350 | | Invista Real Estate Investment Management plc* (United Kingdom) | | | 2,204,770 |
| 365 | | Japan Hotel and Resort, Inc. (Japan) | | | 2,172,619 |
| 1,609,175 | | Mapletree Logistics Trust (Singapore) | | | 1,368,473 |
| 353,365 | | Norwegian Property ASA* (Norway) | | | 4,194,105 |
| 400,070 | | Savills plc (United Kingdom) | | | 5,214,691 |
| 1,870,000 | | Suntec Real Estate Investment Trust (Singapore) | | | 2,440,899 |
| | | | | |
| | | | | 39,727,333 |
| | | | | |
| | Retail 8.6% | | | |
| 16,820 | | Bijou Brigitte AG (Germany) | | | 3,914,510 |
| 3,986,335 | | China Hongxing Sports Ltd. (China) | | | 9,250,379 |
| 371,830 | | Hemtex AB (Sweden) | | | 7,307,540 |
| 265,160 | | Monsoon plc* (United Kingdom) | | | 2,047,885 |
| 4,966,110 | | Peace Mark Holdings Ltd. (Hong Kong) | | | 5,523,090 |
| 42,840 | | Point, Inc. (Japan) | | | 2,728,500 |
| 957,599 | | Pumpkin Patch Ltd. (New Zealand) | | | 2,963,436 |
| 1,164,790 | | Truworths International Ltd. (South Africa) | | | 5,671,382 |
| | | | | |
| | | | | 39,406,722 |
| | | | | |
| | Road and Rail 0.8% | | | |
| 120,975 | | Localiza Rent A Car S.A. (Brazil) | | | 3,708,057 |
| | | | | |
| | | | | | |
| Shares | | | | Value | |
| | | | | | |
| | |
| | Semiconductor Equipment and Products 1.9% | | | | |
| 29,815 | | austriamicrosystems AG* (Austria) | | $ | 1,750,714 | |
| 86,590 | | CSR plc* (United Kingdom) | | | 1,109,899 | |
| 34,225 | | Disco Corp. (Japan) | | | 2,095,408 | |
| 122,190 | | Melexis N.V. (Belgium) | | | 2,304,263 | |
| 185,740 | | O2Micro International Ltd. ADR* (Cayman Islands) | | | 1,467,346 | |
| | | | | | |
| | | | | 8,727,630 | |
| | | | | | |
| | |
| | Software 0.6% | | | | |
| 80,885 | | Nemetschek AG (Germany) | | | 2,923,012 | |
| | | | | | |
| | |
| | Textiles, Apparel and Luxury Goods 5.2% | | | | |
| 10,960,545 | | EganaGoldpfeil (Holdings) Ltd. (Hong Kong) | | | 7,687,033 | |
| 1,145,725 | | Li Ning Co. Ltd. (Hong Kong) | | | 2,269,851 | |
| 87,390 | | Mariella Burani Fashion Group S.p.A. (Italy) | | | 2,642,650 | |
| 1,415,030 | | Ports Design Ltd. (Hong Kong) | | | 3,775,876 | |
| 7,625 | | Puma AG Rudolf Dassler Sport (Germany) | | | 2,791,308 | |
| 405,515 | | Ted Baker plc (United Kingdom) | | | 4,678,851 | |
| | | | | | |
| | | | | 23,845,569 | |
| | | | | | |
| | |
| | Total Common Stocks
(cost $321,859,951) | | | 452,485,490 | |
| | | | | | |
| | |
| | PREFERRED STOCKS 1.2% | | | | |
| | |
| | Road and Rail 1.2% | | | | |
| 462,585 | | All America Latina Logistica S.A. Pfd.** (Brazil) | | | 5,617,586 | |
| | | | | | |
| | |
| | Total Preferred Stocks
(cost $2,379,556) | | | 5,617,586 | |
| | | | | | |
| | |
Principal
Amount | | | | Value | |
| | |
| | SHORT-TERM INVESTMENTS 2.0% | | | | |
| | |
| | Repurchase Agreement 2.0% | | | | |
| $9,096,000 | | Repurchase Agreement dated 3/30/07, 4.30% due 4/2/07 with State Street Bank and Trust Co. collateralized by $6,730,000 of United States Treasury Bonds 8.875% due 2/15/19; value: $9,280,535; repurchase proceeds: $9,099,259 (cost $9,096,000) | | $ | 9,096,000 | |
| | | | | | |
| | |
| | Total Short-Term Investments
(cost $9,096,000) | | | 9,096,000 | |
| | | | | | |
| | |
| | Total Investments
(cost $333,335,507) 101.8% | | | 467,199,076 | |
| | |
| | Liabilities less Other Assets (1.8)% | | | (8,189,666 | ) |
| | | | | | |
| | |
| | NET ASSETS 100.0% | | $ | 459,009,410 | |
| | | | | | |
| |
| | *Non-income producing. **Each unit represents a combination of common and preferred stocks. ***Security was fair valued under procedures adopted by the Board of Directors (see Note 2). ADR American Depositary Receipts. GDR Global Depositary Receipts. See notes to financial statements. | |
38
| | |
| | MARCH 31, 2007 (UNAUDITED) |
|
| |
| |
At March 31, 2007, Wasatch International Growth Fund’s investments, excluding short-term investments, were in the following countries:
| | | |
| Country | | % | |
Australia | | 4.1 | |
Austria | | 1.5 | |
Belgium | | 0.5 | |
Bermuda | | 1.8 | |
Brazil | | 5.9 | |
Canada | | 4.7 | |
Cayman Islands | | 0.3 | |
China | | 2.0 | |
Finland | | 1.2 | |
France | | 3.3 | |
Germany | | 10.2 | |
Greece | | 3.6 | |
Hong Kong | | 5.5 | |
India | | 2.8 | |
Ireland | | 0.7 | |
Italy | | 1.6 | |
Japan | | 11.1 | |
Malaysia | | 0.3 | |
Mexico | | 0.8 | |
Netherlands | | 0.8 | |
New Zealand | | 0.6 | |
Norway | | 6.2 | |
Singapore | | 5.4 | |
South Africa | | 3.4 | |
Sweden | | 4.1 | |
Switzerland | | 4.1 | |
Taiwan | | 0.3 | |
United Kingdom | | 13.2 | |
| | | |
TOTAL | | 100.0 | % |
| | | |
39
| | |
| WASATCH INTERNATIONAL OPPORTUNITIES FUND (WAIOX) — Schedule of Investments |
|
| |
| |
| | | | | |
| Shares | | | | Value |
| | | | | |
| | COMMON STOCKS 97.9% | | | |
| | |
| | Aerospace and Defense 1.0% | | | |
| 16,035 | | Thielert AG* (Germany) | | $ | 498,405 |
| | | | | |
| | Auto Components 1.0% | | | |
| 58,750 | | ARB Corp. Ltd. (Australia) | | | 203,788 |
| 93,050 | | Super Cheap Auto Group Ltd. (Australia) | | | 305,420 |
| | | | | |
| | | | | 509,208 |
| | | | | |
| | Biotechnology Research and Production 1.1% | | | |
| 41,525 | | Abcam plc (United Kingdom) | | | 237,106 |
| 123,110 | | Ark Therapeutics Group plc* (United Kingdom) | | | 307,845 |
| | | | | |
| | | | | 544,951 |
| | | | | |
| | Building Products 1.9% | | | |
| 11,840 | | Demag Cranes AG (Germany) | | | 772,609 |
| 26,145 | | Fleetwood Corp. Ltd. (Australia) | | | 190,279 |
| | | | | |
| | | | | 962,888 |
| | | | | |
| | Chemicals 1.0% | | | |
| 2,094,000 | | Century Sunshine Ecological Technology Holdings Ltd. (Hong Kong) | | | 501,146 |
| | | | | |
| | Commercial Services and Supplies 7.2% | | | |
| 55,175 | | Allen-Vanguard Corp.* (Canada) | | | 231,142 |
| 12,520 | | Anhanguera Educacional Participacoes S.A.* ** (Brazil) | | | 135,730 |
| 21,875 | | Carter & Carter Group plc (United Kingdom) | | | 522,018 |
| 538,031 | | EasyCall International Ltd.* (Bermuda) | | | 270,349 |
| 171,500 | | Environmental Management Solutions, Inc.* (Canada) | | | 86,274 |
| 49,840 | | Intermap Technologies Corp.* (Canada) | | | 258,937 |
| 5,950 | | MegaStudy Co. Ltd. (Korea) | | | 1,043,527 |
| 390,150 | | Oriental Century Ltd.* (Singapore) | | | 255,916 |
| 280,765 | | Raffles Education Corp. Ltd. (Singapore) | | | 423,859 |
| 45,115 | | Semcon AB* (Sweden) | | | 381,143 |
| | | | | |
| | | | | 3,608,895 |
| | | | | |
| | Construction and Engineering 1.3% | | | |
| 78,235 | | Even Construtora e Incorporadora S.A.* (Brazil) | | | 437,386 |
| 86,050 | | Lycopodium Ltd. (Australia) | | | 224,560 |
| | | | | |
| | | | | 661,946 |
| | | | | |
| | Construction Materials 0.9% | | | |
| 465 | | Getaz Romang Holding S.A. (Switzerland) | | | 428,358 |
| | | | | |
| | Distributors 0.4% | | | |
| 42,555 | | Commercial Solutions, Inc.* (Canada) | | | 221,089 |
| | | | | |
| | Diversified Financial Services 16.9% | | | |
| 324,200 | | Acta Holdings ASA (Norway) | | | 1,806,396 |
| 8,675 | | Addenda Capital, Inc. (Canada) | | | 182,461 |
| 32,150 | | Arques Industries AG (Germany) | | | 780,862 |
| 46,175 | | Credit Corp. Group Ltd. (Australia) | | | 382,833 |
| 15,520 | | Hagstromer & Qviberg AB (Sweden) | | | 735,587 |
| 15,985 | | Home Capital Group, Inc. (Canada) | | | 487,058 |
| 46,380 | | International Maritime Exchange ASA* (Norway) | | | 712,956 |
| 105,834 | | JSE Ltd. (South Africa) | | | 1,029,889 |
| 460,000 | | Macquarie International Infrastructure Fund Ltd. (Singapore) | | | 336,608 |
| 41,430 | | Numis Corp. plc (United Kingdom) | | | 252,878 |
| 105 | | Osaka Securities Exchange Co. Ltd. (Japan) | | | 606,250 |
| 6,525 | | Oslo Bors Holdings ASA (Norway) | | | 656,136 |
| 86,715 | | Quest Capital Corp. (Canada) | | | 235,412 |
| 29,575 | | Treasury Group Ltd. (Australia) | | | 324,541 |
| | | | | |
| | | | | 8,529,867 |
| | | | | |
| | | | | |
| Shares | | | | Value |
| | | | | |
| | Diversified Telecommunication Services 0.3% | | | |
| 12,900 | | GVT Holding S.A.* (Brazil) | | $ | 149,256 |
| | | | | |
| | Electrical Equipment 2.2% | | | |
| 239,250 | | Unisteel Technology Ltd. (Singapore) | | | 463,706 |
| 1,117,000 | | Wasion Meters Group Ltd. (Hong Kong) | | | 471,751 |
| 162,000 | | XAC Automation Corp. (Taiwan) | | | 193,382 |
| | | | | |
| | | | | 1,128,839 |
| | | | | |
| | Electronic Equipment and Instruments 1.3% | | | |
| 208,117 | | Chroma ATE, Inc. (Taiwan) | | | 310,069 |
| 618,710 | | QRSciences Holdings Ltd.* (Australia) | | | 190,545 |
| 207,670 | | Virtek Vision International, Inc.* (Canada) | | | 162,108 |
| | | | | |
| | | | | 662,722 |
| | | | | |
| | Energy Equipment and Services 1.6% | | | |
| 14,050 | | Bonnett’s Energy Services Trust (Canada) | | | 125,761 |
| 65,655 | | Bri-Chem Corp.* (Canada) | | | 136,669 |
| 56,900 | | Canadian Sub-Surface Energy Services Corp., Class A* (Canada) | | | 168,289 |
| 26,195 | | Deepwell Energy Services Trust (Canada) | | | 127,459 |
| 31,450 | | Wavefield Inseis ASA* (Norway) | | | 256,631 |
| | | | | |
| | | | | 814,809 |
| | | | | |
| | Food and Drug Retailing 0.6% | | | |
| 4,500 | | Nihon Chouzai Co. Ltd. (Japan) | | | 101,403 |
| 7,090 | | Welcia Kanto Co. Ltd. (Japan) | | | 203,777 |
| | | | | |
| | | | | 305,180 |
| | | | | |
| | Food Products 0.3% | | | |
| 9,900 | | Sao Martinho S.A.* (Brazil) | | | 128,310 |
| | | | | |
| | Health Care Equipment and Supplies 3.7% | | | |
| 1,279,445 | | LMA International N.V.* (Singapore) | | | 493,424 |
| 2,900 | | MANI, Inc. (Japan) | | | 188,155 |
| 1,600 | | Nakanishi, Inc. (Japan) | | | 187,075 |
| 40,020 | | RaySearch Laboratories AB* (Sweden) | | | 1,014,296 |
| | | | | |
| | | | | 1,882,950 |
| | | | | |
| | Health Care Providers and Services 0.5% | | | |
| 27,815 | | Curanum AG (Germany) | | | 267,848 |
| | | | | |
| | Hotels, Restaurants and Leisure 2.9% | | | |
| 746,000 | | Ajisen China Holdings Ltd.* (Hong Kong) | | | 677,865 |
| 42,000 | | Club Cruise Entertainment & Travelling Services Europe N.V.* (Norway) | | | 328,872 |
| 141,000 | | FU JI Food & Catering Services Holdings Ltd. (Cayman Islands) | | | 443,013 |
| | | | | |
| | | | | 1,449,750 |
| | | | | |
| | Household Durables 5.4% | | | |
| 10,170 | | Beter Bed Holding N.V. (Netherlands) | | | 344,127 |
| 38,435 | | Celrun Co. Ltd.* (Korea) | | | 280,255 |
| 18,375 | | easyhome Ltd. (Canada) | | | 294,841 |
| 13,640 | | Fourlis Holdings S.A. (Greece) | | | 319,249 |
| 40,800 | | Homebuy Group plc, Class A* *** (United Kingdom) | | | 803 |
| 14,300 | | Japan General Estate Co. Ltd. (The) (Japan) | | | 368,444 |
| 12,800 | | Joint Corp. (Japan) | | | 487,619 |
| 142,080 | | Nien Made Enterprise Co. Ltd. (Taiwan) | | | 132,677 |
| 7,600 | | Nihon Eslead Corp. (Japan) | | | 197,755 |
| 180,360 | | SARE Holding S.A. de C.V., Class B* (Mexico) | | | 298,124 |
| | | | | |
| | | | | 2,723,894 |
| | | | | |
| | Industrial Conglomerates 1.1% | | | |
| 204,000 | | Mexichem S.A. de C.V. (Mexico) | | | 531,837 |
| | | | | |
40
| | |
| | MARCH 31, 2007 (UNAUDITED) |
|
| |
| |
| | | | | |
| Shares | | | | Value |
| | | | | |
| | Internet and Catalog Retail 0.6% | | | |
| 9,100 | | Submarino S.A. (Brazil) | | $ | 307,020 |
| | | | | |
| | Investment Management Companies 1.2% | | | |
| 62,380 | | Star Asia Finance Ltd.* *** † (Guernsey) | | | 623,800 |
| | | | | |
| | Leisure Equipment and Products 0.6% | | | |
| 19,175 | | KABE Husvagnar AB, Class B (Sweden) | | | 293,788 |
| | | | | |
| | Machinery 8.9% | | | |
| 178,420 | | Awea Mechantronic Co. Ltd. (Taiwan) | | | 464,248 |
| 2,565 | | Burckhardt Compression Holding AG* (Switzerland) | | | 422,018 |
| 517,443 | | Innovalues Precision Ltd. (Singapore) | | | 457,099 |
| 10,685 | | Groupe Laperriere & Verreault, Inc.* (Canada) | | | 273,392 |
| 42,540 | | Martinrea International, Inc.* (Canada) | | | 547,915 |
| 984,940 | | MMI Holdings Ltd. (Singapore) | | | 1,084,350 |
| 5,355 | | Muehlbauer Holding AG & Co. (Germany) | | | 220,591 |
| 41,875 | | Pason Systems, Inc. (Canada) | | | 520,101 |
| 12,200 | | Takeuchi Manufacturing Co. Ltd. (Japan) | | | 509,371 |
| | | | | |
| | | | | 4,499,085 |
| | | | | |
| | Marine 2.1% | | | |
| 303,800 | | Ezra Holdings Ltd. (Singapore) | | | 1,081,495 |
| | | | | |
| | Metals and Mining 1.8% | | | |
| 144,965 | | Bayou Bend Petroleum Ltd. PIPE* *** † (Canada) | | | 223,539 |
| 721,560 | | CBH Resources Ltd.* (Australia) | | | 295,318 |
| 107,708 | | Consolidated Minerals Ltd. (Australia) | | | 218,230 |
| 54,530 | | Perilya Ltd. (Australia) | | | 159,982 |
| | | | | |
| | | | | 897,069 |
| | | | | |
| | Oil and Gas 5.2% | | | |
| 34,170 | | Bow Valley Energy Ltd.* (Canada) | | | 177,822 |
| 42,150 | | Fairquest Energy Ltd.* (Canada) | | | 116,987 |
| 16,655 | | Highpine Oil & Gas Ltd.* (Canada) | | | 197,904 |
| 106,150 | | Ithaca Energy, Inc.* (Canada) | | | 220,964 |
| 44,125 | | JKX Oil and Gas plc (United Kingdom) | | | 263,680 |
| 17,225 | | Melrose Resources plc (United Kingdom) | | | 137,356 |
| 38,305 | | Petrowest Energy Services Trust (Canada) | | | 235,554 |
| 18,060 | | ProEx Energy Ltd.* (Canada) | | | 237,312 |
| 68,750 | | Saxon Energy Services, Inc.* (Canada) | | | 237,922 |
| 70,530 | | Seabird Exploration Ltd.* (Norway) | | | 424,375 |
| 40,750 | | Sondex plc (United Kingdom) | | | 288,043 |
| 18,315 | | Sound Energy Trust (Canada) | | | 61,635 |
| | | | | |
| | | | | 2,599,554 |
| | | | | |
| | Real Estate 5.9% | | | |
| 1,175 | | ARDEPRO Co. Ltd. (Japan) | | | 422,640 |
| 234,540 | | Babcock & Brown Japan Property Trust (Australia) | | | 364,959 |
| 45 | | Century 21 Real Estate of Japan Ltd. (Japan) | | | 256,378 |
| 149,360 | | Charter Hall Group (Australia) | | | 336,516 |
| 55 | | Creed Corp. (Japan) | | | 178,656 |
| 37,200 | | Erinaceous Group plc (United Kingdom) | | | 154,547 |
| 41,360 | | LPS Brasil Consultoria de Imoveis S.A. (Brazil) | | | 422,246 |
| 50,915 | | Norwegian Property ASA* (Norway) | | | 604,312 |
| 16,500 | | Takara Leben Co. Ltd. (Japan) | | | 234,031 |
| | | | | |
| | | | | 2,974,285 |
| | | | | |
| | | | | |
| Shares | | | | Value |
| | | | | |
| | Retail 7.7% | | | |
| 773,325 | | China Hongxing Sports Ltd. (China) | | $ | 1,794,518 |
| 41,205 | | Hemtex AB (Sweden) | | | 809,798 |
| 500,000 | | Hongguo Int’l. Holdings Ltd.* (Singapore) | | | 421,913 |
| 23,900 | | New Wave Group AB, Class B (Sweden) | | | 261,803 |
| 567,000 | | Pertama Holdings Ltd. (Singapore) | | | 155,122 |
| 67,241 | | Pumpkin Patch Ltd. (New Zealand) | | | 208,088 |
| 43,435 | | Swedol AB, Class B* (Sweden) | | | 240,072 |
| | | | | |
| | | | | 3,891,314 |
| | | | | |
| | Road and Rail 0.6% | | | |
| 23,860 | | TransForce Income Fund (Canada) | | | 289,727 |
| | | | | |
| | Semiconductor Equipment and Products 0.6% | | | |
| 5,125 | | austriamicrosystems AG* (Austria) | | | 300,936 |
| | | | | |
| | Software 2.9% | | | |
| 12,815 | | Belzberg Technologies, Inc.* (Canada) | | | 91,698 |
| 18,050 | | Duzon Digital Ware Co. Ltd. (Korea) | | | 415,373 |
| 9,200 | | Isra Vision Systems AG (Germany) | | | 259,256 |
| 6,565 | | Nemetschek AG (Germany) | | | 237,245 |
| 75,760 | | Profdoc* ASA (Norway) | | | 449,599 |
| | | | | |
| | | | | 1,453,171 |
| | | | | |
| | Textiles, Apparel and Luxury Goods 5.6% | | | |
| 1,885,000 | | EganaGoldpfeil (Holdings) Ltd. (Hong Kong) | | | 1,322,020 |
| 473,005 | | Moiselle Int’l. Holdings Ltd. (Hong Kong) | | | 137,416 |
| 171,045 | | Mulberry Group plc (United Kingdom) | | | 626,409 |
| 273,935 | | Ports Design Ltd. (Hong Kong) | | | 730,970 |
| | | | | |
| | | | | 2,816,815 |
| | | | | |
| | Transportation — Miscellaneous 0.5% | | | |
| 25,810 | | Euroseas Ltd. | | | 257,842 |
| | | | | |
| | Transportation Infrastructure 1.1% | | | |
| 391,435 | | Goodpack Ltd. (Singapore) | | | 389,654 |
| 10,000 | | Trancom Co. Ltd. (Japan) | | | 169,218 |
| | | | | |
| | | | | 558,872 |
| | | | | |
| | |
| | Total Common Stocks
(cost $33,119,155) | | | 49,356,921 |
| | | | | |
| | |
| | WARRANTS 0.3% | | | |
| | |
| | Electronic Equipment and Instruments 0.0% | | | |
| 309,355 | | QRSciences Holdings Ltd. expiring 2/15/08* *** † (Australia) | | | — |
| | | | | |
| | Transportation Infrastructure 0.3% | | | |
| 528,875 | | Goodpack Ltd. expiring 4/13/07* (Singapore) | | | 141,205 |
| | | | | |
| | |
| | Total Warrants
(cost $229,771) | | | 141,205 |
| | | | | |
41
| | |
WASATCH INTERNATIONAL OPPORTUNITIES FUND (WAIOX) — Schedule of Investments (continued) |
|
| |
| |
| | | | | | |
Principal
Amount | | | | Value | |
| | | | | | |
| | SHORT-TERM INVESTMENTS 1.8% | | | | |
| | |
| | Repurchase Agreement 1.8% | | | | |
| $918,000 | | Repurchase Agreement dated 3/30/07, 4.30% due 4/2/07 with State Street Bank and Trust Co. collateralized by $680,000 of United States Treasury Bonds 8.875% due 2/15/19; value: $937,706; repurchase proceeds: $918,329 (cost $918,000) | | $ | 918,000 | |
| | | | | | |
| | |
| | Total Short-Term Investments
(cost $918,000) | | | 918,000 | |
| | | | | | |
| | |
| | Total Investments
(cost $34,266,926) 100.0% | | | 50,416,126 | |
| | |
| | Liabilities less Other Assets (0.0)% | | | (7,822 | ) |
| | | | | | |
| | |
| | NET ASSETS 100.0% | | $ | 50,408,304 | |
| | | | | | |
| |
| | *Non-income producing. **Each unit consists of one share of common stock and six shares of preferred stock. ***Security was fair valued under procedures adopted by the Board of Directors (see Note 2). †Security purchased in a private placement transaction or under Rule 144A of the Securities Act of 1933 (see Note 9). PIPE Private Investment in a Public Equity. See notes to financial statements. | |
At March 31, 2007, Wasatch International Opportunities Fund’s investments, excluding short-term investments, were in the following countries:
| | | |
| Country | | % | |
Australia | | 6.5 | |
Austria | | 0.6 | |
Bermuda | | 0.6 | |
Brazil | | 3.2 | |
Canada | | 12.4 | |
Cayman Islands | | 0.9 | |
China | | 3.6 | |
Germany | | 6.1 | |
Greece | | 0.7 | |
Guernsey | | 1.3 | |
Hong Kong | | 7.8 | |
Japan | | 8.3 | |
Korea | | 3.5 | |
Mexico | | 1.7 | |
Netherlands | | 0.7 | |
New Zealand | | 0.4 | |
Norway | | 10.6 | |
Singapore | | 11.5 | |
South Africa | | 2.1 | |
Sweden | | 7.5 | |
Switzerland | | 1.7 | |
Taiwan | | 2.2 | |
United Kingdom | | 5.6 | |
United States | | 0.5 | |
| | | |
TOTAL | | 100.0 | % |
| | | |
42
| | |
| WASATCH MICRO CAP FUND (WMICX) — Schedule of Investments | | MARCH 31, 2007 (UNAUDITED) |
|
| |
| |
| | | | | |
| Shares | | | | Value |
| | | | | |
| | COMMON STOCKS 95.4% | | | |
| | Auto Parts — After Market 1.5% | | | |
| 193,545 | | Keystone Automotive Industries, Inc.* | | $ | 6,522,466 |
| 526,445 | | US Auto Parts Network, Inc.* | | | 2,827,010 |
| | | | | |
| | | | | 9,349,476 |
| | | | | |
| | Banks 2.9% | | | |
| 103,755 | | Bank of the Ozarks, Inc. | | | 2,979,844 |
| 133,114 | | Commonwealth Bankshares, Inc. | | | 2,981,760 |
| 205,868 | | Epic Bancorp†† | | | 3,133,311 |
| 283,940 | | First Bank of Delaware* | | | 1,053,417 |
| 297,080 | | Omni Financial Services, Inc. | | | 2,896,530 |
| 212,800 | | United Western Bancorp, Inc. | | | 5,081,664 |
| | | | | |
| | | | | 18,126,526 |
| | | | | |
| | Chemicals 0.6% | | | |
| 114,675 | | Cabot Microelectronics Corp.* | | | 3,842,759 |
| | | | | |
| | Commercial Information Services 1.0% | | | |
| 182,447 | | LECG Corp.* | | | 2,641,832 |
| 67,915 | | Morningstar, Inc.* | | | 3,507,131 |
| | | | | |
| | | | | 6,148,963 |
| | | | | |
| | Commercial Services and Supplies 7.5% | | | |
| 133,280 | | AMN Healthcare Services, Inc.* | | | 3,014,794 |
| 58,420 | | CRA International, Inc.* | | | 3,048,356 |
| 479,022 | | Datamonitor plc (United Kingdom) | | | 5,569,420 |
| 589,218 | | Hartford Education Corp. Ltd. (Singapore) | | | 233,061 |
| 242,070 | | Liquidity Services, Inc.* | | | 4,100,666 |
| 4,143,815 | | Oriental Century Ltd.* (Singapore) | | | 2,718,107 |
| 493,710 | | Providence Service Corp. (The)* | | | 11,710,801 |
| 2,222,445 | | Raffles Education Corp. Ltd. (Singapore) | | | 3,355,131 |
| 88,710 | | Resources Connection, Inc.* | | | 2,837,833 |
| 1,452,025 | | SM&A* †† | | | 10,309,377 |
| | | | | |
| | | | | 46,897,546 |
| | | | | |
| | Computer Services Software and Systems 5.3% | | | |
| 112,865 | | DealerTrack Holdings, Inc.* | | | 3,467,213 |
| 255,745 | | Interactive Intelligence, Inc.* | | | 3,897,554 |
| 734,340 | | Kana Software, Inc.* | | | 2,717,058 |
| 250,315 | | NCI, Inc., Class A* | | | 3,692,146 |
| 430,895 | | NetScout Systems, Inc.* | | | 3,899,600 |
| 398,835 | | Opnet Technologies, Inc.* | | | 5,388,261 |
| 236,437 | | Retalix Ltd.* (Israel) | | | 4,556,141 |
| 121,053 | | Sourcefire, Inc.* | | | 2,134,164 |
| 266,225 | | Unica Corp.* | | | 3,341,124 |
| | | | | |
| | | | | 33,093,261 |
| | | | | |
| | Computer Technology 0.2% | | | |
| 391,877 | | Qualstar Corp.* | | | 1,210,900 |
| | | | | |
| | Consumer Electronics 0.6% | | | |
| 163,230 | | DTS, Inc.* | | | 3,955,063 |
| | | | | |
| | Distributors 0.5% | | | |
| 617,550 | | Commercial Solutions, Inc.* (Canada) | | | 3,208,400 |
| | | | | |
| | Diversified Financial Services 4.1% | | | |
| 1,763,320 | | Acta Holdings ASA (Norway) | | | 9,824,967 |
| 149,630 | | Addenda Capital, Inc. (Canada) | | | 3,147,168 |
| 203,760 | | Arques Industries AG (Germany) | | | 4,948,939 |
| 123,300 | | Home Capital Group, Inc. (Canada) | | | 3,756,910 |
| 375,525 | | Treasury Group Ltd. (Australia) | | | 4,120,822 |
| | | | | |
| | | | | 25,798,806 |
| | | | | |
| | Diversified Telecommunication Services 0.2% | | | |
| 420,010 | | Astra Microwave Products Ltd. (India) | | | 1,300,356 |
| | | | | |
| | | | | |
| Shares | | | | Value |
| | | | | |
| | Drugs and Pharmaceuticals 0.9% | | | |
| 115,660 | | Animal Health International, Inc.* | | $ | 1,398,330 |
| 238,925 | | La Jolla Pharmaceutical Co.* | | | 1,445,496 |
| 225,695 | | Salix Pharmaceuticals Ltd.* | | | 2,843,757 |
| | | | | |
| | | | | 5,687,583 |
| | | | | |
| | Education Services 0.8% | | | |
| 229,081 | | Universal Technical Institute, Inc.* | | | 5,287,189 |
| | | | | |
| | Electrical and Electronics 2.4% | | | |
| 518,087 | | Power Integrations, Inc.* | | | 11,734,671 |
| 346,875 | | TTM Technologies, Inc.* | | | 3,309,187 |
| | | | | |
| | | | | 15,043,858 |
| | | | | |
| | Electrical Equipment 0.6% | | | |
| 1,807,805 | | Unisteel Technology Ltd. (Singapore) | | | 3,503,821 |
| | | | | |
| | Electronics 1.2% | | | |
| 514,373 | | Nu Horizons Electronics Corp.* | | | 5,416,348 |
| 64,105 | | Supertex, Inc.* | | | 2,128,927 |
| | | | | |
| | | | | 7,545,275 |
| | | | | |
| | Electronics — Medical Systems 0.7% | | | |
| 215,055 | | Cardica, Inc.* | | | 1,169,899 |
| 118,425 | | NXStage Medical, Inc.* | | | 1,577,421 |
| 787,000 | | Ophthalmic Imaging Systems, Inc.* | | | 1,967,500 |
| | | | | |
| | | | | 4,714,820 |
| | | | | |
| | Electronics — Semiconductors/Components 8.6% | | | |
| 401,170 | | ASE Test Ltd.* (Taiwan) | | | 4,565,314 |
| 137,926 | | Cascade Microtech, Inc.* | | | 1,965,445 |
| 242,500 | | Excel Technology, Inc.* | | | 6,627,525 |
| 934,635 | | Micrel, Inc.* | | | 10,299,678 |
| 206,675 | | MIPS Technologies, Inc.* | | | 1,845,608 |
| 824,871 | | Pericom Semiconductor Corp.* | | | 8,067,238 |
| 831,385 | | PLX Technology, Inc.* | | | 8,097,690 |
| 63,940 | | Silicon Laboratories, Inc.* | | | 1,913,085 |
| 113,900 | | SiRF Technology Holdings, Inc.* | | | 3,161,864 |
| 224,025 | | Techwell, Inc.* | | | 2,793,592 |
| 127,035 | | Tessera Technologies, Inc.* | | | 5,048,371 |
| | | | | |
| | | | | 54,385,410 |
| | | | | |
| | Energy Equipment and Services 0.8% | | | |
| 10,888,400 | | Advanced Holdings Ltd. (Singapore) | | | 2,009,857 |
| 969,640 | | Bri-Chem Corp.* †† (Canada) | | | 2,018,419 |
| 99,600 | | Wavefield Inseis ASA* (Norway) | | | 812,733 |
| | | | | |
| | | | | 4,841,009 |
| | | | | |
| | Engineering and Contracting Services 1.5% | | | |
| 338,243 | | Stantec, Inc.* (Canada) | | | 9,237,416 |
| | | | | |
| | Entertainment 0.4% | | | |
| 270,681 | | Outdoor Channel Holdings, Inc.* | | | 2,766,360 |
| | | | | |
| | Finance Companies 1.5% | | | |
| 34,925 | | FCStone Group, Inc.* | | | 1,303,401 |
| 154,000 | | Goldwater Bank, N.A.* *** † | | | 1,540,000 |
| 205,145 | | Nicholas Financial, Inc.* | | | 2,283,264 |
| 323,530 | | United PanAm Financial Corp.* | | | 4,044,125 |
| | | | | |
| | | | | 9,170,790 |
| | | | | |
| | Financial — Miscellaneous 1.2% | | | |
| 154,200 | | First Cash Financial Services, Inc.* | | | 3,435,576 |
| 241,605 | | MarketAxess Holdings, Inc.* | | | 4,044,468 |
| | | | | |
| | | | | 7,480,044 |
| | | | | |
| | Health Care Equipment and Supplies 1.3% | | | |
| 21,990,630 | | LMA International N.V.* (Singapore) | | | 8,480,795 |
| | | | | |
43
| | |
| WASATCH MICRO CAP FUND (WMICX) — Schedule of Investments (continued) | | |
|
| |
| |
| | | | | |
| Shares | | | | Value |
| | | | | |
| | Health Care Facilities 2.4% | | | |
| 192,840 | | Healthways, Inc.* | | $ | 9,015,270 |
| 194,325 | | LHC Group, Inc.* | | | 6,301,960 |
| | | | | |
| | | | | 15,317,230 |
| | | | | |
| | Health Care Management Services 2.5% | | | |
| 522,338 | | AmSurg Corp.* | | | 12,792,058 |
| 113,680 | | Computer Programs & Systems, Inc. | | | 3,048,897 |
| | | | | |
| | | | | 15,840,955 |
| | | | | |
| | Health Care Providers and Services 1.0% | | | |
| 143,797 | | Icon plc ADR* (Ireland) | | | 6,125,752 |
| | | | | |
| | Home Building 0.3% | | | |
| 60,950 | | Meritage Homes Corp.* | | | 1,957,714 |
| | | | | |
| | Household Durables 0.3% | | | |
| 117,188 | | easyhome Ltd. (Canada) | | | 1,880,367 |
| | | | | |
| | Insurance 0.4% | | | |
| 196,690 | | North Pointe Holdings Corp.* | | | 2,377,982 |
| | | | | |
| | Investment Management Companies 0.5% | | | |
| 31,002 | | Diamond Hill Investment Group, Inc.* | | | 3,023,005 |
| | | | | |
| | Machinery 3.2% | | | |
| 158,150 | | Gulf Island Fabrication, Inc. | | | 4,228,931 |
| 364,410 | | Martinrea International, Inc.* (Canada) | | | 4,693,602 |
| 7,560,990 | | MMI Holdings Ltd. (Singapore) | | | 8,324,117 |
| 252,800 | | Pason Systems, Inc. (Canada) | | | 3,139,855 |
| | | | | |
| | | | | 20,386,505 |
| | | | | |
| | Manufacturing 0.1% | | | |
| 64,200 | | Swank, Inc.* | | | 770,400 |
| | | | | |
| | Medical and Dental Instruments
and Supplies 7.3% | | | |
| 413,040 | | Abaxis, Inc.* | | | 10,065,785 |
| 334,520 | | Cryocor, Inc.* | | | 1,789,682 |
| 125,055 | | Cyberonics, Inc.* | | | 2,348,533 |
| 82,715 | | Dexcom, Inc.* | | | 650,140 |
| 546,750 | | Endologix, Inc.* | | | 2,148,727 |
| 399,437 | | Enpath Medical, Inc.* †† | | | 3,994,370 |
| 252,965 | | IntraLase Corp.* | | | 6,319,066 |
| 100,465 | | Northstar Neuroscience, Inc.* | | | 1,285,952 |
| 128,435 | | NuVasive, Inc.* | | | 3,050,331 |
| 226,815 | | Thoratec Corp.* | | | 4,740,434 |
| 979,852 | | VNUS Medical Technologies, Inc.* †† | | | 9,818,117 |
| | | | | |
| | | | | 46,211,137 |
| | | | | |
| | Medical Services 0.6% | | | |
| 267,697 | | U.S. Physical Therapy, Inc.* | | | 3,726,342 |
| | | | | |
| | Metals and Mining 0.5% | | | |
| 2,007,345 | | Bayou Bend Petroleum Ltd. PIPE* *** † (Canada) | | | 3,095,364 |
| | | | | |
| | Miscellaneous Materials and Commodities 0.4% | | | |
| 404,970 | | Luna Innovations, Inc.* | | | 1,372,848 |
| 77,600 | | Symyx Technologies, Inc.* | | | 1,375,072 |
| | | | | |
| | | | | 2,747,920 |
| | | | | |
| | Multi-Sector Companies 0.5% | | | |
| 102,040 | | Raven Industries, Inc. | | | 2,862,222 |
| | | | | |
| | Oil and Gas 1.2% | | | |
| 1,705,710 | | Ithaca Energy, Inc.* (Canada) | | | 3,550,634 |
| 206,060 | | Toreador Resources Corp.* | | | 3,739,989 |
| | | | | |
| | | | | 7,290,623 |
| | | | | |
| | | | | |
| Shares | | | | Value |
| | | | | |
| | Production Technology Equipment 2.5% | | | |
| 104,230 | | Eagle Test Systems, Inc.* | | $ | 1,734,387 |
| 584,675 | | inTEST Corp.* †† | | | 2,631,037 |
| 172,395 | | Intevac, Inc.* | | | 4,546,056 |
| 315,400 | | Nanometrics, Inc.* | | | 2,113,180 |
| 272,290 | | Rudolph Technologies, Inc.* | | | 4,748,738 |
| | | | | |
| | | | | 15,773,398 |
| | | | | |
| | Real Estate 1.4% | | | |
| 457,654 | | DTZ Holdings plc (United Kingdom) | | | 5,965,267 |
| 280,560 | | LPS Brasil Consultoria de Imoveis S.A.* (Brazil) | | | 2,864,249 |
| | | | | |
| | | | | 8,829,516 |
| | | | | |
| | Real Estate Investment Trusts (REIT) 0.7% | | | |
| 279,450 | | NorthStar Realty Finance Corp. | | | 4,250,434 |
| | | | | |
| | Retail 12.5% | | | |
| 331,715 | | America’s Car-Mart, Inc.* | | | 4,431,712 |
| 570,515 | | Big 5 Sporting Goods Corp. | | | 14,787,749 |
| 23,990 | | Bijou Brigitte AG (Germany) | | | 5,583,181 |
| 6,024,620 | | China Hongxing Sports Ltd. (China) | | | 13,980,264 |
| 202,600 | | Global Imaging Systems, Inc.* | | | 3,950,700 |
| 251,305 | | Guitar Center, Inc.* | | | 11,338,882 |
| 173,932 | | Hibbett Sports, Inc.* | | | 4,972,716 |
| 5,930,006 | | Hongguo Int’l. Holdings Ltd.* (Singapore) | | | 5,003,894 |
| 108,580 | | Lithia Motors, Inc., Class A | | | 2,976,178 |
| 324,520 | | Rush Enterprises, Inc., Class B* | | | 5,877,057 |
| 103,585 | | Susser Holdings Corp.* | | | 1,797,200 |
| 283,015 | | Tuesday Morning Corp. | | | 4,199,943 |
| | | | | |
| | | | | 78,899,476 |
| | | | | |
| | Semiconductor Equipment and Products 2.1% | | | |
| 1,568,515 | | O2Micro International Ltd. ADR*
(Cayman Islands) | | | 12,391,269 |
| 506,725 | | PSi Technologies Holdings, Inc. ADR* (Philippines) | | | 770,222 |
| | | | | |
| | | | | 13,161,491 |
| | | | | |
| | Shoes 1.5% | | | |
| 161,925 | | Cache, Inc.* | | | 2,874,169 |
| 206,275 | | Kenneth Cole Productions, Inc., Class A | | | 5,295,079 |
| 254,075 | | Shoe Pavilion, Inc.* | | | 1,575,265 |
| | | | | |
| | | | | 9,744,513 |
| | | | | |
| | Software 0.5% | | | |
| 565,600 | | Profdoc ASA* (Norway) | | | 3,356,566 |
| | | | | |
| | Steel 0.6% | | | |
| 175,535 | | Claymont Steel Holdings, Inc.* | | | 3,498,413 |
| | | | | |
| | Textiles, Apparel and Luxury Goods 1.1% | | | |
| 9,443,536 | | EganaGoldpfeil (Holdings) Ltd. (Hong Kong) | | | 6,623,099 |
| | | | | |
| | Transportation Infrastructure 1.0% | | | |
| 6,051,760 | | Goodpack Ltd. (Singapore) | | | 6,024,232 |
| | | | | |
| | Transportation — Miscellaneous 0.3% | | | |
| 2,206,015 | | AutoInfo, Inc.* †† | | | 2,139,835 |
| | | | | |
| | Truckers 2.3% | | | |
| 135,870 | | Knight Transportation, Inc. | | | 2,421,204 |
| 194,135 | | Universal Truckload Services, Inc.* | | | 4,700,008 |
| 161,215 | | USA Truck, Inc.* | | | 2,505,281 |
| 249,025 | | Vitran Corp., Inc.* (Canada) | | | 4,893,341 |
| | | | | |
| | | | | 14,519,834 |
| | | | | |
44
| | |
| | MARCH 31, 2007 (UNAUDITED) |
|
| |
| |
| | | | | |
| Shares | | | | Value |
| | | | | |
| | Wholesalers 1.4% | | | |
| 555,890 | | Beacon Roofing Supply, Inc.* | | $ | 8,994,300 |
| | | | | |
| | |
| | Total Common Stocks
(cost $466,054,620) | | | 600,505,051 |
| | | | | |
| | |
| | PREFERRED STOCKS 0.1% | | | |
| | |
| | Drugs and Pharmaceuticals 0.1% | | | |
| 1,886,792 | | Point Biomedical Corp., Series F Pfd.* *** † | | | 700,000 |
| | | | | |
| | |
| | Total Preferred Stocks
(cost $1,000,000) | | | 700,000 |
| | | | | |
| | |
| | WARRANTS 0.0% | | | |
| | |
| | Drugs and Pharmaceuticals 0.0% | | | |
| 566,037 | | Point Biomedical Corp.
expiring 2/16/12* *** † | | | — |
| | | | | |
| | Health Care Services 0.0% | | | |
| 25,946 | | Familymeds Group, Inc. expiring 11/30/09* *** † | | | — |
| | | | | |
| | |
| | Total Warrants
(cost $0) | | | — |
| | | | | |
| | |
Principal
Amount | | | | Value |
| | |
| | SHORT-TERM INVESTMENTS 4.3% | | | |
| | Repurchase Agreement 4.3% | | | |
| $27,357,000 | | Repurchase Agreement dated 3/30/07,
4.30% due 4/2/07 with State Street Bank and Trust Co. collateralized by $20,510,000 of United States Treasury Bonds 8.125% due 5/15/21; value: $27,909,372; repurchase proceeds: $27,366,803 (cost $27,357,000) | | $ | 27,357,000 |
| | | | | |
| | |
| | Total Short-Term Investments
(cost $27,357,000) | | | 27,357,000 |
| | | | | |
| | |
| | Total Investments
(cost $494,411,620) 99.8% | | | 628,562,051 |
| | |
| | Other Assets less Liabilities 0.2% | | | 1,112,744 |
| | | | | |
| | |
| | NET ASSETS 100.0% | | $ | 629,674,795 |
| | | | | |
| |
| | *Non-income producing. ***Security was fair valued under procedures adopted by the Board of Directors (see Note 2). †Security purchased in a private placement transaction or under Rule 144A of the Securities Act of 1933 (see Note 9). ††Affiliated company (see Note 8). ADR American Depositary Receipt. PIPE Private Investment in a Public Equity. See notes to financial statements. |
At March 31, 2007, Wasatch Micro Cap Fund’s investments, excluding short-term investments, were in the following countries:
| | | |
| Country | | % | |
Australia | | 0.7 | |
Brazil | | 0.5 | |
Canada | | 7.1 | |
Cayman Islands | | 2.1 | |
China | | 2.3 | |
Germany | | 1.7 | |
Hong Kong | | 1.1 | |
India | | 0.2 | |
Ireland | | 1.0 | |
Israel | | 0.8 | |
Norway | | 2.3 | |
Philippines | | 0.1 | |
Singapore | | 6.6 | |
Taiwan | | 0.8 | |
United Kingdom | | 1.9 | |
United States | | 70.8 | |
| | | |
TOTAL | | 100.0 | % |
| | | |
45
| | |
| WASATCH MICRO CAP VALUE FUND (WAMVX) — Schedule of Investments | | |
|
| |
| |
| | | | | |
| Shares | | | | Value |
| | | | | |
| | COMMON STOCKS 91.4% | | | |
| | |
| | Auto Parts — After Market 1.0% | | | |
| 20,000 | | Keystone Automotive Industries, Inc.* | | $ | 674,000 |
| 91,180 | | US Auto Parts Network, Inc.* | | | 489,637 |
| | | | | |
| | | | | 1,163,637 |
| | | | | |
| | Banks 5.8% | | | |
| 164,622 | | City Union Bank Ltd. (India) | | | 615,423 |
| 49,500 | | Commonwealth Bankshares, Inc. | | | 1,108,800 |
| 40,000 | | Cornerstone Bancshares, Inc. | | | 590,000 |
| 218,162 | | First Bank of Delaware* | | | 809,381 |
| 55,556 | | Idaho Trust Bancorp* *** † | | | 500,004 |
| 70,000 | | Omni Financial Services, Inc. | | | 682,500 |
| 25,065 | | Royal Bancshares of Pennsylvania, Inc., Class A | | | 595,294 |
| 30,090 | | Security Business Bank of San Diego* | | | 589,764 |
| 45,000 | | United Western Bancorp, Inc. | | | 1,074,600 |
| | | | | |
| | | | | 6,565,766 |
| | | | | |
| | Biotechnology Research and Production 0.3% | | | |
| 48,035 | | Abcam plc (United Kingdom) | | | 274,278 |
| | | | | |
| | Commercial Services and Supplies 3.2% | | | |
| 85,305 | | Allen-Vanguard Corp.* (Canada) | | | 357,364 |
| 8,000 | | MegaStudy Co. Ltd. (Korea) | | | 1,403,061 |
| 669,440 | | Oriental Century Ltd.* (Singapore) | | | 439,115 |
| 35,000 | | Providence Service Corp. (The)* | | | 830,200 |
| 100,210 | | Spark Networks plc ADR* | | | 637,336 |
| | | | | |
| | | | | 3,667,076 |
| | | | | |
| | Computer Services Software and Systems 6.4% | | | |
| 79,785 | | Interactive Intelligence, Inc.* | | | 1,215,923 |
| 71,691 | | Jacada Ltd.* | | | 229,411 |
| 276,795 | | Kana Software, Inc.* | | | 1,024,142 |
| 58,000 | | NCI, Inc., Class A* | | | 855,500 |
| 64,240 | | NetScout Systems, Inc.* | | | 581,372 |
| 57,325 | | Opnet Technologies, Inc.* | | | 774,461 |
| 98,775 | | Saba Software, Inc.* | | | 646,482 |
| 140,000 | | Tier Technologies, Inc., Class B* | | | 1,232,000 |
| 604,220 | | Tucows, Inc.* | | | 525,672 |
| 244,950 | | Unify Corp.* | | | 127,374 |
| | | | | |
| | | | | 7,212,337 |
| | | | | |
| | Computer Technology 0.5% | | | |
| 65,075 | | NetList, Inc.* | | | 452,922 |
| 26,859 | | Qualstar Corp.* | | | 82,994 |
| | | | | |
| | | | | 535,916 |
| | | | | |
| | Consumer Products 0.1% | | | |
| 56,250 | | Natural Health Trends Corp.* | | | 104,062 |
| | | | | |
| | Distributors 0.6% | | | |
| 138,500 | | Commercial Solutions, Inc.* (Canada) | | | 719,559 |
| | | | | |
| | Diversified Financial Services 4.8% | | | |
| 250,000 | | Acta Holdings ASA (Norway) | | | 1,392,964 |
| 40,405 | | Addenda Capital, Inc. (Canada) | | | 849,839 |
| 39,435 | | Arques Industries AG (Germany) | | | 957,800 |
| 32,033 | | Euronet Worldwide, Inc.* | | | 860,407 |
| 15,000 | | Home Capital Group, Inc. (Canada) | | | 457,045 |
| 83,000 | | Treasury Group Ltd. (Australia) | | | 910,800 |
| | | | | |
| | | | | 5,428,855 |
| | | | | |
| | Diversified Telecommunication Services 0.5% | | | |
| 50,400 | | GVT Holding S.A.* (Brazil) | | | 583,140 |
| | | | | |
| | | | | |
| Shares | | | | Value |
| | | | | |
| | Drugs and Pharmaceuticals 0.8% | | | |
| 25,000 | | Aspreva Pharmaceuticals Corp.* (Canada) | | $ | 539,000 |
| 25,000 | | La Jolla Pharmaceutical Co.* | | | 151,250 |
| 16,000 | | Novacea, Inc. * | | | 123,680 |
| 10,000 | | Targacept, Inc.* | | | 83,200 |
| | | | | |
| | | | | 897,130 |
| | | | | |
| | Electrical Equipment 1.4% | | | |
| 400,000 | | Unisteel Technology Ltd. (Singapore) | | | 775,265 |
| 650,000 | | XAC Automation Corp. (Taiwan) | | | 775,914 |
| | | | | |
| | | | | 1,551,179 |
| | | | | |
| | Electronic Equipment and Instruments 0.8% | | | |
| 1,489,600 | | QRSciences Holdings Ltd.* (Australia) | | | 458,754 |
| 506,650 | | Virtek Vision International, Inc.* (Canada) | | | 395,494 |
| | | | | |
| | | | | 854,248 |
| | | | | |
| | Electronics 0.6% | | | |
| 67,490 | | Nu Horizons Electronics Corp.* | | | 710,670 |
| | | | | |
| | Electronics — Medical Systems 1.7% | | | |
| 220,000 | | Allied Healthcare International, Inc.* | | | 671,000 |
| 54,050 | | Cardica, Inc.* | | | 294,032 |
| 78,715 | | IRIDEX Corp.* | | | 692,692 |
| 127,500 | | Ophthalmic Imaging Systems, Inc.* | | | 318,750 |
| | | | | |
| | | | | 1,976,474 |
| | | | | |
| | Electronics — Semiconductors/ Components 4.0% | | | |
| 99,710 | | Aviza Technology, Inc.* | | | 718,909 |
| 45,000 | | Cascade Microtech, Inc.* | | | 641,250 |
| 56,840 | | Pericom Semiconductor Corp.* | | | 555,895 |
| 160,210 | | PLX Technology, Inc.* | | | 1,560,446 |
| 40,000 | | SiRF Technology Holdings, Inc.* | | | 1,110,400 |
| | | | | |
| | | | | 4,586,900 |
| | | | | |
| | Energy Equipment and Services 1.0% | | | |
| 25,200 | | Bonnett’s Energy Services Trust (Canada) | | | 225,564 |
| 164,705 | | Bri-Chem Corp.* (Canada) | | | 342,853 |
| 68,365 | | Deepwell Energy Services Trust (Canada) | | | 332,649 |
| 26,030 | | Wavefield Inseis ASA* (Norway) | | | 212,404 |
| | | | | |
| | | | | 1,113,470 |
| | | | | |
| | Energy — Miscellaneous 0.8% | | | |
| 32,170 | | Valero GP Holdings, LLC | | | 892,717 |
| | | | | |
| | Engineering and Contracting Services 0.9% | | | |
| 40,000 | | Michael Baker Corp.* | | | 972,000 |
| | | | | |
| | Entertainment 0.3% | | | |
| 35,894 | | Outdoor Channel Holdings, Inc.* | | | 366,837 |
| | | | | |
| | Finance Companies 1.9% | | | |
| 37,890 | | Dollar Financial Corp.* | | | 958,617 |
| 6,065 | | FCStone Group, Inc.* | | | 226,346 |
| 41,900 | | Goldwater Bank, N.A.* *** † | | | 419,000 |
| 46,400 | | Nicholas Financial, Inc.* | | | 516,432 |
| | | | | |
| | | | | 2,120,395 |
| | | | | |
| | Financial Data Processing Services
and Systems 0.5% | | | |
| 46,300 | | CyberSource Corp.* | | | 579,213 |
| | | | | |
| | Financial — Miscellaneous 1.1% | | | |
| 35,000 | | First Cash Financial Services, Inc.* | | | 779,800 |
| 29,845 | | MarketAxess Holdings, Inc.* | | | 499,605 |
| | | | | |
| | | | | 1,279,405 |
| | | | | |
| | Foods 1.0% | | | |
| 150,145 | | G. Willi-Food International Ltd.* (Israel) | | | 1,094,557 |
| | | | | |
46
| | |
| | MARCH 31, 2007 (UNAUDITED) |
|
| |
| |
| | | | | |
| Shares | | | | Value |
| | | | | |
| | Health Care Equipment and Supplies 0.4% | | | |
| 1,149,000 | | LMA International N.V.* (Singapore) | | $ | 443,118 |
| | | | | |
| | Health Care Facilities 1.4% | | | |
| 49,114 | | LHC Group, Inc.* | | | 1,592,767 |
| | | | | |
| | Health Care Management Services 1.6% | | | |
| 38,000 | | Birner Dental Management Services, Inc. | | | 925,680 |
| 34,000 | | Computer Programs & Systems, Inc. | | | 911,880 |
| | | | | |
| | | | | 1,837,560 |
| | | | | |
| | Health Care Services 1.2% | | | |
| 80,000 | | Five Star Quality Care, Inc.* | | | 822,400 |
| 20,000 | | Healthcare Services Group | | | 573,000 |
| | | | | |
| | | | | 1,395,400 |
| | | | | |
| | Hotels, Restaurants and Leisure 2.0% | | | |
| 1,604,000 | | Ajisen China Holdings Ltd.* (Hong Kong) | | | 1,457,501 |
| 108,000 | | Club Cruise Entertainment & Travelling Services Europe N.V.* (Norway) | | | 845,669 |
| | | | | |
| | | | | 2,303,170 |
| | | | | |
| | Household Durables 1.5% | | | |
| 55,770 | | easyhome Ltd. (Canada) | | | 894,874 |
| 21,000 | | Joint Corp. (Japan) | | | 800,000 |
| | | | | |
| | | | | 1,694,874 |
| | | | | |
| | Household Products 0.6% | | | |
| 206,180 | | Fantastic Holdings Ltd. (Australia) | | | 685,104 |
| | | | | |
| | Insurance 1.3% | | | |
| 105,200 | | CRM Holdings Ltd.* (Bermuda) | | | 915,240 |
| 117,585 | | KMG America Corp.* | | | 544,419 |
| | | | | |
| | | | | 1,459,659 |
| | | | | |
| | Investment Management Companies 0.8% | | | |
| 45,000 | | Thomas Weisel Partners Group, Inc.* | | | 855,900 |
| | | | | |
| | Machinery 3.9% | | | |
| 1,000,000 | | Innovalues Precision Ltd. (Singapore) | | | 883,380 |
| 32,160 | | Kadant, Inc.* | | | 815,578 |
| 110,870 | | Martinrea International, Inc.* (Canada) | | | 1,428,006 |
| 900,000 | | MMI Holdings Ltd. (Singapore) | | | 990,836 |
| 25,000 | | Pason Systems, Inc. (Canada) | | | 310,508 |
| | | | | |
| | | | | 4,428,308 |
| | | | | |
| | Medical and Dental Instruments
and Supplies 7.7% | | | |
| 47,070 | | AtriCure, Inc.* | | | 480,585 |
| 100,000 | | Cryocor, Inc.* | | | 535,000 |
| 25,908 | | Cyberonics, Inc.* | | | 486,552 |
| 40,000 | | Cytori Therapeutics, Inc.* | | | 232,000 |
| 35,300 | | Electro-Optical Sciences, Inc.* | | | 181,795 |
| 147,364 | | Encision, Inc.* | | | 593,877 |
| 95,250 | | Endologix, Inc.* | | | 374,332 |
| 71,736 | | Enpath Medical, Inc.* | | | 717,360 |
| 140,570 | | MTS Medication Technologies, Inc.* | | | 1,572,979 |
| 27,055 | | NuVasive, Inc.* | | | 642,556 |
| 63,000 | | RemoteMDx, Inc.* | | | 96,390 |
| 187,225 | | Retractable Technologies, Inc.* | | | 571,036 |
| 228,305 | | VNUS Medical Technologies, Inc.* | | | 2,287,616 |
| | | | | |
| | | | | 8,772,078 |
| | | | | |
| | Metals and Minerals — Miscellaneous 1.0% | | | |
| 200,000 | | Globe Specialty Metals, Inc.* (United Kingdom) | | | 1,080,000 |
| | | | | |
| | | | | |
| Shares | | | | Value |
| | | | | |
| | Metals and Mining 1.0% | | | |
| 347,690 | | Bayou Bend Petroleum Ltd. PIPE* *** † (Canada) | | $ | 536,145 |
| 1,207,760 | | Farallon Resources Ltd.* (Canada) | | | 618,048 |
| | | | | |
| | | | | 1,154,193 |
| | | | | |
| | Miscellaneous Materials and Commodities 1.3% | | | |
| 205,660 | | Luna Innovations, Inc.* | | | 697,187 |
| 44,085 | | Sterling Construction Co., Inc.* | | | 840,260 |
| | | | | |
| | | | | 1,537,447 |
| | | | | |
| | Oil and Gas 1.7% | | | |
| 60,015 | | Energy Partners Ltd.* | | | 1,089,272 |
| 275,720 | | Ithaca Energy, Inc.* (Canada) | | | 573,944 |
| 15,000 | | Toreador Resources Corp.* | | | 272,250 |
| | | | | |
| | | | | 1,935,466 |
| | | | | |
| | Personal Products 0.7% | | | |
| 1,100,000 | | Beauty China Holdings Ltd. (Cayman Islands) | | | 797,679 |
| | | | | |
| | Production Technology Equipment 2.8% | | | |
| 75,035 | | Eagle Test Systems, Inc.* | | | 1,248,582 |
| 150,600 | | inTEST Corp.* | | | 677,700 |
| 306,000 | | LogicVision, Inc.* | | | 275,400 |
| 138,265 | | Nanometrics, Inc.* | | | 926,376 |
| | | | | |
| | | | | 3,128,058 |
| | | | | |
| | Real Estate 1.4% | | | |
| 575,910 | | Babcock & Brown Japan Property Trust (Australia) | | | 896,153 |
| 70,000 | | LPS Brasil Consultoria de Imoveis S.A.* (Brazil) | | | 714,633 |
| | | | | |
| | | | | 1,610,786 |
| | | | | |
| | Real Estate Investment Trusts (REIT) 0.5% | | | |
| 35,500 | | NorthStar Realty Finance Corp. | | | 539,955 |
| | | | | |
| | Rental and Leasing Services — Commercial 0.5% | | | |
| 113,000 | | MicroFinancial, Inc. | | | 585,340 |
| | | | | |
| | Retail 5.2% | | | |
| 100,000 | | America’s Car-Mart, Inc.* | | | 1,336,000 |
| 35,000 | | Big 5 Sporting Goods Corp. | | | 907,200 |
| 2,000 | | Bijou Brigitte AG (Germany) | | | 465,459 |
| 700,000 | | China Hongxing Sports Ltd. (China) | | | 1,624,366 |
| 25,000 | | Rush Enterprises, Inc., Class A* | | | 480,250 |
| 31,740 | | Susser Holdings Corp.* | | | 550,689 |
| 35,000 | | Tuesday Morning Corp. | | | 519,400 |
| | | | | |
| | | | | 5,883,364 |
| | | | | |
| | Road and Rail 0.8% | | | |
| 76,740 | | TransForce Income Fund (Canada) | | | 931,836 |
| | | | | |
| | Semiconductor Equipment and Products 0.9% | | | |
| 125,465 | | O2Micro International Ltd. ADR* (Cayman Islands) | | | 991,173 |
| | | | | |
| | Software 1.0% | | | |
| 60,000 | | Belzberg Technologies, Inc.* (Canada) | | | 429,333 |
| 30,000 | | Duzon Digital Ware Co. Ltd. (Korea) | | | 690,370 |
| | | | | |
| | | | | 1,119,703 |
| | | | | |
| | Steel 1.5% | | | |
| 39,225 | | Claymont Steel Holdings, Inc.* | | | 781,754 |
| 39,910 | | Wheeling-Pittsburgh Corp.* | | | 945,468 |
| | | | | |
| | | | | 1,727,222 |
| | | | | |
47
| | |
WASATCH MICRO CAP VALUE FUND (WAMVX) — Schedule of Investments (continued) |
|
| |
| |
| | | | | |
Shares | | | | Value |
| | | | | |
| | Telecommunications Equipment 3.0% | | | |
| 351,800 | | AltiGen Communications, Inc.* | | $ | 668,420 |
| 57,685 | | Catapult Communications Corp.* | | | 561,852 |
| 370,772 | | Peco II, Inc.* | | | 318,864 |
| 350,870 | | Sunrise Telecom, Inc.* | | | 1,049,101 |
| 76,090 | | WPCS International, Inc.* | | | 855,252 |
| | | | | |
| | | | | 3,453,489 |
| | | | | |
| | Textiles, Apparel and Luxury Goods 2.6% | | | |
| 2,100,000 | | EganaGoldpfeil (Holdings) Ltd. (Hong Kong) | | | 1,472,807 |
| 2,073,350 | | Moiselle Int’l. Holdings Ltd. (Hong Kong) | | | 602,344 |
| 313,770 | | Ports Design Ltd. (Hong Kong) | | | 837,266 |
| | | | | |
| | | | | 2,912,417 |
| | | | | |
| | Transportation — Miscellaneous 1.3% | | | |
| 800,000 | | AutoInfo, Inc.* | | | 776,000 |
| 72,690 | | Euroseas Ltd. | | | 726,173 |
| | | | | |
| | | | | 1,502,173 |
| | | | | |
| | Truckers 0.7% | | | |
| 38,000 | | Vitran Corp., Inc.* (Canada) | | | 746,700 |
| | | | | |
| | Wholesalers 1.1% | | | |
| 75,000 | | Beacon Roofing Supply, Inc.* | | | 1,213,500 |
| | | | | |
| | |
| | Total Common Stocks
(cost $83,898,011) | | | 103,568,260 |
| | | | | |
| | |
| | PREFERRED STOCKS 0.1% | | | |
| | |
| | Drugs and Pharmaceuticals 0.1% | | | |
| 377,358 | | Point Biomedical Corp., Series F Pfd.* *** † | | | 140,000 |
| | | | | |
| | |
| | Total Preferred Stocks
(cost $200,000) | | | 140,000 |
| | | | | |
| | |
| | WARRANTS 0.0% | | | |
| | |
| | Drugs and Pharmaceuticals 0.0% | | | |
| 7,164 | | Acusphere, Inc. expiring 8/2/08* *** † | | | — |
| 1,436 | | Acusphere, Inc. expiring 10/20/08* *** † | | | — |
| 113,207 | | Point Biomedical Corp. expiring 2/16/12* *** † | | | — |
| | | | | |
| | | | | — |
| | | | | |
| | Electronic Equipment and Instruments 0.0% | | | |
| 744,800 | | QRSciences Holdings Ltd.
expiring 2/15/08* *** † (Australia) | | | — |
| | | | | |
| | Health Care Services 0.0% | | | |
| 6,486 | | Familymeds Group, Inc.
expiring 11/30/09* *** † | | | — |
| | | | | |
| | Medical and Dental Instruments
and Supplies 0.0% | | | |
| 5,295 | | Electro-Optical Sciences, Inc.
expiring 10/31/11* *** † | | | — |
| | | | | |
| | Metals and Mining 0.0% | | | |
| 125,000 | | Equigold NL expiring 5/31/07* (Australia) | | | 26,339 |
| 603,880 | | Farallon Resources Ltd. expiring 12/31/08* *** † (Canada) | | | — |
| | | | | |
| | | | | 26,339 |
| | | | | |
| | |
| | Total Warrants
(cost $0) | | | 26,339 |
| | | | | |
| | | | | |
Principal
Amount | | | | Value |
| | | | | |
| | SHORT-TERM INVESTMENTS 5.8% | | | |
| | |
| | Repurchase Agreement 5.8% | | | |
| $6,594,000 | | Repurchase Agreement dated 3/30/07, 4.30% due 4/2/07 with State Street Bank and Trust Co. collateralized by $5,010,000 of United States Treasury Bonds 8.125% due 8/15/21; value: $6,728,876; repurchase proceeds: $6,596,363††† (cost $6,594,000) | | $ | 6,594,000 |
| | | | | |
| | |
| | Total Short-Term Investments
(cost $6,594,000) | | | 6,594,000 |
| | | | | |
| | |
| | Total Investments
(cost $90,692,011) 97.3% | | | 110,328,599 |
| | |
| | Other Assets less Liabilities 2.7% | | | 3,033,100 |
| | | | | |
| | |
| | NET ASSETS 100.0% | | $ | 113,361,699 |
| | | | | |
| | |
Number of
Contracts | | | | Value |
| | |
| | CALL OPTIONS WRITTEN | | | |
| | |
| 1,602 | | PLX Technology, Inc. expiring 4/21/07 exercise price $10 | | $ | 32,040 |
| 400 | | SiRF Technology Holdings, Inc. expiring 4/21/07 exercise price $27.50 | | | 62,000 |
| 491 | | LHC Group, Inc. expiring 4/21/07
exercise price $30 | | | 120,295 |
| 399 | | Wheeling-Pittsburgh Corp. expiring 4/21/07 exercise price $22.50 | | | 53,865 |
| | | | | |
| | |
| | Total Call Options Written
(premium $233,404) | | | 268,200 |
| | | | | |
| |
| | *Non-income producing. ***Security was fair valued under procedures adopted by the Board of Directors (see Note 2). †Security purchased in a private placement transaction or under Rule 144A of the Securities Act of 1933 (see Note 9). †††All or a portion of this security has been designated as collateral for written options. ADR American Depositary Receipts. PIPE Private Investment in a Public Equity. See notes to financial statements. |
At March 31, 2007, Wasatch Micro Cap Value Fund’s investments, excluding short-term investments and written options, were in the following countries:
| | | |
| Country | | % | |
Australia | | 2.9 | |
Bermuda | | 0.9 | |
Brazil | | 1.2 | |
Canada | | 10.3 | |
Cayman Islands | | 1.7 | |
China | | 1.6 | |
Germany | | 1.4 | |
Hong Kong | | 4.2 | |
India | | 0.6 | |
Israel | | 1.1 | |
Japan | | 0.8 | |
Korea | | 2.0 | |
Norway | | 2.4 | |
Singapore | | 3.4 | |
Taiwan | | 0.7 | |
United Kingdom | | 1.3 | |
United States | | 63.5 | |
| | | |
TOTAL | | 100.0 | % |
| | | |
48
| | |
| WASATCH SMALL CAP GROWTH FUND (WAAEX) — Schedule of Investments | | MARCH 31, 2007 (UNAUDITED) |
|
| |
| |
| | | | | |
| Shares | | | | Value |
| | | | | |
| | COMMON STOCKS 95.9% | | | |
| | |
| | Airlines 0.8% | | | |
| 709,650 | | WestJet Airlines Ltd.* *** | | $ | 9,417,273 |
| | | | | |
| | Auto Parts — After Market 0.3% | | | |
| 654,440 | | US Auto Parts Network, Inc.* | | | 3,514,343 |
| | | | | |
| | Banks 6.7% | | | |
| 702,038 | | Bank of the Ozarks, Inc. | | | 20,162,531 |
| 98,500 | | First Community Bancorp, Inc. | | | 5,569,190 |
| 408,230 | | HDFC Bank Ltd. ADR | | | 26,310,423 |
| 156,395 | | Prosperity Bancshares, Inc. | | | 5,433,162 |
| 210,297 | | The Bank of N.T. Butterfield & Son Ltd. | | | 12,532,852 |
| 642,469 | | UCBH Holding, Inc. | | | 11,962,773 |
| | | | | |
| | | | | 81,970,931 |
| | | | | |
| | Beverage — Soft Drinks 0.8% | | | |
| 357,267 | | Peet’s Coffee & Tea, Inc.* | | | 9,867,715 |
| | | | | |
| | Biotechnology Research and Production 2.6% | | | |
| 161,925 | | ArthroCare Corp.* | | | 5,835,777 |
| 335,500 | | Encysive Pharmaceuticals, Inc.* | | | 909,205 |
| 114,198 | | Myriad Genetics, Inc.* | | | 3,935,263 |
| 188,828 | | Neurochem, Inc.* | | | 2,847,527 |
| 1,068,340 | | QIAGEN N.V.* | | | 18,354,081 |
| | | | | |
| | | | | 31,881,853 |
| | | | | |
| | Commercial Services and Supplies 8.3% | | | |
| 116,555 | | Advisory Board Co.* | | | 5,900,014 |
| 986,825 | | Copart, Inc.* | | | 27,640,968 |
| 43,570 | | Corporate Executive Board Co. | | | 3,309,577 |
| 480,999 | | CRA International, Inc.* | | | 25,098,528 |
| 405,290 | | Liquidity Services, Inc.* | | | 6,865,613 |
| 98,310 | | LoopNet, Inc.* | | | 1,680,118 |
| 1,003,265 | | Resources Connection, Inc.* | | | 32,094,447 |
| | | | | |
| | | | | 102,589,265 |
| | | | | |
| | Computer Services Software and Systems 7.7% | | | |
| 291,915 | | American Reprographics Co.* | | | 8,988,063 |
| 123,527 | | Cognizant Technology Solutions Corp., Class A* | | | 10,903,728 |
| 251,178 | | DealerTrack Holdings, Inc.* | | | 7,716,188 |
| 159,850 | | F5 Networks, Inc.* | | | 10,658,798 |
| 299,600 | | Macrovision Corp.* | | | 7,504,980 |
| 393,035 | | NeuStar, Inc., Class A* | | | 11,177,915 |
| 197,335 | | Quality Systems, Inc. | | | 7,893,400 |
| 714,785 | | Retalix Ltd.* | | | 13,773,907 |
| 52,765 | | Riverbed Technology, Inc.* | | | 1,458,425 |
| 240,474 | | Sourcefire, Inc.* | | | 4,239,557 |
| 429,455 | | SRA International, Inc., Class A* | | | 10,461,524 |
| | | | | |
| | | | | 94,776,485 |
| | | | | |
| | Diversified Financial Services 2.5% | | | |
| 292,960 | | Addenda Capital, Inc. | | | 6,161,828 |
| 62,410 | | Australian Stock Exchange Ltd. | | | 2,225,529 |
| 167,948 | | AWD Holding AG | | | 7,962,847 |
| 471,386 | | Home Capital Group, Inc. | | | 14,362,973 |
| | | | | |
| | | | | 30,713,177 |
| | | | | |
| | Drugs and Pharmaceuticals 1.0% | | | |
| 444,260 | | Alexza Pharmaceuticals, Inc.* | | | 5,713,184 |
| 181,115 | | Ligand Pharmaceuticals, Inc., Class B* | | | 1,825,639 |
| 220,580 | | Novacea, Inc.* | | | 1,705,083 |
| 359,360 | | Valera Pharmaceuticals, Inc.* | | | 3,000,656 |
| | | | | |
| | | | | 12,244,562 |
| | | | | |
| | | | | |
| Shares | | | | Value |
| | | | | |
| | Education Services 2.9% | | | |
| 185,230 | | Strayer Education, Inc. | | $ | 23,153,750 |
| 549,240 | | Universal Technical Institute, Inc.* | | | 12,676,459 |
| | | | | |
| | | | | 35,830,209 |
| | | | | |
| | Electrical and Electronics 1.8% | | | |
| 1,003,829 | | Power Integrations, Inc.* | | | 22,736,727 |
| | | | | |
| | Electronics — Medical Systems 0.5% | | | |
| 474,556 | | NXStage Medical, Inc.* | | | 6,321,086 |
| | | | | |
| | Electronics — Semiconductors/ Components 6.5% | | | |
| 1,944,555 | | Micrel, Inc.* | | | 21,428,996 |
| 992,838 | | Microtune, Inc.* | | | 4,090,493 |
| 514,005 | | Netlogic Microsystems, Inc.* | | | 13,682,813 |
| 1,186,765 | | PLX Technology, Inc.* | | | 11,559,091 |
| 247,580 | | Silicon Laboratories, Inc.* | | | 7,407,594 |
| 275,087 | | SiRF Technology Holdings, Inc.* | | | 7,636,415 |
| 354,915 | | Tessera Technologies, Inc.* | | | 14,104,322 |
| | | | | |
| | | | | 79,909,724 |
| | | | | |
| | Energy Equipment and Services 1.2% | | | |
| 391,910 | | TGS-NOPEC Geophysical Co. ASA* | | | 9,077,075 |
| 308,480 | | Trican Well Service Ltd. | | | 6,113,681 |
| | | | | |
| | | | | 15,190,756 |
| | | | | |
| | Engineering and Contracting Services 2.4% | | | |
| 758,789 | | Stantec, Inc.* | | | 20,722,527 |
| 218,120 | | URS Corp.* | | | 9,289,731 |
| | | | | |
| | | | | 30,012,258 |
| | | | | |
| | Entertainment 0.5% | | | |
| 659,316 | | Outdoor Channel Holdings, Inc.* | | | 6,738,210 |
| | | | | |
| | Financial Data Processing Services
and Systems 0.7% | | | |
| 670,439 | | CyberSource Corp.* | | | 8,387,192 |
| | | | | |
| | Financial Information Services 2.5% |
| 490,650 | | FactSet Research Systems, Inc. | | | 30,837,352 |
| | | | | |
| | Health Care Facilities 3.0% |
| 642,204 | | Healthways, Inc.* | | | 30,023,037 |
| 207,375 | | Pharmaceutical Product Development, Inc. | | | 6,986,464 |
| | | | | |
| | | | | 37,009,501 |
| | | | | |
| | Health Care Management Services 3.9% | | | |
| 853,259 | | AmSurg Corp.* ††† | | | 20,896,313 |
| 479,815 | | Pediatrix Medical Group, Inc.* | | | 27,378,244 |
| | | | | |
| | | | | 48,274,557 |
| | | | | |
| | Health Care Providers and Services 1.5% | | | |
| 446,513 | | Icon plc ADR* | | | 19,021,454 |
| | | | | |
| | Insurance 0.1% | | | |
| 39,600 | | eHealth, Inc.* | | | 932,580 |
| | | | | |
| | Internet and Catalog Retail 0.5% |
| 171,110 | | Submarino S.A. | | | 5,772,987 |
| | | | | |
| | Investment Management Companies 0.8% | | | |
| 535,517 | | Thomas Weisel Partners Group, Inc.* | | | 10,185,533 |
| | | | | |
| | Leisure Time 2.3% |
| 397,215 | | Life Time Fitness, Inc.* | | | 20,420,823 |
| 206,172 | | Pool Corp. | | | 7,380,958 |
| | | | | |
| | | | | 27,801,781 |
| | | | | |
49
| | |
| WASATCH SMALL CAP GROWTH FUND (WAAEX) — Schedule of Investments (continued) |
|
| |
| |
| | | | | |
| Shares | | | | Value |
| | | | | |
| | Machinery 1.7% |
| 7,495,930 | | Emeco Holdings Ltd. | | $ | 10,783,264 |
| 806,230 | | Pason Systems, Inc. | | | 10,013,629 |
| | | | | |
| | | | | 20,796,893 |
| | | | | |
| | Medical and Dental Instruments and Supplies 6.7% | | | |
| 699,947 | | Abaxis, Inc.* | | | 17,057,708 |
| 741,118 | | Dexcom, Inc.* | | | 5,825,187 |
| 120,330 | | FoxHollow Technologies, Inc.* | | | 2,513,694 |
| 261,785 | | LifeCell Corp.* | | | 6,536,771 |
| 247,740 | | Northstar Neuroscience, Inc.* | | | 3,171,072 |
| 219,272 | | ResMed, Inc.* | | | 11,044,731 |
| 633,368 | | Techne Corp.* | | | 36,165,313 |
| | | | | |
| | | | | 82,314,476 |
| | | | | |
| | Medical Services 0.3% |
| 159,800 | | PRA International* | | | 3,445,288 |
| | | | | |
| | Miscellaneous Materials and Commodities 0.1% | | | |
| 102,374 | | Symyx Technologies, Inc.* | | | 1,814,067 |
| | | | | |
| | Oil and Gas 0.5% | | | |
| 367,591 | | Toreador Resources Corp.* | | | 6,671,777 |
| | | | | |
| | Real Estate 0.7% | | | |
| 640,267 | | DTZ Holdings plc | | | 8,345,526 |
| | | | | |
| | Real Estate Investment Trusts (REIT) 0.6% | | | |
| 135,086 | | Redwood Trust, Inc. | | | 7,048,787 |
| | | | | |
| | Retail 15.5% | | | |
| 432,525 | | Aeropostale, Inc.* | | | 17,400,481 |
| 46,120 | | Bijou Brigitte AG | | | 10,733,485 |
| 344,745 | | Blue Nile, Inc.* | | | 14,017,332 |
| 650,347 | | Guitar Center, Inc.* | | | 29,343,657 |
| 612,931 | | Hibbett Sports, Inc.* | | | 17,523,697 |
| 1,111,795 | | Monsoon plc* | | | 8,586,621 |
| 431,395 | | MSC Industrial Direct Co., Inc., Class A | | | 20,137,519 |
| 2,013,774 | | O’Reilly Automotive, Inc.* | | | 66,655,919 |
| 422,648 | | Tuesday Morning Corp. | | | 6,272,096 |
| | | | | |
| | | | | 190,670,807 |
| | | | | |
| | Road and Rail 0.7% | | | |
| 291,785 | | Localiza Rent A Car S.A. | | | 8,943,629 |
| | | | | |
| | Securities Brokerage and Services 1.1% | | | |
| 197,945 | | GFI Group, Inc.* | | | 13,454,322 |
| | | | | |
| | Semiconductor Equipment and Products 1.0% | | | |
| 1,518,825 | | O2Micro International Ltd. ADR* | | | 11,998,717 |
| | | | | |
| | Shoes 0.9% | | | |
| 621,125 | | Cache, Inc.* | | | 11,024,969 |
| | | | | |
| | Truckers 3.9% | | | |
| 2,714,994 | | Knight Transportation, Inc. | | | 48,381,193 |
| | | | | |
| | Wholesalers 0.4% | | | |
| 305,597 | | Beacon Roofing Supply, Inc.* | | | 4,944,559 |
| | | | | |
| | |
| | Total Common Stocks
(cost $905,181,670) | | | 1,181,792,521 |
| | | | | |
| | | | | |
| Shares | | | | Value |
| | | | | |
| | PREFERRED STOCKS 1.0% | | | |
| | |
| | Biotechnology Research and Production 0.2% | | | |
| 677,966 | | Nanosys, Inc., Series D Pfd.* *** † | | $ | 2,000,000 |
| | | | | |
| | Communications Technology 0.0% | | | |
| 404,517 | | Incipient, Inc., Series D Pfd.* *** † | | | 586,550 |
| | | | | |
| | Drugs and Pharmaceuticals 0.2% | | | |
| 292,398 | | Orexigen Therapeutics, Inc.,
Series C Pfd.* *** † | | | 1,000,001 |
| 3,773,584 | | Point Biomedical Corp., Series F Pfd.* *** † | | | 1,400,000 |
| | | | | |
| | | | | 2,400,001 |
| | | | | |
| | Electronics — Medical Systems 0.3% | | | |
| 625,000 | | Fluidigm Corp., Series E Pfd.* *** † | | | 2,500,000 |
| 1,620,220 | | Zonare Medical Systems, Inc.,
Series E Pfd.* *** † | | | 1,343,162 |
| | | | | |
| | | | | 3,843,162 |
| | | | | |
| | Health Care Management Services 0.1% | | | |
| 516,161 | | Elder Health, Inc., Series G Pfd.* *** † | | | 571,428 |
| 362,782 | | TargetRX, Inc., Series D Pfd.* *** † | | | 504,267 |
| | | | | |
| | | | | 1,075,695 |
| | | | | |
| | Medical and Dental Instruments and Supplies 0.1% | | | |
| 750,000 | | Orqis Medical Corp., Series D Pfd.* *** † | | | 1,200,000 |
| | | | | |
| | Utilities — Telecommunications 0.1% | | | |
| 236,372 | | Neutral Tandem, Inc., Series C Pfd.* *** † | | | 1,485,102 |
| | | | | |
| | |
| | Total Preferred Stocks
(cost $14,886,406) | | | 12,590,510 |
| | | | | |
| | |
| | LIMITED PARTNERSHIP INTEREST 0.2% | | | |
| | |
| | Other 0.2% | | | |
| | Montagu Newhall Global Partners II-B, L.P.* *** † | | | 2,142,129 |
| | Montagu Newhall Global Partners III-B, L.P.* *** † | | | 268,519 |
| | | | | |
| | | | | 2,410,648 |
| | | | | |
| | |
| | Total Limited Partnership Interest
(cost $2,656,435) | | | 2,410,648 |
| | | | | |
| | |
| | WARRANTS 0.0% | | | |
| | |
| | Drugs and Pharmaceuticals 0.0% | | | |
| 1,132,075 | | Point Biomedical Corp.
expiring 2/16/12* *** † | | | — |
| | | | | |
| | Electronics — Medical Systems 0.0% | | | |
| 243,033 | | Zonare Medical Systems, Inc.
expiring 6/30/11* *** † | | | — |
| | | | | |
| | |
| | Total Warrants
(cost $0) | | | — |
| | | | | |
50
| | |
| | MARCH 31, 2007 (UNAUDITED) |
|
| |
| |
| | | | | |
Principal
Amount | | | | Value |
| | | | | |
| | SHORT-TERM INVESTMENTS 0.5% |
| | |
| | Repurchase Agreement 0.5% | | | |
| $5,919,000 | | Repurchase Agreement dated 3/30/07,
4.30% due 4/2/07 with State Street Bank and Trust Co. collateralized by $4,380,000 of United States Treasury Bonds 8.875% due 2/15/19; value: $6,039,932; repurchase proceeds: $5,921,121††† (cost $5,919,000) | | $ | 5,919,000 |
| | | | | |
| | |
| | Total Short-Term Investments
(cost $5,919,000) | | | 5,919,000 |
| | | | | |
| | |
| | Total Investments
(cost $928,643,511) 97.6% | | | 1,202,712,679 |
| | |
| | Other Assets less Liabilities 2.4% | | | 29,599,765 |
| | | | | |
| | |
| | NET ASSETS 100.0% | | $ | 1,232,312,444 |
| | | | | |
| |
| | *Non-income producing. ***Security was fair valued under procedures adopted by the Board of Directors (see Note 2). †Security purchased in a private placement transaction or under Rule 144A of the Securities Act of 1933 (see Note 9). †††All or a portion of this security has been designated as collateral for purchase commitments (see Note 10). ADR American Depositary Receipts. See notes to financial statements. |
51
| | |
| WASATCH SMALL CAP VALUE FUND (WMCVX) — Schedule of Investments | | |
|
| |
| |
| | | | | |
| Shares | | | | Value |
| | | | | |
| | |
| | COMMON STOCKS 98.1% | | | |
| | |
| | Air Transport 0.4% | | | |
| 60,545 | | Copa Holdings S.A. | | $ | 3,117,462 |
| | | | | |
| | Auto Parts — After Market 2.0% | | | |
| 329,259 | | Keystone Automotive Industries, Inc.* | | | 11,096,028 |
| 610,795 | | US Auto Parts Network, Inc.* | | | 3,279,969 |
| | | | | |
| | | | | 14,375,997 |
| | | | | |
| | Banks 2.5% | | | |
| 198,000 | | Commonwealth Bankshares, Inc. PIPE*** † | | | 4,080,384 |
| 310,405 | | United Western Bancorp, Inc. | | | 7,412,471 |
| 523,312 | | UTI Bank Ltd. | | | 6,001,340 |
| | | | | |
| | | | | 17,494,195 |
| | | | | |
| | Building — Miscellaneous 1.4% | | | |
| 338,485 | | Drew Industries, Inc.* | | | 9,707,750 |
| | | | | |
| | Commercial Services and Supplies 4.9% | | | |
| 432,542 | | Aegean Marine Petroleum Network, Inc. | | | 7,284,007 |
| 187,469 | | Monro Muffler Brake, Inc. | | | 6,580,162 |
| 712,282 | | SM&A* | | | 5,057,202 |
| 343,545 | | World Fuel Services Corp. | | | 15,892,392 |
| | | | | |
| | | | | 34,813,763 |
| | | | | |
| | Computer Services Software and Systems 0.7% | | | |
| 571,715 | | NetScout Systems, Inc.* | | | 5,174,021 |
| | | | | |
| | Consumer Electronics 0.3% | | | |
| 535,351 | | PLATO Learning, Inc.* | | | 2,248,474 |
| | | | | |
| | Containers and Packaging —
Metal and Glass 1.5% | | | |
| 386,524 | | Mobile Mini, Inc.* | | | 10,351,113 |
| | | | | |
| | Diversified Financial Services 0.9% | | | |
| 174,535 | | Housing Development Finance Corp. Ltd. | | | 6,132,606 |
| | | | | |
| | Diversified Telecommunication Services 0.6% | | | |
| 360,000 | | GVT Holding S.A.* | | | 4,165,289 |
| | | | | |
| | Education Services 0.9% | | | |
| 267,465 | | Universal Technical Institute, Inc.* | | | 6,173,092 |
| | | | | |
| | Electrical and Electronics 0.8% | | | |
| 135,960 | | Power Integrations, Inc.* | | | 3,079,494 |
| 274,370 | | TTM Technologies, Inc.* | | | 2,617,490 |
| | | | | |
| | | | | 5,696,984 |
| | | | | |
| | Electronics 1.5% | | | |
| 659,604 | | Nu Horizons Electronics Corp.* | | | 6,945,630 |
| 106,573 | | Supertex, Inc.* | | | 3,539,289 |
| | | | | |
| | | | | 10,484,919 |
| | | | | |
| | Electronics — Semiconductors/ Components 4.2% | | | |
| 359,890 | | ASE Test Ltd.* | | | 4,095,548 |
| 257,140 | | Excel Technology, Inc.* | | | 7,027,636 |
| 764,995 | | Micrel, Inc.* | | | 8,430,245 |
| 1,031,900 | | Pericom Semiconductor Corp.* | | | 10,091,982 |
| | | | | |
| | | | | 29,645,411 |
| | | | | |
| | Energy — Miscellaneous 4.2% | | | |
| 584,030 | | TETRA Technologies, Inc.* | | | 14,431,381 |
| 548,240 | | Valero GP Holdings, LLC | | | 15,213,660 |
| | | | | |
| | | | | 29,645,041 |
| | | | | |
| | | | | |
| Shares | | | | Value |
| | | | | |
| | Engineering and Contracting Services 0.6% | | | |
| 160,035 | | Michael Baker Corp.* | | $ | 3,888,851 |
| | | | | |
| | Entertainment 0.4% | | | |
| 269,339 | | Outdoor Channel Holdings, Inc.* | | | 2,752,645 |
| | | | | |
| | Finance Companies 1.9% | | | |
| 202,023 | | Dollar Financial Corp.* | | | 5,111,182 |
| 685,745 | | United PanAm Financial Corp.* | | | 8,571,812 |
| | | | | |
| | | | | 13,682,994 |
| | | | | |
| | Finance — Small Loan 0.9% | | | |
| 271,070 | | AmeriCredit Corp.* | | | 6,196,660 |
| | | | | |
| | Financial Data Processing Services
and Systems 1.0% | | | |
| 158,538 | | Fidelity Information Services, Inc. | | | 7,207,137 |
| | | | | |
| | Health Care Facilities 1.9% | | | |
| 470,990 | | Capital Senior Living Corp.* | | | 5,468,194 |
| 238,764 | | LHC Group, Inc.* | | | 7,743,117 |
| | | | | |
| | | | | 13,211,311 |
| | | | | |
| | Health Care Services 1.8% | | | |
| 171,406 | | Amedisys, Inc.* | | | 5,558,697 |
| 686,825 | | Five Star Quality Care, Inc.* | | | 7,060,561 |
| | | | | |
| | | | | 12,619,258 |
| | | | | |
| | Household Durables 0.4% | | | |
| 3,258,960 | | Nien Made Enterprise Co. Ltd. | | | 3,043,272 |
| | | | | |
| | Household Furnishings 1.7% | | | |
| 467,535 | | Select Comfort Corp.* | | | 8,322,123 |
| 173,455 | | Stanley Furniture Co., Inc. | | | 3,607,864 |
| | | | | |
| | | | | 11,929,987 |
| | | | | |
| | Insurance 0.5% | | | |
| 829,890 | | KMG America Corp.* | | | 3,842,391 |
| | | | | |
| | Investment Management Companies 5.3% | | | |
| 313,870 | | Apollo Investment Corp. | | | 6,716,818 |
| 368,500 | | Ares Capital Corp. | | | 6,695,645 |
| 400 | | Brantley Mezzanine Finance, LLC* ** *** † | | | — |
| 285,180 | | Highland Distressed Opportunities, Inc.* | | | 4,098,037 |
| 357,388 | | MCG Capital Corp. | | | 6,704,599 |
| 471,940 | | Solar Capital, LLC* *** † | | | 7,079,100 |
| 600,000 | | Star Asia Finance Ltd.* *** † | | | 6,000,000 |
| | | | | |
| | | | | 37,294,199 |
| | | | | |
| | Jewelry, Watches and Gemstones 2.0% | | | |
| 525,835 | | Fossil, Inc.* | | | 13,918,852 |
| | | | | |
| | Leisure Time 1.5% | | | |
| 302,685 | | Pool Corp. | | | 10,836,123 |
| | | | | |
| | Machinery 3.2% | | | |
| 758,515 | | Martinrea International, Inc.* | | | 9,769,676 |
| 389,215 | | Oil States Int’l., Inc.* | | | 12,489,909 |
| | | | | |
| | | | | 22,259,585 |
| | | | | |
| | Medical Services 1.3% | | | |
| 121,395 | | Magellan Health Services, Inc.* | | | 5,098,590 |
| 300,220 | | U.S. Physical Therapy, Inc.* | | | 4,179,062 |
| | | | | |
| | | | | 9,277,652 |
| | | | | |
| | Metals and Minerals — Miscellaneous 0.7% | | | |
| 895,750 | | Globe Specialty Metals, Inc.* | | | 4,837,050 |
| | | | | |
52
| | |
| | MARCH 31, 2007 (UNAUDITED) |
|
| |
| |
| | | | | |
| Shares | | | | Value |
| | | | | |
| | Miscellaneous Producer Durables 0.3% | | | |
| 165,830 | | Blount International, Inc.* | | $ | 2,064,584 |
| | | | | |
| | Oil and Gas 6.0% | | | |
| 1,474,740 | | Far East Energy Corp.* | | | 1,194,540 |
| 318,440 | | Petrohawk Energy Corp.* | | | 4,193,855 |
| 135,750 | | Plains Exploration & Production Co.* | | | 6,127,755 |
| 1,653,845 | | Saxon Energy Services, Inc.* | | | 5,723,441 |
| 585,725 | | Toreador Resources Corp.* | | | 10,630,909 |
| 276,550 | | Ultra Petroleum Corp.* | | | 14,693,102 |
| | | | | |
| | | | | 42,563,602 |
| | | | | |
| | Printing and Copying Services 1.3% | | | |
| 488,868 | | Schawk, Inc. | | | 8,853,399 |
| | | | | |
| | Production Technology Equipment 0.4% | | | |
| 458,205 | | Nanometrics, Inc.* | | | 3,069,974 |
| | | | | |
| | Publishing — Miscellaneous 2.1% | | | |
| 264,999 | | Courier Corp. | | | 10,353,511 |
| 121,735 | | Idearc, Inc. | | | 4,272,898 |
| | | | | |
| | | | | 14,626,409 |
| | | | | |
| | Real Estate 0.3% | | | |
| 219,215 | | LPS Brasil Consultoria de Imoveis S.A.* | | | 2,237,975 |
| | | | | |
| | Real Estate Investment Trusts (REIT) 8.8% | | | |
| 1,053,750 | | CBRE Realty Finance, Inc. | | | 13,941,113 |
| 580,205 | | Crystal River Capital, Inc. | | | 15,572,702 |
| 818,060 | | NorthStar Realty Finance Corp. | | | 12,442,693 |
| 385,290 | | Redwood Trust, Inc. | | | 20,104,432 |
| | | | | |
| | | | | 62,060,940 |
| | | | | |
| | Rental and Leasing Services — Commercial 2.2% | | | |
| 390,055 | | McGrath RentCorp | | | 12,353,042 |
| 670,108 | | MicroFinancial, Inc. | | | 3,471,159 |
| | | | | |
| | | | | 15,824,201 |
| | | | | |
| | Retail 10.4% | | | |
| 506,302 | | America’s Car-Mart, Inc.* | | | 6,764,195 |
| 500,621 | | Big 5 Sporting Goods Corp. | | | 12,976,096 |
| 31,875 | | Bijou Brigitte AG | | | 7,418,253 |
| 477,080 | | Global Imaging Systems, Inc.* | | | 9,303,060 |
| 405,170 | | MSC Industrial Direct Co., Inc., Class A | | | 18,913,336 |
| 250,023 | | Rush Enterprises, Inc., Class A* | | | 4,802,942 |
| 134,980 | | Rush Enterprises, Inc., Class B* | | | 2,444,488 |
| 246,885 | | Sonic Automotive, Inc. | | | 7,036,222 |
| 231,275 | | Tuesday Morning Corp. | | | 3,432,121 |
| | | | | |
| | | | | 73,090,713 |
| | | | | |
| | Shoes 0.5% | | | |
| 139,515 | | Kenneth Cole Productions, Inc., Class A | | | 3,581,350 |
| | | | | |
| | Steel 1.3% | | | |
| 217,900 | | Claymont Steel Holdings, Inc.* | | | 4,342,747 |
| 189,010 | | Wheeling-Pittsburgh Corp.* | | | 4,477,647 |
| | | | | |
| | | | | 8,820,394 |
| | | | | |
| | Telecommunications Equipment 1.2% | | | |
| 361,325 | | Plantronics, Inc. | | | 8,534,497 |
| | | | | |
| | Textiles, Apparel and Luxury Goods 1.8% | | | |
| 306,965 | | Carter’s, Inc.* | | | 7,778,493 |
| 6,959,145 | | EganaGoldpfeil (Holdings) Ltd. | | | 4,880,704 |
| | | | | |
| | | | | 12,659,197 |
| | | | | |
| | Transportation Infrastructure 1.0% | | | |
| 6,978,335 | | Goodpack Ltd. | | | 6,946,592 |
| | | | | |
| | | | | |
| Shares | | | | Value |
| | | | | |
| | Truckers 3.9% | | | |
| 90,905 | | Con-way, Inc. | | $ | 4,530,705 |
| 373,300 | | J.B. Hunt Transport Services, Inc. | | | 9,795,392 |
| 689,025 | | Vitran Corp., Inc.* †† | | | 13,539,341 |
| | | | | |
| | | | | 27,865,438 |
| | | | | |
| | Utilities — Telecommunications 2.2% | | | |
| 547,873 | | Eschelon Telecom, Inc.* | | | 15,833,530 |
| | | | | |
| | Wholesalers 2.5% | | | |
| 1,098,040 | | Beacon Roofing Supply, Inc.* | | | 17,766,287 |
| | | | | |
| | |
| | Total Common Stocks
(cost $591,220,752) | | | 692,423,166 |
| | | | | |
| | |
Principal
Amount | | | | Value |
| | |
| | SHORT-TERM INVESTMENTS 1.1% | | | |
| | |
| | Repurchase Agreement 1.1% | | | |
| $7,609,000 | | Repurchase Agreement dated 3/30/07, 4.30% due 4/2/07 with State Street Bank and Trust Co. collateralized by $5,705,000 of United States Treasury Bonds 8.125% due 5/15/21; value: $7,763,187; repurchase proceeds: $7,611,727††† (cost $7,609,000) | | $ | 7,609,000 |
| | | | | |
| | |
| | Total Short-Term Investments
(cost $7,609,000) | | | 7,609,000 |
| | | | | |
| | |
| | Total Investments
(cost $598,829,752) 99.2% | | | 700,032,166 |
| | |
| | Other Assets less Liabilities 0.8% | | | 5,521,194 |
| | | | | |
| | |
| | NET ASSETS 100.0% | | $ | 705,553,360 |
| | | | | |
| | |
Number of
Contracts | | | | Value |
| | |
| | CALL OPTIONS WRITTEN | | | |
| | |
| 2,387 | | LHC Group, Inc. expiring 4/21/07 exercise price $30 | | $ | 584,815 |
| | | | | |
| 1,890 | | Wheeling-Pittsburgh Corp. expiring 4/21/07 exercise price $22.50 | | | 255,150 |
| | | | | |
| | |
| | Total Call Options Written
(premium $482,391) | | | 839,965 |
| | | | | |
| |
| | *Non-income producing. **Common units. ***Security was fair valued under procedures adopted by the Board of Directors (see Note 2). †Security purchased in a private placement transaction or under
Rule 144A of the Securities Act of 1933 (see Note 9). ††Affiliated company (see Note 8). †††All or a portion of this security has been designated as collateral for written options. PIPE Private Investment in a Public Equity. See notes to financial statements. |
53
| | |
| WASATCH STRATEGIC INCOME FUND (WASIX) — Schedule of Investments | | |
|
| |
| |
| | | | | |
| Shares | | | | Value |
| | | | | |
| | COMMON STOCKS 88.1% | | | |
| | |
| | Auto Components 0.5% | | | |
| 42,845 | | Super Cheap Auto Group Ltd. (Australia) | | $ | 140,631 |
| | | | | |
| | Banks 4.2% | | | |
| 7,815 | | Commonwealth Bankshares, Inc. | | | 175,056 |
| 5,500 | | Commonwealth Bankshares, Inc. PIPE*** † | | | 113,344 |
| 60,403 | | First Bank of Delaware* | | | 224,095 |
| 17,042 | | The Bank of East Asia Ltd. (Hong Kong) | | | 99,132 |
| 10,201 | | The Bank of N.T. Butterfield & Son Ltd. (Bermuda) | | | 607,938 |
| | | | | |
| | | | | 1,219,565 |
| | | | | |
| | Commercial Services and Supplies 2.4% | | | |
| 5,880 | | Corporate Executive Board Co. | | | 446,645 |
| 4,500 | | Hartford Education Corp. Ltd. (Singapore) | | | 1,780 |
| 6,700 | | Monro Muffler Brake, Inc. | | | 235,170 |
| | | | | |
| | | | | 683,595 |
| | | | | |
| | Diversified Financial Services 8.0% | | | |
| 43,285 | | Acta Holdings ASA (Norway) | | | 241,178 |
| 10,465 | | Arques Industries AG (Germany) | | | 254,175 |
| 3,640 | | AWD Holding AG (Germany) | | | 172,582 |
| 5,592 | | Banco de Chile ADR (Chile) | | | 276,021 |
| 12,380 | | Countrywide Financial Corp. | | | 416,463 |
| 7,505 | | D. Carnegie & Co. AB (Sweden) | | | 156,092 |
| 461,000 | | Macquarie International Infrastructure Fund Ltd. (Singapore) | | | 337,339 |
| 1,460 | | Oslo Bors Holdings ASA (Norway) | | | 146,814 |
| 13,518 | | Treasury Group Ltd. (Australia) | | | 148,340 |
| 2,100 | | Union Financiere de France Banque S.A. (France) | | | 141,836 |
| | | | | |
| | | | | 2,290,840 |
| | | | | |
| | Electronics — Semiconductors/ Components 5.6% | | | |
| 8,920 | | Linear Technology Corp. | | | 281,783 |
| 9,675 | | Maxim Integrated Products, Inc. | | | 284,445 |
| 20,355 | | Microchip Technology, Inc. ††† | | | 723,213 |
| 12,720 | | Xilinx, Inc. | | | 327,286 |
| | | | | |
| | | | | 1,616,727 |
| | | | | |
| | Energy Equipment and Services 0.3% | | | |
| 7,050 | | Bonnett’s Energy Services Trust (Canada) | | | 63,104 |
| 5,440 | | Deepwell Energy Services Trust (Canada) | | | 26,470 |
| | | | | |
| | | | | 89,574 |
| | | | | |
| | Energy — Miscellaneous 1.2% | | | |
| 12,075 | | Valero GP Holdings, LLC | | | 335,081 |
| | | | | |
| | Finance Companies 4.8% | | | |
| 17,179 | | Capital One Financial Corp.††† | | | 1,296,327 |
| 8,100 | | Goldwater Bank, N.A.* *** † | | | 81,000 |
| | | | | |
| | | | | 1,377,327 |
| | | | | |
| | Financial Data Processing Services
and Systems 1.9% | | | |
| 14,740 | | Paychex, Inc. | | | 558,204 |
| | | | | |
| | Financial — Miscellaneous 2.0% | | | |
| 12,083 | | Fidelity National Title Group, Inc., Class A | | | 290,113 |
| 5,670 | | First American Corp. | | | 287,582 |
| | | | | |
| | | | | 577,695 |
| | | | | |
| | Health Care Management Services 1.1% | | | |
| 6,840 | | Birner Dental Management Services, Inc. | | | 166,623 |
| 6,020 | | Computer Programs & Systems, Inc. | | | 161,456 |
| | | | | |
| | | | | 328,079 |
| | | | | |
| | | | | |
| Shares | | | | Value |
| | | | | |
| | Investment Management Companies 9.0% | | | |
| 8,710 | | Allied Capital Corp. | | $ | 250,935 |
| 25,195 | | Apollo Investment Corp. | | | 539,173 |
| 29,739 | | Ares Capital Corp. | | | 540,358 |
| 19,750 | | Highland Distressed Opportunities, Inc.* | | | 283,807 |
| 18,650 | | Kohlberg Capital Corp.* | | | 298,400 |
| 19,600 | | Solar Capital, LLC* *** † | | | 294,000 |
| 37,620 | | Star Asia Finance Ltd.* *** † (Guernsey) | | | 376,200 |
| | | | | |
| | | | | 2,582,873 |
| | | | | |
| | Leisure Time 4.8% | | | |
| 38,215 | | Pool Corp.††† | | | 1,368,097 |
| | | | | |
| | Metals and Minerals — Miscellaneous 0.9% | | | |
| 48,185 | | Globe Specialty Metals, Inc.*
(United Kingdom) | | | 260,199 |
| | | | | |
| | Oil and Gas 0.4% | | | |
| 19,995 | | Petrowest Energy Services Trust (Canada) | | | 122,958 |
| | | | | |
| | Real Estate 2.7% | | | |
| 7,245 | | Babis Vovos Int’l. Construction S.A. (Greece) | | | 271,315 |
| 27,310 | | LPS Brasil Consultoria de Imoveis S.A.* (Brazil) | | | 278,809 |
| 19,075 | | Norwegian Property ASA* (Norway) | | | 226,402 |
| | | | | |
| | | | | 776,526 |
| | | | | |
| | Real Estate Investment Trusts (REIT) 31.5% | | | |
| 62,670 | | Alesco Financial, Inc. | | | 545,856 |
| 57,015 | | Anthracite Capital, Inc. | | | 684,180 |
| 32,680 | | Anworth Mortgage Asset Corp. | | | 319,284 |
| 16,490 | | Arbor Realty Trust, Inc. | | | 501,956 |
| 14,375 | | Capital Lease Funding, Inc. | | | 153,956 |
| 2,970 | | Capital Trust, Inc., Class A | | | 135,343 |
| 34,975 | | CapitalSource, Inc.††† | | | 878,922 |
| 35,470 | | CBRE Realty Finance, Inc. | | | 469,268 |
| 17,340 | | Crystal River Capital, Inc. | | | 465,406 |
| 15,065 | | Gramercy Capital Corp. | | | 462,194 |
| 36,610 | | HomeBanc Corp. | | | 127,769 |
| 16,385 | | iStar Financial, Inc.††† | | | 767,309 |
| 14,570 | | JER Investors Trust, Inc. | | | 277,121 |
| 30,780 | | KKR Financial Corp.††† | | | 844,295 |
| 14,760 | | MFA Mortgage Investments, Inc. | | | 113,652 |
| 115,100 | | New York Mortgage Trust, Inc. | | | 292,354 |
| 37,810 | | NorthStar Realty Finance Corp. | | | 575,090 |
| 15,015 | | RAIT Financial Trust | | | 419,519 |
| 19,885 | | Redwood Trust, Inc.††† | | | 1,037,599 |
| | | | | |
| | | | | 9,071,073 |
| | | | | |
| | Rental and Leasing Services — Commercial 3.6% | | | |
| 24,228 | | McGrath RentCorp††† | | | 767,301 |
| 54,015 | | MicroFinancial, Inc. | | | 279,797 |
| | | | | |
| | | | | 1,047,098 |
| | | | | |
| | Retail 3.2% | | | |
| 11,400 | | Home Depot, Inc. | | | 418,836 |
| 27,930 | | Topps Tiles plc (United Kingdom) | | | 165,253 |
| 7,430 | | Wal-Mart Stores, Inc. | | | 348,839 |
| | | | | |
| | | | | 932,928 |
| | | | | |
| | |
| | Total Common Stocks
(cost $24,934,330) | | | 25,379,070 |
| | | | | |
54
| | |
| | MARCH 31, 2007 (UNAUDITED) |
|
| |
| |
| | | | | |
| Shares | | | | Value |
| | | | | |
| | PREFERRED STOCKS 1.0% | | | |
| | |
| | Machinery 1.0% | | | |
| 37,500 | | Weg S.A. Pfd. (Brazil) | | $ | 282,572 |
| | | | | |
| | |
| | Total Preferred Stocks
(cost $188,542) | | | 282,572 |
| | | | | |
| | |
Principal
Amount | | | | Value |
| | |
| | CORPORATE BONDS 0.7% | | | |
| | |
| | Utilities — Telecommunications 0.7% | | | |
| $200,000 | | Broadview Networks Holdings, Inc., 11.375%, 9/01/12 | | $ | 214,000 |
| | | | | |
| | |
| | Total Corporate Bonds
(cost $208,963) | | | 214,000 |
| | | | | |
| | |
Number of
Contracts | | | | Value |
| | |
| | PUT OPTIONS PURCHASED 2.3% | | | |
| | |
| 2,000 | | Financial Select Sector SPDR expiring 6/16/07 exercise price $30 | | $ | 20,000 |
| 1,000 | | Financial Select Sector SPDR expiring 6/16/07 exercise price $33 | | | 45,000 |
| 500 | | Financial Select Sector SPDR expiring 6/16/07 exercise price $35 | | | 41,500 |
| 50 | | iShares Russell 2000 Index Fund expiring 5/19/07 exercise price $75 | | | 5,150 |
| 50 | | iShares Russell 2000 Index Fund expiring 8/18/07 exercise price $75 | | | 11,200 |
| 300 | | NovaStar Financial, Inc. expiring 1/17/09 exercise price $15 | | | 303,000 |
| 500 | | SPDR S&P Homebuilders ETF expiring 9/22/07 exercise price $31 | | | 100,000 |
| 400 | | SPDR S&P Homebuilders ETF expiring 9/22/07 exercise price $34 | | | 132,000 |
| | |
| | Total Put Options Purchased
(premium $681,000) | | | 657,850 |
| | | | | |
| | |
| | Total Investments
(cost $26,012,835) 92.1% | | | 26,533,492 |
| | |
| | Other Assets less Liabilities 7.9% | | | 2,283,279 |
| | | | | |
| | |
| | NET ASSETS 100.0% | | $ | 28,816,771 |
| | | | | |
| | | | | |
| Shares | | | | Value |
| | | | | |
| | SECURITIES SOLD SHORT | | | |
| 153,625 | | Delta Financial Corp. | | $ | 1,270,479 |
| 6,445 | | Centex Corp. | | | 269,272 |
| 19,625 | | Hovnanian Enterprises, Inc., Class A* | | | 493,765 |
| 12,075 | | Standard Pacific Corp. | | | 252,005 |
| 197,340 | | Opteum, Inc. | | | 888,030 |
| | | | | |
| | |
| | Total Securities Sold Short
(proceeds $3,625,418) | | $ | 3,173,551 |
| | | | | |
| |
| | *Non-income producing. ***Security was fair valued under procedures adopted by the Board of Directors (see Note 2). †Security purchased in a private placement transaction or under Rule 144A of the Securities Act of 1933 (see Note 9). †††All or a portion of this security has been designated as collateral for open short positions. ADR American Depositary Receipts. PIPE Private Investment in a Public Equity. See notes to financial statements. |
At March 31, 2007, Wasatch Strategic Income Fund’s investments, excluding securities sold short were in the following countries:
| | | |
| Country | | % | |
Australia | | 1.1 | |
Bermuda | | 2.3 | |
Brazil | | 2.1 | |
Canada | | 0.8 | |
Chile | | 1.0 | |
France | | 0.5 | |
Germany | | 1.6 | |
Greece | | 1.0 | |
Guernsey | | 1.4 | |
Hong Kong | | 0.4 | |
Norway | | 2.3 | |
Singapore | | 1.3 | |
Sweden | | 0.6 | |
United Kingdom | | 1.6 | |
United States | | 82.0 | |
| | | |
TOTAL | | 100.0 | % |
| | | |
55
| | |
| WASATCH ULTRA GROWTH FUND (WAMCX) — Schedule of Investments | | |
|
| |
| |
| | | | | |
| Shares | | | | Value |
| | | | | |
| | COMMON STOCKS 93.8% | | | |
| | |
| | Air Transport 1.2% | | | |
| 124,100 | | SkyWest, Inc. | | $ | 3,329,603 |
| | | | | |
| | Banks 3.4% | | | |
| 255,300 | | HDFC Bank Ltd. (India) | | | 5,601,562 |
| 62,160 | | HDFC Bank Ltd. ADR (India) | | | 4,006,212 |
| | | | | |
| | | | | 9,607,774 |
| | | | | |
| | Beverage — Soft Drinks 0.8% | | | |
| 76,420 | | Peet’s Coffee & Tea, Inc.* | | | 2,110,721 |
| | | | | |
| | Biotechnology Research and Production 2.6% | | | |
| 200,645 | | ArthroCare Corp.* | | | 7,231,246 |
| | | | | |
| | Casinos and Gambling 0.2% | | | |
| 75,690 | | Century Casinos, Inc.* | | | 624,443 |
| | | | | |
| | Commercial Information Services 1.7% | | | |
| 94,650 | | Morningstar, Inc.* | | | 4,887,726 |
| | | | | |
| | Commercial Services and Supplies 4.9% | | | |
| 13,017 | | Advisory Board Co.* | | | 658,921 |
| 62,260 | | Corporate Executive Board Co. | | | 4,729,270 |
| 5,494 | | CoStar Group, Inc.* | | | 245,472 |
| 27,915 | | Exlservice Holdings, Inc.* | | | 575,886 |
| 186,250 | | Hartford Education Corp. Ltd. (Singapore) | | | 73,670 |
| 1,062,800 | | Oriental Century Ltd.* (Singapore) | | | 697,136 |
| 286,550 | | Providence Service Corp. (The)* | | | 6,796,966 |
| | | | | |
| | | | | 13,777,321 |
| | | | | |
| | Communications and Media 1.1% | | | |
| 110,820 | | National CineMedia, Inc.* | | | 2,958,894 |
| | | | | |
| | Communications Technology 0.7% | | | |
| 35,045 | | WebEx Communications, Inc.* | | | 1,992,659 |
| | | | | |
| | Computer Services Software and Systems 9.5% | | | |
| 87,443 | | Cognizant Technology Solutions Corp., Class A* | | | 7,718,594 |
| 150,805 | | DealerTrack Holdings, Inc.* | | | 4,632,729 |
| 66,245 | | F5 Networks, Inc.* | | | 4,417,217 |
| 141,085 | | Interactive Intelligence, Inc.* | | | 2,150,135 |
| 174,350 | | NeuStar, Inc., Class A* | | | 4,958,514 |
| 125,935 | | Opnet Technologies, Inc.* | | | 1,701,382 |
| 49,291 | | Sourcefire, Inc.* | | | 869,000 |
| | | | | |
| | | | | 26,447,571 |
| | | | | |
| | Computer Technology 0.9% | | | |
| 127,876 | | Trident Microsystems, Inc.* | | | 2,565,193 |
| | | | | |
| | Diversified Financial Services 1.5% | | | |
| 56,295 | | Euronet Worldwide, Inc.* | | | 1,512,084 |
| 26,880 | | Jones Lang LaSalle, Inc. | | | 2,803,046 |
| | | | | |
| | | | | 4,315,130 |
| | | | | |
| | Diversified Telecommunication Services 0.5% | | | |
| 438,838 | | Astra Microwave Products Ltd. (India) | | | 1,358,647 |
| | | | | |
| | Drugs and Pharmaceuticals 1.5% | | | |
| 135,040 | | Aspreva Pharmaceuticals Corp.* (Canada) | | | 2,911,462 |
| 38,850 | | Medicis Pharmaceutical Corp., Class A | | | 1,197,357 |
| | | | | |
| | | | | 4,108,819 |
| | | | | |
| | Education Services 0.8% | | | |
| 17,122 | | Strayer Education, Inc. | | | 2,140,250 |
| | | | | |
| | Electrical and Electronics 2.3% | | | |
| 282,323 | | Power Integrations, Inc.* | | | 6,394,616 |
| | | | | |
| | | | | |
| Shares | | | | Value |
| | | | | |
| | Electronic Equipment and Instruments 0.4% | | | |
| 1,369,680 | | Virtek Vision International, Inc.* (Canada) | | $ | 1,069,181 |
| | | | | |
| | Electronics — Medical Systems 1.9% | | | |
| 43,030 | | Intuitive Surgical, Inc.* | | | 5,231,157 |
| | | | | |
| | Electronics — Semiconductors/ Components 14.7% | | | |
| 155,972 | | Integrated Device Technology, Inc.* | | | 2,405,088 |
| 264,025 | | Micrel, Inc.* | | | 2,909,556 |
| 159,715 | | Microchip Technology, Inc. | | | 5,674,674 |
| 106,840 | | Microsemi Corp.* | | | 2,223,340 |
| 162,985 | | Microtune, Inc.* | | | 671,498 |
| 103,375 | | Netlogic Microsystems, Inc.* | | | 2,751,842 |
| 219,783 | | PLX Technology, Inc.* | | | 2,140,686 |
| 270,725 | | Silicon Laboratories, Inc.* ††† | | | 8,100,092 |
| 267,551 | | SiRF Technology Holdings, Inc.* | | | 7,427,216 |
| 137,746 | | Techwell, Inc.* | | | 1,717,693 |
| 125,855 | | Tessera Technologies, Inc.* | | | 5,001,478 |
| | | | | |
| | | | | 41,023,163 |
| | | | | |
| | Energy Equipment and Services 1.2% | | | |
| 147,415 | | TGS-NOPEC Geophysical Co. ASA* (Norway) | | | 3,414,297 |
| | | | | |
| | Energy — Miscellaneous 0.9% | | | |
| 103,880 | | TETRA Technologies, Inc.* | | | 2,566,875 |
| | | | | |
| | Finance Companies 0.2% | | | |
| 14,145 | | FCStone Group, Inc.* | | | 527,891 |
| | | | | |
| | Financial Information Services 0.5% | | | |
| 21,745 | | FactSet Research Systems, Inc. | | | 1,366,673 |
| | | | | |
| | Financial — Miscellaneous 1.6% | | | |
| 139,393 | | First Cash Financial Services, Inc.* | | | 3,105,676 |
| 82,640 | | MarketAxess Holdings, Inc.* | | | 1,383,394 |
| | | | | |
| | | | | 4,489,070 |
| | | | | |
| | Health Care Facilities 6.8% | | | |
| 261,706 | | Healthways, Inc.* | | | 12,234,755 |
| 169,964 | | Psychiatric Solutions, Inc.* | | | 6,851,249 |
| | | | | |
| | | | | 19,086,004 |
| | | | | |
| | Health Care Management Services 3.7% | | | |
| 180,895 | | Pediatrix Medical Group, Inc.* | | | 10,321,869 |
| | | | | |
| | Health Care Providers and Services 0.9% | | | |
| 58,399 | | Icon plc ADR* (Ireland) | | | 2,487,797 |
| | | | | |
| | Household Durables 0.6% | | | |
| 73,955 | | Fourlis Holdings S.A. (Greece) | | | 1,730,943 |
| | | | | |
| | Leisure Time 1.0% | | | |
| 52,530 | | Life Time Fitness, Inc.* | | | 2,700,567 |
| | | | | |
| | Machinery 1.3% | | | |
| 193,835 | | Martinrea International, Inc.* (Canada) | | | 2,496,595 |
| 100,800 | | Pason Systems, Inc. (Canada) | | | 1,251,968 |
| | | | | |
| | | | | 3,748,563 |
| | | | | |
| | Medical and Dental Instruments
and Supplies 7.4% | | | |
| 92,335 | | Abaxis, Inc.* | | | 2,250,204 |
| 27,185 | | Dexcom, Inc.* | | | 213,674 |
| 103,400 | | Electro-Optical Sciences, Inc.* | | | 532,510 |
| 88,230 | | FoxHollow Technologies, Inc.* | | | 1,843,125 |
| 167,415 | | Kyphon, Inc.* | | | 7,557,113 |
| 89,661 | | NuVasive, Inc.* | | | 2,129,449 |
| 78,685 | | ResMed, Inc.* | | | 3,963,363 |
| 15,645 | | Techne Corp.* | | | 893,329 |
| 93,629 | | VNUS Medical Technologies, Inc.* | | | 938,163 |
| 36,200 | | Xtent, Inc.* | | | 406,526 |
| | | | | |
| | | | | 20,727,456 |
| | | | | |
56
| | |
| | MARCH 31, 2007 (UNAUDITED) |
|
| |
| |
| | | | | |
| Shares | | | | Value |
| | | | | |
| | Metals and Minerals — Miscellaneous 0.8% | | | |
| 401,500 | | Globe Specialty Metals, Inc.* (United Kingdom) | | $ | 2,168,100 |
| | | | | |
| | Metals and Mining 0.2% | | | |
| 903,240 | | Farallon Resources Ltd.* (Canada) | | | 462,216 |
| | | | | |
| | Miscellaneous Materials and Commodities 1.1% | | | |
| 198,185 | | Luna Innovations, Inc.* | | | 671,847 |
| 6,560 | | Sterling Construction Co., Inc.* | | | 125,034 |
| 123,855 | | Symyx Technologies, Inc.* | | | 2,194,710 |
| | | | | |
| | | | | 2,991,591 |
| | | | | |
| | Oil and Gas 0.7% | | | |
| 152,490 | | Petrohawk Energy Corp.* | | | 2,008,293 |
| | | | | |
| | Production Technology Equipment 0.8% | | | |
| 129,935 | | Eagle Test Systems, Inc.* | | | 2,162,118 |
| | | | | |
| | Retail 6.7% | | | |
| 23,710 | | Blue Nile, Inc.* | | | 964,049 |
| 726,000 | | China Hongxing Sports Ltd. (China) | | | 1,684,699 |
| 57,325 | | Guitar Center, Inc.* | | | 2,586,504 |
| 4,697,640 | | Hongguo Int’l. Holdings Ltd.* (Singapore) | | | 3,963,992 |
| 265,625 | | O’Reilly Automotive, Inc.* | | | 8,792,188 |
| 50,750 | | Susser Holdings Corp.* | | | 880,512 |
| | | | | |
| | | | | 18,871,944 |
| | | | | |
| | Securities Brokerage and Services 2.0% | | | |
| 84,290 | | GFI Group, Inc.* | | | 5,729,191 |
| | | | | |
| | Semiconductor Equipment and Products 2.3% | | | |
| 55,535 | | CSR plc* (United Kingdom) | | | 711,840 |
| 717,280 | | O2Micro International Ltd. ADR* (Cayman Islands) | | | 5,666,512 |
| | | | | |
| | | | | 6,378,352 |
| | | | | |
| | Steel 0.5% | | | |
| 11,530 | | Carpenter Technology Corp. | | | 1,392,363 |
| | | | | |
| | Truckers 2.0% | | | |
| 317,157 | | Knight Transportation, Inc. | | | 5,651,738 |
| | | | | |
| | |
| | Total Common Stocks
(cost $221,483,247) | | | 262,158,025 |
| | | | | |
| | | | | |
| Shares | | | | Value |
| | | | | |
| | |
| | PREFERRED STOCKS 2.2% | | | |
| | |
| | Biotechnology Research and Production 0.2% | | | |
| 169,492 | | Nanosys, Inc., Series D Pfd.* *** † | | $ | 500,001 |
| | | | | |
| | Communications Technology 0.0% | | | |
| 91,388 | | Xtera Communications, Inc.,
Series A-1 Pfd.* *** † | | | 99,065 |
| | | | | |
| | Consumer Products 0.3% | | | |
| 201,613 | | Ophthonix, Inc., Series C Pfd.* *** † | | | 844,758 |
| | | | | |
| | Drugs and Pharmaceuticals 0.4% | | | |
| 2,830,188 | | Point Biomedical Corp., Series F Pfd.* *** † | | | 1,050,000 |
| | | | | |
| | Electronics — Medical Systems 0.3% | | | |
| 1,080,146 | | Zonare Medical Systems, Inc.,
Series E Pfd.* *** † | | | 895,441 |
| | | | | |
| | Health Care Management Services 0.3% | | | |
| 516,161 | | Elder Health, Inc., Series G Pfd.* *** † | | | 571,428 |
| 108,917 | | TargetRX, Inc., Series D Pfd.* *** † | | | 151,395 |
| | | | | |
| | | | | 722,823 |
| | | | | |
| | Medical and Dental Instruments and Supplies 0.6% | | | |
| 243,902 | | TherOx, Inc., Series I Pfd.* *** † | | | 999,998 |
| 253,064 | | Transoma Medical, Inc., Series B Pfd.* *** † | | | 604,823 |
| | | | | |
| | | | | 1,604,821 |
| | | | | |
| | Utilities — Telecommunications 0.1% | | | |
| 64,269 | | Neutral Tandem, Inc., Series C Pfd.* *** † | | | 403,796 |
| | | | | |
| | |
| | Total Preferred Stocks
(cost $6,280,195) | | | 6,120,705 |
| | | | | |
| | |
| | LIMITED PARTNERSHIP INTEREST 0.8% | | | |
| | |
| | Other 0.8% | | | |
| | Montagu Newhall Global Partners II-B, L.P.* *** † | | | 1,927,917 |
| | Montagu Newhall Global Partners III-B, L.P.* *** † | | | 268,519 |
| | | | | |
| | | | | 2,196,436 |
| | | | | |
| | |
| | Total Limited Partnership Interest
(cost $2,419,292) | | | 2,196,436 |
| | | | | |
| | |
| | WARRANTS 0.0% | | | |
| | |
| | Drugs and Pharmaceuticals 0.0% | | | |
| 849,056 | | Point Biomedical Corp. expiring 2/16/12* *** † | | | — |
| | | | | |
| | Electronics — Medical Systems 0.0% | | | |
| 162,021 | | Zonare Medical Systems, Inc. expiring 6/30/11* *** † | | | — |
| | | | | |
| | Medical and Dental Instruments and Supplies 0.0% | | | |
| 15,510 | | Electro-Optical Sciences, Inc. expiring 10/31/11* *** † | | | — |
| | | | | |
| | Metals and Mining 0.0% | | | |
| 451,620 | | Farallon Resources Ltd. expiring 12/31/08* *** † (Canada) | | | — |
| | | | | |
| | |
| | Total Warrants
(cost $0) | | | — |
| | | | | |
57
| | |
WASATCH ULTRA GROWTH FUND (WAMCX) — Schedule of Investments (continued) |
|
| |
| |
| | | | | |
| | | | | |
Principal
Amount | | | | Value |
| | SHORT-TERM INVESTMENTS 0.9% | | | |
| | |
| | Repurchase Agreement 0.9% | | | |
| $2,531,000 | | Repurchase Agreement dated 3/30/07, 4.30% due 4/2/07 with State Street Bank and Trust Co. collateralized by $1,875,000 of United States Treasury Bonds 8.875% due 2/15/19; value: $2,585,588; repurchase proceeds: $2,531,907††† (cost $2,531,000) | | $ | 2,531,000 |
| | | | | |
| | |
| | Total Short-Term Investments
(cost $2,531,000) | | | 2,531,000 |
| | | | | |
| | |
| | Total Investments
(cost $232,713,734) 97.7% | | | 273,006,166 |
| | |
| | Other Assets less Liabilities 2.3% | | | 6,319,821 |
| | | | | |
| | |
| | NET ASSETS 100.0% | | $ | 279,325,987 |
| | | | | |
| | |
Number of
Contracts | | | | Value |
| | PUT OPTIONS WRITTEN | | | |
| | |
| 190 | | F5 Networks, Inc. expiring 4/21/07 exercise price $65 (premium $18,525) | | $ | 30,400 |
| | | | | |
| | |
| Shares | | | | Value |
| | |
| | SECURITIES SOLD SHORT | | | |
| | |
| 40,240 | | Charlotte Russe Holdings, Inc.* (proceeds $1,158,247) | | $ | 1,161,729 |
| | | | | |
| |
| | *Non-income producing. ***Security was fair valued under procedures adopted by the Board of Directors (see Note 2). †Security purchased in a private placement transaction or under Rule 144A of the Securities Act of 1933 (see Note 9). †††All or a portion of this security has been designated as collateral for purchase commitments (see Note 10). ADR American Depository Receipts. See notes to financial statements. |
At March 31, 2007, Wasatch Ultra Growth Fund’s investments, excluding short-term investments, written options and securities sold short were in the following countries:
| | | |
| Country | | % | |
Canada | | 3.0 | |
Cayman Islands | | 2.1 | |
China | | 0.6 | |
Greece | | 0.6 | |
India | | 4.1 | |
Ireland | | 0.9 | |
Norway | | 1.3 | |
Singapore | | 1.7 | |
United Kingdom | | 1.1 | |
United States | | 84.6 | |
| | | |
TOTAL | | 100.0 | % |
| | | |
58
| | |
| WASATCH-HOISINGTON U.S. TREASURY FUND (WHOSX) — Schedule of Investments | | MARCH 31, 2007 (UNAUDITED) |
|
| |
| |
| | | | | |
Principal
Amount | | | | Value |
| | | | | |
| | |
| | U.S. GOVERNMENT OBLIGATIONS 99.7% | | | |
| | |
| $11,400,000 | | U.S. Treasury Bond, 5.25%, 11/15/28 | | $ | 11,896,972 |
| 30,540,000 | | U.S. Treasury Bond, 5.25%, 2/15/29 | | | 31,883,271 |
| 6,000,000 | | U.S. Treasury Bond, 5.375%, 2/15/31 | | | 6,396,564 |
| 10,800,000 | | U.S. Treasury Bond, 5.50%, 8/15/28 | | | 11,615,908 |
| 6,800,000 | | U.S. Treasury Bond, 6.125%, 11/15/27 | | | 7,850,811 |
| 4,300,000 | | U.S. Treasury Bond, 6.375%, 8/15/27 | | | 5,092,812 |
| 4,500,000 | | U.S. Treasury Bond, 6.625%, 2/15/27 | | | 5,458,361 |
| 5,650,000 | | U.S. Treasury Bond, 6.75%, 8/15/26 | | | 6,922,572 |
| 4,755,000 | | U.S. Treasury Bond, 6.875%, 8/15/25 | | | 5,864,251 |
| 4,930,000 | | U.S. Treasury Bond, 7.50%, 11/15/24 | | | 6,416,316 |
| 14,216,000 | | U.S. Treasury Strip, principal only, 11/15/21 | | | 6,886,287 |
| 69,600,000 | | U.S. Treasury Strip, principal only, 8/15/25 | | | 27,994,303 |
| 176,800,000 | | U.S. Treasury Strip, principal only, 11/15/27 | | | 63,990,462 |
| | | | | |
| | |
| | Total U.S. Government Obligations (cost $196,956,410) | | | 198,268,890 |
| | | | | |
| | | | | |
Principal
Amount | | | | Value |
| | | | | |
| | |
| | SHORT-TERM INVESTMENTS 0.1% | | | |
| | |
| | Repurchase Agreement 0.1% | | | |
| $279,000 | | Repurchase Agreement dated 3/30/07, 4.30% due 4/2/07 with State Street Bank and Trust Co. collateralized by $210,000 of United States Treasury Bonds 8.875% due 2/15/19; value: $289,586; repurchase proceeds: $279,100 (cost $279,000) | | $ | 279,000 |
| | | | | |
| | |
| | Total Short-Term Investments
(cost $279,000) | | | 279,000 |
| | | | | |
| | |
| | Total Investments
(cost $197,235,410) 99.8% | | | 198,547,890 |
| | |
| | Other Assets less Liabilities 0.2% | | | 415,714 |
| | | | | |
| | |
| | NET ASSETS 100.0% | | $ | 198,963,604 |
| | | | | |
| | |
| | See notes to financial statements. | | | |
59
| | |
| WASATCH FUNDS — Statements of Assets and Liabilities | | |
|
| |
| |
| | | | | | | | | | | | |
| | | CORE
GROWTH
FUND | | | GLOBAL SCIENCE
& TECHNOLOGY
FUND | | | HERITAGE
GROWTH
FUND | |
| | | | | | | | | | | | |
Assets: | | | | | | | | | | | | |
Investments, at cost | | | | | | | | | | | | |
Unaffiliated issuers | | $ | 991,659,105 | | | $ | 120,859,766 | | | $ | 198,857,759 | |
Affiliated issuers* | | | — | | | | — | | | | — | |
Repurchase agreements | | | 43,059,000 | | | | 822,000 | | | | 7,362,000 | |
| | | | | | | | | | | | |
| | $ | 1,034,718,105 | | | $ | 121,681,766 | | | $ | 206,219,759 | |
| | | | | | | | | | | | |
Investments, at value | | | | | | | | | | | | |
Unaffiliated issuers | | $ | 1,285,070,126 | | | $ | 137,285,976 | | | $ | 228,397,678 | |
Affiliated issuers* | | | — | | | | — | | | | — | |
Repurchase agreements | | | 43,059,000 | | | | 822,000 | | | | 7,362,000 | |
| | | | | | | | | | | | |
| | | 1,328,129,126 | | | | 138,107,976 | | | | 235,759,678 | |
Cash | | | 448 | | | | 652 | | | | 684 | |
Foreign currency on deposit (cost of $0, $0, $0, $183,534, $41,260, $235,655, $8,064, $0, and $26,722, respectively) | | | — | | | | — | | | | — | |
Receivable for investment securities sold | | | 21,000 | | | | 542,473 | | | | — | |
Receivable from broker | | | — | | | | 588,061 | | | | 501,522 | |
Capital shares receivable | | | 260,870 | | | | 120,834 | | | | 29,054 | |
Interest and dividends receivable | | | 945,629 | | | | 44,175 | | | | 99,541 | |
Receivable from Investment Advisor | | | — | | | | — | | | | — | |
Prepaid expenses and other assets | | | 36,489 | | | | 14,786 | | | | 20,857 | |
Unrealized appreciation on foreign currency contracts | | | 3,046 | | | | — | | | | — | |
| | | | | | | | | | | | |
Total Assets | | | 1,329,396,608 | | | | 139,418,957 | | | | 236,411,336 | |
| | | | | | | | | | | | |
Liabilities: | | | | | | | | | | | | |
Options written at value (premiums of $0, $18,374, $7,750, $0, $0, $0, $233,404, $0, and $482,391, respectively) | | | — | | | | 20,250 | | | | 10,150 | |
Payable for securities purchased | | | 8,348,587 | | | | — | | | | — | |
Capital shares payable | | | 1,021,563 | | | | 81,346 | | | | 151,254 | |
Accrued investment advisory fees | | | 1,110,876 | | | | 176,220 | | | | 141,558 | |
Accrued expenses and other liabilities | | | 690,325 | | | | 150,431 | | | | 205,536 | |
Accrued deferred foreign capital gains taxes | | | 486,600 | | | | — | | | | 572,147 | |
Unrealized depreciation on foreign currency contracts | | | — | | | | — | | | | — | |
| | | | | | | | | | | | |
Total Liabilities | | | 11,657,951 | | | | 428,247 | | | | 1,080,645 | |
| | | | | | | | | | | | |
Net Assets | | $ | 1,317,738,657 | | | $ | 138,990,710 | | | $ | 235,330,691 | |
| | | | | | | | | | | | |
Net Assets Consist of: | | | | | | | | | | | | |
Capital stock | | $ | 316,281 | | | $ | 91,586 | | | $ | 198,033 | |
Paid-in capital in excess of par | | | 924,033,145 | | | | 110,682,113 | | | | 200,106,405 | |
Undistributed net investment income (loss) | | | (5,624,650 | ) | | | (818,135 | ) | | | (93,338 | ) |
Undistributed net realized gain on investments and foreign currency translations | | | 106,088,157 | | | | 12,610,430 | | | | 6,206,492 | |
Net unrealized appreciation on investments and foreign currency translations | | | 292,925,724 | | | | 16,424,716 | | | | 28,913,099 | |
| | | | | | | | | | | | |
Net Assets | | $ | 1,317,738,657 | | | $ | 138,990,710 | | | $ | 235,330,691 | |
| | | | | | | | | | | | |
Capital Stock, $.01 par value: | | | | | | | | | | | | |
Authorized | | | 10,000,000,000 | | | | 10,000,000,000 | | | | 10,000,000,000 | |
Issued and outstanding | | | 31,628,060 | | | | 9,158,638 | | | | 19,803,264 | |
| | | |
NET ASSET VALUE, REDEMPTION PRICEAND OFFERING
PRICE PER SHARE | | $ | 41.66 | | | $ | 15.18 | | | $ | 11.88 | |
| | | | | | | | | | | | |
| * | | See Note 8 for information on affiliated issuers. |
See notes to financial statements.
60
| | |
| | MARCH 31, 2007 (UNAUDITED) |
|
| |
| |
| | | | | | | | | | | | | | | | | | | | | |
INTERNATIONAL
GROWTH
FUND | | | INTERNATIONAL
OPPORTUNITIES
FUND | | | MICRO
CAP
FUND | | | MICRO CAP
VALUE
FUND | | | SMALL CAP
GROWTH
FUND | | | SMALL CAP
VALUE
FUND |
| | | | | | | | | | | | | | | | | | | | | |
| | | | | | | | | | | | | | | | | | | | | |
| | | | | | | | | | | | | | | | | | | | | |
| $ | 324,239,507 | | | $ | 33,348,926 | | | $ | 431,974,402 | | | $ | 84,098,011 | | | $ | 922,724,511 | | | $ | 580,720,305 |
| | — | | | | — | | | | 35,080,218 | | | | — | | | | — | | | | 10,500,447 |
| | 9,096,000 | | | | 918,000 | | | | 27,357,000 | | | | 6,594,000 | | | | 5,919,000 | | | | 7,609,000 |
| | | | | | | | | | | | | | | | | | | | | | |
| $ | 333,335,507 | | | $ | 34,266,926 | | | $ | 494,411,620 | | | $ | 90,692,011 | | | $ | 928,643,511 | | | $ | 598,829,752 |
| | | | | | | | | | | | | | | | | | | | | | |
| | | | | | | | | | | | | | | | | | | | | |
| $ | 458,103,076 | | | $ | 49,498,126 | | | $ | 567,160,585 | | | $ | 103,734,599 | | | $ | 1,196,793,679 | | | $ | 678,883,825 |
| | — | | | | — | | | | 34,044,466 | | | | — | | | | — | | | | 13,539,341 |
| | 9,096,000 | | | | 918,000 | | | | 27,357,000 | | | | 6,594,000 | | | | 5,919,000 | | | | 7,609,000 |
| | | | | | | | | | | | | | | | | | | | | | |
| | 467,199,076 | | | | 50,416,126 | | | | 628,562,051 | | | | 110,328,599 | | | | 1,202,712,679 | | | | 700,032,166 |
| | 109 | | | | 546 | | | | 631 | | | | 59,628 | | | | 896 | | | | 8,472,887 |
| | 183,442 | | | | 41,117 | | | | 234,860 | | | | 8,063 | | | | — | | | | 26,719 |
| | 422,358 | | | | — | | | | 1,937,790 | | | | 1,040,738 | | | | 39,423,742 | | | | 1,004,060 |
| | — | | | | — | | | | 489,848 | | | | 1,882,646 | | | | — | | | | 5,506,250 |
| | 234,309 | | | | 551,616 | | | | 7,279 | | | | 1,576,478 | | | | 1,431,884 | | | | 163,925 |
| | 1,158,628 | | | | 180,395 | | | | 723,664 | | | | 171,640 | | | | 244,840 | | | | 1,171,419 |
| | — | | | | 9,770 | | | | — | | | | 5,418 | | | | — | | | | — |
| | 22,235 | | | | 11,268 | | | | 16,166 | | | | 7,734 | | | | 32,913 | | | | 23,025 |
| | 10,349 | | | | 735 | | | | — | | | | — | | | | — | | | | — |
| | | | | | | | | | | | | | | | | | | | | | |
| | 469,230,506 | | | | 51,211,573 | | | | 631,972,289 | | | | 115,080,944 | | | | 1,243,846,954 | | | | 716,400,451 |
| | | | | | | | | | | | | | | | | | | | | | |
| | | | | | | | | | | | | | | | | | | | | |
| | — | | | | — | | | | — | | | | 268,200 | | | | — | | | | 839,965 |
| | 6,624,295 | | | | 675,081 | | | | 892,750 | | | | 1,144,673 | | | | 8,861,070 | | | | 6,968,640 |
| | 2,702,388 | | | | — | | | | 127,005 | | | | 44,274 | | | | 974,642 | | | | 1,815,714 |
| | 566,011 | | | | 80,601 | | | | 1,055,276 | | | | 184,424 | | | | 1,042,884 | | | | 893,469 |
| | 268,867 | | | | 47,587 | | | | 222,046 | | | | 70,846 | | | | 653,180 | | | | 323,714 |
| | 59,535 | | | | — | | | | — | | | | 6,631 | | | | — | | | | — |
| | — | | | | — | | | | 417 | | | | 197 | | | | 2,734 | | | | 5,589 |
| | | | | | | | | | | | | | | | | | | | | | |
| | 10,221,096 | | | | 803,269 | | | | 2,297,494 | | | | 1,719,245 | | | | 11,534,510 | | | | 10,847,091 |
| | | | | | | | | | | | | | | | | | | | | | |
| $ | 459,009,410 | | | $ | 50,408,304 | | | $ | 629,674,795 | | | $ | 113,361,699 | | | $ | 1,232,312,444 | | | $ | 705,553,360 |
| | | | | | | | | | | | | | | | | | | | | | |
| | | | | | | | | | | | | | | | | | | | | |
| $ | 203,963 | | | $ | 150,822 | | | $ | 920,358 | | | $ | 400,132 | | | $ | 329,872 | | | $ | 1,350,003 |
| | 301,251,238 | | | | 31,439,585 | | | | 452,343,222 | | | | 85,207,150 | | | | 900,530,092 | | | | 508,018,995 |
| | (850,022 | ) | | | (139,929 | ) | | | (3,782,987 | ) | | | (529,588 | ) | | | (6,506,911 | ) | | | 1,709,574 |
| | 24,593,049 | | | | 2,808,253 | | | | 46,043,902 | | | | 8,688,495 | | | | 63,880,283 | | | | 93,639,838 |
| | 133,811,182 | | | | 16,149,573 | | | | 134,150,300 | | | | 19,595,510 | | | | 274,079,108 | | | | 100,834,950 |
| | | | | | | | | | | | | | | | | | | | | | |
| $ | 459,009,410 | | | $ | 50,408,304 | | | $ | 629,674,795 | | | $ | 113,361,699 | | | $ | 1,232,312,444 | | | $ | 705,553,360 |
| | | | | | | | | | | | | | | | | | | | | | |
| | | | | | | | | | | | | | | | | | | | | |
| | 10,000,000,000 | | | | 10,000,000,000 | | | | 10,000,000,000 | | | | 10,000,000,000 | | | | 10,000,000,000 | | | | 10,000,000,000 |
| | 20,396,323 | | | | 15,082,238 | | | | 92,035,774 | | | | 40,013,222 | | | | 32,987,219 | | | | 135,000,304 |
| | | | | |
| $ | 22.50 | | | $ | 3.34 | | | $ | 6.84 | | | $ | 2.83 | | | $ | 37.36 | | | $ | 5.23 |
| | | | | | | | | | | | | | | | | | | | | | |
61
| | |
| WASATCH FUNDS — Statements of Assets and Liabilities (continued) | | MARCH 31, 2007 (UNAUDITED) |
|
| |
| |
| | | | | | | | | | | |
| | | STRATEGIC
INCOME
FUND | | ULTRA
GROWTH
FUND | | | U.S.
TREASURY
FUND | |
| | | | | | | | | | | |
Assets: | | | | | | | | | | | |
Investments, at cost | | | | | | | | | | | |
Unaffiliated issuers | | $ | 26,012,835 | | $ | 230,182,734 | | | $ | 196,956,410 | |
Affiliated issuers* | | | — | | | — | | | | — | |
Repurchase agreements | | | — | | | 2,531,000 | | | | 279,000 | |
| | | | | | | | | | | |
| | $ | 26,012,835 | | $ | 232,713,734 | | | $ | 197,235,410 | |
| | | | | | | | | | | |
Investments, at value | | | | | | | | | | | |
Unaffiliated issuers | | $ | 26,533,492 | | $ | 270,475,166 | | | $ | 198,268,890 | |
Affiliated issuers* | | | — | | | — | | | | — | |
Repurchase agreements | | | — | | | 2,531,000 | | | | 279,000 | |
| | | | | | | | | | | |
| | | 26,533,492 | | | 273,006,166 | | | | 198,547,890 | |
Cash | | | — | | | 942 | | | | 785 | |
Foreign currency on deposit (cost of $14,019, $115,271, and $0, respectively) | | | 14,020 | | | 115,271 | | | | — | |
Receivable for investment securities sold | | | 270,106 | | | 6,499,011 | | | | — | |
Receivable from broker | | | 5,407,901 | | | 3,140,405 | | | | — | |
Capital shares receivable | | | 1,400 | | | 13,698 | | | | 62,056 | |
Interest and dividends receivable | | | 163,181 | | | 5,493 | | | | 996,552 | |
Receivable from Investment Advisor | | | 7,282 | | | — | | | | — | |
Prepaid expenses and other assets | | | 13,436 | | | 17,806 | | | | 20,693 | |
| | | | | | | | | | | |
Total Assets | | | 32,410,818 | | | 282,798,792 | | | | 199,627,976 | |
| | | | | | | | | | | |
Liabilities: | | | | | | | | | | | |
Options written at value (premiums of $0, $18,525, and $0, respectively) | | | — | | | 30,400 | | | | — | |
Securities sold short, at value (proceeds of $3,625,418, $1,158,247, and $0, respectively) | | | 3,173,551 | | | 1,161,729 | | | | — | |
Bank overdraft | | | 243,649 | | | — | | | | — | |
Payable for securities purchased | | | 88,134 | | | 1,404,104 | | | | — | |
Capital shares payable | | | 9,984 | | | 326,570 | | | | 328,867 | |
Dividends payable to shareholders | | | 6,782 | | | — | | | | 140,302 | |
Accrued investment advisory fees | | | 17,117 | | | 296,584 | | | | 86,716 | |
Accrued expenses and other liabilities | | | 37,282 | | | 213,000 | | | | 108,487 | |
Accrued deferred foreign capital gains taxes | | | 17,548 | | | 40,370 | | | | — | |
Unrealized depreciation on foreign currency contracts | | | — | | | 48 | | | | — | |
| | | | | | | | | | | |
Total Liabilities | | | 3,594,047 | | | 3,472,805 | | | | 664,372 | |
| | | | | | | | | | | |
Net Assets | | $ | 28,816,771 | | $ | 279,325,987 | | | $ | 198,963,604 | |
| | | | | | | | | | | |
Net Assets Consist of: | | | | | | | | | | | |
Capital stock | | $ | 25,381 | | $ | 114,974 | | | $ | 143,462 | |
Paid-in capital in excess of par | | | 27,441,450 | | | 229,371,383 | | | | 203,664,994 | |
Undistributed net investment income (loss) | | | 55,727 | | | (1,773,582 | ) | | | 150 | |
Undistributed net realized gain (loss) on investments and foreign currency translations | | | 321,479 | | | 11,412,350 | | | | (6,157,482 | ) |
Net unrealized appreciation on investments and foreign currency translations | | | 972,734 | | | 40,200,862 | | | | 1,312,480 | |
| | | | | | | | | | | |
Net Assets | | $ | 28,816,771 | | $ | 279,325,987 | | | $ | 198,963,604 | |
| | | | | | | | | | | |
Capital Stock, $.01 par value: | | | | | | | | | | | |
Authorized | | | 10,000,000,000 | | | 10,000,000,000 | | | | 10,000,000,000 | |
Issued and outstanding | | | 2,538,099 | | | 11,497,353 | | | | 14,346,176 | |
| | | |
NET ASSET VALUE, REDEMPTION PRICEAND OFFERING
PRICE PER SHARE | | $ | 11.35 | | $ | 24.29 | | | $ | 13.87 | |
| | | | | | | | | | | |
| * | | See Note 8 for information on affiliated issuers. |
See notes to financial statements.
62
| | |
| WASATCH FUNDS — Statements of Operations | | FORTHESIXMONTHSENDED MARCH 31, 2007 (UNAUDITED) |
|
| |
| |
| | | | | | | | | | | | |
| | | CORE
GROWTH
FUND | | | GLOBAL SCIENCE
& TECHNOLOGY
FUND | | | HERITAGE
GROWTH
FUND | |
| | | | | | | | | | | | |
Investment Income: | | | | | | | | | | | | |
Interest | | $ | 527,080 | | | $ | 81,708 | | | $ | 97,650 | |
Dividends1 | | | | | | | | | | | | |
Unaffiliated issuers | | | 6,332,623 | | | | 535,752 | | | | 977,765 | |
Affiliated issuers* | | | — | | | | — | | | | — | |
| | | | | | | | | | | | |
Total investment income | | | 6,859,703 | | | | 617,460 | | | | 1,075,415 | |
| | | | | | | | | | | | |
Expenses: | | | | | | | | | | | | |
Investment advisory fees | | | 6,745,726 | | | | 1,015,459 | | | | 859,718 | |
Shareholder servicing fees | | | 543,934 | | | | 112,010 | | | | 178,686 | |
Fund administration fees | | | 168,471 | | | | 16,908 | | | | 30,678 | |
Fund accounting fees | | | 82,958 | | | | 19,959 | | | | 20,524 | |
Reports to shareholders | | | 133,749 | | | | 23,625 | | | | 38,308 | |
Custody fees | | | 257,291 | | | | 64,393 | | | | 36,563 | |
Federal and state registration fees | | | 15,627 | | | | 10,351 | | | | 10,931 | |
Legal fees | | | 38,348 | | | | 3,643 | | | | 6,791 | |
Directors’ fees | | | 24,630 | | | | 2,072 | | | | 4,333 | |
Audit fees | | | 11,894 | | | | 11,898 | | | | 11,902 | |
Other | | | 44,568 | | | | 5,722 | | | | 9,642 | |
| | | | | | | | | | | | |
Total expenses before reimbursement | | | 8,067,196 | | | | 1,286,040 | | | | 1,208,076 | |
Reimbursement of expenses by Advisor | | | — | | | | — | | | | (41,316 | ) |
| | | | | | | | | | | | |
Net Expenses | | | 8,067,196 | | | | 1,286,040 | | | | 1,166,760 | |
| | | | | | | | | | | | |
Net Investment Loss | | | (1,207,493 | ) | | | (668,580 | ) | | | (91,345 | ) |
| | | | | | | | | | | | |
Realized and Unrealized Gain: | | | | | | | | | | | | |
Net realized gain on investments and foreign currency translations | | | | | | | | | | | | |
Unaffiliated issuers | | | 120,333,318 | | | | 12,981,356 | | | | 6,424,660 | |
Affiliated issuers* | | | — | | | | — | | | | — | |
Net realized gain on options written | | | — | | | | 47,718 | | | | 69,785 | |
Realized foreign capital gains taxes | | | — | | | | — | | | | 17,066 | |
Change in unrealized appreciation on
investments and foreign currency translations | | | 20,346,826 | | | | 3,641,112 | | | | 12,137,001 | |
Deferred foreign capital gains taxes | | | (486,600 | ) | | | — | | | | (624,399 | ) |
| | | | | | | | | | | | |
Net gain on investments | | | 140,193,544 | | | | 16,670,186 | | | | 18,024,113 | |
| | | | | | | | | | | | |
Net Increase in Net Assets Resulting from Operations | | $ | 138,986,051 | | | $ | 16,001,606 | | | $ | 17,932,768 | |
| | | | | | | | | | | | |
1Net of $36,543, $47,404, and $2,378 in foreign withholding taxes, respectively.
*See Note 8 for information on affiliated issuers.
See notes to financial statements.
63
| | |
| WASATCH FUNDS — Statements of Operations (continued) | | |
|
| |
| |
| | | | | | | | | | | | |
| | | INTERNATIONAL
GROWTH
FUND | | | INTERNATIONAL
OPPORTUNITIES
FUND | | | MICRO
CAP
FUND | |
| | | | | | | | | | | | |
Investment Income: | | | | | | | | | | | | |
Interest | | $ | 208,903 | | | $ | 20,851 | | | $ | 478,212 | |
Dividends1 | | | | | | | | | | | | |
Unaffiliated issuers | | | 3,108,041 | | | | 444,779 | | | | 2,317,029 | |
Affiliated issuers* | | | — | | | | — | | | | 15,392 | |
| | | | | | | | | | | | |
Total investment income | | | 3,316,944 | | | | 465,630 | | | | 2,810,633 | |
| | | | | | | | | | | | |
Expenses: | | | | | | | | | | | | |
Investment advisory fees | | | 3,112,618 | | | | 424,328 | | | | 6,154,472 | |
Shareholder servicing fees | | | 184,465 | | | | 30,413 | | | | 138,691 | |
Fund administration fees | | | 51,818 | | | | 5,298 | | | | 76,844 | |
Fund accounting fees | | | 39,066 | | | | 19,824 | | | | 45,404 | |
Reports to shareholders | | | 44,387 | | | | 2,912 | | | | 31,499 | |
Custody fees | | | 169,088 | | | | 25,552 | | | | 81,452 | |
Federal and state registration fees | | | 12,222 | | | | 7,333 | | | | 9,783 | |
Legal fees | | | 10,488 | | | | 1,085 | | | | 16,033 | |
Directors’ fees | | | 6,461 | | | | 621 | | | | 9,912 | |
Audit fees | | | 11,894 | | | | 11,794 | | | | 11,894 | |
Dividends on securities sold short | | | — | | | | — | | | | — | |
Other | | | 11,705 | | | | 4,357 | | | | 17,636 | |
| | | | | | | | | | | | |
Total expenses before reimbursement | | | 3,654,212 | | | | 533,517 | | | | 6,593,620 | |
Reimbursement of expenses by Advisor | | | — | | | | (56,148 | ) | | | — | |
| | | | | | | | | | | | |
Net Expenses | | | 3,654,212 | | | | 477,369 | | | | 6,593,620 | |
| | | | | | | | | | | | |
Net Investment Income (Loss) | | | (337,268 | ) | | | (11,739 | ) | | | (3,782,987 | ) |
| | | | | | | | | | | | |
Realized and Unrealized Gain (Loss): | | | | | | | | | | | | |
Net realized gain (loss) on investments and foreign currency translations | | | | | | | | | | | | |
Unaffiliated issuers | | | 34,686,745 | | | | 3,073,349 | | | | 59,338,898 | |
Affiliated issuers* | | | — | | | | — | | | | 64,238 | |
Net realized gain on options written | | | — | | | | — | | | | 162,745 | |
Net realized loss on short positions | | | — | | | | — | | | | — | |
Realized foreign capital gains taxes | | | (60,152 | ) | | | — | | | | — | |
Change in unrealized appreciation (depreciation) on
investments and foreign currency translations | | | 53,770,986 | | | | 8,375,708 | | | | 18,500,007 | |
Deferred foreign capital gains taxes | | | (59,535 | ) | | | — | | | | — | |
| | | | | | | | | | | | |
Net gain (loss) on investments | | | 88,338,044 | | | | 11,449,057 | | | | 78,065,888 | |
| | | | | | | | | | | | |
Net Increase in Net Assets Resulting from Operations | | $ | 88,000,776 | | | $ | 11,437,318 | | | $ | 74,282,901 | |
| | | | | | | | | | | | |
1Net of $241,896, $49,191, $156,610, $39,666, $51,716, $4,790, $12,983, $1,015 and $0 in foreign withholding taxes, respectively.
*See Note 8 for information on affiliated issuers.
See notes to financial statements.
64
| | |
| | FORTHESIXMONTHSENDED MARCH 31, 2007 (UNAUDITED) |
|
| |
| |
| | | | | | | | | | | | | | | | | | | | | | |
MICRO CAP
VALUE
FUND | | | SMALL CAP
GROWTH
FUND | | | SMALL CAP
VALUE
FUND | | | STRATEGIC
INCOME
FUND | | | ULTRA
GROWTH
FUND | | | U.S.
TREASURY
FUND | |
| | | | | | | | | | | | | | | | | | | | | | |
| | | | | | | | | | | | | | | | | | | | | | |
| $ | 141,269 | | | $ | 245,387 | | | $ | 421,084 | | | $ | 45,503 | | | $ | 118,678 | | | $ | 4,904,390 | |
| | | | | | | | | | | | | | | | | | | | | | |
| | 520,770 | | | | 2,676,433 | | | | 7,131,048 | | | | 539,777 | | | | 230,371 | | | | — | |
| | — | | | | — | | | | — | | | | — | | | | — | | | | — | |
| | | | | | | | | | | | | | | | | | | | | | | |
| | 662,039 | | | | 2,921,820 | | | | 7,552,132 | | | | 585,280 | | | | 349,049 | | | | 4,904,390 | |
| | | | | | | | | | | | | | | | | | | | | | | |
| | | | | | | | | | | | | | | | | | | | | | |
| | 1,046,007 | | | | 6,248,269 | | | | 5,160,138 | | | | 70,371 | | | | 1,871,953 | | | | 505,552 | |
| | 52,737 | | | | 614,955 | | | | 283,464 | | | | 26,494 | | | | 182,716 | | | | 100,230 | |
| | 13,058 | | | | 155,989 | | | | 85,918 | | | | 2,520 | | | | 37,390 | | | | 25,263 | |
| | 18,491 | | | | 78,591 | | | | 47,017 | | | | 9,588 | | | | 24,762 | | | | 13,286 | |
| | 9,155 | | | | 162,745 | | | | 69,487 | | | | 2,269 | | | | 43,021 | | | | 22,311 | |
| | 34,273 | | | | 62,731 | | | | 70,785 | | | | 6,871 | | | | 38,838 | | | | 2,876 | |
| | 7,594 | | | | 14,164 | | | | 11,106 | | | | 9,265 | | | | 9,573 | | | | 13,164 | |
| | 2,784 | | | | 37,878 | | | | 18,113 | | | | 552 | | | | 10,647 | | | | 5,573 | |
| | 1,615 | | | | 21,435 | | | | 11,594 | | | | 197 | | | | 5,467 | | | | 3,278 | |
| | 11,890 | | | | 11,894 | | | | 11,893 | | | | 12,550 | | | | 11,898 | | | | 11,895 | |
| | — | | | | — | | | | — | | | | 20,856 | | | | — | | | | — | |
| | 5,385 | | | | 37,322 | | | | 20,950 | | | | 3,683 | | | | 11,894 | | | | 5,309 | |
| | | | | | | | | | | | | | | | | | | | | | | |
| | 1,202,989 | | | | 7,445,973 | | | | 5,790,465 | | | | 165,216 | | | | 2,248,159 | | | | 708,737 | |
| | (26,231 | ) | | | — | | | | — | | | | (48,856 | ) | | | — | | | | — | |
| | | | | | | | | | | | | | | | | | | | | | | |
| | 1,176,758 | | | | 7,445,973 | | | | 5,790,465 | | | | 116,360 | | | | 2,248,159 | | | | 708,737 | |
| | | | | | | | | | | | | | | | | | | | | | | |
| | (514,719 | ) | | | (4,524,153 | ) | | | 1,761,667 | | | | 468,920 | | | | (1,899,110 | ) | | | 4,195,653 | |
| | | | | | | | | | | | | | | | | | | | | | | |
| | | | | | | | | | | | | | | | | | | | | | |
| | | | | | | | | | | | | | | | | | | | | | |
| | 9,822,937 | | | | 74,906,636 | | | | 108,499,199 | | | | 380,951 | | | | 19,772,985 | | | | (364,263 | ) |
| | — | | | | (182,143 | ) | | | — | | | | — | | | | — | | | | — | |
| | 461,313 | | | | — | | | | 596,117 | | | | — | | | | — | | | | — | |
| | — | | | | — | | | | — | | | | (39,112 | ) | | | (127,631 | ) | | | — | |
| | (13,030 | ) | | | — | | | | — | | | | — | | | | 45 | | | | — | |
| | 6,178,586 | | | | 37,349,386 | | | | (25,711,310 | ) | | | 558,397 | | | | 6,736,892 | | | | (2,903,966 | ) |
| | (6,631 | ) | | | — | | | | — | | | | — | | | | (76,181 | ) | | | — | |
| | | | | | | | | | | | | | | | | | | | | | | |
| | 16,443,175 | | | | 112,073,879 | | | | 83,384,006 | | | | 900,236 | | | | 26,306,110 | | | | (3,268,229 | ) |
| | | | | | | | | | | | | | | | | | | | | | | |
| $ | 15,928,456 | | | $ | 107,549,726 | | | $ | 85,145,673 | | | $ | 1,369,156 | | | $ | 24,407,000 | | | $ | 927,424 | |
| | | | | | | | | | | | | | | | | | | | | | | |
65
| | |
| WASATCH FUNDS — Statements of Changes in Net Assets | | |
|
| |
| |
| | | | | | | | | | | | | | | | |
| | | CORE GROWTH
FUND | | | GLOBAL SCIENCE & TECHNOLOGY
FUND | |
| | | | | | | | | | | | | | | | |
| | | Six Months
Ended
March 31, 2007
(Unaudited) | | | Year Ended
September 30, 2006 | | | Six Months
Ended
March 31, 2007
(Unaudited) | | | Year Ended
September 30, 2006 | |
| | | | | | | | | | | | | | | | |
Operations: | | | | | | | | | | | | | | | | |
Net investment income (loss) | | $ | (1,207,493 | ) | | $ | 6,089,288 | | | $ | (668,580 | ) | | $ | (1,314,171 | ) |
Net realized gain on investments and foreign
currency translations | | | 120,333,318 | | | | 130,484,166 | | | | 12,981,356 | | | | 6,249,861 | |
Net realized gain on options written | | | — | | | | — | | | | 47,718 | | | | — | |
Net realized gain on short positions | | | — | | | | — | | | | — | | | | 21,058 | |
Change in unrealized appreciation (depreciation) on
investments and foreign currency translations | | | 19,860,226 | | | | (98,543,578 | ) | | | 3,641,112 | | | | 1,779,861 | |
| | | | | | | | | | | | | | | | |
Net increase in net assets resulting from operations | | | 138,986,051 | | | | 38,029,876 | | | | 16,001,606 | | | | 6,736,609 | |
| | | | |
Dividends paid from: | | | | | | | | | | | | | | | | |
Net investment income | | | (4,207,840 | ) | | | (23,612,852 | ) | | | — | | | | — | |
Net realized gains | | | (110,526,195 | ) | | | (123,744,637 | ) | | | (5,210,791 | ) | | | (1,860,003 | ) |
| | | | | | | | | | | | | | | | |
| | | (114,734,035 | ) | | | (147,357,489 | ) | | | (5,210,791 | ) | | | (1,860,003 | ) |
| | | | |
Capital share transactions: | | | | | | | | | | | | | | | | |
Shares sold | | | 52,032,659 | | | | 130,442,780 | | | | 20,550,343 | | | | 66,278,469 | |
Shares issued to holders in reinvestment of dividends | | | 110,575,393 | | | | 141,564,243 | | | | 4,944,636 | | | | 1,820,831 | |
Shares redeemed | | | (250,164,891 | ) | | | (486,370,736 | ) | | | (23,662,326 | ) | | | (36,009,645 | ) |
Redemption fees | | | 16,912 | | | | 27,471 | | | | 8,430 | | | | 39,558 | |
| | | | | | | | | | | | | | | | |
Net increase (decrease) | | | (87,539,927 | ) | | | (214,336,242 | ) | | | 1,841,083 | | | | 32,129,213 | |
| | | | | | | | | | | | | | | | |
Total increase (decrease) in net assets | | | (63,287,911 | ) | | | (323,663,855 | ) | | | 12,631,898 | | | | 37,005,819 | |
| | | | |
Net assets: | | | | | | | | | | | | | | | | |
Beginning of period | | | 1,381,026,568 | | | | 1,704,690,423 | | | | 126,358,812 | | | | 89,352,993 | |
| | | | | | | | | | | | | | | | |
End of period | | $ | 1,317,738,657 | | | $ | 1,381,026,568 | | | $ | 138,990,710 | | | $ | 126,358,812 | |
| | | | | | | | | | | | | | | | |
Undistributed net investment income (loss) included in
net assets at end of period | | $ | (5,624,650 | ) | | $ | (209,317 | ) | | $ | (818,135 | ) | | $ | (149,555 | ) |
| | | | | | | | | | | | | | | | |
| | | | |
Capital share transactions — shares: | | | | | | | | | | | | | | | | |
Shares sold | | | 1,247,711 | | | | 3,073,183 | | | | 1,374,107 | | | | 4,659,422 | |
Shares issued to holders in reinvestment of dividends | | | 2,761,623 | | | | 3,444,385 | | | | 334,097 | | | | 137,317 | |
Shares redeemed | | | (5,997,603 | ) | | | (11,718,400 | ) | | | (1,592,454 | ) | | | (2,638,897 | ) |
| | | | | | | | | | | | | | | | |
Net increase (decrease) in shares outstanding | | | (1,988,269 | ) | | | (5,200,832 | ) | | | 115,750 | | | | 2,157,842 | |
| | | | | | | | | | | | | | | | |
See notes to financial statements.
66
| | | | | | | | | | | | | | | | | | | | | | |
HERITAGE GROWTH
FUND | | | INTERNATIONAL GROWTH
FUND | | | INTERNATIONAL OPPORTUNITIES
FUND | |
| | | | | | | | | | | | | | | | | | | | | | |
Six Months
Ended
March 31, 2007
(Unaudited) | | | Year Ended
September 30, 2006 | | | Six Months
Ended
March 31, 2007
(Unaudited) | | | Year Ended
September 30, 2006 | | | Six Months
Ended
March 31, 2007
(Unaudited) | | | Year Ended
September 30, 2006 | |
| | | | | | | | | | | | | | | | | | | | | | |
| | | | | | | | | | | | | | | | | | | | | | |
| $ | (91,345 | ) | | $ | 42,790 | | | $ | (337,268 | ) | | $ | (1,612,059 | ) | | $ | (11,739 | ) | | $ | (99,504 | ) |
| | 6,441,726 | | | | 8,992,963 | | | | 34,626,593 | | | | 67,609,292 | | | | 3,073,349 | | | | 2,561,582 | |
| | 69,785 | | | | — | | | | — | | | | — | | | | — | | | | — | |
| | — | | | | — | | | | — | | | | — | | | | — | | | | — | |
| | 11,512,602 | | | | (2,397,326 | ) | | | 53,711,451 | | | | (7,047,206 | ) | | | 8,375,708 | | | | 4,519,447 | |
| | | | | | | | | | | | | | | | | | | | | | | |
| | 17,932,768 | | | | 6,638,427 | | | | 88,000,776 | | | | 58,950,027 | | | | 11,437,318 | | | | 6,981,525 | |
| | | | | | | | | | | | | | | | | | | | | | |
| | (23,660 | ) | | | (386,224 | ) | | | — | | | | — | | | | (62,484 | ) | | | — | |
| | (7,225,236 | ) | | | (8,141,020 | ) | | | (69,456,586 | ) | | | (9,365 | ) | | | (2,442,244 | ) | | | — | |
| | | | | | | | | | | | | | | | | | | | | | | |
| | (7,248,896 | ) | | | (8,527,244 | ) | | | (69,456,586 | ) | | | (9,365 | ) | | | (2,504,728 | ) | | | — | |
| | | | | | | | | | | | | | | | | | | | | | |
| | 18,098,730 | | | | 70,694,924 | | | | 38,202,719 | | | | 90,728,441 | | | | 3,711,250 | | | | 2,977,585 | |
| | 6,995,484 | | | | 8,190,379 | | | | 67,578,664 | | | | 9,068 | | | | 2,448,543 | | | | — | |
| | (44,829,598 | ) | | | (137,309,726 | ) | | | (48,457,820 | ) | | | (105,387,826 | ) | | | (1,522,651 | ) | | | (2,560,576 | ) |
| | 1,851 | | | | 23,494 | | | | 7,018 | | | | 52,133 | | | | 30 | | | | 15 | |
| | | | | | | | | | | | | | | | | | | | | | | |
| | (19,733,533 | ) | | | (58,400,929 | ) | | | 57,330,581 | | | | (14,598,184 | ) | | | 4,637,172 | | | | 417,024 | |
| | | | | | | | | | | | | | | | | | | | | | | |
| | (9,049,661 | ) | | | (60,289,746 | ) | | | 75,874,771 | | | | 44,342,478 | | | | 13,569,762 | | | | 7,398,549 | |
| | | | | | | | | | | | | | | | | | | | | | |
| | 244,380,352 | | | | 304,670,098 | | | | 383,134,639 | | | | 338,792,161 | | | | 36,838,542 | | | | 29,439,993 | |
| | | | | | | | | | | | | | | | | | | | | | | |
| $ | 235,330,691 | | | $ | 244,380,352 | | | $ | 459,009,410 | | | $ | 383,134,639 | | | $ | 50,408,304 | | | $ | 36,838,542 | |
| | | | | | | | | | | | | | | | | | | | | | | |
| $ | (93,338 | ) | | $ | 21,667 | | | $ | (850,022 | ) | | $ | (512,754 | ) | | $ | (139,929 | ) | | $ | (65,706 | ) |
| | | | | | | | | | | | | | | | | | | | | | | |
| | | | | | | | | | | | | | | | | | | | | | |
| | 1,535,638 | | | | 6,164,555 | | | | 1,773,748 | | | | 4,311,049 | | | | 1,191,375 | | | | 1,138,942 | |
| | 596,884 | | | | 717,196 | | | | 3,306,197 | | | | 461 | | | | 830,015 | | | | — | |
| | (3,774,317 | ) | | | (12,096,491 | ) | | | (2,231,173 | ) | | | (5,080,255 | ) | | | (513,127 | ) | | | (999,753 | ) |
| | | | | | | | | | | | | | | | | | | | | | | |
| | (1,641,795 | ) | | | (5,214,740 | ) | | | 2,848,772 | | | | (768,745 | ) | | | 1,508,263 | | | | 139,189 | |
| | | | | | | | | | | | | | | | | | | | | | | |
67
| | |
| WASATCH FUNDS — Statements of Changes in Net Assets (continued) | | |
|
| |
| |
| | | | | | | | | | | | | | | | |
| | | MICRO CAP
FUND | | | MICRO CAP VALUE
FUND | |
| | | Six Months
Ended
March 31, 2007
(Unaudited) | | | Year Ended
September 30, 2006 | | | Six Months
Ended
March 31, 2007
(Unaudited) | | | Year Ended
September 30, 2006 | |
| | | | | | | | | | | | | | | | |
Operations: | | | | | | | | | | | | | | | | |
Net investment income (loss) | | $ | (3,782,987 | ) | | $ | (8,206,446 | ) | | $ | (514,719 | ) | | $ | (926,578 | ) |
Net realized gain on investments and foreign
currency translations | | | 59,403,136 | | | | 70,834,183 | | | | 9,809,907 | | | | 18,831,298 | |
Net realized gain on options written | | | 162,745 | | | | — | | | | 461,313 | | | | 28,361 | |
Net realized gain (loss) on short positions | | | — | | | | — | | | | — | | | | 149,589 | |
Change in unrealized appreciation (depreciation) on
investments and foreign currency translations | | | 18,500,007 | | | | (14,703,647 | ) | | | 6,171,955 | | | | (1,980,425 | ) |
| | | | | | | | | | | | | | | | |
Net increase in net assets resulting from operations | | | 74,282,901 | | | | 47,924,090 | | | | 15,928,456 | | | | 16,102,245 | |
| | | | |
Dividends paid from: | | | | | | | | | | | | | | | | |
Net investment income | | | — | | | | — | | | | — | | | | — | |
Net realized gains | | | (67,720,917 | ) | | | (101,306,137 | ) | | | (18,395,781 | ) | | | (8,245,400 | ) |
| | | | | | | | | | | | | | | | |
| | | (67,720,917 | ) | | | (101,306,137 | ) | | | (18,395,781 | ) | | | (8,245,400 | ) |
| | | | |
Capital share transactions: | | | | | | | | | | | | | | | | |
Shares sold | | | 8,018,689 | | | | 17,003,311 | | | | 6,211,734 | | | | 2,557,227 | |
Shares issued to holders in reinvestment of dividends | | | 65,068,973 | | | | 95,482,943 | | | | 18,013,951 | | | | 8,086,056 | |
Shares redeemed | | | (33,876,221 | ) | | | (54,449,841 | ) | | | (3,904,472 | ) | | | (9,895,964 | ) |
Redemption fees | | | 275 | | | | 2,863 | | | | 91 | | | | 126 | |
| | | | | | | | | | | | | | | | |
Net increase (decrease) | | | 39,211,716 | | | | 58,039,276 | | | | 20,321,304 | | | | 747,445 | |
| | | | | | | | | | | | | | | | |
Total increase (decrease) in net assets | | | 45,773,700 | | | | 4,657,229 | | | | 17,853,979 | | | | 8,604,290 | |
| | | | |
Net assets: | | | | | | | | | | | | | | | | |
Beginning of period | | | 583,901,095 | | | | 579,243,866 | | | | 95,507,720 | | | | 86,903,430 | |
| | | | | | | | | | | | | | | | |
End of period | | $ | 629,674,795 | | | $ | 583,901,095 | | | $ | 113,361,699 | | | $ | 95,507,720 | |
| | | | | | | | | | | | | | | | |
Undistributed net investment income (loss) included in
net assets at end of period | | $ | (3,782,987 | ) | | $ | — | | | $ | (529,588 | ) | | $ | (14,869 | ) |
| | | | | | | | | | | | | | | | |
| | | | |
Capital share transactions — shares: | | | | | | | | | | | | | | | | |
Shares sold | | | 1,168,220 | | | | 2,506,938 | | | | 2,184,030 | | | | 903,762 | |
Shares issued to holders in reinvestment of dividends | | | 9,799,544 | | | | 14,989,473 | | | | 6,647,214 | | | | 3,183,486 | |
Shares redeemed | | | (4,924,883 | ) | | | (7,969,522 | ) | | | (1,384,448 | ) | | | (3,521,837 | ) |
| | | | | | | | | | | | | | | | |
Net increase (decrease) in shares outstanding | | | 6,042,881 | | | | 9,526,889 | | | | 7,446,796 | | | | 565,411 | |
| | | | | | | | | | | | | | | | |
1Fund | | inception date was February 1, 2006. |
See notes to financial statements.
68
| | | | | | | | | | | | | | | | | | | | | | |
SMALL CAP GROWTH
FUND | | | SMALL CAP VALUE
FUND | | | STRATEGIC INCOME
FUND | |
Six Months
Ended
March 31, 2007
(Unaudited) | | | Year Ended
September 30, 2006 | | | Six Months
Ended
March 31, 2007
(Unaudited) | | | Year Ended
September 30, 2006 | | | Six Months
Ended
March 31, 2007
(Unaudited) | | | Year Ended
September 30, 20061 | |
| | | | | | | | | | | | | | | | | | | | | | |
| | | | | | | | | | | | | | | | | | | | | | |
| $ | (4,524,153 | ) | | $ | (8,645,084 | ) | | $ | 1,761,667 | | | $ | 5,759,674 | | | $ | 468,920 | | | $ | 326,699 | |
| | 74,724,493 | | | | 101,042,259 | | | | 108,499,199 | | | | 80,060,094 | | | | 380,951 | | | | 35,569 | |
| | — | | | | — | | | | 596,117 | | | | 133,119 | | | | — | | | | — | |
| | — | | | | — | | | | — | | | | (900,860 | ) | | | (39,112 | ) | | | — | |
| | 37,349,386 | | | | (72,428,953 | ) | | | (25,711,310 | ) | | | (29,137,020 | ) | | | 558,397 | | | | 414,337 | |
| | | | | | | | | | | | | | | | | | | | | | | |
| | 107,549,726 | | | | 19,968,222 | | | | 85,145,673 | | | | 55,915,007 | | | | 1,369,156 | | | | 776,605 | |
| | | | | |
| | | | | | | | | | | | | | | | | | | | | | |
| | — | | | | — | | | | (4,575,128 | ) | | | (8,588,688 | ) | | | (485,443 | ) | | | (273,109 | ) |
| | (92,699,099 | ) | | | (159,627,544 | ) | | | (84,556,543 | ) | | | (89,640,909 | ) | | | (54,563 | ) | | | — | |
| | | | | | | | | | | | | | | | | | | | | | | |
| | (92,699,099 | ) | | | (159,627,544 | ) | | | (89,131,671 | ) | | | (98,229,597 | ) | | | (540,006 | ) | | | (273,109 | ) |
| | | | | |
| | | | | | | | | | | | | | | | | | | | | | |
| | 77,831,393 | | | | 192,646,962 | | | | 43,281,274 | | | | 44,209,723 | | | | 18,056,779 | | | | 12,884,756 | |
| | 90,344,199 | | | | 153,540,530 | | | | 86,009,646 | | | | 94,863,257 | | | | 518,352 | | | | 260,187 | |
| | (185,716,566 | ) | | | (329,428,284 | ) | | | (84,378,262 | ) | | | (166,979,115 | ) | | | (3,330,334 | ) | | | (917,103 | ) |
| | 24,692 | | | | 16,285 | | | | 1,846 | | | | 3,571 | | | | 10,792 | | | | 696 | |
| | | | | | | | | | | | | | | | | | | | | | | |
| | (17,516,282 | ) | | | 16,775,493 | | | | 44,914,504 | | | | (27,902,564 | ) | | | 15,255,589 | | | | 12,228,536 | |
| | | | | | | | | | | | | | | | | | | | | | | |
| | (2,665,655 | ) | | | (122,883,829 | ) | | | 40,928,506 | | | | (70,217,154 | ) | | | 16,084,739 | | | | 12,732,032 | |
| | | | | |
| | | | | | | | | | | | | | | | | | | | | | |
| | 1,234,978,099 | | | | 1,357,861,928 | | | | 664,624,854 | | | | 734,842,008 | | | | 12,732,032 | | | | — | |
| | | | | | | | | | | | | | | | | | | | | | | |
| $ | 1,232,312,444 | | | $ | 1,234,978,099 | | | $ | 705,553,360 | | | $ | 664,624,854 | | | $ | 28,816,771 | | | $ | 12,732,032 | |
| | | | | | | | | | | | | | | | | | | | | | | |
| $ | (6,506,911 | ) | | $ | (1,982,758 | ) | | $ | 1,709,574 | | | $ | 4,523,035 | | | $ | 55,727 | | | $ | 72,250 | |
| | | | | | | | | | | | | | | | | | | | | | | |
| | | | | |
| | | | | | | | | | | | | | | | | | | | | | |
| | 2,055,237 | | | | 4,994,782 | | | | 8,214,056 | | | | 8,200,453 | | | | 1,577,453 | | | | 1,280,032 | |
| | 2,431,876 | | | | 4,151,988 | | | | 17,133,396 | | | | 18,822,075 | | | | 45,616 | | | | 25,265 | |
| | (4,889,658 | ) | | | (8,688,441 | ) | | | (15,878,530 | ) | | | (31,046,713 | ) | | | (299,615 | ) | | | (90,652 | ) |
| | | | | | | | | | | | | | | | | | | | | | | |
| | (402,545 | ) | | | 458,329 | | | | 9,468,922 | | | | (4,024,185 | ) | | | 1,323,454 | | | | 1,214,645 | |
| | | | | | | | | | | | | | | | | | | | | | | |
69
| | |
| WASATCH FUNDS — Statements of Changes in Net Assets (continued) | | MARCH 31, 2007 |
|
| |
| |
| | | | | | | | | | | | | | | | |
| | | ULTRA GROWTH
FUND | | | U.S. TREASURY
FUND | |
| | | Six Months
Ended
March 31, 2007
(Unaudited) | | | Year Ended
September 30, 2006 | | | Six Months
Ended
March 31, 2007
(Unaudited) | | | Year Ended
September 30, 2006 | |
| | | | | | | | | | | | | | | | |
Operations: | | | | | | | | | | | | | | | | |
Net investment income (loss) | | $ | (1,899,110 | ) | | $ | (4,286,204 | ) | | $ | 4,195,653 | | | $ | 7,369,958 | |
Net realized gain (loss) on investments and foreign
currency translations | | | 19,773,030 | | | | 26,032,281 | | | | (364,263 | ) | | | (157,464 | ) |
Net realized gain on options written | | | — | | | | 51,190 | | | | — | | | | — | |
Net realized loss on short positions | | | (127,631 | ) | | | — | | | | — | | | | — | |
Change in unrealized appreciation (depreciation) on
investments and foreign currency translations | | | 6,660,711 | | | | (23,377,185 | ) | | | (2,903,966 | ) | | | (1,981,422 | ) |
| | | | | | | | | | | | | | | | |
Net increase (decrease) in net assets resulting from operations | | | 24,407,000 | | | | (1,579,918 | ) | | | 927,424 | | | | 5,231,072 | |
| | | | |
Dividends paid from: | | | | | | | | | | | | | | | | |
Net investment income | | | — | | | | — | | | | (4,195,862 | ) | | | (9,215,585 | ) |
Net realized gains | | | (21,145,437 | ) | | | (51,353,961 | ) | | | — | | | | — | |
| | | | | | | | | | | | | | | | |
| | | (21,145,437 | ) | | | (51,353,961 | ) | | | (4,195,862 | ) | | | (9,215,585 | ) |
| | | | |
Capital share transactions: | | | | | | | | | | | | | | | | |
Shares sold | | | 10,176,269 | | | | 34,763,287 | | | | 29,149,926 | | | | 182,225,053 | |
Shares issued to holders in reinvestment of dividends | | | 20,567,611 | | | | 49,694,426 | | | | 3,910,770 | | | | 8,678,644 | |
Shares redeemed | | | (61,087,996 | ) | | | (115,021,608 | ) | | | (35,843,962 | ) | | | (64,651,364 | ) |
Redemption fees | | | 2,265 | | | | 9,719 | | | | 21,002 | | | | 127,924 | |
| | | | | | | | | | | | | | | | |
Net increase (decrease) | | | (30,341,851 | ) | | | (30,554,176 | ) | | | (2,762,264 | ) | | | 126,380,257 | |
| | | | | | | | | | | | | | | | |
Total increase (decrease) in net assets | | | (27,080,288 | ) | | | (83,488,055 | ) | | | (6,030,702 | ) | | | 122,395,744 | |
| | | | |
Net assets: | | | | | | | | | | | | | | | | |
Beginning of period | | | 306,406,275 | | | | 389,894,330 | | | | 204,994,306 | | | | 82,598,562 | |
| | | | | | | | | | | | | | | | |
End of period | | $ | 279,325,987 | | | $ | 306,406,275 | | | $ | 198,963,604 | | | $ | 204,994,306 | |
| | | | | | | | | | | | | | | | |
Undistributed net investment income (loss) included in
net assets at end of period | | $ | (1,773,582 | ) | | $ | 125,528 | | | $ | 150 | | | $ | 359 | |
| | | | | | | | | | | | | | | | |
| | | | |
Capital share transactions—shares: | | | | | | | | | | | | | | | | |
Shares sold | | | 411,651 | | | | 1,344,846 | | | | 2,083,330 | | | | 12,942,909 | |
Shares issued to holders in reinvestment of dividends | | | 848,849 | | | | 2,050,946 | | | | 280,744 | | | | 622,640 | |
Shares redeemed | | | (2,483,741 | ) | | | (4,609,864 | ) | | | (2,540,298 | ) | | | (4,671,486 | ) |
| | | | | | | | | | | | | | | | |
Net increase (decrease) in shares outstanding | | | (1,223,241 | ) | | | (1,214,072 | ) | | | (176,224 | ) | | | 8,894,063 | |
| | | | | | | | | | | | | | | | |
See notes to financial statements.
70
| | |
| WASATCH FUNDS — Financial Highlights | | MARCH 31, 2007 |
|
| |
| |
| | | | | | | | | | | | | | | | | | | | | | | | |
| CORE GROWTH FUND | | Six Months
Ended
March 31
(Unaudited) | | | Year Ended September 30 | |
| (for a share outstanding throughout each period) | | 2007 | | | 2006 | | | 2005 | | | 2004 | | | 2003 | | | 2002 | |
| | | | | | | | | | | | | | | | | | | | | | | | |
Net asset value, beginning of period | | $ | 41.08 | | | $ | 43.92 | | | $ | 38.49 | | | $ | 33.54 | | | $ | 25.46 | | | $ | 31.57 | |
| | | | | | |
Income (loss) from investment operations: | | | | | | | | | | | | | | | | | | | | | | | | |
Net investment income (loss) | | | (0.03 | ) | | | 0.17 | | | | 0.56 | | | | 0.13 | | | | (0.01 | ) | | | (0.01 | ) |
Net realized and unrealized gains (losses) on investments | | | 4.31 | | | | 0.90 | | | | 6.41 | | | | 4.84 | | | | 8.09 | | | | (3.97 | ) |
Net increase from payment by affiliate | | | — | | | | — | | | | — | 1 | | | — | | | | — | | | | — | |
| | | | | | | | | | | | | | | | | | | | | | | | |
Total from investment operations | | | 4.28 | | | | 1.07 | | | | 6.97 | | | | 4.97 | | | | 8.08 | | | | (3.98 | ) |
| | | | | | |
Redemption fees (see Note 2) | | | — | 1 | | | — | 1 | | | — | 1 | | | — | 1 | | | — | 1 | | | 0.01 | |
| | | | | | |
Less distributions: | | | | | | | | | | | | | | | | | | | | | | | | |
Dividends from net investment income | | | (0.14 | ) | | | (0.63 | ) | | | (0.22 | ) | | | (0.02 | ) | | | — | | | | — | |
Distributions from net realized gains | | | (3.56 | ) | | | (3.28 | ) | | | (1.32 | ) | | | — | | | | — | | | | (2.14 | ) |
| | | | | | | | | | | | | | | | | | | | | | | | |
Total distributions | | | (3.70 | ) | | | (3.91 | ) | | | (1.54 | ) | | | (0.02 | ) | | | — | | | | (2.14 | ) |
| | | | | | | | | | | | | | | | | | | | | | | | |
Net asset value, end of period | | $ | 41.66 | | | $ | 41.08 | | | $ | 43.92 | | | $ | 38.49 | | | $ | 33.54 | | | $ | 25.46 | |
| | | | | | | | | | | | | | | | | | | | | | | | |
Total return2 4 | | | 10.77% | | | | 2.46% | | | | 18.58% | | | | 14.80% | | | | 31.68% | | | | (13.73)% | |
| | | | | | |
Supplemental data and ratios: | | | | | | | | | | | | | | | | | | | | | | | | |
Net assets, end of period (in thousands) | | $ | 1,317,739 | | | $ | 1,381,027 | | | $ | 1,704,690 | | | $ | 1,496,969 | | | $ | 1,318,341 | | | $ | 1,062,944 | |
Ratio of expenses to average net assets3 | | | 1.20% | | | | 1.17% | | | | 1.20% | | | | 1.21% | | | | 1.25% | | | | 1.29% | |
Ratio of net investment income (loss) to average net assets3 | | | (0.18)% | | | | 0.38% | | | | 1.30% | | | | 0.34% | | | | (0.02)% | | | | (0.02)% | |
Portfolio turnover rate2 | | | 25% | | | | 42% | | | | 42% | | | | 47% | | | | 47% | | | | 76% | |
| | |
| GLOBAL SCIENCE & TECHNOLOGY FUND | | Six Months
Ended
March 31 (Unaudited) | | | Year Ended September 30 | |
| (for a share outstanding throughout each period) | | 2007 | | | 2006 | | | 2005 | | | 2004 | | | 2003 | | | 2002 | |
Net asset value, beginning of period | | $ | 13.97 | | | $ | 12.98 | | | $ | 10.15 | | | $ | 10.73 | | | $ | 6.38 | | | $ | 8.02 | |
| | | | | | |
Income (loss) from investment operations: | | | | | | | | | | | | | | | | | | | | | | | | |
Net investment loss | | | (0.07 | ) | | | (0.14 | ) | | | (0.16 | ) | | | (0.18 | ) | | | (0.13 | ) | | | (0.15 | ) |
Net realized and unrealized gains (losses) on investments | | | 1.87 | | | | 1.40 | | | | 2.99 | | | | (0.41 | ) | | | 4.47 | | | | (1.34 | ) |
Net increase from payment by affiliate | | | — | | | | — | | | | — | 1 | | | — | | | | — | | | | — | |
| | | | | | | | | | | | | | | | | | | | | | | | |
Total from investment operations | | | 1.80 | | | | 1.26 | | | | 2.83 | | | | (0.59 | ) | | | 4.34 | | | | (1.49 | ) |
| | | | | | |
Redemption fees (see Note 2) | | | — | 1 | | | — | 1 | | | — | 1 | | | 0.01 | | | | 0.01 | | | | 0.03 | |
| | | | | | |
Less distributions: | | | | | | | | | | | | | | | | | | | | | | | | |
Distributions from net realized gains | | | (0.59 | ) | | | (0.27 | ) | | | — | | | | — | | | | — | | | | (0.18 | ) |
| | | | | | | | | | | | | | | | | | | | | | | | |
Total distributions | | | (0.59 | ) | | | (0.27 | ) | | | — | | | | — | | | | — | | | | (0.18 | ) |
| | | | | | | | | | | | | | | | | | | | | | | | |
Net asset value, end of period | | $ | 15.18 | | | $ | 13.97 | | | $ | 12.98 | | | $ | 10.15 | | | $ | 10.73 | | | $ | 6.38 | |
| | | | | | | | | | | | | | | | | | | | | | | | |
Total return2 5 | | | 12.96% | | | | 9.81% | | | | 27.88% | | | | (5.49)% | | | | 68.34% | | | | (18.83)% | |
| | | | | | |
Supplemental data and ratios: | | | | | | | | | | | | | | | | | | | | | | | | |
Net assets, end of period (in thousands) | | $ | 138,991 | | | $ | 126,359 | | | $ | 89,353 | | | $ | 69,301 | | | $ | 51,517 | | | $ | 20,811 | |
Ratio of expenses to average net assets: | | | | | | | | | | | | | | | | | | | | | | | | |
Net of waivers and reimbursements3 | | | 1.90% | | | | 1.94% | | | | 1.95% | | | | 1.95% | | | | 1.95% | | | | 1.95% | |
Before waivers and reimbursements3 | | | 1.90% | | | | 1.94% | | | | 1.97% | | | | 1.97% | | | | 2.13% | | | | 2.42% | |
Ratio of net investment loss to average net assets: | | | | | | | | | | | | | | | | | | | | | | | | |
Net of waivers and reimbursements3 | | | (0.99)% | | | | (1.15)% | | | | (1.52)% | | | | (1.66)% | | | | (1.87)% | | | | (1.90)% | |
Before waivers and reimbursements3 | | | (0.99)% | | | | (1.15)% | | | | (1.54)% | | | | (1.68)% | | | | (2.05)% | | | | (2.37)% | |
Portfolio turnover rate2 | | | 50% | | | | 58% | | | | 80% | | | | 55% | | | | 88% | | | | 95% | |
1Represents | | amounts less than $.005 per share. |
2Not | | annualized for periods less than one year. |
4In | | 2005, 0.03% of the Fund’s total return consisted of a voluntary reimbursement by the Advisor for amounts relating to errors in applying the Fund’s cross-trading policies. Excluding this item, the total return would have been 18.55%. |
5In | | 2005, the Fund’s total return included a voluntary reimbursement by the Advisor for amounts relating to errors in applying the Funds’ cross-trading policies that had no impact on the total return. |
See notes to financial statements.
71
| | |
| WASATCH FUNDS — Financial Highlights (continued) | | MARCH 31, 2007 |
|
| |
| |
| | | | | | | | | | | | | | | | | | | | | | | | |
| HERITAGE GROWTH FUND | | Six Months
Ended
March 31
(Unaudited) | | | Year or Period Ended September 30 | | | | | | | |
| | | | | | | | | | | | | | | | | | | | | | | | |
| (for a share outstanding throughout each period) | | 2007 | | | 2006 | | | 2005 | | | 20041 | | | | | | | |
Net asset value, beginning of period | | $ | 11.40 | | | $ | 11.43 | | | $ | 9.86 | | | $ | 10.00 | | | | | | | | | |
| | | | | | |
Income (loss) from investment operations: | | | | | | | | | | | | | | | | | | | | | | | | |
Net investment income (loss) | | | (0.01 | ) | | | — | 2 | | | 0.02 | | | | — | 2 | | | | | | | | |
Net realized and unrealized gains (losses) on investments | | | 0.84 | | | | 0.28 | | | | 1.55 | | | | (0.14 | ) | | | | | | | | |
Net increase from payment by affiliate | | | — | | | | — | | | | — | 2 | | | — | | | | | | | | | |
| | | | | | | | | | | | | | | | | | | | | | | | |
Total from investment operations | | | 0.83 | | | | 0.28 | | | | 1.57 | | | | (0.14 | ) | | | | | | | | |
| | | | | | |
Redemption fees (see Note 2) | | | — | 2 | | | — | 2 | | | — | 2 | | | — | 2 | | | | | | | | |
| | | | | | |
Less distributions: | | | | | | | | | | | | | | | | | | | | | | | | |
Dividends from net investment income | | | — | 2 | | | (0.01 | ) | | | — | | | | — | | | | | | | | | |
Distributions from net realized gains | | | (0.35 | ) | | | (0.30 | ) | | | — | 2 | | | — | | | | | | | | | |
| | | | | | | | | | | | | | | | | | | | | | | | |
Total distributions | | | (0.35 | ) | | | (0.31 | ) | | | — | 2 | | | — | | | | | | | | | |
| | | | | | | | | | | | | | | | | | | | | | | | |
Net asset value, end of period | | $ | 11.88 | | | $ | 11.40 | | | $ | 11.43 | | | $ | 9.86 | | | | | | | | | |
| | | | | | | | | | | | | | | | | | | | | | | | |
Total return3 6 | | | 7.35% | | | | 2.46% | | | | 15.95% | | | | (1.40)% | | | | | | | | | |
| | | | | | |
Supplemental data and ratios: | | | | | | | | | | | | | | | | | | | | | | | | |
Net assets, end of period (in thousands) | | $ | 235,331 | | | $ | 244,380 | | | $ | 304,670 | | | $ | 128,136 | | | | | | | | | |
Ratio of expenses to average net assets: | | | | | | | | | | | | | | | | | | | | | | | | |
Net of waivers and reimbursements4 | | | 0.95% | | | | 0.95% | | | | 0.95% | | | | 0.95% | | | | | | | | | |
Before waivers and reimbursements4 | | | 0.98% | | | | 0.95% | | | | 0.99% | | | | 1.26% | | | | | | | | | |
Ratio of net investment income (loss) to average net assets: | | | | | | | | | | | | | | | | | | | | | | | | |
Net of waivers and reimbursements4 | | | (0.07)% | | | | 0.01% | | | | 0.17% | | | | (0.01)% | | | | | | | | | |
Before waivers and reimbursements4 | | | (0.10)% | | | | 0.01% | | | | 0.13% | | | | (0.32)% | | | | | | | | | |
Portfolio turnover rate3 | | | 26% | | | | 54% | | | | 36% | | | | 5% | | | | | | | | | |
| | |
| INTERNATIONAL GROWTH FUND | | Six Months
Ended
March 31
(Unaudited) | | | Year or Period Ended September 30 | |
| (for a share outstanding throughout each period) | | 2007 | | | 2006 | | | 2005 | | | 2004 | | | 2003 | | | 20025 | |
Net asset value, beginning of period | | $ | 21.83 | | | $ | 18.50 | | | $ | 14.71 | | | $ | 12.06 | | | $ | 8.85 | | | $ | 10.00 | |
| | | | | | |
Income (loss) from investment operations: | | | | | | | | | | | | | | | | | | | | | | | | |
Net investment loss | | | (0.01 | ) | | | (0.09 | ) | | | (0.10 | ) | | | (0.11 | ) | | | (0.07 | ) | | | (0.03 | ) |
Net realized and unrealized gains (losses) on investments | | | 4.73 | | | | 3.42 | | | | 3.91 | | | | 2.76 | | | | 3.28 | | | | (1.13 | ) |
Net increase from payment by affiliate | | | — | | | | — | | | | 0.01 | | | | — | | | | — | | | | — | |
| | | | | | | | | | | | | | | | | | | | | | | | |
Total from investment operations | | | 4.72 | | | | 3.33 | | | | 3.82 | | | | 2.65 | | | | 3.21 | | | | (1.16 | ) |
| | | | | | |
Redemption fees (see Note 2) | | | — | 2 | | | — | 2 | | | — | 2 | | | — | 2 | | | — | 2 | | | 0.01 | |
| | | | | | |
Less distributions: | | | | | | | | | | | | | | | | | | | | | | | | |
Distributions from net realized gains | | | (4.05 | ) | | | — | 2 | | | (0.03 | ) | | | — | | | | — | | | | — | |
| | | | | | | | | | | | | | | | | | | | | | | | |
Total distributions | | | (4.05 | ) | | | — | 2 | | | (0.03 | ) | | | — | | | | — | | | | — | |
| | | | | | | | | | | | | | | | | | | | | | | | |
Net asset value, end of period | | $ | 22.50 | | | $ | 21.83 | | | $ | 18.50 | | | $ | 14.71 | | | $ | 12.06 | | | $ | 8.85 | |
| | | | | | | | | | | | | | | | | | | | | | | | |
Total return3 7 8 | | | 23.48% | | | | 18.00% | | | | 26.02% | | | | 21.97% | | | | 36.27% | | | | (11.50)% | |
| | | | | | |
Supplemental data and ratios: | | | | | | | | | | | | | | | | | | | | | | | | |
Net assets, end of period (in thousands) | | $ | 459,009 | | | $ | 383,135 | | | $ | 338,792 | | | $ | 196,990 | | | $ | 44,482 | | | $ | 18,008 | |
Ratio of expenses to average net assets: | | | | | | | | | | | | | | | | | | | | | | | | |
Net of waivers and reimbursements4 | | | 1.76% | | | | 1.78% | | | | 1.84% | | | | 1.92% | | | | 1.95% | | | | 1.95% | |
Before waivers and reimbursements4 | | | 1.76% | | | | 1.78% | | | | 1.84% | | | | 1.92% | | | | 2.30% | | | | 4.26% | |
Ratio of net investment loss to average net assets: | | | | | | | | | | | | | | | | | | | | | | | | |
Net of waivers and reimbursements4 | | | (0.16)% | | | | (0.42)% | | | | (0.64)% | | | | (1.06)% | | | | (1.12)% | | | | (1.39)% | |
Before waivers and reimbursements4 | | | (0.16)% | | | | (0.42)% | | | | (0.64)% | | | | (1.06)% | | | | (1.47)% | | | | (3.70)% | |
Portfolio turnover rate3 | | | 35% | | | | 64% | | | | 32% | | | | 31% | | | | 62% | | | | 3% | |
1Fund | | inception date was June 18, 2004. |
2Represents | | amounts less than $.005 per share. |
3Not | | annualized for periods less than one year. |
5 | | Fund inception date was June 28, 2002. |
6In | | 2005, the Fund’s total return included a voluntary reimbursement by the Advisor for amounts relating to errors in applying the Funds’ cross-trading policies that had no impact on the total return. |
7In | | 2005, 0.07% of the Fund’s total return consisted of a voluntary reimbursement by the Advisor for a realized investment loss. Excluding this item, the total return would have been 25.95%. The Fund’s total return also included, in 2005, a voluntary reimbursement by the Advisor for amounts relating to errors in applying the Funds’ cross-trading policies that had no impact on the total return. |
8In | | 2006, the Fund’s total return included a voluntary reimbursement by the Advisor for an amount relating to an incorrect settlement that had no impact on the total return. |
See notes to financial statements.
72
| | | | | | | | | | | | | | | | | | | | | | | | |
| INTERNATIONAL OPPORTUNITIES FUND | | Six Months
Ended
March 31
(Unaudited) | | | Year or Period Ended September 30 | | | | | | | | | | |
| (for a share outstanding throughout each period) | | 2007 | | | 2006 | | | 20051 | | | | | | | | | | |
| | | | | | | | | | | | | | | | | | | | | | | | |
Net asset value, beginning of period | | $ | 2.71 | | | $ | 2.19 | | | $ | 2.00 | | | | | | | | | | | | | |
| | | | | | |
Income (loss) from investment operations: | | | | | | | | | | | | | | | | | | | | | | | | |
Net investment loss | | | — | 2 | | | (0.01 | ) | | | — | 2 | | | | | | | | | | | | |
Net realized and unrealized gains on investments | | | 0.81 | | | | 0.53 | | | | 0.19 | | | | | | | | | | | | | |
| | | | | | | | | | | | | | | | | | | | | | | | |
Total from investment operations | | | 0.81 | | | | 0.52 | | | | 0.19 | | | | | | | | | | | | | |
| | | | | | |
Redemption fees (see Note 2) | | | — | 2 | | | — | 2 | | | — | 2 | | | | | | | | | | | | |
| | | | | | |
Less distributions: | | | | | | | | | | | | | | | | | | | | | | | | |
Dividends from net investment income | | | — | 2 | | | — | | | | — | | | | | | | | | | | | | |
Distributions from net realized gains | | | (0.18 | ) | | | — | | | | — | | | | | | | | | | | | | |
| | | | | | | | | | | | | | | | | | | | | | | | |
Total distributions | | | (0.18 | ) | | | — | | | | — | | | | | | | | | | | | | |
| | | | | | | | | | | | | | | | | | | | | | | | |
Net asset value, end of period | | $ | 3.34 | | | $ | 2.71 | | | $ | 2.19 | | | | | | | | | | | | | |
| | | | | | | | | | | | | | | | | | | | | | | | |
Total return3 | | | 30.96% | | | | 23.74% | | | | 9.50% | | | | | | | | | | | | | |
| | | | | | |
Supplemental data and ratios: | | | | | | | | | | | | | | | | | | | | | | | | |
Net assets, end of period (in thousands) | | $ | 50,408 | | | $ | 36,839 | | | $ | 29,440 | | | | | | | | | | | | | |
Ratio of expenses to average net assets: | | | | | | | | | | | | | | | | | | | | | | | | |
Net of waivers and reimbursements4 | | | 2.25% | | | | 2.25% | | | | 2.25% | | | | | | | | | | | | | |
Before waivers and reimbursements4 | | | 2.51% | | | | 2.62% | | | | 3.09% | | | | | | | | | | | | | |
Ratio of net investment income (loss) to average net assets: | | | | | | | | | | | | | | | | | | | | | | | | |
Net of waivers and reimbursements4 | | | (0.06)% | | | | (0.29)% | | | | (0.21)% | | | | | | | | | | | | | |
Before waivers and reimbursements4 | | | (0.32)% | | | | (0.66)% | | | | 1.05% | | | | | | | | | | | | | |
Portfolio turnover rate3 | | | 28% | | | | 43% | | | | 12% | | | | | | | | | | | | | |
| | |
| MICRO CAP FUND | | Six Months
Ended
March 31
(Unaudited) | | | Year Ended September 30 | |
| (for a share outstanding throughout each period) | | 2007 | | | 2006 | | | 2005 | | | 2004 | | | 2003 | | | 2002 | |
Net asset value, beginning of period | | $ | 6.79 | | | $ | 7.58 | | | $ | 7.05 | | | $ | 6.98 | | | $ | 5.01 | | | $ | 5.64 | |
| | | | | | |
Income (loss) from investment operations: | | | | | | | | | | | | | | | | | | | | | | | | |
Net investment loss | | | (0.04 | ) | | | (0.10 | ) | | | (0.11 | ) | | | (0.15 | ) | | | (0.12 | ) | | | (0.14 | ) |
Net realized and unrealized gains on investments | | | 0.89 | | | | 0.65 | | | | 1.70 | | | | 0.81 | | | | 2.43 | | | | 0.11 | |
Net increase from payment by affiliate | | | — | | | | — | | | | — | 2 | | | — | | | | — | | | | — | |
| | | | | | | | | | | | | | | | | | | | | | | | |
Total from investment operations | | | 0.85 | | | | 0.55 | | | | 1.59 | | | | 0.66 | | | | 2.31 | | | | (0.03 | ) |
| | | | | | |
Redemption fees (see Note 2) | | | — | 2 | | | — | 2 | | | — | 2 | | | — | 2 | | | — | 2 | | | — | 2 |
| | | | | | |
Less distributions: | | | | | | | | | | | | | | | | | | | | | | | | |
Distributions from net realized gains | | | (0.80 | ) | | | (1.34 | ) | | | (1.06 | ) | | | (0.59 | ) | | | (0.34 | ) | | | (0.60 | ) |
| | | | | | | | | | | | | | | | | | | | | | | | |
Total distributions | | | (0.80 | ) | | | (1.34 | ) | | | (1.06 | ) | | | (0.59 | ) | | | (0.34 | ) | | | (0.60 | ) |
| | | | | | | | | | | | | | | | | | | | | | | | |
Net asset value, end of period | | $ | 6.84 | | | $ | 6.79 | | | $ | 7.58 | | | $ | 7.05 | | | $ | 6.98 | | | $ | 5.01 | |
| | | | | | | | | | | | | | | | | | | | | | | | |
Total return3 5 | | | 12.94% | | | | 8.51% | | | | 26.42% | | | | 9.96% | | | | 50.28% | | | | (1.41)% | |
| | | | | | |
Supplemental data and ratios: | | | | | | | | | | | | | | | | | | | | | | | | |
Net assets, end of period (in thousands) | | $ | 629,675 | | | $ | 583,901 | | | $ | 579,244 | | | $ | 518,291 | | | $ | 517,179 | | | $ | 327,548 | |
Ratio of expenses to average net assets4 | | | 2.14% | | | | 2.14% | | | | 2.18% | | | | 2.19% | | | | 2.24% | | | | 2.28% | |
Ratio of net investment loss to average net assets4 | | | (1.23)% | | | | (1.39)% | | | | (1.58)% | | | | (1.95)% | | | | (2.13)% | | | | (2.21)% | |
Portfolio turnover rate3 | | | 22% | | | | 46% | | | | 50% | | | | 56% | | | | 50% | | | | 62% | |
1Fund | | inception date was January 27, 2005. |
2Represents | | amounts less than $.005 per share. |
3Not | | annualized for periods less than one year. |
5In | | 2005, the Fund’s total return included a voluntary reimbursement by the Advisor for amounts relating to errors in applying the Funds’ cross-trading policies that had no impact on the total return. |
See notes to financial statements.
73
| | |
| WASATCH FUNDS — Financial Highlights (continued) | | MARCH 31, 2007 |
|
| |
| |
| | | | | | | | | | | | | | | | | | | | | | | | |
| MICRO CAP VALUE FUND | | Six Months
Ended
March 31
(Unaudited) | | | Year or Period Ended September 30 | | | | |
| (for a share outstanding throughout each period) | | 2007 | | | 2006 | | | 2005 | | | 2004 | | | 20031 | | | | |
| | | | | | | | | | | | | | | | | | | | | | | | |
Net asset value, beginning of period | | $ | 2.93 | | | $ | 2.72 | | | $ | 2.57 | | | $ | 2.09 | | | $ | 2.00 | | | | | |
| | | | | | |
Income (loss) from investment operations: | | | | | | | | | | | | | | | | | | | | | | | | |
Net investment loss | | | (0.01 | ) | | | (0.03 | ) | | | (0.04 | ) | | | (0.05 | ) | | | (0.01 | ) | | | | |
Net realized and unrealized gains on investments | | | 0.47 | | | | 0.50 | | | | 0.49 | | | | 0.53 | | | | 0.10 | | | | | |
Net increase from payment by affiliate | | | — | | | | — | | | | — | 2 | | | — | | | | — | | | | | |
| | | | | | | | | | | | | | | | | | | | | | | | |
Total from investment operations | | | 0.46 | | | | 0.47 | | | | 0.45 | | | | 0.48 | | | | 0.09 | | | | | |
| | | | | | |
Redemption fees (see Note 2) | | | — | 2 | | | — | 2 | | | — | 2 | | | — | 2 | | | — | 2 | | | | |
| | | | | | |
Less distributions: | | | | | | | | | | | | | | | | | | | | | | | | |
Distributions from net realized gains | | | (0.56 | ) | | | (0.26 | ) | | | (0.30 | ) | | | — | 2 | | | — | | | | | |
| | | | | | | | | | | | | | | | | | | | | | | | |
Total distributions | | | (0.56 | ) | | | (0.26 | ) | | | (0.30 | ) | | | — | | | | — | | | | | |
| | | | | | | | | | | | | | | | | | | | | | | | |
Net asset value, end of period | | $ | 2.83 | | | $ | 2.93 | | | $ | 2.72 | | | $ | 2.57 | | | $ | 2.09 | | | | | |
| | | | | | | | | | | | | | | | | | | | | | | | |
Total return3 5 | | | 16.65% | | | | 18.89% | | | | 19.87% | | | | 23.06% | | | | 4.50% | | | | | |
| | | | | | |
Supplemental data and ratios: | | | | | | | | | | | | | | | | | | | | | | | | |
Net assets, end of period (in thousands) | | $ | 113,362 | | | $ | 95,508 | | | $ | 86,903 | | | $ | 84,835 | | | $ | 70,706 | | | | | |
Ratio of expenses to average net assets: | | | | | | | | | | | | | | | | | | | | | | | | |
Net of waivers and reimbursements4 6 | | | 2.25% | | | | 2.25% | | | | 2.25% | | | | 2.27% | | | | 2.50% | | | | | |
Before waivers and reimbursements4 | | | 2.30% | | | | 2.33% | | | | 2.36% | | | | 2.38% | | | | 2.73% | | | | | |
Ratio of net investment loss to average net assets: | | | | | | | | | | | | | | | | | | | | | | | | |
Net of waivers and reimbursements4 | | | (0.98)% | | | | (0.99)% | | | | (1.41)% | | | | (1.76)% | | | | (1.97)% | | | | | |
Before waivers and reimbursements4 | | | (1.03)% | | | | (1.07)% | | | | (1.52)% | | | | (1.87)% | | | | (2.20)% | | | | | |
Portfolio turnover rate3 | | | 49% | | | | 95% | | | | 85% | | | | 101% | | | | 4% | | | | | |
| | |
| SMALL CAP GROWTH FUND | | Six Months
Ended
March 31
(Unaudited) | | | Year Ended September 30 | |
| (for a share outstanding throughout each period) | | 2007 | | | 2006 | | | 2005 | | | 2004 | | | 2003 | | | 2002 | |
Net asset value, beginning of period | | $ | 36.99 | | | $ | 41.23 | | | $ | 34.94 | | | $ | 32.43 | | | $ | 23.83 | | | $ | 26.18 | |
| | | | | | |
Income (loss) from investment operations: | | | | | | | | | | | | | | | | | | | | | | | | |
Net investment loss | | | (0.14 | ) | | | (0.26 | ) | | | (0.25 | ) | | | (0.33 | ) | | | (0.28 | ) | | | (0.35 | ) |
Net realized and unrealized gains (losses) on investments | | | 3.43 | | | | 0.84 | | | | 7.32 | | | | 3.01 | | | | 8.88 | | | | (1.55 | ) |
Net increase from payment by affiliate | | | — | | | | — | | | | — | 2 | | | — | | | | — | | | | — | |
| | | | | | | | | | | | | | | | | | | | | | | | |
Total from investment operations | | | 3.29 | | | | 0.58 | | | | 7.07 | | | | 2.68 | | | | 8.60 | | | | (1.90 | ) |
| | | | | | |
Redemption fees (see Note 2) | | | — | 2 | | | — | 2 | | | — | 2 | | | — | 2 | | | — | 2 | | | — | 2 |
| | | | | | |
Less distributions: | | | | | | | | | | | | | | | | | | | | | | | | |
Distributions from net realized gains | | | (2.92 | ) | | | (4.82 | ) | | | (0.78 | ) | | | (0.17 | ) | | | — | 2 | | | (0.45 | ) |
| | | | | | | | | | | | | | | | | | | | | | | | |
Total distributions | | | (2.92 | ) | | | (4.82 | ) | | | (0.78 | ) | | | (0.17 | ) | | | — | | | | (0.45 | ) |
| | | | | | | | | | | | | | | | | | | | | | | | |
Net asset value, end of period | | $ | 37.36 | | | $ | 36.99 | | | $ | 41.23 | | | $ | 34.94 | | | $ | 32.43 | | | $ | 23.83 | |
| | | | | | | | | | | | | | | | | | | | | | | | |
Total return3 7 | | | 8.95% | | | | 1.40% | | | | 20.73% | | | | 8.27% | | | | 36.15% | | | | (7.53)% | |
| | | | | | |
Supplemental data and ratios: | | | | | | | | | | | | | | | | | | | | | | | | |
Net assets, end of period (in thousands) | | $ | 1,232,312 | | | $ | 1,234,978 | | | $ | 1,357,862 | | | $ | 1,191,702 | | | $ | 1,134,398 | | | $ | 735,417 | |
Ratio of expenses to average net assets4 8 | | | 1.19% | | | | 1.18% | | | | 1.18% | | | | 1.20% | | | | 1.25% | | | | 1.31% | |
Ratio of net investment loss to average net assets4 | | | (0.72)% | | | | (0.64)% | | | | (0.62)% | | | | (0.91)% | | | | (1.08)% | | | | (1.25)% | |
Portfolio turnover rate3 | | | 23% | | | | 41% | | | | 36% | | | | 41% | | | | 63% | | | | 51% | |
1Fund inception date was July 28, 2003.
2Represents amounts less than $.005 per share.
3Not annualized for periods less than one year.
4Annualized.
5In 2005, the Fund’s total return included a voluntary reimbursement by the Advisor for a realized investment loss that had no impact on the total return.
6On February 1, 2004, the Advisor reduced the contractual expense limitation from 2.50% to 2.25% through January 31, 2005. As a result, the effective expense ratio net of waivers and reimbursements for the period ended September 30, 2004 was 2.27%.
7In 2005, the Fund’s total return included a voluntary reimbursement by the Advisor for amounts relating to errors in applying the Funds’ cross-trading policies that had no impact on the total return. The effect of net realized gains on the disposal of investments in violation of an investment restriction on total return was less than .01%.
8In 2006, the Fund received a reimbursement of investment advisory fees, which had an impact on the Fund’s expense ratio of less than 0.01%.
See notes to financial statements.
74
| | | | | | | | | | | | | | | | | | | | | | | | |
| SMALL CAP VALUE FUND | | Six Months
Ended
March 31
(Unaudited) | | | Year Ended September 30 | |
| (for a share outstanding throughout each period) | | 2007 | | | 2006 | | | 2005 | | | 2004 | | | 2003 | | | 2002 | |
| | | | | | | | | | | | | | | | | | | | | | | | |
| | | | | | | | | | | | | | | | | | | | | | | | |
Net asset value, beginning of period | | $ | 5.29 | | | $ | 5.67 | | | $ | 5.54 | | | $ | 4.62 | | | $ | 3.21 | | | $ | 3.76 | |
| | | | | | |
Income (loss) from investment operations: | | | | | | | | | | | | | | | | | | | | | | | | |
Net investment income (loss) | | | 0.02 | | | | 0.05 | | | | 0.05 | | | | (0.01 | ) | | | (0.02 | ) | | | (0.02 | ) |
Net realized and unrealized gains (losses) on investments | | | 0.67 | | | | 0.36 | | | | 0.86 | | | | 0.93 | | | | 1.43 | | | | (0.43 | ) |
Net increase from payment by affiliate | | | — | | | | — | | | | — | 1 | | | — | | | | — | | | | — | |
| | | | | | | | | | | | | | | | | | | | | | | | |
Total from investment operations | | | 0.69 | | | | 0.41 | | | | 0.91 | | | | 0.92 | | | | 1.41 | | | | (0.45 | ) |
| | | | | | |
Redemption fees (see Note 2) | | | — | 1 | | | — | 1 | | | — | 1 | | | — | 1 | | | — | 1 | | | — | 1 |
| | | | | | |
Less distributions: | | | | | | | | | | | | | | | | | | | | | | | | |
Dividends from net investment income | | | (0.04 | ) | | | (0.07 | ) | | | — | | | | — | | | | — | | | | — | |
Distributions from net realized gains | | | (0.71 | ) | | | (0.72 | ) | | | (0.78 | ) | | | — | 1 | | | — | | | | (0.10 | ) |
| | | | | | | | | | | | | | | | | | | | | | | | |
Total distributions | | | (0.75 | ) | | | (0.79 | ) | | | (0.78 | ) | | | — | | | | — | | | | (0.10 | ) |
| | | | | | | | | | | | | | | | | | | | | | | | |
Net asset value, end of period | | $ | 5.23 | | | $ | 5.29 | | | $ | 5.67 | | | $ | 5.54 | | | $ | 4.62 | | | $ | 3.21 | |
| | | | | | | | | | | | | | | | | | | | | | | | |
Total return4 5 | | | 13.54% | | | | 7.88% | | | | 19.47% | | | | 19.73% | | | | 43.93% | | | | (12.35)% | |
| | | | | | |
Supplemental data and ratios: | | | | | | | | | | | | | | | | | | | | | | | | |
Net assets, end of period (in thousands) | | $ | 705,553 | | | $ | 664,625 | | | $ | 734,842 | | | $ | 734,266 | | | $ | 651,261 | | | $ | 428,082 | |
Ratio of expenses to average net assets2 | | | 1.68% | | | | 1.68% | | | | 1.72% | | | | 1.73% | | | | 1.78% | | | | 1.81% | |
Ratio of net investment income (loss) to average net assets2 | | | 0.51% | | | | 0.81% | | | | 0.94% | | | | (0.26)% | | | | (0.43)% | | | | (0.44)% | |
Portfolio turnover rate4 | | | 48% | | | | 40% | | | | 43% | | | | 56% | | | | 69% | | | | 69% | |
| | | | | | |
| STRATEGIC INCOME FUND | | Six Months
Ended
March 31
(Unaudited) | | | Period
Ended
September 30 | | | | | | | | | | | | | |
| (for a share outstanding throughout each period) | | 2007 | | | 20063 | | | | | | | | | | | | | |
Net asset value, beginning of period | | $ | 10.48 | | | $ | 10.00 | | | | | | | | | | | | | | | | | |
| | | | | | |
Income from investment operations: | | | | | | | | | | | | | | | | | | | | | | | | |
Net investment income | | | 0.24 | | | | 0.31 | | | | | | | | | | | | | | | | | |
Net realized and unrealized gains on investments | | | 0.95 | | | | 0.44 | | | | | | | | | | | | | | | | | |
| | | | | | | | | | | | | | | | | | | | | | | | |
Total from investment operations | | | 1.19 | | | | 0.75 | | | | | | | | | | | | | | | | | |
| | | | | | |
Redemption fees (see Note 2) | | | — | 1 | | | — | 1 | | | | | | | | | | | | | | | | |
| | | | | | |
Less distributions: | | | | | | | | | | | | | | | | | | | | | | | | |
Dividends from net investment income | | | (0.28 | ) | | | (0.27 | ) | | | | | | | | | | | | | | | | |
Distributions from net realized gains | | | (0.04 | ) | | | — | | | | | | | | | | | | | | | | | |
| | | | | | | | | | | | | | | | | | | | | | | | |
Total distributions | | | (0.32 | ) | | | (0.27 | ) | | | | | | | | | | | | | | | | |
| | | | | | | | | | | | | | | | | | | | | | | | |
Net asset value, end of period | | $ | 11.35 | | | $ | 10.48 | | | | | | | | | | | | | | | | | |
| | | | | | | | | | | | | | | | | | | | | | | | |
Total return4 | | | 11.39% | | | | 7.58% | | | | | | | | | | | | | | | | | |
| | | | | | |
Supplemental data and ratios: | | | | | | | | | | | | | | | | | | | | | | | | |
Net assets, end of period (in thousands) | | $ | 28,817 | | | $ | 12,732 | | | | | | | | | | | | | | | | | |
Ratio of expenses to average net assets (including dividend payments for securities sold short): | | | | | | | | | | | | | | | | | | | | | | | | |
Net of waivers and reimbursements2 | | | 1.15% | | | | 0.95% | | | | | | | | | | | | | | | | | |
Before waivers and reimbursements2 | | | 1.64% | | | | 2.66% | | | | | | | | | | | | | | | | | |
Ratio of expenses to average net assets (excluding dividend payments for securities sold short): | | | | | | | | | | | | | | | | | | | | | | | | |
Net of waivers and reimbursements2 | | | 0.95% | | | | 0.95% | | | | | | | | | | | | | | | | | |
Before waivers and reimbursements2 | | | 1.44% | | | | 2.66% | | | | | | | | | | | | | | | | | |
Ratio of net investment income to average net assets: | | | | | | | | | | | | | | | | | | | | | | | | |
Net of waivers and reimbursements2 | | | 4.66% | | | | 5.40% | | | | | | | | | | | | | | | | | |
Before waivers and reimbursements2 | | | 4.17% | | | | 3.69% | | | | | | | | | | | | | | | | | |
Portfolio turnover rate4 | | | 33% | | | | 14% | | | | | | | | | | | | | | | | | |
1 | | Represents amounts less than $.005 per share. |
3 | | Fund inception date was February 1, 2006. |
4 | | Not annualized for periods less than one year. |
5 | | In 2005, the Fund’s total return included a voluntary reimbursement by the Advisor for amounts relating to errors in applying the Funds’ cross-trading policies that had no impact on the total return. |
See notes to financial statements.
75
| | |
| WASATCH FUNDS — Financial Highlights (continued) | | MARCH 31, 2007 |
|
| |
| |
| | | | | | | | | | | | | | | | | | | | | | | | |
| ULTRA GROWTH FUND | | Six Months
Ended
March 31
(Unaudited) | | | Year Ended September 30 | |
| (for a share outstanding throughout each period) | | 2007 | | | 2006 | | | 2005 | | | 2004 | | | 2003 | | | 2002 | |
| | | | | | | | | | | | | | | | | | | | | | | | |
Net asset value, beginning of period | | $ | 24.09 | | | $ | 27.98 | | | $ | 24.07 | | | $ | 25.43 | | | $ | 16.52 | | | $ | 19.15 | |
| | | | | | |
Income (loss) from investment operations: | | | | | | | | | | | | | | | | | | | | | | | | |
Net investment loss | | | (0.16 | ) | | | (0.34 | ) | | | (0.38 | ) | | | (0.42 | ) | | | (0.29 | ) | | | (0.25 | ) |
Net realized and unrealized gains (losses) on investments | | | 2.14 | | | | 0.23 | | | | 5.26 | | | | (0.68 | ) | | | 9.19 | | | | (1.48 | ) |
Net increase from payment by affiliate | | | — | | | | — | | | | — | 1 | | | — | | | | — | | | | — | |
| | | | | | | | | | | | | | | | | | | | | | | | |
Total from investment operations | | | 1.98 | | | | (0.11 | ) | | | 4.88 | | | | (1.10 | ) | | | 8.90 | | | | (1.73 | ) |
| | | | | | |
Redemption fees (see Note 2) | | | — | 1 | | | — | 1 | | | — | 1 | | | — | 1 | | | 0.01 | | | | 0.02 | |
| | | | | | |
Less distributions: | | | | | | | | | | | | | | | | | | | | | | | | |
Distributions from net realized gains | | | (1.78 | ) | | | (3.78 | ) | | | (0.97 | ) | | | (0.26 | ) | | | — | | | | (0.92 | ) |
| | | | | | | | | | | | | | | | | | | | | | | | |
Total distributions | | | (1.78 | ) | | | (3.78 | ) | | | (0.97 | ) | | | (0.26 | ) | | | — | | | | (0.92 | ) |
| | | | | | | | | | | | | | | | | | | | | | | | |
Net asset value, end of period | | $ | 24.29 | | | $ | 24.09 | | | $ | 27.98 | | | $ | 24.07 | | | $ | 25.43 | | | $ | 16.52 | |
| | | | | | | | | | | | | | | | | | | | | | | | |
Total return2 5 | | | 8.29% | | | | (0.48)% | | | | 21.00% | | | | (4.44)% | | | | 53.93% | | | | (9.74)% | |
| | | | | | |
Supplemental data and ratios: | | | | | | | | | | | | | | | | | | | | | | | | |
Net assets, end of period (in thousands) | | $ | 279,326 | | | $ | 306,406 | | | $ | 389,894 | | | $ | 427,013 | | | $ | 538,939 | | | $ | 277,404 | |
Ratio of expenses to average net assets3 | | | 1.50% | | | | 1.48% | | | | 1.50% | | | | 1.50% | | | | 1.57% | | | | 1.71% | |
Ratio of net investment loss to average net assets3 | | | (1.27)% | | | | (1.19)% | | | | (1.30)% | | | | (1.39)% | | | | (1.50)% | | | | (1.67)% | |
Portfolio turnover rate2 | | | 24% | | | | 76% | | | | 65% | | | | 67% | | | | 76% | | | | 78% | |
| | |
| U.S. TREASURY FUND | | Six Months
Ended
March 31
(Unaudited) | | | Year Ended September 30 | |
| (for a share outstanding throughout each period) | | 2007 | | | 2006 | | | 2005 | | | 2004 | | | 2003 | | | 2002 | |
Net asset value, beginning of period | | $ | 14.12 | | | $ | 14.68 | | | $ | 13.77 | | | $ | 13.68 | | | $ | 14.04 | | | $ | 12.97 | |
| | | | | | |
Income (loss) from investment operations: | | | | | | | | | | | | | | | | | | | | | | | | |
Net investment income | | | 0.30 | | | | 0.39 | | | | 0.45 | | | | 0.70 | | | | 0.72 | | | | 0.66 | |
Net realized and unrealized gains (losses) on investments | | | (0.25 | ) | | | (0.24 | ) | | | 1.05 | | | | 0.11 | | | | (0.48 | ) | | | 1.17 | |
| | | | | | | | | | | | | | | | | | | | | | | | |
Total from investment operations | | | 0.05 | | | | 0.15 | | | | 1.50 | | | | 0.81 | | | | 0.24 | | | | 1.83 | |
| | | | | | |
Redemption fees (see Note 2) | | | — | 1 | | | 0.01 | | | | 0.01 | | | | 0.01 | | | | 0.03 | | | | 0.01 | |
| | | | | | |
Less distributions: | | | | | | | | | | | | | | | | | | | | | | | | |
Dividends from net investment income | | | (0.30 | ) | | | (0.72 | ) | | | (0.60 | ) | | | (0.73 | ) | | | (0.63 | ) | | | (0.77 | ) |
| | | | | | | | | | | | | | | | | | | | | | | | |
| | | | | | |
Total distributions | | | (0.30 | ) | | | (0.72 | ) | | | (0.60 | ) | | | (0.73 | ) | | | (0.63 | ) | | | (0.77 | ) |
| | | | | | | | | | | | | | | | | | | | | | | | |
Net asset value, end of period | | $ | 13.87 | | | $ | 14.12 | | | $ | 14.68 | | | $ | 13.77 | | | $ | 13.68 | | | $ | 14.04 | |
| | | | | | | | | | | | | | | | | | | | | | | | |
Total return2 | | | 0.33% | | | | 1.21% | | | | 11.41% | | | | 6.27% | | | | 2.17% | | | | 15.38% | |
| | | | | | |
Supplemental data and ratios: | | | | | | | | | | | | | | | | | | | | | | | | |
Net assets, end of period (in thousands) | | $ | 198,964 | | | $ | 204,994 | | | $ | 82,599 | | | $ | 45,088 | | | $ | 67,134 | | | $ | 83,879 | |
Ratio of expenses to average net assets: | | | | | | | | | | | | | | | | | | | | | | | | |
Net of waivers and reimbursements3 | | | 0.70% | | | | 0.72% | | | | 0.75% | | | | 0.75% | | | | 0.75% | | | | 0.75% | |
Before waivers and reimbursements3 | | | 0.70% | | | | 0.72% | | | | 0.86% | | | | 0.94% | | | | 0.91% | | | | 0.98% | |
Ratio of net investment income to average net assets: | | | | | | | | | | | | | | | | | | | | | | | | |
Net of waivers and reimbursements3 | | | 4.15% | | | | 4.21% | | | | 4.01% | | | | 4.50% | | | | 4.67% | | | | 5.51% | |
Before waivers and reimbursements3 | | | 4.15% | | | | 4.21% | | | | 3.90% | | | | 4.31% | | | | 4.51% | | | | 5.28% | |
Portfolio turnover rate2 | | | 3% | | | | 2% | | | | 19% | | | | 4% | | | | 37% | | | | 22% | |
1Represents amounts less than $.005 per share.
2Not annualized for periods less than one year.
3Annualized.
5 | | In 2005, the Fund’s total return included a voluntary reimbursement by the Advisor for amounts relating to errors in applying the Funds’ cross-trading policies that had no impact on the total return. |
See notes to financial statements.
76
| | |
| WASATCH FUNDS — Notes to Financial Statements | | MARCH 31, 2007 (UNAUDITED) |
|
| |
| |
1. ORGANIZATION
Wasatch Funds, Inc. is a Minnesota corporation registered under the Investment Company Act of 1940, as amended (the “1940 Act”), as an open-end management investment company and consists of 12 series or “funds” (each a “Fund” and collectively the “Funds”). The Core Growth, Global Science & Technology, Heritage Growth, International Growth, International Opportunities, Micro Cap, Micro Cap Value, Small Cap Growth, Small Cap Value, Strategic Income and Ultra Growth Funds (collectively the “Equity Funds”) are non-diversified funds and the Wasatch-Hoisington U.S. Treasury Fund (“U.S. Treasury Fund”) is a diversified fund. Each Fund maintains its own investment objective. The Funds have entered into an investment advisory agreement with Wasatch Advisors, Inc. (the “Advisor”) as investment advisor.
2. SIGNIFICANT ACCOUNTING POLICIES
The financial statements have been prepared in conformity with United States of America generally accepted accounting principles (“GAAP”). The following is a summary of significant policies related to investments of the Funds held at March 31, 2007.
In July 2006, the Financial Accounting Standards Board (“FASB”) issued Interpretation No. 48, “Accounting for Uncertainty in Income Taxes—an Interpretation of FASB Statement No. 109” (“FIN 48”). FIN 48 addresses the accounting for uncertainty in income taxes. The provisions of FIN 48 are effective for fiscal years beginning after December 15, 2006. FASB issued Statement of Financial Accounting Standards No. 157, Fair Value Measurements (“FAS 157”), in September 2006, which is effective for fiscal years beginning after November 15, 2007. FAS 157 defines fair value, establishes a framework for measuring fair value and expands financial statement disclosures about fair value measurements. Management is currently evaluating the impact of adopting FIN 48 and FAS 157.
Valuation of Securities — Securities are valued as of the close of the New York Stock Exchange (generally 4:00 p.m. Eastern Time) on the valuation date. Equity securities are valued using a commercial pricing service at the latest quoted sales price taken from the primary market in which each security trades and, with respect to equity securities traded on Nasdaq, such securities are valued using the Nasdaq Official Closing Price (“NOCP”) or last sales price if no NOCP is available. If there are no sales on any exchange or market on a given day, then the security is valued at the most recent bid price. Debt securities (other than short-term instruments) are valued at current market value by a commercial pricing service, or by using the last sale or bid price. Short term securities, which mature in 60 days or less, are valued at amortized cost, which approximates market value. Exchange-traded options are valued at the last sale price in the market where they are principally traded. If there are no sales on any exchange or market on a given day, then the option is valued at the most recent bid price. If market quotations are not readily available for the Funds’ investments in securities such as restricted securities, private
placements, securities for which trading has been halted or other illiquid securities, these investments will be valued at fair value in accordance with Board-approved Pricing Policies and Procedures by the Pricing Committee of the Advisor (“Pricing Committee”) with oversight by the Board of Directors. Fair value is defined as the amount the owner of a security might reasonably expect to receive upon a current sale. For each applicable investment that is fair valued, the Pricing Committee considers, to the extent applicable, various factors including, but not limited to, the financial condition of the company or limited partnership, operating results, prices paid in follow- on rounds, comparable companies in the public market, the nature and duration of the restrictions for holding the securities, and other relevant factors.
Additionally, a Fund’s investments will be valued at fair value by the Pricing Committee if the Advisor determines that an event impacting the value of an investment occurred between the closing time of a security’s primary market or exchange (for example, a foreign exchange or market) and the time the Fund’s share price is calculated. Significant events include, but are not limited to the following: significant fluctuations in domestic markets, foreign markets or foreign currencies; occurrences not directly tied to the securities markets such as natural disasters, armed conflicts or significant governmental actions; and major announcements affecting a single issuer or an entire market or market sector. In responding to a significant event, the Pricing Committee would determine the fair value of affected securities considering factors including, but not limited to: index options and futures traded subsequent to the close; ADRs, GDRs or other related receipts; currency spot or forward markets that trade after pricing of the foreign exchange; other derivative securities traded after the close such as SPDRs and other exchange traded funds (ETFs); and alternative market quotes on the affected securities. In addition, the Funds may use a systematic fair valuation model provided by an independent third party in certain circumstances to assist in adjusting the valuation of foreign securities.
As of March 31, 2007, the aggregate amount of fair valued securities, excluding any foreign securities fair valued pursuant to a systematic fair valuation model, as a percentage of net assets for the Funds was as follows:
| | | |
Core Growth Fund | | 1.40 | % |
Global Science & Technology Fund | | 0.61 | % |
Heritage Growth Fund | | — | |
International Growth Fund | | 0.49 | % |
International Opportunities Fund | | 1.68 | % |
Micro Cap Fund | | 0.85 | % |
Micro Cap Value Fund | | 1.41 | % |
Small Cap Growth Fund | | 1.98 | % |
Small Cap Value Fund | | 2.43 | % |
Strategic Income Fund | | 3.00 | % |
Ultra Growth Fund | | 2.98 | % |
U.S. Treasury Fund | | — | |
Foreign Currency Translations — Values of investments denominated in foreign currencies are converted into U.S. dollars using the current exchange rate. Purchases and sales of investments and dividend income are translated into U.S. dollars using the current exchange rate prevailing on the
77
| | |
| WASATCH FUNDS — Notes to Financial Statements (continued) | | |
|
| |
| |
transaction date. The effect of changes in foreign exchange rates on realized and unrealized security gains or losses is reflected as a component of such gains or losses. Transactions in foreign denominated assets may involve greater risks than domestic transactions, including currency, political, economic, regulatory and market risks.
At March 31, 2007, the foreign currencies held by the Funds were as follows (amounts in U.S. dollars):
| | | | | | |
| | | Cost of
Currency | | Market Value
of Currency |
International Growth Fund | | | | | | |
Australian Dollar | | $ | 1 | | $ | 1 |
Hong Kong Dollar | | | 42,086 | | | 42,082 |
Japanese Yen | | | 15,994 | | | 15,893 |
Singapore Dollar | | | 125,453 | | | 125,466 |
| | | | | | |
| | $ | 183,534 | | $ | 183,442 |
| | | | | | |
|
| |
International Opportunities Fund | | | | | | |
Australian Dollar | | $ | 7,443 | | $ | 7,443 |
Hong Kong Dollar | | | 6,217 | | | 6,216 |
Japanese Yen | | | 15,471 | | | 15,328 |
Singapore Dollar | | | 12,129 | | | 12,130 |
| | | | | | |
| | $ | 41,260 | | $ | 41,117 |
| | | | | | |
|
| |
Micro Cap Fund | | | | | | |
Hong Kong Dollar | | $ | 36,261 | | $ | 36,258 |
Taiwan Dollar | | | 199,394 | | | 198,602 |
| | | | | | |
| | $ | 235,655 | | $ | 234,860 |
| | | | | | |
|
| |
Micro Cap Value Fund | | | | | | |
Hong Kong Dollar | | $ | 8,064 | | $ | 8,063 |
Small Cap Value Fund | | | | | | |
Hong Kong Dollar | | $ | 26,722 | | $ | 26,719 |
Strategic Income Fund | | | | | | |
Singapore Dollar | | $ | 12,155 | | $ | 12,156 |
Korean Won | | | 1,864 | | | 1,864 |
| | | | | | |
| | $ | 14,019 | | $ | 14,020 |
| | | | | | |
|
| |
Ultra Growth Fund | | | | | | |
Indian Rupee | | $ | 115,271 | | $ | 115,271 |
Investment in Securities and Related Investment Income — Security transactions are accounted for on the trade date. Gains or losses on securities sold are determined on the identified cost basis. Dividend income and distributions to shareholders are recorded on the ex-dividend date except that certain dividends from foreign securities may be recorded after the ex-dividend date based on when the Fund is informed of the dividend. Interest income and estimated expenses are accrued daily. Bond discount and premium are amortized using the interest method. To the extent dividends received from Real Estate Investment Trust securities include return of capital distributions; such distributions are recorded as income, and adjusted accordingly for tax purposes.
Short Sales — To a limited extent, the Equity Funds may enter into short sales whereby a fund sells a security it generally does not own (the security is borrowed), in anticipation of a decline in the security’s price. The initial amount of a short sale is recorded as a liability which is marked to market daily. Fluctuations in the value of the short liability
are recorded as unrealized gains or losses. If a fund shorts a security when also holding a long position in the security (a “short against the box”), as the security’s price declines, the short position increases in value, offsetting the long position’s decrease in value. The opposite effect occurs if the security’s price rises. A fund realizes a gain or loss upon closing of the short sale (returning the security to the counterparty by way of purchase or delivery of a long position owned). The Funds are liable to the buyer for any dividends payable on securities while those securities are in a short position. These dividends are an expense of the Funds. The Funds designate collateral consisting of cash, U.S. government securities or other liquid assets sufficient to collateralize the market value of short positions.
Options Transactions — The Equity Funds may buy and sell put and call options, write covered put and call options, including over-the-counter options, on portfolio securities where the completion of the obligation is dependent upon the credit standing of another party. The risk in writing a call option is that a Fund gives up the opportunity for profit if the market price of the security increases. The risk in writing a put option is that a Fund may incur a loss if the market price of the security decreases and the option is exercised. The risk in buying an option is that a Fund pays a premium whether or not the option is exercised. A Fund also has the additional risk of not being able to enter into a closing transaction if a liquid secondary market does not exist. Option contracts are valued daily and unrealized appreciation or depreciation is recorded. A Fund will realize a gain or loss upon expiration or closing of the option transaction. When an option is exercised, the proceeds on sales for a written call option, the purchase cost for a written put option, or the cost of a security for a purchased put or call option is adjusted by the amount of premium received or paid.
Repurchase Agreements — The Funds may engage in repurchase transactions. Under the terms of a typical repurchase agreement, a fund takes possession of an underlying debt obligation subject to an obligation of the seller to repurchase and the fund to resell the obligation at an agreed upon price and time. The market value of the collateral must be equal at all times to the total amount of the repurchase obligation, including interest. Generally, in the event of counterparty default, the fund has the right to use the collateral to offset losses incurred.
Federal Income Taxes — It is the Funds’ policy to comply with the requirements of the Internal Revenue Code applicable to regulated investment companies and to distribute substantially all taxable income to shareholders. Accordingly, no provision for federal income or excise taxes has been made.
Expenses — The Funds contract for various services mostly on a collective basis. Most expenses are directly attributable to each Fund and therefore are charged accordingly. Expenses that are not directly attributable to one or more Funds are allocated among applicable Funds on an equitable and consistent basis considering such things as the nature and type of expense and the relative net assets of the Funds.
78
| | |
| | MARCH 31, 2007 (UNAUDITED) |
|
| |
| |
Use of Management Estimates — The preparation of financial statements in conformity with GAAP requires management to make estimates and assumptions that affect the reported amounts of assets and liabilities at the date of the financial statements and the reported changes in net assets during the reporting period. Actual results could differ from those estimates.
Guarantees and Indemnifications — In the normal course of business, the Funds enter into contracts that contain a variety of representations and warranties which provide general indemnifications. The maximum exposure under these arrangements is unknown, as this would involve future claims that may be made against the Funds and/or its affiliates that have not yet occurred. Based on experience, however, the risk of loss is expected to be remote.
Redemption Fees — The Funds deduct a fee of 2.00% from redemption proceeds on shares of the Funds held two months or less. Redemption fees retained by the Funds are credited to additional paid-in capital.
3. DISTRIBUTIONS
Dividends from net investment income and net realized gains, if any, are declared and paid at least annually for all Funds, except for dividends from net investment income for the Strategic Income and U.S. Treasury Funds, which are declared and paid quarterly. The amount of dividends and distributions from net investment income and net realized gains are determined in accordance with federal income tax regulations, which may differ from GAAP. The Funds may utilize earnings and profits distributed to shareholders on redemption of shares as part of the dividends paid deduction (tax equalization).
To the extent these book and tax differences are permanent in nature, such amounts are reclassified at the end of the fiscal year among paid-in capital in excess of par value, undistributed net investment income (loss) and undistributed net realized gain (loss) on investments and foreign currency translations.
4. PURCHASESAND SALESOF SECURITIES
Cost of investment securities purchased and proceeds from sales of investment securities, excluding U.S. government and short-term securities for the period ended March 31, 2007 are summarized below:
| | | | | | | | | | | | | | | | | | | | | | | | |
| | | Core
Growth
Fund | | | Global
Science &
Technology
Fund | | | Heritage
Growth
Fund | | | International
Growth
Fund | | | International
Opportunities
Fund | | | Micro
Cap
Fund | |
Purchases | | $ | 331,422,007 | | | $ | 65,761,249 | | | $ | 62,004,948 | | | $ | 144,488,504 | | | $ | 14,390,638 | | | $ | 133,756,653 | |
Sales | | | (558,580,286 | ) | | | (69,175,595 | ) | | | (91,556,917 | ) | | | (152,330,791 | ) | | | (12,122,170 | ) | | | (186,116,230 | ) |
| | | | | | |
| | | Micro Cap
Value
Fund | | | Small Cap
Growth
Fund | | | Small Cap
Value
Fund | | | Strategic
Income
Fund | | | Ultra
Growth
Fund | | | | |
Purchases | | $ | 48,880,052 | | | $ | 283,395,004 | | | $ | 321,081,787 | | | $ | 19,543,632 | | | $ | 68,878,275 | | | | | |
Sales | | | (52,979,215 | ) | | | (429,384,180 | ) | | | (364,299,321 | ) | | | (6,452,616 | ) | | | (128,965,408 | ) | | | | |
Purchases and sales of U.S. government securities in the U.S. Treasury Fund were $6,322,500 and $(14,503,064), respectively.
79
| | |
| WASATCH FUNDS — Notes to Financial Statements (continued) | | |
|
| |
| |
5. OPTIONS CONTRACTS WRITTEN
Options written activity during the period ended March 31, 2007 was as follows:
| | | | | | | | | | | | | | | | | | | | | |
| | | Options
Outstanding at
Beginning of Period | | Written | | Closed | | | Exercised | | | Expired | | | Options
Outstanding at
End of Period |
Global Science & Technology Fund | | | | | | | | | | | | | | | | | | | | | |
Premium amount | | $ | — | | $ | 73,065 | | $ | (28,479 | ) | | $ | — | | | $ | (26,212 | ) | | $ | 18,374 |
Number of contracts | | | — | | | 328 | | | (53 | ) | | | — | | | | (125 | ) | | | 150 |
Heritage Growth Fund | | | | | | | | | | | | | | | | | | | | | |
Premium amount | | $ | — | | $ | 77,535 | | $ | — | | | $ | — | | | $ | (69,785 | ) | | $ | 7,750 |
Number of contracts | | | — | | | 825 | | | — | | | | — | | | | (725 | ) | | | 100 |
Micro Cap Fund | | | | | | | | | | | | | | | | | | | | | |
Premium amount | | $ | — | | $ | 162,745 | | $ | — | | | $ | — | | | $ | (162,745 | ) | | $ | — |
Number of contracts | | | — | | | 2,100 | | | — | | | | — | | | | (2,100 | ) | | | — |
Micro Cap Value Fund | | | | | | | | | | | | | | | | | | | | | |
Premium amount | | $ | 71,028 | | $ | 630,818 | | $ | (63,097 | ) | | $ | (29,946 | ) | | $ | (375,399 | ) | | $ | 233,404 |
Number of contracts | | | 450 | | | 5,431 | | | (300 | ) | | | (205 | ) | | | (2,484 | ) | | | 2,892 |
Small Cap Value Fund | | | | | | | | | | | | | | | | | | | | | |
Premium amount | | $ | 230,882 | | $ | 922,186 | | $ | (238,081 | ) | | $ | (171,135 | ) | | $ | (261,461 | ) | | $ | 482,391 |
Number of contracts | | | 1,500 | | | 7,195 | | | (1,890 | ) | | | (1,174 | ) | | | (1,354 | ) | | | 4,277 |
Ultra Growth Fund | | | | | | | | | | | | | | | | | | | | | |
Premium amount | | $ | — | | $ | 18,525 | | $ | — | | | $ | — | | | $ | — | | | $ | 18,525 |
Number of contracts | | | — | | | 190 | | | — | | | | — | | | | — | | | | 190 |
6. FEDERAL INCOME TAX INFORMATION
As of March 31, 2007, the cost and unrealized appreciation (depreciation) of securities, excluding written options and securities sold short, on a tax basis were as follows:
| | | | | | | | | | | | | | | | | | | | | | | | |
| | | Core
Growth
Fund | | | Global
Science &
Technology
Fund | | | Heritage
Growth
Fund | | | International
Growth
Fund | | | International
Opportunities
Fund | | | Micro
Cap
Fund | |
Cost | | $ | 1,034,757,075 | | | $ | 122,164,012 | | | $ | 206,278,057 | | | $ | 333,452,026 | | | $ | 34,266,926 | | | $ | 494,456,872 | |
| | | | | | | | | | | | | | | | | | | | | | | | |
Gross appreciation | | $ | 323,535,476 | | | $ | 22,746,879 | | | $ | 38,644,383 | | | $ | 141,864,568 | | | $ | 17,705,828 | | | $ | 161,337,432 | |
Gross (depreciation) | | | (30,163,425 | ) | | | (6,802,915 | ) | | | (9,162,762 | ) | | | (8,117,518 | ) | | | (1,556,628 | ) | | | (27,232,253 | ) |
| | | | | | | | | | | | | | | | | | | | | | | | |
Net appreciation | | $ | 293,372,051 | | | $ | 15,943,964 | | | $ | 29,481,621 | | | $ | 133,747,050 | | | $ | 16,149,200 | | | $ | 134,105,179 | |
| | | | | | | | | | | | | | | | | | | | | | | | |
| | | | | | |
| | | Micro Cap
Value
Fund | | | Small Cap
Growth
Fund | | | Small Cap
Value
Fund | | | Strategic
Income
Fund | | | Ultra
Growth
Fund | | | U.S.
Treasury
Fund | |
Cost | | $ | 90,766,867 | | | $ | 929,240,924 | | | $ | 599,448,096 | | | $ | 26,017,304 | | | $ | 232,755,816 | | | $ | 197,279,790 | |
| | | | | | | | | | | | | | | | | | | | | | | | |
Gross appreciation | | $ | 23,528,792 | | | $ | 319,467,932 | | | $ | 120,686,292 | | | $ | 1,587,211 | | | $ | 53,448,603 | | | $ | 2,527,848 | |
Gross (depreciation) | | | (3,967,060 | ) | | | (45,996,177 | ) | | | (20,102,222 | ) | | | (1,071,023 | ) | | | (13,198,253 | ) | | | (1,259,748 | ) |
| | | | | | | | | | | | | | | | | | | | | | | | |
Net appreciation | | $ | 19,561,732 | | | $ | 273,471,755 | | | $ | 100,584,070 | | | $ | 516,188 | | | $ | 40,250,350 | | | $ | 1,268,100 | |
| | | | | | | | | | | | | | | | | | | | | | | | |
The difference between cost amounts for financial statement and federal income tax purposes is due primarily to timing differences in recognizing certain securities gains and losses.
80
| | |
| | MARCH 31, 2007 (UNAUDITED) |
|
| |
| |
The components of accumulated earnings on a tax basis as of September 30, 2006 were as follows:
| | | | | | | | | | | | | | | | | | | | | | | | |
| | | Core
Growth
Fund | | | Global
Science &
Technology
Fund | | | Heritage
Growth
Fund | | | International
Growth
Fund | | | International
Opportunities
Fund | | | Micro
Cap
Fund | |
Undistributed ordinary income | | $ | — | | | $ | — | | | $ | 23,657 | | | $ | — | | | $ | — | | | $ | — | |
Undistributed capital gains | | | 96,409,958 | | | | 4,818,138 | | | | 7,225,246 | | | | 59,539,561 | | | | 2,177,148 | | | | 54,244,190 | |
| | | | | | | | | | | | | | | | | | | | | | | | |
Accumulated earnings | | | 96,409,958 | | | | 4,818,138 | | | | 7,248,903 | | | | 59,539,561 | | | | 2,177,148 | | | | 54,244,190 | |
Accumulated capital and other losses | | | — | | | | — | | | | — | | | | — | | | | — | | | | — | |
Other undistributed ordinary losses | | | (209,317 | ) | | | (66,023 | ) | | | (1,991 | ) | | | (194,099 | ) | | | (30,608 | ) | | | — | |
Net unrealized appreciation* | | | 272,936,574 | | | | 12,674,081 | | | | 17,095,469 | | | | 79,664,557 | | | | 7,738,767 | | | | 115,605,041 | |
| | | | | | | | | | | | | | | | | | | | | | | | |
Total accumulated earnings | | $ | 369,137,215 | | | $ | 17,426,196 | | | $ | 24,342,381 | | | $ | 139,010,019 | | | $ | 9,885,307 | | | $ | 169,849,231 | |
| | | | | | | | | | | | | | | | | | | | | | | | |
| | | | | | |
| | | Micro Cap
Value
Fund | | | Small Cap
Growth
Fund | | | Small Cap
Value
Fund | | | Strategic
Income
Fund1 | | | Ultra
Growth
Fund | | | U.S.
Treasury
Fund | |
Undistributed ordinary income | | $ | 4,854,052 | | | $ | — | | | $ | 12,833,283 | | | $ | 131,066 | | | $ | 722,080 | | | $ | 359 | |
Undistributed capital gains | | | 12,079,649 | | | | 82,763,654 | | | | 61,239,054 | | | | — | | | | 12,926,978 | | | | — | |
| | | | | | | | | | | | | | | | | | | | | | | | |
Accumulated earnings | | | 16,933,701 | | | | 82,763,654 | | | | 74,072,337 | | | | 131,066 | | | | 13,649,058 | | | | 359 | |
Accumulated capital and other losses | | | — | | | | — | | | | — | | | | — | | | | — | | | | (5,748,839 | ) |
Other undistributed ordinary losses | | | (14,869 | ) | | | — | | | | (52,094 | ) | | | (15,868 | ) | | | (7,592 | ) | | | — | |
Net unrealized appreciation* | | | 13,302,910 | | | | 233,838,199 | | | | 126,150,117 | | | | 405,592 | | | | 32,936,601 | | | | 4,172,066 | |
| | | | | | | | | | | | | | | | | | | | | | | | |
Total accumulated earnings | | $ | 30,221,742 | | | $ | 316,601,853 | | | $ | 200,170,360 | | | $ | 520,790 | | | $ | 46,578,067 | | | $ | (1,576,414 | ) |
| | | | | | | | | | | | | | | | | | | | | | | | |
1Inception | | date of the Fund was February 1, 2006. |
| *On | | investments, securities sold short, derivative and foreign currency denominated assets and liabilities. |
Capital loss carryforwards are available through the date specified below to offset future realized net capital gains. To the extent future gains are offset by capital loss carryforwards, such gains will not be distributed.
Capital loss carryforwards expire September 30:
| | | | | | | | | |
| Fund | | 2008 | | 2009 | | 2010 |
U.S. Treasury Fund | | $ | 485,296 | | $ | 4,318,964 | | $ | 831,495 |
The U.S. Treasury Fund had $113,084 of post-October capital losses. The Core Growth, Global Science & Technology, International Growth, Micro Cap Value, Small Cap Value and Ultra Growth Funds had $209,317, $66,024, $194,099, $6,617, $52,093 and $7,592, respectively, of post-October currency losses. Net capital losses incurred after October 31 and within the taxable year are deemed to arise on the first day of the following tax year.
The tax character of distributions paid during the period ended September 30, 2006 was as follows:
| | | | | | | | | | | | | | | | | | |
| 2006 | | Core
Growth
Fund | | Global
Science &
Technology
Fund | | Heritage
Growth
Fund | | International
Growth
Fund | | International
Opportunities
Fund | | Micro
Cap
Fund |
Ordinary income | | $ | 25,301,016 | | $ | — | | $ | 5,846,002 | | $ | — | | $ | — | | $ | 9,692,672 |
Capital gain | | | 122,056,473 | | | 1,860,003 | | | 2,681,242 | | | 9,365 | | | — | | | 91,613,465 |
| | | | | | | | | | | | | | | | | | |
Total | | $ | 147,357,489 | | $ | 1,860,003 | | $ | 8,527,244 | | $ | 9,365 | | $ | — | | $ | 101,306,137 |
| | | | | | | | | | | | | | | | | | |
| | | | | | |
| 2006 | | Micro Cap
Value
Fund | | Small Cap
Growth
Fund | | Small Cap
Value
Fund | | Strategic
Income
Fund1 | | Ultra
Growth
Fund | | U.S.
Treasury
Fund |
Ordinary income | | $ | 2,115,580 | | $ | 3,535,845 | | $ | 17,898,270 | | $ | 273,109 | | $ | 5,104,375 | | $ | 9,215,585 |
Capital gain | | | 6,129,820 | | | 156,091,699 | | | 80,331,327 | | | — | | | 46,249,586 | | | — |
| | | | | | | | | | | | | | | | | | |
Total | | $ | 8,245,400 | | $ | 159,627,544 | | $ | 98,229,597 | | $ | 273,109 | | $ | 51,353,961 | | $ | 9,215,585 |
| | | | | | | | | | | | | | | | | | |
1Inception date of the Fund was February 1, 2006.
81
| | |
| WASATCH FUNDS — Notes to Financial Statements (continued) | | |
|
| |
| |
The tax character of distributions paid during the period ended September 30, 2005 was as follows:
| | | | | | | | | | | | | | | | | | |
| 2005 | | Core
Growth
Fund | | Global
Science &
Technology
Fund | | Heritage
Growth
Fund | | International
Growth
Fund | | International
Opportunities
Fund1 | | Micro
Cap
Fund |
Ordinary income | | $ | 9,428,971 | | $ | — | | $ | 45,181 | | $ | — | | $ | — | | $ | 3,229,671 |
Capital gain | | | 50,650,388 | | | — | | | — | | | 411,692 | | | — | | | 74,334,485 |
| | | | | | | | | | | | | | | | | | |
Total | | $ | 60,079,359 | | $ | — | | $ | 45,181 | | $ | 411,692 | | $ | — | | $ | 77,564,156 |
| | | | | | | | | | | | | | | | | | |
| | | | | | |
| 2005 | | Micro Cap
Value
Fund | | Small Cap
Growth
Fund | | Small Cap
Value
Fund | | Ultra
Growth
Fund | | U.S.
Treasury
Fund | | |
Ordinary income | | $ | 8,935,853 | | $ | — | | $ | 24,887,725 | | $ | — | | $ | 2,078,313 | | | |
Capital gain | | | 947,139 | | | 26,587,298 | | | 78,849,850 | | | 16,837,407 | | | — | | | |
| | | | | | | | | | | | | | | | | | |
Total | | $ | 9,882,992 | | $ | 26,587,298 | | $ | 103,737,575 | | $ | 16,837,407 | | $ | 2,078,313 | | | |
| | | | | | | | | | | | | | | | | | |
1Inception | | date of the Fund was January 27, 2005. |
The tax character of distributions paid may differ from that shown in the Statements of Changes in Net Assets due to short-term gains being treated as ordinary income for tax purposes.
7. RELATED PARTY TRANSACTIONS
Investment Advisory Fees — As the Funds’ investment advisor, the Advisor receives a monthly fee calculated on average daily net assets. The Advisor has contractually agreed to waive its fees and/or reimburse a Fund should a Fund’s operating expenses exceed a specified annual limitation through at least January 31, 2008. Investment advisory fees and fees waived, if any, for the period ended March 31, 2007 are disclosed in the Statements of Operations. Investment advisory fee and expense limitation annual rates are shown below.
| | | | | | | | | | | | | | | | | | |
| | | Core
Growth
Fund | | | Global
Science &
Technology
Fund | | | Heritage
Growth
Fund | | | International
Growth
Fund | | | International
Opportunities
Fund | | | Micro
Cap
Fund | |
Advisory Fee | | 1.00 | % | | 1.50 | % | | 0.70 | % | | 1.50 | % | | 2.00 | % | | 2.00 | % |
Expense Limitation | | 1.50 | % | | 1.95 | % | | 0.95 | % | | 1.95 | % | | 2.25 | % | | 2.50 | % |
| | | | | | |
| | | Micro Cap
Value
Fund | | | Small Cap
Growth
Fund | | | Small Cap
Value
Fund | | | Strategic
Income
Fund | | | Ultra
Growth
Fund | | | U.S.
Treasury
Fund | |
Advisory Fee | | 2.00 | % | | 1.00 | % | | 1.50 | % | | 0.70 | % | | 1.25 | % | | 0.50 | % |
Expense Limitation | | 2.25 | % | | 1.50 | % | | 1.95 | % | | 0.95 | % | | 1.75 | % | | 0.75 | % |
Affiliated Interests — An officer of the Funds owns approximately 15% and 9% of the shares outstanding of the International Opportunities and Strategic Income Funds, respectively, as of March 31, 2007.
82
| | |
| | MARCH 31, 2007 (UNAUDITED) |
|
| |
| |
8. TRANSACTIONSWITH AFFILIATES
If a Fund’s holding represents ownership of 5% or more of the voting securities of a company, the company is deemed to be an affiliate as defined by the 1940 Act. The following Funds conducted transactions during the period ended March 31, 2007 with “affiliated companies” as so defined:
| | | | | | | | | | | | | | | | |
| | | Share Activity | | | Dividends
Credited to
Income for the
Six Months
ended 3/31/07 | | Gain (Loss)
Realized on
Sale of Shares
for the
Six Months
ended 3/31/07 | |
| | | Balance
9/30/06 | | Purchases | | Sales | | Balance
3/31/07 | | | |
Micro Cap Fund | | | | | | | | | | | | | | | | |
AutoInfo, Inc. | | 2,206,015 | | — | | — | | 2,206,015 | | | $ | — | | $ | — | |
Bri-Chem Corp. | | — | | 969,640 | | — | | 969,640 | | | | — | | | | |
Enpath Medical, Inc. | | 436,825 | | — | | 37,388 | | 399,437 | | | | — | | | 64,238 | |
Epic Bancorp | | 192,400 | | 13,468 | | — | | 205,868 | | | | 15,392 | | | — | |
inTEST Corp. | | 528,550 | | 56,125 | | — | | 584,675 | | | | — | | | — | |
SM&A | | 1,341,985 | | 110,040 | | — | | 1,452,025 | | | | — | | | — | |
VNUS Medical Technologies, Inc. | | 918,051 | | 61,801 | | — | | 979,852 | | | | — | | | — | |
| | | | | | | | | | | | | | | | |
| | | | | | | | | | | $ | 15,392 | | $ | 64,238 | |
|
| | |
Small Cap Growth Fund | | | | | | | | | | | | | | | | |
Power Integrations, Inc. | | 1,455,490 | | 29,140 | | 480,801 | | 1,003,829 | * | | $ | — | | $ | (182,143 | ) |
|
| | |
Small Cap Value Fund | | | | | | | | | | | | | | | | |
Vitran Corp., Inc. | | 680,315 | | 8,710 | | — | | 689,025 | | | $ | — | | $ | — | |
| *No | | longer affiliated as of March 31, 2007. |
9. RESTRICTED SECURITIES
The Funds may own investments that were purchased through private placement transactions or under Rule 144A of the Securities Act of 1933 (the “Securities Act”) and cannot be sold without prior registration under the Securities Act or may be limited due to certain restrictions. These securities are generally deemed to be illiquid and are valued at fair value as determined by a designated Pricing Committee, comprised of personnel of the Advisor, with oversight by the Board of Directors and in accordance with Board-approved Pricing Policies and Procedures. If and when such securities are registered, the costs of registering such securities are paid by the issuer. At March 31, 2007, the Funds held the following restricted securities:
| | | | | | | | | | | | | |
| | | Security
Type | | Acquisition
Date | | Acquisition
Cost | | Fair
Value | | Value as %
of Net Assets | |
Core Growth Fund | | | | | | | | | | | | | |
| | | | | |
Brantley Mezzanine Finance, LLC | | Common Units | | 9/21/04 | | $ | 60,000 | | $ | — | | — | |
DataPath, Inc. | | Common Stock | | 6/23/06 | | | 7,602,980 | | | 5,252,968 | | 0.40 | % |
Solar Capital, LLC | | Common Stock | | 3/7/07 | | | 13,200,900 | | | 13,200,900 | | 1.00 | % |
| | | | | | | | |
| | | | | | $ | 20,863,880 | | $ | 18,453,868 | | 1.40 | % |
|
| | |
Global Science & Technology Fund | | | | | | | | | | | | | |
| | | | | |
Acusphere, Inc. | | Warrants | | 7/29/04 - 10/20/04 | | $ | — | | $ | — | | — | |
BlueArc Corp., Series DD | | Preferred Stock | | 6/6/06 | | | 324,998 | | | 366,604 | | 0.26 | % |
Incipient, Inc., Series D | | Preferred Stock | | 2/7/06 | | | 139,219 | | | 43,884 | | 0.03 | % |
Montagu Newhall Global Partners II-B, L.P. | | LP Interest | | 10/10/03 - 3/19/07 | | | 237,144 | | | 214,213 | | 0.15 | % |
Neutral Tandem, Inc., Series C | | Preferred Stock | | 2/2/06 | | | 111,107 | | | 111,107 | | 0.08 | % |
Point Biomedical Corp. | | Warrants | | 2/16/05 | | | — | | | — | | — | |
Point Biomedical Corp., Series F | | Preferred Stock | | 2/16/05 | | | 150,000 | | | 105,000 | | 0.08 | % |
QRSciences Holdings Ltd. | | Warrants | | 2/7/07 | | | — | | | — | | — | |
Xtera Communications, Inc., Series A-1 | | Preferred Stock | | 9/3/03 | | | 7,076 | | | 7,076 | | 0.01 | % |
| | | | | | | | |
| | | | | | $ | 969,544 | | $ | 847,884 | | 0.61 | % |
|
| | |
International Opportunities Fund | | | | | | | | | | | | | |
| | | | | |
Bayou Bend Petroleum Ltd. PIPE | | Common Stock | | 2/5/07 | | $ | 147,123 | | $ | 223,539 | | 0.44 | % |
QRSciences Holdings Ltd. | | Warrants | | 2/7/07 | | | — | | | — | | — | |
Star Asia Finance Ltd. | | Common Stock | | 2/22/07 | | | 623,800 | | | 623,800 | | 1.24 | % |
| | | | | | | | |
| | | | | | $ | 770,923 | | $ | 847,339 | | 1.68 | % |
|
| | |
83
| | |
| WASATCH FUNDS — Notes to Financial Statements (continued) | | |
|
| |
| |
| | | | | | | | | | | | | |
| | | Security
Type | | Acquisition
Date | | Acquisition
Cost | | Fair
Value | | Value as %
of Net Assets | |
Micro Cap Fund | | | | | | | | | | | | | |
| | | | | |
Bayou Bend Petroleum Ltd. PIPE | | Common Stock | | 2/5/07 | | $ | 2,037,224 | | $ | 3,095,364 | | 0.49 | % |
Familymeds Group, Inc. | | Warrants | | 12/1/04 | | | — | | | — | | — | |
Goldwater Bank, N.A. | | Common Stock | | 2/28/07 | | | 1,540,000 | | | 1,540,000 | | 0.25 | % |
Point Biomedical Corp. | | Warrants | | 2/16/05 | | | — | | | — | | — | |
Point Biomedical Corp., Series F | | Preferred Stock | | 2/16/05 | | | 1,000,000 | | | 700,000 | | 0.11 | % |
| | | | | | | | |
| | | | | | $ | 4,577,224 | | $ | 5,335,364 | | 0.85 | % |
|
| | |
Micro Cap Value Fund | | | | | | | | | | | | | |
| | | | | |
Acusphere, Inc. | | Warrants | | 7/29/04 - 10/20/04 | | $ | — | | $ | — | | — | |
Bayou Bend Petroleum Ltd. PIPE | | Common Stock | | 2/5/07 | | | 352,865 | | | 536,145 | | 0.47 | % |
Electro-Optical Sciences, Inc. | | Warrants | | 10/31/06 | | | — | | | — | | — | |
Familymeds Group, Inc. | | Warrants | | 12/1/04 | | | — | | | — | | — | |
Farallon Resources Ltd. | | Warrants | | 12/21/06 | | | — | | | — | | — | |
Goldwater Bank, N.A. | | Common Stock | | 2/28/07 | | | 419,000 | | | 419,000 | | 0.37 | % |
Idaho Trust Bancorp | | Common Stock | | 8/30/06 | | | 500,004 | | | 500,004 | | 0.44 | % |
Point Biomedical Corp. | | Warrants | | 2/16/05 | | | — | | | — | | — | |
Point Biomedical Corp., Series F | | Preferred Stock | | 2/16/05 | | | 200,000 | | | 140,000 | | 0.13 | % |
QRSciences Holdings Ltd. | | Warrants | | 2/7/07 | | | — | | | — | | — | |
| | | | | | | | |
| | | | | | $ | 1,471,869 | | $ | 1,595,149 | | 1.41 | % |
|
| | |
Small Cap Growth Fund | | | | | | | | | | | | | |
| | | | | |
Elder Health, Inc., Series G | | Preferred Stock | | 11/1/04 | | $ | 571,428 | | $ | 571,428 | | 0.05 | % |
Fluidigm Corp., Series E | | Preferred Stock | | 12/22/06 | | | 2,500,000 | | | 2,500,000 | | 0.20 | % |
Incipient, Inc., Series D | | Preferred Stock | | 2/7/06 | | | 1,860,778 | | | 586,550 | | 0.05 | % |
Montagu Newhall Global Partners II-B, L.P. | | LP Interest | | 10/10/03 - 3/19/07 | | | 2,371,435 | | | 2,142,129 | | 0.18 | % |
Montagu Newhall Global Partners III-B, L.P. | | LP Interest | | 3/16/06 - 2/16/07 | | | 285,000 | | | 268,519 | | 0.02 | % |
Nanosys, Inc., Series D | | Preferred Stock | | 11/8/05 | | | 2,000,000 | | | 2,000,000 | | 0.16 | % |
Neutral Tandem, Inc., Series C | | Preferred Stock | | 2/2/06 | | | 1,485,102 | | | 1,485,102 | | 0.12 | % |
Orexigen Therapeutics, Inc., Series C | | Preferred Stock | | 11/21/06 | | | 1,000,001 | | | 1,000,001 | | 0.08 | % |
Orqis Medical Corp., Series D | | Preferred Stock | | 2/28/07 | | | 1,200,000 | | | 1,200,000 | | 0.10 | % |
Point Biomedical Corp. | | Warrants | | 2/16/05 | | | — | | | — | | — | |
Point Biomedical Corp., Series F | | Preferred Stock | | 2/16/05 | | | 2,000,000 | | | 1,400,000 | | 0.11 | % |
TargetRX, Inc., Series D | | Preferred Stock | | 4/8/05 | | | 769,098 | | | 504,267 | | 0.04 | % |
Zonare Medical Systems, Inc. | | Warrants | | 6/30/04 | | | — | | | — | | — | |
Zonare Medical Systems, Inc., Series E | | Preferred Stock | | 6/30/04 | | | 1,500,000 | | | 1,343,162 | | 0.11 | % |
| | | | | | | | |
| | | | | | $ | 17,542,842 | | $ | 15,001,158 | | 1.22 | % |
|
| | |
Small Cap Value Fund | | | | | | | | | | | | | |
| | | | | |
Brantley Mezzanine Finance, LLC | | Common Units | | 9/21/04 | | $ | 40,000 | | $ | — | | — | |
Commonwealth Bankshares, Inc. PIPE | | Common Stock | | 10/24/06 | | | 4,680,000 | | | 4,080,384 | | 0.58 | % |
Solar Capital, LLC | | Common Stock | | 3/7/07 | | | 7,079,100 | | | 7,079,100 | | 1.00 | % |
Star Asia Finance Ltd. | | Common Stock | | 2/22/07 | | | 6,000,000 | | | 6,000,000 | | 0.85 | % |
| | | | | | | | |
| | | | | | $ | 17,799,100 | | $ | 17,159,484 | | 2.43 | % |
|
| | |
Strategic Income Fund | | | | | | | | | | | | | |
| | | | | |
Commonwealth Bankshares, Inc. PIPE | | Common Stock | | 10/24/06 | | $ | 130,000 | | $ | 113,344 | | 0.39 | % |
Goldwater Bank, N.A. | | Common Stock | | 2/28/07 | | | 81,000 | | | 81,000 | | 0.28 | % |
Solar Capital, LLC | | Common Stock | | 3/7/07 | | | 294,000 | | | 294,000 | | 1.02 | % |
Star Asia Finance Ltd. | | Common Stock | | 2/22/07 | | | 376,200 | | | 376,200 | | 1.31 | % |
| | | | | | | | |
| | | | | | $ | 881,200 | | $ | 864,544 | | 3.00 | % |
|
| | |
84
| | |
| | MARCH 31, 2007 (UNAUDITED) |
|
| |
| |
| | | | | | | | | | | | | |
| | | Security
Type | | Acquisition
Date | | Acquisition
Cost | | Fair
Value | | Value as %
of Net Assets | |
Ultra Growth Fund | | | | | | | | | | | | | |
| | | | | |
Elder Health, Inc., Series G | | Preferred Stock | | 11/1/04 | | $ | 571,428 | | $ | 571,428 | | 0.20 | % |
Electro-Optical Sciences, Inc. | | Warrants | | 10/31/06 | | | — | | | — | | — | |
Farallon Resources Ltd. | | Warrants | | 12/21/06 | | | — | | | — | | — | |
Montagu Newhall Global Partners II-B, L.P. | | LP Interest | | 10/10/03 - 3/19/07 | | | 2,134,292 | | | 1,927,917 | | 0.69 | % |
Montagu Newhall Global Partners III-B, L.P. | | LP Interest | | 3/16/06 - 2/16/07 | | | 285,000 | | | 268,519 | | 0.10 | % |
Nanosys, Inc., Series D | | Preferred Stock | | 11/8/05 | | | 500,001 | | | 500,001 | | 0.18 | % |
Neutral Tandem, Inc., Series C | | Preferred Stock | | 2/2/06 | | | 403,796 | | | 403,796 | | 0.14 | % |
Ophthonix, Inc., Series C | | Preferred Stock | | 9/23/05 | | | 500,000 | | | 844,758 | | 0.30 | % |
Point Biomedical Corp. | | Warrants | | 2/16/05 | | | — | | | — | | — | |
Point Biomedical Corp., Series F | | Preferred Stock | | 2/16/05 | | | 1,500,000 | | | 1,050,000 | | 0.38 | % |
TargetRX, Inc., Series D | | Preferred Stock | | 4/8/05 | | | 230,904 | | | 151,395 | | 0.05 | % |
TherOx, Inc., Series I | | Preferred Stock | | 7/7/05 | | | 1,000,000 | | | 999,998 | | 0.36 | % |
Transoma Medical, Inc., Series B | | Preferred Stock | | 1/20/06 | | | 475,001 | | | 604,823 | | 0.22 | % |
Xtera Communications, Inc., Series A-1 | | Preferred Stock | | 9/3/03 | | | 99,065 | | | 99,065 | | 0.04 | % |
Zonare Medical Systems, Inc. | | Warrants | | 6/30/04 | | | — | | | — | | — | |
Zonare Medical Systems, Inc., Series E | | Preferred Stock | | 6/30/04 | | | 1,000,000 | | | 895,441 | | 0.32 | % |
| | | | | | | | |
| | | | | | $ | 8,699,487 | | $ | 8,317,141 | | 2.98 | % |
|
| | |
LP Limited Partnership Interest
PIPE Private Investment in a Public Equity
10. PURCHASE COMMITMENTS
In September 2003, the Global Science & Technology, Small Cap Growth and Ultra Growth Funds entered into subscription agreements to acquire limited partnership interests in Montagu Newhall Global Partners II-B, L.P. The remaining commitment amounts at March 31, 2007 were $260,000, $2,600,000 and $2,340,000, respectively. Securities held by the Funds have been designated to meet these purchase commitments.
In November 2004, the Small Cap Growth and Ultra Growth Funds entered into subscription agreements to acquire shares of Elder Health, Inc., Series G Pfd. The remaining commitment amounts at March 31, 2007 were $428,572 per Fund. Securities held by the Funds have been designated to meet these purchase commitments.
In December 2005, the Small Cap Growth and Ultra Growth Funds entered into subscription agreements to acquire limited partnership interests in Montagu Newhall Global Partners III-B, L.P. The remaining commitment amounts at March 31, 2007 were $1,215,000 per Fund. Securities held by the Funds have been designated to meet these purchase commitments.
11. CONTINGENT PAYMENTS
In February 2006, GeneOhm Sciences, Inc., a holding in the Small Cap Growth and Ultra Growth Funds, was acquired by Becton, Dickinson and Company. The purchase price consisted of an up-front cash payment and may include additional contingent payments up to $1,202,820 and $361,190, respectively, based on future events occurring on or before December 31, 2007.
85
| | |
| WASATCH FUNDS — Directors and Officers | | |
|
| |
| |
MANAGEMENTOFTHE COMPANY
Management Information. The business affairs of Wasatch Funds are supervised by its Board of Directors. The Board consists of four directors who are elected and serve until their successors are elected and qualified.
The directors and executive officers of Wasatch Funds and their principal occupations for at least the last five years are set forth below.
| | | | | | | | | | |
Name, Address
and Age | | Position(s)
Held
with Funds | | Term of Office1 and
Length of Time Served | | Principal Occupation(s)
During Past 5 Years | | Number of
Portfolios
in Fund
Complex
Overseen
by Director | | Other Directorships
Held by Director2 |
Interested Director | | | | | | | | | | |
| | | | | |
Samuel S. Stewart, Jr., Ph.D. CFA3 150 Social Hall Ave. 4th Floor Salt Lake City, UT 84111 Age 64 | | President and Director | | Indefinite Served as President and Director since 1986 | | Chairman of the Board for the Advisor since 1975; Chief Investment Officer of the Advisor since 2004; Director of Research of the Advisor from 1975 to 2004; Chairman of the Board of Wasatch Funds from 1986 to 2004. | | 12 | | None |
|
| |
Independent Directors | | | | | | | | | | |
| | | | | |
James U. Jensen, J.D., MBA 44 North Wolcott Salt Lake City, UT 84103 Age 62 | | Director and Chairman of the Board | | Indefinite Served as Chairman of the Board since 2004 and Director since 1986 | | Co-Founder and Chairman of the Board of Intelisum, Inc. (a company pursuing computer and measurement technology and products) since 2001; Consultant on corporate growth and technology transfer since 2004; Vice President, Corporate Development, Legal Affairs and General Counsel, and Secretary, NPS Pharmaceuticals, Inc. from 1991 to 2004. | | 12 | | Private companies and foundations only. |
| | | | | |
William R. Swinyard, Ph.D. 470 S. Woodland Hills Drive Woodland Hills, UT 84653 Age 66 | | Director and Chairman of the Audit Committee | | Indefinite Served as Chairman of the Audit Committee since 2004 and Director since 1986 | | Professor of Business Management and Holder of the Fred G. Meyer Chair of Marketing (Emeritus), Brigham Young University since 1978. | | 12 | | None |
| | | | | |
D. James Croft, Ph.D. 12030 Sunrise Valley Drive,
Suite 200 Reston, VA 20191 Age 65 | | Director | | Indefinite Served as Director since 2005 | | Consultant since 2004 and Founder & Executive Director, Mortgage Asset Research Institute from 1990 to 2004. | | 12 | | None |
|
| |
1Director may serve until his death, resignation, removal or retirement. Each Independent Director shall retire as Director at the end of the calendar year in which he attains the age of 72 years.
2Directorships are those held by a Director in any company with a class of securities registered pursuant to Section 12 of the Securities Exchange Act of 1934 or subject to the requirements of Section 15(d) of the Securities Exchange Act or any company registered as an investment company under the 1940 Act.
3Mr. Stewart is an Interested Director because he serves as a director and officer of the Advisor.
86
| | |
| | MARCH 31, 2007 (UNAUDITED) |
|
| |
| |
| | | | | | | | | | |
Name, Address
and Age | | Position(s)
Held
with Funds | | Term of Office and
Length of Time Served | | Principal Occupation(s)
During Past 5 Years | | Number of
Portfolios
in Fund
Complex
Overseen
by Director | | Other Directorships
Held by Director |
Officers | | | | | | | | | | |
| | | | | |
Venice F. Edwards, CFA 150 Social Hall Ave. 4th Floor Salt Lake City, UT 84111 Age 56 | | Vice President | | Indefinite Served as Vice President since September 2004 | | Senior Compliance Officer for the Advisor since 2006; Chief Compliance Officer for the Advisor from 2004 to 2006; Treasurer of the Funds from 1996 to 2007; Director of Compliance for the Advisor from 1995 to 2004 and Secretary of the Advisor since 1999. | | Not
Applicable | | Not Applicable |
| | | | | |
Daniel D. Thurber 150 Social Hall Ave. 4th Floor Salt Lake City, UT 84111 Age 37 | | Vice President | | Indefinite Served as Vice President since February 2007 | | General Counsel, Chief Compliance Officer and Director of Compliance for the Advisor since 2006; Chief Compliance Officer and Secretary for Wasatch Funds from May 2006 to February 2007; Associate and Partner at Dorsey & Whitney LLP from 2001 to 2006. | | Not
Applicable | | Not Applicable |
| | | | | |
Russell L. Biles 150 Social Hall Ave. 4th Floor Salt Lake City, UT 84111 Age 39 | | Chief Compliance Officer and Vice President | | Served as Chief Compliance Officer and Vice President since February 2007 | | Chief Compliance Officer and Vice President for Wasatch Funds since February 2007; Counsel for the Advisor since October 2006; Senior Compliance Administrator for the Advisor from October 2005 to October 2006; Attorney and Managing Member of Nicholls Nicholls Biles & Bower, LLC from 2002 to 2005. | | Not
Applicable | | Not Applicable |
| | | | | |
Melanie L. Hulett 150 Social Hall Ave. 4th Floor Salt Lake City, UT 84111 Age 30 | | Treasurer and Secretary | | Indefinite Served as Treasurer and Secretary since February 2007 | | Treasurer and Secretary for Wasatch Funds since February 2007; Assistant Treasurer for Wasatch Funds from November 2006 to February 2007; Senior Fund Administrator for the Advisor since 2005; Compliance Officer at U.S. Bancorp Fund Services, LLC from 2001 to 2005. | | Not
Applicable | | Not Applicable |
|
| |
87
| | |
| WASATCH FUNDS — Supplemental Information | | |
|
| |
| |
PROXY VOTING POLICIES, PROCEDURESAND RECORD
A description of the policies and procedures that the Advisor uses to vote proxies related to the Funds’ portfolio securities is set forth in the Funds’ Statement of Additional Information which is available without charge, upon request, on the Funds’ web site at www.wasatchfunds.com or by calling 800.551.1700 and on the Securities and Exchange Commission’s (SEC) web site at www.sec.gov.
Wasatch Funds’ proxy voting record is available on the Funds’ web site at www.wasatchfunds.com and the SEC’s web site at www.sec.gov no later than August 31 for the prior 12 months ending June 30.
QUARTERLY PORTFOLIO HOLDINGS DISCLOSUREON FORM N-Q
The Funds file their complete schedules of investments with the SEC for their first and third fiscal quarters of each fiscal year, commencing with the quarter ended December 31, 2004, on Form N-Q. The Funds’ Form N-Q is available on the SEC’s web site at www.sec.gov, and may be viewed at the SEC’s Public Reference Room in Washington, D.C. (Information on the operation of the Public Reference Room may be obtained by calling 800.SEC.0330).
DISCLOSURE REGARDING BOARD APPROVALS
THE APPROVAL PROCESS
At a meeting held on February 21, 2007 (the “Meeting”), the Board of Directors of the Company, including the Independent Directors, unanimously approved the Advisory and Service Contract (the “Advisory Contract”) between Wasatch Funds, Inc. and Wasatch Advisors, Inc. (the “Advisor”) on behalf of each Fund and the Sub-Advisory Agreement between the Advisor and Hoisington Investment Management Company (the “Sub-Advisor”).
To assist the Board in its evaluation of the Advisory Contract and Sub-Advisory Agreement, the Independent Directors met with independent counsel in Executive Sessions on February 7, 2007 and February 20, 2007. In advance of these meetings, the Board received materials and other information which outlined, among other things:
| • | | The terms and conditions of the Advisory Contract and Sub-Advisory Agreement, including the nature, extent and quality of services provided by the Advisor and Sub-Advisor; |
| • | | The organization and business operations of the Advisor and Sub-Advisor, including the experience of persons who will manage the respective Fund; |
| • | | The profitability of the Advisor from serving as advisor to the respective Fund (as well as financial information regarding the Sub-Advisor, profitability analysis for advisors to unaffiliated investment companies and the expenses of the Advisor in providing the services); |
| • | | The management fees of the Advisor, including comparisons of such fees with the management fees of comparable, unaffiliated funds prepared by an independent third party and the Advisor’s fee schedule for other clients; |
| • | | The sub-advisory fees of the Sub-Advisor with respect to the U.S. Treasury Fund (including the Sub-Advisor’s fee schedule for other clients); |
| • | | The expenses of each Fund, including comparisons with the expense ratios of comparable, unaffiliated funds compiled by an independent third party; |
| • | | The respective Fund’s past performance as well as such Fund’s performance compared to funds of similar investment objectives compiled by independent third parties and with recognized benchmarks; and from independent counsel, a legal memorandum outlining, among other things, the duties of the Independent Directors under the Investment Company Act of 1940 (the “1940 Act”), as well as the general principles of relevant state law in reviewing and approving advisory contracts; the requirements of the 1940 Act in such matters; an advisor’s fiduciary duty with respect to advisory agreements and compensation; the standards used by courts in determining whether investment company boards of directors have fulfilled their duties and factors to be considered by the Board in voting on advisory agreements. |
The information provided for the Meeting supplements the information the Board receives throughout the year regarding a Fund’s performance, expense ratios, portfolio composition, trade execution and sales activity. At an Execution Session held on November 14, 2006, the Independent Directors reviewed with independent legal counsel the legal framework and their duties in reviewing advisory contracts. At an Executive Session on February 7, 2007, the Independent Directors also discussed the materials provided, their duties in reviewing and approving advisory contracts, outstanding issues or other concerns and requested certain additional information in preparation for the Meeting. The Independent Directors, in consultation with independent counsel, also reviewed the factors set out in judicial decisions and SEC directives relating to the renewal of advisory contracts. As outlined in more detail below, the Independent Directors considered all factors they believed relevant with respect to the Funds, including the following: (a) the nature, extent and quality of the services to be provided by the Advisor and Sub-Advisor; (b) the investment performance of the respective Fund as available (as described in further detail in Section (B) below); (c) the profits to be realized by the Advisor from the relationship with the Fund; (d) the extent to which economies of scale would be realized as a Fund grows; and (e) whether fee levels reflect these economies of scale for the benefit of Fund investors. The Independent Directors also met in Executive Session with independent counsel on February 20, 2007 to further discuss the Advisory Contract and Sub-Advisory Agreement and to review additional information provided by the Advisor and Sub-Advisor, including performance and fees.
| A. | | NATURE, EXTENTAND QUALITYOF SERVICES |
In evaluating the nature, extent and quality of the Advisor’s and Sub-Advisor’s services, the Independent Directors reviewed information concerning the types of services (advisory and non-advisory or administrative services) that the Advisor and Sub-Advisor provide to the respective Fund; the performance record of the applicable Fund; and
88
| | |
| | MARCH 31, 2007 (UNAUDITED) |
|
| |
| |
information describing the Advisor’s and Sub-Advisor’s organization and business. In connection with their service as Independent Directors of the Company, the Independent Directors also periodically have met with the Advisor’s and Sub-Advisor’s personnel and have evaluated their professional experience, qualifications and credentials. Given the Independent Directors’ experience with the Funds, Advisor and Sub-Advisor, the Independent Directors were familiar with and have a good understanding of the organization, operations, investment philosophy and personnel of the Advisor and Sub-Advisor.
In connection with their review of the advisory services being provided, the Independent Directors considered the investment philosophy and investment mandates of each Fund and whether the Advisor and Sub-Advisor (as applicable) have performed consistently with such philosophy and mandates. In this regard, the Directors believe that the Advisor and Sub-Advisor have consistently applied their traditional investment philosophy and processes in managing the applicable Funds. The Directors further noted the Advisor’s management process is research intensive (reviewing, among other things, the ratio of total assets to portfolio management personnel compared to that of other unaffiliated advisors) and recognized the Advisor’s considerable investment and commitment to expanding and developing its research staff to continue to provide quality advisory services. In its review of staffing, the Independent Directors also considered the changes or additions to the personnel involved with the portfolio management of the respective Funds. The Independent Directors also reviewed the compensation arrangements of the Wasatch personnel to evaluate the Advisor’s ability to attract and retain key employees, including portfolio managers, preserve stability and provide for appropriate succession planning, and reward performance. In light of the regulatory emphasis on compliance, in reviewing the services that have been provided to the Funds, the Independent Directors also considered the Advisor’s compliance structure, regulatory history and additions to the compliance and legal department.
In their review of services, the Independent Directors also evaluated the quality of administrative or non-advisory services provided. The terms of the Advisory Contract provide that the Advisor shall administer the Company’s affairs to the extent requested by and subject to the supervision of the Board for the period and terms of the contract. In this regard, the Advisor, among other things, manages the external relationships that provide administration, transfer agency, distribution, accounting and custodial services for the Funds and directs the marketing activities and manages the shareholder relationships for the Funds. As outlined in the materials provided to the Board, some of the services, other than investment management, provided to the Funds, include assistance with preparation and filing of regulatory and tax reports, preparation and distribution of prospectuses and shareholder reports, provision of information to Fund directors, analysis to ensure compliance with federal and state laws and regulations, valuation of portfolio securities, and oversight of the performance of the Funds’ service providers (administrator, fund accountant, transfer agent
and custodian). The Advisor also pays for office space and facilities for the Funds and provides personnel and administrative support services for the Funds’ designated Chief Compliance Officer, an employee of the Advisor.
With respect to the Sub-Advisor for the U.S. Treasury Fund, it was noted that the Sub-Advisory Agreement is essentially an agreement for portfolio management services only and the Sub-Advisor was not expected to supply other significant administrative services.
Based on their review, the Independent Directors found that, overall, the nature, extent and quality of services provided under the Advisory Contract and the Sub-Advisory Agreement were satisfactory on behalf of the applicable Fund.
| B. | | THE INVESTMENT PERFORMANCEOFTHE FUNDS |
In evaluating each Fund’s performance, the Directors reviewed both short-term and long-term performance of each Fund relative to its peer group and relevant benchmarks. More specifically, the Independent Directors reviewed, among other things, materials reflecting the respective Fund’s historic performance for the one-, three-, five-, and 10-year periods ending December 31, 2006 (as applicable) compared to its respective benchmarks and unaffiliated funds in its investment category as well as a report prepared by an unaffiliated third party comparing the respective Fund’s total return for the one-, two-, three-, four-, five-, and 10-year periods ending December 31, 2006 (as applicable) compared to the performance of unaffiliated funds with similar investment objectives or classifications (a “Peer Group”) for the prescribed periods. In addition, the Independent Directors received reports prepared by a second unaffiliated party regarding the Funds, which generally included an analyst report on the respective Fund (other than the International Opportunities, Strategic Income and U.S. Treasury Funds). While the Independent Directors generally gave greater weight to a Fund’s performance over longer periods of time, the Independent Directors also considered any trends in a Fund’s performance. Further, the Independent Directors also recognized the limitations on some of the usefulness of the performance comparison information as the closest Peer Group for a Fund may not adequately reflect the Fund’s investment strategies and may be invested in sectors or industries in which the respective Fund has limited or no exposure. In addition, the Independent Directors are cognizant that individual shareholders may give greater weight to absolute performance as compared to relative performance with peers. Based on their review and in light of the above considerations, the Independent Directors determined that the respective Fund’s investment performance over time had been satisfactory, except as noted.
The Heritage Growth, International Opportunities and Strategic Income Funds are each relatively new funds with performance histories that are too short for a meaningful assessment of performance.
Although the Core Growth and Ultra Growth Funds outperformed their benchmarks over the 10-year period, the
89
| | |
| WASATCH FUNDS — Supplemental Information (continued) | | |
|
| |
| |
Independent Directors have noted the Funds have underperformed their benchmarks in more recent years. Accordingly, at the request of the Independent Directors, the Advisor has provided them with additional analysis regarding its investment philosophy and mandates for such Funds, the factors affecting performance and any recommended changes. The Independent Directors further held Executive Sessions on October 6, 2006 and November 8, 2006 at which they discussed with the Advisor the analysis provided. Based on their review, the Independent Directors are satisfied with the Advisor’s investment philosophy and process, its initiatives to understand the factors affecting performance and to address performance concerns, including additions to the research staff to cover additional market sectors while staying consistent with its investment philosophy and process.
| C. | | FEES, EXPENSESAND PROFITABILITY |
1. Fees and Expenses
In their evaluation of fees and expenses, the Independent Directors reviewed the Advisor’s management fees and expense ratios for each Fund and the sub-advisory fee with respect to the U.S. Treasury Fund in absolute terms as well as with comparisons of fees and expenses of funds with similar objectives. In this regard, the Independent Directors reviewed and considered, among other things, comparisons of the respective Fund’s contractual management fees, total expenses (including and excluding non-12b-1 service fees), and non-management expenses (such as transfer agency, custodian, administrative and accounting fees) with those of unaffiliated funds in its Peer Group compiled by an independent third party. In reviewing fees, the Independent Directors also considered the expense limitation agreement provided by the Advisor for the Funds and the amounts the Advisor has reimbursed to the Funds for the last three fiscal years (if any) which effectively reduces the amount of advisory fees paid to the Advisor. In reviewing the materials, the Independent Directors considered not only the management fees, but also considered a Fund’s overall expenses.
Based upon their review, the Independent Directors noted that the following Funds had advisory and/or total expense ratios below or near the median for its respective Peer Group: the Heritage Growth, Small Cap Growth and Strategic Income Funds. The remaining Funds have advisory fees and total expense ratios higher than the median in their Peer Group. In reviewing fees, the Independent Directors noted that the Funds with the highest advisory fees (i.e., the Micro Cap, Micro Cap Value and International Opportunities Funds) also had superior performance. In considering fees, as noted above, the Independent Directors also recognized that the Advisor’s investment approach is research intensive and noted the costs incurred to support this approach. In addition, the Independent Directors have recognized the continuing practice of closing Funds to new investors at certain asset levels the Advisor deems appropriate or necessary to effectively manage assets, particularly Funds in the small- and micro-cap sectors. However, by closing Funds, the Advisor also foregoes additional revenues generated from advisory fees on larger asset bases as well as exposes the
Advisor to periods of reduced revenues from asset outflows. The Independent Directors seek to encourage the Advisor’s focus on performance as opposed to gathering additional assets under management to increase revenues. Given the foregoing, the Independent Directors recognized that the current advisory fee level may be warranted.
2. Fees Charged to Other Advisor and Sub-Advisor Clients
In reviewing fees, the Independent Directors also compared the advisory fees to the fees the Advisor assesses for other types of clients, including institutional and high net worth separate accounts and a private investment company. Currently, the Advisor manages separate account client assets in a style similar to certain Funds, including Core Growth, Heritage Growth, International Growth, Micro Cap, Micro Cap Value, Small Cap Growth, Small Cap Value and the Ultra Growth Funds. The fees for these accounts are generally lower than the comparable Fund (except the fees are the same in the case of the Heritage Growth Fund and the separate accounts managed in a similar style). Generally, the Advisor charges higher fees to clients who require a higher degree of management, trading, servicing or administrative services. The Independent Directors have recognized that the Advisor provides services to the Funds in managing and operating registered investment companies beyond that provided to its separately managed account clients. These services include business, administrative, compliance, marketing and other services as described above. Further, the Independent Directors recognized the extensive compliance responsibilities required for managing investment companies which operate in a highly regulated industry. Such responsibilities generally are not required to the same extent for separate accounts. Accordingly, the Independent Directors believe the nature and number of services provided to operate a Fund merit higher fees than those of separate accounts. The Independent Directors also noted the hedge fund advised by the Advisor pays a performance fee and therefore its fee structure differs significantly from that of the Funds.
In considering the fees of the Sub-Advisor, the Independent Directors also considered the pricing schedule the Sub-Advisor charges for similar investment management services for other clients. In this regard, the sub-advisory fees for the U.S. Treasury Fund were at the lower end of the Sub-Advisor’s fee schedule. The Independent Directors also noted that the sub-advisory fees were established through arm’s length negotiations between the Advisor and the Sub-Advisor, which is unaffiliated with the Advisor.
3. Profitability of the Advisor
The Independent Directors reviewed the profitability of the Advisor derived from its relationship with each Fund for the calendar year ended December 31, 2006 and as compared to its profitability for 2005. In reviewing profitability, the Independent Directors reviewed the methodology utilized to allocate revenue and expenses of the Advisor among the Funds. In considering profitability, the Independent Directors have recognized the inherent limitations in
90
| | |
| | MARCH 31, 2007 (UNAUDITED) |
|
| |
| |
determining profitability, including the difficulty establishing a method to allocate expenses across multiple investment products served by the Advisor, particularly allocating research and personnel expenses given the Advisor’s shared research culture. The Directors also reviewed the Advisor’s profitability compared to publicly available profitability information concerning unaffiliated advisors. However, the Independent Directors recognized the difficulties in comparing the profitability of various advisors given that individual fund or product line profitability of other advisors generally is not publicly available and is affected by numerous factors including the structure of the particular advisor, the types of funds managed, its business mix, expense allocations, and the advisor’s capital structure and cost of capital. The Independent Directors noted that the Advisor’s profitability is within a reasonable range compared to the peer group of unaffiliated advisors. Based on their review, the Independent Directors were satisfied that the Advisor’s level of profitability from its relationship with each Fund was not unreasonable in light of the services provided.
With respect to the Sub-Advisor, although a profitability analysis was not available, the Independent Directors received certain financial statements of the Sub-Advisor. Given that the Sub-Advisor’s fee is at the low end of its fee schedule and the fact that the sub-advisory fee is established through arm’s length negotiations, the Independent Directors believe the Sub-Advisor’s profitability from its relationship with the U.S. Treasury Fund is not unreasonable.
In addition to the above, the Independent Directors also considered that the Advisor benefits from soft dollar arrangements whereby it receives brokerage and research services from brokers that execute a Fund’s purchases and sales of securities, as described in further detail below.
| D. | | ECONOMIESOF SCALEAND WHETHER FEE LEVELS REFLECT THESE ECONOMIESOF SCALE |
In reviewing advisory fees, the Independent Directors noted that the advisory fee schedules for the Funds do not contain breakpoints that reduce the fee rate on assets above certain levels. However, the Independent Directors recognized that due to the unique nature of managing funds investing in small- and micro-cap companies, the Advisor is somewhat limited in the economies of scale that may be achieved. In this regard, the Independent Directors are aware that it is more difficult to replicate performance in the small- and micro-cap funds at larger asset sizes and therefore, as noted above, a Fund may be closed to new and/or existing shareholders from time to time. This practice enhances the Advisor’s focus on achieving performance by maintaining assets at levels it can effectively manage but may limit economies of scale derived from a larger asset base. The Independent Directors, as noted, also recognized that this practice limits the Advisor’s profit potential from earning additional fees on a larger asset base and exposes the Advisor to reduced revenues from asset outflows. The Independent Directors further recognized the Advisor’s position that to the extent economies of scale exist, the proposed level of advisory fee reflects such economies of scale. Considering
the factors above, the Independent Directors concluded the absence of breakpoints was acceptable.
In evaluating fees, the Independent Directors also considered any indirect benefits or profits the Advisor or its affiliates may receive as a result of its relationship with the Funds. In this regard, the Independent Directors considered that the Advisor benefits from soft dollar arrangements pursuant to which it receives research from brokers that execute the applicable Fund’s brokerage transactions. The Independent Directors reviewed information regarding the soft dollar arrangements including, among other things, the commissions paid, the research credits earned and the services provided. Further, the Independent Directors at prior meetings have had extensive discussions regarding the soft dollar arrangements, including the Advisor’s brokerage allocation procedures, the brokers providing such services and the related commissions, the types of research received, the value of the research to the Advisor, the legal safe harbor for soft dollars permitting the payment of higher commissions in exchange for research services, and the method of allocating the benefits and expenses of soft dollar arrangements. The Independent Directors recognized that soft dollar arrangements provide benefits to the Advisor by obtaining research that it would otherwise have to pay for with hard dollars. Accordingly, the Advisor’s profitability would be somewhat lower if it did not receive the research services pursuant to soft dollar arrangements. The Independent Directors took these “fall out” benefits into account when reviewing the level of advisory fees.
The Independent Directors did not identify any single factor discussed previously as all-important or controlling. The Independent Directors, including a majority of Independent Directors, concluded that the terms of the Advisory Contract for each Fund and the Sub-Advisory Agreement for the U.S. Treasury Fund were fair and reasonable, that the Advisor’s and Sub-Advisor’s fees are reasonable in light of the services provided to the respective Fund, and that the Advisory Contract should be approved on behalf of each Fund and the Sub-Advisory Agreement should be approved on behalf of the U.S. Treasury Fund.
91
| | |
| WASATCH FUNDS — Service Providers | | MARCH 31, 2007 (UNAUDITED) |
|
| |
| |
Investment Advisor
Wasatch Advisors, Inc.
150 Social Hall Avenue, 4th Floor
Salt Lake City, UT 84111
Sub-Advisor for U.S. Treasury Fund
Hoisington Investment Management Co.
1250 Capital of Texas Highway South
Building 3, #600
Austin, TX 78746
Administrator and Fund Accountant
State Street Bank and Trust Company
801 Pennsylvania Avenue
Kansas City, MO 64105
Distributor
ALPS Distributors, Inc.
1290 Broadway, Suite 1100
Denver, CO 80203
Transfer Agent
UMB Fund Services, Inc.
803 West Michigan Street, Suite A
Milwaukee, WI 53233-2301
Custodian
State Street Bank and Trust Company
801 Pennsylvania Avenue
Kansas City, MO 64105
Legal Counsel to Wasatch Funds and
Independent Directors
Chapman & Cutler, LLP
111 West Monroe Street
Chicago, IL 60603
Independent Registered Public Accounting Firm
PricewaterhouseCoopers LLP
1055 Broadway, 10th Floor
Kansas City, MO 64105
92
| | |
| WASATCH FUNDS — Guide to Understanding Financial Statements | | MARCH 31, 2007 (UNAUDITED) |
|
| |
| |
Wasatch Funds provides reports to shareholders twice a year. The annual report is for the Funds’ fiscal year, which ends September 30. The semi-annual report is for the six months or period ending March 31. Additionally, the Funds’ schedules of investments for the first and third quarters of each fiscal year are available to shareholders as described on page 88. These reports provide shareholders with important information that will help them evaluate the management and performance of their investments. It is the desire of Wasatch Funds to help shareholders stay in tune with their investments. If you have any questions about the information in this report, a shareholder services representative will be happy to assist you when you call 800.551.1700.
SCHEDULEOF INVESTMENTS
The holdings of each Wasatch Fund are detailed in the “Schedule of Investments.” This section provides a snapshot of the securities each Fund was invested in on the last day of the reporting period. The Wasatch Equity Funds invest primarily in Common Stocks of companies, which are grouped together by industry. The Wasatch-Hoisington U.S. Treasury Fund invests primarily in U.S. Treasury securities. The Equity Funds will typically have only minor holdings in Short-Term Investments. At times the Funds may take temporary defensive positions by increasing cash or holdings in Short-Term Investments. Please see the prospectus under “Other Investment Strategies and Their Risks.”
STATEMENTSOF ASSETSAND LIABILITIES
These financial statements show the Assets and Liabilities of a Fund on the last day of the reporting period. A Fund’s Assets include the value of securities owned, amounts receivable for purchases of Fund shares (capital shares receivable), securities sold, interest and dividends, prepaid expenses and other assets. Liabilities are amounts owed for shareholder redemptions (capital shares payable), securities purchased, investment advisory fees and other expenses. Totaling up the assets and subtracting the liabilities results in a Fund’s Net Assets.
Net Assets consist of capital stock, paid-in capital in excess of par, undistributed net investment income or loss, undistributed net realized gain or loss on investments and net unrealized appreciation or depreciation on investments. Capital stock is stock authorized by a company’s charter and having par value, stated value or no par value. Par value is set by the company issuing the shares and has no relation to Net Asset Value. The par value of one share of each Wasatch Fund is $.01. Paid-in capital in excess of par is capital received from shareholders in exchange for Fund shares that exceeds the par value of the shares. For example, if you bought one share of a Fund for $10, $.01 would show as “Capital stock” on the books of the Fund, and $9.99 would be accounted for under “Paid-in capital in excess of par.” Undistributed net investment income or loss is the amount of net investment income or loss of a Fund since inception that has not been paid to shareholders as a dividend. Undistributed net realized gain (loss) on investments is the
amount of net realized gains or losses generated by a Fund since inception that have not been distributed to shareholders in the form of a capital gain distribution. A gain or loss is realized when a security is sold by a Fund. Net unrealized appreciation (depreciation) on investments is the change in value from the purchase price of securities a Fund continues to hold.
The number of shares a Fund is authorized to sell can be found under Capital Stock, $.01 par value. Issued and outstanding indicates the number of shares owned by shareholders.
Net Asset Value (NAV), Redemption Price and Offering Price Per Share shows the value of one outstanding share of a Fund on the date of the report. A Fund’s share price (NAV) is calculated by dividing the value of all securities and other assets owned by a Fund, less the liabilities charged to that Fund, by the number of Fund shares outstanding. The share price is calculated at the close of business of the New York Stock Exchange on each day the Exchange is open for trading. Please see Wasatch Funds’ prospectus for more information about how share prices are calculated. Information about how the share price is affected by a Fund’s operation can be found under “Financial Highlights” on page 94.
STATEMENTSOF OPERATIONS
Statements of Operations show investment income and expenses for each Fund as well as realized gains or losses from securities sold and the appreciation or depreciation in the value of a Fund’s holdings during the reporting period.
Investment Income shows Interest and Dividends earned from interest-bearing and dividend-paying securities in a Fund’s portfolio.
Expenses show the various fees and expenses paid out of a Fund’s assets such as the fee paid to Wasatch Advisors, the Funds’ investment advisor. Additional fees include shareholder servicing, fund administration and accounting, custody of fund assets, federal and state registration, legal counsel, auditing and directors’ fees. The Funds pay for printing and mailing statements, prospectuses, annual reports and semi-annual reports to shareholders.
Net Investment Income (Loss) is the amount of dividends and interest income earned on securities held by a Fund, less the Fund’s expenses.
Net realized gain (loss) on investments and foreign currency translations is the net gain or loss on securities a Fund has sold. Change in unrealized appreciation (depreciation) on investments and foreign currency translations is the change in value of securities a Fund continues to hold.
Net gain (loss) on investments is the result of changes in market value of securities a Fund has sold and securities it continues to hold.
STATEMENTSOF CHANGESIN NET ASSETS
Net Assets are a Fund’s remaining assets after taking into consideration any liabilities. Statements of Changes in Net Assets show the increase or decrease in a Fund’s net assets during the reporting period. Investment operations,
93
| | |
| WASATCH FUNDS — Guide to Understanding Financial Statements | | MARCH 31, 2007 (UNAUDITED) |
|
| |
| |
dividends and capital share transactions affect a Fund’s net assets. Operations is a summary of the Statements of Operations. It includes investment income or loss, net realized gain or loss on investments and foreign currency translations a Fund has sold as well as the change in appreciation or depreciation in the value of investments a Fund continues to hold.
Dividends are distributed by Wasatch Funds to shareholders when Fund investments have earned income in excess of net expenses or when capital gains in excess of capital losses are realized from the sale of securities. Most shareholders choose to reinvest their dividends and capital gain distributions. Each Fund is required by Internal Revenue Code regulations to distribute substantially all of its net investment income and capital gains to shareholders in order to retain its status as a “regulated investment company.”
Capital share transactions are any transactions involving shares of a Fund, including the selling of Fund shares, shares issued by a Fund to shareholders for the reinvestment of dividends, and share redemptions.
FINANCIAL HIGHLIGHTS
The Financial Highlights contain important historical operating information that you may find useful in making decisions or understanding the performance of your investment.
Net Asset Value (NAV) is defined under “Statements of Assets and Liabilities” on page 93. The difference between the Net asset value, beginning of period and the Net asset value, end of period in the Financial Highlights is the change in value of a Fund’s shares over the reporting period, but not its total return.
Income (loss) from investment operations shows how the share price was affected by a Fund’s operations on a per share basis. Net investment income (loss) is the per share
amount of dividends and interest income earned on securities held by a Fund, less the Fund’s expenses. Net realized and unrealized gains (losses) on securities is the per share increase or decrease in the value of securities a Fund holds or has sold during the reporting period. Gains or (losses) are realized when securities are sold. Gains or (losses) are unrealized when securities increase or decrease in value but are not sold.
Distributions are the per share amount that a Fund paid to shareholders from net investment income and net realized gains.
Total return is the percentage increase or decrease in the value of an investment over a stated period of time. A total return percentage includes both changes in unrealized and realized gains and income. For the purposes of calculating total return, it is assumed that dividends and distributions are reinvested at the share price on the ex-dividend day of the distribution. A FUND’S TOTAL RETURN CANNOT BE COMPUTED DIRECTLY FROM THE FINANCIAL HIGHLIGHTS.
Supplemental data and ratios are provided to help you better understand your investment. Net assets, end of period, are the net assets of a Fund on the reporting date. Ratio to average net assets of: Expenses shows the total of a Fund’s operating expenses divided by its average net assets for the stated period before and after waivers and reimbursements by the Advisor, if any. Ratio to average net assets of: Net investment income shows a Fund’s net investment income (loss) divided by its average net assets for the stated period before and after waivers and reimbursements by the Advisor, if any. Portfolio turnover rate measures a Fund’s buying and selling activity during the reporting period. It is computed by dividing total purchases or sales, whichever is less, by the average monthly market value of a Fund’s portfolio securities. This calculation does not include securities with a maturity date of less than 12 months.
TELEPHONE
800.551.1700
M - F, 7:00 a.m. to 7:00 p.m. CT
Automated Line, 24 Hours
U.S. MAIL
Wasatch Funds
P.O. Box 2172
Milwaukee, WI 53201-2172
OVERNIGHT MAIL
Wasatch Funds
803 West Michigan Street, Suite A
Milwaukee, WI 53233-2301
ONLINE
www.wasatchfunds.com
shareholderservice@wasatchfunds.com
WAS000534 5/30/2008
94

WWW.WASATCHFUNDS.COM
800.551.1700
Not required.
| Item 3: | Audit Committee Financial Expert. |
Not required.
| Item 4. | Principal Accountant Fees and Services. |
Not required.
| Item 5. | Audit Committee of Listed Registrants. |
Not applicable.
| Item 6. | Schedule of Investments. |
Schedule of Investments is included as a part of the report to shareholders filed under Item 1 of this Form N-CSR.
| Item 7. | Disclosure of Proxy Voting Policies and Procedures for Closed-End Management Investment Companies. |
Not applicable.
| Item 8. | Portfolio Managers of Closed-End Investment Companies. |
Not applicable.
| Item 9. | Purchases of Equity Securities by Closed-End Management Investment Company and Affiliated Purchasers. |
Not applicable.
| Item 10. | Submission of Matters to a Vote of Security Holders. |
The Board of Directors has not adopted procedures by which shareholders may recommend nominees to the Board.
| Item 11. | Controls and Procedures. |
| (a) | | The Registrant’s principal executive and principal financial officers have concluded that the Registrant’s disclosure controls and procedures (as defined in Rule 30a-3(c) under the Investment Company Act of 1940, as amended (the “1940 Act”) (17 CFR 270.30a-3(c)) are effective, as of a date within 90 days of the filing date of this Form N-CSR based on their evaluation of these controls and procedures required by Rule 30a-3(b) under the 1940 Act (17 CFR 270.30a-3(b)) and Rules 13a-15(b) or 15d-15(b) under the Securities Exchange Act of 1934 (17 CFR 240.13a-15(b) or 240.15d-15(b)). |
| (b) | | There were no changes in the Registrant’s internal control over financial reporting (as defined in Rule 30a-3(d) under the 1940 Act (17 CFR 270.30a-3(d)) that occurred during the Registrant’s second fiscal quarter of the period covered by this report that has materially affected, or is reasonably likely to materially affect, the Registrant’s internal control over financial reporting. |
| (a)(2) | | The certifications required by Rule 30a-2 of the 1940 Act are attached hereto. |
| (b) | | The certifications required by Rule 30a-2(b) of the 1940 Act and Section 906 of the Sarbanes-Oxley Act of 2002 are attached hereto. |
SIGNATURES
Pursuant to the requirements of the Securities Exchange Act of 1934 and the Investment Company Act of 1940, the registrant has duly caused this report to be signed on its behalf by the undersigned, thereunto duly authorized.
| | |
| WASATCH FUNDS, INC. |
| |
| By: | | /s/ Samuel S. Stewart, Jr. |
| | Samuel S. Stewart, Jr. |
| | President (principal executive officer) of Wasatch Funds, Inc. |
Date: June 6, 2007
Pursuant to the requirements of the Securities Exchange Act of 1934 and the Investment Company Act of 1940, this report has been signed below by the following persons on behalf of the registrant and in the capacities and on the dates indicated.
| | |
| |
| By: | | /s/ Samuel S. Stewart, Jr. |
| | Samuel S. Stewart, Jr. |
| | President (principal executive officer) of Wasatch Funds, Inc. |
Date: June 6, 2007
| | |
| |
| By: | | /s/ Melanie L. Hulett |
| | Melanie L. Hulett |
| | Secretary/Treasurer (principal financial and accounting officer) of Wasatch Funds, Inc. |
Date: June 6, 2007