UNITED STATES
SECURITIES AND EXCHANGE COMMISSION
Washington, D.C. 20549
FORM N-CSR
CERTIFIED SHAREHOLDER REPORT OF REGISTERED
MANAGEMENT INVESTMENT COMPANIES
Investment Company Act file number: 811-4920
WASATCH FUNDS, INC.
(Exact name of registrant as specified in charter)
150 Social Hall Avenue
4th Floor
Salt Lake City, Utah 84111
(Address of principal executive offices) (Zip code)
| | |
| (Name and Address of Agent for Service) | | Copy to: |
| |
Samuel S. Stewart, Jr. Wasatch Funds, Inc. 150 Social Hall Avenue, 4th Floor Salt Lake City, Utah 84111 | | Eric F. Fess, Esq. Chapman & Cutler LLP 111 West Monroe Street Chicago, IL 60603 |
Registrant’s telephone number, including area code: (801) 533-0777
Date of fiscal year end: September 30
Date of reporting period: March 31, 2008
| Item 1: | Report to Shareholders. |
| | |

| | SEMI-ANNUAL REPORT |
| | |
| MARCH 31, 2008 | | WASATCH CORE GROWTH FUND |
| |
| | WASATCH EMERGING MARKETS SMALL CAP FUND |
| |
| | WASATCH GLOBAL SCIENCE & TECHNOLOGY FUND |
| |
| | WASATCH HERITAGE GROWTH FUND |
| |
| | WASATCH HERITAGE VALUE FUND |
| |
| | WASATCH INTERNATIONAL GROWTH FUND |
| |
| | WASATCH INTERNATIONAL OPPORTUNITIES FUND |
| |
| | WASATCH MICRO CAP FUND |
| |
| | WASATCH MICRO CAP VALUE FUND |
| |
| | WASATCH SMALL CAP GROWTH FUND |
| |
| | WASATCH SMALL CAP VALUE FUND |
| |
| | WASATCH STRATEGIC INCOME FUND |
| |
| | WASATCH ULTRA GROWTH FUND |
| |
| | WASATCH-HOISINGTON U.S. TREASURY FUND |
Wasatch Funds, Inc.
Salt Lake City, Utah
www.wasatchfunds.com
800.551.1700
This material must be accompanied or preceded by a prospectus.
Please read the prospectus carefully before you invest.
Wasatch Funds are distributed by ALPS Distributors, Inc.
1
| | |

Samuel S. Stewart, Jr., PhD, CFA President of
Wasatch Funds | | DEAR FELLOW SHAREHOLDERS: The domestic stock market just suffered through its worst quarter since 2002 as the U.S. economy weakened further. The subprime crisis turned out to be much more contagious than initially expected, and its effects have now spread broadly across the financial system. The housing market also continued to soften, with a lengthy recovery likely once it does reach bottom. The daily headlines likewise have painted a bleak economic picture. However, I believe the complete economic landscape is much more balanced than what we hear. Inflation is likely to be kept in check by the deflationary pressure from the financial and housing markets. Unemployment, although increasing, is still at a reasonable level at 5.1%. The dollar’s drop will help boost the economy in the near-term through increased exports. The Fed has shown great willingness to take aggressive action to bolster the economy. And the wave of financial carnage seems to have gone about as far as it possibly can. The optimistic outlook for the economy is that it will muddle through in 2008 and get back to growth in 2009. The pessimistic view is that the U.S. is entering a protracted, but likely shallow, recession. The correct |
prognosis is probably somewhere between the two.
WASATCH PERFORMANCE
Reporting negative performance is never satisfying regardless of market conditions, and I am frankly disappointed in our performance this past six months. Our style of investing, utilizing deep due diligence and focusing on quality companies, has generally provided nice protection in past down markets. In fact, in each down year since Wasatch Funds began 22 years ago, the funds have almost always outperformed their benchmarks, and at times even delivered positive returns during these down markets.
As the market began to slide in the fourth quarter of last year, most of our funds again outpaced their benchmarks. Unfortunately, our relative gains of the fourth quarter were more than erased in the first quarter of 2008. Here are four key forces that stand out in reviewing the most recent quarter.
| 1. | The financials sector, historically an overweight segment for Wasatch, took a beating. Our holdings, which we believe are some of the best run financial companies, were seemingly tossed out as the baby with the bath water. We expect these high quality financial companies to be among the first to rebound. |
| | You may ask why we weren’t lighter in financials given the environment. We had in fact pulled back and moved toward higher quality financial companies over the course of last year, but at the prices available late in 2007 we saw more long term upside potential than downside risk in this key global sector. Then came this quarter’s bank bailouts and the near collapse of Bear Stearns, sending financial stocks even lower. We still believe that three to five years hence our financial holdings of today will have been good decisions, but we obviously would have preferred to buy them at the prices they dropped to this quarter. |
| 2. | We had a few significant holdings report earnings below expectations — for which the market showed no tolerance. This happens, of course, but in a market where everything is moving down there simply was not the typical counter balance in the portfolios. |
| 3. | The strongest sectors in the market continue to be energy and commodities. We have increased our holdings in these sectors over the past year, but they remain underweight as most companies in these largely cyclical industries don’t fit our long-term investment style. |
| 4. | What we haven’t seen yet in this bear market is quality companies moving to the front, as they often do in such markets. Historically, this shift has been a critical component of our downside protection. We still expect a move to quality will happen either before, or as, the market begins moving up again. |
We clearly could have played our hand better in the first quarter. I hope that sharing our recent shortcomings and providing a little background for why we feel optimistic about our funds going forward will help you better understand your Wasatch investments.
MARKET OUTLOOK
In hindsight, the past six months would have been a good period to be out of the market. As long-term investors, however, we believe it is important to stay invested through the market’s gyrations. It is extremely difficult to successfully time the market, and ultimately we believe it is a fool’s game. I still expect that we will look back on this period as a blip on the overall upward progression of the market.
The stock market is forward looking. In fact, each time the U.S. has faced a recession over the past 50 years the market has almost always turned south ahead of the recession, and then begun moving north again before the recession ended (sometimes even before the recession officially started). As we now sit teetering on negative GDP growth, the fact that the market seems to be moving sideways is a sign of a sluggish economy with no clear catalyst to move it forward yet, but I do expect the market will begin moving up again before the economy actually does.
2
The current valuation (in terms of price-to-earnings ratio) of the Russell 2000 Index is as good as it has been in almost a decade. Companies are selling at interesting values, but I wouldn’t describe them as screaming buys across the board. We are currently looking for, and holding, high quality companies that have the ability to fund their own growth and which are trading at good valuations. We think such stocks are great investments generally, but are especially appropriate for the current environment.
Thank you for the opportunity to manage your assets. At times like this we particularly appreciate the long-term view of our shareholders and the continued trust that you place in us.
Sincerely,

Samuel S. Stewart, Jr.
President of Wasatch Funds
WASATCH-HOISINGTON U.S. TREASURY FUND
For information about the performance and outlook of the Fund, please see the management discussion and portfolio summary on pages 30 and 31. The views expressed in the management discussion are those of Hoisington Investment Management Company, sub-advisor to the Fund, and may differ from the views of Wasatch Advisors, investment advisor to Wasatch Funds.
Information in this shareholder report regarding market or economic trends or the factors influencing the Funds’ historical or future performance reflects the opinions of Fund management as of the date of this report. These statements should not be relied upon for any other purpose. Past performance is no guarantee of future results, and there is no guarantee that the market forecasts discussed will be realized.
3
| | |
| WASATCH CORE GROWTH FUND (WGROX) — Management Discussion | | MARCH 31, 2008 |
|
| |
| |
The Wasatch Core Growth Fund is managed by a team of Wasatch portfolio managers, led by JB Taylor and Paul Lambert.
| | | | |

JB Taylor
Portfolio Manager | | 
Paul Lambert
Portfolio Manager | | OVERVIEW The Wasatch Core Growth Fund lost 15.90% in the six months ended March 31, 2008, underperforming the benchmark Russell 2000 Index, which lost 14.02%. The market |
environment was extremely challenging as the subprime mortgage crisis that began in mid-2007 spread to other areas of the credit markets and investors became increasingly concerned about the U.S. economy falling into recession.
The Fund held up well during the first half of the period posting a small negative absolute return and outperforming the Index by several percentage points. The second half of the period, 2008’s first calendar quarter, however, was a very different story as investor sentiment turned severely negative. Equity investors shunned the slightest perception of risk and sold shares of many less liquid small company stocks, regardless of the underlying fundamentals. We believe our generally well-managed, financially strong companies with solid earnings were treated just as poorly as lower quality businesses with lesser prospects.
The Fund’s financials and consumer discretionary stocks led the decline while our energy holdings fared better. The health care sector, normally an area of shelter during uncertain times, also declined sharply and dragged on results.
We remain focused on our bottom-up research, selecting individual stocks with the potential for price appreciation driven by sustained earnings growth. We expect the Fund to show better returns as investors recognize the solid fundamentals of our portfolio companies. Elevated market volatility has also allowed us to take advantage of increasingly attractive valuations in high quality growth companies thereby improving the earnings growth potential of the overall portfolio.
DETAILSOFTHE PERIOD
Our holdings in the financials sector were the biggest detractors from performance versus the Index due to an overweight position and poor performance in our holdings. Despite weakness in the sector, our position in Redwood Trust, Inc. was the single strongest contributor to performance. Redwood is a real estate investment trust that was hit hard during the initial reaction to the mortgage crisis as it was painted with the same broad brush as lower quality companies with significant subprime holdings. The company invests primarily in residential mortgages and mortgage securities but has deliberately avoided subprime mortgages. As investors recognized this difference, Redwood’s share price rallied nearly 20% in the period.
The Fund’s largest holding, Copart, Inc., was another strong contributor. Copart is a long-time holding and continues to solidify its dominant position in the auto salvage marketplace. The company is having early success expanding into foreign markets and we expect this to continue and help drive future results. Copart is the epitome of the types of businesses we like to own. Specifically, it possesses dominant market share, experienced shareholder-focused management, and significant financial flexibility.
We were surprised by the weakness in our health care holdings. We, like other investors, felt that our health care stocks would provide stability during the volatile market. This was not the case. The stocks of two of our larger health care holdings, Sunrise Senior Living, Inc. and Emeritus Corp. sold off. Both companies own and operate assisted living centers for seniors. We think investors are overlooking the fundamental strengths of their operating businesses for fear that weakness in the residential housing market will dampen demand for their services. We don’t believe this will happen. Our research and due diligence indicate that both companies are positioned to benefit from favorable long-term demographic trends and that their typical resident may be less susceptible to a slowdown in the overall economy.
In the past few years, we have made a concerted effort to expand our research coverage of areas that have not been traditionally viewed as growth sectors such as energy, materials and industrials. While our sector weights are a result of our bottom-up stock selection, the Fund’s underexposure in these areas has been a significant headwind for more than three years. We think our increased effort is starting to yield fruit as we added several positions to the Fund, one of which is an industrial company, EnergySolutions, Inc. The company owns and manages a number of waste disposal facilities and is benefiting from heightened concerns about the environment and environmental stewardship. The licenses to process industrial waste that EnergySolutions possesses are not easily obtained and represent a formidable barrier to entry for would-be competitors.
OUTLOOK
Elevated volatility and negative sentiment characterized the past six months and we think these forces will continue to influence stock prices as investors evaluate the impact of tighter credit markets, decreased consumer spending and the overall health of the U.S. economy. Negative investor sentiment has contributed to the Fund’s poor short-term performance but has given us the opportunity to improve the Fund’s potential to produce better long-term results.
We continue to conduct deep due diligence on our existing and potential investments. Our research reinforces our position that the long-term prospects of the Fund’s holdings are solid. The portfolio has a forward P/E ratio* of less than 16 and we expect earnings growth of more than 20% over the next 12 months. These metrics suggest that the Fund has the potential to post strong results for our shareholders over time.
Thank you for the opportunity to manage your assets.
| *The | forward P/E ratio is the price of a stock divided by its expected earnings per share over the next four quarters. |
4
| | |
| WASATCH CORE GROWTH FUND (WGROX) — Portfolio Summary | | MARCH 31, 2008 |
|
| |
| |
AVERAGE ANNUAL TOTAL RETURNS
| | | | | | | | |
| | | SIX MONTHS* | | 1 YEAR | | 5 YEARS | | 10 YEARS |
Core Growth | | -15.90% | | -13.23% | | 12.75% | | 9.70% |
Russell 2000 Index | | -14.02% | | -13.00% | | 14.90% | | 4.96% |
Performance data quoted represents past performance. Past performance is not indicative of future performance and current performance may be lower or higher than the performance quoted. Wasatch Funds will deduct a fee of 2% from redemption proceeds on Fund shares held 60 days or less. Performance data does not reflect the deduction of this fee which, if charged, would reduce the performance quoted. The table above does not reflect the deduction of taxes that you would pay on fund distributions or the redemption of fund shares.
The Total Annual Fund Operating Expenses for the Wasatch Core Growth Fund are 1.18%. Total Annual Fund Operating Expenses include direct expenses paid to the Advisor as well as indirect expenses incurred by the Fund as a result of its investments in other investment companies (each an “Acquired Fund”), before any expense reimbursements by the Advisor. The Net Expenses may differ due to waivers and reimbursements by the Advisor. See the prospectus for additional information regarding Fund expenses.
To obtain the most recent month-end performance, please visit www.wasatchfunds.com or call 800.551.1700. Investment returns and principal value will fluctuate and shares, when redeemed, may be worth more or less than their original cost. The Advisor may have absorbed, currently or in the past, certain Fund expenses, without which total returns would have been lower.
Investing in small cap funds will be more volatile and loss of principal could be greater than investing in large cap or more diversified funds.
TOP 10 EQUITY HOLDINGS**
| | |
| Company | | % of Fund |
| Copart, Inc. | | 8.51% |
| Vehicle salvage services. | | |
| Annaly Capital Management, Inc. | | 3.64% |
| Mortgage REIT. | | |
| SEI Investments Co. | | 3.15% |
| Outsource financial services provider. | | |
| Pediatrix Medical Group, Inc. | | 3.10% |
| National network of neonatologists. | | |
| Emeritus Corp. | | 3.06% |
| Assisted living centers for seniors. | | |
| | |
| Company | | % of Fund |
| O’Reilly Automotive, Inc. | | 3.00% |
| Automotive parts retailer/distributor. | | |
| Sunrise Senior Living, Inc. | | 2.88% |
| Assisted living centers. | | |
| PSS World Medical, Inc. | | 2.71% |
| Medical products distributor. | | |
| Redwood Trust, Inc. | | 2.46% |
| Jumbo ARM mortgage REIT. | | |
| Dollar Financial Corp. | | 2.40% |
| Payday lender. | | |
| ** | | As of March 31, 2008, the Fund had 34.91% invested in the Top 10 equity holdings and there were 68 long-term holdings in the Fund. Portfolio holdings are subject to change at any time. References to specific securities should not be construed as recommendations by the Funds or their Advisor. |
SECTOR BREAKDOWN†
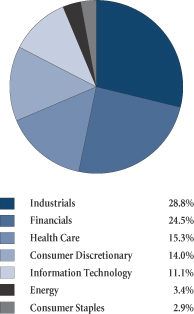
† | Excludes short-term investments, securities sold short and written options, if any. |
GROWTHOFA $10,000 INVESTMENT
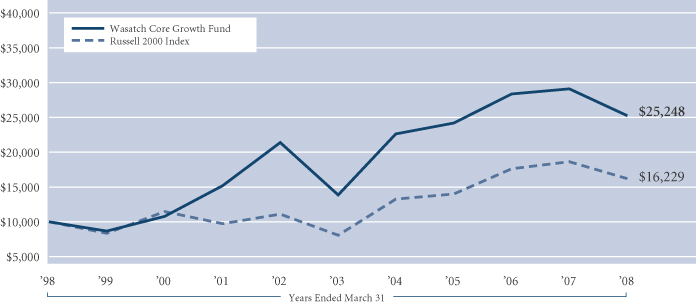
Past performance does not predict future performance and the graph above does not reflect the deduction of taxes that you would pay on fund distributions or the redemption of fund shares. Performance shown in the chart above does not include any applicable sales charges and fees. The chart represents a hypothetical $10, 000 investment at the beginning of the time period shown. The Russell 2000 Index is an unmanaged total return index of the smallest 2,000 companies in the Russell 3000 Index, as ranked by total market capitalization. The Russell 2000 Index is widely regarded in the industry as accurately capturing the universe of small company stocks. You cannot invest directly in this or any index.
5
| | |
| WASATCH EMERGING MARKETS SMALL CAP FUND (WAEMX) — Management Discussion | | MARCH 31, 2008 |
|
| |
| |
The Wasatch Emerging Markets Small Cap Fund is managed by a team of Wasatch portfolio managers, led by Roger D. Edgley.
| | |

Roger D. Edgley, CFA Portfolio Manager | | OVERVIEW The Wasatch Emerging Markets Small Cap Fund posted a loss of 15.83% during its first six months and performed in line with the MSCI EM Small Cap Index, which lost 15.12%. The Fund’s initial six months took place during the most challenging episode for emerging markets since the Asian financial crisis a decade ago. Inflation fears, particularly regarding food and energy prices, entered the equation. Countries and companies |
with strong economic ties to the United States felt the results of our domestic economic slowdown.
Large outflows of capital from more liquid markets such as Hong Kong and India, contributed to the bleak returns with both countries down double digits. Currencies fell in Turkey and South Africa, where current accounts turned sharply negative as foreign investment dollars flowed out of these countries. Our holdings in these countries were down nearly 30% on average during the period.
Some holdings turned in strongly positive performance, notably Mexican chemical and industrial conglomerate Mexichem S.A.B. de C.V. and Dragon Oil plc, an energy exploration and production company headquartered in Dubai. However, there were not enough good performances to overcome the broad downdraft.
DETAILSOFTHE PERIOD
Geographically, there were few bright spots during the period. Indonesia and Egypt were the notable countries where our holdings produced solid gains. China was hit hard despite all signs pointing to continued, albeit slower, growth. Brazil, the biggest country weight in the Fund and the Index, was down, but held up better than most emerging markets and our companies there outperformed the Index.
The Fund added value compared to the Index by being underweight in consumer discretionary, one of the hardest-hit sectors. We also outperformed the Index in consumer staples, health care and energy, while modestly underperforming in financials, industrials, information technology, utilities, and materials.
Mexichem, the Fund’s largest positive contributor, rose on sharply higher profit estimates. It’s worth noting that this company did well despite being situated in Mexico, one of the most important trading partners to the ailing United States. This illustrates the importance of Wasatch’s fundamental, bottom-up stockpicking style, where macroeconomic trends are not the primary drivers of investment allocation decisions.
Energy companies occupied several slots among the top contributors. Dragon Oil reported higher earnings and positive news from its oilfield offshore of Turkmenistan. London-based exploration and production company Afren plc acquired a competitor with African assets. Another firm
with African connections, South African platinum mining concern Northam Platinum Ltd., overcame work-related stoppages to rise strongly as well.
China Infrastructure Machinery Holdings Ltd. was the Fund’s single biggest detractor, losing more than three-quarters of its value as high steel prices hurt results. Weather-related disruptions caused lower earnings and a sharp decline in the stock price of Singapore’s Synear Food Holdings Ltd., the Fund’s second biggest detractor.
Banco Daycoval S.A., a fast-growing lender to small- and medium-sized enterprises in Brazil, also turned in a strongly negative performance. However, we think Banco Daycoval is a well-run bank. It has a history of quality growth and the Brazilian economy is more insulated from global capital markets than other large emerging economies. We continue to feel positively about the well-managed small Brazilian companies in the Fund.
Indian companies in general were poor performers as that formerly red-hot market cooled. We remain underweight there, but continue to look for opportunities to increase our exposure to this growing economy. Industrial equipment maker TIL Ltd. and Federal Bank Ltd. were two of the biggest detractors for the Fund.
During the last six months, we undertook research trips to many parts of the globe, including Brazil, Indonesia, Israel, Mexico, the Mideast, South Africa, Taiwan, and Turkey. We are currently very interested in the Middle East/North Africa, where a combination of improving economic policies and infrastructure, along with farsighted efforts to diversify away from energy production, are bullish signs for long term investment there.
OUTLOOK
In general, emerging stock markets followed the U.S. stock market down the path of a strong re-pricing over the past half-year. However, we believe that emerging economies have not and will not closely follow the same recessionary direction toward which the U.S. economy appears to be headed.
As we visit emerging countries, we are pleased with the growth and the vibrancy we see there, and economic growth figures support what we are seeing. Domestic infrastructure investment is high, and much of the investment is coming from internal sources. Consumer spending is also strong, especially on more discretionary items. Curtailed exports will slow economic growth from the breakneck speed of the past few years, but we believe growth will continue at a more reasonable, sustainable level.
In the coming months, we expect to continue to add to our holdings in energy, materials and industrials. The sell-off in Asia is also providing some attractive entry points to companies we’ve been watching for some time. In addition, we mentioned our interest in the Middle East. While foreigners are not allowed to own companies in strategic industries like oil, there are many other attractive areas of investment.
Eventually, we believe that investors will follow the growth back into emerging markets, regardless of what developed economies look like. When this happens, we believe our bottom up approach to investing in high quality, domestically oriented companies in emerging markets has the potential to reward our shareholders.
Thank you for the opportunity to manage your assets.
6
| | |
| WASATCH EMERGING MARKETS SMALL CAP FUND (WAEMX) — Portfolio Summary | | MARCH 31, 2008 |
|
| |
| |
AVERAGE ANNUAL TOTAL RETURNS
| | | | | | | | |
| | | SIX MONTHS* | | 1 YEAR | | 5 YEARS | | SINCE INCEPTION
10/1/07* |
Emerging Markets Small Cap | | -15.83% | | N/A | | N/A | | -15.83% |
MSCI Emerging Markets Index | | -7.76% | | N/A | | N/A | | -7.76% |
MSCI Emerging Markets Small Cap Index
(Net Div) | | -15.12% | | N/A | | N/A | | -15.12% |
Performance data quoted represents past performance. Past performance is not indicative of future performance and current performance may be lower or higher than the performance quoted. Wasatch Funds will deduct a fee of 2% from redemption proceeds on Fund shares held 60 days or less. Performance data does not reflect the deduction of this fee which, if charged, would reduce the performance quoted. The table above does not reflect the deduction of taxes that you would pay on fund distributions or the redemption of fund shares.
The Total Annual Fund Operating Expenses for the Wasatch Emerging Markets Small Cap Fund are 2.54%. Total Annual Fund Operating Expenses include direct expenses paid to the Advisor as well as indirect expenses incurred by the Fund as a result of its investments in other investment companies (each an “Acquired Fund”), before any expense reimbursements by the Advisor. The Net Expenses may differ due to waivers and reimbursements by the Advisor. See the prospectus for additional information regarding Fund expenses.
To obtain the most recent month-end performance, please visit www.wasatchfunds.com or call 800.551.1700. Investment returns and principal value will fluctuate and shares, when redeemed, may be worth more or less than their original cost. The Advisor may have absorbed, currently or in the past, certain Fund expenses, without which total returns would have been lower.
Investing in foreign securities, especially in emerging markets, entails special risks, such as currency fluctuations and political uncertainties, which are described in more detail in the prospectus. Investing in small cap funds will be more volatile and loss of principal could be greater than investing in large cap or more diversified funds.
TOP 10 EQUITY HOLDINGS**
| | |
| Company | | % of Fund |
MMX Mineracao e Metalicos S.A. (Brazil) Mining and metals production and projects. | | 1.89% |
Banco Compartamos S.A. de C.V. (Mexico) Micro finance bank. | | 1.82% |
OdontoPrev S.A. (Brazil) Dental health plan provider. | | 1.78% |
China Green Holdings Ltd. (Hong Kong) Agricultural and beverage products. | | 1.66% |
Chaoda Modern Agriculture (Hong Kong) Agricultural products producer. | | 1.66% |
| | |
| Company | | % of Fund |
Egyptian Financial Group-Hermes Holding GDR (Egypt) Investment bank. | | 1.61% |
Walsin Lihwa Corp. (Taiwan) Wire, cable and specialty steel manufacturer. | | 1.58% |
Philex Mining Corp. (Philippines) Copper, gold and silver mining. | | 1.58% |
Astra Agro Lestari Tbk PT (Indonesia) Oil palm, rubber and cocoa plantations. | | 1.55% |
Afren plc (United Kingdom) Oil and gas developer. | | 1.48% |
| ** | As of March 31, 2008, the Fund had 16.61% invested in the Top 10 equity holdings and there were 95 long-term holdings in the Fund. Portfolio holdings are subject to change at any time. References to specific securities should not be construed as recommendations by the Funds or their Advisor. |
SECTOR BREAKDOWN†
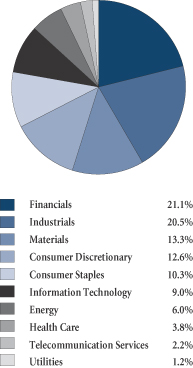
† | Excludes short-term investments, securities sold short and written options, if any. |
GROWTHOFA $10,000 INVESTMENT
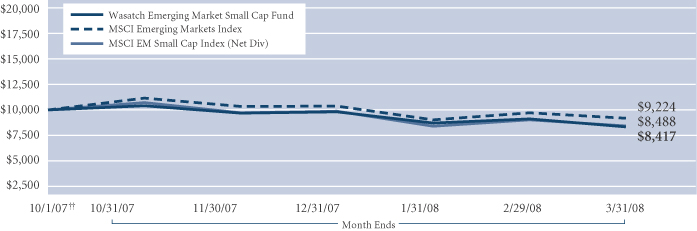
Past performance does not predict future performance and the graph above does not reflect the deduction of taxes that you would pay on fund distributions or the redemption of fund shares. Performance shown in the chart above does not include any applicable sales charges and fees. The chart represents a hypothetical $10,000 investment at the beginning of the time period shown. ††Inception: October 1, 2007. The MSCI Emerging Markets and Small-Mid Cap Indexes are free float-adjusted market capitalization indexes that are designed to measure equity market performance in the global emerging markets. As of June 2006, the MSCI Emerging Markets Index consisted of the following 25 emerging market country indexes: Argentina, Brazil, Chile, China, Colombia, Czech Republic, Egypt, Hungary, India, Indonesia, Israel, Jordan, Korea, Malaysia, Mexico, Morocco, Pakistan, Peru, Philippines, Poland, Russia, South Africa, Taiwan, Thailand, and Turkey. You cannot invest directly in these or any indexes.
7
| | |
| WASATCH GLOBAL SCIENCE & TECHNOLOGY FUND (WAGTX) — Management Discussion | | MARCH 31, 2008 |
|
| |
| |
The Wasatch Global Science & Technology Fund is managed by a team of Wasatch portfolio managers, led by Noor Kamruddin. Effective May 20, 2008, Dr. Samuel S. Stewart assumed sole responsibility as the lead portfolio manager of the Global Science & Technology Fund.
| | |

Noor Kamruddin Portfolio Manager | | OVERVIEW The Wasatch Global Science & Technology Fund returned -26.90% during the six months ended March 31, 2008, lagging both the -23.59% return of its primary benchmark, the Russell 2000 Technology Index, and the -16.88% return of its peer group, as measured by the Lipper Science & Technology Index. The past half-year was characterized by poor performance for the global equity markets. Evidence began to mount that the problems in the |
U.S. housing and credit markets were beginning to weigh on the economy, causing the prospect of a recession to loom increasingly large. Technology stocks underperformed the overall market by a substantial margin, reflecting concerns that the sector is vulnerable to weaker economic growth. Small- and mid-cap stocks were particularly hard-hit, a negative for the Fund given its above-average weighting in these market segments. The health care sector, where the Fund’s weight was nearly 18% of assets, outperformed technology but nonetheless finished the semiannual period in the red.
DETAILSOFTHE PERIOD
We reacted to this challenging backdrop by taking steps to position the portfolio in a more defensive manner. This process played out in four ways:
First, we reduced the Fund’s weighting in semiconductor stocks. Semiconductors — or computer chips — are used in a wide range of consumer products, so the end-market demand for chips is highly sensitive to slower economic growth.
Second, we reduced the number of individual Fund holdings in order to take better advantage of the value opportunities created by market volatility. The result is that the total number of Fund holdings fell to 69 companies on March 31, compared with 94 at year-end and 110 at the close of the third quarter.
Third, we opted to hold the proceeds of some of these sales in cash. At a time of broad market weakness, we prefer to keep some “dry powder” so we will be in a position to add to our favored holdings and take advantage of new opportunities at lower prices.
Finally, we reduced the Fund’s position in the international markets from nearly 45% at the end of September to about 35% on March 31, reflecting the fact that we have begun to find more attractive valuations in U.S. stocks relative to their overseas counterparts. We also increased the Fund’s weighting in larger companies, many of which we believe are in a better position to withstand a difficult economic environment.
While these changes added value on the margin, they were not enough to make up for the poor performance of several
individual Fund holdings. The most significant detractor was SiRF Technology Holdings, Inc., a supplier of global positioning system (GPS) semiconductor chips used in personal navigation devices (PNDs) and cell phones. SiRF issued disappointing first quarter revenue guidance and reported a decline in gross margins. Believing the decline in profit margins was an isolated event; we don’t think the news on SiRF justified such a substantial sell-off in the stock. In fact, we see several positive factors that bode well for SiRF. Most notably, worldwide PND unit sales are expected to grow more than 30% annually over the next few years, and the emerging GPS-enabled cell phone market presents an exciting near-term opportunity that could drive strong earnings growth for the company.
The second-largest detractor from performance was the semiconductor company O2Micro International Ltd. A maker of chips for flat panel televisions, O2Micro was hurt by the prospects of slower consumer spending on high-priced items. Still, we believe the stock is attractively valued at these levels. Other detractors of note included Tessera Technologies, Inc., ArthroCare Corp., F5 Networks, Inc., NII Holdings, Inc. and DealerTrack Holdings, Inc. All five stocks remain in the Fund, reflecting our favorable view of their long-term prospects.
Despite its underperformance, the Fund had its share of winners. A number of these top contributors were in the medical device industry within the health care sector, illustrating the effectiveness of our research in this area. The leading contributor was Intuitive Surgical, Inc. A manufacturer of robotic machines for minimally invasive surgery, Intuitive has been expanding its revenue sources by moving into new geographic markets and applying its technology to new types of surgeries. Our second-largest contributor was VNUS Medical Technologies, Inc., a maker of devices that treat venous reflux disease — the underlying cause of varicose veins — in a minimally invasive fashion. The company’s treatment has been gaining acceptance, leading to increasing market share and strong earnings growth. Also making significant contributions in the medical device area were Possis Medical, Inc. and Icon plc.
OUTLOOK
The past half-year undoubtedly has been difficult for technology investors, with many stocks in the sector trading at sharply lower prices. While this type of environment can be distressing, it can also create compelling long-term opportunities. We have sought to take advantage of recent market conditions by drilling down even deeper into our fundamental, individual company research, a process that has resulted in a more concentrated portfolio of our highest-conviction stocks. We therefore feel confident in the long-term outlook for the companies we hold in the Fund despite ongoing market turbulence.
Finally, it should be noted that our disciplined, research-based approach has placed the Fund ahead of both its benchmark and peer group for the three- and five-year periods as of March 31. Although the Fund underperformed during the past six months, we are confident that our approach continues to have the potential to bear fruit over the long-term.
Thank you for the opportunity to manage your assets.
8
| | |
| WASATCH GLOBAL SCIENCE & TECHNOLOGY FUND (WAGTX) — Portfolio Summary | | MARCH 31, 2008 |
|
| |
| |
AVERAGE ANNUAL TOTAL RETURNS
| | | | | | | | |
| | | SIX MONTHS* | | 1 YEAR | | 5 YEARS | | SINCE INCEPTION
12/19/00 |
Global Science & Technology | | -26.90% | | -14.81% | | 13.47% | | 4.72% |
Russell 2000 Technology Index | | -23.59% | | -18.32% | | 9.40% | | -6.90% |
Lipper Science and Technology Index | | -16.88% | | -2.93% | | 11.83% | | -6.46% |
Nasdaq Composite Index | | -15.28% | | -5.12% | | 11.94% | | -1.34% |
Performance data quoted represents past performance. Past performance is not indicative of future performance and current performance may be lower or higher than the performance quoted. Wasatch Funds will deduct a fee of 2% from redemption proceeds on Fund shares held 60 days or less. Performance data does not reflect the deduction of this fee which, if charged, would reduce the performance quoted. The table above does not reflect the deduction of taxes that you would pay on fund distributions or the redemption of fund shares.
The Total Annual Fund Operating Expenses for the Wasatch Global Science & Technology Fund are 1.87%. Total Annual Fund Operating Expenses include direct expenses paid to the Advisor as well as indirect expenses incurred by the Fund as a result of its investments in other investment companies (each an “Acquired Fund”), before any expense reimbursements by the Advisor. The Net Expenses may differ due to waivers and reimbursements by the Advisor. See the prospectus for additional information regarding Fund expenses.
To obtain the most recent month-end performance, please visit www.wasatchfunds.com or call 800.551.1700. Investment returns and principal value will fluctuate and shares, when redeemed, may be worth more or less than their original cost. The Advisor may have absorbed, currently or in the past, certain Fund expenses, without which total returns would have been lower.
Investing in concentrated funds will be more volatile and loss of principal could be greater than investing in more diversified funds. Investing in foreign securities entails special risks, such as currency fluctuations and political uncertainties, which are described in more detail in the prospectus.
TOP 10 EQUITY HOLDINGS**
| | |
| Company | | % of Fund |
Cognizant Technology Solutions Corp., Class A Professional technology services. | | 5.69% |
Netlogic Microsystems, Inc. Semiconductors. | | 4.21% |
O2Micro International Ltd. ADR (Cayman Islands) Semiconductors. | | 3.37% |
America Movil S.A.B. de C.V., Series L (Mexico) Wireless telecommunication services. | | 3.31% |
Tessera Technologies, Inc. Miniaturization technologies for electronics. | | 2.84% |
| | |
| Company | | % of Fund |
Silicon Laboratories, Inc. Analog and mixed signal integrated circuits. | | 2.84% |
NetApp, Inc. Data management solutions. | | 2.78% |
Adobe Systems, Inc. Business and mobile software and services. | | 2.72% |
Power Integrations, Inc. Semiconductors. | | 2.61% |
ArthroCare Corp. Disposable devices for minimally invasive surgery. | | 2.58% |
| ** | As of March 31, 2008, the Fund had 32.95% invested in the Top 10 equity holdings and there were 69 long-term holdings in the Fund. Portfolio holdings are subject to change at any time. References to specific securities should not be construed as recommendations by the Funds or their Advisor. |
SECTOR BREAKDOWN†
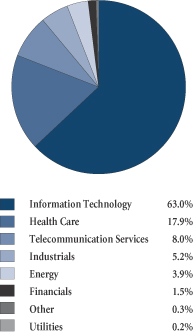
† | Excludes short-term investments, securities sold short and written options, if any. |
GROWTHOFA $10,000 INVESTMENT
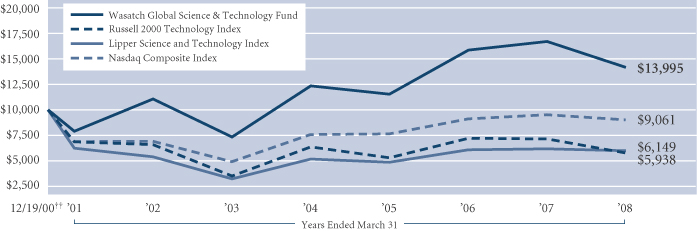
Past performance does not predict future performance and the graph above does not reflect the deduction of taxes that you would pay on fund distributions or the redemption of fund shares. Performance shown in the chart above does not include any applicable sales charges and fees. The chart represents a hypothetical $10,000 investment at the beginning of the time period shown. ††Inception: December 19, 2000. The Russell 2000 Technology Index is a capitalization-weighted index of companies that serve the electronics and computer industries or that manufacture products based on the latest applied science. The Lipper Science and Technology Index is a composite of mutual funds that invest in science and technology companies and have investment objectives similar to those of the Fund. The Nasdaq Composite Index is unmanaged and measures all Nasdaq domestic and non-U.S. based common stocks listed on The Nasdaq Stock Market. The Index is market-value weighted. This means each company’s security affects the Index in proportion to its market value. The market value, the last sale price multiplied by total shares outstanding, is calculated throughout the trading day, and is related to the total value of the Index. Due to their number and size, technology stocks tend to dominate the direction of the Index. You cannot invest directly in these or any indexes.
9
| | |
| WASATCH HERITAGE GROWTH FUND (WAHGX) — Management Discussion | | MARCH 31, 2008 |
|
| |
| |
The Wasatch Heritage Growth Fund is managed by a team of Wasatch portfolio managers, led by Chris Bowen and Ryan Snow.
| | | | |

Chris Bowen Portfolio Manager | | 
Ryan Snow Portfolio Manager | | OVERVIEW The Wasatch Heritage Growth Fund generated a loss for the six-month period ended March 31, 2008 and underperformed its benchmarks. It was a difficult period on a broad level as the Russell |
1000 Growth Index declined 10.87% and the Russell Midcap Growth and S&P 500 indexes each fell 12.46%. The Fund suffered a 14.31% decline over the same span. The Fund’s energy and industrial holdings outperformed those of the benchmarks; however, detractions in the consumer discretionary and financials sectors caused the Fund to lag.
Overall, the U.S. stock market suffered a precipitous drop. In one five-month period — spanning October to March — the Russell 1000 Index fell nearly 25%. Market volatility continued to escalate to levels that hadn’t been witnessed in over 60 years.
It’s undeniable that this was a period of historical significance. Who could have fathomed that 85-year-old Bear Stearns — the nation’s fifth largest investment bank — could stumble to the brink of bankruptcy in just a matter of days? Or, that subprime problems in the U.S. would reach such epic global proportions, causing financial firms worldwide to write-down billions of dollars of securities that had become essentially worthless? Such are the issues of a highly-levered, finance-based global economy.
Certainly, there are real and significant headwinds facing global companies. In a change from the recent past, the U.S. stock market wasn’t the only one that struggled. The markets of China and India, high fliers in recent years, both dropped significantly over the last six months. Most other markets around the world performed poorly as well.
During turbulent markets and uncertain economic times, we believe that our investment discipline based on bottom-up stock selection becomes even more essential. We avoid the pitfalls of leapfrogging from sector to sector or speculating about the impact of the latest economic data by staying focused on investing in growing companies that are attractively valued. Of course, we pay attention to macroeconomic factors that influence equities — such as Federal Reserve policy — but our investment decisions are driven more by in-depth analysis of individual companies.
DETAILSOFTHE PERIOD
Ordinarily, we would expect the Fund to outperform its benchmarks during times of general market weakness, due to our emphasis on high-quality, steady-performing companies. We expect the solid business models of our holdings and their competitive advantages in the marketplace to help them sustain earnings growth even in difficult environments. Unfortunately, over the past six months, even
the stocks of companies with strong fundamentals fell and companies that had missteps, whether real or perceived, were severely punished. While some stock price declines may have been justified, we believe other stocks were oversold.
Three of our largest holdings help illustrate this point. We remain confident about the prospects of India-based technology services outsourcing conglomerate Infosys Technologies Ltd. and Latin America-based cell phone service provider NII Holdings, Inc. However, we began to have concerns about managed health care company WellPoint, Inc., which we were fortunate to start selling before it lost half of its market value. Each of these stocks suffered double digit declines and were the Fund’s top detractors.
In an economic environment bordering on recession, finding companies with attractive growth prospects becomes more difficult. However, we believe our carefully measured approach and hands-on research will help us identify the companies that are positioned to do well over time.
Although there weren’t many big winners during the period, some of our energy and industrial companies saw their stock prices appreciate handsomely. J.B. Hunt Transport Services, Inc., Rio Tinto plc, XTO Energy, Inc. and Chesapeake Energy Corp. were among the Fund’s top contributors.
We’ve been disciplined about buying energy companies at a discount to what we think is their intrinsic value. But we also require that they have the ability to increase production. XTO and Chesapeake have been shrewdly adding to their reserve base and moving previously unproven reserves into proven reserves and then into actual production.
We decided to invest in General Electric Co. during the period. Initially, we found the valuation compelling with a price-to-earnings (P/E) ratio* in the mid-teens and a dividend yield above 3%. As we continued to peel the onion, we found that the company has market-leading divisions in many areas that we find attractive, like aviation, water, infrastructure construction and energy. In addition, we believe the company’s finance division has the potential to benefit from widening spreads. Despite recently reporting less than expected quarterly earnings results, we maintain our conviction about GE’s long-term upside.
OUTLOOK
Looking ahead, we believe our consistent and disciplined approach to investing will serve the Fund well. Overall, we believe the Fund is invested in high quality companies with strong long-term growth potential. In addition, our intensive research process is designed to help us single out companies with attractive prospects. This approach to investing has been honed over the more than 30 years that Wasatch Advisors has been in business. Whether the market is up or down, we strive to be disciplined in conducting thorough research before investing, disciplined in ensuring that our companies meet our investment criteria, and disciplined in our ongoing analysis as we continually put our investment rationale to the test.
With this as our mantra, we remain positive about the long-term outlook for the Wasatch Heritage Growth Fund.
Thank you for the opportunity to manage your assets.
| * | The price-to-earnings (P/E) ratio is the price of a stock divided by its earnings per share. |
10
| | |
| WASATCH HERITAGE GROWTH FUND (WAHGX) — Portfolio Summary | | MARCH 31, 2008 |
|
| |
| |
AVERAGE ANNUAL TOTAL RETURNS
| | | | | | | | |
| | | SIX MONTHS* | | 1 YEAR | | 5 YEARS | | SINCE INCEPTION
6/18/04 |
Heritage Growth | | -14.31% | | -9.33% | | N/A | | 3.53% |
Russell Midcap Growth Index | | -12.46% | | -4.55% | | N/A | | 8.66% |
S&P 500 Index | | -12.46% | | -5.08% | | N/A | | 6.16% |
Russell 1000 Growth Index | | -10.87% | | -0.75% | | N/A | | 4.93% |
Performance data quoted represents past performance. Past performance is not indicative of future performance and current performance may be lower or higher than the performance quoted. Wasatch Funds will deduct a fee of 2% from redemption proceeds on Fund shares held 60 days or less. Performance data does not reflect the deduction of this fee which, if charged, would reduce the performance quoted. The table above does not reflect the deduction of taxes that you would pay on fund distributions or the redemption of fund shares.
The Total Annual Fund Operating Expenses for the Wasatch Heritage Growth Fund are 0.95%. Total Annual Fund Operating Expenses include direct expenses paid to the Advisor as well as indirect expenses incurred by the Fund as a result of its investments in other investment companies (each an “Acquired Fund”), before any expense reimbursements by the Advisor. The Net Expenses may differ due to waivers and reimbursements by the Advisor. See the prospectus for additional information regarding Fund expenses.
To obtain the most recent month-end performance, please visit www.wasatchfunds.com or call 800.551.1700. Investment returns and principal value will fluctuate and shares, when redeemed, may be worth more or less than their original cost. The Advisor may have absorbed, currently or in the past, certain Fund expenses, without which total returns would have been lower.
Investing in mid cap funds will be more volatile and loss of principal could be greater than investing in large cap funds. Equity investing involves risks including potential loss of the principal amount invested.
TOP 10 EQUITY HOLDINGS**
| | |
| Company | | % of Fund |
Infosys Technologies Ltd. (India) Business and information technology consulting. | | 4.12% |
America Movil S.A.B. de C.V., Series L (Mexico) Wireless telecommunication services. | | 3.29% |
St. Jude Medical, Inc. Cardiovascular medical device developer. | | 3.00% |
Amphenol Corp., Class A Interconnect products manufacturer. | | 2.97% |
Cisco Systems, Inc. Internet Protocol-based networking products. | | 2.88% |
| | |
| Company | | % of Fund |
Covance, Inc. Drug development services. | | 2.83% |
DaVita, Inc. Kidney dialysis centers. | | 2.62% |
Copart, Inc. Vehicle salvage services. | | 2.60% |
New York Community Bancorp, Inc. Community and commercial banks. | | 2.49% |
Rio Tinto plc ADR (United Kingdom) International mining company. | | 2.46% |
| ** | As of March 31, 2008, the Fund had 29.26% invested in the Top 10 equity holdings and there were 54 long-term holdings in the Fund. Portfolio holdings are subject to change at any time. References to specific securities should not be construed as recommendations by the Funds or their Advisor. |
SECTOR BREAKDOWN†
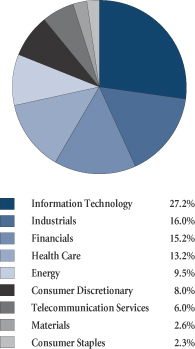
† | Excludes short-term investments, securities sold short and written options, if any. |
GROWTHOFA $10,000 INVESTMENT
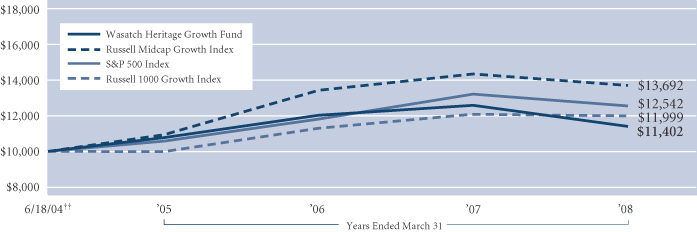
Past performance does not predict future performance and the graph above does not reflect the deduction of taxes that you would pay on fund distributions or the redemption of fund shares. Performance shown in the chart above does not include any applicable sales charges and fees. The chart represents a hypothetical $10,000 investment at the beginning of the time period shown. ††Inception: June 18, 2004. The Russell Midcap Growth Index measures the performance of those Russell Midcap Index companies with higher price-to-book ratios and higher forecasted growth values. The stocks in the Russell Midcap Growth Index are also members of the Russell 1000 Growth Index. The S&P 500 Index represents 500 of the United States’ largest stocks from a broad variety of industries. The index is unmanaged, and a common measure of common stock total return performance. The Russell 1000 Growth Index measures the performance of those Russell 1000 Index companies with higher price-to-book ratios and higher forecasted growth values. You cannot invest directly in these or any indexes.
11
| | |
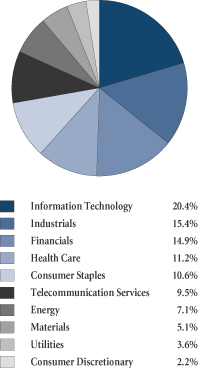
| WASATCH HERITAGE VALUE FUND (WAHVX) — Management Discussion | | MARCH 31, 2008 |
|
| |
| |
The Wasatch Heritage Value Fund is managed by a team of Wasatch portfolio managers, led by Brian Bythrow.
| | |

Brian Bythrow, CFA Portfolio Manager | | OVERVIEW When the Heritage Value Fund launched operations in the second half of 2007, it was greeted by a complex and volatile market environment. The housing market remained in distress, the subprime lending crisis and subsequent credit crunch reverberated throughout the economy, and many believed the U.S. was facing a recession. The Federal Reserve took a number of aggressive steps to help address these situations, but it was not clear whether they were |
sufficient to stop the economy’s decline. Commodity prices remained high and even rose further, driving the performance of many companies in related sectors.
In this environment, the Wasatch Heritage Value Fund posted a return of -10.41%. While a loss is always disappointing, this return represents significant outperformance relative to the Fund’s benchmark, the Russell 1000 Value Index, which returned -14.01% for the same period.
DETAILSOFTHE PERIOD
Our strongest-performing holding for the period, and the main contributor to the Fund’s outperformance of the Index, was Visa, Inc. We were able to take a significant position in the mid-March initial public offering for shares of the electronic payments processing giant, and benefited when the share price soared after trading began.
Visa is an example of a stock we purchased because of what we perceived as positive relative value. Our calculations indicated that Visa was being offered at a discount relative to the valuation of rival payment processor MasterCard, which itself went public not too long ago. Given Visa’s sharp rise, we are now scaling back our position, but will continue to monitor the company closely.
A number of other strong performers in the Fund benefited from the high prices commanded by various commodities. We believe Toronto-based Yamana Gold Inc. is one of the world’s better mining companies, though the main reason it performed so well in the recent period was because of skyrocketing gold prices. We became concerned that the stock was getting a little too expensive, so we sold our position. Anadarko Petroleum Corp., a U.S. oil and gas exploration and production company, registered a healthy return based largely on high prices for energy products. When the stock appeared fully valued, we exited the position.
The Fund’s largest weighting, and another of its strong performers, was agricultural equipment manufacturer Deere & Co. Deere’s fortunes have risen on the growing global demand for agricultural products. Farmers seeking to meet demand — and benefiting from sharply higher crop prices — are investing in new and better equipment to work their land. Another factor in the company’s success is the
strong brand loyalty it has established among its customers. Although Deere has had a strong run up so far, we’re comfortable holding on to the position as we believe the coming year could be strong as well.
Despite high commodity prices, Canada’s Uranium One, Inc. was the greatest detractor from the Fund’s performance for the six-month period. We found this company appealing because of the worldwide demand for power generation. With many countries making heavy use of nuclear power and many others contemplating it, Uranium One appeared to be in a position to benefit. Unfortunately, the company recently encountered a number of production issues that put a damper on its results. We reassessed the company, taking into consideration how long it would probably take it to rectify these issues, and ultimately decided to sell out of the position.
Lundin Mining, also from Canada, saw its share price drop after a number of disappointing announcements from the company regarding goodwill charge-offs, missed earnings, and the need to refile some of its previous financial statements. Although we felt the company had potential, recent problems clouded its future and we chose to sell the stock.
OUTLOOK
The numerous issues afflicting the U.S. economy and the equity markets won’t be solved very quickly, and volatility appears likely to continue over the next few quarters. With that in mind, we remain enthusiastic about the investments we are finding for this portfolio. We believe the stocks of larger companies are as inexpensive as they have been for many years, and we’ve been able to invest in a number of high-quality, fundamentally sound companies.
Having the flexibility to invest a significant portion of the Fund’s assets outside the U.S. is part of our long-term strategy, and should be beneficial going forward. Many international economies are growing at a faster pace than the U.S. economy, and appear poised to do so for some time to come.
Although the softness in the U.S. economy is undeniable, and the timing of its turnaround unclear, we believe large-cap stocks are a good place for investors to be. As we’ve mentioned, large-caps tend to outperform when risk-wary investors favor them over more volatile smaller-cap stocks. For this reason they can serve a valuable function for investors seeking to build a well-diversified investment portfolio.
Thank you for the opportunity to manage your assets.
12
| | |
| WASATCH HERITAGE VALUE FUND (WAHVX) — Portfolio Summary | | MARCH 31, 2008 |
|
| |
| |
AVERAGE ANNUAL TOTAL RETURNS
| | | | | | | | |
| | | SIX MONTHS* | | 1 YEAR | | 5 YEARS | | SINCE INCEPTION
8/30/07* |
Heritage Value | | -10.41% | | N/A | | N/A | | -8.26% |
Russell 1000 Value Index | | -14.01% | | N/A | | N/A | | -10.64% |
Performance data quoted represents past performance. Past performance is not indicative of future performance and current performance may be lower or higher than the performance quoted. Wasatch Funds will deduct a fee of 2% from redemption proceeds on Fund shares held 60 days or less. Performance data does not reflect the deduction of this fee which, if charged, would reduce the performance quoted. The table above does not reflect the deduction of taxes that you would pay on fund distributions or the redemption of fund shares.
The Total Annual Fund Operating Expenses for the Wasatch Heritage Value Fund are 0.97%. Total Annual Fund Operating Expenses include direct expenses paid to the Advisor as well as indirect expenses incurred by the Fund as a result of its investments in other investment companies (each an “Acquired Fund”), before any expense reimbursements by the Advisor. The Net Expenses may differ due to waivers and reimbursements by the Advisor. See the prospectus for additional information regarding Fund expenses.
To obtain the most recent month-end performance, please visit www.wasatchfunds.com or call 800.551.1700. Investment returns and principal value will fluctuate and shares, when redeemed, may be worth more or less than their original cost. The Advisor may have absorbed, currently or in the past, certain Fund expenses, without which total returns would have been lower.
Investments in value stocks can perform differently from the market as a whole and other types of stocks and can continue to be undervalued by the market for long periods of time. Loss of principal is a risk of investing. Being non-diversified, the Fund can invest a larger portion of its assets in the securities of a limited number of companies than a diversified fund. Non-diversification increases the risk of loss to the Fund if the values of these securities decline. Investing in foreign securities entails special risks, such as currency fluctuations and political uncertainties, which are described in more detail in the prospectus.
TOP 10 EQUITY HOLDINGS**
| | |
| Company | | % of Fund |
America Movil S.A.B. de C.V., Series L ADR (Mexico) Wireless telecommunication services. | | 3.57% |
Unilever plc ADR (United Kingdom) Consumer goods. | | 3.51% |
Teva Pharmaceutical Industries Ltd. ADR (Israel) Generic pharmaceutical developer. | | 3.50% |
Comverse Technology, Inc. Network-based multimedia software. | | 3.47% |
Cisco Systems, Inc. Internet Protocol-based networking products. | | 3.44% |
| | |
| Company | | % of Fund |
Microsoft Corp. Computer software. | | 3.40% |
Fred Olsen Energy ASA (Norway) Oil and gas industry services. | | 3.37% |
Forest Laboratories, Inc. Pharmaceuticals developer. | | 3.36% |
EDP — Energias do Brasil S.A. (Brazil) Electric energy distributor. | | 3.34% |
General Electric Co. Diversified technology, media and financial services. | | 3.33% |
| ** | As of March 31, 2008, the Fund had 34.29% invested in the Top 10 equity holdings and there were 34 long-term holdings in the Fund. Portfolio holdings are subject to change at any time. References to specific securities should not be construed as recommendations by the Funds or their Advisor. |
SECTOR BREAKDOWN†
† | Excludes short-term investments, securities sold short and written options, if any. |
GROWTHOFA $10,000 INVESTMENT
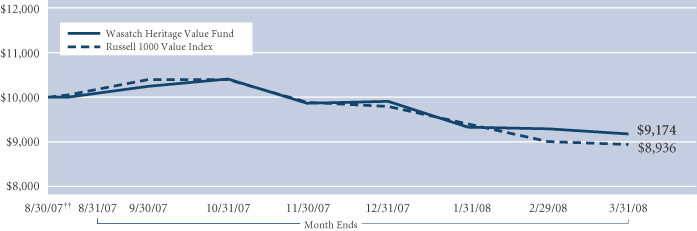
Past performance does not predict future performance and the graph above does not reflect the deduction of taxes that you would pay on fund distributions or the redemption of fund shares. Performance shown in the chart above does not include any applicable sales charges and fees. The chart represents a hypothetical $10,000 investment at the beginning of the time period shown. †† Inception: August 30, 2007. The Russell 1000 Value Index measures the performance of those Russell 1000 Index companies with lower price-to-book ratios and lower forecasted growth values. The Russell 1000 Index measures the performance of the 1,000 largest companies in the Russell 3000 Index. The Russell 3000 Index is an unmanaged total return index of the 3,000 largest U.S. companies based on total market capitalization. You cannot invest directly in these or any indexes.
13
| | |
| WASATCH INTERNATIONAL GROWTH FUND (WAIGX) — Management Discussion | | MARCH 31, 2008 |
|
| |
| |
The Wasatch International Growth Fund is managed by a team of Wasatch portfolio managers, led by Roger D. Edgley and Laura G. Hoffman.
| | | | |
Roger D. Edgley, CFA Portfolio Manager | | 
Laura G. Hoffman, CFA Portfolio Manager | | OVERVIEW The Wasatch International Growth Fund declined 19.69% in the six months ended March 31, 2008 and underperformed the MSCI World Ex-U.S.A. Small Cap Index, which lost 11.02%. Our overweight |
positions in financials, emerging markets and Asia ex-Japan left us vulnerable to global concerns about the anemic U.S. economy and its impact on the rest of the world. While this was a challenging time for the Fund, we believe the broad themes that underlie many of our investment decisions are powerful forces that will continue to support the growth of the companies we are invested in long after the current crisis has passed.
We strive to outperform the Index in every sector each quarter. Over the past six months, we were disappointed to have lagged the Index in almost every sector, which was surprising given the generally strong fundamentals of our companies. The financials sector was, by far, the largest source of underperformance, as our investments in securities exchanges and real estate companies were especially susceptible in this volatile environment. The industrials sector contained five of the Fund’s top 10 contributors but also our biggest detractor. The Fund was broadly diversified among geographic regions, but none provided refuge from the worldwide downturn.
The near term outlook for international stocks is being obscured by macroeconomic and market events. Over the long-term, we believe that powerful trends like infrastructure growth and a growing middle class in emerging markets will continue to drive global economic growth. Despite the weak current environment, the companies held by the Fund are generally sound and appear well positioned for long-term growth.
DETAILSOFTHE PERIOD
Recent events have shown that the performance of the world’s stock markets is still very much tied to what happens in the U.S., despite the fact that many economies are currently holding up better than that of the U.S. We expect this will change at some point, as investors will eventually follow the growth and put their money back to work in countries and companies with the best prospects for growth. We believe the Fund is well positioned for when that happens.
Given the turmoil in the financial markets, it is not surprising that the financials sector was one of the weakest over the last six months. In the Fund, much of this weakness was in our securities exchanges and real estate companies. Our securities exchanges were impacted by concerns that tight liquidity conditions would lead to lower trading volumes and the possible postponement of initial public offerings. We believe these are short-term concerns. While we are positive on the prospects of real estate companies in Brazil,
we eliminated our Japanese real estate holdings. The real estate market in Japan is not recovering as we had expected.
Infrastructure projects in emerging markets continue to support not only local economies but also the growth of developed market companies that provide expertise and equipment. Over the past six months, a number of the Fund’s industrial companies benefited from a positive environment and dominated our list of top contributors. One was Mexichem S.A.B. de C.V. (Mexico), a producer of chemical products, such as PVC pipe, used in the construction industry. We like Mexichem’s experienced management team as well as its status as a low-cost producer in a competitive area.
At the other end of the list was Thielert AG (Germany), our biggest detractor and a major disappointment during the period. Thielert’s stock was down substantially due to a court battle over the company’s pre-IPO financial statements. We sold this holding and have since learned that the company has gone into insolvency.
By geographic region, our investments in Continental Europe and Scandinavia emphasize strong growing industrial and energy companies that are benefiting from global economic and infrastructure growth, particularly in emerging markets. In China, India and Brazil, emerging markets where the middle class is becoming larger, we have found that domestic-focused consumer companies typically have more attractive growth prospects than companies that export products to the U.S., especially when the U.S. economy slows. One example is China Hongxing Sports Ltd., an athletic apparel retailer in China. Although the company’s stock price declined over the past six months, we believe compelling valuation and the huge, relatively untapped Chinese consumer market provide a positive backdrop for long-term growth.
OUTLOOK
The near term outlook for stocks in general is quite uncertain. Inflation, particularly rising energy and food costs, is pressuring economies worldwide. While we do not believe we can predict what will happen in the short term, we believe that we have invested in companies that have good long-term growth prospects.
The fundamentals of our financial companies, for the most part, remain healthy. However, we have reduced our weighting in select financials that are experiencing negative trends. Earnings for our industrial companies remain solid overall, as infrastructure projects have largely been funded.
While we remain upbeat about the economic prospects of most of the regions we are invested in, we feel less optimistic about Japan. The Fund remains significantly underweight relative to the Index, as the Japanese government appears to be doing little to spur the economy.
The wealth created by petro-dollars, particularly in the Middle East and Northern Africa, is leading to infrastructure spending, rising affluence, and broader markets and industries. Foreigners cannot invest directly in these countries’ oil and energy companies, but a recent visit to the region identified several promising non-energy companies.
Down markets often provide rare opportunities to pay attractive prices for quality growth companies. The current market is no different. We feel that our in-depth research and disciplined approach to investing makes us well prepared to take advantage of opportunities as they arise.
Thank you for the opportunity to manage your assets.
14
| | |
| WASATCH INTERNATIONAL GROWTH FUND (WAIGX) — Portfolio Summary | | MARCH 31, 2008 |
|
| |
| |
AVERAGE ANNUAL TOTAL RETURNS
| | | | | | | | |
| | | SIX MONTHS* | | 1 YEAR | | 5 YEARS | | SINCE INCEPTION
6/28/02 |
International Growth | | -19.69% | | -12.83% | | 22.29% | | 16.03% |
MSCI World Ex-U.S.A. Small Cap Index | | -11.02% | | -9.93% | | 25.45% | | 17.85% |
MSCI AC World Ex-U.S.A. Small Cap Index | | -11.73% | | N/A | | N/A | | N/A |
Performance data quoted represents past performance. Past performance is not indicative of future performance and current performance may be lower or higher than the performance quoted. Wasatch Funds will deduct a fee of 2% from redemption proceeds on Fund shares held 60 days or less. Performance data does not reflect the deduction of this fee which, if charged, would reduce the performance quoted. The table above does not reflect the deduction of taxes that you would pay on fund distributions or the redemption of fund shares.
The Total Annual Fund Operating Expenses for the Wasatch International Growth Fund are 1.78%. Total Annual Fund Operating Expenses include direct expenses paid to the Advisor as well as indirect expenses incurred by the Fund as a result of its investments in other investment companies (each an “Acquired Fund”), before any expense reimbursements by the Advisor. The Net Expenses may differ due to waivers and reimbursements by the Advisor. See the prospectus for additional information regarding Fund expenses.
To obtain the most recent month-end performance, please visit www.wasatchfunds.com or call 800.551.1700. Investment returns and principal value will fluctuate and shares, when redeemed, may be worth more or less than their original cost. The Advisor may have absorbed, currently or in the past, certain Fund expenses, without which total returns would have been lower.
Investing in foreign securities, especially in emerging markets, entails special risks, such as currency fluctuations and political uncertainties, which are described in more detail in the prospectus. Investing in small cap funds will be more volatile and loss of principal could be greater than investing in large cap or more diversified funds.
TOP 10 EQUITY HOLDINGS**
| | |
| Company | | % of Fund |
Burckhardt Compression Holding AG (Switzerland) Industrial compressors. | | 3.02% |
Bank of N.T. Butterfield & Son Ltd. (Bermuda) Wealth management services. | | 2.36% |
Demag Cranes AG (Germany) Industrial cranes and port automation. | | 2.00% |
Osaka Securities Exchange Co. Ltd. (Japan) Securities exchange. | | 1.92% |
Outotec Oyj (Finland) Process solutions for mining and metallurgy. | | 1.88% |
| | |
| Company | | % of Fund |
Rotork plc (United Kingdom) Valve actuators and gearboxes. | | 1.82% |
SGL Carbon AG (Germany) Carbon and graphite products for industrial applications. | | 1.71% |
TGS-NOPEC Geophysical Co. ASA (Norway) Geoscience data for energy exploration. | | 1.62% |
Banco Compartamos S.A. de C.V. (Mexico) Micro finance bank. | | 1.52% |
Elekta AB, Class B (Sweden) Radiology equipment. | | 1.48% |
| ** | As of March 31, 2008, the Fund had 19.33% invested in the Top 10 equity holdings and there were 109 long-term holdings in the Fund. Portfolio holdings are subject to change at any time. References to specific securities should not be construed as recommendations by the Funds or their Advisor. |
SECTOR BREAKDOWN†
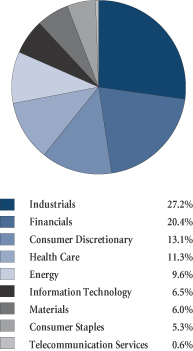
† | Excludes short-term investments, securities sold short and written options, if any. |
GROWTHOFA $10,000 INVESTMENT
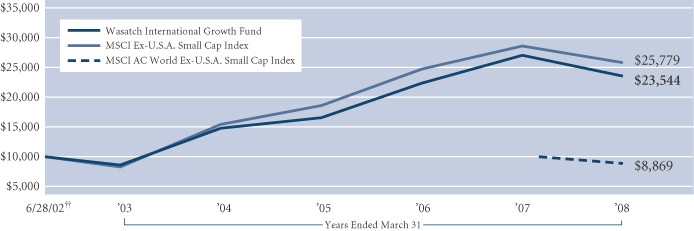
Past performance does not predict future performance and the graph above does not reflect the deduction of taxes that you would pay on fund distributions or the redemption of fund shares. Performance shown in the chart above does not include any applicable sales charges and fees. The chart represents a hypothetical $10, 000 investment at the beginning of the time period shown. †† Inception: June 28, 2002. The MSCI World Ex-U.S.A. Small Cap Index is an unmanaged index that measures the performance of stocks with market capitalizations between US $200 million and $1.5 billion across 22 developed markets, excluding the United States. The MSCI AC World Ex-U.S.A. Small Cap Index is an unmanaged index and includes reinvestment of all dividends of issuers located in countries throughout the world representing developed and emerging markets, excluding securities of U.S. issuers. This index is a free float-adjusted market capitalization index designed to measure the performance of small capitalization securities. The Index recently commenced operations, therefore, data since the Fund’s inception is not available. You cannot invest directly in these or any indexes.
15
| | |
| WASATCH INTERNATIONAL OPPORTUNITIES FUND (WAIOX) — Management Discussion | | MARCH 31, 2008 |
|
| |
| |
The Wasatch International Opportunities Fund is managed by a team of Wasatch portfolio managers, led by Roger D. Edgley and Blake H. Walker.
| | | | |
Roger D. Edgley, CFA Portfolio Manager | | 
Blake H. Walker Portfolio Manager | | OVERVIEW The Wasatch International Opportunities Fund grappled with what proved to be a very challenging environment for international small- and micro-cap stocks. The Fund returned |
-21.06% for the six months, while its benchmark, the MSCI World Ex-U.S.A. Small Cap Index, returned -11.02%.
Most of our underperformance during the period was attributable to our overweighting in China and other Asian markets, where growth remains rapid even if slowing modestly from recent peak levels.
While the downturn in the U.S. stock market is clearly linked with the domestic economy’s softening, market slides elsewhere around the globe appear to be largely driven by investor sentiment that is at odds with economic and company fundamentals. We are seeing significant declines even among companies posting strong earnings and maintaining positive fundamentals, based in countries with still-rapid economic growth. This indicates to us that there are other factors affecting share prices, such as outflows of investors’ capital from stocks in general.
We anticipate continued volatility in international markets for the remainder of the year, but we believe that investors will eventually recognize that the actual risks in many international markets are considerably lower than currently perceived.
DETAILSOFTHE PERIOD
In a difficult period, there were nonetheless a number of bright spots in the Fund. The greatest positive contributor to our performance over the six months also illustrates our focus on growth in the world’s emerging economies. Mexico’s Mexichem S.A.B. de C.V., a producer of chemical products used in the construction industry, benefits from infrastructure improvement in emerging economies. Its PVC products, particularly PVC pipe, have played a large role in the company’s success.
Swiber Holdings Ltd. an offshore engineering and construction provider for the oil and gas industries with operations in Asia, was a positive contributor to performance. We initiated a position in the stock after it was hit hard early in the period. We didn’t see a fundamental reason for the stock to be down — the company has recorded sizable new contracts, and also benefits from rising energy demand. We took advantage of what we considered a low valuation to build a large position in Swiber during the period, and we were rewarded as the stock rebounded off its lows. Swiber
represents another of our favorite themes in the portfolio—companies in the oil and gas industries in Southeast Asia. It still appears undervalued to us.
As one would expect, many of our stocks succumbed to macroeconomic pressures during the period and posted negative returns. Although China Hongxing Sports Ltd., our largest holding, has given us a great deal to be pleased with in the time we have held it, for the half-year it was one of the greatest detractors from performance. As we’ve discussed previously, we believe this sports apparel and footwear maker has the potential to produce strong growth for many years to come. The company primarily serves Chinese consumers, rather than seeking to export its goods to the U.S. or other established markets. Given the rapid expansion of China’s relatively new consumer class, the market for China Hongxing’s products is likely to grow for decades.
Despite our favorable view of China Hongxing, we have been working diligently to make sure the factors supporting our investment decision haven’t changed for the worse. We contacted a wide variety of information sources, and conducted first-hand research into the company’s health while visiting China early in 2008. We found that there was no fundamental issue driving China Hongxing’s share price down. Rather, the company was simply suffering from negative investor sentiment in a time of heightened risk sensitivity.
Another solid company whose stock price took a hit over the period was Arques Industries, a German firm that buys struggling businesses, turns them around, and then resells them. The main concern that drove investors from this company was that, in an environment with tight credit and bearish investor sentiment, the company might have difficulty selling the companies it has turned around. Thus far, however, Arques has been able to continue to make profitable sales. In time, as the market recognizes this, we expect Arques’ share price to improve.
OUTLOOK
Although our overweighting in Asia was the main factor in our underperformance for the period, we’re still confident in the long-term trends that we believe will spur earnings growth — and stock prices — in that region for the next decade or more. In our recent travels to China, it was impossible to ignore the growing wealth that is beginning to permeate the society. People who leave rural towns for China’s cities often increase their income and quickly build an appetite for new clothes, athletic footwear, and other consumer goods.
In looking back at the period, we recognize that we may have erred by not taking profits on some of the companies in the portfolio when their stock prices were at high levels. With the benefit of this experience, we have become more vigilant about our price discipline. We also continue to have a healthy cash position, which gives us the resources to act upon opportunities as they arise.
As the global picture stabilizes, we believe that “smart money” will go where the growth is, and flow back into China and other emerging markets. In time, we expect to be able to look back on this period as a blip in the overall upward progression for these markets, and for the Fund.
Thank you for the opportunity to manage your assets.
16
| | |
| WASATCH INTERNATIONAL OPPORTUNITIES FUND (WAIOX) — Portfolio Summary | | MARCH 31. 2008 |
|
| |
| |
AVERAGE ANNUAL TOTAL RETURNS
| | | | | | | | |
| | | SIX MONTHS* | | 1 YEAR | | 5 YEARS | | SINCE INCEPTION
1/27/05 |
International Opportunities | | -21.06% | | -13.97% | | N/A | | 14.24% |
MSCI World ex USA Small Cap Index | | -11.02% | | -9.93% | | N/A | | 11.85% |
MSCI AC World ex USA Small Cap Index | | -11.73% | | N/A | | N/A | | N/A |
Performance data quoted represents past performance. Past performance is not indicative of future performance and current performance may be lower or higher than the performance quoted. Wasatch Funds will deduct a fee of 2% from redemption proceeds on Fund shares held 60 days or less. Performance data does not reflect the deduction of this fee which, if charged, would reduce the performance quoted. The table above does not reflect the deduction of taxes that you would pay on fund distributions or the redemption of fund shares.
The Total Annual Fund Operating Expenses for the Wasatch International Opportunities Fund are 2.51%. Total Annual Fund Operating Expenses include direct expenses paid to the Advisor as well as indirect expenses incurred by the Fund as a result of its investments in other investment companies (each an “Acquired Fund”), before any expense reimbursements by the Advisor. The Net Expenses may differ due to waivers and reimbursements by the Advisor. See the prospectus for additional information regarding Fund expenses.
To obtain the most recent month-end performance, please visit www.wasatchfunds.com or call 800.551.1700. Investment returns and principal value will fluctuate and shares, when redeemed, may be worth more or less than their original cost. The Advisor may have absorbed, currently or in the past, certain Fund expenses, without which total returns would have been lower.
Investing in foreign securities, especially in emerging markets, entails special risks, such as currency fluctuations and political uncertainties, which are described in more detail in the prospectus. Investing in small cap funds will be more volatile and loss of principal could be greater than investing in large cap or more diversified funds. Being non-diversified, the Fund can invest a larger portion of its assets in the stocks of a limited number of companies than a diversified fund. Non-diversification increases the risk of loss to the Fund if the values of these securities decline.
TOP 10 EQUITY HOLDINGS**
| | |
| Company | | % of Fund |
China Hongxing Sports Ltd. (China) Athletic wear retailer. | | 4.77% |
IMAREX ASA (Norway) Financial derivatives exchange. | | 2.82% |
Swiber Holdings Ltd. (Singapore) Support and systems for offshore oil and gas projects. | | 2.80% |
Goodpack Ltd. (Singapore) Shipping containers and packaging. | | 2.34% |
RaySearch Laboratories AB (Sweden) Dosage software for radiology. | | 2.15% |
| | |
| Company | | % of Fund |
Oslo Bors VPS Holding ASA (Norway) Marketplace for trading financial instruments. | | 2.03% |
Guestlogix, Inc. (Canada) Onboard retail technology for airlines, etc. | | 1.93% |
Burckhardt Compression Holding AG (Switzerland) Industrial compressors. | | 1.88% |
Demag Cranes AG (Germany) Industrial cranes and port automation. | | 1.76% |
International Ferro Metals, Ltd. (Australia) Integrated ferrochrome producer. | | 1.51% |
| ** | | As of March 31, 2008, the Fund had 23.99% invested in the Top 10 equity holdings and there were 102 long-term holdings in the Fund. Portfolio holdings are subject to change at any time. References to specific securities should not be construed as recommendations by the Funds or their Advisor. |
SECTOR BREAKDOWN†
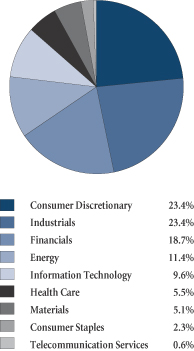
† | Excludes short-term investments, securities sold short and written options, if any. |
GROWTHOFA $10,000 INVESTMENT
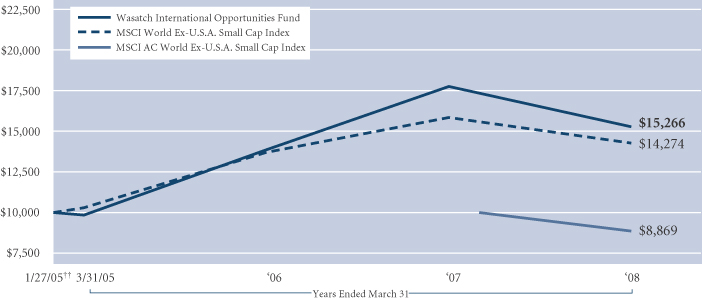
Past performance does not predict future performance and the graph above does not reflect the deduction of taxes that you would pay on fund distributions or the redemption of fund shares. Performance shown in the chart above does not include any applicable sales charges and fees. The chart represents a hypothetical $10,000 investment at the beginning of the time period shown. ††Inception: January 27, 2005. The MSCI World Ex-U.S.A. Small Cap Index is an unmanaged index that measures the performance of stocks with market capitalizations between US $200 million and $1.5 billion across 22 developed markets, excluding the United States. The MSCI AC World Ex-U.S.A. Small Cap Index is an unmanaged index and includes reinvestment of all dividends of issuers located in countries throughout the world representing developed and emerging markets, excluding securities of U.S. issuers. This index is a free float-adjusted market capitalization index designed to measure the performance of small capitalization securities. The Index recently commenced operations, therefore, data since the Fund’s inception is not available. You cannot invest directly in these or any indexes.
17
| | |
| WASATCH MICRO CAP FUND (WMICX) — Management Discussion | | MARCH 31, 2008 |
|
| |
| |
The Wasatch Micro Cap Fund is managed by a team of Wasatch portfolio managers, led by Daniel Chace.
| | |

Daniel Chace, CFA Portfolio Manager | | OVERVIEW The six months ended March 31 was a difficult period for the Wasatch Micro Cap Fund. The Fund lost 21.22% and lagged the Russell 2000 Index, which declined 14.02%. A number of our holdings were extremely weak, and our winners were not enough to offset them. Some of our biggest detractors were hurt by market dynamics, while others were impacted by fundamental issues. Either way, the magnitude of the losses often seemed unwarranted in an |
environment of very negative investor sentiment. While recent performance was disappointing, our long-term outlook for the Fund remains positive given the characteristics of our holdings. We believe the portfolio contains a good mix of attractively valued, high-quality companies with the potential to deliver strong, sustainable earnings growth over time.
DETAILSOFTHE PERIOD
The U.S. equity market was unusually weak in the six months ended March 31. Stock prices declined in response to continued deterioration in the housing and credit markets and signs that the U.S. economy was headed for, or already in, a recession. Uncertainty about the health of the financial system and economy made stock prices volatile and investors less willing to take risk. Consistent with diminished risk appetites, defensive sectors within the Russell 2000 Index outperformed more aggressive groups, and larger names outpaced smaller ones. The underperformance of the smallest stocks in the Index was a headwind for the Fund given our focus on micro cap investing.
The Fund also was negatively impacted by the generally poor performance of our international investments.* A number of our Singapore-listed companies that are domiciled in China or whose businesses are focused on mainland China were particularly weak. We did not see any significant changes in these companies’ fundamentals and therefore believe that the sell-off was likely driven by the liquidity needs of hedge funds. Tighter conditions in the credit markets have forced many hedge funds to sell assets to reduce leverage. Our view is that these funds are selling some of their most liquid assets, which would include Singapore-listed stocks they bought to gain exposure to the rapidly growing Chinese economy.
Company fundamentals did play a role in the weak performance of other stocks in the portfolio, including SiRF Technology Holdings, a supplier of global positioning system (GPS) semiconductor chips. SiRF was hurt by softening demand in the personal navigation device (PND) market and a decline in margins, which raised concerns about increased competition. Because this was the first evidence of
margin pressure, we are going to wait and see if it was the beginning of a trend or just an isolated incident. We also are closely watching for signs of a pickup in SiRF’s cell phone business, since the emerging GPS-enabled cell phone market could be the next big growth driver for the company.
In our opinion, the news on SiRF and other large detractors with fundamental issues did not warrant the dramatic price cuts in the stocks, and we attribute the size of the losses to the market’s negative tone. In the volatile environment, investors had little-to-no tolerance for the slightest hint of disappointment, and companies that missed earnings estimates or issued disappointing guidance were severely punished.
On the plus side, several of our stocks produced strong gains in the down market, including VNUS Medical Technologies. VNUS makes medical devices that use radio frequency (RF) energy to treat varicose veins and is experiencing robust sales of the next-generation system it launched in the spring of 2007. Our investment thesis on VNUS is unfolding as expected, which is that the company’s RF technology will stand out from laser-based competitors and drive higher rates of revenue growth.
The silver lining of the market sell-off is that it gave us the opportunity to add several interesting and inexpensive new names to the Fund. We also were able to increase the weightings in some of our existing holdings at very attractive prices, while paring back or selling our least-favorite holdings. On March 31, the Fund remained well-diversified but with fewer stocks and larger positions in our highest-conviction names.
OUTLOOK
U.S. policymakers have been proactive in their efforts to unfreeze the credit markets and boost economic growth. The Federal Reserve has lowered the target funds rate 2.5% since September and taken unconventional steps to provide extra liquidity to banks and securities dealers. In February, President Bush signed a $170 billion stimulus package into law that includes tax rebates for individuals and tax breaks for businesses. The impact of these efforts remains to be seen, but the response has been swift.
Of course, our focus is not on predicting the direction of the economy or stock market but on identifying high-quality businesses trading at reasonable valuations. From that perspective, our outlook is positive since we feel comfortable with the stocks we own. The valuations of many of our portfolio companies are at multi-year lows, balance sheets are solid and we expect our holdings to generate healthy earnings growth over the next 12 months.
Thank you for the opportunity to manage your assets.
| * | These holdings included American Depositary Receipts (ADRs — receipts issued by domestic banks for shares of foreign-based corporations that trade on U.S. stock exchanges) and companies incorporated in other countries but whose shares trade on U.S. stock exchanges. |
18
| | |
| WASATCH MICRO CAP FUND (WMICX) — Portfolio Summary | | MARCH 31, 2008 |
|
| |
| |
AVERAGE ANNUAL TOTAL RETURNS
| | | | | | | | |
| | | SIX MONTHS* | | 1 YEAR | | 5 YEARS | | 10 YEARS |
Micro Cap | | -21.22% | | -17.19% | | 14.38% | | 16.12% |
Russell 2000 Index | | -14.02% | | -13.00% | | 14.90% | | 4.96% |
Russell Microcap Index | | -18.99% | | -20.16% | | 13.41% | | N/A |
Performance data quoted represents past performance. Past performance is not indicative of future performance and current performance may be lower or higher than the performance quoted. Wasatch Funds will deduct a fee of 2% from redemption proceeds on Fund shares held 60 days or less. Performance data does not reflect the deduction of this fee which, if charged, would reduce the performance quoted. The table above does not reflect the deduction of taxes that you would pay on fund distributions or the redemption of fund shares.
The Total Annual Fund Operating Expenses for the Wasatch Micro Cap Fund are 2.14%. Total Annual Fund Operating Expenses include direct expenses paid to the Advisor as well as indirect expenses incurred by the Fund as a result of its investments in other investment companies (each an “Acquired Fund”), before any expense reimbursements by the Advisor. The Net Expenses may differ due to waivers and reimbursements by the Advisor. See the prospectus for additional information regarding Fund expenses.
To obtain the most recent month-end performance, please visit www.wasatchfunds.com or call 800.551.1700. Investment returns and principal value will fluctuate and shares, when redeemed, may be worth more or less than their original cost. The Advisor may have absorbed, currently or in the past, certain Fund expenses, without which total returns would have been lower.
Investing in micro cap funds will be more volatile and loss of principal could be greater than investing in large cap or more diversified funds. Investing in foreign securities, especially in emerging markets, entails special risks, such as currency fluctuations and political uncertainties, which are described in more detail in the prospectus.
TOP 10 EQUITY HOLDINGS**
| | |
| Company | | % of Fund |
VNUS Medical Technologies, Inc. Minimally invasive varicose vein treatment. | | 2.96% |
Power Integrations, Inc. Semiconductors. | | 2.92% |
Providence Service Corp. (The) Management of U.S. government-sponsored social services. | | 2.71% |
O2Micro International Ltd. ADR (Cayman Islands) Semiconductors. | | 2.46% |
DealerTrack Holdings, Inc. Software and data solutions for auto and specialty retailers. | | 2.08% |
| | |
| Company | | % of Fund |
World Acceptance Corp. Installment loans to consumers. | | 2.08% |
Micrel, Inc. Semiconductors. | | 2.07% |
Swiber Holdings Ltd. (Singapore) Support and systems for offshore oil and gas projects. | | 1.74% |
Goodpack Ltd. (Singapore) Shipping containers and packaging. | | 1.68% |
Treasury Group Ltd. (Australia) Investment management services. | | 1.68% |
| ** | | As of March 31, 2008, the Fund had 22.38% invested in the Top 10 equity holdings and there were 122 long-term holdings in the Fund. Portfolio holdings are subject to change at any time. References to specific securities should not be construed as recommendations by the Funds or their Advisor. |
SECTOR BREAKDOWN†
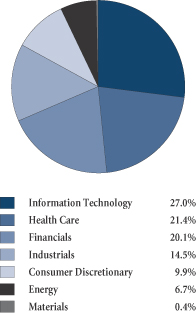
† | Excludes short-term investments, securities sold short and written options, if any. |
GROWTHOFA $10,000 INVESTMENT
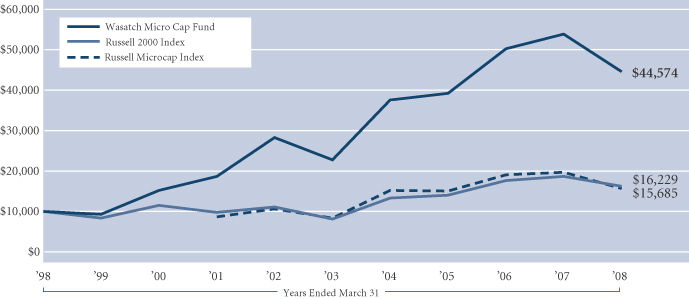
Past performance does not predict future performance and the graph above does not reflect the deduction of taxes that you would pay on fund distributions or the redemption of fund shares. Performance shown in the chart above does not include any applicable sales charges and fees. The chart represents a hypothetical $10,000 investment at the beginning of the time period shown. The Russell 2000 Index is an unmanaged total return index of the smallest 2,000 companies in the Russell 3000 Index, as ranked by total market capitalization. The Russell 2000 Index is widely regarded in the industry as accurately capturing the universe of small company stocks. The Russell Microcap Index is an unmanaged total return index of the smallest 1,000 securities in the small-cap Russell 2000 Index along with the next smallest 1,000 companies, based on a ranking of all U.S. equities by market capitalization. No data was available for the Index prior to 6/30/00. Data for the Index from 6/30/00 until its official start data of July 1, 2005 was from a paper portfolio. You cannot invest directly in these or any indexes.
19
| | |
| WASATCH MICRO CAP VALUE FUND (WAMVX) — Management Discussion | | MARCH 31, 2008 |
|
| |
| |
The Wasatch Micro Cap Value Fund is managed by a team of Wasatch portfolio managers, led by John Malooly and Brian Bythrow.
| | | | |

John Malooly, CFA Portfolio Manager | |
Brian Bythrow, CFA Portfolio Manager | | OVERVIEW Equities faced a complex array of challenges during the six-month period. The credit crunch continued to have impact throughout the economy, and it appeared all but certain that the U.S. would move |
into a recession, if it had not already. As the Federal Reserve took a number of aggressive steps to help address the situation, it was not clear whether they were sufficient to stop the economy’s decline. In this environment, the Wasatch Micro Cap Value Fund posted a return of -15.99%; this placed the Fund slightly behind the Russell 2000 Index, which returned -14.02% for the same period.
In an increasingly uncertain environment, investors’ aversion to risk gained in intensity. Micro cap stocks, which tend to be less liquid and more volatile than larger-cap stocks, remained out of favor. A number of stocks in the portfolio — including some of the main detractors from the Fund’s performance for the period — experienced significant price drops even though they experienced no slippage in their earnings, and their fundamental qualities remained strong. Although this turn of events is disappointing, it does indicate that many of the companies we hold should be in a position to benefit as the economic situation stabilizes. It also gave us some opportunities to add to our positions at extremely reasonable prices.
We continued to limit our exposure to U.S. consumer-focused companies, while taking positions in companies that cater to the growing demands of consumers in emerging economies. International stocks remained an important component of the portfolio, but in a change from the past few years, did not contribute positively to the Fund’s performance versus the Index. International micro caps can be even less liquid than their domestic counterparts. Also, after an extended period of outperformance, many international stocks had become overvalued. Both of these factors may have hurt international micro caps in a risk-averse environment.
DETAILSOFTHE PERIOD
Our weaker performers for the period came from a number of different areas of the market, demonstrating widespread negative sentiment toward stocks. The greatest detractor from performance for the six months was SiRF Technology Holdings, Inc., a maker of semiconductor chips for GPS-based navigation devices. It suffered from declining demand for stand-alone GPS devices, and an unexpected loss of market share. The company’s stock price dropped rapidly, and at this point, it’s unclear how the situation will play out. We are keeping a careful eye on SiRF’s progress.
The next-largest detractor from performance was in a very different industry — auto parts and equipment. Martinrea International, Inc., a supplier of stamped-metal parts to the Big Three automakers, saw its stock slide due to overall weakness among automakers. This weakness was exacerbated by a prolonged labor strike at another major automotive components producer, which resulted in slower new-car production. Martinrea has been a solid performer before, and despite its current challenges, we remain comfortable with the company’s fundamentals, particularly in light of its rising market share. In our experience, we have found that companies capable of this kind of success during a down period for their industry can often be positioned to benefit when their market segment returns to a healthier state.
Despite the difficult environment, there were a number of bright spots in the Fund. Globe Specialty Metals, Inc. has gained on rapid growth in demand for energy alternatives. The company makes silicon metal and silicon-based specialty alloys that are used in the production of aluminum and, perhaps more important, in the manufacture of solar cells. High prices for traditional energy sources have given the company the ability to raise prices on its own alternative-energy-related products. Many of Globe’s costs are relatively fixed, so this pricing power has helped its profit margins surge upward. The company remains somewhat undiscovered, helping to keep it reasonably valued.
A recent addition, Heritage-Crystal Clean, Inc., was another of our top contributors for the period. The company recycles and otherwise disposes of solvents, oil-based products, and hazardous wastes for smaller businesses, particularly auto service centers — not a particularly glamorous market segment, but one that provides a service highly valued by its customers.
Other strong contributions came from health care companies, which tend to be more resilient in times of economic uncertainty. VNUS Medical Technologies, Inc. has benefited from strong acceptance of its devices by medical professionals, allowing it to gain significant market share. The company has been involved in some litigation, the costs of which have weighed on its financials. These costs are expected to fall off as the cases move toward resolution.
OUTLOOK
In the current environment, we are seeing many stocks with valuations that are not just low — they are unreasonably so. In some cases, we are seeing companies trading below the value of their cash holdings, and others trading at discounts to their book value. Looking back historically, unpleasant periods like this that have featured unnaturally low stock valuations have proved to be good times to buy equities.
Rather than attempting to make what are likely to be unproductive economic forecasts, we are focusing on companies that are attractively valued and are well positioned to rebound once the environment begins to stabilize. As is usually the case, we are looking for companies that are growing, gaining market share, improving their earnings, and maintaining strong balance sheets. International stocks continue to play a significant role in the portfolio, with many well-managed, high-quality companies available at very reasonable valuations.
Thank you for the opportunity to manage your assets.
20
| | |
| WASATCH MICRO CAP VALUE FUND (WAMVX) — Portfolio Summary | | MARCH 31, 2008 |
|
| |
| |
AVERAGE ANNUAL TOTAL RETURNS
| | | | | | | | |
| | | SIX MONTHS* | | 1 YEAR | | 5 YEARS | | SINCE INCEPTION
7/28/03 |
Micro Cap Value | | -15.99% | | -11.54% | | N/A | | 14.59% |
Russell 2000 Index | | -14.02% | | -13.00% | | N/A | | 9.58% |
Russell Microcap Index | | -18.99% | | -20.16% | | N/A | | 7.09% |
Performance data quoted represents past performance. Past performance is not indicative of future performance and current performance may be lower or higher than the performance quoted. Wasatch Funds will deduct a fee of 2% from redemption proceeds on Fund shares held 60 days or less. Performance data does not reflect the deduction of this fee which, if charged, would reduce the performance quoted. The table above does not reflect the deduction of taxes that you would pay on fund distributions or the redemption of fund shares.
The Total Annual Fund Operating Expenses for the Wasatch Micro Cap Value Fund are 2.32%. Total Annual Fund Operating Expenses include direct expenses paid to the Advisor as well as indirect expenses incurred by the Fund as a result of its investments in other investment companies (each an “Acquired Fund”), before any expense reimbursements by the Advisor. The Net Expenses may differ due to waivers and reimbursements by the Advisor. See the prospectus for additional information regarding Fund expenses.
To obtain the most recent month-end performance, please visit www.wasatchfunds.com or call 800.551.1700. Investment returns and principal value will fluctuate and shares, when redeemed, may be worth more or less than their original cost. The Advisor may have absorbed, currently or in the past, certain Fund expenses, without which total returns would have been lower.
Investing in micro cap funds will be more volatile and loss of principal could be greater than investing in large cap or more diversified funds. Investing in foreign securities, especially emerging markets, entails special risks, such as currency fluctuations and political uncertainties, which are described in more detail in the prospectus.
TOP 10 EQUITY HOLDINGS**
| | |
| Company | | % of Fund |
Globe Specialty Metals, Inc. (United Kingdom) Silicon metals producer. | | 3.43% |
VNUS Medical Technologies, Inc. Minimally invasive varicose vein treatment. | | 3.25% |
Guestlogix, Inc. (Canada) Onboard retail technology for airlines, etc. | | 1.99% |
Heritage-Crystal Clean, Inc. Industrial and hazardous waste disposal services. | | 1.80% |
Esterline Technologies Corp. Aerospace and defense products manufacturer. | | 1.70% |
| | |
| Company | | % of Fund |
World Fuel Services Corp. Marine, aviation and land fuel products and services. | | 1.62% |
MTS Medication Technologies, Inc. Medication dispensing systems. | | 1.55% |
BPZ Energy, Inc. Oil and gas developer. | | 1.49% |
O2Micro International Ltd. ADR (Cayman Islands) Semiconductors. | | 1.45% |
Opnet Technologies, Inc. Communications network management software. | | 1.44% |
| ** | As of March 31, 2008, the Fund had 19.72% invested in the Top 10 equity holdings and there were 134 long-term holdings in the Fund. Portfolio holdings are subject to change at any time. References to specific securities should not be construed as recommendations by the Funds or their Advisor. |
SECTOR BREAKDOWN†
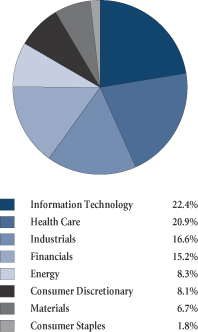
† | Excludes short-term investments, securities sold short and written options, if any. |
GROWTHOFA $10,000 INVESTMENT
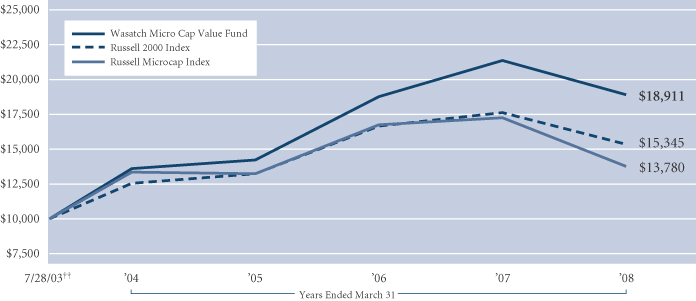
Past performance does not predict future performance and the graph above does not reflect the deduction of taxes that you would pay on fund distributions or the redemption of fund shares. Performance shown in the chart above does not include any applicable sales charges and fees. The chart represents a hypothetical $10,000 investment at the beginning of the time period shown. ††Inception: July 28, 2003. The Russell 2000 Index is an unmanaged total return index of the smallest 2,000 companies in the Russell 3000 Index, as ranked by total market capitalization. The Russell 2000 Index is widely regarded in the industry as accurately capturing the universe of small company stocks. The Russell Microcap Index is an unmanaged total return index of the smallest 1,000 securities in the small-cap Russell 2000 Index along with the next smallest 1,000 companies, based on a ranking of all U.S. equities by market capitalization. No data was available for the Index prior to 6/30/00. Data for the Index from 6/30/00 until its official start date of July 1, 2005 was from a paper portfolio. You cannot invest directly in these or any indexes.
21
| | |
| WASATCH SMALL CAP GROWTH FUND (WAAEX) — Management Discussion | | MARCH 31, 2008 |
|
| |
| |
The Wasatch Small Cap Growth Fund is managed by a team of Wasatch portfolio managers, led by Jeff Cardon.
| | |

Jeff Cardon, CFA Portfolio Manager | | OVERVIEW During the six months ended March 31, the Wasatch Small Cap Growth Fund lost 16.47% in what was a challenging environment for U.S. equities. The Russell 2000 Growth Index fell 14.66% and the Russell 2000 Index shed 14.02%. Weakness in the Fund was broad-based, with every sector of investment posting a decline. Compared to the Russell 2000 Growth Index, the Fund outperformed in the first half of the |
period but trailed for the full six months. A number of our positions fell sharply in the first quarter of 2008 when investors were quick to sell stocks on the slightest hint of negative news. On the plus side, our international investments* outperformed our domestic holdings and positively impacted results versus the Index.
The sell-off in the market gave us the opportunity to add new stocks to the portfolio and increase our weightings in existing names at low prices. At the end of the period, the Fund owned a good mix of what we believe to be fundamentally strong companies with exciting long-term growth potential and attractive valuations.
DETAILSOFTHE PERIOD
The six month period ended March 31 was a volatile time in the U.S. equity market. Stock prices tumbled in response to the ongoing slump in housing, continued turmoil in the credit markets and signs that the U.S. economy was headed for, or already in, a recession. The Federal Reserve aggressively lowered interest rates to bolster confidence in the financial system and economy.
The market was weakest in the second half of the period as problems in the housing and credit markets deepened and risk aversion soared. During that time, small cap investors were especially wary of higher-expectation stocks — stocks of companies with attractive growth prospects that command premium prices. All too often, we saw a higher-growth name plummet on news that the company had narrowly missed Wall Street’s earnings estimates or issued guidance that was solid but below consensus forecasts. Investors had little-to-no tolerance for disappointment, choosing instead to move into what they perceived to be safer-haven investments.
Unfortunately, a number of our portfolio companies fell into the category of higher-expectation stocks whose prices were cut significantly. One example was Life Time Fitness, a health club chain that was hurt by worries about a slowdown in consumer spending. Life Time reported third-quarter earnings that exceeded Wall Street estimates and fourth-quarter earnings that met estimates. However, the company’s 2008 guidance — a respectable 19% to 22% for
revenue growth and 15% to 17% for earnings growth — fell short of expectations. We were disappointed that the stock posted such a big loss but remain positive on Life Time’s long-term potential. We believe the company will be able to maintain an attractive level of growth throughout economic cycles given its differentiated business model and the unique customer experience that it provides. Our long-term outlook also remains positive on other higher-expectation stocks that were weak this period, including DealerTrack Holdings, a provider of software used by auto dealers. Similar to Life Time Fitness, DealerTrack announced solid operating performance and guidance, but guidance was below consensus forecasts and the stock suffered greatly as a result.
Our global focus benefited the Fund this period. Overall, our international stocks outperformed our domestic holdings and the Russell 2000 Growth Index. The portfolio’s top contributor was Icon plc, a contract research organization based in Ireland. Icon is experiencing rapid growth as it capitalizes on the trend among pharmaceutical and biotechnology firms to outsource clinical research to reduce the time and cost of drug development. Our position in the stock is a good illustration of our Multiple Eyes™ culture, because Wasatch also owns Icon in four of our other funds. The input of numerous portfolio managers and analysts from across the firm gives us a broad perspective on this company whose long-term prospects remain exciting to us.
The silver lining of a weak market is that it provides good buying opportunities. During the period, we added a number of interesting companies to the Fund at very attractive prices. For example, we are gradually building positions in two inexpensive consumer businesses that, in our opinion, may have the potential to become several times their current size. We also have been increasing our weightings in select financials, which should perform well once the financials sector begins to recover. On the flip side, a few of our health care companies appear fully valued, and we have been trimming these names.
OUTLOOK
As the result of our stock-by-stock investment decisions, we think the Fund is positioned for an upturn in investor sentiment. We believe that we have assembled a good selection of reasonably priced, high-quality companies and have confidence in their long-term prospects. Evidence of the quality and fundamental strength of our companies, the weighted-average earnings growth rate of the portfolio was above our 15% target in the most recent earnings season, and we expect to maintain a healthy growth rate over the next 12 months. We are particularly positive on the outlook for our top 10 holdings. Our long-term thesis on each of these companies remains intact and, following this period’s market decline, their stock prices have become much more attractive.
Thank you for the opportunity to manage your assets.
| * | These holdings included American Depositary Receipts (ADRs — receipts issued by domestic banks for shares of foreign-based corporations that trade on U.S. stock exchanges) and companies incorporated in other countries but whose shares trade on U.S. stock exchanges. |
22
| | |
| WASATCH SMALL CAP GROWTH FUND (WAAEX) — Portfolio Summary | | MARCH 31, 2008 |
|
| |
| |
AVERAGE ANNUAL TOTAL RETURNS
| | | | | | | | |
| | | SIX MONTHS* | | 1 YEAR | | 5 YEARS | | 10 YEARS |
Small Cap Growth | | -16.47% | | -10.34% | | 11.37% | | 9.65% |
Russell 2000 Growth Index | | -14.66% | | -8.94% | | 14.24% | | 1.75% |
Russell 2000 Index | | -14.02% | | -13.00% | | 14.90% | | 4.96% |
Performance data quoted represents past performance. Past performance is not indicative of future performance and current performance may be lower or higher than the performance quoted. Wasatch Funds will deduct a fee of 2% from redemption proceeds on Fund shares held 60 days or less. Performance data does not reflect the deduction of this fee which, if charged, would reduce the performance quoted. The table above does not reflect the deduction of taxes that you would pay on fund distributions or the redemption of fund shares.
The Total Annual Fund Operating Expenses for the Wasatch Small Cap Growth Fund are 1.19%. Total Annual Fund Operating Expenses include direct expenses paid to the Advisor as well as indirect expenses incurred by the Fund as a result of its investments in other investment companies (each an “Acquired Fund”), before any expense reimbursements by the Advisor. The Net Expenses may differ due to waivers and reimbursements by the Advisor. See the prospectus for additional information regarding Fund expenses.
To obtain the most recent month-end performance, please visit www.wasatchfunds.com or call 800.551.1700. Investment returns and principal value will fluctuate and shares, when redeemed, may be worth more or less than their original cost. The Advisor may have absorbed, currently or in the past, certain Fund expenses, without which total returns would have been lower.
Investing in small cap funds will be more volatile and loss of principal could be greater than investing in large cap or more diversified funds.
TOP 10 EQUITY HOLDINGS**
| | |
| Company | | % of Fund |
O’Reilly Automotive, Inc. Automotive parts retailer/distributor. | | 4.91% |
Knight Transportation, Inc. Long haul trucking and logistics services. | | 4.37% |
Techne Corp. Complex, disposable research kits for biotechnology. | | 3.73% |
Power Integrations, Inc. Semiconductors. | | 3.34% |
Resources Connection, Inc. Professional business services outsourcing. | | 3.18% |
| | |
| Company | | % of Fund |
FactSet Research Systems, Inc. Financial and economic information for investment managers. | | 2.79% |
*HDFC Bank Ltd. ADR (India) Consumer bank. | | 2.51% |
Strayer Education, Inc. Post-secondary education. | | 2.30% |
Pediatrix Medical Group, Inc. National network of neonatologists. | | 2.28% |
DealerTrack Holdings, Inc. Software for auto and specialty retailers. | | 2.14% |
| * | | *As of March 31, 2008, the Fund had 31.55% invested in the Top 10 equity holdings and there were 106 long-term holdings in the Fund. Portfolio holdings are subject to change at any time. References to specific securities should not be construed as recommendations by the Funds or their Advisor. |
SECTOR BREAKDOWN†
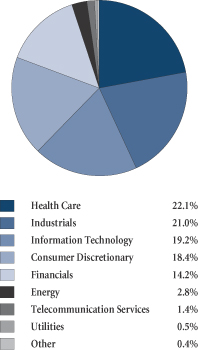
† | Excludes short-term investments, securities sold short and written options, if any. |
GROWTHOFA $10,000 INVESTMENT
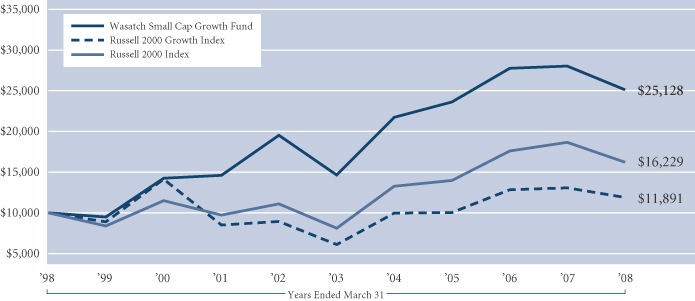
Past performance does not predict future performance and the graph above does not reflect the deduction of taxes that you would pay on fund distributions or the redemption of fund shares. Performance shown in the chart above does not include any applicable sales charges and fees. The chart represents a hypothetical $10,000 investment at the beginning of the time period shown. The Russell 2000 Growth Index is an unmanaged total return index that measures the performance of those Russell 2000 Index companies with higher price-to-book ratios and higher forecasted growth values. The Russell 2000 Index is an unmanaged total return index of the smallest 2,000 companies in the Russell 3000 Index, as ranked by total market capitalization. The Russell 2000 Index is widely regarded in the industry as accurately capturing the universe of small company stocks. You cannot invest directly in these or any indexes.
23
| | |
| WASATCH SMALL CAP VALUE FUND (WMCVX) — Management Discussion | | MARCH 31, 2008 |
|
| |
| |
The Small Cap Value Fund is managed by a team of Wasatch portfolio managers, led by Jim Larkins and John Mazanec. Effective May 20, 2008, Jim Larkins assumed sole responsibility as the lead portfolio manager of the Small Cap Value Fund.
| | | | |

Jim Larkins, MBA Portfolio Manager | | 
John Mazanec, MBA Portfolio Manager | | OVERVIEW The Wasatch Small Cap Value Fund recorded a loss of 14.75% during the period and underperformed the Russell 2000 Value Index, which lost 13.33%. The general market downturn |
that started in mid 2007 extended through the end of this six-month period. Investor worries began with a focus on subprime mortgages, then shifted to prospects for a credit crunch and a consumer spending slowdown and finally appeared to factor in a full-blown recession. While economists differ on whether or not a recession will occur, the market seems to reflect the belief that one has already arrived.
In contrast to the last widespread contraction, the current market slump is undiscriminating. In 2002, the Russell 2000 Value Index lost over 11% for the year, but losses were concentrated in the technology, consumer, and industrials sectors. This time, not even defensive sectors such as health care have escaped. Even more striking is the lack of attention to fundamentals. Companies with strong positions and positive outlooks have declined along with weak operators. Companies reporting even slightly disappointing results were generally pushed down sharply. This state of affairs developed and deepened throughout the six months, resulting in a challenging period for small cap stocks.
Although financial stocks kicked off the downturn, our consumer discretionary holdings emerged as the biggest losers for the period. While investors virtually abandoned financial stocks in the first half of the period, the sector rebounded somewhat toward the end. Materials achieved the only positive return among all sectors in the Fund.
DETAILSOFTHE PERIOD
The consumer discretionary sector offers little positive to report, as both broad trends and specific circumstances combined to depress the Funds’ holdings. Our three biggest detractors were consumer-oriented companies, led by auto parts supplier Martinrea International, Inc., which collided with a crashing auto industry. Falling home prices in its core California market constrained consumer demand and hurt retailer Big 5 Sporting Goods Corp., our second-biggest detractor. Rounding out the top three detractors was mattress maker Select Comfort Corp. The company cancelled plans for a large stock buyback and the stock price fell precipitously.
Our feeling is that the U.S. consumer will continue to feel pinched by rising food and gasoline prices, and credit will be harder for many to procure. With this in mind, we expect to continue to reduce our exposure to consumer-focused companies. Still, times like these often punish companies more than is warranted, and we are looking carefully for
Fallen Angels* that can be had on the cheap. Two such companies are apparel maker Volcom, Inc. and retailer Zumiez, Inc. Both cater to surfing, snowboarding and skating lifestyles, which we believe are deep secular fashion trends.
The Fund’s financial companies generally were depressed in spite of solid underlying fundamentals as investors reacted to the credit crisis by selling the stocks of even high quality companies with little direct exposure to credit issues. Payday lender Dollar Financial Corp., for instance, has a sizable presence in the stronger economies of Europe and particularly Canada and has reported positive overall prospects and results. Yet Dollar was the biggest detractor within our financials holdings. We are underweight in financials versus the Index, and while we are seeing interesting values, we remain cautious.
Our focus on researching energy companies has paid off with a strong group of holdings. Exploration and production company BPZ Energy, Inc. was one of the Fund’s top contributors, as it reported good news about an oil find off South America. Our approach to investing in the energy sector is to find companies that can control their own destiny and avoid those whose success depends solely on high energy prices.
The materials sector, where we follow a similar approach, included the Fund’s top contributor. Globe Specialty Metals, Inc., aided by robust global demand for its specialty silicon metals, had a triple-digit gain for the six months. Globe gives us “back door” exposure to the growing demand for solar energy, which uses the company’s products to make solar cells.
The negative performance of health care was unusual, given that many investors see this sector as a refuge during uncertain times. On the plus side, our health care companies were down less than those in the benchmark. The hardest hit were our senior living providers. The weak real estate market has caused investors to worry that senior citizens will have less home equity to fund assisted living. These companies also own and operate quite a bit of real estate, which could impact their balance sheets. Still, we believe that aging baby boomers will drive demand for quality assisted living for many years to come.
OUTLOOK
Stock prices are depressed, but it is impossible to tell if the bottom has been reached. Accordingly, we have worked on positioning the Fund by selling names likely to recover slowly and adding high-quality names with solid long-term prospects. In that sense, the market drop has provided opportunities to buy companies we have long admired at prices we find equally attractive. The stock prices of many companies we like are at five- and 10-year lows.
In keeping with our philosophy of long-term investing, we are looking for companies we can hold for three to four years or more. We believe that when economic fundamentals improve and investors regain a positive outlook, the Fund will be well-positioned with the kinds of undervalued companies that attract attention. When economic fundamentals will improve is unknown and unknowable. What is certain is that the last time there was such a broad downturn, with the Fund reporting a substantial decline, our long-term focus helped us make decisions that benefited the Fund in the years that followed.
Thank you for the opportunity to manage your assets.
| * | Wasatch defines “Fallen Angels” as growth companies that have suffered a temporary setback. |
24
| | |
| WASATCH SMALL CAP VALUE FUND (WMCVX) — Portfolio Summary | | MARCH 31, 2008 |
|
| |
| |
AVERAGE ANNUAL TOTAL RETURNS
| | | | | | | | |
| | | SIX MONTHS* | | 1 YEAR | | 5 YEARS | | 10 YEARS |
Small Cap Value | | -14.75% | | -14.91% | | 16.00% | | 13.25% |
Russell 2000 Value Index | | -13.33% | | -16.88% | | 15.45% | | 7.46% |
Russell 2000 Index | | -14.02% | | -13.00% | | 14.90% | | 4.96% |
Performance data quoted represents past performance. Past performance is not indicative of future performance and current performance may be lower or higher than the performance quoted. Wasatch Funds will deduct a fee of 2% from redemption proceeds on Fund shares held 60 days or less. Performance data does not reflect the deduction of this fee which, if charged, would reduce the performance quoted. The table above does not reflect the deduction of taxes that you would pay on fund distributions or the redemption of fund shares.
The Total Annual Fund Operating Expenses for the Wasatch Small Cap Value Fund are 1.96%. Total Annual Fund Operating Expenses include direct expenses paid to the Advisor as well as indirect expenses incurred by the Fund as a result of its investments in other investment companies (each an “Acquired Fund”), before any expense reimbursements by the Advisor. The Net Expenses may differ due to waivers and reimbursements by the Advisor. See the prospectus for additional information regarding Fund expenses.
To obtain the most recent month-end performance, please visit www.wasatchfunds.com or call 800.551.1700. Investment returns and principal value will fluctuate and shares, when redeemed, may be worth more or less than their original cost. The Advisor may have absorbed, currently or in the past, certain Fund expenses, without which total returns would have been lower.
Investing in small cap funds will be more volatile and loss of principal could be greater than investing in large cap or more diversified funds.
TOP 10 EQUITY HOLDINGS**
| | |
| Company | | % of Fund |
Globe Specialty Metals, Inc. (United Kingdom) Silicon metals producer. | | 3.27% |
Dollar Financial Corp. Payday lender. | | 3.12% |
NorthStar Realty Finance Corp. Real estate finance company. | | 2.81% |
Redwood Trust, Inc. Jumbo ARM mortgage REIT. | | 2.72% |
World Fuel Services Corp. Marine, aviation and land fuel products and services. | | 2.59% |
| | |
| Company | | % of Fund |
TETRA Technologies, Inc. Oil and gas industry services. | | 2.51% |
Emeritus Corp. Assisted living centers for seniors. | | 2.17% |
CorVel Corp. Medical cost containment services. | | 2.16% |
MSC Industrial Direct Co., Inc., Class A Industrial products distributor. | | 2.12% |
TTM Technologies, Inc. Printed circuit boards. | | 2.04% |
| ** | As of March 31, 2008, the Fund had 25.51% invested in the Top 10 equity holdings and there were 92 long-term holdings in the Fund. Portfolio holdings are subject to change at any time. References to specific securities should not be construed as recommendations by the Funds or their Advisor. |
SECTOR BREAKDOWN†
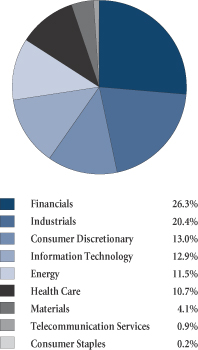
† | Excludes short-term investments, securities sold short and written options, if any. |
GROWTHOFA $10,000 INVESTMENT
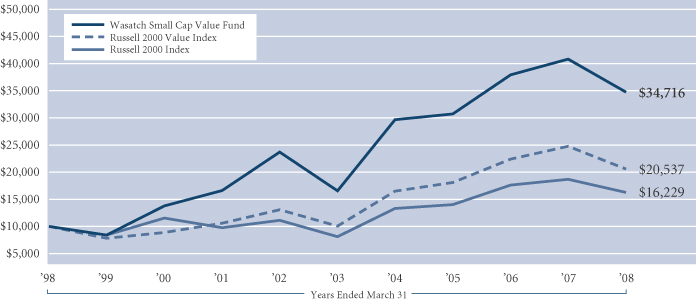
Past performance does not predict future performance and the graph above does not reflect the deduction of taxes that you would pay on fund distributions or the redemption of fund shares. Performance shown in the chart above does not include any applicable sales charges and fees. The chart represents a hypothetical $10,000 investment at the beginning of the time period shown. The Russell 2000 Value Index measures the performance of those Russell 2000 Index companies with lower price-to-book ratios and lower forecasted growth values. The Russell 2000 Index is an unmanaged total return index of the smallest 2,000 companies in the Russell 3000 Index, as ranked by total market capitalization. The Russell 2000 Index is widely regarded in the industry as accurately capturing the universe of small company stocks. You cannot invest directly in these or any indexes.
25
| | |
| WASATCH STRATEGIC INCOME FUND (WASIX) — Management Discussion | | MARCH 31, 2008 |
|
| |
| |
The Wasatch Strategic Income Fund is managed by a team of Wasatch portfolio managers, led by Sam Stewart.
| | |
Sam Stewart, PhD, CFA Portfolio Manager | | OVERVIEW The stock market suffered a significant decline over the six-month period ended March 31, 2008. Although the pullback abated slightly in late March, the S&P 500® Index ended up falling 12.46%. The Wasatch Strategic Income Fund fared better, suffering a setback of 6.20%, while the Lehman Aggregate Bond Index appreciated 5.23%. Overall, there was little relief from recent economic issues. The volatility |
of the stock market escalated to historic levels, while questions about the transparency of financial firms increased. Housing worries also remained front and center, as government intervention was sought to ease the burden of many homeowners.
The S&P financials sector declined over 26% during the period. We have reduced the financial weight in the portfolio but, with about half of the Fund in financial stocks, this again made for a tough environment. In contrast to the Index, however, our financial holdings lost only about 5%, helping to mitigate this head wind.
We were also able to temper the downside somewhat through our dividend-paying investments. Investors’ pessimism about nearly everything related to the economy drove stock prices down, lifting dividend yields up in the process. We have selectively tried to take advantage of opportunities where we believe there has been an overreaction to company-specific risk.
Despite all of the commotion and weakness on both Wall Street and Main Street, the Fund achieved its goal of delivering returns between stocks and bonds. While we will never be pleased posting a negative return in this fund, we were pleased to see that the Strategic Income Fund was down less than the S&P 500 in this difficult environment.
DETAILSOFTHE PERIOD
Financial companies fell over the last six months because the tidal wave of problems came much farther up the beach than almost anyone expected. Even the quality of Fannie Mae and Freddie Mac mortgage-backed securities was called into question.
We saw large banks in need of significant cash infusions, and then, in early March, it took a Federal Reserve-orchestrated bailout of Bear Stearns by JPMorgan Chase & Co. to forestall what could have been a major meltdown. It was remarkable that the nation’s fifth largest investment bank stumbled to the brink of bankruptcy.
Now that the Fed has stepped in to provide much-needed liquidity we believe the wave will begin to recede. Things won’t turn around overnight, however, as it will take some time to unwind this financial crisis.
We believe the key to evaluating financial companies in this environment is to look for two things: (1) ability to access cash, and (2) quality of current assets. We have attempted to construct the Fund’s financial holdings around companies that excel in these areas. With the large margin spread currently created by the steep yield curve,* financial companies with access to cash are actually enjoying a very profitable business environment.
We’re also being diligent about trying to identify companies with tested and proven management teams who can navigate these waters. We have continued to shift our financial positions to companies like Redwood Trust, Inc. and KKR Financial Holdings, LLC that we believe remain on solid footing with significant upside potential as investors reassess and try to differentiate the quality of financial companies.
Unfortunately, this period the stock prices of nearly every financial firm took a beating, and the Fund was not immune. Three of our mortgage real estate investment trusts (REITs) — CapitalSource, Inc., iStar Financial, Inc. and MFA Mortgage Investments, Inc. — witnessed their stock prices drop significantly. In this climate, investor confidence becomes paramount, particularly as it relates to companies like these whose business models revolve around their ability to manage portfolios of mortgage debt. Due in large part to the time-tested aptitude of each management team, we are confident in these firms as the quality of their asset holdings becomes clearer.
We continued to do some moderate financial hedging during the period. These positions added close to two percentage points to performance. Because most of our financial holdings are now quite attractively valued — with what we believe is much more long-term upside than downside — we expect to do less hedging in the future.
With the market pullback, we are increasing our larger cap Blue Chip holdings. Companies like Wal-Mart, Procter & Gamble, and now even GE look increasingly interesting from a value and dividend perspective. In our opinion, they are best-of-breed companies that are good fits for the Strategic Income Fund.
OUTLOOK
In our estimation, both the economy and the stock market are likely to move sideways over the near-term. We expect to continue trimming our financial holdings during periods of strength and to use our cash to increase Blue Chip holdings that are attractively valued and offer alluring dividends.
As a defensive stance in the current environment, we will likely establish small positions in preferred stocks and/or high-yield bonds in order to buffer downside risk with increased cash flow.
Even if the market doesn’t move up appreciably in the coming months, we believe the Fund remains well-positioned.
Thank you for the opportunity to manage your assets.
| * | The yield curve is a graph showing the term structure of interest rates by plotting the yields of all bonds of the same quality with maturities ranging from the shortest to the longest available. The resulting curve shows whether short-term interest rates are higher or lower than long-term interest rates. |
26
| | |
| WASATCH STRATEGIC INCOME FUND (WASIX) — Portfolio Summary | | MARCH 31, 2008 |
|
| |
| |
AVERAGE ANNUAL TOTAL RETURNS
| | | | | | | | |
| | | SIX MONTHS* | | 1 YEAR | | 5 YEARS | | SINCE INCEPTION 2/1/06 |
Strategic Income | | -6.20% | | -7.56% | | N/A | | 4.84% |
Lehman Brothers Aggregate Bond Index | | 5.23% | | 7.67% | | N/A | | 6.25% |
S&P 500 Index | | -12.46% | | -5.08% | | N/A | | 3.51% |
Performance data quoted represents past performance. Past performance is not indicative of future performance and current performance may be lower or higher than the performance quoted. Wasatch Funds will deduct a fee of 2% from redemption proceeds on Fund shares held 60 days or less. Performance data does not reflect the deduction of this fee which, if charged, would reduce the performance quoted. The table above does not reflect the deduction of taxes that you would pay on fund distributions or the redemption of fund shares.
The Total Annual Fund Operating Expenses for the Wasatch Strategic Income Fund are 2.01%. Total Annual Fund Operating Expenses include direct expenses paid to the Advisor as well as indirect expenses incurred by the Fund as a result of its investments in other investment companies (each an “Acquired Fund”), before any expense reimbursements by the Advisor. The Net Expenses may differ due to waivers and reimbursements by the Advisor. See the prospectus for additional information regarding Fund expenses.
To obtain the most recent month-end performance, please visit www.wasatchfunds.com or call 800.551.1700. Investment returns and principal value will fluctuate and shares, when redeemed, may be worth more or less than their original cost. The Advisor may have absorbed, currently or in the past, certain Fund expenses, without which total returns would have been lower.
With respect to the Fund’s assets invested in fixed income securities, you are subject, but not limited to, the same interest rate, inflation and credit risk associated with the underlying fixed-income securities owned by the Fund. Return of principal is not guaranteed. Equity investing involves risks, including potential loss of the principal amount invested. Being non-diversified, the Fund can invest a larger portion of its assets in the securities of a limited number of companies than a diversified fund. Non-diversification increases the risk of loss to the Fund if the values of these securities decline. Investing in foreign securities, especially in emerging markets, entails special risks, such as currency fluctuations and political uncertainties, which are described in more detail in the prospectus.
TOP 10 EQUITY HOLDINGS**
| | |
| Company | | % of Fund |
Redwood Trust, Inc. Jumbo ARM mortgage REIT. | | 5.62% |
Paychex, Inc. Payroll and human resource services. | | 4.31% |
Pool Corp. Swimming pool supplies distributor. | | 4.13% |
Capital One Financial Corp. Credit cards and financial services. | | 3.69% |
Apollo Investment Corp. Investments for businesses. | | 3.56% |
| | |
| Company | | % of Fund |
MFA Mortgage Investments, Inc. Mortgage REIT. | | 3.43% |
Anthracite Capital, Inc. Mortgage lender. | | 3.33% |
Bank of N.T. Butterfield & Son Ltd. (Bermuda) Wealth management services. | | 3.20% |
KKR Financial Holdings, LLC Mortgage REIT. | | 3.16% |
Wal-Mart Stores, Inc. Big box retailer. | | 3.07% |
| ** | | As of March 31, 2008, the Fund had 37.50% invested in the Top 10 equity holdings and there were 60 long-term holdings in the Fund. Portfolio holdings are subject to change at any time. References to specific securities should not be construed as recommendations by the Funds or their Advisor. |
SECTOR BREAKDOWN†
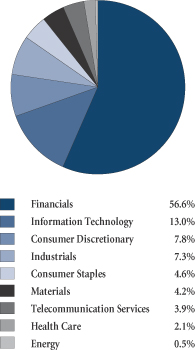
† | Excludes short-term investments, securities sold short and written options, if any. |
GROWTHOFA $10,000 INVESTMENT
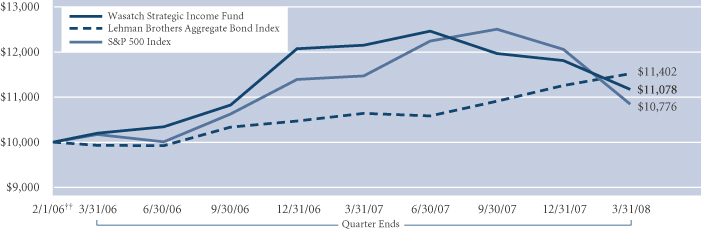
Past performance does not predict future performance and the graph above does not reflect the deduction of taxes that you would pay on fund distributions or the redemption of fund shares. Performance shown in the chart above does not include any applicable sales charges and fees. The chart represents a hypothetical $10,000 investment at the beginning of the time period shown. ††Inception: February 1, 2006. The Lehman Brothers Aggregate Bond Index covers the U.S. investment grade fixed rate bond market, including government and corporate securities, agency mortgage pass-through securities, and asset-backed securities. To be included in the index the security must meet the following criteria: must have at least one year to final maturity, regardless of call features; must have at least $100 million par amount outstanding; must be rated investment grade or better by Moody’s Investors Service, Standard & Poor’s, or Fitch Investor’s Service; must be fixed rate, although it can carry a coupon that steps up or changes to a predetermined schedule; must be dollar-denominated and nonconvertible. All corporate and asset-backed securities must be registered with the SEC and must be publicly issued. The S&P 500 Index represents 500 of the United States’ largest stocks from a broad variety of industries. The Index is unmanaged, and a common measure of common stock total return performance. You cannot invest directly in these or any indexes.
27
| | |
| WASATCH ULTRA GROWTH FUND (WAMCX) — Management Discussion | | MARCH 31, 2008 |
|
| |
| |
The Wasatch Ultra Growth Fund is managed by a team of Wasatch portfolio managers, led by Ajay Krishnan and Neal Dihora.
| | | | |

Ajay Krishnan, CFA Portfolio Manager | | 
Neal Dihora, CFA Portfolio Manager | | OVERVIEW During the six months ended March 31, the Wasatch Ultra Growth Fund lost 20.75% and the Russell 2000 Growth Index declined 14.66% in what was one of the most challenging markets in |
recent memory. Stocks fell sharply as growing concerns about the health of the U.S. financial system and economy caused investors to move into what they perceived to be safer-haven assets.
The Fund was resilient during the first half of the period, producing a flat return and outperforming the decline in the benchmark Index. However, the types of fast-growing companies that we seek to own were the most out of favor during the second half of the period when the market became increasingly weak and volatile.
Looking forward, our outlook for the Fund is positive. Valuations have fallen to multi-year lows, and we expect the weighted-average* earnings growth rate of our holdings to remain above our 20% target over the next year. This combination of growth and value gives us confidence that the Fund is well-positioned for the long-term.
DETAILSOFTHE PERIOD
U.S. stock prices tumbled during the six months ended March 31 in response to continued deterioration in the housing and credit markets and signs that the U.S. economy was slowing toward recession. The Federal Reserve took unprecedented steps to mitigate the situation, including lowering interest rates 2%, but the uncertain outlook made stock prices volatile as investors became exceedingly risk averse.
In this volatile environment, investor sentiment seemed to eclipse company fundamentals as the main driver of stock price performance. This was a challenge for our strategy, given that we select stocks based on bottom-up fundamental research. Our emphasis on rapidly growing companies was another headwind, since investors avoided small companies with higher earnings growth expectations and thus higher perceived risk, especially in the first quarter of 2008. Several of our more aggressive growth names fell sharply, not because of any material weakness in the underlying businesses, but because investors were quick to sell higher-expectation stocks on the first hint of unfavorable news.
GFI Group, an interdealer broker and one of our holdings, is a prime example of the kind of negative sentiment that drove the market. GFI reported better-than-expected earnings and provided a favorable outlook for the first quarter. Yet the
stock plummeted on rumors the company might have credit risks similar to those of a futures brokerage that had disclosed a trading loss and faced intense speculation about its liquidity position. We feel that the decline was unwarranted, since GFI earns commissions and takes minimal trading or counterparty risk. Our long-term outlook on the company remains positive, and we took advantage of the sell-off to modestly increase our weighting in the stock.
SiRF Technology Holdings, a supplier of global positioning system (GPS) semiconductor chips, was another big detractor in the Fund. SiRF provided first-quarter revenue guidance that was below Wall Street forecasts and reported a decrease in gross margins, which raised concerns about increased competition. While the news on SiRF was disappointing, our view is that the steep drop in the stock was overdone, particularly since this was the first sign of margin deterioration. We are being patient and plan to wait and see if the margin decline was the beginning of a trend or simply an isolated incident. We believe it is the latter and foresee several positives on the horizon for SiRF, including the nascent GPS-enabled cell phone market, which could be a major source of growth for the company.
Despite the high level of risk aversion in the market, a number of our holdings delivered strong gains, such as Bucyrus International. The company manufactures mining equipment and is capitalizing on strong demand from developing countries that need raw materials for power generation and construction. Our investment in Bucyrus is a good example of how our bottom-up research has identified exciting opportunities in diverse areas of the global economy, including non-traditional growth sectors like industrials.
The downturn in the market gave us the opportunity to add a number of interesting and attractively valued new companies to the Fund. For example, we initiated a position in a discount retailer that we think will benefit as shoppers seek more affordable venues in these difficult economic times. We also are in the process of evaluating several other stocks in areas of the market that have been especially weak, such as the homebuilding industry.
OUTLOOK
Earnings growth in the Fund has moderated somewhat as the economy has slowed, but we are still finding rapidly growing companies and paying much better prices for them. The weighted-average* earnings growth rate of our holdings is expected to remain above our 20% target over the next 12 months. And, at approximately 23x trailing earnings, the portfolio’s price-to-earnings multiple** is the lowest it has been in several years. The fundamentals of our positions, combined with attractive valuations, give us confidence the Fund has the potential to deliver the solid results we expect over time.
Thank you for the opportunity to manage your assets.
| * | A weighted average takes into account the proportional relevance of each component, rather than treating each component equally. |
| ** | The price-to-earnings (P/E multiple, also called the P/E ratio) is the price of a stock divided by its earnings per share. |
28
| | |
| WASATCH ULTRA GROWTH FUND (WAMCX) — Portfolio Summary | | MARCH 31, 2008 |
|
| |
| |
AVERAGE ANNUAL TOTAL RETURNS
| | | | | | | | |
| | | SIX MONTHS* | | 1 YEAR | | 5 YEARS | | 10 YEARS |
Ultra Growth | | -20.75% | | -9.40% | | 9.84% | | 8.87% |
Russell 2000 Growth Index | | -14.66% | | -8.94% | | 14.24% | | 1.75% |
Performance data quoted represents past performance. Past performance is not indicative of future performance and current performance may be lower or higher than the performance quoted. Wasatch Funds will deduct a fee of 2% from redemption proceeds on Fund shares held 60 days or less. Performance data does not reflect the deduction of this fee which, if charged, would reduce the performance quoted. The table above does not reflect the deduction of taxes that you would pay on fund distributions or the redemption of fund shares.
The Total Annual Fund Operating Expenses for the Wasatch Ultra Growth Fund are 1.50%. Total Annual Fund Operating Expenses include direct expenses paid to the Advisor as well as indirect expenses incurred by the Fund as a result of its investments in other investment companies (each an “Acquired Fund”), before any expense reimbursements by the Advisor. The Net Expenses may differ due to waivers and reimbursements by the Advisor. See the prospectus for additional information regarding Fund expenses.
To obtain the most recent month-end performance, please visit www.wasatchfunds.com or call 800.551.1700. Investment returns and principal value will fluctuate and shares, when redeemed, may be worth more or less than their original cost. The Advisor may have absorbed, currently or in the past, certain Fund expenses, without which total returns would have been lower.
Investing in small cap funds will be more volatile and loss of principal could be greater than investing in large cap or more diversified funds.
TOP 10 EQUITY HOLDINGS**
| | |
| Company | | % of Fund |
Cognizant Technology Solutions Corp., Class A Professional technology services. | | 5.01% |
Psychiatric Solutions, Inc. Inpatient behavioral health care services. | | 4.58% |
Bucyrus International, Inc., Class A Mining equipment manufacturer. | | 4.10% |
Healthways, Inc. Disease management services. | | 3.86% |
Providence Service Corp. (The) Management of U.S. government-sponsored social services. | | 3.65% |
| | |
| Company | | % of Fund |
Power Integrations, Inc. Semiconductors. | | 3.59% |
ArthroCare Corp. Disposable devices for minimally invasive surgery. | | 3.40% |
HDFC Bank Ltd. ADR (India) Consumer bank. | | 2.86% |
Tessera Technologies, Inc. Miniaturization technologies for electronics. | | 2.83% |
Netlogic Microsystems, Inc. Semiconductors. | | 2.55% |
| ** | As of March 31, 2008, the Fund had 36.43% invested in the Top 10 equity holdings and there were 85 long-term holdings in the Fund. Portfolio holdings are subject to change at any time. References to specific securities should not be construed as recommendations by the Funds or their Advisor. |
SECTOR BREAKDOWN†
† | Excludes short-term investments, securities sold short and written options, if any. |
GROWTHOFA $10,000 INVESTMENT
Past performance does not predict future performance and the graph above does not reflect the deduction of taxes that you would pay on fund distributions or the redemption of fund shares. Performance shown in the chart above does not include any applicable sales charges and fees. The chart represents a hypothetical $10,000 investment at the beginning of the time period shown. The Russell 2000 Growth Index is an unmanaged total return index that measures the performance of those Russell 2000 Index companies with higher price-to-book ratios and higher forecasted growth values. The Russell 2000 Index is an unmanaged total return index of the smallest 2,000 companies in the Russell 3000 Index, as ranked by total market capitalization. The Russell 2000 Index is widely regarded in the industry as accurately capturing the universe of small company stocks. You cannot invest directly in these or any indexes.
29
| | |
| WASATCH-HOISINGTON U.S. TREASURY FUND (WHOSX) — Management Discussion | | MARCH 31, 2008 |
|
| |
| |
| | |

Van R. Hoisington Portfolio Manager | | OVERVIEW The Fund gained 10.79% in the six months ended March 31 and outperformed the Lehman Brothers Aggregate Bond Index, which gained 5.23%. Over the past 12 months, the Fund gained 13.39% versus a gain of 7.67% for the Lehman Index. Once again the Fund’s returns provided diversification for stock market investors. By comparison, the S&P 500 Index, which includes 500 of the United States’ largest stocks from a broad |
variety of industries, posted losses of 12.46% and 5.08% in the last six- and 12-months, respectively.
DETAILSOFTHE PERIOD
At March 31, the long Treasury bond yielded 4.30%, or dramatically lower than 4.84%, which was the level at the close of business six months and a year ago. Thus, for both the latest six and 12 months, a sharp drop in bond yields meant that the market value of the Fund’s portfolio increased, enhancing the coupon (interest) on the Treasury bonds held by the Fund. As typically is the case, the lower Treasury bond yields reflected economic conditions.
Nominal gross domestic product (GDP) (GDP that has not been adjusted for inflation) in the first quarter of 2008 totaled an estimated $14.2 trillion, a 3% annual rate of increase from the final quarter of 2007, which also registered a 3% gain. This two quarter growth rate in nominal GDP is typically associated with recessionary periods. The various price deflators applied to this nominal gain will now determine whether real GDP will be negative or positive, possibly clarifying the debate of whether an actual recession has begun. For financial participants, however, this argument is moot since the U.S. economy, at best, has been in a growth recession since mid-2007.
Solomon Fabricant, the New York University professor and National Bureau of Economic Research (NBER) committee member who first identified this particular characteristic of the business cycle, stated that a growth recession occurs when economic conditions are poor enough that unemployment rises and industrial capacity falls. From the cyclical low in March 2007 to March 2008, the unemployment rate jumped from 4.4% to 5.1%. In February 2008, the manufacturing capacity use rate was 78.7%, down 1.4% from its peak in July 2007. Both signify a deteriorating economy. Growth recessions, like full-scale recessions, produce falling inflation, a margin squeeze on corporate profits, eroding stock prices, and declining interest rates. Thus, the difference is really one of semantics. The point for investors is not what type of recession we are experiencing, but rather how long the downturn will last. Our conclusion is that our present economic difficulties will persist for at least two years.
OUTLOOK
The U.S. economy is likely to be in a protracted period of restrained consumer spending since real wealth is declining, with the bottom yet to be found. Assuming home prices fall only 30% from their peak (some estimate a 50% decline) by end of 2010, while stock prices rise 10% from the first quarter level and inflation is 2% per annum, the real wealth loss is about $7 trillion. Econometric research indicates that a $1 change in wealth results in a 7.5 cent change in real consumer expenditures (PCE) over three years. As such, the loss in wealth will detract 1.8% per annum from PCE from 2008 to 2010. Considering that the 3.1% rate of increase was the last expansion’s average, a 1.8% drag will be a 60% reduction in real PCE growth over the next three years just from the wealth effect alone.
However, there are other constraints. During the postwar recessions, real personal income’s average growth was only 1.9%, but it has risen only 1.1% over the past 12 months. If real personal income moves back up to 1.9%, in itself a highly optimistic assumption, it would, nevertheless, be completely offset by the negative wealth impact of 1.8% mentioned above. This means that consumer spending increases should be approximately zero for the next three years. Further exacerbating the problem is the personal saving rate, which declined from 5.2% in the decade of the 1990s to average 1.3% in the last seven years, and now stands at 0.3%. Should declining wealth, rising unemployment and poor economic conditions cause consumers to begin to save and lift the rate back to the 1.3% average of the past seven years, real consumer spending would experience a multi-year contraction. Given these factors, it is not a stretch to predict an extended quasi-recessionary period.
Treasury yields have dropped to near record lows, but the historical record suggests the ultimate bottom in cyclical rates is considerably in the future. On average, 30-year Treasury bond yields are a lagging economic indicator. This is not surprising since inflation is a lagging indicator and inflation is the main long run determinant of bond yields. Since the end of World War II, the 30-year Treasury yields reached their cyclical lows, on average, 14.9 months after the end of the business cycle trough.
Thus, if this growth recession, or outright recession, ends in 2008, the low in bond yields will be some time in 2010. However, if we are in an extended growth recession that lasts into 2009 or 2010, as we suspect, and if rates are at record low levels, similar to the 1940s and 1950s, then the low in rates is likely to coincide with the end of the recessionary period. Until recessionary conditions subside, we expect to maintain the U.S. Treasury Fund’s heavy commitment to long-dated Treasury securities.*
Thank you for the opportunity to manage your assets.
| * | Treasury securities with maturities longer than 20 years. |
30
| | |
| WASATCH-HOISINGTON U.S. TREASURY FUND (WHOSX) — Portfolio Summary | | MARCH 31, 2008 |
|
| |
| |
AVERAGE ANNUAL TOTAL RETURNS
| | | | | | | | |
| | | SIX MONTHS* | | 1 YEAR | | 5 YEARS | | 10 YEARS |
U.S. Treasury | | 10.79% | | 13.39% | | 6.78% | | 7.37% |
Lehman Brothers Aggregate Bond Index | | 5.23% | | 7.67% | | 4.58% | | 6.04% |
Performance data quoted represents past performance. Past performance is not indicative of future performance and current performance may be lower or higher than the performance quoted. Wasatch Funds will deduct a fee of 2% from redemption proceeds on Fund shares held 60 days or less. Performance data does not reflect the deduction of this fee which, if charged, would reduce the performance quoted. The table above does not reflect the deduction of taxes that you would pay on fund distributions or the redemption of fund shares.
The Total Annual Fund Operating Expenses for the Wasatch-Hoisington U.S. Treasury Fund are 0.71%. Total Annual Fund Operating Expenses include direct expenses paid to the Advisor before any expense reimbursements by the Advisor. The Net Expenses may differ due to waivers and reimbursements by the Advisor. See the prospectus for additional information regarding Fund expenses.
To obtain the most recent month-end performance, please visit www.wasatchfunds.com or call 800.551.1700. Investment returns and principal value will fluctuate and shares, when redeemed, may be worth more or less than their original cost. The Advisor may have absorbed, currently or in the past, certain Fund expenses, without which total returns would have been lower.
Investments in fixed income funds are subject to the same interest rate, inflation, credit and other risks associated with the underlying bonds. Return of principal is not guaranteed.
TOP 10 HOLDINGS**
| | | | |
| Holding | | Maturity
Date | | % of
Fund |
| U.S. Treasury Strip, principal only | | 11/15/27 | | 38.45% |
| U.S. Treasury Bond, 4.75% | | 2/15/37 | | 18.75% |
| U.S. Treasury Bond, 4.50% | | 2/15/36 | | 13.10% |
| U.S. Treasury Bond, 5.25% | | 2/15/29 | | 9.44% |
| U.S. Treasury Bond, 5.25% | | 11/15/28 | | 6.24% |
| U.S. Treasury Strip, principal only | | 2/15/37 | | 3.81% |
| | | | |
| Holding | | Maturity
Date | | % of
Fund |
| U.S. Treasury Strip, principal only | | 2/15/36 | | 3.75% |
| U.S. Treasury Strip, principal only | | 8/15/25 | | 2.91% |
| U.S. Treasury Bond, 5.375% | | 2/15/31 | | 2.75% |
| U.S. Treasury Bond, 5.50% | | 8/15/28 | | 0.46% |
| ** | | As of March 31, 2008, the Fund had 99.66% invested in the Top 10 holdings and there were 10 long-term holdings in the Fund. Portfolio holdings are subject to change at any time. References to specific securities should not be construed as recommendations by the Funds or their Advisor. |
INVESTMENTS & CASH
GROWTHOFA $10,000 INVESTMENT
Past performance does not predict future performance and the graph above does not reflect the deduction of taxes that you would pay on fund distributions or the redemption of fund shares. Performance shown in the chart above does not include any applicable sales charges and fees. The chart represents a hypothetical $10,000 investment at the beginning of the time period shown. The Lehman Brothers Aggregate Bond Index covers the U.S. investment grade fixed rate bond market, including government and corporate securities, agency mortgage pass-through securities, and asset-backed securities. To be included in the index the security must meet the following criteria: must have at least one year to final maturity, regardless of call features; must have at least $100 million par amount outstanding; must be rated investment grade or better by Moody’s Investors Service, Standard & Poor’s, or Fitch Investor’s Service; must be fixed rate, although it can carry a coupon that steps up or changes to a predetermined schedule; must be dollar-denominated and nonconvertible. All corporate and asset-backed securities must be registered with the SEC and must be publicly issued. You cannot invest directly in this or any index.
31
| | |
| WASATCH FUNDS — Operating Expenses (UNAUDITED) | | |
|
| |
| |
EXPENSE EXAMPLE
As a shareholder of Wasatch Funds, you incur two types of costs: (1) transaction costs, including redemption fees and (2) ongoing costs, including management fees and other fund expenses. This example is intended to help you understand your ongoing costs (in dollars) of investing in a Wasatch Fund and to compare these costs with the ongoing costs of investing in other mutual funds.
The example is based on an investment of $1,000.00 invested at the beginning of the period and held for the entire six month period ended March 31, 2008.
ACTUAL EXPENSES
The first line of the table below provides information about actual account values and actual expenses, based upon the actual total return of the fund during the most recent six month period ended March 31. You may use the information in this line, together with the amount you invested, to estimate the expenses you paid over the period. Simply divide your account value by $1,000.00 (for example, an $8,600.00 account value divided by $1,000.00 = 8.6), then multiply the result by the number in the first line under the heading entitled “Expenses Paid During Period” to estimate the expenses you paid on your account during this period.
In addition, the Funds charge a $15.00 IRA distribution fee, a $12.50 IRA annual maintenance fee and a $15.00 fee for redemptions paid by wire. To the extent these fees apply to your account, your expenses paid during the period would be higher and your ending account value would be lower than the amounts shown in the table below.
HYPOTHETICAL EXAMPLEFOR COMPARISON PURPOSES
The second line of the table below provides information about hypothetical account values and hypothetical expenses based on a fund’s actual expense ratio and an assumed rate of return of 5% per year before expenses, which is not the fund’s actual return. The hypothetical account values and expenses may not be used to estimate the actual ending account balance or expenses you paid for the period. You may use this information to compare the ongoing costs of investing in a Wasatch Fund and other funds. To do so, compare this 5% hypothetical example with the 5% hypothetical examples that appear in the shareholder reports of other funds.
In addition, the Funds charge a $15.00 IRA distribution fee, a $12.50 IRA annual maintenance fee and a $15.00 fee for redemptions paid by wire. To the extent these fees apply to your account, your expenses paid during the period would be higher and your ending account value would be lower than the amounts shown in the table below. If another fund’s fees differ from those listed above, your expenses paid and your ending account value could be higher or lower than those of other funds.
Please note that the expenses shown in the table are meant to highlight your ongoing costs only and do not reflect any transactional costs, such as redemption fees. Therefore, the second line of the table is useful in comparing ongoing costs only, and will not help you determine the relative total costs of owning different funds. In addition, if these transactional costs were included, your costs would have been higher.
32
| | |
| | MARCH 31, 2008 (UNAUDITED) |
|
| |
| |
| | | | | | | | |
| | | Account Value | | Expenses
Paid
During Period* | | Annualized
Expense
Ratio* |
| Fund/Class and Return | | Beginning of Period
October 1, 2007 | | End of Period
March 31, 2008 | | |
Core Growth Fund | | | | | | | | |
Actual | | $1,000.00 | | $841.00 | | $5.52 | | 1.20% |
Hypothetical (5% before expenses) | | $1,000.00 | | $1,019.00 | | $6.06 | | 1.20% |
|
| |
Emerging Markets Small Cap Fund | | | | | | | | |
Actual | | $1,000.00 | | $841.70 | | $9.67 | | 2.10% |
Hypothetical (5% before expenses) | | $1,000.00 | | $1,014.50 | | $10.58 | | 2.10% |
|
| |
Global Science & Technology Fund | | | | | | | | |
Actual | | $1,000.00 | | $731.00 | | $7.96 | | 1.84% |
Hypothetical (5% before expenses) | | $1,000.00 | | $1,015.80 | | $9.27 | | 1.84% |
|
| |
Heritage Growth Fund1 | | | | | | | | |
Actual | | $1,000.00 | | $856.90 | | $4.46 | | 0.96% |
Hypothetical (5% before expenses) | | $1,000.00 | | $1,020.20 | | $4.85 | | 0.96% |
|
| |
Heritage Value Fund | | | | | | | | |
Actual | | $1,000.00 | | $895.90 | | $4.50 | | 0.95% |
Hypothetical (5% before expenses) | | $1,000.00 | | $1,020.25 | | $4.80 | | 0.95% |
|
| |
International Growth Fund | | | | | | | | |
Actual | | $1,000.00 | | $803.10 | | $8.07 | | 1.79% |
Hypothetical (5% before expenses) | | $1,000.00 | | $1,016.05 | | $9.02 | | 1.79% |
|
| |
International Opportunities Fund | | | | | | | | |
Actual | | $1,000.00 | | $789.40 | | $10.07 | | 2.25% |
Hypothetical (5% before expenses) | | $1,000.00 | | $1,013.75 | | $11.33 | | 2.25% |
|
| |
Micro Cap Fund | | | | | | | | |
Actual | | $1,000.00 | | $787.80 | | $9.65 | | 2.16% |
Hypothetical (5% before expenses) | | $1,000.00 | | $1,014.20 | | $10.88 | | 2.16% |
|
| |
Micro Cap Value Fund | | | | | | | | |
Actual | | $1,000.00 | | $840.10 | | $10.35 | | 2.25% |
Hypothetical (5% before expenses) | | $1,000.00 | | $1,013.75 | | $11.33 | | 2.25% |
|
| |
Small Growth Fund | | | | | | | | |
Actual | | $1,000.00 | | $835.30 | | $5.55 | | 1.21% |
Hypothetical (5% before expenses) | | $1,000.00 | | $1,018.95 | | $6.11 | | 1.21% |
|
| |
Small Cap Value Fund | | | | | | | | |
Actual | | $1,000.00 | | $852.50 | | $8.20 | | 1.77% |
Hypothetical (5% before expenses) | | $1,000.00 | | $1,016.15 | | $8.92 | | 1.77% |
|
| |
Strategic Income Fund1 | | | | | | | | |
Actual | | $1,000.00 | | $938.00 | | $4.65 | | 0.96% |
Hypothetical (5% before expenses) | | $1,000.00 | | $1,020.20 | | $4.85 | | 0.96% |
|
| |
Ultra Growth Fund | | | | | | | | |
Actual | | $1,000.00 | | $792.50 | | $6.81 | | 1.52% |
Hypothetical (5% before expenses) | | $1,000.00 | | $1,017.40 | | $7.67 | | 1.52% |
|
| |
U.S. Treasury Fund | | | | | | | | |
Actual | | $1,000.00 | | $1,107.90 | | $3.90 | | 0.74% |
Hypothetical (5% before expenses) | | $1,000.00 | | $1,021.30 | | $3.74 | | 0.74% |
|
| |
*Expenses are equal to the Funds’ annualized expense ratio as indicated above multiplied by the average account value over the period, multiplied by the number of days in the most recent fiscal half-year divided by the number of days in the full fiscal year (183/366).
1The annualized expense ratio includes dividend payments for securities sold short and/or line of credit interest fees. Excluding these items the annualized expense ratios would have been 0.95%. Dividend payments for securities sold short and line of credit interest fees are not reimbursable expenses under the contractual agreement between the Fund and the Advisor.
33
| | |
| WASATCH CORE GROWTH FUND (WGROX) — Schedule of Investments |
|
| |
| |
| | | | | |
| Shares | | | | Value |
| | | | | |
| | COMMON STOCKS 96.2% | | | |
| | |
| | Aerospace & Defense 0.3% | | | |
| 687,880 | | DataPath, Inc.* *** † | | $ | 2,407,580 |
| | | | | |
| | Apparel, Accessories & Luxury Goods 0.6% | | | |
| 14,539,000 | | EganaGoldpfeil Holdings Ltd.* ***
(Hong Kong) | | | 308,246 |
| 1,649,037 | | Ports Design Ltd. (Hong Kong) | | | 4,691,125 |
| | | | | |
| | | | | 4,999,371 |
| | | | | |
| | Apparel Retail 1.2% | | | |
| 493,400 | | Jos. A. Bank Clothiers, Inc.* | | | 10,114,700 |
| | | | | |
| | Application Software 0.9% | | | |
| 140,245 | | FactSet Research Systems, Inc. | | | 7,554,998 |
| | | | | |
| | Asset Management & Custody Banks 4.5% | | | |
| 1,110,324 | | SEI Investments Co. | | | 27,413,899 |
| 880,060 | | Solar Capital, LLC* ** *** † | | | 12,127,227 |
| | | | | |
| | | | | 39,541,126 |
| | | | | |
| | Automotive Retail 3.0% | | | |
| 916,254 | | O’Reilly Automotive, Inc.* | | | 26,131,564 |
| | | | | |
| | Communications Equipment 0.7% | | | |
| 322,311 | | F5 Networks, Inc.* | | | 5,856,391 |
| | | | | |
| | Construction & Engineering 2.8% | | | |
| 296,440 | | Chicago Bridge & Iron Co. N.V. (Netherlands) | | | 11,632,306 |
| 393,018 | | URS Corp.* | | | 12,847,758 |
| | | | | |
| | | | | 24,480,064 |
| | | | | |
| | Construction & Farm Machinery & Heavy Trucks 0.5% | | | |
| 41,030 | | Bucyrus International, Inc., Class A | | | 4,170,700 |
| | | | | |
| | Consumer Finance 2.7% | | | |
| 907,514 | | Dollar Financial Corp.* | | | 20,872,822 |
| 722,367 | | United PanAm Financial Corp.* | | | 2,629,416 |
| | | | | |
| | | | | 23,502,238 |
| | | | | |
| | Data Processing & Outsourced Services 1.0% | | | |
| 444,346 | | Euronet Worldwide, Inc.* | | | 8,558,104 |
| | | | | |
| | Diversified Banks 1.6% | | | |
| 384,021 | | Axis Bank Ltd. (India) | | | 7,375,497 |
| 187,875 | | HDFC Bank Ltd. (India) | | | 6,282,155 |
| | | | | |
| | | | | 13,657,652 |
| | | | | |
| | Diversified Commercial & Professional Services 11.4% | | | |
| 1,910,485 | | Copart, Inc.* | | | 74,050,398 |
| 282,913 | | CRA International, Inc.* | | | 9,092,824 |
| 884,556 | | LPS Brasil — Consultoria de Imoveis S.A.* (Brazil) | | | 15,764,965 |
| | | | | |
| | | | | 98,908,187 |
| | | | | |
| | Education Services 1.4% |
| 77,723 | | Strayer Education, Inc. | | | 11,852,758 |
| | | | | |
| | Environmental & Facilities Services 1.2% | | | |
| 468,948 | | EnergySolutions, Inc. | | | 10,757,667 |
| | | | | |
| | Footwear 0.8% |
| 16,568,000 | | China Hongxing Sports Ltd. (China) | | | 7,174,596 |
| | | | | |
| | Health Care Distributors 2.7% |
| 1,417,952 | | PSS World Medical, Inc.* | | | 23,623,080 |
| | | | | |
| | | | | |
| Shares | | | | Value |
| | | | | |
| | Health Care Facilities 5.9% | | | |
| 1,276,875 | | Emeritus Corp.* | | $ | 26,635,612 |
| 1,124,942 | | Sunrise Senior Living, Inc.* | | | 25,063,708 |
| | | | | |
| | | | | 51,699,320 |
| | | | | |
| | Health Care Services 5.2% | | | |
| 529,917 | | Healthways, Inc.* | | | 18,727,267 |
| 400,479 | | Pediatrix Medical Group, Inc.* | | | 26,992,284 |
| | | | | |
| | | | | 45,719,551 |
| | | | | |
| | Homefurnishing Retail 1.3% | | | |
| 510,555 | | Aaron Rents, Inc. | | | 10,997,355 |
| | | | | |
| | Human Resource & Employment Services 2.1% | | | |
| 1,004,222 | | Resources Connection, Inc. | | | 17,945,447 |
| | | | | |
| | Industrial Conglomerates 0.9% | | | |
| 262,885 | | Raven Industries, Inc. | | | 7,965,416 |
| | | | | |
| | Industrial Machinery 2.6% | | | |
| 346,425 | | Graco, Inc. | | | 12,561,370 |
| 324,375 | | IDEX Corp. | | | 9,955,069 |
| | | | | |
| | | | | 22,516,439 |
| | | | | |
| | Internet Software & Services 1.9% | | | |
| 516,015 | | DealerTrack Holdings, Inc.* | | | 10,433,823 |
| 798,250 | | Liquidity Services, Inc.* | | | 6,386,000 |
| | | | | |
| | | | | 16,819,823 |
| | | | | |
| | Investment Banking & Brokerage 3.2% | | | |
| 4,879,550 | | ABG Sundal Collier ASA (Norway) | | | 8,922,554 |
| 207,283 | | GFI Group, Inc. | | | 11,877,316 |
| 130,231 | | KIWOOM Securities Co. Ltd.* (Korea) | | | 7,436,881 |
| | | | | |
| | | | | 28,236,751 |
| | | | | |
| | IT Consulting & Other Services 1.1% | | | |
| 409,655 | | SRA International, Inc., Class A* | | | 9,958,713 |
| | | | | |
| | Leisure Facilities 2.3% | | | |
| 653,454 | | Life Time Fitness, Inc.* | | | 20,394,299 |
| | | | | |
| | Leisure Products 1.9% | | | |
| 883,419 | | Pool Corp. | | | 16,687,785 |
| | | | | |
| | Life Sciences Tools & Services 0.8% | | | |
| 166,749 | | Pharmaceutical Product Development, Inc. | | | 6,986,783 |
| | | | | |
| | Mortgage REITs 6.9% | | | |
| 2,065,460 | | Annaly Capital Management, Inc. | | | 31,642,847 |
| 874,080 | | NorthStar Realty Finance Corp. | | | 7,141,234 |
| 588,498 | | Redwood Trust, Inc. | | | 21,391,902 |
| | | | | |
| | | | | 60,175,983 |
| | | | | |
| | Oil & Gas Equipment & Services 2.2% | | | |
| 571,765 | | TETRA Technologies, Inc.* | | | 9,056,758 |
| 355,295 | | TGS-NOPEC Geophysical Co. ASA* (Norway) | | | 5,179,387 |
| 660,285 | | Wavefield Inseis ASA* (Norway) | | | 4,955,047 |
| | | | | |
| | | | | 19,191,192 |
| | | | | |
| | Oil & Gas Exploration & Production 1.1% | | | |
| 261,675 | | GMX Resources, Inc.* | | | 9,140,308 |
| | | | | |
| | Personal Products 2.8% | | | |
| 742,719 | | Emami Ltd. (India) | | | 5,406,961 |
| 379,490 | | Herbalife Ltd. (Cayman Islands) | | | 18,025,775 |
| 40,190 | | USANA Health Sciences, Inc.* | | | 885,386 |
| | | | | |
| | | | | 24,318,122 |
| | | | | |
| | Property & Casualty Insurance 2.0% | | | |
| 680,590 | | Tower Group, Inc. | | | 17,130,450 |
| | | | | |
34
| | |
| | MARCH 31, 2008 (UNAUDITED) |
|
| |
| |
| | | | | |
Shares | | | | Value |
| | | | | |
| | Semiconductor Equipment 0.5% | | | |
| 216,925 | | Tessera Technologies, Inc.* | | $ | 4,512,040 |
| | | | | |
| | Semiconductors 3.1% | | | |
| 116,365 | | Hittite Microwave Corp.* | | | 4,354,378 |
| 714,349 | | Micrel, Inc. | | | 6,622,015 |
| 276,205 | | Netlogic Microsystems, Inc.* | | | 6,667,589 |
| 299,798 | | Silicon Laboratories, Inc.* | | | 9,455,629 |
| | | | | |
| | | | | 27,099,611 |
| | | | | |
| | Specialized Finance 2.0% | | | |
| 1,039,967 | | KKR Financial Holdings, LLC | | | 13,165,982 |
| 147,470 | | MSCI, Inc., Class A* | | | 4,387,233 |
| | | | | |
| | | | | 17,553,215 |
| | | | | |
| | Specialty Stores 1.0% | | | |
| 546,615 | | Hibbett Sports, Inc.* | | | 8,439,736 |
| | | | | |
| | Systems Software 1.4% | | | |
| 419,390 | | Quality Systems, Inc. | | | 12,527,179 |
| | | | | |
| | Thrifts & Mortgage Finance 0.7% | | | |
| 99,260 | | Housing Development Finance Corp. Ltd. (India) | | | 5,909,943 |
| | | | | |
| | Trading Companies & Distributors 2.6% | | | |
| 368,307 | | MSC Industrial Direct Co., Inc., Class A | | | 15,560,971 |
| 486,090 | | Rush Enterprises, Inc., Class B* | | | 7,135,801 |
| | | | | |
| | | | | 22,696,772 |
| | | | | |
| | Trucking 3.4% | | | |
| 368,714 | | Knight Transportation, Inc. | | | 6,069,033 |
| 1,084,520 | | Localiza Rent A Car S.A. (Brazil) | | | 10,352,067 |
| 412,875 | | Old Dominion Freight Line, Inc.* | | | 13,141,811 |
| | | | | |
| | | | | 29,562,911 |
| | | | | |
| | |
| | Total Common Stocks
(cost $816,486,491) | | | 837,475,920 |
| | | | | |
| | | | | |
Principal
Amount | | | | Value |
| | | | | |
| | SHORT-TERM INVESTMENTS 3.5% | | | |
| | |
| | Repurchase Agreement 3.5% | | | |
| $30,057,000 | | Repurchase Agreement dated 3/31/08, 1.10% due 4/1/08 with Fixed Income Clearing Corporation collateralized by $20,790,000 of United States Treasury Bonds 8.75% due 8/15/20; value: $30,665,250; repurchase proceeds: $30,057,918 (cost $30,057,000) | | $ | 30,057,000 |
| | | | | |
| | |
| | Total Short-Term Investments
(cost $30,057,000) | | | 30,057,000 |
| | | | | |
| | |
| | Total Investments
(cost $846,543,491) 99.7%^^ | | | 867,532,920 |
| | |
| | Other Assets less Liabilities 0.3% | | | 2,807,478 |
| | | | | |
| | |
| | NET ASSETS 100.0% | | $ | 870,340,398 |
| | | | | |
| | *Non-income producing. **Common units. ***Security was fair valued under procedures adopted by the Board of Directors (see Note 2). †Security purchased in a private placement transaction or under Rule 144A of the Securities Act of 1933 (see Note 9). ^^The aggregate amount of foreign securities fair valued pursuant to a systematic fair valuation model as a percent of net assets was 7.28%. REIT Real Estate Investment Trust. See notes to financial statements. |
At March 31, 2008, Wasatch Core Growth Fund’s investments, excluding short-term investments, were in the following countries:
| | | |
| Country | | % | |
Brazil | | 3.1 | |
Cayman Islands | | 2.2 | |
China | | 0.8 | |
Hong Kong | | 0.6 | |
India | | 3.0 | |
Korea | | 0.9 | |
Netherlands | | 1.4 | |
Norway | | 2.3 | |
United States | | 85.7 | |
| | | |
TOTAL | | 100.0 | % |
| | | |
35
| | |
| WASATCH EMERGING MARKETS SMALL CAP FUND (WAEMX) — Schedule of Investments | | |
|
| |
| |
| | | | | |
| Shares | | | | Value |
| | | | | |
| | COMMON STOCKS 96.3% | | | |
| | |
| | Agricultural Products 5.4% | | | |
| 265,500 | | Astra Agro Lestari Tbk PT (Indonesia) | | $ | 752,050 |
| 705,692 | | Chaoda Modern Agriculture (Hong Kong) | | | 805,196 |
| 722,595 | | China Green Holdings Ltd. (Hong Kong) | | | 806,070 |
| 17,800 | | Sao Martinho S.A. (Brazil) | | | 264,468 |
| | | | | |
| | | | | 2,627,784 |
| | | | | |
| | Air Freight & Logistics 0.9% | | | |
| 624,070 | | Aramex PJSC* (United Arab Emirates) | | | 453,715 |
| | | | | |
| | Alternative Carriers 2.1% | | | |
| 25,855 | | Global Village Telecom Holding S.A.* (Brazil) | | | 488,861 |
| 24,575 | | Tulip IT Services Ltd. (India) | | | 526,404 |
| | | | | |
| | | | | 1,015,265 |
| | | | | |
| | Apparel, Accessories & Luxury Goods 1.0% | | | |
| 164,515 | | Ports Design Ltd. (Hong Kong) | | | 468,007 |
| | | | | |
| | Apparel Retail 0.4% | | | |
| 62,885 | | Truworths International Ltd. (South Africa) | | | 197,926 |
| | | | | |
| | Application Software 3.1% | | | |
| 789,295 | | Kingdee International Software Group | | | |
| | Co. Ltd. (Cayman Islands) | | | 610,982 |
| 1,416,485 | | Silverlake Axis Ltd. (Singapore) | | | 408,888 |
| 15,865 | | Totvs S.A. (Brazil) | | | 487,478 |
| | | | | |
| | | | | 1,507,348 |
| | | | | |
| | Brewers 1.0% | | | |
| 53,140 | | Anadolu Efes Biracilik ve Malt Sanayii AS (Turkey) | | | 473,121 |
| | | | | |
| | Building Products 1.0% | | | |
| 85,000 | | Satipel Industrial S.A. (Brazil) | | | 468,554 |
| | | | | |
| | Casinos & Gaming 0.6% | | | |
| 21,460 | | Sun International Ltd. (South Africa) | | | 301,344 |
| | | | | |
| | Coal & Consumable Fuels 1.2% | | | |
| 537,500 | | Tambang Batubara Bukit Asam Tbk PT (Indonesia) | | | 591,268 |
| | | | | |
| | Commodity Chemicals 1.2% | | | |
| 1,430,500 | | Titan Chemicals Corp. (Malaysia) | | | 592,127 |
| | | | | |
| | Communications Equipment 1.1% | | | |
| 75,000 | | GeoVision, Inc. (Taiwan) | | | 529,309 |
| | | | | |
| | Computer Hardware 0.5% | | | |
| 20,790 | | Positivo Informatica S.A. (Brazil) | | | 253,551 |
| | | | | |
| | Construction & Engineering 0.9% | | | |
| 571,000 | | Midas Holdings Ltd. (Singapore) | | | 418,833 |
| | | | | |
| | Construction & Farm Machinery & Heavy Trucks 2.1% | | | |
| 1,404,000 | | China Farm Equipment Ltd. (China) | | | 384,024 |
| 319,065 | | China Infrastructure Machinery Holdings | | | |
| | Ltd. (Hong Kong) | | | 242,733 |
| 41,674 | | TIL Ltd. (India) | | | 393,209 |
| | | | | |
| | | | | 1,019,966 |
| | | | | |
| | Consumer Finance 1.8% | | | |
| 199,230 | | Banco Compartamos S.A. de C.V.* (Mexico) | | | 884,614 |
| | | | | |
| | Diversified Banks 2.3% | | | |
| 34,760 | | Commercial International Bank GDR (Egypt) | | | 556,160 |
| 108,620 | | Federal Bank Ltd. (India) | | | 582,140 |
| | | | | |
| | | | | 1,138,300 |
| | | | | |
| | | | | |
| Shares | | | | Value |
| | | | | |
| | Diversified Commercial & Professional Services 1.5% | | | |
| 13,555 | | LPS Brasil — Consultoria de Imoveis S.A.* (Brazil) | | $ | 241,583 |
| 9,550 | | S1 Corp. (Korea) | | | 496,565 |
| | | | | |
| | | | | 738,148 |
| | | | | |
| | Diversified Metals & Mining 4.0% | | | |
| 1,550,000 | | PT Aneka Tambang Tbk (Indonesia) | | | 569,764 |
| 1,700 | | MMX Mineracao e Metalicos S.A.* (Brazil) | | | 917,685 |
| 215,800 | | Sentula Mining Ltd. (South Africa) | | | 472,243 |
| | | | | |
| | | | | 1,959,692 |
| | | | | |
| | Drug Retail 1.1% | | | |
| 44,300 | | Corporativo Fragua S.A.B., Class B (Mexico) | | | 520,368 |
| | | | | |
| | Education Services 0.8% | | | |
| 434,000 | | Raffles Education Corp. Ltd. (Singapore) | | | 420,534 |
| | | | | |
| | Electric Utilities 1.1% | | | |
| 58,345 | | Equatorial Energia S.A.** (Brazil) | | | 557,587 |
| | | | | |
| | Electrical Components & Equipment 2.5% | | | |
| 1,549,000 | | Walsin Lihwa Corp. (Taiwan) | | | 768,478 |
| 1,036,970 | | Wasion Meters Group Ltd. (Hong Kong) | | | 429,515 |
| | | | | |
| | | | | 1,197,993 |
| | | | | |
| | Electronic Equipment Manufacturers 2.0% | | | |
| 86,820 | | Allied Electronics Corp. Ltd. (South Africa) | | | 428,590 |
| 239,000 | | Chroma ATE, Inc. (Taiwan) | | | 566,363 |
| | | | | |
| | | | | 994,953 |
| | | | | |
| | Fertilizers & Agricultural Chemicals 0.7% | | | |
| 38,370 | | Omnia Holdings Ltd. (South Africa) | | | 335,488 |
| | | | | |
| | |
| | Food Retail 0.9% | | | |
| 5,410 | | BIM Birlesik Magazalar AS (Turkey) | | | 430,365 |
| | | | | |
| | |
| | Footwear 1.3% | | | |
| 1,504,000 | | China Hongxing Sports Ltd. (China) | | | 651,291 |
| | | | | |
| | |
| | Gold 1.6% | | | |
| 4,785,300 | | Philex Mining Corp. (Philippines) | | | 768,206 |
| | | | | |
| | |
| | Health Care Facilities 1.1% | | | |
| 493,900 | | Bumrungrad Hospital plc (Thailand) | | | 533,352 |
| | | | | |
| | |
| | Homebuilding 5.4% | | | |
| 48,610 | | PDG Realty S.A. Empreendimentos e Participacoes (Brazil) | | | 572,013 |
| 55,770 | | Rodobens Negocios Imobiliarios S.A. (Brazil) | | | 696,090 |
| 366,370 | | SARE Holding S.A.B. de C.V., Class B* (Mexico) | | | 506,098 |
| 70,900 | | Trisul S.A.* (Brazil) | | | 327,648 |
| 152,695 | | Urbi Desarrollos Urbanos S.A. de C.V.* (Mexico) | | | 502,215 |
| | | | | |
| | | | | 2,604,064 |
| | | | | |
| | |
| | Industrial Conglomerates 1.5% | | | |
| 139,605 | | Mexichem S.A.B. de C.V. (Mexico) | | | 719,573 |
| | | | | |
| | |
| | Industrial Gases 0.7% | | | |
| 108,620 | | African Oxygen Ltd. (South Africa) | | | 365,804 |
| | | | | |
36
| | |
| | MARCH 31, 2008 (UNAUDITED) |
|
| |
| |
| | | | | |
| Shares | | | | Value |
| | | | | |
| | |
| | Industrial Machinery 4.6% | | | |
| 329,000 | | Awea Mechantronic Co. Ltd. (Taiwan) | | $ | 623,961 |
| 47,660 | | Hamlet (Israel-Canada) Ltd.* (Israel) | | | 472,458 |
| 8,735 | | JVM Co., Ltd. (Korea) | | | 397,393 |
| 1,390,355 | | Shanghai Prime Machinery Co. Ltd., Class H (China) | | | 362,692 |
| 258,025 | | Shanthi Gears Ltd. (India) | | | 366,933 |
| | | | | |
| | | | | 2,223,437 |
| | | | | |
| | |
| | Investment Banking & Brokerage 3.3% | | | |
| 37,675 | | Egyptian Financial Group-Hermes Holding | | | |
| | GDR (Egypt) | | | 781,756 |
| 8,160 | | KIWOOM Securities Co. Ltd.* (Korea) | | | 465,979 |
| 27,660 | | Tata Investment Corp. Ltd. (India) | | | 335,928 |
| | | | | |
| | | | | 1,583,663 |
| | | | | |
| | |
| | IT Consulting & Other Services 1.1% | | | |
| 77,830 | | Rolta India Ltd. (India) | | | 512,790 |
| | | | | |
| | |
| | Life & Health Insurance 2.4% | | | |
| 128,385 | | Anadolu Hayat Emeklilik AS (Turkey) | | | 307,951 |
| 37,875 | | OdontoPrev S.A. (Brazil) | | | 863,254 |
| | | | | |
| | | | | 1,171,205 |
| | | | | |
| | |
| | Marine 0.9% | | | |
| 159,170 | | Grindrod Ltd. (South Africa) | | | 432,991 |
| | | | | |
| | |
| | Marine Ports & Services 1.3% | | | |
| 39,290 | | Santos Brasil Participacoes S.A.** (Brazil) | | | 610,470 |
| | | | | |
| | |
| | Multi-Sector Holdings 0.9% | | | |
| 68,210 | | Macquarie Korea Infrastructure Fund (Korea) | | | 460,771 |
| | | | | |
| | |
| | Office REITs 1.2% | | | |
| 1,072,600 | | Axis Real Estate Investment Trust (Malaysia) | | | 570,086 |
| | | | | |
| | |
| | Oil & Gas Equipment & Services 0.7% | | | |
| 1,188,435 | | Anhui Tianda Oil Pipe Co. Ltd., Class H (China) | | | 318,206 |
| | | | | |
| | |
| | Oil & Gas Exploration & Production 4.0% | | | |
| 294,235 | | Afren plc* (United Kingdom) | | | 721,900 |
| 71,320 | | Dragon Oil plc* (Ireland) | | | 633,945 |
| 68,180 | | JKX Oil and Gas plc (United Kingdom) | | | 595,936 |
| | | | | |
| | | | | 1,951,781 |
| | | | | |
| | |
| | Other Diversified Financial Services 0.8% | | | |
| 170,555 | | PSG Group Ltd. (South Africa) | | | 370,132 |
| | | | | |
| | |
| | Packaged Foods & Meats 1.7% | | | |
| 49,385 | | Straus Group Ltd.* (Israel) | | | 717,770 |
| 286,000 | | Synear Food Holdings Ltd. (China) | | | 118,724 |
| | | | | |
| | | | | 836,494 |
| | | | | |
| | |
| | Pharmaceuticals 2.6% | | | |
| 83,675 | | Aspen Pharmacare Holdings Ltd.* (South Africa) | | | 330,175 |
| 21,660 | | Pharmstandard GDR* (Russia) | | | 509,004 |
| 7,200 | | Zentiva N.V. (Czech Republic) | | | 435,271 |
| | | | | |
| | | | | 1,274,450 |
| | | | | |
| | |
| | Precious Metals & Minerals 1.3% | | | |
| 69,675 | | Northam Platinum Ltd. (South Africa) | | | 611,390 |
| | | | | |
| | | | | |
| Shares | | | | Value |
| | | | | |
| | |
| | Real Estate Management & Development 1.6% | | | |
| 627,000 | | Ascendas India Trust** (Singapore) | | $ | 472,899 |
| 193,650 | | Growthpoint Properties Ltd.** (South Africa) | | | 326,375 |
| | | | | |
| | | | | 799,274 |
| | | | | |
| | Regional Banks 0.7% | | | |
| 54,090 | | Asya Katilim Bankasi AS* (Turkey) | | | 340,451 |
| | | | | |
| | Restaurants 2.7% | | | |
| 281,275 | | Ajisen China Holdings Ltd.* (Hong Kong) | | | 354,431 |
| 263,355 | | FU JI Food & Catering Services Holdings | | | |
| | Ltd. (China) | | | 446,116 |
| 458,525 | | Jollibee Foods Corp. (Philippines) | | | 525,646 |
| | | | | |
| | | | | 1,326,193 |
| | | | | |
| | Semiconductors 1.0% | | | |
| 132,000 | | Powertech Technology, Inc. (Taiwan) | | | 478,028 |
| | | | | |
| | Specialized Finance 4.2% | | | |
| 205,770 | | Bursa Malaysia Bhd (Malaysia) | | | 585,864 |
| 15,988 | | GP Investments Ltd. GDR (Brazil) | | | 485,868 |
| 36,610 | | JSE Ltd. (South Africa) | | | 293,493 |
| 38,565 | | Philippine Stock Exchange, Inc.* (Philippines) | | | 684,433 |
| | | | | |
| | | | | 2,049,658 |
| | | | | |
| | Specialty Chemicals 1.0% | | | |
| 177,000 | | China Steel Chemical Corp. (Taiwan) | | | 493,745 |
| | | | | |
| | Steel 2.5% | | | |
| 265,000 | | FerroChina Ltd. (China) | | | 252,115 |
| 136,900 | | Industrias CH, S.A.B. de C.V., Series B* (Mexico) | | | 543,535 |
| 5,120 | | Sesa Goa Ltd. (India) | | | 399,307 |
| | | | | |
| | | | | 1,194,957 |
| | | | | |
| | Trading Companies & Distributors 1.9% | | | |
| 4,310,000 | | AKR Corporindo Tbk PT (Indonesia) | | | 644,993 |
| 145,307 | | Distribution & Warehousing Network Ltd.* (South Africa) | | | 259,282 |
| | | | | |
| | | | | 904,275 |
| | | | | |
| | Trucking 1.1% | | | |
| 54,725 | | Localiza Rent A Car S.A. (Brazil) | | | 522,366 |
| | | | | |
| | |
| | Total Common Stocks
(cost $54,482,619) | | | 46,775,263 |
| | | | | |
| | |
| | PREFERRED STOCKS 1.3% | | | |
| | |
| | Regional Banks 1.3% | | | |
| 104,145 | | Banco Daycoval S.A. Pfd. (Brazil) | | | 649,047 |
| | | | | |
| | |
| | Total Preferred Stocks
(cost $968,751) | | | 649,047 |
| | | | | |
37
| | |
| WASATCH EMERGING MARKETS SMALL CAP FUND (WAEMX) — Schedule of Investments (continued) | | |
|
| |
| |
| | | | | | |
Principal
Amount | | | | Value | |
| | | | | | |
| | SHORT-TERM INVESTMENTS 2.7% | | | | |
| | |
| | Repurchase Agreement 2.7% | | | | |
| $1,333,000 | | Repurchase Agreement dated 3/31/08, 1.10% due 4/1/08 with Fixed Income Clearing Corporation collateralized by $925,000 of United States Treasury Bonds 8.75% due 8/15/20; value: $1,364,375; repurchase proceeds: $1,333,041
(cost $1,333,000) | | $ | 1,333,000 | |
| | | | | | |
| | |
| | Total Short-Term Investments
(cost $1,333,000) | | | 1,333,000 | |
| | | | | | |
| | |
| | Total Investments
(cost $56,784,370) 100.3%^^ | | | 48,757,310 | |
| | |
| | Liabilities less Other Assets (0.3)% | | | (150,664 | ) |
| | | | | | |
| | |
| | NET ASSETS 100.0% | | $ | 48,606,646 | |
| | | | | | |
| | *Non-income producing. **Common units. ^^The aggregate amount of foreign securities fair valued pursuant to a systematic fair valuation model as a percent of net assets was 63.97%. GDR Global Depositary Receipt. REIT Real Estate Investment Trust. See notes to financial statements. | |
At March 31, 2008, Wasatch Emerging Markets Small Cap Fund’s investments, excluding short-term investments, were in the following countries:
| | | |
| COUNTRY | | % | |
Brazil | | 17.7 | |
Cayman Islands | | 1.3 | |
China | | 5.3 | |
Czech Republic | | 0.9 | |
Egypt | | 2.8 | |
Hong Kong | | 6.5 | |
India | | 6.6 | |
Indonesia | | 5.4 | |
Ireland | | 1.3 | |
Israel | | 2.5 | |
Korea | | 3.8 | |
Malaysia | | 3.7 | |
Mexico | | 7.8 | |
Philippines | | 4.2 | |
Russia | | 1.1 | |
Singapore | | 3.6 | |
South Africa | | 10.0 | |
Taiwan | | 7.3 | |
Thailand | | 1.1 | |
Turkey | | 3.3 | |
United Arab Emirates | | 1.0 | |
United Kingdom | | 2.8 | |
| | | |
TOTAL | | 100.0 | % |
| | | |
38
| | |
| WASATCH GLOBAL SCIENCE & TECHNOLOGY FUND (WAGTX) — Schedule of Investments | | MARCH 31, 2008 (UNAUDITED) |
|
| |
| |
| | | | | |
| Shares | | | | Value |
| | | | | |
| | COMMON STOCKS 90.7% | | | |
| | |
| | Air Freight & Logistics 1.4% | | | |
| 1,697,000 | | Goodpack Ltd. (Singapore) | | $ | 1,962,751 |
| | | | | |
| | Alternative Carriers 2.4% | | | |
| 151,073 | | Tulip IT Services Ltd. (India) | | | 3,236,027 |
| | | | | |
| | Application Software 8.2% | | | |
| 103,945 | | Adobe Systems, Inc.* | | | 3,699,403 |
| 66,630 | | Autodesk, Inc.* | | | 2,097,512 |
| 100,275 | | Interactive Intelligence, Inc.* | | | 1,180,237 |
| 2,587,000 | | Kingdee International Software Group Co.
Ltd. (Cayman Islands) | | | 2,002,559 |
| 7,417,561 | | Silverlake Axis Ltd. (Singapore) | | | 2,141,184 |
| | | | | |
| | | | | 11,120,895 |
| | | | | |
| | Communications Equipment 5.4% | | | |
| 128,595 | | Acme Packet, Inc.* | | | 1,027,474 |
| 63,590 | | Cisco Systems, Inc.* | | | 1,531,883 |
| 183,580 | | F5 Networks, Inc.* | | | 3,335,649 |
| 110,920 | | Starent Networks Corp.* | | | 1,497,420 |
| | | | | |
| | | | | 7,392,426 |
| | | | | |
| | Computer Storage & Peripherals 6.4% | | | |
| 101,975 | | Intevac, Inc.* | | | 1,320,576 |
| 188,040 | | NetApp, Inc.* | | | 3,770,202 |
| 1,407,675 | | Unisteel Technology Ltd. (Singapore) | | | 1,344,559 |
| 83,310 | | Western Digital Corp.* | | | 2,252,702 |
| | | | | |
| | | | | 8,688,039 |
| | | | | |
| | Construction & Engineering 0.7% | | | |
| 1,210,000 | | Midas Holdings Ltd. (Singapore) | | | 887,545 |
| | | | | |
| | Construction & Farm Machinery & Heavy Trucks 0.3% | | | |
| 1,684,000 | | China Farm Equipment Ltd. (China) | | | 460,611 |
| | | | | |
| | Data Processing & Outsourced Services 1.6% | | | |
| 131,500 | | Redecard S.A. (Brazil) | | | 2,192,668 |
| | | | | |
| | Diversified Commercial &
Professional Services 1.8% | | | |
| 135,835 | | Wirecard AG* (Germany) | | | 2,380,753 |
| | | | | |
| | Electrical Components & Equipment 0.5% | | | |
| 1,728,000 | | Wasion Meters Group Ltd. (Hong Kong) | | | 715,740 |
| | | | | |
| | Electronic Equipment Manufacturers 0.1% | | | |
| 1,199,075 | | QRSciences Holdings Ltd.* (Australia) | | | 96,190 |
| | | | | |
| | Electronic Manufacturing Services 2.0% | | | |
| 238,025 | | TTM Technologies, Inc.* | | | 2,694,443 |
| | | | | |
| | Health Care Equipment 9.2% | | | |
| 73,480 | | Abaxis, Inc.* | | | 1,702,532 |
| 104,965 | | ArthroCare Corp.* | | | 3,500,583 |
| 53,075 | | Cardica, Inc.* | | | 392,224 |
| 7,973 | | Intuitive Surgical, Inc.* | | | 2,586,042 |
| 107,910 | | Opto Circuits India Ltd. (India) | | | 877,422 |
| 187,920 | | VNUS Medical Technologies, Inc.* | | | 3,418,265 |
| | | | | |
| | | | | 12,477,068 |
| | | | | |
| | Health Care Technology 2.4% | | | |
| 141,625 | | RaySearch Laboratories AB* (Sweden) | | | 3,300,931 |
| | | | | |
| | Internet Software & Services 2.6% | | | |
| 104,625 | | DealerTrack Holdings, Inc.* | | | 2,115,518 |
| 3,245 | | Google, Inc., Class A* | | | 1,429,325 |
| | | | | |
| | | | | 3,544,843 |
| | | | | |
| | | | | |
| Shares | | | | Value |
| | | | | |
| | IT Consulting & Other Services 9.7% | | | |
| 268,240 | | Cognizant Technology Solutions Corp., Class A* ††† | | $ | 7,733,359 |
| 1,247,000 | | CSE Global Ltd. (Singapore) | | | 842,782 |
| 87,830 | | Infosys Technologies Ltd. (India) | | | 3,156,570 |
| 218,000 | | Rolta India Ltd. (India) | | | 1,436,312 |
| | | | | |
| | | | | 13,169,023 |
| | | | | |
| | Life & Health Insurance 1.4% | | | |
| 80,795 | | OdontoPrev S.A. (Brazil) | | | 1,841,495 |
| | | | | |
| | Life Sciences Tools & Services 4.8% | | | |
| 18,385 | | Covance, Inc.* | | | 1,525,403 |
| 20,885 | | Icon plc ADR* (Ireland) | | | 1,355,228 |
| 36,995 | | Pharmaceutical Product Development, Inc. | | | 1,550,090 |
| 29,935 | | Techne Corp.* | | | 2,016,422 |
| | | | | |
| | | | | 6,447,143 |
| | | | | |
| | Oil & Gas Equipment & Services 3.6% | | | |
| 4,217,010 | | Advanced Holdings Ltd. (Singapore) | | | 834,398 |
| 10,830 | | OYO Geospace Corp.* | | | 491,899 |
| 49,410 | | Pason Systems, Inc. (Canada) | | | 726,123 |
| 915,000 | | Swiber Holdings Ltd.* (Singapore) | | | 1,701,361 |
| 73,625 | | TGS-NOPEC Geophysical Co. ASA* (Norway) | | | 1,073,284 |
| | | | | |
| | | | | 4,827,065 |
| | | | | |
| | Semiconductor Equipment 2.8% | | | |
| 185,598 | | Tessera Technologies, Inc.* | | | 3,860,438 |
| | | | | |
| | Semiconductors 16.4% | | | |
| 50,270 | | Hittite Microwave Corp.* | | | 1,881,103 |
| 47,184 | | Intellon Corp.* | | | 232,145 |
| 6,360 | | Microchip Technology, Inc. | | | 208,163 |
| 236,841 | | Netlogic Microsystems, Inc.* | | | 5,717,342 |
| 592,460 | | O2Micro International Ltd. ADR*
(Cayman Islands) | | | 4,579,716 |
| 109,151 | | PLX Technology, Inc.* | | | 728,037 |
| 121,088 | | Power Integrations, Inc.* | | | 3,543,035 |
| 45,445 | | PSi Technologies Holdings, Inc. ADR* | | | 27,267 |
| 122,265 | | Silicon Laboratories, Inc.* | | | 3,856,238 |
| 293,495 | | SiRF Technology Holdings, Inc.* | | | 1,493,890 |
| | | | | |
| | | | | 22,266,936 |
| | | | | |
| | Systems Software 1.1% | | | |
| 76,740 | | Oracle Corp.* | | | 1,501,034 |
| | | | | |
| | Technology Distributors 1.0% | | | |
| 225,884 | | Nu Horizons Electronics Corp.* | | | 1,418,552 |
| | | | | |
| | Wireless Telecommunication Services 4.9% | | | |
| 1,409,000 | | America Movil S.A.B. de C.V., Series L (Mexico) | | | 4,488,569 |
| 68,290 | | NII Holdings, Inc.* | | | 2,170,256 |
| | | | | |
| | | | | 6,658,825 |
| | | | | |
| | |
| | Total Common Stocks
(cost $145,239,889) | | | 123,141,441 |
| | | | | |
| | |
| | PREFERRED STOCKS 0.6% | | | |
| | |
| | Broadcasting & Cable TV 0.0% | | | |
| 1 | | Net Servicos de Comunicacao S.A.,
Series 4 Pfd.* (Brazil) | | | 8 |
| | | | | |
| | Integrated Telecommunication Services 0.2% | | | |
| 17,684 | | Neutral Tandem, Inc.,
Series C Pfd. PIPE* *** † | | | 305,749 |
| | | | | |
39
| | |
| WASATCH GLOBAL SCIENCE & TECHNOLOGY FUND (WAGTX) — Schedule of Investments (continued) |
|
| |
| |
| | | | | |
| Shares | | | |
Value |
| | | | | |
| | Internet Software & Services 0.4% | | | |
| 78,502 | | BlueArc Corp., Series DD Pfd.* *** † | | $ | 407,426 |
| 30,265 | | Incipient, Inc., Series D Pfd.* *** † | | | 35,047 |
| 6,528 | | Xtera Communications, Inc., | | | |
| | Series A-1 Pfd.* *** † | | | 7,076 |
| | | | | |
| | | | | 449,549 |
| | | | | |
| | Pharmaceuticals 0.0% | | | |
| 39,337 | | Point Biomedical Corp., Series A Pfd.* *** † | | | 39,337 |
| | | | | |
| | |
| | Total Preferred Stocks
(cost $603,917) | | | 794,643 |
| | | | | |
| | |
| | LIMITED PARTNERSHIP INTEREST 0.2% | | | |
| | |
| | Other 0.2% | | | |
| | Montagu Newhall Global Partners II-B, L.P.*** † | | | 311,142 |
| | | | | |
| | |
| | Total Limited Partnership Interest
(cost $342,144) | | | 311,142 |
| | | | | |
| | |
| | WARRANTS 0.0% | | | |
| | |
| | Air Freight & Logistics 0.0% | | | |
| 212,125 | | Goodpack Ltd. expiring 7/16/09* (Singapore) | | | 33,844 |
| | | | | |
| | Pharmaceuticals 0.0% | | | |
| 3,832 | | Acusphere, Inc. expiring 8/2/08* *** † | | | — |
| 768 | | Acusphere, Inc. expiring 10/20/08* *** † | | | — |
| | | | | |
| | | | | — |
| | | | | |
| | |
| | Total Warrants
(cost $0) | | | 33,844 |
| | | | | |
| | | | | |
Principal
Amount | | | | Value |
| | | | | |
| | SHORT-TERM INVESTMENTS 7.9% | | | |
| | |
| | Repurchase Agreement 7.9% | | | |
| $10,689,000 | | Repurchase Agreement dated 3/31/08, 1.10% due 4/1/08 with Fixed Income Clearing Corporation collateralized by $7,395,000 of United States Treasury Bonds 8.75% due 8/15/20; value: $10,907,625; repurchase proceeds: $10,689,327
(cost $10,689,000)††† | | $ | 10,689,000 |
| | | | | |
| | |
| | Total Short-Term Investments
(cost $10,689,000) | | | 10,689,000 |
| | | | | |
| | |
| | Total Investments
(cost $156,874,950) 99.4%^^ | | | 134,970,070 |
| | |
| | Other Assets less Liabilities 0.6% | | | 858,636 |
| | | | | |
| | |
| | NET ASSETS 100.0% | | $ | 135,828,706 |
| | | | | |
| |
| | *Non-income producing. ***Security was fair valued under procedures adopted by the Board of Directors (see Note 2). †Security purchased in a private placement transaction or under Rule 144A of the Securities Act of 1933 (see Note 9). †††All or a portion of this security has been designated as collateral for purchase commitments (see Note 10). ^^The aggregate amount of foreign securities fair valued pursuant to a systematic fair valuation model as a percent of net assets was 20.95%. ADR American Depositary Receipts. PIPE Private Investment in a Public Equity. See notes to financial statements. |
At March 31, 2008, Wasatch Global Science & Technology Fund’s investments, excluding short-term investments, were in the following countries:
| | | |
| Country | | % | |
Australia | | 0.1 | |
Brazil | | 3.2 | |
Canada | | 0.6 | |
Cayman Islands | | 5.3 | |
China | | 0.4 | |
Germany | | 1.9 | |
Hong Kong | | 0.6 | |
India | | 7.0 | |
Ireland | | 1.1 | |
Mexico | | 3.6 | |
Norway | | 0.9 | |
Singapore | | 7.8 | |
Sweden | | 2.6 | |
United States | | 64.9 | |
| | | |
TOTAL | | 100.0 | % |
| | | |
40
| | |
| WASATCH HERITAGE GROWTH FUND (WAHGX) — Schedule of Investments | | MARCH 31, 2008 (UNAUDITED) |
|
| |
| |
| | | | | |
| Shares | | | | Value |
| | | | | |
| | COMMON STOCKS 95.6% | | | |
| | |
| | Aerospace & Defense 1.7% | | | |
| 19,505 | | L-3 Communications Holdings, Inc. | | $ | 2,132,677 |
| | | | | |
| | Air Freight & Logistics 1.3% | | | |
| 30,035 | | C.H. Robinson Worldwide, Inc. | | | 1,633,904 |
| | | | | |
| | Apparel Retail 0.9% | | | |
| 92,545 | | Esprit Holdings Ltd. (Hong Kong) | | | 1,123,586 |
| | | | | |
| | Asset Management & Custody Banks 4.5% | | | |
| 58,580 | | SEI Investments Co. | | | 1,446,340 |
| 43,870 | | T. Rowe Price Group, Inc. | | | 2,193,500 |
| 61,805 | | Waddell & Reed Financial, Inc., Class A | | | 1,985,795 |
| | | | | |
| | | | | 5,625,635 |
| | | | | |
| | Automotive Retail 0.6% | | | |
| 26,500 | | O’Reilly Automotive, Inc.* | | | 755,780 |
| | | | | |
| | Communications Equipment 3.9% | | | |
| 149,395 | | Cisco Systems, Inc.* | | | 3,598,925 |
| 72,970 | | F5 Networks, Inc.* | | | 1,325,865 |
| | | | | |
| | | | | 4,924,790 |
| | | | | |
| | Computer & Electronics Retail 0.9% | | | |
| 26,987 | | Best Buy Co., Inc. | | | 1,118,881 |
| | | | | |
| | Construction & Farm Machinery & Heavy Trucks 1.9% | | | |
| 67,050 | | Oshkosh Corp. | | | 2,432,574 |
| | | | | |
| | Consumer Finance 1.0% | | | |
| 26,671 | | Capital One Financial Corp. | | | 1,312,747 |
| | | | | |
| | Data Processing & Outsourced Services 3.7% | | | |
| 43,820 | | Alliance Data Systems Corp.* | | | 2,081,888 |
| 151,200 | | Redecard S.A. (Brazil) | | | 2,521,152 |
| | | | | |
| | | | | 4,603,040 |
| | | | | |
| | Department Stores 1.0% | | | |
| 28,545 | | Kohl’s Corp.* | | | 1,224,295 |
| | | | | |
| | Diversified Commercial & Professional Services 2.6% | | | |
| 83,885 | | Copart, Inc.* | | | 3,251,383 |
| | | | | |
| | Diversified Metals & Mining 2.5% | | | |
| 7,479 | | Rio Tinto plc ADR (United Kingdom) | | | 3,080,151 |
| | | | | |
| | Diversified REITs 1.0% | | | |
| 128,230 | | CapitalSource, Inc. | | | 1,239,984 |
| | | | | |
| | Drug Retail 2.2% | | | |
| 67,705 | | CVS Caremark Corp. | | | 2,742,730 |
| | | | | |
| | Education Services 1.3% | | | |
| 38,820 | | Apollo Group, Inc., Class A* | | | 1,677,024 |
| | | | | |
| | Electronic Equipment Manufacturers 3.0% | | | |
| 99,700 | | Amphenol Corp., Class A | | | 3,713,825 |
| | | | | |
| | Health Care Equipment 3.0% | | | |
| 86,790 | | St. Jude Medical, Inc.* | | | 3,748,460 |
| | | | | |
| | Health Care Services 4.6% | | | |
| 68,560 | | DaVita, Inc.* | | | 3,274,426 |
| 37,560 | | Express Scripts, Inc.* | | | 2,415,859 |
| | | | | |
| | | | | 5,690,285 |
| | | | | |
| | Homebuilding 1.9% | | | |
| 4,076 | | NVR, Inc.* | | | 2,435,410 |
| | | | | |
| | | | | |
| Shares | | | | Value |
| | | | | |
| | Industrial Conglomerates 1.9% | | | |
| 62,940 | | General Electric Co. | | $ | 2,329,409 |
| | | | | |
| | IT Consulting & Other Services 5.8% | | | |
| 72,620 | | Cognizant Technology Solutions Corp., Class A* | | | 2,093,635 |
| 143,295 | | Infosys Technologies Ltd. (India) | | | 5,149,957 |
| | | | | |
| | | | | 7,243,592 |
| | | | | |
| | Life Sciences Tools & Services 2.8% | | | |
| 42,615 | | Covance, Inc.* | | | 3,535,767 |
| | | | | |
| | Mortgage REITs 1.8% | | | |
| 143,050 | | Annaly Capital Management, Inc. | | | 2,191,526 |
| | | | | |
| | Oil & Gas Equipment & Services 1.3% | | | |
| 40,080 | | Cameron International Corp.* | | | 1,668,931 |
| | | | | |
| | Oil & Gas Exploration & Production 7.7% | | | |
| 34,635 | | Anadarko Petroleum Corp. | | | 2,183,044 |
| 50,660 | | Chesapeake Energy Corp. | | | 2,337,959 |
| 43,140 | | Plains Exploration & Production Co.* | | | 2,292,460 |
| 46,168 | | XTO Energy, Inc. | | | 2,855,952 |
| | | | | |
| | | | | 9,669,415 |
| | | | | |
| | Pharmaceuticals 2.2% | | | |
| 60,565 | | Teva Pharmaceutical Industries Ltd. ADR (Israel) | | | 2,797,497 |
| | | | | |
| | Real Estate Management & Development 1.4% | | | |
| 28,790 | | CB Richard Ellis Group, Inc., Class A* | | | 623,015 |
| 14,655 | | Jones Lang LaSalle, Inc. | | | 1,133,418 |
| | | | | |
| | | | | 1,756,433 |
| | | | | |
| | Semiconductor Equipment 0.8% | | | |
| 25,365 | | KLA-Tencor Corp. | | | 941,042 |
| | | | | |
| | Semiconductors 6.7% | | | |
| 88,850 | | Linear Technology Corp. | | | 2,726,806 |
| 104,540 | | Maxim Integrated Products, Inc. | | | 2,131,571 |
| 45,995 | | Microchip Technology, Inc. | | | 1,505,416 |
| 195,669 | | Taiwan Semiconductor Manufacturing Co. Ltd. ADR (Taiwan) | | | 2,009,521 |
| | | | | |
| | | | | 8,373,314 |
| | | | | |
| | Specialized Finance 1.4% | | | |
| 13,145 | | IntercontinentalExchange, Inc.* | | | 1,715,422 |
| | | | | |
| | Specialty Stores 1.0% | | | |
| 58,180 | | Staples, Inc. | | | 1,286,360 |
| | | | | |
| | Systems Software 2.2% | | | |
| 83,050 | | BMC Software, Inc.* | | | 2,700,786 |
| | | | | |
| | Thrifts & Mortgage Finance 3.5% | | | |
| 21,035 | | Housing Development Finance Corp. Ltd. (India) | | | 1,252,424 |
| 171,045 | | New York Community Bancorp, Inc. | | | 3,116,440 |
| | | | | |
| | | | | 4,368,864 |
| | | | | |
| | Trading Companies & Distributors 3.8% | | | |
| 38,620 | | Fastenal Co. | | | 1,773,817 |
| 19,780 | | MSC Industrial Direct Co., Inc., Class A | | | 835,705 |
| 59,425 | | TransDigm Group, Inc.* | | | 2,201,696 |
| | | | | |
| | | | | 4,811,218 |
| | | | | |
| | Trucking 2.1% | | | |
| 83,400 | | J.B. Hunt Transport Services, Inc. | | | 2,621,262 |
| | | | | |
41
| | |
| WASATCH HERITAGE GROWTH FUND (WAHGX) — Schedule of Investments (continued) |
|
| |
| |
| | | | | |
Shares | | | | Value |
| | | | | |
| | Wireless Telecommunication Services 5.7% | | | |
| 1,291,920 | | America Movil S.A.B. de C.V., Series L (Mexico) | | $ | 4,115,593 |
| 94,985 | | NII Holdings, Inc.* | | | 3,018,623 |
| | | | | |
| | | | | 7,134,216 |
| | | | | |
| | |
| | Total Common Stocks
(cost $115,700,485) | | | 119,612,215 |
| | | | | |
| | | | | |
Principal
Amount | | | | Value |
| | | | | |
| | SHORT-TERM INVESTMENTS 3.4% | | | |
| | |
| | Repurchase Agreement 3.4% | | | |
| $4,249,000 | | Repurchase Agreement dated 3/31/08, 1.10% due 4/1/08 with Fixed Income Clearing Corporation collateralized by $2,940,000 of United States Treasury Bonds 8.75% due 8/15/20; value: $4,336,500; repurchase proceeds: $4,249,130 (cost $4,249,000) | | $ | 4,249,000 |
| | | | | |
| | |
| | Total Short-Term Investments
(cost $4,249,000) | | | 4,249,000 |
| | | | | |
| | |
| | Total Investments
(cost $119,949,485) 99.0%^^ | | | 123,861,215 |
| | |
| | Other Assets less Liabilities 1.0% | | | 1,224,834 |
| | | | | |
| | |
| | NET ASSETS 100.0% | | $ | 125,086,049 |
| | | | | |
| |
| | *Non-income producing. ^^The aggregate amount of foreign securities fair valued pursuant to a systematic fair valuation model as a percent of net assets was 6.02%. ADR American Depositary Receipts. REIT Real Estate Investment Trust. See notes to financial statements. |
At March 31, 2008, Wasatch Heritage Growth Fund’s investments, excluding short-term investments, were in the following countries:
| | | |
| Country | | % | |
Brazil | | 2.1 | |
Hong Kong | | 0.9 | |
India | | 5.4 | |
Israel | | 2.3 | |
Mexico | | 3.4 | |
Taiwan | | 1.7 | |
United Kingdom | | 2.6 | |
United States | | 81.6 | |
| | | |
TOTAL | | 100.0 | % |
| | | |
42
| | |
| WASATCH HERITAGE VALUE FUND (WAHVX) — Schedule of Investments | | MARCH 31, 2008 (UNAUDITED) |
|
| |
| |
| | | | | |
| Shares | | | | Value |
| | | | | |
| | |
| | COMMON STOCKS 93.4% | | | |
| | |
| | Aerospace & Defense 3.0% | | | |
| 2,150 | | Goodrich Corp.††† | | $ | 123,646 |
| | | | | |
| | Agricultural Products 2.4% | | | |
| 1,140 | | Bunge Ltd. | | | 99,043 |
| | | | | |
| | Communications Equipment 6.9% | | | |
| 5,890 | | Cisco Systems, Inc.* | | | 141,890 |
| 9,295 | | Comverse Technology, Inc.* | | | 143,143 |
| | | | | |
| | | | | 285,033 |
| | | | | |
| | Computer Hardware 2.4% | | | |
| 6,328 | | Sun Microsystems, Inc.* ††† | | | 98,274 |
| | | | | |
| | Construction & Farm Machinery & Heavy Trucks 3.2% | | | |
| 1,620 | | Deere & Co.††† | | | 130,313 |
| | | | | |
| | Data Processing & Outsourced Services 6.4% | | | |
| 3,465 | | Fidelity National Information Services, Inc. | | | 132,155 |
| 2,120 | | Visa, Inc., Class A* | | | 132,203 |
| | | | | |
| | | | | 264,358 |
| | | | | |
| | Electric Utilities 3.3% | | | |
| 9,200 | | EDP — Energias do Brasil S.A. (Brazil) | | | 137,690 |
| | | | | |
| | Electrical Components & Equipment 2.9% | | | |
| 3,380 | | Belden, Inc. | | | 119,382 |
| | | | | |
| | Environmental & Facilities Services 2.0% | | | |
| 2,420 | | Waste Management, Inc. | | | 81,215 |
| | | | | |
| | Gold 2.0% | | | |
| 11,325 | | IAMGOLD Corp. (Canada) | | | 83,012 |
| | | | | |
| | Health Care Technology 1.9% | | | |
| 3,650 | | IMS Health, Inc. | | | 76,687 |
| | | | | |
| | Home Improvement Retail 2.0% | | | |
| 6,000 | | RONA, Inc.* (Canada) | | | 83,329 |
| | | | | |
| | Hypermarkets & Super Centers 2.0% | | | |
| 1,300 | | Costco Wholesale Corp. | | | 84,461 |
| | | | | |
| | Industrial Conglomerates 3.3% | | | |
| 3,715 | | General Electric Co. | | | 137,492 |
| | | | | |
| | Mortgage REITs 2.8% | | | |
| 7,495 | | Annaly Capital Management, Inc. | | | 114,823 |
| | | | | |
| | Multi-Line Insurance 2.5% | | | |
| 2,350 | | American International Group, Inc. | | | 101,638 |
| | | | | |
| | Oil & Gas Drilling 3.4% | | | |
| 2,440 | | Fred Olsen Energy ASA (Norway) | | | 139,067 |
| | | | | |
| | Oil & Gas Storage & Transportation 3.3% | | | |
| 5,985 | | Spectra Energy Corp.††† | | | 136,159 |
| | | | | |
| | Packaged Foods & Meats 5.5% | | | |
| 4,040 | | Dean Foods Co. | | | 81,164 |
| 4,300 | | Unilever plc ADR (United Kingdom) | | | 144,996 |
| | | | | |
| | | | | 226,160 |
| | | | | |
| | Paper Products 2.8% | | | |
| 4,240 | | International Paper Co. | | | 115,328 |
| | | | | |
| | | | | |
| Shares | | | | Value |
| | | | | |
| | Pharmaceuticals 8.6% | | | |
| 6,675 | | Biovail Corp. (Canada) | | $ | 71,089 |
| 3,470 | | Forest Laboratories, Inc.* | | | 138,835 |
| 3,130 | | Teva Pharmaceutical Industries Ltd. ADR (Israel) | | | 144,574 |
| | | | | |
| | | | | 354,498 |
| | | | | |
| | Property & Casualty Insurance 2.8% | | | |
| 9,035 | | Old Republic International Corp. | | | 116,642 |
| | | | | |
| | Real Estate Management & Development 3.1% | | | |
| 42,515 | | Emaar Properties PJSC
(United Arab Emirates) | | | 127,769 |
| | | | | |
| | Specialized Finance 2.7% | | | |
| 8,900 | | KKR Financial Holdings, LLC | | | 112,674 |
| | | | | |
| | Systems Software 3.4% | | | |
| 4,950 | | Microsoft Corp. | | | 140,481 |
| | | | | |
| | Wireless Telecommunication Services 8.8% | | | |
| 2,315 | | America Movil S.A.B. de C.V., Series L ADR††† (Mexico) | | | 147,442 |
| 1,200 | | Globe Telecom, Inc. (Philippines) | | | 43,381 |
| 2,655 | | Globe Telecom, Inc. | | | 95,980 |
| 3,705 | | Turkcell Iletisim Hizmet AS ADR (Turkey) | | | 77,397 |
| | | | | |
| | | | | 364,200 |
| | | | | |
| | |
| | Total Common Stocks
(cost $4,162,840) | | | 3,853,374 |
| | | | | |
| | |
Principal
Amount | | | | Value |
| | |
| | SHORT-TERM INVESTMENTS 1.4% | | | |
| | |
| | Repurchase Agreement 1.4% | | | |
| $58,000 | | Repurchase Agreement dated 3/31/08, 1.10% due 4/1/08 with Fixed Income Clearing Corporation collateralized by $45,000 of United States Treasury Bonds 8.75% due 8/15/20; value: $66,375; repurchase proceeds: $58,002††† (cost $58,000) | | $ | 58,000 |
| | | | | |
| | |
| | Total Short-Term Investments
(cost $58,000) | | | 58,000 |
| | | | | |
| | |
| | Total Investments
(cost $4,220,840) 94.8%^^ | | | 3,911,374 |
| | |
| | Other Assets less Liabilities 5.2% | | | 214,303 |
| | | | | |
| | |
| | NET ASSETS 100.0% | | $ | 4,125,677 |
| | | | | |
43
| | |
| WASATCH HERITAGE VALUE FUND (WAHVX) — Schedule of Investments (continued) |
|
| |
| |
| | | | | |
| | |
Number of
Contracts | | | | Value |
| | | | | |
| | CALL OPTIONS WRITTEN | | | |
| | |
| 21 | | Goodrich Corp. expiring 4/19/08
exercise price $60 | | $ | 1,260 |
| 63 | | Sun Microsystems, Inc. expiring 4/19/08
exercise price $16 | | | 2,457 |
| 16 | | Deere & Co. expiring 4/19/08
exercise price $80 | | | 5,120 |
| 59 | | Spectra Energy Corp. expiring 4/19/08
exercise price $22.50 | | | 3,540 |
| 2 | | America Movil S.A.B. de C.V., Series L ADR expiring 4/19/08 exercise price $60 | | | 940 |
| | | | | |
| | |
| | Total Call Options Written
(premium $33,305) | | | 13,317 |
| | | | | |
| |
| | *Non-income producing. †††All or a portion of this security has been designated as collateral for written options. ^^The aggregate amount of foreign securities fair valued pursuant to a systematic fair valuation model as a percent of net assets was 7.52%. ADR American Depositary Receipts. REIT Real Estate Investment Trust. See notes to financial statements. |
At March 31, 2008, Wasatch Heritage Value Fund’s investments, excluding short-term investments and options written, were in the following countries:
| | | |
| Country | | % | |
Brazil | | 3.6 | |
Canada | | 6.2 | |
Israel | | 3.7 | |
Mexico | | 3.8 | |
Norway | | 3.6 | |
Philippines | | 1.1 | |
Turkey | | 2.0 | |
United Arab Emirates | | 3.3 | |
United Kingdom | | 3.8 | |
United States | | 68.9 | |
| | | |
TOTAL | | 100.0 | % |
| | | |
44
| | |
| WASATCH INTERNATIONAL GROWTH FUND (WAIGX) — Schedule of Investments | | MARCH 31, 2008 (UNAUDITED) |
|
| |
| |
| | | | | |
| Shares | | | | Value |
| | | | | |
| | COMMON STOCKS 95.9% | | | |
| | |
| | Aerospace & Defense 0.6% | | | |
| 364,363 | | Thielert AG* (Germany) | | $ | 2,321,395 |
| | | | | |
| | Agricultural Products 4.0% | | | |
| 4,421,481 | | Chaoda Modern Agriculture (Hong Kong) | | | 5,044,920 |
| 4,005,870 | | China Green Holdings Ltd. (Hong Kong) | | | 4,468,633 |
| 1,798,920 | | Wilmar International Ltd.* (Singapore) | | | 5,509,576 |
| | | | | |
| | | | | 15,023,129 |
| | | | | |
| | Alternative Carriers 0.6% | | | |
| 118,400 | | Global Village Telecom Holding S.A.* (Brazil) | | | 2,238,684 |
| | | | | |
| | Apparel, Accessories & Luxury Goods 2.5% | | | |
| 1,830,445 | | Ports Design Ltd. (Hong Kong) | | | 5,207,189 |
| 483,750 | | Ted Baker plc (United Kingdom) | | | 4,020,190 |
| | | | | |
| | | | | 9,227,379 |
| | | | | |
| | Apparel Retail 2.3% | | | |
| 251,500 | | KappAhl Holding AB* (Sweden) | | | 2,352,453 |
| 65,060 | | Point, Inc. (Japan) | | | 3,082,145 |
| 1,033,940 | | Truworths International Ltd. (South Africa) | | | 3,254,251 |
| | | | | |
| | | | | 8,688,849 |
| | | | | |
| | Application Software 0.6% | | | |
| 80,885 | | Nemetschek AG (Germany) | | | 2,363,496 |
| | | | | |
| | Asset Management & Custody Banks 0.8% | | | |
| 690 | | Bank Sarasin & Cie AG, Class B (Switzerland) | | | 3,000,849 |
| | | | | |
| | Biotechnology 0.5% | | | |
| 1,396,565 | | Ark Therapeutics Group plc* (United Kingdom) | | | 2,013,735 |
| | | | | |
| | Building Products 0.5% | | | |
| 368,000 | | Satipel Industrial S.A. (Brazil) | | | 2,028,561 |
| | | | | |
| | Commodity Chemicals 0.1% | | | |
| 554,362 | | Yip’s Chemical Holdings Ltd. (Hong Kong) | | | 409,939 |
| | | | | |
| | Communications Equipment 0.7% | | | |
| 186,350 | | Tandberg ASA (Norway) | | | 2,812,655 |
| | | | | |
| | Computer Storage & Peripherals 0.9% | | | |
| 3,410,484 | | Unisteel Technology Ltd. (Singapore) | | | 3,257,567 |
| | | | | |
| | Construction & Engineering 3.1% | | | |
| 2,745,267 | | Ausgroup Ltd. (Singapore) | | | 1,865,756 |
| 285,970 | | Boart Longyear Group (Australia) | | | 479,832 |
| 2,972,000 | | Midas Holdings Ltd. (Singapore) | | | 2,179,988 |
| 132,660 | | Outotec Oyj (Finland) | | | 7,058,765 |
| | | | | |
| | | | | 11,584,341 |
| | | | | |
| | Construction & Farm Machinery & Heavy Trucks 2.5% | | | |
| 164,654 | | Demag Cranes AG (Germany) | | | 7,518,003 |
| 99,825 | | Takeuchi Manufacturing Co. Ltd. (Japan) | | | 2,057,549 |
| | | | | |
| | | | | 9,575,552 |
| | | | | |
| | Consumer Finance 1.5% | | | |
| 1,288,590 | | Banco Compartamos S.A. de C.V.* (Mexico) | | | 5,721,550 |
| | | | | |
| | Diversified Banks 4.6% | | | |
| 170,960 | | Axis Bank Ltd. (India) | | | 3,283,453 |
| 512,461 | | Bank of N.T. Butterfield & Son Ltd. (Bermuda) | | | 8,891,198 |
| 155,895 | | HDFC Bank Ltd. (India) | | | 5,212,809 |
| | | | | |
| | | | | 17,387,460 |
| | | | | |
| | | | | |
| Shares | | | | Value |
| | | | | |
| | Diversified Capital Markets 0.9% | | | |
| 1,031,525 | | Acta Holding ASA* (Norway) | | $ | 3,463,633 |
| | | | | |
| | Diversified Commercial & Professional Services 2.3% | | | |
| 152,370 | | Campbell Brothers Ltd. (Australia) | | | 3,491,824 |
| 287,430 | | Wirecard AG* (Germany) | | | 5,037,729 |
| | | | | |
| | | | | 8,529,553 |
| | | | | |
| | Diversified Metals & Mining 4.4% | | | |
| 226,870 | | Anvil Mining Ltd.* (Canada) | | | 2,726,856 |
| 127,130 | | HudBay Minerals, Inc.* (Canada) | | | 2,016,758 |
| 514,933 | | Independence Group N.L. (Australia) | | | 3,776,742 |
| 338,310 | | Lundin Mining Corp.* (Canada) | | | 2,304,788 |
| 79,895 | | Major Drilling Group International, Inc.* (Canada) | | | 4,159,983 |
| 1,580,856 | | Perilya Ltd. (Australia) | | | 1,529,478 |
| | | | | |
| | | | | 16,514,605 |
| | | | | |
| | Diversified REITs 0.4% | | | |
| 1,152,113 | | Charter Hall Group (Australia) | | | 1,482,574 |
| | | | | |
| | Education Services 0.6% | | | |
| 177,570 | | Kroton Educational S.A.* ** (Brazil) | | | 2,322,834 |
| | | | | |
| | Electrical Components & Equipment 4.1% | | | |
| 101,895 | | SGL Carbon AG* (Germany) | | | 6,440,422 |
| 71,595 | | Solarworld AG (Germany) | | | 3,419,623 |
| 4,504,000 | | Walsin Lihwa Corp. (Taiwan) | | | 2,234,491 |
| 7,689,270 | | Wasion Meters Group Ltd. (Hong Kong) | | | 3,184,908 |
| | | | | |
| | | | | 15,279,444 |
| | | | | |
| | Electronic Equipment Manufacturers 2.4% | | | |
| 940,000 | | Chroma ATE, Inc. (Taiwan) | | | 2,227,538 |
| 319,499 | | Rotork plc (United Kingdom) | | | 6,842,639 |
| | | | | |
| | | | | 9,070,177 |
| | | | | |
| | Environmental & Facilities Services 2.2% | | | |
| 210,157 | | AEON DELIGHT Co., Ltd. (Japan) | | | 5,225,225 |
| 116,000 | | Asahi Pretec Corp. (Japan) | | | 3,118,149 |
| | | | | |
| | | | | 8,343,374 |
| | | | | |
| | Food Retail 1.2% | | | |
| 56,335 | | BIM Birlesik Magazalar AS (Turkey) | | | 4,481,448 |
| | | | | |
| | Footwear 1.4% | | | |
| 12,531,675 | | China Hongxing Sports Ltd. (China) | | | 5,426,709 |
| | | | | |
| | Health Care Distributors 0.1% | | | |
| 16,004 | | Arseus N.V.* (Belgium) | | | 230,935 |
| 16,004 | | Arseus N.V. — VVPR Strip* (Belgium) | | | 506 |
| | | | | |
| | | | | 231,441 |
| | | | | |
| | Health Care Equipment 2.0% | | | |
| 321,835 | | Elekta AB, Class B (Sweden) | | | 5,578,285 |
| 17,710 | | Nakanishi, Inc. (Japan) | | | 1,811,051 |
| | | | | |
| | | | | 7,389,336 |
| | | | | |
| | Health Care Facilities 0.8% | | | |
| 66,620 | | Curanum AG (Germany) | | | 519,147 |
| 39,740 | | Orpea* (France) | | | 2,409,018 |
| | | | | |
| | | | | 2,928,165 |
| | | | | |
| | Health Care Supplies 0.9% | | | |
| 199,000 | | Abcam plc (United Kingdom) | | | 1,342,350 |
| 48,143 | | Omega Pharma S.A. (Belgium) | | | 2,231,361 |
| | | | | |
| | | | | 3,573,711 |
| | | | | |
45
| | |
| WASATCH INTERNATIONAL GROWTH FUND (WAIGX) — Schedule of Investments (continued) |
|
| |
| |
| | | | | |
| Shares | | | | Value |
| | | | | |
| | Health Care Technology 1.9% | | | |
| 224,540 | | RaySearch Laboratories AB* (Sweden) | | $ | 5,233,477 |
| 419 | | So-net M3, Inc. (Japan) | | | 1,705,257 |
| | | | | |
| | | | | 6,938,734 |
| | | | | |
| | Homebuilding 2.7% | | | |
| 522,160 | | Even Construtora e Incorporadora S.A.* (Brazil) | | | 3,012,576 |
| 187,730 | | Japan General Estate Co. Ltd. (The) (Japan) | | | 1,502,217 |
| 1,537,700 | | SARE Holding S.A.B. de C.V., Class B* (Mexico) | | | 2,124,154 |
| 1,086,465 | | Urbi Desarrollos Urbanos S.A. de C.V.* (Mexico) | | | 3,573,394 |
| | | | | |
| | | | | 10,212,341 |
| | | | | |
| | Homefurnishing Retail 1.1% | | | |
| 355,325 | | Hemtex AB (Sweden) | | | 4,029,913 |
| | | | | |
| | Hotels, Resorts & Cruise Lines 0.1% | | | |
| 42,960 | | Club Cruise Entertainment & Travelling | | | |
| | Services Europe N.V.* *** (Norway) | | | 253,252 |
| | | | | |
| | Household Appliances 1.2% | | | |
| 133,040 | | Fourlis Holdings S.A. (Greece) | | | 4,342,013 |
| | | | | |
| | Human Resource & Employment Services 1.5% | | | |
| 645 | | en-japan, Inc. (Japan) | | | 1,382,682 |
| 684,970 | | Michael Page International plc | | | |
| | (United Kingdom) | | | 4,113,179 |
| | | | | |
| | | | | 5,495,861 |
| | | | | |
| | Industrial Conglomerates 1.3% | | | |
| 908,473 | | Mexichem S.A.B. de C.V. (Mexico) | | | 4,682,586 |
| | | | | |
| | Industrial Machinery 6.7% | | | |
| 63,125 | | Andritz AG (Austria) | | | 3,463,579 |
| 35,603 | | Burckhardt Compression Holding AG (Switzerland) | | | 11,346,210 |
| 86,975 | | Frigoglass S.A. (Greece) | | | 2,687,857 |
| 86,310 | | Konecranes Oyj (Finland) | | | 3,329,802 |
| 119,128 | | Palfinger AG (Austria) | | | 4,244,026 |
| | | | | |
| | | | | 25,071,474 |
| | | | | |
| | Investment Banking & Brokerage 1.7% | | | |
| 132,450 | | D. Carnegie AB* (Sweden) | | | 2,231,051 |
| 73,813 | | KIWOOM Securities Co. Ltd.* (Korea) | | | 4,215,114 |
| | | | | |
| | | | | 6,446,165 |
| | | | | |
| | Life Sciences Tools & Services 4.0% | | | |
| 39,258 | | Eurofins Scientific (France) | | | 3,911,018 |
| 57,915 | | Icon plc ADR* (Ireland) | | | 3,758,104 |
| 51,855 | | MorphoSys AG* (Germany) | | | 3,208,199 |
| 200,435 | | QIAGEN N.V.* (Netherlands) | | | 4,169,048 |
| | | | | |
| | | | | 15,046,369 |
| | | | | |
| | Oil & Gas Equipment & Services 7.0% | | | |
| 6,475,347 | | Anhui Tianda Oil Pipe Co. Ltd., Class H (China) | | | 1,733,788 |
| 198,355 | | Pason Systems, Inc. (Canada) | | | 2,914,998 |
| 59,215 | | Schoeller-Bleckmann Oilfield Equipment AG (Austria) | | | 5,290,666 |
| 2,109,000 | | Swiber Holdings Ltd.* (Singapore) | | | 3,921,498 |
| 419,315 | | TGS-NOPEC Geophysical Co. ASA* (Norway) | | | 6,112,652 |
| 139,340 | | Trican Well Service Ltd. (Canada) | | | 2,914,274 |
| 113,965 | | WorleyParsons Ltd. (Australia) | | | 3,492,757 |
| | | | | |
| | | | | 26,380,633 |
| | | | | |
| | | | | |
| Shares | | | | Value |
| | | | | |
| | Oil & Gas Exploration & Production 2.3% | | | |
| 259,902 | | JKX Oil and Gas plc (United Kingdom) | | $ | 2,271,707 |
| 88,095 | | Premier Oil plc* (United Kingdom) | | | 2,427,450 |
| 107,845 | | Soco International plc* (United Kingdom) | | | 4,095,577 |
| | | | | |
| | | | | 8,794,734 |
| | | | | |
| | Other Diversified Financial Services 0.6% | | | |
| 643,395 | | African Bank Investments Ltd. (South Africa) | | | 2,114,084 |
| | | | | |
| | Pharmaceuticals 0.9% | | | |
| 355,155 | | Hikma Pharmaceuticals plc (United Kingdom) | | | 3,301,503 |
| | | | | |
| | Precious Metals & Minerals 0.8% | | | |
| 128,540 | | Harry Winston Diamond Corp. (Canada) | | | 3,076,203 |
| | | | | |
| | Real Estate Management & Development 0.4% | | | |
| 350,219 | | DTZ Holdings plc (United Kingdom) | | | 1,502,983 |
| | | | | |
| | Regional Banks 1.0% | | | |
| 148,440 | | Canadian Western Bank (Canada) | | | 3,721,474 |
| | | | | |
| | Restaurants 1.0% | | | |
| 2,272,295 | | FU JI Food & Catering Services Holdings Ltd. (China) | | | 3,849,207 |
| | | | | |
| | Semiconductors 0.8% | | | |
| 175,816 | | Melexis N.V. (Belgium) | | | 2,911,313 |
| | | | | |
| | Specialized Finance 5.7% | | | |
| 69,199 | | GP Investments Ltd. GDR (Brazil) | | | 2,102,929 |
| 150,780 | | Hellenic Exchanges S.A. (Greece) | | | 3,587,809 |
| 150,220 | | IMAREX ASA* (Norway) | | | 3,952,486 |
| 593,773 | | JSE Ltd. (South Africa) | | | 4,760,125 |
| 1,575 | | Osaka Securities Exchange Co. Ltd. (Japan) | | | 7,221,461 |
| | | | | |
| | | | | 21,624,810 |
| | | | | |
| | Steel 0.5% | | | |
| 272,285 | | Maharashtra Seamless Ltd. (India) | | | 2,048,712 |
| | | | | |
| | Systems Software 0.9% | | | |
| 8,347 | | Simplex Technology, Inc. (Japan) | | | 3,425,412 |
| | | | | |
| | Thrifts & Mortgage Finance 1.4% | | | |
| 154,280 | | Home Capital Group, Inc. (Canada) | | | 5,352,878 |
| | | | | |
| | Trucking 0.9% | | | |
| 362,925 | | Localiza Rent A Car S.A. (Brazil) | | | 3,464,228 |
| | | | | |
| | |
| | Total Common Stocks
(cost $327,554,232) | | | 360,779,027 |
| | | | | |
| | |
| | PREFERRED STOCKS 1.9% | | | |
| | |
| | Railroads 1% | | | |
| 393,055 | | All America Latina Logistica S.A. Pfd.** (Brazil) | | | 3,974,108 |
| | | | | |
| | Regional Banks 0.9% | | | |
| 521,575 | | Banco Daycoval S.A. Pfd. (Brazil) | | | 3,250,533 |
| | | | | |
| | |
| | Total Preferred Stocks
(cost $6,268,320) | | | 7,224,641 |
| | | | | |
46
| | |
| | MARCH 31, 2008 (UNAUDITED) |
|
| |
| |
| | | | | |
| Shares | | | | Value |
| | | | | |
| | WARRANTS 0.0% | | | |
| | |
| | Gold 0.0% | | | |
| 2,678,000 | | Redcorp Ventures Ltd.
expiring 7/10/09* *** † (Canada) | | $ | — |
| | | | | |
| | Health Care Distributors 0.0% | | | |
| 8,002 | | Arseus N.V. expiring 1/28/11* (Belgium) | | | 8,847 |
| | | | | |
| | |
| | Total Warrants
(cost $0) | | | 8,847 |
| | | | | |
| | |
Principal
Amount | | | | Value |
| | |
| | SHORT-TERM INVESTMENTS 0.5% | | | |
| | |
| | Repurchase Agreement 0.5% | | | |
| $1,807,000 | | Repurchase Agreement dated 3/31/08, 1.10% due 4/1/08 with Fixed Income Clearing Corporation collateralized by $1,250,000 of United States Treasury Bonds 8.75% due 8/15/20; value: $1,843,750; repurchase proceeds: $1,807,055 (cost $1,807,000) | | $ | 1,807,000 |
| | | | | |
| | |
| | Total Short-Term Investments
(cost $1,807,000) | | | 1,807,000 |
| | | | | |
| | |
| | Total Investments
(cost $335,629,552) 98.3%^^ | | | 369,819,515 |
| | |
| | Other Assets less Liabilities 1.7% | | | 6,477,089 |
| | | | | |
| | |
| | NET ASSETS 100.0% | | $ | 376,296,604 |
| | | | | |
| | *Non-income producing. **Common units. ***Security was fair valued under procedures adopted by the Board of Directors (see Note 2). †Security purchased in a private placement transaction or under Rule 144A of the Securities Act of 1933 (see Note 9). ^^The aggregate amount of foreign securities fair valued pursuant to a systematic fair valuation model as a percent of net assets was 75.27%. ADR American Depositary Receipt. GDR Global Depositary Receipt. REIT Real Estate Investment Trust. See notes to financial statements. |
At March 31, 2008, Wasatch International Growth Fund’s investments, excluding short-term investments, were in the following countries:
| | | |
| Country | | % | |
Australia | | 3.9 | |
Austria | | 3.5 | |
Belgium | | 1.5 | |
Bermuda | | 2.4 | |
Brazil | | 6.1 | |
Canada | | 7.9 | |
China | | 3.0 | |
Finland | | 2.8 | |
France | | 1.7 | |
Germany | | 8.4 | |
Greece | | 2.9 | |
Hong Kong | | 5.0 | |
India | | 2.9 | |
Ireland | | 1.0 | |
Japan | | 8.3 | |
Korea | | 1.1 | |
Mexico | | 4.4 | |
Netherlands | | 1.1 | |
Norway | | 4.5 | |
Singapore | | 4.5 | |
South Africa | | 2.8 | |
Sweden | | 5.3 | |
Switzerland | | 3.9 | |
Taiwan | | 1.2 | |
Turkey | | 1.2 | |
United Kingdom | | 8.7 | |
| | | |
TOTAL | | 100.0 | % |
| | | |
47
| | |
| WASATCH INTERNATIONAL OPPORTUNITIES FUND (WAIOX) — Schedule of Investments | | |
|
| |
| |
| | | | | |
| Shares | | | | Value |
| | | | | |
| | COMMON STOCKS 92.8% | | | |
| | |
| | Aerospace & Defense 0.3% | | | |
| 21,540 | | Thielert AG* (Germany) | | $ | 137,234 |
| | | | | |
| | Agricultural Products 1.1% | | | |
| 409,000 | | China Green Holdings Ltd. (Hong Kong) | | | 456,248 |
| | | | | |
| | Air Freight & Logistics 3.1% | | | |
| 415,000 | | Aramex PJSC* (United Arab Emirates) | | | 301,716 |
| 879,183 | | Goodpack Ltd. (Singapore) | | | 1,016,863 |
| | | | | |
| | | | | 1,318,579 |
| | | | | |
| | Alternative Carriers 0.6% | | | |
| 11,175 | | Tulip IT Services Ltd. (India) | | | 239,372 |
| | | | | |
| | Apparel, Accessories & Luxury Goods 2.7% | | | |
| 1,885,000 | | EganaGoldpfeil Holdings Ltd.* *** (Hong Kong) | | | 39,964 |
| 130,850 | | Mulberry Group plc (United Kingdom) | | | 345,724 |
| 136,438 | | Ports Design Ltd. (Hong Kong) | | | 388,134 |
| 48,230 | | Ted Baker plc (United Kingdom) | | | 400,814 |
| | | | | |
| | | | | 1,174,636 |
| | | | | |
| | Application Software 5.2% | | | |
| 716,334 | | Guestlogix, Inc.* (Canada) | | | 836,595 |
| 818,500 | | Kingdee International Software Group Co. Ltd. (Cayman Islands) | | | 633,589 |
| 10,315 | | Nemetschek AG (Germany) | | | 301,409 |
| 1,640,953 | | Silverlake Axis Ltd. (Singapore) | | | 473,684 |
| | | | | |
| | | | | 2,245,277 |
| | | | | |
| | Asset Management & Custody Banks 0.6% | | | |
| 29,575 | | Treasury Group Ltd. (Australia) | | | 270,451 |
| | | | | |
| | Auto Parts & Equipment 1.1% | | | |
| 610,000 | | Azure Dynamics Corp.* (Canada) | | | 148,419 |
| 42,540 | | Martinrea International, Inc.* (Canada) | | | 313,409 |
| | | | | |
| | | | | 461,828 |
| | | | | |
| | Biotechnology 0.4% | | | |
| 123,110 | | Ark Therapeutics Group plc* (United Kingdom) | | | 177,515 |
| | | | | |
| | Building Products 0.5% | | | |
| 39,000 | | Satipel Industrial S.A. (Brazil) | | | 214,983 |
| | | | | |
| | Communications Equipment 1.0% | | | |
| 38,435 | | Celrun Co. Ltd. (Korea) | | | 172,214 |
| 1,305,000 | | Sinotel Technologies Ltd.* (China) | | | 246,066 |
| | | | | |
| | | | | 418,280 |
| | | | | |
| | Computer Storage & Peripherals 0.7% | | | |
| 322,933 | | Unisteel Technology Ltd. (Singapore) | | | 308,454 |
| | | | | |
| | Construction & Engineering 4.1% | | | |
| 817,000 | | Ausgroup Ltd. (Singapore) | | | 555,255 |
| 13,800 | | Churchill Corp., Class A* (Canada) | | | 271,031 |
| 86,050 | | Lycopodium Ltd. (Australia) | | | 283,730 |
| 476,960 | | Midas Holdings Ltd. (Singapore) | | | 349,854 |
| 287,965 | | Swick Mining Services Ltd.* (Australia) | | | 317,024 |
| | | | | |
| | | | | 1,776,894 |
| | | | | |
| | Construction & Farm Machinery & Heavy Trucks 3.4% | | | |
| 1,696,000 | | China Farm Equipment Ltd. (China) | | | 463,893 |
| 16,700 | | Demag Cranes AG (Germany) | | | 762,512 |
| 12,200 | | Takeuchi Manufacturing Co. Ltd. (Japan) | | | 251,461 |
| | | | | |
| | | | | 1,477,866 |
| | | | | |
| | | | | |
| Shares | | | | Value |
| | | | | |
| | Consumer Finance 0.6% | | | |
| 54,145 | | Banco Compartamos S.A. de C.V.* (Mexico) | | $ | 240,413 |
| | | | | |
| | Diversified Capital Markets 0.5% | | | |
| 66,130 | | Acta Holding ASA* (Norway) | | | 222,050 |
| | | | | |
| | Diversified Commercial & Professional Services 2.1% | | | |
| 23,305 | | D+S europe AG* (Germany) | | | 319,874 |
| 21,858 | | LPS Brasil — Consultoria de Imoveis S.A.* (Brazil) | | | 389,563 |
| 270,155 | | Management Consulting Group plc (United Kingdom) | | | 198,178 |
| | | | | |
| | | | | 907,615 |
| | | | | |
| | Diversified Metals & Mining 2.7% | | | |
| 234,500 | | International Ferro Metals, Ltd.* (Australia) | | | 656,149 |
| 153,000 | | Mitsui Mining Co. Ltd. (Japan) | | | 438,233 |
| 54,530 | | Perilya Ltd. (Australia) | | | 52,758 |
| | | | | |
| | | | | 1,147,140 |
| | | | | |
| | Diversified REITs 1.2% | | | |
| 60,735 | | Star Asia Finance Ltd.*** † (Guernsey) | | | 524,143 |
| | | | | |
| | Education Services 3.0% | | | |
| 538,031 | | China Education Ltd.* (Singapore) | | | 196,672 |
| 27,785 | | Kroton Educational S.A.* ** (Brazil) | | | 363,462 |
| 1,215 | | MegaStudy Co. Ltd. (Korea) | | | 405,240 |
| 812,150 | | Oriental Century Ltd.* (Singapore) | | | 281,806 |
| 561,530 | | Raffles Education Corp. Ltd. (Singapore) | | | 65,490 |
| | | | | |
| | | | | 1,312,670 |
| | | | | |
| | Electrical Components & Equipment 1.4% | | | |
| 1,459,000 | | Wasion Meters Group Ltd. (Hong Kong) | | | 604,320 |
| | | | | |
| | Electronic Equipment Manufacturers 0.1% | | | |
| 618,710 | | QRSciences Holdings Ltd.* (Australia) | | | 49,633 |
| | | | | |
| | Electronic Manufacturing Services 0.2% | | | |
| 207,670 | | Virtek Vision International, Inc.* (Canada) | | | 74,781 |
| | | | | |
| | Food Retail 1.1% | | | |
| 1,318,397 | | BreadTalk Group Ltd. (Singapore) | | | 479,152 |
| | | | | |
| | Footwear 5.6% | | | |
| 4,777,010 | | China Hongxing Sports Ltd. (China) | | | 2,068,633 |
| 533,000 | | China Sports International Ltd.* (China) | | | 348,414 |
| | | | | |
| | | | | 2,417,047 |
| | | | | |
| | Gold 1.1% | | | |
| 41,935 | | Guyana Goldfields, Inc.* (Canada) | | | 282,832 |
| 855,000 | | Redcorp Ventures Ltd.* (Canada) | | | 191,387 |
| | | | | |
| | | | | 474,219 |
| | | | | |
| | Health Care Equipment 0.5% | | | |
| 1,279,445 | | LMA International N.V.* (Singapore) | | | 200,143 |
| | | | | |
| | Health Care Technology 3.3% | | | |
| 101,760 | | Profdoc ASA* (Norway) | | | 472,286 |
| 40,020 | | RaySearch Laboratories AB* (Sweden) | | | 932,768 |
| | | | | |
| | | | | 1,405,054 |
| | | | | |
| | Home Improvement Retail 0.7% | | | |
| 43,435 | | Swedol AB, Class B (Sweden) | | | 297,531 |
| | | | | |
48
| | |
| | MARCH 31, 2008 (UNAUDITED) |
|
| |
| |
| | | | | |
| Shares | | | | Value |
| | | | | |
| | Homebuilding 1.5% | | | |
| 78,235 | | Even Construtora e Incorporadora S.A.* (Brazil) | | $ | 451,373 |
| 43,600 | | Trisul S.A.* (Brazil) | | | 201,487 |
| | | | | |
| | | | | 652,860 |
| | | | | |
| | Homefurnishing Retail 0.5% | | | |
| 10,170 | | Beter Bed Holding N.V. (Netherlands) | | | 230,990 |
| | | | | |
| | Hotels, Resorts & Cruise Lines 1.4% | | | |
| 99,150 | | Club Cruise Entertainment & Travelling Services Europe N.V.* *** (Norway) | | | 584,496 |
| | | | | |
| | Household Appliances 1.0% | | | |
| 13,640 | | Fourlis Holdings S.A. (Greece) | | | 445,167 |
| | | | | |
| | Human Resource & Employment Services 0.0% | | | |
| 31,805 | | Carter & Carter Group plc* *** (United Kingdom) | | | 631 |
| | | | | |
| | Industrial Conglomerates 1.4% | | | |
| 116,080 | | Mexichem S.A.B. de C.V. (Mexico) | | | 598,317 |
| | | | | |
| | Industrial Machinery 4.6% | | | |
| 168,262 | | Awea Mechantronic Co. Ltd. (Taiwan) | | | 319,115 |
| 2,565 | | Burckhardt Compression Holding AG (Switzerland) | | | 817,432 |
| 1,554,000 | | China Automation Group Ltd.* (China) | | | 493,664 |
| 10,595 | | Muehlbauer Holding AG & Co. KGaA (Germany) | | | 368,401 |
| | | | | |
| | | | | 1,998,612 |
| | | | | |
| | Investment Banking & Brokerage 2.0% | | | |
| 123,005 | | ABG Sundal Collier ASA (Norway) | | | 224,922 |
| 11,061 | | KIWOOM Securities Co. Ltd.* (Korea) | | | 631,642 |
| | | | | |
| | | | | 856,564 |
| | | | | |
| | Leisure Products 0.7% | | | |
| 19,175 | | KABE Husvagnar AB, Class B (Sweden) | | | 310,127 |
| | | | | |
| | Life Sciences Tools & Services 1.0% | | | |
| 7,105 | | MorphoSys AG* (Germany) | | | 439,577 |
| | | | | |
| | Marine 0.9% | | | |
| 31,195 | | Euroseas Ltd. | | | 374,340 |
| | | | | |
| | Office REITs 0.9% | | | |
| 701,235 | | Axis Real Estate Investment Trust (Malaysia) | | | 372,706 |
| | | | | |
| | Oil & Gas Drilling 0.8% | | | |
| 106,150 | | Ithaca Energy, Inc.* (Canada) | | | 283,067 |
| 5,540 | | Phoenix Technology Income Fund** (Canada) | | | 58,500 |
| | | | | |
| | | | | 341,567 |
| | | | | |
| | Oil & Gas Equipment & Services 8.6% | | | |
| 1,682,715 | | Anhui Tianda Oil Pipe Co. Ltd., Class H (China) | | | 450,551 |
| 448,825 | | Bayou Bend Petroleum Ltd.* (Canada) | | | 235,879 |
| 61,965 | | Deep Sea Supply plc* (Norway) | | | 265,870 |
| 421,600 | | Ezra Holdings Ltd. (Singapore) | | | 638,223 |
| 41,875 | | Pason Systems, Inc. (Canada) | | | 615,389 |
| 38,305 | | Petrowest Energy Services Trust** (Canada) | | | 33,552 |
| 653,804 | | Swiber Holdings Ltd.* (Singapore) | | | 1,215,690 |
| 31,450 | | Wavefield Inseis ASA* (Norway) | | | 236,014 |
| | | | | |
| | | | | 3,691,168 |
| | | | | |
| | Oil & Gas Exploration & Production 1.3% | | | |
| 34,170 | | Bow Valley Energy Ltd.* (Canada) | | | 167,608 |
| 44,125 | | JKX Oil and Gas plc (United Kingdom) | | | 385,680 |
| | | | | |
| | | | | 553,288 |
| | | | | |
| | | | | |
| Shares | | | | Value |
| | | | | |
| | Precious Metals & Minerals 0.5% | | | |
| 65,400 | | Andina Minerals, Inc.* (Canada) | | $ | 227,866 |
| | | | | |
| | Real Estate Management & Development 1.8% | | | |
| 45 | | Century 21 Real Estate of Japan Ltd. (Japan) | | | 162,892 |
| 255 | | Funai Zaisan Consultants Co. Ltd. (Japan) | | | 448,401 |
| 7,800 | | Vivacon AG (Germany) | | | 164,925 |
| | | | | |
| | | | | 776,218 |
| | | | | |
| | Restaurants 1.1% | | | |
| 272,950 | | FU JI Food & Catering Services Holdings Ltd. (China) | | | 462,370 |
| | | | | |
| | Semiconductors 1.8% | | | |
| 24,600 | | Melexis N.V. (Belgium) | | | 407,348 |
| 47,020 | | O2Micro International Ltd. ADR* (Cayman Islands) | | | 363,465 |
| | | | | |
| | | | | 770,813 |
| | | | | |
| | Specialized Finance 8.6% | | | |
| 28,095 | | Arques Industries AG (Germany) | | | 549,764 |
| 46,380 | | IMAREX ASA* (Norway) | | | 1,220,319 |
| 73,074 | | JSE Ltd. (South Africa) | | | 585,815 |
| 105 | | Osaka Securities Exchange Co. Ltd. (Japan) | | | 481,431 |
| 32,625 | | Oslo Bors VPS Holding ASA (Norway) | | | 878,291 |
| | | | | |
| | | | | 3,715,620 |
| | | | | |
| | Specialty Chemicals 0.4% | | | |
| 55,175 | | Allen-Vanguard Corp.* (Canada) | | | 183,648 |
| | | | | |
| | Specialty Stores 1.3% | | | |
| 32,005 | | easyhome Ltd. (Canada) | | | 560,672 |
| | | | | |
| | Textiles 0.5% | | | |
| 418,000 | | FibreChem Technologies Ltd. (China) | | | 208,714 |
| | | | | |
| | Thrifts & Mortgage Finance 1.3% | | | |
| 15,985 | | Home Capital Group, Inc. (Canada) | | | 554,613 |
| | | | | |
| | |
| | Total Common Stocks
(cost $37,909,066) | | | 39,944,472 |
| | | | | |
| | |
| | WARRANTS 0.0% | | | |
| | |
| | Gold 0.0% | | | |
| 427,500 | | Redcorp Ventures Ltd.
expiring 7/10/09* *** † (Canada) | | | — |
| | | | | |
| | Hotels, Resorts & Cruise Lines 0.0% | | | |
| 124,456 | | Club Cruise Entertainment & Travelling Services Europe N.V. expiring 4/25/12* *** (Norway) | | | — |
| | | | | |
| | |
| | Total Warrants
(cost $280,622) | | | — |
| | | | | |
49
| | |
| WASATCH INTERNATIONAL OPPORTUNITIES FUND (WAIOX) — Schedule of Investments (continued) |
|
| |
| |
| | | | | | |
Principal
Amount | | | | Value | |
| | | | | | |
| | SHORT-TERM INVESTMENTS 8.5% | | | | |
| | |
| | Repurchase Agreement 8.5% | | | | |
| $3,656,000 | | Repurchase Agreement dated 3/31/08, 1.10% due 4/1/08 with Fixed Income Clearing Corporation collateralized by $2,530,000 of United States Treasury Bonds 8.75% due 8/15/20; value: $3,731,750; repurchase proceeds: $3,656,111 (cost $3,656,000) | | $ | 3,656,000 | |
| | | | | | |
| | |
| | Total Short-Term Investments
(cost $3,656,000) | | | 3,656,000 | |
| | | | | | |
| | |
| | Total Investments
(cost $41,845,688) 101.3%^^ | | | 43,600,472 | |
| | |
| | Liabilities less Other Assets (1.3)% | | | (550,044 | ) |
| | | | | | |
| | |
| | NET ASSETS 100.0% | | $ | 43,050,428 | |
| | | | | | |
| |
| | *Non-income producing. **Common units. ***Security was fair valued under procedures adopted by the Board of Directors (see Note 2). †Security purchased in a private placement transaction or under Rule 144A of the Securities Act of 1933 (see Note 9). ^^The aggregate amount of foreign securities fair valued pursuant to a systematic fair valuation model as a percent of net assets was 66.20%. ADR American Depositary Receipts. REIT Real Estate Investment Trust. See note to financial statements. | |
At March 31, 2008, Wasatch International Opportunities Fund’s investments, excluding short-term investments, were in the following countries:
| | | |
| Country | | % | |
Australia | | 4.1 | |
Belgium | | 1.0 | |
Brazil | | 4.1 | |
Canada | | 12.6 | |
Cayman Islands | | 2.5 | |
China | | 11.9 | |
Germany | | 7.6 | |
Greece | | 1.1 | |
Guernsey | | 1.3 | |
Hong Kong | | 3.7 | |
India | | 0.6 | |
Japan | | 4.5 | |
Korea | | 3.0 | |
Malaysia | | 0.9 | |
Mexico | | 2.1 | |
Netherlands | | 0.6 | |
Norway | | 10.3 | |
Singapore | | 14.5 | |
South Africa | | 1.5 | |
Sweden | | 3.9 | |
Switzerland | | 2.0 | |
Taiwan | | 0.8 | |
United Arab Emirates | | 0.7 | |
United Kingdom | | 3.8 | |
United States | | 0.9 | |
| | | |
TOTAL | | 100.0 | % |
| | | |
50
| | |
| WASATCH MICRO CAP FUND (WMICX) — Schedule of Investments | | MARCH 31, 2008 (UNAUDITED) |
|
| |
| |
| | | | | |
| Shares | | | | Value |
| | | | | |
| | COMMON STOCKS 97.7% | | | |
| | |
| | Aerospace & Defense 0.6% | | | |
| 327,555 | | Luna Innovations, Inc.* | | $ | 2,617,164 |
| | | | | |
| | Air Freight & Logistics 2.0% | | | |
| 1,946,885 | | AutoInfo, Inc.* †† | | | 1,460,164 |
| 6,475,605 | | Goodpack Ltd. (Singapore) | | | 7,489,686 |
| | | | | |
| | | | | 8,949,850 |
| | | | | |
| | Apparel, Accessories & Luxury Goods 1.0% | | | |
| 9,443,536 | | EganaGoldpfeil Holdings Ltd.* *** (Hong Kong) | | | 200,215 |
| 228,400 | | Swank, Inc.* | | | 993,540 |
| 168,215 | | Volcom, Inc.* | | | 3,399,625 |
| | | | | |
| | | | | 4,593,380 |
| | | | | |
| | Apparel Retail 1.2% | | | |
| 278,487 | | Christopher & Banks Corp. | | | 2,782,085 |
| 114,755 | | Jos. A. Bank Clothiers, Inc.* | | | 2,352,478 |
| | | | | |
| | | | | 5,134,563 |
| | | | | |
| | Application Software 1.8% | | | |
| 80,975 | | Interactive Intelligence, Inc.* | | | 953,076 |
| 497,836 | | Opnet Technologies, Inc.* | | | 4,052,385 |
| 11,223,698 | | Silverlake Axis Ltd. (Singapore) | | | 3,239,879 |
| | | | | |
| | | | | 8,245,340 |
| | | | | |
| | Asset Management & Custody Banks 1.7% | | | |
| 816,896 | | Treasury Group Ltd. (Australia) | | | 7,470,161 |
| | | | | |
| | Auto Parts & Equipment 0.9% | | | |
| 4,290,000 | | Azure Dynamics Corp.* (Canada) | | | 1,043,796 |
| 415,880 | | Martinrea International, Inc.* (Canada) | | | 3,063,953 |
| | | | | |
| | | | | 4,107,749 |
| | | | | |
| | Broadcasting & Cable TV 0.4% | | | |
| 270,681 | | Outdoor Channel Holdings, Inc.* | | | 1,989,505 |
| | | | | |
| | Computer & Electronics Retail 0.7% | | | |
| 261,345 | | hhgregg, Inc.* | | | 2,940,131 |
| | | | | |
| | Computer Storage & Peripherals 0.8% | | | |
| 197,685 | | Intevac, Inc.* | | | 2,560,021 |
| 1,181,531 | | Unisteel Technology Ltd. (Singapore) | | | 1,128,554 |
| | | | | |
| | | | | 3,688,575 |
| | | | | |
| | Consumer Finance 4.2% | | | |
| 227,306 | | Dollar Financial Corp.* | | | 5,228,038 |
| 245,680 | | First Cash Financial Services, Inc.* | | | 2,537,874 |
| 448,445 | | United PanAm Financial Corp.* | | | 1,632,340 |
| 290,910 | | World Acceptance Corp.* | | | 9,265,484 |
| | | | | |
| | | | | 18,663,736 |
| | | | | |
| | Diversified Capital Markets 0.6% | | | |
| 852,685 | | Acta Holding ASA* (Norway) | | | 2,863,128 |
| | | | | |
| | Diversified Commercial & Professional Services 0.6% | | | |
| 86,465 | | CRA International, Inc.* | | | 2,778,985 |
| | | | | |
| | Education Services 1.0% | | | |
| 204,405 | | Kroton Educational S.A.* ** (Brazil) | | | 2,673,869 |
| 4,143,815 | | Oriental Century Ltd.* (Singapore) | | | 1,437,855 |
| 4,444,890 | | Raffles Education Corp. Ltd. (Singapore) | | | 442,358 |
| | | | | |
| | | | | 4,554,082 |
| | | | | |
| | Electronic Equipment Manufacturers 0.9% | | | |
| 176,190 | | DTS, Inc.* | | | 4,228,560 |
| | | | | |
| | | | | |
| Shares | | | | Value |
| | | | | |
| | Electronic Manufacturing Services 2.3% | | | |
| 162,185 | | Excel Technology, Inc.* | | $ | 4,372,507 |
| 506,540 | | TTM Technologies, Inc.* | | | 5,734,033 |
| | | | | |
| | | | | 10,106,540 |
| | | | | |
| | Environmental & Facilities Services 1.3% | | | |
| 226,295 | | American Ecology Corp. | | | 5,732,052 |
| | | | | |
| | Footwear 1.6% | | | |
| 16,806,155 | | China Hongxing Sports Ltd. (China) | | | 7,277,727 |
| | | | | |
| | Health Care Distributors 1.0% | | | |
| 127,261 | | MWI Veterinary Supply, Inc.* | | | 4,487,223 |
| | | | | |
| | Health Care Equipment 6.7% | | | |
| 225,445 | | Abaxis, Inc.* | | | 5,223,560 |
| 126,905 | | AtriCure, Inc.* | | | 1,616,770 |
| 366,296 | | Cardica, Inc.* | | | 2,706,927 |
| 25,917,740 | | LMA International N.V.* (Singapore) | | | 4,054,306 |
| 85,360 | | NuVasive, Inc.* | | | 2,945,774 |
| 723,947 | | VNUS Medical Technologies, Inc.* | | | 13,168,596 |
| | | | | |
| | | | | 29,715,933 |
| | | | | |
| | Health Care Facilities 2.4% | | | |
| 188,598 | | AmSurg Corp.* | | | 4,466,001 |
| 729,250 | | NovaMed, Inc.* | | | 2,763,857 |
| 249,622 | | U.S. Physical Therapy, Inc.* | | | 3,599,549 |
| | | | | |
| | | | | 10,829,407 |
| | | | | |
| | Health Care Services 6.4% | | | |
| 225,705 | | CorVel Corp.* | | | 6,904,316 |
| 153,365 | | Healthways, Inc.* | | | 5,419,919 |
| 241,020 | | LHC Group, Inc.* | | | 4,049,136 |
| 401,645 | | Providence Service Corp. (The)* | | | 12,049,350 |
| | | | | |
| | | | | 28,422,721 |
| | | | | |
| | Health Care Supplies 0.5% | | | |
| 527,626 | | CryoCor, Inc.* | | | 833,649 |
| 44,030 | | ICU Medical, Inc.* | | | 1,266,743 |
| | | | | |
| | | | | 2,100,392 |
| | | | | |
| | Health Care Technology 1.2% | | | |
| 171,591 | | Ophthalmic Imaging Systems* | | | 60,057 |
| 645,425 | | Profdoc ASA* (Norway) | | | 2,995,529 |
| 107,635 | | RaySearch Laboratories AB* (Sweden) | | | 2,508,708 |
| | | | | |
| | | | | 5,564,294 |
| | | | | |
| | Human Resource & Employment Services 1.2% | | | |
| 298,380 | | Resources Connection, Inc. | | | 5,332,051 |
| | | | | |
| | Industrial Conglomerates 0.4% | | | |
| 58,895 | | Raven Industries, Inc. | | | 1,784,518 |
| | | | | |
| | Industrial Machinery 0.7% | | | |
| 102,655 | | Kadant, Inc.* | | | 3,016,004 |
| | | | | |
| | Internet Software & Services 2.7% | | | |
| 459,035 | | DealerTrack Holdings, Inc.* | | | 9,281,688 |
| 662,480 | | Kana Software, Inc.* | | | 847,974 |
| 244,285 | | Liquidity Services, Inc.* | | | 1,954,280 |
| | | | | |
| | | | | 12,083,942 |
| | | | | |
| | Investment Banking & Brokerage 3.2% | | | |
| 1,376,140 | | ABG Sundal Collier ASA (Norway) | | | 2,516,356 |
| 64,772 | | Diamond Hill Investment Group, Inc.* | | | 4,955,706 |
| 72,635 | | FCStone Group, Inc.* | | | 2,011,989 |
| 81,685 | | KIWOOM Securities Co. Ltd.* (Korea) | | | 4,664,647 |
| | | | | |
| | | | | 14,148,698 |
| | | | | |
51
| | |
| WASATCH MICRO CAP FUND (WMICX) — Schedule of Investments (continued) | | |
|
| |
| |
| | | | | |
| Shares | | | | Value |
| | | | | |
| | IT Consulting & Other Services 2.5% | | | |
| 289,915 | | NCI, Inc., Class A* | | $ | 5,456,200 |
| 1,366,060 | | SM&A* †† | | | 5,887,719 |
| | | | | |
| | | | | 11,343,919 |
| | | | | |
| | Life Sciences Tools & Services 1.7% | | | |
| 58,042 | | Icon plc ADR* (Ireland) | | | 3,766,345 |
| 86,465 | | Kendle International, Inc.* | | | 3,884,008 |
| | | | | |
| | | | | 7,650,353 |
| | | | | |
| | Marine 0.7% | | | |
| 252,085 | | Euroseas Ltd. | | | 3,025,020 |
| | | | | |
| | Marine Ports & Services 1.5% | | | |
| 525,785 | | CAI International, Inc.* | | | 6,761,595 |
| | | | | |
| | Mortgage REITs 2.1% | | | |
| 607,095 | | MFA Mortgage Investments, Inc. | | | 3,824,698 |
| 676,515 | | NorthStar Realty Finance Corp. | | | 5,527,128 |
| | | | | |
| | | | | 9,351,826 |
| | | | | |
| | Multi-Sector Holdings 0.4% | | | |
| 194,660 | | Resource America, Inc., Class A | | | 1,839,537 |
| | | | | |
| | Oil & Gas Drilling 0.7% | | | |
| 1,090,430 | | Ithaca Energy, Inc.* (Canada) | | | 2,907,813 |
| | | | | |
| | Oil & Gas Equipment & Services 3.6% | | | |
| 13,117,400 | | Advanced Holdings Ltd. (Singapore) | | | 2,595,474 |
| 3,751,565 | | Bayou Bend Petroleum Ltd.* (Canada) | | | 1,971,625 |
| 252,800 | | Pason Systems, Inc. (Canada) | | | 3,715,115 |
| 4,168,830 | | Swiber Holdings Ltd.* (Singapore) | | | 7,751,569 |
| | | | | |
| | | | | 16,033,783 |
| | | | | |
| | Oil & Gas Exploration & Production 1.6% | | | |
| 239,140 | | Approach Resources, Inc.* | | | 3,749,715 |
| 92,085 | | GMX Resources, Inc.* | | | 3,216,529 |
| | | | | |
| | | | | 6,966,244 |
| | | | | |
| | Oil & Gas Refining & Marketing 0.8% | | | |
| 121,140 | | World Fuel Services Corp. | | | 3,400,400 |
| | | | | |
| | Pharmaceuticals 0.9% | | | |
| 336,515 | | Obagi Medical Products, Inc.* | | | 2,920,950 |
| 908,620 | | Osteologix, Inc.* | | | 958,594 |
| | | | | |
| | | | | 3,879,544 |
| | | | | |
| | Real Estate Management & Development 0.7% | | | |
| 679,149 | | DTZ Holdings plc (United Kingdom) | | | 2,914,603 |
| | | | | |
| | Regional Banks 2.3% | | | |
| 152,580 | | CoBiz Financial, Inc. | | | 1,986,592 |
| 133,114 | | Commonwealth Bankshares, Inc. | | | 2,262,938 |
| 254,618 | | Epic Bancorp†† | | | 2,996,854 |
| 283,940 | | First Bank of Delaware* | | | 738,244 |
| 168,040 | | Nara Bancorp, Inc. | | | 2,182,839 |
| | | | | |
| | | | | 10,167,467 |
| | | | | |
| | Reinsurance 0.8% | | | |
| 382,245 | | CastlePoint Holdings Ltd. (Bermuda) | | | 3,719,244 |
| | | | | |
| | Semiconductor Equipment 1.7% | | | |
| 584,675 | | inTEST Corp.* †† | | | 1,198,584 |
| 361,995 | | MEMSIC, Inc.* | | | 2,175,590 |
| 199,375 | | Tessera Technologies, Inc.* | | | 4,147,000 |
| | | | | |
| | | | | 7,521,174 |
| | | | | |
| | | | | |
| Shares | | | | Value |
| | | | | |
| | Semiconductors 12.8% | | | |
| 138,616 | | Intellon Corp.* | | $ | 681,991 |
| 204,645 | | Melexis N.V. (Belgium) | | | 3,388,688 |
| 993,550 | | Micrel, Inc. | | | 9,210,208 |
| 182,996 | | Netlogic Microsystems, Inc.* | | | 4,417,523 |
| 1,413,652 | | O2Micro International Ltd. ADR* (Cayman Islands) | | | 10,927,530 |
| 493,409 | | Pericom Semiconductor Corp.* | | | 7,243,244 |
| 526,190 | | PLX Technology, Inc.* | | | 3,509,687 |
| 444,902 | | Power Integrations, Inc.* | | | 13,017,833 |
| 393,055 | | PSi Technologies Holdings, Inc. ADR* | | | 235,833 |
| 425,590 | | SiRF Technology Holdings, Inc.* | | | 2,166,253 |
| 104,545 | | Supertex, Inc.* | | | 2,133,764 |
| | | | | |
| | | | | 56,932,554 |
| | | | | |
| | Specialized Finance 1.3% | | | |
| 207,435 | | Arques Industries AG (Germany) | | | 4,059,094 |
| 154,000 | | Goldwater Bank, N.A.* *** † | | | 1,540,000 |
| | | | | |
| | | | | 5,599,094 |
| | | | | |
| | Specialty Chemicals 0.4% | | | |
| 430,225 | | Neo Material Technologies, Inc.* (Canada) | | | 1,599,474 |
| | | | | |
| | Specialty Stores 2.8% | | | |
| 482,640 | | Big 5 Sporting Goods Corp. | | | 4,232,753 |
| 197,015 | | easyhome Ltd. (Canada) | | | 3,451,358 |
| 305,612 | | Hibbett Sports, Inc.* | | | 4,718,649 |
| | | | | |
| | | | | 12,402,760 |
| | | | | |
| | Technology Distributors 0.8% | | | |
| 599,149 | | Nu Horizons Electronics Corp.* | | | 3,762,656 |
| | | | | |
| | Thrifts & Mortgage Finance 2.4% | | | |
| 152,525 | | Encore Bancshares, Inc.* | | | 2,669,188 |
| 123,300 | | Home Capital Group, Inc. (Canada) | | | 4,278,000 |
| 212,800 | | United Western Bancorp, Inc. | | | 3,809,120 |
| | | | | |
| | | | | 10,756,308 |
| | | | | |
| | Trading Companies & Distributors 2.5% | | | |
| 498,065 | | Beacon Roofing Supply, Inc.* | | | 4,980,650 |
| 419,647 | | Rush Enterprises, Inc., Class B* | | | 6,160,418 |
| | | | | |
| | | | | 11,141,068 |
| | | | | |
| | Trucking 2.7% | | | |
| 135,870 | | Knight Transportation, Inc. | | | 2,236,420 |
| 159,585 | | Old Dominion Freight Line, Inc.* | | | 5,079,591 |
| 89,575 | | Universal Truckload Services, Inc.* | | | 1,869,430 |
| 186,565 | | Vitran Corp., Inc.* (Canada) | | | 2,662,283 |
| | | | | |
| | | | | 11,847,724 |
| | | | | |
| | |
| | Total Common Stocks
(cost $451,021,529) | | | 434,950,571 |
| | | | | |
| | |
| | PREFERRED STOCKS 0.1% | | | |
| | |
| | Pharmaceuticals 0.1% | | | |
| 414,022 | | Point Biomedical Corp.,
Series A Pfd.* *** † | | | 414,022 |
| | | | | |
| | |
| | Total Preferred Stocks
(cost $226,364) | | | 414,022 |
| | | | | |
52
| | |
| | MARCH 31, 2008 (UNAUDITED) |
|
| |
| |
| | | | | |
Shares | | | | Value |
| | | | | |
| | WARRANTS 0.1% | | | |
| | |
| | Air Freight & Logistics 0.0% | | | |
| 888,830 | | Goodpack Ltd. expiring 7/16/09* (Singapore) | | $ | 141,810 |
| | | | | |
| | Health Care Distributors 0.0% | | | |
| 25,946 | | Familymeds Group, Inc.
expiring 11/30/09* *** † | | | — |
| | | | | |
| | Health Care Equipment 0.1% | | | |
| 121,124 | | Cardica, Inc. expiring 6/7/12* *** † | | | 210,756 |
| | | | | |
| | Health Care Supplies 0.0% | | | |
| 106,208 | | CryoCor, Inc. expiring 4/24/12* *** † | | | — |
| | | | | |
| | | | | — |
| | | | | |
| | |
| | Total Warrants
(cost $26,814) | | | 352,566 |
| | | | | |
| | | | | |
Principal
Amount | | | | Value |
| | | | | |
| | SHORT-TERM INVESTMENTS 2.0% | | | |
| | |
| | Repurchase Agreement 2.0% | | | |
| $9,062,000 | | Repurchase Agreement dated 3/31/08, 1.10% due 4/1/08 with Fixed Income Clearing Corporation collateralized by $6,270,000 of United States Treasury Bonds 8.75% due 8/15/20; value: $9,248,250; repurchase proceeds: $9,062,277 (cost $9,062,000) | | $ | 9,062,000 |
| | | | | |
| | |
| | Total Short-Term Investments
(cost $9,062,000) | | | 9,062,000 |
| | | | | |
| | |
| | Total Investments
(cost $460,336,707) 99.9%^^ | | | 444,779,159 |
| | |
| | Other Assets less Liabilities 0.1% | | | 582,668 |
| | | | | |
| | |
| | NET ASSETS 100.0% | | $ | 445,361,827 |
| | | | | |
| |
| | *Non-income producing. **Common units. ***Security was fair valued under procedures adopted by the Board of Directors (see Note 2). †Security purchased in a private placement transaction or under Rule 144A of the Securities Act of 1933 (see Note 9). ††Affiliated company (see Note 8). ^^The aggregate amount of foreign securities fair valued pursuant to a systematic fair valuation model as a percent of net assets was 15.35%. ADR American Depositary Receipts. REIT Real Estate Investment Trust. See notes to financial statements. |
At March 31, 2008, Wasatch Micro Cap Fund’s investments, excluding short-term investments, were in the following countries:
| | | |
| Country | | % | |
Australia | | 1.7 | |
Belgium | | 0.8 | |
Bermuda | | 0.8 | |
Brazil | | 0.6 | |
Canada | | 5.7 | |
Cayman Islands | | 2.5 | |
China | | 1.7 | |
Germany | | 0.9 | |
Hong Kong | | <0.1 | |
Ireland | | 0.9 | |
Korea | | 1.1 | |
Norway | | 1.9 | |
Singapore | | 6.5 | |
Sweden | | 0.6 | |
United Kingdom | | 0.7 | |
United States | | 73.6 | |
| | | |
TOTAL | | 100.0 | % |
| | | |
53
| | |
| WASATCH MICRO CAP VALUE FUND (WAMVX) — Schedule of Investments | | |
|
| |
| |
| | | | | |
| Shares | | | | Value |
| | | | | |
| | COMMON STOCKS 92.2% | | | |
| | |
| | Advertising 0.6% | | | |
| 81,415 | | MDC Partners, Inc., Class A* (Canada) | | $ | 591,887 |
| | | | | |
| | Aerospace & Defense 2.8% | | | |
| 32,090 | | Esterline Technologies Corp.* ††† | | | 1,616,373 |
| 131,815 | | Luna Innovations, Inc.* | | | 1,053,202 |
| | | | | |
| | | | | 2,669,575 |
| | | | | |
| | Air Freight & Logistics 0.7% | | | |
| 818,345 | | AutoInfo, Inc.* | | | 613,759 |
| | | | | |
| | Apparel, Accessories & Luxury Goods 0.9% | | | |
| 2,150,000 | | EganaGoldpfeil Holdings Ltd.* *** (Hong Kong) | | | 45,583 |
| 40,000 | | Volcom, Inc.* | | | 808,400 |
| | | | | |
| | | | | 853,983 |
| | | | | |
| | Application Software 5.8% | | | |
| 1,622,096 | | Guestlogix, Inc.* (Canada) | | | 1,894,419 |
| 92,600 | | Interactive Intelligence, Inc.* ††† | | | 1,089,902 |
| 168,520 | | Opnet Technologies, Inc.* ††† | | | 1,371,753 |
| 2,399,959 | | Silverlake Axis Ltd. (Singapore) | | | 692,782 |
| 191,120 | | Veraz Networks, Inc.* | | | 470,155 |
| | | | | |
| | | | | 5,519,011 |
| | | | | |
| | Asset Management & Custody Banks 0.9% | | | |
| 91,732 | | Treasury Group Ltd. (Australia) | | | 838,849 |
| | | | | |
| | Auto Parts & Equipment 1.2% | | | |
| 1,735,000 | | Azure Dynamics Corp.* (Canada) | | | 422,142 |
| 90,000 | | Martinrea International, Inc.* (Canada) | | | 663,066 |
| | | | | |
| | | | | 1,085,208 |
| | | | | |
| | Biotechnology 1.0% | | | |
| 88,729 | | Accentia Biopharmaceuticals, Inc.* | | | 98,489 |
| 33,500 | | Array BioPharma, Inc.* | | | 234,835 |
| 63,825 | | Cytori Therapeutics, Inc.* | | | 304,445 |
| 101,331 | | NeurogesX, Inc. PIPE* *** † | | | 353,292 |
| | | | | |
| | | | | 991,061 |
| | | | | |
| | Building Products 1.0% | | | |
| 10,000 | | Ameron International Corp. | | | 935,300 |
| | | | | |
| | Communications Equipment 1.6% | | | |
| 348,425 | | Airspan Networks, Inc.* | | | 327,520 |
| 381,200 | | AltiGen Communications, Inc.* | | | 628,980 |
| 107,360 | | ShoreTel, Inc.* | | | 549,683 |
| | | | | |
| | | | | 1,506,183 |
| | | | | |
| | Computer Storage & Peripherals 0.5% | | | |
| 39,000 | | Intevac, Inc.* | | | 505,050 |
| | | | | |
| | Construction & Engineering 1.2% | | | |
| 130,000 | | Pratibha Industries Ltd. (India) | | | 1,090,483 |
| | | | | |
| | Construction & Farm Machinery & Heavy Trucks 1.2% | | | |
| 2,200,000 | | China Farm Equipment Ltd. (China) | | | 601,748 |
| 30,000 | | Titan Machinery, Inc.* | | | 561,000 |
| | | | | |
| | | | | 1,162,748 |
| | | | | |
| | Consumer Finance 1.7% | | | |
| 48,842 | | Dollar Financial Corp.* ††† | | | 1,123,366 |
| 48,400 | | First Cash Financial Services, Inc.* ††† | | | 499,972 |
| | | | | |
| | | | | 1,623,338 |
| | | | | |
| | Diversified Banks 0.5% | | | |
| 55,556 | | Idaho Trust Bancorp* *** † | | | 500,004 |
| | | | | |
| | | | | |
| Shares | | | | Value |
| | | | | |
| | Diversified Chemicals 0.6% | | | |
| 35,000 | | LSB Industries, Inc.* | | $ | 515,900 |
| | | | | |
| | Diversified Commercial & Professional Services 0.8% | | | |
| 30,683 | | Healthcare Services Group | | | 633,297 |
| 276,000 | | ProLink Holdings Corp.* | | | 129,720 |
| | | | | |
| | | | | 763,017 |
| | | | | |
| | Education Services 0.6% | | | |
| 43,000 | | Kroton Educational S.A.* ** (Brazil) | | | 562,493 |
| | | | | |
| | Electrical Components & Equipment 1.5% | | | |
| 65,907 | | Orion Energy Systems, Inc.* | | | 628,753 |
| 425,100 | | Peco II, Inc.* | | | 242,307 |
| 1,385,000 | | Wasion Meters Group Ltd. (Hong Kong) | | | 573,669 |
| | | | | |
| | | | | 1,444,729 |
| | | | | |
| | Electronic Equipment Manufacturers 0.7% | | | |
| 490,000 | | Interlink Electronics, Inc.* | | | 494,900 |
| 1,519,800 | | QRSciences Holdings Ltd.* (Australia) | | | 121,919 |
| | | | | |
| | | | | 616,819 |
| | | | | |
| | Electronic Manufacturing Services 0.2% | | | |
| 506,650 | | Virtek Vision International, Inc.* (Canada) | | | 182,443 |
| | | | | |
| | Environmental & Facilities Services 2.7% | | | |
| 35,000 | | American Ecology Corp. | | | 886,550 |
| 109,000 | | Heritage-Crystal Clean, Inc.* | | | 1,708,030 |
| | | | | |
| | | | | 2,594,580 |
| | | | | |
| | Food Distributors 0.6% | | | |
| 100,000 | | G. Willi-Food International Ltd.* (Israel) | | | 564,000 |
| | | | | |
| | Food Retail 0.7% | | | |
| 1,818,603 | | BreadTalk Group Ltd. (Singapore) | | | 660,945 |
| | | | | |
| | Footwear 1.1% | | | |
| 2,454,000 | | China Hongxing Sports Ltd. (China) | | | 1,062,679 |
| | | | | |
| | Gold 1.4% | | | |
| 110,000 | | Guyana Goldfields, Inc.* (Canada) | | | 741,898 |
| 2,537,180 | | Redcorp Ventures Ltd.* (Canada) | | | 567,933 |
| | | | | |
| | | | | 1,309,831 |
| | | | | |
| | Health Care Equipment 10.3% | | | |
| 74,500 | | AtriCure, Inc.* | | | 949,130 |
| 159,753 | | Cardica, Inc.* ††† | | | 1,180,575 |
| 64,275 | | Electro-Optical Sciences, Inc.* | | | 381,794 |
| 150,734 | | Encision, Inc.* | | | 330,107 |
| 121,000 | | MTS Medication Technologies, Inc.* ††† | | | 1,476,200 |
| 27,740 | | NuVasive, Inc.* | | | 957,307 |
| 97,000 | | Orthovita, Inc.* | | | 250,260 |
| 92,905 | | SenoRx, Inc.* | | | 599,237 |
| 164,300 | | Thermage, Inc.* | | | 542,190 |
| 170,000 | | VNUS Medical Technologies, Inc.* ††† | | | 3,092,300 |
| | | | | |
| | | | | 9,759,100 |
| | | | | |
| | Health Care Facilities 1.7% | | | |
| 76,475 | | Capital Senior Living Corp.* | | | 615,624 |
| 110,000 | | Five Star Quality Care, Inc.* | | | 698,500 |
| 242,050 | | HearUSA, Inc.* | | | 309,824 |
| | | | | |
| | | | | 1,623,948 |
| | | | | |
54
| | |
| | MARCH 31, 2008 (UNAUDITED) |
|
| |
| |
| | | | | |
| Shares | | | | Value |
| | | | | |
| | Health Care Services 3.0% | | | |
| 38,805 | | Birner Dental Management Services, Inc. | | $ | 720,997 |
| 32,100 | | CorVel Corp.* | | | 981,939 |
| 37,800 | | Providence Service Corp. (The)* | | | 1,134,000 |
| | | | | |
| | | | | 2,836,936 |
| | | | | |
| | Health Care Supplies 1.7% | | | |
| 297,306 | | CryoCor, Inc.* | | | 469,743 |
| 40,700 | | ICU Medical, Inc.* | | | 1,170,939 |
| | | | | |
| | | | | 1,640,682 |
| | | | | |
| | Health Care Technology 0.0% | | | |
| 110,080 | | Ophthalmic Imaging Systems* | | | 38,528 |
| | | | | |
| | Homebuilding 0.6% | | | |
| 120,000 | | Trisul S.A.* (Brazil) | | | 554,553 |
| | | | | |
| | Homefurnishing Retail 0.6% | | | |
| 187,095 | | Fantastic Holdings Ltd. (Australia) | | | 520,233 |
| | | | | |
| | Hotels, Resorts & Cruise Lines 0.8% | | | |
| 131,090 | | Club Cruise Entertainment & Travelling Services Europe N.V.* *** (Norway) | | | 772,784 |
| | | | | |
| | Human Resource & Employment Services 0.9% | | | |
| 50,000 | | Resources Connection, Inc. | | | 893,500 |
| | | | | |
| | Industrial Machinery 1.5% | | | |
| 2,000,000 | | China Automation Group Ltd.* (China) | | | 635,346 |
| 27,705 | | Kadant, Inc.* | | | 813,973 |
| | | | | |
| | | | | 1,449,319 |
| | | | | |
| | Internet Software & Services 1.7% | | | |
| 504,509 | | Selectica, Inc.* | | | 686,132 |
| 65,400 | | TechTarget, Inc.* | | | 926,718 |
| | | | | |
| | | | | 1,612,850 |
| | | | | |
| | Investment Banking & Brokerage 2.3% | | | |
| 350,000 | | ABG Sundal Collier ASA (Norway) | | | 639,996 |
| 23,800 | | FCStone Group, Inc.* | | | 659,260 |
| 15,691 | | KIWOOM Securities Co. Ltd.* (Korea) | | | 896,040 |
| | | | | |
| | | | | 2,195,296 |
| | | | | |
| | IT Consulting & Other Services 3.0% | | | |
| 56,500 | | NCI, Inc., Class A* ††† | | | 1,063,330 |
| 900,022 | | Pfsweb, Inc.* | | | 810,020 |
| 42,015 | | Telvent GIT, S.A. (Spain) | | | 993,655 |
| | | | | |
| | | | | 2,867,005 |
| | | | | |
| | Managed Health Care 0.6% | | | |
| 190,900 | | United American Healthcare Corp.* | | | 538,338 |
| | | | | |
| | Marine 1.0% | | | |
| 80,000 | | Euroseas Ltd. | | | 960,000 |
| | | | | |
| | Mortgage REITs 1.1% | | | |
| 131,800 | | NorthStar Realty Finance Corp. | | | 1,076,806 |
| | | | | |
| | Oil & Gas Drilling 1.4% | | | |
| 174,600 | | Ithaca Energy, Inc.* (Canada) | | | 465,600 |
| 77,160 | | Phoenix Technology Income Fund** (Canada) | | | 814,780 |
| | | | | |
| | | | | 1,280,380 |
| | | | | |
| | Oil & Gas Equipment & Services 1.6% | | | |
| 197,000 | | Aeroquest International Ltd.* (Canada) | | | 460,146 |
| 747,690 | | Bayou Bend Petroleum Ltd.* (Canada) | | | 392,947 |
| 339,000 | | Swiber Holdings Ltd.* (Singapore) | | | 630,340 |
| | | | | |
| | | | | 1,483,433 |
| | | | | |
| | | | | |
| Shares | | | | Value |
| | | | | |
| | Oil & Gas Exploration & Production 3.1% | | | |
| 38,860 | | Approach Resources, Inc.* | | $ | 609,325 |
| 65,000 | | BPZ Energy, Inc.* | | | 1,412,450 |
| 133,000 | | Northern Oil and Gas, Inc.* | | | 942,970 |
| | | | | |
| | | | | 2,964,745 |
| | | | | |
| | Oil & Gas Refining & Marketing 1.6% | | | |
| 55,000 | | World Fuel Services Corp.††† | | | 1,543,850 |
| | | | | |
| | Personal Products 0.4% | | | |
| 628,000 | | Beauty China Holdings Ltd. (Singapore) | | | 350,721 |
| | | | | |
| | Pharmaceuticals 0.8% | | | |
| 53,105 | | Obagi Medical Products, Inc.* | | | 460,951 |
| 286,000 | | Osteologix, Inc.* | | | 301,730 |
| | | | | |
| | | | | 762,681 |
| | | | | |
| | Regional Banks 4.1% | | | |
| 1,100,000 | | City Union Bank Ltd. (India) | | | 772,614 |
| 30,000 | | Commonwealth Bankshares, Inc. | | | 510,000 |
| 60,000 | | Epic Bancorp | | | 706,200 |
| 223,613 | | First Bank of Delaware* | | | 581,394 |
| 28,350 | | First of Long Island Corp. | | | 542,335 |
| 30,000 | | Mercantile Bank Corp. | | | 309,600 |
| 30,710 | | Security Business Bank of San Diego* | | | 422,262 |
| | | | | |
| | | | | 3,844,405 |
| | | | | |
| | Reinsurance 0.7% | | | |
| 70,000 | | CastlePoint Holdings Ltd. (Bermuda) | | | 681,100 |
| | | | | |
| | Semiconductor Equipment 2.9% | | | |
| 184,400 | | inTEST Corp.* | | | 378,020 |
| 287,089 | | LogicVision, Inc.* | | | 456,471 |
| 237,285 | | PDF Solutions, Inc.* | | | 1,307,441 |
| 28,350 | | Tessera Technologies, Inc.* | | | 589,680 |
| | | | | |
| | | | | 2,731,612 |
| | | | | |
| | Semiconductors 4.4% | | | |
| 47,110 | | Intellon Corp.* | | | 231,781 |
| 180,000 | | MIPS Technologies, Inc.* | | | 712,800 |
| 178,340 | | O2Micro International Ltd. ADR* ††† (Cayman Islands) | | | 1,378,568 |
| 90,000 | | PLX Technology, Inc.* | | | 600,300 |
| 26,555 | | Power Integrations, Inc.* | | | 777,000 |
| 88,190 | | SiRF Technology Holdings, Inc.* ††† | | | 448,887 |
| | | | | |
| | | | | 4,149,336 |
| | | | | |
| | Specialized Finance 1.5% | | | |
| 25,000 | | Arques Industries AG (Germany) | | | 489,201 |
| 41,900 | | Goldwater Bank, N.A.* *** † | | | 419,000 |
| 100,000 | | MicroFinancial, Inc. | | | 523,000 |
| | | | | |
| | | | | 1,431,201 |
| | | | | |
| | Specialty Chemicals 0.9% | | | |
| 38,072 | | ADA-ES, Inc.* | | | 318,662 |
| 145,000 | | Allen-Vanguard Corp.* (Canada) | | | 482,628 |
| | | | | |
| | | | | 801,290 |
| | | | | |
| | Specialty Stores 0.9% | | | |
| 50,000 | | easyhome Ltd. (Canada) | | | 875,912 |
| | | | | |
| | Steel 3.4% | | | |
| 159,000 | | Globe Specialty Metals, Inc. * (United Kingdom) | | | 3,259,500 |
| | | | | |
55
| | |
| WASATCH MICRO CAP VALUE FUND (WAMVX) — Schedule of Investments (continued) |
|
| |
| |
| | | | | |
Shares | | | | Value |
| | | | | |
| | Thrifts & Mortgage Finance 1.2% | | | |
| 10,300 | | Home Capital Group, Inc. (Canada) | | $ | 357,367 |
| 45,930 | | United Western Bancorp, Inc. | | | 822,147 |
| | | | | |
| | | | | 1,179,514 |
| | | | | |
| | |
| | Total Common Stocks
(cost $88,229,792) | | | 87,443,433 |
| | | | | |
| | |
| | PREFERRED STOCKS 0.1% | | | |
| | |
| | Pharmaceuticals 0.1% | | | |
| 82,803 | | Point Biomedical Corp., Series A Pfd.* *** † | | | 82,803 |
| | | | | |
| | |
| | Total Preferred Stocks
(cost $45,272) | | | 82,803 |
| | | | | |
| | |
| | WARRANTS 0.1% | | | |
| | |
| | Biotechnology 0.0% | | | |
| 30,399 | | NeurogesX, Inc. expiring 12/28/12* *** † | | | — |
| | | | | |
| | Gold 0.0% | | | |
| 855,000 | | Redcorp Ventures Ltd. expiring 7/10/09* *** † (Canada) | | | — |
| | | | | |
| | Health Care Distributors 0.0% | | | |
| 6,486 | | Familymeds Group, Inc. expiring 11/30/09* *** † | | | — |
| | | | | |
| | Health Care Equipment 0.1% | | | |
| 58,140 | | Cardica, Inc. expiring 6/7/12* *** † | | | 101,164 |
| 5,295 | | Electro-Optical Sciences, Inc. expiring 10/31/11* *** † | | | — |
| | | | | |
| | | | | 101,164 |
| | | | | |
| | Health Care Supplies 0.0% | | | |
| 26,551 | | CryoCor, Inc. expiring 4/24/12* *** † | | | — |
| | | | | |
| | Hotels, Resorts & Cruise Lines 0.0% | | | |
| 94,548 | | Club Cruise Entertainment & Travelling Services Europe N.V. expiring 4/25/12* *** (Norway) | | | — |
| | | | | |
| | Pharmaceuticals 0.0% | | | |
| 7,164 | | Acusphere, Inc. expiring 8/2/08* *** † | | | — |
| 1,436 | | Acusphere, Inc. expiring 10/20/08* *** † | | | — |
| | | | | |
| | | | | — |
| | | | | |
| | Precious Metals & Minerals 0.0% | | | |
| 603,880 | | Farallon Resources Ltd. expiring 12/21/08* *** † (Canada) | | | 32,148 |
| | | | | |
| | |
| | Total Warrants
(cost $228,226) | | | 133,312 |
| | | | | |
| | |
Number of
Contracts | | | | Value |
| | |
| | CALL OPTIONS PURCHASED 0.1% | | | |
| | |
| 891 | | MFA Mortgage Investments, Inc. expiring 4/19/08 exercise price $7.50 | | $ | 8,910 |
| 545 | | MFA Mortgage Investments, Inc. expiring 7/19/08 exercise price $7.50 | | | 29,975 |
| | | | | |
| | |
| | Total Call Options Purchased
(premium $122,450) | | | 38,885 |
| | | | | |
| | | | | | |
| | |
Principal
Amount | | | | Value | |
| | | | | | |
| | SHORT-TERM INVESTMENTS 8.1% | | | | |
| | |
| | Repurchase Agreement 8.1% | | | | |
| $7,707,000 | | Repurchase Agreement dated 3/31/08, 1.10% due 4/1/08 with Fixed Income Clearing Corporation collateralized by $5,330,000 of United States Treasury Bonds 8.75% due 8/15/20; value: $7,861,750; repurchase proceeds: $7,707,235 (cost $7,707,000)††† | | $ | 7,707,000 | |
| | | | | | |
| | |
| | Total Short-Term Investments
(cost $7,707,000) | | | 7,707,000 | |
| | | | | | |
| | |
| | Total Investments
(cost $96,332,740) 100.6%^^ | | | 95,405,433 | |
| | |
| | Liabilities less Other Assets (0.6)% | | | (588,833 | ) |
| | | | | | |
| | |
| | NET ASSETS 100.0% | | $ | 94,816,600 | |
| | | | | | |
| | |
Number of
Contracts | | | | Value | |
| | |
| | CALL OPTIONS WRITTEN | | | | |
| | |
| 650 | | BPZ Resources, Inc. expiring 4/19/08 exercise price $17.50 | | $ | 292,500 | |
| 320 | | Esterline Technologies Corp. expiring 4/19/08 exercise price $50 | | | 49,600 | |
| 484 | | First Cash Financial Services, Inc. expiring 4/19/08 exercise price $7.50 | | | 130,680 | |
| 1,233 | | O2Micro International Ltd. ADR expiring 4/19/08 exercise price $7.50 | | | 61,650 | |
| | | | | | |
| | |
| | Total Call Options Written
(premium $479,510) | | | 534,430 | |
| | | | | | |
| | |
| Shares | | | | Value | |
| | |
| | SECURITIES SOLD SHORT | | | | |
| | |
| 60,000 | | CBIZ, Inc.* | | $ | 487,200 | |
| 13,500 | | Rubicon Technology, Inc.* | | | 391,230 | |
| 9,105 | | Ultimate Software Group, Inc.* | | | 273,696 | |
| | | | | | |
| | |
| | Total Securities Sold Short
(proceeds $1,186,742) | | | 1,152,126 | |
| | | | | | |
| | *Non-income producing. **Common units. ***Security was fair valued under procedures adopted by the Board of Directors (see Note 2). †Security purchased in a private placement transaction or under Rule 144A of the Securities Act of 1933 (see Note 9). †††All or a portion of this security has been designated as collateral for written options and open short positions. ^^The aggregate amount of foreign securities fair valued pursuant to a systematic fair valuation model as a percent of net assets was 11.16%. ADR American Depositary Receipts. PIPE Private Investment in a Public Equity. REIT Real Estate Investment Trust. See notes to financial statements. | |
56
| | |
| | MARCH 31, 2008 (UNAUDITED) |
|
| |
| |
At March 31, 2008, Wasatch Micro Cap Value Fund’s investments, excluding short-term investments, written options, and securities sold short, were in the following countries:
| | | |
| Country | | % | |
Australia | | 1.7 | |
Bermuda | | 0.8 | |
Brazil | | 1.3 | |
Canada | | 10.2 | |
Cayman Islands | | 1.6 | |
China | | 2.6 | |
Germany | | 0.6 | |
Hong Kong | | 0.7 | |
India | | 2.1 | |
Israel | | 0.6 | |
Korea | | 1.0 | |
Norway | | 1.6 | |
Singapore | | 2.7 | |
Spain | | 1.1 | |
United Kingdom | | 3.7 | |
United States | | 67.7 | |
| | | |
TOTAL | | 100.0 | % |
| | | |
57
| | |
| WASATCH SMALL CAP GROWTH FUND (WAAEX) — Schedule of Investments | | |
|
| |
| |
| | | | | |
| Shares | | | | Value |
| | | | | |
| | COMMON STOCKS 95.0% | | | |
| | |
| | Air Freight & Logistics 0.8% | | | |
| 5,549,982 | | Goodpack Ltd. (Singapore) | | $ | 6,419,110 |
| | | | | |
| | Airlines 0.6% | | | |
| 294,875 | | WestJet Airlines Ltd.* (Canada) | | | 5,332,144 |
| | | | | |
| | Apparel, Accessories & Luxury Goods 0.9% | | | |
| 20,365 | | Bijou Brigitte AG (Germany) | | | 3,214,297 |
| 232,540 | | Volcom, Inc.* | | | 4,699,633 |
| | | | | |
| | | | | 7,913,930 |
| | | | | |
| | Apparel Retail 1.0% | | | |
| 538,595 | | Zumiez, Inc.* | | | 8,450,556 |
| | | | | |
| | Application Software 2.8% | | | |
| 443,960 | | FactSet Research Systems, Inc. | | | 23,916,125 |
| | | | | |
| | Automotive Retail 4.9% | | | |
| 1,473,792 | | O’Reilly Automotive, Inc.* | | | 42,032,548 |
| | | | | |
| | Auto Parts & Equipment 0.5% | | | |
| 302,363 | | Amerigon, Inc.* | | | 4,474,972 |
| | | | | |
| | Biotechnology 1.1% | | | |
| 43,268 | | Myriad Genetics, Inc.* | | | 1,743,268 |
| 297,814 | | Orexigen Therapeutics, Inc.* | | | 3,067,484 |
| 243,840 | | Seattle Genetics, Inc.* | | | 2,218,944 |
| 204,600 | | ZymoGenetics, Inc.* | | | 2,005,080 |
| | | | | |
| | | | | 9,034,776 |
| | | | | |
| | Communications Equipment 1.1% | | | |
| 342,235 | | F5 Networks, Inc.* | | | 6,218,410 |
| 174,195 | | Neutral Tandem, Inc.* | | | 3,137,252 |
| | | | | |
| | | | | 9,355,662 |
| | | | | |
| | Computer & Electronics Retail 1.0% | | | |
| 786,503 | | hhgregg, Inc.* | | | 8,848,159 |
| | | | | |
| | Computer Storage & Peripherals 0.6% | | | |
| 225,275 | | Data Domain, Inc.* | | | 5,361,545 |
| | | | | |
| | Construction & Engineering 1.8% | | | |
| 4,855,790 | | Midas Holdings Ltd. (Singapore) | | | 3,561,764 |
| 317,559 | | Stantec, Inc.* (Canada) | | | 9,288,601 |
| 66,095 | | URS Corp.* | | | 2,160,646 |
| | | | | |
| | | | | 15,011,011 |
| | | | | |
| | Construction & Farm Machinery & Heavy Trucks 1.7% | | | |
| 146,300 | | Bucyrus International, Inc., Class A | | | 14,871,395 |
| | | | | |
| | Distributors 1.0% | | | |
| 372,165 | | LKQ Corp.* | | | 8,362,548 |
| | | | | |
| | Diversified Banks 3.6% | | | |
| 520,361 | | Bank of N.T. Butterfield & Son Ltd. (Bermuda) | | | 9,028,263 |
| 218,385 | | HDFC Bank Ltd. ADR (India) | | | 21,454,142 |
| | | | | |
| | | | | 30,482,405 |
| | | | | |
| | Diversified Commercial & Professional Services 5.2% | | | |
| 108,324 | | Advisory Board Co. (The)* | | | 5,951,321 |
| 461,296 | | Copart, Inc.* | | | 17,879,833 |
| 265,298 | | CRA International, Inc.* ††† | | | 8,526,678 |
| 508,186 | | Transfield Services Ltd. (Australia) | | | 5,128,065 |
| 388,805 | | Wirecard AG* (Germany) | | | 6,814,508 |
| | | | | |
| | | | | 44,300,405 |
| | | | | |
| | | | | |
| Shares | | | | Value |
| | | | | |
| | Education Services 2.9% | | | |
| 101,447 | | Capella Education Co.* | | $ | 5,539,006 |
| 129,290 | | Strayer Education, Inc. | | | 19,716,725 |
| | | | | |
| | | | | 25,255,731 |
| | | | | |
| | Environmental & Facilities Services 0.4% | | | |
| 139,722 | | EnergySolutions, Inc. | | | 3,205,223 |
| | | | | |
| | Health Care Distributors 1.5% | | | |
| 364,450 | | MWI Veterinary Supply, Inc.* | | | 12,850,507 |
| | | | | |
| | Health Care Equipment 2.4% | | | |
| 422,992 | | Abaxis, Inc.* ††† | | | 9,800,725 |
| 332,588 | | Dexcom, Inc.* | | | 1,376,914 |
| 609,996 | | NxStage Medical, Inc.* | | | 2,635,183 |
| 152,437 | | ResMed, Inc.* | | | 6,429,793 |
| | | | | |
| | | | | 20,242,615 |
| | | | | |
| | Health Care Facilities 1.2% | | | |
| 428,899 | | AmSurg Corp.* ††† | | | 10,156,328 |
| | | | | |
| | Health Care Services 5.5% | | | |
| 417,711 | | Bio-Reference Laboratories, Inc.* | | | 11,040,102 |
| 304,019 | | Healthways, Inc.* | | | 10,744,031 |
| 590,130 | | Nighthawk Radiology Holdings, Inc.* | | | 5,523,617 |
| 289,700 | | Pediatrix Medical Group, Inc.* | | | 19,525,780 |
| | | | | |
| | | | | 46,833,530 |
| | | | | |
| | Health Care Technology 0.2% | | | |
| 109,150 | | Vital Images, Inc.* | | | 1,617,603 |
| | | | | |
| | Human Resource & Employment Services 3.2% | | | |
| 1,524,151 | | Resources Connection, Inc. | | | 27,236,578 |
| | | | | |
| | Insurance Brokers 0.8% | | | |
| 328,171 | | eHealth, Inc.* | | | 7,242,734 |
| | | | | |
| | Integrated Telecommunication Services 1.3% | | | |
| 426,460 | | NeuStar, Inc., Class A* | | | 11,292,661 |
| | | | | |
| | Internet Retail 0.5% | | | |
| 279,683 | | Shutterfly, Inc.* | | | 4,158,886 |
| | | | | |
| | Internet Software & Services 3.9% | | | |
| 629,671 | | CyberSource Corp.* | | | 9,199,493 |
| 907,029 | | DealerTrack Holdings, Inc.* | | | 18,340,126 |
| 487,900 | | LoopNet, Inc.* | | | 6,196,330 |
| | | | | |
| | | | | 33,735,949 |
| | | | | |
| | Investment Banking & Brokerage 2.4% | | | |
| 177,600 | | GFI Group, Inc. | | | 10,176,480 |
| 121,951 | | KIWOOM Securities Co. Ltd.* (Korea) | | | 6,964,049 |
| 161,380 | | optionsXpress Holdings, Inc. | | | 3,342,180 |
| | | | | |
| | | | | 20,482,709 |
| | | | | |
| | IT Consulting & Other Services 0.0% | | | |
| 8,524 | | EnerNOC, Inc.* | | | 97,174 |
| | | | | |
| | Leisure Facilities 1.1% | | | |
| 312,765 | | Life Time Fitness, Inc.* | | | 9,761,396 |
| | | | | |
| | Leisure Products 0.5% | | | |
| 206,172 | | Pool Corp. | | | 3,894,589 |
| | | | | |
58
| | |
| | MARCH 31, 2008 (UNAUDITED) |
|
| |
| |
| | | | | |
| Shares | | | | Value |
| | | | | |
| | Life Sciences Tools & Services 7.1% | | | |
| 134,710 | | Helicos BioSciences Corp.* | | $ | 813,648 |
| 193,948 | | Icon plc ADR* (Ireland) | | | 12,585,286 |
| 161,415 | | Kendle International, Inc.* | | | 7,250,762 |
| 408,760 | | QIAGEN N.V.* (Netherlands) | | | 8,502,208 |
| 474,170 | | Techne Corp.* | | | 31,940,091 |
| 208,525 | | Valera Pharmaceuticals, Inc. Ureteral Stent* *** † | | | — |
| | | | | |
| | | | | 61,091,995 |
| | | | | |
| | Managed Health Care 0.5% | | | |
| 158,215 | | AMERIGROUP Corp.* | | | 4,324,016 |
| | | | | |
| | Mortgage REITs 1.3% | | | |
| 312,261 | | Redwood Trust, Inc. | | | 11,350,687 |
| | | | | |
| | Office Services & Supplies 0.2% | | | |
| 140,965 | | American Reprographics Co.* | | | 2,091,921 |
| | | | | |
| | Oil & Gas Equipment & Services 2.8% | | | |
| 559,290 | | Pason Systems, Inc. (Canada) | | | 8,219,250 |
| 605,035 | | TGS-NOPEC Geophysical Co. ASA* (Norway) | | | 8,820,024 |
| 308,480 | | Trican Well Service Ltd. (Canada) | | | 6,451,810 |
| | | | | |
| | | | | 23,491,084 |
| | | | | |
| | Other Diversified Financial Services 0.6% | | | |
| 2,446,158 | | Count Financial Ltd. (Australia) | | | 4,351,775 |
| 49,946 | | Riskmetrics Group, Inc.* | | | 966,455 |
| | | | | |
| | | | | 5,318,230 |
| | | | | |
| | Pharmaceuticals 1.0% | | | |
| 577,015 | | Alexza Pharmaceuticals, Inc.* | | | 3,969,863 |
| 680,112 | | Dechra Pharmaceuticals plc (United Kingdom) | | | 4,970,928 |
| 312,788 | | Valera Pharmaceuticals, Inc. CSR VP003* *** † | | | — |
| | | | | |
| | | | | 8,940,791 |
| | | | | |
| | Real Estate Management & Development 0.3% | | | |
| 645,792 | | DTZ Holdings plc (United Kingdom) | | | 2,771,449 |
| | | | | |
| | Regional Banks 3.1% | | | |
| 559,198 | | Bank of the Ozarks, Inc. | | | 13,364,832 |
| 420,915 | | Glacier Bancorp, Inc. | | | 8,068,941 |
| 79,249 | | PrivateBancorp, Inc. | | | 2,493,966 |
| 322,734 | | UCBH Holdings, Inc. | | | 2,504,416 |
| | | | | |
| | | | | 26,432,155 |
| | | | | |
| | Restaurants 1.6% | | | |
| 582,762 | | Peet’s Coffee & Tea, Inc.* | | | 13,700,735 |
| | | | | |
| | Semiconductor Equipment 0.6% | | | |
| 264,845 | | Tessera Technologies, Inc.* | | | 5,508,776 |
| | | | | |
| | Semiconductors 8.1% | | | |
| 439,871 | | Melexis N.V. (Belgium) | | | 7,283,763 |
| 831,040 | | Micrel, Inc. | | | 7,703,741 |
| 738,075 | | Microtune, Inc.* | | | 2,701,354 |
| 420,226 | | Netlogic Microsystems, Inc.* | | | 10,144,255 |
| 1,518,825 | | O2Micro International Ltd. ADR* (Cayman Islands) | | | 11,740,517 |
| 976,378 | | Power Integrations, Inc.* | | | 28,568,820 |
| 296,564 | | SiRF Technology Holdings, Inc.* | | | 1,509,511 |
| | | | | |
| | | | | 69,651,961 |
| | | | | |
| | Specialized Finance 0.3% | | | |
| 62,410 | | ASX Ltd. (Australia) | | | 2,148,868 |
| | | | | |
| | Specialty Stores 1.9% | | | |
| 1,046,984 | | Hibbett Sports, Inc.* | | | 16,165,433 |
| | | | | |
| | | | | |
| Shares | | | | Value |
| | | | | |
| | Systems Software 1.3% | | | |
| 370,660 | | Quality Systems, Inc. | | $ | 11,071,614 |
| | | | | |
| | Thrifts & Mortgage Finance 1.3% | | | |
| 332,541 | | Home Capital Group, Inc. (Canada) | | | 11,537,797 |
| | | | | |
| | Trading Companies & Distributors 2.2% | | | |
| 5,914,875 | | Emeco Holdings Ltd. (Australia) | | | 4,348,616 |
| 341,285 | | MSC Industrial Direct Co., Inc., Class A | | | 14,419,291 |
| | | | | |
| | | | | 18,767,907 |
| | | | | |
| | Trucking 4.4% | | | |
| 2,271,639 | | Knight Transportation, Inc. | | | 37,391,178 |
| 4,550 | | Localiza Rent A Car S.A. (Brazil) | | | 43,431 |
| | | | | |
| | | | | 37,434,609 |
| | | | | |
| | |
| | Total Common Stocks
(cost $716,005,128) | | | 814,031,532 |
| | | | | |
| | |
| | PREFERRED STOCKS 1.5% | | | |
| | |
| | Biotechnology 0.5% | | | |
| 625,000 | | Fluidigm Corp., Series E Pfd.* *** † | | | 2,500,000 |
| 677,966 | | Nanosys, Inc., Series D Pfd.* *** † | | | 2,000,000 |
| | | | | |
| | | | | 4,500,000 |
| | | | | |
| | Health Care Equipment 0.3% | | | |
| 750,000 | | Orqis Medical Corp., Series D Pfd.* *** † | | | 1,200,000 |
| 1,620,220 | | Zonare Medical Systems, Inc., Series E Pfd.* *** † | | | 1,343,162 |
| | | | | |
| | | | | 2,543,162 |
| | | | | |
| | Health Care Services 0.1% | | | |
| 516,161 | | Bravo Health, Inc., Series G Pfd.* *** † | | | 851,666 |
| 362,782 | | TargetRX, Inc., Series D Pfd.* *** † | | | 3,628 |
| | | | | |
| | | | | 855,294 |
| | | | | |
| | Integrated Telecommunication Services 0.4% | | | |
| 236,372 | | Neutral Tandem, Inc., Series C Pfd.
PIPE* *** † | | | 4,086,777 |
| | | | | |
| | Internet Software & Services 0.1% | | | |
| 404,517 | | Incipient, Inc., Series D Pfd.* *** † | | | 468,431 |
| | | | | |
| | Pharmaceuticals 0.1% | | | |
| 524,519 | | Point Biomedical Corp., Series A Pfd.* *** † | | | 524,519 |
| | | | | |
| | |
| | Total Preferred Stocks
(cost $12,173,182) | | | 12,978,183 |
| | | | | |
| | |
| | LIMITED PARTNERSHIP INTEREST 0.4% | | | |
| | |
| | Other 0.4% | | | |
| | Montagu Newhall Global Partners II-B, L.P.*** † | | | 2,984,112 |
| | Montagu Newhall Global Partners III-B, L.P.*** † | | | 589,774 |
| | | | | |
| | | | | 3,573,886 |
| | | | | |
| | |
| | Total Limited Partnership Interest
(cost $4,021,435) | | | 3,573,886 |
| | | | | |
59
| | |
| WASATCH SMALL CAP GROWTH FUND (WAAEX) — Schedule of Investments (continued) |
|
| |
| |
| | | | | |
| Shares | | | | Value |
| | | | | |
| | WARRANTS 0.0% | | | |
| | |
| | Health Care Equipment 0.0% | | | |
| 243,033 | | Zonare Medical Systems, Inc.
expiring 6/30/11* *** † | | $ | — |
| | | | | |
| | |
| | Total Warrants
(cost $0) | | | — |
| | | | | |
| | |
Principal
Amount | | | | Value |
| | SHORT-TERM INVESTMENTS 3.0% | | | |
| | |
| | Repurchase Agreement 3.0% | | | |
| $25,447,000 | | Repurchase Agreement dated 3/31/08, 1.10% due 4/1/08 with Fixed Income Clearing Corporation collateralized by $17,600,000 of United States Treasury Bonds 8.75% due 8/15/20; value: $25,960,000; repurchase proceeds: $25,447,778††† (cost $25,447,000) | | $ | 25,447,000 |
| | | | | |
| | |
| | Total Short-Term Investments
(cost $25,447,000) | | | 25,447,000 |
| | | | | |
| | |
| | Total Investments
(cost $757,646,745) 100.0%^^ | | | 856,030,601 |
| | |
| | Other Assets less Liabilities 0.0% | | | 110,099 |
| | | | | |
| | |
| | NET ASSETS 100.0% | | $ | 856,140,700 |
| | | | | |
| |
| | *Non-income producing. ***Security was fair valued under procedures adopted by the Board of Directors (see Note 2). †Security purchased in a private placement transaction or under Rule 144A of the Securities Act of 1933 (see Note 9). †††All or a portion of this security has been designated as collateral for purchase commitments (see Note 10). ^^The aggregate amount of foreign securities fair valued pursuant to a systematic fair valuation model as a percent of net assets was 7.8%. ADR American Depositary Receipt. PIPE Private Investment in a Public Equity. REIT Real Estate Investment Trust. See notes to financial statements. |
At March 31, 2008, Wasatch Small Cap Growth Fund’s investments, excluding short-term investments, were in the following countries:
| | | |
| Country | | % | |
Australia | | 1.9 | |
Belgium | | 0.9 | |
Bermuda | | 1.1 | |
Brazil | | <0.1 | |
Canada | | 4.9 | |
Cayman Islands | | 1.4 | |
Germany | | 1.2 | |
India | | 2.6 | |
Ireland | | 1.5 | |
Korea | | 0.9 | |
Netherlands | | 1.0 | |
Norway | | 1.1 | |
Singapore | | 1.2 | |
United Kingdom | | 0.9 | |
United States | | 79.4 | |
| | | |
TOTAL | | 100.0 | % |
| | | |
60
| | |
| WASATCH SMALL CAP VALUE FUND (WMCVX) — Schedule of Investments | | MARCH 31, 2008 (UNAUDITED) |
|
| |
| |
| | | | | |
| Shares | | | | Value |
| | | | | |
| | COMMON STOCKS 96.2% | | | |
| | |
| | Air Freight & Logistics 1.8% | | | |
| 6,611,821 | | Goodpack Ltd. (Singapore) | | $ | 7,647,233 |
| | | | | |
| | Airlines 0.1% | | | |
| 15,500 | | Copa Holdings S.A. (Panama) | | | 590,705 |
| | | | | |
| | Alternative Carriers 0.9% | | | |
| 198,200 | | Global Village Telecom Holding S.A.* (Brazil) | | | 3,747,527 |
| | | | | |
| | Apparel, Accessories & Luxury Goods 3.4% | | | |
| 26,413 | | Bijou Brigitte AG (Germany) | | | 4,168,879 |
| 271,420 | | Carter’s, Inc.* | | | 4,383,433 |
| 6,959,145 | | EganaGoldpfeil Holdings Ltd.* *** (Hong Kong) | | | 147,543 |
| 85,220 | | Fossil, Inc.* | | | 2,602,619 |
| 158,345 | | Volcom, Inc.* | | | 3,200,152 |
| | | | | |
| | | | | 14,502,626 |
| | | | | |
| | Apparel Retail 1.2% | | | |
| 549,325 | | New York & Co., Inc.* | | | 3,153,126 |
| 116,005 | | Zumiez, Inc.* | | | 1,820,118 |
| | | | | |
| | | | | 4,973,244 |
| | | | | |
| | Asset Management & Custody Banks 2.3% | | | |
| 205,880 | | Apollo Investment Corp. | | | 3,259,081 |
| 471,940 | | Solar Capital, LLC* ** *** † | | | 6,503,333 |
| | | | | |
| | | | | 9,762,414 |
| | | | | |
| | Automotive Retail 0.1% | | | |
| 13,804 | | Monro Muffler, Inc. | | | 233,288 |
| | | | | |
| | Auto Parts & Equipment 1.1% | | | |
| 633,825 | | Martinrea International, Inc.* (Canada) | | | 4,669,640 |
| | | | | |
| | Building Products 0.9% | | | |
| 39,190 | | Ameron International Corp. | | | 3,665,441 |
| | | | | |
| | Communications Equipment 1.4% | | | |
| 215,190 | | Plantronics, Inc. | | | 4,155,319 |
| 338,350 | | ShoreTel, Inc.* | | | 1,732,352 |
| | | | | |
| | | | | 5,887,671 |
| | | | | |
| | Computer Storage & Peripherals 0.4% | | | |
| 848,355 | | Quantum Corp.* | | | 1,815,480 |
| | | | | |
| | Consumer Finance 3.6% | | | |
| 575,813 | | Dollar Financial Corp.* | | | 13,243,699 |
| 574,060 | | United PanAm Financial Corp.* | | | 2,089,578 |
| | | | | |
| | | | | 15,333,277 |
| | | | | |
| | Diversified Banks 2.3% | | | |
| 143,292 | | Axis Bank Ltd. (India) | | | 2,752,062 |
| 407,220 | | Bank of N.T. Butterfield & Son Ltd. (Bermuda) | | | 7,065,267 |
| | | | | |
| | | | | 9,817,329 |
| | | | | |
| | Diversified Capital Markets 0.6% | | | |
| 391,685 | | JMP Group, Inc. | | | 2,741,795 |
| | | | | |
| | Diversified Commercial & Professional Services 2.7% | | | |
| 258,174 | | LPS Brasil — Consultoria de Imoveis S.A.* (Brazil) | | | 4,601,296 |
| 163,490 | | Mobile Mini, Inc.* | | | 3,106,310 |
| 238,698 | | Schawk, Inc. | | | 3,816,781 |
| | | | | |
| | | | | 11,524,387 |
| | | | | |
| | Diversified REITs 1.2% | | | |
| 600,000 | | Star Asia Finance Ltd.*** † (Guernsey) | | | 5,178,000 |
| | | | | |
| | | | | |
| Shares | | | | Value |
| | | | | |
| | Education Services 0.6% | | | |
| 193,265 | | Kroton Educational S.A.* ** (Brazil) | | $ | 2,528,144 |
| | | | | |
| | Electrical Components & Equipment 1.3% | | | |
| 153,486 | | Encore Wire Corp. | | | 2,794,980 |
| 6,415,066 | | Wasion Meters Group Ltd. (Hong Kong) | | | 2,657,131 |
| | | | | |
| | | | | 5,452,111 |
| | | | | |
| | Electronic Manufacturing Services 3.1% | | | |
| 167,830 | | Excel Technology, Inc.* | | | 4,524,697 |
| 767,150 | | TTM Technologies, Inc.* | | | 8,684,138 |
| | | | | |
| | | | | 13,208,835 |
| | | | | |
| | Environmental & Facilities Services 1.3% | | | |
| 236,831 | | EnergySolutions, Inc. | | | 5,432,903 |
| | | | | |
| | Footwear 0.9% | | | |
| 9,245,000 | | China Hongxing Sports Ltd. (China) | | | 4,003,449 |
| | | | | |
| | Gold 0.7% | | | |
| 13,628,640 | | Redcorp Ventures Ltd.* (Canada) | | | 3,050,693 |
| | | | | |
| | Health Care Equipment 1.5% | | | |
| 286,010 | | Invacare Corp. | | | 6,372,303 |
| | | | | |
| | Health Care Facilities 4.7% | | | |
| 916,710 | | Capital Senior Living Corp.* | | | 7,379,515 |
| 441,590 | | Emeritus Corp.* | | | 9,211,567 |
| 516,690 | | Five Star Quality Care, Inc.* | | | 3,280,982 |
| | | | | |
| | | | | 19,872,064 |
| | | | | |
| | Health Care Services 3.7% | | | |
| 52,501 | | Amedisys, Inc.* | | | 2,065,390 |
| 300,817 | | CorVel Corp.* | | | 9,201,992 |
| 262,294 | | LHC Group, Inc.* | | | 4,406,539 |
| | | | | |
| | | | | 15,673,921 |
| | | | | |
| | Health Care Supplies 0.4% | | | |
| 57,052 | | ICU Medical, Inc.* | | | 1,641,386 |
| | | | | |
| | Home Furnishings 0.5% | | | |
| 187,158 | | Stanley Furniture Co., Inc. | | | 2,322,631 |
| | | | | |
| | Industrial Machinery 2.1% | | | |
| 175,185 | | Graco, Inc. | | | 6,352,208 |
| 81,510 | | Kadant, Inc.* | | | 2,394,764 |
| | | | | |
| | | | | 8,746,972 |
| | | | | |
| | Internet Retail 0.5% | | | |
| 695,648 | | US Auto Parts Network, Inc.* | | | 2,226,074 |
| | | | | |
| | Internet Software & Services 1.2% | | | |
| 248,405 | | DealerTrack Holdings, Inc.* | | | 5,022,749 |
| | | | | |
| | IT Consulting & Other Services 0.8% | | | |
| 645,932 | | SM&A* | | | 2,783,967 |
| 18,745 | | Telvent GIT, S.A. (Spain) | | | 443,319 |
| | | | | |
| | | | | 3,227,286 |
| | | | | |
| | Leisure Products 1.1% | | | |
| 241,150 | | Pool Corp. | | | 4,555,324 |
| | | | | |
| | Mortgage REITs 7.0% | | | |
| 602,225 | | Crystal River Capital, Inc. | | | 5,377,869 |
| 115,545 | | MFA Mortgage Investments, Inc. | | | 727,934 |
| 1,460,435 | | NorthStar Realty Finance Corp. | | | 11,931,754 |
| 317,575 | | Redwood Trust, Inc. | | | 11,543,851 |
| | | | | |
| | | | | 29,581,408 |
| | | | | |
61
| | |
| WASATCH SMALL CAP VALUE FUND (WMCVX) — Schedule of Investments (continued) |
|
| |
| |
| | | | | |
| Shares | | | | Value |
| | | | | |
| | Oil & Gas Equipment & Services 3.3% | | | |
| 79,995 | | Oil States International, Inc.* | | $ | 3,584,576 |
| 674,341 | | TETRA Technologies, Inc.* | | | 10,681,561 |
| | | | | |
| | | | | 14,266,137 |
| | | | | |
| | Oil & Gas Exploration & Production 5.1% | | | |
| 368,948 | | BPZ Energy, Inc.* | | | 8,017,240 |
| 1,968,830 | | Far East Energy Corp.* | | | 885,973 |
| 177,495 | | Northern Oil and Gas, Inc.* | | | 1,258,440 |
| 318,440 | | Petrohawk Energy Corp.* | | | 6,422,935 |
| 94,230 | | Plains Exploration & Production Co.* | | | 5,007,382 |
| | | | | |
| | | | | 21,591,970 |
| | | | | |
| | Oil & Gas Refining & Marketing 2.6% | | | |
| 391,580 | | World Fuel Services Corp. | | | 10,991,651 |
| | | | | |
| | Personal Products 0.2% | | | |
| 30,965 | | USANA Health Sciences, Inc.* | | | 682,159 |
| | | | | |
| | Property & Casualty Insurance 1.2% | | | |
| 210,930 | | Tower Group, Inc. | | | 5,309,108 |
| | | | | |
| | Publishing 1.2% | | | |
| 208,834 | | Courier Corp. | | | 5,210,408 |
| | | | | |
| | Regional Banks 2.6% | | | |
| 232,840 | | Commonwealth Bankshares, Inc. | | | 3,958,280 |
| 295,910 | | Mercantile Bank Corp. | | | 3,053,791 |
| 315,700 | | Nara Bancorp, Inc. | | | 4,100,943 |
| | | | | |
| | | | | 11,113,014 |
| | | | | |
| | Restaurants 0.7% | | | |
| 183,383 | | Landry’s Restaurants, Inc. | | | 2,985,475 |
| | | | | |
| | Semiconductors 4.6% | | | |
| 132,486 | | Intellon Corp.* | | | 651,831 |
| 507,250 | | Micrel, Inc. | | | 4,702,207 |
| 510,290 | | Pericom Semiconductor Corp.* | | | 7,491,057 |
| 81,402 | | Power Integrations, Inc.* | | | 2,381,823 |
| 205,556 | | Supertex, Inc.* | | | 4,195,398 |
| | | | | |
| | | | | 19,422,316 |
| | | | | |
| | Specialized Finance 2.4% | | | |
| 88,551 | | GP Investments Ltd. GDR (Brazil) | | | 2,691,028 |
| 286,980 | | KKR Financial Holdings, LLC | | | 3,633,167 |
| 742,623 | | MicroFinancial, Inc.†† | | | 3,883,918 |
| | | | | |
| | | | | 10,208,113 |
| | | | | |
| | Specialty Stores 1.2% | | | |
| 562,385 | | Big 5 Sporting Goods Corp. | | | 4,932,116 |
| | | | | |
| | Steel 3.3% | | | |
| 678,385 | | Globe Specialty Metals, Inc.* (United Kingdom) | | | 13,906,892 |
| | | | | |
| | Technology Distributors 0.9% | | | |
| 633,658 | | Nu Horizons Electronics Corp.* | | | 3,979,372 |
| | | | | |
| | Thrifts & Mortgage Finance 2.0% | | | |
| 61,760 | | Housing Development Finance Corp. Ltd. (India) | | | 3,677,192 |
| 279,541 | | United Western Bancorp, Inc. | | | 5,003,784 |
| | | | | |
| | | | | 8,680,976 |
| | | | | |
| | Trading Companies & Distributors 4.1% | | | |
| 503,609 | | Beacon Roofing Supply, Inc.* | | | 5,036,090 |
| 213,625 | | MSC Industrial Direct Co., Inc., Class A | | | 9,025,656 |
| 102,407 | | Rush Enterprises, Inc., Class A* | | | 1,622,127 |
| 108,575 | | Rush Enterprises, Inc., Class B* | | | 1,593,881 |
| | | | | |
| | | | | 17,277,754 |
| | | | | |
| | | | | |
| Shares | | | | Value |
| | | | | |
| | Trucking 5.4% | | | |
| 252,570 | | J.B. Hunt Transport Services, Inc. | | $ | 7,938,275 |
| 219,535 | | Knight Transportation, Inc. | | | 3,613,546 |
| 245,590 | | Old Dominion Freight Line, Inc.* | | | 7,817,130 |
| 263,545 | | Vitran Corp., Inc.* (Canada) | | | 3,760,787 |
| | | | | |
| | | | | 23,129,738 |
| | | | | |
| | |
| | Total Common Stocks
(cost $450,625,373) | | | 408,695,509 |
| | | | | |
| | |
| | WARRANTS 0.0% | | | |
| | |
| | Gold 0.0% | | | |
| 5,665,000 | | Redcorp Ventures Ltd. expiring 7/10/09* *** † (Canada) | | | — |
| | | | | |
| | |
| | Total Warrants
(cost $0) | | | — |
| | | | | |
Principal
Amount | | | | Value |
| | |
| | SHORT-TERM INVESTMENTS 2.7% | | | |
| | |
| | Repurchase Agreement 2.7% | | | |
| $11,644,000 | | Repurchase Agreement dated 3/31/08, 1.10% due 4/1/08 with Fixed Income Clearing Corporation collateralized by $8,055,000 of United States Treasury Bonds 8.75% due 8/15/20; value: $11,881,125; repurchase proceeds: $11,644,356 (cost $11,644,000) | | $ | 11,644,000 |
| | | | | |
| | |
| | Total Short-Term Investments
(cost $11,644,000) | | | 11,644,000 |
| | | | | |
| | |
| | Total Investments
(cost $462,269,373) 98.9%^^ | | | 420,339,509 |
| | |
| | Other Assets less Liabilities 1.1% | | | 4,671,406 |
| | | | | |
| | |
| | NET ASSETS 100.0% | | $ | 425,010,915 |
| | | | | |
| |
| | *Non-income producing. **Common units. ***Security was fair valued under procedures adopted by the Board of Directors (see Note 2). †Security purchased in a private placement transaction or under Rule 144A of the Securities Act of 1933 (see Note 9). ††Affiliated company (see Note 8). ^^The aggregate amount of foreign securities fair valued pursuant to a systematic fair valuation model as a percent of net assets was 5.86%. GDR Global Depositary Receipt. PIPE Private Investment in a Public Equity. REIT Real Estate Investment Trust. See notes to financial statements. |
62
| | |
| | MARCH 31, 2008 (UNAUDITED) |
|
| |
| |
At March 31, 2008, Wasatch Small Cap Value Fund’s investments, excluding short-term investments, were in the following countries:
| | | |
| Country | | % | |
Bermuda | | 1.7 | |
Brazil | | 3.3 | |
Canada | | 2.8 | |
China | | 1.0 | |
Germany | | 1.0 | |
Guernsey | | 1.3 | |
Hong Kong | | 0.7 | |
India | | 1.6 | |
Panama | | 0.1 | |
Singapore | | 1.9 | |
Spain | | 0.1 | |
United Kingdom | | 3.4 | |
United States | | 81.1 | |
| | | |
TOTAL | | 100.0 | % |
| | | |
63
| | |
| WASATCH STRATEGIC INCOME FUND (WASIX) — Schedule of Investments | | |
|
| |
| |
| | | | | |
| Shares | | | | Value |
| | | | | |
| | COMMON STOCKS 82.9% | | | |
| | |
| | Apparel, Accessories & Luxury Goods 0.5% | | | |
| 600 | | Bijou Brigitte AG (Germany) | | $ | 94,701 |
| | | | | |
| | Asset Management & Custody Banks 7.8% | | | |
| 41,001 | | Apollo Investment Corp.††† | | | 649,046 |
| 39,996 | | Ares Capital Corp.††† | | | 502,750 |
| 19,600 | | Solar Capital, LLC* ** *** † | | | 270,088 |
| | | | | |
| | | | | 1,421,884 |
| | | | | |
| | Automotive Retail 0.9% | | | |
| 10,050 | | Monro Muffler, Inc.††† | | | 169,845 |
| | | | | |
| | Consumer Finance 3.7% | | | |
| 13,684 | | Capital One Financial Corp.††† | | | 673,527 |
| | | | | |
| | Data Processing & Outsourced Services 6.4% | | | |
| 22,940 | | Paychex, Inc.††† | | | 785,924 |
| 23,100 | | Redecard S.A. (Brazil) | | | 385,176 |
| | | | | |
| | | | | 1,171,100 |
| | | | | |
| | Diversified Banks 4.4% | | | |
| 42,468 | | Bank of East Asia Ltd. (Hong Kong) | | | 215,551 |
| 33,663 | | Bank of N.T. Butterfield & Son Ltd. (Bermuda) | | | 584,053 |
| | | | | |
| | | | | 799,604 |
| | | | | |
| | Diversified Commercial & Professional Services 4.6% | | | |
| 18,383 | | LPS Brasil - Consultoria de Imoveis S.A.* (Brazil) | | | 327,630 |
| 21,028 | | McGrath RentCorp††† | | | 506,985 |
| | | | | |
| | | | | 834,615 |
| | | | | |
| | Diversified REITs 6.3% | | | |
| 52,320 | | CapitalSource, Inc.††† | | | 505,934 |
| 25,235 | | iStar Financial, Inc.††† | | | 354,047 |
| 34,265 | | Star Asia Finance Ltd.*** † (Guernsey) | | | 295,707 |
| | | | | |
| | | | | 1,155,688 |
| | | | | |
| | Education Services 0.0% | | | |
| 9,000 | | Hartford Education Corp. Ltd. (Singapore) | | | 1,140 |
| | | | | |
| | Gold 0.4% | | | |
| 295,680 | | Redcorp Ventures Ltd.* (Canada) | | | 66,186 |
| | | | | |
| | Health Care Services 0.7% | | | |
| 6,840 | | Birner Dental Management Services, Inc.††† | | | 127,087 |
| | | | | |
| | Home Improvement Retail 1.2% | | | |
| 7,700 | | Home Depot, Inc.††† | | | 215,369 |
| | | | | |
| | Household Products 1.0% | | | |
| 2,600 | | Procter & Gamble Co.††† | | | 182,182 |
| | | | | |
| | Hypermarkets & Super Centers 3.1% | | | |
| 10,630 | | Wal-Mart Stores, Inc.††† | | | 559,988 |
| | | | | |
| | Industrial Machinery 1.7% | | | |
| 27,000 | | Weg S.A. (Brazil) | | | 302,296 |
| | | | | |
| | Industrial REITs 1.1% | | | |
| 3,300 | | ProLogis | | | 194,238 |
| | | | | |
| | Leisure Products 4.1% | | | |
| 39,905 | | Pool Corp.††† | | | 753,805 |
| | | | | |
| | Life Sciences Tools & Services 1.1% | | | |
| 2,000 | | Eurofins Scientific (France) | | | 199,247 |
| | | | | |
| | | | | |
| Shares | | | | Value |
| | | | | |
| | Mortgage REITs 19.5% | | | |
| 92,155 | | Anthracite Capital, Inc.††† | | $ | 608,223 |
| 23,955 | | Arbor Realty Trust, Inc.††† | | | 361,242 |
| 5,660 | | Capital Trust, Inc., Class A††† | | | 152,537 |
| 10,100 | | Gramercy Capital Corp.††† | | | 211,393 |
| 99,400 | | MFA Mortgage Investments, Inc.††† | | | 626,220 |
| 77,833 | | New York Mortgage Trust, Inc.††† | | | 210,149 |
| 44,295 | | NorthStar Realty Finance Corp.††† | | | 361,890 |
| 28,200 | | Redwood Trust, Inc.††† | | | 1,025,070 |
| | | | | |
| | | | | 3,556,724 |
| | | | | |
| | Oil & Gas Equipment & Services 0.4% | | | |
| 85,995 | | Petrowest Energy Services Trust** (Canada) | | | 75,324 |
| | | | | |
| | Semiconductors 4.7% | | | |
| 5,770 | | Linear Technology Corp.††† | | | 177,082 |
| 12,775 | | Maxim Integrated Products, Inc.††† | | | 260,482 |
| 6,590 | | Microchip Technology, Inc.††† | | | 215,691 |
| 8,420 | | Xilinx, Inc. | | | 199,975 |
| | | | | |
| | | | | 853,230 |
| | | | | |
| | Specialized Finance 5.5% | | | |
| 8,100 | | Goldwater Bank, NA* *** † | | | 81,000 |
| 45,479 | | KKR Financial Holdings, LLC††† | | | 575,764 |
| 13,035 | | Oslo Bors VPS Holding ASA (Norway) | | | 350,913 |
| | | | | |
| | | | | 1,007,677 |
| | | | | |
| | Steel 1.9% | | | |
| 17,185 | | Globe Specialty Metals, Inc.* (United Kingdom) | | | 352,293 |
| | | | | |
| | Wireless Telecommunication Services 1.9% | | | |
| 5,400 | | America Movil S.A.B. de C.V., Series L ADR††† (Mexico) | | | 343,926 |
| | | | | |
| | |
| | Total Common Stocks
(cost $18,778,772) | | | 15,111,676 |
| | | | | |
| | |
Principal
Amount | | | | Value |
| | |
| | CORPORATE BONDS 2.9% | | | |
| | |
| | Gold 1.3% | | | |
| $299,000 | | Redcorp Ventures Ltd., 13.00%, 7/11/12*** † (Canada) | | $ | 247,348 |
| | | | | |
| | Integrated Telecommunication Services 1.6% | | | |
| 300,000 | | Broadview Networks Holdings, Inc., 11.375%, 9/1/12 | | | 285,000 |
| | | | | |
| | |
| | Total Corporate Bonds
(cost $596,254) | | | 532,348 |
| | | | | |
| | |
| Shares | | | | Value |
| | |
| | RIGHTS 0.0% | | | |
| | |
| | Asset Management & Custody Banks 0.0% | | | |
| 13,332 | | Ares Capital Corp.* | | $ | 7,466 |
| | | | | |
| | |
| | Total Rights
(cost $0) | | | 7,466 |
| | | | | |
64
| | |
| | MARCH 31, 2008 (UNAUDITED) |
|
| |
| |
| | | | | |
Number of
Contracts | | | | Value |
| | | | | |
| | CALL OPTIONS PURCHASED 1.1% | | | |
| | |
| 150 | | CapitalSource, Inc. expiring 4/19/08
exercise price $17.50 | | $ | 750 |
| 250 | | CapitalSource, Inc. expiring 7/19/08
exercise price $17.50 | | | 2,500 |
| 155 | | General Electric Co. expiring 6/21/08
exercise price $37.50 | | | 25,575 |
| 250 | | Gramercy Capital Corp. expiring 4/19/08
exercise price $20 | | | 33,750 |
| 400 | | iStar Financial, Inc. expiring 4/19/08
exercise price $20 | | | 2,000 |
| 608 | | iStar Financial, Inc. expiring 7/19/08
exercise price $25 | | | 9,120 |
| 8 | | iStar Financial, Inc. expiring 7/19/08
exercise price $30 | | | 40 |
| 1,000 | | KKR Financial Holdings, LLC expiring 4/19/08 exercise price $17.50 | | | 5,000 |
| 415 | | KKR Financial Holdings, LLC expiring 7/19/08 exercise price $15 | | | 26,975 |
| 15 | | KKR Financial Holdings, LLC expiring 7/19/08 exercise price $17.50 | | | 300 |
| 350 | | Paychex, Inc. expiring 6/21/08
exercise price $35 | | | 50,750 |
| 400 | | Pool Corp. expiring 7/19/08
exercise price $22.50 | | | 22,000 |
| 25 | | Redwood Trust, Inc. expiring 1/17/09
exercise price $35 | | | 16,250 |
| | | | | |
| | |
| | Total Call Options Purchased
(premium $420,440) | | | 195,010 |
| | | | | |
| | |
| | PUT OPTIONS PURCHASED 0.8% | | | |
| | |
| 100 | | NovaStar Financial, Inc. expiring 1/17/09
exercise price $15 | | | 141,000 |
| | | | | |
| | |
| | Total Put Options Purchased
(premium $105,250) | | | 141,000 |
| | | | | |
| | |
Principal
Amount | | | | Value |
| | |
| | SHORT-TERM INVESTMENTS 8.4% | | | |
| | |
| | Repurchase Agreement 8.4% | | | |
| $1,537,000 | | Repurchase Agreement dated 3/31/08, 1.10% due 4/1/08 with Fixed Income Clearing Corporation collateralized by $1,065,000 of United States Treasury Bonds 8.75% due 8/15/20; value: $1,570,875; repurchase proceeds: $1,537,047††† (cost $1,537,000) | | $ | 1,537,000 |
| | | | | |
| | |
| | Total Short-Term Investments
(cost $1,537,000) | | | 1,537,000 |
| | | | | |
| | |
| | Total Investments
(cost $21,437,716) 96.1%^^ | | | 17,524,500 |
| | |
| | Other Assets less Liabilities 3.9% | | | 717,634 |
| | | | | |
| | |
| | NET ASSETS 100.0% | | $ | 18,242,134 |
| | | | | |
| | | | | |
Number of
Contracts | | | | Value |
| | | | | |
| | PUT OPTIONS WRITTEN | | | |
| | |
| 125 | | CapitalSource, Inc. expiring 4/19/08
exercise price $15 | | $ | 65,000 |
| 125 | | Gramercy Capital Corp. expiring 4/19/08 exercise price $17.50 | | | 4,375 |
| 89 | | Gramercy Capital Corp. expiring 4/19/08 exercise price $20 | | | 10,235 |
| 6 | | iStar Financial, Inc. expiring 4/19/08
exercise price $22.50 | | | 5,040 |
| 30 | | iStar Financial, Inc. expiring 7/19/08
exercise price $22.50 | | | 27,000 |
| 15 | | iStar Financial, Inc. expiring 7/19/08
exercise price $25 | | | 17,100 |
| 5 | | iStar Financial, Inc. expiring 7/19/08
exercise price $30 | | | 8,150 |
| 200 | | KKR Financial Holdings, LLC expiring 7/19/08 exercise price $15 | | | 68,000 |
| 353 | | MFA Mortgage Investments, Inc. expiring 4/19/08 exercise price $7.50 | | | 38,830 |
| 100 | | National Instruments Corp. expiring 6/21/08 exercise price $25 | | | 9,500 |
| 150 | | Pool Corp. expiring 4/19/08
exercise price $17.50 | | | 5,250 |
| | | | | |
| | |
| | Total Put Options Written
(premium $195,078) | | | 258,480 |
| | | | | |
| | |
| Shares | | | | Value |
| | SECURITIES SOLD SHORT | | | |
| | |
| 3,500 | | NovaStar Financial, Inc.* (proceeds $174,927) | | $ | 6,230 |
| | | | | |
| |
| | *Non-income producing. **Common units. ***Security was fair valued under procedures adopted by the Board of Directors (see Note 2). †Security purchased in a private placement transaction or under Rule 144A of the Securities Act of 1933 (see Note 9). †††All or a portion of this security has been designated as collateral for open short positions (see Note 10). ^^The aggregate amount of foreign securities fair valued pursuant to a systematic fair valuation model as a percent of net assets was 2.80%. ADR American Depositary Receipt. REIT Real Estate Investment Trust. See Notes to Financial Statements. |
At March 31, 2008, Wasatch Strategic Income Fund’s investments, excluding short-term investments, options written, and securities sold short, were in the following countries:
| | | |
| Country | | % | |
Bermuda | | 3.7 | |
Brazil | | 6.3 | |
Canada | | 2.4 | |
France | | 1.2 | |
Germany | | 0.6 | |
Guernsey | | 1.9 | |
Hong Kong | | 1.4 | |
Mexico | | 2.2 | |
Norway | | 2.2 | |
Singapore | | <0.1 | |
United Kingdom | | 2.2 | |
United States | | 75.9 | |
| | | |
TOTAL | | 100.0 | % |
| | | |
65
| | |
| WASATCH ULTRA GROWTH FUND (WAMCX) — Schedule of Investments | | |
|
| |
| |
| | | | | |
| Shares | | | | Value |
| | | | | |
| | COMMON STOCKS 87.7% | | | |
| | |
| | Advertising 1.5% | | | |
| 127,215 | | National CineMedia, Inc. | | $ | 2,859,793 |
| | | | | |
| | Aerospace & Defense 0.8% | | | |
| 46,845 | | AAR Corp.* | | | 1,277,463 |
| 42,120 | | Limco-Piedmont, Inc.* | | | 285,995 |
| | | | | |
| | | | | 1,563,458 |
| | | | | |
| | Apparel Retail 0.8% | | | |
| 36,495 | | Gymboree Corp. (The)* | | | 1,455,421 |
| | | | | |
| | Application Software 0.9% | | | |
| 31,935 | | FactSet Research Systems, Inc. | | | 1,720,338 |
| | | | | |
| | Auto Parts & Equipment 1.0% | | | |
| 251,880 | | Martinrea International, Inc.* (Canada) | | | 1,855,700 |
| | | | | |
| | Automotive Retail 0.6% | | | |
| 37,035 | | O’Reilly Automotive, Inc.* | | | 1,056,238 |
| | | | | |
| | Communications Equipment 1.8% | | | |
| 180,575 | | F5 Networks, Inc.* | | | 3,281,048 |
| | | | | |
| | Construction & Engineering 0.4% | | | |
| 1,164,000 | | Midas Holdings Ltd. (Singapore) | | | 853,804 |
| | | | | |
| | Construction & Farm Machinery & Heavy Trucks 4.8% | | | |
| 75,006 | | Bucyrus International, Inc., Class A | | | 7,624,360 |
| 141,835 | | TIL Ltd. (India) | | | 1,338,263 |
| | | | | |
| | | | | 8,962,623 |
| | | | | |
| | Consumer Finance 0.7% | | | |
| 117,503 | | First Cash Financial Services, Inc.* | | | 1,213,806 |
| | | | | |
| | Distillers & Vintners 0.7% | | | |
| 21,385 | | Central European Distribution Corp.* | | | 1,244,393 |
| | | | | |
| | Distributors 1.6% | | | |
| 129,650 | | LKQ Corp.* | | | 2,913,236 |
| | | | | |
| | Diversified Banks 4.2% | | | |
| 77,050 | | HDFC Bank Ltd. (India) | | | 2,576,394 |
| 54,095 | | HDFC Bank Ltd. ADR (India) | | | 5,314,293 |
| | | | | |
| | | | | 7,890,687 |
| | | | | |
| | Diversified Commercial & Professional Services 1.4% | | | |
| 14,040 | | Healthcare Services Group | | | 289,786 |
| 36,480 | | IHS, Inc., Class A* | | | 2,346,029 |
| | | | | |
| | | | | 2,635,815 |
| | | | | |
| | Education Services 0.4% | | | |
| 5,002 | | Strayer Education, Inc. | | | 762,805 |
| | | | | |
| | Electrical Components & Equipment 0.4% | | | |
| 73,814 | | Orion Energy Systems, Inc.* | | | 704,186 |
| | | | | |
| | Electronic Manufacturing Services 0.3% | | | |
| 1,369,680 | | Virtek Vision International, Inc.* (Canada) | | | 493,218 |
| | | | | |
| | Environmental & Facilities Services 1.6% | | | |
| 73,210 | | American Ecology Corp. | | | 1,854,409 |
| 35,370 | | EnergySolutions, Inc. | | | 811,388 |
| 6,070 | | Stericycle, Inc.* | | | 312,605 |
| | | | | |
| | | | | 2,978,402 |
| | | | | |
| | General Merchandise Stores 0.8% | | | |
| 53,040 | | Dollar Tree, Inc.* | | | 1,463,374 |
| | | | | |
| | | | | |
| Shares | | | | Value |
| | | | | |
| | Gold 0.4% | | | |
| 2,995,000 | | Redcorp Ventures Ltd.* (Canada) | | $ | 670,414 |
| | | | | |
| | Health Care Distributors 0.8% | | | |
| 42,882 | | MWI Veterinary Supply, Inc.* | | | 1,512,019 |
| | | | | |
| | Health Care Equipment 6.4% | | | |
| 189,540 | | ArthroCare Corp.* | | | 6,321,159 |
| 66,970 | | Cardica, Inc.* | | | 494,908 |
| 41,966 | | NuVasive, Inc.* | | | 1,448,247 |
| 44,210 | | ResMed, Inc.* | | | 1,864,778 |
| 99,758 | | VNUS Medical Technologies, Inc.* | | | 1,814,598 |
| | | | | |
| | | | | 11,943,690 |
| | | | | |
| | Health Care Facilities 4.9% | | | |
| 251,118 | | Psychiatric Solutions, Inc.* | | | 8,517,922 |
| 20,245 | | VCA Antech, Inc.* | | | 553,701 |
| | | | | |
| | | | | 9,071,623 |
| | | | | |
| | Health Care Services 9.9% | | | |
| 203,216 | | Healthways, Inc.* ††† | | | 7,181,653 |
| 66,745 | | Pediatrix Medical Group, Inc.* | | | 4,498,613 |
| 226,560 | | Providence Service Corp. (The)* | | | 6,796,800 |
| | | | | |
| | | | | 18,477,066 |
| | | | | |
| | Health Care Technology 0.8% | | | |
| 69,890 | | Computer Programs & Systems, Inc. | | | 1,460,701 |
| | | | | |
| | Human Resource & Employment Services 0.3% | | | |
| 26,230 | | Resources Connection, Inc. | | | 468,730 |
| | | | | |
| | Internet Software & Services 2.0% | | | |
| 180,805 | | DealerTrack Holdings, Inc.* | | | 3,655,877 |
| | | | | |
| | Investment Banking & Brokerage 2.8% | | | |
| 58,740 | | FCStone Group, Inc.* | | | 1,627,098 |
| 63,120 | | GFI Group, Inc. | | | 3,616,776 |
| | | | | |
| | | | | 5,243,874 |
| | | | | |
| | IT Consulting & Other Services 6.1% | | | |
| 323,421 | | Cognizant Technology Solutions Corp., Class A* | | | 9,324,227 |
| 1,602,000 | | CSE Global Ltd. (Singapore) | | | 1,082,708 |
| 138,110 | | Rolta India Ltd. (India) | | | 909,949 |
| | | | | |
| | | | | 11,316,884 |
| | | | | |
| | Leisure Facilities 1.1% | | | |
| 66,630 | | Life Time Fitness, Inc.* | | | 2,079,522 |
| | | | | |
| | Life Sciences Tools & Services 1.6% | | | |
| 9,909 | | Icon plc ADR* (Ireland) | | | 642,995 |
| 35,440 | | Techne Corp.* | | | 2,387,238 |
| | | | | |
| | | | | 3,030,233 |
| | | | | |
| | Marine 2.1% | | | |
| 129,635 | | Eagle Bulk Shipping, Inc. | | | 3,339,398 |
| 45,150 | | Euroseas Ltd. | | | 541,800 |
| | | | | |
| | | | | 3,881,198 |
| | | | | |
| | Marine Ports & Services 1.4% | | | |
| 198,285 | | CAI International, Inc.* | | | 2,549,945 |
| | | | | |
| | Oil & Gas Equipment & Services 2.4% | | | |
| 35,370 | | Oil States International., Inc.* | | | 1,584,930 |
| 9,160 | | OYO Geospace Corp.* | | | 416,047 |
| 627,415 | | Swiber Holdings Ltd.* (Singapore) | | | 1,166,622 |
| 80,745 | | TETRA Technologies, Inc.* | | | 1,279,001 |
| | | | | |
| | | | | 4,446,600 |
| | | | | |
| | Oil & Gas Exploration & Production 0.8% | | | |
| 70,110 | | Petrohawk Energy Corp.* | | | 1,414,119 |
| | | | | |
66
| | |
| | MARCH 31, 2008 (UNAUDITED) |
|
| |
| |
| | | | | |
| Shares | | | | Value |
| | | | | |
| | Oil & Gas Refining & Marketing 0.2% | | | |
| 16,425 | | World Fuel Services Corp. | | $ | 461,050 |
| | | | | |
| | Personal Products 1.0% | | | |
| 37,900 | | Herbalife Ltd. (Cayman Islands) | | | 1,800,250 |
| | | | | |
| | Publishing 1.4% | | | |
| 43,571 | | Morningstar, Inc.* | | | 2,673,081 |
| | | | | |
| | Regional Banks 0.1% | | | |
| 18,980 | | Nara Bancorp, Inc. | | | 246,550 |
| | | | | |
| | Semiconductor Equipment 2.8% | | | |
| 252,912 | | Tessera Technologies, Inc.* | | | 5,260,570 |
| | | | | |
| | Semiconductors 11.6% | | | |
| 65,557 | | Intellon Corp.* | | | 322,540 |
| 196,655 | | Netlogic Microsystems, Inc.* | | | 4,747,252 |
| 527,785 | | O2Micro International Ltd. ADR* (Cayman Islands) | | | 4,079,778 |
| 228,275 | | Power Integrations, Inc.* | | | 6,679,326 |
| 120,650 | | Silicon Laboratories, Inc.* ††† | | | 3,805,301 |
| 376,431 | | SiRF Technology Holdings, Inc.* | | | 1,916,034 |
| | | | | |
| | | | | 21,550,231 |
| | | | | |
| | Specialized Finance 0.2% | | | |
| 15,404 | | MSCI, Inc., Class A* | | | 458,269 |
| | | | | |
| | Specialty Chemicals 0.4% | | | |
| 55,355 | | Flotek Industries, Inc.* | | | 807,629 |
| | | | | |
| | Trucking 1.5% | | | |
| 88,835 | | Old Dominion Freight Line, Inc.* | | | 2,827,618 |
| | | | | |
| | |
| | Total Common Stocks
(cost $171,545,797) | | | 163,216,088 |
| | | | | |
| | |
| | PREFERRED STOCKS 3.5% | | | |
| | |
| | Biotechnology 0.3% | | | |
| 169,492 | | Nanosys, Inc., Series D Pfd.* *** † | | | 500,001 |
| | | | | |
| | Health Care Equipment 0.5% | | | |
| 1,080,146 | | Zonare Medical Systems, Inc., | | | |
| | Series E Pfd.* *** † | | | 895,441 |
| | | | | |
| | Health Care Services 0.5% | | | |
| 516,161 | | Bravo Health, Inc., Series G Pfd.* *** † | | | 851,666 |
| 108,917 | | TargetRX, Inc., Series D Pfd.* *** † | | | 1,089 |
| | | | | |
| | | | | 852,755 |
| | | | | |
| | Health Care Technology 1.2% | | | |
| 243,902 | | TherOx, Inc., Series I Pfd.* *** † | | | 1,557,119 |
| 253,064 | | Transoma Medical, Inc., Series B Pfd.* *** † | | | 733,127 |
| | | | | |
| | | | | 2,290,246 |
| | | | | |
| | Household Products 0.3% | | | |
| 201,613 | | Ophthonix, Inc., Series C Pfd.* *** † | | | 500,000 |
| | | | | |
| | Integrated Telecommunication Services 0.6% | | | |
| 64,269 | | Neutral Tandem, Inc., Series C Pfd. PIPE* *** † | | | 1,111,185 |
| | | | | |
| | Internet Software & Services 0.1% | | | |
| 91,388 | | Xtera Communications, Inc., Series A-1 Pfd.* *** † | | | 99,065 |
| | | | | |
| | |
| | Total Preferred Stocks
(cost $4,780,195) | | | 6,248,693 |
| | | | | |
| | | | | |
| Shares | | | | Value |
| | | | | |
| | LIMITED PARTNERSHIP INTEREST 1.8% | | | |
| | |
| | Other 1.8% | | | |
| | Montagu Newhall Global Partners II-B, L.P.*** † | | $ | 2,800,273 |
| | Montagu Newhall Global Partners III-B, L.P.*** † | | | 589,774 |
| | | | | |
| | | | | 3,390,047 |
| | | | | |
| | |
| | Total Limited Partnership Interest
(cost $3,679,292) | | | 3,390,047 |
| | | | | |
| | |
| | WARRANTS 0.0% | | | |
| | |
| | Gold 0.0% | | | |
| 1,497,500 | | Redcorp Ventures Ltd. expiring 7/10/09* *** † (Canada) | | | — |
| | | | | |
| | Health Care Equipment 0.0% | | | |
| 15,510 | | Electro-Optical Sciences, Inc. expiring 10/31/11* *** † | | | — |
| 162,021 | | Zonare Medical Systems, Inc. expiring 6/30/11* *** † | | | — |
| | | | | |
| | | | | — |
| | | | | |
| | Precious Metals & Minerals 0.0% | | | |
| 451,620 | | Farallon Resources Ltd. expiring 12/21/08* *** † (Canada) | | | 24,042 |
| | | | | |
| | |
| | Total Warrants
(cost $0) | | | 24,042 |
| | | | | |
| | |
Principal
Amount | | | | Value |
| | SHORT-TERM INVESTMENTS 3.4% | | | |
| | |
| | Repurchase Agreement 3.4% | | | |
| $6,300,000 | | Repurchase Agreement dated 3/31/08, 1.10% due 4/1/08 with Fixed Income Clearing Corporation collateralized by $4,360,000 of United States Treasury Bonds 8.75% due 8/15/20; value: $6,431,000; repurchase proceeds: $6,300,193†††
(cost $6,300,000) | | $ | 6,300,000 |
| | | | | |
| | |
| | Total Short-Term Investments
(cost $6,300,000) | | | 6,300,000 |
| | | | | |
| | |
| | Total Investments
(cost $186,305,285) 96.4%^^ | | | 179,178,870 |
| | | | | |
| | |
| | Other Assets less Liabilities 3.6% | | | 6,837,980 |
| | | | | |
| | |
| | NET ASSETS 100.0% | | $ | 186,016,850 |
| | | | | |
67
| | |
| WASATCH ULTRA GROWTH FUND (WAMCX) — Schedule of Investments (continued) |
|
| |
| |
| | | | | |
| Shares | | | | Value |
| | | | | |
| | |
| | SECURITIES SOLD SHORT | | | |
| | |
| 35,200 | | Taleo Corp., Class A* | | $ | 682,880 |
| | | | | |
| | |
| | Total Securities Sold Short
(proceeds $901,255) | | | 682,880 |
| | | | | |
| | Non-income producing. ***Security was fair valued under procedures adopted by the Board of Directors (see Note 2). †Security purchased in a private placement transaction or under Rule 144A of the Securities Act of 1933 (see Note 9). †††All or a portion of this security has been designated as collateral for purchase commitments and securities sold short. ^^The aggregate amount of foreign securities fair valued pursuant to a systematic fair valuation model as a percent of net assets was 4.26%. ADR American Depositary Receipt. PIPE Private Investment in a Public Equity. See notes to financial statements. |
At March 31, 2008, Wasatch Ultra Growth Fund’s investments, excluding short-term investments and securities sold short, were in the following countries:
| | | |
| Country | | % | |
Canada | | 1.7 | |
Cayman Islands | | 3.4 | |
India | | 5.9 | |
Ireland | | 0.4 | |
Singapore | | 1.8 | |
United States | | 86.8 | |
| | | |
TOTAL | | 100.0 | % |
| | | |
68
| | |
| WASATCH-HOISINGTON U.S. TREASURY FUND (WHOSX) — Schedule of Investments | | MARCH 31, 2008 (UNAUDITED) |
|
| |
| |
| | | | | |
Principal
Amount | | | | Value |
| | | | | |
| | U.S. GOVERNMENT OBLIGATIONS 99.7% | | | |
| | |
| $16,000,000 | | U.S. Treasury Bond, 4.50%, 2/15/36 | | $ | 16,528,752 |
| 22,000,000 | | U.S. Treasury Bond, 4.75%, 2/15/37 | | | 23,662,034 |
| 7,000,000 | | U.S. Treasury Bond, 5.25%, 11/15/28 | | | 7,877,737 |
| 10,570,000 | | U.S. Treasury Bond, 5.25%, 2/15/29 | | | 11,913,542 |
| 3,000,000 | | U.S. Treasury Bond, 5.375%, 2/15/31 | | | 3,469,686 |
| 500,000 | | U.S. Treasury Bond, 5.50%, 8/15/28 | | | 579,688 |
| 8,100,000 | | U.S. Treasury Strip, principal only, 8/15/25 | | | 3,669,648 |
| 118,000,000 | | U.S. Treasury Strip, principal only, 11/15/27 | | | 48,527,146 |
| 16,000,000 | | U.S. Treasury Strip, principal only, 2/15/36 | | | 4,730,608 |
| 17,000,000 | | U.S. Treasury Strip, principal only, 2/15/37 | | | 4,811,255 |
| | | | | |
| | |
| | Total U.S. Government Obligations
(cost $117,180,269) | | | 125,770,096 |
| | | | | |
| | |
| | SHORT-TERM INVESTMENTS 0.2% | | | |
| | |
| | Repurchase Agreement 0.2% | | | |
| 301,000 | | Repurchase Agreement dated 3/31/08, 1.10% due 4/1/08 with Fixed Income Clearing Corporation collateralized by $210,000 of United States Treasury Bonds 8.75% due 8/15/20; value: $309,750; repurchase proceeds: $301,009
(cost $301,000) | | | 301,000 |
| | | | | |
| | |
| | Total Short-Term Investments
(cost $301,000) | | | 301,000 |
| | | | | |
| | |
| | Total Investments (cost $117,481,269) 99.9% | | | 126,071,096 |
| | |
| | Other Assets less Liabilities 0.1% | | | 126,819 |
| | | | | |
| | |
| | NET ASSETS 100.0% | | $ | 126,197,915 |
| | | | | |
| | See notes to financial statements. |
69
| | |
| WASATCH FUNDS — Statements of Assets and Liabilities | | |
|
| |
| |
| | | | | | | | | | | | | | |
| | | CORE
GROWTH
FUND | | EMERGING MARKETS
SMALL CAP
FUND | | | GLOBAL SCIENCE
& TECHNOLOGY
FUND | | | HERITAGE
GROWTH
FUND |
| | | | | | | | | | | | | | |
Assets: | | | | | | | | | | | | | | |
Investments, at cost | | | | | | | | | | | | | | |
Unaffiliated issuers | | $ | 816,486,491 | | $ | 55,451,370 | | | $ | 146,185,950 | | | $ | 115,700,485 |
Affiliated issuers* | | | — | | | — | | | | — | | | | — |
Repurchase agreements | | | 30,057,000 | | | 1,333,000 | | | | 10,689,000 | | | | 4,249,000 |
| | | | | | | | | | | | | | |
| | $ | 846,543,491 | | $ | 56,784,370 | | | $ | 156,874,950 | | | $ | 119,949,485 |
| | | | | | | | | | | | | | |
Investments, at market value | | | | | | | | | | | | | | |
Unaffiliated issuers | | $ | 837,475,920 | | $ | 47,424,310 | | | $ | 124,281,070 | | | $ | 119,612,215 |
Affiliated issuers* | | | — | | | — | | | | — | | | | — |
Repurchase agreements | | | 30,057,000 | | | 1,333,000 | | | | 10,689,000 | | | | 4,249,000 |
| | | | | | | | | | | | | | |
| | | 867,532,920 | | | 48,757,310 | | | | 134,970,070 | | | | 123,861,215 |
Cash | | | 3,468,511 | | | 790 | | | | 13,882 | | | | 251,151 |
Foreign currency on deposit (cost of $0, $17,068, $4,389, $0, $0, $215,834, $75,066, $225,586, $22,570, and $93,305, respectively) | | | — | | | 17,715 | | | | 4,388 | | | | — |
Receivable for investment securities sold | | | 8,915,968 | | | 317,152 | | | | 1,106,828 | | | | 2,526,252 |
Receivable from broker for securities sold short | | | — | | | — | | | | — | | | | 59,162 |
Capital shares receivable | | | 209,178 | | | 17,738 | | | | 56,774 | | | | 22,366 |
Interest and dividends receivable | | | 1,600,181 | | | 50,727 | | | | 1,123 | | | | 155,282 |
Receivable from Investment Advisor | | | — | | | 97,966 | | | | 2,361 | | | | 12,938 |
Prepaid expenses and other assets | | | 29,056 | | | 27,114 | | | | 15,142 | | | | 18,300 |
| | | | | | | | | | | | | | |
Total Assets | | | 881,755,814 | | | 49,286,512 | | | | 136,170,568 | | | | 126,906,666 |
| | | | | | | | | | | | | | |
Liabilities: | | | | | | | | | | | | | | |
Options written at value (premiums of $0, $0, $0, $0, $33,305, $0, $0, $0, $479,510, and $0, respectively) | | | — | | | — | | | | — | | | | — |
Securities sold short, at value (proceeds of $0, $0, $0, $0, $0, $0, $0, $0, $1,186,742, and $0, respectively) | | | — | | | — | | | | — | | | | — |
Bank overdraft | | | — | | | — | | | | — | | | | — |
Bank overdraft of foreign currency (cost of $0, $0, $0, $0, $214, $0, $0, $0, $0, and $0, respectively) | | | — | | | — | | | | — | | | | — |
Payable for securities purchased | | | 7,988,784 | | | 588,248 | | | | — | | | | 1,534,085 |
Capital shares payable | | | 2,237,896 | | | 9,278 | | | | 82,431 | | | | 93,745 |
Accrued investment advisory fees | | | 738,469 | | | 73,931 | | | | 172,313 | | | | 75,261 |
Accrued expenses and other liabilities | | | 450,267 | | | 7,673 | | | | 81,653 | | | | 117,526 |
Unrealized depreciation on foreign currency contracts | | | — | | | 736 | | | | 5,465 | | | | — |
| | | | | | | | | | | | | | |
Total Liabilities | | | 11,415,416 | | | 679,866 | | | | 341,862 | | | | 1,820,617 |
| | | | | | | | | | | | | | |
Net Assets | | $ | 870,340,398 | | $ | 48,606,646 | | | $ | 135,828,706 | | | $ | 125,086,049 |
| | | | | | | | | | | | | | |
Net Assets Consist of: | | | | | | | | | | | | | | |
Capital stock | | $ | 294,898 | | $ | 288,386 | | | $ | 115,161 | | | $ | 127,253 |
Paid-in capital in excess of par | | | 836,671,955 | | | 57,313,430 | | | | 155,490,298 | | | | 117,694,940 |
Undistributed net investment income (loss) | | | 768,681 | | | (193,575 | ) | | | (1,774,339 | ) | | | 167,944 |
Undistributed net realized gain (loss) on investments and foreign currency translations | | | 11,615,496 | | | (774,621 | ) | | | 3,903,429 | | | | 3,184,188 |
Net unrealized appreciation (depreciation) on investments and foreign currency translations | | | 20,989,368 | | | (8,026,974 | ) | | | (21,905,843 | ) | | | 3,911,724 |
| | | | | | | | | | | | | | |
Net Assets | | $ | 870,340,398 | | $ | 48,606,646 | | | $ | 135,828,706 | | | $ | 125,086,049 |
| | | | | | | | | | | | | | |
Capital Stock, $.01 par value: | | | | | | | | | | | | | | |
Authorized | | | 10,000,000,000 | | | 10,000,000,000 | | | | 10,000,000,000 | | | | 10,000,000,000 |
Issued and outstanding | | | 29,489,838 | | | 28,838,596 | | | | 11,516,131 | | | | 12,725,320 |
| | | | |
NET ASSET VALUE, REDEMPTION PRICEAND OFFERING
PRICE PER SHARE | | $ | 29.51 | | $ | 1.69 | | | $ | 11.79 | | | $ | 9.83 |
| | | | | | | | | | | | | | |
| * | See Note 8 for information on affiliated issuers. |
See notes to financial statements.
70
| | |
| | MARCH 31, 2008 (UNAUDITED) |
|
| |
| |
| | | | | | | | | | | | | | | | | | | | | | |
HERITAGE
VALUE
FUND | | | INTERNATIONAL
GROWTH
FUND | | | INTERNATIONAL
OPPORTUNITIES
FUND | | | MICRO
CAP
FUND | | | MICRO CAP
VALUE
FUND | | | SMALL CAP
GROWTH
FUND | |
| | | | | | | | | | | | | | | | | | | | | | |
| | | | | | | | | | | | | | | | | | | | | | |
| | | | | | | | | | | | | | | | | | | | | | |
| $ | 4,162,840 | | | $ | 333,822,552 | | | $ | 38,189,688 | | | $ | 432,229,215 | | | $ | 88,625,740 | | | $ | 732,199,745 | |
| | — | | | | — | | | | — | | | | 19,045,492 | | | | — | | | | — | |
| | 58,000 | | | | 1,807,000 | | | | 3,656,000 | | | | 9,062,000 | | | | 7,707,000 | | | | 25,447,000 | |
| | | | | | | | | | | | | | | | | | | | | | | |
| $ | 4,220,840 | | | $ | 335,629,552 | | | $ | 41,845,688 | | | $ | 460,336,707 | | | $ | 96,332,740 | | | $ | 757,646,745 | |
| | | | | | | | | | | | | | | | | | | | | | | |
| | | | | | | | | | | | | | | | | | | | | | |
| $ | 3,853,374 | | | $ | 368,012,515 | | | $ | 39,944,472 | | | $ | 424,173,838 | | | $ | 87,698,433 | | | $ | 830,583,601 | |
| | — | | | | — | | | | — | | | | 11,543,321 | | | | — | | | | — | |
| | 58,000 | | | | 1,807,000 | | | | 3,656,000 | | | | 9,062,000 | | | | 7,707,000 | | | | 25,447,000 | |
| | | | | | | | | | | | | | | | | | | | | | | |
| | 3,911,374 | | | | 369,819,515 | | | | 43,600,472 | | | | 444,779,159 | | | | 95,405,433 | | | | 856,030,601 | |
| 736 | | | | 71 | | | | 348 | | | | 1,267,259 | | | | — | | | | 2,230,356 | |
|
— |
| | | 215,865 | | | | 75,014 | | | | 223,956 | | | | 22,407 | | | | 93,297 | |
| | 98,883 | | | | 7,464,625 | | | | — | | | | 4,258,615 | | | | 3,217,615 | | | | 3,645,160 | |
| | 217,935 | | | | — | | | | — | | | | 815 | | | | 1,481,323 | | | | — | |
| | 1,000 | | | | 85,959 | | | | 1,450 | | | | 40,368 | | | | 810 | | | | 694,757 | |
| | 15,340 | | | | 885,129 | | | | 50,965 | | | | 82,434 | | | | 30,922 | | | | 642,587 | |
| | 6,880 | | | | — | | | | 12,262 | | | | — | | | | 8,182 | | | | 130 | |
| | 16,768 | | | | 23,444 | | | | 10,376 | | | | 15,956 | | | | 9,967 | | | | 27,683 | |
| | | | | | | | | | | | | | | | | | | | | | | |
| | 4,268,916 | | | | 378,494,608 | | | | 43,750,887 | | | | 450,668,562 | | | | 100,176,659 | | | | 863,364,571 | |
| | | | | | | | | | | | | | | | | | | | | | | |
| | | | | | | | | | | | | | | | | | | | | | |
|
13,317 |
| | | — | | | | — | | | | — | | | | 534,430 | | | | — | |
|
— |
| | | — | | | | — | | | | — | | | | 1,152,126 | | | | — | |
| | — | | | | — | | | | — | | | | — | | | | 2,078,592 | | | | — | |
|
214 |
| | | — | | | | — | | | | — | | | | — | | | | — | |
| | 108,901 | | | | 1,170,845 | | | | 580,281 | | | | 4,217,070 | | | | 1,371,802 | | | | 5,153,891 | |
| | 3,566 | | | | 325,470 | | | | 6,015 | | | | 196,802 | | | | 10,581 | | | | 940,244 | |
| | 2,460 | | | | 478,917 | | | | 74,149 | | | | 748,817 | | | | 162,051 | | | | 714,519 | |
| | 14,781 | | | | 208,930 | | | | 39,972 | | | | 141,050 | | | | 48,123 | | | | 415,209 | |
| | — | | | | 13,842 | | | | 42 | | | | 2,996 | | | | 2,354 | | | | 8 | |
| | | | | | | | | | | | | | | | | | | | | | | |
| | 143,239 | | | | 2,198,004 | | | | 700,459 | | | | 5,306,735 | | | | 5,360,059 | | | | 7,223,871 | |
| | | | | | | | | | | | | | | | | | | | | | | |
| $ | 4,125,677 | | | $ | 376,296,604 | | | $ | 43,050,428 | | | $ | 445,361,827 | | | $ | 94,816,600 | | | $ | 856,140,700 | |
| | | | | | | | | | | | | | | | | | | | | | | |
| | | | | | | | | | | | | | | | | | | | | | |
| $ | 4,557 | | | $ | 221,791 | | | $ | 188,099 | | | $ | 955,680 | | | $ | 440,127 | | | $ | 288,491 | |
| | 4,559,497 | | | | 357,358,681 | | | | 41,858,983 | | | | 468,455,083 | | | | 97,182,447 | | | | 749,163,659 | |
| | 10,999 | | | | (17,105,369 | ) | | | (1,942,355 | ) | | | (4,010,794 | ) | | | (890,043 | ) | | | (2,246,685 | ) |
| | (159,821 | ) | |
|
1,626,785 |
| | | 1,190,067 | | | | (4,469,800 | ) | | | (968,657 | ) | | | 10,553,003 | |
| | (289,555 | ) | |
|
34,194,716 |
| | | 1,755,634 | | | | (15,568,342 | ) | | | (947,274 | ) | | | 98,382,232 | |
| | | | | | | | | | | | | | | | | | | | | | | |
| $ | 4,125,677 | | | $ | 376,296,604 | | | $ | 43,050,428 | | | $ | 445,361,827 | | | $ | 94,816,600 | | | $ | 856,140,700 | |
| | | | | | | | | | | | | | | | | | | | | | | |
| | | | | | | | | | | | | | | | | | | | | | |
| | 10,000,000,000 | | | | 10,000,000,000 | | | | 10,000,000,000 | | | | 10,000,000,000 | | | | 10,000,000,000 | | | | 10,000,000,000 | |
| | 455,733 | | | | 22,179,134 | | | | 18,809,903 | | | | 95,568,041 | | | | 44,012,737 | | | | 28,849,093 | |
| | | | | |
$ |
9.05 |
| | $ | 16.97 | | | $ | 2.29 | | | $ | 4.66 | | | $ | 2.15 | | | $ | 29.68 | |
| | | | | | | | | | | | | | | | | | | | | | | |
71
| | |
| WASATCH FUNDS — Statements of Assets and Liabilities (continued) | | MARCH 31, 2008 (UNAUDITED) |
|
| |
| |
| | | | | | | | | | | | | | | | |
| | | SMALL CAP
VALUE
FUND | | | STRATEGIC
INCOME
FUND | | | ULTRA
GROWTH
FUND | | | U.S.
TREASURY
FUND | |
| | | | | | | | | | | | | | | | |
Assets: | | | | | | | | | | | | | | | | |
Investments, at cost | | | | | | | | | | | | | | | | |
Unaffiliated issuers | | $ | 442,670,214 | | | $ | 19,900,716 | | | $ | 180,005,285 | | | $ | 117,180,269 | |
Affiliated issuers* | | | 7,955,159 | | | | — | | | | — | | | | — | |
Repurchase agreements | | | 11,644,000 | | | | 1,537,000 | | | | 6,300,000 | | | | 301,000 | |
| | | | | | | | | | | | | | | | |
| | $ | 462,269,373 | | | $ | 21,437,716 | | | $ | 186,305,285 | | | $ | 117,481,269 | |
| | | | | | | | | | | | | | | | |
Investments, at market value | | | | | | | | | | | | | | | | |
Unaffiliated issuers | | $ | 404,811,591 | | | $ | 15,987,500 | | | $ | 172,878,870 | | | $ | 125,770,096 | |
Affiliated issuers* | | | 3,883,918 | | | | — | | | | — | | | | — | |
Repurchase agreements | | | 11,644,000 | | | | 1,537,000 | | | | 6,300,000 | | | | 301,000 | |
| | | | | | | | | | | | | | | | |
| | | 420,339,509 | | | | 17,524,500 | | | | 179,178,870 | | | | 126,071,096 | |
Cash | | | — | | | | 71,535 | | | | 1,212,897 | | | | — | |
Foreign currency on deposit (cost of $59,232, $4,896, $4,223, and $0, respectively) | | | 59,232 | | | | 4,896 | | | | 4,221 | | | | — | |
Receivable for investment securities sold | | | 12,086,281 | | | | 455,938 | | | | 8,053,678 | | | | — | |
Receivable from broker for securities sold short | | | — | | | | 430,823 | | | | 680,076 | | | | — | |
Capital shares receivable | | | 253,942 | | | | 5,400 | | | | 110,218 | | | | 76,962 | |
Interest and dividends receivable | | | 691,000 | | | | 134,302 | | | | 714 | | | | 456,366 | |
Receivable from Investment Advisor | | | — | | | | 7,714 | | | | — | | | | — | |
Prepaid expenses and other assets | | | 22,512 | | | | 11,686 | | | | 17,385 | | | | 20,997 | |
| | | | | | | | | | | | | | | | |
Total Assets | | | 433,452,476 | | | | 18,646,794 | | | | 189,258,059 | | | | 126,625,421 | |
| | | | | | | | | | | | | | | | |
Liabilities: | | | | | | | | | | | | | | | | |
Options written at value (premiums of $0, $195,078, $0, and $0, respectively) | | | — | | | | 258,480 | | | | — | | | | — | |
Securities sold short, at value (proceeds of $0, $174,927, $901,255, and $0, respectively) | | | — | | | | 6,230 | | | | 682,880 | | | | — | |
Bank overdraft | | | 4,618,897 | | | | — | | | | — | | | | 107,346 | |
Payable for securities purchased | | | 1,762,604 | | | | 82,036 | | | | 1,892,215 | | | | — | |
Capital shares payable | | | 1,252,081 | | | | 17,637 | | | | 340,150 | | | | 194,004 | |
Accrued investment advisory fees | | | 537,995 | | | | 11,057 | | | | 198,895 | | | | 55,077 | |
Accrued expenses and other liabilities | | | 269,336 | | | | 29,220 | | | | 127,067 | | | | 71,079 | |
Unrealized depreciation on foreign currency contracts | | | 648 | | | | — | | | | 2 | | | | — | |
| | | | | | | | | | | | | | | | |
Total Liabilities | | | 8,441,561 | | | | 404,660 | | | | 3,241,209 | | | | 427,506 | |
| | | | | | | | | | | | | | | | |
Net Assets | | $ | 425,010,915 | | | $ | 18,242,134 | | | $ | 186,016,850 | | | $ | 126,197,915 | |
| | | | | | | | | | | | | | | | |
Net Assets Consist of: | | | | | | | | | | | | | | | | |
Capital stock | | $ | 1,303,578 | | | $ | 20,402 | | | $ | 96,695 | | | $ | 83,965 | |
Paid-in capital in excess of par | | | 475,437,000 | | | | 22,022,996 | | | | 183,380,140 | | | | 123,074,896 | |
Undistributed net investment income (loss) | | | (34,134 | ) | | | 174,229 | | | | (1,087,724 | ) | | | 85 | |
Undistributed net realized gain (loss) on investments and foreign currency translations | | | (9,765,369 | ) | | | (167,328 | ) | | | 10,535,783 | | | | (5,550,858 | ) |
Net unrealized appreciation (depreciation) on investments and foreign currency translations | | | (41,930,160 | ) | | | (3,808,165 | ) | | | (6,908,044 | ) | | | 8,589,827 | |
| | | | | | | | | | | | | | | | |
Net Assets | | $ | 425,010,915 | | | $ | 18,242,134 | | | $ | 186,016,850 | | | $ | 126,197,915 | |
| | | | | | | | | | | | | | | | |
Capital Stock, $.01 par value: | | | | | | | | | | | | | | | | |
Authorized | | | 10,000,000,000 | | | | 10,000,000,000 | | | | 10,000,000,000 | | | | 10,000,000,000 | |
Issued and outstanding | | | 130,357,780 | | | | 2,040,206 | | | | 9,669,542 | | | | 8,396,503 | |
| | | | |
NET ASSET VALUE, REDEMPTION PRICEAND OFFERING
PRICE PER SHARE | | $ | 3.26 | | | $ | 8.94 | | | $ | 19.24 | | | $ | 15.03 | |
| | | | | | | | | | | | | | | | |
| * | See Note 8 for information on affiliated issuers. |
See notes to financial statements.
72
| | |
| WASATCH FUNDS — Statements of Operations | | FORTHESIXMONTHSENDED MARCH 31, 2008 (UNAUDITED) |
|
| |
| |
| | | | | | | | | | | | | | | | |
| | | CORE
GROWTH
FUND | | | EMERGING MARKETS
SMALL CAP
FUND | | | GLOBAL SCIENCE
& TECHNOLOGY
FUND | | | HERITAGE
GROWTH
FUND | |
| | | | | | | | | | | | | | | | |
Investment Income: | | | | | | | | | | | | | | | | |
Interest | | $ | 176,929 | | | $ | 107,217 | | | $ | 60,920 | | | $ | 39,799 | |
Dividends1 | | | | | | | | | | | | | | | | |
Unaffiliated issuers | | | 8,010,936 | | | | 277,388 | | | | 515,593 | | | | 927,812 | |
Affiliated issuers* | | | — | | | | — | | | | — | | | | — | |
| | | | | | | | | | | | | | | | |
Total investment income | | | 8,187,865 | | | | 384,605 | | | | 576,513 | | | | 967,611 | |
| | | | | | | | | | | | | | | | |
Expenses: | | | | | | | | | | | | | | | | |
Investment advisory fees | | | 5,292,218 | | | | 404,957 | | | | 1,323,795 | | | | 565,493 | |
Shareholder servicing fees | | | 460,120 | | | | 21,146 | | | | 119,871 | | | | 129,977 | |
Fund administration fees | | | 153,139 | | | | 6,676 | | | | 25,506 | | | | 23,356 | |
Fund accounting fees | | | 72,768 | | | | 13,947 | | | | 21,398 | | | | 16,486 | |
Reports to shareholders | | | 70,009 | | | | 22,324 | | | | 20,487 | | | | 21,947 | |
Custody fees | | | 146,969 | | | | 90,394 | | | | 67,487 | | | | 24,719 | |
Federal and state registration fees | | | 16,114 | | | | 15,835 | | | | 12,542 | | | | 8,940 | |
Legal fees | | | 32,309 | | | | 2,478 | | | | 5,508 | | | | 5,254 | |
Directors’ fees | | | 33,207 | | | | 610 | | | | 5,134 | | | | 5,540 | |
Audit fees | | | 12,281 | | | | 12,886 | | | | 12,280 | | | | 12,280 | |
Interest | | | 21,746 | | | | 86 | | | | 3,887 | | | | 4,545 | |
Other | | | 41,860 | | | | 3,010 | | | | 7,711 | | | | 10,029 | |
| | | | | | | | | | | | | | | | |
Total expenses before reimbursement | | | 6,352,740 | | | | 594,349 | | | | 1,625,606 | | | | 828,566 | |
Reimbursement of expenses by Advisor | | | — | | | | (108,314 | ) | | | (2,361 | ) | | | (56,567 | ) |
| | | | | | | | | | | | | | | | |
Net Expenses | | | 6,352,740 | | | | 486,035 | | | | 1,623,245 | | | | 771,999 | |
| | | | | | | | | | | | | | | | |
Net Investment Income (Loss) | | | 1,835,125 | | | | (101,430 | ) | | | (1,046,732 | ) | | | 195,612 | |
| | | | | | | | | | | | | | | | |
Realized and Unrealized Gain (Loss): | | | | | | | | | | | | | | | | |
Net realized gain (loss) on investments and foreign currency translations | | | | | | | | | | | | | | | | |
Unaffiliated issuers | | | 34,131,551 | | | | (767,529 | ) | | | 5,917,816 | | | | 6,280,194 | |
Net realized gain on options written | | | — | | | | — | | | | — | | | | 61,112 | |
Realized foreign capital gains taxes | | | — | | | | — | | | | (73,220 | ) | | | — | |
Change in unrealized depreciation on
investments and foreign currency translations | | | (209,869,974 | ) | | | (8,026,974 | ) | | | (58,948,870 | ) | | | (31,461,611 | ) |
| | | | | | | | | | | | | | | | |
Net loss on investments | | | (175,738,423 | ) | | | (8,794,503 | ) | | | (53,104,274 | ) | | | (25,120,305 | ) |
| | | | | | | | | | | | | | | | |
Net Decrease in Net Assets Resulting from Operations | | $ | (173,903,298 | ) | | $ | (8,895,933 | ) | | $ | (54,151,006 | ) | | $ | (24,924,693 | ) |
| | | | | | | | | | | | | | | | |
1 | Net of $25,907, $20,937, $10,686, and $4,955 in foreign withholding taxes, respectively. |
* | See Note 8 for information on affiliated issuers. |
See notes to financial statements.
73
| | |
| WASATCH FUNDS — Statements of Operations (continued) | | |
|
| |
| |
| | | | | | | | | | | | | | | | |
| | | HERITAGE
VALUE
FUND | | | INTERNATIONAL
GROWTH
FUND | | | INTERNATIONAL
OPPORTUNITIES
FUND | | | MICRO
CAP
FUND | |
| | | | | | | | | | | | | | | | |
Investment Income: | | | | | | | | | | | | | | | | |
Interest | | $ | 13,643 | | | $ | 196,682 | | | $ | 74,867 | | | $ | 173,165 | |
Dividends1 | | | | | | | | | | | | | | | | |
Unaffiliated issuers | | | 36,405 | | | | 2,764,022 | | | | 298,497 | | | | 2,059,345 | |
Affiliated issuers* | | | — | | | | — | | | | — | | | | 24,768 | |
| | | | | | | | | | | | | | | | |
Total investment income | | | 50,048 | | | | 2,960,704 | | | | 373,364 | | | | 2,257,278 | |
| | | | | | | | | | | | | | | | |
Expenses: | | | | | | | | | | | | | | | | |
Investment advisory fees | | | 13,757 | | | | 3,508,164 | | | | 501,409 | | | | 5,381,327 | |
Shareholder servicing fees | | | 12,170 | | | | 228,434 | | | | 33,348 | | | | 138,572 | |
Fund administration fees | | | 569 | | | | 67,567 | | | | 7,253 | | | | 77,794 | |
Fund accounting fees | | | 7,186 | | | | 46,746 | | | | 19,884 | | | | 45,100 | |
Reports to shareholders | | | 3,022 | | | | 34,081 | | | | 2,085 | | | | 19,601 | |
Custody fees | | | 13,169 | | | | 213,813 | | | | 31,557 | | | | 61,947 | |
Federal and state registration fees | | | 17,848 | | | | 18,859 | | | | 7,297 | | | | 10,181 | |
Legal fees | | | 122 | | | | 14,874 | | | | 1,571 | | | | 16,866 | |
Directors’ fees | | | 84 | | | | 14,123 | | | | 1,486 | | | | 16,771 | |
Audit fees | | | 13,279 | | | | 12,281 | | | | 12,286 | | | | 12,281 | |
Dividends on securities sold short | | | — | | | | — | | | | — | | | | — | |
Interest | | | 8 | | | | 14,799 | | | | 117 | | | | 1,285 | |
Other | | | 3,466 | | | | 15,392 | | | | 4,400 | | | | 20,844 | |
| | | | | | | | | | | | | | | | |
Total expenses before reimbursement | | | 84,680 | | | | 4,189,133 | | | | 622,693 | | | | 5,802,569 | |
Reimbursement of expenses by Advisor | | | (66,002 | ) | | | — | | | | (58,492 | ) | | | — | |
| | | | | | | | | | | | | | | | |
Net Expenses | | | 18,678 | | | | 4,189,133 | | | | 564,201 | | | | 5,802,569 | |
| | | | | | | | | | | | | | | | |
Net Investment Income (Loss) | | | 31,370 | | | | (1,228,429 | ) | | | (190,837 | ) | | | (3,545,291 | ) |
| | | | | | | | | | | | | | | | |
Realized and Unrealized Gain (Loss): | | | | | | | | | | | | | | | | |
Net realized gain (loss) on investments and foreign currency translations | | | | | | | | | | | | | | | | |
Unaffiliated issuers | | | (282,975 | ) | | | 11,686,579 | | | | 3,309,866 | | | | 17,818,435 | |
Affiliated issuers* | | | — | | | | — | | | | — | | | | (52,871 | ) |
Net realized gain on options written | | | 136,247 | | | | — | | | | 21,037 | | | | — | |
Net realized gain (loss) on short positions | | | (986 | ) | | | — | | | | 6,404 | | | | — | |
Realized foreign capital gains taxes | | | — | | | | (502,129 | ) | | | — | | | | — | |
Change in unrealized appreciation (depreciation) on
investments and foreign currency translations | | | (332,556 | ) | | | (114,211,202 | ) | | | (15,345,669 | ) | | | (144,653,222 | ) |
| | | | | | | | | | | | | | | | |
Net gain (loss) on investments | | | (480,270 | ) | | | (103,026,752 | ) | | | (12,008,362 | ) | | | (126,887,658 | ) |
| | | | | | | | | | | | | | | | |
Net Increase (Decrease) in Net Assets Resulting from Operations | | $ | (448,900 | ) | | $ | (104,255,181 | ) | | $ | (12,199,199 | ) | | $ | (130,432,949 | ) |
| | | | | | | | | | | | | | | | |
1Net | of $3,351, $145,513, $7,076, $46,916, $1,802, $72,199, $5,958, $1,295, $0, and $0 in foreign withholding taxes, respectively. |
| * | See Note 8 for information on affiliated issuers. |
See notes to financial statements.
74
| | |
| | FORTHESIXMONTHSENDED MARCH 31, 2008 (UNAUDITED) |
|
| |
| |
| | | | | | | | | | | | | | | | | | | | | |
MICRO CAP
VALUE
FUND | | | SMALL CAP
GROWTH
FUND | | | SMALL CAP
VALUE
FUND | | | STRATEGIC
INCOME
FUND | | | ULTRA
GROWTH
FUND | | | U.S.
TREASURY
FUND |
| | | | | | | | | | | | | | | | | | | | | |
| | | | | | | | | | | | | | | | | | | | | |
| $ | 96,941 | | | $ | 145,891 | | | $ | 66,206 | | | $ | 47,806 | | | $ | 78,458 | | | $ | 2,883,480 |
| | | | | | | | | | | | | | | | | | | | | |
| | 403,636 | | | | 3,718,125 | | | | 5,467,960 | | | | 751,649 | | | | 634,950 | | | | — |
| | — | | | | — | | | | 37,131 | | | | — | | | | — | | | | — |
| | | | | | | | | | | | | | | | | | | | | | |
| | 500,577 | | | | 3,864,016 | | | | 5,571,297 | | | | 799,455 | | | | 713,408 | | | | 2,883,480 |
| | | | | | | | | | | | | | | | | | | | | | |
| | | | | | | | | | | | | | | | | | | | | |
| | 1,108,615 | | | | 4,942,992 | | | | 3,893,293 | | | | 72,382 | | | | 1,483,475 | | | | 313,944 |
| | 57,114 | | | | 498,764 | | | | 305,338 | | | | 25,365 | | | | 149,161 | | | | 76,642 |
| | 16,029 | | | | 142,991 | | | | 75,018 | | | | 2,999 | | | | 34,319 | | | | 18,270 |
| | 19,049 | | | | 69,933 | | | | 39,658 | | | | 7,979 | | | | 23,151 | | | | 9,510 |
| | 6,657 | | | | 86,695 | | | | 54,165 | | | | 5,800 | | | | 20,197 | | | | 8,368 |
| | 30,968 | | | | 61,810 | | | | 76,642 | | | | 10,003 | | | | 31,150 | | | | 1,994 |
| | 9,135 | | | | 16,691 | | | | 14,018 | | | | 7,566 | | | | 10,020 | | | | 14,518 |
| | 3,366 | | | | 28,821 | | | | 17,207 | | | | 643 | | | | 6,938 | | | | 3,120 |
| | 3,256 | | | | 29,884 | | | | 17,463 | | | | 625 | | | | 7,266 | | | | 3,542 |
| | 12,281 | | | | 12,281 | | | | 12,281 | | | | 12,243 | | | | 12,280 | | | | 12,281 |
| | — | | | | — | | | | 20,691 | | | | 850 | | | | — | | | | — |
| | 440 | | | | 33,756 | | | | 56,998 | | | | 615 | | | | 10,163 | | | | — |
| | 6,336 | | | | 37,590 | | | | 22,470 | | | | 3,651 | | | | 11,573 | | | | 5,118 |
| | | | | | | | | | | | | | | | | | | | | | |
| | 1,273,246 | | | | 5,962,208 | | | | 4,605,242 | | | | 150,721 | | | | 1,799,693 | | | | 467,307 |
| | (25,614 | ) | | | — | | | | — | | | | (51,024 | ) | | | — | | | | — |
| | | | | | | | | | | | | | | | | | | | | | |
| | 1,247,632 | | | | 5,962,208 | | | | 4,605,242 | | | | 99,697 | | | | 1,799,693 | | | | 467,307 |
| | | | | | | | | | | | | | | | | | | | | | |
| | (747,055 | ) | | | (2,098,192 | ) | | | 966,055 | | | | 699,758 | | | | (1,086,285 | ) | | | 2,416,173 |
| | | | | | | | | | | | | | | | | | | | | | |
| | | | | | | | | | | | | | | | | | | | | |
| | | | | |
| | | | | | | | | | | | | | | | | | | | | |
| | (821,922 | ) | | | 24,680,371 | | | | 5,019,206 | | | | (803,224 | ) | | | 24,195,363 | | | | 1,142,343 |
| | 214,277 | | | | — | | | | — | | | | — | | | | — | | | | — |
| | 859,251 | | | | — | | | | 274,082 | | | | 142,818 | | | | 224,919 | | | | — |
| | 409,459 | | | | (847,296 | ) | | | 862,688 | | | | 1,439,965 | | | | 476,408 | | | | — |
| | — | | | | — | | | | — | | | | — | | | | — | | | | — |
| (18,702,121 | ) | | | (192,393,346 | ) | | | (93,993,315 | ) | | | (2,940,545 | ) | | | (75,594,226 | ) | | | 7,983,408 |
| | | | | | | | | | | | | | | | | | | | | | |
| | (18,041,056 | ) | | | (168,560,271 | ) | | | (87,837,339 | ) | | | (2,160,986 | ) | | | (50,697,536 | ) | | | 9,125,751 |
| | | | | | | | | | | | | | | | | | | | | | |
| $ | (18,788,111 | ) | | $ | (170,658,463 | ) | | $ | (86,871,284 | ) | | $ | (1,461,228 | ) | | $ | (51,783,821 | ) | | $ | 11,541,924 |
| | | | | | | | | | | | | | | | | | | | | | |
75
| | |
| WASATCH FUNDS — Statements of Changes in Net Assets | | |
|
| |
| |
| | | | | | | | | | | | |
| | | CORE GROWTH
FUND | | | EMERGING MARKETS
SMALL CAP FUND1 | |
| | | Six Months
Ended
March 31, 2008
(Unaudited) | | | Year Ended
September 30, 2007 | | | Six Months
Ended
March 31, 2008
(Unaudited) | |
| | | | | | | | | | | | |
Operations: | | | | | | | | | | | | |
Net investment income (loss) | | $ | 1,835,125 | | | $ | (1,181,379 | ) | | $ | (101,430 | ) |
Net realized gain (loss) on investments and foreign
currency translations | | | 34,131,551 | | | | 224,229,226 | | | | (767,529 | ) |
Net realized gain on options written | | | — | | | | — | | | | — | |
Net realized loss on short positions | | | — | | | | — | | | | — | |
Change in unrealized appreciation (depreciation) on
investments and foreign currency translations | | | (209,869,974 | ) | | | (42,206,156 | ) | | | (8,026,974 | ) |
| | | | | | | | | | | | |
Net increase (decrease) in net assets resulting from operations | | | (173,903,298 | ) | | | 180,841,691 | | | | (8,895,933 | ) |
| | | |
Dividends paid from: | | | | | | | | | | | | |
Net investment income | | | — | | | | (4,207,921 | ) | | | (99,237 | ) |
Net realized gains | | | (205,306,297 | ) | | | (110,525,247 | ) | | | — | |
| | | | | | | | | | | | |
| | | (205,306,297 | ) | | | (114,733,168 | ) | | | (99,237 | ) |
| | | |
Capital share transactions: | | | | | | | | | | | | |
Shares sold | | | 43,561,330 | | | | 117,646,419 | | | | 64,381,327 | |
Shares issued to holders in reinvestment of dividends | | | 196,357,419 | | | | 110,575,393 | | | | 97,575 | |
Shares redeemed | | | (241,016,135 | ) | | | (424,777,597 | ) | | | (6,887,814 | ) |
Redemption fees | | | 29,413 | | | | 38,660 | | | | 10,728 | |
| | | | | | | | | | | | |
Net increase (decrease) | | | (1,067,973 | ) | | | (196,517,125 | ) | | | 57,601,816 | |
| | | | | | | | | | | | |
Total increase (decrease) in net assets | | | (380,277,568 | ) | | | (130,408,602 | ) | | | 48,606,646 | |
| | | |
Net assets: | | | | | | | | | | | | |
Beginning of period | | | 1,250,617,966 | | | | 1,381,026,568 | | | | — | |
| | | | | | | | | | | | |
End of period | | $ | 870,340,398 | | | $ | 1,250,617,966 | | | $ | 48,606,646 | |
| | | | | | | | | | | | |
Undistributed net investment income (loss) included in
net assets at end of period | | $ | 768,681 | | | $ | (869,706 | ) | | $ | (193,575 | ) |
| | | | | | | | | | | | |
| | | |
Capital share transactions — shares: | | | | | | | | | | | | |
Shares sold | | | 1,237,652 | | | | 2,744,829 | | | | 32,595,705 | |
Shares issued to holders in reinvestment of dividends | | | 5,657,085 | | | | 2,761,623 | | | | 50,038 | |
Shares redeemed | | | (6,500,645 | ) | | | (10,027,035 | ) | | | (3,807,147 | ) |
| | | | | | | | | | | | |
Net increase (decrease) in shares outstanding | | | 394,092 | | | | (4,520,583 | ) | | | 28,838,596 | |
| | | | | | | | | | | | |
1 | Fund inception date was October 1, 2007. |
2 | Fund inception date was August 30, 2007. |
See notes to financial statements.
76
| | | | | | | | | | | | | | | | | | | | | | |
GLOBAL SCIENCE & TECHNOLOGY
FUND | | | HERITAGE GROWTH
FUND | | | HERITAGE VALUE
FUND | |
Six Months
Ended
March 31, 2008
(Unaudited) | | | Year Ended
September 30, 2007 | | | Six Months
Ended
March 31, 2008
(Unaudited) | | | Year Ended
September 30, 2007 | | | Six Months
Ended
March 31, 2008
(Unaudited) | | | Period Ended
September 30, 20072 | |
| | | | | | | | | | | | | | | | | | | | | | |
| | | | | | | | | | | | | | | | | | | | | | |
| $ | (1,046,732 | ) | | $ | (1,439,039 | ) | | $ | 195,612 | | | $ | (149,563 | ) | | $ | 31,370 | | | $ | 2,146 | |
|
5,917,816 |
| | | 18,704,032 | | | | 6,280,194 | | | | 13,060,221 | | | | (282,975 | ) | | | 249 | |
| | — | | | | 66,092 | | | | 61,112 | | | | 160,696 | | | | 136,247 | | | | — | |
| | (73,220 | ) | | | — | | | | — | | | | — | | | | (986 | ) | | | — | |
| | (58,948,870 | ) | |
|
24,259,423 |
| | | (31,461,611 | ) | | | 17,972,838 | | | | (332,556 | ) | | | 43,001 | |
| | | | | | | | | | | | | | | | | | | | | | | |
| | (54,151,006 | ) | | | 41,590,508 | | | | (24,924,693 | ) | | | 31,044,192 | | | | (448,900 | ) | | | 45,396 | |
| | | | | |
| | | | | | | | | | | | | | | | | | | | | | |
| | — | | | | — | | | | — | | | | (23,660 | ) | | | (40,797 | ) | | | — | |
| | (17,434,195 | ) | | | (5,210,791 | ) | | | (14,407,067 | ) | | | (7,225,236 | ) | | | (15,127 | ) | | | — | |
| | | | | | | | | | | | | | | | | | | | | | | |
| | (17,434,195 | ) | | | (5,210,791 | ) | | | (14,407,067 | ) | | | (7,248,896 | ) | | | (55,924 | ) | | | — | |
| | | | | |
| | | | | | | | | | | | | | | | | | | | | | |
| | 29,299,458 | | | | 79,536,256 | | | | 4,801,254 | | | | 27,445,666 | | | | 2,731,836 | | | | 2,407,615 | |
| | 16,802,106 | | | | 4,944,636 | | | | 14,080,421 | | | | 6,995,484 | | | | 55,698 | | | | — | |
| | (42,857,092 | ) | | | (43,106,438 | ) | | | (63,383,452 | ) | | | (93,704,397 | ) | | | (590,166 | ) | | | (21,048 | ) |
| | 26,945 | | | | 29,507 | | | | 1,475 | | | | 5,710 | | | | 749 | | | | 421 | |
| | | | | | | | | | | | | | | | | | | | | | | |
| | 3,271,417 | | | | 41,403,961 | | | | (44,500,302 | ) | | | (59,257,537 | ) | | | 2,198,117 | | | | 2,386,988 | |
| | | | | | | | | | | | | | | | | | | | | | | |
| | (68,313,784 | ) | | | 77,783,678 | | | | (83,832,062 | ) | | | (35,462,241 | ) | | | 1,693,293 | | | | 2,432,384 | |
| | | | | |
| | | | | | | | | | | | | | | | | | | | | | |
| | 204,142,490 | | | | 126,358,812 | | | | 208,918,111 | | | | 244,380,352 | | | | 2,432,384 | | | | — | |
| | | | | | | | | | | | | | | | | | | | | | | |
| $ | 135,828,706 | | | $ | 204,142,490 | | | $ | 125,086,049 | | | $ | 208,918,111 | | | $ | 4,125,677 | | | $ | 2,432,384 | |
| | | | | | | | | | | | | | | | | | | | | | | |
$ |
(1,774,339 |
) | | $ | (561,209 | ) | | $ | 167,944 | | | $ | (28,414 | ) | | $ | 10,999 | | | $ | 23,446 | |
| | | | | | | | | | | | | | | | | | | | | | | |
| | | | | |
| | | | | | | | | | | | | | | | | | | | | | |
| | 1,886,639 | | | | 4,944,939 | | | | 428,310 | | | | 2,286,187 | | | | 275,125 | | | | 239,802 | |
| | 1,098,177 | | | | 334,097 | | | | 1,267,365 | | | | 596,884 | | | | 5,678 | | | | — | |
| | (3,010,539 | ) | | | (2,780,070 | ) | | | (5,585,749 | ) | | | (7,712,736 | ) | | | (62,798 | ) | | | (2,074 | ) |
| | | | | | | | | | | | | | | | | | | | | | | |
| | (25,723 | ) | | | 2,498,966 | | | | (3,890,074 | ) | | | (4,829,665 | ) | | | 218,005 | | | | 237,728 | |
| | | | | | | | | | | | | | | | | | | | | | | |
77
| | |
| WASATCH FUNDS — Statements of Changes in Net Assets (continued) | | |
|
| |
| |
| | | | | | | | | | | | | | | | |
| | | INTERNATIONAL GROWTH FUND | | | INTERNATIONAL OPPORTUNITIES
FUND | |
| | | Six Months
Ended
March 31, 2008
(Unaudited) | | | Year Ended
September 30, 2007 | | | Six Months
Ended
March 31, 2008
(Unaudited) | | | Year Ended
September 30, 2007 | |
| | | | | | | | | | | | | | | | |
Operations: | | | | | | | | | | | | | | | | |
Net investment income (loss) | | $ | (1,228,429 | ) | | $ | 504,380 | | | $ | (190,837 | ) | | $ | (86,961 | ) |
Net realized gain (loss) on investments and foreign
currency translations | | | 11,184,450 | | | | 57,993,622 | | | | 3,309,866 | | | | 6,802,947 | |
Net realized gain on options written | | | — | | | | — | | | | 21,037 | | | | — | |
Net realized gain (loss) on short positions | | | — | | | | — | | | | 6,404 | | | | — | |
Change in unrealized appreciation (depreciation) on
investments and foreign currency translations | | | (114,211,202 | ) | | | 68,306,187 | | | | (15,345,669 | ) | | | 9,327,438 | |
| | | | | | | | | | | | | | | | |
Net increase (decrease) in net assets resulting from operations | | | (104,255,181 | ) | | | 126,804,189 | | | | (12,199,199 | ) | | | 16,043,424 | |
| | | | |
Dividends paid from: | | | | | | | | | | | | | | | | |
Net investment income | | | (15,000,005 | ) | | | — | | | | (2,089,316 | ) | | | (62,484 | ) |
Net realized gains | | | (53,900,641 | ) | | | (69,456,586 | ) | | | (8,029,593 | ) | | | (2,442,244 | ) |
| | | | | | | | | | | | | | | | |
| | | (68,900,646 | ) | | | (69,456,586 | ) | | | (10,118,909 | ) | | | (2,504,728 | ) |
| | | | |
Capital share transactions: | | | | | | | | | | | | | | | | |
Shares sold | | | 43,316,201 | | | | 123,708,001 | | | | 2,540,290 | | | | 6,367,976 | |
Shares issued to holders in reinvestment of dividends | | | 67,298,924 | | | | 67,578,664 | | | | 9,911,885 | | | | 2,448,543 | |
Shares redeemed | | | (96,088,883 | ) | | | (96,891,205 | ) | | | (3,516,932 | ) | | | (2,761,827 | ) |
Redemption fees | | | 23,504 | | | | 24,983 | | | | 116 | | | | 1,247 | |
| | | | | | | | | | | | | | | | |
Net increase (decrease) | | | 14,549,746 | | | | 94,420,443 | | | | 8,935,359 | | | | 6,055,939 | |
| | | | | | | | | | | | | | | | |
Total increase (decrease) in net assets | | | (158,606,081 | ) | | | 151,768,046 | | | | (13,382,749 | ) | | | 19,594,635 | |
| | | | |
Net assets: | | | | | | | | | | | | | | | | |
Beginning of period | | | 534,902,685 | | | | 383,134,639 | | | | 56,433,177 | | | | 36,838,542 | |
| | | | | | | | | | | | | | | | |
End of period | | $ | 376,296,604 | | | $ | 534,902,685 | | | $ | 43,050,428 | | | $ | 56,433,177 | |
| | | | | | | | | | | | | | | | |
Undistributed net investment income (loss) included in
net assets at end of period | | $ | (17,105,369 | ) | | $ | (788,351 | ) | | $ | (1,942,355 | ) | | $ | 324,678 | |
| | | | | | | | | | | | | | | | |
| | | | |
Capital share transactions — shares: | | | | | | | | | | | | | | | | |
Shares sold | | | 1,993,393 | | | | 5,358,055 | | | | 934,368 | | | | 1,935,461 | |
Shares issued to holders in reinvestment of dividends | | | 3,356,555 | | | | 3,306,197 | | | | 3,604,322 | | | | 830,015 | |
Shares redeemed | | | (5,077,597 | ) | | | (4,305,020 | ) | | | (1,210,914 | ) | | | (857,324 | ) |
| | | | | | | | | | | | | | | | |
Net increase (decrease) in shares outstanding | | | 272,351 | | | | 4,359,232 | | | | 3,327,776 | | | | 1,908,152 | |
| | | | | | | | | | | | | | | | |
See notes to financial statements.
78
| | | | | | | | | | | | | | | | | | | | | | |
MICRO CAP FUND | | | MICRO CAP VALUE FUND | | | SMALL CAP GROWTH FUND | |
Six Months
Ended
March 31, 2008
(Unaudited) | | | Year Ended
September 30, 2007 | | | Six Months
Ended
March 31, 2008
(Unaudited) | | | Year Ended
September 30, 2007 | | | Six Months
Ended
March 31, 2008
(Unaudited) | | | Year Ended
September 30, 2007 | |
| | | | | | | | | | | | | | | | | | | | | | |
| | | | | | | | | | | | | | | | | | | | | | |
| $ | (3,545,291 | ) | | $ | (7,863,539 | ) | | $ | (747,055 | ) | | $ | (1,182,923 | ) | | $ | (2,098,192 | ) | | $ | (6,221,093 | ) |
| | | | | |
| | 17,765,564 | | | | 100,522,049 | | | | (607,645 | ) | | | 18,003,142 | | | | 24,680,371 | | | | 141,862,791 | |
| | — | | | | 162,745 | | | | 859,251 | | | | 950,991 | | | | — | | | | — | |
| | — | | | | — | | | | 409,459 | | | | (104,027 | ) | | | (847,296 | ) | | | (694,035 | ) |
| | | | | |
| | (144,653,222 | ) | | | 13,434,587 | | | | (18,702,121 | ) | | | 4,331,292 | | | | (192,393,346 | ) | | | 54,045,856 | |
| | | | | | | | | | | | | | | | | | | | | | | |
| | (130,432,949 | ) | | | 106,255,842 | | | | (18,788,111 | ) | | | 21,998,475 | | | | (170,658,463 | ) | | | 188,993,519 | |
| | | | | |
| | | | | | | | | | | | | | | | | | | | | | |
| | — | | | | — | | | | — | | | | — | | | | — | | | | — | |
| | (98,389,979 | ) | | | (67,720,917 | ) | | | (16,429,060 | ) | | | (18,395,781 | ) | | | (120,648,854 | ) | | | (92,697,704 | ) |
| | | | | | | | | | | | | | | | | | | | | | | |
| | (98,389,979 | ) | | | (67,720,917 | ) | | | (16,429,060 | ) | | | (18,395,781 | ) | | | (120,648,854 | ) | | | (92,697,704 | ) |
| | | | | |
| | | | | | | | | | | | | | | | | | | | | | |
| | 8,259,068 | | | | 15,698,971 | | | | 4,327,564 | | | | 12,406,622 | | | | 61,486,810 | | | | 130,032,208 | |
| | 94,126,664 | | | | 65,068,973 | | | | 16,104,543 | | | | 18,013,951 | | | | 117,697,647 | | | | 90,344,199 | |
| | (59,619,191 | ) | | | (71,789,168 | ) | | | (10,437,972 | ) | | | (9,491,736 | ) | | | (107,205,833 | ) | | | (476,277,049 | ) |
| | 986 | | | | 2,432 | | | | 207 | | | | 178 | | | | 36,344 | | | | 59,777 | |
| | | | | | | | | | | | | | | | | | | | | | | |
| | 42,767,527 | | | | 8,981,208 | | | | 9,994,342 | | | | 20,929,015 | | | | 72,014,968 | | | | (255,840,865 | ) |
| | | | | | | | | | | | | | | | | | | | | | | |
| | (186,055,401 | ) | | | 47,516,133 | | | | (25,222,829 | ) | | | 24,531,709 | | | | (219,292,349 | ) | | | (159,545,050 | ) |
| | | | | |
| | | | | | | | | | | | | | | | | | | | | | |
| | 631,417,228 | | | | 583,901,095 | | | | 120,039,429 | | | | 95,507,720 | | | | 1,075,433,049 | | | | 1,234,978,099 | |
| | | | | | | | | | | | | | | | | | | | | | | |
| $ | 445,361,827 | | | $ | 631,417,228 | | | $ | 94,816,600 | | | $ | 120,039,429 | | | $ | 856,140,700 | | | $ | 1,075,433,049 | |
| | | | | | | | | | | | | | | | | | | | | | | |
| | | | | |
| $ | (4,010,794 | ) | | $ | (484,240 | ) | | $ | (890,043 | ) | | $ | (121,769 | ) | | $ | (2,246,685 | ) | | $ | 8,751 | |
| | | | | | | | | | | | | | | | | | | | | | | |
| | | | | |
| | | | | | | | | | | | | | | | | | | | | | |
| | 1,484,994 | | | | 2,240,904 | | | | 1,560,830 | | | | 4,359,135 | | | | 1,794,967 | | | | 3,396,315 | |
| | 16,778,372 | | | | 9,799,544 | | | | 6,493,767 | | | | 6,647,215 | | | | 3,294,085 | | | | 2,431,876 | |
| | (10,471,622 | ) | | | (10,257,044 | ) | | | (4,300,950 | ) | | | (3,313,686 | ) | | | (3,057,940 | ) | | | (12,399,974 | ) |
| | | | | | | | | | | | | | | | | | | | | | | |
| | 7,791,744 | | | | 1,783,404 | | | | 3,753,647 | | | | 7,692,664 | | | | 2,031,112 | | | | (6,571,783 | ) |
| | | | | | | | | | | | | | | | | | | | | | | |
79
| | |
| WASATCH FUNDS — Statements of Changes in Net Assets (continued) | | |
|
| |
| |
| | | | | | | | | | | | | | | | |
| | | SMALL CAP VALUE
FUND | | | STRATEGIC INCOME
FUND | |
| | | Six Months
Ended
March 31, 2008
(Unaudited) | | | Year Ended
September 30, 2007 | | | Six Months
Ended
March 31, 2008
(Unaudited) | | | Year Ended
September 30, 2007 | |
| | | | | | | | | | | | | | | | |
Operations: | | | | | | | | | | | | | | | | |
Net investment income (loss) | | $ | 966,055 | | | $ | 1,285,182 | | | $ | 699,758 | | | $ | 974,264 | |
Net realized gain (loss) on investments and foreign currency translations | | | 5,019,206 | | | | 155,779,277 | | | | (803,224 | ) | | | 52,706 | |
Net realized gain on options written | | | 274,082 | | | | 1,078,508 | | | | 142,818 | | | | 24,907 | |
Net realized gain (loss) on short positions | | | 862,688 | | | | — | | | | 1,439,965 | | | | 1,290,734 | |
Change in unrealized appreciation (depreciation) on investments and foreign currency translations | | | (93,993,315 | ) | | | (74,483,105 | ) | | | (2,940,545 | ) | | | (1,281,957 | ) |
| | | | | | | | | | | | | | | | |
Net increase (decrease) in net assets resulting from operations | | | (86,871,284 | ) | | | 83,659,862 | | | | (1,461,228 | ) | | | 1,060,654 | |
| | | | |
Dividends paid from: | | | | | | | | | | | | | | | | |
Net investment income | | | (1,304,044 | ) | | | (4,575,097 | ) | | | (606,094 | ) | | | (903,928 | ) |
Net realized gains | | | (141,787,741 | ) | | | (84,556,633 | ) | | | (2,217,011 | ) | | | (54,564 | ) |
| | | | | | | | | | | | | | | | |
| | | (143,091,785 | ) | | | (89,131,730 | ) | | | (2,823,105 | ) | | | (958,492 | ) |
| | | | |
Capital share transactions: | | | | | | | | | | | | | | | | |
Shares sold | | | 31,718,013 | | | | 91,496,417 | | | | 2,334,502 | | | | 21,723,688 | |
Shares issued to holders in reinvestment of dividends | | | 137,071,808 | | | | 86,009,646 | | | | 2,765,825 | | | | 924,221 | |
Shares redeemed | | | (174,464,608 | ) | | | (176,041,666 | ) | | | (6,197,344 | ) | | | (11,873,932 | ) |
Redemption fees | | | 11,703 | | | | 19,685 | | | | 2,268 | | | | 13,045 | |
| | | | | | | | | | | | | | | | |
Net increase (decrease) | | | (5,663,084 | ) | | | 1,484,082 | | | | (1,094,749 | ) | | | 10,787,022 | |
| | | | | | | | | | | | | | | | |
Total increase (decrease) in net assets | | | (235,626,153 | ) | | | (3,987,786 | ) | | | (5,379,082 | ) | | | 10,889,184 | |
| | | | |
Net assets: | | | | | | | | | | | | | | | | |
Beginning of period | | | 660,637,068 | | | | 664,624,854 | | | | 23,621,216 | | | | 12,732,032 | |
| | | | | | | | | | | | | | | | |
End of period | | $ | 425,010,915 | | | $ | 660,637,068 | | | $ | 18,242,134 | | | $ | 23,621,216 | |
| | | | | | | | | | | | | | | | |
Undistributed net investment income (loss) included in net assets at end of period | | $ | (34,134 | ) | | $ | 333,131 | | | $ | 174,229 | | | $ | 85,088 | |
| | | | | | | | | | | | | | | | |
| | | | |
Capital share transactions — shares: | | | | | | | | | | | | | | | | |
Shares sold | | | 8,356,827 | | | | 17,057,164 | | | | 241,983 | | | | 1,898,641 | |
Shares issued to holders in reinvestment of dividends | | | 38,503,317 | | | | 17,133,396 | | | | 292,625 | | | | 81,799 | |
Shares redeemed | | | (43,148,262 | ) | | | (33,076,044 | ) | | | (641,039 | ) | | | (1,048,448 | ) |
| | | | | | | | | | | | | | | | |
Net increase (decrease) in shares outstanding | | | 3,711,882 | | | | 1,114,516 | | | | (106,431 | ) | | | 931,992 | |
| | | | | | | | | | | | | | | | |
See notes to financial statements.
80
| | | | | | | | | | | | | | | | | | |
ULTRA GROWTH
FUND | | | U.S. TREASURY
FUND | | | | | |
Six Months
Ended
March 31, 2008
(Unaudited) | | | Year Ended
September 30, 2007 | | | Six Months
Ended
March 31, 2008
(Unaudited) | | | Year Ended
September 30, 2007 | | | | | |
| | | | | | | | | | | | | | | | | | |
| | | | | | | | | | | | | | | | | | |
| $ | (1,086,285 | ) | | $ | (3,175,443 | ) | | $ | 2,416,173 | | | $ | 7,950,767 | | | | | |
|
24,195,363 |
| | | 28,644,421 | | | | 1,142,343 | | | | (899,982 | ) | | | | |
| | 224,919 | | | | 18,525 | | | | — | | | | — | | | | | |
| | 476,408 | | | | (119,136 | ) | | | — | | | | — | | | | | |
| (75,594,226 | ) | | | 35,146,031 | | | | 7,983,408 | | | | (3,610,027 | ) | | | | |
| | | | | | | | | | | | | | | | | | | |
| (51,783,821 | ) | | | 60,514,398 | | | | 11,541,924 | | | | 3,440,758 | | | | | |
| | | | | |
| | | | | | | | | | | | | | | | | | |
| | — | | | | — | | | | (2,415,805 | ) | | | (7,951,409 | ) | | | | |
| | (32,302,048 | ) | | | (21,145,437 | ) | | | — | | | | — | | | | | |
| | | | | | | | | | | | | | | | | | | |
| | (32,302,048 | ) | | | (21,145,437 | ) | | | (2,415,805 | ) | | | (7,951,409 | ) | | | | |
| | | | | |
| | | | | | | | | | | | | | | | | | |
| | 14,117,221 | | | | 20,390,670 | | | | 44,398,828 | | | | 57,301,220 | | | | | |
| | 31,508,336 | | | | 20,567,611 | | | | 2,211,192 | | | | 7,407,666 | | | | | |
| | (44,160,287 | ) | | | (118,109,285 | ) | | | (45,396,998 | ) | | | (149,451,060 | ) | | | | |
| | 4,339 | | | | 8,878 | | | | 70,852 | | | | 46,441 | | | | | |
| | | | | | | | | | | | | | | | | | | |
| | 1,469,609 | | | | (77,142,126 | ) | | | 1,283,874 | | | | (84,695,733 | ) | | | | |
| | | | | | | | | | | | | | | | | | | |
| | (82,616,260 | ) | | | (37,773,165 | ) | | | 10,409,993 | | | | (89,206,384 | ) | | | | |
| | | | | |
| | | | | | | | | | | | | | | | | | |
| | 268,633,110 | | | | 306,406,275 | | | | 115,787,922 | | | | 204,994,306 | | | | | |
| | | | | | | | | | | | | | | | | | | |
| $ | 186,016,850 | | | $ | 268,633,110 | | | $ | 126,197,915 | | | $ | 115,787,922 | | | | | |
| | | | | | | | | | | | | | | | | | | |
$ |
(1,087,724 |
) | | $ | (759 | ) | | $ | 85 | | | $ | (283 | ) | | | | |
| | | | | | | | | | | | | | | | | | | |
| | | | | |
| | | | | | | | | | | | | | | | | | |
| | 580,185 | | | | 809,631 | | | | 2,994,322 | | | | 4,157,573 | | | | | |
| | 1,297,707 | | | | 848,849 | | | | 149,464 | | | | 539,219 | | | | | |
| | (1,877,094 | ) | | | (4,710,330 | ) | | | (3,113,263 | ) | | | (10,853,212 | ) | | | | |
| | | | | | | | | | | | | | | | | | | |
| | 798 | | | | (3,051,850 | ) | | | 30,523 | | | | (6,156,420 | ) | | | | |
| | | | | | | | | | | | | | | | | | | |
81
| | |
| WASATCH FUNDS — Financial Highlights | | |
|
| |
| |
| | | | | | | | | | | | | | | | | | | | | | | | |
| CORE GROWTH FUND | | Six Months
Ended
March 31
(Unaudited) | | | Year Ended September 30 | |
| (for a share outstanding throughout each period) | | 2008 | | | 2007 | | | 2006 | | | 2005 | | | 2004 | | | 2003 | |
| | | | | | | | | | | | | | | | | | | | | | | | |
Net asset value, beginning of period | | $ | 42.98 | | | $ | 41.08 | | | $ | 43.92 | | | $ | 38.49 | | | $ | 33.54 | | | $ | 25.46 | |
| | | | | | |
Income (loss) from investment operations: | | | | | | | | | | | | | | | | | | | | | | | | |
Net investment income (loss) | | | 0.06 | | | | (0.05 | ) | | | 0.17 | | | | 0.56 | | | | 0.13 | | | | (0.01 | ) |
Net realized and unrealized gains (losses) on investments | | | (5.72 | ) | | | 5.65 | | | | 0.90 | | | | 6.41 | | | | 4.84 | | | | 8.09 | |
Net increase from payment by affiliate | | | — | | | | — | | | | — | | | | — | 1 | | | — | | | | — | |
| | | | | | | | | | | | | | | | | | | | | | | | |
Total from investment operations | | | (5.66 | ) | | | 5.60 | | | | 1.07 | | | | 6.97 | | | | 4.97 | | | | 8.08 | |
| | | | | | |
Redemption fees (see Note 2) | | | — | 1 | | | — | 1 | | | — | 1 | | | — | 1 | | | — | 1 | | | — | 1 |
| | | | | | |
Less distributions: | | | | | | | | | | | | | | | | | | | | | | | | |
Dividends from net investment income | | | — | | | | (0.14 | ) | | | (0.63 | ) | | | (0.22 | ) | | | (0.02 | ) | | | — | |
Distributions from net realized gains | | | (7.81 | ) | | | (3.56 | ) | | | (3.28 | ) | | | (1.32 | ) | | | — | | | | — | |
| | | | | | | | | | | | | | | | | | | | | | | | |
Total distributions | | | (7.81 | ) | | | (3.70 | ) | | | (3.91 | ) | | | (1.54 | ) | | | (0.02 | ) | | | — | |
| | | | | | | | | | | | | | | | | | | | | | | | |
Net asset value, end of period | | $ | 29.51 | | | $ | 42.98 | | | $ | 41.08 | | | $ | 43.92 | | | $ | 38.49 | | | $ | 33.54 | |
| | | | | | | | | | | | | | | | | | | | | | | | |
Total return2 4 | | | (15.90)% | | | | 14.28% | | | | 2.46% | | | | 18.58% | | | | 14.80% | | | | 31.68% | |
| | | | | | |
Supplemental data and ratios: | | | | | | | | | | | | | | | | | | | | | | | | |
Net assets, end of period (in thousands) | | $ | 870,340 | | | $ | 1,250,618 | | | $ | 1,381,027 | | | $ | 1,704,690 | | | $ | 1,496,969 | | | $ | 1,318,341 | |
Ratio of expenses to average net assets3 | | | 1.20% | | | | 1.18% | | | | 1.17% | | | | 1.20% | | | | 1.21% | | | | 1.25% | |
Ratio of net investment income (loss) to average net assets3 | | | 0.35% | | | | (0.09)% | | | | 0.38% | | | | 1.30% | | | | 0.34% | | | | (0.02)% | |
Portfolio turnover rate2 | | | 23% | | | | 54% | | | | 42% | | | | 42% | | | | 47% | | | | 47% | |
| | | | | | |
| EMERGING MARKETS SMALL CAP FUND | | Six Months
Ended
March 31
(Unaudited) | | | | | | | | | | | | | | | | |
| (for a share outstanding throughout each period) | | 20085 | | | | | | | | | | | | | | | | |
| | | | | | | | | | | | | | | | | | | | | | | | |
Net asset value, beginning of period | | $ | 2.00 | | | | | | | | | | | | | | | | | | | | | |
| | | | | | |
Loss from investment operations: | | | | | | | | | | | | | | | | | | | | | | | | |
Net investment loss | | | (0.01 | ) | | | | | | | | | | | | | | | | | | | | |
Net realized and unrealized losses on investments | | | (0.30 | ) | | | | | | | | | | | | | | | | | | | | |
| | | | | | | | | | | | | | | | | | | | | | | | |
Total from investment operations | | | (0.31 | ) | | | | | | | | | | | | | | | | | | | | |
| | | | | | |
Redemption fees (see Note 2) | | | — | 1 | | | | | | | | | | | | | | | | | | | | |
| | | | | | |
Total distributions | | | — | | | | | | | | | | | | | | | | | | | | | |
| | | | | | | | | | | | | | | | | | | | | | | | |
Net asset value, end of period | | $ | 1.69 | | | | | | | | | | | | | | | | | | | | | |
| | | | | | | | | | | | | | | | | | | | | | | | |
Total return2 | | | (15.83)% | | | | | | | | | | | | | | | | | | | | | |
| | | | | | |
Supplemental data and ratios: | | | | | | | | | | | | | | | | | | | | | | | | |
Net assets, end of period (in thousands) | | $ | 48,607 | | | | | | | | | | | | | | | | | | | | | |
Ratio of expenses to average net assets: | | | | | | | | | | | | | | | | | | | | | | | | |
Net of waivers and reimbursements3 | | | 2.10% | | | | | | | | | | | | | | | | | | | | | |
Before waivers and reimbursements3 | | | 2.57% | | | | | | | | | | | | | | | | | | | | | |
Ratio of net investment loss to average net assets: | | | | | | | | | | | | | | | | | | | | | | | | |
Net of waivers and reimbursements3 | | | (0.44)% | | | | | | | | | | | | | | | | | | | | | |
Before waivers and reimbursements3 | | | (0.91)% | | | | | | | | | | | | | | | | | | | | | |
Portfolio turnover rate2 | | | 6% | | | | | | | | | | | | | | | | | | | | | |
1 | Represents amounts less than $.005 per share. |
2 | Not annualized for periods less than one year. |
4 | In 2005, 0.03% of the Fund’s total return consisted of a voluntary reimbursement by the Advisor for amounts relating to errors in applying the Funds’ cross-trading policies. Excluding this item, the total return would have been 18.55%. |
5 | Fund inception date was October 1, 2007. |
See notes to financial statements.
82
| | | | | | | | | | | | | | | | | | | | | | | | |
| GLOBAL SCIENCE & TECHNOLOGY FUND | | Six Months
Ended
March 31
(Unaudited) | | | Year Ended September 30 | |
| (for a share outstanding throughout each period) | | 2008 | | | 2007 | | | 2006 | | | 2005 | | | 2004 | | | 2003 | |
| | | | | | | | | | | | | | | | | | | | | | | | |
Net asset value, beginning of period | | $ | 17.69 | | | $ | 13.97 | | | $ | 12.98 | | | $ | 10.15 | | | $ | 10.73 | | | $ | 6.38 | |
| | | | | | |
Income (loss) from investment operations: | | | | | | | | | | | | | | | | | | | | | | | | |
Net investment loss | | | (0.09 | ) | | | (0.12 | ) | | | (0.14 | ) | | | (0.16 | ) | | | (0.18 | ) | | | (0.13 | ) |
Net realized and unrealized gains (losses) on investments | | | (4.33 | ) | | | 4.43 | | | | 1.40 | | | | 2.99 | | | | (0.41 | ) | | | 4.47 | |
Net increase from payment by affiliate | | | — | | | | — | | | | — | | | | — | 1 | | | — | | | | — | |
| | | | | | | | | | | | | | | | | | | | | | | | |
Total from investment operations | | | (4.42 | ) | | | 4.31 | | | | 1.26 | | | | 2.83 | | | | (0.59 | ) | | | 4.34 | |
| | | | | | |
Redemption fees (see Note 2) | | | — | | | | — | 1 | | | — | 1 | | | — | 1 | | | 0.01 | | | | 0.01 | |
| | | | | | |
Less distributions: | | | | | | | | | | | | | | | | | | | | | | | | |
Distributions from net realized gains | | | (1.48 | ) | | | (0.59 | ) | | | (0.27 | ) | | | — | | | | — | | | | — | |
| | | | | | | | | | | | | | | | | | | | | | | | |
Total distributions | | | (1.48 | ) | | | (0.59 | ) | | | (0.27 | ) | | | — | | | | — | | | | — | |
| | | | | | | | | | | | | | | | | | | | | | | | |
Net asset value, end of period | | $ | 11.79 | | | $ | 17.69 | | | $ | 13.97 | | | $ | 12.98 | | | $ | 10.15 | | | $ | 10.73 | |
| | | | | | | | | | | | | | | | | | | | | | | | |
Total return3 5 | | | (26.90)% | | | | 31.63% | | | | 9.81% | | | | 27.88% | | | | (5.49)% | | | | 68.34% | |
| | | | | | |
Supplemental data and ratios: | | | | | | | | | | | | | | | | | | | | | | | | |
Net assets, end of period (in thousands) | | $ | 135,829 | | | $ | 204,142 | | | $ | 126,359 | | | $ | 89,353 | | | $ | 69,301 | | | $ | 51,517 | |
Ratio of expenses to average net assets: | | | | | | | | | | | | | | | | | | | | | | | | |
Net of waivers and reimbursements4 | | | 1.84% | | | | 1.85% | | | | 1.94% | | | | 1.95% | | | | 1.95% | | | | 1.95% | |
Before waivers and reimbursements4 | | | 1.84% | | | | 1.85% | | | | 1.94% | | | | 1.97% | | | | 1.97% | | | | 2.13% | |
Ratio of net investment loss to average net assets: | | | | | | | | | | | | | | | | | | | | | | | | |
Net of waivers and reimbursements4 | | | (1.19)% | | | | (0.97)% | | | | (1.15)% | | | | (1.52)% | | | | (1.66)% | | | | (1.87)% | |
Before waivers and reimbursements4 | | | (1.19)% | | | | (0.97)% | | | | (1.15)% | | | | (1.54)% | | | | (1.68)% | | | | (2.05)% | |
Portfolio turnover rate3 | | | 37% | | | | 78% | | | | 58% | | | | 80% | | | | 55% | | | | 88% | |
| | | |
| HERITAGE GROWTH FUND | | Six Months
Ended
March 31
(Unaudited) | | | Year or Period Ended September 30 | | | | |
| (for a share outstanding throughout each period) | | 2008 | | | 2007 | | | 2006 | | | 2005 | | | 20042 | | | | |
| | | | | | | | | | | | | | | | | | | | | | | | |
Net asset value, beginning of period | | $ | 12.57 | | | $ | 11.40 | | | $ | 11.43 | | | $ | 9.86 | | | $ | 10.00 | | | | | |
| | | | | | |
Income (loss) from investment operations: | | | | | | | | | | | | | | | | | | | | | | | | |
Net investment income (loss) | | | 0.01 | | | | (0.01 | ) | | | — | 1 | | | 0.02 | | | | — | 1 | | | | |
Net realized and unrealized gains (losses) on investments | | | (1.69 | ) | | | 1.53 | | | | 0.28 | | | | 1.55 | | | | (0.14 | ) | | | | |
Net increase from payment by affiliate | | | — | | | | — | | | | — | | | | — | 1 | | | — | | | | | |
| | | | | | | | | | | | | | | | | | | | | | | | |
Total from investment operations | | | (1.68 | ) | | | 1.52 | | | | 0.28 | | | | 1.57 | | | | (0.14 | ) | | | | |
| | | | | | |
Redemption fees (see Note 2) | | | — | | | | — | 1 | | | — | 1 | | | — | 1 | | | — | 1 | | | | |
| | | | | | |
Less distributions: | | | | | | | | | | | | | | | | | | | | | | | | |
Dividends from net investment income | | | — | | | | — | 1 | | | (0.01 | ) | | | — | | | | — | | | | | |
Distributions from net realized gains | | | (1.06 | ) | | | (0.35 | ) | | | (0.30 | ) | | | — | 1 | | | — | | | | | |
| | | | | | | | | | | | | | | | | | | | | | | | |
Total distributions | | | (1.06 | ) | | | (0.35 | ) | | | (0.31 | ) | | | — | 1 | | | — | | | | | |
| | | | | | | | | | | | | | | | | | | | | | | | |
Net asset value, end of period | | $ | 9.83 | | | $ | 12.57 | | | $ | 11.40 | | | $ | 11.43 | | | $ | 9.86 | | | | | |
| | | | | | | | | | | | | | | | | | | | | | | | |
Total return3 5 | | | (14.31)% | | | | 13.59% | | | | 2.46% | | | | 15.95% | | | | (1.40)% | | | | | |
| | | | | | |
Supplemental data and ratios: | | | | | | | | | | | | | | | | | | | | | | | | |
Net assets, end of period (in thousands) | | $ | 125,086 | | | $ | 208,918 | | | $ | 244,380 | | | $ | 304,670 | | | $ | 128,136 | | | | | |
Ratio of expenses to average net assets
(including interest expense): | | | | | | | | | | | | | | | | | | | | | | | | |
Net of waivers and reimbursements4 | | | 0.96% | | | | 0.95% | | | | 0.95% | | | | 0.95% | | | | 0.95% | | | | | |
Before waivers and reimbursements4 | | | 1.03% | | | | 0.95% | | | | 0.95% | | | | 0.99% | | | | 1.26% | | | | | |
Ratio of expenses to average net assets
(excluding interest expense): | | | | | | | | | | | | | | | | | | | | | | | | |
Net of waivers and reimbursements4 | | | 0.95% | | | | 0.95% | | | | 0.95% | | | | 0.95% | | | | 0.95% | | | | | |
Before waivers and reimbursements4 | | | 1.02% | | | | 0.95% | | | | 0.95% | | | | 0.99% | | | | 1.26% | | | | | |
Ratio of net investment income (loss) to average net assets: | | | | | | | | | | | | | | | | | | | | | | | | |
Net of waivers and reimbursements4 | | | 0.24% | | | | (0.06)% | | | | 0.01% | | | | 0.17% | | | | (0.01)% | | | | | |
Before waivers and reimbursements4 | | | 0.17% | | | | (0.06)% | | | | 0.01% | | | | 0.13% | | | | (0.32)% | | | | | |
Portfolio turnover rate3 | | | 25% | | | | 56% | | | | 54% | | | | 36% | | | | 5% | | | | | |
1 | Represents amounts less than $.005 per share. |
2 | Fund inception date was June 18, 2004. |
3 | Not annualized for periods less than one year. |
5 | In 2005, the Fund’s total return included a voluntary reimbursement by the Advisor for amounts relating to errors in applying the Funds’ cross-trading policies that had no impact on the total return. |
See notes to financial statements.
83
| | |
| WASATCH FUNDS — Financial Highlights (continued) | | |
|
| |
| |
| | | | | | | | | | | | | | | | | | | | | | | | |
| HERITAGE VALUE FUND | | Six Months
Ended
March 31
(Unaudited) | | | Period
Ended
September 30 | | | | | | | | | | | | | |
| (for a share outstanding throughout each period) | | 2008 | | | 20071 | | | | | | | | | | | | | |
| | | | | | | | | | | | | | | | | | | | | | | | |
Net asset value, beginning of period | | $ | 10.23 | | | $ | 10.00 | | | | | | | | | | | | | | | | | |
| | | | | | |
Income (loss) from investment operations: | | | | | | | | | | | | | | | | | | | | | | | | |
Net investment income | | | 0.03 | | | | 0.01 | | | | | | | | | | | | | | | | | |
Net realized and unrealized gains (losses) on investments | | | (1.07 | ) | | | 0.22 | | | | | | | | | | | | | | | | | |
| | | | | | | | | | | | | | | | | | | | | | | | |
Total from investment operations | | | (1.04 | ) | | | 0.23 | | | | | | | | | | | | | | | | | |
| | | | | | |
Redemption fees (see Note 2) | | | — | 2 | | | — | 2 | | | | | | | | | | | | | | | | |
| | | | | | |
Less distributions: | | | | | | | | | | | | | | | | | | | | | | | | |
Dividends from net investment income | | | (0.10 | ) | | | — | | | | | | | | | | | | | | | | | |
Distributions from net realized gains | | | (0.04 | ) | | | — | | | | | | | | | | | | | | | | | |
| | | | | | | | | | | | | | | | | | | | | | | | |
Total distributions | | | (0.14 | ) | | | — | | | | | | | | | | | | | | | | | |
| | | | | | | | | | | | | | | | | | | | | | | | |
Net asset value, end of period | | $ | 9.05 | | | $ | 10.23 | | | | | | | | | | | | | | | | | |
| | | | | | | | | | | | | | | | | | | | | | | | |
Total return3 | | | (10.41)% | | | | 2.40% | | | | | | | | | | | | | | | | | |
| | | | | | |
Supplemental data and ratios: | | | | | | | | | | | | | | | | | | | | | | | | |
Net assets, end of period (in thousands) | | $ | 4,126 | | | $ | 2,432 | | | | | | | | | | | | | | | | | |
Ratio of expenses to average net assets: | | | | | | | | | | | | | | | | | | | | | | | | |
Net of waivers and reimbursements4 | | | 0.95% | | | | 0.95% | | | | | | | | | | | | | | | | | |
Before waivers and reimbursements4 | | | 4.31% | | | | 24.78% | | | | | | | | | | | | | | | | | |
Ratio of net investment income (loss) to average net assets: | | | | | | | | | | | | | | | | | | | | | | | | |
Net of waivers and reimbursements4 | | | 1.60% | | | | 1.49% | | | | | | | | | | | | | | | | | |
Before waivers and reimbursements4 | | | (1.76)% | | | | (22.34)% | | | | | | | | | | | | | | | | | |
Portfolio turnover rate3 | | | 98% | | | | 0% | | | | | | | | | | | | | | | | | |
| | |
| INTERNATIONAL GROWTH FUND | | Six Months
Ended
March 31
(Unaudited) | | | Year Ended September 30 | |
| (for a share outstanding throughout each period) | | 2008 | | | 2007 | | | 2006 | | | 2005 | | | 2004 | | | 2003 | |
| | | | | | | | | | | | | | | | | | | | | | | | |
Net asset value, beginning of period | | $ | 24.42 | | | $ | 21.83 | | | $ | 18.50 | | | $ | 14.71 | | | $ | 12.06 | | | $ | 8.85 | |
| | | | | | |
Income (loss) from investment operations: | | | | | | | | | | | | | | | | | | | | | | | | |
Net investment income (loss) | | | (0.05 | ) | | | 0.03 | | | | (0.09 | ) | | | (0.10 | ) | | | (0.11 | ) | | | (0.07 | ) |
Net realized and unrealized gains (losses) on investments | | | (4.28 | ) | | | 6.61 | | | | 3.42 | | | | 3.91 | | | | 2.76 | | | | 3.28 | |
Net increase from payment by affiliate | | | — | | | | — | | | | — | | | | 0.01 | | | | — | | | | — | |
| | | | | | | | | | | | | | | | | | | | | | | | |
Total from investment operations | | | (4.33 | ) | | | 6.64 | | | | 3.33 | | | | 3.82 | | | | 2.65 | | | | 3.21 | |
| | | | | | |
Redemption fees (see Note 2) | | | — | 2 | | | — | 2 | | | — | 2 | | | — | 2 | | | — | 2 | | | — | 2 |
| | | | | | |
Less distributions: | | | | | | | | | | | | | | | | | | | | | | | | |
Dividends from net investment income | | | (0.68 | ) | | | — | | | | — | | | | — | | | | — | | | | — | |
Distributions from net realized gains | | | (2.44 | ) | | | (4.05 | ) | | | — | 2 | | | (0.03 | ) | | | — | | | | — | |
| | | | | | | | | | | | | | | | | | | | | | | | |
Total distributions | | | (3.12 | ) | | | (4.05 | ) | | | — | 2 | | | (0.03 | ) | | | — | | | | — | |
| | | | | | | | | | | | | | | | | | | | | | | | |
Net asset value, end of period | | $ | 16.97 | | | $ | 24.42 | | | $ | 21.83 | | | $ | 18.50 | | | $ | 14.71 | | | $ | 12.06 | |
| | | | | | | | | | | | | | | | | | | | | | | | |
Total return3 5 6 | | | (19.69)% | | | | 34.02% | | | | 18.00% | | | | 26.02% | | | | 21.97% | | | | 36.27% | |
| | | | | | |
Supplemental data and ratios: | | | | | | | | | | | | | | | | | | | | | | | | |
Net assets, end of period (in thousands) | | $ | 376,297 | | | $ | 534,903 | | | $ | 383,135 | | | $ | 338,792 | | | $ | 196,990 | | | $ | 44,482 | |
Ratio of expenses to average net assets: | | | | | | | | | | | | | | | | | | | | | | | | |
Net of waivers and reimbursements4 | | | 1.79% | | | | 1.76% | | | | 1.78% | | | | 1.84% | | | | 1.92% | | | | 1.95% | |
Before waivers and reimbursements4 | | | 1.79% | | | | 1.76% | | | | 1.78% | | | | 1.84% | | | | 1.92% | | | | 2.30% | |
Ratio of net investment income (loss) to average net assets: | | | | | | | | | | | | | | | | | | | | | | | | |
Net of waivers and reimbursements4 | | | (0.53)% | | | | 0.11% | | | | (0.42)% | | | | (0.64)% | | | | (1.06)% | | | | (1.12)% | |
Before waivers and reimbursements4 | | | (0.53)% | | | | 0.11% | | | | (0.42)% | | | | (0.64)% | | | | (1.06)% | | | | (1.47)% | |
Portfolio turnover rate3 | | | 21% | | | | 60% | | | | 64% | | | | 32% | | | | 31% | | | | 62% | |
1 | Fund inception date was August 30, 2007. |
2 | Represents amounts less than $.005 per share. |
3 | Not annualized for periods less than one year. |
5 | In 2005, 0.07% of the Fund’s total return consisted of a voluntary reimbursement by the Advisor for a realized investment loss. Excluding this item, the total return would have been 25.95%. The Fund’s total return also included, in 2005, a voluntary reimbursement by the Advisor for amounts relating to errors in applying the Funds’ cross-trading policies that had no impact on the total return. |
6 | In 2006, the Fund’s total return included a voluntary reimbursement by the Advisor for an amount relating to an incorrect settlement that had no impact on the total return. |
See notes to financial statements.
84
| | | | | | | | | | | | | | | | | | | | | | | | |
| INTERNATIONAL OPPORTUNITIES FUND | | Six Months
Ended
March 31
(Unaudited) | | | Year or Period Ended September 30 | | | | | | | |
| (for a share outstanding throughout each period) | | 2008 | | | 2007 | | | 2006 | | | 20051 | | | | | | | |
| | | | | | | | | | | | | | | | | | | | | | | | |
Net asset value, beginning of period | | $ | 3.65 | | | $ | 2.71 | | | $ | 2.19 | | | $ | 2.00 | | | | | | | | | |
| | | | | | |
Income (loss) from investment operations: | | | | | | | | | | | | | | | | | | | | | | | | |
Net investment income (loss) | | | 0.02 | | | | (0.01 | ) | | | (0.01 | ) | | | — | 2 | | | | | | | | |
Net realized and unrealized gains (losses) on investments | | | (0.71 | ) | | | 1.13 | | | | 0.53 | | | | 0.19 | | | | | | | | | |
| | | | | | | | | | | | | | | | | | | | | | | | |
Total from investment operations | | | (0.69 | ) | | | 1.12 | | | | 0.52 | | | | 0.19 | | | | | | | | | |
| | | | | | |
Redemption fees (see Note 2) | | | — | 2 | | | — | 2 | | | — | 2 | | | — | 2 | | | | | | | | |
| | | | | | |
Less distributions: | | | | | | | | | | | | | | | | | | | | | | | | |
Dividends from net investment income | | | (0.14 | ) | | | — | 2 | | | — | | | | — | | | | | | | | | |
Distributions from net realized gains | | | (0.53 | ) | | | (0.18 | ) | | | — | | | | — | | | | | | | | | |
| | | | | | | | | | | | | | | | | | | | | | | | |
Total distributions | | | (0.67 | ) | | | (0.18 | ) | | | — | | | | — | | | | | | | | | |
| | | | | | | | | | | | | | | | | | | | | | | | |
Net asset value, end of period | | $ | 2.29 | | | $ | 3.65 | | | $ | 2.71 | | | $ | 2.19 | | | | | | | | | |
| | | | | | | | | | | | | | | | | | | | | | | | |
Total return3 | | | (21.06)% | | | | 42.73% | | | | 23.74% | | | | 9.50% | | | | | | | | | |
| | | | | | |
Supplemental data and ratios: | | | | | | | | | | | | | | | | | | | | | | | | |
Net assets, end of period (in thousands) | | $ | 43,050 | | | $ | 56,433 | | | $ | 36,839 | | | $ | 29,440 | | | | | | | | | |
Ratio of expenses to average net assets: | | | | | | | | | | | | | | | | | | | | | | | | |
Net of waivers and reimbursements4 | | | 2.25% | | | | 2.25% | | | | 2.25% | | | | 2.25% | | | | | | | | | |
Before waivers and reimbursements4 | | | 2.48% | | | | 2.51% | | | | 2.62% | | | | 3.09% | | | | | | | | | |
Ratio of net investment income (loss) to average net assets: | | | | | | | | | | | | | | | | | | | | | | | | |
Net of waivers and reimbursements4 | | | (0.76)% | | | | (0.18)% | | | | (0.29)% | | | | (0.21)% | | | | | | | | | |
Before waivers and reimbursements4 | | | (0.99)% | | | | (0.44)% | | | | (0.66)% | | | | 1.05% | | | | | | | | | |
Portfolio turnover rate3 | | | 33% | | | | 54% | | | | 43% | | | | 12% | | | | | | | | | |
| | |
| MICRO CAP FUND | | Six Months
Ended
March 31
(Unaudited) | | | Year Ended September 30 | |
| (for a share outstanding throughout each period) | | 2008 | | | 2007 | | | 2006 | | | 2005 | | | 2004 | | | 2003 | |
| | | | | | | | | | | | | | | | | | | | | | | | |
Net asset value, beginning of period | | $ | 7.19 | | | $ | 6.79 | | | $ | 7.58 | | | $ | 7.05 | | | $ | 6.98 | | | $ | 5.01 | |
| | | | | | |
Income (loss) from investment operations: | | | | | | | | | | | | | | | | | | | | | | | | |
Net investment loss | | | (0.04 | ) | | | (0.09 | ) | | | (0.10 | ) | | | (0.11 | ) | | | (0.15 | ) | | | (0.12 | ) |
Net realized and unrealized gains (losses) on investments | | | (1.32 | ) | | | 1.29 | | | | 0.65 | | | | 1.70 | | | | 0.81 | | | | 2.43 | |
Net increase from payment by affiliate | | | — | | | | — | | | | — | | | | — | 2 | | | — | | | | — | |
| | | | | | | | | | | | | | | | | | | | | | | | |
Total from investment operations | | | (1.36 | ) | | | 1.20 | | | | 0.55 | | | | 1.59 | | | | 0.66 | | | | 2.31 | |
| | | | | | |
Redemption fees (see Note 2) | | | — | 2 | | | — | 2 | | | — | 2 | | | — | 2 | | | — | 2 | | | — | 2 |
| | | | | | |
Less distributions: | | | | | | | | | | | | | | | | | | | | | | | | |
Distributions from net realized gains | | | (1.17 | ) | | | (0.80 | ) | | | (1.34 | ) | | | (1.06 | ) | | | (0.59 | ) | | | (0.34 | ) |
| | | | | | | | | | | | | | | | | | | | | | | | |
Total distributions | | | (1.17 | ) | | | (0.80 | ) | | | (1.34 | ) | | | (1.06 | ) | | | (0.59 | ) | | | (0.34 | ) |
| | | | | | | | | | | | | | | | | | | | | | | | |
Net asset value, end of period | | $ | 4.66 | | | $ | 7.19 | | | $ | 6.79 | | | $ | 7.58 | | | $ | 7.05 | | | $ | 6.98 | |
| | | | | | | | | | | | | | | | | | | | | | | | |
Total return3 5 | | | (21.22)% | | | | 18.72% | | | | 8.51% | | | | 26.42% | | | | 9.96% | | | | 50.28% | |
| | | | | | |
Supplemental data and ratios: | | | | | | | | | | | | | | | | | | | | | | | | |
Net assets, end of period (in thousands) | | $ | 445,362 | | | $ | 631,417 | | | $ | 583,901 | | | $ | 579,244 | | | $ | 518,291 | | | $ | 517,179 | |
Ratio of expenses to average net assets4 | | | 2.16% | | | | 2.14% | | | | 2.14% | | | | 2.18% | | | | 2.19% | | | | 2.24% | |
Ratio of net investment loss to average net assets4 | | | (1.32)% | | | | (1.25)% | | | | (1.39)% | | | | (1.58)% | | | | (1.95)% | | | | (2.13)% | |
Portfolio turnover rate3 | | | 30% | | | | 48% | | | | 46% | | | | 50% | | | | 56% | | | | 50% | |
1 | Fund inception date was January 27, 2005. |
2 | Represents amounts less than $.005 per share. |
3 | Not annualized for periods less than one year. |
5 | In 2005, the Fund’s total return included a voluntary reimbursement by the Advisor for amounts relating to errors in applying the Funds’ cross-trading policies that had no impact on the total return. |
See notes to financial statements.
85
| | |
| WASATCH FUNDS — Financial Highlights (continued) | | |
|
| |
| |
| | | | | | | | | | | | | | | | | | | | | | | | |
| MICRO CAP VALUE FUND | | Six Months
Ended
March 31
(Unaudited) | | | Year or Period Ended September 30 | |
| (for a share outstanding throughout each period) | | 2008 | | | 2007 | | | 2006 | | | 2005 | | | 2004 | | | 20031 | |
| | | | | | | | | | | | | | | | | | | | | | | | |
Net asset value, beginning of period | | $ | 2.98 | | | $ | 2.93 | | | $ | 2.72 | | | $ | 2.57 | | | $ | 2.09 | | | $ | 2.00 | |
| | | | | | |
Income (loss) from investment operations: | | | | | | | | | | | | | | | | | | | | | | | | |
Net investment loss | | | (0.01 | ) | | | (0.03 | ) | | | (0.03 | ) | | | (0.04 | ) | | | (0.05 | ) | | | (0.01 | ) |
Net realized and unrealized gains (losses) on investments | | | (0.41 | ) | | | 0.64 | | | | 0.50 | | | | 0.49 | | | | 0.53 | | | | 0.10 | |
Net increase from payment by affiliate | | | — | | | | — | | | | — | | | | — | 2 | | | — | | | | — | |
| | | | | | | | | | | | | | | | | | | | | | | | |
Total from investment operations | | | (0.42 | ) | | | 0.61 | | | | 0.47 | | | | 0.45 | | | | 0.48 | | | | 0.09 | |
| | | | | | |
Redemption fees (see Note 2) | | | — | 2 | | | — | 2 | | | — | 2 | | | — | 2 | | | — | 2 | | | — | 2 |
| | | | | | |
Less distributions: | | | | | | | | | | | | | | | | | | | | | | | | |
Distributions from net realized gains | | | (0.41 | ) | | | (0.56 | ) | | | (0.26 | ) | | | (0.30 | ) | | | — | 2 | | | — | |
| | | | | | | | | | | | | | | | | | | | | | | | |
Total distributions | | | (0.41 | ) | | | (0.56 | ) | | | (0.26 | ) | | | (0.30 | ) | | | — | 2 | | | — | |
| | | | | | | | | | | | | | | | | | | | | | | | |
Net asset value, end of period | | $ | 2.15 | | | $ | 2.98 | | | $ | 2.93 | | | $ | 2.72 | | | $ | 2.57 | | | $ | 2.09 | |
| | | | | | | | | | | | | | | | | | | | | | | | |
Total return3 5 | | | (15.99)% | | | | 22.84% | | | | 18.89% | | | | 19.87% | | | | 23.06% | | | | 4.50% | |
| | | | | | |
Supplemental data and ratios: | | | | | | | | | | | | | | | | | | | | | | | | |
Net assets, end of period (in thousands) | | $ | 94,817 | | | $ | 120,039 | | | $ | 95,508 | | | $ | 86,903 | | | $ | 84,835 | | | $ | 70,706 | |
Ratio of expenses to average net assets: | | | | | | | | | | | | | | | | | | | | | | | | |
Net of waivers and reimbursements4 6 | | | 2.25% | | | | 2.25% | | | | 2.25% | | | | 2.25% | | | | 2.27% | | | | 2.50% | |
Before waivers and reimbursements4 | | | 2.30% | | | | 2.30% | | | | 2.33% | | | | 2.36% | | | | 2.38% | | | | 2.73% | |
Ratio of net investment loss to average net assets: | | | | | | | | | | | | | | | | | | | | | | | | |
Net of waivers and reimbursements4 | | | (1.35)% | | | | (1.06)% | | | | (0.99)% | | | | (1.41)% | | | | (1.76)% | | | | (1.97)% | |
Before waivers and reimbursements4 | | | (1.40)% | | | | (1.11)% | | | | (1.07)% | | | | (1.52)% | | | | (1.87)% | | | | (2.20)% | |
Portfolio turnover rate3 | | | 61% | | | | 105% | | | | 95% | | | | 85% | | | | 101% | | | | 4% | |
| | |
| SMALL CAP GROWTH FUND | | Six Months
Ended
March 31
(Unaudited) | | | Year Ended September 30 | |
| (for a share outstanding throughout each period) | | 2008 | | | 2007 | | | 2006 | | | 2005 | | | 2004 | | | 2003 | |
| | | | | | | | | | | | | | | | | | | | | | | | |
Net asset value, beginning of period | | $ | 40.10 | | | $ | 36.99 | | | $ | 41.23 | | | $ | 34.94 | | | $ | 32.43 | | | $ | 23.83 | |
| | | | | | |
Income (loss) from investment operations: | | | | | | | | | | | | | | | | | | | | | | | | |
Net investment loss | | | (0.05 | ) | | | (0.25 | ) | | | (0.26 | ) | | | (0.25 | ) | | | (0.33 | ) | | | (0.28 | ) |
Net realized and unrealized gains (losses) on investments | | | (5.78 | ) | | | 6.28 | | | | 0.84 | | | | 7.32 | | | | 3.01 | | | | 8.88 | |
Net increase from payment by affiliate | | | — | | | | — | | | | — | | | | — | 2 | | | — | | | | — | |
| | | | | | | | | | | | | | | | | | | | | | | | |
Total from investment operations | | | (5.83 | ) | | | 6.03 | | | | 0.58 | | | | 7.07 | | | | 2.68 | | | | 8.60 | |
| | | | | | |
Redemption fees (see Note 2) | | | — | 2 | | | — | 2 | | | — | 2 | | | — | 2 | | | — | 2 | | | — | 2 |
| | | | | | |
Less distributions: | | | | | | | | | | | | | | | | | | | | | | | | |
Distributions from net realized gains | | | (4.59 | ) | | | (2.92 | ) | | | (4.82 | ) | | | (0.78 | ) | | | (0.17 | ) | | | — | 2 |
| | | | | | | | | | | | | | | | | | | | | | | | |
Total distributions | | | (4.59 | ) | | | (2.92 | ) | | | (4.82 | ) | | | (0.78 | ) | | | (0.17 | ) | | | — | 2 |
| | | | | | | | | | | | | | | | | | | | | | | | |
Net asset value, end of period | | $ | 29.68 | | | $ | 40.10 | | | $ | 36.99 | | | $ | 41.23 | | | $ | 34.94 | | | $ | 32.43 | |
| | | | | | | | | | | | | | | | | | | | | | | | |
Total return3 7 | | | (16.47)% | | | | 16.94% | | | | 1.40% | | | | 20.73% | | | | 8.27% | | | | 36.15% | |
| | | | | | |
Supplemental data and ratios: | | | | | | | | | | | | | | | | | | | | | | | | |
Net assets, end of period (in thousands) | | $ | 856,141 | | | $ | 1,075,433 | | | $ | 1,234,978 | | | $ | 1,357,862 | | | $ | 1,191,702 | | | $ | 1,134,398 | |
Ratio of expenses to average net assets4 8 | | | 1.21% | | | | 1.19% | | | | 1.18% | | | | 1.18% | | | | 1.20% | | | | 1.25% | |
Ratio of net investment loss to average net assets4 | | | (0.42)% | | | | (0.52)% | | | | (0.64)% | | | | (0.62)% | | | | (0.91)% | | | | (1.08)% | |
Portfolio turnover rate3 | | | 23% | | | | 43% | | | | 41% | | | | 36% | | | | 41% | | | | 63% | |
1 | Fund inception date was July 28, 2003. |
2 | Represents amounts less than $.005 per share. |
3 | Not annualized for periods less than one year. |
5 | In 2005, the Fund’s total return included a voluntary reimbursement by the Advisor for a realized investment loss that had no impact on the total return. |
6 | On February 1, 2004, the Advisor reduced the contractual expense limitation from 2.50% to 2.25% through January 31, 2005. As a result, the effective expense ratio net of waivers and reimbursements for the period ended September 30, 2004 was 2.27%. |
7 | In 2005, the Fund’s total return included a voluntary reimbursement by the Advisor for amounts relating to errors in applying the Funds’ cross-trading policies that had no impact on the total return. The effect of net realized gains on the disposal of investments in violation of an investment restriction on total return was less than 0.01%. |
8 | In 2006, the Fund received a reimbursement of investment advisory fees, which had an impact on the Fund’s expense ratio of less than 0.01%. |
See notes to financial statements.
86
| | | | | | | | | | | | | | | | | | | | | | | | |
| SMALL CAP VALUE FUND | | Six Months
Ended
March 31
(Unaudited) | | | Year Ended September 30 | |
| (for a share outstanding throughout each period) | | 2008 | | | 2007 | | | 2006 | | | 2005 | | | 2004 | | | 2003 | |
| | | | | | | | | | | | | | | | | | | | | | | | |
Net asset value, beginning of period | | $ | 5.22 | | | $ | 5.29 | | | $ | 5.67 | | | $ | 5.54 | | | $ | 4.62 | | | $ | 3.21 | |
| | | | | | |
Income (loss) from investment operations: | | | | | | | | | | | | | | | | | | | | | | | | |
Net investment income (loss) | | | 0.01 | | | | 0.01 | | | | 0.05 | | | | 0.05 | | | | (0.01 | ) | | | (0.02 | ) |
Net realized and unrealized gains (losses) on investments | | | (0.67 | ) | | | 0.67 | | | | 0.36 | | | | 0.86 | | | | 0.93 | | | | 1.43 | |
Net increase from payment by affiliate | | | — | | | | — | | | | — | | | | — | 1 | | | — | | | | — | |
| | | | | | | | | | | | | | | | | | | | | | | | |
Total from investment operations | | | (0.66 | ) | | | 0.68 | | | | 0.41 | | | | 0.91 | | | | 0.92 | | | | 1.41 | |
| | | | | | |
Redemption fees (see Note 2) | | | — | 1 | | | — | 1 | | | — | 1 | | | — | 1 | | | — | 1 | | | — | 1 |
| | | | | | |
Less distributions: | | | | | | | | | | | | | | | | | | | | | | | | |
Dividends from net investment income | | | (0.01 | ) | | | (0.04 | ) | | | (0.07 | ) | | | — | | | | — | | | | — | |
Distributions from net realized gains | | | (1.29 | ) | | | (0.71 | ) | | | (0.72 | ) | | | (0.78 | ) | | | — | 1 | | | — | |
| | | | | | | | | | | | | | | | | | | | | | | | |
Total distributions | | | (1.30 | ) | | | (0.75 | ) | | | (0.79 | ) | | | (0.78 | ) | | | — | 1 | | | — | |
| | | | | | | | | | | | | | | | | | | | | | | | |
Net asset value, end of period | | $ | 3.26 | | | $ | 5.22 | | | $ | 5.29 | | | $ | 5.67 | | | $ | 5.54 | | | $ | 4.62 | |
| | | | | | | | | | | | | | | | | | | | | | | | |
Total return2 5 | | | (14.75)% | | | | 13.32% | | | | 7.88% | | | | 19.47% | | | | 19.73% | | | | 43.93% | |
| | | | | | |
Supplemental data and ratios: | | | | | | | | | | | | | | | | | | | | | | | | |
Net assets, end of period (in thousands) | | $ | 425,011 | | | $ | 660,637 | | | $ | 664,625 | | | $ | 734,842 | | | $ | 734,266 | | | $ | 651,261 | |
Ratio of expenses to average net assets3 | | | 1.77% | | | | 1.69% | | | | 1.68% | | | | 1.72% | | | | 1.73% | | | | 1.78% | |
Ratio of net investment income (loss) to average net assets3 | | | 0.37% | | | | 0.18% | | | | 0.81% | | | | 0.94% | | | | (0.26)% | | | | (0.43)% | |
Portfolio turnover rate2 | | | 24% | | | | 84% | | | | 40% | | | | 43% | | | | 56% | | | | 69% | |
| | | | | |
| STRATEGIC INCOME FUND | | Six Months
Ended
March 31
(Unaudited) | | | Year or Period Ended
September 30 | | | | | | | | | | |
| (for a share outstanding throughout each period) | | 2008 | | | 2007 | | | 20064 | | | | | | | | | | |
| | | | | | | | | | | | | | | | | | | | | | | | |
Net asset value, beginning of period | | $ | 11.00 | | | $ | 10.48 | | | $ | 10.00 | | | | | | | | | | | | | |
| | | | | | |
Income (loss) from investment operations: | | | | | | | | | | | | | | | | | | | | | | | | |
Net investment income | | | 0.36 | | | | 0.48 | | | | 0.31 | | | | | | | | | | | | | |
Net realized and unrealized gains (losses) on investments | | | (0.97 | ) | | | 0.54 | | | | 0.44 | | | | | | | | | | | | | |
| | | | | | | | | | | | | | | | | | | | | | | | |
Total from investment operations | | | (0.61 | ) | | | 1.02 | | | | 0.75 | | | | | | | | | | | | | |
| | | | | | |
Redemption fees (see Note 2) | | | — | 1 | | | 0.01 | | | | — | 1 | | | | | | | | | | | | |
| | | | | | |
Less distributions: | | | | | | | | | | | | | | | | | | | | | | | | |
Dividends from net investment income | | | (0.31 | ) | | | (0.47 | ) | | | (0.27 | ) | | | | | | | | | | | | |
Distributions from net realized gains | | | (1.14 | ) | | | (0.04 | ) | | | — | | | | | | | | | | | | | |
| | | | | | | | | | | | | | | | | | | | | | | | |
Total distributions | | | (1.45 | ) | | | (0.51 | ) | | | (0.27 | ) | | | | | | | | | | | | |
| | | | | | | | | | | | | | | | | | | | | | | | |
Net asset value, end of period | | $ | 8.94 | | | $ | 11.00 | | | $ | 10.48 | | | | | | | | | | | | | |
| | | | | | | | | | | | | | | | | | | | | | | | |
Total return2 | | | (6.20)% | | | | 9.77% | | | | 7.58% | | | | | | | | | | | | | |
| | | | | | |
Supplemental data and ratios: | | | | | | | | | | | | | | | | | | | | | | | | |
Net assets, end of period (in thousands) | | $ | 18,242 | | | $ | 23,621 | | | $ | 12,732 | | | | | | | | | | | | | |
Ratio of expenses to average net assets (including interest and dividend payments for securities sold short): | | | | | | | | | | | | | | | | | | | | | | | | |
Net of waivers and reimbursements3 | | | 0.96% | | | | 1.05% | | | | 0.95% | | | | | | | | | | | | | |
Before waivers and reimbursements3 | | | 1.45% | | | | 1.57% | | | | 2.66% | | | | | | | | | | | | | |
Ratio of expenses to average net assets (excluding interest and dividend payments for securities sold short): | | | | | | | | | | | | | | | | | | | | | | | | |
Net of waivers and reimbursements3 | | | 0.95% | | | | 0.95% | | | | 0.95% | | | | | | | | | | | | | |
Before waivers and reimbursements3 | | | 1.44% | | | | 1.47% | | | | 2.66% | | | | | | | | | | | | | |
Ratio of net investment income to average net assets: | | | | | | | | | | | | | | | | | | | | | | | | |
Net of waivers and reimbursements3 | | | 6.77% | | | | 4.14% | | | | 5.40% | | | | | | | | | | | | | |
Before waivers and reimbursements3 | | | 6.28% | | | | 3.62% | | | | 3.69% | | | | | | | | | | | | | |
Portfolio turnover rate2 | | | 27% | | | | 86% | | | | 14% | | | | | | | | | | | | | |
1 | Represents amounts less than $.005 per share. |
2 | Not annualized for periods less than one year. |
4 | Fund inception date was February 1, 2006. |
5 | In 2005, the Fund’s total return included a voluntary reimbursement by the Advisor for amounts relating to errors in applying the Funds’ cross-trading policies that had no impact on the total return. |
See notes to financial statements.
87
| | |
| WASATCH FUNDS — Financial Highlights (continued) | | MARCH 31, 2008 |
|
| |
| |
| | | | | | | | | | | | | | | | | | | | | | | | |
| ULTRA GROWTH FUND | | Six Months
Ended
March 31
(Unaudited) | | | Year Ended September 30 | |
| (for a share outstanding throughout each period) | | 2008 | | | 2007 | | | 2006 | | | 2005 | | | 2004 | | | 2003 | |
| | | | | | | | | | | | | | | | | | | | | | | | |
Net asset value, beginning of period | | $ | 27.78 | | | $ | 24.09 | | | $ | 27.98 | | | $ | 24.07 | | | $ | 25.43 | | | $ | 16.52 | |
| | | | | | |
Income (loss) from investment operations: | | | | | | | | | | | | | | | | | | | | | | | | |
Net investment loss | | | (0.11 | ) | | | (0.33 | ) | | | (0.34 | ) | | | (0.38 | ) | | | (0.42 | ) | | | (0.29 | ) |
Net realized and unrealized gains (losses) on investments | | | (4.91 | ) | | | 5.80 | | | | 0.23 | | | | 5.26 | | | | (0.68 | ) | | | 9.19 | |
Net increase from payment by affiliate | | | — | | | | — | | | | — | | | | — | 1 | | | — | | | | — | |
| | | | | | | | | | | | | | | | | | | | | | | | |
Total from investment operations | | | (5.02 | ) | | | 5.47 | | | | (0.11 | ) | | | 4.88 | | | | (1.10 | ) | | | 8.90 | |
| | | | | | |
Redemption fees (see Note 2) | | | — | 1 | | | — | 1 | | | — | 1 | | | — | 1 | | | — | 1 | | | 0.01 | |
| | | | | | |
Less distributions: | | | | | | | | | | | | | | | | | | | | | | | | |
Distributions from net realized gains | | | (3.52 | ) | | | (1.78 | ) | | | (3.78 | ) | | | (0.97 | ) | | | (0.26 | ) | | | — | |
| | | | | | | | | | | | | | | | | | | | | | | | |
Total distributions | | | (3.52 | ) | | | (1.78 | ) | | | (3.78 | ) | | | (0.97 | ) | | | (0.26 | ) | | | — | |
| | | | | | | | | | | | | | | | | | | | | | | | |
Net asset value, end of period | | $ | 19.24 | | | $ | 27.78 | | | $ | 24.09 | | | $ | 27.98 | | | $ | 24.07 | | | $ | 25.43 | |
| | | | | | | | | | | | | | | | | | | | | | | | |
Total return2 4 | | | (20.75)% | | | | 23.80% | | | | (0.48)% | | | | 21.00% | | | | (4.44)% | | | | 53.93% | |
| | | | | | |
Supplemental data and ratios: | | | | | | | | | | | | | | | | | | | | | | | | |
Net assets, end of period (in thousands) | | $ | 186,017 | | | $ | 268,633 | | | $ | 306,406 | | | $ | 389,894 | | | $ | 427,013 | | | $ | 538,939 | |
Ratio of expenses to average net assets3 | | | 1.52% | | | | 1.49% | | | | 1.48% | | | | 1.50% | | | | 1.50% | | | | 1.57% | |
Ratio of net investment loss to average net assets3 | | | (0.92)% | | | | (1.12)% | | | | (1.19)% | | | | (1.30)% | | | | (1.39)% | | | | (1.50)% | |
Portfolio turnover rate2 | | | 40% | | | | 55% | | | | 76% | | | | 65% | | | | 67% | | | | 76% | |
| | |
| U.S. TREASURY FUND | | Six Months
Ended
March 31
(Unaudited) | | | Year Ended September 30 | |
| (for a share outstanding throughout each period) | | 2008 | | | 2007 | | | 2006 | | | 2005 | | | 2004 | | | 2003 | |
| | | | | | | | | | | | | | | | | | | | | | | | |
Net asset value, beginning of period | | $ | 13.84 | | | $ | 14.12 | | | $ | 14.68 | | | $ | 13.77 | | | $ | 13.68 | | | $ | 14.04 | |
| | | | | | |
Income (loss) from investment operations: | | | | | | | | | | | | | | | | | | | | | | | | |
Net investment income | | | 0.30 | | | | 0.64 | | | | 0.39 | | | | 0.45 | | | | 0.70 | | | | 0.72 | |
Net realized and unrealized gains (losses) on investments | | | 1.18 | | | | (0.29 | ) | | | (0.24 | ) | | | 1.05 | | | | 0.11 | | | | (0.48 | ) |
| | | | | | | | | | | | | | | | | | | | | | | | |
Total from investment operations | | | 1.48 | | | | 0.35 | | | | 0.15 | | | | 1.50 | | | | 0.81 | | | | 0.24 | |
| | | | | | |
Redemption fees (see Note 2) | | | 0.01 | | | | 0.01 | | | | 0.01 | | | | 0.01 | | | | 0.01 | | | | 0.03 | |
| | | | | | |
Less distributions: | | | | | | | | | | | | | | | | | | | | | | | | |
Dividends from net investment income | | | (0.30 | ) | | | (0.64 | ) | | | (0.72 | ) | | | (0.60 | ) | | | (0.73 | ) | | | (0.63 | ) |
| | | | | | | | | | | | | | | | | | | | | | | | |
Total distributions | | | (0.30 | ) | | | (0.64 | ) | | | (0.72 | ) | | | (0.60 | ) | | | (0.73 | ) | | | (0.63 | ) |
| | | | | | | | | | | | | | | | | | | | | | | | |
Net asset value, end of period | | $ | 15.03 | | | $ | 13.84 | | | $ | 14.12 | | | $ | 14.68 | | | $ | 13.77 | | | $ | 13.68 | |
| | | | | | | | | | | | | | | | | | | | | | | | |
Total return2 | | | 10.79% | | | | 2.68% | | | | 1.21% | | | | 11.41% | | | | 6.27% | | | | 2.17% | |
| | | | | | |
Supplemental data and ratios: | | | | | | | | | | | | | | | | | | | | | | | | |
Net assets, end of period (in thousands) | | $ | 126,198 | | | $ | 115,788 | | | $ | 204,994 | | | $ | 82,599 | | | $ | 45,088 | | | $ | 67,134 | |
Ratio of expenses to average net assets: | | | | | | | | | | | | | | | | | | | | | | | | |
Net of waivers and reimbursements3 | | | 0.74% | | | | 0.71% | | | | 0.72% | | | | 0.75% | | | | 0.75% | | | | 0.75% | |
Before waivers and reimbursements3 | | | 0.74% | | | | 0.71% | | | | 0.72% | | | | 0.86% | | | | 0.94% | | | | 0.91% | |
Ratio of net investment income to average net assets: | | | | | | | | | | | | | | | | | | | | | | | | |
Net of waivers and reimbursements3 | | | 3.85% | | | | 4.23% | | | | 4.21% | | | | 4.01% | | | | 4.50% | | | | 4.67% | |
Before waivers and reimbursements3 | | | 3.85% | | | | 4.23% | | | | 4.21% | | | | 3.90% | | | | 4.31% | | | | 4.51% | |
Portfolio turnover rate2 | | | 18% | | | | 19% | | | | 2% | | | | 19% | | | | 4% | | | | 37% | |
1 | Represents amounts less than $.005 per share. |
2 | Not annualized for periods less than one year. |
4 | In 2005, the Fund’s total return included a voluntary reimbursement by the Advisor for amounts relating to errors in applying the Funds’ cross-trading policies that had no impact on the total return. |
See notes to financial statements.
88
| | |
| WASATCH FUNDS — Notes to Financial Statements | | MARCH 31, 2008 (UNAUDITED) |
|
| |
| |
1. ORGANIZATION
Wasatch Funds, Inc. is a Minnesota corporation registered under the Investment Company Act of 1940, as amended (the “1940 Act”), as an open-end management investment company and consists of 14 series or “funds” (each a “Fund” and collectively the “Funds”). The Core Growth, Global Science & Technology, Heritage Growth, International Growth, Micro Cap, Micro Cap Value, Small Cap Growth, Small Cap Value, Ultra Growth and the Wasatch-Hoisington U.S. Treasury Fund (“U.S. Treasury Fund”) are each diversified funds. The Emerging Markets Small Cap, Heritage Value, International Opportunities and Strategic Income Funds are each non-diversified funds. Each Fund maintains its own investment objective. The Funds have entered into an investment advisory agreement with Wasatch Advisors, Inc. (the “Advisor”) as investment advisor.
2. SIGNIFICANT ACCOUNTING POLICIES
The financial statements have been prepared in conformity with United States of America generally accepted accounting principles (“GAAP”). The following is a summary of significant policies related to investments of the Funds held at March 31, 2008.
Valuation of Securities — Securities are valued as of the close of the New York Stock Exchange (generally 4:00 p.m. Eastern Time) on the valuation date. Equity securities are valued using a commercial pricing service at the latest quoted sales price taken from the primary market in which each security trades and, with respect to equity securities traded on Nasdaq, such securities are valued using the Nasdaq Official Closing Price (“NOCP”) or last sales price if no NOCP is available. If there are no sales on any exchange or market on a given day, then the security is valued at the most recent bid price. Debt securities (other than short-term instruments) are valued at current market value by a commercial pricing service, or by using the last sale or bid price. Short term securities, which mature in 60 days or less, are valued at amortized cost, which approximates market value. Exchange-traded options are valued at the last sale price in the market where they are principally traded. If there are no sales on any exchange or market on a given day, then the option is valued at the most recent bid price. If market quotations are not readily available for the Funds’ investments in securities such as restricted securities, private placements, securities for which trading has been halted or other illiquid securities, these investments will be valued at fair value in accordance with Board-approved Pricing Policies and Procedures by the Pricing Committee of the Advisor (“Pricing Committee”) with oversight by the Board of Directors. Fair value is defined as the amount the owner of a security might reasonably expect to receive upon a current sale. For each applicable investment that is fair valued, the Pricing Committee considers, to the extent applicable, various factors including, but not limited to, the financial condition of the company or limited partnership, operating results, prices paid in follow-on rounds, comparable companies in the public market, the nature and duration of the restrictions for holding the securities, and other relevant factors.
Additionally, a Fund’s investments will be valued at fair value by the Pricing Committee if the Advisor determines that an event impacting the value of an investment occurred between the closing time of a security’s primary market or exchange (for example, a foreign exchange or market) and the time the Fund’s share price is calculated. Significant events include, but are not limited to the following: significant fluctuations in domestic markets, foreign markets or foreign currencies; occurrences not directly tied to the securities markets such as natural disasters, armed conflicts or significant governmental actions; and major announcements affecting a single issuer or an entire market or market sector. In responding to a significant event, the Pricing Committee would determine the fair value of affected securities by considering factors including, but not limited to: index options and futures traded subsequent to the close; American Depositary Receipts (“ADRs”), Global Depositary Receipts (“GDRs”) or other related receipts; currency spot or forward markets that trade after pricing of the foreign exchange; other derivative securities traded after the close such as Standard & Poor’s Depository Receipts (“SPDRs”) and other exchange traded funds (“ETFs”); and alternative market quotes on the affected securities. In addition, the Funds may use a systematic fair valuation model provided by an independent third party in certain circumstances to assist in adjusting the valuation of foreign securities.
As of March 31, 2008, the aggregate amount of fair valued securities, excluding any foreign securities fair valued pursuant to a systematic fair valuation model, as a percentage of net assets for the Funds was as follows:
| | | |
Core Growth Fund | | 1.71 | % |
Emerging Markets Small Cap Fund | | — | |
Global Science & Technology Fund | | 0.81 | % |
Heritage Growth Fund | | — | |
Heritage Value Fund | | — | |
International Growth Fund | | 0.07 | % |
International Opportunities Fund | | 2.67 | % |
Micro Cap Fund | | 0.53 | % |
Micro Cap Value Fund | | 2.43 | % |
Small Cap Growth Fund | | 1.93 | % |
Small Cap Value Fund | | 2.78 | % |
Strategic Income Fund | | 4.90 | % |
Ultra Growth Fund | | 5.19 | % |
U.S. Treasury Fund | | — | |
FASB issued Statement of Financial Accounting Standards No. 157, Fair Value Measurements (“FAS 157”), in September 2006, which is effective for fiscal years beginning after November 15, 2007. FAS 157 defines fair value, establishes a framework for measuring fair value and expands financial statement disclosures about fair value measurements. Management is currently evaluating the impact of adopting FAS 157.
In March 2008, the Financial Accounting Standards Board (FASB) issued FASB Statement of Financial Accounting Standards No. 161, Disclosures about Derivative Instruments and Hedging Activities (SFAS 161). SFAS 161 is intended to improve financial reporting about derivative instruments and hedging activities by requiring enhanced disclosures to enable investors to better understand their effects on an entity’s financial position, financial performance and cash flows. SFAS 161 is effective for fiscal years and interim periods beginning after November 15, 2008.
89
| | |
| WASATCH FUNDS — Notes to Financial Statements (continued) | | |
|
| |
| |
Management is currently evaluating the impact the adoption of SFAS 161 will have on the Fund’s financial statement disclosures.
Foreign Currency Translations — Values of investments denominated in foreign currencies are converted into U.S. dollars using the current exchange rate. Purchases and sales of investments and dividend income are translated into U.S. dollars using the current prevailing exchange rate on the transaction date. The effect of changes in foreign exchange rates on realized and unrealized gains or losses on securities is reflected as a component of such gains or losses. Transactions in foreign denominated assets may involve greater risks than domestic transactions, including currency, political, economic, regulatory, and market risks.
At March 31, 2008, the foreign currencies held by the Funds were as follows (amounts in U.S. dollars):
| | | | | | |
| | | Cost of
Currency | | Market Value
of Currency |
Emerging Markets Small Cap Growth Fund | | | | | | |
Taiwan Dollar | | $ | 14,997 | | $ | 15,645 |
Singapore Dollar | | | 2,071 | | | 2,070 |
| | | | | | |
| | $ | 17,068 | | $ | 17,715 |
| | | | | | |
|
| |
Global Science & Technology Fund | | | | | | |
Singapore Dollar | | $ | 4,389 | | $ | 4,388 |
|
| |
International Growth Fund | | | | | | |
Bermudan Dollar | | $ | 74,540 | | $ | 74,540 |
Euro | | | 92,629 | | | 92,693 |
Japanese Yen | | | 37,884 | | | 37,855 |
Singapore Dollar | | | 10,781 | | | 10,777 |
| | | | | | |
| | $ | 215,834 | | $ | 215,865 |
| | | | | | |
|
| |
International Opportunities Fund | | | | | | |
Australian Dollar | | $ | 8,167 | | $ | 8,108 |
Japanese Yen | | | 61,709 | | | 61,541 |
Singapore Dollar | | | 1,146 | | | 1,146 |
Taiwan Dollar | | | 4,044 | | | 4,219 |
| | | | | | |
| | $ | 75,066 | | $ | 75,014 |
| | | | | | |
|
| |
Micro Cap Fund | | | | | | |
Australian Dollar | | $ | 225,586 | | $ | 223,956 |
|
| |
Micro Cap Value Fund | | | | | | |
Australian Dollar | | $ | 22,570 | | $ | 22,407 |
|
| |
Small Cap Growth Fund | | | | | | |
Bermudan Dollar | | $ | 75,689 | | $ | 75,689 |
Singapore Dollar | | | 17,616 | | | 17,608 |
| | | | | | |
| | $ | 93,305 | | $ | 93,297 |
| | | | | | |
|
| |
Small Cap Value Fund | | | | | | |
Bermudan Dollar | | $ | 59,232 | | $ | 59,232 |
|
| |
Strategic Income Fund | | | | | | |
Bermudan Dollar | | $ | 4,896 | | $ | 4,896 |
|
| |
Ultra Growth Fund | | | | | | |
Singapore Dollar | | $ | 4,223 | | $ | 4,221 |
Investment in Securities — Security transactions are accounted for on the trade date.
Short Sales — To a limited extent, the Equity Funds may enter into short sales whereby a fund sells a security it
generally does not own (the security is borrowed), in anticipation of a decline in the security’s price. If a fund shorts a security when also holding a long position in the security (a “short against the box”), as the security’s price declines, the short position increases in value, offsetting the long position’s decrease in value. The opposite effect occurs if the security’s price rises. The Funds designate collateral consisting of cash, U.S. government securities or other liquid assets sufficient to collateralize the market value of short positions.
Options Transactions — The Equity Funds may buy and sell put and call options, write covered put and call options, including over-the-counter options, on portfolio securities where the completion of the obligation is dependent upon the credit standing of another party. The risk in writing a call option is that a Fund gives up the opportunity for profit if the market price of the security increases. The risk in writing a put option is that a Fund may incur a loss if the market price of the security decreases and the option is exercised. The risk in buying an option is that a Fund pays a premium whether or not the option is exercised. A Fund also has the additional risk of not being able to enter into a closing transaction if a liquid secondary market does not exist. Option contracts are valued daily and unrealized appreciation or depreciation is recorded. A Fund will realize a gain or loss upon expiration or closing of the option transaction. When an option is exercised, the proceeds on sales for a written call option, the purchase cost for a written put option, or the cost of a security for a purchased put or call option is adjusted by the amount of premium received or paid.
Repurchase Agreements — The Funds may engage in repurchase transactions. Under the terms of a typical repurchase agreement, a fund takes possession of an underlying debt obligation subject to an obligation of the seller to repurchase and the fund to resell the obligation at an agreed upon price and time. The market value of the collateral must be equal at all times to the total amount of the repurchase obligation, including interest. Generally, in the event of counterparty default, the fund has the right to use the collateral to offset losses incurred.
3. DISTRIBUTIONS
Dividends from net investment income and net realized gains, if any, are declared and paid at least annually for all Funds, except for dividends from net investment income for the Strategic Income and U.S. Treasury Funds, which are declared and paid quarterly. The amount of dividends and distributions from net investment income and net realized gains are determined in accordance with federal income tax regulations, which may differ from GAAP. The Funds may utilize earnings and profits distributed to shareholders on redemption of shares as part of the dividends paid deduction (tax equalization).
To the extent these book and tax differences are permanent in nature, such amounts are reclassified at the end of the fiscal year among paid-in capital in excess of par value, undistributed net investment income (loss), and undistributed net realized gain (loss) on investments and foreign currency translations.
90
| | |
| | MARCH 31, 2008 (UNAUDITED) |
|
| |
| |
4. PURCHASESAND SALESOF SECURITIES
Cost of investment securities purchased and proceeds from sales of investment securities, excluding U.S. government and short-term securities for the period ended March 31, 2008 are summarized below:
| | | | | | | | | | | | | | | | | | | | | |
| | | Core
Growth
Fund | | Emerging
Markets
Small Cap
Fund | | Global
Science &
Technology
Fund | | Heritage
Growth
Fund | | Heritage
Value
Fund | | International
Growth
Fund | | International
Opportunities
Fund |
Purchases | | $ | 240,912,483 | | $ | 59,020,490 | | $ | 64,584,573 | | $ | 40,907,335 | | $ | 5,571,438 | | $ | 95,781,282 | | $ | 14,994,806 |
Sales | | | 442,541,205 | | | 2,791,770 | | | 84,422,608 | | | 103,035,873 | | | 2,943,295 | | | 140,765,798 | | | 15,908,548 |
| | | | | | | |
| | | Micro
Cap
Fund | | Micro Cap
Value
Fund | | Small Cap
Growth
Fund | | Small Cap
Value
Fund | | Strategic
Income
Fund | | Ultra
Growth
Fund | | |
Purchases | | $ | 158,745,004 | | $ | 63,972,968 | | $ | 228,271,135 | | $ | 123,436,777 | | $ | 5,352,807 | | $ | 94,444,776 | | | |
Sales | | | 218,856,878 | | | 75,705,360 | | | 303,441,446 | | | 284,025,104 | | | 7,409,627 | | | 137,246,879 | | | |
Purchases and sales of U.S. government securities in the U.S. Treasury Fund were $23,036,324 and $(22,764,014), respectively.
5. OPTIONS CONTRACTS WRITTEN
Options written activity during the period ended March 31, 2008 was as follows:
| | | | | | | | | | | | | | | | | | | | |
| | | Options
Outstanding at
Beginning of Period | | Written | | Closed | | | Exercised | | Expired | | | Options
Outstanding at
End of Period |
Heritage Growth Fund | | | | | | | | | | | | | | | | | | | | |
Premium amount | | $ | — | | $ | 62,899 | | $ | (5,590 | ) | | $ | — | | $ | (57,309 | ) | | $ | — |
Number of contracts | | | — | | | 480 | | | (84 | ) | | | — | | | (396 | ) | | | — |
Heritage Value Fund | | | | | | | | | | | | | | | | | | | | |
Premium amount | | $ | 3,542 | | $ | 177,300 | | $ | (40,814 | ) | | $ | — | | $ | (106,723 | ) | | $ | 33,305 |
Number of contracts | | | 11 | | | 811 | | | (143 | ) | | | — | | | (518 | ) | | | 161 |
International Opportunities Fund | | | | | | | | | | | | | | | | | | | | |
Premium amount | | $ | — | | $ | 21,037 | | $ | — | | | $ | — | | $ | (21,037 | ) | | $ | — |
Number of contracts | | | — | | | 143 | | | — | | | | — | | | (143 | ) | | | — |
Micro Cap Value Fund | | | | | | | | | | | | | | | | | | | | |
Premium amount | | $ | 91,902 | | $ | 1,308,734 | | $ | (133,212 | ) | | $ | — | | $ | (787,914 | ) | | $ | 479,510 |
Number of contracts | | | 594 | | | 8,985 | | | (938 | ) | | | — | | | (5,954 | ) | | | 2,687 |
Small Cap Value Fund | | | | | | | | | | | | | | | | | | | | |
Premium amount | | $ | — | | $ | 274,082 | | $ | — | | | $ | — | | $ | (274,082 | ) | | $ | — |
Number of contracts | | | — | | | 440 | | | — | | | | — | | | (440 | ) | | | — |
Strategic Income Fund | | | | | | | | | | | | | | | | | | | | |
Premium amount | | $ | — | | $ | 2,242,734 | | $ | (1,944,847 | ) | | $ | — | | $ | (102,809 | ) | | $ | 195,078 |
Number of contracts | | | — | | | 12,034 | | | (10,436 | ) | | | — | | | (400 | ) | | | 1,198 |
Ultra Growth Fund | | | | | | | | | | | | | | | | | | | | |
Premium amount | | $ | — | | $ | 224,919 | | $ | — | | | $ | — | | $ | (224,919 | ) | | $ | — |
Number of contracts | | | — | | | 1,531 | | | — | | | | — | | | (1,531 | ) | | | — |
91
| | |
| WASATCH FUNDS — Notes to Financial Statements (continued) | | |
|
| |
| |
6. FEDERAL INCOME TAX INFORMATION
As of March 31, 2008, the cost and unrealized appreciation (depreciation) of securities, excluding written options and securities sold short, on a tax basis were as follows:
| | | | | | | | | | | | | | | | | | | | | | | | |
| | | Core
Growth
Fund | | | Emerging
Markets
Small Cap
Fund | | | Global
Science &
Technology
Fund | | | Heritage
Growth
Fund | | | Heritage
Value
Fund | | | International
Growth
Fund | |
Cost | | $ | 847,962,843 | | | $ | 56,784,370 | | | $ | 157,054,571 | | | $ | 120,371,961 | | | $ | 4,229,290 | | | $ | 336,255,719 | |
| | | | | | | | | | | | | | | | | | | | | | | | |
Gross appreciation | | $ | 148,792,588 | | | $ | 1,738,529 | | | $ | 11,057,991 | | | $ | 15,624,126 | | | $ | 86,637 | | | $ | 78,182,988 | |
Gross (depreciation) | | | (129,222,511 | ) | | | (9,765,589 | ) | | | (33,142,492 | ) | | | (12,134,872 | ) | | | (404,553 | ) | | | (44,619,192 | ) |
| | | | | | | | | | | | | | | | | | | | | | | | |
Net appreciation (depreciation) | | $ | 19,570,077 | | | $ | (8,027,060 | ) | | $ | (22,084,501 | ) | | $ | 3,489,254 | | | $ | (317,916 | ) | | $ | 33,563,796 | |
| | | | | | | | | | | | | | | | | | | | | | | | |
| | | | | | |
| | | International
Opportunities
Fund | | | Micro
Cap
Fund | | | Micro Cap
Value
Fund | | | Small Cap
Growth
Fund | | | Small Cap
Value
Fund | | | Strategic
Income
Fund | |
Cost | | $ | 41,845,688 | | | $ | 460,360,500 | | | $ | 96,745,089 | | | $ | 761,778,362 | | | $ | 462,747,909 | | | $ | 22,008,901 | |
| | | | | | | | | | | | | | | | | | | | | | | | |
Gross appreciation | | $ | 8,247,677 | | | $ | 67,010,614 | | | $ | 14,107,938 | | | $ | 195,129,350 | | | $ | 46,942,242 | | | $ | 1,176,311 | |
Gross (depreciation) | | | (6,492,893 | ) | | | (82,591,955 | ) | | | (15,447,594 | ) | | | (100,877,111 | ) | | | (89,350,642 | ) | | | (5,660,712 | ) |
| | | | | | | | | | | | | | | | | | | | | | | | |
Net appreciation (depreciation) | | $ | 1,754,784 | | | $ | (15,581,341 | ) | | $ | (1,339,656 | ) | | $ | 94,252,239 | | | $ | (42,408,400 | ) | | $ | (4,484,401 | ) |
| | | | �� | | | | | | | | | | | | | | | | | | | | |
| | | | | | |
| | | Ultra
Growth
Fund | | | U.S.
Treasury
Fund | | | | | | | | | | | | | |
Cost | | $ | 187,052,859 | | | $ | 117,481,269 | | | | | | | | | | | | | | | | | |
| | | | | | | | | | | | | | | | | | | | | | | | |
Gross appreciation | | $ | 23,907,806 | | | $ | 8,589,827 | | | | | | | | | | | | | | | | | |
Gross (depreciation) | | | (31,781,795 | ) | | | — | | | | | | | | | | | | | | | | | |
| | | | | | | | | | | | | | | | | | | | | | | | |
Net appreciation (depreciation) | | $ | (7,873,989 | ) | | $ | 8,589,827 | | | | | | | | | | | | | | | | | |
| | | | | | | | | | | | | | | | | | | | | | | | |
The difference between cost amounts for financial statement and federal income tax purposes is due primarily to timing differences in recognizing certain securities gains and losses.
In June, 2006, the FASB released FASB Interpretation No. 48 “Accounting for Uncertainty in Income Taxes” (FIN 48). FIN 48 provides guidance for how uncertain tax positions should be recognized, measured, presented and disclosed in the financial statements. FIN 48 requires the evaluation of tax positions taken or expected to be taken in the course of preparing the Funds’ tax returns to determine whether the tax positions are “more-likely-than-not” of being sustained by the applicable tax authority. Tax positions not deemed to meet a more-likely-than-not threshold would be recorded as a tax expense in the current year. Adoption of FIN 48 is required for fiscal years beginning after December 15, 2006 and is to be applied to all open tax years as of the effective date. Management has determined that its evaluation of the Interpretation has resulted in no impact to the Funds’ financial statements at March 31, 2008. However, conclusions regarding FIN 48 are subject to review and adjustment at a later date based on factors including, but not limited to, further implementation guidance expected from FASB, and on going analysis of tax laws, regulation, and interpretations thereof.
92
| | |
| | MARCH 31, 2008 (UNAUDITED) |
|
| |
| |
The components of accumulated earnings on a tax basis as of September 30, 2007 were as follows:
| | | | | | | | | | | | | | | | | | | | | | | | |
| | | Core
Growth
Fund | | | Global
Science &
Technology
Fund | | | Heritage
Growth
Fund | | | Heritage
Value
Fund1 | | | International
Growth
Fund | | | International
Opportunities
Fund | |
Undistributed ordinary income | | $ | 8,521,343 | | | $ | 5,351,619 | | | $ | — | | | $ | 27,540 | | | $ | 16,539,102 | | | $ | 3,291,278 | |
Undistributed capital gains | | | 174,694,125 | | | | 10,169,156 | | | | 11,322,253 | | | | — | | | | 38,373,861 | | | | 4,466,603 | |
| | | | | | | | | | | | | | | | | | | | | | | | |
Accumulated earnings | | | 183,215,468 | | | | 15,520,775 | | | | 11,322,253 | | | | 27,540 | | | | 54,912,963 | | | | 7,757,881 | |
Accumulated capital and other losses | | | — | | | | — | | | | — | | | | — | | | | — | | | | — | |
Other undistributed ordinary losses | | | (869,706 | ) | | | (390,952 | ) | | | (18,608 | ) | | | (4,094 | ) | | | — | | | | (28,310 | ) |
Net unrealized appreciation* | | | 230,237,378 | | | | 36,678,625 | | | | 35,291,971 | | | | 43,051 | | | | 136,958,996 | | | | 15,591,883 | |
| | | | | | | | | | | | | | | | | | | | | | | | |
Total accumulated earnings | | $ | 412,583,140 | | | $ | 51,808,448 | | | $ | 46,595,616 | | | $ | 66,497 | | | $ | 191,871,959 | | | $ | 23,321,454 | |
| | | | | | | | | | | | | | | | | | | | | | | | |
| | | | | | |
| | | Micro
Cap
Fund | | | Micro Cap
Value
Fund | | | Small Cap
Growth
Fund | | | Small Cap
Value
Fund | | | Strategic
Income
Fund | | | Ultra
Growth
Fund | |
Undistributed ordinary income | | $ | 1,153,139 | | | $ | 3,517,746 | | | $ | — | | | $ | 30,752,970 | | | $ | 1,200,628 | | | $ | — | |
Undistributed capital gains | | | 75,050,231 | | | | 11,483,993 | | | | 107,746,400 | | | | 96,636,737 | | | | 255,181 | | | | 18,239,103 | |
| | | | | | | | | | | | | | | | | | | | | | | | |
Accumulated earnings | | | 76,203,370 | | | | 15,001,739 | | | | 107,746,400 | | | | 127,389,707 | | | | 1,455,809 | | | | 18,239,103 | |
Accumulated capital and other losses | | | — | | | | — | | | | — | | | | — | | | | — | | | | — | |
Other undistributed ordinary losses | | | (126,003 | ) | | | (17,233 | ) | | | — | | | | — | | | | (21,730 | ) | | | (759 | ) |
Net unrealized appreciation (depreciation)* | | | 128,696,625 | | | | 17,426,691 | | | | 290,249,467 | | | | 50,843,699 | | | | (951,010 | ) | | | 68,387,540 | |
| | | | | | | | | | | | | | | | | | | | | | | | |
Total accumulated earnings | | $ | 204,773,992 | | | $ | 32,411,197 | | | $ | 397,995,867 | | | $ | 178,233,406 | | | $ | 483,069 | | | $ | 86,625,884 | |
| | | | | | | | | | | | | | | | | | | | | | | | |
| | | | | | |
| | | U.S.
Treasury
Fund | | | | | | | | | | | | | | | | |
Undistributed ordinary income | | $ | 129,727 | | | | | | | | | | | | | | | | | | | | | |
Undistributed capital gains | | | — | | | | | | | | | | | | | | | | | | | | | |
| | | | | | | | | | | | | | | | | | | | | | | | |
Accumulated earnings | | | 129,727 | | | | | | | | | | | | | | | | | | | | | |
Accumulated capital and other losses | | | (6,693,201 | ) | | | | | | | | | | | | | | | | | | | | |
Other undistributed ordinary losses | | | (130,010 | ) | | | | | | | | | | | | | | | | | | | | |
Net unrealized appreciation* | | | 606,419 | | | | | | | | | | | | | | | | | | | | | |
| | | | | | | | | | | | | | | | | | | | | | | | |
Total accumulated earnings | | $ | (6,087,065 | ) | | | | | | | | | | | | | | | | | | | | |
| | | | | | | | | | | | | | | | | | | | | | | | |
1 | Inception date of the Fund was August 30, 2007. |
| *On | investments, securities sold short, derivatives and foreign currency denominated assets and liabilities. |
Capital loss carryforwards are available through the date specified below to offset future realized net capital gains. To the extent future gains are offset by capital loss carryforwards, such gains will not be distributed.
Capital loss carryforwards expire September 30:
| | | | | | | | | | | | |
| Fund | | 2008 | | 2009 | | 2010 | | 2015 |
U.S. Treasury Fund | | $ | 485,296 | | $ | 4,318,964 | | $ | 831,495 | | $ | 225,538 |
The U.S. Treasury Fund had $831,908 of post-October capital losses. The Core Growth, Global Science & Technology, Heritage Growth, Micro Cap, Micro Cap Value, and Ultra Growth Funds had $869,706, $390,352, $17,353, $126,003, $13,502, and $759, respectively, of post-October currency losses. Net capital losses incurred after October 31 and within the taxable year are deemed to arise on the first day of the following tax year.
93
| | |
| WASATCH FUNDS — Notes to Financial Statements (continued) | | |
|
| |
| |
The tax character of distributions paid during the year or period ended September 30, 2007 was as follows:
| | | | | | | | | | | | | | | | | | |
| 2007 | | Core
Growth
Fund | | Global
Science &
Technology
Fund | | Heritage
Growth
Fund | | Heritage
Value
Fund1 | | International
Growth
Fund | | International
Opportunities
Fund |
Ordinary income | | $ | 7,290,307 | | $ | — | | $ | 23,657 | | $ | — | | $ | — | | $ | 62,484 |
Capital gain | | | 107,442,861 | | | 5,210,791 | | | 7,225,239 | | | — | | | 69,456,586 | | | 2,442,244 |
| | | | | | | | | | | | | | | | | | |
Total | | $ | 114,733,168 | | $ | 5,210,791 | | $ | 7,248,896 | | $ | — | | $ | 69,456,586 | | $ | 2,504,728 |
| | | | | | | | | | | | | | | | | | |
| | | | | | |
| 2007 | | Micro
Cap
Fund | | Micro Cap
Value
Fund | | Small Cap
Growth
Fund | | Small Cap
Value
Fund | | Strategic
Income
Fund | | Ultra
Growth
Fund |
Ordinary income | | $ | 2,745,719 | | $ | 5,585,055 | | $ | — | | $ | 13,942,266 | | $ | 958,492 | | $ | 5,456,463 |
Capital gain | | | 64,975,198 | | | 12,810,726 | | | 92,697,704 | | | 75,189,464 | | | — | | | 15,688,974 |
| | | | | | | | | | | | | | | | | | |
Total | | $ | 67,720,917 | | $ | 18,395,781 | | $ | 92,697,704 | | $ | 89,131,730 | | $ | 958,492 | | $ | 21,145,437 |
| | | | | | | | | | | | | | | | | | |
| | | | | | |
| 2007 | | U.S.
Treasury
Fund | | | | | | | | | | |
Ordinary income | | $ | 7,951,409 | | | | | | | | | | | | | | | |
Capital gain | | | — | | | | | | | | | | | | | | | |
| | | | | | | | | | | | | | | | | | |
Total | | $ | 7,951,409 | | | | | | | | | | | | | | | |
| | | | | | | | | | | | | | | | | | |
1 | Inception date of the Fund was August 30, 2007. |
The tax character of distributions paid during the period ended September 30, 2006 was as follows:
| | | | | | | | | | | | | | | | | | |
| 2006 | | Core
Growth
Fund | | Global
Science &
Technology
Fund | | Heritage
Growth
Fund | | International
Growth
Fund | | International
Opportunities
Fund | | Micro
Cap
Fund |
Ordinary income | | $ | 25,301,016 | | $ | — | | $ | 5,846,002 | | $ | — | | $ | — | | $ | 9,692,672 |
Capital gain | | | 122,056,473 | | | 1,860,003 | | | 2,681,242 | | | 9,365 | | | — | | | 91,613,465 |
| | | | | | | | | | | | | | | | | | |
Total | | $ | 147,357,489 | | $ | 1,860,003 | | $ | 8,527,244 | | $ | 9,365 | | $ | — | | $ | 101,306,137 |
| | | | | | | | | | | | | | | | | | |
| | | | | | |
| 2006 | | Micro Cap
Value
Fund | | Small Cap
Growth
Fund | | Small Cap
Value
Fund | | Strategic
Income
Fund1 | | Ultra
Growth
Fund | | U.S.
Treasury
Fund |
Ordinary income | | $ | 2,115,580 | | $ | 3,535,845 | | $ | 17,898,270 | | $ | 273,109 | | $ | 5,104,375 | | $ | 9,215,585 |
Capital gain | | | 6,129,820 | | | 156,091,699 | | | 80,331,327 | | | — | | | 46,249,586 | | | — |
| | | | | | | | | | | | | | | | | | |
Total | | $ | 8,245,400 | | $ | 159,627,544 | | $ | 98,229,597 | | $ | 273,109 | | $ | 51,353,961 | | $ | 9,215,585 |
| | | | | | | | | | | | | | | | | | |
1 | Inception date of the Fund was February 1, 2006. |
The tax character of distributions paid may differ from that shown in the Statements of Changes in Net Assets due to short-term gains being treated as ordinary income for tax purposes.
94
| | |
| | MARCH 31, 2008 (UNAUDITED) |
|
| |
| |
7. RELATED PARTY TRANSACTIONS
Investment Advisory Fees — As the Fund’s investment advisor, the Advisor receives a monthly fee calculated on the average daily net assets of each Fund. The Advisor has contractually agreed to waive its fees and/or reimburse a Fund should a Fund’s operating expenses exceed a specified annual limitation through at least January 31, 2009. Investment advisory fees and fees waived, if any, for the period ended March 31, 2008 are disclosed in the Statements of Operations. Investment advisory fee and expense limitation annual rates are shown below.
| | | | | | | | | | | | | | | | | | |
| | | Core
Growth
Fund | | | Emerging
Markets
Small Cap
Fund | | | Global
Science &
Technology
Fund | | | Heritage
Growth
Fund | | | Heritage
Value
Fund | | | International
Growth
Fund | |
Advisory Fee | | 1.00 | % | | 1.75 | % | | 1.50 | % | | 0.70 | % | | 0.70 | % | | 1.50 | % |
Expense Limitation | | 1.50 | % | | 2.10 | % | | 1.95 | % | | 0.95 | % | | 0.95 | % | | 1.95 | % |
| | | | | | |
| | | International
Opportunities
Fund | | | Micro
Cap
Fund | | | Micro Cap
Value
Fund | | | Small Cap
Growth
Fund | | | Small Cap
Value
Fund | | | Strategic
Income
Fund | |
Advisory Fee | | 2.00 | % | | 2.00 | % | | 2.00 | % | | 1.00 | % | | 1.50 | % | | 0.70 | % |
Expense Limitation | | 2.25 | % | | 2.50 | % | | 2.25 | % | | 1.50 | % | | 1.95 | % | | 0.95 | % |
| | | | | | |
| | | Ultra
Growth
Fund | | | U.S.
Treasury
Fund | | | | | | | | | | | | | |
Advisory Fee | | 1.25 | % | | 0.50 | % | | | | | | | | | | | | |
Expense Limitation | | 1.75 | % | | 0.75 | % | | | | | | | | | | | | |
Affiliated Interests — An officer of the Funds owns approximately 14% and 13% of the shares outstanding of the International Opportunities and Strategic Income Funds, respectively, as of March 31, 2008.
8. TRANSACTIONSWITH AFFILIATES
If a Fund’s holding represents ownership of 5% or more of the voting securities of a company, the company is deemed to be an affiliate as defined by the 1940 Act. The following Funds conducted transactions during the period ended March 31, 2008 with “affiliated companies” as so defined:
| | | | | | | | | | | | | | | | |
| | | Share Activity | | | Dividends
Credited to
Income for the
Six Months
ended 3/31/08 | | Gain (Loss)
Realized on
Sale of Shares
for the
Six Months
ended 3/31/08 | |
| | | Balance
9/30/07 | | Purchases/
Additions | | Sales/
Reductions | | Balance
3/31/08 | | | |
Micro Cap Fund | | | | | | | | | | | | | | | | |
AutoInfo, Inc. | | 2,206,015 | | — | | 259,130 | | 1,946,885 | | | $ | — | | $ | (123,376 | ) |
Bri-Chem Corp. | | 969,640 | | — | | 969,640 | | — | * | | | — | | | (542,428 | ) |
Epic Bancorp | | 240,743 | | 13,875 | | — | | 254,618 | | | | 24,768 | | | — | |
inTEST Corp. | | 584,675 | | — | | — | | 584,675 | | | | — | | | — | |
SM&A | | 1,436,475 | | — | | 70,415 | | 1,366,060 | | | | — | | | (442,409 | ) |
VNUS Medical Technologies, Inc. | | 979,852 | | 83,370 | | 339,275 | | 723,947 | * | | | — | | | 1,055,342 | |
| | | | | | | | | | | | | | | | |
| | | | | | | | | | | $ | 24,768 | | $ | (52,871 | ) |
|
| | |
Micro Cap Value Fund | | | | | | | | | | | | | | | | |
Guestlogix, Inc. | | 2,146,615 | | 113,285 | | 637,804 | | 1,622,096 | * | | $ | — | | $ | 214,277 | |
|
| | |
Small Cap Value Fund | | | | | | | | | | | | | | | | |
MicroFinancial, Inc. | | 670,108 | | 72,515 | | — | | 742,623 | | | $ | 37,131 | | $ | — | |
| * | No longer affiliated as of March 31, 2008. |
95
| | |
| WASATCH FUNDS — Notes to Financial Statements (continued) | | |
|
| |
| |
9. RESTRICTED SECURITIES
The Funds may own investments that were purchased through private placement transactions or under Rule 144A of the Securities Act of 1933 (the “Securities Act”) and cannot be sold without prior registration under the Securities Act or may be limited due to certain restrictions. These securities are generally deemed to be illiquid and are valued at fair value as determined by a designated Pricing Committee, comprised of personnel of the Advisor, with oversight by the Board of Directors and in accordance with Board-approved Pricing Policies and Procedures. If and when such securities are registered, the costs of registering such securities are paid by the issuer. At March 31, 2008, the Funds held the following restricted securities:
| | | | | | | | | | | | | |
| | | Security
Type | | Acquisition
Date | | Acquisition
Cost | | Fair
Value | | Value as %
of Net Assets | |
Core Growth Fund | | | | | | | | | | | | | |
| | | | | |
DataPath, Inc. | | Common Stock | | 6/23/06 | | $ | 7,566,680 | | $ | 2,407,580 | | 0.28 | % |
Solar Capital, LLC | | Common Stock | | 3/7/07 | | | 13,200,900 | | | 12,127,227 | | 1.39 | % |
| | | | | | | | |
| | | | | | $ | 20,767,580 | | $ | 14,534,807 | | 1.67 | % |
|
| | |
Global Science & Technology Fund | | | | | | | | | | | | | |
| | | | | |
Acusphere, Inc. | | Warrants | | 7/29/04 - 10/20/04 | | $ | — | | $ | — | | — | |
BlueArc Corp., Series DD | | Preferred Stock | | 6/6/06 | | | 324,998 | | | 407,426 | | 0.30 | % |
Incipient, Inc., Series D | | Preferred Stock | | 2/7/06 | | | 139,219 | | | 35,047 | | 0.03 | % |
Montagu Newhall Global Partners II-B, L.P. | | LP Interest | | 10/10/03 - 1/15/08 | | | 342,144 | | | 311,142 | | 0.23 | % |
Neutral Tandem, Inc., Series C | | Preferred Stock | | 2/2/06 | | | 111,107 | | | 305,749 | | 0.23 | % |
Point Biomedical Corp., Series A | | Preferred Stock | | 12/6/07 - 12/7/07 | | | 21,508 | | | 39,337 | | 0.03 | % |
Xtera Communications, Inc., Series A-1 | | Preferred Stock | | 9/3/03 | | | 7,076 | | | 7,076 | | 0.01 | % |
| | | | | | | | |
| | | | | | $ | 946,052 | | $ | 1,105,777 | | 0.83 | % |
|
| | |
International Growth Fund | | | | | | | | | | | | | |
| | | | | |
Redcorp Ventures Ltd. | | Warrants | | 7/5/07 | | $ | — | | $ | — | | — | |
|
| | |
International Opportunities Fund | | | | | | | | | | | | | |
| | | | | |
QRSciences Holdings Ltd. | | Warrants | | 2/7/07 | | $ | — | | $ | — | | — | |
Redcorp Ventures Ltd. | | Warrants | | 7/5/07 | | | — | | | — | | — | |
Star Asia Finance Ltd. | | Common Stock | | 2/22/07 | | | 607,350 | | | 524,143 | | 1.22 | % |
| | | | | | | | |
| | | | | | $ | 607,350 | | $ | 524,143 | | 1.22 | % |
|
| | |
Micro Cap Fund | | | | | | | | | | | | | |
| | | | | |
Cardica, Inc. | | Warrants | | 6/7/07 | | $ | 19,380 | | $ | 210,756 | | 0.05 | % |
CryoCor, Inc. | | Warrants | | 4/24/07 | | | 7,435 | | | — | | — | |
Familymeds Group, Inc. | | Warrants | | 12/1/04 | | | — | | | — | | — | |
Goldwater Bank, N.A. | | Common Stock | | 2/28/07 | | | 1,540,000 | | | 1,540,000 | | 0.35 | % |
Point Biomedical Corp., Series A | | Preferred Stock | | 12/6/07 - 12/7/07 | | | 226,364 | | | 414,022 | | 0.09 | % |
| | | | | | | | |
| | | | | | $ | 1,793,179 | | $ | 2,164,778 | | 0.49 | % |
|
| | |
Micro Cap Value Fund | | | | | | | | | | | | | |
| | | | | |
Acusphere, Inc. | | Warrants | | 7/29/04 -10/20/04 | | $ | — | | $ | — | | — | |
Cardica, Inc. | | Warrants | | 6/7/07 | | | 9,302 | | | 101,164 | | 0.11 | % |
CryoCor, Inc. | | Warrants | | 4/24/07 | | | 1,859 | | | — | | — | |
Electro-Optical Sciences, Inc. | | Warrants | | 10/31/06 | | | — | | | — | | — | |
Familymeds Group, Inc. | | Warrants | | 12/1/04 | | | — | | | — | | — | |
Farallon Resources Ltd. | | Warrants | | 12/21/06 | | | — | | | 32,148 | | 0.03 | % |
Goldwater Bank, N.A. | | Common Stock | | 2/28/07 | | | 419,000 | | | 419,000 | | 0.44 | % |
Idaho Trust Bancorp | | Common Stock | | 8/30/06 | | | 500,004 | | | 500,004 | | 0.53 | % |
NeurogesX, Inc. | | Warrants | | 12/28/07 | | | 3,800 | | | — | | — | |
NeurogesX, Inc. PIPE | | Common Stock | | 12/28/07 | | | 626,226 | | | 353,292 | | 0.37 | % |
Point Biomedical Corp., Series A | | Preferred Stock | | 12/6/07 - 12/7/07 | | | 45,272 | | | 82,803 | | 0.09 | % |
Redcorp Ventures Ltd. | | Warrants | | 7/5/07 | | | — | | | — | | — | |
| | | | | | | | |
| | | | | | $ | 1,605,463 | | $ | 1,488,411 | | 1.57 | % |
96
| | |
| | MARCH 31, 2008 (UNAUDITED) |
|
| |
| |
| | | | | | | | | | | | | |
| | | Security
Type | | Acquisition
Date | | Acquisition
Cost | | Fair
Value | | Value as %
of Net Assets | |
Small Cap Growth Fund | | | | | | | | | | | | | |
| | | | | |
Bravo Health, Inc., Series G | | Preferred Stock | | 11/1/04 | | $ | 571,428 | | $ | 851,666 | | 0.10 | % |
Fluidigm Corp., Series E | | Preferred Stock | | 12/22/06 | | | 2,500,000 | | | 2,500,000 | | 0.29 | % |
Incipient, Inc., Series D | | Preferred Stock | | 2/7/06 | | | 1,860,778 | | | 468,431 | | 0.05 | % |
Montagu Newhall Global Partners II-B, L.P. | | LP Interest | | 10/10/03 -1/15/08 | | | 3,421,435 | | | 2,984,112 | | 0.35 | % |
Montagu Newhall Global Partners III-B, L.P. | | LP Interest | | 3/16/06 - 3/6/08 | | | 600,000 | | | 589,774 | | 0.07 | % |
Nanosys, Inc., Series D | | Preferred Stock | | 11/8/05 | | | 2,000,000 | | | 2,000,000 | | 0.23 | % |
Neutral Tandem, Inc., Series C | | Preferred Stock | | 2/2/06 | | | 1,485,102 | | | 4,086,777 | | 0.48 | % |
Orqis Medical Corp., Series D | | Preferred Stock | | 2/28/07 | | | 1,200,000 | | | 1,200,000 | | 0.14 | % |
Point Biomedical Corp., Series A | | Preferred Stock | | 12/6/07 - 12/7/07 | | | 286,777 | | | 524,519 | | 0.06 | % |
TargetRX, Inc., Series D | | Preferred Stock | | 4/8/05 | | | 769,098 | | | 3,628 | | — | |
Valera Pharmaceuticals, Inc. CSR VP003 | | Common Stock | | 2/1/06 - 2/2/06 | | | 243,922 | | | — | | — | |
Valera Pharmaceuticals, Inc. Ureteral Stent | | Common Stock | | 2/1/06 - 2/2/06 | | | 162,615 | | | — | | — | |
Zonare Medical Systems, Inc. | | Warrants | | 6/30/04 | | | — | | | — | | — | |
Zonare Medical Systems, Inc., Series E | | Preferred Stock | | 6/30/04 | | | 1,500,000 | | | 1,343,162 | | 0.16 | % |
| | | | | | | | |
| | | | | | $ | 16,601,155 | | $ | 16,552,069 | | 1.93 | % |
|
| | |
Small Cap Value Fund | | | | | | | | | | | | | |
| | | | | |
Redcorp Ventures Ltd. | | Warrants | | 7/5/07 | | $ | — | | $ | — | | — | |
Solar Capital, LLC | | Common Stock | | 3/7/07 | | | 7,079,100 | | | 6,503,333 | | 1.53 | % |
Star Asia Finance Ltd. | | Common Stock | | 2/22/07 | | | 6,000,000 | | | 5,178,000 | | 1.22 | % |
| | | | | | | | |
| | | | | | $ | 13,079,100 | | $ | 11,681,333 | | 2.75 | % |
|
| | |
Strategic Income Fund | | | | | | | | | | | | | |
| | | | | |
Goldwater Bank, N.A. | | Common Stock | | 2/28/07 | | $ | 81,000 | | $ | 81,000 | | 0.44 | % |
Redcorp Ventures Ltd. | | Corporate Bond | | 7/5/07 | | | 282,956 | | | 247,348 | | 1.36 | % |
Solar Capital, LLC | | Common Stock | | 3/7/07 | | | 294,000 | | | 270,088 | | 1.48 | % |
Star Asia Finance Ltd. | | Common Stock | | 2/22/07 | | | 342,650 | | | 295,707 | | 1.62 | % |
| | | | | | | | |
| | | | | | $ | 1,000,606 | | $ | 894,143 | | 4.90 | % |
|
| | |
Ultra Growth Fund | | | | | | | | | | | | | |
| | | | | |
Bravo Health, Inc., Series G | | Preferred Stock | | 11/1/04 | | $ | 571,428 | | $ | 851,666 | | 0.46 | % |
Electro-Optical Sciences, Inc. | | Warrants | | 10/31/06 | | | — | | | — | | — | |
Farallon Resources Ltd. | | Warrants | | 12/21/06 | | | — | | | 24,042 | | 0.01 | % |
Montagu Newhall Global Partners II-B, L.P. | | LP Interest | | 10/10/03 - 1/15/08 | | | 3,079,292 | | | 2,800,273 | | 1.51 | % |
Montagu Newhall Global Partners III-B, L.P. | | LP Interest | | 3/16/06 - 3/6/08 | | | 600,000 | | | 589,774 | | 0.32 | % |
Nanosys, Inc., Series D | | Preferred Stock | | 11/8/05 | | | 500,001 | | | 500,001 | | 0.27 | % |
Neutral Tandem, Inc., Series C | | Preferred Stock | | 2/2/06 | | | 403,796 | | | 1,111,185 | | 0.60 | % |
Ophthonix, Inc., Series C | | Preferred Stock | | 9/23/05 | | | 500,000 | | | 500,000 | | 0.27 | % |
Redcorp Ventures Ltd. | | Warrants | | 7/5/07 | | | — | | | — | | — | |
TargetRX, Inc., Series D | | Preferred Stock | | 4/8/05 | | | 230,904 | | | 1,089 | | — | |
TherOx, Inc., Series I | | Preferred Stock | | 7/7/05 | | | 1,000,000 | | | 1,557,119 | | 0.84 | % |
Transoma Medical, Inc., Series B | | Preferred Stock | | 1/20/06 | | | 475,001 | | | 733,126 | | 0.39 | % |
Xtera Communications, Inc., Series A-1 | | Preferred Stock | | 9/3/03 | | | 99,065 | | | 99,065 | | 0.05 | % |
Zonare Medical Systems, Inc. | | Warrants | | 6/30/04 | | | — | | | — | | — | |
Zonare Medical Systems, Inc., Series E | | Preferred Stock | | 6/30/04 | | | 1,000,000 | | | 895,441 | | 0.48 | % |
| | | | | | | | |
| | | | | | $ | 8,459,487 | | $ | 9,662,781 | | 5.20 | % |
LP Limited Partnership Interest
PIPE Private Investment in a Public Equity
10. PURCHASE COMMITMENTS
In September 2003, the Global Science & Technology, Small Cap Growth and Ultra Growth Funds entered into subscription agreements to acquire limited partnership interests in Montagu Newhall Global Partners II-B, L.P. The remaining commitment amounts at March 31, 2008 were $155,000, $1,550,000, and $1,395,000, respectively. Securities held by the Funds have been designated to meet these purchase commitments.
In November 2004, the Small Cap Growth and Ultra Growth Funds entered into subscription agreements to acquire shares of Bravo Health, Inc., Series G Pfd. The remaining commitment amounts at March 31, 2008 were $428,572 per Fund. Securities held by the Funds have been designated to meet these purchase commitments.
In December 2005, the Small Cap Growth and Ultra Growth Funds entered into subscription agreements to acquire limited partnership interests in Montagu Newhall Global Partners III-B, L.P. The remaining commitment amounts at March 31, 2008 were $900,000 per Fund. Securities held by the Funds have been designated to meet these purchase commitments.
97
| | |
| WASATCH FUNDS — Notes to Financial Statements (continued) | | |
|
| |
| |
11. LINEOF CREDIT
The Equity Funds opened a $75,000,000 Line of Credit (the “Line”), of which $50,000,000 is committed, with State Street Bank and Trust Company on June 4, 2007. The Line is for temporary or emergency purposes such as to provide liquidity for shareholder redemptions. The Equity Funds incur commitment fees on the undrawn portion of the committed part of the Line, and interest expense to the extent of amounts drawn (borrowed) under the entire Line. Interest is based on the federal funds rate in effect at the time of borrowing, plus a margin. Commitment fees are pro-rated among the Equity Funds based upon relative average net assets. Interest expense is charged directly to a fund based upon actual amounts borrowed by the fund.
The following Funds had borrowings:
| | | | | | | | | | | | | | |
| Fund | | Average Daily
Borrowings | | Number of
Days
Outstanding | | Interest
Expense | | Weighted
Average
Annualized
Interest Rate | | | Balance at
March 31,
2008 |
Core Growth | | $ | 4,748,300 | | 30 | | $ | 19,320 | | 4.87 | % | | $ | — |
Global Science & Technology | | | 1,798,929 | | 14 | | | 3,470 | | 4.95 | % | | | — |
Heritage Growth | | | 1,349,091 | | 22 | | | 4,159 | | 5.03 | % | | | — |
International Growth | | | 3,172,325 | | 40 | | | 13,698 | | 3.88 | % | | | — |
Micro Cap Value | | | 246,400 | | 5 | | | 188 | | 5.33 | % | | | — |
Small Cap Growth | | | 4,524,849 | | 53 | | | 31,521 | | 4.72 | % | | | — |
Small Cap Value | | | 8,455,792 | | 48 | | | 55,760 | | 4.94 | % | | | — |
Strategic Income | | | 252,531 | | 16 | | | 570 | | 5.06 | % | | | — |
Ultra Growth | | | 2,671,323 | | 31 | | | 9,614 | | 4.17 | % | | | — |
98
| | |
| WASATCH FUNDS — Directors and Officers | | MARCH 31, 2008 (UNAUDITED) |
|
| |
| |
MANAGEMENTOFTHE COMPANY
Management Information. The business affairs of Wasatch Funds are supervised by its Board of Directors. The Board consists of four directors who are elected and serve until their successors are elected and qualified.
The directors and executive officers of Wasatch Funds and their principal occupations for at least the last five years are set forth below.
| | | | | | | | | | |
Name, Address
and Age | | Position(s)
Held
with Funds | | Term of Office1 and
Length of Time Served | | Principal Occupation(s)
During Past 5 Years | | Number of
Portfolios
in Fund
Complex
Overseen
by Director | | Other Directorships
Held by Director2 |
Interested Director | | | | | | | | | | |
| | | | | |
Samuel S. Stewart, Jr., Ph.D. CFA3 150 Social Hall Ave. 4th Floor Salt Lake City, UT 84111 Age 65 | | President and Director | | Indefinite Served as President and Director since 1986 | | Chairman of the Board for the Advisor since 1975; Chief Investment Officer of the Advisor since 2004; Director of Research of the Advisor from 1975 to 2004; Chairman of the Board of Wasatch Funds from 1986 to 2004. | | 14 | | None |
|
| |
Independent Directors | | | | | | | | | | |
| | | | | |
James U. Jensen, J.D., MBA 44 North Wolcott Salt Lake City, UT 84103 Age 63 | | Director and Chairman of the Board | | Indefinite Served as Chairman of the Board since 2004 and Director since 1986 | | Co-Founder and Chairman of the Board of Intelisum, Inc. (a company pursuing computer and measurement technology and products) since 2001; Consultant on corporate growth and technology transfer since 2004; Vice President, Corporate Development, Legal Affairs and General Counsel, and Secretary, NPS Pharmaceuticals, Inc. from 1991 to 2004. | | 14 | | Bayhill Capital Corp. and private companies and foundations. |
| | | | | |
William R. Swinyard, Ph.D. 470 S. Woodland Hills Drive Woodland Hills, UT 84653 Age 67 | | Director and Chairman of the Audit Committee | | Indefinite Served as Chairman of the Audit Committee since 2004 and Director since 1986 | | Professor of Business Management and Holder of the Fred G. Meyer Chair of Marketing (Emeritus), Brigham Young University since 1978. | | 14 | | None |
| | | | | |
D. James Croft, Ph.D. 9209 Hidden Creek Drive Great Falls, VA 22066-2211 Age 66 | | Director | | Indefinite Served as Director since 2005 | | Consultant since 2004 and Founder and Executive Director, Mortgage Asset Research Institute from 1990 to 2004. | | 14 | | None |
|
| |
1 | Director may serve until his death, resignation, removal or retirement. Each Independent Director shall retire as Director at the end of the calendar year in which he attains the age of 72 years. |
2 | Directorships are those held by a Director in any company with a class of securities registered pursuant to Section 12 of the Securities Exchange Act of 1934 or subject to the requirements of Section 15(d) of the Securities Exchange Act or any company registered as an investment company under the 1940 Act. |
3 | Mr. Stewart is an Interested Director because he serves as a director and officer of the Advisor. |
99
| | |
| WASATCH FUNDS — Directors and Officers (continued) | | |
|
| |
| |
| | | | | | | | | | |
Name, Address
and Age | | Position(s)
Held
with Funds | | Term of Office and
Length of Time Served | | Principal Occupation(s)
During Past 5 Years | | Number of
Portfolios
in Fund
Complex
Overseen
by Director | | Other Directorships
Held by Director |
Officers | | | | | | | | | | |
| | | | | |
Eric Huefner 150 Social Hall Ave. 4th Floor Salt Lake City, UT 84111 Age 43 | | Vice President | | Indefinite Served as Vice President since February 2008 | | Director of Mutual Funds and Brand Management for the Advisor since 2006; Marketing Director, Campbell Soup Company, 2003-2006. | | Not
Applicable | | Not
Applicable |
| | | | | |
Daniel D. Thurber 150 Social Hall Ave. 4th Floor Salt Lake City, UT 84111 Age 38 | | Vice President | | Indefinite Served as Vice President since February 2007 | | General Counsel, Chief Compliance Officer and Director of Compliance for the Advisor since 2006; Chief Compliance Officer and Secretary for Wasatch Funds from May 2006 to February 2007; Associate and Partner at Dorsey & Whitney LLP from 2001 to 2006. | | Not
Applicable | | Not
Applicable |
| | | | | |
Russell Biles 150 Social Hall Ave. 4th Floor Salt Lake City, UT 84111 Age 40 | | Chief Compliance Officer and Vice President | | Served as Chief Compliance Officer and Vice President since February 2007 | | Chief Compliance Officer and Vice President for Wasatch Funds since February 2007; Counsel for the Advisor since October 2006; Senior Compliance Administrator for the Advisor from October 2005 to October 2006; Attorney and Managing Member of Nicholls Nicholls Biles & Bower, LLC from 2002 to 2005. | | Not
Applicable | | Not
Applicable |
| | | | | |
Melanie H. Zimdars 150 Social Hall Ave. 4th Floor Salt Lake City, UT 84111 Age 31 | | Treasurer and Secretary | | Indefinite Served as Treasurer and Secretary since February 2007 | | Treasurer and Secretary for Wasatch Funds since February 2007; Assistant Treasurer for Wasatch Funds from November 2006 to February 2007; Senior Fund Administrator for the Advisor since 2005; Compliance Officer at U.S. Bancorp Fund Services, LLC from 2001 to 2005. | | Not
Applicable | | Not Applicable |
|
| |
Additional information about the Funds’ directors is provided in the Statement of Additional Information and is available without charge, upon request, by calling 800.551.1700.
100
| | |
| WASATCH FUNDS — Supplemental Information | | MARCH 31, 2008 (UNAUDITED) |
|
| |
| |
PROXY VOTING POLICIES, PROCEDURESAND RECORD
A description of the policies and procedures that Wasatch Advisors uses to vote proxies related to the Funds’ portfolio securities is set forth in the Funds’ Statement of Additional Information which is available without charge, upon request, on the Funds’ web site at www.wasatchfunds.com or by calling 800.551.1700 and on the Securities and Exchange Commission’s (SEC) web site at www.sec.gov.
Wasatch Funds’ proxy voting record is available on the Funds’ web site at www.wasatchfunds.com and the SEC’s web site at www.sec.gov no later than August 31 for the prior 12 months ending June 30.
QUARTERLY PORTFOLIO HOLDINGS DISCLOSUREON FORM N-Q
The Funds file their complete schedules of investments with the SEC for their first and third fiscal quarters of each fiscal year, commencing with the quarter ended December 31, 2004, on Form N-Q. The Funds’ Form N-Q is available on the SEC’s web site at www.sec.gov, and may be viewed at the SEC’s Public Reference Room in Washington, D.C. (information on the operation of the Public Reference Room may be obtained by calling 800.SEC.0330).
At a meeting held on February 20, 2008 (the “Meeting”), the Board of Directors of the Company, including the Independent Directors, unanimously approved the Advisory and Service Contract (the “Advisory Contract”) between Wasatch Funds, Inc. and Wasatch Advisors, Inc. (the “Advisor”) on behalf of each Fund (other than the Emerging Markets Small Cap Fund and the Heritage Value Fund) and the Sub-Advisory Agreement between the Advisor and Hoisington Investment Management Company (the “Sub-Advisor”) on behalf of the Wasatch-Hoisington U.S. Treasury Fund. The Emerging Markets Small Cap Fund and the Heritage Value Fund are new funds the advisory contacts of which were not subject to review at this Meeting.
In preparation for their role in the evaluation of the Advisory Contract and Sub-Advisory Agreement, the Independent Directors met with independent counsel in Executive Sessions on February 6, 2008 and February 19, 2008. In advance of these meetings, the Board received materials and other information which outlined, among other things:
| • | | the terms and conditions of the Advisory Contract and Sub-Advisory Agreement, including the nature, extent and quality of services provided by the Advisor and Sub-Advisor; |
| • | | the organization and business operations of the Advisor and Sub-Advisor, including the experience of persons who will manage the respective Fund; |
| • | | the profitability of the Advisor from serving as adviser to the respective Fund (plus financial information regarding the Sub-Advisor, profitability analysis for advisers to unaffiliated investment companies generally and the expenses of the Advisor in providing the services); |
| • | | the management fees of the Advisor, including comparisons of such fees with the management fees of comparable, unaffiliated funds prepared by an independent third party and the Advisor’s fee schedule for other clients; |
| • | | the sub-advisory fees of the Sub-Advisor with respect to the U.S. Treasury Fund (including the Sub-Advisor’s fee schedule for other clients); |
| • | | the expenses of each Fund, including comparisons with the expense ratios of comparable, unaffiliated funds compiled by an independent third party; |
| • | | the respective Fund’s past performance plus such Fund’s performance compared to funds of similar investment objectives compiled by independent third parties and with recognized benchmarks; and |
| • | | from independent counsel, a legal memorandum outlining, among other things, the duties of the Independent Directors under the Investment Company Act of 1940 (the “1940 Act”), as well as the general principles of relevant state law in reviewing and approving advisory contracts; the requirements of the 1940 Act in such matters; an adviser’s fiduciary duty with respect to advisory agreements and compensation; the standards used by courts in determining whether investment company boards of directors have fulfilled their duties and factors to be considered by the Board in voting on advisory agreements. |
The information provided for the Meeting supplements the information the Board receives throughout the year regarding a Fund’s performance, expense ratios, portfolio composition, trade execution and sales activity. As noted, the Independent Directors met in Executive Sessions with independent counsel to discuss, among other things, the Advisory Contract and Sub-Advisory Agreement, the materials provided, and the Board’s duties in reviewing and approving advisory contracts. The Independent Directors, in consultation with independent counsel, also reviewed the factors set out in judicial decisions and SEC directives relating to the renewal of advisory contracts. As outlined in more detail below, the Independent Directors considered all factors they believed relevant with respect to the Funds, including the following: (a) the nature, extent and quality of the services to be provided by the Advisor and Sub-Advisor; (b) the investment performance of the respective Fund as available (as described in further detail in Section (B) below); (c) the profits to be realized by the Advisor from the relationship with the Fund; (d) the extent to which economies of scale would be realized as a Fund grows; and (e) whether fee levels reflect these economies of scale for the benefit of Fund investors.
| A. | | NATURE, EXTENTAND QUALITYOF SERVICES |
In evaluating the nature, extent and quality of the Advisor’s and Sub-Advisor’s services, the Independent Directors reviewed information concerning the types of services (advisory and non-advisory or administrative services) that the Advisor and Sub-Advisor provide to the respective Fund; the performance record of the applicable Fund; and information describing the Advisor’s and Sub-Advisor’s
101
| | |
| WASATCH FUNDS — Supplemental Information (continued) | | |
|
| |
| |
organization and business. In connection with their service as Independent Directors of the Company, the Independent Directors also periodically have met with the Advisor and Sub-Advisor’s personnel and have evaluated their professional experience, qualifications and credentials as well as their investment approach and research process. Given the Independent Directors’ experience with the Funds, Advisor and Sub-Advisor, the Independent Directors were familiar with and have a good understanding of the organization, operations, investment philosophy and personnel of the Advisor and Sub-Advisor.
In connection with their review of the advisory services being provided, the Independent Directors considered the investment philosophy and investment mandates of each Fund and whether the Advisor and Sub-Advisor (as applicable) have performed consistently with such philosophy and mandates. While the Directors believe that the Advisor and Sub-Advisor have consistently applied their traditional investment philosophy and processes in managing the applicable Funds, the Directors also have recognized the Advisor’s continual review of its research process in order to keep refining and improving its investment process. The Directors further recognized the Advisor’s management process is research intensive (reviewing, among other things, the ratio of total assets to portfolio management personnel compared to that of other unaffiliated advisors) and noted the Advisor’s significant investment in research personnel over the past several years. In its review of staffing, the Independent Directors also considered the changes to the personnel involved with the portfolio management of each Fund and its research team. The Independent Directors also reviewed the compensation arrangements of the Advisor’s personnel to evaluate the Advisor’s ability to attract and retain key employees, including portfolio managers, preserve stability and reward performance but not provide an incentive for taking undue risks. In addition to compensation, the Directors also considered the Advisor’s succession plans to preserve stability over time. In light of the regulatory emphasis on compliance, in reviewing the services that have been provided to the Funds, the Independent Directors also considered the Advisor’s compliance activities and regulatory history.
In their review of services, the Independent Directors also evaluated the quality of administrative or non-advisory services provided. The terms of the Advisory Contract provide that the Advisor shall administer the Company’s affairs to the extent requested by and subject to the supervision of the Board for the period and terms of the contract. In this regard, the Advisor provides business, administrative, compliance, marketing and other services required to operate the Funds, such as assistance with preparation and filing of regulatory and tax reports, preparation and distribution of prospectuses and shareholder reports, provision of information to Fund directors, analysis to ensure compliance with federal and state laws and regulations, valuation of portfolio securities, and oversight of the performance of the Funds’ service providers (e.g., administrator, fund accountant, transfer agent and custodian). The Advisor also pays for office space and facilities for the Funds.
With respect to the Sub-Advisor for the U.S. Treasury Fund, it was noted that the Sub-Advisory Agreement is essentially an agreement for portfolio management services only and the Sub-Advisor was not expected to supply other significant administrative services.
Based on their review, the Independent Directors found that, overall, the nature, extent and quality of services provided under the Advisory Contract and the Sub-Advisory Agreement were satisfactory on behalf of the applicable Fund.
| B. | | THE INVESTMENT PERFORMANCEOFTHE FUNDS |
In evaluating each Fund’s performance, the Directors reviewed both short-term and long-term performance of each Fund relative to its peer group and relevant benchmarks, with greater weight given to performance over longer periods of time. More specifically, the Independent Directors reviewed, among other things, materials reflecting the respective Fund’s historic performance for the one-, three-, five-, and ten-year periods ending December 31, 2007 (as applicable) compared to its respective benchmarks and unaffiliated funds in its investment category. Additionally, the Independent Directors reviewed a report prepared by an unaffiliated third party comparing the respective Fund’s total return for the one-, two-, three-, four-, five-, and ten-year periods ending December 31, 2007 (as applicable) compared to the performance of unaffiliated funds with similar investment objectives or classifications (a “Peer Group”) for the prescribed periods. In addition, the Independent Directors received reports prepared by a second unaffiliated party regarding the Funds, which generally included an analyst report on the respective Fund (other than the International Opportunities Fund, Strategic Income Fund and the U.S. Treasury Fund). This information supplemented the performance information provided to the Board at each of its quarterly meetings as well as at other meetings or executive sessions during the year in response to the Board’s requests. Further, the Independent Directors also recognized the limitations on some of the usefulness of the performance comparison information as the closest Peer Group for a Fund may not adequately reflect the Fund’s investment strategies and may be invested in sectors or industries in which the respective Fund has limited or no exposure. Based on their review and in light of the above considerations, the Independent Directors determined that the respective Fund’s investment performance over time had been satisfactory.
| C. | | FEES, EXPENSESAND PROFITABILITY |
1. Fees and Expenses
In their evaluation of fees and expenses, the Independent Directors reviewed the Advisor’s management fees and expense ratios for each Fund and the sub-advisory fee with respect to the U.S. Treasury Fund in absolute terms as well as with comparisons of fees and expenses of funds with similar objectives. In this regard, the Independent Directors reviewed and considered, among other things, comparisons of the respective Fund’s actual management fees, total
102
| | |
| | MARCH 31, 2008 (UNAUDITED) |
|
| |
| |
expenses (including and excluding 12b-1/non-12b-1 service fees), and non-management expenses (such as transfer agency, custodian, administrative and accounting fees) with those of unaffiliated funds in its Peer Group compiled by an independent third party. In reviewing fees, the Independent Directors also considered the expense limitation agreement provided by the Advisor for the Funds and the amounts the Advisor has reimbursed to the Funds for the last three fiscal years (if any) which effectively reduces the amount of advisory fees paid to the Advisor.
As noted above, the Independent Directors considered not only a Fund’s management fee, but also its total expense ratio compared to its Peer Group. In this regard, the Heritage Growth Fund, Small Cap Growth Fund and Strategic Income Fund had total expense ratios below the median in its Peer Group. The remaining Funds had advisory fees and total expense ratios higher than the median in their Peer Group. In reviewing fees, the Independent Directors considered a Fund’s performance, particularly long-term performance, in assessing the fee level. In addition to reviewing fees and expenses in absolute terms and in comparisons to peers, the Independent Directors recognized the Advisor’s research intensive investment approach and the related costs, including, in particular, the Advisor’s significant investment in its research personnel. The Independent Directors also noted the Advisor’s continued investment philosophy to close a Fund to new and/or existing investors when necessary to preserve the integrity of a Fund’s investment strategy, particularly for Funds that primarily invest in smaller companies. The Independent Directors recognized that this practice may result in the Advisor foregoing additional fees on a larger asset base and exposing the Advisor to reduced revenues from asset outflows. The Independent Directors seek to encourage the Advisor’s focus on performance as opposed to gathering additional assets under management to increase revenues. Given the foregoing, the Independent Directors recognized that the current advisory fee levels were acceptable.
2. Fees Charged to Other Advisor and Sub-Advisor Clients
In reviewing fees, the Independent Directors also compared the advisory fees to the fees the Advisor assesses other types of clients, including institutional and high net worth separate accounts and a private investment company. Currently, the Advisor manages separate account client assets in a similar style as certain Funds, including Core Growth, Heritage Growth, International Growth, Micro Cap, Small Cap Growth, Small Cap Value and the Ultra Growth Fund. With respect to separate accounts, the fees for these accounts are generally lower than the comparable Fund (except the fees are the same in the case of the Heritage Growth Fund). The Independent Directors considered the differences in the product types, including the services provided. In this regard, the Independent Directors have noted that the range of services provided to the Funds in managing and operating registered investment companies is more extensive than those provided to separately managed accounts. The Advisor provides services to the Funds that extend beyond the portfolio management services provided to its separate
account clients. As described in more detail above, these services include business, administrative, compliance, marketing and other services required to operate the Funds. Further, the Independent Directors recognized that the Funds operate in a highly regulated industry requiring extensive compliance. Such responsibilities generally are not required to the same extent for separate accounts. Accordingly, the Independent Directors believe the nature and number of services provided to operate a Fund merit higher fees than those of separate accounts. Similarly, with respect to the private investment company, such company is not subject to the extensive regulatory scheme required of operating registered investment companies such as the Funds, and therefore the services required differ. In addition, the Independent Directors noted the private investment company advised by the Advisor pays a performance fee and therefore its fee structure differs significantly from that of the Funds.
In considering the fees of the Sub-Advisor, the Independent Directors also considered the pricing schedule the Sub-Advisor charges for similar investment management services for other clients. In this regard, the sub-advisory fees for the U.S. Treasury Fund were at the lower end of the Sub-Advisor’s fee schedule. The Independent Directors also noted that the sub-advisory fees were established through arm’s length negotiations between the Advisor and the Sub-Advisor which is unaffiliated with the Advisor.
3. Profitability of Advisor
The Independent Directors reviewed profitability information for the Advisor derived from its relationship with each Fund for the calendar year ending December 31, 2007. In reviewing profitability, the Independent Directors reviewed the methodology utilized to allocate revenue and expenses of the Advisor among the Funds. In considering profitability, the Independent Directors have recognized the inherent limitations in determining profitability which may be affected by many factors, including the allocation of expenses across multiple investment products served by the Advisor. The allocation of research and personnel expenses is also particularly difficult given the Advisor’s shared research culture. The Independent Directors further noted the impact on profitability due to the Advisor’s compensation arrangements. In addition to reviewing the Advisor’s profitability, the Directors also reviewed the Advisor’s profitability compared to publicly available profitability information concerning unaffiliated advisers. However, the Independent Directors recognized the difficulties in comparing the profitability of various advisors given that individual fund or product line profitability of other advisers generally is not publicly available and the profitability information that is available for certain advisers or management firms may not be representative of the industry and may be affected by numerous factors including the structure of the particular adviser, the types of funds managed, its business mix, expense allocations, and the adviser’s capital structure and cost of capital. The Independent Directors noted that the Advisor’s profitability is within a reasonable range compared to the peer group of unaffiliated
103
| | |
| WASATCH FUNDS — Supplemental Information (continued) | | |
|
| |
| |
advisers. Based on their review, the Independent Directors were satisfied that the Advisor’s level of profitability from its relationship with each Fund was not unreasonable in light of the services provided.
With respect to the Sub-Advisor, although a profitability analysis was not available, the Independent Directors received certain financial statements of the Sub-Advisor. Given that the Sub-Advisor’s fee is at the low end of its fee schedule and the fact that the sub-advisory fee is established through arm’s length negotiations, the Independent Directors believe the Sub-Advisor’s profitability from its relationship with the U.S. Treasury Fund is not unreasonable.
In addition to the above, the Independent Directors also considered that the Advisor benefits from soft dollar arrangements whereby it receives brokerage and research services from brokers that execute a Fund’s purchases and sales of securities, as described in further detail below.
| D. | | ECONOMIESOF SCALEAND WHETHER FEE LEVELS REFLECT THESE ECONOMIESOF SCALE |
In reviewing advisory fees, the Independent Directors recognized that the advisory fee schedules for the Funds do not contain breakpoints that reduce the fee rate on assets above certain levels. With respect to funds investing in small and micro-cap companies, the Independent Directors recognized that the economies of scale and profit potential that may be achieved may be limited. In this regard, the Independent Directors are aware that it is more difficult to replicate performance in the small and micro-cap funds at larger asset sizes and therefore, as noted above, a Fund may be closed to new and/or existing shareholders from time to time. This practice enhances the Advisor’s focus on achieving performance by maintaining assets at levels it can effectively manage but may limit economies of scale derived from a larger asset base. The Independent Directors, as noted, also recognized that this practice may limit the Advisor’s profit potential from earning additional fees on a larger asset base and expose the Advisor to reduced revenues from asset outflows when Funds are closed to investors. The Independent Directors also has noted the costs associated with the Advisor’s research intensive investment approach. The Independent Directors further recognized the Advisor’s position that to the extent economies of scale exist, the proposed level of advisory fee reflects such economies of scale. Considering the factors above, the Independent Directors concluded the absence of breakpoints was acceptable.
In evaluating fees, the Independent Directors also considered any indirect benefits or profits the Advisor or its affiliates may receive as a result of its relationship with the Funds. In this regard, the Independent Directors considered that the Advisor benefits from soft dollar arrangements pursuant to which it receives research from brokers that execute the applicable Fund’s brokerage transactions. The Independent Directors reviewed information regarding the soft dollar arrangements including, among other things, the commissions paid, the research credits earned and the services provided. Further, the Independent Directors at prior meetings
have had extensive discussions regarding the soft dollar arrangements. The Independent Directors recognized that soft dollar arrangements provide benefits to the Advisor by obtaining research that it would otherwise have to acquire with hard dollars. Accordingly, the Advisor’s profitability would be somewhat lower if it did not receive the research services pursuant to soft dollar arrangements. The Independent Directors took these “fall out” benefits into account when reviewing the level of advisory fees.
The Independent Directors did not identify any single factor discussed previously as all-important or controlling. The Independent Directors, including a majority of Independent Directors, concluded that the terms of the Advisory Contract for each Fund and the Sub-Advisory Agreement for the U.S. Treasury Fund were fair and reasonable, that the Advisor’s and Sub-Advisor’s fees are reasonable in light of the services provided to the respective Fund, and that the Advisory Contract should be approved on behalf of each Fund and the Sub-Advisory Agreement should be approved on behalf of the U.S. Treasury Fund.
DISCLOSUREFOR BOARD APPROVALOF EMERGING MARKETS FUND
At a meeting held on August 29, 2007 (the “August Meeting”), the Board of Directors of Wasatch Funds, Inc. (the “Company”) including the Independent Directors, unanimously approved the Advisory and Service Contract (the “Advisory Contract”) between the Company on behalf of the Emerging Markets Small Cap Fund (the “New Fund”) and Wasatch Advisors, Inc. (the “Advisor”). To assist the Board in its evaluation of the Advisory Contract, the Independent Directors received materials and other information, in adequate time in advance of the August Meeting, which outlined, among other things:
| • | | the terms and conditions of the Advisory Contract, including the nature, extent and quality of services provided to the New Fund by the Advisor; |
| • | | the organization and business operations of the Advisor, including the experience of persons who will manage the New Fund; |
| • | | the proposed management fees of the Advisor, including comparisons of such fees with the management fees of comparable, unaffiliated funds prepared by an independent third party; |
| • | | the projected expenses of the New Fund, including comparisons with the expense ratios of comparable, unaffiliated funds compiled by an independent third party; |
| • | | the profitability of the Advisor for advisory services; and |
| • | | the soft dollar practices of the Advisor. |
In addition to the foregoing materials, independent legal counsel to the Independent Directors provided, in advance of the meeting, a legal memorandum outlining, among other things, the duties of the Independent Directors under the Investment Company Act of 1940, as amended (the “1940 Act”) as well as the general principles of relevant state
104
| | |
| | MARCH 31, 2008 (UNAUDITED) |
|
| |
| |
law in reviewing and approving advisory contracts; the requirements of the 1940 Act in such matters; an adviser’s fiduciary duty with respect to advisory agreements and compensation; the standards used by courts in determining whether investment company boards of directors have fulfilled their duties and factors to be considered by the board in voting on advisory agreements.
At a meeting held on May 11, 2007 (the “May Meeting”), the Board received materials describing the philosophy, investment objectives and strategies of the New Fund. At the May Meeting, the Advisor made a presentation to, and responded to questions from, the Board regarding the proposed New Fund. The Independent Directors met with the portfolio managers designated for the New Fund to discuss, among other things, the New Fund’s investment objectives, strategies and experience of the team. At the August Meeting, the Advisor further explained its investment strategies for the New Fund, discussed market conditions, described proposed fees and expenses, highlighted any changes from the previous presentation at the May Meeting, and responded to questions from the Board.
During the previous day and then again after reviewing the written materials and discussing issues pertaining to the proposed approval of the Advisory Contract with representatives of the Advisor, the Independent Directors met privately with their legal counsel to review the Board’s duties in reviewing advisory contracts and consider approval of the Advisory Contract on behalf of the New Fund. It is with this background that the Independent Directors considered the approval of the Advisory Contract for the New Fund.
The Independent Directors, in consultation with independent counsel, reviewed the factors set out in judicial decisions and SEC directives relating to the approval of advisory contracts. As outlined in more detail below, the Independent Directors considered all factors they believed relevant with respect to the New Fund, including the following: (a) the nature, extent and quality of the services to be provided by the Advisor; (b) the performance of the Advisor; (c) the costs of the services to be provided and profits estimated to be realized by the Advisor and its affiliates; (d) the extent to which economies of scale may be realized as the New Fund grows; and (e) whether fee levels reflect any such economies of scale.
With respect to the nature, extent and quality of services to be provided by the Advisor, the Independent Directors reviewed the information regarding the types of services (advisory and non-advisory or administration) to be provided under the Advisory Contract for the New Fund; narrative and statistical information concerning the Advisor’s performance record with other funds they advise; and information describing the Advisor’s organization and business. As noted above, the Independent Directors met at the May Meeting with the proposed lead managers for the New Fund and reviewed and evaluated their professional experience, qualifications and credentials. Further, given the Independent Directors’ experience with other Wasatch Funds, the Independent Directors noted that they were familiar with and have a good understanding of the
organization, operations and personnel of the Advisor, including its research department and personnel. Based on their review, the Independent Directors concluded that, overall, the nature, extent and quality of services expected to be provided to the New Fund under the Advisory Contract were satisfactory.
With respect to investment performance, it was noted that because the New Fund has not commenced operations and does not have its own performance history, the Board reviewed and considered performance information regarding the Advisor’s past performance record with other funds.
In evaluating the proposed management fees and expenses, the Independent Directors considered the New Fund’s proposed management fees and expected expense ratios in absolute terms and as compared with the fees and expenses of a peer group of comparable unaffiliated funds provided by an independent third party. With respect to the New Fund, the Independent Directors also received the management fee and expense ratio of another unaffiliated emerging markets small cap fund provided by the Advisor. In addition, the Independent Directors considered the expense limitation agreement provided by the Advisor on behalf of the New Fund. Although the Advisor does not currently manage other funds or separately managed accounts with the same investment styles as for the New Fund, the Independent Directors had at previous meetings reviewed the fees charged by the Advisor for non-mutual fund institutional clients and for “high net worth” separate accounts and were familiar with the fees the Advisor assesses to these other clients. Based upon this information, the Independent Directors noted that the proposed advisory fee was the highest compared to the peer group and above the median expense ratio of such funds. The Independent Directors considered the costs of the research personnel-intensive approach followed by the Adviser, the costs of managing a fund with a small cap and emerging market focus, the overall expense structure of the New Fund and peer group, and the overall expense limitation provided by the Advisor.
In light of the foregoing and during lengthy negotiations, the Independent Directors proposed an expense structure of the New Fund as follows: 1.75% advisory fee and a total expense ratio cap that would be reduced as assets in such New Fund grew. The Independent Directors further proposed that the Advisor limit total expenses of the New Fund to 2.10% of average net assets calculated on a daily basis. It was noted that the expense limitation would decrease to 2.05% when average net assets of the New Fund reach $50 million; to 2.00% when average net assets of the New Fund reach $100 million; and to 1.95% when average net assets of the New Fund reach $150 million. Such decrease would take affect on the first day of the quarter after the New Fund’s assets reach such required level and after the New Fund’s assets reach the applicable threshold, the expense limitation would remain even if the New Fund’s assets subsequently decrease below the required level. The expense limitation would continue until January 31, 2009. The Advisor agreed to the fee schedule proposed by the Independent Directors.
105
| | |
| WASATCH FUNDS — Supplemental Information (continued) | | |
|
| |
| |
In conjunction with its review of fees, the Independent Directors also considered the profitability of the Advisor for its advisory activities to the Wasatch Funds. The Independent Directors reviewed information provided by the Advisor concerning the estimated revenue to the Advisor as a result of the proposed relationship with the New Fund. The Independent Directors also reviewed the revenues and expenses of the Advisor for advisory services to the Wasatch Funds for the calendar year ending December 31, 2006 and the allocation methodology used in preparing the profitability data. In reviewing profitability, the Independent Directors have recognized the subjective nature of determining profitability which may be affected by numerous factors including the allocation of expenses. The Independent Directors have also recognized the difficulties in making comparisons as the profitability from other advisers generally is not publicly available and the profitability information that is available for certain advisers or management firms may not be representative of the industry and may be affected by, among other things, the adviser’s particular business mix, capital costs, types of funds managed and expense allocations. The Independent Directors also noted that the Advisor is privately held and is taxed as a Subchapter S corporation, thus certain expenses had to be attributed and/or estimated. As noted below, in considering profitability, the Independent Directors also considered the effect of fall-out benefits (such as soft-dollar arrangements) on the Advisor’s expenses. The Independent Directors further considered the profitability of the Advisor before taxes and marketing expenses (including supermarket fees). Based on their review, the Directors were satisfied that the Advisor’s level of profitability was reasonable in light of the services to be provided.
In reviewing compensation, the Independent Directors noted that similar to other Wasatch funds, the advisory fee schedule for the New Fund did not contain breakpoints that reduce the fee rate on assets above specified levels. The Independent Directors recognized that breakpoints may be one way for the benefits of any economies of scale to be shared with investors. The Independent Directors noted that most of the Wasatch Funds invest in small and micro-cap securities, and that, traditionally, the Advisor has periodically closed certain equity funds at asset levels it believes necessary or appropriate to manage the respective fund effectively. The Independent Directors noted that the New Fund will have a limited asset size and it is anticipated, based on current market conditions, that the New Fund will be closed to new investors when the product reaches its capacity of approximately $500 million thereby limiting the profit potential for the Advisor. As a result, the Independent Directors recognized that a higher profit margin and higher fees may be warranted due to such New Fund’s limited capacity. The Independent Directors also are aware of the Advisor’s position that for small-cap funds, the fees reflect the limited profit potential and research personnel-intensive process. Nevertheless, the Independent Directors noted that there are breakpoints in the total expense ratio cap for the New Fund which help ensure shareholders share in any benefits from the costs of such New Fund being spread over
a large asset base. Considering the above, the Independent Directors concluded that the absence of breakpoints in the New Fund’s advisory fee schedule was acceptable.
In evaluating fees, the Independent Directors also considered any indirect benefits or profits the Advisor or its affiliates may receive as a result of its relationship with the New Fund. In this regard, in connection with its experience with the Advisor for other Wasatch Funds, the Independent Directors have previously reviewed information concerning the Advisor’s soft dollar arrangements, including its policies for allocating brokerage for brokerage and research services. In light of their experience, the Independent Directors are familiar with the Advisor’s soft dollar arrangements and recognize that the Advisor’s profitability may be lower if the Advisor was required to pay for this research with hard dollars.
The Independent Directors did not identify any single factor discussed previously as all-important or controlling. The Directors, including a majority of Independent Directors, concluded that the terms of the Advisory Contract were fair and reasonable, that the Advisor’s fees, as amended in the case of the New Fund, are reasonable in light of the services expected to be provided to the New Funds, and that the Advisory Contract should be and was approved.
106
| | |
| WASATCH FUNDS — Service Providers | | MARCH 31, 2008 (UNAUDITED) |
|
| |
| |
Investment Advisor
Wasatch Advisors, Inc.
150 Social Hall Avenue, 4th Floor
Salt Lake City, UT 84111
Sub-Advisor for U.S. Treasury Fund
Hoisington Investment Management Co.
1250 Capital of Texas Highway South
Building 3, #600
Austin, TX 78746
Administrator and Fund Accountant
State Street Bank and Trust Company
801 Pennsylvania Avenue
Kansas City, MO 64105
Distributor
ALPS Distributors, Inc.
1290 Broadway, Suite 1100
Denver, CO 80203
Transfer Agent
UMB Fund Services, Inc.
803 West Michigan Street, Suite A
Milwaukee, WI 53233-2301
Custodian
State Street Bank and Trust Company
801 Pennsylvania Avenue
Kansas City, MO 64105
Legal Counsel to Wasatch Funds and Independent Directors
Chapman and Cutler, LLP
111 West Monroe Street
Chicago, IL 60603
Independent Registered Public Accounting Firm
PricewaterhouseCoopers LLP
1055 Broadway, 10th Floor
Kansas City, MO 64105
107
| | |
| WASATCH FUNDS — Guide to Understanding Financial Statements | | |
|
| |
| |
Wasatch Funds provides reports to shareholders twice a year. The annual report is for the Funds’ fiscal year which ends September 30. The semi-annual report is for the six months or period ending March 31. Additionally, the Funds’ schedules of investments for the first and third quarters of each fiscal year are available to shareholders as described on page 101. These reports provide shareholders with important information that will help them evaluate the management and performance of their investments. It is the desire of Wasatch Funds to help shareholders stay in tune with their investments. If you have any questions about the information in this report, a shareholder services representative will be happy to assist you when you call 800.551.1700.
SCHEDULEOF INVESTMENTS
The holdings of each Wasatch Fund are detailed in the “Schedule of Investments.” This section provides a snapshot of the securities each Fund was invested in on the last day of the reporting period. The Wasatch Equity Funds invest primarily in Common Stocks of companies which are grouped together by industry. The Wasatch-Hoisington U.S. Treasury Fund invests primarily in U.S. Treasury securities. The Equity Funds will typically have only minor holdings in Short-Term Investments. At times the Funds may take temporary defensive positions by increasing cash or holdings in Short-Term Investments. Please see the prospectus under “Other Investment Strategies and Their Risks.”
STATEMENTSOF ASSETSAND LIABILITIES
These financial statements show the Assets and Liabilities of a Fund on the last day of the reporting period. A Fund’s Assets include the value of securities owned, amounts receivable for purchases of Fund shares (capital shares receivable), securities sold, interest and dividends, prepaid expenses and other assets. Liabilities are amounts owed for shareholder redemptions (capital shares payable), securities purchased, investment advisory fees and other expenses. Totaling up the assets and subtracting the liabilities results in a Fund’s Net Assets.
Net Assets consist of capital stock, paid-in capital in excess of par, undistributed net investment income or loss, undistributed net realized gain or loss on investments and net unrealized appreciation or depreciation on investments. Capital stock is stock authorized by a company’s charter and having par value, stated value or no par value. Par value is set by the company issuing the shares and has no relation to Net Asset Value. The par value of one share of each Wasatch Fund is $.01. Paid-in capital in excess of par is capital received from shareholders in exchange for Fund shares that exceeds the par value of the shares. For example, if you bought one share of a Fund for $10, $.01 would show as “Capital stock” on the books of the Fund, and $9.99 would be accounted for under “Paid-in capital in excess of par.” Undistributed net investment income or loss is the amount of net investment income or loss of a Fund since inception that has not been paid to shareholders as a dividend.
Undistributed net realized gain (loss) on investments is the amount of net realized gains or losses generated by a Fund since inception that have not been distributed to shareholders in the form of a capital gain distribution. A gain or loss is realized when a security is sold by a Fund. Net unrealized appreciation (depreciation) on investments is the change in value from the purchase price of securities a Fund continues to hold.
The number of shares a Fund is authorized to sell can be found under Capital Stock, $.01 par value. Issued and outstanding indicates the number of shares owned by shareholders.
Net Asset Value (NAV), Redemption Price and Offering Price Per Share shows the value of one outstanding share of a Fund on the date of the report. A Fund’s share price (NAV) is calculated by dividing the value of all securities and other assets owned by a Fund, less the liabilities charged to that Fund, by the number of Fund shares outstanding. The share price is calculated at the close of business of the New York Stock Exchange on each day the Exchange is open for trading. Please see Wasatch Funds’ prospectus for more information about how share prices are calculated. Information about how the share price is affected by a Fund’s operation can be found under “Financial Highlights” on page 109.
STATEMENTSOF OPERATIONS
Statements of Operations show investment income and expenses for each Fund as well as realized gains or losses from securities sold and the appreciation or depreciation in the value of a Fund’s holdings during the reporting period.
Investment Income shows Interest and Dividends earned from interest-bearing and dividend-paying securities in a Fund’s portfolio.
Expenses show the various fees and expenses paid out of a Fund’s assets such as the fee paid to Wasatch Advisors, the Funds’ investment advisor. Additional fees include shareholder servicing, fund administration and accounting, custody of fund assets, federal and state registration, legal counsel, auditing and directors’ fees. The Funds pay for printing and mailing statements, prospectuses, annual reports and semi-annual reports to shareholders.
Net Investment Income (Loss) is the amount of dividends and interest income earned on securities held by a Fund, less the Fund’s expenses.
Net realized gain (loss) on investments and foreign currency translations is the net gain or loss on securities a Fund has sold. Change in unrealized appreciation (depreciation) on investments and foreign currency translations is the change in value of securities a Fund continues to hold.
Net gain (loss) on investments is the result of changes in the market value of securities a Fund has sold and securities it continues to hold.
STATEMENTSOF CHANGESIN NET ASSETS
Net Assets are a Fund’s remaining assets after taking into consideration any liabilities. Statements of Changes in Net
108
| | |
| | MARCH 31, 2008 (UNAUDITED) |
|
| |
| |
Assets show the increase or decrease in a Fund’s net assets during the reporting period. Investment operations, dividends and capital share transactions affect a Fund’s net assets. Operations is a summary of the Statements of Operations. It includes investment income or loss, net realized gain or loss on investments and foreign currency translations a Fund has sold as well as the change in appreciation or depreciation in the value of investments a Fund continues to hold.
Dividends are distributed by Wasatch Funds to sharehold-ers when Fund investments have earned income in excess of net expenses or when capital gains in excess of capital losses are realized from the sale of securities. Most shareholders choose to reinvest their dividends and capital gain distribu- tions. Each Fund is required by Internal Revenue Code regulations to distribute substantially all of its net investment income and capital gains to shareholders in order to retain its status as a “regulated investment company.”
Capital share transactions are any transactions involving shares of a Fund, including the selling of Fund shares, shares issued by a Fund to shareholders for the reinvestment of dividends, and share redemptions.
FINANCIAL HIGHLIGHTS
The Financial Highlights contain important historical operating information that you may find useful in making decisions or understanding the performance of your investment.
Net Asset Value (NAV) is defined under “Statements of Assets and Liabilities” on page 108. The difference between the Net asset value, beginning of period and the Net asset value, end of period in the Financial Highlights is the change in value of a Fund’s shares over the reporting period, but not its total return.
Income (loss) from investment operations shows how the share price was affected by a Fund’s operations on a per share basis. Net investment income (loss) is the per share
amount of dividends and interest income earned on securities held by a Fund, less the Fund’s expenses. Net realized and unrealized gains (losses) on securities is the per share increase or decrease in the value of securities a Fund holds or has sold during the reporting period. Gains or (losses) are realized when securities are sold. Gains or (losses) are unrealized when securities increase or decrease in value but are not sold.
Distributions are the per share amount that a Fund paid to shareholders from net investment income and net realized gains.
Total return is the percentage increase or decrease in the value of an investment over a stated period of time. A total return percentage includes both changes in unrealized and realized gains and income. For the purposes of calculating total return, it is assumed that dividends and distributions are reinvested at the share price on the ex-dividend day of the distribution. A FUND’S TOTAL RETURN CANNOT BE COMPUTED DIRECTLY FROM THE FINANCIAL HIGHLIGHTS.
Supplemental data and ratios are provided to help you better understand your investment. Net assets, end of period, are the net assets of a Fund on the reporting date. Ratio of expenses to average net assets shows the total of a Fund’s operating expenses divided by its average net assets for the stated period before and after waivers and reimbursements by the Advisor, if any. Ratio of net investment income to average net assets shows a Fund’s net investment income (loss) divided by its average net assets for the stated period before and after waivers and reimbursements by the Advisor, if any. Portfolio turnover rate measures a Fund’s buying and selling activity during the reporting period. It is computed by dividing total purchases or sales, whichever is less, by the average monthly market value of a Fund’s portfolio securities. This calculation does not include securities with a maturity date of less than 12 months.
TELEPHONE
800.551.1700
M - F, 7:00 a.m. to 7:00 p.m. CT
Automated Line, 24 Hours
U.S. MAIL
Wasatch Funds
P.O. Box 2172
Milwaukee, WI 53201-2172
OVERNIGHT MAIL
Wasatch Funds
803 West Michigan Street, Suite A
Milwaukee, WI 53233-2301
ONLINE
www.wasatchfunds.com
shareholderservice@wasatchfunds.com
109
| | |
| WASATCH FUNDS — Notes | | MARCH 31, 2008 |
|
| |
| |

WWW.WASATCHFUNDS.COM
800.551.1700
Not required.
| Item 3: | Audit Committee Financial Expert. |
Not required.
| Item 4. | Principal Accountant Fees and Services. |
Not required.
| Item 5. | Audit Committee of Listed Registrants. |
Not applicable.
| Item 6. | Schedule of Investments. |
Schedule of Investments is included as a part of the report to shareholders filed under Item 1 of this Form N-CSR.
| Item 7. | Disclosure of Proxy Voting Policies and Procedures for Closed-End Management Investment Companies. |
Not applicable.
| Item 8. | Portfolio Managers of Closed-End Investment Companies. |
Not applicable.
| Item 9. | Purchases of Equity Securities by Closed-End Management Investment Company and Affiliated Purchasers. |
Not applicable.
| Item 10. | Submission of Matters to a Vote of Security Holders. |
The Board of Directors has not adopted procedures by which shareholders may recommend nominees to the Board.
| Item 11. | Controls and Procedures. |
| (a) | The Registrant’s principal executive and principal financial officers have concluded that the Registrant’s disclosure controls and procedures (as defined in Rule 30a-3(c) under the Investment Company Act of 1940, as amended (the “1940 Act”) (17 CFR 270.30a-3(c)) are effective, as of a date within 90 days of the filing date of this Form N-CSR based on their evaluation of these controls and procedures required by Rule 30a-3(b) under the 1940 Act (17 CFR 270.30a-3(b)) and Rules 13a-15(b) or 15d-15(b) under the Securities Exchange Act of 1934 (17 CFR 240.13a-15(b) or 240.15d-15(b)). |
| (b) | There were no changes in the Registrant’s internal control over financial reporting (as defined in Rule 30a-3(d) under the 1940 Act (17 CFR 270.30a-3(d)) that occurred during the Registrant’s second fiscal quarter of the period covered by this report that has materially affected, or is reasonably likely to materially affect, the Registrant’s internal control over financial reporting. |
| (a)(2) | The certifications required by Rule 30a-2 of the 1940 Act are attached hereto. |
| (b) | The certifications required by Rule 30a-2(b) of the 1940 Act and Section 906 of the Sarbanes-Oxley Act of 2002 are attached hereto. |
SIGNATURES
Pursuant to the requirements of the Securities Exchange Act of 1934 and the Investment Company Act of 1940, the registrant has duly caused this report to be signed on its behalf by the undersigned, thereunto duly authorized.
| | |
| WASATCH FUNDS, INC. |
| |
| By: | | /s/ Samuel S. Stewart, Jr. |
| | Samuel S. Stewart, Jr. |
| | President (principal executive officer) of Wasatch Funds, Inc. |
Date: May 30, 2008
Pursuant to the requirements of the Securities Exchange Act of 1934 and the Investment Company Act of 1940, this report has been signed below by the following persons on behalf of the registrant and in the capacities and on the dates indicated.
| | |
| |
| By: | | /s/ Samuel S. Stewart, Jr. |
| | Samuel S. Stewart, Jr. |
| | President (principal executive officer) of Wasatch Funds, Inc. |
Date: May 30, 2008
| | |
| |
| By: | | /s/ Melanie H. Zimdars |
| | Melanie H. Zimdars |
| | Secretary/Treasurer (principal financial and accounting officer) of Wasatch Funds, Inc. |
Date: May 30, 2008