UNITED STATES
SECURITIES AND EXCHANGE COMMISSION
Washington, D.C. 20549
FORM N-CSR
CERTIFIED SHAREHOLDER REPORT OF REGISTERED
MANAGEMENT INVESTMENT COMPANIES
Investment Company Act file number: 811-04920
WASATCH FUNDS TRUST
(Exact name of registrant as specified in charter)
505 Wakara Way, 3rd Floor
Salt Lake City, UT 84108
(Address of principal executive offices)(Zip code)
| | |
| (Name and Address of Agent for Service) | | Copy to: |
| |
Samuel S. Stewart, Jr. Wasatch Advisors, Inc. 505 Wakara Way, 3rd Floor Salt Lake City, UT 84108 | | Eric F. Fess, Esq. Chapman & Cutler LLP 111 West Monroe Street Chicago, IL 60603 |
Registrant’s telephone number, including area code: (801) 533-0777
Date of fiscal year end: September 30
Date of reporting period: September 30, 2016
Item 1: Report to Shareholders.

2016 ANNUAL REPORT
September 30, 2016
WASATCH
FUNDS
EQUITY FUNDS / Wasatch Core Growth Fund Wasatch Emerging India Fund Wasatch Emerging Markets Select Fund Wasatch Emerging Markets Small Cap Fund Wasatch Frontier Emerging Small Countries Fund Wasatch Global Opportunities Fund Wasatch International Growth Fund Wasatch International Opportunities Fund Wasatch Large Cap Value Fund Wasatch Long/Short Fund Wasatch Micro Cap Fund Wasatch Micro Cap Value Fund Wasatch Small Cap Growth Fund Wasatch Small Cap Value Fund Wasatch Strategic Income Fund Wasatch Ultra Growth Fund Wasatch World Innovators Fund BONDS FUNDS / Wasatch-1st Source Income Fund Wasatch-Hoisington U.S. Treasury Fund
WASATCH FUNDS
Salt Lake City, Utah
www.WasatchFunds.com
800.551.1700
This material must be accompanied or preceded by a prospectus.
Please read the prospectus carefully before you invest.
Wasatch Funds are distributed by ALPS Distributors, Inc.
1
| | | | |
| LETTERTO SHAREHOLDERS — THEATREOFTHE ABSURD | | |
| |
| | |
| | |
| | |

Samuel S. Stewart, Jr. PhD, CFA President of
Wasatch Funds | | DEAR FELLOW SHAREHOLDERS: I last used Waiting for Godot as an analogy in my “Message to Shareholders” dated January 4, 2013. This 1953 play is by Samuel Beckett, who wrote about characters caught in hopeless situations. Beckett’s brand of existentialist fiction is often referred to as the “Theatre of the Absurd.” My 2013 message said, “Godot, in the form of resolution [referring to whether our economy was going to expand or tip over into recession], will not arrive for a long time, if ever.” Here we are almost four years later, and Godot still hasn’t arrived. Back in 2013, the U.S. Federal Reserve (Fed) had already instituted zero interest rates and had tried three rounds of massive bond purchases in futile attempts to spur economic growth. Despite these monetary experiments, economic growth has actually declined. As if zero interest rates in the U.S. weren’t crazy enough, the Bank of Japan and the European Central Bank have instituted negative interest rates. So hiding cash under the mattress would produce better returns. In Denmark, some homeowners are actually being paid money back on their mortgages via negative interest rates. Talk about a real-life Theatre of the Absurd! |
ECONOMY
In theory, low and negative central-bank rates should encourage economic growth by making business and personal loans cheaper. In reality, the economic consequences have been very different. Many lenders aren’t particularly excited about providing credit because their projected returns are modest due to the interest-rate environment. Prospective borrowers, if they can even qualify for a loan, are tentative because of the lackluster economy.
There’s also another trend going on. With interest rates so low, individuals approaching retirement realize that the returns on their savings will be minimal or nonexistent. As a result, the members of our aging population — who might otherwise have some wealth to spend — have a tendency to save even more. This creates a vicious cycle in which reduced spending leads to even less growth in the economy.
So from the perspective of soon-to-be retirees, we can certainly criticize the actions of the world’s central bankers. Broadly speaking, I think central banks have pushed accommodative monetary policies way too far — which has done more to drive up asset prices (e.g., stocks, bonds and real estate) than to promote economic growth. Others might disagree and might argue that central banks were simply filling a void left by gridlocked politicians. Nevertheless, there’s a more profound question that goes beyond monetary policies: Are we waiting for Godot in the wrong place (i.e., in the U.S. and other developed countries)?
If Godot represents some sort of economic resolution resulting from our monetary policies, perhaps that resolution will never come because developed countries are facing issues that cannot be addressed by such policies. These issues have more to do with populations in developed countries getting older and productivity growth (the rate of change in output per person) declining. Yet our way of thinking about growth remains stuck in the context of the growth stemming from the phenomenal innovations during the previous century.
In his book, The Rise and Fall of American Growth, Robert J. Gordon discusses the massive improvements in our economy and standard of living since the Civil War. Gordon argues that productivity and hence prosperity accelerated due to an unprecedented age of innovation that is “unlikely to be repeated.” The next time you feel impressed by the new capabilities of your latest smartphone, just consider how insignificant these capabilities are compared to changes in the last century such as indoor plumbing, electric lighting, telephones, air travel, phonographs, television, air conditioning, central heating, antibiotics, automobiles and better working conditions. The last century was characterized by the spread of these modern necessities around the world.
Furthermore, the workforce expanded dramatically during the century. More recently, the same productivity improvements that benefited the U.S. took hold in country after country. As a result, billions of new consumers — and producers — participated in the global economy and wealth in developed countries grew. As wealth grew, there was a surprising side effect: Birth rates eventually fell. Falling birth rates have led to aging populations. In some countries like Japan and Russia, populations are not only aging; these populations are actually getting smaller. Even the population of China is projected to decrease within the next 20 years.
Aging populations create economic effects that account for some of the issues facing the world. Most notable is that aging populations tend to save more and spend less. Economist John Maynard Keynes tried to address the problem of excessive savings and inadequate demand. His solution was to supplement private spending with government spending. While the policies advocated by Keynes have proven effective when an economy is experiencing a spending shortfall due to a recession, they have not proven effective when the spending shortfall is due to an aging population. The resulting widespread demand shortfalls and savings surpluses may have become permanent features of our economic landscape. Demand shortfalls translate into slowing economic growth rates.
Developed countries have been trying to deal with slowing growth rates through stimulative monetary policies ever since the global financial crisis ended in 2009. The disappointing results of these policies underscore the intractability of the slow-growth problem.
In developed countries, maybe it’s time to stop waiting for Godot. Instead, perhaps we should be celebrating the more or less full employment that at least the U.S. economy has managed to achieve. Then, our politicians and the broader government could turn their attention to improving the skills of those who lack adequate jobs.
2
| | |
| | SEPTEMBER 30, 2016 (UNAUDITED) |
|
|
|
MARKETS
While the slow-growth economy may have created an environment of less-excessive behavior on the part of businesses and of increased saving by individuals who are approaching retirement, I still feel nervous about some of the speculative forces in the stock and bond markets.
To review 2016 so far, the year began with widespread declines in stock prices. While many analysts attribute those declines to prospective interest-rate increases by the Fed and to fears of China’s slowing economic growth, I believe the main cause was deteriorating creditworthiness among energy companies.
When oil prices later rebounded from their lows, investors became less concerned about the plight of energy companies being shared by other companies, and stock prices began to rise in February. Since then, we’ve had periodic scares in the markets — notably surrounding the Brexit vote — but stock and bond prices have generally been strong.
So what makes me nervous? First, stock and bond valuations are high relative to historical levels. Second, sales and earnings growth may be harder to achieve in the tepid economic environment I expect to see. Third, relative to earlier periods, equity holders in public markets may be compensated differently because many of today’s businesses are less capital-intensive and companies are finding it easier to raise money through private sources. Fourth, market volatility in recent months has been comparatively low, which indicates that investors may be too complacent.
Based on these factors, I continue to expect lower returns than many investors are counting on. I also expect to see periodic “air pockets” in prices — like we saw during January. Therefore, investors may want to keep some cash on hand in order to take advantage of lower prices after air pockets occur. We should also be prepared for the possibility that markets may not rebound as quickly or as strongly as they did earlier this year.
WASATCH
In a world where aging individuals spend less so they can save more for retirement, supposedly pro-growth economic policies by central banks seem to miss the mark. In countries with aging demographics, it could be that little growth will be possible regardless of monetary policies.
While developed countries contend with challenges inherent in aging populations, the demographics of most emerging-market countries look more attractive. We especially like India, which has one of the youngest populations anywhere in the world. And in stark contrast to most developed countries, where productivity growth has fallen, India’s productivity growth has risen.
An interesting anecdote regarding the relative opportunities in emerging markets versus developed markets is the recent announcement that Wal-Mart is pursuing a stake in Flipkart, India’s largest e-commerce company. Apparently, Wal-Mart realizes one of the best ways to grow is to target countries that, relative to the U.S., are much earlier in their demographic and productivity cycles.
With sincere thanks for your continued investment and for your trust,

Sam Stewart
Information in this document regarding market or economic trends, or the factors influencing historical or future performance, reflects the opinions of management as of the date of this document. These statements should not be relied upon for any other purpose. Past performance is no guarantee of future results, and there is no guarantee that the market forecasts discussed will be realized.
CFA® is a trademark owned by CFA Institute.
Wasatch Advisors is the investment advisor to Wasatch Funds.
As of September 30, 2016, the Wasatch Large Cap Value Fund held 4.1% of its net assets and the Wasatch Long/Short Fund held 1.3% of its net assets in Wal-Mart Stores, Inc. No Wasatch Funds were invested in Flipkart, a private company, as of September 30, 2016.
Portfolio holdings are subject to change at any time. References to specific securities should not be construed as recommendations by the Funds or their Advisor. Current and future holdings are subject to risk.
The investment objectives of the Wasatch Large Cap Value Fund are to seek capital appreciation and income. The investment objective of the Wasatch Long/Short Fund is capital appreciation.
Brexit is an abbreviation for “British exit,” which refers to the June 23, 2016 referendum whereby British citizens voted to exit the European Union. The referendum roiled global markets, including currencies, causing the British pound to fall to its lowest level in decades.
Earnings growth is a measure of growth in a company’s net income over a specific period, often one year.
The financial crisis of 2007-09, also known as the global financial crisis (GFC) and 2008 financial crisis, is considered by many economists to have been the worst financial crisis since the Great Depression of the 1930s.
Valuation is the process of determining the current worth of an asset or company.
3
| | |
| WASATCH CORE GROWTH FUND (WGROX / WIGRX) | | SEPTEMBER 30, 2016 (UNAUDITED) |
|
|
|
Management Discussion
The Wasatch Core Growth Fund is managed by a team of Wasatch portfolio managers led by JB Taylor and Paul Lambert.
| | | | |

JB Taylor Lead Portfolio Manager | | 
Paul Lambert Portfolio Manager | | OVERVIEW The Wasatch Core Growth Fund — Investor Class rose 10.69% for the 12-month period ended September 30, 2016. The Fund trailed the 15.47% return of the Russell 2000 Index |
and the 12.12% return of the Russell 2000 Growth Index.
Information-technology (IT) companies were among the Fund’s top gainers for the year. IT and biotechnology are two areas where we see strong potential for sales and earnings growth. Some of our consumer-discretionary holdings were weaker, the reasons for which we describe later in this discussion.
To recap 2016 so far, the calendar year began with large stock-market declines on fears regarding lower oil prices, widening credit spreads, potential interest-rate increases by the U.S. Federal Reserve (Fed) and slowing economic growth in China. These stock-market declines were particularly brutal for growth-oriented companies in general and for biotech companies in particular.
By early February, however, fears subsided and stock prices almost across the board began a rebound that continued throughout the second and third calendar quarters of 2016 — notwithstanding some hiccups along the way. Growth-oriented stocks and biotechs tended to fully participate in the rebound. But for the 12-month period, they generally lagged the broader indices due to their more-significant losses early in 2016.
On September 21st, Fed Chair Janet Yellen confirmed widespread expectations in the financial markets that the Fed wouldn’t immediately raise the federal-funds target rate. Ms. Yellen also expressed optimism regarding labor conditions and overall economic progress in the United States. These signals from the Fed, along with no major shocks in political and business news, helped keep equities on relatively stable footing for the remainder of the period ended September 30, 2016.
DETAILSOFTHE YEAR
We have held Copart, Inc. in the Fund for over 18 years because this provider of auctions for salvaged vehicles has continued to grow and improve its business. Over the past year, Copart has seen growth reaccelerate after working through some tough comparisons and has continued to gain market share. Our long-term commitment was rewarded as the stock was up more than 60%, making Copart the Fund’s top contributor to performance over the past 12 months.
Seattle Genetics, Inc., a biotech company, was also a strong performer for the Fund. In its most-recent reporting
period, the company saw excellent sales growth for its cancer drug ADCETRIS.® But we think the bigger reasons for the stock’s price increase were general optimism regarding biotech stocks after earlier declines to more-attractive valuations and speculation that several companies in the space are takeover targets.
Printing company Cimpress N.V. (better known in its advertisements as Vistaprint), software provider Cornerstone OnDemand, Inc., and waste-disposal company Waste Connections, Inc. were other top contributors for the year.
Among the detractors from performance over the past 12 months were one of our discount airlines and a couple of food and restaurant companies.
Allegiant Travel Co. is a regional air carrier that caters to budget-conscious flyers. Allegiant saw its stock price drop as summer travel levels came in below expectations and larger carriers continued to pursue increased market share through price-cutting. While we believe Allegiant has long-term competitive advantages, its short-term stock performance may depend on energy prices staying at lower levels and on decisions by carriers to be less aggressive in expansion of capacity.
Food and restaurant companies like Zoe’s Kitchen, Inc. and Fiesta Restaurant Group, Inc. experienced falling stock prices largely due to difficult comparisons with previous revenues that had been particularly robust. In addition, there’s been some food-price deflation, which tends to make consumers more price-aware and lowers sales over the short term — although reduced food costs could boost profits over the long term.
OUTLOOK
The economy has had difficulty growing since the financial crisis ended in 2009. While we can’t change the economy’s sluggishness, which we expect to persist based on the demographics of an aging population and lingering debt problems, we can remain focused on our investment discipline. We seek to invest in companies where we can assess the quality of management and evaluate its success by tracking the company’s financial metrics over time.
As always, we’re searching for companies with the potential to grow their sales and earnings at attractive levels for at least the next five years. In the current environment of sub-par economic growth and high stock valuations, we’d be pleased with relatively moderate growth for companies with greater levels of predictability and at least 15% growth (our traditional metric) for companies with lower levels of predictability.
We focus on company fundamentals within the context of industry dynamics — whether those dynamics be making the most of the e-commerce revolution, or bucking the online trend in areas less susceptible to online competition. We believe such an investment approach is the most prudent way to consistently uncover growth opportunities over time and is the path to long-term success.
Thank you for the opportunity to manage your assets.
| Current | and future holdings are subject to risk. |
4
| | |
| WASATCH CORE GROWTH FUND (WGROX / WIGRX) | | SEPTEMBER 30, 2016 (UNAUDITED) |
|
|
|
Portfolio Summary
AVERAGE ANNUAL TOTAL RETURNS
| | | | | | | | | | | | | | | |
| | | 1 YEAR | | 5 YEARS | | 10 YEARS |
Core Growth (WGROX) — Investor | | | | 10.69% | | | | | 15.31% | | | | | 8.20% | |
Core Growth (WIGRX) — Institutional | | | | 10.83% | | | | | 15.40% | | | | | 8.24% | |
Russell 2000® Index | | | | 15.47% | | | | | 15.82% | | | | | 7.07% | |
Russell 2000® Growth Index | | | | 12.12% | | | | | 16.15% | | | | | 8.29% | |
Data shows past performance, which is not indicative of future performance. Current performance may be lower or higher than the performance quoted. To obtain the most recent month-end performance data available, please visit www.WasatchFunds.com. The Advisor may absorb certain Fund expenses, without which total return would have been lower. Investment returns and principal value will fluctuate and shares, when redeemed, may be worth more or less than their original cost.
As of the January 31, 2016 prospectus, the Total Annual Fund Operating Expenses for the Wasatch Core Growth Fund are Investor Class: 1.17% / Institutional Class — Gross: 1.13%, Net: 1.05%. The expense ratio shown elsewhere in this report may be different. Net expenses are based on Fund expenses, net of waivers and reimbursements. See the prospectus for additional information regarding Fund expenses.
Wasatch Funds will deduct a 2.00% redemption proceeds fee on Fund shares held 60 days or less. Performance data does not reflect the deduction of fees, including sales charges, or the taxes you would pay on fund distributions or the redemption of fund shares. Fees and taxes, if reflected, would reduce the performance quoted. Wasatch does not charge any sales fees. For more complete information including charges, risks and expenses, read the prospectus carefully.
Performance for the Institutional Class prior to 1/31/2012 is based on the performance of the Investor Class. Performance of the Fund’s Institutional Class prior to 1/31/2012 uses the actual expenses of the Fund’s Investor Class without any adjustments. For any such period of time, the performance of the Fund’s Institutional Class would have been substantially similar to, yet higher than, the performance of the Fund’s Investor Class, because the shares of both classes are invested in the same portfolio of securities, but the classes bear different expenses.
Investing in small cap funds will be more volatile and loss of principal could be greater than investing in large cap or more diversified funds. Investing in foreign securities, especially in emerging markets, entails special risks, such as currency fluctuations and political uncertainties, which are described in more detail in the prospectus.
TOP 10 EQUITY HOLDINGS*
| | | | |
| Company | | % of Net
Assets | |
| Cornerstone OnDemand, Inc. | | | 3.8% | |
| Cimpress N.V. | | | 3.4% | |
| Copart, Inc. | | | 2.9% | |
| Waste Connections, Inc. (Canada) | | | 2.9% | |
| Tyler Technologies, Inc. | | | 2.7% | |
| | | | |
| Company | | % of Net
Assets | |
| Seattle Genetics, Inc. | | | 2.6% | |
| Credit Acceptance Corp. | | | 2.6% | |
| ICON plc (Ireland) | | | 2.5% | |
| MEDNAX, Inc. | | | 2.5% | |
| Balchem Corp. | | | 2.4% | |
| * | As of September 30, 2016, there were 63 holdings in the Fund. Foreign currency contracts, written options and repurchase agreements, if any, are not included in the number of holdings. Portfolio holdings are subject to change at any time. References to specific securities should not be construed as recommendations by the Funds or their Advisor. Current and future holdings are subject to risk. |
SECTOR BREAKDOWN**
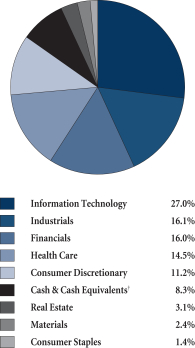
| ** | Excludes securities sold short and options written, if any. |
| † | Also includes Other Assets & Liabilities. |
GROWTHOFA HYPOTHETICAL $10,000 INVESTMENT
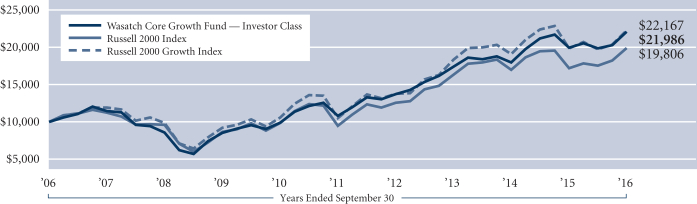
Past performance does not predict future performance. The graph above does not reflect the deduction of fees, sales charges, or taxes that you would pay on fund distributions or the redemption of fund shares. Wasatch does not charge any sales fees. The Russell 2000 Index is an unmanaged total return index of the smallest 2,000 companies in the Russell 3000 Index, as ranked by total market capitalization. The Russell 2000 Index is widely regarded in the industry as accurately capturing the universe of small company stocks. The Russell 2000 Growth Index is an unmanaged total return index that measures the performance of those Russell 2000 Index companies with higher price-to-book ratios and higher forecasted growth values. You cannot invest directly in these or any indices.
5
| | |
| WASATCH EMERGING INDIA FUND (WAINX / WIINX) | | SEPTEMBER 30, 2016 (UNAUDITED) |
|
|
|
Management Discussion
The Wasatch Emerging India Fund is managed by a team of Wasatch portfolio managers led by Ajay Krishnan and Matthew Dreith.
| | | | |

Ajay Krishnan, CFA Lead Portfolio Manager | | 
Matthew Dreith, CFA Associate Portfolio Manager | | OVERVIEW During the 12 months ended September 30, 2016, the Wasatch Emerging India Fund — Investor Class gained 11.98%. The Fund surpassed its bench-
mark, the
MSCI India |
Investable Market Index, which rose 7.50%.
Positive economic data and a resurgence in corporate profits supported Indian equities and reinforced the country’s position as a bright spot in emerging markets. With China’s economy slowing and Russia and Brazil struggling with recession, India’s stellar growth increased its appeal to international investors.
After two years of weak monsoons, the return of normal rains to India spurred optimism that higher farm production would keep food costs and inflation in check. The monsoon affects summer and winter crops and waters over half of India’s farmland.
Slowed by cooling food prices, India’s consumer-price index posted an annual increase of 5.05% in August — down from 6.07% in July and the smallest such rise since March. The dip in inflation gave India’s newly formed monetary-policy committee all the scope it would later need to lower borrowing costs in support of economic growth. A sustained decline in global crude-oil prices has also helped to push down India’s rate of inflation.
DETAILSOFTHE YEAR
The financial and industrial sectors of the market were the Fund’s greatest sources of outperformance relative to the benchmark. The prospect of lower interest rates supported shares of financial companies, while a pickup in economic activity boosted industrial stocks. The Fund’s scant holdings in the poor-performing information-technology and telecommunication-services sectors were another reason it outgained the benchmark by as much as it did.
The Fund’s strongest contributor to performance for the year was Bajaj Finance Ltd. This non-bank financial company is the lending arm of the Bajaj Group — a well-regarded Indian industrial house founded in 1926. Bajaj Finance offers a broad spectrum of lending services that include vehicle loans, mortgage loans and commercial loans. Propelled by favorable earnings reports and increased demand for credit, the company’s shares advanced steadily throughout the period.
MakeMyTrip Ltd. was our second-best contributor. The leading online travel agency (OTA) in India, MakeMyTrip is likely in our view to emerge as the dominant player in a very
large market. Profitability thus far has been elusive, as the company has found itself in a period of intense competition. There are indications, however, that its latest efforts are gaining traction. We see the recent investment by Ctrip, the dominant OTA in China, as another positive sign. We think Ctrip will provide MakeMyTrip with valuable board insight gleaned from China’s similar period of competitive intensity.
Third-largest contributor Quess Corp. Ltd. is an industrials holding added in late June during its initial public offering. Quess is an integrated provider of business services. Formalization of India’s economy is driving increased outsourcing of janitorial services, industrial management, staffing and other services the company offers to its customers.
Concerns about heightened regulatory scrutiny of India’s pharmaceuticals industry impacted several of the Fund’s holdings. These included Lupin Ltd. and Caplin Point Laboratories Ltd. — as well as the Fund’s greatest detractor from performance for the year, Marksans Pharma Ltd. We liquidated the Fund’s investments in all three companies to seek better opportunities elsewhere.
Another weak stock in the Fund was Welspun India Ltd., a global supplier of home-textile products. The company’s share price tumbled in August after U.S. retailer Target severed ties with Welspun, accusing it of having used non-Egyptian cotton in some of its Egyptian-cotton bed sheets. Although the company’s image has suffered, we believe the effects are likely to be temporary.
OUTLOOK
Despite recent technological advances, productivity growth has stagnated in most developed economies. When combined with aging populations in many countries, this often means businesses are competing in industries that are expanding slowly. Such conditions can make for a difficult investment environment.
India, however, is reaping a demographic dividend from its young and growing population. Productivity growth is higher in India, and the Modi government’s business-friendly initiatives offer the prospect of even more rapid improvements. In early August, for example, lawmakers in India’s upper house approved a constitutional amendment to replace the country’s current maze of local tax levies with a national goods-and-services tax (GST). Once fully implemented, the GST is expected to significantly lower the cost of doing business in India, while streamlining administration and enforcement.
With approximately 65% of Indians still living in rural areas, we believe ongoing urbanization holds great potential for expanding India’s middle class. In turn, we expect growing household incomes to continue driving increased demand for consumer goods and services. The result is that domestically oriented Indian companies are likely to find themselves operating in industries that are getting larger. In our experience, such growth industries typically offer attractive opportunities for bottom-up stock picking.
Thank you for the opportunity to manage your assets.
| Current | and future holdings are subject to risk. |
6
| | |
| WASATCH EMERGING INDIA FUND (WAINX / WIINX) | | SEPTEMBER 30, 2016 (UNAUDITED) |
|
|
|
Portfolio Summary
AVERAGE ANNUAL TOTAL RETURNS
| | | | | | | | | | | | | | | |
| | | 1 YEAR | | 5 YEARS | | SINCE INCEPTION
4/26/11 |
Emerging India (WAINX) — Investor | | | | 11.98% | | | | | 13.66% | | | | | 10.69% | |
Emerging India (WIINX) — Institutional | | | | 12.31% | | | | | 13.73% | | | | | 10.75% | |
MSCI India IMI | | | | 7.50% | | | | | 5.79% | | | | | 0.27% | |
Data shows past performance, which is not indicative of future performance. Current performance may be lower or higher than the performance quoted. To obtain the most recent month-end performance data available, please visit www.WasatchFunds.com. The Advisor may absorb certain Fund expenses, without which total return would have been lower. Investment returns and principal value will fluctuate and shares, when redeemed, may be worth more or less than their original cost.
As of the January 31, 2016 prospectus, the Total Annual Fund Operating Expenses for the Wasatch Emerging India Fund are Investor Class — Gross: 1.87%, Net: 1.75% / Institutional Class — Gross: 1.75%, Net: 1.50%. The expense ratio shown elsewhere in this report may be different. Net expenses are based on Fund expenses, net of waivers and reimbursements. See the prospectus for additional information regarding Fund expenses.
Wasatch Funds will deduct a 2.00% redemption proceeds fee on Fund shares held 60 days or less. Performance data does not reflect the deduction of fees, including sales charges, or the taxes you would pay on fund distributions or the redemption of fund shares. Fees and taxes, if reflected, would reduce the performance quoted. Wasatch does not charge any sales fees. For more complete information including charges, risks and expenses, read the prospectus carefully.
Performance for the Institutional Class prior to 2/1/2016 is based on the performance of the Investor Class. Performance of the Fund’s Institutional Class prior to 2/1/2016 uses the actual expenses of the Fund’s Investor Class without any adjustments. For any such period of time, the performance of the Fund’s Institutional Class would have been substantially similar to, yet higher than, the performance of the Fund’s Investor Class, because the shares of both classes are invested in the same portfolio of securities, but the classes bear different expenses.
Investing in small cap funds will be more volatile and loss of principal could be greater than investing in large cap or more diversified funds. Investing in foreign securities, especially in emerging markets, entails special risks, such as unstable currencies, highly volatile securities markets and political and social instability, which are described in more detail in the prospectus.
TOP 10 EQUITY HOLDINGS*
| | | | |
| Company | | % of Net
Assets | |
Bajaj Finance Ltd. (India) | | | 4.6% | |
MakeMyTrip Ltd. (India) | | | 4.1% | |
Dr. Lal PathLabs Ltd. (India) | | | 3.5% | |
Quess Corp. Ltd. (India) | | | 3.2% | |
Berger Paints India Ltd. (India) | | | 3.2% | |
| | | | |
| Company | | % of Net
Assets | |
Natco Pharma Ltd. (India) | | | 2.8% | |
Somany Ceramics Ltd. (India) | | | 2.6% | |
UPL Ltd. (India) | | | 2.6% | |
Pidilite Industries Ltd. (India) | | | 2.6% | |
Manpasand Beverages Ltd. (India) | | | 2.5% | |
| * | As of September 30, 2016, there were 61 holdings in the Fund. Foreign currency contracts, written options and repurchase agreements, if any, are not included in the number of holdings. Portfolio holdings are subject to change at any time. References to specific securities should not be construed as recommendations by the Funds or their Advisor. Current and future holdings are subject to risk. |
SECTOR BREAKDOWN**
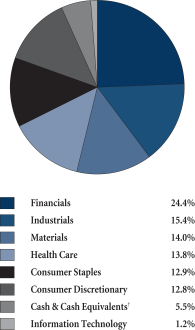
| ** | Excludes securities sold short and options written, if any. |
| † | Also includes Other Assets & Liabilities. |
GROWTHOFA HYPOTHETICAL $10,000 INVESTMENT
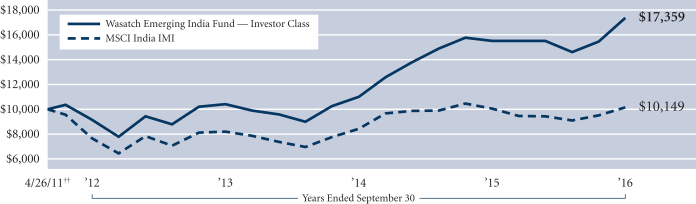
Past performance does not predict future performance. The graph above does not reflect the deduction of fees, sales charges, or taxes that you would pay on fund distributions or the redemption of fund shares. Wasatch does not charge any sales fees. ††Inception: April 26, 2011. The MSCI India IMI (Investable Market Index) is designed to measure the performance of the large-, mid- and small-cap segments of the Indian market. The Index covers approximately 99% of the free-float adjusted market capitalization of the Indian equity universe. You cannot invest directly in this or any index.
7
| | |
| WASATCH EMERGING MARKETS SELECT FUND (WAESX / WIESX) | | SEPTEMBER 30, 2016 (UNAUDITED) |
|
|
|
Management Discussion
The Wasatch Emerging Markets Select Fund is managed by a team of Wasatch portfolio managers led by Ajay Krishnan, Roger Edgley and Scott Thomas.
| | | | |
Ajay Krishnan, CFA Lead Portfolio Manager | | 
Roger Edgley, CFA Portfolio Manager | | 
Scott Thomas, CFA Associate Portfolio
Manager |
OVERVIEW
The Wasatch Emerging Markets Select Fund — Investor Class gained 10.54% in the 12 months ended September 30, 2016. The Fund lagged its benchmark, the MSCI Emerging Markets Index, which rose 16.78%.
The prospect of continued monetary stimulus from central banks in the U.S. and Japan underpinned support for emerging-market equities for most of the year. With interest rates low and growth sluggish in most of the developed world, emerging markets remained among a limited number of options for investors seeking higher returns.
Shares of large companies held in exchange-traded funds (ETFs) and market indices benefited the most as investors sought exposure to emerging markets. Holdings of large exporters, for example, helped the benchmark achieve above-average returns in both Korea and Taiwan. Although the Fund invests in companies of all sizes, its positions in lesser-known and less-widely followed companies hurt performance relative to the benchmark.
Other sources of underperformance for the Fund included India and Mexico, where equity markets were less favorable. While our stocks posted gains ahead of the benchmark in both countries, our overweight allocations to India and Mexico were headwinds for the Fund.
Brazil was the Fund’s best-performing country. Investor sentiment improved significantly after a change in government sparked optimism for the approval of austerity measures needed to fight the country’s ongoing recession.
DETAILSOFTHE YEAR
The Fund’s top contributor to performance was Bajaj Finance Ltd. This non-bank financial company offers a broad spectrum of lending services in India. Propelled by favorable earnings reports and a pickup in loan demand, shares of Bajaj Finance advanced steadily over the period.
MercadoLibre, Inc. was the second-largest contributor. MercadoLibre hosts online-commerce platforms in Latin America. Acceleration in the company’s business pushed its stock price higher. According to the company’s most-recently reported quarter, items sold on MercadoLibre’s platforms were up 44.7% from the year-ago period. With
Latin American e-commerce still in its early stages, we think the company is well-positioned due to increasing online retail penetration throughout the region.
Third-best contributor Raia Drogasil S.A. operates the largest drug-store chain in Brazil. Drug stores were a bright spot in Brazil’s sputtering economy. Shares of Raia Drogasil also benefited from the company’s solid earnings growth and Brazil’s improving investment environment.
The Fund’s greatest detractor from performance was Indian drug maker Lupin Ltd. Concerns about heightened regulatory scrutiny impacted Lupin and other Indian pharmaceutical manufacturers. We later sold the stock when competitive pressures on Lupin also began to increase.
Welspun India Ltd., a global supplier of home-textile products, was the Fund’s second-largest detractor. The company’s share price tumbled in August after U.S. retailer Target severed ties with Welspun, accusing it of having used non-Egyptian cotton in some of its Egyptian-cotton bed sheets. Although the company’s image has suffered, we believe the effects are likely to be temporary.
The Fund’s third-largest detractor was HCL Technologies Ltd. HCL is an Indian information-technology (IT) company providing infrastructure-management services. With increased competition pressuring the profit margins of India’s IT outsourcers, we decided to move on.
OUTLOOK
Despite the sub-par results of equity markets in India, Mexico and the Philippines this year, these countries remain among our favored emerging markets. Rapid household formation in India is creating what we consider to be attractive investment opportunities. Areas of concentration in the Fund include industries tied to India’s transition from joint-family living arrangements to nuclear-family residences.
Although conditions in Mexico were more challenging than we had expected, we think investor sentiment has become too negative. The Mexican peso, like some other emerging-market currencies, now appears undervalued relative to the U.S. dollar. While we continue to monitor the business trends of the companies we own, we believe the fundamentals underlying our Mexican investments remain intact.
In the Philippines, investor confidence was shaken after Philippine president Rodrigo Duterte threatened a “bloody” confrontation with China and publicly insulted U.S. President Barack Obama. The Duterte regime’s brutal crackdown on the illegal-drug trade was an additional source of discomfort for international investors.
We think President Duterte’s remarks are unlikely to derail a Philippine economy in which approximately 70% of output is driven by private consumption. With gross domestic product (GDP) expanding at an annual rate of 7.0% in the second quarter, the Philippines currently boasts the second-fastest growth in Asia. As in India and Mexico, we believe our long horizon and company-focused investment discipline will serve our investors well over time.
Thank you for the opportunity to manage your assets.
| Current | and future holdings are subject to risk. |
8
| | |
| WASATCH EMERGING MARKETS SELECT FUND (WAESX / WIESX) | | SEPTEMBER 30, 2016 (UNAUDITED) |
|
|
|
Portfolio Summary
AVERAGE ANNUAL TOTAL RETURNS
| | | | | | | | | | | | | | | |
| | | 1 YEAR | | 5 YEARS | | SINCE INCEPTION 12/13/12 |
Emerging Markets Select (WAESX) — Investor | | | | 10.54% | | | | | N/A | | | | | -1.98% | |
Emerging Markets Select (WIESX) — Institutional | | | | 10.82% | | | | | N/A | | | | | -1.66% | |
MSCI Emerging Markets Index | | | | 16.78% | | | | | N/A | | | | | -1.24% | |
Data shows past performance, which is not indicative of future performance. Current performance may be lower or higher than the performance quoted. To obtain the most recent month-end performance data available, please visit www.WasatchFunds.com. The Advisor may absorb certain Fund expenses, without which total return would have been lower. Investment returns and principal value will fluctuate and shares, when redeemed, may be worth more or less than their original cost.
As of the January 31, 2016 prospectus, the Total Annual Fund Operating Expenses for the Wasatch Emerging Markets Select Fund are Investor Class — Gross: 1.75%, Net: 1.51% / Institutional Class — Gross: 1.52%, Net: 1.21%. The expense ratio shown elsewhere in this report may be different. Net expenses are based on Fund expenses, net of waivers and reimbursements. See the prospectus for additional information regarding Fund expenses.
Wasatch Funds will deduct a 2.00% redemption proceeds fee on Fund shares held 60 days or less. Performance data does not reflect the deduction of fees, including sales charges, or the taxes you would pay on fund distributions or the redemption of fund shares. Fees and taxes, if reflected, would reduce the performance quoted. Wasatch does not charge any sales fees. For more complete information including charges, risks and expenses, read the prospectus carefully.
Investing in foreign securities, especially in emerging markets, entails special risks, such as currency fluctuations and political uncertainties, which are described in more detail in the prospectus. Investing in small cap funds will be more volatile and loss of principal could be greater than investing in large cap or more diversified funds.
TOP 10 EQUITY HOLDINGS*
| | | | |
| Company | | % of Net
Assets | |
| MercadoLibre, Inc. (Brazil) | | | 5.2% | |
| Bajaj Finance Ltd. (India) | | | 5.1% | |
| Medytox, Inc. (Korea) | | | 4.2% | |
| GT Capital Holdings, Inc. (Philippines) | | | 3.9% | |
| Raia Drogasil S.A. (Brazil) | | | 3.7% | |
| Gentera S.A.B. de C.V. (Mexico) | | | 3.6% | |
| | | | |
| Company | | % of Net
Assets | |
| Grupo Aeroportuario del Pacifico S.A.B. de C.V., Class B (Mexico) | | | 3.5% | |
| Asian Paints Ltd. (India) | | | 3.4% | |
| Promotora y Operadora de Infraestructura S.A.B. de C.V. (Mexico) | | | 3.2% | |
| BGF Retail Co. Ltd. (Korea) | | | 3.1% | |
| * | As of September 30, 2016, there were 38 holdings in the Fund. Foreign currency contracts, written options and repurchase agreements, if any, are not included in the number of holdings. Portfolio holdings are subject to change at any time. References to specific securities should not be construed as recommendations by the Funds or their Advisor. Current and future holdings are subject to risk. |
SECTOR BREAKDOWN**
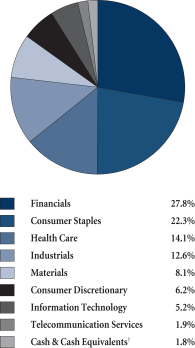
| ** | Excludes securities sold short and options written, if any. |
| † | Also includes Other Assets & Liabilities. |
GROWTHOFA HYPOTHETICAL $10,000 INVESTMENT
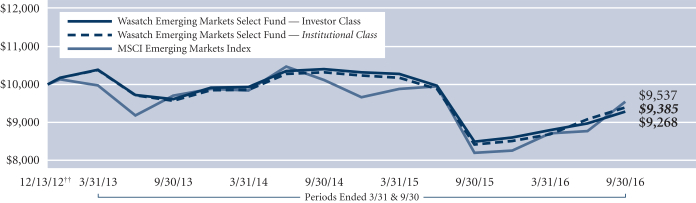
Past performance does not predict future performance. The graph above does not reflect the deduction of fees, sales charges, or taxes that you would pay on fund distributions or the redemption of fund shares. Wasatch does not charge any sales fees. ††Inception: December 13, 2012. The MSCI Emerging Markets Index is a free float-adjusted market capitalization index designed to measure the equity market performance of emerging markets. You cannot invest directly in this or any index.
9
| | |
| WASATCH EMERGING MARKETS SMALL CAP FUND (WAEMX / WIEMX) | | SEPTEMBER 30, 2016 (UNAUDITED) |
|
|
|
Management Discussion
The Wasatch Emerging Markets Small Cap Fund is managed by a team of Wasatch portfolio managers led by Roger Edgley, Andrey Kutuzov and Scott Thomas.
| | | | |
Roger Edgley, CFA Lead Portfolio Manager | | 
Andrey Kutuzov, CFA Associate Portfolio Manager | |
Scott Thomas, CFA Associate Portfolio Manager |
OVERVIEW
The Wasatch Emerging Markets Small Cap Fund — Investor Class gained 11.73% for the 12 months ended September 30, 2016 and lagged the benchmark MSCI Emerging Markets Small Cap Index, which returned 12.65%.
Emerging-market equities bounced back over the past 12 months following a difficult period. Unlike a year ago, China’s slowing economic growth became less of an issue for emerging-market investors. In addition, many emerging-market currencies remained attractively valued relative to the U.S. dollar.
Our structurally overweighted allocation to India and the outperformance of the Fund’s Indian holdings contributed significantly to performance versus the Index during the year. Consistent with a broad pickup in the Indian economy, we have seen improvement in the fundamentals and faster growth for the majority of the Indian companies we follow. The Fund also benefited from the outperformance of our holdings in Brazil, Thailand and Mexico.
China is worth mentioning due to our structurally underweighted position. China was an underperforming market this past year, so the Fund benefited relative to the benchmark from the outperformance of our Chinese stocks and our dramatically underweighted position. Given the challenges we see for investing in China, we feel entirely comfortable with our allocation.
The South Korean government’s decision to allow public and private pension funds to invest in exchange-traded funds favored large-company stocks at the expense of small-company stocks. As a result of this and other developments, Korea was a weak-performing market for the Fund and its small-cap benchmark.
DETAILSOFTHE YEAR
Wasatch has over a decade of experience investing in India, the Fund’s most-heavily weighted country. Indian companies generally have benefited from the Modi government’s new initiatives, which are designed to further the country’s growth and development. In addition, Indian companies often exhibit the quality metrics we favor.
One of the Fund’s largest contributors to performance for the year was Bajaj Finance Ltd. This non-bank financial company offers a broad spectrum of lending services in India, including vehicle loans, mortgage loans, consumer loans and commercial loans. Shares of Bajaj Finance jumped in late July after the company reported a 54% increase in profit after tax compared to the same quarter in 2015.
On the flip side, the Fund’s biggest detractor from performance was Marksans Pharma Ltd. Marksans sells branded and generic drugs in India and internationally, with the United Kingdom (U.K.) accounting for approximately 40% of revenues. Shares of Marksans tumbled in January on news that one of its manufacturing plants had failed an inspection by its U.K. regulator. Our research indicates those deficiencies have been rectified.
Brazil is going through the worst recession on economic record. The recession has not come from some external event but is partially the result of a huge political and corruption mess, occurring when the economy was maturing well into a business cycle. Uncertain and tainted leadership has led to very low levels of confidence in the government, affecting business and consumer spending and investment. Brazil has suffered cuts in gross domestic product (GDP), a depreciating currency and a downgrade to its sovereign debt rating.
We’re impressed by how some of the Brazilian companies in which we’ve invested have navigated this challenging environment. An example is Raia Drogasil S.A., the Fund’s top contributor for the 12-month period. In 2015 — a recession year — the drug-store chain was able to increase its margins, cash flow and investment over the prior year.
Two of the Fund’s biggest detractors for the 12-month period were Korean companies. We sold Interpark Holdings Corp. on deteriorating fundamentals. We continue to hold Hanssem Co. Ltd., a furniture retailer. We think the weakness in Hanssem’s stock was related to investor concerns regarding Korea’s property market and stricter regulations for mortgages.
OUTLOOK
We believe the fundamental case for investing in emerging markets has not changed and remains attractive. Stock valuations are attractive and, despite recent gains against the U.S. dollar, our view is that a number of emerging-market currencies remain undervalued. We believe low energy prices are likely to provide an additional boost to emerging economies like India that are net importers of oil. While we remain cautious toward countries tied to the production of oil and other natural resources, we continue to favor countries such as India, Taiwan, Mexico and the Philippines. Our view toward China remains cautious due to structural concerns.
Thanks to the deep and broad small-cap universe, we’re finding opportunities in a number of emerging markets. We continue to research a rich set of companies we consider to be high quality.
We appreciate your continued support.
| Current | and future holdings are subject to risk. |
10
| | |
| WASATCH EMERGING MARKETS SMALL CAP FUND (WAEMX / WIEMX) | | SEPTEMBER 30, 2016 (UNAUDITED) |
|
|
|
Portfolio Summary
AVERAGE ANNUAL TOTAL RETURNS
| | | | | | | | | | | | | | | |
| | | 1 YEAR | | 5 YEARS | | SINCE INCEPTION 10/1/07 |
Emerging Markets Small Cap (WAEMX) — Investor | | | | 11.73% | | | | | 4.92% | | | | | 3.68% | |
Emerging Markets Small Cap (WIEMX) — Institutional | | | | 11.73% | | | | | 4.92% | | | | | 3.68% | |
MSCI Emerging Markets Small Cap Index | | | | 12.65% | | | | | 4.72% | | | | | 0.37% | |
MSCI Emerging Markets Index | | | | 16.78% | | | | | 3.03% | | | | | -0.79% | |
Data shows past performance, which is not indicative of future performance. Current performance may be lower or higher than the performance quoted. To obtain the most recent month-end performance data available, please visit www.WasatchFunds.com. The Advisor may absorb certain Fund expenses, without which total return would have been lower. Investment returns and principal value will fluctuate and shares, when redeemed, may be worth more or less than their original cost.
As of the January 31, 2016 prospectus, the Total Annual Fund Operating Expenses for the Wasatch Emerging Markets Small Cap Fund are Investor Class: 1.91% / Institutional Class — Gross: 1.82%, Net: 1.80%. The expense ratio shown elsewhere in this report may be different. Net expenses are based on Fund expenses, net of waivers and reimbursements. See the prospectus for additional information regarding Fund expenses.
Wasatch Funds will deduct a 2.00% redemption proceeds fee on Fund shares held 60 days or less. Performance data does not reflect the deduction of fees, including sales charges, or the taxes you would pay on fund distributions or the redemption of fund shares. Fees and taxes, if reflected, would reduce the performance quoted. Wasatch does not charge any sales fees. For more complete information including charges, risks and expenses, read the prospectus carefully.
Performance for the Institutional Class prior to 2/1/2016 is based on the performance of the Investor Class. Performance of the Fund’s Institutional Class prior to 2/1/2016 uses the actual expenses of the Fund’s Investor Class without any adjustments. For any such period of time, the performance of the Fund’s Institutional Class would have been substantially similar to, yet higher than, the performance of the Fund’s Investor Class, because the shares of both classes are invested in the same portfolio of securities, but the classes bear different expenses.
Investing in foreign securities, especially in emerging markets, entails special risks, such as currency fluctuations and political uncertainties, which are described in more detail in the prospectus. Investing in small cap funds will be more volatile and loss of principal could be greater than investing in large cap or more diversified funds.
TOP 10 EQUITY HOLDINGS*
| | | | |
| Company | | % of Net
Assets | |
| Ennoconn Corp. (Taiwan) | | | 2.6% | |
| Poya Co. Ltd. (Taiwan) | | | 2.5% | |
| Raia Drogasil S.A. (Brazil) | | | 2.4% | |
| Clicks Group Ltd. (South Africa) | | | 2.0% | |
| Medytox, Inc. (Korea) | | | 1.9% | |
| Britannia Industries Ltd. (India) | | | 1.9% | |
| | | | |
| Company | | % of Net
Assets | |
| Grupo Aeroportuario del Centro Norte S.A.B. de C.V. (Mexico) | | | 1.9% | |
| Bajaj Finance Ltd. (India) | | | 1.8% | |
| Unifin Financiera SAPI de C.V. SOFOM (Mexico) | | | 1.8% | |
| Security Bank Corp. (Philippines) | | | 1.8% | |
| * | As of September 30, 2016, there were 96 holdings in the Fund. Foreign currency contracts, written options and repurchase agreements, if any, are not included in the number of holdings. Portfolio holdings are subject to change at any time. References to specific securities should not be construed as recommendations by the Funds or their Advisor. Current and future holdings are subject to risk. |
SECTOR BREAKDOWN**
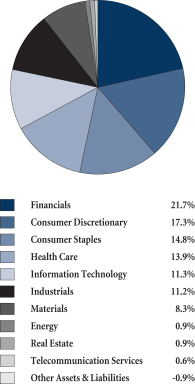
| ** | Excludes securities sold short and options written, if any. |
GROWTHOFA HYPOTHETICAL $10,000 INVESTMENT
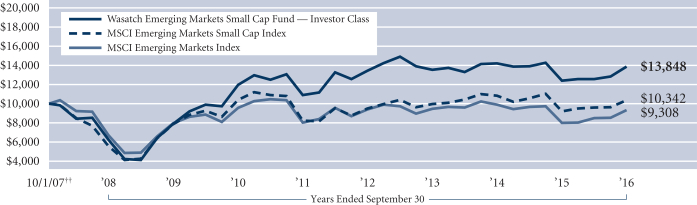
Past performance does not predict future performance. The graph above does not reflect the deduction of fees, sales charges, or taxes that you would pay on fund distributions or the redemption of fund shares. Wasatch does not charge any sales fees. ††Inception: October 1, 2007. The MSCI Emerging Markets and Emerging Markets Small Cap indices are free float-adjusted market capitalization indices designed to measure the equity market performance of emerging markets. You cannot invest directly in these or any indices.
11
| | |
| WASATCH FRONTIER EMERGING SMALL COUNTRIES FUND (WAFMX / WIFMX) | | SEPTEMBER 30, 2016 (UNAUDITED) |
|
|
|
Management Discussion
The Wasatch Frontier Emerging Small Countries Fund is managed by a team of Wasatch portfolio managers led by Roger Edgley, Jared Whatcott and Scott Thomas.
| | | | |
Roger Edgley, CFA Lead Portfolio Manager | | 
Jared Whatcott, CFA Portfolio Manager | |
Scott Thomas, CFA Portfolio Manager |
OVERVIEW
The Wasatch Frontier Emerging Small Countries Fund — Investor Class declined -4.89% for the 12 months ended September 30, 2016. The Fund’s benchmark, the MSCI Frontier Emerging Markets Index, was up 6.80%.
Since the beginning of the 12-month period, emerging markets have seen strong performance, while frontier markets have lagged. There has been significant disparity between the returns of frontier markets like Pakistan and Vietnam and some of the equity markets in Africa. Within frontier markets in general, we are seeing a smaller set of countries with growth and structural characteristics we find attractive.
Like emerging markets, we have seen the case for investing in frontier markets and the Middle East North Africa (MENA) region also become more narrow and specific. A number of countries, including Egypt and Nigeria, have had substantial political and economic challenges, which have severely hurt their equity markets. The Middle East has been hurt by the price of oil, which is significantly off its highs.
DETAILSOFTHE YEAR
The biggest change in frontier markets in the past few years has been the underperformance of Africa. Some of the reasons are structural, like poor export performance with commodity weakness and knock-on currency effects, and some are political. The “Arab Spring” for the MENA region has not translated into more open governments and economies. Instead, it has created more security concerns for countries like Egypt, and these concerns have also hurt currency flows.
Nigeria — the largest country by population and the largest economy in Africa — was especially disappointing, and the Fund was hurt by weakness in the Nigerian currency. Consumer companies in Nigeria struggled during the fiscal year as they saw their import costs rise and as record low oil prices caused the incomes of many households to decline in dollar terms. As a result of this weak macro environment, Nestlé Nigeria plc and Nigerian Breweries plc were the Fund’s two biggest detractors for the year. Nestlé has been active in Nigeria for over half a century. With strong brands and 80% local production of food items, Nestlé has developed a much
better pricing and cost structure than competitors. Even though the recent environment was less than ideal, we have little doubt that the company will be bigger and stronger in the next five to 10 years. Similarly, we think Nigerian Breweries also has a strong growth outlook.
Egypt’s Juhayna Food Industries was the Fund’s third-largest detractor. In addition to the challenging environment for Egyptian companies in general, Juhayna did not live up to our expectations and we have decided to seek better opportunities elsewhere.
Vietnam was the Fund’s top-contributing country over the past 12 months led by Vietnam Dairy Products JSC (Vinamilk), a leading dairy company in Vietnam. With the stock up approximately 70%, Vinamilk contributed the most on a company basis to the Fund’s performance for the year. Along with Vinamilk’s strong brand and distribution network, the company stands out among Vietnamese peers in terms of management caliber and corporate governance.
Pakistan, in our view, is one of the strongest growth markets in our universe and was a big return contributor to the Fund for the 12 months. Pakistani companies have been huge beneficiaries of improved social-economic conditions supported by a burgeoning consumer class. The Fund’s second-best contributing company for the year was Searle Company Ltd., a pharmaceutical manufacturer with leading products in a variety of drug categories, including the number-one cough syrup in the country. Searle has been among the best performers in the Pakistani market, and it wasn’t until our investment team had already discovered the company and met with management in Karachi that the stock was finally covered by sell-side analysts.
OUTLOOK
The story of investing in emerging and frontier markets is ultimately one of innovation, incremental efficiencies, gaining access to markets, and improving corporate governance.
We have been increasing Pakistan’s weight in the Fund, as we see robust conditions for growth and strong earning potential from its corporations with low relative valuations. In addition to Pakistan, we also have been increasing our weights in Argentina, Vietnam, Bangladesh, the Philippines and Colombia. The trends in Latin America have been improving — some of this is commodity and currency related. In contrast, we have been lowering our overall weight in Africa.
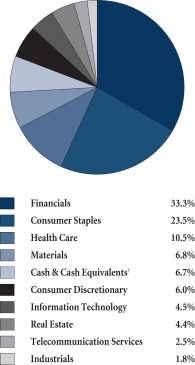
We have been increasing our financials sector weight, notably in the banking industry. We see banks as attractively valued and well-positioned for growth as the economic cycle improves in many countries. On the other hand, the consumer-staples sector has struggled to perform and we have reduced the Fund’s weight.
In conclusion, we see the focused changes we have been making to the Fund as positive and reflective of the opportunities available. The Wasatch research team continues to travel extensively across emerging and frontier markets. We are maintaining the Fund’s focus on companies that we see as high quality with outstanding long-term growth potential.
We very much appreciate your ongoing support.
| Current | and future holdings are subject to risk. |
12
| | |
| WASATCH FRONTIER EMERGING SMALL COUNTRIES FUND (WAFMX / WIFMX) | | SEPTEMBER 30, 2016 (UNAUDITED) |
|
|
|
Portfolio Summary
AVERAGE ANNUAL TOTAL RETURNS
| | | | | | | | | | | | | | | |
| | | 1 YEAR | | 5 YEARS | | SINCE INCEPTION 1/31/12 |
Frontier Emerging Small Countries (WAFMX) — Investor | | | | -4.89% | | | N/A | | | | 6.60% | |
Frontier Emerging Small Countries (WIFMX) — Institutional | | | | -4.53% | | | N/A | | | | 6.69% | |
MSCI Frontier Emerging Markets Index | | | | 6.80% | | | N/A | | | | 3.16% | |
MSCI Frontier Markets Index | | | | 0.91% | | | N/A | | | | 5.39% | |
Data shows past performance, which is not indicative of future performance. Current performance may be lower or higher than the performance quoted. To obtain the most recent month-end performance data available, please visit www.WasatchFunds.com. The Advisor may absorb certain Fund expenses, without which total return would have been lower. Investment returns and principal value will fluctuate and shares, when redeemed, may be worth more or less than their original cost.
As of the January 31, 2016 prospectus, the Total Annual Fund Operating Expenses for the Wasatch Frontier Emerging Small Countries Fund are Investor Class — Gross: 2.28%, Net: 2.25% / Institutional Class — Gross: 2.09%, Net: 2.05%. The expense ratio shown elsewhere in this report may be different. Net expenses are based on Fund expenses, net of waivers and reimbursements. See the prospectus for additional information regarding Fund expenses.
Wasatch Funds will deduct a 2.00% redemption proceeds fee on Fund shares held 60 days or less. Performance data does not reflect the deduction of fees, including sales charges, or the taxes you would pay on fund distributions or the redemption of fund shares. Fees and taxes, if reflected, would reduce the performance quoted. Wasatch does not charge any sales fees. For more complete information including charges, risks and expenses, read the prospectus carefully.
Performance for the Institutional Class prior to 2/1/2016 is based on the performance of the Investor Class. Performance of the Fund’s Institutional Class prior to 2/1/2016 uses the actual expenses of the Fund’s Investor Class without any adjustments. For any such period of time, the performance of the Fund’s Institutional Class would have been substantially similar to, yet higher than, the performance of the Fund’s Investor Class, because the shares of both classes are invested in the same portfolio of securities, but the classes bear different expenses.
Investing in small cap funds will be more volatile and loss of principal could be greater than investing in large cap or more diversified funds. Investing in foreign securities, especially in frontier and emerging markets, entails special risks, such as currency fluctuations and political uncertainties, which are described in more detail in the prospectus.
TOP 10 EQUITY HOLDINGS*
| | | | |
| Company | | % of Net
Assets | |
| Commercial International Bank S.A.E. (Egypt) | | | 4.1% | |
| Vietnam Dairy Products JSC (Vietnam) | | | 3.5% | |
| Ayala Corp. (Philippines) | | | 3.5% | |
| Square Pharmaceuticals Ltd. (Bangladesh) | | | 2.7% | |
| Credicorp Ltd. (Peru) | | | 2.7% | |
| | | | |
| Company | | % of Net
Assets | |
| Safaricom Ltd. (Kenya) | | | 2.4% | |
| Ayala Land, Inc. (Philippines) | | | 2.4% | |
| Habib Bank Ltd. (Pakistan) | | | 2.4% | |
| Lucky Cement Ltd. (Pakistan) | | | 2.3% | |
| FPT Corp. (Vietnam) | | | 2.3% | |
| * | As of September 30, 2016, there were 71 holdings in the Fund. Foreign currency contracts, written options and repurchase agreements, if any, are not included in the number of holdings. Portfolio holdings are subject to change at any time. References to specific securities should not be construed as recommendations by the Funds or their Advisor. Current and future holdings are subject to risk. |
SECTOR BREAKDOWN**
| ** | Excludes securities sold short and options written, if any. |
| † | Also includes Other Assets & Liabilities. |
GROWTHOFA HYPOTHETICAL $10,000 INVESTMENT
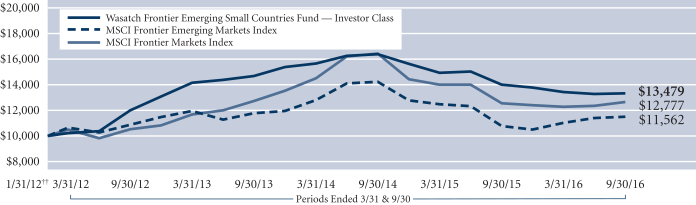
Past performance does not predict future performance. The graph above does not reflect the deduction of fees, sales charges, or taxes that you would pay on fund distributions or the redemption of fund shares. Wasatch does not charge any sales fees. ††Inception: January 31, 2012. The MSCI Frontier Emerging Markets and MSCI Frontier Markets indices are free float-adjusted market capitalization indices designed to measure the equity market performance of the global frontier and emerging markets. You cannot invest directly in these or any indices.
13
| | |
| WASATCH GLOBAL OPPORTUNITIES FUND (WAGOX / WIGOX) | | SEPTEMBER 30, 2016 (UNAUDITED) |
|
|
|
Management Discussion
The Wasatch Global Opportunities Fund is managed by a team of Wasatch portfolio managers led by JB Taylor and Ajay Krishnan.
| | | | |
JB Taylor Lead Portfolio Manager | |
Ajay Krishnan, CFA Lead Portfolio Manager | | OVERVIEW Led by strong contributions from the information-technology, industrials and consumer-discretionary sectors, the Wasatch Global Opportunities Fund — Investor Class
|
gained 13.73% for the 12 months ended September 30, 2016, slightly underperforming the benchmark MSCI All Country (AC) World Small Cap Index, which rose 14.21%. The Fund benefited from stock selection in all three sectors as well as from a large overweighting versus the benchmark in information technology.
On a country basis, Japan and India were two of the leading contributors to Fund performance. Supported by the Bank of Japan’s accommodative monetary policy and our focus on companies with innovative business models, the Fund’s Japanese holdings were major gainers throughout most of the year. That said, we’ve adopted a more-cautious view of the Japanese market going forward.
In India, our holdings have benefited as the country reaps a demographic dividend from its young and expanding population. Indian productivity growth is high, and the Modi government’s business-friendly initiatives offer the prospect of even more rapid improvements.
DETAILSOFTHE YEAR
MercadoLibre, Inc. was the top contributor to Fund performance for the year. This $8.4 billion market-cap company hosts e-commerce platforms in 13 Latin American countries, including Brazil, Argentina and Mexico. As the dominant e-commerce player in Latin America, the company has benefited both from strong regional growth and from the continuing migration of retail sales from brick-and-mortar stores to the online environment.
With the release of a positive earnings report in early September, the Fund’s investment in HealthEquity, Inc. posted a significant gain, adding to the company’s strong performance since January’s market decline. The company reported second-quarter net income of $8.2 million, nearly double that of the year-ago period. HealthEquity is a U.S.-based health-care company that provides an online platform to manage a variety of health-care accounts.
Cornerstone OnDemand, Inc. was another leading contributor to Fund performance. Despite being barely profitable, top-line growth of around 25% and speculation that the company is an acquisition target resulted in strong stock-price performance throughout the year. This U.S.-based company provides a suite of four talent-management SaaS (software-as-a-service) applications to recruit, train,
manage and connect people across an organization. The company has a sizable customer base with recurring revenues, is expanding market share and is developing new products.
Allegiant Travel Co. was the largest detractor from Fund performance for the year as rising oil prices and increasing competition took their toll. Less-than-stellar summer traffic volumes also hurt the company’s financial results. Nevertheless, we think the real driver of Allegiant’s growth prospects is that the airline makes effective use of older planes to serve smaller markets. By promoting low fares to lure travelers, Allegiant keeps those planes relatively full. As the airline continues to add planes and routes, we believe its earnings and stock price will increase over the long term.
Another detractor from Fund performance was Mumbai-based Marksans Pharma Ltd., which manufactures and markets branded prescription and over-the-counter drugs in India and internationally. Following problems with labeling and production delays, we exited our position in the company as we saw more attractive opportunities elsewhere.
The Fund’s investment in PRA Group, Inc. also lost ground during the year. The company purchases, collects and manages defaulted consumer receivables. The stock price declined precipitously from November through February, as revenue and net income fell. Largely based on a string of missed earnings reports, we sold our shares of the stock.
OUTLOOK
For more than a year, our investments in Japan generally outperformed the benchmark’s Japanese allocation and contributed significantly to Fund performance. Although Japan has some systemic problems with an aging population and high debt levels, our investments were especially well-timed. In the past few months, however, as it’s become evident that the government’s efforts to spur economic growth are having little to no effect, we’ve been reducing our allocation.
That raises the question regarding where to initiate new investments and where to increase existing investments. In the wake of the Brexit vote, we’re taking a very cautious approach with respect to further investments in mainland Europe and the United Kingdom (U.K.). We’re currently underweighted relative to the benchmark in mainland Europe, and we see little reason to change. Although we’re slightly more positive on the U.K., we’re moving the composition of the Fund’s portfolio away from domestic companies and toward businesses that are more globally focused.
We’re also looking for additional investments in Australia and emerging markets, especially India. With approximately 65% of Indians still living in rural areas, we believe ongoing urbanization holds great potential for expanding India’s middle class. Increased demand for consumer goods and services should result in domestically oriented Indian companies operating in industries that are getting larger. In our experience, such growth industries typically offer attractive opportunities for bottom-up stock picking.
Thank you for the opportunity to manage your assets.
| | Current and future holdings are subject to risk. |
14
| | |
| WASATCH GLOBAL OPPORTUNITIES FUND (WAGOX / WIGOX) | | SEPTEMBER 30, 2016 (UNAUDITED) |
|
|
|
Portfolio Summary
AVERAGE ANNUAL TOTAL RETURNS
| | | | | | | | | | | | | | | |
| | | 1 YEAR | | 5 YEARS | | SINCE INCEPTION 11/17/08 |
Global Opportunities (WAGOX) — Investor | | | | 13.73% | | | | | 12.33% | | | | | 17.19% | |
Global Opportunities (WIGOX) — Institutional | | | | 13.73% | | | | | 12.33% | | | | | 17.19% | |
MSCI AC World Small Cap Index | | | | 14.21% | | | | | 12.47% | | | | | 15.21% | |
Data shows past performance, which is not indicative of future performance. Current performance may be lower or higher than the performance quoted. To obtain the most recent month-end performance data available, please visit www.WasatchFunds.com. The Advisor may absorb certain Fund expenses, without which total return would have been lower. Investment returns and principal value will fluctuate and shares, when redeemed, may be worth more or less than their original cost.
As of the January 31, 2016 prospectus, the Total Annual Fund Operating Expenses for the Wasatch Global Opportunities Fund are Investor Class: 1.56% / Institutional Class — Gross: 1.46%, Net: 1.35%. The expense ratio shown elsewhere in this report may be different. Net expenses are based on Fund expenses, net of waivers and reimbursements. See the prospectus for additional information regarding Fund expenses.
Wasatch Funds will deduct a 2.00% redemption proceeds fee on Fund shares held 60 days or less. Performance data does not reflect the deduction of fees, including sales charges, or the taxes you would pay on fund distributions or the redemption of fund shares. Fees and taxes, if reflected, would reduce the performance quoted. Wasatch does not charge any sales fees. For more complete information including charges, risks and expenses, read the prospectus carefully.
Performance for the Institutional Class prior to 2/1/2016 is based on the performance of the Investor Class. Performance of the Fund’s Institutional Class prior to 2/1/2016 uses the actual expenses of the Fund’s Investor Class without any adjustments. For any such period of time, the performance of the Fund’s Institutional Class would have been substantially similar to, yet higher than, the performance of the Fund’s Investor Class, because the shares of both classes are invested in the same portfolio of securities, but the classes bear different expenses.
Investing in small and micro cap funds will be more volatile and loss of principal could be greater than investing in large cap or more diversified funds. Investing in foreign securities, especially in emerging markets, entails special risks, such as currency fluctuations and political uncertainties, which are described in more detail in the prospectus.
TOP 10 EQUITY HOLDINGS*
| | | | |
| Company | | % of Net
Assets | |
| Cornerstone OnDemand, Inc. | | | 2.7% | |
| Patrizia Immobilien AG (Germany) | | | 2.7% | |
| Unifin Financiera SAPI de C.V. SOFOM (Mexico) | | | 2.5% | |
| HealthEquity, Inc. | | | 2.4% | |
| Seattle Genetics, Inc. | | | 2.2% | |
| | | | |
| Company | | % of Net
Assets | |
| MercadoLibre, Inc. (Brazil) | | | 2.1% | |
| Sartorius Stedim Biotech (France) | | | 2.1% | |
| Medytox, Inc. (Korea) | | | 2.1% | |
| Ultimate Software Group, Inc. (The) | | | 2.0% | |
| Cavium, Inc. | | | 1.9% | |
| * | As of September 30, 2016, there were 87 holdings in the Fund. Foreign currency contracts, written options and repurchase agreements, if any, are not included in the number of holdings. Portfolio holdings are subject to change at any time. References to specific securities should not be construed as recommendations by the Funds or their Advisor. Current and future holdings are subject to risk. |
SECTOR BREAKDOWN**

| ** | Excludes securities sold short and options written, if any. |
| † | Also includes Other Assets & Liabilities. |
GROWTHOFA HYPOTHETICAL $10,000 INVESTMENT
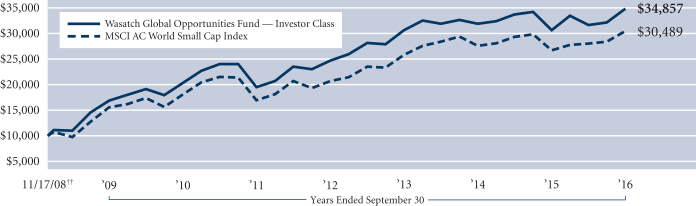
Past performance does not predict future performance. The graph above does not reflect the deduction of fees, sales charges, or taxes that you would pay on fund distributions or the redemption of fund shares. Wasatch does not charge any sales fees. ††Inception: November 17, 2008. The MSCI AC (All Country) World Small Cap Index is a free float-adjusted market capitalization index designed to measure the performance of small capitalization securities in developed and emerging markets. You cannot invest directly in this or any index.
15
| | |
| WASATCH INTERNATIONAL GROWTH FUND (WAIGX / WIIGX) | | SEPTEMBER 30, 2016 (UNAUDITED) |
|
|
|
Management Discussion
The Wasatch International Growth Fund is managed by a team of Wasatch portfolio managers led by Roger Edgley, Ken Applegate, Linda Lasater and Kabir Goyal.
| | | | |
Roger Edgley, CFA Lead Portfolio Manager | | 
Ken Applegate, CFA Portfolio Manager | | OVERVIEW The Wasatch International Growth Fund —
Investor Class gained 12.73%
for the 12
months ended September 30, 2016. The Fund underperformed its benchmark, the MSCI AC World Ex-U.S.A. Small Cap Index, which gained 13.38%. Over the course of the year, global markets were volatile but generally positive (in terms of local currencies), despite uncertainties such as the possible effect of Brexit, |

Linda Lasater, CFA Associate Portfolio Manager | | 
Kabir Goyal, CFA Associate Portfolio Manager | |
the June 23rd referendum whereby the United Kingdom (U.K.) voted to leave the European Union. Central-bank policies around the world remained supportive, acknowledging that the global economic recovery remains fragile. Emerging markets have stabilized, underpinned by positive fund flows and compelling valuations.
DETAILSOFTHE YEAR
The U.K. was a weak-performing market for the year, especially in the run-up to the Brexit vote, although stock prices bounced back in the quarter after the vote. During the 12-month period, the Fund was overweighted in the U.K. and our holdings underperformed the U.K. companies in the benchmark. In the wake of the Brexit vote, we believe the probability of a property-market decline has increased. Housing prices in the U.K. have been elevated for some time, and the uncertainties in the job market following the vote as well as depreciation of the pound may create a tipping point. As such, we have reduced our holdings in U.K. financials, particularly in companies with large exposures to the weak housing market and consumers. Two positions we eliminated were Shawbrook Group plc, a bank that specializes in the buy-to-let market, and OneSavings Bank plc, a company operating in the buy-to-let, residential-mortgage and personal-loans segments. These two former holdings were the largest detractors among our U.K. investments for the year.
The company that detracted the most from the Fund’s performance was KEPCO Plant Service & Engineering Co.
Ltd. We sold our shares in this Korean power plant maintenance service provider when we saw delays in international projects, a key driver of growth for the company, turning into cancellations, a development we think is likely to persist.
Japan and Australia were the Fund’s top-contributing countries for the 12-month period. Australia’s Domino’s Pizza Enterprises Ltd. was the Fund’s largest contributor to performance. The company continued to execute well on the new regions acquired over the last two years. Innovation and technology are driving strong sales and efficiencies for Domino’s. Our second-best contributor was Japan’s Cosmos Pharmaceutical Corp., a concept similar to Walgreens and CVS in the United States. Cosmos offers low-priced prepackaged food, which helps to drive foot traffic, and the company makes a nice margin on add-ons like beauty products (toiletries, cosmetics, etc.) and over-the-counter medicines. The stronger yen allows Cosmos to import goods at a lower price, which is a saving that could be used to improve margins or could be passed on to customers.
Since the beginning of 2016, we have been increasing our weighting in emerging markets given the relatively attractive valuations we have been seeing in our high-quality opportunity set.
OUTLOOK
Our discipline is to research and buy the stocks of companies that we believe are high quality with long-duration growth potential at reasonable prices. This keeps us focused on the companies’ long-term opportunities and the ways they create value for their shareholders. While low-quality or value stocks can do well for short periods of time, companies with strong competitive positions, outstanding business models and good management teams — have the potential to outperform the market.
The small-cap universe is deep and broad and, while conditions are uncertain and volatile, we are finding opportunities across all of our markets. We remain especially positive on emerging markets given relatively more attractive valuations and a rich set of companies we consider to be high quality, particularly in countries like India. Some countries with smaller populations like Australia and those in Scandinavia are also punching above their weight in terms of the number of high-quality companies we have found.
We still believe Japan is an extremely inefficient market. Due to improvements in corporate governance, many Japanese companies are meeting our standards for quality. However, valuations and investors crowding into these high-quality companies have led us to be more cautious.
In the U.K., we made minor adjustments to our positioning, favoring global companies that have the potential to grow regardless of Brexit, and that may even benefit from the weaker currency.
Thank you for the opportunity to manage your assets.
| Current | and future holdings are subject to risk. |
16
| | |
| WASATCH INTERNATIONAL GROWTH FUND (WAIGX / WIIGX) | | SEPTEMBER 30, 2016 (UNAUDITED) |
|
|
|
Portfolio Summary
AVERAGE ANNUAL TOTAL RETURNS
| | | | | | | | | | | | | | | |
| | | 1 YEAR | | 5 YEARS | | 10 YEARS |
International Growth (WAIGX) — Investor | | | | 12.73% | | | | | 13.60% | | | | | 7.56% | |
International Growth (WIIGX) — Institutional | | | | 12.84% | | | | | 13.63% | | | | | 7.57% | |
MSCI AC World Ex-U.S.A. Small Cap Index | | | | 13.38% | | | | | 8.60% | | | | | 4.59% | |
MSCI World Ex-U.S.A. Small Cap Index | | | | 13.50% | | | | | 9.72% | | | | | 4.11% | |
Data shows past performance, which is not indicative of future performance. Current performance may be lower or higher than the performance quoted. To obtain the most recent month-end performance data available, please visit www.WasatchFunds.com. The Advisor may absorb certain Fund expenses, without which total return would have been lower. Investment returns and principal value will fluctuate and shares, when redeemed, may be worth more or less than their original cost.
As of the January 31, 2016 prospectus, the Total Annual Fund Operating Expenses for the Wasatch International Growth Fund are Investor Class: 1.50% / Institutional Class — Gross: 1.37%, Net: 1.35%. The expense ratio shown elsewhere in this report may be different. Net expenses are based on Fund expenses, net of waivers and reimbursements. See the prospectus for additional information regarding Fund expenses.
Wasatch Funds will deduct a 2.00% redemption proceeds fee on Fund shares held 60 days or less. Performance data does not reflect the deduction of fees, including sales charges, or the taxes you would pay on fund distributions or the redemption of fund shares. Fees and taxes, if reflected, would reduce the performance quoted. Wasatch does not charge any sales fees. For more complete information including charges, risks and expenses, read the prospectus carefully.
Performance for the Institutional Class prior to 2/1/2016 is based on the performance of the Investor Class. Performance of the Fund’s Institutional Class prior to 2/1/2016 uses the actual expenses of the Fund’s Investor Class without any adjustments. For any such period of time, the performance of the Fund’s Institutional Class would have been substantially similar to, yet higher than, the performance of the Fund’s Investor Class, because the shares of both classes are invested in the same portfolio of securities, but the classes bear different expenses.
Investing in foreign securities, especially in frontier and emerging markets, entails special risks, such as currency fluctuations and political uncertainties, which are described in more detail in the prospectus. Investing in small cap funds will be more volatile and loss of principal could be greater than investing in large cap or more diversified funds.
TOP 10 EQUITY HOLDINGS*
| | | | |
| Company | | % of Net
Assets | |
| Patrizia Immobilien AG (Germany) | | | 2.9% | |
| Abcam plc (United Kingdom) | | | 2.7% | |
| Domino’s Pizza Enterprises Ltd. (Australia) | | | 2.4% | |
| Sartorius Stedim Biotech (France) | | | 2.4% | |
| Cosmos Pharmaceutical Corp. (Japan) | | | 2.4% | |
| | | | |
| Company | | % of Net
Assets | |
| Seria Co. Ltd. (Japan) | | | 2.4% | |
| Vitasoy International Holdings Ltd. (Hong Kong) | | | 2.3% | |
| Medytox, Inc. (Korea) | | | 2.0% | |
| MISUMI Group, Inc. (Japan) | | | 1.9% | |
| Ipsen S.A. (France) | | | 1.9% | |
| * | As of September 30, 2016, there were 86 holdings in the Fund. Foreign currency contracts, written options and repurchase agreements, if any, are not included in the number of holdings. Portfolio holdings are subject to change at any time. References to specific securities should not be construed as recommendations by the Funds or their Advisor. Current and future holdings are subject to risk. |
SECTOR BREAKDOWN**
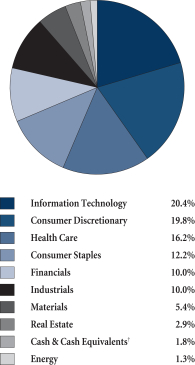
| ** | Excludes securities sold short and options written, if any. |
| †Also | includes Other Assets & Liabilities. |
GROWTHOFA HYPOTHETICAL $10,000 INVESTMENT
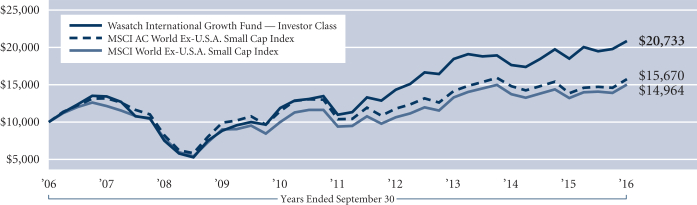
Past performance does not predict future performance. The graph above does not reflect the deduction of fees, sales charges, or taxes that you would pay on fund distributions or the redemption of fund shares. Wasatch does not charge any sales fees. The MSCI AC (All Country) World Ex-U.S.A. Small Cap Index is a free float-adjusted market capitalization index designed to measure the performance of small capitalization securities in developed markets, excluding the United States, and in emerging markets. The MSCI World Ex-U.S.A. Small Cap Index is a free float-adjusted market capitalization index designed to measure the performance of small capitalization securities in developed markets, excluding the United States. You cannot invest directly in these or any indices.
17
| | |
| WASATCH INTERNATIONAL OPPORTUNITIES FUND (WAIOX / WIIOX) | | SEPTEMBER 30, 2016 (UNAUDITED) |
|
|
|
Management Discussion
The Wasatch International Opportunities Fund is managed by a team of Wasatch portfolio managers led by Jared Whatcott and Linda Lasater.
| | | | |
Jared Whatcott, CFA Portfolio Manager | |
Linda Lasater, CFA Portfolio Manager | | OVERVIEW The Wasatch International Opportunities Fund — Investor Class gained 22.73% for the 12 months ended September 30, 2016 and outperformed the MSCI All Country (AC) |
World Ex-U.S.A. Small Cap Index, which gained 13.38%.
DETAILSOFTHE YEAR
Global stocks generally had strong performance over the course of the year, despite a period of weakness surrounding the Brexit vote, whereby British voters approved a referendum in June to leave the European Union. Stocks quickly recovered in the quarter following the Brexit vote and ended the 12-month period on a strong note. China’s gross domestic product (GDP) growth has been better than expected, which eased some concerns on global growth drivers. In addition, the commitment of the world’s central bankers to maintain easy monetary policy and economic-stimulus measures supported both developed- and emerging-market equities. Emerging-market stocks did especially well and, given the Fund’s overweighting in emerging-market equities, the improving momentum was beneficial.
Even with relatively strong performance around the globe, the Fund managed to outperform the Index across developed, emerging and frontier geographies over the past 12 months. Stock-picking in emerging markets was especially helpful to the Fund’s performance. Indonesia, Taiwan and Turkey were the largest contributors to the Fund’s performance in emerging markets.
Among developed markets, Japan and Australia were the Fund’s top-contributing countries. Consumer discretionary was the Fund’s top-contributing sector. Australian online travel company Webjet Ltd. was the clear leader among our consumer-discretionary stocks and was the Fund’s top overall contributor for the year. The company has profited from strong travel momentum aided by a cheaper Australian dollar. Webjet not only reported strong organic growth, but also benefited from signing a deal with a European holiday company, from which it will receive 3,000 hotel contracts.
The information-technology (IT) sector was another area of strength for the Fund, primarily due to the outstanding performance of our Japanese companies, notably Dip Corp. and Gurunavi, Inc. Dip Corp. is an operator of websites focused on part-time and seasonal jobs in Japan. Gurunavi operates a multi-language search-engine platform for restaurants in Japan. Overall, the Fund’s IT names posted a significantly better gain than the benchmark’s IT sector.
Indonesian pharmaceutical company PT Kimia Farma Persero Tbk was the second-best contributor to the Fund’s performance for the year and was a big reason the health-care sector added significantly to the Fund’s return. We expect Kimia Farma to be a major beneficiary of Indonesia’s national health program expansion and the strong subsequent growth in the generic-drug market.
The Fund’s substantially underweighted position in the U.K. helped performance relative to the benchmark for the 12-month period. However, our U.K. stocks underperformed those in the benchmark and detracted from the Fund’s overall return.
The biggest individual detractor from the Fund’s performance for the year was Pepsi Cola Products Philippines, Inc. High sugar costs impacted the company’s margins. In addition, a threatened tax on sugary drinks, which didn’t materialize, spooked some investors. More recently, foreign investors took issue with inflammatory rhetoric from the Philippines’ new president. Despite these outside pressures, we felt encouraged about the company’s momentum after talking to the CFO who said that the new snacks business is taking off, sugar costs are coming down, and the non-carbonated drinks segment is gaining traction.
We sold the Fund’s second-biggest detractor, Wawel S.A., a Polish confectionery manufacturer of mainly chocolates, to seek better opportunities elsewhere. The company’s stock had been struggling in the face of the economic and political headwinds buffeting Eastern Europe, and we didn’t see any significant tailwinds.
OUTLOOK
After years of global integration led by multilateral agreements and advances in technology, the drive toward economic openness has seemingly begun to stall. With cross-border flows of capital and people coming under political fire across much of the developed world, free trade and the global market-oriented system is increasingly at risk. As alarming as some of the rhetoric has been, it remains difficult to predict how these global political trends along with new fiscal measures will interact with central-bank actions going forward.
Fortunately, our investment process at Wasatch doesn’t rely on having to accurately predict the results of these ventures into uncharted macroeconomic and political territories. In fact, our goal is simple, if not daunting: to take a universe of approximately 10,000 stocks from around the world and uncover what we consider to be the highest-quality “World’s Best Growth Companies” — those companies that have the ability to survive and even thrive in the uncertain environments in which they operate.
As we tenaciously travel the globe in search of these rare, small gems — whether in Africa, Europe or Japan (places we visited in the third quarter of 2016) — we are continually impressed with the strong, innovative management teams and great business models just waiting to be discovered among the world’s micro-cap companies. As a result, we can’t help but be optimistic about the future.
Thank you for the opportunity to manage your assets.
| Current | and future holdings are subject to risk. |
18
| | |
| WASATCH INTERNATIONAL OPPORTUNITIES FUND (WAIOX / WIIOX) | | SEPTEMBER 30, 2016 (UNAUDITED) |
|
|
|
Portfolio Summary
AVERAGE ANNUAL TOTAL RETURNS
| | | | | | | | | | | | | | | |
| | | 1 YEAR | | 5 YEARS | | 10 YEARS |
International Opportunities (WAIOX) — Investor | | 22.73% | | 15.02% | | 8.63% |
International Opportunities (WIIOX) — Institutional | | 23.49% | | 15.16% | | 8.70% |
MSCI AC World Ex-U.S.A. Small Cap Index | | 13.38% | | 8.60% | | 4.59% |
MSCI World Ex-U.S.A. Small Cap Index | | 13.50% | | 9.72% | | 4.11% |
Data shows past performance, which is not indicative of future performance. Current performance may be lower or higher than the performance quoted. To obtain the most recent month-end performance data available, please visit www.WasatchFunds.com. The Advisor may absorb certain Fund expenses, without which total return would have been lower. Investment returns and principal value will fluctuate and shares, when redeemed, may be worth more or less than their original cost.
As of the January 31, 2016 prospectus, the Total Annual Fund Operating Expenses for the Wasatch International Opportunities Fund are Investor Class: 2.23% / Institutional Class — Gross: 1.96%, Net: 1.95%. The expense ratio shown elsewhere in this report may be different. Net expenses are based on Fund expenses, net of waivers and reimbursements. See the prospectus for additional information regarding Fund expenses.
Wasatch Funds will deduct a 2.00% redemption proceeds fee on Fund shares held 60 days or less. Performance data does not reflect the deduction of fees, including sales charges, or the taxes you would pay on fund distributions or the redemption of fund shares. Fees and taxes, if reflected, would reduce the performance quoted. Wasatch does not charge any sales fees. For more complete information including charges, risks and expenses, read the prospectus carefully.
Performance for the Institutional Class prior to 2/1/2016 is based on the performance of the Investor Class. Performance of the Fund’s Institutional Class prior to 2/1/2016 uses the actual expenses of the Fund’s Investor Class without any adjustments. For any such period of time, the performance of the Fund’s Institutional Class would have been substantially similar to, yet higher than, the performance of the Fund’s Investor Class, because the shares of both classes are invested in the same portfolio of securities, but the classes bear different expenses.
Investing in foreign securities, especially in frontier and emerging markets, entails special risks, such as currency fluctuations and political uncertainties, which are described in more detail in the prospectus. Investing in micro cap funds will be more volatile and loss of principal could be greater than investing in large cap or more diversified funds.
TOP 10 EQUITY HOLDINGS*
| | | | |
| Company | | % of Net
Assets | |
| Webjet Ltd. (Australia) | | | 2.9% | |
| 7-Eleven Malaysia Holdings Berhad, Class B (Malaysia) | | | 2.4% | |
| Okamoto Industries, Inc. (Japan) | | | 2.4% | |
| Gurunavi, Inc. (Japan) | | | 2.2% | |
| Dip Corp. (Japan) | | | 2.0% | |
| | | | |
| Company | | % of Net
Assets | |
| Collins Foods Ltd. (Australia) | | | 1.7% | |
| Trade Me Group Ltd. (New Zealand) | | | 1.6% | |
| Hu Lane Associate, Inc. (Taiwan) | | | 1.6% | |
| Cloetta AB, Class B (Sweden) | | | 1.4% | |
| Pepsi-Cola Products Philippines, Inc. (Philippines) | | | 1.3% | |
| * | As of September 30, 2016, there were 119 holdings in the Fund. Foreign currency contracts, written options and repurchase agreements, if any, are not included in the number of holdings. Portfolio holdings are subject to change at any time. References to specific securities should not be construed as recommendations by the Funds or their Advisor. Current and future holdings are subject to risk. |
SECTOR BREAKDOWN**
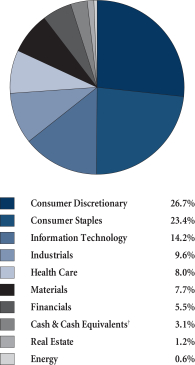
| ** | Excludes securities sold short and options written, if any. |
| † | Also includes Other Assets & Liabilities. |
GROWTHOFA HYPOTHETICAL $10,000 INVESTMENT
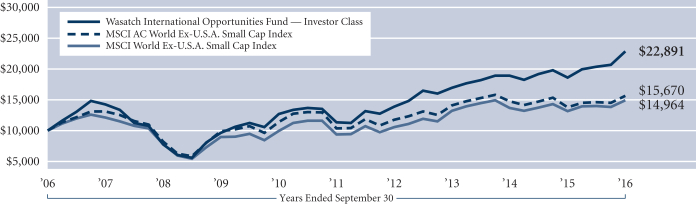
Past performance does not predict future performance. The graph above does not reflect the deduction of fees, sales charges, or taxes that you would pay on fund distributions or the redemption of fund shares. Wasatch does not charge any sales fees. The MSCI AC (All Country) World Ex-U.S.A. Small Cap Index is a free float-adjusted market capitalization index designed to measure the performance of small capitalization securities in developed markets, excluding the United States, and in emerging markets. The MSCI World Ex-U.S.A. Small Cap Index is a free float-adjusted market capitalization index designed to measure the performance of small capitalization securities in developed markets, excluding the United States. You cannot invest directly in these or any indices.
19
| | |
| WASATCH LARGE CAP VALUE FUND (FMIEX / WILCX) | | SEPTEMBER 30, 2016 (UNAUDITED) |
|
|
|
Management Discussion
The Wasatch Large Cap Value Fund is managed by a team of Wasatch portfolio managers led by David Powers.
| | |

David Powers, CFA Lead Portfolio Manager | | OVERVIEW The Wasatch Large Cap Value Fund — Investor Class gained 13.92%, while the benchmark Russell 1000 Value Index returned 16.20% for the 12-months ended September 30, 2016. The period opened with stocks on an upswing, as investors appeared to have digested uncertainties around China’s growth and U.S. Federal Reserve (Fed) policy. Market sentiment continued to benefit from the extraordinary efforts |
on the part of central banks overseas to stimulate growth. The outlook for the U.S. economy was supported by data suggesting that workers were finally poised to experience meaningful growth in wages. Given this backdrop, the Fed’s December move to hike its benchmark short-term rate was widely anticipated and did little to stir the markets.
However, 2016 opened with data showing a contraction in China’s manufacturing sector, leading Chinese stock indices to hit their circuit breakers and dragging down stocks globally. Adding to pressure on risk assets, crude oil prices slid to the $30 a barrel range as January progressed. Equities turned upward in mid-February and eventually more than recovered the ground lost, supported by the ongoing extraordinary efforts on the part of the world’s central banks to promote growth, along with a recovery in the price of oil. In late June, markets were rocked by the surprising outcome of the “Brexit” referendum in the United Kingdom. While the equity markets stabilized after a matter of days, U.S. Treasury rates hovered near historical lows following the ensuing flight to safety.
The Fund’s performance benefited from stock selection within real estate, and to a lesser degree within industrials and consumer staples. Selection within financials and information technology detracted from performance relative to the benchmark.
DETAILSOFTHE YEAR
Leading contributors to the Fund’s performance for the 12 months included EPR Properties, a real estate investment trust (REIT) focused on entertainment-related properties including movie theaters, golf courses, casinos and water parks. Investors were attracted to EPR’s strong, diversified business profile and high dividend in a low interest rate environment.
Within health care, a position in Johnson & Johnson was a standout performer. Johnson & Johnson has internationally diversified business lines that encompass medical devices, pharmaceuticals and consumer products. Results for the pharmaceutical segment have exceeded expectations, and investors also appreciated the company’s AAA credit rating given the uncertain macroeconomic backdrop.
Consumer staples giant Proctor & Gamble Co. saw its share price rise as operating results have improved on stronger sales efforts, the spinning out of lower return
product lines and reinvestment where growth and returns are more attractive.
On the downside, financial services provider Voya Financial, Inc. saw its stock price decline, hurt by the pushed- back expectations for Fed action on interest rates. In addition, the company is viewed as vulnerable to financial market volatility as a result of annuity business it wrote in the mid-2000s that was based on guaranteeing a certain return to retirement investors. We sold our position given the stock’s volatility.
A position in Macy’s, Inc. performed poorly. The strong U.S. dollar has led to reduced international tourist traffic at its flagship Manhattan store. More broadly, Macy’s has been impacted along with other brick-and-mortar retailers from growing e-commerce competition. Like Voya, we sold Macy’s in order to focus on more attractive opportunities.
Shares of Wells Fargo & Co. suffered along with those of the larger banking industry on the outlook for interest rates to stay “lower for longer,” as well as from regulatory scrutiny of the bank’s sales practices.
OUTLOOK
While the U.S. economy continues to show moderate progress, our stance in the Fund has become more cautious overall. With interest rates already at historic lows, the efforts of central banks to stimulate economies are having little, if any, effect. Corporate profits have been falling, even as equity valuations are fairly extended. Market volatility has been low, indicating that investors may have become complacent. Against this backdrop, we have been shifting out of cyclical companies and into more stable areas of the market such as health care, real estate investment trusts (REITs) and consumer staples, while maintaining a focus on relative value.
We have been trimming our financial holdings on strength, even where valuations remain below average by historical measures, on the view that the price-to-earnings multiples awarded the sector may not return to past levels. Of note, in some indices, real estate stocks were recently pulled out of the financials sector and assigned to a new real estate sector under the classification system used to categorize companies within certain equity benchmark indices. This may have the effect over time of supporting REIT valuations as professional investors are confronted with the need to more closely analyze the space.
In broad terms, the Fund continues to have a bias toward larger market capitalization companies that we believe are better positioned to weather shifting sentiment with respect to the global growth outlook. Recently, we have worked to lower the market sensitivity of the Fund, on the view that market upside has become more limited.
We believe the Fund is well-positioned for the longer term, and thank you for your continued investment.
| Current | and future holdings are subject to risk. |
20
| | |
| WASATCH LARGE CAP VALUE FUND (FMIEX / WILCX) | | SEPTEMBER 30, 2016 (UNAUDITED) |
|
|
|
Portfolio Summary
AVERAGE ANNUAL TOTAL RETURNS
| | | | | | | | | | | | | | | |
| | | 1 YEAR | | 5 YEARS | | 10 YEARS |
Large Cap Value (FMIEX) — Investor | | | | 13.92% | | | | | 11.52% | | | | | 5.50% | |
Large Cap Value (WILCX) — Institutional | | | | 13.97% | | | | | 11.63% | | | | | 5.55% | |
Russell 1000® Value Index | | | | 16.20% | | | | | 16.15% | | | | | 5.85% | |
Data shows past performance, which is not indicative of future performance. Current performance may be lower or higher than the performance quoted. To obtain the most recent month-end performance data available, please visit www.WasatchFunds.com. The Advisor may absorb certain Fund expenses, without which total return would have been lower. Investment returns and principal value will fluctuate and shares, when redeemed, may be worth more or less than their original cost.
As of the January 31, 2016 prospectus, the Total Annual Fund Operating Expenses for the Wasatch Large Cap Value Fund are Investor Class — Gross: 1.12%, Net: 1.10% / Institutional Class — Gross: 1.44%, Net: 0.95%. The expense ratio shown elsewhere in this report may be different. Net expenses are based on Fund expenses, net of waivers and reimbursements. See the prospectus for additional information regarding Fund expenses.
Wasatch Funds will deduct a 2.00% redemption proceeds fee on Fund shares held 60 days or less. Performance data does not reflect the deduction of fees, including sales charges, or the taxes you would pay on fund distributions or the redemption of fund shares. Fees and taxes, if reflected, would reduce the performance quoted. Wasatch does not charge any sales fees. For more complete information including charges, risks and expenses, read the prospectus carefully.
Performance for the Institutional Class prior to 1/31/2012 is based on the performance of the Investor Class. Performance of the Fund’s Institutional Class prior to 1/31/2012 uses the actual expenses of the Fund’s Investor Class without any adjustments. For any such period of time, the performance of the Fund’s Institutional Class would have been substantially similar to, yet higher than, the performance of the Fund’s Investor Class, because the shares of both classes are invested in the same portfolio of securities, but the classes bear different expenses.
Investments in value stocks can perform differently from the market as a whole and from other types of stocks and can continue to be undervalued by the market for long periods of time. Loss of principal is a risk of investing.
TOP 10 EQUITY HOLDINGS*
| | | | |
| Company | | % of Net
Assets | |
| Duke Energy Corp. | | | 4.3% | |
| Johnson & Johnson | | | 4.2% | |
| Exelon Corp. | | | 4.2% | |
| Wal-Mart Stores, Inc. | | | 4.1% | |
| Pfizer, Inc. | | | 4.1% | |
| | | | |
| Company | | % of Net
Assets | |
| JPMorgan Chase & Co. | | | 4.1% | |
| Cisco Systems, Inc. | | | 4.1% | |
| Procter & Gamble Co. (The) | | | 4.0% | |
| Citigroup, Inc. | | | 3.9% | |
| General Electric Co. | | | 3.8% | |
| * | As of September 30, 2016, there were 33 holdings in the Fund. Foreign currency contracts, written options and repurchase agreements, if any, are not included in the number of holdings. Portfolio holdings are subject to change at any time. References to specific securities should not be construed as recommendations by the Funds or their Advisor. Current and future holdings are subject to risk. |
SECTOR BREAKDOWN**
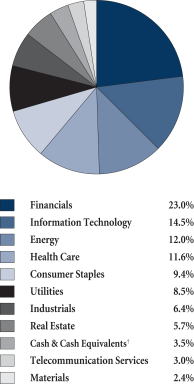
| ** | Excludes securities sold short and options written, if any. |
| † | Also includes Other Assets & Liabilities. |
GROWTHOFA HYPOTHETICAL $10,000 INVESTMENT
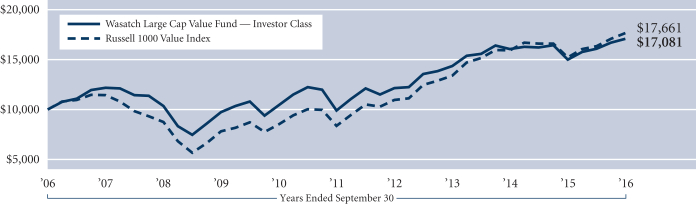
Past performance does not predict future performance. The graph above does not reflect the deduction of fees, sales charges, or taxes that you would pay on fund distributions or the redemption of fund shares. Wasatch does not charge any sales fees. The Russell 1000 Value Index measures the performance of Russell 1000 Index companies with lower price-to-book ratios and lower forecasted growth values. You cannot invest directly in these or any indices.
21
| | |
| WASATCH LONG/SHORT FUND (FMLSX / WILSX) | | SEPTEMBER 30, 2016 (UNAUDITED) |
|
|
|
Management Discussion
The Wasatch Long/Short Fund is managed by a team of Wasatch portfolio managers led by Michael Shinnick and Terry Lally.
| | | | |

Michael Shinnick Lead Portfolio Manager | | 
Terry Lally, CFA Portfolio Manager | | OVERVIEW Stocks opened the period on a positive note, as investors appeared to have digested uncertainties around China’s growth and U.S. Federal Reserve (Fed) policy. In addition, data sug- |
gesting that workers were finally poised to experience meaningful growth in wages supported the outlook for the U.S. economy. Given this backdrop, the Fed’s December move to hike its benchmark short-term rate was widely anticipated and caused little stir in the equity market.
Sentiment shifted dramatically as 2016 opened. Data showing a contraction in China’s manufacturing sector led to a plunge in Chinese stocks that dragged down stocks globally. Adding to pressure on risk assets, crude oil prices slid to the $30 a barrel range as January progressed. Equities turned upward in mid-February and eventually more than recovered the ground lost, supported by the ongoing extraordinary efforts on the part of central banks globally to promote economic growth. In late June, markets were rocked by the United Kingdom’s “Brexit” referendum. While equity markets stabilized after a matter of days, U.S. Treasury rates hovered near historical lows following the ensuing flight to safety.
For the 12 months ended September 30, 2016, the Wasatch Long/Short Fund — Investor Class gained 13.38% versus a 15.43% return for the S&P 500 Index. The long portion of the Fund’s portfolio outperformed the benchmark, led by stock selection within energy and consumer discretionary, while the short side of the portfolio detracted in a rising market.
DETAILSOFTHE YEAR
A number of longstanding energy holdings performed well in the period as prices recovered for both oil and natural gas. These included diversified energy company Unit Corp. and exploration and production firms Denbury Resources, Inc. and Bill Barrett Corp. Several holdings within information technology also performed well, led by consumer electronics icon Apple, Inc. We purchased Apple during the period after the stock had sold off, and quickly made it one of our largest positions. Our optimism was rewarded as the release of an upgraded iPhone was well received, helping to ease concerns that the company’s growth trajectory had stalled. Information-management company Iron Mountain, Inc. also outperformed in the period. The stock has benefited from the company’s 2014 conversion to a real estate investment trust against a backdrop of historically low interest rates.
The Mosaic Co. was the leading detractor on long side. The fertilizer company saw its results negatively impacted by a weakened global outlook for potash demand. We believe Mosaic is attractively valued and positioned to benefit from increased merger and acquisition activity in the materials sector.
A position in Ulta Salon, Cosmetics & Fragrance, Inc. was the leading detractor on the short side. Ulta’s stock price has been the beneficiary of double-digit same-store growth, which we do not believe is sustainable. Shorts in ZELTIQ Aesthetics, Inc. (non-invasive fat reduction) and Inogen, Inc. (oxygen therapy devices), a pair of specialty health-care companies trading at high multiples of earnings, were also notable detractors.
Recent changes in the portfolio included eliminating a long position in footwear retailer DSW, Inc. in anticipation of an earnings disappointment. We took advantage of a take-out bid to sell fuel and convenience retailer CST Brands, Inc. New long positions were initiated in BofI Holding, Inc. and KeyCorp, banks that we believe are positioned to show improving results despite the extended outlook for low interest rates. We also reinitiated a position in agricultural chemical and biotechnology company Monsanto Co. on news of a proposed acquisition by German counterpart Bayer AG.*
Recently added short positions included contract driller Helmerich & Payne, Inc., which we shorted largely as a hedge against our long energy holdings. We also initiated a short in electric car company Tesla Motors, Inc. after reviewing the impact on the company’s financial position of its merger with SolarCity Corp.*
OUTLOOK
We have continued to reduce the Fund’s net exposure to the market due to relatively full equity valuations and signs that U.S. economic growth is becoming more sluggish. In addition, risk conditions as evidenced by the artificially low interest rate environment suggest the potential for a return to heightened market volatility. We are looking to maintain the Fund’s net long position at around 40%. We believe this is a prudent approach in an environment where the risks appear to be greater than the potential rewards.
Our recent move to align the Fund’s sector weightings more closely with those of the benchmark is designed to tighten the focus on stock selection as a driver of performance. We are pleased with the recent performance of the Fund, and believe the market currently comprises a promising opportunity set for our strategy going forward.
Thank you for the opportunity to manage your assets.
| * | As of September 30, 2016, the Wasatch Long/Short Fund was not invested in Bayer AG or SolarCity Corp. |
| | Current and future holdings are subject to risk. |
22
| | |
| WASATCH LONG/SHORT FUND (FMLSX / WILSX) | | SEPTEMBER 30, 2016 (UNAUDITED) |
|
|
|
Portfolio Summary
AVERAGE ANNUAL TOTAL RETURNS
| | | | | | | | | | | | | | | |
| | | 1 YEAR | | 5 YEARS | | 10 YEARS |
Long/Short (FMLSX) — Investor | | | | 13.38% | | | | | 5.19% | | | | | 4.22% | |
Long/Short (WILSX) — Institutional | | | | 13.71% | | | | | 5.32% | | | | | 4.28% | |
S&P 500® Index | | | | 15.43% | | | | | 16.37% | | | | | 7.24% | |
Citigroup U.S. Domestic 3-Month Treasury Bills Index | | | | 0.20% | | | | | 0.08% | | | | | 0.84% | |
Data shows past performance, which is not indicative of future performance. Current performance may be lower or higher than the performance quoted. To obtain the most recent month-end performance data available, please visit www.WasatchFunds.com. The Advisor may absorb certain Fund expenses, without which total return would have been lower. Investment returns and principal value will fluctuate and shares, when redeemed, may be worth more or less than their original cost.
As of the January 31, 2016 prospectus, the Total Annual Fund Operating Expenses for the Wasatch Long/Short Fund are — Investor Class: 1.61% / Institutional Class — Gross: 1.47%, Net: 1.46%. The expense ratio shown elsewhere in this report may be different. Net expenses are based on Fund expenses, net of waivers and reimbursements. Expenses include dividend expense on short sales and interest expense. See the prospectus for additional information regarding Fund expenses.
Wasatch Funds will deduct a 2.00% redemption proceeds fee on Fund shares held 60 days or less. Performance data does not reflect the deduction of fees, including sales charges, or the taxes you would pay on fund distributions or the redemption of fund shares. Fees and taxes, if reflected, would reduce the performance quoted. Wasatch does not charge any sales fees. For more complete information including charges, risks and expenses, read the prospectus carefully.
Performance for the Institutional Class prior to 12/13/2012 is based on the performance of the Investor Class. Performance of the Fund’s Institutional Class prior to 12/13/2012 uses the actual expenses of the Fund’s Investor Class without any adjustments. For any such period of time, the performance of the Fund’s Institutional Class would have been substantially similar to, yet higher than, the performance of the Fund’s Investor Class, because the shares of both classes are invested in the same portfolio of securities, but the classes bear different expenses.
The Fund makes short sales of securities, which involve the risk that losses may exceed the original amount invested. Equity investing involves risks, including potential loss of the principal amount invested.
TOP 10 EQUITY HOLDINGS*
| | | | |
| Company | | % of Net
Assets | |
| Apple, Inc. | | | 4.0% | |
| QUALCOMM, Inc. | | | 3.1% | |
| United Continental Holdings, Inc. | | | 3.0% | |
| Oracle Corp. | | | 2.9% | |
| General Motors Co. | | | 2.9% | |
| | | | |
| Company | | % of Net
Assets | |
| Medtronic plc | | | 2.9% | |
| Michael Kors Holdings Ltd. | | | 2.9% | |
| Citigroup, Inc. | | | 2.8% | |
| Chico’s FAS, Inc. | | | 2.8% | |
| Outfront Media, Inc. | | | 2.8% | |
| * | As of September 30, 2016, there were 39 long and 26 short holdings in the Fund. Foreign currency contracts, written options and repurchase agreements, if any, are not included in the number of holdings. Portfolio holdings are subject to change at any time. References to specific securities should not be construed as recommendations by the Funds or their Advisor. Current and future holdings are subject to risk. |
SECTOR BREAKDOWN**
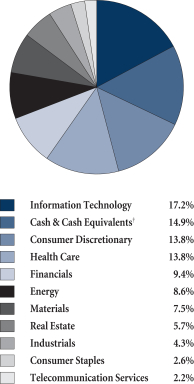
| ** | Excludes securities sold short and options written, if any. |
| † | Also includes Other Assets & Liabilities. |
GROWTHOFA HYPOTHETICAL $10,000 INVESTMENT
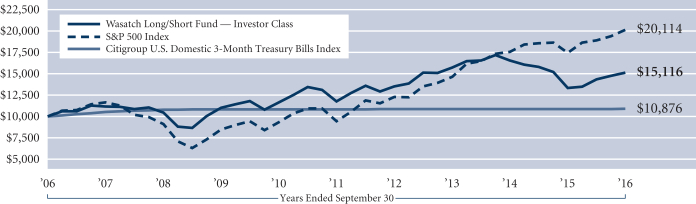
Past performance does not predict future performance. The graph above does not reflect the deduction of fees, sales charges, or taxes that you would pay on fund distributions or the redemption of fund shares. Wasatch does not charge any sales fees. The S&P 500 Index includes 500 of the United States’ largest stocks from a broad variety of industries. The Index is unmanaged and is a commonly used measure of common stock total return performance. The Citigroup U.S. Domestic 3-Month Treasury Bills Index tracks the performance of U.S. Treasury bills with a remaining maturity of three months. U.S. Treasury bills, which are short-term loans to the U.S. government, are full-faith-and-credit obligations of the U.S. Treasury and are generally regarded as being free of any risk of default. You cannot invest directly in these or any indices.
23
| | |
| WASATCH MICRO CAP FUND (WMICX) | | SEPTEMBER 30, 2016 (UNAUDITED) |
|
|
|
Management Discussion
The Wasatch Micro Cap Fund is managed by a team of Wasatch portfolio managers led by Dan Chace.
| | |

Dan Chace, CFA Lead Portfolio Manager | | OVERVIEW In the 12 months ended September 30, 2016, the Wasatch Micro Cap Fund gained 16.04%. The Fund outgained its benchmark, the Russell Microcap Index, which rose 13.47%. Equities advanced for most of the year in an environment in which growth was scarce, valuations rich, and market moves largely driven by broader sentiment. After declining sharply from December through early February, |
stocks quickly regained their lost ground as investor fears evaporated. Investors also appear to have shrugged off June’s Brexit vote in the United Kingdom, presumably with the expectation that the uncertainty it has created will only prolong the highly accommodative monetary policies of the world’s central banks. In late September, the U.S. Federal Reserve’s (Fed’s) decision not to raise interest rates gave further juice to the market.
In the micro-cap equity market especially, we believe it pays to be an active investor rather than to simply own the Index. Indices are often structured with disproportionate exposures to certain sectors in contrast to investment styles such as ours that seek to invest in growth and innovation.
The Wasatch approach served the Fund well during the fiscal year, with outperformance coming mainly from information technology (IT) and financials. While IT has traditionally been a mainstay of the Fund, financials are an area in which the Fund has found itself underweighted. Although banks currently represent approximately 15% of the micro-cap benchmark, the U.S. banking industry is not one that is dynamic and growing. While we do invest in banks that we believe have compelling product strategies and favorable geographic locations, we’ve never been able to find enough of them to get close to the benchmark’s weighting.
DETAILSOFTHE YEAR
The Fund’s strongest contributor to performance for the year was Trupanion, Inc. The company provides medical-insurance plans for cats and dogs. We like Trupanion’s long-run prospects, as pet insurance is very underpenetrated in the U.S. We significantly trimmed the position during the year to maintain our desired weighting for the stock in the Fund.
USA Technologies, Inc. provides cashless systems for vending machines. We first discovered and contacted USA in June 2014 when its market capitalization was $66 million — small even by micro-cap standards. We established and added to the Fund’s position later that year and gradually increased it as we watched how management executed its business plan and furthered our research. Recent conversations with the company and its customers have increased our confidence. The stock was our second-largest contributor to performance for the year.
The third-largest contributor, LGI Homes, Inc., is a homebuilder based in Texas. Since the period of overbuilding prior to the Great Recession, new-home construction has significantly lagged long-term averages. Although construction is recovering, we believe it still has room to expand as long as the U.S. economy stays reasonably healthy. LGI caters to first-time, entry-level home buyers — a segment we consider attractive given today’s low interest rates and the rising cost of renting.
The Fund’s greatest detractor from performance was Papa Murphy’s Holdings, Inc. The company owns, operates and franchises take-and-bake pizza stores. Papa Murphy’s share price tumbled in May after same-store comparable sales fell short of expectations due to distractions from the company’s digital-marketing launch.
Cardiovascular Systems, Inc., our second-largest detractor, is a medical-device company specializing in minimally invasive treatments for vascular diseases. With the company’s shares languishing on slowing sales growth, we liquidated the Fund’s position in Cardiovascular Systems early in the year. Based on our independent research and conversations with the company, we concluded that its sales-force strategy was problematic and a rapid pickup in growth was unlikely.
Another weak stock in the Fund was Welspun India Ltd., a global supplier of home-textile products. The company’s share price fell in August after U.S. retailer Target severed ties with Welspun, accusing it of having used non-Egyptian cotton in some of its Egyptian-cotton bed sheets. Although the company’s image has suffered, we believe the effects are likely to be temporary. In our view, Welspun’s positive attributes continue to make it a worthwhile holding for the Fund.
OUTLOOK
As the past year demonstrated, accommodative monetary policy combined with “good enough” economic and earnings growth can provide a favorable backdrop for U.S. equities — especially micro caps. Looking forward, however, we would not be surprised to see volatility increase and the market give back some of the gains it has made. For our part, we are more focused on business trends at our portfolio companies and continue to be comfortable in the aggregate with the underlying fundamentals of our holdings.
We were pleased by the pickup we observed in micro-cap initial public offerings (IPOs) during the final few weeks of the fiscal year. Prior to that, IPOs had been down significantly from their levels of 2015. Although IPO participation is not a major part of our investment strategy, we think a healthy IPO market is important for a couple of reasons. First, IPOs are needed to replace companies that graduate out of the micro-capitalization asset class. Second, we believe a healthy micro-cap IPO calendar helps to sustain investor interest and create a deeper, more-liquid market for micro-cap equities.
Thank you for the opportunity to manage your assets.
| | Current and future holdings are subject to risk. |
24
| | |
| WASATCH MICRO CAP FUND (WMICX) | | SEPTEMBER 30, 2016 (UNAUDITED) |
|
|
|
Portfolio Summary
AVERAGE ANNUAL TOTAL RETURNS
| | | | | | | | | | | | | | | |
| | | 1 YEAR | | 5 YEARS | | 10 YEARS |
Micro Cap | | | | 16.04% | | | | | 14.74% | | | | | 5.76% | |
Russell Microcap® Index | | | | 13.47% | | | | | 16.37% | | | | | 5.50% | |
Data shows past performance, which is not indicative of future performance. Current performance may be lower or higher than the performance quoted. To obtain the most recent month-end performance data available, please visit www.WasatchFunds.com. The Advisor may absorb certain Fund expenses, without which total return would have been lower. Investment returns and principal value will fluctuate and shares, when redeemed, may be worth more or less than their original cost.
As of the January 31, 2016 prospectus, the Total Annual Fund Operating Expenses for the Wasatch Micro Cap Fund are 1.90%. The expense ratio shown elsewhere in this report may be different. See the prospectus for additional information regarding Fund expenses.
Wasatch Funds will deduct a 2.00% redemption proceeds fee on Fund shares held 60 days or less. Performance data does not reflect the deduction of fees, including sales charges, or the taxes you would pay on fund distributions or the redemption of fund shares. Fees and taxes, if reflected, would reduce the performance quoted. Wasatch does not charge any sales fees. For more complete information including charges, risks and expenses, read the prospectus carefully.
Investing in micro cap funds will be more volatile and loss of principal could be greater than investing in large cap or more diversified funds. Investing in foreign securities, especially in emerging markets, entails special risks, such as currency fluctuations and political uncertainties, which are described in more detail in the prospectus.
TOP 10 EQUITY HOLDINGS*
| | | | |
| Company | | % of Net
Assets | |
LGI Homes, Inc. | | | 2.8% | |
HealthEquity, Inc. | | | 2.7% | |
Superior Uniform Group, Inc. | | | 2.4% | |
MakeMyTrip Ltd. (India) | | | 2.2% | |
CareTrust REIT, Inc. | | | 2.1% | |
| | | | |
| Company | | % of Net
Assets | |
Ensign Group, Inc. (The) | | | 2.0% | |
Tyler Technologies, Inc. | | | 2.0% | |
Installed Building Products, Inc. | | | 2.0% | |
Natco Pharma Ltd. (India) | | | 1.9% | |
Gruh Finance Ltd. (India) | | | 1.9% | |
| * | As of September 30, 2016, there were 93 holdings in the Fund. Foreign currency contracts, written options and repurchase agreements, if any, are not included in the number of holdings. Portfolio holdings are subject to change at any time. References to specific securities should not be construed as recommendations by the Funds or their Advisor. Current and future holdings are subject to risk. |
SECTOR BREAKDOWN**
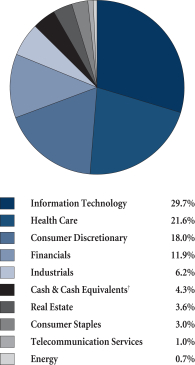
| ** | Excludes securities sold short and options written, if any. |
| † | Also includes Other Assets & Liabilities. |
GROWTHOFA HYPOTHETICAL $10,000 INVESTMENT
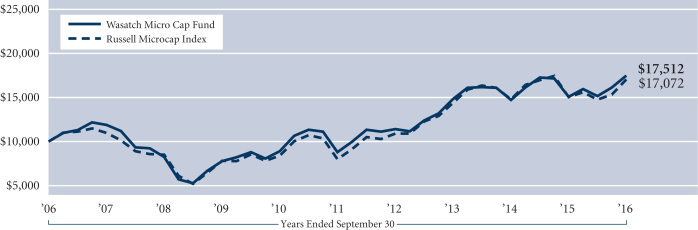
Past performance does not predict future performance. The graph above does not reflect the deduction of fees, sales charges, or taxes that you would pay on fund distributions or the redemption of fund shares. Wasatch does not charge any sales fees. The Russell Microcap Index is an unmanaged total return index of the smallest 1,000 securities in the small-cap Russell 2000 Index along with the next smallest 1,000 companies, based on a ranking of all U.S. equities by market capitalization. The Russell 2000 Index is an unmanaged total return index of the smallest 2,000 companies in the Russell 3000 Index, as ranked by total market capitalization. You cannot invest directly in these or any indices.
25
| | |
| WASATCH MICRO CAP VALUE FUND (WAMVX) | | SEPTEMBER 30, 2016 (UNAUDITED) |
|
|
|
Management Discussion
The Wasatch Micro Cap Value Fund is managed by a team of Wasatch portfolio managers led by Brian Bythrow.
| | |

Brian Bythrow, CFA Lead Portfolio Manager | | OVERVIEW In the 12 months ended September 30, 2016, the Wasatch Micro Cap Value Fund gained 12.04%. The Fund lagged its benchmark, the Russell Microcap Index, which rose 13.47%. Slow economic growth and benign inflation provided a favorable environment for equities for most of the year. According to recent figures from the Commerce Department, real U.S. gross domestic product (GDP) grew at a |
seasonally adjusted annual rate of 1.4% in the second quarter of 2016. While that was up from 0.8% in the first quarter, it indicated an economy performing well below its potential. With growth opportunities scarce and interest rates extremely low, micro-cap stocks remained among the limited options available to investors seeking attractive returns.
Although very slow economic growth typically would not be constructive for stocks, the U.S. Federal Reserve (Fed) has distorted the current situation through its unusually accommodative monetary policy. By holding interest rates near zero and depriving investors of safe yield, the Fed has effectively pushed savers into risky assets such as stocks and bonds. The push has driven price-to-earnings (P/E) multiples and other valuation measures for U.S. equities significantly above their historical norms.
As the market advanced, we applied our discipline of reducing Fund positions in stocks that had risen substantially and reinvesting the proceeds in more-reasonably valued issues. Despite generally higher P/E multiples, we were able to bring down the Fund’s cash position from approximately 14% of assets at the beginning of the period to around 8% by the end of the fiscal year. Even so, the Fund’s cash position was a headwind to performance and was the primary reason the Fund rose less than its benchmark.
DETAILSOFTHE YEAR
The Fund’s strongest contributor to performance for the year was Fabrinet. The company manufactures optical components used to move and store electronic data. The build-out of large data centers for cloud-based computing is driving strong demand for Fabrinet’s products. We expect migration to the cloud to continue benefiting the company for at least the next few years.
Hudson Technologies, Inc. was another top contributor. Hudson is the largest U.S. recycler and processor of the refrigerant chlorodifluoromethane (more commonly known as HCFC-22 or R-22). The company has benefited from a decision by the U.S. Environmental Protection Agency to phase out virgin production of R-22 due to its ozone-depletion potential. In addition, Hudson was awarded a five-year contract with the U.S. Department of Defense for the management and supply of refrigerants, compressed gases and related items.
A company we added to the Fund was Ollie’s Bargain Outlet Holdings, Inc. Through its off-price business model and unique, treasure-hunt shopping experience, Ollie’s seeks to differentiate itself from online retailers and other brick-and-mortar discounters. We believe well-situated operators such as Ollie’s offer attractive growth potential even as competition in the retail industry continues to intensify.
While the Fund’s U.S. holdings significantly outgained the benchmark during the period, our international positions underperformed. This group included a number of equities impacted by the United Kingdom’s (U.K.) vote in June to leave the European Union. Also included was the Fund’s greatest detractor from performance for the year, Marksans Pharma Ltd.
Marksans sells branded and generic drugs in India and internationally, with the U.K. accounting for approximately 40% of revenues. Shares of Marksans tumbled in January on news that one of its manufacturing plants had failed an inspection by its U.K. regulator. Our research indicates those deficiencies have been rectified.
Roadrunner Transportation Systems, Inc., our second-largest detractor, was sold after earnings and revenues at the company fell short of expectations. Roadrunner provides asset-light transportation and logistics services. With low shipping volumes in the road-and-rail industry likely in our view to continue, we decided to move on.
OUTLOOK
The P/E multiple expansion observed in equities during the third calendar quarter of 2016 was especially noteworthy considering the weak economic backdrop. The fact that investors now tend to view economic data primarily in terms of its likely impact on Fed policy — rather than on equity fundamentals — illustrates the extent to which the Fed is distorting financial markets.
Based on statements from Fed officials, it seems clear that the Fed would like to move toward a more-normal interest-rate environment. However, it apparently feels constrained by the weak economy. Thus, every additional piece of soft economic data is cheered by investors and viewed as justification for even higher P/E ratios.
In terms of the threat it poses to corporate profits, the upward pressure on wages that we are beginning to observe is troublesome. With profit margins already very high by historical standards, the simultaneous normalization of profit margins and P/E multiples would be a double-whammy for equities. That is to say, corporate earnings would fall even as those earnings were awarded lower multiples by investors.
Consequently, we believe it’s as important as ever to seek reasonably valued companies with attractive long-term prospects. And with higher interest rates inevitable in our view, we have begun reducing the Fund’s holdings of interest-sensitive securities such as real-estate investment trusts (REITs).
Thank you for the opportunity to manage your assets.
| Current | and future holdings are subject to risk. |
26
| | |
| WASATCH MICRO CAP VALUE FUND (WAMVX) | | SEPTEMBER 30, 2016 (UNAUDITED) |
|
|
|
Portfolio Summary
AVERAGE ANNUAL TOTAL RETURNS
| | | | | | | | | | | | | | | |
| | | 1 YEAR | | 5 YEARS | | 10 YEARS |
Micro Cap Value | | | | 12.04% | | | | | 16.74% | | | | | 8.88% | |
Russell Microcap® Index | | | | 13.47% | | | | | 16.37% | | | | | 5.50% | |
Data shows past performance, which is not indicative of future performance. Current performance may be lower or higher than the performance quoted. To obtain the most recent month-end performance data available, please visit www.WasatchFunds.com. The Advisor may absorb certain Fund expenses, without which total return would have been lower. Investment returns and principal value will fluctuate and shares, when redeemed, may be worth more or less than their original cost.
As of the January 31, 2016 prospectus, the Total Annual Fund Operating Expenses for the Wasatch Micro Cap Value Fund are Gross: 2.09%, Net: 2.03%. The expense ratio shown elsewhere in this report may be different. Expenses include direct expenses paid to the Advisor as well as indirect expenses incurred by the Fund as a result of its investments in other investment companies (each an “Acquired Fund”), before any expense reimbursements by the Advisor. Net expenses are based on Fund expenses, net of waivers and reimbursements. See the prospectus for additional information regarding Fund expenses.
Wasatch Funds will deduct a 2.00% redemption proceeds fee on Fund shares held 60 days or less. Performance data does not reflect the deduction of fees, including sales charges, or the taxes you would pay on fund distributions or the redemption of fund shares. Fees and taxes, if reflected, would reduce the performance quoted. Wasatch does not charge any sales fees. For more complete information including charges, risks and expenses, read the prospectus carefully.
Investing in micro cap funds will be more volatile and loss of principal could be greater than investing in large cap or more diversified funds. Investments in value stocks can perform differently from the market as a whole and from other types of stocks and can continue to be undervalued by the market for long periods of time. Investing in foreign securities, especially in emerging markets, entails special risks, such as currency fluctuations and political uncertainties, which are described in more detail in the prospectus.
TOP 10 EQUITY HOLDINGS*
| | | | |
| Company | | % of Net
Assets | |
| Fabrinet | | | 1.8% | |
| Hudson Technologies, Inc. | | | 1.6% | |
| Tower Semiconductor Ltd. (Israel) | | | 1.6% | |
| BofI Holding, Inc. | | | 1.4% | |
| Tactile Systems Technology, Inc. | | | 1.4% | |
| | | | |
| Company | | % of Net
Assets | |
| Horizon Global Corp. | | | 1.3% | |
| ZAGG, Inc. | | | 1.3% | |
| John Bean Technologies Corp. | | | 1.3% | |
| LGI Homes, Inc. | | | 1.3% | |
| Tucows, Inc., Class A | | | 1.2% | |
| * | As of September 30, 2016, there were 110 holdings in the Fund. Foreign currency contracts, written options and repurchase agreements, if any, are not included in the number of holdings. Portfolio holdings are subject to change at any time. References to specific securities should not be construed as recommendations by the Funds or their Advisor. Current and future holdings are subject to risk. |
SECTOR BREAKDOWN**
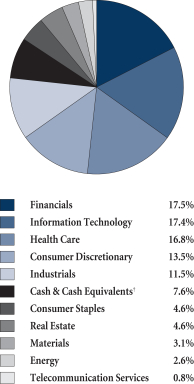
| ** | Excludes securities sold short and options written, if any. |
| † | Also includes Other Assets & Liabilities. |
GROWTHOFA HYPOTHETICAL $10,000 INVESTMENT
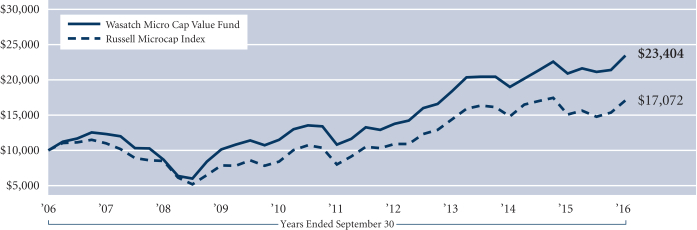
Past performance does not predict future performance. The graph above does not reflect the deduction of fees, sales charges, or taxes that you would pay on fund distributions or the redemption of fund shares. Wasatch does not charge any sales fees. The Russell Microcap Index is an unmanaged total return index of the smallest 1,000 securities in the small-cap Russell 2000 Index along with the next smallest 1,000 companies, based on a ranking of all U.S. equities by market capitalization. The Russell 2000 Index is an unmanaged total return index of the smallest 2,000 companies in the Russell 3000 Index, as ranked by total market capitalization. You cannot invest directly in these or any indices.
27
| | |
| WASATCH SMALL CAP GROWTH FUND (WAAEX / WIAEX) | | SEPTEMBER 30, 2016 (UNAUDITED) |
|
|
|
Management Discussion
The Wasatch Small Cap Growth Fund is managed by a team of Wasatch portfolio managers led by JB Taylor and Jeff Cardon.
| | | | |
JB Taylor Lead Portfolio Manager | | 
Jeff Cardon, CFA Portfolio Manager | | OVERVIEW The Wasatch Small Cap Growth Fund — Investor Class rose 11.87% for the 12-month period ended September 30, 2016, trailing the 12.12% return of the Russell 2000 Growth Index |
and the 15.47% return of the Russell 2000 Index.
Among the Fund’s top contributors for the 12 months were companies in biotech and information technology, two areas with strong potential for sales and earnings growth. Some of our consumer-discretionary holdings and one of our discount airlines were weaker.
The 2016 calendar year commenced with large stock-market declines on fears regarding lower oil prices, widening credit spreads, potential interest-rate increases by the U.S. Federal Reserve (Fed) and slowing economic growth in China. These declines were particularly brutal for growth-oriented companies in general and for biotech companies in particular.
By early February, fears had subsided and stock prices generally began a rebound that continued through the end of September — with some bumps en route. Growth-oriented stocks and biotechs tended to fully participate in the rebound, but they generally lagged the broader indices due to their more-significant losses early in 2016.
On September 21st, Fed Chair Janet Yellen confirmed widespread expectations that the Fed wouldn’t immediately raise the federal-funds target rate. Ms. Yellen also expressed optimism regarding labor conditions and overall economic progress in the United States. The Fed’s signals, along with no major shocks in political and business news, helped keep equities on relatively stable footing as the period ended.
DETAILSOFTHE YEAR
The Fund’s top contributors included newer holdings in high-growth sectors as well as a couple of stalwart holdings that have benefited the Fund for years. Cornerstone OnDemand, Inc., a provider of employee career management software, was the top contributor. The company has reined in costs and focused on more profitable sales, with dramatic impact on operating results.
Seattle Genetics, Inc., a biotech company, was also a strong performer. In its most-recent reporting period, the company saw excellent sales growth for its cancer drug. But we think the bigger reasons for the stock’s price increase in the latest quarter were general optimism regarding biotech stocks and speculation that several biotech companies are takeover targets.
Trucking leader Knight Transportation, Inc. and vehicle-auction company Copart, Inc. have been held in the Fund for
18 and 16 years, respectively, because we consider them to be high-quality companies that continue to find ways to grow. Both companies were top contributors during the period.
Allegiant Travel Co., a regional air carrier catering to budget-conscious flyers, saw its stock price drop as summer travel was below expectations and larger carriers sought increased market share through price-cutting. While we believe Allegiant has long-term competitive advantages, short-term stock performance may depend more on energy prices staying at lower levels and on less-aggressive capacity expansion by other carriers.
Food and restaurant companies like Papa Murphy’s Holdings, Inc., The Chefs’ Warehouse, Inc. and Zoe’s Kitchen, Inc. experienced falling stock prices largely due to difficult comparisons with previous revenues that had been particularly robust. In addition, there’s been some food-price deflation, which tends to make consumers more price-aware and lowers sales over the short term — although reduced food costs could boost profits over the long term. In the case of Papa Murphy’s, the take-and-bake pizza chain struggled through the launch of an online order platform, which hurt short-term results.
OUTLOOK
We’ve explored the reasons why high-growth consumer-discretionary companies have become harder to find in recent years. But that trend has also occurred to varying degrees in other sectors due to the tepid economic growth since the financial crisis ended in 2009.
While we can’t change the economy’s sluggishness, which we expect to persist based on the demographics of an aging population and lingering debt problems, we can remain focused on our investment discipline. Our research assesses the quality of management and evaluates its success by tracking the company’s financial metrics over time.
Our careful, company-specific approach contrasts with other approaches like momentum and factor-based investment strategies and strategies that attempt to correctly time cyclical macro themes such as commodity-price changes. A clear danger with these other approaches is relying too heavily on some characteristic — whether low volatility, high dividends or high price momentum — thereby risking losses when the characteristic falls out of favor among investors.
As always, we’re searching for companies with the potential to grow sales and earnings at attractive levels for at least the next five years. In the current environment of sub-par economic growth and high stock valuations, we’d like to see our more-stable growth companies produce relatively moderate growth and our less-predictable growers achieve at least 15% growth (our traditional metric).
As we search for outstanding investments, we focus on company fundamentals within the context of industry dynamics — whether those dynamics be making the most of the e-commerce revolution, or bucking the online trend in areas less susceptible to online competition. We believe our investment approach can consistently uncover growth opportunities and is the path to long-term success.
Thank you for the opportunity to manage your assets.
| Current | and future holdings are subject to risk. |
28
| | |
| WASATCH SMALL CAP GROWTH FUND (WAAEX / WIAEX) | | SEPTEMBER 30, 2016 (UNAUDITED) |
|
|
|
Portfolio Summary
AVERAGE ANNUAL TOTAL RETURNS
| | | | | | | | | | | | | | | |
| | | 1 YEAR | | 5 YEARS | | 10 YEARS |
Small Cap Growth (WAAEX) — Investor | | | | 11.87% | | | | | 12.99% | | | | | 7.95% | |
Small Cap Growth (WIAEX) — Institutional | | | | 12.02% | | | | | 13.02% | | | | | 7.97% | |
Russell 2000® Growth Index | | | | 12.12% | | | | | 16.15% | | | | | 8.29% | |
Russell 2000® Index | | | | 15.47% | | | | | 15.82% | | | | | 7.07% | |
Data shows past performance, which is not indicative of future performance. Current performance may be lower or higher than the performance quoted. To obtain the most recent month-end performance data available, please visit www.WasatchFunds.com. The Advisor may absorb certain Fund expenses, without which total return would have been lower. Investment returns and principal value will fluctuate and shares, when redeemed, may be worth more or less than their original cost.
As of the January 31, 2016 prospectus, the Total Annual Fund Operating Expenses for the Wasatch Small Cap Growth Fund are Investor Class: 1.22% / Institutional Class — Gross: 1.09%, Net: 1.05%. The expense ratio shown elsewhere in this report may be different. Net expenses are based on Fund expenses, net of waivers and reimbursements. See the prospectus for additional information regarding Fund expenses.
Wasatch Funds will deduct a 2.00% redemption proceeds fee on Fund shares held 60 days or less. Performance data does not reflect the deduction of fees, including sales charges, or the taxes you would pay on fund distributions or the redemption of fund shares. Fees and taxes, if reflected, would reduce the performance quoted. Wasatch does not charge any sales fees. For more complete information including charges, risks and expenses, read the prospectus carefully.
Performance for the Institutional Class prior to 2/1/2016 is based on the performance of the Investor Class. Performance of the Fund’s Institutional Class prior to 2/1/2016 uses the actual expenses of the Fund’s Investor Class without any adjustments. For any such period of time, the performance of the Fund’s Institutional Class would have been substantially similar to, yet higher than, the performance of the Fund’s Investor Class, because the shares of both classes are invested in the same portfolio of securities, but the classes bear different expenses.
Investing in small cap funds will be more volatile and loss of principal could be greater than investing in large cap or more diversified funds. Investing in foreign securities, especially in emerging markets, entails special risks, such as currency fluctuations and political uncertainties, which are described in more detail in the prospectus.
TOP 10 EQUITY HOLDINGS*
| | | | |
| Company | | % of Net
Assets | |
| Cornerstone OnDemand, Inc. | | | 4.7% | |
| Ultimate Software Group, Inc. (The) | | | 4.4% | |
| Knight Transportation, Inc. | | | 4.1% | |
| Copart, Inc. | | | 2.9% | |
| Seattle Genetics, Inc. | | | 2.9% | |
| | | | |
| Company | | % of Net
Assets | |
| ICON plc (Ireland) | | | 2.4% | |
| Cavium, Inc. | | | 2.3% | |
| MakeMyTrip Ltd. (India) | | | 2.2% | |
| Zendesk, Inc. | | | 2.1% | |
| Spirit Airlines, Inc. | | | 2.1% | |
| * | As of September 30, 2016, there were 101 holdings in the Fund. Foreign currency contracts, written options and repurchase agreements, if any, are not included in the number of holdings. Portfolio holdings are subject to change at any time. References to specific securities should not be construed as recommendations by the Funds or their Advisor. Current and future holdings are subject to risk. |
SECTOR BREAKDOWN**
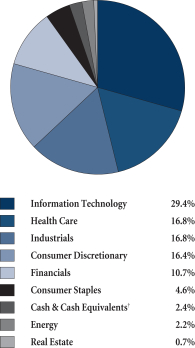
| ** | Excludes securities sold short and options written, if any. |
| † | Also includes Other Assets & Liabilities. |
GROWTHOFA HYPOTHETICAL $10,000 INVESTMENT
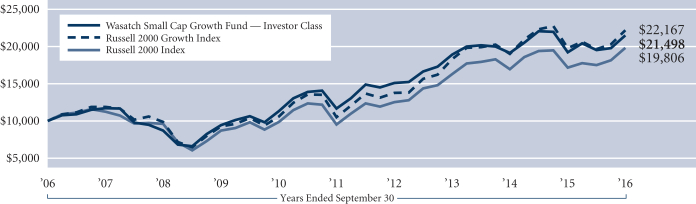
Past performance does not predict future performance. The graph above does not reflect the deduction of fees, sales charges, or taxes that you would pay on fund distributions or the redemption of fund shares. Wasatch does not charge any sales fees. The Russell 2000 Growth Index is an unmanaged total return index that measures the performance of those Russell 2000 Index companies with higher price-to-book ratios and higher forecasted growth values. The Russell 2000 Index is an unmanaged total return index of the smallest 2,000 companies in the Russell 3000 Index, as ranked by total market capitalization. The Russell 2000 Index is widely regarded in the industry as accurately capturing the universe of small company stocks. You cannot invest directly in these or any indices.
29
| | |
| WASATCH SMALL CAP VALUE FUND (WMCVX / WICVX) | | SEPTEMBER 30, 2016 (UNAUDITED) |
|
|
|
Management Discussion
The Wasatch Small Cap Value Fund is managed by a team of Wasatch portfolio managers led by Jim Larkins.
| | |

Jim Larkins Lead Portfolio Manager | | OVERVIEW Domestic small-cap value stocks generated a return of 18.81% for the 12-month reporting period, as gauged by the Fund’s benchmark, the Russell 2000 Value Index. The Wasatch Small Cap Value Fund — Investor Class returned 13.37%. Although the Fund’s relative performance can shift on a year-to-year basis, we think our focus on best-in-breed, undervalued companies forms a solid |
foundation for longer-term results. We believe this is evident in the Fund’s outperformance of the Index over the five-year, 10-year and since-inception periods ended September 30, 2016.
DETAILSOFTHE YEAR
A small group of underperforming stocks accounted for the majority of the Fund’s shortfall relative to its benchmark over the past 12 months. Foremost among these was Skechers U.S.A., Inc., a longtime holding that was adversely affected by increasing competition and fashion trends moving away from the type of footwear the company offers. We reduced the size of our position, and we were monitoring the company’s fundamentals closely as of the end of the period. Intrepid Potash, Inc., a fertilizer producer that struggled with slowing demand and rising inventories, and Kirkland’s, Inc., a home-décor retailer that reported weaker-than-expected sales, also detracted from performance. We sold the stocks of both companies.
If an investment idea doesn’t come to fruition — as was the case with these companies — we put our experience to work to determine if we should hold on to a position, or whether it is in fact a “value trap” (an undervalued stock that continues to weaken due to deteriorating fundamentals). Increasing competition, rising financial leverage, and increased default risk are important reasons for eliminating a position — even if the stock is “cheaper” than when we bought it. In addition, we will sell a stock any time we see that an anticipated catalyst has failed to emerge.
This process informed our decision to reduce the weighting in Skechers and sell Intrepid Potash and Kirkland’s. However, we also exercise discipline in the sense that we will maintain — or add to — an investment if we believe the fundamental story is intact. This was the case with Allegiant Travel Co. The discount airline’s stock price declined on concerns that lower fuel prices would lead to rising industry competition. On a longer-term basis, we think Allegiant can continue to take market share on the strength of a cost structure that is significantly lower than the larger airlines. This allows the company to serve markets where the larger carriers have chosen not to operate, which we believe is a distinct competitive advantage.
Our investment process also includes an emphasis on “Fallen Angels” — growth companies that temporarily fall
into value territory due to short-term factors. The information-technology sector, where volatility is common, often provides us with successful Fallen Angel investments, as it did over the past 12 months. For instance, we established a position in the call-center software provider Interactive Intelligence Group, Inc. in early 2016 when the company’s transition to a greater focus on cloud computing created confusion among investors. Wasatch’s growth analysts knew the company well and their insight gave us the confidence to buy the stock at attractive levels in early 2016, a decision that paid off when the company ultimately received a buyout offer in July. Fabrinet, which we originally purchased as a Fallen Angel in early 2011, also produced a strong gain. As a maker of optical components, Fabrinet has capitalized on the build-out of global bandwidth, leading to a significant rally in its stock price. Fabrinet finished the year as the top contributor to Fund performance.
Ebix, Inc., a provider of software and e-commerce solutions to the insurance industry, is another Fallen Angel stock that added value during the period. We previously owned Ebix and we used our institutional knowledge to reinvest when we felt Ebix’s stock had been unjustly oversold in mid-2013. Since that purchase, Ebix has been one of our most rewarding investments. Outside of technology, Exact Sciences Corp. — developer of a non-invasive test for colon cancer — is another example of a successful investment in an undervalued growth stock. After conducting extensive research on the company for years, we established a position after the stock sold off early in 2016. Exact Sciences’ test was recently recommended for reimbursement by major insurance groups and the stock was rewarded.
OUTLOOK
We believe a degree of caution is warranted at this stage given our view that stock valuations have become stretched. High valuations alone are not enough to spark a downturn in equities, of course, but they do increase the potential risks in the event of unexpected, adverse headlines. We therefore adopted a more defensive posture in the latter part of the period, highlighted by our decision to maintain an above-average weighting in cash. In addition to its ability to cushion the downside, cash provides us with greater latitude to buy shares of companies at attractive prices in periods of market stress. Our discipline of letting stocks trade down to our target prices before investing has added value to the Fund over time, and we believe it remains a prudent way to manage our shareholders’ capital through shifting market environments.
Thank you for the opportunity to manage your assets.
| Current | and future holdings are subject to risk. |
30
| | |
| WASATCH SMALL CAP VALUE FUND (WMCVX / WICVX) | | SEPTEMBER 30, 2016 (UNAUDITED) |
|
|
|
Portfolio Summary
AVERAGE ANNUAL TOTAL RETURNS
| | | | | | | | | | | | | | | |
| | | 1 YEAR | | 5 YEARS | | 10 YEARS |
Small Cap Value (WMCVX) — Investor | | | | 13.37% | | | | | 16.32% | | | | | 7.01% | |
Small Cap Value (WICVX) — Institutional | | | | 13.54% | | | | | 16.47% | | | | | 7.08% | |
Russell 2000® Value Index | | | | 18.81% | | | | | 15.45% | | | | | 5.78% | |
Russell 2000® Index | | | | 15.47% | | | | | 15.82% | | | | | 7.07% | |
Data shows past performance, which is not indicative of future performance. Current performance may be lower or higher than the performance quoted. To obtain the most recent month-end performance data available, please visit www.WasatchFunds.com. The Advisor may absorb certain Fund expenses, without which total return would have been lower. Investment returns and principal value will fluctuate and shares, when redeemed, may be worth more or less than their original cost.
As of the January 31, 2016 prospectus, the Total Annual Fund Operating Expenses for the Wasatch Small Cap Value Fund are Investor Class: 1.21% / Institutional Class — Gross: 1.20%, Net: 1.05%. The expense ratio shown elsewhere in this report may be different. Net expenses are based on Fund expenses, net of waivers and reimbursements. See the prospectus for additional information regarding Fund expenses.
Wasatch Funds will deduct a 2.00% redemption proceeds fee on Fund shares held 60 days or less. Performance data does not reflect the deduction of fees, including sales charges, or the taxes you would pay on fund distributions or the redemption of fund shares. Fees and taxes, if reflected, would reduce the performance quoted. Wasatch does not charge any sales fees. For more complete information including charges, risks and expenses, read the prospectus carefully.
Performance for the Institutional Class prior to 1/31/2012 is based on the performance of the Investor Class. Performance of the Fund’s Institutional Class prior to 1/31/2012 uses the actual expenses of the Fund’s Investor Class without any adjustments. For any such period of time, the performance of the Fund’s Institutional Class would have been substantially similar to, yet higher than, the performance of the Fund’s Investor Class, because the shares of both classes are invested in the same portfolio of securities, but the classes bear different expenses.
Investing in small cap funds will be more volatile and loss of principal could be greater than investing in large cap or more diversified funds. Investments in value stocks can perform differently from the market as a whole and from other types of stocks and can continue to be undervalued by the market for long periods of time. Investing in foreign securities, especially in emerging markets, entails special risks, such as currency fluctuations and political uncertainties, which are described in more detail in the prospectus.
TOP 10 EQUITY HOLDINGS*
| | | | |
| Company | | % of Net
Assets | |
| Ensign Group, Inc. (The) | | | 3.1% | |
| LGI Homes, Inc. | | | 3.0% | |
| Tower Semiconductor Ltd. (Israel) | | | 2.9% | |
| Arbor Realty Trust, Inc. | | | 2.7% | |
| Fabrinet | | | 2.5% | |
| | | | |
| Company | | % of Net
Assets | |
| HEICO Corp., Class A | | | 2.5% | |
| Ebix, Inc. | | | 2.5% | |
| CareTrust REIT, Inc. | | | 2.4% | |
| Customers Bancorp, Inc. | | | 2.4% | |
| Solar Capital Ltd. | | | 2.2% | |
| *As | of September 30, 2016, there were 63 holdings in the Fund. Foreign currency contracts, written options and repurchase agreements, if any, are not included in the number of holdings. Portfolio holdings are subject to change at any time. References to specific securities should not be construed as recommendations by the Funds or their Advisor. Current and future holdings are subject to risk. |
SECTOR BREAKDOWN**
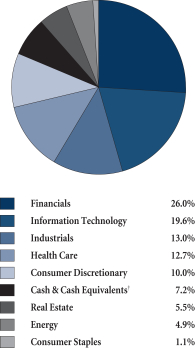
| ** | Excludes securities sold short and options written, if any. |
| † | Also includes Other Assets & Liabilities. |
GROWTHOFA HYPOTHETICAL $10,000 INVESTMENT
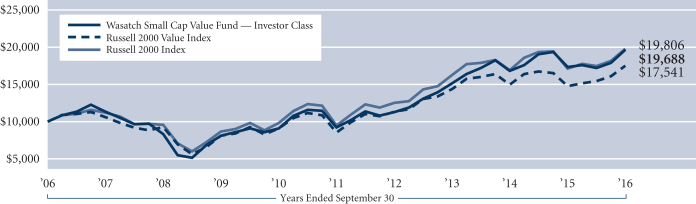
Past performance does not predict future performance. The graph above does not reflect the deduction of fees, sales charges, or taxes that you would pay on fund distributions or the redemption of fund shares. Wasatch does not charge any sales fees. The Russell 2000 Value Index measures the performance of those Russell 2000 Index companies with lower price-to-book ratios and lower forecasted growth values. The Russell 2000 Index is an unmanaged total return index of the smallest 2,000 companies in the Russell 3000 Index, as ranked by total market capitalization. The Russell 2000 Index is widely regarded in the industry as accurately capturing the universe of small company stocks. You cannot invest directly in these or any indices.
31
| | |
| WASATCH STRATEGIC INCOME FUND (WASIX) | | SEPTEMBER 30, 2016 (UNAUDITED) |
|
|
|
Management Discussion
The Wasatch Strategic Income Fund is managed by a team of Wasatch portfolio managers led by Sam Stewart.
| | |
Samuel S. Stewart, Jr. PhD, CFA Lead Portfolio Manager | | OVERVIEW After several quarters of disappointing performance, the Wasatch Strategic Income Fund ended the fiscal year with a quarterly return in line with our expectations: 3.80% versus 3.85% for the S&P 500 Index. Our goal for the Fund was to achieve a return somewhere between its stock and bond benchmarks. For the fiscal year ended September 30, 2016, we were generally satisfied with the Fund’s 7.38% gain —
which trailed the S&P 500’s 15.43% advance, but exceeded the 5.19% |
return of the Barclays Capital U.S. Aggregate Bond Index.
DETAILSOFTHE YEAR
For the year, the only stocks adding more than one percentage point each to the Fund’s return were CBS Corp. and Comcast Corp. In the case of CBS, investors appeared to be pleasantly surprised by television-advertising strength, of which CBS is a significant beneficiary. Comcast benefited from a reduction in churn as its cable customers responded favorably to friendlier consumer policies.
The stock of Nu Skin Enterprises, Inc. also performed well for the year. The company was helped by the Federal Trade Commission settlement with fellow multi-level marketer Herbalife Ltd., which is also held in the Fund, as well as a better outlook for its China business.
NorthStar Realty Finance Corp. was the Fund’s only large loser, subtracting more than one percentage point from performance for the 12-month period. This was in spite of its impending three-way merger with NorthStar Asset Management Corp. and Colony Capital, Inc., which will eliminate NorthStar Realty’s burdensome management contract. As of September 30, 2016, the Fund held all three companies and had reduced its position in each.
Partially in response to the rough sledding the Strategic Income Fund experienced from mid-2015 through mid-2016, we held more than 20% cash during the most recent quarter, which helped reduce the Fund’s beta to less than 0.75. Our purpose in holding so much cash is to lower the sensitivity of the Fund’s returns relative to the market, as we believe the extended valuations of many stocks and bonds increase the odds of these assets encountering weak markets. And like the Boy Scouts, we want to “Be Prepared.”
The Fund’s primary investment focus continues to be on companies that we see as able and willing to pay a growing stream of dividends. Unfortunately, in recent months, the growth of our dividends was impeded by dividend cuts from Medallion Financial Corp. and Apollo Investment Corp. Prior to the dividend cut, we had pared our Medallion Financial position in half due to fear about continuing problems in its taxi medallion loan portfolio. Notwithstanding our lack of dividend growth recently, our 30-day net SEC yield as of September 30, 2016 was 2.65%, which was above
the 2.19% yield of our bond benchmark and above the 2.16% yield of our stock benchmark.*
Speaking of dividends, a bright spot during the past few months was the performance of our “yield stocks,” which represent a small but important portion of the Fund’s portfolio. These stocks are generally mandated to pay out all of their earnings as dividends. While this means they aren’t likely to grow their dividends, they tend to offer much higher yields than our dividend growers. At fiscal year end, the yield on these stocks was in the 10% neighborhood, which is well above the yield of the Fund’s total portfolio.
During the third quarter of 2015, the prices of yield stocks suffered mightily, largely because investors feared that problems in the oil patch would extend beyond oil-related debt into the entire universe of yield-oriented investments. For much of the past 12 months, yield stocks remained down on the mat despite the low yields offered by dividend growers. In the past few months, however, yield stocks captured some attention from investors and rose across the board. This caused us to mostly eliminate PennantPark Investment Corp. and KCAP Financial, Inc. from the Fund, as we fear they potentially face dividend cuts. During the time we held these stocks, their dividend yields often exceeded 15% and, in KCAP’s case, our total return was about 30% since purchasing it last spring.
OUTLOOK
Looking ahead, we continue to prepare the Fund for a subdued business cycle, or “lower for longer” as some have termed it. While this environment will likely produce slower growth rates than our companies have experienced in the past, less cyclicality may be a beneficial side effect of slower economic growth. We try to invest in companies that will be able to grow their dividends even if the economy is sluggish.
Our main worry is that extended stock and bond valuations, primarily resulting from global stimulative monetary policy, will lead to a rougher landing than we had hoped. We will continue seeking to structure the Fund’s portfolio so as to minimize the impact of a rough landing.
Thank you for the opportunity to manage your assets.
| * | The 30-day current net (“SEC”) yield is calculated by dividing the net investment income per share for the 30 days ended on the date of calculation by the maximum offering price per share on that date. The figure is compounded and annualized. |
| Current | and future holdings are subject to risk. |
32
| | |
| WASATCH STRATEGIC INCOME FUND (WASIX) | | SEPTEMBER 30, 2016 (UNAUDITED) |
|
|
|
Portfolio Summary
AVERAGE ANNUAL TOTAL RETURNS
| | | | | | | | | | | | |
| | | 1 YEAR | | | 5 YEARS | | | 10 YEARS | |
Strategic Income | | | 7.38% | | | | 12.29% | | | | 6.03% | |
S&P 500® Index | | | 15.43% | | | | 16.37% | | | | 7.24% | |
Barclays Capital U.S. Aggregate Bond Index | | | 5.19% | | | | 3.08% | | | | 4.79% | |
Data shows past performance, which is not indicative of future performance. Current performance may be lower or higher than the performance quoted. To obtain the most recent month-end performance data available, please visit www.WasatchFunds.com. The Advisor may absorb certain Fund expenses, without which total return would have been lower. Investment returns and principal value will fluctuate and shares, when redeemed, may be worth more or less than their original cost.
As of the January 31, 2016 prospectus, the Total Annual Fund Operating Expenses for the Wasatch Strategic Income Fund are 1.51%. The expense ratio shown elsewhere in this report may be different. Expenses include direct expenses paid to the Advisor as well as indirect expenses incurred by the Fund as a result of its investments in other investment companies (each an “Acquired Fund”), before any expense reimbursements by the Advisor. See the prospectus for additional information regarding Fund expenses.
Wasatch Funds will deduct a 2.00% redemption proceeds fee on Fund shares held 60 days or less. Performance data does not reflect the deduction of fees, including sales charges, or the taxes you would pay on fund distributions or the redemption of fund shares. Fees and taxes, if reflected, would reduce the performance quoted. Wasatch does not charge any sales fees. For more complete information including charges, risks and expenses, read the prospectus carefully.
The Fund has a concentration in the financials sector. Investing in concentrated funds can be more volatile and loss of principal could be greater than investing in more diversified funds. The financials sector can be significantly affected by various market factors, which are described in more detail in the prospectus.
With respect to the Fund’s assets invested in fixed income securities, you are subject, but not limited to, the same interest rate, inflation and credit risk associated with the underlying fixed-income securities owned by the Fund. Return of principal is not guaranteed. Investing in small cap funds will be more volatile and loss of principal could be greater than investing in large cap or more diversified funds. Investing in foreign securities, especially in emerging markets, entails special risks, such as currency fluctuations and political uncertainties, which are described in more detail in the prospectus.
TOP 10 EQUITY HOLDINGS*
| | | | |
| Company | | % of Net
Assets | |
Comcast Corp., Class A | | | 6.3% | |
CBS Corp., Class B | | | 4.2% | |
Suncor Energy, Inc. (Canada) | | | 3.6% | |
Herbalife Ltd. | | | 3.5% | |
Magellan Midstream Partners L.P. | | | 3.5% | |
| | | | |
| Company | | % of Net
Assets | |
Canadian National Railway Co. (Canada) | | | 3.1% | |
MasterCard, Inc., Class A | | | 3.0% | |
Great Ajax Corp. | | | 3.0% | |
Visa, Inc., Class A | | | 3.0% | |
McKesson Corp. | | | 2.7% | |
| * | As of September 30, 2016, there were 54 holdings in the Fund. Foreign currency contracts, written options and repurchase agreements, if any, are not included in the number of holdings. Portfolio holdings are subject to change at any time. References to specific securities should not be construed as recommendations by the Funds or their Advisor. Current and future holdings are subject to risk. |
SECTOR BREAKDOWN**
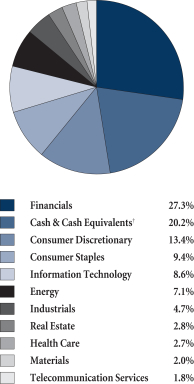
| ** | Excludes securities sold short and options written, if any. |
| † | Also includes Other Assets & Liabilities. |
GROWTHOFA HYPOTHETICAL $10,000 INVESTMENT
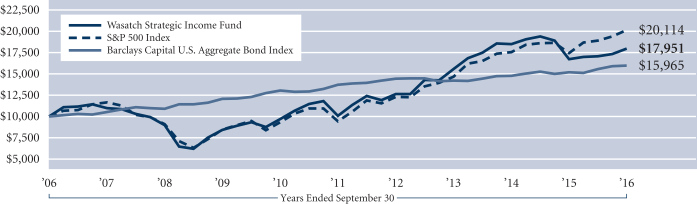
Past performance does not predict future performance. The graph above does not reflect the deduction of fees, sales charges, or taxes that you would pay on fund distributions or the redemption of fund shares. Wasatch does not charge any sales fees. The S&P 500 Index represents 500 of the United States’ largest stocks from a broad variety of industries. The Index is unmanaged and is a commonly used measure of common stock total return performance. The Barclays Capital U.S. Aggregate Bond Index covers the U.S. investment grade fixed rate bond market, including government and corporate securities, agency mortgage pass-through securities, and asset-backed securities. You cannot invest directly in these or any indices.
33
| | |
| WASATCH ULTRA GROWTH FUND (WAMCX) | | SEPTEMBER 30, 2016 (UNAUDITED) |
|
|
|
Management Discussion
The Wasatch Ultra Growth Fund is managed by a team of Wasatch portfolio managers led by John Malooly.
| | |

John Malooly, CFA Lead Portfolio Manager | | OVERVIEW The Wasatch Ultra Growth Fund returned 20.08% for the 12-month period ended September 30, 2016. The Fund outgained its benchmark, the Russell 2000 Growth Index, which rose 12.12%. As they have for the past several years, U.S. businesses operated in an environment of slow economic growth, low interest rates and benign inflation. The slowdown became particularly |
acute in the industrial and manufacturing segments. China’s shift from manufacturing and infrastructure spending toward a service-based economy has lessened demand for oil and industrial commodities. Low prices for those and other raw materials crimped activity in energy and mining, while a strong dollar and soft global demand put additional pressure on factories.
With industrial activity weak and households constrained by sluggish income growth, we focused on companies that we believe can take market share from their competitors. The rapid pace of technological change has allowed innovative companies to use recently developed technologies to disrupt entire industries. We aim to be on the right side of the disruption, with companies that we believe can capture a fair share of the value their products and services create.
In health care, that means finding companies with new drugs and therapies leading to better outcomes at lower cost. In information technology, we look for software companies and other innovators that enable their customers to become more efficient. And in retail, we seek companies that either benefit from the internet, or whose business models do not compete directly with e-commerce giants. We believe Wasatch has the resources and expertise necessary to navigate the changing technological landscape and that our investment performance during the fiscal year bears that out.
DETAILSOFTHE YEAR
The Fund’s strongest contributor to performance for the year was PDF Solutions, Inc. The company provides technologies for optimizing the design and manufacture of integrated-circuit chips. Shares of PDF Solutions rose on growing optimism about its design-for-inspection initiative. The new technology seeks to change the current paradigm of visual chip inspection by incorporating small proprietary test vehicles directly into the chip’s design. Also helping to lift the stock were a pickup in PDF’s software business and an expected upswing in revenues tied to the next generation of smartphones.
Interactive Intelligence Group, Inc. provides communications and work-flow management software for call centers. We continued to own the company in the Fund despite operating losses as it shifted its business model from on-premise software to cloud-based solutions. Our patience was
rewarded in late August when the company agreed to be acquired by a privately held competitor that needed Interactive Intelligence’s cutting-edge solution to refresh its own product cycle.
Exact Sciences Corp. is a health-care innovator that has developed a new molecular-screening test for colon cancer. Federal guidelines elevating the test to the same status as other screening options removed a roadblock that insurers could have used to restrict coverage. The test, known as Cologuard, is now covered for 62% of its total target population. With an added boost from better-than-expected earnings reports, Exact Sciences was another of the year’s strongest contributors.
The Fund’s greatest detractor from performance for the year was footwear manufacturer Skechers U.S.A., Inc. Skechers struggled with slowing sales growth, while operating expenses moved higher. The bankruptcies of Sports Authority and Sport Chalet increased inventory in the channel industry-wide, creating a near-term headwind. Although Skechers appears attractively valued, we are reevaluating our position on concerns about the company’s near-term business trends.
AtriCure, Inc. is a medical-device company whose products are used mainly in the treatment of atrial fibrillation. Investors reacted negatively when AtriCure lowered its 2016 financial guidance to reflect stepped-up investments in clinical trials, product development and sales. While the decline in share price made this holding the Fund’s second-largest detractor from performance for the year, we believe the company’s long-term growth prospects remain intact.
OUTLOOK
Referring to the third round of quantitative easing (QE3) from the U.S. Federal Reserve (Fed), we wrote in our annual commentary for September 2013:
With respect to the current economic recovery, the relevant question is, “Is it real, or is it QE3?”
Not only does the question remain as relevant today as it was three years ago, but the recovery’s weakness has made the issue all the more pressing. With yields on over $11 trillion of the world’s bonds currently below zero, there is little doubt that global quantitative easing has distorted financial markets. It stands to reason that the eventual normalization of those distortions is likely to pose challenges, both for financial markets and for the global economy.
Against that backdrop, we are carefully reviewing our holdings in an attempt to reduce risk. While we do not anticipate making major changes in the Fund, we have done selective selling based on company fundamentals, risk profiles and growth prospects. Our goal is to preserve recent gains to the extent possible, should the investment environment become less favorable. Given the importance we place on owning companies that we believe can continue to grow even in a weak economy, we regard the Fund’s overweight positions in technology and health care as natural outgrowths of our bottom-up investment discipline.
Thank you for the opportunity to manage your assets.
| Current | and future holdings are subject to risk. |
34
| | |
| WASATCH ULTRA GROWTH FUND (WAMCX) | | SEPTEMBER 30, 2016 (UNAUDITED) |
|
|
|
Portfolio Summary
AVERAGE ANNUAL TOTAL RETURNS
| | | | | | | | | | | | | | | |
| | | 1 YEAR | | 5 YEARS | | 10 YEARS |
Ultra Growth | | | | 20.08% | | | | | 13.91% | | | | | 7.00% | |
Russell 2000® Growth Index | | | | 12.12% | | | | | 16.15% | | | | | 8.29% | |
Data shows past performance, which is not indicative of future performance. Current performance may be lower or higher than the performance quoted. To obtain the most recent month-end performance data available, please visit www.WasatchFunds.com. The Advisor may absorb certain Fund expenses, without which total return would have been lower. Investment returns and principal value will fluctuate and shares, when redeemed, may be worth more or less than their original cost.
As of the January 31, 2016 prospectus, the Total Annual Fund Operating Expenses for the Wasatch Ultra Growth Fund are 1.38%. The expense ratio shown elsewhere in this report may be different. Expenses include direct expenses paid to the Advisor as well as indirect expenses incurred by the Fund as a result of its investments in other investment companies (each an “Acquired Fund”), before any expense reimbursements by the Advisor. See the prospectus for additional information regarding Fund expenses.
Wasatch Funds will deduct a 2.00% redemption proceeds fee on Fund shares held 60 days or less. Performance data does not reflect the deduction of fees, including sales charges, or the taxes you would pay on fund distributions or the redemption of fund shares. Fees and taxes, if reflected, would reduce the performance quoted. Wasatch does not charge any sales fees. For more complete information including charges, risks and expenses, read the prospectus carefully.
Investing in small cap funds will be more volatile and loss of principal could be greater than investing in large cap or more diversified funds. Investing in foreign securities, especially in emerging markets, entails special risks, such as currency fluctuations and political uncertainties, which are described in more detail in the prospectus.
TOP 10 EQUITY HOLDINGS*
| | | | |
| Company | | % of Net
Assets | |
FleetMatics Group plc | | | 3.0% | |
Seattle Genetics, Inc. | | | 2.8% | |
PDF Solutions, Inc. | | | 2.7% | |
Ultimate Software Group, Inc. (The) | | | 2.4% | |
Cornerstone OnDemand, Inc. | | | 2.3% | |
| | | | |
| Company | | % of Net
Assets | |
LGI Homes, Inc. | | | 2.2% | |
Greenspring Global Partners II-B, L.P. | | | 2.2% | |
Interactive Intelligence Group, Inc. | | | 2.1% | |
MakeMyTrip Ltd. (India) | | | 2.0% | |
AtriCure, Inc. | | | 1.9% | |
| * | As of September 30, 2016, there were 93 holdings in the Fund. Foreign currency contracts, written options and repurchase agreements, if any, are not included in the number of holdings. Portfolio holdings are subject to change at any time. References to specific securities should not be construed as recommendations by the Funds or their Advisor. Current and future holdings are subject to risk. |
SECTOR BREAKDOWN**
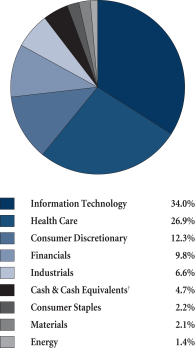
| ** | Excludes securities sold short and options written, if any. |
| † | Also includes Other Assets & Liabilities. |
GROWTHOFA HYPOTHETICAL $10,000 INVESTMENT
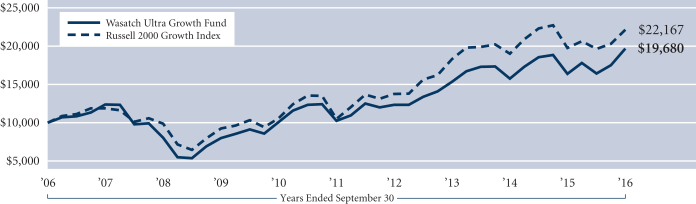
Past performance does not predict future performance. The graph above does not reflect the deduction of fees, sales charges, or taxes that you would pay on fund distributions or the redemption of fund shares. Wasatch does not charge any sales fees. The Russell 2000 Growth Index is an unmanaged total return index that measures the performance of those Russell 2000 Index companies with higher price-to-book ratios and higher forecasted growth values. The Russell 2000 Index is an unmanaged total return index of the smallest 2,000 companies in the Russell 3000 Index, as ranked by total market capitalization. You cannot invest directly in these or any indices.
35
| | |
| WASATCH WORLD INNOVATORS FUND (WAGTX / WIGTX) | | SEPTEMBER 30, 2016 (UNAUDITED) |
|
|
|
Management Discussion
The Wasatch World Innovators Fund is managed by a team of Wasatch portfolio managers led by Josh Stewart and Sam Stewart.
| | | | |

Josh Stewart Lead Portfolio Manager | |
Samuel S. Stewart, Jr. PhD, CFA Portfolio Manager | | OVERVIEW The fiscal year ended September 30, 2016 began at a low point — the bottom of a selloff after markets panicked about China’s slowing economic growth last autumn. Thanks to starting from that low base, |
the period was one of strong returns for many equity investors. The Wasatch World Innovators Fund — Investor Class rose 8.97% during the fiscal year, lagging the 12.25% return of the benchmark MSCI All Country World Investable Markets Index. The Fund’s underperformance, we believe, reflected our positioning in higher-quality companies that outperformed in the previous year and therefore didn’t benefit as much as the benchmark from the low starting point.
We think the narrative for the fiscal year, despite the upswing in stock prices, remains little-changed compared to the prior 18 months when equity markets were mostly on a downward trajectory. The current environment is defined by: 1) central banks’ loose monetary policy; 2) income-oriented investors reacting to low bond payouts by hunting for yields elsewhere, thereby pushing equities to historically expensive levels; and 3) most actors in the real economy not taking the low-interest-rate bait, refusing to invest en masse as returns seemed too low and too risky — resulting in soft and worsening economic growth rates.
DETAILSOFTHE YEAR
Based on our increasing preference for businesses that aren’t overly capital-intensive and for those providing necessities rather than luxuries, we added several consumer-staples companies, including Whole Foods Market, Inc., the top name brand in organic groceries, and Sprouts Farmers Market, Inc., the smaller, regional, more value-based organic-food retailer. We also added Corby Spirit and Wine Ltd. This Canadian wine-and-spirits producer is successfully growing the craft and small-batch wine categories.
Although adding the largest Canadian bookseller, Indigo Books & Music, Inc., along with U.S. bookseller Barnes & Noble, Inc. (B&N) to our already-large position in Amazon.com might seem counterintuitive, we see these booksellers as providing more opportunities. After growing rapidly from 2009 through 2014, the e-book market lost ground in 2015, suggesting that a nice browsing experience, a cup of coffee and a bite to eat might still be relevant in the 21st century. Indigo has 50% market share of all books sold in Canada, has reinvented its stores, and has grown store comparisons in every quarter but one over the last two years. Barnes & Noble might be a year or two behind Indigo and
has lots of work to do, but like Indigo it has a rock-solid balance sheet and the B&N stock trades at a meager multiple of core profits.
We’ve found several new ideas in the medical-diagnostics space. We added test-processing companies Miraca Holdings, Inc. (Japan), Quest Diagnostics, Inc. (U.S.) and test-kit developer bioMérieux (France). We think the diagnostics space has many attractive attributes including demographic tailwinds and rational, competitive price points.
Last but not least, we’ve found several disruptive and exciting online retailers that we think have Amazon-resistant business models. Banzai S.p.A. (Italy) and AO World plc in the United Kingdom, Germany and the Netherlands sell appliances online. Differentiating themselves from Amazon.com and many brick-and-mortar retailers, Banzai and AO World don’t just put a picture and a brief description of a washing machine on a website. Instead, they’re committed to providing outstanding service, including guaranteed same-day delivery, installation and removal of old units for recycling. High service standards have been driving strong growth for both companies.
Of the companies mentioned above, Amazon.com, Quest Diagnostics, bioMérieux and Miraca Holdings were positive contributors to Fund performance for the fiscal year, while Banzai, AO World, Sprouts Farmers Market and Barnes & Noble detracted from Fund performance.
OUTLOOK
We believe the combination of high asset prices sitting atop a flimsy foundation of slow sales growth and shrinking profits has created anxiety in the equity markets. Ironically, despite news headlines about lower volatility during the most-recent quarter, an analysis of the past few years shows that markets have been on a roller-coaster ride. Nonetheless, the press has a point that markets have recently held relatively steady. Unfortunately, without economic growth, we think there’s a ceiling on overall equity prices.
That’s the bad news. The good news is the world is more connected, flexible, fast and innovative than ever before. In addition, great, disruptive businesses can be started more efficiently than was previously possible. Just last month, for example, a good friend of ours didn’t bother calling a traditional bank when he needed additional funding to open his dream pizzeria. Instead, he created an iPhone video, and in two weeks raised more than he needed via crowdfunding. Our point is that the World Innovators theme of buying disruptive companies is alive and well in this “new normal” economy. While the whole pie may not be growing as fast as we’d like, the pieces of the pie are being redistributed to savvy new entrants and other market-share gainers, companies that we believe are the best investments if we can find them before they’re widely recognized.
Thank you for the opportunity to manage your assets.
| Current | and future holdings are subject to risk. |
36
| | |
| WASATCH WORLD INNOVATORS FUND (WAGTX / WIGTX) | | SEPTEMBER 30, 2016 (UNAUDITED) |
|
|
|
Portfolio Summary
AVERAGE ANNUAL TOTAL RETURNS
| | | | | | | | | | | | | | | |
| | | 1 YEAR | | 5 YEARS | | 10 YEARS |
World Innovators (WAGTX) — Investor | | | | 8.97% | | | | | 12.06% | | | | | 7.82% | |
World Innovators (WIGTX) — Institutional | | | | 9.19% | | | | | 12.10% | | | | | 7.85% | |
MSCI AC World IMI | | | | 12.25% | | | | | 10.87% | | | | | 4.63% | |
Data shows past performance, which is not indicative of future performance. Current performance may be lower or higher than the performance quoted. To obtain the most recent month-end performance data available, please visit www.WasatchFunds.com. The Advisor may absorb certain Fund expenses, without which total return would have been lower. Investment returns and principal value will fluctuate and shares, when redeemed, may be worth more or less than their original cost.
As of the January 31, 2016 prospectus, the Total Annual Fund Operating Expenses for the Wasatch World Innovators Fund are Investor Class: 1.76% / Institutional Class — Gross: 1.65%, Net: 1.55%. The expense ratio shown elsewhere in this report may be different. Net expenses are based on Fund expenses, net of waivers and reimbursements. See the prospectus for additional information regarding Fund expenses.
Wasatch Funds will deduct a 2.00% redemption proceeds fee on Fund shares held 60 days or less. Performance data does not reflect the deduction of fees, including sales charges, or the taxes you would pay on fund distributions or the redemption of fund shares. Fees and taxes, if reflected, would reduce the performance quoted. Wasatch does not charge any sales fees. For more complete information including charges, risks and expenses, read the prospectus carefully.
Performance for the Institutional Class prior to 2/1/2016 is based on the performance of the Investor Class. Performance of the Fund’s Institutional Class prior to 2/1/2016 uses the actual expenses of the Fund’s Investor Class without any adjustments. For any such period of time, the performance of the Fund’s Institutional Class would have been substantially similar to, yet higher than, the performance of the Fund’s Investor Class, because the shares of both classes are invested in the same portfolio of securities, but the classes bear different expenses.
Investing in small cap funds will be more volatile and loss of principal could be greater than investing in large cap or more diversified funds. Investing in foreign securities, especially in emerging markets, entails special risks, such as currency fluctuations and political uncertainties, which are described in more detail in the prospectus.
TOP 10 EQUITY HOLDINGS*
| | | | |
| Company | | % of Net
Assets | |
| Fenix Outdoor International AG (Switzerland) | | | 2.6% | |
| Avon Rubber plc (United Kingdom) | | | 2.4% | |
| Take-Two Interactive Software, Inc. | | | 2.4% | |
| Quest Diagnostics, Inc. | | | 2.3% | |
| Gamma Communications plc (United Kingdom) | | | 2.3% | |
| | | | |
| Company | | % of Net
Assets | |
| EVS Broadcast Equipment S.A. (Belgium) | | | 2.3% | |
| Amazon.com, Inc. | | | 2.2% | |
| DiaSorin S.p.A. (Italy) | | | 2.1% | |
| Oisix, Inc. (Japan) | | | 2.0% | |
| bioMérieux (France) | | | 2.0% | |
| * | As of September 30, 2016, there were 101 holdings in the Fund. Foreign currency contracts, written options and repurchase agreements, if any, are not included in the number of holdings. Portfolio holdings are subject to change at any time. References to specific securities should not be construed as recommendations by the Funds or their Advisor. Current and future holdings are subject to risk. |
SECTOR BREAKDOWN**
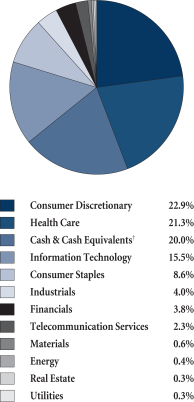
| ** | Excludes securities sold short and options written, if any. |
| † | Also includes Other Assets & Liabilities. |
GROWTHOFA HYPOTHETICAL $10,000 INVESTMENT
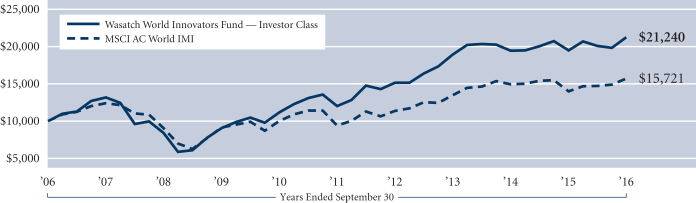
Past performance does not predict future performance. The graph above does not reflect the deduction of fees, sales charges, or taxes that you would pay on fund distributions or the redemption of fund shares. Wasatch does not charge any sales fees. The MSCI AC World IMI (All Country World Investable Market Index) is designed to measure the equity market performance of large, mid, and small cap securities across developed and emerging markets throughout the world. You cannot invest directly in this or any index.
37
| | |
| WASATCH-1ST SOURCE INCOME FUND (FMEQX) | | SEPTEMBER 30, 2016 (UNAUDITED) |
|
|
|
Management Discussion
| | | | |

Paul Gifford, CFA Lead Portfolio Manager | | 
Erik Clapsaddle, CFA Associate Portfolio Manager | | OVERVIEW The Wasatch-1st Source Income Fund returned 2.58% for the fiscal year (the 12 months ended September 30, 2016), while the Barclays Capital U.S. Government/Credit Bond Index returned 3.52%. In |
December 2015, for the first time in nine years, the Federal Reserve (Fed) increased the federal-funds target rate by 0.25 of a percentage point to a range of 0.25% to 0.50%. The front-end of the yield curve (bonds with maturities up to three years) moved higher over the past 12 months, and long-term bonds (those with maturities greater than 20 years) moved lower as the yield curve flattened for six consecutive quarters as of September 30, 2016.
DETAILSOFTHE YEAR
The Fed has spent the past nine months determining when the next target rate increase will happen. The past six months brought differences of opinion among members of the Federal Open Market Committee (FOMC) as to when and how many times the target rate should be raised. At the September 2016 meeting, three members did not agree that the current target rate should be maintained. This was the first time there were three dissenters at an FOMC meeting since December 2014. Esther George, President of the Federal Reserve Bank of Kansas City, dissented for the fourth consecutive time and stated, “I don’t see better outcomes from waiting.”
Global central banks continued to drive easy monetary policy during the fiscal year as yields on some government bonds moved further into negative territory. The European Central Bank, the Bank of Japan and the Swiss National Bank spent the entire year with negative key rates. During the 12 months, six nations had negative yields on their 10-year bonds and negative yields on Switzerland’s government debt extended out to 50-year bonds. Although the number of bonds with negative yields reached an extraordinary level in mid-2016, yields had begun to rise as the period ended.
We would be neglectful to not mention “Brexit” (The June 23rd referendum whereby the citizens of the United Kingdom voted to leave the European Union.) The immediate reaction to Brexit was negative. Bond yields moved into historically low territory and global equities sold off rapidly. The 10-year U.S. Treasury note reached an all-time low yield of 1.318% two weeks after the vote and then rose 0.27 of a percentage point by September 30th.
OUTLOOK
Domestic economic data has been positive enough that the Fed hasn’t had to rapidly raise rates, but it has provided
a backdrop that would allow for gradual increases. Our belief is that the primary factor driving U.S. rates lower and the Fed’s willingness to maintain interest rates at a “lower for longer” level has been the fragile global economy and an overwhelming amount of negative and close-to-zero yielding government debt.
The core of the Income Fund is invested in three types of fixed-income securities. We expect to add to other fixed-income investments, as we have done historically, when we see opportunities to add yield, increase diversification, improve the Fund’s long-term return potential, and where we find dislocation in the market.
The Fund’s largest exposure was to corporate bonds, which ended the year at 46% of total assets — almost identical to the previous year. The most notable change within corporate bonds over the past 12 months was increased allocation to bonds with BBB credit ratings. The Fund ended the 2015 fiscal year with 12% exposure to BBB credits. For the fiscal year ended September 30, 2016, the Fund’s BBB exposure had increased to 16.4%, though the Fund is still slightly underweighted relative to the benchmark. The average credit rating for the Fund’s corporate bonds was A2/A.
U.S. Treasuries and government-agency bonds are the Fund’s second type of core investments. They are intended to provide price stability and liquidity, as well as price upside when external events drive Treasury-bond yields lower. These fixed-income investments provide the Fund with the highest credit ratings of Aaa/AA+ by rating agencies Moody’s and S&P.
The Fund currently has a government-agency mortgage backed securities (MBS) allocation of 16%. We have found MBS and other fixed-income segments more attractive, as yields on U.S. Treasuries have declined for the second straight year. We like the additional government-guaranteed yield that agency MBS provide to investors, but are being defensive by owning MBS with a high weighted-average coupon.
We increased our allocation to taxable municipal bonds and asset-backed securities in 2016, as we found opportunities and more favorable credit spreads in these types of bonds. Our investments in preferred stocks have continued to provide attractive yields, diversification, and the potential for increased long-term returns relative to other fixed-income assets.
Thank you for entrusting us to manage your assets.
A credit rating is an assessment of the credit worthiness of individuals and corporations. It is based upon the history of borrowing and repayment, as well as the availability of assets and extent of liabilities. Ratings are issued by S&P or Moody’s and typically range from AAA (highest) to D (lowest). The credit quality of the investments in the Fund’s portfolio does not apply to the safety or stability of the Fund. Ratings and portfolio credit quality may change over time. Unrated securities do not necessarily indicate low quality. The Fund itself has not been rated by an independent rating agency. For information on the rating agency’s methodology visit: http://www.standardandpoors.com/home/en/us and http://www.moodys.com.
38
| | |
| WASATCH-1ST SOURCE INCOME FUND (FMEQX) | | SEPTEMBER 30, 2016 (UNAUDITED) |
|
|
|
Portfolio Summary
AVERAGE ANNUAL TOTAL RETURNS
| | | | | | | | | | | | |
| | | 1 YEAR | | | 5 YEARS | | | 10 YEARS | |
Income | | | 2.58% | | | | 1.62% | | | | 3.18% | |
Barclays Capital U.S. Intermediate Government/Credit Bond Index | | | 3.52% | | | | 2.45% | | | | 4.17% | |
Data shows past performance, which is not indicative of future performance. Current performance may be lower or higher than the performance quoted. To obtain the most recent month-end performance data available, please visit www.WasatchFunds.com. The Advisor may absorb certain Fund expenses, without which total return would have been lower. Investment returns and principal value will fluctuate and shares, when redeemed, may be worth more or less than their original cost.
As of the January 31, 2016 prospectus, the Total Annual Fund Operating Expenses for the Wasatch-1st Source Income Fund are 0.73%. The expense ratio shown elsewhere in this report may be different. Expenses include direct expenses paid to the Advisor as well as indirect expenses incurred by the Fund as a result of its investments in other investment companies (each an “Acquired Fund”). See the prospectus for additional information regarding Fund expenses.
Wasatch Funds will deduct a 2.00% redemption proceeds fee on Fund shares held 60 days or less. Performance data does not reflect the deduction of fees, including sales charges, or the taxes you would pay on fund distributions or the redemption of fund shares. Fees and taxes, if reflected, would reduce the performance quoted. Wasatch does not charge any sales fees. For more complete information including charges, risks and expenses, read the prospectus carefully.
Investments in fixed income funds are subject to the same interest rate, inflation, credit and other risks associated with the underlying bonds. Return of principal is not guaranteed.
TOP 10 FIXED INCOME HOLDINGS*
| | | | | | | | |
| Holding | | Maturity
Date | | | % of Net
Assets | |
U.S. Treasury Note, 3.625% | | | 8/15/19 | | | | 3.8% | |
Morgan Stanley, MTN, 5.500% | | | 7/24/20 | | | | 2.0% | |
U.S. Treasury Note, 3.125% | | | 5/15/21 | | | | 1.9% | |
U.S. Treasury Note, 3.625% | | | 2/15/20 | | | | 1.6% | |
Citibank Credit Card Issuance Trust, Series 2007-A8, Class A8, 5.650% | | | 9/20/19 | | | | 1.6% | |
| | | | | | | | |
| Holding | | Maturity
Date | | | % of Net
Assets | |
| U.S. Treasury Note, 3.250% | | | 12/31/16 | | | | 1.5% | |
BB&T Corp., MTN, 2.150% | | | 3/22/17 | | | | 1.5% | |
World Financial Network Credit Card Master Trust, Series 2012-A, Class A, 3.140% | | | 1/17/23 | | | | 1.5% | |
General Electric Co., MTN, 5.400% | | | 2/15/17 | | | | 1.4% | |
PNC Bank NA, 3.800% | | | 7/25/23 | | | | 1.4% | |
| * | As of September 30, 2016, there were 146 holdings in the Fund. Repurchase agreements, if any, are not included in the number of holdings. Portfolio holdings are subject to change at any time. References to specific securities should not be construed as recommendations by the Funds or their Advisor. Current and future holdings are subject to risk. |
INVESTMENTS & CASH**
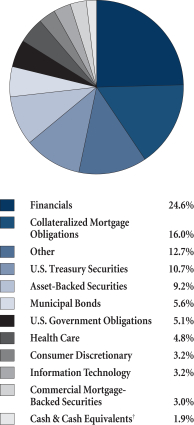
| ** | Excludes options written, if any. |
| † | Also includes Other Assets & Liabilities. |
GROWTHOFA HYPOTHETICAL $10,000 INVESTMENT
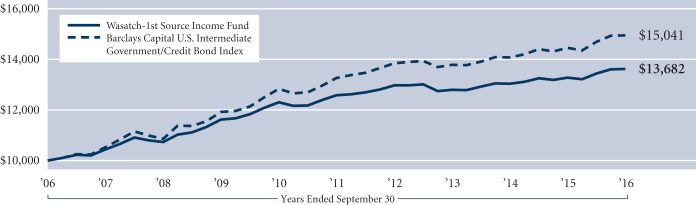
Past performance does not predict future performance. The graph above does not reflect the deduction of fees, sales charges, or taxes that you would pay on fund distributions or the redemption of fund shares. Wasatch does not charge any sales fees. The Barclays Capital U.S. Intermediate Government/Credit Bond Index is an unmanaged index considered representative of the performance of government and corporate bonds with maturities of less than 10 years. You cannot invest directly in this or any index.
39
| | |
| WASATCH-HOISINGTON U.S. TREASURY FUND (WHOSX) | | SEPTEMBER 30, 2016 (UNAUDITED) |
|
|
|
Management Discussion
| | | | |

Van Hoisington Lead Portfolio Manager | | 
Van R. Hoisington, Jr. Portfolio Manager | | 
David Hoisington Portfolio Manager |
OVERVIEW
The third calendar quarter of 2016 was marked by sharp upswings and downswings in Treasury-bond yields. Most of the rising periods occurred when Fed officials indicated that the federal-funds rate would be hiked. Reversals coincided with weak economic developments. Thirty-year Treasury-bond yields gained 0.03 of a percentage point during the third calendar quarter, to a closing level of 2.31% on September 30, 2016. However, yields declined by 0.54 of a percentage point during the fiscal year (the 12-month period ended September 30, 2016).
For the past three and six months and for the fiscal year, the Fund returned 0.00%, 7.78% and 15.49%, respectively, while the benchmark Barclays Capital U.S. Aggregate Bond Index returned 0.46%, 2.68% and 5.19%, respectively. The Fund maintained its substantial outperformance over the Index for the five- and 10-year periods ended September 30, 2016.
DETAILSOFTHE YEAR
Economic activity remained too slow and irregular for the Fed to carry through with those often-promised rate increases in the summer. Growth in real economic activity improved marginally, with the uptick concentrated in the volatile and quick-reversing international trade and inventory investment, areas of the economy that do not produce sustaining growth. The main domestic sectors of final demand — real consumer expenditures, real residential fixed investment and real housing investment — grew more slowly in the third quarter of 2016 than in the first half of the year. Although the Bureau of Economic Analysis has not released a preliminary estimate for third-quarter gross domestic product (GDP), growth for the fiscal year ended September 30, 2016 was substantially less than for fiscal 2015. Estimates from various tracking services indicate that earnings for S&P 500® Index companies registered their sixth consecutive decline in the third quarter.
Job gains have moderated significantly thus far in 2016. The average monthly increase in payroll employment was 178,000 for the first nine months of this year, down from 229,000 and 251,000 in 2015 and 2014, respectively. The quality of the employment also deteriorated, as high-paying manufacturing jobs fell. On average, the manufacturing sector reduced employment by 6,000 jobs per month, compared with gains of 2,000 and 17,000 in 2015 and 2104, respectively. In the latest 12 months, industrial production
contracted 1.1%; excluding the automotive sector the drop was even larger. However, total vehicle sales in the first nine months of 2016 were slightly below the selling rate for all of 2015.
Inflation accelerated slightly in the third quarter of 2016 as medical care rose five times faster than the price of everything else. Costs under the Affordable Care Act jumped across the board. College costs also advanced, with educations being financed with massive new student loans. Rents also rose rapidly, but a boom in apartment construction suggests that rent gains will moderate. The prices of most discretionary goods either declined or were trendless, a reflection of the third consecutive year of decelerating economic growth.
OUTLOOKFORTHE YEAR
Textbooks have historically hypothesized that government expenditures lift economic growth by some multiple of every dollar spent through a positive government-expenditure multiplier. As such, deficit spending has been considered to be positive for economic expansion. If the expansion lasts long and generates faster actual and expected inflation, bond yields should rise according to Irving Fisher’s equation.
Impressive scholarly research demonstrates that the government-spending multiplier is in fact negative, meaning that a dollar of deficit spending slows economic output. The fundamental rationale is that the government has to withdraw, via taxes or borrowing from the private sector, to spend their dollars. When that happens, the more productive private sector of the economy has fewer funds to use to make productive investments. Thus, the economy slows as government spending increases. Further, as an economy becomes more over-indebted (studies suggest 70% to 90% government debt-to-GDP is the critical level), additional government spending slows growth even more due to non-interest costs such as misallocation of saving, reduced productive investment, weaker productivity growth and eventually deterioration in demographics. As underutilized resources build, inflation and subsequently interest rates fall. Increasing deficits have and will continue to result in lower, not higher, interest rates.
The economic horizon for 2017 is clouded by the increasing likelihood of further rises in government spending and debt. The inevitable result will be slower economic expansion and declining interest rates, a pattern similar to that experienced in 2016.
Thank you for the opportunity to manage your assets.
40
| | |
| WASATCH-HOISINGTON U.S. TREASURY FUND (WHOSX) | | SEPTEMBER 30, 2016 (UNAUDITED) |
|
|
|
Portfolio Summary
AVERAGE ANNUAL TOTAL RETURNS
| | | | | | | | | | | | | | | |
| | | 1 YEAR | | 5 YEARS | | 10 YEARS |
U.S. Treasury | | | | 15.49% | | | | | 5.86% | | | | | 9.02% | |
Barclays Capital U.S. Aggregate Bond Index | | | | 5.19% | | | | | 3.08% | | | | | 4.79% | |
Data shows past performance, which is not indicative of future performance. Current performance may be lower or higher than the performance quoted. To obtain the most recent month-end performance data available, please visit www.WasatchFunds.com. The Advisor may absorb certain Fund expenses, without which total return would have been lower. Investment returns and principal value will fluctuate and shares, when redeemed, may be worth more or less than their original cost.
As of the January 31, 2016 prospectus, the Total Annual Fund Operating Expenses for the Wasatch-Hoisington U.S. Treasury Fund are 0.67%. The expense ratio shown elsewhere in this report may be different. See the prospectus for additional information regarding Fund expenses.
Wasatch Funds will deduct a 2.00% redemption proceeds fee on Fund shares held 60 days or less. Performance data does not reflect the deduction of fees, including sales charges, or the taxes you would pay on fund distributions or the redemption of fund shares. Fees and taxes, if reflected, would reduce the performance quoted. Wasatch does not charge any sales fees. For more complete information including charges, risks and expenses, read the prospectus carefully.
Investments in fixed income funds are subject to the same interest rate, inflation, credit and other risks associated with the underlying bonds. Return of principal is not guaranteed.
TOP U.S. TREASURY HOLDINGS*
| | | | | | | | |
| Holding | | Maturity
Date | | | % of Net
Assets | |
| U.S. Treasury Bond, 2.250% | | | 8/15/46 | | | | 30.0% | |
| U.S. Treasury Strip, principal only | | | 8/15/45 | | | | 17.8% | |
| U.S. Treasury Bond, 2.500% | | | 2/15/45 | | | | 12.2% | |
| U.S. Treasury Bond, 2.875% | | | 8/15/45 | | | | 9.5% | |
| U.S. Treasury Strip, principal only | | | 5/15/44 | | | | 9.1% | |
| | | | | | | | |
| Holding | | Maturity
Date | | | % of Net
Assets | |
| U.S. Treasury Bond, 2.500% | | | 5/15/46 | | | | 8.6% | |
| U.S. Treasury Bond, 3.125% | | | 8/15/44 | | | | 6.7% | |
| U.S. Treasury Bond, 3.750% | | | 11/15/43 | | | | 3.8% | |
| U.S. Treasury Bond, 3.000% | | | 5/15/45 | | | | 1.6% | |
| U.S. Treasury Bond, 2.875% | | | 5/15/43 | | | | 0.2% | |
| * | As of September 30, 2016, there were 10 holdings in the Fund. Repurchase agreements, if any, are not included in the number of holdings. Portfolio holdings are subject to change at any time. References to specific securities should not be construed as recommendations by the Funds or their Advisor. Current and future holdings are subject to risk. |
INVESTMENTS & CASH
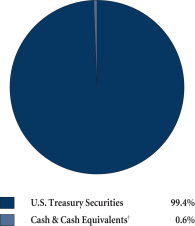
| † | Also includes Other Assets & Liabilities. |
GROWTHOFA HYPOTHETICAL $10,000 INVESTMENT
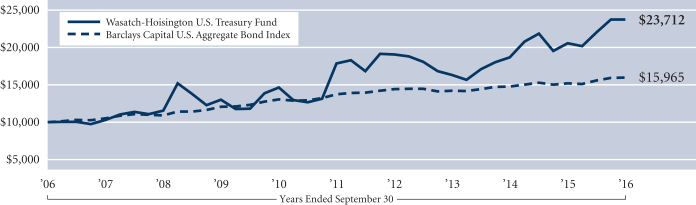
Past performance does not predict future performance. The graph above does not reflect the deduction of fees, sales charges, or taxes that you would pay on fund distributions or the redemption of fund shares. Wasatch does not charge any sales fees. The Barclays Capital U.S. Aggregate Bond Index covers the U.S. investment grade fixed rate bond market, including government and corporate securities, agency mortgage pass-through securities, and asset-backed securities. You cannot invest directly in this or any index.
41
| | |
| WASATCH FUNDS MANAGEMENT DISCUSSIONS | | |
|
|
|
Definitions of Financial Terms
The Patient Protection and Affordable Care Act (PPACA), commonly called the Affordable Care Act (ACA) or “ObamaCare,” is a United States federal statute signed into law by President Barack Obama on March 23, 2010.
An asset-backed security is backed by a loan, lease or receivables against assets other than real estate and mortgage-backed securities. For investors, asset-backed securities are an alternative to investing in corporate debt.
Beta is a measurement of a fund’s trailing return in relation to the overall market (or appropriate market index). A beta of 1 indicates the share price will typically move with the market. A beta of more than 1 indicates the share price will typically be more volatile than the market. A beta of less than 1 indicates the share price will typically be less volatile than the market.
Brexit is an abbreviation for “British exit,” which refers to the June 23, 2016 referendum whereby British citizens voted to exit the European Union. The referendum roiled global markets, including currencies, causing the British pound to fall to its lowest level in decades.
The Bureau of Economic Analysis (BEA) is an agency in the United States Department of Commerce that provides important economic statistics including the gross domestic product of the United States. BEA is a principal agency of the U.S. Federal Statistical System.
The “cloud” is the internet. Cloud-computing is a model for delivering information-technology services in which resources are retrieved from the internet through web-based tools and applications, rather than from a direct connection to a server.
A Consumer Price Index (CPI) is an inflationary indicator that measures the change in the cost of a fixed basket of products and services, including housing, electricity, food and transportation.
In the U.S., the Consumer Price Index (CPI), also called the cost-of-living index, is an inflationary indicator that measures the change in the cost of a fixed basket of products and services, including housing, electricity, food, and transportation. The CPI is published monthly. The headline CPI includes volatile food and energy prices, while the core CPI excludes food and energy.
A corporate bond is a debt security issued by a corporation for the purpose of raising money to expand its business.
A credit (debt) rating is an assessment of the credit worthiness of individuals, corporations and countries. It is based upon the history of borrowing and repayment, as well as the availability of assets and extent of liabilities. Ratings are issued by S&P or Moody’s and typically range from AAA (highest) to D (lowest). The credit quality of the investments in a Fund’s portfolio does not apply to the safety or stability of the Fund. Ratings and portfolio credit quality may change over time. Unrated securities do not necessarily indicate low quality. The Wasatch Funds themselves have not been rated by an independent rating agency. For information on the rating agency’s methodology visit: http://www.standardandpoors.com/home/en/us and http://www.moodys.com.
A credit spread is the difference in yield between two bonds of similar maturity but different credit quality. For
example, if the 10-year Treasury note is trading at a yield of 6% and a 10-year corporate bond is trading at a yield of 8%, the corporate bond is said to offer a spread over the Treasury of two percentage points.
The U.S. Department of Commerce (the Commerce Department) works with businesses, universities, communities, and the Nation’s workers to promote job creation, economic growth, sustainable development, and improved standards of living for Americans.
Dividend yield is a company’s annual dividend payments divided by its market capitalization, or the dividend per share divided by the price per share. For example, a company whose stock sells for $30 per share that pays an annual dividend of $3 per share has a dividend yield of 10%.
Earnings growth is a measure of growth in a company’s net income over a specific period, often one year.
An Exchange-Traded Fund (ETF) is a security that tracks an index, a commodity or a basket of assets like an index fund, but trades like a stock on a securities exchange. ETFs experience price changes throughout the day as they are bought and sold.
The federal-funds rate is the interest rate at which private depository institutions (mostly banks) lend balances (federal funds) at the Federal Reserve to other depository institutions, usually overnight. It is the interest rate banks charge each other for loans.
The federal-funds target rate (also known as the fed-funds target rate) is set by a committee within the Federal Reserve System called the Federal Open Market Committee (FOMC). The FOMC usually meets every six weeks, and it is at these meetings that the FOMC votes on whether or not to make changes to the federal-funds target rate.
The Federal Open Market Committee (FOMC), a component of the Federal Reserve System, is charged under United States law with overseeing the nation’s open market operations. Open market operations are the means of implementing monetary policy by which a central bank controls the short term interest rate and the supply of base money in an economy, and thus indirectly the total money supply.
The financial crisis of 2007-09, also known as the global financial crisis (GFC) and 2008 financial crisis, is considered by many economists to have been the worst financial crisis since the Great Depression of the 1930s. It is also sometimes called the “Great Recession,” a term that applies to the U.S. recession, which officially lasted from December 2007 to June 2009, and the ensuing global recession in 2009. The economic slump began when the bubble in the U.S. housing market burst and large amounts of mortgage-backed securities and derivatives lost significant value.
Government agency bonds are debt securities issued by a U.S. government-sponsored agency.
The government debt-to-GDP ratio is the ratio of a country’s public debt to it gross domestic product (GDP). By comparing what a country owes to what it produces, the debt-to-GDP ratio indicates the country’s ability to pay back its debt. Often expressed as a percentage, the ratio can be interpreted as the number of years needed to pay back debt if GDP is dedicated entirely to debt repayment.
42
| | |
| | SEPTEMBER 30, 2016 (UNAUDITED) |
|
|
|
Gross domestic product (GDP) is a basic measure of a country’s economic performance and is the market value of all final goods and services made within the borders of a country in a year.
An initial public offering (IPO) is a company’s first sale of stock to the public.
Mortgage-backed securities are debt issues backed by a pool of mortgages. Investors receive payments from the interest and principal payments made on the underlying mortgages. Agency mortgage-backed securities are issued by government-sponsored enterprises such as Ginnie Mae, Fannie Mae or Freddie Mac.
The price-to-earnings (P/E) multiple, also known as the P/E ratio, is the price of a stock divided by its earnings per share.
Quantitative easing is a government monetary policy used to increase the money supply by buying government securities or other securities from the market. Quantitative easing increases the money supply by flooding financial institutions with capital in an effort to promote increased lending and liquidity. QE3 is the nickname for the third round of quantitative easing announced by the U.S. Federal Reserve in September of 2012.
Real gross domestic product (GDP) is a macroeconomic measure of the value of economic output adjusted for price changes (i.e., inflation or deflation). This adjustment transforms the money-value measure, nominal GDP, into an index for quantity of total output.
The S&P 500 Index includes 500 of the United States’ largest stocks from a broad variety of industries. The Index is unmanaged but is a commonly used measure of common stock total return performance.
The 30-day current net (“SEC”) yield is calculated by dividing the net investment income per share for the 30 days ended on the date of calculation by the maximum offering price per share on that date. The figure is compounded and annualized.
Sovereign debt is government debt. Under the doctrine of sovereign immunity, creditors cannot force the repayment of sovereign debt. It is subject to compulsory rescheduling, interest rate reduction, or even repudiation. The only recourse available to creditors is threat of the loss of credibility and lowering of the country’s sovereign debt rating, which may make future borrowing more difficult.
Valuation is the process of determining the current worth of an asset or company.
The weighted average coupon (WAC) is the weighted-average gross interest rates of the pool of mortgages that underlie a mortgage-backed security (MBS) at the time the security was issued. A mortgage-backed security’s current WAC can differ from its original WAC as the underlying
mortgages pay down at different speeds. In the weighted-average calculation, the principal balance of each underlying mortgage is used as the weighting factor.
World’s Best Growth Companies are defined by Wasatch as companies that we believe possess an identifiable, sustainable competitive advantage, are well managed, underfollowed, undervalued and are producing above average earnings growth relative to their industry and country of origin.
The yield curve is a line on a graph that plots the interest rates, at a set point in time, of bonds having equal credit quality, but differing maturity dates. The most frequently reported yield curve compares three-month, two-year, five-year and 30-year U.S. Treasury securities. This yield curve is used as a benchmark for other interest rates, such as mortgage rates or bank lending rates. The curve is also used to predict changes in economic output and growth.
Pertaining to the use of MSCI information. Source: MSCI. The MSCI information may only be used for your internal use, may not be reproduced or redisseminated in any form and may not be used as a basis for or a component of any financial instruments or products or indices. None of the MSCI information is intended to constitute investment advice or a recommendation to make (or refrain from making) any kind of investment decision and may not be relied on as such. Historical data and analysis should not be taken as an indication or guarantee of any future performance analysis, forecast or prediction. The MSCI information is provided on an “as is” basis and the user of this information assumes the entire risk of any use made of this information. MSCI, each of its affiliates and each other person involved in or related to compiling, computing or creating any MSCI information (collectively, the “MSCI Parties”) expressly disclaims all warranties (including, without limitation, any warranties or originality, accuracy, completeness, timeliness, non-infringement, merchantability and fitness for a particular purpose) with respect to this information. Without limiting any of the foregoing, in no event shall any MSCI Party have any liability for any direct, indirect, special, incidental, punitive, consequential (including, without limitation, lost profits) or any other damages. (www.msci.com)
Pertaining to the use of Russell information. Frank Russell Company is the source and owner of the Russell Index data contained or reflected in this material and all trademarks and copyrights related thereto. This is a presentation of Wasatch Advisors, Inc. The presentation may contain confidential information and unauthorized use, disclosure, copying, dissemination or redistribution is strictly prohibited. Frank Russell Company is not responsible for the formatting or configuration of this material or for any inaccuracy in Wasatch Advisors, Inc.’s presentation thereof.
43
Operating Expenses (UNAUDITED)
EXPENSE EXAMPLE
As a shareholder of Wasatch Funds, you incur two types of costs: (1) transaction costs, including redemption fees and (2) ongoing costs, including management fees and other fund expenses. This example is intended to help you understand your ongoing costs (in dollars) of investing in a Wasatch Fund and to compare these costs with the ongoing costs of investing in other mutual funds.
The example is based on an investment of $1,000.00 invested at the beginning of the period and held for the entire six-month period ended September 30, 2016.
ACTUAL EXPENSES
The first line of the table below provides information about actual account values and actual expenses, based upon the actual total return of the fund during the most recent six-month period ended September 30, 2016. You may use the information in this line, together with the amount you invested, to estimate the expenses you paid over the period. Simply divide your account value by $1,000.00 (for example, an $8,600.00 account value divided by $1,000.00 = 8.6), then multiply the result by the number in the first line under the heading entitled “Expenses Paid During Period” to estimate the expenses you paid on your account during this period.
In addition, the Funds charge a $12.50 IRA annual maintenance fee and a $15.00 fee for redemptions paid by wire. To the extent these fees apply to your account, your expenses paid during the period would be higher and your ending account value would be lower than the amounts shown in the table below.
HYPOTHETICAL EXAMPLEFOR COMPARISON PURPOSES
The second line of the table on the next page provides information about hypothetical account values and hypothetical expenses based on a fund’s actual expense ratio and
an assumed rate of return of 5% per year before expenses, which is not the fund’s actual return. The hypothetical account values and expenses may not be used to estimate the actual ending account balance or expenses you paid for the period. You may use this information to compare the ongoing costs of investing in a Wasatch Fund and other funds. To do so, compare this 5% hypothetical example with the 5% hypothetical examples that appear in the shareholder reports of other funds.
In addition, the Funds charge a $12.50 IRA annual maintenance fee and a $15.00 fee for redemptions paid by wire. To the extent these fees apply to your account, your expenses paid during the period would be higher and your ending account value would be lower than the amounts shown in the table on the next page. If another fund’s fees differ from those listed above, your expenses paid and your ending account value could be higher or lower than those of other funds.
Please note that the expenses shown in the table are meant to highlight your ongoing costs only and do not reflect any transactional costs, such as redemption fees. Therefore, the second line of the table is useful in comparing ongoing costs only, and will not help you determine the relative total costs of owning different funds. In addition, if these transactional costs were included, your costs would have been higher.
A Fund’s annualized expense ratio may vary as a result of various factors including expenses that are not reimbursable under the contractual agreement between the Fund and the Advisor such as interest, taxes, brokerage commissions, other investment related costs, dividend expense on short sales, and extraordinary expenses. The Long/Short Fund — Investor Class and the Income Fund have no contractual limitation on expenses.
44
| | |
| | SEPTEMBER 30, 2016 (UNAUDITED) |
|
|
|
| | | | | | | | | | | | | | | | |
| | | Account Value | | | Expenses
Paid
During Period* | | | Annualized
Expense
Ratio* | |
| Fund/Class and Return | | Beginning of Period April 1, 2016 | | | End of Period September 30, 2016 | | | |
Core Growth Fund — Investor Class | | | | | | | | | | | | | | | | |
Actual | | | $1,000.00 | | | | $1,110.70 | | | | $6.44 | | | | 1.22% | |
Hypothetical (5% before expenses) | | | $1,000.00 | | | | $1,018.90 | | | | $6.16 | | | | 1.22% | |
Core Growth Fund — Institutional Class | | | | | | | | | | | | | | | | |
Actual | | | $1,000.00 | | | | $1,111.40 | | | | $5.54 | | | | 1.05% | |
Hypothetical (5% before expenses) | | | $1,000.00 | | | | $1,019.75 | | | | $5.30 | | | | 1.05% | |
Emerging India Fund — Investor Class | | | | | | | | | | | | | | | | |
Actual | | | $1,000.00 | | | | $1,189.50 | | | | $9.58 | | | | 1.75% | |
Hypothetical (5% before expenses) | | | $1,000.00 | | | | $1,016.25 | | | | $8.82 | | | | 1.75% | |
Emerging India Fund — Institutional Class | | | | | | | | | | | | | | | | |
Actual | | | $1,000.00 | | | | $1,193.00 | | | | $8.22 | | | | 1.50% | |
Hypothetical (5% before expenses) | | | $1,000.00 | | | | $1,017.50 | | | | $7.57 | | | | 1.50% | |
Emerging Markets Select Fund — Investor Class | | | | | | | | | | | | | | | | |
Actual | | | $1,000.00 | | | | $1,069.50 | | | | $7.81 | | | | 1.51% | |
Hypothetical (5% before expenses) | | | $1,000.00 | | | | $1,017.45 | | | | $7.62 | | | | 1.51% | |
Emerging Markets Select Fund — Institutional Class | | | | | | | | | | | | | | | | |
Actual | | | $1,000.00 | | | | $1,070.00 | | | | $6.26 | | | | 1.21% | |
Hypothetical (5% before expenses) | | | $1,000.00 | | | | $1,018.95 | | | | $6.11 | | | | 1.21% | |
Emerging Markets Small Cap Fund — Investor Class | | | | | | | | | | | | | | | | |
Actual | | | $1,000.00 | | | | $1,103.30 | | | | $10.31 | | | | 1.96% | |
Hypothetical (5% before expenses) | | | $1,000.00 | | | | $1,015.20 | | | | $9.87 | | | | 1.96% | |
Emerging Markets Small Cap Fund — Institutional Class | | | | | | | | | | | | | | | | |
Actual | | | $1,000.00 | | | | $1,103.30 | | | | $9.46 | | | | 1.80% | |
Hypothetical (5% before expenses) | | | $1,000.00 | | | | $1,016.00 | | | | $9.07 | | | | 1.80% | |
Frontier Emerging Small Countries Fund — Investor Class | | | | | | | | | | | | | | | | |
Actual | | | $1,000.00 | | | | $992.50 | | | | $11.26 | | | | 2.26% | |
Hypothetical (5% before expenses) | | | $1,000.00 | | | | $1,013.70 | | | | $11.38 | | | | 2.26% | |
Frontier Emerging Small Countries Fund — Institutional Class | | | | | | | | | | | | | | | | |
Actual | | | $1,000.00 | | | | $992.50 | | | | $10.26 | | | | 2.06% | |
Hypothetical (5% before expenses) | | | $1,000.00 | | | | $1,014.70 | | | | $10.38 | | | | 2.06% | |
Global Opportunities Fund — Investor Class | | | | | | | | | | | | | | | | |
Actual | | | $1,000.00 | | | | $1,100.00 | | | | $7.82 | | | | 1.49% | |
Hypothetical (5% before expenses) | | | $1,000.00 | | | | $1,017.55 | | | | $7.52 | | | | 1.49% | |
Global Opportunities Fund — Institutional Class | | | | | | | | | | | | | | | | |
Actual | | | $1,000.00 | | | | $1,100.00 | | | | $7.14 | | | | 1.36% | |
Hypothetical (5% before expenses) | | | $1,000.00 | | | | $1,018.20 | | | | $6.86 | | | | 1.36% | |
International Growth Fund — Investor Class | | | | | | | | | | | | | | | | |
Actual | | | $1,000.00 | | | | $1,069.80 | | | | $7.40 | | | | 1.43% | |
Hypothetical (5% before expenses) | | | $1,000.00 | | | | $1,017.85 | | | | $7.21 | | | | 1.43% | |
International Growth Fund — Institutional Class | | | | | | | | | | | | | | | | |
Actual | | | $1,000.00 | | | | $1,070.40 | | | | $6.99 | | | | 1.35% | |
Hypothetical (5% before expenses) | | | $1,000.00 | | | | $1,018.25 | | | | $6.81 | | | | 1.35% | |
International Opportunities Fund — Investor Class | | | | | | | | | | | | | | | | |
Actual | | | $1,000.00 | | | | $1,122.40 | | | | $11.94 | | | | 2.25% | |
Hypothetical (5% before expenses) | | | $1,000.00 | | | | $1,013.75 | | | | $11.33 | | | | 2.25% | |
International Opportunities Fund — Institutional Class | | | | | | | | | | | | | | | | |
Actual | | | $1,000.00 | | | | $1,125.40 | | | | $10.36 | | | | 1.95% | |
Hypothetical (5% before expenses) | | | $1,000.00 | | | | $1,015.25 | | | | $9.82 | | | | 1.95% | |
Large Cap Value Fund — Investor Class | | | | | | | | | | | | | | | | |
Actual | | | $1,000.00 | | | | $1,063.20 | | | | $5.67 | | | | 1.10% | |
Hypothetical (5% before expenses) | | | $1,000.00 | | | | $1,019.50 | | | | $5.55 | | | | 1.10% | |
Large Cap Value Fund — Institutional Class | | | | | | | | | | | | | | | | |
Actual | | | $1,000.00 | | | | $1,064.00 | | | | $4.90 | | | | 0.95% | |
Hypothetical (5% before expenses) | | | $1,000.00 | | | | $1,020.25 | | | | $4.80 | | | | 0.95% | |
45
| | |
| WASATCH FUNDS | | SEPTEMBER 30, 2016 (UNAUDITED) |
|
|
|
Operating Expenses (continued)
| | | | | | | | | | | | | | | | |
| | | Account Value | | | Expenses
Paid
During Period* | | | Annualized
Expense
Ratio* | |
| Fund/Class and Return | | Beginning of Period April 1, 2016 | | | End of Period September 30, 2016 | | | |
Long/Short Fund — Investor Class | | | | | | | | | | | | | | | | |
Actual | | | $1,000.00 | | | | $1,053.40 | | | | $9.70 | | | | 1.89% | |
Hypothetical (5% before expenses) | | | $1,000.00 | | | | $1,015.55 | | | | $9.52 | | | | 1.89% | |
Long/Short Fund — Institutional Class | | | | | | | | | | | | | | | | |
Actual | | | $1,000.00 | | | | $1,054.10 | | | | $8.88 | | | | 1.73% | |
Hypothetical (5% before expenses) | | | $1,000.00 | | | | $1,016.35 | | | | $8.72 | | | | 1.73% | |
Micro Cap Fund | | | | | | | | | | | | | | | | |
Actual | | | $1,000.00 | | | | $1,154.10 | | | | $10.34 | | | | 1.92% | |
Hypothetical (5% before expenses) | | | $1,000.00 | | | | $1,015.40 | | | | $9.67 | | | | 1.92% | |
Micro Cap Value Fund | | | | | | | | | | | | | | | | |
Actual | | | $1,000.00 | | | | $1,108.10 | | | | $10.28 | | | | 1.95% | |
Hypothetical (5% before expenses) | | | $1,000.00 | | | | $1,015.25 | | | | $9.82 | | | | 1.95% | |
Small Cap Growth Fund — Investor Class | | | | | | | | | | | | | | | | |
Actual | | | $1,000.00 | | | | $1,102.10 | | | | $6.78 | | | | 1.29% | |
Hypothetical (5% before expenses) | | | $1,000.00 | | | | $1,018.55 | | | | $6.51 | | | | 1.29% | |
Small Cap Growth Fund — Institutional Class | | | | | | | | | | | | | | | | |
Actual | | | $1,000.00 | | | | $1,103.60 | | | | $5.52 | | | | 1.05% | |
Hypothetical (5% before expenses) | | | $1,000.00 | | | | $1,019.75 | | | | $5.30 | | | | 1.05% | |
Small Cap Value Fund — Investor Class | | | | | | | | | | | | | | | | |
Actual | | | $1,000.00 | | | | $1,143.60 | | | | $6.65 | | | | 1.24% | |
Hypothetical (5% before expenses) | | | $1,000.00 | | | | $1,018.80 | | | | $6.26 | | | | 1.24% | |
Small Cap Value Fund — Institutional Class | | | | | | | | | | | | | | | | |
Actual | | | $1,000.00 | | | | $1,144.60 | | | | $5.63 | | | | 1.05% | |
Hypothetical (5% before expenses) | | | $1,000.00 | | | | $1,019.75 | | | | $5.30 | | | | 1.05% | |
Strategic Income Fund | | | | | | | | | | | | | | | | |
Actual | | | $1,000.00 | | | | $1,052.20 | | | | $4.87 | | | | 0.95% | |
Hypothetical (5% before expenses) | | | $1,000.00 | | | | $1,020.25 | | | | $4.80 | | | | 0.95% | |
Ultra Growth Fund | | | | | | | | | | | | | | | | |
Actual | | | $1,000.00 | | | | $1,198.20 | | | | $7.20 | | | | 1.31% | |
Hypothetical (5% before expenses) | | | $1,000.00 | | | | $1,018.45 | | | | $6.61 | | | | 1.31% | |
World Innovators Fund — Investor Class | | | | | | | | | | | | | | | | |
Actual | | | $1,000.00 | | | | $1,058.10 | | | | $9.16 | | | | 1.78% | |
Hypothetical (5% before expenses) | | | $1,000.00 | | | | $1,016.10 | | | | $8.97 | | | | 1.78% | |
World Innovators Fund — Institutional Class | | | | | | | | | | | | | | | | |
Actual | | | $1,000.00 | | | | $1,059.70 | | | | $7.98 | | | | 1.55% | |
Hypothetical (5% before expenses) | | | $1,000.00 | | | | $1,017.25 | | | | $7.82 | | | | 1.55% | |
Income Fund | | | | | | | | | | | | | | | | |
Actual | | | $1,000.00 | | | | $1,012.90 | | | | $3.72 | | | | 0.74% | |
Hypothetical (5% before expenses) | | | $1,000.00 | | | | $1,021.30 | | | | $3.74 | | | | 0.74% | |
U.S. Treasury Fund | | | | | | | | | | | | | | | | |
Actual | | | $1,000.00 | | | | $1,077.80 | | | | $3.58 | | | | 0.69% | |
Hypothetical (5% before expenses) | | | $1,000.00 | | | | $1,021.55 | | | | $3.49 | | | | 0.69% | |
*Expenses are equal to a fund’s annualized expense ratio as indicated above multiplied by the average account value over the period, multiplied by the number of days in the most recent fiscal half-year divided by the number of days in the full fiscal year (183/366).
46
| | |
| WASATCH CORE GROWTH FUND (WGROX / WIGRX) | | SEPTEMBER 30, 2016 |
|
|
|
Schedule of Investments
| | | | | | | | |
| Shares | | | | | Value | |
| | | | | | | |
| | | | COMMON STOCKS 91.4% | | | | |
| | |
| | | | Airlines 4.1% | | | | |
| | 192,940 | | | Allegiant Travel Co. | | $ | 25,481,586 | |
| | 694,245 | | | Spirit Airlines, Inc.* | | | 29,526,240 | |
| | | | | | | | |
| | | | | | | 55,007,826 | |
| | | | | | | | |
| | | | Apparel Retail 0.6% | | | | |
| | 485,770 | | | Zumiez, Inc.* | | | 8,743,860 | |
| | | | | | | | |
| | | | Application Software 7.3% | | | | |
| | 98,069 | | | ANSYS, Inc.* | | | 9,082,170 | |
| | 213,917 | | | Globant S.A.* (Argentina) | | | 9,010,184 | |
| | 207,328 | | | Tyler Technologies, Inc.* | | | 35,500,774 | |
| | 126,501 | | | Ultimate Software Group, Inc. (The)* | | | 25,855,539 | |
| | 594,645 | | | Zendesk, Inc.* | | | 18,261,548 | |
| | | | | | | | |
| | | | | | | 97,710,215 | |
| | | | | | | | |
| | | | Asset Management & Custody Banks 1.3% | | | | |
| | 368,969 | | | SEI Investments Co. | | | 16,828,676 | |
| | | | | | | | |
| | | | Automotive Retail 1.2% | | | | |
| | 273,758 | | | Monro Muffler Brake, Inc. | | | 16,745,777 | |
| | | | | | | | |
| | | | Biotechnology 4.8% | | | | |
| | 1,908,420 | | | Abcam plc (United Kingdom) | | | 20,778,218 | |
| | 195,117 | | | Argos Therapeutics, Inc.* | | | 969,732 | |
| | 1,582,827 | | | Sangamo BioSciences, Inc.* | | | 7,328,489 | |
| | 651,027 | | | Seattle Genetics, Inc.* | | | 35,161,968 | |
| | | | | | | | |
| | | | | | | 64,238,407 | |
| | | | | | | | |
| | | | Building Products 1.9% | | | | |
| | 424,029 | | | Trex Co., Inc.* | | | 24,898,983 | |
| | | | | | | | |
| | | | Consumer Finance 4.1% | | | | |
| | 169,210 | | | Credit Acceptance Corp.* | | | 34,023,055 | |
| | 606,526 | | | PRA Group, Inc.* | | | 20,949,408 | |
| | | | | | | | |
| | | | | | | 54,972,463 | |
| | | | | | | | |
| | | | Distributors 1.2% | | | | |
| | 163,176 | | | Pool Corp. | | | 15,423,395 | |
| | | | | | | | |
| | | | Diversified Banks 2.0% | | | | |
| | 6,656,038 | | | City Union Bank Ltd. (India) | | | 13,256,093 | |
| | 717,994 | | | Yes Bank Ltd. (India) | | | 13,547,850 | |
| | | | | | | | |
| | | | | | | 26,803,943 | |
| | | | | | | | |
| | | | Diversified Support Services 2.9% | | | | |
| | 726,462 | | | Copart, Inc.* | | | 38,909,305 | |
| | | | | | | | |
| | | | Environmental & Facilities Services 2.9% | | | | |
| | 515,581 | | | Waste Connections, Inc. (Canada) | | | 38,513,901 | |
| | | | | | | | |
| | | | Financial Exchanges & Data 0.4% | | | | |
| | 148,269 | | | CRISIL Ltd. (India) | | | 5,055,131 | |
| | | | | | | | |
| | | | General Merchandise Stores 1.1% | | | | |
| | 581,194 | | | Ollie’s Bargain Outlet Holdings, Inc.* | | | 15,233,095 | |
| | | | | | | | |
| | | | Health Care Facilities 2.1% | | | | |
| | 1,414,979 | | | Ensign Group, Inc. (The) | | | 28,483,527 | |
| | | | | | | | |
| | | | Health Care REITs 1.7% | | | | |
| | 1,536,988 | | | CareTrust REIT, Inc. | | | 22,716,683 | |
| | | | | | | | |
| | | | Health Care Services 2.5% | | | | |
| | 500,977 | | | MEDNAX, Inc.* | | | 33,189,726 | |
| | | | | | | | |
| | | | Homebuilding 1.3% | | | | |
| | 492,810 | | | Installed Building Products, Inc.* | | | 17,677,095 | |
| | | | | | | | |
| | | | | | | | |
| Shares | | | | | Value | |
| | | | | | | |
| | | | Internet & Direct Marketing Retail 2.0% | | | | |
| | 86,205 | | | Blue Nile, Inc. | | $ | 2,967,176 | |
| | 508,640 | | | MakeMyTrip Ltd.* (India) | | | 12,003,904 | |
| | 305,676 | | | Wayfair, Inc., Class A* | | | 12,034,464 | |
| | | | | | | | |
| | | | | | | 27,005,544 | |
| | | | | | | | |
| | | | Internet Software & Services 9.3% | | | | |
| | 448,282 | | | Cimpress N.V.* | | | 45,357,173 | |
| | 1,111,166 | | | Cornerstone OnDemand, Inc.* | | | 51,058,078 | |
| | 429,592 | | | Envestnet, Inc.* | | | 15,658,628 | |
| | 179,106 | | | Shutterstock, Inc.* | | | 11,409,052 | |
| | | | | | | | |
| | | | | | | 123,482,931 | |
| | | | | | | | |
| | | | IT Consulting & Other Services 3.2% | | | | |
| | 335,413 | | | EPAM Systems, Inc.* | | | 23,247,475 | |
| | 365,786 | | | Luxoft Holding, Inc.* (Switzerland) | | | 19,331,790 | |
| | | | | | | | |
| | | | | | | 42,579,265 | |
| | | | | | | | |
| | | | Life Sciences Tools & Services 4.2% | | | | |
| | 1,147,000 | | | Divi’s Laboratories Ltd. (India) | | | 22,395,614 | |
| | 436,437 | | | ICON plc* (Ireland) | | | 33,767,131 | |
| | | | | | | | |
| | | | | | | 56,162,745 | |
| | | | | | | | |
| | | | Managed Health Care 0.8% | | | | |
| | 300,389 | | | HealthEquity, Inc.* | | | 11,369,724 | |
| | | | | | | | |
| | | | Personal Products 1.4% | | | | |
| | 283,139 | | | Nu Skin Enterprises, Inc., Class A | | | 18,341,744 | |
| | | | | | | | |
| | | | Real Estate Services 1.4% | | | | |
| | 660,390 | | | HFF, Inc., Class A | | | 18,286,199 | |
| | | | | | | | |
| | | | Regional Banks 8.3% | | | | |
| | 346,902 | | | Eagle Bancorp, Inc.* | | | 17,112,676 | |
| | 340,636 | | | Independent Bank Corp. | | | 18,425,001 | |
| | 577,628 | | | Metro Bank plc* (United Kingdom) | | | 20,671,391 | |
| | 220,804 | | | South State Corp. | | | 16,569,132 | |
| | 376,326 | | | Texas Capital Bancshares, Inc.* | | | 20,667,824 | |
| | 444,763 | | | Webster Financial Corp. | | | 16,905,442 | |
| | | | | | | | |
| | | | | | | 110,351,466 | |
| | | | | | | | |
| | | | Research & Consulting Services 1.0% | | | | |
| | 244,015 | | | CEB, Inc. | | | 13,291,497 | |
| | | | | | | | |
| | | | Restaurants 1.7% | | | | |
| | 681,753 | | | Fiesta Restaurant Group, Inc.* | | | 16,362,072 | |
| | 267,888 | | | Zoe’s Kitchen, Inc.* | | | 5,944,435 | |
| | | | | | | | |
| | | | | | | 22,306,507 | |
| | | | | | | | |
| | | | Semiconductors 4.1% | | | | |
| | 528,687 | | | Cavium, Inc.* | | | 30,769,583 | |
| | 301,196 | | | Monolithic Power Systems, Inc. | | | 24,246,278 | |
| | | | | | | | |
| | | | | | | 55,015,861 | |
| | | | | | | | |
| | | | Specialized Consumer Services 1.0% | | | | |
| | 823,349 | | | LifeLock, Inc.* | | | 13,931,065 | |
| | | | | | | | |
| | | | Specialty Chemicals 2.4% | | | | |
| | 406,646 | | | Balchem Corp. | | | 31,527,264 | |
| | | | | | | | |
| | | | Specialty Stores 1.0% | | | | |
| | 322,333 | | | Five Below, Inc.* | | | 12,986,797 | |
| | | | | | | | |
| | | | Systems Software 2.9% | | | | |
| | 89,611 | | | CyberArk Software Ltd.* (Israel) | | | 4,442,017 | |
| | 166,471 | | | FleetMatics Group plc* | | | 9,984,931 | |
| | 642,523 | | | Fortinet, Inc.* | | | 23,728,374 | |
| | | | | | | | |
| | | | 38,155,322 | |
| | | | | | | | |
47
| | |
| WASATCH CORE GROWTH FUND (WGROX / WIGRX) | | SEPTEMBER 30, 2016 |
|
|
|
Schedule of Investments (continued)
| | | | | | | | |
| Shares | | | | | Value | |
| | | | | | | |
| | | | Trucking 3.3% | | | | |
| | 627,240 | | | Knight Transportation, Inc. | | $ | 17,995,516 | |
| | 375,268 | | | Old Dominion Freight Line, Inc.* | | | 25,747,137 | |
| | | | | | | | |
| | | | 43,742,653 | |
| | | | | | | | |
| | |
| | | | Total Common Stocks
(cost $820,548,948) | | | 1,219,688,592 | |
| | | | | | | | |
| | |
| | | | PREFERRED STOCKS 0.3% | | | | |
| | |
| | | | Systems Software 0.3% | | | | |
| | 209,500 | | | DocuSign, Inc., Series F Pfd.* *** † | | | 3,257,725 | |
| | | | | | | | |
| | |
| | | | Total Preferred Stocks
(cost $4,000,004) | | | 3,257,725 | |
| | | | | | | | |
| | |
| | | | WARRANTS 0.0% | | | | |
| | |
| | | | Biotechnology 0.0% | | | | |
| | 146,337 | | | Argos Therapeutics, Inc., expiring 8/2/2021* *** † | | | 193,457 | |
| | | | | | | | |
| | |
| | | | Total Warrants
(cost $0) | | | 193,457 | |
| | | | | | | | |
| | |
Principal
Amount | | | | | Value | |
| | | | | | | |
| | | | SHORT-TERM INVESTMENTS 7.9% | | | | |
| | |
| | | | Repurchase Agreement 7.9% | | | | |
| | $105,044,901 | | | Repurchase Agreement dated 9/30/16, 0.03% due 10/3/16 with State Street Bank and Trust Co. collateralized by $90,040,000 of United States Treasury Bonds 3.125% due 11/15/41; value $107,147,600; repurchase proceeds: $105,045,163 (cost $105,044,901) | | $ | 105,044,901 | |
| | | | | | | | |
| | |
| | | | Total Short-Term Investments
(cost $105,044,901) | | | 105,044,901 | |
| | | | | | | | |
| | |
| | | | Total Investments
(cost $929,593,853) 99.6% | | | 1,328,184,675 | |
| | |
| | | | Other Assets less Liabilities 0.4% | | | 5,675,830 | |
| | | | | | | | |
| | |
| | | | NET ASSETS 100.0% | | $ | 1,333,860,505 | |
| | | | | | | | |
| |
| | | | *Non-income producing. ***Security was fair valued under procedures adopted by the Board of Trustees (see Note 13). †Security purchased in a private placement transaction or under Rule 144A of the Securities Act of 1933 (see Note 9). REIT Real Estate Investment Trust. See Notes to Financial Statements. | |
At September 30, 2016, Wasatch Core Growth Fund’s investments, excluding short-term investments, were in the following countries (unaudited):
| | | | |
| Country | | % | |
Argentina | | | 0.7 | |
Canada | | | 3.1 | |
India | | | 5.4 | |
Ireland | | | 2.8 | |
Israel | | | 0.4 | |
Switzerland | | | 1.6 | |
United Kingdom | | | 3.4 | |
United States | | | 82.6 | |
| | | | |
TOTAL | | | 100.0 | % |
| | | | |
48
| | |
| WASATCH EMERGING INDIA FUND (WAINX / WIINX) | | SEPTEMBER 30, 2016 |
|
|
|
Schedule of Investments
| | | | | | | | |
| Shares | | | | | Value | |
| | | | | | | |
| | | | COMMON STOCKS 94.5% | | | | |
| | |
| | | | Apparel, Accessories & Luxury Goods 1.5% | | | | |
| | 5,313 | | | Page Industries Ltd. (India) | | $ | 1,204,163 | |
| | | | | | | | |
| | | | Auto Parts & Equipment 2.4% | | | | |
| | 2,331 | | | Bosch Ltd. (India) | | | 797,540 | |
| | 12,156 | | | WABCO India Ltd. (India) | | | 1,134,727 | |
| | | | | | | | |
| | | | 1,932,267 | |
| | | | | | | | |
| | | | Building Products 5.0% | | | | |
| | 93,975 | | | Kajaria Ceramics Ltd. (India) | | | 1,959,106 | |
| | 234,146 | | | Somany Ceramics Ltd. (India) | | | 2,148,742 | |
| | | | | | | | |
| | | | 4,107,848 | |
| | | | | | | | |
| | | | Commodity Chemicals 5.4% | | | | |
| | 659,491 | | | Berger Paints India Ltd. (India) | | | 2,585,763 | |
| | 162,634 | | | Gulf Oil Lubricants India Ltd. (India) | | | 1,788,290 | |
| | | | | | | | |
| | | | 4,374,053 | |
| | | | | | | | |
| | | | Construction Machinery & Heavy Trucks 0.8% | | | | |
| | 1,793 | | | Eicher Motors Ltd. (India) | | | 670,355 | |
| | | | | | | | |
| | | | Consumer Finance 11.7% | | | | |
| | 236,560 | | | Bajaj Finance Ltd. (India) | | | 3,784,321 | |
| | 51,763 | | | Bharat Financial Inclusion Ltd.* (India) | | | 685,405 | |
| | 93,132 | | | Cholamandalam Investment and Finance Co. Ltd. (India) | | | 1,647,785 | |
| | 133,406 | | | Mahindra & Mahindra Financial Services Ltd. (India) | | | 732,350 | |
| | 149,136 | | | Repco Home Finance Ltd. (India) | | | 1,859,160 | |
| | 26,755 | | | Shriram City Union Finance Ltd. (India) | | | 860,355 | |
| | | | | | | | |
| | | | 9,569,376 | |
| | | | | | | | |
| | | | Department Stores 1.1% | | | | |
| | 116,237 | | | V-Mart Retail Ltd. (India) | | | 884,260 | |
| | | | | | | | |
| | | | Diversified Banks 4.0% | | | | |
| | 176,542 | | | Axis Bank Ltd. (India) | | | 1,439,806 | |
| | 9,834 | | | HDFC Bank Ltd. ADR (India) | | | 706,966 | |
| | 64,352 | | | IndusInd Bank Ltd. (India) | | | 1,154,963 | |
| | | | | | | | |
| | | | 3,301,735 | |
| | | | | | | | |
| | | | Diversified Chemicals 2.6% | | | | |
| | 203,219 | | | Pidilite Industries Ltd. (India) | | | 2,081,636 | |
| | | | | | | | |
| | | | Electrical Components & Equipment 2.1% | | | | |
| | 113,497 | | | Amara Raja Batteries Ltd. (India) | | | 1,723,422 | |
| | | | | | | | |
| | | | Fertilizers & Agricultural Chemicals 3.7% | | | | |
| | 13,628 | | | Bayer CropScience Ltd. (India) | | | 906,708 | |
| | 205,892 | | | UPL Ltd. (India) | | | 2,087,370 | |
| | | | | | | | |
| | | | 2,994,078 | |
| | | | | | | | |
| | | | Financial Exchanges & Data 1.3% | | | | |
| | 30,087 | | | CRISIL Ltd. (India) | | | 1,025,796 | |
| | | | | | | | |
| | | | Health Care Facilities 0.7% | | | | |
| | 30,492 | | | Apollo Hospitals Enterprise Ltd. (India) | | | 602,238 | |
| | | | | | | | |
| | | | Health Care Services 3.5% | | | | |
| | 178,867 | | | Dr. Lal PathLabs Ltd. (India) | | | 2,861,120 | |
| | | | | | | | |
| | | | Housewares & Specialties 1.3% | | | | |
| | 131,727 | | | LA Opala RG Ltd. (India) | | | 1,048,197 | |
| | | | | | | | |
| | | | Human Resource & Employment Services 3.2% | | | | |
| | 315,495 | | | Quess Corp. Ltd.* (India) | | | 2,644,131 | |
| | | | | | | | |
| | | | | | | | |
| Shares | | | | | Value | |
| | | | | | | |
| | | | Industrial Machinery 3.6% | | | | |
| | 37,561 | | | AIA Engineering Ltd. (India) | | $ | 724,931 | |
| | 292,019 | | | Elgi Equipments Ltd. (India) | | | 842,987 | |
| | 8,005 | | | FAG Bearings India Ltd. (India) | | | 491,746 | |
| | 57,800 | | | Vesuvius India Ltd. (India) | | | 868,128 | |
| | | | | | | | |
| | | | 2,927,792 | |
| | | | | | | | |
| | | | Internet & Direct Marketing Retail 4.1% | | | | |
| | 142,383 | | | MakeMyTrip Ltd.* (India) | | | 3,360,239 | |
| | | | | | | | |
| | | | IT Consulting & Other Services 0.4% | | | | |
| | 7,633 | | | Cognizant Technology Solutions Corp., Class A* | | | 364,170 | |
| | | | | | | | |
| | | | Life & Health Insurance 2.8% | | | | |
| | 149,732 | | | ICICI Prudential Life Insurance Co. Ltd.* *** † (India) | | | 670,810 | |
| | 38,836 | | | ICICI Prudential Life Insurance Co. Ltd.* (India) | | | 180,356 | |
| | 174,713 | | | Max Financial Services Ltd. (India) | | | 1,460,446 | |
| | | | | | | | |
| | | | 2,311,612 | |
| | | | | | | | |
| | | | Life Sciences Tools & Services 2.7% | | | | |
| | 78,252 | | | Divi’s Laboratories Ltd. (India) | | | 1,527,900 | |
| | 95,203 | | | Syngene International Ltd. (India) | | | 679,205 | |
| | | | | | | | |
| | | | 2,207,105 | |
| | | | | | | | |
| | | | Marine Ports & Services 0.6% | | | | |
| | 199,597 | | | Gujarat Pipavav Port Ltd. (India) | | | 524,624 | |
| | | | | | | | |
| | | | Packaged Foods & Meats 5.9% | | | | |
| | 29,563 | | | Britannia Industries Ltd. (India) | | | 1,495,911 | |
| | 182,374 | | | Manpasand Beverages Ltd. (India) | | | 2,059,583 | |
| | 725,823 | | | Prabhat Dairy Ltd. (India) | | | 1,272,207 | |
| | | | | | | | |
| | | | 4,827,701 | |
| | | | | | | | |
| | | | Personal Products 7.0% | | | | |
| | 101,512 | | | Colgate-Palmolive India Ltd. (India) | | | 1,484,945 | |
| | 193,446 | | | Dabur India Ltd. (India) | | | 788,979 | |
| | 82,400 | | | Godrej Consumer Products Ltd. (India) | | | 1,949,791 | |
| | 14,854 | | | Procter & Gamble Hygiene & Health Care Ltd. (India) | | | 1,517,214 | |
| | | | | | | | |
| | | | 5,740,929 | |
| | | | | | | | |
| | | | Pharmaceuticals 6.8% | | | | |
| | 114,072 | | | Aurobindo Pharma Ltd. (India) | | | 1,468,304 | |
| | 131,396 | | | Glenmark Pharmaceuticals Ltd. (India) | | | 1,823,519 | |
| | 254,689 | | | Natco Pharma Ltd. (India) | | | 2,282,753 | |
| | | | | | | | |
| | | | 5,574,576 | |
| | | | | | | | |
| | | | Restaurants 0.4% | | | | |
| | 21,502 | | | Jubilant Foodworks Ltd. (India) | | | 313,229 | |
| | | | | | | | |
| | | | Specialty Chemicals 2.4% | | | | |
| | 43,751 | | | Asian Paints Ltd. (India) | | | 762,258 | |
| | 260,799 | | | SH Kelkar & Co. Ltd. (India) | | | 1,194,709 | |
| | | | | | | | |
| | | | 1,956,967 | |
| | | | | | | | |
| | | | Systems Software 0.8% | | | | |
| | 31,318 | | | Tata Elxsi Ltd. (India) | | | 652,890 | |
| | | | | | | | |
| | | | Textiles 2.1% | | | | |
| | 2,182,037 | | | Welspun India Ltd. (India) | | | 1,715,675 | |
| | | | | | | | |
| | | | Thrifts & Mortgage Finance 4.6% | | | | |
| | 194,719 | | | Gruh Finance Ltd. (India) | | | 965,699 | |
| | 72,176 | | | Housing Development Finance Corp. Ltd. (India) | | | 1,512,195 | |
| | 64,450 | | | Indiabulls Housing Finance Ltd. (India) | | | 800,446 | |
| | 52,989 | | | LIC Housing Finance Ltd. (India) | | | 461,445 | |
| | | | | | | | |
| | | | 3,739,785 | |
| | | | | | | | |
| | |
| | | | Total Common Stocks
(cost $52,597,994) | | | 77,241,969 | |
| | | | | | | | |
49
| | |
| WASATCH EMERGING INDIA FUND (WAINX / WIINX) | | SEPTEMBER 30, 2016 |
|
|
|
Schedule of Investments (continued)
| | | | | | | | |
Principal
Amount | | | | | Value | |
| | | | | | | |
| | | | CORPORATE BONDS 0.0% | | | | |
| | |
| | | | Air Freight & Logistics 0.0% | | | | |
| | $532,980 | | | Blue Dart Express Ltd., 9.30%, 11/20/17 (India) | | $ | 8,221 | |
| | 304,560 | | | Blue Dart Express Ltd., 9.40%, 11/20/18 (India) | | | 4,735 | |
| | 228,420 | | | Blue Dart Express Ltd., 9.50%, 11/20/19 (India) | | | 3,431 | |
| | | | | | | | |
| | | | 16,387 | |
| | | | | | | | |
| | |
| | | | Total Corporate Bonds
(cost $11,126) | | | 16,387 | |
| | | | | | | | |
| | |
| | | | SHORT-TERM INVESTMENTS 0.8% | | | | |
| | |
| | | | Repurchase Agreement 0.8% | | | | |
| | 681,622 | | | Repurchase Agreement dated 9/30/16, 0.03% due 10/3/16 with State Street Bank and Trust Co. collateralized by $585,000 of United States Treasury Bonds 3.125% due 11/15/41; value: $696,150; repurchase proceeds: $681,624 (cost $681,622) | | | 681,622 | |
| | | | | | | | |
| | |
| | | | Total Short-Term Investments
(cost $681,622) | | | 681,622 | |
| | | | | | | | |
| | |
| | | | Total Investments
(cost $53,290,742) 95.3% | | | 77,939,978 | |
| | |
| | | | Other Assets less Liabilities 4.7% | | | 3,832,098 | |
| | | | | | | | |
| | |
| | | | NET ASSETS 100.0% | | $ | 81,772,076 | |
| | | | | | | | |
| |
| | | | *Non-income producing. ***Security was fair valued under procedures adopted by the Board of Trustees (see Note 13). †Security purchased in a private placement transaction or under Rule 144A of the Securities Act of 1933 (See Note 9). ADR American Depositary Receipt. See Notes to Financial Statements. | |
At September 30, 2016, Wasatch Emerging India Fund’s investments, excluding short-term investments, were in the following countries (unaudited):
| | | | |
| Country | | % | |
India | | | 99.5 | |
United States | | | 0.5 | |
| | | | |
TOTAL | | | 100.0 | % |
| | | | |
50
| | |
| WASATCH EMERGING MARKETS SELECT FUND (WAESX / WIESX) | | SEPTEMBER 30, 2016 |
|
|
|
Schedule of Investments
| | | | | | | | |
| Shares | | | | | Value | |
| | | | | | | |
| | | | COMMON STOCKS 98.2% | | | | |
| | |
| | | | Airport Services 6.0% | | | | |
| | 140,849 | | | Grupo Aeroportuario del Pacifico S.A.B. de C.V., Class B (Mexico) | | $ | 1,338,991 | |
| | 66,656 | | | Grupo Aeroportuario del Sureste S.A.B. de C.V., Class B (Mexico) | | | 975,033 | |
| | | | | | | | |
| | | | | | | 2,314,024 | |
| | | | | | | | |
| | | | Biotechnology 4.2% | | | | |
| | 3,940 | | | Medytox, Inc. (Korea) | | | 1,611,631 | |
| | | | | | | | |
| | | | Commodity Chemicals 2.2% | | | | |
| | 221,832 | | | Berger Paints India Ltd. (India) | | | 869,769 | |
| | | | | | | | |
| | | | Consumer Finance 8.6% | | | | |
| | 122,153 | | | Bajaj Finance Ltd. (India) | | | 1,954,118 | |
| | 760,006 | | | Gentera S.A.B. de C.V. (Mexico) | | | 1,373,045 | |
| | | | | | | | |
| | | | 3,327,163 | |
| | | | | | | | |
| | | | Diversified Banks 8.4% | | | | |
| | 124,701 | | | Axis Bank Ltd. (India) | | | 1,017,012 | |
| | 201,576 | | | Kasikornbank Public Co. Ltd. (Thailand) | | | 1,090,779 | |
| | 198,633 | | | National Bank of Ras Al-Khaimah PSC (United Arab Emirates) | | | 285,538 | |
| | 715,189 | | | PT Bank Central Asia Tbk (Indonesia) | | | 860,353 | |
| | | | | | | | |
| | | | 3,253,682 | |
| | | | | | | | |
| | | | Drug Retail 3.7% | | | | |
| | 69,743 | | | Raia Drogasil S.A. (Brazil) | | | 1,421,388 | |
| | | | | | | | |
| | | | Fertilizers & Agricultural Chemicals 2.5% | | | | |
| | 94,340 | | | UPL Ltd. (India) | | | 956,436 | |
| | | | | | | | |
| | | | Food Retail 4.6% | | | | |
| | 6,854 | | | BGF Retail Co. Ltd. (Korea) | | | 1,201,091 | |
| | 71,665 | | | President Chain Store Corp. (Taiwan) | | | 569,287 | |
| | | | | | | | |
| | | | 1,770,378 | |
| | | | | | | | |
| | | | Health Care Facilities 2.7% | | | | |
| | 1,640,037 | | | Bangkok Dusit Medical Services Public Co. Ltd., Class F (Thailand) | | | 1,031,827 | |
| | | | | | | | |
| | | | Highways & Railtracks 3.2% | | | | |
| | 116,032 | | | Promotora y Operadora de Infraestructura S.A.B. de C.V. (Mexico) | | | 1,249,140 | |
| | | | | | | | |
| | | | Hypermarkets & Super Centers 2.2% | | | | |
| | 106,634 | | | Lenta Ltd. — REG S GDR* (Russia) | | | 863,735 | |
| | | | | | | | |
| | | | Industrial Machinery 1.6% | | | | |
| | 115,215 | | | Weg S.A. (Brazil) | | | 625,647 | |
| | | | | | | | |
| | | | Internet Software & Services 5.2% | | | | |
| | 10,911 | | | MercadoLibre, Inc. (Brazil) | | | 2,018,208 | |
| | | | | | | | |
| | | | Life & Health Insurance 1.9% | | | | |
| | 89,836 | | | Discovery Ltd. (South Africa) | | | 739,768 | |
| | | | | | | | |
| | | | Life Sciences Tools & Services 3.1% | | | | |
| | 61,337 | | | Divi’s Laboratories Ltd. (India) | | | 1,197,629 | |
| | | | | | | | |
| | | | Marine Ports & Services 1.8% | | | | |
| | 438,350 | | | International Container Terminal Services, Inc. (Philippines) | | | 696,009 | |
| | | | | | | | |
| | | | Multi-Line Insurance 2.0% | | | | |
| | 82,822 | | | BB Seguridade Participacoes S.A. (Brazil) | | | 760,949 | |
| | | | | | | | |
| | | | Multi-Sector Holdings 3.9% | | | | |
| | 50,921 | | | GT Capital Holdings, Inc. (Philippines) | | | 1,512,037 | |
| | | | | | | | |
| | | | Packaged Foods & Meats 6.1% | | | | |
| | 19,076 | | | Britannia Industries Ltd. (India) | | | 965,261 | |
| | 191,206 | | | Universal Robina Corp. (Philippines) | | | 701,818 | |
| | | | | | | | |
| Shares | | | | | Value | |
| | | | | | | |
| | | | Packaged Foods & Meats (continued) | | | | |
| | 345,651 | | | Vitasoy International Holdings Ltd. (Hong Kong) | | $ | 696,970 | |
| | | | | | | | |
| | | | 2,364,049 | |
| | | | | | | | |
| | | | Personal Products 5.7% | | | | |
| | 42,792 | | | Colgate-Palmolive India Ltd. (India) | | | 625,973 | |
| | 35,617 | | | Godrej Consumer Products Ltd. (India) | | | 842,788 | |
| | 847 | | | LG Household & Health Care Ltd. (Korea) | | | 734,448 | |
| | | | | | | | |
| | | | 2,203,209 | |
| | | | | | | | |
| | | | Pharmaceuticals 4.2% | | | | |
| | 76,850 | | | Glenmark Pharmaceuticals Ltd. (India) | | | 1,066,527 | |
| | 1,169 | | | Hanmi Pharm Co. Ltd. (Korea) | | | 539,204 | |
| | | | | | | | |
| | | | 1,605,731 | |
| | | | | | | | |
| | | | Regional Banks 3.0% | | | | |
| | 244,333 | | | Grupo Financiero Interacciones S.A. de C.V., Class O (Mexico) | | | 1,153,005 | |
| | | | | | | | |
| | | | Restaurants 2.5% | | | | |
| | 288,525 | | | Alsea S.A.B. de C.V. (Mexico) | | | 976,296 | |
| | | | | | | | |
| | | | Specialty Chemicals 3.4% | | | | |
| | 74,716 | | | Asian Paints Ltd. (India) | | | 1,301,751 | |
| | | | | | | | |
| | | | Textiles 3.7% | | | | |
| | 47,982 | | | Eclat Textile Co. Ltd. (Taiwan) | | | 572,499 | |
| | 1,090,390 | | | Welspun India Ltd. (India) | | | 857,343 | |
| | | | | | | | |
| | | | 1,429,842 | |
| | | | | | | | |
| | | | Wireless Telecommunication Services 1.8% | | | | |
| | 1,473,087 | | | PT Tower Bersama Infrastructure Tbk (Indonesia) | | | 688,517 | |
| | | | | | | | |
| | |
| | | | Total Common Stocks
(cost $32,912,008) | | | 37,941,820 | |
| | | | | | | | |
| | |
| | | | Total Investments
(cost $32,912,008) 98.2% | | | 37,941,820 | |
| | |
| | | | Other Assets less Liabilities 1.8% | | | 712,964 | |
| | | | | | | | |
| | |
| | | | NET ASSETS 100.0% | | $ | 38,654,784 | |
| | | | | | | | |
| |
| | | | *Non-income producing. GDR Global Depositary Receipt. See Notes to Financial Statements. | |
At September 30, 2016, Wasatch Emerging Markets Select Fund’s investments, excluding short-term investments, were in the following countries (unaudited):
| | | | |
| Country | | % | |
Brazil | | | 12.7 | |
Hong Kong | | | 1.8 | |
India | | | 30.7 | |
Indonesia | | | 4.1 | |
Korea | | | 10.8 | |
Mexico | | | 18.6 | |
Philippines | | | 7.7 | |
Russia | | | 2.3 | |
South Africa | | | 1.9 | |
Taiwan | | | 3.0 | |
Thailand | | | 5.6 | |
United Arab Emirates | | | 0.8 | |
| | | | |
TOTAL | | | 100.0 | % |
| | | | |
51
| | |
| WASATCH EMERGING MARKETS SMALL CAP FUND (WAEMX / WIEMX) | | |
|
|
|
Schedule of Investments
| | | | | | | | |
| Shares | | | | | Value | |
| | | | | | | |
| | | | COMMON STOCKS 99.8% | | | | |
| | |
| | | | Airport Services 3.2% | | | | |
| | 2,690,523 | | | Grupo Aeroportuario del Centro Norte S.A.B. de C.V. (Mexico) | | $ | 15,860,276 | |
| | 754,151 | | | Grupo Aeroportuario del Sureste S.A.B. de C.V., Class B (Mexico) | | | 11,031,594 | |
| | | | | | | | |
| | | | 26,891,870 | |
| | | | | | | | |
| | | | Asset Management & Custody Banks 0.8% | | | | |
| | 3,011,355 | | | Peregrine Holdings Ltd. (South Africa) | | | 6,273,976 | |
| | | | | | | | |
| | | | Auto Parts & Equipment 1.7% | | | | |
| | 667,389 | | | Cub Elecparts, Inc. (Taiwan) | | | 7,324,235 | |
| | 505,359 | | | Tung Thih Electronic Co. Ltd. (Taiwan) | | | 7,077,654 | |
| | | | | | | | |
| | | | 14,401,889 | |
| | | | | | | | |
| | | | Biotechnology 4.8% | | | | |
| | 137,307 | | | Cell Biotech Co. Ltd. (Korea) | | | 5,984,234 | |
| | 54,029 | | | China Biologic Products, Inc.* (China) | | | 6,725,530 | |
| | 28,557 | | | Hugel, Inc.* (Korea) | | | 11,043,198 | |
| | 39,611 | | | Medytox, Inc. (Korea) | | | 16,202,620 | |
| | | | | | | | |
| | | | 39,955,582 | |
| | | | | | | | |
| | | | Building Products 1.7% | | | | |
| | 692,167 | | | Kajaria Ceramics Ltd. (India) | | | 14,429,676 | |
| | | | | | | | |
| | | | Commodity Chemicals 1.6% | | | | |
| | 3,460,322 | | | Berger Paints India Ltd. (India) | | | 13,567,393 | |
| | | | | | | | |
| | | | Consumer Finance 11.8% | | | | |
| | 939,590 | | | Bajaj Finance Ltd. (India) | | | 15,030,900 | |
| | 962,728 | | | Bharat Financial Inclusion Ltd.* (India) | | | 12,747,687 | |
| | 534,950 | | | Cholamandalam Investment and Finance Co. Ltd. (India) | | | 9,464,871 | |
| | 4,383,271 | | | Credito Real S.A.B. de C.V. (Mexico) | | | 7,527,839 | |
| | 153,098 | | | KRUK S.A. (Poland) | | | 9,528,838 | |
| | 720,578 | | | Repco Home Finance Ltd. (India) | | | 8,982,874 | |
| | 280,225 | | | Shriram City Union Finance Ltd. (India) | | | 9,011,140 | |
| | 10,819,138 | | | Srisawad Power 1979 Public Co. Ltd. (Thailand) | | | 11,240,663 | |
| | 4,964,021 | | | Unifin Financiera SAPI de C.V. SOFOM (Mexico) | | | 14,976,739 | |
| | | | | | | | |
| | | | 98,511,551 | |
| | | | | | | | |
| | | | Department Stores 3.5% | | | | |
| | 1,388,955 | | | Poya Co. Ltd. (Taiwan) | | | 20,648,994 | |
| | 6,227,772 | | | PT Matahari Department Store Tbk (Indonesia) | | | 8,816,036 | |
| | | | | | | | |
| | | | 29,465,030 | |
| | | | | | | | |
| | | | Diversified Banks 2.5% | | | | |
| | 1,831,830 | | | Moneta Money Bank AS* (Czech Republic) | | | 5,833,587 | |
| | 2,941,764 | | | Security Bank Corp. (Philippines) | | | 14,655,741 | |
| | | | | | | | |
| | | | 20,489,328 | |
| | | | | | | | |
| | | | Diversified Chemicals 1.4% | | | | |
| | 1,110,167 | | | Pidilite Industries Ltd. (India) | | | 11,371,792 | |
| | | | | | | | |
| | | | Drug Retail 4.4% | | | | |
| | 1,838,614 | | | Clicks Group Ltd. (South Africa) | | | 17,033,558 | |
| | 985,422 | | | Raia Drogasil S.A. (Brazil) | | | 20,083,259 | |
| | | | | | | | |
| | | | 37,116,817 | |
| | | | | | | | |
| | | | Electrical Components & Equipment 2.7% | | | | |
| | 788,787 | | | Amara Raja Batteries Ltd. (India) | | | 11,977,526 | |
| | 649,837 | | | Voltronic Power Technology Corp. (Taiwan) | | | 10,158,400 | |
| | | | | | | | |
| | | | 22,135,926 | |
| | | | | | | | |
| | | | | | | | |
| Shares | | | | | Value | |
| | | | | | | |
| | | | Electronic Components 1.9% | | | | |
| | 1,369,851 | | | KCE Electronics Public Co. Ltd. (Thailand) | | $ | 4,190,597 | |
| | 2,345,786 | | | Sunny Optical Technology Group Co. Ltd. (China) | | | 11,583,158 | |
| | | | | | | | |
| | | | 15,773,755 | |
| | | | | | | | |
| | | | Fertilizers & Agricultural Chemicals 2.8% | | | | |
| | 162,217 | | | Bayer CropScience Ltd. (India) | | | 10,792,742 | |
| | 1,213,348 | | | UPL Ltd. (India) | | | 12,301,140 | |
| | | | | | | | |
| | | | 23,093,882 | |
| | | | | | | | |
| | | | Food Retail 1.6% | | | | |
| | 78,299 | | | BGF Retail Co. Ltd. (Korea) | | | 13,721,076 | |
| | | | | | | | |
| | | | Footwear 0.9% | | | | |
| | 153,536 | | | CCC S.A. (Poland) | | | 7,106,847 | |
| | | | | | | | |
| | | | Health Care Equipment 3.4% | | | | |
| | 284,400 | | | DIO Corp.* (Korea) | | | 13,298,770 | |
| | 217,241 | | | InBody Co. Ltd. (Korea) | | | 7,258,790 | |
| | 216,818 | | | Value Added Technologies Co. Ltd. (Korea) | | | 7,402,149 | |
| | | | | | | | |
| | | | 27,959,709 | |
| | | | | | | | |
| | | | Health Care Facilities 1.2% | | | | |
| | 561,579 | | | NMC Health plc (United Arab Emirates) | | | 9,972,097 | |
| | | | | | | | |
| | | | Health Care Services 0.8% | | | | |
| | 430,816 | | | Dr. Lal PathLabs Ltd. (India) | | | 6,891,244 | |
| | | | | | | | |
| | | | Highways & Railtracks 1.5% | | | | |
| | 1,855,980 | | | EcoRodovias Infraestrutura e Logistica S.A. (Brazil) | | | 5,073,463 | |
| | 10,985,514 | | | Yuexiu Transport Infrastructure Ltd. (China) | | | 7,520,638 | |
| | | | | | | | |
| | | | 12,594,101 | |
| | | | | | | | |
| | | | Home Furnishings 3.1% | | | | |
| | 51,543 | | | Hanssem Co. Ltd. (Korea) | | | 8,236,771 | |
| | 11,752,068 | | | Man Wah Holdings Ltd. (Hong Kong) | | | 7,530,269 | |
| | 810,963 | | | Nien Made Enterprise Co. Ltd. (Taiwan) | | | 10,439,252 | |
| | | | | | | | |
| | | | 26,206,292 | |
| | | | | | | | |
| | | | Home Improvement Retail 1.5% | | | | |
| | 41,812,286 | | | Home Product Center Public Co. Ltd. (Thailand) | | | 12,067,038 | |
| | | | | | | | |
| | | | Hotels, Resorts & Cruise Lines 1.6% | | | | |
| | 11,894,375 | | | Minor International Public Co. Ltd. (Thailand) | | | 13,387,608 | |
| | | | | | | | |
| | | | Hypermarkets & Super Centers 2.9% | | | | |
| | 121,549 | | | Al Meera Consumer Goods Co. (Qatar) | | | 6,849,068 | |
| | 1,278,921 | | | Lenta Ltd. — REG S GDR* (Russia) | | | 10,359,260 | |
| | 8,202,926 | | | Puregold Price Club, Inc. (Philippines) | | | 7,188,872 | |
| | | | | | | | |
| | | | 24,397,200 | |
| | | | | | | | |
| | | | Internet Software & Services 1.2% | | | | |
| | 861,368 | | | PChome Online, Inc. (Taiwan) | | | 10,140,045 | |
| | | | | | | | |
| | | | IT Consulting & Other Services 0.8% | | | | |
| | 516,027 | | | EOH Holdings Ltd. (South Africa) | | | 6,304,761 | |
| | | | | | | | |
| | | | Life & Health Insurance 0.9% | | | | |
| | 903,382 | | | Max Financial Services Ltd. (India) | | | 7,551,476 | |
| | | | | | | | |
| | | | Marine Ports & Services 1.5% | | | | |
| | 4,496,235 | | | International Container Terminal Services, Inc. (Philippines) | | | 7,139,088 | |
| | 5,398,274 | | | Westports Holdings Berhad (Malaysia) | | | 5,730,486 | |
| | | | | | | | |
| | | | 12,869,574 | |
| | | | | | | | |
52
| | | | | | | | |
| Shares | | | | | Value | |
| | | | | | | |
| | | | Movies & Entertainment 1.2% | | | | |
| | 877,618 | | | IMAX China Holding, Inc.* (China) | | $ | 4,299,609 | |
| | 74,532 | | | Loen Entertainment, Inc.* (Korea) | | | 5,278,518 | |
| | | | | | | | |
| | | | 9,578,127 | |
| | | | | | | | |
| | | | Multi-Sector Holdings 1.1% | | | | |
| | 319,422 | | | GT Capital Holdings, Inc. (Philippines) | | | 9,484,847 | |
| | | | | | | | |
| | | | Oil & Gas Exploration & Production 0.8% | | | | |
| | 554,631 | | | Parex Resources, Inc.* (Colombia) | | | 7,038,840 | |
| | | | | | | | |
| | | | Other Diversified Financial Services 0.5% | | | | |
| | 290,480 | | | PSG Group Ltd. (South Africa) | | | 4,253,741 | |
| | | | | | | | |
| | | | Packaged Foods & Meats 4.7% | | | | |
| | 315,446 | | | Britannia Industries Ltd. (India) | | | 15,961,814 | |
| | 283,000 | | | Manpasand Beverages Ltd. (India) | | | 3,195,970 | |
| | 3,324,986 | | | Namchow Chemical Industrial Co. Ltd. (Taiwan) | | | 7,372,239 | |
| | 580,133 | | | Standard Foods Corp. (Taiwan) | | | 1,486,168 | |
| | 5,647,933 | | | Vitasoy International Holdings Ltd. (Hong Kong) | | | 11,388,489 | |
| | | | | | | | |
| | | | 39,404,680 | |
| | | | | | | | |
| | | | Pharmaceuticals 3.8% | | | | |
| | 13,017,213 | | | China Animal Healthcare Ltd.* *** (China) | | | 16,783 | |
| | 672,603 | | | Glenmark Pharmaceuticals Ltd. (India) | | | 9,334,412 | |
| | 7,910,915 | | | Marksans Pharma Ltd. (India) | | | 6,261,718 | |
| | 1,105,992 | | | Natco Pharma Ltd. (India) | | | 9,912,898 | |
| | 1,460,834 | | | TTY Biopharm Co. Ltd. (Taiwan) | | | 6,011,950 | |
| | | | | | | | |
| | | | 31,537,761 | |
| | | | | | | | |
| | | | Property & Casualty Insurance 0.4% | | | | |
| | 2,335,693 | | | Qualitas Controladora S.A.B. de C.V.** (Mexico) | | | 3,525,870 | |
| | | | | | | | |
| | | | Real Estate Operating Companies 0.9% | | | | |
| | 3,297,758 | | | Parque Arauco S.A. (Chile) | | | 7,547,045 | |
| | | | | | | | |
| | | | Regional Banks 2.5% | | | | |
| | 1,253,976 | | | Banregio Grupo Financiero S.A.B. de C.V. (Mexico) | | | 7,182,484 | |
| | 1,504,983 | | | Grupo Financiero Interacciones S.A. de C.V., Class O (Mexico) | | | 7,101,997 | |
| | 46,838,100 | | | PT Bank Tabungan Negara Tbk (Indonesia) | | | 6,890,595 | |
| | | | | | | | |
| | | | 21,175,076 | |
| | | | | | | | |
| | | | Reinsurance 0.4% | | | | |
| | 11,500,377 | | | Thaire Life Assurance Public Co. Ltd. (Thailand) | | | 3,285,822 | |
| | | | | | | | |
| | | | Research & Consulting Services 0.6% | | | | |
| | 961,840 | | | Sporton International, Inc. (Taiwan) | | | 4,817,562 | |
| | | | | | | | |
| | | | Restaurants 2.3% | | | | |
| | 3,015,704 | | | Alsea S.A.B. de C.V. (Mexico) | | | 10,204,378 | |
| | 626,851 | | | Famous Brands Ltd. (South Africa) | | | 7,537,287 | |
| | 146,064 | | | Gourmet Master Co. Ltd. (Taiwan) | | | 1,453,860 | |
| | | | | | | | |
| | | | 19,195,525 | |
| | | | | | | | |
| | | | Semiconductor Equipment 0.7% | | | | |
| | 149,850 | | | Koh Young Technology, Inc. (Korea) | | | 6,211,152 | |
| | | | | | | | |
| | | | | | | | |
| Shares | | | | | Value | |
| | | | | | | |
| | | | Semiconductors 2.9% | | | | |
| | 677,322 | | | ASPEED Technology, Inc. (Taiwan) | | $ | 9,723,721 | |
| | 421,612 | | | eMemory Technology, Inc. (Taiwan) | | | 4,505,911 | |
| | 693,202 | | | Silergy Corp. (Taiwan) | | | 10,239,190 | |
| | | | | | | | |
| | | | 24,468,822 | |
| | | | | | | | |
| | | | Specialty Chemicals 2.5% | | | | |
| | 42,554,284 | | | D&L Industries, Inc. (Philippines) | | | 10,003,482 | |
| | 211,769 | | | Frutarom Industries Ltd. (Israel) | | | 11,140,066 | |
| | | | | | | | |
| | | | 21,143,548 | |
| | | | | | | | |
| | | | Systems Software 0.8% | | | | |
| | 314,851 | | | Tata Elxsi Ltd. (India) | | | 6,563,731 | |
| | | | | | | | |
| | | | Technology Hardware, Storage & Peripherals 3.0% | | | | |
| | 1,274,248 | | | Ennoconn Corp. (Taiwan) | | | 21,260,841 | |
| | 528,048 | | | TSC Auto ID Technology Co. Ltd. (Taiwan) | | | 4,026,207 | |
| | | | | | | | |
| | | | 25,287,048 | |
| | | | | | | | |
| | | | Textiles 1.6% | | | | |
| | 340,247 | | | Eclat Textile Co. Ltd. (Taiwan) | | | 4,059,670 | |
| | 11,503,485 | | | Welspun India Ltd. (India) | | | 9,044,870 | |
| | | | | | | | |
| | | | 13,104,540 | |
| | | | | | | | |
| | | | Thrifts & Mortgage Finance 0.8% | | | | |
| | 720,051 | | | LIC Housing Finance Ltd. (India) | | | 6,270,435 | |
| | | | | | | | |
| | | | Wireless Telecommunication Services 0.6% | | | | |
| | 9,960,401 | | | PT Tower Bersama Infrastructure Tbk (Indonesia) | | | 4,655,463 | |
| | | | | | | | |
| | |
| | | | Total Common Stocks
(cost $616,841,471) | | | 833,197,170 | |
| | | | | | | | |
| | |
| | | | WARRANTS 0.0% | | | | |
| | |
| | | | Consumer Finance 0.0% | | | | |
| | 574,831 | | | Srisawad Power 1979 Public Co. Ltd., expiring 5/29/20* (Thailand) | | | 99,538 | |
| | | | | | | | |
| | | | Hotels, Resorts & Cruise Lines 0.0% | | | | |
| | 947,453 | | | Minor International Public Co. Ltd., expiring 11/3/17* (Thailand) | | | 138,085 | |
| | | | | | | | |
| | |
| | | | Total Warrants
(cost $0) | | | 237,623 | |
| | | | | | | | |
| | |
| | | | PREFERRED STOCKS 1.1% | | | | |
| | |
| | | | Personal Products 1.1% | | | | |
| | 19,797 | | | LG Household & Health Care Ltd. (Korea) | | | 9,257,234 | |
| | | | | | | | |
| | |
| | | | Total Preferred Stocks
(cost $10,768,630) | | | 9,257,234 | |
| | | | | | | | |
53
| | |
| WASATCH EMERGING MARKETS SMALL CAP FUND (WAEMX / WIEMX) | | SEPTEMBER 30, 2016 |
|
|
|
Schedule of Investments (continued)
| | | | | | | | |
Principal
Amount | | | | | Value | |
| | | | | | | |
| | | | SHORT-TERM INVESTMENTS 0.8% | | | | |
| | |
| | | | Repurchase Agreement 0.8% | | | | |
| | $6,831,827 | | | Repurchase Agreement dated 9/30/16, 0.03% due 10/3/16 with State Street Bank and Trust Co. collateralized by $5,860,000 of United States Treasury Bonds 3.125% due 11/15/41; value: $6,973,400; repurchase proceeds: $6,831,844 (cost $6,831,827) | | $ | 6,831,827 | |
| | | | | | | | |
| | |
| | | | Total Short-Term Investments
(cost $6,831,827) | | | 6,831,827 | |
| | | | | | | | |
| | |
| | | | Total Investments
(cost $634,441,928) 101.7%§ | | | 849,523,854 | |
| | |
| | | | Liabilities less Other Assets (1.7%) | | | (14,163,012 | ) |
| | | | | | | | |
| | |
| | | | NET ASSETS 100.0% | | $ | 835,360,842 | |
| | | | | | | | |
| |
| | | | *Non-income producing. **Common units. ***Security was fair valued under procedures adopted by the Board of Trustees (see Note 13). §The aggregate amount of foreign securities fair valued pursuant to a systematic valuation model as a percent of net assets was 2.15%. GDR Global Depositary Receipt. See Notes to Financial Statements. | |
At September 30, 2016, Wasatch Emerging Markets Small Cap Fund’s investments, excluding short-term investments, were in the following countries (unaudited):
| | | | |
| Country | | % | |
Brazil | | | 3.0 | |
Chile | | | 0.9 | |
China | | | 3.6 | |
Colombia | | | 0.8 | |
Czech Republic | | | 0.7 | |
Hong Kong | | | 2.2 | |
India | | | 25.0 | |
Indonesia | | | 2.4 | |
Israel | | | 1.3 | |
Korea | | | 12.3 | |
Malaysia | | | 0.7 | |
Mexico | | | 9.2 | |
Philippines | | | 5.8 | |
Poland | | | 2.0 | |
Qatar | | | 0.8 | |
Russia | | | 1.2 | |
South Africa | | | 4.9 | |
Taiwan | | | 16.7 | |
Thailand | | | 5.3 | |
United Arab Emirates | | | 1.2 | |
| | | | |
TOTAL | | | 100.0 | % |
| | | | |
54
| | |
| WASATCH FRONTIER EMERGING SMALL COUNTRIES FUND (WAFMX / WIFMX) | | SEPTEMBER 30, 2016 |
|
|
|
Schedule of Investments
| | | | | | | | |
| Shares | | | | | Value | |
| | | | | | | |
| | | | COMMON STOCKS 91.3% | | | | |
| | |
| | | | Air Freight & Logistics 0.6% | | | | |
| | 3,178,784 | | | Aramex PJSC (United Arab Emirates) | | $ | 3,410,905 | |
| | | | | | | | |
| | | | Automobile Manufacturers 2.7% | | | | |
| | 1,611,618 | | | Honda Atlas Cars Pakistan Ltd. (Pakistan) | | | 9,457,716 | |
| | 443,235 | | | Indus Motor Co. Ltd. (Pakistan) | | | 6,356,479 | |
| | | | | | | | |
| | | | 15,814,195 | |
| | | | | | | | |
| | | | Brewers 4.5% | | | | |
| | 1,845,987 | | | East African Breweries Ltd. (Kenya) | | | 5,065,986 | |
| | 1,074,765 | | | Guinness Ghana Breweries Ltd.* (Ghana) | | | 465,448 | |
| | 221,357 | | | Lion Brewery Ceylon plc (Sri Lanka) | | | 573,749 | |
| | 22,512,337 | | | Nigerian Breweries plc (Nigeria) | | | 10,720,160 | |
| | 1,560,996 | | | Tanzania Breweries Ltd. (Tanzania,
United Republic of) | | | 9,304,424 | |
| | | | | | | | |
| | | | 26,129,767 | |
| | | | | | | | |
| | | | Commodity Chemicals 1.6% | | | | |
| | 119,850 | | | Berger Paints Bangladesh Ltd. (Bangladesh) | | | 3,546,184 | |
| | 4,711,705 | | | Chevron Lubricants Lanka plc (Sri Lanka) | | | 5,350,417 | |
| | | | | | | | |
| | | | 8,896,601 | |
| | | | | | | | |
| | | | Construction Materials 3.7% | | | | |
| | 2,313,293 | | | Kohat Cement Co. Ltd. (Pakistan) | | | 5,658,604 | |
| | 3,450,000 | | | Lafarge Cement Zambia plc (Zambia) | | | 2,408,978 | |
| | 2,087,350 | | | Lucky Cement Ltd. (Pakistan) | | | 13,528,658 | |
| | | | | | | | |
| | | | 21,596,240 | |
| | | | | | | | |
| | | | Consumer Finance 1.0% | | | | |
| | 3,269,700 | | | Gentera S.A.B. de C.V. (Mexico) | | | 5,907,121 | |
| | | | | | | | |
| | | | Distillers & Vintners 1.3% | | | | |
| | 10,808,065 | | | Thai Beverage Public Co. Ltd. (Thailand) | | | 7,687,778 | |
| | | | | | | | |
| | | | Diversified Banks 22.6% | | | | |
| | 11,013,206 | | | Banca Transilvania S.A. (Romania) | | | 6,582,817 | |
| | 161,051 | | | Banco Macro S.A. ADR (Argentina) | | | 12,602,241 | |
| | 2,741,364 | | | Bank for Foreign Trade of Vietnam JSC (Vietnam) | | | 4,709,212 | |
| | 516,814 | | | BLOM Bank SAL GDR (Lebanon) | | | 5,271,503 | |
| | 4,345,631 | | | Commercial International Bank S.A.E (Egypt) | | | 23,373,247 | |
| | 103,528 | | | Credicorp Ltd. (Peru) | | | 15,759,032 | |
| | 514,622 | | | Grupo Aval Acciones y Valores S.A. ADR (Colombia) | | | 4,544,112 | |
| | 313,474 | | | Grupo Financiero Galicia S.A. ADR (Argentina) | | | 9,752,176 | |
| | 71,851,121 | | | Guaranty Trust Bank plc (Nigeria) | | | 5,474,371 | |
| | 6,453,300 | | | Habib Bank Ltd. (Pakistan) | | | 13,653,528 | |
| | 93,970 | | | Intergroup Financial Services Corp. (Peru) | | | 3,002,341 | |
| | 3,617,371 | | | Metropolitan Bank & Trust Co. (Philippines) | | | 6,362,754 | |
| | 722 | | | Military Commercial Joint Stock Bank (Vietnam) | | | 483 | |
| | 4,956,645 | | | PT Bank Central Asia Tbk (Indonesia) | | | 5,962,710 | |
| | 102,128 | | | TBC Bank Group plc* (Georgia) | | | 1,681,139 | |
| | 6,095,294 | | | United Bank Ltd. (Pakistan) | | | 11,612,307 | |
| | | | | | | | |
| | | | 130,343,973 | |
| | | | | | | | |
| | | | Diversified Real Estate Activities 2.8% | | | | |
| | 17,042,106 | | | Ayala Land, Inc. (Philippines) | | | 13,793,230 | |
| | 49,104,901 | | | PT Pakuwon Jati Tbk (Indonesia) | | | 2,539,714 | |
| | | | | | | | |
| | | | 16,332,944 | |
| | | | | | | | |
| | | | Food Retail 3.5% | | | | |
| | 7,123,889 | | | CP ALL Public Co. Ltd. (Thailand) | | | 12,644,132 | |
| | 2,596,316 | | | Philippine Seven Corp. (Philippines) | | | 7,642,522 | |
| | | | | | | | |
| | | | | | | 20,286,654 | |
| | | | | | | | |
| | | | | | | | |
| Shares | | | | | Value | |
| | | | | | | |
| | | | Health Care Facilities 2.0% | | | | |
| | 653,429 | | | NMC Health plc (United Arab Emirates) | | $ | 11,603,100 | |
| | | | | | | | |
| | | | Household Products 0.9% | | | | |
| | 35,770,859 | | | Unilever Nigeria plc (Nigeria) | | | 5,198,698 | |
| | | | | | | | |
| | | | Industrial Conglomerates 0.2% | | | | |
| | 75,080 | | | SM Investments Corp. (Philippines) | | | 1,042,713 | |
| | | | | | | | |
| | | | Internet Software & Services 2.2% | | | | |
| | 67,771 | | | MercadoLibre, Inc. (Brazil) | | | 12,535,602 | |
| | | | | | | | |
| | | | Marine Ports & Services 1.1% | | | | |
| | 241,200 | | | DP World Ltd. (United Arab Emirates) | | | 4,570,740 | |
| | 902,310 | | | International Container Terminal Services, Inc. (Philippines) | | | 1,432,681 | |
| | | | | | | | |
| | | | | | | 6,003,421 | |
| | | | | | | | |
| | | | Multi-Line Insurance 1.3% | | | | |
| | 2,421,700 | | | Bao Viet Holdings (Vietnam) | | | 7,701,040 | |
| | | | | | | | |
| | | | Multi-Sector Holdings 5.5% | | | | |
| | 1,133,440 | | | Ayala Corp. (Philippines) | | | 20,030,067 | |
| | 396,159 | | | GT Capital Holdings, Inc. (Philippines) | | | 11,763,459 | |
| | | | | | | | |
| | | | | | | 31,793,526 | |
| | | | | | | | |
| | | | Other Diversified Financial Services 0.8% | | | | |
| | 1,355,882 | | | FirstRand Ltd. (South Africa) | | | 4,693,343 | |
| | | | | | | | |
| | | | Packaged Foods & Meats 10.8% | | | | |
| | 15,130,254 | | | Cadbury Nigeria plc (Nigeria) | | | 756,032 | |
| | 395,375 | | | Juhayna Food Industries (Egypt) | | | 182,996 | |
| | 343,163 | | | Nestlé Lanka plc (Sri Lanka) | | | 5,143,237 | |
| | 4,535,221 | | | Nestlé Nigeria plc (Nigeria) | | | 11,805,972 | |
| | 1,526,926 | | | Olympic Industries Ltd. (Bangladesh) | | | 5,942,104 | |
| | 14,132,442 | | | PT Indofood CBP Sukses Makmur Tbk (Indonesia) | | | 10,260,125 | |
| | 2,173,009 | | | Universal Robina Corp. (Philippines) | | | 7,975,989 | |
| | 3,240,640 | | | Vietnam Dairy Products JSC (Vietnam) | | | 20,348,932 | |
| | | | | | | | |
| | | | | | | 62,415,387 | |
| | | | | | | | |
| | | | Personal Products 0.6% | | | | |
| | 211,955 | | | Marico Bangladesh Ltd. (Bangladesh) | | | 3,312,853 | |
| | | | | | | | |
| | | | Pharmaceuticals 8.5% | | | | |
| | 1,354,070 | | | Abbott Laboratories Pakistan Ltd. (Pakistan) | | | 10,824,264 | |
| | 2,817,811 | | | Beximco Pharmaceuticals Ltd. (Bangladesh) | | | 2,987,521 | |
| | 946,563 | | | DHG Pharmaceutical JSC (Vietnam) | | | 4,754,998 | |
| | 556,215 | | | GlaxoSmithKline Consumer Healthcare Pakistan Ltd.* *** †† (Pakistan) | | | — | |
| | 297,383 | | | Richter Gedeon Nyrt (Hungary) | | | 6,041,275 | |
| | 1,552,421 | | | Searle Company Ltd. (The) (Pakistan) | | | 8,510,932 | |
| | 4,604,436 | | | Square Pharmaceuticals Ltd. (Bangladesh) | | | 15,791,673 | |
| | | | | | | | |
| | | | | | | 48,910,663 | |
| | | | | | | | |
| | | | Real Estate Operating Companies 1.6% | | | | |
| | 15,702,494 | | | SM Prime Holdings, Inc. (Philippines) | | | 9,114,861 | |
| | | | | | | | |
| | | | Restaurants 3.3% | | | | |
| | 2,169,322 | | | Jollibee Foods Corp. (Philippines) | | | 11,049,027 | |
| | 958,583 | | | Kuwait Foods Americana (Kuwait) | | | 8,014,695 | |
| | 3,302,616 | | | Gulf National Holding* *** ††† (Kuwait) | | | — | |
| | | | | | | | |
| | | | | | | 19,063,722 | |
| | | | | | | | |
| | | | Soft Drinks 0.2% | | | | |
| | 140,278 | | | Societe Frigorifique et Brasserie de Tunis (Tunisia) | | | 1,224,578 | |
| | | | | | | | |
| | | | Steel 1.5% | | | | |
| | 4,310,654 | | | Hoa Phat Group JSC (Vietnam) | | | 8,835,724 | |
| | | | | | | | |
| | | | Technology Distributors 2.3% | | | | |
| | 6,349,490 | | | FPT Corp. (Vietnam) | | | 13,285,358 | |
| | | | | | | | |
55
| | |
| WASATCH FRONTIER EMERGING SMALL COUNTRIES FUND (WAFMX / WIFMX) | | SEPTEMBER 30, 2016 |
|
|
|
Schedule of Investments (continued)
| | | | | | | | |
| Shares | | | | | Value | |
| | | | | | | |
| | | | Tobacco 1.7% | | | | |
| | 245,104 | | | British American Tobacco Bangladesh Co. Ltd. (Bangladesh) | | $ | 7,874,601 | |
| | 299,118 | | | Ceylon Tobacco Co. plc (Sri Lanka) | | | 1,752,326 | |
| | | | | | | | |
| | | | | | | 9,626,927 | |
| | | | | | | | |
| | | | Wireless Telecommunication Services 2.5% | | | | |
| | 310,069 | | | Ooredoo (Oman) | | | 557,062 | |
| | 71,529,438 | | | Safaricom Ltd. (Kenya) | | | 14,051,686 | |
| | | | | | | | |
| | | | | | | 14,608,748 | |
| | | | | | | | |
| | |
| | | | Total Common Stocks
(cost $474,724,413) | | | 527,376,442 | |
| | | | | | | | |
| | |
| | | | PREFERRED STOCKS 2.0% | | | | |
| | |
| | | | Diversified Banks 2.0% | | | | |
| | 1,144,820 | | | Banco Davivienda S.A. (Colombia) | | | 11,712,831 | |
| | | | | | | | |
| | |
| | | | Total Preferred Stocks
(cost $11,386,504) | | | 11,712,831 | |
| | | | | | | | |
| | |
Principal
Amount | | | | | Value | |
| | | | SHORT-TERM INVESTMENTS 5.4% | | | | |
| | |
| | | | Repurchase Agreement 5.4% | | | | |
| | $31,123,151 | | | Repurchase Agreement dated 9/30/16, 0.03% due 10/3/16 with State Street Bank and Trust Co. collateralized by $26,680,000 of United States Treasury Bonds 3.125% due 11/15/41; value: $31,749,200; repurchase proceeds: $31,123,229 (cost $31,123,151) | | $ | 31,123,151 | |
| | | | | | | | |
| | |
| | | | Total Short-Term Investments
(cost $31,123,151) | | | 31,123,151 | |
| | | | | | | | |
| | |
| | | | Total Investments
(cost $517,234,068) 98.7%§ | | | 570,212,424 | |
| | |
| | | | Other Assets less Liabilities 1.3% | | | 7,336,526 | |
| | | | | | | | |
| | |
| | | | NET ASSETS 100.0% | | $ | 577,548,950 | |
| | | | | | | | |
| |
| | | | *Non-income producing. ***Security was fair valued under procedures adopted by the Board of Trustees (see Note 13). ††Shares were received in a spinoff of GlaxoSmithKline Pakistan Ltd. The shares are not listed for trading. †††Shares were received in a spinoff of Kuwait Foods Americana. The shares are not listed for trading. §The aggregate amount of foreign securities fair valued pursuant to a systematic valuation model as a percent of net assets was 5.25%. ADR American Depositary Receipt. GDR Global Depositary Receipt. See Notes to Financial Statements. | |
At September 30, 2016, Wasatch Frontier Emerging Small Countries Fund’s investments, excluding short-term investments, were in the following countries (unaudited):
| | | | |
| Country | | % | |
Argentina | | | 4.1 | |
Bangladesh | | | 7.3 | |
Brazil | | | 2.3 | |
Colombia | | | 3.0 | |
Egypt | | | 4.4 | |
Georgia | | | 0.3 | |
Ghana | | | 0.1 | |
Hungary | | | 1.1 | |
Indonesia | | | 3.5 | |
Kenya | | | 3.5 | |
Kuwait | | | 1.5 | |
Lebanon | | | 1.0 | |
Mexico | | | 1.1 | |
Nigeria | | | 6.3 | |
Oman | | | 0.1 | |
Pakistan | | | 14.8 | |
Peru | | | 3.5 | |
Philippines | | | 16.7 | |
Romania | | | 1.2 | |
South Africa | | | 0.9 | |
Sri Lanka | | | 2.4 | |
Tanzania, United Republic of | | | 1.7 | |
Thailand | | | 3.8 | |
Tunisia | | | 0.2 | |
United Arab Emirates | | | 3.6 | |
Vietnam | | | 11.1 | |
Zambia | | | 0.5 | |
| | | | |
TOTAL | | | 100.0 | % |
| | | | |
56
| | |
| WASATCH GLOBAL OPPORTUNITIES FUND (WAGOX / WIGOX) | | SEPTEMBER 30, 2016 |
|
|
|
Schedule of Investments
| | | | | | | | |
| Shares | | | | | Value | |
| | | | | | | |
| | | | COMMON STOCKS 97.9% | | | | |
| | |
| | | | Advertising 1.1% | | | | |
| | 38,362 | | | REA Group Ltd. (Australia) | | $ | 1,657,392 | |
| | | | | | | | |
| | | | Air Freight & Logistics 0.7% | | | | |
| | 48,396 | | | Echo Global Logistics, Inc.* | | | 1,116,012 | |
| | | | | | | | |
| | | | Airlines 2.4% | | | | |
| | 15,384 | | | Allegiant Travel Co. | | | 2,031,765 | |
| | 39,063 | | | Spirit Airlines, Inc.* | | | 1,661,349 | |
| | | | | | | | |
| | | | 3,693,114 | |
| | | | | | | | |
| | | | Airport Services 1.1% | | | | |
| | 279,025 | | | Grupo Aeroportuario del Centro Norte S.A.B. de C.V. (Mexico) | | | 1,644,815 | |
| | | | | | | | |
| | | | Application Software 6.6% | | | | |
| | 38,586 | | | Aveva Group plc (United Kingdom) | | | 998,264 | |
| | 26,097 | | | Globant S.A.* (Argentina) | | | 1,099,206 | |
| | 27,950 | | | HubSpot, Inc.* | | | 1,610,479 | |
| | 10,012 | | | Tyler Technologies, Inc.* | | | 1,714,355 | |
| | 15,239 | | | Ultimate Software Group, Inc. (The)* | | | 3,114,699 | |
| | 58,340 | | | Zendesk, Inc.* | | | 1,791,621 | |
| | | | | | | | |
| | | | 10,328,624 | |
| | | | | | | | |
| | | | Auto Parts & Equipment 0.7% | | | | |
| | 26,820 | | | Linamar Corp. (Canada) | | | 1,119,859 | |
| | | | | | | | |
| | | | Biotechnology 6.2% | | | | |
| | 170,879 | | | Abcam plc (United Kingdom) | | | 1,860,471 | |
| | 8,004 | | | Medytox, Inc. (Korea) | | | 3,273,984 | |
| | 226,887 | | | Sangamo BioSciences, Inc.* | | | 1,050,487 | |
| | 64,394 | | | Seattle Genetics, Inc.* | | | 3,477,920 | |
| | | | | | | | |
| | | | 9,662,862 | |
| | | | | | | | |
| | | | Building Products 3.6% | | | | |
| | 312,800 | | | Somany Ceramics Ltd. (India) | | | 2,870,544 | |
| | 45,594 | | | Trex Co., Inc.* | | | 2,677,279 | |
| | | | | | | | |
| | | | 5,547,823 | |
| | | | | | | | |
| | | | Consumer Finance 7.4% | | | | |
| | 76,480 | | | Bajaj Finance Ltd. (India) | | | 1,223,473 | |
| | 111,032 | | | Cholamandalam Investment and Finance Co. Ltd. (India) | | | 1,964,489 | |
| | 7,440 | | | Credit Acceptance Corp.* | | | 1,495,961 | |
| | 838,212 | | | Credito Real S.A.B. de C.V. (Mexico) | | | 1,439,547 | |
| | 1,477,461 | | | Srisawad Power 1979 Public Co. Ltd. (Thailand) | | | 1,535,025 | |
| | 1,282,617 | | | Unifin Financiera SAPI de C.V. SOFOM (Mexico) | | | 3,869,730 | |
| | | | | | | | |
| | | | 11,528,225 | |
| | | | | | | | |
| | | | Department Stores 1.7% | | | | |
| | 183,877 | | | Poya Co. Ltd. (Taiwan) | | | 2,733,620 | |
| | | | | | | | |
| | | | Diversified Chemicals 1.1% | | | | |
| | 167,053 | | | Pidilite Industries Ltd. (India) | | | 1,711,177 | |
| | | | | | | | |
| | | | Diversified Real Estate Activities 2.7% | | | | |
| | 192,339 | | | Patrizia Immobilien AG* (Germany) | | | 4,210,005 | |
| | | | | | | | |
| | | | Diversified Support Services 1.5% | | | | |
| | 44,576 | | | Copart, Inc.* | | | 2,387,491 | |
| | | | | | | | |
| | | | Drug Retail 1.5% | | | | |
| | 17,090 | | | Ain Holdings, Inc. (Japan) | | | 1,156,130 | |
| | 5,870 | | | Cosmos Pharmaceutical Corp. (Japan) | | | 1,253,826 | |
| | | | | | | | |
| | | | 2,409,956 | |
| | | | | | | | |
| | | | Electrical Components & Equipment 1.2% | | | | |
| | 120,841 | | | Voltronic Power Technology Corp. (Taiwan) | | | 1,889,014 | |
| | | | | | | | |
| | | | | | | | |
| Shares | | | | | Value | |
| | | | | | | |
| | | | Fertilizers & Agricultural Chemicals 0.8% | | | | |
| | 126,151 | | | UPL Ltd. (India) | | $ | 1,278,942 | |
| | | | | | | | |
| | | | General Merchandise Stores 2.0% | | | | |
| | 50,014 | | | Ollie’s Bargain Outlet Holdings, Inc.* | | | 1,310,867 | |
| | 23,092 | | | Seria Co. Ltd. (Japan) | | | 1,846,813 | |
| | | | | | | | |
| | | | 3,157,680 | |
| | | | | | | | |
| | | | Health Care Equipment 2.6% | | | | |
| | 22,490 | | | Cochlear Ltd. (Australia) | | | 2,426,821 | |
| | 35,242 | | | DIO Corp.* (Korea) | | | 1,647,944 | |
| | | | | | | | |
| | | | 4,074,765 | |
| | | | | | | | |
| | | | Health Care Facilities 1.7% | | | | |
| | 129,690 | | | Ensign Group, Inc. (The) | | | 2,610,660 | |
| | | | | | | | |
| | | | Health Care Services 1.2% | | | | |
| | 112,496 | | | Dr. Lal PathLabs Ltd. (India) | | | 1,799,463 | |
| | | | | | | | |
| | | | Health Care Supplies 2.1% | | | | |
| | 43,644 | | | Sartorius Stedim Biotech (France) | | | 3,276,505 | |
| | | | | | | | |
| | | | Health Care Technology 0.8% | | | | |
| | 37,680 | | | M3, Inc. (Japan) | | | 1,278,233 | |
| | | | | | | | |
| | | | Highways & Railtracks 0.9% | | | | |
| | 125,003 | | | Promotora y Operadora de Infraestructura S.A.B. de C.V. (Mexico) | | | 1,345,718 | |
| | | | | | | | |
| | | | Homebuilding 1.6% | | | | |
| | 30,818 | | | Installed Building Products, Inc.* | | | 1,105,441 | |
| | 39,014 | | | LGI Homes, Inc.* | | | 1,437,276 | |
| | | | | | | | |
| | | | 2,542,717 | |
| | | | | | | | |
| | | | Industrial Machinery 0.4% | | | | |
| | 212,292 | | | Rotork plc (United Kingdom) | | | 581,142 | |
| | | | | | | | |
| | | | Internet & Direct Marketing Retail 2.0% | | | | |
| | 80,325 | | | MakeMyTrip Ltd.* (India) | | | 1,895,670 | |
| | 32,178 | | | Wayfair, Inc., Class A* | | | 1,266,848 | |
| | | | | | | | |
| | | | 3,162,518 | |
| | | | | | | | |
| | | | Internet Software & Services 11.9% | | | | |
| | 23,640 | | | Cimpress N.V.* | | | 2,391,895 | |
| | 93,262 | | | Cornerstone OnDemand, Inc.* | | | 4,285,389 | |
| | 38,870 | | | Dip Corp. (Japan) | | | 1,195,941 | |
| | 65,635 | | | Envestnet, Inc.* | | | 2,392,396 | |
| | 49,698 | | | Gurunavi, Inc. (Japan) | | | 1,356,091 | |
| | 17,962 | | | MercadoLibre, Inc. (Brazil) | | | 3,322,431 | |
| | 21,891 | | | Rightmove plc (United Kingdom) | | | 1,197,950 | |
| | 53,215 | | | SMS Co. Ltd. (Japan) | | | 1,409,026 | |
| | 13,897 | | | SPS Commerce, Inc.* | | | 1,020,179 | |
| | | | | | | | |
| | | | 18,571,298 | |
| | | | | | | | |
| | | | IT Consulting & Other Services 2.1% | | | | |
| | 38,299 | | | Luxoft Holding, Inc.* (Switzerland) | | | 2,024,102 | |
| | 263,741 | | | NCC Group plc (United Kingdom) | | | 1,198,518 | |
| | | | | | | | |
| | | | 3,222,620 | |
| | | | | | | | |
| | | | Life & Health Insurance 0.8% | | | | |
| | 251,020 | | | ICICI Prudential Life Insurance Co. Ltd.* *** † (India) | | | 1,124,588 | |
| | 22,653 | | | ICICI Prudential Life Insurance Co. Ltd.* (India) | | | 105,201 | |
| | | | | | | | |
| | | | 1,229,789 | |
| | | | | | | | |
| | | | Managed Health Care 2.4% | | | | |
| | 98,557 | | | HealthEquity, Inc.* | | | 3,730,383 | |
| | | | | | | | |
| | | | Movies & Entertainment 1.1% | | | | |
| | 24,893 | | | Loen Entertainment, Inc.* (Korea) | | | 1,762,976 | |
| | | | | | | | |
57
| | |
| WASATCH GLOBAL OPPORTUNITIES FUND (WAGOX / WIGOX) | | SEPTEMBER 30, 2016 |
|
|
|
Schedule of Investments (continued)
| | | | | | | | |
| Shares | | | | | Value | |
| | | | | | | |
| | | | Office Services & Supplies 0.4% | | | | |
| | 196,782 | | | Regus plc (United Kingdom) | | $ | 665,449 | |
| | | | | | | | |
| | | | Packaged Foods & Meats 1.7% | | | | |
| | 240,825 | | | Manpasand Beverages Ltd. (India) | | | 2,719,680 | |
| | | | | | | | |
| | | | Pharmaceuticals 2.9% | | | | |
| | 19,419 | | | Intra-Cellular Therapies, Inc.* | | | 295,946 | |
| | 34,801 | | | Ipsen S.A. (France) | | | 2,442,964 | |
| | 204,487 | | | Natco Pharma Ltd. (India) | | | 1,832,797 | |
| | | | | | | | |
| | | | 4,571,707 | |
| | | | | | | | |
| | | | Regional Banks 3.5% | | | | |
| | 23,021 | | | Eagle Bancorp, Inc.* | | | 1,135,626 | |
| | 40,767 | | | Metro Bank plc* (United Kingdom) | | | 1,458,916 | |
| | 12,149 | | | Signature Bank* | | | 1,439,049 | |
| | 27,288 | | | Texas Capital Bancshares, Inc.* | | | 1,498,657 | |
| | | | | | | | |
| | | | 5,532,248 | |
| | | | | | | | |
| | | | Restaurants 3.1% | | | | |
| | 22,644 | | | Chuy’s Holdings, Inc.* | | | 632,673 | |
| | 49,332 | | | Domino’s Pizza Enterprises Ltd. (Australia) | | | 2,655,019 | |
| | 63,945 | | | Fiesta Restaurant Group, Inc.* | | | 1,534,680 | |
| | | | | | | | |
| | | | 4,822,372 | |
| | | | | | | | |
| | | | Semiconductors 4.2% | | | | |
| | 50,557 | | | Cavium, Inc.* | | | 2,942,417 | |
| | 23,622 | | | Melexis N.V. (Belgium) | | | 1,695,370 | |
| | 9,023 | | | U-Blox AG* (Switzerland) | | | 1,949,488 | |
| | | | | | | | |
| | | | 6,587,275 | |
| | | | | | | | |
| | | | Specialized Finance 0.5% | | | | |
| | 37,523 | | | Banca IFIS S.p.A. (Italy) | | | 845,979 | |
| | | | | | | | |
| | | | Specialty Chemicals 1.5% | | | | |
| | 43,036 | | | Frutarom Industries Ltd. (Israel) | | | 2,263,900 | |
| | 20,864 | | | Max Ventures & Industries Ltd.* (India) | | | 15,825 | |
| | | | | | | | |
| | | | 2,279,725 | |
| | | | | | | | |
| | | | Specialty Stores 1.5% | | | | |
| | 17,806 | | | Five Below, Inc.* | | | 717,404 | |
| | 114,560 | | | XXL ASA (Norway) | | | 1,569,099 | |
| | | | | | | | |
| | | | 2,286,503 | |
| | | | | | | | |
| | | | Systems Software 1.7% | | | | |
| | 23,749 | | | CyberArk Software Ltd.* (Israel) | | | 1,177,238 | |
| | 24,065 | | | FleetMatics Group plc* | | | 1,443,419 | |
| | | | | | | | |
| | | | 2,620,657 | |
| | | | | | | | |
| | | | Trading Companies & Distributors 1.3% | | | | |
| | 65,000 | | | MISUMI Group, Inc. (Japan) | | | 1,207,633 | |
| | 33,800 | | | MonotaRO Co. Ltd. (Japan) | | | 899,955 | |
| | | | | | | | |
| | | | 2,107,588 | |
| | | | | | | | |
| | | | Trucking 1.7% | | | | |
| | 93,190 | | | Knight Transportation, Inc. | | | 2,673,621 | |
| | | | | | | | |
| | |
| | | | Total Common Stocks
(cost $118,530,296) | | | 152,978,202 | |
| | | | | | | | |
| | |
| | | | WARRANTS 0.0% | | | | |
| | |
| | | | Consumer Finance 0.0% | | | | |
| | 96,800 | | | Srisawad Power 1979 Public Co. Ltd., expiring 5/29/20* (Thailand) | | | 16,762 | |
| | | | | | | | |
| | |
| | | | Total Warrants
(cost $0) | | | 16,762 | |
| | | | | | | | |
| | | | | | | | |
Principal
Amount | | | | | Value | |
| | | | | | | |
| | | | SHORT-TERM INVESTMENTS 1.5% | | | | |
| | |
| | | | Repurchase Agreement 1.5% | | | | |
| | $2,287,860 | | | Repurchase Agreement dated 9/30/16, 0.03% due 10/3/16 with State Street Bank and Trust Co. collateralized by $1,805,000 of United States Treasury Bonds 3.625% due 2/15/44; value $2,337,475; repurchase proceeds: $2,287,866 (cost $2,287,860) | | $ | 2,287,860 | |
| | | | | | | | |
| | |
| | | | Total Short-Term Investments
(cost $2,287,860) | | | 2,287,860 | |
| | | | | | | | |
| | |
| | | | Total Investments
(cost $120,818,156) 99.4%§ | | | 155,282,824 | |
| | |
| | | | Other Assets less Liabilities 0.6% | | | 1,010,130 | |
| | | | | | | | |
| | |
| | | | NET ASSETS 100.0% | | $ | 156,292,954 | |
| | | | | | | | |
| |
| | | | *Non-income producing. ***Security was fair valued under procedures adopted by the Board of Trustees (see Note 13). †Security purchased in a private placement transaction or under Rule 144A of the Securities Act of 1933 (see Note 9). §The aggregate amount of foreign securities fair valued pursuant to a systematic valuation model as a percent of net assets was 1.45%. See Notes to Financial Statements. | |
At September 30, 2016, Wasatch Global Opportunities Fund’s investments, excluding short-term investments, were in the following countries (unaudited):
| | | | |
| Country | | % | |
Argentina | | | 0.7 | |
Australia | | | 4.4 | |
Belgium | | | 1.1 | |
Brazil | | | 2.2 | |
Canada | | | 0.7 | |
France | | | 3.7 | |
Germany | | | 2.8 | |
India | | | 12.1 | |
Israel | | | 2.3 | |
Italy | | | 0.6 | |
Japan | | | 7.6 | |
Korea | | | 4.4 | |
Mexico | | | 5.4 | |
Norway | | | 1.0 | |
Switzerland | | | 2.6 | |
Taiwan | | | 3.0 | |
Thailand | | | 1.0 | |
United Kingdom | | | 5.2 | |
United States | | | 39.2 | |
| | | | |
TOTAL | | | 100.0 | % |
| | | | |
58
| | |
| WASATCH INTERNATIONAL GROWTH FUND (WAIGX / WIIGX) | | SEPTEMBER 30, 2016 |
|
|
|
Schedule of Investments
| | | | | | | | |
| Shares | | | | | Value | |
| | | | | | | |
| | | | COMMON STOCKS 98.2% | | | | |
| | |
| | | | Advertising 1.0% | | | | |
| | 351,631 | | | REA Group Ltd. (Australia) | | $ | 15,191,865 | |
| | | | | | | | |
| | | | Airport Services 1.7% | | | | |
| | 4,243,889 | | | Grupo Aeroportuario del Centro Norte S.A.B. de C.V. (Mexico) | | | 25,017,162 | |
| | | | | | | | |
| | | | Apparel, Accessories & Luxury
Goods 1.0% | | | | |
| | 427,764 | | | Moncler S.p.A. (Italy) | | | 7,299,227 | |
| | 224,913 | | | Ted Baker plc (United Kingdom) | | | 7,183,073 | |
| | | | | | | | |
| | | | | | | 14,482,300 | |
| | | | | | | | |
| | | | Application Software 2.4% | | | | |
| | 607,861 | | | Aveva Group plc (United Kingdom) | | | 15,726,058 | |
| | 891,526 | | | Computer Modelling Group Ltd. (Canada) | | | 6,666,314 | |
| | 2,771,208 | | | Technology One Ltd. (Australia) | | | 12,598,405 | |
| | | | | | | | |
| | | | | | | 34,990,777 | |
| | | | | | | | |
| | | | Auto Parts & Equipment 1.5% | | | | |
| | 588,334 | | | ARB Corp. Ltd. (Australia) | | | 8,177,109 | |
| | 326,269 | | | Linamar Corp. (Canada) | | | 13,623,245 | |
| | | | | | | | |
| | | | | | | 21,800,354 | |
| | | | | | | | |
| | | | Biotechnology 5.2% | | | | |
| | 3,609,808 | | | Abcam plc (United Kingdom) | | | 39,302,344 | |
| | 20,083 | | | Hugel, Inc.* (Korea) | | | 7,766,241 | |
| | 71,085 | | | Medytox, Inc. (Korea) | | | 29,076,854 | |
| | | | | | | | |
| | | | | | | 76,145,439 | |
| | | | | | | | |
| | | | Consumer Finance 2.6% | | | | |
| | 780,466 | | | Cholamandalam Investment and Finance Co. Ltd. (India) | | | 13,808,786 | |
| | 7,988,690 | | | Gentera S.A.B. de C.V. (Mexico) | | | 14,432,564 | |
| | 291,067 | | | Shriram City Union Finance Ltd. (India) | | | 9,359,784 | |
| | | | | | | | |
| | | | | | | 37,601,134 | |
| | | | | | | | |
| | | | Diversified Banks 1.0% | | | | |
| | 213,753 | | | Secure Trust Bank plc (United Kingdom) | | | 6,599,470 | |
| | 1,616,290 | | | Security Bank Corp. (Philippines) | | | 8,052,287 | |
| | | | | | | | |
| | | | | | | 14,651,757 | |
| | | | | | | | |
| | | | Diversified Real Estate Activities 2.9% | | | | |
| | 1,946,687 | | | Patrizia Immobilien AG* (Germany) | | | 42,609,986 | |
| | | | | | | | |
| | | | Drug Retail 8.0% | | | | |
| | 330,928 | | | Ain Holdings, Inc. (Japan) | | | 22,387,122 | |
| | 2,411,326 | | | Clicks Group Ltd. (South Africa) | | | 22,339,360 | |
| | 165,337 | | | Cosmos Pharmaceutical Corp. (Japan) | | | 35,315,807 | |
| | 1,014,500 | | | Raia Drogasil S.A. (Brazil) | | | 20,675,879 | |
| | 280,573 | | | Sugi Holdings Co. Ltd. (Japan) | | | 15,162,369 | |
| | | | | | | | |
| | | | | | | 115,880,537 | |
| | | | | | | | |
| | | | Electrical Components & Equipment 2.0% | | | | |
| | 1,078,818 | | | Amara Raja Batteries Ltd. (India) | | | 16,381,571 | |
| | 796,232 | | | Voltronic Power Technology Corp. (Taiwan) | | | 12,446,880 | |
| | | | | | | | |
| | | | | | | 28,828,451 | |
| | | | | | | | |
| | | | Electronic Equipment & Instruments 2.4% | | | | |
| | 600,212 | | | Ai Holdings Corp. (Japan) | | | 14,353,475 | |
| | 1,476,820 | | | Halma plc (United Kingdom) | | | 20,079,741 | |
| | | | | | | | |
| | | | | | | 34,433,216 | |
| | | | | | | | |
| | | | Fertilizers & Agricultural
Chemicals 0.8% | | | | |
| | 1,128,169 | | | UPL Ltd. (India) | | | 11,437,580 | |
| | | | | | | | |
| | | | Forest Products 0.9% | | | | |
| | 376,181 | | | Stella-Jones, Inc. (Canada) | | | 13,049,276 | |
| | | | | | | | |
| | | | | | | | |
| Shares | | | | | Value | |
| | | | | | | |
| | | | General Merchandise Stores 2.4% | | | | |
| | 434,963 | | | Seria Co. Ltd. (Japan) | | $ | 34,786,746 | |
| | | | | | | | |
| | | | Health Care Equipment 1.7% | | | | |
| | 233,988 | | | Cochlear Ltd. (Australia) | | | 25,248,867 | |
| | | | | | | | |
| | | | Health Care Supplies 2.4% | | | | |
| | 471,894 | | | Sartorius Stedim Biotech (France) | | | 35,426,705 | |
| | | | | | | | |
| | | | Health Care Technology 1.8% | | | | |
| | 803,042 | | | EMIS Group plc (United Kingdom) | | | 9,778,902 | |
| | 493,260 | | | M3, Inc. (Japan) | | | 16,733,045 | |
| | | | | | | | |
| | | | | | | 26,511,947 | |
| | | | | | | | |
| | | | Highways & Railtracks 0.9% | | | | |
| | 1,194,395 | | | Promotora y Operadora de Infraestructura S.A.B. de C.V. (Mexico) | | | 12,858,238 | |
| | | | | | | | |
| | | | Home Furnishings 1.1% | | | | |
| | 1,232,774 | | | Nien Made Enterprise Co. Ltd. (Taiwan) | | | 15,869,082 | |
| | | | | | | | |
| | | | Home Improvement Retail 1.2% | | | | |
| | 59,371,800 | | | Home Product Center Public Co. Ltd. (Thailand) | | | 17,134,719 | |
| | | | | | | | |
| | | | Hotels, Resorts & Cruise Lines 2.5% | | | | |
| | 778,726 | | | Corporate Travel Management Ltd. (Australia) | | | 10,519,362 | |
| | 22,309,613 | | | Minor International Public Co. Ltd. (Thailand) | | | 25,110,387 | |
| | | | | | | | |
| | | | | | | 35,629,749 | |
| | | | | | | | |
| | | | Household Products 0.6% | | | | |
| | 274,384 | | | Pigeon Corp. (Japan) | | | 8,225,702 | |
| | | | | | | | |
| | | | Industrial Machinery 0.9% | | | | |
| | 5,013,055 | | | Rotork plc (United Kingdom) | | | 13,723,075 | |
| | | | | | | | |
| | | | Internet & Direct Marketing
Retail 2.7% | | | | |
| | 353,841 | | | ASOS plc* (United Kingdom) | | | 22,239,007 | |
| | 1,568,363 | | | Trade Me Group Ltd. (New Zealand) | | | 6,418,062 | |
| | 75,609 | | | zooplus AG* (Germany) | | | 10,956,657 | |
| | | | | | | | |
| | | | | | | 39,613,726 | |
| | | | | | | | |
| | | | Internet Software & Services 8.1% | | | | |
| | 1,429,448 | | | Auto Trader Group plc (United Kingdom) | | | 7,513,015 | |
| | 560,144 | | | Dip Corp. (Japan) | | | 17,234,350 | |
| | 948,107 | | | Gurunavi, Inc. (Japan) | | | 25,870,638 | |
| | 766,757 | | | Infomart Corp. (Japan) | | | 8,839,199 | |
| | 402,807 | | | Rightmove plc (United Kingdom) | | | 22,042,980 | |
| | 758,955 | | | SMS Co. Ltd. (Japan) | | | 20,095,599 | |
| | 75,242 | | | XING AG (Germany) | | | 15,810,037 | |
| | | | | | | | |
| | | | | | | 117,405,818 | |
| | | | | | | | |
| | | | Investment Banking & Brokerage 1.7% | | | | |
| | 783,564 | | | Nihon M&A Center, Inc. (Japan) | | | 24,069,837 | |
| | | | | | | | |
| | | | IT Consulting & Other Services 1.1% | | | | |
| | 3,388,364 | | | NCC Group plc (United Kingdom) | | | 15,397,742 | |
| | | | | | | | |
| | | | Life & Health Insurance 1.1% | | | | |
| | 1,929,183 | | | Max Financial Services Ltd. (India) | | | 16,126,266 | |
| | | | | | | | |
| | | | Life Sciences Tools & Services 2.1% | | | | |
| | 1,092,438 | | | Clinigen Healthcare Ltd. (United Kingdom) | | | 10,152,454 | |
| | 117,118 | | | Tecan Group AG (Switzerland) | | | 20,542,364 | |
| | | | | | | | |
| | | | | | | 30,694,818 | |
| | | | | | | | |
| | | | Movies & Entertainment 1.8% | | | | |
| | 743,418 | | | CTS Eventim AG & Co KGaA (Germany) | | | 26,464,894 | |
| | | | | | | | |
| | | | Multi-Sector Holdings 1.7% | | | | |
| | 847,156 | | | GT Capital Holdings, Inc. (Philippines) | | | 25,155,266 | |
| | | | | | | | |
59
| | |
| WASATCH INTERNATIONAL GROWTH FUND (WAIGX / WIIGX) | | SEPTEMBER 30, 2016 |
|
|
|
Schedule of Investments (continued)
| | | | | | | | |
Shares | | | | | Value | |
| | | | | | | |
| | | | Office Services & Supplies 1.0% | | | | |
| | 4,113,701 | | | Regus plc (United Kingdom) | | $ | 13,911,113 | |
| | | | | | | | |
| | | | Oil & Gas Equipment & Services 1.3% | | | | |
| | 304,639 | | | Pason Systems, Inc. (Canada) | | | 3,898,692 | |
| | 223,197 | | | ShawCor Ltd. (Canada) | | | 5,506,983 | |
| | 502,358 | | | TGS-NOPEC Geophysical Co. ASA (Norway) | | | 9,048,552 | |
| | | | | | | | |
| | | | | | | 18,454,227 | |
| | | | | | | | |
| | | | Packaged Foods & Meats 2.8% | | | | |
| | 196,377 | | | Calbee, Inc. (Japan) | | | 7,387,981 | |
| | 16,513,449 | | | Vitasoy International Holdings Ltd. (Hong Kong) | | | 33,297,708 | |
| | | | | | | | |
| | | | | | | 40,685,689 | |
| | | | | | | | |
| | | | Personal Products 0.8% | | | | |
| | 824,438 | | | Colgate-Palmolive India Ltd. (India) | | | 12,060,099 | |
| | | | | | | | |
| | | | Pharmaceuticals 2.9% | | | | |
| | 1,027,700 | | | Glenmark Pharmaceuticals Ltd. (India) | | | 14,262,463 | |
| | 394,334 | | | Ipsen S.A. (France) | | | 27,681,499 | |
| | | | | | | | |
| | | | | | | 41,943,962 | |
| | | | | | | | |
| | | | Property & Casualty Insurance 0.6% | | | | |
| | 5,374,656 | | | Qualitas Controladora S.A.B. de C.V.** (Mexico) | | | 8,113,368 | |
| | | | | | | | |
| | | | Regional Banks 0.8% | | | | |
| | 341,510 | | | Metro Bank plc* (United Kingdom) | | | 12,221,511 | |
| | | | | | | | |
| | | | Restaurants 3.5% | | | | |
| | 732,000 | | | Create Restaurants Holdings, Inc. (Japan) | | | 7,406,262 | |
| | 658,442 | | | Domino’s Pizza Enterprises Ltd. (Australia) | | | 35,436,955 | |
| | 2,078,099 | | | Patisserie Holdings plc (United Kingdom) | | | 8,316,264 | |
| | | | | | | | |
| | | | | | | 51,159,481 | |
| | | | | | | | |
| | | | Semiconductor Equipment 0.5% | | | | |
| | 205,579 | | | Japan Material Co. Ltd. (Japan) | | | 7,713,901 | |
| | | | | | | | |
| | | | Semiconductors 3.1% | | | | |
| | 231,119 | | | Melexis N.V. (Belgium) | | | 16,587,594 | |
| | 993,999 | | | Silergy Corp. (Taiwan) | | | 14,682,220 | |
| | 64,005 | | | U-Blox AG* (Switzerland) | | | 13,828,769 | |
| | | | | | | | |
| | | | | | | 45,098,583 | |
| | | | | | | | |
| | | | Specialized Finance 0.5% | | | | |
| | 348,186 | | | Banca IFIS S.p.A. (Italy) | | | 7,850,070 | |
| | | | | | | | |
| | | | Specialty Chemicals 3.7% | | | | |
| | 324,755 | | | Chr. Hansen Holding A/S (Denmark) | | | 19,305,281 | |
| | 434,361 | | | Frutarom Industries Ltd. (Israel) | | | 22,849,474 | |
| | 1,329,582 | | | Hexpol AB (Sweden) | | | 11,918,317 | |
| | | | | | | | |
| | | | | | | 54,073,072 | |
| | | | | | | | |
| | | | Specialty Stores 1.1% | | | | |
| | 1,122,013 | | | XXL ASA (Norway) | | | 15,367,926 | |
| | | | | | | | |
| | | | Systems Software 1.1% | | | | |
| | 316,407 | | | Kinaxis, Inc.* (Canada) | | | 16,117,596 | |
| | | | | | | | |
| | | | Technology Hardware, Storage &
Peripherals 1.8% | | | | |
| | 1,574,305 | | | Ennoconn Corp. (Taiwan) | | | 26,267,296 | |
| | | | | | | | |
| | | | Trading Companies &
Distributors 3.5% | | | | |
| | 1,518,215 | | | MISUMI Group, Inc. (Japan) | | | 28,206,864 | |
| | 433,412 | | | MonotaRO Co. Ltd. (Japan) | | | 11,539,987 | |
| | 565,427 | | | Richelieu Hardware Ltd. (Canada) | | | 11,093,480 | |
| | | | | | | | |
| | | | | | | 50,840,331 | |
| | | | | | | | |
| | |
| | | | Total Common Stocks
(cost $1,063,380,470) | | | 1,428,341,256 | |
| | | | | | | | |
| | | | | | | | |
Principal
Amount | | | | | Value | |
| | | | | | | |
| | | | SHORT-TERM INVESTMENTS 1.8% | | | | |
| | |
| | | | Repurchase Agreement 1.8% | | | | |
| | $25,975,306 | | | Repurchase Agreement dated
9/30/16, 0.03% due 10/3/16 with State Street Bank and Trust Co. collateralized by $22,265,000 of United States Treasury Bonds 3.125% due 11/15/41; value: $26,495,350; repurchase proceeds: $25,975,371 (cost $25,975,306) | | $ | 25,975,306 | |
| | | | | | | | |
| | |
| | | | Total Short-Term Investments
(cost $25,975,306) | | | 25,975,306 | |
| | | | | | | | |
| | |
| | | | Total Investments
(cost $1,089,355,776) 100.0%§ | | | 1,454,316,562 | |
| | |
| | | | Liabilities less Other Assets (<0.1%) | | | (132,450 | ) |
| | | | | | | | |
| | |
| | | | NET ASSETS 100.0% | | $ | 1,454,184,112 | |
| | | | | | | | |
| |
| | | | *Non-income producing. **Common units. §The aggregate amount of foreign securities fair valued pursuant to a systematic valuation model as a percent of net assets was 1.57%. See Notes to Financial Statements. | |
At September 30, 2016, Wasatch International Growth Fund’s investments, excluding short-term investments, were in the following countries (unaudited):
| | | | |
| Country | | % | |
Australia | | | 7.5 | |
Belgium | | | 1.2 | |
Brazil | | | 1.4 | |
Canada | | | 4.9 | |
Denmark | | | 1.4 | |
France | | | 4.4 | |
Germany | | | 6.7 | |
Hong Kong | | | 2.3 | |
India | | | 6.5 | |
Israel | | | 1.6 | |
Italy | | | 1.1 | |
Japan | | | 21.4 | |
Korea | | | 2.6 | |
Mexico | | | 4.2 | |
New Zealand | | | 0.4 | |
Norway | | | 1.7 | |
Philippines | | | 2.3 | |
South Africa | | | 1.6 | |
Sweden | | | 0.8 | |
Switzerland | | | 2.4 | |
Taiwan | | | 4.9 | |
Thailand | | | 3.0 | |
United Kingdom | | | 15.7 | |
| | | | |
TOTAL | | | 100.0 | % |
| | | | |
60
| | |
| WASATCH INTERNATIONAL OPPORTUNITIES FUND (WAIOX / WIIOX) | | SEPTEMBER 30, 2016 |
|
|
|
Schedule of Investments
| | | | | | | | |
| Shares | | | | | Value | |
| | | | | | | |
| | | | COMMON STOCKS 96.9% | | | | |
| | |
| | | | Advertising 0.4% | | | | |
| | 20,000,000 | | | Plan B Media Public Co. Ltd. (Thailand) | | $ | 3,001,443 | |
| | | | | | | | |
| | | | Aerospace & Defense 0.2% | | | | |
| | 125,000 | | | Avon Rubber plc (United Kingdom) | | | 1,636,389 | |
| | | | | | | | |
| | | | Air Freight & Logistics 3.4% | | | | |
| | 3,244,120 | | | Allcargo Global Logistics Ltd. (India) | | | 8,867,976 | |
| | 1,503,468 | | | Freightways Ltd. (New Zealand) | | | 7,192,511 | |
| | 47,834 | | | ID Logistics Group* (France) | | | 7,165,468 | |
| | | | | | | | |
| | | | | | | 23,225,955 | |
| | | | | | | | |
| | | | Apparel Retail 0.3% | | | | |
| | 804,622 | | | Apranga PVA (Lithuania) | | | 2,322,950 | |
| | | | | | | | |
| | | | Apparel, Accessories & Luxury Goods 0.5% | | | | |
| | 117,976 | | | Delta-Galil Industries Ltd. (Israel) | | | 3,331,189 | |
| | | | | | | | |
| | | | Application Software 2.1% | | | | |
| | 500,000 | | | Computer Modelling Group Ltd. (Canada) | | | 3,738,710 | |
| | 614,325 | | | Linx S.A. (Brazil) | | | 3,664,623 | |
| | 381,457 | | | Logo Yazilim Sanayi Ve Ticaret A.S.* (Turkey) | | | 7,016,470 | |
| | | | | | | | |
| | | | | | | 14,419,803 | |
| | | | | | | | |
| | | | Asset Management & Custody Banks 1.1% | | | | |
| | 3,423,100 | | | Peregrine Holdings Ltd. (South Africa) | | | 7,131,822 | |
| | | | | | | | |
| | | | Auto Parts & Equipment 3.3% | | | | |
| | 299,990 | | | FIEM Industries Ltd. (India) | | | 5,001,335 | |
| | 2,150,000 | | | Hu Lane Associate, Inc. (Taiwan) | | | 10,734,396 | |
| | 120,000 | | | UNIWHEELS AG (Poland) | | | 6,737,624 | |
| | | | | | | | |
| | | | | | | 22,473,355 | |
| | | | | | | | |
| | | | Automobile Manufacturers 1.2% | | | | |
| | 1,416,600 | | | PAK Suzuki Motor Co. Ltd. (Pakistan) | | | 7,831,952 | |
| | | | | | | | |
| | | | Automotive Retail 1.1% | | | | |
| | 3,500,000 | | | Hascol Petroleum Ltd. (Pakistan) | | | 7,371,595 | |
| | | | | | | | |
| | | | Brewers 4.0% | | | | |
| | 962,475 | | | Carlsberg Brewery Malaysia Berhad, Class B (Malaysia) | | | 3,421,202 | |
| | 17,933,940 | | | International Breweries plc (Nigeria) | | | 1,135,816 | |
| | 265,558 | | | Kopparbergs Bryggeri AB, Class B (Sweden) | | | 8,760,306 | |
| | 197,574 | | | Olvi Oyj, Class A (Finland) | | | 5,870,436 | |
| | 160,100 | | | Royal UNIBREW A/S (Denmark) | | | 7,898,837 | |
| | | | | | | | |
| | | | | | | 27,086,597 | |
| | | | | | | | |
| | | | Building Products 0.1% | | | | |
| | 571,740 | | | Concepcion Industrial Corp. (Philippines) | | | 684,390 | |
| | | | | | | | |
| | | | Commodity Chemicals 6.4% | | | | |
| | 1,354,155 | | | Berger Paints India Ltd. (India) | | | 5,309,435 | |
| | 457,415 | | | Gulf Oil Lubricants India Ltd. (India) | | | 5,029,641 | |
| | 1,317,000 | | | Okamoto Industries, Inc. (Japan) | | | 16,390,257 | |
| | 480,857 | | | Supreme Industries Ltd. (India) | | | 6,500,019 | |
| | 330,700 | | | Tikkurila Oyj (Finland) | | | 7,114,065 | |
| | 1,273,500 | | | Yung Chi Paint & Varnish Manufacturing Co. Ltd. (Taiwan) | | | 3,071,465 | |
| | | | | | | | |
| | | | | | | 43,414,882 | |
| | | | | | | | |
| | | | Communications Equipment 0.6% | | | | |
| | 549,000 | | | Advanced Ceramic X Corp. (Taiwan) | | | 3,835,670 | |
| | | | | | | | |
| | | | Consumer Finance 0.8% | | | | |
| | 193,263 | | | Credit Corp. Group Ltd. (Australia) | | | 2,754,155 | |
| | 840,165 | | | Unifin Financiera SAPI de C.V. SOFOM (Mexico) | | | 2,534,827 | |
| | | | | | | | |
| | | | | | | 5,288,982 | |
| | | | | | | | |
| | | | | | | | |
| Shares | | | | | Value | |
| | | | | | | |
| | | | Department Stores 0.6% | | | | |
| | 257,203 | | | Poya Co. Ltd. (Taiwan) | | $ | 3,823,726 | |
| | | | | | | | |
| | | | Diversified Banks 1.0% | | | | |
| | 8,800,000 | | | BRAC Bank Ltd. (Bangladesh) | | | 6,730,840 | |
| | | | | | | | |
| | | | Diversified Support Services 0.4% | | | | |
| | 362,800 | | | Prestige International, Inc. (Japan) | | | 2,937,319 | |
| | | | | | | | |
| | | | Drug Retail 1.2% | | | | |
| | 1,622,058 | | | Green Cross Health Ltd. (New Zealand) | | | 3,177,164 | |
| | 94,400 | | | Kusuri No Aoki Co. Ltd. (Japan) | | | 4,794,241 | |
| | | | | | | | |
| | | | | | | 7,971,405 | |
| | | | | | | | |
| | | | Electrical Components & Equipment 2.3% | | | | |
| | 519,840 | | | Amara Raja Batteries Ltd. (India) | | | 7,893,635 | |
| | 483,760 | | | Voltronic Power Technology Corp. (Taiwan) | | | 7,562,247 | |
| | | | | | | | |
| | | | | | | 15,455,882 | |
| | | | | | | | |
| | | | Electronic Equipment & Instruments 1.4% | | | | |
| | 42,100 | | | Isra Vision AG (Germany) | | | 4,682,008 | |
| | 650,000 | | | Smart Marketing Systems plc (United Kingdom) | | | 5,000,220 | |
| | | | | | | | |
| | | | | | | 9,682,228 | |
| | | | | | | | |
| | | | Financial Exchanges & Data 0.3% | | | | |
| | 846,129 | | | Morningstar Japan KK (Japan) | | | 2,319,648 | |
| | | | | | | | |
| | | | Food Distributors 0.3% | | | | |
| | 8,606,200 | | | Premier Marketing Public Co. Ltd. (Thailand) | | | 2,235,377 | |
| | | | | | | | |
| | | | Food Retail 6.2% | | | | |
| | 37,850,020 | | | 7-Eleven Malaysia Holdings Berhad, Class B (Malaysia) | | | 16,474,437 | |
| | 220,344 | | | Axial Retailing, Inc. (Japan) | | | 7,616,052 | |
| | 1,511,300 | | | BreadTalk Group Ltd. (Singapore) | | | 1,113,776 | |
| | 2,434,291 | | | Philippine Seven Corp. (Philippines) | | | 7,165,585 | |
| | 90,070 | | | Rami Levi Chain Stores Hashikma Marketing 2006 Ltd. (Israel) | | | 3,661,788 | |
| | 7,749,100 | | | Sheng Siong Group Ltd. (Singapore) | | | 6,023,353 | |
| | | | | | | | |
| | | | | | | 42,054,991 | |
| | | | | | | | |
| | | | General Merchandise Stores 0.9% | | | | |
| | 78,972 | | | Seria Co. Ltd. (Japan) | | | 6,315,891 | |
| | | | | | | | |
| | | | Health Care Equipment 1.2% | | | | |
| | 1,522 | | | STRATEC Biomedical AG (Germany) | | | 87,709 | |
| | 133,175 | | | Vieworks Co. Ltd. (Korea) | | | 7,859,786 | |
| | | | | | | | |
| | | | | | | 7,947,495 | |
| | | | | | | | |
| | | | Health Care Facilities 3.2% | | | | |
| | 30,536,611 | | | Asiri Hospital Holdings plc (Sri Lanka) | | | 6,240,452 | |
| | 430,957 | | | NMC Health plc (United Arab Emirates) | | | 7,652,610 | |
| | 1,171,068 | | | Raffles Medical Group Ltd. (Singapore) | | | 1,313,877 | |
| | 2,032,981 | | | Shifa International Hospitals Ltd. (Pakistan) | | | 6,422,705 | |
| | | | | | | | |
| | | | | | | 21,629,644 | |
| | | | | | | | |
| | | | Health Care Services 0.6% | | | | |
| | 157,400 | | | BML, Inc. (Japan) | | | 4,117,965 | |
| | | | | | | | |
| | | | Health Care Technology 1.7% | | | | |
| | 300,000 | | | EMIS Group plc (United Kingdom) | | | 3,653,197 | |
| | 109,300 | | | Nexus AG (Germany) | | | 2,262,874 | |
| | 191,000 | | | NNIT A/S (Denmark) | | | 5,922,011 | |
| | | | | | | | |
| | | | | | | 11,838,082 | |
| | | | | | | | |
61
| | |
| WASATCH INTERNATIONAL OPPORTUNITIES FUND (WAIOX / WIIOX) | | |
|
|
|
Schedule of Investments (continued)
| | | | | | | | |
| Shares | | | | | Value | |
| | | | | | | |
| | | | Home Improvement Retail 1.9% | | | | |
| | 415,000 | | | Byggmax Group AB (Sweden) | | $ | 3,132,285 | |
| | 275,201 | | | Clas Ohlson AB, Class B (Sweden) | | | 4,282,573 | |
| | 82,494,300 | | | PT Ace Hardware Indonesia Tbk (Indonesia) | | | 5,530,803 | |
| | | | | | | | |
| | | | | | | 12,945,661 | |
| | | | | | | | |
| | | | Human Resource & Employment Services 1.0% | | | | |
| | 305,300 | | | en-japan, Inc. (Japan) | | | 6,563,325 | |
| | | | | | | | |
| | | | Industrial Machinery 1.5% | | | | |
| | 110,968 | | | SLM Solutions Group AG* (Germany) | | | 5,250,504 | |
| | 1,300,000 | | | Sumeeko Industries Co. Ltd. (Taiwan) | | | 4,956,054 | |
| | | | | | | | |
| | | | | | | 10,206,558 | |
| | | | | | | | |
| | | | Insurance Brokers 1.2% | | | | |
| | 1,830,700 | | | FPC Par Corretora de Seguros S.A. (Brazil) | | | 8,218,631 | |
| | | | | | | | |
| | | | Internet & Direct Marketing Retail 4.7% | | | | |
| | 48,800 | | | Open Door, Inc.* (Japan) | | | 1,424,467 | |
| | 2,624,167 | | | Trade Me Group Ltd. (New Zealand) | | | 10,738,627 | |
| | 2,192,973 | | | Webjet Ltd. (Australia) | | | 19,469,342 | |
| | | | | | | | |
| | | | | | | 31,632,436 | |
| | | | | | | | |
| | | | Internet Software & Services 7.6% | | | | |
| | 444,894 | | | Dip Corp. (Japan) | | | 13,688,371 | |
| | 551,399 | | | Gurunavi, Inc. (Japan) | | | 15,045,817 | |
| | 780,100 | | | Infomart Corp. (Japan) | | | 8,993,017 | |
| | 308,718 | | | PChome Online, Inc. (Taiwan) | | | 3,634,236 | |
| | 188,500 | | | SMS Co. Ltd. (Japan) | | | 4,991,100 | |
| | 26,252 | | | XING AG (Germany) | | | 5,516,136 | |
| | | | | | | | |
| | | | | | | 51,868,677 | |
| | | | | | | | |
| | | | IT Consulting & Other Services 1.7% | | | | |
| | 222,618 | | | Altran Technologies S.A.* (France) | | | 3,291,024 | |
| | 45,402 | | | CANCOM SE (Germany) | | | 2,370,332 | |
| | 506,371 | | | EOH Holdings Ltd. (South Africa) | | | 6,186,785 | |
| | | | | | | | |
| | | | | | | 11,848,141 | |
| | | | | | | | |
| | | | Leisure Products 0.3% | | | | |
| | 175,368 | | | Samchuly Bicycle Co. Ltd. (Korea) | | | 2,229,220 | |
| | | | | | | | |
| | | | Marine Ports & Services 0.2% | | | | |
| | 72,930 | | | Thessaloniki Port Authority S.A. (Greece) | | | 1,515,629 | |
| | | | | | | | |
| | | | Office Services & Supplies 0.5% | | | | |
| | 4,603,600 | | | Riverstone Holdings Ltd. (Singapore) | | | 3,038,234 | |
| | | | | | | | |
| | | | Oil & Gas Refining & Marketing 0.6% | | | | |
| | 9,294 | | | Hankook Shell Oil Co. Ltd. (Korea) | | | 3,793,211 | |
| | | | | | | | |
| | | | Other Diversified Financial Services 0.1% | | | | |
| | 8,607 | | | Hypoport AG* (Germany) | | | 810,234 | |
| | | | | | | | |
| | | | Packaged Foods & Meats 7.8% | | | | |
| | 2,643,927 | | | Cloetta AB, Class B (Sweden) | | | 9,584,805 | |
| | 1,262,907 | | | Clover Industries Ltd. (South Africa) | | | 1,813,027 | |
| | 411,100 | | | Dutch Lady Milk Industries Berhad (Malaysia) | | | 5,962,466 | |
| | 271,600 | | | Kotobuki Spirits Co. Ltd. (Japan) | | | 6,910,192 | |
| | 40,000,000 | | | PT Nippon Indosari Corpindo Tbk (Indonesia) | | | 5,179,680 | |
| | 54,297,981 | | | RFM Corp. (Philippines) | | | 4,702,578 | |
| | 105,800 | | | Rokko Butter Co. Ltd. (Japan) | | | 3,035,079 | |
| | 1,863,435 | | | TAT Gida Sanayi A.S. (Turkey) | | | 3,651,116 | |
| | 3,743,120 | | | Vitasoy International Holdings Ltd. (Hong Kong) | | | 7,547,625 | |
| | 234,000 | | | Warabeya Nichiyo Co. Ltd. (Japan) | | | 4,878,221 | |
| | | | | | | | |
| | | | | | | 53,264,789 | |
| | | | | | | | |
| | | | | | | | |
| Shares | | | | | Value | |
| | | | | | | |
| | | | Personal Products 2.3% | | | | |
| | 7,539,825 | | | Karex Berhad (Malaysia) | | $ | 4,485,061 | |
| | 404,832 | | | Sarantis S.A. (Greece) | | | 4,456,724 | |
| | 1,250,000 | | | TCI Co. Ltd. (Taiwan) | | | 6,898,917 | |
| | | | | | | | |
| | | | | | | 15,840,702 | |
| | | | | | | | |
| | | | Pharmaceuticals 1.3% | | | | |
| | 44,714,200 | | | PT Kimia Farma Persero Tbk (Indonesia) | | | 8,462,499 | |
| | 26,325 | | | Renata Ltd. (Bangladesh) | | | 373,161 | |
| | | | | | | | |
| | | | | | | 8,835,660 | |
| | | | | | | | |
| | | | Regional Banks 1.1% | | | | |
| | 1,272,126 | | | Banregio Grupo Financiero S.A.B. de C.V. (Mexico) | | | 7,286,443 | |
| | | | | | | | |
| | | | Restaurants 11.5% | | | | |
| | 113,048 | | | AmRest Holdings SE* (Poland) | | | 7,095,248 | |
| | 4,908,278 | | | Berjaya Food Berhad (Malaysia) | | | 2,207,568 | |
| | 3,260,900 | | | Collins Foods Ltd. (Australia) | | | 11,305,654 | |
| | 109,716 | | | Domino’s Pizza Enterprises Ltd. (Australia) | | | 5,904,850 | |
| | 447,300 | | | Doutor Nichires Holdings Co. Ltd. (Japan) | | | 8,178,041 | |
| | 1,265,900 | | | Fairwood Holdings Ltd. (Hong Kong) | | | 5,875,458 | |
| | 696,953 | | | Famous Brands Ltd. (South Africa) | | | 8,380,196 | |
| | 149,100 | | | Hiday Hidaka Corp. (Japan) | | | 3,578,812 | |
| | 144,900 | | | Kura Corp. (Japan) | | | 7,030,304 | |
| | 369,217 | | | Patisserie Holdings plc (United Kingdom) | | | 1,477,555 | |
| | 2,018,931 | | | Restaurant Brands New Zealand Ltd. (New Zealand) | | | 8,423,587 | |
| | 643,059 | | | Retail Food Group Ltd. (Australia) | | | 3,430,391 | |
| | 2,269,963 | | | Spur Corp. Ltd. (South Africa) | | | 5,425,745 | |
| | | | | | | | |
| | | | | | | 78,313,409 | |
| | | | | | | | |
| | | | Semiconductor Equipment 0.7% | | | | |
| | 131,000 | | | Japan Material Co. Ltd. (Japan) | | | 4,915,487 | |
| | | | | | | | |
| | | | Soft Drinks 1.3% | | | | |
| | 138,893,320 | | | Pepsi-Cola Products Philippines, Inc. (Philippines) | | | 9,136,399 | |
| | | | | | | | |
| | | | Specialized REITs 1.2% | | | | |
| | 6,474,752 | | | National Storage REIT (Australia) | | | 7,953,498 | |
| | | | | | | | |
| | | | Specialty Chemicals 1.4% | | | | |
| | 6,229,947 | | | Chemical and Allied Products plc (Nigeria) | | | 672,439 | |
| | 973,719 | | | DuluxGroup Ltd. (Australia) | | | 4,918,556 | |
| | 811,719 | | | SH Kelkar & Co. Ltd. (India) | | | 3,718,448 | |
| | | | | | | | |
| | | | | | | 9,309,443 | |
| | | | | | | | |
| | | | Tobacco 0.2% | | | | |
| | 5,249 | | | Karelia Tobacco Co., Inc. S.A. (Greece) | | | 1,503,597 | |
| | | | | | | | |
| | |
| | | | Total Common Stocks
(cost $503,946,591) | | | 659,146,851 | |
| | | | | | | | |
62
| | | | | | | | |
Principal
Amount | | | | | Value | |
| | | | | | | |
| | | | SHORT-TERM INVESTMENTS 3.9% | | | | |
| | |
| | | | Repurchase Agreement 3.9% | | | | |
| | $26,393,932 | | | Repurchase Agreement dated 9/30/16, 0.03% due 10/3/16 with State Street Bank and Trust Co. collateralized by $22,625,000 of United States Treasury Bonds 3.125% due 11/15/41; value: $26,923,750; repurchase proceeds: $26,393,998 (cost $26,393,932) | | $ | 26,393,932 | |
| | | | | | | | |
| | |
| | | | Total Short-Term Investments
(cost $26,393,932) | | | 26,393,932 | |
| | | | | | | | |
| | |
| | | | Total Investments
(cost $530,340,523) 100.8%§ | | | 685,540,783 | |
| | |
| | | | Liabilities less Other Assets (0.8%) | | | (5,152,972 | ) |
| | | | | | | | |
| | |
| | | | NET ASSETS 100.0% | | $ | 680,387,811 | |
| | | | | | | | |
| |
| | | | *Non-income producing. §The aggregate amount of foreign securities fair valued pursuant to a systematic valuation model as a percent of net assets was 2.07%. REIT Real Estate Investment Trust. See Notes to Financial Statements. | |
At September 30, 2016, Wasatch International Opportunities Fund’s investments, excluding short-term investments, were in the following countries (unaudited):
| | | | |
| Country | | % | |
Australia | | | 8.5 | |
Bangladesh | | | 1.1 | |
Brazil | | | 1.8 | |
Canada | | | 0.6 | |
Denmark | | | 2.1 | |
Finland | | | 2.0 | |
France | | | 1.6 | |
Germany | | | 3.2 | |
Greece | | | 1.1 | |
Hong Kong | | | 2.0 | |
India | | | 6.4 | |
Indonesia | | | 2.9 | |
Israel | | | 1.1 | |
Japan | | | 20.3 | |
Korea | | | 2.1 | |
Lithuania | | | 0.3 | |
Malaysia | | | 4.9 | |
Mexico | | | 1.5 | |
New Zealand | | | 4.5 | |
Nigeria | | | 0.3 | |
Pakistan | | | 3.3 | |
Philippines | | | 3.3 | |
Poland | | | 2.1 | |
Singapore | | | 1.7 | |
South Africa | | | 4.4 | |
Sri Lanka | | | 0.9 | |
Sweden | | | 3.9 | |
Taiwan | | | 6.7 | |
Thailand | | | 0.8 | |
Turkey | | | 1.6 | |
United Arab Emirates | | | 1.2 | |
United Kingdom | | | 1.8 | |
| | | | |
TOTAL | | | 100.0 | % |
| | | | |
63
| | |
| WASATCH LARGE CAP VALUE FUND (FMIEX / WILCX) | | SEPTEMBER 30, 2016 |
|
|
|
Schedule of Investments
| | | | | | | | |
| Shares | | | | | Value | |
| | | | | | | |
| | | | COMMON STOCKS 96.5% | | | | |
| | |
| | | | Communications Equipment 4.1% | | | | |
| | 246,937 | | | Cisco Systems, Inc. | | $ | 7,832,842 | |
| | | | | | | | |
| | | | Diversified Banks 11.4% | | | | |
| | 159,522 | | | Citigroup, Inc. | | | 7,534,224 | |
| | 118,320 | | | JPMorgan Chase & Co. | | | 7,878,929 | |
| | 147,630 | | | Wells Fargo & Co. | | | 6,537,056 | |
| | | | | | | | |
| | | | | | | 21,950,209 | |
| | | | | | | | |
| | | | Diversified Chemicals 2.4% | | | | |
| | 68,649 | | | Eastman Chemical Co. | | | 4,646,164 | |
| | | | | | | | |
| | | | Diversified REITs 1.8% | | | | |
| | 131,570 | | | Select Income REIT | | | 3,539,233 | |
| | | | | | | | |
| | | | Drug Retail 1.3% | | | | |
| | 28,147 | | | CVS Health Corp. | | | 2,504,802 | |
| | | | | | | | |
| | | | Electric Utilities 8.5% | | | | |
| | 104,413 | | | Duke Energy Corp. | | | 8,357,217 | |
| | 243,884 | | | Exelon Corp. | | | 8,118,898 | |
| | | | | | | | |
| | | | | | | 16,476,115 | |
| | | | | | | | |
| | | | Electrical Components & Equipment 2.5% | | | | |
| | 74,530 | | | Eaton Corp. plc | | | 4,897,366 | |
| | | | | | | | |
| | | | Health Care Distributors 1.2% | | | | |
| | 30,166 | | | Cardinal Health, Inc. | | | 2,343,898 | |
| | | | | | | | |
| | | | Health Care Equipment 2.1% | | | | |
| | 47,652 | | | Medtronic plc | | | 4,117,133 | |
| | | | | | | | |
| | | | Health Care REITs 0.9% | | | | |
| | 60,924 | | | Care Capital Properties, Inc. | | | 1,736,334 | |
| | | | | | | | |
| | | | Household Products 4.0% | | | | |
| | 86,153 | | | Procter & Gamble Co. (The) | | | 7,732,232 | |
| | | | | | | | |
| | | | Hypermarkets & Super Centers 4.1% | | | | |
| | 110,070 | | | Wal-Mart Stores, Inc. | | | 7,938,248 | |
| | | | | | | | |
| | | | Industrial Conglomerates 3.8% | | | | |
| | 248,795 | | | General Electric Co.†† | | | 7,369,308 | |
| | | | | | | | |
| | | | Integrated Oil & Gas 9.4% | | | | |
| | 64,226 | | | Chevron Corp. | | | 6,610,140 | |
| | 116,039 | | | Royal Dutch Shell plc ADR (Netherlands) | | | 5,810,073 | |
| | 207,711 | | | Suncor Energy, Inc. (Canada) | | | 5,770,211 | |
| | | | | | | | |
| | | | | | | 18,190,424 | |
| | | | | | | | |
| | | | Integrated Telecommunication Services 3.0% | | | | |
| | 111,128 | | | Verizon Communications, Inc. | | | 5,776,433 | |
| | | | | | | | |
| | | | Investment Banking & Brokerage 2.4% | | | | |
| | 27,980 | | | Goldman Sachs Group, Inc. (The) | | | 4,512,335 | |
| | | | | | | | |
| | | | Multi-Line Insurance 2.9% | | | | |
| | 95,416 | | | American International Group, Inc. | | | 5,661,985 | |
| | | | | | | | |
| | | | Oil & Gas Equipment & Services 2.6% | | | | |
| | 110,656 | | | Halliburton Co. | | | 4,966,241 | |
| | | | | | | | |
| | | | Pharmaceuticals 8.3% | | | | |
| | 68,953 | | | Johnson & Johnson | | | 8,145,418 | |
| | 233,067 | | | Pfizer, Inc. | | | 7,893,979 | |
| | | | | | | | |
| | | | | | | 16,039,397 | |
| | | | | | | | |
| | | | Property & Casualty Insurance 1.7% | | | | |
| | 60,855 | | | Axis Capital Holdings Ltd. | | | 3,306,252 | |
| | | | | | | | |
| | | | | | | | |
| Shares | | | | | Value | |
| | | | | | | |
| | | | Regional Banks 4.6% | | | | |
| | 271,368 | | | KeyCorp | | $ | 3,302,549 | |
| | 61,236 | | | PNC Financial Services Group, Inc. | | | 5,516,751 | |
| | | | | | | | |
| | | | | | | 8,819,300 | |
| | | | | | | | |
| | | | Semiconductors 2.0% | | | | |
| | 102,600 | | | Intel Corp. | | | 3,873,150 | |
| | | | | | | | |
| | | | Specialized REITs 3.0% | | | | |
| | 73,386 | | | EPR Properties | | | 5,778,414 | |
| | | | | | | | |
| | | | Systems Software 5.7% | | | | |
| | 99,228 | | | Microsoft Corp. | | | 5,715,533 | |
| | 136,649 | | | Oracle Corp. | | | 5,367,573 | |
| | | | | | | | |
| | | | | | | 11,083,106 | |
| | | | | | | | |
| | | | Technology Hardware, Storage &
Peripherals 2.8% | | | | |
| | 47,027 | | | Apple, Inc. | | | 5,316,402 | |
| | | | | | | | |
| | |
| | | | Total Common Stocks
(cost $155,952,971) | | | 186,407,323 | |
| | | | | | | | |
| | |
Principal
Amount | | | | | Value | |
| | | | | | | |
| | | | SHORT-TERM INVESTMENTS 2.2% | | | | |
| | |
| | | | Repurchase Agreement 2.2% | | | | |
| | $4,332,782 | | | Repurchase Agreement dated 9/30/16, 0.03% due 10/3/16 with State Street Bank and Trust Co. collateralized by $3,715,000 of United States Treasury Bonds 3.125% due 11/15/41; value $4,420,850; repurchase proceeds: $4,332,793†† (cost $4,332,782) | | $ | 4,332,782 | |
| | | | | | | | |
| | |
| | | | Total Short-Term Investments
(cost $4,332,782) | | | 4,332,782 | |
| | | | | | | | |
| | |
| | | | Total Investments
(cost $160,285,753) 98.7% | | | 190,740,105 | |
| | |
| | | | Other Assets less Liabilities 1.3% | | | 2,539,989 | |
| | | | | | | | |
| | |
| | | | NET ASSETS 100.0% | | $ | 193,280,094 | |
| | | | | | | | |
| |
| | | | ††All or a portion of this security has been designated as collateral for call options written. As of September 30, 2016, the call options written were no longer held; therefore, the collateral will be subsequently released. ADR American Depositary Receipt. REIT Real Estate Investment Trust. See Notes to Financial Statements. | |
At September 30, 2016, Wasatch Large Cap Value Fund’s investments, excluding short-term investments, were in the following countries (unaudited):
| | | | |
| Country | | % | |
Canada | | | 3.1 | |
Netherlands | | | 3.1 | |
United States | | | 93.8 | |
| | | | |
TOTAL | | | 100.0 | % |
| | | | |
64
| | |
| WASATCH LONG/SHORT FUND (FMLSX / WILSX) | | SEPTEMBER 30, 2016 |
|
|
|
Schedule of Investments
| | | | | | | | |
| Shares | | | | | Value | |
| | | | | | | |
| | | | COMMON STOCKS 85.1% | | | | |
| | |
| | | | Airlines 3.0% | | | | |
| | 141,557 | | | United Continental Holdings, Inc.* †† | | $ | 7,427,496 | |
| | | | | | | | |
| | | | Apparel Retail 2.8% | | | | |
| | 582,803 | | | Chico’s FAS, Inc. | | | 6,935,356 | |
| | | | | | | | |
| | | | Apparel, Accessories & Luxury Goods 2.9% | | | | |
| | 151,965 | | | Michael Kors Holdings Ltd.* | | | 7,110,442 | |
| | | | | | | | |
| | | | Automobile Manufacturers 2.9% | | | | |
| | 226,345 | | | General Motors Co. | | | 7,190,981 | |
| | | | | | | | |
| | | | Communications Equipment 2.1% | | | | |
| | 161,374 | | | Cisco Systems, Inc.†† | | | 5,118,783 | |
| | | | | | | | |
| | | | Department Stores 2.1% | | | | |
| | 142,938 | | | Macy’s, Inc.†† | | | 5,295,853 | |
| | | | | | | | |
| | | | Diversified Banks 2.8% | | | | |
| | 147,676 | | | Citigroup, Inc. | | | 6,974,737 | |
| | | | | | | | |
| | | | Diversified REITs 1.0% | | | | |
| | 398,492 | | | Investors Real Estate Trust†† | | | 2,371,027 | |
| | | | | | | | |
| | | | Electrical Components & Equipment 1.3% | | | | |
| | 58,039 | | | Emerson Electric Co.†† | | | 3,163,706 | |
| | | | | | | | |
| | | | Fertilizers & Agricultural Chemicals 5.2% | | | | |
| | 59,378 | | | Monsanto Co.†† | | | 6,068,432 | |
| | 278,424 | | | Mosaic Co. (The)†† | | | 6,810,251 | |
| | | | | | | | |
| | | | 12,878,683 | |
| | | | | | | | |
| | | | Food Retail 1.3% | | | | |
| | 117,861 | | | Whole Foods Market, Inc.†† | | | 3,341,359 | |
| | | | | | | | |
| | | | Health Care Equipment 4.5% | | | | |
| | 82,711 | | | Medtronic plc | | | 7,146,230 | |
| | 35,162 | | | Stryker Corp.†† | | | 4,093,209 | |
| | | | | | | | |
| | | | 11,239,439 | |
| | | | | | | | |
| | | | Health Care Services 2.5% | | | | |
| | 89,304 | | | Express Scripts Holding Co.* | | | 6,298,611 | |
| | | | | | | | |
| | | | Homefurnishing Retail 1.7% | | | | |
| | 125,288 | | | Restoration Hardware Holdings, Inc.* †† | | | 4,332,459 | |
| | | | | | | | |
| | | | Hotels, Resorts & Cruise Lines 1.4% | | | | |
| | 305,713 | | | La Quinta Holdings, Inc.* †† | | | 3,417,871 | |
| | | | | | | | |
| | | | Hypermarkets & Super Centers 1.3% | | | | |
| | 43,205 | | | Wal-Mart Stores, Inc.†† | | | 3,115,945 | |
| | | | | | | | |
| | | | Integrated Telecommunication Services 2.2% | | | | |
| | 103,205 | | | Verizon Communications, Inc.†† | | | 5,364,596 | |
| | | | | | | | |
| | | | Internet Software & Services 2.4% | | | | |
| | 114,474 | | | Akamai Technologies, Inc.* | | | 6,065,977 | |
| | | | | | | | |
| | | | Multi-Line Insurance 1.8% | | | | |
| | 109,012 | | | Loews Corp.†† | | | 4,485,844 | |
| | | | | | | | |
| | | | Oil & Gas Drilling 2.4% | | | | |
| | 320,387 | | | Unit Corp.* | | | 5,959,198 | |
| | | | | | | | |
| | | | Oil & Gas Exploration &
Production 6.2% | | | | |
| | 101,493 | | | Anadarko Petroleum Corp. | | | 6,430,596 | |
| | 1,096,194 | | | Bill Barrett Corp.* | | | 6,094,839 | |
| | 204,545 | | | Southwestern Energy Co.* †† | | | 2,830,903 | |
| | | | | | | | |
| | | | 15,356,338 | |
| | | | | | | | |
| | | | | | | | |
| Shares | | | | | Value | |
| | | | | | | |
| | | | Pharmaceuticals 6.7% | | | | |
| | 42,089 | | | Johnson & Johnson | | $ | 4,971,974 | |
| | 78,888 | | | Novartis AG ADR (Switzerland) | | | 6,228,996 | |
| | 105,321 | | | Zoetis, Inc.†† | | | 5,477,745 | |
| | | | | | | | |
| | | | 16,678,715 | |
| | | | | | | | |
| | | | Regional Banks 3.1% | | | | |
| | 212,016 | | | KeyCorp†† | | | 2,580,235 | |
| | 56,333 | | | PNC Financial Services Group, Inc. | | | 5,075,040 | |
| | | | | | | | |
| | | | 7,655,275 | |
| | | | | | | | |
| | | | Semiconductors 4.7% | | | | |
| | 91,000 | | | Mellanox Technologies Ltd.* | | | 3,935,750 | |
| | 113,851 | | | QUALCOMM, Inc. | | | 7,798,794 | |
| | | | | | | | |
| | | | 11,734,544 | |
| | | | | | | | |
| | | | Specialized REITs 4.8% | | | | |
| | 134,668 | | | Iron Mountain, Inc.†† | | | 5,054,090 | |
| | 288,925 | | | Outfront Media, Inc.†† | | | 6,833,076 | |
| | | | | | | | |
| | | | 11,887,166 | |
| | | | | | | | |
| | | | Steel 2.3% | | | | |
| | 228,927 | | | Steel Dynamics, Inc. | | | 5,720,886 | |
| | | | | | | | |
| | | | Systems Software 4.0% | | | | |
| | 184,680 | | | Oracle Corp. | | | 7,254,230 | |
| | 35,682 | | | VMware, Inc., Class A* †† | | | 2,617,275 | |
| | | | | | | | |
| | | | 9,871,505 | |
| | | | | | | | |
| | | | Technology Hardware, Storage &
Peripherals 4.0% | | | | |
| | 88,198 | | | Apple, Inc.†† | | | 9,970,784 | |
| | | | | | | | |
| | | | Thrifts & Mortgage Finance 1.7% | | | | |
| | 185,830 | | | BofI Holding, Inc.* †† | | | 4,162,592 | |
| | | | | | | | |
| | |
| | | | Total Common Stocks
(cost $206,060,701) | | | 211,126,168 | |
| | | | | | | | |
| | |
Principal
Amount | | | | | Value | |
| | | | | | | |
| | | | SHORT-TERM INVESTMENTS 21.2% | | | | |
| | |
| | | | Repurchase Agreement 21.2% | | | | |
| | $52,568,539 | | | Repurchase Agreement dated 9/30/16,
0.03% due 10/3/16 with State Street Bank
and Trust Co. collateralized by $44,855,000
of United States Treasury Bonds 3.125%
due 11/15/41; value: $50,622,600;
of United States Treasury Bonds 3.625%
due 2/15/44; value: $2,997,925;
proceeds: $52,568,671 (cost $52,568,539) | | $ | 52,568,539 | |
| | | | | | | | |
| | |
| | | | Total Short-Term Investments
(cost $52,568,539) | | | 52,568,539 | |
| | | | | | | | |
| | |
| | | | Total Investments
(cost $258,629,240) 106.3% | | | 263,694,707 | |
| | |
| | | | Liabilities less Other Assets (6.3%) | | | (15,527,315 | ) |
| | | | | | | | |
| | |
| | | | NET ASSETS 100.0% | | $ | 248,167,392 | |
| | | | | | | | |
65
| | |
| WASATCH LONG/SHORT FUND (FMLSX / WILSX) | | SEPTEMBER 30, 2016 |
|
|
|
Schedule of Investments (continued)
| | | | | | | | |
| Shares | | | | | Value | |
| | | | | | | |
| | | | SECURITIES SOLD SHORT 44.7% | | | | |
| | |
| | | | Airlines 1.1% | | | | |
| | 39,619 | | | Alaska Air Group, Inc. | | $ | 2,609,307 | |
| | | | | | | | |
| | | | Apparel, Accessories & Luxury
Goods 1.7% | | | | |
| | 112,423 | | | Coach, Inc. | | | 4,110,185 | |
| | | | | | | | |
| | | | Application Software 1.7% | | | | |
| | 85,993 | | | Paycom Software, Inc.* | | | 4,310,829 | |
| | | | | | | | |
| | | | Automobile Manufacturers 1.0% | | | | |
| | 11,825 | | | Tesla Motors, Inc.* | | | 2,412,655 | |
| | | | | | | | |
| | | | Automotive Retail 1.4% | | | | |
| | 66,353 | | | CarMax, Inc.* | | | 3,539,932 | |
| | | | | | | | |
| | | | Construction Machinery & Heavy
Trucks 2.1% | | | | |
| | 58,187 | | | Caterpillar, Inc. | | | 5,165,260 | |
| | | | | | | | |
| | | | Copper 1.5% | | | | |
| | 342,385 | | | Freeport-McMoRan, Inc. | | | 3,718,301 | |
| | | | | | | | |
| | | | Department Stores 0.6% | | | | |
| | 169,949 | | | JC Penney Co., Inc.* | | | 1,566,930 | |
| | | | | | | | |
| | | | Diversified Support Services 1.4% | | | | |
| | 90,412 | | | Healthcare Services Group, Inc. | | | 3,578,507 | |
| | | | | | | | |
| | | | Electronic Equipment &
Instruments 1.5% | | | | |
| | 69,825 | | | Cognex Corp. | | | 3,690,949 | |
| | | | | | | | |
| | | | Food Distributors 2.5% | | | | |
| | 124,233 | | | Sysco Corp. | | | 6,088,659 | |
| | | | | | | | |
| | | | Health Care Equipment 5.5% | | | | |
| | 112,405 | | | Inogen, Inc.* | | | 6,733,059 | |
| | 175,798 | | | Zeltiq Aesthetics, Inc.* | | | 6,894,798 | |
| | | | | | | | |
| | | | 13,627,857 | |
| | | | | | | | |
| | | | Health Care Technology 2.0% | | | | |
| | 117,219 | | | Veeva Systems, Inc., Class A* | | | 4,838,800 | |
| | | | | | | | |
| | | | Home Entertainment Software 1.3% | | | | |
| | 36,980 | | | Electronic Arts, Inc.* | | | 3,158,092 | |
| | | | | | | | |
| | | | Housewares & Specialties 2.0% | | | | |
| | 95,716 | | | Newell Brands, Inc. | | | 5,040,405 | |
| | | | | | | | |
| | | | Integrated Oil & Gas 1.8% | | | | |
| | 50,428 | | | Exxon Mobil Corp. | | | 4,401,356 | |
| | | | | | | | |
| | | | Oil & Gas Drilling 2.3% | | | | |
| | 83,486 | | | Helmerich & Payne, Inc. | | | 5,618,608 | |
| | | | | | | | |
| | | | Packaged Foods & Meats 1.3% | | | | |
| | 138,168 | | | Blue Buffalo Pet Products, Inc.* | | | 3,282,872 | |
| | | | | | | | |
| | | | Personal Products 2.6% | | | | |
| | 74,059 | | | Estee Lauder Cos., Inc. (The), Class A | | | 6,558,665 | |
| | | | | | | | |
| | | | Pharmaceuticals 1.9% | | | | |
| | 99,674 | | | Prestige Brands Holdings, Inc.* | | | 4,811,264 | |
| | | | | | | | |
| | | | Property & Casualty Insurance 2.5% | | | | |
| | 158,102 | | | First American Financial Corp. | | | 6,210,247 | |
| | | | | | | | |
| | | | Restaurants 0.8% | | | | |
| | 45,121 | | | Restaurant Brands International, Inc. (Canada) | | | 2,011,494 | |
| | | | | | | | |
| | | | Specialized REITs 1.2% | | | | |
| | 27,336 | | | American Tower Corp. | | | 3,097,989 | |
| | | | | | | | |
| | | | | | | | |
| Shares | | | | | Value | |
| | | | | | | |
| | | | Specialty Stores 3.0% | | | | |
| | 16,040 | | | Tractor Supply Co. | | $ | 1,080,294 | |
| | 26,657 | | | Ulta Salon Cosmetics & Fragrance, Inc.* | | | 6,343,833 | |
| | | | | | | | |
| | | | 7,424,127 | |
| | | | | | | | |
| | |
| | | | Total Securities Sold Short
(proceeds $99,534,144) | | | 110,873,290 | |
| | | | | | | | |
| |
| | | | *Non-income producing. ††All or a portion of this security has been designated as collateral for short sales or purchase commitments (see Note 3). ADR American Depositary Receipt. REIT Real Estate Investment Trust. See Notes to Financial Statements. | |
At September 30, 2016, Wasatch Long/Short Fund’s investments, excluding short-term investments and securities sold short, were in the following countries (unaudited):
| | | | |
| Country | | % | |
Switzerland | | | 3.0 | |
United States | | | 97.0 | |
| | | | |
TOTAL | | | 100.0 | % |
| | | | |
At September 30, 2016, Wasatch Long/Short Fund’s securities sold short were in the following countries (unaudited):
| | | | |
| Country | | % | |
Canada | | | 1.8 | |
United States | | | 98.2 | |
| | | | |
TOTAL | | | 100.0 | % |
| | | | |
66
| | |
| WASATCH MICRO CAP FUND (WMICX) | | SEPTEMBER 30, 2016 |
|
|
|
Schedule of Investments
| | | | | | | | |
| Shares | | | | | Value | |
| | | | | | | |
| | | | COMMON STOCKS 95.7% | | | | |
| | |
| | | | Air Freight & Logistics 1.0% | | | | |
| | 117,168 | | | Echo Global Logistics, Inc.* | | $ | 2,701,894 | |
| | | | | | | | |
| | | | Apparel Retail 1.1% | | | | |
| | 167,365 | | | Zumiez, Inc.* | | | 3,012,570 | |
| | | | | | | | |
| | | | Apparel, Accessories & Luxury Goods 2.4% | | | | |
| | 339,635 | | | Superior Uniform Group, Inc. | | | 6,721,377 | |
| | | | | | | | |
| | | | Application Software 10.5% | | | | |
| | 192,797 | | | Callidus Software, Inc.* | | | 3,537,825 | |
| | 26,063 | | | Ellie Mae, Inc.* | | | 2,744,434 | |
| | 249,716 | | | Exa Corp.* | | | 4,007,942 | |
| | 93,586 | | | Globant S.A.* (Argentina) | | | 3,941,842 | |
| | 39,549 | | | HubSpot, Inc.* | | | 2,278,813 | |
| | 32,840 | | | Tyler Technologies, Inc.* | | | 5,623,193 | |
| | 20,850 | | | Ultimate Software Group, Inc. (The)* | | | 4,261,532 | |
| | 147,896 | | | Workiva, Inc.* | | | 2,681,354 | |
| | | | | | | | |
| | | | 29,076,935 | |
| | | | | | | | |
| | | | Asset Management & Custody Banks 1.0% | | | | |
| | 15,534 | | | Diamond Hill Investment Group, Inc. | | | 2,870,528 | |
| | | | | | | | |
| | | | Automotive Retail 0.9% | | | | |
| | 41,597 | | | Monro Muffler Brake, Inc. | | | 2,544,488 | |
| | | | | | | | |
| | | | Biotechnology 5.7% | | | | |
| | 278,787 | | | Abcam plc (United Kingdom) | | | 3,035,337 | |
| | 151,227 | | | Argos Therapeutics, Inc.* | | | 751,598 | |
| | 15,000 | | | Argos Therapeutics, Inc. PIPE* *** † | | | 74,550 | |
| | 22,500 | | | Argos Therapeutics, Inc. PIPE* *** † | | | 111,825 | |
| | 176,227 | | | ChemoCentryx, Inc.* | | | 1,064,411 | |
| | 250,157 | | | Cytokinetics, Inc.* | | | 2,296,441 | |
| | 62,154 | | | Esperion Therapeutics, Inc.* | | | 860,833 | |
| | 188,539 | | | Exact Sciences Corp.* | | | 3,501,169 | |
| | 61,686 | | | Flexion Therapeutics, Inc.* | | | 1,205,345 | |
| | 129,918 | | | Inovio Pharmaceuticals, Inc.* | | | 1,210,836 | |
| | 210,359 | | | Sangamo BioSciences, Inc.* | | | 973,962 | |
| | 48,501 | | | Selecta Biosciences, Inc.* | | | 691,139 | |
| | | | | | | | |
| | | | 15,777,446 | |
| | | | | | | | |
| | | | Building Products 1.5% | | | | |
| | 68,903 | | | Trex Co., Inc.* | | | 4,045,984 | |
| | | | | | | | |
| | | | Consumer Electronics 1.2% | | | | |
| | 415,264 | | | ZAGG, Inc.* | | | 3,363,638 | |
| | | | | | | | |
| | | | Data Processing & Outsourced Services 0.9% | | | | |
| | 52,474 | | | ExlService Holdings, Inc.* | | | 2,615,304 | |
| | | | | | | | |
| | | | Department Stores 0.9% | | | | |
| | 317,634 | | | V-Mart Retail Ltd. (India) | | | 2,416,366 | |
| | | | | | | | |
| | | | Diversified Banks 1.4% | | | | |
| | 1,918,211 | | | City Union Bank Ltd. (India) | | | 3,820,288 | |
| | | | | | | | |
| | | | Electronic Equipment & Instruments 2.0% | | | | |
| | 34,211 | | | Mesa Laboratories, Inc. | | | 3,912,370 | |
| | 235,599 | | | Napco Security Technologies, Inc.* | | | 1,696,313 | |
| | | | | | | | |
| | | | 5,608,683 | |
| | | | | | | | |
| | | | Electronic Manufacturing Services 2.0% | | | | |
| | 73,529 | | | Fabrinet* | | | 3,278,658 | |
| | 26,759 | | | IPG Photonics Corp.* | | | 2,203,604 | |
| | | | | | | | |
| | | | 5,482,262 | |
| | | | | | | | |
| | | | | | | | |
| Shares | | | | | Value | |
| | | | | | | |
| | | | Environmental & Facilities Services 1.2% | | | | |
| | 241,406 | | | Heritage-Crystal Clean, Inc.* | | $ | 3,205,872 | |
| | | | | | | | |
| | | | Food Distributors 0.9% | | | | |
| | 217,154 | | | Chefs’ Warehouse, Inc. (The)* | | | 2,419,096 | |
| | | | | | | | |
| | | | General Merchandise Stores 1.0% | | | | |
| | 108,663 | | | Ollie’s Bargain Outlet Holdings, Inc.* | | | 2,848,057 | |
| | | | | | | | |
| | | | Health Care Equipment 3.3% | | | | |
| | 209,478 | | | AtriCure, Inc.* | | | 3,313,942 | |
| | 88,199 | | | Entellus Medical, Inc.* | | | 1,956,254 | |
| | 151,770 | | | Novadaq Technologies, Inc.* (Canada) | | | 1,755,979 | |
| | 71,920 | | | Oxford Immunotec Global plc* | | | 903,315 | |
| | 142,380 | | | Tandem Diabetes Care, Inc.* | | | 1,090,631 | |
| | | | | | | | |
| | | | 9,020,121 | |
| | | | | | | | |
| | | | Health Care Facilities 2.1% | | | | |
| | 282,081 | | | Ensign Group, Inc. (The) | | | 5,678,290 | |
| | | | | | | | |
| | | | Health Care REITs 3.0% | | | | |
| | 390,349 | | | CareTrust REIT, Inc. | | | 5,769,358 | |
| | 213,551 | | | MedEquities Realty Trust, Inc.* | | | 2,509,224 | |
| | | | | | | | |
| | | | 8,278,582 | |
| | | | | | | | |
| | | | Health Care Technology 0.9% | | | | |
| | 64,637 | | | Omnicell, Inc.* | | | 2,475,597 | |
| | | | | | | | |
| | | | Heavy Electrical Equipment 1.0% | | | | |
| | 131,694 | | | TPI Composites, Inc.* | | | 2,799,814 | |
| | | | | | | | |
| | | | Homebuilding 4.8% | | | | |
| | 154,656 | | | Installed Building Products, Inc.* | | | 5,547,511 | |
| | 210,367 | | | LGI Homes, Inc.* | | | 7,749,920 | |
| | | | | | | | |
| | | | 13,297,431 | |
| | | | | | | | |
| | | | Industrial Machinery 1.6% | | | | |
| | 47,470 | | | Arcam AB* (Sweden) | | | 1,621,288 | |
| | 46,181 | | | Proto Labs, Inc.* | | | 2,766,704 | |
| | | | | | | | |
| | | | 4,387,992 | |
| | | | | | | | |
| | | | Integrated Telecommunication Services 0.9% | | | | |
| | 287,433 | | | Ooma, Inc.* | | | 2,609,892 | |
| | | | | | | | |
| | | | Internet & Direct Marketing Retail 3.0% | | | | |
| | 82,324 | | | Duluth Holdings, Inc.* | | | 2,182,409 | |
| | 258,154 | | | MakeMyTrip Ltd.* (India) | | | 6,092,435 | |
| | | | | | | | |
| | | | 8,274,844 | |
| | | | | | | | |
| | | | Internet Software & Services 7.8% | | | | |
| | 55,331 | | | Cornerstone OnDemand, Inc.* | | | 2,542,459 | |
| | 138,187 | | | Envestnet, Inc.* | | | 5,036,916 | |
| | 173,301 | | | Reis, Inc. | | | 3,545,739 | |
| | 112,000 | | | SMS Co. Ltd. (Japan) | | | 2,965,534 | |
| | 55,267 | | | SPS Commerce, Inc.* | | | 4,057,151 | |
| | 113,175 | | | Tucows, Inc., Class A* | | | 3,621,600 | |
| | | | | | | | |
| | | | 21,769,399 | |
| | | | | | | | |
| | | | Leisure Products 0.8% | | | | |
| | 189,774 | | | MCBC Holdings, Inc. | | | 2,163,424 | |
| | | | | | | | |
| | | | Life & Health Insurance 1.0% | | | | |
| | 166,218 | | | Trupanion, Inc.* | | | 2,809,084 | |
| | | | | | | | |
| | | | Life Sciences Tools & Services 2.1% | | | | |
| | 122,614 | | | Fluidigm Corp.* | | | 982,138 | |
| | 63,996 | | | ICON plc* (Ireland) | | | 4,951,371 | |
| | | | | | | | |
| | | | 5,933,509 | |
| | | | | | | | |
| | | | Managed Health Care 2.7% | | | | |
| | 194,139 | | | HealthEquity, Inc.* | | | 7,348,161 | |
| | | | | | | | |
67
| | |
| WASATCH MICRO CAP FUND (WMICX) | | SEPTEMBER 30, 2016 |
|
|
|
Schedule of Investments (continued)
| | | | | | | | |
| Shares | | | | | Value | |
| | | | | | | |
| | | | Oil & Gas Equipment & Services 0.7% | | | | |
| | 157,619 | | | Pason Systems, Inc. (Canada) | | $ | 2,017,168 | |
| | | | | | | | |
| | | | Packaged Foods & Meats 2.0% | | | | |
| | 344,649 | | | Freshpet, Inc.* | | | 2,981,214 | |
| | 1,500,000 | | | Prabhat Dairy Ltd. (India) | | | 2,629,168 | |
| | | | | | | | |
| | | | 5,610,382 | |
| | | | | | | | |
| | | | Personal Products 0.1% | | | | |
| | 9,917 | | | elf Beauty, Inc.* | | | 278,866 | |
| | | | | | | | |
| | | | Pharmaceuticals 5.0% | | | | |
| | 14,323 | | | Aerie Pharmaceuticals, Inc.* | | | 540,550 | |
| | 96,749 | | | Akorn, Inc.* | | | 2,637,378 | |
| | 130,954 | | | Auris Medical Holding AG* (Switzerland) | | | 226,550 | |
| | 127,152 | | | Cempra, Inc.* | | | 3,077,078 | |
| | 170,645 | | | Egalet Corp.* | | | 1,298,609 | |
| | 44,566 | | | Intra-Cellular Therapies, Inc.* | | | 679,186 | |
| | 599,945 | | | Natco Pharma Ltd. (India) | | | 5,377,248 | |
| | | | | | | | |
| | | | 13,836,599 | |
| | | | | | | | |
| | | | Real Estate Services 0.6% | | | | |
| | 63,723 | | | HFF, Inc., Class A | | | 1,764,490 | |
| | | | | | | | |
| | | | Regional Banks 5.4% | | | | |
| | 134,808 | | | Cardinal Financial Corp. | | | 3,517,141 | |
| | 125,319 | | | Customers Bancorp, Inc.* | | | 3,153,026 | |
| | 161,075 | | | People’s Utah Bancorp | | | 3,277,876 | |
| | 94,443 | | | Pinnacle Financial Partners, Inc. | | | 5,107,477 | |
| | | | | | | | |
| | | | 15,055,520 | |
| | | | | | | | |
| | | | Restaurants 0.3% | | | | |
| | 138,468 | | | Papa Murphy’s Holdings, Inc.* | | | 893,119 | |
| | | | | | | | |
| | | | Semiconductor Equipment 1.8% | | | | |
| | 277,617 | | | PDF Solutions, Inc.* | | | 5,044,301 | |
| | | | | | | | |
| | | | Semiconductors 1.5% | | | | |
| | 42,129 | | | NVE Corp. | | | 2,483,083 | |
| | 28,212 | | | Power Integrations, Inc. | | | 1,778,203 | |
| | | | | | | | |
| | | | 4,261,286 | |
| | | | | | | | |
| | | | Specialty Stores 1.1% | | | | |
| | 246,472 | | | DavidsTea, Inc.* (Canada) | | | 3,036,535 | |
| | | | | | | | |
| | | | Systems Software 1.5% | | | | |
| | 46,309 | | | FleetMatics Group plc* | | | 2,777,614 | |
| | 151,664 | | | TubeMogul, Inc.* | | | 1,421,091 | |
| | | | | | | | |
| | | | 4,198,705 | |
| | | | | | | | |
| | | | Technology Hardware, Storage & Peripherals 1.5% | | | | |
| | 742,732 | | | USA Technologies, Inc.* | | | 4,163,013 | |
| | | | | | | | |
| | | | Textiles 0.5% | | | | |
| | 1,900,000 | | | Welspun India Ltd. (India) | | | 1,493,917 | |
| | | | | | | | |
| | | | Thrifts & Mortgage Finance 3.1% | | | | |
| | 1,050,006 | | | Gruh Finance Ltd. (India) | | | 5,207,449 | |
| | 34,059 | | | LendingTree, Inc.* | | | 3,300,658 | |
| | | | | | | | |
| | | | | | | 8,508,107 | |
| | | | | | | | |
| | |
| | | | Total Common Stocks
(cost $170,909,724) | | | 265,538,936 | |
| | | | | | | | |
| | |
| | | | WARRANTS 0.0% | | | | |
| | |
| | | | Biotechnology 0.0% | | | | |
| | 16,875 | | | Argos Therapeutics, Inc., expiring 3/14/2021* *** † | | | 16,031 | |
| | | | | | | | |
| | |
| | | | Total Warrants
(cost $2,109) | | | 16,031 | |
| | | | | | | | |
| | | | | | | | |
Principal
Amount | | | | | Value | |
| | | | SHORT-TERM INVESTMENTS 5.4% | | | | |
| | |
| | | | Repurchase Agreement 5.4% | | | | |
| | $15,116,164 | | | Repurchase Agreement dated 9/30/16, 0.03% due 10/3/16 with State Street Bank and Trust Co. collateralized by $12,960,000 of United States Treasury Bonds 3.125% due 11/15/41; value: $15,422,400; repurchase proceeds: $15,116,202 (cost $15,116,164) | | $ | 15,116,164 | |
| | | | | | | | |
| | |
| | | | Total Short-Term Investments
(cost $15,116,164) | | | 15,116,164 | |
| | | | | | | | |
| | |
| | | | Total Investments
(cost $186,027,997) 101.1% | | | 280,671,131 | |
| | |
| | | | Liabilities less Other Assets (1.1%) | | | (2,980,208 | ) |
| | | | | | | | |
| | |
| | | | NET ASSETS 100.0% | | $ | 277,690,923 | |
| | | | | | | | |
| |
| | | | *Non-income producing. ***Security was fair valued under procedures adopted by the Board of Trustees (see Note 13). †Security purchased in a private placement transaction or under Rule 144A of the Securities Act of 1933 (see Note 9). PIPE Private Investment in a Public Equity. REIT Real Estate Investment Trust. See Notes to Financial Statements. | |
At September 30, 2016, Wasatch Micro Cap Fund’s investments, excluding short-term investments, were in the following countries (unaudited):
| | | | |
| Country | | % | |
Argentina | | | 1.5 | |
Canada | | | 2.6 | |
India | | | 10.2 | |
Ireland | | | 1.9 | |
Japan | | | 1.1 | |
Sweden | | | 0.6 | |
Switzerland | | | 0.1 | |
United Kingdom | | | 1.1 | |
United States | | | 80.9 | |
| | | | |
TOTAL | | | 100.0 | % |
| | | | |
68
| | |
| WASATCH MICRO CAP VALUE FUND (WAMVX) | | SEPTEMBER 30, 2016 |
|
|
|
Schedule of Investments
| | | | | | | | |
| Shares | | | | | Value | |
| | | | | | | |
| | | | COMMON STOCKS 90.8% | | | | |
| | |
| | | | Airlines 0.7% | | | | |
| | 10,000 | | | Allegiant Travel Co. | | $ | 1,320,700 | |
| | | | | | | | |
| | | | Alternative Carriers 0.8% | | | | |
| | 140,000 | | | ORBCOMM, Inc.* | | | 1,435,000 | |
| | | | | | | | |
| | | | Apparel, Accessories & Luxury Goods 0.5% | | | | |
| | 41,260 | | | Superior Uniform Group, Inc. | | | 816,535 | |
| | | | | | | | |
| | | | Application Software 4.2% | | | | |
| | 37,000 | | | Ebix, Inc. | | | 2,103,450 | |
| | 42,000 | | | ESI Group* (France) | | | 1,816,456 | |
| | 50,000 | | | Everbridge, Inc.* | | | 843,000 | |
| | 25,000 | | | Globant S.A.* (Argentina) | | | 1,053,000 | |
| | 157,000 | | | Model N, Inc.* | | | 1,744,270 | |
| | | | | | | | |
| | | | 7,560,176 | |
| | | | | | | | |
| | | | Asset Management & Custody Banks 1.5% | | | | |
| | 55,000 | | | mutares AG (Germany) | | | 830,380 | |
| | 87,000 | | | Solar Capital Ltd. | | | 1,785,240 | |
| | | | | | | | |
| | | | 2,615,620 | |
| | | | | | | | |
| | | | Auto Parts & Equipment 2.6% | | | | |
| | 36,000 | | | Gentherm, Inc.* | | | 1,131,120 | |
| | 120,000 | | | Horizon Global Corp.* | | | 2,391,600 | |
| | 97,700 | | | Unique Fabricating, Inc. | | | 1,195,848 | |
| | | | | | | | |
| | | | 4,718,568 | |
| | | | | | | | |
| | | | Biotechnology 0.5% | | | | |
| | 45,000 | | | Exact Sciences Corp.* | | | 835,650 | |
| | | | | | | | |
| | | | Brewers 0.8% | | | | |
| | 700,000 | | | Turk Tuborg Bira ve Malt Sanayii A.S.* (Turkey) | | | 1,492,836 | |
| | | | | | | | |
| | | | Building Products 2.3% | | | | |
| | 32,000 | | | Caesarstone Ltd.* (Israel) | | | 1,206,720 | |
| | 23,000 | | | Patrick Industries, Inc.* | | | 1,424,160 | |
| | 24,000 | | | Trex Co., Inc.* | | | 1,409,280 | |
| | | | | | | | |
| | | | 4,040,160 | |
| | | | | | | | |
| | | | Commercial Printing 1.0% | | | | |
| | 195,000 | | | InnerWorkings, Inc.* | | | 1,836,900 | |
| | | | | | | | |
| | | | Commodity Chemicals 1.0% | | | | |
| | 350,000 | | | Green Seal Holding Ltd. (Taiwan) | | | 1,719,545 | |
| | | | | | | | |
| | | | Communications Equipment 0.9% | | | | |
| | 205,000 | | | ShoreTel, Inc.* | | | 1,640,000 | |
| | | | | | | | |
| | | | Construction & Engineering 1.1% | | | | |
| | 60,000 | | | NV5 Global, Inc.* | | | 1,938,600 | |
| | | | | | | | |
| | | | Consumer Electronics 1.3% | | | | |
| | 290,000 | | | ZAGG, Inc.* | | | 2,349,000 | |
| | | | | | | | |
| | | | Data Processing & Outsourced Services 0.6% | | | | |
| | 700,000 | | | TIO Networks Corp.* (Canada) | | | 1,136,476 | |
| | | | | | | | |
| | | | Diversified Banks 2.2% | | | | |
| | 1,000,000 | | | City Union Bank Ltd. (India) | | | 1,991,589 | |
| | 4,600,000 | | | EastWest Banking Corp. (Philippines) | | | 1,897,103 | |
| | | | | | | | |
| | | | 3,888,692 | |
| | | | | | | | |
| | | | Diversified Support Services 0.9% | | | | |
| | 1,150,000 | | | Johnson Service Group plc (United Kingdom) | | | 1,624,723 | |
| | | | | | | | |
| | | | | | | | |
| Shares | | | | | Value | |
| | | | | | | |
| | | | Electronic Equipment & Instruments 2.0% | | | | |
| | 197,142 | | | CUI Global, Inc.* | | $ | 1,149,338 | |
| | 150,000 | | | Napco Security Technologies, Inc.* | | | 1,080,000 | |
| | 58,000 | | | Optex Co. Ltd. (Japan) | | | 1,366,994 | |
| | | | | | | | |
| | | | 3,596,332 | |
| | | | | | | | |
| | | | Electronic Manufacturing Services 1.8% | | | | |
| | 71,000 | | | Fabrinet* | | | 3,165,890 | |
| | | | | | | | |
| | | | Environmental & Facilities Services 1.6% | | | | |
| | 430,000 | | | Hudson Technologies, Inc.* | | | 2,859,500 | |
| | | | | | | | |
| | | | Food Distributors 0.4% | | | | |
| | 65,100 | | | Chefs’ Warehouse, Inc. (The)* | | | 725,214 | |
| | | | | | | | |
| | | | Food Retail 0.6% | | | | |
| | 255,000 | | | Majestic Wine plc* (United Kingdom) | | | 1,015,517 | |
| | | | | | | | |
| | | | General Merchandise Stores 2.0% | | | | |
| | 71,000 | | | Ollie’s Bargain Outlet Holdings, Inc.* | | | 1,860,910 | |
| | 21,000 | | | Seria Co. Ltd. (Japan) | | | 1,679,503 | |
| | | | | | | | |
| | | | 3,540,413 | |
| | | | | | | | |
| | | | Health Care Equipment 4.2% | | | | |
| | 124,000 | | | AtriCure, Inc.* | | | 1,961,680 | |
| | 300,000 | | | Bovie Medical Corp.* | | | 1,563,000 | |
| | 97,000 | | | iRadimed Corp.* | | | 1,648,030 | |
| | 130,000 | | | Tactile Systems Technology, Inc.* | | | 2,431,000 | |
| | | | | | | | |
| | | | 7,603,710 | |
| | | | | | | | |
| | | | Health Care Facilities 1.9% | | | | |
| | 84,000 | | | Ensign Group, Inc. (The) | | | 1,690,920 | |
| | 2,199,943 | | | RHT Health Trust** (Singapore) | | | 1,685,811 | |
| | | | | | | | |
| | | | 3,376,731 | |
| | | | | | | | |
| | | | Health Care REITs 3.0% | | | | |
| | 110,000 | | | CareTrust REIT, Inc. | | | 1,625,800 | |
| | 137,500 | | | MedEquities Realty Trust, Inc.* | | | 1,615,625 | |
| | 82,000 | | | Sabra Health Care REIT, Inc. | | | 2,064,760 | |
| | | | | | | | |
| | | | 5,306,185 | |
| | | | | | | | |
| | | | Health Care Services 3.7% | | | | |
| | 40,000 | | | Air Methods Corp.* | | | 1,259,600 | |
| | 1,100,000 | | | GHP Specialty Care AB (Sweden) | | | 1,538,677 | |
| | 44,000 | | | LHC Group, Inc.* | | | 1,622,720 | |
| | 63,000 | | | National Research Corp., Class A | | | 1,026,270 | |
| | 350,000 | | | Nobilis Health Corp.* (Canada) | | | 1,168,489 | |
| | | | | | | | |
| | | | 6,615,756 | |
| | | | | | | | |
| | | | Health Care Supplies 0.6% | | | | |
| | 158,000 | | | Cerus Corp.* | | | 981,180 | |
| | 22,068 | | | Chembio Diagnostics, Inc.* | | | 162,641 | |
| | | | | | | | |
| | | | 1,143,821 | |
| | | | | | | | |
| | | | Health Care Technology 2.7% | | | | |
| | 90,000 | | | Nexus AG (Germany) | | | 1,863,300 | |
| | 55,000 | | | Omnicell, Inc.* | | | 2,106,500 | |
| | 22,000 | | | Software Service, Inc. (Japan) | | | 931,808 | |
| | | | | | | | |
| | | | 4,901,608 | |
| | | | | | | | |
| | | | Heavy Electrical Equipment 0.8% | | | | |
| | 70,000 | | | TPI Composites, Inc.* | | | 1,488,200 | |
| | | | | | | | |
| | | | Homebuilding 2.4% | | | | |
| | 55,000 | | | Installed Building Products, Inc.* | | | 1,972,850 | |
| | 63,000 | | | LGI Homes, Inc.* | | | 2,320,920 | |
| | | | | | | | |
| | | | 4,293,770 | |
| | | | | | | | |
69
| | |
| WASATCH MICRO CAP VALUE FUND (WAMVX) | | |
|
|
|
Schedule of Investments (continued)
| | | | | | | | |
| Shares | | | | | Value | |
| | | | | | | |
| | | | Hotel & Resort REITs 0.8% | | | | |
| | 115,000 | | | Summit Hotel Properties, Inc. | | $ | 1,513,400 | |
| | | | | | | | |
| | | | Hotels, Resorts & Cruise Lines 0.5% | | | | |
| | 100,000 | | | Red Lion Hotels Corp.* | | | 834,000 | |
| | | | | | | | |
| | | | Human Resource & Employment Services 0.5% | | | | |
| | 63,000 | | | BG Staffing, Inc. | | | 975,240 | |
| | | | | | | | |
| | | | Industrial Machinery 1.9% | | | | |
| | 33,000 | | | John Bean Technologies Corp. | | | 2,328,150 | |
| | 52,292 | | | Taylor Devices, Inc.* | | | 1,032,767 | |
| | | | | | | | |
| | | | 3,360,917 | |
| | | | | | | | |
| | | | Internet & Direct Marketing Retail 0.8% | | | | |
| | 69,000 | | | Oisix, Inc.* (Japan) | | | 1,438,450 | |
| | | | | | | | |
| | | | Internet Software & Services 2.8% | | | | |
| | 200,000 | | | LivePerson, Inc.* | | | 1,682,000 | |
| | 59,255 | | | Reis, Inc. | | | 1,212,357 | |
| | 68,000 | | | Tucows, Inc., Class A* | | | 2,176,000 | |
| | | | | | | | |
| | | | 5,070,357 | |
| | | | | | | | |
| | | | IT Consulting & Other Services 1.2% | | | | |
| | 14,000 | | | EPAM Systems, Inc.* | | | 970,340 | |
| | 58,000 | | | Perficient, Inc.* | | | 1,168,700 | |
| | | | | | | | |
| | | | 2,139,040 | |
| | | | | | | | |
| | | | Leisure Products 1.1% | | | | |
| | 90,000 | | | Nautilus, Inc.* | | | 2,044,800 | |
| | | | | | | | |
| | | | Life Sciences Tools & Services 0.7% | | | | |
| | 29,000 | | | INC Research Holdings, Inc., Class A* | | | 1,292,820 | |
| | | | | | | | |
| | | | Mortgage REITs 1.1% | | | | |
| | 260,000 | | | Arbor Realty Trust, Inc. | | | 1,929,200 | |
| | | | | | | | |
| | | | Oil & Gas Exploration & Production 1.8% | | | | |
| | 146,000 | | | Earthstone Energy, Inc.* | | | 1,255,600 | |
| | 310,000 | | | Evolution Petroleum Corp. | | | 1,946,800 | |
| | | | | | | | |
| | | | 3,202,400 | |
| | | | | | | | |
| | | | Packaged Foods & Meats 2.3% | | | | |
| | 195,000 | | | Freshpet, Inc.* | | | 1,686,750 | |
| | 1,600,000 | | | Kawan Food BHD (Malaysia) | | | 1,466,328 | |
| | 500,000 | | | Prabhat Dairy Ltd. (India) | | | 876,389 | |
| | | | | | | | |
| | | | 4,029,467 | |
| | | | | | | | |
| | | | Personal Products 0.5% | | | | |
| | 86,000 | | | Sarantis S.A. (Greece) | | | 946,759 | |
| | | | | | | | |
| | | | Pharmaceuticals 1.6% | | | | |
| | 79,000 | | | Cempra, Inc.* | | | 1,911,800 | |
| | 1,200,000 | | | Marksans Pharma Ltd. (India) | | | 949,835 | |
| | | | | | | | |
| | | | 2,861,635 | |
| | | | | | | | |
| | | | Property & Casualty Insurance 2.0% | | | | |
| | 105,000 | | | Atlas Financial Holdings, Inc.* | | | 1,655,850 | |
| | 210,000 | | | Kingstone Cos., Inc. | | | 1,938,300 | |
| | | | | | | | |
| | | | 3,594,150 | |
| | | | | | | | |
| | | | Regional Banks 6.6% | | | | |
| | 50,000 | | | American River Bankshares* | | | 542,000 | |
| | 61,000 | | | Bankwell Financial Group, Inc. | | | 1,445,090 | |
| | 117,000 | | | Blue Hills Bancorp, Inc. | | | 1,757,340 | |
| | 75,000 | | | Capstar Financial Holdings, Inc.* | | | 1,271,250 | |
| | 82,000 | | | Customers Bancorp, Inc.* | | | 2,063,120 | |
| | 51,000 | | | First of Long Island Corp. (The) | | | 1,690,650 | |
| | 106,000 | | | Investar Holding Corp. | | | 1,627,100 | |
| | 74,000 | | | People’s Utah Bancorp | | | 1,505,900 | |
| | | | | | | | |
| | | | 11,902,450 | |
| | | | | | | | |
| | | | | | | | |
| Shares | | | | | Value | |
| | | | | | | |
| | | | Residential REITs 0.8% | | | | |
| | 115,000 | | | Bluerock Residential Growth REIT, Inc. | | $ | 1,495,000 | |
| | | | | | | | |
| | | | Restaurants 0.9% | | | | |
| | 450,000 | | | Collins Foods Ltd. (Australia) | | | 1,560,166 | |
| | | | | | | | |
| | | | Semiconductor Equipment 1.0% | | | | |
| | 98,000 | | | PDF Solutions, Inc.* | | | 1,780,660 | |
| | | | | | | | |
| | | | Semiconductors 1.9% | | | | |
| | 223,500 | | | GigPeak, Inc.* | | | 525,225 | |
| | 187,000 | | | Tower Semiconductor Ltd.* (Israel) | | | 2,838,660 | |
| | | | | | | | |
| | | | 3,363,885 | |
| | | | | | | | |
| | | | Specialty Chemicals 2.2% | | | | |
| | 155,000 | | | Ferro Corp.* | | | 2,140,550 | |
| | 118,000 | | | Flotek Industries, Inc.* | | | 1,715,720 | |
| | | | | | | | |
| | | | 3,856,270 | |
| | | | | | | | |
| | | | Technology Hardware, Storage & Peripherals 0.9% | | | | |
| | 300,000 | | | USA Technologies, Inc.* | | | 1,681,500 | |
| | | | | | | | |
| | | | Textiles 1.5% | | | | |
| | 2,100,000 | | | Best Pacific International Holdings Ltd. (China) | | | 1,784,204 | |
| | 1,100,000 | | | Welspun India Ltd. (India) | | | 864,899 | |
| | | | | | | | |
| | | | 2,649,103 | |
| | | | | | | | |
| | | | Thrifts & Mortgage Finance 4.1% | | | | |
| | 122,000 | | | Beneficial Bancorp, Inc. | | | 1,794,620 | |
| | 112,000 | | | BofI Holding, Inc.* | | | 2,508,800 | |
| | 115,000 | | | Kearny Financial Corp. | | | 1,565,150 | |
| | 360,000 | | | Mortgage Advice Bureau Holdings Ltd. (United Kingdom) | | | 1,479,166 | |
| | | | | | | | |
| | | | 7,347,736 | |
| | | | | | | | |
| | | | Trading Companies & Distributors 0.7% | | | | |
| | 34,000 | | | SiteOne Landscape Supply, Inc.* | | | 1,221,620 | |
| | | | | | | | |
| | |
| | | | Total Common Stocks
(cost $118,078,674) | | | 162,692,853 | |
| | | | | | | | |
| | |
| | | | CONVERTIBLE PREFERRED STOCKS 0.8% | | | | |
| | |
| | | | Oil & Gas Refining & Marketing 0.8% | | | | |
| | 531,208 | | | Vertex Energy, Inc., Pfd., Series B*** † | | | 1,387,781 | |
| | | | | | | | |
| | |
| | | | Total Convertible Preferred Stocks
(cost $1,551,745) | | | 1,387,781 | |
| | | | | | | | |
| | |
| | | | PREFERRED STOCKS 0.8% | | | | |
| | |
| | | | Pharmaceuticals 0.8% | | | | |
| | 105,263 | | | Acetylon Pharmaceuticals, Inc., Series B Pfd.* *** † | | | 1,379,998 | |
| | | | | | | | |
| | |
| | | | Total Preferred Stocks
(cost $499,999) | | | 1,379,998 | |
| | | | | | | | |
| | |
| | | | WARRANTS 0.0% | | | | |
| | |
| | | | Oil & Gas Refining & Marketing 0.0% | | | | |
| | 250,000 | | | Vertex Energy, Inc., expiring 12/24/20* *** † | | | 25,000 | |
| | | | | | | | |
| | |
| | | | Total Warrants
(cost $95,000) | | | 25,000 | |
| | | | | | | | |
70
| | | | | | | | |
| Shares | | | | | Value | |
| | | | | | | |
| | | | RIGHTS 0.0% | | | | |
| | |
| | | | Health Care Supplies 0.0% | | | | |
| | 375,000 | | | Synergetics USA, Inc.* *** † | | $ | 37,500 | |
| | | | | | | | |
| | |
| | | | Total Rights
(cost $71,250) | | | 37,500 | |
| | | | | | | | |
| | |
Principal
Amount | | | | | Value | |
| | | | | | | |
| | | | SHORT-TERM INVESTMENTS 8.1% | | | | |
| | |
| | | | Repurchase Agreement 8.1% | | | | |
| | $14,498,386 | | | Repurchase Agreement dated 9/30/16,
0.03% due 10/3/16 with State Street Bank
and Trust Co. collateralized by $12,430,000 of United States Treasury Bonds 3.125% due 11/15/41; value: $14,791,700; repurchase proceeds: $14,498,423†† (cost $14,498,386) | | $ | 14,498,386 | |
| | | | | | | | |
| | |
| | | | Total Short-Term Investments
(cost $14,498,386) | | | 14,498,386 | |
| | | | | | | | |
| | |
| | | | Total Investments
(cost $134,795,054) 100.5% | | | 180,021,518 | |
| | |
| | | | Liabilities less Other Assets (0.5%) | | | (905,146 | ) |
| | | | | | | | |
| | |
| | | | NET ASSETS 100.0% | | $ | 179,116,372 | |
| | | | | | | | |
| |
| | | | *Non-income producing. **Common units. ***Security was fair valued under procedures adopted by the Board of Trustees (see Note 13). †Security purchased in a private placement transaction or under Rule 144A of the Securities Act of 1933 (see Note 9). ††All or a portion of this security has been designated as collateral for an unfunded loan commitment (see Note 3). REIT Real Estate Investment Trust. See Notes to Financial Statements. | |
At September 30, 2016, Wasatch Micro Cap Value Fund’s investments, excluding short-term investments, were in the following countries (unaudited):
| | | | |
| Country | | % | |
Argentina | | | 0.6 | |
Australia | | | 0.9 | |
Canada | | | 1.4 | |
China | | | 1.1 | |
France | | | 1.1 | |
Germany | | | 1.6 | |
Greece | | | 0.6 | |
India | | | 2.8 | |
Israel | | | 2.5 | |
Japan | | | 3.3 | |
Malaysia | | | 0.9 | |
Philippines | | | 1.2 | |
Singapore | | | 1.0 | |
Sweden | | | 0.9 | |
Taiwan | | | 1.0 | |
Turkey | | | 0.9 | |
United Kingdom | | | 2.5 | |
United States | | | 75.7 | |
| | | | |
TOTAL | | | 100.0 | % |
| | | | |
71
| | |
| WASATCH SMALL CAP GROWTH FUND (WAAEX / WIAEX) | | |
|
|
|
Schedule of Investments
| | | | | | | | |
| Shares | | | | | Value | |
| | | | | | | |
| | | | COMMON STOCKS 95.4% | | | | |
| | |
| | | | Aerospace & Defense 1.7% | | | | |
| | 537,468 | | | HEICO Corp., Class A | | $ | 32,522,189 | |
| | | | | | | | |
| | | | Air Freight & Logistics 3.7% | | | | |
| | 36,319,023 | | | Aramex PJSC (United Arab Emirates) | | | 38,971,103 | |
| | 1,316,353 | | | Echo Global Logistics, Inc.* | | | 30,355,100 | |
| | | | | | | | |
| | | | 69,326,203 | |
| | | | | | | | |
| | | | Airlines 3.2% | | | | |
| | 159,384 | | | Allegiant Travel Co. | | | 21,049,845 | |
| | 926,177 | | | Spirit Airlines, Inc.* | | | 39,390,308 | |
| | | | | | | | |
| | | | 60,440,153 | |
| | | | | | | | |
| | | | Apparel Retail 1.2% | | | | |
| | 1,265,079 | | | Zumiez, Inc.* ‡‡ | | | 22,771,422 | |
| | | | | | | | |
| | | | Application Software 10.9% | | | | |
| | 1,389,324 | | | Callidus Software, Inc.* | | | 25,494,095 | |
| | 263,474 | | | Globant S.A.* (Argentina) | | | 11,097,525 | |
| | 501,314 | | | HubSpot, Inc.* | | | 28,885,713 | |
| | 420,349 | | | Paylocity Holding Corp.* | | | 18,688,716 | |
| | 402,387 | | | Ultimate Software Group, Inc. (The)* | | | 82,243,879 | |
| | 1,283,797 | | | Zendesk, Inc.* | | | 39,425,406 | |
| | | | | | | | |
| | | | 205,835,334 | |
| | | | | | | | |
| | | | Automotive Retail 3.8% | | | | |
| | 521,556 | | | Monro Muffler Brake, Inc. | | | 31,903,581 | |
| | 139,313 | | | O’Reilly Automotive, Inc.* | | | 39,022,964 | |
| | | | | | | | |
| | | | 70,926,545 | |
| | | | | | | | |
| | | | Biotechnology 7.5% | | | | |
| | 2,124,073 | | | Abcam plc (United Kingdom) | | | 23,126,174 | |
| | 1,554,921 | | | Argos Therapeutics, Inc.* | | | 7,727,957 | |
| | 52,450 | | | Argos Therapeutics, Inc. PIPE* *** † | | | 260,676 | |
| | 78,700 | | | Argos Therapeutics, Inc. PIPE* *** † | | | 391,139 | |
| | 1,357,191 | | | ChemoCentryx, Inc.* | | | 8,197,434 | |
| | 683,170 | | | Cytokinetics, Inc.* | | | 6,271,501 | |
| | 240,910 | | | Esperion Therapeutics, Inc.* | | | 3,336,603 | |
| | 560,875 | | | Exact Sciences Corp.* | | | 10,415,449 | |
| | 413,857 | | | Flexion Therapeutics, Inc.* | | | 8,086,766 | |
| | 987,182 | | | Inovio Pharmaceuticals, Inc.* | | | 9,200,536 | |
| | 2,064,571 | | | Sangamo BioSciences, Inc.* | | | 9,558,964 | |
| | 996,987 | | | Seattle Genetics, Inc.* | | | 53,847,268 | |
| | | | | | | | |
| | | | 140,420,467 | |
| | | | | | | | |
| | | | Data Processing & Outsourced Services 0.7% | | | | |
| | 280,078 | | | ExlService Holdings, Inc.* | | | 13,959,088 | |
| | | | | | | | |
| | | | Diversified Banks 2.1% | | | | |
| | 272,169 | | | HDFC Bank Ltd. ADR (India) | | | 19,566,229 | |
| | 1,013,700 | | | Yes Bank Ltd. (India) | | | 19,127,536 | |
| | | | | | | | |
| | | | 38,693,765 | |
| | | | | | | | |
| | | | Diversified Support Services 2.9% | | | | |
| | 1,020,424 | | | Copart, Inc.* | | | 54,653,909 | |
| | | | | | | | |
| | | | Drug Retail 1.4% | | | | |
| | 119,229 | | | Cosmos Pharmaceutical Corp. (Japan) | | | 25,467,187 | |
| | | | | | | | |
| | | | Food Distributors 1.1% | | | | |
| | 1,897,093 | | | Chefs’ Warehouse, Inc. (The)* ‡‡ | | | 21,133,616 | |
| | | | | | | | |
| | | | General Merchandise Stores 1.3% | | | | |
| | 934,626 | | | Ollie’s Bargain Outlet Holdings, Inc.* | | | 24,496,547 | |
| | | | | | | | |
| | | | Health Care Equipment 0.2% | | | | |
| | 593,260 | | | Tandem Diabetes Care, Inc.* | | | 4,544,372 | |
| | | | | | | | |
| | | | Health Care Facilities 1.6% | | | | |
| | 1,533,765 | | | Ensign Group, Inc. (The) | | | 30,874,689 | |
| | | | | | | | |
| | | | | | | | |
| Shares | | | | | Value | |
| | | | | | | |
| | | | Internet & Direct Marketing Retail 5.3% | | | | |
| | 828,553 | | | Blue Nile, Inc.‡‡ | | $ | 28,518,794 | |
| | 1,751,690 | | | MakeMyTrip Ltd.* (India) | | | 41,339,884 | |
| | 398,485 | | | Wayfair, Inc., Class A* | | | 15,688,355 | |
| | 96,295 | | | zooplus AG* (Germany) | | | 13,954,308 | |
| | | | | | | | |
| | | | 99,501,341 | |
| | | | | | | | |
| | | | Internet Software & Services 7.8% | | | | |
| | 1,917,395 | | | Cornerstone OnDemand, Inc.* | | | 88,104,300 | |
| | 711,160 | | | Envestnet, Inc.* | | | 25,921,782 | |
| | 179,336 | | | Shutterstock, Inc.* | | | 11,423,703 | |
| | 296,139 | | | SPS Commerce, Inc.* | | | 21,739,564 | |
| | | | | | | | |
| | | | 147,189,349 | |
| | | | | | | | |
| | | | IT Consulting & Other Services 1.5% | | | | |
| | 547,082 | | | Luxoft Holding, Inc.* (Switzerland) | | | 28,913,284 | |
| | | | | | | | |
| | | | Life & Health Insurance 0.5% | | | | |
| | 561,380 | | | Trupanion, Inc.* | | | 9,487,322 | |
| | | | | | | | |
| | | | Life Sciences Tools & Services 4.9% | | | | |
| | 2,003,520 | | | Divi’s Laboratories Ltd. (India) | | | 39,119,495 | |
| | 961,352 | | | Fluidigm Corp.* | | | 7,700,430 | |
| | 576,523 | | | ICON plc* (Ireland) | | | 44,605,584 | |
| | | | | | | | |
| | | | 91,425,509 | |
| | | | | | | | |
| | | | Managed Health Care 1.3% | | | | |
| | 648,974 | | | HealthEquity, Inc.* | | | 24,563,666 | |
| | | | | | | | |
| | | | Oil & Gas Drilling 0.2% | | | | |
| | 199,608 | | | Nabors Industries Ltd. | | | 2,427,233 | |
| | 343,142 | | | Seadrill Ltd.* | | | 813,247 | |
| | | | | | | | |
| | | | 3,240,480 | |
| | | | | | | | |
| | | | Oil & Gas Equipment & Services 0.8% | | | | |
| | 110,894 | | | Archrock, Inc. | | | 1,450,493 | |
| | 88,407 | | | Dril-Quip, Inc.* | | | 4,927,806 | |
| | 88,632 | | | Frank’s International N.V. | | | 1,152,216 | |
| | 78,835 | | | Oceaneering International, Inc. | | | 2,168,751 | |
| | 349,452 | | | RPC, Inc.* | | | 5,870,794 | |
| | | | | | | | |
| | | | 15,570,060 | |
| | | | | | | | |
| | | | Oil & Gas Exploration & Production 0.4% | | | | |
| | 456,863 | | | EP Energy Corp., Class A* | | | 2,001,060 | |
| | 437,069 | | | WPX Energy, Inc.* | | | 5,764,940 | |
| | | | | | | | |
| | | | 7,766,000 | |
| | | | | | | | |
| | | | Oil & Gas Refining & Marketing 0.2% | | | | |
| | 38,475 | | | CVR Energy, Inc. | | | 529,801 | |
| | 77,771 | | | Delek US Holdings, Inc. | | | 1,344,660 | |
| | 50,917 | | | Western Refining, Inc. | | | 1,347,264 | |
| | | | | | | | |
| | | | 3,221,725 | |
| | | | | | | | |
| | | | Packaged Foods & Meats 1.4% | | | | |
| | 286,067 | | | GlaxoSmithKline Consumer Healthcare Ltd. (India) | | | 26,161,940 | |
| | | | | | | | |
| | | | Personal Products 0.7% | | | | |
| | 945,654 | | | Colgate-Palmolive India Ltd. (India) | | | 13,833,279 | |
| | | | | | | | |
| | | | Pharmaceuticals 1.2% | | | | |
| | 681,518 | | | Auris Medical Holding AG* (Switzerland) | | | 1,179,026 | |
| | 688,529 | | | Cempra, Inc.* | | | 16,662,402 | |
| | 345,185 | | | Intra-Cellular Therapies, Inc.* | | | 5,260,619 | |
| | | | | | | | |
| | | | | | | 23,102,047 | |
| | | | | | | | |
| | | | Real Estate Services 0.7% | | | | |
| | 437,341 | | | HFF, Inc., Class A | | | 12,109,972 | |
| | | | | | | | |
72
| | | | | | | | |
| Shares | | | | | Value | |
| | | | | | | |
| | | | Regional Banks 7.9% | | | | |
| | 515,466 | | | Bank of Hawaii Corp. | | $ | 37,433,141 | |
| | 585,554 | | | Eagle Bancorp, Inc.* | | | 28,885,379 | |
| | 758,469 | | | Glacier Bancorp, Inc. | | | 21,631,536 | |
| | 887,886 | | | Metro Bank plc* (United Kingdom) | | | 31,774,496 | |
| | 249,485 | | | Pinnacle Financial Partners, Inc. | | | 13,492,149 | |
| | 291,070 | | | Texas Capital Bancshares, Inc.* | | | 15,985,564 | |
| | | | | | | | |
| | | | | | | 149,202,265 | |
| | | | | | | | |
| | | | Research & Consulting Services 0.5% | | | | |
| | 412,649 | | | Stantec, Inc. (Canada) | | | 9,705,505 | |
| | | | | | | | |
| | | | Restaurants 3.9% | | | | |
| | 551,425 | | | Chuy’s Holdings, Inc.* | | | 15,406,815 | |
| | 986,342 | | | Fiesta Restaurant Group, Inc.* | | | 23,672,208 | |
| | 1,248,612 | | | Jubilant Foodworks Ltd. (India) | | | 18,189,077 | |
| | 1,042,768 | | | Papa Murphy’s Holdings, Inc.* ‡‡ | | | 6,725,854 | |
| | 387,791 | | | Zoe’s Kitchen, Inc.* | | | 8,605,082 | |
| | | | | | | | |
| | | | | | | 72,599,036 | |
| | | | | | | | |
| | | | Semiconductors 4.2% | | | | |
| | 744,289 | | | Cavium, Inc.* | | | 43,317,620 | |
| | 438,732 | | | Monolithic Power Systems, Inc. | | | 35,317,926 | |
| | | | | | | | |
| | | | | | | 78,635,546 | |
| | | | | | | | |
| | | | Specialty Stores 1.0% | | | | |
| | 473,899 | | | Five Below, Inc.* | | | 19,093,391 | |
| | | | | | | | |
| | | | Systems Software 2.9% | | | | |
| | 304,734 | | | CyberArk Software Ltd.* (Israel) | | | 15,105,664 | |
| | 860,002 | | | Fortinet, Inc.* | | | 31,759,874 | |
| | 711,894 | | | TubeMogul, Inc.* | | | 6,670,447 | |
| | | | | | | | |
| | | | | | | 53,535,985 | |
| | | | | | | | |
| | | | Trading Companies & Distributors 0.7% | | | | |
| | 187,356 | | | MSC Industrial Direct Co., Inc., Class A | | | 13,753,804 | |
| | | | | | | | |
| | | | Trucking 4.1% | | | | |
| | 2,659,181 | | | Knight Transportation, Inc. | | | 76,291,903 | |
| | | | | | | | |
| | |
| | | | Total Common Stocks
(cost $1,261,608,614) | | | 1,794,968,895 | |
| | | | | | | | |
| | |
| | | | PREFERRED STOCKS 2.0% | | | | |
| | |
| | | | Biotechnology 0.0% | | | | |
| | 677,966 | | | Nanosys, Inc., Series D Pfd.* *** † | | | 100,407 | |
| | 161,519 | | | Nanosys, Inc., Series E Pfd.* *** † | | | 95,764 | |
| | | | | | | | |
| | | | | | | 196,171 | |
| | | | | | | | |
| | | | Oil & Gas Equipment & Services 0.7% | | | | |
| | 5,818,582 | | | Drilling Info Holdings, Inc., Series B Pfd.* *** † | | | 12,365,651 | |
| | | | | | | | |
| | | | Systems Software 1.3% | | | | |
| | 1,114,610 | | | DataStax, Inc., Series E Pfd.* *** † | | | 6,286,400 | |
| | 33,296 | | | DocuSign, Inc., Series B Pfd.* *** † | | | 517,753 | |
| | 9,974 | | | DocuSign, Inc., Series B-1 Pfd.* *** † | | | 155,096 | |
| | 23,905 | | | DocuSign, Inc., Series D Pfd.* *** † | | | 371,723 | |
| | 618,152 | | | DocuSign, Inc., Series E Pfd.* *** † | | | 9,612,263 | |
| | 157,124 | | | DocuSign, Inc., Series F Pfd.* *** † | | | 2,443,278 | |
| | 505,604 | | | ForeScout Technologies, Inc., Series G* *** † | | | 6,000,003 | |
| | | | | | | | |
| | | | 25,386,516 | |
| | | | | | | | |
| | |
| | | | Total Preferred Stocks
(cost $43,534,917) | | | 37,948,338 | |
| | | | | | | | |
| | | | | | | | |
| Shares | | | | | Value | |
| | | | | | | |
| | | | LIMITED PARTNERSHIP INTEREST 0.2% | | | | |
| | |
| | | | Asset Management & Custody Banks 0.2% | | | | |
| | | | Greenspring Global Partners II-B, L.P.* *** † | | $ | 2,470,429 | |
| | | | Greenspring Global Partners III-B, L.P.* *** † | | | 1,165,125 | |
| | | | | | | | |
| | | | 3,635,554 | |
| | | | | | | | |
| | |
| | | | Total Limited Partnership Interest
(cost $4,232,047) | | | 3,635,554 | |
| | | | | | | | |
| | |
| | | | WARRANTS 0.0% | | | | |
| | |
| | | | Biotechnology 0.0% | | | | |
| | 59,025 | | | Argos Therapeutics, Inc., expiring 3/14/2021* *** † | | | 56,073 | |
| | 324,314 | | | Argos Therapeutics, Inc., expiring 8/2/2021* *** † | | | 428,743 | |
| | | | | | | | |
| | | | 484,816 | |
| | | | | | | | |
| | |
| | | | Total Warrants
(cost $7,378) | | | 484,816 | |
| | | | | | | | |
| | |
Principal
Amount | | | | | Value | |
| | | | | | | |
| | | | SHORT-TERM INVESTMENTS 2.0% | | | | |
| | |
| | | | Repurchase Agreement 2.0% | | | | |
| | $37,296,316 | | | Repurchase Agreement dated 9/30/16, 0.03% due 10/3/16 with State Street Bank and Trust Co. collateralized by $31,970,000 of United States Treasury Bonds 3.125% due 11/15/41; value: $38,044,300; repurchase proceeds: $ 37,296,409†† (cost $37,296,316) | | $ | 37,296,316 | |
| | | | | | | | |
| | |
| | | | Total Short-Term Investments
(cost $37,296,316) | | | 37,296,316 | |
| | | | | | | | |
| | |
| | | | Total Investments
(cost $1,346,679,272) 99.6%§ | | | 1,874,333,919 | |
| | |
| | | | Other Assets less Liabilities 0.4% | | | 8,066,999 | |
| | | | | | | | |
| | |
| | | | NET ASSETS 100.0% | | $ | 1,882,400,918 | |
| | | | | | | | |
| |
| | | | *Non-income producing. ***Security was fair valued under procedures adopted by the Board of Trustees (see Note 13). †Security purchased in a private placement transaction or under Rule 144A of the Securities Act of 1933 (see Note 9). ††All or a portion of this security has been designated as collateral for purchase commitments (see Note 10). ‡‡Affiliated company (see Note 8). §The aggregate amount of foreign securities fair valued pursuant to a systematic valuation model as a percent of net assets was 2.07%. ADR American Depositary Receipt. PIPE Private Investment in a Public Equity. See Notes to Financial Statements. | |
73
| | |
| WASATCH SMALL CAP GROWTH FUND (WAAEX / WIAEX) | | SEPTEMBER 30, 2016 |
|
|
|
Schedule of Investments (continued)
At September 30, 2016, Wasatch Small Cap Growth Fund’s investments, excluding short-term investments, were in the following countries (unaudited):
| | | | |
| Country | | % | |
Argentina | | | 0.6 | |
Canada | | | 0.5 | |
Germany | | | 0.8 | |
India | | | 9.7 | |
Ireland | | | 2.4 | |
Israel | | | 0.8 | |
Japan | | | 1.4 | |
Switzerland | | | 1.6 | |
United Arab Emirates | | | 2.1 | |
United Kingdom | | | 3.0 | |
United States | | | 77.1 | |
| | | | |
TOTAL | | | 100.0 | % |
| | | | |
74
| | |
| WASATCH SMALL CAP VALUE FUND (WMCVX / WICVX) | | SEPTEMBER 30, 2016 |
|
|
|
Schedule of Investments
| | | | | | | | |
| Shares | | | | | Value | |
| | | | | | | |
| | | | COMMON STOCKS 91.5% | | | | |
| | |
| | | | Aerospace & Defense 2.5% | | | | |
| | 122,073 | | | HEICO Corp., Class A | | $ | 7,386,637 | |
| | | | | | | | |
| | | | Airlines 3.9% | | | | |
| | 43,023 | | | Allegiant Travel Co. | | | 5,682,048 | |
| | 132,885 | | | Spirit Airlines, Inc.* | | | 5,651,599 | |
| | | | | | | | |
| | | | 11,333,647 | |
| | | | | | | | |
| | | | Application Software 3.5% | | | | |
| | 128,204 | | | Ebix, Inc. | | | 7,288,397 | |
| | 74,525 | | | Globant S.A.* (Argentina) | | | 3,138,993 | |
| | | | | | | | |
| | | | 10,427,390 | |
| | | | | | | | |
| | | | Asset Management & Custody Banks 4.2% | | | | |
| | 190,750 | | | Ares Capital Corp. | | | 2,956,625 | |
| | 113,912 | | | Artisan Partners Asset Management, Inc., Class A | | | 3,098,406 | |
| | 308,099 | | | Solar Capital Ltd. | | | 6,322,192 | |
| | | | | | | | |
| | | | 12,377,223 | |
| | | | | | | | |
| | | | Auto Parts & Equipment 2.1% | | | | |
| | 95,209 | | | Dorman Products, Inc.* | | | 6,083,855 | |
| | | | | | | | |
| | | | Biotechnology 1.5% | | | | |
| | 109,229 | | | Argos Therapeutics, Inc.* | | | 542,868 | |
| | 203,824 | | | Exact Sciences Corp.* | | | 3,785,012 | |
| | | | | | | | |
| | | | 4,327,880 | |
| | | | | | | | |
| | | | Consumer Electronics 1.1% | | | | |
| | 403,531 | | | ZAGG, Inc.* | | | 3,268,601 | |
| | | | | | | | |
| | | | Consumer Finance 3.7% | | | | |
| | 22,665 | | | Credit Acceptance Corp.* | | | 4,557,251 | |
| | 104,672 | | | PRA Group, Inc.* | | | 3,615,371 | |
| | 82,592 | | | Shriram City Union Finance Ltd. (India) | | | 2,655,895 | |
| | | | | | | | |
| | | | 10,828,517 | |
| | | | | | | | |
| | | | Diversified Banks 2.6% | | | | |
| | 2,380,835 | | | City Union Bank Ltd. (India) | | | 4,741,645 | |
| | 156,738 | | | Yes Bank Ltd. (India) | | | 2,957,494 | |
| | | | | | | | |
| | | | 7,699,139 | |
| | | | | | | | |
| | | | Diversified Support Services 1.7% | | | | |
| | 92,294 | | | Copart, Inc.* | | | 4,943,267 | |
| | | | | | | | |
| | | | Electronic Manufacturing Services 2.5% | | | | |
| | 166,849 | | | Fabrinet* | | | 7,439,797 | |
| | | | | | | | |
| | | | Footwear 1.1% | | | | |
| | 135,540 | | | Skechers U.S.A., Inc., Class A* | | | 3,103,866 | |
| | | | | | | | |
| | | | Health Care Facilities 3.1% | | | | |
| | 452,541 | | | Ensign Group, Inc. (The) | | | 9,109,650 | |
| | | | | | | | |
| | | | Health Care REITs 4.5% | | | | |
| | 479,105 | | | CareTrust REIT, Inc. | | | 7,081,172 | |
| | 238,550 | | | Sabra Health Care REIT, Inc. | | | 6,006,689 | |
| | | | | | | | |
| | | | 13,087,861 | |
| | | | | | | | |
| | | | Health Care Services 3.9% | | | | |
| | 74,992 | | | Air Methods Corp.* | | | 2,361,498 | |
| | 75,279 | | | Landauer, Inc. | | | 3,348,410 | |
| | 155,150 | | | LHC Group, Inc.* | | | 5,721,932 | |
| | | | | | | | |
| | | | 11,431,840 | |
| | | | | | | | |
| | | | Homebuilding 3.0% | | | | |
| | 241,600 | | | LGI Homes, Inc.* | | | 8,900,544 | |
| | | | | | | | |
| | | | Homefurnishing Retail 0.9% | | | | |
| | 115,997 | | | Select Comfort Corp.* | | | 2,505,535 | |
| | | | | | | | |
| | | | | | | | |
| Shares | | | | | Value | |
| | | | | | | |
| | | | Hotel & Resort REITs 1.0% | | | | |
| | 232,312 | | | Summit Hotel Properties, Inc. | | $ | 3,057,226 | |
| | | | | | | | |
| | | | Internet Software & Services 3.9% | | | | |
| | 54,630 | | | Cimpress N.V.* | | | 5,527,463 | |
| | 62,062 | | | Stamps.com, Inc.* | | | 5,865,480 | |
| | | | | | | | |
| | | | 11,392,943 | |
| | | | | | | | |
| | | | IT Consulting & Other Services 3.2% | | | | |
| | 36,987 | | | EPAM Systems, Inc.* | | | 2,563,569 | |
| | 57,403 | | | Luxoft Holding, Inc.* (Switzerland) | | | 3,033,748 | |
| | 153,028 | | | Virtusa Corp.* | | | 3,776,731 | |
| | | | | | | | |
| | | | 9,374,048 | |
| | | | | | | | |
| | | | Life Sciences Tools & Services 1.2% | | | | |
| | 45,740 | | | ICON plc* (Ireland) | | | 3,538,904 | |
| | | | | | | | |
| | | | Mortgage REITs 4.3% | | | | |
| | 1,074,665 | | | Arbor Realty Trust, Inc. | | | 7,974,014 | |
| | 626,668 | | | MFA Financial, Inc. | | | 4,687,477 | |
| | | | | | | | |
| | | | 12,661,491 | |
| | | | | | | | |
| | | | Oil & Gas Equipment & Services 0.4% | | | | |
| | 58,358 | | | Geospace Technologies Corp.* | | | 1,136,814 | |
| | | | | | | | |
| | | | Oil & Gas Exploration & Production 2.2% | | | | |
| | 320,820 | | | Earthstone Energy, Inc.* | | | 2,759,052 | |
| | 1,262,064 | | | Gran Tierra Energy, Inc.* (Colombia) | | | 3,798,813 | |
| | | | | | | | |
| | | | 6,557,865 | |
| | | | | | | | |
| | | | Oil & Gas Refining & Marketing 1.0% | | | | |
| | 62,918 | | | World Fuel Services Corp. | | | 2,910,587 | |
| | | | | | | | |
| | | | Personal Products 1.1% | | | | |
| | 50,301 | | | Nu Skin Enterprises, Inc., Class A | | | 3,258,499 | |
| | | | | | | | |
| | | | Pharmaceuticals 3.0% | | | | |
| | 152,194 | | | Cempra, Inc.* | | | 3,683,095 | |
| | 336,510 | | | Egalet Corp.* | | | 2,560,841 | |
| | 3,266,806 | | | Marksans Pharma Ltd. (India) | | | 2,585,771 | |
| | | | | | | | |
| | | | 8,829,707 | |
| | | | | | | | |
| | | | Property & Casualty Insurance 1.2% | | | | |
| | 221,235 | | | Atlas Financial Holdings, Inc.* | | | 3,488,876 | |
| | | | | | | | |
| | | | Regional Banks 8.3% | | | | |
| | 274,934 | | | Customers Bancorp, Inc.* | | | 6,917,340 | |
| | 85,904 | | | First of Long Island Corp. (The) | | | 2,847,718 | |
| | 112,729 | | | Pinnacle Financial Partners, Inc. | | | 6,096,384 | |
| | 60,664 | | | Prosperity Bancshares, Inc. | | | 3,329,847 | |
| | 138,937 | | | Webster Financial Corp. | | | 5,280,995 | |
| | | | | | | | |
| | | | 24,472,284 | |
| | | | | | | | |
| | | | Research & Consulting Services 1.3% | | | | |
| | 208,920 | | | Franklin Covey Co.* | | | 3,720,865 | |
| | | | | | | | |
| | | | Restaurants 1.9% | | | | |
| | 166,748 | | | Fiesta Restaurant Group, Inc.* | | | 4,001,952 | |
| | 226,712 | | | Papa Murphy’s Holdings, Inc.* | | | 1,462,292 | |
| | | | | | | | |
| | | | 5,464,244 | |
| | | | | | | | |
| | | | Semiconductor Equipment 1.8% | | | | |
| | 290,141 | | | PDF Solutions, Inc.* | | | 5,271,862 | |
| | | | | | | | |
| | | | Semiconductors 4.7% | | | | |
| | 88,329 | | | Cavium, Inc.* | | | 5,140,748 | |
| | 561,010 | | | Tower Semiconductor Ltd.* (Israel) | | | 8,516,132 | |
| | | | | | | | |
| | | | 13,656,880 | |
| | | | | | | | |
| | | | Thrifts & Mortgage Finance 1.6% | | | | |
| | 212,376 | | | BofI Holding, Inc.* | | | 4,757,222 | |
| | | | | | | | |
75
| | |
| WASATCH SMALL CAP VALUE FUND (WMCVX / WICVX) | | SEPTEMBER 30, 2016 |
|
|
|
Schedule of Investments (continued)
| | | | | | | | |
| Shares | | | | | Value | |
| | | | | | | |
| | | | Trucking 3.6% | | | | |
| | 98,807 | | | Knight Transportation, Inc. | | $ | 2,834,773 | |
| | 46,705 | | | Old Dominion Freight Line, Inc.* | | | 3,204,430 | |
| | 215,356 | | | Swift Transportation Co.* | | | 4,623,693 | |
| | | | | | | | |
| | | | 10,662,896 | |
| | | | | | | | |
| | |
| | | | Total Common Stocks
(cost $208,341,655) | | | 268,468,462 | |
| | | | | | | | |
| | |
| | | | LIMITED PARTNERSHIP INTEREST 1.3% | | | | |
| | |
| | | | Oil & Gas Storage & Transportation 1.3% | | | | |
| | 133,356 | | | Delek Logistics Partners L.P. | | | 3,811,314 | |
| | | | | | | | |
| | |
| | | | Total Limited Partnership Interest
(cost $4,928,039) | | | 3,811,314 | |
| | | | | | | | |
| | |
| | | | WARRANTS 0.0% | | | | |
| | |
| | | | Biotechnology 0.0% | | | | |
| | 81,921 | | | Argos Therapeutics, Inc., expiring 8/2/2021* *** † | | | 108,300 | |
| | | | | | | | |
| | |
| | | | Total Warrants
(cost $0) | | | 108,300 | |
| | | | | | | | |
| | |
Principal
Amount | | | | | Value | |
| | | | | | | |
| | | | SHORT-TERM INVESTMENTS 7.8% | | | | |
| | |
| | | | Repurchase Agreement 7.8% | | | | |
| | $22,861,806 | | | Repurchase Agreement dated 9/30/16, 0.03% due 10/3/16 with State Street Bank and Trust Co. collateralized by $19,600,000 of United States Treasury Bonds 3.125% due 11/15/41; value: $23,324,000; repurchase proceeds: $22,861,863 (cost $22,861,806) | | $ | 22,861,806 | |
| | | | | | | | |
| | |
| | | | Total Short-Term Investments
(cost $22,861,806) | | | 22,861,806 | |
| | | | | | | | |
| | |
| | | | Total Investments
(cost $236,131,500) 100.6% | | | 295,249,882 | |
| | |
| | | | Liabilities less Other Assets (0.6%) | | | (1,700,759 | ) |
| | | | | | | | |
| | |
| | | | NET ASSETS 100.0% | | $ | 293,549,123 | |
| | | | | | | | |
| |
| | | | *Non-income producing. ***Security was fair valued under procedures adopted by the Board of Trustees (see Note 13). †Security purchased in a private placement transaction or under Rule 144A of the Securities Act of 1933 (see Note 9). REIT Real Estate Investment Trust. See Notes to Financial Statements. | |
At September 30, 2016, Wasatch Small Cap Value Fund’s investments, excluding short-term investments, were in the following countries (unaudited):
| | | | |
| Country | | % | |
Argentina | | | 1.2 | |
Colombia | | | 1.4 | |
India | | | 4.7 | |
Ireland | | | 1.3 | |
Israel | | | 3.1 | |
Switzerland | | | 1.1 | |
United States | | | 87.2 | |
| | | | |
TOTAL | | | 100.0 | % |
| | | | |
76
| | |
| WASATCH STRATEGIC INCOME FUND (WASIX) | | SEPTEMBER 30, 2016 |
|
|
|
Schedule of Investments
| | | | | | | | |
| Shares | | | | | Value | |
| | | | | | | |
| | | | COMMON STOCKS 71.8% | | | | |
| | |
| | | | Air Freight & Logistics 0.5% | | | | |
| | 1,600 | | | FedEx Corp. | | $ | 279,488 | |
| | | | | | | | |
| | | | Asset Management & Custody Banks 7.3% | | | | |
| | 84,238 | | | Alcentra Capital Corp. | | | 1,094,251 | |
| | 1,600 | | | Ameriprise Financial, Inc. | | | 159,632 | |
| | 83,600 | | | Apollo Investment Corp. | | | 484,880 | |
| | 47,100 | | | Ares Capital Corp. | | | 730,050 | |
| | 15,608 | | | Hercules Capital, Inc. | | | 211,644 | |
| | 12,782 | | | KCAP Financial, Inc. | | | 59,181 | |
| | 156,100 | | | Medallion Financial Corp. | | | 658,742 | |
| | 58,500 | | | Medley Capital Corp. | | | 446,355 | |
| | 15,189 | | | NorthStar Asset Management Group, Inc. | | | 196,394 | |
| | | | | | | | |
| | | | 4,041,129 | |
| | | | | | | | |
| | | | Automotive Retail 1.7% | | | | |
| | 19,215 | | | Penske Automotive Group, Inc. | | | 925,779 | |
| | | | | | | | |
| | | | Broadcasting 4.2% | | | | |
| | 42,100 | | | CBS Corp., Class B | | | 2,304,554 | |
| | | | | | | | |
| | | | Cable & Satellite 6.3% | | | | |
| | 52,655 | | | Comcast Corp., Class A | | | 3,493,133 | |
| | | | | | | | |
| | | | Consumer Finance 2.7% | | | | |
| | 5,580 | | | Capital One Financial Corp. | | | 400,811 | |
| | 19,400 | | | Discover Financial Services | | | 1,097,070 | |
| | | | | | | | |
| | | | 1,497,881 | |
| | | | | | | | |
| | | | Data Processing & Outsourced Services 6.0% | | | | |
| | 16,350 | | | MasterCard, Inc., Class A | | | 1,663,939 | |
| | 19,890 | | | Visa, Inc., Class A | | | 1,644,903 | |
| | | | | | | | |
| | | | 3,308,842 | |
| | | | | | | | |
| | | | Diversified REITs 2.3% | | | | |
| | 57,840 | | | NorthStar Realty Finance Corp. | | | 761,753 | |
| | 355,714 | | | Star Asia Financial Ltd.* *** † | | | 497,999 | |
| | | | | | | | |
| | | | 1,259,752 | |
| | | | | | | | |
| | | | Drug Retail 2.2% | | | | |
| | 13,400 | | | CVS Health Corp. | | | 1,192,466 | |
| | | | | | | | |
| | | | Fertilizers & Agricultural Chemicals 2.0% | | | | |
| | 10,700 | | | Monsanto Co. | | | 1,093,540 | |
| | | | | | | | |
| | | | Financial Exchanges & Data 0.1% | | | | |
| | 3,300 | | | OTC Markets Group, Inc. | | | 60,390 | |
| | | | | | | | |
| | | | Health Care Distributors 2.7% | | | | |
| | 8,779 | | | McKesson Corp. | | | 1,463,898 | |
| | | | | | | | |
| | | | Home Improvement Retail 0.7% | | | | |
| | 3,200 | | | Home Depot, Inc. (The) | | | 411,776 | |
| | | | | | | | |
| | | | Integrated Oil & Gas 3.6% | | | | |
| | 71,283 | | | Suncor Energy, Inc. (Canada) | | | 1,978,831 | |
| | | | | | | | |
| | | | Integrated Telecommunication Services 1.8% | | | | |
| | 19,400 | | | Verizon Communications, Inc. | | | 1,008,412 | |
| | | | | | | | |
| | | | Internet Software & Services 0.6% | | | | |
| | 16,600 | | | Reis, Inc. | | | 339,636 | |
| | | | | | | | |
| | | | | | | | |
| Shares | | | | | Value | |
| | | | | | | |
| | | | Mortgage REITs 12.7% | | | | |
| | 156,900 | | | Arbor Realty Trust, Inc. | | $ | 1,164,198 | |
| | 21,700 | | | Blackstone Mortgage Trust, Inc., Class A | | | 639,065 | |
| | 12,976 | | | Chimera Investment Corp. | | | 206,967 | |
| | 11,801 | | | Colony Capital, Inc., Class A | | | 215,132 | |
| | 121,200 | | | Great Ajax Corp. | | | 1,654,380 | |
| | 30,400 | | | MTGE Investment Corp. REIT | | | 522,576 | |
| | 18,800 | | | New Residential Investment Corp. | | | 259,628 | |
| | 54,500 | | | PennyMac Mortgage Investment Trust | | | 849,110 | |
| | 64,067 | | | Resource Capital Corp. | | | 820,699 | |
| | 29,900 | | | Starwood Property Trust, Inc. | | | 673,348 | |
| | | | | | | | |
| | | | 7,005,103 | |
| | | | | | | | |
| | | | Personal Products 5.8% | | | | |
| | 31,483 | | | Herbalife Ltd.* | | | 1,951,631 | |
| | 18,938 | | | Nu Skin Enterprises, Inc., Class A | | | 1,226,804 | |
| | | | | | | | |
| | | | 3,178,435 | |
| | | | | | | | |
| | | | Railroads 3.1% | | | | |
| | 26,000 | | | Canadian National Railway Co. (Canada) | | | 1,699,577 | |
| | | | | | | | |
| | | | Real Estate Services 0.5% | | | | |
| | 2,600 | | | Jones Lang LaSalle, Inc. | | | 295,854 | |
| | | | | | | | |
| | | | Semiconductors 1.4% | | | | |
| | 12,300 | | | Microchip Technology, Inc. | | | 764,322 | |
| | | | | | | | |
| | | | Soft Drinks 1.5% | | | | |
| | 8,900 | | | Dr Pepper Snapple Group, Inc. | | | 812,659 | |
| | | | | | | | |
| | | | Specialty Stores 0.5% | | | | |
| | 4,100 | | | Tractor Supply Co. | | | 276,135 | |
| | | | | | | | |
| | | | Technology Hardware, Storage & Peripherals 0.5% | | | | |
| | 2,672 | | | Apple, Inc. | | | 302,070 | |
| | | | | | | | |
| | | | Trading Companies &
Distributors 1.1% | | | | |
| | 2,630 | | | W.W. Grainger, Inc. | | | 591,329 | |
| | | | | | | | |
| | |
| | | | Total Common Stocks
(cost $33,897,371) | | | 39,584,991 | |
| | | | | | | | |
| | |
| | | | EXCHANGE-TRADED FUNDS 0.9% | | | | |
| | |
| | | | Asset Management & Custody
Banks 0.9% | | | | |
| | 500 | | | Guggenheim S&P 500 Equal Weight Consumer Staples ETF | | | 61,190 | |
| | 600 | | | iShares Global Consumer Staples ETF | | | 59,580 | |
| | 5,800 | | | PowerShares Dynamic Pharmaceuticals Portfolio | | | 357,512 | |
| | | | | | | | |
| | | | 478,282 | |
| | | | | | | | |
| | |
| | | | Total Exchange-Traded Funds
(cost $326,661) | | | 478,282 | |
| | | | | | | | |
77
| | |
| WASATCH STRATEGIC INCOME FUND (WASIX) | | SEPTEMBER 30, 2016 |
|
|
|
Schedule of Investments (continued)
| | | | | | | | |
| Shares | | | | | Value | |
| | | | | | | |
| | | | LIMITED LIABILITY COMPANY MEMBERSHIP INTEREST 0.1% | | | | |
| | |
| | | | Asset Management & Custody
Banks 0.1% | | | | |
| | 2,779 | | | Ellington Financial, LLC | | $ | 46,326 | |
| | | | | | | | |
| | |
| | | | Total Limited Liability Company Membership Interest
(cost $48,605) | | | 46,326 | |
| | | | | | | | |
| | |
| | | | LIMITED PARTNERSHIP
INTEREST 7.0% | | | | |
| | |
| | | | Asset Management & Custody
Banks 3.6% | | | | |
| | 38,200 | | | Blackstone Group L.P. | | | 975,246 | |
| | 70,325 | | | KKR & Co. L.P. | | | 1,002,834 | |
| | | | | | | | |
| | | | 1,978,080 | |
| | | | | | | | |
| | | | Oil & Gas Storage &
Transportation 3.4% | | | | |
| | 27,094 | | | Magellan Midstream Partners L.P. | | | 1,916,630 | |
| | | | | | | | |
| | |
| | | | Total Limited Partnership Interest
(cost $4,475,539) | | | 3,894,710 | |
| | | | | | | | |
| | |
Principal
Amount | | | | | Value | |
| | | | | | | |
| | | | CORPORATE BONDS 0.0% | | | | |
| | |
| | | | Gold 0.0% | | | | |
| $ | 205,804 | | | Redcorp Ventures Ltd., 13.00%, 7/11/12,
Series D* *** † §§ (Canada) | | $ | 314 | |
| | | | | | | | |
| | |
| | | | Total Corporate Bonds
(cost $151,992) | | | 314 | |
| | | | | | | | |
| | |
| | | | SHORT-TERM INVESTMENTS 20.2% | | | | |
| | |
| | | | Repurchase Agreement 20.2% | | | | |
| | 11,117,499 | | | Repurchase Agreement dated 9/30/16, 0.03% due 10/3/16 with State Street Bank and Trust Co. collateralized by $9,530,000 of United States Treasury Bonds 3.125% due 11/15/41; value: $11,340,700; repurchase proceeds: $11,117,526 (cost $11,117,499) | | | 11,117,499 | |
| | | | | | | | |
| | |
| | | | Total Short-Term Investments
(cost $11,117,499) | | | 11,117,499 | |
| | | | | | | | |
| | |
| | | | Total Investments
(cost $50,017,667) 100.0% | | | 55,122,122 | |
| | |
| | | | Liabilities less Other Assets (<0.1%) | | | (10,290 | ) |
| | | | | | | | |
| | |
| | | | NET ASSETS 100.0% | | $ | 55,111,832 | |
| | | | | | | | |
| |
| | | | *Non-income producing. ***Security was fair valued under procedures adopted by the Board of Trustees (see Note 13). †Security purchased in a private placement transaction or under Rule 144A of the Securities Act of 1933 (see Note 9). §§In default. ETF Exchange-Traded Fund. REIT Real Estate Investment Trust. See Notes to Financial Statements. | |
At September 30, 2016, Wasatch Strategic Income Fund’s investments, excluding short-term investments, were in the following countries (unaudited):
| | | | |
| Country | | % | |
Canada | | | 8.4 | |
United States | | | 91.6 | |
| | | | |
TOTAL | | | 100.0 | % |
| | | | |
78
| | |
| WASATCH ULTRA GROWTH FUND (WAMCX) | | SEPTEMBER 30, 2016 |
|
|
|
Schedule of Investments
| | | | | | | | |
| Shares | | | | | Value | |
| | | | | | | |
| | | | COMMON STOCKS 90.7% | | | | |
| | |
| | | | Air Freight & Logistics 1.2% | | | | |
| | 52,068 | | | Echo Global Logistics, Inc.* | | $ | 1,200,688 | |
| | | | | | | | |
| | | | Application Software 12.3% | | | | |
| | 114,403 | | | Exa Corp.* | | | 1,836,168 | |
| | 13,915 | | | Globant S.A.* (Argentina) | | | 586,100 | |
| | 31,944 | | | HubSpot, Inc.* | | | 1,840,613 | |
| | 35,814 | | | Interactive Intelligence Group, Inc.* | | | 2,153,854 | |
| | 43,126 | | | Paylocity Holding Corp.* | | | 1,917,382 | |
| | 11,811 | | | Ultimate Software Group, Inc. (The)* | | | 2,414,051 | |
| | 56,841 | | | Zendesk, Inc.* | | | 1,745,587 | |
| | | | | | | | |
| | | | 12,493,755 | |
| | | | | | | | |
| | | | Biotechnology 12.2% | | | | |
| | 109,092 | | | Argos Therapeutics, Inc.* | | | 542,187 | |
| | 7,300 | | | Argos Therapeutics, Inc. PIPE* *** † | | | 36,281 | |
| | 10,950 | | | Argos Therapeutics, Inc. PIPE* *** † | | | 54,422 | |
| | 22,805 | | | Bellicum Pharmaceuticals, Inc.* | | | 453,820 | |
| | 192,162 | | | ChemoCentryx, Inc.* | | | 1,160,659 | |
| | 161,463 | | | Cytokinetics, Inc.* | | | 1,482,230 | |
| | 29,752 | | | Esperion Therapeutics, Inc.* | | | 412,065 | |
| | 85,786 | | | Exact Sciences Corp.* | | | 1,593,046 | |
| | 31,791 | | | Flexion Therapeutics, Inc.* | | | 621,196 | |
| | 90,329 | | | Inovio Pharmaceuticals, Inc.* | | | 841,866 | |
| | 185,224 | | | MEI Pharma, Inc.* | | | 325,994 | |
| | 30,492 | | | Pfenex, Inc.* | | | 272,903 | |
| | 312,935 | | | Sangamo BioSciences, Inc.* | | | 1,448,889 | |
| | 52,377 | | | Seattle Genetics, Inc.* | | | 2,828,882 | |
| | 19,388 | | | Selecta Biosciences, Inc.* | | | 276,279 | |
| | | | | | | | |
| | | | 12,350,719 | |
| | | | | | | | |
| | | | Building Products 1.3% | | | | |
| | 22,260 | | | Trex Co., Inc.* | | | 1,307,107 | |
| | | | | | | | |
| | | | Department Stores 0.6% | | | | |
| | 82,194 | | | V-Mart Retail Ltd. (India) | | | 625,282 | |
| | | | | | | | |
| | | | Diversified Banks 2.7% | | | | |
| | 692,534 | | | City Union Bank Ltd. (India) | | | 1,379,243 | |
| | 69,622 | | | Yes Bank Ltd. (India) | | | 1,313,700 | |
| | | | | | | | |
| | | | 2,692,943 | |
| | | | | | | | |
| | | | Electronic Manufacturing Services 1.0% | | | | |
| | 12,755 | | | IPG Photonics Corp.* | | | 1,050,374 | |
| | | | | | | | |
| | | | Environmental & Facilities Services 0.9% | | | | |
| | 12,496 | | | Waste Connections, Inc. (Canada) | | | 933,451 | |
| | | | | | | | |
| | | | Food Distributors 0.4% | | | | |
| | 39,930 | | | Chefs’ Warehouse, Inc. (The)* | | | 444,820 | |
| | | | | | | | |
| | | | Footwear 0.9% | | | | |
| | 38,655 | | | Skechers U.S.A., Inc., Class A* | | | 885,199 | |
| | | | | | | | |
| | | | General Merchandise Stores 0.8% | | | | |
| | 31,733 | | | Ollie’s Bargain Outlet Holdings, Inc.* | | | 831,722 | |
| | | | | | | | |
| | | | Health Care Equipment 8.8% | | | | |
| | 123,934 | | | AtriCure, Inc.* | | | 1,960,636 | |
| | 154,935 | | | ConforMIS, Inc.* | | | 1,536,955 | |
| | 81,408 | | | Entellus Medical, Inc.* | | | 1,805,629 | |
| | 85,800 | | | Novadaq Technologies, Inc.* (Canada) | | | 992,706 | |
| | 143,037 | | | Oxford Immunotec Global plc* | | | 1,796,545 | |
| | 107,656 | | | Tandem Diabetes Care, Inc.* | | | 824,645 | |
| | | | | | | | |
| | | | 8,917,116 | |
| | | | | | | | |
| | | | Health Care Services 0.6% | | | | |
| | 37,343 | | | Dr. Lal PathLabs Ltd. (India) | | | 597,331 | |
| | | | | | | | |
| | | | Health Care Technology 0.9% | | | | |
| | 16,502 | | | Medidata Solutions, Inc.* | | | 920,152 | |
| | | | | | | | |
| | | | | | | | |
| Shares | | | | | Value | |
| | | | | | | |
| | | | Homebuilding 3.3% | | | | |
| | 29,769 | | | Installed Building Products, Inc.* | | $ | 1,067,814 | |
| | 60,927 | | | LGI Homes, Inc.* | | | 2,244,551 | |
| | | | | | | | |
| | | | 3,312,365 | |
| | | | | | | | |
| | | | Industrial Machinery 2.2% | | | | |
| | 10,251 | | | Arcam AB* (Sweden) | | | 350,112 | |
| | 31,699 | | | Proto Labs, Inc.* | | | 1,899,087 | |
| | | | | | | | |
| | | | 2,249,199 | |
| | | | | | | | |
| | | | Internet & Direct Marketing Retail 2.5% | | | | |
| | 84,719 | | | MakeMyTrip Ltd.* (India) | | | 1,999,368 | |
| | 13,602 | | | Wayfair, Inc., Class A* | | | 535,511 | |
| | | | | | | | |
| | | | 2,534,879 | |
| | | | | | | | |
| | | | Internet Software & Services 6.0% | | | | |
| | 51,446 | | | Cornerstone OnDemand, Inc.* | | | 2,363,944 | |
| | 43,499 | | | Reis, Inc. | | | 889,990 | |
| | 17,802 | | | Shutterstock, Inc.* | | | 1,133,987 | |
| | 23,605 | | | SPS Commerce, Inc.* | | | 1,732,843 | |
| | | | | | | | |
| | | | 6,120,764 | |
| | | | | | | | |
| | | | IT Consulting & Other Services 0.8% | | | | |
| | 15,232 | | | Luxoft Holding, Inc.* (Switzerland) | | | 805,011 | |
| | | | | | | | |
| | | | Life & Health Insurance 0.7% | | | | |
| | 41,998 | | | Trupanion, Inc.* | | | 709,766 | |
| | | | | | | | |
| | | | Life Sciences Tools & Services 0.3% | | | | |
| | 43,388 | | | Fluidigm Corp.* | | | 347,538 | |
| | | | | | | | |
| | | | Managed Health Care 1.5% | | | | |
| | 40,568 | | | HealthEquity, Inc.* | | | 1,535,499 | |
| | | | | | | | |
| | | | Oil & Gas Equipment & Services 0.3% | | | | |
| | 2,258 | | | Core Laboratories N.V. | | | 253,641 | |
| | | | | | | | |
| | | | Oil & Gas Exploration & Production 0.3% | | | | |
| | 19,609 | | | WPX Energy, Inc.* | | | 258,643 | |
| | | | | | | | |
| | | | Packaged Foods & Meats 1.7% | | | | |
| | 155,072 | | | Freshpet, Inc.* | | | 1,341,373 | |
| | 218,693 | | | Prabhat Dairy Ltd. (India) | | | 383,320 | |
| | | | | | | | |
| | | | 1,724,693 | |
| | | | | | | | |
| | | | Pharmaceuticals 2.3% | | | | |
| | 87,835 | | | Auris Medical Holding AG* (Switzerland) | | | 151,955 | |
| | 42,352 | | | Cempra, Inc.* | | | 1,024,918 | |
| | 107,381 | | | Egalet Corp.* | | | 817,169 | |
| | 20,075 | | | Intra-Cellular Therapies, Inc.* | | | 305,943 | |
| | | | | | | | |
| | | | 2,299,985 | |
| | | | | | | | |
| | | | Regional Banks 3.1% | | | | |
| | 23,704 | | | Bank of the Ozarks, Inc. | | | 910,234 | |
| | 32,304 | | | Customers Bancorp, Inc.* | | | 812,769 | |
| | 22,023 | | | Metro Bank plc* (United Kingdom) | | | 788,130 | |
| | 12,141 | | | Pinnacle Financial Partners, Inc. | | | 656,585 | |
| | | | | | | | |
| | | | 3,167,718 | |
| | | | | | | | |
| | | | Restaurants 1.6% | | | | |
| | 35,263 | | | Chuy’s Holdings, Inc.* | | | 985,248 | |
| | 22,113 | | | Jubilant Foodworks Ltd. (India) | | | 322,130 | |
| | 15,744 | | | Zoe’s Kitchen, Inc.* | | | 349,359 | |
| | | | | | | | |
| | | | 1,656,737 | |
| | | | | | | | |
| | | | Semiconductor Equipment 2.7% | | | | |
| | 151,247 | | | PDF Solutions, Inc.* | | | 2,748,158 | |
| | | | | | | | |
79
| | |
| WASATCH ULTRA GROWTH FUND (WAMCX) | | SEPTEMBER 30, 2016 |
|
|
|
Schedule of Investments (continued)
| | | | | | | | |
| Shares | | | | | Value | |
| | | | | | | |
| | | | Semiconductors 4.7% | | | | |
| | 20,929 | | | Cavium, Inc.* | | $ | 1,218,068 | |
| | 19,142 | | | Monolithic Power Systems, Inc. | | | 1,540,931 | |
| | 13,668 | | | NVE Corp. | | | 805,592 | |
| | 19,178 | | | Power Integrations, Inc. | | | 1,208,789 | |
| | | | | | | | |
| | | | 4,773,380 | |
| | | | | | | | |
| | | | Specialized Consumer Services 0.8% | | | | |
| | 49,181 | | | LifeLock, Inc.* | | | 832,143 | |
| | | | | | | | |
| | | | Specialty Chemicals 2.1% | | | | |
| | 19,176 | | | Balchem Corp. | | | 1,486,715 | |
| | 358,040 | | | EcoSynthetix, Inc.* (Canada) | | | 619,499 | |
| | | | | | | | |
| | | | 2,106,214 | |
| | | | | | | | |
| | | | Specialty Stores 1.8% | | | | |
| | 85,171 | | | DavidsTea, Inc.* (Canada) | | | 1,049,307 | |
| | 19,399 | | | Five Below, Inc.* | | | 781,585 | |
| | | | | | | | |
| | | | 1,830,892 | |
| | | | | | | | |
| | | | Systems Software 6.4% | | | | |
| | 51,285 | | | FleetMatics Group plc* | | | 3,076,074 | |
| | 12,705 | | | NetSuite, Inc.* | | | 1,406,317 | |
| | 28,570 | | | Qualys, Inc.* | | | 1,091,088 | |
| | 95,232 | | | TubeMogul, Inc.* | | | 892,324 | |
| | | | | | | | |
| | | | 6,465,803 | |
| | | | | | | | |
| | | | Trucking 1.0% | | | | |
| | 35,659 | | | Knight Transportation, Inc. | | | 1,023,057 | |
| | | | | | | | |
| | |
| | | | Total Common Stocks
(cost $65,962,866) | | | 92,006,744 | |
| | | | | | | | |
| | |
| | | | PREFERRED STOCKS 1.2% | | | | |
| | |
| | | | Biotechnology 0.0% | | | | |
| | 169,492 | | | Nanosys, Inc., Series D Pfd.* *** † | | | 25,102 | |
| | 40,380 | | | Nanosys, Inc., Series E Pfd.* *** † | | | 23,941 | |
| | | | | | | | |
| | | | 49,043 | |
| | | | | | | | |
| | | | Health Care Technology 0.3% | | | | |
| | 253,064 | | | Data Sciences International, Inc., Series B Pfd.* *** † | | | 275,840 | |
| | | | | | | | |
| | | | Oil & Gas Equipment & Services 0.9% | | | | |
| | 435,920 | | | Drilling Info Holdings, Inc., Series B
Pfd.* *** † | | | 926,417 | |
| | | | | | | | |
| | |
| | | | Total Preferred Stocks
(cost $2,096,048) | | | 1,251,300 | |
| | | | | | | | |
| | |
| | | | LIMITED PARTNERSHIP INTEREST 3.4% | | | | |
| | |
| | | | Asset Management & Custody Banks 3.4% | | | | |
| | | | Greenspring Global Partners II-B, L.P.* *** † | | | 2,223,376 | |
| | | | Greenspring Global Partners III-B, L.P.* *** † | | | 1,165,125 | |
| | | | | | | | |
| | | | 3,388,501 | |
| | | | | | | | |
| | |
| | | | Total Limited Partnership Interest
(cost $3,949,764) | | | 3,388,501 | |
| | | | | | | | |
| | | | | | | | |
| Shares | | | | | Value | |
| | | | | | | |
| | | | WARRANTS 0.0% | | | | |
| | |
| | | | Biotechnology 0.0% | | | | |
| | 8,212 | | | Argos Therapeutics, Inc., expiring 3/14/2021* *** † | | $ | 7,802 | |
| | 9,926 | | | Argos Therapeutics, Inc., expiring 8/2/2021* *** † | | | 13,122 | |
| | | | | | | | |
| | | | 20,924 | |
| | | | | | | | |
| | |
| | | | Total Warrants
(cost $1,027) | | | 20,924 | |
| | | | | | | | |
| | |
Principal
Amount | | | | | Value | |
| | | | | | | |
| | | | SHORT-TERM INVESTMENTS 3.9% | | | | |
| | |
| | | | Repurchase Agreement 3.9% | | | | |
| | $3,908,753 | | | Repurchase Agreement dated 9/30/16,
0.03% due 10/3/16 with State Street Bank
and Trust Co. collateralized by $3,355,000
of United States Treasury Bonds 3.125%
due 11/15/41; value: $3,992,450; repurchase
proceeds: $3,908,763†† (cost $3,908,753) | | $ | 3,908,753 | |
| | | | | | | | |
| | |
| | | | Total Short-Term Investments
(cost $3,908,753) | | | 3,908,753 | |
| | | | | | | | |
| | |
| | | | Total Investments
(cost $75,918,458) 99.2% | | | 100,576,222 | |
| | |
| | | | Other Assets less Liabilities 0.8% | | | 825,682 | |
| | | | | | | | |
| | |
| | | | NET ASSETS 100.0% | | $ | 101,401,904 | |
| | | | | | | | |
| |
| | | | *Non-income producing. ***Security was fair valued under procedures adopted by the Board of Trustees (see Note 13). †Security purchased in a private placement transaction or under Rule 144A of the Securities Act of 1933 (see Note 9). ††All or a portion of this security has been designated as collateral for an unfunded loan commitment and purchase commitments (see Note 3 and Note 10, respectively). PIPE Private Investment in a Public Equity. See Notes to Financial Statements. | |
At September 30, 2016, Wasatch Ultra Growth Fund’s investments, excluding short-term investments, were in the following countries (unaudited):
| | | | |
| Country | | % | |
Argentina | | | 0.6 | |
Canada | | | 3.7 | |
India | | | 6.8 | |
Sweden | | | 0.4 | |
Switzerland | | | 1.0 | |
United Kingdom | | | 0.8 | |
United States | | | 86.7 | |
| | | | |
TOTAL | | | 100.0 | % |
| | | | |
80
| | |
| WASATCH WORLD INNOVATORS FUND (WAGTX / WIGTX) | | SEPTEMBER 30, 2016 |
|
|
|
Schedule of Investments
| | | | | | | | |
| Shares | | | | | Value | |
| | | | | | | |
| | | | COMMON STOCKS 79.9% | | | | |
| | |
| | | | Aerospace & Defense 2.4% | | | | |
| | 361,895 | | | Avon Rubber plc (United Kingdom) | | $ | 4,737,607 | |
| | | | | | | | |
| | | | Air Freight & Logistics 0.5% | | | | |
| | 5,976 | | | FedEx Corp. | | | 1,043,888 | |
| | | | | | | | |
| | | | Alternative Carriers 2.3% | | | | |
| | 705,416 | | | Gamma Communications plc (United Kingdom) | | | 4,612,767 | |
| | | | | | | | |
| | | | Application Software 0.1% | | | | |
| | 4,100 | | | Splunk, Inc.* | | | 240,588 | |
| | | | | | | | |
| | | | Asset Management & Custody
Banks 0.5% | | | | |
| | 455 | | | Ameriprise Financial, Inc. | | | 45,395 | |
| | 488,300 | | | Tarpon Investimentos S.A. (Brazil) | | | 975,955 | |
| | | | | | | | |
| | | | 1,021,350 | |
| | | | | | | | |
| | | | Auto Parts & Equipment 0.3% | | | | |
| | 11,012 | | | Brembo S.p.A. (Italy) | | | 656,864 | |
| | | | | | | | |
| | | | Automobile Manufacturers 0.1% | | | | |
| | 8,000 | | | Honda Motor Co. Ltd. (Japan) | | | 227,799 | |
| | | | | | | | |
| | | | Automotive Retail 0.4% | | | | |
| | 16,258 | | | Penske Automotive Group, Inc. | | | 783,310 | |
| | | | | | | | |
| | | | Biotechnology 2.5% | | | | |
| | 195,696 | | | Abcam plc (United Kingdom) | | | 2,130,671 | |
| | 165,850 | | | Bioventix plc (United Kingdom) | | | 2,418,372 | |
| | 12,100 | | | Myriad Genetics, Inc.* | | | 249,018 | |
| | 26,655 | | | OPKO Health, Inc.* | | | 282,276 | |
| | | | | | | | |
| | | | 5,080,337 | |
| | | | | | | | |
| | | | Broadcasting 1.0% | | | | |
| | 34,785 | | | CBS Corp., Class B | | | 1,904,131 | |
| | 2,330 | | | Discovery Communications, Inc., Class A* | | | 62,723 | |
| | | | | | | | |
| | | | 1,966,854 | |
| | | | | | | | |
| | | | Cable & Satellite 2.0% | | | | |
| | 59,365 | | | Comcast Corp., Class A | | | 3,938,274 | |
| | | | | | | | |
| | | | Communications Equipment 2.4% | | | | |
| | 114,478 | | | EVS Broadcast Equipment S.A. (Belgium) | | | 4,602,551 | |
| | 1,211,303 | | | Sepura plc (United Kingdom) | | | 266,905 | |
| | | | | | | | |
| | | | 4,869,456 | |
| | | | | | | | |
| | | | Consumer Electronics 1.8% | | | | |
| | 90,300 | | | Sony Corp. (Japan) | | | 2,932,379 | |
| | 268,541 | | | Sprue Aegis plc (United Kingdom) | | | 567,353 | |
| | | | | | | | |
| | | | 3,499,732 | |
| | | | | | | | |
| | | | Consumer Finance 2.5% | | | | |
| | 7,887 | | | American Express Co. | | | 505,083 | |
| | 3,970 | | | Capital One Financial Corp. | | | 285,165 | |
| | 17,263 | | | Discover Financial Services | | | 976,223 | |
| | 10,785 | | | Encore Capital Group, Inc.* | | | 242,447 | |
| | 38,660 | | | PRA Group, Inc.* | | | 1,335,316 | |
| | 210,200 | | | SLM Corp.* | | | 1,570,194 | |
| | | | | | | | |
| | | | 4,914,428 | |
| | | | | | | | |
| | | | Data Processing & Outsourced
Services 1.3% | | | | |
| | 12,350 | | | MasterCard, Inc., Class A | | | 1,256,859 | |
| | 5,409 | | | Net 1 UEPS Technologies, Inc.* | | | 46,301 | |
| | 15,175 | | | Visa, Inc., Class A | | | 1,254,973 | |
| | | | | | | | |
| | | | | | | 2,558,133 | |
| | | | | | | | |
| | | | | | | | |
| Shares | | | | | Value | |
| | | | | | | |
| | | | Distillers & Vintners 0.9% | | | | |
| | 74,597 | | | Corby Spirit and Wine Ltd. (Canada) | | $ | 1,290,145 | |
| | 29,486 | | | Corby Spirit and Wine Ltd., Class B (Canada) | | | 458,264 | |
| | | | | | | | |
| | | | | | | 1,748,409 | |
| | | | | | | | |
| | | | Diversified Banks 0.3% | | | | |
| | 6,483 | | | Canadian Imperial Bank of Commerce (Canada) | | | 502,699 | |
| | | | | | | | |
| | | | Diversified Support Services 0.4% | | | | |
| | 546,400 | | | Blue Label Telecoms Ltd. (South Africa) | | | 756,539 | |
| | | | | | | | |
| | | | Drug Retail 0.1% | | | | |
| | 3,000 | | | Walgreens Boots Alliance, Inc. | | | 241,860 | |
| | | | | | | | |
| | | | Education Services 1.0% | | | | |
| | 220,100 | | | Kroton Educacional S.A. (Brazil) | | | 1,000,962 | |
| | 12,824 | | | TAL Education Group ADR* (China) | | | 908,452 | |
| | | | | | | | |
| | | | | | | 1,909,414 | |
| | | | | | | | |
| | | | Electronic Equipment & Instruments 3.2% | | | | |
| | 19,519 | | | Barco N.V. (Belgium) | | | 1,531,577 | |
| | 190,767 | | | Evertz Technologies Ltd. (Canada) | | | 2,438,479 | |
| | 24,605 | | | Kapsch TrafficCom AG (Austria) | | | 1,098,691 | |
| | 1,800 | | | KEYENCE Corp. (Japan) | | | 1,303,959 | |
| | | | | | | | |
| | | | | | | 6,372,706 | |
| | | | | | | | |
| | | | Fertilizers & Agricultural Chemicals 0.5% | | | | |
| | 2,056 | | | FMC Corp. | | | 99,387 | |
| | 9,600 | | | Monsanto Co. | | | 981,120 | |
| | | | | | | | |
| | | | | | | 1,080,507 | |
| | | | | | | | |
| | | | Food Retail 4.3% | | | | |
| | 1,015,650 | | | Majestic Wine plc* (United Kingdom) | | | 4,044,744 | |
| | 92,740 | | | Sprouts Farmers Market, Inc.* | | | 1,915,081 | |
| | 33,759 | | | Village Super Market, Inc., Class A | | | 1,080,626 | |
| | 53,029 | | | Whole Foods Market, Inc. | | | 1,503,372 | |
| | | | | | | | |
| | | | | | | 8,543,823 | |
| | | | | | | | |
| | | | Health Care Distributors 1.0% | | | | |
| | 63,477 | | | Dvx, Inc. (Japan) | | | 805,004 | |
| | 7,217 | | | McKesson Corp. | | | 1,203,435 | |
| | | | | | | | |
| | | | | | | 2,008,439 | |
| | | | | | | | |
| | | | Health Care Equipment 6.0% | | | | |
| | 27,178 | | | bioMérieux (France) | | | 4,051,383 | |
| | 66,174 | | | DiaSorin S.p.A. (Italy) | | | 4,252,049 | |
| | 62,369 | | | LivaNova plc* | | | 3,749,000 | |
| | | | | | | | |
| | | | | | | 12,052,432 | |
| | | | | | | | |
| | | | Health Care Services 4.4% | | | | |
| | 44,200 | | | BML, Inc. (Japan) | | | 1,156,379 | |
| | 59,000 | | | Miraca Holdings, Inc. (Japan) | | | 2,914,945 | |
| | 54,862 | | | Quest Diagnostics, Inc. | | | 4,642,971 | |
| | | | | | | | |
| | | | | | | 8,714,295 | |
| | | | | | | | |
| | | | Health Care Supplies 2.6% | | | | |
| | 1,311,610 | | | Advanced Medical Solutions Group plc (United Kingdom) | | | 3,876,097 | |
| | 618,467 | | | Tristel plc (United Kingdom) | | | 1,270,577 | |
| | | | | | | | |
| | | | | | | 5,146,674 | |
| | | | | | | | |
| | | | Health Care Technology 2.2% | | | | |
| | 68,756 | | | Computer Programs and Systems, Inc. | | | 1,791,782 | |
| | 50,786 | | | Nexus AG (Germany) | | | 1,051,439 | |
| | 37,970 | | | Software Service, Inc. (Japan) | | | 1,608,216 | |
| | | | | | | | |
| | | | | | | 4,451,437 | |
| | | | | | | | |
81
| | |
| WASATCH WORLD INNOVATORS FUND (WAGTX / WIGTX) | | |
|
|
|
Schedule of Investments (continued)
| | | | | | | | |
| Shares | | | | | Value | |
| | | | | | | |
| | | | Home Entertainment Software 2.4% | | | | |
| | 104,630 | | | Take-Two Interactive Software, Inc.* | | $ | 4,716,720 | |
| | | | | | | | |
| | | | Home Improvement Retail 0.1% | | | | |
| | 2,325 | | | Home Depot, Inc. (The) | | | 299,181 | |
| | | | | | | | |
| | | | Household Products 0.6% | | | | |
| | 48,600 | | | Unicharm Corp. (Japan) | | | 1,250,166 | |
| | | | | | | | |
| | | | Hypermarkets & Super Centers 1.5% | | | | |
| | 19,575 | | | Costco Wholesale Corp. | | | 2,985,383 | |
| | | | | | | | |
| | | | Industrial Machinery 0.7% | | | | |
| | 190,164 | | | Porvair plc (United Kingdom) | | | 983,459 | |
| | 505,392 | | | Skellerup Holdings Ltd. (New Zealand) | | | 504,162 | |
| | | | | | | | |
| | | | | | | 1,487,621 | |
| | | | | | | | |
| | | | Internet & Direct Marketing
Retail 7.3% | | | | |
| | 5,303 | | | Amazon.com, Inc.* | | | 4,440,255 | |
| | 1,215,276 | | | AO World plc* (United Kingdom) | | | 2,662,053 | |
| | 460,951 | | | Banzai S.p.A.* (Italy) | | | 1,391,871 | |
| | 195,232 | | | Oisix, Inc.* (Japan) | | | 4,070,021 | |
| | 1,040 | | | Priceline Group, Inc. (The)* | | | 1,530,349 | |
| | 87,224 | | | Sportamore AB* (Sweden) | | | 589,708 | |
| | | | | | | | |
| | | | | | | 14,684,257 | |
| | | | | | | | |
| | | | Internet Software & Services 3.3% | | | | |
| | 12,640 | | | Alibaba Group Holding Ltd. ADR* (China) | | | 1,337,186 | |
| | 3,792 | | | Alphabet, Inc., Class A* | | | 3,048,995 | |
| | 259,702 | | | NetGem S.A. (France) | | | 539,712 | |
| | 49,088 | | | Tucows, Inc., Class A* | | | 1,570,816 | |
| | | | | | | | |
| | | | | | | 6,496,709 | |
| | | | | | | | |
| | | | Investment Banking & Brokerage 0.3% | | | | |
| | 16,421 | | | Charles Schwab Corp. (The) | | | 518,411 | |
| | | | | | | | |
| | | | IT Consulting & Other Services 1.4% | | | | |
| | 57,547 | | | Cognizant Technology Solutions Corp., Class A* | | | 2,745,567 | |
| | | | | | | | |
| | | | Leisure Products 3.4% | | | | |
| | 109,095 | | | Escalade, Inc. | | | 1,392,052 | |
| | 392,156 | | | Performance Sports Group Ltd.* (Canada) | | | 1,592,154 | |
| | 1,874,573 | | | Photo-Me International plc (United Kingdom) | | | 3,766,076 | |
| | 700 | | | Polaris Industries, Inc. | | | 54,208 | |
| | | | | | | | |
| | | | | | | 6,804,490 | |
| | | | | | | | |
| | | | Life Sciences Tools & Services 1.6% | | | | |
| | 18,745 | | | Tecan Group AG (Switzerland) | | | 3,287,852 | |
| | | | | | | | |
| | | | Multi-Utilities 0.3% | | | | |
| | 43,611 | | | Telecom Plus plc (United Kingdom) | | | 625,182 | |
| | | | | | | | |
| | | | Oil & Gas Refining & Marketing 0.3% | | | | |
| | 14,891 | | | World Fuel Services Corp. | | | 688,858 | |
| | | | | | | | |
| | | | Personal Products 1.2% | | | | |
| | 27,090 | | | Herbalife Ltd.* | | | 1,679,309 | |
| | 71,671 | | | Sarantis S.A. (Greece) | | | 789,014 | |
| | | | | | | | |
| | | | | | | 2,468,323 | |
| | | | | | | | |
| | | | Pharmaceuticals 0.9% | | | | |
| | 15,440 | | | Novo Nordisk A/S, Class B (Denmark) | | | 641,557 | |
| | 3,200 | | | Roche Holding AG (Switzerland) | | | 793,824 | |
| | 11,763 | | | Valeant Pharmaceuticals International, Inc.* (Canada) | | | 288,782 | |
| | | | | | | | |
| | | | 1,724,163 | |
| | | | | | | | |
| | | | Real Estate Services 0.3% | | | | |
| | 5,728 | | | Jones Lang LaSalle, Inc. | | | 651,789 | |
| | | | | | | | |
| | | | | | | | |
| Shares | | | | | Value | |
| | | | | | | |
| | | | Regional Banks 0.1% | | | | |
| | 3,720 | | | Metro Bank plc* (United Kingdom) | | $ | 133,126 | |
| | | | | | | | |
| | | | Semiconductors 1.0% | | | | |
| | 8,261 | | | Microchip Technology, Inc. | | | 513,338 | |
| | 269,000 | | | Taiwan Semiconductor Manufacturing Co. Ltd. (Taiwan) | | | 1,566,174 | |
| | | | | | | | |
| | | | 2,079,512 | |
| | | | | | | | |
| | | | Specialized Finance 0.1% | | | | |
| | 6,200 | | | Zenkoku Hosho Co. Ltd. (Japan) | | | 254,652 | |
| | | | | | | | |
| | | | Specialty Chemicals 0.1% | | | | |
| | 1,181 | | | Albemarle Corp. | | | 100,964 | |
| | | | | | | | |
| | | | Specialty Stores 5.5% | | | | |
| | 301,685 | | | Barnes & Noble, Inc. | | | 3,409,040 | |
| | 325,563 | | | Container Store Group, Inc. (The)* | | | 1,634,326 | |
| | 71,729 | | | Fenix Outdoor International AG (Switzerland) | | | 5,100,328 | |
| | 62,016 | | | Indigo Books & Music, Inc.* (Canada) | | | 802,174 | |
| | | | | | | | |
| | | | 10,945,868 | |
| | | | | | | | |
| | | | Systems Software 0.5% | | | | |
| | 12,466 | | | Check Point Software Technologies Ltd.* (Israel) | | | 967,486 | |
| | | | | | | | |
| | |
| | | | Total Common Stocks
(cost $139,368,371) | | | 159,596,901 | |
| | | | | | | | |
| | |
| | | | LIMITED PARTNERSHIP INTEREST 0.1% | | | | |
| | |
| | | | Asset Management & Custody Banks 0.1% | | | | |
| | | | Greenspring Global Partners II-B, L.P.* *** † | | | 247,043 | |
| | | | | | | | |
| | |
| | | | Total Limited Partnership Interest
(cost $282,273) | | | 247,043 | |
| | | | | | | | |
| | |
Principal
Amount | | | | | Value | |
| | | | | | | |
| | | | SHORT-TERM INVESTMENTS 19.9% | | | | |
| | |
| | | | Repurchase Agreement 19.9% | | | | |
| | $39,800,296 | | | Repurchase Agreement dated 9/30/16,
0.03% due 10/3/16 with State Street Bank
and Trust Co. collateralized by $34,115,000
of United States Treasury Bonds 3.125%
due 11/15/41; value: $40,596,850; repurchase proceeds: $39,800,395†† (cost $39,800,296) | | $ | 39,800,296 | |
| | | | | | | | |
| | |
| | | | Total Short-Term Investments
(cost $39,800,296) | | | 39,800,296 | |
| | | | | | | | |
| | |
| | | | Total Investments
(cost $179,450,940) 99.9% | | | 199,644,240 | |
| | |
| | | | Other Assets less Liabilities 0.1% | | | 158,773 | |
| | | | | | | | |
| | |
| | | | NET ASSETS 100.0% | | $ | 199,803,013 | |
| | | | | | | | |
82
| | | | | | | | |
| Contracts | | | | | Net Unrealized
Depreciation | |
| | | | | | | |
| | | | FORWARD FOREIGN CURRENCY EXCHANGE CONTRACTS SHORT 0.1% | | | | |
| | |
| | 17,000,000 EUR | | | USD, State Street Bank and Trust Co., settlement date 12/22/16,
(cost $19,053,600; value: $19,166,967) | | $ | (113,367 | ) |
| | | | | | | | |
| | |
| | | | Total Forward Foreign Currency Exchange Contracts Short
(cost $19,053,600; value: $19,166,967) | | | (113,367 | ) |
| | | | | | | | |
| |
| | | | *Non-income producing. ***Security was fair valued under procedures adopted by the Board of Trustees (see Note 13). †Security purchased in a private placement transaction or under Rule 144A of the Securities Act of 1933 (see Note 9). ††All or a portion of this security has been designated as collateral for forward foreign currency exchange contracts and purchase commitments (see Note 4 and Note 10, respectively). ADR American Depositary Receipt. See Notes to Financial Statements. | |
At September 30, 2016, Wasatch World Innovators Fund’s investments, excluding short-term investments and forward foreign currency exchange contracts, were in the following countries (unaudited):
| | | | |
| Country | | % | |
Austria | | | 0.7 | |
Belgium | | | 3.8 | |
Brazil | | | 1.2 | |
Canada | | | 4.6 | |
China | | | 1.4 | |
Denmark | | | 0.4 | |
France | | | 2.9 | |
Germany | | | 0.7 | |
Greece | | | 0.5 | |
Israel | | | 0.6 | |
Italy | | | 3.9 | |
Japan | | | 10.3 | |
New Zealand | | | 0.3 | |
South Africa | | | 0.5 | |
Sweden | | | 0.4 | |
Switzerland | | | 5.7 | |
Taiwan | | | 1.0 | |
United Kingdom | | | 20.1 | |
United States | | | 41.0 | |
| | | | |
TOTAL | | | 100.0 | % |
| | | | |
83
| | |
| WASATCH-1ST SOURCE INCOME FUND (FMEQX) | | |
|
|
|
Schedule of Investments
| | | | | | | | |
Principal
Amount | | | | | Value | |
| | | | | | | |
| | | | ASSET-BACKED SECURITIES 9.2% | | | | |
| | |
| | $1,000,000 | | | Avis Budget Rental Car Funding AESOP, LLC, 2.50%, 7/20/21, Series 2015-1A, Class A† | | $ | 1,009,974 | |
| | 500,000 | | | Avis Budget Rental Car Funding AESOP, LLC, 2.63%, 12/20/21, Series 2015-2A, Class A† | | | 506,013 | |
| | 1,500,000 | | | Citibank Credit Card Issuance Trust,
5.65%, 9/20/19, Series 2007-A8, Class A8 | | | 1,566,037 | |
| | 398,148 | | | Cronos Containers Program I Ltd.,
3.27%, 11/18/29, Series 2014-2A, Class A† (Bermuda) | | | 387,153 | |
| | 492,500 | | | DB Master Finance, LLC 2015-1, 3.262%, 2/20/45, Series 2015-1A, Class A2I† | | | 495,061 | |
| | 675,000 | | | Element Rail Leasing II, LLC, 3.585%, 2/19/45, Series 2015-1A, Class A2† | | | 665,179 | |
| | 500,000 | | | Exeter Automobile Receivables Trust, 3.59%, 8/16/21, Series 2015-3A, Class B† | | | 510,279 | |
| | 1,250,000 | | | GE Capital Credit Card Master Note Trust, 2.22%, 1/15/22, Series 2012-2, Class A | | | 1,271,953 | |
| | 742,500 | | | Wendys Funding LLC, 3.371%, 6/15/45, Series 2015-1A, Class A2I† | | | 745,777 | |
| | 585,000 | | | World Financial Network Credit Card Master Trust, 1.76%, 5/17/21, Series 2012-B, Class A | | | 588,173 | |
| | 1,400,000 | | | World Financial Network Credit Card Master Trust, 3.14%, 1/17/23, Series 2012-A, Class A | | | 1,456,923 | |
| | | | | | | | |
| | |
| | | | Total Asset-Backed Securities
(cost $9,199,538) | | | 9,202,522 | |
| | | | | | | | |
| | |
| | | | COLLATERALIZED MORTGAGE OBLIGATIONS 16.0% | | | | |
| | |
| | 264,728 | | | Federal Home Loan Mortgage Corp., 1.50%, 9/15/22, Series 3760, Class BA | | | 267,464 | |
| | 482,895 | | | Federal Home Loan Mortgage Corp., 1.50%, 7/15/23, Series 4221, Class HJ | | | 486,220 | |
| | 25,334 | | | Federal Home Loan Mortgage Corp., 1.50%, 4/15/24, Series 3780, Class TA | | | 25,466 | |
| | 38,189 | | | Federal Home Loan Mortgage Corp., 2.635%, 12/1/32, Series 847527††† | | | 40,435 | |
| | 53,358 | | | Federal Home Loan Mortgage Corp., 2.854%, 5/1/31, Series 847292††† | | | 56,246 | |
| | 11,193 | | | Federal Home Loan Mortgage Corp., 2.907%, 8/1/33, Series 847281††† | | | 11,620 | |
| | 128,800 | | | Federal Home Loan Mortgage Corp., 2.969%, 1/1/25, Series 775629††† | | | 132,050 | |
| | 81,868 | | | Federal Home Loan Mortgage Corp., 3.061%, 5/1/25, Series 775617††† | | | 84,933 | |
| | 331,852 | | | Federal Home Loan Mortgage Corp., 3.50%, 6/15/25, Series 4057, Class VB | | | 354,349 | |
| | 456,120 | | | Federal Home Loan Mortgage Corp., 3.50%, 2/1/33, Series C91620 | | | 486,875 | |
| | 400,822 | | | Federal Home Loan Mortgage Corp., 3.50%, 9/1/40, Series A93792 | | | 422,810 | |
| | 710,000 | | | Federal Home Loan Mortgage Corp., 3.50%, 7/15/45, Series 4495, Class JC | | | 703,631 | |
| | 327,152 | | | Federal Home Loan Mortgage Corp., 4.00%, 11/15/38, Series 3740, Class AB | | | 342,232 | |
| | 122,743 | | | Federal Home Loan Mortgage Corp., 5.50%, 8/1/29, Series C46102 | | | 139,443 | |
| | 576,899 | | | Federal Home Loan Mortgage Corp., 5.983%, 7/15/42, Series 4080, Class HS, INV FL††† | | | 580,238 | |
| | 250,291 | | | Federal Home Loan Mortgage Corp., 10.338%, 8/15/43, Series 4238, Class SY††† | | | 266,950 | |
| | | | | | | | |
Principal
Amount | | | | | Value | |
| | | | | | | |
| | | | COLLATERALIZED MORTGAGE OBLIGATIONS (continued) | | | | |
| | |
| | $ 194,094 | | | Federal National Mortgage Assoc., 2.266%, 1/1/35, Series 825245††† | | $ | 205,404 | |
| | 223,097 | | | Federal National Mortgage Assoc., 2.311%, 12/1/35, Series 848390††† | | | 232,106 | |
| | 39,613 | | | Federal National Mortgage Assoc., 2.37%, 2/1/21, Series 313380††† | | | 40,100 | |
| | 1,000,000 | | | Federal National Mortgage Assoc., 2.42%, 4/1/22, Series AM8263 | | | 1,037,038 | |
| | 830,552 | | | Federal National Mortgage Assoc., 3.00%, 1/1/28, Series AB7546 | | | 875,656 | |
| | 1,234,142 | | | Federal National Mortgage Assoc., 3.50%, 6/1/32, Series AL2525 | | | 1,325,245 | |
| | 759,401 | | | Federal National Mortgage Assoc., 3.50%, 5/1/33, Series AB9412 | | | 809,986 | |
| | 750,000 | | | Federal National Mortgage Assoc., 3.50%, 4/25/42, Series 2015-56, Class ME | | | 789,683 | |
| | 448,113 | | | Federal National Mortgage Assoc., 3.50%, 10/1/42, Series MA1209 | | | 464,872 | |
| | 79,805 | | | Federal National Mortgage Assoc., 3.875%, 1/25/39, Series 2009-2, Class WJ | | | 84,520 | |
| | 512,000 | | | Federal National Mortgage Assoc., 4.00%, 9/25/33, Series 2014-67, Class VK | | | 576,497 | |
| | 287,589 | | | Federal National Mortgage Assoc., 4.00%, 2/1/42, Series MA0988 | | | 302,445 | |
| | 34,851 | | | Federal National Mortgage Assoc., 4.079%, 7/1/19, Series 070377††† | | | 35,880 | |
| | 759,397 | | | Federal National Mortgage Assoc., 4.55%, 10/1/33, Series 386320 | | | 759,630 | |
| | 140,051 | | | Federal National Mortgage Assoc., 5.50%, 5/25/23, Series 2003-42, Class EK | | | 155,864 | |
| | 266,805 | | | Federal National Mortgage Assoc., 6.50%, 8/25/42, Series 2012-81, Class TP | | | 294,424 | |
| | 49,841 | | | Federal National Mortgage Assoc., 7.554%, 11/25/44, Series 2014-73, Class US††† | | | 49,639 | |
| | 77,592 | | | Government National Mortgage Assoc., 2.375%, 7/20/34, Series 80987††† | | | 79,953 | |
| | 172,795 | | | Government National Mortgage Assoc., 3.00%, 8/20/38, Series 2010-47, Class CG | | | 176,038 | |
| | 55,984 | | | Government National Mortgage Assoc., 3.00%, 12/20/38, Series 2010-89, Class PA | | | 56,182 | |
| | 372,643 | | | Government National Mortgage Assoc., 3.00%, 5/20/39, Series 2010-68, Class YE | | | 384,767 | |
| | 447,932 | | | Government National Mortgage Assoc., 3.50%, 7/20/40, Series 2012-10, Class LA | | | 470,318 | |
| | 300,000 | | | Government National Mortgage Assoc., 3.674%, 10/16/43, Series 2010-140, Class C††† | | | 311,904 | |
| | 250,446 | | | Government National Mortgage Assoc., 4.00%, 9/20/38, Series 2009-108, Class WG | | | 259,406 | |
| | 262,661 | | | Government National Mortgage Assoc., 4.00%, 4/16/39, Series 2009-110, Class AB | | | 280,318 | |
| | 224,681 | | | Government National Mortgage Assoc., 4.00%, 8/20/39, Series 2009-69, Class PV | | | 241,461 | |
| | 433,257 | | | Government National Mortgage Assoc., 4.236%, 7/16/43, Series 2010-52, Class E††† | | | 439,843 | |
| | 241,313 | | | Government National Mortgage Assoc., 4.50%, 3/20/39, Series 2009-14, Class AG | | | 262,280 | |
| | 132,570 | | | Government National Mortgage Assoc., 5.00%, 7/20/34, Series 2004-105, Class MC | | | 135,880 | |
| | 28,088 | | | Government National Mortgage Assoc., 5.00%, 8/20/39, Series 004513 | | | 30,073 | |
| | 254,988 | | | Government National Mortgage Assoc., 7.05%, 1/20/44, Series 2015-82, Class SA, INV FL††† | | | 258,291 | |
84
| | | | | | | | |
Principal
Amount | | | | | Value | |
| | | | | | | |
| | | | COLLATERALIZED MORTGAGE OBLIGATIONS (continued) | | | | |
| | |
| | $ 110,913 | | | Government National Mortgage Assoc., 7.636%, 4/20/45, Series 2015-53, Class US, INV FL††† | | $ | 111,853 | |
| | | | | | | | |
| | |
| | | | Total Collateralized Mortgage Obligations
(cost $15,698,704) | | | 15,938,518 | |
| | | | | | | | |
| | |
| | | | COMMERCIAL MORTGAGE-BACKED SECURITIES 3.0% | | | | |
| | |
| | 579,987 | | | Banc of America Commercial Mortgage Trust, 5.791%, 4/10/49, Series 2007-2, Class A4††† | | | 583,031 | |
| | 363,544 | | | JP Morgan Chase Commercial Mortgage Securities Trust, 5.42%, 1/15/49, Series 2007-LDPX, Class A3 | | | 366,251 | |
| | 938,011 | | | LB-UBS Commercial Mortgage Trust, 5.858%, 7/15/40, Series 2007-C6, Class A4††† | | | 949,479 | |
| | 127,572 | | | Morgan Stanley Capital I Trust,
5.319%, 12/15/43, Series 2006-IQ12, Class A1A | | | 127,558 | |
| | 200,000 | | | RBSCF Trust, 5.692%, 4/16/49, Series 2010-RR4, Class MSCA† ††† | | | 200,265 | |
| | 277,935 | | | RBSCF Trust, 6.158%, 2/16/51, Series 2010-RR3, Class WBTA† ††† | | | 277,584 | |
| | 45,912 | | | Wachovia Bank Commercial Mortgage Trust Series, 5.308%, 11/15/48, Series 2006-C29, Class A4 | | | 45,874 | |
| | 479,135 | | | WaMu Commercial Mortgage Securities Trust, 5.96%, 3/23/45, Series 2007-SL3, Class AJ† ††† | | | 478,670 | |
| | | | | | | | |
| | |
| | | | Total Commercial Mortgage-Backed Securities
(cost $3,115,628) | | | 3,028,712 | |
| | | | | | | | |
| | |
| | | | CORPORATE BONDS 46.4% | | | | |
| | |
| | | | Air Freight & Logistics 0.7% | | | | |
| | 620,000 | | | United Parcel Service, Inc., 5.50%, 1/15/18 | | | 655,821 | |
| | | | | | | | |
| | | | Automobile Manufacturers 1.3% | | | | |
| | 750,000 | | | Ford Motor Credit Co., LLC, 4.375%, 8/6/23 | | | 806,272 | |
| | 500,000 | | | Toyota Motor Credit Corp., 2.00%, 10/24/18 MTN | | | 507,317 | |
| | | | | | | | |
| | | | 1,313,589 | |
| | | | | | | | |
| | | | Beverages — Non-alcoholic 1.3% | | | | |
| | 500,000 | | | PepsiAmericas, Inc., 5.00%, 5/15/17 | | | 512,557 | |
| | 750,000 | | | PepsiCo, Inc., 5.00%, 6/1/18 | | | 797,134 | |
| | | | | | | | |
| | | | 1,309,691 | |
| | | | | | | | |
| | | | Construction Machinery & Heavy Trucks 1.5% | | | | |
| | 500,000 | | | Caterpillar Financial Services Corp., 5.85%, 9/1/17 MTN | | | 521,374 | |
| | 1,000,000 | | | John Deere Capital Corp., 2.25%, 4/17/19 | | | 1,023,037 | |
| | | | | | | | |
| | | | 1,544,411 | |
| | | | | | | | |
| | | | Consumer Finance 1.0% | | | | |
| | 1,000,000 | | | American Express Credit Corp., 2.25%, 8/15/19 MTN | | | 1,020,414 | |
| | | | | | | | |
| | | | | | | | |
Principal
Amount | | | | | Value | |
| | | | | | | |
| | | | CORPORATE BONDS (continued) | | | | |
| | |
| | | | Cosmetics & Toiletries 0.3% | | | | |
| $ | 288,773 | | | Procter & Gamble — ESOP, 9.36%, 1/1/21, Series A | | $ | 339,101 | |
| | | | | | | | |
| | | | Diversified Banks 5.1% | | | | |
| | 500,000 | | | Bank of America Corp., 5.875%, 1/5/21 | | | 573,428 | |
| | 500,000 | | | HSBC Holdings plc, 5.10%, 4/5/21 (United Kingdom) | | | 552,761 | |
| | 1,250,000 | | | PNC Bank NA, 3.80%, 7/25/23 | | | 1,353,331 | |
| | 600,000 | | | RBC USA Holdco Corp., 5.25%, 9/15/20 | | | 676,320 | |
| | 1,125,000 | | | US Bancorp, 3.00%, 3/15/22 MTN | | | 1,191,867 | |
| | 700,000 | | | Wachovia Corp., 5.75%, 2/1/18 MTN | | | 739,607 | |
| | | | | | | | |
| | | | 5,087,314 | |
| | | | | | | | |
| | | | Diversified Financial Services 5.2% | | | | |
| | 750,000 | | | Franklin Resources, Inc., 4.625%, 5/20/20 | | | 826,384 | |
| | 1,000,000 | | | General Electric Co., 4.65%, 10/17/21 MTN | | | 1,139,316 | |
| | 1,350,000 | | | General Electric Co., 5.40%, 2/15/17 MTN | | | 1,372,002 | |
| | 1,000,000 | | | General Electric Co., 5.625%, 5/1/18 MTN | | | 1,069,905 | |
| | 750,000 | | | New York Life Global Funding, 2.15%, 6/18/19† | | | 765,614 | |
| | | | | | | | |
| | | | 5,173,221 | |
| | | | | | | | |
| | | | E-Commerce/Products 1.5% | | | | |
| | 800,000 | | | Alibaba Group Holding Ltd., 3.125%, 11/28/21 (Cayman Islands) | | | 834,155 | |
| | 600,000 | | | Alibaba Group Holding Ltd., 3.60%, 11/28/24 (Cayman Islands) | | | 628,370 | |
| | | | | | | | |
| | | | 1,462,525 | |
| | | | | | | | |
| | | | Electric Utilities 1.1% | | | | |
| | 1,000,000 | | | Integrys Holding, Inc., 4.17%, 11/1/20 | | | 1,082,374 | |
| | | | | | | | |
| | | | Electric — Integrated 0.7% | | | | |
| | 700,000 | | | PSEG Power, LLC, 4.15%, 9/15/21 | | | 748,528 | |
| | | | | | | | |
| | | | Enterprise Software & Services 2.4% | | | | |
| | 1,000,000 | | | CA, Inc., 5.375%, 12/1/19 | | | 1,104,344 | |
| | 1,250,000 | | | Oracle Corp., 2.50%, 10/15/22 | | | 1,282,616 | |
| | | | | | | | |
| | | | 2,386,960 | |
| | | | | | | | |
| | | | Health Care Facilities 0.8% | | | | |
| | 750,000 | | | Express Scripts Holding Co., 3.90%, 2/15/22 | | | 809,252 | |
| | | | | | | | |
| | | | Health Care Services 0.6% | | | | |
| | 500,000 | | | Cigna Corp., 7.65%, 3/1/23 | | | 623,205 | |
| | | | | | | | |
| | | | Insurance 2.4% | | | | |
| | 750,000 | | | Aspen Insurance Holdings Ltd., 4.65%, 11/15/23 (Bermuda) | | | 797,810 | |
| | 560,000 | | | Jackson National Life Global Funding, 4.70%, 6/1/18† | | | 588,749 | |
| | 950,000 | | | Lincoln National Corp., 4.20%, 3/15/22 | | | 1,028,066 | |
| | | | | | | | |
| | | | 2,414,625 | |
| | | | | | | | |
| | | | Integrated Telecommunication Services 1.8% | | | | |
| | 750,000 | | | AT&T, Inc., 5.20%, 3/15/20 | | | 831,586 | |
| | 870,000 | | | AT&T, Inc., 5.50%, 2/1/18 | | | 916,639 | |
| | | | | | | | |
| | | | 1,748,225 | |
| | | | | | | | |
| | | | Investment Banking & Brokerage 3.3% | | | | |
| | 1,250,000 | | | JPMorgan Chase & Co., 3.25%, 9/23/22 | | | 1,311,101 | |
| | 1,750,000 | | | Morgan Stanley, 5.50%, 7/24/20 MTN | | | 1,961,108 | |
| | | | | | | | |
| | | | 3,272,209 | |
| | | | | | | | |
85
| | |
| WASATCH-1ST SOURCE INCOME FUND (FMEQX) | | |
|
|
|
Schedule of Investments (continued)
| | | | | | | | |
Principal
Amount | | | | | Value | |
| | | | | | | |
| | | | CORPORATE BONDS (continued) | | | | |
| | |
| | | | Medical — Health Maintenance Organizations 1.0% | | | | |
| | $ 1,000,000 | | | Coventry Health Care, Inc., 5.95%, 3/15/17 | | $ | 1,021,110 | |
| | | | | | | | |
| | | | Movies & Entertainment 0.4% | | | | |
| | 350,000 | | | Walt Disney Co. (The), 6.00%, 7/17/17, Series C MTN | | | 363,659 | |
| | | | | | | | |
| | | | Multimedia 0.9% | | | | |
| | 800,000 | | | NBCUniversal Media, LLC, 5.15%, 4/30/20 | | | 897,471 | |
| | | | | | | | |
| | | | Office Furnishings 0.6% | | | | |
| | 500,000 | | | Steelcase, Inc., 6.375%, 2/15/21 | | | 570,083 | |
| | | | | | | | |
| | | | Oil Companies — Integrated 0.6% | | | | |
| | 500,000 | | | Phillips 66, 4.30%, 4/1/22 | | | 549,620 | |
| | | | | | | | |
| | | | Pharmaceuticals 2.4% | | | | |
| | 745,000 | | | AstraZeneca plc, 5.90%, 9/15/17 (United Kingdom) | | | 777,460 | |
| | 725,000 | | | Pharmacia LLC, 6.50%, 12/1/18 | | | 805,906 | |
| | 575,000 | | | Pharmacia LLC, 6.75%, 12/15/27 | | | 779,528 | |
| | | | | | | | |
| | | | 2,362,894 | |
| | | | | | | | |
| | | | Property & Casualty Insurance 1.2% | | | | |
| | 1,000,000 | | | CNA Financial Corp., 7.35%, 11/15/19 | | | 1,152,962 | |
| | | | | | | | |
| | | | Railroads 1.1% | | | | |
| | 1,000,000 | | | Union Pacific Corp., 5.70%, 8/15/18 | | | 1,082,937 | |
| | | | | | | | |
| | | | Regional Banks 2.0% | | | | |
| | 1,500,000 | | | BB&T Corp., 2.15%, 3/22/17 MTN | | | 1,505,793 | |
| | 500,000 | | | SunTrust Banks, Inc., 3.50%, 1/20/17 | | | 502,534 | |
| | | | | | | | |
| | | | 2,008,327 | |
| | | | | | | | |
| | | | Semiconductor Equipment 0.8% | | | | |
| | 700,000 | | | Applied Materials, Inc., 4.30%, 6/15/21 | | | 778,749 | |
| | | | | | | | |
| | | | Specialty Chemicals 1.3% | | | | |
| | 1,150,000 | | | Lubrizol Corp., 8.875%, 2/1/19 | | | 1,344,197 | |
| | | | | | | | |
| | | | Steel 1.0% | | | | |
| | 1,000,000 | | | Nucor Corp., 5.75%, 12/1/17 | | | 1,041,038 | |
| | | | | | | | |
| | | | Super-Regional Banks — U.S. 1.3% | | | | |
| | 1,250,000 | | | Wells Fargo & Co., 4.125%, 8/15/23 | | | 1,337,682 | |
| | | | | | | | |
| | | | Television 0.8% | | | | |
| | 600,000 | | | CBS Corp., 7.875%, 9/1/23 | | | 763,526 | |
| | | | | | | | |
| | |
| | | | Total Corporate Bonds
(cost $45,412,963) | | | 46,265,720 | |
| | | | | | | | |
| | |
| | | | MUNICIPAL BONDS 5.6% | | | | |
| | |
| | 730,000 | | | City of Dublin, Ohio, 5.00%, 12/1/22, Series B | | | 844,004 | |
| | 695,000 | | | City of Westminster, Colorado, 2.415%, 12/1/19, Series B | | | 712,792 | |
| | 500,000 | | | Columbus-Franklin County Finance Authority, 3.00%, 8/15/21 | | | 525,105 | |
| | 489,087 | | | Minnesota Housing Finance Agency, 2.70%, 9/1/41 | | | 488,328 | |
| | 245,000 | | | New Hampshire Housing Finance Authority, 3.469%, 7/1/23, Series B | | | 257,902 | |
| | 325,000 | | | Richmond Joint Powers Financing Authority, 8.25%, 7/1/19, Class B | | | 354,296 | |
| | 500,000 | | | State of Louisiana, 5.00%, 7/15/26, Series C | | | 605,120 | |
| | 1,100,000 | | | State of New York Mortgage Agency, 3.653%, 4/1/23 | | | 1,152,998 | |
| | 250,000 | | | State of New York Mortgage Agency, 3.869%, 10/1/25 | | | 262,795 | |
| | | | | | | | |
Principal
Amount | | | | | Value | |
| | | | | | | |
| | | | MUNICIPAL BONDS (continued) | | | | |
| | |
| | $ 310,000 | | | Township of Robbinsville, 4.00%, 7/15/23, Series B | | $ | 346,152 | |
| | | | | | | | |
| | |
| | | | Total Municipal Bonds
(cost $5,373,286) | | | 5,549,492 | |
| | | | | | | | |
| | |
| Shares | | | | | Value | |
| | | | | | | |
| | | | EXCHANGE-TRADED FUNDS 0.9% | | | | |
| | |
| | | | Asset Management & Custody Banks 0.9% | | | | |
| | 9,000 | | | iShares S&P U.S. Preferred Stock Index Fund ETF | | $ | 355,500 | |
| | 25,000 | | | VanEck Vectors Preferred Securities ex Financials ETF | | | 518,625 | |
| | | | | | | | |
| | | | 874,125 | |
| | | | | | | | |
| | |
| | | | Total Exchange-Traded Funds
(cost $881,693) | | | 874,125 | |
| | | | | | | | |
| | |
Principal
Amount | | | | | Value | |
| | | | | | | |
| | | | U.S. GOVERNMENT AGENCY SECURITIES 5.1% | | | | |
| | |
| | $ 500,000 | | | Federal Farm Credit Banks, 1.54%, 12/14/20 | | $ | 500,434 | |
| | 1,050,000 | | | Federal Farm Credit Banks, 2.60%, 10/6/22 | | | 1,107,379 | |
| | 1,000,000 | | | Federal Farm Credit Banks, 4.95%, 12/16/19 | | | 1,121,381 | |
| | 361,872 | | | New Valley Generation IV, 4.687%, 1/15/22 | | | 391,376 | |
| | 800,000 | | | Tennessee Valley Authority, 3.875%, 2/15/21 | | | 887,434 | |
| | 1,000,000 | | | Tennessee Valley Authority, 6.25%, 12/15/17, Series E | | | 1,064,568 | |
| | | | | | | | |
| | |
| | | | Total U.S. Government Agency Securities
(cost $4,962,379) | | | 5,072,572 | |
| | | | | | | | |
| | |
| | | | U.S. TREASURY NOTES 10.7% | | | | |
| | |
| | 750,000 | | | U.S. Treasury Note, 2.625%, 8/15/20 | | | 794,356 | |
| | 1,750,000 | | | U.S. Treasury Note, 3.125%, 5/15/21 | | | 1,904,082 | |
| | 1,500,000 | | | U.S. Treasury Note, 3.25%, 12/31/16 | | | 1,510,796 | |
| | 3,500,000 | | | U.S. Treasury Note, 3.625%, 8/15/19 | | | 3,771,659 | |
| | 1,500,000 | | | U.S. Treasury Note, 3.625%, 2/15/20 | | | 1,631,250 | |
| | 1,000,000 | | | U.S. Treasury Note, 3.625%, 2/15/21 | | | 1,106,289 | |
| | | | | | | | |
| | |
| | | | Total U.S. Treasury Notes
(cost $10,574,181) | | | 10,718,432 | |
| | | | | | | | |
86
| | | | | | | | |
| Shares | | | | | Value | |
| | | | | | | |
| | | | PREFERRED STOCKS 1.2% | | | | |
| | |
| | | | Consumer Finance 0.3% | | | | |
| | 12,000 | | | Capital One Financial Corp., 6.70%, Series D Pfd.§§§ | | $ | 337,560 | |
| | | | | | | | |
| | | | Diversified Banks 0.9% | | | | |
| | 20,000 | | | Bank of America Corp., 6.625%, Series W Pfd.§§§ | | | 541,400 | |
| | 12,000 | | | Citigroup, Inc., 6.875%, Series L Pfd.§§§ | | | 333,360 | |
| | | | | | | | |
| | | | 874,760 | |
| | | | | | | | |
| | |
| | | | Total Preferred Stocks
(cost $1,145,092) | | | 1,212,320 | |
| | | | | | | | |
| | |
Principal
Amount | | | | | Value | |
| | | | | | | |
| | | | SHORT-TERM INVESTMENTS 1.2% | | | | |
| | |
| | | | Repurchase Agreement 1.2% | | | | |
| | $1,147,491 | | | Repurchase Agreement dated 9/30/16, 0.03% due 10/3/16 with State Street Bank and Trust Co. collateralized by $985,000
of United States Treasury Bonds 3.125% due 11/15/41; value: $1,172,150; repurchase proceeds: $1,147,494 (cost $1,147,491) | | $ | 1,147,491 | |
| | | | | | | | |
| | |
| | | | Total Short-Term Investments
(cost $1,147,491) | | | 1,147,491 | |
| | | | | | | | |
| | |
| | | | Total Investments
(cost $97,510,955) 99.3% | | | 99,009,904 | |
| | |
| | | | Other Assets less Liabilities 0.7% | | | 696,167 | |
| | | | | | | | |
| | |
| | | | NET ASSETS 100.0% | | $ | 99,706,071 | |
| | | | | | | | |
| |
| | | | †Liquid security purchased in a private placement transaction or under Rule 144A of the Securities Act of 1933. †††Variable rate securities. §§§Perpetual maturity. Callable any time after first call date. Maturity date is next call date. ESOP Employee Stock Ownership Plan. ETF Exchange-Traded Fund. MTN Medium Term Note. See Notes to Financial Statements. | |
At September 30, 2016, Wasatch-1st Source Income Fund’s investments, excluding short-term investments, were in the following countries (unaudited):
| | | | |
| Country | | % | |
Bermuda | | | 1.2 | |
Cayman Islands | | | 1.5 | |
United Kingdom | | | 1.4 | |
United States | | | 95.9 | |
| | | | |
TOTAL | | | 100.0 | % |
| | | | |
87
| | |
| WASATCH-HOISINGTON U.S. TREASURY FUND (WHOSX) | | SEPTEMBER 30, 2016 |
|
|
|
Schedule of Investments
| | | | | | | | |
Principal
Amount | | | | | Value | |
| | | | | | | |
| | | | U.S. GOVERNMENT OBLIGATIONS 99.4% | | | | |
| | |
| | $149,500,000 | | | U.S. Treasury Bond, 2.25%, 8/15/46 | | $ | 146,790,312 | |
| | 57,500,000 | | | U.S. Treasury Bond, 2.50%, 2/15/45 | | | 59,422,685 | |
| | 40,450,000 | | | U.S. Treasury Bond, 2.50%, 5/15/46 | | | 41,865,750 | |
| | 1,000,000 | | | U.S. Treasury Bond, 2.875%, 5/15/43 | | | 1,113,438 | |
| | 41,700,000 | | | U.S. Treasury Bond, 2.875%, 8/15/45 | | | 46,446,628 | |
| | 7,000,000 | | | U.S. Treasury Bond, 3.00%, 5/15/45 | | | 7,981,092 | |
| | 28,000,000 | | | U.S. Treasury Bond, 3.125%, 8/15/44 | | | 32,677,960 | |
| | 14,100,000 | | | U.S. Treasury Bond, 3.75%, 11/15/43 | | | 18,350,924 | |
| | 86,000,000 | | | U.S. Treasury Strip, principal only, 5/15/44 | | | 44,340,310 | |
| | 175,700,000 | | | U.S. Treasury Strip, principal only, 8/15/45 | | | 87,075,339 | |
| | | | | | | | |
| | |
| | | | Total U.S. Government Obligations
(cost $464,163,881) | | | 486,064,438 | |
| | | | | | | | |
| | | | | | | | |
Principal
Amount | | | | | Value | |
| | | | | | | |
| | | | SHORT-TERM INVESTMENTS 1.1% | | | | |
| | |
| | | | Repurchase Agreement 1.1% | | | | |
| | $ 5,292,824 | | | Repurchase Agreement dated 9/30/16, 0.03% due 10/3/16 with State Street Bank and Trust Co. collateralized by $4,540,000 of United States Treasury Bonds 3.125% due 11/15/41; value: $5,402,600; repurchase proceeds: $5,292,837 (cost $5,292,824) | | $ | 5,292,824 | |
| | | | | | | | |
| | |
| | | | Total Short-Term Investments
(cost $5,292,824) | | | 5,292,824 | |
| | | | | | | | |
| | |
| | | | Total Investments
(cost $469,456,705) 100.5% | | | 491,357,262 | |
| | |
| | | | Liabilities less Other Assets (0.5%) | | | (2,346,447 | ) |
| | | | | | | | |
| | |
| | | | NET ASSETS 100.0% | | $ | 489,010,815 | |
| | | | | | | | |
| |
| | | | See Notes to Financial Statements. | |
88
(This page intentionally left blank.)
89
Statements of Assets and Liabilities
| | | | | | | | | | | | |
| | | CORE GROWTH FUND | | | EMERGING INDIA FUND1 | | | EMERGING MARKETS SELECT FUND | |
| | | | | | | | | | | | |
Assets: | | | | | | | | | | | | |
Investments, at cost | | | | | | | | | | | | |
Unaffiliated issuers | | $ | 824,548,952 | | | $ | 52,609,120 | | | $ | 32,912,008 | |
Repurchase agreements | | | 105,044,901 | | | | 681,622 | | | | — | |
| | | | | | | | | | | | |
| | $ | 929,593,853 | | | $ | 53,290,742 | | | $ | 32,912,008 | |
| | | | | | | | | | | | |
Investments, at market value | | | | | | | | | | | | |
Unaffiliated issuers | | $ | 1,223,139,774 | | | $ | 77,258,356 | | | $ | 37,941,820 | |
Repurchase agreements | | | 105,044,901 | | | | 681,622 | | | | — | |
| | | | | | | | | | | | |
| | | 1,328,184,675 | | | | 77,939,978 | | | | 37,941,820 | |
Cash | | | — | | | | — | | | | — | |
Foreign currency on deposit (cost of $0, $5,018,101, $1,122,951, $557,415, $9,933,315, $1,976,959, $242,407 and $4,524,928, respectively) | | | — | | | | 5,030,601 | | | | 1,121,102 | |
Receivable for investment securities sold | | | 7,134,801 | | | | — | | | | — | |
Capital shares receivable | | | 624,428 | | | | 77,903 | | | | 250 | |
Interest and dividends receivable | | | 476,999 | | | | 7,625 | | | | 11,522 | |
Prepaid expenses and other assets | | | 62,629 | | | | 38,968 | | | | 18,356 | |
| | | | | | | | | | | | |
Total Assets | | | 1,336,483,532 | | | | 83,095,075 | | | | 39,093,050 | |
| | | | | | | | | | | | |
Liabilities: | | | | | | | | | | | | |
Payable for securities purchased | | | — | | | | — | | | | — | |
Capital shares payable | | | 1,283,062 | | | | 23,694 | | | | — | |
Payable to Advisor | | | 1,055,288 | | | | 88,517 | | | | 39,179 | |
Accrued fund administration fees | | | 18,894 | | | | 645 | | | | 185 | |
Accrued expenses and other liabilities | | | 265,783 | | | | 53,438 | | | | 43,832 | |
Foreign capital gains taxes payable | | | — | | | | 1,156,705 | | | | 222,975 | |
Line of credit payable | | | — | | | | — | | | | 132,095 | |
| | | | | | | | | | | | |
Total Liabilities | | | 2,623,027 | | | | 1,322,999 | | | | 438,266 | |
| | | | | | | | | | | | |
Net Assets | | $ | 1,333,860,505 | | | $ | 81,772,076 | | | $ | 38,654,784 | |
| | | | | | | | | | | | |
Net Assets Consist of: | | | | | | | | | | | | |
Capital stock | | $ | 234,207 | | | $ | 240,988 | | | $ | 41,609 | |
Paid-in-capital in excess of par | | | 938,704,775 | | | | 59,703,692 | | | | 42,702,208 | |
Undistributed net investment income (loss) | | | (5,575,059 | ) | | | (1,649,540 | ) | | | (157,877 | ) |
Undistributed net realized gain (loss) on investments and foreign currency translations | | | 1,905,760 | | | | (28,129 | ) | | | (8,736,484 | ) |
Net unrealized appreciation on investments and foreign currency translations | | | 398,590,822 | | | | 23,505,065 | | | | 4,805,328 | |
| | | | | | | | | | | | |
Net Assets | | $ | 1,333,860,505 | | | $ | 81,772,076 | | | $ | 38,654,784 | |
| | | | | | | | | | | | |
Net Assets | | | | | | | | | | | | |
Investor Class | | | 1,082,679,365 | | | | 71,973,116 | | | | 11,891,825 | |
Institutional Class | | | 251,181,140 | | | | 9,798,960 | | | | 26,762,959 | |
| | | |
Capital Stock Issued and Outstanding (Unlimited number of shares authorized,
$.01 par value) | | | | | | | | | | | | |
Investor Class | | | 19,026,406 | | | | 21,219,253 | | | | 1,288,929 | |
Institutional Class | | | 4,394,303 | | | | 2,879,575 | | | | 2,871,970 | |
| | | |
NET ASSET VALUE, REDEMPTION PRICEAND OFFERING PRICE PER SHARE | | | | | | | | | | | | |
Investor Class | | $ | 56.90 | | | $ | 3.39 | | | $ | 9.23 | |
| | | | | | | | | | | | |
Institutional Class | | $ | 57.16 | | | $ | 3.40 | | | $ | 9.32 | |
| | | | | | | | | | | | |
| 1 | Institutional class inception date was February 1, 2016. |
See Notes to Financial Statements.
90
| | | | | | | | | | | | | | | | | | |
EMERGING MARKETS SMALL CAP FUND1 | | | FRONTIER EMERGING SMALL COUNTRIES
FUND1 | | | GLOBAL OPPORTUNITIES FUND1 | | | INTERNATIONAL
GROWTH FUND1 | | | INTERNATIONAL
OPPORTUNITIES
FUND1 | |
| | | | | | | | | | | | | | | | | | |
| | | | | | | | | | | | | | | | | | |
| | | | | | | | | | | | | | | | | | |
| $ | 627,610,101 | | | $ | 486,110,917 | | | $ | 118,530,296 | | | $ | 1,063,380,470 | | | $ | 503,946,591 | |
| | 6,831,827 | | | | 31,123,151 | | | | 2,287,860 | | | | 25,975,306 | | | | 26,393,932 | |
| | | | | | | | | | | | | | | | | | |
| $ | 634,441,928 | | | $ | 517,234,068 | | | $ | 120,818,156 | | | $ | 1,089,355,776 | | | $ | 530,340,523 | |
| | | | | | | | | | | | | | | | | | |
| | | | | | | | | | | | | | | | | | |
| $ | 842,692,027 | | | $ | 539,089,273 | | | $ | 152,994,964 | | | $ | 1,428,341,256 | | | $ | 659,146,851 | |
| | 6,831,827 | | | | 31,123,151 | | | | 2,287,860 | | | | 25,975,306 | | | | 26,393,932 | |
| | | | | | | | | | | | | | | | | | |
| | 849,523,854 | | | | 570,212,424 | | | | 155,282,824 | | | | 1,454,316,562 | | | | 685,540,783 | |
| | — | | | | 13,367,891 | | | | — | | | | — | | | | — | |
|
558,425 |
| | | 9,937,854 | | | | 1,990,880 | | | | 242,642 | | | | 4,530,339 | |
| | 1,351,081 | | | | 11,627,481 | | | | — | | | | — | | | | 883,114 | |
| | 352,230 | | | | 286,401 | | | | 33,264 | | | | 2,014,941 | | | | 595,719 | |
| | 443,788 | | | | 1,651,343 | | | | 130,278 | | | | 1,864,319 | | | | 1,637,925 | |
| | 150,186 | | | | 102,015 | | | | 53,078 | | | | 90,298 | | | | 92,110 | |
| | | | | | | | | | | | | | | | | | |
| | 852,379,564 | | | | 607,185,409 | | | | 157,490,324 | | | | 1,458,528,762 | | | | 693,279,990 | |
| | | | | | | | | | | | | | | | | | |
| | | | | | | | | | | | | | | | | | |
| | 12,113,803 | | | | 23,098,605 | | | | 439,055 | | | | 1,839,062 | | | | 9,962,271 | |
| | 1,190,525 | | | | 1,250,664 | | | | 22,080 | | | | 561,459 | | | | 631,246 | |
| | 1,269,098 | | | | 1,020,574 | | | | 158,601 | | | | 1,452,126 | | | | 934,172 | |
| | 14,378 | | | | 9,363 | | | | 2,055 | | | | 22,525 | | | | 9,287 | |
| | 233,410 | | | | 423,356 | | | | 63,999 | | | | 294,954 | | | | 291,713 | |
| | 2,197,508 | | | | 3,833,897 | | | | 511,580 | | | | 174,524 | | | | 1,063,490 | |
| | — | | | | — | | | | — | | | | — | | | | — | |
| | | | | | | | | | | | | | | | | | |
| | 17,018,722 | | | | 29,636,459 | | | | 1,197,370 | | | | 4,344,650 | | | | 12,892,179 | |
| | | | | | | | | | | | | | | | | | |
| $ | 835,360,842 | | | $ | 577,548,950 | | | $ | 156,292,954 | | | $ | 1,454,184,112 | | | $ | 680,387,811 | |
| | | | | | | | | | | | | | | | | | |
| | | | | | | | | | | | | | | | | | |
| $ | 3,131,574 | | | $ | 2,196,147 | | | $ | 443,897 | | | $ | 462,538 | | | $ | 2,117,630 | |
| | 711,467,097 | | | | 680,191,743 | | | | 116,015,365 | | | | 1,052,297,656 | | | | 530,243,177 | |
| | (7,177,380 | ) | | | (5,926,809 | ) | | | (1,429,652 | ) | | | (1,771,842 | ) | | | (237,268 | ) |
| | (84,954,851 | ) | | | (148,629,498 | ) | | | 7,303,786 | | | | 38,420,308 | | | | (5,880,277 | ) |
| | 212,894,402 | | | | 49,717,367 | | | | 33,959,558 | | | | 364,775,452 | | | | 154,144,549 | |
| | | | | | | | | | | | | | | | | | |
| $ | 835,360,842 | | | $ | 577,548,950 | | | $ | 156,292,954 | | | $ | 1,454,184,112 | | | $ | 680,387,811 | |
| | | | | | | | | | | | | | | | | | |
| | | | | | | | | | | | | | | | | | |
| | 674,631,569 | | | | 437,849,939 | | | | 150,944,566 | | | | 945,167,647 | | | | 512,251,767 | |
| | 160,729,273 | | | | 139,699,011 | | | | 5,348,388 | | | | 509,016,465 | | | | 168,136,044 | |
| | | | |
| | | | | | | | | | | | | | | | | | |
| | 252,933,657 | | | | 166,626,546 | | | | 42,871,025 | | | | 30,072,946 | | | | 159,659,637 | |
| | 60,223,742 | | | | 52,988,198 | | | | 1,518,647 | | | | 16,180,857 | | | | 52,103,335 | |
| | | | |
| | | | | | | | | | | | | | | | | | |
| $ | 2.67 | | | $ | 2.63 | | | $ | 3.52 | | | $ | 31.43 | | | $ | 3.21 | |
| | | | | | | | | | | | | | | | | | |
| $ | 2.67 | | | $ | 2.64 | | | $ | 3.52 | | | $ | 31.46 | | | $ | 3.23 | |
| | | | | | | | | | | | | | | | | | |
91
Statements of Assets and Liabilities (continued)
| | | | | | | | | | | | |
| | | LARGE CAP
VALUE FUND | | | LONG/SHORT
FUND | | | MICRO CAP FUND | |
| | | | | | | | | | | | |
Assets: | | | | | | | | | | | | |
Investments, at cost | | | | | | | | | | | | |
Unaffiliated issuers | | $ | 155,952,971 | | | $ | 206,060,701 | | | $ | 170,911,833 | |
Affiliated issuers2 | | | — | | | | — | | | | — | |
Repurchase agreements | | | 4,332,782 | | | | 52,568,539 | | | | 15,116,164 | |
| | | | | | | | | | | | |
| | $ | 160,285,753 | | | $ | 258,629,240 | | | $ | 186,027,997 | |
| | | | | | | | | | | | |
Investments, at market value | | | | | | | | | | | | |
Unaffiliated issuers | | $ | 186,407,323 | | | $ | 211,126,168 | | | $ | 265,554,967 | |
Affiliated issuers2 | | | — | | | | — | | | | — | |
Repurchase agreements | | | 4,332,782 | | | | 52,568,539 | | | | 15,116,164 | |
| | | | | | | | | | | | |
| | | 190,740,105 | | | | 263,694,707 | | | | 280,671,131 | |
Cash | | | — | | | | — | | | | — | |
Foreign currency on deposit (cost of $0, $0, $17,320, $0, $0, $0, $0 and $0, respectively) | | | — | | | | — | | | | 17,360 | |
Receivable for investment securities sold | | | 4,228,097 | | | | 18,773,224 | | | | — | |
Receivable from broker for securities sold short | | | — | | | | 80,621,981 | | | | — | |
Capital shares receivable | | | 4,077 | | | | 37,397 | | | | 1,800 | |
Interest and dividends receivable | | | 190,886 | | | | 773,580 | | | | 87,145 | |
Prepaid expenses and other assets | | | 13,340 | | | | 23,705 | | | | 20,098 | |
| | | | | | | | | | | | |
Total Assets | | | 195,176,505 | | | | 363,924,594 | | | | 280,797,534 | |
| | | | | | | | | | | | |
Liabilities: | | | | | | | | | | | | |
Securities sold short, at value (proceeds of $0, $99,534,144, $0, $0, $0, $0, $0 and $0, respectively) | | | — | | | | 110,873,290 | | | | — | |
Payable for securities purchased | | | 1,307,753 | | | | 4,136,793 | | | | 2,562,630 | |
Capital shares payable | | | 298,044 | | | | 333,367 | | | | 82,393 | |
Dividends payable to shareholders | | | 8,727 | | | | — | | | | — | |
Payable to Advisor | | | 138,261 | | | | 232,385 | | | | 395,169 | |
Accrued fund administration fees | | | 3,295 | | | | 9,033 | | | | 3,874 | |
Accrued expenses and other liabilities | | | 140,331 | | | | 119,356 | | | | 62,545 | |
Dividends payable on securities sold short | | | — | | | | 52,978 | | | | — | |
| | | | | | | | | | | | |
Total Liabilities | | | 1,896,411 | | | | 115,757,202 | | | | 3,106,611 | |
| | | | | | | | | | | | |
Net Assets | | $ | 193,280,094 | | | $ | 248,167,392 | | | $ | 277,690,923 | |
| | | | | | | | | | | | |
Net Assets Consist of: | | | | | | | | | | | | |
Capital stock | | $ | 214,195 | | | $ | 196,285 | | | $ | 386,204 | |
Paid-in-capital in excess of par | | | 159,235,402 | | | | 412,924,111 | | | | 167,283,063 | |
Undistributed net investment income (loss) | | | (3,731 | ) | | | (145,368 | ) | | | (1,971,779 | ) |
Undistributed net realized gain (loss) on investments and foreign currency translations | | | 3,379,876 | | | | (158,533,957 | ) | | | 17,350,217 | |
Net unrealized appreciation (depreciation) on investments and foreign currency translations | | | 30,454,352 | | | | (6,273,679 | ) | | | 94,643,218 | |
| | | | | | | | | | | | |
Net Assets | | $ | 193,280,094 | | | $ | 248,167,392 | | | $ | 277,690,923 | |
| | | | | | | | | | | | |
Net Assets | | | | | | | | | | | | |
Investor Class | | | 189,691,057 | | | | 184,157,967 | | | | 277,690,923 | |
Institutional Class | | | 3,589,037 | | | | 64,009,425 | | | | — | |
| | | |
Capital Stock Issued and Outstanding (Unlimited number of shares authorized,
$.01 par value) | | | | | | | | | | | | |
Investor Class | | | 21,021,265 | | | | 14,578,155 | | | | 38,620,377 | |
Institutional Class | | | 398,217 | | | | 5,050,297 | | | | — | |
| | | |
NET ASSET VALUE, REDEMPTION PRICEAND OFFERING PRICE PER SHARE | | | | | | | | | | | | |
Investor Class | | $ | 9.02 | | | $ | 12.63 | | | $ | 7.19 | |
| | | | | | | | | | | | |
Institutional Class | | $ | 9.01 | | | $ | 12.67 | | | $ | — | |
| | | | | | | | | | | | |
| 1 | Institutional class inception date was February 1, 2016. |
| 2 | See Note 8 for information on affiliated issuers. |
See Notes to Financial Statements.
92
| | | | | | | | | | | | | | | | | | |
MICRO CAP
VALUE FUND | | | SMALL CAP
GROWTH
FUND1 | | | SMALL CAP
VALUE FUND | | | STRATEGIC
INCOME
FUND | | | ULTRA
GROWTH
FUND | |
| | | | | | | | | | | | | | | | | | |
| | | | | | | | | | | | | | | | | | |
| | | | | | | | | | | | | | | | | | |
| $ | 120,296,668 | | | $ | 1,198,435,512 | | | $ | 213,269,694 | | | $ | 38,900,168 | | | $ | 72,009,705 | |
| | — | | | | 110,947,444 | | | | — | | | | — | | | | — | |
| | 14,498,386 | | | | 37,296,316 | | | | 22,861,806 | | | | 11,117,499 | | | | 3,908,753 | |
| | | | | | | | | | | | | | | | | | |
| $ | 134,795,054 | | | $ | 1,346,679,272 | | | $ | 236,131,500 | | | $ | 50,017,667 | | | $ | 75,918,458 | |
| | | | | | | | | | | | | | | | | | |
| | | | | | | | | | | | | | | | | | |
| $ | 165,523,132 | | | $ | 1,757,887,917 | | | $ | 272,388,076 | | | $ | 44,004,623 | | | $ | 96,667,469 | |
| | — | | | | 79,149,686 | | | | — | | | | — | | | | — | |
| | 14,498,386 | | | | 37,296,316 | | | | 22,861,806 | | | | 11,117,499 | | | | 3,908,753 | |
| | | | | | | | | | | | | | | | | | |
| | 180,021,518 | | | | 1,874,333,919 | | | | 295,249,882 | | | | 55,122,122 | | | | 100,576,222 | |
| | 670,641 | | | | — | | | | — | | | | 6,359 | | | | — | |
| | — | | | | — | | | | — | | | | — | | | | — | |
| | 203,576 | | | | 10,478,429 | | | | 8,277,492 | | | | 155,825 | | | | 1,116,120 | |
| | — | | | | — | | | | — | | | | — | | | | — | |
| | 42,550 | | | | 17,107,629 | | | | 340,940 | | | | 1,699 | | | | 943 | |
| | 208,851 | | | | 246,909 | | | | 415,294 | | | | 176,934 | | | | 56,391 | |
| | 32,272 | | | | 73,175 | | | | 30,009 | | | | 10,771 | | | | 16,740 | |
| | | | | | | | | | | | | | | | | | |
| | 181,179,408 | | | | 1,902,240,061 | | | | 304,313,617 | | | | 55,473,710 | | | | 101,766,416 | |
| | | | | | | | | | | | | | | | | | |
| | | | | | | | | | | | | | | | | | |
| — | | | | — | | | | — | | | | — | | | | — | |
| | 1,650,000 | | | | — | | | | 10,312,844 | | | | 219,504 | | | | 226,790 | |
| | 82,575 | | | | 17,592,374 | | | | 120,312 | | | | 71,668 | | | | 925 | |
| | — | | | | — | | | | — | | | | 3,237 | | | | — | |
| | 263,863 | | | | 1,525,453 | | | | 237,116 | | | | 32,318 | | | | 82,052 | |
| | 2,299 | | | | 29,606 | | | | 4,088 | | | | 395 | | | | 1,119 | |
| | 64,299 | | | | 691,710 | | | | 90,134 | | | | 34,756 | | | | 53,626 | |
| | — | | | | — | | | | — | | | | — | | | | — | |
| | | | | | | | | | | | | | | | | | |
| | 2,063,036 | | | | 19,839,143 | | | | 10,764,494 | | | | 361,878 | | | | 364,512 | |
| | | | | | | | | | | | | | | | | | |
| $ | 179,116,372 | | | $ | 1,882,400,918 | | | $ | 293,549,123 | | | $ | 55,111,832 | | | $ | 101,401,904 | |
| | | | | | | | | | | | | | | | | | |
| | | | | | | | | | | | | | | | | | |
| $ | 623,646 | | | $ | 432,450 | | | $ | 443,670 | | | $ | 51,872 | | | $ | 50,975 | |
| | 135,315,313 | | | | 1,219,814,729 | | | | 247,476,470 | | | | 58,646,046 | | | | 70,489,829 | |
| | (689,111 | ) | | | (10,697,296 | ) | | | 223,317 | | | | (159,843 | ) | | | (1,199,720 | ) |
| | (1,360,136 | ) | | | 147,319,424 | | | | (13,712,728 | ) | | | (8,530,680 | ) | | | 9,312,750 | |
| 45,226,660 | | | | 525,531,611 | | | | 59,118,394 | | | | 5,104,437 | | | | 22,748,070 | |
| | | | | | | | | | | | | | | | | | |
| $ | 179,116,372 | | | $ | 1,882,400,918 | | | $ | 293,549,123 | | | $ | 55,111,832 | | | $ | 101,401,904 | |
| | | | | | | | | | | | | | | | | | |
| | | | | | | | | | | | | | | | | | |
| | 179,116,372 | | | | 1,544,796,310 | | | | 269,710,468 | | | | 55,111,832 | | | | 101,401,904 | |
| | — | | | | 337,604,608 | | | | 23,838,655 | | | | — | | | | — | |
| | | | |
| | | | | | | | | | | | | | | | | | |
| | 62,364,594 | | | | 35,497,977 | | | | 40,782,789 | | | | 5,187,247 | | | | 5,097,506 | |
| | — | | | | 7,747,045 | | | | 3,584,217 | | | | — | | | | — | |
| | | | |
| | | | | | | | | | | | | | | | | | |
| $ | 2.87 | | | $ | 43.52 | | | $ | 6.61 | | | $ | 10.62 | | | $ | 19.89 | |
| | | | | | | | | | | | | | | | | | |
| $ | — | | | $ | 43.58 | | | $ | 6.65 | | | $ | — | | | $ | — | |
| | | | | | | | | | | | | | | | | | |
93
| | |
| WASATCH FUNDS | | SEPTEMBER 30, 2016 |
|
|
|
Statements of Assets and Liabilities (continued)
| | | | | | | | | | | | |
| | | WORLD
INNOVATORS
FUND1 | | | INCOME
FUND | | | U.S.
TREASURY
FUND | |
| | | | | | | | | | | | |
| | | | | | | | | | | | |
Assets: | | | | | | | | | | | | |
Investments, at cost | | | | | | | | | | | | |
Unaffiliated issuers | | $ | 139,650,644 | | | $ | 96,363,464 | | | $ | 464,163,881 | |
Repurchase agreements | | | 39,800,296 | | | | 1,147,491 | | | | 5,292,824 | |
| | | | | | | | | | | | |
| | $ | 179,450,940 | | | $ | 97,510,955 | | | $ | 469,456,705 | |
| | | | | | | | | | | | |
Investments, at market value | | | | | | | | | | | | |
Unaffiliated issuers | | $ | 159,843,944 | | | $ | 97,862,413 | | | $ | 486,064,438 | |
Repurchase agreements | | | 39,800,296 | | | | 1,147,491 | | | | 5,292,824 | |
| | | | | | | | | | | | |
| | | 199,644,240 | | | | 99,009,904 | | | | 491,357,262 | |
Foreign currency on deposit (cost of $11,138, $0 and $0, respectively) | | | 11,164 | | | | — | | | | — | |
Receivable for investment securities sold | | | 1,002,963 | | | | 545 | | | | — | |
Capital shares receivable | | | 4,984 | | | | 84,656 | | | | 601,058 | |
Interest and dividends receivable | | | 242,159 | | | | 728,486 | | | | 1,549,942 | |
Prepaid expenses and other assets | | | 37,916 | | | | 7,641 | | | | 54,384 | |
| | | | | | | | | | | | |
Total Assets | | | 200,943,426 | | | | 99,831,232 | | | | 493,562,646 | |
| | | | | | | | | | | | |
Liabilities: | | | | | | | | | | | | |
Payable for securities purchased | | | 650,530 | | | | — | | | | — | |
Capital shares payable | | | 39,512 | | | | 4,725 | | | | 4,149,148 | |
Dividends payable to shareholders | | | — | | | | 34,889 | | | | 89,863 | |
Payable to Advisor | | | 245,684 | | | | 45,325 | | | | 205,605 | |
Accrued fund administration fees | | | 2,878 | | | | 1,095 | | | | 6,698 | |
Accrued expenses and other liabilities | | | 88,442 | | | | 39,127 | | | | 100,517 | |
Unrealized depreciation on foreign currency contracts | | | 113,367 | | | | — | | | | — | |
| | | | | | | | | | | | |
Total Liabilities | | | 1,140,413 | | | | 125,161 | | | | 4,551,831 | |
| | | | | | | | | | | | |
Net Assets | | $ | 199,803,013 | | | $ | 99,706,071 | | | $ | 489,010,815 | |
| | | | | | | | | | | | |
Net Assets Consist of: | | | | | | | | | | | | |
Capital stock | | $ | 103,387 | | | $ | 97,284 | | | $ | 246,172 | |
Paid-in-capital in excess of par | | | 177,050,702 | | | | 98,011,514 | | | | 442,937,402 | |
Undistributed net investment income (loss) | | | (456,077 | ) | | | 10,454 | | | | (1,860 | ) |
Undistributed net realized gain on investments and foreign currency translations | | | 3,236,199 | | | | 87,870 | | | | 23,928,544 | |
Net unrealized appreciation on investments and foreign currency translations | | | 19,868,802 | | | | 1,498,949 | | | | 21,900,557 | |
| | | | | | | | | | | | |
Net Assets | | $ | 199,803,013 | | | $ | 99,706,071 | | | $ | 489,010,815 | |
| | | | | | | | | | | | |
Net Assets | | | | | | | | | | | | |
Investor Class | | | 193,826,077 | | | | 99,706,071 | | | | 489,010,815 | |
Institutional Class | | | 5,976,936 | | | | — | | | | — | |
| | | |
Capital Stock Issued and Outstanding (Unlimited number of shares authorized,
$.01 par value) | | | | | | | | | | | | |
Investor Class | | | 10,029,994 | | | | 9,728,370 | | | | 24,617,234 | |
Institutional Class | | | 308,677 | | | | — | | | | — | |
| | | |
NET ASSET VALUE, REDEMPTION PRICEAND OFFERING PRICE PER SHARE | | | | | | | | | | | | |
Investor Class | | $ | 19.32 | | | $ | 10.25 | | | $ | 19.86 | |
| | | | | | | | | | | | |
Institutional Class | | $ | 19.36 | | | $ | — | | | $ | — | |
| | | | | | | | | | | | |
| 1 | Institutional class inception date was February 1, 2016. |
See Notes to Financial Statements.
94
(This page intentionally left blank.)
95
Statements of Operations
| | | | | | | | | | | | |
| | | CORE
GROWTH
FUND | | | EMERGING
INDIA FUND1 | | | EMERGING
MARKETS
SELECT FUND | |
| | | | | | | | | | | | |
Investment Income: | | | | | | | | | | | | |
Interest | | $ | 20,690 | | | $ | 3,624 | 2 | | $ | 166 | |
Dividends3 | | | | | | | | | | | | |
Unaffiliated issuers | | | 7,186,372 | | | | 435,016 | | | | 570,419 | |
| | | | | | | | | | | | |
Total investment income | | | 7,207,062 | | | | 438,640 | | | | 570,585 | |
| | | | | | | | | | | | |
Expenses: | | | | | | | | | | | | |
Investment advisory fees | | | 12,103,943 | | | | 898,153 | | | | 407,158 | |
Shareholder servicing fees — Investor Class | | | 1,424,100 | | | | 130,634 | | | | 58,558 | |
Shareholder servicing fees — Institutional Class | | | 12,961 | | | | 2,381 | | | | 13,135 | |
Fund administration fees | | | 193,889 | | | | 10,807 | | | | 6,022 | |
Fund accounting fees | | | 119,688 | | | | 31,367 | | | | 20,990 | |
Reports to shareholders — Investor Class | | | 115,352 | | | | 15,696 | | | | 6,855 | |
Reports to shareholders — Institutional Class | | | 21,021 | | | | 1,636 | | | | 4,074 | |
Custody fees | | | 80,670 | | | | 84,404 | | | | 47,757 | |
Federal and state registration fees — Investor Class | | | 43,683 | | | | 23,839 | | | | 13,751 | |
Federal and state registration fees — Institutional Class | | | 17,482 | | | | 5,984 | | | | 13,740 | |
Legal fees | | | 67,587 | | | | 6,881 | | | | 2,694 | |
Trustees’ fees | | | 145,059 | | | | 7,882 | | | | 4,549 | |
Interest | | | 31,878 | | | | 3,226 | | | | 2,481 | |
Audit fees | | | 34,093 | | | | 31,149 | | | | 31,149 | |
Other expenses | | | 53,201 | | | | 70,768 | | | | 24,955 | |
| | | | | | | | | | | | |
Total expenses before reimbursement | | | 14,464,607 | | | | 1,324,807 | | | | 657,868 | |
Reimbursement of expenses by Advisor | | | (38,411 | ) | | | (106,144 | ) | | | (126,894 | ) |
| | | | | | | | | | | | |
Net Expenses | | | 14,426,196 | | | | 1,218,663 | | | | 530,974 | |
| | | | | | | | | | | | |
Net Investment Income (Loss) | | | (7,219,134 | ) | | | (780,023 | ) | | | 39,611 | |
| | | | | | | | | | | | |
Realized and Unrealized Gain (Loss): | | | | | | | | | | | | |
Net realized gain (loss) on investments and foreign currency translations | | | | | | | | | | | | |
Unaffiliated issuers | | | 6,560,806 | | | | 145,965 | | | | (1,209,469 | ) |
Realized foreign capital gains taxes | | | — | | | | (70,102 | ) | | | (85,973 | ) |
Change in unrealized appreciation (depreciation) on
investments and foreign currency translations | | | 126,438,065 | | | | 9,603,227 | | | | 5,287,932 | |
Change in deferred foreign capital gains taxes | | | 1,407,632 | | | | (595,854 | ) | | | (106,947 | ) |
| | | | | | | | | | | | |
Net gain (loss) on investments | | | 134,406,503 | | | | 9,083,236 | | | | 3,885,543 | |
| | | | | | | | | | | | |
Net Increase (Decrease) in Net Assets Resulting from Operations | | $ | 127,187,369 | | | $ | 8,303,213 | | | $ | 3,925,154 | |
| | | | | | | | | | | | |
| 1 | Institutional class inception date was February 1, 2016. |
| 2 | Net of $72 in foreign withholding taxes, respectively. |
| 3 | Net of $11,214, $0, $44,853, $1,325,969, $2,299,163, $84,121, $1,412,501 and $1,263,057 in foreign withholding taxes, respectively. |
See Notes to Financial Statements.
96
| | | | | | | | | | | | | | | | | | |
EMERGING
MARKETS
SMALL CAP
FUND1 | | | FRONTIER
EMERGING
SMALL COUNTRIES
FUND1 | | | GLOBAL
OPPORTUNITIES
FUND1 | | | INTERNATIONAL
GROWTH FUND1 | | | INTERNATIONAL
OPPORTUNITIES
FUND1 | |
| | | | | | | | | | | | | | | | | | |
| | | | | | | | | | | | | | | | | | |
| $ | 1,361 | | | $ | 9,016 | | | $ | 666 | | | $ | 8,368 | | | $ | 5,694 | |
| | | | | | | | | | | | | | | | | | |
| | 10,670,090 | | | | 22,691,675 | | | | 994,698 | | | | 15,402,389 | | | | 10,592,009 | |
| | | | | | | | | | | | | | | | | | |
| | 10,671,451 | | | | 22,700,691 | | | | 995,364 | | | | 15,410,757 | | | | 10,597,703 | |
| | | | | | | | | | | | | | | | | | |
| | | | | | | | | | | | | | | | | | |
| | 14,224,440 | | | | 14,825,790 | | | | 2,072,350 | | | | 17,233,909 | | | | 9,614,191 | |
| | 1,055,855 | | | | 2,278,211 | | | | 214,814 | | | | 1,597,204 | | | | 1,410,477 | |
| | 2,530 | | | | 3,269 | | | | 2,388 | | | | 3,061 | | | | 81,760 | |
| | 134,778 | | | | 135,421 | | | | 24,830 | | | | 220,894 | | | | 85,232 | |
| | 103,933 | | | | 108,397 | | | | 38,245 | | | | 147,606 | | | | 83,687 | |
| | 72,241 | | | | 161,026 | | | | 11,847 | | | | 137,797 | | | | 107,439 | |
| | 8,617 | | | | 12,771 | | | | 1,638 | | | | 25,059 | | | | 23,876 | |
| | 699,978 | | | | 2,054,979 | | | | 33,464 | | | | 374,968 | | | | 375,490 | |
| | 39,808 | | | | 48,754 | | | | 18,203 | | | | 43,253 | | | | 34,335 | |
| | 6,106 | | | | 7,023 | | | | 5,980 | | | | 6,308 | | | | 6,703 | |
| | 55,076 | | | | 54,852 | | | | 7,792 | | | | 87,835 | | | | 34,745 | |
| | 109,543 | | | | 115,040 | | | | 19,040 | | | | 164,370 | | | | 58,679 | |
| | 50,773 | | | | 34,792 | | | | 8,019 | | | | 36,829 | | | | 13,836 | |
| | 31,610 | | | | 31,610 | | | | 31,149 | | | | 31,841 | | | | 31,379 | |
| | 102,496 | | | | 102,154 | | | | 36,074 | | | | 62,518 | | | | 45,894 | |
| | | | | | | | | | | | | | | | | | |
| | 16,697,784 | | | | 19,974,089 | | | | 2,525,833 | | | | 20,173,452 | | | | 12,007,723 | |
| | (322,521 | ) | | | (1,023,972 | ) | | | (12,559 | ) | | | (14,232 | ) | | | (260,334 | ) |
| | | | | | | | | | | | | | | | | | |
| | 16,375,263 | | | | 18,950,117 | | | | 2,513,274 | | | | 20,159,220 | | | | 11,747,389 | |
| | | | | | | | | | | | | | | | | | |
| | (5,703,812 | ) | | | 3,750,574 | | | | (1,517,910 | ) | | | (4,748,463 | ) | | | (1,149,686 | ) |
| | | | | | | | | | | | | | | | | | |
| | | | | | | | | | | | | | | | | | |
| | | | | | | | | | | | | | | | | | |
| | (56,197,737 | ) | | | (117,455,036 | ) | | | 8,726,971 | | | | 55,162,839 | | | | (6,100,467 | ) |
| | (955,090 | ) | | | (5,141,359 | ) | | | (296,155 | ) | | | (26,031 | ) | | | (117,613 | ) |
|
151,586,823 |
| | | 66,194,671 | | | | 14,173,011 | | | | 116,265,854 | | | | 124,158,622 | |
| | (1,327,313 | ) | | | 4,975,902 | | | | (102,590 | ) | | | (174,524 | ) | | | (931,166 | ) |
| | | | | | | | | | | | | | | | | | |
| | 93,106,683 | | | | (51,425,822 | ) | | | 22,501,237 | | | | 171,228,138 | | | | 117,009,376 | |
| | | | | | | | | | | | | | | | | | |
| $ | 87,402,871 | | | $ | (47,675,248 | ) | | $ | 20,983,327 | | | $ | 166,479,675 | | | $ | 115,859,690 | |
| | | | | | | | | | | | | | | | | | |
97
Statements of Operations (continued)
| | | | | | | | | | | | |
| | | LARGE CAP
VALUE FUND | | | LONG/SHORT
FUND | | | MICRO CAP FUND | |
| | | | | | | | | | | | |
Investment Income: | | | | | | | | | | | | |
Interest | | $ | 948 | | | $ | — | | | $ | 2,448 | |
Dividends2 | | | | | | | | | | | | |
Unaffiliated issuers | | | 6,049,905 | | | | 8,493,457 | | | | 2,077,555 | |
Affiliated issuers3 | | | — | | | | — | | | | — | |
| | | | | | | | | | | | |
Total investment income | | | 6,050,853 | | | | 8,493,457 | | | | 2,080,003 | |
| | | | | | | | | | | | |
Expenses: | | | | | | | | | | | | |
Investment advisory fees | | | 1,946,807 | | | | 5,358,336 | | | | 4,640,023 | |
Shareholder servicing fees — Investor Class | | | 356,774 | | | | 735,674 | | | | 197,371 | |
Shareholder servicing fees — Institutional Class | | | 3,408 | | | | 15,626 | | | | — | |
Fund administration fees | | | 34,588 | | | | 81,826 | | | | 42,433 | |
Fund accounting fees | | | 27,989 | | | | 54,518 | | | | 40,356 | |
Reports to shareholders — Investor Class | | | 30,537 | | | | 56,467 | | | | 17,017 | |
Reports to shareholders — Institutional Class | | | 1,832 | | | | 11,290 | | | | — | |
Custody fees | | | 7,150 | | | | 28,077 | | | | 35,918 | |
Federal and state registration fees — Investor Class | | | 21,923 | | | | 35,054 | | | | 21,200 | |
Federal and state registration fees — Institutional Class | | | 10,813 | | | | 28,385 | | | | — | |
Legal fees | | | 10,785 | | | | 38,830 | | | | 13,044 | |
Trustees’ fees | | | 28,346 | | | | 90,806 | | | | 32,719 | |
Dividends on securities sold short | | | — | | | | 1,283,149 | | | | — | |
Interest | | | 6,011 | | | | 611,023 | | | | 6,860 | |
Audit fees | | | 33,149 | | | | 33,149 | | | | 28,749 | |
Other expenses | | | 14,960 | | | | 61,473 | | | | 25,133 | |
| | | | | | | | | | | | |
Total expenses before reimbursement | | | 2,535,072 | | | | 8,523,683 | | | | 5,100,823 | |
Reimbursement of expenses by Advisor | | | (153,287 | ) | | | (75,299 | ) | | | — | |
| | | | | | | | | | | | |
Net Expenses | | | 2,381,785 | | | | 8,448,384 | | | | 5,100,823 | |
| | | | | | | | | | | | |
Net Investment Income (Loss) | | | 3,669,068 | | | | 45,073 | | | | (3,020,820 | ) |
| | | | | | | | | | | | |
Realized and Unrealized Gain (Loss): | | | | | | | | | | | | |
Net realized gain (loss) on investments and foreign currency translations | | | | | | | | | | | | |
Unaffiliated issuers | | | 5,613,690 | | | | (125,012,468 | ) | | | 17,504,123 | |
Affiliated issuers | | | — | | | | — | | | | — | |
Net realized gain on options written | | | 132,873 | | | | — | | | | — | |
Net realized loss on short positions | | | — | | | | (24,738,165 | ) | | | — | |
Realized foreign capital gains taxes | | | — | | | | — | | | | (97 | ) |
Change in unrealized appreciation (depreciation) on
investments, options, securities sold short and foreign currency translations | | | 19,112,212 | | | | 196,133,025 | | | | 25,086,105 | |
Change in deferred foreign capital gains taxes | | | — | | | | — | | | | — | |
| | | | | | | | | | | | |
Net gain on investments | | | 24,858,775 | | | | 46,382,392 | | | | 42,590,131 | |
| | | | | | | | | | | | |
Net Increase in Net Assets Resulting from Operations | | $ | 28,527,843 | | | $ | 46,427,465 | | | $ | 39,569,311 | |
| | | | | | | | | | | | |
| 1 | Institutional class inception date was February 1, 2016. |
| 2 | Net of $107,500, $58,066, $13,759, $40,875, $34,516, $0, $15,786 and $1,042 in foreign withholding taxes, respectively. |
| 3 | See Note 8 for information on affiliated issuers. |
See Notes to Financial Statements.
98
| | | | | | | | | | | | | | | | | | |
MICRO CAP
VALUE FUND | | | SMALL CAP
GROWTH
FUND1 | | | SMALL CAP
VALUE FUND | | | STRATEGIC
INCOME
FUND | | | ULTRA
GROWTH
FUND | |
| | | | | | | | | | | | | | | | | | |
| | | | | | | | | | | | | | | | | | |
| $ | 56,680 | | | $ | 6,825 | | | $ | 3,892 | | | $ | 2,192 | | | $ | 51,689 | |
| | | | | | | | | | | | | | | | | | |
| | 2,210,617 | | | | 8,763,256 | | | | 4,066,427 | | | | 2,334,468 | | | | 225,702 | |
| | — | | | | 579,987 | | | | — | | | | — | | | | — | |
| | | | | | | | | | | | | | | | | | |
| | 2,267,297 | | | | 9,350,068 | | | | 4,070,319 | | | | 2,336,660 | | | | 277,391 | |
| | | | | | | | | | | | | | | | | | |
| | | | | | | | | | | | | | | | | | |
| | 2,917,280 | | | | 18,986,748 | | | | 2,767,060 | | | | 474,325 | | | | 950,690 | |
| | 230,377 | | | | 3,686,933 | | | | 355,304 | | | | 111,753 | | | | 162,688 | |
| | — | | | | 5,545 | | | | 4,585 | | | | — | | | | — | |
| | 26,718 | | | | 303,660 | | | | 44,316 | | | | 10,801 | | | | 15,214 | |
| | 38,403 | | | | 185,036 | | | | 37,135 | | | | 16,177 | | | | 25,995 | |
| | 25,860 | | | | 236,699 | | | | 30,410 | | | | 10,845 | | | | 13,523 | |
| | — | | | | 12,969 | | | | 3,835 | | | | — | | | | — | |
| | 21,786 | | | | 319,209 | | | | 18,782 | | | | 3,239 | | | | 7,720 | |
| | 21,428 | | | | 61,626 | | | | 27,912 | | | | 24,429 | | | | 18,181 | |
| | — | | | | 6,254 | | | | 11,687 | | | | — | | | | — | |
| | 9,308 | | | | 100,409 | | | | 14,549 | | | | 3,496 | | | | 4,666 | |
| | 19,528 | | | | 238,539 | | | | 33,585 | | | | 9,619 | | | | 11,692 | |
| | — | | | | — | | | | — | | | | — | | | | — | |
| | 4,357 | | | | 53,999 | | | | 7,234 | | | | 2,017 | | | | 2,967 | |
| | 61,314 | | | | 36,807 | | | | 31,149 | | | | 28,749 | | | | 28,749 | |
| | 18,840 | | | | 89,150 | | | | 23,974 | | | | 7,071 | | | | 17,622 | |
| | | | | | | | | | | | | | | | | | |
| | 3,395,199 | | | | 24,323,583 | | | | 3,411,517 | | | | 702,521 | | | | 1,259,707 | |
| | (140,159 | ) | | | (49,361 | ) | | | (23,450 | ) | | | (56,776 | ) | | | — | |
| | | | | | | | | | | | | | | | | | |
| | 3,255,040 | | | | 24,274,222 | | | | 3,388,067 | | | | 645,745 | | | | 1,259,707 | |
| | | | | | | | | | | | | | | | | | |
| | (987,743 | ) | | | (14,924,154 | ) | | | 682,252 | | | | 1,690,915 | | | | (982,316 | ) |
| | | | | | | | | | | | | | | | | | |
| | | | | | | | | | | | | | | | | | |
| | | | | | | | | | | | | | | | | | |
| | 2,365,278 | | | | 162,972,786 | | | | 16,744,107 | | | | (7,539,689 | ) | | | 7,330,801 | |
| | — | | | | (334,925 | ) | | | — | | | | — | | | | — | |
| | — | | | | — | | | | — | | | | — | | | | — | |
| | — | | | | — | | | | — | | | | — | | | | — | |
| | (58,479 | ) | | | — | | | | 31,036 | | | | — | | | | — | |
|
18,247,780 |
| | | 63,548,823 | | | | 18,006,823 | | | | 9,420,214 | | | | 11,054,954 | |
| | 158,971 | | | | 3,640,617 | | | | 255,189 | | | | — | | | | — | |
| | | | | | | | | | | | | | | | | | |
| | 20,713,550 | | | | 229,827,301 | | | | 35,037,155 | | | | 1,880,525 | | | | 18,385,755 | |
| | | | | | | | | | | | | | | | | | |
| $ | 19,725,807 | | | $ | 214,903,147 | | | $ | 35,719,407 | | | $ | 3,571,440 | | | $ | 17,403,439 | |
| | | | | | | | | | | | | | | | | | |
99
| | |
| WASATCH FUNDS | | SEPTEMBER 30, 2016 |
|
|
|
Statements of Operations (continued)
| | | | | | | | | | | | |
| | | WORLD
INNOVATORS
FUND1 | | | INCOME FUND | | | U.S. TREASURY
FUND | |
| | | | | | | | | | | | |
Investment Income: | | | | | | | | | | | | |
Interest | | $ | 7,175 | | | $ | 2,602,718 | | | $ | 10,763,228 | |
Dividends2 | | | | | | | | | | | | |
Unaffiliated issuers | | | 2,135,796 | | | | 123,332 | | | | — | |
| | | | | | | | | | | | |
Total investment income | | | 2,142,971 | | | | 2,726,050 | | | | 10,763,228 | |
| | | | | | | | | | | | |
Expenses: | | | | | | | | | | | | |
Investment advisory fees | | | 2,847,261 | | | | 580,706 | | | | 2,017,529 | |
Shareholder servicing fees — Investor Class | | | 303,523 | | | | 45,675 | | | | 456,650 | |
Shareholder servicing fees — Institutional Class | | | 2,248 | | | | — | | | | — | |
Fund administration fees | | | 30,391 | | | | 16,918 | | | | 64,836 | |
Fund accounting fees | | | 40,050 | | | | 39,519 | | | | 40,079 | |
Reports to shareholders — Investor Class | | | 21,825 | | | | 4,351 | | | | 119,439 | |
Reports to shareholders — Institutional Class | | | 1,355 | | | | — | | | | — | |
Custody fees | | | 34,866 | | | | 12,131 | | | | 12,299 | |
Federal and state registration fees — Investor Class | | | 22,684 | | | | 18,364 | | | | 54,949 | |
Federal and state registration fees — Institutional Class | | | 5,979 | | | | — | | | | — | |
Legal fees | | | 9,196 | | | | 5,234 | | | | 62,105 | |
Trustees’ fees | | | 23,010 | | | | 13,123 | | | | 42,659 | |
Interest | | | 4,853 | | | | 2,808 | | | | 10,173 | |
Audit fees | | | 31,610 | | | | 28,749 | | | | 30,749 | |
Other expenses | | | 17,113 | | | | 7,093 | | | | 14,848 | |
| | | | | | | | | | | | |
Total expenses before reimbursement | | | 3,395,964 | | | | 774,671 | | | | 2,926,315 | |
Reimbursement of expenses by Advisor | | | (12,353 | ) | | | — | | | | (126,710 | )3 |
| | | | | | | | | | | | |
Net Expenses | | | 3,383,611 | | | | 774,671 | | | | 2,799,605 | |
| | | | | | | | | | | | |
Net Investment Income (Loss) | | | (1,240,640 | ) | | | 1,951,379 | | | | 7,963,623 | |
| | | | | | | | | | | | |
Realized and Unrealized Gain (Loss): | | | | | | | | | | | | |
Net realized gain on investments and foreign currency translations | | | | | | | | | | | | |
Unaffiliated issuers | | | 11,700,774 | | | | 125,294 | | | | 23,928,544 | |
Realized foreign capital gains taxes | | | (8,764 | ) | | | — | | | | — | |
Change in unrealized appreciation (depreciation) on
investments and foreign currency translations | | | 6,110,487 | | | | 544,033 | | | | 24,193,265 | |
| | | | | | | | | | | | |
Net gain on investments | | | 17,802,497 | | | | 669,327 | | | | 48,121,809 | |
| | | | | | | | | | | | |
Net Increase in Net Assets Resulting from Operations | | $ | 16,561,857 | | | $ | 2,620,706 | | | $ | 56,085,432 | |
| | | | | | | | | | | | |
| 1 | Institutional class inception date was February 1, 2016. |
| 2 | Net of $133,688, $0 and $0 in foreign withholding taxes, respectively. |
| 3 | Reimbursement by Hoisington Investment Management Co., the Sub-Advisor, for proxy statement expenses. |
See Notes to Financial Statements.
100
(This page intentionally left blank.)
101
Statements of Changes in Net Assets
| | | | | | | | | | | | | | | | |
| | |
CORE GROWTH
FUND | | | EMERGING INDIA
FUND | |
| | | Year Ended
September 30, 2016 | | | Year Ended
September 30, 2015 | | | Year Ended
September 30, 20161 | | | Year Ended
September 30, 2015 | |
| | | | | | | | | | | | | | | | |
Operations: | |
Net investment income (loss) | | $ | (7,219,134 | ) | | $ | (3,060,122 | ) | | $ | (780,023 | ) | | $ | (885,207 | ) |
Net realized gain (loss) on investments, foreign
currency translations and foreign capital gains taxes | | | 6,560,806 | | | | 134,651,115 | | | | 75,863 | | | | 1,404,976 | |
Change in unrealized appreciation (depreciation) on
investments, foreign currency translations
and deferred capital gains taxes | | | 127,845,697 | | | | (40,629,610 | ) | | | 9,007,373 | | | | 4,956,291 | |
| | | | | | | | | | | | | | | | |
Net increase (decrease) in net assets resulting from operations | | | 127,187,369 | | | | 90,961,383 | | | | 8,303,213 | | | | 5,476,060 | |
| | | | |
Dividends paid from: | | | | | | | | | | | | | | | | |
Investor Class | | | | | | | | | | | | | | | | |
Net investment income | | | — | | | | — | | | | — | | | | (29,439 | ) |
Net realized gains | | | (119,772,338 | ) | | | (22,822,588 | ) | | | (958,580 | ) | | | — | |
| | | | | | | | | | | | | | | | |
| | | (119,772,338 | ) | | | (22,822,588 | ) | | | (958,580 | ) | | | (29,439 | ) |
Institutional Class | | | | | | | | | | | | | | | | |
Net investment income | | | — | | | | — | | | | — | | | | — | |
Net realized gains | | | (18,740,216 | ) | | | (1,317,073 | ) | | | — | | | | — | |
| | | | | | | | | | | | | | | | |
| | | (18,740,216 | ) | | | (1,317,073 | ) | | | — | | | | — | |
| | | | |
Capital share transactions: | | | | | | | | | | | | | | | | |
Investor Class | | | | | | | | | | | | | | | | |
Shares sold | | | 235,595,333 | | | | 257,284,741 | | | | 29,211,166 | | | | 53,513,984 | |
Shares issued to holders in reinvestment of dividends | | | 117,452,918 | | | | 22,299,104 | | | | 881,647 | | | | 28,983 | |
Shares redeemed | | | (270,607,879 | ) | | | (190,917,065 | ) | | | (27,875,778 | ) | | | (39,349,330 | ) |
Redemption fees | | | 57,589 | | | | 32,774 | | | | 16,274 | | | | 59,862 | |
| | | | | | | | | | | | | | | | |
Net increase (decrease) | | | 82,497,961 | | | | 88,699,554 | | | | 2,233,309 | | | | 14,253,499 | |
| | | | | | | | | | | | | | | | |
Institutional Class | | | | | | | | | | | | | | | | |
Shares sold | | | 102,256,296 | | | | 105,047,781 | | | | 8,344,245 | | | | — | |
Shares issued to holders in reinvestment of dividends | | | 17,489,140 | | | | 1,317,073 | | | | — | | | | — | |
Shares redeemed | | | (22,196,227 | ) | | | (5,212,229 | ) | | | — | | | | — | |
Redemption fees | | | 9,043 | | | | 561 | | | | — | | | | — | |
| | | | | | | | | | | | | | | | |
Net increase (decrease) | | | 97,558,252 | | | | 101,153,186 | | | | 8,344,245 | | | | — | |
| | | | | | | | | | | | | | | | |
Total increase (decrease) in net assets | | | 168,731,028 | | | | 256,674,462 | | | | 17,922,187 | | | | 19,700,120 | |
| | | | |
Net assets: | | | | | | | | | | | | | | | | |
Beginning of period | | | 1,165,129,477 | | | | 908,455,015 | | | | 63,849,889 | | | | 44,149,769 | |
| | | | | | | | | | | | | | | | |
End of period | | $ | 1,333,860,505 | | | $ | 1,165,129,477 | | | $ | 81,772,076 | | | $ | 63,849,889 | |
| | | | | | | | | | | | | | | | |
Undistributed net investment income (loss) included
in net assets at end of period | | $ | (5,575,059 | ) | | $ | (8,200,589 | ) | | $ | (1,649,540 | ) | | $ | (1,394,746 | ) |
| | | | | | | | | | | | | | | | |
| | | | |
Capital share transactions — shares: | | | | | | | | | | | | | | | | |
Investor Class | | | | | | | | | | | | | | | | |
Shares sold | | | 4,389,841 | | | | 4,323,060 | | | | 9,619,706 | | | | 17,696,899 | |
Shares issued to holders in reinvestment of dividends | | | 2,179,898 | | | | 385,598 | | | | 291,936 | | | | 10,029 | |
Shares redeemed | | | (5,086,949 | ) | | | (3,235,178 | ) | | | (9,479,876 | ) | | | (13,093,287 | ) |
| | | | | | | | | | | | | | | | |
Net increase (decrease) in shares outstanding | | | 1,482,790 | | | | 1,473,480 | | | | 431,766 | | | | 4,613,641 | |
| | | | | | | | | | | | | | | | |
Institutional Class | | | | | | | | | | | | | | | | |
Shares sold | | | 1,883,923 | | | | 1,739,883 | | | | 2,879,575 | | | | — | |
Shares issued to holders in reinvestment of dividends | | | 323,513 | | | | 22,720 | | | | — | | | | — | |
Shares redeemed | | | (410,462 | ) | | | (86,771 | ) | | | — | | | | — | |
| | | | | | | | | | | | | | | | |
Net increase (decrease) in shares outstanding | | | 1,796,974 | | | | 1,675,832 | | | | 2,879,575 | | | | — | |
| | | | | | | | | | | | | | | | |
| 1 | Institutional class inception date was February 1, 2016. |
See Notes to Financial Statements.
102
| | | | | | | | | | | | | | | | | | | | | | |
EMERGING MARKETS SELECT
FUND | | | EMERGING MARKETS SMALL CAP
FUND | | | FRONTIER EMERGING SMALL COUNTRIES
FUND | |
Year Ended
September 30, 2016 | | | Year Ended
September 30, 2015 | | | Year Ended
September 30, 20161 | | | Year Ended
September 30, 2015 | | | Year Ended
September 30, 20161 | | | Year Ended
September 30, 2015 | |
| | | | | | | | | | | | | | | | | | | | | | |
| | | | | | | | | | | | | | | | | | | | | | |
| $ | 39,611 | | | $ | (77,515 | ) | | $ | (5,703,812 | ) | | $ | (7,933,740 | ) | | $ | 3,750,574 | | | $ | 4,660,025 | |
| (1,295,442 | ) | | | (4,968,701 | ) | | | (57,152,827 | ) | | | (10,258,156 | ) | | | (122,596,395 | ) | | | (37,208,268 | ) |
| 5,180,985 | | | | (4,625,817 | ) | | | 150,259,510 | | | | (134,735,257 | ) | | | 71,170,573 | | | | (156,479,551 | ) |
| | | | | | | | | | | | | | | | | | | | | | |
| 3,925,154 | | | | (9,672,033 | ) | | | 87,402,871 | | | | (152,927,153 | ) | | | (47,675,248 | ) | | | (189,027,794 | ) |
| | | | | |
| | | | | | | | | | | | | | | | | | | | | | |
| | | | | | | | | | | | | | | | | | | | | | |
| | — | | | | (85,929 | ) | | | (132,483 | ) | | | (1,814,628 | ) | | | (1,618,755 | ) | | | (6,526,410 | ) |
| | — | | | | — | | | | — | | | | — | | | | — | | | | (19,311,554 | ) |
| | | | | | | | | | | | | | | | | | | | | | |
| | — | | | | (85,929 | ) | | | (132,483 | ) | | | (1,814,628 | ) | | | (1,618,755 | ) | | | (25,837,964 | ) |
| | | | | | | | | | | | | | | | | | | | | | |
| | — | | | | (151,968 | ) | | | — | | | | — | | | | — | | | | — | |
| | — | | | | — | | | | — | | | | — | | | | — | | | | — | |
| | | | | | | | | | | | | | | | | | | | | | |
| | — | | | | (151,968 | ) | | | — | | | | — | | | | — | | | | — | |
| | | | | |
| | | | | | | | | | | | | | | | | | | | | | |
| | | | | | | | | | | | | | | | | | | | | | |
| | 5,021,512 | | | | 7,293,767 | | | | 135,426,837 | | | | 180,971,456 | | | | 256,042,228 | | | | 490,118,465 | |
| | — | | | | 85,177 | | | | 117,400 | | | | 1,494,676 | | | | 1,545,813 | | | | 24,103,894 | |
| | (13,057,233 | ) | | | (10,592,721 | ) | | | (508,099,796 | ) | | | (504,253,544 | ) | | | (796,859,735 | ) | | | (596,403,419 | ) |
| | 1,244 | | | | 596 | | | | 6,249 | | | | 14,069 | | | | 47,252 | | | | 25,583 | |
| | | | | | | | | | | | | | | | | | | | | | |
| | (8,034,477 | ) | | | (3,213,181 | ) | | | (372,549,310 | ) | | | (321,773,343 | ) | | | (539,224,442 | ) | | | (82,155,477 | ) |
| | | | | | | | | | | | | | | | | | | | | | |
| | | | | | | | | | | | | | | | | | | | | | |
| | 6,298,780 | | | | 3,739,143 | | | | 163,579,317 | | | | — | | | | 156,914,661 | | | | — | |
| | — | | | | 151,968 | | | | — | | | | — | | | | — | | | | — | |
| | (1,330,793 | ) | | | (11,784,081 | ) | | | (24,306,522 | ) | | | — | | | | (18,521,165 | ) | | | — | |
| | — | | | | 4,245 | | | | 242 | | | | — | | | | 839 | | | | — | |
| | | | | | | | | | | | | | | | | | | | | | |
| | 4,967,987 | | | | (7,888,725 | ) | | | 139,273,037 | | | | — | | | | 138,394,335 | | | | — | |
| | | | | | | | | | | | | | | | | | | | | | |
| | 858,664 | | | | (21,011,836 | ) | | | (146,005,885 | ) | | | (476,515,124 | ) | | | (450,124,110 | ) | | | (297,021,235 | ) |
| | | | | |
| | | | | | | | | | | | | | | | | | | | | | |
| | 37,796,120 | | | | 58,807,956 | | | | 981,366,727 | | | | 1,457,881,851 | | | | 1,027,673,060 | | | | 1,324,694,295 | |
| | | | | | | | | | | | | | | | | | | | | | |
| $ | 38,654,784 | | | $ | 37,796,120 | | | $ | 835,360,842 | | | $ | 981,366,727 | | | $ | 577,548,950 | | | $ | 1,027,673,060 | |
| | | | | | | | | | | | | | | | | | | | | | |
$ | (157,877 | ) | | $ | (277,867 | ) | | $ | (7,177,380 | ) | | $ | (13,624,992 | ) | | $ | (5,926,809 | ) | | $ | 1,547,031 | |
| | | | | | | | | | | | | | | | | | | | | | |
| | | | | |
| | | | | | | | | | | | | | | | | | | | | | |
| | | | | | | | | | | | | | | | | | | | | | |
| | 607,896 | | | | 723,608 | | | | 55,771,862 | | | | 67,698,717 | | | | 96,401,830 | | | | 162,889,608 | |
| | — | | | | 8,392 | | | | 48,512 | | | | 561,908 | | | | 574,652 | | | | 7,800,613 | |
| | (1,537,017 | ) | | | (1,085,598 | ) | | | (213,187,447 | ) | | | (190,175,016 | ) | | | (300,906,259 | ) | | | (198,903,713 | ) |
| | | | | | | | | | | | | | | | | | | | | | |
| | (929,121 | ) | | | (353,598 | ) | | | (157,367,073 | ) | | | (121,914,391 | ) | | | (203,929,777 | ) | | | (28,213,492 | ) |
| | | | | | | | | | | | | | | | | | | | | | |
| | | | | | | | | | | | | | | | | | | | | | |
| | 735,711 | | | | 363,354 | | | | 69,868,540 | | | | — | | | | 60,003,922 | | | | — | |
| | — | | | | 14,899 | | | | — | | | | — | | | | — | | | | — | |
| | (154,025 | ) | | | (1,202,260 | ) | | | (9,644,798 | ) | | | — | | | | (7,015,724 | ) | | | — | |
| | | | | | | | | | | | | | | | | | | | | | |
| | 581,686 | | | | (824,007 | ) | | | 60,223,742 | | | | — | | | | 52,988,198 | | | | — | |
| | | | | | | | | | | | | | | | | | | | | | |
103
Statements of Changes in Net Assets (continued)
| | | | | | | | | | | | | | | | |
| | | GLOBAL OPPORTUNITIES
FUND | | | INTERNATIONAL GROWTH
FUND | |
| | | Year Ended
September 30, 20161 | | | Year Ended
September 30, 2015 | | | Year Ended
September 30, 20161 | | | Year Ended
September 30, 2015 | |
| | | | | | | | | | | | | | | | |
Operations: | | | | | | | | | | | | | | | | |
Net investment income (loss) | | $ | (1,517,910 | ) | | $ | (1,988,404 | ) | | $ | (4,748,463 | ) | | $ | (4,282,733 | ) |
Net realized gain (loss) on investments, foreign currency translations and foreign capital gains taxes | | | 8,430,816 | | | | 21,190,451 | | | | 55,136,808 | | | | (15,787,782 | ) |
Net realized gain (loss) on options written | | | — | | | | — | | | | — | | | | — | |
Net realized loss on short positions | | | — | | | | — | | | | — | | | | — | |
Change in unrealized appreciation (depreciation) on investments, foreign currency translations and deferred capital gains taxes | | | 14,070,421 | | | | (24,943,634 | ) | | | 116,091,330 | | | | 77,362,244 | |
| | | | | | | | | | | | | | | | |
Net increase (decrease) in net assets resulting from operations | | | 20,983,327 | | | | (5,741,587 | ) | | | 166,479,675 | | | | 57,291,729 | |
| | | | |
Dividends paid from: | | | | | | | | | | | | | | | | |
Investor Class | | | | | | | | | | | | | | | | |
Net investment income | | | (427,375 | ) | | | (470,408 | ) | | | — | | | | (284,964 | ) |
Net realized gains | | | (19,259,921 | ) | | | (26,548,276 | ) | | | — | | | | (8,896,949 | ) |
| | | | | | | | | | | | | | | | |
| | | (19,687,296 | ) | | | (27,018,684 | ) | | | — | | | | (9,181,913 | ) |
Institutional Class | | | | | | | | | | | | | | | | |
Net investment income | | | — | | | | — | | | | — | | | | — | |
Net realized gains | | | — | | | | — | | | | — | | | | — | |
| | | | | | | | | | | | | | | | |
| | | — | | | | — | | | | — | | | | — | |
| | | | |
Capital share transactions: | | | | | | | | | | | | | | | | |
Investor Class | | | | | | | | | | | | | | | | |
Shares sold | | | 21,166,046 | | | | 24,113,199 | | | | 222,578,093 | | | | 304,243,470 | |
Shares issued to holders in reinvestment of dividends | | | 19,452,688 | | | | 26,821,337 | | | | — | | | | 8,765,593 | |
Shares redeemed | | | (46,667,870 | ) | | | (54,874,473 | ) | | | (726,095,437 | ) | | | (466,136,694 | ) |
Redemption fees | | | 12,452 | | | | 3,950 | | | | 11,556 | | | | 26,761 | |
| | | | | | | | | | | | | | | | |
Net increase (decrease) | | | (6,036,684 | ) | | | (3,935,987 | ) | | | (503,505,788 | ) | | | (153,100,870 | ) |
| | | | | | | | | | | | | | | | |
Institutional Class | | | | | | | | | | | | | | | | |
Shares sold | | | 5,065,715 | | | | — | | | | 483,795,090 | | | | — | |
Shares issued to holders in reinvestment of dividends | | | — | | | | — | | | | — | | | | — | |
Shares redeemed | | | — | | | | — | | | | (8,682,445 | ) | | | — | |
Redemption fees | | | — | | | | — | | | | 2,492 | | | | — | |
| | | | | | | | | | | | | | | | |
Net increase (decrease) | | | 5,065,715 | | | | — | | | | 475,115,137 | | | | — | |
| | | | | | | | | | | | | | | | |
Total increase (decrease) in net assets | | | 325,062 | | | | (36,696,258 | ) | | | 138,089,024 | | | | (104,991,054 | ) |
| | | | |
Net assets: | | | | | | | | | | | | | | | | |
Beginning of period | | | 155,967,892 | | | | 192,664,150 | | | | 1,316,095,088 | | | | 1,421,086,142 | |
| | | | | | | | | | | | | | | | |
End of period | | $ | 156,292,954 | | | $ | 155,967,892 | | | $ | 1,454,184,112 | | | $ | 1,316,095,088 | |
| | | | | | | | | | | | | | | | |
Undistributed net investment income (loss) included in net assets at end of period | | $ | (1,429,652 | ) | | $ | (2,258,540 | ) | | $ | (1,771,842 | ) | | $ | (4,649,406 | ) |
| | | | | | | | | | | | | | | | |
| | | | |
Capital share transactions — shares: | | | | | | | | | | | | | | | | |
Investor Class | | | | | | | | | | | | | | | | |
Shares sold | | | 6,694,423 | | | | 6,305,552 | | | | 7,681,730 | | | | 10,961,555 | |
Shares issued to holders in reinvestment of dividends | | | 5,704,601 | | | | 7,229,471 | | | | — | | | | 333,419 | |
Shares redeemed | | | (13,949,592 | ) | | | (14,099,286 | ) | | | (24,818,248 | ) | | | (17,143,695 | ) |
| | | | | | | | | | | | | | | | |
Net increase (decrease) in shares outstanding | | | (1,550,568 | ) | | | (564,263 | ) | | | (17,136,518 | ) | | | (5,848,721 | ) |
| | | | | | | | | | | | | | | | |
Institutional Class | | | | | | | | | | | | | | | | |
Shares sold | | | 1,518,647 | | | | — | | | | 16,466,250 | | | | — | |
Shares issued to holders in reinvestment of dividends | | | — | | | | — | | | | — | | | | — | |
Shares redeemed | | | — | | | | — | | | | (285,393 | ) | | | — | |
| | | | | | | | | | | | | | | | |
Net increase (decrease) in shares outstanding | | | 1,518,647 | | | | — | | | | 16,180,857 | | | | — | |
| | | | | | | | | | | | | | | | |
| 1 | Institutional class inception date was February 1, 2016. |
See Notes to Financial Statements.
104
| | | | | | | | | | | | | | | | | | | | | | |
INTERNATIONAL OPPORTUNITIES
FUND | | | LARGE CAP VALUE
FUND | | | LONG/SHORT
FUND | |
Year Ended
September 30, 20161 | | | Year Ended
September 30, 2015 | | | Year Ended
September 30, 2016 | | | Year Ended
September 30, 2015 | | | Year Ended
September 30, 2016 | | | Year Ended
September 30, 2015 | |
| | | | | | | | | | | | | | | | | | | | | | |
| | | | | | | | | | | | | | | | | | | | | | |
| $ | (1,149,686 | ) | | $ | (1,455,524 | ) | | $ | 3,669,068 | | | $ | 4,417,033 | | | $ | 45,073 | | | $ | 3,700,470 | |
| (6,218,080 | ) | | | 22,684,497 | | | | 5,613,690 | | | | 23,888,706 | | | | (125,012,468 | ) | | | 113,223,926 | |
| | — | | | | — | | | | 132,873 | | | | — | | | | — | | | | (1,377,491 | ) |
| | — | | | | — | | | | — | | | | — | | | | (24,738,165 | ) | | | (2,298,097 | ) |
|
123,227,456 |
| | | (30,215,034 | ) | | | 19,112,212 | | | | (44,068,657 | ) | | | 196,133,025 | | | | (484,033,257 | ) |
| | | | | | | | | | | | | | | | | | | | | | |
|
115,859,690 |
| | | (8,986,061 | ) | | | 28,527,843 | | | | (15,762,918 | ) | | | 46,427,465 | | | | (370,784,449 | ) |
| | | | | |
| | | | | | | | | | | | | | | | | | | | | | |
| | | | | | | | | | | | | | | | | | | | | | |
| | — | | | | — | | | | (3,733,214 | ) | | | (4,717,198 | ) | | | (364,125 | ) | | | (13,117,322 | ) |
| | (22,512,072 | ) | | | (32,985,697 | ) | | | (20,730,247 | ) | | | (90,487,206 | ) | | | (49,332,592 | ) | | | (75,718,399 | ) |
| | | | | | | | | | | | | | | | | | | | | | |
| | (22,512,072 | ) | | | (32,985,697 | ) | | | (24,463,461 | ) | | | (95,204,404 | ) | | | (49,696,717 | ) | | | (88,835,721 | ) |
| | | | | | | | | | | | | | | | | | | | | | |
| | — | | | | — | | | | (60,085 | ) | | | (58,397 | ) | | | (479,596 | ) | | | (10,613,371 | ) |
| | — | | | | — | | | | (252,053 | ) | | | (1,885,955 | ) | | | (22,243,655 | ) | | | (50,288,258 | ) |
| | | | | | | | | | | | | | | | | | | | | | |
| | — | | | | — | | | | (312,138 | ) | | | (1,944,352 | ) | | | (22,723,251 | ) | | | (60,901,629 | ) |
| | | | | |
| | | | | | | | | | | | | | | | | | | | | | |
| | | | | | | | | | | | | | | | | | | | | | |
| | 151,939,973 | | | | 185,060,513 | | | | 9,656,161 | | | | 12,556,127 | | | | 64,920,986 | | | | 230,166,705 | |
| | 22,015,075 | | | | 32,189,321 | | | | 24,129,587 | | | | 94,061,044 | | | | 49,262,675 | | | | 86,127,189 | |
| | (184,742,350 | ) | | | (61,450,925 | ) | | | (91,876,593 | ) | | | (160,845,016 | ) | | | (527,803,631 | ) | | | (1,090,754,118 | ) |
| | 18,842 | | | | 8,758 | | | | 1,216 | | | | 3,511 | | | | 15,132 | | | | 43,449 | |
| | | | | | | | | | | | | | | | | | | | | | |
| | (10,768,460 | ) | | | 155,807,667 | | | | (58,089,629 | ) | | | (54,224,334 | ) | | | (413,604,838 | ) | | | (774,416,775 | ) |
| | | | | | | | | | | | | | | | | | | | | | |
| | | | | | | | | | | | | | | | | | | | | | |
| | 153,515,811 | | | | — | | | | 3,327,996 | | | | 213,244 | | | | 41,876,317 | | | | 168,746,062 | |
| | — | | | | — | | | | 309,072 | | | | 1,934,190 | | | | 22,325,848 | | | | 58,822,477 | |
| | (9,205,095 | ) | | | — | | | | (1,601,692 | ) | | | (6,667,455 | ) | | | (401,523,032 | ) | | | (626,995,982 | ) |
| | 2,811 | | | | — | | | | 1,120 | | | | — | | | | 101,712 | | | | 74,853 | |
| | | | | | | | | | | | | | | | | | | | | | |
| | 144,313,527 | | | | — | | | | 2,036,496 | | | | (4,520,021 | ) | | | (337,219,155 | ) | | | (399,352,590 | ) |
| | | | | | | | | | | | | | | | | | | | | | |
| | 226,892,685 | | | | 113,835,909 | | | | (52,300,889 | ) | | | (171,656,029 | ) | | | (776,816,496 | ) | | | (1,694,291,164 | ) |
| | | | | |
| | | | | | | | | | | | | | | | | | | | | | |
| | 453,495,126 | | | | 339,659,217 | | | | 245,580,983 | | | | 417,237,012 | | | | 1,024,983,888 | | | | 2,719,275,052 | |
| | | | | | | | | | | | | | | | | | | | | | |
| $ | 680,387,811 | | | $ | 453,495,126 | | | $ | 193,280,094 | | | $ | 245,580,983 | | | $ | 248,167,392 | | | $ | 1,024,983,888 | |
| | | | | | | | | | | | | | | | | | | | | | |
$ |
(237,268 |
) | | $ | (710,582 | ) | | $ | (3,731 | ) | | $ | (17,753 | ) | | $ | (145,368 | ) | | $ | 330,202 | |
| | | | | | | | | | | | | | | | | | | | | | |
| | | | | |
| | | | | | | | | | | | | | | | | | | | | | |
| | | | | | | | | | | | | | | | | | | | | | |
| | 52,855,854 | | | | 65,274,231 | | | | 1,120,728 | | | | 1,202,742 | | | | 5,339,083 | | | | 15,339,817 | |
| | 7,862,527 | | | | 12,055,926 | | | | 2,807,480 | | | | 9,575,413 | | | | 4,332,689 | | | | 5,703,787 | |
| | (66,779,782 | ) | | | (21,478,869 | ) | | | (10,503,774 | ) | | | (15,418,721 | ) | | | (44,954,538 | ) | | | (75,345,316 | ) |
| | | | | | | | | | | | | | | | | | | | | | |
| | (6,061,401 | ) | | | 55,851,288 | | | | (6,575,566 | ) | | | (4,640,566 | ) | | | (35,282,766 | ) | | | (54,301,712 | ) |
| | | | | | | | | | | | | | | | | | | | | | |
| | | | | | | | | | | | | | | | | | | | | | |
| | 55,197,121 | | | | — | | | | 365,881 | | | | 21,708 | | | | 3,395,227 | | | | 11,145,839 | |
| | — | | | | — | | | | 35,987 | | | | 196,684 | | | | 1,961,850 | | | | 3,892,950 | |
| | (3,093,786 | ) | | | — | | | | (176,253 | ) | | | (681,797 | ) | | | (33,338,059 | ) | | | (44,674,081 | ) |
| | | | | | | | | | | | | | | | | | | | | | |
| | 52,103,335 | | | | — | | | | 225,615 | | | | (463,405 | ) | | | (27,980,982 | ) | | | (29,635,292 | ) |
| | | | | | | | | | | | | | | | | | | | | | |
105
Statements of Changes in Net Assets (continued)
| | | | | | | | | | | | | | | | |
| | | MICRO CAP FUND | | | MICRO CAP VALUE FUND | |
| | | Year Ended
September 30, 2016 | | | Year Ended
September 30, 2015 | | | Year Ended
September 30, 2016 | | | Year Ended
September 30, 2015 | |
| | | | | | | | | | | | | | | | |
Operations: | | | | | | | | | | | | | | | | |
Net investment income (loss) | | $ | (3,020,820 | ) | | $ | (2,613,931 | ) | | $ | (987,743 | ) | | $ | (879,035 | ) |
Net realized gain (loss) on investments, foreign currency translations and foreign capital gains taxes | | | 17,504,026 | | | | 42,447,306 | | | | 2,306,799 | | | | 18,597,991 | |
Net realized gain on options written | | | — | | | | — | | | | — | | | | 272,422 | |
Change in unrealized appreciation (depreciation) on investments, foreign currency translations
and deferred capital gains taxes | | | 25,086,105 | | | | (30,582,373 | ) | | | 18,406,751 | | | | (2,960,212 | ) |
| | | | | | | | | | | | | | | | |
Net increase (decrease) in net assets resulting from operations | | | 39,569,311 | | | | 9,251,002 | | | | 19,725,807 | | | | 15,031,166 | |
| | | | |
Dividends paid from: | | | | | | | | | | | | | | | | |
Investor Class | | | | | | | | | | | | | | | | |
Net investment income | | | — | | | | (57,541 | ) | | | — | | | | — | |
Net realized gains | | | (40,544,074 | ) | | | (13,743,034 | ) | | | (17,904,955 | ) | | | (21,640,698 | ) |
Return of capital | | | — | | | | — | | | | — | | | | — | |
| | | | | | | | | | | | | | | | |
| | | (40,544,074 | ) | | | (13,800,575 | ) | | | (17,904,955 | ) | | | (21,640,698 | ) |
Institutional Class | | | | | | | | | | | | | | | | |
Net investment income | | | — | | | | — | | | | — | | | | — | |
Net realized gains | | | — | | | | — | | | | — | | | | — | |
| | | | | | | | | | | | | | | | |
| | | — | | | | — | | | | — | | | | — | |
| | | | |
Capital share transactions: | | | | | | | | | | | | | | | | |
Investor Class | | | | | | | | | | | | | | | | |
Shares sold | | | 6,546,097 | | | | 8,870,349 | | | | 36,255,073 | | | | 18,213,412 | |
Shares issued to holders in reinvestment of dividends | | | 38,421,674 | | | | 13,148,507 | | | | 17,528,757 | | | | 21,205,896 | |
Shares redeemed | | | (39,615,512 | ) | | | (37,976,905 | ) | | | (30,678,179 | ) | | | (37,443,746 | ) |
Redemption fees | | | 2,584 | | | | 3,154 | | | | 21,005 | | | | 2,428 | |
| | | | | | | | | | | | | | | | |
Net increase (decrease) | | | 5,354,843 | | | | (15,954,895 | ) | | | 23,126,656 | | | | 1,977,990 | |
| | | | | | | | | | | | | | | | |
Institutional Class | | | | | | | | | | | | | | | | |
Shares sold | | | — | | | | — | | | | — | | | | — | |
Shares issued to holders in reinvestment of dividends | | | — | | | | — | | | | — | | | | — | |
Shares redeemed | | | — | | | | — | | | | — | | | | — | |
Redemption fees | | | — | | | | — | | | | — | | | | — | |
| | | | | | | | | | | | | | | | |
Net increase | | | — | | | | — | | | | — | | | | — | |
| | | | | | | | | | | | | | | | |
Total increase (decrease) in net assets | | | 4,380,080 | | | | (20,504,468 | ) | | | 24,947,508 | | | | (4,631,542 | ) |
| | | | |
Net assets: | | | | | | | | | | | | | | | | |
Beginning of period | | | 273,310,843 | | | | 293,815,311 | | | | 154,168,864 | | | | 158,800,406 | |
| | | | | | | | | | | | | | | | |
End of period | | $ | 277,690,923 | | | $ | 273,310,843 | | | $ | 179,116,372 | | | $ | 154,168,864 | |
| | | | | | | | | | | | | | | | |
Undistributed net investment income (loss) included
in net assets at end of period | | $ | (1,971,779 | ) | | $ | (764,789 | ) | | $ | (689,111 | ) | | $ | 22,777 | |
| | | | | | | | | | | | | | | | |
| | | | |
Capital share transactions — shares: | | | | | | | | | | | | | | | | |
Investor Class | | | | | | | | | | | | | | | | |
Shares sold | | | 973,225 | | | | 1,119,278 | | | | 13,603,287 | | | | 6,134,016 | |
Shares issued to holders in reinvestment of dividends | | | 5,777,695 | | | | 1,700,971 | | | | 6,565,078 | | | | 7,655,558 | |
Shares redeemed | | | (6,040,054 | ) | | | (4,853,557 | ) | | | (11,446,018 | ) | | | (12,687,971 | ) |
| | | | | | | | | | | | | | | | |
Net increase (decrease) in shares outstanding | | | 710,866 | | | | (2,033,308 | ) | | | 8,722,347 | | | | 1,101,603 | |
| | | | | | | | | | | | | | | | |
Institutional Class | | | | | | | | | | | | | | | | |
Shares sold | | | — | | | | — | | | | — | | | | — | |
Shares issued to holders in reinvestment of dividends | | | — | | | | — | | | | — | | | | — | |
Shares redeemed | | | — | | | | — | | | | — | | | | — | |
| | | | | | | | | | | | | | | | |
Net increase in shares outstanding | | | — | | | | — | | | | — | | | | — | |
| | | | | | | | | | | | | | | | |
| 1 | Institutional class inception date was February 1, 2016. |
See Notes to Financial Statements.
106
| | | | | | | | | | | | | | | | | | | | | | |
SMALL CAP GROWTH FUND | | | SMALL CAP VALUE FUND | | | STRATEGIC INCOME FUND | |
Year Ended
September 30, 20161 | | | Year Ended
September 30, 2015 | | | Year Ended
September 30, 2016 | | | Year Ended
September 30, 2015 | | | Year Ended
September 30, 2016 | | | Year Ended
September 30, 2015 | |
| | | | | | | | | | | | | | | | | | | | | | |
| | | | | | | | | | | | | | | | | | | | | | |
| $ | (14,924,154 | ) | | $ | (17,146,891 | ) | | $ | 682,252 | | | $ | 2,406,464 | | | $ | 1,690,915 | | | $ | 2,881,370 | |
| 162,637,861 | | | | 339,817,590 | | | | 16,775,143 | | | | 10,252,311 | | | | (7,539,689 | ) | | | 3,027,134 | |
| | — | | | | — | | | | — | | | | — | | | | — | | | | — | |
| 67,189,440 | | | | (290,530,333 | ) | | | 18,262,012 | | | | (5,669,868 | ) | | | 9,420,214 | | | | (15,972,843 | ) |
| | | | | | | | | | | | | | | | | | | | | | |
| 214,903,147 | | | | 32,140,366 | | | | 35,719,407 | | | | 6,988,907 | | | | 3,571,440 | | | | (10,064,339 | ) |
| | | | | |
| | | | | | | | | | | | | | | | | | | | | | |
| | | | | | | | | | | | | | | | | | | | | | |
| | — | | | | — | | | | (1,366,134 | ) | | | — | | | | (1,501,048 | ) | | | (4,052,160 | ) |
| | (322,361,340 | ) | | | (210,961,388 | ) | | | — | | | | — | | | | (2,658,712 | ) | | | (5,830,282 | ) |
| | — | | | | — | | | | — | | | | — | | | | (287,336 | ) | | | — | |
| | | | | | | | | | | | | | | | | | | | | | |
| | (322,361,340 | ) | | | (210,961,388 | ) | | | (1,366,134 | ) | | | — | | | | (4,447,096 | ) | | | (9,882,442 | ) |
| | | | | | | | | | | | | | | | | | | | | | |
| | — | | | | — | | | | (98,715 | ) | | | — | | | | — | | | | — | |
| | — | | | | — | | | | — | | | | — | | | | — | | | | — | |
| | | | | | | | | | | | | | | | | | | | | | |
| | — | | | | — | | | | (98,715 | ) | | | — | | | | — | | | | — | |
| | | | | |
| | | | | | | | | | | | | | | | | | | | | | |
| | | | | | | | | | | | | | | | | | | | | | |
| | 209,117,699 | | | | 306,525,902 | | | | 35,656,524 | | | | 42,777,490 | | | | 5,689,341 | | | | 67,443,100 | |
| | 309,835,993 | | | | 202,491,582 | | | | 1,301,422 | | | | — | | | | 4,380,286 | | | | 9,799,845 | |
| | (844,914,263 | ) | | | (549,309,702 | ) | | | (56,085,285 | ) | | | (57,465,289 | ) | | | (42,746,118 | ) | | | (63,607,687 | ) |
| | 67,941 | | | | 63,180 | | | | 1,743 | | | | 12,491 | | | | 3,056 | | | | 14,686 | |
| | | | | | | | | | | | | | | | | | | | | | |
| | (325,892,630 | ) | | | (40,229,038 | ) | | | (19,125,596 | ) | | | (14,675,308 | ) | | | (32,673,435 | ) | | | 13,649,944 | |
| | | | | | | | | | | | | | | | | | | | | | |
| | | | | | | | | | | | | | | | | | | | | | |
| | 334,206,662 | | | | — | | | | 5,124,166 | | | | 11,214,884 | | | | — | | | | — | |
| | — | | | | — | | | | 98,258 | | | | — | | | | — | | | | — | |
| | (19,042,923 | ) | | | — | | | | (3,397,604 | ) | | | (2,892,431 | ) | | | — | | | | — | |
| | 369 | | | | — | | | | 79 | | | | 2,995 | | | | — | | | | — | |
| | | | | | | | | | | | | | | | | | | | | | |
| | 315,164,108 | | | | — | | | | 1,824,899 | | | | 8,325,448 | | | | — | | | | — | |
| | | | | | | | | | | | | | | | | | | | | | |
| | (118,186,715 | ) | | | (219,050,060 | ) | | | 16,953,861 | | | | 639,047 | | | | (33,549,091 | ) | | | (6,296,837 | ) |
| | | | | |
| | | | | | | | | | | | | | | | | | | | | | |
| | 2,000,587,633 | | | | 2,219,637,693 | | | | 276,595,262 | | | | 275,956,215 | | | | 88,660,923 | | | | 94,957,760 | |
| | | | | | | | | | | | | | | | | | | | | | |
| $ | 1,882,400,918 | | | $ | 2,000,587,633 | | | $ | 293,549,123 | | | $ | 276,595,262 | | | $ | 55,111,832 | | | $ | 88,660,923 | |
| | | | | | | | | | | | | | | | | | | | | | |
$ | (10,697,296 | ) | | $ | (12,167,564 | ) | | $ | 223,317 | | | $ | 1,323,863 | | | $ | (159,843 | ) | | $ | 98,362 | |
| | | | | | | | | | | | | | | | | | | | | | |
| | | | | |
| | | | | | | | | | | | | | | | | | | | | | |
| | | | | | | | | | | | | | | | | | | | | | |
| | 5,131,888 | | | | 5,977,502 | | | | 6,099,737 | | | | 6,914,700 | | | | 548,323 | | | | 5,399,978 | |
| | 7,380,562 | | | | 4,103,173 | | | | 216,904 | | | | — | | | | 425,080 | | | | 806,797 | |
| | (20,536,916 | ) | | | (10,734,199 | ) | | | (9,526,792 | ) | | | (9,548,655 | ) | | | (4,239,042 | ) | | | (5,270,070 | ) |
| | | | | | | | | | | | | | | | | | | | | | |
| | (8,024,466 | ) | | | (653,524 | ) | | | (3,210,151 | ) | | | (2,633,955 | ) | | | (3,265,639 | ) | | | 936,705 | |
| | | | | | | | | | | | | | | | | | | | | | |
| | | | | | | | | | | | | | | | | | | | | | |
| | 8,204,969 | | | | — | | | | 902,562 | | | | 1,844,006 | | | | — | | | | — | |
| | — | | | | — | | | | 16,322 | | | | — | | | | — | | | | — | |
| | (457,924 | ) | | | — | | | | (553,403 | ) | | | (450,381 | ) | | | — | | | | — | |
| | | | | | | | | | | | | | | | | | | | | | |
| | 7,747,045 | | | | — | | | | 365,481 | | | | 1,393,625 | | | | — | | | | — | |
| | | | | | | | | | | | | | | | | | | | | | |
107
Statements of Changes in Net Assets (continued)
| | | | | | | | | | | | | | | | |
| | |
ULTRA GROWTH FUND | | | WORLD INNOVATORS FUND | |
| | | Year Ended September 30, 2016 | | | Year Ended September 30, 2015 | | | Year Ended September 30, 20161 | | | Year Ended September 30, 2015 | |
| | | | | | | | | | | | | | | | |
Operations: | | | | | | | | | | | | | | | | |
Net investment income (loss) | | $ | (982,316 | ) | | $ | (1,149,038 | ) | | $ | (1,240,640 | ) | | $ | (1,611,952 | ) |
Net realized gain on investments, foreign
currency translations and foreign capital gains taxes | | | 7,330,801 | | | | 9,017,957 | | | | 11,692,010 | | | | 20,035,191 | |
Change in unrealized appreciation (depreciation) on investments, foreign currency translations and deferred capital gains taxes | | | 11,054,954 | | | | (3,043,910 | ) | | | 6,110,487 | | | | (17,578,392 | ) |
| | | | | | | | | | | | | | | | |
Net increase in net assets resulting from operations | | | 17,403,439 | | | | 4,825,009 | | | | 16,561,857 | | | | 844,847 | |
| | | | |
Dividends paid from: | | | | | | | | | | | | | | | | |
Investor Class | | | | | | | | | | | | | | | | |
Net investment income | | | — | | | | (50,881 | ) | | | — | | | | — | |
Net realized gains | | | (8,679,065 | ) | | | (29,102,465 | ) | | | (24,130,023 | ) | | | (25,428,998 | ) |
| | | | | | | | | | | | | | | | |
| | | (8,679,065 | ) | | | (29,153,346 | ) | | | (24,130,023 | ) | | | (25,428,998 | ) |
Institutional Class | | | | | | | | | | | | | | | | |
Net investment income | | | — | | | | — | | | | — | | | | — | |
Net realized gains | | | — | | | | — | | | | — | | | | — | |
| | | | | | | | | | | | | | | | |
| | | — | | | | — | | | | — | | | | — | |
| | | | |
Capital share transactions: | | | | | | | | | | | | | | | | |
Investor Class | | | | | | | | | | | | | | | | |
Shares sold | | | 4,877,275 | | | | 4,721,549 | | | | 59,829,188 | | | | 23,707,197 | |
Shares issued to holders in reinvestment of dividends | | | 8,403,349 | | | | 28,117,008 | | | | 22,861,112 | | | | 23,823,818 | |
Shares redeemed | | | (16,619,659 | ) | | | (15,331,162 | ) | | | (67,566,485 | ) | | | (89,996,316 | ) |
Redemption fees | | | 1,273 | | | | 2,527 | | | | 1,953 | | | | 10,860 | |
| | | | | | | | | | | | | | | | |
Net increase (decrease) | | | (3,337,762 | ) | | | 17,509,922 | | | | 15,125,768 | | | | (42,454,441 | ) |
| | | | | | | | | | | | | | | | |
Institutional Class | | | | | | | | | | | | | | | | |
Shares sold | | | — | | | | — | | | | 5,998,939 | | | | — | |
Shares redeemed | | | — | | | | — | | | | (25,551 | ) | | | — | |
| | | | | | | | | | | | | | | | |
Net increase | | | — | | | | — | | | | 5,973,388 | | | | — | |
| | | | | | | | | | | | | | | | |
Total increase (decrease) in net assets | | | 5,386,612 | | | | (6,818,415 | ) | | | 13,530,990 | | | | (67,038,592 | ) |
| | | | |
Net assets: | | | | | | | | | | | | | | | | |
Beginning of period | | | 96,015,292 | | | | 102,833,707 | | | | 186,272,023 | | | | 253,310,615 | |
| | | | | | | | | | | | | | | | |
End of period | | $ | 101,401,904 | | | $ | 96,015,292 | | | $ | 199,803,013 | | | $ | 186,272,023 | |
| | | | | | | | | | | | | | | | |
Undistributed net investment income (loss) included
in net assets at end of period | | $ | (1,199,720 | ) | | $ | 1,796,075 | | | $ | (456,077 | ) | | $ | (854,667 | ) |
| | | | | | | | | | | | | | | | |
| | | | |
Capital share transactions — shares: | | | | | | | | | | | | | | | | |
Investor Class | | | | | | | | | | | | | | | | |
Shares sold | | | 273,554 | | | | 228,979 | | | | 3,189,238 | | | | 1,119,343 | |
Shares issued to holders in reinvestment of dividends | | | 459,702 | | | | 1,481,402 | | | | 1,198,171 | | | | 1,171,279 | |
Shares redeemed | | | (952,369 | ) | | | (738,870 | ) | | | (3,591,062 | ) | | | (4,257,523 | ) |
| | | | | | | | | | | | | | | | |
Net increase (decrease) in shares outstanding | | | (219,113 | ) | | | 971,511 | | | | 796,347 | | | | (1,966,901 | ) |
| | | | | | | | | | | | | | | | |
Institutional Class | | | | | | | | | | | | | | | | |
Shares sold | | | — | | | | — | | | | 309,990 | | | | — | |
Shares redeemed | | | — | | | | — | | | | (1,313 | ) | | | — | |
| | | | | | | | | | | | | | | | |
Net increase in shares outstanding | | | — | | | | — | | | | 308,677 | | | | — | |
| | | | | | | | | | | | | | | | |
| 1 | Institutional class inception date was February 1, 2016. |
See Notes to Financial Statements.
108
| | | | | | | | | | | | | | |
INCOME FUND | | | U.S. TREASURY FUND | |
Year Ended September 30, 2016 | | | Year Ended September 30, 2015 | | | Year Ended September 30, 2016 | | | Year Ended September 30, 2015 | |
| | | | | | | | | | | | | | |
| | | | | | | | | | | | | | |
| $ | 1,951,379 | | | $ | 1,719,040 | | | $ | 7,963,623 | | | $ | 6,605,799 | |
| 125,294 | | | | 407,021 | | | | 23,928,544 | | | | 40,074,870 | |
| 544,033 | | | | (23,148 | ) | | | 24,193,265 | | | | (26,646,790 | ) |
| | | | | | | | | | | | | | |
| | 2,620,706 | | | | 2,102,913 | | | | 56,085,432 | | | | 20,033,879 | |
| | | |
| | | | | | | | | | | | | | |
| | | | | | | | | | | | | | |
| | (1,963,364 | ) | | | (1,693,986 | ) | | | (7,944,602 | ) | | | (6,608,427 | ) |
| | — | | | | — | | | | (15,905,989 | ) | | | — | |
| | | | | | | | | | | | | | |
| | (1,963,364 | ) | | | (1,693,986 | ) | | | (23,850,591 | ) | | | (6,608,427 | ) |
| | | | | | | | | | | | | | |
| | — | | | | — | | | | — | | | | — | |
| | — | | | | — | | | | — | | | | — | |
| | | | | | | | | | | | | | |
| | — | | | | — | | | | — | | | | — | |
| | | |
| | | | | | | | | | | | | | |
| | | | | | | | | | | | | | |
| | 27,381,821 | | | | 19,309,510 | | | | 288,787,957 | | | | 263,443,321 | |
| | 1,491,903 | | | | 1,594,129 | | | | 22,804,737 | | | | 6,348,154 | |
| | (38,794,414 | ) | | | (29,108,583 | ) | | | (182,878,814 | ) | | | (180,211,720 | ) |
| | 10,533 | | | | 2,724 | | | | 201,177 | | | | 192,080 | |
| | | | | | | | | | | | | | |
| | (9,910,157 | ) | | | (8,202,220 | ) | | | 128,915,057 | | | | 89,771,835 | |
| | | | | | | | | | | | | | |
| | | | | | | | | | | | | | |
| | — | | | | — | | | | — | | | | — | |
| | — | | | | — | | | | — | | | | — | |
| | | | | | | | | | | | | | |
| | — | | | | — | | | | — | | | | — | |
| | | | | | | | | | | | | | |
| | (9,252,815 | ) | | | (7,793,293 | ) | | | 161,149,898 | | | | 103,197,287 | |
| | | |
| | | | | | | | | | | | | | |
| | 108,958,886 | | | | 116,752,179 | | | | 327,860,917 | | | | 224,663,630 | |
| | | | | | | | | | | | | | |
| $ | 99,706,071 | | | $ | 108,958,886 | | | $ | 489,010,815 | | | $ | 327,860,917 | |
| | | | | | | | | | | | | | |
$ | 10,454 | | | $ | 33,864 | | | $ | (1,860 | ) | | $ | (20,881 | ) |
| | | | | | | | | | | | | | |
| | | |
| | | | | | | | | | | | | | |
| | | | | | | | | | | | | | |
| | 2,685,166 | | | | 1,896,861 | | | | 15,149,367 | | | | 14,002,689 | |
| | 146,414 | | | | 156,439 | | | | 1,296,239 | | | | 341,021 | |
| | (3,804,979 | ) | | | (2,856,744 | ) | | | (9,625,892 | ) | | | (9,698,391 | ) |
| | | | | | | | | | | | | | |
| | (973,399 | ) | | | (803,444 | ) | | | 6,819,714 | | | | 4,645,319 | |
| | | | | | | | | | | | | | |
| | | | | | | | | | | | | | |
| | — | | | | — | | | | — | | | | — | |
| | — | | | | — | | | | — | | | | — | |
| | | | | | | | | | | | | | |
| | — | | | | — | | | | — | | | | — | |
| | | | | | | | | | | | | | |
109
Financial Highlights
| | | | | | | | | | | | | | | | | | | | | | | | | | | | | | | | |
| | | | | | Income (Loss) from
Investment Operations | | | | | | | | | Less Distributions | | | | |
| | | Net Asset
Value
Beginning
of Period | | | Net
Investment
Income (Loss) | | | Net Realized
and Unrealized
Gains (Losses)
on Investments | | | Total from
Investment
Operations | | | Redemption
Fees (See Note 2) | | | Dividends
from Net
Investment
Income | | | Distributions
from Net
Realized
Gains | | | Total
Distributions | |
Core Growth Fund — Investor Class | |
Year ended 9/30/1622 | | $ | 57.83 | | | | (0.30 | ) | | | 6.09 | | | | 5.79 | | | | — | 4 | | | — | | | | (6.72 | ) | | | (6.72 | ) |
Year ended 9/30/15 | | $ | 53.46 | | | | (0.14 | )14 | | | 5.95 | | | | 5.81 | | | | — | 4 | | | — | | | | (1.44 | ) | | | (1.44 | ) |
Year ended 9/30/14 | | $ | 52.49 | | | | (0.39 | ) | | | 2.12 | | | | 1.73 | | | | — | 4 | | | — | | | | (0.76 | ) | | | (0.76 | ) |
Year ended 9/30/13 | | $ | 41.41 | | | | (0.12 | ) | | | 11.19 | | | | 11.07 | | | | 0.01 | | | | — | | | | — | | | | — | |
Year ended 9/30/12 | | $ | 32.63 | | | | (0.26 | ) | | | 9.04 | | | | 8.78 | | | | — | 4 | | | — | | | | — | | | | — | |
Core Growth Fund — Institutional Class | |
Year ended 9/30/1622 | | $ | 57.99 | | | | (0.14 | ) | | | 6.03 | | | | 5.89 | | | | — | 4 | | | — | | | | (6.72 | ) | | | (6.72 | ) |
Year ended 9/30/15 | | $ | 53.58 | | | | 0.06 | | | | 5.79 | | | | 5.85 | | | | — | 4 | | | — | | | | (1.44 | ) | | | (1.44 | ) |
Year ended 9/30/14 | | $ | 52.57 | | | | (0.23 | ) | | | 2.00 | | | | 1.77 | | | | — | 4 | | | — | | | | (0.76 | ) | | | (0.76 | ) |
Year ended 9/30/13 | | $ | 41.44 | | | | (0.07 | ) | | | 11.20 | | | | 11.13 | | | | — | 4 | | | — | | | | — | | | | — | |
Year ended 9/30/128 | | $ | 38.32 | | | | (0.16 | ) | | | 3.28 | | | | 3.12 | | | | — | | | | — | | | | — | | | | — | |
Emerging India Fund — Investor Class | |
Year ended 9/30/1622 | | $ | 3.07 | | | | (0.03 | ) | | | 0.39 | | | | 0.36 | | | | — | 4 | | | — | | | | (0.04 | ) | | | (0.04 | ) |
Year ended 9/30/15 | | $ | 2.73 | | | | (0.04 | ) | | | 0.38 | | | | 0.34 | | | | — | 4 | | | — | 4 | | | — | | | | — | 4 |
Year ended 9/30/14 | | $ | 1.78 | | | | (— | )4 | | | 0.95 | | | | 0.95 | | | | — | 4 | | | — | | | | — | | | | — | |
Year ended 9/30/13 | | $ | 2.02 | | | | (0.01 | ) | | | (0.23 | ) | | | (0.24 | ) | | | — | 4 | | | — | | | | — | | | | — | |
Year ended 9/30/12 | | $ | 1.83 | | | | (0.01 | ) | | | 0.21 | | | | 0.20 | | | | — | 4 | | | (0.01 | ) | | | — | | | | (0.01 | ) |
Emerging India Fund — Institutional Class | |
Period ended 9/30/1619 22 | | $ | 2.82 | | | | (0.01 | ) | | | 0.59 | | | | 0.58 | | | | — | | | | — | | | | — | | | | — | |
Emerging Markets Select Fund — Investor Class | |
Year ended 9/30/1622 | | $ | 8.35 | | | | (0.05 | ) | | | 0.93 | | | | 0.88 | | | | — | 4 | | | — | | | | — | | | | — | |
Year ended 9/30/15 | | $ | 10.31 | | | | (0.04 | ) | | | (1.89 | ) | | | (1.93 | ) | | | — | 4 | | | (0.03 | ) | | | — | | | | (0.03 | ) |
Year ended 9/30/14 | | $ | 9.56 | | | | (0.01 | ) | | | 0.77 | | | | 0.76 | | | | — | 4 | | | (0.01 | ) | | | — | | | | (0.01 | ) |
Year ended 9/30/1312 | | $ | 10.00 | | | | — | 4 | | | (0.44 | ) | | | (0.44 | ) | | | — | 4 | | | — | | | | — | | | | — | |
Emerging Markets Select Fund — Institutional Class | |
Year ended 9/30/1622 | | $ | 8.41 | | | | 0.04 | | | | 0.87 | | | | 0.91 | | | | — | | | | — | | | | — | | | | — | |
Year ended 9/30/15 | | $ | 10.37 | | | | (0.03 | ) | | | (1.88 | ) | | | (1.91 | ) | | | — | 4 | | | (0.05 | ) | | | — | | | | (0.05 | ) |
Year ended 9/30/14 | | $ | 9.61 | | | | — | 4 | | | 0.78 | | | | 0.78 | | | | — | 4 | | | (0.02 | ) | | | — | | | | (0.02 | ) |
Year ended 9/30/1313 | | $ | 10.00 | | | | (— | )4 | | | (0.39 | ) | | | (0.39 | ) | | | — | 4 | | | — | | | | — | | | | — | |
Emerging Markets Small Cap Fund — Investor Class | |
Year ended 9/30/1622 | | $ | 2.39 | | | | (0.04 | ) | | | 0.32 | | | | 0.28 | | | | — | 4 | | | — | 4 | | | — | | | | — | 4 |
Year ended 9/30/15 | | $ | 2.74 | | | | (0.03 | ) | | | (0.32 | ) | | | (0.35 | ) | | | — | 4 | | | — | 4 | | | — | | | | — | 4 |
Year ended 9/30/14 | | $ | 2.67 | | | | (0.01 | ) | | | 0.14 | | | | 0.13 | | | | — | 4 | | | — | | | | (0.06 | ) | | | (0.06 | ) |
Year ended 9/30/13 | | $ | 2.66 | | | | 0.01 | | | | 0.01 | | | | 0.02 | | | | — | 4 | | | (0.01 | ) | | | — | | | | (0.01 | ) |
Year ended 9/30/12 | | $ | 2.16 | | | | 0.01 | | | | 0.49 | | | | 0.50 | | | | — | 4 | | | — | | | | — | | | | — | |
Emerging Markets Small Cap Fund — Institutional Class | |
Period ended 9/30/1619 22 | | $ | 2.31 | | | | (— | )4 | | | 0.36 | | | | 0.36 | | | | — | | | | — | | | | — | | | | — | |
Frontier Emerging Small Countries Fund — Investor Class | |
Year ended 9/30/1622 | | $ | 2.77 | | | | 0.02 | | | | (0.16 | ) | | | (0.14 | ) | | | — | 4 | | | — | 4 | | | — | | | | — | 4 |
Year ended 9/30/15 | | $ | 3.32 | | | | 0.02 | | | | (0.50 | ) | | | (0.48 | ) | | | — | 4 | | | (0.02 | ) | | | (0.05 | ) | | | (0.07 | ) |
Year ended 9/30/14 | | $ | 2.97 | | | | 0.03 | | | | 0.33 | | | | 0.36 | | | | — | 4 | | | (0.01 | ) | | | — | | | | (0.01 | ) |
Year ended 9/30/13 | | $ | 2.41 | | | | 0.01 | | | | 0.55 | | | | 0.56 | | | | — | 4 | | | — | 4 | | | — | 4 | | | — | 4 |
Year ended 9/30/129 | | $ | 2.00 | | | | 0.01 | | | | 0.40 | | | | 0.41 | | | | — | 4 | | | — | | | | — | | | | — | |
Frontier Emerging Small Countries Fund — Institutional Class | |
Period ended 9/30/1619 22 | | $ | 2.58 | | | | 0.02 | | | | 0.04 | | | | 0.06 | | | | — | 4 | | | — | | | | — | | | | — | |
Global Opportunities Fund — Investor Class | |
Year ended 9/30/1622 | | $ | 3.51 | | | | (0.04 | ) | | | 0.51 | | | | 0.47 | | | | — | 4 | | | (0.01 | ) | | | (0.45 | ) | | | (0.46 | ) |
Year ended 9/30/15 | | $ | 4.28 | | | | (0.05 | ) | | | (0.08 | ) | | | (0.13 | ) | | | — | 4 | | | (0.01 | ) | | | (0.63 | ) | | | (0.64 | ) |
Year ended 9/30/14 | | $ | 4.58 | | | | (0.05 | ) | | | 0.23 | | | | 0.18 | | | | — | 4 | | | — | 4 | | | (0.48 | ) | | | (0.48 | ) |
Year ended 9/30/13 | | $ | 4.15 | | | | (0.02 | ) | | | 0.93 | | | | 0.91 | | | | — | 4 | | | — | | | | (0.48 | ) | | | (0.48 | ) |
Year ended 9/30/12 | | $ | 3.68 | | | | (0.03 | ) | | | 0.93 | | | | 0.90 | | | | — | 4 | | | — | | | | (0.43 | ) | | | (0.43 | ) |
Global Opportunities Fund — Institutional Class | |
Period ended 9/30/1619 22 | | $ | 3.09 | | | | (— | )4 | | | 0.43 | | | | 0.43 | | | | — | | | | — | | | | — | | | | — | |
See Notes to Financial Highlights and Notes to Financial Statements.
110
| | |
| | (for a share outstanding throughout each period) |
|
|
|
| | | | | | | | | | | | | | | | | | | | | | | | | | | | | | |
| | | | | | |
Ratios to Average Net Assets | | | Supplemental Data | |
Net Asset
Value
End of
Period | | | Total Return (%)1 | | | Expenses Net of Waivers and
Reimbursements (%)2 | | | Expenses Before Waivers and
Reimbursements (%)2 | | | Net Investment
Income Net of
Waivers and
Reimbursements (%)2 | | | Net Investment
Income Before
Waivers and
Reimbursements (%)2 | | | Net Assets
End of
Period
(000s) | | | Portfolio
Turnover
Rate1 3 | |
| | | | | | | | | | | | | | | | | | | | | | | | | | | | | | |
| $ | 56.90 | | | | 10.69 | | | | 1.21 | 5 | | | 1.21 | 5 | | | (0.62 | ) | | | (0.62 | ) | | $ | 1,082,679 | | | | 18 | % |
| $ | 57.83 | | | | 10.87 | | | | 1.17 | 5 | | | 1.17 | 5 | | | (0.29 | )14 | | | (0.29 | )14 | | $ | 1,014,515 | | | | 39 | % |
| $ | 53.46 | | | | 3.26 | | | | 1.18 | 5 | | | 1.18 | 5 | | | (0.64 | ) | | | (0.64 | ) | | $ | 859,086 | | | | 26 | % |
| $ | 52.49 | | | | 26.76 | | | | 1.21 | 5 | | | 1.21 | 5 | | | (0.39 | ) | | | (0.39 | ) | | $ | 924,304 | | | | 16 | % |
| $ | 41.41 | | | | 26.91 | | | | 1.23 | 5 | | | 1.23 | 5 | | | (0.70 | ) | | | (0.70 | ) | | $ | 581,371 | | | | 28 | % |
| | | | | | | | | | | | | | | | | | | | | | | | | | | | | | |
| $ | 57.16 | | | | 10.83 | | | | 1.07 | 5 | | | 1.09 | 5 | | | (0.48 | ) | | | (0.50 | ) | | $ | 251,181 | | | | 18 | % |
| $ | 57.99 | | | | 10.94 | | | | 1.12 | 5 | | | 1.13 | 5 | | | (0.29 | )14 | | | (0.30 | )14 | | $ | 150,614 | | | | 39 | % |
| $ | 53.58 | | | | 3.31 | | | | 1.13 | 5 | | | 1.19 | 5 | | | (0.59 | ) | | | (0.65 | )5 | | $ | 49,369 | | | | 26 | % |
| $ | 52.57 | | | | 26.86 | | | | 1.12 | 5 | | | 1.32 | 5 | | | (0.32 | ) | | | (0.52 | )5 | | $ | 19,971 | | | | 16 | % |
| $ | 41.44 | | | | 8.14 | | | | 1.12 | 5 | | | 1.55 | 5 | | | (0.62 | ) | | | (1.05 | ) | | $ | 9,101 | | | | 28 | % |
| | | | | | | | | | | | | | | | | | | | | | | | | | | | | | |
| $ | 3.39 | | | | 11.98 | | | | 1.82 | 5 | | | 1.96 | 5 | | | (1.18 | ) | | | (1.32 | ) | | $ | 71,973 | | | | 42 | % |
| $ | 3.07 | | | | 12.51 | | | | 1.95 | 5 | | | 2.12 | 5 | | | (1.38 | ) | | | (1.55 | ) | | $ | 63,850 | | | | 36 | % |
| $ | 2.73 | | | | 53.37 | | | | 1.96 | 5 | | | 2.58 | 5 | | | (0.76 | ) | | | (1.38 | ) | | $ | 44,150 | | | | 13 | % |
| $ | 1.78 | | | | (11.88 | ) | | | 1.95 | 5 | | | 2.99 | 5 | | | (0.99 | ) | | | (2.03 | ) | | $ | 15,938 | | | | 40 | % |
| $ | 2.02 | | | | 11.42 | | | | 1.95 | 5 | | | 3.41 | 5 | | | (0.65 | ) | | | (2.11 | ) | | $ | 13,658 | | | | 17 | % |
| | | | | | | | | | | | | | | | | | | | | | | | | | | | | | |
| $ | 3.40 | | | | 20.57 | | | | 1.50 | 5 | | | 2.00 | 5 | | | (0.70 | ) | | | (1.20 | ) | | $ | 9,799 | | | | 42 | % |
| | | | | | | | | | | | | | | | | | | | | | | | | | | | | | |
| $ | 9.23 | | | | 10.54 | | | | 1.58 | 6 | | | 1.98 | 6 | | | (0.15 | ) | | | (0.55 | ) | | $ | 11,892 | | | | 62 | % |
| $ | 8.35 | | | | (18.81 | ) | | | 1.70 | 6 | | | 2.00 | 6 | | | (0.23 | ) | | | (0.53 | ) | | $ | 18,527 | | | | 46 | % |
| $ | 10.31 | | | | 7.92 | | | | 1.69 | 5 | | | 1.88 | 5 | | | (0.09 | ) | | | (0.28 | ) | | $ | 26,502 | | | | 59 | % |
| $ | 9.56 | | | | (4.40 | ) | | | 1.69 | 5 | | | 2.40 | 5 | | | 0.04 | | | | (0.67 | ) | | $ | 29,374 | | | | 43 | % |
| | | | | | | | | | | | | | | | | | | | | | | | | | | | | | |
| $ | 9.32 | | | | 10.82 | | | | 1.29 | 6 | | | 1.59 | 6 | | | 0.29 | | | | (0.01 | ) | | $ | 26,763 | | | | 62 | % |
| $ | 8.41 | | | | (18.67 | ) | | | 1.51 | 6 | | | 1.77 | 6 | | | (0.06 | ) | | | (0.32 | ) | | $ | 19,270 | | | | 46 | % |
| $ | 10.37 | | | | 8.13 | | | | 1.51 | 5 | | | 1.71 | 5 | | | 0.05 | | | | (0.15 | ) | | $ | 32,306 | | | | 59 | % |
| $ | 9.61 | | | | (3.90 | ) | | | 1.50 | 5 | | | 2.21 | 5 | | | (0.18 | ) | | | (0.89 | ) | | $ | 28,861 | | | | 43 | % |
| | | | | | | | | | | | | | | | | | | | | | | | | | | | | | |
| $ | 2.67 | | | | 11.73 | | | | 1.96 | 6 | | | 2.00 | 6 | | | (0.75 | ) | | | (0.79 | ) | | $ | 674,632 | | | | 42 | % |
| $ | 2.39 | | | | (12.65 | ) | | | 1.95 | 5 | | | 2.01 | 5 | | | (0.63 | ) | | | (0.69 | ) | | $ | 981,367 | | | | 59 | % |
| $ | 2.74 | | | | 4.90 | | | | 1.95 | 5 | | | 2.02 | 5 | | | (0.28 | ) | | | (0.35 | ) | | $ | 1,457,882 | | | | 55 | % |
| $ | 2.67 | | | | 0.85 | | | | 1.95 | 5 | | | 2.06 | 5 | | | 0.21 | | | | 0.09 | | | $ | 1,785,681 | | | | 41 | % |
| $ | 2.66 | | | | 23.15 | | | | 1.95 | 5 | | | 2.13 | 5 | | | 0.29 | | | | 0.11 | | | $ | 1,482,265 | | | | 39 | % |
| | | | | | | | | | | | | | | | | | | | | | | | | | | | | | |
| $ | 2.67 | | | | 15.58 | | | | 1.80 | 6 | | | 1.81 | 6 | | | (0.03 | ) | | | (0.04 | ) | | $ | 160,729 | | | | 42 | % |
| | | | | | | | | | | | | | | | | | | | | | | | | | | | | | |
| $ | 2.63 | | | | (4.89 | ) | | | 2.25 | 5 | | | 2.39 | 5 | | | 0.35 | | | | 0.21 | | | $ | 437,850 | | | | 80 | % |
| $ | 2.77 | | | | (14.88 | ) | | | 2.25 | 5 | | | 2.28 | 5 | | | 0.39 | | | | 0.36 | | | $ | 1,027,673 | | | | 34 | % |
| $ | 3.32 | | | | 11.97 | | | | 2.24 | 5 | | | 2.24 | 5 | | | 0.79 | | | | 0.79 | | | $ | 1,324,694 | | | | 22 | % |
| $ | 2.97 | | | | 22.88 | | | | 2.25 | 5 | | | 2.43 | 5 | | | 0.81 | | | | 0.63 | | | $ | 730,694 | | | | 13 | % |
| $ | 2.41 | | | | 20.50 | | | | 2.25 | 5 | | | 3.64 | 5 | | | 1.31 | | | | (0.08 | ) | | $ | 33,045 | | | | 5 | % |
| | | | | | | | | | | | | | | | | | | | | | | | | | | | | | |
| $ | 2.64 | | | | 2.33 | | | | 2.06 | 6 | | | 2.06 | 6 | | | 1.40 | | | | 1.40 | | | $ | 139,699 | | | | 80 | % |
| | | | | | | | | | | | | | | | | | | | | | | | | | | | | | |
| $ | 3.52 | | | | 13.73 | | | | 1.62 | 6 | | | 1.62 | 6 | | | (0.98 | ) | | | (0.98 | ) | | $ | 150,945 | | | | 44 | % |
| $ | 3.51 | | | | (3.88 | ) | | | 1.81 | 5 | | | 1.81 | 5 | | | (1.10 | ) | | | (1.10 | ) | | $ | 155,968 | | | | 54 | % |
| $ | 4.28 | | | | 3.94 | | | | 1.78 | 5 | | | 1.78 | 5 | | | (0.83 | ) | | | (0.83 | ) | | $ | 192,664 | | | | 42 | % |
| $ | 4.58 | | | | 24.23 | | | | 1.80 | 5 | | | 1.80 | 5 | | | (0.70 | ) | | | (0.70 | ) | | $ | 220,460 | | | | 43 | % |
| $ | 4.15 | | | | 26.69 | | | | 1.84 | 5 | | | 1.84 | 5 | | | (0.61 | ) | | | (0.61 | ) | | $ | 153,582 | | | | 38 | % |
| | | | | | | | | | | | | | | | | | | | | | | | | | | | | | |
| $ | 3.52 | | | | 13.92 | | | | 1.35 | 5 | | | 2.32 | 5 | | | (0.57 | ) | | | (1.54 | ) | | $ | 5,348 | | | | 44 | % |
111
Financial Highlights (continued)
| | | | | | | | | | | | | | | | | | | | | | | | | | | | | | | | |
| | | | | | Income (Loss) from
Investment Operations | | | | | | | | | Less Distributions | | | | |
| | | Net Asset
Value
Beginning
of Period | | | Net
Investment
Income (Loss) | | | Net Realized
and Unrealized
Gains (Losses)
on Investments | | | Total from
Investment
Operations | | | Redemption
Fees
(See Note 2) | | | Dividends
from Net
Investment
Income | | | Distributions
from Net
Realized
Gains | | | Total
Distributions | |
International Growth Fund — Investor Class | | | | | | | | | | | | | | | | | | | | | | | | | |
Year ended 9/30/1622 | | $ | 27.88 | | | | (0.22 | ) | | | 3.77 | | | | 3.55 | | | | — | 4 | | | — | | | | — | | | | — | |
Year ended 9/30/15 | | $ | 26.78 | | | | (0.09 | ) | | | 1.39 | | | | 1.30 | | | | — | 4 | | | (0.01 | ) | | | (0.19 | ) | | | (0.20 | ) |
Year ended 9/30/14 | | $ | 28.76 | | | | (0.02 | ) | | | (1.24 | ) | | | (1.26 | ) | | | — | 4 | | | — | | | | (0.72 | ) | | | (0.72 | ) |
Year ended 9/30/13 | | $ | 22.44 | | | | 0.07 | | | | 6.32 | | | | 6.39 | | | | 0.01 | | | | (0.08 | ) | | | — | | | | (0.08 | ) |
Year ended 9/30/12 | | $ | 17.21 | | | | 0.09 | | | | 5.14 | | | | 5.23 | | | | — | 4 | | | — | | | | — | | | | — | |
International Growth Fund — Institutional Class | | | | | | | | | | | | | | | | | | | | | |
Period ended 9/30/1619 22 | | $ | 28.46 | | | | 0.01 | | | | 2.99 | | | | 3.00 | | | | — | 4 | | | — | | | | — | | | | — | |
International Opportunities Fund — Investor Class | | | | | | | | | | | | | | | | | | | | | |
Year ended 9/30/1622 | | $ | 2.74 | | | | (0.01 | ) | | | 0.61 | | | | 0.60 | | | | — | 4 | | | — | | | | (0.13 | ) | | | (0.13 | ) |
Year ended 9/30/15 | | $ | 3.09 | | | | (0.01 | ) | | | (0.04 | ) | | | (0.05 | ) | | | — | 4 | | | — | | | | (0.30 | ) | | | (0.30 | ) |
Year ended 9/30/14 | | $ | 2.94 | | | | (0.01 | ) | | | 0.33 | | | | 0.32 | | | | — | 4 | | | — | | | | (0.17 | ) | | | (0.17 | ) |
Year ended 9/30/13 | | $ | 2.41 | | | | (— | )4 | | | 0.53 | | | | 0.53 | | | | — | 4 | | | — | | | | — | | | | — | |
Year ended 9/30/12 | | $ | 2.24 | | | | — | 4 | | | 0.44 | | | | 0.44 | | | | — | 4 | | | — | | | | (0.27 | ) | | | (0.27 | ) |
International Opportunities Fund — Institutional Class | | | | | | | | | | | | | | | | | |
Period ended 9/30/1619 22 | | $ | 2.71 | | | | 0.01 | | | | 0.51 | | | | 0.52 | | | | — | 4 | | | — | | | | — | | | | — | |
Large Cap Value Fund — Investor Class | | | | | | | | | | | | | | | | | | | | | | | | | |
Year ended 9/30/1622 | | $ | 8.84 | | | | 0.16 | | | | 1.01 | | | | 1.17 | | | | — | 4 | | | (0.16 | ) | | | (0.83 | ) | | | (0.99 | ) |
Year ended 9/30/15 | | $ | 12.69 | | | | 0.15 | | | | (0.69 | ) | | | (0.54 | ) | | | — | 4 | | | (0.16 | ) | | | (3.15 | ) | | | (3.31 | ) |
Year ended 9/30/14 | | $ | 16.57 | | | | 0.21 | | | | 1.49 | | | | 1.70 | | | | — | 4 | | | (0.22 | ) | | | (5.36 | ) | | | (5.58 | ) |
Year ended 9/30/13 | | $ | 14.31 | | | | 0.22 | | | | 2.37 | | | | 2.59 | | | | — | 4 | | | (0.20 | ) | | | (0.13 | ) | | | (0.33 | ) |
Year ended 9/30/12 | | $ | 11.85 | | | | 0.20 | | | | 2.46 | | | | 2.66 | | | | — | 4 | | | (0.20 | ) | | | — | | | | (0.20 | ) |
Large Cap Value Fund — Institutional Class | | | | | | | | | | | | | | | | | | | | | | | | | |
Year ended 9/30/1622 | | $ | 8.84 | | | | 0.29 | | | | 0.88 | | | | 1.17 | | | | — | 4 | | | (0.17 | ) | | | (0.83 | ) | | | (1.00 | ) |
Year ended 9/30/15 | | $ | 12.69 | | | | (0.04 | ) | | | (0.49 | ) | | | (0.53 | ) | | | — | 4 | | | (0.17 | ) | | | (3.15 | ) | | | (3.32 | ) |
Year ended 9/30/14 | | $ | 16.57 | | | | 0.20 | | | | 1.52 | | | | 1.72 | | | | — | 4 | | | (0.24 | ) | | | (5.36 | ) | | | (5.60 | ) |
Year ended 9/30/13 | | $ | 14.31 | | | | 0.22 | | | | 2.39 | | | | 2.61 | | | | — | 4 | | | (0.22 | ) | | | (0.13 | ) | | | (0.35 | ) |
Period ended 9/30/128 | | $ | 13.77 | | | | 0.12 | | | | 0.57 | | | | 0.69 | | | | — | 4 | | | (0.15 | ) | | | — | | | | (0.15 | ) |
Long/Short Fund — Investor Class | | | | | | | | | | | | | | | | | | | | | | | | | |
Year ended 9/30/1622 | | $ | 12.36 | | | | (0.08 | ) | | | 1.60 | | | | 1.52 | | | | — | 4 | | | (0.01 | ) | | | (1.24 | ) | | | (1.25 | ) |
Year ended 9/30/15 | | $ | 16.29 | | | | 0.02 | | | | (3.00 | ) | | | (2.98 | ) | | | — | 4 | | | (0.14 | ) | | | (0.81 | ) | | | (0.95 | ) |
Year ended 9/30/14 | | $ | 15.82 | | | | 0.17 | | | | 0.65 | | | | 0.82 | | | | — | 4 | | | — | | | | (0.35 | ) | | | (0.35 | ) |
Year ended 9/30/13 | | $ | 13.66 | | | | (0.04 | ) | | | 2.23 | | | | 2.19 | | | | — | 4 | | | — | | | | (0.03 | ) | | | (0.03 | ) |
Year ended 9/30/12 | | $ | 11.85 | | | | (0.02 | ) | | | 1.83 | | | | 1.81 | | | | — | 4 | | | — | | | | — | | | | — | |
Long/Short Fund — Institutional Class | | | | | | | | | | | | | | | | | | | | | | | | | |
Year ended 9/30/1622 | | $ | 12.38 | | | | 0.21 | | | | 1.33 | | | | 1.54 | | | | 0.02 | | | | (0.03 | ) | | | (1.24 | ) | | | (1.27 | ) |
Year ended 9/30/15 | | $ | 16.32 | | | | 0.06 | | | | (3.02 | ) | | | (2.96 | ) | | | — | 4 | | | (0.17 | ) | | | (0.81 | ) | | | (0.98 | ) |
Year ended 9/30/14 | | $ | 15.83 | | | | 0.18 | | | | 0.66 | | | | 0.84 | | | | — | 4 | | | — | | | | (0.35 | ) | | | (0.35 | ) |
Period ended 9/30/1313 | | $ | 13.80 | | | | (0.01 | ) | | | 2.07 | | | | 2.06 | | | | — | 4 | | | — | | | | (0.03 | ) | | | (0.03 | ) |
Micro Cap Fund | | | | | | | | | | | | | | | | | | | | | | | | | | | | | | | | |
Year ended 9/30/1622 | | $ | 7.21 | | | | (0.08 | ) | | | 1.15 | | | | 1.07 | | | | — | 4 | | | — | | | | (1.09 | ) | | | (1.09 | ) |
Year ended 9/30/15 | | $ | 7.36 | | | | (0.08 | )15 | | | 0.28 | | | | 0.20 | | | | — | 4 | | | — | 4 | | | (0.35 | ) | | | (0.35 | ) |
Year ended 9/30/14 | | $ | 7.42 | | | | (0.14 | ) | | | 0.08 | | | | (0.06 | ) | | | — | 4 | | | — | | | | — | | | | — | |
Year ended 9/30/13 | | $ | 5.71 | | | | (0.10 | ) | | | 1.81 | | | | 1.71 | | | | — | 4 | | | — | | | | — | | | | — | |
Year ended 9/30/12 | | $ | 4.40 | | | | (0.09 | ) | | | 1.40 | | | | 1.31 | | | | — | 4 | | | — | | | | — | | | | — | |
Micro Cap Value Fund | | | | | | | | | | | | | | | | | | | | | | | | | | | | | | | | |
Year ended 9/30/1622 | | $ | 2.87 | | | | (0.02 | ) | | | 0.34 | | | | 0.32 | | | | — | 4 | | | — | | | | (0.32 | ) | | | (0.32 | ) |
Year ended 9/30/15 | | $ | 3.02 | | | | (0.02 | )16 | | | 0.31 | | | | 0.29 | | | | — | 4 | | | — | | | | (0.44 | ) | | | (0.44 | ) |
Year ended 9/30/14 | | $ | 3.45 | | | | (0.04 | ) | | | 0.18 | | | | 0.14 | | | | — | 4 | | | — | | | | (0.57 | ) | | | (0.57 | ) |
Year ended 9/30/13 | | $ | 2.85 | | | | (0.03 | ) | | | 0.91 | | | | 0.88 | | | | — | 4 | | | — | | | | (0.28 | ) | | | (0.28 | ) |
Year ended 9/30/12 | | $ | 2.24 | | | | (0.04 | ) | | | 0.65 | | | | 0.61 | | | | — | 4 | | | — | | | | — | | | | — | |
See Notes to Financial Highlights and Notes to Financial Statements.
112
| | |
| | (for a share outstanding throughout each period) |
|
|
|
| | | | | | | | | | | | | | | | | | | | | | | | | | | | | | |
| | | | | | | Ratios to Average Net Assets | | | Supplemental Data | |
Net Asset
Value
End of
Period | | | Total Return (%)1 | | | Expenses
Net of
Waivers and
Reimbursements (%)2 | | | Expenses
Before
Waivers and
Reimbursements (%)2 | | | Net Investment
Income Net of
Waivers and
Reimbursements (%)2 | | | Net Investment
Income Before
Waivers and
Reimbursements (%)2 | | | Net Assets
End of
Period
(000s) | | | Portfolio
Turnover
Rate1 3 | |
| | | | | | | | | | | | | | | | | | | | | | | | | | | | | | |
| $ | 31.43 | | | | 12.73 | | | | 1.48 | 5 | | | 1.48 | 5 | | | (0.41 | ) | | | (0.41 | ) | | $ | 945,168 | | | | 50% | |
| $ | 27.88 | | | | 4.83 | | | | 1.50 | 5 | | | 1.50 | 5 | | | (0.32 | ) | | | (0.32 | ) | | $ | 1,316,095 | | | | 46% | |
| $ | 26.78 | | | | (4.53 | ) | | | 1.46 | 5 | | | 1.46 | 5 | | | (0.06 | ) | | | (0.06 | ) | | $ | 1,421,086 | | | | 42% | |
| $ | 28.76 | | | | 28.63 | | | | 1.49 | 5 | | | 1.49 | 5 | | | 0.25 | | | | 0.25 | | | $ | 1,326,931 | | | | 44% | |
| $ | 22.44 | | | | 30.39 | | | | 1.57 | 6 | | | 1.57 | 6 | | | 0.51 | | | | 0.51 | | | $ | 434,824 | | | | 44% | |
| | | | | | | | | | | | | | | | | | | | | | | | | | | | | | |
| $ | 31.46 | | | | 10.54 | | | | 1.35 | 5 | | | 1.36 | 5 | | | 0.07 | | | | 0.06 | | | $ | 509,016 | | | | 50% | |
| | | | | | | | | | | | | | | | | | | | | | | | | | | | | | |
| $ | 3.21 | | | | 22.73 | | | | 2.25 | 5 | | | 2.29 | 5 | | | (0.35 | ) | | | (0.39 | ) | | $ | 512,252 | | | | 41% | |
| $ | 2.74 | | | | (1.44 | ) | | | 2.25 | 5 | | | 2.43 | 5 | | | (0.36 | ) | | | (0.54 | ) | | $ | 453,495 | | | | 25% | |
| $ | 3.09 | | | | 11.53 | | | | 2.25 | 5 | | | 2.41 | 5 | | | (0.40 | ) | | | (0.56 | ) | | $ | 339,659 | | | | 38% | |
| $ | 2.94 | | | | 21.99 | | | | 2.25 | 5 | | | 2.42 | 5 | | | (0.03 | ) | | | (0.20 | ) | | $ | 278,216 | | | | 49% | |
| $ | 2.41 | | | | 22.33 | | | | 2.25 | 6 | | | 2.48 | 6 | | | (0.16 | ) | | | (0.39 | ) | | $ | 194,563 | | | | 41% | |
| | | | | | | | | | | | | | | | | | | | | | | | | | | | | | |
| $ | 3.23 | | | | 19.19 | | | | 1.95 | 5 | | | 2.04 | 5 | | | 0.64 | | | | 0.55 | | | $ | 168,136 | | | | 41% | |
| | | | | | | | | | | | | | | | | | | | | | | | | | | | | | |
| $ | 9.02 | | | | 13.92 | | | | 1.10 | 5 | | | 1.17 | 5 | | | 1.70 | | | | 1.63 | | | $ | 189,691 | | | | 26% | |
| $ | 8.84 | | | | (6.61 | ) | | | 1.10 | 5 | | | 1.12 | 5 | | | 1.34 | | | | 1.32 | | | $ | 244,056 | | | | 39% | |
| $ | 12.69 | | | | 11.78 | | | | 1.11 | 5 10 | | | 1.12 | 5 10 | | | 1.38 | | | | 1.37 | | | $ | 409,169 | | | | 53% | |
| $ | 16.57 | | | | 18.40 | | | | 1.10 | 5 | | | 1.16 | 5 | | | 1.27 | | | | 1.21 | | | $ | 786,910 | | | | 47% | |
| $ | 14.31 | | | | 22.50 | | | | 1.10 | 5 | | | 1.15 | 5 | | | 1.42 | | | | 1.37 | | | $ | 1,298,365 | | | | 14% | |
| | | | | | | | | | | | | | | | | | | | | | | | | | | | | | |
| $ | 9.01 | | | | 13.97 | | | | 0.96 | 5 | | | 1.72 | 5 | | | 1.76 | | | | 1.00 | | | $ | 3,589 | | | | 26% | |
| $ | 8.84 | | | | (6.50 | ) | | | 0.98 | 5 | | | 1.44 | 5 | | | 1.40 | | | | 0.94 | | | $ | 1,525 | | | | 39% | |
| $ | 12.69 | | | | 11.95 | | | | 0.98 | 5 | | | 1.25 | 5 | | | 1.52 | | | | 1.25 | | | $ | 8,068 | | | | 53% | |
| $ | 16.57 | | | | 18.54 | | | | 0.98 | 5 | | | 1.35 | 5 | | | 1.37 | | | | 1.00 | | | $ | 15,444 | | | | 47% | |
| $ | 14.31 | | | | 5.02 | | | | 0.98 | 5 | | | 1.31 | 5 | | | 1.44 | | | | 1.11 | | | $ | 15,511 | | | | 14% | |
| | | | | | | | | | | | | | | | | | | | | | | | | | | | | | |
| $ | 12.63 | | | | 13.38 | | | | 1.83 | 6 7 | | | 1.83 | 6 7 | | | (0.06 | ) | | | (0.06 | ) | | $ | 184,158 | | | | 47% | |
| $ | 12.36 | | | | (19.33 | ) | | | 1.61 | 7 | | | 1.61 | 7 | | | 0.12 | | | | 0.12 | | | $ | 616,192 | | | | 44% | |
| $ | 16.29 | | | | 5.21 | | | | 1.53 | 7 11 | | | 1.53 | 7 11 | | | 1.05 | | | | 1.05 | | | $ | 1,696,707 | | | | 47% | |
| $ | 15.82 | | | | 16.09 | | | | 1.51 | 7 | | | 1.51 | 7 | | | (0.22 | ) | | | (0.22 | ) | | $ | 1,479,371 | | | | 47% | |
| $ | 13.66 | | | | 15.27 | | | | 1.51 | 7 | | | 1.51 | 7 | | | (0.20 | ) | | | (0.20 | ) | | $ | 1,537,220 | | | | 71% | |
| | | | | | | | | | | | | | | | | | | | | | | | | | | | | | |
| $ | 12.67 | | | | 13.71 | | | | 1.52 | 6 7 | | | 1.57 | 6 7 | | | 0.18 | | | | 0.13 | | | $ | 64,009 | | | | 47% | |
| $ | 12.38 | | | | (19.19 | ) | | | 1.47 | 7 | | | 1.47 | 7 | | | 0.25 | | | | 0.25 | | | $ | 408,792 | | | | 44% | |
| $ | 16.32 | | | | 5.33 | | | | 1.42 | 7 | | | 1.42 | 7 | | | 1.18 | | | | 1.18 | | | $ | 1,022,568 | | | | 47% | |
| $ | 15.83 | | | | 14.99 | | | | 1.39 | 7 | | | 1.40 | 7 | | | (0.16 | ) | | | (0.17 | ) | | $ | 824,780 | | | | 47% | |
| | | | | | | | | | | | | | | | | | | | | | | | | | | | | | |
| $ | 7.19 | | | | 16.04 | | | | 1.92 | 5 | | | 1.92 | 5 | | | (1.14 | ) | | | (1.14 | ) | | $ | 277,691 | | | | 32% | |
| $ | 7.21 | | | | 2.45 | | | | 1.90 | 5 | | | 1.90 | 5 | | | (0.85 | )15 | | | (0.85 | )15 | | $ | 273,311 | | | | 31% | |
| $ | 7.36 | | | | (0.81 | ) | | | 1.97 | | | | 1.97 | | | | (1.67 | ) | | | (1.67 | ) | | $ | 293,815 | | | | 26% | |
| $ | 7.42 | | | | 29.95 | | | | 2.13 | 5 | | | 2.13 | 5 | | | (1.28 | ) | | | (1.28 | ) | | $ | 323,175 | | | | 17% | |
| $ | 5.71 | | | | 29.77 | | | | 2.14 | 5 | | | 2.14 | 5 | | | (1.50 | ) | | | (1.50 | ) | | $ | 289,449 | | | | 25% | |
| | | | | | | | | | | | | | | | | | | | | | | | | | | | | | |
| $ | 2.87 | | | | 12.04 | | | | 1.95 | 5 | | | 2.04 | 5 | | | (0.59 | ) | | | (0.68 | ) | | $ | 179,116 | | | | 73% | |
| $ | 2.87 | | | | 9.99 | | | | 1.96 | 6 | | | 2.02 | 6 | | | (0.55 | )16 | | | (0.61 | )16 | | $ | 154,169 | | | | 53% | |
| $ | 3.02 | | | | 3.26 | | | | 2.03 | 5 | | | 2.09 | 5 | | | (1.31 | ) | | | (1.37 | ) | | $ | 158,800 | | | | 71% | |
| $ | 3.45 | | | | 33.92 | | | | 2.25 | 5 | | | 2.25 | 5 | | | (0.92 | ) | | | (0.92 | ) | | $ | 166,487 | | | | 66% | |
| $ | 2.85 | | | | 27.23 | | | | 2.25 | 5 | | | 2.31 | 5 | | | (1.27 | ) | | | (1.33 | ) | | $ | 138,299 | | | | 78% | |
113
Financial Highlights (continued)
| | | | | | | | | | | | | | | | | | | | | | | | | | | | | | | | |
| | | | | | Income (Loss) from
Investment Operations | | | | | | | | | Less Distributions | | | | |
| | | Net Asset
Value
Beginning
of Period | | | Net
Investment
Income (Loss) | | | Net Realized
and Unrealized
Gains (Losses)
on Investments | | | Total from
Investment
Operations | | | Redemption
Fees
(See Note 2) | | | Dividends
from Net
Investment
Income | | | Distributions
from Net
Realized
Gains | | | Total
Distributions | |
Small Cap Growth Fund — Investor Class | | | | | | | | | | | | | | | | | | | | | |
Year ended 9/30/1622 | | $ | 45.97 | | | | (0.47 | ) | | | 5.65 | | | | 5.18 | | | | — | 4 | | | — | | | | (7.63 | ) | | | (7.63 | ) |
Year ended 9/30/15 | | $ | 50.25 | | | | (0.40 | ) | | | 0.93 | | | | 0.53 | | | | — | 4 | | | — | | | | (4.81 | ) | | | (4.81 | ) |
Year ended 9/30/14 | | $ | 51.31 | | | | (0.41 | ) | | | 1.03 | | | | 0.62 | | | | — | 4 | | | — | | | | (1.68 | ) | | | (1.68 | ) |
Year ended 9/30/13 | | $ | 43.82 | | | | (0.15 | ) | | | 10.53 | | | | 10.38 | | | | — | 4 | | | — | | | | (2.89 | ) | | | (2.89 | ) |
Year ended 9/30/12 | | $ | 35.37 | | | | (0.29 | ) | | | 10.40 | | | | 10.11 | | | | — | 4 | | | — | | | | (1.66 | ) | | | (1.66 | ) |
Small Cap Growth Fund — Institutional Class | | | | | | | | | | | | | | | | | |
Period ended 9/30/1619 22 | | $ | 37.58 | | | | (0.07 | ) | | | 6.07 | | | | 6.00 | | | | — | 4 | | | ��� | | | | — | | | | — | |
Small Cap Value Fund — Investor Class | | | | | | | | | | | | | | | | | | | | | |
Year ended 9/30/1622 | | $ | 5.86 | | | | 0.01 | | | | 0.77 | | | | 0.78 | | | | — | 4 | | | (0.03 | ) | | | — | | | | (0.03 | ) |
Year ended 9/30/15 | | $ | 5.69 | | | | 0.05 | 17 | | | 0.12 | | | | 0.17 | | | | — | 4 | | | — | | | | — | | | | — | |
Year ended 9/30/14 | | $ | 5.12 | | | | (0.02 | ) | | | 0.59 | | | | 0.57 | | | | — | 4 | | | — | | | | — | | | | — | |
Year ended 9/30/13 | | $ | 3.81 | | | | (0.01 | ) | | | 1.32 | | | | 1.31 | | | | — | 4 | | | — | | | | — | | | | — | |
Year ended 9/30/12 | | $ | 3.12 | | | | (0.03 | ) | | | 0.72 | | | | 0.69 | | | | — | 4 | | | — | | | | — | | | | — | |
Small Cap Value Fund — Institutional Class | | | | | | | | | | | | | | | | | |
Year ended 9/30/1622 | | $ | 5.88 | | | | 0.02 | | | | 0.78 | | | | 0.80 | | | | — | 4 | | | (0.03 | ) | | | — | | | | (0.03 | ) |
Year ended 9/30/15 | | $ | 5.72 | | | | 0.05 | 17 | | | 0.11 | | | | 0.16 | | | | — | 4 | | | — | | | | — | | | | — | |
Year ended 9/30/14 | | $ | 5.14 | | | | (0.03 | ) | | | 0.61 | | | | 0.58 | | | | — | | | | — | | | | — | | | | — | |
Year ended 9/30/13 | | $ | 3.82 | | | | (0.01 | ) | | | 1.33 | | | | 1.32 | | | | — | 4 | | | — | | | | — | | | | — | |
Period ended 9/30/128 | | $ | 3.68 | | | | (0.01 | ) | | | 0.15 | | | | 0.14 | | | | — | | | | — | | | | — | | | | — | |
Strategic Income Fund | | | | | | | | | | | | | | | | | | | | | | | | | |
Year ended 9/30/1622 | | $ | 10.49 | | | | 0.26 | | | | 0.49 | | | | 0.75 | | | | — | 4 | | | (0.27 | )20 | | | (0.35 | ) | | | (0.62 | ) |
Year ended 9/30/15 | | $ | 12.63 | | | | 0.30 | | | | (1.38 | ) | | | (1.08 | ) | | | — | 4 | | | (0.44 | ) | | | (0.62 | ) | | | (1.06 | ) |
Year ended 9/30/14 | | $ | 11.08 | | | | 0.32 | | | | 1.74 | | | | 2.06 | | | | — | 4 | | | (0.35 | ) | | | (0.16 | ) | | | (0.51 | ) |
Year ended 9/30/13 | | $ | 9.30 | | | | 0.33 | | | | 1.78 | | | | 2.11 | | | | — | 4 | | | (0.33 | ) | | | — | | | | (0.33 | ) |
Year ended 9/30/12 | | $ | 7.57 | | | | 0.16 | | | | 1.77 | | | | 1.93 | | | | — | 4 | | | (0.20 | ) | | | — | | | | (0.20 | ) |
Ultra Growth Fund | | | | | | | | | | | | | | | | | | | | | | | | | | | | | | | | |
Year ended 9/30/1622 | | $ | 18.06 | | | | (0.18 | ) | | | 3.66 | | | | 3.48 | | | | — | 4 | | | — | | | | (1.65 | ) | | | (1.65 | ) |
Year ended 9/30/15 | | $ | 23.67 | | | | (0.26 | ) | | | 1.54 | | | | 1.28 | | | | — | 4 | | | (0.01 | ) | | | (6.88 | ) | | | (6.89 | ) |
Year ended 9/30/14 | | $ | 24.57 | | | | (0.06 | ) | | | 0.80 | | | | 0.74 | | | | — | 4 | | | — | | | | (1.64 | ) | | | (1.64 | ) |
Year ended 9/30/13 | | $ | 22.83 | | | | (0.15 | ) | | | 4.96 | | | | 4.81 | | | | — | 4 | | | — | | | | (3.07 | ) | | | (3.07 | ) |
Year ended 9/30/12 | | $ | 20.11 | | | | (0.08 | ) | | | 3.98 | | | | 3.90 | | | | — | 4 | | | — | | | | (1.18 | ) | | | (1.18 | ) |
World Innovators Fund — Investor Class | | | | | | | | | | | | | | | | | |
Year ended 9/30/1622 | | $ | 20.17 | | | | (0.12 | ) | | | 1.90 | | | | 1.78 | | | | — | 4 | | | — | | | | (2.63 | ) | | | (2.63 | ) |
Year ended 9/30/15 | | $ | 22.62 | | | | (0.21 | ) | | | 0.30 | | | | 0.09 | | | | — | 4 | | | — | | | | (2.54 | ) | | | (2.54 | ) |
Year ended 9/30/14 | | $ | 23.15 | | | | (0.24 | ) | | | 0.91 | | | | 0.67 | | | | — | 4 | | | — | | | | (1.20 | ) | | | (1.20 | ) |
Year ended 9/30/13 | | $ | 18.55 | | | | (0.12 | ) | | | 4.72 | | | | 4.60 | | | | — | 4 | | | — | | | | — | | | | — | |
Year ended 9/30/12 | | $ | 14.71 | | | | (0.12 | ) | | | 3.96 | | | | 3.84 | | | | — | 4 | | | — | | | | — | | | | — | |
World Innovators Fund — Institutional Class | | | | | | | | | | | | | | | | | | | | | |
Period ended 9/30/1619 22 | | $ | 17.54 | | | | (— | )4 | | | 1.82 | | | | 1.82 | | | | — | | | | — | | | | — | | | | — | |
Income Fund | | | | | | | | | | | | | | | | | | | | | | | | | | | | | | | | |
Year ended 9/30/1622 | | $ | 10.18 | | | | 0.19 | | | | 0.07 | | | | 0.26 | | | | — | 4 | | | (0.19 | ) | | | — | | | | (0.19 | ) |
Year ended 9/30/15 | | $ | 10.15 | | | | 0.16 | | | | 0.03 | | | | 0.19 | | | | — | 4 | | | (0.16 | ) | | | — | | | | (0.16 | ) |
Year ended 9/30/14 | | $ | 10.13 | | | | 0.17 | | | | 0.02 | | | | 0.19 | | | | — | 4 | | | (0.17 | ) | | | — | | | | (0.17 | ) |
Year ended 9/30/13 | | $ | 10.44 | | | | 0.17 | | | | (0.31 | ) | | | (0.14 | ) | | | — | | | | (0.17 | ) | | | — | | | | (0.17 | ) |
Year ended 9/30/12 | | $ | 10.32 | | | | 0.20 | | | | 0.12 | | | | 0.32 | | | | — | 4 | | | (0.20 | ) | | | — | | | | (0.20 | ) |
U.S. Treasury Fund | | | | | | | | | | | | | | | | | | | | | | | | | | | | | | | | |
Year ended 9/30/1622 | | $ | 18.42 | | | | 0.37 | | | | 2.29 | | | | 2.66 | | | | 0.01 | | | | (0.36 | ) | | | (0.87 | ) | | | (1.23 | ) |
Year ended 9/30/15 | | $ | 17.08 | | | | 0.38 | | | | 1.33 | | | | 1.71 | | | | 0.01 | | | | (0.38 | ) | | | — | | | | (0.38 | ) |
Year ended 9/30/14 | | $ | 15.33 | | | | 0.45 | | | | 1.75 | | | | 2.20 | | | | — | 4 | | | (0.45 | ) | | | — | | | | (0.45 | ) |
Year ended 9/30/13 | | $ | 18.75 | | | | 0.44 | | | | (3.08 | ) | | | (2.64 | ) | | | 0.01 | | | | (0.44 | ) | | | (0.35 | ) | | | (0.79 | ) |
Year ended 9/30/12 | | $ | 18.75 | | | | 0.42 | | | | 0.77 | | | | 1.19 | | | | 0.01 | | | | (0.42 | ) | | | (0.78 | ) | | | (1.20 | ) |
See Notes to Financial Highlights and Notes to Financial Statements.
114
| | |
| | (for a share outstanding throughout each period) |
|
|
|
| | | | | | | | | | | | | | | | | | | | | | | | | | | | | | |
| | | | | | |
Ratios to Average Net Assets | | | Supplemental Data | |
Net Asset
Value
End of
Period | | | Total Return (%)1 | | | Expenses
Net of
Waivers and
Reimbursements (%)2 | | | Expenses
Before
Waivers and
Reimbursements (%)2 | | | Net Investment
Income Net of
Waivers and
Reimbursements (%)2 | | | Net Investment
Income Before
Waivers and
Reimbursements (%)2 | | | Net Assets
End of
Period
(000s) | | | Portfolio
Turnover
Rate1 3 | |
| | | | | | | | | | | | | | | | | | | | | | | | | | | | | | |
| $ | 43.52 | | | | 11.87 | | | | 1.29 | 5 | | | 1.29 | 5 | | | (0.79 | ) | | | (0.79 | ) | | $ | 1,544,796 | | | | 20% | |
| $ | 45.97 | | | | 0.39 | | | | 1.22 | 5 | | | 1.22 | 5 | | | (0.75 | ) | | | (0.75 | ) | | $ | 2,000,588 | | | | 31% | |
| $ | 50.25 | | | | 1.09 | | | | 1.21 | 5 | | | 1.21 | 5 | | | (0.75 | ) | | | (0.75 | ) | | $ | 2,219,638 | | | | 23% | |
| $ | 51.31 | | | | 25.34 | | | | 1.23 | 5 | | | 1.23 | 5 | | | (0.42 | ) | | | (0.42 | ) | | $ | 2,487,031 | | | | 10% | |
| $ | 43.82 | | | | 29.41 | | | | 1.24 | 5 | | | 1.24 | 5 | | | (0.73 | ) | | | (0.73 | ) | | $ | 1,824,781 | | | | 20% | |
| | | | | | | | | | | | | | | | | | | | | | | | | | | | | | |
| $ | 43.58 | | | | 15.97 | | | | 1.05 | 5 | | | 1.11 | 5 | | | (0.63 | ) | | | (0.69 | ) | | $ | 337,605 | | | | 20% | |
| | | | | | | | | | | | | | | | | | | | | | | | | | | | | | |
| $ | 6.61 | | | | 13.37 | | | | 1.24 | 5 | | | 1.24 | 5 | | | 0.23 | | | | 0.23 | | | $ | 269,710 | | | | 57% | |
| $ | 5.86 | | | | 2.99 | | | | 1.21 | 5 | | | 1.21 | 5 | | | 0.82 | 17 | | | 0.82 | 17 | | $ | 257,655 | | | | 57% | |
| $ | 5.69 | | | | 11.13 | | | | 1.20 | 5 | | | 1.20 | 5 | | | (0.52 | ) | | | (0.52 | ) | | $ | 265,521 | | | | 50% | |
| $ | 5.12 | | | | 34.38 | | | | 1.26 | 5 | | | 1.27 | 5 | | | (0.21 | ) | | | (0.22 | ) | | $ | 201,581 | | | | 40% | |
| $ | 3.81 | | | | 22.12 | | | | 1.46 | 5 | | | 1.46 | 5 | | | (0.73 | ) | | | (0.73 | ) | | $ | 166,330 | | | | 55% | |
| | | | | | | | | | | | | | | | | | | | | | | | | | | | | | |
| $ | 6.65 | | | | 13.54 | | | | 1.08 | 5 | | | 1.20 | 5 | | | 0.40 | | | | 0.28 | | | $ | 23,839 | | | | 57% | |
| $ | 5.88 | | | | 2.97 | | | | 1.15 | 5 | | | 1.20 | 5 | | | 0.92 | 17 | | | 0.87 | 17 | | $ | 18,941 | | | | 57% | |
| $ | 5.72 | | | | 11.28 | | | | 1.15 | 5 | | | 1.44 | 5 | | | (0.49 | ) | | | (0.78 | ) | | $ | 10,436 | | | | 50% | |
| $ | 5.14 | | | | 34.55 | | | | 1.15 | 5 | | | 1.46 | 5 | | | (0.11 | ) | | | (0.42 | ) | | $ | 9,359 | | | | 40% | |
| $ | 3.82 | | | | 3.80 | | | | 1.15 | 5 | | | 1.66 | 5 | | | (0.42 | ) | | | (0.93 | ) | | $ | 7,243 | | | | 55% | |
| | | | | | | | | | | | | | | | | | | | | | | | | | | | | | |
| $ | 10.62 | | | | 7.38 | | | | 0.95 | 5 | | | 1.04 | 5 | | | 2.50 | | | | 2.41 | | | $ | 55,112 | | | | 45% | |
| $ | 10.49 | | | | (9.54 | ) | | | 0.95 | 5 | | | 0.95 | 5 | | | 2.51 | | | | 2.51 | | | $ | 88,661 | | | | 78% | |
| $ | 12.63 | | | | 18.94 | | | | 0.95 | 5 | | | 0.96 | 5 | | | 2.59 | | | | 2.58 | | | $ | 94,958 | | | | 69% | |
| $ | 11.08 | | | | 23.01 | | | | 0.95 | 5 | | | 1.06 | 5 | | | 3.16 | | | | 3.05 | | | $ | 66,579 | | | | 54% | |
| $ | 9.30 | | | | 25.61 | | | | 0.95 | 5 | | | 1.14 | 5 | | | 1.74 | | | | 1.55 | | | $ | 44,635 | | | | 57% | |
| | | | | | | | | | | | | | | | | | | | | | | | | | | | | | |
| $ | 19.89 | | | | 20.08 | | | | 1.33 | 5 | | | 1.33 | 5 | | | (1.03 | ) | | | (1.03 | ) | | $ | 101,402 | | | | 28% | |
| $ | 18.06 | | | | 4.02 | | | | 1.31 | 5 | | | 1.31 | 5 | | | (1.06 | ) | | | (1.06 | ) | | $ | 96,015 | | | | 38% | |
| $ | 23.67 | | | | 2.66 | | | | 1.26 | 5 | | | 1.26 | 5 | | | (1.00 | ) | | | (1.00 | ) | | $ | 102,834 | | | | 38% | |
| $ | 24.57 | | | | 24.52 | | | | 1.29 | 5 | | | 1.29 | 5 | | | (0.64 | ) | | | (0.64 | ) | | $ | 151,697 | | | | 25% | |
| $ | 22.83 | | | | 20.13 | | | | 1.32 | 5 | | | 1.32 | 5 | | | (0.35 | ) | | | (0.35 | ) | | $ | 143,259 | | | | 43% | |
| | | | | | | | | | | | | | | | | | | | | | | | | | | | | | |
| $ | 19.32 | | | | 8.97 | | | | 1.78 | 5 | | | 1.78 | 5 | | | (0.66 | ) | | | (0.66 | ) | | $ | 193,826 | | | | 112% | |
| $ | 20.17 | | | | 0.32 | | | | 1.76 | 5 | | | 1.76 | 5 | | | (0.76 | ) | | | (0.76 | ) | | $ | 186,272 | | | | 100% | |
| $ | 22.62 | | | | 2.69 | | | | 1.73 | 5 | | | 1.73 | 5 | | | (0.89 | ) | | | (0.89 | ) | | $ | 253,311 | | | | 111% | |
| $ | 23.15 | | | | 24.80 | | | | 1.77 | 5 | | | 1.79 | 5 | | | (0.84 | ) | | | (0.86 | ) | | $ | 266,911 | | | | 84% | |
| $ | 18.55 | | | | 26.10 | | | | 1.85 | 5 | | | 1.85 | 5 | | | (0.99 | ) | | | (0.99 | ) | | $ | 167,934 | | | | 66% | |
| | | | | | | | | | | | | | | | | | | | | | | | | | | | | | |
| $ | 19.36 | | | | 10.38 | | | | 1.55 | 5 | | | 3.69 | 5 | | | (0.01 | ) | | | (2.15 | ) | | $ | 5,977 | | | | 112% | |
| | | | | | | | | | | | | | | | | | | | | | | | | | | | | | |
| $ | 10.25 | | | | 2.58 | | | | 0.73 | 5 | | | 0.73 | 5 | | | 1.85 | | | | 1.85 | | | $ | 99,706 | | | | 37% | |
| $ | 10.18 | | | | 1.87 | | | | 0.72 | 5 | | | 0.72 | 5 | | | 1.57 | | | | 1.57 | | | $ | 108,959 | | | | 44% | |
| $ | 10.15 | | | | 1.91 | | | | 0.70 | 5 | | | 0.70 | 5 | | | 1.66 | | | | 1.66 | | | $ | 116,752 | | | | 13% | |
| $ | 10.13 | | | | (1.34 | ) | | | 0.71 | | | | 0.71 | | | | 1.67 | | | | 1.67 | | | $ | 130,285 | | | | 35% | |
| $ | 10.44 | | | | 3.16 | | | | 0.70 | 5 | | | 0.70 | 5 | | | 1.97 | | | | 1.97 | | | $ | 139,186 | | | | 48% | |
| | | | | | | | | | | | | | | | | | | | | | | | | | | | | | |
| $ | 19.86 | | | | 15.49 | | | | 0.69 | 5 21 | | | 0.73 | 5 | | | 1.97 | 21 | | | 1.93 | | | $ | 489,011 | | | | 59% | |
| $ | 18.42 | | | | 10.09 | | | | 0.67 | 5 | | | 0.67 | 5 | | | 2.12 | | | | 2.12 | | | $ | 327,861 | | | | 131% | |
| $ | 17.08 | | | | 14.54 | | | | 0.70 | 5 | | | 0.70 | 5 | | | 2.77 | | | | 2.77 | | | $ | 224,664 | | | | 28% | |
| $ | 15.33 | | | | (14.43 | ) | | | 0.71 | 5 | | | 0.71 | 5 | | | 2.46 | | | | 2.46 | | | $ | 193,231 | | | | 34% | |
| $ | 18.75 | | | | 6.66 | | | | 0.72 | 5 | | | 0.72 | 5 | | | 2.33 | | | | 2.33 | | | $ | 271,495 | | | | 13% | |
115
Notes to Financial Highlights
| 1 | Not annualized for periods less than one year. |
| 2 | Annualized for periods less than one year. |
| 3 | Portfolio turnover is calculated on the basis of the Fund as a whole without distinguishing between the classes of shares issued. |
| 4 | Represents amounts less than $0.005 per share. |
| 5 | Includes interest expense of less than 0.005%. |
| 6 | Includes interest expenses of more than 0.005%. |
| 7 | Includes interest expense and dividend payments for securities sold short. The ratios excluding such expenses are listed below: |
| | | | | | | | | | |
| | | Expenses Net of
Waivers and
Reimbursements2 | | Expenses Before
Waivers and
Reimbursements2 |
Long/Short Fund — Investor Class | | | | | | | | | | |
Year ended 9/30/16 | | | | 1.42% | | | | | 1.42% | |
Year ended 9/30/15 | | | | 1.30% | | | | | 1.30% | |
Year ended 9/30/14 | | | | 1.27% | | | | | 1.27% | |
Year ended 9/30/13 | | | | 1.28% | | | | | 1.28% | |
Year ended 9/30/12 | | | | 1.27% | | | | | 1.27% | |
| | |
Long/Short Fund — Institutional Class | | | | | | | | | | |
Year ended 9/30/16 | | | | 1.17% | | | | | 1.22% | |
Year ended 9/30/15 | | | | 1.16% | | | | | 1.16% | |
Year ended 9/30/14 | | | | 1.16% | | | | | 1.16% | |
Period ended 9/30/1313 | | | | 1.17% | | | | | 1.18% | |
| 8 | Institutional class inception date was January 31, 2012. |
| 9 | Fund inception date was January 31, 2012. |
| 10 | Includes extraordinary expenses of 0.01% (see Note 7). |
| 11 | Includes extraordinary expenses of less than 0.01% (see Note 7). |
| 12 | Fund inception date was December 13, 2012. |
| 13 | Institutional class inception date was December 13, 2012. |
| 14 | Investment income per share reflects a large, non-recurring dividend which amounted to $0.17 and $0.08 per share for the Investor Class and Institutional Class, respectively. Excluding this non-recurring dividend, income (loss) to average net assets would have been as follows: |
| | | | | | | | | | |
| | | Net Investment
Income (Loss)
Net of
Waivers and
Reimbursements | | Net Investment
Income (Loss)
Before
Waivers and
Reimbursements |
Core Growth Fund — Investor Class | | | | (0.58 | )% | | | | (0.58 | )% |
| | |
Core Growth Fund — Institutional Class | | | | (0.59 | )% | | | | (0.60 | )% |
| 15 | Investment income per share reflects a large, non-recurring dividend which amounted to $0.04 per share. Excluding this non-recurring dividend, the ratio of net investment income (loss) to average net assets would have been (1.40)%. |
| 16 | Investment income per share reflects a large, non-recurring dividend which amounted to $0.01 per share. Excluding this non-recurring dividend, the ratio of net investment income (loss) to average net assets would have been (1.04)% for Net Investment Income Net of Waivers and Reimbursements and (1.10)% for Net Investment Income Before Waivers and Reimbursements. |
| 17 | Investment income per share reflects a large, non-recurring dividend which amounted to $0.05 and $0.05 per share for the Investor Class and Institutional Class, respectively. Excluding this non-recurring dividend, the ratio of net investment income (loss) to average net assets would have been as follows: |
| | | | | | | | | | |
| | | Net Investment
Income (Loss)
Net of
Waivers and
Reimbursements | | Net Investment
Income (Loss)
Before
Waivers and
Reimbursements |
Small Cap Value Fund — Investor Class | | | | (0.00 | )%18 | | | | (0.00 | )%18 |
| | |
Small Cap Value Fund — Institutional Class | | | | 0.10 | % | | | | 0.05 | % |
| 18 | Amount is less than 0.005%. |
| 19 | Institutional class inception date was February 1, 2016. |
| 20 | Dividends from net investment income includes a return of capital distribution, which amounted to 0.04 per share. |
| 21 | Includes reimbursement by Hoisington Investment Management Co., the Sub-Advisor, for proxy statement expenses which amounted to 0.01 per share. |
116
| 22 | Includes a non-recurring offer to reimburse prior period custody and fund accounting out-of-pocket expenses (see Note 7 “Custodian Out-of-Pocket Expense Reimbursement”). Excluding this non-recurring reimbursement, the ratio of expenses to average net assets would have been as follows: |
| | | | | | | | | | |
| | | Expenses Net of
Waivers and
Reimbursements (%) | | Expenses Before
Waivers and
Reimbursements (%) |
Core Growth Fund — Investor Class | | | | 1.21 | | | | | 1.21 | |
Core Growth Fund — Institutional Class | | | | 1.07 | | | | | 1.09 | |
Emerging India Fund — Investor Class | | | | 1.84 | | | | | 1.98 | |
Emerging India Fund — Institutional Class | | | | 1.56 | | | | | 2.06 | |
Emerging Markets Select Fund — Investor Class | | | | 1.60 | | | | | 2.00 | |
Emerging Markets Select Fund — Institutional Class | | | | 1.33 | | | | | 1.63 | |
Emerging Markets Small Cap Fund — Investor Class | | | | 1.97 | | | | | 2.01 | |
Emerging Markets Small Cap Fund — Institutional Class | | | | 1.82 | | | | | 1.83 | |
Frontier Emerging Small Countries Fund — Investor Class | | | | 2.25 | | | | | 2.39 | |
Frontier Emerging Small Countries Fund — Institutional Class | | | | 2.08 | | | | | 2.08 | |
Global Opportunities Fund — Investor Class | | | | 1.64 | | | | | 1.64 | |
Global Opportunities Fund — Institutional Class | | | | 1.42 | | | | | 2.39 | |
International Growth Fund — Investor Class | | | | 1.48 | | | | | 1.48 | |
International Growth Fund — Institutional Class | | | | 1.36 | | | | | 1.37 | |
International Opportunities Fund — Investor Class | | | | 2.26 | | | | | 2.30 | |
International Opportunities Fund — Institutional Class | | | | 1.97 | | | | | 2.06 | |
Large Cap Value Fund — Investor Class | | | | 1.10 | | | | | 1.17 | |
Large Cap Value Fund — Institutional Class | | | | 0.96 | | | | | 1.72 | |
Long/Short Fund — Investor Class | | | | 1.83 | | | | | 1.83 | |
Long/Short Fund — Institutional Class | | | | 1.52 | | | | | 1.57 | |
Micro Cap Fund — Investor Class | | | | 1.92 | | | | | 1.92 | |
Micro Cap Value Fund — Investor Class | | | | 1.96 | | | | | 2.05 | |
Small Cap Growth Fund — Investor Class | | | | 1.29 | | | | | 1.29 | |
Small Cap Growth Fund — Institutional Class | | | | 1.05 | | | | | 1.11 | |
Small Cap Value Fund — Investor Class | | | | 1.24 | | | | | 1.24 | |
Small Cap Value Fund — Institutional Class | | | | 1.08 | | | | | 1.20 | |
Strategic Income Fund — Investor Class | | | | 0.95 | | | | | 1.04 | |
Ultra Growth Fund — Investor Class | | | | 1.34 | | | | | 1.34 | |
World Innovators Fund — Investor Class | | | | 1.79 | | | | | 1.79 | |
World Innovators Fund — Institutional Class | | | | 1.63 | | | | | 3.77 | |
Income Fund — Investor Class | | | | 0.73 | | | | | 0.73 | |
U.S. Treasury Fund — Investor Class | | | | 0.69 | | | | | 0.73 | |
See Notes to Financial Statements.
117
Notes to Financial Statements
1. ORGANIZATION
Wasatch Funds Trust (the “Trust”) is a Massachusetts business trust registered under the Investment Company Act of 1940, as amended (the “1940 Act”), as an open-end management investment company and consists of 19 series or funds (each a “Fund” and collectively the “Funds”). The Core Growth Fund, Emerging India Fund, Emerging Markets Select Fund, Emerging Markets Small Cap Fund, Frontier Emerging Small Countries Fund, Global Opportunities Fund, International Growth Fund, International Opportunities Fund, Large Cap Value Fund, Long/Short Fund, Micro Cap Fund, Micro Cap Value Fund, Small Cap Growth Fund, Small Cap Value Fund, Strategic Income Fund, Ultra Growth Fund, World Innovators Fund, Wasatch-1st Source Income Fund (“Income Fund”) (sub-advised), and Wasatch-Hoisington U.S. Treasury Fund (“U.S. Treasury Fund”) (sub-advised) are each diversified funds. Each Fund maintains its own investment objective(s).
On November 9, 2011, the Trust re-designated the shares of the Funds into Investor Class shares effective January 31, 2012, and authorized and designated a new Institutional Class of shares in the Funds. Currently 13 funds offer Institutional Class shares: Core Growth Fund, Large Cap Value Fund and Small Cap Value Fund, which commenced operations on January 31, 2012, Emerging Markets Select Fund and Long/Short Fund, which commenced operations on December 13, 2012 and Emerging India Fund, Emerging Markets Small Cap Fund, Frontier Emerging Small Countries Fund, Global Opportunities Fund, International Growth Fund, International Opportunities Fund, Small Cap Growth Fund and World Innovators Fund, which commenced operations on February 1, 2016. Each class of shares for each Fund has identical rights and privileges except with respect to purchase minimums, distribution and service charges, shareholder services, voting rights on matters affecting a single class of shares, and the exchange and conversion features. The Funds have entered into an investment advisory agreement with Wasatch Advisors, Inc. (the “Advisor” or “Wasatch”) as investment advisor.
The Core Growth, Emerging India, Emerging Markets Select, Emerging Markets Small Cap, Frontier Emerging Small Countries, Global Opportunities, International Growth, International Opportunities, Large Cap Value, Long/Short, Micro Cap, Micro Cap Value, Small Cap Growth, Small Cap Value, Strategic Income, Ultra Growth and World Innovators Funds are referred to herein as the “Equity Funds.”
2. SIGNIFICANT ACCOUNTING POLICIES
The following is a summary of significant policies related to investments of the Funds held at September 30, 2016. These policies are in conformity with accounting principles generally accepted in the United States of America (“U.S. GAAP”).
Valuation of Securities — All investments in securities are recorded at their estimated fair value as described in Note 13.
Foreign Currency Translations — Values of investments denominated in foreign currencies are converted into U.S. dollars using the current exchange rates each business day (generally 4:00 p.m. Eastern Time). Purchases and sales of investments and dividend income are translated into U.S. dollars using the current prevailing exchange rate on the transaction date. The effect of changes in foreign exchange rates on realized and unrealized gains or losses on securities is reflected as a component of such gains or losses. Transactions in foreign denominated assets may involve greater risks than domestic transactions.
Investment in Securities and Related Investment Income — Security transactions are accounted for on the trade date. Gains or losses on securities sold are determined on the identified cost basis. Dividend income and distributions to shareholders are recorded on the ex-dividend date except that certain dividends from foreign securities may be recorded after the ex-dividend date based on when the Fund is informed of the dividend. Interest income and estimated expenses are accrued daily. Bond discount and premiums are amortized using the interest method. To the extent dividends received include return of capital or capital gain distributions, such distributions are recorded as a reduction to cost of the related security or as realized gain or loss.
Expenses — The Funds contract for various services on a collective basis. Most expenses are directly attributable to each Fund and therefore are charged accordingly. Expenses that are not directly attributable to one or more Funds are allocated among applicable Funds on an equitable and consistent basis considering such things as the nature and type of expense and the relative net assets of the Funds.
Use of Management Estimates — The preparation of financial statements in conformity with U.S. GAAP requires management to make estimates and assumptions that affect the reported amounts of assets and liabilities at the date of the financial statements and the reported changes in net assets during the reporting period. Actual results could differ from those estimates.
Guarantees and Indemnifications — In the normal course of business, the Funds enter into contracts that contain a variety of representations and warranties which provide general indemnifications. The maximum exposure under these arrangements is unknown, as this would involve future claims that may be made against the Funds and/or their affiliates that have not yet occurred. Based on experience, however, the risk of loss is expected to be remote.
Redemption Fees — The Funds deduct a fee of 2.00% from redemption proceeds on shares of the Funds held 60 days or less. Redemption fees retained by the Funds are credited to additional paid-in capital.
New Accounting Pronouncements — In May 2015, the Financial Accounting Standards Board (“FASB”) issued ASU 2015-07 entitled Fair Value Measurement (Topic 820) — Disclosures for Investments in Certain Entities That Calculate Net Asset Value per Share (or Its Equivalent) which is intended to address the diversity in practice of how investments measured at net asset value with redemption dates in the future (including periodic redemption dates) are categorized within the fair value hierarchy. The FASB guidance
118
allows reporting entities to exclude investments measured at net asset value (NAV) per share under the existing practical expedient in ASC 820 from the fair value hierarchy. ASU 2015-07 is effective for interim and annual reporting periods in fiscal years that begin after December 15, 2015. At this time, management is evaluating the implications of ASU 2015-07 and its impact to financial statements.
Other — Income, expenses, and realized and unrealized gains or losses on investments are generally allocated to each class of shares based on its relative net assets, except that each class separately bears expenses related specifically to that class, such as certain shareholder servicing fees.
3. SECURITIESAND OTHER INVESTMENTS
Repurchase Agreements — The Funds may engage in repurchase transactions. Under the terms of a typical repurchase agreement, a fund takes possession of an underlying debt obligation subject to an obligation of the seller to repurchase and the fund to resell the obligation at an agreed upon price and time. The market value of the collateral must be at least equal at all times to the total amount of the repurchase obligation, including interest. Generally, in the event of counterparty default, the fund has the right to use the collateral to offset losses incurred. Refer to Note 14 (Offsetting) for more information about the offsetting of assets and liabilities.
Short Sales — The Long/Short Fund and to a lesser extent the other Equity Funds may enter into short sales whereby a fund sells a security it generally does not own (the security is borrowed), in anticipation of a decline in the security’s price. The initial amount of a short sale is recorded as a liability which is marked-to-market daily. Fluctuations in the value of the short liability are recorded as unrealized gains or losses. If a Fund shorts a security when also holding a long position in the security (a “short against the box”), as the security’s price declines, the short position increases in value, offsetting the long position’s decrease in value. The opposite effect occurs if the security’s price rises. A Fund realizes a gain or loss upon closing of the short sale (returning the security to the counterparty by way of purchase or delivery of a long position owned). Possible losses from short sales may be unlimited, whereas losses from security purchases cannot exceed the total amount invested. The Funds are liable to the buyer for any dividends payable on securities while those securities are in a short position. These dividends are an expense of the Funds. The Funds designate collateral consisting of cash, U.S. government securities or other liquid assets sufficient to collateralize the market value of short positions. Refer to Note 14 (Offsetting) for more information about the offsetting of assets and liabilities.
Participation Notes — The Frontier Emerging Small Countries and the Global Opportunities Funds may invest in Participation Notes (P-Notes). P-Notes are promissory notes that are designed to offer a return linked to the performance of a particular underlying equity security or market. P-Notes are issued by banks or broker-dealers and allow a fund to gain exposure to common stocks in markets in which the fund is currently not approved to directly invest,
or in markets that prohibit direct investment by foreign purchasers (e.g. Saudi Arabia). While the holder of a P-Note is entitled to receive from the bank or broker-dealer any dividends or other distributions paid on the underlying securities, the holder is not entitled to the same rights as an owner of the underlying securities, such as voting rights. Income received from P-Notes is recorded as dividend income in the Statement of Operations. P-Notes are considered general unsecured contractual obligations of the bank or broker-dealer. Risks associated with P-Notes include the possible failure of a counterparty (i.e., the issuing bank or broker-dealer) to perform in accordance with the terms of the agreement, inability to transfer or liquidate the notes, potential delays or an inability to redeem the notes before maturity under certain market conditions, and limited legal recourse against the issuer of the underlying common stock.
Unfunded Commitments — The Equity Funds may participate in unfunded loan commitments. Pursuant to the terms of a Convertible Note Purchase Agreement, the Micro Cap Value and Ultra Growth Funds held unfunded loan commitments at the end of the period. The Funds are obligated to fund these loan commitments at the borrower’s discretion. The Funds reserve against such contingent obligations by segregating cash and/or other liquid assets. As of September 30, 2016, the total amount of unfunded commitments for each Fund was as follows:
| | | | | | | | |
| | | Unfunded Loan Commitment | | | Unrealized Appreciation (Depreciation) | |
Acetylon Pharmaceuticals, Inc. Convertible Promissory Note (structured as a Line of Credit), 12.00%, 12/31/17 | | $ | 500,000 | | | $ | — | |
4. FINANCIAL DERIVATIVE INSTRUMENTS
Foreign Currency Contracts — The Funds may enter into foreign currency contracts to settle planned purchases or sales of securities or to protect against a possible loss resulting from the adverse change in the relationship between the U.S. dollar and a foreign currency involved in an underlying transaction. Foreign currency contracts are agreements between two parties to buy and sell a currency at a set price on a future date. The market value of a foreign currency contract fluctuates with changes in currency exchange rates. Foreign currency contracts are marked-to-market daily and the change in market value is recorded by a fund as unrealized appreciation or depreciation. When a foreign currency contract is closed, the fund records a realized gain or loss equal to the difference between the value at the time it was opened and the value at the time it was closed. These contracts may involve market risk in excess of the unrealized gain or loss reflected in the Schedule of Investments. In addition, a fund could be exposed to credit risk if a counterparty is unable or unwilling to meet the terms of the contracts or if the value of the currency changes unfavorably. In connection with these contracts, the Funds may segregate cash and/or securities in a sufficient amount as collateral in accordance with the terms of the respective contracts.
119
Notes to Financial Statements (continued)
Options Transactions — The Equity Funds and the Income Fund may buy and sell put and call options and write covered put and call options, including over-the-counter options, on portfolio securities where the completion of the obligation is dependent upon the credit standing of another party. Options are a type of derivative financial instrument. The Funds may invest in derivative financial instruments, including options, in order to manage risk or gain exposure to various other investments or markets. The risk in writing a call option is that a fund gives up the opportunity for profit if the market price of the security increases. The risk in writing a put option is that a fund may incur a loss if the market price of the security decreases and the option is exercised. The risk in buying an option is that a fund pays a premium whether or not the option is exercised.
A fund also has the additional risk of not being able to enter into a closing transaction if a liquid secondary market does not exist. Possible losses from uncovered written options may be unlimited. Option contracts are valued daily and unrealized appreciation or depreciation is recorded. A fund will realize a gain or loss upon expiration or closing of the option transaction. When an option is exercised, the proceeds on sales for a written call option, the purchase cost for a written put option, or the cost of a security for a purchased put or call option is adjusted by the amount of premium received or paid. The Funds designate collateral consisting of cash, U.S. government securities or other liquid assets sufficient to collateralize the market value of written options. Refer to Note 14 (Offsetting) for more information about the offsetting of assets and liabilities.
Options written activity during the year ended September 30, 2016 was as follows:
| | | | | | | | | | | | | | | | | | | | | | | | |
| | | Options Outstanding at 9/30/2015 | | | Written | | | Closed | | | Exercised | | | Expired | | | Options Outstanding at
9/30/2016 | |
Large Cap Value Fund | | | | | | | | | | | | | | | | | | | | | | | | |
Premium amount | | $ | — | | | $ | 132,873 | | | $ | — | | | $ | (23,850 | ) | | $ | (109,023 | ) | | $ | — | |
Number of contracts | | | — | | | | 1,100 | | | | — | | | | (200 | ) | | | (900 | ) | | | — | |
5. PURCHASESAND SALESOF SECURITIES
Cost of investment securities purchased and proceeds from sales of investment securities, excluding U.S. government and short-term securities for the year ended September 30, 2016 are summarized below:
| | | | | | | | | | | | | | | | | | | | | | | | |
| | | Core
Growth
Fund | | | Emerging
India
Fund | | | Emerging
Markets
Select
Fund | | | Emerging
Markets
Small Cap
Fund | | | Frontier
Emerging
Small Countries
Fund | | | Global
Opportunities
Fund | |
Purchases | | $ | 238,977,261 | | | $ | 33,929,625 | | | $ | 22,903,125 | | | $ | 354,768,576 | | | $ | 631,518,928 | | | $ | 67,437,006 | |
Sales | | | 198,864,707 | | | | 27,793,650 | | | | 23,493,797 | | | | 562,829,381 | | | | 1,028,170,576 | | | | 93,223,722 | |
| | | | | | |
| | | International
Growth
Fund | | | International
Opportunities
Fund | | | Large Cap
Value
Fund | | | Long/Short
Fund | | | Micro
Cap
Fund | | | Micro Cap
Value
Fund | |
Purchases | | $ | 671,416,025 | | | $ | 320,220,759 | | | $ | 54,234,227 | | | $ | 213,926,115 | | | $ | 82,215,585 | | | $ | 117,635,126 | |
Sales | | | 719,335,273 | | | | 209,849,235 | | | | 135,408,603 | | | | 1,019,733,097 | | | | 110,812,099 | | | | 104,988,216 | |
| | | | | | |
| | | Small Cap
Growth
Fund | | | Small Cap
Value
Fund | | | Strategic
Income
Fund | | | Ultra
Growth
Fund | | | World
Innovators
Fund | | | Income
Fund | |
Purchases | | $ | 370,017,563 | | | $ | 148,949,638 | | | $ | 26,768,448 | | | $ | 26,050,995 | | | $ | 180,097,748 | | | $ | 30,181,754 | |
Sales | | | 675,746,855 | | | | 181,059,509 | | | | 68,203,911 | | | | 41,106,159 | | | | 204,590,267 | | | | 29,117,885 | |
Purchases and sales of U.S. government securities in the Income Fund were $8,363,189 and $16,986,276, respectively. Purchases and sales of U.S. government securities in the U.S. Treasury Fund were $350,076,718 and $236,203,748, respectively.
6. FEDERAL INCOME TAX INFORMATION
It is each Fund’s policy to comply with the requirements under Subchapter M of the Internal Revenue Code applicable to regulated investment companies and to distribute substantially all taxable income to shareholders. The Funds are no longer subject to examination by tax authorities for years prior to 2013. At this time, management believes there are no uncertain tax positions which, based on their technical merit, would not be sustained upon examination and for which it is reasonably possible that the total of amounts of unrecognized tax benefits will significantly change in the next 12 months. Accordingly, no provision for federal income or excise taxes has been made.
120
As of September 30, 2016 the cost and unrealized appreciation (depreciation) of securities on a tax basis were as follows:
| | | | | | | | | | | | | | | | | | | | | | | | | | | | |
| | | Core Growth Fund | | | Emerging
India Fund | | | Emerging
Markets
Select Fund | | | Emerging
Markets
Small Cap
Fund | | | Frontier
Emerging
Small
Countries
Fund | | | Global
Opportunities
Fund | | | International
Growth Fund | |
| | | | | | | | | | | | | | | | | | | | | | | | | | | | |
Cost | | $ | 929,809,105 | | | $ | 55,149,633 | | | $ | 33,454,287 | | | $ | 644,362,466 | | | $ | 517,951,753 | | | $ | 121,060,679 | | | $ | 1,089,922,615 | |
| | | | |
Gross appreciation | | $ | 426,006,974 | | | $ | 23,775,170 | | | $ | 6,346,620 | | | $ | 236,929,666 | | | $ | 105,559,043 | | | $ | 40,041,922 | | | $ | 414,377,606 | |
Gross (depreciation) | | | (27,631,404 | ) | | | (984,825 | ) | | | (1,859,087 | ) | | | (31,768,278 | ) | | | (53,298,372 | ) | | | (5,819,777 | ) | | | (49,983,659 | ) |
| | | | |
Net appreciation | | $ | 398,375,570 | | | $ | 22,790,345 | | | $ | 4,487,533 | | | $ | 205,161,388 | | | $ | 52,260,671 | | | $ | 34,222,145 | | | $ | 364,393,947 | |
| | | | |
| | | | | | | |
| | | International
Opportunities
Fund | | | Large Cap
Value Fund | | | Long/Short
Fund | | | Micro Cap Fund | | | Micro Cap
Value Fund | | | Small Cap
Growth Fund | | | Small Cap
Value Fund | |
Cost | | $ | 530,548,779 | | | $ | 162,080,343 | | | $ | 159,502,383 | | | $ | 187,049,293 | | | $ | 135,897,970 | | | $ | 1,345,619,836 | | | $ | 236,642,148 | |
| | | | |
Gross appreciation | | $ | 172,005,587 | | | $ | 31,604,162 | | | $ | 32,607,899 | | | $ | 105,839,362 | | | $ | 46,636,767 | | | $ | 649,791,869 | | | $ | 67,005,190 | |
Gross (depreciation) | | | (17,013,583 | ) | | | (2,944,400 | ) | | | (39,288,865 | ) | | | (12,217,524 | ) | | | (2,513,219 | ) | | | (121,077,786 | ) | | | (8,397,456 | ) |
| | | | |
Net appreciation | | $ | 154,992,004 | | | $ | 28,659,762 | | | $ | (6,680,966 | ) | | $ | 93,621,838 | | | $ | 44,123,548 | | | $ | 528,714,083 | | | $ | 58,607,734 | |
| | | | |
| | | | | | | |
| | | Strategic
Income Fund | | | Ultra
Growth
Fund | | | World
Innovators
Fund | | | Income
Fund | | | U.S.
Treasury
Fund | | | | | | | |
Cost | | $ | 50,992,391 | | | $ | 74,714,096 | | | $ | 180,572,331 | | | $ | 97,548,031 | | | $ | 469,456,705 | | | | | | | | | |
| | | | | | | | | | | | |
Gross appreciation | | $ | 6,211,556 | | | $ | 33,961,268 | | | $ | 25,073,996 | | | $ | 1,718,141 | | | $ | 24,110,848 | | | | | | | | | |
Gross (depreciation) | | | (2,081,825 | ) | | | (8,099,142 | ) | | | (6,002,087 | ) | | | (256,268 | ) | | | (2,210,291 | ) | | | | | | | | |
| | | | | | | | | | | | |
Net appreciation | | $ | 4,129,731 | | | $ | 25,862,126 | | | $ | 19,071,909 | | | $ | 1,461,873 | | | $ | 21,900,557 | | | | | | | | | |
| | | | | | | | | | | | |
The difference between book-basis and tax-basis unrealized gains is primarily attributable to the tax deferral of losses on wash sales, unrealized appreciation on passive foreign investment companies, partnership adjustments and other temporary tax adjustments.
The components of accumulated earnings on a tax basis as of September 30, 2016 were as follows:
| | | | | | | | | | | | | | | | | | | | |
| | | Core Growth Fund | | | Emerging
India Fund | | | Emerging
Markets
Select Fund | | | Emerging
Markets
Small Cap
Fund | | | Frontier
Emerging
Small Countries
Fund | |
| | | | | | | | | | | | | | | | | | | | |
| | | | | | | | | | | | | | | | | | | | |
Undistributed ordinary income | | $ | — | | | $ | — | | | $ | — | | | $ | — | | | $ | — | |
Undistributed capital gains | | | 2,121,012 | | | | 819,636 | | | | — | | | | — | | | | — | |
| | | | |
Accumulated earnings | | | 2,121,012 | | | | 819,636 | | | | — | | | | — | | | | — | �� |
Accumulated capital and other losses | | | (5,575,059 | ) | | | (580,549 | ) | | | (8,281,984 | ) | | | (82,211,693 | ) | | | (153,784,036 | ) |
Other undistributed ordinary losses | | | — | | | | (57,865 | ) | | | (70,098 | ) | | | — | | | | (54,586 | ) |
Net unrealized appreciation (depreciation)* | | | 398,375,570 | | | | 21,646,174 | | | | 4,263,049 | | | | 202,973,864 | | | | 48,999,682 | |
| | | | |
Total accumulated earnings | | $ | 394,921,523 | | | $ | 21,827,396 | | | $ | (4,089,033 | ) | | $ | 120,762,171 | | | $ | (104,838,940 | ) |
| | | | |
| | | | | |
| | | Global
Opportunities
Fund | | | International
Growth Fund | | | International
Opportunities
Fund | | | Large Cap
Value Fund | | | Long/Short Fund | |
Undistributed ordinary income | | $ | — | | | $ | — | | | $ | — | | | $ | 4,996 | | | $ | — | |
Undistributed capital gains | | | 7,456,138 | | | | 38,987,147 | | | | — | | | | 5,174,466 | | | | 61,070 | |
| | | | | | | | | | | | | | | | | | | | |
Accumulated earnings | | | 7,456,138 | | | | 38,987,147 | | | | — | | | | 5,179,462 | | | | 61,070 | |
Accumulated capital and other losses | | | (1,333,351 | ) | | | (1,771,842 | ) | | | (5,907,308 | ) | | | — | | | | (157,790,103 | ) |
Other undistributed ordinary losses | | | (6,130 | ) | | | — | | | | (7,630 | ) | | | (8,727 | ) | | | — | |
Net unrealized appreciation (depreciation)* | | | 33,717,035 | | | | 364,208,613 | | | | 153,941,942 | | | | 28,659,762 | | | | (7,223,971 | ) |
| | | | | | | | | | | | | | | | | | | | |
Total accumulated earnings | | $ | 39,833,692 | | | $ | 401,423,918 | | | $ | 148,027,004 | | | $ | 33,830,497 | | | $ | (164,953,004 | ) |
| | | | | | | | | | | | | | | | | | | | |
121
Notes to Financial Statements (continued)
| | | | | | | | | | | | | | | | | | | | |
| | | Micro Cap Fund | | | Micro Cap
Value Fund | | | Small Cap
Growth Fund | | | Small Cap Value Fund | | | Strategic
Income Fund | |
| | | | | | | | | | | | | | | | | | | | |
Undistributed ordinary income | | $ | — | | | $ | — | | | $ | — | | | $ | 223,317 | | | $ | — | |
Undistributed capital gains | | | 18,371,513 | | | | — | | | | 144,143,182 | | | | — | | | | — | |
| | | | | | | | | | | | | | | | | | | | |
Accumulated earnings | | | 18,371,513 | | | | — | | | | 144,143,182 | | | | 223,317 | | | | | |
Accumulated capital and other losses | | | (1,971,779 | ) | | | (946,331 | ) | | | (10,697,296 | ) | | | (13,202,080 | ) | | | (7,707,764 | ) |
Other undistributed ordinary losses | | | — | | | | — | | | | — | | | | — | | | | (8,035 | ) |
Net unrealized appreciation (depreciation)* | | | 93,621,922 | | | | 44,123,744 | | | | 528,707,853 | | | | 58,607,746 | | | | 4,129,713 | |
| | | | | | | | | | | | | | | | | | | | |
Total accumulated earnings | | $ | 110,021,656 | | | $ | 43,177,413 | | | $ | 662,153,739 | | | $ | 45,628,983 | | | $ | (3,586,086 | ) |
| | | | | | | | | | | | | | | | | | | | |
| | | | | |
| | | Ultra Growth Fund | | | World
Innovators
Fund | | | Income Fund | | | U.S.
Treasury
Fund | | | | |
Undistributed ordinary income | | $ | — | | | $ | — | | | $ | 45,343 | | | $ | 88,003 | | | | | |
Undistributed capital gains | | | 6,198,685 | | | | 4,136,083 | | | | 124,946 | | | | 23,928,544 | | | | | |
| | | | | | | | | | | | | | | | | | | | |
Accumulated earnings | | | 6,198,685 | | | | 4,136,083 | | | | 170,289 | | | | 24,016,547 | | | | | |
Accumulated capital and other losses | | | (1,199,720 | ) | | | (555,051 | ) | | | — | | | | — | | | | | |
Other undistributed ordinary losses | | | — | | | | — | | | | (34,889 | ) | | | (89,863 | ) | | | | |
Net unrealized appreciation (depreciation)* | | | 25,862,135 | | | | 19,067,892 | | | | 1,461,873 | | | | 21,900,557 | | | | | |
| | | | | | | | | | | | | | | | | | | | |
Total accumulated earnings | | $ | 30,861,100 | | | $ | 22,648,924 | | | $ | 1,597,273 | | | $ | 45,827,241 | | | | | |
| | | | | | | | | | | | | | | | | | | | |
Dividends from net investment income and net realized gains, if any, are declared and paid at least annually for all Funds, except for dividends from net investment income in four funds. The Income Fund declares and pays dividends monthly. The Large Cap Value, Strategic Income and U.S. Treasury Funds declare and pay dividends quarterly. The amount of dividends and distributions from net investment income and net realized gains are determined in accordance with federal income tax regulations, which may differ from U.S. GAAP. The Funds may utilize earnings and profits distributed to shareholders on redemption of shares as part of the dividends paid deduction (tax equalization).
To the extent these book and tax differences are permanent in nature, such amounts are reclassified at the end of the fiscal year among additional paid-in capital, undistributed net investment income (loss), and undistributed net realized gain (loss) on investments, options and foreign currency translations.
Accordingly, at September 30, 2016, reclassifications were recorded as follows:
| | | | | | | | | | | | | | | | | | | | |
| | | Core Growth Fund | | | Emerging India Fund | | | Emerging Markets Select Fund | | | Emerging Markets Small Cap
Fund | | | Frontier
Emerging
Small
Countries
Fund | |
| | | | | | | | | | | | | | | | | | | | |
Increase (decrease) paid-in-capital in excess of par | | $ | (9,080,743 | ) | | $ | (595,490 | ) | | $ | (139,948 | ) | | $ | (10,813,869 | ) | | $ | (1,538,427 | ) |
Increase (decrease) undistributed net investment income | | | 9,844,664 | | | | 525,229 | | | | 80,379 | | | | 12,283,907 | | | | (9,605,659 | ) |
Increase (decrease) undistributed net realized gain (loss) | | | (763,921 | ) | | | 70,261 | | | | 59,569 | | | | (1,470,038 | ) | | | 11,144,086 | |
| | | | | |
| | | Global
Opportunities
Fund | | | International Growth Fund | | | International
Opportunities
Fund | | | Large Cap Value Fund | | | Long/Short
Fund | |
Increase (decrease) paid-in-capital in excess of par | | $ | (2,335,324 | ) | | $ | (8,128,228 | ) | | $ | (1,986,766 | ) | | $ | (6,732 | ) | | $ | (363,108 | ) |
Increase (decrease) undistributed net investment income | | | 2,774,173 | | | | 7,626,027 | | | | 1,623,000 | | | | 138,253 | | | | 323,078 | |
Increase (decrease) undistributed net realized gain (loss) | | | (438,849 | ) | | | 502,201 | | | | 363,766 | | | | (131,521 | ) | | | 40,030 | |
| | | | | |
| | | Micro Cap Fund | | | Micro Cap Value Fund | | | Small Cap Growth Fund | | | Small Cap Value Fund | | | Strategic
Income
Fund | |
Increase (decrease) paid-in-capital in excess of par | | $ | (1,824,925 | ) | | $ | (28 | ) | | $ | (19,286,674 | ) | | $ | (45 | ) | | $ | (602 | ) |
Increase (decrease) undistributed net investment income | | | 1,813,830 | | | | 275,855 | | | | 16,394,422 | | | | (317,949 | ) | | | (448,072 | ) |
Increase (decrease) undistributed net realized gain (loss) | | | 11,095 | | | | (275,827 | ) | | | 3,390,296 | | | | 317,994 | | | | 448,674 | |
122
| | | | | | | | | | | | | | | | | | | | |
| | | Ultra Growth Fund | | | World
Innovators
Fund | | | Income Fund | | | | | | | |
| | | | | | | | | | | | | | | | | | | | |
Increase (decrease) paid-in-capital in excess of par | | $ | (1,044,715 | ) | | $ | (15 | ) | | $ | — | | | | | | | | | |
Increase (decrease) undistributed net investment income | | | (2,013,479 | ) | | | 1,639,230 | | | | (11,425 | ) | | | | | | | | |
Increase (decrease) undistributed net realized gain (loss) | | | 3,517,216 | | | | (1,600,196 | ) | | | 11,425 | | | | | | | | | |
Capital loss carryforwards are available through the date specified below to offset future realized net capital gains for federal income tax purposes. Future capital loss carryover utilization in any given year may be subject to Internal Revenue Code limitations. To the extent future gains are offset by capital loss carryforwards, such gains will not be distributed.
Under the Regulated Investment Company Modernization Act of 2010, a Fund will be permitted to carry forward capital losses incurred in taxable years beginning after December 22, 2010 for an unlimited period. Post-enactment losses that are carried forward will retain their character as either short-term or long-term capital losses rather than being considered all short-term as under previous law. However, any losses incurred during those future taxable years will be required to be utilized prior to the losses incurred in pre-enactment taxable years, which carry an expiration date. As a result of this ordering rule, pre-enactment capital loss carryforwards may be more likely to expire unused.
Capital loss carryforwards as of September 30, 2016 were as follows:
| | | | | | | | | | | | | | | | |
| | | Expiring | | | Non-expiring | |
| Fund | | 9/30/2017 | | | 9/30/2018 | | | Short Term | | | Long Term | |
Emerging Markets Select Fund | | $ | — | | | $ | — | | | $ | 7,565,978 | | | $ | 713,332 | |
Emerging Markets Small Cap Fund | | | — | | | | — | | | | 55,712,840 | | | | 22,118,288 | |
Frontier Emerging Small Countries Fund | | | — | | | | — | | | | 73,690,727 | | | | 74,221,086 | |
International Opportunities Fund | | | — | | | | — | | | | 3,041,476 | | | | 2,630,545 | |
Small Cap Value Fund | | | — | | | | 13,202,080 | | | | — | | | | — | |
Strategic Income Fund | | | — | | | | — | | | | 4,973,715 | | | | 2,717,608 | |
During the tax year ended September 30, 2016, the Funds used capital loss carryforwards in the following amounts:
| | | | |
| Fund | | Amount Used | |
Small Cap Value Fund | | $ | 6,934,432 | |
The Funds have elected to defer losses incurred from November 1, 2015 through September 30, 2016 in accordance with federal income tax rules. These losses are treated as having arisen on the first day of the following fiscal year. The Funds have elected to defer losses as follows:
| | | | | | | | |
| Fund | | Post-October
Capital Losses | | | Late-Year Ordinary
Losses | |
Core Growth Fund | | $ | — | | | $ | 5,575,059 | |
Emerging India Fund | | | — | | | | 580,549 | |
Emerging Markets Select Fund | | | — | | | | 2,674 | |
Emerging Markets Small Cap Fund | | | — | | | | 4,380,565 | |
Frontier Emerging Small Countries Fund | | | — | | | | 5,872,223 | |
Global Opportunities Fund | | | — | | | | 1,333,351 | |
International Growth Fund | | | — | | | | 1,771,842 | |
International Opportunities Fund | | | — | | | | 235,287 | |
Long/Short Fund | | | 157,644,735 | | | | 145,368 | |
Micro Cap Fund | | | — | | | | 1,971,779 | |
Micro Cap Value Fund | | | 257,220 | | | | 689,111 | |
Small Cap Growth Fund | | | — | | | | 10,697,296 | |
Strategic Income Fund | | | — | | | | 16,441 | |
Ultra Growth Fund | | | — | | | | 1,199,720 | |
World Innovators Fund | | | — | | | | 555,051 | |
123
Notes to Financial Statements (continued)
The tax character of distributions paid during the year ended September 30, 2016 was as follows:
| | | | | | | | | | | | | | | | | | | | |
| 2016 | | Core
Growth
Fund | | | Emerging
India
Fund | | | Emerging
Markets
Select
Fund | | | Emerging
Markets
Small Cap
Fund | | | Frontier
Emerging
Small Countries
Fund | |
| | | | | | | | | | | | | | | | | | | | |
Ordinary Income | | $ | — | | | $ | — | | | $ | — | | | $ | 132,483 | | | $ | 1,618,755 | |
Capital Gain | | | 138,512,554 | | | | 958,580 | | | | — | | | | — | | | | — | |
| | | | |
Total | | $ | 138,512,554 | | | $ | 958,580 | | | $ | — | | | $ | 132,483 | | | $ | 1,618,755 | |
| | | | |
| | | | | |
| 2016 | | Global Opportunities Fund | | | International Growth Fund | | | International Opportunities Fund | | | Large Cap Value Fund | | | Long/Short Fund | |
Ordinary Income | | $ | — | | | $ | — | | | $ | — | | | $ | 3,793,299 | | | $ | 2,216,991 | |
Capital Gain | | | 19,687,296 | | | | — | | | | 22,512,072 | | | | 20,982,300 | | | | 70,202,977 | |
| | | | |
Total | | $ | 19,687,296 | | | $ | — | | | $ | 22,512,072 | | | $ | 24,775,599 | | | $ | 72,419,968 | |
| | | | |
| | | | | |
| 2016 | | Micro Cap Fund | | | Micro Cap Value Fund | | | Small Cap Growth Fund | | | Small Cap Value Fund | | | Strategic Income Fund | |
Ordinary Income | | $ | — | | | $ | 2,417,065 | | | $ | — | | | $ | 1,464,849 | | | $ | 1,474,213 | |
Capital Gain | | | 40,544,074 | | | | 15,487,890 | | | | 322,361,340 | | | | — | | | | 2,685,547 | |
Return of Capital | | | — | | | | — | | | | — | | | | — | | | | 287,336 | |
| | | | |
Total | | $ | 40,544,074 | | | $ | 17,904,955 | | | $ | 322,361,340 | | | $ | 1,464,849 | | | $ | 4,447,096 | |
| | | | |
| | | | | |
| 2016 | | Ultra Growth Fund | | | World Innovators Fund | | | Income Fund | | | U.S. Treasury Fund | | | | |
Ordinary Income | | $ | — | | | $ | — | | | $ | 1,963,364 | | | $ | 7,944,602 | | | | | |
Capital Gain | | | 8,679,065 | | | | 24,130,023 | | | | — | | | | 15,905,989 | | | | | |
| | | | | | | | |
Total | | $ | 8,679,065 | | | $ | 24,130,023 | | | $ | 1,963,364 | | | $ | 23,850,591 | | | | | |
| | | | | | | | |
The tax character of distributions paid during the year ended September 30, 2015 was as follows:
| | | | | | | | | | | | | | | | | | | | |
| 2015 | | Core Growth Fund | | | Emerging India Fund | | | Emerging Markets Select Fund | | | Emerging Markets Small Cap Fund | | | Frontier Emerging Small Countries Fund | |
Ordinary Income | | $ | — | | | $ | 29,439 | | | $ | 237,897 | | | $ | 1,814,628 | | | $ | 11,253,991 | |
Capital Gain | | | 24,139,661 | | | | — | | | | — | | | | — | | | | 14,583,973 | |
| | | | |
Total | | $ | 24,139,661 | | | $ | 29,439 | | | $ | 237,897 | | | $ | 1,814,628 | | | $ | 25,837,964 | |
| | | | |
| | | | | |
| 2015 | | Global Opportunities Fund | | | International Growth Fund | | | International Opportunities Fund | | | Large Cap Value Fund | | | Long/Short Fund | |
Ordinary Income | | $ | — | | | $ | — | | | $ | — | | | $ | 9,564,501 | | | $ | 23,730,693 | |
Capital Gain | | | 27,018,684 | | | | 9,181,913 | | | | 32,985,697 | | | | 87,584,255 | | | | 126,006,657 | |
| | | | |
Total | | $ | 27,018,684 | | | $ | 9,181,913 | | | $ | 32,985,697 | | | $ | 97,148,756 | | | $ | 149,737,350 | |
| | | | |
| | | | | |
| 2015 | | Micro Cap Fund | | | Micro Cap Value Fund | | | Small Cap Growth Fund | | | Small Cap Value Fund | | | Strategic Income Fund | |
Ordinary Income | | $ | — | | | $ | — | | | $ | — | | | $ | — | | | $ | 2,614,478 | |
Capital Gain | | | 13,800,575 | | | | 21,640,698 | | | | 210,961,388 | | | | — | | | | 7,267,964 | |
| | | | |
Total | | $ | 13,800,575 | | | $ | 21,640,698 | | | $ | 210,961,388 | | | $ | — | | | $ | 9,882,442 | |
| | | | |
124
| | | | | | | | | | | | | | | | | | | | |
| 2015 | | Ultra Growth Fund | | | World Innovators Fund | | | Income Fund | | | U.S. Treasury Fund | | | | |
Ordinary Income | | $ | — | | | $ | — | | | $ | 1,693,986 | | | $ | 6,608,427 | | | | | |
Capital Gain | | | 29,153,346 | | | | 25,428,998 | | | | — | | | | — | | | | | |
| | | | | | | | |
Total | | $ | 29,153,346 | | | $ | 25,428,998 | | | $ | 1,693,986 | | | $ | 6,608,427 | | | | | |
| | | | | | | | |
The tax character of distributions paid may differ from that shown in the Statements of Changes in Net Assets due to short-term gains being treated as ordinary income for tax purposes.
7. RELATED PARTY TRANSACTIONS
Investment Advisory Fees, Expense Limitations — As the Funds’ investment advisor, the Advisor receives a monthly fee calculated on average daily net assets. The Advisor has contractually agreed to waive its fees and/or reimburse certain Funds should a Fund’s operating expenses exceed a specified annual limitation through at least January 31, 2017. If operating expenses are less than the specified expense limit for the Fund, the Advisor shall be entitled to recoup the fees waived or reduced to the extent that the operating expenses and the amounts reimbursed do not exceed such expense limit for the Fund, under the period of the agreement (currently through January 31, 2017). Such reimbursement shall be paid only while the expense limitation agreement is in effect and only if such amount paid, together with all other amounts reimbursed under this agreement in the fiscal year, do not cause the Fund to exceed the expense limitation. All amounts not recovered at the end of the period expire on January 31, 2017. Ordinary operating expenses exclude any interest, dividend expense on short sales/interest expense, taxes, brokerage commissions, other investment-related costs and extraordinary expenses, such as litigation and other expenses not incurred in the ordinary course of the Funds’ business. In late October 2013, it was discovered that the Long/Short Fund and Large Cap Value Fund had a 12b-1 receivable on the books which dated back to 2008 prior to the conversion of the 1st Source Funds to Wasatch Funds. It was determined that the amount should be written off as an extraordinary expense and posted to other expenses. The balance for the Large Cap Value Fund was $70,993 and the Long/Short Fund was $8,622. The impact of these write-offs is reflected in the Financial Highlights. Investment advisory fees and fees waived, if any, for the year ended September 30, 2016 are disclosed in the Statements of Operations. Investment advisory fee and expense limitation annual rates are shown below.
| | | | | | | | | | | | | | | | | | | | |
| Fund | | Advisory
Fee | | | Expense
Limitation
Investor Class | | | Expense
Limitation
Institutional Class | | | Contractual Expense
Limitation/
Reimbursement
Recoverable
Expiration Date | | | Reimbursement
Recoverable | |
Core Growth Fund | | | 1.00% | | | | 1.50% | | | | 1.05% | | | | 1/31/2017 | | | $ | 58,586 | |
Emerging India Fund | | | 1.25% | 1 | | | 1.75% | | | | 1.50% | | | | 1/31/2017 | | | | 106,144 | |
Emerging Markets Select Fund | | | 1.00% | 2 | | | 1.50% | | | | 1.20% | | | | 1/31/2017 | | | | 126,894 | |
Emerging Markets Small Cap Fund | | | 1.65% | 3 | | | 1.95% | | | | 1.80% | | | | 1/31/2017 | | | | 322,521 | |
Frontier Emerging Small Countries Fund | | | 1.75% | | | | 2.25% | | | | 2.05% | | | | 1/31/2017 | | | | 1,023,972 | |
Global Opportunities Fund | | | 1.25% | 1 | | | 1.75% | | | | 1.35% | | | | 1/31/2017 | | | | 12,559 | |
International Growth Fund | | | 1.25% | | | | 1.75% | | | | 1.35% | | | | 1/31/2017 | | | | 14,232 | |
International Opportunities Fund | | | 1.75% | 4 | | | 2.25% | | | | 1.95% | | | | 1/31/2017 | | | | 260,334 | |
Large Cap Value Fund | | | 0.90% | | | | 1.10% | | | | 0.95% | | | | 1/31/2017 | | | | 153,287 | |
Long/Short Fund | | | 1.10% | | | | 1.60% | | | | 1.15% | | | | 1/31/2017 | | | | 75,299 | |
Micro Cap Fund | | | 1.75% | | | | 1.95% | | | | N/A | | | | 1/31/2017 | | | | — | |
Micro Cap Value Fund | | | 1.75% | | | | 1.95% | | | | N/A | | | | 1/31/2017 | | | | 140,159 | |
Small Cap Growth Fund | | | 1.00% | | | | 1.50% | | | | 1.05% | | | | 1/31/2017 | | | | 49,361 | |
Small Cap Value Fund | | | 1.00% | | | | 1.50% | | | | 1.05% | | | | 1/31/2017 | | | | 23,450 | |
Strategic Income Fund | | | 0.70% | | | | 0.95% | | | | N/A | | | | 1/31/2017 | | | | 56,776 | |
Ultra Growth Fund | | | 1.00% | | | | 1.50% | | | | N/A | | | | 1/31/2017 | | | | — | |
World Innovators Fund | | | 1.50% | | | | 1.95% | | | | 1.55% | | | | 1/31/2017 | | | | 12,353 | |
Income Fund | | | 0.55% | | | | N/A | | | | N/A | | | | N/A | | | | N/A | |
U.S. Treasury Fund | | | 0.50% | | | | 0.75% | | | | N/A | | | | 1/31/2017 | | | | — | |
| 1 | Effective January 31, 2016, the management fee was reduced from 1.50% to 1.25%. |
| 2 | Effective January 31, 2016, the management fee was reduced from 1.25% to 1.00%. |
| 3 | Effective January 31, 2016, the management fee was reduced from 1.75% to 1.65%. |
| 4 | Effective January 31, 2016, the management fee was reduced from 1.95% to 1.75%. |
Affiliated Trades — Certain Funds are permitted to purchase or sell securities from or to certain related affiliated funds under specified conditions outlined in the procedures adopted by the Board of Trustees (the “Board”). The procedures have been designed to ensure that any purchase or sale of securities by the Funds from or to another fund (or funds) that are, or could be, considered an affiliate by virtue of having a common investment advisor (or affiliated investment advisors), common Trustees and/or common officers complies with Rule 17a-7 of the 1940 Act. Further, each transaction is effected at the current market
125
Notes to Financial Statements (continued)
price, as that term is defined under the procedures. During the year ended September 30, 2016, the Funds had no purchases or sales of securities pursuant to Rule 17a-7 of the 1940 Act.
Compensation — Officers of the Funds serve in that capacity without compensation from the Trust. Beginning in the calendar year of 2016, the Funds’ method of compensating Trustees is to pay each Independent Trustee a retainer of $100,000 per year for services rendered and a fee of $12,000 for each Board of Trustees meeting attended in person or telephonically. Also, members of the Audit Committee receive a fee of $8,000 for each Audit Committee meeting attended in person or telephonically, and members of the Nominating Committee receive a fee of $8,000 for each Nominating Committee meeting attended in person or telephonically. In addition, each Independent Trustee receives a fee of $12,000 for attendance at an executive session held with respect to the contract renewal process for the Funds. In addition, the Chairman of the Board receives an additional fee of $25,000 a year as Chairman and $3,000 for attendance in person or telephonically at a Board meeting. The Chairman of the Audit Committee receives an additional $15,000 per year as Chairman and $1,200 for attendance in person or telephonically at an Audit Committee meeting. The Chairman of the Nominating Committee receives an additional $15,000 per year as Chairman and $1,200 for attendance in person or telephonically at a Nominating Committee meeting. Additionally, each Independent Trustee is entitled to reimbursement of expenses related to his or her duties as a Trustee of the Funds. The 2016 calendar year compensation is an increase of approximately 12 percent from the previous calendar year.
Institutional Class Legal Fees — As disclosed in the annual report dated September 30, 2011, the Board approved a multi-class plan pursuant to which the Board established and designated two classes for each series known as Investor Class shares and Institutional Class shares. The Advisor paid the legal costs associated with the establishment and designation of the new share classes for existing funds.
Payments by Advisor — During the 2012 fiscal year, the Advisor discovered a trade allocation error involving several of the Wasatch Funds. In August 2012, the Advisor paid the Global Opportunities Fund $1,167, the Micro Cap Fund $1,074, the Micro Cap Value Fund $1,282, the Small Cap Growth Fund $46,199, the Ultra Growth Fund $940 and the World Innovators Fund $437 as reimbursement for the error plus interest.
During the 2013 and 2014 fiscal years, the Advisor paid certain audit, legal and/or printing fees of the Core Growth, Emerging Markets Small Cap, Large Cap Value, Long/Short (Institutional Class), Small Cap Growth, Small Cap Value, Strategic Income and World Innovators Funds. The Advisor does not intend to be reimbursed for these amounts.
On February 20, 2013, the Advisor discovered a trade error involving the Frontier Emerging Small Countries Fund. The Advisor reimbursed the Fund $4,421. On October 16, 2014, the Advisor discovered a trade error involving the Ultra Growth Fund. The Advisor reimbursed the Fund $12,267. On August 2, 2016, the Advisor discovered a trade error involving the Small Cap Growth Fund. The Advisor reimbursed the Fund $12,890.
The impact of the payments detailed above is reflected in the net expense ratios in the Financial Highlights.
Payments by Sub-Advisor — In June 2016, the Funds filed a proxy statement with the Securities and Exchange Commission to inform shareholders about a Special Meeting of Shareholders of the Wasatch-Hoisington U.S. Treasury Fund. The purpose of the Shareholder Meeting was to ask shareholders to approve a new Sub-Advisory Agreement between Wasatch Advisors, Inc. and Hoisington Investment Management Company with respect to the Wasatch Hoisington U.S. Treasury Fund. Hoisington Investment Management Co., the Sub-Advisor for the Fund, reimbursed the Wasatch-Hoisington U.S. Treasury Fund for the costs associated with the proxy statement filing. The Sub-Advisor does not intend to be reimbursed for this amount.
10% Shareholders — As of September 30, 2016, the Funds had individual shareholder accounts and/or omnibus shareholder accounts (comprised of a group of individual shareholders), which individually amounted to more than 10% of the total shares outstanding of the Fund as detailed below:
| | | | | | | | |
| Fund | | Number of
Accounts | | | Percent of Shares
Outstanding | |
Core Growth Fund | | | 2 | | | | 52.24 | % |
Emerging India Fund | | | 2 | | | | 57.20 | % |
Emerging Markets Select Fund | | | 3 | | | | 78.98 | % |
Emerging Markets Small Cap Fund | | | 3 | | | | 65.49 | % |
Frontier Emerging Small Countries Fund | | | 2 | | | | 79.12 | % |
Global Opportunities Fund | | | 2 | | | | 58.96 | % |
International Growth Fund | | | 2 | | | | 53.36 | % |
International Opportunities Fund | | | 2 | | | | 68.18 | % |
Large Cap Value Fund | | | 2 | | | | 76.94 | % |
Long/Short Fund | | | 2 | | | | 59.95 | % |
Micro Cap Fund | | | 2 | | | | 26.62 | % |
Micro Cap Value Fund | | | 2 | | | | 51.48 | % |
Small Cap Growth Fund | | | 2 | | | | 54.34 | % |
Small Cap Value Fund | | | 2 | | | | 40.75 | % |
Strategic Income Fund | | | 3 | | | | 52.50 | % |
Ultra Growth Fund | | | 2 | | | | 29.47 | % |
World Innovators Fund | | | 3 | | | | 50.07 | % |
Income Fund | | | 1 | | | | 84.78 | % |
U.S. Treasury Fund | | | 3 | | | | 65.17 | % |
126
Affiliated Interests — As of September 30, 2016, Wasatch Advisors, Inc. and its affiliates, and the retirement plans of Wasatch Advisors, Inc. and its affiliates, held shares of the Funds which may be redeemed at any time as detailed below:
| | | | | | | | |
| | | Number of Accounts* | | | Percent of Shares Outstanding | |
Core Growth Fund | | | 20 | | | | 0.99 | % |
Emerging India Fund | | | 22 | | | | 19.65 | % |
Emerging Markets Select Fund | | | 17 | | | | 18.52 | % |
Emerging Markets Small Cap Fund | | | 15 | | | | 0.79 | % |
Frontier Emerging Small Countries Fund | | | 21 | | | | 0.51 | % |
Global Opportunities Fund | | | 21 | | | | 6.32 | % |
International Growth Fund | | | 15 | | | | 0.73 | % |
International Opportunities Fund | | | 24 | | | | 1.63 | % |
Large Cap Value Fund | | | 13 | | | | 1.83 | % |
Long/Short Fund | | | 8 | | | | 1.30 | % |
Micro Cap Fund | | | 11 | | | | 0.97 | % |
Micro Cap Value Fund | | | 13 | | | | 2.09 | % |
Small Cap Growth Fund | | | 20 | | | | 2.60 | % |
Small Cap Value Fund | | | 10 | | | | 1.97 | % |
Strategic Income Fund | | | 6 | | | | 17.10 | % |
Ultra Growth Fund | | | 8 | | | | 3.04 | % |
World Innovators Fund | | | 10 | | | | 1.86 | % |
Income Fund | | | 3 | | | | 0.02 | % |
U.S. Treasury Fund | | | 10 | | | | 0.52 | % |
| * | Multiple accounts with the same beneficial owner are treated as one account. |
Transfer Agent Intermediary Fees Reimbursed to the Advisor — Each Fund paid fees to, and reimbursed certain out-of-pocket expenses of, the Funds’ transfer agent during the period. In addition, the Advisor and the Funds’ distributor have entered into selling dealer agreements and service agreements with certain financial services companies, broker-dealers, banks, advisors, retirement service providers or other authorized agents or organizations (each an “Intermediary,” together, “Intermediaries”) to accept purchase, exchange and redemption orders on the Funds’ behalf. For Investor Class shares of the Funds, some Intermediaries do not charge investors a direct transaction fee, but instead charge a fee for accounting and shareholder services that the agent provided to Fund shareholders on the Funds’ behalf. Those services typically included recordkeeping, transaction processing for shareholders’ accounts, communication of tax information, income distribution and other services. Generally, the fee was either a per account charge based on the number of accounts to which the Intermediary provided such services, or was a percentage (as of September 30, 2016 up to 0.40% annually) of the average value of Fund Investor Class shares held in such accounts. The Advisor paid the Intermediary fees and the Funds reimbursed the Advisor for the portion of such fees, which is intended to compensate the Intermediary for provision of services of the type that would be provided by the Funds’ transfer agent or other service providers if the shares were registered on the books of the Funds’ transfer agent. Institutional Class shares of the Funds do not reimburse the Advisor for payments to Intermediaries. The Funds’ reimbursement of expenses incurred for services provided by Intermediaries are included in “Shareholder servicing fees — Investor Class” in the Statements of Operations.
Custodian Out-of-Pocket Expense Reimbursement — In September 2016, State Street Bank and Trust Company (“SSB”), the Funds’ custodian, provided each Fund with an offer to reimburse the Fund for certain out-of-pocket expenses it charged the Fund between 2003 and 2015. The incorrect charges were due to inaccurate billing rates used by SSB for certain out-of-pocket expenses. The Funds continue to review the information provided by SSB in anticipation of settling the matter. For each Fund, the reimbursement amount offered by SSB is included in “Prepaid expenses and other assets” in the Statements of Assets and Liabilities and reduced “Custody fees,” “Fund accounting fees” and, if applicable, “Reimbursement of expenses by Advisor” in the Statements of Operations. Based on the information provided by SSB, the Funds believe the impact of these errors is immaterial for each Fund.
127
Notes to Financial Statements (continued)
8. TRANSACTIONSWITH AFFILIATES
If a Fund’s holding represents ownership of 5% or more of the voting securities of a company, the company is deemed to be an affiliate as defined by the 1940 Act. The following Funds conducted transactions during the year ended September 30, 2016 with an “affiliated company” as so defined:
| | | | | | | | | | | | | | | | | | | | | | | | |
| | | Share Activity | | | Dividends
Credited to
Income for the period ended
9/30/2016 | | | Gain (Loss)
Realized on
Sale of Shares
for the period ended
9/30/2016 | |
| | | Balance
9/30/2015 | | | Purchases/
Additions | | | Sales/
Reductions | | | Balance
9/30/2016 | | | |
Frontier Emerging Small Countries Fund | | | | | | | | | | | | | | | | | | | | | | | | |
Akzo Nobel Pakistan Ltd.* | | | 3,698,992 | | | | — | | | | 3,698,992 | | | | — | | | $ | 191,832 | | | $ | (6,365,524 | ) |
Chevron Lubricants Lanka plc* | | | 6,300,185 | | | | 5,990,614 | | | | 7,579,094 | | | | 4,711,705 | | | | 1,199,001 | | | | (1,540,340 | ) |
Tokyo Cement Co. Lanka plc* | | | 11,548,669 | | | | — | | | | 11,548,669 | | | | — | | | | — | | | | (2,246,827 | ) |
|
| |
Long/Short Fund | | | | | | | | | | | | | | | | | | | | | | | | |
Bill Barrett Corp.* | | | 5,653,316 | | | | 386,486 | | | | 4,943,608 | | | | 1,096,194 | | | $ | — | | | $ | (48,203,938 | ) |
|
| |
Small Cap Growth Fund | | | | | | | | | | | | | | | | | | | | | | | | |
Argos Therapeutics, Inc.* | | | 1,162,454 | | | | 471,756 | | | | 79,289 | | | | 1,554,921 | | | $ | — | | | $ | 197,599 | |
Blue Nile, Inc. | | | 828,553 | | | | — | | | | — | | | | 828,553 | | | | 579,987 | | | | — | |
Chefs’ Warehouse, Inc. (The) | | | 1,897,093 | | | | — | | | | — | | | | 1,897,093 | | | | — | | | | — | |
Papa Murphy’s Holdings, Inc. | | | 883,565 | | | | 159,203 | | | | — | | | | 1,042,768 | | | | — | | | | — | |
Zumiez, Inc. | | | 1,309,779 | | | | — | | | | 44,700 | | | | 1,265,079 | | | | — | | | | (334,925 | ) |
| * | This security was deemed to no longer meet the criteria of an affiliated company at the reporting date. |
9. RESTRICTED SECURITIES
The Funds may own investments that were purchased through private placement transactions or under Rule 144A of the Securities Act of 1933 (the “Securities Act”) and cannot be sold without prior registration under the Securities Act or may be limited due to certain restrictions. These securities are generally deemed to be illiquid and are valued at fair value as determined by a designated Pricing Committee of the Advisor (“Pricing Committee”), comprised of personnel of the Advisor, with oversight by the Board of Trustees and in accordance with Board-approved Pricing Policies and Procedures. If and when such securities are registered, the costs of registering such securities are paid by the issuer. At September 30, 2016, the Funds held the following restricted securities:
| | | | | | | | | | | | | | | | | | |
| | | Security
Type | | Acquisition
Date | | | Cost | | | Fair
Value | | | Value as Percent
of Net Assets | |
Core Growth Fund | | | | | | | | | | | | | | | | | | |
Argos Therapeutics, Inc. | | Warrant | | | 7/28/16 | | | $ | — | | | $ | 193,457 | | | | 0.02 | % |
DocuSign, Inc., Series F Pfd. | | Preferred Stock | | | 4/30/15 | | | | 4,000,004 | | | | 3,257,725 | | | | 0.24 | % |
| | | | | | | | | | |
| | | | | | | | $ | 4,000,004 | | | $ | 3,451,182 | | | | 0.26 | % |
|
| |
Emerging India Fund | | | | | | | | | | | | | | | | | | |
ICICI Prudential Life Insurance Co. Ltd. | | Common Stock | | | 9/16/16 | | | $ | 746,314 | | | $ | 670,810 | | | | 0.82 | % |
|
| |
Global Opportunities Fund | | | | | | | | | | | | | | | | | | |
ICICI Prudential Life Insurance Co. Ltd. | | Common Stock | | | 9/16/16 | | | $ | 1,251,167 | | | $ | 1,124,588 | | | | 0.72 | % |
|
| |
Micro Cap Fund | | | | | | | | | | | | | | | | | | |
Argos Therapeutics, Inc. | | PIPE | | | 3/14/16 | | | $ | 80,250 | | | $ | 74,550 | | | | 0.03 | % |
Argos Therapeutics, Inc. | | PIPE | | | 6/22/16 | | | | 120,375 | | | | 111,825 | | | | 0.04 | % |
Argos Therapeutics, Inc. | | Warrant | | | 6/22/16 | | | | 2,109 | | | | 16,031 | | | | 0.00 | % |
| | | | | | | | | | |
| | | | | | | | $ | 202,734 | | | $ | 202,406 | | | | 0.07 | % |
|
| |
Micro Cap Value Fund | | | | | | | | | | | | | | | | | | |
Acetylon Pharmaceuticals, Inc., Series B Pfd. | | Preferred Stock | | | 2/3/11 - 5/25/12 | | | $ | 499,999 | | | $ | 1,379,998 | | | | 0.77 | % |
Synergetics USA, Inc. | | Right | | | 10/14/15 | | | | 71,250 | | | | 37,500 | | | | 0.02 | % |
Vertex Energy, Inc. | | Warrant | | | 6/22/15 | | | | 95,000 | | | | 25,000 | | | | 0.01 | % |
Vertex Energy, Inc., Pfd. Series B | | Convertible Preferred Stock | | | 6/22/15 - 7/8/16 | | | | 1,551,745 | | | | 1,387,781 | | | | 0.78 | % |
| | | | | | | | | | |
| | | | | | | | $ | 2,217,994 | | | $ | 2,830,279 | | | | 1.58 | % |
|
| |
128
| | | | | | | | | | | | | | | | | | |
| | | Security
Type | | Acquisition
Date | | | Cost | | | Fair
Value | | | Value as Percent
of Net Assets | |
Small Cap Growth Fund | | | | | | | | | | | | | | | | | | |
Argos Therapeutics, Inc. | | PIPE | | | 3/14/16 | | | $ | 280,608 | | | $ | 260,676 | | | | 0.01 | % |
Argos Therapeutics, Inc. | | PIPE | | | 6/22/16 | | | | 421,045 | | | | 391,139 | | | | 0.02 | % |
Argos Therapeutics, Inc. | | Warrant | | | 6/22/16 | | | | 7,378 | | | | 56,073 | | | | 0.00 | % |
Argos Therapeutics, Inc. | | Warrant | | | 7/28/16 | | | | — | | | | 428,743 | | | | 0.02 | % |
DataStax, Inc., Series E Pfd. | | Preferred Stock | | | 8/12/14 | | | | 8,000,002 | | | | 6,286,400 | | | | 0.33 | % |
DocuSign, Inc., Series B Pfd. | | Preferred Stock | | | 3/3/14 | | | | 437,257 | | | | 517,753 | | | | 0.03 | % |
DocuSign, Inc., Series B-1 Pfd. | | Preferred Stock | | | 3/3/14 | | | | 130,983 | | | | 155,096 | | | | 0.01 | % |
DocuSign, Inc., Series D Pfd. | | Preferred Stock | | | 3/3/14 | | | | 313,930 | | | | 371,723 | | | | 0.02 | % |
DocuSign, Inc., Series E Pfd. | | Preferred Stock | | | 3/3/14 | | | | 8,117,819 | | | | 9,612,263 | | | | 0.51 | % |
DocuSign, Inc., Series F Pfd. | | Preferred Stock | | | 4/30/15 | | | | 2,999,984 | | | | 2,443,278 | | | | 0.13 | % |
Drilling Info Holdings, Inc., Series B Pfd. | | Preferred Stock | | | 9/5/13 | | | | 15,350,001 | | | | 12,365,651 | | | | 0.66 | % |
ForeScout Technologies, Inc., Series G | | Preferred Stock | | | 11/25/15 | | | | 6,000,003 | | | | 6,000,003 | | | | 0.32 | % |
Greenspring Global Partners II-B, L.P. | | LP Interest | | | 10/10/03 - 7/16/15 | | | | 2,822,731 | | | | 2,470,429 | | | | 0.13 | % |
Greenspring Global Partners III-B, L.P. | | LP Interest | | | 3/16/06 - 11/17/15 | | | | 1,409,316 | | | | 1,165,125 | | | | 0.06 | % |
Nanosys, Inc., Series D Pfd. | | Preferred Stock | | | 11/8/05 | | | | 2,000,000 | | | | 100,407 | | | | 0.01 | % |
Nanosys, Inc., Series E Pfd. | | Preferred Stock | | | 8/13/10 | | | | 184,939 | | | | 95,764 | | | | 0.01 | % |
| | | | | | | | | | |
| | | | | | | | $ | 48,475,996 | | | $ | 42,720,523 | | | | 2.27 | % |
|
| |
Small Cap Value Fund | | | | | | | | | | | | | | | | | | |
Argos Therapeutics, Inc. | | Warrant | | | 7/28/16 | | | $ | — | | | $ | 108,300 | | | | 0.04 | % |
|
| |
Strategic Income Fund | | | | | | | | | | | | | | | | | | |
Redcorp Ventures Ltd. Series D | | Corporate Bond | | | 7/5/07 | | | $ | 151,992 | | | $ | 314 | | | | 0.00 | % |
Star Asia Financial Ltd. | | Common Stock | | | 2/22/07 - 5/11/15 | | | | 572,598 | | | | 497,999 | | | | 0.90 | % |
| | | | | | | | | | |
| | | | | | | | $ | 724,590 | | | $ | 498,313 | | | | 0.90 | % |
|
| |
Ultra Growth Fund | | | | | | | | | | | | | | | | | | |
Argos Therapeutics, Inc. | | PIPE | | | 3/14/16 | | | $ | 39,055 | | | $ | 36,281 | | | | 0.04 | % |
Argos Therapeutics, Inc. | | PIPE | | | 6/22/16 | | | | 58,582 | | | | 54,422 | | | | 0.05 | % |
Argos Therapeutics, Inc. | | Warrant | | | 6/22/16 | | | | 1,027 | | | | 7,802 | | | | 0.01 | % |
Argos Therapeutics, Inc. | | Warrant | | | 7/28/16 | | | | — | | | | 13,122 | | | | 0.01 | % |
Data Sciences International, Inc., Series B Pfd. | | Preferred Stock | | | 1/20/06 | | | | 399,811 | | | | 275,840 | | | | 0.27 | % |
Drilling Info Holdings, Inc., Series B Pfd. | | Preferred Stock | | | 9/5/13 | | | | 1,150,001 | | | | 926,417 | | | | 0.91 | % |
Greenspring Global Partners II-B, L.P. | | LP Interest | | | 10/10/03 - 7/16/15 | | | | 2,540,448 | | | | 2,223,376 | | | | 2.19 | % |
Greenspring Global Partners III-B, L.P. | | LP Interest | | | 3/16/06 - 11/17/15 | | | | 1,409,316 | | | | 1,165,125 | | | | 1.15 | % |
Nanosys, Inc., Series D Pfd. | | Preferred Stock | | | 11/8/05 | | | | 500,001 | | | | 25,102 | | | | 0.03 | % |
Nanosys, Inc., Series E Pfd. | | Preferred Stock | | | 8/13/10 | | | | 46,235 | | | | 23,941 | | | | 0.02 | % |
| | | | | | | | | | |
| | | | | | | | $ | 6,144,476 | | | $ | 4,751,428 | | | | 4.68 | % |
|
| |
World Innovators Fund | | | | | | | | | | | | | | | | | | |
Greenspring Global Partners II-B, L.P. | | LP Interest | | | 10/10/03 - 7/16/15 | | | $ | 282,273 | | | $ | 247,043 | | | | 0.12 | % |
|
| |
10. PURCHASE COMMITMENTS
In September 2003, the Small Cap Growth, Ultra Growth and World Innovators Funds entered into subscription agreements to acquire limited partnership interests in Greenspring Global Partners II-B, L.P. The remaining commitment amounts at September 30, 2016 were $50,000, $45,000 and $5,000, respectively.
In December 2005, the Small Cap Growth and Ultra Growth Funds entered into subscription agreements to acquire limited partnership interests in Greenspring Global Partners III-B, L.P. The remaining commitment amounts at September 30, 2016 were $45,000 per Fund.
Securities held by the Funds have been designated to meet these purchase commitments as indicated in the Schedules of Investments.
11. LINEOF CREDIT
Effective May 20, 2016, the Funds in the Trust renewed and amended agreements for two open lines of credit totaling $300,000,000, one of which is $100,000,000 committed, and the other of which is $200,000,000 uncommitted, with State Street Bank and Trust Company (together, the “Line”). The agreements, as amended, have no change in the committed, uncommitted and total amounts available on the Line. The Funds incur commitment fees on the undrawn portion of the committed part of the Line, and interest expense to the extent of amounts drawn (borrowed) under the entire Line. Interest is based on the higher of (a) the federal funds rate in effect on the date of borrowing, plus a margin, or (b) the overnight London Interbank Offered Rate (LIBOR) in effect on the date of borrowing, plus a margin. Commitment fees are pro-rated among the Funds based upon relative average net assets. Interest expense is charged directly to a Fund based upon actual amounts borrowed by that Fund.
129
Notes to Financial Statements (continued)
For the year ended September 30, 2016, the following Funds had borrowings:
| | | | | | | | | | | | | | | | | | |
Funds Utilizing the Line of Credit | | Average Daily
Borrowings | | | Number of
Days
Outstanding | | | Interest
Expense | | | Weighted
Average
Annualized
Interest Rate | | Balance at
9/30/2016 | |
Emerging India Fund | | $ | 609,924 | | | | 45 | | | $ | 1,284 | | | 1.68% | | $ | — | |
Emerging Markets Select Fund | | | 652,567 | | | | 50 | | | | 1,528 | | | 1.69% | | �� | 132,095 | |
Emerging Markets Small Cap Fund | | | 6,035,797 | | | | 105 | | | | 29,277 | | | 1.66% | | | — | |
Frontier Emerging Small Countries Fund | | | 7,352,023 | | | | 33 | | | | 11,519 | | | 1.71% | | | — | |
Global Opportunities Fund | | | 1,132,996 | | | | 75 | | | | 3,955 | | | 1.68% | | | — | |
International Growth Fund | | | 1,782,118 | | | | 7 | | | | 580 | | | 1.67% | | | — | |
International Opportunities Fund | | | 3,481,926 | | | | 1 | | | | 164 | | | 1.69% | | | — | |
Large Cap Value Fund | | | 737,199 | | | | 14 | | | | 486 | | | 1.70% | | | — | |
Long/Short Fund | | | 16,606,483 | | | | 6 | | | | 4,650 | | | 1.68% | | | — | |
Small Cap Growth Fund | | | 4,910,654 | | | | 20 | | | | 4,602 | | | 1.69% | | | — | |
Ultra Growth Fund | | | 488,273 | | | | 22 | | | | 503 | | | 1.68% | | | — | |
Income Fund | | | 334,993 | | | | 1 | | | | 16 | | | 1.70% | | | — | |
12. PRINCIPAL RISKS
Market and Credit Risk — In the normal course of business the Funds trade financial instruments and enter into financial transactions where risk of loss exists due to changes in the market (market risk) or the failure of the other party to a transaction to perform (credit risk). Similar to credit risk, the Funds may be exposed to counterparty risk, or the risk that an institution or other entity with which the Funds have unsettled or open transactions will default. The potential loss could exceed the value of the financial assets recorded in the financial statements. Financial assets, which potentially expose the Funds to credit risk, consist principally of cash due from counterparties and investments. The extent of the Funds’ exposure to credit and counterparty risks with respect to these financial assets approximates their carrying value as recorded in the Funds’ Statements of Assets and Liabilities.
Inflation Risk — Inflation risk is the possibility that inflation will reduce the purchasing power of a currency, and subsequently reduce the value of a security or asset, and may result in rising interest rates. Inflation is the overall upward price movement of goods and services in an economy that causes the value of a currency to decline.
Interest Rate Risk — Interest rate risk is the risk that fixed income securities will decline in value because of changes in interest rates. A rise in interest rates typically causes a fall in values. Interest rate risk should be modest for shorter-term securities, moderate for intermediate-term securities and high for longer-term securities. Generally, an increase in the average maturity of a fund will make it more sensitive to interest rate risk. The interest rate is the amount charged, expressed as a percentage of principal, by a lender to a borrower for the use of assets.
Foreign Currency Risk — If a fund invests directly in foreign currencies or in securities that trade in, and receive revenues in, foreign currencies, or in derivatives that provide exposure to foreign currencies, it will be subject to the risk that those currencies will decline in value relative to the U.S. dollar. This also includes the risk associated with higher transaction costs, delayed settlements, currency controls and adverse economic developments related to foreign investments.
Region Risk — The Funds, except the U.S. Treasury Fund, invest in equity and fixed income securities of non-U.S. issuers. Because certain foreign markets are illiquid, market prices may not necessarily represent realizable value. Although the Funds maintain diversified investment portfolios, political or economic developments within a particular country or region may have an adverse effect on the ability of domiciled issuers to meet their obligations. These risks are exaggerated for securities of issuers tied economically to emerging and frontier market countries. Additionally, political or economic developments may have an adverse effect on the liquidity and volatility of portfolio securities and currency holdings.
Liquidity Risk — The trading market for a particular security may be less liquid than it appears and the market prices may not represent realizable value. This may be likely when a fund has a proportionately large investment in securities with small market capitalizations or securities in foreign markets that trade infrequently. Reduced liquidity will have an adverse impact on a fund’s ability to sell such securities quickly at the currently marked price if necessary to meet redemptions.
Shareholder Concentration Risk — A significant portion of the net assets of the Frontier Emerging Small Countries Fund and International Opportunities Fund are owned by a group of shareholders advised by a common investment advisor. If these shareholders simultaneously redeem on the advice of their investment advisor, Fund expenses may increase and performance may be materially affected. However, the Advisor has contractually agreed to waive its fees and/or reimburse both the Frontier Emerging Small Countries Fund and the International Opportunities Fund should the operating expenses exceed 2.25% for the Investor Class and 2.05% and 1.95%, respectively, for the Institutional Class through at least January 31, 2017. The Emerging Markets Select Fund also has a significant portion of net assets concentrated in relatively few related accounts. The Advisor has contractually agreed to waive its fees and/or reimburse the Emerging Markets Select Fund should the operating expenses exceed 1.50% for the Investor Class and 1.20% for the Institutional Class through at least January 31, 2017.
130
13. FAIR VALUE MEASUREMENTS AND INVESTMENTS
The fair value of a financial instrument is the amount that would be received to sell an asset or paid to transfer a liability in an orderly transaction between market participants at the measurement date. The Funds use various methods to measure the fair value of their investments on a recurring basis. U.S. GAAP established a hierarchy that prioritizes inputs to valuation methods. The three levels of inputs are:
| | • | | Level 1 — Unadjusted quoted prices in active markets for identical assets or liabilities that the Funds have the ability to access. |
| | • | | Level 2 — Observable inputs other than quoted prices included in Level 1 that are observable for the asset or liability, either directly or indirectly. The inputs may include quoted prices for the identical investment on an inactive market, prices for similar investments, interest rates, prepayment speeds, credit risk, yield curves, default rates and similar data. |
| | • | | Level 3 — Unobservable inputs for the asset or liability, to the extent relevant observable inputs are not available, representing the Funds’ own assumptions about the assumptions a market participant would use in valuing the asset or liability, and would be based on the best information available. |
The availability of observable inputs can vary from security to security and is affected by a wide variety of factors, including, for example, the type of security, whether a security is new and not yet established in the marketplace, the liquidity of markets, and other characteristics particular to the security. To the extent that valuation is based on models or inputs that are less observable or unobservable in the market, the determination of fair value requires more judgment. Accordingly, the degree of judgment exercised in determining fair value is greatest for instruments categorized in Level 3.
Equity Securities (common and preferred stock) — Securities are valued as of the close of the New York Stock Exchange (“NYSE”) (generally 4:00 p.m. Eastern Time) on the valuation date. Equity securities and listed warrants are valued using a commercial pricing service at the last quoted sales price taken from the primary market in which each security trades and, with respect to equity securities traded on the National Association of Securities Dealer Automated Quotation system (“NASDAQ”), such securities are valued using the NASDAQ Official Closing Price (“NOCP”) or last sales price if no NOCP is available. If there are no sales on the primary exchange or market on a day, then the security shall be valued at the mean of the last bid and ask price on the primary exchange or market as provided by a pricing service. If the mean cannot be calculated or there is no trade activity on a day, then the security shall be valued at the previous trading day’s price as provided by a pricing service. In some instances, particularly on foreign exchanges, an official close or evaluated price may be used if the pricing service is unable to provide the last trade or most recent mean price. To the extent that
these securities are actively traded and valuation adjustments are not applied, they are categorized in Level 1 of the fair value hierarchy. Additionally, a fund’s investments are valued at fair value by the Pricing Committee if the Advisor determines that an event impacting the value of an investment occurred between the closing time of a security’s primary market or exchange (for example, a foreign exchange or market) and the time the fund’s share price is calculated. Significant events include, but are not limited to the following: significant fluctuations in domestic markets, foreign markets or foreign currencies; occurrences not directly tied to the securities markets such as natural disasters, armed conflicts or significant governmental actions; and major announcements affecting a single issuer or an entire market or market sector. In responding to a significant event, the Pricing Committee determines the fair value of affected securities by considering factors including, but not limited to: index options and futures traded subsequent to the close; American Depositary Receipts (“ADRs”), Global Depositary Receipts (“GDRs”) or other related receipts; currency spot or forward markets that trade after pricing of the foreign exchange; other derivative securities traded after the close such as Standard & Poor’s Depositary Receipts (“SPDRs”) and other exchange-traded funds (“ETFs”); and alternative market quotes on the affected securities. When applicable, the Funds use a systematic fair valuation model provided by an independent third party to assist in adjusting the valuation of foreign securities. When a Fund uses this fair value pricing method, the values assigned to the Fund’s foreign securities may not be the quoted or published prices of the investments on their primary markets or exchanges, and the securities are categorized in Level 2 of the fair value hierarchy. These valuation procedures apply equally to long or short equity positions in a fund.
Participation Notes — Investments are valued at the market price of the underlying security. Counterparty risk is regularly reviewed and considered for valuation.
Corporate Debt Securities — Investments are valued at current market value by a pricing service, or by using the last sale or bid price based on observable inputs. Observable inputs may include benchmark yields, reported trades, broker/dealer quotes, issuer spreads, two-sided markets, benchmark securities, bids, offers and reference data including market research publications. Although most corporate bonds are categorized in Level 2 of the fair value hierarchy, in instances where observable inputs are not available, they are categorized as Level 3.
Short-Term Notes — Investments maturing in 60 days or less at the time of purchase, are generally valued at amortized cost, unless it is determined that the amortized cost method would not represent fair value, in which case the securities are marked-to-market. To the extent the inputs are observable and timely, the values would be categorized in Level 2 of the fair value hierarchy.
Asset-Backed Securities — Investments are priced using the closing bid as supplied by a pricing service based on observable inputs. Observable inputs may include benchmark yields, reported trades, broker/dealer quotes, issuer
131
Notes to Financial Statements (continued)
spreads, two-sided markets, benchmark securities, bids, offers and reference data including market research publications, new issue data, monthly payment information and collateral performance. Although most asset-backed securities are categorized in Level 2 of the fair value hierarchy, in instances where observable inputs are not available, they are categorized as Level 3.
U.S. Government Issuers — Investments are priced using the closing bid as supplied by a pricing service based on observable inputs. Observable inputs may include benchmark yields, reported trades, broker/dealer quotes, issuer spreads, two-sided markets, benchmark securities, bids, offers and reference data including market research publications. Although most U.S. government bonds are categorized in Level 2 of the fair value hierarchy, in instances where observable inputs are not available, they are categorized as Level 3.
Derivative Instruments — Listed derivatives that are actively traded are valued based on quoted prices from the exchange and are categorized in Level 1 of the fair value hierarchy. Exchange-traded options are valued at the last sale price in the market where they are principally traded. If there are no sales on the primary exchange or market on a given day, then the option is valued at the mean of the last bid price and ask price on the primary exchange or market as provided by a pricing service. Forward foreign currency contracts are valued at the market rate provided by the pricing service.
Restricted Securities — If market quotations are not readily available for the Funds’ investments in securities
such as restricted securities, private placements, securities for which trading has been halted or other illiquid securities, these investments are valued at fair value in accordance with Board-approved Pricing Policies and Procedures by the Pricing Committee with oversight by the Board of Trustees. Fair value is defined as the price that would be received upon the sale of an asset, or paid to transfer a liability, in an orderly transaction between market participants at the measurement date under current market conditions. For each applicable investment that is fair valued, the Pricing Committee considers, to the extent applicable, various factors including, but not limited to, the financial condition of the company or limited partnership, operating results, prices paid in follow-on rounds, comparable companies in the public market, the nature and duration of the restrictions for holding the securities, a stated net asset value (NAV) for the partnership, if applicable, and other relevant factors. Depending on the relative significance of valuation inputs, these instruments may be classified in either Level 2 or Level 3 of the fair value hierarchy.
When the last day of the reporting period is a non-business day, certain foreign markets may be open on days the NYSE is closed, which could result in differences between the value of a fund’s portfolio securities on the last business day and the last calendar day of the reporting period. Any significant security valuation changes due to an open foreign market are adjusted and reflected by the fund for financial reporting purposes.
The following is a summary of the fair valuations according to the inputs used as of September 30, 2016 in valuing the Funds’ assets and liabilities:
| | | | | | | | | | | | | | | | | | |
| Fund | | Category | | Quoted Prices
in Active Markets
for Identical
Investments
(Level 1) | | | Significant Other
Observable Inputs
(Level 2) | | | Significant
Unobservable
Inputs
(Level 3) | | | Value at
9/30/2016 | |
| | | | | | | | | | | | | | | | | | |
Core Growth Fund | | | | | | | | | | | | | | | | | | |
Assets | | | | | | | | | | | | | | | | | | |
Common Stocks | | | | $ | 1,219,688,592 | | | $ | — | | | $ | — | | | $ | 1,219,688,592 | |
Preferred Stocks | | | | | — | | | | — | | | | 3,257,725 | | | | 3,257,725 | |
Warrants | | | | | — | | | | — | | | | 193,457 | | | | 193,457 | |
Short-Term Investments | | | | | — | | | | 105,044,901 | | | | — | | | | 105,044,901 | |
| | | | | | |
| | | | $ | 1,219,688,592 | | | $ | 105,044,901 | | | $ | 3,451,182 | | | $ | 1,328,184,675 | |
| | | | | | |
Emerging India Fund | | | | | | | | | | | | | | | | | | |
Assets | | | | | | | | | | | | | | | | | | |
Common Stocks | | Life & Health Insurance | | $ | 1,640,802 | | | $ | — | | | $ | 670,810 | | | $ | 2,311,612 | |
| | Other | | | 74,930,357 | | | | — | | | | — | | | | 74,930,357 | |
Corporate Bonds | | | | | — | | | | 16,387 | | | | — | | | | 16,387 | |
Short-Term Investments | | | | | — | | | | 681,622 | | | | — | | | | 681,622 | |
| | | | | | |
| | | | $ | 76,571,159 | | | $ | 698,009 | | | $ | 670,810 | | | $ | 77,939,978 | |
| | | | | | |
Emerging Markets Select Fund | | | | | | | | | | | | | | | | | | |
Assets | | | | | | | | | | | | | | | | | | |
Common Stocks | | Health Care Facilities | | $ | — | | | $ | 1,031,827 | | | $ | — | | | $ | 1,031,827 | |
| | Other | | | 36,909,993 | | | | — | | | | — | | | | 36,909,993 | |
| | | | | | |
| | | | $ | 36,909,993 | | | $ | 1,031,827 | | | $ | — | | | $ | 37,941,820 | |
| | | | | | |
132
| | | | | | | | | | | | | | | | | | |
| Fund | | Category | | Quoted Prices
in Active Markets
for Identical
Investments
(Level 1) | | | Significant Other
Observable Inputs
(Level 2) | | | Significant
Unobservable
Inputs
(Level 3) | | | Value at
9/30/2016 | |
| | | | | | | | | | | | | | | | | | |
Emerging Markets Small Cap Fund | | | | | | | | | | | | | | | | | | |
Assets | | | | | | | | | | | | | | | | | | |
Common Stocks | | Consumer Finance | | $ | 87,270,888 | | | $ | 11,240,663 | | | $ | — | | | $ | 98,511,551 | |
| | Electronic Components | | | 11,583,158 | | | | 4,190,597 | | | | — | | | | 15,773,755 | |
| | Home Improvement Retail | | | — | | | | 12,067,038 | | | | — | | | | 12,067,038 | |
| | Hotels, Resorts &
Cruise Lines | | | — | | | | 13,387,608 | | | | — | | | | 13,387,608 | |
| | Hypermarkets & Super Centers | | | 17,548,132 | | | | 6,849,068 | | | | — | | | | 24,397,200 | |
| | Pharmaceuticals | | | 31,520,978 | | | | — | | | | 16,783 | | | | 31,537,761 | |
| | Reinsurance | | | — | | | | 3,285,822 | | | | — | | | | 3,285,822 | |
| | Specialty Chemicals | | | 10,003,482 | | | | 11,140,066 | | | | — | | | | 21,143,548 | |
| | Other | | | 613,092,887 | | | | — | | | | — | | | | 613,092,887 | |
Warrants | | | | | 237,623 | | | | — | | | | — | | | | 237,623 | |
Preferred Stocks | | | | | 9,257,234 | | | | — | | | | — | | | | 9,257,234 | |
Short-Term Investments | | | | | — | | | | 6,831,827 | | | | — | | | | 6,831,827 | |
| | | | | | |
| | | | $ | 780,514,382 | | | $ | 68,992,689 | | | $ | 16,783 | | | $ | 849,523,854 | |
| | | | | | |
Frontier Emerging Small Countries Fund | | | | | | | | | | | | | | | | | | |
Assets | | | | | | | | | | | | | | | | | | |
Common Stocks | | Air Freight & Logistics | | $ | — | | | $ | 3,410,905 | | | $ | — | | | $ | 3,410,905 | |
| | Diversified Banks | | | 106,970,726 | | | | 23,373,247 | | | | — | | | | 130,343,973 | |
| | Food Retail | | | 7,642,522 | | | | 12,644,132 | | | | — | | | | 20,286,654 | |
| | Pharmaceuticals | | | 45,923,142 | | | | 2,987,521 | | | | — | | | | 48,910,663 | |
| | Wireless Telecommunication | | | | | | | | | | | | | | | | |
| | Services | | | 14,051,686 | | | | 557,062 | | | | — | | | | 14,608,748 | |
| | Other | | | 309,815,499 | | | | — | | | | — | | | | 309,815,499 | |
Preferred Stocks | | | | | 11,712,831 | | | | — | | | | — | | | | 11,712,831 | |
Short-Term Investments | | | | | — | | | | 31,123,151 | | | | — | | | | 31,123,151 | |
| | | | | | |
| | | | $ | 496,116,406 | | | $ | 74,096,018 | | | $ | — | | | $ | 570,212,424 | |
| | | | | | |
Global Opportunities Fund | | | | | | | | | | | | | | | | | | |
Assets | | | | | | | | | | | | | | | | | | |
Common Stocks | | Consumer Finance | | $ | 9,993,200 | | | $ | 1,535,025 | | | $ | — | | | $ | 11,528,225 | |
| | Life & Health Insurance | | | 105,201 | | | | — | | | | 1,124,588 | | | | 1,229,789 | |
| | Specialty Chemicals | | | 15,825 | | | | 2,263,900 | | | | — | | | | 2,279,725 | |
| | Other | | | 137,940,463 | | | | — | | | | — | | | | 137,940,463 | |
Warrants | | | | | 16,762 | | | | — | | | | — | | | | 16,762 | |
Short-Term Investments | | | | | — | | | | 2,287,860 | | | | — | | | | 2,287,860 | |
| | | | | | |
| | | | $ | 148,071,451 | | | $ | 6,086,785 | | | $ | 1,124,588 | | | $ | 155,282,824 | |
| | | | | | |
International Growth Fund | | | | | | | | | | | | | | | | | | |
Assets | | | | | | | | | | | | | | | | | | |
Common Stocks | | Home Improvement Retail | | $ | — | | | $ | 17,134,719 | | | $ | — | | | $ | 17,134,719 | |
| | Hotels, Resorts &
Cruise Lines | | | 10,519,362 | | | | 25,110,387 | | | | — | | | | 35,629,749 | |
| | Specialty Chemicals | | | 31,223,598 | | | | 22,849,474 | | | | — | | | | 54,073,072 | |
| | Other | | | 1,321,503,716 | | | | — | | | | — | | | | 1,321,503,716 | |
Short-Term Investments | | | | | — | | | | 25,975,306 | | | | — | | | | 25,975,306 | |
| | | | | | |
| | | | $ | 1,363,246,676 | | | $ | 91,069,886 | | | $ | — | | | $ | 1,454,316,562 | |
| | | | | | |
International Opportunities Fund | | | | | | | | | | | | | | | | | | |
Assets | | | | | | | | | | | | | | | | | | |
Common Stocks | | Advertising | | $ | — | | | $ | 3,001,443 | | | $ | — | | | $ | 3,001,443 | |
| | Apparel, Accessories & Luxury Goods | | | — | | | | 3,331,189 | | | | — | | | | 3,331,189 | |
| | Diversified Banks | | | — | | | | 6,730,840 | | | | — | | | | 6,730,840 | |
| | Food Distributors | | | — | | | | 2,235,377 | | | | — | | | | 2,235,377 | |
| | Food Retail | | | 38,393,203 | | | | 3,661,788 | | | | — | | | | 42,054,991 | |
| | Pharmaceuticals | | | 8,462,499 | | | | 373,161 | | | | — | | | | 8,835,660 | |
| | Other | | | 592,957,351 | | | | — | | | | — | | | | 592,957,351 | |
Short-Term Investments | | | | | — | | | | 26,393,932 | | | | — | | | | 26,393,932 | |
| | | | | | |
| | | | $ | 639,813,053 | | | $ | 45,727,730 | | | $ | — | | | $ | 685,540,783 | |
| | | | | | |
133
Notes to Financial Statements (continued)
| | | | | | | | | | | | | | | | | | |
| Fund | | Category | | Quoted Prices
in Active Markets
for Identical
Investments
(Level 1) | | | Significant Other
Observable Inputs
(Level 2) | | | Significant
Unobservable
Inputs
(Level 3) | | | Value at
9/30/2016 | |
| | | | | | | | | | | | | | | | | | |
Large Cap Value Fund | | | | | | | | | | | | | | | | | | |
Assets | | | | | | | | | | | | | | | | | | |
Common Stocks | | | | $ | 186,407,323 | | | $ | — | | | $ | — | | | $ | 186,407,323 | |
Short-Term Investments | | | | | — | | | | 4,332,782 | | | | — | | | | 4,332,782 | |
| | | | | | |
| | | | $ | 186,407,323 | | | $ | 4,332,782 | | | $ | — | | | $ | 190,740,105 | |
| | | | | | |
Long/Short Fund | | | | | | | | | | | | | | | | | | |
Assets | | | | | | | | | | | | | | | | | | |
Common Stocks | | | | $ | 211,126,168 | | | $ | — | | | $ | — | | | $ | 211,126,168 | |
Short-Term Investments | | | | | — | | | | 52,568,539 | | | | — | | | | 52,568,539 | |
| | | | | | |
| | | | $ | 211,126,168 | | | $ | 52,568,539 | | | $ | — | | | $ | 263,694,707 | |
| | | | | | |
Liabilities | | | | | | | | | | | | | | | | | | |
Securities Sold Short | | | | $ | (110,873,290 | ) | | $ | — | | | $ | — | | | $ | (110,873,290 | ) |
| | | | | | |
| | | | $ | (110,873,290 | ) | | $ | — | | | $ | — | | | $ | (110,873,290 | ) |
| | | | | | |
Micro Cap Fund | | | | | | | | | | | | | | | | | | |
Assets | | | | | | | | | | | | | | | | | | |
Common Stocks | | Biotechnology | | $ | 15,591,071 | | | $ | 186,375 | | | $ | — | | | $ | 15,777,446 | |
| | Other | | | 249,761,490 | | | | — | | | | — | | | | 249,761,490 | |
Warrants | | | | | — | | | | — | | | | 16,031 | | | | 16,031 | |
Short-Term Investments | | | | | — | | | | 15,116,164 | | | | — | | | | 15,116,164 | |
| | | | | | |
| | | | $ | 265,352,561 | | | $ | 15,302,539 | | | $ | 16,031 | | | $ | 280,671,131 | |
| | | | | | |
Micro Cap Value Fund | | | | | | | | | | | | | | | | | | |
Assets | | | | | | | | | | | | | | | | | | |
Common Stocks | | | | $ | 162,692,853 | | | $ | — | | | $ | — | | | $ | 162,692,853 | |
Convertible Preferred Stocks | | | | | — | | | | — | | | | 1,387,781 | | | | 1,387,781 | |
Preferred Stocks | | | | | — | | | | — | | | | 1,379,998 | | | | 1,379,998 | |
Warrants | | | | | — | | | | — | | | | 25,000 | | | | 25,000 | |
Rights | | | | | — | | | | — | | | | 37,500 | | | | 37,500 | |
Short-Term Investments | | | | | — | | | | 14,498,386 | | | | — | | | | 14,498,386 | |
| | | | | | |
| | | | $ | 162,692,853 | | | $ | 14,498,386 | | | $ | 2,830,279 | | | $ | 180,021,518 | |
| | | | | | |
Small Cap Growth Fund | | | | | | | | | | | | | | | | | | |
Assets | | | | | | | | | | | | | | | | | | |
Common Stocks | | Air Freight & Logistics | | $ | 30,355,100 | | | $ | 38,971,103 | | | $ | — | | | $ | 69,326,203 | |
| | Biotechnology | | | 139,768,652 | | | | 651,815 | | | | — | | | | 140,420,467 | |
| | Other | | | 1,585,222,225 | | | | — | | | | — | | | | 1,585,222,225 | |
Preferred Stocks | | | | | — | | | | — | | | | 37,948,338 | | | | 37,948,338 | |
Limited Partnership Interest | | | | | — | | | | — | | | | 3,635,554 | | | | 3,635,554 | |
Warrants | | | | | — | | | | — | | | | 484,816 | | | | 484,816 | |
Short-Term Investments | | | | | — | | | | 37,296,316 | | | | — | | | | 37,296,316 | |
| | | | | | | | | | | | | | | | | | |
| | | | $ | 1,755,345,977 | | | $ | 76,919,234 | | | $ | 42,068,708 | | | $ | 1,874,333,919 | |
| | | | | | |
Small Cap Value Fund | | | | | | | | | | | | | | | | | | |
Assets | | | | | | | | | | | | | | | | | | |
Common Stocks | | | | $ | 268,468,462 | | | $ | — | | | $ | — | | | $ | 268,468,462 | |
Limited Partnership Interest | | | | | 3,811,314 | | | | — | | | | — | | | | 3,811,314 | |
Warrants | | | | | — | | | | — | | | | 108,300 | | | | 108,300 | |
Short-Term Investments | | | | | — | | | | 22,861,806 | | | | — | | | | 22,861,806 | |
| | | | | | | | | | | | | | | | | | |
| | | | $ | 272,279,776 | | | $ | 22,861,806 | | | $ | 108,300 | | | $ | 295,249,882 | |
| | | | | | |
Strategic Income Fund | | | | | | | | | | | | | | | | | | |
Assets | | | | | | | | | | | | | | | | | | |
Common Stocks | | Diversified REITs | | $ | 761,753 | | | $ | 497,999 | | | $ | — | | | $ | 1,259,752 | |
| | Other | | | 38,325,239 | | | | — | | | | — | | | | 38,325,239 | |
Exchange-Traded Funds | | | | | 478,282 | | | | — | | | | — | | | | 478,282 | |
Limited Liability Company Membership Interest | | | | | 46,326 | | | | — | | | | — | | | | 46,326 | |
Limited Partnership Interest | | | | | 3,894,710 | | | | — | | | | — | | | | 3,894,710 | |
Corporate Bonds | | | | | — | | | | — | | | | 314 | | | | 314 | |
Short-Term Investments | | | | | — | | | | 11,117,499 | | | | — | | | | 11,117,499 | |
| | | | | | | | | | | | | | | | | | |
| | | | $ | 43,506,310 | | | $ | 11,615,498 | | | $ | 314 | | | $ | 55,122,122 | |
| | | | | | |
134
| | | | | | | | | | | | | | | | | | |
| Fund | | Category | | Quoted Prices
in Active Markets
for Identical
Investments
(Level 1) | | | Significant Other
Observable Inputs
(Level 2) | | | Significant
Unobservable
Inputs
(Level 3) | | | Value at
9/30/2016 | |
| | | | | | | | | | | | | | | | | | |
Ultra Growth Fund | | | | | | | | | | | | | | | | | | |
Assets | | | | | | | | | | | | | | | | | | |
Common Stocks | | Biotechnology | | $ | 12,260,016 | | | $ | 90,703 | | | $ | — | | | $ | 12,350,719 | |
| | Other | | | 79,656,025 | | | | — | | | | — | | | | 79,656,025 | |
Preferred Stocks | | | | | — | | | | — | | | | 1,251,300 | | | | 1,251,300 | |
Limited Partnership Interest | | | | | — | | | | — | | | | 3,388,501 | | | | 3,388,501 | |
Warrants | | | | | — | | | | — | | | | 20,924 | | | | 20,924 | |
Short-Term Investments | | | | | — | | | | 3,908,753 | | | | — | | | | 3,908,753 | |
| | | | | | | | | | | | | | | | | | |
| | | | $ | 91,916,041 | | | $ | 3,999,456 | | | $ | 4,660,725 | | | $ | 100,576,222 | |
| | | | | | |
World Innovators Fund | | | | | | | | | | | | | | | | | | |
Assets | | | | | | | | | | | | | | | | | | |
Common Stocks | | | | $ | 159,596,901 | | | $ | — | | | $ | — | | | $ | 159,596,901 | |
Limited Partnership Interest | | | | | — | | | | — | | | | 247,043 | | | | 247,043 | |
Short-Term Investments | | | | | — | | | | 39,800,296 | | | | — | | | | 39,800,296 | |
| | | | | | | | | | | | | | | | | | |
| | | | $ | 159,596,901 | | | $ | 39,800,296 | | | $ | 247,043 | | | $ | 199,644,240 | |
| | | | | | |
Income Fund | | | | | | | | | | | | | | | | | | |
Assets | | | | | | | | | | | | | | | | | | |
Asset-Backed Securities | | | | $ | — | | | $ | 9,202,522 | | | $ | — | | | $ | 9,202,522 | |
Collateralized Mortgage Obligations | | | | | — | | | | 15,938,518 | | | | — | | | | 15,938,518 | |
Commercial Mortgage-Backed Securities | | | | | — | | | | 3,028,712 | | | | — | | | | 3,028,712 | |
Corporate Bonds | | | | | — | | | | 46,265,720 | | | | — | | | | 46,265,720 | |
Municipal Bonds | | | | | — | | | | 5,549,492 | | | | — | | | | 5,549,492 | |
Exchange-Traded Funds | | | | | 874,125 | | | | — | | | | — | | | | 874,125 | |
U.S. Government Agency Securities | | | | | — | | | | 5,072,572 | | | | — | | | | 5,072,572 | |
U.S. Treasury Notes | | | | | — | | | | 10,718,432 | | | | — | | | | 10,718,432 | |
Preferred Stocks | | | | | 1,212,320 | | | | — | | | | — | | | | 1,212,320 | |
Short-Term Investments | | | | | — | | | | 1,147,491 | | | | — | | | | 1,147,491 | |
| | | | | | | | | | | | | | | | | | |
| | | | $ | 2,086,445 | | | $ | 96,923,459 | | | $ | — | | | $ | 99,009,904 | |
| | | | | | |
U.S. Treasury Fund | | | | | | | | | | | | | | | | | | |
Assets | | | | | | | | | | | | | | | | | | |
U.S. Government Obligations | | | | $ | — | | | $ | 486,064,438 | | | $ | — | | | $ | 486,064,438 | |
Short-Term Investments | | | | | — | | | | 5,292,824 | | | | — | | | | 5,292,824 | |
| | | | | | | | | | | | | | | | | | |
| | | | $ | — | | | $ | 491,357,262 | | | $ | — | | | $ | 491,357,262 | |
| | | | | | |
If the securities of an Asset Class are all the same level, the asset class is shown in total. If the securities of an Asset Class cross levels, the level with the smallest number of categories and with multiple levels within a category is displayed by category. The remaining categories that do not cross levels are combined into the “Other” category.
The valuation techniques used by the Funds to measure fair value for the year ended September 30, 2016 maximized the use of observable inputs and minimized the use of unobservable inputs.
The Funds’ policy is to recognize transfers between levels at the end of the reporting period. The table below shows the significant transfers between Level 1 and Level 2 due to fair valuation in certain foreign markets pursuant to a systematic valuation model.
| | | | | | | | |
| Fund | | Transfers Out
Of Level 1 at
Market Value | | | Transfers Into
Level 2 at
Market Value | |
International Opportunities Fund | | $ | 373,161 | | | $ | 373,161 | |
| | |
| Fund | | Transfers Out
Of Level 2 at
Market Value | | | Transfers Into
Level 1 at
Market Value | |
Core Growth Fund | | $ | 75,032,907 | | | $ | 75,032,907 | |
Emerging India Fund | | | 43,164,341 | | | | 43,164,341 | |
Emerging Markets Select Fund | | | 12,934,081 | | | | 12,934,081 | |
Emerging Markets Small Cap Fund | | | 455,216,944 | | | | 455,216,944 | |
Frontier Emerging Small Countries Fund | | | 175,258,115 | | | | 175,258,115 | |
Global Opportunities Fund | | | 31,840,920 | | | | 31,840,920 | |
135
Notes to Financial Statements (continued)
| | | | | | | | |
| Fund | | Transfers Out
Of Level 2 at
Market Value | | | Transfers Into
Level 1 at
Market Value | |
International Growth Fund | | $ | 776,899,604 | | | $ | 776,899,604 | |
International Opportunities Fund | | | 410,108,419 | | | | 410,108,419 | |
Micro Cap Fund | | | 16,649,897 | | | | 16,649,897 | |
Micro Cap Value Fund | | | 15,311,789 | | | | 15,311,789 | |
Small Cap Growth Fund | | | 152,817,056 | | | | 152,817,056 | |
Small Cap Value Fund | | | 12,940,805 | | | | 12,940,805 | |
Ultra Growth Fund | | | 3,365,185 | | | | 3,365,185 | |
World Innovators Fund | | | 37,009,567 | | | | 37,009,567 | |
The following is a reconciliation of the fair valuations using significant unobservable inputs (Level 3) for the Funds during the year ended September 30, 2016:
| | | | | | | | | | | | | | | | | | | | | | | | | | | | | | | | | | | | | | | | |
| Fund | | Market Value
Beginning
Balance
9/30/2015 | | | Purchases
at Cost | | | Sales (Proceeds) | | | Accrued Discounts (Premiums) | | | Realized Gain/ (Loss) | | | Change in Unrealized Appreciation (Depreciation) | | | Transfers in at Market Value | | | Transfers out at Market Value | | | Market Value Ending Balance 9/30/2016 | | | Net Change in Unrealized
Appreciation (Depreciation) on Investments Held at 9/30/2016 | |
Core Growth Fund | | | | | | | | | | | | | | | | | | | | | | | | | | | | | | | | | | | | | | | | |
Preferred Stocks | | $ | 4,000,004 | | | $ | — | | | $ | — | | | $ | — | | | $ | — | | | $ | (742,279 | ) | | $ | — | | | $ | — | | | $ | 3,257,725 | | | $ | (742,279 | ) |
Warrants | | | — | | | | — | | | | — | | | | — | | | | — | | | | 193,457 | | | | — | | | | — | | | | 193,457 | | | | 193,457 | |
| | | | |
| | | 4,000,004 | | | | — | | | | — | | | | — | | | | — | | | | (548,822 | ) | | | — | | | | — | | | | 3,451,182 | | | | (548,822 | ) |
| | | | |
Emerging India Fund | | | | | | | | | | | | | | | | | | | | | | | | | | | | | | | | | | | | | | | | |
Common Stocks | | | — | | | | 746,314 | | | | — | | | | — | | | | — | | | | (75,504 | ) | | | — | | | | — | | | | 670,810 | | | | (75,504 | ) |
| | | | |
| | | — | | | | 746,314 | | | | — | | | | — | | | | — | | | | (75,504 | ) | | | — | | | | — | | | | 670,810 | | | | (75,504 | ) |
| | | | |
Emerging Markets Small Cap Fund | | | | | | | | | | | | | | | | | | | | | | | | | | | | | | | | | | | | | | | | |
Common Stocks | | | 873,390 | | | | — | | | | — | | | | — | | | | — | | | | (856,607 | ) | | | — | | | | — | | | | 16,783 | | | | (856,607 | ) |
| | | | |
| | | 873,390 | | | | — | | | | — | | | | — | | | | — | | | | (856,607 | ) | | | — | | | | — | | | | 16,783 | | | | (856,607 | ) |
| | | | |
Global Opportunities Fund | | | | | | | | | | | | | | | | | | | | | | | | | | | | | | | | | | | | | | | | |
Common Stocks | | | — | | | | 1,251,167 | | | | — | | | | — | | | | — | | | | (126,579 | ) | | | — | | | | — | | | | 1,124,588 | | | | (126,579 | ) |
| | | | |
| | | — | | | | 1,251,167 | | | | — | | | | — | | | | — | | | | (126,579 | ) | | | — | | | | — | | | | 1,124,588 | | | | (126,579 | ) |
| | | | |
Micro Cap Fund | | | | | | | | | | | | | | | | | | | | | | | | | | | | | | | | | | | | | | | | |
Warrants | | | — | | | | 2,109 | | | | — | | | | — | | | | — | | | | 13,922 | | | | — | | | | — | | | | 16,031 | | | | 13,922 | |
| | | | |
| | | — | | | | 2,109 | | | | — | | | | — | | | | — | | | | 13,922 | | | | — | | | | — | | | | 16,031 | | | | 13,922 | |
| | | | |
Micro Cap Value Fund | | | | | | | | | | | | | | | | | | | | | | | | | | | | | | | | | | | | | | | | |
Convertible Preferred Stocks | | | 1,310,000 | | | | 96,745 | | | | — | | | | — | | | | — | | | | (18,964 | ) | | | — | | | | — | | | | 1,387,781 | | | | (18,964 | ) |
Preferred Stocks | | | 1,801,050 | | | | — | | | | | | | | | | | | | | | | (421,052 | ) | | | | | | | | | | | 1,379,998 | | | | (421,052 | ) |
Warrants | | | 42,019 | | | | — | | | | — | | | | — | | | | — | | | | (17,019 | ) | | | — | | | | — | | | | 25,000 | | | | (17,019 | ) |
Rights | | | — | | | | 71,250 | | | | — | | | | — | | | | — | | | | (33,750 | ) | | | — | | | | — | | | | 37,500 | | | | (33,750 | ) |
| | | | |
| | | 3,153,069 | | | | 167,995 | | | | — | | | | — | | | | — | | | | (490,785 | ) | | | — | | | | — | | | | 2,830,279 | | | | (490,785 | ) |
| | | | |
Small Cap Growth Fund | |
Preferred Stocks | | | 36,789,588 | | | | 6,000,003 | | | | — | | | | — | | | | — | | | | (4,841,253 | ) | | | — | | | | — | | | | 37,948,338 | | | | (4,841,253 | ) |
Limited Partnership Interest | | | 4,827,863 | | | | 15,000 | | | | (1,100,730 | ) | | | — | | | | 602,686 | | | | (709,265 | ) | | | — | | | | — | | | | 3,635,554 | | | | (709,265 | ) |
Warrants | | | — | | | | 7,378 | | | | — | | | | — | | | | — | | | | 477,438 | | | | — | | | | — | | | | 484,816 | | | | 477,438 | |
| | | | |
| | | 41,617,451 | | | | 6,022,381 | | | | (1,100,730 | ) | | | — | | | | 602,686 | | | | (5,073,080 | ) | | | — | | | | — | | | | 42,068,708 | | | | (5,073,080 | ) |
| | | | |
Small Cap Value Fund | |
Warrants | | | — | | | | — | | | | — | | | | — | | | | — | | | | 108,300 | | | | — | | | | — | | | | 108,300 | | | | 108,300 | |
| | | | |
| | | — | | | | — | | | | — | | | | — | | | | — | | | | 108,300 | | | | — | | | | — | | | | 108,300 | | | | 108,300 | |
| | | | |
Strategic Income Fund | |
Corporate Bonds | | | 804 | | | | — | | | | (580 | ) | | | — | | | | (11 | ) | | | 101 | | | | — | | | | — | | | | 314 | | | | 101 | |
| | | | |
| | | 804 | | | | — | | | | (580 | ) | | | — | | | | (11 | ) | | | 101 | | | | — | | | | — | | | | 314 | | | | 101 | |
| | | | |
Ultra Growth Fund | |
Common Stocks | | | 914 | | | | — | | | | (99,065 | ) | | | — | | | | — | | | | 98,151 | | | | — | | | | — | | | | — | | | | 98,151 | |
Preferred Stocks | | | 1,573,562 | | | | — | | | | (75,191 | ) | | | — | | | | — | | | | (247,071 | ) | | | — | | | | — | | | | 1,251,300 | | | | (247,071 | ) |
Limited Partnership Interest | | | 4,511,302 | | | | 15,000 | | | | (1,027,558 | ) | | | — | | | | 568,536 | | | | (678,779 | ) | | | — | | | | — | | | | 3,388,501 | | | | (678,779 | ) |
Warrants | | | — | | | | 1,027 | | | | — | | | | — | | | | — | | | | 19,897 | | | | — | | | | — | | | | 20,924 | | | | 19,897 | |
| | | | |
| | | 6,085,778 | | | | 16,027 | | | | (1,201,814 | ) | | | — | | | | 568,536 | | | | (807,802 | ) | | | — | | | | — | | | | 4,660,725 | | | | (807,802 | ) |
| | | | |
136
| | | | | | | | | | | | | | | | | | | | | | | | | | | | | | | | | | | | | | | | |
| Fund | | Market Value
Beginning
Balance
9/30/2015 | | | Purchases
at Cost | | | Sales (Proceeds) | | | Accrued Discounts (Premiums) | | | Realized Gain/ (Loss) | | | Change in Unrealized Appreciation (Depreciation) | | | Transfers in at Market Value | | | Transfers out at Market Value | | | Market Value Ending Balance 9/30/2016 | | | Net Change in Unrealized
Appreciation (Depreciation) on Investments Held at 9/30/2016 | |
World Innovators Fund | |
Common Stocks | | $ | 65 | | | $ | — | | | $ | (7,076 | ) | | $ | — | | | $ | — | | | $ | 7,011 | | | $ | — | | | $ | — | | | $ | — | | | $ | 7,011 | |
Limited Partnership Interest | | | 316,546 | | | | — | | | | (73,171 | ) | | | — | | | | 34,152 | | | | (30,484 | ) | | | — | | | | — | | | | 247,043 | | | | (30,484 | ) |
| | | | |
| | | 316,611 | | | | — | | | | (80,247 | ) | | | — | | | | 34,152 | | | | (23,473 | ) | | | — | | | | — | | | | 247,043 | | | | (23,473 | ) |
| | | | |
QUANTITATIVE INFORMATION ABOUT LEVEL 3 FAIR VALUE MEASUREMENTS
| | | | | | | | | | | | | | |
| Fund | | Description | | Fair Value
at 9/30/2016 | | | Valuation Technique | | Unobservable Input | | Range
(Average) | |
| Core Growth Fund | | Direct Venture Capital Investments: Systems Software | | $ | 3,257,725 | | | Market comparable companies | | EV/R* multiple Discount for lack of marketability | |
| 6.9 - 10.7(8.3)
20% |
|
| Emerging India Fund | | Common Stock: Life & Health Insurance | | $ | 670,810 | | | Discount to market | | Discount for lack of marketability | | | 4% | |
| Global Opportunities Fund | | Common Stock: Life & Health Insurance | | $ | 1,124,588 | | | Discount to market | | Discount for lack of marketability | | | 4% | |
| Micro Cap Value Fund | | Direct Venture Capital Investments: Pharmaceuticals | | $ | 1,379,998 | | | Probability of product approval | | Product approval payout | | | 50% | |
| Micro Cap Value Fund | | Private Investment in a Public Equity: Oil & Gas Refining & Marketing | | $ | 1,387,781 | | | Underlying price Liquidation preference | | Probability weighting Probability weighting | |
| 25%
75% |
|
| Small Cap Growth Fund | | Direct Venture Capital Investments: Biotechnology | | $ | 196,171 | | | Market comparable companies | | EV/R* multiple Discount for lack of marketability | |
| 1.2 - 5.4(3.2)
20% |
|
| Small Cap Growth Fund | | Direct Venture Capital Investments: Computer Services Software & Systems | | $ | 6,286,400 | | | Market comparable companies | | EV/GP† multiple Discount for lack of marketability | |
| 4.2 - 15.7(8.7)
20% |
|
| Small Cap Growth Fund | | Direct Venture Capital Investments: Oil & Gas Equipment & Services | | $ | 12,365,650 | | | Market comparable companies | | EV/R* multiple Discount for lack of marketability | |
| 1.4 - 8.8(5.3)
20% |
|
| Small Cap Growth Fund | | Direct Venture Capital Investments: Systems Software | | $ | 13,100,113 | | | Market comparable companies | | EV/R* multiple Discount for lack of marketability | |
| 6.9 - 10.7(8.3)
20% |
|
| Ultra Growth Fund | | Direct Venture Capital Investments: Biotechnology | | $ | 49,043 | | | Market comparable companies | | EV/R* multiple Discount for lack of marketability | |
| 1.2 - 5.4(3.2)
20% |
|
| Ultra Growth Fund | | Direct Venture Capital Investments: Health Care Technology | | $ | 275,840 | | | Probability of completion of repurchase | | Discount to repurchase amount | | | 20% | |
| Ultra Growth Fund | | Direct Venture Capital Investments: Oil & Gas Equipment & Services | | $ | 926,417 | | | Market comparable companies | | EV/R* multiple Discount for lack of marketability | |
| 1.4 - 8.8(5.3)
20% |
|
| *Enterprise-Value-To-Revenue | Multiple — (“EV/R”) A measure of the value of a stock that compares a company’s enterprise value to its revenue. |
| †Enterprise-Value-To-Gross | Profit Multiple — (“EV/GP”) A measure of the value of a stock that compares a company’s enterprise value to its gross profit. |
Changes in multiples may change the fair value of an investment. Generally, a decrease in the multiple will result in a decrease in the fair value of an investment.
The Funds’ other Level 3 investments have been valued using observable inputs, unadjusted third-party transactions and quotations, unadjusted historical third party information or the unadjusted NAV. No unobservable inputs internally developed by the Funds have been applied to these investments, thus they have been excluded from the above table.
14. OFFSETTING
Each Fund is party to various netting arrangements. The FASB requires disclosure about certain netting arrangements and similar agreements to enable users of a Fund’s financial statements to evaluate the effect or potential effect of netting arrangements on the Fund’s financial position. The scope of the disclosure is limited to derivative instruments, repurchase agreements and reverse repurchase agreements, and securities borrowing and securities lending transactions.
137
Notes to Financial Statements (continued)
The following tables present information about financial instruments that were subject to enforceable netting arrangements as of September 30, 2016:
REPURCHASE AGREEMENTS
| | | | | | | | | | | | | | | | | | |
| | | Gross Amounts Not Offset in the Statements of Assets and Liabilities | |
| Fund | | Counterparty | | Gross Asset Amounts
Presented in Statements
of Assets and Liabilities | | | Financial
Instrument | | | Collateral
Received1 | | | Net Amount
(Not Less
Than 0) | |
Core Growth Fund | | State Street Bank and Trust Co. | | $ | 105,044,901 | | | $ | — | | | $ | (105,044,901 | ) | | $ | — | |
Emerging India Fund | | State Street Bank and Trust Co. | | | 681,622 | | | | — | | | | (681,622 | ) | | | — | |
Emerging Markets Small Cap Fund | | State Street Bank and Trust Co. | | | 6,831,827 | | | | — | | | | (6,831,827 | ) | | | — | |
Frontier Emerging Small Countries Fund | | State Street Bank and Trust Co. | | | 31,123,151 | | | | — | | | | (31,123,151 | ) | | | — | |
Global Opportunities Fund | | State Street Bank and Trust Co. | | | 2,287,860 | | | | — | | | | (2,287,860 | ) | | | — | |
International Growth Fund | | State Street Bank and Trust Co. | | | 25,975,306 | | | | — | | | | (25,975,306 | ) | | | — | |
International Opportunities Fund | | State Street Bank and Trust Co. | | | 26,393,932 | | | | — | | | | (26,393,932 | ) | | | — | |
Large Cap Value Fund | | State Street Bank and Trust Co. | | | 4,332,782 | | | | — | | | | (4,332,782 | ) | | | — | |
Long/Short Fund | | State Street Bank and Trust Co. | | | 52,568,539 | | | | — | | | | (52,568,539 | ) | | | — | |
Micro Cap Fund | | State Street Bank and Trust Co. | | | 15,116,164 | | | | — | | | | (15,116,164 | ) | | | — | |
Micro Cap Value Fund | | State Street Bank and Trust Co. | | | 14,498,386 | | | | — | | | | (14,498,386 | ) | | | — | |
Small Cap Growth Fund | | State Street Bank and Trust Co. | | | 37,296,316 | | | | — | | | | (37,296,316 | ) | | | — | |
Small Cap Value Fund | | State Street Bank and Trust Co. | | | 22,861,806 | | | | — | | | | (22,861,806 | ) | | | — | |
Strategic Income Fund | | State Street Bank and Trust Co. | | | 11,117,499 | | | | — | | | | (11,117,499 | ) | | | — | |
Ultra Growth Fund | | State Street Bank and Trust Co. | | | 3,908,753 | | | | — | | | | (3,908,753 | ) | | | — | |
World Innovators Fund | | State Street Bank and Trust Co. | | | 39,800,296 | | | | — | | | | (39,800,296 | ) | | | — | |
Income Fund | | State Street Bank and Trust Co. | | | 1,147,491 | | | | — | | | | (1,147,491 | ) | | | — | |
U.S. Treasury Fund | | State Street Bank and Trust Co. | | | 5,292,824 | | | | — | | | | (5,292,824 | ) | | | — | |
| 1 | Repurchase agreements are classified as short-term investments in the Statements of Assets and Liabilities. The market value of the collateral received is greater than the amounts indicated in the table above. For further information, see Note 3 — Securities and Other Investments “Repurchase Agreements” and the Schedules of Investments. |
SECURITIES BORROWEDFOR SHORT SALES
| | | | | | | | | | | | | | | | | | |
| | | | | Gross Amounts Not Offset in the Statements of Assets and Liabilities | |
| Fund | | Counterparty | | Gross Liability Amounts
Presented in Statements
of Assets and Liabilities | | | Financial
Instrument | | | Collateral
Pledged1 | | | Net Amount
(Not Less Than 0) | |
Long/Short Fund | | JPMorgan Chase | | $ | 110,873,290 | | | $ | — | | | $ | (110,873,290 | ) | | $ | — | |
| 1 | The market value of the collateral received is greater than the amounts indicated in the table above. For further information, see Note 3 — Securities and Other Investments “Short Sales” and the Schedule of Investments. |
15. FAIR VALUEOF DERIVATIVE INSTRUMENTS*
The following is a summary of the fair valuations of the Funds’ derivative instruments categorized by risk exposure:
WASATCH LARGE CAP VALUE FUND
The Effect of Derivative Instruments on the Statement of Operations for the year ended September 30, 2016:
| | | | | | | | | | | | | | | | | | | | | | |
| | | Derivatives not accounted for as hedging instruments under Statement 133 |
| | | Interest Rate
Contracts | | | Foreign Exchange
Contracts | | | Credit
Contracts | | | Equity
Contracts | | | Other
Contracts | | | Total |
Realized Gain on Derivatives Recognized in Income | | | | | | | | | | | | | | | | | | | | | | |
Net realized gain on options written | | $ | — | | | $ | — | | | $ | — | | | $ | 132,873 | | | $ | — | | | $132,873 |
| | | |
138
WASATCH WORLD INNOVATORS FUND
Fair Values of Derivative Instruments on the Statement of Assets and Liabilities as of September 30, 2016:
| | | | | | | | | | | | | | | | | | | | | | | | |
| | | Derivatives not accounted for as hedging instruments under Statement 133 | |
| | | Interest Rate
Contracts | | | Foreign Exchange
Contracts | | | Credit
Contracts | | | Equity
Contracts | | | Other
Contracts | | | Total | |
Liabilities Derivatives | | | | | | | | | | | | | | | | | | | | | | | | |
Unrealized depreciation on foreign currency contracts | | $ | — | | | $ | 113,367 | | | $ | — | | | $ | — | | | $ | — | | | $ | 113,367 | |
| | | | |
The Effect of Derivative Instruments on the Statement of Operations for the year ended September 30, 2016:
| | | | | | | | | | | | | | | | | | | | | | |
| | | Derivatives not accounted for as hedging instruments under Statement 133 |
| | | Interest Rate
Contracts | | | Foreign Exchange
Contracts | | | Credit
Contracts | | | Equity
Contracts | | | Other
Contracts | | | Total |
Realized Gain on Derivatives Recognized in Income | | | | | | | | | | | | | | | | | | | | | | |
Net realized gain on investments and foreign currency translations | | $ | — | | | $ | 1,861,473 | | | $ | — | | | $ | — | | | $ | — | | | $1,861,473 |
| | | |
Net Change in Unrealized Appreciation (Depreciation) on Derivatives Recognized in Income | | | | | | | | | | | | | | | | | | | | | | |
Change in unrealized appreciation (depreciation) on investments and foreign currency translations | | $ | — | | | $ | (113,367 | ) | | $ | — | | | $ | — | | | $ | — | | | $(113,367) |
| | | |
For the year ended September 30, 2016, the average monthly balance of outstanding derivative financial instruments was as follows:
| | | | |
| | | Large Cap
Value Fund | |
Option contracts: | | | | |
Average number of call contracts written | | | 125 | |
Average value of call contracts written | | $ | 16,242 | |
| |
| | | World
Innovators Fund | |
Forward currency contracts: | | | | |
Average number of contracts — U.S. dollars purchased | | | — | 1 |
Average U.S. dollar amounts | | $ | 6,266,095 | |
Average number of contracts — U.S. dollars sold | | | 1 | |
Average U.S. dollar amounts sold | | $ | 15,439,326 | |
| * | See Note 4 — Financial Derivative Instruments for additional information. |
| 1 | Amount represents less than 0.05. |
16. SUBSEQUENT EVENTS
Management has evaluated the possibility of subsequent events and has determined that there are no additional events that would require adjustment to or additional disclosure in the Funds’ financial statements.
139
| | |
| WASATCH FUNDS | | SEPTEMBER 30, 2016 |
|
|
|
Report of Independent Registered Public Accounting Firm
To the Board of Trustees and Shareholders of
Wasatch Funds Trust:
In our opinion, the accompanying statements of assets and liabilities, including the schedules of investments, and the related statements of operations and of changes in net assets and the financial highlights present fairly, in all material respects, the financial position of Wasatch Core Growth Fund, Wasatch Emerging India Fund, Wasatch Emerging Markets Select Fund, Wasatch Emerging Markets Small Cap Fund, Wasatch Frontier Emerging Small Countries Fund, Wasatch Global Opportunities Fund, Wasatch International Growth Fund, Wasatch International Opportunities Fund, Wasatch Large Cap Value Fund, Wasatch Long/Short Fund, Wasatch Micro Cap Fund, Wasatch Micro Cap Value Fund, Wasatch Small Cap Growth Fund, Wasatch Small Cap Value Fund, Wasatch Strategic Income Fund, Wasatch Ultra Growth Fund, Wasatch World Innovators Fund, Wasatch-1st Source Income Fund, and Wasatch-Hoisington U.S. Treasury Fund (hereafter referred to as the “Funds”) at September 30, 2016, the results of each of their operations for the year then ended, the changes in each of their net assets for each of the two years in the period then ended and the financial highlights for each of the periods presented, in conformity with accounting principles generally accepted in the United States of America. These financial statements and financial highlights (hereafter referred to as “financial statements”) are the responsibility of the Funds’ management. Our responsibility is to express an opinion on these financial statements based on our audits. We conducted our audits of these financial statements in accordance with the standards of the Public Company Accounting Oversight Board (United States). Those standards require that we plan and perform the audit to obtain reasonable assurance about whether the financial statements are free of material misstatement. An audit includes examining, on a test basis, evidence supporting the amounts and disclosures in the financial statements, assessing the accounting principles used and significant estimates made by management, and evaluating the overall financial statement presentation. We believe that our audits, which included confirmation of securities at September 30, 2016 by correspondence with the custodian and brokers, provide a reasonable basis for our opinion.
/s/PricewaterhouseCoopers LLP
Kansas City, Missouri
November 22, 2016
140
| | |
| WASATCH FUNDS | | SEPTEMBER 30, 2016 (UNAUDITED) |
|
|
|
Supplemental Information
MANAGEMENT INFORMATION
The business affairs of Wasatch Funds are overseen by its Board of Trustees. The Board consists of five Independent Trustees and one Interested Trustee. Three of the Independent Trustees and the Interested Trustee were elected by shareholders to serve until their successors are qualified, appointed or elected in accordance with the Trust’s Declaration of Trust and By-Laws. Two Independent Trustees have been appointed by the elected Independent Trustees to serve until his or her successor is qualified, appointed or elected in accordance with the Trust’s Declaration of Trust and By-Laws.
The Trustees and executive officers of Wasatch Funds and their principal occupations for at least the last five years are set forth below. The Advisor retains proprietary rights to the Trust name.
| | | | | | | | | | | | |
Name, Address and Age | | Position(s)
Held with
Wasatch Funds | | Term of Office1 and Length of
Time Served | | Principal Occupation(s)
during Past 5 Years | | Number of
Portfolios
in Fund
Complex
Overseen
by Trustee | | | Other Directorships
Held by Trustees
during Past 5 Years2 |
Independent Trustees | | | | | | | | | | | | |
| | | | | |
James U. Jensen, J.D., MBA 505 Wakara Way 3rd Floor Salt Lake City, UT 84108 Age 72 | | Trustee and Chairman of the Board | | Indefinite Served as Chairman of the Board since 2004 and Trustee since 1986 | | Chief Executive Officer of Clearwater Law & Governance Group (an operating law firm board governance consulting company) April 2008 to present; Co-Founder and Chairman of the Board of Intelisum, Inc. (a company pursuing computer and measurement technology and products) 2001 - 2008; Consultant on corporate growth and technology transfer since 2004; Vice President, Corporate Development, Legal Affairs and General Counsel, and Secretary, NPS Pharmaceuticals, Inc. from 1991 to 2004. | | | 19 | | | Director and Board Chairman of Agricon Global Corporation (formerly known as Bayhill Capital Corporation (telephone communications) since December 2007 to February 2014; Trustee, Northern Lights Fund Trust III (30 portfolios) since 2012. |
| | | | | |
D. James Croft, Ph.D. 505 Wakara Way 3rd Floor Salt Lake City, UT 84108 Age 74 | | Trustee and Chairman of the Governance and Nominating Committee | | Indefinite Served as Trustee since 2005 | | Consultant to the mortgage industry on issues of mortgage quality, identification of mortgage fraud, strategic planning and client development since 2004; Founder & Executive Director, Mortgage Asset Research Institute, from 1990 to 2004. | | | 19 | | | None. |
| | | | | |
Miriam M. Allison 505 Wakara Way 3rd Floor Salt Lake City, UT 84108 Age 69 | | Trustee and Chairman of the Audit Committee | | Indefinite Served as Trustee since 2010 | | Rancher since 2004. From 2001 to 2005, Chairman of UMB Fund Services, Inc. | | | 19 | | | Director, Northwestern Mutual Series Fund, Inc. (27 portfolios) since 2006. |
| | | | | |
Heikki Rinne 505 Wakara Way 3rd Floor Salt Lake City, UT 84108 Age 64 | | Trustee | | Indefinite Served as Trustee since October 2012 | | Chief Executive Officer of the Halton Group Ltd. (an indoor environmental control manufacturing and technology company), from 2002 to 2016. | | | 19 | | | Director, Halton Group Ltd. since 2016. |
| | | | | |
Kristen M. Fletcher 505 Wakara Way 3rd Floor Salt Lake City, UT 84108 Age 63 | | Trustee | | Indefinite Served as Trustee since October 2014 | | Director, Youth Sports Alliance since 2015; Director, Utah Symphony/Utah Opera since 2005; Director, Woodlands Commercial Bank 2009 - 2012; Chairman and CEO, ABN AMRO, Inc. and U.S. Country Representative, ABN AMRO Bank, NV from 2002 - 2004. | | | 19 | | | Director, Youth Sports Alliance since 2015; Director, Woodlands Commercial Bank 2009 - 2012; Director Utah Symphony/Utah Opera since 2005. |
|
|
Interested Trustee | | | | | | | | | | | | |
| | | | | |
Samuel S. Stewart, Jr.3, Ph.D. CFA 505 Wakara Way 3rd Floor Salt Lake City, UT 84108 Age 74 | | President and Trustee | | Indefinite Served as President and Trustee since 1986 | | Chairman of the Board for the Advisor since 1975; Chief Investment Officer of the Advisor from 2004 to June 2009; Director of Research of the Advisor from 1975 to 2004; Chairman of the Board of Wasatch Funds from 1986 to 2004. | | | 19 | | | None. |
|
|
| 1 | A Trustee may serve until his/her death, resignation, removal or retirement. Each Independent Trustee shall retire as Trustee at the end of the calendar year in which he/she attains the age of 75 years. |
| 2 | Directorships are those held by a Trustee in any company with a class of securities registered pursuant to Section 12 of the Securities Exchange Act of 1934 or subject to the requirements of Section 15(d) of the Securities Exchange Act or any company registered as an investment company under the 1940 Act. |
| 3 | Dr. Stewart is an Interested Trustee because he serves as the Chairman of the Board of the Advisor and is an employee of the Advisor. |
141
Supplemental Information (continued)
| | | | | | |
Name, Address and Age | | Position(s) Held with Trust | | Term of Office and Length of Time Served | | Principal Occupation(s) during Past 5 Years |
Officers | | | | | | |
| | | |
Daniel D. Thurber 505 Wakara Way 3rd Floor Salt Lake City, UT 84108 Age 47 | | Vice President | | Indefinite Served as Vice President since February 2007 | | General Counsel, Chief Compliance Officer and Director of Compliance for the Advisor since 2006. |
| | | |
Russell L. Biles 505 Wakara Way 3rd Floor Salt Lake City, UT 84108 Age 48 | | Chief Compliance Officer, Vice President and Secretary | | Indefinite Served as Chief Compliance Officer and Vice President since February 2007 and Secretary since November 2008 | | Chief Compliance Officer and Vice President for Wasatch Funds since February 2007; Secretary for Wasatch Funds since November 2008; Counsel for the Advisor since October 2006. |
| | | |
Cindy B. Firestone, CPA 505 Wakara Way 3rd Floor Salt Lake City, UT 84108 Age 58 | | Treasurer | | Indefinite Served as Treasurer since May 2009 | | Treasurer for Wasatch Funds since May 2009; Assistant Treasurer for Wasatch Funds from November 2008 to May 2009; Internal Auditor for the Advisor from December 2002 to August 2011. |
| | | |
David Corbett 505 Wakara Way 3rd Floor Salt Lake City, UT 84108 Age 43 | | Assistant Vice President | | Indefinite Served as Assistant Vice President since August 2012 | | Assistant Vice President for Wasatch Funds since August 2012; Director of Mutual Fund Services for the Advisor since June 2007. |
|
|
Additional information about the Funds’ trustees is provided in the Statement of Additional Information and is available without charge, upon request, by calling 800.551.1700.
ADDITIONAL TAX INFORMATION
The Funds hereby designate the following amounts or maximum amounts allowable as long term capital gain dividends for the purpose of the dividends paid deduction. The amounts designated here include the utilization of earnings and profits distributed to shareholders on the redemption of shares.
| | | | |
| Fund | | Amount | |
Core Growth Fund | | $ | 138,512,554 | |
Emerging India | | | 958,580 | |
Global Opportunities Fund | | | 19,687,296 | |
International Opportunities Fund | | | 22,512,072 | |
Large Cap Value Fund | | | 20,982,300 | |
Long/Short Fund | | | 70,202,977 | |
Micro Cap Fund | | | 40,544,074 | |
Micro Cap Value Fund | | | 15,487,890 | |
Small Cap Growth Fund | | | 322,361,340 | |
Strategic Income Fund | | | 2,685,547 | |
Ultra Growth Fund | | | 8,679,065 | |
World Innovators Fund | | | 24,130,023 | |
U.S. Treasury Fund | | | 15,905,989 | |
For the fiscal year ended September 30, 2016, certain dividends paid by each Fund may be subject to a maximum tax rate of 20% as provided for by the Jobs and Growth Tax Relief Reconciliation Act of 2003. To the extent dividends are paid during the calendar year 2016, complete information will be reported on shareholders’ 2016 Form 1099-DIV.
The amount designated as qualified dividend income for the year ended September 30, 2016 will be at the highest amount permitted by law.
Corporate shareholders should note for the year ended September 30, 2016, the percentage of the Funds’ investment income (i.e., net investment income plus short-term capital gains) that qualified for the corporate dividends received deductions are as follows:
| | | | |
| Fund | | Percentage | |
Frontier Emerging Small Countries Fund | | | 4 | % |
Large Cap Value Fund | | | 100 | % |
Long/Short Fund | | | 100 | % |
Small Cap Value Fund | | | 100 | % |
Strategic Income Fund | | | 38 | % |
Income Fund | | | 4 | % |
SHAREHOLDER MEETING RESULTS
A Special Meeting of Shareholders of the Wasatch-Hoisington U.S. Treasury Fund was held on July 28, 2016. The purpose of the Shareholder Meeting was to ask shareholders to approve a new Sub-Advisory Agreement between Wasatch Advisors, Inc. and Hoisington Investment Management Company with respect to the Wasatch-Hoisington U.S. Treasury Fund.
The results of the voting are as follows:
| | | | | | |
| Affirmative | | Against | | Abstain | | Total |
9,489,754 | | 122,474 | | 1,777,164 | | 11,389,393 |
142
| | |
| | SEPTEMBER 30, 2016 (UNAUDITED) |
|
|
|
PROXY VOTING POLICIES, PROCEDURESAND RECORD
A description of the policies and procedures that Wasatch Advisors uses to vote proxies related to the Funds’ portfolio securities is set forth in the Funds’ Statement of Additional Information which is available without charge, upon request, on the Funds’ website at www.WasatchFunds.com or by calling 800.551.1700 and on the Securities and Exchange Commission’s (SEC) website at www.sec.gov.
Wasatch Funds’ proxy voting record is available without charge on the Funds’ website at www.WasatchFunds.com and the SEC’s website at www.sec.gov no later than August 31 for the prior 12 months ending June 30.
QUARTERLY PORTFOLIO HOLDINGS DISCLOSUREON FORM N-Q
The Funds file their complete schedules of investments with the SEC for their first and third quarters of each fiscal year on Form N-Q. The Funds’ Form N-Q filings are available on the SEC’s website at www.sec.gov, and may be reviewed and copied at the SEC’s Public Reference Room in Washington, D.C. (information on the operation of the Public Reference room may be obtained by calling 800.SEC.0330).
143
| | |
| WASATCH FUNDS | | SEPTEMBER 30, 2016 (UNAUDITED) |
|
|
|
Service Providers
INVESTMENT ADVISOR
Wasatch Advisors, Inc.
505 Wakara Way, 3rd Floor
Salt Lake City, UT 84108
SUB-ADVISORFORTHE WASATCH-1ST SOURCE INCOME FUND
1st Source Corporation Investment Advisors, Inc.
100 North Michigan Street
South Bend, IN 46601
SUB-ADVISORFORTHE U.S. TREASURY FUND
Hoisington Investment Management Co.
6836 Bee Caves Road
Building 2, Suite 100
Austin, TX 78746
ADMINISTRATORAND FUND ACCOUNTANT
State Street Bank and Trust Company
801 Pennsylvania Avenue
Kansas City, MO 64105
DISTRIBUTOR
ALPS Distributors, Inc.
1290 Broadway, Suite 1100
Denver, CO 80203
TRANSFER AGENT
UMB Fund Services, Inc.
235 West Galena Street
Milwaukee, WI 53212
CUSTODIAN
State Street Bank and Trust Company
801 Pennsylvania Avenue
Kansas City, MO 64105
LEGAL COUNSELTO WASATCH FUNDSANDINDEPENDENT TRUSTEES
Chapman and Cutler, LLP
111 West Monroe Street
Chicago, IL 60603
INDEPENDENT REGISTERED PUBLIC ACCOUNTING FIRM
PricewaterhouseCoopers LLP
1100 Walnut Street, Suite 1300
Kansas City, MO 64106
TELEPHONE
800.551.1700
M - F, 7:00 a.m. to 7:00 p.m. Central Time
Automated Line, 24 Hours
U.S. MAIL
Wasatch Funds
P.O. Box 2172
Milwaukee, WI 53201-2172
OVERNIGHT DELIVERY
Wasatch Funds
235 West Galena Street
Milwaukee, WI 53212
ONLINE
www.WasatchFunds.com
shareholderservice@wasatchfunds.com
144

WASATCH
FUNDS
2016 Annual Report
www.WasatchFunds.com 800.551.1700
FSC
www.fsc.org
MIX
Paper from
responsible source
FSC C132107
Item 2: Code of Ethics.
| (a) | Wasatch Funds Trust (the “Registrant”) has adopted a Code of Ethics that applies to the Registrant’s principal executive officer and principal financial officer. |
| (b) | No disclosures are required by this Item 2(b). |
| (c) | There have been no amendments to the Registrant’s Code of Ethics during the reporting period for this form N-CSR. |
| (d) | There have been no waivers granted by the Registrant to individuals covered by the Registrant’s Code of Ethics during the reporting period for this Form N-CSR. |
| (f) | A copy of the Registrant’s Code of Ethics is attached as an exhibit to this Form N-CSR. |
Item 3: Audit Committee Financial Expert.
(a) | (1) | The Board of Trustees of the Registrant has determined that the Registrant has at least one member serving on the Registrant’s Audit Committee that possesses the attributes identified in Instruction 2(b) of Item 3 to Form N-CSR to qualify as “audit committee financial expert.” |
| | (2) | The name of the audit committee financial expert is Miriam M. Allison. Ms. Allison is deemed to be “independent” as that term is defined in Item 3(a)(2) of Form N-CSR. |
Item 4. Principal Accountant Fees and Services.
| (a) | Audit Fees - The aggregate fees billed for professional services rendered by the independent registered public accounting firm for the audit of the Registrant’s annual financial statements or services normally provided in connection with statutory and regulatory filings or engagements for the last two fiscal years ended September 30, 2016 and 2015 were $464,935 and $469,663, respectively. |
| (b) | Audit Related Fees – During the fiscal years ended September 30, 2016 and 2015, the Registrant was not billed any fees by the independent registered public accounting firm for assurance and related services rendered by the independent registered public accounting firm to the Registrant that are reasonably related to the performance of the audit of the Registrant’s financial statements and are not reported under paragraph (a) of this Item 4. |
During the fiscal years ended September 30, 2016 and 2015, no fees for assurance and related services that relate directly to the operations and financial reporting of the Registrant were billed by the independent registered public accounting firm to the Registrant’s investment adviser (the “Advisor”) or any other entity controlling, controlled by, or under common control with the Advisor that provides ongoing services to the Registrant.
| (c) | Tax Fees - The aggregate fees billed for professional services rendered by the independent registered public accounting firm to the Registrant for tax compliance, tax advice, tax planning and tax return preparation for the last two fiscal years ended September 30, 2016 and 2015 were $101,430 and $111,965, respectively. These services consisted of the independent registered public accounting firm reviewing the Registrant’s excise tax returns, distribution requirements and RIC tax returns, as well as consultations regarding the liquidation of a series of the Trust. |
During the fiscal years ended September 30, 2016 and 2015, no fees for tax compliance, tax advice or tax planning services that relate directly to the operations and financial reporting of the Registrant were billed by the independent registered public accounting firm to the Advisor or any other entity controlling, controlled by, or under common control with the Advisor that provides ongoing services to the Registrant.
| (d) | All Other Fees – The aggregate fees billed for products and services provided by the independent registered public accounting firm to the Registrant, other than the services reported in paragraph (a) – (c) of this Item 4, for the fiscal years ended September 30, 2016 and 2015 were $0 and $0, respectively. |
During the fiscal years ended September 30, 2016 and 2015, no fees for other services that relate directly to the operations and financial reporting of the Registrant were billed by the independent registered public accounting firm to the Advisor or any other entity controlling, controlled by, or under common control with the Advisor that provides ongoing services to the Registrant.
| (e) | Pre-Approval Policies and Procedures |
(1) Pursuant to the registrant’s Audit Committee Charter, the Audit Committee shall evaluate the independence of the independent public accountants, including evaluating whether the independent public accountants provide audit services or consulting services to the Registrant or consulting services to the Advisor, and to receive the specific representations of the independent registered public accounting firm as to their independence. Specifically, the Audit Committee will be responsible for evaluating the provision of non-audit services to the Registrant as required by Section 201 of the Sarbanes-Oxley Act, any pre-approval requests submitted by the independent registered public accounting firm as required by Section 202 of the Sarbanes-Oxley Act or as otherwise required under Section 2-01 of Regulation S-X, and shall monitor the conflict of interest requirements in Section 206 of the Sarbanes-Oxley Act, and the prohibitions on improper influence on the conduct of audits in Section 303 of the Sarbanes-Oxley Act. The Audit Committee shall pre-approve any engagement of the independent registered public accounting firm to provide any services (other than prohibited non-audit services) including the fees and other compensation to be paid to the independent registered public accounting firm.
The independent registered public accounting firm is authorized by the Audit Committee to provide non-audit services to the extent allowable under the Sarbanes-Oxley Act of 2002 for the Registrant provided that (i) the fees payable with respect to such services do not exceed $5,000 in any calendar quarter and (ii) such fees are ratified by the Audit Committee at its next meeting. The fees payable with respect to non-audit services may be increased by the affirmative vote of a majority of the members of the Audit Committee.
(2) There were no pre-approval requirements waived for the services provided to the Registrant described in paragraphs (b)-(d) of Item 4 by the Audit Committee pursuant to paragraph (c)(7)(i)(C) of Rule 2-01 of Regulation S-X (the “De Minimis Rule”). There were no fees billed for services provided to the Advisor described in paragraphs (b)-(d) of Item 4 that were required to be pre-approved by the Audit Committee as described in paragraph (e)(1) of Item 4.
| (f) | No disclosures are required by this Item 4(f). |
| (g) | For the fiscal years ended September 30, 2016 and 2015, the aggregate non-audit fees billed by the independent registered public accounting firm for services rendered to the Registrant and the Advisor and any entity controlling, controlled by, or under common control with the Advisor that provided ongoing services to the Registrant were approximately $0 and $0, respectively. |
| (h) | No disclosures are required by this Item 4(h). |
Item 5. Audit Committee of Listed Registrants.
Not applicable.
Item 6. Schedule of Investments.
| (a) | Schedule of Investments is included as a part of the report to shareholders filed under Item 1 of this Form N-CSR. |
Item 7. Disclosure of Proxy Voting Policies and Procedures for Closed-End Management Investment Companies.
Not applicable.
Item 8. Portfolio Managers of Closed-End Investment Companies.
Not applicable.
Item 9. Purchases of Equity Securities by Closed-End Management Investment Company and Affiliated Purchasers.
Not applicable.
Item 10. Submission of Matters to a Vote of Security Holders.
There have been no material changes to the procedures by which shareholders may recommend nominees to the Registrant’s board of trustees, where those changes were implemented after the Registrant last provided disclosure in response to this item.
Item 11. Controls and Procedures.
| (a) | The Registrant’s principal executive and principal financial officers have concluded that the Registrant’s disclosure controls and procedures (as defined in Rule 30a-3(c) under the Investment Company Act of 1940, as amended (the “1940 Act”)) are effective, as of a date within 90 days of the filing date of this Form N-CSR based on their evaluation of these controls and procedures required by Rule 30a-3(b) under the 1940 Act) and Rules 13a-15(b) or 15d-15(b) under the Securities Exchange Act of 1934). |
| (b) | There were no changes in the Registrant’s internal control over financial reporting (as defined in Rule 30a-3(d) under the 1940 Act) that occurred during the Registrant’s second fiscal quarter of the period covered by this report that has materially affected, or is reasonably likely to materially affect, the Registrant’s internal control over financial reporting. |
Item 12. Exhibits.
| (a)(1) | Code of Ethics is attached hereto. |
| (a)(2) | The certifications required by Rule 30a-2(a) of the 1940 Act are attached hereto. |
| (b) | The certifications required by Rule 30a-2(b) of the 1940 Act and Section 906 of the Sarbanes-Oxley Act of 2002 are attached hereto. |
SIGNATURES
Pursuant to the requirements of the Securities Exchange Act of 1934 and the Investment Company Act of 1940, the Registrant has duly caused this report to be signed on its behalf by the undersigned, thereunto duly authorized.
WASATCH FUNDS TRUST
| | |
| |
By: | | /s/ Samuel S. Stewart, Jr. |
| | Samuel S. Stewart, Jr. |
| | President (principal executive officer) of Wasatch Funds Trust |
Date: December 6, 2016
Pursuant to the requirements of the Securities Exchange Act of 1934 and the Investment Company Act of 1940, this report has been signed below by the following persons on behalf of the Registrant and in the capacities and on the dates indicated.
| | |
| |
By: | | /s/ Samuel S. Stewart, Jr. |
| | Samuel S. Stewart, Jr. |
| | President (principal executive officer) of Wasatch Funds Trust |
Date: December 6, 2016
| | |
| |
By: | | /s/ Cindy B. Firestone |
| | Cindy B. Firestone |
| | Treasurer (principal financial officer) of Wasatch Funds Trust |
Date: December 6, 2016