UNITED STATES
SECURITIES AND EXCHANGE COMMISSION
Washington, D.C. 20549
FORM N-CSR
CERTIFIED SHAREHOLDER REPORT OF REGISTERED
MANAGEMENT INVESTMENT COMPANIES
Investment Company Act file number: 811-04920
WASATCH FUNDS TRUST
(Exact name of registrant as specified in charter)
505 Wakara Way, 3rd Floor
Salt Lake City, UT 84108
(Address of principal executive offices)(Zip code)
| | |
| (Name and Address of Agent for Service) | | Copy to: |
| |
Eric S. Bergeson Wasatch Advisors, Inc. 505 Wakara Way, 3rd Floor Salt Lake City, UT 84108 | | Eric F. Fess, Esq. Chapman & Cutler LLP 111 West Monroe Street Chicago, IL 60603 |
Registrant’s telephone number, including area code: (801) 533-0777
Date of fiscal year end: September 30
Date of reporting period: September 30, 2018
Item 1. Report to Shareholders.

2018 ANNUAL REPORT September 30, 2018 WASATCH FUNDS EQUITY FUNDS / Wasatch Core Growth Fund • Wasatch Emerging India Fund • Wasatch Emerging Markets Select Fund • Wasatch Emerging Markets Small Cap Fund • Wasatch Frontier Emerging Small Countries Fund • Wasatch Global Opportunities Fund • Wasatch Global Value Fund • Wasatch International Growth Fund • Wasatch International Opportunities Fund • Wasatch Micro Cap Fund • Wasatch Micro Cap Value Fund • Wasatch Small Cap Growth Fund • Wasatch Small Cap Value Fund • Wasatch Ultra Growth Fund BOND FUND / Wasatch-Hoisington U.S. Treasury Fund
WASATCH FUNDS
Salt Lake City, Utah
www.WasatchFunds.com
800.551.1700
This material must be accompanied or preceded by a prospectus.
Please read the prospectus carefully before you invest.
Wasatch Funds are distributed by ALPS Distributors, Inc.
1
| | |
| LETTERTO SHAREHOLDERS — CLEAR SKIESINTHE U.S., STORM CLOUDSIN EMERGING MARKETS | | |
|
|
|
| | | | |

Ajay Krishnan, CFA Portfolio Manager | | 
John Malooly, CFA Portfolio Manager | | DEAR FELLOW SHAREHOLDERS: American mathematician and meteorologist Edward Norton Lorenz coined the term “butterfly effect” after he discovered that small changes in the initial conditions of his weather model could produce vastly different outcomes. Although a butterfly doesn’t directly create a hurricane, its fluttering wings can theoretically alter initial conditions just enough to affect the weather in other parts of the world. The interconnectedness of world financial markets is more intuitive than that of the weather but similarly complex. Like air flowing from areas of high pressure to areas of low pressure, money tends to flow toward countries offering investors the highest returns. In 2018, U.S. tax reform set in motion events that pulled investment assets away from emerging markets toward the U.S. By lowering corporate and individual tax rates, the new tax law boosted economic activity and improved the earnings of U.S. companies. Because small companies tend to |
have more exposure to the U.S. and higher effective tax rates than larger peers, small-company stocks stood to gain the most. The greater domestic focus of smaller firms was an added bonus in 2018, as newly imposed tariffs on steel and other imports threatened to disrupt the businesses of large U.S. companies and multinationals.
As capital flowed to America’s shores, the dollar strengthened against other currencies and made riskier investments in emerging markets less attractive to international investors. It also raised the cost of servicing dollar-denominated debt taken on by developing nations in the years following the global financial crisis. Emerging-market equities came under additional pressure on worries surrounding the trade dispute between the U.S. and China. Rising U.S. interest rates further underpinned support for the dollar and added to the woes of emerging markets.
While this outline of recent events may sound like a case for pessimism regarding the future of emerging-market stocks and a case for unbridled confidence regarding U.S. equities, we believe both views should be tempered. In fact, market dislocations — such as those we’ve seen in emerging countries — have a way of creating opportunities for astute investors. Moreover, investors should keep in mind that a large portion of the poor performance in emerging-market stocks was due to currency effects rather than company fundamentals.
ECONOMY
Regarding economic news, let’s start in the U.S. The Bureau of Economic Analysis upwardly revised its estimate of second-quarter gross domestic product (GDP) growth to 4.2% thanks to healthy consumer spending on durable goods. And although economic growth will likely moderate, government data suggests the U.S. economy will continue to expand at a healthy clip.
Consistent with robust economic growth, the U.S. unemployment rate — which is hovering at its lowest level since 2000 — has continued to fall as the labor market has tightened. Job openings continue to exceed the number of unemployed workers. And these conditions have likely contributed to accelerating wage growth. Not surprisingly, consumer sentiment among individuals hit an 18-year high in September.
For its part, the U.S. Federal Reserve (Fed) characterized economic conditions as “strong,” an improvement from its previously “solid” assessment. And Fed policy makers raised the federal-funds rate to a range of 2% to 2.25%. In addition to the Fed raising short-term interest rates, a few days after September 30th the 10-year U.S. Treasury yield jumped to its highest level in seven years. While this may simply reflect the strong economy, higher U.S. interest rates could put some upward pressure on rates overseas.
This brings us to a discussion of international economies. While the eurozone is still growing, the pace of growth has slowed from a year ago. In Japan, Prime Minister Shinzo Abe’s policies appear to be working, and the country has achieved its highest rate of GDP growth in over a year. Like the U.S., both the eurozone and Japan are experiencing some labor shortages and rising wages.
On the subject of global trade, tensions between the United States and the rest of the world remain a top-of-mind concern, especially as the administration moved forward with new tariffs on $200 billion worth of Chinese imports into the United States, and China retaliated by announcing new tariffs of its own. Moreover, China’s $12 trillion economy has faced additional challenges. Measures of factory activity came in weaker than expected in September, reflecting China’s economic slowdown and the impact of tariffs on the country’s export manufacturers. With little hope for a quick resolution on trade, China’s economic outlook now depends largely on the government’s ability to implement appropriate stimulus measures. A key importer of raw materials, components and finished goods from other countries, China functions as a locomotive of growth for other emerging markets.
Although the impacts of the storm clouds over emerging markets are difficult to predict, we expect a resolution similar to the one in the aftermath of the so-called “Taper Tantrum” of 2013. Back then, investors feared that as the Fed tapered its bond purchases, U.S. interest rates would rise substantially and cause money to flow out of emerging markets into the U.S. These fears never materialized in an overwhelming way. And emerging markets are generally in better shape today than they were in 2013. Current-account deficits are much lower. Foreign-exchange reserves are generally higher. And fiscal-budget balances are better too.
Among emerging markets, we’re most optimistic regarding India. The Indian economy is largely driven by domestic demand and is tied less to exports and global supply chains. With tariffs on Chinese exports to the U.S. posing threats for China and its trading partners, we think India’s relatively closed economy offers attractive opportunities for international investors seeking to reduce exposure to global risks.
2
| | |
| | SEPTEMBER 30, 2018 (UNAUDITED) |
|
|
|
MARKETS
While economic news doesn’t always drive global financial-market performance, returns during the 12 months ended September 30, 2018 were consistent with the headlines.
Stocks in the U.S. mostly traded up. The large-cap S&P 500® Index advanced 17.91%. The technology-heavy Nasdaq Composite Index gained 25.17%. The Russell 2000® Index of small caps rose 15.24%, and the Russell 2000 Growth Index gained 21.06%. Value-oriented small caps in the Russell 2000 Value Index were relative laggards at 9.33%, as value stocks — including those across larger market capitalizations — generally trailed growth stocks.
Along with somewhat higher interest rates, longer-term U.S. government bonds felt moderate price declines as evidenced by the Bloomberg Barclays US 20+ Year Treasury Bond Index being down -3.52% for the 12-month period. Shorter-term and higher-yielding bonds held up better, as indicated by the Bloomberg Barclays US Aggregate Bond Index having only a small loss of -1.22%. Despite some recent price declines, we’re not necessarily bearish on U.S. bonds because we think extremely low interest rates overseas may help keep U.S. rates from rising too dramatically.
For the most part, international stock markets didn’t fare as well as those in the U.S. The MSCI World ex USA Index rose just 2.67% and the MSCI Emerging Markets Index fell -0.81% for the annual period ended September 30, 2018.
Although U.S. stocks have been setting records recently, we don’t know when the next period of flat or down performance will arrive. We also don’t know when changes in initial conditions like those theoretically created by a butterfly’s wings will cause investors to favor international and emerging-market stocks over those in the U.S. So rather than paying too much attention to market cycles, we focus on finding high-quality growth companies — wherever they exist in the world — that we believe will help us take advantage of favorable conditions, and hopefully help us navigate more-difficult environments as well.
WASATCH
Throughout the year, most of Wasatch’s U.S. funds benefited from steady business conditions and subdued inflation, which favored the stocks of growth-oriented small companies — including many that were somewhat insulated from tariffs and global trade concerns. Beyond the tailwind of a favorable environment for our investment style, we were pleased to see that most of our companies continued to boost revenues and deliver outstanding earnings growth that wasn’t simply related to tax cuts. In fact, we’ve been hearing from company management teams that the business environment is the best it’s been in a decade.
Among emerging markets, pockets of concern flared up with greater intensity. There’s no question that investors were generally more comfortable with what they perceived as the safer — and still fast-growing — U.S. stock market. But we remain optimistic about the prospects for our current emerging-market holdings. We’re pleased that the emerging-market companies we own have generally delivered strong earnings growth despite the recent underperformance of their stocks.
Moreover, we continue to see solid opportunities for new investments. For example, with recent declines in Chinese stocks having brought valuations to more-attractive levels, our research has identified approximately 200 Chinese companies that we think merit further evaluation. Toward that end, analysts from the Wasatch international team recently visited 65 companies in China. This was the first of a series of trips designed to cover our list of candidates for investment in China.
While it’s impossible to predict the timing of market cycles, the “butterfly effect” could easily work in the opposite direction. At Wasatch, it’s our job to find the best companies we can no matter where they are in the world. And we think it’s a good idea for individual investors to have a long-term perspective and portfolios that are geographically diversified too, because when you’ve got the world covered it doesn’t matter as much what the butterflies do.
With sincere thanks for your continuing investment and for your trust,


Ajay Krishnan and John Malooly
Information in this report regarding market or economic trends, or the factors influencing historical or future performance, reflects the opinions of management as of the date of this report. These statements should not be relied upon for any other purpose. Past performance is no guarantee of future results, and there is no guarantee that the market forecasts discussed will be realized.
CFA® is a trademark owned by CFA Institute.
Wasatch Advisors is the investment advisor to Wasatch Funds.
Wasatch Funds are distributed by ALPS Distributors, Inc. (ADI). ADI is not affiliated with Wasatch Advisors, Inc.
For definitions of financial terms and index descriptions and disclosures, please see page 34.
3
| | |
| WASATCH CORE GROWTH FUND (WGROX / WIGRX) | | SEPTEMBER 30, 2018 (UNAUDITED) |
|
|
|
Management Discussion
The Wasatch Core Growth Fund is managed by a team of Wasatch portfolio managers led by JB Taylor, Paul Lambert and Mike Valentine.
| | | | |

JB Taylor Lead Portfolio Manager | | 
Paul Lambert Portfolio Manager | | 
Mike Valentine Portfolio Manager |
OVERVIEW
The Wasatch Core Growth Fund — Investor Class gained 27.66% for the 12 months ended September 30, 2018, outperforming the 15.24% rise in the benchmark Russell 2000 Index and the 21.06% advance in the Russell 2000 Growth Index.
The Fund’s outperformance for the 12 months came largely as a result of favorable stock selection, particularly among our U.S. retailers and other holdings in the consumer-discretionary sector. Names in the information-technology, health-care and industrials sectors also contributed.
As a whole, the U.S. market is in the vicinity of record highs. While large technology firms have been responsible for much of the gains, investors have also been attracted to smaller companies in a highly positive economic environment. Although this dynamic has been favorable to our investment style, it’s encouraging to see that the returns have been justified by strong underlying fundamentals. In fact, the anecdotes we’ve been hearing from company management teams suggest that the business environment is as positive as any we’ve seen since the global financial crisis, something our bottom-up analysis also supports.
DETAILSOFTHE YEAR
Two of the Fund’s U.S. retailers were among the top contributors to performance for the 12 months. Strong sales growth in a robust consumer-spending environment played a role in driving the stocks of both companies higher. But we also believe investors have gained greater appreciation for the companies’ business models, which insulate them to some extent from the “Amazon effect” that’s been disrupting the operations of many traditional brick-and-mortar retailers. Each company anticipates substantially increasing the number of its stores.
The Fund’s top-contributing retailer was Five Below, Inc., which has established itself among teens and young consumers as the destination store for inexpensive, fun merchandise. The company’s competitive advantage is low pricing — everything in the store sells for $5 or less. E-commerce companies find it difficult to offer such products with the free-shipping benefit that online customers have come to expect.
Moreover, Five Below has self-funded its store expansions. We expect it to continue to do so.
The other strong-contributing retailer was Ollie’s Bargain Outlet Holdings, Inc. The company acquires excess inventory of brand-name products in a wide variety of categories, and then offers those products to customers who enjoy the bargain-priced, “treasure hunt” shopping experience. We believe Ollie’s business model would be hard for online competitors to replicate. Its loyal customer base is a competitive advantage continually strengthened through its “Ollie’s Army” membership and rewards program. We believe Ollie’s can double the number of stores to more than 500.
The largest detractor from Fund performance was Healthcare Services Group, Inc. (HCSG), a provider of housekeeping, laundry and dining services to skilled nursing facilities. Recently, some of HCSG’s customers had operating challenges and some even went bankrupt. This caused short-term deterioration in the company’s fundamentals. We believe the management team has the experience and depth to navigate these recent challenges. Moreover, we think HCSG has the potential for double-digit growth by adding more facilities to the housekeeping and laundry business segments and by cross-selling dining services to the existing client base.
The second-largest detractor was U.S. regional bank Eagle Bancorp, Inc. The stock price slid on concerns that, as interest rates rise, Eagle may not be able to maintain what have been highly attractive differentials between what it pays depositors and its income from lending. We think investors have overreacted. Due to its variable-rate loans, Eagle’s earnings yield also rises as interest rates increase.
OUTLOOK
As we’ve spoken with corporate management teams in the U.S., we’ve heard again and again that they’re seeking ways to grow their businesses and make their companies operate more efficiently. Both of these endeavors are aimed at helping the companies benefit even more from an expanding economy. We believe one reason the information-technology sector has continued to thrive is that by invest-ing in technology, executives can address their desire to achieve both growth and efficiency. Technology can facilitate growth by creating ways to reach more customers in more ways. Technology can improve efficiency through initiatives such as shifting applications to the cloud and, in a tight labor market, finding more ways to automate processes.
Although we’re always watchful for deterioration in fundamentals, we don’t see any broad-based challenges to the strong growth prospects we believe are represented by the companies held in the Fund. In certain industries, such as autos and homebuilding, market action seems to suggest a tug-of-war between continuing economic optimism on the one hand and concern that we’ve reached “peak earnings” on the other hand. But broadly speaking, we see little standing in the way of further growth in the U.S. economy.
Thank you for the opportunity to manage your assets.
| | Current and future holdings are subject to risk. |
4
| | |
| WASATCH CORE GROWTH FUND (WGROX / WIGRX) | | SEPTEMBER 30, 2018 (UNAUDITED) |
|
|
|
Portfolio Summary
AVERAGE ANNUAL TOTAL RETURNS
| | | | | | | | | | | | | | | |
| | | 1 YEAR | | 5 YEARS | | 10 YEARS |
Core Growth (WGROX) — Investor | | | | 27.66% | | | | | 13.94% | | | | | 14.51% | |
Core Growth (WIGRX) — Institutional | | | | 27.82% | | | | | 14.06% | | | | | 14.59% | |
Russell 2000® Index | | | | 15.24% | | | | | 11.07% | | | | | 11.11% | |
Russell 2000® Growth Index | | | | 21.06% | | | | | 12.14% | | | | | 12.65% | |
Data shows past performance, which is not indicative of future performance. Current performance may be lower or higher than the performance quoted. To obtain the most recent month-end performance data available, please visit www.WasatchFunds.com. The Advisor may absorb certain Fund expenses, without which total return would have been lower. Investment returns and principal value will fluctuate and shares, when redeemed, may be worth more or less than their original cost.
As of the January 31, 2018 prospectus, the Total Annual Fund Operating Expenses for the Wasatch Core Growth Fund are Investor Class: 1.21% / Institutional Class — Gross: 1.10%, Net: 1.05%. The expense ratio shown elsewhere in this report may be different. Net expenses are based on Fund expenses, net of waivers and reimbursements. See the prospectus for additional information regarding Fund expenses.
Wasatch Funds will deduct a 2.00% redemption proceeds fee on Fund shares held 60 days or less. Performance data does not reflect the deduction of fees, including sales charges, or the taxes you would pay on fund distributions or the redemption of fund shares. Fees and taxes, if reflected, would reduce the performance quoted. Wasatch does not charge any sales fees. For more complete information including charges, risks and expenses, read the prospectus carefully.
Performance for the Institutional Class prior to 1/31/2012 is based on the performance of the Investor Class. Performance of the Fund’s Institutional Class prior to 1/31/2012 uses the actual expenses of the Fund’s Investor Class without any adjustments. For any such period of time, the performance of the Fund’s Institutional Class would have been substantially similar to, yet higher than, the performance of the Fund’s Investor Class, because the shares of both classes are invested in the same portfolio of securities, but the classes bear different expenses.
Investing in small cap funds will be more volatile and loss of principal could be greater than investing in large cap or more diversified funds. Investing in foreign securities, especially in emerging markets, entails special risks, such as currency fluctuations and political uncertainties, which are described in more detail in the prospectus.
TOP 10 EQUITY HOLDINGS*
| | | | |
| Company | | % of Net
Assets | |
| Euronet Worldwide, Inc. | | | 3.8% | |
| Monro, Inc. | | | 3.4% | |
| RBC Bearings, Inc. | | | 3.3% | |
| Barnes Group, Inc. | | | 3.1% | |
| ICON plc (Ireland) | | | 3.0% | |
| | | | |
| Company | | % of Net
Assets | |
| Trex Co., Inc. | | | 2.7% | |
| Ollie’s Bargain Outlet Holdings, Inc. | | | 2.7% | |
| Pool Corp. | | | 2.6% | |
| Cantel Medical Corp. | | | 2.5% | |
| Ensign Group, Inc. (The) | | | 2.5% | |
| * | As of September 30, 2018, there were 54 holdings in the Fund. Foreign currency contracts, written options and repurchase agreements, if any, are not included in the number of holdings. Portfolio holdings are subject to change at any time. References to specific securities should not be construed as recommendations by the Funds or their Advisor. Current and future holdings are subject to risk. |
SECTOR BREAKDOWN**
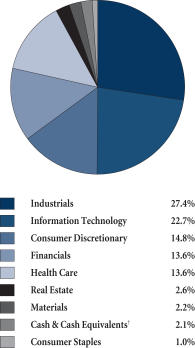
| ** | Excludes securities sold short and options written, if any. |
| † | Also includes Other Assets & Liabilities. |
GROWTHOFA HYPOTHETICAL $10,000 INVESTMENT
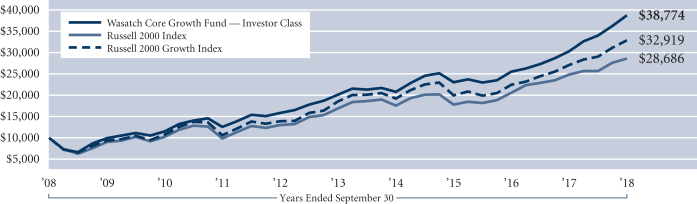
Past performance does not predict future performance. The graph above does not reflect the deduction of fees, sales charges, or taxes that you would pay on fund distributions or the redemption of fund shares. Wasatch does not charge any sales fees. The Russell 2000 Index is an unmanaged total return index of the smallest 2,000 companies in the Russell 3000 Index, as ranked by total market capitalization. The Russell 2000 Index is widely regarded in the industry as accurately capturing the universe of small company stocks. The Russell 2000 Growth Index is an unmanaged total return index that measures the performance of those Russell 2000 Index companies with higher price-to-book ratios and higher forecasted growth values. You cannot invest directly in these or any indexes.
5
| | |
| WASATCH EMERGING INDIA FUND (WAINX / WIINX) | | SEPTEMBER 30, 2018 (UNAUDITED) |
|
|
|
Management Discussion
The Wasatch Emerging India Fund is managed by a team of Wasatch portfolio managers led by Ajay Krishnan and Matthew Dreith.
| | | | |
Ajay Krishnan, CFA Lead Portfolio Manager | | 
Matthew Dreith, CFA Associate Portfolio Manager | | OVERVIEW The Wasatch Emerging India Fund — Investor Class declined -0.33% during the 12 months ended September 30, 2018. The Fund outperformed the benchmark MSCI India |
Investable Market Index (IMI), which fell -2.40%.
Indian stocks rose during the first three months of the period on the back of strong company fundamentals and solid economic growth. Following an additional surge in January, however, further gains in equities were offset by currency weakness in the rupee against the U.S. dollar. Even as India’s major stock averages pushed to all-time highs in August, routs in the currencies of Turkey and Argentina brought countries with current-account and fiscal deficits under mounting scrutiny from investors. The rupee came under renewed pressure in September after a report showed that higher oil prices had pushed India’s quarterly current-account deficit to its widest in five years.
The combination of higher oil and a weaker rupee sent retail prices of diesel fuel and gasoline to record highs in Mumbai, fanning fears of inflation and raising concerns about prospects for Prime Minister Narendra Modi’s Bharatiya Janata Party in upcoming elections. International investors reacted to growing uncertainty and the rupee’s woes by selling Indian stocks and bonds — setting off a vicious cycle that moved the Fund’s return into the minus column during the final trading sessions of the fiscal year.
Consumer discretionary and health care were the Fund’s largest sources of outperformance relative to the benchmark. In both sectors, our stocks generated gains compared to losses in the benchmark’s positions. Information technology and energy were the top-performing sectors of the Index. However, our significant underexposure to these areas was a headwind for the Fund.
Financials were another source of outperformance in the Fund. A late-period slide erased earlier gains in the sector after a credit default at a lender to infrastructure firms sparked a selloff in the stocks of non-bank financial companies.
DETAILSOFTHE YEAR
The strongest contributor to Fund performance was V-Mart Retail Ltd. The company operates department stores specializing in apparel. V-Mart also sells a wide range of general merchandise and fast-moving consumer goods. V-Mart’s shares moved higher amid strong top-line and bottom-line growth at the company. Because V-Mart operates primarily in India’s rural areas, the company stands to
benefit as the Modi government seeks to create jobs and appeal to voters in advance of national elections in 2019.
Page Industries Ltd. was the second-best contributor. The company manufactures and sells Jockey-branded undergarments in India, Sri Lanka, Bangladesh, Nepal and the United Arab Emirates. Page is also the exclusive licensee for the manufacture, marketing and distribution of the Speedo brand in India. In the company’s most-recent quarter, net profit surged 46% on 17% revenue growth versus the same quarter a year ago. The inclusion of Page in the MSCI India Domestic Index as of August 31st also lifted the stock.
The greatest detractor from Fund performance was Somany Ceramics Ltd. The company makes wall and floor tiles, sanitary ware and bath fittings. Although comparable sales at Somany held up reasonably well, earnings disappointed investors. Management cited higher prices for natural gas and ongoing pricing pressure from competitors using dubious means to avoid India’s goods-and-services tax (GST). The company expects India’s implementation of the e-way bill to curb non-compliance with the GST and create fairer competition in the industry.
Another weak stock in the Fund was Amara Raja Batteries Ltd. The company makes lead-acid storage batteries for industrial and automotive applications. Higher prices for lead and other raw materials squeezed margins at Amara Raja, while uncertainty about future government policy with respect to electric vehicles (EVs) also appears to have weighed on the company’s share price. Though the risks posed to Amara Raja by EVs are real, we believe India’s government currently lacks the resources necessary to subsidize rapid adoption of EV technology.
OUTLOOK
As fears of contagion from the crises in Turkey and Argentina continue to ripple through emerging markets, the currencies of India and other countries are being tested. In September, the Indian government raised tariffs on non-essential imports and announced other measures designed to stem the rupee’s decline. One option being considered is the issuance of Non-Resident Indian (NRI) bonds to wealthy Indians living abroad.
The government used NRI bonds to raise approximately $34 billion during the so-called “Taper Tantrum” of 2013. Despite that and other difficult periods in the recent past, the Wasatch Emerging India Fund — Investor Class generated an average annual total return of 10.53% from its inception on April 26, 2011 through September 30, 2018, compared to a gain of 1.95% for the MSCI India IMI.
Moreover, the Indian economy is largely driven by domestic demand and tied less to exports and global supply chains. With tariffs on Chinese exports to the U.S. posing threats for China and its trading partners, we think India’s relatively closed economy offers attractive opportunities for international investors seeking to reduce exposure to global risks.
Thank you for the opportunity to manage your assets.
| | Current and future holdings are subject to risk. |
6
| | |
| WASATCH EMERGING INDIA FUND (WAINX / WIINX) | | SEPTEMBER 30, 2018 (UNAUDITED) |
|
|
|
Portfolio Summary
AVERAGE ANNUAL TOTAL RETURNS
| | | | | | | | | | | | | | | |
| | | 1 YEAR | | 5 YEARS | | SINCE INCEPTION
4/26/11 |
Emerging India (WAINX) — Investor | | | | -0.33% | | | | | 18.57% | | | | | 10.53% | |
Emerging India (WIINX) — Institutional | | | | -0.33% | | | | | 18.68% | | | | | 10.60% | |
MSCI India IMI | | | | -2.40% | | | | | 10.67% | | | | | 1.95% | |
Data shows past performance, which is not indicative of future performance. Current performance may be lower or higher than the performance quoted. To obtain the most recent month-end performance data available, please visit www.WasatchFunds.com. The Advisor may absorb certain Fund expenses, without which total return would have been lower. Investment returns and principal value will fluctuate and shares, when redeemed, may be worth more or less than their original cost.
As of the January 31, 2018 prospectus, the Total Annual Fund Operating Expenses for the Wasatch Emerging India Fund are Investor Class — 1.73% / Institutional Class — Gross: 1.67%, Net: 1.50%. The expense ratio shown elsewhere in this report may be different. Net expenses are based on Fund expenses, net of waivers and reimbursements. See the prospectus for additional information regarding Fund expenses.
Wasatch Funds will deduct a 2.00% redemption proceeds fee on Fund shares held 60 days or less. Performance data does not reflect the deduction of fees, including sales charges, or the taxes you would pay on fund distributions or the redemption of fund shares. Fees and taxes, if reflected, would reduce the performance quoted. Wasatch does not charge any sales fees. For more complete information including charges, risks and expenses, read the prospectus carefully.
Performance for the Institutional Class prior to 2/1/2016 is based on the performance of the Investor Class. Performance of the Fund’s Institutional Class prior to 2/1/2016 uses the actual expenses of the Fund’s Investor Class without any adjustments. For any such period of time, the performance of the Fund’s Institutional Class would have been substantially similar to, yet higher than, the performance of the Fund’s Investor Class, because the shares of both classes are invested in the same portfolio of securities, but the classes bear different expenses.
Investing in small cap funds will be more volatile and loss of principal could be greater than investing in large cap or more diversified funds. Investing in foreign securities, especially in emerging markets, entails special risks, such as unstable currencies, highly volatile securities markets and political and social instability, which are described in more detail in the prospectus.
TOP 10 EQUITY HOLDINGS*
| | | | |
| Company | | % of Net
Assets | |
| V-Mart Retail Ltd. (India) | | | 6.7% | |
| Bajaj Finance Ltd. (India) | | | 5.9% | |
| ICICI Lombard General Insurance Co. Ltd. (India) | | | 5.1% | |
| Divi’s Laboratories Ltd. (India) | | | 4.7% | |
| Amara Raja Batteries Ltd. (India) | | | 4.7% | |
| | | | |
| Company | | % of Net
Assets | |
| Endurance Technologies Ltd. (India) | | | 4.6% | |
| Housing Development Finance Corp. Ltd. (India) | | | 4.4% | |
| Pidilite Industries Ltd. (India) | | | 4.3% | |
| Dr. Lal PathLabs Ltd. (India) | | | 4.2% | |
| HDFC Bank Ltd. (India) | | | 3.8% | |
| * | As of September 30, 2018, there were 39 holdings in the Fund. Foreign currency contracts, written options and repurchase agreements, if any, are not included in the number of holdings. Portfolio holdings are subject to change at any time. References to specific securities should not be construed as recommendations by the Funds or their Advisor. Current and future holdings are subject to risk. |
SECTOR BREAKDOWN**
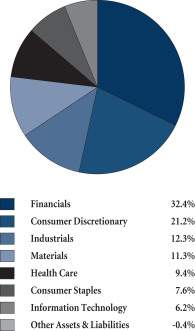
| ** | Excludes securities sold short and options written, if any. |
GROWTHOFA HYPOTHETICAL $10,000 INVESTMENT
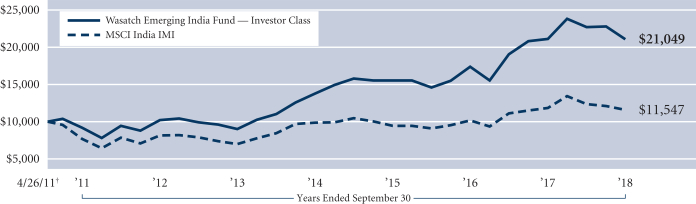
Past performance does not predict future performance. The graph above does not reflect the deduction of fees, sales charges, or taxes that you would pay on fund distributions or the redemption of fund shares. Wasatch does not charge any sales fees. †Inception: April 26, 2011. The MSCI India IMI (Investable Market Index) is designed to measure the performance of the large-, mid- and small-cap segments of the Indian market. The Index covers approximately 99% of the free-float adjusted market capitalization of the Indian equity universe. You cannot invest directly in this or any index.
7
| | |
| WASATCH EMERGING MARKETS SELECT FUND (WAESX / WIESX) | | SEPTEMBER 30, 2018 (UNAUDITED) |
|
|
|
Management Discussion
The Wasatch Emerging Markets Select Fund is managed by a team of Wasatch portfolio managers led by Ajay Krishnan, Roger Edgley, Scott Thomas and Matthew Dreith.
| | | | |
Ajay Krishnan, CFA Lead Portfolio Manager 
Scott Thomas, CFA Associate Portfolio
Manager | | 
Roger Edgley, CFA Portfolio Manager
Matthew Dreith, CFA Associate Portfolio Manager | | OVERVIEW Rising U.S. interest rates and worries about global trade dogged emerging-market equities for most of the 12-month period ended September 30, 2018. The Wasatch Emerging Markets Select Fund — Investor Class lost -0.57% during the period, while the benchmark MSCI Emerging Markets Index fell -0.81%. After a favorable start to the Fund’s fiscal year, trade concerns moved to the forefront in March after the White House |
announced tariffs on imported aluminum and steel. Fears intensified after separate measures directed specifically at China sparked an escalating sequence of retaliation by both countries. Tighter monetary policy in the U.S. posed additional headwinds for emerging markets by making dollar-denominated assets more appealing to international investors.
Surveys of Chinese manufacturing weakened during the summer as U.S. tariffs impacted export production. In July, the Chinese government announced stimulus measures designed to boost domestic demand and ward off an economic slowdown. A key importer of raw materials, components and finished goods from other countries, China functions as a locomotive of growth for other developing nations. The prospect of shrinking exports to China confronted emerging markets at a time when routs in the currencies of Argentina and Turkey placed countries with current-account deficits under mounting scrutiny from investors.
Korea, South Africa and the United Arab Emirates (UAE) were the Fund’s largest sources of outperformance relative to the benchmark, as our stocks significantly outpaced the benchmark’s positions. The largest source of weakness against the benchmark was Taiwan, where our technology holdings were significant detractors.
DETAILSOFTHE YEAR
The strongest contributor to Fund performance was NMC Health plc. The company provides health-care services in the UAE and other Middle Eastern countries. Shares of NMC
rose on news that the company had landed a contract to manage two hospitals in Egypt. NMC also continued its planned expansion in Saudi Arabia where the government seeks to privatize the health-care sector. We liquidated the Fund’s position on concerns about rising valuation and management’s increased focus outside NMC’s core geography.
Naspers Ltd. was the second-best contributor. Based in South Africa, Naspers is a global internet and entertainment group. Continued expansion of digital media and e-commerce has driven rapid growth at the company. We sold the stock to reduce exposure to Naspers-held companies owned separately in the Fund.
The greatest detractor from Fund performance was Ctrip.com International Ltd. ADR, a leading online travel agency in China. Ctrip’s depositary receipts languished amid skepticism about the company’s expansion into low-tier cities. Management said the expansion, which includes offline stores, was necessary for building long-term brand awareness. We think Ctrip’s strong market position leaves it well-positioned to capture a larger portion of China’s growing travel market.
Raia Drogasil S.A. was the second-largest detractor from performance. The company operates a chain of drug stores in Brazil. Raia Drogasil’s stock price declined amid broad weakness in Brazilian equities, which were among the poorest performers in the Index. Although top-line growth and same-store sales at Raia Drogasil fell short of expectations, we believe deterioration in these metrics is likely to be temporary. With the company gaining market share and its long-term fundamentals attractive in our view, we added to the Fund’s position.
OUTLOOK
Recent data indicate China’s economic momentum has slowed as the government has curbed risky lending, and as tariffs on Chinese exports to the U.S. have begun to bite. As policy makers shift into a stimulative mode, their ability to provide appropriate economic medicine will be a key determinant of China’s near-term economic health. The Chinese government has an abundance of policy levers at its disposal and has demonstrated an uncanny ability to pull the right ones at the right time.
With recent declines in Chinese stocks having brought valuations to more-attractive levels, our research has identified approximately 200 Chinese companies for further evaluation. Analysts from the Wasatch international team recently visited 65 companies in China. This was the first of a series of trips designed to cover our list of candidates.
Despite continued uncertainty surrounding tariffs and trade, the investment environment in emerging markets remains generally favorable in our view. We’re pleased that, for the most part, the companies we own have delivered strong earnings growth. As fundamental, bottom-up investors, we believe earnings-driven market environments will provide beneficial conditions for our investment approach to outperform over the long term.
Thank you for the opportunity to manage your assets.
| | Current and future holdings are subject to risk. |
8
| | |
| WASATCH EMERGING MARKETS SELECT FUND (WAESX / WIESX) | | SEPTEMBER 30, 2018 (UNAUDITED) |
|
|
|
Portfolio Summary
AVERAGE ANNUAL TOTAL RETURNS
| | | | | | | | | | | | | | | |
| | | 1 YEAR | | 5 YEARS | | SINCE INCEPTION 12/13/12 |
Emerging Markets Select (WAESX) — Investor | | | | -0.57% | | | | | 1.78% | | | | | 0.75% | |
Emerging Markets Select (WIESX) — Institutional | | | | -0.38% | | | | | 2.04% | | | | | 1.06% | |
MSCI Emerging Markets Index | | | | -0.81% | | | | | 3.61% | | | | | 2.57% | |
Data shows past performance, which is not indicative of future performance. Current performance may be lower or higher than the performance quoted. To obtain the most recent month-end performance data available, please visit www.WasatchFunds.com. The Advisor may absorb certain Fund expenses, without which total return would have been lower. Investment returns and principal value will fluctuate and shares, when redeemed, may be worth more or less than their original cost.
As of the January 31, 2018 prospectus, the Total Annual Fund Operating Expenses for the Wasatch Emerging Markets Select Fund are Investor Class — Gross: 1.90%, Net: 1.51% / Institutional Class — Gross: 1.52%, Net: 1.21%. The expense ratio shown elsewhere in this report may be different. Net expenses are based on Fund expenses, net of waivers and reimbursements. See the prospectus for additional information regarding Fund expenses.
Wasatch Funds will deduct a 2.00% redemption proceeds fee on Fund shares held 60 days or less. Performance data does not reflect the deduction of fees, including sales charges, or the taxes you would pay on fund distributions or the redemption of fund shares. Fees and taxes, if reflected, would reduce the performance quoted. Wasatch does not charge any sales fees. For more complete information including charges, risks and expenses, read the prospectus carefully.
Investing in foreign securities, especially in emerging markets, entails special risks, such as currency fluctuations and political uncertainties, which are described in more detail in the prospectus. Investing in small cap funds will be more volatile and loss of principal could be greater than investing in large cap or more diversified funds.
TOP 10 EQUITY HOLDINGS*
| | | | |
| Company | | % of Net
Assets | |
Bajaj Finance Ltd. (India) | | | 5.0% | |
Alibaba Group Holding Ltd. ADR (China) | | | 4.9% | |
BGF Retail Co. Ltd. (Korea) | | | 4.3% | |
Medytox, Inc. (Korea) | | | 4.3% | |
Tencent Holdings Ltd. (China) | | | 4.1% | |
| | | | |
| Company | | % of Net
Assets | |
Raia Drogasil S.A. (Brazil) | | | 4.0% | |
Ctrip.com International Ltd. ADR (China) | | | 4.0% | |
HDFC Bank Ltd. (India) | | | 3.7% | |
Silergy Corp. (Taiwan) | | | 3.4% | |
51job, Inc. ADR (China) | | | 3.1% | |
| * | As of September 30, 2018, there were 38 holdings in the Fund. Foreign currency contracts, written options and repurchase agreements, if any, are not included in the number of holdings. Portfolio holdings are subject to change at any time. References to specific securities should not be construed as recommendations by the Funds or their Advisor. Current and future holdings are subject to risk. |
SECTOR BREAKDOWN**

| ** | Excludes securities sold short and options written, if any. |
| † | Also includes Other Assets & Liabilities. |
GROWTHOFA HYPOTHETICAL $10,000 INVESTMENT
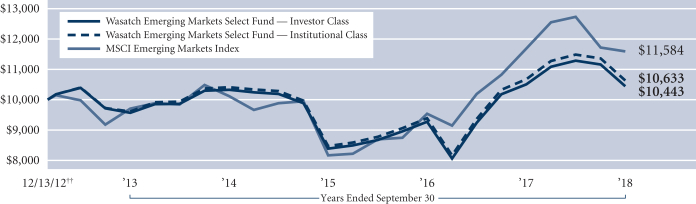
Past performance does not predict future performance. The graph above does not reflect the deduction of fees, sales charges, or taxes that you would pay on fund distributions or the redemption of fund shares. Wasatch does not charge any sales fees. ††Inception: December 13, 2012. The MSCI Emerging Markets Index is a free float-adjusted market capitalization index designed to measure the equity market performance of emerging markets. You cannot invest directly in this or any index.
9
| | |
| WASATCH EMERGING MARKETS SMALL CAP FUND (WAEMX / WIEMX) | | SEPTEMBER 30, 2018 (UNAUDITED) |
|
|
|
Management Discussion
The Wasatch Emerging Markets Small Cap Fund is managed by a team of Wasatch portfolio managers led by Roger Edgley, Andrey Kutuzov, Scott Thomas and Kevin Unger.
| | | | |
Roger Edgley, CFA Lead Portfolio Manager
Scott Thomas, CFA Associate Portfolio Manager | | 
Andrey Kutuzov, CFA Associate Portfolio Manager 
Kevin Unger, CFA Associate Portfolio Manager | | OVERVIEW For the 12 months ended September 30, 2018, the Wasatch Emerging Markets Small Cap Fund — Investor Class declined -7.02% and underperformed the benchmark MSCI Emerging Markets Small Cap Index, which lost -4.20%. The escalating trade war between the United States and China, pres-sure from rising U.S. interest rates, a stronger dollar, and political uncertainty damp-ened enthusiasm for emerging-market assets and |
unsettled global markets over the past 12 months.
Surveys of Chinese manufacturing weakened during the summer as U.S. tariffs impacted export production. In July, the Chinese government announced stimulus measures designed to boost domestic demand and ward off an economic slowdown. A key importer of raw materials, components and finished goods from other countries, China functions as a locomotive of growth for other developing nations.
The Fund’s four most-heavily weighted countries — India, China, Korea and Taiwan — had considerable impact on performance for the 12-month period. The Fund’s holdings in India and China, though down, held up significantly better than their benchmark counterparts. Korea added to the Fund’s return and our holdings outperformed their benchmark peers, but an underweight position caused the country to detract from performance relative to the benchmark. In Taiwan, our stocks declined and the country was the largest detractor from relative performance.
DETAILSOFTHE YEAR
The top contributor to Fund performance was Vitasoy International Holdings Ltd. The company offers soy milk, tofu, rice milk, tea, juices and related food-and-beverage products in over 40 countries. Mainland China continued to drive strong growth at Vitasoy in the company’s most-recent reporting period. Vitasoy’s gross margin widened as improved manufacturing efficiency offset higher prices for soybeans, sugar and other inputs.
The Fund’s second-best contributor was Korea-based Koh Young Technology, Inc. The company has seen high demand for its 3D optical inspection equipment used in manufacturing semiconductors, integrated circuits and other components used in electronics. The benefit of 3D inspection is that it decreases the failure rate of printed circuit boards and removes the requirement for human inspection. Our favorable view of the company continues to be supported by recently reported strong earnings growth.
Taiwan has been increasingly affected by trade-war issues between the U.S. and China, and by changes in investor sentiment and expected growth for the information-technology (IT) sector in general and the semiconductor industry in particular. Three IT investments in Taiwan — Win Semiconductors Corp., Ennoconn Corp. and Silergy Corp. — were among the Fund’s leading detractors for the period. Win manufactures gallium arsenide (GaAs) wafers. The company has seen revenues decline as some customers have made what we view as temporary inventory reductions. Although Ennoconn’s stock price declined, we have no fundamental concerns regarding the company. Ennoconn provides hardware system solutions for market applications including point-of-sale locations, banking automation, kiosk, lottery and industrial automation. We see Ennoconn as having massive headroom for growth as it continues to gain share in the markets it serves. Silergy manufactures high-performance mixed-signal and analog integrated circuits. A global shortage of passive electronic components impacted production of its products. We believe the shortage will be temporary and expect the company to ramp up production when components become more-readily available.
OUTLOOK
Experience has taught us that while macro-related events may feature prominently in news headlines, they usually have minimal impact on the long-term underlying value of the businesses in which we invest. Rather than paying too much attention to the headlines, we focus on identifying and thoroughly researching companies that we see as high quality with outstanding potential for long-duration growth.
With recent declines in Chinese stocks having brought valuations to more-attractive levels, our research has identified approximately 200 Chinese companies that we think merit further evaluation. Toward that end, analysts from the Wasatch international team recently visited 65 companies in China. This was the first of a series of trips designed to cover our list of candidates for investment in China.
Notwithstanding continued uncertainty surrounding tariffs and global trade, the investment environment in emerging markets remains generally favorable in our view. We’re pleased that, for the most part, the companies we own have delivered strong earnings growth despite the recent underperformance of their stocks. As fundamental, bottom-up investors, we believe — over the longer term — earnings-driven market environments will provide beneficial conditions for our investment approach to outperform.
Thank you for the opportunity to manage your assets.
| | Current and future holdings are subject to risk. |
10
| | |
| WASATCH EMERGING MARKETS SMALL CAP FUND (WAEMX / WIEMX) | | SEPTEMBER 30, 2018 (UNAUDITED) |
|
|
|
Portfolio Summary
AVERAGE ANNUAL TOTAL RETURNS
| | | | | | | | | | | | | | | |
| | | 1 YEAR | | 5 YEARS | | 10 YEARS |
Emerging Markets Small Cap (WAEMX) — Investor | | | | -7.02% | | | | | 1.29% | | | | | 8.78% | |
Emerging Markets Small Cap (WIEMX) — Institutional | | | | -7.00% | | | | | 1.36% | | | | | 8.82% | |
MSCI Emerging Markets Small Cap Index | | | | -4.20% | | | | | 2.72% | | | | | 7.43% | |
MSCI Emerging Markets Index | | | | -0.81% | | | | | 3.61% | | | | | 5.40% | |
Data shows past performance, which is not indicative of future performance. Current performance may be lower or higher than the performance quoted. To obtain the most recent month-end performance data available, please visit www.WasatchFunds.com. The Advisor may absorb certain Fund expenses, without which total return would have been lower. Investment returns and principal value will fluctuate and shares, when redeemed, may be worth more or less than their original cost.
As of the January 31, 2018 prospectus, the Total Annual Fund Operating Expenses for the Wasatch Emerging Markets Small Cap Fund are Investor Class — Gross: 2.02%, Net: 1.96% / Institutional Class: 1.88%, Net: 1.81%. The expense ratio shown elsewhere in this report may be different. See the prospectus for additional information regarding Fund expenses.
Wasatch Funds will deduct a 2.00% redemption proceeds fee on Fund shares held 60 days or less. Performance data does not reflect the deduction of fees, including sales charges, or the taxes you would pay on fund distributions or the redemption of fund shares. Fees and taxes, if reflected, would reduce the performance quoted. Wasatch does not charge any sales fees. For more complete information including charges, risks and expenses, read the prospectus carefully.
Performance for the Institutional Class prior to 2/1/2016 is based on the performance of the Investor Class. Performance of the Fund’s Institutional Class prior to 2/1/2016 uses the actual expenses of the Fund’s Investor Class without any adjustments. For any such period of time, the performance of the Fund’s Institutional Class would have been substantially similar to, yet higher than, the performance of the Fund’s Investor Class, because the shares of both classes are invested in the same portfolio of securities, but the classes bear different expenses.
Investing in foreign securities, especially in emerging markets, entails special risks, such as currency fluctuations and political uncertainties, which are described in more detail in the prospectus. Investing in small cap funds will be more volatile and loss of principal could be greater than investing in large cap or more diversified funds.
TOP 10 EQUITY HOLDINGS*
| | | | |
| Company | | % of Net
Assets | |
| Medytox, Inc. (Korea) | | | 2.9% | |
| Grupo Aeroportuario del Centro Norte S.A.B. de C.V. (Mexico) | | | 2.8% | |
| 51job, Inc. ADR (China) | | | 2.8% | |
| Silergy Corp. (Taiwan) | | | 2.5% | |
| Vitasoy International Holdings Ltd. (China) | | | 2.4% | |
| | | | |
| Company | | % of Net
Assets | |
| ICICI Lombard General Insurance Co. Ltd. (India) | | | 2.3% | |
| Douzone Bizon Co. Ltd. (Korea) | | | 2.2% | |
| Raia Drogasil S.A. (Brazil) | | | 2.2% | |
| Microport Scientific Corp. (China) | | | 2.1% | |
| Clicks Group Ltd. (South Africa) | | | 1.9% | |
| * | As of September 30, 2018, there were 77 holdings in the Fund. Foreign currency contracts, written options and repurchase agreements, if any, are not included in the number of holdings. Portfolio holdings are subject to change at any time. References to specific securities should not be construed as recommendations by the Funds or their Advisor. Current and future holdings are subject to risk. |
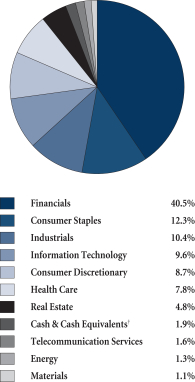
SECTOR BREAKDOWN**

| ** | Excludes securities sold short and options written, if any. |
| † | Also includes Other Assets & Liabilities. |
GROWTHOFA HYPOTHETICAL $10,000 INVESTMENT
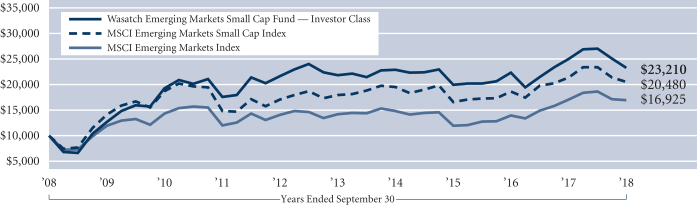
Past performance does not predict future performance. The graph above does not reflect the deduction of fees, sales charges, or taxes that you would pay on fund distributions or the redemption of fund shares. Wasatch does not charge any sales fees. The MSCI Emerging Markets and Emerging Markets Small Cap indexes are free float-adjusted market capitalization indexes designed to measure the equity market performance of emerging markets. You cannot invest directly in these or any indexes.
11
| | |
| WASATCH FRONTIER EMERGING SMALL COUNTRIES FUND (WAFMX / WIFMX) | | SEPTEMBER 30, 2018 (UNAUDITED) |
|
|
|
Management Discussion
The Wasatch Frontier Emerging Small Countries Fund is managed by a team of Wasatch portfolio managers led by Roger Edgley, Jared Whatcott and Scott Thomas.
| | | | |
Roger Edgley, CFA Lead Portfolio Manager | | 
Jared Whatcott, CFA Portfolio Manager | |
Scott Thomas, CFA Portfolio Manager |
OVERVIEW
The Wasatch Frontier Emerging Small Countries Fund — Investor Class declined -8.73% for the 12 months ended September 30, 2018, while the benchmark MSCI Frontier Emerging Markets Index lost -6.57%.
Emerging and frontier markets witnessed historic volatility over the past 12 months brought on by a cascade of factors. Sources of concern for investors in frontier and emerging small countries have been a rising U.S. dollar, the prospect of a trade war between the United States and China, and the U.S. Federal Reserve’s continued gradual increases in short-term interest rates. These fears found some life when Argentina and Turkey experienced severe currency devaluations. The combination of these factors, their relative severity, and their occurrence in such a short period of time caused many global investors to reduce exposure to the frontier asset class.
As bottom-up stock pickers, we find comfort in the fact that the companies in which the Fund has invested are robust and continue to see strong demand for their products and services from their home markets. While their stock prices may decline, these domestic companies are resilient and less likely to be affected by global trade concerns.
DETAILSOFTHE YEAR
For the 12 months, Argentina was the worst-performing country in the Fund and the benchmark. Although our Argentinian stocks declined about the same as their benchmark counterparts, the Fund’s overweight position in this weak market detracted from performance relative to the benchmark. Another weak-performing market in the Fund and one in which we underperformed the benchmark was Pakistan. On the other hand, our investments in the United Arab Emirates contributed to the Fund’s performance. The Philippines was an area of strength relative to the benchmark, as our holdings did not decline as much as those in the benchmark.
Three financial holdings in Argentina — Grupo Supervielle S.A., Grupo Financiero Galicia S.A. and Bolsas y Mercados Argentinos S.A. — were the Fund’s largest detractors for the 12-month period. Argentina’s financial companies
generally struggled in an uncertain economic environment where growth prospects were potentially being undermined by efforts to stabilize the currency. However, we believe that if Argentina’s government can continue to implement reforms and fix the structural issues, the country’s long-term economic potential remains enormous. In our view, the holdings we have selected in Argentina are well-managed companies with financial positions strong enough to weather the current storm.
The top contributor to Fund performance had its initial public offering earlier this year and so is a relatively new holding. ASA International Group plc is a leading micro-finance lender with operations spanning Asia and Africa. The company spun out of ASA NGO (non-governmental organization) based in Bangladesh that is a pioneer in the realm of micro-finance lending to individual female entrepreneurs. ASA’s model was widely adopted across India where it has created more than a few multi-billion dollar businesses. As long-time investors in India, and being familiar with this business model, we quickly recognized that ASA International had the right ingredients for success. The company operates in a variety of key geographies that we believe give it exposure to the right customer profiles and help mitigate geographic concentration risk.
FPT Corp., a Vietnamese information-technology company, was also a leading contributor. The company has seen strong growth driven by its software outsourcing segment. FPT has developed capabilities to do higher-value outsourcing including artificial intelligence (AI), the Internet of Things (IoT), cloud and digital transformation. FPT has a cost advantage relative to Indian and Chinese peers given that it can find engineers and developers at 80% of the cost of those in China or India.
OUTLOOK
This past year has seen significant volatility across a number of frontier and emerging markets. Despite the challenges these markets have faced, we still believe in the quality of the companies held by the Fund and in the long-term fundamentals of the frontier and emerging small countries they call home. Many of these countries have made difficult adjustments and taken steps to repair structural issues, which has created a more stable and positive economic growth outlook. What’s more, domestic demand seems to have troughed and many economies appear poised for a continued cyclical recovery. With pullbacks in a number of frontier and small emerging markets, stock valuations are now even more attractive.
It is also worth reminding shareholders that as the emerging-market universe improves and strengthens, frontier markets should also benefit. We believe that by continually striving to position the Fund in what we regard as the highest-quality companies across frontier and emerging small countries, we provide the Fund with the best chance of reaping the potential long-term rewards.
Thank you for the opportunity to manage your assets.
| | Current and future holdings are subject to risk. |
12
| | |
| WASATCH FRONTIER EMERGING SMALL COUNTRIES FUND (WAFMX / WIFMX) | | SEPTEMBER 30, 2018 (UNAUDITED) |
|
|
|
Portfolio Summary
AVERAGE ANNUAL TOTAL RETURNS
| | | | | | | | | | | | | | | |
| | | 1 YEAR | | 5 YEARS | | SINCE INCEPTION 1/31/12 |
Frontier Emerging Small Countries (WAFMX) — Investor | | -8.73% | | | | -2.86% | | | | | 3.85% | |
Frontier Emerging Small Countries (WIFMX) — Institutional | | -8.33% | | | | -2.70% | | | | | 3.97% | |
MSCI Frontier Emerging Markets Index | | -6.57% | | | | 1.04% | | | | | 3.38% | |
MSCI Frontier Markets Index | | -7.73% | | | | 2.87% | | | | | 6.05% | |
Data shows past performance, which is not indicative of future performance. Current performance may be lower or higher than the performance quoted. To obtain the most recent month-end performance data available, please visit www.WasatchFunds.com. The Advisor may absorb certain Fund expenses, without which total return would have been lower. Investment returns and principal value will fluctuate and shares, when redeemed, may be worth more or less than their original cost.
As of the January 31, 2018 prospectus, the Total Annual Fund Operating Expenses for the Wasatch Frontier Emerging Small Countries Fund are Investor Class — Gross: 2.36%, Net: 2.18% / Institutional Class — Gross: 2.07%, Net: 1.98%. The expense ratio shown elsewhere in this report may be different. Net expenses are based on Fund expenses, net of waivers and reimbursements. See the prospectus for additional information regarding Fund expenses.
Wasatch Funds will deduct a 2.00% redemption proceeds fee on Fund shares held 60 days or less. Performance data does not reflect the deduction of fees, including sales charges, or the taxes you would pay on fund distributions or the redemption of fund shares. Fees and taxes, if reflected, would reduce the performance quoted. Wasatch does not charge any sales fees. For more complete information including charges, risks and expenses, read the prospectus carefully.
Performance for the Institutional Class prior to 2/1/2016 is based on the performance of the Investor Class. Performance of the Fund’s Institutional Class prior to 2/1/2016 uses the actual expenses of the Fund’s Investor Class without any adjustments. For any such period of time, the performance of the Fund’s Institutional Class would have been substantially similar to, yet higher than, the performance of the Fund’s Investor Class, because the shares of both classes are invested in the same portfolio of securities, but the classes bear different expenses.
Investing in small cap funds will be more volatile and loss of principal could be greater than investing in large cap or more diversified funds. Investing in foreign securities, especially in frontier and emerging markets, entails special risks, such as currency fluctuations and political uncertainties, which are described in more detail in the prospectus.
TOP 10 EQUITY HOLDINGS*
| | | | |
| Company | | % of Net
Assets | |
Aramex PJSC (United Arab Emirates) | | | 6.7% | |
FPT Corp. (Vietnam) | | | 5.5% | |
Philippine Seven Corp. (Philippines) | | | 4.8% | |
ASA International Group plc (United Kingdom) | | | 4.1% | |
National Bank of Kuwait SAK (Kuwait) | | | 4.0% | |
| | | | |
| Company | | % of Net
Assets | |
Banco Davivienda S.A., 2.18% (Colombia) | | | 3.5% | |
Credicorp Ltd. (Peru) | | | 3.2% | |
Unifin Financiera S.A.B. de C.V. SOFOM ENR (Mexico) | | | 3.2% | |
TCS Group Holding plc GDR (Russia) | | | 3.0% | |
InRetail Peru Corp. (Peru) | | | 2.8% | |
| * | As of September 30, 2018, there were 47 holdings in the Fund. Foreign currency contracts, written options and repurchase agreements, if any, are not included in the number of holdings. Portfolio holdings are subject to change at any time. References to specific securities should not be construed as recommendations by the Funds or their Advisor. Current and future holdings are subject to risk. |
SECTOR BREAKDOWN**
| ** | Excludes securities sold short and options written, if any. |
| † | Also includes Other Assets & Liabilities. |
GROWTHOFA HYPOTHETICAL $10,000 INVESTMENT
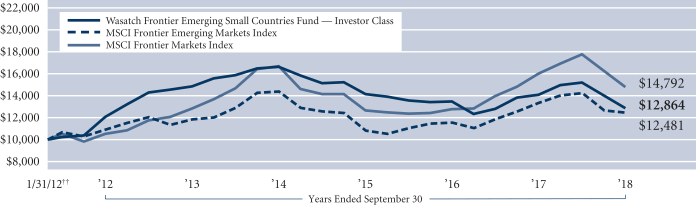
Past performance does not predict future performance. The graph above does not reflect the deduction of fees, sales charges, or taxes that you would pay on fund distributions or the redemption of fund shares. Wasatch does not charge any sales fees. ††Inception: January 31, 2012. The MSCI Frontier Emerging Markets and MSCI Frontier Markets indexes are free float-adjusted market capitalization indexes designed to measure the equity market performance of the global frontier and emerging markets. You cannot invest directly in these or any indexes.
13
| | |
| WASATCH GLOBAL OPPORTUNITIES FUND (WAGOX / WIGOX) | | SEPTEMBER 30, 2018 (UNAUDITED) |
|
|
|
Management Discussion
The Wasatch Global Opportunities Fund is managed by a team of Wasatch portfolio managers led by JB Taylor and Ajay Krishnan.
| | | | |
JB Taylor Lead Portfolio Manager | |
Ajay Krishnan, CFA Lead Portfolio Manager | | OVERVIEW The Wasatch Global Opportunities Fund — Investor Class gained 20.75% for the 12 months ended September 30, 2018, outperforming the 8.67% rise in the benchmark MSCI ACWI |
(All Country World Index) Small Cap Index.
The U.S. added the most to the Fund’s return and to its outperformance of the benchmark. Net gains in other countries also added somewhat to Fund performance.
Although U.S. stock prices have increased robustly, valuations appear somewhat more reasonable than one might expect. That’s because earnings growth rates have generally been even stronger than stock-price increases. As a whole, the U.S. market is now at or near record highs. While large technology firms have been responsible for much of these gains, investors have also favored smaller companies. And among the small-cap companies we focus on, we continue to see strong fundamentals.
On a sector basis, information-technology, health-care and consumer-discretionary holdings, especially U.S. retailers, contributed strongly to the Fund’s outperformance of the benchmark. Continuing overall economic strength in the U.S. and a surge in consumer spending have benefited both online sellers and traditional brick-and-mortar retail companies. While our investment reasons for the retail names in the Fund are specific to each company’s growth prospects, the supportive macroenvironment has created a welcome tailwind.
In other sectors, our financials detracted from the Fund’s performance on an absolute basis and relative to the Index.
DETAILSOFTHE YEAR
The Fund’s best contributor for the 12 months was U.S.-based Ollie’s Bargain Outlet Holdings, Inc. The company acquires excess inventory of brand-name products in a wide variety of categories, and then offers those products to customers who enjoy the bargain-priced, “treasure hunt” shopping experience. We believe Ollie’s business model would be hard for online competitors to replicate. Its loyal customer base is a competitive advantage continually strengthened through its “Ollie’s Army” membership and rewards program. We believe Ollie’s can double the number of stores to more than 500 in the coming years.
Another leading contributor was HealthEquity, Inc., a U.S.-based health-care company that provides an online platform to manage health-related accounts such as Health Savings Accounts (HSAs), Health Reimbursement Arrangements and Flexible Spending Accounts. HealthEquity’s stock
price experienced some volatility earlier this year as investors grew wary about growth potential in the company’s market. But we continue to like HealthEquity’s prospects in what we still view as a fast-growing HSA market.
The greatest detractor from Fund performance for the 12 months was Somany Ceramics Ltd. in India. The company makes wall and floor tiles, sanitary ware and bath fittings. Although comparable sales at Somany held up reasonably well, earnings disappointed investors. Management cited the higher cost of natural gas and ongoing pricing pressure from competitors using dubious means to avoid India’s goods-and-services tax (GST). The company expects India’s implementation of the e-way bill to curb non-compliance with the GST and create fairer competition in the industry.
Italy’s Banca IFIS S.p.A. was the second-largest detractor. This was not surprising given the political drama in Italy, which hit the financials sector particularly hard. Banca IFIS purchases nonperforming bank loans at a discount and seeks to collect the higher amount owed from borrowers. The disruption in Italy’s financials sector could potentially favor Banca IFIS because the company has many years of familiarity with the Italian domestic market and would-be foreign competitors may become more reluctant to enter that market. We reevaluated Banca IFIS in the context of Italy’s political upheaval, and while we anticipate further volatility, we currently expect to maintain our position in the stock.
OUTLOOK
After such strong performance, there are valid concerns about the future of the U.S. economy, including a flattening yield curve and potential impacts from international trade tensions. However, we don’t see these or other macro factors as likely to usher in a recession in the coming months. That leaves the question, then, of whether conditions are already “as good as they can get” — a concern that’s held down stock prices in some industries such as trucking, even though companies have been reporting record earnings. From our perspective, both in analyzing company fundamentals and in talking with management teams, we see the potential for further gains.
Beyond the U.S., our view on Japan has become increasingly positive as structural reforms have taken hold. We believe the re-election of Prime Minister Shinzo Abe for an unprecedented third term could usher in another wave of reforms. The positive macro-level backdrop in Japan complements what we see as high levels of innovation and strong fundamentals among the Fund’s Japanese holdings. We’ve been watching Japanese companies that are compelling based on our metrics. And we’ve been finding opportunities to add to our holdings in Japan when stock prices pull back.
Elsewhere, we also have reasons for optimisms. In the eurozone, we think many investors may have erred too much on the side of caution in their estimation of the region’s growth prospects. And despite volatility in emerging markets, we see solid opportunities and remain optimistic about prospects for the Fund’s emerging-market holdings.
Thank you for the opportunity to manage your assets.
| | Current and future holdings are subject to risk. |
14
| | |
| WASATCH GLOBAL OPPORTUNITIES FUND (WAGOX / WIGOX) | | SEPTEMBER 30, 2018 (UNAUDITED) |
|
|
|
Portfolio Summary
AVERAGE ANNUAL TOTAL RETURNS
| | | | | | | | | | | | | | | |
| | | 1 YEAR | | 5 YEARS | | SINCE INCEPTION 11/17/08 |
Global Opportunities (WAGOX) — Investor | | | | 20.75% | | | | | 9.85% | | | | | 17.49% | |
Global Opportunities (WIGOX) — Institutional | | | | 21.04% | | | | | 9.97% | | | | | 17.55% | |
MSCI ACWI Small Cap Index | | | | 8.67% | | | | | 8.86% | | | | | 14.93% | |
Data shows past performance, which is not indicative of future performance. Current performance may be lower or higher than the performance quoted. To obtain the most recent month-end performance data available, please visit www.WasatchFunds.com. The Advisor may absorb certain Fund expenses, without which total return would have been lower. Investment returns and principal value will fluctuate and shares, when redeemed, may be worth more or less than their original cost.
As of the January 31, 2018 prospectus, the Total Annual Fund Operating Expenses for the Wasatch Global Opportunities Fund are Investor Class: 1.59% / Institutional Class — Gross: 1.93%, Net: 1.36%. The expense ratio shown elsewhere in this report may be different. Net expenses are based on Fund expenses, net of waivers and reimbursements. See the prospectus for additional information regarding Fund expenses.
Wasatch Funds will deduct a 2.00% redemption proceeds fee on Fund shares held 60 days or less. Performance data does not reflect the deduction of fees, including sales charges, or the taxes you would pay on fund distributions or the redemption of fund shares. Fees and taxes, if reflected, would reduce the performance quoted. Wasatch does not charge any sales fees. For more complete information including charges, risks and expenses, read the prospectus carefully.
Performance for the Institutional Class prior to 2/1/2016 is based on the performance of the Investor Class. Performance of the Fund’s Institutional Class prior to 2/1/2016 uses the actual expenses of the Fund’s Investor Class without any adjustments. For any such period of time, the performance of the Fund’s Institutional Class would have been substantially similar to, yet higher than, the performance of the Fund’s Investor Class, because the shares of both classes are invested in the same portfolio of securities, but the classes bear different expenses.
Investing in small and micro cap funds will be more volatile and loss of principal could be greater than investing in large cap or more diversified funds. Investing in foreign securities, especially in emerging markets, entails special risks, such as currency fluctuations and political uncertainties, which are described in more detail in the prospectus.
TOP 10 EQUITY HOLDINGS*
| | | | |
| Company | | % of Net
Assets | |
| Ollie’s Bargain Outlet Holdings, Inc. | | | 2.6% | |
| Ensign Group, Inc. (The) | | | 2.4% | |
| Trex Co., Inc. | | | 2.3% | |
| HealthEquity, Inc. | | | 2.3% | |
| Ultimate Software Group, Inc. (The) | | | 2.2% | |
| | | | |
| Company | | % of Net
Assets | |
| Euronet Worldwide, Inc. | | | 2.2% | |
| Zendesk, Inc. | | | 2.2% | |
| Medytox, Inc. (Korea) | | | 2.1% | |
| Copart, Inc. | | | 2.1% | |
| Metro Bank plc | | | 2.1% | |
| * | As of September 30, 2018, there were 75 holdings in the Fund. Foreign currency contracts, written options and repurchase agreements, if any, are not included in the number of holdings. Portfolio holdings are subject to change at any time. References to specific securities should not be construed as recommendations by the Funds or their Advisor. Current and future holdings are subject to risk. |
SECTOR BREAKDOWN**
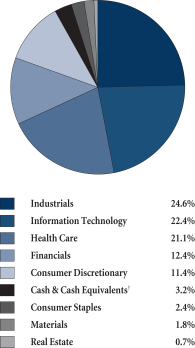
| ** | Excludes securities sold short and options written, if any. |
| † | Also includes Other Assets & Liabilities. |
GROWTHOFA HYPOTHETICAL $10,000 INVESTMENT
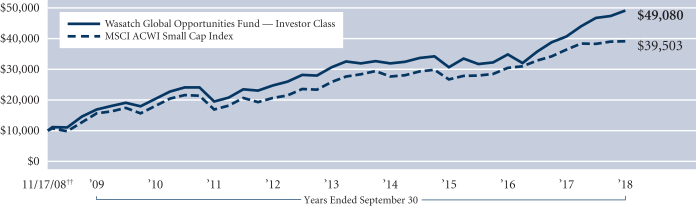
Past performance does not predict future performance. The graph above does not reflect the deduction of fees, sales charges, or taxes that you would pay on fund distributions or the redemption of fund shares. Wasatch does not charge any sales fees. ††Inception: November 17, 2008. The MSCI ACWI (All Country World Index) Small Cap Index is a free float-adjusted market capitalization index designed to measure the performance of small capitalization securities in developed and emerging markets. You cannot invest directly in this or any index.
15
| | |
| WASATCH GLOBAL VALUE FUND (FMIEX / WILCX) | | SEPTEMBER 30, 2018 (UNAUDITED) |
|
|
|
Management Discussion — On October 31, 2017, the Fund changed its name from the Wasatch Large Cap Value Fund and its primary benchmark from the Russell 1000 Value Index.
The Wasatch Global Value Fund is managed by a team of Wasatch portfolio managers led by David Powers.
| | |

David Powers, CFA Lead Portfolio Manager | | OVERVIEW The Wasatch Global Value Fund — Investor Class rose 9.56% for the 12 months ended September 30, 2018, lagging the 9.77% return of its primary benchmark, the MSCI ACWI (All Country World Index) and the 9.45% return of its secondary benchmark, the Russell 1000 Value Index. The Fund outperformed the 4.79% return of the MSCI ACWI Value Index. In November 2017, the Fund began |
its transition from a U.S. large-cap value strategy to global value in order to take advantage of a deeper investment pool and, so far, we are pleased with the results. While U.S. stock indexes have outperformed their international counterparts, our international holdings contributed to the Fund’s return. Moreover, as the U.S. economy reaches the late stages of the business cycle, having the flexibility to increase our international weighting could prove to be beneficial for shareholders.
Stock selection in the Fund was particularly strong in health care, utilities, consumer staples and telecommunication services. Our information-technology stocks were up 23% on average, but a large underweight versus the MSCI ACWI Index hurt relative results. Consumer discretionary and financials were the only sectors to finish in slightly negative territory.
DETAILSOFTHE YEAR
Leading contributors to the Fund’s performance included technology company Cisco Systems, Inc. Cisco has seen a notable increase in recurring revenue as it moves from selling hardware and networking services to a subscription-based business model. In addition, it is a prime beneficiary of tax reform, and plans to deploy a significant portion of its $67 billion in cash holdings in the form of a share buyback program.
Holdings of Pfizer, Inc. also added to performance. Pfizer shares were rewarded as management communicated that it expects as many as 30 new drugs to be approved by 2022, with perhaps half carrying “blockbuster” potential. We trimmed the position on strength, but it remains a top weight.
A position in Ireland-based Smurfit Kappa Group plc, Europe’s largest corrugated-box manufacturer, added to relative performance. The company’s shares moved higher on a buyout offer from U.S. rival International Paper. We took advantage of the upward movement in the stock and sold our position.
On the downside, shares of Netherlands-based multinational bank ING Groep N.V. were in negative territory for the period. Bank profitability in general has been suppressed by the recent flattening of the yield curve. In addition, European banks have been required to increase reserves to meet new accounting standards. Sentiment with respect to
ING was impacted by concerns over a larger-than-expected fine related to money laundering, and shaky execution in the move to ramp up digital capabilities.
Within energy, shares of oil-field services giant Schlumberger Ltd. slumped in the period. The company’s latest results were negatively affected by the cost of mobilizing rigs from the U.S. to meet rising international demand in the wake of the recovery in oil prices experienced since early 2016. In addition, Permian basin demand for the company’s land services has softened as exploration and production spending has been trimmed there given a lack of takeaway capacity (i.e., pipelines). We maintained our position as Schlumberger has demonstrated the highest return on capital in its space and results stand to benefit from the redeployment of assets to the highly profitable international arena.
Exposure to industrial conglomerate General Electric Co. weighed on the Fund’s return as well. GE has tried to tighten its industrial focus, shedding many of its financial assets, but liabilities related to its corporate pension plan and legacy insurance portfolio came to the forefront in the period. In addition, its natural gas turbine business struggled in the wake of a large acquisition, contributing to the slashing of GE’s dividend. We exited the position before the bottom but at a loss nonetheless.
OUTLOOK
The U.S. economy remains on a positive trajectory, with growth slowing to a degree but remaining higher than in most of the rest of the world. Earnings growth for U.S. companies should remain strong, but the rate of growth is expected to ease from here, which has led to a decline in price/earnings multiples. Outside the U.S., the Fund’s investments are well-diversified by geography and sector. The Fund is positioned defensively in companies we believe are less risky than the broader market. For example, we have avoided companies with exposure to emerging markets, as prolonged trade tensions will be felt there more than in developed markets.
We continue to prefer a defensive-minded approach that we expect to be beneficial as late-cycle dynamics gain additional traction. The Fund remains tilted toward higher-quality companies within the large-cap value universe, as gauged by lower market sensitivity, lower valuations, higher cash flows, higher dividends, and stronger balance sheets. In terms of sectors, we remain overweight in energy, which tends to outperform late in the business cycle, as well as in the defensive utilities and telecommunication-services sectors. The Fund remains underweight in the highly cyclical consumer-discretionary, materials and industrials sectors.
With U.S. inflation concerns increasing on strong employment data and the risks of Fed policy tilted to the upside as it continues on a path of gradually raising interest rates, we believe value stocks are broadly poised to assume the mantle of performance leadership.
Thank you for the opportunity to manage your assets.
| | Current and future holdings are subject to risk. |
16
| | |
| WASATCH GLOBAL VALUE FUND (FMIEX / WILCX) | | SEPTEMBER 30, 2018 (UNAUDITED) |
|
|
|
Portfolio Summary
AVERAGE ANNUAL TOTAL RETURNS
| | | | | | | | | | | | | | | |
| | | 1 YEAR | | 5 YEARS | | 10 YEARS |
Global Value (FMIEX) — Investor | | | | 9.56% | | | | | 8.63% | | | | | 7.72% | |
Global Value (WILCX) — Institutional | | | | 9.61% | | | | | 8.75% | | | | | 7.80% | |
MSCI ACWI | | | | 9.77% | | | | | 8.67% | | | | | 8.19% | |
Russell 1000® Value Index | | | | 9.45% | | | | | 10.72% | | | | | 9.79% | |
Data shows past performance, which is not indicative of future performance. Current performance may be lower or higher than the performance quoted. To obtain the most recent month-end performance data available, please visit www.WasatchFunds.com. The Advisor may absorb certain Fund expenses, without which total return would have been lower. Investment returns and principal value will fluctuate and shares, when redeemed, may be worth more or less than their original cost.
As of the January 31, 2018 prospectus, the Total Annual Fund Operating Expenses for the Wasatch Global Value Fund are Investor Class — Gross: 1.19%, Net: 1.10% / Institutional Class — Gross: 2.31%, Net: 0.95%. The expense ratio shown elsewhere in this report may be different. Net expenses are based on Fund expenses, net of waivers and reimbursements. See the prospectus for additional information regarding Fund expenses.
Wasatch Funds will deduct a 2.00% redemption proceeds fee on Fund shares held 60 days or less. Performance data does not reflect the deduction of fees, including sales charges, or the taxes you would pay on fund distributions or the redemption of fund shares. Fees and taxes, if reflected, would reduce the performance quoted. Wasatch does not charge any sales fees. For more complete information including charges, risks and expenses, read the prospectus carefully.
Performance for the Institutional Class prior to 1/31/2012 is based on the performance of the Investor Class. Performance of the Fund’s Institutional Class prior to 1/31/2012 uses the actual expenses of the Fund’s Investor Class without any adjustments. For any such period of time, the performance of the Fund’s Institutional Class would have been substantially similar to, yet higher than, the performance of the Fund’s Investor Class, because the shares of both classes are invested in the same portfolio of securities, but the classes bear different expenses.
Investments in value stocks can perform differently from the market as a whole and from other types of stocks and can continue to be undervalued by the market for long periods of time. Investing in foreign securities entails special risks, such as currency fluctuations and political uncertainties, which are described in more detail in the prospectus. Loss of principal is a risk of investing.
TOP 10 EQUITY HOLDINGS*
| | | | |
| Company | | % of Net
Assets | |
China Mobile Ltd. (China) | | | 4.8% | |
Pfizer, Inc. | | | 4.4% | |
Exelon Corp. | | | 4.3% | |
Novartis AG (Switzerland) | | | 4.3% | |
CVS Health Corp. | | | 4.2% | |
Royal Dutch Shell plc ADR (Netherlands) | | | 4.0% | |
| | | | |
| Company | | % of Net
Assets | |
Muenchener Rueckversicherungs-Gesellschaft AG in Muenchen (Germany) | | | 3.9% | |
Nordea Bank AB (Sweden) | | | 3.7% | |
Wells Fargo & Co. | | | 3.5% | |
Suncor Energy, Inc. (Canada) | | | 3.4% | |
| * | As of September 30, 2018, there were 36 holdings in the Fund. Foreign currency contracts, written options and repurchase agreements, if any, are not included in the number of holdings. Portfolio holdings are subject to change at any time. References to specific securities should not be construed as recommendations by the Funds or their Advisor. Current and future holdings are subject to risk. |
SECTOR BREAKDOWN**
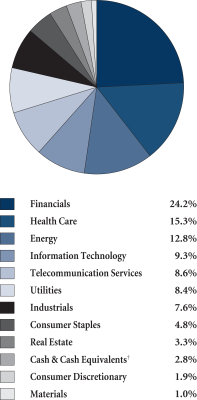
| ** | Excludes securities sold short and options written, if any. |
| † | Also includes Other Assets & Liabilities. |
GROWTHOFA HYPOTHETICAL $10,000 INVESTMENT
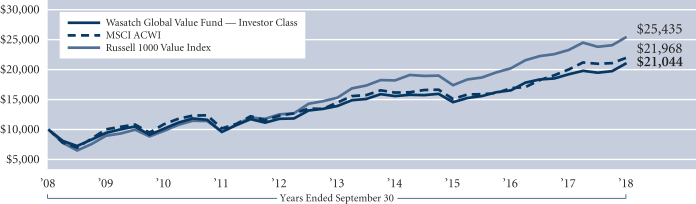
Past performance does not predict future performance. The graph above does not reflect the deduction of fees, sales charges, or taxes that you would pay on fund distributions or the redemption of fund shares. Wasatch does not charge any sales fees. The MSCI ACWI (All Country World Index) captures large- and mid-cap representation across 23 developed-market and 24 emerging-market countries. With 2,791 constituents, the Index covers approximately 85% of the global investable equity opportunity set. The Russell 1000 Value Index measures the performance of Russell 1000 Index companies with lower price-to-book ratios and lower forecasted growth values. You cannot invest directly in these or any indexes.
17
| | |
| WASATCH INTERNATIONAL GROWTH FUND (WAIGX / WIIGX) | | SEPTEMBER 30, 2018 (UNAUDITED) |
|
|
|
Management Discussion
The Wasatch International Growth Fund is managed by a team of Wasatch portfolio managers led by Roger Edgley, Ken Applegate and Linda Lasater.
| | | | |
Roger Edgley, CFA Lead Portfolio Manager | | 
Ken Applegate, CFA Portfolio Manager | | 
Linda Lasater, CFA Associate Portfolio Manager |
OVERVIEW
The Wasatch International Growth Fund — Investor Class increased 12.13% in the 12 months ended September 30, 2018 and outperformed the benchmark MSCI ACWI (All Country World Index) ex USA Small Cap Index, which added 1.86%.
Over the course of the year, the world saw no shortage of events that affected its financial markets. Among them were the growing trade tiff between the U.S. and China, Italy’s financial and political issues, and trouble in some emerging markets highlighted by currency devaluations in Argentina and Turkey. Though newsworthy, experience has taught us that macro-related events such as these usually have minimal impact on the long-term underlying value of the businesses in which we seek to invest. Rather than pay too much attention to the headlines, we seek to identify changes at the company level such as new competitive challenges or deteriorating fundamentals. We also look at broader themes that can specifically affect businesses such as disruptive technology or the trend toward healthier lifestyles. Our unrelenting focus is on thoroughly researching companies that we see as high quality with outstanding potential for long-duration growth.
DETAILSOFTHE YEAR
Our focus has led us to faraway places like Australia, Japan and the United Kingdom. These three countries added the most to the Fund’s return for the 12 months, and we outperformed the benchmark in all three.
The Fund did not fare as well in India and Taiwan where our holdings were down and we underperformed the benchmark. Emerging markets in general had a rough go of it over the past 12 months. Nevertheless, we retain our positive outlook for the emerging-market countries and companies in which we have invested, especially India and Taiwan.
Australia’s WiseTech Global Ltd. was among the Fund’s top contributors for the 12 months. The company provides cloud-based logistics software that features an end-to-end solution built on a single source code and database giving it outstanding and seamless functionality and unrivaled data integrity. The SaaS (Software-as-a-Service) model allows customers to quickly implement the software, while WiseTech retains full control over updates, upgrades and functionality.
The top contributor was MonotaRO Co. Ltd. of Japan. This Japanese e-commerce company is a leading online provider of maintenance, repair and operations (MRO) supplies to small and medium-size businesses. The company has been seeing strong growth through new customer acquisitions and increased average spending per customer.
We sold long-time holding, Seria Co. Ltd., an operator of 100-yen shops in Japan. With the stock trading at a lofty valuation, we were having a harder time penciling out returns high enough to justify continuing to hold this $2.7 billion market-cap company. Wasatch first invested in Seria nearly six years ago when it had a market capitalization of under $700 million. Seria was one of the largest detractors from performance in the past 12 months.
U-Blox Holding AG, a Swiss semiconductor and module solutions provider for industrial and automotive end markets, was another significant detractor. Management reported weak sales, citing uncertainty in China and softness in semiconductor end markets. We dramatically reduced our exposure to the semiconductor industry earlier in 2018 but held onto a position in U-Blox. We expect the stock to bounce back as industry conditions improve.
OUTLOOK
We believe the backdrop for international small-cap equities remains constructive. There is turmoil in some emerging-market countries, but we are extremely selective from a country and company perspective and we see market selloffs as a great time for bargain hunting.
In Europe, our positioning remains focused on the Nordic countries as well as core European countries such as Germany, France and Switzerland. We are overweight relative to the benchmark in the United Kingdom but we have deemphasized domestically oriented companies that we feel could be disproportionately affected by uncertainty surrounding Brexit. We remain optimistic regarding the prospects of our globally focused U.K. holdings. Although trouble spots in Europe remain, we see many exciting areas of opportunity.
Japan is an inefficient market, which allows us to use our expertise and on-the-ground research to find companies with outstanding investment potential. The re-election of Prime Minister Shinzo Abe to his third term in office provides us with increased confidence that positive structural changes in Japan will be continued.
We focus on what we consider to be high-quality companies with experienced management teams, strong business models, leading market-share positions or innovative products or processes. We are confident such companies have the ability to navigate uncertain times and decide where best to invest the capital we entrust to them.
We thank you for your support as we continue to work hard at the challenging and exciting task of finding great small companies around the world.
| | Current and future holdings are subject to risk. |
18
| | |
| WASATCH INTERNATIONAL GROWTH FUND (WAIGX / WIIGX) | | SEPTEMBER 30, 2018 (UNAUDITED) |
|
|
|
Portfolio Summary
AVERAGE ANNUAL TOTAL RETURNS
| | | | | | | | | | | | | | | |
| | | 1 YEAR | | 5 YEARS | | 10 YEARS |
International Growth (WAIGX) — Investor | | | | 12.13% | | | | | 7.23% | | | | | 13.25% | |
International Growth (WIIGX) — Institutional | | | | 12.24% | | | | | 7.29% | | | | | 13.29% | |
MSCI ACWI ex USA Small Cap Index | | | | 1.86% | | | | | 6.14% | | | | | 8.73% | |
MSCI World ex USA Small Cap Index | | | | 3.42% | | | | | 7.07% | | | | | 9.04% | |
Data shows past performance, which is not indicative of future performance. Current performance may be lower or higher than the performance quoted. To obtain the most recent month-end performance data available, please visit www.WasatchFunds.com. The Advisor may absorb certain Fund expenses, without which total return would have been lower. Investment returns and principal value will fluctuate and shares, when redeemed, may be worth more or less than their original cost.
As of the January 31, 2018 prospectus, the Total Annual Fund Operating Expenses for the Wasatch International Growth Fund are Investor Class: 1.46% / Institutional Class — Gross: 1.37%, Net: 1.35%. The expense ratio shown elsewhere in this report may be different. Net expenses are based on Fund expenses, net of waivers and reimbursements. See the prospectus for additional information regarding Fund expenses.
Wasatch Funds will deduct a 2.00% redemption proceeds fee on Fund shares held 60 days or less. Performance data does not reflect the deduction of fees, including sales charges, or the taxes you would pay on fund distributions or the redemption of fund shares. Fees and taxes, if reflected, would reduce the performance quoted. Wasatch does not charge any sales fees. For more complete information including charges, risks and expenses, read the prospectus carefully.
Performance for the Institutional Class prior to 2/1/2016 is based on the performance of the Investor Class. Performance of the Fund’s Institutional Class prior to 2/1/2016 uses the actual expenses of the Fund’s Investor Class without any adjustments. For any such period of time, the performance of the Fund’s Institutional Class would have been substantially similar to, yet higher than, the performance of the Fund’s Investor Class, because the shares of both classes are invested in the same portfolio of securities, but the classes bear different expenses.
Investing in foreign securities, especially in frontier and emerging markets, entails special risks, such as currency fluctuations and political uncertainties, which are described in more detail in the prospectus. Investing in small cap funds will be more volatile and loss of principal could be greater than investing in large cap or more diversified funds.
TOP 10 EQUITY HOLDINGS*
| | | | |
| Company | | % of Net
Assets | |
| Vitasoy International Holdings Ltd. (China) | | | 2.5% | |
| Abcam plc (United Kingdom) | | | 2.3% | |
| MonotaRO Co. Ltd. (Japan) | | | 2.2% | |
| Cochlear Ltd. (Australia) | | | 2.1% | |
| Asahi Intecc Co. Ltd. (Japan) | | | 2.0% | |
| | | | |
| Company | | % of Net
Assets | |
| Ipsen S.A. (France) | | | 2.0% | |
| Ain Holdings, Inc. (Japan) | | | 1.9% | |
| Rotork plc (United Kingdom) | | | 1.9% | |
| XING SE (Germany) | | | 1.8% | |
| Nihon M&A Center, Inc. (Japan) | | | 1.7% | |
| * | As of September 30, 2018, there were 87 holdings in the Fund. Foreign currency contracts, written options and repurchase agreements, if any, are not included in the number of holdings. Portfolio holdings are subject to change at any time. References to specific securities should not be construed as recommendations by the Funds or their Advisor. Current and future holdings are subject to risk. |
SECTOR BREAKDOWN**
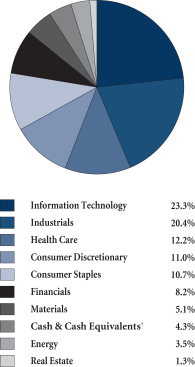
| ** | Excludes securities sold short and options written, if any. |
| † | Also includes Other Assets & Liabilities. |
GROWTHOFA HYPOTHETICAL $10,000 INVESTMENT
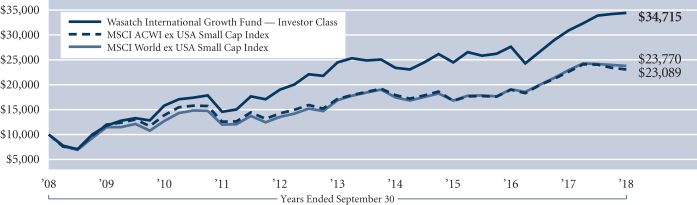
Past performance does not predict future performance. The graph above does not reflect the deduction of fees, sales charges, or taxes that you would pay on fund distributions or the redemption of fund shares. Wasatch does not charge any sales fees. The MSCI ACWI (All Country World Index) ex USA Small Cap Index is a free float-adjusted market capitalization index designed to measure the performance of small capitalization securities in developed markets, excluding the United States, and in emerging markets. The MSCI World ex USA Small Cap Index is a free float-adjusted market capitalization index designed to measure the performance of small capitalization securities in developed markets, excluding the United States. You cannot invest directly in these or any indexes.
19
| | |
| WASATCH INTERNATIONAL OPPORTUNITIES FUND (WAIOX / WIIOX) | | SEPTEMBER 30, 2018 (UNAUDITED) |
|
|
|
Management Discussion
The Wasatch International Opportunities Fund is managed by a team of Wasatch portfolio managers led by Jared Whatcott, Linda Lasater and Allison He.
| | | | |
Jared Whatcott, CFA Portfolio Manager | |
Linda Lasater, CFA Portfolio Manager | | 
Allison He, CFA Associate Portfolio Manager |
OVERVIEW
The Wasatch International Opportunities Fund — Investor Class added 10.45% and outperformed the benchmark MSCI ACWI (All Country World Index) ex USA Small Cap Index, which gained just 1.86% for the 12 months ended September 30, 2018.
The year saw mounting investor scrutiny of emerging markets brought on by global trade concerns and worries over the vulnerability of some economies to tighter U.S. monetary policy. As Federal Reserve officials continued to gradually raise short-term interest rates, emerging-market countries with large dollar-denominated debt loads and expanding current-account deficits were disproportionately affected. Especially vulnerable were countries such as Argentina and Turkey, which have had to defend their currencies and control inflation by significantly raising interest rates. Moreover, countries that rely on imported oil have been seeing imports cost more in local-currency terms as oil prices have risen.
Developed markets also had increased volatility as investors watched for cracks in the armor. In the United Kingdom, investors feared the possibility of a “no deal” Brexit. European manufacturers have seen new export orders weaken, especially to China. Although falling unemployment helped support domestic consumption, consumer confidence trended down across the continent.
Japan’s economy appeared to stabilize, yet inflation, as measured by the consumer-price index excluding fresh food and energy, remained stubbornly low. On the other hand, Japan has been seeing wage growth, and also has had more job openings per applicant than at any point since 1974. Japanese equities were supported during the year by the yen’s depreciation, aided by the rising interest-rate differential.
DETAILSOFTHE YEAR
Japan was by far the largest contributor to the Fund’s performance and to its outperformance of the benchmark over the past 12 months. Five of the Fund’s top 10 contributors were Japanese companies, including online travel-comparison website Open Door, Inc. and online food delivery company Yume No Machi Souzou Inkai Co. Ltd. As these two online companies have continued to take market
share from more-traditional competitors, investors have increasingly been taking notice of their quality and headroom for growth.
Although a distant second to Japan, our Australian holdings contributed nearly two percentage points to the Fund’s return for the 12-month period. We outperformed the benchmark in the country led by Pro Medicus Ltd. This Australian company provides enterprise medical imaging and radiology information systems to medical groups including the Mayo Clinic, Mercyhealth, WellSpan Health and Sutter Health. The company continued to see strong fundamental growth.
Among the countries in which the Fund is invested, our position in India is the most overweight relative to the benchmark. As a result, the poor performance of Indian equities (along with the rupee’s depreciation against the U.S. dollar) weighed more on the Fund’s results than on the benchmark’s. In addition, the Fund’s Indian holdings underperformed their benchmark peers.
Reflecting the difficult environment in Turkey, our two holdings in the country — Logo Yazilim Sanayi Ve Ticaret A.S. and Mavi Giyim Sanayi Ve Ticaret A.S. — were among the largest detractors for the 12-month period. We continue to closely monitor the situation in Turkey.
Although the United Kingdom added to the Fund’s return and our holdings slightly outperformed their benchmark counterparts, an underweight position neutralized the benefit to relative performance. A notable detractor was Clipper Logistics plc, a non-food retail supply chain logistics operator with a strong focus on e-fulfillment and return services. Given the retail environment in the U.K., Clipper management tempered growth expectations for the company.
OUTLOOK
We continue to be excited about the opportunities we are seeing in international micro-cap companies. While risks to the global economy include the potential for further escalation in trade tensions between the U.S. and China and ongoing currency volatility in emerging markets, we have been continually impressed with the strong management teams of the companies in which we invest. We are optimistic that they will continue to find ways to help their companies thrive and succeed across various market conditions.
Despite recent weakness, we continue to be constructive on the long-term opportunities in the emerging economies of the world. Our investments in emerging markets are the result of bottom-up research into the prospects of individual companies rather than target allocations to these markets. Our research has uncovered a number of promising micro-cap opportunities in developing markets that we believe have the potential to contribute to the Fund’s success going forward.
Our confidence, of course, comes from our experience with our trusted process. As we continue to travel the planet, we search for growing micro-cap companies in developed and emerging markets that we see as being of the highest quality.
Thank you for the opportunity to manage your assets.
| | Current and future holdings are subject to risk. |
20
| | |
| WASATCH INTERNATIONAL OPPORTUNITIES FUND (WAIOX / WIIOX) | | SEPTEMBER 30, 2018 (UNAUDITED) |
|
|
|
Portfolio Summary
AVERAGE ANNUAL TOTAL RETURNS
| | | | | | | | | | | | | | | |
| | | 1 YEAR | | 5 YEARS | | 10 YEARS |
International Opportunities (WAIOX) — Investor | | | | 10.45% | | | | | 10.00% | | | | | 13.35% | |
International Opportunities (WIIOX) — Institutional | | | | 10.66% | | | | | 10.23% | | | | | 13.47% | |
MSCI ACWI ex USA Small Cap Index | | | | 1.86% | | | | | 6.14% | | | | | 8.73% | |
MSCI World ex USA Small Cap Index | | | | 3.42% | | | | | 7.07% | | | | | 9.04% | |
Data shows past performance, which is not indicative of future performance. Current performance may be lower or higher than the performance quoted. To obtain the most recent month-end performance data available, please visit www.WasatchFunds.com. The Advisor may absorb certain Fund expenses, without which total return would have been lower. Investment returns and principal value will fluctuate and shares, when redeemed, may be worth more or less than their original cost.
As of the January 31, 2018 prospectus, the Total Annual Fund Operating Expenses for the Wasatch International Opportunities Fund are Investor Class: 2.24% / Institutional Class — Gross: 2.04%, Net: 1.96%. The expense ratio shown elsewhere in this report may be different. Net expenses are based on Fund expenses, net of waivers and reimbursements. See the prospectus for additional information regarding Fund expenses.
Wasatch Funds will deduct a 2.00% redemption proceeds fee on Fund shares held 60 days or less. Performance data does not reflect the deduction of fees, including sales charges, or the taxes you would pay on fund distributions or the redemption of fund shares. Fees and taxes, if reflected, would reduce the performance quoted. Wasatch does not charge any sales fees. For more complete information including charges, risks and expenses, read the prospectus carefully.
Performance for the Institutional Class prior to 2/1/2016 is based on the performance of the Investor Class. Performance of the Fund’s Institutional Class prior to 2/1/2016 uses the actual expenses of the Fund’s Investor Class without any adjustments. For any such period of time, the performance of the Fund’s Institutional Class would have been substantially similar to, yet higher than, the performance of the Fund’s Investor Class, because the shares of both classes are invested in the same portfolio of securities, but the classes bear different expenses.
Investing in foreign securities, especially in frontier and emerging markets, entails special risks, such as currency fluctuations and political uncertainties, which are described in more detail in the prospectus. Investing in micro cap funds will be more volatile and loss of principal could be greater than investing in large cap or more diversified funds.
TOP 10 EQUITY HOLDINGS*
| | | | |
| Company | | % of Net
Assets | |
Pro Medicus Ltd. (Australia) | | | 3.0% | |
Open Door, Inc. (Japan) | | | 2.4% | |
Webjet Ltd. (Australia) | | | 2.3% | |
Hypoport AG (Germany) | | | 2.3% | |
Yume No Machi Souzou Iinkai Co. Ltd. (Japan) | | | 2.1% | |
| | | | |
| Company | | % of Net
Assets | |
Rakus Co. Ltd. (Japan) | | | 1.9% | |
Philippine Seven Corp. (Philippines) | | | 1.8% | |
Yihai International Holding Ltd. (China) | | | 1.8% | |
TCI Co. Ltd. (Taiwan) | | | 1.7% | |
| ASA International Group plc (United Kingdom) | | | 1.5% | |
| * | As of September 30, 2018, there were 102 holdings in the Fund. Foreign currency contracts, written options and repurchase agreements, if any, are not included in the number of holdings. Portfolio holdings are subject to change at any time. References to specific securities should not be construed as recommendations by the Funds or their Advisor. Current and future holdings are subject to risk. |
SECTOR BREAKDOWN**
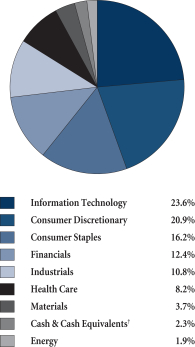
| ** | Excludes securities sold short and options written, if any. |
| † | Also includes Other Assets & Liabilities. |
GROWTHOFA HYPOTHETICAL $10,000 INVESTMENT
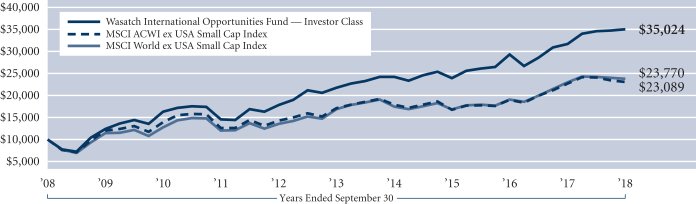
Past performance does not predict future performance. The graph above does not reflect the deduction of fees, sales charges, or taxes that you would pay on fund distributions or the redemption of fund shares. Wasatch does not charge any sales fees. The MSCI ACWI (All Country World Index) ex USA Small Cap Index is a free float-adjusted market capitalization index designed to measure the performance of small capitalization securities in developed markets, excluding the United States, and in emerging markets. The MSCI World ex USA Small Cap Index is a free float-adjusted market capitalization index designed to measure the performance of small capitalization securities in developed markets, excluding the United States. You cannot invest directly in these or any indexes.
21
| | |
| WASATCH MICRO CAP FUND (WMICX) | | SEPTEMBER 30, 2018 (UNAUDITED) |
|
|
|
Management Discussion
The Wasatch Micro Cap Fund is managed by a team of Wasatch portfolio managers led by Ken Korngiebel and Dan Chace.
| | | | |

Ken Korngiebel, CFA Lead Portfolio Manager | | 
Dan Chace, CFA Portfolio Manager | | OVERVIEW The Wasatch Micro Cap Fund gained 38.04% in what was a positive 12 months for U.S. micro caps. The Fund significantly outperformed its benchmark, the Russell Microcap Index, which |
rose 13.65%. Although economic growth appeared to moderate from the 4.2% pace logged during the second quarter of calendar 2018, government data suggested the U.S. economy continued to expand at a healthy clip in the quarter ended September 30th. Steady business conditions and subdued inflation favored the stocks of growth companies, which outperformed value stocks during the 12 months. With micro-cap companies remaining somewhat insulated from risks related to tariffs and global trade, the micro-cap growth investment style was an advantage for the Fund.
Solid gains in the revenues and earnings of the companies we own drove returns across most areas of the Fund. This was especially true in information technology and health care, which were the largest sources of outperformance relative to the benchmark. Other areas of substantial outperformance included consumer discretionary, industrials and financials.
As the Fund’s information-technology and health-care stocks extended recent gains, we trimmed position sizes in certain holdings to limit exposure and reduce risk. We invested some of the sales proceeds in the stocks of industrial companies that we think have become attractively valued relative to their growth prospects and are now well-positioned to pass higher input costs along to customers.
DETAILSOFTHE YEAR
The strongest contributor to Fund performance for the 12 months was Tandem Diabetes Care, Inc. The company offers insulin-delivery systems for people with diabetes. In August, Tandem launched its t:slim X2™ Insulin Pump with Basal-IQ™ Technology, a predictive feature designed to reduce the frequency and duration of low-glucose events (hypoglycemia). The new system requires no finger sticks for calibration or diabetes-treatment decisions. Encouraging financial results and improved forward guidance also helped to drive Tandem’s stock price higher.
Freshpet, Inc. was another solid contributor. The company sells fresh, refrigerated meals and treats for dogs and cats in the U.S., Canada and the United Kingdom. Shares of Freshpet rose sharply in early August after the company reported better-than-expected net sales, which jumped 23% compared to the same quarter a year ago. Management raised its full-year guidance for 2018 as Freshpet’s core dog
household penetration increased at its fastest rate in more than three years. To meet growing demand for the company’s products, Freshpet plans to expand its manufacturing facility in Pennsylvania. We reduced the Fund’s position in Freshpet in response to the company’s significantly higher valuation.
The Fund’s largest detractor for the 12 months was Impinj, Inc., an information-technology company that offers a wireless inventory and asset-tracking platform that we thought had the potential to revolutionize the management of supply chains. The company saw its stock price fall in November 2017 after it reported a wider-than-expected quarterly loss and guided revenue and profits lower. While we remain impressed with the potentially disruptive nature of the technology and continue to follow the stock, we liquidated it from the Fund. Broad-based installation delays across multiple industries could be indicative of either significant implementation costs and/or technology-integration issues.
Zoe’s Kitchen, Inc., another poor performer, was sold on deteriorating fundamentals. The company operates fast-casual, Mediterranean-cuisine restaurants. Both top-line and bottom-line results at Zoe’s fell short of expectations. Comparable sales were off -2.3% due to a drop in foot traffic. Management cited increased competition in select markets and disruption from delivery and discounting. With the company also guiding full-year revenue lower and slowing its plans for expansion, we decided to move on.
OUTLOOK
One of the positions in the Fund is Chuy’s Holdings, Inc. Based in Texas, the company operates more than 90 Tex-Mex restaurants across 19 states. Although Chuy’s stock performed well for the full 12 months, rising labor costs weighed on the stock price more recently as Chuy’s profit margins narrowed. Given what we consider the company’s attractive long-term prospects, we purchased additional shares for the Fund.
Nonetheless, the wage pressures faced by Chuy’s have become fairly common throughout the restaurant industry. In other parts of the economy as well, competition for workers is beginning to push labor costs higher. With the price of crude oil at multi-year highs and tariffs adding to the cost of imported goods, the inflationary backdrop has become less auspicious for businesses and consumers.
As long as inflation remains contained, we don’t think it’s likely to pose a threat to the U.S. economy. An unexpected acceleration in inflation would be more problematic. At the press conference following the September meeting of the Federal Open Market Committee, Chairman Jerome Powell said he doesn’t see inflation surprising to the upside. When researching and analyzing companies, we’ll be keeping a close eye on wages and input costs for signs of inflationary pressures.
Thank you for the opportunity to manage your assets.
| | Current and future holdings are subject to risk. |
22
| | |
| WASATCH MICRO CAP FUND (WMICX) | | SEPTEMBER 30, 2018 (UNAUDITED) |
|
|
|
Portfolio Summary
AVERAGE ANNUAL TOTAL RETURNS
| | | | | | | | | | | | | | | |
| | | 1 YEAR | | 5 YEARS | | 10 YEARS |
Micro Cap | | | | 38.04% | | | | | 15.28% | | | | | 13.86% | |
Russell Microcap® Index | | | | 13.65% | | | | | 10.51% | | | | | 10.82% | |
Data shows past performance, which is not indicative of future performance. Current performance may be lower or higher than the performance quoted. To obtain the most recent month-end performance data available, please visit www.WasatchFunds.com. The Advisor may absorb certain Fund expenses, without which total return would have been lower. Investment returns and principal value will fluctuate and shares, when redeemed, may be worth more or less than their original cost.
As of the January 31, 2018 prospectus, the Total Annual Fund Operating Expenses for the Wasatch Micro Cap Fund are 1.67%. The expense ratio shown elsewhere in this report may be different. See the prospectus for additional information regarding Fund expenses.
Wasatch Funds will deduct a 2.00% redemption proceeds fee on Fund shares held 60 days or less. Performance data does not reflect the deduction of fees, including sales charges, or the taxes you would pay on fund distributions or the redemption of fund shares. Fees and taxes, if reflected, would reduce the performance quoted. Wasatch does not charge any sales fees. For more complete information including charges, risks and expenses, read the prospectus carefully.
Investing in micro cap funds will be more volatile and loss of principal could be greater than investing in large cap or more diversified funds. Investing in foreign securities, especially in emerging markets, entails special risks, such as currency fluctuations and political uncertainties, which are described in more detail in the prospectus.
TOP 10 EQUITY HOLDINGS*
| | | | |
| Company | | % of Net
Assets | |
| V-Mart Retail Ltd. (India) | | | 2.2% | |
| Tandem Diabetes Care, Inc. | | | 2.0% | |
| Freshpet, Inc. | | | 2.0% | |
| Kadant, Inc. | | | 1.8% | |
| Fabrinet | | | 1.8% | |
| | | | |
| Company | | % of Net
Assets | |
| Fiesta Restaurant Group, Inc. | | | 1.8% | |
| Altra Industrial Motion Corp. | | | 1.8% | |
| Sun Hydraulics Corp. | | | 1.7% | |
| OrthoPediatrics Corp. | | | 1.5% | |
| Rapid7, Inc. | | | 1.5% | |
| * | As of September 30, 2018, there were 93 holdings in the Fund. Foreign currency contracts, written options and repurchase agreements, if any, are not included in the number of holdings. Portfolio holdings are subject to change at any time. References to specific securities should not be construed as recommendations by the Funds or their Advisor. Current and future holdings are subject to risk. |
SECTOR BREAKDOWN**
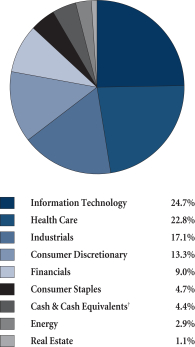
| ** | Excludes securities sold short and options written, if any. |
| † | Also includes Other Assets & Liabilities. |
GROWTHOFA HYPOTHETICAL $10,000 INVESTMENT
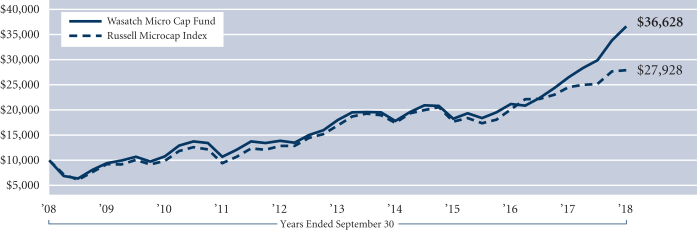
Past performance does not predict future performance. The graph above does not reflect the deduction of fees, sales charges, or taxes that you would pay on fund distributions or the redemption of fund shares. Wasatch does not charge any sales fees. The Russell Microcap Index is an unmanaged total return index of the smallest 1,000 securities in the small-cap Russell 2000 Index along with the next smallest 1,000 companies, based on a ranking of all U.S. equities by market capitalization. The Russell 2000 Index is an unmanaged total return index of the smallest 2,000 companies in the Russell 3000 Index, as ranked by total market capitalization. You cannot invest directly in these or any indexes.
23
| | |
| WASATCH MICRO CAP VALUE FUND (WAMVX) | | SEPTEMBER 30, 2018 (UNAUDITED) |
|
|
|
Management Discussion
The Wasatch Micro Cap Value Fund is managed by a team of Wasatch portfolio managers led by Brian Bythrow.
| | |

Brian Bythrow, CFA Lead Portfolio Manager | | OVERVIEW The Wasatch Micro Cap Value Fund gained 18.84% during the 12 months ended September 30, 2018, outperforming the 13.65% advance in the benchmark Russell Microcap Index. We were pleased to see the Fund outpace the benchmark as we continued to focus on companies with the potential to do well in a wide range of economic environments. Health care was a significant area of |
strength for the benchmark during the 12 months. The Fund’s health-care holdings outperformed their benchmark peers, and the group contributed the most to the Fund’s return. In general, health-care stocks have benefited from rising revenues and earnings growth boosted by corporate tax cuts. Based on our concerns about rising valuations within the sector, however, we were underweight relative to the benchmark. Information technology (IT) was another area of strength for the Fund, and our holdings outperformed the IT names in the Index. Micro-cap technology stocks also seemed to be enjoying the halo effect from intense investor interest in big-cap tech stocks. The consumer-discretionary and materials sectors were sources of weakness against the benchmark, as our holdings in these sectors underperformed their benchmark peers.
Although trade tensions between the United States and the rest of the world remained a top-of-mind concern, there was plenty of good economic news during the 12 months. The U.S. unemployment rate fell as the labor market tightened. Job openings exceeded the number of unemployed workers. The Federal Reserve raised its benchmark interest rate in September based on its latest assessment of economic conditions as “strong,” an improvement from its previously “solid” assessment. And the government’s Bureau of Economic Analysis upwardly revised its estimate of second quarter 2018 gross domestic product growth to 4.2% thanks to healthy consumer spending on durable goods.
DETAILSOFTHE YEAR
OrthoPediatrics Corp., a U.S. health-care company, was the most-significant contributor to Fund performance for the 12 months. The company continued its strong run following a revenue announcement that topped Wall Street estimates. We believe the company’s focus on child-sized orthopedic implants gives it an attractive niche unlikely to be pressured by larger competitors.
Freshpet, Inc. was another large contributor. The company sells fresh, refrigerated meals and treats for dogs and cats in the U.S., Canada and the United Kingdom. Shares of Freshpet rose sharply in early August after the company reported better-than-expected net sales. Management raised its full-year guidance for 2018 as Freshpet’s core dog household penetration increased at its fastest rate in more than three years. To meet growing demand for the
company’s products, Freshpet plans to expand its manufacturing facility in Pennsylvania.
The Fund’s greatest detractor from performance for the 12 months was Hudson Technologies, Inc. This industrial company distributes refrigerants and reclaims and resells still-usable refrigerants from non-functioning systems. Regulations intended to phase out older refrigerants harmful to the environment created uncertainty for Hudson’s reclamation business. This resulted in a greater-than-expected quarterly loss, and pricing headwinds forced Hudson to lower revenue and earnings guidance for full-year 2018.
Another industrial holding, va-Q-tec AG, was the second-largest detractor. The company is a German manufacturer of thin-walled insulated containers used in appliances and for transportation. As va-Q-tec has faced challenges in trying to grow its container-rental business, the stock traded lower based on weaker-than-expected earnings.
OUTLOOK
The equity markets, especially in the U.S., have been benefiting from a favorable economic environment. While the Fund has benefited as well, we don’t base our investment decisions on macroeconomic conditions or political events. Instead, we focus on in-depth, bottom-up research to uncover opportunities in individual companies that other investors might not yet fully appreciate. We seek out companies that are temporarily undervalued because they are relatively undiscovered, or because they are growth companies experiencing what we consider a short-term setback, or because their growth has stalled but we’ve identified a catalyst — such as a niche strategy — that provides strong potential for future growth.
As the current record-length bull market pushes deeper into old age, lofty valuations are testing the selling discipline of portfolio managers. We’ve seen this especially in areas like health care, IT and SaaS (Software-as-a-Service). An example from the Fund is Exact Sciences Corp. The company’s stock jumped up on the announcement of a co-promotion agreement with Pfizer. We sold our position in Exact Sciences to put the proceeds to work in more-attractively valued new names, including IRIDEX Corp., which makes a laser-treatment system for glaucoma. We’ve been establishing a position in IRIDEX at a price of less than two times sales.
Another new Fund holding is Magnolia Oil & Gas Corp., a special purpose acquisition company, or SPAC. Within the energy sector, SPACs are sometimes viewed unfavorably, as they may be shell companies created to operate lower-quality assets. However, a high-quality operation can also use the SPAC structure. In this case, we’re optimistic about Magnolia’s prospects given its experienced CEO, outstanding energy properties and conservative balance sheet.
Finally, we’re scouring the micro-cap universe for new opportunities in Asia. We’ve been attracted to Taiwan and Hong Kong, in particular, as recent market weakness has made stock valuations attractive in a number of companies that have what we consider to be solid growth prospects.
Thank you for the opportunity to manage your assets.
| | Current and future holdings are subject to risk. |
24
| | |
| WASATCH MICRO CAP VALUE FUND (WAMVX) | | SEPTEMBER 30, 2018 (UNAUDITED) |
|
|
|
Portfolio Summary
AVERAGE ANNUAL TOTAL RETURNS
| | | | | | | | | | | | | | | |
| | | 1 YEAR | | 5 YEARS | | 10 YEARS |
Micro Cap Value | | | | 18.84% | | | | | 13.27% | | | | | 14.78% | |
Russell Microcap® Index | | | | 13.65% | | | | | 10.51% | | | | | 10.82% | |
Data shows past performance, which is not indicative of future performance. Current performance may be lower or higher than the performance quoted. To obtain the most recent month-end performance data available, please visit www.WasatchFunds.com. The Advisor may absorb certain Fund expenses, without which total return would have been lower. Investment returns and principal value will fluctuate and shares, when redeemed, may be worth more or less than their original cost.
As of the January 31, 2018 prospectus, the Total Annual Fund Operating Expenses for the Wasatch Micro Cap Value Fund are 1.84%. The expense ratio shown elsewhere in this report may be different. Expenses include direct expenses paid to the Advisor as well as indirect expenses incurred by the Fund as a result of its investments in other investment companies (each an “Acquired Fund”), before any expense reimbursements by the Advisor. See the prospectus for additional information regarding Fund expenses.
Wasatch Funds will deduct a 2.00% redemption proceeds fee on Fund shares held 60 days or less. Performance data does not reflect the deduction of fees, including sales charges, or the taxes you would pay on fund distributions or the redemption of fund shares. Fees and taxes, if reflected, would reduce the performance quoted. Wasatch does not charge any sales fees. For more complete information including charges, risks and expenses, read the prospectus carefully.
Investing in micro cap funds will be more volatile and loss of principal could be greater than investing in large cap or more diversified funds. Investments in value stocks can perform differently from the market as a whole and from other types of stocks and can continue to be undervalued by the market for long periods of time. Investing in foreign securities, especially in emerging markets, entails special risks, such as currency fluctuations and political uncertainties, which are described in more detail in the prospectus.
TOP 10 EQUITY HOLDINGS*
| | | | |
| Company | | % of Net
Assets | |
| Freshpet, Inc. | | | 2.0% | |
| i3 Verticals, Inc., Class A | | | 1.8% | |
| OrthoPediatrics Corp. | | | 1.7% | |
| Sun Hydraulics Corp. | | | 1.7% | |
| Oxford Immunotec Global plc | | | 1.5% | |
| | | | |
| Company | | % of Net
Assets | |
| Kadant, Inc. | | | 1.5% | |
| Ferro Corp. | | | 1.5% | |
| Esquire Financial Holdings, Inc. | | | 1.5% | |
| Napco Security Technologies, Inc. | | | 1.4% | |
| Datawatch Corp. | | | 1.4% | |
| * | As of September 30, 2018, there were 96 holdings in the Fund. Foreign currency contracts, written options and repurchase agreements, if any, are not included in the number of holdings. Portfolio holdings are subject to change at any time. References to specific securities should not be construed as recommendations by the Funds or their Advisor. Current and future holdings are subject to risk. |
SECTOR BREAKDOWN**

| ** | Excludes securities sold short and options written, if any. |
| †Also | includes Other Assets & Liabilities. |
GROWTHOFA HYPOTHETICAL $10,000 INVESTMENT

Past performance does not predict future performance. The graph above does not reflect the deduction of fees, sales charges, or taxes that you would pay on fund distributions or the redemption of fund shares. Wasatch does not charge any sales fees. The Russell Microcap Index is an unmanaged total return index of the smallest 1,000 securities in the small-cap Russell 2000 Index along with the next smallest 1,000 companies, based on a ranking of all U.S. equities by market capitalization. The Russell 2000 Index is an unmanaged total return index of the smallest 2,000 companies in the Russell 3000 Index, as ranked by total market capitalization. You cannot invest directly in these or any indexes.
25
| | |
| WASATCH SMALL CAP GROWTH FUND (WAAEX / WIAEX) | | SEPTEMBER 30, 2018 (UNAUDITED) |
|
|
|
Management Discussion
The Wasatch Small Cap Growth Fund is managed by a team of Wasatch portfolio managers led by JB Taylor, Ken Korngiebel and Ryan Snow.
| | | | |
JB Taylor Lead Portfolio Manager | |
Ken Korngiebel, CFA Portfolio Manager | | 
Ryan Snow Portfolio Manager |
OVERVIEW
The Wasatch Small Cap Growth Fund — Investor Class gained 35.08% for the 12 months ended September 30, 2018, outperforming the 21.06% rise in the benchmark Russell 2000 Growth Index and the 15.24% advance in the Russell 2000 Index.
The Fund’s outperformance for the 12 months came largely as a result of favorable stock selection, particularly among our holdings in the information-technology sector. Names in the consumer-discretionary sector — including U.S. retailers — and in the health-care sector also contributed. On the minus side, financials were the major detractors from Fund performance.
In this environment of record and near-record stock prices, it’s helpful to consider the long-term trajectories in the history of investments. Looking back over the decades, it’s easy to identify extended periods of time — 17 or 18 years, for example — that were characterized by generally rising U.S. stock prices. Sure, shorter-term bear markets were contained within these periods, but the overall movement was upward. Viewed in this way, stock-market history seems like periods of long-term rising trends interspersed with periods of sideways movements.
We don’t know when the next period of flat or down performance will arrive. What we do know is that — based on historical stock-market data — the current rising trend may still have legs. So rather than paying too much attention to market cycles, we focus on finding high-quality growth companies that we believe will help us take advantage of favorable conditions and navigate more-difficult environments too.
DETAILSOFTHE YEAR
The top contributor to Fund performance was Five Below, Inc., a retailer that has established itself among teens and young consumers as the destination for inexpensive, fun merchandise. Everything in the store sells for $5 or less. Online retailers find it difficult to offer such products with the free-shipping benefit that their customers have come to expect. Moreover, Five Below has self-funded its store expansions and we expect it to continue to do so.
Another retailer, Ollie’s Bargain Outlet Holdings, Inc., was the second-best contributor. Ollie’s acquires excess inventory of brand-name products in a wide variety of categories, and then offers those products to customers who enjoy the bargain-priced, “treasure hunt” shopping experience. We believe Ollie’s business model would be hard for online competitors to replicate. Ollie’s loyal customer base is a competitive advantage that’s continually strengthened through its “Ollie’s Army” membership and rewards program. We see the potential for Ollie’s to double the number of stores to more than 500 in the coming years.
The Fund’s largest detractor was U.S. regional bank Eagle Bancorp, Inc. Eagle’s stock price slid on concerns that, as interest rates rise, Eagle may not be able to maintain what have been highly attractive differentials between what it pays depositors and its income from lending. We think investors have overreacted. Due to its variable-rate loans, Eagle’s earnings yield also rises as interest rates increase.
The second-largest detractor was Healthcare Services Group, Inc. (HCSG). The company provides housekeeping, laundry and dining services to skilled nursing facilities. Recently, some of HCSG’s customers had operating challenges and some even went bankrupt. This caused short-term deterioration in the company’s fundamentals. We believe the management team has the experience and depth to navigate the recent challenges. Moreover, we think HCSG has the potential for double-digit growth by adding more facilities to the housekeeping and laundry business segments and by cross-selling dining services to the existing client base.
OUTLOOK
Broadly speaking, we see little standing in the way of further growth in the U.S. economy. Having said that, a robust economy and strong company-specific fundamentals don’t always translate into stock-price gains. It’s possible for a company to experience growth without being rewarded by a higher stock price. That’s one reason we focus on researching companies we consider to be high quality. We believe such companies are more likely to perform solidly in a variety of business conditions. In our view, the companies held in the Fund are top-notch operators that we’d want to own during any type of market environment.
Of course, we do make adjustments to the Fund over time, for reasons usually relating to company-specific fundamentals — but sometimes for reasons relating to broader market dynamics. At present, the SaaS (Software-as-a-Service) industry provides a good example of the latter. Although the momentum of corporate investment could carry SaaS names even higher, we’ve trimmed some holdings in this area because we think valuations have reached levels at which even strong growth over several years is unlikely to translate into attractive share-price gains. As we took profits in some SaaS holdings, we reinvested the proceeds in what we see as more-reasonably valued names.
Thank you for the opportunity to manage your assets.
| | Current and future holdings are subject to risk. |
26
| | |
| WASATCH SMALL CAP GROWTH FUND (WAAEX / WIAEX) | | SEPTEMBER 30, 2018 (UNAUDITED) |
|
|
|
Portfolio Summary
AVERAGE ANNUAL TOTAL RETURNS
| | | | | | | | | | | | | | | |
| | | 1 YEAR | | 5 YEARS | | 10 YEARS |
Small Cap Growth (WAAEX) — Investor | | | | 35.08% | | | | | 11.88% | | | | | 14.30% | |
Small Cap Growth (WIAEX) — Institutional | | | | 35.27% | | | | | 11.99% | | | | | 14.36% | |
Russell 2000® Growth Index | | | | 21.06% | | | | | 12.14% | | | | | 12.65% | |
Russell 2000® Index | | | | 15.24% | | | | | 11.07% | | | | | 11.11% | |
Data shows past performance, which is not indicative of future performance. Current performance may be lower or higher than the performance quoted. To obtain the most recent month-end performance data available, please visit www.WasatchFunds.com. The Advisor may absorb certain Fund expenses, without which total return would have been lower. Investment returns and principal value will fluctuate and shares, when redeemed, may be worth more or less than their original cost.
As of the January 31, 2018 prospectus, the Total Annual Fund Operating Expenses for the Wasatch Small Cap Growth Fund are Investor Class: 1.27% / Institutional Class — Gross: 1.11%, Net: 1.05%. The expense ratio shown elsewhere in this report may be different. Net expenses are based on Fund expenses, net of waivers and reimbursements. See the prospectus for additional information regarding Fund expenses.
Wasatch Funds will deduct a 2.00% redemption proceeds fee on Fund shares held 60 days or less. Performance data does not reflect the deduction of fees, including sales charges, or the taxes you would pay on fund distributions or the redemption of fund shares. Fees and taxes, if reflected, would reduce the performance quoted. Wasatch does not charge any sales fees. For more complete information including charges, risks and expenses, read the prospectus carefully.
Performance for the Institutional Class prior to 2/1/2016 is based on the performance of the Investor Class. Performance of the Fund’s Institutional Class prior to 2/1/2016 uses the actual expenses of the Fund’s Investor Class without any adjustments. For any such period of time, the performance of the Fund’s Institutional Class would have been substantially similar to, yet higher than, the performance of the Fund’s Investor Class, because the shares of both classes are invested in the same portfolio of securities, but the classes bear different expenses.
Investing in small cap funds will be more volatile and loss of principal could be greater than investing in large cap or more diversified funds. Investing in foreign securities, especially in emerging markets, entails special risks, such as currency fluctuations and political uncertainties, which are described in more detail in the prospectus.
TOP 10 EQUITY HOLDINGS*
| | | | |
| Company | | % of Net
Assets | |
| Euronet Worldwide, Inc. | | | 3.9% | |
| HEICO Corp., Class A | | | 3.7% | |
| Ollie’s Bargain Outlet Holdings, Inc. | | | 3.4% | |
| ICON plc (Ireland) | | | 3.4% | |
| Barnes Group, Inc. | | | 3.3% | |
| | | | |
| Company | | % of Net
Assets | |
| RBC Bearings, Inc. | | | 3.0% | |
| Cantel Medical Corp. | | | 2.7% | |
| Ultimate Software Group, Inc. (The) | | | 2.7% | |
| Ensign Group, Inc. (The) | | | 2.6% | |
| Monro, Inc. | | | 2.6% | |
| * | As of September 30, 2018, there were 64 holdings in the Fund. Foreign currency contracts, written options and repurchase agreements, if any, are not included in the number of holdings. Portfolio holdings are subject to change at any time. References to specific securities should not be construed as recommendations by the Funds or their Advisor. Current and future holdings are subject to risk. |
SECTOR BREAKDOWN**
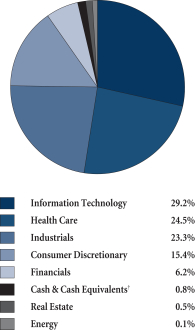
| ** | Excludes securities sold short and options written, if any. |
| † | Also includes Other Assets & Liabilities. |
GROWTHOFA HYPOTHETICAL $10,000 INVESTMENT

Past performance does not predict future performance. The graph above does not reflect the deduction of fees, sales charges, or taxes that you would pay on fund distributions or the redemption of fund shares. Wasatch does not charge any sales fees. The Russell 2000 Growth Index is an unmanaged total return index that measures the performance of those Russell 2000 Index companies with higher price-to-book ratios and higher forecasted growth values. The Russell 2000 Index is an unmanaged total return index of the smallest 2,000 companies in the Russell 3000 Index, as ranked by total market capitalization. The Russell 2000 Index is widely regarded in the industry as accurately capturing the universe of small company stocks. You cannot invest directly in these or any indexes.
27
| | |
| WASATCH SMALL CAP VALUE FUND (WMCVX / WICVX) | | SEPTEMBER 30, 2018 (UNAUDITED) |
|
|
|
Management Discussion
The Wasatch Small Cap Value Fund is managed by a team of Wasatch portfolio managers led by Jim Larkins.
| | |

Jim Larkins Lead Portfolio Manager | | OVERVIEW U.S. equities performed very well in the past year thanks to the highly favorable combination of strengthening economic growth and rising corporate earnings. Value stocks, while certainly participating in the rally, lagged the broader market amid investors’ continued preference for faster-growing companies. The Russell 2000 Value Index returned 9.33% for the 12-month period but fell well short of the 15.24% |
return of the broad-based Russell 2000 Index, which includes both growth and value stocks.
The Wasatch Small Cap Value Fund — Investor Class returned 14.54% and finished the period ahead of the benchmark Russell 2000 Value Index. Our strong showing of the past 12 months builds on the Fund’s favorable long-term results. As of September 30, 2018, the Fund had outperformed the Index over the five- and 10-year periods, as well as since its inception on December 17, 1997.
DETAILSOFTHE YEAR
A key part of our investment process is our effort to identify “Fallen Angels,” or growth companies that have hit a bump in the road and slid into value territory for what we think are temporary reasons. The main element of this strategy is the “Angel” aspect. Although these stocks are typically depressed when we first establish positions, our research indicates that the underlying companies have outstanding business models and robust growth prospects. Our belief is that over time, investors will grow to appreciate these traits and the stocks will rebound to their full valuation. We believe the Fallen Angels facet of our approach, when combined with our investments in more traditional value companies, creates diversification for the Fund by allowing it to hold both growth and value stocks. As a result, the Fund doesn’t necessarily rely on periods when value stocks outperform in order to drive its returns. Holding more growth stocks than its benchmark helped the Fund outperform for the 12-month period, because it enabled us to participate in the strong outperformance by the growth category.
Stock selection was a key driver of the Fund’s 12-month performance advantage, helping to generate a healthy margin of outperformance across the majority of sectors in which we were invested. The best results occurred in the financials, health-care, information-technology and industrials sectors.
Fallen Angels, including Ensign Group, Inc., were heavily represented among the Fund’s top contributors for the year. An operator of assisted-living facilities, Ensign came under pressure in 2017 due to the combination of a challenging acquisition, choppy earnings and broader uncertainty surrounding U.S. health-care policy. We chose to maintain the position because we believed in the management team’s positive long-term record and its plan to get Ensign back on
track. In addition, the company’s financial metrics stacked up well versus its competitors. Our patient approach paid off. Ensign’s stock recovered nicely in the first nine months of 2018. A number of Fallen Angels in the industrials sector also added to the Fund’s return, including HEICO Corp. and Copart, Inc.
On the negative side, our holdings in the consumer-discretionary and real-estate sectors detracted from performance relative to the benchmark. Commercial auto insurer Atlas Financial Holdings, Inc., whose underwriting results came in below expectations, was the largest detractor. We retained the position, as we trust the management team and it has been making some changes to address the issues.
Trucking company Knight-Swift Transportation Holdings, Inc. was another laggard. Investors punished the stock after the company reported weaker-than-expected earnings. Our analysis showed that the stock’s decline was largely due to investor overreaction to short-term issues related to the integration of the recently acquired Swift operation, rather than deterioration in the company’s profit margins or longer-term earnings outlook. Believing Knight-Swift is a well-managed company that stands to benefit from the ongoing strength in the U.S. economy, we used the selloff as an opportunity to significantly add to the Fund’s position.
OUTLOOK
Over the past 12 months, our investment activity was largely geared toward concentrating the Fund in our “best ideas.” A number of years ago, we determined that establishing larger weights in our highest-conviction holdings would help maximize the impact our research had on performance. The result is that the Fund now has a smaller number of holdings. This helps preserve our intellectual capital by allowing us to focus on a more select list of companies. Our largest positions are typically in companies with improving fundamentals, yet still attractive valuations. We finished the annual period with 50 individual positions, which is consistent with our goal of having an average weight of about 2% in each portfolio holding.
While the ongoing stock market rally has provided a tailwind for the Fund it has also led to higher valuations across the market. As a result, we have been considering the “value versus growth” question more heavily in the past several months. Since growth stocks have largely outperformed — and therefore have been more likely to reach full valuations — we’ve looked for more opportunities to add companies with strong characteristics that still appear to be attractively valued. We believe the net result of this process is a blended portfolio with the potential to participate in the market’s upside no matter which style happens to be in favor.
Thank you for the opportunity to manage your assets.
| | Current and future holdings are subject to risk. |
28
| | |
| WASATCH SMALL CAP VALUE FUND (WMCVX / WICVX) | | SEPTEMBER 30, 2018 (UNAUDITED) |
|
|
|
Portfolio Summary
AVERAGE ANNUAL TOTAL RETURNS
| | | | | | | | | | | | | | | |
| | | 1 YEAR | | 5 YEARS | | 10 YEARS |
Small Cap Value (WMCVX) — Investor | | | | 14.54% | | | | | 12.31% | | | | | 12.49% | |
Small Cap Value (WICVX) — Institutional | | | | 14.78% | | | | | 12.43% | | | | | 12.59% | |
Russell 2000® Value Index | | | | 9.33% | | | | | 9.91% | | | | | 9.52% | |
Russell 2000® Index | | | | 15.24% | | | | | 11.07% | | | | | 11.11% | |
Data shows past performance, which is not indicative of future performance. Current performance may be lower or higher than the performance quoted. To obtain the most recent month-end performance data available, please visit www.WasatchFunds.com. The Advisor may absorb certain Fund expenses, without which total return would have been lower. Investment returns and principal value will fluctuate and shares, when redeemed, may be worth more or less than their original cost.
As of the January 31, 2018 prospectus, the Total Annual Fund Operating Expenses for the Wasatch Small Cap Value Fund are Investor Class: 1.41% / Institutional Class — Gross: 1.36%, Net: 1.25%. The expense ratio shown elsewhere in this report may be different. Expenses include direct expenses paid to the Advisor as well as indirect expenses incurred by the Fund as a result of its investments in other investment companies (each an “Acquired Fund”), before any expense reimbursements by the Advisor. Net expenses are based on Fund expenses, net of waivers and reimbursements. See the prospectus for additional information regarding Fund expenses.
Wasatch Funds will deduct a 2.00% redemption proceeds fee on Fund shares held 60 days or less. Performance data does not reflect the deduction of fees, including sales charges, or the taxes you would pay on fund distributions or the redemption of fund shares. Fees and taxes, if reflected, would reduce the performance quoted. Wasatch does not charge any sales fees. For more complete information including charges, risks and expenses, read the prospectus carefully.
Performance for the Institutional Class prior to 1/31/2012 is based on the performance of the Investor Class. Performance of the Fund’s Institutional Class prior to 1/31/2012 uses the actual expenses of the Fund’s Investor Class without any adjustments. For any such period of time, the performance of the Fund’s Institutional Class would have been substantially similar to, yet higher than, the performance of the Fund’s Investor Class, because the shares of both classes are invested in the same portfolio of securities, but the classes bear different expenses.
Investing in small cap funds will be more volatile and loss of principal could be greater than investing in large cap or more diversified funds. Investments in value stocks can perform differently from the market as a whole and from other types of stocks and can continue to be undervalued by the market for long periods of time. Investing in foreign securities, especially in emerging markets, entails special risks, such as currency fluctuations and political uncertainties, which are described in more detail in the prospectus.
TOP 10 EQUITY HOLDINGS*
| | | | |
| Company | | % of Net
Assets | |
| Euronet Worldwide, Inc. | | | 5.0% | |
| Monro, Inc. | | | 4.4% | |
| Knight-Swift Transportation Holdings, Inc. | | | 4.4% | |
| Kadant, Inc. | | | 4.0% | |
| Arbor Realty Trust, Inc. | | | 3.7% | |
| | | | |
| Company | | % of Net
Assets | |
| Dorman Products, Inc. | | | 3.2% | |
| Ensign Group, Inc. (The) | | | 3.1% | |
| Innospec, Inc. | | | 3.0% | |
| Altra Industrial Motion Corp. | | | 2.9% | |
| Monmouth Real Estate Investment Corp. | | | 2.6% | |
| * | As of September 30, 2018, there were 50 holdings in the Fund. Foreign currency contracts, written options and repurchase agreements, if any, are not included in the number of holdings. Portfolio holdings are subject to change at any time. References to specific securities should not be construed as recommendations by the Funds or their Advisor. Current and future holdings are subject to risk. |
SECTOR BREAKDOWN**
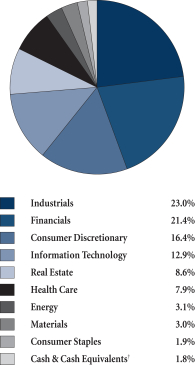
| ** | Excludes securities sold short and options written, if any. |
| † | Also includes Other Assets & Liabilities. |
GROWTHOFA HYPOTHETICAL $10,000 INVESTMENT

Past performance does not predict future performance. The graph above does not reflect the deduction of fees, sales charges, or taxes that you would pay on fund distributions or the redemption of fund shares. Wasatch does not charge any sales fees. The Russell 2000 Value Index measures the performance of those Russell 2000 Index companies with lower price-to-book ratios and lower forecasted growth values. The Russell 2000 Index is an unmanaged total return index of the smallest 2,000 companies in the Russell 3000 Index, as ranked by total market capitalization. The Russell 2000 Index is widely regarded in the industry as accurately capturing the universe of small company stocks. You cannot invest directly in these or any indexes.
29
| | |
| WASATCH ULTRA GROWTH FUND (WAMCX) | | SEPTEMBER 30, 2018 (UNAUDITED) |
|
|
|
Management Discussion
The Wasatch Ultra Growth Fund is managed by a team of Wasatch portfolio managers led by John Malooly.
| | |
John Malooly, CFA Lead Portfolio Manager | | OVERVIEW Equities of small companies continued their impressive run during the 12 months ended September 30, 2018. The Wasatch Ultra Growth Fund advanced 41.97% and significantly outperformed the benchmark Russell 2000 Growth Index, which rose 21.06%. With growth stocks outgaining value stocks during the 12 months, the small-cap growth investment style was a tailwind for the Fund. Health care was the |
largest source of strength against the benchmark, as favorable developments at the company level propelled our holdings to outsized gains. When investing in health care, we look for companies using new technologies to do things better, faster and less expensively. By focusing on companies creating significant value, our goal is to identify businesses with long-term growth prospects not closely tied to macroeconomic or political developments.
Software stocks also did well. Improvements in software technology are expanding its application to an ever-widening range of human activities. Software stocks tend to shine late in an economic cycle, when businesses are more likely to favor technology investments over human capital.
Laggards during the 12 months were primarily comprised of financial stocks. Rising short-term interest rates threatened to raise the funding costs of banks and other lenders, which weighed on their stock prices.
We attribute the strong performance of the Fund during the 12 months to the solid fundamentals of the companies we own. In an environment of rich valuations, we believe the experienced management teams, strong balance sheets and other favorable characteristics of our companies became increasingly attractive to investors. As equity prices rose, we sought to control risk by trimming positions in stocks that had moved up significantly in price and reinvesting the proceeds in more-reasonably valued issues.
DETAILSOFTHE YEAR
The strongest contributor to Fund performance was Tandem Diabetes Care, Inc. The company offers insulin-delivery systems for people with diabetes. In August, Tandem launched its t:slim X2™ Insulin Pump with Basal-IQ™ Technology, a predictive feature designed to reduce the frequency and duration of low-glucose events (hypoglycemia). The new system requires no finger sticks for calibration or diabetes-treatment decisions. Encouraging financial results and improved forward guidance also helped to drive Tandem’s stock price higher.
Freshpet, Inc. was another significant contributor. The company sells fresh, refrigerated meals and treats for dogs and cats in the U.S., Canada and the United Kingdom. Shares of Freshpet rose sharply in early August after the company reported better-than-expected net sales. In addition, Freshpet’s core dog household penetration increased at
its fastest rate in more than three years. The company announced plans to expand its manufacturing facility in Pennsylvania to meet the growing demand for its products.
PDF Solutions, Inc. was the Fund’s largest detractor for the 12 months. The company provides technologies for optimizing the design and manufacture of integrated-circuit chips. We sold our position in PDF following a key management change and deterioration in the company’s growth prospects. With a main customer exiting the space and little indication that PDF’s management team will be able to execute on the opportunities available, we decided to move on.
Metro Bank plc was also a sizable detractor. This U.K. bank’s competitive advantage is a disruptive, customer-first model offering unparalleled levels of service. The bank’s branches are open early and late, seven days a week. Metro Bank has been gaining significant market share in the retail/commercial banking market in the United Kingdom. The founder, Vernon Hill, was successful in the U.S. with Commerce Bank, which he grew from one bank location with nine employees to 440 branches and $50 billion in assets. Wasatch was a longtime investor in Commerce Bank. The cause of the pullback in Metro Bank’s stock seemed to have been that some investors were displeased with the bank having raised capital via the issuance of additional equity, which diluted existing shareholders. Our perspective is that the capital raise was well-considered and consistent with management’s long-term growth plans and the opportunities available to the bank. Metro Bank’s branch network — by the nature of having physical locations — requires capital to expand. Even in the context of Brexit-related uncertainty, we see Metro Bank as a high-quality, long-term holding.
OUTLOOK
As company-focused, fundamental investors, we believe earnings drive stock prices between upper and lower extremes of undervaluation and overvaluation. While these extremes do not represent impermeable boundaries, valuations historically have shown a strong tendency to revert toward their long-term mean. Even under the optimistic assumption that price/earnings multiples will remain static at currently elevated levels indefinitely, annualized stock returns (net of dividends) would be expected to approximate annual rates of earnings growth.
Looking forward, we’re pleased with the makeup of the Fund. We believe that the fundamentals of our companies are solid, and that they are run by strong management teams. However, it also feels like the outstanding results this year have pulled in forward returns.
We typically expect to generate a 12% to 15% annualized return when we buy a company. Because not all companies hit their targets, however, we’d consider annualized returns of 10% to 12% over a five-year period to represent good investment results. Given that the Fund has returned 17.33% annually for the five years ended September 30, 2018, we expect performance to moderate significantly in the years to come.
Thank you for the opportunity to manage your assets.
| | Current and future holdings are subject to risk. |
30
| | |
| WASATCH ULTRA GROWTH FUND (WAMCX) | | SEPTEMBER 30, 2018 (UNAUDITED) |
|
|
�� |
Portfolio Summary
AVERAGE ANNUAL TOTAL RETURNS
| | | | | | | | | | | | | | | |
| | | 1 YEAR | | 5 YEARS | | 10 YEARS |
Ultra Growth | | | | 41.97% | | | | | 17.33% | | | | | 15.56% | |
Russell 2000® Growth Index | | | | 21.06% | | | | | 12.14% | | | | | 12.65% | |
Data shows past performance, which is not indicative of future performance. Current performance may be lower or higher than the performance quoted. To obtain the most recent month-end performance data available, please visit www.WasatchFunds.com. The Advisor may absorb certain Fund expenses, without which total return would have been lower. Investment returns and principal value will fluctuate and shares, when redeemed, may be worth more or less than their original cost.
As of the January 31, 2018 prospectus, the Total Annual Fund Operating Expenses for the Wasatch Ultra Growth Fund are 1.35%. The expense ratio shown elsewhere in this report may be different. Expenses include direct expenses paid to the Advisor as well as indirect expenses incurred by the Fund as a result of its investments in other investment companies (each an “Acquired Fund”), before any expense reimbursements by the Advisor. See the prospectus for additional information regarding Fund expenses.
Wasatch Funds will deduct a 2.00% redemption proceeds fee on Fund shares held 60 days or less. Performance data does not reflect the deduction of fees, including sales charges, or the taxes you would pay on fund distributions or the redemption of fund shares. Fees and taxes, if reflected, would reduce the performance quoted. Wasatch does not charge any sales fees. For more complete information including charges, risks and expenses, read the prospectus carefully.
Investing in small cap funds will be more volatile and loss of principal could be greater than investing in large cap or more diversified funds. Investing in foreign securities, especially in emerging markets, entails special risks, such as currency fluctuations and political uncertainties, which are described in more detail in the prospectus.
TOP 10 EQUITY HOLDINGS*
| | | | |
| Company | | % of Net
Assets | |
| Paylocity Holding Corp. | | | 2.8% | |
| Knight-Swift Transportation Holdings, Inc. | | | 2.3% | |
| Exact Sciences Corp. | | | 2.3% | |
| Freshpet, Inc. | | | 2.2% | |
| Box, Inc., Class A | | | 2.1% | |
| | | | |
| Company | | % of Net
Assets | |
| Metro Bank plc (United Kingdom) | | | 2.1% | |
| Sangamo Therapeutics, Inc. | | | 2.1% | |
| Ultimate Software Group, Inc. (The) | | | 1.9% | |
| Eagle Bancorp, Inc. | | | 1.9% | |
| HubSpot, Inc. | | | 1.9% | |
| * | As of September 30, 2018, there were 81 holdings in the Fund. Foreign currency contracts, written options and repurchase agreements, if any, are not included in the number of holdings. Portfolio holdings are subject to change at any time. References to specific securities should not be construed as recommendations by the Funds or their Advisor. Current and future holdings are subject to risk. |
SECTOR BREAKDOWN**
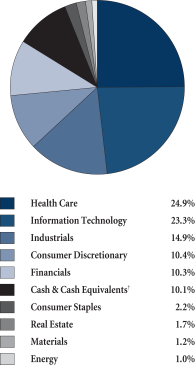
| ** | Excludes securities sold short and options written, if any. |
| † | Also includes Other Assets & Liabilities. |
GROWTHOFA HYPOTHETICAL $10,000 INVESTMENT
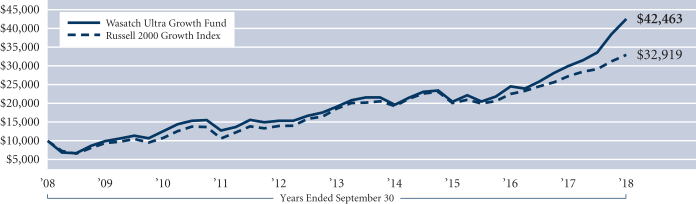
Past performance does not predict future performance. The graph above does not reflect the deduction of fees, sales charges, or taxes that you would pay on fund distributions or the redemption of fund shares. Wasatch does not charge any sales fees. The Russell 2000 Growth Index is an unmanaged total return index that measures the performance of those Russell 2000 Index companies with higher price-to-book ratios and higher forecasted growth values. The Russell 2000 Index is an unmanaged total return index of the smallest 2,000 companies in the Russell 3000 Index, as ranked by total market capitalization. You cannot invest directly in these or any indexes.
31
| | |
| WASATCH-HOISINGTON U.S. TREASURY FUND (WHOSX) | | SEPTEMBER 30, 2018 (UNAUDITED) |
|
|
|
Management Discussion
| | | | |

Van Hoisington Lead Portfolio Manager | | 
Van R. Hoisington, Jr. Portfolio Manager | | 
David Hoisington Portfolio Manager |
OVERVIEW
The Wasatch-Hoisington U.S. Treasury Fund declined -4.47% for the 12 months ended September 30, 2018 and underperformed the benchmark Bloomberg Barclays US Aggregate Index, which fell -1.22% over the same period. The 30-year Treasury bond yield ended the period at 3.21% compared with 2.86% on September 30, 2017. Because bond prices move opposite to yields, this 0.35 percentage point increase in yield resulted in reduced market value for the securities held by the Fund and more than offset coupon payments to the Fund over the past year.
For the five- and 10-year periods ended September 30, 2018, the Fund posted average annual returns of 4.86% and 5.99%, respectively, and significantly outperformed the benchmark.
REVIEWOFTHE YEAR
For the past decade, year-over-year growth in nominal gross domestic product (GDP) was a record. Additionally, the U.S. has experienced record stock prices, record confidence levels, a steady upward march of coincident economic indicators and the lowest unemployment rate in the past 49 years. Such measures will not determine future economic activity. Monetary policy has played a major role in determining recessions. Unlike the past, today’s extremely high government debt levels will also serve to restrain future economic growth. Hence, the U.S. economy appears to be on a steadily descending path toward recession and disinflation if not outright deflation.
OUTLOOKFORTHE YEAR
Eight increases in the policy rate by the U.S. Federal Reserve (Fed) and a $1 trillion reduction in banks’ excess reserves appear to have had little impact on U.S. growth, as of yet. True, interest-sensitive areas of the economy — autos and housing — have ceased expanding and are currently a slight drag on overall output, but overall consumption, which represents about 70% of GDP, has remained relatively steady.
With lags, the impact of Fed policy, however, has a broad reach. Federal Reserve policy is shrinking liquidity outside the U.S. where debt productivity is considerably lower. As such, foreign economies should weaken before monetary restraint is visible domestically. The symptoms can be seen in emerging markets with declining equity prices and in
locations where the cheap-money policy of the past has encouraged borrowing in U.S. dollars. These markets now face rising interest costs and a more expensive dollar, making debt repayment difficult. Significantly, U.S. monetary restraint has caused a similar slowdown in local currency money growth around the world. Additionally, money velocity in Japan, the euro area and China has been declining secularly since the late 1990s, as debt has become increasingly less productive.
Fed policy has cut into money and credit growth. The annual growth rate in money supply (M2) has slowed to 4%, well below the 6.6% annual rate of expansion since 1900. Loans and leases funded by banks and commercial paper have dropped to a 2.5% three-month annualized growth rate, and the asset growth of banks has ceased to expand this year. Another symptom of monetary change, the term spread, which is derived from the yield curve, is now clearly reinforcing the restrictiveness of Fed policy by reducing the profitability of banks and others who borrow at short-term rates and lend at long-term rates.
For all economies, what is produced equals what is spent, which in turn equals what is earned. Algebraically, national saving must equal physical investment. Investment is critical to the growth of productivity. Productivity plus labor-force growth determines potential economic growth rates. Therefore, to get an investment boom, greater national saving is required. Herein lies the problem. Government deficits are not saving, but dissaving, reducing the total saving available for investment. Since 1929, net national saving has averaged 6.4%, but with increasing government deficits (dissaving) over the past 17 years, the national saving rate has dropped by more than half to about 3%. Due to looming deficits, net national saving could decrease from approximately 3% to 2% or possibly even zero. Investment would be forced downward, continuing to erode productivity, unless, of course, consumer saving were to rise. But, if consumer saving were to rise, this would reduce consumer spending and economic growth, undermining the incentive for more investment. This is a recipe for semi-recessionary economic conditions, regardless of any monetary-policy mistakes that might be made by central bankers.
The response by policy makers to this eventuality is a guess, but a higher interest-rate policy does not appear to be an option. Compared to times when 30-year bond yields were close to 15%, the current 30-year Treasury rate of approximately 3% seems ridiculously low. In the near future, at 1.5%, the current yield of about 3% will seem generous.
Thank you for the opportunity to manage your assets.
32
| | |
| WASATCH-HOISINGTON U.S. TREASURY FUND (WHOSX) | | SEPTEMBER 30, 2018 (UNAUDITED) |
|
|
|
Portfolio Summary
AVERAGE ANNUAL TOTAL RETURNS
| | | | | | | | | | | | | | | |
| | | 1 YEAR | | 5 YEARS | | 10 YEARS |
U.S. Treasury | | | | -4.47% | | | | | 4.86% | | | | | 5.99% | |
Bloomberg Barclays US Aggregate Bond Index | | | | -1.22% | | | | | 2.16% | | | | | 3.77% | |
Data shows past performance, which is not indicative of future performance. Current performance may be lower or higher than the performance quoted. To obtain the most recent month-end performance data available, please visit www.WasatchFunds.com. The Advisor may absorb certain Fund expenses, without which total return would have been lower. Investment returns and principal value will fluctuate and shares, when redeemed, may be worth more or less than their original cost.
As of the January 31, 2018 prospectus, the Total Annual Fund Operating Expenses for the Wasatch-Hoisington U.S. Treasury Fund are 0.72%. The expense ratio shown elsewhere in this report may be different. See the prospectus for additional information regarding Fund expenses.
Wasatch Funds will deduct a 2.00% redemption proceeds fee on Fund shares held 60 days or less. Performance data does not reflect the deduction of fees, including sales charges, or the taxes you would pay on fund distributions or the redemption of fund shares. Fees and taxes, if reflected, would reduce the performance quoted. Wasatch does not charge any sales fees. For more complete information including charges, risks and expenses, read the prospectus carefully.
Investments in fixed income funds are subject to the same interest rate, inflation, credit and other risks associated with the underlying bonds. Return of principal is not guaranteed.
TOP U.S. TREASURY HOLDINGS*
| | | | | | | | |
| Holding | | Maturity
Date | | | % of Net
Assets | |
| U.S. Treasury Bond, 2.250% | | | 8/15/46 | | | | 31.8% | |
| U.S. Treasury Strip, principal only | | | 8/15/45 | | | | 24.6% | |
| U.S. Treasury Bond, 2.500% | | | 2/15/45 | | | | 15.1% | |
| U.S. Treasury Strip, principal only | | | 5/15/44 | | | | 11.8% | |
| | | | | | | | |
| Holding | | Maturity
Date | | | % of Net
Assets | |
| U.S. Treasury Strip, principal only | | | 8/15/40 | | | | 6.5% | |
| U.S. Treasury Bond, 3.750% | | | 11/15/43 | | | | 5.1% | |
| U.S. Treasury Bond, 3.125% | | | 8/15/44 | | | | 2.6% | |
| U.S. Treasury Bond, 3.000% | | | 8/15/48 | | | | 2.2% | |
| * | As of September 30, 2018, there were 8 holdings in the Fund. Repurchase agreements, if any, are not included in the number of holdings. Portfolio holdings are subject to change at any time. References to specific securities should not be construed as recommendations by the Funds or their Advisor. Current and future holdings are subject to risk. |
INVESTMENTS & CASH
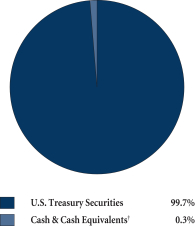
| † | Also includes Other Assets & Liabilities. |
GROWTHOFA HYPOTHETICAL $10,000 INVESTMENT
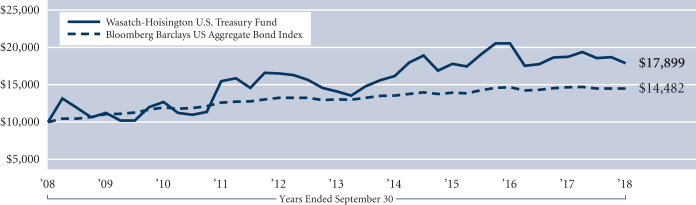
Past performance does not predict future performance. The graph above does not reflect the deduction of fees, sales charges, or taxes that you would pay on fund distributions or the redemption of fund shares. Wasatch does not charge any sales fees. The Bloomberg Barclays US Aggregate Bond Index is a broad-based flagship benchmark that measures the investment grade, US dollar denominated, fixed-rate taxable bond market. The index includes Treasuries, government-related and corporate securities, MBS (agency fixed-rate and hybrid ARM pass-throughs), ABS and CMBS (agency and non-agency). You cannot invest directly in this or any index.
33
| | |
| WASATCH FUNDS MANAGEMENT DISCUSSIONS | | |
|
|
|
Definitions of Financial Terms
A bear market is generally defined as a drop of 20% or more in stock prices over at least a two-month period.
Someone who is “bearish” or “a bear” is pessimistic with regard to the prospects of a market or asset.
Brexit is an abbreviation for “British exit,” which refers to the June 23, 2016 referendum whereby British citizens voted to exit the European Union. The referendum roiled global markets, including currencies, causing the British pound to fall to its lowest level in decades.
A bull market is defined as a prolonged period in which investment prices rise faster than their historical average. Bull markets can happen as the result of an economic recovery, an economic boom, or investor psychology.
The Bureau of Economic Analysis (BEA) is an agency in the United States Department of Commerce that provides important economic statistics including the gross domestic product of the United States. BEA is a principal agency of the U.S. Federal Statistical System.
The “cloud” is the internet. Cloud-computing is a model for delivering information-technology services in which resources are retrieved from the internet through web-based tools and applications, rather than from a direct connection to a server.
A Consumer Price Index (CPI) is a measure that examines the weighted average of prices of a basket of consumer goods and services, such as transportation, food and medical care. The CPI is calculated by taking price changes for each item in the predetermined basket of goods and averaging them. The goods are weighted according to their importance.
Earnings growth is a measure of growth in a company’s net income over a specific period, often one year.
Earnings yield refers to a company’s earnings per share for the most recent 12-month period divided by the current market price per share. The earnings yield (which is the inverse of the P/E ratio) shows the percentage of each dollar invested in the stock that was earned by the company.
The federal-funds rate is the interest rate at which private depository institutions (mostly banks) lend balances (federal funds) at the Federal Reserve to other depository institutions, usually overnight. It is the interest rate banks charge each other for loans.
The Federal Open Market Committee (FOMC), a component of the Federal Reserve System, is charged under United States law with overseeing the nation’s open market operations. Open market operations are the means of implementing monetary policy by which a central bank controls the short-term interest rate and the supply of base money in an economy, and thus indirectly the total money supply.
The global financial crisis, also known as the financial crisis of 2007-09 and 2008 financial crisis, is considered by many economists to have been the worst financial crisis since the Great Depression of the 1930s.
Gross domestic product (GDP) is a basic measure of a country’s economic performance and is the market value of all final goods and services made within the borders of a country in a year.
An initial public offering (IPO) is a company’s first sale of stock to the public.
M2 money supply consists of currency and checking accounts, consumer-type time and savings accounts and
equivalent near monies, while M3 money supply consists of M2 plus business-type time deposits and less liquid near monies. Both M2 and M3 exclude monies and near monies owned by the Treasury, depository institutions and foreign banks and official institutions and IRA and Keogh balances owned by consumers.
The price/earnings (P/E) multiple, also known as the P/E ratio, is the price of a stock divided by its earnings per share.
Return on capital is a measure of how effectively a company uses the money, owned or borrowed, that has been invested in its operations.
Valuation is the process of determining the current worth of an asset or company.
The velocity of money (V) is defined as the rate at which money circulates, changes hands or turns over in an economy.
U.S. Treasury yield is the return on investment, expressed as a percentage, on the U.S. government’s debt obligations.
The yield curve is a line on a graph that plots the interest rates, at a set point in time, of bonds having equal credit quality, but differing maturity dates. The most frequently reported yield curve compares three-month, two-year, five-year and 30-year U.S. Treasury securities. This yield curve is used as a benchmark for other interest rates, such as mortgage rates or bank lending rates. The curve is also used to predict changes in economic output and growth.
The Russell 2000 Index is an unmanaged total-return index of the smallest 2,000 companies in the Russell 3000 Index, as ranked by total market capitalization. The Russell 2000 is widely used in the industry to measure the performance of small-company stocks.
The Russell 2000 Growth Index measures the performance of Russell 2000 Index companies with higher price-to-book ratios and higher forecasted growth values.
The Russell 2000 Value Index measures the performance of Russell 2000 Index companies with lower price-to-book ratios and lower forecasted growth values.
Pertaining to the use of Russell information. All rights in the Russell 2000, Russell 2000 Growth and Russell 2000 Value vest in the relevant London Stock Exchange Group plc (collectively, the “LSE Group”), which owns these indexes. Russell® is a trademark of the relevant LSE Group company and is used by any other LSE Group company under license. These indexes are calculated by or on behalf of FTSE International Limited or its affiliate, agent or partner. The LSE Group does not accept any liability whatsoever to any person arising out of (a) the use of, reliance on or any error in the Index or (b) investment in or operation of any Wasatch portfolio. The LSE Group makes no claim, prediction, warranty or representation either as to the results to be obtained from any Wasatch portfolio or the suitability of these indexes for the purpose to which they are being put by Wasatch Advisors, Inc.
The Nasdaq Composite Index, launched in 1971, is a market-capitalization weighted index of the more than 3,000 securities listed on The Nasdaq Stock Market. The types of securities in the index include American depositary receipts, common stocks, limited partnership interests, ordinary shares, real estate investment trusts (REITs), shares of beneficial interest (SBIs) and tracking stocks.
34
| | |
| | SEPTEMBER 30, 2018 (UNAUDITED) |
|
|
|
The S&P 500 Index includes 500 of the United States’ largest stocks from a broad variety of industries. The Index is unmanaged and is a commonly used measure of common stock total return performance.
The MSCI ACWI Value Index captures large- and mid-cap securities exhibiting overall value style characteristics across 23 developed-market countries and 24 emerging-market countries.
The MSCI Emerging Markets Index captures large- and mid-cap representation across 24 emerging market countries. With 1,151 constituents, the index covers approximately 85% of the free float-adjusted market capitalization in each country.
The MSCI India Domestic Index is designed to measure the performance of the large- and mid-cap segments of the domestic Indian market.
The MSCI World ex USA Index captures large- and mid-cap representation across 22 of 23 developed market countries — excluding the United States. With 1,015 constituents, the index covers approximately 85% of the free float-adjusted market capitalization in each country.
Pertaining to the use of MSCI information. Source: MSCI. The MSCI information may only be used for your internal use, may not be reproduced or redisseminated in any form and may not be used as a basis for or a component of any financial instruments or products or indexes. None of the MSCI information is intended to constitute investment advice or a recommendation to make (or refrain from making) any kind of investment decision and may not be relied
on as such. Historical data and analysis should not be taken as an indication or guarantee of any future performance analysis, forecast or prediction. The MSCI information is provided on an “as is” basis and the user of this information assumes the entire risk of any use made of this information. MSCI, each of its affiliates and each other person involved in or related to compiling, computing or creating any MSCI information (collectively, the “MSCI Parties”) expressly disclaims all warranties (including, without limitation, any warranties or originality, accuracy, completeness, timeliness, non-infringement, merchantability and fitness for a particular purpose) with respect to this information. Without limiting any of the foregoing, in no event shall any MSCI Party have any liability for any direct, indirect, special, incidental, punitive, consequential (including, without limitation, lost profits) or any other damages. (www.msci.com)
The Bloomberg Barclays US Aggregate Bond Index is a broad-based flagship benchmark that measures the investment grade, US dollar denominated, fixed-rate taxable bond market. The index includes Treasuries, government-related and corporate securities, mortgage-backed securities (MBS) (agency fixed-rate and hybrid adjustable-rate mortgage [ARM] pass-throughs), asset-backed securities (ABS) and commercial mortgage-backed securities (CMBS) (agency and non-agency).
The Bloomberg Barclays US 20+ Year Treasury Bond Index measures the performance of U.S. Treasury securities that have remaining maturities of 20 or more years.
You cannot invest directly in these or any indexes.
35
Operating Expenses (UNAUDITED)
EXPENSE EXAMPLE
As a shareholder of Wasatch Funds, you incur two types of costs: (1) transaction costs, including redemption fees and (2) ongoing costs, including management fees and other fund expenses. This example is intended to help you understand your ongoing costs (in dollars) of investing in a Wasatch Fund and to compare these costs with the ongoing costs of investing in other mutual funds.
The example is based on an investment of $1,000.00 invested at the beginning of the period and held for the entire six-month period ended September 30, 2018.
ACTUAL EXPENSES
The first line of the table on the next page provides information about actual account values and actual expenses, based upon the actual total return of the fund during the most recent six-month period ended September 30, 2018. You may use the information in this line, together with the amount you invested, to estimate the expenses you paid over the period. Simply divide your account value by $1,000.00 (for example, an $8,600.00 account value divided by $1,000.00 = 8.6), then multiply the result by the number in the first line under the heading entitled “Expenses Paid During Period” to estimate the expenses you paid on your account during this period.
In addition, the funds charge a $12.50 IRA annual maintenance fee and a $15.00 fee for redemptions paid by wire. To the extent these fees apply to your account, your expenses paid during the period would be higher and your ending account value would be lower than the amounts shown in the table on the next page.
HYPOTHETICAL EXAMPLEFOR COMPARISON PURPOSES
The second line of the table on the next page provides information about hypothetical account values and hypothetical expenses based on a fund’s actual expense ratio and
an assumed rate of return of 5% per year before expenses, which is not the fund’s actual return. The hypothetical account values and expenses may not be used to estimate the actual ending account balance or expenses you paid for the period. You may use this information to compare the ongoing costs of investing in a Wasatch Fund and other funds. To do so, compare this 5% hypothetical example with the 5% hypothetical examples that appear in the shareholder reports of other funds.
In addition, the funds charge a $12.50 IRA annual maintenance fee and a $15.00 fee for redemptions paid by wire. To the extent these fees apply to your account, your expenses paid during the period would be higher and your ending account value would be lower than the amounts shown in the table on the next page. If another fund’s fees differ from those listed above, your expenses paid and your ending account value could be higher or lower than those of other funds.
Please note that the expenses shown in the table are meant to highlight your ongoing costs only and do not reflect any transactional costs, such as redemption fees. Therefore, the second line of the table is useful in comparing ongoing costs only, and will not help you determine the relative total costs of owning different funds. In addition, if these transactional costs were included, your costs would have been higher.
A fund’s annualized expense ratio may vary as a result of various factors including expenses that are not reimbursable under the contractual agreement between the fund and the Advisor such as interest, taxes, brokerage commissions, other investment related costs, dividend expense on short sales, and extraordinary expenses.
36
| | |
| | SEPTEMBER 30, 2018 (UNAUDITED) |
|
|
|
| | | | | | | | | | | | | | | | |
| | | Account Value | | | Expenses
Paid
During Period* | | | Annualized
Expense
Ratio* | |
| Fund/Class and Return | | Beginning of Period
April 1, 2018 | | | End of Period
September 30, 2018 | |
Core Growth Fund — Investor Class | | | | | | | | | | | | | | | | |
Actual | | | $1,000.00 | | | | $1,138.70 | | | | $6.33 | | | | 1.18% | |
Hypothetical (5% before expenses) | | | $1,000.00 | | | | $1,019.15 | | | | $5.97 | | | | 1.18% | |
Core Growth Fund — Institutional Class | | | | | | | | | | | | | | | | |
Actual | | | $1,000.00 | | | | $1,139.30 | | | | $5.68 | | | | 1.06% | |
Hypothetical (5% before expenses) | | | $1,000.00 | | | | $1,019.75 | | | | $5.37 | | | | 1.06% | |
Emerging India Fund —��Investor Class | | | | | | | | | | | | | | | | |
Actual | | | $1,000.00 | | | | $927.20 | | | | $8.60 | | | | 1.78% | |
Hypothetical (5% before expenses) | | | $1,000.00 | | | | $1,016.14 | | | | $9.00 | | | | 1.78% | |
Emerging India Fund — Institutional Class | | | | | | | | | | | | | | | | |
Actual | | | $1,000.00 | | | | $927.60 | | | | $7.34 | | | | 1.52% | |
Hypothetical (5% before expenses) | | | $1,000.00 | | | | $1,017.45 | | | | $7.69 | | | | 1.52% | |
Emerging Markets Select Fund — Investor Class | | | | | | | | | |
Actual | | | $1,000.00 | | | | $925.30 | | | | $7.29 | | | | 1.51% | |
Hypothetical (5% before expenses) | | | $1,000.00 | | | | $1,017.50 | | | | $7.64 | | | | 1.51% | |
Emerging Markets Select Fund — Institutional Class | | | | | | | | | |
Actual | | | $1,000.00 | | | | $926.30 | | | | $5.84 | | | | 1.21% | |
Hypothetical (5% before expenses) | | | $1,000.00 | | | | $1,019.00 | | | | $6.12 | | | | 1.21% | |
Emerging Markets Small Cap Fund — Investor Class | | | | | | | | | |
Actual | | | $1,000.00 | | | | $860.70 | | | | $9.19 | | | | 1.97% | |
Hypothetical (5% before expenses) | | | $1,000.00 | | | | $1,015.19 | | | | $9.95 | | | | 1.97% | |
Emerging Markets Small Cap Fund — Institutional Class | | | | | | | | | | | | | | | | |
Actual | | | $1,000.00 | | | | $861.10 | | | | $8.49 | | | | 1.82% | |
Hypothetical (5% before expenses) | | | $1,000.00 | | | | $1,015.94 | | | | $9.20 | | | | 1.82% | |
Frontier Emerging Small Countries Fund — Investor Class | | | | | | | | | | | | | | | | |
Actual | | | $1,000.00 | | | | $845.10 | | | | $10.27 | | | | 2.22% | |
Hypothetical (5% before expenses) | | | $1,000.00 | | | | $1,013.94 | | | | $11.21 | | | | 2.22% | |
Frontier Emerging Small Countries Fund — Institutional Class | | | | | | | | | | | | | | | | |
Actual | | | $1,000.00 | | | | $846.20 | | | | $9.26 | | | | 2.00% | |
Hypothetical (5% before expenses) | | | $1,000.00 | | | | $1,015.04 | | | | $10.10 | | | | 2.00% | |
Global Opportunities Fund — Investor Class | | | | | | | | | |
Actual | | | $1,000.00 | | | | $1,051.40 | | | | $7.97 | | | | 1.55% | |
Hypothetical (5% before expenses) | | | $1,000.00 | | | | $1,017.30 | | | | $7.84 | | | | 1.55% | |
Global Opportunities Fund — Institutional Class | | | | | | | | | |
Actual | | | $1,000.00 | | | | $1,054.00 | | | | $7.00 | | | | 1.36% | |
Hypothetical (5% before expenses) | | | $1,000.00 | | | | $1,018.25 | | | | $6.88 | | | | 1.36% | |
Global Value Fund — Investor Class | | | | | | | | | | | | | | | | |
Actual | | | $1,000.00 | | | | $1,080.60 | | | | $5.79 | | | | 1.11% | |
Hypothetical (5% before expenses) | | | $1,000.00 | | | | $1,019.50 | | | | $5.62 | | | | 1.11% | |
Global Value Fund — Institutional Class | | | | | | | | | | | | | | | | |
Actual | | | $1,000.00 | | | | $1,080.40 | | | | $4.95 | | | | 0.95% | |
Hypothetical (5% before expenses) | | | $1,000.00 | | | | $1,020.31 | | | | $4.81 | | | | 0.95% | |
International Growth Fund — Investor Class | | | | | | | | | |
Actual | | | $1,000.00 | | | | $1,024.40 | | | | $7.36 | | | | 1.45% | |
Hypothetical (5% before expenses) | | | $1,000.00 | | | | $1,017.80 | | | | $7.33 | | | | 1.45% | |
International Growth Fund — Institutional Class | | | | | | | | | |
Actual | | | $1,000.00 | | | | $1,024.90 | | | | $6.90 | | | | 1.36% | |
Hypothetical (5% before expenses) | | | $1,000.00 | | | | $1,018.25 | | | | $6.88 | | | | 1.36% | |
International Opportunities Fund — Investor Class | | | | | | | | | |
Actual | | | $1,000.00 | | | | $1,011.30 | | | | $10.59 | | | | 2.10% | |
Hypothetical (5% before expenses) | | | $1,000.00 | | | | $1,014.54 | | | | $10.61 | | | | 2.10% | |
International Opportunities Fund — Institutional Class | | | | | | | | | | | | | |
Actual | | | $1,000.00 | | | | $1,014.00 | | | | $9.95 | | | | 1.97% | |
Hypothetical (5% before expenses) | | | $1,000.00 | | | | $1,015.19 | | | | $9.95 | | | | 1.97% | |
37
| | |
| WASATCH FUNDS | | SEPTEMBER 30, 2018 (UNAUDITED) |
|
|
|
Operating Expenses (continued)
| | | | | | | | | | | | | | | | |
| | | Account Value | | | Expenses
Paid
During Period* | | | Annualized
Expense
Ratio* | |
| Fund/Class and Return | | Beginning of Period
April 1, 2018 | | | End of Period
September 30, 2018 | |
Micro Cap Fund | | | | | | | | | | | | | | | | |
Actual | | | $1,000.00 | | | | $1,224.80 | | | | $9.20 | | | | 1.65% | |
Hypothetical (5% before expenses) | | | $1,000.00 | | | | $1,016.80 | | | | $8.34 | | | | 1.65% | |
Micro Cap Value Fund | | | | | | | | | | | | | | | | |
Actual | | | $1,000.00 | | | | $1,136.50 | | | | $9.43 | | | | 1.76% | |
Hypothetical (5% before expenses) | | | $1,000.00 | | | | $1,016.24 | | | | $8.90 | | | | 1.76% | |
Small Cap Growth Fund — Investor Class | | | | | | | | | | | | | |
Actual | | | $1,000.00 | | | | $1,182.40 | | | | $6.46 | | | | 1.18% | |
Hypothetical (5% before expenses) | | | $1,000.00 | | | | $1,019.15 | | | | $5.97 | | | | 1.18% | |
Small Cap Growth Fund — Institutional Class | | | | | | | | | |
Actual | | | $1,000.00 | | | | $1,182.90 | | | | $5.80 | | | | 1.06% | |
Hypothetical (5% before expenses) | | | $1,000.00 | | | | $1,019.75 | | | | $5.37 | | | | 1.06% | |
Small Cap Value Fund — Investor Class | | | | | | | | | | | | | | | | |
Actual | | | $1,000.00 | | | | $1,097.80 | | | | $6.31 | | | | 1.20% | |
Hypothetical (5% before expenses) | | | $1,000.00 | | | | $1,019.05 | | | | $6.07 | | | | 1.20% | |
Small Cap Value Fund — Institutional Class | | | | | | | | | | | | | |
Actual | | | $1,000.00 | | | | $1,098.60 | | | | $5.58 | | | | 1.06% | |
Hypothetical (5% before expenses) | | | $1,000.00 | | | | $1,019.75 | | | | $5.37 | | | | 1.06% | |
Ultra Growth Fund | | | | | | | | | | | | | | | | |
Actual | | | $1,000.00 | | | | $1,264.50 | | | | $6.98 | | | | 1.23% | |
Hypothetical (5% before expenses) | | | $1,000.00 | | | | $1,018.90 | | | | $6.23 | | | | 1.23% | |
U.S. Treasury Fund | | | | | | | | | | | | | | | | |
Actual | | | $1,000.00 | | | | $964.40 | | | | $3.45 | | | | 0.70% | |
Hypothetical (5% before expenses) | | | $1,000.00 | | | | $1,021.56 | | | | $3.55 | | | | 0.70% | |
*Expenses are equal to a fund’s annualized expense ratio as indicated above multiplied by the average account value over the period, multiplied by the number of days in the most recent fiscal half-year divided by the number of days in the full fiscal year (183/365).
38
| | |
| WASATCH CORE GROWTH FUND (WGROX / WIGRX) | | SEPTEMBER 30, 2018 |
|
|
|
Schedule of Investments
| | | | | | | | |
| Shares | | | | | Value | |
| | | | | | | |
| | | | COMMON STOCKS 97.9% | | | | |
| | |
| | | | Airlines 1.0% | | | | |
| | 189,465 | | | Allegiant Travel Co. | | $ | 24,024,162 | |
| | | | | | | | |
| | | | Application Software 7.3% | | | | |
| | 499,751 | | | Guidewire Software, Inc.* | | | 50,479,849 | |
| | 224,739 | | | Paylocity Holding Corp.* | | | 18,051,037 | |
| | 215,318 | | | Tyler Technologies, Inc.* | | | 52,765,829 | |
| | 144,176 | | | Ultimate Software Group, Inc. (The)* | | | 46,452,065 | |
| | | | | | | | |
| | | | | | | 167,748,780 | |
| | | | | | | | |
| | | | Asset Management & Custody Banks 1.7% | | | | |
| | 858,667 | | | Hamilton Lane, Inc., Class A | | | 38,021,775 | |
| | | | | | | | |
| | | | Automotive Retail 4.4% | | | | |
| | 1,082,042 | | | Camping World Holdings, Inc., Class A | | | 23,069,135 | |
| | 1,108,585 | | | Monro, Inc. | | | 77,157,516 | |
| | | | | | | | |
| | | | | | | 100,226,651 | |
| | | | | | | | |
| | | | Biotechnology 2.3% | | | | |
| | 1,908,420 | | | Abcam plc (United Kingdom) | | | 35,620,072 | |
| | 957,384 | | | Sangamo Therapeutics, Inc.* | | | 16,227,659 | |
| | 17,671 | | | Seattle Genetics, Inc.* | | | 1,362,788 | |
| | | | | | | | |
| | | | | | | 53,210,519 | |
| | | | | | | | |
| | | | Building Products 2.7% | | | | |
| | 818,057 | | | Trex Co., Inc.* | | | 62,974,028 | |
| | | | | | | | |
| | | | Commercial Printing 2.0% | | | | |
| | 328,486 | | | Cimpress N.V.* | | | 44,874,472 | |
| | | | | | | | |
| | | | Consumer Finance 2.1% | | | | |
| | 112,207 | | | Credit Acceptance Corp.* | | | 49,154,520 | |
| | | | | | | | |
| | | | Data Processing & Outsourced Services 3.8% | | | | |
| | 873,401 | | | Euronet Worldwide, Inc.* | | | 87,532,248 | |
| | | | | | | | |
| | | | Distributors 2.6% | | | | |
| | 355,664 | | | Pool Corp. | | | 59,353,208 | |
| | | | | | | | |
| | | | Diversified Banks 0.8% | | | | |
| | 8,053,805 | | | City Union Bank Ltd. (India) | | | 19,465,121 | |
| | | | | | | | |
| | | | Diversified Support Services 4.4% | | | | |
| | 1,046,945 | | | Copart, Inc.* | | | 53,949,076 | |
| | 1,155,363 | | | Healthcare Services Group, Inc. | | | 46,930,845 | |
| | | | | | | | |
| | | | | | | 100,879,921 | |
| | | | | | | | |
| | | | General Merchandise Stores 2.7% | | | | |
| | 654,894 | | | Ollie’s Bargain Outlet Holdings, Inc.* | | | 62,935,313 | |
| | | | | | | | |
| | | | Health Care Equipment 2.5% | | | | |
| | 613,835 | | | Cantel Medical Corp. | | | 56,509,650 | |
| | | | | | | | |
| | | | Health Care Facilities 2.5% | | | | |
| | 1,489,903 | | | Ensign Group, Inc. (The) | | | 56,497,122 | |
| | | | | | | | |
| | | | Health Care Supplies 1.8% | | | | |
| | 568,410 | | | Neogen Corp.* | | | 40,658,367 | |
| | | | | | | | |
| | | | Industrial Machinery 11.9% | | | | |
| | 1,044,330 | | | Altra Industrial Motion Corp. | | | 43,130,829 | |
| | 1,002,197 | | | Barnes Group, Inc. | | | 71,186,053 | |
| | 331,286 | | | Kadant, Inc. | | | 35,729,195 | |
| | 506,932 | | | RBC Bearings, Inc.* | | | 76,222,296 | |
| | 863,762 | | | Sun Hydraulics Corp. | | | 47,316,882 | |
| | | | | | | | |
| | | | | | | 273,585,255 | |
| | | | | | | | |
| | | | Industrial REITs 2.2% | | | | |
| | 3,001,755 | | | Monmouth Real Estate Investment Corp. | | | 50,189,344 | |
| | | | | | | | |
| | | | | | | | |
| Shares | | | | | Value | |
| | | | | | | |
| | | | Interactive Media & Services 4.0% | | | | |
| | 177,748 | | | DocuSign, Inc.* | | $ | 9,344,212 | |
| | 209,500 | | | DocuSign, Inc. — Restricted Shares* *** † | | | 10,632,125 | |
| | 860,348 | | | Envestnet, Inc.* | | | 52,438,211 | |
| | 306,746 | | | Q2 Holdings, Inc.* | | | 18,573,470 | |
| | | | | | | | |
| | | | | | | 90,988,018 | |
| | | | | | | | |
| | | | Internet & Direct Marketing Retail 0.8% | | | | |
| | 130,172 | | | Wayfair, Inc., Class A* | | | 19,222,499 | |
| | | | | | | | |
| | | | IT Consulting & Other Services 3.8% | | | | |
| | 343,944 | | | EPAM Systems, Inc.* | | | 47,361,089 | |
| | 607,729 | | | InterXion Holding N.V.* (Netherlands) | | | 40,900,162 | |
| | | | | | | | |
| | | | | | | 88,261,251 | |
| | | | | | | | |
| | | | Leisure Facilities 2.0% | | | | |
| | 830,373 | | | Planet Fitness, Inc., Class A* | | | 44,865,053 | |
| | | | | | | | |
| | | | Life Sciences Tools & Services 3.0% | | | | |
| | 452,985 | | | ICON plc* (Ireland) | | | 69,646,444 | |
| | | | | | | | |
| | | | Managed Health Care 1.6% | | | | |
| | 390,612 | | | HealthEquity, Inc.* | | | 36,877,679 | |
| | | | | | | | |
| | | | Personal Products 1.0% | | | | |
| | 283,139 | | | Nu Skin Enterprises, Inc., Class A | | | 23,336,316 | |
| | | | | | | | |
| | | | Real Estate Services 0.4% | | | | |
| | 219,565 | | | HFF, Inc., Class A | | | 9,327,121 | |
| | | | | | | | |
| | | | Regional Banks 9.0% | | | | |
| | 1,023,602 | | | Eagle Bancorp, Inc.* | | | 51,794,261 | |
| | 340,636 | | | Independent Bank Corp. | | | 28,136,534 | |
| | 1,046,554 | | | Metro Bank plc* (United Kingdom) | | | 40,567,704 | |
| | 343,485 | | | South State Corp. | | | 28,165,770 | |
| | 295,626 | | | Texas Capital Bancshares, Inc.* | | | 24,433,489 | |
| | 564,573 | | | Webster Financial Corp. | | | 33,287,224 | |
| | | | | | | | |
| | | | | | | 206,384,982 | |
| | | | | | | | |
| | | | Semiconductors 2.2% | | | | |
| | 403,856 | | | Monolithic Power Systems, Inc. | | | 50,696,044 | |
| | | | | | | | |
| | | | Specialty Chemicals 2.2% | | | | |
| | 461,056 | | | Balchem Corp. | | | 51,679,767 | |
| | | | | | | | |
| | | | Specialty Stores 2.3% | | | | |
| | 410,326 | | | Five Below, Inc.* | | | 53,367,000 | |
| | | | | | | | |
| | | | Systems Software 1.6% | | | | |
| | 337,304 | | | Proofpoint, Inc.* | | | 35,865,534 | |
| | | | | | | | |
| | | | Trading Companies & Distributors 1.3% | | | | |
| | 397,177 | | | SiteOne Landscape Supply, Inc.* | | | 29,923,315 | |
| | | | | | | | |
| | | | Trucking 4.0% | | | | |
| | 1,126,590 | | | Knight-Swift Transportation Holdings, Inc. | | | 38,844,823 | |
| | 336,768 | | | Old Dominion Freight Line, Inc. | | | 54,307,208 | |
| | | | | | | | |
| | | | | | | 93,152,031 | |
| | | | | | | | |
| | |
| | | | Total Common Stocks
(cost $1,388,514,530) | | | 2,251,433,510 | |
| | | | | | | | |
39
| | |
| WASATCH CORE GROWTH FUND (WGROX / WIGRX) | | SEPTEMBER 30, 2018 |
|
|
|
Schedule of Investments (continued)
| | | | | | | | |
Principal
Amount | | | | | Value | |
| | | | | | | |
| | | | SHORT-TERM INVESTMENTS 1.2% | | | | |
| | |
| | | | Repurchase Agreement 1.2% | | | | |
| | $27,036,867 | | | Repurchase Agreement dated 9/28/18, 0.42% due 10/1/18 with Fixed Income Clearing Corp. collateralized by $18,860,000 of United States Treasury Inflation Protected Securities 2.375% due 1/15/25; value: $27,578,054; repurchase proceeds: $27,037,813 (cost $27,036,867) | | $ | 27,036,867 | |
| | | | | | | | |
| | |
| | | | Total Short-Term Investments
(cost $27,036,867) | | | 27,036,867 | |
| | | | | | | | |
| | |
| | | | Total Investments
(cost $1,415,551,397) 99.1% | | | 2,278,470,377 | |
| | |
| | | | Other Assets less Liabilities 0.9% | | | 21,385,788 | |
| | | | | | | | |
| | |
| | | | NET ASSETS 100.0% | | $ | 2,299,856,165 | |
| | | | | | | | |
| |
| | | | *Non-income producing. ***Security was fair valued under procedures adopted by the Board of Trustees (see Note 12). †Security purchased in a private placement transaction or under Rule 144A of the Securities Act of 1933 (see Note 9). REIT Real Estate Investment Trust. See Notes to Financial Statements. | |
At September 30, 2018, Wasatch Core Growth Fund’s investments, excluding short-term investments, were in the following countries (unaudited):
| | | | |
| Country | | % | |
India | | | 0.9 | |
Ireland | | | 3.1 | |
Netherlands | | | 1.8 | |
United Kingdom | | | 3.4 | |
United States | | | 90.8 | |
| | | | |
TOTAL | | | 100.0 | % |
| | | | |
40
| | |
| WASATCH EMERGING INDIA FUND (WAINX / WIINX) | | SEPTEMBER 30, 2018 |
|
|
|
Schedule of Investments
| | | | | | | | |
| Shares | | | | | Value | |
| | | | | | | |
| | | | COMMON STOCKS 100.4% | | | | |
| | |
| | | | Apparel, Accessories & Luxury Goods 3.4% | | | | |
| | 16,511 | | | Page Industries Ltd. (India) | | $ | 7,630,262 | |
| | | | | | | | |
| | | | Auto Parts & Equipment 6.6% | | | | |
| | 571,931 | | | Endurance Technologies Ltd. (India) | | | 10,390,856 | |
| | 1,339,844 | | | Minda Corp. Ltd. (India) | | | 2,471,198 | |
| | 21,642 | | | WABCO India Ltd. (India) | | | 2,074,933 | |
| | | | | | | | |
| | | | | | | 14,936,987 | |
| | | | | | | | |
| | | | Building Products 2.4% | | | | |
| | 519,782 | | | Kajaria Ceramics Ltd. (India) | | | 2,623,289 | |
| | 530,647 | | | Somany Ceramics Ltd. (India) | | | 2,752,425 | |
| | | | | | | | |
| | | | | | | 5,375,714 | |
| | | | | | | | |
| | | | Commodity Chemicals 5.8% | | | | |
| | 1,713,086 | | | Berger Paints India Ltd. (India) | | | 6,900,553 | |
| | 621,399 | | | Gulf Oil Lubricants India Ltd. (India) | | | 6,283,854 | |
| | | | | | | | |
| | | | | | | 13,184,407 | |
| | | | | | | | |
| | | | Consumer Finance 7.1% | | | | |
| | 244,494 | | | Aavas Financiers Ltd.* *** † (India) | | | 2,628,758 | |
| | 447,860 | | | Bajaj Finance Ltd. (India) | | | 13,459,586 | |
| | | | | | | | |
| | | | | | | 16,088,344 | |
| | | | | | | | |
| | | | Department Stores 6.6% | | | | |
| | 436,061 | | | V-Mart Retail Ltd. (India) | | | 15,098,815 | |
| | | | | | | | |
| | | | Diversified Banks 6.1% | | | | |
| | 309,982 | | | HDFC Bank Ltd. (India) | | | 8,588,755 | |
| | 132,569 | | | IndusInd Bank Ltd. (India) | | | 3,090,747 | |
| | 308,819 | | | RBL Bank Ltd. (India) | | | 2,185,462 | |
| | | | | | | | |
| | | | | | | 13,864,964 | |
| | | | | | | | |
| | | | Diversified Chemicals 4.3% | | | | |
| | 684,089 | | | Pidilite Industries Ltd. (India) | | | 9,843,275 | |
| | | | | | | | |
| | | | Electrical Components & Equipment 4.7% | | | | |
| | 1,040,944 | | | Amara Raja Batteries Ltd. (India) | | | 10,614,785 | |
| | | | | | | | |
| | | | Financial Exchanges & Data 1.9% | | | | |
| | 179,132 | | | CRISIL Ltd. (India) | | | 4,312,117 | |
| | | | | | | | |
| | | | Health Care Services 4.2% | | | | |
| | 738,395 | | | Dr. Lal PathLabs Ltd. (India) | | | 9,634,073 | |
| | | | | | | | |
| | | | Hotels, Resorts & Cruise Lines 1.4% | | | | |
| | 757,046 | | | Byke Hospitality Ltd. (The) (India) | | | 720,598 | |
| | 2,417,073 | | | Lemon Tree Hotels Ltd.* (India) | | | 2,419,074 | |
| | | | | | | | |
| | | | | | | 3,139,672 | |
| | | | | | | | |
| | | | Housewares & Specialties 0.6% | | | | |
| | 457,793 | | | LA Opala RG Ltd. (India) | | | 1,401,987 | |
| | | | | | | | |
| | | | Industrial Conglomerates 2.5% | | | | |
| | 18,019 | | | 3M India Ltd.* (India) | | | 5,686,835 | |
| | | | | | | | |
| | | | Industrial Machinery 2.7% | | | | |
| | 1,837,575 | | | Elgi Equipments Ltd. (India) | | | 6,210,593 | |
| | | | | | | | |
| | | | Interactive Media & Services 2.7% | | | | |
| | 303,002 | | | Info Edge India Ltd. (India) | | | 6,186,273 | |
| | | | | | | | |
| | | | Internet & Direct Marketing Retail 2.6% | | | | |
| | 219,347 | | | MakeMyTrip Ltd.* (India) | | | 6,021,075 | |
| | | | | | | | |
| | | | IT Consulting & Other Services 3.5% | | | | |
| | 293,646 | | | Larsen & Toubro Infotech Ltd. (India) | | | 7,899,154 | |
| | | | | | | | |
| | | | | | | | |
| Shares | | | | | Value | |
| | | | | | | |
| | | | Life & Health Insurance 2.1% | | | | |
| | 615,819 | | | ICICI Prudential Life Insurance Co. Ltd. (India) | | $ | 2,834,857 | |
| | 357,004 | | | Max Financial Services Ltd.* (India) | | | 2,029,048 | |
| | | | | | | | |
| | | | | | | 4,863,905 | |
| | | | | | | | |
| | | | Life Sciences Tools & Services 4.7% | | | | |
| | 586,741 | | | Divi’s Laboratories Ltd. (India) | | | 10,636,451 | |
| | | | | | | | |
| | | | Packaged Foods & Meats 3.3% | | | | |
| | 92,038 | | | Britannia Industries Ltd. (India) | | | 7,428,745 | |
| | | | | | | | |
| | | | Personal Products 4.4% | | | | |
| | 642,689 | | | Godrej Consumer Products Ltd. (India) | | | 6,862,200 | |
| | 22,631 | | | Procter & Gamble Hygiene & Health Care Ltd. (India) | | | 3,025,870 | |
| | | | | | | | |
| | | | | | | 9,888,070 | |
| | | | | | | | |
| | | | Pharmaceuticals 0.5% | | | | |
| | 303,113 | | | Amrutanjan Health Care Ltd. (India) | | | 1,037,626 | |
| | | | | | | | |
| | | | Property & Casualty Insurance 5.1% | | | | |
| | 1,043,922 | | | ICICI Lombard General Insurance Co. Ltd. (India) | | | 11,592,733 | |
| | | | | | | | |
| | | | Regional Banks 4.6% | | | | |
| | 972,195 | | | AU Small Finance Bank Ltd. (India) | | | 7,680,729 | |
| | 346,760 | | | Bandhan Bank Ltd. (India) | | | 2,712,277 | |
| | | | | | | | |
| | | | | | | 10,393,006 | |
| | | | | | | | |
| | | | Specialty Chemicals 1.1% | | | | |
| | 147,093 | | | Asian Paints Ltd. (India) | | | 2,613,544 | |
| | | | | | | | |
| | | | Thrifts & Mortgage Finance 5.5% | | | | |
| | 613,753 | | | GRUH Finance Ltd. (India) | | | 2,494,298 | |
| | 416,910 | | | Housing Development Finance Corp. Ltd. (India) | | | 10,064,733 | |
| | | | | | | | |
| | | | | | | 12,559,031 | |
| | | | | | | | |
| | |
| | | | Total Common Stocks
(cost $197,794,802) | | | 228,142,443 | |
| | | | | | | | |
| | |
| | | | Total Investments
(cost $197,794,802) 100.4% | | | 228,142,443 | |
| | |
| | | | Liabilities less Other Assets (0.4%) | | | (952,055 | ) |
| | | | | | | | |
| | |
| | | | NET ASSETS 100.0% | | $ | 227,190,388 | |
| | | | | | | | |
| |
| | | | *Non-income producing. ***Security was fair valued under procedures adopted by the Board of Trustees (see Note 12). †Security purchased in a private placement transaction or under Rule 144A of the Securities Act of 1933 (see Note 9). See Notes to Financial Statements. | |
At September 30, 2018, Wasatch Emerging India Fund’s investments were in the following countries (unaudited):
| | | | |
| Country | | % | |
India | | | 100.0 | |
| | | | |
TOTAL | | | 100.0 | % |
| | | | |
41
| | |
| WASATCH EMERGING MARKETS SELECT FUND (WAESX / WIESX) | | |
|
|
|
Schedule of Investments
| | | | | | | | |
| Shares | | | | | Value | |
| | | | | | | |
| | | | COMMON STOCKS 96.3% | | | | |
| | |
| | | | Airport Services 5.2% | | | | |
| | 98,526 | | | Grupo Aeroportuario del Pacifico S.A.B. de C.V., Class B (Mexico) | | $ | 1,077,921 | |
| | 58,968 | | | Grupo Aeroportuario del Sureste S.A.B. de C.V., Class B (Mexico) | | | 1,204,946 | |
| | | | | | | | |
| | | | | | | 2,282,867 | |
| | | | | | | | |
| | | | Apparel, Accessories & Luxury Goods 3.1% | | | | |
| | 2,918 | | | Page Industries Ltd. (India) | | | 1,348,501 | |
| | | | | | | | |
| | | | Biotechnology 4.3% | | | | |
| | 3,350 | | | Medytox, Inc. (Korea) | | | 1,869,416 | |
| | | | | | | | |
| | | | Consumer Finance 5.0% | | | | |
| | 72,834 | | | Bajaj Finance Ltd. (India) | | | 2,188,888 | |
| | | | | | | | |
| | | | Diversified Banks 9.9% | | | | |
| | 57,636 | | | HDFC Bank Ltd. (India) | | | 1,596,936 | |
| | 105,776 | | | Kasikornbank Public Co. Ltd. (Thailand) | | | 713,023 | |
| | 790,464 | | | PT Bank Central Asia Tbk (Indonesia) | | | 1,281,059 | |
| | 39,343 | | | TCS Group Holding plc GDR (Russia) | | | 727,846 | |
| | | | | | | | |
| | | | | | | 4,318,864 | |
| | | | | | | | |
| | | | Diversified Chemicals 1.4% | | | | |
| | 43,501 | | | Pidilite Industries Ltd. (India) | | | 625,931 | |
| | | | | | | | |
| | | | Drug Retail 4.0% | | | | |
| | 97,766 | | | Raia Drogasil S.A. (Brazil) | | | 1,753,400 | |
| | | | | | | | |
| | | | Electrical Components & Equipment 2.0% | | | | |
| | 85,497 | | | Amara Raja Batteries Ltd. (India) | | | 871,836 | |
| | | | | | | | |
| | | | Food Retail 4.3% | | | | |
| | 10,172 | | | BGF Retail Co. Ltd. (Korea) | | | 1,884,468 | |
| | | | | | | | |
| | | | Health Care Equipment 1.6% | | | | |
| | 536,103 | | | Microport Scientific Corp. (China) | | | 709,476 | |
| | | | | | | | |
| | | | Highways & Railtracks 1.1% | | | | |
| | 43,909 | | | Promotora y Operadora de Infraestructura S.A.B. de C.V. (Mexico) | | | 467,363 | |
| | | | | | | | |
| | | | Home Furnishings 1.1% | | | | |
| | 61,814 | | | Nien Made Enterprise Co. Ltd. (Taiwan) | | | 483,855 | |
| | | | | | | | |
| | | | Household Appliances 2.9% | | | | |
| | 200,000 | | | Techtronic Industries Co. Ltd. (Hong Kong) | | | 1,277,409 | |
| | | | | | | | |
| | | | Human Resource & Employment Services 3.1% | | | | |
| | 17,693 | | | 51job, Inc. ADR* (China) | | | 1,362,184 | |
| | | | | | | | |
| | | | Industrial Machinery 2.0% | | | | |
| | 176,901 | | | Weg S.A. (Brazil) | | | 865,111 | |
| | | | | | | | |
| | | | Interactive Media & Services 11.2% | | | | |
| | 12,944 | | | Alibaba Group Holding Ltd. ADR* (China) | | | 2,132,653 | |
| | 2,828 | | | MercadoLibre, Inc. (Brazil) | | | 962,849 | |
| | 43,425 | | | Tencent Holdings Ltd. (China) | | | 1,792,838 | |
| | | | | | | | |
| | | | | | | 4,888,340 | |
| | | | | | | | |
| | | | Internet & Direct Marketing Retail 6.8% | | | | |
| | 47,164 | | | Ctrip.com International Ltd. ADR* (China) | | | 1,753,086 | |
| | 44,175 | | | MakeMyTrip Ltd.* (India) | | | 1,212,604 | |
| | | | | | | | |
| | | | | | | 2,965,690 | |
| | | | | | | | |
| | | | | | | | |
| Shares | | | | | Value | |
| | | | | | | |
| | | | Life & Health Insurance 3.5% | | | | |
| | 66,023 | | | Discovery Ltd. (South Africa) | | $ | 793,700 | |
| | 156,718 | | | ICICI Prudential Life Insurance Co. Ltd. (India) | | | 721,435 | |
| | | | | | | | |
| | | | 1,515,135 | |
| | | | | | | | |
| | | | Packaged Foods & Meats 7.2% | | | | |
| | 13,677 | | | Britannia Industries Ltd. (India) | | | 1,103,924 | |
| | 74,400 | | | M Dias Branco S.A. (Brazil) | | | 725,661 | |
| | 391,393 | | | Vitasoy International Holdings Ltd. (China) | | | 1,334,916 | |
| | | | | | | | |
| | | | 3,164,501 | |
| | | | | | | | |
| | | | Personal Products 4.3% | | | | |
| | 90,618 | | | Godrej Consumer Products Ltd. (India) | | | 967,559 | |
| | 780 | | | LG Household & Health Care Ltd. (Korea) | | | 897,255 | |
| | | | | | | | |
| | | | | | | 1,864,814 | |
| | | | | | | | |
| | | | Property & Casualty Insurance 2.7% | | | | |
| | 107,871 | | | ICICI Lombard General Insurance Co. Ltd. (India) | | | 1,197,905 | |
| | | | | | | | |
| | | | Semiconductors 5.2% | | | | |
| | 41,297 | | | ASPEED Technology, Inc. (Taiwan) | | | 825,047 | |
| | 81,959 | | | Silergy Corp. (Taiwan) | | | 1,476,352 | |
| | | | | | | | |
| | | | | | | 2,301,399 | |
| | | | | | | | |
| | | | Specialty Chemicals 2.5% | | | | |
| | 61,654 | | | Asian Paints Ltd. (India) | | | 1,095,466 | |
| | | | | | | | |
| | | | Technology Hardware, Storage & Peripherals 1.1% | | | | |
| | 52,175 | | | Ennoconn Corp. (Taiwan) | | | 477,612 | |
| | | | | | | | |
| | | | Thrifts & Mortgage Finance 0.8% | | | | |
| | 28,235 | | | PNB Housing Finance Ltd. (India) | | | 345,118 | |
| | | | | | | | |
| | |
| | | | Total Common Stocks (cost $36,122,355) | | | 42,125,549 | |
| | | | | | | | |
| | |
| | | | PREFERRED STOCKS 3.1% | | | | |
| | |
| | | | Diversified Banks 3.1% | | | | |
| | 114,843 | | | Banco Davivienda S.A., 2.34% (Colombia) | | | 1,325,648 | |
| | | | | | | | |
| | |
| | | | Total Preferred Stocks (cost $1,117,963) | | | 1,325,648 | |
| | | | | | | | |
42
| | | | | | | | |
Principal Amount | | | | | Value | |
| | | | | | | |
| | | | SHORT-TERM INVESTMENTS 1.0% | | | | |
| | |
| | | | Repurchase Agreement 1.0% | | | | |
| | $457,817 | | | Repurchase Agreement dated 9/28/18, 0.42% due 10/1/18 with Fixed Income Clearing Corp. collateralized by $320,000 of United States Treasury Notes 2.375% due 1/15/25; value: $467,920; repurchase proceeds: $457,833 (cost $457,817) | | $ | 457,817 | |
| | | | | | | | |
| | |
| | | | Total Short-Term Investments (cost $457,817) | | | 457,817 | |
| | | | | | | | |
| | |
| | | | Total Investments (cost $37,698,135) 100.4% | | | 43,909,014 | |
| | |
| | | | Liabilities less Other Assets (0.4%) | | | (173,882 | ) |
| | | | | | | | |
| | |
| | | | NET ASSETS 100.0% | | $ | 43,735,132 | |
| | | | | | | | |
| | | | *Non-income producing. ADR American Depositary Receipt. GDR Global Depositary Receipt. See Notes to Financial Statements. | |
At September 30, 2018, Wasatch Emerging Markets Select Fund’s investments, excluding short-term investments, were in the following countries (unaudited):
| | | | |
| Country | | % | |
Brazil | | | 9.9 | |
China | | | 20.9 | |
Colombia | | | 3.1 | |
Hong Kong | | | 2.9 | |
India | | | 30.6 | |
Indonesia | | | 3.0 | |
Korea | | | 10.7 | |
Mexico | | | 6.3 | |
Russia | | | 1.7 | |
South Africa | | | 1.8 | |
Taiwan | | | 7.5 | |
Thailand | | | 1.6 | |
| | | | |
TOTAL | | | 100.0 | % |
| | | | |
43
| | |
| WASATCH EMERGING MARKETS SMALL CAP FUND (WAEMX / WIEMX) | | |
|
|
|
Schedule of Investments
| | | | | | | | |
| Shares | | | | | Value | |
| | | | | | | |
| | | | COMMON STOCKS 97.1% | | | | |
| | |
| | | | Air Freight & Logistics 0.9% | | | | |
| | 4,203,917 | | | Aramex PJSC (United Arab Emirates) | | $ | 4,726,974 | |
| | | | | | | | |
| | | | Airport Services 4.2% | | | | |
| | 2,053,525 | | | Grupo Aeroportuario del Centro Norte S.A.B. de C.V. (Mexico) | | | 14,676,658 | |
| | 357,966 | | | Grupo Aeroportuario del Sureste S.A.B. de C.V., Class B (Mexico) | | | 7,314,641 | |
| | | | | | | | |
| | | | 21,991,299 | |
| | | | | | | | |
| | | | Application Software 1.8% | | | | |
| | 162,134 | | | Globant S.A.* (Argentina) | | | 9,564,285 | |
| | | | | | | | |
| | | | Auto Parts & Equipment 1.7% | | | | |
| | 2,233,768 | | | Minth Group Ltd. (Hong Kong) | | | 9,216,592 | |
| | | | | | | | |
| | | | Automotive Retail 3.0% | | | | |
| | 9,675,624 | | | China Yongda Automobiles Services Holdings Ltd. (China) | | | 8,688,885 | |
| | 3,030,735 | | | Zhongsheng Group Holdings Ltd. (China) | | | 7,379,053 | |
| | | | | | | | |
| | | | 16,067,938 | |
| | | | | | | | |
| | | | Biotechnology 4.2% | | | | |
| | 88,341 | | | China Biologic Products Holdings, Inc.* (China) | | | 7,067,280 | |
| | 27,024 | | | Medytox, Inc. (Korea) | | | 15,080,330 | |
| | | | | | | | |
| | | | 22,147,610 | |
| | | | | | | | |
| | | | Building Products 1.0% | | | | |
| | 1,052,358 | | | Kajaria Ceramics Ltd. (India) | | | 5,311,149 | |
| | | | | | | | |
| | | | Commodity Chemicals 3.1% | | | | |
| | 2,085,843 | | | Berger Paints India Ltd. (India) | | | 8,402,071 | |
| | 6,679,202 | | | TOA Paint Thailand Public Co. Ltd. (Thailand) | | | 7,796,533 | |
| | | | | | | | |
| | | | 16,198,604 | |
| | | | | | | | |
| | | | Consumer Finance 6.2% | | | | |
| | 199,729 | | | Bajaj Finance Ltd. (India) | | | 6,002,478 | |
| | 92,376 | | | KRUK S.A. (Poland) | | | 5,041,242 | |
| | 3,977,575 | | | Muangthai Capital Public Co. Ltd. (Thailand) | | | 5,934,384 | |
| | 4,511,163 | | | Srisawad Corp. Public Co. Ltd. (Thailand) | | | 6,730,477 | |
| | 3,438,486 | | | Unifin Financiera S.A.B. de C.V. SOFOM ENR (Mexico) | | | 8,729,426 | |
| | | | | | | | |
| | | | 32,438,007 | |
| | | | | | | | |
| | | | Data Processing & Outsourced Services 0.8% | | | | |
| | 9,488,727 | | | My EG Services Berhad (Malaysia) | | | 4,012,389 | |
| | | | | | | | |
| | | | Department Stores 1.3% | | | | |
| | 734,946 | | | Poya International Co. Ltd. (Taiwan) | | | 6,691,612 | |
| | | | | | | | |
| | | | Distillers & Vintners 1.0% | | | | |
| | 917,857 | | | Sichuan Swellfun Co. Ltd. (China) | | | 5,455,971 | |
| | | | | | | | |
| | | | Diversified Banks 3.8% | | | | |
| | 1,021,810 | | | RBL Bank Ltd. (India) | | | 7,231,184 | |
| | 1,268,443 | | | Security Bank Corp. (Philippines) | | | 3,615,403 | |
| | 506,745 | | | TCS Group Holding plc GDR (Russia) | | | 9,374,782 | |
| | | | | | | | |
| | | | 20,221,369 | |
| | | | | | | | |
| | | | Diversified Chemicals 1.2% | | | | |
| | 449,715 | | | Pidilite Industries Ltd. (India) | | | 6,470,896 | |
| | | | | | | | |
| | | | Diversified Support Services 0.4% | | | | |
| | 2,339,331 | | | Greentown Service Group Co. Ltd. (China) | | | 1,876,641 | |
| | | | | | | | |
| | | | Drug Retail 4.1% | | | | |
| | 817,029 | | | Clicks Group Ltd. (South Africa) | | | 10,110,851 | |
| | 638,610 | | | Raia Drogasil S.A. (Brazil) | | | 11,453,250 | |
| | | | | | | | |
| | | | 21,564,101 | |
| | | | | | | | |
| | | | | | | | |
| Shares | | | | | Value | |
| | | | | | | |
| | | | Electrical Components & Equipment 2.8% | | | | |
| | 542,726 | | | Amara Raja Batteries Ltd. (India) | | $ | 5,534,323 | |
| | 538,021 | | | Voltronic Power Technology Corp. (Taiwan) | | | 9,444,838 | |
| | | | | | | | |
| | | | 14,979,161 | |
| | | | | | | | |
| | | | Electronic Equipment & Instruments 0.9% | | | | |
| | 996,616 | | | Chroma ATE, Inc. (Taiwan) | | | 4,781,851 | |
| | | | | | | | |
| | | | Electronic Manufacturing Services 0.5% | | | | |
| | 4,577,850 | | | Inari Amertron Berhad (Malaysia) | | | 2,522,049 | |
| | | | | | | | |
| | | | Food Retail 1.6% | | | | |
| | 46,381 | | | BGF Retail Co. Ltd. (Korea) | | | 8,592,558 | |
| | | | | | | | |
| | | | Footwear 0.5% | | | | |
| | 238,157 | | | Arezzo Industria e Comercio S.A. (Brazil) | | | 2,527,494 | |
| | | | | | | | |
| | | | General Merchandise Stores 1.8% | | | | |
| | 316,038 | | | Magazine Luiza S.A. (Brazil) | | | 9,585,493 | |
| | | | | | | | |
| | | | Health Care Equipment 3.1% | | | | |
| | 184,625 | | | DIO Corp.* (Korea) | | | 5,359,410 | |
| | 8,189,723 | | | Microport Scientific Corp. (China) | | | 10,838,239 | |
| | | | | | | | |
| | | | 16,197,649 | |
| | | | | | | | |
| | | | Health Care Services 1.6% | | | | |
| | 642,676 | | | Dr. Lal PathLabs Ltd. (India) | | | 8,385,197 | |
| | | | | | | | |
| | | | Highways & Railtracks 1.1% | | | | |
| | 7,552,875 | | | Yuexiu Transport Infrastructure Ltd. (China) | | | 5,991,474 | |
| | | | | | | | |
| | | | Home Furnishings 1.0% | | | | |
| | 29,202 | | | Hanssem Co. Ltd. (Korea) | | | 2,016,563 | |
| | 5,288,025 | | | Man Wah Holdings Ltd. (China) | | | 3,168,080 | |
| | | | | | | | |
| | | | 5,184,643 | |
| | | | | | | | |
| | | | Hotels, Resorts & Cruise Lines 3.8% | | | | |
| | 350,150 | | | GreenTree Hospitality Group Ltd. ADR* (China) | | | 4,446,905 | |
| | 227,712 | | | Huazhu Group Ltd. ADR (China) | | | 7,355,098 | |
| | 6,313,091 | | | Minor International Public Co. Ltd. (Thailand) | | | 8,003,609 | |
| | | | | | | | |
| | | | 19,805,612 | |
| | | | | | | | |
| | | | Human Resource & Employment Services 2.8% | | | | |
| | 189,787 | | | 51job, Inc. ADR* (China) | | | 14,611,701 | |
| | | | | | | | |
| | | | Industrial Conglomerates 1.7% | | | | |
| | 27,880 | | | 3M India Ltd.* (India) | | | 8,798,988 | |
| | | | | | | | |
| | | | Industrial Machinery 1.7% | | | | |
| | 816,583 | | | Airtac International Group (Taiwan) | | | 7,996,539 | |
| | 344,797 | | | Elgi Equipments Ltd. (India) | | | 1,165,337 | |
| | | | | | | | |
| | | | 9,161,876 | |
| | | | | | | | |
| | | | Interactive Media & Services 3.0% | | | | |
| | 57,085 | | | Cafe24 Corp.* (Korea) | | | 7,698,820 | |
| | 399,639 | | | Info Edge India Ltd. (India) | | | 8,159,273 | |
| | | | | | | | |
| | | | 15,858,093 | |
| | | | | | | | |
| | | | Internet & Direct Marketing Retail 1.5% | | | | |
| | 281,048 | | | MakeMyTrip Ltd.* (India) | | | 7,714,768 | |
| | | | | | | | |
| | | | IT Consulting & Other Services 1.7% | | | | |
| | 334,858 | | | Larsen & Toubro Infotech Ltd. (India) | | | 9,007,768 | |
| | | | | | | | |
| | | | Life & Health Insurance 0.8% | | | | |
| | 744,881 | | | Max Financial Services Ltd.* (India) | | | 4,233,563 | |
| | | | | | | | |
44
| | | | | | | | |
| Shares | | | | | Value | |
| | | | | | | |
| | | | Marine 0.5% | | | | |
| | 3,145,597 | | | SITC International Holdings Co. Ltd. (China) | | $ | 2,539,510 | |
| | | | | | | | |
| | | | Oil & Gas Exploration & Production 0.7% | | | | |
| | 222,148 | | | Parex Resources, Inc.* (Colombia) | | | 3,775,132 | |
| | | | | | | | |
| | | | Packaged Foods & Meats 5.0% | | | | |
| | 88,486 | | | Britannia Industries Ltd. (India) | | | 7,142,050 | |
| | 701,539 | | | M Dias Branco S.A. (Brazil) | | | 6,842,461 | |
| | 3,683,755 | | | Vitasoy International Holdings Ltd. (China) | | | 12,564,111 | |
| | | | | | | | |
| | | | 26,548,622 | |
| | | | | | | | |
| | | | Pharmaceuticals 0.8% | | | | |
| | 13,017,213 | | | China Animal Healthcare Ltd.* *** (China) | | | 16,628 | |
| | 9,268 | | | Hanmi Pharm Co. Ltd. (Korea) | | | 4,177,598 | |
| | | | | | | | |
| | | | 4,194,226 | |
| | | | | | | | |
| | | | Property & Casualty Insurance 2.3% | | | | |
| | 1,073,199 | | | ICICI Lombard General Insurance Co. Ltd. (India) | | | 11,917,853 | |
| | | | | | | | |
| | | | Real Estate Operating Companies 0.9% | | | | |
| | 1,771,451 | | | Parque Arauco S.A. (Chile) | | | 4,577,845 | |
| | | | | | | | |
| | | | Regional Banks 2.6% | | | | |
| | 914,257 | | | AU Small Finance Bank Ltd. (India) | | | 7,222,996 | |
| | 15,338,060 | | | PT Bank Tabungan Negara Tbk (Indonesia) | | | 2,707,049 | |
| | 562,062 | | | Regional S.A.B. de C.V. (Mexico) | | | 3,543,748 | |
| | | | | | | | |
| | | | 13,473,793 | |
| | | | | | | | |
| | | | Research & Consulting Services 0.0% | | | | |
| | 1 | | | Sporton International, Inc. (Taiwan) | | | 4 | |
| | | | | | | | |
| | | | Restaurants 1.1% | | | | |
| | 684,622 | | | Gourmet Master Co. Ltd. (Taiwan) | | | 5,874,659 | |
| | | | | | | | |
| | | | Semiconductor Equipment 1.6% | | | | |
| | 86,117 | | | Koh Young Technology, Inc. (Korea) | | | 8,462,252 | |
| | | | | | | | |
| | | | Semiconductors 6.4% | | | | |
| | 473,374 | | | ASPEED Technology, Inc. (Taiwan) | | | 9,457,247 | |
| | 47,488 | | | LEENO Industrial, Inc. (Korea) | | | 2,821,239 | |
| | 241,735 | | | Parade Technologies Ltd. (Taiwan) | | | 3,681,485 | |
| | 724,848 | | | Silergy Corp. (Taiwan) | | | 13,056,902 | |
| | 1,070,760 | | | Win Semiconductors Corp. (Taiwan) | | | 4,716,773 | |
| | | | | | | | |
| | | | 33,733,646 | |
| | | | | | | | |
| | | | Specialty Chemicals 0.6% | | | | |
| | 17,929,224 | | | D&L Industries, Inc. (Philippines) | | | 3,268,607 | |
| | | | | | | | |
| | | | Systems Software 2.2% | | | | |
| | 212,949 | | | Douzone Bizon Co. Ltd. (Korea) | | | 11,729,713 | |
| | | | | | | | |
| | | | Technology Hardware, Storage &
Peripherals 1.2% | | | | |
| | 678,538 | | | Ennoconn Corp. (Taiwan) | | | 6,211,357 | |
| | | | | | | | |
| | | | Thrifts & Mortgage Finance 0.6% | | | | |
| | 257,670 | | | PNB Housing Finance Ltd. (India) | | | 3,149,517 | |
| | | | | | | | |
| | |
| | | | Total Common Stocks
(cost $407,188,482) | | | 511,352,111 | |
| | | | | | | | |
| | | | | | | | |
| Shares | | | | | Value | |
| | | | | | | |
| | | | PREFERRED STOCKS 1.5% | | | | |
| | |
| | | | Personal Products 1.5% | | | | |
| | 10,828 | | | LG Household & Health Care Ltd., 1.13% (Korea) | | $ | 7,848,286 | |
| | | | | | | | |
| | |
| | | | Total Preferred Stocks
(cost $4,567,725) | | | 7,848,286 | |
| | | | | | | | |
| | |
Principal
Amount | | | | | Value | |
| | | | | | | |
| | | | SHORT-TERM INVESTMENTS 1.2% | | | | |
| | |
| | | | Repurchase Agreement 1.2% | | | | |
| | $6,157,408 | | | Repurchase Agreement dated 9/28/18, 0.42% due 10/1/18 with Fixed Income Clearing Corp. collateralized by $4,300,000 of United States Treasury Notes 2.375% due 1/15/25; value: $6,287,679; repurchase proceeds: $6,157,623 (cost $6,157,408) | | $ | 6,157,408 | |
| | | | | | | | |
| | |
| | | | Total Short-Term Investments
(cost $6,157,408) | | | 6,157,408 | |
| | | | | | | | |
| | |
| | | | Total Investments
(cost $417,913,615) 99.8% | | | 525,357,805 | |
| | |
| | | | Other Assets less Liabilities 0.2% | | | 1,074,519 | |
| | | | | | | | |
| | |
| | | | NET ASSETS 100.0% | | $ | 526,432,324 | |
| | | | | | | | |
| |
| | | | *Non-income producing. ***Security was fair valued under procedures adopted by the Board of Trustees (see Note 12). ADR American Depositary Receipt. GDR Global Depositary Receipt. See Notes to Financial Statements. | |
At September 30, 2018, Wasatch Emerging Markets Small Cap Fund’s investments, excluding short-term investments, were in the following countries (unaudited):
| | | | |
| Country | | % | |
Argentina | | | 1.8 | |
Brazil | | | 5.9 | |
Chile | | | 0.9 | |
China | | | 17.7 | |
Colombia | | | 0.7 | |
Hong Kong | | | 1.8 | |
India | | | 22.3 | |
Indonesia | | | 0.5 | |
Korea | | | 14.2 | |
Malaysia | | | 1.3 | |
Mexico | | | 6.6 | |
Philippines | | | 1.3 | |
Poland | | | 1.0 | |
Russia | | | 1.8 | |
South Africa | | | 1.9 | |
Taiwan | | | 13.9 | |
Thailand | | | 5.5 | |
United Arab Emirates | | | 0.9 | |
| | | | |
TOTAL | | | 100.0 | % |
| | | | |
45
| | |
| WASATCH FRONTIER EMERGING SMALL COUNTRIES FUND (WAFMX / WIFMX) | | |
|
|
|
Schedule of Investments
| | | | | | | | |
| Shares | | | | | Value | |
| | | | | | | |
| | | | COMMON STOCKS 92.4% | | | | |
| | |
| | | | Air Freight & Logistics 6.6% | | | | |
| | 4,610,011 | | | Aramex PJSC (United Arab Emirates) | | $ | 5,183,595 | |
| | | | | | | | |
| | | | Airport Services 2.4% | | | | |
| | 122,800 | | | Airports Corp. of Vietnam JSC (Vietnam) | | | 453,772 | |
| | 70,519 | | | Grupo Aeroportuario del Sureste S.A.B. de C.V., Class B (Mexico) | | | 1,440,978 | |
| | | | | | | | |
| | | | | | | 1,894,750 | |
| | | | | | | | |
| | | | Apparel, Accessories & Luxury Goods 1.7% | | | | |
| | 296,060 | | | Phu Nhuan Jewelry JSC (Vietnam) | | | 1,338,949 | |
| | | | | | | | |
| | | | Application Software 2.1% | | | | |
| | 27,265 | | | Globant S.A.* (Argentina) | | | 1,608,362 | |
| | | | | | | | |
| | | | Cable & Satellite 2.5% | | | | |
| | 9,014 | | | Naspers Ltd., Class N (South Africa) | | | 1,945,195 | |
| | | | | | | | |
| | | | Consumer Finance 12.0% | | | | |
| | 504,789 | | | ASA International Group plc* (United Kingdom) | | | 3,155,491 | |
| | 669,799 | | | Delta Brac Housing Finance Corp. Ltd. (Bangladesh) | | | 1,079,305 | |
| | 1,180,600 | | | Srisawad Corp. Public Co. Ltd. (Thailand) | | | 1,761,408 | |
| | 710,887 | | | Transaction Capital Ltd. (South Africa) | | | 889,284 | |
| | 986,020 | | | Unifin Financiera S.A.B. de C.V. SOFOM ENR (Mexico) | | | 2,503,249 | |
| | | | | | | | |
| | | | | | | 9,388,737 | |
| | | | | | | | |
| | | | Diversified Banks 19.7% | | | | |
| | 1,867,920 | | | Banca Transilvania S.A. (Romania) | | | 1,081,110 | |
| | 459,016 | | | Commercial International Bank S.A.E (Egypt) | | | 2,145,908 | |
| | 11,299 | | | Credicorp Ltd. (Peru) | | | 2,520,581 | |
| | 36,732 | | | Grupo Financiero Galicia S.A. ADR (Argentina) | | | 934,095 | |
| | 32,145 | | | Grupo Supervielle S.A. ADR (Argentina) | | | 246,552 | |
| | 1,201,990 | | | HDBank (Vietnam) | | | 2,001,814 | |
| | 1,153,691 | | | National Bank of Kuwait SAK (Kuwait) | | | 3,146,776 | |
| | 27,544 | | | TBC Bank Group plc (Georgia) | | | 604,570 | |
| | 125,193 | | | TCS Group Holding plc GDR (Russia) | | | 2,316,070 | |
| | 270,000 | | | Vietnam Technological & Commercial Joint Stock Bank* (Vietnam) | | | 337,391 | |
| | | | | | | | |
| | | | | | | 15,334,867 | |
| | | | | | | | |
| | | | Diversified Real Estate Activities 2.7% | | | | |
| | 2,051,726 | | | Ayala Land, Inc. (Philippines) | | | 1,520,852 | |
| | 493,584 | | | Consultatio S.A. (Argentina) | | | 549,888 | |
| | | | | | | | |
| | | | | | | 2,070,740 | |
| | | | | | | | |
| | | | Education Services 2.7% | | | | |
| | 198,096 | | | Human Soft Holding Co. KSC (Kuwait) | | | 2,123,390 | |
| | | | | | | | |
| | | | Financial Exchanges & Data 1.8% | | | | |
| | 160,480 | | | Bolsas y Mercados Argentinos S.A. (Argentina) | | | 1,399,196 | |
| | | | | | | | |
| | | | Food Retail 7.3% | | | | |
| | 936,400 | | | CP ALL Public Co. Ltd. (Thailand) | | | 1,997,885 | |
| | 1,965,994 | | | Philippine Seven Corp. (Philippines) | | | 3,704,205 | |
| | | | | | | | |
| | | | | | | 5,702,090 | |
| | | | | | | | |
| | | | Health Care Distributors 2.6% | | | | |
| | 4,002,283 | | | Ibnsina Pharma S.A.E.* (Egypt) | | | 2,061,444 | |
| | | | | | | | |
| | | | Health Care Facilities 3.0% | | | | |
| | 5,817,792 | | | Cleopatra Hospital* (Egypt) | | | 1,136,287 | |
| | 26,396 | | | NMC Health plc (United Arab Emirates) | | | 1,167,691 | |
| | | | | | | | |
| | | | | | | 2,303,978 | |
| | | | | | | | |
| | | | | | | | |
| Shares | | | | | Value | |
| | | | | | | |
| | | | Hypermarkets & Super Centers 2.8% | | | | |
| | 84,362 | | | InRetail Peru Corp.* (Peru) | | $ | 2,176,540 | |
| | | | | | | | |
| | | | Industrial Conglomerates 1.3% | | | | |
| | 61,125 | | | SM Investments Corp. (Philippines) | | | 1,022,710 | |
| | | | | | | | |
| | | | Interactive Media & Services 2.0% | | | | |
| | 4,669 | | | MercadoLibre, Inc. (Brazil) | | | 1,589,654 | |
| | | | | | | | |
| | | | Multi-Sector Holdings 1.3% | | | | |
| | 57,960 | | | Ayala Corp. (Philippines) | | | 995,500 | |
| | | | | | | | |
| | | | Oil & Gas Storage & Transportation 1.3% | | | | |
| | 70,191 | | | Transportadora de Gas del Sur S.A. ADR (Argentina) | | | 1,019,173 | |
| | | | | | | | |
| | | | Packaged Foods & Meats 2.2% | | | | |
| | 394,662 | | | Alicorp S.A. (Peru) | | | 1,260,157 | |
| | 78,090 | | | Vietnam Dairy Products JSC (Vietnam) | | | 459,619 | |
| | | | | | | | |
| | | | | | | 1,719,776 | |
| | | | | | | | |
| | | | Pharmaceuticals 2.2% | | | | |
| | 334,843 | | | Searle Company Ltd. (The) (Pakistan) | | | 851,884 | |
| | 264,181 | | | Square Pharmaceuticals Ltd. (Bangladesh) | | | 849,507 | |
| | | | | | | | |
| | | | | | | 1,701,391 | |
| | | | | | | | |
| | | | Real Estate Operating Companies 2.2% | | | | |
| | 1,812,109 | | | SM Prime Holdings, Inc. (Philippines) | | | 1,212,433 | |
| | 258,980 | | | Vincom Retail JSC* (Vietnam) | | | 465,170 | |
| | | | | | | | |
| | | | | | | 1,677,603 | |
| | | | | | | | |
| | | | Restaurants 1.8% | | | | |
| | 11,336 | | | AmRest Holdings SE* (Poland) | | | 1,382,102 | |
| | | | | | | | |
| | | | Specialty Chemicals 1.1% | | | | |
| | 4,610,197 | | | D&L Industries, Inc. (Philippines) | | | 840,467 | |
| | | | | | | | |
| | | | Technology Distributors 5.5% | | | | |
| | 2,167,089 | | | FPT Corp. (Vietnam) | | | 4,301,199 | |
| | | | | | | | |
| | | | Wireless Telecommunication Services 1.6% | | | | |
| | 5,187,338 | | | Safaricom plc (Kenya) | | | 1,261,437 | |
| | | | | | | | |
| | |
| | | | Total Common Stocks
(cost $70,169,180) | | | 72,042,845 | |
| | | | | | | | |
| | |
| | | | PREFERRED STOCKS 3.5% | | | | |
| | |
| | | | Diversified Banks 3.5% | | | | |
| | 234,668 | | | Banco Davivienda S.A., 2.34% (Colombia) | | | 2,708,804 | |
| | | | | | | | |
| | |
| | | | Total Preferred Stocks
(cost $2,489,676) | | | 2,708,804 | |
| | | | | | | | |
46
| | | | | | | | |
| Shares | | | | | Value | |
| | | | | | | |
| | | | PARTICIPATION NOTES 2.2% | | | | |
| | |
| | | | Diversified Banks 2.2% | | | | |
| | 76,441 | | | Al-Rajhi Bank, HSBC Bank plc, expiring 1/19/21*** (Saudi Arabia) | | $ | 1,757,379 | |
| | | | | | | | |
| | |
| | | | Total Participation Notes
(cost $1,577,677) | | | 1,757,379 | |
| | | | | | | | |
| | |
| | | | Total Investments
(cost $74,236,533) 98.1%§ | | | 76,509,028 | |
| | |
| | | | Other Assets less Liabilities 1.9%§§ | | | 1,483,182 | |
| | | | | | | | |
| | |
| | | | NET ASSETS 100.0% | | $ | 77,992,210 | |
| | | | | | | | |
| |
| | | | *Non-income producing. ***Security was fair valued under procedures adopted by the Board of Trustees (see Note 12). §The aggregate amount of foreign securities fair valued pursuant to a systematic valuation model as a percent of net assets was 2.75%. §§Other Assets less Liabilities included U.S. dollars held in Zimbabwe. The position was fair valued during the period (see Note 12). ADR American Depositary Receipt. GDR Global Depositary Receipt. See Notes to Financial Statements. | |
At September 30, 2018, Wasatch Frontier Emerging Small Countries Fund’s investments were in the following countries (unaudited):
| | | | |
| Country | | % | |
Argentina | | | 7.5 | |
Bangladesh | | | 2.5 | |
Brazil | | | 2.1 | |
Colombia | | | 3.5 | |
Egypt | | | 7.0 | |
Georgia | | | 0.8 | |
Kenya | | | 1.7 | |
Kuwait | | | 6.9 | |
Mexico | | | 5.2 | |
Pakistan | | | 1.1 | |
Peru | | | 7.8 | |
Philippines | | | 12.2 | |
Poland | | | 1.8 | |
Romania | | | 1.4 | |
Russia | | | 3.0 | |
Saudi Arabia | | | 2.3 | |
South Africa | | | 3.7 | |
Thailand | | | 4.9 | |
United Arab Emirates | | | 8.3 | |
United Kingdom | | | 4.1 | |
Vietnam | | | 12.2 | |
| | | | |
TOTAL | | | 100.0 | % |
| | | | |
47
| | |
| WASATCH GLOBAL OPPORTUNITIES FUND (WAGOX / WIGOX) | | |
|
|
|
Schedule of Investments
| | | | | | | | |
| Shares | | | | | Value | |
| | | | | | | |
| | | | COMMON STOCKS 96.7% | | | | |
| | |
| | | | Airlines 0.9% | | | | |
| | 9,235 | | | Allegiant Travel Co. | | $ | 1,170,998 | |
| | | | | | | | |
| | | | Apparel, Accessories & Luxury Goods 0.6% | | | | |
| | 27,088 | | | Ted Baker plc (United Kingdom) | | | 816,993 | |
| | | | | | | | |
| | | | Application Software 10.1% | | | | |
| | 13,831 | | | Aveva Group plc (United Kingdom) | | | 521,711 | |
| | 37,703 | | | Globant S.A.* (Argentina) | | | 2,224,100 | |
| | 16,408 | | | HubSpot, Inc.* | | | 2,476,788 | |
| | 8,255 | | | Tyler Technologies, Inc.* | | | 2,022,970 | |
| | 8,781 | | | Ultimate Software Group, Inc. (The)* | | | 2,829,150 | |
| | 38,387 | | | Zendesk, Inc.* | | | 2,725,477 | |
| | | | | | | | |
| | | | 12,800,196 | |
| | | | | |
| | | | Automotive Retail 1.7% | | | | |
| | 30,154 | | | Monro, Inc. | | | 2,098,718 | |
| | | | | | | | |
| | | | Biotechnology 7.2% | | | | |
| | 106,661 | | | Abcam plc (United Kingdom) | | | 1,990,795 | |
| | 13,494 | | | China Biologic Products Holdings, Inc.* (China) | | | 1,079,520 | |
| | 26,770 | | | Exact Sciences Corp.* | | | 2,112,688 | |
| | 4,839 | | | Medytox, Inc. (Korea) | | | 2,700,330 | |
| | 75,197 | | | Sangamo Therapeutics, Inc.* | | | 1,274,589 | |
| | | | | | | | |
| | | | 9,157,922 | |
| | | | | |
| | | | Building Products 2.9% | | | | |
| | 141,009 | | | Somany Ceramics Ltd. (India) | | | 731,403 | |
| | 37,948 | | | Trex Co., Inc.* | | | 2,921,237 | |
| | | | | | | | |
| | | | 3,652,640 | |
| | | | | |
| | | | Commercial Printing 1.3% | | | | |
| | 12,006 | | | Cimpress N.V.* | | | 1,640,140 | |
| | | | | | | | |
| | | | Consumer Finance 4.4% | | | | |
| | 34,477 | | | Bajaj Finance Ltd. (India) | | | 1,036,141 | |
| | 4,108 | | | Credit Acceptance Corp.* | | | 1,799,592 | |
| | 731,271 | | | Srisawad Corp. Public Co. Ltd. (Thailand) | | | 1,091,027 | |
| | 660,800 | | | Unifin Financiera S.A.B. de C.V. SOFOM ENR (Mexico) | | | 1,677,600 | |
| | | | | | | | |
| | | | 5,604,360 | |
| | | | | |
| | | | Data Processing & Outsourced Services 3.0% | | | | |
| | 28,201 | | | Euronet Worldwide, Inc.* | | | 2,826,304 | |
| | 16,600 | | | GMO Payment Gateway, Inc. (Japan) | | | 1,028,552 | |
| | | | | | | | |
| | | | 3,854,856 | |
| | | | | |
| | | | Diversified Chemicals 0.9% | | | | |
| | 75,307 | | | Pidilite Industries Ltd. (India) | | | 1,083,583 | |
| | | | | | | | |
| | | | Diversified Real Estate Activities 0.7% | | | | |
| | 44,883 | | | Patrizia Immobilien AG (Germany) | | | 861,923 | |
| | | | | | | | |
| | | | Diversified Support Services 2.1% | | | | |
| | 52,313 | | | Copart, Inc.* | | | 2,695,689 | |
| | | | | | | | |
| | | | Drug Retail 1.3% | | | | |
| | 19,690 | | | Ain Holdings, Inc. (Japan) | | | 1,589,133 | |
| | | | | | | | |
| | | | Electrical Components & Equipment 2.1% | | | | |
| | 96,242 | | | Amara Raja Batteries Ltd. (India) | | | 981,406 | |
| | 92,744 | | | Voltronic Power Technology Corp. (Taiwan) | | | 1,628,100 | |
| | | | | | | | |
| | | | 2,609,506 | |
| | | | | |
| | | | General Merchandise Stores 2.6% | | | | |
| | 34,488 | | | Ollie’s Bargain Outlet Holdings, Inc.* | | | 3,314,297 | |
| | | | | | | | |
| | | | | | | | |
| Shares | | | | | Value | |
| | | | | | | |
| | | | Health Care Equipment 3.0% | | | | |
| | 22,552 | | | Cantel Medical Corp. | | $ | 2,076,137 | |
| | 12,089 | | | Cochlear Ltd. (Australia) | | | 1,753,299 | |
| | | | | | | | |
| | | | 3,829,436 | |
| | | | | |
| | | | Health Care Facilities 2.3% | | | | |
| | 78,674 | | | Ensign Group, Inc. (The) | | | 2,983,318 | |
| | | | | | | | |
| | | | Health Care Services 0.9% | | | | |
| | 87,039 | | | Dr. Lal PathLabs Ltd. (India) | | | 1,135,625 | |
| | | | | | | | |
| | | | Health Care Supplies 1.4% | | | | |
| | 41,900 | | | Asahi Intecc Co. Ltd. (Japan) | | | 1,829,115 | |
| | | | | | | | |
| | | | Health Care Technology 0.7% | | | | |
| | 41,360 | | | M3, Inc. (Japan) | | | 938,445 | |
| | | | | | | | |
| | | | Homebuilding 1.0% | | | | |
| | 26,917 | | | LGI Homes, Inc.* | | | 1,276,942 | |
| | | | | | | | |
| | | | Human Resource & Employment Services 1.6% | | | | |
| | 16,900 | | | en-japan, Inc. (Japan) | | | 847,826 | |
| | 58,630 | | | SMS Co. Ltd. (Japan) | | | 1,166,717 | |
| | | | | | | | |
| | | | 2,014,543 | |
| | | | | |
| | | | Industrial Conglomerates 1.1% | | | | |
| | 4,332 | | | 3M India Ltd.* (India) | | | 1,367,189 | |
| | | | | | | | |
| | | | Industrial Machinery 7.5% | | | | |
| | 37,468 | | | Altra Industrial Motion Corp. | | | 1,547,428 | |
| | 18,143 | | | Barnes Group, Inc. | | | 1,288,697 | |
| | 35,600 | | | MISUMI Group, Inc. (Japan) | | | 921,176 | |
| | 16,246 | | | RBC Bearings, Inc.* | | | 2,442,749 | |
| | 347,031 | | | Rotork plc (United Kingdom) | | | 1,494,919 | |
| | 32,117 | | | Sun Hydraulics Corp. | | | 1,759,369 | |
| | | | | | | | |
| | | | 9,454,338 | |
| | | | | |
| | | | Interactive Media & Services 5.7% | | | | |
| | 28,300 | | | Envestnet, Inc.* | | | 1,724,885 | |
| | 139,800 | | | Infomart Corp. (Japan) | | | 1,821,017 | |
| | 4,969 | | | MercadoLibre, Inc. (Brazil) | | | 1,691,795 | |
| | 22,504 | | | Scout24 AG (Germany) | | | 1,049,312 | |
| | 2,875 | | | XING SE (Germany) | | | 983,047 | |
| | | | | | | | |
| | | | 7,270,056 | |
| | | | | |
| | | | Internet & Direct Marketing Retail 2.9% | | | | |
| | 71,818 | | | MakeMyTrip Ltd.* (India) | | | 1,971,404 | |
| | 11,913 | | | Wayfair, Inc., Class A* | | | 1,759,193 | |
| | | | | | | | |
| | | | 3,730,597 | |
| | | | | |
| | | | Life & Health Insurance 1.1% | | | | |
| | 291,667 | | | ICICI Prudential Life Insurance Co. Ltd. (India) | | | 1,342,658 | |
| | | | | | | | |
| | | | Life Sciences Tools & Services 1.3% | | | | |
| | 12,302 | | | Sartorius Stedim Biotech (France) | | | 1,692,564 | |
| | | | | | | | |
| | | | Managed Health Care 2.3% | | | | |
| | 30,272 | | | HealthEquity, Inc.* | | | 2,857,979 | |
| | | | | | | | |
| | | | Packaged Foods & Meats 1.1% | | | | |
| | 416,000 | | | Vitasoy International Holdings Ltd. (China) | | | 1,418,843 | |
| | | | | | | | |
| | | | Pharmaceuticals 1.8% | | | | |
| | 25,464 | | | Intra-Cellular Therapies, Inc.* | | | 552,569 | |
| | 10,223 | | | Ipsen S.A. (France) | | | 1,718,692 | |
| | | | | | | | |
| | | | 2,271,261 | |
| | | | | |
| | | | Property & Casualty Insurance 1.0% | | | | |
| | 111,427 | | | ICICI Lombard General Insurance Co. Ltd. (India) | | | 1,237,395 | |
| | | | | | | | |
48
| | | | | | | | |
Shares | | | | | Value | |
| | | | | | | |
| | | | Regional Banks 5.5% | | | | |
| | 179,478 | | | AU Small Finance Bank Ltd. (India) | | $ | 1,417,948 | |
| | 43,506 | | | Canadian Western Bank (Canada) | | | 1,148,573 | |
| | 36,094 | | | Eagle Bancorp, Inc.* | | | 1,826,357 | |
| | 68,018 | | | Metro Bank plc* (United Kingdom) | | | 2,636,590 | |
| | | | | | | | |
| | | | 7,029,468 | |
| | | | | |
| | | | Research & Consulting Services 1.5% | | | | |
| | 63,400 | | | Nihon M&A Center, Inc. (Japan) | | | 1,902,781 | |
| | | | | | | | |
| | | | Restaurants 0.7% | | | | |
| | 22,244 | | | Domino’s Pizza Enterprises Ltd. (Australia) | | | 855,407 | |
| | | | | | | | |
| | | | Semiconductor Equipment 0.8% | | | | |
| | 73,600 | | | Japan Material Co. Ltd. (Japan) | | | 987,854 | |
| | | | | | | | |
| | | | Semiconductors 2.7% | | | | |
| | 50,000 | | | ASPEED Technology, Inc. (Taiwan) | | | 998,919 | |
| | 10,649 | | | Melexis N.V. (Belgium) | | | 824,063 | |
| | 12,825 | | | Monolithic Power Systems, Inc. | | | 1,609,922 | |
| | | | | | | | |
| | | | 3,432,904 | |
| | | | | |
| | | | Specialized Finance 0.4% | | | | |
| | 22,817 | | | Banca IFIS S.p.A. (Italy) | | | 513,939 | |
| | | | | | | | |
| | | | Specialty Chemicals 1.0% | | | | |
| | 110,380 | | | Hexpol AB (Sweden) | | | 1,217,143 | |
| | | | | | | | |
| | | | Specialty Stores 1.9% | | | | |
| | 18,258 | | | Five Below, Inc.* | | | 2,374,635 | |
| | | | | | | | |
| | | | Trading Companies & Distributors 1.9% | | | | |
| | 84,800 | | | MonotaRO Co. Ltd. (Japan) | | | 2,392,044 | |
| | | | | | | | |
| | | | Trucking 1.8% | | | | |
| | 68,104 | | | Knight-Swift Transportation Holdings, Inc. | | | 2,348,226 | |
| | | | | | | | |
| | |
| | | | Total Common Stocks
(cost $79,925,749) | | | 122,655,659 | |
| | | | | | | | |
| | | | | | | | |
Principal
Amount | | | | | Value | |
| | | | | | | |
| | | | SHORT-TERM INVESTMENTS 3.9% | | | | |
| | |
| | | | Repurchase Agreement 3.9% | | | | |
| | $4,918,109 | | | Repurchase Agreement dated 9/28/18, 0.42% due 10/1/18 with Fixed Income Clearing Corp. collateralized by $3,435,000 of United States Treasury Notes 2.375% due 1/15/25; value: $5,022,832; repurchase proceeds: $4,918,281 (cost $4,918,109) | | $ | 4,918,109 | |
| | | | | | | | |
| | |
| | | | Total Short-Term Investments
(cost $4,918,109) | | | 4,918,109 | |
| | | | | | | | |
| | |
| | | | Total Investments
(cost $84,843,858) 100.6% | | | 127,573,768 | |
| | |
| | | | Liabilities less Other Assets (0.6%) | | | (820,748 | ) |
| | | | | | | | |
| | |
| | | | NET ASSETS 100.0% | | $ | 126,753,020 | |
| | | | | | | | |
| |
| | | | *Non-income producing. See Notes to Financial Statements. | |
At September 30, 2018, Wasatch Global Opportunities Fund’s investments, excluding short-term investments, were in the following countries (unaudited):
| | | | |
| Country | | % | |
Argentina | | | 1.8 | |
Australia | | | 2.1 | |
Belgium | | | 0.7 | |
Brazil | | | 1.4 | |
Canada | | | 0.9 | |
China | | | 2.0 | |
France | | | 2.8 | |
Germany | | | 2.4 | |
India | | | 10.0 | |
Italy | | | 0.4 | |
Japan | | | 12.6 | |
Korea | | | 2.2 | |
Mexico | | | 1.4 | |
Sweden | | | 1.0 | |
Taiwan | | | 2.1 | |
Thailand | | | 0.9 | |
United Kingdom | | | 6.1 | |
United States | | | 49.2 | |
| | | | |
TOTAL | | | 100.0 | % |
| | | | |
49
| | |
| WASATCH GLOBAL VALUE FUND (FMIEX / WILCX) | | |
|
|
|
Schedule of Investments
| | | | | | | | |
| Shares | | | | | Value | |
| | | | | | | |
| | | | COMMON STOCKS 97.2% | | | | |
| | |
| | | | Airlines 2.3% | | | | |
| | 130,000 | | | Japan Airlines Co. Ltd. (Japan) | | $ | 4,672,769 | |
| | | | | | | | |
| | | | Casinos & Gaming 1.9% | | | | |
| | 145,000 | | | Kangwon Land, Inc. (Korea) | | | 3,751,634 | |
| | | | | | | | |
| | | | Communications Equipment 3.3% | | | | |
| | 138,677 | | | Cisco Systems, Inc. | | | 6,746,636 | |
| | | | | | | | |
| | | | Construction & Engineering 2.3% | | | | |
| | 1,600,000 | | | CTCI Corp. (Taiwan) | | | 2,572,954 | |
| | 96,000 | | | Koninklijke Volkerwessels N.V. (Netherlands) | | | 2,017,441 | |
| | | | | | | | |
| | | | 4,590,395 | |
| | | | | |
| | | | Diversified Banks 15.4% | | | | |
| | 89,778 | | | Citigroup, Inc. | | | 6,440,673 | |
| | 327,000 | | | ING Groep N.V. ADR (Netherlands) | | | 4,241,190 | |
| | 3,390,000 | | | Mizuho Financial Group, Inc. (Japan) | | | 5,913,554 | |
| | 683,210 | | | Nordea Bank AB (Sweden) | | | 7,446,016 | |
| | 135,950 | | | Wells Fargo & Co. | | | 7,145,532 | |
| | | | | | | | |
| | | | 31,186,965 | |
| | | | | |
| | | | Diversified Metals & Mining 1.0% | | | | |
| | 94,000 | | | Anglo American plc (United Kingdom) | | | 2,111,013 | |
| | | | | | | | |
| | | | Electric Utilities 7.2% | | | | |
| | 72,500 | | | Entergy Corp. | | | 5,881,925 | |
| | 198,000 | | | Exelon Corp. | | | 8,644,680 | |
| | | | | | | | |
| | | | 14,526,605 | |
| | | | | |
| | | | Electrical Components & Equipment 3.0% | | | | |
| | 71,000 | | | Eaton Corp. plc | | | 6,157,830 | |
| | | | | | | | |
| | | | Health Care Services 6.7% | | | | |
| | 106,735 | | | CVS Health Corp. | | | 8,402,179 | |
| | 29,200 | | | Laboratory Corp. of America Holdings* | | | 5,071,456 | |
| | | | | | | | |
| | | | 13,473,635 | |
| | | | | |
| | | | Hypermarkets & Super Centers 2.9% | | | | |
| | 61,600 | | | Walmart, Inc. | | | 5,784,856 | |
| | | | | | | | |
| | | | Integrated Oil & Gas 7.5% | | | | |
| | 119,624 | | | Royal Dutch Shell plc ADR (Netherlands) | | | 8,151,179 | |
| | 180,091 | | | Suncor Energy, Inc. (Canada) | | | 6,967,721 | |
| | | | | | | | |
| | | | 15,118,900 | |
| | | | | |
| | | | Integrated Telecommunication Services 2.7% | | | | |
| | 164,000 | | | AT&T, Inc. | | | 5,507,120 | |
| | | | | | | | |
| | | | Interactive Home Entertainment 1.4% | | | | |
| | 221,400 | | | Nexon Co. Ltd.* (Japan) | | | 2,893,672 | |
| | | | | | | | |
| | | | Oil & Gas Drilling 1.0% | | | | |
| | 247,000 | | | Ensco plc, Class A | | | 2,084,680 | |
| | | | | | | | |
| | | | Oil & Gas Equipment & Services 2.9% | | | | |
| | 96,700 | | | Schlumberger Ltd. | | | 5,890,964 | |
| | | | | | | | |
| | | | Oil & Gas Storage & Transportation 1.4% | | | | |
| | 118,000 | | | Enbridge Income Fund Holdings, Inc. (Canada) | | | 2,865,838 | |
| | | | | | | | |
| | | | Other Diversified Financial Services 2.6% | | | | |
| | 3,100,000 | | | Fubon Financial Holding Co. Ltd. (Taiwan) | | | 5,259,228 | |
| | | | | | | | |
| | | | Pharmaceuticals 8.6% | | | | |
| | 100,376 | | | Novartis AG (Switzerland) | | | 8,632,295 | |
| | 200,000 | | | Pfizer, Inc. | | | 8,814,000 | |
| | | | | | | | |
| | | | 17,446,295 | |
| | | | | |
| | | | | | | | |
| Shares | | | | | Value | |
| | | | | | | |
| | | | Property & Casualty Insurance 2.3% | | | | |
| | 80,681 | | | Axis Capital Holdings Ltd. | | $ | 4,656,101 | |
| | | | | | | | |
| | | | Reinsurance 3.9% | | | | |
| | 35,647 | | | Muenchener Rueckversicherungs-Gesellschaft AG in Muenchen (Germany) | | | 7,894,755 | |
| | | | | | | | |
| | | | Specialized REITs 3.3% | | | | |
| | 97,000 | | | EPR Properties | | | 6,635,770 | |
| | | | | | | | |
| | | | Systems Software 4.5% | | | | |
| | 25,864 | | | Check Point Software Technologies Ltd.* (Israel) | | | 3,043,417 | |
| | 117,600 | | | Oracle Corp. | | | 6,063,456 | |
| | | | | | | | |
| | | | 9,106,873 | |
| | | | | |
| | | | Tobacco 1.9% | | | | |
| | 41,000 | | | KT&G Corp. (Korea) | | | 3,844,039 | |
| | | | | | | | |
| | | | Water Utilities 1.3% | | | | |
| | 1,450,000 | | | Guangdong Investment Ltd. (China) | | | 2,574,617 | |
| | | | | | | | |
| | | | Wireless Telecommunication Services 5.9% | | | | |
| | 979,900 | | | China Mobile Ltd. (China) | | | 9,657,116 | |
| | 83,500 | | | NTT DOCOMO, Inc. (Japan) | | | 2,245,137 | |
| | | | | | | | |
| | | | 11,902,253 | |
| | | | | |
| | |
| | | | Total Common Stocks
(cost $173,706,959) | | | 196,683,443 | |
| | | | | | | | |
| | |
Principal
Amount | | | | | Value | |
| | | | SHORT-TERM INVESTMENTS 2.9% | | | | |
| | |
| | | | Repurchase Agreement 2.9% | | | | |
| | $5,900,513 | | | Repurchase Agreement dated 9/28/18, 0.42% due 10/1/18 with Fixed Income Clearing Corp. collateralized by $4,120,000 of United States Treasury Notes 2.375% due 1/15/25; value: $6,024,474; repurchase proceeds: $5,900,720 (cost $5,900,513) | | $ | 5,900,513 | |
| | | | | | | | |
| | |
| | | | Total Short-Term Investments
(cost $5,900,513) | | | 5,900,513 | |
| | | | | | | | |
| | |
| | | | Total Investments
(cost $179,607,472) 100.1% | | | 202,583,956 | |
| | |
| | | | Liabilities less Other Assets (0.1%) | | | (158,346 | ) |
| | | | | | | | |
| | |
| | | | NET ASSETS 100.0% | | $ | 202,425,610 | |
| | | | | | | | |
| |
| | | | *Non-income producing. ADR American Depositary Receipt. REIT Real Estate Investment Trust. See Notes to Financial Statements. | |
50
At September 30, 2018, Wasatch Global Value Fund’s investments, excluding short-term investments, were in the following countries (unaudited):
| | | | |
| Country | | % | |
Canada | | | 5.0 | |
China | | | 6.2 | |
Germany | | | 4.0 | |
Israel | | | 1.5 | |
Japan | | | 8.0 | |
Korea | | | 3.9 | |
Netherlands | | | 7.3 | |
Sweden | | | 3.8 | |
Switzerland | | | 4.4 | |
Taiwan | | | 4.0 | |
United Kingdom | | | 1.1 | |
United States | | | 50.8 | |
| | | | |
TOTAL | | | 100.0 | % |
| | | | |
51
| | |
| WASATCH INTERNATIONAL GROWTH FUND (WAIGX / WIIGX) | | |
|
|
|
Schedule of Investments
| | | | | | | | |
| Shares | | | | | Value | |
| | | | | | | |
| | | | COMMON STOCKS 95.6% | | | | |
| | |
| | | | Airport Services 1.7% | | | | |
| | 3,629,872 | | | Grupo Aeroportuario del Centro Norte S.A.B. de C.V. (Mexico) | | $ | 25,942,897 | |
| | | | | | | | |
| | | | Apparel, Accessories & Luxury Goods 3.7% | | | | |
| | 555,782 | | | Moncler S.p.A. (Italy) | | | 23,940,294 | |
| | 39,818 | | | Page Industries Ltd. (India) | | | 18,401,173 | |
| | 541,177 | | | Ted Baker plc (United Kingdom) | | | 16,322,268 | |
| | | | | | | | |
| | | | 58,663,735 | |
| | | | | |
| | | | Application Software 5.0% | | | | |
| | 592,850 | | | Aveva Group plc (United Kingdom) | | | 22,362,542 | |
| | 1,012,974 | | | GB Group plc (United Kingdom) | | | 7,684,208 | |
| | 77,315 | | | Nemetschek SE (Germany) | | | 11,310,594 | |
| | 4,046,484 | | | Technology One Ltd. (Australia) | | | 16,321,504 | |
| | 1,294,328 | | | WiseTech Global Ltd. (Australia) | | | 20,667,512 | |
| | | | | | | | |
| | | | 78,346,360 | |
| | | | | |
| | | | Asset Management & Custody Banks 1.2% | | | | |
| | 729,026 | | | Burford Capital Ltd. (United Kingdom) | | | 18,472,135 | |
| | | | | | | | |
| | | | Biotechnology 3.2% | | | | |
| | 1,923,929 | | | Abcam plc (United Kingdom) | | | 35,909,543 | |
| | 26,520 | | | Medytox, Inc. (Korea) | | | 14,799,081 | |
| | | | | | | | |
| | | | 50,708,624 | |
| | | | | |
| | | | Commodity Chemicals 1.9% | | | | |
| | 3,599,405 | | | Berger Paints India Ltd. (India) | | | 14,498,914 | |
| | 12,852,446 | | | TOA Paint Thailand Public Co. Ltd. (Thailand) | | | 15,002,469 | |
| | | | | | | | |
| | | | 29,501,383 | |
| | | | | |
| | | | Construction Machinery & Heavy Trucks 0.9% | | | | |
| | 498,400 | | | Takeuchi Manufacturing Co. Ltd. (Japan) | | | 13,444,781 | |
| | | | | | | | |
| | | | Data Processing & Outsourced Services 1.7% | | | | |
| | 692,649 | | | Afterpay Touch Group Ltd.* (Australia) | | | 8,987,229 | |
| | 279,400 | | | GMO Payment Gateway, Inc. (Japan) | | | 17,311,882 | |
| | | | | | | | |
| | | | 26,299,111 | |
| | | | | |
| | | | Diversified Banks 0.5% | | | | |
| | 2,681,302 | | | Security Bank Corp. (Philippines) | | | 7,642,430 | |
| | | | | | | | |
| | | | Diversified Real Estate Activities 1.3% | | | | |
| | 1,047,770 | | | Patrizia Immobilien AG (Germany) | | | 20,121,139 | |
| | | | | | | | |
| | | | Drug Retail 5.1% | | | | |
| | 369,928 | | | Ain Holdings, Inc. (Japan) | | | 29,856,009 | |
| | 981,298 | | | Clicks Group Ltd. (South Africa) | | | 12,143,704 | |
| | 237,800 | | | Kusuri no Aoki Holdings Co. Ltd. (Japan) | | | 18,941,120 | |
| | 1,096,100 | | | Raia Drogasil S.A. (Brazil) | | | 19,658,175 | |
| | | | | | | | |
| | | | 80,599,008 | |
| | | | | |
| | | | Electrical Components & Equipment 1.7% | | | | |
| | 1,164,444 | | | Amara Raja Batteries Ltd. (India) | | | 11,874,148 | |
| | 869,277 | | | Voltronic Power Technology Corp. (Taiwan) | | | 15,259,964 | |
| | | | | | | | |
| | | | 27,134,112 | |
| | | | | |
| | | | Electronic Equipment & Instruments 1.6% | | | | |
| | 1,336,672 | | | Halma plc (United Kingdom) | | | 25,175,060 | |
| | | | | | | | |
| | | | | | | | |
| Shares | | | | | Value | |
| | | | | | | |
| | | | General Merchandise Stores 1.1% | | | | |
| | 3,346,393 | | | B&M European Value Retail S.A. (United Kingdom) | | $ | 16,871,015 | |
| | 21,057 | | | Seria Co. Ltd. (Japan) | | | 745,020 | |
| | | | | | | | |
| | | | 17,616,035 | |
| | | | | |
| | | | Health Care Distributors 0.7% | | | | |
| | 522,500 | | | Japan Lifeline Co. Ltd. (Japan) | | | 11,064,381 | |
| | | | | | | | |
| | | | Health Care Equipment 2.2% | | | | |
| | 223,059 | | | Cochlear Ltd. (Australia) | | | 32,350,830 | |
| | 1,317,615 | | | Microport Scientific Corp. (China) | | | 1,743,725 | |
| | 25,014 | | | Nakanishi, Inc. (Japan) | | | 520,446 | |
| | | | | | | | |
| | | | 34,615,001 | |
| | | | | |
| | | | Health Care Supplies 2.0% | | | | |
| | 719,800 | | | Asahi Intecc Co. Ltd. (Japan) | | | 31,422,355 | |
| | | | | | | | |
| | | | Health Care Technology 1.2% | | | | |
| | 858,320 | | | M3, Inc. (Japan) | | | 19,474,995 | |
| | | | | | | | |
| | | | Home Furnishing Retail 0.6% | | | | |
| | 307,416 | | | Maisons du Monde S.A. (France) | | | 8,973,107 | |
| | | | | | | | |
| | | | Hotels, Resorts & Cruise Lines 1.6% | | | | |
| | 1,148,667 | | | Corporate Travel Management Ltd. (Australia) | | | 25,349,482 | |
| | | | | | | | |
| | | | Household Products 1.6% | | | | |
| | 449,184 | | | Pigeon Corp. (Japan) | | | 25,301,686 | |
| | | | | | | | |
| | | | Human Resource & Employment Services 4.5% | | | | |
| | 289,549 | | | 51job, Inc. ADR* (China) | | | 22,292,378 | |
| | 192,200 | | | Benefit One, Inc. (Japan) | | | 6,275,849 | |
| | 215,197 | | | en-japan, Inc. (Japan) | | | 10,795,836 | |
| | 1,249,142 | | | SMS Co. Ltd. (Japan) | | | 24,857,508 | |
| | 164,137 | | | UT Group Co. Ltd.* (Japan) | | | 5,857,908 | |
| | | | | | | | |
| | | | 70,079,479 | |
| | | | | |
| | | | Industrial Machinery 3.8% | | | | |
| | 674,415 | | | MISUMI Group, Inc. (Japan) | | | 17,450,978 | |
| | 6,760,531 | | | Rotork plc (United Kingdom) | | | 29,122,596 | |
| | 158,084 | | | Stabilus S.A. (Germany) | | | 13,049,943 | |
| | | | | | | | |
| | | | 59,623,517 | |
| | | | | |
| | | | Internet & Direct Marketing Retail 2.5% | | | | |
| | 110,742 | | | ASOS plc* (United Kingdom) | | | 8,316,938 | |
| | 2,023,925 | | | Webjet Ltd. (Australia) | | | 22,573,998 | |
| | 255,733 | | | Yume No Machi Souzou Iinkai Co. Ltd. (Japan) | | | 8,237,835 | |
| | | | | | | | |
| | | | 39,128,771 | |
| | | | | |
| | | | Interactive Media & Services 5.6% | | | | |
| | 1,852,100 | | | Infomart Corp. (Japan) | | | 24,125,224 | |
| | 2,393,560 | | | Rightmove plc (United Kingdom) | | | 14,694,102 | |
| | 424,918 | | | Scout24 AG (Germany) | | | 19,812,986 | |
| | 82,922 | | | XING SE (Germany) | | | 28,353,467 | |
| | | | | | | | |
| | | | 86,985,779 | |
| | | | | | | | |
| | | | Investment Banking & Brokerage 0.9% | | | | |
| | 300,072 | | | Avanza Bank Holding AB (Sweden) | | | 13,667,568 | |
| | | | | | | | |
| | | | IT Consulting & Other Services 1.5% | | | | |
| | 152,444 | | | CANCOM SE (Germany) | | | 6,888,652 | |
| | 244,620 | | | Reply S.p.A. (Italy) | | | 16,827,958 | |
| | | | | | | | |
| | | | 23,716,610 | |
| | | | | |
| | | | Life & Health Insurance 0.3% | | | | |
| | 826,135 | | | Max Financial Services Ltd.* (India) | | | 4,695,373 | |
| | | | | | | | |
52
| | | | | | | | |
| Shares | | | | | Value | |
| | | | | | | |
| | | | Life Sciences Tools & Services 0.8% | | | | |
| | 54,007 | | | Tecan Group AG (Switzerland) | | $ | 12,778,098 | |
| | | | | | | | |
| | | | Movies & Entertainment 0.7% | | | | |
| | 244,921 | | | CTS Eventim AG & Co KGaA (Germany) | | | 10,982,201 | |
| | | | | | | | |
| | | | Oil & Gas Equipment & Services 3.5% | | | | |
| | 1,273,637 | | | Computer Modelling Group Ltd. (Canada) | | | 8,332,159 | |
| | 1,260,640 | | | Pason Systems, Inc. (Canada) | | | 19,119,682 | |
| | 137,132 | | | Schoeller-Bleckmann Oilfield Equipment AG (Austria) | | | 15,038,062 | |
| | 301,185 | | | TGS-NOPEC Geophysical Co. ASA (Norway) | | | 12,274,989 | |
| | | | | | | | |
| | | | 54,764,892 | |
| | | | | |
| | | | Other Diversified Financial Services 1.3% | | | | |
| | 85,787 | | | Hypoport AG* (Germany) | | | 19,741,322 | |
| | | | | | | | |
| | | | Packaged Foods & Meats 2.5% | | | | |
| | 11,431,449 | | | Vitasoy International Holdings Ltd. (China) | | | 38,989,019 | |
| | | | | | | | |
| | | | Pharmaceuticals 1.9% | | | | |
| | 181,122 | | | Ipsen S.A. (France) | | | 30,450,250 | |
| | | | | | | | |
| | | | Regional Banks 3.7% | | | | |
| | 1,730,235 | | | AU Small Finance Bank Ltd. (India) | | | 13,669,549 | |
| | 881,814 | | | Canadian Western Bank (Canada) | | | 23,280,190 | |
| | 529,084 | | | Metro Bank plc* (United Kingdom) | | | 20,508,949 | |
| | | | | | | | |
| | | | 57,458,688 | |
| | | | | |
| | | | Research & Consulting Services 2.3% | | | | |
| | 416,143 | | | Funai Soken Holdings, Inc. (Japan) | | | 9,442,146 | |
| | 878,928 | | | Nihon M&A Center, Inc. (Japan) | | | 26,378,670 | |
| | | | | | | | |
| | | | 35,820,816 | |
| | | | | |
| | | | Restaurants 0.7% | | | | |
| | 295,944 | | | Domino’s Pizza Enterprises Ltd. (Australia) | | | 11,380,709 | |
| | | | | | | | |
| | | | Semiconductor Equipment 1.7% | | | | |
| | 877,000 | | | Japan Material Co. Ltd. (Japan) | | | 11,771,035 | |
| | 158,857 | | | Koh Young Technology, Inc. (Korea) | | | 15,610,019 | |
| | | | | | | | |
| | | | 27,381,054 | |
| | | | | |
| | | | Semiconductors 2.8% | | | | |
| | 185,092 | | | Melexis N.V. (Belgium) | | | 14,323,162 | |
| | 840,040 | | | Silergy Corp. (Taiwan) | | | 15,131,890 | |
| | 101,140 | | | U-Blox Holding AG* (Switzerland) | | | 14,489,794 | |
| | | | | | | | |
| | | | 43,944,846 | |
| | | | | |
| | | | Soft Drinks 1.4% | | | | |
| | 470,541 | | | Fevertree Drinks plc (United Kingdom) | | | 22,127,983 | |
| | | | | | | | |
| | | | Specialized Finance 0.4% | | | | |
| | 302,241 | | | Banca IFIS S.p.A. (Italy) | | | 6,807,791 | |
| | | | | | | | |
| | | | Specialty Chemicals 3.3% | | | | |
| | 247,226 | | | Chr. Hansen Holding A/S (Denmark) | | | 25,096,351 | |
| | 2,344,985 | | | Hexpol AB (Sweden) | | | 25,857,791 | |
| | | | | | | | |
| | | | 50,954,142 | |
| | | | | |
| | | | Systems Software 2.4% | | | | |
| | 374,369 | | | Douzone Bizon Co. Ltd. (Korea) | | | 20,621,092 | |
| | 226,300 | | | Kinaxis, Inc.* (Canada) | | | 17,017,395 | |
| | | | | | | | |
| | | | 37,638,487 | |
| | | | | |
| | | | Technology Distributors 1.0% | | | | |
| | 1,646,468 | | | Electrocomponents plc (United Kingdom) | | | 15,412,622 | |
| | | | | | | | |
| | | | | | | | |
| Shares | | | | | Value | |
| | | | | | | |
| | | | Trading Companies & Distributors 5.6% | | | | |
| | 994,904 | | | Diploma plc (United Kingdom) | | $ | 18,362,096 | |
| | 172,825 | | | IMCD N.V. (Netherlands) | | | 13,454,156 | |
| | 1,228,824 | | | MonotaRO Co. Ltd. (Japan) | | | 34,662,743 | |
| | 917,166 | | | Richelieu Hardware Ltd. (Canada) | | | 21,231,188 | |
| | | | | | | | |
| | | | 87,710,183 | |
| | | | | |
| | |
| | | | Total Common Stocks
(cost $1,000,825,479) | | | 1,498,108,017 | |
| | | | | | | | |
| | |
Principal
Amount | | | | | Value | |
| | | | | | | |
| | | | SHORT-TERM INVESTMENTS 4.5% | | | | |
| | |
| | | | Repurchase Agreement 4.5% | | | | |
| | $69,877,797 | | | Repurchase Agreement dated 9/28/18, 0.42% due 10/1/18 with Fixed Income Clearing Corp. collateralized by $48,745,000 of United States Treasury Notes 2.375% due 1/15/25; value: $71,277,425; repurchase proceeds: $69,880,243 (cost $69,877,797) | | $ | 69,877,797 | |
| | | | | | | | |
| | |
| | | | Total Short-Term Investments
(cost $69,877,797) | | | 69,877,797 | |
| | | | | | | | |
| | |
| | | | Total Investments
(cost $1,070,703,276) 100.1% | | | 1,567,985,814 | |
| | |
| | | | Liabilities less Other Assets (0.1%) | | | (2,197,093 | ) |
| | | | | | | | |
| | |
| | | | NET ASSETS 100.0% | | $ | 1,565,788,721 | |
| | | | | | | | |
| |
| | | | *Non-income producing. ADR American Depositary Receipt. See Notes to Financial Statements. | |
At September 30, 2018, Wasatch International Growth Fund’s investments, excluding short-term investments, were in the following countries (unaudited):
| | | | |
| Country | | % | |
Australia | | | 9.2 | |
Austria | | | 1.0 | |
Belgium | | | 1.0 | |
Brazil | | | 1.3 | |
Canada | | | 6.0 | |
China | | | 4.2 | |
Denmark | | | 1.7 | |
France | | | 2.6 | |
Germany | | | 8.7 | |
India | | | 4.2 | |
Italy | | | 3.2 | |
Japan | | | 23.2 | |
Korea | | | 3.4 | |
Mexico | | | 1.7 | |
Netherlands | | | 0.9 | |
Norway | | | 0.8 | |
Philippines | | | 0.5 | |
South Africa | | | 0.8 | |
Sweden | | | 2.7 | |
Switzerland | | | 1.8 | |
Taiwan | | | 2.0 | |
Thailand | | | 1.0 | |
United Kingdom | | | 18.1 | |
| | | | |
TOTAL | | | 100.0 | % |
| | | | |
53
| | |
| WASATCH INTERNATIONAL OPPORTUNITIES FUND (WAIOX / WIIOX) | | |
|
|
|
Schedule of Investments
| | | | | | | | |
| Shares | | | | | Value | |
| | | | | | | |
| | | | COMMON STOCKS 97.7% | | | | |
| | |
| | | | Advertising 1.7% | | | | |
| | 14,646,600 | | | Plan B Media Public Co. Ltd. (Thailand) | | $ | 3,147,615 | |
| | 242,000 | | | Vector, Inc. (Japan) | | | 5,714,540 | |
| | | | | | | | |
| | | | 8,862,155 | |
| | | | | |
| | | | Aerospace & Defense 0.6% | | | | |
| | 183,082 | | | Avon Rubber plc (United Kingdom) | | | 3,078,316 | |
| | | | | | | | |
| | | | Air Freight & Logistics 0.5% | | | | |
| | 519,695 | | | Freightways Ltd. (New Zealand) | | | 2,693,832 | |
| | | | | | | | |
| | | | Application Software 6.1% | | | | |
| | 81,690 | | | Esker S.A. (France) | | | 6,117,581 | |
| | 759,306 | | | Fortnox AB (Sweden) | | | 6,664,026 | |
| | 814,938 | | | GB Group plc (United Kingdom) | | | 6,181,948 | |
| | 16,567,900 | | | Humanica Public Co. Ltd. (Thailand) | | | 5,993,953 | |
| | 537,200 | | | Systena Corp. (Japan) | | | 7,342,648 | |
| | | | | | | | |
| | | | 32,300,156 | |
| | | | | |
| | | | Asset Management & Custody Banks 0.9% | | | | |
| | 565,900 | | | Sanne Group plc (United Kingdom) | | | 4,720,603 | |
| | | | | | | | |
| | | | Auto Parts & Equipment 1.6% | | | | |
| | 1,023,000 | | | Hota Industrial Manufacturing Co. Ltd. (Taiwan) | | | 4,422,625 | |
| | 2,103,361 | | | Minda Corp. Ltd. (India) | | | 3,879,423 | |
| | | | | | | | |
| | | | 8,302,048 | |
| | | | | |
| | | | Automotive Retail 0.9% | | | | |
| | 2,117,400 | | | Hascol Petroleum Ltd. (Pakistan) | | | 4,740,193 | |
| | | | | | | | |
| | | | Brewers 1.6% | | | | |
| | 685,845 | | | Carlsberg Brewery Malaysia Berhad, Class B (Malaysia) | | | 3,314,462 | |
| | 64,217 | | | Royal Unibrew A/S (Denmark) | | | 5,289,011 | |
| | | | | | | | |
| | | | 8,603,473 | |
| | | | | |
| | | | Commodity Chemicals 2.9% | | | | |
| | 980,135 | | | Berger Paints India Ltd. (India) | | | 3,948,123 | |
| | 753,179 | | | Gulf Oil Lubricants India Ltd. (India) | | | 7,616,469 | |
| | 288,077 | | | Supreme Industries Ltd. (India) | | | 3,906,267 | |
| | | | | | | | |
| | | | 15,470,859 | |
| | | | | |
| | | | Consumer Finance 4.0% | | | | |
| | 1,283,043 | | | ASA International Group plc* (United Kingdom) | | | 8,020,440 | |
| | 360,137 | | | Gruppo MutuiOnline S.p.A. (Italy) | | | 7,041,431 | |
| | 2,489,862 | | | Unifin Financiera S.A.B. de C.V. SOFOM ENR (Mexico) | | | 6,321,115 | |
| | | | | | | | |
| | | | 21,382,986 | |
| | | | | |
| | | | Department Stores 2.1% | | | | |
| | 379,908 | | | Poya International Co. Ltd. (Taiwan) | | | 3,459,026 | |
| | 227,874 | | | V-Mart Retail Ltd. (India) | | | 7,890,243 | |
| | | | | | | | |
| | | | 11,349,269 | |
| | | | | |
| | | | Diversified Support Services 3.1% | | | | |
| | 1,343,912 | | | Clipper Logistics plc (United Kingdom) | | | 5,202,416 | |
| | 285,400 | | | Japan Elevator Service Holdings Co. Ltd. (Japan) | | | 4,270,199 | |
| | 585,900 | | | Prestige International, Inc. (Japan) | | | 7,018,218 | |
| | | | | | | | |
| | | | 16,490,833 | |
| | | | | |
| | | | Drug Retail 2.3% | | | | |
| | 56,500 | | | Kusuri no Aoki Holdings Co. Ltd. (Japan) | | | 4,500,308 | |
| | 178,000 | | | Qol Co. Ltd. (Japan) | | | 3,896,198 | |
| | 116,800 | | | Yakuodo Co. Ltd. (Japan) | | | 3,998,873 | |
| | | | | | | | |
| | | | 12,395,379 | |
| | | | | |
| | | | | | | | |
| Shares | | | | | Value | |
| | | | | | | |
| | | | Electrical Components & Equipment 1.6% | | | | |
| | 252,355 | | | Amara Raja Batteries Ltd. (India) | | $ | 2,573,331 | |
| | 350,627 | | | Voltronic Power Technology Corp. (Taiwan) | | | 6,155,179 | |
| | | | | | | | |
| | | | 8,728,510 | |
| | | | | |
| | | | Electronic Equipment & Instruments 3.2% | | | | |
| | 144,956 | | | accesso Technology Group plc* (United Kingdom) | | | 5,535,816 | |
| | 107,323 | | | Isra Vision AG (Germany) | | | 5,395,501 | |
| | 743,876 | | | Smart Metering Systems plc (United Kingdom) | | | 5,972,540 | |
| | | | | | | | |
| | | | 16,903,857 | |
| | | | | |
| | | | Electronic Manufacturing Services 0.8% | | | | |
| | 251,298 | | | HMS Networks AB (Sweden) | | | 4,495,846 | |
| | | | | | | | |
| | | | Financial Exchanges & Data 0.7% | | | | |
| | 1,003,429 | | | Morningstar Japan KK (Japan) | | | 3,506,084 | |
| | | | | | | | |
| | | | Food Retail 4.5% | | | | |
| | 21,847,236 | | | 7-Eleven Malaysia Holdings Berhad, Class B (Malaysia) | | | 7,760,164 | |
| | 5,057,282 | | | Philippine Seven Corp. (Philippines) | | | 9,528,620 | |
| | 79,639 | | | Rami Levy Chain Stores Hashikma Marketing 2006 Ltd. (Israel) | | | 3,758,031 | |
| | 3,661,600 | | | Sheng Siong Group Ltd. (Singapore) | | | 2,999,884 | |
| | | | | | | | |
| | | | 24,046,699 | |
| | | | | |
| | | | Health Care Equipment 0.7% | | | | |
| | 131,781 | | | DIO Corp.* (Korea) | | | 3,825,421 | |
| | | | | | | | |
| | | | Health Care Facilities 0.6% | | | | |
| | 17,205,696 | | | Cleopatra Hospital* (Egypt) | | | 3,360,488 | |
| | | | | | | | |
| | | | Health Care Services 0.3% | | | | |
| | 170,255 | | | Carenet, Inc. (Japan) | | | 1,528,429 | |
| | | | | | | | |
| | | | Health Care Supplies 1.6% | | | | |
| | 1,069,632 | | | Advanced Medical Solutions Group plc (United Kingdom) | | | 4,607,695 | |
| | 1,472,451 | | | Nanosonics Ltd.* (Australia) | | | 3,821,056 | |
| | | | | | | | |
| | | | 8,428,751 | |
| | | | | |
| | | | Health Care Technology 3.6% | | | | |
| | 112,058 | | | Nexus AG (Germany) | | | 3,473,803 | |
| | 1,762,231 | | | Pro Medicus Ltd. (Australia) | | | 15,871,904 | |
| | | | | | | | |
| | | | 19,345,707 | |
| | | | | |
| | | | Home Furnishing Retail 0.4% | | | | |
| | 495,148 | | | Nick Scali Ltd. (Australia) | | | 2,304,990 | |
| | | | | | | | |
| | | | Home Improvement Retail 1.9% | | | | |
| | 4,500,567 | | | Italtile Ltd. (South Africa) | | | 4,490,622 | |
| | 59,630,900 | | | PT Ace Hardware Indonesia Tbk (Indonesia) | | | 5,762,406 | |
| | | | | | | | |
| | | | 10,253,028 | |
| | | | | |
| | | | Hotels, Resorts & Cruise Lines 0.1% | | | | |
| | 673,754 | | | Byke Hospitality Ltd. (The) (India) | | | 641,316 | |
| | | | | | | | |
| | | | Human Resource & Employment Services 2.7% | | | | |
| | 67,288 | | | en-japan, Inc. (Japan) | | | 3,375,652 | |
| | 376,262 | | | SMS Co. Ltd. (Japan) | | | 7,487,488 | |
| | 90,700 | | | Trust Tech, Inc. (Japan) | | | 3,536,358 | |
| | | | | | | | |
| | | | 14,399,498 | |
| | | | | |
| | | | Industrial Machinery 0.4% | | | | |
| | 34,573 | | | Aumann AG (Germany) | | | 2,392,403 | |
| | | | | | | | |
54
| | | | | | | | |
| Shares | | | | | Value | |
| | | | | | | |
| | | | Interactive Media & Services 6.5% | | | | |
| | 321,247 | | | BusinessOn Communication Co. Ltd. (Korea) | | $ | 6,298,961 | |
| | 604,900 | | | Infomart Corp. (Japan) | | | 7,879,352 | |
| | 72,800 | | | Itokuro, Inc.* (Japan) | | | 4,421,052 | |
| | 464,186 | | | Rakus Co. Ltd. (Japan) | | | 10,021,548 | |
| | 18,123 | | | XING SE (Germany) | | | 6,196,786 | |
| | | | | | | | |
| | | | 34,817,699 | |
| | | | | |
| | | | Internet & Direct Marketing Retail 7.9% | | | | |
| | 130,415 | | | Evolable Asia Corp. (Japan) | | | 3,181,750 | |
| | 422,730 | | | On the Beach Group plc (United Kingdom) | | | 2,727,383 | |
| | 434,318 | | | Open Door, Inc.* (Japan) | | | 12,767,313 | |
| | 1,092,560 | | | Webjet Ltd. (Australia) | | | 12,185,949 | |
| | 354,221 | | | Yume No Machi Souzou Iinkai Co. Ltd. (Japan) | | | 11,410,393 | |
| | | | | | | | |
| | | | 42,272,788 | |
| | | | | |
| | | | Investment Banking & Brokerage 2.3% | | | | |
| | 112,709 | | | M&A Capital Partners Co. Ltd.* (Japan) | | | 6,814,917 | |
| | 153,400 | | | Strike Co. Ltd. (Japan) | | | 5,191,190 | |
| | | | | | | | |
| | | | 12,006,107 | |
| | | | | |
| | | | IT Consulting & Other Services 2.0% | | | | |
| | 53,934 | | | Aubay (France) | | | 2,476,625 | |
| | 101,362 | | | CANCOM SE (Germany) | | | 4,580,354 | |
| | 212,496 | | | eWork Group AB (Sweden) | | | 2,477,056 | |
| | 22,303 | | | Infotel S.A. (France) | | | 1,074,639 | |
| | | | | | | | |
| | | | 10,608,674 | |
| | | | | |
| | | | Leisure Products 0.5% | | | | |
| | 211,936 | | | MIPS AB* (Sweden) | | | 2,599,301 | |
| | | | | | | | |
| | | | Life Sciences Tools & Services 0.6% | | | | |
| | 1,162,428 | | | Horizon Discovery Group plc* (United Kingdom) | | | 3,181,729 | |
| | | | | | | | |
| | | | Office Services & Supplies 0.7% | | | | |
| | 4,176,200 | | | Riverstone Holdings Ltd. (Singapore) | | | 3,604,781 | |
| | | | | | | | |
| | | | Oil & Gas Equipment & Services 1.9% | | | | |
| | 659,666 | | | Computer Modelling Group Ltd. (Canada) | | | 4,315,548 | |
| | 749,362 | | | Spectrum ASA (Norway) | | | 5,671,719 | |
| | | | | | | | |
| | | | 9,987,267 | |
| | | | | |
| | | | Other Diversified Financial Services 2.3% | | | | |
| | 52,488 | | | Hypoport AG* (Germany) | | | 12,078,549 | |
| | | | | | | | |
| | | | Packaged Foods & Meats 3.9% | | | | |
| | 257,500 | | | Dutch Lady Milk Industries Berhad (Malaysia) | | | 3,999,541 | |
| | 2,263,120 | | | Vitasoy International Holdings Ltd. (China) | | | 7,718,779 | |
| | 4,102,000 | | | Yihai International Holding Ltd. (China) | | | 9,327,074 | |
| | | | | | | | |
| | | | 21,045,394 | |
| | | | | |
| | | | Personal Products 3.8% | | | | |
| | 276,384 | | | Jamieson Wellness, Inc. (Canada) | | | 5,704,640 | |
| | 614,108 | | | Sarantis S.A. (Greece) | | | 5,290,537 | |
| | 576,474 | | | TCI Co. Ltd. (Taiwan) | | | 9,270,256 | |
| | | | | | | | |
| | | | 20,265,433 | |
| | | | | |
| | | | Pharmaceuticals 0.7% | | | | |
| | 22,330,405 | | | PT Kimia Farma Persero Tbk (Indonesia) | | | 3,821,262 | |
| | | | | | | | |
| | | | Property & Casualty Insurance 1.5% | | | | |
| | 2,925,000 | | | Qualitas Controladora S.A.B. de C.V. (Mexico) | | | 7,774,367 | |
| | | | | | | | |
| | | | | | | | |
| Shares | | | | | Value | |
| | | | | | | |
| | | | Research & Consulting Services 1.2% | | | | |
| | 45,703 | | | Akka Technologies (France) | | $ | 3,311,162 | |
| | 191,400 | | | IR Japan Holdings Ltd. (Japan) | | | 3,059,165 | |
| | | | | | | | |
| | | | 6,370,327 | |
| | | | | |
| | | | Restaurants 3.6% | | | | |
| | 54,302 | | | AmRest Holdings SE* (Poland) | | | 6,620,578 | |
| | 212,200 | | | Arcland Service Holdings Co. Ltd. (Japan) | | | 4,013,535 | |
| | 630,045 | | | Patisserie Holdings plc (United Kingdom) | | | 3,572,224 | |
| | 951,184 | | | Restaurant Brands New Zealand Ltd. (New Zealand) | | | 4,930,450 | |
| | | | | | | | |
| | | | 19,136,787 | |
| | | | | |
| | | | Semiconductor Equipment 1.7% | | | | |
| | 376,100 | | | Japan Material Co. Ltd. (Japan) | | | 5,047,989 | |
| | 226,000 | | | Machvision, Inc. (Taiwan) | | | 2,738,676 | |
| | 22,075 | | | Tokai Carbon Korea Co. Ltd. (Korea) | | | 1,219,921 | |
| | | | | | | | |
| | | | 9,006,586 | |
| | | | | |
| | | | Semiconductors 1.1% | | | | |
| | 228,000 | | | ASPEED Technology, Inc. (Taiwan) | | | 4,555,072 | |
| | 17,776 | | | LEENO Industrial, Inc. (Korea) | | | 1,056,063 | |
| | | | | | | | |
| | | | 5,611,135 | |
| | | | | |
| | | | Specialty Chemicals 0.8% | | | | |
| | 752,199 | | | DuluxGroup Ltd. (Australia) | | | 4,170,386 | |
| | | | | | | | |
| | | | Specialty Stores 0.1% | | | | |
| | 109,726 | | | Gear4Music Holdings plc* (United Kingdom) | | | 739,397 | |
| | | | | | | | |
| | | | Systems Software 1.7% | | | | |
| | 96,600 | | | Digital Arts, Inc. (Japan) | | | 4,540,081 | |
| | 212,683 | | | Minwise Co. Ltd. (Korea) | | | 4,381,164 | |
| | | | | | | | |
| | | | 8,921,245 | |
| | | | | |
| | | | Technology Hardware, Storage & Peripherals 0.6% | | | | |
| | 53,149 | | | MGI Digital Graphic Technology* (France) | | | 2,962,016 | |
| | | | | | | | |
| | | | Thrifts & Mortgage Finance 0.9% | | | | |
| | 88,892 | | | Equitable Group, Inc. (Canada) | | | 4,739,668 | |
| | | | | | | | |
| | |
| | | | Total Common Stocks
(cost $362,581,867) | | | 520,272,027 | |
| | | | | | | | |
| | |
Principal
Amount | | | | | Value | |
| | | | | | | |
| | | | SHORT-TERM INVESTMENTS 2.4% | | | | |
| | |
| | | | Repurchase Agreement 2.4% | | | | |
| | $12,901,903 | | | Repurchase Agreement dated 9/28/18, 0.42% due 10/1/18 with Fixed Income Clearing Corp. collateralized by $9,000,000 of United States Treasury Notes 2.375% due 1/15/25; value: $13,160,259; repurchase proceeds: $12,902,354 (cost $12,901,903) | | $ | 12,901,903 | |
| | | | | | | | |
| | |
| | | | Total Short-Term Investments
(cost $12,901,903) | | | 12,901,903 | |
| | | | | | | | |
| | |
| | | | Total Investments
(cost $375,483,770) 100.1%§ | | | 533,173,930 | |
| | |
| | | | Liabilities less Other Assets (0.1%) | | | (340,197 | ) |
| | | | | | | | |
| | |
| | | | NET ASSETS 100.0% | | $ | 532,833,733 | |
| | | | | | | | |
| |
| | | | *Non-income producing. §The aggregate amount of foreign securities fair valued pursuant to a systematic valuation model as a percent of net assets was 0.71%. See Notes to Financial Statements. | |
55
| | |
| WASATCH INTERNATIONAL OPPORTUNITIES FUND (WAIOX / WIIOX) | | SEPTEMBER 30, 2018 |
|
|
|
Schedule of Investments (continued)
At September 30, 2018, Wasatch International Opportunities Fund’s investments, excluding short-term investments, were in the following countries (unaudited):
| | | | |
| Country | | % | |
Australia | | | 7.4 | |
Canada | | | 2.8 | |
China | | | 3.3 | |
Denmark | | | 1.0 | |
Egypt | | | 0.6 | |
France | | | 3.1 | |
Germany | | | 6.6 | |
Greece | | | 1.0 | |
India | | | 5.8 | |
Indonesia | | | 1.8 | |
Israel | | | 0.7 | |
Italy | | | 1.3 | |
Japan | | | 25.9 | |
Korea | | | 3.2 | |
Malaysia | | | 2.9 | |
Mexico | | | 2.7 | |
New Zealand | | | 1.5 | |
Norway | | | 1.1 | |
Pakistan | | | 0.9 | |
Philippines | | | 1.8 | |
Poland | | | 1.3 | |
Singapore | | | 1.3 | |
South Africa | | | 0.9 | |
Sweden | | | 3.1 | |
Taiwan | | | 5.9 | |
Thailand | | | 1.8 | |
United Kingdom | | | 10.3 | |
| | | | |
TOTAL | | | 100.0 | % |
| | | | |
56
| | |
| WASATCH MICRO CAP FUND (WMICX) | | SEPTEMBER 30, 2018 |
|
|
|
Schedule of Investments
| | | | | | | | |
| Shares | | | | | Value | |
| | | | | | | |
| | | | COMMON STOCKS 95.7% | | | | |
| | |
| | | | Apparel, Accessories & Luxury Goods 1.1% | | | | |
| | 277,275 | | | Superior Group of Cos., Inc. | | $ | 5,273,771 | |
| | | | | | | | |
| | | | Application Software 5.9% | | | | |
| | 85,191 | | | Digimarc Corp.* | | | 2,679,257 | |
| | 54,600 | | | Esker S.A. (France) | | | 4,088,871 | |
| | 84,625 | | | Everbridge, Inc.* | | | 4,877,785 | |
| | 610,000 | | | Fortnox AB (Sweden) | | | 5,353,647 | |
| | 86,412 | | | Globant S.A.* (Argentina) | | | 5,097,444 | |
| | 217,893 | | | Upland Software, Inc.* | | | 7,040,123 | |
| | | | | | | | |
| | | | 29,137,127 | |
| | | | | |
| | | | Asset Management & Custody Banks 0.6% | | | | |
| | 800,000 | | | Tatton Asset Management plc (United Kingdom) | | | 2,971,753 | |
| | | | | | | | |
| | | | Biotechnology 7.0% | | | | |
| | 241,491 | | | Abcam plc (United Kingdom) | | | 4,507,355 | |
| | 268,316 | | | ChemoCentryx, Inc.* | | | 3,391,514 | |
| | 206,600 | | | Cytokinetics, Inc.* | | | 2,035,010 | |
| | 93,547 | | | Esperion Therapeutics, Inc.* | | | 4,150,680 | |
| | 84,411 | | | Exact Sciences Corp.* | | | 6,661,716 | |
| | 121,335 | | | Flexion Therapeutics, Inc.* | | | 2,270,178 | |
| | 461,529 | | | Inovio Pharmaceuticals, Inc.* | | | 2,566,101 | |
| | 296,846 | | | Sangamo Therapeutics, Inc.* | | | 5,031,540 | |
| | 138,488 | | | Selecta Biosciences, Inc.* | | | 2,153,489 | |
| | 184,157 | | | Unum Therapeutics, Inc.* | | | 1,896,817 | |
| | | | | | | | |
| | | | 34,664,400 | |
| | | | | |
| | | | Construction & Engineering 2.2% | | | | |
| | 391,500 | | | Construction Partners, Inc., Class A* | | | 4,737,150 | |
| | 72,293 | | | NV5 Global, Inc.* | | | 6,267,803 | |
| | | | | | | | |
| | | | 11,004,953 | |
| | | | | |
| | | | Consumer Electronics 1.1% | | | | |
| | 381,820 | | | ZAGG, Inc.* | | | 5,631,845 | |
| | | | | | | | |
| | | | Consumer Finance 1.3% | | | | |
| | 208,519 | | | Curo Group Holdings Corp.* | | | 6,303,529 | |
| | | | | | | | |
| | | | Department Stores 2.2% | | | | |
| | 317,634 | | | V-Mart Retail Ltd. (India) | | | 10,998,225 | |
| | | | | | | | |
| | | | Diversified Banks 0.8% | | | | |
| | 1,607,909 | | | City Union Bank Ltd. (India) | | | 3,886,131 | |
| | | | | | | | |
| | | | Diversified Support Services 1.9% | | | | |
| | 660,000 | | | Clipper Logistics plc (United Kingdom) | | | 2,554,925 | |
| | 459,400 | | | Japan Elevator Service Holdings Co. Ltd. (Japan) | | | 6,873,614 | |
| | | | | | | | |
| | | | 9,428,539 | |
| | | | | |
| | | | Drug Retail 1.3% | | | | |
| | 130,000 | | | Qol Co. Ltd. (Japan) | | | 2,845,538 | |
| | 100,000 | | | Yakuodo Co. Ltd. (Japan) | | | 3,423,693 | |
| | | | | | | | |
| | | | 6,269,231 | |
| | | | | |
| | | | Education Services 1.4% | | | | |
| | 582,098 | | | Cambium Learning Group, Inc.* | | | 6,892,040 | |
| | | | | | | | |
| | | | Electronic Equipment & Instruments 3.0% | | | | |
| | 30,032 | | | Mesa Laboratories, Inc. | | | 5,574,540 | |
| | 356,017 | | | Napco Security Technologies, Inc.* | | | 5,322,454 | |
| | 180,303 | | | nLight, Inc.* | | | 4,004,530 | |
| | | | | | | | |
| | | | 14,901,524 | |
| | | | | |
| | | | | | | | |
| Shares | | | | | Value | |
| | | | | | | |
| | | | Electronic Manufacturing Services 1.8% | | | | |
| | 194,650 | | | Fabrinet* | | $ | 9,004,509 | |
| | | | | | | | |
| | | | Environmental & Facilities Services 0.9% | | | | |
| | 205,554 | | | Heritage-Crystal Clean, Inc.* | | | 4,388,578 | |
| | | | | | | | |
| | | | Food Distributors 1.2% | | | | |
| | 157,034 | | | Chefs’ Warehouse, Inc. (The)* | | | 5,708,186 | |
| | | | | | | | |
| | | | General Merchandise Stores 0.9% | | | | |
| | 45,991 | | | Ollie’s Bargain Outlet Holdings, Inc.* | | | 4,419,735 | |
| | | | | | | | |
| | | | Health Care Distributors 1.2% | | | | |
| | 147,314 | | | PetIQ, Inc.* | | | 5,790,913 | |
| | | | | | | | |
| | | | Health Care Equipment 6.2% | | | | |
| | 161,127 | | | AtriCure, Inc.* | | | 5,644,279 | |
| | 765,198 | | | IRIDEX Corp.* ‡‡ | | | 4,859,007 | |
| | 150,414 | | | LeMaitre Vascular, Inc. | | | 5,827,039 | |
| | 281,518 | | | Oxford Immunotec Global plc* | | | 4,569,037 | |
| | 235,357 | | | Tandem Diabetes Care, Inc.* | | | 10,082,694 | |
| | | | | | | | |
| | | | 30,982,056 | |
| | | | | |
| | | | Health Care Facilities 1.3% | | | | |
| | 170,346 | | | Ensign Group, Inc. (The) | | | 6,459,520 | |
| | | | | | | | |
| | | | Health Care Supplies 1.5% | | | | |
| | 202,715 | | | OrthoPediatrics Corp.* | | | 7,427,478 | |
| | | | | | | | |
| | | | Health Care Technology 3.5% | | | | |
| | 75,065 | | | Omnicell, Inc.* | | | 5,397,173 | |
| | 264,669 | | | Simulations Plus, Inc. | | | 5,346,314 | |
| | 84,488 | | | Tabula Rasa HealthCare, Inc.* | | | 6,859,581 | |
| | | | | | | | |
| | | | 17,603,068 | |
| | | | | |
| | | | Heavy Electrical Equipment 1.1% | | | | |
| | 189,444 | | | TPI Composites, Inc.* | | | 5,408,626 | |
| | | | | | | | |
| | | | Homebuilding 0.7% | | | | |
| | 77,130 | | | LGI Homes, Inc.* | | | 3,659,047 | |
| | | | | | | | |
| | | | Human Resource & Employment Services 2.2% | | | | |
| | 224,000 | | | SMS Co. Ltd. (Japan) | | | 4,457,525 | |
| | 174,100 | | | UT Group Co. Ltd.* (Japan) | | | 6,213,479 | |
| | | | | | | | |
| | | | 10,671,004 | |
| | | | | |
| | | | Industrial Machinery 7.1% | | | | |
| | 209,884 | | | Altra Industrial Motion Corp. | | | 8,668,209 | |
| | 616,621 | | | Elgi Equipments Ltd. (India) | | | 2,084,041 | |
| | 83,708 | | | Kadant, Inc. | | | 9,027,908 | |
| | 330,608 | | | Kornit Digital Ltd.* (Israel) | | | 7,240,315 | |
| | 149,217 | | | Sun Hydraulics Corp. | | | 8,174,108 | |
| | | | | | | | |
| | | | 35,194,581 | |
| | | | | |
| | | | Industrial REITs 1.1% | | | | |
| | 330,946 | | | Monmouth Real Estate Investment Corp. | | | 5,533,417 | |
| | | | | | | | |
| | | | Insurance Brokers 1.2% | | | | |
| | 98,125 | | | Health Insurance Innovations, Inc.* | | | 6,049,406 | |
| | | | | | | | |
| | | | Interactive Media & Services 6.1% | | | | |
| | 110,439 | | | Bandwidth, Inc., Class A* | | | 5,916,217 | |
| | 117,042 | | | Five9, Inc.* | | | 5,113,565 | |
| | 102,028 | | | Instructure, Inc.* | | | 3,611,791 | |
| | 1,135,321 | | | Limelight Networks, Inc.* | | | 5,699,312 | |
| | 273,832 | | | TrueCar, Inc.* | | | 3,861,031 | |
| | 70,335 | | | Twilio, Inc.* | | | 6,068,504 | |
| | | | | | | | |
| | | | 30,270,420 | |
| | | | | |
57
| | |
| WASATCH MICRO CAP FUND (WMICX) | | SEPTEMBER 30, 2018 |
|
|
|
Schedule of Investments (continued)
| | | | | | | | |
| Shares | | | | | Value | |
| | | | | | | |
| | | | Internet & Direct Marketing Retail 1.0% | | | | |
| | 166,800 | | | Open Door, Inc.* (Japan) | | $ | 4,903,292 | |
| | | | | | | | |
| | | | Investment Banking & Brokerage 0.6% | | | | |
| | 50,000 | | | M&A Capital Partners Co. Ltd.* (Japan) | | | 3,023,235 | |
| | | | | | | | |
| | | | Leisure Products 1.3% | | | | |
| | 176,930 | | | MCBC Holdings, Inc.* | | | 6,348,248 | |
| | | | | | | | |
| | | | Managed Health Care 1.1% | | | | |
| | 56,120 | | | HealthEquity, Inc.* | | | 5,298,289 | |
| | | | | | | | |
| | | | Oil & Gas Equipment & Services 1.7% | | | | |
| | 277,618 | | | Pason Systems, Inc. (Canada) | | | 4,210,534 | |
| | 212,965 | | | Solaris Oilfield Infrastructure, Inc.* | | | 4,022,909 | |
| | | | | | | | |
| | | | 8,233,443 | |
| | | | | |
| | | | Oil & Gas Exploration & Production 1.3% | | | | |
| | 1,185,046 | | | Abraxas Petroleum Corp.* | | | 2,761,157 | |
| | 448,332 | | | Lonestar Resources US, Inc., Class A* | | | 3,492,507 | |
| | | | | | | | |
| | | | 6,253,664 | |
| | | | | |
| | | | Packaged Foods & Meats 2.3% | | | | |
| | 264,616 | | | Freshpet, Inc.* | | | 9,711,407 | |
| | 900,000 | | | Prabhat Dairy Ltd.* (India) | | | 1,512,209 | |
| | | | | | | | |
| | | | 11,223,616 | |
| | | | | |
| | | | Pharmaceuticals 0.9% | | | | |
| | 211,126 | | | Intra-Cellular Therapies, Inc.* | | | 4,581,434 | |
| | | | | | | | |
| | | | Regional Banks 3.0% | | | | |
| | 158,490 | | | CBTX, Inc. | | | 5,632,735 | |
| | 102,221 | | | Customers Bancorp, Inc.* | | | 2,405,260 | |
| | 205,660 | | | People’s Utah Bancorp | | | 6,982,157 | |
| | | | | | | | |
| | | | 15,020,152 | |
| | | | | |
| | | | Research & Consulting Services 0.7% | | | | |
| | 230,000 | | | IR Japan Holdings Ltd. (Japan) | | | 3,676,113 | |
| | | | | | | | |
| | | | Restaurants 2.8% | | | | |
| | 190,900 | | | Chuy’s Holdings, Inc.* | | | 5,011,125 | |
| | 326,974 | | | Fiesta Restaurant Group, Inc.* | | | 8,746,555 | |
| | | | | | | | |
| | | | 13,757,680 | |
| | | | | |
| | | | Semiconductors 2.5% | | | | |
| | 180,020 | | | Inphi Corp.* | | | 6,837,159 | |
| | 24,988 | | | LEENO Industrial, Inc. (Korea) | | | 1,484,525 | |
| | 37,603 | | | NVE Corp. | | | 3,981,406 | |
| | | | | | | | |
| | | | 12,303,090 | |
| | | | | |
| | | | Specialized Consumer Services 0.8% | | | | |
| | 392,308 | | | Select Interior Concepts, Inc.* | | | 4,178,080 | |
| | | | | | | | |
| | | | Systems Software 4.8% | | | | |
| | 73,108 | | | CyberArk Software Ltd.* (Israel) | | | 5,836,943 | |
| | 70,000 | | | Douzone Bizon Co. Ltd. (Korea) | | | 3,855,758 | |
| | 197,111 | | | Rapid7, Inc.* | | | 7,277,338 | |
| | 94,998 | | | Varonis Systems, Inc.* | | | 6,958,604 | |
| | | | | | | | |
| | | | 23,928,643 | |
| | | | | |
| | | | Technology Hardware, Storage & Peripherals 0.6% | | | | |
| | 437,692 | | | USA Technologies, Inc.* | | | 3,151,382 | |
| | | | | | | | |
| | | | | | | | |
| Shares | | | | | Value | |
| | | | | | | |
| | | | Thrifts & Mortgage Finance 1.5% | | | | |
| | 78,507 | | | Equitable Group, Inc. (Canada) | | $ | 4,185,946 | |
| | 832,990 | | | GRUH Finance Ltd. (India) | | | 3,385,279 | |
| | | | | | | | |
| | | | 7,571,225 | |
| | | | | |
| | | | Trading Companies & Distributors 1.0% | | | | |
| | 222,492 | | | Transcat, Inc.* | | | 5,083,942 | |
| | | | | | | | |
| | |
| | | | Total Common Stocks
(cost $311,765,102) | | | 474,469,140 | |
| | | | | | | | |
| | |
Principal
Amount | | | | | Value | |
| | | | SHORT-TERM INVESTMENTS 4.5% | | | | |
| | |
| | | | Repurchase Agreement 4.5% | | | | |
| | $22,571,864 | | | Repurchase Agreement dated 9/28/18, 0.42% due 10/1/18 with Fixed Income Clearing Corp. collateralized by $15,750,000 of United States Treasury Notes 2.375% due 1/15/25; value: $23,030,453; repurchase proceeds: $22,572,654 (cost $22,571,864) | | $ | 22,571,864 | |
| | | | | | | | |
| | |
| | | | Total Short-Term Investments
(cost $22,571,864) | | | 22,571,864 | |
| | | | | | | | |
| | |
| | | | Total Investments
(cost $334,336,966) 100.2% | | | 497,041,004 | |
| | |
| | | | Liabilities less Other Assets (0.2%) | | | (912,921 | ) |
| | | | | | | | |
| | |
| | | | NET ASSETS 100.0% | | $ | 496,128,083 | |
| | | | | | | | |
| |
| | | | *Non-income producing. ‡‡Affiliated company (see Note 8). REIT Real Estate Investment Trust. See Notes to Financial Statements. | |
At September 30, 2018, Wasatch Micro Cap Fund’s investments, excluding short-term investments, were in the following countries (unaudited):
| | | | |
| Country | | % | |
Argentina | | | 1.1 | |
Canada | | | 1.8 | |
France | | | 0.9 | |
India | | | 4.6 | |
Israel | | | 2.7 | |
Japan | | | 7.5 | |
Korea | | | 1.1 | |
Sweden | | | 1.1 | |
United Kingdom | | | 2.1 | |
United States | | | 77.1 | |
| | | | |
TOTAL | | | 100.0 | % |
| | | | |
58
| | |
| WASATCH MICRO CAP VALUE FUND (WAMVX) | | SEPTEMBER 30, 2018 |
|
|
|
Schedule of Investments
| | | | | | | | |
| Shares | | | | | Value | |
| | | | | | | |
| | | | COMMON STOCKS 92.0% | | | | |
| | |
| | | | Air Freight & Logistics 1.4% | | | | |
| | 665,000 | | | Radiant Logistics, Inc.* | | $ | 3,930,150 | |
| | | | | | | | |
| | | | Alternative Carriers 2.1% | | | | |
| | 250,000 | | | Gamma Communications plc (United Kingdom) | | | 2,789,277 | |
| | 292,000 | | | ORBCOMM, Inc.* | | | 3,171,120 | |
| | | | | | | | |
| | | | | | | 5,960,397 | |
| | | | | |
| | | | Apparel, Accessories & Luxury Goods 0.6% | | | | |
| | 95,000 | | | Superior Group of Cos., Inc. | | | 1,806,900 | |
| | | | | | | | |
| | | | Application Software 6.4% | | | | |
| | 339,000 | | | Datawatch Corp.* | | | 3,949,350 | |
| | 34,000 | | | Ebix, Inc. | | | 2,691,100 | |
| | 39,000 | | | Esker S.A. (France) | | | 2,920,623 | |
| | 67,055 | | | Everbridge, Inc.* | | | 3,865,050 | |
| | 46,000 | | | Globant S.A.* (Argentina) | | | 2,713,540 | |
| | 400,000 | | | Telenav, Inc.* | | | 2,020,000 | |
| | | | | | | | |
| | | | | | | 18,159,663 | |
| | | | | |
| | | | Asset Management & Custody Banks 2.1% | | | | |
| | 800,000 | | | Fiducian Group Ltd. (Australia) | | | 2,677,436 | |
| | 73,000 | | | Hamilton Lane, Inc., Class A | | | 3,232,440 | |
| | | | | | | | |
| | | | | | | 5,909,876 | |
| | | | | |
| | | | Automotive Retail 0.9% | | | | |
| | 123,000 | | | Camping World Holdings, Inc., Class A | | | 2,622,360 | |
| | | | | | | | |
| | | | Biotechnology 1.2% | | | | |
| | 175,000 | | | Cytokinetics, Inc.* | | | 1,723,750 | |
| | 102,000 | | | Sangamo Therapeutics, Inc.* | | | 1,728,900 | |
| | | | | | | | |
| | | | | | | 3,452,650 | |
| | | | | |
| | | | Building Products 1.3% | | | | |
| | 60,200 | | | Patrick Industries, Inc.* | | | 3,563,840 | |
| | | | | | | | |
| | | | Construction & Engineering 2.5% | | | | |
| | 302,000 | | | Construction Partners, Inc., Class A* | | | 3,654,200 | |
| | 40,000 | | | NV5 Global, Inc.* | | | 3,468,000 | |
| | | | | | | | |
| | | | | | | 7,122,200 | |
| | | | | |
| | | | Construction Machinery & Heavy Trucks 0.8% | | | | |
| | 122,000 | | | Wabash National Corp. | | | 2,224,060 | |
| | | | | | | | |
| | | | Consumer Electronics 1.3% | | | | |
| | 254,000 | | | ZAGG, Inc.* | | | 3,746,500 | |
| | | | | | | | |
| | | | Consumer Finance 0.7% | | | | |
| | 750,000 | | | Unifin Financiera S.A.B. de C.V. SOFOM ENR (Mexico) | | | 1,904,056 | |
| | | | | | | | |
| | | | Data Processing & Outsourced Services 1.8% | | | | |
| | 220,000 | | | i3 Verticals, Inc., Class A* | | | 5,055,600 | |
| | | | | | | | |
| | | | Diversified Banks 1.0% | | | | |
| | 63,135 | | | Capital Bancorp, Inc.* | | | 803,077 | |
| | 858,000 | | | City Union Bank Ltd. (India) | | | 2,073,688 | |
| | | | | | | | |
| | | | | | | 2,876,765 | |
| | | | | |
| | | | Diversified Support Services 1.0% | | | | |
| | 1,550,000 | | | Johnson Service Group plc (United Kingdom) | | | 2,727,365 | |
| | | | | | | | |
| | | | | | | | |
| Shares | | | | | Value | |
| | | | | | | |
| | | | Electronic Equipment & Instruments 2.1% | | | | |
| | 265,000 | | | Napco Security Technologies, Inc.* | | $ | 3,961,750 | |
| | 106,000 | | | Optex Group Co. Ltd. (Japan) | | | 2,097,236 | |
| | | | | | | | |
| | | | | | | 6,058,986 | |
| | | | | |
| | | | Electronic Manufacturing Services 1.4% | | | | |
| | 83,000 | | | Fabrinet* | | | 3,839,580 | |
| | | | | | | | |
| | | | Financial Exchanges & Data 0.4% | | | | |
| | 350,000 | | | Infront ASA (Norway) | | | 1,204,116 | |
| | | | | | | | |
| | | | Food Retail 0.7% | | | | |
| | 409,900 | | | Majestic Wine plc (United Kingdom) | | | 2,083,629 | |
| | | | | | | | |
| | | | Health Care Distributors 1.4% | | | | |
| | 1,911,527 | | | Ibnsina Pharma S.A.E.* (Egypt) | | | 984,564 | |
| | 78,000 | | | PetIQ, Inc.* | | | 3,066,180 | |
| | | | | | | | |
| | | | | | | 4,050,744 | |
| | | | | |
| | | | Health Care Equipment 5.6% | | | | |
| | 90,000 | | | AtriCure, Inc.* | | | 3,152,700 | |
| | 427,793 | | | IRIDEX Corp.* | | | 2,716,485 | |
| | 80,133 | | | Neuronetics, Inc.* | | | 2,569,064 | |
| | 269,926 | | | Oxford Immunotec Global plc* | | | 4,380,899 | |
| | 43,000 | | | Tactile Systems Technology, Inc.* | | | 3,055,150 | |
| | | | | | | | |
| | | | | | | 15,874,298 | |
| | | | | |
| | | | Health Care Facilities 1.2% | | | | |
| | 93,000 | | | Ensign Group, Inc. (The) | | | 3,526,560 | |
| | | | | | | | |
| | | | Health Care Services 2.3% | | | | |
| | 35,000 | | | LHC Group, Inc.* | | | 3,604,650 | |
| | 540,000 | | | Viemed Healthcare, Inc.* | | | 2,801,068 | |
| | | | | | | | |
| | | | | | | 6,405,718 | |
| | | | | |
| | | | Health Care Supplies 1.7% | | | | |
| | 134,360 | | | OrthoPediatrics Corp.* | | | 4,922,950 | |
| | | | | | | | |
| | | | Health Care Technology 3.0% | | | | |
| | 106,000 | | | Nexus AG (Germany) | | | 3,286,005 | |
| | 41,000 | | | Omnicell, Inc.* | | | 2,947,900 | |
| | 33,412 | | | OptimizeRx Corp.* | | | 601,416 | |
| | 84,948 | | | RA Medical Systems, Inc.* | | | 1,546,054 | |
| | | | | | | | |
| | | | | | | 8,381,375 | |
| | | | | |
| | | | Heavy Electrical Equipment 1.3% | | | | |
| | 128,000 | | | TPI Composites, Inc.* | | | 3,654,400 | |
| | | | | | | | |
| | | | Home Furnishing Retail 0.9% | | | | |
| | 68,215 | | | Sleep Number Corp.* | | | 2,508,948 | |
| | | | | | | | |
| | | | Homebuilding 0.8% | | | | |
| | 48,000 | | | LGI Homes, Inc.* | | | 2,277,120 | |
| | | | | | | | |
| | | | Human Resource & Employment Services 1.1% | | | | |
| | 112,382 | | | BG Staffing, Inc. | | | 3,056,790 | |
| | | | | | | | |
| | | | Industrial Machinery 4.2% | | | | |
| | 24,000 | | | John Bean Technologies Corp. | | | 2,863,200 | |
| | 40,493 | | | Kadant, Inc. | | | 4,367,170 | |
| | 88,000 | | | Sun Hydraulics Corp. | | | 4,820,640 | |
| | | | | | | | |
| | | | | | | 12,051,010 | |
| | | | | |
| | | | Industrial REITs 1.2% | | | | |
| | 196,000 | | | Monmouth Real Estate Investment Corp. | | | 3,277,120 | |
| | | | | | | | |
| | | | Insurance Brokers 1.3% | | | | |
| | 112,000 | | | Goosehead Insurance, Inc., Class A* | | | 3,793,440 | |
| | | | | | | | |
59
| | |
| WASATCH MICRO CAP VALUE FUND (WAMVX) | | |
|
|
|
Schedule of Investments (continued)
| | | | | | | | |
| Shares | | | | | Value | |
| | | | | | | |
| | | | Integrated Telecommunication Services 1.3% | | | | |
| | 226,000 | | | Ooma, Inc.* | | $ | 3,751,600 | |
| | | | | | | | |
| | | | Interactive Media & Services 0.7% | | | | |
| | 34,000 | | | Tucows, Inc., Class A* | | | 1,895,500 | |
| | | | | | | | |
| | | | IT Consulting & Other Services 1.3% | | | | |
| | 186,000 | | | Hackett Group, Inc. (The) | | | 3,747,900 | |
| | | | | | | | |
| | | | Mortgage REITs 1.3% | | | | |
| | 330,000 | | | Arbor Realty Trust, Inc. | | | 3,788,400 | |
| | | | | | | | |
| | | | Multi-Sector Holdings 1.1% | | | | |
| | 171,361 | | | Compass Diversified Holdings | | | 3,110,202 | |
| | | | | | | | |
| | | | Oil & Gas Equipment & Services 0.9% | | | | |
| | 130,000 | | | Solaris Oilfield Infrastructure, Inc.* | | | 2,455,700 | |
| | | | | | | | |
| | | | Oil & Gas Exploration & Production 1.2% | | | | |
| | 225,000 | | | Magnolia Oil & Gas Corp.* | | | 3,377,250 | |
| | | | | | | | |
| | | | Packaged Foods & Meats 2.9% | | | | |
| | 154,000 | | | Freshpet, Inc.* | | | 5,651,800 | |
| | 1,135,000 | | | Yihai International Holding Ltd. (China) | | | 2,580,748 | |
| | | | | | | | |
| | | | 8,232,548 | |
| | | | | |
| | | | Personal Products 0.7% | | | | |
| | 240,000 | | | Sarantis S.A. (Greece) | | | 2,067,599 | |
| | | | | | | | |
| | | | Pharmaceuticals 0.8% | | | | |
| | 109,000 | | | Intra-Cellular Therapies, Inc.* | | | 2,365,300 | |
| | | | | | | | |
| | | | Property & Casualty Insurance 0.9% | | | | |
| | 131,952 | | | Kingstone Cos., Inc. | | | 2,507,088 | |
| | | | | | | | |
| | | | Regional Banks 7.3% | | | | |
| | 148,000 | | | Blue Hills Bancorp, Inc. | | | 3,566,800 | |
| | 166,925 | | | Esquire Financial Holdings, Inc.* | | | 4,166,448 | |
| | 141,000 | | | First Western Financial, Inc.* | | | 2,466,090 | |
| | 98,000 | | | Investar Holding Corp. | | | 2,631,300 | |
| | 69,000 | | | People’s Utah Bancorp | | | 2,342,550 | |
| | 112,000 | | | SmartFinancial, Inc.* | | | 2,637,600 | |
| | 71,713 | | | Sound Financial Bancorp, Inc. | | | 2,836,249 | |
| | | | | | | | |
| | | | 20,647,037 | |
| | | | | |
| | | | Research & Consulting Services 0.7% | | | | |
| | 120,084 | | | IR Japan Holdings Ltd. (Japan) | | | 1,919,315 | |
| | | | | | | | |
| | | | Restaurants 2.0% | | | | |
| | 100,000 | | | Chuy’s Holdings, Inc.* | | | 2,625,000 | |
| | 109,000 | | | Fiesta Restaurant Group, Inc.* | | | 2,915,750 | |
| | | | | | | | |
| | | | 5,540,750 | |
| | | | | |
| | | | Semiconductors 3.1% | | | | |
| | 91,997 | | | Inphi Corp.* | | | 3,494,046 | |
| | 149,000 | | | MaxLinear, Inc., Class A* | | | 2,962,120 | |
| | 105,000 | | | Tower Semiconductor Ltd.* (Israel) | | | 2,284,800 | |
| | | | | | | | |
| | | | 8,740,966 | |
| | | | | |
| | | | Specialized Consumer Services 1.1% | | | | |
| | 295,644 | | | Select Interior Concepts, Inc.* | | | 3,148,609 | |
| | 8,643 | | | Tear Corp. (Japan) | | | 68,462 | |
| | | | | | | | |
| | | | 3,217,071 | |
| | | | | |
| | | | Specialty Chemicals 1.5% | | | | |
| | 181,000 | | | Ferro Corp.* | | | 4,202,820 | |
| | | | | | | | |
| | | | Systems Software 1.0% | | | | |
| | 140,000 | | | Minwise Co. Ltd. (Korea) | | | 2,883,931 | |
| | | | | | | | |
| | | | | | | | |
| Shares | | | | | Value | |
| | | | | | | |
| | | | Technology Hardware, Storage & Peripherals 1.8% | | | | |
| | 549,990 | | | One Stop Systems, Inc.* | | $ | 2,045,963 | |
| | 425,000 | | | USA Technologies, Inc.* | | | 3,060,000 | |
| | | | | | | | |
| | | | 5,105,963 | |
| | | | | |
| | | | Thrifts & Mortgage Finance 2.6% | | | | |
| | 78,000 | | | Axos Financial, Inc.* | | | 2,682,420 | |
| | 92,123 | | | Entegra Financial Corp.* | | | 2,445,866 | |
| | 290,000 | | | Mortgage Advice Bureau Holdings Ltd. (United Kingdom) | | | 2,222,558 | |
| | | | | | | | |
| | | | 7,350,844 | |
| | | | | |
| | | | Trading Companies & Distributors 1.6% | | | | |
| | 161,000 | | | Hardwoods Distribution, Inc. (Canada) | | | 2,131,460 | |
| | 32,000 | | | SiteOne Landscape Supply, Inc.* | | | 2,410,880 | |
| | | | | | | | |
| | | | 4,542,340 | |
| | | | | |
| | | | Water Utilities 0.5% | | | | |
| | 138,233 | | | Global Water Resources, Inc. | | | 1,463,887 | |
| | | | | | | | |
| | |
| | | | Total Common Stocks
(cost $178,991,524) | | | 260,943,177 | |
| | | | | | | | |
| | |
| | | | CONVERTIBLE PREFERRED STOCKS 0.7% | | | | |
| | |
| | | | Oil & Gas Refining & Marketing 0.7% | | | | |
| | 598,406 | | | Vertex Energy, Inc., Pfd., 6.00% PIK, Series B*** † | | | 1,855,059 | |
| | | | | | | | |
| | |
| | | | Total Convertible Preferred Stocks
(cost $1,760,059) | | | 1,855,059 | |
| | | | | | | | |
| | |
| | | | RIGHTS 0.1% | | | | |
| | |
| | | | Pharmaceuticals 0.1% | | | | |
| | 1 | | | Acetylon Pharmaceuticals, Inc.* *** † | | | 326,356 | |
| | 1 | | | Acetylon Pharmaceuticals, Inc.* *** † | | | — | |
| | | | | | | | |
| | | | 326,356 | |
| | | | | |
| | |
| | | | Total Rights
(cost $0) | | | 326,356 | |
| | | | | | | | |
| | |
| | | | LIMITED LIABILITY COMPANY MEMBERSHIP INTEREST 0.0% | | | | |
| | |
| | | | Pharmaceuticals 0.0% | | | | |
| | 50,528 | | | Regenacy Pharmaceuticals, LLC* *** † | | | 44,465 | |
| | | | | | | | |
| | |
| | | | Total Limited Liability Company Membership Interest
(cost $30,001) | | | 44,465 | |
| | | | | | | | |
| | |
| | | | WARRANTS 0.0% | | | | |
| | |
| | | | Oil & Gas Refining & Marketing 0.0% | | | | |
| | 250,000 | | | Vertex Energy, Inc., expiring 12/24/2020* *** † | | | 40,000 | |
| | | | | | | | |
| | |
| | | | Total Warrants
(cost $95,000) | | | 40,000 | |
| | | | | | | | |
60
| | | | | | | | |
Principal
Amount | | | | | Value | |
| | | | | | | |
| | | | SHORT-TERM INVESTMENTS 7.7% | | | | |
| | |
| | | | Repurchase Agreement 7.7% | | | | |
| | $21,952,092 | | | Repurchase Agreement dated 9/28/18, 0.42% due 10/1/18 with Fixed Income Clearing Corp. collateralized by $15,315,000 of United States Treasury Notes 2.375% due 1/15/25; value: $22,394,374; repurchase proceeds: $21,952,861 (cost $21,952,092) | | $ | 21,952,092 | |
| | | | | | | | |
| | |
| | | | Total Short-Term Investments
(cost $21,952,092) | | | 21,952,092 | |
| | | | | | | | |
| | |
| | | | Total Investments
(cost $202,828,676) 100.5% | | | 285,161,149 | |
| | |
| | | | Liabilities less Other Assets (0.5%) | | | (1,538,163 | ) |
| | | | | | | | |
| | |
| | | | NET ASSETS 100.0% | | $ | 283,622,986 | |
| | | | | | | | |
| |
| | | | *Non-income producing. ***Security was fair valued under procedures adopted by the Board of Trustees (see Note 12). †Security purchased in a private placement transaction or under Rule 144A of the Securities Act of 1933 (see Note 9). PIK Payment In Kind. REIT Real Estate Investment Trust. See Notes to Financial Statements. | |
At September 30, 2018, Wasatch Micro Cap Value Fund’s investments, excluding short-term investments, were in the following countries (unaudited):
| | | | |
| Country | | % | |
Argentina | | | 1.0 | |
Australia | | | 1.0 | |
Canada | | | 0.8 | |
China | | | 1.0 | |
Egypt | | | 0.4 | |
France | | | 1.1 | |
Germany | | | 1.2 | |
Greece | | | 0.8 | |
India | | | 0.8 | |
Israel | | | 0.9 | |
Japan | | | 1.6 | |
Korea | | | 1.1 | |
Mexico | | | 0.7 | |
Norway | | | 0.5 | |
United Kingdom | | | 3.7 | |
United States | | | 83.4 | |
| | | | |
TOTAL | | | 100.0 | % |
| | | | |
61
| | |
| WASATCH SMALL CAP GROWTH FUND (WAAEX / WIAEX) | | |
|
|
|
Schedule of Investments
| | | | | | | | |
| Shares | | | | | Value | |
| | | | | | | |
| | | | COMMON STOCKS 98.4% | | | | |
| | |
| | | | Aerospace & Defense 3.7% | | | | |
| | 913,092 | | | HEICO Corp., Class A | | $ | 68,938,446 | |
| | | | | | | | |
| | | | Air Freight & Logistics 1.4% | | | | |
| | 23,549,523 | | | Aramex PJSC (United Arab Emirates) | | | 26,479,589 | |
| | | | | | | | |
| | | | Airlines 1.3% | | | | |
| | 186,914 | | | Allegiant Travel Co. | | | 23,700,695 | |
| | | | | | | | |
| | | | Application Software 10.6% | | | | |
| | 571,407 | | | Globant S.A.* (Argentina) | | | 33,707,299 | |
| | 208,962 | | | HubSpot, Inc.* | | | 31,542,814 | |
| | 592,022 | | | Paylocity Holding Corp.* | | | 47,551,207 | |
| | 155,150 | | | Ultimate Software Group, Inc. (The)* | | | 49,987,778 | |
| | 513,310 | | | Zendesk, Inc.* | | | 36,445,010 | |
| | | | | | | | |
| | | | 199,234,108 | |
| | | | | |
| | | | Automotive Retail 2.6% | | | | |
| | 692,677 | | | Monro, Inc. | | | 48,210,319 | |
| | | | | | | | |
| | | | Biotechnology 7.9% | | | | |
| | 2,039,033 | | | Abcam plc (United Kingdom) | | | 38,057,924 | |
| | 452,531 | | | Bellicum Pharmaceuticals, Inc.* | | | 2,787,591 | |
| | 1,055,554 | | | ChemoCentryx, Inc.* | | | 13,342,203 | |
| | 629,778 | | | Cytokinetics, Inc.* | | | 6,203,313 | |
| | 227,128 | | | Esperion Therapeutics, Inc.* | | | 10,077,670 | |
| | 375,802 | | | Exact Sciences Corp.* | | | 29,658,294 | |
| | 369,654 | | | Flexion Therapeutics, Inc.* | | | 6,916,226 | |
| | 1,922,804 | | | Inovio Pharmaceuticals, Inc.* | | | 10,690,790 | |
| | 537,687 | | | MacroGenics, Inc.* | | | 11,528,009 | |
| | 1,176,257 | | | Sangamo Therapeutics, Inc.* | | | 19,937,556 | |
| | | | | | | | |
| | | | 149,199,576 | |
| | | | | |
| | | | Building Products 1.8% | | | | |
| | 910,410 | | | AAON, Inc. | | | 34,413,498 | |
| | | | | | | | |
| | | | Data Processing & Outsourced Services 3.9% | | | | |
| | 733,761 | | | Euronet Worldwide, Inc.* | | | 73,537,527 | |
| | | | | | | | |
| | | | Diversified Support Services 4.0% | | | | |
| | 775,541 | | | Copart, Inc.* | | | 39,963,628 | |
| | 850,392 | | | Healthcare Services Group, Inc. | | | 34,542,923 | |
| | | | | | | | |
| | | | 74,506,551 | |
| | | | | |
| | | | General Merchandise Stores 3.4% | | | | |
| | 671,752 | | | Ollie’s Bargain Outlet Holdings, Inc.* | | | 64,555,367 | |
| | | | | | | | |
| | | | Health Care Distributors 1.2% | | | | |
| | 586,600 | | | PetIQ, Inc.* | | | 23,059,246 | |
| | | | | | | | |
| | | | Health Care Equipment 4.3% | | | | |
| | 544,165 | | | Cantel Medical Corp. | | | 50,095,830 | |
| | 294,883 | | | Insulet Corp.* | | | 31,242,854 | |
| | | | | | | | |
| | | | 81,338,684 | |
| | | | | |
| | | | Health Care Facilities 2.6% | | | | |
| | 1,309,231 | | | Ensign Group, Inc. (The) | | | 49,646,039 | |
| | | | | | | | |
| | | | Health Care Supplies 2.0% | | | | |
| | 514,566 | | | Neogen Corp.* | | | 36,806,906 | |
| | | | | | | | |
| | | | Homebuilding 1.0% | | | | |
| | 391,177 | | | LGI Homes, Inc.* | | | 18,557,437 | |
| | | | | | | | |
| | | | Industrial Machinery 8.1% | | | | |
| | 886,878 | | | Barnes Group, Inc. | | | 62,994,945 | |
| | 380,687 | | | RBC Bearings, Inc.* | | | 57,240,097 | |
| | 606,153 | | | Sun Hydraulics Corp. | | | 33,205,061 | |
| | | | | | | | |
| | | | 153,440,103 | |
| | | | | |
| | | | | | | | |
| Shares | | | | | Value | |
| | | | | | | |
| | | | Interactive Media & Services 5.4% | | | | |
| | 842,451 | | | DocuSign, Inc. — Restricted Shares* *** † | | $ | 42,754,388 | |
| | 646,978 | | | Envestnet, Inc.* | | | 39,433,309 | |
| | 436,521 | | | Five9, Inc.* | | | 19,071,603 | |
| | | | | | | | |
| | | | 101,259,300 | |
| | | | | |
| | | | Internet & Direct Marketing Retail 0.8% | | | | |
| | 105,165 | | | Wayfair, Inc., Class A* | | | 15,529,716 | |
| | | | | | | | |
| | | | IT Consulting & Other Services 1.4% | | | | |
| | 397,953 | | | InterXion Holding N.V.* (Netherlands) | | | 26,782,237 | |
| | | | | | | | |
| | | | Life Sciences Tools & Services 3.4% | | | | |
| | 418,185 | | | ICON plc* (Ireland) | | | 64,295,944 | |
| | | | | | | | |
| | | | Managed Health Care 2.1% | | | | |
| | 425,995 | | | HealthEquity, Inc.* | | | 40,218,188 | |
| | | | | | | | |
| | | | Pharmaceuticals 0.9% | | | | |
| | 769,967 | | | Intra-Cellular Therapies, Inc.* | | | 16,708,284 | |
| | | | | | | | |
| | | | Real Estate Services 0.5% | | | | |
| | 210,726 | | | HFF, Inc., Class A | | | 8,951,640 | |
| | | | | | | | |
| | | | Regional Banks 6.0% | | | | |
| | 694,847 | | | Eagle Bancorp, Inc.* | | | 35,159,258 | |
| | 925,237 | | | Metro Bank plc* (United Kingdom) | | | 35,865,078 | |
| | 370,208 | | | Pinnacle Financial Partners, Inc. | | | 22,268,011 | |
| | 248,733 | | | Texas Capital Bancshares, Inc.* | | | 20,557,783 | |
| | | | | | | | |
| | | | 113,850,130 | |
| | | | | |
| | | | Restaurants 3.6% | | | | |
| | 788,112 | | | Chuy’s Holdings, Inc.* | | | 20,687,940 | |
| | 726,602 | | | Fiesta Restaurant Group, Inc.* | | | 19,436,604 | |
| | 438,111 | | | Shake Shack, Inc., Class A* | | | 27,605,374 | |
| | | | | | | | |
| | | | 67,729,918 | |
| | | | | |
| | | | Semiconductors 1.9% | | | | |
| | 285,900 | | | Monolithic Power Systems, Inc. | | | 35,889,027 | |
| | | | | | | | |
| | | | Specialty Stores 4.0% | | | | |
| | 364,245 | | | Five Below, Inc.* | | | 47,373,705 | |
| | 613,793 | | | National Vision Holdings, Inc.* | | | 27,706,616 | |
| | | | | | | | |
| | | | 75,080,321 | |
| | | | | |
| | | | Systems Software 5.5% | | | | |
| | 351,295 | | | CyberArk Software Ltd.* (Israel) | | | 28,047,393 | |
| | 275,835 | | | Proofpoint, Inc.* | | | 29,329,535 | |
| | 814,476 | | | Rapid7, Inc.* | | | 30,070,454 | |
| | 215,081 | | | Varonis Systems, Inc.* | | | 15,754,683 | |
| | | | | | | | |
| | | | 103,202,065 | |
| | | | | |
| | | | Trading Companies & Distributors 1.5% | | | | |
| | 381,996 | | | SiteOne Landscape Supply, Inc.* | | | 28,779,579 | |
| | | | | | | | |
| | | | Trucking 1.6% | | | | |
| | 875,309 | | | Knight-Swift Transportation Holdings, Inc. | | | 30,180,654 | |
| | | | | | | | |
| | |
| | | | Total Common Stocks
(cost $1,110,275,649) | | | 1,854,081,094 | |
| | | | | | | | |
62
| | | | | | | | |
Shares | | | | | Value | |
| | | | | | | |
| | | | PREFERRED STOCKS 0.6% | | | | |
| | |
| | | | Biotechnology 0.0% | | | | |
| | 677,966 | | | Nanosys, Inc., Series D Pfd.* *** † | | $ | 183,051 | |
| | 161,519 | | | Nanosys, Inc., Series E Pfd.* *** † | | | 167,980 | |
| | | | | | | | |
| | | | 351,031 | |
| | | | | |
| | | | Systems Software 0.6% | | | | |
| | 1,114,610 | | | DataStax, Inc., Series E Pfd.* *** † | | | 11,179,538 | |
| | | | | | | | |
| | |
| | | | Total Preferred Stocks
(cost $10,184,941) | | | 11,530,569 | |
| | | | | | | | |
| | |
| | | | SELLER’S NOTE 0.1% | | | | |
| | |
| | | | Oil & Gas Equipment & Services 0.1% | | | | |
| | 1,728,000 | | | Drilling Info Holdings, Inc., 7.25%*** † | | | 1,728,000 | �� |
| | | | | | | | |
| | |
| | | | Total Seller’s Note
(cost $659,150) | | | 1,728,000 | |
| | | | | | | | |
| | |
| | | | LIMITED PARTNERSHIP INTEREST 0.1% | | | | |
| | |
| | | | Asset Management & Custody Banks 0.1% | | | | |
| | 1 | | | Greenspring Global Partners II-B, L.P.* *** † | | | 1,830,415 | |
| | 1 | | | Greenspring Global Partners III-B, L.P.* *** † | | | 1,017,825 | |
| | | | | | | | |
| | | | 2,848,240 | |
| | | | | |
| | |
| | | | Total Limited Partnership Interest
(cost $2,475,523) | | | 2,848,240 | |
| | | | | | | | |
| | | | | | | | |
Principal
Amount | | | | | Value | |
| | | | | | | |
| | | | SHORT-TERM INVESTMENTS 1.4% | | | | |
| | |
| | | | Repurchase Agreement 1.4% | | | | |
| | $26,729,494 | | | Repurchase Agreement dated 9/28/18, 0.42% due 10/1/18 with Fixed Income Clearing Corp. collateralized by $6,880,000 of United States Treasury Notes 2.375% due 1/15/25; value: $10,060,287; $13,860,000 of United States Treasury Notes 0.250% due 1/15/25; value: $14,160,748; $3,230,000 of United States Treasury Notes 2.000% due 2/15/25; value: $3,049,126; repurchase proceeds: $26,730,430 (cost $26,729,494) | | $ | 26,729,494 | |
| | | | | | | | |
| | |
| | | | Total Short-Term Investments
(cost $26,729,494) | | | 26,729,494 | |
| | | | | | | | |
| | |
| | | | Total Investments
(cost $1,150,324,757) 100.6% | | | 1,896,917,397 | |
| | |
| | | | Liabilities less Other Assets (0.6%) | | | (11,924,887 | ) |
| | | | | | | | |
| | |
| | | | NET ASSETS 100.0% | | $ | 1,884,992,510 | |
| | | | | | | | |
| |
| | | | *Non-income producing. ***Security was fair valued under procedures adopted by the Board of Trustees (see Note 12). †Security purchased in a private placement transaction or under Rule 144A of the Securities Act of 1933 (see Note 9). See Notes to Financial Statements. | |
At September 30, 2018, Wasatch Small Cap Growth Fund’s investments, excluding short-term investments, were in the following countries (unaudited):
| | | | |
| Country | | % | |
Argentina | | | 1.8 | |
Ireland | | | 3.4 | |
Israel | | | 1.5 | |
Netherlands | | | 1.4 | |
United Arab Emirates | | | 1.4 | |
United Kingdom | | | 4.0 | |
United States | | | 86.5 | |
| | | | |
TOTAL | | | 100.0 | % |
| | | | |
63
| | |
| WASATCH SMALL CAP VALUE FUND (WMCVX / WICVX) | | |
|
|
|
Schedule of Investments
| | | | | | | | |
| Shares | | | | | Value | |
| | | | | | | |
| | | | COMMON STOCKS 98.2% | | | | |
| | |
| | | | Aerospace & Defense 2.6% | | | | |
| | 149,788 | | | HEICO Corp., Class A | | $ | 11,308,994 | |
| | | | | | | | |
| | | | Airlines 2.2% | | | | |
| | 29,208 | | | Allegiant Travel Co. | | | 3,703,574 | |
| | 76,137 | | | Copa Holdings S.A., Class A | | | 6,078,778 | |
| | | | | | | | |
| | | | | | | 9,782,352 | |
| | | | | | | | |
| | | | Application Software 1.3% | | | | |
| | 72,937 | | | Ebix, Inc. | | | 5,772,964 | |
| | | | | | | | |
| | | | Asset Management & Custody Banks 1.9% | | | | |
| | 189,785 | | | Hamilton Lane, Inc., Class A | | | 8,403,680 | |
| | | | | | | | |
| | | | Auto Parts & Equipment 3.2% | | | | |
| | 181,566 | | | Dorman Products, Inc.* | | | 13,966,057 | |
| | | | | | | | |
| | | | Automotive Retail 8.0% | | | | |
| | 438,695 | | | Camping World Holdings, Inc., Class A | | | 9,352,977 | |
| | 80,206 | | | Lithia Motors, Inc., Class A | | | 6,549,622 | |
| | 279,508 | | | Monro, Inc. | | | 19,453,757 | |
| | | | | | | | |
| | | | | | | 35,356,356 | |
| | | | | | | | |
| | | | Commercial Printing 2.0% | | | | |
| | 63,202 | | | Cimpress N.V.* | | | 8,634,025 | |
| | | | | | | | |
| | | | Consumer Electronics 1.9% | | | | |
| | 574,483 | | | ZAGG, Inc.* | | | 8,473,624 | |
| | | | | | | | |
| | | | Consumer Finance 2.0% | | | | |
| | 19,739 | | | Credit Acceptance Corp.* | | | 8,647,064 | |
| | | | | | | | |
| | | | Data Processing & Outsourced Services 5.0% | | | | |
| | 218,631 | | | Euronet Worldwide, Inc.* | | | 21,911,199 | |
| | | | | | | | |
| | | | Diversified Banks 1.0% | | | | |
| | 1,786,639 | | | City Union Bank Ltd. (India) | | | 4,318,101 | |
| | | | | | | | |
| | | | Diversified Support Services 1.6% | | | | |
| | 138,444 | | | Copart, Inc.* | | | 7,134,019 | |
| | | | | | | | |
| | | | Electronic Manufacturing Services 2.5% | | | | |
| | 239,663 | | | Fabrinet* | | | 11,086,810 | |
| | | | | | | | |
| | | | Health Care Facilities 3.1% | | | | |
| | 361,389 | | | Ensign Group, Inc. (The) | | | 13,703,871 | |
| | | | | | | | |
| | | | Health Care REITs 1.5% | | | | |
| | 280,997 | | | Sabra Health Care REIT, Inc. | | | 6,496,651 | |
| | | | | | | | |
| | | | Health Care Services 2.6% | | | | |
| | 108,799 | | | LHC Group, Inc.* | | | 11,205,209 | |
| | | | | | | | |
| | | | Home Furnishing Retail 1.2% | | | | |
| | 142,652 | | | Sleep Number Corp.* | | | 5,246,741 | |
| | | | | | | | |
| | | | Home Furnishings 0.6% | | | | |
| | 99,222 | | | Lovesac Co. (The)* | | | 2,478,566 | |
| | | | | | | | |
| | | | Homebuilding 1.2% | | | | |
| | 113,741 | | | LGI Homes, Inc.* | | | 5,395,873 | |
| | | | | | | | |
| | | | Hotel & Resort REITs 2.0% | | | | |
| | 660,816 | | | Summit Hotel Properties, Inc. | | | 8,940,840 | |
| | | | | | | | |
| | | | Industrial Machinery 6.9% | | | | |
| | 303,290 | | | Altra Industrial Motion Corp. | | | 12,525,877 | |
| | 163,873 | | | Kadant, Inc. | | | 17,673,703 | |
| | | | | | | | |
| | | | | | | 30,199,580 | |
| | | | | | | | |
| | | | Industrial REITs 2.6% | | | | |
| | 693,595 | | | Monmouth Real Estate Investment Corp. | | | 11,596,908 | |
| | | | | | | | |
| | | | | | | | |
| Shares | | | | | Value | |
| | | | | | | |
| | | | Internet Retail 1.1% | | | | |
| | 21,444 | | | Stamps.com, Inc.* | | $ | 4,850,633 | |
| | | | | | | | |
| | | | IT Consulting & Other Services 1.9% | | | | |
| | 406,166 | | | Hackett Group, Inc. (The) | | | 8,184,245 | |
| | | | | | | | |
| | | | Life Sciences Tools & Services 2.2% | | | | |
| | 62,939 | | | ICON plc* (Ireland) | | | 9,676,871 | |
| | | | | | | | |
| | | | Mortgage REITs 4.8% | | | | |
| | 1,414,761 | | | Arbor Realty Trust, Inc. | | | 16,241,457 | |
| | 651,792 | | | MFA Financial, Inc. | | | 4,790,671 | |
| | | | | | | | |
| | | | | | | 21,032,128 | |
| | | | | | | | |
| | | | Oil & Gas Equipment & Services 1.2% | | | | |
| | 158,472 | | | Oil States International, Inc.* | | | 5,261,270 | |
| | | | | | | | |
| | | | Oil & Gas Exploration & Production 1.9% | | | | |
| | 2,209,161 | | | Gran Tierra Energy, Inc.* (Colombia) | | | 8,438,995 | |
| | | | | | | | |
| | | | Personal Products 1.9% | | | | |
| | 98,729 | | | Nu Skin Enterprises, Inc., Class A | | | 8,137,244 | |
| | | | | | | | |
| | | | Property & Casualty Insurance 0.9% | | | | |
| | 388,948 | | | Atlas Financial Holdings, Inc.* | | | 3,908,927 | |
| | | | | | | | |
| | | | Regional Banks 9.4% | | | | |
| | 171,668 | | | FB Financial Corp. | | | 6,725,952 | |
| | 299,077 | | | First of Long Island Corp. (The) | | | 6,504,925 | |
| | 99,720 | | | Metropolitan Bank Holding Corp.* | | | 4,100,486 | |
| | 173,867 | | | People’s Utah Bancorp | | | 5,902,785 | |
| | 59,317 | | | Prosperity Bancshares, Inc. | | | 4,113,634 | |
| | 577,484 | | | Republic First Bancorp, Inc.* | | | 4,129,011 | |
| | 166,337 | | | Webster Financial Corp. | | | 9,807,229 | |
| | | | | | | | |
| | | | | | | 41,284,022 | |
| | | | | | | | |
| | | | Restaurants 0.3% | | | | |
| | 47,500 | | | Fiesta Restaurant Group, Inc.* | | | 1,270,625 | |
| | | | | | | | |
| | | | Semiconductors 1.1% | | | | |
| | 216,463 | | | Tower Semiconductor Ltd.* (Israel) | | | 4,710,235 | |
| | | | | | | | |
| | | | Specialized REITs 2.4% | | | | |
| | 420,873 | | | National Storage Affiliates Trust | | | 10,707,009 | |
| | | | | | | | |
| | | | Specialty Chemicals 3.0% | | | | |
| | 172,791 | | | Innospec, Inc. | | | 13,261,709 | |
| | | | | | | | |
| | | | Thrifts & Mortgage Finance 1.5% | | | | |
| | 189,227 | | | Axos Financial, Inc.* | | | 6,507,517 | |
| | | | | | | | |
| | | | Trading Companies & Distributors 1.9% | | | | |
| | 135,781 | | | WESCO International, Inc.* | | | 8,343,742 | |
| | | | | | | | |
| | | | Trucking 5.8% | | | | |
| | 561,148 | | | Knight-Swift Transportation Holdings, Inc. | | | 19,348,383 | |
| | 38,894 | | | Old Dominion Freight Line, Inc. | | | 6,272,047 | |
| | | | | | | | |
| | | | | | | 25,620,430 | |
| | | | | | | | |
| | |
| | | | Total Common Stocks
(cost $324,286,854) | | | 431,255,086 | |
| | | | | | | | |
64
| | | | | | | | |
Principal
Amount | | | | | Value | |
| | | | | | | |
| | | | SHORT-TERM INVESTMENTS 2.0% | | | | |
| | |
| | | | Repurchase Agreement 2.0% | | | | |
| | $8,769,310 | | | Repurchase Agreement dated 9/28/18,
0.42% due 10/1/18 with Fixed Income
Clearing Corp. collateralized by $6,120,000
of United States Treasury Notes 2.375%
due 1/15/25; value: $8,948,976; repurchase
proceeds: $8,769,617 (cost $8,769,310) | | $ | 8,769,310 | |
| | | | | | | | |
| | |
| | | | Total Short-Term Investments
(cost $8,769,310) | | | 8,769,310 | |
| | | | | | | | |
| | |
| | | | Total Investments
(cost $333,056,164) 100.2% | | | 440,024,396 | |
| | |
| | | | Liabilities less Other Assets (0.2%) | | | (869,584 | ) |
| | | | | | | | |
| | |
| | | | NET ASSETS 100.0% | | $ | 439,154,812 | |
| | | | | | | | |
| |
| | | | *Non-income producing. REIT Real Estate Investment Trust. See Notes to Financial Statements. | |
At September 30, 2018, Wasatch Small Cap Value Fund’s investments, excluding short-term investments, were in the following countries (unaudited):
| | | | |
| Country | | % | |
Colombia | | | 2.0 | |
India | | | 1.0 | |
Ireland | | | 2.2 | |
Israel | | | 1.1 | |
United States | | | 93.7 | |
| | | | |
TOTAL | | | 100.0 | % |
| | | | |
65
| | |
| WASATCH ULTRA GROWTH FUND (WAMCX) | | |
|
|
|
Schedule of Investments
| | | | | | | | |
| Shares | | | | | Value | |
| | | | | | | |
| | | | COMMON STOCKS 89.0% | | | | |
| | |
| | | | Application Software 9.6% | | | | |
| | 67,431 | | | Globant S.A.* (Argentina) | | $ | 3,977,755 | |
| | 36,435 | | | HubSpot, Inc.* | | | 5,499,863 | |
| | 105,128 | | | Paylocity Holding Corp.* | | | 8,443,881 | |
| | 17,814 | | | Ultimate Software Group, Inc. (The)* | | | 5,739,493 | |
| | 67,590 | | | Zendesk, Inc.* | | | 4,798,890 | |
| | | | | | | | |
| | | | 28,459,882 | |
| | | | | | | | |
| | | | Automotive Retail 1.2% | | | | |
| | 51,130 | | | Monro, Inc. | | | 3,558,648 | |
| | | | | | | | |
| | | | Biotechnology 12.2% | | | | |
| | 14,019 | | | Atara Biotherapeutics, Inc.* | | | 579,686 | |
| | 110,271 | | | Bellicum Pharmaceuticals, Inc.* | | | 679,269 | |
| | 194,837 | | | ChemoCentryx, Inc.* | | | 2,462,740 | |
| | 234,352 | | | Cytokinetics, Inc.* | | | 2,308,367 | |
| | 58,597 | | | Denali Therapeutics, Inc.* | | | 1,273,899 | |
| | 54,912 | | | Esperion Therapeutics, Inc.* | | | 2,436,445 | |
| | 86,167 | | | Exact Sciences Corp.* | | | 6,800,300 | |
| | 70,311 | | | Flexion Therapeutics, Inc.* | | | 1,315,519 | |
| | 661,183 | | | Inovio Pharmaceuticals, Inc.* | | | 3,676,177 | |
| | 106,131 | | | MacroGenics, Inc.* | | | 2,275,449 | |
| | 311,342 | | | MEI Pharma, Inc.* | | | 1,341,884 | |
| | 362,117 | | | Sangamo Therapeutics, Inc.* | | | 6,137,883 | |
| | 35,320 | | | Seattle Genetics, Inc.* | | | 2,723,878 | |
| | 90,868 | | | Selecta Biosciences, Inc.* | | | 1,412,997 | |
| | 76,676 | | | Unum Therapeutics, Inc.* | | | 789,763 | |
| | | | | | | | |
| | | | 36,214,256 | |
| | | | | | | | |
| | | | Building Products 2.9% | | | | |
| | 111,059 | | | AAON, Inc. | | | 4,198,030 | |
| | 56,086 | | | Trex Co., Inc.* | | | 4,317,500 | |
| | | | | | | | |
| | | | 8,515,530 | |
| | | | | | | | |
| | | | Construction & Engineering 1.0% | | | | |
| | 35,620 | | | NV5 Global, Inc.* | | | 3,088,254 | |
| | | | | | | | |
| | | | Department Stores 1.1% | | | | |
| | 93,092 | | | V-Mart Retail Ltd. (India) | | | 3,223,354 | |
| | | | | | | | |
| | | | Diversified Banks 1.7% | | | | |
| | 2,122,474 | | | City Union Bank Ltd. (India) | | | 5,129,776 | |
| | | | | | | | |
| | | | Diversified Support Services 1.5% | | | | |
| | 107,871 | | | Healthcare Services Group, Inc. | | | 4,381,720 | |
| | | | | | | | |
| | | | Electronic Equipment & Instruments 0.7% | | | | |
| | 90,536 | | | nLight, Inc.* | | | 2,010,805 | |
| | | | | | | | |
| | | | Electronic Manufacturing Services 1.2% | | | | |
| | 23,748 | | | IPG Photonics Corp.* | | | 3,706,350 | |
| | | | | | | | |
| | | | Environmental & Facilities Services 1.2% | | | | |
| | 45,481 | | | Waste Connections, Inc. | | | 3,628,019 | |
| | | | | | | | |
| | | | General Merchandise Stores 1.2% | | | | |
| | 36,801 | | | Ollie’s Bargain Outlet Holdings, Inc.* | | | 3,536,576 | |
| | | | | | | | |
| | | | Health Care Equipment 7.0% | | | | |
| | 119,370 | | | AtriCure, Inc.* | | | 4,181,531 | |
| | 69,282 | | | Glaukos Corp.* | | | 4,496,402 | |
| | 38,052 | | | Insulet Corp.* | | | 4,031,609 | |
| | 215,612 | | | Oxford Immunotec Global plc* | | | 3,499,383 | |
| | 109,980 | | | Tandem Diabetes Care, Inc.* | | | 4,711,543 | |
| | | | | | | | |
| | | | 20,920,468 | |
| | | | | | | | |
| | | | Health Care Services 0.5% | | | | |
| | 103,297 | | | Dr. Lal PathLabs Ltd. (India) | | | 1,347,749 | |
| | | | | | | | |
| | | | | | | | |
| Shares | | | | | Value | |
| | | | | | | |
| | | | Health Care Technology 1.7% | | | | |
| | 34,583 | | | Inspire Medical Systems, Inc.* | | $ | 1,455,253 | |
| | 34,090 | | | Veeva Systems, Inc., Class A* | | | 3,711,378 | |
| | | | | | | | |
| | | | 5,166,631 | |
| | | | | | | | |
| | | | Heavy Electrical Equipment 1.8% | | | | |
| | 190,778 | | | TPI Composites, Inc.* | | | 5,446,712 | |
| | | | | | | | |
| | | | Homebuilding 1.2% | | | | |
| | 75,168 | | | LGI Homes, Inc.* | | | 3,565,970 | |
| | | | | | | | |
| | | | Industrial Machinery 4.2% | | | | |
| | 54,105 | | | Barnes Group, Inc. | | | 3,843,078 | |
| | 188,985 | | | Kornit Digital Ltd.* (Israel) | | | 4,138,771 | |
| | 28,009 | | | Proto Labs, Inc.* | | | 4,530,456 | |
| | | | | | | | |
| | | | 12,512,305 | |
| | | | | | | | |
| | | | Industrial REITs 1.7% | | | | |
| | 303,665 | | | Monmouth Real Estate Investment Corp. | | | 5,077,279 | |
| | | | | | | | |
| | | | Interactive Media & Services 4.3% | | | | |
| | 266,623 | | | Box, Inc., Class A* | | | 6,374,956 | |
| | 28,166 | | | DocuSign, Inc.* | | | 1,480,687 | |
| | 140,333 | | | Instructure, Inc.* | | | 4,967,788 | |
| | | | | | | | |
| | | | 12,823,431 | |
| | | | | | | | |
| | | | Internet & Direct Marketing Retail 2.1% | | | | |
| | 56,664 | | | MakeMyTrip Ltd.* (India) | | | 1,555,427 | |
| | 24,572 | | | Wayfair, Inc., Class A* | | | 3,628,547 | |
| | 6,224 | | | zooplus AG* (Germany) | | | 1,081,789 | |
| | | | | | | | |
| | | | 6,265,763 | |
| | | | | | | | |
| | | | IT Consulting & Other Services 1.4% | | | | |
| | 60,048 | | | InterXion Holding N.V.* (Netherlands) | | | 4,041,230 | |
| | | | | | | | |
| | | | Managed Health Care 1.3% | | | | |
| | 41,032 | | | HealthEquity, Inc.* | | | 3,873,831 | |
| | | | | | | | |
| | | | Oil & Gas Equipment & Services 1.0% | | | | |
| | 23,468 | | | Oil States International, Inc.* | | | 779,138 | |
| | 111,486 | | | Solaris Oilfield Infrastructure, Inc.* | | | 2,105,970 | |
| | | | | | | | |
| | | | 2,885,108 | |
| | | | | | | | |
| | | | Packaged Foods & Meats 2.2% | | | | |
| | 176,991 | | | Freshpet, Inc.* | | | 6,495,570 | |
| | | | | | | | |
| | | | Pharmaceuticals 2.2% | | | | |
| | 143,888 | | | Aquestive Therapeutics, Inc.* | | | 2,519,479 | |
| | 460,622 | | | Cocrystal Pharma, Inc.* | | | 1,151,555 | |
| | 126,729 | | | Intra-Cellular Therapies, Inc.* | | | 2,750,019 | |
| | | | | | | | |
| | | | 6,421,053 | |
| | | | | | | | |
| | | | Regional Banks 7.7% | | | | |
| | 72,055 | | | Bank OZK | | | 2,735,208 | |
| | 110,478 | | | Eagle Bancorp, Inc.* | | | 5,590,187 | |
| | 106,499 | | | Esquire Financial Holdings, Inc.* | | | 2,658,215 | |
| | 163,269 | | | Metro Bank plc* (United Kingdom) | | | 6,328,816 | |
| | 55,358 | | | Pinnacle Financial Partners, Inc. | | | 3,329,784 | |
| | 327,859 | | | Republic First Bancorp, Inc.* | | | 2,344,192 | |
| | | | | | | | |
| | | | 22,986,402 | |
| | | | | | | | |
| | | | Restaurants 2.5% | | | | |
| | 131,986 | | | Chuy’s Holdings, Inc.* | | | 3,464,633 | |
| | 253,920 | | | Habit Restaurants, Inc. (The)* | | | 4,050,024 | |
| | | | | | | | |
| | | | 7,514,657 | |
| | | | | | | | |
| | | | Semiconductors 3.9% | | | | |
| | 41,639 | | | Ambarella, Inc.* | | | 1,610,596 | |
| | 99,572 | | | Inphi Corp.* | | | 3,781,745 | |
| | 37,973 | | | Monolithic Power Systems, Inc. | | | 4,766,751 | |
| | 12,733 | | | NVE Corp. | | | 1,348,170 | |
| | | | | | | | |
| | | | 11,507,262 | |
| | | | | | | | |
66
| | | | | | | | |
Shares | | | | | Value | |
| | | | | | | |
| | | | Specialty Chemicals 1.2% | | | | |
| | 32,822 | | | Balchem Corp. | | $ | 3,679,018 | |
| | | | | | | | |
| | | | Specialty Stores 1.1% | | | | |
| | 25,180 | | | Five Below, Inc.* | | | 3,274,911 | |
| | | | | | | | |
| | | | Systems Software 2.2% | | | | |
| | 35,635 | | | Proofpoint, Inc.* | | | 3,789,070 | |
| | 74,440 | | | Tenable Holdings, Inc.* | | | 2,894,227 | |
| | | | | | | | |
| | | | 6,683,297 | |
| | | | | | | | |
| | | | Trucking 2.3% | | | | |
| | 197,409 | | | Knight-Swift Transportation Holdings, Inc. | | | 6,806,662 | |
| | | | | | | | |
| | |
| | | | Total Common Stocks
(cost $197,795,156) | | | 264,748,479 | |
| | | | | | | | |
| | |
| | | | LIMITED PARTNERSHIP INTEREST 0.9% | | | | |
| | | | Asset Management & Custody Banks 0.9% | | | | |
| | 1 | | | Greenspring Global Partners II-B, L.P.* *** † | | | 1,647,368 | |
| | 1 | | | Greenspring Global Partners III-B, L.P.* *** † | | | 1,017,825 | |
| | | | | | | | |
| | | | 2,665,193 | |
| | | | | | | | |
| | |
| | | | Total Limited Partnership Interest
(cost $2,290,979) | | | 2,665,193 | |
| | | | | | | | |
| | |
| | | | PREFERRED STOCKS 0.0% | | | | |
| | | | Biotechnology 0.0% | | | | |
| | 169,492 | | | Nanosys, Inc., Series D Pfd.* *** † | | | 45,763 | |
| | 40,380 | | | Nanosys, Inc., Series E Pfd.* *** † | | | 41,995 | |
| | | | | | | | |
| | | | 87,758 | |
| | | | | | | | |
| | |
| | | | Total Preferred Stocks
(cost $546,236) | | | 87,758 | |
| | | | | | | | |
| | |
| | | | SELLER’S NOTE 0.1% | | | | |
| | | | Oil & Gas Equipment & Services 0.1% | | | | |
| | 132,000 | | | Drilling Info Holdings, Inc., 7.25%*** † | | | 132,000 | |
| | | | | | | | |
| | |
| | | | Total Seller’s Note
(cost $49,502) | | | 132,000 | |
| | | | | | | | |
| | | | | | | | |
Principal
Amount | | | | | Value | |
| | | | | | | |
| | | | SHORT-TERM INVESTMENTS 9.9% | | | | |
| | |
| | | | Repurchase Agreement 9.9% | | | | |
| | $29,580,653 | | | Repurchase Agreement dated 9/28/18, 0.42% due 10/1/18 with Fixed Income Clearing Corp. collateralized by $20,635,000 of United States Treasury Notes 2.375% due 1/15/25; value: $30,173,549; repurchase proceeds: $29,581,689 (cost $29,580,653) | | $ | 29,580,653 | |
| | | | | | | | |
| | |
| | | | Total Short-Term Investments
(cost $29,580,653) | | | 29,580,653 | |
| | | | | | | | |
| | |
| | | | Total Investments
(cost $230,262,526) 99.9% | | | 297,214,083 | |
| | |
| | | | Other Assets less Liabilities 0.1% | | | 347,866 | |
| | | | | | | | |
| | |
| | | | NET ASSETS 100.0% | | $ | 297,561,949 | |
| | | | | | | | |
| |
| | | | *Non-income producing. ***Security was fair valued under procedures adopted by the Board of Trustees (see Note 12). †Security purchased in a private placement transaction or under Rule 144A of the Securities Act of 1933 (see Note 9). See Notes to Financial Statements. | |
At September 30, 2018, Wasatch Ultra Growth Fund’s investments, excluding short-term investments, were in the following countries (unaudited):
| | | | |
| Country | | % | |
Argentina | | | 1.5 | |
Germany | | | 0.4 | |
India | | | 4.2 | |
Israel | | | 1.5 | |
Netherlands | | | 1.5 | |
United Kingdom | | | 2.4 | |
United States | | | 88.5 | |
| | | | |
TOTAL | | | 100.0 | % |
| | | | |
67
| | |
| WASATCH-HOISINGTON U.S. TREASURY FUND (WHOSX) | | SEPTEMBER 30, 2018 |
|
|
|
Schedule of Investments
| | | | | | | | |
Principal
Amount | | | | | Value | |
| | | | U.S. GOVERNMENT OBLIGATIONS 99.7% | | | | |
| | |
| $ | 7,000,000 | | | U.S. Treasury Bond, 3.00%, 8/15/48 | | $ | 6,736,680 | |
| | 116,800,000 | | | U.S. Treasury Bond, 2.25%, 8/15/46 | | | 96,451,250 | |
| | 52,250,000 | | | U.S. Treasury Bond, 2.50%, 2/15/45 | | | 45,761,611 | |
| | 8,000,000 | | | U.S. Treasury Bond, 3.125%, 8/15/44 | | | 7,899,688 | |
| | 14,100,000 | | | U.S. Treasury Bond, 3.75%, 11/15/43 | | | 15,438,949 | |
| | 39,000,000 | | | U.S. Treasury Strip, principal only,
8/15/40 | | | 19,572,950 | |
| | 81,000,000 | | | U.S. Treasury Strip, principal only,
5/15/44 | | | 35,851,007 | |
| | 175,700,000 | | | U.S. Treasury Strip, principal only,
8/15/45 | | | 74,686,032 | |
| | | | | | | | |
| | |
| | | | Total U.S. Government Obligations
(cost $339,846,018) | | | 302,398,167 | |
| | | | | | | | |
| | | | | | | | |
Principal
Amount | | | | | Value | |
| | |
| | | | SHORT-TERM INVESTMENTS 0.2% | | | | |
| | |
| | | | Repurchase Agreement 0.2% | | | | |
| | $ 503,311 | | | Repurchase Agreement dated 9/28/18, 0.42% due 10/1/18 with Fixed Income Clearing Corp. collateralized by $355,000 of United States Treasury Notes 2.375% due 1/15/25; value: $519,099; repurchase proceeds: $503,329 (cost $503,311) | | $ | 503,311 | |
| | | | | | | | |
| | |
| | | | Total Short-Term Investments
(cost $503,311) | | | 503,311 | |
| | | | | | | | |
| | |
| | | | Total Investments
(cost $340,349,329) 99.9% | | | 302,901,478 | |
| | |
| | | | Other Assets less Liabilities 0.1% | | | 203,946 | |
| | | | | | | | |
| | |
| | | | NET ASSETS 100.0% | | $ | 303,105,424 | |
| | | | | | | | |
| |
| | | | See Notes to Financial Statements. | |
68
(This page intentionally left blank.)
69
Statements of Assets and Liabilities
| | | | | | | | | | | | |
| | | CORE
GROWTH FUND | | | EMERGING INDIA
FUND | | | EMERGING
MARKETS
SELECT
FUND | |
| | | | | | | | | | | | |
Assets: | | | | | | | | | | | | |
Investments, at cost | | | | | | | | | | | | |
Unaffiliated issuers | | $ | 1,388,514,530 | | | $ | 197,794,802 | | | $ | 37,240,318 | |
Repurchase agreements | | | 27,036,867 | | | | — | | | | 457,817 | |
| | | | | | | | | | | | |
| | $ | 1,415,551,397 | | | $ | 197,794,802 | | | $ | 37,698,135 | |
| | | | | | | | | | | | |
Investments, at market value | | | | | | | | | | | | |
Unaffiliated issuers | | $ | 2,251,433,510 | | | $ | 228,142,443 | | | $ | 43,451,197 | |
Repurchase agreements | | | 27,036,867 | | | | — | | | | 457,817 | |
| | | | | | | | | | | | |
| | | 2,278,470,377 | | | | 228,142,443 | | | | 43,909,014 | |
Cash | | | 1,955,503 | | | | — | | | | — | |
Foreign currency on deposit (cost of $0, $5,181,530, $0, $841,478,
$174,065, $13,882, $1,575,399 and $438,546, respectively) | | | — | | | | 5,179,587 | | | | — | |
Receivable for investment securities sold | | | 23,244,830 | | | | 81,609 | | | | — | |
Receivable for security litigation | | | — | | | | — | | | | — | |
Receivable from broker for securities sold short | | | — | | | | — | | | | — | |
Capital shares receivable | | | 11,160,181 | | | | 392,064 | | | | 39,200 | |
Interest and dividends receivable | | | 646,949 | | | | 68,154 | | | | 31,905 | |
Prepaid expenses and other assets | | | 112,930 | | | | 27,386 | | | | 8,380 | |
| | | | | | | | | | | | |
Total Assets | | | 2,315,590,770 | | | | 233,891,243 | | | | 43,988,499 | |
| | | | | | | | | | | | |
Liabilities: | | | | | | | | | | | | |
Bank overdraft | | | — | | | | — | | | | — | |
Payable for securities purchased | | | 9,713,606 | | | | 2,769,066 | | | | — | |
Capital shares payable | | | 3,211,314 | | | | 587,117 | | | | — | |
Dividends payable to shareholders | | | — | | | | — | | | | — | |
Payable to Trustees | | | 2,208 | | | | 309 | | | | 57 | |
Payable to Advisor | | | 1,892,681 | | | | 242,176 | | | | 29,055 | |
Accrued fund administration fees | | | 88,798 | | | | 9,075 | | | | 980 | |
Accrued expenses and other liabilities | | | 413,651 | | | | 201,940 | | | | 61,397 | |
Foreign capital gains taxes payable | | | 412,347 | | | | 2,488,867 | | | | 161,878 | |
Line of credit payable | | | — | | | | 402,305 | | | | — | |
Dividends payable on securities sold short | | | — | | | | — | | | | — | |
| | | | | | | | | | | | |
Total Liabilities | | | 15,734,605 | | | | 6,700,855 | | | | 253,367 | |
| | | | | | | | | | | | |
Net Assets | | $ | 2,299,856,165 | | | $ | 227,190,388 | | | $ | 43,735,132 | |
| | | | | | | | | | | | |
Net Assets Consist of: | | | | | | | | | | | | |
Capital stock | | $ | 283,155 | | | $ | 575,067 | | | $ | 41,616 | |
Paid-in-capital in excess of par | | | 1,292,925,290 | | | | 188,782,488 | | | | 42,764,971 | |
Distributable earnings (accumulated loss) | | | 1,006,647,720 | | | | 37,832,833 | | | | 928,545 | |
| | | | | | | | | | | | |
Net Assets | | $ | 2,299,856,165 | | | $ | 227,190,388 | | | $ | 43,735,132 | |
| | | | | | | | | | | | |
Net Assets | | | | | | | | | | | | |
Investor Class | | | 1,577,554,497 | | | | 184,732,919 | | | | 13,519,972 | |
Institutional Class | | | 722,301,668 | | | | 42,457,469 | | | | 30,215,160 | |
| | | |
Capital Stock Issued and Outstanding (Unlimited number of
shares authorized, $0.01 par value) | | | | | | | | | | | | |
Investor Class | | | 19,466,466 | | | | 46,813,133 | | | | 1,300,345 | |
Institutional Class | | | 8,849,070 | | | | 10,693,518 | | | | 2,861,228 | |
| | | |
NET ASSET VALUE, REDEMPTION PRICE AND OFFERING PRICE PER SHARE | | | | | | | | | | | | |
Investor Class | | $ | 81.04 | | | $ | 3.95 | | | $ | 10.40 | |
| | | | | | | | | | | | |
Institutional Class | | $ | 81.62 | | | $ | 3.97 | | | $ | 10.56 | |
| | | | | | | | | | | | |
| 1 | Incudes U.S. dollars held in Zimbabwe. The position was fair valued during the period (see Note 12). |
See Notes to Financial Statements.
70
| | | | | | | | | | | | | | | | | | |
EMERGING
MARKETS
SMALL CAP
FUND | | | FRONTIER
EMERGING
SMALL COUNTRIES
FUND | | | GLOBAL
OPPORTUNITIES
FUND | | | GLOBAL
VALUE
FUND | | | INTERNATIONAL
GROWTH
FUND | |
| | | | | | | | | | | | | | | | | | |
| | | | | | | | | | | | | | | | | | |
| | | | | | | | | | | | | | | | | | |
| $ | 411,756,207 | | | $ | 74,236,533 | | | $ | 79,925,749 | | | $ | 173,706,959 | | | $ | 1,000,825,479 | |
| | 6,157,408 | | | | — | | | | 4,918,109 | | | | 5,900,513 | | | | 69,877,797 | |
| | | | | | | | | | | | | | | | | | |
| $ | 417,913,615 | | | $ | 74,236,533 | | | $ | 84,843,858 | | | $ | 179,607,472 | | | $ | 1,070,703,276 | |
| | | | | | | | | | | | | | | | | | |
| | | | | | | | | | | | | | | | | | |
| $ | 519,200,397 | | | $ | 76,509,028 | | | $ | 122,655,659 | | | $ | 196,683,443 | | | $ | 1,498,108,017 | |
| | 6,157,408 | | | | — | | | | 4,918,109 | | | | 5,900,513 | | | | 69,877,797 | |
| | | | | | | | | | | | | | | | | | |
| | 525,357,805 | | | | 76,509,028 | | | | 127,573,768 | | | | 202,583,956 | | | | 1,567,985,814 | |
| | — | | | | 1,971,483 | 1 | | | — | | | | 119,183 | | | | — | |
| 841,478 | | | | 174,216 | | | | 13,942 | | | | 1,580,231 | | | | 441,504 | |
| | 1,344,441 | | | | 605,840 | | | | — | | | | 860,822 | | | | 4,579,175 | |
| | — | | | | — | | | | — | | | | 1,329,412 | | | | — | |
| | — | | | | — | | | | — | | | | 5,728 | | | | — | |
| | 257,299 | | | | 1,037 | | | | 37,052 | | | | 25,398 | | | | 1,224,451 | |
| | 895,210 | | | | 45,610 | | | | 78,131 | | | | 685,588 | | | | 1,830,469 | |
| | 39,996 | | | | 14,536 | | | | 20,948 | | | | 8,814 | | | | 55,025 | |
| | | | | | | | | | | | | | | | | | |
| | 528,736,229 | | | | 79,321,750 | | | | 127,723,841 | | | | 207,199,132 | | | | 1,576,116,438 | |
| | | | | | | | | | | | | | | | | | |
| | | | | | | | | | | | | | | | | | |
| | — | | | | — | | | | 14 | | | | — | | | | — | |
| | 1,022,405 | | | | 87 | | | | 676,406 | | | | 3,885,737 | | | | 8,008,329 | |
| | 232,518 | | | | 78,836 | | | | 39,739 | | | | 465,958 | | | | 222,872 | |
| | — | | | | — | | | | — | | | | 9,063 | | | | — | |
| | 758 | | | | 200 | | | | 136 | | | | 1,368 | | | | 1,892 | |
| | 734,436 | | | | 120,983 | | | | 128,532 | | | | 67,046 | | | | 1,617,187 | |
| | 24,435 | | | | 5,853 | | | | 4,392 | | | | 13,711 | | | | 63,726 | |
| | 289,353 | | | | 203,042 | | | | 67,980 | | | | 325,010 | | | | 366,017 | |
| | — | | | | 610,361 | | | | 53,622 | | | | — | | | | 47,694 | |
| | — | | | | 310,178 | | | | — | | | | — | | | | — | |
| | — | | | | — | | | | — | | | | 5,629 | | | | — | |
| | | | | | | | | | | | | | | | | | |
| | 2,303,905 | | | | 1,329,540 | | | | 970,821 | | | | 4,773,522 | | | | 10,327,717 | |
| | | | | | | | | | | | | | | | | | |
| $ | 526,432,324 | | | $ | 77,992,210 | | | $ | 126,753,020 | | | $ | 202,425,610 | | | $ | 1,565,788,721 | |
| | | | | | | | | | | | | | | | | | |
| | | | | | | | | | | | | | | | | | |
| $ | 1,890,914 | | | $ | 310,062 | | | $ | 310,040 | | | $ | 217,839 | | | $ | 423,253 | |
| | 375,883,969 | | | | 186,085,644 | | | | 69,647,839 | | | | 327,283,584 | | | | 910,719,602 | |
| | 148,657,441 | | | | (108,403,496 | ) | | | 56,795,141 | | | | (125,075,813 | ) | | | 654,645,866 | |
| | | | | | | | | | | | | | | | | | |
| $ | 526,432,324 | | | $ | 77,992,210 | | | $ | 126,753,020 | | | $ | 202,425,610 | | | $ | 1,565,788,721 | |
| | | | | | | | | | | | | | | | | | |
| | | | | | | | | | | | | | | | | | |
| | 285,540,185 | | | | 57,405,881 | | | | 110,873,583 | | | | 192,810,921 | | | | 748,846,930 | |
| | 240,892,139 | | | | 20,586,329 | | | | 15,879,437 | | | | 9,614,689 | | | | 816,941,791 | |
| | | | |
|
|
| | | | | | | | | | | | | | | | |
| | 102,750,540 | | | | 22,863,328 | | | | 27,126,620 | | | | 20,747,873 | | | | 20,264,437 | |
| | 86,340,879 | | | | 8,142,833 | | | | 3,877,402 | | | | 1,036,020 | | | | 22,060,867 | |
| | | | |
| | | | | | | | | | | | | | | | | | |
| $ | 2.78 | | | $ | 2.51 | | | $ | 4.09 | | | $ | 9.29 | | | $ | 36.95 | |
| | | | | | | | | | | | | | | | | | |
| $ | 2.79 | | | $ | 2.53 | | | $ | 4.10 | | | $ | 9.28 | | | $ | 37.03 | |
| | | | | | | | | | | | | | | | | | |
71
Statements of Assets and Liabilities (continued)
| | | | | | | | | | | | |
| | | INTERNATIONAL
OPPORTUNITIES
FUND | | | MICRO
CAP
FUND | | | MICRO CAP
VALUE
FUND | |
| | | | | | | | | | | | |
Assets: | | | | | | | | | | | | |
Investments, at cost | | | | | | | | | | | | |
Unaffiliated issuers | | $ | 362,581,867 | | | $ | 307,142,880 | | | $ | 180,876,584 | |
Affiliated issuers1 | | | — | | | | 4,622,222 | | | | — | |
Repurchase agreements | | | 12,901,903 | | | | 22,571,864 | | | | 21,952,092 | |
| | | | | | | | | | | | |
| | $ | 375,483,770 | | | $ | 334,336,966 | | | $ | 202,828,676 | |
| | | | | | | | | | | | |
Investments, at market value | | | | | | | | | | | | |
Unaffiliated issuers | | $ | 520,272,027 | | | $ | 469,610,133 | | | $ | 263,209,057 | |
Affiliated issuers1 | | | — | | | | 4,859,007 | | | | — | |
Repurchase agreements | | | 12,901,903 | | | | 22,571,864 | | | | 21,952,092 | |
| | | | | | | | | | | | |
| | | 533,173,930 | | | | 497,041,004 | | | | 285,161,149 | |
Cash | | | — | | | | — | | | | 9,004 | |
Foreign currency on deposit (cost of $118,766, $32,559, $0, $0,
$2, $254,670 and $0, respectively) | | | 118,766 | | | | 32,887 | | | | — | |
Receivable for investment securities sold | | | 2,276 | | | | 424,538 | | | | 652,359 | |
Capital shares receivable | | | 405,748 | | | | 620,693 | | | | 106,010 | |
Interest and dividends receivable | | | 768,449 | | | | 141,760 | | | | 62,745 | |
Prepaid expenses and other assets | | | 21,646 | | | | 30,258 | | | | 46,492 | |
| | | | | | | | | | | | |
Total Assets | | | 534,490,815 | | | | 498,291,140 | | | | 286,037,759 | |
| | | | | | | | | | | | |
Liabilities: | | | | | | | | | | | | |
Bank overdraft | | | — | | | | 265,926 | | | | — | |
Payable for securities purchased | | | 415,218 | | | | 654,687 | | | | 1,830,666 | |
Capital shares payable | | | 212,906 | | | | 59,051 | | | | 90,525 | |
Dividends payable to shareholders | | | — | | | | — | | | | — | |
Payable to Trustees | | | 622 | | | | 457 | | | | 302 | |
Payable to Advisor | | | 752,173 | | | | 608,194 | | | | 349,647 | |
Accrued fund administration fees | | | 20,626 | | | | 18,796 | | | | 10,500 | |
Accrued expenses and other liabilities | | | 255,537 | | | | 101,552 | | | | 99,257 | |
Foreign capital gains taxes payable | | | — | | | | 454,394 | | | | 33,876 | |
| | | | | | | | | | | | |
Total Liabilities | | | 1,657,082 | | | | 2,163,057 | | | | 2,414,773 | |
| | | | | | | | | | | | |
Net Assets | | $ | 532,833,733 | | | $ | 496,128,083 | | | $ | 283,622,986 | |
| | | | | | | | | | | | |
Net Assets Consist of: | | | | | | | | | | | | |
Capital stock | | $ | 1,481,090 | | | $ | 503,095 | | | $ | 740,704 | |
Paid-in-capital in excess of par | | | 374,160,946 | | | | 257,831,005 | | | | 175,389,226 | |
Distributable earnings (accumulated loss) | | | 157,191,697 | | | | 237,793,983 | | | | 107,493,056 | |
| | | | | | | | | | | | |
Net Assets | | $ | 532,833,733 | | | $ | 496,128,083 | | | $ | 283,622,986 | |
| | | | | | | | | | | | |
Net Assets | | | | | | | | | | | | |
Investor Class | | | 240,488,741 | | | | 496,128,083 | | | | 283,622,986 | |
Institutional Class | | | 292,344,992 | | | | — | | | | — | |
| | | |
Capital Stock Issued and Outstanding (Unlimited number of
shares authorized, $0.01 par value) | | | | | | | | | | | | |
Investor Class | | | 67,241,706 | | | | 50,309,523 | | | | 74,070,425 | |
Institutional Class | | | 80,867,284 | | | | — | | | | — | |
| | | |
NET ASSET VALUE, REDEMPTION PRICEAND OFFERING PRICE PER SHARE | | | | | | | | | | | | |
Investor Class | | $ | 3.58 | | | $ | 9.86 | | | $ | 3.83 | |
| | | | | | | | | | | | |
Institutional Class | | $ | 3.62 | | | $ | — | | | $ | — | |
| | | | | | | | | | | | |
| 1 | See Note 8 for information on affiliated issuers. |
See Notes to Financial Statements.
72
| | | | | | | | | | | | | | | | | | |
SMALL CAP
GROWTH
FUND | | | SMALL CAP
VALUE
FUND | | | ULTRA
GROWTH
FUND | | | U.S.
TREASURY
FUND | | | | |
| | | | | | | | | | | | | | | | | | |
| | | | | | | | | | | | | | | | | | |
| | | | | | | | | | | | | | | | | | |
| $ | 1,123,595,263 | | | $ | 324,286,854 | | | $ | 200,681,873 | | | $ | 339,846,018 | | | | | |
| | — | | | | — | | | | — | | | | — | | | | | |
| | 26,729,494 | | | | 8,769,310 | | | | 29,580,653 | | | | 503,311 | | | | | |
| | | | | | | | | | | | | | | | | | |
| $ | 1,150,324,757 | | | $ | 333,056,164 | | | $ | 230,262,526 | | | $ | 340,349,329 | | | | | |
| | | | | | | | | | | | | | | | | | |
| | | | | | | | | | | | | | | | | | |
| $ | 1,870,187,903 | | | $ | 431,255,086 | | | $ | 267,633,430 | | | $ | 302,398,167 | | | | | |
| | — | | | | — | | | | — | | | | — | | | | | |
| | 26,729,494 | | | | 8,769,310 | | | | 29,580,653 | | | | 503,311 | | | | | |
| | | | | | | | | | | | | | | | | | |
| | 1,896,917,397 | | | | 440,024,396 | | | | 297,214,083 | | | | 302,901,478 | | | | | |
| | 1,864,901 | | | | 32,112 | | | | — | | | | — | | | | | |
|
— |
| | | 2 | | | | 254,670 | | | | — | | | | | |
| | 165,076 | | | | 3,126,562 | | | | 4,870,448 | | | | — | | | | | |
| | 642,624 | | | | 126,912 | | | | 1,443,189 | | | | 107,552 | | | | | |
| | 193,635 | | | | 260,947 | | | | 13,961 | | | | 761,068 | | | | | |
| | 51,981 | | | | 27,857 | | | | 37,559 | | | | 26,935 | | | | | |
| | | | | | | | | | | | | | | | | | |
| | 1,899,835,614 | | | | 443,598,788 | | | | 303,833,910 | | | | 303,797,033 | | | | | |
| | | | | | | | | | | | | | | | | | |
| | | | | | | | | | | | | | | | | | |
| | — | | | | — | | | | — | | | | — | | | | | |
| | 3,033,117 | | | | 3,884,723 | | | | 5,597,534 | | | | — | | | | | |
| | 9,749,843 | | | | 24,825 | | | | 150,244 | | | | 314,734 | | | | | |
| | — | | | | — | | | | — | | | | 144,716 | | | | | |
| | 2,107 | | | | 484 | | | | 180 | | | | 399 | | | | | |
| | 1,557,522 | | | | 357,986 | | | | 231,857 | | | | 128,031 | | | | | |
| | 79,332 | | | | 16,964 | | | | 8,899 | | | | 12,299 | | | | | |
| | 421,183 | | | | 117,731 | | | | 84,480 | | | | 91,430 | | | | | |
| | — | | | | 41,263 | | | | 198,767 | | | | — | | | | | |
| | | | | | | | | | | | | | | | | | |
| | 14,843,104 | | | | 4,443,976 | | | | 6,271,961 | | | | 691,609 | | | | | |
| | | | | | | | | | | | | | | | | | |
| $ | 1,884,992,510 | | | $ | 439,154,812 | | | $ | 297,561,949 | | | $ | 303,105,424 | | | | | |
| | | | | | | | | | | | | | | | | | |
| | | | | | | | | | | | | | | | | | |
| $ | 340,157 | | | $ | 514,001 | | | $ | 107,494 | | | $ | 198,571 | | | | | |
| | 763,067,524 | | | | 302,903,639 | | | | 212,928,227 | | | | 357,184,306 | | | | | |
| | 1,121,584,829 | | | | 135,737,172 | | | | 84,526,228 | | | | (54,277,453 | ) | | | | |
| | | | | | | | | | | | | | | | | | |
| $ | 1,884,992,510 | | | $ | 439,154,812 | | | $ | 297,561,949 | | | $ | 303,105,424 | | | | | |
| | | | | | | | | | | | | | | | | | |
| | | | | | | | | | | | | | | | | | |
| | 1,170,808,786 | | | | 347,298,125 | | | | 297,561,949 | | | | 303,105,424 | | | | | |
| | 714,183,724 | | | | 91,856,687 | | | | — | | | | — | | | | | |
| | | | | | | | | | | | | | | | | | |
| | | | |
| | | | | | | | | | | | | | | | | | |
| | 21,172,759 | | | | 40,695,958 | | | | 10,749,401 | | | | 19,857,131 | | | | | |
| | 12,842,927 | | | | 10,704,102 | | | | — | | | | — | | | | | |
| | | | |
| | | | | | | | | | | | | | | | | | |
| $ | 55.30 | | | $ | 8.53 | | | $ | 27.68 | | | $ | 15.26 | | | | | |
| | | | | | | | | | | | | | | | | | |
| $ | 55.61 | | | $ | 8.58 | | | $ | — | | | $ | — | | | | | |
| | | | | | | | | | | | | | | | | | |
73
Statements of Operations
| | | | | | | | | | | | |
| | | CORE
GROWTH
FUND | | | EMERGING
INDIA
FUND | | | EMERGING
MARKETS
SELECT FUND | |
| | | | | | | | | | | | |
Investment Income: | | | | | | | | | | | | |
Interest | | $ | 103,895 | | | $ | 6,422 | | | $ | 1,333 | |
Dividends1 | | | | | | | | | | | | |
Unaffiliated issuers | | | 9,708,223 | | | | 1,293,230 | | | | 394,598 | |
| | | | | | | | | | | | |
Total investment income | | | 9,812,118 | | | | 1,299,652 | | | | 395,931 | |
| | | | | | | | | | | | |
Expenses: | | | | | | | | | | | | |
Investment advisory fees | | | 18,641,896 | | | | 3,202,849 | | | | 468,942 | |
Shareholder servicing fees — Investor Class | | | 1,430,096 | | | | 398,303 | | | | 37,749 | |
Shareholder servicing fees — Institutional Class | | | 16,517 | | | | 2,654 | | | | 3,635 | |
Fund administration fees | | | 302,372 | | | | 41,691 | | | | 7,632 | |
Fund accounting fees | | | 181,122 | | | | 48,331 | | | | 25,524 | |
Reports to shareholders — Investor Class | | | 152,375 | | | | 46,083 | | | | 9,577 | |
Reports to shareholders — Institutional Class | | | 33,299 | | | | 4,971 | | | | 3,573 | |
Custody fees | | | 74,497 | | | | 312,050 | | | | 60,190 | |
Federal and state registration fees — Investor Class | | | 48,831 | | | | 40,832 | | | | 14,761 | |
Federal and state registration fees — Institutional Class | | | 44,107 | | | | 17,052 | | | | 17,014 | |
Legal fees | | | 125,701 | | | | 18,406 | | | | 3,596 | |
Trustees’ fees | | | 238,429 | | | | 35,393 | | | | 6,509 | |
Interest | | | 55,471 | | | | 26,448 | | | | 5,211 | |
Audit fees | | | 34,552 | | | | 33,802 | | | | 33,802 | |
Other expenses | | | 168,946 | | | | 126,705 | | | | 29,697 | |
| | | | | | | | | | | | |
Total expenses before reimbursement | | | 21,548,211 | | | | 4,355,570 | | | | 727,412 | |
Reimbursement of expenses by Advisor | | | (127,888 | ) | | | (29,308 | ) | | | (113,133 | ) |
| | | | | | | | | | | | |
Net Expenses | | | 21,420,323 | | | | 4,326,262 | | | | 614,279 | |
| | | | | | | | | | | | |
Net Investment Income (Loss) | | | (11,608,205 | ) | | | (3,026,610 | ) | | | (218,348 | ) |
| | | | | | | | | | | | |
Realized Gain (Loss): | | | | | | | | | | | | |
Investments sold | | | 181,997,805 | | | | 24,317,317 | | | | 4,521,052 | |
Foreign currency transactions | | | 12,643 | | | | (125,603 | ) | | | (26,711 | ) |
Options written | | | — | | | | — | | | | — | |
Foreign capital gains taxes | | | (1 | ) | | | (1,147,276 | ) | | | (63,752 | ) |
| | | | | | | | | | | | |
Net realized gain | | | 182,010,447 | | | | 23,044,438 | | | | 4,430,589 | |
| | | | | | | | | | | | |
Change in Unrealized Appreciation (Depreciation): | | | | | | | | | | | | |
Investments | | | 277,713,931 | | | | (22,166,417 | ) | | | (4,439,194 | ) |
Foreign currency translations | | | — | | | | (3,717 | ) | | | (1,717 | ) |
Deferred foreign capital gains taxes | | | (266,385 | ) | | | 96,788 | | | | 16,761 | |
| | | | | | | | | | | | |
Net change in unrealized appreciation (depreciation) | | | 277,447,546 | | | | (22,073,346 | ) | | | (4,424,150 | ) |
| | | | | | | | | | | | |
Net gain (loss) on investments | | | 459,457,993 | | | | 971,092 | | | | 6,439 | |
| | | | | | | | | | | | |
Net Increase (Decrease) in Net Assets Resulting from Operations | | $ | 447,849,788 | | | $ | (2,055,518 | ) | | $ | (211,909 | ) |
| | | | | | | | | | | | |
| 1 | Net of $0, $0, $33,214, $874,927, $149,900, $40,867, $506,334 and $1,594,541 in foreign withholding taxes, respectively. |
See Notes to Financial Statements.
74
| | | | | | | | | | | | | | | | | | |
EMERGING
MARKETS
SMALL CAP
FUND | | | FRONTIER
EMERGING
SMALL COUNTRIES
FUND | | | GLOBAL
OPPORTUNITIES
FUND | | | GLOBAL
VALUE
FUND | | | INTERNATIONAL
GROWTH
FUND | |
| | | | | | | | | | | | | | | | | | |
| | | | | | | | | | | | | | | | | | |
| $ | 15,401 | | | $ | 5,699 | | | $ | 6,006 | | | $ | 27,917 | | | $ | 120,709 | |
| | | | | | | | | | | | | | | | | | |
| | 9,126,623 | | | | 2,905,117 | | | | 867,654 | | | | 5,495,693 | | | | 23,194,731 | |
| | | | | | | | | | | | | | | | | | |
| | 9,142,024 | | | | 2,910,816 | | | | 873,660 | | | | 5,523,610 | | | | 23,315,440 | |
| | | | | | | | | | | | | | | | | | |
| | | | | | | | | | | | | | | | | | |
| | 10,288,820 | | | | 2,718,368 | | | | 1,420,602 | | | | 1,518,322 | | | | 19,628,699 | |
| | 506,197 | | | | 392,539 | | | | 106,742 | | | | 237,155 | | | | 709,502 | |
| | 7,702 | | | | 2,364 | | | | 2,300 | | | | 1,848 | | | | 12,649 | |
| | 101,612 | | | | 26,278 | | | | 18,474 | | | | 27,482 | | | | 255,513 | |
| | 87,913 | | | | 39,009 | | | | 38,172 | | | | 34,834 | | | | 171,608 | |
| | 53,439 | | | | 44,801 | | | | 16,530 | | | | 36,834 | | | | 73,040 | |
| | 19,097 | | | | 3,916 | | | | 3,652 | | | | 4,284 | | | | 74,252 | |
| | 531,943 | | | | 311,488 | | | | 36,142 | | | | 28,145 | | | | 477,845 | |
| | 27,717 | | | | 23,104 | | | | 18,838 | | | | 21,761 | | | | 28,911 | |
| | 25,906 | | | | 17,676 | | | | 12,457 | | | | 13,449 | | | | 29,597 | |
| | 45,972 | | | | 12,834 | | | | 8,053 | | | | 11,812 | | | | 111,058 | |
| | 92,225 | | | | 26,741 | | | | 15,138 | | | | 24,960 | | | | 215,454 | |
| | 42,933 | | | | 34,855 | | | | 7,787 | | | | 5,347 | | | | 52,371 | |
| | 29,768 | | | | 33,512 | | | | 33,802 | | | | 46,036 | | | | 33,802 | |
| | 132,273 | | | | 31,709 | | | | 33,928 | | | | 19,071 | | | | 125,216 | |
| | | | | | | | | | | | | | | | | | |
| | 11,993,517 | | | | 3,719,194 | | | | 1,772,617 | | | | 2,031,340 | | | | 21,999,517 | |
| | (142,830 | ) | | | (207,438 | ) | | | (30,562 | ) | | | (171,111 | ) | | | (11,472 | ) |
| | | | | | | | | | | | | | | | | | |
| | 11,850,687 | | | | 3,511,756 | | | | 1,742,055 | | | | 1,860,229 | | | | 21,988,045 | |
| | | | | | | | | | | | | | | | | | |
| | (2,708,663 | ) | | | (600,940 | ) | | | (868,395 | ) | | | 3,663,381 | | | | 1,327,395 | |
| | | | | | | | | | | | | | | | | | |
| | | | | | | | | | | | | | | | | | |
| | 61,796,626 | | | | 44,076,086 | | | | 16,504,325 | | | | 21,660,111 | | | | 174,803,636 | |
| | (391,220 | ) | | | (350,292 | ) | | | (27,135 | ) | | | (93,240 | ) | | | (431,708 | ) |
| | — | | | | — | | | | — | | | | 41,716 | | | | — | |
| | (295,014 | ) | | | (347,403 | ) | | | (109,835 | ) | | | — | | | | — | |
| | | | | | | | | | | | | | | | | | |
| | 61,110,392 | | | | 43,378,391 | | | | 16,367,355 | | | | 21,608,587 | | | | 174,371,928 | |
| | | | | | | | | | | | | | | | | | |
| | | | | | | | | | | | | | | | | | |
| | (96,289,740 | ) | | | (50,847,979 | ) | | | 5,121,732 | | | | (10,074,059 | ) | | | 5,246,665 | |
| | (66,759 | ) | | | (1,308,342 | ) | | | (3,667 | ) | | | 14,895 | | | | (50,143 | ) |
| | 194,004 | | | | 491,960 | | | | 158,015 | | | | — | | | | 351,937 | |
| | | | | | | | | | | | | | | | | | |
| | (96,162,495 | ) | | | (51,664,361 | ) | | | 5,276,080 | | | | (10,059,164 | ) | | | 5,548,459 | |
| | | | | | | | | | | | | | | | | | |
| | (35,052,103 | ) | | | (8,285,970 | ) | | | 21,643,435 | | | | 11,549,423 | | | | 179,920,387 | |
| | | | | | | | | | | | | | | | | | |
| $ | (37,760,766 | ) | | $ | (8,886,910 | ) | | $ | 20,775,040 | | | $ | 15,212,804 | | | $ | 181,247,782 | |
| | | | | | | | | | | | | | | | | | |
75
Statements of Operations (continued)
| | | | | | | | | | | | |
| | | INTERNATIONAL
OPPORTUNITIES
FUND | | | MICRO
CAP
FUND | | | MICRO CAP
VALUE
FUND | |
| | | | | | | | | | | | |
Investment Income: | | | | | | | | | | | | |
Interest | | $ | 45,576 | | | $ | 42,395 | | | $ | 39,887 | |
Dividends1 | | | | | | | | | | | | |
Unaffiliated issuers | | | 5,484,013 | | | | 1,429,926 | | | | 2,111,550 | |
| | | | | | | | | | | | |
Total investment income | | | 5,529,589 | | | | 1,472,321 | | | | 2,151,437 | |
| | | | | | | | | | | | |
Expenses: | | | | | | | | | | | | |
Investment advisory fees | | | 9,053,921 | | | | 5,802,242 | | | | 3,790,512 | |
Shareholder servicing fees — Investor Class | | | 491,594 | | | | 193,219 | | | | 288,482 | |
Shareholder servicing fees — Institutional Class | | | 158,191 | | | | — | | | | — | |
Fund administration fees | | | 84,178 | | | | 62,762 | | | | 41,066 | |
Fund accounting fees | | | 83,629 | | | | 54,584 | | | | 46,599 | |
Reports to shareholders — Investor Class | | | 55,004 | | | | 27,003 | | | | 40,237 | |
Reports to shareholders — Institutional Class | | | 45,772 | | | | — | | | | — | |
Custody fees | | | 262,028 | | | | 58,806 | | | | 35,180 | |
Federal and state registration fees — Investor Class | | | 23,457 | | | | 25,730 | | | | 27,358 | |
Federal and state registration fees — Institutional Class | | | 18,700 | | | | — | | | | — | |
Legal fees | | | 36,733 | | | | 25,257 | | | | 17,544 | |
Trustees’ fees | | | 71,945 | | | | 47,158 | | | | 33,004 | |
Interest | | | 15,643 | | | | 11,224 | | | | 7,445 | |
Audit fees | | | 30,966 | | | | 31,202 | | | | 35,952 | |
Other expenses | | | 109,990 | | | | 43,932 | | | | 41,169 | |
| | | | | | | | | | | | |
Total expenses before reimbursement | | | 10,541,751 | | | | 6,383,119 | | | | 4,404,548 | |
Reimbursement of expenses by Advisor | | | (26,065 | ) | | | — | | | | — | |
| | | | | | | | | | | | |
Net Expenses | | | 10,515,686 | �� | | | 6,383,119 | | | | 4,404,548 | |
| | | | | | | | | | | | |
Net Investment Income (Loss) | | | (4,986,097 | ) | | | (4,910,798 | ) | | | (2,253,111 | ) |
| | | | | | | | | | | | |
Realized Gain (Loss): | | | | | | | | | | | | |
Investments sold | | | 11,972,544 | | | | 91,829,653 | | | | 31,140,480 | |
Foreign currency transactions | | | (199,460 | ) | | | 2,063 | | | | (24,549 | ) |
Foreign capital gains taxes | | | (679,936 | ) | | | — | | | | (74,671 | ) |
| | | | | | | | | | | | |
Net realized gain (loss) | | | 11,093,148 | | | | 91,831,716 | | | | 31,041,260 | |
| | | | | | | | | | | | |
Change in Unrealized Appreciation (Depreciation): | | | | | | | | | | | | |
Investments | | | 44,069,784 | | | | 39,545,079 | | | | 14,906,506 | |
Foreign currency translations | | | 2,303 | | | | (810 | ) | | | (1,681 | ) |
Deferred foreign capital gains taxes | | | 608,007 | | | | (454,394 | ) | | | 7,939 | |
| | | | | | | | | | | | |
Net change in unrealized appreciation (depreciation) | | | 44,680,094 | | | | 39,089,875 | | | | 14,912,764 | |
| | | | | | | | | | | | |
Net gain (loss) on investments | | | 55,773,242 | | | | 130,921,591 | | | | 45,954,024 | |
| | | | | | | | | | | | |
Net Increase (Decrease) in Net Assets Resulting from Operations | | $ | 50,787,145 | | | $ | 126,010,793 | | | $ | 43,700,913 | |
| | | | | | | | | | | | |
| 1 | Net of $595,322, $43,449, $39,038, $4,814, $0, $3,424 and $0 in foreign withholding taxes, respectively. |
See Notes to Financial Statements.
76
| | | | | | | | | | | | | | | | | | |
SMALL CAP
GROWTH
FUND | | | SMALL CAP
VALUE
FUND | | | ULTRA
GROWTH
FUND | | | U.S.
TREASURY
FUND | | | | |
| | | | | | | | | | | | | | | | | | |
| | | | | | | | | | | | | | | | | | |
| $ | 145,915 | | | $ | 18,041 | | | $ | 37,215 | | | $ | 9,335,645 | | | | | |
| | | | | | | | | | | | | | | | | | |
| | 6,192,911 | | | | 5,998,853 | | | | 340,778 | | | | — | | | | | |
| | | | | | | | | | | | | | | | | | |
| | 6,338,826 | | | | 6,016,894 | | | | 377,993 | | | | 9,335,645 | | | | | |
| | | | | | | | | | | | | | | | | | |
| | | | | | | | | | | | | | | | | | |
| | 17,594,474 | | | | 4,044,519 | | | | 1,578,440 | | | | 1,650,676 | | | | | |
| | 1,366,879 | | | | 351,380 | | | | 166,699 | | | | 338,098 | | | | | |
| | 13,353 | | | | 3,228 | | | | — | | | | — | | | | | |
| | 286,109 | | | | 65,757 | | | | 25,537 | | | | 53,771 | | | | | |
| | 174,453 | | | | 52,852 | | | | 32,101 | | | | 35,567 | | | | | |
| | 111,266 | | | | 39,914 | | | | 24,376 | | | | 38,770 | | | | | |
| | 97,088 | | | | 7,979 | | | | — | | | | — | | | | | |
| | 182,070 | | | | 15,466 | | | | 11,959 | | | | 9,997 | | | | | |
| | 34,753 | | | | 27,082 | | | | 21,079 | | | | 37,611 | | | | | |
| | 26,027 | | | | 19,326 | | | | — | | | | — | | | | | |
| | 122,969 | | | | 28,326 | | | | 10,605 | | | | 24,145 | | | | | |
| | 240,034 | | | | 54,466 | | | | 16,969 | | | | 48,801 | | | | | |
| | 55,535 | | | | 11,970 | | | | 4,204 | | | | 10,728 | | | | | |
| | 59,633 | | | | 37,225 | | | | 32,832 | | | | 31,202 | | | | | |
| | 171,031 | | | | 46,376 | | | | 28,380 | | | | 30,266 | | | | | |
| | | | | | | | | | | | | | | | | | |
| | 20,535,674 | | | | 4,805,866 | | | | 1,953,181 | | | | 2,309,632 | | | | | |
| | (233,239 | ) | | | (50,294 | ) | | | — | | | | — | | | | | |
| | | | | | | | | | | | | | | | | | |
| | 20,302,435 | | | | 4,755,572 | | | | 1,953,181 | | | | 2,309,632 | | | | | |
| | | | | | | | | | | | | | | | | | |
| | (13,963,609 | ) | | | 1,261,322 | | | | (1,575,188 | ) | | | 7,026,013 | | | | | |
| | | | | | | | | | | | | | | | | | |
| | | | | | | | | | | | | | | | | | |
| | 423,030,426 | | | | 38,334,585 | | | | 23,738,317 | | | | (1,506,576 | ) | | | | |
| | (24,421 | ) | | | 5,952 | | | | 604 | | | | — | | | | | |
| | — | | | | — | | | | — | | | | — | | | | | |
| | | | | | | | | | | | | | | | | | |
| | 423,006,005 | | | | 38,340,537 | | | | 23,738,921 | | | | (1,506,576 | ) | | | | |
| | | | | | | | | | | | | | | | | | |
| | | | | | | | | | | | | | | | | | |
| | 121,557,014 | | | | 14,405,512 | | | | 32,674,337 | | | | (20,060,898 | ) | | | | |
| | 252 | | | | — | | | | (333 | ) | | | — | | | | | |
| | — | | | | (41,263 | ) | | | (198,767 | ) | | | — | | | | | |
| | | | | | | | | | | | | | | | | | |
| | 121,557,266 | | | | 14,364,249 | | | | 32,475,237 | | | | (20,060,898 | ) | | | | |
| | | | | | | | | | | | | | | | | | |
| | 544,563,271 | | | | 52,704,786 | | | | 56,214,158 | | | | (21,567,474 | ) | | | | |
| | | | | | | | | | | | | | | | | | |
| $ | 530,599,662 | | | $ | 53,966,108 | | | $ | 54,638,970 | | | $ | (14,541,461 | ) | | | | |
| | | | | | | | | | | | | | | | | | |
77
Statements of Changes in Net Assets
| | | | | | | | | | | | | | | | |
| | | CORE GROWTH
FUND | | |
EMERGING INDIA
FUND | |
| | | Year Ended
September 30, 2018 | | | Year Ended
September 30, 2017 | | | Year Ended
September 30, 2018 | | | Year Ended
September 30, 2017 | |
| | | | | | | | | | | | | | | | |
Operations: | | | | | | | | | | | | | | | | |
Net investment loss | | $ | (11,608,205 | ) | | $ | (10,825,622 | ) | | $ | (3,026,610 | ) | | $ | (1,291,008 | ) |
Net realized gain (loss) on investments, foreign currency translations and foreign capital gains taxes | | | 182,010,447 | | | | 76,972,163 | | | | 23,044,438 | | | | 337,887 | |
Change in unrealized appreciation (depreciation) on investments, foreign currency translations and deferred capital gains taxes | | | 277,447,546 | | | | 186,468,265 | | | | (22,073,346 | ) | | | 26,464,287 | |
| | | | | | | | | | | | | | | | |
Net increase (decrease) in net assets resulting from operations | | | 447,849,788 | | | | 252,614,806 | | | | (2,055,518 | ) | | | 25,511,166 | |
| | | | |
Distributions to shareholders from distributable earnings | | | | | | | | | | | | | | | | |
Investor Class1 2 | | | (74,038,213 | ) | | | (1,693,023 | ) | | | (6,742,776 | ) | | | (681,183 | ) |
Institutional Class3 4 | | | (25,182,119 | ) | | | (559,771 | ) | | | (754,072 | ) | | | (138,465 | ) |
| | | | |
Capital share transactions: | | | | | | | | | | | | | | | | |
Investor Class | | | | | | | | | | | | | | | | |
Shares sold | | | 358,201,529 | | | | 158,213,538 | | | | 102,505,750 | | | | 173,266,065 | |
Shares issued to holders in reinvestment of dividends | | | 72,335,682 | | | | 1,656,949 | | | | 6,714,681 | | | | 675,573 | |
Shares redeemed | | | (315,840,657 | ) | | | (224,407,684 | ) | | | (125,799,692 | ) | | | (58,350,522 | ) |
Redemption fees | | | 44,161 | | | | 18,973 | | | | 102,468 | | | | 197,218 | |
| | | | | | | | | | | | | | | | |
Net increase (decrease) | | | 114,740,715 | | | | (64,518,224 | ) | | | (16,476,793 | ) | | | 115,788,334 | |
| | | | | | | | | | | | | | | | |
Institutional Class | | | | | | | | | | | | | | | | |
Shares sold | | | 310,116,006 | | | | 136,598,360 | | | | 27,917,185 | | | | 21,762,904 | |
Shares issued to holders in reinvestment of dividends | | | 24,509,684 | | | | 533,314 | | | | 754,071 | | | | 63,166 | |
Shares redeemed | | | (92,409,153 | ) | | | (62,595,979 | ) | | | (7,140,599 | ) | | | (12,400,532 | ) |
Redemption fees | | | 21,866 | | | | 7,603 | | | | 391 | | | | 11,033 | |
| | | | | | | | | | | | | | | | |
Net increase (decrease) | | | 242,238,403 | | | | 74,543,298 | | | | 21,531,048 | | | | 9,436,571 | |
| | | | | | | | | | | | | | | | |
Total increase (decrease) in net assets | | | 705,608,574 | | | | 260,387,086 | | | | (4,498,111 | ) | | | 149,916,423 | |
| | | | |
Net assets: | | | | | | | | | | | | | | | | |
Beginning of period | | | 1,594,247,591 | | | | 1,333,860,505 | | | | 231,688,499 | | | | 81,772,076 | |
| | | | | | | | | | | | | | | | |
End of period | | $ | 2,299,856,165 | | | $ | 1,594,247,591 | | | $ | 227,190,388 | | | $ | 231,688,499 | |
| | | | | | | | | | | | | | | | |
| | | | |
Capital share transactions — shares: | | | | | | | | | | | | | | | | |
Investor Class | | | | | | | | | | | | | | | | |
Shares sold | | | 4,751,145 | | | | 2,604,740 | | | | 23,579,153 | | | | 45,211,975 | |
Shares issued to holders in reinvestment of dividends | | | 1,057,230 | | | | 28,319 | | | | 1,522,603 | | | | 229,008 | |
Shares redeemed | | | (4,300,532 | ) | | | (3,700,842 | ) | | | (29,275,298 | ) | | | (15,673,561 | ) |
| | | | | | | | | | | | | | | | |
Net increase (decrease) in shares outstanding | | | 1,507,843 | | | | (1,067,783 | ) | | | (4,173,542 | ) | | | 29,767,422 | |
| | | | | | | | | | | | | | | | |
Institutional Class | | | | | | | | | | | | | | | | |
Shares sold | | | 4,089,089 | | | | 2,250,747 | | | | 6,380,519 | | | | 5,981,814 | |
Shares issued to holders in reinvestment of dividends | | | 355,987 | | | | 9,075 | | | | 169,836 | | | | 21,340 | |
Shares redeemed | | | (1,246,310 | ) | | | (1,003,821 | ) | | | (1,651,902 | ) | | | (3,087,664 | ) |
| | | | | | | | | | | | | | | | |
Net increase (decrease) in shares outstanding | | | 3,198,766 | | | | 1,256,001 | | | | 4,898,453 | | | | 2,915,490 | |
| | | | | | | | | | | | | | | | |
| 1 | For the year ended September 30, 2017, dividends paid from net investment income were $0, $0, $0, $0 and $0, respectively. |
| 2 | For the year ended September 30, 2017, dividends paid from net realized gains were $(1,693,023), $(681,183), $0, $0 and $0, respectively. |
| 3 | For the year ended September 30, 2017, dividends paid from net investment income were $(131,773), $0, $0, $0 and $0, respectively. |
| 4 | For the year ended September 30, 2017, dividends paid from net realized gains were $(427,998), $(138,465), $0, $0 and $0, respectively. |
See Notes to Financial Statements.
78
| | | | | | | | | | | | | | | | | | | | | | |
EMERGING MARKETS
SELECT
FUND | | | EMERGING MARKETS
SMALL CAP
FUND | | | FRONTIER
EMERGING
SMALL COUNTRIES
FUND | |
Year Ended
September 30, 2018 | | | Year Ended
September 30, 2017 | | | Year Ended
September 30, 2018 | | | Year Ended
September 30, 2017 | | | Year Ended
September 30, 2018 | | | Year Ended
September 30, 2017 | |
| | | | | | | | | | | | | | | | | | | | | | |
| | | | | | | | | | | | | | | | | | | | | | |
| $ | (218,348 | ) | | $ | (70,308 | ) | | $ | (2,708,663 | ) | | $ | (2,494,433 | ) | | $ | (600,940 | ) | | $ | (1,473,195 | ) |
| 4,430,589 | | | | (569,305 | ) | | | 61,110,392 | | | | 71,270,719 | | | | 43,378,391 | | | | (8,115,718 | ) |
| (4,424,150 | ) | | | 5,667,067 | | | | (96,162,495 | ) | | | (9,352,461 | ) | | | (51,664,361 | ) | | | 2,787,356 | |
| | | | | | | | | | | | | | | | | | | | | | |
| (211,909 | ) | | | 5,027,454 | | | | (37,760,766 | ) | | | 59,423,825 | | | | (8,886,910 | ) | | | (6,801,557 | ) |
| | | | | |
| | | | | | | | | | | | | | | | | | | | | | |
| | — | | | | — | | | | — | | | | — | | | | — | | | | — | |
| | — | | | | — | | | | — | | | | — | | | | — | | | | — | |
| | | | | |
| | | | | | | | | | | | | | | | | | | | | | |
| | | | | | | | | | | | | | | | | | | | | | |
| | 2,193,564 | | | | 5,170,460 | | | | 45,521,661 | | | | 71,727,934 | | | | 8,969,259 | | | | 50,572,101 | |
| | — | | | | — | | | | — | | | | — | | | | — | | | | — | |
| | (3,946,229 | ) | | | (3,358,306 | ) | | | (131,435,723 | ) | | | (390,658,618 | ) | | | (99,486,901 | ) | | | (329,333,843 | ) |
| | 399 | | | | 4,694 | | | | 3,298 | | | | 14,789 | | | | 3,549 | | | | 8,464 | |
| | | | | | | | | | | | | | | | | | | | | | |
| | (1,752,266 | ) | | | 1,816,848 | | | | (85,910,764 | ) | | | (318,915,895 | ) | | | (90,514,093 | ) | | | (278,753,278 | ) |
| | | | | | | | | | | | | | | | | | | | | | |
| | | | | | | | | | | | | | | | | | | | | | |
| | 5,746,471 | | | | 4,104,118 | | | | 78,307,626 | | | | 148,425,692 | | | | 2,740,953 | | | | 17,267,589 | |
| | — | | | | — | | | | — | | | | — | | | | — | | | | — | |
| | (4,188,806 | ) | | | (5,462,642 | ) | | | (71,984,206 | ) | | | (80,570,428 | ) | | | (23,112,008 | ) | | | (111,498,183 | ) |
| | 7 | | | | 1,073 | | | | 54,542 | | | | 1,856 | | | | 35 | | | | 712 | |
| | | | | | | | | | | | | | | | | | | | | | |
| | 1,557,672 | | | | (1,357,451 | ) | | | 6,377,962 | | | | 67,857,120 | | | | (20,371,020 | ) | | | (94,229,882 | ) |
| | | | | | | | | | | | | | | | | | | | | | |
| | (406,503 | ) | | | 5,486,851 | | | | (117,293,568 | ) | | | (191,634,950 | ) | | | (119,772,023 | ) | | | (379,784,717 | ) |
| | | | | |
| | | | | | | | | | | | | | | | | | | | | | |
| | 44,141,635 | | | | 38,654,784 | | | | 643,725,892 | | | | 835,360,842 | | | | 197,764,233 | | | | 577,548,950 | |
| | | | | | | | | | | | | | | | | | | | | | |
| $ | 43,735,132 | | | $ | 44,141,635 | | | $ | 526,432,324 | | | $ | 643,725,892 | | | $ | 77,992,210 | | | $ | 197,764,233 | |
| | | | | | | | | | | | | | | | | | | | | | |
| | | | | |
| | | | | | | | | | | | | | | | | | | | | | |
| | | | | | | | | | | | | | | | | | | | | | |
| | 199,186 | | | | 533,891 | | | | 14,614,067 | | | | 27,967,821 | | | | 3,178,358 | | | | 20,091,652 | |
| | — | | | | — | | | | — | | | | — | | | | — | | | | — | |
| | (358,486 | ) | | | (363,175 | ) | | | (42,517,719 | ) | | | (150,247,286 | ) | | | (36,982,253 | ) | | | (130,050,975 | ) |
| | | | | | | | | | | | | | | | | | | | | | |
| | (159,300 | ) | | | 170,716 | | | | (27,903,652 | ) | | | (122,279,465 | ) | | | (33,803,895 | ) | | | (109,959,323 | ) |
| | | | | | | | | | | | | | | | | | | | | | |
| | | | | | | | | | | | | | | | | | | | | | |
| | 507,748 | | | | 414,375 | | | | 25,231,531 | | | | 53,895,941 | | | | 942,852 | | | | 6,898,616 | |
| | — | | | | — | | | | — | | | | — | | | | — | | | | — | |
| | (370,942 | ) | | | (561,923 | ) | | | (23,196,088 | ) | | | (29,814,247 | ) | | | (8,004,076 | ) | | | (44,682,757 | ) |
| | | | | | | | | | | | | | | | | | | | | | |
| | 136,806 | | | | (147,548 | ) | | | 2,035,443 | | | | 24,081,694 | | | | (7,061,224 | ) | | | (37,784,141 | ) |
| | | | | | | | | | | | | | | | | | | | | | |
79
Statements of Changes in Net Assets (continued)
| | | | | | | | | | | | | | | | |
| | | GLOBAL OPPORTUNITIES FUND | | | GLOBAL VALUE FUND | |
| | | Year Ended
September 30, 2018 | | | Year Ended
September 30, 2017 | | | Year Ended
September 30, 2018 | | | Year Ended
September 30, 2017 | |
| | | | | | | | | | | | | | | | |
Operations: | | | | | | | | | | | | | | | | |
Net investment income (loss) | | $ | (868,395 | ) | | $ | (1,208,416 | ) | | $ | 3,663,381 | | | $ | 3,607,580 | |
Net realized gain on investments, foreign
currency translations and foreign capital gains taxes | | | 16,367,355 | | | | 10,511,340 | | | | 21,566,871 | | | | 25,170,035 | |
Net realized gain on options written | | | — | | | | — | | | | 41,716 | | | | 99,363 | |
Change in unrealized appreciation (depreciation) on investments, foreign currency translations and deferred capital gains taxes | | | 5,276,080 | | | | 3,438,339 | | | | (10,059,164 | ) | | | (810,916 | ) |
| | | | | | | | | | | | | | | | |
Net increase in net assets resulting from operations | | | 20,775,040 | | | | 12,741,263 | | | | 15,212,804 | | | | 28,066,062 | |
| | | | |
Distributions to shareholders from distributable earnings | | | | | | | | | | | | | | | | |
Investor Class1 2 | | | (10,116,438 | ) | | | (7,751,937 | ) | | | (25,233,408 | ) | | | (9,970,859 | ) |
Institutional Class3 4 | | | (782,771 | ) | | | (417,462 | ) | | | (720,421 | ) | | | (139,356 | ) |
| | | | |
Capital share transactions: | | | | | | | | | | | | | | | | |
Investor Class | | | | | | | | | | | | | | | | |
Shares sold | | | 22,249,432 | | | | 9,564,866 | | | | 7,657,799 | | | | 7,997,702 | |
Shares issued to holders in connection with acquisition | | | — | | | | — | | | | 39,139,789 | | | | — | |
Shares issued to holders in reinvestment of dividends | | | 10,031,552 | | | | 7,688,280 | | | | 25,041,958 | | | | 9,870,606 | |
Shares redeemed | | | (26,188,981 | ) | | | (76,357,387 | ) | | | (44,302,978 | ) | | | (49,536,033 | ) |
Redemption fees | | | 4,814 | | | | 3,721 | | | | 1,397 | | | | 1,840 | |
| | | | | | | | | | | | | | | | |
Net increase (decrease) | | | 6,096,817 | | | | (59,100,520 | ) | | | 27,537,965 | | | | (31,665,885 | ) |
| | | | | | | | | | | | | | | | |
Institutional Class | | | | | | | | | | | | | | | | |
Shares sold | | | 7,932,736 | | | | 1,731,118 | | | | 608,303 | | | | 4,408,174 | |
Shares issued to holders in connection with acquisition | | | — | | | | — | | | | 5,168,422 | | | | — | |
Shares issued to holders in reinvestment of dividends | | | 653,577 | | | | 338,803 | | | | 715,126 | | | | 137,747 | |
Shares redeemed | | | (802,638 | ) | | | (837,522 | ) | | | (1,186,958 | ) | | | (3,793,616 | ) |
Redemption fees | | | — | | | | — | | | | 316 | | | | 1,100 | |
| | | | | | | | | | | | | | | | |
Net increase | | | 7,783,675 | | | | 1,232,399 | | | | 5,305,209 | | | | 753,405 | |
| | | | | | | | | | | | | | | | |
Total increase (decrease) in net assets | | | 23,756,323 | | | | (53,296,257 | ) | | | 22,102,149 | | | | (12,956,633 | ) |
| | | | |
Net assets: | | | | | | | | | | | | | | | | |
Beginning of period | | | 102,996,697 | | | | 156,292,954 | | | | 180,323,461 | | | | 193,280,094 | |
| | | | | | | | | | | | | | | | |
End of period | | $ | 126,753,020 | | | $ | 102,996,697 | | | $ | 202,425,610 | | | $ | 180,323,461 | |
| | | | | | | | | | | | | | | | |
| | | | |
Capital share transactions — shares: | | | | | | | | | | | | | | | | |
Investor Class | | | | | | | | | | | | | | | | |
Shares sold | | | 5,630,302 | | | | 2,822,944 | | | | 847,365 | | | | 843,060 | |
Shares issued to holders in connection with acquisition | | | — | | | | — | | | | 4,198,411 | | | | — | |
Shares issued to holders in reinvestment of dividends | | | 2,725,965 | | | | 2,606,197 | | | | 2,818,313 | | | | 1,045,628 | |
Shares redeemed | | | (6,742,741 | ) | | | (22,787,072 | ) | | | (4,812,767 | ) | | | (5,213,402 | ) |
| | | | | | | | | | | | | | | | |
Net increase (decrease) in shares outstanding | | | 1,613,526 | | | | (17,357,931 | ) | | | 3,051,322 | | | | (3,324,714 | ) |
| | | | | | | | | | | | | | | | |
Institutional Class | | | | | | | | | | | | | | | | |
Shares sold | | | 2,002,122 | | | | 515,951 | | | | 66,961 | | | | 460,307 | |
Shares issued to holders in connection with acquisition | | | — | | | | — | | | | 554,971 | | | | — | |
Shares issued to holders in reinvestment of dividends | | | 177,603 | | | | 114,848 | | | | 80,502 | | | | 14,478 | |
Shares redeemed | | | (205,199 | ) | | | (246,570 | ) | | | (129,575 | ) | | | (409,841 | ) |
| | | | | | | | | | | | | | | | |
Net increase in shares outstanding | | | 1,974,526 | | | | 384,229 | | | | 572,859 | | | | 64,944 | |
| | | | | | | | | | | | | | | | |
| 1 | For the year ended September 30, 2017, dividends paid from net investment income were $(141,725), $(3,557,468), $0, $0 and $(194,392), respectively. |
| 2 | For the year ended September 30, 2017, dividends paid from net realized gains were $(7,610,212), $(6,413,391), $(29,626,224), $0 and $(22,635,465), respectively. |
| 3 | For the year ended September 30, 2017, dividends paid from net investment income were $(20,477), $(75,697), $(393,058), $0 and $0, respectively. |
| 4 | For the year ended September 30, 2017, dividends paid from net realized gains were $(396,985), $(63,659), $(17,283,293), $0 and $0, respectively. |
See Notes to Financial Statements.
80
| | | | | | | | | | | | | | | | | | | | | | |
INTERNATIONAL GROWTH
FUND | | | INTERNATIONAL OPPORTUNITIES
FUND | | | MICRO CAP
FUND | |
Year Ended
September 30, 2018 | | | Year Ended
September 30, 2017 | | | Year Ended
September 30, 2018 | | | Year Ended
September 30, 2017 | | | Year Ended
September 30, 2018 | | | Year Ended
September 30, 2017 | |
| | | | | | | | | | | | | | | | | | | | | | |
| | | | | | | | | | | | | | | | | | | | | | |
| $ | 1,327,395 | | | $ | (3,106,494 | ) | | $ | (4,986,097 | ) | �� | $ | (4,032,634 | ) | | $ | (4,910,798 | ) | | $ | (3,976,227 | ) |
|
174,371,928 |
| | | 32,278,787 | | | | 11,093,148 | | | | 76,542,399 | | | | 91,831,716 | | | | 39,173,711 | |
| | — | | | | — | | | | — | | | | — | | | | — | | | | — | |
|
5,548,459 |
| | | 126,910,430 | | | | 44,680,094 | | | | (41,137,947 | ) | | | 39,089,875 | | | | 28,515,635 | |
| | | | | | | | | | | | | | | | | | | | | | |
| | 181,247,782 | | | | 156,082,723 | | | | 50,787,145 | | | | 31,371,818 | | | | 126,010,793 | | | | 63,713,119 | |
| | | | | |
| | | | | | | | | | | | | | | | | | | | | | |
| | (21,443,568 | ) | | | (29,626,224 | ) | | | (17,973,730 | ) | | | — | | | | (44,480,704 | ) | | | (22,829,857 | ) |
| | (19,841,666 | ) | | | (17,676,351 | ) | | | (16,042,894 | ) | | | — | | | | — | | | | — | |
| | | | | |
| | | | | | | | | | | | | | | | | | | | | | |
| | | | | | | | | | | | | | | | | | | | | | |
| | 91,347,750 | | | | 106,544,800 | | | | 18,056,611 | | | | 244,935,438 | | | | 136,695,602 | | | | 8,493,440 | |
| | — | | | | — | | | | — | | | | — | | | | — | | | | — | |
| | 20,391,366 | | | | 28,617,516 | | | | 17,102,675 | | | | — | | | | 41,927,060 | | | | 21,444,591 | |
| | (236,312,491 | ) | | | (330,404,896 | ) | | | (68,604,554 | ) | | | (503,406,532 | ) | | | (75,674,016 | ) | | | (36,929,156 | ) |
| | 6,992 | | | | 16,380 | | | | 1,351 | | | | 13,213 | | | | 66,098 | | | | 190 | |
| | | | | | | | | | | | | | | | | | | | | | |
| | (124,566,383 | ) | | | (195,226,200 | ) | | | (33,443,917 | ) | | | (258,457,881 | ) | | | 103,014,744 | | | | (6,990,935 | ) |
| | | | | | | | | | | | | | | | | | | | | | |
| | | | | | | | | | | | | | | | | | | | | | |
| | 273,956,806 | | | | 219,622,439 | | | | 84,972,195 | | | | 81,335,149 | | | | — | | | | — | |
| | — | | | | — | | | | — | | | | — | | | | — | | | | — | |
| | 18,746,866 | | | | 16,749,716 | | | | 12,562,516 | | | | — | | | | — | | | | — | |
| | (203,784,419 | ) | | | (142,642,997 | ) | | | (48,703,591 | ) | | | (33,966,318 | ) | | | — | | | | — | |
| | 381 | | | | 5,704 | | | | 1,905 | | | | 3,525 | | | | — | | | | — | |
| | | | | | | | | | | | | | | | | | | | | | |
| | 88,919,634 | | | | 93,734,862 | | | | 48,833,025 | | | | 47,372,356 | | | | — | | | | — | |
| | | | | | | | | | | | | | | | | | | | | | |
| | 104,315,799 | | | | 7,288,810 | | | | 32,159,629 | | | | (179,713,707 | ) | | | 184,544,833 | | | | 33,892,327 | |
| | | | | |
| | | | | | | | | | | | | | | | | | | | | | |
| | 1,461,472,922 | | | | 1,454,184,112 | | | | 500,674,104 | | | | 680,387,811 | | | | 311,583,250 | | | | 277,690,923 | |
| | | | | | | | | | | | | | | | | | | | | | |
| $ | 1,565,788,721 | | | $ | 1,461,472,922 | | | $ | 532,833,733 | | | $ | 500,674,104 | | | $ | 496,128,083 | | | $ | 311,583,250 | |
| | | | | | | | | | | | | | | | | | | | | | |
| | | | | |
| | | | | | | | | | | | | | | | | | | | | | |
| | | | | | | | | | | | | | | | | | | | | | |
| | 2,553,941 | | | | 3,614,830 | | | | 5,128,419 | | | | 78,958,491 | | | | 15,566,533 | | | | 1,187,956 | |
| | — | | | | — | | | | — | | | | — | | | | — | | | | — | |
| | 595,542 | | | | 1,081,948 | | | | 4,957,297 | | | | — | | | | 5,459,253 | | | | 3,309,350 | |
| | (6,660,899 | ) | | | (10,993,871 | ) | | | (19,470,757 | ) | | | (161,991,381 | ) | | | (8,577,892 | ) | | | (5,256,054 | ) |
| | | | | | | | | | | | | | | | | | | | | | |
| | (3,511,416 | ) | | | (6,297,093 | ) | | | (9,385,041 | ) | | | (83,032,890 | ) | | | 12,447,894 | | | | (758,748 | ) |
| | | | | | | | | | | | | | | | | | | | | | |
| | | | | | | | | | | | | | | | | | | | | | |
| | 7,763,822 | | | | 7,190,613 | | | | 23,864,087 | | | | 25,860,622 | | | | — | | | | — | |
| | — | | | | — | | | | — | | | | — | | | | — | | | | — | |
| | 546,715 | | | | 633,020 | | | | 3,609,918 | | | | — | | | | — | | | | — | |
| | (5,638,547 | ) | | | (4,615,613 | ) | | | (13,694,830 | ) | | | (10,875,848 | ) | | | — | | | | — | |
| | | | | | | | | | | | | | | | | | | | | | |
| | 2,671,990 | | | | 3,208,020 | | | | 13,779,175 | | | | 14,984,774 | | | | — | | | | — | |
| | | | | | | | | | | | | | | | | | | | | | |
81
Statements of Changes in Net Assets (continued)
| | | | | | | | | | | | | | | | |
| | | MICRO CAP VALUE FUND | | | SMALL CAP GROWTH
FUND | |
| | | Year Ended
September 30, 2018 | | | Year Ended
September 30, 2017 | | | Year Ended
September 30, 2018 | | | Year Ended
September 30, 2017 | |
| | | | | | | | | | | | | | | | |
Operations: | | | | | | | | | | | | | | | | |
Net investment income (loss) | | $ | (2,253,111 | ) | | $ | (1,541,548 | ) | | $ | (13,963,609 | ) | | $ | (14,311,581 | ) |
Net realized gain (loss) on investments, foreign
currency translations and foreign capital gains taxes | | | 31,041,260 | | | | 19,891,004 | | | | 423,006,005 | | | | 147,279,152 | |
Change in unrealized appreciation (depreciation) on investments, foreign currency translations and deferred capital gains taxes | | | 14,912,764 | | | | 22,157,781 | | | | 121,557,266 | | | | 97,387,849 | |
| | | | | | | | | | | | | | | | |
Net increase (decrease) in net assets resulting from operations | | | 43,700,913 | | | | 40,507,237 | | | | 530,599,662 | | | | 230,355,420 | |
| | | | |
Distributions to shareholders from distributable earnings | | | | | | | | | | | | | | | | |
Investor Class1 2 | | | (17,823,539 | ) | | | (3,065,003 | ) | | | (123,041,326 | ) | | | (114,348,061 | ) |
Institutional Class3 4 | | | — | | | | — | | | | (54,835,253 | ) | | | (29,795,156 | ) |
| | | | |
Capital share transactions: | | | | | | | | | | | | | | | | |
Investor Class | | | | | | | | | | | | | | | | |
Shares sold | | | 76,281,206 | | | | 29,303,153 | | | | 103,483,962 | | | | 101,783,116 | |
Shares issued to holders in reinvestment of dividends | | | 17,525,660 | | | | 3,005,231 | | | | 119,583,666 | | | | 111,807,878 | |
Shares redeemed | | | (52,176,052 | ) | | | (32,783,681 | ) | | | (460,000,362 | ) | | | (631,140,322 | ) |
Redemption fees | | | 27,574 | | | | 3,915 | | | | 12,208 | | | | 21,451 | |
| | | | | | | | | | | | | | | | |
Net increase (decrease) | | | 41,658,388 | | | | (471,382 | ) | | | (236,920,526 | ) | | | (417,527,877 | ) |
| | | | | | | | | | | | | | | | |
Institutional Class | | | | | | | | | | | | | | | | |
Shares sold | | | — | | | | — | | | | 218,762,228 | | | | 231,976,705 | |
Shares issued to holders in reinvestment of dividends | | | — | | | | — | | | | 51,205,368 | | | | 27,104,939 | |
Shares redeemed | | | — | | | | — | | | | (191,739,249 | ) | | | (119,228,883 | ) |
Redemption fees | | | — | | | | — | | | | 16,558 | | | | 7,043 | |
| | | | | | | | | | | | | | | | |
Net increase | | | — | | | | — | | | | 78,244,905 | | | | 139,859,804 | |
| | | | | | | | | | | | | | | | |
Total increase (decrease) in net assets | | | 67,535,762 | | | | 36,970,852 | | | | 194,047,462 | | | | (191,455,870 | ) |
| | | | |
Net assets: | | | | | | | | | | | | | | | | |
Beginning of period | | | 216,087,224 | | | | 179,116,372 | | | | 1,690,945,048 | | | | 1,882,400,918 | |
| | | | | | | | | | | | | | | | |
End of period | | $ | 283,622,986 | | | $ | 216,087,224 | | | $ | 1,884,992,510 | | | $ | 1,690,945,048 | |
| | | | | | | | | | | | | | | | |
| | | | |
Capital share transactions — shares: | | | | | | | | | | | | | | | | |
Investor Class | | | | | | | | | | | | | | | | |
Shares sold | | | 21,640,833 | | | | 9,461,106 | | | | 2,095,912 | | | | 2,390,725 | |
Shares issued to holders in reinvestment of dividends | | | 5,109,522 | | | | 1,029,189 | | | | 2,752,847 | | | | 2,797,995 | |
Shares redeemed | | | (14,782,849 | ) | | | (10,751,970 | ) | | | (9,540,169 | ) | | | (14,822,528 | ) |
| | | | | | | | | | | | | | | | |
Net increase (decrease) in shares outstanding | | | 11,967,506 | | | | (261,675 | ) | | | (4,691,410 | ) | | | (9,633,808 | ) |
| | | | | | | | | | | | | | | | |
Institutional Class | | | | | | | | | | | | | | | | |
Shares sold | | | — | | | | — | | | | 4,404,164 | | | | 5,418,588 | |
Shares issued to holders in reinvestment of dividends | | | — | | | | — | | | | 1,173,359 | | | | 676,777 | |
Shares redeemed | | | — | | | | — | | | | (3,812,497 | ) | | | (2,764,509 | ) |
| | | | | | | | | | | | | | | | |
Net increase in shares outstanding | | | — | | | | — | | | | 1,765,026 | | | | 3,330,856 | |
| | | | | | | | | | | | | | | | |
| 1 | For the year ended September 30, 2017, dividends paid from net investment income were $(119,575), $0, $(204,563), $(520,867) and $(7,013,012), respectively. |
| 2 | For the year ended September 30, 2017, dividends paid from net realized gains were $(2,945,428), $(114,348,061), $0, $(9,189,783) and $(23,928,558), respectively. |
| 3 | For the year ended September 30, 2017, dividends paid from net investment income were $0, $0, $(86,356), $0, and $0, respectively. |
| 4 | For the year ended September 30, 2017, dividends paid from net realized gains were $0, $(29,795,156), $0, $0 and $0, respectively. |
See Notes to Financial Statements.
82
| | | | | | | | | | | | | | | | | | | | | | |
SMALL CAP VALUE
FUND | | | ULTRA GROWTH
FUND | | | U.S. TREASURY FUND | |
Year Ended
September 30, 2018 | | | Year Ended
September 30, 2017 | | | Year Ended
September 30, 2018 | | | Year Ended
September 30, 2017 | | | Year Ended
September 30, 2018 | | | Year Ended
September 30, 2017 | |
| | | | | | | | | | | | | | | | | | | | | | |
| | | | | | | | | | | | | | | | | | | | | | |
| $ | 1,261,322 | | | $ | 209,668 | | | $ | (1,575,188 | ) | | $ | (1,064,997 | ) | | $ | 7,026,013 | | | $ | 7,051,224 | |
|
38,340,537 |
| | | 27,358,515 | | | | 23,738,921 | | | | 11,892,472 | | | | (1,506,576 | ) | | | (15,383,863 | ) |
| 14,364,249 | | | | 33,444,326 | | | | 32,475,237 | | | | 9,619,447 | | | | (20,060,898 | ) | | | (39,287,510 | ) |
| | | | | | | | | | | | | | | | | | | | | | |
| 53,966,108 | | | | 61,012,509 | | | | 54,638,970 | | | | 20,446,922 | | | | (14,541,461 | ) | | | (47,620,149 | ) |
| | | | | |
| | | | | | | | | | | | | | | | | | | | | | |
| | (20,987,095 | ) | | | (204,563 | ) | | | (12,347,975 | ) | | | (9,710,650 | ) | | | (7,001,515 | ) | | | (30,941,570 | ) |
| | (3,592,448 | ) | | | (86,356 | ) | | | — | | | | — | | | | — | | | | — | |
| | | | | |
| | | | | | | | | | | | | | | | | | | | | | |
| | | | | | | | | | | | | | | | | | | | | | |
| | 43,736,056 | | | | 58,194,449 | | | | 165,853,614 | | | | 4,951,716 | | | | 81,723,309 | | | | 172,273,407 | |
| | 20,420,605 | | | | 197,942 | | | | 12,027,369 | | | | 9,435,416 | | | | 6,519,228 | | | | 29,434,378 | |
| | (62,665,103 | ) | | | (61,034,771 | ) | | | (34,017,446 | ) | | | (15,159,900 | ) | | | (124,477,163 | ) | | | (251,422,062 | ) |
| | 5,767 | | | | 8,744 | | | | 41,794 | | | | 215 | | | | 17,262 | | | | 130,945 | |
| | | | | | | | | | | | | | | | | | | | | | |
| | 1,497,325 | | | | (2,633,636 | ) | | | 143,905,331 | | | | (772,553 | ) | | | (36,217,364 | ) | | | (49,583,332 | ) |
| | | | | | | | | | | | | | | | | | | | | | |
| | | | | | | | | | | | | | | | | | | | | | |
| | 44,009,151 | | | | 25,348,797 | | | | — | | | | — | | | | — | | | | — | |
| | 3,561,193 | | | | 85,869 | | | | — | | | | — | | | | — | | | | — | |
| | (9,949,041 | ) | | | (6,422,594 | ) | | | — | | | | — | | | | — | | | | — | |
| | 171 | | | | 299 | | | | — | | | | — | | | | — | | | | — | |
| | | | | | | | | | | | | | | | | | | | | | |
| | 37,621,474 | | | | 19,012,371 | | | | — | | | | — | | | | — | | | | — | |
| | | | | | | | | | | | | | | | | | | | | | |
| | 68,505,364 | | | | 77,100,325 | | | | 186,196,326 | | | | 9,963,719 | | | | (57,760,340 | ) | | | (128,145,051 | ) |
| | | | | |
| | | | | | | | | | | | | | | | | | | | | | |
| | 370,649,448 | | | | 293,549,123 | | | | 111,365,623 | | | | 101,401,904 | | | | 360,865,764 | | | | 489,010,815 | |
| | | | | | | | | | | | | | | | | | | | | | |
| $ | 439,154,812 | | | $ | 370,649,448 | | | $ | 297,561,949 | | | $ | 111,365,623 | | | $ | 303,105,424 | | | $ | 360,865,764 | |
| | | | | | | | | | | | | | | | | | | | | | |
| | | | | |
| | | | | | | | | | | | | | | | | | | | | | |
| | | | | | | | | | | | | | | | | | | | | | |
| | 5,320,230 | | | | 8,126,959 | | | | 6,439,623 | | | | 254,111 | | | | 5,144,647 | | | | 10,519,433 | |
| | 2,565,403 | | | | 27,919 | | | | 583,853 | | | | 538,244 | | | | 407,089 | | | | 1,897,444 | |
| | (7,616,110 | ) | | | (8,511,232 | ) | | | (1,379,623 | ) | | | (784,313 | ) | | | (7,804,349 | ) | | | (14,924,367 | ) |
| | | | | | | | | | | | | | | | | | | | | | |
| | 269,523 | | | | (356,354 | ) | | | 5,643,853 | | | | 8,042 | | | | (2,252,613 | ) | | | (2,507,490 | ) |
| | | | | | | | | | | | | | | | | | | | | | |
| | | | | | | | | | | | | | | | | | | | | | |
| | 5,233,966 | | | | 3,512,510 | | | | — | | | | — | | | | — | | | | — | |
| | 445,149 | | | | 12,060 | | | | — | | | | — | | | | — | | | | — | |
| | (1,196,895 | ) | | | (886,905 | ) | | | — | | | | — | | | | — | | | | — | |
| | | | | | | | | | | | | | | | | | | | | | |
| | 4,482,220 | | | | 2,637,665 | | | | — | | | | — | | | | — | | | | — | |
| | | | | | | | | | | | | | | | | | | | | | |
83
Financial Highlights
| | | | | | | | | | | | | | | | | | | | | | | | | | | | | | | | |
| | | | | | Income (Loss) from
Investment Operations | | | | | | | | | Less Distributions | | | | |
| | | Net Asset
Value
Beginning
of Period | | | Net
Investment
Income (Loss) | | | Net Realized
and Unrealized
Gains (Losses)
on Investments | | | Total from
Investment
Operations | | | Redemption
Fees
(See Note 2) | | | Dividends
from Net
Investment
Income | | | Distributions
from Net
Realized
Gains | | | Total
Distributions | |
Core Growth Fund — Investor Class | |
Year ended 9/30/18 | | $ | 67.44 | | | | (0.43 | ) | | | 18.30 | | | | 17.87 | | | | — | 4 | | | — | | | | (4.27 | ) | | | (4.27 | ) |
Year ended 9/30/17 | | $ | 56.90 | | | | (0.50 | ) | | | 11.13 | | | | 10.63 | | | | — | 4 | | | — | | | | (0.09 | ) | | | (0.09 | ) |
Year ended 9/30/1616 | | $ | 57.83 | | | | (0.30 | ) | | | 6.09 | | | | 5.79 | | | | — | 4 | | | — | | | | (6.72 | ) | | | (6.72 | ) |
Year ended 9/30/15 | | $ | 53.46 | | | | (0.14 | )9 | | | 5.95 | | | | 5.81 | | | | — | 4 | | | — | | | | (1.44 | ) | | | (1.44 | ) |
Year ended 9/30/14 | | $ | 52.49 | | | | (0.39 | ) | | | 2.12 | | | | 1.73 | | | | — | 4 | | | — | | | | (0.76 | ) | | | (0.76 | ) |
Core Growth Fund — Institutional Class | |
Year ended 9/30/18 | | $ | 67.81 | | | | (0.21 | ) | | | 18.29 | | | | 18.08 | | | | — | 4 | | | — | | | | (4.27 | ) | | | (4.27 | ) |
Year ended 9/30/17 | | $ | 57.16 | | | | (0.30 | ) | | | 11.07 | | | | 10.77 | | | | — | 4 | | | (0.03 | ) | | | (0.09 | ) | | | (0.12 | ) |
Year ended 9/30/1616 | | $ | 57.99 | | | | (0.14 | ) | | | 6.03 | | | | 5.89 | | | | — | 4 | | | — | | | | (6.72 | ) | | | (6.72 | ) |
Year ended 9/30/15 | | $ | 53.58 | | | | 0.06 | 9 | | | 5.79 | | | | 5.85 | | | | — | 4 | | | — | | | | (1.44 | ) | | | (1.44 | ) |
Year ended 9/30/14 | | $ | 52.57 | | | | (0.23 | ) | | | 2.00 | | | | 1.77 | | | | — | 4 | | | — | | | | (0.76 | ) | | | (0.76 | ) |
Emerging India Fund — Investor Class | |
Year ended 9/30/18 | | $ | 4.08 | | | | (0.06 | ) | | | 0.06 | | | | — | | | | — | 4 | | | — | | | | (0.13 | ) | | | (0.13 | ) |
Year ended 9/30/17 | | $ | 3.39 | | | | 0.02 | 17 | | | 0.70 | | | | 0.72 | | | | — | 4 | | | — | | | | (0.03 | ) | | | (0.03 | ) |
Year ended 9/30/1616 | | $ | 3.07 | | | | (0.03 | ) | | | 0.39 | | | | 0.36 | | | | — | 4 | | | — | | | | (0.04 | ) | | | (0.04 | ) |
Year ended 9/30/15 | | $ | 2.73 | | | | (0.04 | ) | | | 0.38 | | | | 0.34 | | | | — | 4 | | | — | 4 | | | — | | | | — | 4 |
Year ended 9/30/14 | | $ | 1.78 | | | | (— | )4 | | | 0.95 | | | | 0.95 | | | | — | 4 | | | — | | | | — | | | | — | |
Emerging India Fund — Institutional Class | |
Year ended 9/30/18 | | $ | 4.10 | | | | — | 4 | | | — | 4 | | | — | 4 | | | — | 4 | | | — | | | | (0.13 | ) | | | (0.13 | ) |
Year ended 9/30/17 | | $ | 3.40 | | | | 0.02 | 17 | | | 0.71 | | | | 0.73 | | | | — | 4 | | | — | | | | (0.03 | ) | | | (0.03 | ) |
Period ended 9/30/1614 16 | | $ | 2.82 | | | | (0.01 | ) | | | 0.59 | | | | 0.58 | | | | — | | | | — | | | | — | | | | — | |
Emerging Markets Select Fund — Investor Class | |
Year ended 9/30/18 | | $ | 10.46 | | | | (0.09 | ) | | | 0.03 | | | | (0.06 | ) | | | — | 4 | | | — | | | | — | | | | — | |
Year ended 9/30/17 | | $ | 9.23 | | | | (0.03 | ) | | | 1.26 | | | | 1.23 | | | | — | 4 | | | — | | | | — | | | | — | |
Year ended 9/30/1616 | | $ | 8.35 | | | | (0.05 | ) | | | 0.93 | | | | 0.88 | | | | — | 4 | | | — | | | | — | | | | — | |
Year ended 9/30/15 | | $ | 10.31 | | | | (0.04 | ) | | | (1.89 | ) | | | (1.93 | ) | | | — | 4 | | | (0.03 | ) | | | — | | | | (0.03 | ) |
Year ended 9/30/14 | | $ | 9.56 | | | | (0.01 | ) | | | 0.77 | | | | 0.76 | | | | — | 4 | | | (0.01 | ) | | | — | | | | (0.01 | ) |
Emerging Markets Select Fund — Institutional Class | |
Year ended 9/30/18 | | $ | 10.60 | | | | (0.04 | ) | | | — | 4 | | | (0.04 | ) | | | — | 4 | | | — | | | | — | | | | — | |
Year ended 9/30/17 | | $ | 9.32 | | | | (0.01 | ) | | | 1.29 | | | | 1.28 | | | | — | 4 | | | — | | | | — | | | | — | |
Year ended 9/30/1616 | | $ | 8.41 | | | | 0.04 | | | | 0.87 | | | | 0.91 | | | | — | | | | — | | | | — | | | | — | |
Year ended 9/30/15 | | $ | 10.37 | | | | (0.03 | ) | | | (1.88 | ) | | | (1.91 | ) | | | — | 4 | | | (0.05 | ) | | | — | | | | (0.05 | ) |
Year ended 9/30/14 | | $ | 9.61 | | | | — | 4 | | | 0.78 | | | | 0.78 | | | | — | 4 | | | (0.02 | ) | | | — | | | | (0.02 | ) |
Emerging Markets Small Cap Fund — Investor Class | |
Year ended 9/30/18 | | $ | 2.99 | | | | (0.03 | ) | | | (0.18 | ) | | | (0.21 | ) | | | — | 4 | | | — | | | | — | | | | — | |
Year ended 9/30/17 | | $ | 2.67 | | | | (0.04 | ) | | | 0.36 | | | | 0.32 | | | | — | 4 | | | — | | | | — | | | | — | |
Year ended 9/30/1616 | | $ | 2.39 | | | | (0.04 | ) | | | 0.32 | | | | 0.28 | | | | — | 4 | | | — | 4 | | | — | | | | — | 4 |
Year ended 9/30/15 | | $ | 2.74 | | | | (0.03 | ) | | | (0.32 | ) | | | (0.35 | ) | | | — | 4 | | | — | 4 | | | — | | | | — | 4 |
Year ended 9/30/14 | | $ | 2.67 | | | | (0.01 | ) | | | 0.14 | | | | 0.13 | | | | — | 4 | | | — | | | | (0.06 | ) | | | (0.06 | ) |
Emerging Markets Small Cap Fund — Institutional Class | |
Year ended 9/30/18 | | $ | 3.00 | | | | (0.01 | ) | | | (0.20 | ) | | | (0.21 | ) | | | — | 4 | | | — | | | | — | | | | — | |
Year ended 9/30/17 | | $ | 2.67 | | | | 0.01 | | | | 0.32 | | | | 0.33 | | | | — | 4 | | | — | | | | — | | | | — | |
Period ended 9/30/1614 16 | | $ | 2.31 | | | | (— | )4 | | | 0.36 | | | | 0.36 | | | | — | | | | — | | | | — | | | | — | |
Frontier Emerging Small Countries Fund — Investor Class | |
Year ended 9/30/18 | | $ | 2.75 | | | | (0.11 | ) | | | (0.13 | ) | | | (0.24 | ) | | | — | 4 | | | — | | | | — | | | | — | |
Year ended 9/30/17 | | $ | 2.63 | | | | (0.08 | ) | | | 0.20 | | | | 0.12 | | | | — | 4 | | | — | | | | — | | | | — | |
Year ended 9/30/1616 | | $ | 2.77 | | | | 0.02 | | | | (0.16 | ) | | | (0.14 | ) | | | — | 4 | | | — | 4 | | | — | | | | — | 4 |
Year ended 9/30/15 | | $ | 3.32 | | | | 0.02 | | | | (0.50 | ) | | | (0.48 | ) | | | — | 4 | | | (0.02 | ) | | | (0.05 | ) | | | (0.07 | ) |
Year ended 9/30/14 | | $ | 2.97 | | | | 0.03 | | | | 0.33 | | | | 0.36 | | | | — | 4 | | | (0.01 | ) | | | — | | | | (0.01 | ) |
Frontier Emerging Small Countries Fund — Institutional Class | |
Year ended 9/30/18 | | $ | 2.76 | | | | (0.04 | ) | | | (0.19 | ) | | | (0.23 | ) | | | — | 4 | | | — | | | | — | | | | — | |
Year ended 9/30/17 | | $ | 2.64 | | | | (0.06 | ) | | | 0.18 | | | | 0.12 | | | | — | 4 | | | — | | | | — | | | | — | |
Period ended 9/30/1614 16 | | $ | 2.58 | | | | 0.02 | | | | 0.04 | | | | 0.06 | | | | — | 4 | | | — | | | | — | | | | — | |
See Notes to Financial Highlights and Notes to Financial Statements.
84
| | |
| | (for a share outstanding throughout each period) |
|
|
|
| | | | | | | | | | | | | | | | | | | | | | | | | | | | | | |
| | | | | | | Ratios to Average Net Assets | | | Supplemental Data | |
Net Asset
Value
End of
Period | | | Total Return (%)1 | | | Expenses
Net of
Waivers and
Reimbursements (%)2 | | | Expenses
Before
Waivers and
Reimbursements (%)2 | | | Net Investment
Income (Loss) Net
of Waivers and
Reimbursements (%)2 | | | Net Investment
Income (Loss)
Before Waivers and
Reimbursements (%)2 | | | Net Assets
End of
Period
(000s) | | | Portfolio
Turnover
Rate1 3 | |
| | | | | | | | | | | | | | | | | | | | | | | | | | | | | | |
| $ | 81.04 | | | | 27.66 | | | | 1.18 | 5 8 | | | 1.18 | 5 8 | | | (0.66 | ) | | | (0.66 | ) | | $ | 1,577,554 | | | | 27% | |
| $ | 67.44 | | | | 18.69 | | | | 1.21 | 5 | | | 1.21 | 5 | | | (0.78 | ) | | | (0.78 | ) | | $ | 1,211,089 | | | | 26% | |
| $ | 56.90 | | | | 10.69 | | | | 1.21 | 5 | | | 1.21 | 5 | | | (0.62 | ) | | | (0.62 | ) | | $ | 1,082,679 | | | | 18% | |
| $ | 57.83 | | | | 10.87 | | | | 1.17 | 5 | | | 1.17 | 5 | | | (0.29 | )9 | | | (0.29 | )9 | | $ | 1,014,515 | | | | 39% | |
| $ | 53.46 | | | | 3.26 | | | | 1.18 | 5 | | | 1.18 | 5 | | | (0.64 | ) | | | (0.64 | ) | | $ | 859,086 | | | | 26% | |
| | | | | | | | | | | | | | | | | | | | | | | | | | | | | | |
| $ | 81.62 | | | | 27.82 | | | | 1.06 | 5 8 | | | 1.08 | 5 8 | | | (0.53 | ) | | | (0.55 | ) | | $ | 722,302 | | | | 27% | |
| $ | 67.81 | | | | 18.87 | | | | 1.05 | 5 | | | 1.10 | 5 | | | (0.63 | ) | | | (0.67 | ) | | $ | 383,159 | | | | 26% | |
| $ | 57.16 | | | | 10.83 | | | | 1.07 | 5 | | | 1.09 | 5 | | | (0.48 | ) | | | (0.50 | ) | | $ | 251,181 | | | | 18% | |
| $ | 57.99 | | | | 10.94 | | | | 1.12 | 5 | | | 1.13 | 5 | | | (0.29 | )9 | | | (0.30 | )9 | | $ | 150,614 | | | | 39% | |
| $ | 53.58 | | | | 3.31 | | | | 1.13 | 5 | | | 1.19 | 5 | | | (0.59 | ) | | | (0.65 | )5 | | $ | 49,369 | | | | 26% | |
| | | | | | | | | | | | | | | | | | | | | | | | | | | | | | |
| $ | 3.95 | | | | (0.33 | ) | | | 1.71 | 6 7 | | | 1.71 | 6 7 | | | (1.22 | ) | | | (1.22 | ) | | $ | 184,733 | | | | 48% | |
| $ | 4.08 | | | | 21.65 | | | | 1.73 | 5 | | | 1.73 | 5 | | | (0.92 | ) | | | (0.92 | ) | | $ | 207,949 | | | | 17% | |
| $ | 3.39 | | | | 11.98 | | | | 1.82 | 5 | | | 1.96 | 5 | | | (1.18 | ) | | | (1.32 | ) | | $ | 71,973 | | | | 42% | |
| $ | 3.07 | | | | 12.51 | | | | 1.95 | 5 | | | 2.12 | 5 | | | (1.38 | ) | | | (1.55 | ) | | $ | 63,850 | | | | 36% | |
| $ | 2.73 | | | | 53.37 | | | | 1.96 | 5 | | | 2.58 | 5 | | | (0.76 | ) | | | (1.38 | ) | | $ | 44,150 | | | | 13% | |
| | | | | | | | | | | | | | | | | | | | | | | | | | | | | | |
| $ | 3.97 | | | | (0.33 | ) | | | 1.51 | 6 8 | | | 1.60 | 6 8 | | | (0.93 | ) | | | (1.02 | ) | | $ | 42,457 | | | | 48% | |
| $ | 4.10 | | | | 21.89 | | | | 1.50 | 5 | | | 1.67 | 5 | | | (0.77 | ) | | | (0.94 | ) | | $ | 23,739 | | | | 17% | |
| $ | 3.40 | | | | 20.57 | | | | 1.50 | 5 | | | 2.00 | 5 | | | (0.70 | ) | | | (1.20 | ) | | $ | 9,799 | | | | 42% | |
| | | | | | | | | | | | | | | | | | | | | | | | | | | | | | |
| $ | 10.40 | | | | (0.57 | ) | | | 1.51 | 6 8 | | | 1.76 | 6 8 | | | (0.67 | ) | | | (0.92 | ) | | $ | 13,520 | | | | 44% | |
| $ | 10.46 | | | | 13.33 | | | | 1.51 | 6 | | | 1.90 | 6 | | | (0.38 | ) | | | (0.76 | ) | | $ | 15,273 | | | | 55% | |
| $ | 9.23 | | | | 10.54 | | | | 1.58 | 6 | | | 1.98 | 6 | | | (0.15 | ) | | | (0.55 | ) | | $ | 11,892 | | | | 62% | |
| $ | 8.35 | | | | (18.81 | ) | | | 1.70 | 6 | | | 2.00 | 6 | | | (0.23 | ) | | | (0.53 | ) | | $ | 18,527 | | | | 46% | |
| $ | 10.31 | | | | 7.92 | | | | 1.69 | 5 | | | 1.88 | 5 | | | (0.09 | ) | | | (0.28 | ) | | $ | 26,502 | | | | 59% | |
| | | | | | | | | | | | | | | | | | | | | | | | | | | | | | |
| $ | 10.56 | | | | (0.38 | ) | | | 1.21 | 6 8 | | | 1.45 | 6 8 | | | (0.36 | ) | | | (0.60 | ) | | $ | 30,215 | | | | 44% | |
| $ | 10.60 | | | | 13.73 | | | | 1.21 | 6 | | | 1.52 | 6 | | | (0.09 | ) | | | (0.39 | ) | | $ | 28,868 | | | | 55% | |
| $ | 9.32 | | | | 10.82 | | | | 1.29 | 6 | | | 1.59 | 6 | | | 0.29 | | | | (0.01 | ) | | $ | 26,763 | | | | 62% | |
| $ | 8.41 | | | | (18.67 | ) | | | 1.51 | 6 | | | 1.77 | 6 | | | (0.06 | ) | | | (0.32 | ) | | $ | 19,270 | | | | 46% | |
| $ | 10.37 | | | | 8.13 | | | | 1.51 | 5 | | | 1.71 | 5 | | | 0.05 | | | | (0.15 | ) | | $ | 32,306 | | | | 59% | |
| | | | | | | | | | | | | | | | | | | | | | | | | | | | | | |
| $ | 2.78 | | | | (7.02 | ) | | | 1.96 | 6 7 | | | 1.98 | 6 7 | | | (0.51 | ) | | | (0.53 | ) | | $ | 285,540 | | | | 40% | |
| $ | 2.99 | | | | 11.99 | | | | 1.96 | 6 | | | 2.02 | 6 | | | (0.49 | ) | | | (0.56 | ) | | $ | 390,903 | | | | 58% | |
| $ | 2.67 | | | | 11.73 | | | | 1.96 | 6 | | | 2.00 | 6 | | | (0.75 | ) | | | (0.79 | ) | | $ | 674,632 | | | | 42% | |
| $ | 2.39 | | | | (12.65 | ) | | | 1.95 | 5 | | | 2.01 | 5 | | | (0.63 | ) | | | (0.69 | ) | | $ | 981,367 | | | | 59% | |
| $ | 2.74 | | | | 4.90 | | | | 1.95 | 5 | | | 2.02 | 5 | | | (0.28 | ) | | | (0.35 | ) | | $ | 1,457,882 | | | | 55% | |
| | | | | | | | | | | | | | | | | | | | | | | | | | | | | | |
| $ | 2.79 | | | | (7.00 | ) | | | 1.82 | 6 7 | | | 1.84 | 6 7 | | | (0.33 | ) | | | (0.35 | ) | | $ | 240,892 | | | | 40% | |
| $ | 3.00 | | | | 12.36 | | | | 1.81 | 6 | | | 1.88 | 6 | | | (0.05 | ) | | | (0.12 | ) | | $ | 252,823 | | | | 58% | |
| $ | 2.67 | | | | 15.58 | | | | 1.80 | 6 | | | 1.81 | 6 | | | (0.03 | ) | | | (0.04 | ) | | $ | 160,729 | | | | 42% | |
| | | | | | | | | | | | | | | | | | | | | | | | | | | | | | |
| $ | 2.51 | | | | (8.73 | ) | | | 2.22 | 6 7 | | | 2.36 | 6 7 | | | (0.39 | ) | | | (0.53 | ) | | $ | 57,406 | | | | 42% | |
| $ | 2.75 | | | | 4.56 | | | | 2.28 | 6 | | | 2.46 | 6 | | | (0.48 | ) | | | (0.67 | ) | | $ | 155,758 | | | | 59% | |
| $ | 2.63 | | | | (4.89 | ) | | | 2.25 | 5 | | | 2.39 | 5 | | | 0.35 | | | | 0.21 | | | $ | 437,850 | | | | 80% | |
| $ | 2.77 | | | | (14.88 | ) | | | 2.25 | 5 | | | 2.28 | 5 | | | 0.39 | | | | 0.36 | | | $ | 1,027,673 | | | | 34% | |
| $ | 3.32 | | | | 11.97 | | | | 2.24 | 5 | | | 2.24 | 5 | | | 0.79 | | | | 0.79 | | | $ | 1,324,694 | | | | 22% | |
| | | | | | | | | | | | | | | | | | | | | | | | | | | | | | |
| $ | 2.53 | | | | (8.33 | ) | | | 2.02 | 6 8 | | | 2.11 | 6 8 | | | (0.30 | ) | | | (0.39 | ) | | $ | 20,586 | | | | 42% | |
| $ | 2.76 | | | | 4.55 | | | | 2.08 | 6 | | | 2.17 | 6 | | | (0.34 | ) | | | (0.44 | ) | | $ | 42,006 | | | | 59% | |
| $ | 2.64 | | | | 2.33 | | | | 2.06 | 6 | | | 2.06 | 6 | | | 1.40 | | | | 1.40 | | | $ | 139,699 | | | | 80% | |
85
Financial Highlights (continued)
| | | | | | | | | | | | | | | | | | | | | | | | | | | | | | | | |
| | | | | | Income (Loss) from
Investment Operations | | | | | | | | | Less Distributions | | | | |
| | | Net Asset
Value
Beginning
of Period | | | Net
Investment
Income (Loss) | | | Net Realized
and Unrealized
Gains (Losses)
on Investments | | | Total from
Investment
Operations | | | Redemption
Fees
(See Note 2) | | | Dividends
from Net
Investment
Income | | | Distributions
from Net
Realized
Gains | | | Total
Distributions | |
Global Opportunities Fund — Investor Class | |
Year ended 9/30/18 | | $ | 3.76 | | | | (0.03 | ) | | | 0.77 | | | | 0.74 | | | | — | 4 | | | — | | | | (0.41 | ) | | | (0.41 | ) |
Year ended 9/30/17 | | $ | 3.52 | | | | (0.07 | ) | | | 0.58 | | | | 0.51 | | | | — | 4 | | | — | 4 | | | (0.27 | ) | | | (0.27 | ) |
Year ended 9/30/1616 | | $ | 3.51 | | | | (0.04 | ) | | | 0.51 | | | | 0.47 | | | | — | 4 | | | (0.01 | ) | | | (0.45 | ) | | | (0.46 | ) |
Year ended 9/30/15 | | $ | 4.28 | | | | (0.05 | ) | | | (0.08 | ) | | | (0.13 | ) | | | — | 4 | | | (0.01 | ) | | | (0.63 | ) | | | (0.64 | ) |
Year ended 9/30/14 | | $ | 4.58 | | | | (0.05 | ) | | | 0.23 | | | | 0.18 | | | | — | 4 | | | — | 4 | | | (0.48 | ) | | | (0.48 | ) |
Global Opportunities Fund — Institutional Class | |
Year ended 9/30/18 | | $ | 3.76 | | | | (0.02 | ) | | | 0.77 | | | | 0.75 | | | | — | | | | — | | | | (0.41 | ) | | | (0.41 | ) |
Year ended 9/30/17 | | $ | 3.52 | | | | (0.02 | ) | | | 0.54 | | | | 0.52 | | | | — | | | | (0.01 | ) | | | (0.27 | ) | | | (0.28 | ) |
Period ended 9/30/1614 16 | | $ | 3.09 | | | | (— | )4 | | | 0.43 | | | | 0.43 | | | | — | | | | — | | | | — | | | | — | |
Global Value Fund — Investor Class | |
Year ended 9/30/18 | | $ | 9.93 | | | | 0.19 | | | | 0.65 | 18 | | | 0.84 | | | | — | 4 | | | (0.19 | ) | | | (1.29 | ) | | | (1.48 | ) |
Year ended 9/30/17 | | $ | 9.02 | | | | 0.19 | | | | 1.23 | | | | 1.42 | | | | — | 4 | | | (0.19 | ) | | | (0.32 | ) | | | (0.51 | ) |
Year ended 9/30/1616 | | $ | 8.84 | | | | 0.16 | | | | 1.01 | | | | 1.17 | | | | — | 4 | | | (0.16 | ) | | | (0.83 | ) | | | (0.99 | ) |
Year ended 9/30/15 | | $ | 12.69 | | | | 0.15 | | | | (0.69 | ) | | | (0.54 | ) | | | — | 4 | | | (0.16 | ) | | | (3.15 | ) | | | (3.31 | ) |
Year ended 9/30/14 | | $ | 16.57 | | | | 0.21 | | | | 1.49 | | | | 1.70 | | | | — | 4 | | | (0.22 | ) | | | (5.36 | ) | | | (5.58 | ) |
Global Value Fund — Institutional Class | |
Year ended 9/30/18 | | $ | 9.92 | | | | 0.20 | | | | 0.66 | 18 | | | 0.86 | | | | — | 4 | | | (0.20 | ) | | | (1.30 | ) | | | (1.50 | ) |
Year ended 9/30/17 | | $ | 9.01 | | | | 0.18 | | | | 1.25 | | | | 1.43 | | | | — | 4 | | | (0.20 | ) | | | (0.32 | ) | | | (0.52 | ) |
Year ended 9/30/1616 | | $ | 8.84 | | | | 0.29 | | | | 0.88 | | | | 1.17 | | | | — | 4 | | | (0.17 | ) | | | (0.83 | ) | | | (1.00 | ) |
Year ended 9/30/15 | | $ | 12.69 | | | | (0.04 | ) | | | (0.49 | ) | | | (0.53 | ) | | | — | 4 | | | (0.17 | ) | | | (3.15 | ) | | | (3.32 | ) |
Year ended 9/30/14 | | $ | 16.57 | | | | 0.20 | | | | 1.52 | | | | 1.72 | | | | — | 4 | | | (0.24 | ) | | | (5.36 | ) | | | (5.60 | ) |
International Growth Fund — Investor Class | |
Year ended 9/30/18 | | $ | 33.84 | | | | (— | )4 | | | 4.04 | | | | 4.04 | | | | — | 4 | | | — | | | | (0.93 | ) | | | (0.93 | ) |
Year ended 9/30/17 | | $ | 31.43 | | | | (0.13 | ) | | | 3.61 | | | | 3.48 | | | | — | 4 | | | — | | | | (1.07 | ) | | | (1.07 | ) |
Year ended 9/30/1616 | | $ | 27.88 | | | | (0.22 | ) | | | 3.77 | | | | 3.55 | | | | — | 4 | | | — | | | | — | | | | — | |
Year ended 9/30/15 | | $ | 26.78 | | | | (0.09 | ) | | | 1.39 | | | | 1.30 | | | | — | 4 | | | (0.01 | ) | | | (0.19 | ) | | | (0.20 | ) |
Year ended 9/30/14 | | $ | 28.76 | | | | (0.02 | ) | | | (1.24 | ) | | | (1.26 | ) | | | — | 4 | | | — | | | | (0.72 | ) | | | (0.72 | ) |
International Growth Fund — Institutional Class | |
Year ended 9/30/18 | | $ | 33.88 | | | | 0.06 | | | | 4.02 | | | | 4.08 | | | | — | 4 | | | — | | | | (0.93 | ) | | | (0.93 | ) |
Year ended 9/30/17 | | $ | 31.46 | | | | (0.05 | ) | | | 3.56 | | | | 3.51 | | | | — | 4 | | | (0.02 | ) | | | (1.07 | ) | | | (1.09 | ) |
Period ended 9/30/1614 16 | | $ | 28.46 | | | | 0.01 | | | | 2.99 | | | | 3.00 | | | | — | 4 | | | — | | | | — | | | | — | |
International Opportunities Fund — Investor Class | |
Year ended 9/30/18 | | $ | 3.47 | | | | (0.05 | ) | | | 0.40 | | | | 0.35 | | | | — | 4 | | | — | | | | (0.24 | ) | | | (0.24 | ) |
Year ended 9/30/17 | | $ | 3.21 | | | | (0.04 | ) | | | 0.30 | | | | 0.26 | | | | — | 4 | | | — | | | | — | | | | — | |
Year ended 9/30/1616 | | $ | 2.74 | | | | (0.01 | ) | | | 0.61 | | | | 0.60 | | | | — | 4 | | | — | | | | (0.13 | ) | | | (0.13 | ) |
Year ended 9/30/15 | | $ | 3.09 | �� | | | (0.01 | ) | | | (0.04 | ) | | | (0.05 | ) | | | — | 4 | | | — | | | | (0.30 | ) | | | (0.30 | ) |
Year ended 9/30/14 | | $ | 2.94 | | | | (0.01 | ) | | | 0.33 | | | | 0.32 | | | | — | 4 | | | — | | | | (0.17 | ) | | | (0.17 | ) |
International Opportunities Fund — Institutional Class | |
Year ended 9/30/18 | | $ | 3.50 | | | | (0.03 | ) | | | 0.39 | | | | 0.36 | | | | — | 4 | | | — | | | | (0.24 | ) | | | (0.24 | ) |
Year ended 9/30/17 | | $ | 3.23 | | | | (0.01 | ) | | | 0.28 | | | | 0.27 | | | | — | 4 | | | — | | | | — | | | | — | |
Period ended 9/30/1614 16 | | $ | 2.71 | | | | 0.01 | | | | 0.51 | | | | 0.52 | | | | — | 4 | | | — | | | | — | | | | — | |
Micro Cap Fund | |
Year ended 9/30/18 | | $ | 8.23 | | | | (0.08 | ) | | | 2.88 | | | | 2.80 | | | | — | 4 | | | — | | | | (1.17 | ) | | | (1.17 | ) |
Year ended 9/30/17 | | $ | 7.19 | | | | (0.11 | ) | | | 1.75 | | | | 1.64 | | | | — | 4 | | | (0.01 | ) | | | (0.59 | ) | | | (0.60 | ) |
Year ended 9/30/1616 | | $ | 7.21 | | | | (0.08 | ) | | | 1.15 | | | | 1.07 | | | | — | 4 | | | — | | | | (1.09 | ) | | | (1.09 | ) |
Year ended 9/30/15 | | $ | 7.36 | | | | (0.08 | )10 | | | 0.28 | | | | 0.20 | | | | — | 4 | | | — | 4 | | | (0.35 | ) | | | (0.35 | ) |
Year ended 9/30/14 | | $ | 7.42 | | | | (0.14 | ) | | | 0.08 | | | | (0.06 | ) | | | — | 4 | | | — | | | | — | | | | — | |
Micro Cap Value Fund | |
Year ended 9/30/18 | | $ | 3.48 | | | | (0.03 | ) | | | 0.65 | | | | 0.62 | | | | — | 4 | | | — | | | | (0.27 | ) | | | (0.27 | ) |
Year ended 9/30/17 | | $ | 2.87 | | | | (0.02 | ) | | | 0.68 | | | | 0.66 | | | | — | 4 | | | — | 4 | | | (0.05 | ) | | | (0.05 | ) |
Year ended 9/30/1616 | | $ | 2.87 | | | | (0.02 | ) | | | 0.34 | | | | 0.32 | | | | — | 4 | | | — | | | | (0.32 | ) | | | (0.32 | ) |
Year ended 9/30/15 | | $ | 3.02 | | | | (0.02 | )11 | | | 0.31 | | | | 0.29 | | | | — | 4 | | | — | | | | (0.44 | ) | | | (0.44 | ) |
Year ended 9/30/14 | | $ | 3.45 | | | | (0.04 | ) | | | 0.18 | | | | 0.14 | | | | — | 4 | | | — | | | | (0.57 | ) | | | (0.57 | ) |
See Notes to Financial Highlights and Notes to Financial Statements.
86
| | |
| | (for a share outstanding throughout each period) |
|
|
|
| | | | | | | | | | | | | | | | | | | | | | | | | | | | | | |
| | | | | | | Ratios to Average Net Assets | | | Supplemental Data | |
Net Asset
Value
End of
Period | | | Total Return (%)1 | | | Expenses
Net of
Waivers and
Reimbursements (%)2 | | | Expenses
Before
Waivers and
Reimbursements (%)2 | | | Net Investment
Income (Loss) Net
of Waivers and
Reimbursements (%)2 | | | Net Investment
Income (Loss)
Before Waivers and
Reimbursements (%)2 | | | Net Assets
End of
Period
(000s) | | | Portfolio
Turnover
Rate1 3 | |
| | | | | | | | | | | | | | | | | | | | | | | | | | | | | | |
| $ | 4.09 | | | | 20.75 | | | | 1.55 | 6 8 | | | 1.55 | 6 8 | | | (0.78 | ) | | | (0.78 | ) | | $ | 110,874 | | | | 40% | |
| $ | 3.76 | | | | 16.61 | | | | 1.59 | 6 | | | 1.59 | 6 | | | (1.09 | ) | | | (1.09 | ) | | $ | 95,847 | | | | 27% | |
| $ | 3.52 | | | | 13.73 | | | | 1.62 | 6 | | | 1.62 | 6 | | | (0.98 | ) | | | (0.98 | ) | | $ | 150,945 | | | | 44% | |
| $ | 3.51 | | | | (3.88 | ) | | | 1.81 | 5 | | | 1.81 | 5 | | | (1.10 | ) | | | (1.10 | ) | | $ | 155,968 | | | | 54% | |
| $ | 4.28 | | | | 3.94 | | | | 1.78 | 5 | | | 1.78 | 5 | | | (0.83 | ) | | | (0.83 | ) | | $ | 192,664 | | | | 42% | |
| | | | | | | | | | | | | | | | | | | | | | | | | | | | | | |
| $ | 4.10 | | | | 21.04 | | | | 1.36 | 6 8 | | | 1.66 | 6 8 | | | (0.57 | ) | | | (0.86 | ) | | $ | 15,879 | | | | 40% | |
| $ | 3.76 | | | | 16.92 | | | | 1.36 | 6 | | | 1.93 | 6 | | | (0.85 | ) | | | (1.41 | ) | | $ | 7,149 | | | | 27% | |
| $ | 3.52 | | | | 13.92 | | | | 1.35 | 5 | | | 2.32 | 5 | | | (0.57 | ) | | | (1.54 | ) | | $ | 5,348 | | | | 44% | |
| | | | | | | | | | | | | | | | | | | | | | | | | | | | | | |
| $ | 9.29 | | | | 9.56 | 18 | | | 1.11 | 5 8 | | | 1.19 | 5 8 | | | 2.17 | | | | 2.08 | | | $ | 192,811 | | | | 72% | |
| $ | 9.93 | | | | 16.11 | | | | 1.10 | 5 | | | 1.19 | 5 | | | 1.93 | | | | 1.84 | | | $ | 175,730 | | | | 44% | |
| $ | 9.02 | | | | 13.92 | | | | 1.10 | 5 | | | 1.17 | 5 | | | 1.70 | | | | 1.63 | | | $ | 189,691 | | | | 26% | |
| $ | 8.84 | | | | (6.61 | ) | | | 1.10 | 5 | | | 1.12 | 5 | | | 1.34 | | | | 1.32 | | | $ | 244,056 | | | | 39% | |
| $ | 12.69 | | | | 11.78 | | | | 1.11 | 5 7 | | | 1.12 | 5 7 | | | 1.38 | | | | 1.37 | | | $ | 409,169 | | | | 53% | |
| | | | | | | | | | | | | | | | | | | | | | | | | | | | | | |
| $ | 9.28 | | | | 9.61 | 18 | | | 0.95 | 5 8 | | | 1.58 | 5 8 | | | 2.39 | | | | 1.76 | | | $ | 9,615 | | | | 72% | |
| $ | 9.92 | | | | 16.31 | | | | 0.95 | 5 | | | 2.31 | 5 | | | 2.05 | | | | 0.70 | | | $ | 4,594 | | | | 44% | |
| $ | 9.01 | | | | 13.97 | | | | 0.96 | 5 | | | 1.72 | 5 | | | 1.76 | | | | 1.00 | | | $ | 3,589 | | | | 26% | |
| $ | 8.84 | | | | (6.50 | ) | | | 0.98 | 5 | | | 1.44 | 5 | | | 1.40 | | | | 0.94 | | | $ | 1,525 | | | | 39% | |
| $ | 12.69 | | | | 11.95 | | | | 0.98 | 5 | | | 1.25 | 5 | | | 1.52 | | | | 1.25 | | | $ | 8,068 | | | | 53% | |
| | | | | | | | | | | | | | | | | | | | | | | | | | | | | | |
| $ | 36.95 | | | | 12.13 | | | | 1.45 | 5 8 | | | 1.45 | 5 8 | | | 0.01 | | | | 0.01 | | | $ | 748,847 | | | | 44% | |
| $ | 33.84 | | | | 12.04 | | | | 1.46 | 5 | | | 1.46 | 5 | | | (0.28 | ) | | | (0.28 | ) | | $ | 804,613 | | | | 31% | |
| $ | 31.43 | | | | 12.73 | | | | 1.48 | 5 | | | 1.48 | 5 | | | (0.41 | ) | | | (0.41 | ) | | $ | 945,168 | | | | 50% | |
| $ | 27.88 | | | | 4.83 | | | | 1.50 | 5 | | | 1.50 | 5 | | | (0.32 | ) | | | (0.32 | ) | | $ | 1,316,095 | | | | 46% | |
| $ | 26.78 | | | | (4.53 | ) | | | 1.46 | 5 | | | 1.46 | 5 | | | (0.06 | ) | | | (0.06 | ) | | $ | 1,421,086 | | | | 42% | |
| | | | | | | | | | | | | | | | | | | | | | | | | | | | | | |
| $ | 37.03 | | | | 12.24 | | | | 1.35 | 5 8 | | | 1.36 | 5 8 | | | 0.16 | | | | 0.16 | | | $ | 816,942 | | | | 44% | |
| $ | 33.88 | | | | 12.16 | | | | 1.35 | 5 | | | 1.37 | 5 | | | (0.14 | ) | | | (0.16 | ) | | $ | 656,860 | | | | 31% | |
| $ | 31.46 | | | | 10.54 | | | | 1.35 | 5 | | | 1.36 | 5 | | | 0.07 | | | | 0.06 | | | $ | 509,016 | | | | 50% | |
| | | | | | | | | | | | | | | | | | | | | | | | | | | | | | |
| $ | 3.58 | | | | 10.45 | | | | 2.10 | 5 7 | | | 2.10 | 5 7 | | | (1.07 | ) | | | (1.07 | ) | | $ | 240,489 | | | | 36% | |
| $ | 3.47 | | | | 8.10 | | | | 2.24 | 6 | | | 2.24 | 6 | | | (0.88 | ) | | | (0.88 | ) | | $ | 265,879 | | | | 59% | |
| $ | 3.21 | | | | 22.73 | | | | 2.25 | 5 | | | 2.29 | 5 | | | (0.35 | ) | | | (0.39 | ) | | $ | 512,252 | | | | 41% | |
| $ | 2.74 | | | | (1.44 | ) | | | 2.25 | 5 | | | 2.43 | 5 | | | (0.36 | ) | | | (0.54 | ) | | $ | 453,495 | | | | 25% | |
| $ | 3.09 | | | | 11.53 | | | | 2.25 | 5 | | | 2.41 | 5 | | | (0.40 | ) | | | (0.56 | ) | | $ | 339,659 | | | | 38% | |
| | | | | | | | | | | | | | | | | | | | | | | | | | | | | | |
| $ | 3.62 | | | | 10.66 | | | | 1.96 | 5 7 | | | 1.97 | 5 7 | | | (0.86 | ) | | | (0.87 | ) | | $ | 292,345 | | | | 36% | |
| $ | 3.50 | | | | 8.36 | | | | 1.96 | 6 | | | 2.04 | 6 | | | (0.39 | ) | | | (0.47 | ) | | $ | 234,795 | | | | 59% | |
| $ | 3.23 | | | | 19.19 | | | | 1.95 | 5 | | | 2.04 | 5 | | | 0.64 | | | | 0.55 | | | $ | 168,136 | | | | 41% | |
| | | | | | | | | | | | | | | | | | | | | | | | | | | | | | |
| $ | 9.86 | | | | 38.04 | | | | 1.65 | 5 8 | | | 1.65 | 5 8 | | | (1.27 | ) | | | (1.27 | ) | | $ | 496,128 | | | | 54% | |
| $ | 8.23 | | | | 25.10 | | | | 1.75 | 5 | | | 1.75 | 5 | | | (1.43 | ) | | | (1.43 | ) | | $ | 311,583 | | | | 31% | |
| $ | 7.19 | | | | 16.04 | | | | 1.92 | 5 | | | 1.92 | 5 | | | (1.14 | ) | | | (1.14 | ) | | $ | 277,691 | | | | 32% | |
| $ | 7.21 | | | | 2.45 | | | | 1.90 | 5 | | | 1.90 | 5 | | | (0.85 | )10 | | | (0.85 | )10 | | $ | 273,311 | | | | 31% | |
| $ | 7.36 | | | | (0.81 | ) | | | 1.97 | | | | 1.97 | | | | (1.67 | ) | | | (1.67 | ) | | $ | 293,815 | | | | 26% | |
| | | | | | | | | | | | | | | | | | | | | | | | | | | | | | |
| $ | 3.83 | | | | 18.84 | | | | 1.74 | 5 8 | | | 1.74 | 5 8 | | | (0.89 | ) | | | (0.89 | ) | | $ | 283,623 | | | | 69% | |
| $ | 3.48 | | | | 23.29 | | | | 1.85 | 5 | | | 1.85 | 5 | | | (0.81 | ) | | | (0.81 | ) | | $ | 216,087 | | | | 57% | |
| $ | 2.87 | | | | 12.04 | | | | 1.95 | 5 | | | 2.04 | 5 | | | (0.59 | ) | | | (0.68 | ) | | $ | 179,116 | | | | 73% | |
| $ | 2.87 | | | | 9.99 | | | | 1.96 | 6 | | | 2.02 | 6 | | | (0.55 | )11 | | | (0.61 | )11 | | $ | 154,169 | | | | 53% | |
| $ | 3.02 | | | | 3.26 | | | | 2.03 | 5 | | | 2.09 | 5 | | | (1.31 | ) | | | (1.37 | ) | | $ | 158,800 | | | | 71% | |
87
Financial Highlights (continued)
| | | | | | | | | | | | | | | | | | | | | | | | | | | | | | | | |
| | | | | | Income (Loss) from
Investment Operations | | | | | | | | | Less Distributions | | | | |
| | | Net Asset
Value
Beginning
of Period | | | Net
Investment
Income (Loss) | | | Net Realized
and Unrealized
Gains (Losses)
on Investments | | | Total from
Investment
Operations | | | Redemption
Fees
(See Note 2) | | | Dividends
from Net
Investment
Income | | | Distributions
from Net
Realized
Gains | | | Total
Distributions | |
Small Cap Growth Fund — Investor Class | |
Year ended 9/30/18 | | $ | 45.72 | | | | (0.54 | ) | | | 15.19 | | | | 14.65 | | | | — | 4 | | | — | | | | (5.07 | ) | | | (5.07 | ) |
Year ended 9/30/17 | | $ | 43.52 | | | | (0.53 | ) | | | 6.24 | | | | 5.71 | | | | — | 4 | | | — | | | | (3.51 | ) | | | (3.51 | ) |
Year ended 9/30/1616 | | $ | 45.97 | | | | (0.47 | ) | | | 5.65 | | | | 5.18 | | | | — | 4 | | | — | | | | (7.63 | ) | | | (7.63 | ) |
Year ended 9/30/15 | | $ | 50.25 | | | | (0.40 | ) | | | 0.93 | | | | 0.53 | | | | — | 4 | | | — | | | | (4.81 | ) | | | (4.81 | ) |
Year ended 9/30/14 | | $ | 51.31 | | | | (0.41 | ) | | | 1.03 | | | | 0.62 | | | | — | 4 | | | — | | | | (1.68 | ) | | | (1.68 | ) |
Small Cap Growth Fund — Institutional Class | |
Year ended 9/30/18 | | $ | 45.89 | | | | (0.31 | ) | | | 15.10 | | | | 14.79 | | | | — | 4 | | | — | | | | (5.07 | ) | | | (5.07 | ) |
Year ended 9/30/17 | | $ | 43.58 | | | | (0.17 | ) | | | 5.99 | | | | 5.82 | | | | — | 4 | | | — | | | | (3.51 | ) | | | (3.51 | ) |
Period ended 9/30/1614 16 | | $ | 37.58 | | | | (0.07 | ) | | | 6.07 | | | | 6.00 | | | | — | 4 | | | — | | | | — | | | | — | |
Small Cap Value Fund — Investor Class | |
Year ended 9/30/18 | | $ | 7.94 | | | | 0.02 | | | | 1.10 | | | | 1.12 | | | | — | 4 | | | (0.01 | ) | | | (0.52 | ) | | | (0.53 | ) |
Year ended 9/30/17 | | $ | 6.61 | | | | — | 4 | | | 1.33 | | | | 1.33 | | | | — | 4 | | | — | 4 | | | — | | | | — | |
Year ended 9/30/1616 | | $ | 5.86 | | | | 0.01 | | | | 0.77 | | | | 0.78 | | | | — | 4 | | | (0.03 | ) | | | — | | | | (0.03 | ) |
Year ended 9/30/15 | | $ | 5.69 | | | | 0.05 | 12 | | | 0.12 | | | | 0.17 | | | | — | 4 | | | — | | | | — | | | | — | |
Year ended 9/30/14 | | $ | 5.12 | | | | (0.02 | ) | | | 0.59 | | | | 0.57 | | | | — | 4 | | | — | | | | — | | | | — | |
Small Cap Value Fund — Institutional Class | |
Year ended 9/30/18 | | $ | 7.98 | | | | 0.04 | | | | 1.10 | | | | 1.14 | | | | — | 4 | | | (0.02 | ) | | | (0.52 | ) | | | (0.54 | ) |
Year ended 9/30/17 | | $ | 6.65 | | | | 0.01 | | | | 1.34 | | | | 1.35 | | | | — | 4 | | | (0.02 | ) | | | — | | | | (0.02 | ) |
Year ended 9/30/1616 | | $ | 5.88 | | | | 0.02 | | | | 0.78 | | | | 0.80 | | | | — | 4 | | | (0.03 | ) | | | — | | | | (0.03 | ) |
Year ended 9/30/15 | | $ | 5.72 | | | | 0.05 | 12 | | | 0.11 | | | | 0.16 | | | | — | 4 | | | — | | | | — | | | | — | |
Year ended 9/30/14 | | $ | 5.14 | | | | (0.03 | ) | | | 0.61 | | | | 0.58 | | | | — | | | | — | | | | — | | | | — | |
Ultra Growth Fund | | | | | | | | | | | | | | | | | | | | | | | | | | | | | | | | |
Year ended 9/30/18 | | $ | 21.81 | | | | — | 4 | | | 8.31 | | | | 8.31 | | | | — | 4 | | | (0.10 | ) | | | (2.34 | ) | | | (2.44 | ) |
Year ended 9/30/17 | | $ | 19.89 | | | | (0.20 | ) | | | 4.12 | | | | 3.92 | | | | — | 4 | | | (0.11 | ) | | | (1.89 | ) | | | (2.00 | ) |
Year ended 9/30/1616 | | $ | 18.06 | | | | (0.18 | ) | | | 3.66 | | | | 3.48 | | | | — | 4 | | | — | | | | (1.65 | ) | | | (1.65 | ) |
Year ended 9/30/15 | | $ | 23.67 | | | | (0.26 | ) | | | 1.54 | | | | 1.28 | | | | — | 4 | | | (0.01 | ) | | | (6.88 | ) | | | (6.89 | ) |
Year ended 9/30/14 | | $ | 24.57 | | | | (0.06 | ) | | | 0.80 | | | | 0.74 | | | | — | 4 | | | — | | | | (1.64 | ) | | | (1.64 | ) |
U.S. Treasury Fund | | | | | | | | | | | | | | | | | | | | | | | | | | | | | | | | |
Year ended 9/30/18 | | $ | 16.32 | | | | 0.35 | | | | (1.07 | ) | | | (0.72 | ) | | | — | 4 | | | (0.34 | ) | | | — | | | | (0.34 | ) |
Year ended 9/30/17 | | $ | 19.86 | | | | 0.35 | | | | (2.23 | ) | | | (1.88 | ) | | | 0.01 | | | | (0.35 | ) | | | (1.32 | ) | | | (1.67 | ) |
Year ended 9/30/1616 | | $ | 18.42 | | | | 0.37 | | | | 2.29 | | | | 2.66 | | | | 0.01 | | | | (0.36 | ) | | | (0.87 | ) | | | (1.23 | ) |
Year ended 9/30/15 | | $ | 17.08 | | | | 0.38 | | | | 1.33 | | | | 1.71 | | | | 0.01 | | | | (0.38 | ) | | | — | | | | (0.38 | ) |
Year ended 9/30/14 | | $ | 15.33 | | | | 0.45 | | | | 1.75 | | | | 2.20 | | | | — | 4 | | | (0.45 | ) | | | — | | | | (0.45 | ) |
See Notes to Financial Highlights and Notes to Financial Statements.
88
| | |
| | (for a share outstanding throughout each period) |
|
|
|
| | | | | | | | | | | | | | | | | | | | | | | | | | | | | | |
| | | | | | |
Ratios to Average Net Assets | | | Supplemental Data | |
Net Asset
Value
End of
Period | | | Total Return (%)1 | | | Expenses
Net of
Waivers and
Reimbursements (%)2 | | | Expenses Before Waivers and
Reimbursements (%)2 | | | Net Investment
Income (Loss) Net
of Waivers and
Reimbursements (%)2 | | | Net Investment
Income (Loss)
Before Waivers and
Reimbursements (%)2 | | | Net Assets
End of
Period
(000s) | | | Portfolio
Turnover
Rate1 3 | |
| | | | | | | | | | | | | | | | | | | | | | | | | | | | | | |
| $ | 55.30 | | | | 35.08 | | | | 1.20 | 5 8 | | | 1.20 | 5 8 | | | (0.84 | ) | | | (0.84 | ) | | $ | 1,170,809 | | | | 36% | |
| $ | 45.72 | | | | 14.29 | | | | 1.27 | 5 | | | 1.27 | 5 | | | (0.88 | ) | | | (0.88 | ) | | $ | 1,182,573 | | | | 19% | |
| $ | 43.52 | | | | 11.87 | | | | 1.29 | 5 | | | 1.29 | 5 | | | (0.79 | ) | | | (0.79 | ) | | $ | 1,544,796 | | | | 20% | |
| $ | 45.97 | | | | 0.39 | | | | 1.22 | 5 | | | 1.22 | 5 | | | (0.75 | ) | | | (0.75 | ) | | $ | 2,000,588 | | | | 31% | |
| $ | 50.25 | | | | 1.09 | | | | 1.21 | 5 | | | 1.21 | 5 | | | (0.75 | ) | | | (0.75 | ) | | $ | 2,219,638 | | | | 23% | |
| | | | | | | | | | | | | | | | | | | | | | | | | | | | | | |
| $ | 55.61 | | | | 35.27 | | | | 1.06 | 5 7 | | | 1.10 | 5 7 | | | (0.70 | ) | | | (0.74 | ) | | $ | 714,184 | | | | 36% | |
| $ | 45.89 | | | | 14.54 | | | | 1.05 | 5 | | | 1.11 | 5 | | | (0.66 | ) | | | (0.72 | ) | | $ | 508,373 | | | | 19% | |
| $ | 43.58 | | | | 15.97 | | | | 1.05 | 5 | | | 1.11 | 5 | | | (0.63 | ) | | | (0.69 | ) | | $ | 337,605 | | | | 20% | |
| | | | | | | | | | | | | | | | | | | | | | | | | | | | | | |
| $ | 8.53 | | | | 14.54 | | | | 1.20 | 5 8 | | | 1.20 | 5 8 | | | 0.29 | | | | 0.29 | | | $ | 347,298 | | | | 46% | |
| $ | 7.94 | | | | 20.20 | | | | 1.21 | 5 | | | 1.21 | 5 | | | 0.04 | | | | 0.04 | | | $ | 320,978 | | | | 37% | |
| $ | 6.61 | | | | 13.37 | | | | 1.24 | 5 | | | 1.24 | 5 | | | 0.23 | | | | 0.23 | | | $ | 269,710 | | | | 57% | |
| $ | 5.86 | | | | 2.99 | | | | 1.21 | 5 | | | 1.21 | 5 | | | 0.82 | 12 | | | 0.82 | 12 | | $ | 257,655 | | | | 57% | |
| $ | 5.69 | | | | 11.13 | | | | 1.20 | 5 | | | 1.20 | 5 | | | (0.52 | ) | | | (0.52 | ) | | $ | 265,521 | | | | 50% | |
| | | | | | | | | | | | | | | | | | | | | | | | | | | | | | |
| $ | 8.58 | | | | 14.78 | | | | 1.06 | 5 8 | | | 1.13 | 5 8 | | | 0.43 | | | | 0.35 | | | $ | 91,857 | | | | 46% | |
| $ | 7.98 | | | | 20.28 | | | | 1.05 | 5 | | | 1.16 | 5 | | | 0.21 | | | | 0.11 | | | $ | 49,671 | | | | 37% | |
| $ | 6.65 | | | | 13.54 | | | | 1.08 | 5 | | | 1.20 | 5 | | | 0.40 | | | | 0.28 | | | $ | 23,839 | | | | 57% | |
| $ | 5.88 | | | | 2.97 | | | | 1.15 | 5 | | | 1.20 | 5 | | | 0.92 | 12 | | | 0.87 | 12 | | $ | 18,941 | | | | 57% | |
| $ | 5.72 | | | | 11.28 | | | | 1.15 | 5 | | | 1.44 | 5 | | | (0.49 | ) | | | (0.78 | ) | | $ | 10,436 | | | | 50% | |
| | | | | | | | | | | | | | | | | | | | | | | | | | | | | | |
| $ | 27.68 | | | | 41.97 | | | | 1.24 | 5 8 | | | 1.24 | 5 8 | | | (1.00 | ) | | | (1.00 | ) | | $ | 297,562 | | | | 44% | |
| $ | 21.81 | | | | 22.13 | | | | 1.30 | 5 | | | 1.30 | 5 | | | (1.06 | ) | | | (1.06 | ) | | $ | 111,366 | | | | 34% | |
| $ | 19.89 | | | | 20.08 | | | | 1.33 | 5 | | | 1.33 | 5 | | | (1.03 | ) | | | (1.03 | ) | | $ | 101,402 | | | | 28% | |
| $ | 18.06 | | | | 4.02 | | | | 1.31 | 5 | | | 1.31 | 5 | | | (1.06 | ) | | | (1.06 | ) | | $ | 96,015 | | | | 38% | |
| $ | 23.67 | | | | 2.66 | | | | 1.26 | 5 | | | 1.26 | 5 | | | (1.00 | ) | | | (1.00 | ) | | $ | 102,834 | | | | 38% | |
| | | | | | | | | | | | | | | | | | | | | | | | | | | | | | |
| $ | 15.26 | | | | (4.47 | ) | | | 0.70 | 5 8 | | | 0.70 | 5 8 | | | 2.13 | | | | 2.13 | | | $ | 303,105 | | | | 6% | |
| $ | 16.32 | | | | (8.86 | ) | | | 0.72 | 5 | | | 0.72 | 5 | | | 2.04 | | | | 2.04 | | | $ | 360,866 | | | | 20% | |
| $ | 19.86 | | | | 15.49 | | | | 0.69 | 5 15 | | | 0.73 | 5 | | | 1.97 | 15 | | | 1.93 | | | $ | 489,011 | | | | 59% | |
| $ | 18.42 | | | | 10.09 | | | | 0.67 | 5 | | | 0.67 | 5 | | | 2.12 | | | | 2.12 | | | $ | 327,861 | | | | 131% | |
| $ | 17.08 | | | | 14.54 | | | | 0.70 | 5 | | | 0.70 | 5 | | | 2.77 | | | | 2.77 | | | $ | 224,664 | | | | 28% | |
89
| | |
| WASATCH FUNDS | | SEPTEMBER 30, 2018 |
|
|
|
Notes to Financial Highlights
| 1 | Not annualized for periods less than one year. |
| 2 | Annualized for periods less than one year. |
| 3 | Portfolio turnover is calculated on the basis of the Fund as a whole without distinguishing between the classes of shares issued. |
| 4 | Represents amounts less than $0.005 per share. |
| 5 | Includes interest expense of less than 0.005%. |
| 6 | Includes interest expenses of more than 0.005%. |
| 7 | Includes extraordinary expenses greater than or equal to 0.01% (see Note 7 in “Notes to Financial Statements”). |
| 8 | Includes extraordinary expenses of less than 0.01% (see Note 7 in “Notes to Financial Statements”). |
| 9 | Investment income per share reflects a large, non-recurring dividend which amounted to $0.17 and $0.08 per share for the Investor Class and Institutional Class, respectively. Excluding this non-recurring dividend, the ratio of net investment income (loss) to average net assets would have been as follows: |
| | | | | | | | | | | | |
| | | Net Investment
Income (Loss) Net
of Waivers and
Reimbursements (%) | | Net Investment
Income (Loss)
Before Waivers and
Reimbursements (%) | | |
Core Growth Fund — Investor Class | | | | (0.58 | ) | | | | (0.58 | ) | | |
Core Growth Fund — Institutional Class | | | | (0.59 | ) | | | | (0.60 | ) | | |
| 10 | Investment income per share reflects a large, non-recurring dividend which amounted to $0.04 per share. Excluding this non-recurring dividend, the ratio of net investment income (loss) to average net assets would have been (1.40)%. |
| 11 | Investment income per share reflects a large, non-recurring dividend which amounted to $0.01 per share. Excluding this non-recurring dividend, the ratio of net investment income (loss) to average net assets would have been (1.04)% for Net Investment Income Net of Waivers and Reimbursements and (1.10)% for Net Investment Income Before Waivers and Reimbursements. |
| 12 | Investment income per share reflects a large, non-recurring dividend which amounted to $0.05 and $0.05 per share for the Investor Class and Institutional Class, respectively. Excluding this non-recurring dividend, the ratio of net investment income (loss) to average net assets would have been as follows: |
| | | | | | | | | | | | |
| | | |
| | | Net Investment
Income (Loss) Net
of Waivers and
Reimbursements (%) | | Net Investment
Income (Loss)
Before Waivers and
Reimbursements (%) | | |
Small Cap Value Fund — Investor Class | | | | (0.00 | )13 | | | | (0.00 | )13 | | |
Small Cap Value Fund — Institutional Class | | | | 0.10 | | | | | 0.05 | | | |
| 13 | Amount is less than 0.005%. |
| 14 | Institutional class inception date was February 1, 2016. |
| 15 | Includes reimbursement by Hoisington Investment Management Co., the Sub-Advisor, for proxy statement expenses which amounted to $0.01 per share. |
| 16 | Includes a non-recurring offer to reimburse prior period custody and fund accounting out-of-pocket expenses (see Note 7 “Related Party Transactions” “Custodian Out-of-Pocket Expense Reimbursement” in “Notes to Financial Statements”). Excluding this non-recurring reimbursement, the ratio of expenses to average net assets would have been as follows: |
| | | | | | | | | | | | |
| | | |
| | | Expenses
Net of
Waivers and
Reimbursements (%) | | Expenses
Before
Waivers and
Reimbursements (%) | | |
Core Growth Fund — Investor Class | | | | 1.21 | | | | | 1.21 | | | |
Core Growth Fund — Institutional Class | | | | 1.07 | | | | | 1.09 | | | |
Emerging India Fund — Investor Class | | | | 1.84 | | | | | 1.98 | | | |
Emerging India Fund — Institutional Class | | | | 1.56 | | | | | 2.06 | | | |
Emerging Markets Select Fund — Investor Class | | | | 1.60 | | | | | 2.00 | | | |
Emerging Markets Select Fund — Institutional Class | | | | 1.33 | | | | | 1.63 | | | |
Emerging Markets Small Cap Fund — Investor Class | | | | 1.97 | | | | | 2.01 | | | |
Emerging Markets Small Cap Fund — Institutional Class | | | | 1.82 | | | | | 1.83 | | | |
Frontier Emerging Small Countries Fund — Investor Class | | | | 2.25 | | | | | 2.39 | | | |
Frontier Emerging Small Countries Fund — Institutional Class | | | | 2.08 | | | | | 2.08 | | | |
Global Opportunities Fund — Investor Class | | | | 1.64 | | | | | 1.64 | | | |
Global Opportunities Fund — Institutional Class | | | | 1.42 | | | | | 2.39 | | | |
Global Value Fund — Investor Class | | | | 1.10 | | | | | 1.17 | | | |
Global Value Fund — Institutional Class | | | | 0.96 | | | | | 1.72 | | | |
International Growth Fund — Investor Class | | | | 1.48 | | | | | 1.48 | | | |
International Growth Fund — Institutional Class | | | | 1.36 | | | | | 1.37 | | | |
International Opportunities Fund — Investor Class | | | | 2.26 | | | | | 2.30 | | | |
International Opportunities Fund — Institutional Class | | | | 1.97 | | | | | 2.06 | | | |
Micro Cap Fund | | | | 1.92 | | | | | 1.92 | | | |
Micro Cap Value Fund | | | | 1.96 | | | | | 2.05 | | | |
Small Cap Growth Fund — Investor Class | | | | 1.29 | | | | | 1.29 | | | |
Small Cap Growth Fund — Institutional Class | | | | 1.05 | | | | | 1.11 | | | |
Small Cap Value Fund — Investor Class | | | | 1.24 | | | | | 1.24 | | | |
Small Cap Value Fund — Institutional Class | | | | 1.08 | | | | | 1.20 | | | |
Ultra Growth Fund | | | | 1.34 | | | | | 1.34 | | | |
U.S. Treasury Fund | | | | 0.69 | | | | | 0.73 | | | |
| 17 | Per share amounts do not correlate to amounts reported in the Statements of Operations due to timing of share activity. |
| 18 | Net Realized and Unrealized Gains (Losses) on Investments per share reflects a large, non-recurring receivable for security litigation which amounted to $0.06 and $0.06 per share for the Investor Class and Institutional Class, respectively. Excluding this non-recurring receivable, net realized and unrealized gains (losses) would have been $0.59 and $0.60 per share for the Investor Class and Institutional Class, respectively. Excluding this non-recurring receivable, total return would have been 8.74% and 8.91% for the Investor Class and Institutional Class, respectively. |
See Notes to Financial Statements.
90
| | |
| WASATCH FUNDS | | SEPTEMBER 30, 2018 |
|
|
|
Notes to Financial Statements
1. ORGANIZATION
Wasatch Funds Trust (the “Trust”) is a Massachusetts business trust registered under the Investment Company Act of 1940, as amended (the “1940 Act”), as an open-end management investment company and consists of 15 series or funds (each a “Fund” and collectively the “Funds”). The Core Growth Fund, Emerging India Fund, Emerging Markets Select Fund, Emerging Markets Small Cap Fund, Frontier Emerging Small Countries Fund, Global Opportunities Fund, Global Value Fund (formerly Large Cap Value Fund), International Growth Fund, International Opportunities Fund, Micro Cap Fund, Micro Cap Value Fund, Small Cap Growth Fund, Small Cap Value Fund, Ultra Growth Fund, and Wasatch-Hoisington U.S. Treasury Fund (“U.S. Treasury Fund”) (sub-advised) are each diversified funds. Each Fund maintains its own investment objective(s).
On November 9, 2011, the Trust re-designated the shares of the Funds into Investor Class shares effective January 31, 2012, and authorized and designated a new Institutional Class of shares in the Funds. Currently 11 funds offer Institutional Class shares: Core Growth Fund, Global Value Fund and Small Cap Value Fund, which commenced operations on January 31, 2012, Emerging Markets Select Fund commenced operations on December 13, 2012 and Emerging India Fund, Emerging Markets Small Cap Fund, Frontier Emerging Small Countries Fund, Global Opportunities Fund, International Growth Fund, International Opportunities Fund and Small Cap Growth Fund, which commenced operations on February 1, 2016. Each class of shares for each Fund has identical rights and privileges except with respect to purchase minimums, distribution and service charges, shareholder services, voting rights on matters affecting a single class of shares, and the exchange and conversion features. The Funds have entered into an investment advisory agreement with Wasatch Advisors, Inc. (the “Advisor” or “Wasatch”) as investment advisor.
The Core Growth, Emerging India, Emerging Markets Select, Emerging Markets Small Cap, Frontier Emerging Small Countries, Global Opportunities, Global Value, International Growth, International Opportunities, Micro Cap, Micro Cap Value, Small Cap Growth, Small Cap Value and Ultra Growth Funds are referred to herein as the “Equity Funds.”
2. SIGNIFICANT ACCOUNTING POLICIES
The following is a summary of significant policies related to investments of the Funds held at September 30, 2018. These policies are in conformity with accounting principles generally accepted in the United States of America (“U.S. GAAP”).
Valuation of Securities — All investments in securities are recorded at their estimated fair value as described in Note 12.
Foreign Currency Translations — Values of investments denominated in foreign currencies are converted into U.S. dollars using the current exchange rates each business day (generally 4:00 p.m. Eastern Time). Purchases and sales of
investments and dividend income are translated into U.S. dollars using the current prevailing exchange rate on the transaction date. The effect of changes in foreign exchange rates on realized and unrealized gains or losses on securities is reflected as a component of such gains or losses. Transactions in foreign denominated assets may involve greater risks than domestic transactions.
Investment in Securities and Related Investment Income — Security transactions are accounted for on the trade date. Gains or losses on securities sold are determined on the identified cost basis. Dividend income and distributions to shareholders are recorded on the ex-dividend date except that certain dividends from foreign securities may be recorded after the ex-dividend date based on when the Fund is informed of the dividend. Interest income and estimated expenses are accrued daily. Bond discount and premiums are amortized using the interest method. To the extent dividends received include return of capital or capital gain distributions, such distributions are recorded as a reduction to cost of the related security or as realized gain or loss.
Expenses — The Funds contract for various services on a collective basis. Most expenses are directly attributable to each Fund and therefore are charged accordingly. Expenses that are not directly attributable to one or more Funds are allocated among applicable Funds on an equitable and consistent basis considering such things as the nature and type of expense and the relative net assets of the Funds.
Use of Management Estimates — The preparation of financial statements in conformity with U.S. GAAP requires management to make estimates and assumptions that affect the reported amounts of assets and liabilities at the date of the financial statements and the reported changes in net assets during the reporting period. Actual results could differ from those estimates.
Guarantees and Indemnifications — In the normal course of business, the Funds enter into contracts that contain a variety of representations and warranties which provide general indemnifications. The maximum exposure under these arrangements is unknown, as this would involve future claims that may be made against the Funds and/or their affiliates that have not yet occurred. Based on experience, however, the risk of loss is expected to be remote.
Redemption Fees — The Funds deduct a fee of 2.00% from redemption proceeds on shares of the Funds held 60 days or less. Redemption fees retained by the Funds are credited to additional paid-in capital.
New Accounting Pronouncements — In October 2018, the U.S. Securities and Exchange Commission adopted amendments to certain disclosure requirements that had become “redundant, duplicative, overlapping, outdated or superseded, in light of the other Commission disclosure requirements, GAAP or changes in the information environment.” The compliance date for the amendments to Regulation S-X is November 5, 2018 (for reporting period end dates of September 30, 2018 or after). Management has evaluated the impact of the amendments and determined the effect on the financial statements of adopting the simplification rules will be limited to a change in disclosures at September 30, 2018.
91
Notes to Financial Statements (continued)
Other — Income, expenses, and realized and unrealized gains or losses on investments are generally allocated to each class of shares based on its relative net assets, except that each class separately bears expenses related specifically to that class, such as certain shareholder servicing fees.
3. SECURITIESAND OTHER INVESTMENTS
Repurchase Agreements — The Funds may engage in repurchase transactions. Under the terms of a typical repurchase agreement, a fund takes possession of an underlying debt obligation subject to an obligation of the seller to repurchase and the fund to resell the obligation at an agreed upon price and time. The market value of the collateral must be at least equal at all times to the total amount of the repurchase obligation, including interest. Generally, in the event of counterparty default, the fund has the right to use the collateral to offset losses incurred. Refer to Note 13 (Offsetting) for more information about the offsetting of assets and liabilities.
Short Sales — The Equity Funds may enter into short sales whereby a fund sells a security it generally does not own (the security is borrowed), in anticipation of a decline in the security’s price. The initial amount of a short sale is recorded as a liability which is marked-to-market daily. Fluctuations in the value of the short liability are recorded as unrealized gains or losses. If a Fund shorts a security when also holding a long position in the security (a “short against the box”), as the security’s price declines, the short position increases in value, offsetting the long position’s decrease in value. The opposite effect occurs if the security’s price rises. A Fund realizes a gain or loss upon closing of the short sale (returning the security to the counterparty by way of purchase or delivery of a long position owned). Possible losses from short sales may be unlimited, whereas losses from security purchases cannot exceed the total amount invested. The Funds are liable to the buyer for any dividends payable on securities while those securities are in a short position. These dividends are an expense of the Funds. The Funds designate collateral consisting of cash, U.S. government securities or other liquid assets sufficient to collateralize the market value of short positions.
Participation Notes — Certain Funds may invest in Participation Notes (P-Notes). P-Notes are promissory notes that are designed to offer a return linked to the performance of a particular underlying equity security or market. P-Notes are issued by banks or broker-dealers and allow a fund to gain exposure to common stocks in markets in which the fund is currently not approved to directly invest, or in markets that prohibit direct investment by foreign purchasers. While the holder of a P-Note is entitled to receive from the bank or broker-dealer any dividends or other distributions paid on the underlying securities, the holder is not entitled to the same rights as an owner of the underlying securities, such as voting rights. Income received from P-Notes is recorded as dividend income in the Statement of Operations. P-Notes are considered general unsecured contractual obligations of the bank or broker-dealer. Risks associated with P-Notes include the possible failure of a counterparty
(i.e., the issuing bank or broker-dealer) to perform in accordance with the terms of the agreement, inability to transfer or liquidate the notes, potential delays or an inability to redeem the notes before maturity under certain market conditions, and limited legal recourse against the issuer of the underlying common stock.
4. FINANCIAL DERIVATIVE INSTRUMENTS
Foreign Currency Contracts — The Funds may enter into foreign currency contracts to settle planned purchases or sales of securities or to protect against a possible loss resulting from adverse change in the relationship between the U.S. dollar and a foreign currency involved in an underlying transaction. Foreign currency contracts are agreements between two parties to buy and sell a currency at a set price on a future date. The market value of a foreign currency contract fluctuates with changes in currency exchange rates. Foreign currency contracts are marked-to-market daily and the change in market value is recorded by a fund as unrealized appreciation or depreciation. When a foreign currency contract is closed, the fund records a realized gain or loss equal to the difference between the value at the time it was opened and the value at the time it was closed. These contracts may involve market risk in excess of the unrealized gain or loss reflected in the Schedule of Investments. In addition, a fund could be exposed to credit risk if a counterparty is unable or unwilling to meet the terms of the contracts or if the value of the currency changes unfavorably. In connection with these contracts, the Funds may segregate cash and/or securities in a sufficient amount as collateral in accordance with the terms of the respective contracts.
Options Transactions — The Equity Funds may buy and sell put and call options and write covered put and call options, including over-the-counter options, on portfolio securities where the completion of the obligation is dependent upon the credit standing of another party. Options are a type of derivative financial instrument. The Funds may invest in derivative financial instruments, including options, in order to manage risk or gain exposure to various other investments or markets. The risk in writing a call option is that a fund gives up the opportunity for profit if the market price of the security increases. The risk in writing a put option is that a fund may incur a loss if the market price of the security decreases and the option is exercised. The risk in buying an option is that a fund pays a premium whether or not the option is exercised. A fund also has the additional risk of not being able to enter into a closing transaction if a liquid secondary market does not exist. Possible losses from uncovered written options may be unlimited. Option contracts are valued daily and unrealized appreciation or depreciation is recorded. A fund will realize a gain or loss upon expiration or closing of the option transaction. When an option is exercised, the proceeds on sales for a written call option, the purchase cost for a written put option, or the cost of a security for a purchased put or call option is adjusted by the amount of premium received or paid. The Funds designate collateral consisting of cash, U.S. government securities or other liquid assets sufficient to collateralize the market value of written options.
92
5. PURCHASESAND SALESOF SECURITIES
Cost of investment securities purchased and proceeds from sales of investment securities, excluding U.S. government and short-term securities, for the year ended September 30, 2018 are summarized below:
| | | | | | | | | | | | | | | | | | | | |
| | | Core
Growth
Fund | | | Emerging
India
Fund | | | Emerging
Markets
Select
Fund | | | Emerging Markets
Small Cap
Fund | | | Frontier
Emerging
Small Countries
Fund | |
Purchases | | $ | 735,753,170 | | | $ | 123,230,316 | | | $ | 20,256,849 | | | $ | 245,562,463 | | | $ | 64,873,730 | |
Sales | | | 498,810,491 | | | | 127,790,545 | | | | 21,240,178 | | | | 334,187,423 | | | | 174,598,104 | |
| | | | | |
| | | Global
Opportunities
Fund | | | Global Value
Fund | | | International Growth Fund | | | International Opportunities Fund | | | Micro
Cap
Fund | |
Purchases | | $ | 44,778,202 | | | $ | 120,891,932 | | | $ | 660,999,756 | | | $ | 182,121,890 | | | $ | 239,406,831 | |
Sales | | | 46,867,016 | | | | 138,755,322 | | | | 768,058,121 | | | | 203,148,830 | | | | 200,633,770 | |
| | | | | |
| | | Micro Cap
Value
Fund | | | Small Cap
Growth
Fund | | | Small Cap
Value
Fund | | | Ultra
Growth
Fund | | | | |
Purchases | | $ | 177,942,685 | | | $ | 616,312,567 | | | $ | 194,537,882 | | | $ | 171,635,073 | | | | | |
Sales | | | 163,100,415 | | | | 941,307,131 | | | | 184,037,207 | | | | 67,164,663 | | | | | |
Purchases and sales of U.S. government securities in the U.S. Treasury Fund were $19,360,062 and $58,180,821, respectively.
6. FEDERAL INCOME TAX INFORMATION
It is each Fund’s policy to comply with the requirements under Subchapter M of the Internal Revenue Code applicable to regulated investment companies and to distribute substantially all taxable income to shareholders. The Funds are no longer subject to examination by tax authorities for years prior to 2015. At this time, management believes there are no uncertain tax positions which, based on their technical merit, would not be sustained upon examination and for which it is reasonably possible that the total of amounts of unrecognized tax benefits will significantly change in the next 12 months. Accordingly, no provision for federal income or excise taxes has been made.
As of September 30, 2018, the cost and unrealized appreciation (depreciation) of securities on a tax basis were as follows:
| | | | | | | | | | | | | | | | | | | | |
| | | Core
Growth
Fund | | | Emerging
India
Fund | | | Emerging
Markets
Select
Fund | | | Emerging Markets
Small Cap
Fund | | | Frontier
Emerging
Small Countries
Fund | |
Cost | | $ | 1,415,613,222 | | | $ | 198,452,994 | | | $ | 37,941,430 | | | $ | 422,099,933 | | | $ | 75,309,095 | |
| | | | |
Gross appreciation | | $ | 884,589,135 | | | $ | 43,917,256 | | | $ | 8,357,728 | | | $ | 137,210,991 | | | $ | 8,053,527 | |
Gross (depreciation) | | | (21,731,980 | ) | | | (14,227,807 | ) | | | (2,390,144 | ) | | | (33,953,119 | ) | | | (6,853,594 | ) |
| | | | |
Net appreciation | | $ | 862,857,155 | | | $ | 29,689,449 | | | $ | 5,967,584 | | | $ | 103,257,872 | | | $ | 1,199,933 | |
| | | | |
| | | | | |
| | | Global
Opportunities
Fund | | | Global
Value
Fund* | | | International
Growth
Fund | | | International
Opportunities
Fund | | | Micro
Cap
Fund | |
Cost | | $ | 84,977,226 | | | $ | 181,438,669 | | | $ | 1,072,753,367 | | | $ | 378,796,613 | | | $ | 334,932,948 | |
| | | | |
Gross appreciation | | $ | 45,674,289 | | | $ | 24,700,792 | | | $ | 527,824,055 | | | $ | 167,191,400 | | | $ | 168,044,690 | |
Gross (depreciation) | | | (3,077,747 | ) | | | (6,963,387 | ) | | | (32,591,608 | ) | | | (12,814,083 | ) | | | (5,936,634 | ) |
| | | | |
Net appreciation | | $ | 42,596,542 | | | $ | 17,737,405 | | | $ | 495,232,447 | | | $ | 154,377,317 | | | $ | 162,108,056 | |
| | | | |
93
Notes to Financial Statements (continued)
| | | | | | | | | | | | | | | | | | | | |
| | | Micro Cap
Value
Fund | | | Small Cap
Growth
Fund | | | Small Cap
Value
Fund | | | Ultra
Growth
Fund | | | U.S.
Treasury
Fund | |
Cost | | $ | 202,854,059 | | | $ | 1,150,670,134 | | | $ | 333,557,198 | | | $ | 229,891,176 | | | $ | 340,349,329 | |
| | | | |
Gross appreciation | | $ | 85,665,522 | | | $ | 782,501,584 | | | $ | 117,593,481 | | | $ | 74,448,657 | | | $ | 774,809 | |
Gross (depreciation) | | | (3,358,432 | ) | | | (36,254,321 | ) | | | (11,126,283 | ) | | | (7,125,750 | ) | | | (38,222,660 | ) |
| | | | |
Net appreciation (depreciation) | | $ | 82,307,090 | | | $ | 746,247,263 | | | $ | 106,467,198 | | | $ | 67,322,907 | | | $ | (37,447,851 | ) |
| | | | |
| * | Does not include $3,407,882 of unrealized gain from acquired portfolio. See note 15 for further details regarding the reorganization. |
The difference between book-basis and tax-basis unrealized gains is primarily attributable to the tax deferral of losses on wash sales, unrealized appreciation on passive foreign investment companies (PFICs), partnership adjustments and other temporary tax adjustments.
The components of accumulated earnings on a tax basis as of September 30, 2018 were as follows:
| | | | | | | | | | | | | | | | | | | | |
| | | Core
Growth
Fund | | | Emerging
India
Fund | | | Emerging
Markets
Select
Fund | | | Emerging
Markets
Small Cap
Fund | | | Frontier
Emerging
Small Countries
Fund | |
Undistributed capital gains | | $ | 153,648,095 | | | $ | 15,619,783 | | | $ | — | | | $ | 48,977,361 | | | $ | — | |
| | | | |
Accumulated earnings | | | 153,648,095 | | | | 15,619,783 | | | | — | | | | 48,977,361 | | | | — | |
Accumulated capital and other losses | | | (9,445,183 | ) | | | (4,978,993 | ) | | | (4,818,821 | ) | | | (3,513,046 | ) | | | (108,127,274 | ) |
Other undistributed ordinary losses | | | — | | | | (45,771 | ) | | | (57,584 | ) | | | — | | | | (44,022 | ) |
Net unrealized appreciation (depreciation) | | | 862,444,808 | | | | 27,237,814 | | | | 5,804,950 | | | | 103,193,126 | | | | (232,200 | ) |
| | | | |
Total accumulated earnings (accumulated losses) | | $ | 1,006,647,720 | | | $ | 37,832,833 | | | $ | 928,545 | | | $ | 148,657,441 | | | $ | (108,403,496 | ) |
| | | | |
| | | | | |
| | | Global
Opportunities
Fund | | | Global
Value
Fund | | | International
Growth
Fund | | | International
Opportunities
Fund | | | Micro Cap Fund | |
Undistributed ordinary income | | $ | — | | | $ | 365,474 | | | $ | 1,629,607 | | | $ | — | | | $ | — | |
Undistributed capital gains | | | 14,978,234 | | | | 21,276,430 | | | | 157,834,766 | | | | 5,763,555 | | | | 79,916,710 | |
| | | | |
Accumulated earnings | | | 14,978,234 | | | | 21,641,904 | | | | 159,464,373 | | | | 5,763,555 | | | | 79,916,710 | |
Accumulated capital and other losses | | | (720,294 | ) | | | (164,468,359 | ) | | | — | | | | (2,942,677 | ) | | | (4,029,779 | ) |
Other undistributed ordinary losses | | | (4,412 | ) | | | — | | | | — | | | | (3,030 | ) | | | — | |
Net unrealized appreciation | | | 42,541,613 | | | | 17,750,642 | | | | 495,181,492 | | | | 154,373,849 | | | | 161,652,746 | |
| | | | |
Total accumulated earnings (accumulated losses) | | $ | 56,795,141 | | | $ | (125,075,813 | ) | | $ | 654,645,865 | | | $ | 157,191,697 | | | $ | 237,539,677 | |
| | | | |
| | | | | |
| | | Micro Cap
Value
Fund | | | Small Cap Growth Fund | | | Small Cap Value Fund | | | Ultra Growth Fund | | | U.S. Treasury Fund | |
Undistributed ordinary income | | $ | 57,411 | | | $ | — | | | $ | — | | | $ | 7,109,309 | | | $ | 204,605 | |
Undistributed capital gains | | | 25,164,784 | | | | 385,976,895 | | | | 31,718,786 | | | | 10,293,112 | | | | — | |
| | | | |
Accumulated earnings | | | 25,222,225 | | | | 385,976,895 | | | | 31,718,786 | | | | 17,402,421 | | | | 204,605 | |
Accumulated capital and other losses | | | — | | | | (10,640,221 | ) | | | (2,407,550 | ) | | | — | | | | (16,889,491 | ) |
Other undistributed ordinary income/(losses) | | | — | | | | — | | | | — | | | | — | | | | (144,716 | ) |
Net unrealized appreciation (depreciation) | | | 82,270,831 | | | | 746,248,155 | | | | 106,425,936 | | | | 67,123,807 | | | | (37,447,851 | ) |
| | | | |
Total accumulated earnings (accumulated losses) | | $ | 107,493,056 | | | $ | 1,121,584,829 | | | $ | 135,737,172 | | | $ | 84,526,228 | | | $ | (54,277,453 | ) |
| | | | |
Dividends from net investment income and net realized gains, if any, are declared and paid at least annually for all Funds, except for dividends from net investment income in two funds. The Global Value and U.S. Treasury Funds declare and pay dividends quarterly. The amount of dividends and distributions from net investment income and net realized gains are determined in accordance with federal income tax regulations, which may differ from U.S. GAAP. The Funds may utilize earnings and profits distributed to shareholders on redemption of shares as part of the dividends paid deduction (tax equalization).
To the extent these book and tax differences are permanent in nature, such amounts are reclassified at the end of the fiscal year among additional paid-in capital, undistributed net investment income (loss), and undistributed net realized gain (loss) on investments, options and foreign currency translations. The reclassifications generally relate to the tax treatment of net operating losses, the netting of net operating loss to short-term gains, investment in REITs and partnerships, distribution reclassifications, foreign capital gains taxes, Section 988 currency gains and losses, PFICs, and non-REIT return of capital dividends. These reclassifications have no impact on the net asset values of the Funds.
94
Accordingly, at September 30, 2018, reclassifications were recorded as follows:
| | | | | | | | | | | | | | | | | | | | |
| | | Core
Growth
Fund | | | Emerging
India
Fund | | | Emerging
Markets
Select
Fund | | | Emerging Markets
Small Cap
Fund | | | Frontier
Emerging
Small Countries
Fund | |
Increase (decrease) paid-in-capital in excess of par | | $ | (5,435,404 | ) | | $ | — | | | $ | (112,879 | ) | | $ | (3,618,499 | ) | | $ | (3,609,278 | ) |
Increase (decrease) undistributed net investment income | | | 10,344,317 | | | | 2,289,720 | | | | 38,189 | | | | 3,367,695 | | | | 3,465,269 | |
Increase (decrease) undistributed net realized gain (loss) | | | (4,908,913 | ) | | | (2,289,720 | ) | | | 74,690 | | | | 250,804 | | | | 144,009 | |
| | | | | |
| | | Global
Opportunities
Fund | | | Global Value Fund | | | International Growth Fund | | | International Opportunities Fund | | | Micro Cap Fund | |
Increase (decrease) paid-in-capital in excess of par | | $ | (1,065,779 | ) | | $ | 164,486,046 | | | $ | 1 | | | $ | (3,079,196 | ) | | $ | (1,748,243 | ) |
Increase (decrease) undistributed net investment income | | | 1,067,442 | | | | (64,204 | ) | | | (436,507 | ) | | | 2,507,878 | | | | 3,488,387 | |
Increase (decrease) undistributed net realized gain (loss) | | | (1,663 | ) | | | (164,421,842 | ) | | | 436,506 | | | | 571,318 | | | | (1,740,144 | ) |
| | | | | |
| | | Micro Cap Value Fund | | | Small Cap Growth Fund | | | Small Cap Value Fund | | | Ultra Growth Fund | | | U.S. Treasury Fund | |
Increase (decrease) paid-in-capital in excess of par | | $ | (8,544 | ) | | $ | (5,194,387 | ) | | $ | (11 | ) | | $ | (8 | ) | | $ | — | |
Increase (decrease) undistributed net investment income | | | 3,347,751 | | | | 13,146,198 | | | | (747,781 | ) | | | 3,000,044 | | | | (947 | ) |
Increase (decrease) undistributed net realized gain (loss) | | | (3,339,207 | ) | | | (7,951,811 | ) | | | 747,792 | | | | (3,000,036 | ) | | | 947 | |
Capital loss carryforwards are available through the date specified below to offset future realized net capital gains for federal income tax purposes. Future capital loss carryover utilization in any given year may be subject to Internal Revenue Code limitations. To the extent future gains are offset by capital loss carryforwards, such gains will not be distributed.
Under the Regulated Investment Company Modernization Act of 2010, a Fund will be permitted to carry forward capital losses incurred in taxable years beginning after December 22, 2010 for an unlimited period. Post-enactment losses that are carried forward will retain their character as either short-term or long-term capital losses rather than being considered all short-term as under previous law.
Capital loss carryforwards as of September 30, 2018 are as follows:
| | | | | | | | |
| | | Non-expiring | |
| Fund | | Short Term | | | Long Term | |
Emerging Markets Select Fund | | $ | 4,595,885 | | | $ | — | |
Frontier Emerging Small Countries Fund | | | 92,845,849 | | | | 15,281,425 | |
Global Value Fund* | | | 24,394,990 | | | | 140,073,369 | |
U.S. Treasury Fund | | | 11,360,448 | | | | 5,529,043 | |
| * | The Fund’s capital loss carryforward is subject to an annual limitation under the Internal Revenue Code and related regulations. |
During the tax year ended September 30, 2018, the Funds used capital loss carryforwards in the following amounts:
| | | | |
| Fund | | Amount Used | |
Emerging Markets Select Fund | | $ | 4,355,751 | |
Emerging Markets Small Cap Fund | | | 11,373,715 | |
Frontier Emerging Small Countries Fund | | | 43,422,052 | |
The Funds have elected to defer losses incurred from November 1, 2017 through September 30, 2018 in accordance with federal income tax rules. These losses are treated as having arisen on the first day of the following fiscal year. The Funds have elected to defer losses as follows:
| | | | | | | | |
| Fund | | Post-October
Capital Losses | | | Late-Year Ordinary
Losses | |
Core Growth Fund | | $ | — | | | $ | 9,445,183 | |
Emerging India Fund | | | 2,369,031 | | | | 2,609,962 | |
Emerging Markets Select Fund | | | — | | | | 222,936 | |
Emerging Markets Small Cap Fund | | | — | | | | 3,513,046 | |
Global Opportunities Fund | | | — | | | | 720,294 | |
International Opportunities Fund | | | — | | | | 2,942,677 | |
Micro Cap Fund | | | — | | | | 4,029,779 | |
Small Cap Growth Fund | | | — | | | | 10,640,221 | |
Small Cap Value Fund | | | 2,338,541 | | | | 69,009 | |
95
Notes to Financial Statements (continued)
The tax character of distributions paid during the year ended September 30, 2018 was as follows:
| | | | | | | | | | | | | | | | | | | | |
| 2018 | | Core
Growth
Fund | | | Emerging
India
Fund | | | Emerging
Markets
Select
Fund | | | Emerging Markets
Small Cap
Fund | | | Frontier
Emerging
Small Countries
Fund | |
Ordinary Income | | $ | — | | | $ | 2,905,323 | | | $ | — | | | $ | — | | | $ | — | |
Capital Gain | | | 99,220,332 | | | | 4,591,525 | | | | — | | | | — | | | | — | |
| | | | |
Total | | $ | 99,220,332 | | | $ | 7,496,848 | | | $ | — | | | $ | — | | | $ | — | |
| | | | |
| | | | | |
| 2018 | | Global
Opportunities
Fund | | | Global Value Fund | | | International Growth Fund | | | International Opportunities Fund | | | Micro Cap Fund | |
Ordinary Income | | $ | — | | | $ | 5,418,138 | | | $ | — | | | $ | — | | | $ | — | |
Capital Gain | | | 10,899,209 | | | | 20,535,691 | | | | 41,285,234 | | | | 34,016,624 | | | | 44,480,704 | |
| | | | |
Total | | $ | 10,899,209 | | | $ | 25,953,829 | | | $ | 41,285,234 | | | $ | 34,016,624 | | | $ | 44,480,704 | |
| | | | |
| | | | | |
| 2018 | | Micro Cap Value Fund | | | Small Cap Growth Fund | | | Small Cap Value Fund | | | Ultra Growth Fund | | | U.S. Treasury Fund | |
Ordinary Income | | $ | — | | | $ | — | | | $ | 1,077,165 | | | $ | 520,869 | | | $ | 7,001,515 | |
Capital Gain | | | 17,823,539 | | | | 177,876,579 | | | | 23,502,378 | | | | 11,827,106 | | | | — | |
| | | | |
Total | | $ | 17,823,539 | | | $ | 177,876,579 | | | $ | 24,579,543 | | | $ | 12,347,975 | | | $ | 7,001,515 | |
| | | | |
The tax character of distributions paid during the year ended September 30, 2017 was as follows:
| | | | | | | | | | | | | | | | | | | | |
| 2017 | | Core
Growth
Fund | | | Emerging
India
Fund | | | Emerging
Markets
Select
Fund | | | Emerging Markets
Small Cap
Fund | | | Frontier
Emerging
Small Countries
Fund | |
Ordinary Income | | $ | — | | | $ | — | | | $ | — | | | $ | — | | | $ | — | |
Capital Gain | | | 2,252,794 | | | | 819,648 | | | | — | | | | — | | | | — | |
| | | | |
Total | | $ | 2,252,794 | | | $ | 819,648 | | | $ | — | | | $ | — | | | $ | — | |
| | | | |
| | | | | |
| 2017 | | Global
Opportunities
Fund | | | Global
Value
Fund | | | International Growth Fund | | | International Opportunities Fund | | | Micro Cap Fund | |
Ordinary Income | | $ | — | | | $ | 3,653,028 | | | $ | — | | | $ | — | | | $ | — | |
Capital Gain | | | 8,169,399 | | | | 6,457,187 | | | | 47,302,575 | | | | — | | | | 22,829,857 | |
| | | | |
Total | | $ | 8,169,399 | | | $ | 10,110,215 | | | $ | 47,302,575 | | | $ | — | | | $ | 22,829,857 | |
| | | | |
| | | | | |
| 2017 | | Micro Cap Value Fund | | | Small Cap Growth Fund | | | Small Cap Value Fund | | | Ultra Growth Fund | | | U.S. Treasury Fund | |
Ordinary Income | | $ | — | | | $ | — | | | $ | 136,248 | | | $ | — | | | $ | 7,013,026 | |
Capital Gain | | | 3,065,003 | | | | 144,143,218 | | | | 154,671 | | | | 9,710,650 | | | | 23,928,544 | |
| | | | |
Total | | $ | 3,065,003 | | | $ | 144,143,218 | | | $ | 290,919 | | | $ | 9,710,650 | | | $ | 30,941,570 | |
| | | | |
The tax character of distributions paid may differ from that shown in the Statements of Changes in Net Assets due to short-term gains being treated as ordinary income for tax purposes.
EU Reclaims — In December of 2016, as a result of several court cases in certain countries across the European Union, the Emerging Markets Small Cap Fund, Global Opportunities Fund, Global Value Fund, International Growth Fund and International Opportunities Fund filed tax reclaims for previously withheld taxes on dividends earned in Finland and Poland (EU Reclaims). These additional filings are subject to various administrative proceedings by the local jurisdictions’ tax authorities within the European Union, as well as a number of related judicial proceedings. Income recognized, if any, for EU reclaims is reflected as dividend income in the Statements of Operations and related receivables, if any, are reflected as interest and dividends receivable in the Statements of Assets and Liabilities. When uncertainty exists as to the ultimate resolution of these proceedings, the likelihood of receipt of these EU reclaims and the potential timing of payment, no amounts are reflected in the financial statements.
96
7. RELATED PARTY TRANSACTIONS
Investment Advisory Fees, Expense Limitations — As the Funds’ investment advisor, the Advisor receives a monthly fee calculated on average daily net assets. The Advisor has contractually agreed to waive its fees and/or reimburse certain Funds should a Fund’s operating expenses exceed a specified annual limitation through at least January 31, 2019 (with the exception of the Wasatch Global Value Fund, which has been extended through January 31, 2020). If operating expenses are less than the specified expense limit for the Fund, the Advisor shall be entitled to recoup the fees waived or reduced to the extent that the operating expenses and the amounts reimbursed do not exceed such expense limit for the Fund, under the period of the agreement (currently through January 31, 2019 or January 31, 2020 in the case of the Global Value Fund). The Funds may only make repayments to the Advisor for amounts reimbursed if such repayment does not cause the Funds’ expense ratio, after repayment is taken into account, to exceed both (i) the expense cap in place at the time such amounts were waived; and (ii) the Fund’s current expense cap. All amounts not recovered at the end of the period expire on January 31, 2019. Shareholder expenses will increase if the Advisor does not renew the contractual expense cap after its expiration date. Ordinary operating expenses exclude any interest, dividend expense on short sales/interest expense, taxes, brokerage commissions, other investment-related costs and extraordinary expenses, such as litigation and other expenses not incurred in the ordinary course of the Funds’ business. The Wasatch Funds’ Board of Trustees determined that the costs of the Proxy Statement related to the identification and shareholder approval of Trustee Nominees were extraordinary expenses. In late October 2013, it was discovered that the Global Value Fund had a 12b-1 receivable on the books which dated back to 2008 prior to the conversion of the 1st Source Funds to Wasatch Funds. It was determined that the amount should be written off as an extraordinary expense and posted to other expenses. The balance for the Global Value Fund was $70,993. The impact of these write-offs is reflected in the Financial Highlights. Investment advisory fees and fees waived, if any, for the year ended September 30, 2018 are disclosed in the Statements of Operations. Investment advisory fee and expense limitation annual rates are shown below.
| | | | | | | | | | | | | | | | | | | | |
| Fund | | Advisory
Fee | | | Expense
Limitation
Investor Class | | | Expense
Limitation
Institutional Class | | | Contractual Expense
Limitation/
Reimbursement
Recoverable
Expiration Date | | | Reimbursement
Recoverable | |
Core Growth Fund | | | 1.00% | | | | 1.50% | | | | 1.05% | | | | 1/31/2019 | | | $ | 127,888 | |
Emerging India Fund | | | 1.25% | | | | 1.75% | | | | 1.50% | | | | 1/31/2019 | | | | 29,308 | |
Emerging Markets Select Fund | | | 1.00% | | | | 1.50% | | | | 1.20% | | | | 1/31/2019 | | | | 113,133 | |
Emerging Markets Small Cap Fund | | | 1.65% | | | | 1.95% | | | | 1.80% | | | | 1/31/2019 | | | | 142,830 | |
Frontier Emerging Small Countries Fund1 | | | 1.65% | | | | 2.15% | | | | 1.95% | | | | 1/31/2019 | | | | 207,438 | |
Global Opportunities Fund | | | 1.25% | | | | 1.75% | | | | 1.35% | | | | 1/31/2019 | | | | 30,562 | |
Global Value Fund | | | 0.90% | | | | 1.10% | | | | 0.95% | | | | 1/31/2020 | | | | 171,111 | |
International Growth Fund | | | 1.25% | | | | 1.75% | | | | 1.35% | | | | 1/31/2019 | | | | 11,472 | |
International Opportunities Fund | | | 1.75% | | | | 2.25% | | | | 1.95% | | | | 1/31/2019 | | | | 26,065 | |
Micro Cap Fund | | | 1.50% | | | | 1.95% | | | | N/A | | | | 1/31/2019 | | | | — | |
Micro Cap Value Fund | | | 1.50% | | | | 1.95% | | | | N/A | | | | 1/31/2019 | | | | — | |
Small Cap Growth Fund | | | 1.00% | | | | 1.50% | | | | 1.05% | | | | 1/31/2019 | | | | 233,239 | |
Small Cap Value Fund | | | 1.00% | | | | 1.50% | | | | 1.05% | | | | 1/31/2019 | | | | 50,294 | |
Ultra Growth Fund | | | 1.00% | | | | 1.50% | | | | N/A | | | | 1/31/2019 | | | | — | |
U.S. Treasury Fund | | | 0.50% | | | | 0.75% | | | | N/A | | | | 1/31/2019 | | | | — | |
| 1 | Effective January 31, 2018 the management fee was reduced from 1.75% to 1.65%. |
Affiliated Trades — Certain Funds are permitted to purchase or sell securities from or to certain related affiliated funds under specified conditions outlined in the procedures adopted by the Board of Trustees (the “Board”). The procedures have been designed to ensure that any purchase or sale of securities by the Funds from or to another fund (or funds) that are, or could be, considered an affiliate by virtue of having a common investment advisor (or affiliated investment advisors), common Trustees and/or common officers complies with Rule 17a-7 of the 1940 Act. Further, each transaction is effected at the current market price, as that term is defined under the procedures. During the year ended September 30, 2018, the Funds did not engage in purchases or sales of securities pursuant to Rule 17a-7 of the 1940 Act.
In-Kind Transaction — In April 2017, the Wasatch International Opportunities Fund had a large in-kind redemption with an affiliated person. The transaction was effected consistent with the Funds’ Procedures for Effecting In-Kind Redemptions and was approved in advance by the Independent Trustees of the Wasatch Funds Trust.
Compensation — Officers serve in that capacity without compensation from the Trust. Beginning in the calendar year of 2017, the Funds’ method of compensating Trustees is to pay each Independent Trustee a retainer of $120,000 per year for services rendered and a fee of $24,000 for each Board of Trustees meeting attended in person or telephonically. In addition, each Independent Trustee receives a fee of $24,000 for attendance at an executive session held with respect to the contract renewal process for the Funds. In addition, the Chairman of the Board receives an additional fee of $30,000 a year as Chairman and $6,000 for attendance in person or telephonically at a Board meeting; the Chairman of the Audit Committee and the Chairman of the Nominating Committee each receive an additional $18,000 per year as Chairman and $3,600 for attendance in person or telephonically at a Board meeting. Additionally, each Independent Trustee is entitled to reimbursement of expenses related to his or her duties as a Trustee of the Funds.
97
Notes to Financial Statements (continued)
Payments by Advisor — During the 2014 fiscal year, the Advisor paid certain audit, legal and/or printing fees of the Core Growth, Emerging Markets Small Cap, Global Value, Small Cap Growth and Small Cap Value Funds. The Advisor does not intend to be reimbursed for these amounts.
On October 16, 2014, the Advisor discovered a trade error involving the Ultra Growth Fund. The Advisor reimbursed the Fund $12,267. On August 2, 2016, the Advisor discovered a trade error involving the Small Cap Growth Fund. The Advisor reimbursed the Fund $12,890.
During 2018, the Advisor paid for a portion of the expenses in connection with the merger of the Long/Short and Global Value Funds. The Advisor will not be reimbursed for these amounts.
The impact of the payments detailed above is reflected in the net expense ratios in the Financial Highlights.
Payments by Sub-Advisor — In June 2016, the Funds filed a proxy statement with the Securities and Exchange Commission to inform shareholders about a Special Meeting of Shareholders of the Wasatch-Hoisington U.S. Treasury Fund. The purpose of the Shareholder Meeting was to ask shareholders to approve a new Sub-Advisory Agreement between Wasatch Advisors, Inc. and Hoisington Investment Management Company (HIMCO) with respect to the Wasatch-Hoisington U.S. Treasury Fund. HIMCO, the Sub-Advisor for the Fund, reimbursed the Wasatch-Hoisington U.S. Treasury Fund for the costs associated with the proxy statement filing. The Sub-Advisor does not intend to be reimbursed for this amount.
Transfer Agent Intermediary Fees Reimbursed to the Advisor — Each Fund paid fees to, and reimbursed certain out-of-pocket expenses of, the Funds’ transfer agent during the period. In addition, the Advisor and the Funds’ distributor have entered into selling dealer agreements and service agreements with certain financial services companies, broker-dealers, banks, advisors, retirement service providers or other authorized agents or organizations (each an “Intermediary,” together, “Intermediaries”) to accept purchase, exchange and redemption orders on the Funds’ behalf. For Investor Class shares of the Funds, some Intermediaries do not charge investors a direct transaction fee, but instead charge a fee for accounting and shareholder services that the agent provided to Fund shareholders on the Funds’ behalf. Those services typically included recordkeeping, transaction processing for shareholders’ accounts, communication of tax information, income distribution and other services. Generally, the fee was either a per account charge based on the number of accounts to which the Intermediary provided such services, or was a percentage (as of September 30, 2018 up to 0.40% annually) of the average value of Fund Investor Class shares held in such accounts. The Advisor paid the Intermediary fees and the Funds reimbursed the Advisor for the portion of such fees intended to compensate the Intermediary for provision of services of the type that would be provided by the Funds’ transfer agent or other service providers if the shares were registered on the books of the Funds’ transfer agent. Institutional Class shares of the Funds do not reimburse the Advisor for payments to Intermediaries. The Funds’ reimbursement of expenses incurred for services provided by Intermediaries are included in “Shareholder servicing fees—Investor Class” in the Statements of Operations.
Custodian Out-of-Pocket Expense Reimbursement — In September 2016, State Street Bank and Trust Company (“SSB”), the Funds’ custodian, provided each Fund with an offer to reimburse the Fund for certain out-of-pocket expenses it charged the Fund between 2003 and 2015. The incorrect charges were due to inaccurate billing rates used by SSB for certain out-of-pocket expenses. SSB made the reimbursements in May 2017.
10% Shareholders — As of September 30, 2018, the Funds had individual shareholder accounts and/or omnibus shareholder accounts (comprised of a group of individual shareholders), which individually amounted to more than 10% of the total shares outstanding of the Fund as detailed below:
| | | | | | | | |
| Fund | | Number of
Accounts | | | Percent of Shares
Outstanding | |
Core Growth Fund | | | 2 | | | | 46.95 | % |
Emerging India Fund | | | 2 | | | | 63.62 | % |
Emerging Markets Select Fund | | | 3 | | | | 67.95 | % |
Emerging Markets Small Cap Fund | | | 3 | | | | 67.62 | % |
Frontier Emerging Small Countries Fund | | | 2 | | | | 43.01 | % |
Global Opportunities Fund | | | 3 | | | | 59.22 | % |
Global Value Fund | | | 2 | | | | 69.07 | % |
International Growth Fund | | | 2 | | | | 57.55 | % |
International Opportunities Fund | | | 2 | | | | 58.35 | % |
Micro Cap Fund | | | 2 | | | | 32.35 | % |
Micro Cap Value Fund | | | 3 | | | | 66.18 | % |
Small Cap Growth Fund | | | 2 | | | | 51.99 | % |
Small Cap Value Fund | | | 2 | | | | 40.70 | % |
Ultra Growth Fund | | | 2 | | | | 36.53 | % |
U.S. Treasury Fund | | | 3 | | | | 54.37 | % |
98
Affiliated Interests — As of September 30, 2018, Wasatch Advisors, Inc. and its affiliates, and the retirement plans of Wasatch Advisors, Inc. and its affiliates, held shares of the Funds which may be redeemed at any time as detailed below:
| | | | | | | | |
| Fund | | Number of
Accounts* | | | Percent of Shares
Outstanding | |
Core Growth Fund | | | 20 | | | | 0.99 | % |
Emerging India Fund | | | 28 | | | | 5.95 | % |
Emerging Markets Select Fund | | | 22 | | | | 17.93 | % |
Emerging Markets Small Cap Fund | | | 17 | | | | 1.32 | % |
Frontier Emerging Small Countries Fund | | | 17 | | | | 2.04 | % |
Global Opportunities Fund | | | 17 | | | | 5.99 | % |
Global Value Fund | | | 10 | | | | 1.35 | % |
International Growth Fund | | | 16 | | | | 0.78 | % |
International Opportunities Fund | | | 20 | | | | 1.15 | % |
Micro Cap Fund | | | 13 | | | | 0.46 | % |
Micro Cap Value Fund | | | 14 | | | | 2.61 | % |
Small Cap Growth Fund | | | 16 | | | | 0.51 | % |
Small Cap Value Fund | | | 44 | | | | 1.56 | % |
Ultra Growth Fund | | | 10 | | | | 0.96 | % |
U.S. Treasury Fund | | | 13 | | | | 2.09 | % |
| * | Multiple accounts with the same beneficial owner are treated as one account. |
8. TRANSACTIONSWITH AFFILIATES
If a Fund’s holding represents ownership of 5% or more of the voting securities of a company, the company is deemed to be an affiliate as defined by the 1940 Act. The following Funds conducted transactions during the year ended September 30, 2018 with an “affiliated company” as so defined:
| | | | | | | | | | | | | | | | | | | | | | | | | | | | |
| | | Share Activity | | | Dividends
Credited to
Income for the
period ended
9/30/2018 | | | Gain (Loss)
Realized on
Sale of Shares
for the
period ended
9/30/2018 | | | Change in
Unrealized
Appreciation
for the
period ended
9/30/2018 | |
| | | Balance
9/30/2017 | | | Purchases/
Additions | | | Sales/
Reductions | | | Balance
9/30/2018 | |
Micro Cap Fund | | | | | | | | | | | | | | | | | | | | | | | | |
IRIDEX Corp. | | | — | | | | 765,198 | | | | — | | | | 765,198 | | | $ | — | | | $ | — | | | $ | 236,786 | |
9. RESTRICTED SECURITIES
The Funds may own investments that were purchased through private placement transactions or under Rule 144A of the Securities Act of 1933 (the “Securities Act”) and cannot be sold without prior registration under the Securities Act or may be limited due to certain restrictions. These securities are generally deemed to be illiquid and are valued at fair value as determined by a designated Pricing Committee of the Advisor (“Pricing Committee”), comprised of personnel of the Advisor, with oversight by the Board of Trustees and in accordance with Board-approved Pricing Policies and Procedures. If and when such securities are registered, the costs of registering such securities are paid by the issuer. At September 30, 2018, the Funds held the following restricted securities:
| | | | | | | | | | | | | | | | | | |
| | | Security
Type | | Acquisition
Date | | | Cost | | | Fair
Value | | | Value as a Percent
of Net Assets | |
Core Growth Fund | | | | | | | | | | | | | | | | | | |
DocuSign, Inc. | | Common Stock | | | 4/27/18 | | | $ | 4,000,004 | | | $ | 10,632,125 | | | | 0.46 | % |
|
| |
Emerging India Fund | | | | | | | | | | | | | | | | | | |
Aavas Financiers Ltd. | | Common Stock | | | 9/24//18 | | | $ | 2,765,442 | | | $ | 2,628,758 | | | | 1.16 | % |
|
| |
Micro Cap Value Fund | | | | | | | | | | | | | | | | | | |
Acetylon Pharmaceuticals, Inc. | | Rights | | | 12/21/16 | | | $ | — | | | $ | 326,356 | | | | 0.12 | % |
Acetylon Pharmaceuticals, Inc. | | Rights | | | 12/21/16 | | | | — | | | | — | | | | 0.00 | % |
Regenacy Pharmaceuticals, LLC | | LLC Membership Interest | | | 12/21/16 | | | | 30,001 | | | | 44,465 | | | | 0.02 | % |
Vertex Energy, Inc., Pfd., Series B | | Convertible Preferred Stock | | | 6/22/15 - 7/12/18 | | | | 1,760,059 | | | | 1,855,059 | | | | 0.65 | % |
Vertex Energy, Inc. | | Warrants | | | 6/22/15 | | | | 95,000 | | | | 40,000 | | | | 0.01 | % |
| | | | | | | | | | |
| | | | | | | | $ | 1,885,060 | | | $ | 2,265,880 | | | | 0.80 | % |
|
| |
99
Notes to Financial Statements (continued)
| | | | | | | | | | | | | | | | | | |
| | | Security
Type | | Acquisition
Date | | | Cost | | | Fair
Value | | | Value as a Percent
of Net Assets | |
Small Cap Growth Fund | | | | | | | | | | | | | | | | | | |
DataStax, Inc., Series E Pfd. | | Preferred Stock | | | 8/12/14 | | | $ | 8,000,002 | | | $ | 11,179,538 | | | | 0.59 | % |
DocuSign, Inc. | | Common Stock | | | 4/27/18 | | | | 11,999,973 | | | | 42,754,388 | | | | 2.27 | % |
Drilling Info Holdings, Inc., | | Seller’s Note | | | 8/3/2018 | | | | 659,150 | | | | 1,728,000 | | | | 0.09 | % |
Greenspring Global Partners II-B, L.P. | | LP Interest | | | 10/10/03 - 3/31/17 | | | | 1,876,586 | | | | 1,830,415 | | | | 0.10 | % |
Greenspring Global Partners III-B, L.P. | | LP Interest | | | 3/16/06 - 6/29/17 | | | | 598,937 | | | | 1,017,825 | | | | 0.05 | % |
Nanosys, Inc., Series D Pfd. | | Preferred Stock | | | 11/8/05 | | | | 2,000,000 | | | | 183,051 | | | | 0.01 | % |
Nanosys, Inc., Series E Pfd. | | Preferred Stock | | | 8/13/10 | | | | 184,939 | | | | 167,980 | | | | 0.01 | % |
| | | | | | | | | | | | | | | | | | |
| | | | | | | | $ | 25,319,587 | | | $ | 58,861,197 | | | | 3.12 | % |
|
| |
Ultra Growth Fund | | | | | | | | | | | | | | | | | | |
Drilling Info Holdings, Inc., | | Seller’s Note | | | 8/3/18 | | | $ | 49,502 | | | $ | 132,000 | | | | 0.05 | % |
Greenspring Global Partners II-B, L.P. | | LP Interest | | | 10/10/03 - 3/31/17 | | | | 1,691,030 | | | | 1,647,368 | | | | 0.55 | % |
Greenspring Global Partners III-B, L.P. | | LP Interest | | | 3/16/06 - 6/29/17 | | | | 599,949 | | | | 1,017,825 | | | | 0.34 | % |
Nanosys, Inc., Series D Pfd. | | Preferred Stock | | | 11/8/05 | | | | 500,001 | | | | 45,763 | | | | 0.02 | % |
Nanosys, Inc., Series E Pfd. | | Preferred Stock | | | 8/13/10 | | | | 46,235 | | | | 41,995 | | | | 0.01 | % |
| | | | | | | | | | | | | | | | | | |
| | | | | | | | $ | 2,886,717 | | | $ | 2,884,951 | | | | 0.97 | % |
|
| |
10. LINEOF CREDIT
Effective May 17, 2018, the Funds in the Trust renewed and amended agreements for two open lines of credit totaling $300,000,000, one of which is $100,000,000 committed, and the other of which is $200,000,000 uncommitted, with State Street Bank and Trust Company (together, the “Line”). The agreements, as amended, have no change in the committed, uncommitted and total amounts available on the Line. The Funds incur commitment fees on the undrawn portion of the committed part of the Line, and interest expense to the extent of amounts drawn (borrowed) under the entire Line. Interest is based on the higher of (a) the overnight federal-funds rate in effect on the date of borrowing, plus a margin, or (b) the daily 1-Month London Interbank Offered Rate (LIBOR) in effect on the date of borrowing, plus a margin. Commitment fees are pro-rated among the Funds based upon relative average net assets. Interest expense is charged directly to a Fund based upon actual amounts borrowed by that Fund.
For the year ended September 30, 2018, the following Funds had borrowings:
| | | | | | | | | | | | | | | | | | | | |
| Funds Utilizing the Line of Credit | | Average Daily
Borrowings | | | Number of
Days
Outstanding | | | Interest
Expense | | | Weighted
Average
Annualized
Interest Rate | | | Balance at
9/30/2018 | |
Core Growth Fund | | $ | 4,727,180 | | | | 5 | | | $ | 1,803 | | | | 2.75 | % | | $ | — | |
Emerging India Fund | | | 1,563,072 | | | | 130 | | | | 18,118 | | | | 3.21 | % | | | 402,305 | |
Emerging Markets Select Fund | | | 439,437 | | | | 100 | | | | 3,601 | | | | 2.95 | % | | | — | |
Emerging Markets Small Cap Fund | | | 3,950,629 | | | | 78 | | | | 24,170 | | | | 2.82 | % | | | — | |
Frontier Emerging Small Countries Fund | | | 2,087,068 | | | | 167 | | | | 30,956 | | | | 3.20 | % | | | 310,178 | |
Global Opportunities Fund | | | 1,258,952 | | | | 47 | | | | 4,514 | | | | 2.75 | % | | | — | |
Global Value Fund | | | 1,964,733 | | | | 2 | | | | 348 | | | | 3.19 | % | | | — | |
International Growth Fund | | | 33,111,186 | | | | 2 | | | | 4,567 | | | | 2.48 | % | | | — | |
International Opportunities Fund | | | 1,051,263 | | | | 12 | | | | 872 | | | | 2.49 | % | | | — | |
Small Cap Growth Fund | | | 2,915,241 | | | | 19 | | | | 4,954 | | | | 3.22 | % | | | — | |
Ultra Growth Fund | | | 230,707 | | | | 4 | | | | 73 | | | | 2.85 | % | | | — | |
U.S. Treasury Fund | | | 7,985,926 | | | | 1 | | | | 754 | | | | 3.40 | % | | | — | |
100
11. PRINCIPAL RISKS
Market and Credit Risk — In the normal course of business the Funds trade financial instruments and enter into financial transactions where risk of loss exists due to changes in the market (market risk) or the failure of the other party to a transaction to perform (credit risk). Similar to credit risk, the Funds may be exposed to counterparty risk, or the risk that an institution or other entity with which the Funds have unsettled or open transactions will default. The potential loss could exceed the value of the financial assets recorded in the financial statements. Financial assets, which potentially expose the Funds to credit risk, consist principally of cash due from counterparties and investments. The extent of the Funds’ exposure to credit and counterparty risks with respect to these financial assets approximates their carrying value as recorded in the Funds’ Statements of Assets and Liabilities.
Inflation Risk — Inflation risk is the possibility that inflation will reduce the purchasing power of a currency, and subsequently reduce the value of a security or asset, and may result in rising interest rates. Inflation is the overall upward price movement of goods and services in an economy that causes the value of a currency to decline.
Interest Rate Risk — Interest rate risk is the risk that fixed-income securities will decline in value because of changes in interest rates. A rise in interest rates typically causes a fall in values. Interest rate risk should be modest for shorter-term securities, moderate for intermediate-term securities and high for longer-term securities. Generally, an increase in the average maturity of a fund will make it more sensitive to interest rate risk. The interest rate is the amount charged, expressed as a percentage of principal, by a lender to a borrower for the use of assets.
Foreign Currency Risk — If a fund invests directly in foreign currencies or in securities that trade in, and receive revenues in, foreign currencies, or in derivatives that pro-vide exposure to foreign currencies, it will be subject to the risk that those currencies will decline in value relative to the U.S. dollar. This also includes the risk associated with higher transaction costs, delayed settlements, currency controls and adverse economic developments related to foreign investments.
Region Risk — The Funds, except the U.S. Treasury Fund, invest in equity securities of non-U.S. issuers. Because certain foreign markets are illiquid, market prices may not necessarily represent realizable value. Although the Funds maintain diversified investment portfolios, political or economic developments within a particular country or region may have an adverse effect on the ability of domiciled issuers to meet their obligations. These risks are exaggerated for securities of issuers tied economically to emerging and frontier market countries. Additionally, political or economic developments may have an adverse effect on the liquidity and volatility of portfolio securities and currency holdings. For example, there has been significant political upheaval in Zimbabwe, and as a result the Pricing Committee has applied a discount to the Zimbabwe assets held by the Frontier Emerging Small Countries Fund. This discount is included in the change in unrealized gain/(loss).
India Region Risk — The securities markets in the India region (India, Bangladesh, Pakistan and Sri Lanka) are substantially smaller, less liquid and more volatile than the major securities markets in the United States. The securities industries in these countries are comparatively underdeveloped. Financial intermediaries may not perform as well as their counterparts in the United States or in other countries with more developed securities markets. In some cases, physical delivery of securities in small lots has been required in India and shortages of vault capacity and trained personnel have existed among qualified custodial Indian banks. A fund may be unable to sell securities when the registration process is incomplete and may experience delays in receipt of dividends. If trading volume is limited by operational difficulties, the ability of the fund to invest may be impaired and the fund’s ability to buy or sell Indian securities may be impaired if the fund’s ability to transact is denied, delayed, suspended or not renewed by local regulators. In recent years, exchange-listed companies in the information technology sector and related industries (such as software) have grown so as to represent a significant portion of the total capitalization of the Indian market. The value of these companies will generally fluctuate in response to technological and regulatory developments. In addition, governmental actions can have a significant effect on economic conditions in the India region, which could adversely affect the value and liquidity of investments. Although the governments of India, Bangladesh, Pakistan and Sri Lanka have recently begun to institute economic reform policies, there can be no assurance that they will continue to pursue such policies or, if they do, that such policies will succeed. The region is an uncertain tax environment and it is difficult to know and predict the potential implications of future tax developments. Religious, cultural and military disputes persist in India, and between India and Pakistan (as well as sectarian groups within each country). The longstanding border dispute with Pakistan remains unresolved. In recent years, terrorists believed to be based in Pakistan struck Mumbai (India’s financial capital), further damaging relations between the two countries. If the Indian government is unable to control the violence and disruption associated with these tensions (including both domestic and external sources of terrorism), the result may be military conflict, which could destabilize the economy of India. Both India and Pakistan have tested nuclear arms, and the threat of deployment of such weapons could hinder development of the Indian economy, and escalating tensions could impact the broader region, including China.
Liquidity Risk — The trading market for a particular security may be less liquid than it appears and market prices may not represent realizable value. This may be likely when a fund has a proportionately large investment in securities with small market capitalizations or securities in foreign markets that trade infrequently. Reduced liquidity will have an adverse impact on a fund’s ability to sell such securities quickly at the currently marked price if necessary to meet redemptions.
101
Notes to Financial Statements (continued)
Shareholder Concentration Risk — A significant portion of the net assets of the Frontier Emerging Small Countries Fund, Emerging Markets Select Fund, Emerging Markets Small Cap Fund, and the International Opportunities Fund are owned by a group of shareholders advised by a common investment advisor or are concentrated in relatively few accounts. In the event of significant redemption activity by these shareholders, the Funds could experience a loss when selling portfolio securities to meet such redemption requests. The Funds could be forced to sell portfolio securities at unfavorable prices in an effort to generate sufficient cash to pay redeeming shareholders. Fund expenses may increase and performance may be materially affected.
12. FAIR VALUE MEASUREMENTSAND INVESTMENTS
The fair value of a financial instrument is the amount that would be received to sell an asset or paid to transfer a liability in an orderly transaction between market participants at the measurement date. The Funds use various methods to measure the fair value of their investments on a recurring basis. U.S. GAAP established a hierarchy that prioritizes inputs to valuation methods. The three levels of inputs are:
| | • | | Level 1 — Unadjusted quoted prices in active markets for identical assets or liabilities that the Funds have the ability to access. |
| | • | | Level 2 — Observable inputs other than quoted prices included in Level 1 that are observable for the asset or liability, either directly or indirectly. The inputs may include quoted prices for the identical investment on an inactive market, prices for similar investments, interest rates, prepayment speeds, credit risk, yield curves, default rates and similar data. |
| | • | | Level 3 — Unobservable inputs for the asset or liability, to the extent relevant observable inputs are not available, representing the Funds’ own assumptions about the assumptions a market participant would use in valuing the asset or liability, and would be based on the best information available. |
The availability of observable inputs can vary from security to security and is affected by a wide variety of factors, including, for example, the type of security, whether a security is new and not yet established in the marketplace, the liquidity of markets, and other characteristics particular to the security. To the extent that valuation is based on models or inputs that are less observable or unobservable in the market, the determination of fair value requires more judgment. Accordingly, the degree of judgment exercised in determining fair value is greatest for instruments categorized in Level 3.
Equity Securities (common and preferred stock) — Securities are valued as of the close of the New York Stock Exchange (“NYSE”) (generally 4:00 p.m. Eastern Time) on the valuation date. Equity securities and listed warrants are valued using a commercial pricing service at the last quoted sales price taken from the primary market in which each security trades and, with respect to equity securities traded
on the National Association of Securities Dealer Automated Quotation (“NASDAQ”) system, such securities are valued using the NASDAQ Official Closing Price (“NOCP”) or last sales price if no NOCP is available. If there are no sales on the primary exchange or market on a day, then the security shall be valued at the mean of the last bid and ask price on the primary exchange or market as provided by a pricing service. If the mean cannot be calculated or there is no trade activity on a day, then the security shall be valued at the previous trading day’s price as provided by a pricing service. In some instances, particularly on foreign exchanges, an official close or evaluated price may be used if the pricing service is unable to provide the last trade or most recent mean price. To the extent that these securities are actively traded and valuation adjustments are not applied, they are categorized in Level 1 of the fair value hierarchy. Additionally, a fund’s investments are valued at fair value by the Pricing Committee if the Advisor determines that an event impacting the value of an investment occurred between the closing time of a security’s primary market or exchange (for example, a foreign exchange or market) and the time the fund’s share price is calculated. Significant events include, but are not limited to the following: significant fluctuations in domestic markets, foreign markets or foreign currencies; occurrences not directly tied to the securities markets such as natural disasters, armed conflicts or significant governmental actions; and major announcements affecting a single issuer or an entire market or market sector. In responding to a significant event, the Pricing Committee determines the fair value of affected securities by considering factors including, but not limited to: index options and futures traded subsequent to the close; American Depositary Receipts (“ADRs”), Global Depositary Receipts (“GDRs”) or other related receipts; currency spot or forward markets that trade after pricing of the foreign exchange; other derivative securities traded after the close such as Standard & Poor’s Depositary Receipts (“SPDRs”) and other exchange-traded funds (“ETFs”); and alternative market quotes on the affected securities. When applicable, the Funds use a systematic fair valuation model provided by an independent third party to assist in adjusting the valuation of foreign securities. When a Fund uses this fair value pricing method, the values assigned to the Fund’s foreign securities may not be the quoted or published prices of the investments on their primary markets or exchanges, and the securities are categorized in Level 2 of the fair value hierarchy.
Participation Notes — Investments are valued at the market price of the underlying security. Counterparty risk is regularly reviewed and considered for valuation. To the extent the inputs are observable and timely, the values would be categorized in Level 2 of the fair value hierarchy.
Short-Term Notes — Investments maturing in 60 days or less at the time of purchase, are generally valued at amortized cost, unless it is determined that the amortized cost method would not represent fair value, in which case the securities are marked-to-market. To the extent the inputs are observable and timely, the values would be categorized in Level 2 of the fair value hierarchy.
102
U.S. Government Issuers — Investments are priced using the closing bid as supplied by a pricing service based on observable inputs. Observable inputs may include benchmark yields, reported trades, broker/dealer quotes, issuer spreads, two-sided markets, benchmark securities, bids, offers and reference data including market research publications. Although most U.S. government bonds are categorized in Level 2 of the fair value hierarchy, in instances where observable inputs are not available, they are categorized as Level 3.
Derivative Instruments — Listed derivatives that are actively traded are valued based on quoted prices from the exchange and categorized in Level 1 of the fair value hierarchy. Exchange-traded options are valued at the last sale price in the market where they are principally traded. If there are no sales on the primary exchange or market on a given day, then the option is valued at the mean of the last bid price and ask price on the primary exchange or market as provided by a pricing service. Forward foreign currency contracts are valued at the market rate provided by the pricing service and categorized as Level 2.
Restricted Securities — If market quotations are not readily available for the Funds’ investments in securities such as restricted securities, private placements, securities for which trading has been halted or other illiquid securities, these investments are valued at fair value in accordance with
Board-approved Pricing Policies and Procedures by the Pricing Committee with oversight by the Board of Trustees. Fair value is defined as the price that would be received upon the sale of an asset, or paid to transfer a liability, in an orderly transaction between market participants at the measurement date under current market conditions. For each applicable investment that is fair valued, the Pricing Committee considers, to the extent applicable, various factors including, but not limited to, the financial condition of the company or limited partnership, operating results, prices paid in follow-on rounds, comparable companies in the public market, the nature and duration of the restrictions for holding the securities, a stated net asset value (NAV) for the partnership, if applicable, and other relevant factors. Depending on the relative significance of valuation inputs, these instruments may be classified in either Level 2 or Level 3 of the fair value hierarchy.
When the last day of the reporting period is a non-business day, certain foreign markets may be open on days the NYSE is closed, which could result in differences between the value of a fund’s portfolio securities on the last business day and the last calendar day of the reporting period. Any significant security valuation changes due to an open foreign market are adjusted and reflected by the fund for financial reporting purposes.
The following is a summary of the fair valuations according to the inputs used as of September 30, 2018 in valuing the Funds’ assets and liabilities:
| | | | | | | | | | | | | | | | | | |
| Fund | | Category | | Quoted Prices
in Active Markets
for Identical
Investments
(Level 1) | | | Significant Other
Observable Inputs
(Level 2) | | | Significant
Unobservable
Inputs
(Level 3) | | | Value at
9/30/2018 | |
Core Growth Fund | | | | | | | | | | | | | | | | | | |
Assets | | | | | | | | | | | | | | | | | | |
Common Stocks | | | | | | | | | | | �� | | | | | | | |
| | Interactive Media & Services | | $ | 80,355,893 | | | $ | — | | | $ | 10,632,125 | | | $ | 90,988,018 | |
| | Other | | | 2,160,445,492 | | | | — | | | | — | | | | 2,160,445,492 | |
Short-Term Investments | | | | | — | | | | 27,036,867 | | | | — | | | | 27,036,867 | |
| | | | | | |
| | | | $ | 2,240,801,385 | | | $ | 27,036,867 | | | $ | 10,632,125 | | | $ | 2,278,470,377 | |
| | | | | | |
Emerging India Fund | | | | | | | | | | | | | | | | | | |
Assets | | | | | | | | | | | | | | | | | | |
Common Stocks | | | | | | | | | | | | | | | | | | |
| | Consumer Finance | | $ | 13,459,586 | | | $ | — | | | $ | 2,628,758 | | | $ | 16,088,344 | |
| | Other | | | 212,054,099 | | | | — | | | | — | | | | 212,054,099 | |
| | | | | | |
| | | | $ | 225,513,685 | | | $ | — | | | $ | 2,628,758 | | | $ | 228,142,443 | |
| | | | | | |
Emerging Markets Select Fund | | | | | | | | | | | | | | | | | | |
Assets | | | | | | | | | | | | | | | | | | |
Common Stocks | | | | $ | 42,125,549 | | | $ | — | | | $ | — | | | $ | 42,125,549 | |
Preferred Stocks | | | | | 1,325,648 | | | | — | | | | — | | | | 1,325,648 | |
Short-Term Investments | | | | | — | | | | 457,817 | | | | — | | | | 457,817 | |
| | | | | | |
| | | | $ | 43,451,197 | | | $ | 457,817 | | | $ | — | | | $ | 43,909,014 | |
| | | | | | |
103
Notes to Financial Statements (continued)
| | | | | | | | | | | | | | | | | | |
| Fund | | Category | | Quoted Prices
in Active Markets
for Identical
Investments
(Level 1) | | | Significant Other
Observable Inputs
(Level 2) | | | Significant
Unobservable
Inputs
(Level 3) | | | Value at
9/30/2018 | |
Emerging Markets Small Cap Fund | | | | | | | | | | | | | | | | | | |
Assets | | | | | | | | | | | | | | | | | | |
Common Stocks | | | | | | | | | | | | | | | | | | |
| | Commodity Chemicals | | $ | 8,402,071 | | | $ | 7,796,533 | | | $ | — | | | $ | 16,198,604 | |
| | Consumer Finance | | | 19,773,146 | | | | 12,664,861 | | | | — | | | | 32,438,007 | |
| | Hotels, Resorts & Cruise Lines | | | 11,802,003 | | | | 8,003,609 | | | | — | | | | 19,805,612 | |
| | Pharmaceuticals | | | 4,177,598 | | | | — | | | | 16,628 | | | | 4,194,226 | |
| | Other | | | 438,715,662 | | | | — | | | | — | | | | 438,715,662 | |
Preferred Stocks | | | | | 7,848,286 | | | | — | | | | — | | | | 7,848,286 | |
Short-Term Investments | | | | | — | | | | 6,157,408 | | | | — | | | | 6,157,408 | |
| | | | | | |
| | | | $ | 490,718,766 | | | $ | 34,622,411 | | | $ | 16,628 | | | $ | 525,357,805 | |
| | | | | | |
Frontier Emerging Small Countries Fund | | | | | | | | | | | | | | | | | | |
Assets | | | | | | | | | | | | | | | | | | |
Common Stocks | | | | | | | | | | | | | | | | | | |
| | Consumer Finance | | $ | 7,627,329 | | | $ | 1,761,408 | | | $ | — | | | $ | 9,388,737 | |
| | Diversified Banks | | | 13,188,959 | | | | 2,145,908 | | | | — | | | | 15,334,867 | |
| | Food Retail | | | 3,704,205 | | | | 1,997,885 | | | | — | | | | 5,702,090 | |
| | Other | | | 41,617,151 | | | | — | | | | — | | | | 41,617,151 | |
Preferred Stocks | | | | | 2,708,804 | | | | — | | | | — | | | | 2,708,804 | |
Participation Notes | | | | | — | | | | 1,757,379 | | | | — | | | | 1,757,379 | |
Other Assets less Liabilities | | | | | (486,639 | ) | | | — | | | | 1,969,821 | | | | 1,483,182 | |
| | | | | | |
| | | | $ | 68,359,809 | | | $ | 7,662,580 | | | $ | 1,969,821 | | | $ | 77,992,210 | |
| | | | | | |
Global Opportunities Fund | | | | | | | | | | | | | | | | | | |
Assets | | | | | | | | | | | | | | | | | | |
Common Stocks | | | | | | | | | | | | | | | | | | |
| | Consumer Finance | | $ | 4,513,333 | | | $ | 1,091,027 | | | $ | — | | | $ | 5,604,360 | |
| | Other | | | 117,051,299 | | | | — | | | | — | | | | 117,051,299 | |
Short-Term Investments | | | | | — | | | | 4,918,109 | | | | — | | | | 4,918,109 | |
| | | | | | |
| | | | $ | 121,564,632 | | | $ | 6,009,136 | | | $ | — | | | $ | 127,573,768 | |
| | | | | | |
Global Value Fund | | | | | | | | | | | | | | | | | | |
Assets | | | | | | | | | | | | | | | | | | |
Common Stocks | | | | $ | 196,683,443 | | | $ | — | | | $ | — | | | $ | 196,683,443 | |
Short-Term Investments | | | | | — | | | | 5,900,513 | | | | — | | | | 5,900,513 | |
| | | | | | |
| | | | $ | 196,683,443 | | | $ | 5,900,513 | | | $ | — | | | $ | 202,583,956 | |
| | | | | | |
International Growth Fund | | | | | | | | | | | | | | | | | | |
Assets | | | | | | | | | | | | | | | | | | |
Common Stocks | | | | | | | | | | | | | | | | | | |
| | Commodity Chemicals | | $ | 14,498,914 | | | $ | 15,002,469 | | | $ | — | | | $ | 29,501,383 | |
| | Other | | | 1,468,606,634 | | | | — | | | | — | | | | 1,468,606,634 | |
Short-Term Investments | | | | | — | | | | 69,877,797 | | | | — | | | | 69,877,797 | |
| | | | | | |
| | | | $ | 1,483,105,548 | | | $ | 84,880,266 | | | $ | — | | | $ | 1,567,985,814 | |
| | | | | | |
International Opportunities Fund | | | | | | | | | | | | | | | | | | |
Assets | | | | | | | | | | | | | | | | | | |
Common Stocks | | | | | | | | | | | | | | | | | | |
| | Advertising | | $ | 5,714,540 | | | $ | 3,147,615 | | | $ | — | | | $ | 8,862,155 | |
| | Application Software | | | 26,306,203 | | | | 5,993,953 | | | | — | | | | 32,300,156 | |
| | Food Retail | | | 20,288,668 | | | | 3,758,031 | | | | — | | | | 24,046,699 | |
| | Other | | | 455,063,017 | | | | — | | | | — | | | | 455,063,017 | |
Short-Term Investments | | | | | — | | | | 12,901,903 | | | | — | | | | 12,901,903 | |
| | | | | | |
| | | | $ | 507,372,428 | | | $ | 25,801,502 | | | $ | — | | | $ | 533,173,930 | |
| | | | | | |
Micro Cap Fund | | | | | | | | | | | | | | | | | | |
Assets | | | | | | | | | | | | | | | | | | |
Common Stocks | | | | | | | | | | | | | | | | | | |
| | Other | | $ | 474,469,140 | | | $ | — | | | $ | — | | | $ | 474,469,140 | |
Short-Term Investments | | | | | — | | | | 22,571,864 | | | | — | | | | 22,571,864 | |
| | | | | | |
| | | | $ | 474,469,140 | | | $ | 22,571,864 | | | $ | — | | | $ | 497,041,004 | |
| | | | | | |
104
| | | | | | | | | | | | | | | | | | |
| Fund | | Category | | Quoted Prices
in Active Markets
for Identical
Investments
(Level 1) | | | Significant Other
Observable Inputs
(Level 2) | | | Significant
Unobservable
Inputs
(Level 3) | | | Value at
9/30/2018 | |
Micro Cap Value Fund | | | | | | | | | | | | | | | | | | |
Assets | | | | | | | | | | | | | | | | | | |
Common Stocks | | | | $ | 260,943,177 | | | $ | — | | | $ | — | | | $ | 260,943,177 | |
Convertible Preferred Stocks | | | | | — | | | | — | | | | 1,855,059 | | | | 1,855,059 | |
Rights | | | | | — | | | | — | | | | 326,356 | | | | 326,356 | |
Limited Liability Company Membership Interest | | | | | — | | | | — | | | | 44,465 | | | | 44,465 | |
Warrant | | | | | — | | | | — | | | | 40,000 | | | | 40,000 | |
Short-Term Investments | | | | | — | | | | 21,952,092 | | | | — | | | | 21,952,092 | |
| | | | | | |
| | | | $ | 260,943,177 | | | $ | 21,952,092 | | | $ | 2,265,880 | | | $ | 285,161,149 | |
| | | | | | |
Small Cap Growth Fund | | | | | | | | | | | | | | | | | | |
Assets | | | | | | | | | | | | | | | | | | |
Common Stocks | | | | | | | | | | | | | | | | | | |
| | Interactive Media & Services | | $ | 58,504,912 | | | $ | — | | | $ | 42,754,388 | | | $ | 101,259,300 | |
| | Other | | | 1,752,821,794 | | | | — | | | | — | | | | 1,752,821,794 | |
Preferred Stocks | | | | | — | | | | — | | | | 11,530,569 | | | | 11,530,569 | |
Seller’s Note | | | | | — | | | | — | | | | 1,728,000 | | | | 1,728,000 | |
Limited Partnership Interest1 | | | | | — | | | | — | | | | — | | | | 2,848,240 | |
Short-Term Investments | | | | | — | | | | 26,729,494 | | | | — | | | | 26,729,494 | |
| | | | | | |
| | | | $ | 1,811,326,706 | | | $ | 26,729,494 | | | $ | 56,012,957 | | | $ | 1,896,917,397 | |
| | | | | | |
Small Cap Value Fund | | | | | | | | | | | | | | | | | | |
Assets | | | | | | | | | | | | | | | | | | |
Common Stocks | | | | $ | 431,255,086 | | | $ | — | | | $ | — | | | $ | 431,255,086 | |
Short-Term Investments | | | | | — | | | | 8,769,310 | | | | — | | | | 8,769,310 | |
| | | | | | |
| | | | $ | 431,255,086 | | | $ | 8,769,310 | | | $ | — | | | $ | 440,024,396 | |
| | | | | | |
Ultra Growth Fund | | | | | | | | | | | | | | | | | | |
Assets | | | | | | | | | | | | | | | | | | |
Common Stocks | | | | $ | 264,748,479 | | | $ | — | | | $ | — | | | $ | 264,748,479 | |
Limited Partnership Interest1 | | | | | — | | | | — | | | | — | | | | 2,665,193 | |
Preferred Stocks | | | | | — | | | | — | | | | 87,758 | | | | 87,758 | |
Seller’s Note | | | | | — | | | | — | | | | 132,000 | | | | 132,000 | |
Short-Term Investments | | | | | — | | | | 29,580,653 | | | | — | | | | 29,580,653 | |
| | | | | | |
| | | | $ | 264,748,479 | | | $ | 29,580,653 | | | $ | 219,758 | | | $ | 297,214,083 | |
| | | | | | |
U.S. Treasury Fund | | | | | | | | | | | | | | | | | | |
Assets | | | | | | | | | | | | | | | | | | |
U.S. Government Obligations | | | | $ | — | | | $ | 302,398,167 | | | $ | — | | | $ | 302,398,167 | |
Short-Term Investments | | | | | — | | | | 503,311 | | | | — | | | | 503,311 | |
| | | | | | |
| | | | $ | — | | | $ | 302,901,478 | | | $ | — | | | $ | 302,901,478 | |
| | | | | | |
| 1 | Certain investments measured at fair value using the net asset value per share (or its equivalent) practical expedient have not been classified in the fair value levels. The fair value amounts presented in the table are intended to permit reconciliation to the amounts presented in the Schedule of Investments. |
| | | | | | | | | | | | | | | | |
| Fund | | Fair Value
at 9/30/2018 | | | Unfunded Commitments | | | Redemption
Frequency (if currently
eligible) | | | Redemption Notice Period | |
Small Cap Growth Fund | | | | | | | | | | | | | | | | |
Limited Partnership Interests1 | | $ | 2,848,240 | | | $ | — | | | | Never | | | | N/A | |
Ultra Growth Fund | | | | | | | | | | | | | | | | |
Limited Partnership Interests1 | | $ | 2,665,193 | | | $ | — | | | | Never | | | | N/A | |
| 1 | The fair values of these limited partnership interests have been estimated using the net asset value of the Fund’s Limited Partner’s Capital Account. These limited partnership interests can never be redeemed. Distributions from each limited partnership will be received as the underlying investments are liquidated. It is estimated that the underlying assets of the limited partnerships will be liquidated over the next one to five years. |
If the securities of an Asset Class are all the same level, the asset class is shown in total. If the securities of an Asset Class cross levels, the level with the smallest number of categories and with multiple levels within a category is displayed by category. The remaining categories that do not cross levels are combined into the “Other” category.
105
Notes to Financial Statements (continued)
The valuation techniques used by the Funds to measure fair value for the year ended September 30, 2018 maximized the use of observable inputs and minimized the use of unobservable inputs.
The Funds’ policy is to recognize transfers between levels at the end of the reporting period. The table below shows the significant transfers between Level 1 and Level 2 due to fair valuation in certain foreign markets pursuant to a systematic valuation model.
| | | | | | | | |
| Fund | | Transfers Out
Of Level 1 at
Market Value | | | Transfers Into
Level 2 at
Market Value | |
Frontier Emerging Small Countries Fund | | $ | 2,145,908 | | | $ | 2,145,908 | |
| | |
| Fund | | Transfers Out
Of Level 2 at
Market Value | | | Transfers Into
Level 1 at
Market Value | |
International Opportunities Fund | | $ | 3,360,488 | | | $ | 3,360,488 | |
There were transfers of $4,024,495 in the Core Growth Fund and $16,183,484 in the Small Cap Growth Fund from a preferred stock Level 3 to a common stock Level 3. This transfer amount represents the beginning of the period value for DocuSign, Inc., which had its initial public offering during the period.
There was a transfer of $1,521,247 in the Emerging India Fund from Level 3 to Level 1 due to a change in pricing strategy on a private company that came public. This transfer amount represents the beginning of the period value for ICICI Lombard General Insurance Co. Ltd., which transferred to Level 1 during the period in order to properly represent the activity on the Level 3 Rollforward presented below.
There was a transfer of $9,116,040 in the Small Cap Growth Fund from Level 3 to Level 1 due to a change in pricing strategy on a private company that came public. This transfer amount represents the beginning of the period value for ForeScout Technologies, Inc., which transferred to Level 1 during the period in order to properly represent the activity on the Level 3 Rollforward presented below.
During the period, $1,969,821 in the Frontier Emerging Small Countries Fund was transferred to Level 3 due to the fair valuation of U.S. dollars held in Zimbabwe.
The following is a reconciliation of the fair valuations using significant unobservable inputs (Level 3) for the Funds during the year ended September 30, 2018:
| | | | | | | | | | | | | | | | | | | | | | | | | | | | | | | | | | | | | | | | |
| Fund | | Market
Value
Beginning
Balance
9/30/2017 | | | Purchases
at Cost | | | Sales
(Proceeds) | | | Accrued
Discounts
(Premiums) | | | Realized
Gain/
(Loss) | | | Change in
Unrealized
Appreciation
(Depreciation) | | | Transfers
in at
Market
Value | | | Transfers
out at
Market
Value | | | Market
Value
Ending
Balance
9/30/2018 | | | Net Change
in Unrealized
Appreciation
(Depreciation)
on Investments
Held at
9/30/2018 | |
Core Growth Fund | | | | | | | | | | | | | | | | | | | | | | | | | | | | | | | | | | | | | | | | |
Common Stocks | | $ | — | | | $ | — | | | $ | — | | | $ | — | | | $ | — | | | $ | 6,607,630 | | | $ | 4,024,495 | | | $ | — | | | $ | 10,632,125 | | | $ | 6,607,630 | |
Preferred Stocks | | | 4,024,495 | | | | — | | | | — | | | | — | | | | — | | | | — | | | | — | | | | (4,024,495 | ) | | | — | | | | — | |
| | | | |
| | | 4,024,495 | | | | — | | | | — | | | | — | | | | — | | | | 6,607,630 | | | | 4,024,495 | | | | (4,024,495 | ) | | | 10,632,125 | | | | 6,607,630 | |
| | | | |
Emerging India Fund | | | | | | | | | | | | | | | | | | | | | | | | | | | | | | | | | | | | | | | | |
Common Stocks | | | 1,521,247 | | | | 2,765,442 | | | | — | | | | — | | | | — | | | | (136,684 | ) | | | — | | | | (1,521,247 | ) | | | 2,628,758 | | | | (136,684 | ) |
| | | | |
| | | 1,521,247 | | | | 2,765,442 | | | | — | | | | — | | | | — | | | | (136,684 | ) | | | — | | | | (1,521,247 | ) | | | 2,628,758 | | | | (136,684 | ) |
| | | | |
Emerging Markets
Small Cap Fund | | | | | | | | | | | | | | | | | | | | | | | | | | | | | | | | | | | | | | | | |
Common Stocks | | | 16,664 | | | | — | | | | — | | | | — | | | | — | | | | (36 | ) | | | — | | | | — | | | | 16,628 | | | | (36 | ) |
| | | | |
| | | 16,664 | | | | — | | | | — | | | | — | | | | — | | | | (36 | ) | | | — | | | | — | | | | 16,628 | | | | (36 | ) |
| | | | |
Frontier Emerging
Small Countries
Fund | | | | | | | | | | | | | | | | | | | | | | | | | | | | | | | | | | | | | | | | |
Other Assets less Liabilities | | | — | | | | — | | | | — | | | | — | | | | — | | | | — | | | | 1,969,821 | | | | — | | | | 1,969,821 | | | | — | |
| | | | |
| | | — | | | | — | | | | — | | | | — | | | | — | | | | — | | | | 1,969,821 | | | | — | | | | 1,969,821 | | | | — | |
| | | | |
106
| | | | | | | | | | | | | | | | | | | | | | | | | | | | | | | | | | | | | | | | |
| Fund | | Market
Value
Beginning
Balance
9/30/2017 | | | Purchases
at Cost | | | Sales
(Proceeds) | | | Accrued
Discounts
(Premiums) | | | Realized
Gain/
(Loss) | | | Change in
Unrealized
Appreciation
(Depreciation) | | | Transfers
in at
Market
Value | | | Transfers
out at
Market
Value | | | Market
Value
Ending
Balance
9/30/2018 | | | Net Change
in Unrealized
Appreciation
(Depreciation)
on Investments
Held at
9/30/2018 | |
Micro Cap Value Fund | | | | | | | | | | | | | | | | | | | | | | | | | | | | | | | | | | | | | | | | |
Convertible Preferred Stocks | | $ | 1,460,260 | | | $ | 107,257 | | | $ | — | | | $ | — | | | $ | — | | | $ | 287,542 | | | $ | — | | | $ | — | | | $ | 1,855,059 | | | $ | 287,542 | |
Rights | | | 345,106 | | | | — | | | | — | | | | — | | | | (71,250 | ) | | | 52,500 | | | | — | | | | — | | | | 326,356 | | | | 52,500 | |
Limited Liability Company Membership Interest | | | 51,476 | | | | — | | | | — | | | | — | | | | — | | | | (7,011 | ) | | | — | | | | — | | | | 44,465 | | | | (7,011 | ) |
Warrants | | | 2500 | | | | — | | | | — | | | | — | | | | — | | | | 37,500 | | | | — | | | | — | | | | 40,000 | | | | 37,500 | |
| | | | |
| | | 1,859,342 | | | | 107,257 | | | | — | | | | — | | | | (71,250 | ) | | | 370,531 | | | | — | | | | — | | | | 2,265,880 | | | | 370,531 | |
| | | | |
Small Cap Growth Fund | | | | | | | | | | | | | | | | | | | | | | | | | | | | | | | | | | | | | | | | |
Common Stocks | | | — | | | | — | | | | — | | | | — | | | | — | | | | 26,570,904 | | | | 16,183,484 | | | | — | | | | 42,754,388 | | | | 26,570,904 | |
Preferred Stocks | | | 44,874,176 | | | | — | | | | (22,508,482 | ) | | | — | | | | 10,221,102 | | | | 4,243,297 | | | | — | | | | (25,299,524 | ) | | | 11,530,569 | | | | 3,653,012 | |
Seller’s Note | | | — | | | | 582,409 | | | | — | | | | 76,741 | | | | — | | | | 1,068,850 | | | | — | | | | — | | | | 1,728,000 | | | | 1,068,850 | |
| | | | |
| | | 44,874,176 | | | | 582,409 | | | | (22,508,482 | ) | | | 76,741 | | | | 10,221,102 | | | | 31,883,051 | | | | 16,183,484 | | | | (25,299,524 | ) | | | 56,012,957 | | | | 31,292,766 | |
| | | | |
Ultra Growth Fund | | | | | | | | | | | | | | | | | | | | | | | | | | | | | | | | | | | | | | | | |
Preferred Stocks | | | 1,511,972 | | | | — | | | | (2,371,773 | ) | | | — | | | | 1,051,410 | | | | (103,851 | ) | | | — | | | | — | | | | 87,758 | | | | (282,167 | ) |
Seller’s Note | | | — | | | | 43,634 | | | | — | | | | 5,868 | | | | — | | | | 82,498 | | | | — | | | | — | | | | 132,000 | | | | 82,498 | |
| | | | |
| | | 1,511,972 | | | | 43,634 | | | | (2,371,773 | ) | | | 5,868 | | | | 1,051,410 | | | | (21,353 | ) | | | — | | | | — | | | | 219,758 | | | | (199,669 | ) |
| | | | |
QUANTITATIVE INFORMATION ABOUT LEVEL 3 FAIR VALUE MEASUREMENTS
| | | | | | | | | | | | | | |
| Fund | | Description | | Fair Value
at 9/30/2018 | | | Valuation Technique | | Unobservable Input | | Range
(Average) | |
Core Growth Fund | | Direct Venture Capital Investments: Systems Software | | $ | 10,632,125 | | | Discount for lack
of marketability | | Discount for lack
of marketability | | | 3% | |
Emerging India | | Common Stock: Consumer Finance | | $ | 2,628,758 | | | Discount for lack
of marketability | | Discount for lack
of marketability | | | 5% | |
Frontier Emerging Small Countries Fund | | Other Assets Less Liabilities: USD held in Zimbabwe | | $ | 1,969,821 | | | Discount for lack of
marketability of currency | | Discount for lack of
marketability of currency | | | 40% | |
Micro Cap Value Fund | | Rights: Pharmaceuticals | | $ | 326,356 | | | Probability of receipt | | Probability of receipt | | | 50% | |
Micro Cap Value Fund | | Convertible Preferred: Oil & Gas Refining & Marketing | | $ | 1,855,059 | | | Bond model with
call option | | Bond model with
call option | | | 100% | |
Small Cap Growth Fund | | Direct Venture Capital Investments: Biotechnology | | $ | 351,031 | | | Market comparable
companies | | EV/R* multiple Discount for lack
of marketability | |
| 1.3 - 14.2 (4.7)
20% |
|
Small Cap Growth Fund | | Direct Venture Capital Investments: Systems Software | | $ | 11,179,538 | | | Market comparable
companies | | EV/R* multiple Discount for lack
of marketability | |
| 1.9 - 21.4 (11.2)
20% |
|
Small Cap Growth Fund | | Seller’s Note: Oil & Gas Equipment & Services | | $ | 1,728,000 | | | Par | | Par | | | 100% | |
Small Cap Growth Fund | | Direct Venture Capital Investments: Systems Software | | $ | 42,754,388 | | | Discount for lack
of marketability | | Discount for lack
of marketability | | | 3% | |
Ultra Growth Fund | | Direct Venture Capital Investments: Biotechnology | | $ | 87,758 | | | Market comparable
companies | | EV/R* multiple Discount for lack
of marketability | |
| 1.3 - 14.2 (4.7)
20% |
|
Ultra Growth Fund | | Seller’s Note: Oil & Gas Equipment & Services | | $ | 132,000 | | | Par | | Par | | | 100% | |
| * | Enterprise-Value-To-Revenue Multiple (“EV/R”) is a measure of the value of a stock that compares a company’s enterprise value to its revenue. |
A change to an EV/R multiple may affect the fair value of an investment. Generally, a decrease in this multiple will result in a decrease in the fair value of an investment.
107
Notes to Financial Statements (continued)
The Funds’ other Level 3 investments have been valued using observable inputs, unadjusted third-party transactions and quotations or unadjusted historical third party information. No unobservable inputs internally developed by the Funds have been applied to these investments, thus they have been excluded from the above table.
13. OFFSETTING
Each Fund is party to various netting arrangements. The Financial Accounting Standards Board (“FASB”) requires disclosure about certain netting arrangements and similar agreements to enable users of a Fund’s financial statements to evaluate the effect or potential effect of netting arrangements on the Fund’s financial position. The scope of the disclosure is limited to derivative instruments, repurchase agreements and reverse repurchase agreements, and securities borrowing and securities lending transactions.
The following table presents information about financial instruments that were subject to enforceable netting arrangements as of September 30, 2018:
REPURCHASE AGREEMENTS
| | | | | | | | | | | | | | | | | | |
| | | Gross Amounts Not Offset in the Statements of Assets and Liabilities | |
| Fund | | Counterparty | | Gross Asset Amounts
Presented in Statements
of Assets and Liabilities | | | Financial
Instrument | | | Collateral
Received1 | | | Net Amount
(Not Less
Than 0) | |
Core Growth Fund | | Fixed Income Clearing Corp. | | $ | 27,036,867 | | | $ | — | | | $ | (27,036,867 | ) | | $ | — | |
Emerging Markets Select Fund | | Fixed Income Clearing Corp. | | | 457,817 | | | | — | | | | (457,817 | ) | | | — | |
Emerging Markets Small Cap Fund | | Fixed Income Clearing Corp. | | | 6,157,408 | | | | — | | | | (6,157,408 | ) | | | — | |
Global Opportunities Fund | | Fixed Income Clearing Corp. | | | 4,918,109 | | | | — | | | | (4,918,109 | ) | | | — | |
Global Value Fund | | Fixed Income Clearing Corp. | | | 5,900,513 | | | | — | | | | (5,900,513 | ) | | | — | |
International Growth Fund | | Fixed Income Clearing Corp. | | | 69,877,797 | | | | — | | | | (69,877,797 | ) | | | — | |
International Opportunities Fund | | Fixed Income Clearing Corp. | | | 12,901,903 | | | | — | | | | (12,901,903 | ) | | | — | |
Micro Cap Fund | | Fixed Income Clearing Corp. | | | 22,571,864 | | | | — | | | | (22,571,864 | ) | | | — | |
Micro Cap Value Fund | | Fixed Income Clearing Corp. | | | 21,952,092 | | | | — | | | | (21,952,092 | ) | | | — | |
Small Cap Growth Fund | | Fixed Income Clearing Corp. | | | 26,729,494 | | | | — | | | | (26,729,494 | ) | | | — | |
Small Cap Value Fund | | Fixed Income Clearing Corp. | | | 8,769,310 | | | | — | | | | (8,769,310 | ) | | | — | |
Ultra Growth Fund | | Fixed Income Clearing Corp. | | | 29,580,653 | | | | — | | | | (29,580,653 | ) | | | — | |
U.S. Treasury Fund | | Fixed Income Clearing Corp. | | | 503,311 | | | | — | | | | (503,311 | ) | | | — | |
| 1 | Repurchase agreements are classified as short-term investments in the Statements of Assets and Liabilities. The market value of the collateral received is greater than the amounts indicated in the table. For further information, see Note 3 — Securities and Other Investments “Repurchase Agreements” and the Schedules of Investments. |
14. FAIR VALUEOF DERIVATIVE INSTRUMENTS*
The following is a summary of the fair valuations of the Funds’ derivative instruments categorized by risk exposure:
WASATCH GLOBAL VALUE FUND
The Effect of Derivative Instruments on the Statement of Operations for the year ended September 30, 2018:
| | | | | | | | | | | | | | | | | | | | | | | | |
| | | Derivatives not accounted for as hedging instruments under Statement 133 | |
| | | Interest Rate
Contracts | | | Foreign Exchange
Contracts | | | Credit
Contracts | | | Equity
Contracts | | | Other
Contracts | | | Total | |
Realized Gain on Derivatives Recognized in Income | | | | |
Realized gain on options written | | $ | — | | | $ | — | | | $ | — | | | $ | 41,716 | | | $ | — | | | $ | 41,716 | |
| | | | |
For the year ended September 30, 2018, the average monthly balance of outstanding derivative financial instruments was as follows:
| | | | |
| | | Global
Value Fund | |
Option contracts: | | | | |
Average number of call contracts written | | | 58 | |
Average value of call contracts written | | $ | 2,850 | |
| * | See Note 4 — Financial Derivative Instruments for additional information. |
15. REORGANIZATION
On September 21, 2018, the Global Value Fund (“Surviving Portfolio”) acquired all of the assets and liabilities of the Long/Short Fund (“Acquired Portfolio”), in a tax free exchange for Federal tax purposes, pursuant to the plan of reorganization (“Reorganization”) approved by the Board and shareholders of record of the Long/Short Fund as of the applicable record date. The costs of the
108
reorganization incurred by the Acquired Portfolio were split equally between the Advisor and the Acquired Fund, subject to the contractual expense cap limitations. The shares issued by the Surviving Portfolio are presented in the Statements of Changes in Net Assets. The number of shares acquired and issued by the Surviving Portfolio, the net assets and unrealized appreciation or depreciation of the Acquired Portfolio as of the reorganization date immediately prior to the Reorganization, and the net assets of the Surviving Portfolio as of the reorganization date immediately prior to and after the Reorganization were as follows:
| | | | | | | | | | | | | | | | | | | | | | | | | | | | |
| Date of Reorganization | | Surviving
Portfolio | | Acquired
Portfolio | | Shares
Acquired | | | Shares
Issued in
Acquisition | | | Surviving
Portfolio
Net Assets | | | Acquired
Portfolio
Net Assets | | | Net Assets
After
Reorganization | | | Acquired
Portfolio
Unrealized
Appreciation | |
September 21, 2018 | | Global Value Fund | | Long/Short Fund | | | 3,422,905 | | | | 4,753,382 | | | $ | 159,659,315 | | | $ | 44,308,211 | | | $ | 203,967,525 | | | $ | 3,407,882 | |
Assuming the Reorganization had been completed on October 1, 2017, the beginning of the annual reporting period, the pro forma results of operations for the year ended September 30, 2018 would have been as follows:
Net investment income: $4,443,348
Net realized and unrealized gain: $3,889,153
Net increase in net assets resulting from operations: $8,332,501
16. SUBSEQUENT EVENTS
Management has evaluated the possibility of subsequent events and has determined that there are no additional events that would require adjustment to or additional disclosure in the Funds’ financial statements.
109
| | |
| WASATCH FUNDS | | SEPTEMBER 30, 2018 |
|
|
|
Report of Independent Registered Public Accounting Firm
To the Board of Trustees of Wasatch Funds Trust and Shareholders of Wasatch Core Growth Fund®, Wasatch Emerging India Fund®, Wasatch Emerging Markets Select Fund®, Wasatch Emerging Markets Small Cap Fund®, Wasatch Frontier Emerging Small Countries Fund®, Wasatch Global Opportunities Fund®, Wasatch International Growth Fund®, Wasatch International Opportunities Fund®, Wasatch Global Value Fund®, Wasatch Micro Cap Fund®, Wasatch Micro Cap Value Fund®, Wasatch Small Cap Growth Fund®, Wasatch Small Cap Value Fund®, Wasatch Ultra Growth Fund® and Wasatch-Hoisington U.S. Treasury Fund®
Opinions on the Financial Statements
We have audited the accompanying statements of assets and liabilities, including the schedules of investments, of Wasatch Core Growth Fund®, Wasatch Emerging India Fund®, Wasatch Emerging Markets Select Fund®, Wasatch Emerging Markets Small Cap Fund®, Wasatch Frontier Emerging Small Countries Fund®, Wasatch Global Opportunities Fund®, Wasatch International Growth Fund®, Wasatch International Opportunities Fund®, Wasatch Global Value Fund®, Wasatch Micro Cap Fund®, Wasatch Micro Cap Value Fund®, Wasatch Small Cap Growth Fund®, Wasatch Small Cap Value Fund®, Wasatch Ultra Growth Fund® and Wasatch-Hoisington U.S. Treasury Fund® (constituting Wasatch Funds Trust, hereafter collectively referred to as the “Funds”) as of September 30, 2018, the related statements of operations for the year ended September 30, 2018, the statements of changes in net assets for each of the two years in the period ended September 30, 2018, including the related notes, and the financial highlights for each of the periods indicated (collectively referred to as the “financial statements”). In our opinion, the financial statements present fairly, in all material respects, the financial position of each of the Funds as of September 30, 2018, the results of each of their operations for the year then ended, the changes in each of their net assets for each of the two years in the period ended September 30, 2018 and each of the financial highlights for each of the periods indicated therein in conformity with accounting principles generally accepted in the United States of America.
Basis for Opinions
These financial statements are the responsibility of the Funds’ management. Our responsibility is to express an opinion on the Funds’ financial statements based on our audits. We are a public accounting firm registered with the Public Company Accounting Oversight Board (United States) (“PCAOB”) and are required to be independent with respect to the Funds in accordance with the U.S. federal securities laws and the applicable rules and regulations of the Securities and Exchange Commission and the PCAOB.
We conducted our audits of these financial statements in accordance with the standards of the PCAOB. Those standards require that we plan and perform the audit to obtain reasonable assurance about whether the financial statements are free of material misstatement, whether due to error or fraud.
Our audits included performing procedures to assess the risks of material misstatement of the financial statements, whether due to error or fraud, and performing procedures that respond to those risks. Such procedures included examining, on a test basis, evidence regarding the amounts and disclosures in the financial statements. Our audits also included evaluating the accounting principles used and significant estimates made by management, as well as evaluating the overall presentation of the financial statements. Our procedures included confirmation of securities owned as of September 30, 2018 by correspondence with the custodian, transfer agent and brokers; when replies were not received from brokers, we performed other auditing procedures. We believe that our audits provide a reasonable basis for our opinions.
/s/ PricewaterhouseCoopers LLP
Kansas City, Missouri
November 21, 2018
We have served as the auditor of one or more investment companies in Wasatch Funds Trust since 2002.
110
| | |
| WASATCH FUNDS | | SEPTEMBER 30, 2018 (UNAUDITED) |
|
|
|
Supplemental Information
MANAGEMENTOFTHE TRUST
Management Information. The business affairs of Wasatch Funds are overseen by its Board of Trustees. The Board consists of four Independent Trustees, all of whom were elected by shareholders to serve until their successors are qualified, appointed or elected in accordance with the Trust’s Declaration of Trust and By-Laws.
The Trustees and executive officers of Wasatch Funds and their principal occupations for at least the last five years are set forth below. The Advisor retains proprietary rights to the Trust name.
| | | | | | | | | | | | |
Name, Address
and Age | | Position(s)
Held with
Wasatch Funds | | Term of Office1
and Length of
Time Served | | Principal Occupation(s)
during Past 5 Years | | Number of
Portfolios
in Fund
Complex
Overseen
by Trustee | | | Other Directorships
Held by Trustees
during Past 5 Years2 |
Independent Trustees | | | | | | | | | | | | |
| | | | | |
James U. Jensen, J.D., MBA 505 Wakara Way 3rd Floor Salt Lake City, UT 84108 Age 74 | | Trustee and Chairman of the Board | | Indefinite Served as
Chairman
of the Board
since 2004 and Trustee since
1986 | | Chief Executive Officer of Clearwater Law & Governance Group (an operating law firm board governance consulting company) April 2008 to present. Vice President, Corporate Development, Legal Affairs and General Counsel, and Secretary, NPS Pharmaceuticals, Inc. from 1991 to 2004. | | | 15 | | | Director and Board Chairman of Agricon Global Corporation (formerly known as Bayhill Capital
Corporation (telephone communications) from December 2007 to February 2014.
Trustee, Northern Lights Fund Trust III (33 portfolios) since 2012. |
| | | | | |
Miriam M. Allison 505 Wakara Way 3rd Floor Salt Lake City, UT 84108 Age 71 | | Trustee and Chairman of the Audit Committee | | Indefinite Served as
Trustee since
2010 | | Rancher since 2004. From 2001 to 2005, Chairman of UMB Fund Services, Inc. | | | 15 | | | Director, Northwestern Mutual Series Fund, Inc. (27 portfolios) since 2006. |
| | | | | |
Heikki Rinne, MBA, Ph.D. 505 Wakara Way 3rd Floor Salt Lake City, UT 84108 Age 66 | | Trustee and Chairman of the Governance and Nominating Committee | | Indefinite Served as
Trustee since October 2012 | | Chief Executive Officer of the Halton Group Ltd. (an indoor environmental control manufacturing and technology company), from 2002 to 2016.
A Founder and Principal Owner of Sitoumus LLC (a training and consulting firm focusing on empowering organizational and individual engagement as well as general consulting), January 2017 to present. | | | 15 | | | Director, Halton Group Ltd. since 2016. |
| | | | | |
Kristen M. Fletcher 505 Wakara Way 3rd Floor Salt Lake City, UT 84108 Age 65 | | Trustee | | Indefinite Served as
Trustee since October 2014 | | Director, Youth Sports Alliance since 2015.
Director, Utah Symphony/Utah Opera since 2005.
Trustee, Woodlands Commercial Bank (a/k/a Lehman Brothers Commercial Bank) 2009 to 2012.
Chairman and CEO, ABN AMRO, Inc. and U.S. Country Representative, ABN AMRO Bank, NV from 2002 to 2004. | | | 15 | | | Director, Youth Sports Alliance since 2015.
Trustee, Woodlands Commercial Bank (a/k/a Lehman Brothers Commercial Bank) 2009 to 2012.
Director Emeritus, Utah Symphony/Utah Opera since September 2017.
Director, Utah Symphony/Utah Opera from 2005 to September 2017. |
|
|
| 1 | A Trustee may serve until his/her death, resignation, removal or retirement. Each Independent Trustee shall retire as Trustee at the end of the calendar year in which he/she attains the age of 75 years. The Board of Trustees reserves the right to permit continued service after the mandatory retirement age for any individual Trustee in its sole discretion. The Board has approved a one-year waiver of the mandatory retirement age for Mr. Jensen. |
| 2 | Directorships are those held by a Trustee in any company with a class of securities registered pursuant to Section 12 of the Securities Exchange Act of 1934 or subject to the requirements of Section 15(d) of the Securities Exchange Act or any company registered as an investment company under the 1940 Act. |
111
Supplemental Information (continued)
| | | | | | |
Name, Address
and Age | | Position(s)
Held with
Trust | | Term of Office and
Length of Time Served | | Principal Occupation(s)
during Past 5 Years |
Officers | | | | | | |
| | | |
Eric S. Bergeson 505 Wakara Way 3rd Floor Salt Lake City, UT 84108 Age 52 | | President | | Indefinite Served as President since May 2018 | | President for the Trust since May 2018.
President of the Advisor since January 2017.
Vice President of Institutional Sales for
the Advisor since June 1998. |
| | | |
Russell L. Biles 505 Wakara Way 3rd Floor Salt Lake City, UT 84108 Age 50 | | Chief Compliance
Officer, Vice President
and Secretary | | Indefinite Served as Chief Compliance
Officer and Vice President
since February 2007
and Secretary since
November 2008 | | Chief Compliance Officer and Vice President
for Wasatch Funds since February 2007.
Secretary for Wasatch Funds since November 2008.
Counsel for the Advisor since October 2006. |
| | | |
Michael K. Yeates 505 Wakara Way 3rd Floor Salt Lake City, UT 84108 Age 36 | | Treasurer | | Indefinite Served as Treasurer
since May 2018 | | Treasurer for the Trust since May 2018.
Chief Financial Officer of the Advisor since
September 2007. |
| | | |
David Corbett 505 Wakara Way 3rd Floor Salt Lake City, UT 84108 Age 45 | | Assistant
Vice President | | Indefinite Served as Assistant
Vice President
since August 2012 | | Assistant Vice President for Wasatch Funds
since August 2012.
Director of Mutual Fund Services for the
Advisor since June 2007. |
| | | |
Cheryl Reich 505 Wakara Way 3rd Floor Salt Lake City, UT 84108 Age 35 | | Assistant Secretary | | Indefinite Served as Assistant
Secretary since
February 2017 | | Assistant Secretary for the Wasatch Funds
since February 2017.
Compliance Associate for the Advisor since September 2012.
Branch Manager for Investment Planning Counsel Corp. from November 2009 to August 2012. |
| | | |
Kara H. Becker 505 Wakara Way 3rd Floor Salt Lake City, UT 84108 Age 34 | | Assistant Treasurer | | Indefinite Served as Assistant
Treasurer since
May 2018 | | Assistant Treasurer for the Trust since May 2018. Controller for the Advisor since January 2012. |
|
|
Additional information about the Funds’ trustees is provided in the Statement of Additional Information and is available without charge, upon request, by calling 800.551.1700.
112
| | |
| | SEPTEMBER 30, 2018 (UNAUDITED) |
|
|
|
ADDITIONAL TAX INFORMATION
The Funds hereby designate the following amounts or maximum amounts allowable as long term capital gain dividends for the purpose of the dividends paid deduction. The amounts designated here include the utilization of earnings and profits distributed to shareholders on the redemption of shares.
| | | | |
| Fund | | Amount | |
Core Growth Fund | | $ | 99,220,332 | |
Emerging India Fund | | | 4,591,525 | |
Global Opportunities Fund | | | 10,899,209 | |
Global Value Fund | | | 20,535,691 | |
International Growth Fund | | | 41,285,234 | |
International Opportunities Fund | | | 34,016,624 | |
Micro Cap Fund | | | 44,480,704 | |
Micro Cap Value Fund | | | 17,823,539 | |
Small Cap Growth Fund | | | 177,876,579 | |
Small Cap Value Fund | | | 23,502,378 | |
Ultra Growth Fund | | | 11,827,106 | |
For the fiscal year ended September 30, 2018, certain dividends paid by each Fund may be subject to a maximum tax rate of 20% as provided for by the Jobs and Growth Tax Relief Reconciliation Act of 2003. To the extent dividends are paid during the calendar year 2018, complete information will be reported on shareholders’ 2018 Form 1099-DIV.
The amount designated as qualified dividend income for the year ended September 30, 2018 will be at the highest amount permitted by law.
Corporate shareholders should note that for the year ended September 30, 2018, the percentage of the Funds’ investment income (i.e., net investment income plus short-term capital gains) that qualified for the corporate dividends received deductions are as follows:
| | | | |
| Fund | | Percentage | |
Global Value Fund | | | 47 | % |
Small Cap Value Fund | | | 100 | % |
Ultra Growth | | | 3 | % |
SHAREHOLDER MEETING RESULTS
A Special Meeting of the Shareholders of the Funds (the “Shareholder Meeting”) was held on July 26, 2018. The purpose of the Shareholder Meeting was to ask shareholders to approve the election of Trustees. The results of the votes of the Shareholder Meeting are as set forth below.
Shares outstanding eligible to vote: Wasatch Funds Trust 842,937,553.
| | | | | | | | | | | | |
| | | Affirmative | | | Abstain | | | Total | |
| James U. Jensen, J.D. | | | 644,499,111 | | | | 15,360,472 | | | | 659,859,583 | |
| Miriam M. Allison | | | 645,021,161 | | | | 14,838,422 | | | | 659,859,583 | |
| Heikki Rinne | | | 645,844,460 | | | | 14,105,123 | | | | 659,949,583 | |
| Kristen M. Fletcher | | | 645,812,097 | | | | 14,047,486 | | | | 659,859,583 | |
A Special Meeting of Shareholders of the Wasatch Long/Short Fund (the “Long/Short Special Meeting”) was held on August 30, 2018, and adjourned until September 20, 2018 to allow further time to gather shareholder votes on the proposal. The purpose of the Long/Short Special Meeting was to approve an Agreement and Plan of Reorganization (and the related transactions) which provides for (i) the transfer of all the assets of the Wasatch Long/Short Fund (the “Target Fund”) to the Wasatch Global Value Fund (the “Acquiring Fund”) in exchange solely for Investor Class and Institutional Class shares of beneficial interest of the Acquiring Fund and the assumption by the Acquiring Fund of all the liabilities of the Target Fund; and (ii) the pro rata distribution of Investor Class and Institutional Class shares of the Acquiring Fund to the shareholders of Investor Class and Institutional Class shares of the Target Fund, respectively, in complete liquidation and termination of the Target Fund (the “Reorganization”). The results of the votes of the Long/Short Fund Special Meeting are set forth below.
Shares outstanding eligible to vote: Wasatch Long/Short Fund 4,778,248.
| | | | | | | | | | | | | | | | | | | | |
| | | Affirmative | | | Against | | | Abstain | | | Total | | | Uninstructed
Shares | |
To Approve an
Agreement
and Plan of
Reorganization | | | 1,825,888 | | | | 61,785 | | | | 164,443 | | | | 2,475,429 | | | | 423,313 | |
PROXY VOTING POLICIES, PROCEDURESAND RECORD
A description of the policies and procedures that Wasatch Advisors uses to vote proxies related to the Funds’ portfolio securities is set forth in the Funds’ Statement of Additional Information, which is available without charge, upon request, on the Funds’ website at www.WasatchFunds.com or by calling 800.551.1700 and on the Securities and Exchange Commission’s (SEC) website at www.sec.gov.
Wasatch Funds’ proxy voting record is available without charge on the Funds’ website at www.WasatchFunds.com and on the SEC’s website at www.sec.gov no later than August 31 for the prior 12 months ending June 30.
QUARTERLY PORTFOLIO HOLDINGS DISCLOSUREON FORM N-Q
The Funds file their complete schedules of investments with the SEC for their first and third quarters of each fiscal year on Form N-Q. The Funds’ Form N-Q filings are available on the SEC’s website at www.sec.gov, and may be reviewed and copied at the SEC’s Public Reference Room in Washington, D.C. (information on the operation of the Public Reference room may be obtained by calling 800.SEC.0330).
113
| | |
| WASATCH FUNDS | | SEPTEMBER 30, 2018 (UNAUDITED) |
|
|
|
Service Providers
INVESTMENT ADVISOR
Wasatch Advisors, Inc.
505 Wakara Way, 3rd Floor
Salt Lake City, UT 84108
SUB-ADVISORFORTHE WASATCH-1ST SOURCE INCOME FUND
1st Source Corporation Investment Advisors, Inc.
100 North Michigan Street
South Bend, IN 46601
SUB-ADVISORFORTHE WASATCH-HOISINGTON U.S. TREASURY FUND
Hoisington Investment Management Co.
6836 Bee Caves Road
Building 2, Suite 100
Austin, TX 78746
ADMINISTRATORAND FUND ACCOUNTANT
State Street Bank and Trust Company
801 Pennsylvania Avenue
Kansas City, MO 64105
DISTRIBUTOR
ALPS Distributors, Inc.
1290 Broadway, Suite 1100
Denver, CO 80203
TRANSFER AGENT
UMB Fund Services, Inc.
235 West Galena Street
Milwaukee, WI 53212
CUSTODIAN
State Street Bank and Trust Company
801 Pennsylvania Avenue
Kansas City, MO 64105
LEGAL COUNSELTO WASATCH FUNDSANDINDEPENDENT TRUSTEES
Chapman and Cutler, LLP
111 West Monroe Street
Chicago, IL 60603
INDEPENDENT REGISTERED PUBLIC ACCOUNTING FIRM
PricewaterhouseCoopers LLP
1100 Walnut Street, Suite 1300
Kansas City, MO 64106
TELEPHONE
800.551.1700
M - F, 7:00 a.m. to 7:00 p.m. Central Time
Automated Line, 24 Hours
U.S. MAIL
Wasatch Funds
P.O. Box 2172
Milwaukee, WI 53201-2172
OVERNIGHT DELIVERY
Wasatch Funds
235 West Galena Street
Milwaukee, WI 53212
ONLINE
www.WasatchFunds.com
shareholderservice@wasatchfunds.com
114

WASATCH FUNDS
2018 ANNUAL REPORT
www.WasatchFunds.com 800.551.1700
MIX Paper from responsible sources FSC C132107
Item 2. Code of Ethics.
| (a) | Wasatch Funds Trust (the “Registrant”) has adopted a Code of Ethics that applies to the Registrant’s principal executive officer and principal financial officer. |
| (b) | No disclosures are required by this Item 2(b). |
| (c) | There have been no amendments to the Registrant’s Code of Ethics during the reporting period for this form N-CSR. |
| (d) | There have been no waivers granted by the Registrant to individuals covered by the Registrant’s Code of Ethics during the reporting period for this Form N-CSR. |
| (f) | A copy of the Registrant’s Code of Ethics is attached as an exhibit to this Form N-CSR. |
Item 3. Audit Committee Financial Expert.
| (a) (1) | The Board of Trustees of the Registrant has determined that the Registrant has at least one member serving on the Registrant’s Audit Committee that possesses the attributes identified in Instruction 2(b) of Item 3 to Form N-CSR to qualify as “audit committee financial expert.” |
| | (2) | The name of the audit committee financial expert is Miriam M. Allison. Ms. Allison is deemed to be “independent” as that term is defined in Item 3(a)(2) of Form N-CSR. |
Item 4. Principal Accountant Fees and Services.
| (a) | Audit Fees - The aggregate fees billed for professional services rendered by the independent registered public accounting firm for the audit of the Registrant’s annual financial statements or services normally provided in connection with statutory and regulatory filings or engagements for the last two fiscal years ended September 30, 2018 and 2017 were $404,327 and $603,830, respectively. |
| (b) | Audit Related Fees – During the fiscal years ended September 30, 2018 and 2017, the Registrant was not billed any fees by the independent registered public accounting firm for assurance and related services rendered by the independent registered public accounting firm to the Registrant that are reasonably related to the performance of the audit of the Registrant’s financial statements and are not reported under paragraph (a) of this Item 4. |
During the fiscal years ended September 30, 2018 and 2017, no fees for assurance and related services that relate directly to the operations and financial reporting of the Registrant were billed by the independent registered public accounting firm to the Registrant’s investment adviser (the “Advisor”) or any other entity controlling, controlled by, or under common control with the Advisor that provides ongoing services to the Registrant.
| (c) | Tax Fees - The aggregate fees billed for professional services rendered by the independent registered public accounting firm to the Registrant for tax compliance, tax advice, tax planning and tax return preparation for the last two fiscal years ended September 30, 2018 and 2017 were $97,900 and $135,500, respectively. These services consisted of the independent registered public accounting firm reviewing the Registrant’s excise tax returns, distribution requirements and RIC tax returns, as well as consultations regarding the liquidation of a series of the Trust. |
During the fiscal years ended September 30, 2018 and 2017, no fees for tax compliance, tax advice or tax planning services that relate directly to the operations and financial reporting of the Registrant were billed by the independent registered public accounting firm to the Advisor or any other entity controlling, controlled by, or under common control with the Advisor that provides ongoing services to the Registrant.
| (d) | All Other Fees – The aggregate fees billed for products and services provided by the independent registered public accounting firm to the Registrant, other than the services reported in paragraph (a) – (c) of this Item 4, for the fiscal years ended September 30, 2018 and 2017 were $0 and $107,193, respectively. The fees for September 30, 2017 are related to the filing for EU reclaims and advice regarding foreign capital gain tax accruals. |
During the fiscal years ended September 30, 2018 and 2017, no fees for other services that relate directly to the operations and financial reporting of the Registrant were billed by the independent registered public accounting firm to the Advisor or any other entity controlling, controlled by, or under common control with the Advisor that provides ongoing services to the Registrant.
| (e) | Pre-Approval Policies and Procedures |
(1) Pursuant to the registrant’s Audit Committee Charter, the Audit Committee shall evaluate the independence of the independent public accountants, including evaluating whether the independent public accountants provide audit services or consulting services to the Registrant or consulting services to the Advisor, and to receive the specific representations of the independent registered public accounting firm as to their independence. Specifically, the Audit Committee will be responsible for evaluating the provision of non-audit services to the Registrant as required by Section 201 of the Sarbanes-Oxley Act, any pre-approval requests submitted by the independent registered public accounting firm as required by Section 202 of the Sarbanes-Oxley Act or as otherwise required under Section 2-01 of Regulation S-X, and shall monitor the conflict of interest requirements in Section 206 of the Sarbanes-Oxley Act, and the prohibitions on improper influence on the conduct of audits in Section 303 of the Sarbanes-Oxley Act. The Audit Committee shall pre-approve any engagement of the independent registered public accounting firm to provide any services (other than prohibited non-audit services) including the fees and other compensation to be paid to the independent registered public accounting firm.
The independent registered public accounting firm is authorized by the Audit Committee to provide non-audit services to the extent allowable under the Sarbanes-Oxley Act of 2002 for the Registrant provided that (i) the fees payable with respect to such services do not exceed $5,000 in any calendar quarter and (ii) such fees are ratified by the Audit Committee at its next meeting. The fees payable with respect to non-audit services may be increased by the affirmative vote of a majority of the members of the Audit Committee.
(2) There were no pre-approval requirements waived for the services provided to the Registrant described in paragraphs (b)-(d) of Item 4 by the Audit Committee pursuant to paragraph (c)(7)(i)(C) of Rule 2-01 of Regulation S-X (the “De Minimis Rule”). There were no fees billed for services provided to the Advisor described in paragraphs (b)-(d) of Item 4 that were required to be pre-approved by the Audit Committee as described in paragraph (e)(1) of Item 4.
| (f) | No disclosures are required by this Item 4(f). |
| (g) | For the fiscal years ended September 30, 2018 and 2017, the aggregate non-audit fees billed by the independent registered public accounting firm for services rendered to the Registrant and the Advisor and any entity controlling, controlled by, or under common control with the Advisor that provided ongoing services to the Registrant were approximately $0 and $107,193, respectively. |
| (h) | No disclosures are required by this Item 4(h). |
Item 5. Audit Committee of Listed Registrants.
Not applicable.
Item 6. Schedule of Investments.
| (a) | Schedule of Investments is included as a part of the report to shareholders filed under Item 1 of this Form N-CSR. |
Item 7. Disclosure of Proxy Voting Policies and Procedures for Closed-End Management Investment Companies.
Not applicable.
Item 8. Portfolio Managers of Closed-End Investment Companies.
Not applicable.
Item 9. Purchases of Equity Securities by Closed-End Management Investment Company and Affiliated Purchasers.
Not applicable.
Item 10. Submission of Matters to a Vote of Security Holders.
There have been no material changes to the procedures by which shareholders may recommend nominees to the Registrant’s board of trustees, where those changes were implemented after the Registrant last provided disclosure in response to this item.
Item 11. Controls and Procedures.
| (a) | The Registrant’s principal executive and principal financial officers have concluded that the Registrant’s disclosure controls and procedures (as defined in Rule 30a-3(c) under the Investment Company Act of 1940, as amended (the “1940 Act”)) are effective, as of a date within 90 days of the filing date of this Form N-CSR based on their evaluation of these controls and procedures required by Rule 30a-3(b) under the 1940 Act) and Rules 13a-15(b) or 15d-15(b) under the Securities Exchange Act of 1934). |
| (b) | There were no changes in the Registrant’s internal control over financial reporting (as defined in Rule 30a-3(d) under the 1940 Act) that occurred during the Registrant’s second fiscal quarter of the period covered by this report that has materially affected, or is reasonably likely to materially affect, the Registrant’s internal control over financial reporting. |
Item 12. Disclosure of Securities Lending Activities for Closed-End Management Investment Companies.
Item 13. Exhibits.
| (a)(1) | Code of Ethics is attached hereto. |
| (a)(2) | The certifications required by Rule 30a-2(a) of the 1940 Act are attached hereto. |
| (b) | The certifications required by Rule 30a-2(b) of the 1940 Act and Section 906 of the Sarbanes-Oxley Act of 2002 are attached hereto. |
SIGNATURES
Pursuant to the requirements of the Securities Exchange Act of 1934 and the Investment Company Act of 1940, the Registrant has duly caused this report to be signed on its behalf by the undersigned, thereunto duly authorized.
| | |
WASATCH FUNDS TRUST |
| |
By: | | /s/ Eric S. Bergeson |
| | Eric S. Bergeson |
| | President (principal executive officer) of Wasatch Funds Trust |
| |
Date: | | November 29, 2018 |
Pursuant to the requirements of the Securities Exchange Act of 1934 and the Investment Company Act of 1940, this report has been signed below by the following persons on behalf of the Registrant and in the capacities and on the dates indicated.
| | |
By: | | /s/ Eric S. Bergeson |
| | Eric S. Bergeson |
| | President (principal executive officer) of Wasatch Funds Trust |
| |
Date: | | November 29, 2018 |
| | |
By: | | /s/ Michael K. Yeates |
| | Michael K. Yeates |
| | Treasurer (principal financial officer) of Wasatch Funds Trust |
| |
Date: | | November 29, 2018 |