UNITED STATES
SECURITIES AND EXCHANGE COMMISSION
Washington, D.C. 20549
FORM N-CSR
CERTIFIED SHAREHOLDER REPORT OF REGISTERED
MANAGEMENT INVESTMENT COMPANIES
Investment Company Act file number: 811-04920
WASATCH FUNDS TRUST
(Exact name of registrant as specified in charter)
505 Wakara Way, 3rd Floor
Salt Lake City, UT 84108
(Address of principal executive offices)(Zip code)
| | |
| (Name and Address of Agent for Service) | | Copy to: |
| |
Eric S. Bergeson Wasatch Advisors, Inc. 505 Wakara Way, 3rd Floor Salt Lake City, UT 84108 | | Eric F. Fess, Esq. Chapman & Cutler LLP 111 West Monroe Street Chicago, IL 60603 |
Registrant’s telephone number, including area code: (801) 533-0777
Date of fiscal year end: September 30
Date of reporting period: September 30, 2020
Item 1. Report to Shareholders.
WASATCHGLOBAL.COM SEPTEMBER 30, 2020 2020 Annual Report Fund Investor Institutional Fund Investor Institutional Name Class Class Name Class Class Wasatch Core Growth Fund *52; ,*5; DVDWFK ,QWHUQDWLRQDO 2SSRUWXQLWLHV )XQG $,2; ,,2; DVDWFK (PHUJLQJ ,QGLD )XQG $,1; ,,1; DVDWFK ,QWHUQDWLRQDO 6HOHFW )XQG $,6; *,6; DVDWFK (PHUJLQJ 0DUNHWV 6HOHFW )XQG $(6; ,(6; Wasatch Micro Cap Fund 0,&; *,&; DVDWFK (PHUJLQJ 0DUNHWV 6PDOO &DS )XQG $(0; ,(0; Wasatch Micro Cap Value Fund $09; *09; Wasatch Frontier Emerging Small $)0; ,)0; Wasatch Small Cap Growth Fund $$(; ,$(; Countries Fund Wasatch Small Cap Value Fund 0&9; ,&9; DVDWFK *OREDO 2SSRUWXQLWLHV )XQG $*2; ,*2; Wasatch Ultra Growth Fund $0&; *0&; Wasatch Global Select Fund $*6; **6; DVDWFK +RLVLQJWRQ 8 6 7UHDVXU )XQG +26; Wasatch Global Value Fund )0,(; , &; DVDWFK ,QWHUQDWLRQDO *URZWK )XQG $,*; ,,*; Beginning January 31, 2021, as permitted by regulations adopted by the Securities and Exchange Commission, paper copies of DVDWFK )XQGV VKDUHKROGHU UHSRUWV ZLOO QR ORQJHU EH VHQW E PDLO XQOHVV RX VSHFL LFDOO UHTXHVW SDSHU FRSLHV RI WKH UHSRUWV IURP DVDWFK )XQGV RU IURP RXU LQDQFLDO LQWHUPHGLDU VXFK DV D EURNHU GHDOHU RU EDQN ,QVWHDG UHSRUWV ZLOO EH PDGH DYDLODEOH RQ DVDWFK )XQGVo ZHEVLWH ZDVDWFKJOREDO FRP DQG RX ZLOO EH QRWL LHG E PDLO HDFK WLPH D UHSRUW LV SRVWHG DQG SURYLGHG ZLWK D ZHEVLWH OLQN WR DFFHVV WKH UHSRUW ,I RX DOUHDG HOHFWHG WR UHFHLYH VKDUHKROGHU UHSRUWV HOHFWURQLFDOO RX ZLOO QRW EH D HFWHG E WKLV FKDQJH DQG RX QHHG QRW WDNH DQ DFWLRQ RX PD HOHFW WR UHFHLYH VKDUHKROGHU UHSRUWV DQG RWKHU FRPPXQLFDWLRQV IURP DVDWFK )XQGV HOHFWURQLFDOO E FRQWDFWLQJ RXU LQDQFLDO LQWHUPHGLDU VXFK DV D EURNHU GHDOHU RU EDQN RU IRU )XQG VKDUHV KHOG GLUHFWO ZLWK DVDWFK )XQGV E FDOOLQJ RU E HQUROOLQJ LQ H’HOLYHU E ORJJLQJ LQWR RXU DFFRXQW DW KWWSV ZDVDWFKIXQGV RODFFHVV FRP RX PD HOHFW WR UHFHLYH DOO IXWXUH UHSRUWV LQ SDSHU IUHH RI FKDUJH ,I RX LQYHVW WKURXJK D LQDQFLDO LQWHUPHGLDU RX FDQ FRQWDFW RXU LQDQFLDO LQWHUPHGLDU WR UHTXHVW WKDW RX FRQWLQXH UHFHLYLQJ SDSHU FRSLHV RI RXU VKDUHKROGHU UHSRUWV ,I RX LQYHVW GLUHFWO ZLWK DVDWFK )XQGV RX FDQ FDOO WR OHW WKH )XQGV NQRZ RX ZLVK WR FRQWLQXH UHFHLYLQJ SDSHU FRSLHV RI RXU VKDUHKROGHU UHSRUWV RXU HOHFWLRQ WR UHFHLYH UHSRUWV LQ SDSHU ZLOO DSSO WR DOO DVDWFK )XQGV KHOG LQ RXU DFFRXQW LI RX LQYHVW WKURXJK D LQDQFLDO LQWHUPHGLDU RU DOO DVDWFK )XQGV KHOG ZLWK WKH IXQG FRPSOH[ LI RX LQYHVW GLUHFWO ZLWK DVDWFK )XQGV
Wasatch Funds
Salt Lake City, Utah
wasatchglobal.com
800.551.1700
This material must be accompanied or preceded by a prospectus.
Please read the prospectus carefully before you invest.
Wasatch Funds are distributed by ALPS Distributors, Inc.
1
| | |
| Letter to Shareholders — Our Thoughts on Stock Valuations | | |
| | | | |

Ken Korngiebel, CFA Portfolio Manager | | 
Jagjit Sahota Portfolio Manager | | DEAR FELLOW SHAREHOLDERS: Because stocks have rebounded so strongly despite the ongoing effects of the coronavirus, we’re frequently asked about the level of valuations in the market. In response, we acknowledge the higher prices but we emphasize that many of our companies — tech-related companies, in particular — have actually benefited from the pandemic because they facilitate activities like working remotely, seeing a doctor online, renovating household spaces and enjoying home-based recreation. Moreover, we think these activities will continue even after the pandemic ends because people have become accustomed to new routines. |
STOCK PRICES ARE FORWARD-LOOKING
Another consideration has to do with the forward-looking nature of stock prices. In this regard, think about the discussion from a recent CNBC interview with Wharton School professor Dr. Jeremy Siegel. The interviewer asked him to assess the effects of potentially lost earnings on stock valuations. Dr. Siegel responded that stocks represent claims on long-term company performance. He said that over 90% of a stock’s worth is generally based on earnings beyond one year into the future. In other words, if a company loses all of its earnings in the current year, the stock price should be down less than 10%. This is a very broad generalization, of course, and from our perspective it assumes the company can stay in business without impairment to its long-term competitive position, without dilution to its ownership structure and without a major increase in debt.
Because so much of a stock’s worth is forward-looking, it can be perfectly rational for a stock to experience a V-shaped recovery in the short term even if it takes the business and the broad economy much longer to get back on track. Additionally, for fast-growing small-cap companies such as those targeted by Wasatch, it’s likely that an even greater percentage of a stock’s worth is based on future earnings.
This is because especially fast growth puts extra emphasis on the future. For example, with the benefit of 20/20 hindsight, we all would have paid what would have seemed like very expensive share prices in the early years of Amazon.com and Netflix if we had known how fast the companies would grow and how long the duration of the growth would be.*
WASATCH’S PERSPECTIVE ON GROWTH-ORIENTED INVESTING
When considering the stock valuations of growth-oriented companies — especially in the current environment of generally elevated prices — we think there are two main points to keep in mind. But before we describe them, let’s start with a discussion of a standard valuation measure: the price/earnings (P/E) ratio.
While we generally prefer metrics like enterprise value to sales (EV/S), the more common expression of the perceived expensiveness of a company is the P/E ratio, which is the stock price divided by the earnings per share (EPS). The P/E ratio can be calculated in several ways — for example, based on trailing earnings or based on projected future earnings. We think most investors would agree that a high-quality company deserves to sell at a greater P/E ratio than a lower-quality company. The question is: How much greater?
At Wasatch Global Investors, we often invest in companies with significantly larger P/E ratios than the ratios for companies in the benchmark indexes. Our reason for this is we believe the high-quality characteristics we emphasize will allow our companies to grow sales and earnings much faster than the average index constituent. In other words, we’re not afraid to “pay up” for growth if, for example, we think a company can double in size within the next five years or so. Moreover, we believe high-quality companies are often better able to maintain operations during periodic downturns (like the current pandemic) and emerge stronger and well-positioned for the long term — even if their stocks are priced somewhat more richly in the short term.
This brings us to our first point. When we invest in a company with a high P/E ratio today, we don’t do so with the expectation the ratio will stay high indefinitely because that would require us to depend on the irrational behavior of other investors. Instead, we plan for P/E ratio contraction.
We try to estimate the company’s earnings about five years into the future. Then we calculate an expected future stock price based on the estimated earnings and based on a lower, less expensive P/E ratio. If the stock price at today’s higher P/E ratio is significantly below the expected future stock price at the less expensive P/E ratio, we think we can make an adequate return.
Our second point is we try to assess the likely duration of a company’s growth at various rates. For example, consider hypothetical investments in two different companies at the same valuation today. One company grows 25% annually for 10 years. The other company grows 25% annually for five years and then 10% annually for the next five years.
After the full 10 years, the company that maintained its 25% annual growth would be almost twice as large as the company that faltered in its growth. As you can see from this example, an investor who made good assessments of the differing growth rates and durations would have been well-rewarded for choosing the company with consistent 25% growth — even if the investor had been willing to pay a somewhat higher starting valuation.
2
FOCUS ON QUALITY FIRST, GROWTH SECOND
At Wasatch, we consider ourselves to be quality-oriented investors first and growth-oriented investors second. In contrast, we think some other growth investors that are less focused on quality get into trouble when there’s a bubble in stock prices for companies that don’t live up to their hype as total game-changers. A prime example was 2000’s peak in the dot-com mania — which, by the way, we at Wasatch largely avoided because we were grounded in our bottom-up research of company fundamentals.
Today, we don’t see a situation that’s analogous to the dot-com mania. Software-as-a-Service (SaaS) companies, for example, really are changing productivity, commerce and entertainment for the better. As mentioned earlier, many of these companies have actually benefited from the pandemic. Moreover, we continue to see headroom for ongoing growth based on new ways of living and conducting business.
An attractive feature of many higher-tech and other non-capital-intensive businesses is they can grow sales quickly without the risk of having to take on large amounts of debt or having to dilute their equity ownership excessively or repeatedly. Although these businesses may have stocks that seem to sell at relatively high P/E ratios, many of the businesses could reduce their sales growth and immediately become much more profitable if necessary. For example, Amazon and Netflix continue to operate with low earnings compared to their sales volumes because it still makes sense to plow cash back into expanding their businesses.
WASATCH OUTLOOK AND POSITIONING
Despite the lingering effects of the pandemic, stock markets around the world remained relatively strong during the third quarter of 2020, supported to a large extent by government-sponsored fiscal measures and accommodative central-bank monetary policies. In fact, the U.S. Federal Reserve recently announced its intention to keep interest rates extremely low for at least the next few years.
A close analysis of stock-price movements during September, however, showed the U.S. generally lagged many international developed markets and emerging markets. In addition, the information-technology sector trailed several other sectors. This underperformance wasn’t surprising to us because the U.S. and the information-technology sector were previously the leading areas of the markets, and it’s often the case that stocks take a breather after strong upward surges.
Going forward, we think that international developed markets and emerging markets — supported by strengthening currencies versus the dollar — may continue to outperform the U.S. as they did in September. After all, non-U.S. markets prior to their recent leadership had lagged the U.S. for several years. And they may still have some catching up to do. Moreover, our research indicates the combination of high-quality businesses and reasonable stock prices is especially prevalent beyond U.S. borders.
As for information technology, the sector holds an important place in our quality-oriented approach to investing because it is being propelled by key secular trends such as remote work, telemedicine and streaming entertainment that could continue to accelerate.
More generally, we believe sales and earnings growth drive stock prices over the long term. We favor industry-leading companies that are largely able to self-fund their growth without much debt and, if possible, without high fixed costs. We also look for sustainable competitive advantages, healthy balance sheets, high returns on capital and strong cash flows.
To sum up, we think well-chosen growth companies will benefit from the fact that today’s worth of a quickly developing business is especially dependent on future earnings. And this characteristic is likely to be reinforced by the Fed’s “lower for longer” interest-rate policy, which also places a premium on the future. So rather than attempting to navigate macro events like vaccine development and political election results, we prefer to stay squarely focused on assessing duration and quality for the long term.
With sincere thanks for your continuing investment and for your trust,
Ken Korngiebel and Jagjit Sahota
| * | As of September 30, 2020, none of the Wasatch Funds held Amazon.com, Inc. or Netflix, Inc. |
Information in this report regarding market or economic trends, or the factors influencing historical or future performance, reflects the opinions of management as of the date of this report. These statements should not be relied upon for any other purpose. Past performance is no guarantee of future results, and there is no guarantee that the market forecasts discussed will be realized.
The recent growth in the stock market has helped to produce short-term returns for some asset classes that are not typical and may not continue in the future.
CFA® is a trademark owned by the CFA Institute.
Wasatch Global Investors is the investment advisor to Wasatch Funds.
Wasatch Funds are distributed by ALPS Distributors, Inc. (ADI). ADI is not affiliated with Wasatch Global Investors.
Definitions of financial terms and index descriptions and disclosures begin on page 38.
3
| | |
| Wasatch Core Growth Fund (WGROX / WIGRX) | | SEPTEMBER 30, 2020 |
Management Discussion
The Wasatch Core Growth Fund is managed by a team of Wasatch portfolio managers led by JB Taylor, Paul Lambert and Mike Valentine.
| | | | |

JB Taylor Lead Portfolio Manager | | 
Paul Lambert Portfolio Manager | | 
Mike Valentine Portfolio Manager |
OVERVIEW
During the 12-month period ended September 30, 2020, stocks fluctuated wildly in large part due to the outbreak of the novel coronavirus and the ensuing responses. For the full period, the Wasatch Core Growth Fund — Investor Class gained 17.41% while the benchmark Russell 2000 Index increased 0.39% and the Russell 2000 Growth Index rose 15.71%.
Many stocks showed strong returns during the 12 months even though the pandemic remained unresolved. While companies were fairly resilient, no reasonable analyst would minimize the effects on stock prices from support by fiscal initiatives and monetary policies. For example, the U.S. Federal Reserve (Fed) recently announced its plans to keep interest rates extremely low for at least the next few years and to promote higher employment and inflation. In addition, the Fed stepped outside its monetary mandate by publicly encouraging Congress to do even more on the fiscal front to assist individuals and businesses facing hardship.
DETAILS OF THE YEAR
The information-technology and consumer-discretionary sectors were large sources of outperformance relative to the benchmark. In both sectors, a significant weighting and stock selection were key factors. In financials, the Fund benefited from being underweighted and having a few strong performers. Elsewhere, the Fund’s industrials did well and having no energy stocks was fortuitous. On the other hand, lagging returns in health care and an underweight in the sector were detrimental to the Fund’s relative performance.
The Fund’s top contributor was Five9, Inc., which provides contact-center software that is managed and hosted from the cloud. The company offers real-time and historical reporting, quality monitoring, and workforce and customer-relationship-management integrations. The stock benefited from the superiority of cloud-based software, which has become especially evident during the pandemic. On a longer-term basis, Five9 has competitive advantages that make it the dominant growth company in its industry. First, Five9 offers compelling products that address mission-critical customer needs, and the company has been leveraging these products with high research-and-development spending. Second, the company
has been enhancing its products for reliability, functionality and scalability at the enterprise level — thereby opening new revenue opportunities. Third, in our estimation, Five9’s leadership team has talent and depth at the home office and at the regional levels, and the company has created a culture that attracts and retains best-in-class personnel.
The largest detractor from Fund performance was Monro, Inc., a leading chain of automotive-repair shops with more than 1,280 locations spread across 32 states. The company has certainly been impacted in the short term by stay-at-home orders and decreased travel. Also, Monro’s CEO recently resigned to become the CEO of a larger company. Board Chairman Robert Mellor has been appointed interim CEO, and the search for a successor has been initiated. We spoke to Mr. Mellor recently and feel comfortable that a sound, long-term business plan remains in place for the company. Given an already-impressive footprint, we believe Monro still has significant headroom for growth over the next few years despite the company’s short-term challenges.
OUTLOOK
With the success of growth-oriented tech and tech-related stocks over the past several years, many investors are questioning whether there will be a market rotation away from growth stocks and toward value stocks — which are typically in more basic industries like oil drilling, mining and banking. For our part, we don’t think it’s possible to successfully navigate growth and value cycles. Instead, we prefer to stay invested in growth names that meet our strict quality standards.
More broadly, with the Fed committed to near-zero interest rates (and therefore a low cost of capital) for years on end, cash-generative growth companies should be particularly well-positioned to produce attractive returns on invested capital — especially if the companies’ total addressable markets are very large and expanding. Additionally, from a discounted-cash-flow perspective, low interest rates should favor companies that defer profits today in order to achieve large, recurring profits well into the future.
In closing, we’d like to emphasize that our expertise isn’t in trying to predict the intricacies of politics, vaccine development, the “reopening trade” or growth versus value cycles. We leave attempts at those predictions to others. For our part, we prefer to stay immersed in analyzing company fundamentals, activities we think actually give us an edge in the competitive field of investments.
Thank you for the opportunity to manage your assets.
Current and future holdings are subject to risk.
4
| | |
| Wasatch Core Growth Fund (WGROX / WIGRX) | | SEPTEMBER 30, 2020 |
Portfolio Summary
AVERAGE ANNUAL TOTAL RETURNS
| | | | | | | | | | | | | | | |
| | | |
| | | 1 Year | | 5 Years | | 10 Years |
| | | |
Core Growth (WGROX) — Investor | | | | 17.41% | | | | | 14.43% | | | | | 14.69% | |
| | | |
Core Growth (WIGRX) — Institutional | | | | 17.58% | | | | | 14.59% | | | | | 14.80% | |
| | | |
Russell 2000® Index | | | | 0.39% | | | | | 8.00% | | | | | 9.85% | |
| | | |
Russell 2000® Growth Index | | | | 15.71% | | | | | 11.42% | | | | | 12.34% | |
Data show past performance, which is not indicative of future performance. Current performance may be lower or higher than the performance quoted. To obtain the most recent month-end performance data available, please visit wasatchglobal.com. The Advisor may absorb certain Fund expenses, without which total returns would have been lower. Investment returns and principal value will fluctuate and shares, when redeemed, may be worth more or less than their original cost.
As of the January 31, 2020 prospectus, the Total Annual Fund Operating Expenses for the Wasatch Core Growth Fund are Investor Class: 1.19% / Institutional Class — Gross: 1.09%, Net: 1.05%. The expense ratio shown elsewhere in this report may be different. Net expenses are based on Fund expenses, net of waivers and reimbursements. See the prospectus for additional information regarding Fund expenses.
Wasatch will deduct a 2.00% redemption fee on Fund shares held 60 days or less. Performance data do not reflect the deduction of fees, including sales charges, or the taxes you would pay on fund distributions or the redemption of fund shares. Fees and taxes, if reflected, would reduce the performance quoted. Wasatch does not charge any sales fees. For more complete information including charges, risks and expenses, read the prospectus carefully.
Performance for the Institutional Class prior to 1/31/2012 is based on the performance of the Investor Class. Performance of the Fund’s Institutional Class prior to 1/31/2012 uses the actual expenses of the Fund’s Investor Class without any adjustments. For any such period of time, the performance of the Fund’s Institutional Class would have been substantially similar to, yet higher than, the performance of the Fund’s Investor Class, because the shares of both classes are invested in the same portfolio of securities, but the classes bear different expenses.
Investing in small cap funds will be more volatile and loss of principal could be greater than investing in large cap or more diversified funds. Investing in foreign securities, especially in emerging markets, entails special risks, such as currency fluctuations and political uncertainties, which are described in more detail in the prospectus.
TOP 10 EQUITY HOLDINGS*
| | | | |
| |
| Company | | % of Net Assets | |
| |
Pool Corp. | | | 3.8% | |
| |
ICON plc (Ireland) | | | 3.1% | |
| |
Trex Co., Inc. | | | 3.0% | |
| |
Paylocity Holding Corp. | | | 2.9% | |
| |
Floor & Decor Holdings, Inc., Class A | | | 2.8% | |
| | | | |
| |
| Company | | % of Net Assets | |
| |
Monolithic Power Systems, Inc. | | | 2.7% | |
| |
Five9, Inc. | | | 2.7% | |
| |
Medpace Holdings, Inc. | | | 2.6% | |
| |
Morningstar, Inc. | | | 2.6% | |
| |
Ensign Group, Inc. (The) | | | 2.4% | |
| * | As of September 30, 2020, there were 58 holdings in the Fund. Foreign currency contracts, written options and repurchase agreements, if any, are not included in the number of holdings. Portfolio holdings are subject to change at any time. References to specific securities should not be construed as recommendations by the Funds or their Advisor. Current and future holdings are subject to risk. |
SECTOR BREAKDOWN**
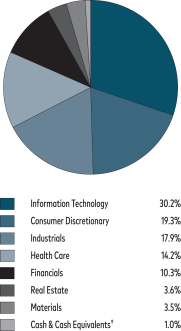
| ** | Excludes securities sold short and options written, if any. |
| † | Also includes Other Assets & Liabilities. |
GROWTH OF A HYPOTHETICAL $10,000 INVESTMENT
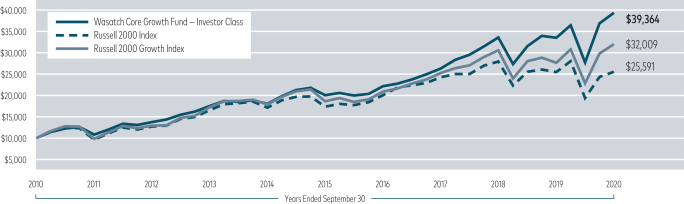
Past performance does not predict future performance. The graph above does not reflect the deduction of fees, sales charges, or taxes that you would pay on fund distributions or the redemption of fund shares. Wasatch does not charge any sales fees.
5
| | |
| Wasatch Emerging India Fund (WAINX / WIINX) | | SEPTEMBER 30, 2020 |
Management Discussion
The Wasatch Emerging India Fund is managed by a team of Wasatch portfolio managers led by Ajay Krishnan and Matthew Dreith.
| | | | |

Ajay Krishnan, CFA Lead Portfolio Manager | | 
Matthew Dreith, CFA Portfolio Manager | | OVERVIEW Although the coronavirus pandemic roiled equity markets during the 12-month period ended September 30, 2020, the Wasatch Emerging India |
Fund — Investor Class declined only -0.38%. The Fund modestly underperformed the benchmark MSCI India Investable Market Index (IMI), which rose 1.10%.
During the second half of the period, Indian equities moved solidly higher amid better-than-expected corporate earnings and strong inflows of foreign capital. Restrictions on the activities of individuals and businesses eased as the government continued to unlock India’s economy in phases. Many investors are now optimistic regarding consumer sentiment heading into the annual festive season. The period from mid-October through December is typically the busiest time of the year in India for sales of big-ticket items such as gold jewelry, automobiles and apartments.
Additionally, manufacturing activity in September jumped to its highest level in more than eight years — which helped to reassure investors that India’s economy was on the mend following a sharp contraction in the April-to-June quarter. As for agriculture, India has reported the best monsoon rainfall in the past six years. This has improved crop yields and should also support gross domestic product (GDP) growth and rural consumption.
DETAILS OF THE YEAR
Although financials were down for the 12 months, the Fund benefited relative to the benchmark from favorable stock selection. Regarding communication services, the Fund saw excellent relative performance in a strong sector. Health care also proved advantageous, as the Fund was overweighted in this highflying sector. On the other hand, the Fund was disadvantaged by having no exposure to soaring energy stocks. Also on the negative side of the ledger, the Fund experienced poor stock performance among consumer-discretionary names.
Top contributors for the Fund included Divi’s Laboratories Ltd. and Info Edge India Ltd. Divi’s produces active pharmaceutical ingredients and intermediates. The company has benefited as international manufacturers of pharmaceuticals shift supply chains out of China or seek secondary sources of supply. Info Edge runs an online job-posting website and leading internet portals dedicated to matrimony, real estate and education. Following a sharp drop-off during India’s Covid-19 lockdown, traffic on the company’s flagship
recruitment-solutions platform has increased in recent months. Management noted significant acceleration in the real-estate segment as well. The matrimony segment of Info Edge also has benefited as Indians sheltering in place browsed the company’s portal, uploaded their profiles and availed themselves of industry-first video applications.
Financial companies accounted for several of the Fund’s greatest detractors. Among these were Bajaj Finance Ltd., AU Small Finance Bank Ltd. and Aavas Financiers Ltd. Bajaj is a non-bank financial company (NBFC) offering a broad spectrum of lending services. AU is a small finance bank that primarily targets unbanked and underbanked low- and middle-income individuals and small businesses. Aavas is an NBFC specializing in housing loans to low- and middle-income customers in semi-urban and rural areas. After contacting all three of these companies, we believe they have ample capital buffers and we expect them to emerge from the coronavirus crisis even stronger. We used the sharp declines in their share prices to add selectively to our positions. We think Bajaj is particularly well-situated because it focuses on India’s salaried class, whose loan payments are often made through automatic transfers.
OUTLOOK
In August, Federal Reserve Chairman Jerome Powell announced a new, more accommodative approach to U.S. monetary policy. As governments around the world struggle to revive their economies from virus-induced slowdowns, we think the Fed’s shift toward keeping U.S. interest rates lower for longer will prove especially beneficial for countries such as India.
India’s government and central bank sometimes find themselves hamstrung by rising energy prices. Because India imports about 80% of the oil it uses, higher-priced oil widens the country’s current-account deficit and stokes inflation. That, in turn, forces the Reserve Bank of India to keep interest rates high to defend the currency, and limits the government’s ability to run large deficits without scaring away the foreign capital needed to fund them. Although the risk of escalating crude-oil prices seems remote in the current environment, other factors can also create inflationary pressures that constrain efforts by India’s government and central bank to stimulate economic growth.
By making the U.S. dollar less attractive to international investors, the Fed’s new approach should give India’s policy makers some additional breathing room on both the fiscal and monetary sides. Moreover, we think the Fed’s updated monetary framework is likely to provide India and other emerging markets with a tailwind for at least the next few years.
Thank you for the opportunity to manage your assets.
Current and future holdings are subject to risk.
6
| | |
| Wasatch Emerging India Fund (WAINX / WIINX) | | SEPTEMBER 30, 2020 |
Portfolio Summary
AVERAGE ANNUAL TOTAL RETURNS
| | | | | | | | | | | | | | | |
| | | |
| | | 1 Year | | 5 Years | | Since Inception 4/26/2011 |
| | | |
Emerging India (WAINX) — Investor | | | | -0.38% | | | | | 9.25% | | | | | 9.79% | |
| | | |
Emerging India (WIINX) — Institutional | | | | -0.15% | | | | | 9.44% | | | | | 9.89% | |
| | | |
MSCI India IMI | | | | 1.10% | | | | | 5.01% | | | | | 2.00% | |
Data show past performance, which is not indicative of future performance. Current performance may be lower or higher than the performance quoted. To obtain the most recent month-end performance data available, please visit wasatchglobal.com. The Advisor may absorb certain Fund expenses, without which total returns would have been lower. Investment returns and principal value will fluctuate and shares, when redeemed, may be worth more or less than their original cost.
As of the January 31, 2020 prospectus, the Total Annual Fund Operating Expenses for the Wasatch Emerging India Fund are Investor Class: 1.68% / Institutional Class: 1.49%. The expense ratio shown elsewhere in this report may be different. Net expenses are based on Fund expenses, net of waivers and reimbursements. See the prospectus for additional information regarding Fund expenses.
Wasatch will deduct a 2.00% redemption fee on Fund shares held 60 days or less. Performance data do not reflect the deduction of fees, including sales charges, or the taxes you would pay on fund distributions or the redemption of fund shares. Fees and taxes, if reflected, would reduce the performance quoted. Wasatch does not charge any sales fees. For more complete information including charges, risks and expenses, read the prospectus carefully.
Performance for the Institutional Class prior to 2/1/2016 is based on the performance of the Investor Class. Performance of the Fund’s Institutional Class prior to 2/1/2016 uses the actual expenses of the Fund’s Investor Class without any adjustments. For any such period of time, the performance of the Fund’s Institutional Class would have been substantially similar to, yet higher than, the performance of the Fund’s Investor Class, because the shares of both classes are invested in the same portfolio of securities, but the classes bear different expenses.
Investing in small cap funds will be more volatile and loss of principal could be greater than investing in large cap or more diversified funds. Investing in foreign securities, especially in emerging markets, entails special risks, such as unstable currencies, highly volatile securities markets and political and social instability, which are described in more detail in the prospectus. Investing in small cap funds will be more volatile and loss of principal could be greater than investing in large cap or more diversified funds. Being non-diversified, the Fund can invest a larger portion of its assets in the stocks of a limited number of companies than a diversified fund. Non-diversification increases the risk of loss to the Fund if the values of these securities decline.
TOP 10 EQUITY HOLDINGS*
| | | | |
| |
| Company | | % of Net Assets | |
| |
Bajaj Finance Ltd. (India) | | | 8.7% | |
| |
Divi’s Laboratories Ltd. (India) | | | 7.0% | |
| |
HDFC Bank Ltd. (India) | | | 6.0% | |
| |
Mindtree Ltd. (India) | | | 5.9% | |
| |
Larsen & Toubro Infotech Ltd. (India) | | | 5.8% | |
| | | | |
| |
| Company | | % of Net Assets | |
| |
Info Edge India Ltd. (India) | | | 5.3% | |
| |
Avenue Supermarts Ltd. (India) | | | 4.8% | |
| |
Dr. Lal PathLabs Ltd. (India) | | | 4.5% | |
| |
Trent Ltd. (India) | | | 4.5% | |
| |
Britannia Industries Ltd. (India) | | | 4.4% | |
| * | As of September 30, 2020, there were 27 holdings in the Fund. Foreign currency contracts, written options and repurchase agreements, if any, are not included in the number of holdings. Portfolio holdings are subject to change at any time. References to specific securities should not be construed as recommendations by the Funds or their Advisor. Current and future holdings are subject to risk. |
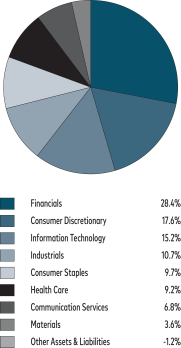
SECTOR BREAKDOWN**
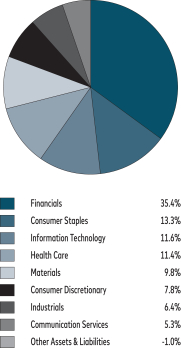
| ** | Excludes securities sold short and options written, if any. |
GROWTH OF A HYPOTHETICAL $10,000 INVESTMENT
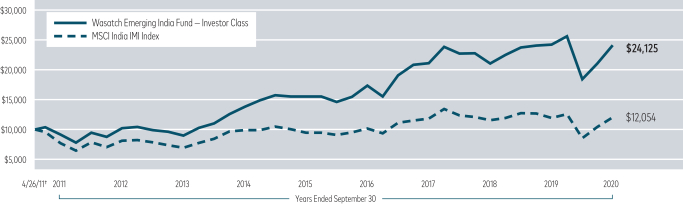
†Inception: April 26, 2011. Past performance does not predict future performance. The graph above does not reflect the deduction of fees, sales charges, or taxes that you would pay on fund distributions or the redemption of fund shares. Wasatch does not charge any sales fees.
7
| | |
| Wasatch Emerging Markets Select Fund (WAESX / WIESX) | | SEPTEMBER 30, 2020 |
Management Discussion
The Wasatch Emerging Markets Select Fund is managed by a team of Wasatch portfolio managers led by Ajay Krishnan, Scott Thomas and Matthew Dreith.
| | | | |

Ajay Krishnan, CFA Lead Portfolio Manager | | 
Scott Thomas, CFA Associate Portfolio
Manager | | 
Matthew Dreith, CFA Associate Portfolio
Manager |
OVERVIEW
Despite the arrival of the coronavirus pandemic during the 12-month period ended September 30, 2020, the Wasatch Emerging Markets Select Fund — Investor Class rose 27.12%. The Fund significantly outperformed the benchmark MSCI Emerging Markets Index, which increased 10.54%.
Optimism for a rapid economic recovery drove solid gains in emerging-market equities during the second half of the period. A flagging U.S. dollar and progress toward vaccines and therapeutics also encouraged investors. Appreciation of emerging-market currencies against the dollar boosted performance of both the Fund and the Index. In addition to its direct effects on performance, a falling dollar supports riskier assets in emerging markets by increasing their appeal to international investors. A weaker greenback also makes it easier for developing nations to issue debt denominated in their own currencies. The dollar dropped to two-year lows against a basket of major rivals after the Federal Reserve unveiled a more accommodative approach to monetary policy.
DETAILS OF THE YEAR
From a country perspective, the Fund benefited relative to the benchmark from especially advantageous stock selection in Taiwan and Brazil. China, including Hong Kong, also contributed to the Fund’s return, but a larger weighting there would have been beneficial to relative performance. On the negative side of the ledger, the Fund was hurt by poor results in Korea and a sizable allocation and underperformance in India.
The Fund’s top contributor for the 12-month period was Silergy Corp., a Taiwanese manufacturer of high-performance mixed-signal and analog integrated circuits (ICs) used in a wide array of electronic devices. The company’s products include step-down regulators, step-up regulators, linear regulators, protection switches, power-management ICs and audio amplifiers. We think Silergy’s business model — which is based on analog design engineering — is difficult to replicate and is likely to provide the company with significant headroom for growth over the coming decade. On a shorter-term basis, strong revenues have recently helped alleviate concerns about potentially weak demand from China.
The Fund’s largest detractor was Bajaj Finance Ltd., a leading Indian non-bank financial company that offers a broad spectrum of lending services. The company’s shares languished earlier in the period as strict stay-at-home orders and a government-imposed moratorium on loan repayments battered Indian financials. Confident in the ability of Bajaj to ride out the pandemic and emerge stronger competitively, we continued to hold the Fund’s position. Our patience was rewarded with a rebound in the stock as the phased unlocking of India’s economy drove steady improvement in the company’s collection efficiency. Still, the stock hasn’t fully recovered its losses for the period.
OUTLOOK
We expect China to remain in the spotlight regarding issues such as the country’s response to the outbreak of Covid-19 in Wuhan, the Hong Kong national security law, human-rights concerns, and a host of issues related to trade and intellectual property. In a speech meant to demonstrate the failure of engagement efforts with China, U.S. Secretary of State Michael Pompeo added accusations of general nefariousness, lying, global hegemony, tyranny and communism.
For its part, China may already have concluded that — no matter what it does — the United States will never accept China’s rise and will instead seek to constrain it. If so, China’s leaders have little incentive to make concessions designed to appease U.S. antagonism. In the short term, this tension may create some volatility in emerging-market stocks. From a longer-term perspective, however, China appears to already have reached critical mass in terms of its own economy and sphere of influence. As a result, it’s doubtful that U.S.-led containment efforts will succeed to any significant degree. Put simply, we think China is too big to ignore, and we believe its relative contribution to world gross domestic product is only likely to increase from here.
Beyond China, we think Covid-19 has highlighted technological changes that are here to stay. In particular, the abrupt transformation of the workplace through videoconferencing and productivity platforms — initially adopted out of necessity — now appears likely to benefit both businesses and their employees going forward. In short, we expect what began as social-distancing requirements during the coronavirus pandemic to hasten a broad societal trend that had already been underway. We believe emerging markets with young populations are uniquely positioned to reap the benefits of these changes.
Thank you for the opportunity to manage your assets.
Current and future holdings are subject to risk.
8
| | |
| Wasatch Emerging Markets Select Fund (WAESX / WIESX) | | SEPTEMBER 30, 2020 |
Portfolio Summary
AVERAGE ANNUAL TOTAL RETURNS
| | | | | | | | | | | | | | | |
| | | |
| | | 1 Year | | 5 Years | | Since Inception 12/13/2012 |
| | | |
Emerging Markets Select (WAESX) — Investor | | |
| 27.21%
|
| | |
| 11.50%
|
| | |
| 4.83%
|
|
| | | |
Emerging Markets Select (WIESX) — Institutional | | |
| 27.58%
|
| | |
| 11.80%
|
| | |
| 5.15%
|
|
| | | |
MSCI Emerging Markets Index | | |
| 10.54%
|
| | |
| 8.97%
|
| | |
| 2.95%
|
|
Data show past performance, which is not indicative of future performance. Current performance may be lower or higher than the performance quoted. To obtain the most recent month-end performance data available, please visit wasatchglobal.com. The Advisor may absorb certain Fund expenses, without which total returns would have been lower. Investment returns and principal value will fluctuate and shares, when redeemed, may be worth more or less than their original cost.
As of the January 31, 2020 prospectus, the Total Annual Fund Operating Expenses for the Wasatch Emerging Markets Select Fund are Investor Class — Gross: 1.97%, Net: 1.51% / Institutional Class — Gross: 1.43%, Net: 1.21%. The expense ratio shown elsewhere in this report may be different. Net expenses are based on Fund expenses, net of waivers and reimbursements. See the prospectus for additional information regarding Fund expenses.
Wasatch will deduct a 2.00% redemption fee on Fund shares held 60 days or less. Performance data do not reflect the deduction of fees, including sales charges, or the taxes you would pay on fund distributions or the redemption of fund shares. Fees and taxes, if reflected, would reduce the performance quoted. Wasatch does not charge any sales fees. For more complete information including charges, risks and expenses, read the prospectus carefully.
Investing in foreign securities, especially in emerging markets, entails special risks, such as currency fluctuations and political uncertainties, which are described in more detail in the prospectus. Investing in small cap funds will be more volatile and loss of principal could be greater than investing in large cap or more diversified funds. Being non-diversified, the Fund can invest a larger portion of its assets in the stocks of a limited number of companies than a diversified fund. Non-diversification increases the risk of loss to the Fund if the values of these securities decline.
TOP 10 EQUITY HOLDINGS*
| | | | |
| |
| Company | | % of Net Assets | |
| |
Bajaj Finance Ltd. (India) | | | 7.2% | |
| |
MercadoLibre, Inc. | | | 5.7% | |
| |
HDFC Bank Ltd. (India) | | | 5.1% | |
| |
Silergy Corp. (Taiwan) | | | 5.0% | |
| |
Sea Ltd. ADR (Singapore) | | | 4.7% | |
| | | | |
| |
| Company | | % of Net Assets | |
| |
Larsen & Toubro Infotech Ltd. (India) | | | 4.2% | |
| |
Globant S.A. (Argentina) | | | 4.1% | |
| |
Voltronic Power Technology Corp. (Taiwan) | | | 3.6% | |
| |
Raia Drogasil S.A. (Brazil) | | | 3.5% | |
| |
Wuxi Biologics Cayman, Inc. (China) | | | 3.2% | |
| * | As of September 30, 2020, there were 41 holdings in the Fund. Foreign currency contracts, written options and repurchase agreements, if any, are not included in the number of holdings. Portfolio holdings are subject to change at any time. References to specific securities should not be construed as recommendations by the Funds or their Advisor. Current and future holdings are subject to risk. |
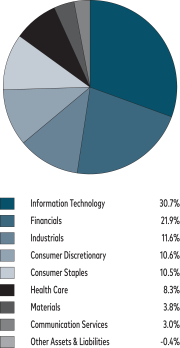
SECTOR BREAKDOWN**
| ** | Excludes securities sold short and options written, if any. |
GROWTH OF A HYPOTHETICAL $10,000 INVESTMENT
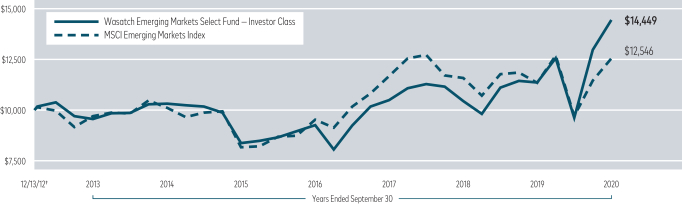
†Inception: December 13, 2012. Past performance does not predict future performance. The graph above does not reflect the deduction of fees, sales charges, or taxes that you would pay on fund distributions or the redemption of fund shares. Wasatch does not charge any sales fees.
9
| | |
| Wasatch Emerging Markets Small Cap Fund (WAEMX / WIEMX) | | SEPTEMBER 30, 2020 |
Management Discussion
The Wasatch Emerging Markets Small Cap Fund is managed by a team of Wasatch portfolio managers led by Ajay Krishnan, Dan Chace, Scott Thomas and Kevin Unger.
| | | | |

Ajay Krishnan, CFA Lead Portfolio Manager 
Scott Thomas, CFA Associate Portfolio Manager | | 
Dan Chace, CFA Portfolio Manager 
Kevin Unger, CFA Associate Portfolio Manager | | OVERVIEW Although the coronavirus pandemic took hold during the 12-month period ended September 30, 2020, the Wasatch Emerging Markets Small Cap Fund — Investor Class gained 21.12%. The Fund meaningfully outperformed the benchmark MSCI Emerging Markets Small Cap Index, which rose 6.89%. Following steep |
|
Covid-related losses, emerging-market equities rebounded during the second half of the period as economies battered by the virus began to reopen and hopes grew that vaccines and therapeutics would be developed. Stimulus measures enacted by governments and central banks also encouraged investors.
Moreover, our emphasis on what we consider high-quality companies with strong balance sheets and robust business models served the Fund well. Against a backdrop of heightened uncertainty, well-situated firms with the potential to survive and benefit from consolidation in their industries became more appealing to investors.
DETAILS OF THE YEAR
Although business conditions in many developing nations remained poor, not all companies were affected equally. The pandemic has been accelerating the adoption of e-commerce, social media and other technologies that replace person-to-person contact with digital content. We tend to focus our research on businesses we believe are aligned with broad societal trends. Companies that have been benefiting from increased use of digital forms of interaction were among the key contributors to Fund performance during the period.
In terms of countries, the Fund’s return relative to the benchmark was helped by favorable stock selection in Taiwan, Brazil, Argentina and Hong Kong. Conversely, Korea was a source of disappointment because our holdings lagged the benchmark’s Korean positions and the Fund was underweighted in a country that saw strong returns overall. Similarly, we were disappointed by the Fund’s performance in Mexico, where our overweight position was disadvantageous and where our holdings trailed the benchmark’s Mexican constituents.
One of the Fund’s largest contributors was Microport Scientific Corp., which is based in Shanghai, China. The company manufactures interventional and minimally invasive devices for keyhole surgery. While Microport’s current products are used in the treatment of vascular diseases, the company is developing additional devices to treat diabetes and orthopedic disorders. Reports that a well-respected, Asia-focused private-equity firm had acquired an ownership stake sent Microport’s stock price soaring.
Indian financial companies accounted for some of the Fund’s greatest detractors, including Bajaj Finance Ltd., AU Small Finance Bank Ltd. and Aavas Financiers Ltd. Bajaj is a non-bank financial company (NBFC) offering a broad spectrum of lending services. AU is a small finance bank that primarily targets unbanked and underbanked low- and middle-income individuals and small businesses. Aavas is an NBFC specializing in housing loans to low- and middle-income customers in semi-urban and rural areas. After contacting all three of these companies, we believe they have ample capital buffers and we expect them to emerge from the coronavirus crisis even stronger. We think Bajaj is particularly well-situated because it focuses on India’s salaried class, whose loan payments are often made through automatic transfers.
OUTLOOK
In September, Chinese manufacturing activity grew faster than expected. Driven by a pickup in export demand as global economies reopened, China’s economic recovery appears to be on relatively firm footing. Consumption also increased as the Chinese government continued to ease restrictions on travel and in-person entertainment. China’s success in battling the Covid-19 pandemic has cemented its substantial regional influence and growing economic status. These developments aren’t difficult to understand. As of this writing, China’s vast industrial sector has approached its pre-pandemic might — fueled by government-funded infrastructure expansion, rising exports and pent-up demand.
Of course, investing in China carries its own unique set of risks. Among these are the country’s deepening disputes with the U.S. over issues such as trade, technology and the situation in Hong Kong. When researching companies to own in the Fund, we seek firms whose fortunes are comparatively independent of geopolitics. We look for growing businesses that we think are well-positioned to benefit from secular trends in areas that include health care and technology.
We believe China will continue to develop and open up its economy. At the same time, we think ongoing improvements in China’s financial markets will deepen liquidity and attract increasing capital flows from around the world.
Thank you for the opportunity to manage your assets.
Current and future holdings are subject to risk.
10
| | |
| Wasatch Emerging Markets Small Cap Fund (WAEMX / WIEMX) | | SEPTEMBER 30, 2020 |
Portfolio Summary
AVERAGE ANNUAL TOTAL RETURNS
| | | | | | | | | | | | | | | |
| | | |
| | | 1 Year | | 5 Years | | 10 Years |
| | | |
Emerging Markets Small Cap (WAEMX) — Investor | | | | 21.12% | | | | | 8.62% | | | | | 4.60% | |
| | | |
Emerging Markets Small Cap (WIEMX) — Institutional | | | | 21.41% | | | | | 8.74% | | | | | 4.66% | |
| | | |
MSCI Emerging Markets Small Cap Index | | | | 6.89% | | | | | 4.60% | | | | | 1.03% | |
| | | |
MSCI Emerging Markets Index | | | | 10.54% | | | | | 8.97% | | | | | 2.50% | |
Data show past performance, which is not indicative of future performance. Current performance may be lower or higher than the performance quoted. To obtain the most recent month-end performance data available, please visit wasatchglobal.com. The Advisor may absorb certain Fund expenses, without which total returns would have been lower. Investment returns and principal value will fluctuate and shares, when redeemed, may be worth more or less than their original cost.
As of the January 31, 2020 prospectus, the Total Annual Fund Operating Expenses for the Wasatch Emerging Markets Small Cap Fund are Investor Class — Gross: 1.99%, Net: 1.97% / Institutional Class — Gross: 1.85%, Net: 1.82%. The expense ratio shown elsewhere in this report may be different. Net expenses are based on Fund expenses, net of waivers and reimbursements. See the prospectus for additional information regarding Fund expenses.
Wasatch will deduct a 2.00% redemption fee on Fund shares held 60 days or less. Performance data do not reflect the deduction of fees, including sales charges, or the taxes you would pay on fund distributions or the redemption of fund shares. Fees and taxes, if reflected, would reduce the performance quoted. Wasatch does not charge any sales fees. For more complete information including charges, risks and expenses, read the prospectus carefully.
Performance for the Institutional Class prior to 2/1/2016 is based on the performance of the Investor Class. Performance of the Fund’s Institutional Class prior to 2/1/2016 uses the actual expenses of the Fund’s Investor Class without any adjustments. For any such period of time, the performance of the Fund’s Institutional Class would have been substantially similar to, yet higher than, the performance of the Fund’s Investor Class, because the shares of both classes are invested in the same portfolio of securities, but the classes bear different expenses.
Investing in foreign securities, especially in emerging markets, entails special risks, such as currency fluctuations and political uncertainties, which are described in more detail in the prospectus. Investing in small cap funds will be more volatile and loss of principal could be greater than investing in large cap or more diversified funds. Being non-diversified, the Fund can invest a larger portion of its assets in the stocks of a limited number of companies than a diversified fund. Non-diversification increases the risk of loss to the Fund if the values of these securities decline.
TOP 10 EQUITY HOLDINGS*
| | | | |
| |
| Company | | % of Net Assets | |
| |
Voltronic Power Technology Corp. (Taiwan) | | | 5.5% | |
| |
Silergy Corp. (Taiwan) | | | 5.0% | |
| |
Magazine Luiza S.A. (Brazil) | | | 4.6% | |
| |
Globant S.A. (Argentina) | | | 4.6% | |
| |
Bajaj Finance Ltd. (India) | | | 3.1% | |
| | | | |
| |
| Company | | % of Net Assets | |
| |
Raia Drogasil S.A. (Brazil) | | | 3.1% | |
| |
Larsen & Toubro Infotech Ltd. (India) | | | 3.1% | |
| |
Info Edge India Ltd. (India) | | | 3.0% | |
| |
Mindtree Ltd. (India) | | | 3.0% | |
| |
ICICI Lombard General Insurance Co. Ltd. (India) | | | 3.0% | |
| * | As of September 30, 2020, there were 53 holdings in the Fund. Foreign currency contracts, written options and repurchase agreements, if any, are not included in the number of holdings. Portfolio holdings are subject to change at any time. References to specific securities should not be construed as recommendations by the Funds or their Advisor. Current and future holdings are subject to risk. |
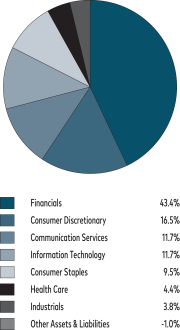
SECTOR BREAKDOWN**
| ** | Excludes securities sold short and options written, if any. |
GROWTH OF A HYPOTHETICAL $10,000 INVESTMENT
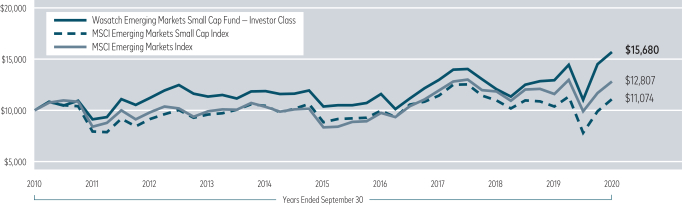
Past performance does not predict future performance. The graph above does not reflect the deduction of fees, sales charges, or taxes that you would pay on fund distributions or the redemption of fund shares. Wasatch does not charge any sales fees.
11
| | |
| Wasatch Frontier Emerging Small Countries Fund (WAFMX / WIFMX) | | SEPTEMBER 30, 2020 |
Management Discussion
The Wasatch Frontier Emerging Small Countries Fund is managed by a team of Wasatch portfolio managers led by Scott Thomas.
| | |
Scott Thomas, CFA Lead Portfolio Manager | | OVERVIEW The Wasatch Frontier Emerging Small Countries Fund — Investor Class finished the fiscal year ended September 30, 2020 with a gain of 9.85%, significantly outperforming its benchmark, the MSCI Frontier Emerging Markets Index, which declined -11.52% over the same period. |
Macroeconomic concerns, including upcoming elections in numerous countries, ongoing trade wars and the coronavirus pandemic, made the past 12-month period an unprecedented time. That said, we believe signs generally have been positive relative to worst-case projections earlier in 2020 following the onset of the pandemic. Certainly, given the unprecedented market environment, it was easy to envision a more muted outcome.
DETAILS OF THE YEAR
MercadoLibre, Inc., whose stock is traded in the U.S., was the largest individual contributor to the Fund’s return for the 12-month period. The company operates e-commerce platforms in Latin America. We believe MercadoLibre’s investments into payment and logistics opportunities has been paying off in the current environment, which has seemed to favor companies facilitating access to digital payment platforms.
As the demand for and adoption of online shopping has accelerated during the pandemic, we believe e-commerce is an industry in which companies may have valuations that appear high compared to their pre-pandemic levels, but that may in fact be justified by the industry’s growth. A Fund holding that highlights the dramatic rise of e-commerce across the world is Sea Ltd., a Singapore-based company and one of our top contributors for the fiscal year. The company’s offerings include digital gaming content, e-commerce and digital-payment platforms across Southeast Asia. We believe Sea’s market position is advantageous and we expect that will help the company to continue to grow over the long-term, in addition to being aided by rapid digitalization across the region in countries such as Indonesia, Vietnam, the Philippines and Thailand to name a few.
Globant S.A., a software-solutions company headquartered in Argentina, was also among the Fund’s top overall contributors. Globant provides engineering, design and innovation services for clients in North and South America, Europe and other regions. The large-scale migration of corporate clients to digital platforms has been benefiting IT service providers such as Globant. The company is considered a world-wide leader in digital-strategy consulting services.
AU Small Finance Bank Ltd. was the most-significant individual detractor from Fund performance for the period.
Based in India, AU primarily serves underbanked low- and middle-income individuals and small businesses. Indian financials have faced challenges in recent months. In addition to their stocks selling off early in the pandemic, financial institutions have also reckoned with stringent economic measures from the government in response to the crisis.
Philippine Seven Corp. was another of the Fund’s largest individual detractors. The company licenses the operation of 7-Eleven convenience stores in the Philippines, as well as leasing and constructing commercial real estate. The pandemic is likely to impact the company’s earnings over the short term, but we believe it should bounce back quickly and resume its earnings trajectory once the environment normalizes. However, we are monitoring Philippine Seven to make sure our investment thesis continues to hold true.
Cleopatra Hospital also detracted, but we continue to like the company’s long-term prospects. Cleopatra is the largest private hospital operator in Egypt and is at the forefront of consolidating a fragmented and underdeveloped hospital market. Egypt has a population of nearly 100 million people, a significant undersupply of hospital beds, and one of the lowest levels of health care spending per capita in the region. As a result, we believe demand for Cleopatra’s services is set to grow at a rapid pace.
OUTLOOK
The 12-month period was dominated by unique macroeconomic factors, not the least of which is the ongoing global pandemic. While we are cognizant of these factors and their potential impacts, we strive to be “macro aware” rather than “macro driven.” We have found that the news of the day rarely has much relevance to the fundamental investment thesis we develop for each of our holdings. Our investment thesis is grounded in research of company fundamentals — including whether a company has adequate cash reserves and a management team capable of guiding it through crises like the current one.
Indeed, in addition to highlighting the value of a bottom-up focus on fundamentals, we believe the current environment also highlights the value of thoughtful, active management with an eye toward the longer term. We believe our disciplined approach to investing in frontier markets and emerging small countries accounted for the strength of the Fund and was key to positive performance in an otherwise uncertain year for these markets.
Thank you for the opportunity to manage your assets.
Current and future holdings are subject to risk.
12
| | |
| Wasatch Frontier Emerging Small Countries Fund (WAFMX / WIFMX) | | SEPTEMBER 30, 2020 |
Portfolio Summary
AVERAGE ANNUAL TOTAL RETURNS
| | | | | | | | | | | | | | | |
| | | |
| | | 1 Year | | 5 Years | | Since Inception 1/31/2012 |
| | | |
Frontier Emerging Small Countries (WAFMX) — Investor | | | | 10.22% | | | | | 1.71% | | | | | 5.13% | |
| | | |
Frontier Emerging Small Countries (WIFMX) — Institutional | | | | 10.51% | | | | | 1.98% | | | | | 5.29% | |
| | | |
MSCI Frontier Emerging Markets Index | | | | -11.52% | | | | | 0.92% | | | | | 1.45% | |
| | | |
MSCI Frontier Markets Index | | | | -2.74% | | | | | 3.76% | | | | | 4.97% | |
Data show past performance, which is not indicative of future performance. Current performance may be lower or higher than the performance quoted. To obtain the most recent month-end performance data available, please visit wasatchglobal.com. The Advisor may absorb certain Fund expenses, without which total returns would have been lower. Investment returns and principal value will fluctuate and shares, when redeemed, may be worth more or less than their original cost.
As of the January 31, 2020 prospectus, the Total Annual Fund Operating Expenses for the Wasatch Frontier Emerging Small Countries Fund are Investor Class — Gross: 2.30%, Net: 2.20% / Institutional Class — Gross: 2.15%, Net: 2.00%. The expense ratio shown elsewhere in this report may be different. Net expenses are based on Fund expenses, net of waivers and reimbursements. See the prospectus for additional information regarding Fund expenses.
Wasatch will deduct a 2.00% redemption fee on Fund shares held 60 days or less. Performance data do not reflect the deduction of fees, including sales charges, or the taxes you would pay on fund distributions or the redemption of fund shares. Fees and taxes, if reflected, would reduce the performance quoted. Wasatch does not charge any sales fees. For more complete information including charges, risks and expenses, read the prospectus carefully.
Performance for the Institutional Class prior to 2/1/2016 is based on the performance of the Investor Class. Performance of the Fund’s Institutional Class prior to 2/1/2016 uses the actual expenses of the Fund’s Investor Class without any adjustments. For any such period of time, the performance of the Fund’s Institutional Class would have been substantially similar to, yet higher than, the performance of the Fund’s Investor Class, because the shares of both classes are invested in the same portfolio of securities, but the classes bear different expenses.
Investing in foreign securities, especially in frontier and emerging markets, entails special risks, such as currency fluctuations and political uncertainties, which are described in more detail in the prospectus. Investing in small cap funds will be more volatile and loss of principal could be greater than investing in large cap or more diversified funds. Being non-diversified, the Fund can invest a larger portion of its assets in the stocks of a limited number of companies than a diversified fund. Non-diversification increases the risk of loss to the Fund if the values of these securities decline.
TOP 10 EQUITY HOLDINGS*
| | | | |
| |
| Company | | % of Net Assets | |
| |
Sea Ltd. ADR (Singapore) | | | 9.0% | |
| |
MercadoLibre, Inc. | | | 7.0% | |
| |
Globant S.A. (Argentina) | | | 5.2% | |
| |
Qualitas Controladora S.A.B. de C.V. (Mexico) | | | 4.7% | |
| |
Bajaj Finance Ltd. (India) | | | 4.6% | |
| | | | |
| |
| Company | | % of Net Assets | |
| |
TCS Group Holding plc (Russia) | | | 4.5% | |
| |
Raia Drogasil S.A. (Brazil) | | | 4.5% | |
| |
TQM Corp. Public Co. Ltd. (Thailand) | | | 4.3% | |
| |
Naspers Ltd., Class N (South Africa) | | | 3.9% | |
| |
Bank for Foreign Trade of Vietnam JSC (Vietnam) | | | 3.8% | |
| * | As of September 30, 2020, there were 39 holdings in the Fund. Foreign currency contracts, written options and repurchase agreements, if any, are not included in the number of holdings. Portfolio holdings are subject to change at any time. References to specific securities should not be construed as recommendations by the Funds or their Advisor. Current and future holdings are subject to risk. |
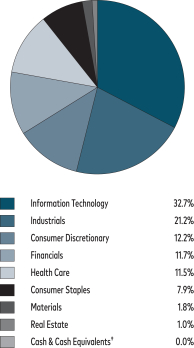
SECTOR BREAKDOWN**
| ** | Excludes securities sold short and options written, if any. |
GROWTH OF A HYPOTHETICAL $10,000 INVESTMENT
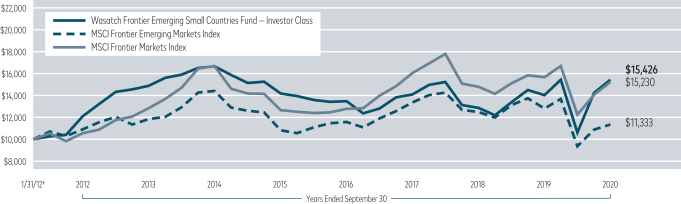
†Inception: January 31, 2012. Past performance does not predict future performance. The graph above does not reflect the deduction of fees, sales charges, or taxes that you would pay on fund distributions or the redemption of fund shares. Wasatch does not charge any sales fees.
13
| | |
| Wasatch Global Opportunities Fund (WAGOX / WIGOX) | | SEPTEMBER 30, 2020 |
Management Discussion
The Wasatch Global Opportunities Fund is managed by a team of Wasatch portfolio managers led by JB Taylor, Ajay Krishnan, Ken Applegate and Paul Lambert.
| | | | |

JB Taylor Lead Portfolio Manager 
Ken Applegate, CFA Portfolio Manager | | 
Ajay Krishnan, CFA Lead Portfolio Manager 
Paul Lambert Portfolio Manager | | OVERVIEW The Wasatch Global Opportunities Fund — Investor Class finished the fiscal year ended September 30, 2020 with a gain of 23.20%, significantly outperforming its benchmark, the MSCI AC (All Country) World Small Cap Index, which gained 3.22% over the same period. A large portion of the Fund’s outper- |
|
formance of the benchmark came from the information-technology (IT) sector. Going forward, it’s certainly possible that tech companies may have short-term trouble exceeding their recent success and that other sectors may outpace IT for a period of time. It’s also possible that value-oriented stocks may temporarily outshine growth-oriented stocks. But we don’t attempt to navigate such cycles in the market. Instead, we remain focused on the fundamentals of individual companies: management quality, business-model viability, scope for increased market share and market expansion, returns on capital and balance-sheet health.
DETAILS OF THE YEAR
Beyond the contribution from IT, the Fund’s outperformance of the benchmark was aided by stock selection, most notably in the U.S., Japan, the United Kingdom and Taiwan. India, Korea and Mexico were among the markets where the Fund had lagging performance for the 12-month period.
Taiwan-based Silergy Corp. was the top individual contributor to Fund performance for the year. The company manufactures high-performance mixed-signal and analog integrated circuits used in a wide variety of consumer and enterprise electronic devices.
Globant S.A., a software-solutions company headquartered in Argentina, was also among the Fund’s top overall contributors. Globant provides engineering, design and innovation services for clients in North and South America, Europe and other regions. The large-scale migration of corporate clients to digital platforms has been benefiting IT service providers such as Globant. The company is considered a world-wide leader in digital-strategy consulting services.
Another leading contributor was MercadoLibre, Inc. The company operates e-commerce platforms in Latin America.
We believe MercadoLibre’s investments into payment and logistics opportunities have been paying off in the current environment, which has seemed to favor companies facilitating access to digital payment platforms.
Indian financials have faced challenges in recent months. In addition to their stocks selling off early in the pandemic, financial institutions have also reckoned with stringent economic measures from the government in response to the crisis. India-based financial firms — AU Small Finance Bank Ltd. and Bajaj Finance Ltd. — were two of the Fund’s most-significant detractors for the 12-month period. AU is a bank that primarily serves underbanked low- and middle-income individuals and small businesses. Bajaj is a non-bank financial company. We are optimistic that positive trends in the most-recent quarter may continue over the long-term and believe both companies should benefit from pent-up demand as India slowly returns to normalcy.
Euronet Worldwide, Inc. was also a notable detractor. The company provides electronic-payment services, including automated teller machines, point-of-sale services and related financial services. Despite the anticipated drop-off in financial transactions due to the pandemic, we believe Euronet has the ability to generate double-digit annual sales growth over the long term, fueled by its meaningfully improved earnings and potential to generate significant free cash flows.
OUTLOOK
The 12-month period was dominated by unique macroeconomic factors, not the least of which is the ongoing global pandemic. While we are cognizant of these factors and their potential impacts, we strive to be “macro aware” rather than “macro driven.” We have found that the news of the day rarely has much relevance to the fundamental investment thesis we develop for each of our holdings. Our investment thesis is grounded in in-depth research of company fundamentals—including whether a company has adequate cash reserves and a management team capable of guiding it through crises like the current one.
As we navigate the current environment, we feel confident in the companies we hold. We also believe that irrational reactions to market volatility can lead to great buying opportunities for us as long-term investors. By applying our due-diligence process to companies that we see as having the strongest underlying fundamentals and management teams and by making thoughtful tactical decisions, we believe we can continue to make the Fund’s portfolio of companies even stronger over the five-year-plus time horizon toward which we prefer to invest.
Thank you for the opportunity to manage your assets.
Current and future holdings are subject to risk.
14
| | |
| Wasatch Global Opportunities Fund (WAGOX / WIGOX) | | SEPTEMBER 30, 2020 |
Portfolio Summary
AVERAGE ANNUAL TOTAL RETURNS
| | | | | | | | | | | | | | | |
| | | |
| | | 1 Year | | 5 Years | | 10 Years |
| | | |
Global Opportunities (WAGOX) — Investor | | | | 23.20% | | | | | 14.74% | | | | | 11.60% | |
| | | |
Global Opportunities (WIGOX) — Institutional | | | | 23.09% | | | | | 14.90% | | | | | 11.67% | |
| | | |
MSCI AC World Small Cap Index | | | | 3.22% | | | | | 7.63% | | | | | 7.88% | |
Data show past performance, which is not indicative of future performance. Current performance may be lower or higher than the performance quoted. To obtain the most recent month-end performance data available, please visit wasatchglobal.com. The Advisor may absorb certain Fund expenses, without which total returns would have been lower. Investment returns and principal value will fluctuate and shares, when redeemed, may be worth more or less than their original cost.
As of the January 31, 2020 prospectus, the Total Annual Fund Operating Expenses for the Wasatch Global Opportunities Fund are Investor Class: 1.56% / Institutional Class — Gross: 1.57%, Net: 1.36%. The expense ratio shown elsewhere in this report may be different. Net expenses are based on Fund expenses, net of waivers and reimbursements. See the prospectus for additional information regarding Fund expenses.
Wasatch will deduct a 2.00% redemption fee on Fund shares held 60 days or less. Performance data do not reflect the deduction of fees, including sales charges, or the taxes you would pay on fund distributions or the redemption of fund shares. Fees and taxes, if reflected, would reduce the performance quoted. Wasatch does not charge any sales fees. For more complete information including charges, risks and expenses, read the prospectus carefully.
Performance for the Institutional Class prior to 2/1/2016 is based on the performance of the Investor Class. Performance of the Fund’s Institutional Class prior to 2/1/2016 uses the actual expenses of the Fund’s Investor Class without any adjustments. For any such period of time, the performance of the Fund’s Institutional Class would have been substantially similar to, yet higher than, the performance of the Fund’s Investor Class, because the shares of both classes are invested in the same portfolio of securities, but the classes bear different expenses.
Investing in small and micro cap funds will be more volatile and loss of principal could be greater than investing in large cap or more diversified funds. Investing in foreign securities, especially in emerging markets, entails special risks, such as currency fluctuations and political uncertainties, which are described in more detail in the prospectus.
TOP 10 EQUITY HOLDINGS*
| | | | |
| |
| Company | | % of Net Assets | |
| |
MercadoLibre, Inc. | | | 3.1% | |
| |
Silergy Corp. (Taiwan) | | | 3.0% | |
| |
Globant S.A. (Argentina) | | | 3.0% | |
| |
Trex Co., Inc. | | | 2.9% | |
| |
Kornit Digital Ltd. (Israel) | | | 2.7% | |
| | | | |
| |
| Company | | % of Net Assets | |
| |
HubSpot, Inc. | | | 2.5% | |
| |
Monolithic Power Systems, Inc. | | | 2.5% | |
| |
Five9, Inc. | | | 2.4% | |
| |
Voltronic Power Technology Corp. (Taiwan) | | | 2.4% | |
| |
AU Small Finance Bank Ltd. (India) | | | 2.3% | |
| * | As of September 30, 2020, there were 77 holdings in the Fund. Foreign currency contracts, written options and repurchase agreements, if any, are not included in the number of holdings. Portfolio holdings are subject to change at any time. References to specific securities should not be construed as recommendations by the Funds or their Advisor. Current and future holdings are subject to risk. |
SECTOR BREAKDOWN**
| ** | Excludes securities sold short and options written, if any. |
| †Also | includes Other Assets & Liabilities. |
GROWTH OF A HYPOTHETICAL $10,000 INVESTMENT
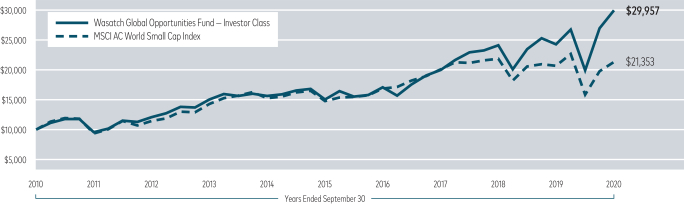
Past performance does not predict future performance. The graph above does not reflect the deduction of fees, sales charges, or taxes that you would pay on fund distributions or the redemption of fund shares. Wasatch does not charge any sales fees.
15
| | |
| Wasatch Global Select Fund (WAGSX / WGGSX) | | SEPTEMBER 30, 2020 |
Management Discussion
The Wasatch Global Select Fund is managed by a team of Wasatch portfolio managers led by Ken Applegate, Ken Korngiebel, Paul Lambert, Linda Lasater and Mike Valentine.
| | | | |
Ken Applegate, CFA Portfolio Manager 
Linda Lasater, CFA Portfolio Manager | |
Ken Korngiebel, CFA Portfolio Manager
Mike Valentine Portfolio Manager | |
Paul Lambert Portfolio Manager |
OVERVIEW
The Wasatch Global Select Fund — Investor Class gained 26.00% for the 12 months ended September 30, 2020. The Fund outperformed its benchmark, the MSCI AC (All Country) World Index, which gained 10.44% over the same period.
DETAILS OF THE YEAR
The largest individual contributor to Fund performance for the 12-month period was DocuSign, Inc. The San Francisco-based company offers e-signature software that enables businesses to digitally prepare and execute agreements. With the pandemic scattering corporate operations to home offices and curtailing business travel, DocuSign has been positioned to benefit as more companies sign contracts electronically over the internet.
Another strong contributor was Pool Corp., a wholesale distributor of swimming pools and related equipment and supplies. The company is headquartered in the U.S. and has sales centers in locations around the world including North America, Europe and Australia. Pool saw its stock price increase over the 12 months on rising demand from families increasingly favoring activities that can be enjoyed at home. The company also benefited from cost-saving measures put in place at the start of the pandemic. We believe Pool is on a promising long-term growth trajectory and also has the potential to see more business in the short term from greater use of swimming pools by housing communities and individual households.
Adyen NV was also one of the Fund’s leading contributors. Adyen is a Dutch company that provides payment solutions including an online payment processing platform, as well as mobile and point-of-sale systems. By enabling businesses to streamline payments coming from multiple channels, we
believe Adyen is timely in addressing a broad operational need of companies seeking to modernize.
Based in India, Bajaj Finance Ltd. is a non-bank financial company that finished the 12-month period as the Fund’s largest individual detractor. Indian financials have faced challenges in recent months. In addition to their stocks selling off early in the pandemic, financial institutions have also reckoned with stringent economic measures from the government in response to the crisis. We are optimistic that positive trends in the most-recent quarter may continue over the long-term and believe Bajaj and other Indian financial firms should benefit from pent-up demand as the country slowly returns to normalcy.
Euronet Worldwide, Inc. was also a notable detractor. The company provides electronic-payment services, including automated teller machines, point-of-sale services and related financial services. Despite the anticipated drop-off in financial transactions due to the pandemic, we believe Euronet has the ability to generate double-digit annual sales growth over the long term, fueled by its meaningfully improved earnings and potential to generate significant free cash flows.
Sonova Holding AG, a medical-device manufacturer based in Switzerland, was another detractor. A recall of one of Sonova’s devices caused us to question our long-term investment thesis for the company. As a result, we chose to exit our position in Sonova during the second quarter of 2020.
OUTLOOK
The 12-month period was dominated by unique macroeconomic factors, not the least of which is the ongoing global pandemic. While we are cognizant of these factors and their potential impacts, we strive to be “macro aware” rather than “macro driven.” We have found that the news of the day rarely has much relevance to the fundamental investment thesis we develop for each of our holdings. Our investment thesis is grounded in in-depth research of company fundamentals — including whether a company has adequate cash reserves and a management team capable of guiding it through crises like the current one.
As we navigate the current environment, we feel confident in the companies we hold. We also believe that irrational reactions to market volatility can lead to great buying opportunities for us as long-term investors. By applying our due-diligence process to companies that we see as having the strongest underlying fundamentals and management teams and by making thoughtful tactical decisions, we believe we can continue to make the Fund’s portfolio of companies even stronger over the five-year-plus time horizon toward which we prefer to invest.
Thank you for the opportunity to manage your assets.
Current and future holdings are subject to risk.
16
| | |
| Wasatch Global Select Fund (WAGSX / WGGSX) | | SEPTEMBER 30, 2020 |
Portfolio Summary
AVERAGE ANNUAL TOTAL RETURNS
| | | | | | | | | | |
| | |
| | | 1 Year | | Since Inception 10/1/2019 |
| | |
Global Select (WAGSX) — Investor | | | | 26.00% | | | | | 26.00% | |
| | |
Global Select (WGGSX) — Institutional | | | | 26.40% | | | | | 26.40% | |
| | |
MSCI AC World Index | | | | 10.44% | | | | | 10.44% | |
Data show past performance, which is not indicative of future performance. Current performance may be lower or higher than the performance quoted. To obtain the most recent month-end performance data available, please visit wasatchglobal.com. The Advisor may absorb certain Fund expenses, without which total returns would have been lower. Investment returns and principal value will fluctuate and shares, when redeemed, may be worth more or less than their original cost.
As of the January 31, 2020 prospectus, the Total Annual Fund Operating Expenses for the Wasatch Global Select Fund are Investor Class — Gross: 1.86%, Net: 1.35% / Institutional Class — Gross: 1.55%, Net: 0.95%. The expense ratio shown elsewhere in this report may be different. Net expenses are based on Fund expenses, net of waivers and reimbursements. See the prospectus for additional information regarding Fund expenses.
Wasatch will deduct a 2.00% redemption fee on Fund shares held 60 days or less. Performance data do not reflect the deduction of fees, including sales charges, or the taxes you would pay on fund distributions or the redemption of fund shares. Fees and taxes, if reflected, would reduce the performance quoted. Wasatch does not charge any sales fees. For more complete information including charges, risks and expenses, read the prospectus carefully.
Investing in foreign securities, especially in emerging and frontier markets, entails special risks, such as currency fluctuations and political uncertainties, which are described in more detail in the prospectus. Investing in small cap funds will be more volatile and loss of principal could be greater than investing in large cap or more diversified funds. Being non-diversified, the Fund can invest a larger portion of its assets in the stocks of a limited number of companies than a diversified fund. Non-diversification increases the risk of loss to the Fund if the values of these securities decline.
TOP 10 EQUITY HOLDINGS*
| | | | |
| |
| Company | | % of Net Assets | |
| |
Copart, Inc. | | | 4.6% | |
| |
Pool Corp. | | | 4.2% | |
| |
Assa Abloy AB, Class B (Sweden) | | | 4.0% | |
| |
AMETEK, Inc. | | | 3.8% | |
| |
Amphenol Corp., Class A | | | 3.8% | |
| | | | |
| |
| Company | | % of Net Assets | |
| |
Bajaj Finance Ltd. (India) | | | 3.6% | |
| |
Old Dominion Freight Line, Inc. | | | 3.6% | |
| |
Cochlear Ltd. (Australia) | | | 3.6% | |
| |
ICON plc (Ireland) | | | 3.4% | |
| |
Veeva Systems, Inc., Class A | | | 3.4% | |
| * | As of September 30, 2020, there were 32 holdings in the Fund. Foreign currency contracts, written options and repurchase agreements, if any, are not included in the number of holdings. Portfolio holdings are subject to change at any time. References to specific securities should not be construed as recommendations by the Funds or their Advisor. Current and future holdings are subject to risk. |
SECTOR BREAKDOWN**
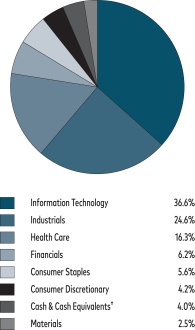
| ** | Excludes securities sold short and options written, if any. |
| † | Also includes Other Assets & Liabilities. |
GROWTH OF A HYPOTHETICAL $10,000 INVESTMENT
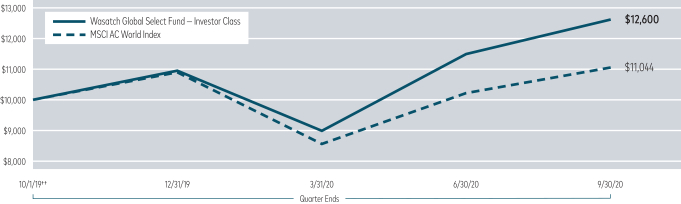
††Inception: October 1, 2019. Past performance does not predict future performance. The graph above does not reflect the deduction of fees, sales charges, or taxes that you would pay on fund distributions or the redemption of fund shares. Wasatch does not charge any sales fees.
17
| | |
| Wasatch Global Value Fund (FMIEX / WILCX) | | SEPTEMBER 30, 2020 |
Management Discussion
The Wasatch Global Value Fund is managed by a team of Wasatch portfolio managers led by David Powers.
| | |

David Powers, CFA Lead Portfolio Manager | | OVERVIEW For the 12-month period ended September 30, 2020, the Wasatch Global Value Fund — Investor Class declined -12.18% and underperformed its benchmark, the MSCI AC (All Country) World Index, which gained 10.44%. Early in 2020, as investors, businesses and city, state and national govern- |
ments struggled to grasp the implications of the unforeseen emergence of the novel coronavirus, stocks around the world plummeted on economic concerns and fear of the unknown. Later, when lockdown restrictions imposed to prevent the spread of Covid-19 began to be eased, progress was made toward developing vaccines and therapeutics to treat the disease, and central banks injected unprecedented amounts of stimulus into ailing economies, investors began to feel more optimistic and stocks rallied. In particular, markets responded when U.S. Federal Reserve Chairman Jerome Powell outlined a new approach to monitoring inflation that gives the central bank the flexibility to maintain an exceptionally low benchmark interest rate even if inflation were to break through the 2% target.
DETAILS OF THE YEAR
The Fund’s underperformance of its benchmark for the 12-month period was driven by our position in the U.S. Our U.S. stocks underperformed their benchmark counterparts and an underweight position was detrimental given that the U.S. constituent outperformed the benchmark’s overall return. Information technology (IT), the Index’s strongest-performing sector, also detracted from the Fund’s performance versus the benchmark. Our IT holdings lagged those in the benchmark and an underweight position hurt. An overweight position in the energy sector was also disadvantageous, and our energy stocks were weaker than the benchmark’s.
A significant position in Canadian oil-sands company Suncor Energy, Inc. drove much of the Fund’s underperformance within energy, and the stock was the largest individual detractor from Fund performance for the year. Suncor’s business is refining the petroleum byproduct bitumen into a range of products including oil, gas and asphalt. The company faced challenges in August as a fire led to a halt in production at its base plant mining operation. Presented with this downtime, Suncor decided to accelerate planned maintenance, which will impact results in the short term as the associated expenses are brought forward. We expect that this decision will help production in 2021, and we believe that Suncor will be well-positioned to benefit as oil prices likely strengthen in coming quarters.
Real estate investment trusts focused on entertainment and leisure activities — EPR Properties and VICI Properties, Inc. — also weighed on performance given the dimmed outlook for public venues such as casinos, hotels, amusement parks and theaters. Given that people may want to avoid large public gatherings for some time, we decided to move on and invest the proceeds from the sale of these holdings into companies that we believe have better prospects.
A number of the Fund’s leading individual contributors for the 12-month period were U.S. companies. The top contributor was homebuilder PulteGroup, Inc. We purchased Pulte as its stock suffered along with most other cyclicals in April as coronavirus concerns crested. Pulte has benefited from the recovery in housing, which has been supported by undersupply and high affordability given the low cost of borrowing. In addition, the work-from-home trend has sparked an increase in demand for housing in the suburbs and exurbs.
Electrical equipment and hydraulic-systems manufacturer Eaton Corp. plc was also a notable contributor. With customers ranging across industries including vehicle and aircraft manufacturers, builders and utilities, Eaton is highly levered to the global economy. As such, Eaton has been a prime beneficiary of the rebound in conditions that began in the second quarter of 2020, especially in the U.S. We continue to hold both Eaton and Pulte on the view that the up cycle has just begun for both companies.
OUTLOOK
We are of the opinion that, in the wake of the coronavirus-driven recession, a new cycle has begun and the global economy is likely to slowly mend and gain strength from here. In addition to ongoing support from policy makers world-wide, substantial progress has been made in treating Covid-19 and it appears likely that one or more vaccines may become broadly available by the middle of 2021. Moreover, absent a razor-thin margin and contested outcome in the presidential race, a significant source of uncertainty will be eliminated with the U.S. elections in early November. There is also the potential for the legislative logjam around a second stimulus package to break after the elections. Against this backdrop, we have continued to shift toward smaller, more cyclical companies within our value universe and have raised the overall market sensitivity of the Fund.
Thank you for the opportunity to manage your assets.
Current and future holdings are subject to risk.
18
| | |
| Wasatch Global Value Fund (FMIEX / WILCX) | | SEPTEMBER 30, 2020 |
Portfolio Summary
AVERAGE ANNUAL TOTAL RETURNS
| | | | | | | | | | | | | | | |
| | | |
| | | 1 Year | | 5 Years | | 10 Years |
| | | |
Global Value (FMIEX) — Investor | | | | -12.18% | | | | | 4.48% | | | | | 5.99% | |
| | | |
Global Value (WILCX) — Institutional | | | | -11.93% | | | | | 4.61% | | | | | 6.11% | |
| | | |
MSCI AC World Index | | | | 10.44% | | | | | 10.30% | | | | | 8.55% | |
Data show past performance, which is not indicative of future performance. Current performance may be lower or higher than the performance quoted. To obtain the most recent month-end performance data available, please visit wasatchglobal.com. The Advisor may absorb certain Fund expenses, without which total returns would have been lower. Investment returns and principal value will fluctuate and shares, when redeemed, may be worth more or less than their original cost.
As of the January 31, 2020 prospectus, the Total Annual Fund Operating Expenses for the Wasatch Global Value Fund are Investor Class — Gross: 1.19%, Net: 1.10% / Institutional Class — Gross: 1.23%, Net: 0.97%. The expense ratio shown elsewhere in this report may be different. Net expenses are based on Fund expenses, net of waivers and reimbursements. See the prospectus for additional information regarding Fund expenses.
Wasatch will deduct a 2.00% redemption fee on Fund shares held 60 days or less. Performance data do not reflect the deduction of fees, including sales charges, or the taxes you would pay on fund distributions or the redemption of fund shares. Fees and taxes, if reflected, would reduce the performance quoted. Wasatch does not charge any sales fees. For more complete information including charges, risks and expenses, read the prospectus carefully.
Performance for the Institutional Class prior to 1/31/2012 is based on the performance of the Investor Class. Performance of the Fund’s Institutional Class prior to 1/31/2012 uses the actual expenses of the Fund’s Investor Class without any adjustments. For any such period of time, the performance of the Fund’s Institutional Class would have been substantially similar to, yet higher than, the performance of the Fund’s Investor Class, because the shares of both classes are invested in the same portfolio of securities, but the classes bear different expenses.
Investments in value stocks can perform differently from the market as a whole and from other types of stocks and can continue to be undervalued by the market for long periods of time. Investing in foreign securities entails special risks, such as currency fluctuations and political uncertainties, which are described in more detail in the prospectus. Loss of principal is a risk of investing.
TOP 10 EQUITY HOLDINGS*
| | | | |
| |
| Company | | % of Net Assets | |
| |
China Mobile Ltd. (China) | | | 4.7% | |
| |
Duke Energy Corp. | | | 4.4% | |
| |
Johnson & Johnson | | | 4.3% | |
| |
Exelon Corp. | | | 3.9% | |
| |
Eaton Corp. plc | | | 3.8% | |
| | | | |
| |
| Company | | % of Net Assets | |
| |
Science Applications International Corp. | | | 3.4% | |
| |
Novartis AG (Switzerland) | | | 3.4% | |
| |
Axis Capital Holdings Ltd. | | | 3.0% | |
| |
KT&G Corp. (South Korea) | | | 3.0% | |
| |
Universal Health Services, Inc., Class B | | | 3.0% | |
| * | As of September 30, 2020, there were 39 holdings in the Fund. Foreign currency contracts, written options and repurchase agreements, if any, are not included in the number of holdings. Portfolio holdings are subject to change at any time. References to specific securities should not be construed as recommendations by the Funds or their Advisor. Current and future holdings are subject to risk. |
SECTOR BREAKDOWN**
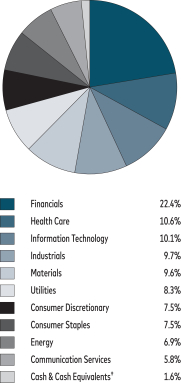
| ** | Excludes securities sold short and options written, if any. |
| † | Also includes Other Assets & Liabilities. |
GROWTH OF A HYPOTHETICAL $10,000 INVESTMENT
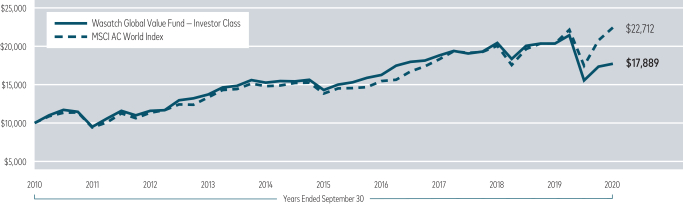
Past performance does not predict future performance. The graph above does not reflect the deduction of fees, sales charges, or taxes that you would pay on fund distributions or the redemption of fund shares. Wasatch does not charge any sales fees.
19
| | |
| Wasatch International Growth Fund (WAIGX / WIIGX) | | SEPTEMBER 30, 2020 |
Management Discussion
The Wasatch International Growth Fund is managed by a team of Wasatch portfolio managers led by Ken Applegate, Linda Lasater and Derrick Tzau.
| | | | |

Ken Applegate, CFA Lead Portfolio Manager | | 
Linda Lasater, CFA Portfolio Manager | | 
Derrick Tzau, CFA Associate Portfolio Manager |
OVERVIEW
The Wasatch International Growth Fund — Investor Class finished the fiscal year ended September 30, 2020 with a gain of 23.73% and outperformed its benchmark, the MSCI AC (All Country) World ex USA Small Cap Index, which gained 6.97% over the same period.
DETAILS OF THE YEAR
Silergy Corp. was the top individual contributor to Fund performance for the 12-month period. The company is a Taiwanese manufacturer of high-performance mixed-signal and analog integrated circuits used in a wide variety of consumer and enterprise electronic devices.
Italian diagnostics company DiaSorin S.p.A. was also among the top contributors. The company saw its stock price rally starting in the second quarter of 2020 following a March announcement that DiaSorin had received Emergency Use Authorization from the U.S. Food and Drug Administration for a test that detects the virus that causes Covid-19. DiaSorin is also currently developing a saliva-based test for Covid-19 that we expect will drive greater revenue and awareness of the company’s products and services. Fundamentally, we believe DiaSorin is in an even stronger place today with a sharp acceleration in placements of its diagnostic instruments, which should continue to support growth in recurring revenues.
Another top contributor was Hypoport SE, which also saw the strongest stock-price rally of all the Fund’s holdings during the period. Hypoport is a property-financing intermediary between financial sales teams and credit institutions in Germany. The company operates Europace, the country’s largest business-to-business financial marketplace, as well as operating a franchise system of advisors and providing institutional financing. Moreover, Hypoport has been investing to replicate its platform in other areas including real estate and insurance. Hypoport has seen a strong increase in customer interest during the pandemic and its stock price gained more than 150% during the period.
AU Small Finance Bank Ltd. was the most-significant individual detractor from Fund performance for the 12 months. Based in India, AU primarily serves underbanked low- and
middle-income individuals and small businesses. Indian financials, in particular, have faced challenges in recent months. In addition to their stocks selling off early in the pandemic, financial institutions have also reckoned with stringent economic measures from the government in response to the crisis.
However, we believe recent trends may suggest a positive turn. After a downturn in August that followed a rally from mid-May through the end of July, AU’s stock was up in September and finished the most recent quarter with a double-digit positive return. We believe the bank is moving in the right direction through improving credit quality, cost controls and net interest margins. In light of these trends, we continue to believe AU has a convincing growth narrative ahead of it.
Two positions we exited in the most recent quarter — Ashmore Group plc and Webjet Ltd. — were the Fund’s second- and third-largest detractors, respectively.
Ashmore Group is a United Kingdom-based investment manager focused on emerging markets. In our view, Ashmore Group remains a great company, but we chose to focus on other opportunities after the company’s weak relative investment performance and heightened uncertainty in emerging-market economies led to net outflows and lower-than expected earnings growth for Ashmore Group.
Webjet is an online travel agency that offers travel shopping and reservation booking in Australia and New Zealand. Although we still believe the company has a shot at gaining market share in the current pandemic, we ultimately chose to consolidate the Fund’s travel-related holdings and decided that our long-term thesis for Webjet was less convincing than other, similarly positioned holdings.
OUTLOOK
This year has been unprecedented, both from a market perspective and otherwise. The unforeseen emergence of the Covid-19 pandemic has combined with other macro factors — an election year in many countries (including the U.S.), increased discussion of climate change and social issues, to name a few — to create a volatile and uncertain environment. We believe our disciplined approach to investing in growing companies in international markets accounted for the strength of the Fund and was key to our positive performance in an uncertain time for many markets.
As we look to the future, we feel confident in the companies we hold. We also believe that irrational reactions to market volatility can lead to great buying opportunities for long-term-oriented investors such as ourselves.
Thank you for the opportunity to manage your assets.
Current and future holdings are subject to risk.
20
| | |
| Wasatch International Growth Fund (WAIGX / WIIGX) | | SEPTEMBER 30, 2020 |
Portfolio Summary
AVERAGE ANNUAL TOTAL RETURNS
| | | | | | | | | | | | | | | |
| | | |
| | | 1 Year | | 5 Years | | 10 Years |
| | | |
International Growth (WAIGX) — Investor | | | | 23.73% | | | | | 9.60% | | | | | 9.37% | |
| | | |
International Growth (WIIGX) — Institutional | | | | 23.89% | | | | | 9.71% | | | | | 9.42% | |
| | | |
MSCI AC World ex USA Small Cap Index | | | | 6.97% | | | | | 6.80% | | | | | 5.31% | |
| | | |
MSCI World ex USA Small Cap Index | | | | 6.88% | | | | | 7.35% | | | | | 6.55% | |
Data show past performance, which is not indicative of future performance. Current performance may be lower or higher than the performance quoted. To obtain the most recent month-end performance data available, please visit wasatchglobal.com. The Advisor may absorb certain Fund expenses, without which total returns would have been lower. Investment returns and principal value will fluctuate and shares, when redeemed, may be worth more or less than their original cost.
As of the January 31, 2020 prospectus, the Total Annual Fund Operating Expenses for the Wasatch International Growth Fund are Investor Class: 1.46% / Institutional Class: 1.35%. The expense ratio shown elsewhere in this report may be different. Net expenses are based on Fund expenses, net of waivers and reimbursements. See the prospectus for additional information regarding Fund expenses.
Wasatch will deduct a 2.00% redemption fee on Fund shares held 60 days or less. Performance data do not reflect the deduction of fees, including sales charges, or the taxes you would pay on fund distributions or the redemption of fund shares. Fees and taxes, if reflected, would reduce the performance quoted. Wasatch does not charge any sales fees. For more complete information including charges, risks and expenses, read the prospectus carefully.
Performance for the Institutional Class prior to 2/1/2016 is based on the performance of the Investor Class. Performance of the Fund’s Institutional Class prior to 2/1/2016 uses the actual expenses of the Fund’s Investor Class without any adjustments. For any such period of time, the performance of the Fund’s Institutional Class would have been substantially similar to, yet higher than, the performance of the Fund’s Investor Class, because the shares of both classes are invested in the same portfolio of securities, but the classes bear different expenses.
Investing in foreign securities, especially in frontier and emerging markets, entails special risks, such as currency fluctuations and political uncertainties, which are described in more detail in the prospectus. Investing in small cap funds will be more volatile and loss of principal could be greater than investing in large cap or more diversified funds.
TOP 10 EQUITY HOLDINGS*
| | | | |
| |
| Company | | % of Net Assets | |
| |
DiaSorin S.p.A. (Italy) | | | 2.2% | |
| |
Cochlear Ltd. (Australia) | | | 2.2% | |
| |
Fevertree Drinks plc (United Kingdom) | | | 2.0% | |
| |
Descartes Systems Group, Inc. (The) (Canada) | | | 1.9% | |
| |
Halma plc (United Kingdom) | | | 1.8% | |
| | | | |
| |
| Company | | % of Net Assets | |
| |
Voltronic Power Technology Corp. (Taiwan) | | | 1.8% | |
| |
Reply S.p.A. (Italy) | | | 1.8% | |
| |
Diploma plc (United Kingdom) | | | 1.7% | |
| |
Tecan Group AG (Switzerland) | | | 1.7% | |
| |
Patrizia AG (Germany) | | | 1.6% | |
| * | As of September 30, 2020, there were 88 holdings in the Fund. Foreign currency contracts, written options and repurchase agreements, if any, are not included in the number of holdings. Portfolio holdings are subject to change at any time. References to specific securities should not be construed as recommendations by the Funds or their Advisor. Current and future holdings are subject to risk. |
SECTOR BREAKDOWN**
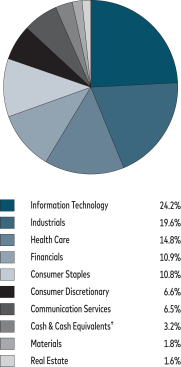
| ** | Excludes securities sold short and options written, if any. |
| † | Also includes Other Assets & Liabilities. |
GROWTH OF A HYPOTHETICAL $10,000 INVESTMENT
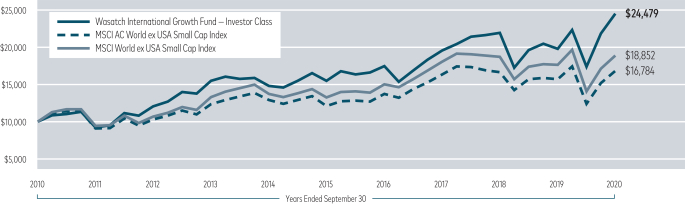
Past performance does not predict future performance. The graph above does not reflect the deduction of fees, sales charges, or taxes that you would pay on fund distributions or the redemption of fund shares. Wasatch does not charge any sales fees.
21
| | |
| Wasatch International Opportunities Fund (WAIOX / WIIOX) | | SEPTEMBER 30, 2020 |
Management Discussion
The Wasatch International Opportunities Fund is managed by a team of Wasatch portfolio managers led by Linda Lasater, Dan Chace and Allison He.
| | | | |
Linda Lasater, CFA Lead Portfolio Manager | |
Dan Chace, CFA Portfolio Manager | | 
Allison He, CFA Associate Portfolio Manager |
OVERVIEW
The Wasatch International Opportunities Fund — Investor Class finished the 12-month period ended September 30, 2020 with a gain of 34.24%, significantly outperforming its benchmark, the MSCI AC (All Country) World ex USA Small Cap Index, which increased 6.97% over the same period.
DETAILS OF THE YEAR
On a country basis, Japan was the Fund’s top contributor to performance relative to the benchmark for the 12-month period as our holdings outperformed their benchmark peers by a wide margin. In fact, three of our five top individual contributors were Japanese companies, including BASE, Inc. and IR Japan Holdings Ltd.
BASE is a provider of internet-based services including net-shop creation, shopping-application development and online-payment development. The current market environment has favored companies such as BASE that offer innovative and effective products and services that help people adhere to stay-at-home orders and social-distancing measures.
IR Japan’s consulting business aligns with the increasing focus in Japan on shareholder-friendly investor relations. The company, which we have owned for several years, was also among the Fund’s top contributors in the previous annual period.
Hypoport SE was also a strong contributor for the Fund. Hypoport is a property-financing intermediary between financial sales teams and credit institutions in Germany. The company operates Europace, the country’s largest business-to-business financial marketplace, as well as operating a franchise system of advisors and providing institutional financing. Moreover, Hypoport has been investing to replicate its platform in other areas including real estate and insurance. Hypoport has seen a strong increase in customer interest during the pandemic and its stock price gained more than 150% during the period.
Johnson Service Group plc was the largest detractor from Fund performance for the 12-month period. The company provides workwear and linens for hotels, restaurants and catering businesses throughout the United Kingdom. The company reported that the overwhelming majority of the customers it
serves are now back in operation following pandemic-induced shutdowns. With high customer retention and satisfaction rates and a strong market position, we believe Johnson Service Group is poised for continued growth.
The Fund’s overweight position in Mexico hindered relative performance as the country’s equity market was down for the 12-month period. Nevertheless, we believe Mexico offers exciting opportunities for long-term investors. Recent stock-market volatility has caused some Mexican companies to confront valuations of “worth more dead than alive,” so to speak. We see much of this activity as being rooted in irrational responses to market volatility, and in a myopic view of current pandemic-related pressures on business activity. One example is Unifin Financiera S.A.B. de C.V., which operates as a multi-purpose financial firm and is the largest equipment-leasing company in Mexico. Despite finishing the period as a large detractor, we continue to believe Unifin Financiera possesses significant headroom for growth, particularly as the company increases its focus on financial-technology offerings.
Another detractor was Webjet Ltd., an online travel agency that offers travel shopping and reservation booking in Australia and New Zealand. Although we still believe the company has a shot at gaining market share in the current pandemic, we ultimately chose to consolidate the Fund’s travel-related holdings and decided that our long-term thesis for Webjet was less convincing than other, similarly positioned holdings. As a result, we exited the position in order to focus on what we believe are more promising new ideas.
OUTLOOK
The past 12 months were an unprecedented time, to say the least, both from a market perspective and otherwise. Numerous macro factors, not the least of which is the ongoing global pandemic, created a uniquely volatile and uncertain environment that is likely to continue in the months ahead.
In addition to highlighting the value of a bottom-up focus on company fundamentals, we believe the current environment also highlights the value of thoughtful, active management with an eye toward the longer term. We believe our disciplined approach to investing in micro-cap companies in international markets accounted for the strength of the Fund and was key to positive performance in an uncertain year for many markets. We think our investment discipline will continue to serve the Fund well going forward.
Thank you for the opportunity to manage your assets.
Current and future holdings are subject to risk.
22
| | |
| Wasatch International Opportunities Fund (WAIOX / WIIOX) | | SEPTEMBER 30, 2020 |
Portfolio Summary
AVERAGE ANNUAL TOTAL RETURNS
| | | | | | | | | | | | | | | |
| | | |
| | | 1 Year | | 5 Years | | 10 Years |
| | | |
International Opportunities (WAIOX) — Investor | | | | 34.24% | | | | | 14.85% | | | | | 11.37% | |
| | | |
International Opportunities (WIIOX) — Institutional | | | | 34.71% | | | | | 15.17% | | | | | 11.52% | |
| | | |
MSCI AC World ex USA Small Cap Index | | | | 6.97% | | | | | 6.80% | | | | | 5.31% | |
| | | |
MSCI World ex USA Small Cap Index | | | | 6.88% | | | | | 7.35% | | | | | 6.55% | |
Data show past performance, which is not indicative of future performance. Current performance may be lower or higher than the performance quoted. To obtain the most recent month-end performance data available, please visit wasatchglobal.com. The Advisor may absorb certain Fund expenses, without which total returns would have been lower. Investment returns and principal value will fluctuate and shares, when redeemed, may be worth more or less than their original cost.
As of the January 31, 2020 prospectus, the Total Annual Fund Operating Expenses for the Wasatch International Opportunities Fund are Investor Class: 2.09% / Institutional Class: 1.96%. The expense ratio shown elsewhere in this report may be different. Net expenses are based on Fund expenses, net of waivers and reimbursements. See the prospectus for additional information regarding Fund expenses.
Wasatch will deduct a 2.00% redemption fee on Fund shares held 60 days or less. Performance data do not reflect the deduction of fees, including sales charges, or the taxes you would pay on fund distributions or the redemption of fund shares. Fees and taxes, if reflected, would reduce the performance quoted. Wasatch does not charge any sales fees. For more complete information including charges, risks and expenses, read the prospectus carefully.
Performance for the Institutional Class prior to 2/1/2016 is based on the performance of the Investor Class. Performance of the Fund’s Institutional Class prior to 2/1/2016 uses the actual expenses of the Fund’s Investor Class without any adjustments. For any such period of time, the performance of the Fund’s Institutional Class would have been substantially similar to, yet higher than, the performance of the Fund’s Investor Class, because the shares of both classes are invested in the same portfolio of securities, but the classes bear different expenses.
Investing in foreign securities, especially in frontier and emerging markets, entails special risks, such as currency fluctuations and political uncertainties, which are described in more detail in the prospectus. Investing in micro cap funds will be more volatile and loss of principal could be greater than investing in large cap or more diversified funds.
TOP 10 EQUITY HOLDINGS*
| | | | |
| |
| Company | | % of Net Assets | |
| |
BASE, Inc. (Japan) | | | 3.0% | |
| |
Rakus Co. Ltd. (Japan) | | | 3.0% | |
| |
Fortnox AB (Sweden) | | | 2.5% | |
| |
Avon Rubber plc (United Kingdom) | | | 2.5% | |
| |
Hypoport SE (Germany) | | | 2.5% | |
| | | | |
| |
| Company | | % of Net Assets | |
| |
IR Japan Holdings Ltd. (Japan) | | | 2.3% | |
| |
Metropolis Healthcare Ltd. (India) | | | 2.3% | |
| |
Esker S.A. (France) | | | 2.3% | |
| |
Future plc (United Kingdom) | | | 2.1% | |
| |
LEENO Industrial, Inc. (South Korea) | | | 2.0% | |
| * | As of September 30, 2020, there were 88 holdings in the Fund. Foreign currency contracts, written options and repurchase agreements, if any, are not included in the number of holdings. Portfolio holdings are subject to change at any time. References to specific securities should not be construed as recommendations by the Funds or their Advisor. Current and future holdings are subject to risk. |
SECTOR BREAKDOWN**
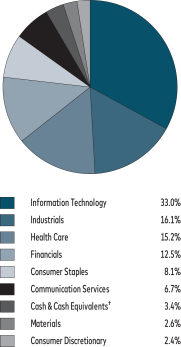
| ** | Excludes securities sold short and options written, if any. |
| † | Also includes Other Assets & Liabilities. |
GROWTH OF A HYPOTHETICAL $10,000 INVESTMENT
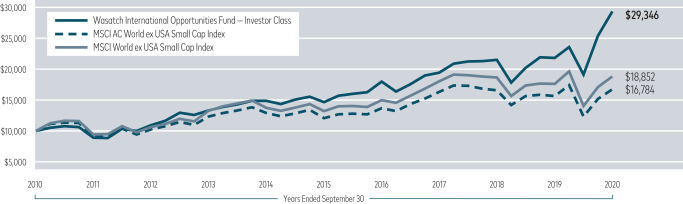
Past performance does not predict future performance. The graph above does not reflect the deduction of fees, sales charges, or taxes that you would pay on fund distributions or the redemption of fund shares. Wasatch does not charge any sales fees.
23
| | |
| Wasatch International Select Fund (WAISX / WGISX) | | SEPTEMBER 30, 2020 |
Management Discussion
The Wasatch International Select Fund is managed by a team of Wasatch portfolio managers led by Ken Applegate, Linda Lasater and Derrick Tzau.
| | | | |
Ken Applegate, CFA Lead Portfolio Manager | |
Linda Lasater, CFA Lead Portfolio Manager | |
Derrick Tzau, CFA Associate Portfolio Manager |
OVERVIEW
For the 12 months ended September 30, 2020, the Wasatch International Select Fund — Investor Class gained 26.10%. In its first full year of operation, the Fund dramatically outperformed its benchmark, the MSCI EAFE Index, which rose just 0.49% over the same period.
DETAILS OF THE YEAR
Sartorius Stedim Biotech was the top individual contributor to Fund performance for the 12-month period. The company is based in France and makes products used in biopharmaceutical manufacturing and life-sciences research, including cell lines, cell-culture media, laboratory services, and a data-analytics tool that aids in the development and production of biopharmaceuticals. We believe the company possesses deep expertise and a strong position in a rapidly expanding segment of the $1.25 trillion-plus pharmaceuticals market.
Japan’s M3, Inc. was also among the Fund’s top contributors. M3 provides medical-related services online, including portals through which medical professionals can easily access up-to-date medical news and journal articles, learn about available services and communicate with other medical professionals.
We previously held M3 in our International Growth Fund and first bought shares in 2007 when the company’s market capitalization was about US$1 billion. M3 subsequently leveraged its technology platform to expand into adjacent markets, which drove growth and ultimately carried M3’s market cap well beyond the small-cap mandate of our International Growth Fund. The Wasatch International Select Fund was created to capture precisely these sorts of “graduates” — companies that we know and like, but that have grown beyond the small-cap realm. We still like M3’s long-term growth potential.
Another leading contributor was Adyen NV, a Dutch company that provides payment solutions including an online payment processing platform, as well as mobile and point-of-sale systems. By enabling businesses to streamline payments coming from multiple channels, we believe Adyen is timely in addressing a broad operational need of companies seeking to modernize.
CAE, Inc., a leading commercial and defense pilot-training vendor, was the largest detractor from Fund performance for the 12-month period. We chose to sell our position and put the proceeds toward companies that we viewed as having more attractive prospects given the current environment.
Sonova Holding AG, a medical-device manufacturer based in Switzerland, was another detractor. A recall of one of Sonova’s devices caused us to question our long-term investment thesis for the company. As a result, we chose to exit our position in Sonova during the second quarter of 2020.
Temenos AG also detracted from Fund performance. Temenos provides software designed for managing administrative tasks within financial institutions. The company’s services include tools to provide analytics, mitigate potential financial crimes and simplify the processes associated with risk and compliance. We believe secular trends have favored software companies that enable their business customers to shift to the more-centralized, cloud-based framework that has quickly become the standard across innumerable industries. We expect this trend to continue and believe Temenos will be among the companies to benefit long-term.
OUTLOOK
The 12-month period was dominated by unique macroeconomic factors, not the least of which is the ongoing global pandemic. While we are cognizant of these factors and their potential impacts, we strive to be “macro aware” rather than “macro driven.” We have found that the news of the day rarely has much relevance to the fundamental investment thesis we develop for each of our holdings. Our investment thesis is grounded in in-depth research of fundamentals —including whether a company has adequate cash reserves and a management team capable of guiding it through crises like the current one.
In addition to highlighting the value of a bottom-up focus on fundamentals, we believe the current environment also highlights the value of thoughtful, active management with an eye toward the longer term. We believe our disciplined approach to investing in select companies in international markets accounted for the strength of the Fund and was key to positive performance in an otherwise uncertain year for many markets.
Thank you for the opportunity to manage your assets.
Current and future holdings are subject to risk.
24
| | |
| Wasatch International Select Fund (WAISX / WGISX) | | SEPTEMBER 30, 2020 |
Portfolio Summary
AVERAGE ANNUAL TOTAL RETURNS
| | | | | | | | | | |
| | |
| | | 1 Year | | Since Inception 10/1/2019 |
| | |
International Select (WAISX) — Investor | | | | 26.10% | | | | | 26.10% | |
| | |
International Select (WGISX) — Institutional | | | | 26.90% | | | | | 26.90% | |
| | |
MSCI EAFE Index | | | | 0.49% | | | | | 0.49% | |
Data show past performance, which is not indicative of future performance. Current performance may be lower or higher than the performance quoted. To obtain the most recent month-end performance data available, please visit wasatchglobal.com. The Advisor may absorb certain Fund expenses, without which total returns would have been lower. Investment returns and principal value will fluctuate and shares, when redeemed, may be worth more or less than their original cost.
As of the January 31, 2020 prospectus, the Total Annual Fund Operating Expenses for the Wasatch International Select Fund are Investor Class — Gross: 2.03%, Net: 1.30% / Institutional Class — Gross: 1.79%, Net: 0.90%. The expense ratio shown elsewhere in this report may be different. Net expenses are based on Fund expenses, net of waivers and reimbursements. See the prospectus for additional information regarding Fund expenses.
Wasatch will deduct a 2.00% redemption fee on Fund shares held 60 days or less. Performance data do not reflect the deduction of fees, including sales charges, or the taxes you would pay on fund distributions or the redemption of fund shares. Fees and taxes, if reflected, would reduce the performance quoted. Wasatch does not charge any sales fees. For more complete information including charges, risks and expenses, read the prospectus carefully.
Investing in foreign securities, especially in frontier and emerging markets, entails special risks, such as currency fluctuations and political uncertainties, which are described in more detail in the prospectus. Investing in small cap funds will be more volatile and loss of principal could be greater than investing in large cap or more diversified funds. Being non-diversified, the Fund can invest a larger portion of its assets in the stocks of a limited number of companies than a diversified fund. Non-diversification increases the risk of loss to the Fund if the values of these securities decline.
TOP 10 EQUITY HOLDINGS*
| | | | |
| |
| Company | | % of Net Assets | |
| |
Assa Abloy AB, Class B (Sweden) | | | 4.1% | |
| |
Xero Ltd. (New Zealand) | | | 4.1% | |
| |
Tsuruha Holdings, Inc. (Japan) | | | 3.7% | |
| |
Fisher & Paykel Healthcare Corp. Ltd. (New Zealand) | | | 3.7% | |
| |
Dassault Systemes SE (France) | | | 3.6% | |
| | | | |
| |
| Company | | % of Net Assets | |
| |
ICON plc (Ireland) | | | 3.5% | |
| |
Intertek Group plc (United Kingdom) | | | 3.5% | |
| |
Halma plc (United Kingdom) | | | 3.5% | |
| |
Kakaku.com, Inc. (Japan) | | | 3.5% | |
| |
Sartorius Stedim Biotech (France) | | | 3.4% | |
| * | As of September 30, 2020, there were 30 holdings in the Fund. Foreign currency contracts, written options and repurchase agreements, if any, are not included in the number of holdings. Portfolio holdings are subject to change at any time. References to specific securities should not be construed as recommendations by the Funds or their Advisor. Current and future holdings are subject to risk. |
SECTOR BREAKDOWN**
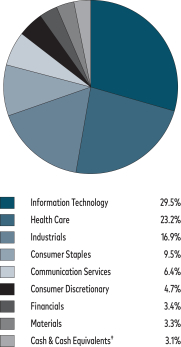
| ** | Excludes securities sold short and options written, if any. |
| † | Also includes Other Assets & Liabilities. |
GROWTH OF A HYPOTHETICAL $10,000 INVESTMENT
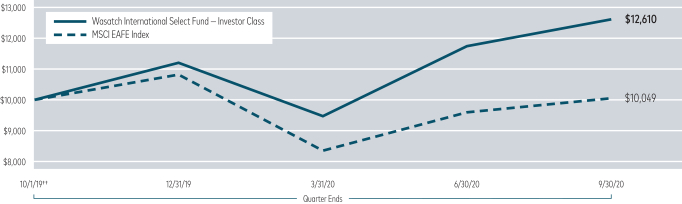
††Inception: October 1, 2019. Past performance does not predict future performance. The graph above does not reflect the deduction of fees, sales charges, or taxes that you would pay on fund distributions or the redemption of fund shares. Wasatch does not charge any sales fees.
25
| | |
| Wasatch Micro Cap Fund (WMICX / WGICX) | | SEPTEMBER 30, 2020 |
Management Discussion
The Wasatch Micro Cap Fund is managed by a team of Wasatch portfolio managers led by Ken Korngiebel and Dan Chace.
| | | | |
Ken Korngiebel, CFA Lead Portfolio Manager | | 
Dan Chace, CFA Portfolio Manager | | OVERVIEW For the 12-month period ended September 30, 2020, the Wasatch Micro Cap Fund — Investor Class gained 43.47% and outperformed the benchmark |
Russell Microcap Index, which increased 4.44%.
Concerns over the effects of the coronavirus pandemic on business and the economy overshadowed most other factors during the 12-month period. Stocks were down significantly early in 2020 as whole cities shut down in an effort to contain the spread of the virus. Stocks then staged a remarkable rally over the next six months as lockdowns eased and there was positive news on the development of vaccines and therapeutics.
In this environment, our disciplined approach and long-term focus served the Fund well. Over the past 12 months, the leading contributors to the Fund’s performance relative to the benchmark were the financials, health-care and information-technology (IT) sectors. The Fund also outperformed the benchmark in the consumer-discretionary, communication-services and industrials sectors. The Fund’s low weighting in the weak-performing energy sector aided relative performance too, although our energy stocks were also down.
DETAILS OF THE YEAR
For the 12-month period, the top individual contributor to Fund performance was communication-services firm Bandwidth, Inc. The company operates a cloud-based software platform that enables enterprises to create, scale and operate voice or text communications. Use of Bandwidth’s platform skyrocketed during the first quarter of 2020 as the pandemic scattered corporate operations to home offices.
The next-best contributor to Fund performance was Inovio Pharmaceuticals, Inc., a biotechnology company developing a Covid-19 vaccine candidate, INO-4800. The company’s stock was lifted by an upswell of optimism from March through June, but then headed lower amid worries that Inovio may be falling behind its competitors in the race to develop a vaccine for the disease. Concerns grew in September after the company disclosed that the U.S. Food and Drug Administration (FDA) had placed a partial hold on a combined Phase 2/3 clinical trial of INO-4800 that Inovio had planned to initiate by the end of the month. According to the company, the FDA’s partial hold did not result from any adverse events in its ongoing Phase 1 trial. Additionally, the hold does not affect the advancement of the company’s other pipeline
assets. Should INO-4800 eventually gain approval, we think its advantages — especially with respect to safety, storage and administration — would position it as a potentially valuable weapon in the fight against Covid-19. Inovio’s DNA medicines currently in development for various cancers and pre-cancers also offer meaningful upside potential, in our view.
In a year of such strong performance, the majority of our holdings contributed to the Fund’s return. Of the companies that detracted, ICF International, Inc. was notable. The company provides consulting and contracting services to government and commercial clients in the U.S. and internationally. Noting general uncertainty surrounding the pandemic, management cited program cancellations in ICF’s commercial marketing-services business and postponements by international government clients in its event-management segment. We believe these developments represent a temporary setback for ICF. Because the great majority of the company’s revenues are derived from government and utility clients under long-term contracts, we continue to view ICF as a stable grower. In addition, we believe the company’s IT segment is positioned to benefit from increased government outlays for computer modernization and cybersecurity.
Other large detractors included three holdings — Chefs’ Warehouse, Inc., Heritage-Crystal Clean, Inc. and Lonestar Resources US, Inc. — that were sold because we saw better opportunities elsewhere.
OUTLOOK
While the coronavirus pandemic will eventually fade and life will begin to approach some form of normalcy, the impact on America’s economy will linger. In particular, massive debts incurred by the government and corporate sectors are likely to restrain U.S. economic growth for at least the next decade.
The primary drivers of economic growth are demographics and productivity — more people producing more goods and services more efficiently. As a larger share of future cash flows are diverted to servicing debt, those resources cannot be used for productive investment. The demographic picture isn’t any better, as aging Baby Boomers continue to exit the workforce faster than they are replaced by younger workers and the birthrate decreases.
With structural economic growth in the U.S. likely to remain subdued, we believe it will be the type of environment that tends to favor our active, bottom-up investment style. As businesses vie for their respective shares of a slowly growing macroeconomic pie, we think innovative micro caps taking market share from their competitors have the potential to generate attractive returns over time.
Thank you for the opportunity to manage your assets.
Current and future holdings are subject to risk.
26
| | |
| Wasatch Micro Cap Fund (WMICX / WGICX) | | SEPTEMBER 30, 2020 |
Portfolio Summary
AVERAGE ANNUAL TOTAL RETURNS
| | | | | | | | | | | | | | | |
| | | |
| | | 1 Year | | 5 Years | | 10 Years |
| | | |
Micro Cap (WMICX) — Investor | | | | 43.47% | | | | | 23.23% | | | | | 17.05% | |
| | | |
Micro Cap (WGICX) — Institutional | | | | 43.32% | | | | | 23.21% | | | | | 17.04% | |
| | | |
Russell Microcap® Index | | | | 4.44% | | | | | 6.72% | | | | | 9.50% | |
Data show past performance, which is not indicative of future performance. Current performance may be lower or higher than the performance quoted. To obtain the most recent month-end performance data available, please visit wasatchglobal.com. The Advisor may absorb certain Fund expenses, without which total returns would have been lower. Investment returns and principal value will fluctuate and shares, when redeemed, may be worth more or less than their original cost.
As of the January 31, 2020 prospectus, the Total Annual Fund Operating Expenses for the Wasatch Micro Cap Fund are Investor Class: 1.66% / Institutional Class: 1.59%. The expense ratio shown elsewhere in this report may be different. Net expenses are based on Fund expenses, net of waivers and reimbursements. See the prospectus for additional information regarding Fund expenses.
Wasatch will deduct a 2.00% redemption fee on Fund shares held 60 days or less. Performance data do not reflect the deduction of fees, including sales charges, or the taxes you would pay on fund distributions or the redemption of fund shares. Fees and taxes, if reflected, would reduce the performance quoted. Wasatch does not charge any sales fees. For more complete information including charges, risks and expenses, read the prospectus carefully.
Performance for the Institutional Class prior to 1/31/2020 is based on the performance of the Investor Class. Performance of the Fund’s Institutional Class prior to 1/31/2020 uses the actual expenses of the Fund’s Investor Class without any adjustments. For any such period of time, the performance of the Fund’s Institutional Class would have been substantially similar to, yet higher than, the performance of the Fund’s Investor Class, because the shares of both classes are invested in the same portfolio of securities, but the classes bear different expenses.
Investing in micro cap funds will be more volatile and loss of principal could be greater than investing in large cap or more diversified funds. Investing in foreign securities, especially in emerging markets, entails special risks, such as currency fluctuations and political uncertainties, which are described in more detail in the prospectus.
TOP 10 EQUITY HOLDINGS*
| | | | |
| |
| Company | | % of Net Assets | |
| |
Kornit Digital Ltd. (Israel) | | | 3.1% | |
| |
Silk Road Medical, Inc. | | | 2.8% | |
| |
Purple Innovation, Inc. | | | 2.8% | |
| |
Open Lending Corp., Class A | | | 2.8% | |
| |
GenMark Diagnostics, Inc. | | | 2.7% | |
| | | | |
| |
| Company | | % of Net Assets | |
| |
Freshpet, Inc. | | | 2.5% | |
| |
Castle Biosciences, Inc. | | | 2.4% | |
| |
Collectors Universe, Inc. | | | 2.1% | |
| |
Five9, Inc. | | | 2.1% | |
| |
Cresco Labs, Inc. (Canada) | | | 2.0% | |
| * | As of September 30, 2020, there were 71 holdings in the Fund. Foreign currency contracts, written options and repurchase agreements, if any, are not included in the number of holdings. Portfolio holdings are subject to change at any time. References to specific securities should not be construed as recommendations by the Funds or their Advisor. Current and future holdings are subject to risk. |
SECTOR BREAKDOWN**

| ** | Excludes securities sold short and options written, if any. |
| † | Also includes Other Assets & Liabilities. |
GROWTH OF A HYPOTHETICAL $10,000 INVESTMENT
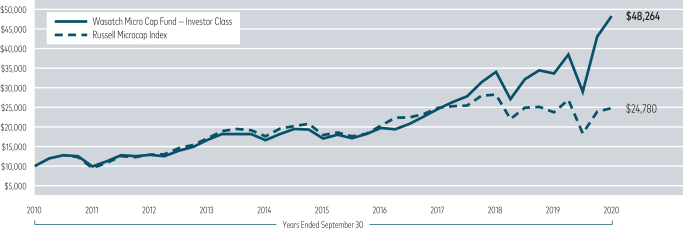
Past performance does not predict future performance. The graph above does not reflect the deduction of fees, sales charges, or taxes that you would pay on fund distributions or the redemption of fund shares. Wasatch does not charge any sales fees.
27
| | |
| Wasatch Micro Cap Value Fund (WAMVX / WGMVX) | | SEPTEMBER 30, 2020 |
Management Discussion
The Wasatch Micro Cap Value Fund is managed by a team of Wasatch portfolio managers led by Brian Bythrow.
| | |

Brian Bythrow, CFA Lead Portfolio Manager | | OVERVIEW During the fiscal year ended September 30, 2020, the Wasatch Micro Cap Value Fund — Investor Class outperformed the benchmark Russell Microcap Index by a wide margin. Despite the ramifications of the coronavirus, the Fund gained 24.17% while the benchmark rose 4.44%. |
Beyond progress health-care companies are making toward developing vaccines and therapeutics to treat the virus, we believe the Federal Reserve’s low-interest-rate policies have been important in driving optimism among investors. And while it had already been leading other central banks around the world, the Fed recently unveiled an even more accommodative approach. In August, Fed Chairman Jerome Powell announced a shift toward letting inflation and employment run higher.
DETAILS OF THE YEAR
From a sector perspective, the Fund’s performance relative to the benchmark was aided by an underweighting and beneficial stock selection in financials. As for information technology, a large weighting and favorable stock selection were beneficial. Stock selection was also favorable in industrials. Regarding communication services and consumer staples, the weighting was small for each sector, but stock selection was advantageous. On the negative side, an underweighting in health care and disadvantageous stock selection in consumer discretionary subtracted from relative performance.
One of the Fund’s top contributors was SiTime Corp., a developer of silicon-based timing components. The company made a special announcement to raise its earnings guidance. SiTime manufactures oscillators, clock generators and embedded resonators used for ethernet switches, computing devices, graphics cards, disk drives, mobile phones and subscriber-identity cards. With time-keeping devices transitioning from quartz to silicon, which improves accuracy, we think the company is particularly well-positioned as a technology leader that’s years ahead of the competition. As we’ve communicated before, SiTime is an almost ideal example of a holding we like for the Fund. The company ranks exceedingly well in our assessment of its balance sheet, business model, management team, market share and growth potential. Moreover, we want to own SiTime in good environments and in bad ones too.
The greatest detractor from Fund performance was National CineMedia, Inc., which operates the largest cinema-advertising network in the United States. The company also facilitates meetings and digital-programming events. Relative to companies that provide “essential” services, we’re less
optimistic about National CineMedia because we think sizable public gatherings for entertainment may be on hold for an extended period. Broadly speaking, companies that make us nervous are those that continually need to raise capital to pay for ongoing operations. If such a company issues more equity, our ownership stake would be diluted. And if the company issues more debt, interest payments could become burdensome. For these reasons, we sold National CineMedia during the fiscal year.
OUTLOOK
Based on the recent runup, we’ve been expecting a pause in the stock market. That hasn’t yet happened to any significant degree. And regardless of this expectation, our investment approach remains unchanged because we’re fully aware that the market often delivers returns in unpredictable ways — particularly for micro-cap stocks. The good news is that we’ve been pleased with the Fund’s long- and short-term performance. This trend of strong performance continued during the fiscal year even as we witnessed some evidence of market rotation.
We think many investors are grappling with two potential scenarios: (1) the economy returns to normal in relatively short order, or (2) the economy muddles along with certain segments of business and society partially or completely shut down. While we saw some signs during the past few months of a rotation toward the first scenario, our recent positioning has mostly been in alignment with the second scenario. Fortunately, based on the Fund’s strong absolute and relative performance, this has been a good decision.
Now the question is: Should we shift our positioning to be more in alignment with the first scenario? Our response is a wavering yes. Our reason is that some of the stocks likely to benefit from the first scenario look attractively priced while some of the stocks that have already benefited from the second scenario look relatively expensive. But our response is wavering because although we believe the economy will eventually approach some level of normalcy, we don’t believe that will happen “in relatively short order.” Moreover, we think many recent changes in the economy will linger on for years to come — or will even become permanent.
So how do our views translate into actions? First, we’ve trimmed some of our especially strong growth-oriented companies. Second, we’ve continued to add, increase or hold positions in more modest growth companies and in more value-oriented companies that have relatively limited exposure to credit risk.
Thank you for the opportunity to manage your assets.
Current and future holdings are subject to risk.
28
| | |
| Wasatch Micro Cap Value Fund (WAMVX / WGMVX) | | SEPTEMBER 30, 2020 |
Portfolio Summary
AVERAGE ANNUAL TOTAL RETURNS
| | | | | | | | | | | | | | | |
| | | |
| | | 1 Year | | 5 Years | | 10 Years |
| | | |
Micro Cap Value (WAMVX) — Investor | | | | 24.17% | | | | | 14.25% | | | | | 13.49% | |
| | | |
Micro Cap Value (WGMVX) — Institutional | | | | 24.51% | | | | | 14.31% | | | | | 13.52% | |
| | | |
Russell Microcap® Index | | | | 4.44% | | | | | 6.72% | | | | | 9.50% | |
Data show past performance, which is not indicative of future performance. Current performance may be lower or higher than the performance quoted. To obtain the most recent month-end performance data available, please visit wasatchglobal.com. The Advisor may absorb certain Fund expenses, without which total returns would have been lower. Investment returns and principal value will fluctuate and shares, when redeemed, may be worth more or less than their original cost.
As of the January 31, 2020 prospectus, the Total Annual Fund Operating Expenses for the Wasatch Micro Cap Value Fund are Investor Class: 1.74% / Institutional Class: 1.59%. The expense ratio shown elsewhere in this report may be different. Net expenses are based on Fund expenses, net of waivers and reimbursements. See the prospectus for additional information regarding Fund expenses.
Wasatch will deduct a 2.00% redemption fee on Fund shares held 60 days or less. Performance data do not reflect the deduction of fees, including sales charges, or the taxes you would pay on fund distributions or the redemption of fund shares. Fees and taxes, if reflected, would reduce the performance quoted. Wasatch does not charge any sales fees. For more complete information including charges, risks and expenses, read the prospectus carefully.
Performance for the Institutional Class prior to 1/31/2020 is based on the performance of the Investor Class. Performance of the Fund’s Institutional Class prior to 1/31/2020 uses the actual expenses of the Fund’s Investor Class without any adjustments. For any such period of time, the performance of the Fund’s Institutional Class would have been substantially similar to, yet higher than, the performance of the Fund’s Investor Class, because the shares of both classes are invested in the same portfolio of securities, but the classes bear different expenses.
Investing in micro cap funds will be more volatile and loss of principal could be greater than investing in large cap or more diversified funds. Investments in value stocks can perform differently from the market as a whole and from other types of stocks and can continue to be undervalued by the market for long periods of time. Investing in foreign securities, especially in emerging markets, entails special risks, such as currency fluctuations and political uncertainties, which are described in more detail in the prospectus.
TOP 10 EQUITY HOLDINGS*
| | | | |
| |
| Company | | % of Net Assets | |
| |
Skyline Champion Corp. | | | 2.5% | |
| |
SiTime Corp. | | | 2.0% | |
| |
Open Lending Corp., Class A | | | 2.0% | |
| |
OptimizeRx Corp. | | | 1.8% | |
| |
Kornit Digital Ltd. (Israel) | | | 1.8% | |
| | | | |
| |
| Company | | % of Net Assets | |
| |
va-Q-tec AG (Germany) | | | 1.7% | |
| |
JDC Group AG (Germany) | | | 1.7% | |
| |
Fabrinet | | | 1.6% | |
| |
PetIQ, Inc. | | | 1.6% | |
| |
Addus HomeCare Corp. | | | 1.6% | |
| * | As of September 30, 2020, there were 90 holdings in the Fund. Foreign currency contracts, written options and repurchase agreements, if any, are not included in the number of holdings. Portfolio holdings are subject to change at any time. References to specific securities should not be construed as recommendations by the Funds or their Advisor. Current and future holdings are subject to risk. |
SECTOR BREAKDOWN**
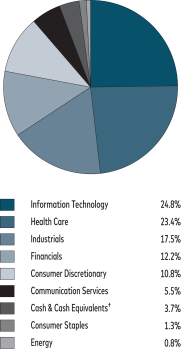
| ** | Excludes securities sold short and options written, if any. |
| † | Also includes Other Assets & Liabilities. |
GROWTH OF A HYPOTHETICAL $10,000 INVESTMENT
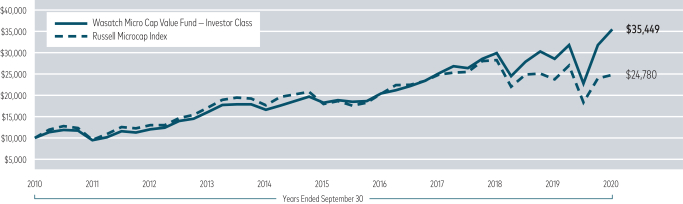
Past performance does not predict future performance. The graph above does not reflect the deduction of fees, sales charges, or taxes that you would pay on fund distributions or the redemption of fund shares. Wasatch does not charge any sales fees.
29
| | |
| Wasatch Small Cap Growth Fund (WAAEX / WIAEX) | | SEPTEMBER 30, 2020 |
Management Discussion
The Wasatch Small Cap Growth Fund is managed by a team of Wasatch portfolio managers led by JB Taylor, Ken Korngiebel and Ryan Snow.
| | | | |

JB Taylor Lead Portfolio Manager | | 
Ken Korngiebel, CFA Portfolio Manager | | 
Ryan Snow Portfolio Manager |
OVERVIEW
During the 12-month period ended September 30, 2020, stocks rose, then crashed and finally recovered. Investors initially felt optimistic about the economy and later grappled with the ramifications of Covid-19. For the full period, the Wasatch Small Cap Growth Fund — Investor Class gained 33.26% while the benchmark Russell 2000 Growth Index rose 15.71%.
A large portion of the Fund’s outperformance came from information technology (IT). Going forward, it’s certainly possible that tech companies may have short-term trouble exceeding their recent success and that other sectors may outpace IT for a period of time. It’s also possible that value-oriented stocks may temporarily outshine growth-oriented stocks. But we don’t attempt to navigate such cycles in the market. Instead, we remain focused on the fundamentals: management quality, business-model viability, scope for increased market share and market expansion, returns on capital and balance-sheet health.
DETAILS OF THE YEAR
Beyond the contribution from IT, the Fund’s outperformance of the benchmark resulted from beneficial stock selection in health care and consumer staples (mostly attributable to Freshpet, Inc, the leading refrigerated-pet-food company). It was also advantageous for the Fund to have no holdings in the poor-performing real-estate sector. The main detractor from Fund performance was lagging stock selection in financials.
One of the Fund’s largest contributors was DocuSign, Inc., which offers e-signature software that enables businesses to digitally prepare and execute agreements. With the pandemic scattering corporate operations to home offices and curtailing business travel, DocuSign has been positioned to benefit as more companies sign contracts electronically over the internet. We still like DocuSign, but the valuation set a higher bar for the future, and we recently sold our shares. With the proceeds of our DocuSign sale, we rotated into what we viewed as more reasonably priced names.
Largely due to the pandemic, many companies in the industrials sector were impacted by a broad slowdown in demand and production. The Fund’s greatest detractors in the sector
included RBC Bearings, Inc. and Barnes Group, Inc. RBC designs and manufactures precision bearings and components such as couplings, rollers, shafts, pins, rods, tubes and ball bearings. The company serves industrial, aerospace and defense markets world-wide. Barnes is a global provider of highly engineered products, differentiated industrial technologies and innovative solutions that serve a wide range of end markets and customers. Despite the challenging environment, we expect both companies to bounce back.
OUTLOOK
Because information technology is a significant weighting in the Small Cap Growth Fund, we’re offering our perspective on the sector and the types of companies we hold. Notwithstanding a temporary pullback during September 2020, IT stocks have continued their strong performance as many tech companies have actually benefited from the pandemic. Tech companies have been the leaders in replacing face-to-face activities with online, virtual alternatives. Additionally, many technology-enabled services have become increasingly important in delivering goods and services during the pandemic. What’s more, we don’t think these trends will necessarily reverse after the pandemic ends because people have become used to new ways of living and working.
While the Fund is significantly overweighted in IT relative to the benchmark, we’re very particular about the specific tech and tech-related names we own. First, we invest in what we consider high-quality companies with excellent management teams, innovative business models and expanding markets. Second, we tend to avoid really expensive companies that in our opinion are selling at excessive price-to-sales ratios. This means the Fund may lag some more aggressive portfolios during exceptionally strong upward moves in the market but may also hold up better during major downdrafts. Third, we try to own a balance of some especially fast growers that have been firing on all cylinders and some more moderately priced companies.
The reason we own a balance of companies is that the especially fast growers may be well-positioned for the current environment but may be trading at somewhat expensive valuations. And the more moderately priced companies may be having some challenges at the present time but may be poised to see accelerating growth if the environment changes. By owning a balance, we’re positioned for the possibilities of a new environment and a general reset in valuations.
Thank you for the opportunity to manage your assets.
Current and future holdings are subject to risk.
30
| | |
| Wasatch Small Cap Growth Fund (WAAEX / WIAEX) | | SEPTEMBER 30, 2020 |
Portfolio Summary
AVERAGE ANNUAL TOTAL RETURNS
| | | | | | | | | | | | | | | |
| | | |
| | | 1 Year | | 5 Years | | 10 Years |
| | | |
Small Cap Growth (WAAEX) — Investor | | | | 33.26% | | | | | 18.54% | | | | | 14.81% | |
| | | |
Small Cap Growth (WIAEX) — Institutional | | | | 33.39% | | | | | 18.70% | | | | | 14.89% | |
| | | |
Russell 2000® Growth Index | | | | 15.71% | | | | | 11.42% | | | | | 12.34% | |
| | | |
Russell 2000® Index | | | | 0.39% | | | | | 8.00% | | | | | 9.85% | |
Data show past performance, which is not indicative of future performance. Current performance may be lower or higher than the performance quoted. To obtain the most recent month-end performance data available, please visit wasatchglobal.com. The Advisor may absorb certain Fund expenses, without which total returns would have been lower. Investment returns and principal value will fluctuate and shares, when redeemed, may be worth more or less than their original cost.
As of the January 31, 2020 prospectus, the Total Annual Fund Operating Expenses for the Wasatch Small Cap Growth Fund are Investor Class: 1.17% / Institutional Class — Gross: 1.09%, Net: 1.06%. The expense ratio shown elsewhere in this report may be different. Net expenses are based on Fund expenses, net of waivers and reimbursements. See the prospectus for additional information regarding Fund expenses.
Wasatch will deduct a 2.00% redemption fee on Fund shares held 60 days or less. Performance data do not reflect the deduction of fees, including sales charges, or the taxes you would pay on fund distributions or the redemption of fund shares. Fees and taxes, if reflected, would reduce the performance quoted. Wasatch does not charge any sales fees. For more complete information including charges, risks and expenses, read the prospectus carefully.
Performance for the Institutional Class prior to 2/1/2016 is based on the performance of the Investor Class. Performance of the Fund’s Institutional Class prior to 2/1/2016 uses the actual expenses of the Fund’s Investor Class without any adjustments. For any such period of time, the performance of the Fund’s Institutional Class would have been substantially similar to, yet higher than, the performance of the Fund’s Investor Class, because the shares of both classes are invested in the same portfolio of securities, but the classes bear different expenses.
Investing in small cap funds will be more volatile and loss of principal could be greater than investing in large cap or more diversified funds. Investing in foreign securities, especially in emerging markets, entails special risks, such as currency fluctuations and political uncertainties, which are described in more detail in the prospectus.
TOP 10 EQUITY HOLDINGS*
| | | | |
| |
| Company | | % of Net Assets | |
| |
Kornit Digital Ltd. (Israel) | | | 3.4% | |
| |
Five9, Inc. | | | 3.3% | |
| |
Globant S.A. (Argentina) | | | 3.1% | |
| |
Paylocity Holding Corp. | |
| 3.1%
|
|
| |
Floor & Decor Holdings, Inc. | |
| 3.1%
|
|
| | | | |
| |
| Company | | % of Net Assets | |
| |
HubSpot, Inc. | | | 3.1% | |
| |
Freshpet, Inc. | | | 3.0% | |
| |
LGI Homes, Inc. | | | 2.9% | |
| |
Ensign Group, Inc. (The) | | | 2.9% | |
| |
Monolithic Power Systems, Inc. | | | 2.9% | |
| * | As of September 30, 2020, there were 65 holdings in the Fund. Foreign currency contracts, written options and repurchase agreements, if any, are not included in the number of holdings. Portfolio holdings are subject to change at any time. References to specific securities should not be construed as recommendations by the Funds or their Advisor. Current and future holdings are subject to risk. |
SECTOR BREAKDOWN**
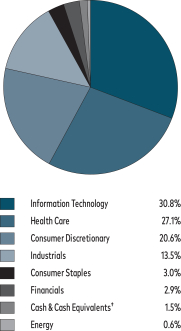
| ** | Excludes securities sold short and options written, if any. |
| † | Also includes Other Assets & Liabilities. |
GROWTH OF A HYPOTHETICAL $10,000 INVESTMENT
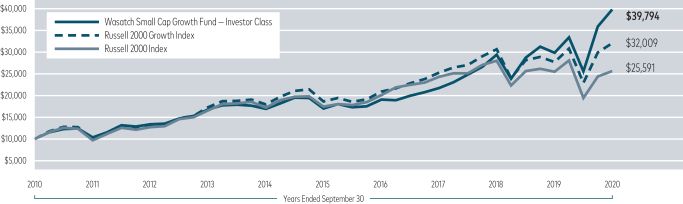
Past performance does not predict future performance. The graph above does not reflect the deduction of fees, sales charges, or taxes that you would pay on fund distributions or the redemption of fund shares. Wasatch does not charge any sales fees.
31
| | |
| Wasatch Small Cap Value Fund (WMCVX / WICVX) | | SEPTEMBER 30, 2020 |
Management Discussion
The Wasatch Small Cap Value Fund is managed by a team of Wasatch portfolio managers led by Jim Larkins and Austin Bone.
| | | | |

Jim Larkins Lead Portfolio Manager | | 
Austin Bone Associate Portfolio Manager | | OVERVIEW During the 12 months ended September 30, 2020, which included the start of the novel coronavirus pandemic, the Wasatch Small Cap Value |
Fund — Investor Class declined -7.13%. The Fund outperformed the benchmark Russell 2000 Value Index, which fell -14.88%.
Although U.S. equities rallied after the Covid-related selloff, the rally was largely driven by larger companies and growth-oriented names. The small-cap value category lagged the broader market. At a time of uncertainty surrounding the spread of the disease and the resulting impact on the economy, investors displayed a clear preference for more well-established and faster-growing companies.
Relative to the benchmark, this environment worked to the Fund’s advantage — even with the weakness in the small-cap value category. The Fund’s portfolio tends to be tilted toward the “growthier” side of the category thanks to a unique approach that seeks Fallen Angels (defined by Wasatch as high-quality growth companies that have stumbled temporarily), Undiscovered Gems (our term for inexpensive growth companies that are flying below Wall Street’s radar) and the more traditional value stocks, which we call Quality Value.
DETAILS OF THE YEAR
The Fund’s performance relative to the benchmark was helped by stocks in financials, which were down — but down less than the benchmark constituents in the sector. As for consumer discretionary, the Fund was overweighted in a relatively strong-performing sector. Regarding energy and real estate, the Fund benefited from small weightings in these especially weak sectors. Sources of poor relative returns included the Fund’s information-technology and communication-services holdings, which underperformed the benchmark positions in these sectors.
The top contributor to the Fund’s return was Camping World Holdings, Inc., which offers new and used recreational vehicles (RVs), associated parts, accessories, appliances, camping equipment, and tailgating products, as well as product-installation services, roadside assistance, and RV and auto insurance. The stock declined early in the pandemic on worries that big-ticket consumer durables would be difficult to sell due to the uncertain employment picture. Those worries quickly faded as RVs became a go-to option for many families looking for safe recreation options, leading to record demand. We’ve since sold our position in Camping World based on the elevated valuation.
The largest detractor from the Fund’s return was Ladder Capital Corp., which operates as a commercial real-estate company offering commercial mortgage lending, investments in securities secured by first-mortgage loans, and investments in other real-estate assets. Ladder serves clients in New York, California and Florida. While financials experienced a difficult environment as loans and securities derived from loans came under pressure due to increased concerns about liquidity conditions and potential credit losses, Ladder’s stock was down especially hard. Moreover, we liquidated our position because we lost confidence in Ladder when management suspended guidance, making it more difficult to understand the makeup of the company’s internally managed portfolio.
OUTLOOK
We don’t typically offer a detailed outlook because we’re bottom-up investors with a focus on individual company analysis. But we think it’s important to express our belief that the United States is still a great, dynamic country despite the persistently negative headlines of 2020. Small-business formation remains strong, indicating that the entrepreneurial spirit is alive and that the U.S. economy remains resilient. Accordingly, governments, businesses and families are demonstrating the flexibility to adapt to the changing environment. In our view, these factors continue to provide a firm long-term foundation for the small-cap space.
At the same time, we view risk management as essential in light of the high potential for near-term headwinds. We began taking steps to improve the overall quality of the Fund’s portfolio in late 2019, and we’ve continued this process throughout 2020. We remain intensely focused on mitigating downside risk through an ongoing emphasis on well-managed companies with low debt. Moreover, we’re striving to ensure that the Fund has balanced exposure that mitigates the vulnerability to a resurgence of Covid-19 while at the same time allowing some participation on the upside if the virus retreats and the economy moves toward fully reopening.
We’re also tracking the volatility characteristics of each individual stock in the Fund, since unusual price action can be a sign of rising risk. It’s important to note, however, that we don’t plan to reduce risk much further because we want to maintain the latitude to participate in potential market gains. We think our balanced, risk-conscious approach remains the best course for the Fund given the wide range of factors that could affect the investment landscape in the coming months.
Thank you for the opportunity to manage your assets.
Current and future holdings are subject to risk.
32
| | |
| Wasatch Small Cap Value Fund (WMCVX / WICVX) | | SEPTEMBER 30, 2020 |
Portfolio Summary
AVERAGE ANNUAL TOTAL RETURNS
| | | | | | | | | | | | | | | |
| | | |
| | | 1 Year | | 5 Years | | 10 Years |
| | | |
Small Cap Value (WMCVX) — Investor | | | | -7.13% | | | | | 7.12% | | | | | 10.38% | |
| | | |
Small Cap Value (WICVX) — Institutional | | | | -6.94% | | | | | 7.29% | | | | | 10.52% | |
| | | |
Russell 2000® Value Index | | | | -14.88% | | | | | 4.11% | | | | | 7.09% | |
| | | |
Russell 2000® Index | | | | 0.39% | | | | | 8.00% | | | | | 9.85% | |
Data show past performance, which is not indicative of future performance. Current performance may be lower or higher than the performance quoted. To obtain the most recent month-end performance data available, please visit wasatchglobal.com. The Advisor may absorb certain Fund expenses, without which total returns would have been lower. Investment returns and principal value will fluctuate and shares, when redeemed, may be worth more or less than their original cost.
As of the January 31, 2020 prospectus, the Total Annual Fund Operating Expenses for the Wasatch Small Cap Value Fund are Investor Class: 1.20% / Institutional Class — Gross: 1.09%, Net: 1.05%. The expense ratio shown elsewhere in this report may be different. Net expenses are based on Fund expenses, net of waivers and reimbursements. See the prospectus for additional information regarding Fund expenses.
Wasatch will deduct a 2.00% redemption fee on Fund shares held 60 days or less. Performance data do not reflect the deduction of fees, including sales charges, or the taxes you would pay on fund distributions or the redemption of fund shares. Fees and taxes, if reflected, would reduce the performance quoted. Wasatch does not charge any sales fees. For more complete information including charges, risks and expenses, read the prospectus carefully.
Performance for the Institutional Class prior to 1/31/2012 is based on the performance of the Investor Class. Performance of the Fund’s Institutional Class prior to 1/31/2012 uses the actual expenses of the Fund’s Investor Class without any adjustments. For any such period of time, the performance of the Fund’s Institutional Class would have been substantially similar to, yet higher than, the performance of the Fund’s Investor Class, because the shares of both classes are invested in the same portfolio of securities, but the classes bear different expenses.
Investing in small cap funds will be more volatile and loss of principal could be greater than investing in large cap or more diversified funds. Investments in value stocks can perform differently from the market as a whole and from other types of stocks and can continue to be undervalued by the market for long periods of time. Investing in foreign securities, especially in emerging markets, entails special risks, such as currency fluctuations and political uncertainties, which are described in more detail in the prospectus.
TOP 10 EQUITY HOLDINGS*
| | | | |
| |
| Company | | % of Net Assets | |
| |
Kadant, Inc. | | | 4.4% | |
| |
Fabrinet | | | 3.8% | |
| |
Ensign Group, Inc. (The) | | | 3.5% | |
| |
Valvoline, Inc. | | | 3.3% | |
| |
Altra Industrial Motion Corp. | | | 3.0% | |
| | | | |
| |
| Company | | % of Net Assets | |
| |
Artisan Partners Asset Management, Inc., Class A | | | 2.7% | |
| |
Construction Partners, Inc., Class A | | | 2.5% | |
| |
Euronet Worldwide, Inc. | | | 2.5% | |
| |
Arbor Realty Trust, Inc. | | | 2.3% | |
| |
National Storage Affiliates Trust | | | 2.3% | |
| * | As of September 30, 2020, there were 63 holdings in the Fund. Foreign currency contracts, written options and repurchase agreements, if any, are not included in the number of holdings. Portfolio holdings are subject to change at any time. References to specific securities should not be construed as recommendations by the Funds or their Advisor. Current and future holdings are subject to risk. |
SECTOR BREAKDOWN**
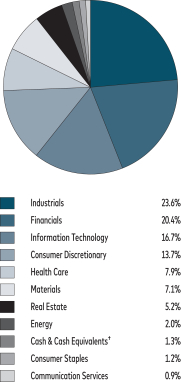
| ** | Excludes securities sold short and options written, if any. |
| † | Also includes Other Assets & Liabilities. |
GROWTH OF A HYPOTHETICAL $10,000 INVESTMENT
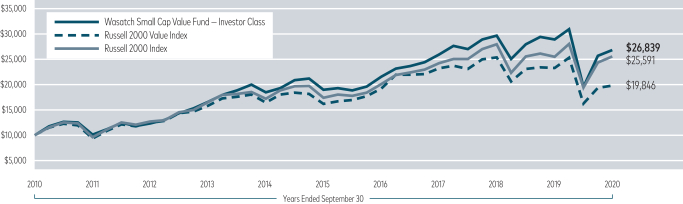
Past performance does not predict future performance. The graph above does not reflect the deduction of fees, sales charges, or taxes that you would pay on fund distributions or the redemption of fund shares. Wasatch does not charge any sales fees.
33
| | |
| Wasatch Ultra Growth Fund (WAMCX / WGMCX) | | SEPTEMBER 30, 2020 |
Management Discussion
The Wasatch Ultra Growth Fund is managed by a team of Wasatch portfolio managers led by John Malooly.
| | |

John Malooly, CFA Lead Portfolio Manager | | OVERVIEW The Wasatch Ultra Growth Fund— Investor Class had an outstanding return of 59.54% and outperformed its benchmark, the Russell 2000 Growth Index, which rose 15.71% for the 12-month period ended September 30, 2020. In a move that proved to be fortuitous, we had positioned the Fund somewhat |
more defensively prior to the coronavirus pandemic. With the economic expansion that began in 2009 getting long in the tooth by historical standards, we sought to tilt the Fund’s portfolio away from businesses tied to the economic cycle. We didn’t anticipate that a global health crisis would upend daily life and wreak havoc on the U.S. economy. Nor could we have predicted that over the past few months small-cap stocks would have such a dramatic rally. While we don’t have a crystal ball to see into what might happen next in the market, we do know that the rally has raised investors’ expectations across the board.
DETAILS OF THE YEAR
We believe the solid fundamentals of our portfolio companies benefited the Fund throughout the past 12 months. On a sector basis, the leading contributors to performance relative to the benchmark were health care and information technology. While nearly all sectors contributed to the Fund’s relative performance, the financials sector was an area of weakness.
A number of the Fund’s top contributors to performance were health-care companies led by ChemoCentryx, Inc. and Inovio Pharmaceuticals, Inc.
ChemoCentryx develops orally administered therapeutics for autoimmune diseases, inflammatory disorders and cancer. The stock was rewarded as the company’s lead drug candidate, Avacopan, progressed through clinical trials and was approved for use by the U.S. Food and Drug Administration (FDA). Avacopan was developed to treat ANCA-associated vasculitis, a systemic disease leading to the inflammation and destruction of small blood vessels.
Inovio Pharmaceuticals, Inc. is a biotechnology company developing a Covid-19 vaccine candidate, INO-4800. The company’s stock was lifted by an upswell of optimism from March through June, but then headed lower amid worries that Inovio may be falling behind its competitors in the race to develop a vaccine for the disease. Concerns grew in September after the company disclosed that the FDA had placed a partial hold on a combined Phase 2/3 clinical trial of INO-4800 that Inovio had planned to initiate by the end of the month. According to the company, the FDA’s partial hold did not result from any adverse events in its ongoing Phase 1 trial. Additionally, the hold does not affect the advancement
of the company’s other pipeline assets. Should INO-4800 eventually gain approval, we think its advantages — especially with respect to safety, storage and administration — would position it as a potentially valuable weapon in the fight against Covid-19. Inovio’s DNA medicines currently in development for various cancers and pre-cancers also offer meaningful upside potential, in our view.
CryoLife, Inc. was the Fund’s largest detractor from performance for the year. The company manufactures, processes and distributes medical devices and implantable human tissues. Disappointing revenue growth and concerns that the company has debt on the balance sheet weighed on its share price. We scrutinized the company’s debt and believe it is reasonable. We also think CryoLife’s business will be less impacted by the slowdown in non-Covid medical activity because the procedures that utilize its products are generally more serious than the elective procedures that are being postponed.
OUTLOOK
On the economic front, the full effects of the pandemic are yet to be felt. With financial stress continuing to build in areas such as commercial real estate, home mortgages and the restaurant industry, an impending wave of loan defaults threatens banks and other lenders. Moreover, while the Federal Reserve is in no imminent danger of running out of paper and green ink (and their digital counterparts), the implications of financing massive fiscal deficits with printed money are dubious at best — especially if this becomes the norm going forward.
In short, our optimism is tempered with a heavy dose of reality. Should the road ahead prove longer and more difficult than investors currently expect, companies positioned to endure a period of renewed challenges — and to emerge from them even stronger than before — appear especially attractive in our view.
No matter what stock prices do in the months ahead, we are pleased with the fundamentals of the companies we hold in the Fund, but believe we earned some forward returns that may not be repeated.
Thank you for the opportunity to manage your assets.
Current and future holdings are subject to risk.
34
| | |
| Wasatch Ultra Growth Fund (WAMCX / WGMCX) | | SEPTEMBER 30, 2020 |
Portfolio Summary
AVERAGE ANNUAL TOTAL RETURNS
| | | | | | | | | | | | | | | |
| | | |
| | | 1 Year | | 5 Years | | 10 Years |
| | | |
Ultra Growth (WAMCX) — Investor | | | | 59.54% | | | | | 26.79% | | | | | 18.18% | |
| | | |
Ultra Growth (WGMCX) — Institutional | | | | 59.62% | | | | | 26.80% | | | | | 18.19% | |
| | | |
Russell 2000® Growth Index | | | | 15.71% | | | | | 11.42% | | | | | 12.34% | |
Data show past performance, which is not indicative of future performance. Current performance may be lower or higher than the performance quoted. To obtain the most recent month-end performance data available, please visit wasatchglobal.com. The Advisor may absorb certain Fund expenses, without which total returns would have been lower. Investment returns and principal value will fluctuate and shares, when redeemed, may be worth more or less than their original cost.
As of the January 31, 2020 prospectus, the Total Annual Fund Operating Expenses for the Wasatch Ultra Growth Fund are Investor Class: 1.25% / Institutional Class — Gross: 1.10%, Net: 1.06%. The expense ratio shown elsewhere in this report may be different. Expenses include direct expenses paid to the Advisor as well as indirect expenses incurred by the Fund as a result of its investments in other investment companies (each an “Acquired Fund”), before any expense reimbursements by the Advisor. Net expenses are based on Fund expenses, net of waivers and reimbursements. See the prospectus for additional information regarding Fund expenses.
Wasatch will deduct a 2.00% redemption fee on Fund shares held 60 days or less. Performance data do not reflect the deduction of fees, including sales charges, or the taxes you would pay on fund distributions or the redemption of fund shares. Fees and taxes, if reflected, would reduce the performance quoted. Wasatch does not charge any sales fees. For more complete information including charges, risks and expenses, read the prospectus carefully.
Performance for the Institutional Class prior to 1/31/2020 is based on the performance of the Investor Class. Performance of the Fund’s Institutional Class prior to 1/31/2020 uses the actual expenses of the Fund’s Investor Class without any adjustments. For any such period of time, the performance of the Fund’s Institutional Class would have been substantially similar to, yet higher than, the performance of the Fund’s Investor Class, because the shares of both classes are invested in the same portfolio of securities, but the classes bear different expenses.
Investing in small cap funds will be more volatile and loss of principal could be greater than investing in large cap or more diversified funds. Investing in foreign securities, especially in emerging markets, entails special risks, such as currency fluctuations and political uncertainties, which are described in more detail in the prospectus.
TOP 10 EQUITY HOLDINGS*
| | | | |
| |
| Company | | % of Net Assets | |
| |
Silk Road Medical, Inc. | | | 3.0% | |
| |
Five Below, Inc. | | | 2.6% | |
| |
Kornit Digital Ltd. (Israel) | | | 2.6% | |
| |
Floor & Decor Holdings, Inc., Class A | | | 2.5% | |
| |
Castle Biosciences, Inc. | | | 2.4% | |
| | | | |
| |
| Company | | % of Net Assets | |
| |
Freshpet, Inc. | | | 2.4% | |
| |
Zendesk, Inc. | | | 2.3% | |
| |
Inspire Medical Systems, Inc. | | | 2.3% | |
| |
Open Lending Corp., Class A | | | 2.1% | |
| |
Paylocity Holding Corp. | | | 1.9% | |
| * | As of September 30, 2020, there were 86 holdings in the Fund. Foreign currency contracts, written options and repurchase agreements, if any, are not included in the number of holdings. Portfolio holdings are subject to change at any time. References to specific securities should not be construed as recommendations by the Funds or their Advisor. Current and future holdings are subject to risk. |
SECTOR BREAKDOWN**
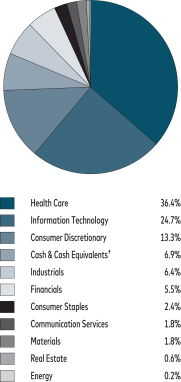
| ** | Excludes securities sold short and options written, if any. |
| † | Also includes Other Assets & Liabilities. |
GROWTH OF A HYPOTHETICAL $10,000 INVESTMENT
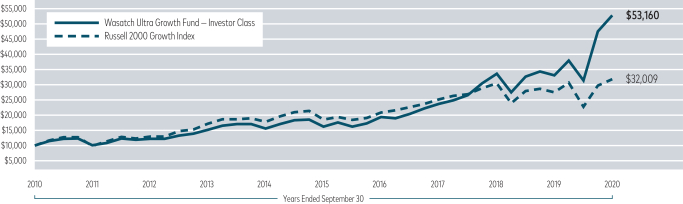
Past performance does not predict future performance. The graph above does not reflect the deduction of fees, sales charges, or taxes that you would pay on fund distributions or the redemption of fund shares. Wasatch does not charge any sales fees.
35
| | |
| Wasatch-Hoisington U.S. Treasury Fund (WHOSX) | | SEPTEMBER 30, 2020 |
Management Discussion
The Wasatch-Hoisington U.S. Treasury Fund is sub-advised by Hoisington Investment Management Company (HIMCo).
| | | | |

Van Hoisington Lead Portfolio Manager | | 
Van R. Hoisington, Jr. Portfolio Manager | | 
David Hoisington Portfolio Manager |
OVERVIEW
Thirty-year U.S. Treasury bond yields closed at 1.45% on September 30, 2020, down from 2.11% a year earlier. The U.S. and global economies were weakening as 2019 ended and inflationary pressures were easing. The pandemic, which hit early in 2020, reinforced those trends.
DETAILS OF THE YEAR
For periods ended September 30, 2020, the Wasatch-Hoisington U.S. Treasury Fund gained 18.06% for the 12-month period, with a three-year average annual total return of 13.24%. Returns over the same periods for the benchmark Bloomberg Barclays US Aggregate Bond Index were far less. The benchmark’s 12-month return was 6.98%, with an annualized three-year return of 5.24%.
PREVAILING ECONOMIC CONDITIONS
Over the past 40 years, real per capita gross domestic product (GDP), employment, population and productivity all exhibited pronounced secular deterioration. From 1980 through 2019, real GDP per capita grew 1.7% per annum, sharply lower than 3.1% in the prior 40 years (1940 to 1979). Secular deterioration in economic growth, a large amount of unused resources and negative foreign conditions led to a dramatic fall in the inflation rate.
During the most recent 40-year period, the U.S. was caught in a debt trap. A term originated by the Bank for International Settlements, a debt trap is a condition where too much debt weakens growth, which elicits a policy response that creates more debt that results in even more disappointing business conditions.
The secular decline in economic conditions and the debt trap preclude the textbook conditions for powerful monetary policy measures to stimulate economic activity. Further, debt financed fiscal programs only boost the economy in the very short run, but ultimately reduce growth.
These major economic trends confirm that high debt levels undermine economic growth. This causality is supported by the law of diminishing returns, derived from the universally applicable production function. Historical declines in economic growth rates have coincided with record levels of public and private debt. Total public and private debt jumped from 167.2% of GDP in 1980 to an estimated record 405% in 2020.
The workings of the Fisher equation, which have brought Treasury bond yields lower, have been reinforced by a sharp decline in the marginal revenue product of debt.
We identify two tail risks for investors in long-term U.S. Treasury securities (bonds with maturities longer than 20 years). A major new debt financed fiscal program would change the short-run trajectory of the economy. This could place transitory upward pressure on interest rates in a fashion that has been experienced many times. Ultimately, we believe disinflation would prevail and the downward trend in Treasury yields would resume.
The second risk would bring a rising inflationary dynamic into the picture, potentially becoming much more consequential. General disappointment with trying to solve economic underperformance by more indebtedness may crystalize along with the realization that debt will not work any better in the U.S. than in Japan, the Euro Area or many other countries. As this dissatisfaction intensifies, either de jure or de facto, the Federal Reserve’s liabilities could be made legal tender, or a medium of exchange.
Some advocate making the Fed’s liabilities spendable, a step already taken by a few foreign central banks. If the Fed’s liabilities were made a medium of exchange, the inflation rate would rise and inflationary expectations would move ahead of actual inflation. In due course, Gresham’s law could be triggered as individuals move to hold commodities that can be consumed or traded for consumable items. This would result in a massive decline in productivity, thus real economic growth and the standard of living would fall as inflation escalates. Lower- and moderate-income households would be the most adversely affected. The velocity of money would rise dramatically. This would make Treasury bills and inflation-adjusted Treasury securities preferable to longer-dated Treasury bonds.
As long as the federal government’s policy prescription is ever higher levels of debt, we believe the path toward disinflation will hold and investing the Fund in long-term U.S. Treasury bonds will be our preference. The continuing shift in economic conditions over the past 40 years has necessitated several dramatic changes in HIMCo’s yield curve positioning. We retain the flexibility to respond to changing economic conditions as we seek to position the Fund for what we believe lies ahead.
Thank you for the opportunity to manage your assets.
36
| | |
| Wasatch-Hoisington U.S. Treasury Fund (WHOSX) | | SEPTEMBER 30, 2020 |
Portfolio Summary
AVERAGE ANNUAL TOTAL RETURNS
| | | | | | | | | | | | | | | |
| | | |
| | | 1 Year | | 5 Years | | 10 Years |
| | | |
U.S. Treasury | | | | 18.06% | | | | | 8.85% | | | | | 7.94% | |
| | | |
Bloomberg Barclays US Aggregate Bond Index | | | | 6.98% | | | | | 4.18% | | | | | 3.64% | |
Data show past performance, which is not indicative of future performance. Current performance may be lower or higher than the performance quoted. To obtain the most recent month-end performance data available, please visit wasatchglobal.com. The Advisor may absorb certain Fund expenses, without which total returns would have been lower. Investment returns and principal value will fluctuate and shares, when redeemed, may be worth more or less than their original cost.
As of the January 31, 2020 prospectus, the Total Annual Fund Operating Expenses for the Wasatch-Hoisington U.S. Treasury Fund are 0.69%. The expense ratio shown elsewhere in this report may be different. Net expenses are based on Fund expenses, net of waivers and reimbursements. See the prospectus for additional information regarding Fund expenses.
Wasatch will deduct a 2.00% redemption fee on Fund shares held 60 days or less. Performance data do not reflect the deduction of fees, including sales charges, or the taxes you would pay on fund distributions or the redemption of fund shares. Fees and taxes, if reflected, would reduce the performance quoted. Wasatch does not charge any sales fees. For more complete information including charges, risks and expenses, read the prospectus carefully.
Investments in fixed income funds are subject to the same interest rate, inflation, credit and other risks associated with the underlying bonds. Return of principal is not guaranteed.
TOP U.S. TREASURY HOLDINGS*
| | | | | | | | |
| | |
| Holding | | Maturity
Date | | | % of Net
Assets | |
| | |
U.S. Treasury Bond, 2.250% | | | 8/15/46 | | | | 19.1% | |
| | |
U.S. Treasury Strip, principal only | | | 8/15/45 | | | | 17.4% | |
| | |
U.S. Treasury Strip, principal only | | | 5/15/44 | | | | 12.6% | |
| | |
U.S. Treasury Bond, 1.250% | | | 5/15/50 | | | | 11.9% | |
| | |
U.S. Treasury Bond, 3.000% | | | 8/15/48 | | | | 11.4% | |
| | | | | | | | |
| | |
| Holding | | Maturity
Date | | | % of Net
Assets | |
| | |
U.S. Treasury Bond, 2.250% | | | 8/15/49 | | | | 10.9% | |
| | |
U.S. Treasury Bond, 2.500% | | | 2/15/45 | | | | 5.7% | |
| | |
U.S. Treasury Strip, principal only | | | 8/15/40 | | | | 4.8% | |
| | |
U.S. Treasury Bond, 2.875% | | | 5/15/49 | | | | 4.7% | |
| * | As of September 30, 2020, there were 9 holdings in the Fund. Repurchase agreements, if any, are not included in the number of holdings. Portfolio holdings are subject to change at any time. References to specific securities should not be construed as recommendations by the Funds or their Advisor. Current and future holdings are subject to risk. |
INVESTMENTS & CASH
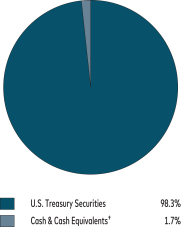
| † | Also includes Other Assets & Liabilities. |
GROWTH OF A HYPOTHETICAL $10,000 INVESTMENT
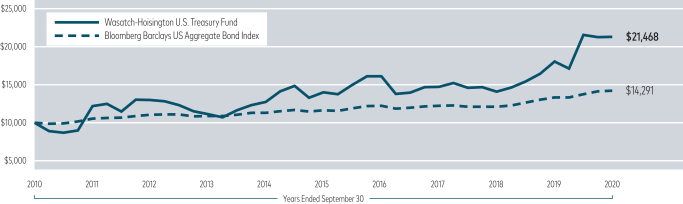
Past performance does not predict future performance. The graph above does not reflect the deduction of fees, sales charges, or taxes that you would pay on fund distributions or the redemption of fund shares. Wasatch does not charge any sales fees.
37
| | |
| Wasatch Funds Management Discussions | | |
DEFINITIONS OF FINANCIAL TERMS
CFA® stands for Chartered Financial Analyst and is a trademark owned by the CFA Institute.
The “cloud” is the internet. Cloud-computing is a model for delivering information-technology services in which resources are retrieved from the internet through web-based tools and applications, rather than from a direct connection to a server.
Earnings growth is a measure of growth in a company’s net income over a specific period, often one year.
The Fisher equation in economics estimates the relationship between nominal and real interest rates under inflation. It is named after Irving Fisher, who was renowned for his work on the theory of interest. In economics, this equation is used to predict nominal and real interest rate behavior.
Gresham’s law is a monetary principle stating that “bad money drives out good.” For example, if there are two forms of commodity money (i.e., gold and silver coins) in circulation, which are accepted by law as having similar face value, the more valuable commodity will gradually disappear from circulation because people will hoard it. (Englishman Sir Thomas Gresham lived from 1519 to 1579.)
Gross domestic product (GDP) is a basic measure of a country’s economic performance and is the market value of all final goods and services made within the borders of a country in a year.
The marginal revenue product of debt is the ratio of GDP to debt.
Per capita GDP is a universal measure for gauging the prosperity of nations. It is calculated by dividing GDP by a country’s total population.
The price-to-sales ratio is a stock’s capitalization divided by the company’s sales over the trailing 12 months. The value is the same whether the calculation is done for the whole company or on a per-share basis.
Return on capital is a measure of how effectively a company uses the money, owned or borrowed, that has been invested in its operations.
Sales growth is the increase in sales over a specified period of time, not necessarily one year.
Valuation is the process of determining the current worth of an asset or company.
The velocity of money is defined as the rate at which money circulates, changes hands or turns over in an economy.
The yield curve is a line on a graph that plots the interest rates, at a set point in time, of bonds having equal credit quality, but differing maturity dates. The most frequently reported yield curve compares three-month, two-year, five-year and 30-year U.S. Treasury securities. This yield curve is used as a benchmark for other interest rates, such as mortgage rates or bank lending rates. The curve is also used to predict changes in economic output and growth.
INDEX DESCRIPTIONS AND DISCLOSURES
The Bloomberg Barclays US Aggregate Bond Index is a broad-based flagship benchmark that measures the investment grade, U.S. dollar denominated, fixed-rate taxable bond market. The index includes Treasuries, government-related and corporate securities, mortgage-backed securities (MBS) (agency fixed-rate and hybrid adjustable-rate mortgage [ARM] pass-throughs), asset-backed securities (ABS) and commercial mortgage-backed securities (CMBS) (agency and non-agency).
The MSCI AC (All Country) World Index captures large- and mid-cap representation across 23 developed-market and 26 emerging-market countries.
The MSCI AC (All Country) World ex USA Small Cap Index is an unmanaged index and includes reinvestment of all dividends of issuers located in countries throughout the world representing developed and emerging markets, excluding securities of U.S. issuers. This index is a free float-adjusted market capitalization index designed to measure the performance of small-capitalization securities.
The MSCI AC (All Country) World Small Cap Index is an unmanaged index and includes reinvestment of all dividends of issuers located in countries throughout the world representing developed and emerging markets. This index is a free float-adjusted market capitalization index designed to measure the performance of small-capitalization securities.
The MSCI EAFE Index is an unmanaged index and includes reinvestment of all dividends of issuers located in 21 developed-market countries, excluding the U.S. and Canada. This index is a free float-adjusted market capitalization index designed to measure the performance of mid-cap and large-cap securities.
The MSCI Emerging Markets Index captures large- and mid-cap representation across 26 emerging-market countries.
The MSCI Emerging Markets Small Cap Index captures small-cap representation across 26 emerging-market countries.
The MSCI Frontier Emerging Markets and MSCI Frontier Markets indexes are free float-adjusted market capitalization indexes designed to measure equity market performance in the global frontier and emerging markets.
The MSCI India Investable Market Index (IMI) covers all investable large-, mid- and small-cap securities across India, targeting approximately 99% of the Indian market’s free-float adjusted market capitalization.
The MSCI World ex USA Index captures large- and mid-cap representation across 22 of 23 developed market countries, excluding the United States.
The MSCI World ex USA Small Cap Index is a free float-adjusted market capitalization weighted index designed to measure the equity market performance of developed markets, excluding the United States.
38
Pertaining to the use of MSCI information. Source: MSCI. The MSCI information may only be used for your internal use, may not be reproduced or redisseminated in any form and may not be used as a basis for or a component of any financial instruments or products or indices. None of the MSCI information is intended to constitute investment advice or a recommendation to make (or refrain from making) any kind of investment decision and may not be relied on as such. Historical data and analysis should not be taken as an indication or guarantee of any future performance analysis, forecast or prediction. The MSCI information is provided on an “as is” basis and the user of this information assumes the entire risk of any use made of this information. MSCI, each of its affiliates and each other person involved in or related to compiling, computing or creating any MSCI information (collectively, the “MSCI Parties”) expressly disclaims all warranties (including, without limitation, any warranties or originality, accuracy, completeness, timeliness, non-infringement, merchantability and fitness for a particular purpose) with respect to this information. Without limiting any of the foregoing, in no event shall any MSCI Party have any liability for any direct, indirect, special, incidental, punitive, consequential (including, without limitation, lost profits) or any other damages. (www.msci.com)
The Russell 2000 Index is an unmanaged total-return index of the smallest 2,000 companies in the Russell 3000 Index, as ranked by total market capitalization. The Russell 2000 is widely used in the industry to measure the performance of small-company stocks.
The Russell 2000 Growth Index measures the performance of Russell 2000 Index companies with higher price-to-book ratios and higher forecasted growth values.
The Russell 2000 Value Index measures the performance of Russell 2000 Index companies with lower price-to-book ratios and lower forecasted growth values.
The Russell Microcap Index is an unmanaged total return index of the smallest 1,000 securities in the small-cap Russell 2000 Index along with the next smallest 1,000 companies, based on a ranking of all U.S. equities by market capitalization.
Pertaining to the use of Russell information. All rights in the Russell 2000, Russell 2000 Growth, Russell 2000 Value and Russell Microcap vest in the relevant London Stock Exchange Group plc (collectively, the “LSE Group”), which owns these indexes. Russell® is a trademark of the relevant LSE Group company and is used by any other LSE Group company under license. These indexes are calculated by or on behalf of FTSE International Limited or its affiliate, agent or partner. The LSE Group does not accept any liability whatsoever to any person arising out of (a) the use of, reliance on or any error in the Index or (b) investment in or operation of any Wasatch portfolio. The LSE Group makes no claim, prediction, warranty or representation either as to the results to be obtained from any Wasatch portfolio or the suitability of these indexes for the purpose to which they are being put by Wasatch Global Investors.
You cannot invest directly in these or any indexes.
39
Operating Expenses
EXPENSE EXAMPLE
As a shareholder of Wasatch Funds, you incur two types of costs: (1) transaction costs, including redemption fees and (2) ongoing costs, including management fees and other fund expenses. This example is intended to help you understand your ongoing costs (in dollars) of investing in a Wasatch Fund and to compare these costs with the ongoing costs of investing in other mutual funds.
The example is based on an investment of $1,000.00 invested at the beginning of the period and held for the entire six-month period ended September 30, 2020.
ACTUAL EXPENSES
The first line of the table on the next page provides information about actual account values and actual expenses, based upon the actual total return of the fund during the most recent six-month period ended September 30, 2020. You may use the information in this line, together with the amount you invested, to estimate the expenses you paid over the period. Simply divide your account value by $1,000.00 (for example, an $8,600.00 account value divided by $1,000.00 = 8.6), then multiply the result by the number in the first line under the heading entitled “Expenses Paid During Period” to estimate the expenses you paid on your account during this period.
In addition, the Funds charge a $12.50 IRA annual maintenance fee and a $15.00 fee for redemptions paid by wire. To the extent these fees apply to your account, your expenses paid during the period would be higher and your ending account value would be lower than the amounts shown in the table on the next page.
HYPOTHETICAL EXAMPLE FOR COMPARISON PURPOSES
The second line of the table on the next page provides information about hypothetical account values and hypothetical expenses based on a fund’s actual expense ratio and
an assumed rate of return of 5% per year before expenses, which is not the fund’s actual return. The hypothetical account values and expenses may not be used to estimate the actual ending account balance or expenses you paid for the period. You may use this information to compare the ongoing costs of investing in a Wasatch Fund and other funds. To do so, compare this 5% hypothetical example with the 5% hypothetical examples that appear in the shareholder reports of other funds.
In addition, the Funds charge a $12.50 IRA annual maintenance fee and a $15.00 fee for redemptions paid by wire. To the extent these fees apply to your account, your expenses paid during the period would be higher and your ending account value would be lower than the amounts shown in the table on the next page. If another fund’s fees differ from those listed above, your expenses paid and your ending account value could be higher or lower than those of other funds.
Please note that the expenses shown in the table are meant to highlight your ongoing costs only and do not reflect any transactional costs, such as redemption fees. Therefore, the second line of the table is useful in comparing ongoing costs only, and will not help you determine the relative total costs of owning different funds. In addition, if these transactional costs were included, your costs would have been higher.
A Fund’s annualized expense ratio may vary as a result of various factors including expenses that are not reimbursable under the contractual agreement between the Fund and the Advisor such as interest, taxes, brokerage commissions, other investment related costs, dividend expense on short sales, and extraordinary expenses.
40
| | | | | | | | | | | | | | | | | | | | |
| | | Account Value | | | | |
| Fund/Class and Return | | Beginning of Period
April 1, 2020 | | End of Period
September 30, 2020 | | Expenses Paid
During Period* | | Annualized Expense
Ratio* |
Core Growth Fund — Investor Class | | | | | | | | | | | | | | | | | | | | |
Actual | | | $ | 1,000.00 | | | | $ | 1,419.10 | | | | $ | 7.26 | | | | | 1.20% | |
Hypothetical (5% before expenses) | | | $ | 1,000.00 | | | | $ | 1,019.00 | | | | $ | 6.06 | | | | | 1.20% | |
Core Growth Fund — Institutional Class | | | | | | | | | | | | | | | | | | | | |
Actual | | | $ | 1,000.00 | | | | $ | 1,420.30 | | | | $ | 6.35 | | | | | 1.05% | |
Hypothetical (5% before expenses) | | | $ | 1,000.00 | | | | $ | 1,019.75 | | | | $ | 5.30 | | | | | 1.05% | |
Emerging India Fund — Investor Class | | | | | | | | | | | | | | | | | | | | |
Actual | | | $ | 1,000.00 | | | | $ | 1,310.60 | | | | $ | 9.70 | | | | | 1.68% | |
Hypothetical (5% before expenses) | | | $ | 1,000.00 | | | | $ | 1,016.60 | | | | $ | 8.47 | | | | | 1.68% | |
Emerging India Fund — Institutional Class | | | | | | | | | | | | | | | | | | | | |
Actual | | | $ | 1,000.00 | | | | $ | 1,310.80 | | | | $ | 8.43 | | | | | 1.46% | |
Hypothetical (5% before expenses) | | | $ | 1,000.00 | | | | $ | 1,017.70 | | | | $ | 7.36 | | | | | 1.46% | |
Emerging Markets Select Fund — Investor Class | | | | | | | | | | | | | | | | | | | | |
Actual | | | $ | 1,000.00 | | | | $ | 1,502.10 | | | | $ | 9.38 | | | | | 1.50% | |
Hypothetical (5% before expenses) | | | $ | 1,000.00 | | | | $ | 1,017.50 | | | | $ | 7.57 | | | | | 1.50% | |
Emerging Markets Select Fund — Institutional Class | | | | | | | | | | | | | | | | | | | | |
Actual | | | $ | 1,000.00 | | | | $ | 1,503.60 | | | | $ | 7.51 | | | | | 1.20% | |
Hypothetical (5% before expenses) | | | $ | 1,000.00 | | | | $ | 1,019.00 | | | | $ | 6.06 | | | | | 1.20% | |
Emerging Markets Small Cap Fund — Investor Class | | | | | | | | | | | | | | | | | | | | |
Actual | | | $ | 1,000.00 | | | | $ | 1,424.50 | | | | $ | 11.76 | | | | | 1.94% | |
Hypothetical (5% before expenses) | | | $ | 1,000.00 | | | | $ | 1,015.30 | | | | $ | 9.77 | | | | | 1.94% | |
Emerging Markets Small Cap Fund — Institutional Class | | | | | | | | | | | | | | | | | | | | |
Actual | | | $ | 1,000.00 | | | | $ | 1,420.60 | | | | $ | 10.89 | | | | | 1.80% | |
Hypothetical (5% before expenses) | | | $ | 1,000.00 | | | | $ | 1,016.00 | | | | $ | 9.07 | | | | | 1.80% | |
Frontier Emerging Small Countries Fund — Investor Class | | | | | | | | | | | | | | | | | | | | |
Actual | | | $ | 1,000.00 | | | | $ | 1,454.10 | | | | $ | 13.19 | | | | | 2.15% | |
Hypothetical (5% before expenses) | | | $ | 1,000.00 | | | | $ | 1,014.25 | | | | $ | 10.83 | | | | | 2.15% | |
Frontier Emerging Small Countries Fund — Institutional Class | | | | | | | | | | | | | | | | | | | | |
Actual | | | $ | 1,000.00 | | | | $ | 1,459.30 | | | | $ | 12.05 | | | | | 1.96% | |
Hypothetical (5% before expenses) | | | $ | 1,000.00 | | | | $ | 1,015.20 | | | | $ | 9.87 | | | | | 1.96% | |
Global Opportunities Fund — Investor Class | | | | | | | | | | | | | | | | | | | | |
Actual | | | $ | 1,000.00 | | | | $ | 1,501.90 | | | | $ | 9.51 | | | | | 1.52% | |
Hypothetical (5% before expenses) | | | $ | 1,000.00 | | | | $ | 1,017.40 | | | | $ | 7.67 | | | | | 1.52% | |
Global Opportunities Fund — Institutional Class | | | | | | | | | | | | | | | | | | | | |
Actual | | | $ | 1,000.00 | | | | $ | 1,503.80 | | | | $ | 8.45 | | | | | 1.35% | |
Hypothetical (5% before expenses) | | | $ | 1,000.00 | | | | $ | 1,018.25 | | | | $ | 6.81 | | | | | 1.35% | |
Global Select Fund — Investor Class | | | | | | | | | | | | | | | | | | | | |
Actual | | | $ | 1,000.00 | | | | $ | 1,401.60 | | | | $ | 8.17 | | | | | 1.36% | |
Hypothetical (5% before expenses) | | | $ | 1,000.00 | | | | $ | 1,018.20 | | | | $ | 6.86 | | | | | 1.36% | |
Global Select Fund — Institutional Class | | | | | | | | | | | | | | | | | | | | |
Actual | | | $ | 1,000.00 | | | | $ | 1,402.90 | | | | $ | 5.77 | | | | | 0.96% | |
Hypothetical (5% before expenses) | | | $ | 1,000.00 | | | | $ | 1,020.20 | | | | $ | 4.85 | | | | | 0.96% | |
Global Value Fund — Investor Class | | | | | | | | | | | | | | | | | | | | |
Actual | | | $ | 1,000.00 | | | | $ | 1,142.20 | | | | $ | 5.89 | | | | | 1.10% | |
Hypothetical (5% before expenses) | | | $ | 1,000.00 | | | | $ | 1,019.50 | | | | $ | 5.55 | | | | | 1.10% | |
Global Value Fund — Institutional Class | | | | | | | | | | | | | | | | | | | | |
Actual | | | $ | 1,000.00 | | | | $ | 1,143.30 | | | | $ | 5.09 | | | | | 0.95% | |
Hypothetical (5% before expenses) | | | $ | 1,000.00 | | | | $ | 1,020.25 | | | | $ | 4.80 | | | | | 0.95% | |
International Growth Fund — Investor Class | | | | | | | | | | | | | | | | | | | | |
Actual | | | $ | 1,000.00 | | | | $ | 1,411.30 | | | | $ | 8.86 | | | | | 1.47% | |
Hypothetical (5% before expenses) | | | $ | 1,000.00 | | | | $ | 1,017.65 | | | | $ | 7.41 | | | | | 1.47% | |
International Growth Fund — Institutional Class | | | | | | | | | | | | | | | | | | | | |
Actual | | | $ | 1,000.00 | | | | $ | 1,412.50 | | | | $ | 8.14 | | | | | 1.35% | |
Hypothetical (5% before expenses) | | | $ | 1,000.00 | | | | $ | 1,018.25 | | | | $ | 6.81 | | | | | 1.35% | |
41
| | |
| Wasatch Funds | | SEPTEMBER 30, 2020 |
Operating Expenses (continued)
| | | | | | | | | | | | | | | | | | | | |
| | | Account Value | | | | |
| Fund/Class and Return | | Beginning of Period
April 1, 2020 | | End of Period
September 30, 2020 | | Expenses Paid
During Period* | | Annualized Expense
Ratio* |
International Opportunities Fund — Investor Class | | | | | | | | | | | | | | | | | | | | |
Actual | | | $ | 1,000.00 | | | | $ | 1,531.40 | | | | $ | 12.72 | | | | | 2.01% | |
Hypothetical (5% before expenses) | | | $ | 1,000.00 | | | | $ | 1,014.95 | | | | $ | 10.13 | | | | | 2.01% | |
International Opportunities Fund — Institutional Class | | | | | | | | | | | | | | | | | | | | |
Actual | | | $ | 1,000.00 | | | | $ | 1,534.20 | | | | $ | 12.16 | | | | | 1.92% | |
Hypothetical (5% before expenses) | | | $ | 1,000.00 | | | | $ | 1,015.40 | | | | $ | 9.67 | | | | | 1.92% | |
International Select Fund — Investor Class | | | | | | | | | | | | | | | | | | | | |
Actual | | | $ | 1,000.00 | | | | $ | 1,331.60 | | | | $ | 7.58 | | | | | 1.30% | |
Hypothetical (5% before expenses) | | | $ | 1,000.00 | | | | $ | 1,018.50 | | | | $ | 6.56 | | | | | 1.30% | |
International Select Fund — Institutional Class | | | | | | | | | | | | | | | | | | | | |
Actual | | | $ | 1,000.00 | | | | $ | 1,333.00 | | | | $ | 5.25 | | | | | 0.90% | |
Hypothetical (5% before expenses) | | | $ | 1,000.00 | | | | $ | 1,020.50 | | | | $ | 4.55 | | | | | 0.90% | |
Micro Cap Fund — Investor Class | | | | | | | | | | | | | | | | | | | | |
Actual | | | $ | 1,000.00 | | | | $ | 1,668.40 | | | | $ | 11.14 | | | | | 1.67% | |
Hypothetical (5% before expenses) | | | $ | 1,000.00 | | | | $ | 1,016.65 | | | | $ | 8.42 | | | | | 1.67% | |
Micro Cap Fund — Institutional Class | | | | | | | | | | | | | | | | | | | | |
Actual | | | $ | 1,000.00 | | | | $ | 1,666.70 | | | | $ | 10.67 | | | | | 1.60% | |
Hypothetical (5% before expenses) | | | $ | 1,000.00 | | | | $ | 1,017.00 | | | | $ | 8.07 | | | | | 1.60% | |
Micro Cap Value Fund — Investor Class | | | | | | | | | | | | | | | | | | | | |
Actual | | | $ | 1,000.00 | | | | $ | 1,559.80 | | | | $ | 11.20 | | | | | 1.75% | |
Hypothetical (5% before expenses) | | | $ | 1,000.00 | | | | $ | 1,016.25 | | | | $ | 8.82 | | | | | 1.75% | |
Micro Cap Value Fund — Institutional Class | | | | | | | | | | | | | | | | | | | | |
Actual | | | $ | 1,000.00 | | | | $ | 1,564.10 | | | | $ | 10.26 | | | | | 1.60% | |
Hypothetical (5% before expenses) | | | $ | 1,000.00 | | | | $ | 1,017.00 | | | | $ | 8.07 | | | | | 1.60% | |
Small Cap Growth Fund — Investor Class | | | | | | | | | | | | | | | | | | | | |
Actual | | | $ | 1,000.00 | | | | $ | 1,558.30 | | | | $ | 7.42 | | | | | 1.16% | |
Hypothetical (5% before expenses) | | | $ | 1,000.00 | | | | $ | 1,019.20 | | | | $ | 5.86 | | | | | 1.16% | |
Small Cap Growth Fund — Institutional Class | | | | | | | | | | | | | | | | | | | | |
Actual | | | $ | 1,000.00 | | | | $ | 1,558.60 | | | | $ | 6.72 | | | | | 1.05% | |
Hypothetical (5% before expenses) | | | $ | 1,000.00 | | | | $ | 1,019.75 | | | | $ | 5.30 | | | | | 1.05% | |
Small Cap Value Fund — Investor Class | | | | | | | | | | | | | | | | | | | | |
Actual | | | $ | 1,000.00 | | | | $ | 1,373.30 | | | | $ | 7.30 | | | | | 1.23% | |
Hypothetical (5% before expenses) | | | $ | 1,000.00 | | | | $ | 1,018.85 | | | | $ | 6.21 | | | | | 1.23% | |
Small Cap Value Fund — Institutional Class | | | | | | | | | | | | | | | | | | | | |
Actual | | | $ | 1,000.00 | | | | $ | 1,374.30 | | | | $ | 6.23 | | | | | 1.05% | |
Hypothetical (5% before expenses) | | | $ | 1,000.00 | | | | $ | 1,019.75 | | | | $ | 5.30 | | | | | 1.05% | |
Ultra Growth Fund — Investor Class | | | | | | | | | | | | | | | | | | | | |
Actual | | | $ | 1,000.00 | | | | $ | 1,681.30 | | | | $ | 7.98 | | | | | 1.19% | |
Hypothetical (5% before expenses) | | | $ | 1,000.00 | | | | $ | 1,019.05 | | | | $ | 6.01 | | | | | 1.19% | |
Ultra Growth Fund — Institutional Class | | | | | | | | | | | | | | | | | | | | |
Actual | | | $ | 1,000.00 | | | | $ | 1,682.10 | | | | $ | 7.04 | | | | | 1.05% | |
Hypothetical (5% before expenses) | | | $ | 1,000.00 | | | | $ | 1,019.75 | | | | $ | 5.30 | | | | | 1.05% | |
U.S. Treasury Fund | | | | | | | | | | | | | | | | | | | | |
Actual | | | $ | 1,000.00 | | | | $ | 987.30 | | | | $ | 3.28 | | | | | 0.66% | |
Hypothetical (5% before expenses) | | | $ | 1,000.00 | | | | $ | 1,021.70 | | | | $ | 3.34 | | | | | 0.66% | |
*Expenses are equal to a fund’s annualized expense ratio as indicated above multiplied by the average account value over the period, multiplied by the number of days in the most recent fiscal half-year divided by the number of days in the full fiscal year (183/366).
42
| | |
| Wasatch Core Growth Fund (WGROX / WIGRX) | | SEPTEMBER 30, 2020 |
Schedule of Investments
| | | | | | | | |
| Shares | | | | | Value | |
| | | | | | | |
| |
| | | | COMMON STOCKS 99.1% | |
| | |
| | | | Airlines 1.5% | | | |
| | 338,739 | | | Allegiant Travel Co. | | $ | 40,580,932 | |
| | | | | | | | |
| | |
| | | | Application Software 14.3% | | | |
| | 442,895 | | | Avalara, Inc.* | | | 56,398,249 | |
| | 559,377 | | | Five9, Inc.* | | | 72,540,010 | |
| | 366,086 | | | Guidewire Software, Inc.* | | | 38,171,787 | |
| | 199,117 | | | HubSpot, Inc.* | | | 58,187,961 | |
| | 1,389,696 | | | Medallia, Inc.* | | | 38,105,464 | |
| | 484,730 | | | Paylocity Holding Corp.* | | | 78,245,117 | |
| | 537,312 | | | Q2 Holdings, Inc.* | | | 49,035,093 | |
| | | | | | | | |
| | | | 390,683,681 | |
| | | | | | | | |
| | |
| | | | Asset Management & Custody
Banks 3.8% | | | |
| | 740,804 | | | Cohen & Steers, Inc. | | | 41,292,415 | |
| | 980,130 | | | Hamilton Lane, Inc., Class A | | | 63,306,597 | |
| | | | | | | | |
| | | | 104,599,012 | |
| | | | | | | | |
| | |
| | | | Automotive Retail 2.3% | | | |
| | 821,653 | | | Camping World Holdings, Inc., Class A | | | 24,444,177 | |
| | 936,405 | | | Monro, Inc. | | | 37,989,951 | |
| | | | | | | | |
| | | | 62,434,128 | |
| | | | | | | | |
| | |
| | | | Biotechnology 1.3% | | | |
| | 386,219 | | | Ligand Pharmaceuticals, Inc.* | | | 36,814,395 | |
| | | | | | | | |
| | |
| | | | Building Products 3.0% | | | |
| | 1,125,532 | | | Trex Co., Inc.* | | | 80,588,091 | |
| | | | | | | | |
| | |
| | | | Commercial Printing 0.9% | | | |
| | 308,572 | | | Cimpress plc* | | | 23,192,271 | |
| | | | | | | | |
| | |
| | | | Commodity Chemicals 2.2% | | | |
| | 3,169,709 | | | Valvoline, Inc. | | | 60,351,259 | |
| | | | | | | | |
| | |
| | | | Data Processing & Outsourced
Services 2.8% | | | |
| | 566,509 | | | Euronet Worldwide, Inc.* | | | 51,608,970 | |
| | 187,615 | | | WEX, Inc.* | | | 26,072,856 | |
| | | | | | | | |
| | | | 77,681,826 | |
| | | | | | | | |
| | |
| | | | Distributors 3.8% | | | |
| | 310,951 | | | Pool Corp. | | | 104,025,548 | |
| | | | | | | | |
| | |
| | | | Diversified Banks 0.6% | | | |
| | 9,322,681 | | | City Union Bank Ltd. (India) | | | 17,639,554 | |
| | | | | | | | |
| | |
| | | | Electronic Equipment &
Instruments 1.9% | | | |
| | 479,205 | | | Novanta, Inc.* | | | 50,479,455 | |
| | | | | | | | |
| |
| | | | Electronic Manufacturing Services 2.0% | |
| | 883,156 | | | Fabrinet* | | | 55,665,323 | |
| | | | | | | | |
| | |
| | | | Financial Exchanges & Data 2.9% | | | |
| | 438,955 | | | Morningstar, Inc. | | | 70,500,563 | |
| | 380,574 | | | Open Lending Corp., Class A* | | | 9,704,637 | |
| | | | | | | | |
| | | | 80,205,200 | |
| | | | | | | | |
| | | | | | | | |
| Shares | | | | | Value | |
| | | | | | | |
| | |
| | | | General Merchandise Stores 1.5% | | | |
| | 470,759 | | | Ollie’s Bargain Outlet Holdings, Inc.* | | $ | 41,120,799 | |
| | | | | | | | |
| | |
| | | | Health Care Equipment 0.1% | | | |
| | 45,524 | | | Cantel Medical Corp. | | | 2,000,325 | |
| | | | | | | | |
| | |
| | | | Health Care Facilities 4.1% | | | |
| | 1,141,543 | | | Ensign Group, Inc. (The) | | | 65,136,444 | |
| | 640,738 | | | Pennant Group, Inc. (The)* | | | 24,706,857 | |
| | 243,968 | | | U.S. Physical Therapy, Inc. | | | 21,195,940 | |
| | | | | | | | |
| | | | 111,039,241 | |
| | | | | | | | |
| | |
| | | | Health Care Supplies 1.5% | | | |
| | 507,370 | | | Neogen Corp.* | | | 39,701,702 | |
| | | | | | | | |
| | |
| | | | Home Improvement Retail 2.8% | | | |
| | 1,014,712 | | | Floor & Decor Holdings, Inc., Class A* | | | 75,900,458 | |
| | | | | | | | |
| | |
| | | | Homebuilding 1.4% | | | |
| | 376,552 | | | Installed Building Products, Inc.* | | | 38,314,166 | |
| | | | | | | | |
| | |
| | | | Industrial Machinery 8.8% | | | |
| | 1,707,732 | | | Altra Industrial Motion Corp. | | | 63,134,852 | |
| | 1,153,704 | | | Barnes Group, Inc. | | | 41,233,381 | |
| | 1,001,548 | | | Helios Technologies, Inc. | | | 36,456,347 | |
| | 491,597 | | | Kadant, Inc. | | | 53,888,863 | |
| | 374,381 | | | RBC Bearings, Inc.* | | | 45,378,721 | |
| | | | | | | | |
| | | | 240,092,164 | |
| | | | | | | | |
| | |
| | | | Industrial REITs 1.8% | | | |
| | 3,495,993 | | | Monmouth Real Estate Investment Corp. | | | 48,419,503 | |
| | | | | | | | |
| | |
| | | | Internet & Direct Marketing
Retail 1.0% | | | |
| | 1,125,644 | | | 1-800-Flowers.com, Inc., Class A* | | | 28,073,561 | |
| | | | | | | | |
| |
| | | | IT Consulting & Other Services 2.1% | |
| | 178,067 | | | EPAM Systems, Inc.* | | | 57,565,500 | |
| | | | | | | | |
| | |
| | | | Leisure Facilities 1.2% | | | |
| | 509,300 | | | Planet Fitness, Inc., Class A* | | | 31,383,066 | |
| | | | | | | | |
| | |
| | | | Leisure Products 1.6% | | | |
| | 976,351 | | | YETI Holdings, Inc.* | | | 44,248,227 | |
| | | | | | | | |
| | |
| | | | Life Sciences Tools & Services 5.7% | | | |
| | 446,882 | | | ICON plc* (Ireland) | | | 85,394,681 | |
| | 631,966 | | | Medpace Holdings, Inc.* | | | 70,622,201 | |
| | | | | | | | |
| | | | 156,016,882 | |
| | | | | | | | |
| | |
| | | | Managed Health Care 1.6% | | | |
| | 835,650 | | | HealthEquity, Inc.* | | | 42,927,340 | |
| | | | | | | | |
| | |
| | | | Regional Banks 2.9% | | | |
| | 1,281,451 | | | Bank OZK | | | 27,320,535 | |
| | 881,523 | | | Eagle Bancorp, Inc. | | | 23,616,001 | |
| | 1,041,872 | | | Webster Financial Corp. | | | 27,515,840 | |
| | | | | | | | |
| | | | 78,452,376 | |
| | | | | | | | |
| |
| | | | Research & Consulting Services 1.5% | |
| | 1,312,154 | | | Clarivate plc* | | | 40,663,652 | |
| | | | | | | | |
43
| | |
| Wasatch Core Growth Fund (WGROX / WIGRX) | | SEPTEMBER 30, 2020 |
Schedule of Investments (continued)
| | | | | | | | |
| Shares | | | | | Value | |
| | | | | | | |
| | |
| | | | Semiconductors 2.7% | | | |
| | 267,607 | | | Monolithic Power Systems, Inc. | | $ | 74,825,593 | |
| | | | | | | | |
| | |
| | | | Specialized REITs 1.8% | | | |
| | 1,506,274 | | | National Storage Affiliates Trust | | | 49,270,223 | |
| | | | | | | | |
| | |
| | | | Specialty Chemicals 1.3% | | | |
| | 352,829 | | | Balchem Corp. | | | 34,446,695 | |
| | | | | | | | |
| | |
| | | | Specialty Stores 3.7% | | | |
| | 491,752 | | | Five Below, Inc.* | | | 62,452,504 | |
| | 1,027,809 | | | National Vision Holdings, Inc.* | | | 39,303,416 | |
| | | | | | | | |
| | | | 101,755,920 | |
| | | | | | | | |
| | |
| | | | Systems Software 4.3% | | | |
| | 579,866 | | | CyberArk Software Ltd.* (Israel) | | | 59,969,742 | |
| | 555,995 | | | Proofpoint, Inc.* | | | 58,685,272 | |
| | | | | | | | |
| | | | 118,655,014 | |
| | | | | | | | |
| |
| | | | Trading Companies & Distributors 0.9% | |
| | 197,558 | | | SiteOne Landscape Supply, Inc.* | | | 24,092,198 | |
| | | | | | | | |
| | |
| | | | Trucking 1.5% | | | |
| | 220,900 | | | Old Dominion Freight Line, Inc. | | | 39,965,228 | |
| | | | | | | | |
| | |
| | | | Total Common Stocks
(cost $1,903,959,566) | | | 2,703,870,508 | |
| | | | | | | | |
| | |
Principal
Amount | | | | | Value | |
| | | | | | | |
| |
| | | | SHORT-TERM INVESTMENTS 1.0% | |
| | |
| | | | Repurchase Agreement 1.0% | | | |
| $ | 28,439,862 | | | Repurchase Agreement dated 9/30/20, 0.00% due 10/1/20 with Fixed Income Clearing Corp. collateralized by $26,600,200
of United States Treasury Notes 2.750% due 2/15/24; value: $29,008,755; repurchase
proceeds: $28,439,862 (cost $28,439,862) | | $ | 28,439,862 | |
| | | | | | | | |
| | |
| | | | Total Short-Term Investments
(cost $28,439,862) | | | 28,439,862 | |
| | | | | | | | |
| | |
| | | | Total Investments
(cost $1,932,399,428) 100.1% | | | 2,732,310,370 | |
| | |
| | | | Liabilities less Other Assets (0.1%) | | | (2,162,056 | ) |
| | | | | | | | |
| | |
| | | | Net Assets 100.0% | | $ | 2,730,148,314 | |
| | | | | | | | |
| |
| | | | *Non-income producing. REIT Real Estate Investment Trust. | |
| |
| | | | See Notes to Financial Statements. | |
At September 30, 2020, Wasatch Core Growth Fund’s investments, excluding short-term investments, were in the following countries (unaudited):
| | | | | |
| Country | | % |
India | | | | 0.6 | |
Ireland | | | | 3.1 | |
Israel | | | | 2.2 | |
United States | | | | 94.1 | |
| | | | | |
TOTAL | | | | 100.0 | % |
| | | | | |
44
| | |
| Wasatch Emerging India Fund (WAINX / WIINX) | | SEPTEMBER 30, 2020 |
Schedule of Investments
| | | | | | | | |
| Shares | | | | | Value | |
| | | | | | | |
| |
| | | | COMMON STOCKS 101.1% | |
| |
| | | | Apparel, Accessories & Luxury Goods 2.8% | |
| | 27,249 | | | Page Industries Ltd. (India) | | $ | 7,995,945 | |
| | | | | | | | |
| | |
| | | | Brewers 3.0% | | | |
| | 652,349 | | | United Breweries Ltd. (India) | | | 8,523,508 | |
| | | | | | | | |
| | |
| | | | Commodity Chemicals 4.2% | | | |
| | 1,491,411 | | | Berger Paints India Ltd. (India) | | | 11,752,594 | |
| | | | | | | | |
| | |
| | | | Consumer Finance 11.9% | | | |
| | 554,376 | | | Bajaj Finance Ltd. (India) | | | 24,532,904 | |
| | 781,167 | | | SBI Cards & Payment Services Ltd. (India) | | | 8,952,504 | |
| | | | | | | | |
| | | | 33,485,408 | |
| | | | | | | | |
| | |
| | | | Department Stores 4.4% | | | |
| | 1,362,498 | | | Trent Ltd. (India) | | | 12,560,355 | |
| | | | | | | | |
| | |
| | | | Diversified Banks 11.1% | | | |
| | 2,239,479 | | | City Union Bank Ltd. (India) | | | 4,237,344 | |
| | 1,150,198 | | | HDFC Bank Ltd.* (India) | | | 16,805,550 | |
| | 596,488 | | | Kotak Mahindra Bank Ltd.* (India) | | | 10,240,869 | |
| | | | | | | | |
| | | | 31,283,763 | |
| | | | | | | | |
| | |
| | | | Diversified Chemicals 3.4% | | | |
| | 501,664 | | | Pidilite Industries Ltd. (India) | | | 9,709,626 | |
| | | | | | | | |
| | |
| | | | Food Retail 4.8% | | | |
| | 454,374 | | | Avenue Supermarts Ltd.* (India) | | | 13,468,636 | |
| | | | | | | | |
| | |
| | | | Health Care Services 4.5% | | | |
| | 495,154 | | | Dr. Lal PathLabs Ltd. (India) | | | 12,617,098 | |
| | | | | | | | |
| | |
| | | | Industrial Conglomerates 2.1% | | | |
| | 24,166 | | | 3M India Ltd.* (India) | | | 5,994,007 | |
| | | | | | | | |
| | |
| | | | Industrial Machinery 4.3% | | | |
| | 5,868,490 | | | Elgi Equipments Ltd. (India) | | | 9,624,387 | |
| | 44,363 | | | GMM Pfaudler Ltd. (India) | | | 2,395,409 | |
| | | | | | | | |
| | | | 12,019,797 | |
| | | | | | | | |
| |
| | | | Interactive Media & Services 5.3% | |
| | 302,213 | | | Info Edge India Ltd. (India) | | | 14,836,414 | |
| | | | | | | | |
| |
| | | | Internet & Direct Marketing Retail 0.6% | |
| | 101,826 | | | MakeMyTrip Ltd.* (India) | | | 1,564,047 | |
| | | | | | | | |
| |
| | | | IT Consulting & Other Services 11.6% | |
| | 471,914 | | | Larsen & Toubro Infotech Ltd. (India) | | | 16,278,411 | |
| | 912,500 | | | Mindtree Ltd. (India) | | | 16,555,604 | |
| | | | | | | | |
| | | | 32,834,015 | |
| | | | | | | | |
| | |
| | | | Life & Health Insurance 2.2% | | | |
| | 1,092,127 | | | ICICI Prudential Life Insurance Co. Ltd. (India) | | | 6,202,239 | |
| | | | | | | | |
| |
| | | | Life Sciences Tools & Services 7.0% | |
| | 476,501 | | | Divi’s Laboratories Ltd. (India) | | | 19,711,047 | |
| | | | | | | | |
| | |
| | | | Packaged Foods & Meats 4.4% | | | |
| | 243,402 | | | Britannia Industries Ltd. (India) | | | 12,521,446 | |
| | | | | | | | |
| | | | | | | | |
| Shares | | | | | Value | |
| | | | | | | |
| | |
| | | | Personal Products 1.1% | | | |
| | 22,410 | | | Procter & Gamble Hygiene & Health Care Ltd. (India) | | $ | 3,010,300 | |
| | | | | | | | |
| |
| | | | Property & Casualty Insurance 4.2% | |
| | 685,427 | | | ICICI Lombard General Insurance Co. Ltd. (India) | | | 11,983,824 | |
| | | | | | | | |
| | |
| | | | Regional Banks 2.7% | | | |
| | 863,737 | | | AU Small Finance Bank Ltd.* (India) | | | 7,714,864 | |
| | | | | | | | |
| | |
| | | | Specialty Chemicals 2.2% | | | |
| | 232,627 | | | Asian Paints Ltd. (India) | | | 6,247,949 | |
| | | | | | | | |
| |
| | | | Thrifts & Mortgage Finance 3.3% | |
| | 474,203 | | | Aavas Financiers Ltd.* (India) | | | 9,255,250 | |
| | | | | | | | |
| | |
| | | | Total Common Stocks
(cost $206,218,413) | | | 285,292,132 | |
| | | | | | | | |
| | |
Principal
Amount | | | | | Value | |
| | | | | | | |
| |
| | | | SHORT-TERM INVESTMENTS 2.1% | |
| | |
| | | | Repurchase Agreement 2.1% | | | |
| $ | 6,008,474 | | | Repurchase Agreement dated 9/30/20, 0.00% due 10/1/20 with Fixed Income Clearing Corp. collateralized by $5,641,500 of United States Treasury Notes 2.625% due 12/31/23; value: $6,128,742; repurchase proceeds: $6,008,474 (cost $6,008,474) | | $ | 6,008,474 | |
| | | | | | | | |
| | |
| | | | Total Short-Term Investments
(cost $6,008,474) | | | 6,008,474 | |
| | | | | | | | |
| | |
| | | | Total Investments
(cost $212,226,887) 103.2% | | | 291,300,606 | |
| | |
| | | | Liabilities less Other Assets (3.2%) | | | (8,904,137 | ) |
| | | | | | | | |
| | |
| | | | Net Assets 100.0% | | $ | 282,396,469 | |
| | | | | | | | |
| |
| | | | *Non-income producing. | |
| |
| | | | See Notes to Financial Statements. | |
At September 30, 2020, Wasatch Emerging India Fund’s investments, excluding short-term investments, were in the following countries (unaudited):
| | | | | |
| Country | | % |
India | | | | 100.0 | |
| | | | | |
TOTAL | | | | 100.0 | % |
| | | | | |
45
| | |
| Wasatch Emerging Markets Select Fund (WAESX / WIESX) | | |
Schedule of Investments
| | | | | | | | |
| Shares | | | | | Value | |
| | | | | | | |
| |
| | | | COMMON STOCKS 100.0% | |
| | |
| | | | Airport Services 2.0% | | | |
| | 148,526 | | | Grupo Aeroportuario del Pacifico S.A.B. de C.V., Class B (Mexico) | | $ | 1,191,620 | |
| | | | | | | | |
| | |
| | | | Apparel, Accessories & Luxury Goods 1.4% | | | |
| | 2,871 | | | Page Industries Ltd. (India) | | | 842,466 | |
| | | | | | | | |
| | |
| | | | Application Software 4.1% | | | |
| | 13,489 | | | Globant S.A.* (Argentina) | | | 2,417,499 | |
| | | | | | | | |
| | |
| | | | Consumer Finance 7.2% | | | |
| | 94,898 | | | Bajaj Finance Ltd. (India) | | | 4,199,539 | |
| | | | | | | | |
| | |
| | | | Department Stores 1.6% | | | |
| | 100,027 | | | Trent Ltd. (India) | | | 922,111 | |
| | | | | | | | |
| | |
| | | | Diversified Banks 8.9% | | | |
| | 203,757 | | | HDFC Bank Ltd.* (India) | | | 2,977,095 | |
| | 567,364 | | | PT Bank Central Asia Tbk (Indonesia) | | | 1,033,304 | |
| | 46,037 | | | TCS Group Holding plc (Russia) | | | 1,217,679 | |
| | | | | | | | |
| | | | 5,228,078 | |
| | | | | | | | |
| | |
| | | | Diversified Chemicals 1.5% | | | |
| | 44,514 | | | Pidilite Industries Ltd. (India) | | | 861,561 | |
| | | | | | | | |
| | |
| | | | Drug Retail 3.5% | | | |
| | 491,330 | | | Raia Drogasil S.A. (Brazil) | | | 2,048,995 | |
| | | | | | | | |
| |
| | | | Electrical Components & Equipment 5.6% | |
| | 62,645 | | | Voltronic Power Technology Corp. (Taiwan) | | | 2,126,236 | |
| | 96,364 | | | Weg S.A. (Brazil) | | | 1,127,355 | |
| | | | | | | | |
| | | | 3,253,591 | |
| | | | | | | | |
| | |
| | | | General Merchandise Stores 1.8% | | | |
| | 65,785 | | | Magazine Luiza S.A. (Brazil) | | | 1,044,894 | |
| | | | | | | | |
| | |
| | | | Health Care Equipment 1.8% | | | |
| | 262,102 | | | Microport Scientific Corp. (Hong Kong) | | | 1,039,946 | |
| | | | | | | | |
| | |
| | | | Health Care Technology 1.1% | | | |
| | 51,900 | | | Ping An Healthcare & Technology Co. Ltd.* (China) | | | 664,651 | |
| | | | | | | | |
| | |
| | | | Industrial Machinery 3.1% | | | |
| | 139,000 | | | Techtronic Industries Co. Ltd. (Hong Kong) | | | 1,822,233 | |
| | | | | | | | |
| | |
| | | | Interactive Home Entertainment 4.7% | | | |
| | 18,045 | | | Sea Ltd. ADR* (Singapore) | | | 2,779,652 | |
| | | | | | | | |
| | |
| | | | Interactive Media & Services 2.1% | | | |
| | 18,200 | | | Tencent Holdings Ltd. (China) | | | 1,201,192 | |
| | | | | | | | |
| |
| | | | Internet & Direct Marketing Retail 12.8% | |
| | 4,861 | | | Alibaba Group Holding Ltd. ADR* (China) | | | 1,429,037 | |
| | 23,317 | | | MakeMyTrip Ltd.* (India) | | | 358,149 | |
| | 34,800 | | | Meituan Dianping, Class B* (China) | | | 1,085,753 | |
| | 3,111 | | | MercadoLibre, Inc.* | | | 3,367,595 | |
| | 40,408 | | | Trip.com Group Ltd. ADR* (China) | | | 1,258,305 | |
| | | | | | | | |
| | | | 7,498,839 | |
| | | | | | | | |
| | | | | | | | |
| Shares | | | | | Value | |
| | | | | | | |
| |
| | | | IT Consulting & Other Services 4.2% | |
| | 71,838 | | | Larsen & Toubro Infotech Ltd. (India) | | $ | 2,478,012 | |
| | | | | | | | |
| | |
| | | | Life & Health Insurance 2.4% | | | |
| | 120,098 | | | Discovery Ltd. (South Africa) | | | 917,190 | |
| | 85,892 | | | ICICI Prudential Life Insurance Co. Ltd. (India) | | | 487,785 | |
| | | | | | | | |
| | | | 1,404,975 | |
| | | | | | | | |
| | |
| | | | Life Sciences Tools & Services 3.2% | | | |
| | 78,000 | | | Wuxi Biologics Cayman, Inc.* (China) | | | 1,898,156 | |
| | | | | | | | |
| | |
| | | | Managed Health Care 1.4% | | | |
| | 75,100 | | | Hapvida Participacoes e Investimentos S.A. (Brazil) | | | 830,982 | |
| | | | | | | | |
| | |
| | | | Packaged Foods & Meats 5.0% | | | |
| | 23,851 | | | Britannia Industries Ltd. (India) | | | 1,226,979 | |
| | 435,393 | | | Vitasoy International Holdings Ltd. (Hong Kong) | | | 1,688,190 | |
| | | | | | | | |
| | | | 2,915,169 | |
| | | | | | | | |
| | |
| | | | Personal Products 1.2% | | | |
| | 582 | | | LG Household & Health Care Ltd. (South Korea) | | | 718,220 | |
| | | | | | | | |
| | |
| | | | Pharmaceuticals 1.6% | | | |
| | 71,640 | | | Jiangsu Hengrui Medicine Co. Ltd., Class A§§ (China) | | | 944,807 | |
| | | | | | | | |
| |
| | | | Property & Casualty Insurance 4.1% | |
| | 82,541 | | | ICICI Lombard General Insurance Co. Ltd. (India) | | | 1,443,125 | |
| | 253,740 | | | Qualitas Controladora S.A.B. de C.V. (Mexico) | | | 958,317 | |
| | | | | | | | |
| | | | 2,401,442 | |
| | | | | | | | |
| | |
| | | | Regional Banks 2.1% | | | |
| | 135,972 | | | AU Small Finance Bank Ltd.* (India) | | | 1,214,497 | |
| | | | | | | | |
| | |
| | | | Semiconductors 6.8% | | | |
| | 27,297 | | | ASPEED Technology, Inc. (Taiwan) | | | 1,069,750 | |
| | 49,959 | | | Silergy Corp. (Taiwan) | | | 2,941,098 | |
| | | | | | | | |
| | | | 4,010,848 | |
| | | | | | | | |
| | |
| | | | Specialized Finance 1.9% | | | |
| | 250,403 | | | Chailease Holding Co. Ltd. (Taiwan) | | | 1,132,615 | |
| | | | | | | | |
| | |
| | | | Specialty Chemicals 2.2% | | | |
| | 47,766 | | | Asian Paints Ltd. (India) | | �� | 1,282,910 | |
| | | | | | | | |
| | |
| | | | Thrifts & Mortgage Finance 0.7% | | | |
| | 20,124 | | | Aavas Financiers Ltd.* (India) | | | 392,770 | |
| | | | | | | | |
| | |
| | | | Total Common Stocks
(cost $37,508,739) | | | 58,642,270 | |
| | | | | | | | |
46
| | |
| Wasatch Emerging Markets Select Fund (WAESX / WIESX) | | SEPTEMBER 30, 2020 |
Schedule of Investments (continued)
| | | | | | | | |
| Shares | | | | | Value | |
| | | | | | | |
| |
| | | | PREFERRED STOCKS 1.1% | |
| | |
| | | | Diversified Banks 1.2% | | | |
| | 94,031 | | | Banco Davivienda S.A., 3.38% (Colombia) | | $ | 673,229 | |
| | | | | | | | |
| | |
| | | | Total Preferred Stocks
(cost $886,978) | | | 673,229 | |
| | | | | | | | |
| | |
Principal
Amount | | | | | Value | |
| | | | | | | |
| |
| | | | SHORT-TERM INVESTMENTS 0.7% | |
| | |
| | | | Repurchase Agreement 0.6% | | | |
| $ | 381,249 | | | Repurchase Agreement dated 9/30/20,
0.00% due 10/1/20 with Fixed Income Clearing Corp. collateralized by $358,000 of United States Treasury Notes 2.625% due 12/31/23; value: $388,920; repurchase
proceeds: $381,249 (cost $381,249) | | $ | 381,249 | |
| | | | | | | | |
| | |
| | | | Total Investments
(cost $38,776,966) 101.8%§ | | | 59,696,748 | |
| | |
| | | | Liabilities less Other Assets (1.8%) | | | (1,030,663 | ) |
| | | | | | | | |
| | |
| | | | Net Assets 100.0% | | $ | 58,666,085 | |
| | | | | | | | |
| |
| | | | *Non-income producing. | |
| |
| | | | §The aggregate amount of foreign securities fair valued pursuant to a systematic valuation model as a percent of net assets was 1.22%. | |
| |
| | | | §§The aggregate value of illiquid holdings at September 30, 2020, amounted to approximately $944,807, and represented 1.61% of net assets. | |
| |
| | | | ADR American Depositary Receipt. | |
| |
| | | | See Notes to Financial Statements. | |
At September 30, 2020, Wasatch Emerging Markets Select Fund’s investments, excluding short-term investments, were in the following countries (unaudited):
| | | | | |
| Country | | % |
Argentina | | | | 4.1 | |
Brazil | | | | 8.5 | |
China | | | | 14.3 | |
Colombia | | | | 1.1 | |
Hong Kong | | | | 7.7 | |
India | | | | 31.5 | |
Indonesia | | | | 1.7 | |
Mexico | | | | 3.6 | |
Russia | | | | 2.1 | |
Singapore | | | | 4.7 | |
South Africa | | | | 1.5 | |
South Korea | | | | 1.2 | |
Taiwan | | | | 12.3 | |
United States | | | | 5.7 | |
| | | | | |
TOTAL | | | | 100.0 | % |
| | | | | |
47
| | |
| Wasatch Emerging Markets Small Cap Fund (WAEMX / WIEMX) | | |
Schedule of Investments
| | | | | | | | |
| Shares | | | | | Value | |
| | | | | | | |
| |
| | | | COMMON STOCKS 98.7% | |
| | |
| | | | Airport Services 1.7% | | | |
| | 1,374,525 | | | Grupo Aeroportuario del Centro Norte S.A.B. de C.V.* (Mexico) | | $ | 6,302,121 | |
| | | | | | | | |
| | |
| | | | Application Software 6.0% | | | |
| | 123,709 | | | Agora, Inc., ADR* (China) | | | 5,317,013 | |
| | 95,972 | | | Globant S.A.* (Argentina) | | | 17,200,102 | |
| | | | | | | | |
| | | | 22,517,115 | |
| | | | | | | | |
| | |
| | | | Commodity Chemicals 2.5% | | | |
| | 1,197,391 | | | Berger Paints India Ltd. (India) | | | 9,435,662 | |
| | | | | | | | |
| | |
| | | | Communications Equipment 0.3% | | | |
| | 136,370 | | | Accton Technology Corp. (Taiwan) | | | 1,047,660 | |
| | | | | | | | |
| | |
| | | | Consumer Finance 6.5% | | | |
| | 265,148 | | | Bajaj Finance Ltd. (India) | | | 11,733,644 | |
| | 2,110,475 | | | Muangthai Capital Public Co. Ltd. (Thailand) | | | 3,280,186 | |
| | 2,414,829 | | | Srisawad Corp. Public Co. Ltd. (Thailand) | | | 3,715,122 | |
| | 6,671,723 | | | Unifin Financiera S.A.B. de C.V.* (Mexico) | | | 5,548,831 | |
| | | | | | | | |
| | | | 24,277,782 | |
| | | | | | | | |
| | |
| | | | Data Processing & Outsourced
Services 1.2% | | | |
| | 2,848,758 | | | Fawry for Banking & Payment Technology Services S.A.E.* (Egypt) | | | 4,609,693 | |
| | | | | | | | |
| | |
| | | | Department Stores 1.2% | | | |
| | 215,946 | | | Poya International Co. Ltd. (Taiwan) | | | 4,123,270 | |
| | 35,482 | | | Trent Ltd. (India) | | | 327,095 | |
| | | | | | | | |
| | | | 4,450,365 | |
| | | | | | | | |
| | |
| | | | Diversified Banks 2.5% | | | |
| | 352,916 | | | TCS Group Holding plc (Russia) | | | 9,334,628 | |
| | | | | | | | |
| | |
| | | | Diversified Chemicals 1.3% | | | |
| | 242,697 | | | Pidilite Industries Ltd. (India) | | | 4,697,361 | |
| | | | | | | | |
| | |
| | | | Drug Retail 4.1% | | | |
| | 282,185 | | | Clicks Group Ltd. (South Africa) | | | 3,745,564 | |
| | 2,795,550 | | | Raia Drogasil S.A. (Brazil) | | | 11,658,288 | |
| | | | | | | | |
| | | | 15,403,852 | |
| | | | | | | | |
| |
| | | | Electrical Components & Equipment 5.5% | |
| | 602,388 | | | Voltronic Power Technology Corp. (Taiwan) | | | 20,445,667 | |
| | | | | | | | |
| |
| | | | Electronic Equipment & Instruments 1.6% | |
| | 1,096,616 | | | Chroma ATE, Inc. (Taiwan) | | | 5,793,186 | |
| | | | | | | | |
| |
| | | | Electronic Manufacturing Services 1.6% | |
| | 92,851 | | | Fabrinet* | | | 5,852,398 | |
| | | | | | | | |
| | |
| | | | General Merchandise Stores 4.6% | | | |
| | 1,093,866 | | | Magazine Luiza S.A. (Brazil) | | | 17,374,392 | |
| | | | | | | | |
| | |
| | | | Health Care Equipment 3.6% | | | |
| | 2,084,000 | | | AK Medical Holdings Ltd. (China) | | | 5,318,871 | |
| | 2,025,019 | | | Microport Scientific Corp. (Hong Kong) | | | 8,034,701 | |
| | | | | | | | |
| | | | 13,353,572 | |
| | | | | | | | |
| | | | | | | | |
| Shares | | | | | Value | |
| | | | | | | |
| | |
| | | | Health Care Facilities 1.4% | | | |
| | 16,606,200 | | | Cleopatra Hospital* (Egypt) | | $ | 5,319,462 | |
| | | | | | | | |
| | |
| | | | Health Care Services 2.6% | | | |
| | 384,446 | | | Dr. Lal PathLabs Ltd. (India) | | | 9,796,130 | |
| | | | | | | | |
| | |
| | | | Health Care Supplies 0.7% | | | |
| | 440,001 | | | Shanghai Kindly Medical Instruments Co. Ltd., Class H (China) | | | 2,668,376 | |
| | | | | | | | |
| | |
| | | | Home Improvement Retail 1.2% | | | |
| | 41,666,224 | | | PT Ace Hardware Indonesia Tbk (Indonesia) | | | 4,466,238 | |
| | | | | | | | |
| | |
| | | | Hotels, Resorts & Cruise Lines 1.6% | | | |
| | 139,457 | | | Huazhu Group Ltd. ADR (China) | | | 6,030,121 | |
| | | | | | | | |
| | |
| | | | Human Resource & Employment
Services 3.0% | | | |
| | 84,875 | | | 51job, Inc. ADR* (China) | | | 6,619,401 | |
| | 189,249 | | | HeadHunter Group plc ADR (Russia) | | | 4,632,816 | |
| | | | | | | | |
| | | | 11,252,217 | |
| | | | | | | | |
| | |
| | | | Industrial Conglomerates 1.5% | | | |
| | 22,180 | | | 3M India Ltd.* (India) | | | 5,501,410 | |
| | | | | | | | |
| | |
| | | | Insurance Brokers 1.9% | | | |
| | 1,773,285 | | | TQM Corp. Public Co. Ltd. (Thailand) | | | 7,191,073 | |
| | | | | | | | |
| | |
| | | | Interactive Media & Services 3.0% | | | |
| | 231,533 | | | Info Edge India Ltd. (India) | | | 11,366,551 | |
| | | | | | | | |
| |
| | | | Internet & Direct Marketing Retail 1.9% | |
| | 183,648 | | | MakeMyTrip Ltd.* (India) | | | 2,820,833 | |
| | 178,000 | | | momo.com, Inc. (Taiwan) | | | 4,320,627 | |
| | | | | | | | |
| | | | 7,141,460 | |
| | | | | | | | |
| | |
| | | | IT Consulting & Other Services 6.1% | | | |
| | 335,075 | | | Larsen & Toubro Infotech Ltd. (India) | | | 11,558,225 | |
| | 625,061 | | | Mindtree Ltd. (India) | | | 11,340,562 | |
| | | | | | | | |
| | | | 22,898,787 | |
| | | | | | | | |
| | |
| | | | Packaged Foods & Meats 4.7% | | | |
| | 135,161 | | | Britannia Industries Ltd. (India) | | | 6,953,152 | |
| | 2,687,755 | | | Vitasoy International Holdings Ltd. (Hong Kong) | | | 10,421,486 | |
| | | | | | | | |
| | | | 17,374,638 | |
| | | | | | | | |
| | |
| | | | Pharmaceuticals 0.0% | | | |
| | 13,017,213 | | | China Animal Healthcare Ltd.* *** §§ (China) | | | 16,796 | |
| | | | | | | | |
| | |
| | | | Property & Casualty Insurance 4.8% | | | |
| | 631,929 | | | ICICI Lombard General Insurance Co. Ltd. (India) | | | 11,048,480 | |
| | 1,819,584 | | | Qualitas Controladora S.A.B. de C.V. (Mexico) | | | 6,872,146 | |
| | | | | | | | |
| | | | 17,920,626 | |
| | | | | | | | |
48
| | |
| Wasatch Emerging Markets Small Cap Fund (WAEMX / WIEMX) | | SEPTEMBER 30, 2020 |
Schedule of Investments (continued)
| | | | | | | | |
| Shares | | | | | Value | |
| | | | | | | |
| | |
| | | | Regional Banks 5.2% | | | |
| | 1,127,181 | | | AU Small Finance Bank Ltd.* (India) | | $ | 10,067,936 | |
| | 34,167,900 | | | PT Bank BTPN Syariah Tbk (Indonesia) | | | 7,531,634 | |
| | 782,362 | | | Regional S.A.B. de C.V.* (Mexico) | | | 1,843,786 | |
| | | | | | | | |
| | | | 19,443,356 | |
| | | | | | | | |
| | |
| | | | Semiconductors 12.2% | | | |
| | 174,374 | | | ASPEED Technology, Inc. (Taiwan) | | | 6,833,592 | |
| | 91,933 | | | LEENO Industrial, Inc. (South Korea) | | | 9,682,342 | |
| | 174,735 | | | Parade Technologies Ltd. (Taiwan) | | | 6,334,913 | |
| | 320,143 | | | Silergy Corp. (Taiwan) | | | 18,846,897 | |
| | 408,000 | | | Win Semiconductors Corp. (Taiwan) | | | 4,036,047 | |
| | | | | | | | |
| | | | 45,733,791 | |
| | | | | | | | |
| | |
| | | | Systems Software 1.7% | | | |
| | 72,533 | | | Douzone Bizon Co. Ltd. (South Korea) | | | 6,463,555 | |
| | | | | | | | |
| | |
| | | | Thrifts & Mortgage Finance 1.0% | | | |
| | 195,327 | | | Aavas Financiers Ltd.* (India) | | | 3,812,292 | |
| | | | | | | | |
| | |
| | | | Total Common Stocks
(cost $215,096,107) | | | 369,292,333 | |
| | | | | | | | |
| |
| | | | PREFERRED STOCKS 1.7% | |
| | |
| | | | Personal Products 1.7% | | | |
| | 10,702 | | | LG Household & Health Care Ltd., 1.56% (South Korea) | | | 6,466,398 | |
| | | | | | | | |
| | |
| | | | Total Preferred Stocks
(cost $5,002,853) | | | 6,466,398 | |
| | | | | | | | |
| |
| | | | WARRANTS 0.0% | |
| | |
| | | | Consumer Finance 0.0% | | | |
| | 96,593 | | | Srisawad Corp. Public Co. Ltd. expiring 8/29/2025* (Thailand) | | | 35,665 | |
| | | | | | | | |
| | |
| | | | Total Warrants
(cost $0) | | | 35,665 | |
| | | | | | | | |
| | | | | | | | |
Principal
Amount | | | | | Value | |
| | | | | | | |
| |
| | | | SHORT-TERM INVESTMENTS 1.5% | |
| | |
| | | | Repurchase Agreement 1.5% | | | |
| $ | 5,440,477 | | | Repurchase Agreement dated 9/30/20, 0.00% due 10/1/20 with Fixed Income
Clearing Corp. collateralized by $4,663,500 of United States Treasury Notes 2.875% due 5/15/28; value: $5,549,384; repurchase proceeds: $5,440,477 (cost $5,440,477) | | $ | 5,440,477 | |
| | | | | | | | |
| | |
| | | | Total Short-Term Investments
(cost $5,440,477) | | | 5,440,477 | |
| | | | | | | | |
| | |
| | | | Total Investments
(cost $225,539,437) 101.9%�� | | | 381,234,873 | |
| | | | | | | | |
| | |
| | | | Liabilities less Other Assets (1.9%) | | | (7,157,854 | ) |
| | | | | | | | |
| | |
| | | | Net Assets 100.0% | | $ | 374,077,019 | |
| | | | | | | | |
| |
| | | | *Non-income producing. ***Security was fair valued under procedures adopted by the Board of Trustees (see Note 12). §The aggregate amount of foreign securities fair valued pursuant to a systematic valuation model as a percent of net assets was 6.04%. §§The aggregate value of illiquid holdings at September 30, 2020, amounted to approximately $16,796, and represented 0.01% of net assets. ADR American Depositary Receipt. | |
| |
| | | | See Notes to Financial Statements. | |
At September 30, 2020, Wasatch Emerging Markets Small Cap Fund’s investments, excluding short-term investments, were in the following countries (unaudited):
| | | | | |
| Country | | % |
Argentina | | | | 4.6 | |
Brazil | | | | 7.7 | |
China | | | | 6.9 | |
Egypt | | | | 2.6 | |
Hong Kong | | | | 4.9 | |
India | | | | 29.4 | |
Indonesia | | | | 3.2 | |
Mexico | | | | 5.5 | |
Russia | | | | 3.7 | |
South Africa | | | | 1.0 | |
South Korea | | | | 6.0 | |
Taiwan | | | | 19.1 | |
Thailand | | | | 3.8 | |
United States | | | | 1.6 | |
| | | | | |
TOTAL | | | | 100.0 | % |
| | | | | |
49
| | |
| Wasatch Frontier Emerging Small Countries Fund (WAFMX / WIFMX) | | |
Schedule of Investments
| | | | | | | | |
| Shares | | | | | Value | |
| | | | | | | |
| |
| | | | COMMON STOCKS 98.3% | |
| | |
| | | | Airport Services 1.7% | | | |
| | 183,600 | | | Grupo Aeroportuario del Centro Norte S.A.B. de C.V.* (Mexico) | | $ | 841,796 | |
| | | | | | | | |
| | |
| | | | Application Software 5.2% | | | |
| | 14,689 | | | Globant S.A.* (Argentina) | | | 2,632,563 | |
| | | | | | | | |
| | |
| | | | Asset Management & Custody
Banks 2.9% | | | |
| | 5,154,275 | | | Vostok Emerging Finance Ltd.* (Sweden) | | | 1,479,088 | |
| | | | | | | | |
| | |
| | | | Brewers 0.6% | | | |
| | 36,900 | | | Saigon Beer Alcohol Beverage Corp. (Vietnam) | | | 291,768 | |
| | | | | | | | |
| | |
| | | | Consumer Finance 10.2% | | | |
| | 289,466 | | | ASA International Group plc* (United Kingdom) | | | 709,673 | |
| | 52,874 | | | Bajaj Finance Ltd. (India) | | | 2,339,843 | |
| | 189,600 | | | Muangthai Capital Public Co. Ltd. (Thailand) | | | 294,684 | |
| | 419,500 | | | Srisawad Corp. Public Co. Ltd. (Thailand) | | | 645,384 | |
| | 1,401,116 | | | Unifin Financiera S.A.B. de C.V.* (Mexico) | | | 1,165,300 | |
| | | | | | | | |
| | | | 5,154,884 | |
| | | | | | | | |
| |
| | | | Data Processing & Outsourced Services 3.2% | |
| | 987,858 | | | Fawry for Banking & Payment Technology Services S.A.E.* (Egypt) | | | 1,598,494 | |
| | | | | | | | |
| | |
| | | | Diversified Banks 12.4% | | | |
| | 521,520 | | | Bank for Foreign Trade of Vietnam JSC (Vietnam) | | | 1,891,978 | |
| | 125,235 | | | Commercial International Bank Egypt S.A.E. (Egypt) | | | 528,267 | |
| | 369 | | | Credicorp Ltd. (Peru) | | | 45,752 | |
| | 825,600 | | | PT Bank Central Asia Tbk (Indonesia) | | | 1,503,613 | |
| | 86,084 | | | TCS Group Holding plc (Russia) | | | 2,276,922 | |
| | | | | | | | |
| | | | 6,246,532 | |
| | | | | | | | |
| | |
| | | | Drug Retail 5.0% | | | |
| | 18,489 | | | Clicks Group Ltd. (South Africa) | | | 245,412 | |
| | 542,500 | | | Raia Drogasil S.A. (Brazil) | | | 2,262,389 | |
| | | | | | | | |
| | | | 2,507,801 | |
| | | | | | | | |
| |
| | | | Electrical Components & Equipment 1.2% | |
| | 50,400 | | | Weg S.A. (Brazil) | | | 589,626 | |
| | | | | | | | |
| | |
| | | | Food Retail 3.4% | | | |
| | 312,400 | | | CP ALL Public Co. Ltd. (Thailand) | | | 593,991 | |
| | 477,954 | | | Philippine Seven Corp. (Philippines) | | | 1,139,676 | |
| | | | | | | | |
| | | | 1,733,667 | |
| | | | | | | | |
| | |
| | | | General Merchandise Stores 3.0% | | | |
| | 95,100 | | | Magazine Luiza S.A. (Brazil) | | | 1,510,518 | |
| | | | | | | | |
| | |
| | | | Health Care Distributors 0.8% | | | |
| | 938,429 | | | Ibnsina Pharma S.A.E. (Egypt) | | | 429,183 | |
| | | | | | | | |
| | | | | | | | |
| Shares | | | | | Value | |
| | | | | | | |
| | |
| | | | Health Care Facilities 3.5% | | | |
| | 5,526,430 | | | Cleopatra Hospital* (Egypt) | | $ | 1,770,280 | |
| | | | | | | | |
| | |
| | | | Home Improvement Retail 0.7% | | | |
| | 1,095,900 | | | Wilcon Depot, Inc. (Philippines) | | | 361,683 | |
| | | | | | | | |
| | |
| | | | Human Resource & Employment
Services 1.0% | | | |
| | 20,884 | | | HeadHunter Group plc ADR (Russia) | | | 511,240 | |
| | | | | | | | |
| | |
| | | | Hypermarkets & Super Centers 0.5% | | | |
| | 7,445 | | | InRetail Peru Corp. (Peru) | | | 249,408 | |
| | | | | | | | |
| | |
| | | | Insurance Brokers 4.3% | | | |
| | 529,488 | | | TQM Corp. Public Co. Ltd. (Thailand) | | | 2,147,194 | |
| | | | | | | | |
| | |
| | | | Interactive Home Entertainment 9.0% | | | |
| | 29,421 | | | Sea Ltd. ADR* (Singapore) | | | 4,532,011 | |
| | | | | | | | |
| |
| | | | Internet & Direct Marketing Retail 12.8% | |
| | 3,239 | | | MercadoLibre, Inc.* | | | 3,506,153 | |
| | 11,040 | | | Naspers Ltd., Class N (South Africa) | | | 1,950,949 | |
| | 11,040 | | | Prosus N.V.* (Netherlands) | | | 1,018,681 | |
| | | | | | | | |
| | | | 6,475,783 | |
| | | | | | | | |
| | |
| | | | Life & Health Insurance 1.6% | | | |
| | 106,702 | | | Discovery Ltd. (South Africa) | | | 814,885 | |
| | | | | | | | |
| | |
| | | | Property & Casualty Insurance 4.6% | | | |
| | 621,728 | | | Qualitas Controladora S.A.B. de C.V. (Mexico) | | | 2,348,122 | |
| | | | | | | | |
| | |
| | | | Regional Banks 4.7% | | | |
| | 176,252 | | | AU Small Finance Bank Ltd.* (India) | | | 1,574,276 | |
| | 3,580,900 | | | PT Bank BTPN Syariah Tbk (Indonesia) | | | 789,338 | |
| | | | | | | | |
| | | | 2,363,614 | |
| | | | | | | | |
| | |
| | | | Technology Distributors 3.3% | | | |
| | 770,534 | | | FPT Corp. (Vietnam) | | | 1,661,923 | |
| | | | | | | | |
| |
| | | | Wireless Telecommunication Services 2.7% | |
| | 4,919,838 | | | Safaricom plc (Kenya) | | | 1,351,255 | |
| | | | | | | | |
| | |
| | | | Total Common Stocks
(cost $41,528,033) | | | 49,603,319 | |
| | | | | | | | |
| |
| | | | PREFERRED STOCKS 2.6% | |
| | |
| | | | Diversified Banks 2.6% | | | |
| | 183,559 | | | Banco Davivienda S.A., 3.38% (Colombia) | | | 1,314,219 | |
| | | | | | | | |
| | |
| | | | Total Preferred Stocks
(cost $2,032,420) | | | 1,314,219 | |
| | | | | | | | |
50
| | |
| Wasatch Frontier Emerging Small Countries Fund (WAFMX / WIFMX) | | SEPTEMBER 30, 2020 |
Schedule of Investments (continued)
| | | | | | | | |
| Shares | | | | | Value | |
| | | | | | | |
| |
| | | | WARRANTS 0.0% | |
| | |
| | | | Consumer Finance 0.0% | | | |
| | 16,780 | | | Srisawad Corp. Public Co. Ltd. expiring 8/29/2025* (Thailand) | | $ | 6,196 | |
| | | | | | | | |
| | |
| | | | Total Warrants
(cost $0) | | | 6,196 | |
| | | | | | | | |
| | |
Principal
Amount | | | | | Value | |
| | | | | | | |
| |
| | | | SHORT-TERM INVESTMENTS 0.2% | |
| | |
| | | | Repurchase Agreement 0.2% | | | |
| $ | 105,576 | | | Repurchase Agreement dated 9/30/20,
0.00% due 10/1/20 with Fixed Income
Clearing Corp. collateralized by $99,200
of United States Treasury Notes 2.625%
due 12/31/23; value: $107,768; repurchase
proceeds: $105,576 (cost $105,576) | | $ | 105,576 | |
| | | | | | | | |
| | |
| | | | Total Short-Term Investments
(cost $105,576) | | | 105,576 | |
| | | | | | | | |
| | |
| | | | Total Investments
(cost $43,666,029) 101.1% | | | 51,029,310 | |
| | |
| | | | Liabilities less Other Assets (1.1%) | | | (569,786 | ) |
| | | | | | | | |
| | |
| | | | Net Assets 100.0% | | $ | 50,459,524 | |
| | | | | | | | |
| |
| | | | *Non-income producing. ADR American Depositary Receipt. | |
| |
| | | | See Notes to Financial Statements. | |
At September 30, 2020, Wasatch Frontier Emerging Small Countries Fund’s investments, excluding short-term investments, were in the following countries (unaudited):
| | | | | |
| Country | | % |
Argentina | | | | 5.2 | |
Brazil | | | | 8.6 | |
Colombia | | | | 2.6 | |
Egypt | | | | 8.5 | |
India | | | | 7.7 | |
Indonesia | | | | 4.5 | |
Kenya | | | | 2.7 | |
Mexico | | | | 8.5 | |
Netherlands | | | | 2.0 | |
Peru | | | | 0.6 | |
Philippines | | | | 2.9 | |
Russia | | | | 5.5 | |
Singapore | | | | 8.9 | |
South Africa | | | | 5.9 | |
Sweden | | | | 2.9 | |
Thailand | | | | 7.2 | |
United Kingdom | | | | 1.4 | |
United States | | | | 6.9 | |
Vietnam | | | | 7.5 | |
| | | | | |
TOTAL | | | | 100.0 | % |
| | | | | |
51
| | |
| Wasatch Global Opportunities Fund (WAGOX / WIGOX) | | |
Schedule of Investments
| | | | | | | | |
| Shares | | | | | Value | |
| | | | | | | |
| |
| | | | COMMON STOCKS 100.0% | |
| | |
| | | | Airlines 0.9% | | | |
| | 10,185 | | | Allegiant Travel Co. | | $ | 1,220,163 | |
| | | | | | | | |
| | |
| | | | Application Software 16.6% | | | |
| | 25,745 | | | Five9, Inc.* | | | 3,338,612 | |
| | 23,393 | | | Globant S.A.* (Argentina) | | | 4,192,493 | |
| | 12,121 | | | HubSpot, Inc.* | | | 3,542,120 | |
| | 64,483 | | | Medallia, Inc.* | | | 1,768,124 | |
| | 17,197 | | | Paylocity Holding Corp.* | | | 2,775,940 | |
| | 15,725 | | | Q2 Holdings, Inc.* | | | 1,435,063 | |
| | 133,018 | | | Systena Corp. (Japan) | | | 2,300,525 | |
| | 143,111 | | | Technology One Ltd. (Australia) | | | 813,875 | |
| | 28,480 | | | Zendesk, Inc.* | | | 2,931,162 | |
| | | | | | | | |
| | | | 23,097,914 | |
| | | | | | | | |
| | |
| | | | Automotive Retail 0.6% | | | |
| | 21,743 | | | Monro, Inc. | | | 882,113 | |
| | | | | | | | |
| | |
| | | | Biotechnology 2.2% | | | |
| | 96,768 | | | Abcam plc (United Kingdom) | | | 1,528,342 | |
| | 22,320 | | | Esperion Therapeutics, Inc.* | | | 829,634 | |
| | 83,399 | | | Sangamo Therapeutics, Inc.* | | | 788,121 | |
| | | | | | | | |
| | | | 3,146,097 | |
| | | | | | | | |
| | |
| | | | Building Products 2.9% | | | |
| | 56,884 | | | Trex Co., Inc.* | | | 4,072,894 | |
| | | | | | | | |
| | |
| | | | Commodity Chemicals 0.9% | | | |
| | 63,067 | | | Valvoline, Inc. | | | 1,200,796 | |
| | | | | | | | |
| | |
| | | | Consumer Finance 3.2% | | | |
| | 47,701 | | | Bajaj Finance Ltd. (India) | | | 2,110,921 | |
| | 747,808 | | | Srisawad Corp. Public Co. Ltd. (Thailand) | | | 1,150,474 | |
| | 1,450,700 | | | Unifin Financiera S.A.B. de C.V.* (Mexico) | | | 1,206,538 | |
| | | | | | | | |
| | | | 4,467,933 | |
| | | | | | | | |
| | |
| | | | Data Processing & Outsourced
Services 3.0% | | | |
| | 22,356 | | | Euronet Worldwide, Inc.* | | | 2,036,632 | |
| | 10,800 | | | GMO Payment Gateway, Inc. (Japan) | | | 1,151,017 | |
| | 109,530 | | | Infomart Corp. (Japan) | | | 965,845 | |
| | | | | | | | |
| | | | 4,153,494 | |
| | | | | | | | |
| | |
| | | | Diversified Chemicals 1.0% | | | |
| | 70,007 | | | Pidilite Industries Ltd. (India) | | | 1,354,974 | |
| | | | | | | | |
| | |
| | | | Diversified Real Estate
Activities 1.0% | | | |
| | 50,036 | | | Patrizia AG (Germany) | | | 1,363,954 | |
| | | | | | | | |
| | |
| | | | Diversified Support Services 1.9% | | | |
| | 24,881 | | | Copart, Inc.* | | | 2,616,486 | |
| | | | | | | | |
| | |
| | | | Drug Retail 2.3% | | | |
| | 23,123 | | | Ain Holdings, Inc. (Japan) | | | 1,613,666 | |
| | 23,100 | | | Sugi Holdings Co. Ltd. (Japan) | | | 1,629,583 | |
| | | | | | | | |
| | | | 3,243,249 | |
| | | | | | | | |
| | | | | | | | |
| Shares | | | | | Value | |
| | | | | | | |
| | |
| | | | Electrical Components &
Equipment 2.3% | | | |
| | 96,896 | | | Voltronic Power Technology Corp. (Taiwan) | | $ | 3,288,750 | |
| | | | | | | | |
| | |
| | | | Financial Exchanges & Data 1.6% | | | |
| | 89,505 | | | Open Lending Corp., Class A* | | | 2,282,377 | |
| | | | | | | | |
| | |
| | | | General Merchandise Stores 1.6% | | | |
| | 25,220 | | | Ollie’s Bargain Outlet Holdings, Inc.* | | | 2,202,967 | |
| | | | | | | | |
| | |
| | | | Health Care Equipment 1.7% | | | |
| | 2,778 | | | Cantel Medical Corp. | | | 122,066 | |
| | 16,241 | | | Cochlear Ltd. (Australia) | | | 2,303,257 | |
| | | | | | | | |
| | | | 2,425,323 | |
| | | | | | | | |
| | |
| | | | Health Care Facilities 2.9% | | | |
| | 51,411 | | | Ensign Group, Inc. (The) | | | 2,933,511 | |
| | 29,896 | | | Pennant Group, Inc. (The)* | | | 1,152,790 | |
| | | | | | | | |
| | | | 4,086,301 | |
| | | | | | | | |
| | |
| | | | Health Care Services 1.0% | | | |
| | 56,573 | | | Dr. Lal PathLabs Ltd. (India) | | | 1,441,546 | |
| | | | | | | | |
| | |
| | | | Health Care Supplies 1.0% | | | |
| | 43,600 | | | Asahi Intecc Co. Ltd. (Japan) | | | 1,364,244 | |
| | | | | | | | |
| | |
| | | | Health Care Technology 0.5% | | | |
| | 15,600 | | | JMDC, Inc.* (Japan) | | | 684,853 | |
| | | | | | | | |
| | |
| | | | Home Improvement Retail 0.9% | | | |
| | 16,641 | | | Floor & Decor Holdings, Inc., Class A* | | | 1,244,747 | |
| | | | | | | | |
| | |
| | | | Homebuilding 2.0% | | | |
| | 24,421 | | | LGI Homes, Inc.* | | | 2,836,988 | |
| | | | | | | | |
| | |
| | | | Human Resource & Employment
Services 1.3% | | | |
| | 15,206 | | | en-japan, Inc. (Japan) | | | 380,781 | |
| | 48,330 | | | SMS Co. Ltd. (Japan) | | | 1,393,099 | |
| | | | | | | | |
| | | | 1,773,880 | |
| | | | | | | | |
| | |
| | | | Industrial Conglomerates 0.7% | | | |
| | 3,832 | | | 3M India Ltd.* (India) | | | 950,469 | |
| | | | | | | | |
| | |
| | | | Industrial Machinery 6.6% | | | |
| | 34,470 | | | Altra Industrial Motion Corp. | | | 1,274,356 | |
| | 29,139 | | | Helios Technologies, Inc. | | | 1,060,660 | |
| | 57,629 | | | Kornit Digital Ltd.* (Israel) | | | 3,738,393 | |
| | 59,400 | | | MISUMI Group, Inc. (Japan) | | | 1,653,051 | |
| | 12,482 | | | RBC Bearings, Inc.* | | | 1,512,943 | |
| | | | | | | | |
| | | | 9,239,403 | |
| | | | | | | | |
| | |
| | | | Internet & Direct Marketing
Retail 4.2% | | | |
| | 37,039 | | | MakeMyTrip Ltd.* (India) | | | 568,919 | |
| | 3,952 | | | MercadoLibre, Inc.* | | | 4,277,961 | |
| | 214,073 | | | Trainline plc* (United Kingdom) | | | 1,002,711 | |
| | | | | | | | |
| | | | 5,849,591 | |
| | | | | | | | |
| | |
| | | | IT Consulting & Other Services 0.9% | | | |
| | 19,508 | | | Endava plc ADR* (United Kingdom) | | | 1,231,930 | |
| | | | | | | | |
52
| | |
| Wasatch Global Opportunities Fund (WAGOX / WIGOX) | | SEPTEMBER 30, 2020 |
Schedule of Investments (continued)
| | | | | | | | |
| Shares | | | | | Value | |
| | | | | | | |
| | |
| | | | Leisure Facilities 0.6% | | | |
| | 12,858 | | | Planet Fitness, Inc., Class A* | | $ | 792,310 | |
| | | | | | | | |
| | |
| | | | Life & Health Insurance 0.5% | | | |
| | 133,797 | | | ICICI Prudential Life Insurance Co. Ltd. (India) | | | 759,839 | |
| | | | | | | | |
| | |
| | | | Managed Health Care 0.8% | | | |
| | 22,413 | | | HealthEquity, Inc.* | | | 1,151,356 | |
| | | | | | | | |
| | |
| | | | Other Diversified Financial
Services 0.9% | | | |
| | 1,997 | | | Hypoport SE* (Germany) | | | 1,250,298 | |
| | | | | | | | |
| | |
| | | | Packaged Foods & Meats 4.2% | | | |
| | 25,541 | | | Freshpet, Inc.* | | | 2,851,653 | |
| | 782,000 | | | Vitasoy International Holdings Ltd. (Hong Kong) | | | 3,032,122 | |
| | | | | | | | |
| | | | 5,883,775 | |
| | | | | | | | |
| | |
| | | | Pharmaceuticals 1.3% | | | |
| | 69,100 | | | Intra-Cellular Therapies, Inc.* | | | 1,773,106 | |
| | | | | | | | |
| | |
| | | | Property & Casualty Insurance 1.7% | | | |
| | 136,141 | | | ICICI Lombard General Insurance Co. Ltd. (India) | | | 2,380,253 | |
| | | | | | | | |
| | |
| | | | Regional Banks 3.0% | | | |
| | 364,704 | | | AU Small Finance Bank Ltd.* (India) | | | 3,257,521 | |
| | 34,025 | | | Eagle Bancorp, Inc. | | | 911,530 | |
| | | | | | | | |
| | | | 4,169,051 | |
| | | | | | | | |
| | |
| | | | Research & Consulting
Services 1.4% | | | |
| | 35,000 | | | Nihon M&A Center, Inc. (Japan) | | | 1,984,545 | |
| | | | | | | | |
| | |
| | | | Restaurants 0.9% | | | |
| | 23,051 | | | Domino’s Pizza Enterprises Ltd. (Australia) | | | 1,307,944 | |
| | | | | | | | |
| | |
| | | | Semiconductor Equipment 1.2% | | | |
| | 33,591 | | | Nova Measuring Instruments Ltd.* (Israel) | | | 1,751,435 | |
| | | | | | | | |
| | |
| | | | Semiconductors 8.0% | | | |
| | 45,000 | | | ASPEED Technology, Inc. (Taiwan) | | | 1,763,518 | |
| | 21,545 | | | Melexis N.V. (Belgium) | | | 1,678,555 | |
| | 12,242 | | | Monolithic Power Systems, Inc. | | | 3,422,986 | |
| | 72,000 | | | Silergy Corp. (Taiwan) | | | 4,238,657 | |
| | | | | | | | |
| | | | 11,103,716 | |
| | | | | | | | |
| | |
| | | | Soft Drinks 1.4% | | | |
| | 63,472 | | | Fevertree Drinks plc (United Kingdom) | | | 1,896,828 | |
| | | | | | | | |
| | |
| | | | Specialty Stores 1.4% | | | |
| | 14,926 | | | Five Below, Inc.* | | | 1,895,602 | |
| | | | | | | | |
| | |
| | | | Systems Software 2.4% | | | |
| | 19,486 | | | CyberArk Software Ltd.* (Israel) | | | 2,015,242 | |
| | 20,983 | | | Rapid7, Inc.* | | | 1,284,999 | |
| | | | | | | | |
| | | | 3,300,241 | |
| | | | | | | | |
| | | | | | | | |
| Shares | | | | | Value | |
| | | | | | | |
| | |
| | | | Thrifts & Mortgage Finance 0.8% | | | |
| | 54,689 | | | Aavas Financiers Ltd.* (India) | | $ | 1,067,392 | |
| | | | | | | | |
| | |
| | | | Trading Companies &
Distributors 3.8% | | | |
| | 87,767 | | | Diploma plc (United Kingdom) | | | 2,493,767 | |
| | 106,046 | | | Electrocomponents plc (United Kingdom) | | | 974,959 | |
| | 37,700 | | | MonotaRO Co. Ltd. (Japan) | | | 1,865,965 | |
| | | | | | | | |
| | | | 5,334,691 | |
| | | | | | | | |
| | |
| | | | Total Common Stocks
(cost $82,850,423) | | | 139,525,818 | |
| | | | | | | | |
| | |
| | | | WARRANTS 0.0% | | | | |
| | |
| | | | Consumer Finance 0.0% | | | |
| | 30,336 | | | Srisawad Corp. Public Co. Ltd. expiring 8/29/2025* (Thailand) | | | 11,201 | |
| | | | | | | | |
| | |
| | | | Total Warrants
(cost $0) | | | 11,201 | |
| | | | | | | | |
| | |
Principal
Amount | | | | | Value | |
| | | | | | | |
| |
| | | | SHORT-TERM INVESTMENTS 0.5% | |
| | |
| | | | Repurchase Agreement 0.5% | | | |
| $ | 720,290 | | | Repurchase Agreement dated 9/30/20, 0.00% due 10/1/20 with Fixed Income Clearing Corp. collateralized by $676,300 of United States Treasury Notes 2.625% due 12/31/23; value: $734,710; repurchase proceeds: $720,290 (cost $720,290) | | $ | 720,290 | |
| | | | | | | | |
| | |
| | | | Total Short-Term Investments
(cost $720,290) | | | 720,290 | |
| | | | | | | | |
| | |
| | | | Total Investments
(cost $83,570,713) 100.5% | | | 140,257,309 | |
| | |
| | | | Liabilities less Other Assets (0.5%) | | | (764,156 | ) |
| | | | | | | | |
| | |
| | | | NET ASSETS 100.0% | | $ | 139,493,153 | |
| | | | | | | | |
| |
| | | | *Non-income producing. ADR American Depositary Receipt. | |
| |
| | | | See Notes to Financial Statements. | |
53
| | |
| Wasatch Global Opportunities Fund (WAGOX / WIGOX) | | SEPTEMBER 30, 2020 |
Schedule of Investments (continued)
At September 30, 2020, Wasatch Global Opportunities Fund’s investments, excluding short-term investments, were in the following countries (unaudited):
| | | | | |
| Country | | % |
Argentina | | | | 3.0 | |
Australia | | | | 3.2 | |
Belgium | | | | 1.2 | |
Germany | | | | 1.9 | |
Hong Kong | | | | 2.2 | |
India | | | | 9.9 | |
Israel | | | | 5.4 | |
Japan | | | | 12.1 | |
Mexico | | | | 0.9 | |
Taiwan | | | | 6.6 | |
Thailand | | | | 0.8 | |
United Kingdom | | | | 6.5 | |
United States | | | | 46.3 | |
| | | | | |
TOTAL | | | | 100.0 | % |
| | | | | |
54
| | |
| Wasatch Global Select Fund (WAGSX / WGGSX) | | SEPTEMBER 30, 2020 |
Schedule of Investments
| | | | | | | | |
| Shares | | | | | Value | |
| | | | | | | |
| | |
| | | | COMMON STOCKS 96.0% | | | | |
| | |
| | | | Aerospace & Defense 2.4% | | | |
| | 3,688 | | | HEICO Corp., Class A | | $ | 326,978 | |
| | | | | | | | |
| | |
| | | | Application Software 14.8% | | | |
| | 2,267 | | | Dassault Systemes SE (France) | | | 424,607 | |
| | 1,422 | | | DocuSign, Inc.* | | | 306,071 | |
| | 2,105 | | | Guidewire Software, Inc.* | | | 219,488 | |
| | 2,039 | | | Paylocity Holding Corp.* | | | 329,135 | |
| | 826 | | | Tyler Technologies, Inc.* | | | 287,911 | |
| | 5,726 | | | Xero Ltd.* (New Zealand) | | | 413,201 | |
| | | | | | | | |
| | | | 1,980,413 | |
| | | | | | | | |
| | |
| | | | Building Products 4.0% | | | |
| | 22,586 | | | Assa Abloy AB, Class B (Sweden) | | | 529,857 | |
| | | | | | | | |
| | |
| | | | Consumer Finance 3.6% | | | |
| | 11,004 | | | Bajaj Finance Ltd. (India) | | | 486,962 | |
| | | | | | | | |
| | |
| | | | Data Processing & Outsourced
Services 15.3% | | | |
| | 196 | | | Adyen N.V.* (Netherlands) | | | 361,361 | |
| | 7,614 | | | Amadeus IT Group S.A. (Spain) | | | 424,837 | |
| | 3,787 | | | Euronet Worldwide, Inc.* | | | 344,995 | |
| | 1,542 | | | Jack Henry & Associates, Inc. | | | 250,714 | |
| | 2,498 | | | Square, Inc., Class A* | | | 406,050 | |
| | 1,876 | | | WEX, Inc.* | | | 260,708 | |
| | | | | | | | |
| | | | 2,048,665 | |
| | | | | | | | |
| | |
| | | | Distributors 4.2% | | | |
| | 1,684 | | | Pool Corp. | | | 563,365 | |
| | | | | | | | |
| | |
| | | | Diversified Support Services 4.6% | | | |
| | 5,824 | | | Copart, Inc.* | | | 612,452 | |
| | | | | | | | |
| | |
| | | | Drug Retail 2.8% | | | |
| | 2,600 | | | Tsuruha Holdings, Inc. (Japan) | | | 367,572 | |
| | | | | | | | |
| | |
| | | | Electrical Components &
Equipment 3.8% | | | |
| | 5,135 | | | AMETEK, Inc. | | | 510,419 | |
| | | | | | | | |
| | |
| | | | Electronic Components 3.8% | | | |
| | 4,704 | | | Amphenol Corp., Class A | | | 509,302 | |
| | | | | | | | |
| | |
| | | | Electronic Equipment &
Instruments 2.6% | | | |
| | 5,376 | | | Cognex Corp. | | | 349,978 | |
| | | | | | | | |
| | |
| | | | Financial Exchanges & Data 2.6% | | | |
| | 718 | | | MarketAxess Holdings, Inc. | | | 345,782 | |
| | | | | | | | |
| | |
| | | | Health Care Equipment 3.6% | | | |
| | 3,374 | | | Cochlear Ltd. (Australia) | | | 478,492 | |
| | | | | | | | |
| | |
| | | | Health Care Supplies 6.0% | | | |
| | 12,500 | | | Asahi Intecc Co. Ltd. (Japan) | | | 391,125 | |
| | 2,576 | | | Coloplast A/S, Class B (Denmark) | | | 407,095 | |
| | | | | | | | |
| | | | 798,220 | |
| | | | | | | | |
| | |
| | | | Health Care Technology 3.4% | | | |
| | 1,593 | | | Veeva Systems, Inc., Class A* | | | 447,936 | |
| | | | | | | | |
| | | | | | | | |
| Shares | | | | | Value | |
| | | | | | | |
| | |
| | | | Industrial Conglomerates 3.0% | | | |
| | 1,026 | | | Roper Technologies, Inc. | | $ | 405,383 | |
| | | | | | | | |
| | |
| | | | Industrial Machinery 3.1% | | | |
| | 15,000 | | | MISUMI Group, Inc. (Japan) | | | 417,437 | |
| | | | | | | | |
| | |
| | | | Life Sciences Tools & Services 3.4% | | | |
| | 2,387 | | | ICON plc* (Ireland) | | | 456,132 | |
| | | | | | | | |
| | |
| | | | Packaged Foods & Meats 2.9% | | | |
| | 7,417 | | | Britannia Industries Ltd. (India) | | | 381,556 | |
| | | | | | | | |
| | |
| | | | Specialty Chemicals 2.5% | | | |
| | 3,038 | | | Chr. Hansen Holding A/S (Denmark) | | | 337,678 | |
| | | | | | | | |
| | |
| | | | Trucking 3.6% | | | |
| | 2,649 | | | Old Dominion Freight Line, Inc. | | | 479,257 | |
| | | | | | | | |
| | |
| | | | Total Common Stocks
(cost $10,354,030) | | | 12,833,836 | |
| | | | | | | | |
| | |
Principal
Amount | | | | | Value | |
| | | | | | | |
| |
| | | | SHORT-TERM INVESTMENTS 4.0% | |
| | |
| | | | Repurchase Agreement 4.0% | | | |
| $ | 538,556 | | | Repurchase Agreement dated 9/30/20, 0.00% due 10/1/20 with Fixed Income Clearing Corp. collateralized by $505,700 of United States Treasury Notes 2.625% due 12/31/23; value: $549,376; repurchase proceeds: $538,556 (cost $538,556) | | $ | 538,556 | |
| | | | | | | | |
| | |
| | | | Total Short-Term Investments
(cost $538,556) | | | 538,556 | |
| | | | | | | | |
| | |
| | | | Total Investments
(cost $10,892,586) 100.0% | | | 13,372,392 | |
| | |
| | | | Liabilities less Other Assets 0.0% | | | (1,466 | ) |
| | | | | | | | |
| | |
| | | | NET ASSETS 100.0% | | $ | 13,370,926 | |
| | | | | | | | |
| |
| | | | *Non-income producing. | |
| |
| | | | See Notes to Financial Statements. | |
At September 30, 2020, Wasatch Global Select Fund’s investments, excluding short-term investments, were in the following countries (unaudited):
| | | | | |
| Country | | % |
Australia | | | | 3.7 | |
Denmark | | | | 5.8 | |
France | | | | 3.3 | |
India | | | | 6.8 | |
Ireland | | | | 3.6 | |
Japan | | | | 9.2 | |
Netherlands | | | | 2.8 | |
New Zealand | | | | 3.2 | |
Spain | | | | 3.3 | |
Sweden | | | | 4.1 | |
United States | | | | 54.2 | |
| | | | | |
TOTAL | | | | 100.0 | % |
| | | | | |
55
| | |
| Wasatch Global Value Fund (FMIEX / WILCX) | | |
Schedule of Investments
| | | | | | | | |
| Shares | | | | | Value | |
| | | | | | | |
| |
| | | | COMMON STOCKS 97.4% | |
| | |
| | | | Aerospace & Defense 2.1% | | | |
| | 37,000 | | | Raytheon Technologies Corp. | | $ | 2,128,980 | |
| | | | | | | | |
| | |
| | | | Automobile Manufacturers 2.9% | | | |
| | 100,000 | | | General Motors Co. | | | 2,959,000 | |
| | | | | | | | |
| | |
| | | | Construction Materials 1.4% | | | |
| | 23,000 | | | HeidelbergCement AG (Germany) | | | 1,410,879 | |
| | | | | | | | |
| | |
| | | | Diversified Banks 11.6% | | | |
| | 63,000 | | | Citigroup, Inc. | | | 2,715,930 | |
| | 410,000 | | | ING Groep N.V. ADR (Netherlands) | | | 2,902,800 | |
| | 25,000 | | | JPMorgan Chase & Co. | | | 2,406,750 | |
| | 575,000 | | | Kasikornbank Public Co. Ltd. (Thailand) | | | 1,392,702 | |
| | 180,000 | | | United Overseas Bank Ltd. (Singapore) | | | 2,509,359 | |
| | | | | | | | |
| | | | 11,927,541 | |
| | | | | | | | |
| | |
| | | | Diversified Metals & Mining 1.6% | | | |
| | 70,000 | | | Anglo American plc (United Kingdom) | | | 1,694,306 | |
| | | | | | | | |
| | |
| | | | Electric Utilities 8.2% | | | |
| | 50,000 | | | Duke Energy Corp. | | | 4,428,000 | |
| | 112,000 | | | Exelon Corp. | | | 4,005,120 | |
| | | | | | | | |
| | | | 8,433,120 | |
| | | | | | | | |
| | |
| | | | Electrical Components &
Equipment 3.8% | | | |
| | 38,000 | | | Eaton Corp. plc | | | 3,877,140 | |
| | | | | | | | |
| | |
| | | | Electronic Manufacturing
Services 2.2% | | | |
| | 850,000 | | | Hon Hai Precision Industry Co. Ltd. (Taiwan) | | | 2,271,597 | |
| | | | | | | | |
| | |
| | | | Food Retail 4.5% | | | |
| | 63,000 | | | Koninklijke Ahold Delhaize N.V. (Netherlands) | | | 1,865,075 | |
| | 89,000 | | | Seven & i Holdings Co. Ltd. (Japan) | | | 2,742,616 | |
| | | | | | | | |
| | | | 4,607,691 | |
| | | | | | | | |
| | |
| | | | Health Care Facilities 2.9% | | | |
| | 28,000 | | | Universal Health Services, Inc., Class B | | | 2,996,560 | |
| | | | | | | | |
| | |
| | | | Homebuilding 4.5% | | | |
| | 69,000 | | | Bellway plc (United Kingdom) | | | 2,093,192 | |
| | 55,000 | | | PulteGroup, Inc. | | | 2,545,950 | |
| | | | | | | | |
| | | | 4,639,142 | |
| | | | | | | | |
| | |
| | | | Integrated Oil & Gas 4.1% | | | |
| | 220,000 | | | Suncor Energy, Inc. (Canada) | | | 2,686,493 | |
| | 45,000 | | | TOTAL SE (France) | | | 1,540,599 | |
| | | | | | | | |
| | | | 4,227,092 | |
| | | | | | | | |
| | |
| | | | Integrated Telecommunication
Services 1.1% | | | |
| | 39,000 | | | AT&T, Inc. | | | 1,111,890 | |
| | | | | | | | |
| | |
| | | | IT Consulting & Other Services 3.4% | | | |
| | 44,000 | | | Science Applications International Corp. | | | 3,450,480 | |
| | | | | | | | |
| | | | | | | | |
| Shares | | | | | Value | |
| | | | | | | |
| | |
| | | | Multi-Line Insurance 2.0% | | | |
| | 110,000 | | | AXA S.A. (France) | | $ | 2,034,623 | |
| | | | | | | | |
| | |
| | | | Office Services & Supplies 1.3% | | | |
| | 125,000 | | | Kimball International, Inc., Class B | | | 1,317,500 | |
| | | | | | | | |
| | |
| | | | Oil & Gas Equipment &
Services 1.1% | | | |
| | 98,000 | | | Halliburton Co. | | | 1,180,900 | |
| | | | | | | | |
| | |
| | | | Oil & Gas Exploration &
Production 1.6% | | | |
| | 45,000 | | | EOG Resources, Inc. | | | 1,617,300 | |
| | | | | | | | |
| | |
| | | | Pharmaceuticals 7.5% | | | |
| | 29,000 | | | Johnson & Johnson | | | 4,317,520 | |
| | 39,500 | | | Novartis AG (Switzerland) | | | 3,427,007 | |
| | | | | | | | |
| | | | 7,744,527 | |
| | | | | | | | |
| | |
| | | | Property & Casualty Insurance 3.0% | | | |
| | 70,000 | | | Axis Capital Holdings Ltd. | | | 3,082,800 | |
| | | | | | | | |
| | |
| | | | Railroads 2.5% | | | |
| | 13,000 | | | Union Pacific Corp. | | | 2,559,310 | |
| | | | | | | | |
| | |
| | | | Regional Banks 2.9% | | | |
| | 138,000 | | | Bank OZK | | | 2,942,160 | |
| | | | | | | | |
| | |
| | | | Reinsurance 2.8% | | | |
| | 11,000 | | | Muenchener Rueckversicherungs-Gesellschaft AG in Muenchen (Germany) | | | 2,793,479 | |
| | | | | | | | |
| | |
| | | | Specialty Chemicals 2.5% | | | |
| | 21,000 | | | PPG Industries, Inc. | | | 2,563,680 | |
| | | | | | | | |
| | |
| | | | Steel 4.0% | | | |
| | 1,300,000 | | | NMDC Ltd. (India) | | | 1,446,598 | |
| | 60,000 | | | Nucor Corp. | | | 2,691,600 | |
| | | | | | | | |
| | | | 4,138,198 | |
| | | | | | | | |
| | |
| | | | Technology Hardware, Storage &
Peripherals 4.4% | | | |
| | 57,000 | | | Samsung Electronics Co. Ltd. (South Korea) | | | 2,829,715 | |
| | 90,000 | | | Xerox Holdings Corp. | | | 1,689,300 | |
| | | | | | | | |
| | | | 4,519,015 | |
| | | | | | | | |
| | |
| | | | Tobacco 2.9% | | | |
| | 43,000 | | | KT&G Corp. (South Korea) | | | 3,036,745 | |
| | | | | | | | |
| | |
| | | | Wireless Telecommunication
Services 4.6% | | | |
| | 750,000 | | | China Mobile Ltd. (China) | | | 4,785,453 | |
| | | | | | | | |
| | |
| | | | Total Common Stocks
(cost $103,694,507) | | | 100,051,108 | |
| | | | | | | | |
56
| | |
| Wasatch Global Value Fund (FMIEX / WILCX) | | SEPTEMBER 30, 2020 |
Schedule of Investments (continued)
| | | | | | | | |
Principal
Amount | | | | | Value | |
| | | | | | | |
| |
| | | | SHORT-TERM INVESTMENTS 0.9% | |
| | |
| | | | Repurchase Agreement 0.9% | | | |
| $ | 948,033 | | | Repurchase Agreement dated 9/30/20, 0.00% due 10/1/20 with Fixed Income Clearing Corp. collateralized by $890,200 of United States Treasury Notes 2.625% due 12/31/23; value: $967,084; repurchase proceeds: $948,033 (cost $948,033) | | $ | 948,033 | |
| | | | | | | | |
| | |
| | | | Total Short-Term Investments
(cost $948,033) | | | 948,033 | |
| | | | | | | | |
| | |
| | | | Total Investments
(cost $104,642,540) 98.3%§ | | | 100,999,141 | |
| | |
| | | | Other Assets less Liabilities 1.7% | | | 1,772,382 | |
| | | | | | | | |
| | |
| | | | NET ASSETS 100.0% | | $ | 102,771,523 | |
| | | | | | | | |
| |
| | | | §The aggregate amount of foreign securities fair valued pursuant to a systematic valuation model as a percent of net assets was 5.77%. ADR American Depositary Receipt. | |
| |
| | | | See Notes to Financial Statements. | |
At September 30, 2020, Wasatch Global Value Fund’s investments, excluding short-term investments, were in the following countries (unaudited):
| | | | | |
| Country | | % |
Canada | | | | 2.7 | |
China | | | | 4.8 | |
France | | | | 3.6 | |
Germany | | | | 4.2 | |
India | | | | 1.4 | |
Japan | | | | 2.7 | |
Netherlands | | | | 4.8 | |
Singapore | | | | 2.5 | |
South Korea | | | | 5.9 | |
Switzerland | | | | 3.4 | |
Taiwan | | | | 2.3 | |
Thailand | | | | 1.4 | |
United Kingdom | | | | 3.8 | |
United States | | | | 56.5 | |
| | | | | |
TOTAL | | | | 100.0 | % |
| | | | | |
57
| | |
| Wasatch International Growth Fund (WAIGX / WIIGX) | | |
Schedule of Investments
| | | | | | | | |
| Shares | | | | | Value | |
| | | | | | | |
| |
| | | | COMMON STOCKS 96.8% | |
| | |
| | | | Aerospace & Defense 1.5% | | | |
| | 120,186 | | | Avon Rubber plc (United Kingdom) | | $ | 6,590,981 | |
| | 621,542 | | | CAE, Inc. (Canada) | | | 9,092,891 | |
| | | | | | | | |
| | | | 15,683,872 | |
| | | | | | | | |
| | |
| | | | Airport Services 1.1% | | | |
| | 2,613,860 | | | Grupo Aeroportuario del Centro Norte S.A.B. de C.V.* (Mexico) | | | 11,984,403 | |
| | | | | | | | |
| | |
| | | | Alternative Carriers 0.5% | | | |
| | 451,062 | | | Chief Telecom, Inc. (Taiwan) | | | 5,365,336 | |
| | | | | | | | |
| | |
| | | | Apparel, Accessories & Luxury
Goods 0.8% | | | |
| | 273,829 | | | Canada Goose Holdings, Inc.* (Canada) | | | 8,795,514 | |
| | | | | | | | |
| | |
| | | | Application Software 8.7% | | | |
| | 360,973 | | | Descartes Systems Group, Inc. (The)* (Canada) | | | 20,562,354 | |
| | 58,641 | | | Globant S.A.* (Argentina) | | | 10,509,640 | |
| | 61,461 | | | Kinaxis, Inc.* (Canada) | | | 9,047,329 | |
| | 191,388 | | | Lightspeed POS, Inc.* (Canada) | | | 6,131,660 | |
| | 400,801 | | | Miroku Jyoho Service Co. Ltd. (Japan) | | | 8,330,306 | |
| | 134,190 | | | Nemetschek SE (Germany) | | | 9,833,190 | |
| | 997,950 | | | Systena Corp. (Japan) | | | 17,259,383 | |
| | 1,910,419 | | | Technology One Ltd. (Australia) | | | 10,864,597 | |
| | | | | | | | |
| | | | 92,538,459 | |
| | | | | | | | |
| | |
| | | | Asset Management & Custody
Banks 2.8% | | | |
| | 2,189,928 | | | AJ Bell plc (United Kingdom) | | | 12,744,231 | |
| | 1,581,321 | | | Netwealth Group Ltd. (Australia) | | | 17,193,184 | |
| | | | | | | | |
| | | | 29,937,415 | |
| | | | | | | | |
| | |
| | | | Biotechnology 1.0% | | | |
| | 687,678 | | | Abcam plc (United Kingdom) | | | 10,861,100 | |
| | | | | | | | |
| | |
| | | | Brewers 1.4% | | | |
| | 212,314 | | | Carlsberg Brewery Malaysia Bhd (Malaysia) | | | 1,057,610 | |
| | 137,457 | | | Royal Unibrew A/S (Denmark) | | | 14,191,847 | |
| | | | | | | | |
| | | | 15,249,457 | |
| | | | | | | | |
| | |
| | | | Commodity Chemicals 0.7% | | | |
| | 987,621 | | | Berger Paints India Ltd. (India) | | | 7,782,635 | |
| | | | | | | | |
| | |
| | | | Data Processing & Outsourced
Services 1.7% | | | |
| | 96,900 | | | GMO Payment Gateway, Inc. (Japan) | | | 10,327,180 | |
| | 847,079 | | | Infomart Corp. (Japan) | | | 7,469,620 | |
| | | | | | | | |
| | | | 17,796,800 | |
| | | | | | | | |
| | |
| | | | Department Stores 0.4% | | | |
| | 245,574 | | | Poya International Co. Ltd. (Taiwan) | | | 4,688,986 | |
| | | | | | | | |
| | |
| | | | Diversified Real Estate
Activities 1.6% | | | |
| | 639,146 | | | Patrizia AG (Germany) | | | 17,422,773 | |
| | | | | | | | |
| | | | | | | | |
| Shares | | | | | Value | |
| | | | | | | |
| | |
| | | | Diversified Support Services 1.8% | | | |
| | 583,539 | | | HomeServe plc (United Kingdom) | | $ | 9,306,698 | |
| | 1,040,352 | | | Prestige International, Inc. (Japan) | | | 9,390,936 | |
| | | | | | | | |
| | | | 18,697,634 | |
| | | | | | | | |
| | |
| | | | Drug Retail 5.1% | | | |
| | 248,895 | | | Ain Holdings, Inc. (Japan) | | | 17,369,433 | |
| | 361,779 | | | Clicks Group Ltd. (South Africa) | | | 4,802,049 | |
| | 137,800 | | | Kusuri no Aoki Holdings Co. Ltd. (Japan) | | | 11,210,582 | |
| | 1,228,500 | | | Raia Drogasil S.A. (Brazil) | | | 5,123,216 | |
| | 226,200 | | | Sugi Holdings Co. Ltd. (Japan) | | | 15,957,218 | |
| | | | | | | | |
| | | | 54,462,498 | |
| | | | | | | | |
| | |
| | | | Electrical Components &
Equipment 1.8% | | | |
| | 561,485 | | | Voltronic Power Technology Corp. (Taiwan) | | | 19,057,377 | |
| | | | | | | | |
| | |
| | | | Electronic Equipment &
Instruments 1.8% | | | |
| | 644,124 | | | Halma plc (United Kingdom) | | | 19,490,348 | |
| | | | | | | | |
| | |
| | | | General Merchandise Stores 1.5% | | | |
| | 2,499,168 | | | B&M European Value Retail S.A. (United Kingdom) | | | 15,953,083 | |
| | | | | | | | |
| | |
| | | | Health Care Equipment 5.2% | | | |
| | 3,038,000 | | | AK Medical Holdings Ltd. (China) | | | 7,753,710 | |
| | 165,959 | | | Cochlear Ltd. (Australia) | | | 23,535,883 | |
| | 118,526 | | | DiaSorin S.p.A. (Italy) | | | 23,888,218 | |
| | | | | | | | |
| | | | 55,177,811 | |
| | | | | | | | |
| | |
| | | | Health Care Services 1.5% | | | |
| | 610,745 | | | Dr. Lal PathLabs Ltd. (India) | | | 15,562,491 | |
| | | | | | | | |
| | |
| | | | Health Care Supplies 2.9% | | | |
| | 351,000 | | | Asahi Intecc Co. Ltd. (Japan) | | | 10,982,791 | |
| | 907,000 | | | Bioteque Corp. (Taiwan) | | | 4,306,073 | |
| | 242,714 | | | Menicon Co. Ltd. (Japan) | | | 16,155,618 | |
| | | | | | | | |
| | | | 31,444,482 | |
| | | | | | | | |
| | |
| | | | Health Care Technology 1.6% | | | |
| | 378,453 | | | JMDC, Inc.* (Japan) | | | 16,614,397 | |
| | | | | | | | |
| | |
| | | | Home Improvement Retail 0.4% | | | |
| | 43,720,925 | | | PT Ace Hardware Indonesia Tbk (Indonesia) | | | 4,686,484 | |
| | | | | | | | |
| | |
| | | | Household Appliances 0.9% | | | |
| | 521,656 | | | Breville Group Ltd. (Australia) | | | 9,404,418 | |
| | | | | | | | |
| | |
| | | | Human Resource & Employment
Services 3.5% | | | |
| | 104,176 | | | 51job, Inc., ADR* (China) | | | 8,124,686 | |
| | 363,611 | | | Benefit One, Inc. (Japan) | | | 9,143,283 | |
| | 361,133 | | | en-japan, Inc. (Japan) | | | 9,043,306 | |
| | 376,192 | | | SMS Co. Ltd. (Japan) | | | 10,843,633 | |
| | | | | | | | |
| | | | 37,154,908 | |
| | | | | | | | |
| | |
| | | | Industrial Conglomerates 0.4% | | | |
| | 18,207 | | | 3M India Ltd.* (India) | | | 4,515,968 | |
| | | | | | | | |
58
| | |
| Wasatch International Growth Fund (WAIGX / WIIGX) | | SEPTEMBER 30, 2020 |
Schedule of Investments (continued)
| | | | | | | | |
| Shares | | | | | Value | |
| | | | | | | |
| | |
| | | | Industrial Machinery 1.9% | | | |
| | 375,615 | | | MISUMI Group, Inc. (Japan) | | $ | 10,453,042 | |
| | 2,779,115 | | | Rotork plc (United Kingdom) | | | 10,119,773 | |
| | | | | | | | |
| | | | 20,572,815 | |
| | | | | | | | |
| | |
| | | | Insurance Brokers 1.0% | | | |
| | 2,693,500 | | | TQM Corp. Public Co. Ltd. (Thailand) | | | 10,922,753 | |
| | | | | | | | |
| | |
| | | | Interactive Media & Services 4.0% | | | |
| | 68,920 | | | Atrae, Inc.* (Japan) | | | 2,009,472 | |
| | 217,310 | | | Info Edge India Ltd. (India) | | | 10,668,307 | |
| | 526,800 | | | Kakaku.com, Inc. (Japan) | | | 13,821,226 | |
| | 1,995,129 | | | Rightmove plc (United Kingdom) | | | 16,136,422 | |
| | | | | | | | |
| | | | 42,635,427 | |
| | | | | | | | |
| | |
| | | | Internet & Direct Marketing
Retail 0.9% | | | |
| | 1,990,870 | | | Trainline plc* (United Kingdom) | | | 9,325,171 | |
| | | | | | | | |
| | |
| | | | Investment Banking &
Brokerage 1.3% | | | |
| | 717,321 | | | Avanza Bank Holding AB (Sweden) | | | 14,080,744 | |
| | | | | | | | |
| | |
| | | | IT Consulting & Other
Services 5.0% | | | |
| | 162,295 | | | Endava plc ADR* (United Kingdom) | | | 10,248,929 | |
| | 411,760 | | | Larsen & Toubro Infotech Ltd. (India) | | | 14,203,432 | |
| | 162,199 | | | Reply S.p.A. (Italy) | | | 18,722,254 | |
| | 649,599 | | | Softcat plc (United Kingdom) | | | 10,117,190 | |
| | | | | | | | |
| | | | 53,291,805 | |
| | | | | | | | |
| | |
| | | | Life Sciences Tools &
Services 1.7% | | | |
| | 36,531 | | | Tecan Group AG (Switzerland) | | | 18,205,015 | |
| | | | | | | | |
| | |
| | | | Movies & Entertainment 1.4% | | | |
| | 297,991 | | | CTS Eventim AG & Co. KGaA* (Germany) | | | 14,422,385 | |
| | | | | | | | |
| | |
| | | | Other Diversified Financial
Services 1.2% | | | |
| | 21,218 | | | Hypoport SE* (Germany) | | | 13,284,339 | |
| | | | | | | | |
| | |
| | | | Packaged Foods & Meats 2.3% | | | |
| | 267,914 | | | Morinaga & Co. Ltd. (Japan) | | | 10,529,593 | |
| | 3,525,449 | | | Vitasoy International Holdings Ltd. (Hong Kong) | | | 13,669,556 | |
| | | | | | | | |
| | | | 24,199,149 | |
| | | | | | | | |
| | |
| | | | Pharmaceuticals 0.9% | | | |
| | 326,759 | | | JCR Pharmaceuticals Co. Ltd. (Japan) | | | 9,511,688 | |
| | | | | | | | |
| | |
| | | | Property & Casualty
Insurance 1.1% | | | |
| | 659,087 | | | ICICI Lombard General Insurance Co. Ltd. (India) | | | 11,523,303 | |
| | | | | | | | |
| | |
| | | | Publishing 0.7% | | | |
| | 281,994 | | | Future plc (United Kingdom) | | | 7,066,370 | |
| | | | | | | | |
| | | | | | | | |
| Shares | | | | | Value | |
| | | | | | | |
| | |
| | | | Regional Banks 3.4% | | | |
| | 1,175,394 | | | AU Small Finance Bank Ltd.* (India) | | $ | 10,498,572 | |
| | 683,247 | | | Canadian Western Bank (Canada) | | | 13,777,313 | |
| | 53,321,045 | | | PT Bank BTPN Syariah Tbk (Indonesia) | | | 11,753,564 | |
| | | | | | | | |
| | | | 36,029,449 | |
| | | | | | | | |
| | |
| | | | Research & Consulting
Services 1.9% | | | |
| | 587,038 | | | NICE Information Service Co. Ltd. (South Korea) | | | 9,886,663 | |
| | 189,128 | | | Nihon M&A Center, Inc. (Japan) | | | 10,723,799 | |
| | | | | | | | |
| | | | 20,610,462 | |
| | | | | | | | |
| | |
| | | | Restaurants 1.6% | | | |
| | 302,909 | | | Domino’s Pizza Enterprises Ltd. (Australia) | | | 17,187,453 | |
| | | | | | | | |
| | |
| | | | Semiconductors 4.0% | | | |
| | 289,550 | | | Elmos Semiconductor SE (Germany) | | | 7,078,217 | |
| | 104,703 | | | LEENO Industrial, Inc. (South Korea) | | | 11,027,273 | |
| | 162,689 | | | Melexis N.V. (Belgium) | | | 12,674,984 | |
| | 206,249 | | | Silergy Corp. (Taiwan) | | | 12,141,929 | |
| | | | | | | | |
| | | | 42,922,403 | |
| | | | | | | | |
| | |
| | | | Soft Drinks 2.0% | | | |
| | 700,609 | | | Fevertree Drinks plc (United Kingdom) | | | 20,937,341 | |
| | | | | | | | |
| | |
| | | | Specialty Chemicals 1.1% | | | |
| | 106,365 | | | Chr. Hansen Holding A/S (Denmark) | | | 11,822,614 | |
| | | | | | | | |
| | |
| | | | Systems Software 1.8% | | | |
| | 95,045 | | | CyberArk Software Ltd.* (Israel) | | | 9,829,554 | |
| | 107,962 | | | Douzone Bizon Co. Ltd. (South Korea) | | | 9,620,701 | |
| | | | | | | | |
| | | | 19,450,255 | |
| | | | | | | | |
| | |
| | | | Trading Companies &
Distributors 7.0% | | | |
| | 643,107 | | | Diploma plc (United Kingdom) | | | 18,272,914 | |
| | 1,422,402 | | | Electrocomponents plc (United Kingdom) | | | 13,077,192 | |
| | 1,915,958 | | | Howden Joinery Group plc (United Kingdom) | | | 14,601,138 | |
| | 116,905 | | | IMCD N.V. (Netherlands) | | | 13,925,828 | |
| | 289,124 | | | MonotaRO Co. Ltd. (Japan) | | | 14,310,219 | |
| | | | | | | | |
| | | | 74,187,291 | |
| | | | | | | | |
| | |
| | | | Total Common Stocks
(cost $651,435,776) | | | 1,032,516,881 | |
| | | | | | | | |
59
| | |
| Wasatch International Growth Fund (WAIGX / WIIGX) | | SEPTEMBER 30, 2020 |
Schedule of Investments (continued)
| | | | | | | | |
Principal
Amount | | | | | Value | |
| | | | | | | |
| |
| | | | SHORT-TERM INVESTMENTS 3.8% | |
| | |
| | | | Repurchase Agreement 3.8% | | | |
| $ | 40,358,435 | | | Repurchase Agreement dated 9/30/20, 0.00% due 10/1/20 with Fixed Income Clearing Corp. collateralized by $37,747,700 of United States Treasury Notes 2.750% due 2/15/24; value: $41,165,622; repurchase proceeds: $40,358,435 (cost $40,358,435) | | $ | 40,358,435 | |
| | | | | | | | |
| | |
| | | | Total Short-Term Investments
(cost $40,358,435) | | | 40,358,435 | |
| | | | | | | | |
| | |
| | | | Total Investments
(cost $691,794,211) 100.6%§ | | | 1,072,875,316 | |
| | |
| | | | Liabilities less Other Assets (0.6%) | | | (6,703,428 | ) |
| | | | | | | | |
| | |
| | | | NET ASSETS 100.0% | | $ | 1,066,171,888 | |
| | | | | | | | |
| |
| | | | *Non-income producing. §The aggregate amount of foreign securities fair valued pursuant to a systematic valuation model as a percent of net assets was 2.86%. ADR American Depositary Receipt. | |
| |
| | | | See Notes to Financial Statements. | |
At September 30, 2020, Wasatch International Growth Fund’s investments, excluding short-term investments, were in the following countries (unaudited):
| | | | | |
| Country | | % |
Argentina | | | | 1.0 | |
Australia | | | | 7.6 | |
Belgium | | | | 1.2 | |
Brazil | | | | 0.5 | |
Canada | | | | 6.5 | |
China | | | | 1.5 | |
Denmark | | | | 2.5 | |
Germany | | | | 6.0 | |
Hong Kong | | | | 1.3 | |
India | | | | 7.2 | |
Indonesia | | | | 1.6 | |
Israel | | | | 1.0 | |
Italy | | | | 4.1 | |
Japan | | | | 23.4 | |
Malaysia | | | | 0.1 | |
Mexico | | | | 1.2 | |
Netherlands | | | | 1.3 | |
South Africa | | | | 0.5 | |
South Korea | | | | 3.0 | |
Sweden | | | | 1.4 | |
Switzerland | | | | 1.8 | |
Taiwan | | | | 4.4 | |
Thailand | | | | 1.1 | |
United Kingdom | | | | 19.8 | |
| | | | | |
TOTAL | | | | 100.0 | % |
| | | | | |
60
| | |
| Wasatch International Opportunities Fund (WAIOX / WIIOX) | | SEPTEMBER 30, 2020 |
Schedule of Investments
| | | | | | | | |
| Shares | | | | | Value | |
| | | | | | | |
| |
| | | | COMMON STOCKS 96.6% | |
| | |
| | | | Advertising 2.2% | | | |
| | 124,324 | | | 4imprint Group plc* (United Kingdom) | | $ | 2,996,671 | |
| | 1,105,327 | | | YouGov plc (United Kingdom) | | | 12,080,404 | |
| | | | | | | | |
| | | | 15,077,075 | |
| | | | | | | | |
| | |
| | | | Aerospace & Defense 2.5% | | | |
| | 307,531 | | | Avon Rubber plc (United Kingdom) | | | 16,864,951 | |
| | | | | | | | |
| | |
| | | | Alternative Carriers 1.8% | | | |
| | 703,000 | | | Chief Telecom, Inc. (Taiwan) | | | 8,362,113 | |
| | 49,230 | | | KINX, Inc. (South Korea) | | | 3,706,193 | |
| | | | | | | | |
| | | | 12,068,306 | |
| | | | | | | | |
| | |
| | | | Application Software 18.0% | | | |
| | 84,848 | | | Atoss Software AG (Germany) | | | 13,280,582 | |
| | 974,810 | | | dotdigital Group plc (United Kingdom) | | | 1,779,851 | |
| | 1,000,180 | | | Elmo Software Ltd.* (Australia) | | | 3,782,480 | |
| | 88,882 | | | Esker S.A. (France) | | | 15,172,930 | |
| | 565,957 | | | Fortnox AB (Sweden) | | | 17,062,411 | |
| | 138,000 | | | freee KK* (Japan) | | | 10,402,503 | |
| | 791,092 | | | GB Group plc* (United Kingdom) | | | 7,165,910 | |
| | 81,168 | | | Mensch und Maschine Software SE (Germany) | | | 5,234,097 | |
| | 187,928 | | | Miroku Jyoho Service Co. Ltd. (Japan) | | | 3,905,923 | |
| | 1,021,149 | | | Pexip Holding ASA* (Norway) | | | 9,124,928 | |
| | 1,112,744 | | | Rakus Co. Ltd. (Japan) | | | 19,877,776 | |
| | 667,500 | | | Systena Corp. (Japan) | | | 11,544,304 | |
| | 98,170 | | | Vitec Software Group AB, Class B (Sweden) | | | 3,250,100 | |
| | | | | | | | |
| | | | 121,583,795 | |
| | | | | | | | |
| | |
| | | | Brewers 0.8% | | | |
| | 160,486 | | | Carlsberg Brewery Malaysia Bhd (Malaysia) | | | 799,437 | |
| | 42,497 | | | Royal Unibrew A/S (Denmark) | | | 4,387,633 | |
| | | | | | | | |
| | | | 5,187,070 | |
| | | | | | | | |
| | |
| | | | Commodity Chemicals 2.6% | | | |
| | 867,649 | | | Berger Paints India Ltd. (India) | | | 6,837,234 | |
| | 672,437 | | | Gulf Oil Lubricants India Ltd. (India) | | | 5,960,154 | |
| | 255,016 | | | Supreme Industries Ltd. (India) | | | 4,856,469 | |
| | | | | | | | |
| | | | 17,653,857 | |
| | | | | | | | |
| | |
| | | | Consumer Finance 1.1% | | | |
| | 236,148 | | | Gruppo MutuiOnline S.p.A. (Italy) | | | 6,561,858 | |
| | 88,925 | | | Spandana Sphoorty Financial Ltd.* (India) | | | 614,689 | |
| | | | | | | | |
| | | | 7,176,547 | |
| | | | | | | | |
| | |
| | | | Data Processing & Outsourced
Services 2.3% | | | |
| | 3,863,153 | | | Fawry for Banking & Payment Technology Services S.A.E.* (Egypt) | | | 6,251,128 | |
| | 1,036,400 | | | Infomart Corp. (Japan) | | | 9,139,070 | |
| | | | | | | | |
| | | | 15,390,198 | |
| | | | | | | | |
| | |
| | | | Department Stores 1.1% | | | |
| | 396,908 | | | Poya International Co. Ltd. (Taiwan) | | | 7,578,555 | |
| | | | | | | | |
| | | | | | | | |
| Shares | | | | | Value | |
| | | | | | | |
| | |
| | | | Diversified Banks 0.9% | | | |
| | 3,215,411 | | | City Union Bank Ltd. (India) | | $ | 6,083,917 | |
| | | | | | | | |
| | |
| | | | Diversified Support Services 4.5% | | | |
| | 338,900 | | | Japan Elevator Service Holdings Co. Ltd. (Japan) | | | 11,744,934 | |
| | 5,279,657 | | | Johnson Service Group plc (United Kingdom) | | | 6,131,341 | |
| | 1,354,362 | | | Prestige International, Inc. (Japan) | | | 12,225,408 | |
| | | | | | | | |
| | | | 30,101,683 | |
| | | | | | | | |
| | |
| | | | Drug Retail 1.3% | | | |
| | 50,000 | | | Kusuri no Aoki Holdings Co. Ltd. (Japan) | | | 4,067,700 | |
| | 192,510 | | | Yakuodo Holdings Co. Ltd. (Japan) | | | 4,806,133 | |
| | | | | | | | |
| | | | 8,873,833 | |
| | | | | | | | |
| | |
| | | | Electrical Components &
Equipment 2.8% | | | |
| | 676,611 | | | Amara Raja Batteries Ltd. (India) | | | 7,006,381 | |
| | 342,471 | | | Voltronic Power Technology Corp. (Taiwan) | | | 11,623,817 | |
| | | | | | | | |
| | | | 18,630,198 | |
| | | | | | | | |
| | |
| | | | Electronic Components 0.8% | | | |
| | 1,815,934 | | | Strix Group plc (United Kingdom) | | | 5,693,949 | |
| | | | | | | | |
| | |
| | | | Electronic Equipment &
Instruments 0.6% | | | |
| | 189,470 | | | Carel Industries S.p.A. (Italy) | | | 4,007,479 | |
| | | | | | | | |
| | |
| | | | Food Retail 2.9% | | | |
| | 3,819,129 | | | Philippine Seven Corp. (Philippines) | | | 9,106,669 | |
| | 70,499 | | | Rami Levy Chain Stores Hashikma Marketing 2006 Ltd. (Israel) | | | 4,854,691 | |
| | 4,502,100 | | | Sheng Siong Group Ltd. (Singapore) | | | 5,309,974 | |
| | | | | | | | |
| | | | 19,271,334 | |
| | | | | | | | |
| | |
| | | | Health Care Equipment 4.0% | | | |
| | 4,128,000 | | | AK Medical Holdings Ltd. (China) | | | 10,535,653 | |
| | 166,826 | | | CellaVision AB* (Sweden) | | | 6,691,034 | |
| | 180,316 | | | Medistim ASA* (Norway) | | | 4,446,281 | |
| | 184,891 | | | Xvivo Perfusion AB* (Sweden) | | | 5,605,041 | |
| | | | | | | | |
| | | | 27,278,009 | |
| | | | | | | | |
| | |
| | | | Health Care Facilities 1.2% | | | |
| | 24,257,437 | | | Cleopatra Hospital* (Egypt) | | | 7,770,381 | |
| | | | | | | | |
| | |
| | | | Health Care Services 3.2% | | | |
| | 255,177 | | | Dr. Lal PathLabs Ltd. (India) | | | 6,502,206 | |
| | 629,362 | | | Metropolis Healthcare Ltd.* (India) | | | 15,197,924 | |
| | | | | | | | |
| | | | 21,700,130 | |
| | | | | | | | |
| | |
| | | | Health Care Supplies 2.5% | | | |
| | 1,537,000 | | | Bioteque Corp. (Taiwan) | | | 7,297,061 | |
| | 1,259,493 | | | Nanosonics Ltd.* (Australia) | | | 5,123,994 | |
| | 727,000 | | | Shanghai Kindly Medical Instruments Co. Ltd., Class H (China) | | | 4,408,875 | |
| | | | | | | | |
| | | | 16,829,930 | |
| | | | | | | | |
61
| | |
| Wasatch International Opportunities Fund (WAIOX / WIIOX) | | |
Schedule of Investments (continued)
| | | | | | | | |
| Shares | | | | | Value | |
| | | | | | | |
| | |
| | | | Health Care Technology 3.3% | | | |
| | 52,812 | | | Craneware plc (United Kingdom) | | $ | 1,056,262 | |
| | 168,200 | | | Medley, Inc.* (Japan) | | | 8,038,003 | |
| | 99,198 | | | Nexus AG (Germany) | | | 5,350,015 | |
| | 396,745 | | | Pro Medicus Ltd. (Australia) | | | 7,692,442 | |
| | | | | | | | |
| | | | 22,136,722 | |
| | | | | | | | |
| | |
| | | | Home Improvement Retail 0.7% | | | |
| | 43,238,500 | | | PT Ace Hardware Indonesia Tbk (Indonesia) | | | 4,634,772 | |
| | | | | | | | |
| | |
| | | | Human Resource & Employment
Services 2.3% | | | |
| | 168,288 | | | en-japan, Inc. (Japan) | | | 4,214,181 | |
| | 240,477 | | | HeadHunter Group plc ADR (Russia) | | | 5,886,877 | |
| | 179,762 | | | SMS Co. Ltd. (Japan) | | | 5,181,591 | |
| | | | | | | | |
| | | | 15,282,649 | |
| | | | | | | | |
| | |
| | | | Insurance Brokers 1.4% | | | |
| | 2,397,000 | | | TQM Corp. Public Co. Ltd. (Thailand) | | | 9,720,379 | |
| | | | | | | | |
| | |
| | | | Interactive Media & Services 0.6% | | | |
| | 138,087 | | | Atrae, Inc.* (Japan) | | | 4,026,146 | |
| | | | | | | | |
| | |
| | | | Internet & Direct Marketing
Retail 0.6% | | | |
| | 860,583 | | | Trainline plc* (United Kingdom) | | | 4,030,943 | |
| | | | | | | | |
| | |
| | | | Internet Services &
Infrastructure 4.4% | | | |
| | 193,032 | | | BASE, Inc.* (Japan) | | | 20,133,239 | |
| | 144,590 | | | Hennge KK* (Japan) | | | 9,254,089 | |
| | | | | | | | |
| | | | 29,387,328 | |
| | | | | | | | |
| | |
| | | | IT Consulting & Other
Services 3.1% | | | |
| | 233,971 | | | Appen Ltd. (Australia) | | | 5,711,184 | |
| | 79,256 | | | Aubay (France) | | | 2,913,157 | |
| | 891,944 | | | Avant Corp. (Japan) | | | 8,820,913 | |
| | 284,581 | | | FDM Group Holdings plc (United Kingdom) | | | 3,738,186 | |
| | | | | | | | |
| | | | 21,183,440 | |
| | | | | | | | |
| | |
| | | | Life Sciences Tools & Services 1.0% | | | |
| | 344,409 | | | Biotage AB* (Sweden) | | | 6,818,305 | |
| | | | | | | | |
| | |
| | | | Other Diversified Financial
Services 2.5% | | | |
| | 26,512 | | | Hypoport SE* (Germany) | | | 16,598,850 | |
| | | | | | | | |
| | |
| | | | Packaged Foods & Meats 2.2% | | | |
| | 2,003,120 | | | Vitasoy International Holdings Ltd. (Hong Kong) | | | 7,766,886 | |
| | 445,000 | | | Yihai International Holding Ltd.* (China) | | | 6,941,955 | |
| | | | | | | | |
| | | | 14,708,841 | |
| | | | | | | | |
| | |
| | | | Personal Products 0.9% | | | |
| | 617,619 | | | Sarantis S.A. (Greece) | | | 6,184,047 | |
| | | | | | | | |
| | | | | | | | |
| Shares | | | | | Value | |
| | | | | | | |
| | |
| | | | Property & Casualty
Insurance 1.7% | | | |
| | 2,966,567 | | | Qualitas Controladora S.A.B. de C.V. (Mexico) | | $ | 11,204,035 | |
| | | | | | | | |
| | |
| | | | Publishing 2.1% | | | |
| | 569,927 | | | Future plc (United Kingdom) | | | 14,281,562 | |
| | | | | | | | |
| | |
| | | | Regional Banks 1.1% | | | |
| | 32,993,260 | | | PT Bank BTPN Syariah Tbk (Indonesia) | | | 7,272,708 | |
| | | | | | | | |
| | |
| | | | Research & Consulting
Services 4.1% | | | |
| | 124,200 | | | IR Japan Holdings Ltd. (Japan) | | | 15,568,426 | |
| | 206,471 | | | JTC plc (United Kingdom) | | | 1,294,800 | |
| | 655,364 | | | NICE Information Service Co. Ltd. (South Korea) | | | 11,037,383 | |
| | | | | | | | |
| | | | 27,900,609 | |
| | | | | | | | |
| | |
| | | | Restaurants 0.0% | | | |
| | 630,045 | | | Patisserie Holdings plc* *** §§ (United Kingdom) | | | 8,130 | |
| | | | | | | | |
| | |
| | | | Semiconductor Equipment 0.6% | | | |
| | 289,332 | | | Japan Material Co. Ltd. (Japan) | | | 4,024,558 | |
| | | | | | | | |
| | |
| | | | Semiconductors 2.9% | | | |
| | 242,181 | | | Elmos Semiconductor SE (Germany) | | | 5,920,255 | |
| | 130,715 | | | LEENO Industrial, Inc. (South Korea) | | | 13,766,845 | |
| | | | | | | | |
| | | | 19,687,100 | |
| | | | | | | | |
| | |
| | | | Specialized Finance 1.4% | | | |
| | 410,900 | | | eGuarantee, Inc. (Japan) | | | 9,331,110 | |
| | | | | | | | |
| | |
| | | | Systems Software 0.2% | | | |
| | 45,139 | | | Unifiedpost Group S.A.* (Belgium) | | | 1,163,781 | |
| | | | | | | | |
| | |
| | | | Technology Hardware, Storage &
Peripherals 0.0% | | | |
| | 3,170 | | | MGI Digital Graphic Technology* (France) | | | 144,207 | |
| | | | | | | | |
| | |
| | | | Thrifts & Mortgage Finance 2.4% | | | |
| | 533,136 | | | Aavas Financiers Ltd.* (India) | | | 10,405,474 | |
| | 108,532 | | | Equitable Group, Inc. (Canada) | | | 6,120,437 | |
| | | | | | | | |
| | | | 16,525,911 | |
| | | | | | | | |
| | |
| | | | Total Common Stocks
(cost $347,082,160) | | | 651,077,330 | |
| | | | | | | | |
62
| | |
| Wasatch International Opportunities Fund (WAIOX / WIIOX) | | SEPTEMBER 30, 2020 |
Schedule of Investments (continued)
| | | | | | | | |
Principal
Amount | | | | | Value | |
| | | | | | | |
| |
| | | | SHORT-TERM INVESTMENTS 3.2% | |
| | |
| | | | Repurchase Agreement 3.2% | | | |
| $ | 21,877,750 | | | Repurchase Agreement dated 9/30/20, 0.00% due 10/1/20 with Fixed Income Clearing Corp. collateralized by $20,541,300 of United States Treasury Notes 2.625% due 12/31/23; value: $22,315,401; repurchase proceeds: $21,877,750 (cost $21,877,750) | | $ | 21,877,750 | |
| | | | | | | | |
| | |
| | | | Total Short-Term Investments
(cost $21,877,750) | | | 21,877,750 | |
| | | | | | | | |
| | |
| | | | Total Investments
(cost $368,959,910) 99.8%§ | | | 672,955,080 | |
| | |
| | | | Other Assets less Liabilities 0.2% | | | 1,029,628 | |
| | | | | | | | |
| | |
| | | | NET ASSETS 100.0% | | $ | 673,984,708 | |
| | | | | | | | |
| |
| | | | *Non-income producing. ***Security was fair valued under procedures adopted by the Board of Trustees (see Note 12). §The aggregate amount of foreign securities fair valued pursuant to a systematic valuation model as a percent of net assets was 4.23%. §§The aggregate value of illiquid holdings at September 30, 2020, amounted to approximately $8,130 and represented 0.00% of net assets. ADR American Depositary Receipt. | |
| |
| | | | See Notes to Financial Statements. | |
At September 30, 2020, Wasatch International Opportunities Fund’s investments, excluding short-term investments, were in the following countries (unaudited):
| | | | | |
| Country | | % |
Australia | | | | 3.4 | |
Belgium | | | | 0.2 | |
Canada | | | | 0.9 | |
China | | | | 3.4 | |
Denmark | | | | 0.7 | |
Egypt | | | | 2.1 | |
France | | | | 2.8 | |
Germany | | | | 7.1 | |
Greece | | | | 0.9 | |
Hong Kong | | | | 1.2 | |
India | | | | 9.9 | |
Indonesia | | | | 1.8 | |
Israel | | | | 0.7 | |
Italy | | | | 1.6 | |
Japan | | | | 27.1 | |
Malaysia | | | | 0.1 | |
Mexico | | | | 1.7 | |
Norway | | | | 2.0 | |
Philippines | | | | 1.4 | |
Russia | | | | 0.9 | |
Singapore | | | | 0.8 | |
South Korea | | | | 4.4 | |
Sweden | | | | 6.1 | |
Taiwan | | | | 5.4 | |
Thailand | | | | 1.5 | |
United Kingdom | | | | 11.9 | |
| | | | | |
TOTAL | | | | 100.0 | % |
| | | | | |
63
| | |
| Wasatch International Select Fund (WAISX / WGISX) | | |
Schedule of Investments
| | | | | | | | |
| Shares | | | | | Value | |
| | | | | | | |
| | |
| | | | COMMON STOCKS 97.0% | | | | |
| | |
| | | | Apparel, Accessories & Luxury
Goods 2.7% | | | |
| | 153 | | | Hermes International (France) | | $ | 132,063 | |
| | | | | | | | |
| | |
| | | | Application Software 13.6% | | | |
| | 939 | | | Dassault Systemes SE (France) | | | 175,874 | |
| | 2,710 | | | TeamViewer AG* (Germany) | | | 133,829 | |
| | 1,172 | | | Temenos AG (Switzerland) | | | 157,849 | |
| | 2,788 | | | Xero Ltd.* (New Zealand) | | | 201,188 | |
| | | | | | | | |
| | | | | | | 668,740 | |
| | | | | | | | |
| | |
| | | | Asset Management & Custody
Banks 3.4% | | | |
| | 183 | | | Partners Group Holding AG (Switzerland) | | | 168,406 | |
| | | | | | | | |
| | |
| | | | Building Products 4.1% | | | |
| | 8,709 | | | Assa Abloy AB, Class B (Sweden) | | | 204,309 | |
| | | | | | | | |
| | |
| | | | Data Processing & Outsourced
Services 9.3% | | | |
| | 90 | | | Adyen N.V.* (Netherlands) | | | 165,931 | |
| | 2,883 | | | Amadeus IT Group S.A. (Spain) | | | 160,863 | |
| | 1,571 | | | Worldline S.A.* (France) | | | 129,155 | |
| | | | | | | | |
| | | | | | | 455,949 | |
| | | | | | | | |
| | |
| | | | Drug Retail 3.7% | | | |
| | 1,300 | | | Tsuruha Holdings, Inc. (Japan) | | | 183,786 | |
| | | | | | | | |
| | |
| | | | Electronic Equipment &
Instruments 3.5% | | | |
| | 5,707 | | | Halma plc (United Kingdom) | | | 172,686 | |
| | | | | | | | |
| | |
| | | | Health Care Equipment 6.8% | | | |
| | 1,067 | | | Cochlear Ltd. (Australia) | | | 151,319 | |
| | 8,321 | | | Fisher & Paykel Healthcare Corp. Ltd. (New Zealand) | | | 183,143 | |
| | | | | | | | |
| | | | | | | 334,462 | |
| | | | | | | | |
| | |
| | | | Health Care Supplies 6.2% | | | |
| | 4,500 | | | Asahi Intecc Co. Ltd. (Japan) | | | 140,805 | |
| | 1,044 | | | Coloplast A/S, Class B (Denmark) | | | 164,988 | |
| | | | | | | | |
| | | | | | | 305,793 | |
| | | | | | | | |
| | |
| | | | Health Care Technology 3.3% | | | |
| | 2,600 | | | M3, Inc. (Japan) | | | 160,243 | |
| | | | | | | | |
| | |
| | | | Industrial Machinery 6.3% | | | |
| | 5,500 | | | MISUMI Group, Inc. (Japan) | | | 153,060 | |
| | 199 | | | Rational AG (Germany) | | | 156,090 | |
| | | | | | | | |
| | | | | | | 309,150 | |
| | | | | | | | |
| | |
| | | | Interactive Media & Services 6.4% | | | |
| | 6,500 | | | Kakaku.com, Inc. (Japan) | | | 170,535 | |
| | 1,829 | | | REA Group Ltd. (Australia) | | | 144,063 | |
| | | | | | | | |
| | | | | | | 314,598 | |
| | | | | | | | |
| | |
| | | | IT Consulting & Other Services 3.2% | | | |
| | 900 | | | Obic Co. Ltd. (Japan) | | | 157,360 | |
| | | | | | | | |
| | | | | | | | |
| Shares | | | | | Value | |
| | | | | | | |
| | |
| | | | Leisure Products 2.0% | | | |
| | 500 | | | Shimano, Inc. (Japan) | | $ | 98,232 | |
| | | | | | | | |
| | |
| | | | Life Sciences Tools & Services 6.9% | | | |
| | 906 | | | ICON plc* (Ireland) | | | 173,128 | |
| | 489 | | | Sartorius Stedim Biotech (France) | | | 168,902 | |
| | | | | | | | |
| | | | | | | 342,030 | |
| | | | | | | | |
| | |
| | | | Packaged Foods & Meats 3.0% | | | |
| | 38,000 | | | Vitasoy International Holdings Ltd. (Hong Kong) | | | 147,341 | |
| | | | | | | | |
| | |
| | | | Research & Consulting Services 6.5% | | | |
| | 2,117 | | | Intertek Group plc (United Kingdom) | | | 173,024 | |
| | 1,722 | | | Wolters Kluwer N.V. (Netherlands) | | | 147,061 | |
| | | | | | | | |
| | | | | | | 320,085 | |
| | | | | | | | |
| | |
| | | | Soft Drinks 2.8% | | | |
| | 4,667 | | | Fevertree Drinks plc (United Kingdom) | | | 139,471 | |
| | | | | | | | |
| | |
| | | | Specialty Chemicals 3.3% | | | |
| | 1,485 | | | Chr. Hansen Holding A/S (Denmark) | | | 165,060 | |
| | | | | | | | |
| | |
| | | | Total Common Stocks
(cost $4,002,872) | | | 4,779,764 | |
| | | | | | | | |
| | |
Principal
Amount | | | | | Value | |
| | | | | | | |
| |
| | | | SHORT-TERM INVESTMENTS 3.1% | |
| | |
| | | | Repurchase Agreement 3.1% | | | |
| $ | 153,091 | | | Repurchase Agreement dated 9/30/20,
0.00% due 10/1/20 with Fixed Income
Clearing Corp. collateralized by $143,800
of United States Treasury Notes 2.625%
due 12/31/23; value: $156,220; repurchase
proceeds: $153,091 (cost $153,091) | | $ | 153,091 | |
| | | | | | | | |
| | |
| | | | Total Short-Term Investments
(cost $153,091) | | | 153,091 | |
| | | | | | | | |
| | |
| | | | Total Investments
(cost $4,155,963) 100.1% | | | 4,932,855 | |
| | |
| | | | Liabilities less Other Assets (0.1%) | | | (2,729 | ) |
| | | | | | | | |
| | |
| | | | NET ASSETS 100.0% | | $ | 4,930,126 | |
| | | | | | | | |
| | |
| | | | *Non-income producing. | | | | |
| |
| | | | See Notes to Financial Statements. | |
64
| | |
| Wasatch International Select Fund (WAISX / WGISX) | | SEPTEMBER 30, 2020 |
Schedule of Investments (continued)
At September 30, 2020, Wasatch International Select Fund’s investments, excluding short-term investments, were in the following countries (unaudited):
| | | | | |
| Country | | % |
Australia | | | | 6.2 | |
Denmark | | | | 6.9 | |
France | | | | 12.7 | |
Germany | | | | 6.1 | |
Hong Kong | | | | 3.1 | |
Ireland | | | | 3.6 | |
Japan | | | | 22.3 | |
Netherlands | | | | 6.5 | |
New Zealand | | | | 8.0 | |
Spain | | | | 3.4 | |
Sweden | | | | 4.3 | |
Switzerland | | | | 6.8 | |
United Kingdom | | | | 10.1 | |
| | | | | |
TOTAL | | | | 100.0 | % |
| | | | | |
65
| | |
| Wasatch Micro Cap Fund (WMICX / WGICX) | | |
Schedule of Investments
| | | | | | | | |
| Shares | | | | | Value | |
| | | | | | | |
| | |
| | | | COMMON STOCKS 98.5% | | | | |
| | |
| | | | Alternative Carriers 1.7% | | | |
| | 76,862 | | | Bandwidth, Inc., Class A* | | $ | 13,417,799 | |
| | | | | | | | |
| | |
| | | | Apparel Retail 1.7% | | | |
| | 502,307 | | | Boot Barn Holdings, Inc.* | | | 14,134,919 | |
| | | | | | | | |
| | |
| | | | Apparel, Accessories & Luxury
Goods 1.2% | | | |
| | 434,027 | | | Superior Group of Cos., Inc. | | | 10,082,447 | |
| | | | | | | | |
| | |
| | | | Application Software 8.6% | | | |
| | 128,261 | | | Five9, Inc.* | | | 16,632,886 | |
| | 559,411 | | | Medallia, Inc.* | | | 15,339,050 | |
| | 300,553 | | | Model N, Inc.* | | | 10,603,510 | |
| | 1,170,711 | | | Pexip Holding ASA* (Norway) | | | 10,461,406 | |
| | 424,829 | | | Upland Software, Inc.* | | | 16,016,053 | |
| | | | | | | | |
| | | | | | | 69,052,905 | |
| | | | | | | | |
| | |
| | | | Auto Parts & Equipment 1.6% | | | |
| | 499,342 | | | XPEL, Inc.* | | | 13,022,839 | |
| | | | | | | | |
| | |
| | | | Biotechnology 10.6% | | | |
| | 381,295 | | | Castle Biosciences, Inc.* | | | 19,617,628 | |
| | 122,792 | | | ChemoCentryx, Inc.* | | | 6,729,001 | |
| | 296,281 | | | Cytokinetics, Inc.* | | | 6,414,484 | |
| | 192,072 | | | Esperion Therapeutics, Inc.* | | | 7,139,316 | |
| | 352,870 | | | Flexion Therapeutics, Inc.* | | | 3,673,377 | |
| | 402,336 | | | Frequency Therapeutics, Inc.* | | | 7,728,874 | |
| | 206,845 | | | Inovio Pharmaceuticals, Inc.* | | | 2,399,402 | |
| | 339,467 | | | MacroGenics, Inc.* | | | 8,551,174 | |
| | 904,735 | | | MEI Pharma, Inc.* | | | 2,822,773 | |
| | 175,317 | | | Nkarta, Inc.* | | | 5,270,029 | |
| | 676,842 | | | Sangamo Therapeutics, Inc.* | | | 6,396,157 | |
| | 112,877 | | | Twist Bioscience Corp.* | | | 8,575,266 | |
| | | | | | | | |
| | | | | | | 85,317,481 | |
| | | | | | | | |
| | |
| | | | Building Products 1.1% | | | |
| | 149,321 | | | Patrick Industries, Inc. | | | 8,588,944 | |
| | | | | | | | |
| | |
| | | | Casinos & Gaming 2.1% | | | |
| | 172,714 | | | DraftKings, Inc., Class A* | | | 10,162,492 | |
| | 383,747 | | | GAN Ltd.* (United Kingdom) | | | 6,485,324 | |
| | | | | | | | |
| | | | | | | 16,647,816 | |
| | | | | | | | |
| | |
| | | | Construction & Engineering 1.7% | | | |
| | 776,319 | | | Construction Partners, Inc., Class A* | | | 14,129,006 | |
| | | | | | | | |
| | |
| | | | Data Processing & Outsourced
Services 3.1% | | | |
| | 1,013,125 | | | Paysign, Inc.* | | | 5,754,550 | |
| | 338,208 | | | Repay Holdings Corp.* | | | 7,947,888 | |
| | 1,285,437 | | | USA Technologies, Inc.* | | | 11,247,574 | |
| | | | | | | | |
| | | | | | | 24,950,012 | |
| | | | | | | | |
| | |
| | | | Electronic Equipment &
Instruments 4.1% | | | |
| | 304,765 | | | Napco Security Technologies, Inc.* | | | 7,161,978 | |
| | 563,921 | | | nLight, Inc.* | | | 13,240,865 | |
| | 316,771 | | | PAR Technology Corp.* | | | 12,832,393 | |
| | | | | | | | |
| | | | | | | 33,235,236 | |
| | | | | | | | |
| | | | | | | | |
| Shares | | | | | Value | |
| | | | | | | |
| | |
| | | | Financial Exchanges & Data 2.8% | | | |
| | 878,249 | | | Open Lending Corp., Class A* | | $ | 22,395,350 | |
| | | | | | | | |
| | |
| | | | Health Care Equipment 3.5% | | | |
| | 170,734 | | | AtriCure, Inc.* | | | 6,812,287 | |
| | 1,506,232 | | | GenMark Diagnostics, Inc.* | | | 21,388,494 | |
| | | | | | | | |
| | | | | | | 28,200,781 | |
| | | | | | | | |
| | |
| | | | Health Care Facilities 2.8% | | | |
| | 400,351 | | | Pennant Group, Inc. (The)* | | | 15,437,535 | |
| | 84,680 | | | U.S. Physical Therapy, Inc. | | | 7,356,998 | |
| | | | | | | | |
| | | | | | | 22,794,533 | |
| | | | | | | | |
| | |
| | | | Health Care Services 1.6% | | | |
| | 134,083 | | | Addus HomeCare Corp.* | | | 12,672,184 | |
| | | | | | | | |
| | |
| | | | Health Care Supplies 5.9% | | | |
| | 434,984 | | | BioLife Solutions, Inc.* | | | 12,588,437 | |
| | 262,849 | | | OrthoPediatrics Corp.* | | | 12,070,026 | |
| | 340,290 | | | Silk Road Medical, Inc.* | | | 22,870,891 | |
| | | | | | | | |
| | | | | | | 47,529,354 | |
| | | | | | | | |
| | |
| | | | Health Care Technology 2.6% | | | |
| | 76,554 | | | Inspire Medical Systems, Inc.* | | | 9,879,294 | |
| | 148,160 | | | Simulations Plus, Inc. | | | 11,165,337 | |
| | | | | | | | |
| | | | | | | 21,044,631 | |
| | | | | | | | |
| | |
| | | | Home Furnishings 2.8% | | | |
| | 919,312 | | | Purple Innovation, Inc.* | | | 22,854,096 | |
| | | | | | | | |
| | |
| | | | Homebuilding 2.5% | | | |
| | 90,357 | | | LGI Homes, Inc.* | | | 10,496,773 | |
| | 356,081 | | | Skyline Champion Corp.* | | | 9,532,288 | |
| | | | | | | | |
| | | | | | | 20,029,061 | |
| | | | | | | | |
| | |
| | | | Industrial Machinery 7.3% | | | |
| | 250,785 | | | Altra Industrial Motion Corp. | | | 9,271,522 | |
| | 267,227 | | | Helios Technologies, Inc. | | | 9,727,063 | |
| | 137,331 | | | Kadant, Inc. | | | 15,054,224 | |
| | 378,636 | | | Kornit Digital Ltd.* (Israel) | | | 24,562,117 | |
| | | | | | | | |
| | | | | | | 58,614,926 | |
| | | | | | | | |
| | |
| | | | Internet & Direct Marketing
Retail 1.4% | | | |
| | 451,746 | | | 1-800-Flowers.com, Inc., Class A* | | | 11,266,545 | |
| | | | | | | | |
| | |
| | | | Internet Services &
Infrastructure 1.0% | | | |
| | 1,451,594 | | | Limelight Networks, Inc.* | | | 8,361,181 | |
| | | | | | | | |
| | |
| | | | Leisure Products 1.4% | | | |
| | 662,816 | | | MasterCraft Boat Holdings, Inc.* | | | 11,592,652 | |
| | | | | | | | |
| | |
| | | | Oil & Gas Equipment &
Services 1.2% | | | |
| | 301,946 | | | DMC Global, Inc. | | | 9,946,101 | |
| | | | | | | | |
| | |
| | | | Packaged Foods & Meats 2.5% | | | |
| | 178,744 | | | Freshpet, Inc.* | | | 19,956,768 | |
| | | | | | | | |
| | |
| | | | Paper Packaging 1.3% | | | |
| | 255,465 | | | UFP Technologies, Inc.* | | | 10,581,360 | |
| | | | | | | | |
66
| | |
| Wasatch Micro Cap Fund (WMICX / WGICX) | | SEPTEMBER 30, 2020 |
Schedule of Investments (continued)
| | | | | | | | |
Shares | | | | | Value | |
| | | | | | | |
| | |
| | | | Pharmaceuticals 7.3% | | | |
| | 1,345,719 | | | BioDelivery Sciences International, Inc.* | | $ | 5,019,532 | |
| | 2,738,723 | | | Cresco Labs, Inc.* (Canada) | | | 16,392,642 | |
| | 950,896 | | | Green Thumb Industries, Inc.* | | | 12,318,858 | |
| | 11,325,643 | | | IM Cannabis Corp. * §§ ‡‡ (Canada) | | | 10,206,730 | |
| | 349,579 | | | Intra-Cellular Therapies, Inc.* | | | 8,970,197 | |
| | 1,406,025 | | | TerrAscend Corp.* (Canada) | | | 6,092,722 | |
| | | | | | | | |
| | | | | | | 59,000,681 | |
| | | | | | | | |
| | |
| | | | Regional Banks 0.9% | | | |
| | 351,773 | | | Altabancorp | | | 7,077,673 | |
| | | | | | | | |
| | |
| | | | Research & Consulting
Services 1.8% | | | |
| | 230,164 | | | ICF International, Inc. | | | 14,161,991 | |
| | | | | | | | |
| | |
| | | | Restaurants 1.1% | | | |
| | 448,769 | | | Chuy’s Holdings, Inc.* | | | 8,786,897 | |
| | | | | | | | |
| | |
| | | | Semiconductor Equipment 1.8% | | | |
| | 272,006 | | | Nova Measuring Instruments Ltd.* (Israel) | | | 14,182,393 | |
| | | | | | | | |
| | |
| | | | Semiconductors 0.6% | | | |
| | 789,042 | | | NeoPhotonics Corp.* | | | 4,805,266 | |
| | | | | | | | |
| | |
| | | | Specialized Consumer
Services 2.1% | | | |
| | 338,683 | | | Collectors Universe, Inc. | | | 16,761,422 | |
| | | | | | | | |
| | |
| | | | Systems Software 2.8% | | | |
| | 92,752 | | | CyberArk Software Ltd.* (Israel) | | | 9,592,412 | |
| | 212,052 | | | Rapid7, Inc.* | | | 12,986,064 | |
| | | | | | | | |
| | | | | | | 22,578,476 | |
| | | | | | | | |
| | |
| | | | Trading Companies &
Distributors 2.0% | | | |
| | 545,086 | | | Transcat, Inc.* ‡‡ | | | 15,971,020 | |
| | | | | | | | |
| | |
| | | | Total Common Stocks
(cost $532,960,969) | | | 793,744,746 | |
| | | | | | | | |
| |
| | | | WARRANTS 0.1% | |
| | |
| | | | Pharmaceuticals 0.1% | | | |
| | 1,897,571 | | | IM Cannabis Corp., 10/10/2021* §§ ‡‡ (Canada) | | | 356,271 | |
| | | | | | | | |
| | |
| | | | Total Warrants
(cost $0) | | | 356,271 | |
| | | | | | | | |
| | | | | | | | |
Principal
Amount | | | | | Value | |
| | | | | | | |
| |
| | | | SHORT-TERM INVESTMENTS 2.1% | |
| | |
| | | | Repurchase Agreement 2.1% | | | |
| $ | 17,242,065 | | | Repurchase Agreement dated 9/30/20, 0.00% due 10/1/20 with Fixed Income Clearing Corp. collateralized by $16,126,700 of United States Treasury Notes 2.750% due 2/15/24; value: $17,586,916; repurchase proceeds: $17,242,065 (cost $17,242,065) | | $ | 17,242,065 | |
| | | | | | | | |
| | |
| | | | Total Short-Term Investments
(cost $17,242,065) | | | 17,242,065 | |
| | | | | | | | |
| | |
| | | | Total Investments
(cost $550,203,034) 100.7% | | | 811,343,082 | |
| | |
| | | | Liabilities less Other Assets (0.7%) | | | (5,470,203 | ) |
| | | | | | | | |
| | |
| | | | NET ASSETS 100.0% | | $ | 805,872,879 | |
| | | | | | | | |
| |
| | | | *Non-income producing. ‡‡Affiliated company (see Note 8). §§The aggregate value of illiquid holdings at September 30, 2020, amounted to approximately $10,563,001, and represented 1.31% of net assets. | |
| |
| | | | See Notes to Financial Statements. | |
At September 30, 2020, Wasatch Micro Cap Fund’s investments, excluding short-term investments, were in the following countries (unaudited):
| | | | | |
| Country | | % |
Canada | | | | 4.2 | |
Israel | | | | 6.1 | |
Norway | | | | 1.3 | |
United Kingdom | | | | 0.8 | |
United States | | | | 87.6 | |
| | | | | |
TOTAL | | | | 100.0 | % |
| | | | | |
67
| | |
| Wasatch Micro Cap Value Fund (WAMVX / WGMVX) | | |
Schedule of Investments
| | | | | | | | |
| Shares | | | | | Value | |
| | | | | | | |
| |
| | | | COMMON STOCKS 95.5% | |
| | |
| | | | Advertising 1.2% | | | |
| | 272,000 | | | YouGov plc (United Kingdom) | | $ | 2,972,758 | |
| | | | | | | | |
| | |
| | | | Air Freight & Logistics 1.2% | | | |
| | 568,000 | | | Radiant Logistics, Inc.* | | | 2,919,520 | |
| | | | | | | | |
| | |
| | | | Airlines 0.5% | | | |
| | 11,000 | | | Allegiant Travel Co. | | | 1,317,800 | |
| | | | | | | | |
| | |
| | | | Alternative Carriers 2.0% | | | |
| | 14,000 | | | Bandwidth, Inc., Class A* | | | 2,443,980 | |
| | 121,000 | | | Gamma Communications plc (United Kingdom) | | | 2,576,182 | |
| | | | | | | | |
| | | | | | | 5,020,162 | |
| | | | | | | | |
| | |
| | | | Application Software 7.3% | | | |
| | 91,245 | | | Agilysys, Inc.* | | | 2,204,479 | |
| | 270,000 | | | eGain Corp.* | | | 3,825,900 | |
| | 18,000 | | | Esker S.A. (France) | | | 3,072,757 | |
| | 88,000 | | | Model N, Inc.* | | | 3,104,640 | |
| | 75,000 | | | QAD, Inc., Class A | | | 3,165,000 | |
| | 239,000 | | | SharpSpring, Inc.* | | | 2,664,850 | |
| | | | | | | | |
| | | | | | | 18,037,626 | |
| | | | | | | | |
| | |
| | | | Asset Management & Custody
Banks 2.8% | | | |
| | 648,340 | | | Fiducian Group Ltd. (Australia) | | | 2,600,491 | |
| | 240,000 | | | FinTech Acquisition Corp. III, Class A* | | | 2,474,400 | |
| | 31,000 | | | Hamilton Lane, Inc., Class A | | | 2,002,290 | |
| | | | | | | | |
| | | | | | | 7,077,181 | |
| | | | | | | | |
| | |
| | | | Biotechnology 3.0% | | | |
| | 88,000 | | | Cytokinetics, Inc.* | | | 1,905,200 | |
| | 27,000 | | | Esperion Therapeutics, Inc.* | | | 1,003,590 | |
| | 66,000 | | | Frequency Therapeutics, Inc.* | | | 1,267,860 | |
| | 43,000 | | | Inovio Pharmaceuticals, Inc.* | | | 498,800 | |
| | 300,000 | | | MEI Pharma, Inc.* | | | 936,000 | |
| | 199,000 | | | Sangamo Therapeutics, Inc.* | | | 1,880,550 | |
| | | | | | | | |
| | | | | | | 7,492,000 | |
| | | | | | | | |
| | |
| | | | Building Products 1.0% | | | |
| | 45,000 | | | Patrick Industries, Inc. | | | 2,588,400 | |
| | | | | | | | |
| | |
| | | | Communications Equipment 1.5% | | | |
| | 243,000 | | | Digi International, Inc.* | | | 3,798,090 | |
| | | | | | | | |
| | |
| | | | Construction & Engineering 1.1% | | | |
| | 149,000 | | | Construction Partners, Inc., Class A* | | | 2,711,800 | |
| | | | | | | | |
| | |
| | | | Data Processing & Outsourced
Services 3.0% | | | |
| | 104,000 | | | I3 Verticals, Inc., Class A* | | | 2,626,000 | |
| | 423,736 | | | Paysign, Inc.* | | | 2,406,820 | |
| | 98,899 | | | Repay Holdings Corp.* | | | 2,324,127 | |
| | | | | | | | |
| | | | | | | 7,356,947 | |
| | | | | | | | |
| | |
| | | | Diversified Support Services 0.9% | | | |
| | 1,934,000 | | | Johnson Service Group plc (United Kingdom) | | | 2,245,982 | |
| | | | | | | | |
| | | | | | | | |
| Shares | | | | | Value | |
| | | | | | | |
| | |
| | | | Education Services 2.0% | | | |
| | 222,000 | | | Aspen Group, Inc.* | | $ | 2,479,740 | |
| | 99,000 | | | K12, Inc.* | | | 2,607,660 | |
| | | | | | | | |
| | | | | | | 5,087,400 | |
| | | | | | | | |
| | |
| | | | Electronic Equipment &
Instruments 2.7% | | | |
| | 48,000 | | | FARO Technologies, Inc.* | | | 2,927,040 | |
| | 157,000 | | | Napco Security Technologies, Inc.* | | | 3,689,500 | |
| | | | | | | | |
| | | | | | | 6,616,540 | |
| | | | | | | | |
| | |
| | | | Electronic Manufacturing
Services 1.6% | | | |
| | 64,000 | | | Fabrinet* | | | 4,033,920 | |
| | | | | | | | |
| | |
| | | | Financial Exchanges & Data 2.0% | | | |
| | 193,000 | | | Open Lending Corp., Class A* | | | 4,921,500 | |
| | | | | | | | |
| | |
| | | | Health Care Distributors 2.3% | | | |
| | 4,161,922 | | | Ibnsina Pharma S.A.E. (Egypt) | | | 1,903,422 | |
| | 119,017 | | | PetIQ, Inc.* | | | 3,918,040 | |
| | | | | | | | |
| | | | | | | 5,821,462 | |
| | | | | | | | |
| | |
| | | | Health Care Equipment 4.5% | | | |
| | 45,000 | | | AtriCure, Inc.* | | | 1,795,500 | |
| | 55,000 | | | Cantel Medical Corp. | | | 2,416,700 | |
| | 107,000 | | | Inmode Ltd.* (Israel) | | | 3,871,260 | |
| | 323,371 | | | IRIDEX Corp.* | | | 633,807 | |
| | 67,000 | | | Tactile Systems Technology, Inc.* | | | 2,451,530 | |
| | | | | | | | |
| | | | | | | 11,168,797 | |
| | | | | | | | |
| | |
| | | | Health Care Facilities 2.5% | | | |
| | 44,000 | | | Ensign Group, Inc. (The) | | | 2,510,640 | |
| | 218,000 | | | Joint Corp. (The)* | | | 3,791,020 | |
| | | | | | | | |
| | | | | | | 6,301,660 | |
| | | | | | | | |
| | |
| | | | Health Care Services 2.5% | | | |
| | 41,000 | | | Addus HomeCare Corp.* | | | 3,874,910 | |
| | 362,000 | | | Sharps Compliance Corp.* | | | 2,269,740 | |
| | | | | | | | |
| | | | | | | 6,144,650 | |
| | | | | | | | |
| | |
| | | | Health Care Supplies 2.8% | | | |
| | 91,000 | | | BioLife Solutions, Inc.* | | | 2,633,540 | |
| | 47,000 | | | OrthoPediatrics Corp.* | | | 2,158,240 | |
| | 1,159,000 | | | Surgalign Holdings, Inc.* | | | 2,097,790 | |
| | | | | | | | |
| | | | | | | 6,889,570 | |
| | | | | | | | |
| | |
| | | | Health Care Technology 3.2% | | | |
| | 62,369 | | | Nexus AG (Germany) | | | 3,363,728 | |
| | 219,000 | | | OptimizeRx Corp.* | | | 4,566,150 | |
| | | | | | | | |
| | | | | | | 7,929,878 | |
| | | | | | | | |
| | |
| | | | Heavy Electrical Equipment 1.1% | | | |
| | 98,000 | | | TPI Composites, Inc.* | | | 2,838,080 | |
| | | | | | | | |
| | |
| | | | Home Furnishings 1.1% | | | |
| | 103,000 | | | Lovesac Co. (The)* | | | 2,854,130 | |
| | | | | | | | |
| | |
| | | | Homebuilding 3.5% | | | |
| | 22,000 | | | LGI Homes, Inc.* | | | 2,555,740 | |
| | 228,000 | | | Skyline Champion Corp.* | | | 6,103,560 | |
| | | | | | | | |
| | | | | | | 8,659,300 | |
| | | | | | | | |
68
| | |
| Wasatch Micro Cap Value Fund (WAMVX / WGMVX) | | SEPTEMBER 30, 2020 |
Schedule of Investments (continued)
| | | | | | | | |
| Shares | | | | | Value | |
| | | | | | | |
| | |
| | | | Industrial Machinery 5.2% | | | |
| | 21,000 | | | John Bean Technologies Corp. | | $ | 1,929,690 | |
| | 22,000 | | | Kadant, Inc. | | | 2,411,640 | |
| | 67,000 | | | Kornit Digital Ltd.* (Israel) | | | 4,346,290 | |
| | 138,000 | | | va-Q-tec AG* (Germany) | | | 4,303,829 | |
| | | | | | | | |
| | | | | | | 12,991,449 | |
| | | | | | | | |
| | |
| | | | Insurance Brokers 0.7% | | | |
| | 19,000 | | | Goosehead Insurance, Inc., Class A | | | 1,645,210 | |
| | | | | | | | |
| | |
| | | | Integrated Telecommunication
Services 1.5% | | | |
| | 277,000 | | | Ooma, Inc.* | | | 3,614,850 | |
| | | | | | | | |
| | |
| | | | Internet & Direct Marketing
Retail 2.0% | | | |
| | 620,000 | | | Leaf Group Ltd.* | | | 3,112,400 | |
| | 397,000 | | | Trainline plc* (United Kingdom) | | | 1,859,535 | |
| | | | | | | | |
| | | | | | | 4,971,935 | |
| | | | | | | | |
| | |
| | | | Internet Services &
Infrastructure 1.0% | | | |
| | 35,000 | | | Tucows, Inc., Class A* | | | 2,411,500 | |
| | | | | | | | |
| | |
| | | | Investment Banking &
Brokerage 1.7% | | | |
| | 434,000 | | | JDC Group AG* (Germany) | | | 4,192,868 | |
| | | | | | | | |
| | |
| | | | IT Consulting & Other
Services 3.5% | | | |
| | 236,000 | | | Avant Corp. (Japan) | | | 2,333,931 | |
| | 49,000 | | | Endava plc ADR* (United Kingdom) | | | 3,094,350 | |
| | 67,000 | | | Virtusa Corp.* | | | 3,293,720 | |
| | | | | | | | |
| | | | | | | 8,722,001 | |
| | | | | | | | |
| | |
| | | | Leisure Facilities 0.9% | | | |
| | 1,228,000 | | | Gym Group plc (The)* (United Kingdom) | | | 2,161,325 | |
| | | | | | | | |
| | |
| | | | Leisure Products 1.3% | | | |
| | 223,387 | | | Clarus Corp. | | | 3,154,225 | |
| | | | | | | | |
| | |
| | | | Mortgage REITs 1.0% | | | |
| | 217,000 | | | Arbor Realty Trust, Inc. | | | 2,488,990 | |
| | | | | | | | |
| | |
| | | | Movies & Entertainment 0.8% | | | |
| | 1,274,932 | | | Thunderbird Entertainment Group, Inc.* (Canada) | | | 1,953,258 | |
| | | | | | | | |
| | |
| | | | Office Services & Supplies 0.9% | | | |
| | 218,000 | | | Kimball International, Inc., Class B | | | 2,297,720 | |
| | | | | | | | |
| | |
| | | | Packaged Foods & Meats 1.3% | | | |
| | 29,000 | | | Freshpet, Inc.* | | | 3,237,850 | |
| | | | | | | | |
| | |
| | | | Pharmaceuticals 2.6% | | | |
| | 279,798 | | | Green Thumb Industries, Inc.* | | | 3,624,783 | |
| | 85,000 | | | Intra-Cellular Therapies, Inc.* | | | 2,181,100 | |
| | 532,341 | | | Vireo Health International, Inc* (Canada) | | | 553,582 | |
| | | | | | | | |
| | | | | | | 6,359,465 | |
| | | | | | | | |
| | | | | | | | |
| Shares | | | | | Value | |
| | | | | | | |
| | |
| | | | Regional Banks 1.7% | | | |
| | 169,000 | | | Esquire Financial Holdings, Inc.* | | $ | 2,535,000 | |
| | 60,728 | | | Sound Financial Bancorp, Inc. | | | 1,779,330 | |
| | | | | | | | |
| | | | | | | 4,314,330 | |
| | | | | | | | |
| | |
| | | | Research & Consulting
Services 2.4% | | | |
| | 24,000 | | | IR Japan Holdings Ltd. (Japan) | | | 3,008,391 | |
| | 164,000 | | | Red Violet, Inc.* | | | 3,027,440 | |
| | | | | | | | |
| | | | | | | 6,035,831 | |
| | | | | | | | |
| | |
| | | | Semiconductor Equipment 1.5% | | | |
| | 71,000 | | | Nova Measuring Instruments Ltd.* (Israel) | | | 3,701,940 | |
| | | | | | | | |
| | |
| | | | Semiconductors 2.0% | | | |
| | 60,000 | | | SiTime Corp.* | | | 5,041,800 | |
| | | | | | | | |
| | |
| | | | Technology Hardware, Storage &
Peripherals 0.8% | | | |
| | 42,000 | | | MGI Digital Graphic Technology* (France) | | | 1,910,624 | |
| | | | | | | | |
| | |
| | | | Thrifts & Mortgage Finance 2.3% | | | |
| | 98,000 | | | Axos Financial, Inc.* | | | 2,284,380 | |
| | 366,000 | | | Mortgage Advice Bureau Holdings Ltd. (United Kingdom) | | | 3,329,488 | |
| | | | | | | | |
| | | | | | | 5,613,868 | |
| | | | | | | | |
| | |
| | | | Trading Companies &
Distributors 3.1% | | | |
| | 171,000 | | | Hardwoods Distribution, Inc. (Canada) | | | 3,110,375 | |
| | 22,090 | | | Lawson Products, Inc.* | | | 906,353 | |
| | 150,000 | | | Systemax, Inc. | | | 3,591,000 | |
| | | | | | | | |
| | | | | | | 7,607,728 | |
| | | | | | | | |
| | |
| | | | Total Common Stocks
(cost $162,140,060) | | | 237,233,920 | |
| | | | | | | | |
| |
| | | | CONVERTIBLE PREFERRED STOCKS 0.8% | |
| | |
| | | | Oil & Gas Refining &
Marketing 0.8% | | | |
| | 674,404 | | | Vertex Energy, Inc., Pfd., 10.00% PIK, Series B* *** † | | | 1,888,331 | |
| | | | | | | | |
| | |
| | | | Total Convertible Preferred Stocks
(cost $1,995,653) | | | 1,888,331 | |
| | | | | | | | |
69
| | |
| Wasatch Micro Cap Value Fund (WAMVX / WGMVX) | | SEPTEMBER 30, 2020 |
Schedule of Investments (continued)
| | | | | | | | |
| Shares | | | | | Value | |
| | | | | | | |
| |
| | | | LIMITED LIABILITY COMPANY MEMBERSHIP INTEREST 0.0% | |
| | |
| | | | Pharmaceuticals 0.0% | | | |
| | 50,528 | | | Regenacy Pharmaceuticals, LLC* *** † | | $ | 17,685 | |
| | | | | | | | |
| | |
| | | | Total Limited Liability Company Membership Interest
(cost $30,001) | | | 17,685 | |
| | | | | | | | |
| |
| | | | WARRANTS 0.0% | |
| | |
| | | | Oil & Gas Refining &
Marketing 0.0% | | | |
| | 250,000 | | | Vertex Energy, Inc., expiring 12/24/2020* *** † | | | 0 | |
| | | | | | | | |
| | |
| | | | Total Warrants
(cost $95,000) | | | 0 | |
| | | | | | | | |
| | |
Principal
Amount | | | | | Value | |
| | | | | | | |
| |
| | | | SHORT-TERM INVESTMENTS 4.6% | |
| | |
| | | | Repurchase Agreement 4.6% | | | |
| $ | 11,437,026 | | | Repurchase Agreement dated 9/30/20, 0.00% due 10/1/20 with Fixed Income Clearing Corp. collateralized by $9,803,500 of United States Treasury Notes 2.875% due 5/15/28; value: $11,665,785; repurchase proceeds: $11,437,026 (cost $11,437,026) | | $ | 11,437,026 | |
| | | | | | | | |
| | |
| | | | Total Short-Term Investments
(cost $11,437,026) | | | 11,437,026 | |
| | | | | | | | |
| | |
| | | | Total Investments
(cost $175,697,740) 100.9% | | | 250,576,962 | |
| | |
| | | | Liabilities less Other Assets (0.9%) | | | (2,296,802 | ) |
| | | | | | | | |
| | |
| | | | NET ASSETS 100.0% | | $ | 248,280,160 | |
| | | | | | | | |
| |
| | | | *Non-income producing. ***Security was fair valued under procedures adopted by the Board of Trustees (see Note 12). †Security purchased in a private placement transaction or under Rule 144A of the Securities Act of 1933 (see Note 9). The aggregate value of securities purchased in a private placement transaction or under Rule 144A of the Securities Act of 1933 at September 30, 2020, amounted to approximately $1,906,016, and represented 0.77% of net assets. | |
| |
| | | | ADR American Depositary Receipt. PIK Payment In Kind. REIT Real Estate Investment Trust. | |
| |
| | | | See Notes to Financial Statements. | |
At September 30, 2020, Wasatch Micro Cap Value Fund’s investments, excluding short-term investments, were in the following countries (unaudited):
| | | | | |
| Country | | % |
Australia | | | | 1.0 | |
Canada | | | | 2.2 | |
Egypt | | | | 0.8 | |
France | | | | 2.0 | |
Germany | | | | 4.7 | |
Israel | | | | 4.8 | |
Japan | | | | 2.1 | |
United Kingdom | | | | 7.3 | |
United States | | | | 75.1 | |
| | | | | |
TOTAL | | | | 100.0 | % |
| | | | | |
70
| | |
| Wasatch Small Cap Growth Fund (WAAEX / WIAEX) | | SEPTEMBER 30, 2020 |
Schedule of Investments
| | | | | | | | |
| Shares | | | | | Value | |
| | | | | | | |
| |
| | | | COMMON STOCKS 98.1% | |
| | |
| | | | Aerospace & Defense 1.4% | | | |
| | 379,488 | | | HEICO Corp., Class A | | $ | 33,645,406 | |
| | | | | | | | |
| | |
| | | | Airlines 1.3% | | | |
| | 275,983 | | | Allegiant Travel Co. | | | 33,062,763 | |
| | | | | | | | |
| | |
| | | | Apparel Retail 1.6% | | | |
| | 1,430,657 | | | Boot Barn Holdings, Inc.* | | | 40,258,688 | |
| | | | | | | | |
| | |
| | | | Application Software 16.4% | | | |
| | 635,946 | | | Five9, Inc.* | | | 82,469,477 | |
| | 434,708 | | | Globant S.A.* (Argentina) | | | 77,908,368 | |
| | 261,180 | | | HubSpot, Inc.* | | | 76,324,631 | |
| | 1,974,319 | | | Medallia, Inc.* | | | 54,135,827 | |
| | 480,709 | | | Paylocity Holding Corp.* | | | 77,596,047 | |
| | 385,809 | | | Zendesk, Inc.* | | | 39,707,462 | |
| | | | | | | | |
| | | | 408,141,812 | |
| | | | | | | | |
| | |
| | | | Automotive Retail 1.5% | | | |
| | 906,371 | | | Monro, Inc. | | | 36,771,471 | |
| | | | | | | | |
| | |
| | | | Biotechnology 6.8% | | | |
| | 975,808 | | | Atara Biotherapeutics, Inc.* | | | 12,646,472 | |
| | 325,241 | | | ChemoCentryx, Inc.* | | | 17,823,207 | |
| | 948,995 | | | Cytokinetics, Inc.* | | | 20,545,742 | |
| | 609,172 | | | Denali Therapeutics, Inc.* | | | 21,826,633 | |
| | 439,790 | | | Esperion Therapeutics, Inc.* | | | 16,346,994 | |
| | 1,311,016 | | | Flexion Therapeutics, Inc.* | | | 13,647,677 | |
| | 1,092,807 | | | Frequency Therapeutics, Inc.* | | | 20,992,822 | |
| | 1,030,274 | | | Inovio Pharmaceuticals, Inc.* | | | 11,951,178 | |
| | 725,145 | | | MacroGenics, Inc.* | | | 18,266,402 | |
| | 1,474,647 | | | Sangamo Therapeutics, Inc.* | | | 13,935,414 | |
| | | | | | | | |
| | | | 167,982,541 | |
| | | | | | | | |
| | |
| | | | Building Products 1.3% | | | |
| | 542,452 | | | AAON, Inc. | | | 32,682,733 | |
| | | | | | | | |
| | |
| | | | Data Processing & Outsourced
Services 3.3% | | | |
| | 505,577 | | | Euronet Worldwide, Inc.* | | | 46,058,065 | |
| | 1,536,392 | | | Repay Holdings Corp.* | | | 36,105,212 | |
| | | | | | | | |
| | | | 82,163,277 | |
| | | | | | | | |
| | |
| | | | Electronic Equipment &
Instruments 1.0% | | | |
| | 1,090,987 | | | nLight, Inc.* | | | 25,616,375 | |
| | | | | | | | |
| | |
| | | | Financial Exchanges & Data 0.3% | | | |
| | 339,812 | | | Open Lending Corp., Class A* | | | 8,665,206 | |
| | | | | | | | |
| | |
| | | | General Merchandise Stores 2.0% | | | |
| | 556,405 | | | Ollie’s Bargain Outlet Holdings, Inc.* | | | 48,601,977 | |
| | | | | | | | |
| | |
| | | | Health Care Distributors 1.1% | | | |
| | 800,255 | | | PetIQ, Inc.* | | | 26,344,395 | |
| | | | | | | | |
| | |
| | | | Health Care Equipment 1.2% | | | |
| | 50,392 | | | Cantel Medical Corp. | | | 2,214,224 | |
| | 112,393 | | | Insulet Corp.* | | | 26,591,060 | |
| | | | | | | | |
| | | | 28,805,284 | |
| | | | | | | | |
| | | | | | | | |
| Shares | | | | | Value | |
| | | | | | | |
| | |
| | | | Health Care Facilities 4.0% | | | |
| | 1,251,280 | | | Ensign Group, Inc. (The) | | $ | 71,398,037 | |
| | 695,267 | | | Pennant Group, Inc. (The)* | | | 26,809,495 | |
| | | | | | | | |
| | | | 98,207,532 | |
| | | | | | | | |
| | |
| | | | Health Care Supplies 3.7% | | | |
| | 514,931 | | | Neogen Corp.* | | | 40,293,351 | |
| | 774,964 | | | Silk Road Medical, Inc.* | | | 52,085,330 | |
| | | | | | | | |
| | | | 92,378,681 | |
| | | | | | | | |
| | |
| | | | Health Care Technology 2.1% | | | |
| | 411,807 | | | Inspire Medical Systems, Inc.* | | | 53,143,693 | |
| | | | | | | | |
| | |
| | | | Home Furnishings 1.5% | | | |
| | 1,465,890 | | | Purple Innovation, Inc.* | | | 36,442,025 | |
| | | | | | | | |
| | |
| | | | Home Improvement Retail 3.1% | | | |
| | 1,028,580 | | | Floor & Decor Holdings, Inc., Class A* | | | 76,937,784 | |
| | | | | | | | |
| | |
| | | | Homebuilding 2.9% | | | |
| | 619,004 | | | LGI Homes, Inc.* | | | 71,909,695 | |
| | | | | | | | |
| | |
| | | | Industrial Machinery 8.3% | | | |
| | 1,025,872 | | | Barnes Group, Inc. | | | 36,664,665 | |
| | 977,701 | | | Helios Technologies, Inc. | | | 35,588,316 | |
| | 1,281,120 | | | Kornit Digital Ltd.* (Israel) | | | 83,106,255 | |
| | 415,528 | | | RBC Bearings, Inc.* | | | 50,366,149 | |
| | | | | | | | |
| | | | 205,725,385 | |
| | | | | | | | |
| | |
| | | | Insurance Brokers 1.3% | | | |
| | 379,396 | | | Goosehead Insurance, Inc., Class A | | | 32,851,900 | |
| | | | | | | | |
| | |
| | | | Leisure Facilities 1.4% | | | |
| | 565,737 | | | Planet Fitness, Inc., Class A* | | | 34,860,714 | |
| | | | | | | | |
| | |
| | | | Leisure Products 1.5% | | | |
| | 839,124 | | | YETI Holdings, Inc.* | | | 38,029,100 | |
| | | | | | | | |
| | |
| | | | Life Sciences Tools &
Services 5.4% | | | |
| | 340,050 | | | ICON plc* (Ireland) | | | 64,980,155 | |
| | 627,888 | | | Medpace Holdings, Inc.* | | | 70,166,484 | |
| | | | | | | | |
| | | | 135,146,639 | |
| | | | | | | | |
| | |
| | | | Managed Health Care 1.9% | | | |
| | 896,519 | | | HealthEquity, Inc.* | | | 46,054,181 | |
| | | | | | | | |
| | |
| | | | Oil & Gas Equipment &
Services 0.6% | | | |
| | 427,197 | | | DMC Global, Inc. | | | 14,071,869 | |
| | | | | | | | |
| | |
| | | | Packaged Foods & Meats 3.0% | �� | | |
| | 668,614 | | | Freshpet, Inc.* | | | 74,650,753 | |
| | | | | | | | |
| | |
| | | | Pharmaceuticals 1.0% | | | |
| | 960,172 | | | Intra-Cellular Therapies, Inc.* | | | 24,638,014 | |
| | | | | | | | |
| | |
| | | | Regional Banks 1.2% | | | |
| | 832,677 | | | Pinnacle Financial Partners, Inc. | | | 29,634,974 | |
| | | | | | | | |
| | |
| | | | Restaurants 0.9% | | | |
| | 1,140,058 | | | Chuy’s Holdings, Inc.* ‡‡ | | | 22,322,336 | |
| | | | | | | | |
71
| | |
| Wasatch Small Cap Growth Fund (WAAEX / WIAEX) | | SEPTEMBER 30, 2020 |
Schedule of Investments (continued)
| | | | | | | | |
Shares | | | | | Value | |
| | | | | | | |
| | |
| | | | Semiconductors 2.9% | | | |
| | 254,957 | | | Monolithic Power Systems, Inc. | | $ | 71,288,527 | |
| | | | | | | | |
| | |
| | | | Specialty Stores 4.2% | | | |
| | 425,609 | | | Five Below, Inc.* | | | 54,052,343 | |
| | 1,340,046 | | | National Vision Holdings, Inc.* | | | 51,243,359 | |
| | | | | | | | |
| | | | 105,295,702 | |
| | | | | | | | |
| | |
| | | | Systems Software 6.8% | | | |
| | 571,654 | | | CyberArk Software Ltd.* (Israel) | | | 59,120,457 | |
| | 310,400 | | | Proofpoint, Inc.* | | | 32,762,720 | |
| | 858,338 | | | Rapid7, Inc.* | | | 52,564,619 | |
| | 201,038 | | | Varonis Systems, Inc.* | | | 23,203,806 | |
| | | | | | | | |
| | | | 167,651,602 | |
| | | | | | | | |
| | |
| | | | Trading Companies &
Distributors 1.2% | | | |
| | 244,226 | | | SiteOne Landscape Supply, Inc.* | | | 29,783,361 | |
| | | | | | | | |
| | |
| | | | Total Common Stocks
(cost $1,523,659,538) | | | 2,433,766,395 | |
| | | | | | | | |
| |
| | | | PREFERRED STOCKS 0.4% | |
| | |
| | | | Semiconductor Equipment 0.0% | | | |
| | 677,966 | | | Nanosys, Inc., Series D Pfd.* *** † | | | 725,424 | |
| | 161,519 | | | Nanosys, Inc., Series E Pfd.* *** † | | | 188,977 | |
| | | | | | | | |
| | | | 914,401 | |
| | | | | | | | |
| | |
| | | | Systems Software 0.4% | | | |
| | 1,114,610 | | | DataStax, Inc., Series E Pfd.* *** † | | | 9,217,824 | |
| | | | | | | | |
| | |
| | | | Total Preferred Stocks
(cost $10,184,940) | | | 10,132,225 | |
| | | | | | | | |
| |
| | | | LIMITED PARTNERSHIP INTEREST 0.0% | |
| | |
| | | | Asset Management & Custody
Banks 0.0% | | | |
| | 1 | | | Greenspring Global Partners II-B, L.P.* *** † | | | 149,227 | |
| | 1 | | | Greenspring Global Partners III-B, L.P.* *** † | | | 68,651 | |
| | | | | | | | |
| | | | 217,878 | |
| | | | | | | | |
| | |
| | | | Total Limited Partnership Interest
(cost $1,148,383) | | | 217,878 | |
| | | | | | | | |
| | | | | | | | |
Principal
Amount | | | | | Value | |
| | | | | | | |
| |
| | | | SHORT-TERM INVESTMENTS 1.7% | |
| | |
| | | | Repurchase Agreement 1.7% | | | |
| $ | 43,083,458 | | | Repurchase Agreement dated 9/30/20, 0.00% due 10/1/20 with Fixed Income Clearing Corp. collateralized by $38,739,700 of United States Treasury Notes 2.250%—2.750% due 2/15/24—11/15/27; value: $43,945,162; repurchase proceeds: $43,083,458 (cost $43,083,458) | | $ | 43,083,458 | |
| | | | | | | | |
| | |
| | | | Total Short-Term Investments
(cost $43,083,458) | | | 43,083,458 | |
| | | | | | | | |
| | |
| | | | Total Investments
(cost $1,578,076,319) 100.2% | | | 2,487,199,956 | |
| | |
| | | | Liabilities less Other Assets (0.2%) | | | (5,998,026 | ) |
| | | | | | | | |
| | |
| | | | NET ASSETS 100.0% | | $ | 2,481,201,930 | |
| | | | | | | | |
| |
| | | | *Non-income producing. ***Security was fair valued under procedures adopted by the Board of Trustees (see Note 12). †Security purchased in a private placement transaction or under Rule 144A of the Securities Act of 1933 (see Note 9). The aggregate value of securities purchased in a private placement transaction or under Rule 144A of the Securities Act of 1933 at September 30, 2020, amounted to approximately $10,350,103, and represented 0.42% of net assets. ‡‡Affiliated company (see Note 8). | |
| |
| | | | See Notes to Financial Statements. | |
At September 30, 2020, Wasatch Small Cap Growth Fund’s investments, excluding short-term investments, were in the following countries (unaudited):
| | | | | |
| Country | | % |
Argentina | | | | 3.1 | |
Ireland | | | | 2.6 | |
Israel | | | | 5.7 | |
United States | | | | 88.6 | |
| | | | | |
TOTAL | | | | 100.0 | % |
| | | | | |
72
| | |
| Wasatch Small Cap Value Fund (WMCVX / WICVX) | | SEPTEMBER 30, 2020 |
Schedule of Investments
| | | | | | | | |
| Shares | | | | | Value | |
| | | | | | | |
| | |
| | | | COMMON STOCKS 98.7% | | | | |
| | |
| | | | Advertising 0.9% | | | |
| | 3,295,532 | | | National CineMedia, Inc. | | $ | 8,947,369 | |
| | | | | | | | |
| | |
| | | | Aerospace & Defense 1.3% | | | |
| | 145,308 | | | HEICO Corp., Class A | | | 12,883,007 | |
| | | | | | | | |
| | |
| | | | Airlines 1.1% | | | |
| | 95,047 | | | Allegiant Travel Co. | | | 11,386,631 | |
| | | | | | | | |
| | |
| | | | Application Software 3.1% | | | |
| | 443,112 | | | Ebix, Inc. | | | 9,128,107 | |
| | 376,544 | | | Medallia, Inc.* | | | 10,324,836 | |
| | 309,435 | | | Upland Software, Inc.* | | | 11,665,700 | |
| | | | | | | | |
| | | | 31,118,643 | |
| | | | | | | | |
| | |
| | | | Asset Management & Custody
Banks 4.0% | | | |
| | 678,394 | | | Artisan Partners Asset Management, Inc., Class A | | | 26,450,582 | |
| | 210,566 | | | Hamilton Lane, Inc., Class A | | | 13,600,458 | |
| | | | | | | | |
| | | | 40,051,040 | |
| | | | | | | | |
| | |
| | | | Auto Parts & Equipment 1.1% | | | |
| | 120,691 | | | Dorman Products, Inc.* | | | 10,908,053 | |
| | | | | | | | |
| | |
| | | | Automotive Retail 1.8% | | | |
| | 445,715 | | | Monro, Inc. | | | 18,082,658 | |
| | | | | | | | |
| | |
| | | | Biotechnology 1.5% | | | |
| | 167,923 | | | Esperion Therapeutics, Inc.* | | | 6,241,698 | |
| | 95,835 | | | Ligand Pharmaceuticals, Inc.* | | | 9,134,992 | |
| | | | | | | | |
| | | | 15,376,690 | |
| | | | | | | | |
| | |
| | | | Building Products 1.0% | | | |
| | 142,260 | | | Trex Co., Inc.* | | | 10,185,816 | |
| | | | | | | | |
| | |
| | | | Commercial Printing 1.5% | | | |
| | 201,322 | | | Cimpress plc* | | | 15,131,362 | |
| | | | | | | | |
| | |
| | | | Commodity Chemicals 3.3% | | | |
| | 1,725,660 | | | Valvoline, Inc. | | | 32,856,566 | |
| | | | | | | | |
| | |
| | | | Construction & Engineering 2.5% | | | |
| | 1,382,782 | | | Construction Partners, Inc., Class A* | | | 25,166,632 | |
| | | | | | | | |
| | |
| | | | Data Processing & Outsourced
Services 3.8% | | | |
| | 275,348 | | | Euronet Worldwide, Inc.* | | | 25,084,203 | |
| | 535,534 | | | Repay Holdings Corp.* | | | 12,585,049 | |
| | | | | | | | |
| | | | 37,669,252 | |
| | | | | | | | |
| | |
| | | | Diversified Banks 0.7% | | | |
| | 3,741,795 | | | City Union Bank Ltd. (India) | | | 7,079,894 | |
| | | | | | | | |
| | |
| | | | Electrical Components &
Equipment 1.2% | | | |
| | 124,193 | | | Regal Beloit Corp. | | | 11,657,997 | |
| | | | | | | | |
| | | | | | | | |
| Shares | | | | | Value | |
| | | | | | | |
| | |
| | | | Electronic Manufacturing
Services 5.0% | | | |
| | 600,176 | | | Fabrinet* | | $ | 37,829,093 | |
| | 437,289 | | | Sanmina Corp.* | | | 11,828,668 | |
| | | | | | | | |
| | | | 49,657,761 | |
| | | | | | | | |
| | |
| | | | Financial Exchanges & Data 1.9% | | | |
| | 731,976 | | | Open Lending Corp., Class A* | | | 18,665,388 | |
| | | | | | | | |
| | |
| | | | General Merchandise Stores 0.9% | | | |
| | 96,687 | | | Ollie’s Bargain Outlet Holdings, Inc.* | | | 8,445,610 | |
| | | | | | | | |
| | |
| | | | Health Care Facilities 3.5% | | | |
| | 608,910 | | | Ensign Group, Inc. (The) | | | 34,744,405 | |
| | | | | | | | |
| | |
| | | | Health Care REITs 0.9% | | | |
| | 265,827 | | | LTC Properties, Inc. | | | 9,266,729 | |
| | | | | | | | |
| | |
| | | | Heavy Electrical Equipment 1.2% | | | |
| | 354,084 | | | AZZ, Inc. | | | 12,081,346 | |
| | | | | | | | |
| | |
| | | | Home Furnishings 1.1% | | | |
| | 387,069 | | | Lovesac Co. (The)* | | | 10,725,682 | |
| | | | | | | | |
| | |
| | | | Homebuilding 3.5% | | | |
| | 176,623 | | | LGI Homes, Inc.* | | | 20,518,294 | |
| | 522,983 | | | Skyline Champion Corp.* | | | 14,000,255 | |
| | | | | | | | |
| | | | 34,518,549 | |
| | | | | | | | |
| | |
| | | | Human Resource & Employment
Services 1.2% | | | |
| | 162,387 | | | ManpowerGroup, Inc. | | | 11,907,839 | |
| | | | | | | | |
| | |
| | | | Industrial Machinery 11.4% | | | |
| | 808,114 | | | Altra Industrial Motion Corp. | | | 29,875,975 | |
| | 419,604 | | | Barnes Group, Inc. | | | 14,996,647 | |
| | 444,555 | | | Flowserve Corp. | | | 12,131,906 | |
| | 368,040 | | | Helios Technologies, Inc. | | | 13,396,656 | |
| | 396,999 | | | Kadant, Inc. | | | 43,519,030 | |
| | | | | | | | |
| | | | 113,920,214 | |
| | | | | | | | |
| | |
| | | | Industrial REITs 2.0% | | | |
| | 1,432,439 | | | Monmouth Real Estate Investment Corp. | | | 19,839,280 | |
| | | | | | | | |
| | |
| | | | Internet & Direct Marketing
Retail 1.6% | | | |
| | 632,804 | | | 1-800-Flowers.com, Inc., Class A* | | | 15,782,132 | |
| | | | | | | | |
| | |
| | | | Investment Banking &
Brokerage 2.0% | | | |
| | 566,077 | | | Moelis & Co., Class A | | | 19,891,946 | |
| | | | | | | | |
| | |
| | | | Leisure Facilities 1.4% | | | |
| | 225,039 | | | Planet Fitness, Inc., Class A* | | | 13,866,903 | |
| | | | | | | | |
| | |
| | | | Leisure Products 1.5% | | | |
| | 329,704 | | | YETI Holdings, Inc.* | | | 14,942,185 | |
| | | | | | | | |
73
| | |
| Wasatch Small Cap Value Fund (WMCVX / WICVX) | | SEPTEMBER 30, 2020 |
Schedule of Investments (continued)
| | | | | | | | |
| Shares | | | | | Value | |
| | | | | | | |
| | |
| | | | Life Sciences Tools & Services 1.7% | | | |
| | 89,581 | | | ICON plc* (Ireland) | | $ | 17,118,033 | |
| | | | | | | | |
| | |
| | | | Mortgage REITs 2.3% | | | |
| | 2,038,890 | | | Arbor Realty Trust, Inc. | | | 23,386,068 | |
| | | | | | | | |
| | |
| | | | Oil & Gas Equipment &
Services 1.0% | | | |
| | 521,618 | | | Cactus, Inc., Class A | | | 10,009,849 | |
| | | | | | | | |
| | |
| | | | Oil & Gas Exploration &
Production 0.9% | | | |
| | 1,816,757 | | | Magnolia Oil & Gas Corp., Class A* | | | 9,392,634 | |
| | | | | | | | |
| | |
| | | | Personal Products 1.2% | | | |
| | 234,068 | | | Nu Skin Enterprises, Inc., Class A | | | 11,724,466 | |
| | | | | | | | |
| | |
| | | | Pharmaceuticals 1.2% | | | |
| | 455,070 | | | Intra-Cellular Therapies, Inc.* | | | 11,677,096 | |
| | | | | | | | |
| | |
| | | | Property & Casualty
Insurance 1.0% | | | |
| | 312,914 | | | Employers Holdings, Inc. | | | 9,465,649 | |
| | | | | | | | |
| | |
| | | | Regional Banks 6.6% | | | |
| | 769,245 | | | Bank OZK | | | 16,400,303 | |
| | 1,192,953 | | | Boston Private Financial Holdings, Inc. | | | 6,585,101 | |
| | 347,326 | | | Eagle Bancorp, Inc. | | | 9,304,863 | |
| | 596,456 | | | FB Financial Corp. | | | 14,982,975 | |
| | 719,104 | | | Webster Financial Corp. | | | 18,991,537 | |
| | | | | | | | |
| | | | 66,264,779 | |
| | | | | | | | |
| | |
| | | | Semiconductor Equipment 2.1% | | | |
| | 397,796 | | | Nova Measuring Instruments Ltd.* (Israel) | | | 20,741,083 | |
| | | | | | | | |
| | |
| | | | Semiconductors 1.5% | | | |
| | 843,627 | | | Tower Semiconductor Ltd.* (Israel) | | | 15,370,884 | |
| | | | | | | | |
| | |
| | | | Specialized Consumer
Services 1.0% | | | |
| | 239,925 | | | ServiceMaster Global Holdings, Inc.* | | | 9,568,209 | |
| | | | | | | | |
| | |
| | | | Specialized REITs 2.3% | | | |
| | 691,596 | | | National Storage Affiliates Trust | | | 22,622,105 | |
| | | | | | | | |
| | |
| | | | Specialty Chemicals 3.8% | | | |
| | 218,049 | | | Innospec, Inc. | | | 13,806,863 | |
| | 235,205 | | | Minerals Technologies, Inc. | | | 12,018,975 | |
| | 217,470 | | | Sensient Technologies Corp. | | | 12,556,718 | |
| | | | | | | | |
| | | | 38,382,556 | |
| | | | | | | | |
| | |
| | | | Technology Hardware, Storage &
Peripherals 1.2% | | | |
| | 651,583 | | | Xerox Holdings Corp. | | | 12,230,213 | |
| | | | | | | | |
| | | | | | | | |
| Shares | | | | | Value | |
| | | | | | | |
| | |
| | | | Thrifts & Mortgage Finance 1.9% | | | |
| | 825,483 | | | Axos Financial, Inc.* | | $ | 19,242,009 | |
| | | | | | | | |
| | |
| | | | Trucking 1.1% | | | |
| | 272,866 | | | Knight-Swift Transportation Holdings, Inc. | | | 11,105,646 | |
| | | | | | | | |
| | |
| | | | Total Common Stocks
(cost $903,823,426) | | | 985,058,858 | |
| | | | | | | | |
Principal
Amount | | | | | Value | |
| | | | | | | |
| |
| | | | SHORT-TERM INVESTMENTS 1.5% | |
| | |
| | | | Repurchase Agreement 1.5% | | | |
| $ | 14,809,933 | | | Repurchase Agreement dated 9/30/20, 0.00% due 10/1/20 with Fixed Income Clearing Corp. collateralized by $13,309,400 of United States Treasury Notes 2.250% due 11/15/27; value: $15,106,162; repurchase proceeds: $14,809,933 (cost $14,809,933) | | $ | 14,809,933 | |
| | | | | | | | |
| | |
| | | | Total Short-Term Investments
(cost $14,809,933) | | | 14,809,933 | |
| | | | | | | | |
| | |
| | | | Total Investments
(cost $918,633,359) 100.2% | | | 999,868,791 | |
| | |
| | | | Liabilities less Other Assets (0.2%) | | | (1,580,273 | ) |
| | | | | | | | |
| | |
| | | | NET ASSETS 100.0% | | $ | 998,288,518 | |
| | | | | | | | |
| |
| | | | *Non-income producing. REIT Real Estate Investment Trust. | |
| |
| | | | See Notes to Financial Statements. | |
At September 30, 2020, Wasatch Small Cap Value Fund’s investments, excluding short-term investments, were in the following countries (unaudited):
| | | | | |
| Country | | % |
India | | | | 0.7 | |
Ireland | | | | 1.7 | |
Israel | | | | 3.6 | |
United States | | | | 94.0 | |
| | | | | |
TOTAL | | | | 100.0 | % |
| | | | | |
74
| | |
| Wasatch Ultra Growth Fund (WAMCX / WGMCX) | | SEPTEMBER 30, 2020 |
Schedule of Investments
| | | | | | | | |
| Shares | | | | | Value | |
| | | | | | | |
| |
| | | | COMMON STOCKS 93.1% | |
| | |
| | | | Alternative Carriers 1.8% | | | |
| | 214,738 | | | Bandwidth, Inc., Class A* | | $ | 37,486,813 | |
| | | | | | | | |
| | |
| | | | Application Software 14.7% | | | |
| | 264,341 | | | Avalara, Inc.* | | | 33,661,183 | |
| | 131,188 | | | DocuSign, Inc.* | | | 28,236,905 | |
| | 273,689 | | | Five9, Inc.* | | | 35,491,990 | |
| | 111,110 | | | Globant S.A.* (Argentina) | | | 19,913,134 | |
| | 130,224 | | | HubSpot, Inc.* | | | 38,055,359 | |
| | 1,014,470 | | | Medallia, Inc.* | | | 27,816,767 | |
| | 220,310 | | | New Relic, Inc.* | | | 12,416,672 | |
| | 250,603 | | | Paylocity Holding Corp.* | | | 40,452,336 | |
| | 2,349,045 | | | Pexip Holding ASA* (Norway) | | | 20,990,930 | |
| | 473,579 | | | Zendesk, Inc.* | | | 48,740,751 | |
| | | | | | | | |
| | | | | | | 305,776,027 | |
| | | | | | | | |
| | |
| | | | Automotive Retail 1.0% | | | |
| | 424,877 | | | Camping World Holdings, Inc., Class A | | | 12,640,091 | |
| | 183,722 | | | Monro, Inc. | | | 7,453,601 | |
| | | | | | | | |
| | | | | | | 20,093,692 | |
| | | | | | | | |
| | |
| | | | Biotechnology 16.1% | | | |
| | 1,037,569 | | | Atara Biotherapeutics, Inc.* | | | 13,446,894 | |
| | 981,162 | | | Castle Biosciences, Inc.* | | | 50,480,785 | |
| | 414,123 | | | ChemoCentryx, Inc.* | | | 22,693,940 | |
| | 985,208 | | | Cytokinetics, Inc.* | | | 21,329,753 | |
| | 356,986 | | | Denali Therapeutics, Inc.* | | | 12,790,808 | |
| | 809,880 | | | Esperion Therapeutics, Inc.* | | | 30,103,240 | |
| | 373,966 | | | Exact Sciences Corp.* | | | 38,125,834 | |
| | 1,084,475 | | | Flexion Therapeutics, Inc.* | | | 11,289,385 | |
| | 1,120,938 | | | Frequency Therapeutics, Inc.* | | | 21,533,219 | |
| | 1,318,038 | | | Inovio Pharmaceuticals, Inc.* | | | 15,289,241 | |
| | 267,000 | | | Ligand Pharmaceuticals, Inc.* | | | 25,450,440 | |
| | 883,467 | | | MacroGenics, Inc.* | | | 22,254,534 | |
| | 3,447,274 | | | MEI Pharma, Inc.* | | | 10,755,495 | |
| | 404,525 | | | Nkarta, Inc.* | | | 12,160,022 | |
| | 2,443,267 | | | Sangamo Therapeutics, Inc.* | | | 23,088,873 | |
| | 2,044,034 | | | Selecta Biosciences, Inc.* | | | 5,069,204 | |
| | | | | | | | |
| | | | | | | 335,861,667 | |
| | | | | | | | |
| | |
| | | | Building Products 1.4% | | | |
| | 395,502 | | | Trex Co., Inc.* | | | 28,317,943 | |
| | | | | | | | |
| | |
| | | | Commodity Chemicals 1.0% | | | |
| | 1,150,346 | | | Valvoline, Inc. | | | 21,902,588 | |
| | | | | | | | |
| | |
| | | | Data Processing & Outsourced
Services 2.4% | | | |
| | 1,110,773 | | | Repay Holdings Corp.* | | | 26,103,166 | |
| | 144,848 | | | Square, Inc., Class A* | | | 23,545,042 | |
| | | | | | | | |
| | | | | | | 49,648,208 | |
| | | | | | | | |
| | |
| | | | Electronic Equipment &
Instruments 1.6% | | | |
| | 1,438,238 | | | nLight, Inc.* | | | 33,769,828 | |
| | | | | | | | |
| | |
| | | | Electronic Manufacturing
Services 0.6% | | | |
| | 75,925 | | | IPG Photonics Corp.* | | | 12,904,972 | |
| | | | | | | | |
| | | | | | | | |
| Shares | | | | | Value | |
| | | | | | | |
| | |
| | | | Financial Exchanges &
Data 3.4% | | | |
| | 1,685,696 | | | Open Lending Corp., Class A* | | $ | 42,985,248 | |
| | 481,969 | | | Tradeweb Markets, Inc., Class A | | | 27,954,202 | |
| | | | | | | | |
| | | | | | | 70,939,450 | |
| | | | | | | | |
| | |
| | | | General Merchandise
Stores 1.1% | | | |
| | 260,399 | | | Ollie’s Bargain Outlet Holdings, Inc.* | | | 22,745,853 | |
| | | | | | | | |
| | |
| | | | Health Care Equipment 6.0% | | | |
| | 653,838 | | | AtriCure, Inc.* | | | 26,088,136 | |
| | 1,703,138 | | | CryoLife, Inc.* | | | 31,456,959 | |
| | 513,406 | | | Glaukos Corp.* | | | 25,423,865 | |
| | 48,411 | | | Insulet Corp.* | | | 11,453,558 | |
| | 271,419 | | | Tandem Diabetes Care, Inc.* | | | 30,806,057 | |
| | | | | | | | |
| | | | | | | 125,228,575 | |
| | | | | | | | |
| | |
| | | | Health Care Services 0.5% | | | |
| | 931,024 | | | Exagen, Inc.* ‡‡ | | | 10,092,300 | |
| | | | | | | | |
| | |
| | | | Health Care Supplies 4.5% | | | |
| | 1,073,575 | | | BioLife Solutions, Inc.* | | | 31,069,260 | |
| | 936,208 | | | Silk Road Medical, Inc.* | | | 62,922,540 | |
| | | | | | | | |
| | | | | | | 93,991,800 | |
| | | | | | | | |
| | |
| | | | Health Care Technology 4.5% | | | |
| | 362,377 | | | Inspire Medical Systems, Inc.* | | | 46,764,752 | |
| | 367,199 | | | Tabula Rasa HealthCare, Inc.* | | | 14,970,703 | |
| | 110,649 | | | Veeva Systems, Inc., Class A* | | | 31,113,392 | |
| | | | | | | | |
| | | | | | | 92,848,847 | |
| | | | | | | | |
| | |
| | | | Heavy Electrical
Equipment 0.9% | | | |
| | 646,957 | | | TPI Composites, Inc.* | | | 18,735,875 | |
| | | | | | | | |
| | |
| | | | Home Furnishings 1.9% | | | |
| | 1,585,331 | | | Purple Innovation, Inc.* | | | 39,411,329 | |
| | | | | | | | |
| | |
| | | | Home Improvement Retail 2.5% | | | |
| | 695,117 | | | Floor & Decor Holdings, Inc., Class A* | | | 51,994,752 | |
| | | | | | | | |
| | |
| | | | Homebuilding 2.5% | | | |
| | 256,222 | | | LGI Homes, Inc.* | | | 29,765,310 | |
| | 810,306 | | | Skyline Champion Corp.* | | | 21,691,891 | |
| | | | | | | | |
| | | | | | | 51,457,201 | |
| | | | | | | | |
| | |
| | | | Industrial Machinery 3.3% | | | |
| | 172,703 | | | Barnes Group, Inc. | | | 6,172,405 | |
| | 79,125 | | | John Bean Technologies Corp. | | | 7,270,796 | |
| | 845,954 | | | Kornit Digital Ltd.* (Israel) | | | 54,877,036 | |
| | | | | | | | |
| | | | | | | 68,320,237 | |
| | | | | | | | |
| | |
| | | | Industrial REITs 0.6% | | | |
| | 938,929 | | | Monmouth Real Estate Investment Corp. | | | 13,004,167 | |
| | | | | | | | |
| | |
| | | | Insurance Brokers 0.4% | | | |
| | 86,876 | | | Goosehead Insurance, Inc., Class A | | | 7,522,593 | |
| | | | | | | | |
75
| | |
| Wasatch Ultra Growth Fund (WAMCX / WGMCX) | | |
Schedule of Investments (continued)
| | | | | | | | |
| Shares | | | | | Value | |
| | | | | | | |
| | |
| | | | Internet & Direct Marketing
Retail 1.3% | | | |
| | 3,404,582 | | | Trainline plc* (United Kingdom) | | $ | 15,946,952 | |
| | 38,751 | | | Wayfair, Inc., Class A* | | | 11,276,929 | |
| | | | | | | | |
| | | | | | | 27,223,881 | |
| | | | | | | | |
| | |
| | | | Internet Services &
Infrastructure 0.2% | | | |
| | 14,856 | | | Snowflake, Inc., Class A* | | | 3,728,856 | |
| | | | | | | | |
| | |
| | | | IT Consulting & Other
Services 1.3% | | | |
| | 415,639 | | | Endava plc ADR* (United Kingdom) | | | 26,247,603 | |
| | | | | | | | |
| | |
| | | | Life Sciences Tools &
Services 1.3% | | | |
| | 136,748 | | | ICON plc* (Ireland) | | | 26,131,175 | |
| | | | | | | | |
| | |
| | | | Managed Health Care 1.3% | | | |
| | 543,593 | | | HealthEquity, Inc.* | | | 27,924,372 | |
| | | | | | | | |
| | |
| | | | Oil & Gas Equipment &
Services 0.2% | | | |
| | 738,838 | | | Solaris Oilfield Infrastructure, Inc., Class A | | | 4,684,233 | |
| | | | | | | | |
| | |
| | | | Packaged Foods & Meats 2.4% | | | |
| | 442,573 | | | Freshpet, Inc.* | | | 49,413,275 | |
| | | | | | | | |
| | |
| | | | Pharmaceuticals 2.2% | | | |
| | 707,597 | | | BioDelivery Sciences International, Inc.* | | | 2,639,337 | |
| | 1,569,016 | | | Intra-Cellular Therapies, Inc.* | | | 40,260,950 | |
| | 751,410 | | | Optinose, Inc.* | | | 2,930,499 | |
| | | | | | | | |
| | | | | | | 45,830,786 | |
| | | | | | | | |
| | |
| | | | Regional Banks 1.8% | | | |
| | 678,448 | | | Bank OZK | | | 14,464,511 | |
| | 357,478 | | | Eagle Bancorp, Inc. | | | 9,576,836 | |
| | 376,698 | | | Esquire Financial Holdings, Inc.* | | | 5,650,470 | |
| | 197,467 | | | Pinnacle Financial Partners, Inc. | | | 7,027,851 | |
| | | | | | | | |
| | | | | | | 36,719,668 | |
| | | | | | | | |
| | |
| | | | Restaurants 0.4% | | | |
| | 440,343 | | | Chuy’s Holdings, Inc.* | | | 8,621,916 | |
| | | | | | | | |
| | |
| | | | Semiconductor Equipment 0.8% | | | |
| | 337,399 | | | Nova Measuring Instruments Ltd.* (Israel) | | | 17,591,984 | |
| | | | | | | | |
| | |
| | | | Semiconductors 1.6% | | | |
| | 111,268 | | | Monolithic Power Systems, Inc. | | | 31,111,645 | |
| | 42,910 | | | NVE Corp. | | | 2,106,023 | |
| | | | | | | | |
| | | | | | | 33,217,668 | |
| | | | | | | | |
| | |
| | | | Specialty Chemicals 0.7% | | | |
| | 157,944 | | | Balchem Corp. | | | 15,420,073 | |
| | | | | | | | |
| | |
| | | | Specialty Stores 2.6% | | | |
| | 432,349 | | | Five Below, Inc.* | | | 54,908,323 | |
| | | | | | | | |
| | | | | | | | |
| Shares | | | | | Value | |
| | | | | | | |
| | |
| | | | Systems Software 1.5% | | | |
| | 295,767 | | | Proofpoint, Inc.* | | $ | 31,218,207 | |
| | | | | | | | |
| | |
| | | | Trucking 0.8% | | | |
| | 425,618 | | | Knight-Swift Transportation Holdings, Inc. | | | 17,322,653 | |
| | | | | | | | |
| | |
| | | | Total Common Stocks
(cost $1,399,142,423) | | | 1,938,259,390 | |
| | | | | | | | |
| |
| | | | PREFERRED STOCKS 0.0% | |
| | |
| | | | Semiconductor Equipment 0.0% | | | |
| | 169,492 | | | Nanosys, Inc., Series D Pfd.* *** † | | | 181,356 | |
| | 40,380 | | | Nanosys, Inc., Series E Pfd.* *** † | | | 47,245 | |
| | | | | | | | |
| | | | | | | 228,601 | |
| | | | | | | | |
| | |
| | | | Total Preferred Stocks
(cost $546,237) | | | 228,601 | |
| | | | | | | | |
| |
| | | | LIMITED PARTNERSHIP INTEREST 0.0% | |
| | |
| | | | Asset Management & Custody
Banks 0.0% | | | |
| | 1 | | | Greenspring Global Partners II-B, L.P.* *** † | | | 134,301 | |
| | 1 | | | Greenspring Global Partners III-B, L.P.* *** † | | | 68,651 | |
| | | | | | | | |
| | | | | | | 202,952 | |
| | | | | | | | |
| | |
| | | | Total Limited Partnership Interest
(cost $1,037,371) | | | 202,952 | |
| | | | | | | | |
76
| | |
| Wasatch Ultra Growth Fund (WAMCX / WGMCX) | | SEPTEMBER 30, 2020 |
Schedule of Investments (continued)
| | | | | | | | |
Principal
Amount | | | | | Value | |
| | | | | | | |
| |
| | | | SHORT-TERM INVESTMENTS 7.0% | |
| | |
| | | | Repurchase Agreement 7.0% | | | |
| $ | 144,864,879 | | | Repurchase Agreement dated 9/30/20, 0.00% due 10/1/20 with Fixed Income Clearing Corp. collateralized by $130,187,000 of United States Treasury Notes 2.250% due 11/15/27; value: $147,762,180; repurchase proceeds: $144,864,879 (cost $144,864,879) | | $ | 144,864,879 | |
| | | | | | | | |
| | |
| | | | Total Short-Term Investments
(cost $144,864,879) | | | 144,864,879 | |
| | | | | | | | |
| | |
| | | | Total Investments
(cost $1,545,590,910) 100.1% | | | 2,083,555,822 | |
| | |
| | | | Liabilities less Other Assets (0.1%) | | | (1,888,013 | ) |
| | | | | | | | |
| | |
| | | | NET ASSETS 100.0% | | $ | 2,081,667,809 | |
| | | | | | | | |
| |
| | | | *Non-income producing. ***Security was fair valued under procedures adopted by the Board of Trustees (see Note 12). †Security purchased in a private placement transaction or under Rule 144A of the Securities Act of 1933 (see Note 9). The aggregate value of securities purchased in a private placement transaction or under Rule 144A of the Securities Act of 1933 at September 30, 2020, amounted to approximately $431,553, and represented 0.02% of net assets. ‡‡Affiliated company (see Note 8). | |
| | | | ADR American Depositary Receipt. REIT Real Estate Investment Trust. | |
| |
| | | | See Notes to Financial Statements. | |
At September 30, 2020, Wasatch Ultra Growth Fund’s investments, excluding short-term investments, were in the following countries (unaudited):
| | | | | |
| Country | | % |
Argentina | | | | 1.0 | |
Ireland | | | | 1.3 | |
Israel | | | | 3.5 | |
Norway | | | | 1.0 | |
United Kingdom | | | | 2.0 | |
United States | | | | 91.2 | |
| | | | | |
TOTAL | | | | 100.0 | % |
| | | | | |
77
| | |
| Wasatch-Hoisington U.S. Treasury Fund (WHOSX) | | SEPTEMBER 30, 2020 |
Schedule of Investments
| | | | | | | | |
Principal
Amount | | | | | Value | |
| | | | | | | |
| |
| | | | U.S. GOVERNMENT
OBLIGATIONS 98.3% | |
| | |
| $ | 68,000,000 | | | U.S. Treasury Bond 1.25%, 5/15/50 | | $ | 64,642,500 | |
| | 87,900,000 | | | U.S. Treasury Bond, 2.25%, 8/15/46 | | | 104,044,758 | |
| | 50,000,000 | | | U.S. Treasury Bond, 2.25%, 8/15/49 | | | 59,634,765 | |
| | 25,150,000 | | | U.S. Treasury Bond, 2.50%, 2/15/45 | | | 31,020,953 | |
| | 19,000,000 | | | U.S. Treasury Bond, 2.875%, 5/15/49 | | | 25,508,242 | |
| | 45,530,000 | | | U.S. Treasury Bond, 3.00%, 8/15/48 | | | 62,200,027 | |
| | 33,000,000 | | | U.S. Treasury Strip, principal only, 0.00%, 8/15/40 | | | 25,896,102 | |
| | 96,000,000 | | | U.S. Treasury Strip, principal only, 0.00%, 5/15/44 | | | 68,532,214 | |
| | 136,700,000 | | | U.S. Treasury Strip, principal only, 0.00%, 8/15/45 | | | 95,058,259 | |
| | | | | | | | |
| | |
| | | | Total U.S. Government Obligations
(cost $442,364,530) | | | 536,537,820 | |
| | | | | | | | |
| |
| | | | SHORT-TERM INVESTMENTS 1.6% | |
| | |
| | | | Repurchase Agreement 1.6% | | | |
| | 8,559,652 | | | Repurchase Agreement dated 9/30/20, 0.00% due 10/1/20 with Fixed Income Clearing Corp. collateralized by $7,467,300 of United States Treasury Notes 2.750% due 2/15/28; value $8,730,905; repurchase proceeds: $8,559,652 (cost $8,559,652) | | | 8,559,652 | |
| | | | | | | | |
| | |
| | | | Total Short-Term Investments
(cost $8,559,652) | | | 8,559,652 | |
| | | | | | | | |
| | |
| | | | Total Investments
(cost $450,924,182) 99.9% | | | 545,097,472 | |
| | |
| | | | Other Assets less Liabilities 0.1% | | | 488,983 | |
| | | | | | | | |
| | |
| | | | NET ASSETS 100.0% | | $ | 545,586,455 | |
| | | | | | | | |
| |
| | | | See Notes to Financial Statements. | |
78
(This page intentionally left blank.)
79
Statements of Assets and Liabilities
| | | | | | | | | | | | | | | |
| | | Core
Growth
Fund | | Emerging
India
Fund | | Emerging
Markets
Select
Fund |
| | | | | | | | | | | | | | | |
Assets: | | | | | | | | | | | | | | | |
Investments, at cost | | | | | | | | | | | | | | | |
Unaffiliated issuers | | | $ | 1,903,959,566 | | | | $ | 206,218,413 | | | | $ | 38,395,717 | |
Repurchase agreements | | | | 28,439,862 | | | | | 6,008,474 | | | | | 381,249 | |
| | | | | | | | | | | | | | | |
| | | $ | 1,932,399,428 | | | | $ | 212,226,887 | | | | $ | 38,776,966 | |
| | | | | | | | | | | | | | | |
Investments, at market value | | | | | | | | | | | | | | | |
Unaffiliated issuers | | | $ | 2,703,870,508 | | | | $ | 285,292,132 | | | | $ | 59,315,499 | |
Repurchase agreements | | | | 28,439,862 | | | | | 6,008,474 | | | | | 381,249 | |
| | | | | | | | | | | | | | | |
| | | | 2,732,310,370 | | | | | 291,300,606 | | | | | 59,696,748 | |
Cash | | | | — | | | | | — | | | | | — | |
Foreign currency on deposit (cost of $0, $0, $3, $542,544, $2, $36,984, $833, $0, $95,248, $1,272,977, $259, $215,570, $0, $0, $0, $0 and $0, respectively) | | | | — | | | | | — | | | | | 3 | |
Receivable for investment securities sold | | | | 4,100,757 | | | | | — | | | | | 55,607 | |
Receivable for security litigation | | | | — | | | | | — | | | | | — | |
Capital shares receivable | | | | 3,042,674 | | | | | 90,134 | | | | | 25,200 | |
Interest and dividends receivable | | | | 565,481 | | | | | 473,443 | | | | | 58,249 | |
Receivable from Investment Advisor | | | | — | | | | | — | | | | | — | |
Prepaid expenses and other assets | | | | 95,805 | | | | | 30,152 | | | | | 3,994 | |
| | | | | | | | | | | | | | | |
Total Assets | | | | 2,740,115,087 | | | | | 291,894,335 | | | | | 59,839,801 | |
| | | | | | | | | | | | | | | |
Liabilities: | | | | | | | | | | | | | | | |
Payable for securities purchased | | | | 5,986,088 | | | | | 1,906,888 | | | | | 662,516 | |
Capital shares payable | | | | 911,846 | | | | | 169,641 | | | | | — | |
Dividends payable to shareholders | | | | — | | | | | — | | | | | — | |
Payable to Advisor | | | | 2,198,996 | | | | | 291,230 | | | | | 15,966 | |
Accrued fund administration fees | | | | 341,204 | | | | | 41,480 | | | | | 7,470 | |
Accrued expenses and other liabilities | | | | 466,387 | | | | | 163,188 | | | | | 83,299 | |
Foreign capital gains taxes payable | | | | 62,252 | | | | | 6,925,439 | | | | | 404,465 | |
| | | | | | | | | | | | | | | |
Total Liabilities | | | | 9,966,773 | | | | | 9,497,866 | | | | | 1,173,716 | |
| | | | | | | | | | | | | | | |
Net Assets | | | $ | 2,730,148,314 | | | | $ | 282,396,469 | | | | $ | 58,666,085 | |
| | | | | | | | | | | | | | | |
Net Assets Consist of: | | | | | | | | | | | | | | | |
Capital stock | | | $ | 350,061 | | | | $ | 666,402 | | | | $ | 40,108 | |
Paid-in-capital in excess of par | | | | 1,718,722,708 | | | | | 223,868,315 | | | | | 41,286,632 | |
Distributable earnings (accumulated loss) | | | | 1,011,075,545 | | | | | 57,861,752 | | | | | 17,339,345 | |
| | | | | | | | | | | | | | | |
Net Assets | | | $ | 2,730,148,314 | | | | $ | 282,396,469 | | | | $ | 58,666,085 | |
| | | | | | | | | | | | | | | |
Net Assets | | | | | | | | | | | | | | | |
Investor Class | | | | 1,595,919,759 | | | | | 136,415,179 | | | | | 14,984,043 | |
Institutional Class | | | | 1,134,228,555 | | | | | 145,981,290 | | | | | 43,682,042 | |
| | | |
Capital Stock Issued and Outstanding (Unlimited number of
shares authorized, $0.01 par value) | | | | | | | | | | | | | | | |
Investor Class | | | | 20,562,507 | | | | | 32,351,453 | | | | | 1,040,496 | |
Institutional Class | | | | 14,443,600 | | | | | 34,288,781 | | | | | 2,970,255 | |
| | | |
Net Asset Value, Redemption Price and Offering Price Per Share | | | | | | | | | | | | | | | |
Investor Class | | | $ | 77.61 | | | | $ | 4.22 | | | | $ | 14.40 | |
| | | | | | | | | | | | | | | |
Institutional Class | | | $ | 78.53 | | | | $ | 4.26 | | | | $ | 14.71 | |
| | | | | | | | | | | | | | | |
| 1 | Fund inception date was October 1, 2019. |
| 2 | See Note 14 for information on revision of prior year financial statements. |
See Notes to Financial Statements.
80
| | | | | | | | | | | | | | | | | | | | | | | | | | | | |
Emerging
Markets
Small Cap
Fund | | Frontier
Emerging
Small Countries
Fund | | Global
Opportunities
Fund | | Global
Select
Fund1 | | Global
Value
Fund2 | | International
Growth
Fund |
| | | | | | | | | | | | | | | | | | | | | | | | | | | | | |
| | | | | | | | | | | | | | | | | | | | | | | | | | | | | |
| | | | | | | | | | | | | | | | | | | | | | | | | | | | | |
| | $ | 220,098,960 | | | | $ | 43,560,453 | | | | $ | 82,850,423 | | | | $ | 10,354,030 | | | | $ | 103,694,507 | | | | $ | 651,435,776 | |
| | | 5,440,477 | | | | | 105,576 | | | | | 720,290 | | | | | 538,556 | | | | | 948,033 | | | | | 40,358,435 | |
| | | | | | | | | | | | | | | | | | | | | | | | | | | | | |
| | $ | 225,539,437 | | | | $ | 43,666,029 | | | | $ | 83,570,713 | | | | $ | 10,892,586 | | | | $ | 104,642,540 | | | | $ | 691,794,211 | |
| | | | | | | | | | | | | | | | | | | | | | | | | | | | | |
| | | | | | | | | | | | | | | | | | | | | | | | | | | | | |
| | $ | 375,794,396 | | | | $ | 50,923,734 | | | | $ | 139,537,019 | | | | $ | 12,833,836 | | | | $ | 100,051,108 | | | | $ | 1,032,516,881 | |
| | | 5,440,477 | | | | | 105,576 | | | | | 720,290 | | | | | 538,556 | | | | | 948,033 | | | | | 40,358,435 | |
| | | | | | | | | | | | | | | | | | | | | | | | | | | | | |
| | | 381,234,873 | | | | | 51,029,310 | | | | | 140,257,309 | | | | | 13,372,392 | | | | | 100,999,141 | | | | | 1,072,875,316 | |
| | | — | | | | | 1,653 | | | | | — | | | | | — | | | | | 69,087 | | | | | — | |
| | | 542,544 | | | | | 2 | | | | | 36,647 | | | | | 835 | | | | | — | | | | | 95,331 | |
| | | 1,995,815 | | | | | — | | | | | 86,381 | | | | | — | | | | | 691,284 | | | | | 1,125,095 | |
| | | — | | | | | — | | | | | — | | | | | — | | | | | 1,094,160 | | | | | — | |
| | | 207,907 | | | | | 300 | | | | | 50,448 | | | | | — | | | | | 1,813 | | | | | 608,745 | |
| | | 490,617 | | | | | 7,787 | | | | | 117,303 | | | | | 2,025 | | | | | 444,344 | | | | | 1,914,579 | |
| | | — | | | | | — | | | | | — | | | | | 17,818 | | | | | — | | | | | — | |
| | | 30,516 | | | | | 9,917 | | | | | 15,146 | | | | | 10,593 | | | | | 10,573 | | | | | 67,117 | |
| | | | | | | | | | | | | | | | | | | | | | | | | | | | | |
| | | 384,502,272 | | | | | 51,048,969 | | | | | 140,563,234 | | | | | 13,403,663 | | | | | 103,310,402 | | | | | 1,076,686,183 | |
| | | | | | | | | | | | | | | | | | | | | | | | | | | | | |
| | | | | | | | | | | | | | | | | | | | | | | | | | | | | |
| | | 5,471,967 | | | | | — | | | | | 451,497 | | | | | — | | | | | 182,827 | | | | | 6,561,806 | |
| | | 112,341 | | | | | 1,202 | | | | | 80,167 | | | | | — | | | | | 92,141 | | | | | 371,148 | |
| | | — | | | | | — | | | | | — | | | | | — | | | | | 16,392 | | | | | — | |
| | | 520,471 | | | | | 45,505 | | | | | 141,732 | | | | | — | | | | | 39,556 | | | | | 1,060,505 | |
| | | 63,221 | | | | | 10,888 | | | | | 20,702 | | | | | 1,513 | | | | | 26,786 | | | | | 185,786 | |
| | | 184,754 | | | | | 104,059 | | | | | 67,296 | | | | | 29,356 | | | | | 173,472 | | | | | 301,955 | |
| | | 4,072,499 | | | | | 427,791 | | | | | 308,687 | | | | | 1,868 | | | | | 7,705 | | | | | 2,033,095 | |
| | | | | | | | | | | | | | | | | | | | | | | | | | | | | |
| | | 10,425,253 | | | | | 589,445 | | | | | 1,070,081 | | | | | 32,737 | | | | | 538,879 | | | | | 10,514,295 | |
| | | | | | | | | | | | | | | | | | | | | | | | | | | | | |
| | $ | 374,077,019 | | | | $ | 50,459,524 | | | | $ | 139,493,153 | | | | $ | 13,370,926 | | | | $ | 102,771,523 | | | | $ | 1,066,171,888 | |
| | | | | | | | | | | | | | | | | | | | | | | | | | | | | |
| | | | | | | | | | | | | | | | | | | | | | | | | | | | | |
| | $ | 1,234,954 | | | | $ | 166,963 | | | | $ | 355,324 | | | | $ | 10,589 | | | | $ | 156,623 | | | | $ | 312,115 | |
| | | 201,375,057 | | | | | 147,509,933 | | | | | 80,925,117 | | | | | 11,104,214 | | | | | 277,490,512 | | | | | 588,109,944 | |
| | | 171,467,008 | | | | | (97,217,372 | ) | | | | 58,212,712 | | | | | 2,256,123 | | | | | (174,875,612 | ) | | | | 477,749,829 | |
| | | | | | | | | | | | | | | | | | | | | | | | | | | | | |
| | $ | 374,077,019 | | | | $ | 50,459,524 | | | | $ | 139,493,153 | | | | $ | 13,370,926 | | | | $ | 102,771,523 | | | | $ | 1,066,171,888 | |
| | | | | | | | | | | | | | | | | | | | | | | | | | | | | |
| | | | | | | | | | | | | | | | | | | | | | | | | | | | | |
| | | 197,524,373 | | | | | 39,899,347 | | | | | 100,698,057 | | | | | 4,305,710 | | | | | 96,322,701 | | | | | 497,104,209 | |
| | | 176,552,646 | | | | | 10,560,177 | | | | | 38,795,096 | | | | | 9,065,216 | | | | | 6,448,822 | | | | | 569,067,679 | |
| | | | | |
| |
|
|
| | | | | | | | | | | | | | | | | | | | | | | | | |
| | | 65,470,101 | | | | | 13,231,796 | | | | | 25,696,289 | | | | | 341,757 | | | | | 14,678,484 | | | | | 14,590,475 | |
| | | 58,025,305 | | | | | 3,464,509 | | | | | 9,836,114 | | | | | 717,122 | | | | | 983,776 | | | | | 16,621,012 | |
| | | | | |
| | | | | | | | | | | | | | | | | | | | | | | | | | | | | |
| | $ | 3.02 | | | | $ | 3.02 | | | | $ | 3.92 | | | | $ | 12.60 | | | | $ | 6.56 | | | | $ | 34.07 | |
| | | | | | | | | | | | | | | | | | | | | | | | | | | | | |
| | $ | 3.04 | | | | $ | 3.05 | | | | $ | 3.94 | | | | $ | 12.64 | | | | $ | 6.56 | | | | $ | 34.24 | |
| | | | | | | | | | | | | | | | | | | | | | | | | | | | | |
81
Statements of Assets and Liabilities (continued)
| | | | | | | | | | | | | | | |
| | | International
Opportunities
Fund | | International
Select
Fund1 | | Micro
Cap
Fund2 |
| | | | | | | | | | | | | | | |
Assets: | | | | | | | | | | | | | | | |
Investments, at cost | | | | | | | | | | | | | | | |
Unaffiliated issuers | | | $ | 347,082,160 | | | | $ | 4,002,872 | | | | $ | 513,208,283 | |
Affiliated issuers3 | | | | — | | | | | — | | | | | 19,752,686 | |
Repurchase agreements | | | | 21,877,750 | | | | | 153,091 | | | | | 17,242,065 | |
| | | | | | | | | | | | | | | |
| | | $ | 368,959,910 | | | | $ | 4,155,963 | | | | $ | 550,203,034 | |
| | | | | | | | | | | | | | | |
Investments, at market value | | | | | | | | | | | | | | | |
Unaffiliated issuers | | | $ | 651,077,330 | | | | $ | 4,779,764 | | | | $ | 767,566,996 | |
Affiliated issuers3 | | | | — | | | | | — | | | | | 26,534,021 | |
Repurchase agreements | | | | 21,877,750 | | | | | 153,091 | | | | | 17,242,065 | |
| | | | | | | | | | | | | | | |
| | | | 672,955,080 | | | | | 4,932,855 | | | | | 811,343,082 | |
Cash | | | | — | | | | | — | | | | | — | |
Foreign currency on deposit (cost of $0, $0, $3, $542,544, $2, $36,984, $833, $0, $95,248, $1,272,977, $259, $215,570, $0, $0, $0, $0 and $0, respectively) | | | | 1,273,135 | | | | | 260 | | | | | 215,570 | |
Receivable for investment securities sold | | | | 1,221,081 | | | | | — | | | | | 1,732 | |
Capital shares receivable | | | | 378,213 | | | | | — | | | | | 672,057 | |
Interest and dividends receivable | | | | 647,451 | | | | | 4,831 | | | | | 42,254 | |
Receivable from Investment Advisor | | | | — | | | | | 7,550 | | | | | — | |
Prepaid expenses and other assets | | | | 25,352 | | | | | 10,728 | | | | | 40,624 | |
| | | | | | | | | | | | | | | |
Total Assets | | | | 676,500,312 | | | | | 4,956,224 | | | | | 812,315,319 | |
| | | | | | | | | | | | | | | |
Liabilities: | | | | | | | | | | | | | | | |
Payable for securities purchased | | | | 427,694 | | | | | — | | | | | 4,702,556 | |
Capital shares payable | | | | 264,841 | | | | | — | | | | | 572,287 | |
Dividends payable to shareholders | | | | — | | | | | — | | | | | — | |
Payable to Advisor | | | | 948,686 | | | | | — | | | | | 954,622 | |
Accrued fund administration fees | | | | 87,051 | | | | | — | | | | | 88,377 | |
Accrued expenses and other liabilities | | | | 208,463 | | | | | 26,098 | | | | | 124,598 | |
Foreign capital gains taxes payable | | | | 578,869 | | | | | — | | | | | — | |
| | | | | | | | | | | | | | | |
Total Liabilities | | | | 2,515,604 | | | | | 26,098 | | | | | 6,442,440 | |
| | | | | | | | | | | | | | | |
Net Assets | | | $ | 673,984,708 | | | | $ | 4,930,126 | | | | $ | 805,872,879 | |
| | | | | | | | | | | | | | | |
Net Assets Consist of: | | | | | | | | | | | | | | | |
Capital stock | | | $ | 1,435,872 | | | | $ | 3,899 | | | | $ | 842,810 | |
Paid-in-capital in excess of par | | | | 365,375,210 | | | | | 4,240,071 | | | | | 495,360,779 | |
Distributable earnings (accumulated loss) | | | | 307,173,626 | | | | | 686,156 | | | | | 309,669,290 | |
| | | | | | | | | | | | | | | |
Net Assets | | | $ | 673,984,708 | | | | $ | 4,930,126 | | | | $ | 805,872,879 | |
| | | | | | | | | | | | | | | |
Net Assets | | | | | | | | | | | | | | | |
Investor Class | | | | 129,071,018 | | | | | 2,860,859 | | | | | 746,749,317 | |
Institutional Class | | | | 544,913,690 | | �� | | | 2,069,267 | | | | | 59,123,562 | |
| | | |
Capital Stock Issued and Outstanding (Unlimited number of
shares authorized, $0.01 par value) | | | | | | | | | | | | | | | |
Investor Class | | | | 27,795,325 | | | | | 226,835 | | | | | 78,092,126 | |
Institutional Class | | | | 115,791,896 | | | | | 163,064 | | | | | 6,188,867 | |
| | | |
Net Asset Value, Redemption Price and Offering Price Per Share | | | | | | | | | | | | | | | |
Investor Class | | | $ | 4.64 | | | | $ | 12.61 | | | | $ | 9.56 | |
| | | | | | | | | | | | | | | |
Institutional Class | | | $ | 4.71 | | | | $ | 12.69 | | | | $ | 9.55 | |
| | | | | | | | | | | | | | | |
| 1 | Fund inception date was October 1, 2019. |
| 2 | Institutional class inception date was January 31, 2020. |
| 3 | See Note 8 for information on affiliated issuers. |
See Notes to Financial Statements.
82
| | | | | | | | | | | | | | | | | | | | | | | |
Micro Cap
Value
Fund2 | | Small Cap
Growth
Fund | | Small Cap
Value
Fund | | Ultra
Growth
Fund2 | | U.S.
Treasury
Fund |
| | | | | | | | | | | | | | | | | | | | | | | | |
| | | | | | | | | | | | | | | | | | | | | | | | |
| | | | | | | | | | | | | | | | | | | | | | | | |
| | $ | 164,260,714 | | | | $ | 1,505,486,082 | | | | $ | 903,823,426 | | | | $ | 1,386,566,008 | | | | $ | 442,364,530 | |
| | | — | | | | | 29,506,779 | | | | | — | | | | | 14,160,023 | | | | | — | |
| | | 11,437,026 | | | | | 43,083,458 | | | | | 14,809,933 | | | | | 144,864,879 | | | | | 8,559,652 | |
| | | | | | | | | | | | | | | | | | | | | | | | |
| | $ | 175,697,740 | | | | $ | 1,578,076,319 | | | | $ | 918,633,359 | | | | $ | 1,545,590,910 | | | | $ | 450,924,182 | |
| | | | | | | | | | | | | | | | | | | | | | | | |
| | | | | | | | | | | | | | | | | | | | | | | | |
| | $ | 239,139,936 | | | | $ | 2,421,794,162 | | | | $ | 985,058,858 | | | | $ | 1,928,598,643 | | | | $ | 536,537,820 | |
| | | — | | | | | 22,322,336 | | | | | — | | | | | 10,092,300 | | | | | — | |
| | | 11,437,026 | | | | | 43,083,458 | | | | | 14,809,933 | | | | | 144,864,879 | | | | | 8,559,652 | |
| | | | | | | | | | | | | | | | | | | | | | | | |
| | | 250,576,962 | | | | | 2,487,199,956 | | | | | 999,868,791 | | | | | 2,083,555,822 | | | | | 545,097,472 | |
| | | — | | | | | — | | | | | 2,416,321 | | | | | — | | | | | — | |
| | | — | | | | | — | | | | | — | | | | | — | | | | | — | |
| | | 1,088,596 | | | | | 2,438,475 | | | | | 1,780,084 | | | | | — | | | | | — | |
| | | 15,177 | | | | | 881,230 | | | | | 870,158 | | | | | 3,257,288 | | | | | 504,750 | |
| | | 104,320 | | | | | 190,043 | | | | | 409,186 | | | | | 68,157 | | | | | 1,178,415 | |
| | | — | | | | | — | | | | | — | | | | | — | | | | | — | |
| | | 62,718 | | | | | 100,333 | | | | | 75,325 | | | | | 153,604 | | | | | 33,661 | |
| | | | | | | | | | | | | | | | | | | | | | | | |
| | | 251,847,773 | | | | | 2,490,810,037 | | | | | 1,005,419,865 | | | | | 2,087,034,871 | | | | | 546,814,298 | |
| | | | | | | | | | | | | | | | | | | | | | | | |
| | | | | | | | | | | | | | | | | | | | | | | | |
| | | 348,254 | | | | | 5,344,944 | | | | | 5,571,600 | | | | | — | | | | | — | |
| | | 2,791,114 | | | | | 1,666,136 | | | | | 508,934 | | | | | 3,343,584 | | | | | 795,562 | |
| | | — | | | | | — | | | | | — | | | | | — | | | | | 77,115 | |
| | | 300,572 | | | | | 1,991,376 | | | | | 808,736 | | | | | 1,640,084 | | | | | 224,427 | |
| | | 23,333 | | | | | 307,951 | | | | | 117,000 | | | | | 116,533 | | | | | 42,249 | |
| | | 104,340 | | | | | 297,700 | | | | | 125,077 | | | | | 266,861 | | | | | 88,490 | |
| | | — | | | | | — | | | | | — | | | | | — | | | | | — | |
| | | | | | | | | | | | | | | | | | | | | | | | |
| | | 3,567,613 | | | | | 9,608,107 | | | | | 7,131,347 | | | | | 5,367,062 | | | | | 1,227,843 | |
| | | | | | | | | | | | | | | | | | | | | | | | |
| | $ | 248,280,160 | | | | $ | 2,481,201,930 | | | | $ | 998,288,518 | | | | $ | 2,081,667,809 | | | | $ | 545,586,455 | |
| | | | | | | | | | | | | | | | | | | | | | | | |
| | | | | | | | | | | | | | | | | | | | | | | | |
| | $ | 679,999 | | | | $ | 528,952 | | | | $ | 1,422,339 | | | | $ | 526,172 | | | | $ | 243,390 | |
| | | 152,477,033 | | | | | 1,405,432,901 | | | | | 982,155,231 | | | | | 1,475,638,335 | | | | | 465,208,194 | |
| | | 95,123,128 | | | | | 1,075,240,077 | | | | | 14,710,948 | | | | | 605,503,302 | | | | | 80,134,871 | |
| | | | | | | | | | | | | | | | | | | | | | | | |
| | $ | 248,280,160 | | | | $ | 2,481,201,930 | | | | $ | 998,288,518 | | | | $ | 2,081,667,809 | | | | $ | 545,586,455 | |
| | | | | | | | | | | | | | | | | | | | | | | | |
| | | | | | | | | | | | | | | | | | | | | | | | |
| | | 222,962,991 | | | | | 1,247,871,154 | | | | | 525,957,147 | | | | | 1,733,280,138 | | | | | 545,586,455 | |
| | | 25,317,169 | | | | | 1,233,330,776 | | | | | 472,331,371 | | | | | 348,387,671 | | | | | — | |
| | | | |
| | | | | | |
|
|
| | | | | | | | | | | | | | | |
| | | 61,084,608 | | | | | 26,756,682 | | | | | 75,214,778 | | | | | 43,814,073 | | | | | 24,338,951 | |
| | | 6,915,258 | | | | | 26,138,478 | | | | | 67,019,116 | | | | | 8,803,148 | | | | | — | |
| | | | |
| |
|
|
| | | | | | | | | | | | | | | | | | | | |
| | $ | 3.65 | | | | $ | 46.64 | | | | $ | 6.99 | | | | $ | 39.56 | | | | $ | 22.42 | |
| | | | | | | | | | | | | | | | | | | | | | | | |
| | $ | 3.66 | | | | $ | 47.18 | | | | $ | 7.05 | | | | $ | 39.58 | | | | $ | — | |
| | | | | | | | | | | | | | | | | | | | | | | | |
83
Statements of Operations
| | | | | | | | | | | | | | | |
| | | Core
Growth
Fund | | Emerging
India
Fund | | Emerging
Markets
Select
Fund |
| | | | | | | | | | | | | | | |
Investment Income: | |
Interest | | | $ | 14,315 | | | | $ | 1,218 | | | | $ | — | |
Dividends2 | | | | | | | | | | | | | | | |
Unaffiliated issuers | | | | 16,380,878 | | | | | 2,046,481 | | | | | 386,739 | |
| | | | | | | | | | | | | | | |
Total investment income | | | | 16,395,193 | | | | | 2,047,699 | | | | | 386,739 | |
| | | | | | | | | | | | | | | |
Expenses: | |
Investment advisory fees | | | | 24,418,785 | | | | | 3,399,335 | | | | | 475,524 | |
Shareholder servicing fees — Investor Class | | | | 1,724,512 | | | | | 266,150 | | | | | 32,346 | |
Shareholder servicing fees — Institutional Class | | | | 27,789 | | | | | 1,887 | | | | | 2,809 | |
Fund administration fees | | | | 458,889 | | | | | 56,521 | | | | | 10,334 | |
Fund accounting fees | | | | 263,338 | | | | | 51,247 | | | | | 26,945 | |
Reports to shareholders — Investor Class | | | | 179,548 | | | | | 56,497 | | | | | 14,744 | |
Reports to shareholders — Institutional Class | | | | 130,214 | | | | | 4,612 | | | | | 3,363 | |
Custody fees | | | | 12,921 | | | | | 140,872 | | | | | 23,813 | |
Federal and state registration fees — Investor Class | | | | 63,032 | | | | | 22,045 | | | | | 6,417 | |
Federal and state registration fees — Institutional Class | | | | 57,838 | | | | | 24,542 | | | | | 8,217 | |
Legal fees | | | | 161,737 | | | | | 18,768 | | | | | 3,396 | |
Trustees’ fees | | | | 322,596 | | | | | 37,633 | | | | | 6,031 | |
Interest | | | | 71,644 | | | | | 32,923 | | | | | 4,187 | |
Audit fees | | | | 41,896 | | | | | 41,896 | | | | | 41,896 | |
Other expenses | | | | 126,718 | | | | | 79,062 | | | | | 54,697 | |
| | | | | | | | | | | | | | | |
Total expenses before reimbursement | | | | 28,061,457 | | | | | 4,233,990 | | | | | 714,719 | |
Reimbursement of expenses by Advisor | | | | (287,305 | ) | | | | — | | | | | (104,959 | ) |
| | | | | | | | | | | | | | | |
Net Expenses | | | | 27,774,152 | | | | | 4,233,990 | | | | | 609,760 | |
| | | | | | | | | | | | | | | |
Net Investment Income (Loss) | | | | (11,378,959 | ) | | | | (2,186,291 | ) | | | | (223,021 | ) |
| | | | | | | | | | | | | | | |
Realized Gain (Loss): | |
Investments sold | | | | 267,022,182 | | | | | (8,836,104 | ) | | | | 1,861,070 | |
Foreign currency transactions | | | | 3,210 | | | | | (583,598 | ) | | | | (22,478 | ) |
Foreign capital gains taxes | | | | (13,756 | ) | | | | (622,036 | ) | | | | (74,871 | ) |
| | | | | | | | | | | | | | | |
Net realized gain (loss) | | | | 267,011,636 | | | | | (10,041,738 | ) | | | | 1,763,721 | |
| | | | | | | | | | | | | | | |
Change in Unrealized Appreciation (Depreciation): | |
Investments | | | | 152,933,445 | | | | | 8,456,943 | | | | | 10,415,568 | |
Foreign currency translations | | | | — | | | | | 10,455 | | | | | 416 | |
Deferred foreign capital gains taxes | | | | 945,033 | | | | | (1,070,702 | ) | | | | 67,784 | |
| | | | | | | | | | | | | | | |
Net change in unrealized appreciation (depreciation) | | | | 153,878,478 | | | | | 7,396,696 | | | | | 10,483,768 | |
| | | | | | | | | | | | | | | |
Net gain (loss) on investments | | | | 420,890,114 | | | | | (2,645,042 | ) | | | | 12,247,489 | |
| | | | | | | | | | | | | | | |
Net Increase (Decrease) in Net Assets Resulting from Operations | | | $ | 409,511,155 | | | | $ | (4,831,333 | ) | | | $ | 12,024,468 | |
| | | | | | | | | | | | | | | |
| 1 | Fund inception date was October 1, 2019. |
| 2 | Net of $0, $171,971, $41,141, $421,343, $48,682, $45,802, $6,099 $260,433 and $1,119,704 in foreign withholding taxes, respectively. |
See Notes to Financial Statements.
84
| | |
| | | YEAR ENDED SEPTEMBER 30, 2020 |
| | | | | | | | | | | | | | | | | | | | | | | | | | | | |
Emerging
Markets
Small Cap
Fund | | Frontier
Emerging
Small Countries
Fund | | Global
Opportunities
Fund | | Global
Select
Fund1 | | Global
Value
Fund | | International
Growth
Fund |
| | | | | | | | | | | | | | | | | | | | | | | | | | | | | |
| | | | | | | | | | | | | | | | | | | | | | | | | | | | | |
| | $ | 27,857 | | | | $ | 340 | | | | $ | 11,285 | | | | $ | 39 | | | | $ | 2,823 | | | | $ | 11,837 | |
| | | | | | | | | | | | | | | | | | | | | | | | | | | | | |
| | | 3,341,282 | | | | | 551,807 | | | | | 624,638 | | | | | 48,008 | | | | | 3,926,930 | | | | | 10,433,630 | |
| | | | | | | | | | | | | | | | | | | | | | | | | | | | | |
| | | 3,369,139 | | | | | 552,147 | | | | | 635,923 | | | | | 48,047 | | | | | 3,929,753 | | | | | 10,445,467 | |
| | | | | | | | | | | | | | | | | | | | | | | | | | | | | |
| | | | | | | | | | | | | | | | | | | | | | | | | | | | | |
| | | 5,978,112 | | | | | 895,894 | | | | | 1,576,803 | | | | | 75,873 | | | | | 1,124,896 | | | | | 13,435,526 | |
| | | 256,601 | | | | | 104,020 | | | | | 111,795 | | | | | 26,503 | | | | | 212,897 | | | | | 536,871 | |
| | | 1,652 | | | | | 509 | | | | | 1,004 | | | | | 8,168 | | | | | 1,705 | | | | | 8,280 | |
| | | 76,400 | | | | | 11,864 | | | | | 26,668 | | | | | 1,967 | | | | | 26,703 | | | | | 225,394 | |
| | | 64,771 | | | | | 27,863 | | | | | 39,479 | | | | | 16,913 | | | | | 33,033 | | | | | 152,814 | |
| | | 48,211 | | | | | 27,997 | | | | | 23,640 | | | | | 14,840 | | | | | 45,970 | | | | | 82,065 | |
| | | 16,447 | | | | | — | | | | | 1,781 | | | | | 5,927 | | | | | 1,528 | | | | | 28,609 | |
| | | 131,391 | | | | | 63,407 | | | | | 17,116 | | | | | 7,903 | | | | | 15,070 | | | | | 177,475 | |
| | | 17,656 | | | | | 14,366 | | | | | 12,191 | | | | | 21,054 | | | | | 12,543 | | | | | 33,202 | |
| | | 23,485 | | | | | 12,369 | | | | | 14,534 | | | | | 21,258 | | | | | 10,172 | | | | | 61,765 | |
| | | 31,820 | | | | | 5,149 | | | | | 8,768 | | | | | 34,774 | | | | | 13,162 | | | | | 95,198 | |
| | | 50,213 | | | | | 7,850 | | | | | 17,033 | | | | | 866 | | | | | 18,792 | | | | | 151,889 | |
| | | 27,299 | | | | | 2,536 | | | | | 5,633 | | | | | 569 | | | | | 3,241 | | | | | 36,945 | |
| | | 41,896 | | | | | 41,896 | | | | | 41,896 | | | | | 41,681 | | | | | 94,028 | | | | | 47,411 | |
| | | 59,376 | | | | | 47,331 | | | | | 15,808 | | | | | 20,153 | | | | | 19,232 | | | | | 72,415 | |
| | | | | | | | | | | | | | | | | | | | | | | | | | | | | |
| | | 6,825,330 | | | | | 1,263,051 | | | | | 1,914,149 | | | | | 298,449 | | | | | 1,632,972 | | | | | 15,145,859 | |
| | | (4,564 | ) | | | | (120,327 | ) | | | | (31,005 | ) | | | | (202,753 | ) | | | | (265,804 | ) | | | | (22,008 | ) |
| | | | | | | | | | | | | | | | | | | | | | | | | | | | | |
| | | 6,820,766 | | | | | 1,142,724 | | | | | 1,883,144 | | | | | 95,696 | | | | | 1,367,168 | | | | | 15,123,851 | |
| | | | | | | | | | | | | | | | | | | | | | | | | | | | | |
| | | (3,451,627 | ) | | | | (590,577 | ) | | | | (1,247,221 | ) | | | | (47,649 | ) | | | | 2,562,585 | | | | | (4,678,384 | ) |
| | | | | | | | | | | | | | | | | | | | | | | | | | | | | |
| | | | | | | | | | | | | | | | | | | | | | | | | | | | | |
| | | 29,211,502 | | | | | 3,408,571 | | | | | 4,334,942 | | | | | (157,557 | ) | | | | (6,561,673 | ) | | | | 112,340,123 | |
| | | (265,554 | ) | | | | (50,531 | ) | | | | 165 | | | | | (16,476 | ) | | | | (33,943 | ) | | | | (134,817 | ) |
| | | (122,891 | ) | | | | (80,572 | ) | | | | (26,870 | ) | | | | (138 | ) | | | | — | | | | | (305,325 | ) |
| | | | | | | | | | | | | | | | | | | | | | | | | | | | | |
| | | 28,823,057 | | | | | 3,277,468 | | | | | 4,308,237 | | | | | (174,171 | ) | | | | (6,595,616 | ) | | | | 111,899,981 | |
| | | | | | | | | | | | | | | | | | | | | | | | | | | | | |
| | | | | | | | | | | | | | | | | | | | | | | | | | | | | |
| | | 41,580,200 | | | | | 2,029,647 | | | | | 22,295,886 | | | | | 2,479,806 | | | | | (13,356,975 | ) | | | | 83,079,561 | |
| | | 50,703 | | | | | 3,442 | | | | | 1,660 | | | | | 5 | | | | | 17,063 | | | | | 77,493 | |
| | | (1,131,354 | ) | | | | 6,542 | | | | | 20,322 | | | | | (1,868 | ) | | | | (7,705 | ) | | | | (841,789 | ) |
| | | | | | | | | | | | | | | | | | | | | | | | | | | | | |
| | | 40,499,549 | | | | | 2,039,631 | | | | | 22,317,868 | | | | | 2,477,943 | | | | | (13,347,617 | ) | | | | 82,315,265 | |
| | | | | | | | | | | | | | | | | | | | | | | | | | | | | |
| | | 69,322,606 | | | | | 5,317,099 | | | | | 26,626,105 | | | | | 2,303,772 | | | | | (19,943,233 | ) | | | | 194,215,246 | |
| | | | | | | | | | | | | | | | | | | | | | | | | | | | | |
| | $ | 65,870,979 | | | | $ | 4,726,522 | | | | $ | 25,378,884 | | | | $ | 2,256,123 | | | | $ | (17,380,648 | ) | | | $ | 189,536,862 | |
| | | | | | | | | | | | | | | | | | | | | | | | | | | | | |
85
Statements of Operations (continued)
| | | | | | | | | | | | | | | |
| | | International
Opportunities
Fund | | International
Select
Fund1 | | Micro
Cap
Fund2 |
| | | | | | | | | | | | | | | |
Investment Income: | | | | | | |
Interest | | | $ | 10,692 | | | | $ | 31 | | | | $ | 12,124 | |
Dividends3 | | | | | | | | | | | | | | | |
Unaffiliated issuers | | | | 4,715,379 | | | | | 23,573 | | | | | 1,059,821 | |
| | | | | | | | | | | | | | | |
Total investment income | | | | 4,726,071 | | | | | 23,604 | | | | | 1,071,945 | |
| | | | | | | | | | | | | | | |
Expenses: | | | | | | |
Investment advisory fees | | | | 9,661,959 | | | | | 25,606 | | | | | 9,003,400 | |
Shareholder servicing fees — Investor Class | | | | 169,625 | | | | | 24,774 | | | | | 434,645 | |
Shareholder servicing fees — Institutional Class | | | | 238,669 | | | | | 9,815 | | | | | 1,314 | |
Fund administration fees | | | | 112,038 | | | | | 700 | | | | | 113,806 | |
Fund accounting fees | | | | 92,886 | | | | | 18,841 | | | | | 78,760 | |
Reports to shareholders — Investor Class | | | | 35,538 | | | | | 11,947 | | | | | 52,861 | |
Reports to shareholders — Institutional Class | | | | 65,894 | | | | | 6,712 | | | | | 1,917 | |
Custody fees | | | | 123,866 | | | | | 9,176 | | | | | 5,594 | |
Federal and state registration fees — Investor Class | | | | 11,538 | | | | | 21,234 | | | | | 39,660 | |
Federal and state registration fees — Institutional Class | | | | 25,046 | | | | | 21,829 | | | | | 1,528 | |
Legal fees | | | | 49,934 | | | | | 33,942 | | | | | 37,149 | |
Trustees’ fees | | | | 71,729 | | | | | 328 | | | | | 67,772 | |
Interest | | | | 14,291 | | | | | 152 | | | | | 15,125 | |
Audit fees | | | | 41,896 | | | | | 41,681 | | | | | 39,297 | |
Other expenses | | | | 38,767 | | | | | 6,156 | | | | | 38,722 | |
| | | | | | | | | | | | | | | |
Total expenses before reimbursement | | | | 10,753,676 | | | | | 232,893 | | | | | 9,931,550 | |
Reimbursement of expenses by Advisor | | | | — | | | | | (196,692 | ) | | | | (4,073 | ) |
| | | | | | | | | | | | | | | |
Net Expenses | | | | 10,753,676 | | | | | 36,201 | | | | | 9,927,477 | |
| | | | | | | | | | | | | | | |
Net Investment Income (Loss) | | | | (6,027,605 | ) | | | | (12,597 | ) | | | | (8,855,532 | ) |
| | | | | | | | | | | | | | | |
Realized Gain (Loss): | | | | | | |
Investments sold | | | | 11,951,337 | | | | | (68,963 | ) | | | | 71,967,521 | |
Investments in affiliates | | | | — | | | | | — | | | | | 25,007 | |
Foreign currency transactions | | | | (61,942 | ) | | | | (12,468 | ) | | | | (41,830 | ) |
Foreign capital gains taxes | | | | — | | | | | — | | | | | (201,149 | ) |
| | | | | | | | | | | | | | | |
Net realized gain (loss) | | | | 11,889,395 | | | | | (81,431 | ) | | | | 71,749,549 | |
| | | | | | | | | | | | | | | |
Change in Unrealized Appreciation (Depreciation): | | | | | | |
Investments | | | | 165,361,090 | | | | | 776,892 | | | | | 149,497,109 | |
Investments in affiliates | | | | — | | | | | — | | | | | 9,595,398 | |
Foreign currency translations | | | | 27,693 | | | | | 29 | | | | | (1,195 | ) |
Deferred foreign capital gains taxes | | | | 130,388 | | | | | — | | | | | 168,978 | |
| | | | | | | | | | | | | | | |
Net change in unrealized appreciation (depreciation) | | | | 165,519,171 | | | | | 776,921 | | | | | 159,260,290 | |
| | | | | | | | | | | | | | | |
Net gain (loss) on investments | | | | 177,408,566 | | | | | 695,490 | | | | | 231,009,839 | |
| | | | | | | | | | | | | | | |
Net Increase (Decrease) in Net Assets Resulting from Operations | | | $ | 171,380,961 | | | | $ | 682,893 | | | | $ | 222,154,307 | |
| | | | | | | | | | | | | | | |
| 1 | Fund inception date was October 1, 2019. |
| 2 | Institutional class inception date was January 31, 2020. |
| 3 | Net of $555,457, $3,229, $9, $30,609, $(1,416), $0, $0 and $0 in foreign withholding taxes, respectively. |
See Notes to Financial Statements.
86
| | |
| | | YEAR ENDED SEPTEMBER 30, 2020 |
| | | | | | | | | | | | | | | | | | | | | | | |
Micro Cap
Value
Fund2 | | Small Cap
Growth
Fund | | Small Cap
Value
Fund | | Ultra
Growth
Fund2 | | U.S.
Treasury
Fund |
| | | | | | | | | | | | | | | | | | | | | | | | |
| | | | | | | | | | | | | | | | | | | | | | | | |
| | $ | 25,710 | | | | $ | 394,325 | | | | $ | 15,490 | | | | $ | 46,924 | | | | $ | 9,014,537 | |
| | | | | | | | | | | | | | | | | | | | | | | | |
| | | 1,702,492 | | | | | 5,092,480 | | | | | 11,891,234 | | | | | 2,528,847 | | | | | — | |
| | | | | | | | | | | | | | | | | | | | | | | | |
| | | 1,728,202 | | | | | 5,486,805 | | | | | 11,906,724 | | | | | 2,575,771 | | | | | 9,014,537 | |
| | | | | | | | | | | | | | | | | | | | | | | | |
| | | | | | | | | | | | | | | | | | | | | | | | |
| | | 3,564,265 | | | | | 20,146,796 | | | | | 8,334,572 | | | | | 11,219,985 | | | | | 2,181,873 | |
| | | 265,753 | | | | | 947,607 | | | | | 500,919 | | | | | 1,308,315 | | | | | 352,061 | |
| | | 1,197 | | | | | 14,033 | | | | | 4,536 | | | | | 1,280 | | | | | — | |
| | | 37,614 | | | | | 389,283 | | | | | 158,117 | | | | | 168,860 | | | | | 66,665 | |
| | | 43,066 | | | | | 226,232 | | | | | 101,036 | | | | | 108,866 | | | | | 40,150 | |
| | | 46,442 | | | | | 99,359 | | | | | 75,249 | | | | | 103,720 | | | | | 44,508 | |
| | | 1,902 | | | | | 157,342 | | | | | 27,942 | | | | | 2,803 | | | | | — | |
| | | 28,887 | | | | | 19,553 | | | | | 4,860 | | | | | 16,527 | | | | | 1,432 | |
| | | 26,461 | | | | | 45,447 | | | | | 41,513 | | | | | 96,913 | | | | | 35,943 | |
| | | 481 | | | | | 64,827 | | | | | 43,688 | | | | | 3,933 | | | | | — | |
| | | 22,929 | | | | | 126,101 | | | | | 41,029 | | | | | 35,665 | | | | | 24,009 | |
| | | 30,355 | | | | | 254,418 | | | | | 112,377 | | | | | 109,629 | | | | | 54,505 | |
| | | 6,013 | | | | | 50,826 | | | | | 23,007 | | | | | 26,165 | | | | | 11,396 | |
| | | 39,297 | | | | | 41,896 | | | | | 41,896 | | | | | 39,297 | | | | | 39,297 | |
| | | 25,176 | | | | | 95,292 | | | | | 45,550 | | | | | 45,799 | | | | | 18,965 | |
| | | | | | | | | | | | | | | | | | | | | | | | |
| | | 4,139,838 | | | | | 22,679,012 | | | | | 9,556,291 | | | | | 13,287,757 | | | | | 2,870,804 | |
| | | (12,332 | ) | | | | (306,012 | ) | | | | (123,421 | ) | | | | (11,370 | ) | | | | — | |
| | | | | | | | | | | | | | | | | | | | | | | | |
| | | 4,127,506 | | | | | 22,373,000 | | | | | 9,432,870 | | | | | 13,276,387 | | | | | 2,870,804 | |
| | | | | | | | | | | | | | | | | | | | | | | | |
| | | (2,399,304 | ) | | | | (16,886,195 | ) | | | | 2,473,854 | | | | | (10,700,616 | ) | | | | 6,143,733 | |
| | | | | | | | | | | | | | | | | | | | | | | | |
| | | | | | | | | | | | | | | | | | | | | | | | |
| | | 24,304,279 | | | | | 191,851,106 | | | | | (59,214,340 | ) | | | | 82,068,877 | | | | | 5,952,590 | |
| | | — | | | | | — | | | | | — | | | | | (211,936 | ) | | | | — | |
| | | (3,073 | ) | | | | 8,208 | | | | | (34,246 | ) | | | | 19,175 | | | | | — | |
| | | (16,410 | ) | | | | — | | | | | — | | | | | (10,939 | ) | | | | — | |
| | | | | | | | | | | | | | | | | | | | | | | | |
| | | 24,284,796 | | | | | 191,859,314 | | | | | (59,248,586 | ) | | | | 81,865,177 | | | | | 5,952,590 | |
| | | | | | | | | | | | | | | | | | | | | | | | |
| | | | | | | | | | | | | | | | | | | | | | | | |
| | | 25,684,426 | | | | | 440,400,232 | | | | | (16,107,490 | ) | | | | 486,468,803 | | | | | 51,081,119 | |
| | | — | | | | | (7,184,443 | ) | | | | — | | | | | (4,067,723 | ) | | | | — | |
| | | 1,694 | | | | | 820 | | | | | — | | | | | 348 | | | | | — | |
| | | 95,153 | | | | | — | | | | | 145,879 | | | | | 255,086 | | | | | — | |
| | | | | | | | | | | | | | | | | | | | | | | | |
| | | 25,781,273 | | | | | 433,216,609 | | | | | (15,961,611 | ) | | | | 482,656,514 | | | | | 51,081,119 | |
| | | | | | | | | | | | | | | | | | | | | | | | |
| | | 50,066,069 | | | | | 625,075,923 | | | | | (75,210,197 | ) | | | | 564,521,691 | | | | | 57,033,709 | |
| | | | | | | | | | | | | | | | | | | | | | | | |
| | $ | 47,666,765 | | | | $ | 608,189,728 | | | | $ | (72,736,343 | ) | | | $ | 553,821,075 | | | | $ | 63,177,442 | |
| | | | | | | | | | | | | | | | | | | | | | | | |
87
Statements of Changes in Net Assets
| | | | | | | | | | | | | | | | | | | | |
| | | Core Growth
Fund | | Emerging India
Fund |
| | | Year Ended
September 30, 2020 | | Year Ended
September 30, 2019 | | Year Ended
September 30, 2020 | | Year Ended
September 30, 2019 |
| | | | | | | | | | | | | | | | | | | | |
Operations: | | | | | | | | | | | | | | | | | | | | |
Net investment income (loss) | | | $ | (11,378,959 | ) | | | $ | (11,786,255 | ) | | | $ | (2,186,291 | ) | | | $ | (2,348,420 | ) |
Net realized gain (loss) on investments, foreign currency translations and foreign capital gains taxes | | | | 267,011,636 | | | | | 215,644,009 | | | | | (10,041,738 | ) | | | | 411,045 | |
Change in unrealized appreciation (depreciation) on investments, foreign currency translations and deferred foreign capital gains taxes | | | | 153,878,478 | | | | | (216,536,421 | ) | | | | 7,396,696 | | | | | 36,867,160 | |
| | | | | | | | | | | | | | | | | | | | |
Net increase (decrease) in net assets resulting from operations | | | | 409,511,155 | | | | | (12,678,667 | ) | | | | (4,831,333 | ) | | | | 34,929,785 | |
| | | | |
Distributions to shareholders from distributable earnings | | | | | | | | | | | | | | | | | | | | |
Investor Class | | | | (149,403,088 | ) | | | | (115,894,672 | ) | | | | (641,437 | ) | | | | (12,103,683 | ) |
Institutional Class | | | | (93,662,303 | ) | | | | (56,240,911 | ) | | | | (372,918 | ) | | | | (3,516,107 | ) |
| | | | |
Capital share transactions: | | | | | | | | | | | | | | | | | | | | |
Investor Class | | | | | | | | | | | | | | | | | | | | |
Shares sold | | | | 300,231,603 | | | | | 189,187,622 | | | | | 49,187,928 | | | | | 65,709,960 | |
Shares issued to holders in reinvestment of dividends | | | | 145,016,231 | | | | | 112,651,644 | | | | | 638,968 | | | | | 12,002,230 | |
Shares redeemed | | | | (366,379,267 | ) | | | | (308,539,799 | ) | | | | (93,141,751 | ) | | | | (87,395,827 | ) |
Redemption fees | | | | 86,545 | | | | | 117,547 | | | | | 46,810 | | | | | 76,280 | |
| | | | | | | | | | | | | | | | | | | | |
Net increase (decrease) | | | | 78,955,112 | | | | | (6,582,986 | ) | | | | (43,268,045 | ) | | | | (9,607,357 | ) |
| | | | | | | | | | | | | | | | | | | | |
Institutional Class | | | | | | | | | | | | | | | | | | | | |
Shares sold | | | | 440,775,070 | | | | | 325,369,900 | | | | | 80,901,116 | | | | | 54,672,753 | |
Shares issued to holders in reinvestment of dividends | | | | 89,581,586 | | | | | 53,665,284 | | | | | 372,838 | | | | | 3,516,108 | |
Shares redeemed | | | | (331,456,790 | ) | | | | (201,747,911 | ) | | | | (29,618,917 | ) | | | | (15,244,042 | ) |
Redemption fees | | | | 66,478 | | | | | 34,892 | | | | | 17,127 | | | | | 193 | |
| | | | | | | | | | | | | | | | | | | | |
Net increase (decrease) | | | | 198,966,344 | | | | | 177,322,165 | | | | | 51,672,164 | | | | | 42,945,012 | |
| | | | | | | | | | | | | | | | | | | | |
Total increase (decrease) in net assets | | | | 444,367,220 | | | | | (14,075,071 | ) | | | | 2,558,431 | | | | | 52,647,650 | |
| | | | |
Net assets: | | | | | | | | | | | | | | | | | | | | |
Beginning of period | | | | 2,285,781,094 | | | | | 2,299,856,165 | | | | | 279,838,038 | | | | | 227,190,388 | |
| | | | | | | | | | | | | | | | | | | | |
End of period | | | $ | 2,730,148,314 | | | | $ | 2,285,781,094 | | | | $ | 282,396,469 | | | | $ | 279,838,038 | |
| | | | | | | | | | | | | | | | | | | | |
| | | | |
Capital share transactions — shares: | | | | | | | | | | | | | | | | | | | | |
Investor Class | | | | | | | | | | | | | | | | | | | | |
Shares sold | | | | 4,313,782 | | | | | 2,666,806 | | | | | 12,159,532 | | | | | 16,292,452 | |
Shares issued to holders in reinvestment of dividends | | | | 2,011,879 | | | | | 1,925,011 | | | | | 143,266 | | | | | 3,030,866 | |
Shares redeemed | | | | (5,387,481 | ) | | | | (4,433,956 | ) | | | | (24,079,210 | ) | | | | (22,008,586 | ) |
| | | | | | | | | | | | | | | | | | | | |
Net increase (decrease) in shares outstanding | | | | 938,180 | | | | | 157,861 | | | | | (11,776,412 | ) | | | | (2,685,268 | ) |
| | | | | | | | | | | | | | | | | | | | |
Institutional Class | | | | | | | | | | | | | | | | | | | | |
Shares sold | | | | 6,308,855 | | | | | 4,595,902 | | | | | 20,515,166 | | | | | 13,743,037 | |
Shares issued to holders in reinvestment of dividends | | | | 1,229,841 | | | | | 909,581 | | | | | 83,038 | | | | | 881,230 | |
Shares redeemed | | | | (4,601,085 | ) | | | | (2,848,564 | ) | | | | (7,831,162 | ) | | | | (3,796,046 | ) |
| | | | | | | | | | | | | | | | | | | | |
Net increase (decrease) in shares outstanding | | | | 2,937,611 | | | | | 2,656,919 | | | | | 12,767,042 | | | | | 10,828,221 | |
| | | | | | | | | | | | | | | | | | | | |
See Notes to Financial Statements.
88
| | | | | | | | | | | | | | | | | | | | | | | | | | | | |
Emerging Markets Select
Fund | | Emerging Markets Small Cap
Fund | | Frontier Emerging Small Countries
Fund |
Year Ended
September 30, 2020 | | Year Ended
September 30, 2019 | | Year Ended
September 30, 2020 | | Year Ended
September 30, 2019 | | Year Ended
September 30, 2020 | | Year Ended
September 30, 2019 |
| | | | | | | | | | | | | | | | | | | | | | | | | | | | | |
| | | | | | | | | | | | | | | | | | | | | | | | | | | | | |
| | $ | (223,021 | ) | | | $ | (100,282 | ) | | | $ | (3,451,627 | ) | | | $ | (3,225,668 | ) | | | $ | (590,577 | ) | | | $ | 553,025 | |
| | | 1,763,721 | | | | | (12,717 | ) | | | | 28,823,057 | | | | | 19,514,955 | | | | | 3,277,468 | | | | | (81,296 | ) |
| | | 10,483,768 | | | | | 3,983,601 | | | | | 40,499,549 | | | | | 3,745,786 | | | | | 2,039,631 | | | | | 4,525,461 | |
| | | | | | | | | | | | | | | | | | | | | | | | | | | | | |
| | | 12,024,468 | | | | | 3,870,602 | | | | | 65,870,979 | | | | | 20,035,073 | | | | | 4,726,522 | | | | | 4,997,190 | |
| | | | | |
| |
|
|
| | | | | | | | | | | | | | | | | | | | | | | | | |
| | | — | | | | | — | | | | | (11,627,154 | ) | | | | (26,880,563 | ) | | | | — | | | | | — | |
| | | — | | | | | — | | | | | (10,395,643 | ) | | | | (22,096,890 | ) | | | | — | | | | | — | |
| | | | | |
| | | | | | | | | | | | | | | | | | | | | | | | | | | | | |
| | | | | | | | | | | | | | | | | | | | | | | | | | | | | |
| | | 4,233,619 | | | | | 1,051,049 | | | | | 29,769,453 | | | | | 26,627,101 | | | | | 3,402,404 | | | | | 3,387,642 | |
| | | — | | | | | — | | | | | 11,005,252 | | | | | 25,451,093 | | | | | — | | | | | — | |
| | | (1,976,142 | ) | | | | (5,608,056 | ) | | | | (56,935,590 | ) | | | | (130,410,766 | ) | | | | (10,813,720 | ) | | | | (20,744,583 | ) |
| | | 5,058 | | | | | 3,152 | | | | | 11,864 | | | | | 3,897 | | | | | 8,614 | | | | | 7,717 | |
| | | | | | | | | | | | | | | | | | | | | | | | | | | | | |
| | | 2,262,535 | | | | | (4,553,855 | ) | | | | (16,149,021 | ) | | | | (78,328,675 | ) | | | | (7,402,702 | ) | | | | (17,349,224 | ) |
| | | | | | | | | | | | | | | | | | | | | | | | | | | | | |
| | | | | | | | | | | | | | | | | | | | | | | | | | | | | |
| | | 8,078,012 | | | | | 4,503,557 | | | | | 37,383,900 | | | | | 69,254,821 | | | | | 1,168,124 | | | | | 920,083 | |
| | | — | | | | | — | | | | | 9,521,929 | | | | | 20,773,470 | | | | | — | | | | | — | |
| | | (7,846,119 | ) | | | | (3,409,102 | ) | | | | (65,995,973 | ) | | | | (143,750,216 | ) | | | | (8,278,645 | ) | | | | (6,315,306 | ) |
| | | 540 | | | | | 315 | | | | | 13,541 | | | | | 15,117 | | | | | 1,272 | | | | | — | |
| | | | | | | | | | | | | | | | | | | | | | | | | | | | | |
| | | 232,433 | | | | | 1,094,770 | | | | | (19,076,603 | ) | | | | (53,706,808 | ) | | | | (7,109,249 | ) | | | | (5,395,223 | ) |
| | | | | | | | | | | | | | | | | | | | | | | | | | | | | |
| | | 14,519,436 | | | | | 411,517 | | | | | 8,622,558 | | | | | (160,977,863 | ) | | | | (9,785,429 | ) | | | | (17,747,257 | ) |
| | | | | |
| | | | | | | | | | | | | | | | | | | | | | | | | | | | | |
| | | 44,146,649 | | | | | 43,735,132 | | | | | 365,454,461 | | | | | 526,432,324 | | | | | 60,244,953 | | | | | 77,992,210 | |
| | | | | | | | | | | | | | | | | | | | | | | | | | | | | |
| | $ | 58,666,085 | | | | $ | 44,146,649 | | | | $ | 374,077,019 | | | | $ | 365,454,461 | | | | $ | 50,459,524 | | | | $ | 60,244,953 | |
| | | | | | | | | | | | | | | | | | | | | | | | | | | | | |
| | | | | |
| | | | | | | | | | | | | | | | | | | | | | | | | | | | | |
| | | | | | | | | | | | | | | | | | | | | | | | | | | | | |
| | | 346,285 | | | | | 102,864 | | | | | 10,864,214 | | | | | 10,680,727 | | | | | 1,305,878 | | | | | 1,324,685 | |
| | | — | | | | | — | | | | | 4,001,910 | | | | | 11,162,760 | | | | | — | | | | | — | |
| | | (168,675 | ) | | | | (540,323 | ) | | | | (21,953,707 | ) | | | | (52,036,343 | ) | | | | (4,053,476 | ) | | | | (8,208,619 | ) |
| | | | | | | | | | | | | | | | | | | | | | | | | | | | | |
| | | 177,610 | | | | | (437,459 | ) | | | | (7,087,583 | ) | | | | (30,192,856 | ) | | | | (2,747,598 | ) | | | | (6,883,934 | ) |
| | | | | | | | | | | | | | | | | | | | | | | | | | | | | |
| | | | | | | | | | | | | | | | | | | | | | | | | | | | | |
| | | 666,834 | | | | | 419,680 | | | | | 13,643,138 | | | | | 27,208,564 | | | | | 412,481 | | | | | 362,002 | |
| | | — | | | | | — | | | | | 3,437,519 | | | | | 9,071,384 | | | | | — | | | | | — | |
| | | (676,956 | ) | | | | (300,531 | ) | | | | (24,611,629 | ) | | | | (57,064,550 | ) | | | | (2,901,120 | ) | | | | (2,551,687 | ) |
| | | | | | | | | | | | | | | | | | | | | | | | | | | | | |
| | | (10,122 | ) | | | | 119,149 | | | | | (7,530,972 | ) | | | | (20,784,602 | ) | | | | (2,488,639 | ) | | | | (2,189,685 | ) |
| | | | | | | | | | | | | | | | | | | | | | | | | | | | | |
89
Statements of Changes in Net Assets (continued)
| | | | | | | | | | | | | | | |
| | | Global Opportunities
Fund | | Global Select
Fund |
| | | Year Ended
September 30, 2020 | | Year Ended
September 30, 2019 | | Year Ended
September 30, 20201 |
| | | | | | | | | | | | | | | |
Operations: | | | | | | | | | | | | | | | |
Net investment income (loss) | | | $ | (1,247,221 | ) | | | $ | (1,068,879 | ) | | | $ | (47,649 | ) |
Net realized gain (loss) on investments, foreign currency translations and foreign capital gains taxes | | | | 4,308,237 | | | | | 9,825,436 | | | | | (174,171 | ) |
Change in unrealized appreciation (depreciation) on investments, foreign currency translations and deferred foreign capital gains taxes | | | | 22,317,868 | | | | | (8,613,376 | ) | | | | 2,477,943 | |
| | | | | | | | | | | | | | | |
Net increase (decrease) in net assets resulting from operations | | | | 25,378,884 | | | | | 143,181 | | | | | 2,256,123 | |
| | | |
Distributions to shareholders from distributable earnings | | | | | | | | | | | | | | | |
Investor Class | | | | (8,871,843 | ) | | | | (13,508,893 | ) | | | | — | |
Institutional Class | | | | (1,711,832 | ) | | | | (2,069,212 | ) | | | | — | |
| | | |
Capital share transactions: | | | | | | | | | | | | | | | |
Investor Class | | | | | | | | | | | | | | | |
Shares sold | | | | 17,857,634 | | | | | 18,263,643 | | | | | 4,723,784 | |
Shares issued to holders in reinvestment of dividends | | | | 8,792,560 | | | | | 13,261,385 | | | | | — | |
Shares redeemed | | | | (41,451,598 | ) | | | | (24,803,012 | ) | | | | (1,063,555 | ) |
Redemption fees | | | | 12,387 | | | | | 5,927 | | | | | 2,117 | |
| | | | | | | | | | | | | | | |
Net increase (decrease) | | | | (14,789,017 | ) | | | | 6,727,943 | | | | | 3,662,346 | |
| | | | | | | | | | | | | | | |
Institutional Class | | | | | | | | | | | | | | | |
Shares sold | | | | 21,541,722 | | | | | 7,653,936 | | | | | 9,431,467 | |
Shares issued to holders in reinvestment of dividends | | | | 1,626,534 | | | | | 1,897,942 | | | | | — | |
Shares redeemed | | | | (6,453,459 | ) | | | | (4,830,069 | ) | | | | (1,979,132 | ) |
Redemption fees | | | | 2,084 | | | | | 2,232 | | | | | 122 | |
| | | | | | | | | | | | | | | |
Net increase (decrease) | | | | 16,716,881 | | | | | 4,724,041 | | | | | 7,452,457 | |
| | | | | | | | | | | | | | | |
Total increase (decrease) in net assets | | | | 16,723,073 | | | | | (3,982,940 | ) | | | | 13,370,926 | |
| | | |
Net assets: | | | | | | | | | | | | | | | |
Beginning of period | | | | 122,770,080 | | | | | 126,753,020 | | | | | — | |
| | | | | | | | | | | | | | | |
End of period | | | $ | 139,493,153 | | | | $ | 122,770,080 | | | | $ | 13,370,926 | |
| | | | | | | | | | | | | | | |
| | | |
Capital share transactions — shares: | | | | | | | | | | | | | | | |
Investor Class | | | | | | | | | | | | | | | |
Shares sold | | | | 5,250,318 | | | | | 5,400,753 | | | | | 438,061 | |
Shares issued to holders in reinvestment of dividends | | | | 2,541,202 | | | | | 4,736,209 | | | | | — | |
Shares redeemed | | | | (12,067,930 | ) | | | | (7,290,883 | ) | | | | (96,304 | ) |
| | | | | | | | | | | | | | | |
Net increase (decrease) in shares outstanding | | | | (4,276,410 | ) | | | | 2,846,079 | | | | | 341,757 | |
| | | | | | | | | | | | | | | |
Institutional Class | | | | | | | | | | | | | | | |
Shares sold | | | | 5,824,322 | | | | | 2,341,370 | | | | | 909,171 | |
Shares issued to holders in reinvestment of dividends | | | | 468,742 | | | | | 675,424 | | | | | — | |
Shares redeemed | | | | (1,940,154 | ) | | | | (1,410,992 | ) | | | | (192,049 | ) |
| | | | | | | | | | | | | | | |
Net increase (decrease) in shares outstanding | | | | 4,352,910 | | | | | 1,605,802 | | | | | 717,122 | |
| | | | | | | | | | | | | | | |
| 1 | Fund inception date was October 1, 2019. |
See Notes to Financial Statements.
90
| | | | | | | | | | | | | | | | | | | | | | | | | | | | |
Global Value
Fund | | International Growth
Fund | | International Opportunities
Fund |
Year Ended
September 30, 2020 | | Year Ended
September 30, 2019 | | Year Ended
September 30, 2020 | | Year Ended
September 30, 2019 | | Year Ended
September 30, 2020 | | Year Ended
September 30, 2019 |
| | | | | | | | | | | | | | | | | | | | | | | | | | | | | |
| | | | | | | | | | | | | | | | | | | | | | | | | | | | | |
| | $ | 2,562,585 | | | | $ | 3,930,311 | | | | $ | (4,678,384 | ) | | | $ | (2,330,095 | ) | | | $ | (6,027,605 | ) | | | $ | (4,015,942 | ) |
| | | (6,595,616 | ) | | | | 5,362,420 | | | | | 111,899,981 | | | | | 35,546,556 | | | | | 11,889,395 | | | | | 19,328,327 | |
| | | (13,347,617 | ) | | | | (13,287,556 | ) | | | | 82,315,265 | | | | | (200,457,253 | ) | | | | 165,519,171 | | | | | (19,771,713 | ) |
| | | | | | | | | | | | | | | | | | | | | | | | | | | | | |
| | | (17,380,648 | ) | | | | (3,994,825 | ) | | | | 189,536,862 | | | | | (167,240,792 | ) | | | | 171,380,961 | | | | | (4,459,328 | ) |
| | | | | |
| | | | | | | | | | | | | | | | | | | | | | | | | | | | | |
| | | (4,249,075 | ) | | | | (26,014,674 | ) | | | | (14,384,249 | ) | | | | (85,858,576 | ) | | | | (3,279,205 | ) | | | | (5,015,701 | ) |
| | | (273,749 | ) | | | | (1,351,568 | ) | | | | (16,077,813 | ) | | | | (85,816,934 | ) | | | | (9,208,298 | ) | | | | (6,283,811 | ) |
| | | | | |
| | | | | | | | | | | | | | | | | | | | | | | | | | | | | |
| | | | | | | | | | | | | | | | | | | | | | | | | | | | | |
| | | 2,404,272 | | | | | 5,167,863 | | | | | 38,419,767 | | | | | 91,035,974 | | | | | 11,153,760 | | | | | 13,999,031 | |
| | | 4,138,782 | | | | | 25,699,903 | | | | | 12,847,729 | | | | | 79,082,009 | | | | | 3,145,044 | | | | | 4,816,572 | |
| | | (36,447,748 | ) | | | | (47,130,370 | ) | | | | (178,985,286 | ) | | | | (210,507,702 | ) | | | | (50,837,678 | ) | | | | (109,687,557 | ) |
| | | 2,711 | | | | | 4,784 | | | | | 22,305 | | | | | 11,574 | | | | | 2,714 | | | | | 259 | |
| | | | | | | | | | | | | | | | | | | | | | | | | | | | | |
| | | (29,901,983 | ) | | | | (16,257,820 | ) | | | | (127,695,485 | ) | | | | (40,378,145 | ) | | | | (36,536,160 | ) | | | | (90,871,695 | ) |
| | | | | | | | | | | | | | | | | | | | | | | | | | | | | |
| | | | | | | | | | | | | | | | | | | | | | | | | | | | | |
| | | 2,380,179 | | | | | 1,335,472 | | | | | 149,586,508 | | | | | 208,768,921 | | | | | 161,755,041 | | | | | 134,483,838 | |
| | | 272,181 | | | | | 1,324,616 | | | | | 15,159,166 | | | | | 80,888,827 | | | | | 6,000,461 | | | | | 4,723,790 | |
| | | (2,757,736 | ) | | | | (2,784,876 | ) | | | | (269,336,480 | ) | | | | (336,838,011 | ) | | | | (125,211,452 | ) | | | | (56,333,268 | ) |
| | | 371 | | | | | 48 | | | | | 52,102 | | | | | 17,266 | | | | | 2,900 | | | | | 2,902 | |
| | | | | | | | | | | | | | | | | | | | | | | | | | | | | |
| | | (105,005 | ) | | | | (124,740 | ) | | | | (104,538,704 | ) | | | | (47,162,997 | ) | | | | 42,546,950 | | | | | 82,877,262 | |
| | | | | | | | | | | | | | | | | | | | | | | | | | | | | |
| | | (51,910,460 | ) | | | | (47,743,627 | ) | | | | (73,159,389 | ) | | | | (426,457,444 | ) | | | | 164,904,248 | | | | | (23,753,273 | ) |
| | | | | |
| | | | | | | | | | | | | | | | | | | | | | | | | | | | | |
| | | 154,681,983 | | | | | 202,425,610 | | | | | 1,139,331,277 | | | | | 1,565,788,721 | | | | | 509,080,460 | | | | | 532,833,733 | |
| | | | | | | | | | | | | | | | | | | | | | | | | | | | | |
| | $ | 102,771,523 | | | | $ | 154,681,983 | | | | $ | 1,066,171,888 | | | | $ | 1,139,331,277 | | | | $ | 673,984,708 | | | | $ | 509,080,460 | |
| | | | | | | | | | | | | | | | | | | | | | | | | | | | | |
| | | | | |
| | | | | | | | | | | | | | | | | | | | | | | | | | | | | |
| | | | | | | | | | | | | | | | | | | | | | | | | | | | | |
| | | 346,672 | | | | | 657,457 | | | | | 1,297,642 | | | | | 3,254,697 | | | | | 2,967,711 | | | | | 4,249,540 | |
| | | 577,686 | | | | | 3,590,285 | | | | | 417,405 | | | | | 3,267,852 | | | | | 854,632 | | | | | 1,684,116 | |
| | | (5,196,115 | ) | | | | (6,045,374 | ) | | | | (6,396,738 | ) | | | | (7,514,820 | ) | | | | (13,451,519 | ) | | | | (35,750,861 | ) |
| | | | | | | | | | | | | | | | | | | | | | | | | | | | | |
| | | (4,271,757 | ) | | | | (1,797,632 | ) | | | | (4,681,691 | ) | | | | (992,271 | ) | | | | (9,629,176 | ) | | | | (29,817,205 | ) |
| | | | | | | | | | | | | | | | | | | | | | | | | | | | | |
| | | | | | | | | | | | | | | | | | | | | | | | | | | | | |
| | | 335,696 | | | | | 167,348 | | | | | 5,139,067 | | | | | 7,461,278 | | | | | 42,670,160 | | | | | 39,730,459 | |
| | | 38,237 | | | | | 185,078 | | | | | 490,429 | | | | | 3,332,872 | | | | | 1,613,027 | | | | | 1,628,893 | |
| | | (422,343 | ) | | | | (356,260 | ) | | | | (10,024,153 | ) | | | | (11,839,348 | ) | | | | (33,548,262 | ) | | | | (17,169,665 | ) |
| | | | | | | | | | | | | | | | | | | | | | | | | | | | | |
| | | (48,410 | ) | | | | (3,834 | ) | | | | (4,394,657 | ) | | | | (1,045,198 | ) | | | | 10,734,925 | | | | | 24,189,687 | |
| | | | | | | | | | | | | | | | | | | | | | | | | | | | | |
91
Statements of Changes in Net Assets (continued)
| | | | | | | | | | | | | | | |
| | | International Select
Fund
| | Micro Cap
Fund |
| | | Year Ended
September 30, 20201 | | Year Ended
September 30, 20202 | | Year Ended
September 30, 2019 |
| | | | | | | | | | | | | | | |
Operations: | | | | | | | | | | | | | | | |
Net investment income (loss) | | | $ | (12,597 | ) | | | $ | (8,855,532 | ) | | | $ | (5,839,436 | ) |
Net realized gain (loss) on investments, foreign currency translations and foreign capital gains taxes | | | | (81,431 | ) | | | | 71,749,549 | | | | | 55,047,174 | |
Change in unrealized appreciation (depreciation) on investments, foreign currency translations and deferred foreign capital gains taxes | | | | 776,921 | | | | | 159,260,290 | | | | | (60,370,211 | ) |
| | | | | | | | | | | | | | | |
Net increase (decrease) in net assets resulting from operations | | | | 682,893 | | | | | 222,154,307 | | | | | (11,162,473 | ) |
| | | |
Distributions to shareholders from distributable earnings | | | | | | | | | | | | | | | |
Investor Class | | | | — | | | | | (56,926,728 | ) | | | | (87,356,742 | ) |
Institutional Class | | | | — | | | | | — | | | | | — | |
| | | |
Capital share transactions: | | | | | | | | | | | | | | | |
Investor Class | | | | | | | | | | | | | | | |
Shares sold | | | | 3,068,305 | | | | | 232,967,630 | | | | | 101,288,047 | |
Shares issued to holders in reinvestment of dividends | | | | — | | | | | 53,969,369 | | | | | 82,402,243 | |
Shares redeemed | | | | (640,960 | ) | | | | (166,371,042 | ) | | | | (107,977,732 | ) |
Redemption fees | | | | 2,330 | | | | | 208,712 | | | | | 183,961 | |
| | | | | | | | | | | | | | | |
Net increase (decrease) | | | | 2,429,675 | | | | | 120,774,669 | | | | | 75,896,519 | |
| | | | | | | | | | | | | | | |
Institutional Class | | | | | | | | | | | | | | | |
Shares sold | | | | 2,471,590 | | | | | 50,341,604 | | | | | — | |
Shares issued to holders in reinvestment of dividends | | | | — | | | | | — | | | | | — | |
Shares redeemed | | | | (659,210 | ) | | | | (3,988,022 | ) | | | | — | |
Redemption fees | | | | 5,178 | | | | | 11,662 | | | | | — | |
| | | | | | | | | | | | | | | |
Net increase | | | | 1,817,558 | | | | | 46,365,244 | | | | | — | |
| | | | | | | | | | | | | | | |
Total increase (decrease) in net assets | | | | 4,930,126 | | | | | 332,367,492 | | | | | (22,622,696 | ) |
| | | |
Net assets: | | | | | | | | | | | | | | | |
Beginning of period | | | | — | | | | | 473,505,387 | | | | | 496,128,083 | |
| | | | | | | | | | | | | | | |
End of period | | | $ | 4,930,126 | | | | $ | 805,872,879 | | | | $ | 473,505,387 | |
| | | | | | | | | | | | | | | |
| | | |
Capital share transactions — shares: | | | | | | | | | | | | | | | |
Investor Class | | | | | | | | | | | | | | | |
Shares sold | | | | 283,704 | | | | | 29,949,457 | | | | | 13,494,255 | |
Shares issued to holders in reinvestment of dividends | | | | — | | | | | 7,332,795 | | | | | 14,256,443 | |
Shares redeemed | | | | (56,869 | ) | | | | (22,790,341 | ) | | | | (14,460,006 | ) |
| | | | | | | | | | | | | | | |
Net increase (decrease) in shares outstanding | | | | 226,835 | | | | | 14,491,911 | | | | | 13,290,692 | |
| | | | | | | | | | | | | | | |
Institutional Class | | | | | | | | | | | | | | | |
Shares sold | | | | 224,263 | | | | | 6,663,273 | | | | | — | |
Shares issued to holders in reinvestment of dividends | | | | — | | | | | — | | | | | — | |
Shares redeemed | | | | (61,199 | ) | | | | (474,406 | ) | | | | — | |
| | | | | | | | | | | | | | | |
Net increase in shares outstanding | | | | 163,064 | | | | | 6,188,867 | | | | | — | |
| | | | | | | | | | | | | | | |
| 1 | Fund inception date was October 1, 2019. |
| 2 | Institutional class inception date was January 31, 2020. |
See Notes to Financial Statements.
92
| | | | | | | | | | | | | | | | | | | | | | | | | | | | |
Micro Cap Value
Fund | | Small Cap Growth
Fund | | Small Cap Value
Fund |
Year Ended
September 30, 20202 | | Year Ended
September 30, 2019 | | Year Ended
September 30, 2020 | | Year Ended
September 30, 2019 | | Year Ended
September 30, 2020 | | Year Ended
September 30, 2019 |
| | | | | | | | | | | | | | | | | | | | | | | | | | | | | |
| | | | | | | | | | | | | | | | | | | | | | | | | | | | | |
| | $ | (2,399,304 | ) | | | $ | (2,283,385 | ) | | | $ | (16,886,195 | ) | | | $ | (12,773,288 | ) | | | $ | 2,473,854 | | | | $ | 3,208,817 | |
| | | 24,284,796 | | | | | 21,624,333 | | | | | 191,859,314 | | | | | 288,451,840 | | | | | (59,248,586 | ) | | | | 605,596 | |
| | | 5,781,273 | | | | | (33,197,979 | ) | | | | 433,216,609 | | | | | (270,686,501 | ) | | | | (15,961,611 | ) | | | | (9,729,926 | ) |
| | | | | | | | | | | | | | | | | | | | | | | | | | | | | |
| | | 47,666,765 | | | | | (13,857,031 | ) | | | | 608,189,728 | | | | | 4,992,051 | | | | | (72,736,343 | ) | | | | (5,915,513 | ) |
| | | | | |
| | | | | | | | | | | | | | | | | | | | | | | | | | | | | |
| | | (22,300,292 | ) | | | | (26,873,692 | ) | | | | (142,862,943 | ) | | | | (254,160,201 | ) | | | | (5,460,620 | ) | | | | (24,527,924 | ) |
| | | — | | | | | — | | | | | (122,088,144 | ) | | | | (160,748,953 | ) | | | | (5,195,933 | ) | | | | (7,190,903 | ) |
| | | | | |
| | | | | | | | | | | | | | | | | | | | | | | | | | | | | |
| | | | | | | | | | | | | | | | | | | | | | | | | | | | | |
| | | 23,219,509 | | | | | 36,404,994 | | | | | 194,535,268 | | | | | 86,238,800 | | | | | 260,086,350 | | | | | 172,350,782 | |
| | | 21,926,724 | | | | | 26,433,514 | | | | | 138,509,163 | | | | | 244,434,466 | | | | | 5,350,153 | | | | | 23,919,067 | |
| | | (93,886,619 | ) | | | | (56,224,461 | ) | | | | (236,107,117 | ) | | | | (266,135,679 | ) | | | | (136,954,752 | ) | | | | (58,961,428 | ) |
| | | 19,268 | | | | | 16,557 | | | | | 57,812 | | | | | 31,675 | | | | | 52,908 | | | | | 28,941 | |
| | | | | | | | | | | | | | | | | | | | | | | | | | | | | |
| | | (48,721,118 | ) | | | | 6,630,604 | | | | | 96,995,126 | | | | | 64,569,262 | | | | | 128,534,659 | | | | | 137,337,362 | |
| | | | | | | | | | | | | | | | | | | | | | | | | | | | | |
| | | | | | | | | | | | | | | | | | | | | | | | | | | | | |
| | | 23,678,349 | | | | | — | | | | | 475,702,556 | | | | | 206,555,979 | | | | | 230,400,086 | | | | | 307,998,467 | |
| | | — | | | | | — | | | | | 115,509,794 | | | | | 150,566,964 | | | | | 5,117,346 | | | | | 6,896,928 | |
| | | (1,567,206 | ) | | | | — | | | | | (241,973,147 | ) | | | | (205,138,374 | ) | | | | (105,372,734 | ) | | | | (30,806,582 | ) |
| | | 795 | | | | | — | | | | | 70,515 | | | | | 29,207 | | | | | 52,293 | | | | | 3,117 | |
| | | | | | | | | | | | | | | | | | | | | | | | | | | | | |
| | | 22,111,938 | | | | | — | | | | | 349,309,718 | | | | | 152,013,776 | | | | | 130,196,991 | | | | | 284,091,930 | |
| | | | | | | | | | | | | | | | | | | | | | | | | | | | | |
| | | (1,242,707 | ) | | | | (34,100,119 | ) | | | | 789,543,485 | | | | | (193,334,065 | ) | | | | 175,338,754 | | | | | 383,794,952 | |
| | | | | |
| | | | | | | | | | | | | | | | | | | | | | | | | | | | | |
| | | 249,522,867 | | | | | 283,622,986 | | | | | 1,691,658,445 | | | | | 1,884,992,510 | | | | | 822,949,764 | | | | | 439,154,812 | |
| | | | | | | | | | | | | | | | | | | | | | | | | | | | | |
| | $ | 248,280,160 | | | | $ | 249,522,867 | | | | $ | 2,481,201,930 | | | | $ | 1,691,658,445 | | | | $ | 998,288,518 | | | | $ | 822,949,764 | |
| | | | | | | | | | | | | | | | | | | | | | | | | | | | | |
| | | | | |
| | | | | | | | | | | | | | | | | | | | | | | | | | | | | |
| | | | | | | | | | | | | | | | | | | | | | | | | | | | | |
| | | 7,646,773 | | | | | 11,499,085 | | | | | 4,956,735 | | | | | 2,157,282 | | | | | 36,261,490 | | | | | 23,179,792 | |
| | | 6,830,755 | | | | | 9,863,251 | | | | | 3,578,123 | | | | | 7,801,930 | | | | | 662,968 | | | | | 3,662,950 | |
| | | (31,059,309 | ) | | | | (17,766,372 | ) | | | | (6,107,294 | ) | | | | (6,802,853 | ) | | | | (21,407,115 | ) | | | | (7,841,265 | ) |
| | | | | | | | | | | | | | | | | | | | | | | | | | | | | |
| | | (16,581,781 | ) | | | | 3,595,964 | | | | | 2,427,564 | | | | | 3,156,359 | | | | | 15,517,343 | | | | | 19,001,477 | |
| | | | | | | | | | | | | | | | | | | | | | | | | | | | | |
| | | | | | | | | | | | | | | | | | | | | | | | | | | | | |
| | | 7,418,609 | | | | | — | | | | | 11,769,214 | | | | | 5,108,334 | | | | | 34,517,402 | | | | | 40,388,583 | |
| | | — | | | | | — | | | | | 2,951,950 | | | | | 4,766,286 | | | | | 630,215 | | | | | 1,049,761 | |
| | | (503,351 | ) | | | | — | | | | | (6,139,142 | ) | | | | (5,161,091 | ) | | | | (16,166,230 | ) | | | | (4,104,717 | ) |
| | | | | | | | | | | | | | | | | | | | | | | | | | | | | |
| | | 6,915,258 | | | | | — | | | | | 8,582,022 | | | | | 4,713,529 | | | | | 18,981,387 | | | | | 37,333,627 | |
| | | | | | | | | | | | | | | | | | | | | | | | | | | | | |
93
| | |
| Wasatch Funds | | SEPTEMBER 30, 2020 |
Statements of Changes in Net Assets (continued)
| | | | | | | | | | | | | | | | | | | | |
| | | Ultra Growth
Fund | | U.S. Treasury
Fund |
| | | Year Ended
September 30, 20202 | | Year Ended
September 30, 2019 | | Year Ended
September 30, 2020 | | Year Ended
September 30, 2019 |
| | | | | | | | | | | | | | | | | | | | |
Operations: | | | | | | | | | | | | | | | | | | | | |
Net investment income (loss) | | | $ | (10,700,616 | ) | | | $ | (4,333,950 | ) | | | $ | 6,143,733 | | | | $ | 6,654,738 | |
Net realized gain (loss) on investments, foreign currency translations and foreign capital gains taxes | | | | 81,865,177 | | | | | 16,498,858 | | | | | 5,952,590 | | | | | (3,118,076 | ) |
Change in unrealized appreciation (depreciation) on investments, foreign currency translations and deferred foreign capital gains taxes | | | | 482,656,514 | | | | | (11,443,749 | ) | | | | 51,081,119 | | | | | 80,540,022 | |
| | | | | | | | | | | | | | | | | | | | |
Net increase in net assets resulting from operations | | | | 553,821,075 | | | | | 721,159 | | | | | 63,177,442 | | | | | 84,076,684 | |
| | | | |
Distributions to shareholder from distributable earnings | | | | | | | | | | | | | | | | | | | | |
Investor Class | | | | (14,642,656 | ) | | | | (18,922,846 | ) | | | | (6,196,484 | ) | | | | (6,645,318 | ) |
Institutional Class | | | | — | | | | | — | | | | | — | | | | | — | |
| | | | |
Capital share transactions: | | | | | | | | | | | | | | | | | | | | |
Investor Class | | | | | | | | | | | | | | | | | | | | |
Shares sold | | | | 1,071,172,841 | | | | | 531,592,985 | | | | | 321,867,445 | | | | | 186,910,235 | |
Shares issued to holders in reinvestment of dividends | | | | 13,973,397 | | | | | 17,633,875 | | | | | 5,880,234 | | | | | 6,204,428 | |
Shares redeemed | | | | (464,495,265 | ) | | | | (205,793,858 | ) | | | | (219,546,431 | ) | | | | (194,165,022 | ) |
Redemption fees | | | | 608,786 | | | | | 360,528 | | | | | 760,303 | | | | | 157,515 | |
| | | | | | | | | | | | | | | | | | | | |
Net increase (decrease) | | | | 621,259,759 | | | | | 343,793,530 | | | | | 108,961,551 | | | | | (892,844 | ) |
| | | | | | | | | | | | | | | | | | | | |
Institutional Class | | | | | | | | | | | | | | | | | | | | |
Shares sold | | | | 309,234,258 | | | | | — | | | | | — | | | | | — | |
Shares issued to holders in reinvestment of dividends | | | | — | | | | | — | | | | | — | | | | | — | |
Shares redeemed | | | | (11,167,045 | ) | | | | — | | | | | — | | | | | — | |
Redemption fees | | | | 8,626 | | | | | — | | | | | — | | | | | — | |
| | | | | | | | | | | | | | | | | | | | |
Net increase | | | | 298,075,839 | | | | | — | | | | | — | | | | | — | |
| | | | | | | | | | | | | | | | | | | | |
Total increase in net assets | | | | 1,458,514,017 | | | | | 325,591,843 | | | | | 165,942,509 | | | | | 76,538,522 | |
| | | | |
Net assets: | | | | | | | | | | | | | | | | | | | | |
Beginning of period | | | | 623,153,792 | | | | | 297,561,949 | | | | | 379,643,946 | | | | | 303,105,424 | |
| | | | | | | | | | | | | | | | | | | | |
End of period | | | $ | 2,081,667,809 | | | | $ | 623,153,792 | | | | $ | 545,586,455 | | | | $ | 379,643,946 | |
| | | | | | | | | | | | | | | | | | | | |
| | | | |
Capital share transactions — shares: | | | | | | | | | | | | | | | | | | | | |
Investor Class | | | | | | | | | | | | | | | | | | | | |
Shares sold | | | | 33,985,094 | | | | | 21,348,607 | | | | | 14,604,656 | | | | | 11,232,700 | |
Shares issued to holders in reinvestment of dividends | | | | 508,678 | | | | | 869,520 | | | | | 276,978 | | | | | 360,102 | |
Shares redeemed | | | | (15,312,466 | ) | | | | (8,334,761 | ) | | | | (10,255,060 | ) | | | | (11,737,556 | ) |
| | | | | | | | | | | | | | | | | | | | |
Net increase in shares outstanding | | | | 19,181,306 | | | | | 13,883,366 | | | | | 4,626,574 | | | | | (144,754 | ) |
| | | | | | | | | | | | | | | | | | | | |
Institutional Class | | | | | | | | | | | | | | | | | | | | |
Shares sold | | | | 9,111,555 | | | | | — | | | | | — | | | | | — | |
Shares issued to holders in reinvestment of dividends | | | | — | | | | | — | | | | | — | | | | | — | |
Shares redeemed | | | | (308,407 | ) | | | | — | | | | | — | | | | | — | |
| | | | | | | | | | | | | | | | | | | | |
Net increase in shares outstanding | | | | 8,803,148 | | | | | — | | | | | — | | | | | — | |
| | | | | | | | | | | | | | | | | | | | |
| 2 | Institutional class inception date was January 31, 2020. |
See Notes to Financial Statements.
94
(This page intentionally left blank.)
95
Financial Highlights
| | | | | | | | | | | | | | | | | | | | | | | | | | | | | | | | | | | | | | | | |
| | | | | Income (Loss) from
Investment Operations | | | | | | Less Distributions | | |
| | | Net Asset
Value
Beginning
of Period | | Net
Investment
Income (Loss) | | Net Realized
and Unrealized
Gains (Losses)
on Investments | | Total from
Investment
Operations | | Redemption
Fees
(See Note 2) | | Dividends
from Net
Investment
Income | | Distributions
from Net
Realized
Gains | | Total
Distributions |
| Core Growth Fund — Investor Class | | | | | | | | | | | | | | | | | | | | | | | | | | |
| Year ended 9/30/20 | | | $ | 73.17 | | | | | (0.32 | ) | | | | 12.47 | | | | | 12.15 | | | | | — | 4 | | | | — | | | | | (7.71 | ) | | | | (7.71 | ) |
| Year ended 9/30/19 | | | $ | 81.04 | | | | | (0.42 | ) | | | | (1.40 | ) | | | | (1.82 | ) | | | | 0.01 | | | | | — | | | | | (6.06 | ) | | | | (6.06 | ) |
| Year ended 9/30/18 | | | $ | 67.44 | | | | | (0.43 | ) | | | | 18.30 | | | | | 17.87 | | | | | — | 4 | | | | — | | | | | (4.27 | ) | | | | (4.27 | ) |
| Year ended 9/30/17 | | | $ | 56.90 | | | | | (0.50 | ) | | | | 11.13 | | | | | 10.63 | | | | | — | 4 | | | | — | | | | | (0.09 | ) | | | | (0.09 | ) |
| Year ended 9/30/1611 | | | $ | 57.83 | | | | | (0.30 | ) | | | | 6.09 | | | | | 5.79 | | | | | — | 4 | | | | — | | | | | (6.72 | ) | | | | (6.72 | ) |
| Core Growth Fund — Institutional Class | | | | | | | | | | | | | | | | | | | | | | | | | | |
| Year ended 9/30/20 | | | $ | 73.86 | | | | | (0.29 | ) | | | | 12.67 | | | | | 12.38 | | | | | — | 4 | | | | — | | | | | (7.71 | ) | | | | (7.71 | ) |
| Year ended 9/30/19 | | | $ | 81.62 | | | | | (0.26 | ) | | | | (1.44 | ) | | | | (1.70 | ) | | | | — | 4 | | | | — | | | | | (6.06 | ) | | | | (6.06 | ) |
| Year ended 9/30/18 | | | $ | 67.81 | | | | | (0.21 | ) | | | | 18.29 | | | | | 18.08 | | | | | — | 4 | | | | — | | | | | (4.27 | ) | | | | (4.27 | ) |
| Year ended 9/30/17 | | | $ | 57.16 | | | | | (0.30 | ) | | | | 11.07 | | | | | 10.77 | | | | | — | 4 | | | | (0.03 | ) | | | | (0.09 | ) | | | | (0.12 | ) |
| Year ended 9/30/1611 | | | $ | 57.99 | | | | | (0.14 | ) | | | | 6.03 | | | | | 5.89 | | | | | — | 4 | | | | — | | | | | (6.72 | ) | | | | (6.72 | ) |
| Emerging India Fund — Investor Class | | | | | | | | | | | | | | | | | | | | | | | | | | | | | | | | | | | | | | | | |
| Year ended 9/30/20 | | | $ | 4.25 | | | | | (0.06 | ) | | | | 0.04 | | | | | (0.02 | ) | | | | — | 4 | | | | — | | | | | (0.01 | ) | | | | (0.01 | ) |
| Year ended 9/30/19 | | | $ | 3.95 | | | | | (0.05 | ) | | | | 0.62 | | | | | 0.57 | | | | | — | 4 | | | | — | | | | | (0.27 | ) | | | | (0.27 | ) |
| Year ended 9/30/18 | | | $ | 4.08 | | | | | (0.06 | ) | | | | 0.06 | | | | | — | | | | | — | 4 | | | | — | | | | | (0.13 | ) | | | | (0.13 | ) |
| Year ended 9/30/17 | | | $ | 3.39 | | | | | 0.02 | 12 | | | | 0.70 | | | | | 0.72 | | | | | — | 4 | | | | — | | | | | (0.03 | ) | | | | (0.03 | ) |
| Year ended 9/30/1611 | | | $ | 3.07 | | | | | (0.03 | ) | | | | 0.39 | | | | | 0.36 | | | | | — | 4 | | | | — | | | | | (0.04 | ) | | | | (0.04 | ) |
| Emerging India Fund — Institutional Class | | | | | | | | | | | | | | | | | | | | | | | | | | |
| Year ended 9/30/20 | | | $ | 4.28 | | | | | (0.02 | ) | | | | 0.01 | | | | | (0.01 | ) | | | | — | 4 | | | | — | | | | | (0.01 | ) | | | | (0.01 | ) |
| Year ended 9/30/19 | | | $ | 3.97 | | | | | (0.01 | ) | | | | 0.59 | | | | | 0.58 | | | | | — | 4 | | | | — | | | | | (0.27 | ) | | | | (0.27 | ) |
| Year ended 9/30/18 | | | $ | 4.10 | | | | | — | 4 | | | | — | 4 | | | | — | 4 | | | | — | 4 | | | | — | | | | | (0.13 | ) | | | | (0.13 | ) |
| Year ended 9/30/17 | | | $ | 3.40 | | | | | 0.02 | 12 | | | | 0.71 | | | | | 0.73 | | | | | — | 4 | | | | — | | | | | (0.03 | ) | | | | (0.03 | ) |
| Period ended 9/30/169 11 | | | $ | 2.82 | | | | | (0.01 | ) | | | | 0.59 | | | | | 0.58 | | | | | — | | | | | — | | | | | — | | | | | — | |
| Emerging Markets Select Fund — Investor Class | | | | | | | | | | | | | | | | | | | | | | | | | | |
| Year ended 9/30/20 | | | $ | 11.32 | | | | | (0.04 | ) | | | | 3.12 | | | | | 3.08 | | | | | — | 4 | | | | — | | | | | — | | | | | — | |
| Year ended 9/30/19 | | | $ | 10.40 | | | | | (0.13 | ) | | | | 1.05 | | | | | 0.92 | | | | | — | 4 | | | | — | | | | | — | | | | | — | |
| Year ended 9/30/18 | | | $ | 10.46 | | | | | (0.09 | ) | | | | 0.03 | | | | | (0.06 | ) | | | | — | 4 | | | | — | | | | | — | | | | | — | |
| Year ended 9/30/17 | | | $ | 9.23 | | | | | (0.03 | ) | | | | 1.26 | | | | | 1.23 | | | | | — | 4 | | | | — | | | | | — | | | | | — | |
| Year ended 9/30/1611 | | | $ | 8.35 | | | | | (0.05 | ) | | | | 0.93 | | | | | 0.88 | | | | | — | 4 | | | | — | | | | | — | | | | | — | |
| Emerging Markets Select Fund — Institutional Class | | | | | | | | | | | | | | | | | | | | | | | | | | |
| Year ended 9/30/20 | | | $ | 11.53 | | | | | (0.05 | ) | | | | 3.23 | | | | | 3.18 | | | | | — | 4 | | | | — | | | | | — | | | | | — | |
| Year ended 9/30/19 | | | $ | 10.56 | | | | | (0.01 | ) | | | | 0.98 | | | | | 0.97 | | | | | — | 4 | | | | — | | | | | — | | | | | — | |
| Year ended 9/30/18 | | | $ | 10.60 | | | | | (0.04 | ) | | | | — | 4 | | | | (0.04 | ) | | | | — | 4 | | | | — | | | | | — | | | | | — | |
| Year ended 9/30/17 | | | $ | 9.32 | | | | | (0.01 | ) | | | | 1.29 | | | | | 1.28 | | | | | — | 4 | | | | — | | | | | — | | | | | — | |
| Year ended 9/30/1611 | | | $ | 8.41 | | | | | 0.04 | | | | | 0.87 | | | | | 0.91 | | | | | — | | | | | — | | | | | — | | | | | — | |
| Emerging Markets Small Cap Fund — Investor Class | | | | | | | | | | | | | | | | | | | | | | | | | | |
| Year ended 9/30/20 | | | $ | 2.64 | | | | | (0.04 | ) | | | | 0.58 | | | | | 0.54 | | | | | — | 4 | | | | — | | | | | (0.16 | ) | | | | (0.16 | ) |
| Year ended 9/30/19 | | | $ | 2.78 | | | | | (0.05 | ) | | | | 0.21 | | | | | 0.16 | | | | | — | 4 | | | | — | | | | | (0.30 | ) | | | | (0.30 | ) |
| Year ended 9/30/18 | | | $ | 2.99 | | | | | (0.03 | ) | | | | (0.18 | ) | | | | (0.21 | ) | | | | — | 4 | | | | — | | | | | — | | | | | — | |
| Year ended 9/30/17 | | | $ | 2.67 | | | | | (0.04 | ) | | | | 0.36 | | | | | 0.32 | | | | | — | 4 | | | | — | | | | | — | | | | | — | |
| Year ended 9/30/1611 | | | $ | 2.39 | | | | | (0.04 | ) | | | | 0.32 | | | | | 0.28 | | | | | — | 4 | | | | — | 4 | | | | — | | | | | — | 4 |
| Emerging Markets Small Cap Fund — Institutional Class | | | | | | | | | | | | | | | | | | | | | | | | | | |
| Year ended 9/30/20 | | | $ | 2.65 | | | | | (0.02 | ) | | | | 0.57 | | | | | 0.55 | | | | | — | 4 | | | | — | | | | | (0.16 | ) | | | | (0.16 | ) |
| Year ended 9/30/19 | | | $ | 2.79 | | | | | (0.02 | ) | | | | 0.18 | | | | | 0.16 | | | | | — | 4 | | | | — | | | | | (0.30 | ) | | | | (0.30 | ) |
| Year ended 9/30/18 | | | $ | 3.00 | | | | | (0.01 | ) | | | | (0.20 | ) | | | | (0.21 | ) | | | | — | 4 | | | | — | | | | | — | | | | | — | |
| Year ended 9/30/17 | | | $ | 2.67 | | | | | 0.01 | | | | | 0.32 | | | | | 0.33 | | | | | — | 4 | | | | — | | | | | — | | | | | — | |
| Period ended 9/30/169 11 | | | $ | 2.31 | | | | | (— | )4 | | | | 0.36 | | | | | 0.36 | | | | | — | | | | | — | | | | | — | | | | | — | |
See Notes to Financial Highlights and Notes to Financial Statements.
96
| | |
| | | (for a share outstanding throughout each period) |
| | | | | | | | | | | | | | | | | | | | | | | | | | | | | | |
| | | | | | | Ratios to Average Net Assets | | | Supplemental Data | |
Net Asset
Value
End of
Period | | | Total Return (%)1 | | | Expenses Net of Waivers and
Reimbursements (%)2 | | | Expenses Before Waivers and
Reimbursements (%)2 | | | Net Investment
Income (loss) Net
of Waivers and
Reimbursements (%)2 | | | Net Investment
Income (loss)
Before Waivers and
Reimbursements (%)2 | | | Net Assets
End of Period
(000’s) | | | Portfolio
Turnover
Rate1 3 | |
| | | | | | | | | | | | | | | | | | | | | | | | | | | | | | |
| $ | 77.61 | | | | 17.41 | | | | 1.19 | 5 | | | 1.19 | 5 | | | (0.48 | ) | | | (0.48 | ) | | $ | 1,595,920 | | | | 38% | |
| $ | 73.17 | | | | (0.37 | ) | | | 1.19 | 5 | | | 1.19 | 5 | | | (0.59 | ) | | | (0.59 | ) | | $ | 1,435,994 | | | | 31% | |
| $ | 81.04 | | | | 27.66 | | | | 1.18 | 5 8 | | | 1.18 | 5 8 | | | (0.66 | ) | | | (0.66 | ) | | $ | 1,577,554 | | | | 27% | |
| $ | 67.44 | | | | 18.69 | | | | 1.21 | 5 | | | 1.21 | 5 | | | (0.78 | ) | | | (0.78 | ) | | $ | 1,211,089 | | | | 26% | |
| $ | 56.90 | | | | 10.69 | | | | 1.21 | 5 | | | 1.21 | 5 | | | (0.62 | ) | | | (0.62 | ) | | $ | 1,082,679 | | | | 18% | |
| | | | | | | | | | | | | | | | | | | | | | | | | | | | | | |
| $ | 78.53 | | | | 17.58 | | | | 1.05 | 5 | | | 1.08 | 5 | | | (0.45 | ) | | | (0.48 | ) | | $ | 1,134,229 | | | | 38% | |
| $ | 73.86 | | | | (0.22 | ) | | | 1.05 | 5 | | | 1.09 | 5 | | | (0.45 | ) | | | (0.48 | ) | | $ | 849,787 | | | | 31% | |
| $ | 81.62 | | | | 27.82 | | | | 1.06 | 5 8 | | | 1.08 | 5 8 | | | (0.53 | ) | | | (0.55 | ) | | $ | 722,302 | | | | 27% | |
| $ | 67.81 | | | | 18.87 | | | | 1.05 | 5 | | | 1.10 | 5 | | | (0.63 | ) | | | (0.67 | ) | | $ | 383,159 | | | | 26% | |
| $ | 57.16 | | | | 10.83 | | | | 1.07 | 5 | | | 1.09 | 5 | | | (0.48 | ) | | | (0.50 | ) | | $ | 251,181 | | | | 18% | |
| | | | | | | | | | | | | | | | | | | | | | | | | | | | | | |
| $ | 4.22 | | | | (0.38 | ) | | | 1.64 | 6 | | | 1.64 | 6 | | | (0.89 | ) | | | (0.89 | ) | | $ | 136,415 | | | | 44% | |
| $ | 4.25 | | | | 15.06 | | | | 1.68 | 6 | | | 1.68 | 6 | | | (0.99 | ) | | | (0.99 | ) | | $ | 187,625 | | | | 21% | |
| $ | 3.95 | | | | (0.33 | ) | | | 1.71 | 6 7 | | | 1.71 | 6 7 | | | (1.22 | ) | | | (1.22 | ) | | $ | 184,733 | | | | 48% | |
| $ | 4.08 | | | | 21.65 | | | | 1.73 | 5 | | | 1.73 | 5 | | | (0.92 | ) | | | (0.92 | ) | | $ | 207,949 | | | | 17% | |
| $ | 3.39 | | | | 11.98 | | | | 1.82 | 5 | | | 1.96 | 5 | | | (1.18 | ) | | | (1.32 | ) | | $ | 71,973 | | | | 42% | |
| | | | | | | | | | | | | | | | | | | | | | | | | | | | | | |
| $ | 4.26 | | | | (0.15 | ) | | | 1.45 | 6 | | | 1.45 | 6 | | | (0.69 | ) | | | (0.69 | ) | | $ | 145,981 | | | | 44% | |
| $ | 4.28 | | | | 15.23 | | | | 1.49 | 6 | | | 1.49 | 6 | | | (0.75 | ) | | | (0.75 | ) | | $ | 92,214 | | | | 21% | |
| $ | 3.97 | | | | (0.33 | ) | | | 1.51 | 6 8 | | | 1.60 | 6 8 | | | (0.93 | ) | | | (1.02 | ) | | $ | 42,457 | | | | 48% | |
| $ | 4.10 | | | | 21.89 | | | | 1.50 | 5 | | | 1.67 | 5 | | | (0.77 | ) | | | (0.94 | ) | | $ | 23,739 | | | | 17% | |
| $ | 3.40 | | | | 20.57 | | | | 1.50 | 5 | | | 2.00 | 5 | | | (0.70 | ) | | | (1.20 | ) | | $ | 9,799 | | | | 42% | |
| | | | | | | | | | | | | | | | | | | | | | | | | | | | | | |
| $ | 14.40 | | | | 27.21 | | | | 1.51 | 6 | | | 1.80 | 6 | | | (0.69 | ) | | | (0.99 | ) | | $ | 14,984 | | | | 35% | |
| $ | 11.32 | | | | 8.85 | 5 | | | 1.51 | 6 | | | 1.97 | 6 | | | (0.51 | ) | | | (0.97 | ) | | $ | 9,771 | | | | 14% | |
| $ | 10.40 | | | | (0.57 | ) | | | 1.51 | 6 8 | | | 1.76 | 6 8 | | | (0.67 | ) | | | (0.92 | ) | | $ | 13,520 | | | | 44% | |
| $ | 10.46 | | | | 13.33 | | | | 1.51 | 6 | | | 1.90 | 6 | | | (0.38 | ) | | | (0.76 | ) | | $ | 15,273 | | | | 55% | |
| $ | 9.23 | | | | 10.54 | | | | 1.58 | 6 | | | 1.98 | 6 | | | (0.15 | ) | | | (0.55 | ) | | $ | 11,892 | | | | 62% | |
| | | | | | | | | | | | | | | | | | | | | | | | | | | | | | |
| $ | 14.71 | | | | 27.58 | | | | 1.21 | 6 | | | 1.41 | 6 | | | (0.40 | ) | | | (0.59 | ) | | $ | 43,682 | | | | 35% | |
| $ | 11.53 | | | | 9.19 | | | | 1.21 | 6 | | | 1.43 | 6 | | | (0.14 | ) | | | (0.36 | ) | | $ | 34,375 | | | | 14% | |
| $ | 10.56 | | | | (0.38 | ) | | | 1.21 | 6 8 | | | 1.45 | 6 8 | | | (0.36 | ) | | | (0.60 | ) | | $ | 30,215 | | | | 44% | |
| $ | 10.60 | | | | 13.73 | | | | 1.21 | 6 | | | 1.52 | 6 | | | (0.09 | ) | | | (0.39 | ) | | $ | 28,868 | | | | 55% | |
| $ | 9.32 | | | | 10.82 | | | | 1.29 | 6 | | | 1.59 | 6 | | | 0.29 | | | | (0.01 | ) | | $ | 26,763 | | | | 62% | |
| | | | | | | | | | | | | | | | | | | | | | | | | | | | | | |
| $ | 3.02 | | | | 21.12 | | | | 1.95 | 6 | | | 1.95 | 6 | | | (1.02 | ) | | | (1.02 | ) | | $ | 197,524 | | | | 20% | |
| $ | 2.64 | | | | 7.29 | | | | 1.97 | 6 | | | 1.99 | 6 | | | (0.83 | ) | | | (0.84 | ) | | $ | 191,405 | | | | 16% | |
| $ | 2.78 | | | | (7.02 | ) | | | 1.96 | 7 | | | 1.98 | 6 7 | | | (0.51 | ) | | | (0.53 | ) | | $ | 285,540 | | | | 40% | |
| $ | 2.99 | | | | 11.99 | | | | 1.96 | 6 | | | 2.02 | 6 | | | (0.49 | ) | | | (0.56 | ) | | $ | 390,903 | | | | 58% | |
| $ | 2.67 | | | | 11.73 | | | | 1.96 | 6 | | | 2.00 | 6 | | | (0.75 | ) | | | (0.79 | ) | | $ | 674,632 | | | | 42% | |
| | | | | | | | | | | | | | | | | | | | | | | | | | | | | | |
| $ | 3.04 | | | | 21.41 | | | | 1.81 | 6 | | | 1.81 | 6 | | | (0.88 | ) | | | (0.88 | ) | | $ | 176,548 | | | | 20% | |
| $ | 2.65 | | | | 7.25 | | | | 1.82 | 6 | | | 1.85 | 6 | | | (0.73 | ) | | | (0.76 | ) | | $ | 174,050 | | | | 16% | |
| $ | 2.79 | | | | (7.00 | ) | | | 1.82 | 6 7 | | | 1.84 | 6 7 | | | (0.33 | ) | | | (0.35 | ) | | $ | 240,892 | | | | 40% | |
| $ | 3.00 | | | | 12.36 | | | | 1.81 | 6 | | | 1.88 | 6 | | | (0.05 | ) | | | (0.12 | ) | | $ | 252,823 | | | | 8% | |
| $ | 2.67 | | | | 15.58 | | | | 1.80 | 6 | | | 1.81 | 6 | | | (0.03 | ) | | | (0.04 | ) | | $ | 160,729 | | | | 42% | |
97
Financial Highlights (continued)
| | | | | | | | | | | | | | | | | | | | | | | | | | | | | | | | | | | | | | | | |
| | | | | Income (Loss) from
Investment Operations | | | | | | Less Distributions | | |
| | | Net Asset
Value
Beginning
of Period | | Net
Investment
Income (Loss) | | Net Realized
and Unrealized
Gains (Losses)
on Investments | | Total from
Investment
Operations | | Redemption
Fees
(See Note 2) | | Dividends
from Net
Investment
Income | | Distributions
from Net
Realized
Gains | | Total
Distributions |
| Frontier Emerging Small Countries Fund — Investor Class | | | | | | | | | | | | | | | | | | | | | | | | | | |
| Year ended 9/30/20 | | | $ | 2.74 | | | | | (0.07 | ) | | | | 0.35 | | | | | 0.28 | | | | | — | 4 | | | | — | | | | | — | | | | | — | |
| Year ended 9/30/19 | | | $ | 2.51 | | | | | — | 4 | | | | 0.23 | | | | | 0.23 | | | | | — | 4 | | | | — | | | | | — | | | | | — | |
| Year ended 9/30/18 | | | $ | 2.75 | | | | | (0.11 | ) | | | | (0.13 | ) | | | | (0.24 | ) | | | | — | 4 | | | | — | | | | | — | | | | | — | |
| Year ended 9/30/17 | | | $ | 2.63 | | | | | (0.08 | ) | | | | 0.20 | | | | | 0.12 | | | | | — | 4 | | | | — | | | | | — | | | | | — | |
| Year ended 9/30/1611 | | | $ | 2.77 | | | | | 0.02 | | | | | (0.16 | ) | | | | (0.14 | ) | | | | — | 4 | | | | — | 4 | | | | — | | | | | — | 4 |
| Frontier Emerging Small Countries Fund — Institutional Class | | | | | | | | | | | | | | | | | | | | | | | | | | |
| Year ended 9/30/20 | | | $ | 2.76 | | | | | (0.08 | ) | | | | 0.37 | | | | | 0.29 | | | | | — | 4 | | | | — | | | | | — | | | | | — | |
| Year ended 9/30/19 | | | $ | 2.53 | | | | | 0.03 | | | | | 0.20 | | | | | 0.23 | | | | | — | 4 | | | | — | | | | | — | | | | | — | |
| Year ended 9/30/18 | | | $ | 2.76 | | | | | (0.04 | ) | | | | (0.19 | ) | | | | (0.23 | ) | | | | — | 4 | | | | — | | | | | — | | | | | — | |
| Year ended 9/30/17 | | | $ | 2.64 | | | | | (0.06 | ) | | | | 0.18 | | | | | 0.12 | | | | | — | 4 | | | | — | | | | | — | | | | | — | |
| Period ended 9/30/169 11 | | | $ | 2.58 | | | | | 0.02 | | | | | 0.04 | | | | | 0.06 | | | | | — | 4 | | | | — | | | | | — | | | | | — | |
| Global Opportunities Fund — Investor Class | | | | | | | | | | | | | | | | | | | | | | | | | | |
| Year ended 9/30/20 | | | $ | 3.46 | | | | | (0.05 | ) | | | | 0.81 | | | | | 0.76 | | | | | — | 4 | | | | — | | | | | (0.30 | ) | | | | (0.30 | ) |
| Year ended 9/30/19 | | | $ | 4.09 | | | | | (0.03 | ) | | | | (0.06 | ) | | | | (0.09 | ) | | | | — | 4 | | | | — | | | | | (0.54 | ) | | | | (0.54 | ) |
| Year ended 9/30/18 | | | $ | 3.76 | | | | | (0.03 | ) | | | | 0.77 | | | | | 0.74 | | | | | — | 4 | | | | — | | | | | (0.41 | ) | | | | (0.41 | ) |
| Year ended 9/30/17 | | | $ | 3.52 | | | | | (0.07 | ) | | | | 0.58 | | | | | 0.51 | | | | | — | 4 | | | | — | 4 | | | | (0.27 | ) | | | | (0.27 | ) |
| Year ended 9/30/1611 | | | $ | 3.51 | | | | | (0.04 | ) | | | | 0.51 | | | | | 0.47 | | | | | — | 4 | | | | (0.01 | ) | | | | (0.45 | ) | | | | (0.46 | ) |
| Global Opportunities Fund — Institutional Class | | | | | | | | | | | | | | | | | | | | | | | | | | |
| Year ended 9/30/20 | | | $ | 3.48 | | | | | (0.03 | ) | | | | 0.79 | | | | | 0.76 | | | | | — | 4 | | | | — | | | | | (0.30 | ) | | | | (0.30 | ) |
| Year ended 9/30/19 | | | $ | 4.10 | | | | | (0.03 | ) | | | | (0.05 | ) | | | | (0.08 | ) | | | | — | | | | | — | | | | | (0.54 | ) | | | | (0.54 | ) |
| Year ended 9/30/18 | | | $ | 3.76 | | | | | (0.02 | ) | | | | 0.77 | | | | | 0.75 | | | | | — | | | | | — | | | | | (0.41 | ) | | | | (0.41 | ) |
| Year ended 9/30/17 | | | $ | 3.52 | | | | | (0.02 | ) | | | | 0.54 | | | | | 0.52 | | | | | — | | | | | (0.01 | ) | | | | (0.27 | ) | | | | (0.28 | ) |
| Period ended 9/30/169 11 | | | $ | 3.09 | | | | | — | 4 | | | | 0.43 | | | | | 0.43 | | | | | — | | | | | — | | | | | — | | | | | — | |
| Global Select Fund — Investor Class | | | | | | | | | | | | | | | | | | | | | | | | | | |
| Year ended 9/30/2014 | | | $ | 10.00 | | | | | (0.06 | ) | | | | 2.65 | | | | | 2.59 | | | | | 0.01 | | | | | — | | | | | — | | | | | — | |
| Global Select Fund — Institutional Class | | | | | | | | | | | | | | | | | | | | | | | | | | |
| Year ended 9/30/2014 | | | $ | 10.00 | | | | | (0.04 | ) | | | | 2.68 | | | | | 2.64 | | | | | — | 4 | | | | — | | | | | — | | | | | — | |
| Global Value Fund — Investor Class | | | | | | | | | | | | | | | | | | | | | | | | | | | | | | | | | | | | |
| Year ended 9/30/20 | | | $ | 7.74 | | | | | 0.16 | | | | | (1.09 | )16 | | | | (0.93 | ) | | | | — | 4 | | | | (0.21 | ) | | | | (0.04 | ) | | | | (0.25 | ) |
| Year ended 9/30/19 | | | $ | 9.29 | | | | | 0.19 | | | | | (0.42 | ) | | | | (0.23 | ) | | | | — | 4 | | | | (0.19 | ) | | | | (1.13 | ) | | | | (1.32 | ) |
| Year ended 9/30/18 | | | $ | 9.93 | | | | | 0.19 | | | | | 0.65 | 13 | | | | 0.84 | | | | | — | 4 | | | | (0.19 | ) | | | | (1.29 | ) | | | | (1.48 | ) |
| Year ended 9/30/17 | | | $ | 9.02 | | | | | 0.19 | | | | | 1.23 | | | | | 1.42 | | | | | — | 4 | | | | (0.19 | ) | | | | (0.32 | ) | | | | (0.51 | ) |
| Year ended 9/30/1611 | | | $ | 8.84 | | | | | 0.16 | | | | | 1.01 | | | | | 1.17 | | | | | — | 4 | | | | (0.16 | ) | | | | (0.83 | ) | | | | (0.99 | ) |
| Global Value Fund — Institutional Class | | | | | | | | | | | | | | | | | | | | | | | | | | | | | | | | | | | | |
| Year ended 9/30/20 | | | $ | 7.73 | | | | | 0.16 | | | | | (1.07 | )16 | | | | (0.91 | ) | | | | — | 4 | | | | (0.22 | ) | | | | (0.04 | ) | | | | (0.26 | ) |
| Year ended 9/30/19 | | | $ | 9.28 | | | | | 0.19 | | | | | (0.41 | ) | | | | (0.22 | ) | | | | — | 4 | | | | (0.20 | ) | | | | (1.13 | ) | | | | (1.33 | ) |
| Year ended 9/30/18 | | | $ | 9.92 | | | | | 0.20 | | | | | 0.66 | 13 | | | | 0.86 | | | | | — | 4 | | | | (0.20 | ) | | | | (1.30 | ) | | | | (1.50 | ) |
| Year ended 9/30/17 | | | $ | 9.01 | | | | | 0.18 | | | | | 1.25 | | | | | 1.43 | | | | | — | 4 | | | | (0.20 | ) | | | | (0.32 | ) | | | | (0.52 | ) |
| Year ended 9/30/1611 | | | $ | 8.84 | | | | | 0.29 | | | | | 0.88 | | | | | 1.17 | | | | | — | 4 | | | | (0.17 | ) | | | | (0.83 | ) | | | | (1.00 | ) |
| International Growth Fund — Investor Class | | | | | | | | | | | | | | | | | | | | | | | | | | | | | | | | | | | | |
| Year ended 9/30/20 | | | $ | 28.23 | | | | | (0.20 | ) | | | | 6.82 | | | | | 6.62 | | | | | — | 4 | | | | — | | | | | (0.78 | ) | | | | (0.78 | ) |
| Year ended 9/30/19 | | | $ | 36.95 | | | | | (0.08 | ) | | | | (4.26 | ) | | | | (4.34 | ) | | | | — | 4 | | | | — | | | | | (4.38 | ) | | | | (4.38 | ) |
| Year ended 9/30/18 | | | $ | 33.84 | | | | | (— | )4 | | | | 4.04 | | | | | 4.04 | | | | | — | 4 | | | | — | | | | | (0.93 | ) | | | | (0.93 | ) |
| Year ended 9/30/17 | | | $ | 31.43 | | | | | (0.13 | ) | | | | 3.61 | | | | | 3.48 | | | | | — | 4 | | | | — | | | | | (1.07 | ) | | | | (1.07 | ) |
| Year ended 9/30/1611 | | | $ | 27.88 | | | | | (0.22 | ) | | | | 3.77 | | | | | 3.55 | | | | | — | 4 | | | | — | | | | | — | | | | | — | |
| International Growth Fund — Institutional Class | | | | | | | | | | | | | | | | | | | | | | | | | | | | | | | | | | | | |
| Year ended 9/30/20 | | | $ | 28.33 | | | | | (0.12 | ) | | | | 6.81 | | | | | 6.69 | | | | | — | 4 | | | | — | | | | | (0.78 | ) | | | | (0.78 | ) |
| Year ended 9/30/19 | | | $ | 37.03 | | | | | (0.04 | ) | | | | (4.28 | ) | | | | (4.32 | ) | | | | — | 4 | | | | — | | | | | (4.38 | ) | | | | (4.38 | ) |
| Year ended 9/30/18 | | | $ | 33.88 | | | | | 0.06 | | | | | 4.02 | | | | | 4.08 | | | | | — | 4 | | | | — | | | | | (0.93 | ) | | | | (0.93 | ) |
| Year ended 9/30/17 | | | $ | 31.46 | | | | | (0.05 | ) | | | | 3.56 | | | | | 3.51 | | | | | — | 4 | | | | (0.02 | ) | | | | (1.07 | ) | | | | (1.09 | ) |
| Period ended 9/30/169 11 | | | $ | 28.46 | | | | | 0.01 | | | | | 2.99 | | | | | 3.00 | | | | | — | 4 | | | | — | | | | | — | | | | | — | |
See Notes to Financial Highlights and Notes to Financial Statements.
98
| | |
| | | (for a share outstanding throughout each period) |
| | | | | | | | | | | | | | | | | | | | | | | | | | | | | | |
| | | | | | | Ratios to Average Net Assets | | | Supplemental Data | |
Net Asset
Value
End of
Period | | | Total Return (%)1 | | | Expenses Net of Waivers and
Reimbursements (%)2 | | | Expenses Before Waivers and
Reimbursements (%)2 | | | Net Investment
Income (loss) Net
of Waivers and
Reimbursements (%)2 | | | Net Investment
Income (loss)
Before Waivers and
Reimbursements (%)2 | | | Net Assets
End of Period
(000’s) | | | Portfolio
Turnover
Rate1 3 | |
| | | | | | | | | | | | | | | | | | | | | | | | | | | | | | |
| $ | 3.02 | | | | 10.22 | | | | 2.15 | 5 | | | 2.38 | 5 | | | (1.12 | ) | | | (1.34 | ) | | $ | 39,899 | | | | 33% | |
| $ | 2.74 | | | | 9.16 | | | | 2.20 | 6 | | | 2.30 | 6 | | | 0.78 | | | | 0.69 | | | $ | 43,789 | | | | 63% | |
| $ | 2.51 | | | | (8.73 | ) | | | 2.22 | 6 7 | | | 2.36 | 6 7 | | | (0.39 | ) | | | (0.53 | ) | | $ | 57,406 | | | | 42% | |
| $ | 2.75 | | | | 4.56 | | | | 2.28 | 6 | | | 2.46 | 6 | | | (0.48 | ) | | | (0.67 | ) | | $ | 155,758 | | | | 59% | |
| $ | 2.63 | | | | (4.89 | ) | | | 2.25 | 5 | | | 2.39 | 5 | | | 0.35 | | | | 0.21 | | | $ | 437,850 | | | | 80% | |
| | | | | | | | | | | | | | | | | | | | | | | | | | | | | | |
| $ | 3.05 | | | | 10.51 | | | | 1.96 | 5 | | | 2.18 | 5 | | | (0.98 | ) | | | (1.20 | ) | | $ | 10,560 | | | | 33% | |
| $ | 2.76 | | | | 9.09 | | | | 2.00 | 6 | | | 2.15 | 6 | | | 1.04 | | | | 0.90 | | | $ | 16,456 | | | | 63% | |
| $ | 2.53 | | | | (8.33 | ) | | | 2.02 | 6 8 | | | 2.11 | 6 8 | | | (0.30 | ) | | | (0.39 | ) | | $ | 20,586 | | | | 42% | |
| $ | 2.76 | | | | 4.55 | | | | 2.08 | 6 | | | 2.17 | 6 | | | (0.34 | ) | | | (0.44 | ) | | $ | 42,006 | | | | 59% | |
| $ | 2.64 | | | | 2.33 | | | | 2.06 | 6 | | | 2.06 | 6 | | | 1.40 | | | | 1.40 | | | $ | 139,699 | | | | 80% | |
| | | | | | | | | | | | | | | | | | | | | | | | | | | | | | |
| $ | 3.92 | | | | 23.20 | | | | 1.53 | 5 | | | 1.53 | 5 | | | (1.03 | ) | | | (1.03 | ) | | $ | 100,698 | | | | 20% | |
| $ | 3.46 | | | | 0.82 | | | | 1.56 | 5 | | | 1.56 | 5 | | | (0.95 | ) | | | (0.95 | ) | | $ | 103,710 | | | | 24% | |
| $ | 4.09 | | | | 20.75 | | | | 1.55 | 6 8 | | | 1.55 | 6 8 | | | (0.78 | ) | | | (0.78 | ) | | $ | 110,874 | | | | 40% | |
| $ | 3.76 | | | | 16.61 | | | | 1.59 | 6 | | | 1.59 | 6 | | | (1.09 | ) | | | (1.09 | ) | | $ | 95,847 | | | | 27% | |
| $ | 3.52 | | | | 13.73 | | | | 1.62 | 6 | | | 1.62 | 6 | | | (0.98 | ) | | | (0.98 | ) | | $ | 150,945 | | | | 44% | |
| | | | | | | | | | | | | | | | | | | | | | | | | | | | | | |
| $ | 3.94 | | | | 23.09 | | | | 1.35 | 5 | | | 1.48 | 5 | | | (0.83 | ) | | | (0.96 | ) | | $ | 38,795 | | | | 20% | |
| $ | 3.48 | | | | 1.09 | | | | 1.35 | 5 | | | 1.57 | 5 | | | (0.74 | ) | | | (0.95 | ) | | $ | 19,060 | | | | 24% | |
| $ | 4.10 | | | | 21.04 | | | | 1.36 | 6 8 | | | 1.66 | 6 8 | | | (0.57 | ) | | | (0.86 | ) | | $ | 15,879 | | | | 40% | |
| $ | 3.76 | | | | 16.92 | | | | 1.36 | 6 | | | 1.93 | 6 | | | (0.85 | ) | | | (1.41 | ) | | $ | 7,149 | | | | 27% | |
| $ | 3.52 | | | | 13.92 | | | | 1.35 | 5 | | | 2.32 | 5 | | | (0.57 | ) | | | (1.54 | ) | | $ | 5,348 | | | | 44% | |
| | | | | | | | | | | | | | | | | | | | | | | | | | | | | | |
| $ | 12.60 | | | | 26.00 | | | | 1.36 | 6 | | | 4.70 | 6 | | | (0.81 | ) | | | (4.16 | ) | | $ | 4,306 | | | | 35% | |
| | | | | | | | | | | | | | | | | | | | | | | | | | | | | | |
| $ | 12.64 | | | | 26.40 | | | | 0.96 | 6 | | | 2.79 | 6 | | | (0.42 | ) | | | (2.25 | ) | | $ | 9,065 | | | | 35% | |
| | | | | | | | | | | | | | | | | | | | | | | | | | | | | | |
| $ | 6.56 | | | | (12.18 | )16 | | | 1.10 | 5 | | | 1.30 | 5 | | | 2.04 | | | | 1.84 | | | $ | 96,323 | | | | 76% | |
| $ | 7.74 | | | | (0.40 | ) | | | 1.10 | 5 | | | 1.19 | 5 | | | 2.30 | | | | 2.22 | | | $ | 146,704 | | | | 49% | |
| $ | 9.29 | | | | 9.56 | 13 | | | 1.11 | 5 8 | | | 1.19 | 5 8 | | | 2.17 | | | | 2.08 | | | $ | 192,811 | | | | 72% | |
| $ | 9.93 | | | | 16.11 | | | | 1.10 | 5 | | | 1.19 | 5 | | | 1.93 | | | | 1.84 | | | $ | 175,730 | | | | 44% | |
| $ | 9.02 | | | | 13.92 | | | | 1.10 | 5 | | | 1.17 | 5 | | | 1.70 | | | | 1.63 | | | $ | 189,691 | | | | 26% | |
| | | | | | | | | | | | | | | | | | | | | | | | | | | | | | |
| $ | 6.56 | | | | (11.93 | )16 | | | 0.95 | 5 | | | 1.38 | 5 | | | 2.21 | | | | 1.78 | | | $ | 6,449 | | | | 76% | |
| $ | 7.73 | | | | (0.25 | ) | | | 0.97 | 5 | | | 1.23 | 5 | | | 2.44 | | | | 2.19 | | | $ | 7,978 | | | | 49% | |
| $ | 9.28 | | | | 9.61 | 13 | | | 0.95 | 5 8 | | | 1.58 | 5 8 | | | 2.39 | | | | 1.76 | | | $ | 9,615 | | | | 72% | |
| $ | 9.92 | | | | 16.31 | | | | 0.95 | 5 | | | 2.31 | 5 | | | 2.05 | | | | 0.70 | | | $ | 4,594 | | | | 44% | |
| $ | 9.01 | | | | 13.97 | | | | 0.96 | 5 | | | 1.72 | 5 | | | 1.76 | | | | 1.00 | | | $ | 3,589 | | | | 26% | |
| | | | | | | | | | | | | | | | | | | | | | | | | | | | | | |
| $ | 34.07 | | | | 23.73 | | | | 1.47 | 5 | | | 1.47 | 5 | | | (0.50 | ) | | | (0.50 | ) | | $ | 497,104 | | | | 45% | |
| $ | 28.23 | | | | (9.76 | ) | | | 1.46 | 5 | | | 1.46 | 5 | | | (0.25 | ) | | | (0.25 | ) | | $ | 543,990 | | | | 40% | |
| $ | 36.95 | | | | 12.13 | | | | 1.45 | 5 8 | | | 1.45 | 5 8 | | | 0.01 | | | | 0.01 | | | $ | 748,847 | | | | 44% | |
| $ | 33.84 | | | | 12.04 | | | | 1.46 | 5 | | | 1.46 | 5 | | | (0.28 | ) | | | (0.28 | ) | | $ | 804,613 | | | | 31% | |
| $ | 31.43 | | | | 12.73 | | | | 1.48 | 5 | | | 1.48 | 5 | | | (0.41 | ) | | | (0.41 | ) | | $ | 945,168 | | | | 50% | |
| | | | | | | | | | | | | | | | | | | | | | | | | | | | | | |
| $ | 34.24 | | | | 23.89 | | | | 1.35 | 5 | | | 1.36 | 5 | | | (0.38 | ) | | | (0.38 | ) | | $ | 569,068 | | | | 45% | |
| $ | 28.33 | | | | (9.67 | ) | | | 1.35 | 5 | | | 1.35 | 5 | | | (0.13 | ) | | | (0.13 | ) | | $ | 595,341 | | | | 40% | |
| $ | 37.03 | | | | 12.24 | | | | 1.35 | 5 8 | | | 1.36 | 5 8 | | | 0.16 | | | | 0.16 | | | $ | 816,942 | | | | 44% | |
| $ | 33.88 | | | | 12.16 | | | | 1.35 | 5 | | | 1.37 | 5 | | | (0.14 | ) | | | (0.16 | ) | | $ | 656,860 | | | | 31% | |
| $ | 31.46 | | | | 10.54 | | | | 1.35 | 5 | | | 1.36 | 5 | | | 0.07 | | | | 0.06 | | | $ | 509,016 | | | | 50% | |
99
Financial Highlights (continued)
| | | | | | | | | | | | | | | | | | | | | | | | | | | | | | | | | | | | | | | | |
| | | | | Income (Loss) from
Investment Operations | | | | | | Less Distributions | | |
| | | Net Asset
Value
Beginning
of Period | | Net
Investment
Income (Loss) | | Net Realized
and Unrealized
Gains (Losses)
on Investments | | Total from
Investment
Operations | | Redemption
Fees
(See Note 2) | | Dividends
from Net
Investment
Income | | Distributions
from Net
Realized
Gains | | Total
Distributions |
| International Opportunities Fund — Investor Class | | | | | | | | | | | | | | | | | | | | | | | | | | | | | | | | | | | | |
| Year ended 9/30/20 | | | $ | 3.54 | | | | | (0.09 | ) | | | | 1.28 | | | | | 1.19 | | | | | — | | | | | — | | | | | (0.09 | ) | | | | (0.09 | ) |
| Year ended 9/30/19 | | | $ | 3.58 | | | | | (0.09 | ) | | | | 0.13 | | | | | 0.04 | | | | | — | 4 | | | | — | | | | | (0.08 | ) | | | | (0.08 | ) |
| Year ended 9/30/18 | | | $ | 3.47 | | | | | (0.05 | ) | | | | 0.40 | | | | | 0.35 | | | | | — | 4 | | | | — | | | | | (0.24 | ) | | | | (0.24 | ) |
| Year ended 9/30/17 | | | $ | 3.21 | | | | | (0.04 | ) | | | | 0.30 | | | | | 0.26 | | | | | — | 4 | | | | — | | | | | — | | | | | — | |
| Year ended 9/30/1611 | | | $ | 2.74 | | | | | (0.01 | ) | | | | 0.61 | | | | | 0.60 | | | | | — | 4 | | | | — | | | | | (0.13 | ) | | | | (0.13 | ) |
| International Opportunities Fund — Institutional Class | | | | | | | | | | | | | | | | | | | | | | | | | | | | | | | | | | | | |
| Year ended 9/30/20 | | | $ | 3.58 | | | | | (0.04 | ) | | | | 1.26 | | | | | 1.22 | | | | | — | | | | | — | | | | | (0.09 | ) | | | | (0.09 | ) |
| Year ended 9/30/19 | | | $ | 3.62 | | | | | (0.02 | ) | | | | 0.06 | | | | | 0.04 | | | | | — | 4 | | | | — | | | | | (0.08 | ) | | | | (0.08 | ) |
| Year ended 9/30/18 | | | $ | 3.50 | | | | | (0.03 | ) | | | | 0.39 | | | | | 0.36 | | | | | — | 4 | | | | — | | | | | (0.24 | ) | | | | (0.24 | ) |
| Year ended 9/30/17 | | | $ | 3.23 | | | | | (0.01 | ) | | | | 0.28 | | | | | 0.27 | | | | | — | 4 | | | | — | | | | | — | | | | | — | |
| Period ended 9/30/169 11 | | | $ | 2.71 | | | | | 0.01 | | | | | 0.51 | | | | | 0.52 | | | | | — | 4 | | | | — | | | | | — | | | | | — | |
| International Select Fund — Investor Class | | | | | | | | | | | | | | | | | | | | | | | | | | | | | | | | | | | | |
| Year ended 9/30/2014 | | | $ | 10.00 | | | | | (0.04 | ) | | | | 2.64 | | | | | 2.60 | | | | | 0.01 | | | | | — | | | | | — | | | | | — | |
| International Select Fund — Institutional Class | | | | | | | | | | | | | | | | | | | | | | | | | | | | | | | | | | | | |
| Year ended 9/30/2014 | | | $ | 10.00 | | | | | (0.02 | ) | | | | 2.68 | | | | | 2.66 | | | | | 0.03 | | | | | — | | | | | — | | | | | — | |
| Micro Cap Fund — Investor Class | | | | | | | | | | | | | | | | | | | | | | | | | | | | | | | | | | | | |
| Year ended 9/30/20 | | | $ | 7.45 | | | | | (0.10 | ) | | | | 3.08 | | | | | 2.98 | | | | | — | | | | | — | | | | | (0.87 | ) | | | | (0.87 | ) |
| Year ended 9/30/19 | | | $ | 9.86 | | | | | (0.08 | ) | | | | (0.55 | ) | | | | (0.63 | ) | | | | — | 4 | | | | — | | | | | (1.78 | ) | | | | (1.78 | ) |
| Year ended 9/30/18 | | | $ | 8.23 | | | | | (0.08 | ) | | | | 2.88 | | | | | 2.80 | | | | | — | 4 | | | | — | | | | | (1.17 | ) | | | | (1.17 | ) |
| Year ended 9/30/17 | | | $ | 7.19 | | | | | (0.11 | ) | | | | 1.75 | | | | | 1.64 | | | | | — | 4 | | | | (0.01 | ) | | | | (0.59 | ) | | | | (0.60 | ) |
| Year ended 9/30/1611 | | | $ | 7.21 | | | | | (0.08 | ) | | | | 1.15 | | | | | 1.07 | | | | | — | 4 | | | | — | | | | | (1.09 | ) | | | | (1.09 | ) |
| Micro Cap Fund — Institutional Class | | | | | | | | | | | | | | | | | | | | | | | | | | | | | | | | | | | | |
| Period ended 9/30/2015 | | | $ | 7.74 | | | | | (0.05 | ) | | | | 1.86 | | | | | 1.81 | | | | | — | | | | | — | | | | | — | | | | | — | |
| Micro Cap Value Fund — Investor Class | | | | | | | | | | | | | | | | | | | | | | | | | | | | | | | | | | | | |
| Year ended 9/30/20 | | | $ | 3.21 | | | | | (0.04 | ) | | | | 0.78 | | | | | 0.74 | | | | | — | | | | | — | | | | | (0.30 | ) | | | | (0.30 | ) |
| Year ended 9/30/19 | | | $ | 3.83 | | | | | (0.03 | ) | | | | (0.20 | ) | | | | (0.23 | ) | | | | — | 4 | | | | (0.02 | ) | | | | (0.37 | ) | | | | (0.39 | ) |
| Year ended 9/30/18 | | | $ | 3.48 | | | | | (0.03 | ) | | | | 0.65 | | | | | 0.62 | | | | | — | 4 | | | | — | | | | | (0.27 | ) | | | | (0.27 | ) |
| Year ended 9/30/17 | | | $ | 2.87 | | | | | (0.02 | ) | | | | 0.68 | | | | | 0.66 | | | | | — | 4 | | | | — | 4 | | | | (0.05 | ) | | | | (0.05 | ) |
| Year ended 9/30/1611 | | | $ | 2.87 | | | | | (0.02 | ) | | | | 0.34 | | | | | 0.32 | | | | | — | 4 | | | | — | | | | | (0.32 | ) | | | | (0.32 | ) |
| Micro Cap Value Fund — Institutional Class | | | | | | | | | | | | | | | | | | | | | | | | | | | | | | | | | | | | |
| Period ended 9/30/2015 | | | $ | 3.26 | | | | | (0.01 | ) | | | | 0.41 | | | | | 0.40 | | | | | — | | | | | — | | | | | — | | | | | — | |
| Small Cap Growth Fund — Investor Class | | | | | | | | | | | | | | | | | | | | | | | | | | | | | | | | | | | | |
| Year ended 9/30/20 | | | $ | 40.23 | | | | | (0.32 | ) | | | | 12.52 | | | | | 12.20 | | | | | — | | | | | — | | | | | (5.79 | ) | | | | (5.79 | ) |
| Year ended 9/30/19 | | | $ | 55.30 | | | | | (0.28 | ) | | | | (2.33 | ) | | | | (2.61 | ) | | | | — | 4 | | | | — | | | | | (12.46 | ) | | | | (12.46 | ) |
| Year ended 9/30/18 | | | $ | 45.72 | | | | | (0.54 | ) | | | | 15.19 | | | | | 14.65 | | | | | — | 4 | | | | — | | | | | (5.07 | ) | | | | (5.07 | ) |
| Year ended 9/30/17 | | | $ | 43.52 | | | | | (0.53 | ) | | | | 6.24 | | | | | 5.71 | | | | | — | 4 | | | | — | | | | | (3.51 | ) | | | | (3.51 | ) |
| Year ended 9/30/1611 | | | $ | 45.97 | | | | | (0.47 | ) | | | | 5.65 | | | | | 5.18 | | | | | — | 4 | | | | — | | | | | (7.63 | ) | | | | (7.63 | ) |
| Small Cap Growth Fund — Institutional Class | | | | | | | | | | | | | | | | | | | | | | | | | | | | | | | | | | | | |
| Year ended 9/30/20 | | | $ | 40.60 | | | | | (0.28 | ) | | | | 12.65 | | | | | 12.37 | | | | | — | | | | | — | | | | | (5.79 | ) | | | | (5.79 | ) |
| Year ended 9/30/19 | | | $ | 55.61 | | | | | (0.24 | ) | | | | (2.31 | ) | | | | (2.55 | ) | | | | — | 4 | | | | — | | | | | (12.46 | ) | | | | (12.46 | ) |
| Year ended 9/30/18 | | | $ | 45.89 | | | | | (0.31 | ) | | | | 15.10 | | | | | 14.79 | | | | | — | 4 | | | | — | | | | | (5.07 | ) | | | | (5.07 | ) |
| Year ended 9/30/17 | | | $ | 43.58 | | | | | (0.17 | ) | | | | 5.99 | | | | | 5.82 | | | | | — | 4 | | | | — | | | | | (3.51 | ) | | | | (3.51 | ) |
| Period ended 9/30/169 11 | | | $ | 37.58 | | | | | (0.07 | ) | | | | 6.07 | | | | | 6.00 | | | | | — | 4 | | | | — | | | | | — | | | | | — | |
See Notes to Financial Highlights and Notes to Financial Statements.
100
| | |
| | | (for a share outstanding throughout each period) |
| | | | | | | | | | | | | | | | | | | | | | | | | | | | | | |
| | | | | | | Ratios to Average Net Assets | | | Supplemental Data | |
Net Asset
Value
End of
Period | | | Total Return (%)1 | | | Expenses Net of Waivers and
Reimbursements (%)2 | | | Expenses Before Waivers and
Reimbursements (%)2 | | | Net Investment
Income (loss) Net
of Waivers and
Reimbursements (%)2 | | | Net Investment
Income (loss)
Before Waivers and
Reimbursements (%)2 | | | Net Assets
End of Period
(000’s) | | | Portfolio
Turnover
Rate1 3 | |
| | | | | | | | | | | | | | | | | | | | | | | | | | | | | | |
| $ | 4.64 | | | | 34.24 | | | | 2.02 | 6 | | | 2.02 | 6 | | | (1.20 | ) | | | (1.20 | ) | | $ | 129,071 | | | | 35% | |
| $ | 3.54 | | | | 1.61 | | | | 2.09 | 6 | | | 2.09 | 6 | | | (1.04 | ) | | | (1.04 | ) | | $ | 132,503 | | | | 46% | |
| $ | 3.58 | | | | 10.45 | | | | 2.10 | 5 7 | | | 2.10 | 5 7 | | | (1.07 | ) | | | (1.07 | ) | | $ | 240,489 | | | | 36% | |
| $ | 3.47 | | | | 8.10 | | | | 2.24 | 6 | | | 2.24 | 6 | | | (0.88 | ) | | | (0.88 | ) | | $ | 265,879 | | | | 59% | |
| $ | 3.21 | | | | 22.73 | | | | 2.25 | 5 | | | 2.29 | 5 | | | (0.35 | ) | | | (0.39 | ) | | $ | 512,252 | | | | 41% | |
| | | | | | | | | | | | | | | | | | | | | | | | | | | | | | |
| $ | 4.71 | | | | 34.71 | | | | 1.93 | 5 | | | 1.93 | 5 | | | (1.06 | ) | | | (1.06 | ) | | $ | 544,914 | | | | 35% | |
| $ | 3.58 | | | | 1.59 | | | | 1.96 | 6 | | | 1.96 | 6 | | | (0.81 | ) | | | (0.81 | ) | | $ | 376,578 | | | | 46% | |
| $ | 3.62 | | | | 10.66 | | | | 1.96 | 5 7 | | | 1.97 | 5 7 | | | (0.86 | ) | | | (0.87 | ) | | $ | 292,345 | | | | 36% | |
| $ | 3.50 | | | | 8.36 | | | | 1.96 | 6 | | | 2.04 | 6 | | | (0.39 | ) | | | (0.47 | ) | | $ | 234,795 | | | | 59% | |
| $ | 3.23 | | | | 19.19 | | | | 1.95 | 5 | | | 2.04 | 5 | | | 0.64 | | | | 0.55 | | | $ | 168,136 | | | | 41% | |
| | | | | | | | | | | | | | | | | | | | | | | | | | | | | | |
| $ | 12.61 | | | | 26.10 | | | | 1.30 | 5 | | | 6.96 | 5 | | | (0.55 | ) | | | (6.20 | ) | | $ | 2,861 | | | | 36% | |
| | | | | | | | | | | | | | | | | | | | | | | | | | | | | | |
| $ | 12.69 | | | | 26.90 | | | | 0.90 | 6 | | | 7.68 | 6 | | | (0.19 | ) | | | (6.96 | ) | | $ | 2,069 | | | | 36% | |
| | | | | | | | | | | | | | | | | | | | | | | | | | | | | | |
| $ | 9.56 | | | | 43.47 | | | | 1.66 | 5 | | | 1.66 | 5 | | | (1.48 | ) | | | (1.48 | ) | | $ | 746,749 | | | | 75% | |
| $ | 7.45 | | | | (1.15 | ) | | | 1.66 | 5 | | | 1.66 | 5 | | | (1.31 | ) | | | (1.31 | ) | | $ | 473,505 | | | | 67% | |
| $ | 9.86 | | | | 38.04 | | | | 1.65 | 5 8 | | | 1.65 | 5 8 | | | (1.27 | ) | | | (1.27 | ) | | $ | 496,128 | | | | 54% | |
| $ | 8.23 | | | | 25.10 | | | | 1.75 | 5 | | | 1.75 | 5 | | | (1.43 | ) | | | (1.43 | ) | | $ | 311,583 | | | | 31% | |
| $ | 7.19 | | | | 16.04 | | | | 1.92 | 5 | | | 1.92 | 5 | | | (1.14 | ) | | | (1.14 | ) | | $ | 277,691 | | | | 32% | |
| | | | | | | | | | | | | | | | | | | | | | | | | | | | | | |
| $ | 9.55 | | | | 23.39 | | | | 1.60 | 5 | | | 1.62 | 5 | | | (1.43 | ) | | | (1.45 | ) | | $ | 59,124 | | | | 75% | |
| | | | | | | | | | | | | | | | | | | | | | | | | | | | | | |
| $ | 3.65 | | | | 24.17 | | | | 1.74 | 5 | | | 1.74 | 5 | | | (1.01 | ) | | | (1.01 | ) | | $ | 222,963 | | | | 63% | |
| $ | 3.21 | | | | (4.50 | ) | | | 1.74 | 5 | | | 1.74 | 5 | | | (0.90 | ) | | | (0.90 | ) | | $ | 249,523 | | | | 66% | |
| $ | 3.83 | | | | 18.84 | | | | 1.74 | 5 8 | | | 1.74 | 5 8 | | | (0.89 | ) | | | (0.89 | ) | | $ | 283,623 | | | | 69% | |
| $ | 3.48 | | | | 23.29 | | | | 1.85 | 5 | | | 1.85 | 5 | | | (0.81 | ) | | | (0.81 | ) | | $ | 216,087 | | | | 57% | |
| $ | 2.87 | | | | 12.04 | | | | 1.95 | 5 | | | 2.04 | 5 | | | (0.59 | ) | | | (0.68 | ) | | $ | 179,116 | | | | 73% | |
| | | | | | | | | | | | | | | | | | | | | | | | | | | | | | |
| $ | 3.66 | | | | 12.27 | | | | 1.60 | 5 | | | 1.84 | 5 | | | (0.99 | ) | | | (1.23 | ) | | $ | 25,317 | | | | 63% | |
| | | | | | | | | | | | | | | | | | | | | | | | | | | | | | |
| $ | 46.64 | | | | 33.26 | | | | 1.16 | 5 | | | 1.16 | 5 | | | (0.89 | ) | | | (0.89 | ) | | $ | 1,247,871 | | | | 37% | |
| $ | 40.23 | | | | 1.67 | 5 | | | 1.17 | 6 | | | 1.17 | 6 | | | (0.80 | ) | | | (0.80 | ) | | $ | 978,825 | | | | 26% | |
| $ | 55.30 | | | | 35.08 | | | | 1.20 | 5 8 | | | 1.20 | 5 8 | | | (0.84 | ) | | | (0.84 | ) | | $ | 1,170,809 | | | | 36% | |
| $ | 45.72 | | | | 14.29 | | | | 1.27 | 5 | | | 1.27 | 5 | | | (0.88 | ) | | | (0.88 | ) | | $ | 1,182,573 | | | | 19% | |
| $ | 43.52 | | | | 11.87 | | | | 1.29 | 5 | | | 1.29 | 5 | | | (0.79 | ) | | | (0.79 | ) | | $ | 1,544,796 | | | | 20% | |
| | | | | | | | | | | | | | | | | | | | | | | | | | | | | | |
| $ | 47.18 | | | | 33.39 | | | | 1.05 | 5 | | | 1.08 | 5 | | | (0.78 | ) | | | (0.81 | ) | | $ | 1,233,331 | | | | 37% | |
| $ | 40.60 | | | | 1.80 | | | | 1.06 | 6 | | | 1.09 | 6 | | | (0.68 | ) | | | (0.72 | ) | | $ | 712,833 | | | | 26% | |
| $ | 55.61 | | | | 35.27 | | | | 1.06 | 5 7 | | | 1.10 | 5 7 | | | (0.70 | ) | | | (0.74 | ) | | $ | 714,184 | | | | 36% | |
| $ | 45.89 | | | | 14.54 | | | | 1.05 | 5 | | | 1.11 | 5 | | | (0.66 | ) | | | (0.72 | ) | | $ | 508,373 | | | | 19% | |
| $ | 43.58 | | | | 15.97 | | | | 1.05 | 5 | | | 1.11 | 5 | | | (0.63 | ) | | | (0.69 | ) | | $ | 337,605 | | | | 20% | |
101
Financial Highlights (continued)
| | | | | | | | | | | | | | | | | | | | | | | | | | | | | | | | | | | | | | | | |
| | | | | Income (Loss) from
Investment Operations | | | | | | Less Distributions | | |
| | | Net Asset
Value
Beginning
of Period | | Net
Investment
Income (Loss) | | Net Realized
and Unrealized
Gains (Losses)
on Investments | | Total from
Investment
Operations | | Redemption
Fees
(See Note 2) | | Dividends
from Net
Investment
Income | | Distributions
from Net
Realized
Gains | | Total
Distributions |
| Small Cap Value Fund — Investor Class | | | | | | | | | | | | | | | | | | | | | | | | | | | | | | | | | | | | |
| Year ended 9/30/20 | | | $ | 7.61 | | | | | 0.01 | | | | | (0.54 | ) | | | | (0.53 | ) | | | | — | | | | | (0.04 | ) | | | | (0.05 | ) | | | | (0.09 | ) |
| Year ended 9/30/19 | | | $ | 8.53 | | | | | 0.03 | | | | | (0.36 | ) | | | | (0.33 | ) | | | | — | 4 | | | | — | | | | | (0.59 | ) | | | | (0.59 | ) |
| Year ended 9/30/18 | | | $ | 7.94 | | | | | 0.02 | | | | | 1.10 | | | | | 1.12 | | | | | — | 4 | | | | (0.01 | ) | | | | (0.52 | ) | | | | (0.53 | ) |
| Year ended 9/30/17 | | | $ | 6.61 | | | | | — | 4 | | | | 1.33 | | | | | 1.33 | | | | | — | 4 | | | | — | 4 | | | | — | | | | | — | |
| Year ended 9/30/1611 | | | $ | 5.86 | | | | | 0.01 | | | | | 0.77 | | | | | 0.78 | | | | | — | 4 | | | | (0.03 | ) | | | | — | | | | | (0.03 | ) |
| Small Cap Value Fund — Institutional Class | | | | | | | | | | | | | | | | | | | | | | | | | | | | | | | | | | | | |
| Year ended 9/30/20 | | | $ | 7.67 | | | | | 0.03 | | | | | (0.55 | ) | | | | (0.52 | ) | | | | — | | | | | (0.05 | ) | | | | (0.05 | ) | | | | (0.10 | ) |
| Year ended 9/30/19 | | | $ | 8.58 | | | | | 0.03 | | | | | (0.35 | ) | | | | (0.32 | ) | | | | — | 4 | | | | — | | | | | (0.59 | ) | | | | (0.59 | ) |
| Year ended 9/30/18 | | | $ | 7.98 | | | | | 0.04 | | | | | 1.10 | | | | | 1.14 | | | | | — | 4 | | | | (0.02 | ) | | | | (0.52 | ) | | | | (0.54 | ) |
| Year ended 9/30/17 | | | $ | 6.65 | | | | | 0.01 | | | | | 1.34 | | | | | 1.35 | | | | | — | 4 | | | | (0.02 | ) | | | | — | | | | | (0.02 | ) |
| Year ended 9/30/1611 | | | $ | 5.88 | | | | | 0.02 | | | | | 0.78 | | | | | 0.80 | | | | | — | 4 | | | | (0.03 | ) | | | | — | | | | | (0.03 | ) |
| Ultra Growth Fund — Investor Class | | | | | | | | | | | | | | | | | | | | | | | | | | | | | | | | | | | | |
| Year ended 9/30/20 | | | $ | 25.30 | | | | | (0.17 | ) | | | | 14.98 | | | | | 14.81 | | | | | 0.01 | | | | | — | | | | | (0.56 | ) | | | | (0.56 | ) |
| Year ended 9/30/19 | | | $ | 27.68 | | | | | (0.18 | ) | | | | (0.60 | ) | | | | (0.78 | ) | | | | 0.01 | | | | | — | | | | | (1.61 | ) | | | | (1.61 | ) |
| Year ended 9/30/18 | | | $ | 21.81 | | | | | — | 4 | | | | 8.31 | | | | | 8.31 | | | | | — | 4 | | | | (0.10 | ) | | | | (2.34 | ) | | | | (2.44 | ) |
| Year ended 9/30/17 | | | $ | 19.89 | | | | | (0.20 | ) | | | | 4.12 | | | | | 3.92 | | | | | — | 4 | | | | (0.11 | ) | | | | (1.89 | ) | | | | (2.00 | ) |
| Year ended 9/30/1611 | | | $ | 18.06 | | | | | (0.18 | ) | | | | 3.66 | | | | | 3.48 | | | | | — | 4 | | | | — | | | | | (1.65 | ) | | | | (1.65 | ) |
| Ultra Growth Fund — Institutional Class | | | | | | | | | | | | | | | | | | | | | | | | | | | | | | | | | | | | |
| Period ended 9/30/2015 | | | $ | 29.39 | | | | | (0.09 | ) | | | | 10.28 | | | | | 10.19 | | | | | — | 4 | | | | — | | | | | — | | | | | — | |
| U.S. Treasury Fund | | | | | | | | | | | | | | | | | | | | | | | | | | | | | | | | | | | | |
| Year ended 9/30/20 | | | $ | 19.26 | | | | | 0.30 | | | | | 3.13 | | | | | 3.43 | | | | | 0.03 | | | | | (0.30 | ) | | | | — | | | | | (0.30 | ) |
| Year ended 9/30/19 | | | $ | 15.26 | | | | | 0.34 | | | | | 3.99 | | | | | 4.33 | | | | | 0.01 | | | | | (0.34 | ) | | | | — | | | | | (0.34 | ) |
| Year ended 9/30/18 | | | $ | 16.32 | | | | | 0.35 | | | | | (1.07 | ) | | | | (0.72 | ) | | | | — | 4 | | | | (0.34 | ) | | | | — | | | | | (0.34 | ) |
| Year ended 9/30/17 | | | $ | 19.86 | | | | | 0.35 | | | | | (2.23 | ) | | | | (1.88 | ) | | | | 0.01 | | | | | (0.35 | ) | | | | (1.32 | ) | | | | (1.67 | ) |
| Year ended 9/30/1611 | | | $ | 18.42 | | | | | 0.37 | | | | | 2.29 | | | | | 2.66 | | | | | 0.01 | | | | | (0.36 | ) | | | | (0.87 | ) | | | | (1.23 | ) |
See Notes to Financial Highlights and Notes to Financial Statements.
102
| | |
| | | (for a share outstanding throughout each period) |
| | | | | | | | | | | | | | | | | | | | | | | | | | | | | | |
| | | | | | | Ratios to Average Net Assets | | | Supplemental Data | |
Net Asset
Value
End of
Period | | | Total Return (%)1 | | | Expenses Net of Waivers and
Reimbursements (%)2 | | | Expenses Before Waivers and
Reimbursements (%)2 | | | Net Investment
Income (loss) Net
of Waivers and
Reimbursements (%)2 | | | Net Investment
Income (loss)
Before Waivers and
Reimbursements (%)2 | | | Net Assets
End of Period
(000’s) | | | Portfolio
Turnover
Rate1 3 | |
| | | | | | | | | | | | | | | | | | | | | | | | | | | | | | |
| $ | 6.99 | | | | (7.13 | ) | | | 1.21 | 5 | | | 1.21 | 5 | | | 0.22 | | | | 0.22 | | | $ | 525,957 | | | | 58% | |
| $ | 7.61 | | | | (2.69 | ) | | | 1.20 | 5 | | | 1.20 | 5 | | | 0.51 | | | | 0.51 | | | $ | 454,451 | | | | 25% | |
| $ | 8.53 | | | | 14.54 | | | | 1.20 | 5 8 | | | 1.20 | 5 8 | | | 0.29 | | | | 0.29 | | | $ | 347,298 | | | | 46% | |
| $ | 7.94 | | | | 20.20 | | | | 1.21 | 5 | | | 1.21 | 5 | | | 0.04 | | | | 0.04 | | | $ | 320,978 | | | | 37% | |
| $ | 6.61 | | | | 13.37 | | | | 1.24 | 5 | | | 1.24 | 5 | | | 0.23 | | | | 0.23 | | | $ | 269,710 | | | | 57% | |
| | | | | | | | | | | | | | | | | | | | | | | | | | | | | | |
| $ | 7.05 | | | | (6.94 | ) | | | 1.05 | 5 | | | 1.08 | 5 | | | 0.38 | | | | 0.34 | | | $ | 472,331 | | | | 58% | |
| $ | 7.67 | | | | (2.55 | ) | | | 1.05 | 5 | | | 1.09 | 5 | | | 0.70 | | | | 0.66 | | | $ | 368,498 | | | | 25% | |
| $ | 8.58 | | | | 14.78 | | | | 1.06 | 5 8 | | | 1.13 | 5 8 | | | 0.43 | | | | 0.35 | | | $ | 91,857 | | | | 46% | |
| $ | 7.98 | | | | 20.28 | | | | 1.05 | 5 | | | 1.16 | 5 | | | 0.21 | | | | 0.11 | | | $ | 49,671 | | | | 37% | |
| $ | 6.65 | | | | 13.54 | | | | 1.08 | 5 | | | 1.20 | 5 | | | 0.40 | | | | 0.28 | | | $ | 23,839 | | | | 57% | |
| | | | | | | | | | | | | | | | | | | | | | | | | | | | | | |
| $ | 39.56 | | | | 59.54 | | | | 1.19 | 5 | | | 1.19 | 5 | | | (0.95 | ) | | | (0.95 | ) | | $ | 1,733,280 | | | | 37% | |
| $ | 25.30 | | | | (1.35 | ) | | | 1.24 | 5 | | | 1.24 | 5 | | | (0.93 | ) | | | (0.93 | ) | | $ | 623,154 | | | | 17% | |
| $ | 27.68 | | | | 41.97 | | | | 1.24 | 5 8 | | | 1.24 | 5 8 | | | (1.00 | ) | | | (1.00 | ) | | $ | 297,562 | | | | 44% | |
| $ | 21.81 | | | | 22.13 | | | | 1.30 | 5 | | | 1.30 | 5 | | | (1.06 | ) | | | (1.06 | ) | | $ | 111,366 | | | | 34% | |
| $ | 19.89 | | | | 20.08 | | | | 1.33 | 5 | | | 1.33 | 5 | | | (1.03 | ) | | | (1.03 | ) | | $ | 101,402 | | | | 28% | |
| | | | | | | | | | | | | | | | | | | | | | | | | | | | | | |
| $ | 39.58 | | | | 34.67 | | | | 1.05 | 5 | | | 1.07 | 5 | | | (0.97 | ) | | | (0.98 | ) | | $ | 348,388 | | | | 37% | |
| | | | | | | | | | | | | | | | | | | | | | | | | | | | | | |
| $ | 22.42 | | | | 18.06 | | | | 0.66 | 5 | | | 0.66 | 5 | | | 1.41 | | | | 1.41 | | | $ | 545,586 | | | | 13% | |
| $ | 19.26 | | | | 28.73 | | | | 0.69 | 5 | | | 0.69 | 5 | | | 2.05 | | | | 2.05 | | | $ | 379,644 | | | | 29% | |
| $ | 15.26 | | | | (4.47 | ) | | | 0.70 | 5 8 | | | 0.70 | 5 8 | | | 2.13 | | | | 2.13 | | | $ | 303,105 | | | | 6% | |
| $ | 16.32 | | | | (8.86 | ) | | | 0.72 | 5 | | | 0.72 | 5 | | | 2.04 | | | | 2.04 | | | $ | 360,866 | | | | 20% | |
| $ | 19.86 | | | | 15.49 | | | | 0.69 | 5 10 | | | 0.73 | 5 | | | 1.97 | 10 | | | 1.93 | | | $ | 489,011 | | | | 59% | |
103
| | |
| Wasatch Funds | | SEPTEMBER 30, 2020 |
Notes to Financial Highlights
| 1 | Not annualized for periods less than one year. |
| 2 | Annualized for periods less than one year. |
| 3 | Portfolio turnover is calculated on the basis of the Fund as a whole without distinguishing between the classes of shares issued. |
| 4 | Represents amounts less than $0.005 per share. |
| 5 | Includes interest expense of less than 0.005%. |
| 6 | Includes interest expenses of more than 0.005%. |
| 7 | Includes extraordinary expenses greater than or equal to 0.01% (see Note 7 in “Notes to Financial Statements”). |
| 8 | Includes extraordinary expenses of less than 0.01% (see Note 7 in “Notes to Financial Statements”). |
| 9 | Institutional class inception date was February 1, 2016. |
| 10 | Includes reimbursement by Hoisington Investment Management Co., the Sub-Advisor, for proxy statement expenses which amounted to $0.01 per share. |
| 11 | Includes a non-recurring offer to reimburse prior period custody and fund accounting out-of-pocket expenses (see Note 7 “Related Party Transactions” “Custodian Out-of-Pocket Expense Reimbursement” in “Notes to Financial Statements”). Excluding this non-recurring reimbursement, the Ratio of Expenses to Average Net Assets would have been as follows: |
| | | | | | | | | | | | |
| | | Expenses Net of
Waivers and
Reimbursements (%) | | Expenses Before
Waivers and
Reimbursements (%) | | |
Core Growth Fund — Investor Class | | | | 1.21 | | | | | 1.21 | | | |
Core Growth Fund — Institutional Class | | | | 1.07 | | | | | 1.09 | | | |
Emerging India Fund — Investor Class | | | | 1.84 | | | | | 1.98 | | | |
Emerging India Fund — Institutional Class | | | | 1.56 | | | | | 2.06 | | | |
Emerging Markets Select Fund — Investor Class | | | | 1.60 | | | | | 2.00 | | | |
Emerging Markets Select Fund — Institutional Class | | | | 1.33 | | | | | 1.63 | | | |
Emerging Markets Small Cap Fund — Investor Class | | | | 1.97 | | | | | 2.01 | | | |
Emerging Markets Small Cap Fund — Institutional Class | | | | 1.82 | | | | | 1.83 | | | |
Frontier Emerging Small Countries Fund — Investor Class | | | | 2.25 | | | | | 2.39 | | | |
Frontier Emerging Small Countries Fund — Institutional Class | | | | 2.08 | | | | | 2.08 | | | |
Global Opportunities Fund — Investor Class | | | | 1.64 | | | | | 1.64 | | | |
Global Opportunities Fund — Institutional Class | | | | 1.42 | | | | | 2.39 | | | |
Global Value Fund — Investor Class | | | | 1.10 | | | | | 1.17 | | | |
Global Value Fund — Institutional Class | | | | 0.96 | | | | | 1.72 | | | |
International Growth Fund — Investor Class | | | | 1.48 | | | | | 1.48 | | | |
International Growth Fund — Institutional Class | | | | 1.36 | | | | | 1.37 | | | |
International Opportunities Fund — Investor Class | | | | 2.26 | | | | | 2.30 | | | |
International Opportunities Fund — Institutional Class | | | | 1.97 | | | | | 2.06 | | | |
Micro Cap Fund — Investor Class | | | | 1.92 | | | | | 1.92 | | | |
Micro Cap Value Fund — Investor Class | | | | 1.96 | | | | | 2.05 | | | |
Small Cap Growth Fund — Investor Class | | | | 1.29 | | | | | 1.29 | | | |
Small Cap Growth Fund — Institutional Class | | | | 1.05 | | | | | 1.11 | | | |
Small Cap Value Fund — Investor Class | | | | 1.24 | | | | | 1.24 | | | |
Small Cap Value Fund — Institutional Class | | | | 1.08 | | | | | 1.20 | | | |
Ultra Growth Fund — Investor Class | | | | 1.34 | | | | | 1.34 | | | |
U.S. Treasury Fund | | | | 0.69 | | | | | 0.73 | | | |
| 12 | Per share amounts do not correlate to amounts reported in the Statement of Operations due to timing of share activity. |
| 13 | Net Realized and Unrealized Gains (Losses) on Investments per share reflects a large, non-recurring receivable for security litigation which amounted to $0.06 and $0.06 per share for the Investor Class and Institutional Class, respectively. Excluding this non-recurring receivable, Net Realized and Unrealized Gains (Losses) on Investments would have been $0.59 and $0.60 per share for the Investor Class and Institutional Class, respectively. Excluding this non-recurring receivable, Total Return would have been 8.74% and 8.91% for the Investor Class and Institutional Class, respectively. |
| 14 | Fund inception date was October 1, 2019. |
| 15 | Institutional Class inception date was January 31, 2020. |
| 16 | Net Realized and Unrealized Gains (Losses) on Investments per share reflects a large, non-recurring receivable for security litigation which amounted to $0.07 and $0.07 per share for the Investor Class and Institutional Class, respectively. Excluding this non-recurring receivable, Net Realized and Unrealized Gains (Losses) on Investments would have been $(1.16) and $(1.14) per share for the Investor Class and Institutional Class, respectively. Excluding this non-recurring receivable, total return would have been (13.11)% and (13.00)% for the Investor Class and Institutional Class, respectively. |
See Notes to Financial Statements.
104
| | |
| Wasatch Funds | | SEPTEMBER 30, 2020 |
Notes to Financial Statements
1. ORGANIZATION
Wasatch Funds Trust (the “Trust”) is a Massachusetts business trust registered under the Investment Company Act of 1940, as amended (the “1940 Act”), as an open-end management investment company and consists of 17 series or funds (each a “Fund” and collectively the “Funds”). The Core Growth Fund, Global Opportunities Fund, Global Value Fund, International Growth Fund, International Opportunities Fund, Micro Cap Fund, Micro Cap Value Fund, Small Cap Growth Fund, Small Cap Value Fund, Ultra Growth Fund and Wasatch-Hoisington U.S. Treasury Fund (“U.S. Treasury Fund”) (sub-advised) are each a diversified fund. The Emerging India Fund, Emerging Markets Select Fund, Emerging Markets Small Cap Fund, Frontier Emerging Small Countries Fund, Global Select Fund and International Select Fund are each a non-diversified fund. Each Fund maintains its own investment objective(s).
On November 9, 2011, the Trust re-designated the shares of the Funds into Investor Class shares effective January 31, 2012, and authorized and designated a new Institutional Class of shares in the Funds. Currently 16 funds offer Institutional Class shares: Core Growth Fund, Global Value Fund and Small Cap Value Fund, which commenced operations on January 31, 2012, Emerging Markets Select Fund, which commenced operations on December 13, 2012, Emerging India Fund, Emerging Markets Small Cap Fund, Frontier Emerging Small Countries Fund, Global Opportunities Fund, International Growth Fund, International Opportunities Fund and Small Cap Growth Fund, which commenced operations on February 1, 2016, International Select Fund and Global Select Fund, which commenced operations on October 1, 2019, and Wasatch Micro Cap Fund, Wasatch Micro Cap Value Fund and Wasatch Ultra Growth Fund, which commenced operations on January 31, 2020. Each class of shares for each Fund has identical rights and privileges except with respect to purchase minimums, distribution and service charges, shareholder services, voting rights on matters affecting a single class of shares, and the exchange and conversion features. The Funds have entered into an investment advisory agreement with Wasatch Advisors, Inc., doing business as Wasatch Global Investors, as investment advisor (the “Advisor” or “Wasatch”).
The Core Growth, Emerging India, Emerging Markets Select, Emerging Markets Small Cap, Frontier Emerging Small Countries, Global Opportunities, Global Select, Global Value, International Growth, International Opportunities, International Select, Micro Cap, Micro Cap Value, Small Cap Growth, Small Cap Value and Ultra Growth Funds are referred to herein as the “Equity Funds.”
2. SIGNIFICANT ACCOUNTING POLICIES
The following is a summary of significant policies related to investments of the Funds held at September 30, 2020.
These policies are in conformity with accounting principles generally accepted in the United States of America (“U.S. GAAP”).
Valuation of Securities — All investments in securities are recorded at their estimated fair value as described in Note 12.
Foreign Currency Translations — Values of investments denominated in foreign currencies are converted into U.S. dollars using the current exchange rates each business day (generally 4:00 p.m. Eastern Time). Purchases and sales of investments and dividend income are translated into U.S. dollars using the current prevailing exchange rate on the transaction date. The effect of changes in foreign exchange rates on realized and unrealized gains or losses on securities is reflected as a component of such gains or losses. Transactions in foreign denominated assets may involve greater risks than domestic transactions.
Investment in Securities and Related Investment Income — Security transactions are accounted for on the trade date. Gains or losses on securities sold are determined on the identified cost basis. Dividend income and distributions to shareholders are recorded on the ex-dividend date except that certain dividends from foreign securities may be recorded after the ex-dividend date based on when the Fund is informed of the dividend. Interest income and estimated expenses are accrued daily. Bond discount and premiums are amortized using the interest method. To the extent dividends received include return of capital or capital gain distributions, such distributions are recorded as a reduction to cost of the related security or as a realized gain or loss.
For financial purposes the estimate on all real estate investment trust (REIT) rates are based on prior year average rates made public by the REITs. To obtain these rates we utilize a service through Wall Street Concepts, which gathers and disseminates the information. Prior to filing tax returns, REIT rates are trued up for actual rates. The differences between the actual versus the trued-up rates are captured in the next fiscal year’s financial process.
Expenses — The Funds contract for various services on a collective basis. Most expenses are directly attributable to each Fund and therefore are charged accordingly. Expenses that are not directly attributable to one or more Funds are allocated among applicable Funds on an equitable and consistent basis considering such things as the nature and type of expense and the relative net assets of the Funds.
Use of Management Estimates — The preparation of financial statements in conformity with U.S. GAAP requires management to make estimates and assumptions that affect the reported amounts of assets and liabilities at the date of the financial statements and the reported changes in net assets during the reporting period. Actual results could differ from those estimates.
Guarantees and Indemnifications — In the normal course of business, the Funds enter into contracts that contain a
105
Notes to Financial Statements (continued)
variety of representations and warranties which provide general indemnifications. The maximum exposure under these arrangements is unknown, as this would involve future claims that may be made against the Funds and/or their affiliates that have not yet occurred. Based on experience, however, the risk of loss is expected to be remote.
Redemption Fees — The Funds deduct a fee of 2.00% from redemption proceeds on shares of the Funds held 60 days or less. Redemption fees retained by the Funds are credited to additional paid-in capital.
New Accounting Pronouncements — To improve the effectiveness of fair value disclosure requirements, the Financial Accounting Standards Board issued Accounting Standards Update 2018-13, Fair Value Measurement Disclosure Framework — Changes to the Disclosure Requirements for Fair Value Measurement (“ASU 2018-13”), which adds, removes, and modifies certain fair value measurement disclosure requirements. ASU 2018-13 is effective for interim and annual reporting periods beginning after December 15, 2019. The Manager evaluated the implications of certain provisions of ASU 2018-13 and determined to early adopt aspects related to the removal and modifications of certain fair value measurement disclosures, which are currently in place as of September 30, 2020. The Manager is evaluating the implications of certain other provisions of ASU 2018-13 related to new disclosure requirements and has not yet determined the impact of those provisions on the financial statement disclosures, if any.
Other — Income, expenses, and realized and unrealized gains or losses on investments are generally allocated to each class of shares based on its relative net assets, except that each class separately bears expenses related specifically to that class, such as certain shareholder servicing fees.
3. SECURITIES AND OTHER INVESTMENTS
Repurchase Agreements — The Funds may engage in repurchase transactions. Under the terms of a typical repurchase agreement, a fund takes possession of an underlying debt obligation subject to an obligation of the seller to repurchase and the fund to resell the obligation at an agreed upon price and time. The market value of the collateral must be at least equal at all times to the total amount of the repurchase obligation, including interest. Generally, in the event of counterparty default, the fund has the right to use the collateral to offset losses incurred.
Participation Notes — Certain Funds may invest in Participation Notes (P-Notes). P-Notes are promissory notes that are designed to offer a return linked to the performance of a particular underlying equity security or market. P-Notes are issued by banks or broker-dealers and allow a fund to gain exposure to common stocks in markets in which the fund is currently not approved to directly invest, or in markets that prohibit direct investment by foreign purchasers. While the holder of a P-Note is entitled to receive from the bank or
broker-dealer any dividends or other distributions paid on the underlying securities, the holder is not entitled to the same rights as an owner of the underlying securities, such as voting rights. Income received from P-Notes is recorded as dividend income in the Statement of Operations. P-Notes are considered general unsecured contractual obligations of the bank or broker-dealer. Risks associated with P-Notes include the possible failure of a counterparty (i.e., the issuing bank or broker-dealer) to perform in accordance with the terms of the agreement, inability to transfer or liquidate the notes, potential delays or an inability to redeem the notes before maturity under certain market conditions, and limited legal recourse against the issuer of the underlying common stock.
4. FINANCIAL DERIVATIVE INSTRUMENTS
Foreign Currency Contracts — The Funds may enter into foreign currency contracts to settle planned purchases or sales of securities or to protect against a possible loss resulting from an adverse change in the relationship between the U.S. dollar and a foreign currency involved in an underlying transaction. Foreign currency contracts are agreements between two parties to buy and sell a currency at a set price on a future date. The market value of a foreign currency contract fluctuates with changes in currency exchange rates. Foreign currency contracts are marked-to-market daily and the change in market value is recorded by a fund as unrealized appreciation or depreciation. When a foreign currency contract is closed, the fund records a realized gain or loss equal to the difference between the value at the time it was opened and the value at the time it was closed. These contracts may involve market risk in excess of the unrealized gain or loss reflected in the Schedule of Investments. In addition, a fund could be exposed to credit risk if a counterparty is unable or unwilling to meet the terms of the contracts or if the value of the currency changes unfavorably. In connection with these contracts, the Funds may segregate cash and/or securities in a sufficient amount as collateral in accordance with the terms of the respective contracts. None of the Funds entered into foreign currency contracts transaction during the fiscal year ending September 30, 2020.
106
5. PURCHASES AND SALES OF SECURITIES
The cost of investment securities purchased and proceeds from sales of investment securities, excluding U.S. government and short-term securities, for the year ended September 30, 2020 are summarized below:
| | | | | | | | | | | | | | | | | | | | | | | | | | | | | | |
| | | Core Growth
Fund | | Emerging India
Fund | | Emerging
Markets
Select Fund | | Emerging
Markets
Small Cap Fund | | Frontier Emerging
Small Countries
Fund | | Global
Opportunities
Fund |
Purchases | | | $ | 934,821,358 | | | | $ | 123,632,444 | | | | $ | 19,409,204 | | | | $ | 73,487,850 | | | | $ | 17,934,974 | | | | $ | 24,971,100 | |
Sales | | | | 936,331,319 | | | | | 122,581,653 | | | | | 16,925,065 | | | | | 136,343,532 | | | | | 33,133,942 | | | | | 34,727,327 | |
| | | | | | |
| | | Global Select
Fund | | Global Value
Fund | | International
Growth Fund | | International
Opportunities Fund | | International
Select Fund | | Micro Cap
Fund |
Purchases | | | $ | 13,715,584 | | | | $ | 91,726,895 | | | | $ | 477,966,629 | | | | $ | 186,431,455 | | | | $ | 5,248,161 | | | | $ | 539,336,260 | |
Sales | | | | 3,185,992 | | | | | 117,830,710 | | | | | 743,374,623 | | | | | 192,615,384 | | | | | 1,165,770 | | | | | 444,021,528 | |
| | | | | | |
| | | Micro Cap
Value Fund | | Small Cap
Growth Fund | | Small Cap
Value Fund | | Ultra Growth
Fund | | | | |
Purchases | | | $ | 145,975,608 | | | | $ | 872,311,737 | | | | $ | 734,764,701 | | | | $ | 1,167,348,210 | | | | | | | | | | | |
Sales | | | | 192,463,715 | | | | | 737,859,030 | | | | | 481,663,055 | | | | | 400,578,172 | | | | | | | | | | | |
Purchases and sales of U.S. government securities in the U.S. Treasury Fund were $ 154,981,891 and $ 56,634,513, respectively.
6. FEDERAL INCOME TAX INFORMATION
It is each Fund’s policy to comply with the requirements under Subchapter M of the Internal Revenue Code applicable to regulated investment companies and to distribute substantially all taxable income to shareholders. The Funds are no longer subject to examination by tax authorities for years prior to 2017. At this time, management believes there are no uncertain tax positions which, based on their technical merit, would not be sustained upon examination and for which it is reasonably possible that the total of amounts of unrecognized tax benefits will significantly change in the next 12 months. Accordingly, no provision for federal income or excise taxes has been made.
As of September 30, 2020, the cost and unrealized appreciation (depreciation) of securities on a tax basis were as follows:
| | | | | | | | | | | | | | | | | | | | | | | | | | | | | | |
| | | Core Growth
Fund | | Emerging India
Fund | | Emerging
Markets
Select Fund | | Emerging
Markets
Small Cap Fund | | Frontier Emerging
Small Countries
Fund | | Global
Opportunities
Fund |
Cost | | | $ | 1,934,455,023 | | | | $ | 218,567,125 | | | | $ | 38,928,383 | | | | $ | 228,310,379 | | | | $ | 44,450,697 | | | | $ | 83,779,062 | |
| | | | | |
Gross appreciation | | | $ | 930,538,735 | | | | $ | 81,409,206 | | | | $ | 22,529,794 | | | | $ | 177,943,860 | | | | $ | 11,907,715 | | | | $ | 62,041,814 | |
Gross (depreciation) | | | | (132,683,388 | ) | | | | (8,675,725 | ) | | | | (1,761,429 | ) | | | | (25,019,366 | ) | | | | (5,329,102 | ) | | | | (5,563,567 | ) |
| | | | | |
Net appreciation | | | $ | 797,855,347 | | | | $ | 72,733,481 | | | | $ | 20,768,365 | | | | $ | 152,924,494 | | | | $ | 6,578,613 | | | | $ | 56,478,247 | |
| | | | | |
| | | | | | |
| | | Global Select
Fund | | Global Value Fund | | International
Growth Fund | | International
Opportunities Fund | | International Select Fund | | Micro Cap Fund |
Cost | | | $ | 11,128,201 | | | | $ | 105,921,912 | | | | $ | 707,385,879 | | | | $ | 370,711,274 | | | | $ | 4,201,366 | | | | $ | 557,640,135 | |
| | | | | |
Gross appreciation | | | $ | 2,448,602 | | | | $ | 9,392,293 | | | | $ | 372,529,107 | | | | $ | 313,056,555 | | | | $ | 774,395 | | | | $ | 270,751,525 | |
Gross (depreciation) | | | | (204,411 | ) | | | | (14,315,064 | ) | | | | (7,039,670 | ) | | | | (10,812,749 | ) | | | | (42,906 | ) | | | | (17,048,578 | ) |
| | | | | |
Net appreciation | | | $ | 2,244,191 | | | | $ | (4,922,771 | ) | | | $ | 365,489,437 | | | | $ | 302,243,806 | | | | $ | 731,489 | | | | $ | 253,702,947 | |
| | | | | |
| | | | | | |
| | | Micro Cap
Value Fund | | Small Cap
Growth Fund | | Small Cap
Value Fund | | Ultra Growth
Fund | | U.S. Treasury
Fund | | |
Cost | | | $ | 178,450,148 | | | | $ | 1,581,630,255 | | | | $ | 925,968,469 | | | | $ | 1,554,142,422 | | | | $ | 451,394,823 | | | | | | |
| | | | | | | | | | |
Gross appreciation | | | $ | 79,102,001 | | | | $ | 980,351,555 | | | | $ | 137,781,778 | | | | $ | 597,598,622 | | | | $ | 96,123,109 | | | | | | |
Gross (depreciation) | | | | (6,975,187 | ) | | | | (74,781,854 | ) | | | | (63,881,456 | ) | | | | (68,185,222 | ) | | | | (2,420,460 | ) | | | | | |
| | | | | | | | | | |
Net appreciation | | | $ | 72,126,814 | | | | $ | 905,569,701 | | | | $ | 73,900,322 | | | | $ | 529,413,400 | | | | $ | 93,702,649 | | | | | | |
| | | | | | | | | | |
107
Notes to Financial Statements (continued)
The difference between book-basis and tax-basis unrealized gains (losses) is primarily attributable to the tax deferral of losses on wash sales, unrealized appreciation (depreciation) on passive foreign investment companies (PFICs), partnership adjustments and other temporary tax adjustments.
The components of accumulated earnings on a tax basis as of September 30, 2020 were as follows:
| | | | | | | | | | | | | | | | | | | | | | | | | |
| | | Core Growth
Fund | | Emerging India
Fund | | Emerging
Markets
Select Fund | | Emerging
Markets
Small Cap Fund | | Frontier Emerging
Small Countries
Fund |
Undistributed capital gains | | | $ | 223,149,252 | | | | $ | — | | | | $ | — | | | | $ | 24,801,840 | | | | $ | — | |
| | | | | |
Accumulated earnings | | | | 223,149,252 | | | | | — | | | | | — | | | | | 24,801,840 | | | | | — | |
Accumulated capital and other losses | | | | (9,866,802 | ) | | | | (7,924,195 | ) | | | | (2,973,553 | ) | | | | (2,188,671 | ) | | | | (103,775,229 | ) |
Other undistributed ordinary losses | | | | — | | | | | (33,677 | ) | | | | (51,299 | ) | | | | — | | | | | (62,929 | ) |
Net unrealized appreciation (depreciation) | | | | 797,793,095 | | | | | 65,819,624 | | | | | 20,364,197 | | | | | 148,853,839 | | | | | 6,620,786 | |
| | | | | |
Total accumulated earnings (accumulated losses) | | | $ | 1,011,075,545 | | | | $ | 57,861,752 | | | | $ | 17,339,345 | | | | $ | 171,467,008 | | | | $ | (97,217,372 | ) |
| | | | | |
| | | | | |
| | | Global
Opportunities
Fund | | Global Select
Fund | | Global Value Fund | | International
Growth Fund | | International
Opportunities Fund |
Undistributed ordinary income | | | $ | — | | | | $ | 13,795 | | | | $ | — | | | | $ | — | | | | $ | — | |
Undistributed capital gains | | | | 2,998,314 | | | | | — | | | | | — | | | | | 117,458,793 | | | | | 9,704,479 | |
| | | | | |
Accumulated earnings | | | | 2,998,314 | | | | | 13,795 | | | | | — | | | | | 117,458,793 | | | | | 9,704,479 | |
Accumulated capital and other losses | | | | (953,028 | ) | | | | — | | | | | (169,952,802 | ) | | | | (3,209,649 | ) | | | | (4,213,643 | ) |
Other undistributed ordinary losses | | | | (2,694 | ) | | | | — | | | | | (418 | ) | | | | — | | | | | — | |
Net unrealized appreciation (depreciation) | | | | 56,170,120 | | | | | 2,242,328 | | | | | (4,922,392 | ) | | | | 363,500,685 | | | | | 301,682,790 | |
| | | | | |
Total accumulated earnings (accumulated losses) | | | $ | 58,212,712 | | | | $ | 2,256,123 | | | | $ | (174,875,612 | ) | | | $ | 477,749,829 | | | | $ | 307,173,626 | |
| | | | | |
| | | | | |
| | | International Select Fund | | Micro Cap Fund | | Micro Cap Value Fund | | Small Cap
Growth Fund | | Small Cap
Value Fund |
Undistributed ordinary income | | | $ | — | | | | $ | — | | | | $ | — | | | | $ | — | | | | $ | — | |
Undistributed capital gains | | | | — | | | | | 58,152,284 | | | | | 24,792,923 | | | | | 183,176,302 | | | | | — | |
| | | | | |
Accumulated earnings | | | | — | | | | | 58,152,284 | | | | | 24,792,923 | | | | | 183,176,302 | | | | | — | |
Accumulated capital and other losses | | | | (45,241 | ) | | | | (2,184,700 | ) | | | | (1,797,886 | ) | | | | (13,505,929 | ) | | | | (59,189,374 | ) |
Other undistributed ordinary (losses) | | | | (121 | ) | | | | — | | | | | — | | | | | — | | | | | — | |
Net unrealized appreciation (depreciation) | | | | 731,518 | | | | | 253,701,706 | | | | | 72,128,091 | | | | | 905,569,704 | | | | | 73,900,322 | |
| | | | | |
Total accumulated earnings (accumulated losses) | | | $ | 686,156 | | | | $ | 309,669,290 | | | | $ | 95,123,128 | | | | $ | 1,075,240,077 | | | | $ | 14,710,948 | |
| | | | | |
| | | | | |
| | | Ultra Growth
Fund | | U.S. Treasury
Fund | | | | | | |
Undistributed ordinary income | | | $ | 30,515,720 | | | | $ | 93,661 | | | | | | | | | | | | | | | | |
Undistributed capital gains | | | | 45,573,873 | | | | | — | | | | | | | | | | | | | | | | |
| | | | | | | | | | | | | | | | | | | | |
Accumulated earnings | | | | 76,089,593 | | | | | 93,661 | | | | | | | | | | | | | | | | |
Accumulated capital and other losses | | | | — | | | | | (13,584,324 | ) | | | | | | | | | | | | | | | |
Other undistributed ordinary (losses) | | | | — | | | | | (77,115 | ) | | | | | | | | | | | | | | | |
Net unrealized appreciation (depreciation) | | | | 529,413,710 | | | | | 93,702,649 | | | | | | | | | | | | | | | | |
| | | | | | | | | | | | | | | | | | | | |
Total accumulated earnings (accumulated losses) | | | $ | 605,503,303 | | | | $ | 80,134,871 | | | | | | | | | | | | | | | | |
| | | | | | | | | | | | | | | | | | | | |
Dividends from net investment income and net realized gains, if any, are declared and paid at least annually for all Funds, except for dividends from net investment income in two funds. The Global Value and U.S. Treasury Funds declare and pay dividends quarterly. The amount of dividends and distributions from net investment income and net realized gains are determined in accordance with federal income tax regulations, which may differ from U.S. GAAP. The Funds may utilize earnings and profits distributed to shareholders on redemption of shares as part of the dividends paid deduction (tax equalization).
108
To the extent these book and tax differences are permanent in nature, such amounts are reclassified at the end of the fiscal year among additional paid-in capital in excess of par and distributable earnings (accumulated loss). The reclassifications generally relate to the tax treatment of net operating losses, the netting of net operating losses to short-term gains, investments in REITs and partnerships, distribution reclassifications, foreign capital gains taxes, Section 988 currency gains and losses, PFICs, paydown gains and losses and non-REIT return of capital dividends. These reclassifications have no impact on the net asset values of the Funds.
Under the Regulated Investment Company Modernization Act of 2010, a Fund will be permitted to carry forward capital losses incurred in taxable years beginning after December 22, 2010 for an unlimited period. Post-enactment losses that are carried forward will retain their character as either short-term or long-term capital losses rather than being considered all short-term as under previous law.
Capital loss carryforwards as of September 30, 2020 are as follows:
| | | | | | | | | | |
| | | Non-expiring |
| Fund | | Short Term | | Long Term |
Emerging Markets Select Fund | | | $ | 2,806,868 | | | | $ | — | |
Frontier Emerging Small Countries Fund | | | | 92,477,662 | | | | | 9,744,720 | |
Global Value Fund* | | | | 24,084,505 | | | | | 138,271,096 | |
International Select Fund | | | | 23,560 | | | | | — | |
U.S. Treasury Fund | | | | 11,921,042 | | | | | 1,663,282 | |
| * | The Fund’s capital loss carryforward is subject to an annual limitation under the Internal Revenue Code and related regulations. |
During the tax year ended September 30, 2020, the Funds used capital loss carryforwards in the following amounts:
| | | | | |
| Fund | | Amount Used |
Emerging India Fund | | | $ | 1,258,163 | |
Emerging Markets Select Fund | | | | 1,789,059 | |
Frontier Emerging Small Countries Fund | | | | 3,739,699 | |
Global Value Fund | | | | 1,027,950 | |
U.S. Treasury Fund | | | | 6,131,664 | |
The Funds have elected to defer losses incurred from November 1, 2019 through September 30, 2020 in accordance with federal income tax rules. These losses are treated as having arisen on the first day of the following fiscal year. The Funds have elected to defer losses as follows:
| | | | | | | | | | |
| Fund | | Post-October
Capital Losses | | Late-Year
Ordinary Losses |
Core Growth Fund | | | $ | | | | | $ | (9,866,802 | ) |
Emerging India Fund | | | | (5,551,969 | ) | | | | (2,372,226 | ) |
Emerging Markets Select Fund | | | | — | | | | | (166,685 | ) |
Emerging Markets Small Cap Fund | | | | — | | | | | (2,188,671 | ) |
Frontier Emerging Small Countries Fund | | | | (836,639 | ) | | | | (716,208 | ) |
Global Opportunities Fund | | | | — | | | | | (953,028 | ) |
Global Value Fund | | | | (7,583,264 | ) | | | | (13,937 | ) |
International Opportunities Fund | | | | — | | | | | (4,213,643 | ) |
International Growth Fund | | | | — | | | | | (3,209,649 | ) |
International Select Fund | | | | — | | | | | (21,681 | ) |
Micro Cap Fund | | | | — | | | | | (2,184,700 | ) |
Micro Cap Value Fund | | | | — | | | | | (1,797,886 | ) |
Small Cap Growth Fund | | | | — | | | | | (13,505,929 | ) |
Small Cap Value Fund | | | | (59,162,409 | ) | | | | (26,965 | ) |
109
Notes to Financial Statements (continued)
The tax character of distributions paid during the year ended September 30, 2020 was as follows:
| | | | | | | | | | | | | | | | | | | | | | | | | | | | | | |
| 2020 | | Core Growth
Fund | | Emerging India
Fund | | Emerging
Markets
Select Fund | | Emerging
Markets
Small Cap Fund | | Frontier Emerging
Small Countries
Fund | | Global
Opportunities
Fund |
Ordinary Income | | | $ | — | | | | $ | — | | | | $ | — | | | | $ | — | | | | $ | — | | | | $ | — | |
Capital Gain | | | | 243,065,391 | | | | | 1,014,355 | | | | | — | | | | | 22,022,797 | | | | | — | | | | | 10,583,675 | |
| | | | | |
Total | | | $ | 243,065,391 | | | | $ | 1,014,355 | | | | $ | — | | | | $ | 22,022,797 | | | | $ | — | | | | $ | 10,583,675 | |
| | | | | |
| | | | | | |
| 2020 | | Global Select
Fund | | Global Value
Fund | | International
Growth Fund | | International
Opportunities Fund | | International
Select Fund | | Micro Cap
Fund |
Ordinary Income | | | $ | — | | | | $ | 3,749,206 | | | | $ | — | | | | $ | — | | | | $ | — | | | | $ | — | |
Capital Gain | | | | — | | | | | 773,618 | | | | | 30,462,062 | | | | | 12,487,503 | | | | | — | | | | | 56,926,728 | |
| | | | | |
Total | | | $ | — | | | | $ | 4,522,824 | | | | $ | 30,462,062 | | | | $ | 12,487,503 | | | | $ | — | | | | $ | 56,926,728 | |
| | | | | |
| | | | | | |
| 2020 | | Micro Cap
Value Fund | | Small Cap
Growth Fund | | Small Cap
Value Fund | | Ultra Growth Fund | | U.S. Treasury Fund | | |
Ordinary Income | | | $ | — | | | | $ | — | | | | $ | 5,725,554 | | | | $ | — | | | | $ | 6,196,484 | | | | | | |
Capital Gain | | | | 22,300,292 | | | | | 264,951,087 | | | | | 4,930,999 | | | | | 14,642,656 | | | | | — | | | | | | |
| | | | | | | | | | |
Total | | | $ | 22,300,292 | | | | $ | 264,951,087 | | | | $ | 10,656,553 | | | | $ | 14,642,656 | | | | $ | 6,196,484 | | | | | | |
| | | | | | | | | | |
The tax character of distributions paid during the year ended September 30, 2019 was as follows:
| | | | | | | | | | | | | | | | | | | | | | | | | |
| 2019 | | Core Growth
Fund | | Emerging India
Fund | | Emerging
Markets
Select Fund | | Emerging
Markets
Small Cap Fund | | Frontier Emerging
Small Countries
Fund |
Ordinary Income | | | $ | — | | | | $ | — | | | | $ | — | | | | $ | — | | | | $ | — | |
Capital Gain | | | | 172,135,583 | | | | | 15,619,790 | | | | | — | | | | | 48,977,453 | | | | | — | |
| | | | | |
Total | | | $ | 172,135,583 | | | | $ | 15,619,790 | | | | $ | — | | | | $ | 48,977,453 | | | | $ | — | |
| | | | | |
| | | | | |
| 2019 | | Global
Opportunities
Fund | | Global Value
Fund | | International
Growth Fund | | International
Opportunities Fund | | Micro Cap
Fund |
Ordinary Income | | | $ | — | | | | $ | 4,347,203 | | | | $ | 1,629,607 | | | | $ | — | | | | $ | — | |
Capital Gain | | | | 15,578,105 | | | | | 23,019,039 | | | | | 170,045,903 | | | | | 11,299,512 | | | | | 87,356,742 | |
| | | | | |
Total | | | $ | 15,578,105 | | | | $ | 27,366,242 | | | | $ | 171,675,510 | | | | $ | 11,299,512 | | | | $ | 87,356,742 | |
| | | | | |
| | | | | |
| 2019 | | Micro Cap
Value Fund | | Small Cap
Growth Fund | | Small Cap
Value Fund | | Ultra Growth
Fund | | U.S. Treasury
Fund |
Ordinary Income | | | $ | 53,031 | | | | $ | — | | | | $ | — | | | | $ | 7,109,314 | | | | $ | 6,645,318 | |
Capital Gain | | | | 26,820,661 | | | | | 414,909,154 | | | | | 31,718,827 | | | | | 11,813,532 | | | | | — | |
| | | | | |
Total | | | $ | 26,873,692 | | | | $ | 414,909,154 | | | | $ | 31,718,827 | | | | $ | 18,922,846 | | | | $ | 6,645,318 | |
| | | | | |
The tax character of distributions paid may differ from that shown in the Statements of Changes in Net Assets due to short-term gains being treated as ordinary income for tax purposes.
EU Reclaims — As a result of several court cases in certain countries across the European Union, the Emerging Markets Small Cap Fund, Global Opportunities Fund, Global Value Fund, International Growth Fund and International Opportunities Fund filed tax reclaims for previously withheld taxes on dividends earned in Finland and Poland (EU Reclaims). These additional filings are subject to various administrative proceedings by the local jurisdictions’ tax authorities within the European Union, as well as a number of related judicial
proceedings. Income recognized, if any, for EU Reclaims is reflected as dividend income in the Statements of Operations and related receivables, if any, are reflected as interest and dividends receivable in the Statements of Assets and Liabilities. When uncertainty exists as to the ultimate resolution of these proceedings, the likelihood of receipt of these EU Reclaims and the potential timing of payment, no amounts are reflected in the financial statements.
110
7. RELATED PARTY TRANSACTIONS
Investment Advisory Fees, Expense Limitations — As the Funds’ investment advisor, the Advisor receives a monthly fee calculated on average daily net assets. The Advisor has contractually agreed to waive its fees and/or reimburse certain Funds should a Fund’s operating expenses exceed a specified annual limitation through at least January 31, 2021. If operating expenses are less than the specified expense limit for the Fund, the Advisor shall be entitled to recoup the fees waived or reduced to the extent that the operating expenses and the amounts reimbursed do not exceed such expense limit for the Fund, under the period of the agreement (currently through January 31, 2021). The Funds may only make repayments to the Advisor for the amounts reimbursed if such repayment does not cause the Funds’ expense ratio, after repayment is taken into account, to exceed both (i) the
expense cap at the time such amounts were waived; and (ii) the Fund’s current expense cap. All amounts not recovered at the end of the period expire on January 31, 2021. Shareholder expenses will increase if the Advisor does not renew the contractual expense cap after its expiration date. Ordinary operating expenses exclude any interest, dividend expense on short sales/interest expense, taxes, brokerage commissions, other investment-related costs, acquired fund fees and expenses, and extraordinary expenses, such as litigation and other expenses not incurred in the ordinary course of the Funds’ business in excess of such limitations. Investment advisory fees and fees waived, if any, for the year ended September 30, 2020 are disclosed in the Statements of Operations. Investment advisory fee and expense limitation annual rates are shown below.
| | | | | | | | | | | | | | | | | | | | | | | | | |
| Fund | | Advisory
Fee | | Expense
Limitation
Investor Class | | Expense
Limitation
Institutional Class | | Contractual Expense
Limitation/
Reimbursement
Recoverable
Expiration Date | | Reimbursement
Recoverable |
Core Growth Fund | | | | 1.00% | | | | | 1.50% | | | | | 1.05% | | | | | 1/31/2021 | | | | $ | 287,305 | |
Emerging India Fund | | | | 1.25% | | | | | 1.75% | | | | | 1.50% | | | | | 1/31/2021 | | | | | — | |
Emerging Markets Select Fund | | | | 1.00% | | | | | 1.50% | | | | | 1.20% | | | | | 1/31/2021 | | | | | 104,959 | |
Emerging Markets Small Cap Fund | | | | 1.65% | | | | | 1.95% | | | | | 1.80% | | | | | 1/31/2021 | | | | | 4,564 | |
Frontier Emerging Small Countries Fund | | | | 1.65% | | | | | 2.15% | | | | | 1.95% | | | | | 1/31/2021 | | | | | 120,327 | |
Global Opportunities Fund | | | | 1.25% | | | | | 1.75% | | | | | 1.35% | | | | | 1/31/2021 | | | | | 31,005 | |
Global Select Fund | | | | 0.85% | | | | | 1.35% | | | | | 0.95% | | | | | 1/31/2021 | | | | | 202,753 | |
Global Value Fund | | | | 0.90% | | | | | 1.10% | | | | | 0.95% | | | | | 1/31/2021 | | | | | 265,804 | |
International Growth Fund | | | | 1.25% | | | | | 1.75% | | | | | 1.35% | | | | | 1/31/2021 | | | | | 22,008 | |
International Opportunities Fund | | | | 1.75% | | | | | 2.25% | | | | | 1.95% | | | | | 1/31/2021 | | | | | — | |
International Select Fund | | | | 0.80% | | | | | 1.30% | | | | | 0.90% | | | | | 1/31/2021 | | | | | 196,692 | |
Micro Cap Fund | | | | 1.50% | | | | | 1.95% | | | | | 1.60% | | | | | 1/31/2021 | | | | | 4,073 | |
Micro Cap Value Fund | | | | 1.50% | | | | | 1.95% | | | | | 1.60% | | | | | 1/31/2021 | | | | | 12,332 | |
Small Cap Growth Fund | | | | 1.00% | | | | | 1.50% | | | | | 1.05% | | | | | 1/31/2021 | | | | | 306,012 | |
Small Cap Value Fund | | | | 1.00% | | | | | 1.50% | | | | | 1.05% | | | | | 1/31/2021 | | | | | 123,421 | |
Ultra Growth Fund | | | | 1.00% | | | | | 1.50% | | | | | 1.05% | | | | | 1/31/2021 | | | | | 11,370 | |
U.S. Treasury Fund | | | | 0.50% | | | | | 0.75% | | | | | N/A | | | | | 1/31/2021 | | | | | — | |
Affiliated Trades — Certain Funds are permitted to purchase or sell securities from or to certain related affiliated funds under specified conditions outlined in the procedures adopted by the Board of Trustees (the “Board”). The procedures have been designed to ensure that any purchase or sale of securities by the Funds from or to another fund (or funds) that is, or could be, considered an affiliate by virtue of having a common investment advisor (or affiliated investment advisors), common Trustees and/or common officers complies with Rule 17a-7 of the 1940 Act. Further, each transaction is effected at the current market price, as that term is defined under the procedures. During the year ended September 30, 2020, the Funds did not engage in purchases or sales of securities pursuant to Rule 17a-7 of the 1940 Act.
Compensation — Officers serve in that capacity without compensation from the Trust. Beginning in the calendar year of 2020, the Funds’ method of compensating Trustees is to pay each Independent Trustee a retainer of $125,000 per
year for services rendered and a fee of $25,000 for each Board of Trustees meeting attended in person or telephonically. In addition, each Independent Trustee receives a fee of $25,000 for attendance at an executive session held with respect to the contract renewal process for the Funds. In addition, the Chairman of the Board receives an additional fee of $31,250 a year as Chairman and $7,813 for attendance in person or telephonically at a Board meeting. The Chairman of the Audit Committee and the Chairman of the Nominating Committee each receive an additional $18,750 per year as Chairman and $4,688 for attendance in person or telephonically at a Board meeting. Additionally, each Independent Trustee is entitled to reimbursement of expenses related to his or her duties as a Trustee of the Funds.
Payments by Advisor — On August 2, 2016, the Advisor discovered a trade error involving the Small Cap Growth Fund. The Advisor reimbursed the Fund $12,890.
111
Notes to Financial Statements (continued)
During 2018, the Advisor paid for a portion of the expenses in connection with the merger of the Long/Short and Global Value Funds. The Advisor will not be reimbursed for these amounts.
The impact of the payments detailed above is reflected in the net expense ratios in the Financial Highlights.
Payments by Sub-Advisor — In June 2016, the Funds filed a proxy statement with the Securities and Exchange Commission to inform shareholders about a Special Meeting of Shareholders of the Wasatch-Hoisington U.S. Treasury Fund (“U.S. Treasury Fund”). The purpose of the Shareholder Meeting was to ask shareholders to approve a new Sub-Advisory Agreement between the Advisor and Hoisington Investment Management Company (HIMCo) with respect to the U.S. Treasury Fund. HIMCo, the Sub-Advisor for the Fund, reimbursed the U.S. Treasury Fund for the costs associated with the proxy statement filing. The Sub-Advisor does not intend to be reimbursed for this amount.
Pursuant to a sub-advisory agreement entered into between the Advisor and HIMCo (“HIMCo Sub-Advisory Agreement”), and subject to the supervision of the Advisor, HIMCo directs the investment of the U.S. Treasury Fund’s assets and is responsible for the continuing management of the Fund’s assets, including the placement of purchase and sale orders on behalf of the Fund. The HIMCo Sub-Advisory Agreement provides that the Advisor shall pay HIMCo a monthly management fee computed at the annual rate of 0.02% of the Fund’s average daily net assets as long as and whenever the Fund has net assets less than $20 million and one-half (1/2) of the monthly fee the Advisor receives from the Fund under the Advisory and Service Contract as long as and whenever the Fund has net assets of $20 million or more. The Advisor retains the remainder of the advisory fee paid under the Advisory and Service Contract. The Sub-Advisor may reimburse the Advisor for certain expenses.
Transfer Agent Intermediary Fees Reimbursed to the Advisor — Each Fund paid fees to, and reimbursed certain out-of-pocket expenses of, the Funds’ transfer agent during
the period. In addition, the Advisor and the Funds’ distributor have entered into selling dealer agreements and service agreements with certain financial services companies, broker-dealers, banks, advisors, retirement service providers or other authorized agents or organizations (each an “Intermediary,” together, “Intermediaries”) to accept purchase, exchange and redemption orders on the Funds’ behalf. For Investor Class shares of the Funds, some Intermediaries do not charge investors a direct transaction fee, but instead charge a fee for accounting and shareholder services that the agent provided to Fund shareholders on the Funds’ behalf. Those services typically included recordkeeping, transaction processing for shareholders’ accounts, communication of tax information, income distribution and other services. Generally, the fee was either a per account charge based on the number of accounts to which the Intermediary provided such services, or was a percentage (as of September 30, 2020 up to 0.40% annually) of the average value of Fund Investor Class shares held in such accounts. The Advisor paid the Intermediary fees and the Funds reimbursed the Advisor for the portion of such fees, which are intended to compensate the Intermediary for provision of services of the type that would be provided by the Funds’ transfer agent or other service providers if the shares were registered on the books of the Funds’ transfer agent. Institutional Class shares of the Funds do not reimburse the Advisor for payments to Intermediaries. The Funds’ reimbursement of expenses incurred for services provided by Intermediaries are included in “Shareholder servicing fees—Investor Class” in the Statements of Operations.
Custodian Out-of-Pocket Expense Reimbursement — In September 2016, State Street Bank and Trust Company (“SSB”), the Funds’ custodian, provided each Fund with an offer to reimburse the Fund for certain out-of- pocket expenses it charged the Fund between 2003 and 2015. The incorrect charges were due to inaccurate billing rates used by SSB for certain out-of-pocket expenses. SSB made the reimbursements in May 2017.
10% Shareholders — As of September 30, 2020, the Funds had individual shareholder accounts and/or omnibus shareholder accounts (comprised of a group of individual shareholders), which individually amounted to more than 10% of the total shares outstanding of each Fund as detailed below:
| | | | | | | | | | | | | | | |
| Fund | | Number of
Accounts | | | | Percent of Shares
Outstanding |
Core Growth Fund | | | | 2 | | | | | | | | | | 43.14 | % |
Emerging India Fund | | | | 3 | | | | | | | | | | 71.43 | % |
Emerging Markets Select Fund | | | | 2 | | | | | | | | | | 62.37 | % |
Emerging Markets Small Cap Fund | | | | 2 | | | | | | | | | | 56.78 | % |
Frontier Emerging Small Countries Fund | | | | 3 | | | | | | | | | | 57.24 | % |
Global Opportunities Fund | | | | 3 | | | | | | | | | | 60.81 | % |
Global Select Fund | | | | 3 | | | | | | | | | | 68.78 | % |
Global Value Fund | | | | 2 | | | | | | | | | | 71.57 | % |
International Growth Fund | | | | 2 | | | | | | | | | | 52.59 | % |
International Opportunities Fund | | | | 2 | | | | | | | | | | 41.51 | % |
International Select Fund | | | | 4 | | | | | | | | | | 83.62 | % |
112
| | | | | | | | | | | | | | | |
| Fund | | Number of
Accounts | | | | Percent of Shares
Outstanding |
Micro Cap Fund | | | | 2 | | | | | | | | | | 42.32 | % |
Micro Cap Value Fund | | | | 3 | | | | | | | | | | 59.41 | % |
Small Cap Growth Fund | | | | 2 | | | | | | | | | | 48.48 | % |
Small Cap Value Fund | | | | 4 | | | | | | | | | | 67.10 | % |
Ultra Growth Fund | | | | 2 | | | | | | | | | | 58.63 | % |
U.S. Treasury Fund | | | | 3 | | | | | | | | | | 56.93 | % |
Affiliated Interests — As of September 30, 2020, the Advisor and its affiliates, and the retirement plans of the Advisor and its affiliates, held shares of the Funds which may be redeemed at any time as detailed below:
| | | | | | | | | | | | | | | |
| Fund | | Number of
Accounts* | | | | Percent of Shares
Outstanding |
Core Growth Fund | | | | 24 | | | | | | | | | | 1.08 | % |
Emerging India Fund | | | | 36 | | | | | | | | | | 9.80 | % |
Emerging Markets Select Fund | | | | 24 | | | | | | | | | | 26.14 | % |
Emerging Markets Small Cap Fund | | | | 15 | | | | | | | | | | 2.44 | % |
Frontier Emerging Small Countries Fund | | | | 15 | | | | | | | | | | 2.70 | % |
Global Opportunities Fund | | | | 19 | | | | | | | | | | 8.13 | % |
Global Select Fund | | | | 20 | | | | | | | | | | 78.33 | % |
Global Value Fund | | | | 10 | | | | | | | | | | 2.46 | % |
International Growth Fund | | | | 19 | | | | | | | | | | 1.24 | % |
International Opportunities Fund | | | | 21 | | | | | | | | | | 0.97 | % |
International Select Fund | | | | 14 | | | | | | | | | | 58.47 | % |
Micro Cap Fund | | | | 20 | | | | | | | | | | 1.21 | % |
Micro Cap Value Fund | | | | 18 | | | | | | | | | | 2.91 | % |
Small Cap Growth Fund | | | | 23 | | | | | | | | | | 1.06 | % |
Small Cap Value Fund | | | | 18 | | | | | | | | | | 1.30 | % |
Ultra Growth Fund | | | | 19 | | | | | | | | | | 0.44 | % |
U.S. Treasury Fund | | | | 14 | | | | | | | | | | 2.79 | % |
| * | Multiple accounts with the same beneficial owner are treated as one account. |
8. TRANSACTIONS WITH AFFILIATES
If a Fund’s holding represents ownership of 5% or more of the voting securities of a company, the company is deemed to be an affiliate as defined by the 1940 Act. The following Funds conducted transactions during the year ended September 30, 2020 with an “affiliated company” as so defined:
| | | | | | | | | | | | | | | | | | | | | | | | | | | | | | | | | | | |
| | | Value,
Beginning
of Year | | Purchases
at Cost | | Proceeds
from Sales | | Value, End
of Year | | Dividends
Credited to
Income for the year ended
9/30/2020 | | Gain (Loss)
Realized on
Sale of Shares
for the year ended
9/30/2020 | | Change in
Unrealized
Appreciation for the year ended
9/30/2020 |
Micro Cap Fund | | | | | | | | | | | | | | | | |
Common Stock | | | | | | | | | | | | | | | | |
IM Cannabis Corp. | | | $ | 3,007,812 | | | | $ | 3,537,691 | | | | $ | — | | | | $ | 10,206,730 | | | | $ | — | | | | $ | — | | | | $ | 3,661,227 | |
Transcat, Inc. | | | | 10,031,463 | | | | | 6,106,018 | | | | | 1,818,449 | | | | | 15,971,020 | | | | | — | | | | | 25,007 | | | | | 1,626,981 | |
Lonestar Resources US, Inc., Class A* | | | | 5,180,047 | | | | | 462,685 | | | | | 1,397,235 | | | | | — | | | | | — | | | | | (8,185,108 | ) | | | | 3,939,611 | |
Warrants | | | | | | | | | | | | | | | | | | | | | | | | | | | | | | | | | | | |
IM Cannabis Corp—Warrants $1.30 10/10/2021 | | | | — | | | | | — | | | | | — | | | | | 356,271 | | | | | — | | | | | — | | | | | 356,271 | |
| | | | | |
| | | $ | 18,219,322 | | | | $ | 10,106,394 | | | | $ | 3,215,684 | | | | $ | 26,534,021 | | | | $ | — | | | | $ | (8,160,101 | ) | | | $ | 9,584,090 | |
| | | | | |
Small Cap Growth Fund | | | | | | | | | | | | | | | | | | | | | | | | | | | | | | | | | | | |
Common Stock | | | | | | | | | | | | | | | | |
Chuy’s Holdings Inc. | | | $ | 15,835,134 | | | | $ | 9,289,276 | | | | $ | — | | | | $ | 22,322,336 | | | | $ | — | | | | $ | — | | | | $ | (2,802,074 | ) |
| | | | | |
Ultra Growth Fund | | | | | | | | | | | | | | | | | | | | | | | | | | | | | | | | | | | |
Common Stock | | | | | | | | | | | | | | | | |
Exagen Inc. | | | $ | 3,382,877 | | | | $ | 12,568,694 | | | | $ | 1,323,625 | | | | $ | 10,092,300 | | | | $ | — | | | | $ | (211,936 | ) | | | $ | (4,323,710 | ) |
Cocrystal Pharma, Inc.* | | | | 1,726,744 | | | | | 803,250 | | | | | 2,415,020 | | | | | — | | | | | — | | | | | (367,802 | ) | | | | 252,828 | |
| | | | | |
| | | $ | 5,109,621 | | | | $ | 13,371,944 | | | | $ | 3,738,645 | | | | $ | 10,092,300 | | | | $ | — | | | | $ | (579,738 | ) | | | $ | (4,070,882 | ) |
| | | | | |
113
Notes to Financial Statements (continued)
| | | | | | | | | | | | | | | | | | | | | | | | | | | | | | | | | | | |
| | | Share Activity | | Dividends
Credited to
Income for the period ended
9/30/2020 | | Gain (Loss)
Realized on
Sale of Shares
for the period ended
9/30/2020 | | Change in
Unrealized
Appreciation
for the period ended
9/30/2020 |
| | | Balance
9/30/2019 | | Purchases/
Additions | | Sales/
Reductions | | Balance
9/30/2020 |
Micro Cap Fund | | | | | | | | | | | | | | | | | | | | | | | | | | | | | | | | | | | |
Common Stock | | | | | | | | | | | | | | | | | | | | | | | | | | | | | | | | | | | |
IM Cannabis Corp | | | | 3,795,143 | | | | | 7,530,500 | | | | | — | | | | | 11,325,643 | | | | $ | — | | | | $ | — | | | | $ | 3,661,227 | |
Transcat, Inc. | | | | 391,701 | | | | | 216,676 | | | | | 63,291 | | | | | 545,086 | | | | | — | | | | | 25,007 | | | | | 1,626,981 | |
Lonestar Resources US, Inc., Class A* | | | | 1,904,429 | | | | | 191,600 | | | | | 2,096,029 | | | | | — | | | | | | | | | | (8,185,108 | ) | | | | 3.939.611 | |
Warrants | | | | | | | | | | | | | | | | | | | | | | | | | | | | | | | | | | | |
IM Cannabis Corp-Warrants $1.30 10/10/2021 | | | | — | | | | | 1,897,571 | | | | | — | | | | | 1,897,571 | | | | | — | | | | | — | | | | | 356,271 | |
| | | | | |
| | | | 6,091,273 | | | | | 9,836,347 | | | | | 2,159,320 | | | | | 13,768,300 | | | | $ | — | | | | $ | (8,160,101 | ) | | | $ | 5,644,479 | |
| | | | | |
Small Cap Growth Fund | | | | | | | | | | | | | | | | | | | | | | | | | | | | | | | | | | | |
Common Stock | | | | | | | | | | | | | | | | | | | | | | | | | | | | | | | | | | | |
Chuy’s Holdings Inc. | | | | 639,545 | | | | | 500,513 | | | | | — | | | | | 1,140,058 | | | | $ | — | | | | $ | — | | | | $ | (2,802,074 | ) |
| | | | | |
Ultra Growth Fund | | | | | | | | | | | | | | | | | | | | | | | | | | | | | | | | | | | |
Common Stock | | | | | | | | | | | | | | | | | | | | | | | | | | | | | | | | | | | |
Exagen Inc. | | | | 218,391 | | | | | 793,497 | | | | | 80,864 | | | | | 931,024 | | | | $ | — | | | | $ | (211,936 | ) | | | $ | (4,323,710 | ) |
Cocrystal Pharma, Inc.* | | | | 846,443 | | | | | 945,000 | | | | | 1,791,443 | | | | | — | | | | | — | | | | | (367,802 | ) | | | | 252,828 | |
| | | | | |
| | | | 1,064,834 | | | | | 1,738,497 | | | | | 1,872,307 | | | | | 931,024 | | | | $ | — | | | | $ | (579,738 | ) | | | $ | (4,070,882 | ) |
| | | | | |
| * | This security was deemed to no longer meet the criteria of an affiliated company at the reporting date. For financial statement purposes, the total amount of the gain (loss) realized on sale of shares and the total change in unrealized appreciation for the period ended September 30, 2019 is included in the Statement of Operations even though the securities were not affiliated companies as of year end. |
9. RESTRICTED SECURITIES
The Funds may own investments that were purchased through private placement transactions or under Rule 144A of the Securities Act of 1933 (the “Securities Act”) and cannot be sold without prior registration under the Securities Act or may be limited due to certain restrictions. These securities are generally deemed to be illiquid and are valued at fair value as determined by a designated Pricing Committee of the Advisor (“Pricing Committee”), comprised of personnel of the Advisor, with oversight by the Board of Trustees and in accordance with Board-approved Pricing Policies and Procedures. If and when such securities are registered, the costs of registering such securities are paid by the issuer. At September 30, 2020, the Funds held the following restricted securities:
| | | | | | | | | | | | | | | | | | | | | | |
| | | Security Type | | Acquisition Date | | Cost | | Fair Value | | Value as a Percent of Net Assets |
Micro Cap Value Fund | | | | | | | | | | | | | | | | | | | | | | |
Regenacy Pharmaceuticals, LLC | | LLC Membership Interest | | | | 12/21/16 | | | | $ | 30,001 | | | | $ | 17,685 | | | | | 0.01 | % |
Vertex Energy, Inc., Pfd., 10.00% PIK Series B | | Convertible Preferred Stock | | | | 6/22/15 - 7/16/20 | | | | | 1,995,652 | | | | | 1,888,331 | | | | | 0.76 | % |
Vertex Energy, Inc., expiring 12/24/2020 | | Warrants | | | | 6/22/15 | | | | | 95,000 | | | | | — | | | | | — | % |
| | | | | | | | | | | | | | | | | | | | | | |
| | | | | | | | | | $ | 2,120,653 | | | | $ | 1,906,016 | | | | | 0.77 | % |
|
| |
Small Cap Growth Fund | | | | | | | | | | | | | | | | | | | | | | |
DataStax, Inc., Series E Pfd. | | Preferred Stock | | | | 8/12/2014 | | | | $ | 8,000,002 | | | | $ | 9,217,825 | | | | | 0.37 | % |
Greenspring Global Partners II-B, L.P. | | LP Interest | | | | 10/10/03 - 3/31/17 | | | | | 1,141,197 | | | | | 149,227 | | | | | 0.01 | % |
Greenspring Global Partners III-B, L.P. | | LP Interest | | | | 3/16/06 - 6/29/17 | | | | | 7,186 | | | | | 68,651 | | | | | 0.00 | % |
Nanosys, Inc., Series D Pfd. | | Preferred Stock | | | | 11/8/2005 | | | | | 2,000,000 | | | | | 725,424 | | | | | 0.03 | % |
Nanosys, Inc., Series E Pfd. | | Preferred Stock | | | | 8/13/2010 | | | | | 184,939 | | | | | 188,977 | | | | | 0.01 | % |
| | | | | | | | | | | | | | | | | | | | | | |
| | | | | | | | | | $ | 11,333,324 | | | | $ | 10,350,104 | | | | | 0.42 | % |
|
| |
Ultra Growth Fund | | | | | | | | | | | | | | | | | | | | | | |
Greenspring Global Partners II-B, L.P. | | LP Interest | | | | 10/10/03 - 3/31/17 | | | | $ | 1,029,173 | | | | $ | 134,301 | | | | | 0.01 | % |
Greenspring Global Partners III-B, L.P. | | LP Interest | | | | 3/16/06 - 6/29/17 | | | | | 8,198 | | | | | 68,651 | | | | | 0.00 | % |
Nanosys, Inc., Series D Pfd. | | Preferred Stock | | | | 11/8/05 | | | | | 500,001 | | | | | 181,356 | | | | | 0.01 | % |
Nanosys, Inc., Series E Pfd. | | Preferred Stock | | | | 8/13/10 | | | | | 46,235 | | | | | 47,245 | | | | | 0.00 | % |
| | | | | | | | | | | | | | | | | | | | | | |
| | | | | | | | | | $ | 1,583,607 | | | | $ | 431,553 | | | | | 0.02 | % |
|
| |
114
10. LINE OF CREDIT
Effective May 15, 2020, the Trust and each Fund renewed and amended agreements for two open lines of credit totaling $300,000,000, one of which is $100,000,000 committed, and the other of which is $200,000,000 uncommitted, with State Street Bank and Trust Company (together, the “Line”). The agreements, as amended, have no change in the committed, uncommitted and total amounts available on the Line. The Funds incur commitment fees on the undrawn portion of the committed part of the Line, and interest expense to the extent of amounts drawn (borrowed) under the entire Line. Interest is based on the higher of (a) the overnight federal-funds rate in effect on the date of borrowing, plus a margin, or (b) the daily 1-Month London Interbank Offered Rate (LIBOR) in effect on the date of borrowing, plus a margin. Commitment fees are pro-rated among the Funds based upon relative average net assets. Interest expense is charged directly to a Fund based upon actual amounts borrowed by that Fund.
For the year ended September 30, 2020, the following Funds had borrowings:
| | | | | | | | | | | | | | | | | | | | | | | | | |
| Funds Utilizing the Line of Credit | | Average Daily
Borrowings | | Number of
Days
Outstanding | | Interest
Expense | | Weighted
Average
Annualized
Interest Rate | | Balance at
9/30/2020 |
Core Growth Fund | | | $ | 8,488,232 | | | | | 15 | | | | $ | 8,584 | | | | | 2.43% | | | | $ | — | |
Emerging India Fund | | | | 3,852,254 | | | | | 103 | | | | | 25,245 | | | | | 2.29% | | | | | — | |
Emerging Markets Select Fund | | | | 557,626 | | | | | 68 | | | | | 2,824 | | | | | 2.68% | | | | | — | |
Emerging Markets Small Cap Fund | | | | 1,916,829 | | | | | 144 | | | | | 17,815 | | | | | 2.32% | | | | | — | |
Frontier Emerging Small Countries Fund | | | | 378,903 | | | | | 56 | | | | | 1,079 | | | | | 1.83% | | | | | — | |
Global Opportunities Fund | | | | 638,977 | | | | | 63 | | | | | 2,358 | | | | | 2.11% | | | | | — | |
Global Select Fund | | | | 708,987 | | | | | 11 | | | | | 347 | | | | | 1.60% | | | | | — | |
Global Value Fund | | | | 320,437 | | | | | 3 | | | | | 39 | | | | | 1.48% | | | | | — | |
International Growth Fund | | | | 8,005,058 | | | | | 23 | | | | | 9,473 | | | | | 1.85% | | | | | — | |
International Select Fund | | | | 87,929 | | | | | 11 | | | | | 73 | | | | | 2.73% | | | | | — | |
Micro Cap Fund | | | | 601,010 | | | | | 7 | | | | | 221 | | | | | 1.89% | | | | | — | |
11. PRINCIPAL RISKS
Market Risk — Market risk is the risk that a particular security, or shares of a Fund in general, may fall in value. Securities are subject to market fluctuations caused by such factors as economic, political, regulatory or market developments, changes in interest rates and perceived trends in securities prices. Shares of a Fund could decline in value or underperform other investments due to short-term market movements or any longer periods during more prolonged market downturns. In addition, local, regional or global events such as war, acts of terrorism, spread of infectious diseases or other public health issues, recessions, or other events could have a significant negative impact on a Fund and its investments. Such events may affect certain geographic regions, countries, sectors and industries more significantly than others. Such events could adversely affect the prices and liquidity of a Fund’s portfolio securities or other instruments and could result in disruptions in trading markets. Any of such circumstances could have a materially negative impact on the value of a Fund’s shares and result in increased market volatility.
Global Pandemic Risk — The value of a Fund’s investments may be impacted by global health crises or other events. For example, an outbreak of the respiratory disease designated as Covid-19 was first detected in China in December 2019 and subsequently spread internationally. The transmission of Covid-19 and efforts to contain its spread have resulted in international, national and local border closings and other
significant travel restrictions and disruptions, significant disruptions to business operations, supply chains and customer activity, event cancellations and restrictions, service cancellations, reductions and other changes, significant challenges in health-care service preparation and delivery, and quarantines, as well as general concern and uncertainty that has negatively affected the economic environment. These impacts also have caused significant volatility and declines in global financial markets, which have caused losses for investors. The impact of this Covid-19 pandemic may be short term or may last for an extended period of time, and in either case could result in a substantial economic downturn or recession.
Credit Risk — In the normal course of business, the Funds trade financial instruments and enter into financial transactions where risk of loss exists due to the failure of the other party to a transaction to perform (credit risk). Similar to credit risk, the Funds may be exposed to counterparty risk, or the risk that an institution or other entity with which the Funds have unsettled or open transactions will default. The potential loss could exceed the value of the financial assets recorded in the financial statements. Financial assets, which potentially expose the Funds to credit risk, consist principally of cash due from counterparties and investments. The extent of the Funds’ exposure to credit and counterparty risks with respect to these financial assets approximates their carrying value as recorded in the Funds’ Statements of Assets and Liabilities.
115
Notes to Financial Statements (continued)
Inflation Risk — Inflation risk is the possibility that inflation will reduce the purchasing power of a currency, and subsequently reduce the value of a security or asset, and may result in rising interest rates. Inflation is the overall upward price movement of goods and services in an economy that causes the value of a currency to decline.
Interest Rate Risk — Interest rate risk is the risk that fixed-income securities will decline in value because of changes in interest rates. A rise in interest rates typically causes a fall in values. Interest rate risk should be modest for shorter-term securities, moderate for intermediate-term securities and high for longer-term securities. Generally, an increase in the average maturity of a fund will make it more sensitive to interest rate risk. The interest rate is the amount charged, expressed as a percentage of principal, by a lender to a borrower for the use of assets.
Foreign Currency Risk — If a fund invests directly in foreign currencies or in securities that trade in, and receive revenues in, foreign currencies, or in derivatives that provide exposure to foreign currencies, it will be subject to the risk that those currencies will decline in value relative to the U.S. dollar. This also includes the risk associated with higher transaction costs, delayed settlements, currency controls and adverse economic developments related to foreign investments.
Region Risk — The Funds, except the U.S. Treasury Fund, invest in equity and fixed-income securities of non-U.S. issuers. Because certain foreign markets are illiquid, market prices may not necessarily represent realizable value. Although the Funds maintain diversified investment portfolios, political or economic developments within a particular country or region may have an adverse effect on the ability of domiciled issuers to meet their obligations. These risks are exaggerated for securities of issuers tied economically to emerging- and frontier-market countries. Additionally, political or economic developments may have an adverse effect on the liquidity and volatility of portfolio securities and currency holdings.
India Region Risk — The securities markets in the India region (India, Bangladesh, Pakistan and Sri Lanka) are substantially smaller, less liquid and more volatile than the major securities markets in the United States and the securities industries in these countries are comparatively underdeveloped. Financial intermediaries may not perform as well as their counterparts in the United States or in other countries with more developed securities markets. In some cases, physical delivery of securities in small lots has been required in India and shortages of vault capacity and trained personnel have existed among qualified custodial Indian banks. A fund may be unable to sell securities when the registration process is incomplete and may experience delays in receipt of dividends. If trading volume is limited by operational difficulties, the ability of the fund to invest may be impaired and the fund’s ability to buy or sell Indian securities may be impaired
if the fund’s ability to transact is denied, delayed, suspended or not renewed by local regulators. In recent years, exchange-listed companies in the information-technology sector and related industries (such as software) have grown so as to represent a significant portion of the total capitalization of the Indian market. The value of these companies will generally fluctuate in response to technological and regulatory developments. In addition, governmental actions can have a significant effect on economic conditions in the India region, which could adversely affect the value and liquidity of investments. Although the governments of India, Bangladesh, Pakistan and Sri Lanka have recently begun to institute economic reform policies, there can be no assurance that they will continue to pursue such policies or, if they do, that such policies will succeed. The region is an uncertain tax environment and it is difficult to know and predict the potential implications of future tax developments. Religious, cultural and military disputes persist in India, and between India and Pakistan (as well as sectarian groups within each country). The longstanding border dispute with Pakistan remains unresolved. In recent years, terrorists believed to be based in Pakistan struck Mumbai (India’s financial capital), further damaging relations between the two countries. If the Indian government is unable to control the violence and disruption associated with these tensions (including both domestic and external sources of terrorism), the result may be military conflict, which could destabilize the economy of India. Both India and Pakistan have tested nuclear arms, and the threat of deployment of such weapons could hinder development of the Indian economy, and escalating tensions could impact the broader region, including China.
Liquidity Risk — The trading market for a particular security may be less liquid than it appears and market prices may not represent realizable value. This may be likely when a fund has a proportionately large investment in securities with small market capitalizations or securities in foreign markets that trade infrequently. Reduced liquidity will have an adverse impact on a fund’s ability to sell such securities quickly at the currently marked price if necessary to meet redemptions.
Shareholder Concentration Risk — A significant portion of the net assets of the Frontier Emerging Small Countries Fund is owned by a group of shareholders advised by a common investment advisor. The Emerging Markets Select Fund also has a significant portion of net assets concentrated in relatively few related accounts. In the event of significant redemption activity by these shareholders, the Funds could experience a loss when selling portfolio securities to meet such redemption requests. The Funds could be forced to sell portfolio securities at unfavorable prices in an effort to generate sufficient cash to pay redeeming shareholders. Fund expenses may increase and performance may be materially affected.
116
12. FAIR VALUE MEASUREMENTS AND INVESTMENTS
The fair value of a financial instrument is the amount that would be received to sell an asset or paid to transfer a liability in an orderly transaction between market participants at the measurement date. The Funds use various methods to measure the fair value of their investments on a recurring basis. U.S. GAAP established a hierarchy that prioritizes inputs to valuation methods. The three levels of inputs are:
��
| | • | | Level 1 — Unadjusted quoted prices in active markets for identical assets or liabilities that the Funds have the ability to access. |
| | • | | Level 2 — Observable inputs other than quoted prices included in Level 1 that are observable for the asset or liability, either directly or indirectly. The inputs may include quoted prices for the identical investment on an inactive market, prices for similar investments, interest rates, prepayment speeds, credit risk, yield curves, default rates and similar data. |
| | • | | Level 3 — Unobservable inputs for the asset or liability, to the extent relevant observable inputs are not available, representing the Funds’ own assumptions about the assumptions a market participant would use in valuing the asset or liability, and would be based on the best information available. |
The availability of observable inputs can vary from security to security and is affected by a wide variety of factors, including, for example, the type of security, whether a security is new and not yet established in the marketplace, the liquidity of markets, and other characteristics particular to the security. To the extent that valuation is based on models or inputs that are less observable or unobservable in the market, the determination of fair value requires more judgment. Accordingly, the degree of judgment exercised in determining fair value is greatest for instruments categorized in Level 3.
Equity Securities (common and preferred stock) — Securities are valued as of the close of the New York Stock Exchange (“NYSE”) (generally 4:00 p.m. Eastern Time) on the valuation date. Equity securities and listed warrants are valued using a commercial pricing service at the last quoted sales price taken from the primary market in which each security trades and, with respect to equity securities traded on the National Association of Securities Dealer Automated Quotation (“NASDAQ”) system, such securities are valued using the NASDAQ Official Closing Price (“NOCP”) or last sales price if no NOCP is available. If there are no sales on the primary exchange or market on a day, then the security shall be valued at the mean of the last bid and ask price on the primary exchange or market as provided by a pricing service. If the mean cannot be calculated or there is no trade activity on a day, then the security shall be valued at the previous trading day’s price as provided by a pricing service. In some instances, particularly on foreign exchanges, an official close or evaluated price may be used if the pricing service is unable
to provide the last trade or most recent mean price. To the extent that these securities are actively traded and valuation adjustments are not applied, they are categorized in Level 1 of the fair value hierarchy. Additionally, a Fund’s investments are valued at fair value by the Pricing Committee if the Advisor determines that an event impacting the value of an investment occurred between the closing time of a security’s primary market or exchange (for example, a foreign exchange or market) and the time the Fund’s share price is calculated. Significant events include, but are not limited to the following: significant fluctuations in domestic markets, foreign markets or foreign currencies; occurrences not directly tied to the securities markets such as natural disasters, armed conflicts or significant governmental actions; and major announcements affecting a single issuer or an entire market or market sector. In responding to a significant event, the Pricing Committee determines the fair value of affected securities by considering factors including, but not limited to: index options and futures traded subsequent to the close; American Depositary Receipts (“ADRs”), Global Depositary Receipts (“GDRs”) or other related receipts; currency spot or forward markets that trade after pricing of the foreign exchange; other derivative securities traded after the close such as Standard & Poor’s Depositary Receipts (“SPDRs”) and other exchange-traded funds (“ETFs”); and alternative market quotes on the affected securities. When applicable, the Funds use a systematic fair valuation model provided by an independent third party to assist in adjusting the valuation of foreign securities. When a Fund uses this fair value pricing method, the values assigned to the Fund’s foreign securities may not be the quoted or published prices of the investments on their primary markets or exchanges, and the securities are categorized in Level 2 of the fair value hierarchy. These valuation procedures apply equally to long or short equity positions in a Fund.
Participation Notes — Investments are valued at the market price of the underlying security. Counterparty risk is regularly reviewed and considered for valuation. To the extent the inputs are observable and timely, the values would be categorized in Level 2 of the fair value hierarchy.
Corporate Debt Securities — Investments are valued at current market value by a pricing service, or by using the last sale or bid price based on observable inputs. Observable inputs may include benchmark yields, reported trades, broker/dealer quotes, issuer spreads, two-sided markets, benchmark securities, bids, offers and reference data including market research publications. Although most corporate bonds are categorized in Level 2 of the fair value hierarchy, in instances where observable inputs are not available, they are categorized as Level 3.
Short-Term Notes — Investments maturing in 60 days or less at the time of purchase, are generally valued at amortized cost, unless it is determined that the amortized cost method would not represent fair value, in which case the securities are marked-to-market. To the extent the inputs are observable and timely, the values would be categorized in Level 2 of the fair value hierarchy.
117
Notes to Financial Statements (continued)
Asset-Backed Securities — Investments are priced using the closing bid as supplied by a pricing service based on observable inputs. Observable inputs may include benchmark yields, reported trades, broker/dealer quotes, issuer spreads, two-sided markets, benchmark securities, bids, offers and reference data including market research publications, new issue data, monthly payment information and collateral performance. Although most asset-backed securities are categorized in Level 2 of the fair value hierarchy, in instances where observable inputs are not available, they are categorized as Level 3.
U.S. Government Issuers — Investments are priced using the closing bid as supplied by a pricing service based on observable inputs. Observable inputs may include benchmark yields, reported trades, broker/dealer quotes, issuer spreads, two-sided markets, benchmark securities, bids, offers and reference data including market research publications. Although most U.S. government securities are categorized in Level 2 of the fair value hierarchy, in instances where observable inputs are not available, they are categorized as Level 3.
Derivative Instruments — Listed derivatives that are actively traded are valued based on quoted prices from the exchange and categorized in Level 1 of the fair value hierarchy. Exchange-traded options are valued at the last sale price in the market where they are principally traded. If there are no sales on the primary exchange or market on a given day, then the option is valued at the mean of the last bid price and ask price on the primary exchange or market as provided by a pricing service. Forward foreign currency contracts are valued at the market rate provided by the pricing service and categorized as Level 2.
Restricted Securities — If market quotations are not readily available for the Funds’ investments in securities such as restricted securities, private placements, securities for which trading has been halted or other illiquid securities, these investments are valued at fair value in accordance with Board-approved Pricing Policies and Procedures by the Pricing Committee with oversight by the Board of Trustees. Fair value is defined as the price that would be received upon the sale of an asset, or paid to transfer a liability, in an orderly transaction between market participants at the measurement date under current market conditions. For each applicable investment that is fair valued, the Pricing Committee considers, to the extent applicable, various factors including, but not limited to, the financial condition of the company or limited partnership, operating results, prices paid in follow-on rounds, comparable companies in the public market, the nature and duration of the restrictions for holding the securities, a stated net asset value (NAV) for the partnership, if applicable, and other relevant factors. Depending on the relative significance of valuation inputs, these instruments may be classified in either Level 2 or Level 3 of the fair value hierarchy.
When the last day of the reporting period is a non-business day, certain foreign markets may be open on days the NYSE is closed, which could result in differences between the value of a Fund’s portfolio securities on the last business day and the last calendar day of the reporting period. Any significant security valuation changes due to an open foreign market are adjusted and reflected by the Fund for financial reporting purposes.
The following is a summary of the fair valuations according to the inputs used as of September 30, 2020 in valuing the Funds’ assets and liabilities:
| | | | | | | | | | | | | | | | | | | | | | |
| Fund | | Category | | Quoted Prices
in Active Markets
for Identical
Investments
(Level 1) | | Significant Other
Observable Inputs
(Level 2) | | Significant
Unobservable
Inputs
(Level 3) | | Value at
9/30/2020 |
Core Growth Fund | |
Assets | |
Common Stocks | | | | | $ | 2,703,870,508 | | | | $ | — | | | | $ | — | | | | $ | 2,703,870,508 | |
Short-Term Investments | | | | | | — | | | | | 28,439,862 | | | | | — | | | | | 28,439,862 | |
| | | | | | | | | | | | | | | | | | | | | | |
| | | | | $ | 2,703,870,508 | | | | $ | 28,439,862 | | | | $ | — | | | | $ | 2,732,310,370 | |
| | | | | | | |
Emerging India Fund | |
Assets | |
Common Stocks | | | | | $ | 285,292,132 | | | | $ | — | | | | $ | — | | | | $ | 285,292,132 | |
Short-Term Investments | | | | | | — | | | | | 6,008,474 | | | | | — | | | | | 6,008,474 | |
| | | | | | | |
| | | | | $ | 285,292,132 | | | | $ | 6,008,474 | | | | $ | — | | | | $ | 291,300,606 | |
| | | | | | | |
Emerging Markets Select Fund | |
Assets | |
Common Stocks | | | | | | | | | | | | | | | | | | | | | | |
| | Personal Products | | | $ | — | | | | $ | 718,220 | | | | $ | — | | | | $ | 718,220 | |
| | Other | | | | 57,924,050 | | | | | — | | | | | — | | | | | 57,924,050 | |
Preferred Stocks | | | | | | 673,229 | | | | | — | | | | | — | | | | | 673,229 | |
Short-Term Investments | | | | | | — | | | | | 381,249 | | | | | — | | | | | 381,249 | |
| | | | | | | |
| | | | | $ | 58,597,279 | | | | $ | 1,099,469 | | | | $ | — | | | | $ | 59,696,748 | |
| | | | | | | |
118
| | | | | | | | | | | | | | | | | | | | | | |
| Fund | | Category | | Quoted Prices
in Active Markets
for Identical
Investments
(Level 1) | | Significant Other
Observable Inputs
(Level 2) | | Significant
Unobservable
Inputs
(Level 3) | | Value at
9/30/2020 |
Emerging Markets Small Cap Fund | |
Assets | | | | | | | | | | | | | | | | | | | | | | |
Common Stocks | | | | | | | | | | | | | | | | | | | | | | |
| | Consumer Finance | | | $ | 17,282,475 | | | | $ | 6,995,308 | | | | $ | — | | | | $ | 24,277,783 | |
| | Insurance Brokers | | | | — | | | | | 7,191,073 | | | | | — | | | | | 7,191,073 | |
| | Pharmaceuticals | | | | — | | | | | — | | | | | 16,796 | | | | | 16,796 | |
| | Semiconductors | | | | 36,051,449 | | | | | 9,682,342 | | | | | — | | | | | 45,733,791 | |
| | Systems Software | | | | — | | | | | 6,463,555 | | | | | — | | | | | 6,463,555 | |
| | Other | | | | 285,609,335 | | | | | — | | | | | — | | | | | 285,609,335 | |
Preferred Stocks | | | | | | — | | | | | 6,466,398 | | | | | — | | | | | 6,466,398 | |
Warrants | | | | | | 35,665 | | | | | — | | | | | — | | | | | 35,665 | |
Short-Term Investments | | | | | | — | | | | | 5,440,477 | | | | | — | | | | | 5,440,477 | |
| | | | | | | |
| | | $ | 338,978,924 | | | | $ | 42,239,153 | | | | $ | 16,796 | | | | $ | 381,234,873 | |
| | | | | | | |
Frontier Emerging Small Countries Fund | |
Assets | | | | | | | | | | | | | | | | | | | | | | |
Common Stocks | | | | | | | | | | | | | | | | | | | | | | |
| | Consumer Finance | | | $ | 4,214,816 | | | | $ | 940,068 | | | | $ | — | | | | $ | 5,154,884 | |
| | Food Retail | | | | 1,139,676 | | | | | 593,991 | | | | | — | | | | | 1,733,667 | |
| | Insurance Brokers | | | | — | | | | | 2,147,194 | | | | | — | | | | | 2,147,194 | |
| | Other | | | | 40,567,574 | | | | | — | | | | | — | | | | | 40,567,574 | |
Preferred Stocks | | | | | | 1,314,219 | | | | | — | | | | | — | | | | | 1,314,219 | |
Warrants | | | | | | 6,196 | | | | | — | | | | | — | | | | | 6,196 | |
Short-Term Investments | | | | | | — | | | | | 105,576 | | | | | — | | | | | 105,576 | |
| | | | | | | |
| | | $ | 47,242,481 | | | | $ | 3,786,829 | | | | $ | — | | | | $ | 51,029,310 | |
| | | | | | | |
Global Opportunities Fund | |
Assets | | | | | | | | | | | | | | | | | | | | | | |
Common Stocks | | | | | | | | | | | | | | | | | | | | | | |
| | Consumer Finance | | | $ | 3,317,459 | | | | $ | 1,150,474 | | | | $ | — | | | | $ | 4,467,933 | |
| | Other | | | | 135,057,885 | | | | | — | | | | | — | | | | | 135,057,885 | |
Warrants | | | | | | 11,201 | | | | | — | | | | | — | | | | | 11,201 | |
Short-Term Investments | | | | | | — | | | | | 720,290 | | | | | — | | | | | 720,290 | |
| | | | | | | |
| | | | | $ | 138,386,545 | | | | $ | 1,870,764 | | | | $ | — | | | | $ | 140,257,309 | |
| | | | | | | |
Global Select Fund | |
Assets | | | | | | | | | | | | | | | | | | | | | | |
Common Stocks | | | | | $ | 12,833,836 | | | | $ | — | | | | $ | — | | | | $ | 12,833,836 | |
Short-Term Investments | | | | | | — | | | | | 538,556 | | | | | — | | | | | 538,556 | |
| | | | | | | |
| | | $ | 12,833,836 | | | | $ | 538,556 | | | | $ | — | | | | $ | 13,372,392 | |
| | | | | | | |
Global Value Fund | |
Assets | | | | | | | | | | | | | | | | | | | | | | |
Common Stocks | | | | | | | | | | | | | | | | | | | | | | |
| | Technology Hardware, Storage & Peripherals | | | $ | 1,689,300 | | | | $ | 2,829,716 | | | | $ | — | | | | $ | 4,519,016 | |
| | Tobacco | | | | — | | | | | 3,036,745 | | | | | — | | | | | 3,036,745 | |
| | Other | | | | 92,495,347 | | | | | — | | | | | — | | | | | 92,495,347 | |
Short-Term Investments | | | | | | — | | | | | 948,033 | | | | | — | | | | | 948,033 | |
| | | | | | | | | | | | | | | | | | | | | | |
| | | $ | 94,184,647 | | | | $ | 6,814,494 | | | | $ | — | | | | $ | 100,999,141 | |
| | | | | | | |
119
Notes to Financial Statements (continued)
| | | | | | | | | | | | | | | | | | | | | | |
| Fund | | Category | | Quoted Prices
in Active Markets
for Identical
Investments
(Level 1) | | Significant Other
Observable Inputs
(Level 2) | | Significant
Unobservable
Inputs
(Level 3) | | Value at
9/30/2020 |
International Growth Fund | |
Assets | | | | | | | | | | | | | | | | | | | | | | |
Common Stocks | | | | | | | | | | | | | | | | | | | | | | |
| | Insurance Brokers | | | $ | — | | | | $ | 10,922,753 | | | | $ | — | | | | $ | 10,922,753 | |
| | Research & Consulting Services | | | | 10,723,799 | | | | | 9,886,664 | | | | | — | | | | | 20,610,463 | |
| | Semiconductors | | | | 31,895,130 | | | | | 11,027,273 | | | | | — | | | | | 42,922,403 | |
| | Systems Software | | | | 9,829,554 | | | | | 9,620,701 | | | | | — | | | | | 19,450,255 | |
| | Other | | | | 938,611,007 | | | | | — | | | | | — | | | | | 938,611,007 | |
Short-Term Investments | | | | | | — | | | | | 40,358,435 | | | | | — | | | | | 40,358,435 | |
| | | | | | | |
| | | $ | 991,059,490 | | | | $ | 81,815,826 | | | | $ | — | | | | $ | 1,072,875,316 | |
| | | | | | | |
International Opportunities Fund | |
Assets | | | | | | | | | | | | | | | | | | | | | | |
Common Stocks | | | | | | | | | | | | | | | | | | | | | | |
| | Alternative Carriers | | | $ | 8,362,112 | | | | $ | 3,706,193 | | | | $ | — | | | | $ | 12,068,305 | |
| | Insurance Brokers | | | | — | | | | | 9,720,379 | | | | | — | | | | | 9,720,379 | |
| | Research & Consulting Services | | | | 16,863,225 | | | | | 11,037,383 | | | | | — | | | | | 27,900,608 | |
| | Restaurants | | | | — | | | | | — | | | | | 8,130 | | | | | 8,130 | |
| | Semiconductors | | | | 5,920,254 | | | | | 13,766,845 | | | | | — | | | | | 19,687,099 | |
| | Other | | | | 581,692,809 | | | | | — | | | | | — | | | | | 581,692,809 | |
Short-Term Investments | | | | | | — | | | | | 21,877,750 | | | | | — | | | | | 21,877,750 | |
| | | | | | | |
| | | $ | 612,838,400 | | | | $ | 60,108,550 | | | | $ | 8,130 | | | | $ | 672,955,080 | |
| | | | | | | |
International Select Fund | |
Assets | | | | | | | | | | | | | | | | | | | | | | |
Common Stocks | | | | | $ | 4,779,764 | | | | $ | — | | | | $ | — | | | | $ | 4,779,764 | |
Short-Term Investments | | | | | | — | | | | | 153,091 | | | | | — | | | | | 153,091 | |
| | | | | | | | | | | | | | | | | | | | | | |
| | | $ | 4,779,764 | | | | $ | 153,091 | | | | $ | — | | | | $ | 4,932,855 | |
| | | | | | | |
Micro Cap Fund | |
Assets | | | | | | | | | | | | | | | | | | | | | | |
Common Stocks | | | | | $ | 793,744,746 | | | | $ | — | | | | $ | — | | | | $ | 793,744,746 | |
Warrants | | | | | | 356,271 | | | | | — | | | | | — | | | | | 356,271 | |
Short-Term Investments | | | | | | — | | | | | 17,242,065 | | | | | — | | | | | 17,242,065 | |
| | | | | | | | | | | | | | | | | | | | | | |
| | | $ | 794,101,017 | | | | $ | 17,242,065 | | | | $ | — | | | | $ | 811,343,082 | |
| | | | | | | |
Micro Cap Value Fund | | | | | | | | | | | | | | | | | | | | | | |
Assets | |
Common Stocks | | | | | $ | 237,233,920 | | | | $ | — | | | | $ | — | | | | $ | 237,233,920 | |
Convertible Preferred Stocks | | | | | | — | | | | | — | | | | | 1,888,331 | | | | | 1,888,331 | |
Limited Liability Company Membership Interest | | | | | | — | | | | | — | | | | | 17,685 | | | | | 17,685 | |
Short-Term Investments | | | | | | — | | | | | 11,437,026 | | | | | — | | | | | 11,437,026 | |
| | | | | | | | | | | | | | | | | | | | | | |
| | | | | $ | 237,233,920 | | | | $ | 11,437,026 | | | | $ | 1,906,016 | | | | $ | 250,576,962 | |
| | | | | | | |
Small Cap Growth Fund | |
Assets | |
Common Stocks | | | | | $ | 2,433,766,395 | | | | $ | — | | | | $ | — | | | | $ | 2,433,766,395 | |
Limited Partnership Interest | | | | | | — | | | | | — | | | | | 217,878 | | | | | 217,878 | |
Preferred Stocks | | | | | | — | | | | | — | | | | | 10,132,225 | | | | | 10,132,225 | |
Short-Term Investments | | | | | | — | | | | | 43,083,458 | | | | | — | | | | | 43,083,458 | |
| | | | | | | | | | | | | | | | | | | | | | |
| | | | | $ | 2,433,766,395 | | | | $ | 43,083,458 | | | | $ | 10,350,103 | | | | $ | 2,487,199,956 | |
| | | | | | | |
Small Cap Value Fund | | | | | | | | | | | | | | | | | | | | | | |
Assets | |
Common Stocks | | | | | $ | 985,058,858 | | | | $ | — | | | | $ | — | | | | $ | 985,058,858 | |
Short-Term Investments | | | | | | — | | | | | 14,809,933 | | | | | — | | | | | 14,809,933 | |
| | | | | | | | | | | | | | | | | | | | | | |
| | | | | $ | 985,058,858 | | | | $ | 14,809,933 | | | | $ | — | | | | $ | 999,868,791 | |
| | | | | | | |
120
| | | | | | | | | | | | | | | | | | | | | | |
| Fund | | Category | | Quoted Prices
in Active Markets
for Identical
Investments
(Level 1) | | Significant Other
Observable Inputs
(Level 2) | | Significant
Unobservable
Inputs
(Level 3) | | Value at
9/30/2020 |
Ultra Growth Fund | | | | | | | | | | | | | | | | | | | | | | |
Assets | |
Common Stocks | | | | | $ | 1,938,259,390 | | | | $ | — | | | | $ | — | | | | $ | 1,938,259,390 | |
Limited Partnership Interest | | | | | | — | | | | | — | | | | | 202,952 | | | | | 202,952 | |
Preferred Stocks | | | | | | — | | | | | — | | | | | 228,601 | | | | | 228,601 | |
Short-Term Investments | | | | | | — | | | | | 144,864,879 | | | | | — | | | | | 144,864,879 | |
| | | | | | | | | | | | | | | | | | | | | | |
| | | | | $ | 1,938,259,390 | | | | $ | 144,864,879 | | | | $ | 431,553 | | | | $ | 2,083,555,822 | |
| | | | | | | |
U.S. Treasury Fund | | | | | | | | | | | | | | | | | | | | | | |
Assets | | | | | | | | | | | | | | | | | | | | | | |
U.S. Government Obligations | | | | | $ | — | | | | $ | 536,537,820 | | | | $ | — | | | | $ | 536,537,820 | |
Short-Term Investments | | | | | | — | | | | | 8,559,652 | | | | | — | | | | | 8,559,652 | |
| | | | | | | | | | | | | | | | | | | | | | |
| | | | | $ | — | | | | $ | 545,097,472 | | | | $ | — | | | | $ | 545,097,472 | |
| | | | | | | |
If the securities of an Asset Class are all the same level, the asset class is shown in total. If the securities of an Asset Class cross levels, the level with the smallest number of categories and with multiple levels within a category is displayed by category. The remaining categories that do not cross levels are combined into the “Other” category.
The valuation techniques used by the Funds to measure fair value for the year ended September 30, 2020 maximized the use of observable inputs and minimized the use of unobservable inputs.
There was a transfer of $3,007,812 in the Micro Cap Fund from Level 3 to Level 1 due to a change in pricing technique on a private company that became public. This transfer amount represents the beginning of the period value for IM Cannabis Corp., which transferred to Level 1 during the period in order to properly represent the activity on the Level 3 Rollforward presented below.
There were transfers of $14,841,216 in the Micro Cap Fund, $16,980,008 in the Small Cap Growth Fund and $3,820,500 in the Ultra Growth Fund from Level 3 to Level 1 due to a change in pricing technique on a private company that became public. This transfer amount represents the beginning of the period value for Medallia, Inc., which transferred to Level 1 during the period in order to properly represent the activity on the Level 3 Rollforward of the Micro Cap Fund that is shown below and Small Cap Growth Fund, the Ultra Growth Fund is presented on the next page.
The following is a reconciliation of the fair valuations using significant unobservable inputs (Level 3) for the Funds during the year ended September 30, 2020:
| | | | | | | | | | | | | | | | | | | | | | | | | | | | | | | | | | | | | | | | | | | | | | | | | | |
| Fund | | Market Value
Beginning
Balance
9/30/2019 | | Purchases
at Cost | | Sales
(Proceeds) | | Accrued
Discounts
(Premiums) | | Realized
Gain/
(Loss) | | Change in
Unrealized
Appreciation
(Depreciation) | | Transfers
in at
Market
Value | | Transfers
out at
Market
Value | | Market Value
Ending
Balance
9/30/2020 | | Net Change
in Unrealized
Appreciation
(Depreciation)
on Investments
Held at
9/30/2020 |
Emerging Markets Small
Cap Fund | | | | | | | | | | | | | | | | | | | | | | | | | | | | | | | | | | | | | | | | | | | | | | | | | | |
Common Stocks | | | $ | 16,608 | | | | $ | — | | | | $ | — | | | | $ | — | | | | $ | — | | | | $ | 188 | | | | $ | — | | | | $ | — | | | | $ | 16,796 | | | | $ | 188 | |
| | | | | |
| | | $ | 16,608 | | | | $ | — | | | | $ | — | | | | $ | — | | | | $ | — | | | | $ | 188 | | | | $ | — | | | | $ | — | | | | $ | 16,796 | | | | $ | 188 | |
| | | | | |
International Opportunities Fund | | | | | | | | | | | | | | | | | | | | | | | | | | | | | | | | | | | | | | | | | | | | | | | | | | |
Common Stocks | | | $ | 7,747 | | | | $ | — | | | | $ | — | | | | $ | — | | | | $ | — | | | | $ | 383 | | | | $ | — | | | | $ | — | | | | $ | 8,130 | | | | $ | 383 | |
| | | | | |
| | | $ | 7,747 | | | | $ | — | | | | $ | — | | | | $ | — | | | | $ | — | | | | $ | 383 | | | | $ | — | | | | $ | — | | | | $ | 8,130 | | | | $ | 383 | |
| | | | | |
Micro Cap Fund | | | | | | | | | | | | | | | | | | | | | | | | | | | | | | | | | | | | | | | | | | | | | | | | | | |
Common Stocks | | | $ | 17,849,029 | | | | $ | — | | | | $ | — | | | | $ | — | | | | $ | — | | | | $ | — | | | | $ | — | | | | $ | (17,849,029 | ) | | | $ | — | | | | $ | — | |
| | | | | |
| | | | $17,849,029 | | | | $ | — | | | | $ | — | | | | $ | — | | | | $ | — | | | | $ | — | | | | $ | — | | | | $ | (17,849,029 | ) | | | $ | — | | | | $ | — | |
| | | | | |
121
Notes to Financial Statements (continued)
| | | | | | | | | | | | | | | | | | | | | | | | | | | | | | | | | | | | | | | | | | | | | | | | | | |
| Fund | | Market Value
Beginning
Balance
9/30/2019 | | Purchases
at Cost | | Sales
(Proceeds) | | Accrued
Discounts
(Premiums) | | Realized
Gain/
(Loss) | | Change in
Unrealized
Appreciation
(Depreciation) | | Transfers
in at
Market
Value | | Transfers
out at
Market
Value | | Market Value
Ending
Balance
9/30/2020 | | Net Change
in Unrealized
Appreciation
(Depreciation)
on Investments
Held at
9/30/2020 |
Micro Cap Value Fund | | | | | | | | | | | | | | | | | | | | | | | | | | | | | | | | | | | | | | | | | | | | | | | | | | |
Common Stocks | | | $ | 20,211 | | | | $ | — | | | | $ | — | | | | $ | — | | | | $ | — | | | | $ | (2,526 | ) | | | $ | — | | | | $ | — | | | | $ | 17,685 | | | | $ | (2,526 | ) |
Preferred Stocks | | | | 1,956,197 | | | | | 121,753 | | | | | — | | | | | — | | | | | — | | | | | (189,619 | ) | | | | — | | | | | — | | | | | 1,888,331 | | | | | (189,619 | ) |
Warrants | | | | 28,900 | | | | | — | | | | | (79,198 | ) | | | | — | | | | | (195,484 | ) | | | | 245,782 | | | | | — | | | | | — | | | | | — | | | | | (2,500 | ) |
Rights | | | | 391,628 | | | | | — | | | | | — | | | | | — | | | | | — | | | | | (391,628 | ) | | | | — | | | | | — | | | | | — | | | | | — | |
| | | | | |
| | | $ | 2,396,936 | | | | $ | 121,753 | | | | $ | (79,198 | ) | | | $ | — | | | | $ | (195,484 | ) | | | $ | (337,991 | ) | | | $ | — | | | | $ | — | | | | $ | 1,906,016 | | | | $ | (194,645 | ) |
| | | | | |
Small Cap Growth Fund | | | | | | | | | | | | | | | | | | | | | | | | | | | | | | | | | | | | | | | | | | | | | | | | | | |
Common Stocks | | | $ | 16,980,008 | | | | $ | — | | | | $ | — | | | | $ | — | | | | $ | — | | | | $ | — | | | | $ | — | | | | $ | (16,980,008 | ) | | | $ | — | | | | $ | — | |
Preferred Stocks | | | | 11,141,900 | | | | | — | | | | | — | | | | | — | | | | | — | | | | | (1,009,675 | ) | | | | — | | | | | — | | | | | 10,132,225 | | | | | (1,009,674 | ) |
Limited Partnership
Interest | | | | 2,552,478 | | | | | — | | | | | (1,210,000 | ) | | | | — | | | | | — | | | | | (1,124,600 | ) | | | | — | | | | | — | | | | | 217,878 | | | | | (1,124,600 | ) |
Seller’s Note | | | | 1,728,000 | | | | | — | | | | | (1,728,000 | ) | | | | 363,859 | | | | | — | | | | | (363,859 | ) | | | | — | | | | | — | | | | | — | | | | | — | |
| | | | | |
| | | $ | 32,402,386 | | | | $ | — | | | | $ | (2,938,000 | ) | | | $ | 363,859 | | | | $ | — | | | | $ | (2,498,134 | ) | | | $ | — | | | | $ | (16,980,008 | ) | | | $ | 10,350,103 | | | | $ | (2,134,274 | ) |
| | | | | |
Ultra Growth Fund | |
Common Stocks | | | $ | 3,820,500 | | | | $ | — | | | | $ | — | | | | $ | — | | | | $ | — | | | | $ | — | | | | $ | — | | | | $ | (3,820,500 | ) | | | $ | — | | | | $ | — | |
Preferred Stocks | | | | 377,919 | | | | | — | | | | | — | | | | | — | | | | | — | | | | | (149,318 | ) | | | | — | | | | | — | | | | | 228,601 | | | | | (149,318 | ) |
Limited Partnership
Interest | | | | 2,391,055 | | | | | — | | | | | (1,140,000 | ) | | | | — | | | | | — | | | | | (1,048,103 | ) | | | | — | | | | | — | | | | | 202,952 | | | | | (1,048,103 | ) |
Seller’s Note | | | | 132,000 | | | | | — | | | | | (132,000 | ) | | | | 28,207 | | | | | — | | | | | (28,207 | ) | | | | — | | | | | — | | | | | — | | | | | — | |
| | | | | |
| | | $ | 6,721,474 | | | | $ | — | | | | $ | (1,272,000 | ) | | | $ | 28,207 | | | | $ | — | | | | $ | (1,225,628 | ) | | | $ | — | | | | $ | (3,820,500 | ) | | | $ | 431,553 | | | | $ | (1,197,421 | ) |
| | | | | |
Quantitative Information About Level 3 Fair Value Measurements
| | | | | | | | | | | | | | |
| Fund | | Description | | Fair Value
at 9/30/2020 | | | Valuation Technique | | Unobservable Input | | Range (Average) | |
| Micro Cap Value Fund | | Convertible Preferred Stocks: Oil & Gas Refining & Marketing | | $ | 1,888,331 | | | Market comparable companies | | Par multiple | |
| 0.98 - 1.05
(1.00) |
|
| | | | | | | | | | | Discount for lack of marketability, lower debt seniority & lower credit quality | | | 10% | |
| Small Cap Growth Fund | | Direct Venture Capital Investments: Biotechnology | | $ | 914,401 | | | Market comparable companies | | EV/R* multiple | |
| 0.5 - 20.1
(8.4) |
|
| | | | | | | | | | | Discount for lack of marketability | | | 20% | |
| Small Cap Growth Fund | | Direct Venture Capital Investments: Systems Software | | $ | 9,217,824 | | | Market comparable companies | | EV/R* multiple | |
| 1.6 - 24.1
(10.7) |
|
| | | | | | | | | | | Discount for lack of marketability | | | 20% | |
| Small Cap Growth Fund | | Limited Partnership Interest: Asset Management & Custody Banks | | $ | 217,878 | | | Discount to NAV | | Discount to NAV | | | 25% | |
| Ultra Growth Fund | | Direct Venture Capital Investments: Biotechnology | | $ | 228,601 | | | Market comparable companies | | EV/R* multiple | |
| 0.5 - 20.1
(8.4) |
|
| | | | | | | | | | | Discount for lack of marketability | | | 20% | |
| Ultra Growth Fund | | Limited Partnership Interest: Asset Management & Custody Banks | | $ | 202,952 | | | Discount to NAV | | Discount to NAV | | | 25% | |
| * | Enterprise-Value-To-Revenue Multiple (“EV/R”) is a measure of the value of a stock that compares a company’s enterprise value to its revenue. |
Changes in EV/R multiples may change the fair value of an investment. Generally, a decrease in this multiple will result in a decrease in the fair value of an investment.
122
The Funds’ other Level 3 investments have been valued using observable inputs, unadjusted third-party transactions and quotations or unadjusted historical third party information. No unobservable inputs internally developed by the Funds have been applied to these investments, thus they have been excluded from the above table.
Other information regarding the Funds is available in the Funds’ most recent Prospectus and Report to Shareholders. This information is available on the Funds’ website at wasatchglobal.com and on the Securities and Exchange Commission’s website at www.sec.gov.
13. OFFSETTING
Each Fund is party to various netting arrangements. The Financial Accounting Standards Board (“FASB”) requires disclosure about certain netting arrangements and similar agreements to enable users of a Fund’s financial statements to evaluate the effect or potential effect of netting arrangements on the Fund’s financial position. The scope of the disclosure is limited to derivative instruments, repurchase agreements and reverse repurchase agreements, and securities borrowing and securities lending transactions.
The following tables present information about financial instruments that were subject to enforceable netting arrangements as of September 30, 2020:
Repurchase Agreements
| | | | | | | | | | | | | | | | | | | | | | |
| | | | | Gross Amounts Not Offset in the Statements of Assets and Liabilities |
| Fund | | Counterparty | | Gross Asset Amounts
Presented in Statements
of Assets and Liabilities | | Financial
Instrument | | Collateral
Received1 | | Net Amount
(not less
than 0) |
Core Growth Fund | | Fixed Income Clearing Corp. | | | $ | 28,439,862 | | | | $ | — | | | | $ | (28,439,862 | ) | | | $ | — | |
Emerging India Fund | | Fixed Income Clearing Corp. | | | | 6,008,474 | | | | | — | | | | | (6,008,474 | ) | | | | — | |
Emerging Markets Select Fund | | Fixed Income Clearing Corp. | | | | 381,249 | | | | | — | | | | | (381,249 | ) | | | | — | |
Emerging Markets Small Cap Fund | | Fixed Income Clearing Corp. | | | | 5,440,477 | | | | | — | | | | | (5,440,477 | ) | | | | — | |
Frontier Emerging Small Countries Fund | | Fixed Income Clearing Corp. | | | | 105,576 | | | | | — | | | | | (105,576 | ) | | | | — | |
Global Opportunities Fund | | Fixed Income Clearing Corp. | | | | 720,290 | | | | | — | | | | | (720,290 | ) | | | | — | |
Global Select Fund | | Fixed Income Clearing Corp. | | | | 538,556 | | | | | — | | | | | (538,556 | ) | | | | — | |
Global Value Fund | | Fixed Income Clearing Corp. | | | | 948,033 | | | | | — | | | | | (948,033 | ) | | | | — | |
International Growth Fund | | Fixed Income Clearing Corp. | | | | 40,358,435 | | | | | — | | | | | (40,358,435 | ) | | | | — | |
International Opportunities Fund | | Fixed Income Clearing Corp. | | | | 21,877,750 | | | | | — | | | | | (21,877,750 | ) | | | | — | |
International Select Fund | | Fixed Income Clearing Corp. | | | | 153,091 | | | | | — | | | | | (153,091 | ) | | | | — | |
Micro Cap Fund | | Fixed Income Clearing Corp. | | | | 17,242,065 | | | | | — | | | | | (17,242,065 | ) | | | | — | |
Micro Cap Value Fund | | Fixed Income Clearing Corp. | | | | 11,437,026 | | | | | — | | | | | (11,437,026 | ) | | | | — | |
Small Cap Growth Fund | | Fixed Income Clearing Corp. | | | | 43,083,458 | | | | | — | | | | | (43,083,458 | ) | | | | — | |
Small Cap Value Fund | | Fixed Income Clearing Corp. | | | | 14,809,933 | | | | | — | | | | | (14,809,933 | ) | | | | — | |
Ultra Growth Fund | | Fixed Income Clearing Corp. | | | | 144,864,879 | | | | | — | | | | | (144,864,879 | ) | | | | — | |
U.S. Treasury Fund | | Fixed Income Clearing Corp. | | | | 8,559,652 | | | | | — | | | | | (8,559,652 | ) | | | | — | |
| 1 | Repurchase agreements are classified as short-term investments in the Statements of Assets and Liabilities. The market value of the collateral received is greater than the amounts indicated in the table above. For further information, see Note 3—Securities and Other Investments “Repurchase Agreements” and the Schedules of Investments. |
14. REVISION OF PRIOR YEAR FINANCIAL STATEMENTS
During the preparation of the September 30, 2020 financial statements, it was determined that certain amounts reported in the September 30, 2018 and September 30, 2019 financial statements for the Global Value Fund were incorrect due to an error in accounting for the Fund’s reorganization in 2018. The error resulted in a $3,407,882 overstatement of paid-in capital in excess of par and a $3,407,882 understatement of distributable earnings (accumulated loss) on the Statement of Assets and Liabilities for the periods ended September 30, 2018 and September 30, 2019. The adjustment had no impact on the Fund’s net assets or NAV at September 30, 2020 and had no impact on the Fund’s assets and liabilities, Statement
of Operations, Statement of Changes in Net Assets or Financial Highlights for the years ended September 30, 2018 and September 30, 2019. Management evaluated the impact of the error on the current and prior year financial statements and determined that the previously issued financial statements were not materially misstated; therefore the adjustment was corrected in these financial statements.
15. SUBSEQUENT EVENTS
Management has evaluated the possibility of subsequent events and has determined that there are no additional events that would require adjustment to or additional disclosure in the Funds’ financial statements.
123
| | |
| Wasatch Funds | | SEPTEMBER 30, 2020 |
Report of Independent Registered Public Accounting Firm
To the Board of Trustees of Wasatch Funds Trust and Shareholders of each of the seventeen funds listed in the table below
OPINIONS ON THE FINANCIAL STATEMENTS
We have audited the accompanying statements of assets and liabilities, including the schedules of investments, of each of the funds indicated in the table below (constituting Wasatch Funds Trust, hereafter collectively referred to as the “Funds”) as of September 30, 2020, the related statements of operations and of changes in net assets for each of the periods indicated in the table below, including the related notes, and the financial highlights for each of the periods indicated in the table below (collectively referred to as the “financial statements”). In our opinion, the financial statements present fairly, in all material respects, the financial position of each of the Funds as of September 30, 2020, the results of each of their operations, the changes in each of their net assets, and each of the financial highlights for each of the periods indicated in the table below, in conformity with accounting principles generally accepted in the United States of America.
| | |
Wasatch Core Growth Fund® (1) | | Wasatch Emerging India Fund® (2) |
Wasatch Emerging Markets Select Fund® (1) | | Wasatch Emerging Markets Small Cap Fund® (2) |
Wasatch Frontier Emerging Small Countries Fund® (2) | | Wasatch Global Opportunities Fund® (2) |
Wasatch Global Select Fund® (3) | | Wasatch Global Value Fund® (1) |
Wasatch International Growth Fund® (2) | | Wasatch International Opportunities Fund® (2) |
Wasatch International Select Fund® (3) | | Wasatch Micro Cap Fund® (2) |
Wasatch Micro Cap Value Fund® (2) | | Wasatch Small Cap Growth Fund® (2) |
Wasatch Small Cap Value Fund® (1) | | Wasatch Ultra Growth Fund® (2) |
Wasatch-Hoisington U.S. Treasury Fund® (1) | | |
| | 1. | Statement of operations for the year ended September 30, 2020, statement of changes in net assets for the years ended September 30, 2020 and 2019 and financial highlights for the years ended September 30, 2020, 2019, 2018, 2017 and 2016 |
| | 2. | Statement of operations for the year ended September 30, 2020, statement of changes in net assets for the years ended September 30, 2020 and 2019 and financial highlights for each of the periods indicated therein |
| | 3. | Statement of operations, statement of changes in net assets and financial highlights for the period October 1, 2019 (inception) through September 30, 2020 |
BASIS FOR OPINIONS
These financial statements are the responsibility of the Funds’ management. Our responsibility is to express an opinion on the Funds’ financial statements based on our audits. We are a public accounting firm registered with the Public Company Accounting Oversight Board (United States) (“PCAOB”) and are required to be independent with respect to the Funds in accordance with the U.S. federal securities laws and the applicable rules and regulations of the Securities and Exchange Commission and the PCAOB.
We conducted our audits of these financial statements in accordance with the standards of the PCAOB. Those standards require that we plan and perform the audit to obtain reasonable assurance about whether the financial statements are free of material misstatement, whether due to error or fraud.
Our audits included performing procedures to assess the risks of material misstatement of the financial statements, whether due to error or fraud, and performing procedures that respond to those risks. Such procedures included examining, on a test basis, evidence regarding the amounts and disclosures in the financial statements. Our audits also included evaluating the accounting principles used and significant estimates made by management, as well as evaluating the overall presentation of the financial statements. Our procedures included confirmation of securities owned as of September 30, 2020 by correspondence with the custodian, transfer agent and brokers; when replies were not received from brokers, we performed other auditing procedures. We believe that our audits provide a reasonable basis for our opinions.
/s/ PricewaterhouseCoopers LLP
Kansas City, Missouri
November 19, 2020
We have served as the auditor of one or more investment companies in Wasatch Funds Trust since 2002.
124
| | |
| Wasatch Funds | | SEPTEMBER 30, 2020 |
Supplemental Information
MANAGEMENT OF THE TRUST
Management Information. The business affairs of Wasatch Funds are overseen by its Board of Trustees. The Board consists of five Independent Trustees. Each of the Independent Trustees was elected by shareholders to serve until their successors are qualified, appointed or elected in accordance with the Trust’s Declaration of Trust and By-Laws.
The Trustees and executive officers of Wasatch Funds and their principal occupations for at least the last five years are set forth below. The Advisor retains proprietary rights to the Trust name. The Advisor retains proprietary rights to the Trust name. The Funds’ Statement of Additional Information includes additional information about the Trustees and is available, without charge, online at wasatchglobal.com or upon request by calling Wasatch Funds at 800.551.1700.
| | | | | | | | | | | | |
Name, Address
and Age | | Position(s) Held with
Wasatch Funds | | Term of Office1
and Length of
Time Served | | Principal Occupation(s)
during Past 5 Years | | Number of
Portfolios
in Fund
Complex
Overseen
by Trustee | | | Other Directorships
Held by Trustees
during Past 5 Years2 |
Independent Trustees | | | | | | | | | | | | |
| | | | | |
Miriam M. Allison 505 Wakara Way 3rd Floor Salt Lake City, UT 84108 Age 73 | | Trustee and Chair of the Board | | Indefinite Served as Trustee since 2010 | | Rancher since 2004. From 2001 to 2005, Chairman of UMB Fund Services, Inc. | | | 17 | | | Director, Northwestern Mutual Series Fund, Inc. (27 portfolios) since 2006. |
| | | | | |
James U. Jensen, J.D., MBA 505 Wakara Way 3rd Floor Salt Lake City, UT 84108 Age 76 | | Trustee and former Chair of the Board | | Indefinite Served as Chair of the Board from 2004 to 2019 and Trustee since
1986 | | Chief Executive Officer of Clearwater Law & Governance Group (an operating law firm board governance consulting company) April 2008 to present; Vice President, Corporate Development, Legal Affairs and General Counsel, and Secretary, NPS Pharmaceuticals, Inc. from 1991 to 2004. | | | 17 | | | Trustee, Northern Lights Fund Trust III (38 portfolios) since 2012. |
| | | | | |
Heikki Rinne 505 Wakara Way 3rd Floor Salt Lake City, UT 84108 Age 68 | | Trustee and Chair of the Governance and Nominating Committee | | Indefinite Served as Trustee since October 2012 | | Chief Executive Officer of the Halton Group Ltd. (an indoor environmental control manufacturing and technology company), from 2002 to 2016. A Founder and Principal Owner of Sitoumus LLC (a training and consulting firm focusing on empowering organizational and individual engagement as well as general consulting) from January 2017 to present. | | | 17 | | | Director, Halton Group Ltd. since 2016. |
| | | | | |
Kristen M. Fletcher 505 Wakara Way 3rd Floor Salt Lake City, UT 84108 Age 67 | | Trustee and Chair of
the Audit Committee | | Indefinite Served as Trustee since October 2014 | | Director, Youth Sports Alliance since 2015. Trustee, Woodlands Commercial Bank (a/k/a Lehman Brothers Commercial Bank) from 2009 to 2012. Chairman and CEO, ABN AMRO, Inc. and U.S. Country Representative, ABN AMRO Bank, NV from 2002 to 2004. | | | 17 | | | Director, Youth Sports Alliance since 2015. Trustee, Woodlands Commercial Bank (a/k/a Lehman Brothers Commercial Bank) from 2009 to 2012. Director Emeritus, Utah Symphony/Utah Opera since September 2017. Director, Utah Symphony/Utah Opera from 2005 to 2017. |
| | | | | |
Mark Robinson3 505 Wakara Way 3rd Floor Salt Lake City, UT 84108 Age 61 | | Trustee | | Indefinite Served as Trustee since 2020 | | Chief Financial Officer of Truckstop.com LLC from 2016 to 2019. Chief Financial Officer of SABA Software, Inc. from 2013 to 2015. | | | 17 | | | Chairman of Vita Vis Nutrition, Inc. from 2014 to 2016. |
|
|
| 1. | A Trustee may serve until his/her death, resignation, removal or retirement. Each Independent Trustee shall retire as Trustee at the end of the calendar year in which he/she attains the age of 75 years. The Board of Trustees reserves the right to permit continued service after the mandatory retirement age for any individual Trustee in its sole discretion. The Board has approved a one-year waiver from the mandatory retirement age for Mr. Jensen. |
| 2. | Directorships are those held by a Trustee in any company with a class of securities registered pursuant to Section 12 of the Securities Exchange Act of 1934 or subject to the requirements of Section 15(d) of the Securities Exchange Act or any company registered as an investment company under the 1940 Act. |
| 3. | Effective April 1, 2020, Mr. Robinson was appointed as a Trustee of the Trust. |
125
Supplemental Information (continued)
| | | | | | |
Name, Address
and Age | | Position(s)
Held with
Trust | | Term of Office and
Length of Time Served | | Principal Occupation(s)
during Past 5 Years |
Officers | | | | | | |
| | | |
Eric S. Bergeson 505 Wakara Way 3rd Floor Salt Lake City, UT 84108 Age 54 | | President | | Indefinite Served as President since May 2018 | | President for Wasatch Funds since May 2018. President of the Advisor since January 2017. Vice President of Institutional Sales for the Advisor since June 1998. |
| | | |
Russell L. Biles 505 Wakara Way 3rd Floor Salt Lake City, UT 84108 Age 52 | | Chief Compliance Officer, Vice President and Secretary | | Indefinite Served as Chief Compliance Officer and Vice President since February 2007 and Secretary since November 2008 | | Chief Compliance Officer and Vice President for Wasatch Funds since February 2007. Secretary for Wasatch Funds since November 2008. Counsel for the Advisor since October 2006. |
| | | |
Michael K. Yeates 505 Wakara Way 3rd Floor Salt Lake City, UT 84108 Age 38 | | Treasurer | | Indefinite Served as Treasurer since May 2018 | | Treasurer for Wasatch Funds since May 2018. Chief Financial Officer of the Advisor since September 2007. |
| | | |
David Corbett 505 Wakara Way 3rd Floor Salt Lake City, UT 84108 Age 47 | | Assistant Vice President | | Indefinite Served as Assistant Vice President since August 2012 | | Assistant Vice President for Wasatch Funds since August 2012. Director of Mutual Fund Services for the Advisor since June 2007. |
| | | |
Cheryl Reich 505 Wakara Way 3rd Floor Salt Lake City, UT 84108 Age 37 | | Assistant Secretary | | Indefinite Served as Assistant Secretary since February 2017 | | Assistant Secretary for Wasatch Funds since February 2017. Compliance Associate for the Advisor since September 2012. |
| | | |
Kara H. Becker 505 Wakara Way 3rd Floor Salt Lake City, UT 84108 Age 37 | | Assistant Treasurer | | Indefinite Served as Assistant Treasurer since May 2018 | | Assistant Treasurer for Wasatch Funds since May 2018. Controller for the Advisor since January 2012. |
|
|
126
PROXY VOTING POLICIES, PROCEDURES AND RECORD
A description of the policies and procedures that Wasatch Advisors uses to vote proxies related to the Funds’ portfolio securities is set forth in the Funds’ Statement of Additional Information, which is available without charge, upon request, on the Funds’ website at wasatchglobal.com or by calling 800.551.1700 and on the Securities and Exchange Commission’s (SEC) website at www.sec.gov.
Wasatch Funds’ proxy voting record is available without charge on the Funds’ website at wasatchglobal.com and on the SEC’s website at www.sec.gov no later than August 31 for the prior 12 months ended June 30.
QUARTERLY PORTFOLIO HOLDINGS DISCLOSURE ON FORM N-PORT
The Funds file their complete schedules of investments with the SEC for their first and third quarters of each fiscal year as an exhibit to its reports on Form N-PORT. The Funds’ Form N-PORT reports are available on the SEC’s website at www.sec.gov.
STATEMENT REGARDING LIQUIDITY RISK MANAGEMENT PROGRAM
Consistent with Rule 22e-4 under the Investment Company Act of 1940, the Wasatch Funds have adopted a Liquidity Risk Management Program to govern the approach to managing liquidity risk within the Wasatch Funds (the “Program”). The Board has approved the designation of the Advisor’s Liquidity Risk Committee to oversee the Program.
The Program’s principal objectives include supporting each Fund’s compliance with limits on investments in illiquid assets
and mitigating the risk that a Fund will be unable to meet its redemption obligations in a timely manner. The Program also includes a number of elements that support the management and assessment of liquidity risk, including an annual assessment of factors that influence a Fund’s liquidity and the periodic classification and re-classification of a Fund’s investments into groupings that reflect the Liquidity Risk Committee’s assessment of their relative liquidity under current market conditions.
Each of the Wasatch Funds maintains a high level of liquidity and is deemed to be a Fund that primarily holds assets that are defined as highly liquid investments. A Highly Liquid Investment is defined as cash and any investment reasonably expected to be convertible to cash in current market conditions in three business days or less without the conversion to cash significantly changing the market value of the investment. A Fund that is deemed to primarily hold assets that are Highly Liquid Investments will have at least 55% of its net assets in Highly Liquid Investments. As a result, each Fund has not adopted a Highly Liquid Investment minimum.
There have been no liquidity events that have materially affected the performance of each Fund or its ability to timely meet redemptions without dilution to existing shareholders. The Liquidity Risk Committee has determined, and reported to the Board, that the Program has operated adequately and effectively to manage each Fund’s liquidity risk since implementation. There can be no assurance that the Program will achieve its objectives in the future. Please refer to your Fund’s prospectus for more information regarding the Fund’s exposure to liquidity risk and other principal risks to which an investment in the Fund may be subject.
Further information on liquidity risks applicable to the Fund can be found within the Prospectus.
127
| | |
| Wasatch Funds | | SEPTEMBER 30, 2020 |
Service Providers
Investment Advisor
Wasatch Advisors, Inc. d/b/a Wasatch Global Investors
505 Wakara Way, 3rd Floor
Salt Lake City, UT 84108
Sub-Advisor for the Wasatch-Hoisington U.S. Treasury Fund
Hoisington Investment Management Co. (HIMCo)
6836 Bee Caves Road
Building 2, Suite 100
Austin, TX 78746
Administrator and Fund Accountant
State Street Bank and Trust Company
801 Pennsylvania Avenue
Kansas City, MO 64105
Distributor
ALPS Distributors, Inc.
1290 Broadway, Suite 1100
Denver, CO 80203
Transfer Agent
UMB Fund Services, Inc.
235 West Galena Street
Milwaukee, WI 53212
Custodian
State Street Bank and Trust Company
801 Pennsylvania Avenue
Kansas City, MO 64105
Legal Counsel to Wasatch Funds and Independent Trustees
Chapman and Cutler, LLP
111 West Monroe Street
Chicago, IL 60603
Independent Registered Public Accounting Firm
PricewaterhouseCoopers LLP
1100 Walnut Street, Suite 1300
Kansas City, MO 64106
ONLINE
wasatchglobal.com
or via email
shareholderservice@wasatchfunds.com
TELEPHONE
800.551.1700
M - F, 7:00 a.m. to 7:00 p.m. Central Time
Automated Line, 24 Hours
MAIL
Regular Mail Delivery
Wasatch Funds
P.O. Box 2172
Milwaukee, WI 53201-2172
Overnight Delivery
Wasatch Funds
235 West Galena Street
Milwaukee, WI 53212
128
WASATCHGLOBAL.COM ACTIVE MANAGEMENT FOR INEFFICIENT MARKETS SMALL CAP MICRO CAP INTERNATIONAL EMERGING MARKETS FRONTIER MARKETS GLOBAL
Item 2. Code of Ethics.
| (a) | Wasatch Funds Trust (the “Registrant”) has adopted a Code of Ethics that applies to the Registrant’s principal executive officer and principal financial officer. |
| (b) | No disclosures are required by this Item 2(b). |
| (c) | There have been no amendments to the Registrant’s Code of Ethics during the reporting period for this Form N-CSR. |
| (d) | There have been no waivers granted by the Registrant to individuals covered by the Registrant’s Code of Ethics during the reporting period for this Form N-CSR. |
| (f) | A copy of the Registrant’s Code of Ethics is attached as an exhibit to this Form N-CSR. |
Item 3. Audit Committee Financial Expert.
| (1) | The Board of Trustees of the Registrant has determined that the Registrant has at least one member serving on the Registrant’s Audit Committee that possesses the attributes identified in Instruction 2(b) of Item 3 to Form N-CSR to qualify as “audit committee financial expert.” |
| (2) | The name of the audit committee financial experts are Miriam M. Allison and Kristen Fletcher. Each is deemed to be “independent” as that term is defined in Item 3(a)(2) of Form N-CSR. |
Item 4. Principal Accountant Fees and Services.
| (a) | Audit Fees - The aggregate fees billed for professional services rendered by the independent registered public accounting firm for the audit of the Registrant’s annual financial statements or services normally provided in connection with statutory and regulatory filings or engagements for the last two fiscal years ended September 30, 2020 and 2019 were $497,528 and $418,480, respectively. |
| (b) | Audit Related Fees – During the fiscal years ended September 30, 2020 and 2019, the Registrant was not billed any fees by the independent registered public accounting firm for assurance and related services rendered by the independent registered public accounting firm to the Registrant that are reasonably related to the performance of the audit of the Registrant’s financial statements and are not reported under paragraph (a) of this Item 4. |
During the fiscal years ended September 30, 2020 and 2019, no fees for assurance and related services that relate directly to the operations and financial reporting of the Registrant were billed by the independent registered public accounting firm to the Registrant’s investment adviser (the “Advisor”) or any other entity controlling, controlled by, or under common control with the Advisor that provides ongoing services to the Registrant.
| (c) | Tax Fees - The aggregate fees billed for professional services rendered by the independent registered public accounting firm to the Registrant for tax compliance, tax advice, tax planning and tax return preparation for the last two fiscal years ended September 30, 2020 and 2019 were $106,275 and $146,642, respectively. These services consisted of the independent registered public accounting firm reviewing the Registrant’s excise tax returns, distribution requirements and RIC tax returns. |
During the fiscal years ended September 30, 2020 and 2019, no fees for tax compliance, tax advice or tax planning services that relate directly to the operations and financial reporting of the Registrant were billed
by the independent registered public accounting firm to the Advisor or any other entity controlling, controlled by, or under common control with the Advisor that provides ongoing services to the Registrant.
| (d) | All Other Fees – The aggregate fees billed for products and services provided by the independent registered public accounting firm to the Registrant, other than the services reported in paragraph (a) – (c) of this Item 4, for the fiscal years ended September 30, 2020 and 2019 were $0 and $0, respectively. |
During the fiscal years ended September 30, 2020 and 2019, no fees for other services that relate directly to the operations and financial reporting of the Registrant were billed by the independent registered public accounting firm to the Advisor or any other entity controlling, controlled by, or under common control with the Advisor that provides ongoing services to the Registrant.
| (e) | Pre-Approval Policies and Procedures |
(1) Pursuant to the registrant’s Audit Committee Charter, the Audit Committee shall evaluate the independence of the independent public accountants, including evaluating whether the independent public accountants provide audit services or consulting services to the Registrant or consulting services to the Advisor, and to receive the specific representations of the independent registered public accounting firm as to their independence. Specifically, the Audit Committee will be responsible for evaluating the provision of non-audit services to the Registrant as required by Section 201 of the Sarbanes-Oxley Act, any pre-approval requests submitted by the independent registered public accounting firm as required by Section 202 of the Sarbanes-Oxley Act or as otherwise required under Section 2-01 of Regulation S-X, and shall monitor the conflict of interest requirements in Section 206 of the Sarbanes-Oxley Act, and the prohibitions on improper influence on the conduct of audits in Section 303 of the Sarbanes-Oxley Act. The Audit Committee shall pre-approve any engagement of the independent registered public accounting firm to provide any services (other than prohibited non-audit services) including the fees and other compensation to be paid to the independent registered public accounting firm.
The independent registered public accounting firm is authorized by the Audit Committee to provide non-audit services to the extent allowable under the Sarbanes-Oxley Act of 2002 for the Registrant provided that (i) the fees payable with respect to such services do not exceed $5,000 in any calendar quarter and (ii) such fees are ratified by the Audit Committee at its next meeting. The fees payable with respect to non-audit services may be increased by the affirmative vote of a majority of the members of the Audit Committee.
(2) There were no pre-approval requirements waived for the services provided to the Registrant described in paragraphs (b)-(d) of Item 4 by the Audit Committee pursuant to paragraph (c)(7)(i)(C) of Rule 2-01 of Regulation S-X (the “De Minimis Rule”). There were no fees billed for services provided to the Advisor described in paragraphs (b)-(d) of Item 4 that were required to be pre-approved by the Audit Committee as described in paragraph (e)(1) of Item 4.
| (f) | No disclosures are required by this Item 4(f). |
| (g) | For the fiscal years ended September 30, 2020 and 2019, the aggregate non-audit fees billed by the independent registered public accounting firm for services rendered to the Registrant and the Advisor and any entity controlling, controlled by, or under common control with the Advisor that provided ongoing services to the Registrant were approximately $0 and $0, respectively. |
| (h) | No disclosures are required by this Item 4(h). |
Item 5. Audit Committee of Listed Registrants.
Not applicable.
Item 6. Investments.
| (a) | Schedule of Investments is included as a part of the report to shareholders filed under Item 1 of this Form N-CSR. |
Item 7. Disclosure of Proxy Voting Policies and Procedures for Closed-End Management Investment Companies.
Not applicable.
Item 8. Portfolio Managers of Closed-End Investment Companies.
Not applicable.
Item 9. Purchases of Equity Securities by Closed-End Management Investment Company and Affiliated Purchasers.
Not applicable.
Item 10. Submission of Matters to a Vote of Security Holders.
There have been no material changes to the procedures by which shareholders may recommend nominees to the Registrant’s board of trustees, where those changes were implemented after the Registrant last provided disclosure in response to this item.
Item 11. Controls and Procedures.
| (a) | The Registrant’s principal executive and principal financial officers have concluded that the Registrant’s disclosure controls and procedures (as defined in Rule 30a-3(c) under the Investment Company Act of 1940, as amended (the “1940 Act”)) are effective, as of a date within 90 days of the filing date of this Form N-CSR based on their evaluation of these controls and procedures required by Rule 30a-3(b) under the 1940 Act) and Rules 13a-15(b) or 15d-15(b) under the Securities Exchange Act of 1934). |
| (b) | There were no changes in the Registrant’s internal control over financial reporting (as defined in Rule 30a-3(d) under the 1940 Act) that occurred during the period covered by this report that has materially affected, or is reasonably likely to materially affect, the Registrant’s internal control over financial reporting. |
Item 12. Disclosure of Securities Lending Activities for Closed-End Management Investment Companies.
Item 13. Exhibits.
SIGNATURES
Pursuant to the requirements of the Securities Exchange Act of 1934 and the Investment Company Act of 1940, the Registrant has duly caused this report to be signed on its behalf by the undersigned, thereunto duly authorized.
WASATCH FUNDS TRUST
| | |
By: | | /s/ Eric S. Bergeson |
| | Eric S. Bergeson |
| | President (principal executive officer) of Wasatch Funds Trust |
| |
Date: | | December 1, 2020 |
Pursuant to the requirements of the Securities Exchange Act of 1934 and the Investment Company Act of 1940, this report has been signed below by the following persons on behalf of the Registrant and in the capacities and on the dates indicated.
| | |
By: | | /s/ Eric S. Bergeson |
| | Eric S. Bergeson |
| | President (principal executive officer) of Wasatch Funds Trust |
| |
Date: | | December 1, 2020 |
| |
By: | | /s/ Michael K. Yeates |
| | Michael K. Yeates |
| | Treasurer (principal financial officer) of Wasatch Funds Trust |
| |
Date: | | December 1, 2020 |