UNITED STATES
SECURITIES AND EXCHANGE COMMISSION
Washington, D.C. 20549
FORM N-CSR
CERTIFIED SHAREHOLDER REPORT OF REGISTERED
MANAGEMENT INVESTMENT COMPANIES
Investment Company Act file number: 811-04920
WASATCH FUNDS TRUST
(Exact name of registrant as specified in charter)
505 Wakara Way, 3rd Floor
Salt Lake City, UT 84108
(Address of principal executive offices)(Zip code)
| | |
| (Name and Address of Agent for Service) | | Copy to: |
| |
Samuel S. Stewart, Jr. Wasatch Advisors, Inc. 505 Wakara Way, 3rd Floor Salt Lake City, UT 84108 | | Eric F. Fess, Esq. Chapman & Cutler LLP 111 West Monroe Street Chicago, IL 60603 |
Registrant’s telephone number, including area code: (801) 533-0777
Date of fiscal year end: September 30
Date of reporting period: September 30, 2017
Item 1. Report to Shareholders.

2017 Annual Report September 30, 2017 Equity Funds / Wasatch Core Fund Wasatch Emerging India Fund Wasatch Emerging Markets Select Fund Wasatch Emerging Markets Small Cap Fund Wasatch Frontier Emerging Small Countries Fund Wasatch Global Opportunities Fund Wasatch International Growth Fund Wasatch International Opportunities Fund Wasatch Large Cap Value Fund Wasatch Long/Short Fund Wasatch Micro Cap Fund Wasatch Micro Cap Value Fund Wasatch Small Cap Growth Fund Wasatch Small Cap Value Fund Wasatch Strategic Income Fund Wasatch Ultra Growth Fund Wasatch World Innovators Fund Bond Funds / Wasatch-1st Source Income Fund Wasatch-Hoisington U.S. Treasury Fund
WASATCH FUNDS
Salt Lake City, Utah
www.WasatchFunds.com
800.551.1700
This material must be accompanied or preceded by a prospectus.
Please read the prospectus carefully before you invest.
Wasatch Funds are distributed by ALPS Distributors, Inc.
1
| | |
| LETTERTO SHAREHOLDERS — THE CALM AMIDSTTHE STORMS | | |
|
|
|
| | |

Samuel S. Stewart, Jr. PhD, CFA President of
Wasatch Funds | | DEAR FELLOW SHAREHOLDERS: Hurricane Harvey came first, pummeling Texas on August 25th. Less than two weeks later, Irma battered the Caribbean and Florida. Jose and Maria soon followed, again striking the Caribbean and disabling much of Puerto Rico’s infrastructure. In less than a month, four storms (two rated Category 4 and two Category 5) left a trail of destruction — estimated in the hundreds of billions of dollars — that will take months, if not years, to repair. Yet the financial markets hardly blinked. Hurricanes weren’t the only storms. There were political storms over health care, the debt ceiling, the National Football League and the Russia investigation. A storm of words raged between North Korea’s supreme leader Kim Jong Un and President Donald Trump. The belated announcement of a data breach at Equifax, potentially affecting nearly one of every two Americans, unleashed a storm of concern about cybersecurity. The Trump Twitter storm was unrelenting. And yet the markets hardly blinked. So far at least, regardless of the perils that have dominated the news day after day, the economy and markets have continued to advance. Truly, it’s been the calm amidst the storms. Which, of course, begs the question: Can it last? Or, from an investor’s point of view, might this be the calm before the storm in the |
financial markets?
As you know from my prior letters, I’ve been cautiously optimistic regarding the market. Generally speaking, financial markets take their cues from the economy. While investors have been quick to complain about the economy’s slow growth rate, it’s that very same measured pace that so far has prevented the economy from developing the excesses that typically lead to recessions and market declines.
With the current economic expansion now in its 100th month, the third-longest run since 1854, it’s important to note that recessions don’t occur in response to a timetable. Rather, they result from problems in the economy, of which there appear to be few.
I’m reluctant to go on record with a letter supporting the continuation of a bull market without also making an argument for the onset of a bear market. My bear-market argument depends on an unexpected event/catalyst, possibly geopolitical in nature. I’m not predicting such an event, and I’m surprised that one of the events cited above didn’t lead to a market correction. Even so, I still regard an event as the likely cause of the next bear market.
MARKETS
Many of my recent letters have commented that stocks — particularly in the U.S. — are expensive. However, I must admit that stocks aren’t as expensive if we consider the level of interest rates. After all, the inverse of the price/earnings (P/E) ratio (the price paid for $1 of earnings) is termed the earnings yield or the return in earnings for $1 of investment in a stock. The interest rate on a bond is the return in cash for $1 invested in the bond. While I won’t argue that the earnings yield on a stock and the interest rate on a bond are equivalent, they are related.
Going back 35 years when interest rates were in double-digit territory, P/E ratios for stocks were in single digits, with the result that the earnings yield on stocks was in double digits. In comparison, stocks today look quite expensive, with multiples close to three times what they were back then. However, that comparison overlooks the fact that bond rates are now only about one-fifth of what they were then, making bonds five times more expensive today than they were 35 years ago.
Avoiding much of the detail about what makes our economy today different from that of 35 years ago (and ignoring the risk premium stocks must offer for providing investors with earnings instead of cash), I could argue that stocks today are inexpensive relative to bonds. So if bonds aren’t overly expensive, then neither are stocks.
This might lead one to ask: Are bonds expensive? Relative to recent history, bonds in the U.S. seem expensive. Bond yields have generally fallen from double-digit territory into low single-digit territory. Ten-year U.S. Treasury bonds currently yield about 2.3%. However, German and Japanese government bonds of the same maturity yield less than 0.5%. Moreover, five-year government bonds in Germany and Japan have negative yields. So U.S. government bonds certainly aren’t expensive on a relative basis.
In a sign that interest rates overseas may remain low, some countries have been issuing 100-year bonds. Austria, for example, recently issued bonds that won’t mature until 2117 and that yield just 2.1%. Other recent issuers of 100-year bonds include Argentina, Ireland and Mexico. Purchased mainly by institutional investors to meet long-term pension and insurance obligations, these bonds indicate that slow economic growth around the world may constrain future investment returns. Why else would an institutional investor tie up money for so long? As for interest rates in the U.S., I have to wonder how much they can rise when rates are so low overseas.
Why are interest rates so low? At the heart of this question are cyclical vs. secular forces. If rates are low because the economy is weak, then the cyclical forces of our strengthening economy should drive rates higher. The fact that this has failed to happen suggests secular forces may be at play. For example, changing demographics may be weighing on interest rates. As people get older, they’re less likely to build new homes. Instead, they’re more likely to be downsizing. The primary concern of most older people is having adequate savings to support themselves in retirement. This global flood of savings is likely playing a major role in keeping interest rates low.
2
| | |
| | SEPTEMBER 30, 2017 (UNAUDITED) |
|
|
|
If in fact secular forces are keeping interest rates low, these forces may also be keeping stock prices high. So while valuations are stretched relative to earnings, they may not be as stretched relative to interest rates. For this reason and for the reasons discussed above, I remain cautiously optimistic that the economy and markets, both in the U.S. and abroad, will continue to advance at a slow pace overall.
WASATCH
While U.S. equities are generally more expensive, we’re often finding better valuations and/or greater headroom for growth overseas — both in developed markets and in emerging markets. Indeed, Japan is one of our largest investment allocations to an international developed market and India is one of our largest allocations to an emerging market.
We readily acknowledge that for many years — particularly in the 1990s and 2000s — Japan’s economy was mired in deflation, creating a difficult investment environment. For many investors, the perception remains that it’s tough to make money in Japan. Moreover, it’s true that the Japanese population is shrinking, the country’s overall economic growth is slow, and there’s not much inflation on the horizon. Nonetheless, we think that investors who look no further than these issues are missing out on significant opportunities.
Known as Abenomics, the economic policies introduced by Prime Minister Shinzo Abe in 2012 appear to be taking hold. Over the past few years, based on our investment team’s frequent visits to Japan, we’ve seen the positive results of these policies — from improvements in corporate governance to efforts addressing the country’s labor shortage.
Because Japan is a global leader in innovation, it’s no surprise the country has a vibrant market for small-cap stocks. This indicates Japan has created an entrepreneurial environment that favors investment. Unlike in much of the developed world, there are fewer dominant industry players in Japan. That’s beginning to change, however, and we’re investing in companies that we believe can consolidate their industries and gain market share from competitors.
After investing in the country for over a decade, the members of our investment team are more excited than ever about the investment opportunities they’re finding in India. With its democratic government and strong institutions, India has avoided much of the political turmoil, massive borrowing, debt defaults and runaway inflation that have plagued other emerging-market countries over the past 30 years. India’s population of greater than 1.3 billion is among the youngest in the world. In addition, the country’s growing middle class, increasing urbanization and rapid household formation are driving domestic consumer demand. Moreover, reforms introduced by Prime Minister Narendra Modi are designed to further the country’s growth and development.
With sincere thanks for your continued investment and for your trust,

Sam Stewart
Information in this document regarding market or economic trends, or the factors influencing historical or future performance, reflects the opinions of management as of the date of this document. These statements should not be relied upon for any other purpose. Past performance is no guarantee of future results, and there is no guarantee that the market forecasts discussed will be realized.
CFA® is a trademark owned by CFA Institute.
Wasatch Advisors is the investment advisor to Wasatch Funds.
Wasatch Funds are distributed by ALPS Distributors, Inc. (ADI). ADI is not affiliated with Wasatch Advisors or Wasatch Funds.
Abenomics refers to the economic policies advocated by Japanese Prime Minister Shinzo Abe after his December 2012 re-election to the post he last held in 2007. His aim was to revive the sluggish economy with “three arrows” — a massive fiscal stimulus, more aggressive monetary easing from the Bank of Japan, and structural reforms to boost Japan’s competitiveness.
A bull market is defined as a prolonged period in which investment prices rise faster than their historical average. Bull markets can happen as the result of an economic recovery, an economic boom, or investor psychology.
A bear market is generally defined as a drop of 20% or more in stock prices over at least a two-month period. Bears are investors who are pessimistic with regard to the stock market’s prospects.
The price/earnings (P/E) ratio, also known as the P/E multiple, is the price of a stock divided by its earnings per share.
Valuation is the process of determining the current worth of an asset or company.
3
| | |
| WASATCH CORE GROWTH FUND (WGROX / WIGRX) | | SEPTEMBER 30, 2017 (UNAUDITED) |
|
|
|
Management Discussion
The Wasatch Core Growth Fund is managed by a team of Wasatch portfolio managers led by JB Taylor, Paul Lambert and Mike Valentine.
| | | | |

JB Taylor Lead Portfolio Manager | | 
Paul Lambert Portfolio Manager | | 
Mike Valentine Portfolio Manager |
OVERVIEW
The Wasatch Core Growth Fund — Investor Class gained 18.69% for the 12 months ended September 30, 2017, lagging the 20.74% return of its benchmark, the Russell 2000 Index, and the 20.98% return of the Russell 2000 Growth Index.
The industrials and consumer-discretionary sectors were two of the strongest contributors to the Fund’s return during the 12-month period, outperforming the benchmark driven by stock selection. In addition, the Fund’s investments in the financials sector contributed significantly to results for the period.
The Fund’s strong showing in the industrials sector, particularly for the three months ended September 30, 2017, was also aided by an overweight position relative to the benchmark. Unlike the post-election “reflation trade” (or “Trump trade”) of the kind we avoided late last year, we recognize that the slow-growth economy is chugging along well enough now to favor a positive turn for the sector, which we believe bodes well for our industrial holdings.
DETAILSOFTHE YEAR
ICON plc, a global contract research organization providing drug development and other services to the pharmaceutical, biotechnology and medical-device industries, was a top contributor to the Fund’s performance for the 12-month period. ICON’s most-recent quarterly financial results were reported in July and showed an increase in net income of 10.7% and a rise in earnings per share of 14.9% compared to the same quarter a year ago. Given the company’s strong backlog of business, we believe ICON can continue to do well.
Another top contributor was online retailer Wayfair, Inc. Wayfair’s stock leapt higher as the company reported strong growth throughout the year. Wayfair’s growth stands in contrast to many traditional retailers that are experiencing a slowdown in business to the point of having to close stores. In fact, more retail store closings have been announced so far in the 2017 calendar year than in all of the previous year. We continue to like Wayfair’s ongoing growth prospects —
namely its focus on expanding share in the online marketplace for home furnishings.
Cornerstone OnDemand, Inc. was the leading detractor from the Fund’s performance for the fiscal year. Despite showing signs of strength midway through the period, management eventually reported numbers that didn’t wow investors, missing expectations on earnings even while reporting stronger sales. In addition, we viewed the company’s mix of new contracts as far from ideal. We see little room for error on management’s part at this point and so we sold our position.
Another leading detractor was MEDNAX, Inc., which struggled over the past several months. MEDNAX operates neonatal intensive care units (NICUs) in partnership with health-care organizations. The company’s net revenue for its most-recently reported quarter increased 9.2% driven largely by contributions from acquisitions completed since April 2016. While management said that operating results for the company’s second quarter were mostly in line with their expectations, trends remained challenging. Overall same-unit revenue fell 0.9% year-over-year due primarily to a decline in the number of days infants spent in NICUs and an increase in services reimbursed through government programs. We have chosen to monitor the challenges MEDNAX faces from the sidelines and have sold our position.
OUTLOOK
The economic scenario of the past year appears to be continuing in the U.S. with regard to sustained moderate growth, low inflation and rising asset prices. Looking forward, we don’t expect valuation tailwinds to continue. Company fundamentals will have to matter more to investors at some point, which we believe would bode well for the Fund. We believe we have a great team that learns from mistakes and the best culture for applying a disciplined investment approach. As valuations right-size to growth rates, we think our discipline will shine.
Fundamentals are certainly of more central importance to investors now than in the period after the presidential election, but there are distractions such as the extraordinary monetary accommodation by the Federal Reserve (Fed). Recently, the Fed announced its intention to start reducing bond holdings acquired during its quantitative-easing program. While it’s not exactly clear how quickly that will unfold, the announcement itself represents a step toward normalcy.
In the Fund, we’re especially focused at present on companies that seem poised to deliver long-term growth by benefiting from world-wide economic strength, industrial-production trends and increased capital expenditure by businesses. Our disciplined approach continues to turn up attractive prospects, such as in the industrials sector mentioned above. Elsewhere, too, we’re finding what we consider to be high-quality companies with outstanding long-term growth prospects. There’s no shortage of opportunities for the Fund’s investment style, although we always have to remain vigilant regarding valuations.
Thank you for the opportunity to manage your assets.
| | Current and future holdings are subject to risk. |
4
| | |
| WASATCH CORE GROWTH FUND (WGROX / WIGRX) | | SEPTEMBER 30, 2017 (UNAUDITED) |
|
|
|
Portfolio Summary
AVERAGE ANNUAL TOTAL RETURNS
| | | | | | | | | | | | | | | |
| | | 1 YEAR | | 5 YEARS | | 10 YEARS |
Core Growth (WGROX) — Investor | | | | 18.69% | | | | | 13.77% | | | | | 8.61% | |
Core Growth (WIGRX) — Institutional | | | | 18.87% | | | | | 13.88% | | | | | 8.67% | |
Russell 2000® Index | | | | 20.74% | | | | | 13.79% | | | | | 7.85% | |
Russell 2000® Growth Index | | | | 20.98% | | | | | 14.28% | | | | | 8.47% | |
Data shows past performance, which is not indicative of future performance. Current performance may be lower or higher than the performance quoted. To obtain the most recent month-end performance data available, please visit www.WasatchFunds.com. The Advisor may absorb certain Fund expenses, without which total return would have been lower. Investment returns and principal value will fluctuate and shares, when redeemed, may be worth more or less than their original cost.
As of the September 1, 2017 prospectus, the Total Annual Fund Operating Expenses for the Wasatch Core Growth Fund are Investor Class: 1.21% / Institutional Class — Gross: 1.09%, Net: 1.05%. The expense ratio shown elsewhere in this report may be different. Net expenses are based on Fund expenses, net of waivers and reimbursements. See the prospectus for additional information regarding Fund expenses.
Wasatch Funds will deduct a 2.00% redemption proceeds fee on Fund shares held 60 days or less. Performance data does not reflect the deduction of fees, including sales charges, or the taxes you would pay on fund distributions or the redemption of fund shares. Fees and taxes, if reflected, would reduce the performance quoted. Wasatch does not charge any sales fees. For more complete information including charges, risks and expenses, read the prospectus carefully.
Performance for the Institutional Class prior to 1/31/2012 is based on the performance of the Investor Class. Performance of the Fund’s Institutional Class prior to 1/31/2012 uses the actual expenses of the Fund’s Investor Class without any adjustments. For any such period of time, the performance of the Fund’s Institutional Class would have been substantially similar to, yet higher than, the performance of the Fund’s Investor Class, because the shares of both classes are invested in the same portfolio of securities, but the classes bear different expenses.
Investing in small cap funds will be more volatile and loss of principal could be greater than investing in large cap or more diversified funds. Investing in foreign securities, especially in emerging markets, entails special risks, such as currency fluctuations and political uncertainties, which are described in more detail in the prospectus.
TOP 10 EQUITY HOLDINGS*
| | | | |
| Company | | % of Net
Assets | |
| ICON plc (Ireland) | | | 3.2% | |
| Copart, Inc. | | | 3.1% | |
| Old Dominion Freight Line, Inc. | | | 2.6% | |
| Trex Co., Inc. | | | 2.6% | |
| Eagle Bancorp, Inc. | | | 2.5% | |
| | | | |
| Company | | % of Net
Assets | |
| Cimpress N.V. | | | 2.4% | |
| Tyler Technologies, Inc. | | | 2.4% | |
| Balchem Corp. | | | 2.4% | |
| Texas Capital Bancshares, Inc. | | | 2.4% | |
| Euronet Worldwide, Inc. | | | 2.3% | |
| * | As of September 30, 2017, there were 60 holdings in the Fund. Foreign currency contracts, written options and repurchase agreements, if any, are not included in the number of holdings. Portfolio holdings are subject to change at any time. References to specific securities should not be construed as recommendations by the Funds or their Advisor. Current and future holdings are subject to risk. |
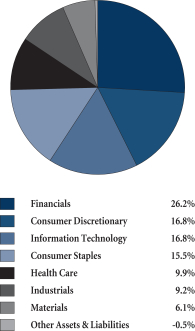
SECTOR BREAKDOWN**
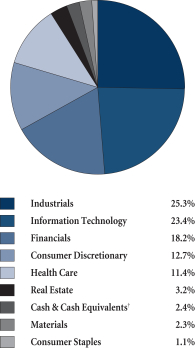
| ** | Excludes securities sold short and options written, if any. |
| † | Also includes Other Assets & Liabilities. |
GROWTHOFA HYPOTHETICAL $10,000 INVESTMENT
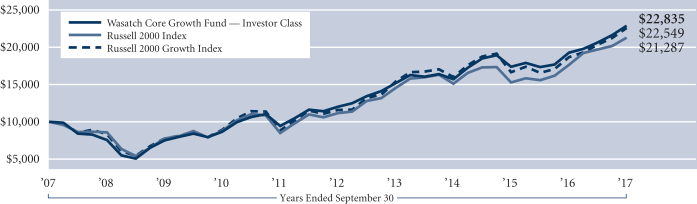
Past performance does not predict future performance. The graph above does not reflect the deduction of fees, sales charges, or taxes that you would pay on fund distributions or the redemption of fund shares. Wasatch does not charge any sales fees. The Russell 2000 Index is an unmanaged total return index of the smallest 2,000 companies in the Russell 3000 Index, as ranked by total market capitalization. The Russell 2000 Index is widely regarded in the industry as accurately capturing the universe of small company stocks. The Russell 2000 Growth Index is an unmanaged total return index that measures the performance of those Russell 2000 Index companies with higher price-to-book ratios and higher forecasted growth values. You cannot invest directly in these or any indexes.
5
| | |
| WASATCH EMERGING INDIA FUND (WAINX / WIINX) | | SEPTEMBER 30, 2017 (UNAUDITED) |
|
|
|
Management Discussion
The Wasatch Emerging India Fund is managed by a team of Wasatch portfolio managers led by Ajay Krishnan and Matthew Dreith.
| | | | |

Ajay Krishnan, CFA Lead Portfolio Manager | | 
Matthew Dreith, CFA Associate Portfolio Manager | | OVERVIEW The Wasatch Emerging India Fund — Investor Class returned 21.65% during what was an eventful 12 months ended September 30, 2017. The Fund outpaced its benchmark, the |
MSCI India Investable Market Index (IMI), which rose 16.58%.
Soon after the fiscal year’s outset, Prime Minister Narendra Modi rattled investors by banning large-denomination banknotes from circulation in a surprise move designed to root out unaccounted wealth. Though the demonetization initiative fell short of its stated goals, it came to be viewed by many Indians as a victory for the common citizen over corrupt interests. Mr. Modi’s Bharatiya Janata Party (BJP) reaped the benefits in March when it scored landslide gains in elections to the state assembly of Uttar Pradesh, India’s most-populous province. The decisive win left Mr. Modi unchallenged as a national leader and raised optimism for additional reforms aimed at furthering India’s growth and development.
Those hopes were realized in July with the long-awaited replacement of India’s complex jumble of federal, state and interstate taxes. The newly implemented goods-and-services tax (GST) soon began speeding up the flow of goods throughout India by eliminating time-consuming stops at various checkpoints. By easing the burden of double taxation, streamlining compliance and eliminating other inefficiencies, GST is expected to lower the cost of doing business in India.
Fueled in part by an influx of banned currency into the country’s financial system, Indian stock prices rose for most of the past 12 months. The Modi government’s success at advancing its legislative agenda, meanwhile, attracted significant purchases from overseas investors. Trading was choppy during the final two months of the period, as heavy flooding and disruptions related to demonetization and GST appeared to weigh on India’s economy. According to an official report released in late August, India’s year-over-year gross-domestic-product (GDP) growth slowed to 5.7% during the April-to-June quarter from 6.1% growth during the previous quarter.
DETAILSOFTHE YEAR
Performance in the Fund was driven mainly by outsized gains in its consumer and financial stocks. Very low exposure to the poor-performing information-technology sector was another reason the Fund surpassed its benchmark by as much as it did. Underperformance in the materials sector
and lack of exposure to the strong energy sector were the Fund’s primary sources of weakness against the benchmark.
The strongest contributor to Fund performance for the year was Avenue Supermarts Ltd., which benefited from rising profits. The company operates a chain of supermarkets that offer items ranging from food to apparel and general merchandise. With retail distribution in India still largely dominated by small neighborhood stores called kiranas, we think opportunities abound for well-managed operators such as Avenue to formalize their industries and reap significant economies of scale.
Bajaj Finance Ltd. was the second-best contributor. A non-bank financial company, Bajaj offers a broad spectrum of lending services. The company’s stock price reached a 52-week high in September after its qualified institutional placement of equity shares was well-received by investors. Bajaj Finance has also profited from robust demand for credit.
The greatest detractor from Fund performance for the year was Divi’s Laboratories Ltd., a manufacturer of active pharmaceutical ingredients and intermediates. Shares of Divi’s tumbled after management announced that the U.S. Food and Drug Administration had issued an import alert for products manufactured at its Unit II facility in Visakhapatnam, Andhra Pradesh. Paring earlier losses, however, the stock rose sharply when the plant was reinspected in September. We increased the Fund’s position in Divi’s based on our positive assessment of its long-term prospects.
Second-largest detractor Amara Raja Batteries Ltd. makes lead-acid storage batteries for industrial and automotive applications. The company’s shares languished for most of the year as higher prices for lead impacted earnings. Looking forward, we think Amara Raja’s price increases will improve profit margins across its various business segments.
OUTLOOK
We don’t believe the disappointing GDP growth reported near the end of the period is anything to be overly concerned about and certainly don’t believe it signals a prolonged deceleration of India’s economy. We had been expecting India’s economic growth to slow for a few quarters as companies reduced inventories ahead of the July 1st rollout of GST. So, it’s not surprising to see a moderate downtick in growth during the quarter leading up to the GST launch date.
Much has been written about the likely impact on India and other emerging markets as central banks in developed countries prepare to unwind their quantitative-easing programs. Here again, we expect the effects to be limited and short-lived. Current circumstances are very different from 2013, when the prospect of U.S. monetary tightening chased investors out of higher-yielding emerging-market currencies. Recently, in fact, India’s central bank has struggled at times to prevent vast inflows of foreign capital from causing the rupee to appreciate too rapidly.
Longer term, we believe India’s improved political climate will underpin investor confidence as recent reforms work their way through the economy.
Thank you for the opportunity to manage your assets.
| | Current and future holdings are subject to risk. |
6
| | |
| WASATCH EMERGING INDIA FUND (WAINX / WIINX) | | SEPTEMBER 30, 2017 (UNAUDITED) |
|
|
|
Portfolio Summary
AVERAGE ANNUAL TOTAL RETURNS
| | | | | | | | | | | | | | | |
| | | 1 YEAR | | 5 YEARS | | SINCE INCEPTION
4/26/11 |
Emerging India (WAINX) — Investor | | | | 21.65% | | | | | 15.68% | | | | | 12.32% | |
Emerging India (WIINX) — Institutional | | | | 21.89% | | | | | 15.79% | | | | | 12.41% | |
MSCI India IMI | | | | 16.58% | | | | | 7.81% | | | | | 2.65% | |
Data shows past performance, which is not indicative of future performance. Current performance may be lower or higher than the performance quoted. To obtain the most recent month-end performance data available, please visit www.WasatchFunds.com. The Advisor may absorb certain Fund expenses, without which total return would have been lower. Investment returns and principal value will fluctuate and shares, when redeemed, may be worth more or less than their original cost.
As of the September 1, 2017 prospectus, the Total Annual Fund Operating Expenses for the Wasatch Emerging India Fund are Investor Class — Gross: 1.87%, Net: 1.75% / Institutional Class — Gross: 2.00%, Net: 1.50%. The expense ratio shown elsewhere in this report may be different. Net expenses are based on Fund expenses, net of waivers and reimbursements. See the prospectus for additional information regarding Fund expenses.
Wasatch Funds will deduct a 2.00% redemption proceeds fee on Fund shares held 60 days or less. Performance data does not reflect the deduction of fees, including sales charges, or the taxes you would pay on fund distributions or the redemption of fund shares. Fees and taxes, if reflected, would reduce the performance quoted. Wasatch does not charge any sales fees. For more complete information including charges, risks and expenses, read the prospectus carefully.
Performance for the Institutional Class prior to 2/1/2016 is based on the performance of the Investor Class. Performance of the Fund’s Institutional Class prior to 2/1/2016 uses the actual expenses of the Fund’s Investor Class without any adjustments. For any such period of time, the performance of the Fund’s Institutional Class would have been substantially similar to, yet higher than, the performance of the Fund’s Investor Class, because the shares of both classes are invested in the same portfolio of securities, but the classes bear different expenses.
Investing in small cap funds will be more volatile and loss of principal could be greater than investing in large cap or more diversified funds. Investing in foreign securities, especially in emerging markets, entails special risks, such as unstable currencies, highly volatile securities markets and political and social instability, which are described in more detail in the prospectus.
TOP 10 EQUITY HOLDINGS*
| | | | |
| Company | | % of Net
Assets | |
| Bajaj Finance Ltd. (India) | | | 5.7% | |
| HDFC Bank Ltd. ADR (India) | | | 5.0% | |
| Housing Development Finance Corp. Ltd. (India) | | | 4.8% | |
| Avenue Supermarts Ltd. (India) | | | 4.7% | |
| MakeMyTrip Ltd. (India) | | | 3.7% | |
| | | | |
| Company | | % of Net
Assets | |
| AU Small Finance Bank Ltd. (India) | | | 3.6% | |
| Divi’s Laboratories Ltd. (India) | | | 3.4% | |
| Endurance Technologies Ltd. (India) | | | 3.0% | |
| Quess Corp. Ltd. (India) | | | 3.0% | |
| V-Mart Retail Ltd. (India) | | | 2.9% | |
| * | As of September 30, 2017, there were 53 holdings in the Fund. Foreign currency contracts, written options and repurchase agreements, if any, are not included in the number of holdings. Portfolio holdings are subject to change at any time. References to specific securities should not be construed as recommendations by the Funds or their Advisor. Current and future holdings are subject to risk. |
SECTOR BREAKDOWN**
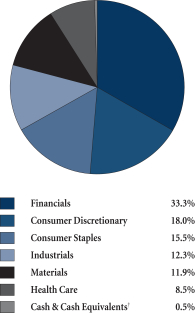
| ** | Excludes securities sold short and options written, if any. |
| † | Also includes Other Assets & Liabilities. |
GROWTHOFA HYPOTHETICAL $10,000 INVESTMENT
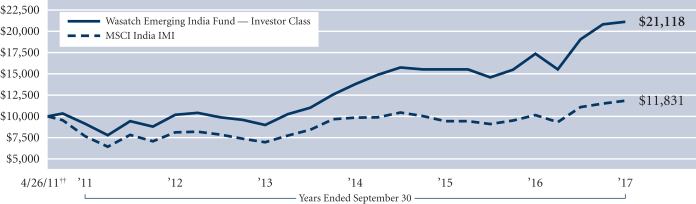
Past performance does not predict future performance. The graph above does not reflect the deduction of fees, sales charges, or taxes that you would pay on fund distributions or the redemption of fund shares. Wasatch does not charge any sales fees. ††Inception: April 26, 2011. The MSCI India IMI (Investable Market Index) is designed to measure the performance of the large-, mid- and small-cap segments of the Indian market. The Index covers approximately 99% of the free-float adjusted market capitalization of the Indian equity universe. You cannot invest directly in this or any index.
7
| | |
| WASATCH EMERGING MARKETS SELECT FUND (WAESX / WIESX) | | SEPTEMBER 30, 2017 (UNAUDITED) |
|
|
|
Management Discussion
The Wasatch Emerging Markets Select Fund is managed by a team of Wasatch portfolio managers led by Ajay Krishnan, Roger Edgley and Scott Thomas.
| | | | |
Ajay Krishnan, CFA Lead Portfolio Manager | | 
Roger Edgley, CFA Portfolio Manager | | 
Scott Thomas, CFA Associate Portfolio
Manager |
OVERVIEW
Rich valuations in developed countries and improving fundamentals across a number of emerging economies helped push emerging-market equities higher during the 12 months ended September 30, 2017. The Wasatch Emerging Markets Select Fund — Investor Class returned 13.33% during the period. Outpacing the Fund, the benchmark MSCI Emerging Markets Index rose 22.46%.
Initial strength in the U.S. dollar gave way to a sustained slide that underpinned support for emerging markets for most of the fiscal year. Against a basket of major rivals, the greenback slipped -2.5% during the period. By making assets in other currencies more appealing to international investors, a weaker dollar encourages financial flows into developing nations. In so doing, the weak dollar has loosened global financial conditions by making it easier for governments and companies outside the U.S. to issue securities.
Korea was the largest among several sources of Fund underperformance. Markets reacted negatively when China clamped down on tourism to Korea in retaliation for its deployment of the United States’ Terminal High Altitude Area Defense (THAAD) anti-missile defense system. As investors sought the perceived safety of larger Korean companies, small and mid-cap stocks — such as those held in the Fund — were hurt the most.
The Fund’s substantial weighting in Mexican stocks also impacted performance as equity returns in Mexico lagged stronger gains in other countries. Although the Fund’s Mexican holdings posted a healthy double-digit return, they underperformed the benchmark’s Mexican component.
Bright spots for the Fund included South Africa and the United Arab Emirates, two countries in which the Fund handily outgained its benchmark. Though our underweight exposure to China was a headwind to Fund performance, we significantly increased the Fund’s investments in China as the year progressed.
DETAILSOFTHE YEAR
The strongest contributor to Fund performance for the year was Bajaj Finance Ltd. An Indian non-bank financial company, Bajaj offers a broad spectrum of lending services.
The company’s stock price reached a 52-week high in September after its qualified institutional placement of equity shares was well-received by investors.
The Fund’s second-largest contributor was MercadoLibre, Inc., a Latin American e-commerce company that generates approximately half its sales in Brazil. Originally a provider of auction-type platforms that connect buyers with sellers, MercadoLibre has been increasing its fulfillment capabilities.
Key additions to the Fund included Alibaba Group Holding Ltd. and Tencent Holdings Ltd., two Chinese companies increasingly viewed by international investors as proxies for China’s growing middle class.
The greatest detractor from Fund performance for the year was Divi’s Laboratories Ltd., an Indian manufacturer of active pharmaceutical ingredients and intermediates. Shares of Divi’s tumbled after it announced that the U.S. Food and Drug Administration had issued an import alert for products manufactured at its Unit II facility in Visakhapatnam, Andhra Pradesh. We sold the stock to seek better opportunities elsewhere.
Second-largest detractor GT Capital Holdings, Inc. is based in the Philippines. GT Capital’s interests include lending, car distribution and insurance. The company’s stock came under pressure amid mounting fears that the Duterte government’s overhaul of the country’s vehicle excise tax would depress sales of automobiles. With the stock languishing and sentiment continuing to deteriorate, we moved on.
OUTLOOK
Much has been written about the likely implications for emerging markets as central banks in developed countries prepare to unwind their quantitative-easing programs. For our part, we expect any negative effects to be limited and short-lived. Current circumstances are very different from 2013, when the prospect of U.S. monetary tightening chased investors out of higher-yielding emerging-market currencies. Today, fiscal and current-account balances in most countries are stronger, foreign-exchange reserves are generally higher, and investor sentiment is better.
During the period from December 31, 2015 through September 30, 2017 the Fund returned approximately 24%, while the MSCI Emerging Markets Index climbed about 43% on a total-return basis. Despite its recent strong run, the Index has been essentially flat since its peak in the fall of 2007, and price-to-book ratios in most emerging markets remain below their long-term averages.
Moreover, greater than one-fourth of the 43% move in the Index over the past seven quarters was delivered by just four mega-cap information-technology stocks. We believe large-cap outperformance on that scale is unsustainable, and future gains are likely to be more broadly based. With economic fundamentals in countries such as Mexico, India, Brazil and Russia stabilizing or improving, we think stocks of well-situated small and mid-size companies in emerging markets may begin to close the gap in recent performance compared to larger peers.
Thank you for the opportunity to manage your assets.
| | Current and future holdings are subject to risk. |
8
| | |
| WASATCH EMERGING MARKETS SELECT FUND (WAESX / WIESX) | | SEPTEMBER 30, 2017 (UNAUDITED) |
|
|
|
Portfolio Summary
AVERAGE ANNUAL TOTAL RETURNS
| | | | | | | | | | | | | | | |
| | | 1 YEAR | | 5 YEARS | | SINCE INCEPTION 12/13/12 |
Emerging Markets Select (WAESX) — Investor | | | | 13.33% | | | N/A | | | | 1.03% | |
Emerging Markets Select (WIESX) — Institutional | | | | 13.73% | | | N/A | | | | 1.37% | |
MSCI Emerging Markets Index | | | | 22.46% | | | N/A | | | | 3.29% | |
Data shows past performance, which is not indicative of future performance. Current performance may be lower or higher than the performance quoted. To obtain the most recent month-end performance data available, please visit www.WasatchFunds.com. The Advisor may absorb certain Fund expenses, without which total return would have been lower. Investment returns and principal value will fluctuate and shares, when redeemed, may be worth more or less than their original cost.
As of the September 1, 2017 prospectus, the Total Annual Fund Operating Expenses for the Wasatch Emerging Markets Select Fund are Investor Class — Gross: 1.88%, Net: 1.51% / Institutional Class — Gross: 1.52%, Net: 1.21%. The expense ratio shown elsewhere in this report may be different. Net expenses are based on Fund expenses, net of waivers and reimbursements. See the prospectus for additional information regarding Fund expenses.
Wasatch Funds will deduct a 2.00% redemption proceeds fee on Fund shares held 60 days or less. Performance data does not reflect the deduction of fees, including sales charges, or the taxes you would pay on fund distributions or the redemption of fund shares. Fees and taxes, if reflected, would reduce the performance quoted. Wasatch does not charge any sales fees. For more complete information including charges, risks and expenses, read the prospectus carefully.
Investing in foreign securities, especially in emerging markets, entails special risks, such as currency fluctuations and political uncertainties, which are described in more detail in the prospectus. Investing in small cap funds will be more volatile and loss of principal could be greater than investing in large cap or more diversified funds.
TOP 10 EQUITY HOLDINGS*
| | | | |
| Company | | % of Net
Assets | |
| Bajaj Finance Ltd. (India) | | | 5.9% | |
| Alibaba Group Holding Ltd. ADR (China) | | | 5.9% | |
| MercadoLibre, Inc. (Brazil) | | | 5.8% | |
| Tencent Holdings Ltd. (China) | | | 5.1% | |
| Ctrip.com International Ltd. ADR (China) | | | 4.6% | |
| | | | |
| Company | | % of Net
Assets | |
| NMC Health plc (United Arab Emirates) | | | 4.5% | |
| Medytox, Inc. (Korea) | | | 4.4% | |
| Raia Drogasil S.A. (Brazil) | | | 4.4% | |
| Naspers Ltd., Class N (South Africa) | | | 3.8% | |
| BGF Retail Co. Ltd. (Korea) | | | 3.5% | |
| * | As of September 30, 2017, there were 37 holdings in the Fund. Foreign currency contracts, written options and repurchase agreements, if any, are not included in the number of holdings. Portfolio holdings are subject to change at any time. References to specific securities should not be construed as recommendations by the Funds or their Advisor. Current and future holdings are subject to risk. |
SECTOR BREAKDOWN**
| ** | Excludes securities sold short and options written, if any. |
GROWTHOFA HYPOTHETICAL $10,000 INVESTMENT
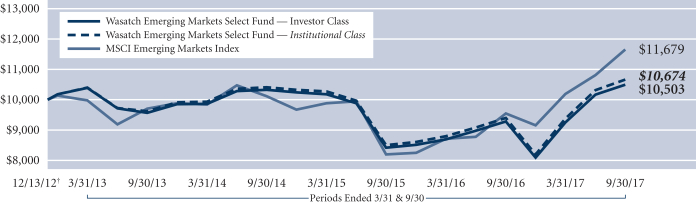
Past performance does not predict future performance. The graph above does not reflect the deduction of fees, sales charges, or taxes that you would pay on fund distributions or the redemption of fund shares. Wasatch does not charge any sales fees. †Inception: December 13, 2012. The MSCI Emerging Markets Index is a free float-adjusted market capitalization index designed to measure the equity market performance of emerging markets. You cannot invest directly in this or any index.
9
| | |
| WASATCH EMERGING MARKETS SMALL CAP FUND (WAEMX / WIEMX) | | SEPTEMBER 30, 2017 (UNAUDITED) |
|
|
|
Management Discussion
The Wasatch Emerging Markets Small Cap Fund is managed by a team of Wasatch portfolio managers led by Roger Edgley, Andrey Kutuzov and Scott Thomas.
| | | | |
Roger Edgley, CFA Lead Portfolio Manager | | 
Andrey Kutuzov, CFA Associate Portfolio Manager | |
Scott Thomas, CFA Associate Portfolio Manager |
OVERVIEW
The Wasatch Emerging Markets Small Cap Fund — Investor Class gained 11.99% for the 12 months ended September 30, 2017 and underperformed the benchmark MSCI Emerging Markets Small Cap Index, which returned 14.89%.
Strong country fundamentals, firming commodity prices and a sagging U.S. dollar underpinned stock markets in developing nations for most of the 12-month period. Emerging markets continued to perform well based on optimism over economic growth and returning investment. Emerging-market currencies appear to have stabilized and are more competitive, current-account balances have improved for the majority of emerging markets and company valuations are still below their long-term averages.
Over the course of the period, we became more constructive on China and increased the Fund’s weight. China was the Fund’s top-contributing country for the 12 months. However, we recognize that challenges unique to the Chinese market remain. As a result, the Fund’s is underweight versus the benchmark in China. One holding in the United Arab Emirates (UAE) drove that country’s outperformance of its benchmark peer. Brazil was also a top-contributing country driven by one of our newer holdings.
The Fund’s substantial exposure to India hurt performance during the period. Indian stocks lost ground after soft economic data appeared to spook international investors. Largely the side effect of recent reforms, the slowdown in our view is short-term in nature. One of these reforms was the long-awaited replacement of India’s previous complex array of federal, state and interstate taxes with a nationwide goods-and-services tax (GST). Initial confusion over certain compliance issues has offset some of GST’s benefits in the short term, especially for small businesses. We think growth in India will pick up again once the reforms have worked their way through the country’s economy. Taiwan was also a significant detractor due primarily to company-specific factors. In Mexico, a significant overweight relative to the benchmark hindered the Fund’s results.
DETAILSOFTHE YEAR
The Fund’s top contributor for the period came from China. Sunny Optical Technology Group Co. Ltd., whose stock is listed in Hong Kong, designs and manufactures optical-related products. Sunny Optical continues to gain business in high-end product lines like multi-cameras in smartphones and cars.
The Fund’s second-best contributor was Magazine Luiza S.A., which operates consumer-electronics stores in Brazil. The company has put in place strong information-technology infrastructure to make the business an e-commerce player using its stores as showrooms and mini distribution centers. In Brazil, we believe the fundamentals of the country are improving as interest rates are coming down, inflation is decreasing, and the current-account situation has improved. Further, company earnings are improving after two years of decline. We are confident in the Fund’s positioning in Brazil.
The third-best contributor was NMC Health plc, the largest private health-care provider in the UAE. Health care has been an investment theme in the Fund, as emerging markets seek to build out their health-care infrastructure. NMC has been benefiting from new insurance rules that remove or reduce certain copayments and restrictions for holders of the UAE’s Thiqa medical-insurance card.
Several holdings in Taiwan were among the Fund’s largest detractors for the year. We sold our positions in PChome Online, Inc., a Chinese language internet company that offers e-commerce, advertising and portal services along with digital content, and Tung Thih Electronic Co. Ltd., which sells sensors to auto manufacturers. PChome was sold due to earnings weakness as we saw better opportunities elsewhere. We sold our shares of Tung Thih as the company’s core products faced increased competition and it was becoming less clear how Tung Thih’s new products would offset the slowing growth of core products. Poya International Co. Ltd. operates retail stores selling cosmetics, fashion accessories and groceries. Poya’s stock was down due to negative same-store-sales growth numbers. In our estimation, Poya is a high-quality business, as demonstrated by stable growth, cash generation and margin expansion.
OUTLOOK
We remain positive on the investment outlook for a majority of the emerging markets in our universe, and we are confident in the Fund’s positioning. In fact, we have been struggling to make space for the attractive new investments we have been finding. Emerging-market macro environments continue to improve, and we are finding numerous growth companies that we consider high quality with outstanding investment potential.
Wasatch is confident on the outlook for emerging markets. We see increasing innovation and significant improvement in the earnings of our portfolio companies and ongoing and sustainable economic development of emerging economies. We think these factors are likely to provide tailwinds for equities of well-positioned, high-quality businesses.
We thank you for the opportunity to manage your assets.
| | Current and future holdings are subject to risk. |
10
| | |
| WASATCH EMERGING MARKETS SMALL CAP FUND (WAEMX / WIEMX) | | SEPTEMBER 30, 2017 (UNAUDITED) |
|
|
|
Portfolio Summary
AVERAGE ANNUAL TOTAL RETURNS
| | | | | | | | | | | | | | | |
| | | 1 YEAR | | 5 YEARS | | 10 YEARS |
Emerging Markets Small Cap (WAEMX) — Investor | | | | 11.99% | | | | | 2.95% | | | | | 4.49% | |
Emerging Markets Small Cap (WIEMX) — Institutional | | | | 12.36% | | | | | 3.01% | | | | | 4.52% | |
MSCI Emerging Markets Small Cap Index | | | | 14.89% | | | | | 4.60% | | | | | 1.74% | |
MSCI Emerging Markets Index | | | | 22.46% | | | | | 3.99% | | | | | 1.32% | |
Data shows past performance, which is not indicative of future performance. Current performance may be lower or higher than the performance quoted. To obtain the most recent month-end performance data available, please visit www.WasatchFunds.com. The Advisor may absorb certain Fund expenses, without which total return would have been lower. Investment returns and principal value will fluctuate and shares, when redeemed, may be worth more or less than their original cost.
As of the September 1, 2017 prospectus, the Total Annual Fund Operating Expenses for the Wasatch Emerging Markets Small Cap Fund are Investor Class: 1.96% / Institutional Class: 1.81%. The expense ratio shown elsewhere in this report may be different. See the prospectus for additional information regarding Fund expenses.
Wasatch Funds will deduct a 2.00% redemption proceeds fee on Fund shares held 60 days or less. Performance data does not reflect the deduction of fees, including sales charges, or the taxes you would pay on fund distributions or the redemption of fund shares. Fees and taxes, if reflected, would reduce the performance quoted. Wasatch does not charge any sales fees. For more complete information including charges, risks and expenses, read the prospectus carefully.
Performance for the Institutional Class prior to 2/1/2016 is based on the performance of the Investor Class. Performance of the Fund’s Institutional Class prior to 2/1/2016 uses the actual expenses of the Fund’s Investor Class without any adjustments. For any such period of time, the performance of the Fund’s Institutional Class would have been substantially similar to, yet higher than, the performance of the Fund’s Investor Class, because the shares of both classes are invested in the same portfolio of securities, but the classes bear different expenses.
Investing in foreign securities, especially in emerging markets, entails special risks, such as currency fluctuations and political uncertainties, which are described in more detail in the prospectus. Investing in small cap funds will be more volatile and loss of principal could be greater than investing in large cap or more diversified funds.
TOP 10 EQUITY HOLDINGS*
| | | | |
| Company | | % of Net
Assets | |
| Magazine Luiza S.A. (Brazil) | | | 3.1% | |
| Sunny Optical Technology Group Co. Ltd. (China) | | | 2.7% | |
| 51job, Inc. ADR (China) | | | 2.6% | |
| China Yongda Automobiles Services Holdings Ltd. (China) | | | 2.4% | |
| Clicks Group Ltd. (South Africa) | | | 2.4% | |
| | | | |
| Company | | % of Net
Assets | |
| Medytox, Inc. (Korea) | | | 2.2% | |
| ASPEED Technology, Inc. (Taiwan) | | | 2.1% | |
| Raia Drogasil S.A. (Brazil) | | | 2.0% | |
| Silergy Corp. (Taiwan) | | | 1.9% | |
| NMC Health plc (United Arab Emirates) | | | 1.8% | |
| * | As of September 30, 2017, there were 95 holdings in the Fund. Foreign currency contracts, written options and repurchase agreements, if any, are not included in the number of holdings. Portfolio holdings are subject to change at any time. References to specific securities should not be construed as recommendations by the Funds or their Advisor. Current and future holdings are subject to risk. |
SECTOR BREAKDOWN**
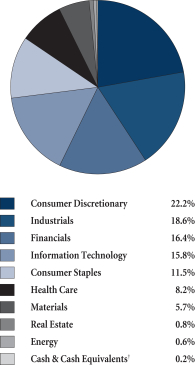
| ** | Excludes securities sold short and options written, if any. |
| † | Also includes Other Assets & Liabilities. |
GROWTHOFA HYPOTHETICAL $10,000 INVESTMENT
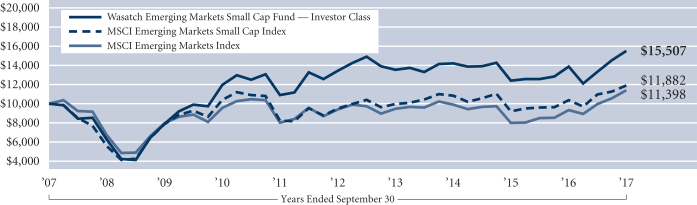
Past performance does not predict future performance. The graph above does not reflect the deduction of fees, sales charges, or taxes that you would pay on fund distributions or the redemption of fund shares. Wasatch does not charge any sales fees. The MSCI Emerging Markets and Emerging Markets Small Cap indexes are free float-adjusted market capitalization indexes designed to measure the equity market performance of emerging markets. You cannot invest directly in these or any indexes.
11
| | |
| WASATCH FRONTIER EMERGING SMALL COUNTRIES FUND (WAFMX / WIFMX) | | SEPTEMBER 30, 2017 (UNAUDITED) |
|
|
|
Management Discussion
The Wasatch Frontier Emerging Small Countries Fund is managed by a team of Wasatch portfolio managers led by Roger Edgley, Jared Whatcott and Scott Thomas.
| | | | |
Roger Edgley, CFA Lead Portfolio Manager | | 
Jared Whatcott, CFA Portfolio Manager | |
Scott Thomas, CFA Portfolio Manager |
OVERVIEW
The Wasatch Frontier Emerging Small Countries Fund — Investor Class gained 4.56% for the 12 months ended September 30, 2017 and underperformed its benchmark, the MSCI Frontier Emerging Markets Index, which was up 15.53%.
Performance in frontier markets has been strong, and Wasatch is increasingly optimistic for many frontier and emerging small countries where we see improving macro conditions after a multi-year period of difficult adjustments. Frontier economies have now fiscally adjusted to weaker commodity prices, and depreciating currencies relative to a strong U.S. dollar. What’s more, domestic demand appears to have troughed and many economies appear poised for a continued cyclical recovery.
In the first six months of the period, due to lower oil prices, Nigerian stocks were pressured by economic and currency issues and we opted to sell our holdings and monitor conditions from the sidelines. As a result, the Fund did not participate when the Nigerian equity market subsequently rebounded. Nigeria ended the 12-month period as one of the best-performing markets in the benchmark and as the Fund’s largest detractor on a country basis. During the year, Pakistan faced some significant challenges — which, while not likely to be repeated, resulted in Pakistan being one of the benchmark’s weakest-performing markets. Although the Fund’s overweight position in Pakistan detracted from performance relative to the benchmark, we remain confident in the growth prospects of our holdings. Conversely, Kuwait was one of the benchmark’s best-performing markets; therefore, the Fund’s underweight position was detrimental.
On the positive side, we were well-positioned in Argentina as our stocks outperformed their benchmark counterparts. The Fund also benefited from investments in the United Arab Emirates (UAE), which is not in the benchmark.
DETAILSOFTHE YEAR
The top contributor to the Fund’s performance for the year was NMC Health plc, a hospital operator in the UAE, whose stock is listed on the London Stock Exchange. Since NMC Health’s initial public offering in 2012, the company
has rapidly grown its hospital network and now has nearly 1,600 beds. Further, as the Emirate of Dubai fully rolls out mandatory health insurance, we estimate that the value of the health-care market in Dubai could double.
Transportadora de Gas del Sur S.A., the exclusive pipeline company for the Southern Argentina region, and the largest in Argentina today, was the Fund’s second-best contributor. The company currently transports approximately two-thirds of the country’s natural gas and operates over half the installed natural gas liquids production capacity. We continue to believe tariff reforms will provide a boost to the company’s revenues and profits and put in place the right incentives to spur increased production.
The third-best contributor was MercadoLibre, an online e-commerce company focused on Latin America. Originally a provider of auction-type platforms that connect buyers with sellers, MercadoLibre has been increasing its fulfillment capabilities and recently introduced free shipping to customers in Brazil, Colombia and Chile. While this strategy pressures margins in the short-term, we believe it increases user satisfaction, business scale and further strengthens barriers to entry against would-be competitors.
In addition to the Fund’s Nigerian holdings, which were plagued by currency pressure and sold earlier in the year, our Egyptian holdings were also affected by currency adjustments. Egypt moved to a fully floating foreign exchange policy and the currency depreciated 50% in November 2016. The currency depreciation caused two of our names — Commercial International Bank S.A.E. and Global Telecom Holding S.A.E. — to be significant detractors in U.S. dollar terms for the 12-month period.
Olympic Industries Ltd., Bangladesh’s largest biscuit and confectionery manufacturer, was also a significant detractor. Growth of the company’s main biscuits segment slowed and other new products have yet to make up the difference. In addition, the stock fell from peak levels, reflecting softening of customers’ purchasing power. We expect these conditions to be temporary, and remain confident in Olympic Industries’ management and future business opportunities.
OUTLOOK
We have seen significant improvement in the outlook for our portfolio companies, and we are starting to see a rebound in earnings growth. This accelerating growth combined with reasonable valuations, and low correlations relative to developed and larger emerging markets continue to give us confidence in the Fund’s holdings in frontier and emerging small countries.
We believe that bottom-up analysis and travel to the regions in which we invest is critical, as economic growth, political structures and willingness to reform vary widely in developing markets. We continue to travel extensively and are excited about the future of frontier and emerging small countries and their expanding role in the global economy.
Thank you for the opportunity to manage your assets.
| | Current and future holdings are subject to risk. |
12
| | |
| WASATCH FRONTIER EMERGING SMALL COUNTRIES FUND (WAFMX / WIFMX) | | SEPTEMBER 30, 2017 (UNAUDITED) |
|
|
|
Portfolio Summary
AVERAGE ANNUAL TOTAL RETURNS
| | | | | | | | | | | | | | | |
| | | 1 YEAR | | 5 YEARS | | SINCE INCEPTION 1/31/12 |
Frontier Emerging Small Countries (WAFMX) — Investor | | | | 4.56% | | | | | 3.10% | | | | | 6.24% | |
Frontier Emerging Small Countries (WIFMX) — Institutional | | | | 4.55% | | | | | 3.17% | | | | | 6.31% | |
MSCI Frontier Emerging Markets Index | | | | 15.53% | | | | | 4.13% | | | | | 5.24% | |
MSCI Frontier Markets Index | | | | 25.47% | | | | | 8.73% | | | | | 8.68% | |
Data shows past performance, which is not indicative of future performance. Current performance may be lower or higher than the performance quoted. To obtain the most recent month-end performance data available, please visit www.WasatchFunds.com. The Advisor may absorb certain Fund expenses, without which total return would have been lower. Investment returns and principal value will fluctuate and shares, when redeemed, may be worth more or less than their original cost.
As of the September 1, 2017 prospectus, the Total Annual Fund Operating Expenses for the Wasatch Frontier Emerging Small Countries Fund are Investor Class — Gross: 2.39%, Net: 2.25% / Institutional Class: 2.06%. The expense ratio shown elsewhere in this report may be different. Net expenses are based on Fund expenses, net of waivers and reimbursements. See the prospectus for additional information regarding Fund expenses.
Wasatch Funds will deduct a 2.00% redemption proceeds fee on Fund shares held 60 days or less. Performance data does not reflect the deduction of fees, including sales charges, or the taxes you would pay on fund distributions or the redemption of fund shares. Fees and taxes, if reflected, would reduce the performance quoted. Wasatch does not charge any sales fees. For more complete information including charges, risks and expenses, read the prospectus carefully.
Performance for the Institutional Class prior to 2/1/2016 is based on the performance of the Investor Class. Performance of the Fund’s Institutional Class prior to 2/1/2016 uses the actual expenses of the Fund’s Investor Class without any adjustments. For any such period of time, the performance of the Fund’s Institutional Class would have been substantially similar to, yet higher than, the performance of the Fund’s Investor Class, because the shares of both classes are invested in the same portfolio of securities, but the classes bear different expenses.
Investing in small cap funds will be more volatile and loss of principal could be greater than investing in large cap or more diversified funds. Investing in foreign securities, especially in frontier and emerging markets, entails special risks, such as currency fluctuations and political uncertainties, which are described in more detail in the prospectus.
TOP 10 EQUITY HOLDINGS*
| | | | |
| Company | | % of Net
Assets | |
| NMC Health plc (United Arab Emirates) | | | 5.2% | |
| Transportadora de Gas del Sur S.A. ADR (Argentina) | | | 4.6% | |
| Philippine Seven Corp. (Philippines) | | | 4.3% | |
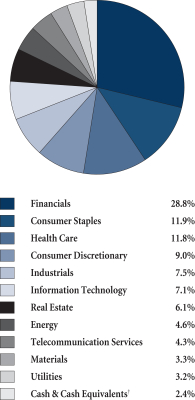
| Aramex PJSC (United Arab Emirates) | | | 4.2% | |
| Vietnam Dairy Products JSC (Vietnam) | | | 4.1% | |
| | | | |
| Company | | % of Net
Assets | |
| MercadoLibre, Inc. (Brazil) | | | 4.1% | |
| Ayala Land, Inc. (Philippines) | | | 4.0% | |
| Banco Davivienda S.A. (Colombia) | | | 3.6% | |
| Credicorp Ltd. (Peru) | | | 3.4% | |
| Naspers Ltd., Class N (South Africa) | | | 3.2% | |
| * | As of September 30, 2017, there were 48 holdings in the Fund. Foreign currency contracts, written options and repurchase agreements, if any, are not included in the number of holdings. Portfolio holdings are subject to change at any time. References to specific securities should not be construed as recommendations by the Funds or their Advisor. Current and future holdings are subject to risk. |
SECTOR BREAKDOWN**
| ** | Excludes securities sold short and options written, if any. |
| † | Also includes Other Assets & Liabilities. |
GROWTHOFA HYPOTHETICAL $10,000 INVESTMENT
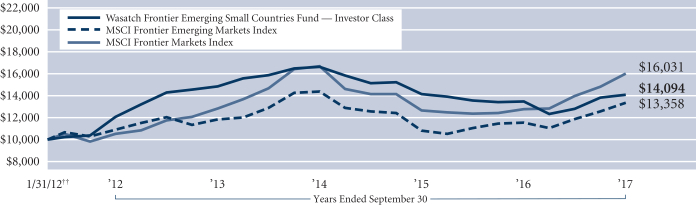
Past performance does not predict future performance. The graph above does not reflect the deduction of fees, sales charges, or taxes that you would pay on fund distributions or the redemption of fund shares. Wasatch does not charge any sales fees. ††Inception: January 31, 2012. The MSCI Frontier Emerging Markets and MSCI Frontier Markets indexes are free float-adjusted market capitalization indexes designed to measure the equity market performance of the global frontier and emerging markets. You cannot invest directly in these or any indexes.
13
| | |
| WASATCH GLOBAL OPPORTUNITIES FUND (WAGOX / WIGOX) | | SEPTEMBER 30, 2017 (UNAUDITED) |
|
|
|
Management Discussion
The Wasatch Global Opportunities Fund is managed by a team of Wasatch portfolio managers led by JB Taylor and Ajay Krishnan.
| | | | |
JB Taylor Lead Portfolio Manager | |
Ajay Krishnan, CFA Lead Portfolio Manager | | OVERVIEW On the strength of stock selection, the health-care, financials and consumer-discretionary sectors made strong contributions as the Wasatch Global Opportunities Fund — Investor Class |
| gained 16.61% for the 12 months ended September 30, 2017. The Fund also benefited from a significant underweighting versus the benchmark in the real-estate sector. The Fund lagged its benchmark, the MSCI ACWI Small Cap Index, which rose 19.23%. |
Among all countries, the U.S. was the top contributor to the Fund’s performance for the 12-month period driven by strong stock selection. Overseas, India was the leading contributor to the Fund’s absolute performance on a country basis, despite a pullback in the last three months of the period. India’s new goods-and-services tax (GST), introduced in July, resulted in trade disruptions that adversely affected the country’s equity market. We believe the volatility will be short-lived, and that GST will ultimately prove to be beneficial over time, a pattern similar to that which ensued following last year’s demonetization program. We believe India’s economy will continue to improve under the direction of the Modi government, and we remain positive on the outlook for our Indian holdings.
DETAILSOFTHE YEAR
Exact Sciences Corp. was the top contributor to the Fund’s performance for the 12-month period. The molecular-diagnostics company has an innovative test for colon cancer. Named Cologuard,® the test avoids the high cost and invasiveness of a colonoscopy by screening a stool sample for cancerous cells. Shares of Exact Sciences began climbing in late April after accelerating demand for Cologuard produced better-than-expected revenues and earnings.
MercadoLibre, Inc. was also a top contributor to performance for the period. This $10.4 billion market-cap company is engaged in online e-commerce focused on Latin America. The company has benefited both from strong regional growth and from the continuing migration of retail sales from brick-and-mortar stores to the online environment.
Another leading contributor during the period, Trex Co., Inc. is an industrial company that has been benefiting from growth in the housing market. The company has established leadership in composite decking, railing and other outdoor-living products. The firm’s current management team, we believe, is especially strong and able to take advantage of homeowners’ preference for the durability, maintenance and
environmental benefits that composite products provide over wood-based competitors. With mortgage rates still attractive, we expect the company to maintain its strong growth rate and competitive advantage.
Cornerstone OnDemand, Inc. was the leading detractor from the Fund’s performance for the period. Despite showing signs of strength midway through the period, management eventually reported numbers that didn’t wow investors, missing expectations on earnings even while reporting stronger sales. In addition, we viewed the company’s mix of new contracts as far from ideal. We see little room for error on management’s part at this point and so we sold our position.
Another detractor was Gurunavi, Inc., a Japanese company that operates an internet portal for ordering food from restaurants online. We like the company’s dominant market position and its opportunity to offer more services and products to customers. Gurunavi has been investing heavily to grow its business. As a result, the company’s recent financial results missed analysts’ expectations.
Australia’s Domino’s Pizza Enterprises Ltd. also detracted. Domino’s has seen growth slow in 2017 and also had negative press surrounding how some franchises pay their employees. Our investment team was in Australia during September, and we remain impressed with the quality of Domino’s management and their use of data and information technology to make their business better.
OUTLOOK
As the 12-month period drew to a close, Japanese Prime Minister Shinzo Abe called for a general election to be held on October 22nd. For years, many investors have avoided Japan and thus may have little interest in the outcome. But with our substantial commitment to Japanese equities — the country represents one of our largest non-U.S. allocations — we think the vote, which can be viewed as a referendum on Abenomics, is significant.
Prior to Abe’s reforms, Japan’s economy had been stagnating. Today, there are many indications that the country’s economy is improving. For example, Japan’s gross domestic product (GDP) has now expanded in the last six quarters, the longest sustained period of growth since before the global financial crisis. With unemployment at a multi-decade low of 2.8%, we’re starting to see modest wage inflation in some parts of the economy.
One factor contributing to our positive view is that Japanese companies are underfollowed. Nearly half the listed companies in Japan have just two or fewer analysts researching them. With an investment approach that includes frequent company visits, we think we have an advantage over other investors. Japan’s small-cap market, one of the most vibrant we’ve found anywhere, is another factor contributing to the country’s reputation as a leading global innovator.
Although our research focus isn’t macro-oriented, we’re aware of economic and geopolitical issues. Overall, we’re optimistic regarding investment opportunities available around the globe.
Thank you for the opportunity to manage your assets.
| | Current and future holdings are subject to risk. |
14
| | |
| WASATCH GLOBAL OPPORTUNITIES FUND (WAGOX / WIGOX) | | SEPTEMBER 30, 2017 (UNAUDITED) |
|
|
|
Portfolio Summary
AVERAGE ANNUAL TOTAL RETURNS
| | | | | | | | | | | | | | | |
| | | 1 YEAR | | 5 YEARS | | SINCE INCEPTION 11/17/08 |
Global Opportunities (WAGOX) — Investor | | | | 16.61% | | | | | 10.48% | | | | | 17.13% | |
Global Opportunities (WIGOX) — Institutional | | | | 16.92% | | | | | 10.54% | | | | | 17.16% | |
MSCI ACWI Small Cap Index | | | | 19.23% | | | | | 11.94% | | | | | 15.66% | |
Data shows past performance, which is not indicative of future performance. Current performance may be lower or higher than the performance quoted. To obtain the most recent month-end performance data available, please visit www.WasatchFunds.com. The Advisor may absorb certain Fund expenses, without which total return would have been lower. Investment returns and principal value will fluctuate and shares, when redeemed, may be worth more or less than their original cost.
As of the September 1, 2017 prospectus, the Total Annual Fund Operating Expenses for the Wasatch Global Opportunities Fund are Investor Class: 1.53% / Institutional Class — Gross: 2.32%, Net: 1.35%. The expense ratio shown elsewhere in this report may be different. Net expenses are based on Fund expenses, net of waivers and reimbursements. See the prospectus for additional information regarding Fund expenses.
Wasatch Funds will deduct a 2.00% redemption proceeds fee on Fund shares held 60 days or less. Performance data does not reflect the deduction of fees, including sales charges, or the taxes you would pay on fund distributions or the redemption of fund shares. Fees and taxes, if reflected, would reduce the performance quoted. Wasatch does not charge any sales fees. For more complete information including charges, risks and expenses, read the prospectus carefully.
Performance for the Institutional Class prior to 2/1/2016 is based on the performance of the Investor Class. Performance of the Fund’s Institutional Class prior to 2/1/2016 uses the actual expenses of the Fund’s Investor Class without any adjustments. For any such period of time, the performance of the Fund’s Institutional Class would have been substantially similar to, yet higher than, the performance of the Fund’s Investor Class, because the shares of both classes are invested in the same portfolio of securities, but the classes bear different expenses.
Investing in small and micro cap funds will be more volatile and loss of principal could be greater than investing in large cap or more diversified funds. Investing in foreign securities, especially in emerging markets, entails special risks, such as currency fluctuations and political uncertainties, which are described in more detail in the prospectus.
TOP 10 EQUITY HOLDINGS*
| | | | |
| Company | | % of Net
Assets | |
| MercadoLibre, Inc. (Brazil) | | | 3.1% | |
| Medytox, Inc. (Korea) | | | 2.9% | |
| Cavium, Inc. | | | 2.8% | |
| Trex Co., Inc. | | | 2.7% | |
| HealthEquity, Inc. | | | 2.5% | |
| | | | |
| Company | | % of Net
Assets | |
| MakeMyTrip Ltd. (India) | | | 2.3% | |
| Knight-Swift Transportation Holdings, Inc. | | | 2.2% | |
| Copart, Inc. | | | 2.0% | |
| Somany Ceramics Ltd. (India) | | | 2.0% | |
| Ollie’s Bargain Outlet Holdings, Inc. | | | 2.0% | |
| * | As of September 30, 2017, there were 81 holdings in the Fund. Foreign currency contracts, written options and repurchase agreements, if any, are not included in the number of holdings. Portfolio holdings are subject to change at any time. References to specific securities should not be construed as recommendations by the Funds or their Advisor. Current and future holdings are subject to risk. |
SECTOR BREAKDOWN**
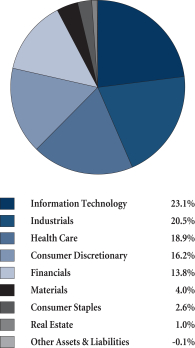
| ** | Excludes securities sold short and options written, if any. |
GROWTHOFA HYPOTHETICAL $10,000 INVESTMENT
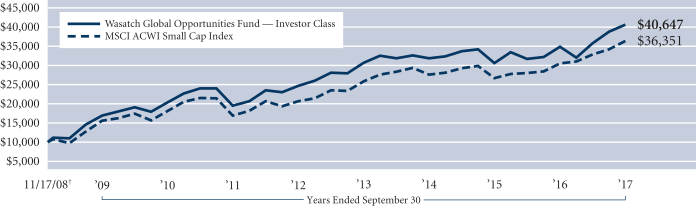
Past performance does not predict future performance. The graph above does not reflect the deduction of fees, sales charges, or taxes that you would pay on fund distributions or the redemption of fund shares. Wasatch does not charge any sales fees. †Inception: November 17, 2008. The MSCI ACWI (All Country World Index) Small Cap Index is a free float-adjusted market capitalization index designed to measure the performance of small capitalization securities in developed and emerging markets. You cannot invest directly in this or any index.
15
| | |
| WASATCH INTERNATIONAL GROWTH FUND (WAIGX / WIIGX) | | SEPTEMBER 30, 2017 (UNAUDITED) |
|
|
|
Management Discussion
The Wasatch International Growth Fund is managed by a team of Wasatch portfolio managers led by Roger Edgley, Ken Applegate and Linda Lasater.
| | | | |
Roger Edgley, CFA Lead Portfolio Manager | | 
Ken Applegate, CFA Portfolio Manager | | 
Linda Lasater, CFA Associate Portfolio Manager |
OVERVIEW
The Wasatch International Growth Fund — Investor Class gained 12.04% for the 12 months ended September 30, 2017 and underperformed its benchmark, the MSCI ACWI ex USA Small Cap Index, which gained 19.19%.
Late in 2016, value stocks dramatically outperformed growth stocks. High-quality (based on returns on equity) growth stocks were among the weakest performers. That began to change in 2017. Throughout the first nine months of the year, investors in developed markets became refocused on quality and growth stocks. Although the Fund outperformed its benchmark for the first nine months of calendar year 2017, the underperformance that occurred in the last quarter of 2016 hindered the Fund’s results relative to the Index for the 12-month period.
Among developed international markets, European corporate earnings have been recovering after years of underinvestment and economic indicators have continued to improve. In the United Kingdom (U.K.), Brexit still clouds the future. Most of the Fund’s U.K. investments derive a meaningful portion of their revenue from outside the country, and so have been benefiting from increased global economic activity. We have seen signs that Brexit is weakening Britain’s domestic consumers. Since the referendum in June 2016, we have reduced our exposure to U.K. domestic focused companies.
During the last five years we have identified a number of positive changes in Japan, many of which have been sparked by policies introduced by Prime Minister Shinzo Abe. These changes have opened up more interesting and attractive investment opportunities, and we have been increasing our weighting in Japan.
Emerging markets continued to perform well based on optimism over growth and returning investment. India was a strong-performing market for the 12-month period. However, Indian stocks experienced volatility as the Modi government’s reforms, including last year’s demonetization of large-denomination bank notes and the nationwide goods-and-services tax initiated in June, continue to work their way through the economy. Although the Fund’s Indian holdings trailed those in the Index for the period, we continue to like their growth prospects.
DETAILSOFTHE YEAR
The Fund’s top contributor for the 12-month period was Ipsen S.A., a French pharmaceutical company that has transitioned into a global supplier of oncology products and is leveraging its global sales force to sell an increasing number of products.
Nihon M&A Center, Inc., a Japanese company that connects sellers and buyers of small businesses, was the Fund’s second-best contributor. Nihon M&A has been benefiting from the demographic trends of baby boomers retiring and looking to sell their businesses. Management has enhanced the company’s market position by hosting informational seminars for sellers, and by building relationships with banks, accounting firms and other lead-generating sources.
Another Japanese holding, Seria Co. Ltd., was the Fund’s third-best contributor. Seria, which operates a chain of 100-yen stores (essentially dollar stores), continued to generate strong earnings growth.
The greatest detractor from performance for the year was also from Japan. Gurunavi, Inc. operates an internet portal for ordering food from restaurants online. We like the company’s dominant market position and its opportunity to offer more services and products to customers. Gurunavi has been investing heavily to grow its business. As a result, the company’s recent financial results missed analysts’ expectations.
NCC Group plc, which provides security software and consulting services, was the Fund’s second-largest detractor. The U.K.-based company issued a second profit warning early in 2017 and the CEO stepped down. Our conviction regarding the company’s long-term prospects waned, and we sold our shares.
Australia’s Domino’s Pizza Enterprises Ltd. was the third-largest detractor. Domino’s has seen growth slow in 2017 and has had negative press surrounding how some franchises pay their employees. Our investment team was in Australia during September, and we nevertheless remain impressed with the quality of Domino’s management.
OUTLOOK
We continue to be upbeat on the investment outlook for Japanese small caps. We believe Japan is an inefficient market and remains misunderstood — providing opportunities for investors like Wasatch who are willing to do the work. Each time we visit Japan, we return incrementally more positive.
In emerging markets, we also like what we’re seeing. Currencies appear to have stabilized and are more competitive, current-account balances have improved for the majority of emerging markets and stock valuations are still below their long-term averages.
We have had a busy travel schedule over the past year. So we will take some time to consolidate our thoughts, update our models, screen the world for new and exciting investment opportunities, and plan our research efforts for 2018. We already have research trips planned to the U.K., Europe and India. We remain excited about the future of investing internationally.
Thank you for the opportunity to manage your assets.
| | Current and future holdings are subject to risk. |
16
| | |
| WASATCH INTERNATIONAL GROWTH FUND (WAIGX / WIIGX) | | SEPTEMBER 30, 2017 (UNAUDITED) |
|
|
|
Portfolio Summary
AVERAGE ANNUAL TOTAL RETURNS
| | | | | | | | | | | | | | | |
| | | 1 YEAR | | 5 YEARS | | 10 YEARS |
International Growth (WAIGX) — Investor | | | | 12.04% | | | | | 10.21% | | | | | 5.65% | |
International Growth (WIIGX) — Institutional | | | | 12.16% | | | | | 10.25% | | | | | 5.68% | |
MSCI ACWI ex USA Small Cap Index | | | | 19.19% | | | | | 9.68% | | | | | 3.58% | |
MSCI World ex USA Small Cap Index | | | | 20.42% | | | | | 11.16% | | | | | 4.04% | |
Data shows past performance, which is not indicative of future performance. Current performance may be lower or higher than the performance quoted. To obtain the most recent month-end performance data available, please visit www.WasatchFunds.com. The Advisor may absorb certain Fund expenses, without which total return would have been lower. Investment returns and principal value will fluctuate and shares, when redeemed, may be worth more or less than their original cost.
As of the September 1, 2017 prospectus, the Total Annual Fund Operating Expenses for the Wasatch International Growth Fund are Investor Class: 1.48% / Institutional Class — Gross: 1.36%, Net: 1.35%. The expense ratio shown elsewhere in this report may be different. Net expenses are based on Fund expenses, net of waivers and reimbursements. See the prospectus for additional information regarding Fund expenses.
Wasatch Funds will deduct a 2.00% redemption proceeds fee on Fund shares held 60 days or less. Performance data does not reflect the deduction of fees, including sales charges, or the taxes you would pay on fund distributions or the redemption of fund shares. Fees and taxes, if reflected, would reduce the performance quoted. Wasatch does not charge any sales fees. For more complete information including charges, risks and expenses, read the prospectus carefully.
Performance for the Institutional Class prior to 2/1/2016 is based on the performance of the Investor Class. Performance of the Fund’s Institutional Class prior to 2/1/2016 uses the actual expenses of the Fund’s Investor Class without any adjustments. For any such period of time, the performance of the Fund’s Institutional Class would have been substantially similar to, yet higher than, the performance of the Fund’s Investor Class, because the shares of both classes are invested in the same portfolio of securities, but the classes bear different expenses.
Investing in foreign securities, especially in frontier and emerging markets, entails special risks, such as currency fluctuations and political uncertainties, which are described in more detail in the prospectus. Investing in small cap funds will be more volatile and loss of principal could be greater than investing in large cap or more diversified funds.
TOP 10 EQUITY HOLDINGS*
| | | | |
| Company | | % of Net
Assets | |
| Seria Co. Ltd. (Japan) | | | 2.8% | |
| Abcam plc (United Kingdom) | | | 2.6% | |
| MISUMI Group, Inc. (Japan) | | | 2.6% | |
| Vitasoy International Holdings Ltd. (China) | | | 2.5% | |
| Ipsen S.A. (France) | | | 2.3% | |
| | | | |
| Company | | % of Net
Assets | |
| Nihon M&A Center, Inc. (Japan) | | | 2.2% | |
| Cochlear Ltd. (Australia) | | | 2.1% | |
| Cosmos Pharmaceutical Corp. (Japan) | | | 2.0% | |
| SMS Co. Ltd. (Japan) | | | 2.0% | |
| Clinigen Healthcare plc (United Kingdom) | | | 1.8% | |
| * | As of September 30, 2017, there were 89 holdings in the Fund. Foreign currency contracts, written options and repurchase agreements, if any, are not included in the number of holdings. Portfolio holdings are subject to change at any time. References to specific securities should not be construed as recommendations by the Funds or their Advisor. Current and future holdings are subject to risk. |
SECTOR BREAKDOWN**
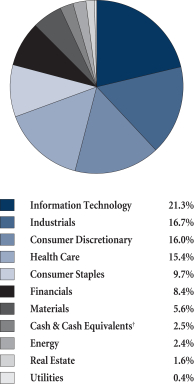
| ** | Excludes securities sold short and options written, if any. |
| † | Also includes Other Assets & Liabilities. |
GROWTHOFA HYPOTHETICAL $10,000 INVESTMENT
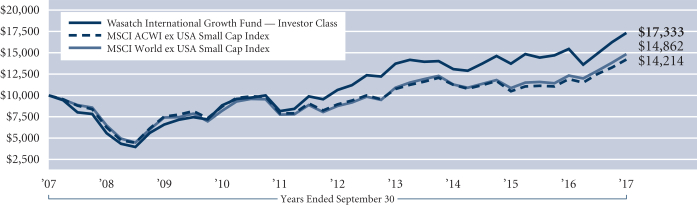
Past performance does not predict future performance. The graph above does not reflect the deduction of fees, sales charges, or taxes that you would pay on fund distributions or the redemption of fund shares. Wasatch does not charge any sales fees. The MSCI ACWI (All Country World Index) ex USA Small Cap Index is a free float-adjusted market capitalization index designed to measure the performance of small capitalization securities in developed markets, excluding the United States, and in emerging markets. The MSCI World ex USA Small Cap Index is a free float-adjusted market capitalization index designed to measure the performance of small capitalization securities in developed markets, excluding the United States. You cannot invest directly in these or any indexes.
17
| | |
| WASATCH INTERNATIONAL OPPORTUNITIES FUND (WAIOX / WIIOX) | | SEPTEMBER 30, 2017 (UNAUDITED) |
|
|
|
Management Discussion
The Wasatch International Opportunities Fund is managed by a team of Wasatch portfolio managers led by Jared Whatcott and Linda Lasater.
| | | | |
Jared Whatcott, CFA Portfolio Manager | |
Linda Lasater, CFA Portfolio Manager | | OVERVIEW The Wasatch International Opportunities Fund — Investor Class gained 8.10% for the 12 months ended September 30, 2017 and underperformed its benchmark, the |
MSCI ACWI ex USA Small Cap Index, which gained 19.19%.
The latter part of 2016 following the U.S. presidential election was a tough time for international equity markets and especially for emerging markets. In contrast, the U.S. equity markets and cyclical industries that usually track the strength of an economy rallied. In a low-growth reality, investors seemed to pin their hopes on stronger economic growth. In keeping with this apparent mindset, they favored investments in beaten-down, slower-growing companies in sectors like energy, financials, materials and industrials that usually do well when an economy is strengthening. As a result, high-quality (based on returns on equity) growth stocks that are most often found in sectors like consumer discretionary, consumer staples and information technology underperformed. In the last three months of calendar year 2016, the Fund was down more than its benchmark due to its overweighting of these underperforming sectors. It should be noted that the Fund is overweight in sectors where we typically find companies capable of growing whether an economy is expanding or contracting. For the 12-month period, the Fund’s largest sector overweights were consumer staples, consumer discretionary and information technology. While these sectors contributed to the Fund’s absolute performance, they detracted from results versus the benchmark.
Investors’ “risk-on” mindset that began late in calendar year 2016 has been unwinding more recently with high-quality growth stocks outperforming their value counterparts for the first nine months of calendar year 2017.
In Europe, economic growth exceeded expectations in the first three-quarters of 2017 with continued support from the European Central Bank. After two decades of deflation, Japan also benefited from a stronger economy, but is still below the Bank of Japan’s 2% target inflation rate. More importantly, in Japan we observed continued improvement in corporate fundamentals and governance. Companies’ revenues, profitability and dividends generally have been increasing, and Japanese management teams have been investing in their businesses with an eye to spurring growth.
Emerging markets have also been improving, driven by macroeconomic stability and strength in corporate fundamentals. In addition, stabilizing or rising commodity prices have helped many resource-dependent emerging economies.
Although the Fund is underweight in Japan and the United Kingdom (U.K.), our holdings in these countries outperformed for the 12-month period. India and Malaysia are notable emerging markets where our holdings underperformed their benchmark counterparts.
DETAILSOFTHE YEAR
Four of the Fund’s top 10 contributors for the period were from Japan led by Yume No Machi Souzou Iinkai Co. Ltd. and M&A Capital Partners Co. Ltd. Yume No Machi’s market-leading “Demae-can” portal connects eight million customers (20% to 25% are considered “active”) with 13,000 restaurants and takes 5% of the order fee and monthly charges. M&A Capital is an advisory firm poised to benefit from increasing consolidation of small and medium-size enterprises in Japan.
Also among the top contributors was Germany’s Hypoport AG, which operates the largest electronic marketplace for financial products, particularly mortgages. The company’s core business has been gaining market share and generating strong cash flows, which management has been using to expand into adjacent product categories.
Two of the Fund’s largest detractors were from Japan. Dip Corp. operates online job sites focused on part-time and seasonal workers. Over the past nine months, the stock has been weak as growth is slowing and the part-time and temporary market is reaching a cyclical peak. Dip was gaining market share but at the expense of pricing. The company was also investing outside of its core business. We elected to sell the stock. Gurunavi is an online restaurant guide and search site. The company is poised to benefit as more restaurants spend their marketing dollars to advertise online. Gurunavi missed analysts’ expectations given heavy investments to grow its business.
In Malaysia, 7-Eleven Malaysia Holdings Berhad was a notable detractor, but we believe the long-term fundamentals of the company are still intact. 7-Eleven, the largest convenience-store operator in Malaysia, missed expectations due to operational issues by its third-party logistics provider. Furthermore, industry volumes of high-ticket items such as cigarettes and non-alcoholic beverages were down significantly.
OUTLOOK
Global equity markets — from Europe to China to Japan to South America — have continued to benefit from increasing strength of their underlying economies. Of course, this brings up the possibility of the “risk trade” reversing — whether due to eventual interest-rate hikes in developed countries, an economic slowdown in China, a geopolitical event, or some other development — that could set up global markets for a correction. And while trying to forecast which markets will outperform and which will underperform is not something we do, we are confident that our years of experience and our disciplined investment process will continue to lead us to what we believe are the highest-quality companies wherever they might be in the world.
Thank you for the opportunity to manage your assets.
| | Current and future holdings are subject to risk. |
18
| | |
| WASATCH INTERNATIONAL OPPORTUNITIES FUND (WAIOX / WIIOX) | | SEPTEMBER 30, 2017 (UNAUDITED) |
|
|
|
Portfolio Summary
AVERAGE ANNUAL TOTAL RETURNS
| | | | | | | | | | | | | | | |
| | | 1 YEAR | | 5 YEARS | | 10 YEARS |
International Opportunities (WAIOX) — Investor | | | | 8.10% | | | | | 12.21% | | | | | 5.66% | |
International Opportunities (WIIOX) — Institutional | | | | 8.36% | | | | | 12.40% | | | | | 5.75% | |
MSCI ACWI ex USA Small Cap Index | | | | 19.19% | | | | | 9.68% | | | | | 3.58% | |
MSCI World ex USA Small Cap Index | | | | 20.42% | | | | | 11.16% | | | | | 4.04% | |
Data shows past performance, which is not indicative of future performance. Current performance may be lower or higher than the performance quoted. To obtain the most recent month-end performance data available, please visit www.WasatchFunds.com. The Advisor may absorb certain Fund expenses, without which total return would have been lower. Investment returns and principal value will fluctuate and shares, when redeemed, may be worth more or less than their original cost.
As of the September 1, 2017 prospectus, the Total Annual Fund Operating Expenses for the Wasatch International Opportunities Fund are Investor Class: 2.22% / Institutional Class — Gross: 2.04%, Net: 1.95%. The expense ratio shown elsewhere in this report may be different. Net expenses are based on Fund expenses, net of waivers and reimbursements. See the prospectus for additional information regarding Fund expenses.
Wasatch Funds will deduct a 2.00% redemption proceeds fee on Fund shares held 60 days or less. Performance data does not reflect the deduction of fees, including sales charges, or the taxes you would pay on fund distributions or the redemption of fund shares. Fees and taxes, if reflected, would reduce the performance quoted. Wasatch does not charge any sales fees. For more complete information including charges, risks and expenses, read the prospectus carefully.
Performance for the Institutional Class prior to 2/1/2016 is based on the performance of the Investor Class. Performance of the Fund’s Institutional Class prior to 2/1/2016 uses the actual expenses of the Fund’s Investor Class without any adjustments. For any such period of time, the performance of the Fund’s Institutional Class would have been substantially similar to, yet higher than, the performance of the Fund’s Investor Class, because the shares of both classes are invested in the same portfolio of securities, but the classes bear different expenses.
Investing in foreign securities, especially in frontier and emerging markets, entails special risks, such as currency fluctuations and political uncertainties, which are described in more detail in the prospectus. Investing in micro cap funds will be more volatile and loss of principal could be greater than investing in large cap or more diversified funds.
TOP 10 EQUITY HOLDINGS*
| | | | |
| Company | | % of Net
Assets | |
| Philippine Seven Corp. (Philippines) | | | 2.1% | |
| Open Door, Inc. (Japan) | | | 1.9% | |
| Infomart Corp. (Japan) | | | 1.9% | |
| Webjet Ltd. (Australia) | | | 1.9% | |
| AmRest Holdings SE (Poland) | | | 1.8% | |
| SMS Co. Ltd. (Japan) | | | 1.7% | |
| | | | |
| Company | | % of Net
Assets | |
| Yume No Machi Souzou Iinkai Co. Ltd. (Japan) | | | 1.7% | |
| 7-Eleven Malaysia Holdings Berhad, Class B (Malaysia) | | | 1.6% | |
| Hypoport AG (Germany) | | | 1.6% | |
| Can Fin Homes Ltd. (India) | | | 1.5% | |
| * | As of September 30, 2017, there were 118 holdings in the Fund. Foreign currency contracts, written options and repurchase agreements, if any, are not included in the number of holdings. Portfolio holdings are subject to change at any time. References to specific securities should not be construed as recommendations by the Funds or their Advisor. Current and future holdings are subject to risk. |
SECTOR BREAKDOWN**
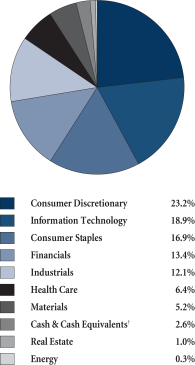
| ** | Excludes securities sold short and options written, if any. |
| † | Also includes Other Assets & Liabilities. |
GROWTHOFA HYPOTHETICAL $10,000 INVESTMENT
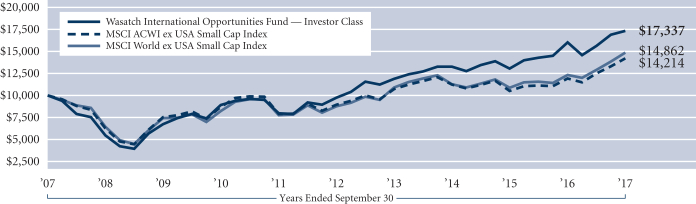
Past performance does not predict future performance. The graph above does not reflect the deduction of fees, sales charges, or taxes that you would pay on fund distributions or the redemption of fund shares. Wasatch does not charge any sales fees. The MSCI ACWI (All Country World Index) ex USA Small Cap Index is a free float-adjusted market capitalization index designed to measure the performance of small capitalization securities in developed markets, excluding the United States, and in emerging markets. The MSCI World ex USA Small Cap Index is a free float-adjusted market capitalization index designed to measure the performance of small capitalization securities in developed markets, excluding the United States. You cannot invest directly in these or any indexes.
19
| | |
| WASATCH LARGE CAP VALUE FUND (FMIEX / WILCX) | | SEPTEMBER 30, 2017 (UNAUDITED) |
|
|
|
Management Discussion
The Wasatch Large Cap Value Fund is managed by a team of Wasatch portfolio managers led by David Powers.
| | |

David Powers, CFA Lead Portfolio Manager | | OVERVIEW The Wasatch Large Cap Value Fund — Investor Class gained 16.11% and outperformed its benchmark, the Russell 1000 Value Index, which returned 15.12% for the 12-months ended September 30, 2017. Effective October 31, 2017, the Wasatch Large Cap Value Fund will become the Wasatch Global Value Fund. Global equity markets experienced strong positive returns in the 12-month |
| period. Stocks were supported by signs of continued improvement in the U.S. economy, accelerating growth in Europe and Japan, and stabilization of China’s economy. A rebound in commodity prices further improved risk sentiment among investors. The outcome of the November 2016 U.S. election played a notable role in equity returns for the entire 12-month period, as investors anticipated business-friendly policies would be forthcoming with Republicans holding the White House and both houses of Congress. Investors took additional comfort as the Federal Reserve (Fed) continued to exercise patience in moving toward the removal of monetary accommodation. |
The improvement in global growth was reflected in corporate earnings, which experienced a synchronized, world-wide upturn, helping to underpin somewhat elevated stock-market valuations. Within the value-stock universe, performance was led by cyclical areas of the market, such as financials, industrials and materials. Information-technology stocks also did well.
The Fund’s performance relative to the benchmark was aided by stock selection within the energy and financials sectors, while selection within industrials was the leading detractor.
DETAILSOFTHE YEAR
The five top contributors to the Fund’s performance for the period were financial companies, specifically Citigroup, Inc., JPMorgan Chase & Co., PNC Financial Services Group, Inc., Goldman Sachs Group, Inc. and Wells Fargo & Co. Large bank stocks benefited from the outlook for rising interest rates, as well as positive grades on the Fed’s stress tests, raising the prospect of share repurchases and dividend increases. Outside of financials, the Fund’s top contributor was Apple, Inc. Shares of the consumer-technology giant benefited in the run-up to a refresh of the iPhone. A number of energy stocks also contributed to performance for the 12 months, including Suncor Energy, Inc., Chevron Corp. and Royal Dutch Shell plc. Integrated oil and gas companies rebounded off lows in the period as the price of oil stabilized somewhere around the middle of its range over the last few years.
On the downside, the share price of industrial conglomerate General Electric Co. (GE) declined even as the broader market moved higher. Investors have looked askance at the
company’s cash-flow levels relative to stated income. We view GE’s somewhat lumpy cash-flow results as reasonable given the substantial outlays required and the prolonged payment cycle for many of its industrial products such as power-plant turbines. GE reported slower organic growth and orders in the period, primarily due to the power and oil and gas segments, and management guided earnings and cash flow to the lower end of the range analysts had been expecting. We continue to view GE as an ongoing turnaround story, but opted to trim the position as we monitor the actions of GE’s new CEO as he seeks to manage expectations and works to improve margins and cash flow. Medical-device manufacturer Medtronic plc saw its share price decline, in part due to an industry slowdown as the adoption of higher-deductible insurance plans pushed back medical procedures. More to the point, Medtronic experienced systems issues in the third quarter of 2017 that hindered its ability to process business, and also experienced shortages in a key component of its new diabetes treatment. EPR Properties, a real estate investment trust focused on entertainment-related properties including movie theaters, golf courses, casinos and water parks, was another leading detractor. EPR’s shares suffered as investors reacted unfavorably to the issuance of additional equity and lower reported profits from one of the company’s key tenants. We continue to like EPR’s strong, diversified business profile and high dividend in a low interest-rate environment.
OUTLOOK
The Fund remains tilted toward higher-quality companies within the large-cap value universe, as gauged by lower market sensitivity, lower valuations, higher cash flows, higher dividends and stronger balance sheets. Our cautious stance is based on the view that at this point in the current prolonged U.S. economic cycle, few stocks are attractively valued by our standards.
We are witnessing synchronized growth across economic regions, led by Europe and Japan, which are in earlier stages of the economic cycle than the U.S. That said, U.S. growth will receive a boost from post-hurricane season rebuilding and replacement purchases. Tax reform is currently at the top of the Trump administration’s agenda, following its failed effort to revamp health care. Reduced corporate tax rates would boost earnings results, especially for smaller, U.S.-oriented companies.
Toward the end of the Fund’s fiscal year, the performance divergence seen in recent quarters between value and growth stocks began to show signs of easing or reversing, as investors rotated toward more value-oriented sectors. In addition, we believe large-cap value stocks are better positioned to weather late-cycle dynamics than their growth and momentum counterparts. In any event, we do not believe it makes sense to add risk at this point and expect to maintain a strong focus on higher-quality, better-valued stocks.
Thank you for the opportunity to manage your assets.
| | Current and future holdings are subject to risk. |
20
| | |
| WASATCH LARGE CAP VALUE FUND (FMIEX / WILCX) | | SEPTEMBER 30, 2017 (UNAUDITED) |
|
|
|
Portfolio Summary
AVERAGE ANNUAL TOTAL RETURNS
| | | | | | | | | | | | | | | |
| | | 1 YEAR | | 5 YEARS | | 10 YEARS |
Large Cap Value (FMIEX) — Investor | | | | 16.11% | | | | | 10.33% | | | | | 5.00% | |
Large Cap Value (WILCX) — Institutional | | | | 16.31% | | | | | 10.46% | | | | | 5.07% | |
Russell 1000® Value Index | | | | 15.12% | | | | | 13.20% | | | | | 5.92% | |
Data shows past performance, which is not indicative of future performance. Current performance may be lower or higher than the performance quoted. To obtain the most recent month-end performance data available, please visit www.WasatchFunds.com. The Advisor may absorb certain Fund expenses, without which total return would have been lower. Investment returns and principal value will fluctuate and shares, when redeemed, may be worth more or less than their original cost.
As of the September 1, 2017 prospectus, the Total Annual Fund Operating Expenses for the Wasatch Large Cap Value Fund are Investor Class — Gross: 1.17%, Net: 1.10% / Institutional Class — Gross: 1.72%, Net: 0.95%. The expense ratio shown elsewhere in this report may be different. Net expenses are based on Fund expenses, net of waivers and reimbursements. See the prospectus for additional information regarding Fund expenses.
Wasatch Funds will deduct a 2.00% redemption proceeds fee on Fund shares held 60 days or less. Performance data does not reflect the deduction of fees, including sales charges, or the taxes you would pay on fund distributions or the redemption of fund shares. Fees and taxes, if reflected, would reduce the performance quoted. Wasatch does not charge any sales fees. For more complete information including charges, risks and expenses, read the prospectus carefully.
Performance for the Institutional Class prior to 1/31/2012 is based on the performance of the Investor Class. Performance of the Fund’s Institutional Class prior to 1/31/2012 uses the actual expenses of the Fund’s Investor Class without any adjustments. For any such period of time, the performance of the Fund’s Institutional Class would have been substantially similar to, yet higher than, the performance of the Fund’s Investor Class, because the shares of both classes are invested in the same portfolio of securities, but the classes bear different expenses.
Investments in value stocks can perform differently from the market as a whole and from other types of stocks and can continue to be undervalued by the market for long periods of time. Loss of principal is a risk of investing.
TOP 10 EQUITY HOLDINGS*
| | | | |
| Company | | % of Net
Assets | |
| Pfizer, Inc. | | | 4.6% | |
| Exelon Corp. | | | 4.3% | |
| Chevron Corp. | | | 4.2% | |
| Johnson & Johnson | | | 4.1% | |
| Cisco Systems, Inc. | | | 3.8% | |
| | | | |
| Company | | % of Net
Assets | |
| Procter & Gamble Co. (The) | | | 3.7% | |
| Wal-Mart Stores, Inc. | | | 3.7% | |
| Duke Energy Corp. | | | 3.6% | |
| Wells Fargo & Co. | | | 3.3% | |
| Oracle Corp. | | | 3.2% | |
| * | As of September 30, 2017, there were 36 holdings in the Fund. Foreign currency contracts, written options and repurchase agreements, if any, are not included in the number of holdings. Portfolio holdings are subject to change at any time. References to specific securities should not be construed as recommendations by the Funds or their Advisor. Current and future holdings are subject to risk. |
SECTOR BREAKDOWN**
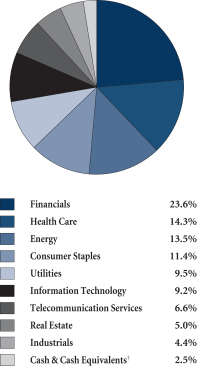
| ** | Excludes securities sold short and options written, if any. |
| † | Also includes Other Assets & Liabilities. |
GROWTHOFA HYPOTHETICAL $10,000 INVESTMENT
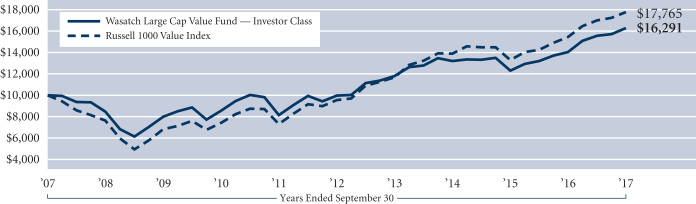
Past performance does not predict future performance. The graph above does not reflect the deduction of fees, sales charges, or taxes that you would pay on fund distributions or the redemption of fund shares. Wasatch does not charge any sales fees. The Russell 1000 Value Index measures the performance of Russell 1000 Index companies with lower price-to-book ratios and lower forecasted growth values. You cannot invest directly in these or any indexes.
21
| | |
| WASATCH LONG/SHORT FUND (FMLSX / WILSX) | | SEPTEMBER 30, 2017 (UNAUDITED) |
|
|
|
Management Discussion
The Wasatch Long/Short Fund is managed by a team of Wasatch portfolio managers.
OVERVIEW
Global equity markets experienced strong positive returns in the 12-month period. Stocks were supported by signs of continued improvement in the U.S. economy, accelerating growth in Europe and Japan, and stabilization of China’s economy. A rebound in commodity prices further bolstered investors’ risk sentiment. The improvement in global growth was reflected in corporate earnings, which experienced a synchronized upturn across all economic regions, helping to underpin somewhat elevated stock-market valuations. Stock performance for the 12 months was led by cyclical areas of the market, such as financials, industrials and materials. Information-technology stocks also had strong performance over the period.
For the 12 months ended September 30, 2017, the Wasatch Long/Short Fund — Investor Class declined -0.37%, underperforming the 18.61% return of the S&P 500 Index. The Fund’s average net long position of 46% weighed on performance relative to the Index for the period, as did short exposure to momentum stocks and the continued outperformance of growth versus value stocks.
DETAILSOFTHE YEAR
On the long side of the portfolio, performance was led by consumer-electronics icon Apple, Inc. Apple saw its share price rise in anticipation of a product refresh of the iPhone. Stock analysts believe that Apple customers will willingly spend close to $1,000 for the 10th anniversary edition of the iconic device. A position in Citigroup, Inc. was another notable contributor. Large bank stocks benefited in the period from the outlook for rising interest rates, as well as positive grades on the Fed’s stress tests, raising the prospect of share repurchases and dividend increases.
Southwestern Energy Co. was the leading detractor on the long side. Shares of the natural gas exploration and production company suffered in the wake of lower-than-expected cash flow caused by low natural gas prices in the Northeast. We believe the selloff in the stock was overdone and that it should rebound as new pipeline capacity leads to more-normalized pricing in the Northeast. Shares of retailer Macy’s, Inc. weakened throughout the period, as the company’s results disappointed and sentiment with respect to brick-and-mortar retailers continued to deteriorate. We believe Macy’s current stock price fails to recognize the value of its assets, which include a substantial real-estate portfolio.
Positive contributors among short positions for the period included oil-field services provider Helmerich & Payne, Inc. The company’s share price fell as the outlook for utilization and day rates declined with the price of oil in early 2017. A short in Newell Brands, Inc. also worked well. The highly-levered manufacturer of consumer products, with brands that include Rubbermaid, was negatively affected by higher materials prices in the wake of the historic hurricane season.
Shorts in a pair of specialty health-care companies trading at high multiples of earnings — Zeltiq Aesthetics, Inc., a
marketer and licensor of non-invasive fat-reduction procedures, and Inogen, Inc., a developer of oxygen-therapy devices — were notable detractors. A short position within industrials in Caterpillar, Inc. detracted, as the equipment manufacturer’s share price rose on raised guidance with respect to its cyclical earnings power.
Recently added companies included a long position in Alaska Air Group, Inc. We think that its acquisition of Virgin Airlines was transformational in nature. Alaska Air is now the fifth-largest airline in the nation and, with the acquisition, is able to offer potentially lucrative coast-to- coast routes from its San Francisco hub. Alaska Air also makes almost as much money on its credit-card business, which provides flight-related rewards, as it does from its core business. Growing its credit-card loyalty business was a key synergy lever for the Virgin Airlines acquisition.
We initiated a short position in home-furnishings company RH, better known as Restoration Hardware. We expect the company to have difficulty meeting expectations after beating year-over-year results with the aid of a one-time inventory-clearance sale. In addition, RH has added leverage, thus risking rapid multiple compression should earnings miss expectations in the face of a generally challenging environment for retailers.
OUTLOOK
The Fund’s low net exposure versus its history reflects our view that the market currently contains significant downside risk at this late stage of the cycle. The high expectations embedded in current stock prices raise the question of when multiples will revert to more normal levels.
Free cash flow or the absence thereof remains our top criteria for both longs and shorts. This leads to a long-value and short-growth bias in the Fund. As a result, the sustained period of significant outperformance of growth stocks over value stocks has been a headwind on both the long and short sides of the portfolio. Toward the end of the period, the Fund’s performance began to benefit from a market rotation toward sectors with better value characteristics, such as financials and energy.
Following the failed effort to revamp health care, tax reform is now front and center on the Washington agenda. The high free-cash-flow companies favored by our strategy could be particular beneficiaries of any reduction in corporate tax rates, which would encourage repatriation of cash and enable share repurchases.
At a meeting held in November 2017, the Board of Trustees of Wasatch Funds Trust approved the reorganization of the Wasatch Long/Short Fund with and into the Wasatch Global Value Fund. In order for the reorganization to occur, it must be approved by the shareholders of the Long/Short Fund. If approved, it is anticipated the reorganization will be consummated in April, 2018.
Thank you for the opportunity to manage your assets.
| | Current and future holdings are subject to risk. |
22
| | |
| WASATCH LONG/SHORT FUND (FMLSX / WILSX) | | SEPTEMBER 30, 2017 (UNAUDITED) |
|
|
|
Portfolio Summary
AVERAGE ANNUAL TOTAL RETURNS
| | | | | | | | | | | | | | | |
| | | 1 YEAR | | 5 YEARS | | 10 YEARS |
Long/Short (FMLSX) — Investor | | | | -0.37% | | | | | 2.17% | | | | | 3.03% | |
Long/Short (WILSX) — Institutional | | | | -0.05% | | | | | 2.36% | | | | | 3.13% | |
S&P 500® Index | | | | 18.61% | | | | | 14.22% | | | | | 7.44% | |
Citigroup U.S. Domestic 3-Month Treasury Bills Index | | | | 0.64% | | | | | 0.19% | | | | | 0.42% | |
Data shows past performance, which is not indicative of future performance. Current performance may be lower or higher than the performance quoted. To obtain the most recent month-end performance data available, please visit www.WasatchFunds.com. The Advisor may absorb certain Fund expenses, without which total return would have been lower. Investment returns and principal value will fluctuate and shares, when redeemed, may be worth more or less than their original cost.
As of the September 1, 2017 prospectus, the Total Annual Fund Operating Expenses for the Wasatch Long/Short Fund are — Investor Class: 1.83% / Institutional Class — Gross: 1.57%, Net: 1.50%. The expense ratio shown elsewhere in this report may be different. Net expenses are based on Fund expenses, net of waivers and reimbursements. Expenses include dividend expense on short sales and interest expense. See the prospectus for additional information regarding Fund expenses.
Wasatch Funds will deduct a 2.00% redemption proceeds fee on Fund shares held 60 days or less. Performance data does not reflect the deduction of fees, including sales charges, or the taxes you would pay on fund distributions or the redemption of fund shares. Fees and taxes, if reflected, would reduce the performance quoted. Wasatch does not charge any sales fees. For more complete information including charges, risks and expenses, read the prospectus carefully.
Performance for the Institutional Class prior to 12/13/2012 is based on the performance of the Investor Class. Performance of the Fund’s Institutional Class prior to 12/13/2012 uses the actual expenses of the Fund’s Investor Class without any adjustments. For any such period of time, the performance of the Fund’s Institutional Class would have been substantially similar to, yet higher than, the performance of the Fund’s Investor Class, because the shares of both classes are invested in the same portfolio of securities, but the classes bear different expenses.
The Fund makes short sales of securities, which involve the risk that losses may exceed the original amount invested. Equity investing involves risks, including potential loss of the principal amount invested.
TOP 10 EQUITY HOLDINGS*
| | | | |
| Company | | % of Net
Assets | |
| Amgen, Inc. | | | 6.2% | |
| Apple, Inc. | | | 5.0% | |
| QUALCOMM, Inc. | | | 5.0% | |
| McKesson Corp. | | | 4.6% | |
| Michael Kors Holdings Ltd. | | | 4.3% | |
| | | | |
| Company | | % of Net
Assets | |
| Medtronic plc | | | 4.3% | |
| Allergan plc | | | 3.7% | |
| Citigroup, Inc. | | | 3.4% | |
| Cisco Systems, Inc. | | | 3.3% | |
| Bill Barrett Corp. | | | 3.2% | |
| * | As of September 30, 2017, there were 36 long and 22 short holdings in the Fund. Foreign currency contracts, written options and repurchase agreements, if any, are not included in the number of holdings. Portfolio holdings are subject to change at any time. References to specific securities should not be construed as recommendations by the Funds or their Advisor. Current and future holdings are subject to risk. |
SECTOR BREAKDOWN**
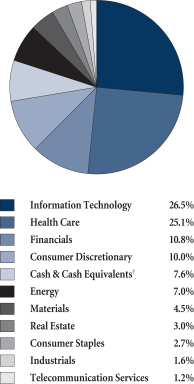
| ** | Excludes securities sold short and options written, if any. |
| † | Also includes Other Assets & Liabilities. |
GROWTHOFA HYPOTHETICAL $10,000 INVESTMENT
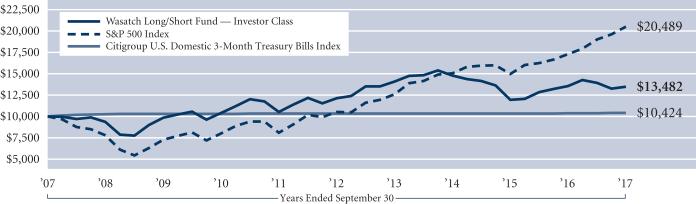
Past performance does not predict future performance. The graph above does not reflect the deduction of fees, sales charges, or taxes that you would pay on fund distributions or the redemption of fund shares. Wasatch does not charge any sales fees. The S&P 500 Index includes 500 of the United States’ largest stocks from a broad variety of industries. The Index is unmanaged and is a commonly used measure of common stock total return performance. The Citigroup U.S. Domestic 3-Month Treasury Bills Index tracks the performance of U.S. Treasury bills with a remaining maturity of three months. U.S. Treasury bills, which are short-term loans to the U.S. government, are full-faith-and-credit obligations of the U.S. Treasury and are generally regarded as being free of any risk of default. You cannot invest directly in these or any indexes.
23
| | |
| WASATCH MICRO CAP FUND (WMICX) | | SEPTEMBER 30, 2017 (UNAUDITED) |
|
|
|
Management Discussion
The Wasatch Micro Cap Fund is managed by a team of Wasatch portfolio managers led by Ken Korngiebel and Dan Chace.
| | | | |

Ken Korngiebel, CFA Lead Portfolio Manager | | 
Dan Chace, CFA Portfolio Manager | | OVERVIEW In the 12 months ended September 30, 2017, the Wasatch Micro Cap Fund generated a total return of 25.10%. The Fund outgained its benchmark, the Russell Microcap Index, which rose 22.33%. |
After underperforming our benchmark during the first three months of the fiscal year, we considered adding to some of the areas that had driven the benchmark higher after the November elections. As long-term investors, however, we decided against allowing political factors to significantly influence our investment decisions. Our companies had been growing faster, had less debt and had been using capital more efficiently than the average company in the Index. History told us that these characteristics drive stock prices over the long run.
Our stocks performed well as investors’ post-election optimism gave way to a renewed focus on fundamentals. The cooling of enthusiasm was evident in the slowdown of asset flows into exchange-traded funds (ETFs). Net purchases of ETFs — especially sector ETFs in areas such as financials and materials — had spiked dramatically after the elections. Because we base our investment decisions on the business trends and growth prospects of individual companies, we believe a market driven by company fundamentals plays to Wasatch’s strengths.
Consumer-discretionary and health-care stocks were the Fund’s largest sources of outperformance relative to the benchmark. In the consumer-discretionary sector especially, the Fund’s Indian stocks lifted performance. Our companies in India benefited from the country’s continued economic growth and the ongoing development of its middle class.
DETAILSOFTHE YEAR
The strongest contributor to Fund performance for the year was V-Mart Retail Ltd. The company operates department stores in India. Specializing in apparel, V-Mart also sells a wide range of general merchandise and fast-moving consumer goods. Shares of V-Mart began climbing steadily in late January in response to a sharp upturn in its same-store sales. Management cited rising household incomes and favorable weather during India’s marriage season as factors in an improved retail environment.
Second-best contributor Exact Sciences Corp. is a biotechnology company with an innovative test for colon cancer. Named Cologuard,® the test avoids the high cost and invasiveness of a colonoscopy by screening a stool sample for cancerous and precancerous cells. Among the positive developments helping to push the company’s stock price
higher was an announcement from a major health insurer that it planned to cover Cologuard in a move expected to add about 30 million covered lives.
The greatest detractor from Fund performance for the fiscal year was Cempra, Inc. The company develops antibiotics for the treatment of bacterial infectious diseases. Shares of Cempra tumbled after the U.S. Food and Drug Administration released briefing documents highlighting concerns about the safety of the company’s lead pneumonia antibiotic, solithromycin. Rather than wait for the outcome of a larger study, we sold the Fund’s remaining shares.
Tandem Diabetes Care, Inc. was the second-largest detractor. The company offers insulin-delivery systems for people with diabetes. A competitor’s introduction of an insulin pump with continuous glucose monitoring (CGM) weighed on Tandem’s stock price. While we are optimistic about the prospects for Tandem’s own CGM pump, we are limiting this holding to a small weighting in the Fund.
OUTLOOK
Earnings of U.S. companies remained on reasonably firm footing after having surprised to the upside for most of the fiscal year. Aside from ever-present international, political and other risks that are difficult to anticipate and quantify, the most likely threats to continued profit growth include a tightening labor market and falling participation rates as baby boomers exit the workforce in large numbers.
While low unemployment is obviously good for people with jobs and for those seeking work, businesses need qualified workers — both to support future growth and to replace those who leave. Luring away employees from competitors with promises of higher wages and benefits drives up employment costs but does not add any new workers to the workforce. Instead, wage increases driven by a scarcity of labor rather than by gains in productivity typically squeeze profit margins and create inflationary pressures. To the extent those pressures force the Fed to raise interest rates more rapidly than expected, a sustained rise in average hourly earnings might ultimately threaten the positive environment that has underpinned recent equity performance and economic growth.
Fortunately, factors opposing such a scenario are significant. As mergers and acquisitions eliminate duplication in the workforce, laid-off workers can help fill the employment needs of other companies. In addition, low energy and commodity prices are generating deflationary forces that would likely offset potential wage increases at least partially, keeping overall inflation in check.
Against that backdrop, we continue to seek high-quality micro caps with the potential to grow into small and medium-size companies over a reasonable period of time. Examples include companies with unique opportunities to serve new markets, undiscovered growers with favorable business trends, as well as disruptive companies whose technologies make them attractive candidates for acquisition by competitors.
Thank you for the opportunity to manage your assets.
| | Current and future holdings are subject to risk. |
24
| | |
| WASATCH MICRO CAP FUND (WMICX) | | SEPTEMBER 30, 2017 (UNAUDITED) |
|
|
|
Portfolio Summary
AVERAGE ANNUAL TOTAL RETURNS
| | | | | | | | | | | | | | | |
| | | 1 YEAR | | 5 YEARS | | 10 YEARS |
Micro Cap | | | | 25.10% | | | | | 13.90% | | | | | 6.32% | |
Russell Microcap® Index | | | | 22.33% | | | | | 13.89% | | | | | 6.65% | |
Data shows past performance, which is not indicative of future performance. Current performance may be lower or higher than the performance quoted. To obtain the most recent month-end performance data available, please visit www.WasatchFunds.com. The Advisor may absorb certain Fund expenses, without which total return would have been lower. Investment returns and principal value will fluctuate and shares, when redeemed, may be worth more or less than their original cost.
As of the September 1, 2017 prospectus, the Total Annual Fund Operating Expenses for the Wasatch Micro Cap Fund are 1.67%. The expense ratio shown elsewhere in this report may be different. See the prospectus for additional information regarding Fund expenses.
Wasatch Funds will deduct a 2.00% redemption proceeds fee on Fund shares held 60 days or less. Performance data does not reflect the deduction of fees, including sales charges, or the taxes you would pay on fund distributions or the redemption of fund shares. Fees and taxes, if reflected, would reduce the performance quoted. Wasatch does not charge any sales fees. For more complete information including charges, risks and expenses, read the prospectus carefully.
Investing in micro cap funds will be more volatile and loss of principal could be greater than investing in large cap or more diversified funds. Investing in foreign securities, especially in emerging markets, entails special risks, such as currency fluctuations and political uncertainties, which are described in more detail in the prospectus.
TOP 10 EQUITY HOLDINGS*
| | | | |
| Company | | % of Net
Assets | |
| Superior Uniform Group, Inc. | | | 2.7% | |
| LGI Homes, Inc. | | | 2.7% | |
| HealthEquity, Inc. | | | 2.6% | |
| Installed Building Products, Inc. | | | 2.5% | |
| V-Mart Retail Ltd. (India) | | | 2.3% | |
| | | | |
| Company | | % of Net
Assets | |
| Freshpet, Inc. | | | 2.1% | |
| Ensign Group, Inc. (The) | | | 2.0% | |
| Envestnet, Inc. | | | 2.0% | |
| Trex Co., Inc. | | | 1.9% | |
| Exact Sciences Corp. | | | 1.9% | |
| * | As of September 30, 2017, there were 80 holdings in the Fund. Foreign currency contracts, written options and repurchase agreements, if any, are not included in the number of holdings. Portfolio holdings are subject to change at any time. References to specific securities should not be construed as recommendations by the Funds or their Advisor. Current and future holdings are subject to risk. |
SECTOR BREAKDOWN**
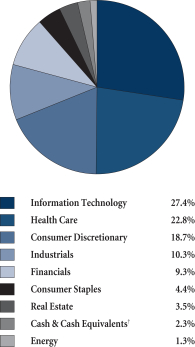
| ** | Excludes securities sold short and options written, if any. |
| † | Also includes Other Assets & Liabilities. |
GROWTHOFA HYPOTHETICAL $10,000 INVESTMENT
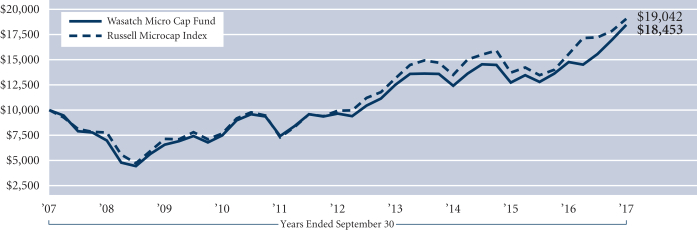
Past performance does not predict future performance. The graph above does not reflect the deduction of fees, sales charges, or taxes that you would pay on fund distributions or the redemption of fund shares. Wasatch does not charge any sales fees. The Russell Microcap Index is an unmanaged total return index of the smallest 1,000 securities in the small-cap Russell 2000 Index along with the next smallest 1,000 companies, based on a ranking of all U.S. equities by market capitalization. The Russell 2000 Index is an unmanaged total return index of the smallest 2,000 companies in the Russell 3000 Index, as ranked by total market capitalization. You cannot invest directly in these or any indexes.
25
| | |
| WASATCH MICRO CAP VALUE FUND (WAMVX) | | SEPTEMBER 30, 2017 (UNAUDITED) |
|
|
|
Management Discussion
The Wasatch Micro Cap Value Fund is managed by a team of Wasatch portfolio managers led by Brian Bythrow.
| | |

Brian Bythrow, CFA Lead Portfolio Manager | | OVERVIEW During the 12 months ended September 30, 2017, the Wasatch Micro Cap Value Fund returned 23.29%. The Fund surpassed its benchmark, the Russell Microcap Index, which rose 22.33%. Steady economic growth and benign inflation provided a favorable environment for equities. Though growth in the U.S. has remained sluggish since the end of the last recession, data |
released near the end of the period suggested the economy may be gaining steam. Gross domestic product (GDP) expanded at a seasonally adjusted annual rate of 3.1% during the April-to-June quarter — up from 1.2% during the previous quarter and the strongest growth since the first quarter of 2015.
With the economy seemingly on firm footing, the Federal Reserve (Fed) said it will begin normalizing its massive balance sheet in October. The move will essentially unwind the monetary stimulus the Fed has provided since the global financial crisis. For the most part, investors appeared to view the news as signaling a healthy U.S. economy no longer in need of extraordinary support from the Fed.
Boosted by strength in the Fund’s international holdings, the consumer-staples sector was the largest source of Fund outperformance relative to the benchmark. Nascent consumer economies in emerging markets have created growing demand for packaged foods, bottled beverages and other items that are commonplace in more-developed countries.
Financials were another area in which the Fund outperformed. Improved prospects on the interest-rate, regulatory and housing fronts appeared to help some of the Fund’s bank and mortgage-related holdings. By favoring reasonably valued banks in growing metropolitan statistical areas, we have found that the Fund’s small banks tend to make attractive targets for acquisition by larger competitors.
DETAILSOFTHE YEAR
The strongest contributor to Fund performance for the year was Tower Semiconductor Ltd., a rapidly growing semiconductor manufacturer headquartered in Israel. Shares of Tower surged after management announced an agreement with a Hong Kong-based company for the establishment of a new semiconductor-fabrication facility in Nanjing, China. In addition to the $18 million initial payment Tower has already received, it stands to collect future milestone payments and will be entitled to up to half of the facility’s fabrication capacity.
Kingstone Cos., Inc., another top contributor, offers property and casualty insurance for small businesses and individuals in New York. The decision of large carriers to limit exposure to coastal areas has allowed Kingstone to rapidly gain market share. Recent changes to the company’s underwriting guidelines and claims-handling process have reduced
claims payouts, leading to record quarterly earnings.
The greatest detractor from Fund performance for the year was Cempra, Inc., a clinical-stage biopharmaceutical company developing antibiotics for the treatment of bacterial infectious diseases. Cempra’s stock price tumbled after the U.S. Food and Drug Administration (FDA) released briefing documents highlighting concerns about the safety of Cempra’s lead pneumonia antibiotic, solithromycin. Rather than wait for the outcome of a larger study, we sold the Fund’s remaining shares.
Another weak stock in the Fund was Flotek Industries, Inc., a supplier of drilling and production products to the energy industry. Flotek’s shares languished for most of the period as low energy prices suppressed production of oil and natural gas. In addition, citrus-greening disease and damage from Hurricanes Harvey and Irma created shortages of citrus oils the company uses in its products. Despite the challenges, we think Flotek’s depressed valuation and upside potential justify continuing to own it at a low weight in the Fund.
OUTLOOK
Recent gains in U.S. equity prices have outstripped the earnings growth of the underlying companies, pushing price/earnings multiples higher. Even so, the Fund has significant exposure to small, growing companies yet to be discovered by mainstream investors. These undiscovered growers have seen more-modest increases in their stock prices and offer valuations that are still very attractive in our view.
Higher market valuations for equities bring increased risk for investors. One risk starting to garner attention is the low unemployment rate — or, more specifically, tightness in the labor market. During research visits to companies, management teams have commented to us recently on the difficulties they encounter finding qualified employees to help them grow their businesses.
When a scarcity of labor raises employment expenses, companies must either pass the higher costs along to customers in the form of higher prices, or see their profit margins shrink. While neither inflation nor a downturn in corporate profits would be good for investors, a modest uptick in wages would not be entirely bad. By boosting the purchasing power of U.S. households, a shift toward wages in the division of national income between wages and profits would directly benefit consumer-related businesses. Other companies stand to benefit indirectly through an overall increase in economic activity.
Small banks in particular have faced headwinds in recent years, as sluggish wage growth crimped demand for housing, auto and consumer loans. As a result, the banking industry remains one of more-attractively valued areas of the micro-cap equity market. With Japan just recently having emerged from its decades-long recession, reasonably priced growth opportunities can still be found in Japanese stocks as well. We’ve added several Japanese companies to the Fund this year, and we’re looking to increase the Fund’s holdings in Japan going forward.
Thank you for the opportunity to manage your assets.
| | Current and future holdings are subject to risk. |
26
| | |
| WASATCH MICRO CAP VALUE FUND (WAMVX) | | SEPTEMBER 30, 2017 (UNAUDITED) |
|
|
|
Portfolio Summary
AVERAGE ANNUAL TOTAL RETURNS
| | | | | | | | | | | | | | | |
| | | 1 YEAR | | 5 YEARS | | 10 YEARS |
Micro Cap Value | | | | 23.29% | | | | | 16.00% | | | | | 8.92% | |
Russell Microcap® Index | | | | 22.33% | | | | | 13.89% | | | | | 6.65% | |
Data shows past performance, which is not indicative of future performance. Current performance may be lower or higher than the performance quoted. To obtain the most recent month-end performance data available, please visit www.WasatchFunds.com. The Advisor may absorb certain Fund expenses, without which total return would have been lower. Investment returns and principal value will fluctuate and shares, when redeemed, may be worth more or less than their original cost.
As of the September 1, 2017 prospectus, the Total Annual Fund Operating Expenses for the Wasatch Micro Cap Value Fund are 1.84%. The expense ratio shown elsewhere in this report may be different. Expenses include direct expenses paid to the Advisor as well as indirect expenses incurred by the Fund as a result of its investments in other investment companies (each an “Acquired Fund”), before any expense reimbursements by the Advisor. See the prospectus for additional information regarding Fund expenses.
Wasatch Funds will deduct a 2.00% redemption proceeds fee on Fund shares held 60 days or less. Performance data does not reflect the deduction of fees, including sales charges, or the taxes you would pay on fund distributions or the redemption of fund shares. Fees and taxes, if reflected, would reduce the performance quoted. Wasatch does not charge any sales fees. For more complete information including charges, risks and expenses, read the prospectus carefully.
Investing in micro cap funds will be more volatile and loss of principal could be greater than investing in large cap or more diversified funds. Investments in value stocks can perform differently from the market as a whole and from other types of stocks and can continue to be undervalued by the market for long periods of time. Investing in foreign securities, especially in emerging markets, entails special risks, such as currency fluctuations and political uncertainties, which are described in more detail in the prospectus.
TOP 10 EQUITY HOLDINGS*
| | | | |
| Company | | % of Net
Assets | |
| Tower Semiconductor Ltd. (Israel) | | | 2.1% | |
| ZAGG, Inc. | | | 1.6% | |
| NV5 Global, Inc. | | | 1.6% | |
| Tucows, Inc., Class A | | | 1.5% | |
| Esquire Financial Holdings, Inc. | | | 1.5% | |
| | | | |
| Company | | % of Net
Assets | |
| USA Technologies, Inc. | | | 1.5% | |
| BofI Holding, Inc. | | | 1.4% | |
| Patrick Industries, Inc. | | | 1.4% | |
| LGI Homes, Inc. | | | 1.4% | |
| Installed Building Products, Inc. | | | 1.4% | |
| * | As of September 30, 2017, there were 105 holdings in the Fund. Foreign currency contracts, written options and repurchase agreements, if any, are not included in the number of holdings. Portfolio holdings are subject to change at any time. References to specific securities should not be construed as recommendations by the Funds or their Advisor. Current and future holdings are subject to risk. |
SECTOR BREAKDOWN**
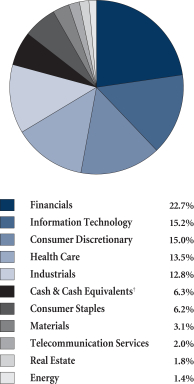
| ** | Excludes securities sold short and options written, if any. |
| † | Also includes Other Assets & Liabilities. |
GROWTHOFA HYPOTHETICAL $10,000 INVESTMENT
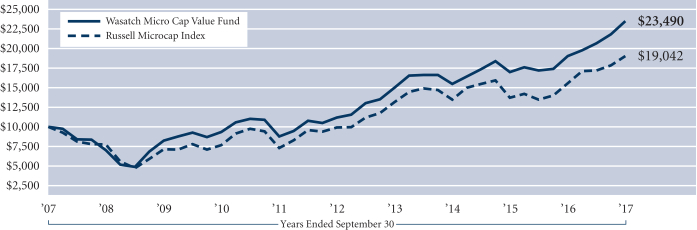
Past performance does not predict future performance. The graph above does not reflect the deduction of fees, sales charges, or taxes that you would pay on fund distributions or the redemption of fund shares. Wasatch does not charge any sales fees. The Russell Microcap Index is an unmanaged total return index of the smallest 1,000 securities in the small-cap Russell 2000 Index along with the next smallest 1,000 companies, based on a ranking of all U.S. equities by market capitalization. The Russell 2000 Index is an unmanaged total return index of the smallest 2,000 companies in the Russell 3000 Index, as ranked by total market capitalization. You cannot invest directly in these or any indexes.
27
| | |
| WASATCH SMALL CAP GROWTH FUND (WAAEX / WIAEX) | | SEPTEMBER 30, 2017 (UNAUDITED) |
|
|
|
Management Discussion
The Wasatch Small Cap Growth Fund is managed by a team of Wasatch portfolio managers led by JB Taylor, Jeff Cardon, Ken Korngiebel and Ryan Snow.
| | | | |
JB Taylor Lead Portfolio Manager
Ken Korngiebel, CFA Portfolio Manager | | 
Jeff Cardon, CFA Portfolio Manager 
Ryan Snow Portfolio Manager | | OVERVIEW The Wasatch Small Cap Growth Fund — Investor Class rose 14.29% for the 12 months ended September 30, 2017, trailing the 20.98% return of its benchmark, the Russell 2000 Growth Index, and the 20.74% return of the Russell 2000 Index. Among the Fund’s top contributors to absolute performance for the 12-month period were companies in the financials, health-care and industrials sectors. |
Performance relative to the benchmark benefited from stock selection in the health-care sector. In contrast, the Fund significantly underperformed the benchmark in the information-technology sector as our stocks trailed their benchmark counterparts.
The Fund’s gain for the period was helped by strong returns among our industrial holdings, particularly in the three months ended September 30, 2017. Unlike the post-election “reflation trade” (or “Trump trade”) of the kind we avoided late last year, we recognize that the slow-growth economy is chugging along well enough now to favor a positive turn for the industrials sector. We anticipate maintaining our overweight position in the sector as long as conditions remain favorable and we can continue to find companies with attractive growth prospects.
DETAILSOFTHE YEAR
Transportation and logistics-services provider Knight-Swift Transportation Holdings, Inc. is the product of a recent merger. The newly combined company turned in the leading contribution to Fund performance for the 12-month period. Whereas the former Swift Transportation had been underperforming the market prior to the merger, Knight Transportation, which had been held by the Fund for many years, had enjoyed steady growth and had benefited from a strong management team. Investors viewed the combined entity favorably, believing that management will derive more earnings power from Swift’s assets. Additionally, a new requirement for electronic logging is expected to drive some small competitors out of the trucking market.
Exact Sciences Corp. was the second-best contributor to the Fund’s performance for the year. The molecular-diagnostics company has an innovative test for colon cancer. Named Cologuard,® the test avoids the high cost and invasiveness of a colonoscopy by screening a stool sample for cancerous and precancerous cells. Shares of Exact Sciences began climbing in late April after accelerating demand for Cologuard produced better-than-expected revenues and earnings.
Cempra, Inc., a clinical-stage biopharmaceutical company developing antibiotics for the treatment of bacterial infectious diseases, was a notable detractor. Cempra’s stock price tumbled after the U.S. Food and Drug Administration released briefing documents highlighting concerns about the safety of the company’s key treatments. Believing that this development materially changed our investment thesis for Cempra, we elected to sell the position.
Cornerstone OnDemand, Inc. was another leading detractor from performance. Despite showing signs of strength midway through the period, management eventually reported numbers that didn’t wow investors, missing expectations on earnings even while reporting stronger sales. In addition, we viewed the company’s mix of new contracts as far from ideal. We see little room for error on management’s part at this point and have reduced our position.
OUTLOOK
The economic scenario of the past year appears to be continuing in the U.S. with regard to sustained moderate growth, low inflation and rising asset prices. Looking forward, we don’t expect valuation tailwinds to continue. Company fundamentals will have to matter more to investors at some point, which we believe would bode well for the Fund. We believe we have a great team that learns from mistakes and the best culture for applying a disciplined investment approach. As valuations right-size to growth rates, we think our discipline will shine.
Fundamentals are certainly of more central importance to investors now than in the period after the presidential election, but there are distractions such as the extraordinary monetary accommodation by the Federal Reserve (Fed). Recently, the Fed announced its intention to start reducing bond holdings acquired during its quantitative-easing program. While it’s not exactly clear how quickly that will unfold, the announcement itself represents a step toward normalcy.
In the Fund, we’re especially focused at present on companies that seem poised to deliver long-term growth by benefiting from world-wide economic strength, industrial-production trends and increased capital expenditure by businesses. Our disciplined approach continues to turn up attractive prospects, such as in the industrials sector mentioned above. Elsewhere, too, we’re finding what we consider to be high-quality companies with outstanding long-term growth prospects. There’s no shortage of opportunities for the Fund’s investment style, although we always have to remain vigilant regarding valuations.
Thank you for the opportunity to manage your assets.
| | Current and future holdings are subject to risk. |
28
| | |
| WASATCH SMALL CAP GROWTH FUND (WAAEX / WIAEX) | | SEPTEMBER 30, 2017 (UNAUDITED) |
|
|
|
Portfolio Summary
AVERAGE ANNUAL TOTAL RETURNS
| | | | | | | | | | | | | | | |
| | | 1 YEAR | | 5 YEARS | | 10 YEARS |
Small Cap Growth (WAAEX) — Investor | | | | 14.29% | | | | | 10.22% | | | | | 7.71% | |
Small Cap Growth (WIAEX) — Institutional | | | | 14.54% | | | | | 10.29% | | | | | 7.75% | |
Russell 2000® Growth Index | | | | 20.98% | | | | | 14.28% | | | | | 8.47% | |
Russell 2000® Index | | | | 20.74% | | | | | 13.79% | | | | | 7.85% | |
Data shows past performance, which is not indicative of future performance. Current performance may be lower or higher than the performance quoted. To obtain the most recent month-end performance data available, please visit www.WasatchFunds.com. The Advisor may absorb certain Fund expenses, without which total return would have been lower. Investment returns and principal value will fluctuate and shares, when redeemed, may be worth more or less than their original cost.
As of the September 1, 2017 prospectus, the Total Annual Fund Operating Expenses for the Wasatch Small Cap Growth Fund are Investor Class: 1.30% / Institutional Class — Gross: 1.12%, Net: 1.06%. The expense ratio shown elsewhere in this report may be different. Expenses include direct expenses paid to the Advisor as well as indirect expenses incurred by the Fund as a result of its investments in other investment companies (each an “Acquired Fund”), before any expense reimbursements by the Advisor. Net expenses are based on Fund expenses, net of waivers and reimbursements. See the prospectus for additional information regarding Fund expenses.
Wasatch Funds will deduct a 2.00% redemption proceeds fee on Fund shares held 60 days or less. Performance data does not reflect the deduction of fees, including sales charges, or the taxes you would pay on fund distributions or the redemption of fund shares. Fees and taxes, if reflected, would reduce the performance quoted. Wasatch does not charge any sales fees. For more complete information including charges, risks and expenses, read the prospectus carefully.
Performance for the Institutional Class prior to 2/1/2016 is based on the performance of the Investor Class. Performance of the Fund’s Institutional Class prior to 2/1/2016 uses the actual expenses of the Fund’s Investor Class without any adjustments. For any such period of time, the performance of the Fund’s Institutional Class would have been substantially similar to, yet higher than, the performance of the Fund’s Investor Class, because the shares of both classes are invested in the same portfolio of securities, but the classes bear different expenses.
Investing in small cap funds will be more volatile and loss of principal could be greater than investing in large cap or more diversified funds. Investing in foreign securities, especially in emerging markets, entails special risks, such as currency fluctuations and political uncertainties, which are described in more detail in the prospectus.
TOP 10 EQUITY HOLDINGS*
| | | | |
| Company | | % of Net
Assets | |
| Knight-Swift Transportation Holdings, Inc. | | | 4.8% | |
| Copart, Inc. | | | 4.2% | |
| ICON plc (Ireland) | | | 3.9% | |
| Ultimate Software Group, Inc. (The) | | | 3.6% | |
| HEICO Corp., Class A | | | 3.0% | |
| | | | |
| Company | | % of Net
Assets | |
| Cavium, Inc. | | | 2.9% | |
| Metro Bank plc (United Kingdom) | | | 2.4% | |
| Ollie’s Bargain Outlet Holdings, Inc. | | | 2.4% | |
| Eagle Bancorp, Inc. | | | 2.3% | |
| WESCO International, Inc. | | | 2.3% | |
| * | As of September 30, 2017, there were 73 holdings in the Fund. Foreign currency contracts, written options and repurchase agreements, if any, are not included in the number of holdings. Portfolio holdings are subject to change at any time. References to specific securities should not be construed as recommendations by the Funds or their Advisor. Current and future holdings are subject to risk. |
SECTOR BREAKDOWN**
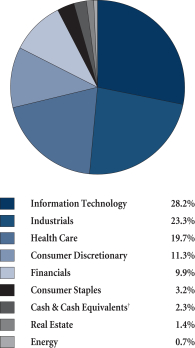
| ** | Excludes securities sold short and options written, if any. |
| † | Also includes Other Assets & Liabilities. |
GROWTHOFA HYPOTHETICAL $10,000 INVESTMENT
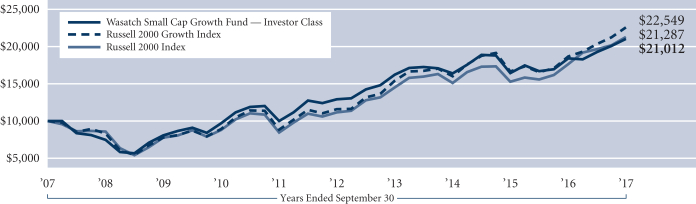
Past performance does not predict future performance. The graph above does not reflect the deduction of fees, sales charges, or taxes that you would pay on fund distributions or the redemption of fund shares. Wasatch does not charge any sales fees. The Russell 2000 Growth Index is an unmanaged total return index that measures the performance of those Russell 2000 Index companies with higher price-to-book ratios and higher forecasted growth values. The Russell 2000 Index is an unmanaged total return index of the smallest 2,000 companies in the Russell 3000 Index, as ranked by total market capitalization. The Russell 2000 Index is widely regarded in the industry as accurately capturing the universe of small company stocks. You cannot invest directly in these or any indexes.
29
| | |
| WASATCH SMALL CAP VALUE FUND (WMCVX / WICVX) | | SEPTEMBER 30, 2017 (UNAUDITED) |
|
|
|
Management Discussion
The Wasatch Small Cap Value Fund is managed by a team of Wasatch portfolio managers led by Jim Larkins.
| | |

Jim Larkins Lead Portfolio Manager | | OVERVIEW U.S. equity markets performed well in the 12-month period, with most of the gains coming after the November 2016 election. Investors were cheered by continued acceleration in the U.S. economy, a robust increase in corporate earnings and a shift toward a more business-friendly political environment in the U.S. These factors fueled a series of record highs in the major indexes and led to a gain of 20.55% for the |
Russell 2000 Value Index. The Wasatch Small Cap Value Fund — Investor Class finished just behind the benchmark with a return of 20.20% for the 12-month period. It is worth noting that the Fund has produced an average annual return of 12.29% since its inception in 1997, which compares favorably with 8.73% for the Russell 2000 Value Index in the same interval.
The Fund’s modest shortfall relative to the Index for the annual period is entirely attributable to the weeks immediately following the U.S. election. Stocks spiked higher in the wake of the vote, led by sectors seen as likely to benefit from a Donald Trump presidency. The momentum-driven nature of the move meant that lower-quality, speculative companies generally provided the best returns. That left our bottom-up approach and focus on fundamentals briefly out of step with the market.
The Fund’s relative performance improved in 2017 with the wane of the “Trump Rally.” Many of the deeper-value stocks that surged in the immediate aftermath of the election gave back some of their gains, while faster-growing companies started to show more resilience. Although this trend was a headwind for the small-cap value group as a whole, it proved helpful for the Fund, given our tilt toward “growthier” companies in the category.
DETAILSOFTHE YEAR
As part of our value style, we seek to identify “Fallen Angels,” or companies that have sustainable competitive advantages or long-run opportunities in niche markets, but whose stocks have temporarily fallen out of favor. We are also particularly interested in companies whose compelling long-term outlook has yet to be discovered by Wall Street. The potential benefit of this strategy was apparent in the health-care sector, where Exact Sciences Corp. and LHC Group, Inc. were among the top contributors to performance for the year. Now that Exact Sciences’ colon-cancer test is being reimbursed by insurance companies and health-care systems, the company’s share price has advanced sharply. LHC benefited from the ongoing growth of home health care through its role as a leading provider of this cost-saving service.
Our emphasis on companies with solid growth potential was also evident in the information-technology sector,
where two companies were among the top contributors to performance. Strong revenues and profit margin and free cash flow gains lifted the stock price of Tower Semiconductor Ltd. Stamps.com, Inc., which we think is positioned to ride the wave of e-commerce growth, also delivered a return well above the broader sector.
Another example of the Fund’s balance between stocks with growth and value characteristics can be found in our trucking-industry investments. The Fund owned positions in Knight Transportation, Inc., a solid trucker with steady growth, and Swift Transportation Co., which we see as more of a value play. Knight announced it is buying Swift, a move investors viewed as mutually beneficial. Both stocks performed well in the period, boosting the Fund’s results.
Cempra, Inc., a clinical-stage biopharmaceutical company developing antibiotics for the treatment of bacterial infectious diseases, was the Fund’s largest detractor. Cempra’s stock price tumbled after the U.S. Food and Drug Administration released briefing documents highlighting concerns about the safety of the company’s key treatments. Believing that this development materially changed our investment thesis for Cempra, we sold the position. The share price of WESCO International, Inc., a multinational electronics distribution and services company, slid along with other stocks in its space. We maintained the investment because we believe WESCO is better-positioned than its peers due to its focus on more specialty areas and products, together with its ability to benefit from a turn in the industrial economy.
The Fund’s cash weighting, while modest, was a further headwind to performance in the rising market of the past 12 months.
Our role as “value managers in a growth shop” has long provided us with a unique advantage, as Wasatch’s history of robust research coverage on growth companies has led us to hold a meaningful weighting in value stocks with above-average growth prospects. We believe this aspect of our approach, when combined with our investments in more traditional value companies, has created diversification between the growth and value styles. As a result, the Fund doesn’t necessarily rely on the outperformance of value stocks to drive its returns.
OUTLOOK
Although we continue to see a favorable path for domestic growth trends, we think the risk/reward profile in stocks has become somewhat less attractive with valuations having risen so significantly since the November 2016 election. We have therefore adopted a cautious approach that seeks to own only fundamentally sound, reasonably valued companies and reduce or eliminate those stocks we see as having rich valuations and/or above-average risk. We believe this strategy can help the Fund continue to participate in the expansion of the U.S. economy, while simultaneously managing the possibility of increased market volatility.
Thank you for the opportunity to manage your assets.
| | Current and future holdings are subject to risk. |
30
| | |
| WASATCH SMALL CAP VALUE FUND (WMCVX / WICVX) | | SEPTEMBER 30, 2017 (UNAUDITED) |
|
|
|
Portfolio Summary
AVERAGE ANNUAL TOTAL RETURNS
| | | | | | | | | | | | | | | |
| | | 1 YEAR | | 5 YEARS | | 10 YEARS |
Small Cap Value (WMCVX) — Investor | | | | 20.20% | | | | | 15.95% | | | | | 7.64% | |
Small Cap Value (WICVX) — Institutional | | | | 20.28% | | | | | 16.06% | | | | | 7.72% | |
Russell 2000® Value Index | | | | 20.55% | | | | | 13.27% | | | | | 7.14% | |
Russell 2000® Index | | | | 20.74% | | | | | 13.79% | | | | | 7.85% | |
Data shows past performance, which is not indicative of future performance. Current performance may be lower or higher than the performance quoted. To obtain the most recent month-end performance data available, please visit www.WasatchFunds.com. The Advisor may absorb certain Fund expenses, without which total return would have been lower. Investment returns and principal value will fluctuate and shares, when redeemed, may be worth more or less than their original cost.
As of the September 1, 2017 prospectus, the Total Annual Fund Operating Expenses for the Wasatch Small Cap Value Fund are Investor Class: 1.45% / Institutional Class — Gross: 1.41%, Net: 1.26%. The expense ratio shown elsewhere in this report may be different. Expenses include direct expenses paid to the Advisor as well as indirect expenses incurred by the Fund as a result of its investments in other investment companies (each an “Acquired Fund”), before any expense reimbursements by the Advisor. Net expenses are based on Fund expenses, net of waivers and reimbursements. See the prospectus for additional information regarding Fund expenses.
Wasatch Funds will deduct a 2.00% redemption proceeds fee on Fund shares held 60 days or less. Performance data does not reflect the deduction of fees, including sales charges, or the taxes you would pay on fund distributions or the redemption of fund shares. Fees and taxes, if reflected, would reduce the performance quoted. Wasatch does not charge any sales fees. For more complete information including charges, risks and expenses, read the prospectus carefully.
Performance for the Institutional Class prior to 1/31/2012 is based on the performance of the Investor Class. Performance of the Fund’s Institutional Class prior to 1/31/2012 uses the actual expenses of the Fund’s Investor Class without any adjustments. For any such period of time, the performance of the Fund’s Institutional Class would have been substantially similar to, yet higher than, the performance of the Fund’s Investor Class, because the shares of both classes are invested in the same portfolio of securities, but the classes bear different expenses.
Investing in small cap funds will be more volatile and loss of principal could be greater than investing in large cap or more diversified funds. Investments in value stocks can perform differently from the market as a whole and from other types of stocks and can continue to be undervalued by the market for long periods of time. Investing in foreign securities, especially in emerging markets, entails special risks, such as currency fluctuations and political uncertainties, which are described in more detail in the prospectus.
TOP 10 EQUITY HOLDINGS*
| | | | |
| Company | | % of Net
Assets | |
| Knight-Swift Transportation Holdings, Inc. | | | 3.1% | |
| Monro, Inc. | | | 3.1% | |
| Ensign Group, Inc. (The) | | | 2.9% | |
| Altra Industrial Motion Corp. | | | 2.9% | |
| Arbor Realty Trust, Inc. | | | 2.7% | |
| | | | |
| Company | | % of Net
Assets | |
| Select Comfort Corp. | | | 2.7% | |
| Webster Financial Corp. | | | 2.7% | |
| First of Long Island Corp. (The) | | | 2.6% | |
| HEICO Corp., Class A | | | 2.6% | |
| Tower Semiconductor Ltd. (Israel) | | | 2.5% | |
| * | As of September 30, 2017, there were 55 holdings in the Fund. Foreign currency contracts, written options and repurchase agreements, if any, are not included in the number of holdings. Portfolio holdings are subject to change at any time. References to specific securities should not be construed as recommendations by the Funds or their Advisor. Current and future holdings are subject to risk. |
SECTOR BREAKDOWN**
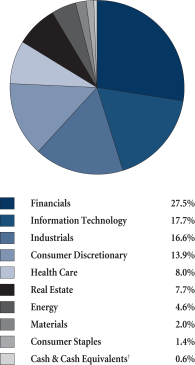
| ** | Excludes securities sold short and options written, if any. |
| † | Also includes Other Assets & Liabilities. |
GROWTHOFA HYPOTHETICAL $10,000 INVESTMENT
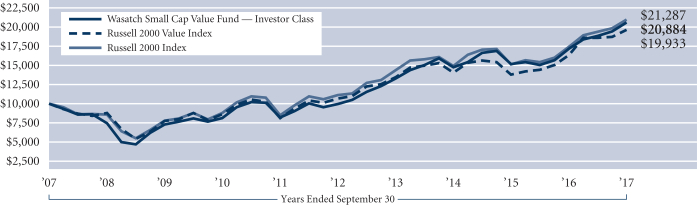
Past performance does not predict future performance. The graph above does not reflect the deduction of fees, sales charges, or taxes that you would pay on fund distributions or the redemption of fund shares. Wasatch does not charge any sales fees. The Russell 2000 Value Index measures the performance of those Russell 2000 Index companies with lower price-to-book ratios and lower forecasted growth values. The Russell 2000 Index is an unmanaged total return index of the smallest 2,000 companies in the Russell 3000 Index, as ranked by total market capitalization. The Russell 2000 Index is widely regarded in the industry as accurately capturing the universe of small company stocks. You cannot invest directly in these or any indexes.
31
| | |
| WASATCH STRATEGIC INCOME FUND (WASIX) | | SEPTEMBER 30, 2017 (UNAUDITED) |
|
|
|
Management Discussion
The Wasatch Strategic Income Fund is managed by a team of Wasatch portfolio managers led by Sam Stewart.
| | |
Samuel S. Stewart, Jr. PhD, CFA Lead Portfolio Manager | | OVERVIEW For the fiscal year ended September 30, 2017, I was pleased with the Wasatch Strategic Income Fund’s 12.09% gain and that it achieved a return between those of its stock and bond benchmarks. Ideally, I like to see at least a high-single-digit annual return, so the Fund exceeded my expectations for the period. Although the Fund lagged the S&P 500 Index’s 18.61% advance, the Fund significantly outpaced the 0.07% return of the Bloomberg Barclays US Aggregate Bond Index. |
DETAILSOFTHE YEAR
For the fiscal year, the only stocks adding more than one percentage point each to the Fund’s return were Comcast Corp., MasterCard, Inc. and Suncor Energy, Inc. Of note, Comcast benefited from a marked improvement in the company’s customer service as it has automated a number of processes, reducing the need for the dreaded “truck roll” as a solution to cable problems. The company has also consistently increased internet speeds for its customers.
Visa, Inc. was another strong contributor during the period. Even as transaction technology changes, both Visa and MasterCard have continued to benefit as the newest technological approaches to payments still rely on this pair of transaction processors to link customers, merchants and banks.
Suncor benefited from the stabilization of oil prices. The company uses a manufacturing-like process to harvest its long-lived oil-sands reserves. Suncor’s cost to produce oil declines as more technology is introduced into the process.
Medallion Financial Corp. was the most significant detractor from performance during the fiscal year, and the only one that subtracted as much as 0.75 of a percentage point from the Fund’s return. Engaged partly in the financing of taxi medallions, the company’s stock price continued to suffer from the rise of Uber and other online ride-sharing companies. While the portion of the company’s loans secured by taxi medallions is declining, the increase in the default rate on those loans led Medallion to eliminate its dividend. The reason the Fund continues to hold a small position in Medallion is that the stock trades at only 20% of the company’s book value.
The next-largest detractor, McKesson Corp., subtracted just 0.35 of a percentage point. Early in the year, McKesson was faced with aggressive competition in the pharmaceuticals-distribution industry, and lost some clients due to merger activity among its customers. In response to these challenges, we trimmed our position in McKesson.
Although I have modestly reduced the Fund’s cash position over the course of the fiscal year, it is still running about 16%. This was not done as an attempt to time the market. Instead, the cash position is intended to dampen the volatility of the portfolio. The Fund’s larger cash position and my
efforts to increase the number of holdings that are willing and able to pay a growing stream of dividends is largely a response to the difficulty we experienced from mid-2015 through mid-2016, which I have discussed in past quarterly commentaries. Dampening the Fund’s volatility is reflected in its beta, which during the fiscal year was less than that of the market. With a lower beta, the Fund will lag in a rising market. Conversely, if the market declines, the Fund should experience less volatility. And with a bull market that has now entered its ninth year, I think maintaining the Fund’s cash position is a prudent approach.
For that same reason — limiting potential volatility — I also chose to sell some of the Fund’s more cyclical holdings, concerned that these stocks might be volatile in a downturn. The companies we sold included Penske Automotive Group, Inc., a leading global car dealer that has produced a string of rising dividends; Altisource Residential Corp., a business in transition from buying troubled mortgage debt to renting low-end homes; and Jones Lang LaSalle, Inc., a global real-estate broker.
The Fund’s primary investment focus continues to be on dividend-paying companies. Over the course of the fiscal year, the Fund’s holdings continued to experience solid dividend growth. On an annualized basis, the dividend growth rate of the portfolio was just over 8% as of September 30, 2017. One of the most-recent additions to the Fund was tool-manufacturer Snap-on, Inc., which has paid a flat or increased dividend every quarter for more than 75 years.
OUTLOOK
While I continue to be concerned about the elevated price level of many stocks, especially in the face of the future monetary tightening being discussed by both the U.S. Federal Reserve and the European Central Bank, the market generally takes its cues from the economy, which has continued to advance at a slow but steady pace. Economists are coming to understand that the slower economic growth we are experiencing tends to avoid the recession-inducing excesses of more-rapid growth. While the downside is that those lacking jobs must wait longer to find employment, they eventually do as reflected in our currently low unemployment rate of 4.2%.
This isn’t to say that the economy and the market will enjoy clear skies forever. Every historic declaration of “permanent prosperity” has proven false. I have no doubt that, as usual, this current episode of prosperity will end in tears. They all have. So I am doing my best to prepare the Fund for what could lie ahead.
Thank you for the opportunity to manage your assets.
| | Current and future holdings are subject to risk. |
32
| | |
| WASATCH STRATEGIC INCOME FUND (WASIX) | | SEPTEMBER 30, 2017 (UNAUDITED) |
|
|
|
Portfolio Summary
AVERAGE ANNUAL TOTAL RETURNS
| | | | | | | | | | | | | | | |
| | | 1 YEAR | | 5 YEARS | | 10 YEARS |
Strategic Income | | | | 12.09% | | | | | 9.76% | | | | | 6.25% | |
S&P 500® Index | | | | 18.61% | | | | | 14.22% | | | | | 7.44% | |
Bloomberg Barclays US Aggregate Bond Index | | | | 0.07% | | | | | 2.06% | | | | | 4.27% | |
Data shows past performance, which is not indicative of future performance. Current performance may be lower or higher than the performance quoted. To obtain the most recent month-end performance data available, please visit www.WasatchFunds.com. The Advisor may absorb certain Fund expenses, without which total return would have been lower. Investment returns and principal value will fluctuate and shares, when redeemed, may be worth more or less than their original cost.
As of the September 1, 2017 prospectus, the Total Annual Fund Operating Expenses for the Wasatch Strategic Income Fund are Gross: 1.76%, Net: 1.67%. The expense ratio shown elsewhere in this report may be different. Expenses include direct expenses paid to the Advisor as well as indirect expenses incurred by the Fund as a result of its investments in other investment companies (each an “Acquired Fund”), before any expense reimbursements by the Advisor. Net expenses are based on Fund expenses, net of waivers and reimbursements. See the prospectus for additional information regarding Fund expenses.
Wasatch Funds will deduct a 2.00% redemption proceeds fee on Fund shares held 60 days or less. Performance data does not reflect the deduction of fees, including sales charges, or the taxes you would pay on fund distributions or the redemption of fund shares. Fees and taxes, if reflected, would reduce the performance quoted. Wasatch does not charge any sales fees. For more complete information including charges, risks and expenses, read the prospectus carefully.
The Fund has a concentration in the financials sector. Investing in concentrated funds can be more volatile and loss of principal could be greater than investing in more diversified funds. The financials sector can be significantly affected by various market factors, which are described in more detail in the prospectus.
With respect to the Fund’s assets invested in fixed income securities, you are subject, but not limited to, the same interest rate, inflation and credit risk associated with the underlying fixed-income securities owned by the Fund. Return of principal is not guaranteed. Investing in small cap funds will be more volatile and loss of principal could be greater than investing in large cap or more diversified funds. Investing in foreign securities, especially in emerging markets, entails special risks, such as currency fluctuations and political uncertainties, which are described in more detail in the prospectus.
TOP 10 EQUITY HOLDINGS*
| | | | |
| Company | | % of Net
Assets | |
| Comcast Corp., Class A | | | 5.9% | |
| MasterCard, Inc., Class A | | | 3.9% | |
| Suncor Energy, Inc. (Canada) | | | 3.9% | |
| Visa, Inc., Class A | | | 3.9% | |
| Walgreens Boots Alliance, Inc. | | | 3.8% | |
| | | | |
| Company | | % of Net
Assets | |
| Magellan Midstream Partners L.P. | | | 3.5% | |
| CBS Corp., Class B | | | 3.5% | |
| CVS Health Corp. | | | 3.2% | |
| Canadian National Railway Co. (Canada) | | | 3.0% | |
| Microchip Technology, Inc. | | | 2.5% | |
| * | As of September 30, 2017, there were 53 holdings in the Fund. Foreign currency contracts, written options and repurchase agreements, if any, are not included in the number of holdings. Portfolio holdings are subject to change at any time. References to specific securities should not be construed as recommendations by the Funds or their Advisor. Current and future holdings are subject to risk. |
SECTOR BREAKDOWN**
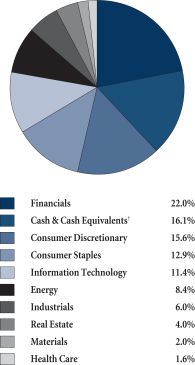
| ** | Excludes securities sold short and options written, if any. |
| † | Also includes Other Assets & Liabilities. |
GROWTHOFA HYPOTHETICAL $10,000 INVESTMENT
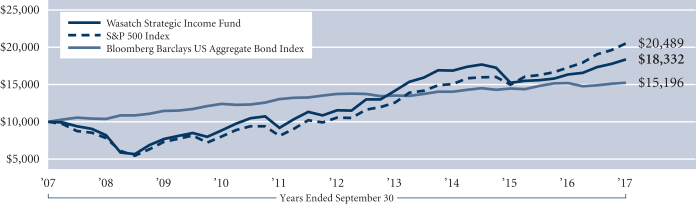
Past performance does not predict future performance. The graph above does not reflect the deduction of fees, sales charges, or taxes that you would pay on fund distributions or the redemption of fund shares. Wasatch does not charge any sales fees. The S&P 500 Index represents 500 of the United States’ largest stocks from a broad variety of industries. The Index is unmanaged and is a commonly used measure of common stock total return performance. The Bloomberg Barclays US Aggregate Bond Index is a broad-based flagship benchmark that measures the investment grade, US dollar denominated, fixed-rate taxable bond market. The index includes Treasuries, government-related and corporate securities, MBS (agency fixed-rate and hybrid ARM pass-throughs), ABS and CMBS (agency and non-agency). You cannot invest directly in these or any indexes.
33
| | |
| WASATCH ULTRA GROWTH FUND (WAMCX) | | SEPTEMBER 30, 2017 (UNAUDITED) |
|
|
|
Management Discussion
The Wasatch Ultra Growth Fund is managed by a team of Wasatch portfolio managers led by John Malooly.
| | |

John Malooly, CFA Lead Portfolio Manager | | OVERVIEW Rapid swings in investor sentiment marked the 12 months ended September 30, 2017. Political factors had a greater-than-usual impact on financial markets, as investors reacted to the unexpected election and subsequent presidency of Donald Trump. The Wasatch Ultra Growth Fund closed its fiscal year with a return of 22.13%. The Fund outgained its benchmark, the Russell 2000 Growth Index, which rose 20.98%. |
Stocks of the rapidly growing companies on which the Fund focuses significantly underperformed value stocks during the early part of the fiscal year. Many value companies had been struggling with sluggish demand and a lack of pricing power that hampered their profitability. In the weeks after the November election, their stocks rose on hopes for a turnaround driven by new federal infrastructure spending and tax cuts.
Undeterred and confident in our approach, we maintained our growth-oriented investment strategy in the belief that company earnings determine stock prices over the long term. Our patience was rewarded when high-growth stocks found renewed favor with investors as a recalcitrant Congress dashed expectations for rapid passage of Mr. Trump’s proposals.
Consumer-discretionary stocks were the Fund’s largest source of outperformance versus the benchmark, followed by consumer staples. In the consumer-discretionary sector, as well as in financials, the Fund’s Indian stocks significantly boosted performance. Our companies in India benefited from ongoing development of the country’s middle class and banking system.
DETAILSOFTHE YEAR
Reflecting the substantial growth opportunities we’ve found in information technology and health care, those areas continued to account for a majority of the Fund’s assets. Health-care companies Sangamo Therapeutics, Inc. and Exact Sciences Corp., respectively, were the strongest contributors to Fund performance for the year. Sangamo is a biopharmaceutical company specializing in the treatment and cure of single-gene disorders. The company’s stock price jumped in May and again in August on positive developments for SB-525, an investigational gene therapy for the treatment of Hemophilia A.
Exact Sciences is a biotechnology company with an innovative test for colon cancer that avoids the high cost and invasiveness of a colonoscopy. As the benefits of the new test resonated with patients, the company raised its full-year sales guidance to 550,000 tests in 2017, up from 244,000 the previous year.
Consumer-staples company Freshpet, Inc. was the Fund’s third-largest contributor. The company sells fresh, refriger-
ated meals and treats for dogs and cats in the U.S., Canada and the United Kingdom. The prior experience of the company’s recently hired CEO has helped Freshpet improve its products, marketing and distribution.
The greatest detractor from Fund performance for the year was Tandem Diabetes Care, Inc. The company offers insulin-delivery systems for people with diabetes. A competitor’s introduction of an insulin pump with continuous glucose monitoring (CGM) weighed on Tandem’s stock price throughout the period. While we’re optimistic about prospects for Tandem’s own CGM pump, we’re limiting this holding to a small weighting in the Fund.
Second-largest detractor Cempra, Inc. develops antibiotics for the treatment of bacterial infectious diseases. The company’s stock tumbled after the U.S. Food and Drug Administration (FDA) released briefing documents highlighting concerns about the safety of Cempra’s lead pneumonia antibiotic, solithromycin. Rather than wait for the outcome of a larger study, we sold the Fund’s remaining shares.
OUTLOOK
In recent years, advances in modern science have created a revolution in our understanding of human biology and the causes of disease. The resulting progress in our ability to treat disease at a fundamental, curative level has produced functional cures and potential cures for a variety of afflictions.
In evaluating the investment potential of health-care companies seeking to develop new therapies, we consider three main aspects: science, management team and market potential. We want companies with compelling science that addresses an important medical need. We consider the origin of the technology and how the company plans to translate scientific breakthroughs into treatments for humans.
The management team in some ways is more difficult to assess than the science. Because running a public company engaged in health-care research is a complex task even under the best of circumstances, recovery from missteps often proves difficult. In our experience, the best management teams contemplate a wide range of outcomes and develop appropriate contingency plans. We’re always trying to gain a better understanding of our management teams, as their decisions drive the success or failure of our portfolio companies.
The final element is the market potential for a new treatment or cure. Solving an unmet medical need generally creates high barriers to entry for would-be competitors and generates substantial cost savings for the health-care system and society. A growing risk for investors is that biotechnology companies in particular may become “victims of their own success.” That is to say, the variety of ways being developed to treat disease may produce a corresponding variety of competing solutions. While greater competition and fewer unmet medical needs may mean fewer opportunities for investors, the obvious benefits to society would be enormous.
Thank you for the opportunity to manage your assets.
| | Current and future holdings are subject to risk. |
34
| | |
| WASATCH ULTRA GROWTH FUND (WAMCX) | | SEPTEMBER 30, 2017 (UNAUDITED) |
|
|
|
Portfolio Summary
AVERAGE ANNUAL TOTAL RETURNS
| | | | | | | | | | | | | | | |
| | | 1 YEAR | | 5 YEARS | | 10 YEARS |
Ultra Growth | | | | 22.13% | | | | | 14.29% | | | | | 6.86% | |
Russell 2000® Growth Index | | | | 20.98% | | | | | 14.28% | | | | | 8.47% | |
Data shows past performance, which is not indicative of future performance. Current performance may be lower or higher than the performance quoted. To obtain the most recent month-end performance data available, please visit www.WasatchFunds.com. The Advisor may absorb certain Fund expenses, without which total return would have been lower. Investment returns and principal value will fluctuate and shares, when redeemed, may be worth more or less than their original cost.
As of the September 1, 2017 prospectus, the Total Annual Fund Operating Expenses for the Wasatch Ultra Growth Fund are 1.43%. The expense ratio shown elsewhere in this report may be different. Expenses include direct expenses paid to the Advisor as well as indirect expenses incurred by the Fund as a result of its investments in other investment companies (each an “Acquired Fund”), before any expense reimbursements by the Advisor. See the prospectus for additional information regarding Fund expenses.
Wasatch Funds will deduct a 2.00% redemption proceeds fee on Fund shares held 60 days or less. Performance data does not reflect the deduction of fees, including sales charges, or the taxes you would pay on fund distributions or the redemption of fund shares. Fees and taxes, if reflected, would reduce the performance quoted. Wasatch does not charge any sales fees. For more complete information including charges, risks and expenses, read the prospectus carefully.
Investing in small cap funds will be more volatile and loss of principal could be greater than investing in large cap or more diversified funds. Investing in foreign securities, especially in emerging markets, entails special risks, such as currency fluctuations and political uncertainties, which are described in more detail in the prospectus.
TOP 10 EQUITY HOLDINGS*
| | | | |
| Company | | % of Net
Assets | |
| Ultimate Software Group, Inc. (The) | | | 2.7% | |
| LGI Homes, Inc. | | | 2.7% | |
| Freshpet, Inc. | | | 2.6% | |
| Oxford Immunotec Global plc | | | 2.6% | |
| Waste Connections, Inc. | | | 2.5% | |
| | | | |
| Company | | % of Net
Assets | |
| Paylocity Holding Corp. | | | 2.5% | |
| Sangamo Therapeutics, Inc. | | | 2.5% | |
| HubSpot, Inc. | | | 2.2% | |
| Exact Sciences Corp. | | | 2.1% | |
| Instructure, Inc. | | | 2.0% | |
| * | As of September 30, 2017, there were 77 holdings in the Fund. Foreign currency contracts, written options and repurchase agreements, if any, are not included in the number of holdings. Portfolio holdings are subject to change at any time. References to specific securities should not be construed as recommendations by the Funds or their Advisor. Current and future holdings are subject to risk. |
SECTOR BREAKDOWN**
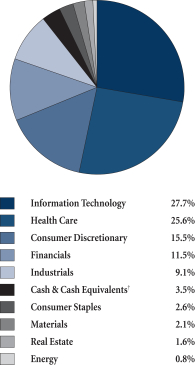
| ** | Excludes securities sold short and options written, if any. |
| † | Also includes Other Assets & Liabilities. |
GROWTHOFA HYPOTHETICAL $10,000 INVESTMENT
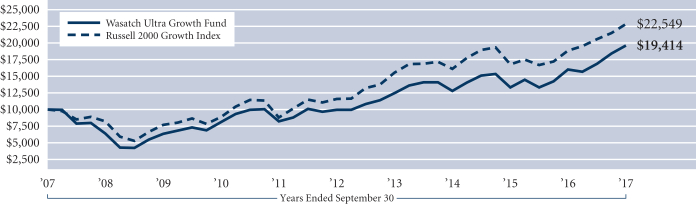
Past performance does not predict future performance. The graph above does not reflect the deduction of fees, sales charges, or taxes that you would pay on fund distributions or the redemption of fund shares. Wasatch does not charge any sales fees. The Russell 2000 Growth Index is an unmanaged total return index that measures the performance of those Russell 2000 Index companies with higher price-to-book ratios and higher forecasted growth values. The Russell 2000 Index is an unmanaged total return index of the smallest 2,000 companies in the Russell 3000 Index, as ranked by total market capitalization. You cannot invest directly in these or any indexes.
35
| | |
| WASATCH WORLD INNOVATORS FUND (WAGTX / WIGTX) | | SEPTEMBER 30, 2017 (UNAUDITED) |
|
|
|
Management Discussion
The Wasatch World Innovators Fund is managed by a team of Wasatch portfolio managers led by Josh Stewart and Sam Stewart.
| | | | |

Josh Stewart Lead Portfolio Manager | |
Samuel S. Stewart, Jr. PhD, CFA Portfolio Manager | | OVERVIEW The 12 months ended September 30, 2017 began with global markets producing mixed results. While U.S. stocks rallied after the presidential election in November, foreign markets, both developed |
and emerging, lost ground partially based on concerns about the future U.S. role in international trade. As the period progressed, however, U.S. markets continued to show strength and overseas markets rebounded. The Wasatch World Innovators Fund — Investor Class rose 22.23% for the 12-month period and outperformed the 18.73% return of the benchmark MSCI ACWI Investable Market Index.
While we’re pleased with the Fund’s performance over the past 12 months, we note that gains in equity prices continued to outpace improvements in earnings and other company fundamentals, pushing valuations to levels that are high by historical standards. This was particularly true in the U.S., where we remain considerably underweight versus the benchmark. Although we reduced the Fund’s cash position somewhat during the period, it remains elevated, reflecting both our caution as well as the relative scarcity of suitably attractive investments.
DETAILSOFTHE YEAR
As a consequence of continually evaluating the potential of companies we’re considering as additions to the Fund as well as each of the companies we already own, we made several noteworthy additions and deletions during the period. We added Kornit Digital Ltd., an Israeli manufacturer of digital inkjet printers used for printing on cloth. Amazon* has seen the potential of these printers to help its retailers produce quick-turn clothing. We exited several long-term holdings, among them Mekonomen AB, a Swedish auto-parts retailer similar to AutoZone* in the U.S. As success for Mekonomen always seemed to be “just around the corner,” we decided to move on. We had also been intrigued by the possibility that Indigo Books & Music, Inc. in Canada could become a new kind of bookstore and succeed in the digital era. However, recent results haven’t been supportive of its ability to transition from an old-school bookstore model.
Over the course of the year, Take-Two Interactive Software, Inc., Bioventix plc, PayPal Holdings, Inc., bioMérieux and WANdisco plc each contributed more than one percentage point to the Fund’s return. Take-Two continues making progress in transforming its business model from plug-in game cartridges to digital games that can be accessed online.
Its most recent results were up almost 100% over the prior period, and management raised guidance for the coming year. Bioventix develops and supplies monoclonal antibodies that are critical in developing diagnostic tests. PayPal continued to gain traction as the dominant online payment provider. bioMérieux, a manufacturer of medical-diagnostics equipment, has been benefiting because accurate diagnoses of health conditions lead to better patient outcomes at less cost. Its most-recent half-year earnings as of June 30, 2017 were up substantially compared to the same period a year ago. Britain’s WANdisco, whose name is an acronym for “wide area network distributed computing,” specializes in providing enterprise customers with real-time access to their computer data anytime and anywhere.
Just three stocks subtracted more than half a percentage point — and none more than 0.8% — from the Fund’s 12-month return: Performance Sports Group Ltd., LivaNova plc and AO World plc. We sold Performance Sports Group, a manufacturer of sports equipment and apparel, when the company sought approval from bankruptcy courts in the U.S. and Canada to be jointly acquired by two of its creditors. Medical-technology company LivaNova experienced disappointing sales, and we initially trimmed our position. Continued weakness led us to eventually exit the position entirely. AO World also experienced weak sales late in 2016. Based in the United Kingdom, AO World is an online retailer of appliances such as washing machines, dishwashers, refrigerators and ovens. We believe AO World’s focus on customer service, which includes removal of old appliances and installation of new ones, continues to give it the potential to successfully grow its business.
OUTLOOK
We note that the current market environment has made pursuing long-duration, compound-growth opportunities in equities a bit like chasing ghosts. Under normal circumstances, the price/earnings multiple of a high-quality growth stock evolves fairly slowly over time. This characteristic typically enables a growth investor to “capture” the company’s earnings growth at a relatively stable multiple, generating price appreciation in the stock that’s roughly in line with the growth in earnings.
Recently, however, we’ve seen earnings multiples of stocks we’ve owned expand more rapidly as investors have driven their prices beyond what we considered fair value. Leaving us with uninspiring prospects for future appreciation, the higher prices have triggered our sell discipline. As a result, what we thought were long-term growth opportunities have quickly vanished into thin air.
While history suggests that periods of liquidity-driven speculation tend to last longer than most people expect, we believe high valuations in the U.S. and elsewhere continue to dictate a cautious approach to world equity markets.
Thank you for the opportunity to manage your assets.
| * | As of September 30, 2017, the Wasatch World Innovators Fund held 0.39% of its net assets in Amazon.com, Inc. and was not invested in AutoZone, Inc. |
| Current | and future holdings are subject to risk. |
36
| | |
| WASATCH WORLD INNOVATORS FUND (WAGTX / WIGTX) | | SEPTEMBER 30, 2017 (UNAUDITED) |
|
|
|
Portfolio Summary
AVERAGE ANNUAL TOTAL RETURNS
| | | | | | | | | | | | | | | |
| | | 1 YEAR | | 5 YEARS | | 10 YEARS |
World Innovators (WAGTX) — Investor | | | | 22.23% | | | | | 11.36% | | | | | 7.03% | |
World Innovators (WIGTX) — Institutional | | | | 22.55% | | | | | 11.46% | | | | | 7.08% | |
MSCI ACWI IMI | | | | 18.73% | | | | | 10.42% | | | | | 4.18% | |
Data shows past performance, which is not indicative of future performance. Current performance may be lower or higher than the performance quoted. To obtain the most recent month-end performance data available, please visit www.WasatchFunds.com. The Advisor may absorb certain Fund expenses, without which total return would have been lower. Investment returns and principal value will fluctuate and shares, when redeemed, may be worth more or less than their original cost.
As of the September 1, 2017 prospectus, the Total Annual Fund Operating Expenses for the Wasatch World Innovators Fund are Investor Class: 1.78% / Institutional Class — Gross: 3.69%, Net: 1.55%. The expense ratio shown elsewhere in this report may be different. Net expenses are based on Fund expenses, net of waivers and reimbursements. See the prospectus for additional information regarding Fund expenses.
Wasatch Funds will deduct a 2.00% redemption proceeds fee on Fund shares held 60 days or less. Performance data does not reflect the deduction of fees, including sales charges, or the taxes you would pay on fund distributions or the redemption of fund shares. Fees and taxes, if reflected, would reduce the performance quoted. Wasatch does not charge any sales fees. For more complete information including charges, risks and expenses, read the prospectus carefully.
Performance for the Institutional Class prior to 2/1/2016 is based on the performance of the Investor Class. Performance of the Fund’s Institutional Class prior to 2/1/2016 uses the actual expenses of the Fund’s Investor Class without any adjustments. For any such period of time, the performance of the Fund’s Institutional Class would have been substantially similar to, yet higher than, the performance of the Fund’s Investor Class, because the shares of both classes are invested in the same portfolio of securities, but the classes bear different expenses.
Investing in small cap funds will be more volatile and loss of principal could be greater than investing in large cap or more diversified funds. Investing in foreign securities, especially in emerging markets, entails special risks, such as currency fluctuations and political uncertainties, which are described in more detail in the prospectus.
TOP 10 EQUITY HOLDINGS*
| | | | |
| Company | | % of Net
Assets | |
| Costco Wholesale Corp. | | | 3.0% | |
| Majestic Wine plc (United Kingdom) | | | 2.5% | |
| SodaStream International Ltd. (Israel) | | | 2.5% | |
| New York Times Co. (The) | | | 2.4% | |
| Computer Programs and Systems, Inc. | | | 2.3% | |
| | | | |
| Company | | % of Net
Assets | |
| Nintendo Co. Ltd. (Japan) | | | 2.2% | |
| Gamma Communications plc (United Kingdom) | | | 2.0% | |
| PayPal Holdings, Inc. | | | 2.0% | |
| Comcast Corp., Class A | | | 1.9% | |
| DiaSorin S.p.A. (Italy) | | | 1.6% | |
| * | As of September 30, 2017, there were 130 holdings in the Fund. Foreign currency contracts, written options and repurchase agreements, if any, are not included in the number of holdings. Portfolio holdings are subject to change at any time. References to specific securities should not be construed as recommendations by the Funds or their Advisor. Current and future holdings are subject to risk. |
SECTOR BREAKDOWN**
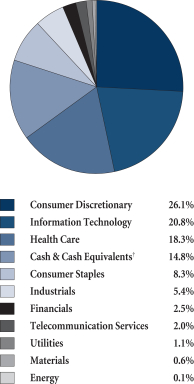
| ** | Excludes securities sold short and options written, if any. |
| † | Also includes Other Assets & Liabilities. |
GROWTHOFA HYPOTHETICAL $10,000 INVESTMENT
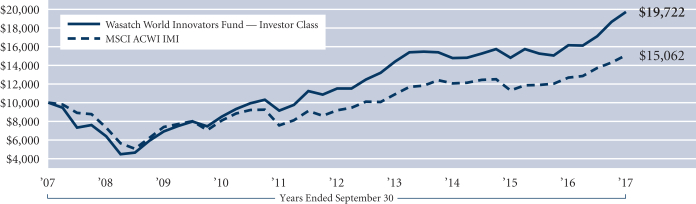
Past performance does not predict future performance. The graph above does not reflect the deduction of fees, sales charges, or taxes that you would pay on fund distributions or the redemption of fund shares. Wasatch does not charge any sales fees. The MSCI ACWI (All Country World Index) IMI (Investable Market Index) is designed to measure the equity market performance of large, mid, and small cap securities across developed and emerging markets throughout the world. You cannot invest directly in this or any index.
37
| | |
| WASATCH-1ST SOURCE INCOME FUND (FMEQX) | | SEPTEMBER 30, 2017 (UNAUDITED) |
|
|
|
Management Discussion
| | | | |

Paul Gifford, CFA Lead Portfolio Manager | | 
Erik Clapsaddle, CFA Associate Portfolio Manager | | OVERVIEW For the 12 months ended September 30, 2017, the Wasatch-1st Source Income Fund returned 0.68%, while its benchmark, the Bloomberg Barclays US Intermediate Govern- |
ment/Credit Index, returned 0.23%. The Federal Reserve (Fed) has increased the federal-funds target rate three times during the past 12 months. The entire yield curve moved higher over the year as long-term rates shifted up almost immediately following the U.S. presidential election in November.
DETAILSOFTHE YEAR
Short-term interest rates gradually increased over the past 12 months on the back of Fed rate increases. Despite the parallel shift of interest rates during the aforementioned 12-month period through September 30, 2017, the yield curve had flattened for nine out of 10 quarters. On September 29, 2017, the three-month LIBOR, the global rate for lending, reached its highest level in U.S. dollar terms since January 2009. At their most-recent meeting, Fed officials seemed fairly convinced that they would increase the target rate one more time before December 31st.
Center stage this past year was the Fed’s internal conundrum — lack of inflation in the United States despite full employment, steady economic growth and fairly accommodative monetary policy. The lack of inflation has caused disagreement within the Fed as to the appropriate path for raising interest rates. Chair Janet Yellen believes that lower inflation readings are “transitory” and that the Fed needs to get ahead of the inflation that will likely occur in 2018. Contrarily, Lael Brainard, a voting member on the Fed’s monetary policy committee, in September 2017, said, “We should be cautious about tightening policy further until we are confident inflation is on track to achieve our target.” She went on to say that the Fed should feel comfortable allowing prices to rise above its 2% target inflation rate before raising interest rates.
The Federal Reserve’s favorite inflation gauge, the core Personal Consumption Expenditure (PCE) price index, showed a year-over-year change in August of 1.3%, which was well below the Fed’s base 2% target inflation rate and was the PCE’s smallest change since October 2015. The core PCE has not breached 2% since April 2012, though the core Consumer Price Index (CPI), which excludes volatile food and energy prices, did exceed 2% for 17-months between late 2015 and early 2017. The most recent reading of the core CPI showed a year-over-year change of 1.7%. The change in CPI (including food and energy prices) is what determines the principal value of U.S. Treasury Inflation-Protected
Securities (TIPS). The Fund has a small allocation to TIPS, as we believe there is some value relative to fixed-rate Treasurys.
The Fund’s effective duration declined over the past 12 months from 3.22 years on September 30, 2016 to 2.60 years on September 30, 2017. We reduced the Fund’s duration by adding corporate floating-rate senior unsecured debt, securities with an approximate duration of 0.05 to 0.25 years, and fix-to-floating rate securities that are currently floating or are within three-years of floating. These additions to the Fund increased its allocation to corporate credit. We markedly reduced our allocation to mortgage-backed securities over the past 12 months.
Asset-backed securities (ABS) continue to be an integral part of the Fund. By investing in ABS, we believe we can find value and increase yield while still maintaining or improving credit quality and owning securitized cash flows. Over the past year, the Fund’s ABS allocation increased from 9.2% to 15.7%.
OUTLOOK
The end of Janet Yellen’s term as Federal Reserve Chair on February 3, 2018 will likely be the most important factor in interest rate and monetary policy changes in 2018. In addition to questions as to whether Yellen will continue as Chair or be replaced, there will be multiple openings at the Fed, starting with replacing Stanley Fischer, who resigned his positions as Vice Chair and Regulatory Vice Chair — though President Donald Trump’s nomination to replace Fischer, will likely be appointed.
By February 3rd, President Trump will have the chance to fill five of the seven seats on the Board of Governors of the Federal Reserve System. We suspect Fed appointees will maintain the status quo — some may like less regulation, but most will likely continue to favor lower interest rates. And like the remaining Board members and voting members, we expect they will be mostly moderate on monetary policy. Expectation is one thing, but certainly a definitive outcome is another. Given the current administration, we would not be surprised if one or more outsiders are appointed to the Federal Reserve Board. Any significant surprise could cause both the fixed-income and equity markets to tremble.
We expect 2018 to be a year of tepid returns in the fixed-income markets, although they could be better than those in 2017. We expect returns for fixed-income securities to have the potential to continue improving in 2019 and beyond as interest rates slowly increase and the Fed gets closer to its terminal rate.
Thank you for entrusting us to manage your assets.
38
| | |
| WASATCH-1ST SOURCE INCOME FUND (FMEQX) | | SEPTEMBER 30, 2017 (UNAUDITED) |
|
|
|
Portfolio Summary
AVERAGE ANNUAL TOTAL RETURNS
| | | | | | | | | | | | | | | |
| | | 1 YEAR | | 5 YEARS | | 10 YEARS |
Income | | | | 0.68% | | | | | 1.13% | | | | | 2.80% | |
Bloomberg Barclays US Intermediate Government/Credit Index | | | | 0.23% | | | | | 1.61% | | | | | 3.64% | |
Data shows past performance, which is not indicative of future performance. Current performance may be lower or higher than the performance quoted. To obtain the most recent month-end performance data available, please visit www.WasatchFunds.com. The Advisor may absorb certain Fund expenses, without which total return would have been lower. Investment returns and principal value will fluctuate and shares, when redeemed, may be worth more or less than their original cost.
As of the September 1, 2017 prospectus, the Total Annual Fund Operating Expenses for the Wasatch-1st Source Income Fund are 0.73%. The expense ratio shown elsewhere in this report may be different. Expenses include direct expenses paid to the Advisor as well as indirect expenses incurred by the Fund as a result of its investments in other investment companies (each an “Acquired Fund”). See the prospectus for additional information regarding Fund expenses.
Wasatch Funds will deduct a 2.00% redemption proceeds fee on Fund shares held 60 days or less. Performance data does not reflect the deduction of fees, including sales charges, or the taxes you would pay on fund distributions or the redemption of fund shares. Fees and taxes, if reflected, would reduce the performance quoted. Wasatch does not charge any sales fees. For more complete information including charges, risks and expenses, read the prospectus carefully.
Investments in fixed income funds are subject to the same interest rate, inflation, credit and other risks associated with the underlying bonds. Return of principal is not guaranteed.
TOP 10 FIXED INCOME HOLDINGS*
| | | | | | | | |
| Holding | | Maturity
Date | | | % of Net
Assets | |
| U.S. Treasury Note, 3.625% | | | 8/15/19 | | | | 2.7% | |
| Hewlett Packard Enterprise Co., 3.600% | | | 10/15/20 | | | | 2.1% | |
| Federal National Mortgage Assoc., Series AL4936, 3.000% | | | 3/1/29 | | | | 1.9% | |
| Goldman Sachs Group, Inc. (The), MTN, 3.064% | | | 10/28/27 | | | | 1.8% | |
| General Electric Co., MTN, 4.650% | | | 10/17/21 | | | | 1.8% | |
| | | | | | | | |
| Holding | | Maturity
Date | | | % of Net
Assets | |
| World Financial Network Credit Card Master Trust, Series 2012-A, Class A, 3.140% | | | 1/17/23 | | | | 1.7% | |
| U.S. Treasury Note, 3.625% | | | 2/15/20 | | | | 1.6% | |
| BP Capital Markets plc, 3.245% | | | 5/6/22 | | | | 1.6% | |
| Wendys Funding LLC, Series 2015-1A, Class A2I, 3.371% | | | 6/15/45 | | | | 1.6% | |
| Federal Home Loan Mortgage Corp., Series G18637, 3.500% | | | 2/1/32 | | | | 1.5% | |
| * | As of September 30, 2017, there were 82 holdings in the Fund. Repurchase agreements, if any, are not included in the number of holdings. Portfolio holdings are subject to change at any time. References to specific securities should not be construed as recommendations by the Funds or their Advisor. Current and future holdings are subject to risk. |
INVESTMENTS & CASH**
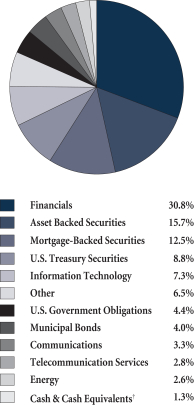
| ** | Excludes options written, if any. |
| † | Also includes Other Assets & Liabilities. |
GROWTHOFA HYPOTHETICAL $10,000 INVESTMENT
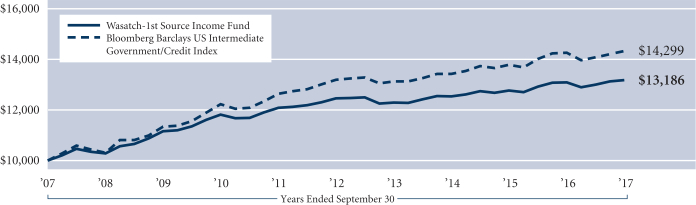
Past performance does not predict future performance. The graph above does not reflect the deduction of fees, sales charges, or taxes that you would pay on fund distributions or the redemption of fund shares. Wasatch does not charge any sales fees. The Bloomberg Barclays US Intermediate Government/Credit Index is a broad-based flagship benchmark that measures the non-securitized component of the US Aggregate Index. It includes investment grade, U.S. dollar-denominated, fixed-rate Treasuries, government-related and corporate securities. You cannot invest directly in this or any index.
39
| | |
| WASATCH-HOISINGTON U.S. TREASURY FUND (WHOSX) | | SEPTEMBER 30, 2017 (UNAUDITED) |
|
|
|
Management Discussion
| | | | |

Van Hoisington Lead Portfolio Manager | | 
Van R. Hoisington, Jr. Portfolio Manager | | 
David Hoisington Portfolio Manager |
OVERVIEW
Although bond yields were volatile during the 12 months ended September 30, 2017, the period saw little net movement overall. The 30-year U.S. Treasury bond yield began the 12-month period at 2.31% and closed the period at 2.86% on September 30, 2017, an increase of just 0.55 of a percentage point. For the first nine months of 2017, it has fallen 0.21 of a percentage point. Since late 2015, when the Federal Reserve (Fed) began raising rates, the 30-year Treasury bond yield has declined slightly, albeit with large swings up and down over that time. The combined four Fed increases since December 2015 have brought the federal-funds rate into a range of 1.00% to 1.25%. With the 30-year bond yield declining, a flattening of the yield curve has resulted.
DETAILSOFTHE YEAR
Over the 12-month period, the consumer sector continued to experience paltry income growth and a low and falling saving rate. In the past five years, real disposable personal income (DPI) growth has averaged a disappointing 2%. Real DPI has been flat over the last three months and has risen only 1.2% over the past year. On a per-capita basis over the past year, the growth rate was one-half of 1%, which is one-quarter of the historic growth rate.
In an effort to maintain their standard of living in the face of slowing income growth, consumers stepped up their borrowing and significantly reduced their savings. For the month of August, personal saving was $523 billion, or 3.6% of income. That is about three-fifths less than the 8.5% saving rate level that has existed since 1900. As recently as five years ago, the saving rate was 7.6%.
These constraints on consumer spending, as well as increasingly restrictive Fed policy, have served to push the prices of discretionary goods and services downward. Both the core Consumer Price Index (CPI) and Personal Consumption Expenditures (PCE) price index decelerated in the latest 12 months. In the latest six months, all items in the CPI except the essentials of food, shelter and housing fell at a 0.5% annual rate, the largest six-month decline since the beginning of this data in 1967.
For the past six and 12 months, the Wasatch-Hoisington U.S. Treasury Fund returned 5.48% and -8.86%, respectively, while the benchmark Bloomberg Barclays US Aggregate Bond Index returned 2.31% and 0.07%, respectively. The weak 12-month performance reflected a sharp rise in
Treasury bond yields immediately after the presidential election in early November. The Fund maintained its outperformance over the Index for the three-, five- and 10-year periods ended September 30, 2017.
OUTLOOK
With monetary restraint continuing to weigh on economic growth for the remainder of 2017 and 2018, inflation, which receded sharply this year (the PCE was up 1.2% year-to-date through September 30, 2017 and 1.4% year-over-year), will continue on a downward path. Coupled with extreme over-indebtedness, these are the dominant factors causing both cyclical and secular growth to weaken. Additionally, these negative impulses are presently being reinforced by the problems of poor demographics and productivity. Population growth in 2016 was the slowest since 1936–37 — roughly half of the post-war average. The fertility rate in 2016 was the lowest on record. These trends have contributed to the declining growth of household formation, which is now less than one-half the rate of increase that had been experienced since 1960. Productivity in the eight years of this expansion was the lowest for any eight-year period since the end of World War II.
These circumstances indicate that a Fed policy of quantitative tightening (QT) and an indicated December hike in the federal-funds rate will put upward pressure on short-term interest rates. At the same time, lower inflation and the resultant decline in inflationary expectations will place downward pressure on the yields of long-term Treasury bonds (maturities longer than 20 years), thus causing the yield curve to flatten further. Continuation of QT deep into 2018 would probably cause the yield curve to invert. Short-term interest rates are determined by the intersection of the demand and supply of credit that the Fed largely controls by shifting the monetary base and interest rates. Changes in long-term Treasury bond yields are primarily determined by inflationary expectations. Inflationary expectations will ratchet downward in this environment, pushing long-term Treasury bond yields lower.
Thank you for the opportunity to manage your assets.
40
| | |
| WASATCH-HOISINGTON U.S. TREASURY FUND (WHOSX) | | SEPTEMBER 30, 2017 (UNAUDITED) |
|
|
|
Portfolio Summary
AVERAGE ANNUAL TOTAL RETURNS
| | | | | | | | | | | | | | | |
| | | 1 YEAR | | 5 YEARS | | 10 YEARS |
U.S. Treasury | | | | -8.86% | | | | | 2.58% | | | | | 7.73% | |
Bloomberg Barclays US Aggregate Bond Index | | | | 0.07% | | | | | 2.06% | | | | | 4.27% | |
Data shows past performance, which is not indicative of future performance. Current performance may be lower or higher than the performance quoted. To obtain the most recent month-end performance data available, please visit www.WasatchFunds.com. The Advisor may absorb certain Fund expenses, without which total return would have been lower. Investment returns and principal value will fluctuate and shares, when redeemed, may be worth more or less than their original cost.
As of the September 1, 2017 prospectus, the Total Annual Fund Operating Expenses for the Wasatch-Hoisington U.S. Treasury Fund are 0.69%. The expense ratio shown elsewhere in this report may be different. See the prospectus for additional information regarding Fund expenses.
Wasatch Funds will deduct a 2.00% redemption proceeds fee on Fund shares held 60 days or less. Performance data does not reflect the deduction of fees, including sales charges, or the taxes you would pay on fund distributions or the redemption of fund shares. Fees and taxes, if reflected, would reduce the performance quoted. Wasatch does not charge any sales fees. For more complete information including charges, risks and expenses, read the prospectus carefully.
Investments in fixed income funds are subject to the same interest rate, inflation, credit and other risks associated with the underlying bonds. Return of principal is not guaranteed.
TOP U.S. TREASURY HOLDINGS*
| | | | | | | | |
| Holding | | Maturity
Date | | | % of Net
Assets | |
| U.S. Treasury Bond, 2.250% | | | 8/15/46 | | | | 35.7% | |
| U.S. Treasury Strip, principal only | | | 8/15/45 | | | | 21.5% | |
| U.S. Treasury Bond, 2.500% | | | 2/15/45 | | | | 17.2% | |
| U.S. Treasury Strip, principal only | | | 5/15/44 | | | | 10.4% | |
| U.S. Treasury Strip, principal only | | | 8/15/40 | | | | 5.7% | |
| | | | | | | | |
| Holding | | Maturity
Date | | | % of Net
Assets | |
| U.S. Treasury Bond, 3.750% | | | 11/15/43 | | | | 4.6% | |
| U.S. Treasury Bond, 3.125% | | | 8/15/44 | | | | 2.3% | |
| U.S. Treasury Bond, 2.500% | | | 5/15/46 | | | | 2.1% | |
| * | As of September 30, 2017, there were 8 holdings in the Fund. Repurchase agreements, if any, are not included in the number of holdings. Portfolio holdings are subject to change at any time. References to specific securities should not be construed as recommendations by the Funds or their Advisor. Current and future holdings are subject to risk. |
INVESTMENTS & CASH
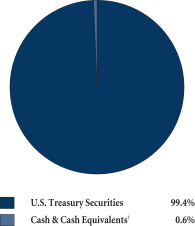
| † | Also includes Other Assets & Liabilities. |
GROWTHOFA HYPOTHETICAL $10,000 INVESTMENT
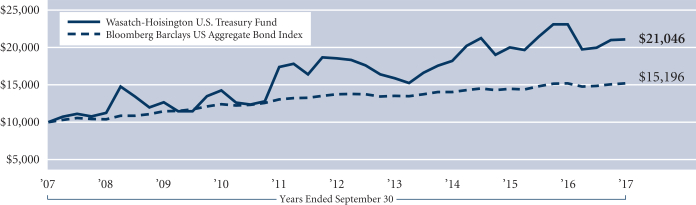
Past performance does not predict future performance. The graph above does not reflect the deduction of fees, sales charges, or taxes that you would pay on fund distributions or the redemption of fund shares. Wasatch does not charge any sales fees. The Bloomberg Barclays US Aggregate Bond Index is a broad-based flagship benchmark that measures the investment grade, US dollar denominated, fixed-rate taxable bond market. The index includes Treasuries, government-related and corporate securities, MBS (agency fixed-rate and hybrid ARM pass-throughs), ABS and CMBS (agency and non-agency). You cannot invest directly in this or any index.
41
| | |
| WASATCH FUNDS MANAGEMENT DISCUSSIONS | | |
|
|
|
Definitions of Financial Terms
Abenomics refers to the economic policies advocated by Japanese Prime Minister Shinzo Abe after his December 2012 re-election to the post he last held in 2007. His aim was to revive the sluggish economy with “three arrows” — a massive fiscal stimulus, more aggressive monetary easing from the Bank of Japan, and structural reforms to boost Japan’s competitiveness.
Asset-backed securities are securities backed by loans, leases or receivables against assets other than real estate and mortgage-backed securities.
Beta is a measurement of a fund’s trailing return in relation to the overall market (or appropriate market index). A beta of 1 indicates the share price will typically move with the market. A beta of more than 1 indicates the share price will typically be more volatile than the market. A beta of less than 1 indicates the share price will typically be less volatile than the market.
Book value is the value of a security or asset as entered in a company’s books.
Brexit is an abbreviation for “British exit,” which refers to the June 23, 2016 referendum whereby British citizens voted to exit the European Union. The referendum roiled global markets, including currencies, causing the British pound to fall to its lowest level in decades.
A bull market is defined as a prolonged period in which investment prices rise faster than their historical average. Bull markets can happen as the result of an economic recovery, an economic boom, or investor psychology.
The Consumer Price Index (CPI), also called the cost-of-living index, is an inflationary indicator that measures the change in the cost of a fixed basket of products and services, including housing, electricity, food, and transportation. The CPI is published monthly. The headline CPI includes volatile food and energy prices, while the core CPI excludes food and energy.
A corporate bond is a debt security issued by a corporation for the purpose of raising money to expand its business. Floating rate notes (FRNs) are bonds that have a variable coupon, equal to a money market reference rate, like LIBOR or the federal-funds rate, plus a quoted spread (also known as a quoted margin). The spread is a rate that remains constant. A corporation can borrow money by issuing bonds or getting a bank loan. Both are different forms of debt.
Correlation, in the financial world, is a statistical measure of how asset classes, securities, markets, or countries move in relation to each other.
Earnings growth is a measure of growth in a company’s net income over a specific period, often one year.
Earnings-per-share or EPS is the portion of a company’s profit allocated to each outstanding share of common stock. EPS growth rates help investors identify companies that are increasing or decreasing in profitability.
Effective duration is a measure of the responsiveness of a bond’s price to market interest rate changes. For example, if the interest rate increased 1%, a bond with an effective duration of five years would experience a decline in price of 5%.
An Exchange-Traded Fund (ETF) is a security that tracks an index, a commodity or a basket of assets like an index
fund, but trades like a stock on a securities exchange. ETFs experience price changes throughout the day as they are bought and sold.
The federal-funds rate is the interest rate at which private depository institutions (mostly banks) lend balances (federal funds) at the Federal Reserve to other depository institutions, usually overnight. It is the interest rate banks charge each other for loans.
The federal-funds target rate (also known as the fed-funds target rate) is set by a committee within the Federal Reserve System called the Federal Open Market Committee (FOMC). The FOMC usually meets every six weeks, and it is at these meetings that the FOMC votes on whether or not to make changes to the federal-funds target rate.
Fixed-to-floating securities (preferred shares and bonds) offer a steady yield for several years, then switch to a floating rate that keeps pace with market interest rates.
A floating exchange rate is a regime where a currency’s price is set by the foreign exchange market based on supply and demand compared with other currencies. In contrast, a fixed exchange rate is one that is predominantly determined by a country’s government. The currencies of most of the world’s major economies are allowed to float freely.
The global financial crisis, also known as the financial crisis of 2007-09 and 2008 financial crisis, is considered by many economists to have been the worst financial crisis since the Great Depression of the 1930s.
Gross domestic product (GDP) is a basic measure of a country’s economic performance and is the market value of all final goods and services made within the borders of a country in a year.
An initial public offering (IPO) is a company’s first sale of stock to the public.
LIBOR or ICE LIBOR stands for IntercontinentalExchange London Interbank Offered Rate. It is a benchmark interest rate that some of the world’s leading banks charge each other for short-term loans. LIBOR serves as the first step to calculating interest rates on various loans throughout the world.
Mortgage-backed securities are debt issues backed by a pool of mortgages. Investors receive payments from the interest and principal payments made on the underlying mortgages.
The Personal Consumption Expenditure (PCE) price index, also referred to as the PCE deflator, is a United States-wide indicator of the average increase in prices for all domestic personal consumption using a variety of data including U.S. Consumer Price Index and Producer Price Index prices. It is derived from personal consumption expenditures, the largest component of Gross Domestic Product in the National Income and Product Accounts of the Bureau of Economic Analysis (BEA). The less volatile measure of the PCE price index is the core PCE price index, which excludes the more volatile and seasonal food and energy prices.
The price-to-book ratio is used to compare a company’s book value to its current market price.
The price/earnings (P/E) multiple, also known as the P/E ratio, is the price of a stock divided by its earnings per share.
42
| | |
| | SEPTEMBER 30, 2017 (UNAUDITED) |
|
|
|
Quantitative easing is a government monetary policy used to increase the money supply by buying government securities or other securities from the market. Quantitative easing increases the money supply by flooding financial institutions with capital in an effort to promote increased lending and liquidity.
Quantitative tightening is the opposite of quantitative easing. It is the plan of Federal Reserve officials to reduce the Fed’s massive balance sheet by letting the bonds it has bought mature, receiving the cash and not buying new ones.
Return on equity (ROE) measures a company’s efficiency at generating profits from shareholders’ equity.
“Risk-on” is when investors are seeking the potentially higher returns of riskier assets and put money back in the market willing to risk the money, thus risk on.
The terminal rate is the federal-funds rate at which the economy is in balance.
U.S. Treasury Inflation-Protected Securities, or TIPS, provide protection against inflation. The principal of a TIPS increases with inflation and decreases with deflation, as measured by the Consumer Price Index. When a TIPS matures, you are paid the adjusted principal or original principal, whichever is greater.
Valuation is the process of determining the current worth of an asset or company.
The yield curve is a line on a graph that plots the interest rates, at a set point in time, of bonds having equal credit quality, but differing maturity dates. The most frequently reported yield curve compares three-month, two-year, five-year and 30-year U.S. Treasury securities. This yield curve is used as a benchmark for other interest rates, such as mortgage rates or bank lending rates. The curve is also used to predict changes in economic output and growth.
Pertaining to the use of MSCI information. Source: MSCI. The MSCI information may only be used for your
internal use, may not be reproduced or redisseminated in any form and may not be used as a basis for or a component of any financial instruments or products or indexes. None of the MSCI information is intended to constitute investment advice or a recommendation to make (or refrain from making) any kind of investment decision and may not be relied on as such. Historical data and analysis should not be taken as an indication or guarantee of any future performance analysis, forecast or prediction. The MSCI information is provided on an “as is” basis and the user of this information assumes the entire risk of any use made of this information. MSCI, each of its affiliates and each other person involved in or related to compiling, computing or creating any MSCI information (collectively, the “MSCI Parties”) expressly disclaims all warranties (including, without limitation, any warranties or originality, accuracy, completeness, timeliness, non-infringement, merchantability and fitness for a particular purpose) with respect to this information. Without limiting any of the foregoing, in no event shall any MSCI Party have any liability for any direct, indirect, special, incidental, punitive, consequential (including, without limitation, lost profits) or any other damages. (www.msci.com)
Pertaining to the use of Russell information. Frank Russell Company is the source and owner of the Russell Index data contained or reflected in this material and all trademarks and copyrights related thereto. This is a presentation of Wasatch Advisors, Inc. The presentation may contain confidential information and unauthorized use, disclosure, copying, dissemination or redistribution is strictly prohibited. Frank Russell Company is not responsible for the formatting or configuration of this material or for any inaccuracy in Wasatch Advisors, Inc.’s presentation thereof.
43
Operating Expenses (UNAUDITED)
EXPENSE EXAMPLE
As a shareholder of Wasatch Funds, you incur two types of costs: (1) transaction costs, including redemption fees and (2) ongoing costs, including management fees and other fund expenses. This example is intended to help you understand your ongoing costs (in dollars) of investing in a Wasatch Fund and to compare these costs with the ongoing costs of investing in other mutual funds.
The example is based on an investment of $1,000.00 invested at the beginning of the period and held for the entire six-month period ended September 30, 2017.
ACTUAL EXPENSES
The first line of the table below provides information about actual account values and actual expenses, based upon the actual total return of the fund during the most recent six-month period ended September 30, 2017. You may use the information in this line, together with the amount you invested, to estimate the expenses you paid over the period. Simply divide your account value by $1,000.00 (for example, an $8,600.00 account value divided by $1,000.00 = 8.6), then multiply the result by the number in the first line under the heading entitled “Expenses Paid During Period” to estimate the expenses you paid on your account during this period.
In addition, the Funds charge a $12.50 IRA annual maintenance fee and a $15.00 fee for redemptions paid by wire. To the extent these fees apply to your account, your expenses paid during the period would be higher and your ending account value would be lower than the amounts shown in the table on the next page.
HYPOTHETICAL EXAMPLEFOR COMPARISON PURPOSES
The second line of the table on the next page provides information about hypothetical account values and hypothetical expenses based on a fund’s actual expense ratio and
an assumed rate of return of 5% per year before expenses, which is not the fund’s actual return. The hypothetical account values and expenses may not be used to estimate the actual ending account balance or expenses you paid for the period. You may use this information to compare the ongoing costs of investing in a Wasatch Fund and other funds. To do so, compare this 5% hypothetical example with the 5% hypothetical examples that appear in the shareholder reports of other funds.
In addition, the Funds charge a $12.50 IRA annual maintenance fee and a $15.00 fee for redemptions paid by wire. To the extent these fees apply to your account, your expenses paid during the period would be higher and your ending account value would be lower than the amounts shown in the table on the next page. If another fund’s fees differ from those listed above, your expenses paid and your ending account value could be higher or lower than those of other funds.
Please note that the expenses shown in the table are meant to highlight your ongoing costs only and do not reflect any transactional costs, such as redemption fees. Therefore, the second line of the table is useful in comparing ongoing costs only, and will not help you determine the relative total costs of owning different funds. In addition, if these transactional costs were included, your costs would have been higher.
A Fund’s annualized expense ratio may vary as a result of various factors including expenses that are not reimbursable under the contractual agreement between the Fund and the Advisor such as interest, taxes, brokerage commissions, other investment related costs, dividend expense on short sales, and extraordinary expenses. The Long/Short Fund — Investor Class and the Income Fund have no contractual limitation on expenses.
44
| | |
| | SEPTEMBER 30, 2017 (UNAUDITED) |
|
|
|
| | | | | | | | | | | | | | | | |
| | | Account Value | | | Expenses Paid
During Period* | | | Annualized Expense
Ratio* | |
| Fund/Class and Return | | Beginning of Period
April 1, 2017 | | | End of Period
September 30, 2017 | | | |
Core Growth Fund — Investor Class | | | | | | | | | | | | | | | | |
Actual | | | $1,000.00 | | | | $1,107.80 | | | | $6.39 | | | | 1.21% | |
Hypothetical (5% before expenses) | | | $1,000.00 | | | | $1,019.00 | | | | $6.12 | | | | 1.21% | |
Core Growth Fund — Institutional Class | | | | | | | | | | | | | | | | |
Actual | | | $1,000.00 | | | | $1,108.60 | | | | $5.55 | | | | 1.05% | |
Hypothetical (5% before expenses) | | | $1,000.00 | | | | $1,019.80 | | | | $5.32 | | | | 1.05% | |
Emerging India Fund — Investor Class | | | | | | | | | | | | | | | | |
Actual | | | $1,000.00 | | | | $1,108.70 | | | | $9.09 | | | | 1.72% | |
Hypothetical (5% before expenses) | | | $1,000.00 | | | | $1,016.44 | | | | $8.69 | | | | 1.72% | |
Emerging India Fund — Institutional Class | | | | | | | | | | | | | | | | |
Actual | | | $1,000.00 | | �� | | $1,108.10 | | | | $7.93 | | | | 1.50% | |
Hypothetical (5% before expenses) | | | $1,000.00 | | | | $1,017.55 | | | | $7.59 | | | | 1.50% | |
Emerging Markets Select Fund — Investor Class | | | | | | | | | | | | | | | | |
Actual | | | $1,000.00 | | | | $1,137.00 | | | | $8.09 | | | | 1.51% | |
Hypothetical (5% before expenses) | | | $1,000.00 | | | | $1,017.50 | | | | $7.64 | | | | 1.51% | |
Emerging Markets Select Fund — Institutional Class | | | | | | | | | | | | | | | | |
Actual | | | $1,000.00 | | | | $1,139.80 | | | | $6.49 | | | | 1.21% | |
Hypothetical (5% before expenses) | | | $1,000.00 | | | | $1,019.00 | | | | $6.12 | | | | 1.21% | |
Emerging Markets Small Cap Fund — Investor Class | | | | | | | | | | | | | | | | |
Actual | | | $1,000.00 | | | | $1,163.40 | | | | $10.63 | | | | 1.96% | |
Hypothetical (5% before expenses) | | | $1,000.00 | | | | $1,015.24 | | | | $9.90 | | | | 1.96% | |
Emerging Markets Small Cap Fund — Institutional Class | | | | | | | | | | | | | | | | |
Actual | | | $1,000.00 | | | | $1,167.30 | | | | $9.83 | | | | 1.81% | |
Hypothetical (5% before expenses) | | | $1,000.00 | | | | $1,015.99 | | | | $9.15 | | | | 1.81% | |
Frontier Emerging Small Countries Fund — Investor Class | | | | | | | | | | | | | | | | |
Actual | | | $1,000.00 | | | | $1,100.00 | | | | $11.95 | | | | 2.27% | |
Hypothetical (5% before expenses) | | | $1,000.00 | | | | $1,013.69 | | | | $11.46 | | | | 2.27% | |
Frontier Emerging Small Countries Fund — Institutional Class | | | | | | | | | | | | | | | | |
Actual | | | $1,000.00 | | | | $1,099.60 | | | | $10.90 | | | | 2.07% | |
Hypothetical (5% before expenses) | | | $1,000.00 | | | | $1,014.69 | | | | $10.45 | | | | 2.07% | |
Global Opportunities Fund — Investor Class | | | | | | | | | | | | | | | | |
Actual | | | $1,000.00 | | | | $1,136.00 | | | | $8.25 | | | | 1.54% | |
Hypothetical (5% before expenses) | | | $1,000.00 | | | | $1,017.35 | | | | $7.79 | | | | 1.54% | |
Global Opportunities Fund — Institutional Class | | | | | | | | | | | | | | | | |
Actual | | | $1,000.00 | | | | $1,139.40 | | | | $7.29 | | | | 1.36% | |
Hypothetical (5% before expenses) | | | $1,000.00 | | | | $1,018.25 | | | | $6.88 | | | | 1.36% | |
International Growth Fund — Investor Class | | | | | | | | | | | | | | | | |
Actual | | | $1,000.00 | | | | $1,161.20 | | | | $7.80 | | | | 1.44% | |
Hypothetical (5% before expenses) | | | $1,000.00 | | | | $1,017.85 | | | | $7.28 | | | | 1.44% | |
International Growth Fund — Institutional Class | | | | | | | | | | | | | | | | |
Actual | | | $1,000.00 | | | | $1,161.80 | | | | $7.32 | | | | 1.35% | |
Hypothetical (5% before expenses) | | | $1,000.00 | | | | $1,018.30 | | | | $6.83 | | | | 1.35% | |
International Opportunities Fund — Investor Class | | | | | | | | | | | | | | | | |
Actual | | | $1,000.00 | | | | $1,108.60 | | | | $11.68 | | | | 2.21% | |
Hypothetical (5% before expenses) | | | $1,000.00 | | | | $1,013.99 | | | | $11.16 | | | | 2.21% | |
International Opportunities Fund — Institutional Class | | | | | | | | | | | | | | | | |
Actual | | | $1,000.00 | | | | $1,111.10 | | | | $10.37 | | | | 1.96% | |
Hypothetical (5% before expenses) | | | $1,000.00 | | | | $1,015.24 | | | | $9.90 | | | | 1.96% | |
Large Cap Value Fund — Investor Class | | | | | | | | | | | | | | | | |
Actual | | | $1,000.00 | | | | $1,046.40 | | | | $5.64 | | | | 1.10% | |
Hypothetical (5% before expenses) | | | $1,000.00 | | | | $1,019.55 | | | | $5.57 | | | | 1.10% | |
Large Cap Value Fund — Institutional Class | | | | | | | | | | | | | | | | |
Actual | | | $1,000.00 | | | | $1,048.40 | | | | $4.88 | | | | 0.95% | |
Hypothetical (5% before expenses) | | | $1,000.00 | | | | $1,020.31 | | | | $4.81 | | | | 0.95% | |
45
| | |
| WASATCH FUNDS | | SEPTEMBER 30, 2017 (UNAUDITED) |
|
|
|
Operating Expenses (continued)
| | | | | | | | | | | | | | | | |
| | | Account Value | | | Expenses Paid
During Period* | | | Annualized Expense
Ratio* | |
| Fund/Class and Return | | Beginning of Period
April 1, 2017 | | | End of Period
September 30, 2017 | | | |
Long/Short Fund — Investor Class | | | | | | | | | | | | | | | | |
Actual | | | $1,000.00 | | | | $967.70 | | | | $11.64 | | | | 2.36% | |
Hypothetical (5% before expenses) | | | $1,000.00 | | | | $1,013.24 | | | | $11.91 | | | | 2.36% | |
Long/Short Fund — Institutional Class | | | | | | | | | | | | | | | | |
Actual | | | $1,000.00 | | | | $969.40 | | | | $10.71 | | | | 2.17% | |
Hypothetical (5% before expenses) | | | $1,000.00 | | | | $1,014.19 | | | | $10.96 | | | | 2.17% | |
Micro Cap Fund | | | | | | | | | | | | | | | | |
Actual | | | $1,000.00 | | | | $1,185.90 | | | | $9.15 | | | | 1.67% | |
Hypothetical (5% before expenses) | | | $1,000.00 | | | | $1,016.70 | | | | $8.44 | | | | 1.67% | |
Micro Cap Value Fund | | | | | | | | | | | | | | | | |
Actual | | | $1,000.00 | | | | $1,137.30 | | | | $9.59 | | | | 1.79% | |
Hypothetical (5% before expenses) | | | $1,000.00 | | | | $1,016.09 | | | | $9.05 | | | | 1.79% | |
Small Cap Growth Fund — Investor Class | | | | | | | | | | | | | | | | |
Actual | | | $1,000.00 | | | | $1,090.90 | | | | $6.39 | | | | 1.22% | |
Hypothetical (5% before expenses) | | | $1,000.00 | | | | $1,018.95 | | | | $6.17 | | | | 1.22% | |
Small Cap Growth Fund — Institutional Class | | | | | | | | | | | | | | | | |
Actual | | | $1,000.00 | | | | $1,091.80 | | | | $5.51 | | | | 1.05% | |
Hypothetical (5% before expenses) | | | $1,000.00 | | | | $1,019.80 | | | | $5.32 | | | | 1.05% | |
Small Cap Value Fund — Investor Class | | | | | | | | | | | | | | | | |
Actual | | | $1,000.00 | | | | $1,093.70 | | | | $6.35 | | | | 1.21% | |
Hypothetical (5% before expenses) | | | $1,000.00 | | | | $1,019.00 | | | | $6.12 | | | | 1.21% | |
Small Cap Value Fund — Institutional Class | | | | | | | | | | | | | | | | |
Actual | | | $1,000.00 | | | | $1,094.70 | | | | $5.51 | | | | 1.05% | |
Hypothetical (5% before expenses) | | | $1,000.00 | | | | $1,019.80 | | | | $5.32 | | | | 1.05% | |
Strategic Income Fund | | | | | | | | | | | | | | | | |
Actual | | | $1,000.00 | | | | $1,057.50 | | | | $4.90 | | | | 0.95% | |
Hypothetical (5% before expenses) | | | $1,000.00 | | | | $1,020.31 | | | | $4.81 | | | | 0.95% | |
Ultra Growth Fund | | | | | | | | | | | | | | | | |
Actual | | | $1,000.00 | | | | $1,161.30 | | | | $6.99 | | | | 1.29% | |
Hypothetical (5% before expenses) | | | $1,000.00 | | | | $1,018.60 | | | | $6.53 | | | | 1.29% | |
World Innovators Fund — Investor Class | | | | | | | | | | | | | | | | |
Actual | | | $1,000.00 | | | | $1,152.50 | | | | $9.87 | | | | 1.83% | |
Hypothetical (5% before expenses) | | | $1,000.00 | | | | $1,015.89 | | | | $9.25 | | | | 1.83% | |
World Innovators Fund — Institutional Class | | | | | | | | | | | | | | | | |
Actual | | | $1,000.00 | | | | $1,154.00 | | | | $8.37 | | | | 1.55% | |
Hypothetical (5% before expenses) | | | $1,000.00 | | | | $1,017.30 | | | | $7.84 | | | | 1.55% | |
Income Fund | | | | | | | | | | | | | | | | |
Actual | | | $1,000.00 | | | | $1,014.50 | | | | $3.84 | | | | 0.76% | |
Hypothetical (5% before expenses) | | | $1,000.00 | | | | $1,021.26 | | | | $3.85 | | | | 0.76% | |
U.S. Treasury Fund | | | | | | | | | | | | | | | | |
Actual | | | $1,000.00 | | | | $1,054.80 | | | | $3.55 | | | | 0.69% | |
Hypothetical (5% before expenses) | | | $1,000.00 | | | | $1,021.61 | | | | $3.50 | | | | 0.69% | |
*Expenses are equal to a fund’s annualized expense ratio as indicated above multiplied by the average account value over the period, multiplied by the number of days in the most recent fiscal half-year divided by the number of days in the full fiscal year (183/365).
46
| | |
| WASATCH CORE GROWTH FUND (WGROX / WIGRX) | | SEPTEMBER 30, 2017 |
|
|
|
Schedule of Investments
| | | | | | | | |
| Shares | | | | | Value | |
| | | | | | | |
| | | | COMMON STOCKS 97.4% | | | | |
| | |
| | | | Airlines 2.7% | | | | |
| | 185,476 | | | Allegiant Travel Co. | | $ | 24,427,189 | |
| | 570,425 | | | Spirit Airlines, Inc.* | | | 19,057,899 | |
| | | | | | | | |
| | | | | | | 43,485,088 | |
| | | | | | | | |
| | | | Application Software 7.0% | | | | |
| | 436,556 | | | Guidewire Software, Inc.* | | | 33,990,250 | |
| | 215,318 | | | Tyler Technologies, Inc.* | | | 37,534,234 | |
| | 144,176 | | | Ultimate Software Group, Inc. (The)* | | | 27,335,769 | |
| | 414,724 | | | Zendesk, Inc.* | | | 12,072,616 | |
| | | | | | | | |
| | | | | | | 110,932,869 | |
| | | | | | | | |
| | | | Asset Management & Custody Banks 2.0% | | | | |
| | 365,191 | | | Hamilton Lane, Inc., Class A | | | 9,805,378 | |
| | 368,969 | | | SEI Investments Co. | | | 22,529,247 | |
| | | | | | | | |
| | | | | | | 32,334,625 | |
| | | | | | | | |
| | | | Automotive Retail 2.3% | | | | |
| | 651,578 | | | Monro, Inc. | | | 36,520,947 | |
| | | | | | | | |
| | | | Biotechnology 3.7% | | | | |
| | 1,908,420 | | | Abcam plc (United Kingdom) | | | 26,084,273 | |
| | 1,006,772 | | | Sangamo Therapeutics Inc.* | | | 15,101,580 | |
| | 311,800 | | | Seattle Genetics, Inc.* | | | 16,965,038 | |
| | | | | | | | |
| | | | | | | 58,150,891 | |
| | | | | | | | |
| | | | Building Products 2.6% | | | | |
| | 452,234 | | | Trex Co., Inc.* | | | 40,732,716 | |
| | | | | | | | |
| | | | Consumer Finance 2.0% | | | | |
| | 112,207 | | | Credit Acceptance Corp.* | | | 31,437,035 | |
| | | | | | | | |
| | | | Data Processing & Outsourced Services 2.3% | | | | |
| | 390,466 | | | Euronet Worldwide, Inc.* | | | 37,012,272 | |
| | | | | | | | |
| | | | Distributors 1.1% | | | | |
| | 163,176 | | | Pool Corp. | | | 17,650,748 | |
| | | | | | | | |
| | | | Diversified Banks 2.1% | | | | |
| | 7,321,641 | | | City Union Bank Ltd. (India) | | | 18,382,565 | |
| | 2,917,620 | | | Yes Bank Ltd. (India) | | | 15,602,031 | |
| | | | | | | | |
| | | | | | | 33,984,596 | |
| | | | | | | | |
| | | | Diversified Support Services 5.2% | | | | |
| | 1,452,924 | | | Copart, Inc.* | | | 49,936,998 | |
| | 606,047 | | | Healthcare Services Group, Inc. | | | 32,708,356 | |
| | | | | | | | |
| | | | | | | 82,645,354 | |
| | | | | | | | |
| | | | Environmental & Facilities Services 1.9% | | | | |
| | 429,742 | | | Waste Connections, Inc. | | | 30,064,750 | |
| | | | | | | | |
| | | | General Merchandise Stores 1.7% | | | | |
| | 581,194 | | | Ollie’s Bargain Outlet Holdings, Inc.* | | | 26,967,402 | |
| | | | | | | | |
| | | | Health Care Equipment 0.9% | | | | |
| | 153,145 | | | Cantel Medical Corp. | | | 14,421,665 | |
| | | | | | | | |
| | | | Health Care Facilities 2.1% | | | | |
| | 1,489,903 | | | Ensign Group, Inc. (The) | | | 33,656,909 | |
| | | | | | | | |
| | | | Health Care REITs 1.6% | | | | |
| | 1,301,097 | | | CareTrust REIT, Inc. | | | 24,772,887 | |
| | | | | | | | |
| | | | Health Care Supplies 0.1% | | | | |
| | 23,248 | | | Neogen Corp.* | | | 1,800,790 | |
| | | | | | | | |
| | | | Homebuilding 1.4% | | | | |
| | 333,585 | | | Installed Building Products, Inc.* | | | 21,616,308 | |
| | | | | | | | |
| | | | | | | | |
| Shares | | | | | Value | |
| | | | | | | |
| | | | Industrial Machinery 6.1% | | | | |
| | 334,551 | | | Altra Industrial Motion Corp. | | $ | 16,091,903 | |
| | 493,598 | | | Barnes Group, Inc. | | | 34,769,043 | |
| | 284,169 | | | RBC Bearings, Inc.* | | | 35,563,751 | |
| | 204,450 | | | Sun Hydraulics Corp. | | | 11,040,300 | |
| | | | | | | | |
| | | | | | | 97,464,997 | |
| | | | | | | | |
| | | | Internet & Direct Marketing Retail 2.2% | | | | |
| | 508,640 | | | MakeMyTrip Ltd.* (India) | | | 14,623,400 | |
| | 294,885 | | | Wayfair, Inc., Class A* | | | 19,875,249 | |
| | | | | | | | |
| | | | | | | 34,498,649 | |
| | | | | | | | |
| | | | Internet Software & Services 3.8% | | | | |
| | 397,730 | | | Cimpress N.V.* | | | 38,842,312 | |
| | 429,592 | | | Envestnet, Inc.* | | | 21,909,192 | |
| | | | | | | | |
| | | | | | | 60,751,504 | |
| | | | | | | | |
| | | | IT Consulting & Other Services 4.3% | | | | |
| | 319,418 | | | EPAM Systems, Inc.* | | | 28,086,425 | |
| | 444,522 | | | InterXion Holding N.V.* (Netherlands) | | | 22,639,505 | |
| | 377,986 | | | Luxoft Holding, Inc.* (Switzerland) | | | 18,067,731 | |
| | | | | | | | |
| | | | | | | 68,793,661 | |
| | | | | | | | |
| | | | Leisure Facilities 1.8% | | | | |
| | 1,086,506 | | | Planet Fitness, Inc., Class A | | | 29,313,932 | |
| | | | | | | | |
| | | | Life Sciences Tools & Services 3.2% | | | | |
| | 452,985 | | | ICON plc* (Ireland) | | | 51,585,932 | |
| | | | | | | | |
| | | | Managed Health Care 1.4% | | | | |
| | 439,385 | | | HealthEquity, Inc.* | | | 22,224,093 | |
| | | | | | | | |
| | | | Personal Products 1.1% | | | | |
| | 283,139 | | | Nu Skin Enterprises, Inc., Class A | | | 17,407,386 | |
| | | | | | | | |
| | | | Real Estate Services 1.6% | | | | |
| | 660,390 | | | HFF, Inc., Class A | | | 26,125,028 | |
| | | | | | | | |
| | | | Regional Banks 12.1% | | | | |
| | 602,244 | | | Eagle Bancorp, Inc.* | | | 40,380,460 | |
| | 340,636 | | | Independent Bank Corp. | | | 25,428,477 | |
| | 727,101 | | | Metro Bank plc* (United Kingdom) | | | 32,931,843 | |
| | 305,049 | | | South State Corp. | | | 27,469,663 | |
| | 436,026 | | | Texas Capital Bancshares, Inc.* | | | 37,411,031 | |
| | 564,573 | | | Webster Financial Corp. | | | 29,668,311 | |
| | | | | | | | |
| | | | | | | 193,289,785 | |
| | | | | | | | |
| | | | Restaurants 0.8% | | | | |
| | 681,753 | | | Fiesta Restaurant Group, Inc.* | | | 12,953,307 | |
| | | | | | | | |
| | | | Semiconductors 3.2% | | | | |
| | 396,940 | | | Cavium, Inc.* | | | 26,174,223 | |
| | 237,314 | | | Monolithic Power Systems, Inc. | | | 25,285,807 | |
| | | | | | | | |
| | | | | | | 51,460,030 | |
| | | | | | | | |
| | | | Specialty Chemicals 2.4% | | | | |
| | 461,056 | | | Balchem Corp. | | | 37,479,242 | |
| | | | | | | | |
| | | | Specialty Stores 1.4% | | | | |
| | 406,157 | | | Five Below, Inc.* | | | 22,289,896 | |
| | | | | | | | |
| | | | Systems Software 2.5% | | | | |
| | 642,523 | | | Fortinet, Inc.* | | | 23,028,024 | |
| | 188,794 | | | Proofpoint, Inc.* | | | 16,466,613 | |
| | | | | | | | |
| | | | | | | 39,494,637 | |
| | | | | | | | |
| | | | Trading Companies & Distributors 2.2% | | | | |
| | 605,434 | | | WESCO International, Inc.* | | | 35,266,531 | |
| | | | | | | | |
47
| | |
| WASATCH CORE GROWTH FUND (WGROX / WIGRX) | | SEPTEMBER 30, 2017 |
|
|
|
Schedule of Investments (continued)
| | | | | | | | |
| Shares | | | | | Value | |
| | | | | | | |
| | | | Trucking 4.6% | | | | |
| | 778,810 | | | Knight-Swift Transportation Holdings, Inc.* | | $ | 32,359,556 | |
| | 375,268 | | | Old Dominion Freight Line, Inc. | | | 41,320,759 | |
| | | | | | | | |
| | | | | | | 73,680,315 | |
| | | | | | | | |
| | |
| | | | Total Common Stocks
(cost $967,086,219) | | | 1,552,266,777 | |
| | | | | | | | |
| | |
| | | | PREFERRED STOCKS 0.2% | | | | |
| | |
| | | | Systems Software 0.2% | | | | |
| | 209,500 | | | DocuSign, Inc., Series F Pfd.* *** † | | | 4,024,495 | |
| | | | | | | | |
| | |
| | | | Total Preferred Stocks
(cost $4,000,004) | | | 4,024,495 | |
| | | | | | | | |
| | |
Principal
Amount | | | | | Value | |
| | | | | | | |
| | | | SHORT-TERM INVESTMENTS 1.9% | | | | |
| | |
| | | | Repurchase Agreement 1.9% | | | | |
| | $30,607,602 | | | Repurchase Agreement dated 9/29/17, 0.12% due 10/2/17 with Fixed Income Clearing Corp. collateralized by $30,750,000 of United States Treasury Notes 2.250% due 11/15/24; value: $31,220,906; repurchase proceeds: $30,607,908 (cost $30,607,602) | | $ | 30,607,602 | |
| | | | | | | | |
| | |
| | | | Total Short-Term Investments
(cost $30,607,602) | | | 30,607,602 | |
| | | | | | | | |
| | |
| | | | Total Investments
(cost $1,001,693,825) 99.5% | | | 1,586,898,874 | |
| | |
| | | | Other Assets less Liabilities 0.5% | | | 7,348,717 | |
| | | | | | | | |
| | |
| | | | NET ASSETS 100.0% | | $ | 1,594,247,591 | |
| | | | | | | | |
| |
| | | | *Non-income producing. ***Security was fair valued under procedures adopted by the Board of Trustees (see Note 12). †Security purchased in a private placement transaction or under Rule 144A of the Securities Act of 1933 (see Note 9). REIT Real Estate Investment Trust. See Notes to Financial Statements. | |
At September 30, 2017, Wasatch Core Growth Fund’s investments, excluding short-term investments, were in the following countries (unaudited):
| | | | |
| Country | | % | |
India | | | 3.1 | |
Ireland | | | 3.3 | |
Netherlands | | | 1.5 | |
Switzerland | | | 1.2 | |
United Kingdom | | | 3.8 | |
United States | | | 87.1 | |
| | | | |
TOTAL | | | 100.0 | % |
| | | | |
48
| | |
| WASATCH EMERGING INDIA FUND (WAINX / WIINX) | | SEPTEMBER 30, 2017 |
|
|
|
Schedule of Investments
| | | | | | | | |
| Shares | | | | | Value | |
| | | | | | | |
| | | | COMMON STOCKS 99.5% | | | | |
| | |
| | | | Apparel, Accessories & Luxury Goods 1.9% | | | | |
| | 15,776 | | | Page Industries Ltd. (India) | | $ | 4,468,096 | |
| | | | | | | | |
| | | | Auto Parts & Equipment 4.5% | | | | |
| | 4,993 | | | Bosch Ltd. (India) | | | 1,567,001 | |
| | 462,509 | | | Endurance Technologies Ltd. (India) | | | 7,045,261 | |
| | 20,185 | | | WABCO India Ltd. (India) | | | 1,854,103 | |
| | | | | | | | |
| | | | 10,466,365 | |
| | | | | | | | |
| | | | Building Products 4.1% | | | | |
| | 484,837 | | | Kajaria Ceramics Ltd. (India) | | | 5,265,514 | |
| | 332,780 | | | Somany Ceramics Ltd. (India) | | | 4,335,514 | |
| | | | | | | | |
| | | | 9,601,028 | |
| | | | | | | | |
| | | | Commodity Chemicals 4.9% | | | | |
| | 1,377,194 | | | Berger Paints India Ltd. (India) | | | 5,165,532 | |
| | 524,752 | | | Gulf Oil Lubricants India Ltd. (India) | | | 6,185,839 | |
| | | | | | | | |
| | | | 11,351,371 | |
| | | | | | | | |
| | | | Consumer Finance 10.4% | | | | |
| | 955,558 | | | AU Small Finance Bank Ltd.* (India) | | | 8,294,571 | |
| | 467,386 | | | Bajaj Finance Ltd. (India) | | | 13,137,897 | |
| | 275,056 | | | Repco Home Finance Ltd. (India) | | | 2,652,867 | |
| | | | | | | | |
| | | | 24,085,335 | |
| | | | | | | | |
| | | | Department Stores 2.9% | | | | |
| | 304,497 | | | V-Mart Retail Ltd. (India) | | | 6,712,732 | |
| | | | | | | | |
| | | | Diversified Banks 7.4% | | | | |
| | 120,231 | | | HDFC Bank Ltd. ADR (India) | | | 11,586,661 | |
| | 138,349 | | | IndusInd Bank Ltd. (India) | | | 3,548,741 | |
| | 125,025 | | | Kotak Mahindra Bank Ltd. (India) | | | 1,916,144 | |
| | | | | | | | |
| | | | 17,051,546 | |
| | | | | | | | |
| | | | Diversified Chemicals 1.8% | | | | |
| | 346,066 | | | Pidilite Industries Ltd. (India) | | | 4,214,832 | |
| | | | | | | | |
| | | | Electrical Components & Equipment 1.5% | | | | |
| | 316,646 | | | Amara Raja Batteries Ltd. (India) | | | 3,434,775 | |
| | | | | | | | |
| | | | Fertilizers & Agricultural Chemicals 1.9% | | | | |
| | 16,155 | | | Bayer CropScience Ltd. (India) | | | 964,551 | |
| | 291,385 | | | UPL Ltd. (India) | | | 3,471,015 | |
| | | | | | | | |
| | | | 4,435,566 | |
| | | | | | | | |
| | | | Financial Exchanges & Data 1.4% | | | | |
| | 116,122 | | | CRISIL Ltd. (India) | | | 3,235,310 | |
| | | | | | | | |
| | | | Food Retail 4.7% | | | | |
| | 655,442 | | | Avenue Supermarts Ltd.* (India) | | | 10,897,275 | |
| | | | | | | | |
| | | | Health Care Services 2.5% | | | | |
| | 466,591 | | | Dr. Lal PathLabs Ltd. (India) | | | 5,679,167 | |
| | | | | | | | |
| | | | Hotels, Resorts & Cruise Lines 1.9% | | | | |
| | 1,671,385 | | | Byke Hospitality Ltd. (The) (India) | | | 4,415,148 | |
| | | | | | | | |
| | | | Housewares & Specialties 1.6% | | | | |
| | 487,269 | | | LA Opala RG Ltd. (India) | | | 3,670,183 | |
| | | | | | | | |
| | | | Human Resource & Employment Services 3.0% | | | | |
| | 548,447 | | | Quess Corp. Ltd.* (India) | | | 7,027,712 | |
| | | | | | | | |
| | | | Industrial Machinery 2.1% | | | | |
| | 51,833 | | | AIA Engineering Ltd. (India) | | | 1,055,387 | |
| | 569,687 | | | Elgi Equipments Ltd. (India) | | | 1,866,396 | |
| | 93,174 | | | Vesuvius India Ltd. (India) | | | 1,896,074 | |
| | | | | | | | |
| | | | 4,817,857 | |
| | | | | | | | |
| | | | | | | | |
| Shares | | | | | Value | |
| | | | | | | |
| | | | Internet & Direct Marketing Retail 3.7% | | | | |
| | 297,873 | | | MakeMyTrip Ltd.* (India) | | $ | 8,563,849 | |
| | | | | | | | |
| | | | Life & Health Insurance 2.9% | | | | |
| | 642,669 | | | ICICI Prudential Life Insurance Co. Ltd. (India) | | | 3,823,349 | |
| | 308,210 | | | Max Financial Services Ltd.* (India) | | | 2,788,612 | |
| | | | | | | | |
| | | | 6,611,961 | |
| | | | | | | | |
| | | | Life Sciences Tools & Services 3.4% | | | | |
| | 593,786 | | | Divi’s Laboratories Ltd. (India) | | | 7,841,848 | |
| | | | | | | | |
| | | | Office Services & Supplies 1.6% | | | | |
| | 16,805 | | | 3M India Ltd.* (India) | | | 3,704,728 | |
| | | | | | | | |
| | | | Packaged Foods & Meats 3.4% | | | | |
| | 52,930 | | | Britannia Industries Ltd. (India) | | | 3,520,834 | |
| | 345,540 | | | Manpasand Beverages Ltd. (India) | | | 2,499,504 | |
| | 968,967 | | | Prabhat Dairy Ltd. (India) | | | 1,878,004 | |
| | | | | | | | |
| | | | 7,898,342 | |
| | | | | | | | |
| | | | Personal Products 5.2% | | | | |
| | 171,985 | | | Colgate-Palmolive India Ltd. (India) | | | 2,778,169 | |
| | 326,592 | | | Cupid Ltd. (India) | | | 1,371,716 | |
| | 405,357 | | | Dabur India Ltd. (India) | | | 1,894,293 | |
| | 234,225 | | | Godrej Consumer Products Ltd. (India) | | | 3,286,393 | |
| | 21,109 | | | Procter & Gamble Hygiene & Health Care Ltd. (India) | | | 2,751,732 | |
| | | | | | | | |
| | | | 12,082,303 | |
| | | | | | | | |
| | | | Pharmaceuticals 2.7% | | | | |
| | 142,978 | | | Amrutanjan Health Care Ltd. (India) | | | 1,287,065 | |
| | 406,949 | | | Natco Pharma Ltd. (India) | | | 4,903,075 | |
| | | | | | | | |
| | | | 6,190,140 | |
| | | | | | | | |
| | | | Property & Casualty Insurance 1.0% | | | | |
| | 151,294 | | | ICICI Lombard General Insurance Co. Ltd.* *** † (India) | | | 1,521,247 | |
| | 73,677 | | | ICICI Lombard General Insurance Co. Ltd.* (India) | | | 768,127 | |
| | | | | | | | |
| | | | 2,289,374 | |
| | | | | | | | |
| | | | Soft Drinks 2.1% | | | | |
| | 628,668 | | | Varun Beverages Ltd. (India) | | | 4,910,867 | |
| | | | | | | | |
| | | | Specialty Chemicals 3.2% | | | | |
| | 312,472 | | | Asian Paints Ltd. (India) | | | 5,410,616 | |
| | 540,619 | | | SH Kelkar & Co. Ltd. (India) | | | 2,071,187 | |
| | | | | | | | |
| | | | 7,481,803 | |
| | | | | | | | |
| | | | Textiles 1.5% | | | | |
| | 3,303,763 | | | Welspun India Ltd. (India) | | | 3,436,784 | |
| | | | | | | | |
| | | | Thrifts & Mortgage Finance 10.3% | | | | |
| | 320,256 | | | GRUH Finance Ltd. (India) | | | 2,387,702 | |
| | 422,889 | | | Housing Development Finance Corp. Ltd. (India) | | | 11,201,832 | |
| | 207,160 | | | Indiabulls Housing Finance Ltd. (India) | | | 3,793,070 | |
| | 295,733 | | | PNB Housing Finance Ltd. (India) | | | 6,592,872 | |
| | | | | | | | |
| | | | 23,975,476 | |
| | | | | | | | |
| | |
| | | | Total Common Stocks
(cost $178,037,715) | | | 230,551,773 | |
| | | | | | | | |
49
| | |
| WASATCH EMERGING INDIA FUND (WAINX / WIINX) | | SEPTEMBER 30, 2017 |
|
|
|
Schedule of Investments (continued)
| | | | | | | | |
Principal
Amount | | | | | Value | |
| | | | | | | |
| | | | SHORT-TERM INVESTMENTS 1.4% | | | | |
| | |
| | | | Repurchase Agreement 1.4% | | | | |
| | $3,284,123 | | | Repurchase Agreement dated 9/29/17, 0.12% due 10/2/17 with Fixed Income Clearing Corp. collateralized by $3,300,000 of United States Treasury Notes 2.250% due 11/15/24; value: $3,350,536; repurchase proceeds: $3,284,156 (cost $3,284,123) | | $ | 3,284,123 | |
| | | | | | | | |
| | |
| | | | Total Short-Term Investments
(cost $3,284,123) | | | 3,284,123 | |
| | | | | | | | |
| | |
| | | | Total Investments
(cost $181,321,838) 100.9% | | | 233,835,896 | |
| | |
| | | | Liabilities less Other Assets (0.9%) | | | (2,147,397 | ) |
| | | | | | | | |
| | |
| | | | NET ASSETS 100.0% | | $ | 231,688,499 | |
| | | | | | | | |
| |
| | | | *Non-income producing. ***Security was fair valued under procedures adopted by the Board of Trustees (see Note 12). †Security purchased in a private placement transaction or under Rule 144A of the Securities Act of 1933 (see Note 9). ADR American Depositary Receipt. See Notes to Financial Statements. | |
At September 30, 2017, Wasatch Emerging India Fund’s investments, excluding short-term investments, were in the following countries (unaudited):
| | | | |
| Country | | % | |
India | | | 100.0 | |
| | | | |
TOTAL | | | 100.0 | % |
| | | | |
50
| | |
| WASATCH EMERGING MARKETS SELECT FUND (WAESX / WIESX) | | SEPTEMBER 30, 2017 |
|
|
|
Schedule of Investments
| | | | | | | | |
| Shares | | | | | Value | |
| | | | | | | |
| | | | COMMON STOCKS 98.2% | | | | |
| | |
| | | | Airport Services 4.4% | | | | |
| | 108,569 | | | Grupo Aeroportuario del Pacifico S.A.B. de C.V., Class B (Mexico) | | $ | 1,111,923 | |
| | 44,506 | | | Grupo Aeroportuario del Sureste S.A.B. de C.V., Class B (Mexico) | | | 848,816 | |
| | | | | | | | |
| | | | 1,960,739 | |
| | | | | | | | |
| | | | Biotechnology 4.4% | | | | |
| | 4,498 | | | Medytox, Inc. (Korea) | | | 1,941,992 | |
| | | | | | | | |
| | | | Cable & Satellite 3.8% | | | | |
| | 7,757 | | | Naspers Ltd., Class N (South Africa) | | | 1,673,008 | |
| | | | | | | | |
| | | | Commercial Printing 0.0% | | | | |
| | 2,683 | | | Novus Holdings Ltd. (South Africa) | | | 1,294 | |
| | | | | | | | |
| | | | Commodity Chemicals 1.9% | | | | |
| | 225,646 | | | Berger Paints India Ltd. (India) | | | 846,345 | |
| | | | | | | | |
| | | | Consumer Finance 5.9% | | | | |
| | 93,236 | | | Bajaj Finance Ltd. (India) | | | 2,620,799 | |
| | | | | | | | |
| | | | Diversified Banks 8.4% | | | | |
| | 50,817 | | | HDFC Bank Ltd. (India) | | | 1,400,385 | |
| | 194,576 | | | Kasikornbank Public Co. Ltd. (Thailand) | | | 1,248,554 | |
| | 690,889 | | | PT Bank Central Asia Tbk (Indonesia) | | | 1,041,283 | |
| | | | | | | | |
| | | | 3,690,222 | |
| | | | | | | | |
| | | | Drug Retail 4.4% | | | | |
| | 81,558 | | | Raia Drogasil S.A. (Brazil) | | | 1,931,342 | |
| | | | | | | | |
| | | | Fertilizers & Agricultural Chemicals 1.8% | | | | |
| | 65,970 | | | UPL Ltd. (India) | | | 785,843 | |
| | | | | | | | |
| | | | Food Retail 3.4% | | | | |
| | 21,067 | | | BGF Retail Co. Ltd. (Korea) | | | 1,526,661 | |
| | | | | | | | |
| | | | Health Care Facilities 5.5% | | | | |
| | 725,737 | | | Bangkok Dusit Medical Services Public Co. Ltd., Class F (Thailand) | | | 446,105 | |
| | 53,268 | | | NMC Health plc (United Arab Emirates) | | | 1,963,639 | |
| | | | | | | | |
| | | | 2,409,744 | |
| | | | | | | | |
| | | | Highways & Railtracks 1.3% | | | | |
| | 55,237 | | | Promotora y Operadora de Infraestructura S.A.B. de C.V. (Mexico) | | | 583,189 | |
| | | | | | | | |
| | | | Home Furnishings 2.2% | | | | |
| | 97,000 | | | Nien Made Enterprise Co. Ltd. (Taiwan) | | | 994,823 | |
| | | | | | | | |
| | | | Industrial Machinery 1.6% | | | | |
| | 105,135 | | | Weg S.A. (Brazil) | | | 710,383 | |
| | | | | | | | |
| | | | Internet & Direct Marketing Retail 7.9% | | | | |
| | 38,708 | | | Ctrip.com International Ltd., ADR* (China) | | | 2,041,460 | |
| | 49,653 | | | MakeMyTrip Ltd.* (India) | | | 1,427,524 | |
| | | | | | | | |
| | | | 3,468,984 | |
| | | | | | | | |
| | | | Internet Software & Services 16.8% | | | | |
| | 15,042 | | | Alibaba Group Holding Ltd., ADR* (China) | | | 2,597,904 | |
| | 9,954 | | | MercadoLibre, Inc. (Brazil) | | | 2,577,389 | |
| | 51,825 | | | Tencent Holdings Ltd. (China) | | | 2,230,473 | |
| | | | | | | | |
| | | | 7,405,766 | |
| | | | | | | | |
| | | | Life & Health Insurance 4.3% | | | | |
| | 76,914 | | | Discovery Ltd. (South Africa) | | | 799,093 | |
| | 182,568 | | | ICICI Prudential Life Insurance Co. Ltd. (India) | | | 1,086,129 | |
| | | | | | | | |
| | | | 1,885,222 | |
| | | | | | | | |
| | | | | | | | |
| Shares | | | | | Value | |
| | | | | | | |
| | | | Marine Ports & Services 1.9% | | | | |
| | 404,100 | | | International Container Terminal Services, Inc. (Philippines) | | $ | 827,299 | |
| | | | | | | | |
| | | | Packaged Foods & Meats 4.8% | | | | |
| | 12,233 | | | Britannia Industries Ltd. (India) | | | 813,723 | |
| | 29,600 | | | M Dias Branco S.A. (Brazil) | | | 464,493 | |
| | 369,651 | | | Vitasoy International Holdings Ltd. (China) | | | 823,382 | |
| | | | | | | | |
| | | | 2,101,598 | |
| | | | | | | | |
| | | | Personal Products 2.9% | | | | |
| | 39,921 | | | Godrej Consumer Products Ltd. (India) | | | 560,129 | |
| | 908 | | | LG Household & Health Care Ltd. (Korea) | | | 742,033 | |
| | | | | | | | |
| | | | 1,302,162 | |
| | | | | | | | |
| | | | Regional Banks 2.3% | | | | |
| | 170,103 | | | Grupo Financiero Interacciones S.A. de C.V., Class O (Mexico) | | | 1,015,387 | |
| | | | | | | | |
| | | | Restaurants 1.8% | | | | |
| | 215,370 | | | Alsea S.A.B. de C.V. (Mexico) | | | 794,539 | |
| | | | | | | | |
| | | | Specialty Chemicals 2.4% | | | | |
| | 60,148 | | | Asian Paints Ltd. (India) | | | 1,041,494 | |
| | | | | | | | |
| | | | Textiles 1.1% | | | | |
| | 471,810 | | | Welspun India Ltd. (India) | | | 490,807 | |
| | | | | | | | |
| | | | Thrifts & Mortgage Finance 3.0% | | | | |
| | 60,026 | | | PNB Housing Finance Ltd. (India) | | | 1,338,179 | |
| | | | | | | | |
| | |
| | | | Total Common Stocks (cost $32,877,142) | | | 43,347,821 | |
| | | | | | | | |
| | |
| | | | PREFERRED STOCKS 2.3% | | | | |
| | |
| | | | Diversified Banks 2.3% | | | | |
| | 88,613 | | | Banco Davivienda S.A., 2.86% (Colombia) | | | 1,003,628 | |
| | | | | | | | |
| | |
| | | | Total Preferred Stocks
(cost $824,234) | | | 1,003,628 | |
| | | | | | | | |
| | |
| | | | Total Investments
(cost $33,701,376) 100.5% | | | 44,351,449 | |
| | |
| | | | Liabilities less Other Assets (0.5%) | | | (209,814 | ) |
| | | | | | | | |
| | |
| | | | NET ASSETS 100.0% | | $ | 44,141,635 | |
| | | | | | | | |
| | |
| | | | *Non-income producing. ADR American Depositary Receipt. See Notes to Financial Statements. | | | | |
51
| | |
| WASATCH EMERGING MARKETS SELECT FUND (WAESX / WIESX) | | SEPTEMBER 30, 2017 |
|
|
|
Schedule of Investments (continued)
At September 30, 2017, Wasatch Emerging Markets Select Fund’s investments, excluding short-term investments, were in the following countries (unaudited):
| | | | |
| Country | | % | |
Brazil | | | 12.8 | |
China | | | 17.3 | |
Colombia | | | 2.3 | |
India | | | 28.0 | |
Indonesia | | | 2.4 | |
Korea | | | 9.5 | |
Mexico | | | 9.8 | |
Philippines | | | 1.9 | |
South Africa | | | 5.6 | |
Taiwan | | | 2.2 | |
Thailand | | | 3.8 | |
United Arab Emirates | | | 4.4 | |
| | | | |
TOTAL | | | 100.0 | % |
| | | | |
52
| | |
| WASATCH EMERGING MARKETS SMALL CAP FUND (WAEMX / WIEMX) | | SEPTEMBER 30, 2017 |
|
|
|
Schedule of Investments
| | | | | | | | |
| Shares | | | | | Value | |
| | | | | | | |
| | | | COMMON STOCKS 98.4% | | | | |
| | |
| | | | Air Freight & Logistics 0.9% | | | | |
| | 4,059,900 | | | Aramex PJSC (United Arab Emirates) | | $ | 5,505,174 | |
| | | | | | | | |
| | | | Airport Services 2.5% | | | | |
| | 1,832,412 | | | Grupo Aeroportuario del Centro Norte S.A.B. de C.V. (Mexico) | | | 10,136,126 | |
| | 318,747 | | | Grupo Aeroportuario del Sureste S.A.B. de C.V., Class B (Mexico) | | | 6,079,123 | |
| | | | | | | | |
| | | | | | | 16,215,249 | |
| | | | | | | | |
| | | | Application Software 0.5% | | | | |
| | 553,000 | | | Linx S.A. (Brazil) | | | 3,415,272 | |
| | | | | | | | |
| | | | Asset Management & Custody Banks 0.6% | | | | |
| | 1,831,330 | | | Peregrine Holdings Ltd. (South Africa) | | | 3,961,936 | |
| | | | | | | | |
| | | | Auto Parts & Equipment 2.9% | | | | |
| | 327,894 | | | Cub Elecparts, Inc. (Taiwan) | | | 3,854,841 | |
| | 672,615 | | | Hu Lane Associate, Inc. (Taiwan) | | | 3,770,761 | |
| | 2,113,768 | | | Minth Group Ltd. (China) | | | 11,067,273 | |
| | | | | | | | |
| | | | | | | 18,692,875 | |
| | | | | | | | |
| | | | Automobile Manufacturers 0.7% | | | | |
| | 297,465 | | | Indus Motor Co. Ltd. (Pakistan) | | | 4,821,544 | |
| | | | | | | | |
| | | | Automotive Retail 3.7% | | | | |
| | 11,639,124 | | | China Yongda Automobiles Services Holdings Ltd. (China) | | | 15,644,785 | |
| | 3,646,735 | | | Zhongsheng Group Holdings Ltd. (China) | | | 7,898,863 | |
| | | | | | | | |
| | | | | | | 23,543,648 | |
| | | | | | | | |
| | | | Biotechnology 2.9% | | | | |
| | 50,919 | | | China Biologic Products Holdings, Inc.* (China) | | | 4,698,296 | |
| | 32,508 | | | Medytox, Inc. (Korea) | | | 14,035,191 | |
| | | | | | | | |
| | | | | | | 18,733,487 | |
| | | | | | | | |
| | | | Building Products 1.7% | | | | |
| | 1,032,420 | | | Kajaria Ceramics Ltd. (India) | | | 11,212,473 | |
| | | | | | | | |
| | | | Commodity Chemicals 1.1% | | | | |
| | 1,819,448 | | | Berger Paints India Ltd. (India) | | | 6,824,323 | |
| | | | | | | | |
| | | | Communications Equipment 0.5% | | | | |
| | 212,237 | | | Advanced Ceramic X Corp. (Taiwan) | | | 2,953,569 | |
| | | | | | | | |
| | | | Consumer Finance 8.7% | | | | |
| | 591,675 | | | AU Small Finance Bank Ltd.* (India) | | | 5,135,942 | |
| | 298,908 | | | Bajaj Finance Ltd. (India) | | | 8,402,097 | |
| | 1,617,161 | | | Credito Real S.A.B. de C.V. SOFOM ER (Mexico) | | | 2,742,336 | |
| | 111,121 | | | KRUK S.A. (Poland) | | | 8,936,272 | |
| | 4,667,275 | | | Muangthai Leasing Public Co. Ltd. (Thailand) | | | 4,933,177 | |
| | 396,449 | | | Repco Home Finance Ltd. (India) | | | 3,823,681 | |
| | 6,155,249 | | | Srisawad Corp. Public Co. Ltd. (Thailand) | | | 11,073,911 | |
| | 3,345,494 | | | Unifin Financiera S.A.B. de C.V. SOFOM ENR (Mexico) | | | 11,215,948 | |
| | | | | | | | |
| | | | | | | 56,263,364 | |
| | | | | | | | |
| | | | Data Processing & Outsourced Services 0.5% | | | | |
| | 6,061,727 | | | My EG Services Berhad (Malaysia) | | | 2,942,934 | |
| | | | | | | | |
| | | | Department Stores 0.9% | | | | |
| | 495,946 | | | Poya International Co. Ltd. (Taiwan) | | | 5,920,474 | |
| | | | | | | | |
| | | | Diversified Banks 3.2% | | | | |
| | 1,151,467 | | | Moneta Money Bank AS (Czech Republic) | | | 4,054,231 | |
| | 1,525,814 | | | Security Bank Corp. (Philippines) | | | 7,304,756 | |
| | 546,819 | | | TCS Group Holding plc GDR (Russia) | | | 8,995,172 | |
| | | | | | | | |
| | | | | | | 20,354,159 | |
| | | | | | | | |
| | | | | | | | |
| Shares | | | | | Value | |
| | | | | | | |
| | | | Diversified Chemicals 1.0% | | | | |
| | 508,408 | | | Pidilite Industries Ltd. (India) | | $ | 6,192,039 | |
| | | | | | | | |
| | | | Drug Retail 4.4% | | | | |
| | 1,306,802 | | | Clicks Group Ltd. (South Africa) | | | 15,253,544 | |
| | 549,807 | | | Raia Drogasil S.A. (Brazil) | | | 13,019,758 | |
| | | | | | | | |
| | | | | | | 28,273,302 | |
| | | | | | | | |
| | | | Electrical Components & Equipment 3.4% | | | | |
| | 363,924 | | | Amara Raja Batteries Ltd. (India) | | | 3,947,617 | |
| | 713,580 | | | Bizlink Holding, Inc. (Taiwan) | | | 6,518,324 | |
| | 647,021 | | | Voltronic Power Technology Corp. (Taiwan) | | | 11,607,289 | |
| | | | | | | | |
| | | | | | | 22,073,230 | |
| | | | | | | | |
| | | | Electronic Components 4.1% | | | | |
| | 72,340 | | | Chunghwa Precision Test Tech Co. Ltd. (Taiwan) | | | 2,850,755 | |
| | 1,083,851 | | | Sunny Optical Technology Group Co. Ltd. (China) | | | 17,232,615 | |
| | 23,765,232 | | | Tongda Group Holdings Ltd. (China) | | | 6,358,407 | |
| | | | | | | | |
| | | | | | | 26,441,777 | |
| | | | | | | | |
| | | | Electronic Equipment & Instruments 2.1% | | | | |
| | 1,968,676 | | | Chroma ATE, Inc. (Taiwan) | | | 6,946,588 | |
| | 185,016 | | | SFA Engineering Corp. (Korea) | | | 6,679,540 | |
| | | | | | | | |
| | | | | | | 13,626,128 | |
| | | | | | | | |
| | | | Fertilizers & Agricultural Chemicals 1.4% | | | | |
| | 66,187 | | | Bayer CropScience Ltd. (India) | | | 3,951,765 | |
| | 439,447 | | | UPL Ltd. (India) | | | 5,234,748 | |
| | | | | | | | |
| | | | | | | 9,186,513 | |
| | | | | | | | |
| | | | Food Retail 1.1% | | | | |
| | 95,231 | | | BGF Retail Co. Ltd. (Korea) | | | 6,901,098 | |
| | | | | | | | |
| | | | Footwear 1.0% | | | | |
| | 86,909 | | | CCC S.A. (Poland) | | | 6,573,550 | |
| | | | | | | | |
| | | | General Merchandise Stores 3.1% | | | | |
| | 847,032 | | | Magazine Luiza S.A. (Brazil) | | | 19,846,943 | |
| | | | | | | | |
| | | | Health Care Equipment 1.1% | | | | |
| | 177,258 | | | DIO Corp.* (Korea) | | | 4,697,062 | |
| | 89,506 | | | Value Added Technologies Co. Ltd. (Korea) | | | 2,133,421 | |
| | | | | | | | |
| | | | | | | 6,830,483 | |
| | | | | | | | |
| | | | Health Care Facilities 1.8% | | | | |
| | 316,886 | | | NMC Health plc (United Arab Emirates) | | | 11,681,490 | |
| | | | | | | | |
| | | | Health Care Services 0.4% | | | | |
| | 215,205 | | | Dr. Lal PathLabs Ltd. (India) | | | 2,619,393 | |
| | | | | | | | |
| | | | Health Care Supplies 0.3% | | | | |
| | 4,262,899 | | | Yestar Healthcare Holdings Co. Ltd. (China) | | | 1,882,713 | |
| | | | | | | | |
| | | | Highways & Railtracks 2.5% | | | | |
| | 2,553,850 | | | EcoRodovias Infraestrutura e Logistica S.A. (Brazil) | | | 9,200,521 | |
| | 9,084,875 | | | Yuexiu Transport Infrastructure Ltd. (China) | | | 6,826,798 | |
| | | | | | | | |
| | | | | | | 16,027,319 | |
| | | | | | | | |
| | | | Home Furnishings 3.2% | | | | |
| | 34,653 | | | Hanssem Co. Ltd. (Korea) | | | 4,583,690 | |
| | 12,293,522 | | | Man Wah Holdings Ltd. (China) | | | 11,016,265 | |
| | 502,878 | | | Nien Made Enterprise Co. Ltd. (Taiwan) | | | 5,157,468 | |
| | | | | | | | |
| | | | | | | 20,757,423 | |
| | | | | | | | |
53
| | |
| WASATCH EMERGING MARKETS SMALL CAP FUND (WAEMX / WIEMX) | | |
|
|
|
Schedule of Investments (continued)
| | | | | | | | |
| Shares | | | | | Value | |
| | | | | | | |
| | | | Hotels, Resorts & Cruise Lines 2.4% | | | | |
| | 53,756 | | | China Lodging Group Ltd., ADR* (China) | | $ | 6,387,288 | |
| | 7,594,791 | | | Minor International Public Co. Ltd. (Thailand) | | | 9,279,992 | |
| | | | | | | | |
| | | | 15,667,280 | |
| | | | | | | | |
| | | | Human Resource & Employment Services 2.6% | | | | |
| | 276,732 | | | 51job, Inc. ADR* (China) | | | 16,772,726 | |
| | | | | | | | |
| | | | Industrial Conglomerates 0.7% | | | | |
| | 7,460,260 | | | KAP Industrial Holdings Ltd. (South Africa) | | | 4,667,226 | |
| | | | | | | | |
| | | | Industrial Machinery 1.5% | | | | |
| | 724,583 | | | Airtac International Group (Taiwan) | | | 9,987,986 | |
| | | | | | | | |
| | | | Insurance Brokers 0.4% | | | | |
| | 497,348 | | | Wiz Solucoes e Corretagem de Seguros S.A. (Brazil) | | | 2,700,973 | |
| | | | | | | | |
| | | | Internet & Direct Marketing Retail 0.8% | | | | |
| | 185,337 | | | MakeMyTrip Ltd.* (India) | | | 5,328,439 | |
| | | | | | | | |
| | | | Life & Health Insurance 0.6% | | | | |
| | 416,054 | | | Max Financial Services Ltd.* (India) | | | 3,764,359 | |
| | | | | | | | |
| | | | Marine 0.4% | | | | |
| | 2,734,597 | | | SITC International Holdings Co. Ltd. (Hong Kong) | | | 2,478,487 | |
| | | | | | | | |
| | | | Marine Ports & Services 1.2% | | | | |
| | 3,685,175 | | | International Container Terminal Services, Inc. (Philippines) | | | 7,544,527 | |
| | | | | | | | |
| | | | Movies & Entertainment 1.2% | | | | |
| | 99,700 | | | Loen Entertainment, Inc. (Korea) | | | 7,607,963 | |
| | | | | | | | |
| | | | Office Services & Supplies 1.1% | | | | |
| | 31,519 | | | 3M India Ltd.* (India) | | | 6,948,487 | |
| | | | | | | | |
| | | | Oil & Gas Exploration & Production 0.6% | | | | |
| | 337,340 | | | Parex Resources, Inc.* (Colombia) | | | 4,068,898 | |
| | | | | | | | |
| | | | Other Diversified Financial Services 0.4% | | | | |
| | 138,625 | | | PSG Group Ltd. (South Africa) | | | 2,397,082 | |
| | | | | | | | |
| | | | Packaged Foods & Meats 4.8% | | | | |
| | 106,442 | | | Britannia Industries Ltd. (India) | | | 7,080,381 | |
| | 584,740 | | | Manpasand Beverages Ltd. (India) | | | 4,229,786 | |
| | 1,234,149 | | | Ulker Biskuvi Sanayi A.S. (Turkey) | | | 6,702,531 | |
| | 4,429,243 | | | Vitasoy International Holdings Ltd. (China) | | | 9,865,947 | |
| | 2,965,470 | | | Zhou Hei Ya International Holdings Co. Ltd. (China) | | | 2,869,957 | |
| | | | | | | | |
| | | | 30,748,602 | |
| | | | | | | | |
| | | | Pharmaceuticals 1.7% | | | | |
| | 13,017,213 | | | China Animal Healthcare Ltd.* *** (China) | | | 16,664 | |
| | 10,931 | | | Hanmi Pharm Co. Ltd.* (Korea) | | | 4,337,661 | |
| | 533,024 | | | Natco Pharma Ltd. (India) | | | 6,422,074 | |
| | | | | | | | |
| | | | 10,776,399 | |
| | | | | | | | |
| | | | Real Estate Operating Companies 0.8% | | | | |
| | 1,767,055 | | | Parque Arauco S.A. (Chile) | | | 4,886,630 | |
| | | | | | | | |
| | | | | | | | |
| Shares | | | | | Value | |
| | | | | | | |
| | | | Regional Banks 1.6% | | | | |
| | 666,928 | | | Banregio Grupo Financiero S.A.B. de C.V. (Mexico) | | $ | 3,971,902 | |
| | 28,484,160 | | | PT Bank Tabungan Negara Tbk (Indonesia) | | | 6,661,601 | |
| | | | | | | | |
| | | | 10,633,503 | |
| | | | | | | | |
| | | | Research & Consulting Services 0.0% | | | | |
| | 1 | | | Sporton International, Inc. (Taiwan) | | | 5 | |
| | | | | | | | |
| | | | Restaurants 2.2% | | | | |
| | 1,695,008 | | | Alsea S.A.B. de C.V. (Mexico) | | | 6,253,192 | |
| | 745,984 | | | Gourmet Master Co. Ltd. (Taiwan) | | | 7,933,645 | |
| | | | | | | | |
| | | | 14,186,837 | |
| | | | | | | | |
| | | | Semiconductor Equipment 1.4% | | | | |
| | 149,266 | | | Koh Young Technology, Inc. (Korea) | | | 8,731,673 | |
| | | | | | | | |
| | | | Semiconductors 5.1% | | | | |
| | 579,645 | | | ASPEED Technology, Inc. (Taiwan) | | | 13,399,655 | |
| | 276,982 | | | eMemory Technology, Inc. (Taiwan) | | | 3,548,592 | |
| | 521,352 | | | Silergy Corp. (Taiwan) | | | 11,948,940 | |
| | 581,760 | | | Win Semiconductors Corp. (Taiwan) | | | 3,721,852 | |
| | | | | | | | |
| | | | 32,619,039 | |
| | | | | | | | |
| | | | Specialty Chemicals 2.2% | | | | |
| | 21,276,024 | | | D&L Industries, Inc. (Philippines) | | | 4,230,117 | |
| | 128,961 | | | Frutarom Industries Ltd. (Israel) | | | 9,919,697 | |
| | | | | | | | |
| | | | 14,149,814 | |
| | | | | | | | |
| | | | Technology Hardware, Storage & Peripherals 1.7% | | | | |
| | 776,158 | | | Ennoconn Corp. (Taiwan) | | | 11,134,043 | |
| | | | | | | | |
| | | | Thrifts & Mortgage Finance 0.8% | | | | |
| | 246,667 | | | PNB Housing Finance Ltd. (India) | | | 5,499,028 | |
| | | | | | | | |
| | |
| | | | Total Common Stocks
(cost $430,563,512) | | | 633,573,888 | |
| | | | | | | | |
| | |
| | | | PREFERRED STOCKS 1.3% | | | | |
| | |
| | | | Personal Products 1.3% | | | | |
| | 11,718 | | | Amorepacific Corp., 1.02% (Korea) | | | 1,596,026 | |
| | 13,024 | | | LG Household & Health Care Ltd., 1.26% (Korea) | | | 6,799,975 | |
| | | | | | | | |
| | | | 8,396,001 | |
| | | | | | | | |
| | |
| | | | Total Preferred Stocks
(cost $7,842,127) | | | 8,396,001 | |
| | | | | | | | |
| | |
| | | | WARRANTS 0.1% | | | | |
| | |
| | | | Consumer Finance 0.1% | | | | |
| | 475,530 | | | Srisawad Corp. Public Co. Ltd., expiring 05/29/20* (Thailand) | | | 169,680 | |
| | | | | | | | |
| | |
| | | | Total Warrants
(cost $0) | | | 169,680 | |
| | | | | | | | |
54
| | | | | | | | |
Principal
Amount | | | | | Value | |
| | | | | | | |
| | | | SHORT-TERM INVESTMENTS 0.0% | | | | |
| | |
| | | | Repurchase Agreement 0.0% | | | | |
| | $114,452 | | | Repurchase Agreement dated 9/29/17,
0.12% due 10/2/17 with Fixed Income Clearing Corp. collateralized by $120,000 of United States Treasury Notes 2.250%
due 2/15/27; value: $119,792; repurchase
proceeds: $114,454 (cost $114,452) | | $ | 114,452 | |
| | | | | | | | |
| | |
| | | | Total Short-Term Investments
(cost $114,452) | | | 114,452 | |
| | | | | | | | |
| | |
| | | | Total Investments
(cost $438,520,091) 99.8%§ | | | 642,254,021 | |
| | |
| | | | Other Assets less Liabilities 0.2% | | | 1,471,871 | |
| | | | | | | | |
| | |
| | | | NET ASSETS 100.0% | | $ | 643,725,892 | |
| | | | | | | | |
| |
| | | | *Non-income producing. ***Security was fair valued under procedures adopted by the Board of Trustees (see Note 12). §The aggregate amount of foreign securities fair valued pursuant to a systematic valuation model as a percent of net assets was 1.54%. ADR American Depositary Receipt. GDR Global Depositary Receipt. See Notes to Financial Statements. | |
At September 30, 2017, Wasatch Emerging Markets Small Cap Fund’s investments, excluding short-term investments, were in the following countries (unaudited):
| | | | |
| Country | | % | |
Brazil | | | 7.5 | |
Chile | | | 0.8 | |
China | | | 18.5 | |
Colombia | | | 0.6 | |
Czech Republic | | | 0.6 | |
Hong Kong | | | 0.4 | |
India | | | 15.0 | |
Indonesia | | | 1.0 | |
Israel | | | 1.5 | |
Korea | | | 10.6 | |
Malaysia | | | 0.5 | |
Mexico | | | 6.3 | |
Pakistan | | | 0.8 | |
Philippines | | | 3.0 | |
Poland | | | 2.4 | |
Russia | | | 1.4 | |
South Africa | | | 4.1 | |
Taiwan | | | 17.3 | |
Thailand | | | 4.0 | |
Turkey | | | 1.0 | |
United Arab Emirates | | | 2.7 | |
| | | | |
TOTAL | | | 100.0 | % |
| | | | |
55
| | |
| WASATCH FRONTIER EMERGING SMALL COUNTRIES FUND (WAFMX / WIFMX) | | |
|
|
|
Schedule of Investments
| | | | | | | | |
| Shares | | | | | Value | |
| | | | | | | |
| | | | COMMON STOCKS 94.0% | | | | |
| | |
| | | | Aerospace & Defense 1.3% | | | | |
| | 354,038 | | | Aselsan Elektronik Sanayi Ve Ticaret A.S. (Turkey) | | $ | 2,613,340 | |
| | | | | | | | |
| | | | Air Freight & Logistics 4.2% | | | | |
| | 6,065,527 | | | Aramex PJSC (United Arab Emirates) | | | 8,224,779 | |
| | | | | | | | |
| | | | Apparel, Accessories & Luxury Goods 0.9% | | | | |
| | 340,000 | | | Phu Nhuan Jewelry JSC (Vietnam) | | | 1,702,506 | |
| | | | | | | | |
| | | | Automobile Manufacturers 3.0% | | | | |
| | 531,618 | | | Honda Atlas Cars Pakistan Ltd. (Pakistan) | | | 2,721,783 | |
| | 198,970 | | | Indus Motor Co. Ltd. (Pakistan) | | | 3,225,061 | |
| | | | | | | | |
| | | | | | | 5,946,844 | |
| | | | | | | | |
| | | | Cable & Satellite 3.2% | | | | |
| | 29,713 | | | Naspers Ltd., Class N (South Africa) | | | 6,408,417 | |
| | | | | | | | |
| | | | Commercial Printing 0.0% | | | | |
| | 10,277 | | | Novus Holdings Ltd. (South Africa) | | | 4,957 | |
| | | | | | | | |
| | | | Commodity Chemicals 1.2% | | | | |
| | 91,365 | | | Berger Paints Bangladesh Ltd. (Bangladesh) | | | 2,338,409 | |
| | | | | | | | |
| | | | Construction Materials 2.2% | | | | |
| | 1,127,500 | | | DG Khan Cement Co. Ltd. (Pakistan) | | | 1,571,385 | |
| | 507,092 | | | Lucky Cement Ltd. (Pakistan) | | | 2,718,927 | |
| | | | | | | | |
| | | | | | | 4,290,312 | |
| | | | | | | | |
| | | | Consumer Finance 3.5% | | | | |
| | 2,245,200 | | | Srisawad Corp. Public Co. Ltd. (Thailand) | | | 4,039,340 | |
| | 884,500 | | | Unifin Financiera S.A.B. de C.V. SOFOM ENR (Mexico) | | | 2,965,334 | |
| | | | | | | | |
| | | | | | | 7,004,674 | |
| | | | | | | | |
| | | | Diversified Banks 19.0% | | | | |
| | 3,239,524 | | | Banca Transilvania S.A. (Romania) | | | 1,850,823 | |
| | 30,559 | | | Banco Macro S.A., ADR (Argentina) | | | 3,586,099 | |
| | 446,190 | | | Bank for Foreign Trade of Vietnam JSC (Vietnam) | | | 738,202 | |
| | 1,929,879 | | | CIMB Group Holdings Berhad (Malaysia) | | | 2,879,393 | |
| | 658,651 | | | Commercial International Bank S.A.E (Egypt) | | | 3,043,229 | |
| | 32,472 | | | Credicorp Ltd. (Peru) | | | 6,657,410 | |
| | 80,473 | | | Grupo Financiero Galicia S.A., ADR (Argentina) | | | 4,147,578 | |
| | 206,025 | | | Grupo Supervielle S.A., ADR (Argentina) | | | 5,086,757 | |
| | 2,137,182 | | | National Bank of Kuwait SAK (Kuwait) | | | 5,387,199 | |
| | 155,482 | | | TBC Bank Group plc (Georgia) | | | 3,458,540 | |
| | 387,794 | | | United Bank Ltd. (Pakistan) | | | 691,865 | |
| | | | | | | | |
| | | | | | | 37,527,095 | |
| | | | | | | | |
| | | | Diversified Real Estate Activities 5.0% | | | | |
| | 9,340,826 | | | Ayala Land, Inc. (Philippines) | | | 7,998,621 | |
| | 824,787 | | | Consultatio S.A. (Argentina) | | | 1,858,165 | |
| | | | | | | | |
| | | | | | | 9,856,786 | |
| | | | | | | | |
| | | | Electric Utilities 3.2% | | | | |
| | 97,708 | | | Pampa Energia S.A., ADR* (Argentina) | | | 6,360,791 | |
| | | | | | | | |
| | | | Food Retail 5.7% | | | | |
| | 129,432 | | | BIM Birlesik Magazalar A.S. (Turkey) | | | 2,697,295 | |
| | 2,559,716 | | | Philippine Seven Corp. (Philippines) | | | 8,566,063 | |
| | | | | | | | |
| | | | | | | 11,263,358 | |
| | | | | | | | |
| | | | | | | | |
| Shares | | | | | Value | |
| | | | | | | |
| | | | Health Care Facilities 5.2% | | | | |
| | 281,273 | | | NMC Health plc (United Arab Emirates) | | $ | 10,368,674 | |
| | | | | | | | |
| | | | Industrial Conglomerates 1.6% | | | | |
| | 187,205 | | | SM Investments Corp. (Philippines) | | | 3,254,009 | |
| | | | | | | | |
| | | | Internet Software & Services 4.1% | | | | |
| | 31,273 | | | MercadoLibre, Inc. (Brazil) | | | 8,097,518 | |
| | | | | | | | |
| | | | Marine Ports & Services 0.3% | | | | |
| | 29,225 | | | DP World Ltd. (United Arab Emirates) | | | 656,393 | |
| | | | | | | | |
| | | | Multi-Sector Holdings 2.7% | | | | |
| | 278,030 | | | Ayala Corp. (Philippines) | | | 5,308,893 | |
| | | | | | | | |
| | | | Oil & Gas Storage & Transportation 4.6% | | | | |
| | 450,422 | | | Transportadora de Gas del Sur S.A., ADR* (Argentina) | | | 9,148,071 | |
| | | | | | | | |
| | | | Packaged Foods & Meats 6.2% | | | | |
| | 1,691,959 | | | Century Pacific Food, Inc. (Philippines) | | | 562,881 | |
| | 1,038,503 | | | Olympic Industries Ltd. (Bangladesh) | | | 3,452,086 | |
| | 1,247,805 | | | Vietnam Dairy Products JSC (Vietnam) | | | 8,191,869 | |
| | | | | | | | |
| | | | | | | 12,206,836 | |
| | | | | | | | |
| | | | Pharmaceuticals 6.6% | | | | |
| | 273,310 | | | Abbott Laboratories Pakistan Ltd. (Pakistan) | | | 2,049,015 | |
| | 1,576,262 | | | Beximco Pharmaceuticals Ltd. (Bangladesh) | | | 2,057,497 | |
| | 651,499 | | | DHG Pharmaceutical JSC (Vietnam) | | | 3,053,028 | |
| | 539,700 | | | Searle Company Ltd. (The) (Pakistan) | | | 2,068,760 | |
| | 1,027,785 | | | Square Pharmaceuticals Ltd. (Bangladesh) | | | 3,831,803 | |
| | | | | | | | |
| | | | | | | 13,060,103 | |
| | | | | | | | |
| | | | Real Estate Operating Companies 1.1% | | | | |
| | 3,209,109 | | | SM Prime Holdings, Inc. (Philippines) | | | 2,176,277 | |
| | | | | | | | |
| | | | Restaurants 1.9% | | | | |
| | 37,684 | | | AmRest Holdings SE* (Poland) | | | 3,748,778 | |
| | | | | | | | |
| | | | Technology Distributors 3.0% | | | | |
| | 2,777,400 | | | FPT Corp. (Vietnam) | | | 5,957,726 | |
| | | | | | | | |
| | | | Wireless Telecommunication Services 4.3% | | | | |
| | 475,885 | | | GrameenPhone Ltd. (Bangladesh) | | | 2,406,145 | |
| | 24,842,338 | | | Safaricom Ltd. (Kenya) | | | 6,020,925 | |
| | | | | | | | |
| | | | | | | 8,427,070 | |
| | | | | | | | |
| | |
| | | | Total Common Stocks
(cost $133,612,402) | | | 185,952,616 | |
| | | | | | | | |
| | |
| | | | PREFERRED STOCKS 3.6% | | | | |
| | |
| | | | Diversified Banks 3.6% | | | | |
| | 622,344 | | | Banco Davivienda S.A., 2.86% (Colombia) | | | 7,048,647 | |
| | | | | | | | |
| | |
| | | | Total Preferred Stocks
(cost $6,268,387) | | | 7,048,647 | |
| | | | | | | | |
56
| | | | | | | | |
Principal
Amount | | | | | Value | |
| | | | | | | |
| | | | SHORT-TERM INVESTMENTS 1.3% | | | | |
| | |
| | | | Repurchase Agreement 1.3% | | | | |
| | $2,545,919 | | | Repurchase Agreement dated 9/29/17, 0.12% due 10/2/17 with Fixed Income Clearing Corp. collateralized by $2,625,000 of United States Treasury Notes 2.000% due 2/15/25; value: $2,600,640; Repurchase proceeds: $2,545,944 (cost $2,545,919) | | $ | 2,545,919 | |
| | | | | | | | |
| | |
| | | | Total Short-Term Investments
(cost $2,545,919) | | | 2,545,919 | |
| | | | | | | | |
| | |
| | | | Total Investments
(cost $142,426,708) 98.9%§ | | | 195,547,182 | |
| | |
| | | | Other Assets less Liabilities 1.1% | | | 2,217,051 | |
| | | | | | | | |
| | |
| | | | NET ASSETS 100.0% | | $ | 197,764,233 | |
| | | | | | | | |
| |
| | | | *Non-income producing. §The aggregate amount of foreign securities fair valued pursuant to a systematic valuation model as a percent of net assets was 2.96%. ADR American Depositary Receipt. See Notes to Financial Statements. | |
At September 30, 2017, Wasatch Frontier Emerging Small Countries Fund’s investments, excluding short-term investments, were in the following countries (unaudited):
| | | | |
| Country | | % | |
Argentina | | | 15.6 | |
Bangladesh | | | 7.3 | |
Brazil | | | 4.2 | |
Colombia | | | 3.7 | |
Egypt | | | 1.6 | |
Georgia | | | 1.8 | |
Kenya | | | 3.1 | |
Kuwait | | | 2.8 | |
Malaysia | | | 1.5 | |
Mexico | | | 1.5 | |
Pakistan | | | 7.8 | |
Peru | | | 3.4 | |
Philippines | | | 14.4 | |
Poland | | | 1.9 | |
Romania | | | 1.0 | |
South Africa | | | 3.3 | |
Thailand | | | 2.1 | |
Turkey | | | 2.8 | |
United Arab Emirates | | | 10.0 | |
Vietnam | | | 10.2 | |
| | | | |
TOTAL | | | 100.0 | % |
| | | | |
57
| | |
| WASATCH GLOBAL OPPORTUNITIES FUND (WAGOX / WIGOX) | | |
|
|
|
Schedule of Investments
| | | | | | | | |
| Shares | | | | | Value | |
| | | | | | | |
| | | | COMMON STOCKS 100.1% | | | | |
| | |
| | | | Airlines 2.0% | | | | |
| | 9,983 | | | Allegiant Travel Co. | | $ | 1,314,761 | |
| | 21,275 | | | Spirit Airlines, Inc.* | | | 710,798 | |
| | | | | | | | |
| | | | | | | 2,025,559 | |
| | | | | | | | |
| | | | Apparel, Accessories & Luxury Goods 1.0% | | | | |
| | 29,892 | | | Ted Baker plc (United Kingdom) | | | 1,061,464 | |
| | | | | | | | |
| | | | Application Software 8.4% | | | | |
| | 15,655 | | | AVEVA Group plc (United Kingdom) | | | 510,807 | |
| | 55,866 | | | Callidus Software, Inc.* | | | 1,377,097 | |
| | 23,050 | | | Globant S.A.* (Argentina) | | | 923,614 | |
| | 21,942 | | | HubSpot, Inc.* | | | 1,844,225 | |
| | 5,915 | | | Tyler Technologies, Inc.* | | | 1,031,103 | |
| | 9,492 | | | Ultimate Software Group, Inc. (The)* | | | 1,799,683 | |
| | 41,520 | | | Zendesk, Inc.* | | | 1,208,647 | |
| | | | | | | | |
| | | | | | | 8,695,176 | |
| | | | | | | | |
| | | | Automotive Retail 1.2% | | | | |
| | 22,526 | | | Monro, Inc. | | | 1,262,582 | |
| | | | | | | | |
| | | | Biotechnology 7.5% | | | | |
| | 69,937 | | | Abcam plc (United Kingdom) | | | 955,898 | |
| | 28,921 | | | Exact Sciences Corp.* | | | 1,362,758 | |
| | 6,985 | | | Medytox, Inc. (Korea) | | | 3,015,744 | |
| | 83,126 | | | Sangamo Therapeutics Inc.* | | | 1,246,890 | |
| | 20,561 | | | Seattle Genetics, Inc.* | | | 1,118,724 | |
| | | | | | | | |
| | | | | | | 7,700,014 | |
| | | | | | | | |
| | | | Building Products 4.7% | | | | |
| | 159,589 | | | Somany Ceramics Ltd. (India) | | | 2,079,152 | |
| | 31,121 | | | Trex Co., Inc.* | | | 2,803,069 | |
| | | | | | | | |
| | | | | | | 4,882,221 | |
| | | | | | | | |
| | | | Consumer Finance 5.4% | | | | |
| | 39,021 | | | Bajaj Finance Ltd. (India) | | | 1,096,854 | |
| | 4,453 | | | Credit Acceptance Corp.* | | | 1,247,597 | |
| | 784,083 | | | Srisawad Corp. Public Co. Ltd. (Thailand) | | | 1,410,644 | |
| | 524,800 | | | Unifin Financiera S.A.B. de C.V. SOFOM ENR (Mexico) | | | 1,759,420 | |
| | | | | | | | |
| | | | | | | 5,514,515 | |
| | | | | | | | |
| | | | Data Processing & Outsourced Services 0.5% | | | | |
| | 7,700 | | | GMO Payment Gateway, Inc. (Japan) | | | 481,742 | |
| | | | | | | | |
| | | | Diversified Chemicals 1.0% | | | | |
| | 85,230 | | | Pidilite Industries Ltd. (India) | | | 1,038,039 | |
| | | | | | | | |
| | | | Diversified Real Estate Activities 1.0% | | | | |
| | 50,234 | | | Patrizia Immobilien AG* (Germany) | | | 1,046,721 | |
| | | | | | | | |
| | | | Diversified Support Services 2.0% | | | | |
| | 60,851 | | | Copart, Inc.* | | | 2,091,449 | |
| | | | | | | | |
| | | | Drug Retail 1.1% | | | | |
| | 6,290 | | | Ain Holdings, Inc. (Japan) | | | 433,774 | |
| | 3,070 | | | Cosmos Pharmaceutical Corp. (Japan) | | | 685,344 | |
| | | | | | | | |
| | | | | | | 1,119,118 | |
| | | | | | | | |
| | | | Electrical Components & Equipment 1.1% | | | | |
| | 60,841 | | | Voltronic Power Technology Corp. (Taiwan) | | | 1,091,462 | |
| | | | | | | | |
| | | | Fertilizers & Agricultural Chemicals 0.7% | | | | |
| | 64,363 | | | UPL Ltd. (India) | | | 766,700 | |
| | | | | | | | |
| | | | Food Retail 0.0% | | | | |
| | 2,654 | | | Avenue Supermarts Ltd.* (India) | | | 44,125 | |
| | | | | | | | |
| | | | | | | | |
| Shares | | | | | Value | |
| | | | | | | |
| | | | General Merchandise Stores 3.4% | | | | |
| | 44,239 | | | Ollie’s Bargain Outlet Holdings, Inc.* | | $ | 2,052,690 | |
| | 25,584 | | | Seria Co. Ltd. (Japan) | | | 1,421,017 | |
| | | | | | | | |
| | | | | | | 3,473,707 | |
| | | | | | | | |
| | | | Health Care Equipment 2.3% | | | | |
| | 5,171 | | | Cantel Medical Corp. | | | 486,953 | |
| | 8,992 | | | Cochlear Ltd. (Australia) | | | 1,122,960 | |
| | 28,191 | | | DIO Corp.* (Korea) | | | 747,018 | |
| | | | | | | | |
| | | | | | | 2,356,931 | |
| | | | | | | | |
| | | | Health Care Facilities 1.9% | | | | |
| | 88,521 | | | Ensign Group, Inc. (The) | | | 1,999,689 | |
| | | | | | | | |
| | | | Health Care Services 0.7% | | | | |
| | 57,395 | | | Dr. Lal PathLabs Ltd. (India) | | | 698,590 | |
| | | | | | | | |
| | | | Health Care Supplies 0.9% | | | | |
| | 13,926 | | | Sartorius Stedim Biotech (France) | | | 964,506 | |
| | | | | | | | |
| | | | Health Care Technology 0.5% | | | | |
| | 19,180 | | | M3, Inc. (Japan) | | | 546,296 | |
| | | | | | | | |
| | | | Highways & Railtracks 1.6% | | | | |
| | 450,000 | | | EcoRodovias Infraestrutura e Logistica S.A. (Brazil) | | | 1,621,174 | |
| | | | | | | | |
| | | | Homebuilding 3.1% | | | | |
| | 21,242 | | | Installed Building Products, Inc.* | | | 1,376,482 | |
| | 36,711 | | | LGI Homes, Inc.* | | | 1,783,053 | |
| | | | | | | | |
| | | | | | | 3,159,535 | |
| | | | | | | | |
| | | | Industrial Machinery 1.3% | | | | |
| | 392,767 | | | Rotork plc (United Kingdom) | | | 1,370,505 | |
| | | | | | | | |
| | | | Internet & Direct Marketing Retail 4.1% | | | | |
| | 81,407 | | | MakeMyTrip Ltd.* (India) | | | 2,340,451 | |
| | 19,724 | | | Wayfair, Inc., Class A* | | | 1,329,398 | |
| | 33,975 | | | Yume No Machi Souzou Iinkai Co. Ltd. (Japan) | | | 518,117 | |
| | | | | | | | |
| | | | | | | 4,187,966 | |
| | | | | | | | |
| | | | Internet Software & Services 9.2% | | | | |
| | 12,978 | | | Cimpress N.V.* | | | 1,267,431 | |
| | 40,057 | | | Envestnet, Inc.* | | | 2,042,907 | |
| | 39,898 | | | Gurunavi, Inc. (Japan) | | | 577,949 | |
| | 12,260 | | | MercadoLibre, Inc. (Brazil) | | | 3,174,482 | |
| | 8,872 | | | Rightmove plc (United Kingdom) | | | 480,889 | |
| | 27,115 | | | SMS Co. Ltd. (Japan) | | | 863,873 | |
| | 3,249 | | | XING SE (Germany) | | | 1,017,599 | |
| | | | | | | | |
| | | | | | | 9,425,130 | |
| | | | | | | | |
| | | | IT Consulting & Other Services 1.1% | | | | |
| | 23,619 | | | Luxoft Holding, Inc.* (Switzerland) | | | 1,128,988 | |
| | | | | | | | |
| | | | Life & Health Insurance 1.7% | | | | |
| | 295,966 | | | ICICI Prudential Life Insurance Co. Ltd. (India) | | | 1,760,753 | |
| | | | | | | | |
| | | | Managed Health Care 2.5% | | | | |
| | 50,842 | | | HealthEquity, Inc.* | | | 2,571,588 | |
| | | | | | | | |
| | | | Movies & Entertainment 0.9% | | | | |
| | 12,437 | | | Loen Entertainment, Inc. (Korea) | | | 949,049 | |
| | | | | | | | |
| | | | Office Services & Supplies 1.9% | | | | |
| | 4,899 | | | 3M India Ltd.* (India) | | | 1,080,004 | |
| | 216,710 | | | IWG plc (United Kingdom) | | | 898,761 | |
| | | | | | | | |
| | | | | | | 1,978,765 | |
| | | | | | | | |
| | | | Packaged Foods & Meats 1.5% | | | | |
| | 209,800 | | | Manpasand Beverages Ltd. (India) | | | 1,517,613 | |
| | | | | | | | |
58
| | | | | | | | |
| Shares | | | | |
Value | |
| | | | | | | |
| | | | Pharmaceuticals 2.5% | | | | |
| | 13,782 | | | Intra-Cellular Therapies, Inc.* | | $ | 217,480 | |
| | 11,565 | | | Ipsen S.A. (France) | | | 1,537,043 | |
| | 70,167 | | | Natco Pharma Ltd. (India) | | | 845,398 | |
| | | | | | | | |
| | | | | | | 2,599,921 | |
| | | | | | | | |
| | | | Regional Banks 5.7% | | | | |
| | 17,755 | | | Eagle Bancorp, Inc.* | | | 1,190,473 | |
| | 37,319 | | | Metro Bank plc* (United Kingdom) | | | 1,690,251 | |
| | 10,552 | | | Signature Bank* | | | 1,351,078 | |
| | 18,626 | | | Texas Capital Bancshares, Inc.* | | | 1,598,111 | |
| | | | | | | | |
| | | | | | | 5,829,913 | |
| | | | | | | | |
| | | | Research & Consulting Services 1.7% | | | | |
| | 36,600 | | | Nihon M&A Center, Inc. (Japan) | | | 1,788,936 | |
| | | | | | | | |
| | | | Restaurants 0.9% | | | | |
| | 25,170 | | | Domino’s Pizza Enterprises Ltd. (Australia) | | | 904,640 | |
| | | | | | | | |
| | | | Semiconductors 4.0% | | | | |
| | 44,090 | | | Cavium, Inc.* | | | 2,907,294 | |
| | 12,052 | | | Melexis N.V. (Belgium) | | | 1,165,181 | |
| | | | | | | | |
| | | | | | | 4,072,475 | |
| | | | | | | | |
| | | | Specialized Finance 1.0% | | | | |
| | 19,146 | | | Banca IFIS S.p.A. (Italy) | | | 1,046,802 | |
| | | | | | | | |
| | | | Specialty Chemicals 2.3% | | | | |
| | 18,124 | | | Frutarom Industries Ltd. (Israel) | | | 1,394,100 | |
| | 91,925 | | | Hexpol AB (Sweden) | | | 967,228 | |
| | | | | | | | |
| | | | | | | 2,361,328 | |
| | | | | | | | |
| | | | Specialty Stores 1.7% | | | | |
| | 19,748 | | | Five Below, Inc.* | | | 1,083,770 | |
| | 58,449 | | | XXL ASA (Norway) | | | 636,632 | |
| | | | | | | | |
| | | | | | | 1,720,402 | |
| | | | | | | | |
| | | | Trading Companies & Distributors 1.9% | | | | |
| | 33,000 | | | MISUMI Group, Inc. (Japan) | | | 868,953 | |
| | 39,400 | | | MonotaRO Co. Ltd. (Japan) | | | 1,053,935 | |
| | | | | | | | |
| | | | | | | 1,922,888 | |
| | | | | | | | |
| | | | Trucking 2.2% | | | | |
| | 55,475 | | | Knight-Swift Transportation Holdings, Inc.* | | | 2,304,986 | |
| | | | | | | | |
| | |
| | | | Total Common Stocks
(cost $65,507,888) | | | 103,083,963 | |
| | | | | | | | |
| | |
| | | | WARRANTS 0.0% | | | | |
| | |
| | | | Consumer Finance 0.0% | | | | |
| | 89,968 | | | Srisawad Corp. Public Co. Ltd., expiring 05/29/20* (Thailand) | | | 32,103 | |
| | | | | | | | |
| | |
| | | | Total Warrants
(cost $0) | | | 32,103 | |
| | | | | | | | |
| | | | | | | | |
Principal
Amount | | | | | Value | |
| | | | | | | |
| | | | SHORT-TERM INVESTMENTS 0.2% | | | | |
| | |
| | | | Repurchase Agreement 0.2% | | | | |
| | $170,608 | | | Repurchase Agreement dated 9/29/17,
0.12% due 10/2/17 with Fixed Income
Clearing Corp. collateralized by $175,000
of United States Treasury Notes 2.250%
due 2/15/27; value: $174,697; repurchase
proceeds: $170,610 (cost $170,608) | | $ | 170,608 | |
| | | | | | | | |
| | |
| | | | Total Short-Term Investments
(cost $170,608) | | | 170,608 | |
| | | | | | | | |
| | |
| | | | Total Investments
(cost $65,678,496) 100.3%§ | | | 103,286,674 | |
| | |
| | | | Liabilities less Other Assets (0.3%) | | | (289,977 | ) |
| | | | | | | | |
| | |
| | | | NET ASSETS 100.0% | | $ | 102,996,697 | |
| | | | | | | | |
| |
| | | | *Non-income producing. §The aggregate amount of foreign securities fair valued pursuant to a systematic valuation model as a percent of net assets was 1.35%. See Notes to Financial Statements. | |
At September 30, 2017, Wasatch Global Opportunities Fund’s investments, excluding short-term investments, were in the following countries (unaudited):
| | | | |
| Country | | % | |
Argentina | | | 0.9 | |
Australia | | | 2.0 | |
Belgium | | | 1.1 | |
Brazil | | | 4.6 | |
France | | | 2.4 | |
Germany | | | 2.0 | |
India | | | 12.9 | |
Israel | | | 1.3 | |
Italy | | | 1.0 | |
Japan | | | 9.0 | |
Korea | | | 4.6 | |
Mexico | | | 1.7 | |
Norway | | | 0.6 | |
Sweden | | | 0.9 | |
Switzerland | | | 1.1 | |
Taiwan | | | 1.1 | |
Thailand | | | 1.4 | |
United Kingdom | | | 6.8 | |
United States | | | 44.6 | |
| | | | |
TOTAL | | | 100.0 | % |
| | | | |
59
| | |
| WASATCH INTERNATIONAL GROWTH FUND (WAIGX / WIIGX) | | |
|
|
|
Schedule of Investments
| | | | | | | | |
| Shares | | | | | Value | |
| | | | | | | |
| | | | COMMON STOCKS 97.5% | | | | |
| | |
| | | | Airport Services 0.7% | | | | |
| | 1,725,872 | | | Grupo Aeroportuario del Centro Norte S.A.B. de C.V. (Mexico) | | $ | 9,546,792 | |
| | | | | | | | |
| | | | Apparel Retail 0.3% | | | | |
| | 93,960 | | | Tokyo Base Co. Ltd.* (Japan) | | | 4,525,778 | |
| | | | | | | | |
| | | | Apparel, Accessories & Luxury Goods 2.7% | | | | |
| | 727,130 | | | Moncler S.p.A. (Italy) | | | 20,986,431 | |
| | 504,171 | | | Ted Baker plc (United Kingdom) | | | 17,903,104 | |
| | | | | | | | |
| | | | | | | 38,889,535 | |
| | | | | | | | |
| | | | Application Software 2.8% | | | | |
| | 461,347 | | | Aveva Group plc (United Kingdom) | | | 15,053,284 | |
| | 1,290,333 | | | Computer Modelling Group Ltd. (Canada) | | | 9,472,611 | |
| | 45,170 | | | Nemetschek SE (Germany) | | | 3,671,386 | |
| | 3,397,119 | | | Technology One Ltd. (Australia) | | | 13,376,792 | |
| | 14,913 | | | WiseTech Global Ltd. (Australia) | | | 101,771 | |
| | | | | | | | |
| | | | | | | 41,675,844 | |
| | | | | | | | |
| | | | Asset Management & Custody Banks 0.6% | | | | |
| | 636,452 | | | Burford Capital Ltd. (United Kingdom) | | | 8,826,949 | |
| | | | | | | | |
| | | | Biotechnology 4.2% | | | | |
| | 2,824,168 | | | Abcam plc (United Kingdom) | | | 38,600,710 | |
| | 53,686 | | | Medytox, Inc. (Korea) | | | 23,178,703 | |
| | | | | | | | |
| | | | | | | 61,779,413 | |
| | | | | | | | |
| | | | Data Processing & Outsourced Services 0.7% | | | | |
| | 169,200 | | | GMO Payment Gateway, Inc. (Japan) | | | 10,585,808 | |
| | | | | | | | |
| | | | Diversified Real Estate Activities 1.6% | | | | |
| | 1,141,752 | | | Patrizia Immobilien AG* (Germany) | | | 23,790,576 | |
| | | | | | | | |
| | | | Drug Retail 5.3% | | | | |
| | 181,828 | | | Ain Holdings, Inc. (Japan) | | | 12,539,305 | |
| | 1,338,623 | | | Clicks Group Ltd. (South Africa) | | | 15,624,972 | |
| | 128,537 | | | Cosmos Pharmaceutical Corp. (Japan) | | | 28,694,507 | |
| | 871,900 | | | Raia Drogasil S.A. (Brazil) | | | 20,647,112 | |
| | | | | | | | |
| | | | | | | 77,505,896 | |
| | | | | | | | |
| | | | Electric Utilities 0.4% | | | | |
| | 111,864 | | | Direct Energie (France) | | | 6,325,027 | |
| | | | | | | | |
| | | | Electrical Components & Equipment 1.6% | | | | |
| | 891,448 | | | Amara Raja Batteries Ltd. (India) | | | 9,669,863 | |
| | 804,364 | | | Voltronic Power Technology Corp. (Taiwan) | | | 14,429,957 | |
| | | | | | | | |
| | | | | | | 24,099,820 | |
| | | | | | | | |
| | | | Electronic Equipment & Instruments 2.4% | | | | |
| | 814,212 | | | Ai Holdings Corp. (Japan) | | | 20,332,688 | |
| | 1,028,147 | | | Halma plc (United Kingdom) | | | 15,430,423 | |
| | | | | | | | |
| | | | | | | 35,763,111 | |
| | | | | | | | |
| | | | Electronic Manufacturing Services 1.3% | | | | |
| | 1,449,500 | | | Venture Corp. Ltd. (Singapore) | | | 18,850,072 | |
| | | | | | | | |
| | | | Fertilizers & Agricultural Chemicals 1.0% | | | | |
| | 1,285,377 | | | UPL Ltd. (India) | | | 15,311,571 | |
| | | | | | | | |
| | | | General Merchandise Stores 3.5% | | | | |
| | 2,162,575 | | | B&M European Value Retail S.A. (United Kingdom) | | | 11,232,063 | |
| | 722,926 | | | Seria Co. Ltd. (Japan) | | | 40,153,633 | |
| | | | | | | | |
| | | | | | | 51,385,696 | |
| | | | | | | | |
| | | | | | | | |
| Shares | | | | | Value | |
| | | | | | | |
| | | | Health Care Distributors 1.2% | | | | |
| | 344,200 | | | Japan Lifeline Co. Ltd. (Japan) | | $ | 17,007,350 | |
| | | | | | | | |
| | | | Health Care Equipment 2.1% | | | | |
| | 247,855 | | | Cochlear Ltd. (Australia) | | | 30,953,198 | |
| | | | | | | | |
| | | | Health Care Services 0.5% | | | | |
| | 563,871 | | | Dr. Lal PathLabs Ltd. (India) | | | 6,863,222 | |
| | | | | | | | |
| | | | Health Care Supplies 1.4% | | | | |
| | 2,653,565 | | | Nanosonics Ltd.* (Australia) | | | 5,432,600 | |
| | 209,341 | | | Sartorius Stedim Biotech (France) | | | 14,498,824 | |
| | | | | | | | |
| | | | | | | 19,931,424 | |
| | | | | | | | |
| | | | Health Care Technology 1.1% | | | | |
| | 464,160 | | | M3, Inc. (Japan) | | | 13,220,465 | |
| | 120,240 | | | RaySearch Laboratories AB* (Sweden) | | | 2,561,313 | |
| | | | | | | | |
| | | | | | | 15,781,778 | |
| | | | | | | | |
| | | | Home Furnishings 0.8% | | | | |
| | 1,159,774 | | | Nien Made Enterprise Co. Ltd. (Taiwan) | | | 11,894,530 | |
| | | | | | | | |
| | | | Home Furnishing Retail 0.9% | | | | |
| | 286,108 | | | Maisons du Monde S.A. (France) | | | 12,577,532 | |
| | | | | | | | |
| | | | Hotels, Resorts & Cruise Lines 2.4% | | | | |
| | 810,447 | | | Corporate Travel Management Ltd. (Australia) | | | 13,896,719 | |
| | 17,421,713 | | | Minor International Public Co. Ltd. (Thailand) | | | 21,287,401 | |
| | | | | | | | |
| | | | | | | 35,184,120 | |
| | | | | | | | |
| | | | Household Products 0.6% | | | | |
| | 258,284 | | | Pigeon Corp. (Japan) | | | 8,825,612 | |
| | | | | | | | |
| | | | Human Resource & Employment Services 2.2% | | | | |
| | 254,273 | | | 51job, Inc. ADR* (China) | | | 15,411,486 | |
| | 449,000 | | | en-japan, Inc. (Japan) | | | 16,459,676 | |
| | | | | | | | |
| | | | | | | 31,871,162 | |
| | | | | | | | |
| | | | Industrial Machinery 2.3% | | | | |
| | 6,476,553 | | | Rotork plc (United Kingdom) | | | 22,599,015 | |
| | 127,811 | | | Stabilus S.A. (Germany) | | | 11,599,887 | |
| | | | | | | | |
| | | | | | | 34,198,902 | |
| | | | | | | | |
| | | | Internet & Direct Marketing Retail 1.9% | | | | |
| | 119,567 | | | ASOS plc* (United Kingdom) | | | 9,541,084 | |
| | 1,286,551 | | | Trade Me Group Ltd. (New Zealand) | | | 4,246,791 | |
| | 306,725 | | | Yume No Machi Souzou Iinkai Co. Ltd. (Japan) | | | 4,677,539 | |
| | 58,819 | | | zooplus AG* (Germany) | | | 9,906,343 | |
| | | | | | | | |
| | | | | | | 28,371,757 | |
| | | | | | | | |
| | | | Internet Software & Services 7.7% | | | | |
| | 619,826 | | | Gurunavi, Inc. (Japan) | | | 8,978,595 | |
| | 1,454,500 | | | Infomart Corp. (Japan) | | | 10,444,221 | |
| | 184,568 | | | Rightmove plc (United Kingdom) | | | 10,004,135 | |
| | 426,126 | | | Scout24 AG (Germany) | | | 17,425,891 | |
| | 899,255 | | | SMS Co. Ltd. (Japan) | | | 28,649,892 | |
| | 83,977 | | | XING SE (Germany) | | | 26,301,899 | |
| | 2,105,806 | | | ZPG plc (United Kingdom) | | | 10,206,374 | |
| | | | | | | | |
| | | | | | | 112,011,007 | |
| | | | | | | | |
| | | | IT Consulting & Other Services 1.0% | | | | |
| | 798,691 | | | Altran Technologies S.A. (France) | | | 14,688,223 | |
| | | | | | | | |
| | | | Leisure Products 0.0% | | | | |
| | 8,488 | | | Yonex Co. Ltd. (Japan) | | | 63,288 | |
| | | | | | | | |
| | | | Life & Health Insurance 1.1% | | | | |
| | 1,815,561 | | | Max Financial Services Ltd.* (India) | | | 16,426,769 | |
| | | | | | | | |
60
| | | | | | | | |
| Shares | | | | | Value | |
| | | | | | | |
| | | | Life Sciences Tools & Services 2.7% | | | | |
| | 1,885,473 | | | Clinigen Group plc (United Kingdom) | | $ | 26,932,838 | |
| | 58,466 | | | Tecan Group AG (Switzerland) | | | 12,099,537 | |
| | | | | | | | |
| | | | | | | 39,032,375 | |
| | | | | | | | |
| | | | Movies & Entertainment 1.7% | | | | |
| | 566,699 | | | CTS Eventim AG & Co KGaA (Germany) | | | 24,735,040 | |
| | | | | | | | |
| | | | Office Services & Supplies 1.4% | | | | |
| | 4,903,752 | | | IWG plc (United Kingdom) | | | 20,337,321 | |
| | | | | | | | |
| | | | Oil & Gas Equipment & Services 2.4% | | | | |
| | 650,859 | | | Pason Systems, Inc. (Canada) | | | 9,796,139 | |
| | 433,061 | | | ShawCor Ltd. (Canada) | | | 9,582,700 | |
| | 634,740 | | | TGS-NOPEC Geophysical Co. ASA (Norway) | | | 15,102,421 | |
| | | | | | | | |
| | | | | | | 34,481,260 | |
| | | | | | | | |
| | | | Other Diversified Financial Services 0.6% | | | | |
| | 48,965 | | | Hypoport AG* (Germany) | | | 8,614,210 | |
| | | | | | | | |
| | | | Packaged Foods & Meats 2.6% | | | | |
| | 44,034 | | | Kotobuki Spirits Co. Ltd. (Japan) | | | 1,571,175 | |
| | 16,225,449 | | | Vitasoy International Holdings Ltd. (China) | | | 36,141,484 | |
| | | | | | | | |
| | | | | | | 37,712,659 | |
| | | | | | | | |
| | | | Pharmaceuticals 2.3% | | | | |
| | 251,667 | | | Ipsen S.A. (France) | | | 33,447,727 | |
| | | | | | | | |
| | | | Property & Casualty Insurance 0.3% | | | | |
| | 2,829,506 | | | Qualitas Controladora S.A.B. de C.V. (Mexico) | | | 4,649,029 | |
| | | | | | | | |
| | | | Regional Banks 2.8% | | | | |
| | 680,283 | | | Canadian Western Bank (Canada) | | | 18,378,954 | |
| | 487,069 | | | Metro Bank plc* (United Kingdom) | | | 22,060,319 | |
| | | | | | | | |
| | | | | | | 40,439,273 | |
| | | | | | | | |
| | | | Research & Consulting Services 2.2% | | | | |
| | 664,064 | | | Nihon M&A Center, Inc. (Japan) | | | 32,458,138 | |
| | | | | | | | |
| | | | Restaurants 0.8% | | | | |
| | 328,842 | | | Domino’s Pizza Enterprises Ltd. (Australia) | | | 11,818,977 | |
| | | | | | | | |
| | | | Semiconductor Equipment 0.7% | | | | |
| | 389,900 | | | Japan Material Co. Ltd. (Japan) | | | 10,277,213 | |
| | | | | | | | |
| | | | Semiconductors 2.8% | | | | |
| | 200,671 | | | Melexis N.V. (Belgium) | | | 19,400,762 | |
| | 934,999 | | | Silergy Corp. (Taiwan) | | | 21,429,373 | |
| | | | | | | | |
| | | | | | | 40,830,135 | |
| | | | | | | | |
| | | | Soft Drinks 1.3% | | | | |
| | 625,111 | | | Fevertree Drinks plc (United Kingdom) | | | 18,319,370 | |
| | | | | | | | |
| | | | Specialized Finance 1.2% | | | | |
| | 327,680 | | | Banca IFIS S.p.A. (Italy) | | | 17,915,809 | |
| | | | | | | | |
| | | | Specialty Chemicals 4.6% | | | | |
| | 305,629 | | | Chr. Hansen Holding A/S (Denmark) | | | 26,212,374 | |
| | 273,331 | | | Frutarom Industries Ltd. (Israel) | | | 21,024,656 | |
| | 1,873,405 | | | Hexpol AB (Sweden) | | | 19,711,821 | |
| | | | | | | | |
| | | | | | | 66,948,851 | |
| | | | | | | | |
| | | | Specialty Stores 1.0% | | | | |
| | 1,287,977 | | | XXL ASA (Norway) | | | 14,028,753 | |
| | | | | | | | |
| | | | Systems Software 1.0% | | | | |
| | 246,740 | | | Kinaxis, Inc.* (Canada) | | | 14,574,024 | |
| | | | | | | | |
| | | | Technology Hardware, Storage & Peripherals 0.8% | | | | |
| | 843,305 | | | Ennoconn Corp. (Taiwan) | | | 12,097,272 | |
| | | | | | | | |
| | | | | | | | |
| Shares | | | | | Value | |
| | | | | | | |
| | | | Thrifts & Mortgage Finance 1.8% | | | | |
| | 1,159,427 | | | PNB Housing Finance Ltd. (India) | | $ | 25,847,483 | |
| | | | | | | | |
| | | | Trading Companies & Distributors 6.2% | | | | |
| | 1,084,318 | | | Diploma plc (United Kingdom) | | | 15,459,765 | |
| | 1,428,715 | | | MISUMI Group, Inc. (Japan) | | | 37,620,818 | |
| | 752,212 | | | MonotaRO Co. Ltd. (Japan) | | | 20,121,379 | |
| | 706,946 | | | Richelieu Hardware Ltd. (Canada) | | | 17,779,175 | |
| | | | | | | | |
| | | | | | | 90,981,137 | |
| | | | | | | | |
| | |
| | | | Total Common Stocks
(cost $933,021,945) | | | 1,425,057,818 | |
| | | | | | | | |
| | |
| | | | Total Investments
(cost $933,021,945) 97.5%§ | | | 1,425,057,818 | |
| | |
| | | | Other Assets less Liabilities 2.5% | | | 36,415,104 | |
| | | | | | | | |
| | |
| | | | NET ASSETS 100.0% | | $ | 1,461,472,922 | |
| | | | | | | | |
| |
| | | | *Non-income producing. §The aggregate amount of foreign securities fair valued pursuant to a systematic valuation model as a percent of net assets was 1.44%. ADR American Depositary Receipt. See Notes to Financial Statements. | |
At September 30, 2017, Wasatch International Growth Fund’s investments, excluding short-term investments, were in the following countries (unaudited):
| | | | |
| Country | | % | |
Australia | | | 5.3 | |
Belgium | | | 1.4 | |
Brazil | | | 1.5 | |
Canada | | | 5.6 | |
China | | | 3.6 | |
Denmark | | | 1.8 | |
France | | | 5.7 | |
Germany | | | 8.8 | |
India | | | 5.2 | |
Israel | | | 1.5 | |
Italy | | | 2.7 | |
Japan | | | 23.0 | |
Korea | | | 1.6 | |
Mexico | | | 1.0 | |
New Zealand | | | 0.3 | |
Norway | | | 2.0 | |
Singapore | | | 1.3 | |
South Africa | | | 1.1 | |
Sweden | | | 1.6 | |
Switzerland | | | 0.9 | |
Taiwan | | | 4.2 | |
Thailand | | | 1.5 | |
United Kingdom | | | 18.4 | |
| | | | |
TOTAL | | | 100.0 | % |
| | | | |
61
| | |
| WASATCH INTERNATIONAL OPPORTUNITIES FUND (WAIOX / WIIOX) | | |
|
|
|
Schedule of Investments
| | | | | | | | |
| Shares | | | | | Value | |
| | | | | | | |
| | | | COMMON STOCKS 97.4% | | | | |
| | |
| | | | Advertising 1.2% | | | | |
| | 14,646,600 | | | Plan B Media Public Co. Ltd. (Thailand) | | $ | 2,657,030 | |
| | 242,000 | | | Vector, Inc. (Japan) | | | 3,445,314 | |
| | | | | | | | |
| | | | | | | 6,102,344 | |
| | | | | | | | |
| | | | Aerospace & Defense 0.5% | | | | |
| | 183,082 | | | Avon Rubber plc (United Kingdom) | | | 2,299,967 | |
| | | | | | | | |
| | | | Air Freight & Logistics 2.8% | | | | |
| | 1,258,273 | | | Allcargo Logistics Ltd. (India) | | | 3,282,451 | |
| | 1,027,553 | | | Freightways Ltd. (New Zealand) | | | 5,774,329 | |
| | 26,512 | | | ID Logistics Group* (France) | | | 4,731,516 | |
| | | | | | | | |
| | | | | | | 13,788,296 | |
| | | | | | | | |
| | | | Apparel Retail 1.1% | | | | |
| | 114,740 | | | Tokyo Base Co. Ltd.* (Japan) | | | 5,526,690 | |
| | | | | | | | |
| | | | Apparel, Accessories & Luxury Goods 0.2% | | | | |
| | 316,991 | | | Bon Fame Co. Ltd. (Taiwan) | | | 842,550 | |
| | | | | | | | |
| | | | Application Software 5.7% | | | | |
| | 424,134 | | | Computer Modelling Group Ltd. (Canada) | | | 3,113,659 | |
| | 65,760 | | | Esker S.A. (France) | | | 3,781,164 | |
| | 759,306 | | | Fortnox AB (Sweden) | | | 3,691,699 | |
| | 814,938 | | | GB Group plc (United Kingdom) | | | 4,018,620 | |
| | 80,342 | | | Lectra (France) | | | 2,522,038 | |
| | 460,135 | | | Linx S.A. (Brazil) | | | 2,841,748 | |
| | 351,387 | | | Logo Yazilim Sanayi Ve Ticaret A.S.* (Turkey) | | | 5,355,201 | |
| | 134,300 | | | Systena Corp. (Japan) | | | 3,348,996 | |
| | | | | | | | |
| | | | | | | 28,673,125 | |
| | | | | | | | |
| | | | Asset Management & Custody Banks 2.0% | | | | |
| | 1,778,200 | | | Peregrine Holdings Ltd. (South Africa) | | | 3,846,993 | |
| | 565,900 | | | Sanne Group plc (United Kingdom) | | | 6,032,322 | |
| | | | | | | | |
| | | | | | | 9,879,315 | |
| | | | | | | | |
| | | | Auto Parts & Equipment 1.9% | | | | |
| | 1,023,000 | | | Hota Industrial Manufacturing Co. Ltd. (Taiwan) | | | 4,824,198 | |
| | 818,609 | | | Hu Lane Associate, Inc. (Taiwan) | | | 4,589,221 | |
| | | | | | | | |
| | | | | | | 9,413,419 | |
| | | | | | | | |
| | | | Automobile Manufacturers 0.5% | | | | |
| | 626,200 | | | PAK Suzuki Motor Co. Ltd. (Pakistan) | | | 2,721,704 | |
| | | | | | | | |
| | | | Automotive Retail 1.2% | | | | |
| | 3,864,000 | | | China Meidong Auto Holdings Ltd. (China) | | | 1,429,535 | |
| | 1,764,500 | | | Hascol Petroleum Ltd. (Pakistan) | | | 4,696,961 | |
| | | | | | | | |
| | | | | | | 6,126,496 | |
| | | | | | | | |
| | | | Brewers 3.1% | | | | |
| | 685,845 | | | Carlsberg Brewery Malaysia Berhad, Class B (Malaysia) | | | 2,410,406 | |
| | 183,082 | | | Kopparbergs Bryggeri AB, Class B (Sweden) | | | 4,900,229 | |
| | 50,645 | | | Olvi Oyj, Class A (Finland) | | | 1,735,863 | |
| | 117,246 | | | Royal Unibrew A/S (Denmark) | | | 6,424,439 | |
| | | | | | | | |
| | | | | | | 15,470,937 | |
| | | | | | | | |
| | | | Building Products 0.8% | | | | |
| | 2,828,760 | | | Concepcion Industrial Corp. (Philippines) | | | 3,833,899 | |
| | | | | | | | |
| | | | Commodity Chemicals 2.7% | | | | |
| | 980,135 | | | Berger Paints India Ltd. (India) | | | 3,676,257 | |
| | 420,387 | | | Gulf Oil Lubricants India Ltd. (India) | | | 4,955,572 | |
| | 288,077 | | | Supreme Industries Ltd. (India) | | | 4,890,076 | |
| | | | | | | | |
| | | | | | | 13,521,905 | |
| | | | | | | | |
| | | | | | | | |
| Shares | | | | | Value | |
| | | | | | | |
| | | | Communications Equipment 1.3% | | | | |
| | 455,000 | | | Advanced Ceramic X Corp. (Taiwan) | | $ | 6,331,948 | |
| | | | | | | | |
| | | | Consumer Finance 2.0% | | | | |
| | 44,428 | | | Ferratum Oyj (Germany) | | | 1,404,628 | |
| | 157,228 | | | Gruppo MutuiOnline S.p.A. (Italy) | | | 2,465,936 | |
| | 1,816,862 | | | Unifin Financiera S.A.B. de C.V. SOFOM ENR (Mexico) | | | 6,091,127 | |
| | | | | | | | |
| | | | | | | 9,961,691 | |
| | | | | | | | |
| | | | Department Stores 0.4% | | | | |
| | 184,908 | | | Poya International Co. Ltd. (Taiwan) | | | 2,207,383 | |
| | | | | | | | |
| | | | Diversified Banks 1.4% | | | | |
| | 6,834,169 | | | BRAC Bank Ltd. (Bangladesh) | | | 7,163,175 | |
| | | | | | | | |
| | | | Diversified Support Services 2.1% | | | | |
| | 876,708 | | | Clipper Logistics plc (United Kingdom) | | | 4,728,522 | |
| | 585,900 | | | Prestige International, Inc. (Japan) | | | 5,847,285 | |
| | | | | | | | |
| | | | | | | 10,575,807 | |
| | | | | | | | |
| | | | Drug Retail 1.1% | | | | |
| | 1,150,435 | | | Green Cross Health Ltd. (New Zealand) | | | 1,786,563 | |
| | 65,900 | | | Kusuri no Aoki Holdings Co. Ltd. (Japan) | | | 3,912,126 | |
| | | | | | | | |
| | | | | | | 5,698,689 | |
| | | | | | | | |
| | | | Electrical Components & Equipment 2.8% | | | | |
| | 252,355 | | | Amara Raja Batteries Ltd. (India) | | | 2,737,387 | |
| | 2,638,500 | | | Pak Elektron Ltd. (Pakistan) | | | 1,901,723 | |
| | 8,124,000 | | | Ten Pao Group Holdings Ltd. (Hong Kong) | | | 2,943,177 | |
| | 350,627 | | | Voltronic Power Technology Corp. (Taiwan) | | | 6,290,103 | |
| | | | | | | | |
| | | | | | | 13,872,390 | |
| | | | | | | | |
| | | | Electronic Equipment & Instruments 2.4% | | | | |
| | 27,696 | | | Isra Vision AG (Germany) | | | 5,229,243 | |
| | 743,876 | | | Smart Metering Systems plc (United Kingdom) | | | 6,927,714 | |
| | | | | | | | |
| | | | | | | 12,156,957 | |
| | | | | | | | |
| | | | Financial Exchanges & Data 0.6% | | | | |
| | 912,529 | | | Morningstar Japan KK (Japan) | | | 2,765,362 | |
| | | | | | | | |
| | | | Food Retail 5.1% | | | | |
| | 22,250,161 | | | 7-Eleven Malaysia Holdings Berhad, Class B (Malaysia) | | | 8,220,308 | |
| | 3,163,203 | | | Philippine Seven Corp. (Philippines) | | | 10,585,626 | |
| | 79,639 | | | Rami Levy Chain Stores Hashikma Marketing 2006 Ltd. (Israel) | | | 4,072,621 | |
| | 3,661,600 | | | Sheng Siong Group Ltd. (Singapore) | | | 2,483,447 | |
| | | | | | | | |
| | | | | | | 25,362,002 | |
| | | | | | | | |
| | | | General Merchandise Stores 1.2% | | | | |
| | 106,144 | | | Seria Co. Ltd. (Japan) | | | 5,895,579 | |
| | | | | | | | |
| | | | Health Care Equipment 1.1% | | | | |
| | 74,735 | | | DIO Corp.* (Korea) | | | 1,980,362 | |
| | 9,231 | | | STRATEC Biomedical AG (Germany) | | | 552,270 | |
| | 80,358 | | | Vieworks Co. Ltd. (Korea) | | | 2,746,772 | |
| | | | | | | | |
| | | | | | | 5,279,404 | |
| | | | | | | | |
| | | | Health Care Facilities 0.7% | | | | |
| | 2,150,712 | | | Cleopatra Hospital* (Egypt) | | | 3,311,468 | |
| | | | | | | | |
| | | | Health Care Supplies 1.4% | | | | |
| | 1,033,987 | | | Advanced Medical Solutions Group plc (United Kingdom) | | | 4,014,608 | |
| | 1,472,451 | | | Nanosonics Ltd.* (Australia) | | | 3,014,525 | |
| | | | | | | | |
| | | | | | | 7,029,133 | |
| | | | | | | | |
62
| | | | | | | | |
| Shares | | | | | Value | |
| | | | | | | |
| | | | Health Care Technology 1.4% | | | | |
| | 80,043 | | | Nexus AG (Germany) | | $ | 2,506,975 | |
| | 348,700 | | | Onyx Healthcare, Inc. (Taiwan) | | | 2,156,089 | |
| | 33,070 | | | Pro Medicus Ltd. (Australia) | | | 153,047 | |
| | 102,402 | | | RaySearch Laboratories AB* (Sweden) | | | 2,181,334 | |
| | | | | | | | |
| | | | | | | 6,997,445 | |
| | | | | | | | |
| | | | Home Improvement Retail 2.6% | | | | |
| | 459,160 | | | Byggmax Group AB (Sweden) | | | 3,861,614 | |
| | 3,688,989 | | | Italtile Ltd. (South Africa) | | | 3,583,064 | |
| | 59,630,900 | | | PT Ace Hardware Indonesia Tbk (Indonesia) | | | 5,379,133 | |
| | | | | | | | |
| | | | | | | 12,823,811 | |
| | | | | | | | |
| | | | Hotels, Resorts & Cruise Lines 0.4% | | | | |
| | 835,773 | | | Byke Hospitality Ltd. (The) (India) | | | 2,207,787 | |
| | | | | | | | |
| | | | Human Resource & Employment Services 1.0% | | | | |
| | 134,588 | | | en-japan, Inc. (Japan) | | | 4,933,797 | |
| | | | | | | | |
| | | | Industrial Machinery 1.2% | | | | |
| | 34,573 | | | Aumann AG* (Germany) | | | 3,489,601 | |
| | 91,204 | | | va-Q-tec AG* (Germany) | | | 2,455,010 | |
| | | | | | | | |
| | | | | | | 5,944,611 | |
| | | | | | | | |
| | | | Insurance Brokers 1.3% | | | | |
| | 1,220,966 | | | Wiz Solucoes e Corretagem de Seguros S.A. (Brazil) | | | 6,630,761 | |
| | | | | | | | |
| | | | Internet & Direct Marketing Retail 7.3% | | | | |
| | 156,915 | | | Evolable Asia Corp. (Japan) | | | 3,288,208 | |
| | 488,500 | | | On the Beach Group plc (United Kingdom) | | | 2,585,629 | |
| | 236,400 | | | Open Door, Inc.* (Japan) | | | 9,621,968 | |
| | 952,421 | | | Trade Me Group Ltd. (New Zealand) | | | 3,143,858 | |
| | 1,092,560 | | | Webjet Ltd. (Australia) | | | 9,238,502 | |
| | 561,889 | | | Yume No Machi Souzou Iinkai Co. Ltd. (Japan) | | | 8,568,776 | |
| | | | | | | | |
| | | | | | | 36,446,941 | |
| | | | | | | | |
| | | | Internet Software & Services 6.9% | | | | |
| | 227,961 | | | Gurunavi, Inc. (Japan) | | | 3,302,168 | |
| | 1,288,600 | | | Infomart Corp. (Japan) | | | 9,252,955 | |
| | 72,800 | | | Itokuro, Inc.* (Japan) | | | 3,179,844 | |
| | 232,093 | | | Rakus Co. Ltd. (Japan) | | | 4,269,562 | |
| | 273,731 | | | SMS Co. Ltd. (Japan) | | | 8,720,957 | |
| | 18,123 | | | XING SE (Germany) | | | 5,676,189 | |
| | | | | | | | |
| | | | | | | 34,401,675 | |
| | | | | | | | |
| | | | Investment Banking & Brokerage 1.2% | | | | |
| | 125,183 | | | M&A Capital Partners Co. Ltd.* (Japan) | | | 6,218,822 | |
| | | | | | | | |
| | | | IT Consulting & Other Services 1.3% | | | | |
| | 50,681 | | | CANCOM SE (Germany) | | | 3,803,643 | |
| | 212,496 | | | eWork Group AB (Sweden) | | | 2,778,527 | |
| | | | | | | | |
| | | | | | | 6,582,170 | |
| | | | | | | | |
| | | | Life Sciences Tools & Services 1.0% | | | | |
| | 1,599,141 | | | Horizon Discovery Group plc* (United Kingdom) | | | 4,864,265 | |
| | | | | | | | |
| | | | Office Services & Supplies 0.5% | | | | |
| | 3,371,300 | | | Riverstone Holdings Ltd. (Singapore) | | | 2,597,227 | |
| | | | | | | | |
| | | | Oil & Gas Refining & Marketing 0.3% | | | | |
| | 5,156 | | | Hankook Shell Oil Co. Ltd. (Korea) | | | 1,755,656 | |
| | | | | | | | |
| | | | Other Diversified Financial Services 1.6% | | | | |
| | 45,573 | | | Hypoport AG* (Germany) | | | 8,017,470 | |
| | | | | | | | |
| | | | | | | | |
| Shares | | | | | Value | |
| | | | | | | |
| | | | Packaged Foods & Meats 4.3% | | | | |
| | 257,500 | | | Dutch Lady Milk Industries Berhad (Malaysia) | | $ | 3,680,924 | |
| | 175,000 | | | Kotobuki Spirits Co. Ltd. (Japan) | | | 6,244,168 | |
| | 166,215 | | | Nestlé Lanka plc (Sri Lanka) | | | 1,845,868 | |
| | 29,364,454 | | | PT Nippon Indosari Corpindo Tbk (Indonesia) | | | 2,746,990 | |
| | 2,263,120 | | | Vitasoy International Holdings Ltd. (China) | | | 5,041,002 | |
| | 2,383,000 | | | Yihai International Holding Ltd. (China) | | | 1,909,670 | |
| | | | | | | | |
| | | | | | | 21,468,622 | |
| | | | | | | | |
| | | | Personal Products 2.6% | | | | |
| | 8,954,830 | | | Karex Berhad (Malaysia) | | | 3,202,319 | |
| | 283,604 | | | Sarantis S.A. (Greece) | | | 4,153,025 | |
| | 935,521 | | | TCI Co. Ltd. (Taiwan) | | | 5,892,511 | |
| | | | | | | | |
| | | | | | | 13,247,855 | |
| | | | | | | | |
| | | | Pharmaceuticals 0.9% | | | | |
| | 22,330,405 | | | PT Kimia Farma Persero Tbk (Indonesia) | | | 4,542,677 | |
| | | | | | | | |
| | | | Real Estate Operating Companies 0.6% | | | | |
| | 215,000 | | | Japan Property Management Center Co. Ltd. (Japan) | | | 2,936,725 | |
| | | | | | | | |
| | | | Real Estate Services 0.5% | | | | |
| | 452,993 | | | Purplebricks Group plc* (United Kingdom) | | | 2,352,165 | |
| | | | | | | | |
| | | | Regional Banks 1.0% | | | | |
| | 826,926 | | | Banregio Grupo Financiero S.A.B. de C.V. (Mexico) | | | 4,924,773 | |
| | | | | | | | |
| | | | Research & Consulting Services 0.5% | | | | |
| | 45,703 | | | Akka Technologies (France) | | | 2,665,709 | |
| | | | | | | | |
| | | | Restaurants 4.9% | | | | |
| | 90,266 | | | AmRest Holdings SE* (Poland) | | | 8,979,599 | |
| | 212,200 | | | Arcland Service Holdings Co. Ltd. (Japan) | | | 4,459,925 | |
| | 63,900 | | | Kura Corp. (Japan) | | | 2,856,405 | |
| | 548,434 | | | Patisserie Holdings plc (United Kingdom) | | | 2,535,409 | |
| | 1,199,613 | | | Restaurant Brands New Zealand Ltd. (New Zealand) | | | 5,909,398 | |
| | | | | | | | |
| | | | | | | 24,740,736 | |
| | | | | | | | |
| | | | Semiconductor Equipment 0.9% | | | | |
| | 180,200 | | | Japan Material Co. Ltd. (Japan) | | | 4,749,817 | |
| | | | | | | | |
| | | | Soft Drinks 0.6% | | | | |
| | 54,337,320 | | | Pepsi-Cola Products Philippines, Inc. (Philippines) | | | 3,187,536 | |
| | | | | | | | |
| | | | Specialty Chemicals 2.5% | | | | |
| | 726,174 | | | DuluxGroup Ltd. (Australia) | | | 3,987,275 | |
| | 647,743 | | | Scapa Group plc (United Kingdom) | | | 3,836,451 | |
| | 1,174,929 | | | SH Kelkar & Co. Ltd. (India) | | | 4,501,316 | |
| | | | | | | | |
| | | | | | | 12,325,042 | |
| | | | | | | | |
| | | | Specialty Stores 0.2% | | | | |
| | 109,726 | | | Gear4Music Holdings plc* (United Kingdom) | | | 1,238,751 | |
| | | | | | | | |
| | | | Technology Hardware, Storage & Peripherals 0.3% | | | | |
| | 24,211 | | | MGI Digital Graphic Technology* (France) | | | 1,522,317 | |
| | | | | | | | |
| | | | Thrifts & Mortgage Finance 2.3% | | | | |
| | 184,027 | | | Can Fin Homes Ltd. (India) | | | 7,474,336 | |
| | 88,892 | | | Equitable Group, Inc. (Canada) | | | 3,989,543 | |
| | | | | | | | |
| | | | | | | 11,463,879 | |
| | | | | | | | |
| | |
| | | | Total Common Stocks
(cost $373,980,301) | | | 487,600,677 | |
| | | | | | | | |
63
| | |
| WASATCH INTERNATIONAL OPPORTUNITIES FUND (WAIOX / WIIOX) | | SEPTEMBER 30, 2017 |
|
|
|
Schedule of Investments (continued)
| | | | | | | | |
Principal
Amount | | | | | Value | |
| | | | | | | |
| | | | SHORT-TERM INVESTMENTS 1.4% | | | | |
| | |
| | | | Repurchase Agreement 1.4% | | | | |
| | $6,840,234 | | | Repurchase Agreement dated 9/29/17, 0.12% due 10/2/17 with Fixed Income Clearing Corp. collateralized by $6,875,000 of United States Treasury Notes 2.250% due 11/15/24; value: $6,980,284; repurchase proceeds: $6,840,302 (cost $6,840,234) | | $ | 6,840,234 | |
| | | | | | | | |
| | |
| | | | Total Short-Term Investments
(cost $6,840,234) | | | 6,840,234 | |
| | | | | | | | |
| | |
| | | | Total Investments
(cost $380,820,535) 98.8% | | | 494,440,911 | |
| | |
| | | | Other Assets less Liabilities 1.2% | | | 6,233,193 | |
| | | | | | | | |
| | |
| | | | NET ASSETS 100.0% | | $ | 500,674,104 | |
| | | | | | | | |
| |
| | | | *Non-income producing. §The aggregate amount of foreign securities fair valued pursuant to a systematic valuation model as a percent of net assets was 1.47%. See Notes to Financial Statements. | |
At September 30, 2017, Wasatch International Opportunities Fund’s investments, excluding short-term investments, were in the following countries (unaudited):
| | | | |
| Country | | % | |
Australia | | | 3.4 | |
Bangladesh | | | 1.5 | |
Brazil | | | 1.9 | |
Canada | | | 1.5 | |
China | | | 1.7 | |
Denmark | | | 1.3 | |
Egypt | | | 0.7 | |
Finland | | | 0.4 | |
France | | | 3.1 | |
Germany | | | 6.8 | |
Greece | | | 0.9 | |
Hong Kong | | | 0.6 | |
India | | | 6.9 | |
Indonesia | | | 2.6 | |
Israel | | | 0.8 | |
Italy | | | 0.5 | |
Japan | | | 23.3 | |
Korea | | | 1.3 | |
Malaysia | | | 3.6 | |
Mexico | | | 2.3 | |
New Zealand | | | 3.4 | |
Pakistan | | | 1.9 | |
Philippines | | | 3.6 | |
Poland | | | 1.8 | |
Singapore | | | 1.0 | |
South Africa | | | 1.5 | |
Sri Lanka | | | 0.4 | |
Sweden | | | 3.6 | |
Taiwan | | | 6.8 | |
Thailand | | | 0.5 | |
Turkey | | | 1.1 | |
United Kingdom | | | 9.3 | |
| | | | |
TOTAL | | | 100.0 | % |
| | | | |
64
| | |
| WASATCH LARGE CAP VALUE FUND (FMIEX / WILCX) | | SEPTEMBER 30, 2017 |
|
|
|
Schedule of Investments
| | | | | | | | |
| Shares | | | | | Value | |
| | | | | | | |
| | | | COMMON STOCKS 97.5% | | | | |
| | |
| | | | Communications Equipment 3.8% | | | | |
| | 205,925 | | | Cisco Systems, Inc. | | $ | 6,925,258 | |
| | | | | | | | |
| | | | Diversified Banks 16.9% | | | | |
| | 77,794 | | | Citigroup, Inc. | | | 5,658,736 | |
| | 224,461 | | | ING Groep N.V., ADR (Netherlands) | | | 4,134,572 | |
| | 56,774 | | | JPMorgan Chase & Co. | | | 5,422,485 | |
| | 347,300 | | | Nordea Bank AB (Sweden) | | | 4,707,476 | |
| | 85,428 | | | US Bancorp | | | 4,578,086 | |
| | 109,275 | | | Wells Fargo & Co. | | | 6,026,516 | |
| | | | | | | | |
| | | | 30,527,871 | |
| | | | | | | | |
| | | | Diversified REITs 1.1% | | | | |
| | 86,527 | | | Select Income REIT | | | 2,026,462 | |
| | | | | | | | |
| | | | Drug Retail 3.0% | | | | |
| | 66,993 | | | CVS Health Corp. | | | 5,447,871 | |
| | | | | | | | |
| | | | Electric Utilities 7.9% | | | | |
| | 77,613 | | | Duke Energy Corp. | | | 6,513,283 | |
| | 206,709 | | | Exelon Corp. | | | 7,786,728 | |
| | | | | | | | |
| | | | 14,300,011 | |
| | | | | | | | |
| | | | Electrical Components & Equipment 2.3% | | | | |
| | 53,734 | | | Eaton Corp. plc | | | 4,126,234 | |
| | | | | | | | |
| | | | Health Care Equipment 2.4% | | | | |
| | 54,793 | | | Medtronic plc | | | 4,261,252 | |
| | | | | | | | |
| | | | Health Care REITs 1.6% | | | | |
| | 133,259 | | | Sabra Health Care REIT, Inc. | | | 2,923,702 | |
| | | | | | | | |
| | | | Household Products 3.7% | | | | |
| | 72,782 | | | Procter & Gamble Co. (The) | | | 6,621,706 | |
| | | | | | | | |
| | | | Hypermarkets & Super Centers 3.6% | | | | |
| | 84,168 | | | Wal-Mart Stores, Inc. | | | 6,576,888 | |
| | | | | | | | |
| | | | Industrial Conglomerates 2.1% | | | | |
| | 157,736 | | | General Electric Co. | | | 3,814,056 | |
| | | | | | | | |
| | | | Integrated Oil & Gas 10.4% | | | | |
| | 64,234 | | | Chevron Corp. | | | 7,547,495 | |
| | 95,546 | | | Royal Dutch Shell plc ADR (Netherlands) | | | 5,788,177 | |
| | 152,221 | | | Suncor Energy, Inc. (Canada) | | | 5,332,301 | |
| | | | | | | | |
| | | | 18,667,973 | |
| | | | | | | | |
| | | | Integrated Telecommunication Services 1.5% | | | | |
| | 54,476 | | | Verizon Communications, Inc. | | | 2,696,017 | |
| | | | | | | | |
| | | | Oil & Gas Equipment & Services 3.2% | | | | |
| | 81,957 | | | Schlumberger Ltd. | | | 5,717,320 | |
| | | | | | | | |
| | | | Pharmaceuticals 12.0% | | | | |
| | 206,600 | | | Astellas Pharma, Inc. (Japan) | | | 2,628,286 | |
| | 56,304 | | | Johnson & Johnson | | | 7,320,083 | |
| | 39,455 | | | Novartis AG (Switzerland) | | | 3,377,724 | |
| | 230,941 | | | Pfizer, Inc. | | | 8,244,594 | |
| | | | | | | | |
| | | | 21,570,687 | |
| | | | | | | | |
| | | | Property & Casualty Insurance 2.2% | | | | |
| | 68,073 | | | Axis Capital Holdings Ltd. | | | 3,901,264 | |
| | | | | | | | |
| | | | Regional Banks 2.1% | | | | |
| | 27,743 | | | PNC Financial Services Group, Inc. (The) | | | 3,738,924 | |
| | | | | | | | |
| | | | Reinsurance 2.5% | | | | |
| | 20,750 | | | Muenchener Rueckversicherungs-Gesellschaft AG in Muenchen (Germany) | | | 4,436,470 | |
| | | | | | | | |
| | | | Specialized REITs 2.3% | | | | |
| | 58,254 | | | EPR Properties | | | 4,062,634 | |
| | | | | | | | |
| | | | | | | | |
| Shares | | | | | Value | |
| | | | | | | |
| | | | Systems Software 3.2% | | | | |
| | 120,109 | | | Oracle Corp. | | $ | 5,807,270 | |
| | | | | | | | |
| | | | Technology Hardware, Storage & Peripherals 2.1% | | | | |
| | 24,301 | | | Apple, Inc. | | | 3,745,270 | |
| | | | | | | | |
| | | | Tobacco 1.0% | | | | |
| | 20,000 | | | KT&G Corp. (Korea) | | | 1,842,232 | |
| | | | | | | | |
| | | | Water Utilities 1.5% | | | | |
| | 1,950,000 | | | Guangdong Investment Ltd. (China) | | | 2,780,864 | |
| | | | | | | | |
| | | | Wireless Telecommunication Services 5.1% | | | | |
| | 485,500 | | | China Mobile Ltd. (China) | | | 4,919,264 | |
| | 190,000 | | | NTT DOCOMO, Inc. (Japan) | | | 4,340,325 | |
| | | | | | | | |
| | | | 9,259,589 | |
| | | | | | | | |
| | |
| | | | Total Common Stocks
(cost $146,135,164) | | | 175,777,825 | |
| | | | | | | | |
| | |
Principal
Amount | | | | | Value | |
| | | | | | | |
| | | | SHORT-TERM INVESTMENTS 3.0% | | | | |
| | |
| | | | Repurchase Agreement 3.0% | | | | |
| | $5,442,486 | | | Repurchase Agreement dated 9/29/17, 0.12% due 10/2/17 with Fixed Income Clearing Corp. collateralized by $5,565,000 of United States Treasury Notes 2.250% due 2/15/27; value: $5,555,367; repurchase proceeds: $5,442,540 (cost $5,442,486) | | $ | 5,442,486 | |
| | | | | | | | |
| | |
| | | | Total Short-Term Investments
(cost $5,442,486) | | | 5,442,486 | |
| | | | | | | | |
| | |
| | | | Total Investments
(cost $151,577,650) 100.5% | | | 181,220,311 | |
| | |
| | | | Liabilities less Other Assets (0.5%) | | | (896,850 | ) |
| | | | | | | | |
| | |
| | | | NET ASSETS 100.0% | | $ | 180,323,461 | |
| | | | | | | | |
| |
| | | | ADR American Depositary Receipt. REIT Real Estate Investment Trust. See Notes to Financial Statements. | |
At September 30, 2017, Wasatch Large Cap Value Fund’s investments, excluding short-term investments, were in the following countries (unaudited):
| | | | |
| Country | | % | |
Canada | | | 3.0 | |
China | | | 4.4 | |
Germany | | | 2.5 | |
Japan | | | 4.0 | |
Korea | | | 1.1 | |
Netherlands | | | 5.6 | |
Sweden | | | 2.7 | |
Switzerland | | | 1.9 | |
United States | | | 74.8 | |
| | | | |
TOTAL | | | 100.0 | % |
| | | | |
65
| | |
| WASATCH LONG/SHORT FUND (FMLSX / WILSX) | | |
|
|
|
Schedule of Investments
| | | | | | | | |
| Shares | | | | | Value | |
| | | | | | | |
| | | | COMMON STOCKS 89.9% | | | | |
| | |
| | | | Airlines 0.5% | | | | |
| | 6,985 | | | Alaska Air Group, Inc. | | $ | 532,746 | |
| | | | | | | | |
| | | | Apparel, Accessories & Luxury Goods 4.3% | | | | |
| | 95,862 | | | Michael Kors Holdings Ltd.* | | | 4,586,997 | |
| | | | | | | | |
| | | | Automobile Manufacturers 2.5% | | | | |
| | 66,020 | | | General Motors Co.†† | | | 2,665,888 | |
| | | | | | | | |
| | | | Biotechnology 6.2% | | | | |
| | 35,048 | | | Amgen, Inc. | | | 6,534,699 | |
| | | | | | | | |
| | | | Communications Equipment 3.3% | | | | |
| | 103,011 | | | Cisco Systems, Inc.†† | | | 3,464,260 | |
| | | | | | | | |
| | | | Department Stores 1.3% | | | | |
| | 65,007 | | | Macy’s, Inc.†† | | | 1,418,453 | |
| | | | | | | | |
| | | | Diversified Banks 3.4% | | | | |
| | 49,016 | | | Citigroup, Inc.†† | | | 3,565,424 | |
| | | | | | | | |
| | | | Electrical Components & Equipment 1.1% | | | | |
| | 18,023 | | | Emerson Electric Co.†† | | | 1,132,565 | |
| | | | | | | | |
| | | | Electronic Manufacturing Services 2.1% | | | | |
| | 59,785 | | | Fabrinet* | | | 2,215,632 | |
| | | | | | | | |
| | | | Fertilizers & Agricultural Chemicals 1.6% | | | | |
| | 79,995 | | | Mosaic Co. (The)†† | | | 1,727,092 | |
| | | | | | | | |
| | | | Food Retail 2.7% | | | | |
| | 142,869 | | | Kroger Co. (The)†† | | | 2,865,952 | |
| | | | | | | | |
| | | | Health Care Distributors 4.5% | | | | |
| | 31,351 | | | McKesson Corp.†† | | | 4,815,827 | |
| | | | | | | | |
| | | | Health Care Equipment 4.3% | | | | |
| | 58,100 | | | Medtronic plc | | | 4,518,437 | |
| | | | | | | | |
| | | | Hotels, Resorts & Cruise Lines 1.9% | | | | |
| | 98,255 | | | Extended Stay America, Inc.** †† | | | 1,965,100 | |
| | | | | | | | |
| | | | Integrated Telecommunication Services 1.2% | | | | |
| | 26,665 | | | Verizon Communications, Inc.†† | | | 1,319,651 | |
| | | | | | | | |
| | | | Internet Software & Services 1.9% | | | | |
| | 40,670 | | | Akamai Technologies, Inc.* †† | | | 1,981,442 | |
| | | | | | | | |
| | | | Oil & Gas Exploration & Production 7.0% | | | | |
| | 47,896 | | | Anadarko Petroleum Corp.†† | | | 2,339,720 | |
| | 797,863 | | | Bill Barrett Corp.* †† | | | 3,422,832 | |
| | 269,169 | | | Southwestern Energy Co.* †† | | | 1,644,622 | |
| | | | | | | | |
| | | | 7,407,174 | |
| | | | | | | | |
| | | | Pharmaceuticals 10.1% | | | | |
| | 19,231 | | | Allergan plc†† | | | 3,941,393 | |
| | 25,948 | | | Johnson & Johnson†† | | | 3,373,500 | |
| | 39,273 | | | Novartis AG ADR (Switzerland) | | | 3,371,587 | |
| | | | | | | | |
| | | | 10,686,480 | |
| | | | | | | | |
| | | | Regional Banks 2.8% | | | | |
| | 100,728 | | | KeyCorp†† | | | 1,895,701 | |
| | 8,349 | | | PNC Financial Services Group, Inc. (The)†† | | | 1,125,195 | |
| | | | | | | | |
| | | | 3,020,896 | |
| | | | | | | | |
| | | | Semiconductors 10.2% | | | | |
| | 56,567 | | | Mellanox Technologies Ltd.* | | | 2,667,134 | |
| | 101,495 | | | QUALCOMM, Inc.†† | | | 5,261,501 | |
| | 93,891 | | | Tower Semiconductor Ltd.* (Israel) | | | 2,887,148 | |
| | | | | | | | |
| | | | | | | 10,815,783 | |
| | | | | | | | |
| | | | | | | | |
| Shares | | | | | Value | |
| | | | | | | |
| | | | Specialized REITs 3.0% | | | | |
| | 28,731 | | | Iron Mountain, Inc.†† | | $ | 1,117,636 | |
| | 81,746 | | | Outfront Media, Inc.†† | | | 2,058,364 | |
| | | | | | | | |
| | | | | | | 3,176,000 | |
| | | | | | | | |
| | | | Steel 2.9% | | | | |
| | 87,891 | | | Steel Dynamics, Inc.†† | | | 3,029,603 | |
| | | | | | | | |
| | | | Systems Software 4.1% | | | | |
| | 76,267 | | | Barracuda Networks, Inc.* †† | | | 1,847,949 | |
| | 38,062 | | | Oracle Corp.†† | | | 1,840,298 | |
| | 5,906 | | | VMware, Inc., Class A* †† | | | 644,876 | |
| | | | | | | | |
| | | | | | | 4,333,123 | |
| | | | | | | | |
| | | | Technology Hardware, Storage & Peripherals 5.0% | | | | |
| | 34,256 | | | Apple, Inc.†† | | | 5,279,535 | |
| | | | | | | | |
| | | | Thrifts & Mortgage Finance 2.0% | | | | |
| | 74,446 | | | BofI Holding, Inc.* †† | | | 2,119,478 | |
| | | | | | | | |
| | |
| | | | Total Common Stocks
(cost $93,009,851) | | | 95,178,237 | |
| | | | | | | | |
| | |
| | | | LIMITED PARTNERSHIP INTEREST 2.5% | | | | |
| | |
| | | | Asset Management & Custody Banks 2.5% | | | | |
| | 80,892 | | | Blackstone Group L.P. (The)†† | | | 2,699,366 | |
| | | | | | | | |
| | |
| | | | Total Limited Partnership Interest
(cost $2,453,448) | | | 2,699,366 | |
| | | | | | | | |
| | |
Principal
Amount | | | | | Value | |
| | | | SHORT-TERM INVESTMENTS 33.2% | | | | |
| | |
| | | | Repurchase Agreement 33.2% | | | | |
| | $35,132,336 | | | Repurchase Agreement dated 9/29/17,
0.12% due 10/2/17 with Fixed Income
Clearing Corp. collateralized by
$36,155,000 of United States Treasury
Notes 2.000% due 2/15/25; value:
$23,851,584; United States Treasury
Notes 2.000% due 11/15/26; value:
$4,802,649; United States Treasury
Notes 2.250% due 2/15/27; value:
$7,182,545; repurchase proceeds:
$35,132,687 (cost $35,132,336) | | $ | 35,132,336 | |
| | | | | | | | |
| | |
| | | | Total Short-Term Investments
(cost $35,132,336) | | | 35,132,336 | |
| | | | | | | | |
| | |
| | | | Total Investments
(cost $130,595,635) 125.6% | | | 133,009,939 | |
| | |
| | | | Liabilities less Other Assets (25.6%) | | | (27,091,330 | ) |
| | | | | | | | |
| | |
| | | | NET ASSETS 100.0% | | $ | 105,918,609 | |
| | | | | | | | |
66
| | | | | | | | |
| Shares | | | | | Value | |
| | | | | | | |
| | | | SECURITIES SOLD SHORT 48.5% | | | | |
| | |
| | | | Apparel, Accessories & Luxury Goods 2.6% | | | | |
| | 68,534 | | | Coach, Inc. | | $ | 2,760,549 | |
| | | | | | | | |
| | | | Application Software 3.4% | | | | |
| | 47,717 | | | Paycom Software, Inc.* | | | 3,576,866 | |
| | | | | | | | |
| | | | Automotive Retail 2.5% | | | | |
| | 35,121 | | | CarMax, Inc.* | | | 2,662,523 | |
| | | | | | | | |
| | | | Construction Machinery & Heavy Trucks 3.7% | | | | |
| | 31,075 | | | Caterpillar, Inc. | | | 3,875,363 | |
| | | | | | | | |
| | | | Copper 2.0% | | | | |
| | 154,362 | | | Freeport-McMoRan, Inc.* | | | 2,167,242 | |
| | | | | | | | |
| | | | Diversified Support Services 2.6% | | | | |
| | 51,147 | | | Healthcare Services Group, Inc. | | | 2,760,404 | |
| | | | | | | | |
| | | | Food Distributors 2.6% | | | | |
| | 50,218 | | | Sysco Corp. | | | 2,709,261 | |
| | | | | | | | |
| | | | Health Care Equipment 3.5% | | | | |
| | 38,836 | | | Inogen, Inc.* | | | 3,693,304 | |
| | | | | | | | |
| | | | Health Care Technology 3.0% | | | | |
| | 56,991 | | | Veeva Systems, Inc., Class A* | | | 3,214,862 | |
| | | | | | | | |
| | | | Home Furnishing Retail 0.5% | | | | |
| | 7,399 | | | RH* | | | 520,298 | |
| | | | | | | | |
| | | | Hotels, Resorts & Cruise Lines 1.1% | | | | |
| | 18,120 | | | Choice Hotels International, Inc. | | | 1,157,868 | |
| | | | | | | | |
| | | | Housewares & Specialties 0.9% | | | | |
| | 23,380 | | | Newell Brands, Inc. | | | 997,625 | |
| | | | | | | | |
| | | | Internet & Direct Marketing Retail 1.1% | | | | |
| | 20,200 | | | Nutrisystem, Inc. | | | 1,129,180 | |
| | | | | | | | |
| | | | Internet Software & Services 1.1% | | | | |
| | 26,878 | | | Criteo S.A., ADR* (France) | | | 1,115,437 | |
| | | | | | | | |
| | | | Oil & Gas Drilling 2.2% | | | | |
| | 45,106 | | | Helmerich & Payne, Inc. | | | 2,350,474 | |
| | | | | | | | |
| | | | Packaged Foods & Meats 2.8% | | | | |
| | 104,598 | | | Blue Buffalo Pet Products, Inc.* | | | 2,965,353 | |
| | | | | | | | |
| | | | Personal Products 3.5% | | | | |
| | 33,993 | | | Estee Lauder Cos., Inc. (The), Class A | | | 3,665,805 | |
| | | | | | | | |
| | | | Pharmaceuticals 2.6% | | | | |
| | 55,232 | | | Prestige Brands Holdings, Inc.* | | | 2,766,571 | |
| | | | | | | | |
| | | | Property & Casualty Insurance 2.6% | | | | |
| | 56,226 | | | First American Financial Corp. | | | 2,809,613 | |
| | | | | | | | |
| | | | Restaurants 2.4% | | | | |
| | 40,352 | | | Restaurant Brands International, Inc. (Canada) | | | 2,577,686 | |
| | | | | | | | |
| | | | Semiconductors 1.2% | | | | |
| | 33,339 | | | Synaptics, Inc.* | | | 1,306,222 | |
| | | | | | | | |
| | | | | | | | |
| Shares | | | | | Value | |
| | | | | | | |
| | | | Specialty Stores 0.6% | | | | |
| | 2,612 | | | Ulta Beauty, Inc.* | | $ | 590,469 | |
| | | | | | | | |
| | |
| | | | Total Securities Sold Short
(proceeds $39,530,978) | | | 51,372,975 | |
| | | | | | | | |
| |
| | | | *Non-income producing. **Common units. ††All or a portion of this security has been designated as collateral for short sales (see Note 3). ADR American Depositary Receipt. REIT Real Estate Investment Trust. See Notes to Financial Statements. | |
At September 30, 2017, Wasatch Long/Short Fund’s investments, excluding short-term investments and securities sold short, were in the following countries (unaudited):
| | | | |
| Country | | % | |
Israel | | | 3.0 | |
Switzerland | | | 3.4 | |
United States | | | 93.6 | |
| | | | |
TOTAL | | | 100.0 | % |
| | | | |
67
| | |
| WASATCH MICRO CAP FUND (WMICX) | | |
|
|
|
Schedule of Investments
| | | | | | | | |
| Shares | | | | | Value | |
| | | | | | | |
| | | | COMMON STOCKS 97.7% | | | | |
| | |
| | | | Apparel, Accessories & Luxury Goods 2.7% | | | | |
| | 368,245 | | | Superior Uniform Group, Inc. | | $ | 8,432,810 | |
| | | | | | | | |
| | | | Application Software 11.0% | | | | |
| | 219,207 | | | Callidus Software, Inc.* | | | 5,403,453 | |
| | 26,063 | | | Ellie Mae, Inc.* | | | 2,140,554 | |
| | 47,000 | | | Esker S.A. (France) | | | 2,702,474 | |
| | 204,716 | | | Exa Corp.* | | | 4,950,033 | |
| | 427,000 | | | Fortnox AB (Sweden) | | | 2,076,048 | |
| | 133,954 | | | Globant S.A.* (Argentina) | | | 5,367,537 | |
| | 39,549 | | | HubSpot, Inc.* | | | 3,324,093 | |
| | 24,720 | | | Tyler Technologies, Inc.* | | | 4,309,190 | |
| | 189,897 | | | Upland Software, Inc.* | | | 4,018,221 | |
| | | | | | | | |
| | | | 34,291,603 | |
| | | | | | | | |
| | | | Asset Management & Custody Banks 1.1% | | | | |
| | 15,534 | | | Diamond Hill Investment Group, Inc. | | | 3,298,645 | |
| | | | | | | | |
| | | | Automotive Retail 0.7% | | | | |
| | 41,597 | | | Monro, Inc. | | | 2,331,512 | |
| | | | | | | | |
| | | | Biotechnology 8.6% | | | | |
| | 278,787 | | | Abcam plc (United Kingdom) | | | 3,810,459 | |
| | 229,798 | | | ChemoCentryx, Inc.* | | | 1,705,101 | |
| | 60,913 | | | Cytokinetics, Inc.* | | | 883,239 | |
| | 62,154 | | | Esperion Therapeutics, Inc.* | | | 3,115,158 | |
| | 123,353 | | | Exact Sciences Corp.* | | | 5,812,393 | |
| | 99,748 | | | Flexion Therapeutics, Inc.* | | | 2,411,907 | |
| | 214,683 | | | Inovio Pharmaceuticals, Inc.* | | | 1,361,090 | |
| | 384,705 | | | Sangamo Therapeutics Inc.* | | | 5,770,575 | |
| | 97,782 | | | Selecta Biosciences, Inc.* | | | 1,784,522 | |
| | | | | | | | |
| | | | 26,654,444 | |
| | | | | | | | |
| | | | Building Products 1.9% | | | | |
| | 64,889 | | | Trex Co., Inc.* | | | 5,844,552 | |
| | | | | | | | |
| | | | Construction & Engineering 1.2% | | | | |
| | 66,255 | | | NV5 Global, Inc.* | | | 3,620,836 | |
| | | | | | | | |
| | | | Consumer Electronics 1.3% | | | | |
| | 257,317 | | | ZAGG, Inc.* | | | 4,052,743 | |
| | | | | | | | |
| | | | Department Stores 2.2% | | | | |
| | 317,634 | | | V-Mart Retail Ltd. (India) | | | 7,002,342 | |
| | | | | | | | |
| | | | Diversified Banks 1.2% | | | | |
| | 1,461,736 | | | City Union Bank Ltd. (India) | | | 3,670,005 | |
| | | | | | | | |
| | | | Electronic Equipment & Instruments 2.6% | | | | |
| | 34,211 | | | Mesa Laboratories, Inc. | | | 5,108,387 | |
| | 314,049 | | | Napco Security Technologies, Inc.* | | | 3,046,275 | |
| | | | | | | | |
| | | | 8,154,662 | |
| | | | | | | | |
| | | | Electronic Manufacturing Services 1.0% | | | | |
| | 88,036 | | | Fabrinet* | | | 3,262,614 | |
| | | | | | | | |
| | | | Environmental & Facilities Services 1.1% | | | | |
| | 157,734 | | | Heritage-Crystal Clean, Inc.* | | | 3,430,714 | |
| | | | | | | | |
| | | | Food Distributors 1.3% | | | | |
| | 217,154 | | | Chefs’ Warehouse, Inc. (The)* | | | 4,191,072 | |
| | | | | | | | |
| | | | General Merchandise Stores 1.5% | | | | |
| | 101,901 | | | Ollie’s Bargain Outlet Holdings, Inc.* | | | 4,728,206 | |
| | | | | | | | |
| | | | Health Care Distributors 1.3% | | | | |
| | 148,698 | | | PetIQ, Inc.* | | | 4,026,742 | |
| | | | | | | | |
| | | | | | | | |
| Shares | | | | | Value | |
| | | | | | | |
| | | | Health Care Equipment 3.3% | | | | |
| | 209,478 | | | AtriCure, Inc.* | | $ | 4,686,023 | |
| | 88,199 | | | Entellus Medical, Inc.* | | | 1,628,154 | |
| | 185,814 | | | Oxford Immunotec Global plc* | | | 3,121,675 | |
| | 1,017,822 | | | Tandem Diabetes Care, Inc.* | | | 743,010 | |
| | | | | | | | |
| | | | 10,178,862 | |
| | | | | | | | |
| | | | Health Care Facilities 2.0% | | | | |
| | 282,081 | | | Ensign Group, Inc. (The) | | | 6,372,210 | |
| | | | | | | | |
| | | | Health Care REITs 1.8% | | | | |
| | 156,482 | | | CareTrust REIT, Inc. | | | 2,979,418 | |
| | 213,551 | | | MedEquities Realty Trust, Inc. | | | 2,509,224 | |
| | | | | | | | |
| | | | 5,488,642 | |
| | | | | | | | |
| | | | Health Care Technology 2.2% | | | | |
| | 53,733 | | | Omnicell, Inc.* | | | 2,743,070 | |
| | 149,929 | | | Tabula Rasa HealthCare, Inc.* | | | 4,009,101 | |
| | | | | | | | |
| | | | 6,752,171 | |
| | | | | | | | |
| | | | Heavy Electrical Equipment 2.2% | | | | |
| | 216,292 | | | TPI Composites, Inc.* | | | 4,831,963 | |
| | 1,000,000 | | | Triveni Turbine Ltd. (India) | | | 1,980,251 | |
| | | | | | | | |
| | | | 6,812,214 | |
| | | | | | | | |
| | | | Homebuilding 5.2% | | | | |
| | 121,664 | | | Installed Building Products, Inc.* | | | 7,883,827 | |
| | 170,875 | | | LGI Homes, Inc.* | | | 8,299,399 | |
| | | | | | | | |
| | | | 16,183,226 | |
| | | | | | | | |
| | | | Human Resource & Employment Services 1.0% | | | | |
| | 154,100 | | | UT Group Co., Ltd.* (Japan) | | | 3,012,842 | |
| | | | | | | | |
| | | | Industrial Machinery 3.0% | | | | |
| | 63,012 | | | Altra Industrial Motion Corp. | | | 3,030,877 | |
| | 210,591 | | | Kornit Digital Ltd.* (Israel) | | | 3,222,042 | |
| | 111,977 | | | va-Q-tec AG* (Germany) | | | 3,014,173 | |
| | | | | | | | |
| | | | 9,267,092 | |
| | | | | | | | |
| | | | Industrial REITs 1.0% | | | | |
| | 187,585 | | | Monmouth Real Estate Investment Corp. | | | 3,037,001 | |
| | | | | | | | |
| | | | Internet & Direct Marketing Retail 0.8% | | | | |
| | 120,832 | | | Duluth Holdings, Inc.* | | | 2,451,681 | |
| | | | | | | | |
| | | | Internet Software & Services 8.1% | | | | |
| | 119,769 | | | Envestnet, Inc.* | | | 6,108,219 | |
| | 180,548 | | | Five9, Inc.* | | | 4,315,097 | |
| | 128,170 | | | Instructure, Inc.* | | | 4,248,836 | |
| | 112,000 | | | SMS Co. Ltd. (Japan) | | | 3,568,274 | |
| | 202,057 | | | TrueCar, Inc.* | | | 3,190,480 | |
| | 66,788 | | | Tucows, Inc., Class A* | | | 3,910,437 | |
| | | | | | | | |
| | | | 25,341,343 | |
| | | | | | | | |
| | | | Leisure Products 1.1% | | | | |
| | 164,909 | | | MCBC Holdings, Inc.* | | | 3,360,845 | |
| | | | | | | | |
| | | | Life Sciences Tools & Services 1.0% | | | | |
| | 27,884 | | | ICON plc* (Ireland) | | | 3,175,430 | |
| | | | | | | | |
| | | | Managed Health Care 2.6% | | | | |
| | 161,084 | | | HealthEquity, Inc.* | | | 8,147,629 | |
| | | | | | | | |
| | | | Oil & Gas Equipment & Services 1.0% | | | | |
| | 197,618 | | | Pason Systems, Inc. (Canada) | | | 2,974,367 | |
| | | | | | | | |
| | | | Oil & Gas Exploration & Production 0.4% | | | | |
| | 624,030 | | | Abraxas Petroleum Corp.* | | | 1,173,176 | |
| | | | | | | | |
68
| | | | | | | | |
Shares | | | | | Value | |
| | | | | | | |
| | | | Packaged Foods & Meats 3.0% | | | | |
| | 415,274 | | | Freshpet, Inc.* | | $ | 6,499,038 | |
| | 1,500,000 | | | Prabhat Dairy Ltd. (India) | | | 2,907,226 | |
| | | | | | | | |
| | | | 9,406,264 | |
| | | | | | | | |
| | | | Pharmaceuticals 1.8% | | | | |
| | 197,037 | | | Intra-Cellular Therapies, Inc.* | | | 3,109,244 | |
| | 209,945 | | | Natco Pharma Ltd. (India) | | | 2,529,496 | |
| | | | | | | | |
| | | | 5,638,740 | |
| | | | | | | | |
| | | | Real Estate Services 0.8% | | | | |
| | 63,723 | | | HFF, Inc., Class A | | | 2,520,882 | |
| | | | | | | | |
| | | | Regional Banks 2.5% | | | | |
| | 78,590 | | | Customers Bancorp, Inc.* | | | 2,563,606 | |
| | 161,075 | | | People’s Utah Bancorp | | | 5,226,884 | |
| | | | | | | | |
| | | | 7,790,490 | |
| | | | | | | | |
| | | | Restaurants 2.3% | | | | |
| | 153,485 | | | Chuy’s Holdings, Inc.* | | | 3,230,859 | |
| | 210,615 | | | Fiesta Restaurant Group, Inc.* | | | 4,001,685 | |
| | | | | | | | |
| | | | 7,232,544 | |
| | | | | | | | |
| | | | Semiconductors 2.1% | | | | |
| | 78,164 | | | Impinj, Inc.* | | | 3,252,404 | |
| | 42,129 | | | NVE Corp. | | | 3,326,927 | |
| | | | | | | | |
| | | | 6,579,331 | |
| | | | | | | | |
| | | | Systems Software 0.9% | | | | |
| | 71,862 | | | CyberArk Software Ltd.* (Israel) | | | 2,946,342 | |
| | | | | | | | |
| | | | Technology Hardware, Storage & Peripherals 1.5% | | | | |
| | 742,732 | | | USA Technologies, Inc.* | | | 4,642,075 | |
| | | | | | | | |
| | | | Textiles 0.8% | | | | |
| | 2,406,652 | | | Welspun India Ltd. (India) | | | 2,503,552 | |
| | | | | | | | |
| | | | Thrifts & Mortgage Finance 4.6% | | | | |
| | 78,507 | | | Equitable Group, Inc. (Canada) | | | 3,523,456 | |
| | 676,404 | | | GRUH Finance Ltd. (India) | | | 5,043,000 | |
| | 23,703 | | | LendingTree, Inc.* | | | 5,794,198 | |
| | | | | | | | |
| | | | 14,360,654 | |
| | | | | | | | |
| | |
| | | | Total Common Stocks
(cost $181,184,148) | | | 304,343,107 | |
| | | | | | | | |
| | | | | | | | |
Principal
Amount | | | | | Value | |
| | | | | | | |
| | | | SHORT-TERM INVESTMENTS 0.3% | | | | |
| | |
| | | | Repurchase Agreement 0.3% | | | | |
| | $1,061,240 | | | Repurchase Agreement dated 9/29/17,
0.12% due 10/2/17 with Fixed Income
Clearing Corp. collateralized by $1,070,000
of United States Treasury Notes 2.250%
due 11/15/24; value: $1,086,386; repurchase
proceeds: $1,061,251 (cost $1,061,240) | | $ | 1,061,240 | |
| | | | | | | | |
| | |
| | | | Total Short-Term Investments
(cost $1,061,240) | | | 1,061,240 | |
| | | | | | | | |
| | |
| | | | Total Investments
(cost $182,245,388) 98.0% | | | 305,404,347 | |
| | |
| | | | Other Assets less Liabilities 2.0% | | | 6,178,903 | |
| | | | | | | | |
| | |
| | | | NET ASSETS 100.0% | | $ | 311,583,250 | |
| | | | | | | | |
| |
| | | | *Non-income producing. REIT Real Estate Investment Trust. See Notes to Financial Statements. | |
At September 30, 2017, Wasatch Micro Cap Fund’s investments, excluding short-term investments, were in the following countries (unaudited):
| | | | |
| Country | | % | |
Argentina | | | 1.8 | |
Canada | | | 2.1 | |
France | | | 0.9 | |
Germany | | | 1.0 | |
India | | | 8.4 | |
Ireland | | | 1.0 | |
Israel | | | 2.0 | |
Japan | | | 2.2 | |
Sweden | | | 0.7 | |
United Kingdom | | | 1.3 | |
United States | | | 78.6 | |
| | | | |
TOTAL | | | 100.0 | % |
| | | | |
69
| | |
| WASATCH MICRO CAP VALUE FUND (WAMVX) | | |
|
|
|
Schedule of Investments
| | | | | | | | |
| Shares | | | | | Value | |
| | | | | | | |
| | | | COMMON STOCKS 92.8% | | | | |
| | |
| | | | Air Freight & Logistics 1.8% | | | | |
| | 500,000 | | | Allcargo Logistics Ltd. (India) | | $ | 1,304,348 | |
| | 500,000 | | | Radiant Logistics, Inc.* | | | 2,655,000 | |
| | | | | | | | |
| | | | 3,959,348 | |
| | | | | | | | |
| | | | Alternative Carriers 0.9% | | | | |
| | 187,000 | | | ORBCOMM, Inc.* | | | 1,957,890 | |
| | | | | | | | |
| | | | Apparel, Accessories & Luxury Goods 1.0% | | | | |
| | 95,000 | | | Superior Uniform Group, Inc. | | | 2,175,500 | |
| | | | | | | | |
| | | | Application Software 3.7% | | | | |
| | 37,000 | | | Ebix, Inc. | | | 2,414,250 | |
| | 24,000 | | | ESI Group* (France) | | | 1,133,206 | |
| | 97,000 | | | Everbridge, Inc.* | | | 2,562,740 | |
| | 46,000 | | | Globant S.A.* (Argentina) | | | 1,843,220 | |
| | | | | | | | |
| | | | 7,953,416 | |
| | | | | | | | |
| | | | Asset Management & Custody Banks 1.1% | | | | |
| | 92,000 | | | Hamilton Lane, Inc., Class A | | | 2,470,200 | |
| | | | | | | | |
| | | | Auto Parts & Equipment 1.2% | | | | |
| | 87,000 | | | Horizon Global Corp.* | | | 1,534,680 | |
| | 128,000 | | | Unique Fabricating, Inc. | | | 1,081,600 | |
| | | | | | | | |
| | | | 2,616,280 | |
| | | | | | | | |
| | | | Biotechnology 0.9% | | | | |
| | 39,000 | | | Exact Sciences Corp.* | | | 1,837,680 | |
| | | | | | | | |
| | | | Brewers 1.0% | | | | |
| | 700,000 | | | Turk Tuborg Bira ve Malt Sanayii A.S. (Turkey) | | | 2,117,908 | |
| | | | | | | | |
| | | | Building Products 1.4% | | | | |
| | 36,000 | | | Patrick Industries, Inc.* | | | 3,027,600 | |
| | | | | | | | |
| | | | Construction & Engineering 1.6% | | | | |
| | 64,000 | | | NV5 Global, Inc.* | | | 3,497,600 | |
| | | | | | | | |
| | | | Construction Materials 0.6% | | | | |
| | 1,200,000 | | | Low & Bonar plc (United Kingdom) | | | 1,274,339 | |
| | | | | | | | |
| | | | Consumer Electronics 1.6% | | | | |
| | 225,000 | | | ZAGG, Inc.* | | | 3,543,750 | |
| | | | | | | | |
| | | | Diversified Banks 1.8% | | | | |
| | 780,000 | | | City Union Bank Ltd. (India) | | | 1,958,359 | |
| | 3,100,000 | | | East West Banking Corp. (Philippines) | | | 1,980,236 | |
| | | | | | | | |
| | | | 3,938,595 | |
| | | | | | | | |
| | | | Diversified Metals & Mining 1.0% | | | | |
| | 160,000 | | | Ferroglobe plc (United Kingdom) | | | 2,105,600 | |
| | | | | | | | |
| | | | Diversified Support Services 1.1% | | | | |
| | 1,150,000 | | | Johnson Service Group plc (United Kingdom) | | | 2,272,974 | |
| | | | | | | | |
| | | | Education Services 0.7% | | | | |
| | 200,000 | | | AcadeMedia AB* (Sweden) | | | 1,596,091 | |
| | | | | | | | |
| | | | Electronic Equipment & Instruments 2.1% | | | | |
| | 255,000 | | | Napco Security Technologies, Inc.* | | | 2,473,500 | |
| | 58,000 | | | Optex Group Co., Ltd. (Japan) | | | 2,170,007 | |
| | | | | | | | |
| | | | 4,643,507 | |
| | | | | | | | |
| | | | Electronic Manufacturing Services 1.2% | | | | |
| | 68,000 | | | Fabrinet* | | | 2,520,080 | |
| | | | | | | | |
| | | | Environmental & Facilities Services 0.5% | | | | |
| | 133,000 | | | Hudson Technologies, Inc.* | | | 1,038,730 | |
| | | | | | | | |
| | | | | | | | |
| Shares | | | | | Value | |
| | | | | | | |
| | | | Food Retail 0.9% | | | | |
| | 390,000 | | | Majestic Wine plc (United Kingdom) | | $ | 1,846,084 | |
| | | | | | | | |
| | | | General Merchandise Stores 1.7% | | | | |
| | 36,000 | | | Ollie’s Bargain Outlet Holdings, Inc.* | | | 1,670,400 | |
| | 36,000 | | | Seria Co. Ltd. (Japan) | | | 1,999,556 | |
| | | | | | | | |
| | | | 3,669,956 | |
| | | | | | | | |
| | | | Health Care Distributors 1.3% | | | | |
| | 100,761 | | | PetIQ, Inc.* | | | 2,728,608 | |
| | | | | | | | |
| | | | Health Care Equipment 3.3% | | | | |
| | 100,000 | | | Accuray, Inc.* | | | 400,000 | |
| | 90,000 | | | AtriCure, Inc.* | | | 2,013,300 | |
| | 142,000 | | | Oxford Immunotec Global plc* | | | 2,385,600 | |
| | 60,000 | | | Tactile Systems Technology, Inc.* | | | 1,857,000 | |
| | 782,646 | | | Tandem Diabetes Care, Inc.* | | | 571,332 | |
| | | | | | | | |
| | | | 7,227,232 | |
| | | | | | | | |
| | | | Health Care Facilities 1.4% | | | | |
| | 70,000 | | | Ensign Group, Inc. (The) | | | 1,581,300 | |
| | 70,000 | | | Japan Animal Referral Medical Center Co. Ltd.* (Japan) | | | 1,380,404 | |
| | | | | | | | |
| | | | 2,961,704 | |
| | | | | | | | |
| | | | Health Care Services 2.4% | | | | |
| | 40,000 | | | LHC Group, Inc.* | | | 2,836,800 | |
| | 63,000 | | | National Research Corp., Class A | | | 2,375,100 | |
| | | | | | | | |
| | | | 5,211,900 | |
| | | | | | | | |
| | | | Health Care Technology 2.3% | | | | |
| | 90,000 | | | Nexus AG (Germany) | | | 2,818,832 | |
| | 41,000 | | | Omnicell, Inc.* | | | 2,093,050 | |
| | | | | | | | |
| | | | 4,911,882 | |
| | | | | | | | |
| | | | Heavy Electrical Equipment 1.1% | | | | |
| | 107,000 | | | TPI Composites, Inc.* | | | 2,390,380 | |
| | | | | | | | |
| | | | Homebuilding 2.7% | | | | |
| | 45,000 | | | Installed Building Products, Inc.* | | | 2,916,000 | |
| | 62,000 | | | LGI Homes, Inc.* | | | 3,011,340 | |
| | | | | | | | |
| | | | 5,927,340 | |
| | | | | | | | |
| | | | Home Furnishing Retail 1.2% | | | | |
| | 85,000 | | | Select Comfort Corp.* | | | 2,639,250 | |
| | | | | | | | |
| | | | Hotels, Resorts & Cruise Lines 1.5% | | | | |
| | 400,000 | | | Byke Hospitality Ltd. (The) (India) | | | 1,056,644 | |
| | 242,600 | | | Red Lion Hotels Corp.* | | | 2,098,490 | |
| | | | | | | | |
| | | | 3,155,134 | |
| | | | | | | | |
| | | | Housewares & Specialties 0.1% | | | | |
| | 79,137 | | | OurPet’s Co.* | | | 142,447 | |
| | | | | | | | |
| | | | Human Resource & Employment Services 0.8% | | | | |
| | 105,034 | | | BG Staffing, Inc. | | | 1,738,313 | |
| | | | | | | | |
| | | | Industrial Machinery 3.2% | | | | |
| | 24,000 | | | John Bean Technologies Corp. | | | 2,426,400 | |
| | 85,000 | | | Kornit Digital Ltd.* (Israel) | | | 1,300,500 | |
| | 60,456 | | | Taylor Devices, Inc.* | | | 707,940 | |
| | 96,000 | | | va-Q-tec AG* (Germany) | | | 2,584,107 | |
| | | | | | | | |
| | | | 7,018,947 | |
| | | | | | | | |
| | | | Industrial REITs 1.0% | | | | |
| | 132,489 | | | Monmouth Real Estate Investment Corp. | | | 2,144,997 | |
| | | | | | | | |
| | | | Integrated Telecommunication Services 1.1% | | | | |
| | 220,000 | | | Ooma, Inc.* | | | 2,321,000 | |
| | | | | | | | |
| | | | Internet & Direct Marketing Retail 0.6% | | | | |
| | 334,166 | | | ePrice S.p.A. (Italy) | | | 1,212,499 | |
| | | | | | | | |
70
| | | | | | | | |
| Shares | | | | | Value | |
| | | | | | | |
| | | | Internet Software & Services 3.0% | | | | |
| | 89,000 | | | Rakus Co. Ltd. (Japan) | | $ | 1,637,236 | |
| | 86,000 | | | Reis, Inc. | | | 1,548,000 | |
| | 55,000 | | | Tucows, Inc., Class A* | | | 3,220,250 | |
| | | | | | | | |
| | | | 6,405,486 | |
| | | | | | | | |
| | | | Leisure Products 0.9% | | | | |
| | 110,000 | | | Nautilus, Inc.* | | | 1,859,000 | |
| | | | | | | | |
| | | | Life & Health Insurance 1.0% | | | | |
| | 42,000 | | | Kansas City Life Insurance Co. | | | 2,069,970 | |
| | | | | | | | |
| | | | Life Sciences Tools & Services 0.8% | | | | |
| | 555,000 | | | Horizon Discovery Group plc* (United Kingdom) | | | 1,688,198 | |
| | | | | | | | |
| | | | Mortgage REITs 1.0% | | | | |
| | 260,000 | | | Arbor Realty Trust, Inc. | | | 2,132,000 | |
| | | | | | | | |
| | | | Oil & Gas Exploration & Production 0.8% | | | | |
| | 148,000 | | | Earthstone Energy, Inc., Class A* | | | 1,626,520 | |
| | | | | | | | |
| | | | Packaged Foods & Meats 3.5% | | | | |
| | 85,000 | | | Bombay Burmah Trading Co. (India) | | | 1,659,140 | |
| | 152,000 | | | Freshpet, Inc.* | | | 2,378,800 | |
| | 1,800,000 | | | Kawan Food BHD (Malaysia) | | | 1,453,641 | |
| | 2,700,000 | | | Yihai International Holding Ltd. (China) | | | 2,163,705 | |
| | | | | | | | |
| | | | 7,655,286 | |
| | | | | | | | |
| | | | Personal Products 0.8% | | | | |
| | 120,000 | | | Sarantis S.A. (Greece) | | | 1,757,249 | |
| | | | | | | | |
| | | | Pharmaceuticals 1.0% | | | | |
| | 140,000 | | | Intra-Cellular Therapies, Inc.* | | | 2,209,200 | |
| | | | | | | | |
| | | | Property & Casualty Insurance 2.5% | | | | |
| | 150,000 | | | Atlas Financial Holdings, Inc.* | | | 2,835,000 | |
| | 158,000 | | | Kingstone Cos., Inc. | | | 2,575,400 | |
| | | | | | | | |
| | | | 5,410,400 | |
| | | | | | | | |
| | | | Real Estate Operating Companies 0.8% | | | | |
| | 133,000 | | | Japan Property Management Center Co. Ltd. (Japan) | | | 1,816,672 | |
| | | | | | | | |
| | | | Regional Banks 11.6% | | | | |
| | 69,000 | | | Bankwell Financial Group, Inc. | | | 2,548,860 | |
| | 111,000 | | | Blue Hills Bancorp, Inc. | | | 2,131,200 | |
| | 80,839 | | | Capstar Financial Holdings, Inc.* | | | 1,582,827 | |
| | 45,000 | | | Customers Bancorp, Inc.* | | | 1,467,900 | |
| | 200,000 | | | Esquire Financial Holdings, Inc.* | | | 3,218,000 | |
| | 85,000 | | | First of Long Island Corp. (The) | | | 2,588,250 | |
| | 92,911 | | | Investar Holding Corp. | | | 2,239,155 | |
| | 76,000 | | | People’s Utah Bancorp | | | 2,466,200 | |
| | 99,000 | | | SmartFinancial, Inc.* | | | 2,381,940 | |
| | 71,713 | | | Sound Financial Bancorp, Inc. | | | 2,398,800 | |
| | 90,000 | | | Sunshine Bancorp, Inc.* | | | 2,091,600 | |
| | | | | | | | |
| | | | 25,114,732 | |
| | | | | | | | |
| | | | Restaurants 0.6% | | | | |
| | 300,000 | | | Collins Foods Ltd. (Australia) | | | 1,376,622 | |
| | | | | | | | |
| | | | Semiconductor Equipment 0.7% | | | | |
| | 103,000 | | | PDF Solutions, Inc.* | | | 1,595,470 | |
| | | | | | | | |
| | | | Semiconductors 2.1% | | | | |
| | 145,000 | | | Tower Semiconductor Ltd.* (Israel) | | | 4,458,750 | |
| | | | | | | | |
| | | | Specialty Chemicals 1.5% | | | | |
| | 115,000 | | | Ferro Corp.* | | | 2,564,500 | |
| | 150,000 | | | Flotek Industries, Inc.* | | | 697,500 | |
| | | | | | | | |
| | | | 3,262,000 | |
| | | | | | | | |
| | | | Systems Software 0.2% | | | | |
| | 80,000 | | | Attunity Ltd.* (Israel) | | | 540,800 | |
| | | | | | | | |
| | | | | | | | |
| Shares | | | | | Value | |
| | | | | | | |
| | | | Technology Hardware, Storage & Peripherals 2.2% | | | | |
| | 25,000 | | | MGI Digital Graphic Technology* (France) | | $ | 1,571,927 | |
| | 510,000 | | | USA Technologies, Inc.* | | | 3,187,500 | |
| | | | | | | | |
| | | | 4,759,427 | |
| | | | | | | | |
| | | | Textiles 1.1% | | | | |
| | 2,100,000 | | | Best Pacific International Holdings Ltd. (China) | | | 1,182,856 | |
| | 1,200,000 | | | Welspun India Ltd. (India) | | | 1,248,316 | |
| | | | | | | | |
| | | | 2,431,172 | |
| | | | | | | | |
| | | | Thrifts & Mortgage Finance 3.6% | | | | |
| | 131,000 | | | Beneficial Bancorp, Inc. | | | 2,174,600 | |
| | 109,000 | | | BofI Holding, Inc.* | | | 3,103,230 | |
| | 2,343 | | | Entegra Financial Corp.* | | | 58,458 | |
| | 360,000 | | | Mortgage Advice Bureau Holdings Ltd. (United Kingdom) | | | 2,460,239 | |
| | | | | | | | |
| | | | 7,796,527 | |
| | | | | | | | |
| | | | Trading Companies & Distributors 1.3% | | | | |
| | 48,000 | | | SiteOne Landscape Supply, Inc.* | | | 2,788,800 | |
| | | | | | | | |
| | |
| | | | Total Common Stocks
(cost $133,133,365) | | | 200,549,042 | |
| | | | | | | | |
| | |
| | | | CONVERTIBLE PREFERRED STOCKS 0.7% | | | | |
| | |
| | | | Oil & Gas Refining & Marketing 0.7% | | | | |
| | 563,807 | | | Vertex Energy, Inc., Pfd., 6.00% PIK Series B*** † | | | 1,460,260 | |
| | | | | | | | |
| | |
| | | | Total Convertible Preferred Stocks
(cost $1,652,801) | | | 1,460,260 | |
| | | | | | | | |
| | |
| | | | RIGHTS 0.2% | | | | |
| | |
| | | | Health Care Supplies 0.0% | | | | |
| | 375,000 | | | Synergetics USA, Inc.* *** † | | | 18,750 | |
| | | | | | | | |
| | | | Pharmaceuticals 0.2% | | | | |
| | 1 | | | Acetylon Pharmaceuticals, Inc.* *** † | | | 326,356 | |
| | 1 | | | Acetylon Pharmaceuticals, Inc.* *** † | | | — | |
| | | | | | | | |
| | | | 326,356 | |
| | | | | | | | |
| | |
| | | | Total Rights
(cost $71,250) | | | 345,106 | |
| | | | | | | | |
| | |
| | | | LIMITED LIABILITY COMPANY MEMBERSHIP INTEREST 0.0% | | | | |
| | |
| | | | Pharmaceuticals 0.0% | | | | |
| | 50,528 | | | Regenacy Pharmaceuticals, LLC* *** † | | | 51,476 | |
| | | | | | | | |
| | |
| | | | Total Limited Liability Company Membership Interest
(cost $30,001) | | | 51,476 | |
| | | | | | | | |
| | |
| | | | WARRANTS 0.0% | | | | |
| | |
| | | | Oil & Gas Refining & Marketing 0.0% | | | | |
| | 250,000 | | | Vertex Energy, Inc., expiring 12/24/2020* *** † | | | 2,500 | |
| | | | | | | | |
| | |
| | | | Total Warrants
(cost $95,000) | | | 2,500 | |
| | | | | | | | |
71
| | |
| WASATCH MICRO CAP VALUE FUND (WAMVX) | | SEPTEMBER 30, 2017 |
|
|
|
Schedule of Investments (continued)
| | | | | | | | |
Principal
Amount | | | | | Value | |
| | | | | | | |
| | | | SHORT-TERM INVESTMENTS 6.7% | | | | |
| | |
| | | | Repurchase Agreement 6.7% | | | | |
| | $14,565,031 | | | Repurchase Agreement dated 9/29/17, 0.12% due 10/2/17 with Fixed Income Clearing Corp. collateralized by $14,635,000 of United States Treasury Notes 2.250% due 11/15/24; value: $14,859,120; repurchase proceeds: $14,565,177 (cost $14,565,031) | | $ | 14,565,031 | |
| | | | | | | | |
| | |
| | | | Total Short-Term Investments
(cost $14,565,031) | | | 14,565,031 | |
| | | | | | | | |
| | |
| | | | Total Investments
(cost $149,547,448) 100.4% | | | 216,973,415 | |
| | |
| | | | Liabilities less Other Assets (0.4%) | | | (886,191 | ) |
| | | | | | | | |
| | |
| | | | NET ASSETS 100.0% | | $ | 216,087,224 | |
| | | | | | | | |
| |
| | | | *Non-income producing. ***Security was fair valued under procedures adopted by the Board of Trustees (see Note 12). †Security purchased in a private placement transaction or under Rule 144A of the Securities Act of 1933 (see Note 9). PIK Payment in kind. REIT Real Estate Investment Trust. See Notes to Financial Statements. | |
At September 30, 2017, Wasatch Micro Cap Value Fund’s investments, excluding short-term investments, were in the following countries (unaudited):
| | | | |
| Country | | % | |
Argentina | | | 0.9 | |
Australia | | | 0.7 | |
China | | | 1.6 | |
France | | | 1.3 | |
Germany | | | 2.7 | |
Greece | | | 0.9 | |
India | | | 3.6 | |
Israel | | | 3.1 | |
Italy | | | 0.6 | |
Japan | | | 4.4 | |
Malaysia | | | 0.7 | |
Philippines | | | 1.0 | |
Sweden | | | 0.8 | |
Turkey | | | 1.0 | |
United Kingdom | | | 5.8 | |
United States | | | 70.9 | |
| | | | |
TOTAL | | | 100.0 | % |
| | | | |
72
| | |
| WASATCH SMALL CAP GROWTH FUND (WAAEX / WIAEX) | | SEPTEMBER 30, 2017 |
|
|
|
Schedule of Investments
| | | | | | | | |
| Shares | | | | | Value | |
| | | | | | | |
| | | | COMMON STOCKS 94.8% | | | | |
| | |
| | | | Aerospace & Defense 3.0% | | | | |
| | 671,835 | | | HEICO Corp., Class A | | $ | 51,193,827 | |
| | | | | | | | |
| | | | Air Freight & Logistics 1.9% | | | | |
| | 23,918,023 | | | Aramex PJSC (United Arab Emirates) | | | 32,432,542 | |
| | | | | | | | |
| | | | Airlines 2.2% | | | | |
| | 140,778 | | | Allegiant Travel Co. | | | 18,540,462 | |
| | 584,085 | | | Spirit Airlines, Inc.* | | | 19,514,280 | |
| | | | | | | | |
| | | | | | | 38,054,742 | |
| | | | | | | | |
| | | | Application Software 10.8% | | | | |
| | 1,501,652 | | | Callidus Software, Inc.* | | | 37,015,722 | |
| | 344,774 | | | Globant S.A.* (Argentina) | | | 13,815,094 | |
| | 286,302 | | | HubSpot, Inc.* | | | 24,063,683 | |
| | 420,349 | | | Paylocity Holding Corp.* | | | 20,521,438 | |
| | 316,789 | | | Ultimate Software Group, Inc. (The)* | | | 60,063,194 | |
| | 936,169 | | | Zendesk, Inc.* | | | 27,251,880 | |
| | | | | | | | |
| | | | | | | 182,731,011 | |
| | | | | | | | |
| | | | Automotive Retail 2.2% | | | | |
| | 656,134 | | | Monro, Inc. | | | 36,776,311 | |
| | | | | | | | |
| | | | Biotechnology 9.8% | | | | |
| | 2,124,073 | | | Abcam plc (United Kingdom) | | | 29,031,817 | |
| | 1,086,829 | | | ChemoCentryx, Inc.* | | | 8,064,271 | |
| | 299,624 | | | Cytokinetics, Inc.* | | | 4,344,548 | |
| | 339,894 | | | Esperion Therapeutics, Inc.* | | | 17,035,487 | |
| | 596,206 | | | Exact Sciences Corp.* | | | 28,093,227 | |
| | 477,149 | | | Flexion Therapeutics, Inc.* | | | 11,537,463 | |
| | 1,218,886 | | | Inovio Pharmaceuticals, Inc.* | | | 7,727,737 | |
| | 346,891 | | | Juno Therapeutics, Inc.* | | | 15,561,530 | |
| | 546,626 | | | MacroGenics, Inc.* | | | 10,101,649 | |
| | 1,463,102 | | | Sangamo Therapeutics Inc.* | | | 21,946,530 | |
| | 227,469 | | | Seattle Genetics, Inc.* | | | 12,376,588 | |
| | | | | | | | |
| | | | | | | 165,820,847 | |
| | | | | | | | |
| | | | Building Products 1.1% | | | | |
| | 518,240 | | | AAON, Inc. | | | 17,866,324 | |
| | | | | | | | |
| | | | Diversified Banks 1.2% | | | | |
| | 3,778,620 | | | Yes Bank Ltd. (India) | | | 20,206,246 | |
| | | | | | | | |
| | | | Diversified Support Services 4.1% | | | | |
| | 2,040,848 | | | Copart, Inc.* | | | 70,143,946 | |
| | | | | | | | |
| | | | Drug Retail 1.6% | | | | |
| | 119,229 | | | Cosmos Pharmaceutical Corp. (Japan) | | | 26,616,596 | |
| | | | | | | | |
| | | | Food Distributors 1.1% | | | | |
| | 944,388 | | | Chefs’ Warehouse, Inc. (The)* | | | 18,226,688 | |
| | | | | | | | |
| | | | General Merchandise Stores 2.4% | | | | |
| | 861,512 | | | Ollie’s Bargain Outlet Holdings, Inc.* | | | 39,974,157 | |
| | | | | | | | |
| | | | Health Care Equipment 0.9% | | | | |
| | 161,783 | | | Cantel Medical Corp. | | | 15,235,105 | |
| | | | | | | | |
| | | | Health Care Facilities 2.0% | | | | |
| | 1,533,765 | | | Ensign Group, Inc. (The) | | | 34,647,751 | |
| | | | | | | | |
| | | | Health Care Supplies 0.2% | | | | |
| | 49,843 | | | Neogen Corp.* | | | 3,860,839 | |
| | | | | | | | |
| | | | Industrial Machinery 3.8% | | | | |
| | 242,595 | | | Barnes Group, Inc. | | | 17,088,392 | |
| | 278,819 | | | RBC Bearings, Inc.* | | | 34,894,198 | |
| | 214,721 | | | Sun Hydraulics Corp. | | | 11,594,934 | |
| | | | | | | | |
| | | | | | | 63,577,524 | |
| | | | | | | | |
| | | | | | | | |
| Shares | | | | | Value | |
| | | | | | | |
| | | | Internet & Direct Marketing Retail 3.1% | | | | |
| | 504,651 | | | MakeMyTrip Ltd.* (India) | | $ | 14,508,716 | |
| | 344,121 | | | Wayfair, Inc., Class A* | | | 23,193,756 | |
| | 86,482 | | | zooplus AG* (Germany) | | | 14,565,368 | |
| | | | | | | | |
| | | | | | | 52,267,840 | |
| | | | | | | | |
| | | | Internet Software & Services 4.5% | | | | |
| | 763,021 | | | Cornerstone OnDemand, Inc.* | | | 30,986,283 | |
| | 514,655 | | | Envestnet, Inc.* | | | 26,247,405 | |
| | 1,183,084 | | | TrueCar, Inc.* | | | 18,680,896 | |
| | | | | | | | |
| | | | | | | 75,914,584 | |
| | | | | | | | |
| | | | IT Consulting & Other Services 1.3% | | | | |
| | 462,364 | | | Luxoft Holding, Inc.* (Switzerland) | | | 22,100,999 | |
| | | | | | | | |
| | | | Life Sciences Tools & Services 3.9% | | | | |
| | 576,523 | | | ICON plc* (Ireland) | | | 65,654,439 | |
| | | | | | | | |
| | | | Managed Health Care 2.0% | | | | |
| | 654,195 | | | HealthEquity, Inc.* | | | 33,089,183 | |
| | | | | | | | |
| | | | Personal Products 0.5% | | | | |
| | 546,807 | | | Colgate-Palmolive India Ltd. (India) | | | 8,832,875 | |
| | | | | | | | |
| | | | Pharmaceuticals 0.7% | | | | |
| | 792,780 | | | Intra-Cellular Therapies, Inc.* | | | 12,510,068 | |
| | | | | | | | |
| | | | Real Estate Services 1.4% | | | | |
| | 581,081 | | | HFF, Inc., Class A | | | 22,987,564 | |
| | | | | | | | |
| | | | Regional Banks 8.5% | | | | |
| | 585,554 | | | Eagle Bancorp, Inc.* | | | 39,261,396 | |
| | 887,886 | | | Metro Bank plc* (United Kingdom) | | | 40,214,114 | |
| | 512,849 | | | Pinnacle Financial Partners, Inc. | | | 34,335,241 | |
| | 357,628 | | | Texas Capital Bancshares, Inc.* | | | 30,684,482 | |
| | | | | | | | |
| | | | | | | 144,495,233 | |
| | | | | | | | |
| | | | Restaurants 1.9% | | | | |
| | 608,786 | | | Chuy’s Holdings, Inc.* | | | 12,814,945 | |
| | 986,342 | | | Fiesta Restaurant Group, Inc.* | | | 18,740,498 | |
| | | | | | | | |
| | | | | | | 31,555,443 | |
| | | | | | | | |
| | | | Semiconductors 4.8% | | | | |
| | 744,289 | | | Cavium, Inc.* | | | 49,078,417 | |
| | 307,942 | | | Monolithic Power Systems, Inc. | | | 32,811,220 | |
| | | | | | | | |
| | | | | | | 81,889,637 | |
| | | | | | | | |
| | | | Specialty Stores 1.9% | | | | |
| | 571,541 | | | Five Below, Inc.* | | | 31,366,170 | |
| | | | | | | | |
| | | | Systems Software 4.9% | | | | |
| | 457,258 | | | CyberArk Software Ltd.* (Israel) | | | 18,747,578 | |
| | 659,966 | | | Fortinet, Inc.* | | | 23,653,181 | |
| | 261,834 | | | Proofpoint, Inc.* | | | 22,837,162 | |
| | 1,016,263 | | | Rapid7, Inc.* | | | 17,886,229 | |
| | | | | | | | |
| | | | | | | 83,124,150 | |
| | | | | | | | |
| | | | Trading Companies & Distributors 2.3% | | | | |
| | 666,218 | | | WESCO International, Inc.* | | | 38,807,199 | |
| | | | | | | | |
| | | | Trucking 4.8% | | | | |
| | 1,962,710 | | | Knight-Swift Transportation Holdings, Inc.* | | | 81,550,601 | |
| | | | | | | | |
| | |
| | | | Total Common Stocks
(cost $983,230,458) | | | 1,603,510,441 | |
| | | | | | | | |
73
| | |
| WASATCH SMALL CAP GROWTH FUND (WAAEX / WIAEX) | | SEPTEMBER 30, 2017 |
|
|
|
Schedule of Investments (continued)
| | | | | | | | |
| Shares | | | | | Value | |
| | | | | | | |
| | | | PREFERRED STOCKS 2.7% | | | | |
| | |
| | | | Biotechnology 0.1% | | | | |
| | 677,966 | | | Nanosys, Inc., Series D Pfd.* *** † | | $ | 1,275,390 | |
| | 161,519 | | | Nanosys, Inc., Series E Pfd.* *** † | | | 204,305 | |
| | | | | | | | |
| | | | 1,479,695 | |
| | | | | | | | |
| | | | Oil & Gas Equipment & Services 0.7% | | | | |
| | 5,818,582 | | | Drilling Info Holdings, Inc., 0.64%, Series B Pfd.*** † | | | 11,697,096 | |
| | | | | | | | |
| | | | Systems Software 1.9% | | | | |
| | 1,114,610 | | | DataStax, Inc., Series E Pfd.* *** † | | | 6,397,861 | |
| | 33,296 | | | DocuSign, Inc., Series B Pfd.* *** † | | | 639,616 | |
| | 9,974 | | | DocuSign, Inc., Series B-1 Pfd.* *** † | | | 191,601 | |
| | 23,905 | | | DocuSign, Inc., Series D Pfd.* *** † | | | 459,215 | |
| | 618,152 | | | DocuSign, Inc., Series E Pfd.* *** † | | | 11,874,700 | |
| | 157,124 | | | DocuSign, Inc., Series F Pfd.* *** † | | | 3,018,352 | |
| | 505,604 | | | ForeScout Technologies, Inc., Series G* *** † | | | 9,116,040 | |
| | | | | | | | |
| | | | 31,697,385 | |
| | | | | | | | |
| | |
| | | | Total Preferred Stocks
(cost $40,472,297) | | | 44,874,176 | |
| | | | | | | | |
| | |
| | | | LIMITED PARTNERSHIP INTEREST 0.2% | | | | |
| | |
| | | | Asset Management & Custody Banks 0.2% | | | | |
| | | | Greenspring Global Partners II-B, L.P.* *** † | | | 2,155,108 | |
| | | | Greenspring Global Partners III-B, L.P.* *** † | | | 1,090,237 | |
| | | | | | | | |
| | | | 3,245,345 | |
| | | | | | | | |
| | |
| | | | Total Limited Partnership Interest
(cost $2,891,579) | | | 3,245,345 | |
| | | | | | | | |
| | |
Principal
Amount | | | | | Value | |
| | | | SHORT-TERM INVESTMENTS 2.1% | | | | |
| | |
| | | | Repurchase Agreement 2.1% | | | | |
| | $35,091,465 | | | Repurchase Agreement dated 9/29/17, 0.12% due 10/2/17 with Fixed Income Clearing Corp. collateralized by $35,505,000 of United States Treasury Notes 2.000% due 2/15/25; value: $10,258,906; United States Treasury Notes 2.250% due 11/15/24; value: $25,535,147; repurchase proceeds: $35,091,816 (cost $35,091,465) | | $ | 35,091,465 | |
| | | | | | | | |
| | |
| | | | Total Short-Term Investments
(cost $35,091,465) | | | 35,091,465 | |
| | | | | | | | |
| | |
| | | | Total Investments
(cost $1,061,685,799) 99.8% | | | 1,686,721,427 | |
| | |
| | | | Other Assets less Liabilities 0.2% | | | 4,223,621 | |
| | | | | | | | |
| | |
| | | | NET ASSETS 100.0% | | $ | 1,690,945,048 | |
| | | | | | | | |
| |
| | | | *Non-income producing. ***Security was fair valued under procedures adopted by the Board of Trustees (see Note 12). †Security purchased in a private placement transaction or under Rule 144A of the Securities Act of 1933 (see Note 9). See Notes to Financial Statements. | |
At September 30, 2017, Wasatch Small Cap Growth Fund’s investments, excluding short-term investments, were in the following countries (unaudited):
| | | | |
| Country | | % | |
Argentina | | | 0.8 | |
Germany | | | 0.9 | |
India | | | 2.6 | |
Ireland | | | 4.0 | |
Israel | | | 1.1 | |
Japan | | | 1.6 | |
Switzerland | | | 1.4 | |
United Arab Emirates | | | 2.0 | |
United Kingdom | | | 4.2 | |
United States | | | 81.4 | |
| | | | |
TOTAL | | | 100.0 | % |
| | | | |
74
| | |
| WASATCH SMALL CAP VALUE FUND (WMCVX / WICVX) | | SEPTEMBER 30, 2017 |
|
|
|
Schedule of Investments
| | | | | | | | |
| Shares | | | | | Value | |
| | | | | | | |
| | | | COMMON STOCKS 98.0% | | | | |
| | |
| | | | Aerospace & Defense 2.6% | | | | |
| | 124,277 | | | HEICO Corp., Class A | | $ | 9,469,907 | |
| | | | | | | | |
| | | | Airlines 2.7% | | | | |
| | 45,167 | | | Allegiant Travel Co. | | | 5,948,494 | |
| | 115,438 | | | Spirit Airlines, Inc.* | | | 3,856,783 | |
| | | | | | | | |
| | | | 9,805,277 | |
| | | | | | | | |
| | | | Application Software 3.5% | | | | |
| | 135,797 | | | Ebix, Inc. | | | 8,860,754 | |
| | 98,749 | | | Globant S.A.* (Argentina) | | | 3,956,873 | |
| | | | | | | | |
| | | | 12,817,627 | |
| | | | | | | | |
| | | | Asset Management & Custody Banks 2.5% | | | | |
| | 115,573 | | | Artisan Partners Asset Management, Inc., Class A | | | 3,767,680 | |
| | 205,593 | | | Hamilton Lane, Inc., Class A | | | 5,520,172 | |
| | | | | | | | |
| | | | 9,287,852 | |
| | | | | | | | |
| | | | Auto Parts & Equipment 1.4% | | | | |
| | 70,448 | | | Dorman Products, Inc.* | | | 5,045,486 | |
| | | | | | | | |
| | | | Automotive Retail 4.0% | | | | |
| | 30,745 | | | Lithia Motors, Inc., Class A | | | 3,698,931 | |
| | 201,392 | | | Monro, Inc. | | | 11,288,022 | |
| | | | | | | | |
| | | | 14,986,953 | |
| | | | | | | | |
| | | | Biotechnology 1.2% | | | | |
| | 94,666 | | | Exact Sciences Corp.* | | | 4,460,662 | |
| | | | | | | | |
| | | | Consumer Electronics 2.1% | | | | |
| | 492,928 | | | ZAGG, Inc.* | | | 7,763,616 | |
| | | | | | | | |
| | | | Consumer Finance 1.9% | | | | |
| | 14,307 | | | Credit Acceptance Corp.* | | | 4,008,392 | |
| | 101,095 | | | PRA Group, Inc.* | | | 2,896,372 | |
| | | | | | | | |
| | | | 6,904,764 | |
| | | | | | | | |
| | | | Data Processing & Outsourced Services 2.0% | | | | |
| | 78,970 | | | Euronet Worldwide, Inc.* | | | 7,485,566 | |
| | | | | | | | |
| | | | Diversified Banks 2.1% | | | | |
| | 1,624,218 | | | City Union Bank Ltd. (India) | | | 4,077,951 | |
| | 697,790 | | | Yes Bank Ltd. (India) | | | 3,731,446 | |
| | | | | | | | |
| | | | 7,809,397 | |
| | | | | | | | |
| | | | Diversified Support Services 1.7% | | | | |
| | 184,588 | | | Copart, Inc.* | | | 6,344,290 | |
| | | | | | | | |
| | | | Electronic Manufacturing Services 2.0% | | | | |
| | 202,593 | | | Fabrinet* | | | 7,508,097 | |
| | | | | | | | |
| | | | Health Care Facilities 2.9% | | | | |
| | 480,203 | | | Ensign Group, Inc. (The) | | | 10,847,786 | |
| | | | | | | | |
| | | | Health Care REITs 4.0% | | | | |
| | 332,891 | | | CareTrust REIT, Inc. | | | 6,338,244 | |
| | 387,286 | | | Sabra Health Care REIT, Inc. | | | 8,497,055 | |
| | | | | | | | |
| | | | 14,835,299 | |
| | | | | | | | |
| | | | Health Care Services 2.0% | | | | |
| | 104,253 | | | LHC Group, Inc.* | | | 7,393,623 | |
| | | | | | | | |
| | | | Homebuilding 2.3% | | | | |
| | 178,826 | | | LGI Homes, Inc.* | | | 8,685,579 | |
| | | | | | | | |
| | | | Home Furnishing Retail 2.7% | | | | |
| | 327,126 | | | Select Comfort Corp.* | | | 10,157,262 | |
| | | | | | | | |
| | | | Hotel & Resort REITs 1.7% | | | | |
| | 400,251 | | | Summit Hotel Properties, Inc. | | | 6,400,014 | |
| | | | | | | | |
| | | | | | | | |
| Shares | | | | | Value | |
| | | | | | | |
| | | | Industrial Machinery 2.9% | | | | |
| | 222,571 | | | Altra Industrial Motion Corp. | | $ | 10,705,665 | |
| | | | | | | | |
| | | | Industrial REITs 2.0% | | | | |
| | 454,227 | | | Monmouth Real Estate Investment Corp. | | | 7,353,935 | |
| | | | | | | | |
| | | | Internet Software & Services 3.7% | | | | |
| | 74,398 | | | Cimpress N.V.* | | | 7,265,709 | |
| | 30,827 | | | Stamps.com, Inc.* | | | 6,247,091 | |
| | | | | | | | |
| | | | | | | 13,512,800 | |
| | | | | | | | |
| | | | IT Consulting & Other Services 2.2% | | | | |
| | 285,068 | | | Hackett Group, Inc. (The) | | | 4,330,183 | |
| | 79,137 | | | Luxoft Holding, Inc.* (Switzerland) | | | 3,782,749 | |
| | | | | | | | |
| | | | | | | 8,112,932 | |
| | | | | | | | |
| | | | Life Sciences Tools & Services 1.9% | | | | |
| | 60,141 | | | ICON plc* (Ireland) | | | 6,848,857 | |
| | | | | | | | |
| | | | Mortgage REITs 4.7% | | | | |
| | 1,239,847 | | | Arbor Realty Trust, Inc. | | | 10,166,745 | |
| | 845,058 | | | MFA Financial, Inc. | | | 7,402,708 | |
| | | | | | | | |
| | | | | | | 17,569,453 | |
| | | | | | | | |
| | | | Oil & Gas Exploration & Production 2.3% | | | | |
| | 414,117 | | | Earthstone Energy, Inc., Class A* | | | 4,551,146 | |
| | 1,767,994 | | | Gran Tierra Energy, Inc.* (Colombia) | | | 4,031,026 | |
| | | | | | | | |
| | | | | | | 8,582,172 | |
| | | | | | | | |
| | | | Oil & Gas Refining & Marketing 0.8% | | | | |
| | 90,640 | | | World Fuel Services Corp. | | | 3,073,602 | |
| | | | | | | | |
| | | | Personal Products 1.4% | | | | |
| | 81,129 | | | Nu Skin Enterprises, Inc., Class A | | | 4,987,811 | |
| | | | | | | | |
| | | | Property & Casualty Insurance 1.9% | | | | |
| | 378,038 | | | Atlas Financial Holdings, Inc.* | | | 7,144,918 | |
| | | | | | | | |
| | | | Regional Banks 12.2% | | | | |
| | 186,498 | | | Customers Bancorp, Inc.* | | | 6,083,565 | |
| | 311,769 | | | First of Long Island Corp. (The) | | | 9,493,366 | |
| | 127,452 | | | Pinnacle Financial Partners, Inc. | | | 8,532,911 | |
| | 101,509 | | | Prosperity Bancshares, Inc. | | | 6,672,187 | |
| | 162,517 | | | State Bank Financial Corp. | | | 4,656,112 | |
| | 187,319 | | | Webster Financial Corp. | | | 9,843,613 | |
| | | | | | | | |
| | | | | | | 45,281,754 | |
| | | | | | | | |
| | | | Restaurants 1.4% | | | | |
| | 265,299 | | | Fiesta Restaurant Group, Inc.* | | | 5,040,681 | |
| | | | | | | | |
| | | | Semiconductors 4.4% | | | | |
| | 103,921 | | | Cavium, Inc.* | | | 6,852,551 | |
| | 306,448 | | | Tower Semiconductor Ltd.* (Israel) | | | 9,423,276 | |
| | | | | | | | |
| | | | | | | 16,275,827 | |
| | | | | | | | |
| | | | Specialty Chemicals 2.0% | | | | |
| | 121,929 | | | Innospec, Inc. | | | 7,516,923 | |
| | | | | | | | |
| | | | Thrifts & Mortgage Finance 2.1% | | | | |
| | 274,749 | | | BofI Holding, Inc.* | | | 7,822,104 | |
| | | | | | | | |
| | | | Trading Companies & Distributors 2.3% | | | | |
| | 149,128 | | | WESCO International, Inc.* | | | 8,686,706 | |
| | | | | | | | |
| | | | Trucking 4.5% | | | | |
| | 277,370 | | | Knight-Swift Transportation Holdings, Inc.* | | | 11,524,723 | |
| | 46,705 | | | Old Dominion Freight Line, Inc. | | | 5,142,688 | |
| | | | | | | | |
| | | | 16,667,411 | |
| | | | | | | | |
| | |
| | | | Total Common Stocks
(cost $269,890,643) | | | 363,192,608 | |
| | | | | | | | |
75
| | |
| WASATCH SMALL CAP VALUE FUND (WMCVX / WICVX) | | SEPTEMBER 30, 2017 |
|
|
|
Schedule of Investments (continued)
| | | | | | | | |
| Shares | | | | | Value | |
| | | | | | | |
| | | | LIMITED PARTNERSHIP INTEREST 1.4% | | | | |
| | |
| | | | Oil & Gas Storage & Transportation 1.4% | | | | |
| | 167,821 | | | Delek Logistics Partners L.P. | | $ | 5,244,406 | |
| | | | | | | | |
| | |
| | | | Total Limited Partnership Interest
(cost $5,983,651) | | | 5,244,406 | |
| | | | | | | | |
| | |
Principal
Amount | | | | | Value | |
| | | | | | | |
| | | | SHORT-TERM INVESTMENTS 0.8% | | | | |
| | |
| | | | Repurchase Agreement 0.8% | | | | |
| | $3,047,345 | | | Repurchase Agreement dated 9/29/17, 0.12% due 10/2/17 with Fixed Income Clearing Corp. collateralized by $3,065,000 of United States Treasury Notes 2.250% due 11/15/24; value: $3,111,937; repurchase proceeds: $3,047,376 (cost $3,047,345) | | $ | 3,047,345 | |
| | | | | | | | |
| | |
| | | | Total Short-Term Investments
(cost $3,047,345) | | | 3,047,345 | |
| | | | | | | | |
| | |
| | | | Total Investments
(cost $278,921,639) 100.2% | | | 371,484,359 | |
| | |
| | | | Liabilities less Other Assets (0.2%) | | | (834,911 | ) |
| | | | | | | | |
| | |
| | | | NET ASSETS 100.0% | | $ | 370,649,448 | |
| | | | | | | | |
| |
| | | | *Non-income producing. REIT Real Estate Investment Trust. See Notes to Financial Statements. | |
At September 30, 2017, Wasatch Small Cap Value Fund’s investments, excluding short-term investments, were in the following countries (unaudited):
| | | | |
| Country | | % | |
Argentina | | | 1.1 | |
Colombia | | | 1.1 | |
India | | | 2.1 | |
Ireland | | | 1.9 | |
Israel | | | 2.5 | |
Switzerland | | | 1.0 | |
United States | | | 90.3 | |
| | | | |
TOTAL | | | 100.0 | % |
| | | | |
76
| | |
| WASATCH STRATEGIC INCOME FUND (WASIX) | | SEPTEMBER 30, 2017 |
|
|
|
Schedule of Investments
| | | | | | | | |
| Shares | | | | | Value | |
| | | | | | | |
| | | | COMMON STOCKS 75.3% | | | | |
| | |
| | | | Air Freight & Logistics 1.0% | | | | |
| | 2,000 | | | FedEx Corp. | | $ | 451,160 | |
| | | | | | | | |
| | | | Apparel Retail 0.7% | | | | |
| | 4,905 | | | Ross Stores, Inc. | | | 316,716 | |
| | | | | | | | |
| | | | Asset Management & Custody Banks 6.4% | | | | |
| | 34,124 | | | Alcentra Capital Corp. | | | 365,468 | |
| | 3,964 | | | Ameriprise Financial, Inc. | | | 588,694 | |
| | 64,528 | | | Ares Capital Corp. | | | 1,057,614 | |
| | 3,413 | | | Hercules Capital, Inc. | | | 44,028 | |
| | 92,913 | | | Medallion Financial Corp. | | | 201,621 | |
| | 31,859 | | | Medley Capital Corp. | | | 190,198 | |
| | 30,134 | | | Triangle Capital Corp. | | | 430,313 | |
| | | | | | | | |
| | | | 2,877,936 | |
| | | | | | | | |
| | | | Broadcasting 3.5% | | | | |
| | 26,860 | | | CBS Corp., Class B | | | 1,557,880 | |
| | | | | | | | |
| | | | Cable & Satellite 5.8% | | | | |
| | 68,476 | | | Comcast Corp., Class A | | | 2,634,956 | |
| | | | | | | | |
| | | | Consumer Finance 2.5% | | | | |
| | 4,900 | | | American Express Co. | | | 443,254 | |
| | 10,289 | | | Discover Financial Services | | | 663,435 | |
| | | | | | | | |
| | | | 1,106,689 | |
| | | | | | | | |
| | | | Data Processing & Outsourced Services 7.8% | | | | |
| | 12,485 | | | MasterCard, Inc., Class A | | | 1,762,882 | |
| | 16,525 | | | Visa, Inc., Class A | | | 1,739,091 | |
| | | | | | | | |
| | | | 3,501,973 | |
| | | | | | | | |
| | | | Diversified REITs 3.0% | | | | |
| | 35,540 | | | Colony NorthStar, Inc., Class A | | | 446,382 | |
| | 100 | | | Spirit Realty Capital, Inc. | | | 857 | |
| | 355,714 | | | Star Asia Capital Corp Ltd.* *** † | | | 885,728 | |
| | | | | | | | |
| | | | 1,332,967 | |
| | | | | | | | |
| | | | Drug Retail 7.0% | | | | |
| | 17,772 | | | CVS Health Corp. | | | 1,445,219 | |
| | 22,029 | | | Walgreens Boots Alliance, Inc. | | | 1,701,079 | |
| | | | | | | | |
| | | | 3,146,298 | |
| | | | | | | | |
| | | | Fertilizers & Agricultural Chemicals 2.0% | | | | |
| | 7,579 | | | Monsanto Co. | | | 908,116 | |
| | | | | | | | |
| | | | Financial Exchanges & Data 0.3% | | | | |
| | 1,091 | | | MSCI, Inc., Class A | | | 127,538 | |
| | 300 | | | OTC Markets Group, Inc. | | | 8,850 | |
| | | | | | | | |
| | | | 136,388 | |
| | | | | | | | |
| | | | General Merchandise Stores 0.0% | | | | |
| | 100 | | | Dollarama, Inc. (Canada) | | | 10,942 | |
| | | | | | | | |
| | | | Health Care Distributors 1.1% | | | | |
| | 3,347 | | | McKesson Corp. | | | 514,133 | |
| | | | | | | | |
| | | | Home Improvement Retail 2.4% | | | | |
| | 6,500 | | | Home Depot, Inc. (The) | | | 1,063,140 | |
| | | | | | | | |
| | | | Hotels, Resorts & Cruise Lines 1.5% | | | | |
| | 33,600 | | | Extended Stay America, Inc.** | | | 672,000 | |
| | | | | | | | |
| | | | Industrial Conglomerates 0.1% | | | | |
| | 436 | | | Siemens AG (Germany) | | | 61,425 | |
| | | | | | | | |
| | | | Industrial Machinery 0.5% | | | | |
| | 1,500 | | | Snap-on, Inc. | | | 223,515 | |
| | | | | | | | |
| | | | | | | | |
| Shares | | | | | Value | |
| | | | | | | |
| | | | Integrated Oil & Gas 3.9% | | | | |
| | 50,023 | | | Suncor Energy, Inc. (Canada) | | $ | 1,753,160 | |
| | | | | | | | |
| | | | IT Consulting & Other Services 1.1% | | | | |
| | 7,000 | | | Cognizant Technology Solutions Corp., Class A | | | 507,780 | |
| | | | | | | | |
| | | | Managed Health Care 0.5% | | | | |
| | 1,165 | | | UnitedHealth Group, Inc. | | | 228,165 | |
| | | | | | | | |
| | | | Mortgage REITs 8.8% | | | | |
| | 109,990 | | | Arbor Realty Trust, Inc. | | | 901,918 | |
| | 28,250 | | | Blackstone Mortgage Trust, Inc., Class A | | | 876,315 | |
| | 61,400 | | | Great Ajax Corp. | | | 865,126 | |
| | 41,092 | | | Resource Capital Corp. | | | 442,972 | |
| | 40,300 | | | Starwood Property Trust, Inc. | | | 875,316 | |
| | | | | | | | |
| | | | 3,961,647 | |
| | | | | | | | |
| | | | Movies & Entertainment 0.5% | | | | |
| | 2,250 | | | Walt Disney Co. (The) | | | 221,782 | |
| | | | | | | | |
| | | | Personal Products 4.0% | | | | |
| | 14,761 | | | Herbalife Ltd.* | | | 1,001,239 | |
| | 13,271 | | | Nu Skin Enterprises, Inc., Class A | | | 815,901 | |
| | | | | | | | |
| | | | 1,817,140 | |
| | | | | | | | |
| | | | Railroads 3.0% | | | | |
| | 16,167 | | | Canadian National Railway Co. (Canada) | | | 1,339,487 | |
| | | | | | | | |
| | | | Retail REITs 1.0% | | | | |
| | 2,785 | | | Simon Property Group, Inc. | | | 448,413 | |
| | | | | | | | |
| | | | Semiconductors 2.5% | | | | |
| | 12,600 | | | Microchip Technology, Inc. | | | 1,131,228 | |
| | | | | | | | |
| | | | Soft Drinks 1.9% | | | | |
| | 9,592 | | | Dr Pepper Snapple Group, Inc. | | | 848,604 | |
| | | | | | | | |
| | | | Specialty Stores 1.2% | | | | |
| | 8,400 | | | Tractor Supply Co. | | | 531,636 | |
| | | | | | | | |
| | | | Technology Hardware, Storage & Peripherals 0.0% | | | | |
| | 81 | | | Apple, Inc. | | | 12,484 | |
| | | | | | | | |
| | | | Trading Companies & Distributors 1.3% | | | | |
| | 4,530 | | | MSC Industrial Direct Co., Inc., Class A | | | 342,332 | |
| | 1,449 | | | W.W. Grainger, Inc. | | | 260,458 | |
| | | | | | | | |
| | | | 602,790 | |
| | | | | | | | |
| | |
| | | | Total Common Stocks
(cost $27,002,414) | | | 33,920,550 | |
| | | | | | | | |
| | |
| | | | LIMITED PARTNERSHIP INTEREST 8.6% | | | | |
| | | | Asset Management & Custody Banks 4.1% | | | | |
| | 26,720 | | | Blackstone Group L.P. (The) | | | 891,646 | |
| | 45,394 | | | KKR & Co. L.P. | | | 922,860 | |
| | | | | | | | |
| | | | 1,814,506 | |
| | | | | | | | |
| | | | Oil & Gas Storage & Transportation 4.5% | | | | |
| | 19,800 | | | Golar LNG Partners L.P. | | | 459,954 | |
| | 21,971 | | | Magellan Midstream Partners L.P. | | | 1,561,259 | |
| | | | | | | | |
| | | | 2,021,213 | |
| | | | | | | | |
| | |
| | | | Total Limited Partnership Interest
(cost $3,552,104) | | | 3,835,719 | |
| | | | | | | | |
77
| | |
| WASATCH STRATEGIC INCOME FUND (WASIX) | | SEPTEMBER 30, 2017 |
|
|
|
Schedule of Investments (continued)
| | | | | | | | |
| Shares | | | | | Value | |
| | | | | | | |
| | | | LIMITED LIABILITY COMPANY MEMBERSHIP INTEREST 0.0% | | | | |
| | |
| | | | Asset Management & Custody Banks 0.0% | | | | |
| | 100 | | | Ellington Financial, LLC | | $ | 1,579 | |
| | | | | | | | |
| | |
| | | | Total Limited Liability Company Membership Interest
(cost $1,601) | | | 1,579 | |
| | | | | | | | |
| | |
Principal
Amount | | | | | Value | |
| | | | | | | |
| | | | SHORT-TERM INVESTMENTS 15.9% | | | | |
| | |
| | | | Repurchase Agreement 15.9% | | | | |
| | $7,174,334 | | | Repurchase Agreement dated 9/29/17, 0.12% due 10/2/17 with Fixed Income Clearing Corp. collateralized by $7,335,000 of United States Treasury Notes 2.250% due 2/15/27; value: $7,322,303; repurchase proceeds: $7,174,405 (cost $7,174,334) | | $ | 7,174,334 | |
| | | | | | | | |
| | |
| | | | Total Short-Term Investments
(cost $7,174,334) | | | 7,174,334 | |
| | | | | | | | |
| | |
| | | | Total Investments
(cost $37,730,453) 99.8% | | | 44,932,182 | |
| | |
| | | | Other Assets less Liabilities 0.2% | | | 112,520 | |
| | | | | | | | |
| | |
| | | | NET ASSETS 100.0% | | $ | 45,044,702 | |
| | | | | | | | |
| |
| | | | *Non-income producing. **Common units. ***Security was fair valued under procedures adopted by the Board of Trustees (see Note 12). †Security purchased in a private placement transaction or under Rule 144A of the Securities Act of 1933 (see Note 9). REIT Real Estate Investment Trust. See Notes to Financial Statements. | |
At September 30, 2017, Wasatch Strategic Income Fund’s investments, excluding short-term investments, were in the following countries (unaudited):
| | | | |
| Country | | % | |
Canada | | | 8.2 | |
Germany | | | 0.2 | |
United States | | | 91.6 | |
| | | | |
TOTAL | | | 100.0 | % |
| | | | |
78
| | |
| WASATCH ULTRA GROWTH FUND (WAMCX) | | SEPTEMBER 30, 2017 |
|
|
|
Schedule of Investments
| | | | | | | | |
| Shares | | | | | Value | |
| | | | | | | |
| | | | COMMON STOCKS 92.4% | | | | |
| | |
| | | | Application Software 8.7% | | | | |
| | 28,694 | | | HubSpot, Inc.* | | $ | 2,411,731 | |
| | 56,605 | | | Paylocity Holding Corp.* | | | 2,763,456 | |
| | 15,627 | | | Ultimate Software Group, Inc. (The)* | | | 2,962,879 | |
| | 55,090 | | | Zendesk, Inc.* | | | 1,603,670 | |
| | | | | | | | |
| | | | 9,741,736 | |
| | | | | | | | |
| | | | Automotive Retail 1.5% | | | | |
| | 30,012 | | | Monro, Inc. | | | 1,682,173 | |
| | | | | | | | |
| | | | Biotechnology 11.9% | | | | |
| | 513,577 | | | Argos Therapeutics, Inc.* | | | 92,187 | |
| | 101,022 | | | ChemoCentryx, Inc.* | | | 749,583 | |
| | 68,922 | | | Cytokinetics, Inc.* | | | 999,369 | |
| | 19,667 | | | Esperion Therapeutics, Inc.* | | | 985,710 | |
| | 49,879 | | | Exact Sciences Corp.* | | | 2,350,299 | |
| | 23,588 | | | Flexion Therapeutics, Inc.* | | | 570,358 | |
| | 181,199 | | | Inovio Pharmaceuticals, Inc.* | | | 1,148,802 | |
| | 14,709 | | | Juno Therapeutics, Inc.* | | | 659,846 | |
| | 30,665 | | | MacroGenics, Inc.* | | | 566,689 | |
| | 185,224 | | | MEI Pharma, Inc.* | | | 496,400 | |
| | 183,949 | | | Sangamo Therapeutics Inc.* | | | 2,759,235 | |
| | 28,756 | | | Seattle Genetics, Inc.* | | | 1,564,614 | |
| | 19,388 | | | Selecta Biosciences, Inc.* | | | 353,831 | |
| | | | | | | | |
| | | | 13,296,923 | |
| | | | | | | | |
| | | | Building Products 1.7% | | | | |
| | 21,260 | | | Trex Co., Inc.* | | | 1,914,888 | |
| | | | | | | | |
| | | | Communications Equipment 1.2% | | | | |
| | 9,105 | | | Palo Alto Networks, Inc.* | | | 1,312,030 | |
| | | | | | | | |
| | | | Department Stores 1.6% | | | | |
| | 82,194 | | | V-Mart Retail Ltd. (India) | | | 1,811,993 | |
| | | | | | | | |
| | | | Diversified Banks 2.7% | | | | |
| | 599,262 | | | City Union Bank Ltd. (India) | | | 1,504,577 | |
| | 271,285 | | | Yes Bank Ltd. (India) | | | 1,450,702 | |
| | | | | | | | |
| | | | 2,955,279 | |
| | | | | | | | |
| | | | Electronic Manufacturing Services 1.8% | | | | |
| | 10,930 | | | IPG Photonics Corp.* | | | 2,022,706 | |
| | | | | | | | |
| | | | Environmental & Facilities Services 2.5% | | | | |
| | 40,156 | | | Waste Connections, Inc. | | | 2,809,314 | |
| | | | | | | | |
| | | | General Merchandise Stores 0.9% | | | | |
| | 20,491 | | | Ollie’s Bargain Outlet Holdings, Inc.* | | | 950,782 | |
| | | | | | | | |
| | | | Health Care Equipment 7.2% | | | | |
| | 83,474 | | | AtriCure, Inc.* | | | 1,867,313 | |
| | 104,009 | | | Entellus Medical, Inc.* | | | 1,920,006 | |
| | 72,201 | | | Obalon Therapeutics, Inc.* | | | 688,076 | |
| | 171,035 | | | Oxford Immunotec Global plc* | | | 2,873,388 | |
| | 906,398 | | | Tandem Diabetes Care, Inc.* | | | 661,671 | |
| | | | | | | | |
| | | | 8,010,454 | |
| | | | | | | | |
| | | | Health Care Services 0.4% | | | | |
| | 37,343 | | | Dr. Lal PathLabs Ltd. (India) | | | 454,525 | |
| | | | | | | | |
| | | | Health Care Technology 1.5% | | | | |
| | 20,780 | | | Medidata Solutions, Inc.* | | | 1,622,087 | |
| | | | | | | | |
| | | | Homebuilding 4.1% | | | | |
| | 24,796 | | | Installed Building Products, Inc.* | | | 1,606,781 | |
| | 60,927 | | | LGI Homes, Inc.* | | | 2,959,224 | |
| | | | | | | | |
| | | | 4,566,005 | |
| | | | | | | | |
| | | | | | | | |
| Shares | | | | | Value | |
| | | | | | | |
| | | | Industrial Machinery 3.7% | | | | |
| | 11,428 | | | Barnes Group, Inc. | | $ | 804,989 | |
| | 98,864 | | | Kornit Digital Ltd.* (Israel) | | | 1,512,619 | |
| | 22,587 | | | Proto Labs, Inc.* | | | 1,813,736 | |
| | | | | | | | |
| | | | 4,131,344 | |
| | | | | | | | |
| | | | Industrial REITs 1.6% | | | | |
| | 109,047 | | | Monmouth Real Estate Investment Corp. | | | 1,765,471 | |
| | | | | | | | |
| | | | Internet & Direct Marketing Retail 3.7% | | | | |
| | 50,030 | | | MakeMyTrip Ltd.* (India) | | | 1,438,363 | |
| | 19,595 | | | Wayfair, Inc., Class A* | | | 1,320,703 | |
| | 8,021 | | | zooplus AG* (Germany) | | | 1,350,903 | |
| | | | | | | | |
| | | | 4,109,969 | |
| | | | | | | | |
| | | | Internet Software & Services 5.8% | | | | |
| | 52,675 | | | Cornerstone OnDemand, Inc.* | | | 2,139,132 | |
| | 66,649 | | | Instructure, Inc.* | | | 2,209,414 | |
| | 49,913 | | | Reis, Inc. | | | 898,434 | |
| | 22,213 | | | SPS Commerce, Inc.* | | | 1,259,699 | |
| | | | | | | | |
| | | | 6,506,679 | |
| | | | | | | | |
| | | | IT Consulting & Other Services 1.3% | | | | |
| | 30,259 | | | Luxoft Holding, Inc.* (Switzerland) | | | 1,446,380 | |
| | | | | | | | |
| | | | Life Sciences Tools & Services 0.7% | | | | |
| | 251,025 | | | Horizon Discovery Group plc* (United Kingdom) | | | 763,567 | |
| | | | | | | | |
| | | | Managed Health Care 1.7% | | | | |
| | 38,383 | | | HealthEquity, Inc.* | | | 1,941,412 | |
| | | | | | | | |
| | | | Packaged Foods & Meats 2.6% | | | | |
| | 184,070 | | | Freshpet, Inc.* | | | 2,880,695 | |
| | | | | | | | |
| | | | Pharmaceuticals 1.6% | | | | |
| | 87,835 | | | Auris Medical Holding AG* (Switzerland) | | | 72,025 | |
| | 107,381 | | | Egalet Corp.* | | | 137,448 | |
| | 97,685 | | | Intra-Cellular Therapies, Inc.* | | | 1,541,469 | |
| | | | | | | | |
| | | | 1,750,942 | |
| | | | | | | | |
| | | | Regional Banks 6.2% | | | | |
| | 23,704 | | | Bank of the Ozarks, Inc. | | | 1,138,977 | |
| | 24,264 | | | Customers Bancorp, Inc.* | | | 791,492 | |
| | 18,489 | | | Eagle Bancorp, Inc.* | | | 1,239,687 | |
| | 40,996 | | | Metro Bank plc* (United Kingdom) | | | 1,856,790 | |
| | 27,338 | | | Pinnacle Financial Partners, Inc. | | | 1,830,279 | |
| | | | | | | | |
| | | | 6,857,225 | |
| | | | | | | | |
| | | | Restaurants 2.7% | | | | |
| | 49,638 | | | Chuy’s Holdings, Inc.* | | | 1,044,880 | |
| | 81,337 | | | Habit Restaurants, Inc. (The)* | | | 1,061,448 | |
| | 69,679 | | | Zoe’s Kitchen, Inc.* | | | 880,045 | |
| | | | | | | | |
| | | | 2,986,373 | |
| | | | | | | | |
| | | | Semiconductor Equipment 1.8% | | | | |
| | 132,481 | | | PDF Solutions, Inc.* | | | 2,052,131 | |
| | | | | | | | |
| | | | Semiconductors 5.4% | | | | |
| | 25,599 | | | Cavium, Inc.* | | | 1,687,998 | |
| | 18,107 | | | Monolithic Power Systems, Inc. | | | 1,929,301 | |
| | 13,668 | | | NVE Corp. | | | 1,079,362 | |
| | 18,426 | | | Power Integrations, Inc. | | | 1,348,783 | |
| | | | | | | | |
| | | | 6,045,444 | |
| | | | | | | | |
| | | | Specialty Chemicals 2.1% | | | | |
| | 19,176 | | | Balchem Corp. | | | 1,558,817 | |
| | 411,433 | | | EcoSynthetix, Inc.* (Canada) | | | 745,212 | |
| | | | | | | | |
| | | | 2,304,029 | |
| | | | | | | | |
79
| | |
| WASATCH ULTRA GROWTH FUND (WAMCX) | | SEPTEMBER 30, 2017 |
|
|
|
Schedule of Investments (continued)
| | | | | | | | |
Shares | | | | | Value | |
| | | | | | | |
| | | | Specialty Stores 1.1% | | | | |
| | 22,232 | | | Five Below, Inc.* | | $ | 1,220,092 | |
| | | | | | | | |
| | | | Systems Software 1.5% | | | | |
| | 32,734 | | | Qualys, Inc.* | | | 1,695,621 | |
| | | | | | | | |
| | | | Trucking 1.2% | | | | |
| | 31,152 | | | Knight-Swift Transportation Holdings, Inc.* | | | 1,294,366 | |
| | | | | | | | |
| | |
| | | | Total Common Stocks
(cost $68,616,894) | | | 102,902,635 | |
| | | | | | | | |
| |
| | | | LIMITED PARTNERSHIP INTEREST 2.7% | |
| | |
| | | | Asset Management & Custody Banks 2.7% | | | | |
| | | | Greenspring Global Partners II-B,
L.P.* *** † | | | 1,939,589 | |
| | | | Greenspring Global Partners III-B,
L.P.* *** † | | | 1,090,237 | |
| | | | | | | | |
| | | | 3,029,826 | |
| | | | | | | | |
| | |
| | | | Total Limited Partnership Interest
(cost $2,683,719) | | | 3,029,826 | |
| | | | | | | | |
| | |
| | | | PREFERRED STOCKS 1.4% | | | | |
| | |
| | | | Biotechnology 0.3% | | | | |
| | 169,492 | | | Nanosys, Inc., Series D Pfd.* *** † | | | 318,848 | |
| | 40,380 | | | Nanosys, Inc., Series E Pfd.* *** † | | | 51,077 | |
| | | | | | | | |
| | | | 369,925 | |
| | | | | | | | |
| | |
| | | | Health Care Technology 0.3% | | | | |
| | 253,064 | | | Data Sciences International, Inc., 5.05%, Series B Pfd.*** † | | | 265,717 | |
| | | | | | | | |
| | |
| | | | Oil & Gas Equipment & Services 0.8% | | | | |
| | 435,920 | | | Drilling Info Holdings, Inc., 0.64%, Series B Pfd.*** † | | | 876,330 | |
| | | | | | | | |
| | |
| | | | Total Preferred Stocks
(cost $1,866,600) | | | 1,511,972 | |
| | | | | | | | |
| | | | | | | | |
Principal
Amount | | | | | Value | |
| | | | | | | |
| | | | SHORT-TERM INVESTMENTS 0.7% | |
| | |
| | | | Repurchase Agreement 0.7% | | | | |
| | $807,568 | | | Repurchase Agreement dated 9/29/17,
0.12% due 10/2/17 with Fixed Income
Clearing Corp. collateralized by $815,000
of United States Treasury Notes 2.250%
due 11/15/24; value: $827,481; repurchase
proceeds: $807,576 (cost $807,568) | | $ | 807,568 | |
| | | | | | | | |
| | |
| | | | Total Short-Term Investments
(cost $807,568) | | | 807,568 | |
| | | | | | | | |
| | |
| | | | Total Investments
(cost $73,974,781) 97.2% | | | 108,252,001 | |
| | |
| | | | Other Assets less Liabilities 2.8% | | | 3,113,622 | |
| | | | | | | | |
| | |
| | | | NET ASSETS 100.0% | | $ | 111,365,623 | |
| | | | | | | | |
| |
| | | | *Non-income producing. ***Security was fair valued under procedures adopted by the Board of Trustees (see Note 12). †Security purchased in a private placement transaction or under Rule 144A of the Securities Act of 1933 (see Note 9). See Notes to Financial Statements. | |
At September 30, 2017, Wasatch Ultra Growth Fund’s investments, excluding short-term investments, were in the following countries (unaudited):
| | | | |
| Country | | % | |
Canada | | | 0.7 | |
Germany | | | 1.3 | |
India | | | 6.2 | |
Israel | | | 1.4 | |
Switzerland | | | 1.4 | |
United Kingdom | | | 2.4 | |
United States | | | 86.6 | |
| | | | |
TOTAL | | | 100.0 | % |
| | | | |
80
| | |
| WASATCH WORLD INNOVATORS FUND (WAGTX / WIGTX) | | SEPTEMBER 30, 2017 |
|
|
|
Schedule of Investments
| | | | | | | | |
| Shares | | | | | Value | |
| | | | | | | |
| | | | COMMON STOCKS 85.0% | | | | |
| | |
| | | | Advertising 0.1% | | | | |
| | 4,500 | | | Interpublic Group of Cos., Inc. (The) | | $ | 93,555 | |
| | | | | | | | |
| | | | Aerospace & Defense 0.9% | | | | |
| | 135,599 | | | Avon Rubber plc (United Kingdom) | | | 1,703,462 | |
| | | | | | | | |
| | | | Agricultural Products 0.9% | | | | |
| | 35,000 | | | Kaneko Seeds Co. Ltd. (Japan) | | | 483,359 | |
| | 47,000 | | | Sakata Seed Corp. (Japan) | | | 1,336,592 | |
| | | | | | | | |
| | | | 1,819,951 | |
| | | | | | | | |
| | | | Air Freight & Logistics 0.5% | | | | |
| | 4,726 | | | FedEx Corp. | | | 1,066,091 | |
| | | | | | | | |
| | | | Alternative Carriers 2.0% | | | | |
| | 480,416 | | | Gamma Communications plc (United Kingdom) | | | 3,830,355 | |
| | | | | | | | |
| | | | Application Software 0.8% | | | | |
| | 4,100 | | | Splunk, Inc.* | | | 272,363 | |
| | 235,000 | | | Tracsis plc (United Kingdom) | | | 1,377,687 | |
| | | | | | | | |
| | | | 1,650,050 | |
| | | | | | | | |
| | | | Asset Management & Custody Banks 0.2% | | | | |
| | 710 | | | BlackRock, Inc. | | | 317,434 | |
| | 117,800 | | | Tarpon Investimentos S.A. (Brazil) | | | 149,521 | |
| | | | | | | | |
| | | | 466,955 | |
| | | | | | | | |
| | | | Auto Parts & Equipment 0.5% | | | | |
| | 59,060 | | | Brembo S.p.A. (Italy) | | | 999,579 | |
| | | | | | | | |
| | | | Automotive Retail 0.3% | | | | |
| | 11,232 | | | Penske Automotive Group, Inc. | | | 534,306 | |
| | | | | | | | |
| | | | Biotechnology 1.8% | | | | |
| | 59,382 | | | Abcam plc (United Kingdom) | | | 811,633 | |
| | 53,244 | | | Bioventix plc (United Kingdom) | | | 1,953,122 | |
| | 77,228 | | | MDxHealth* (Belgium) | | | 431,735 | |
| | 6,600 | | | Myriad Genetics, Inc.* | | | 238,788 | |
| | 2,000 | | | PeptiDream, Inc.* (Japan) | | | 61,675 | |
| | | | | | | | |
| | | | 3,496,953 | |
| | | | | | | | |
| | | | Broadcasting 1.0% | | | | |
| | 29,841 | | | CBS Corp., Class B | | | 1,730,778 | |
| | 11,462 | | | Discovery Communications, Inc., Class A* | | | 244,026 | |
| | | | | | | | |
| | | | 1,974,804 | |
| | | | | | | | |
| | | | Cable & Satellite 1.9% | | | | |
| | 94,168 | | | Comcast Corp., Class A | | | 3,623,585 | |
| | | | | | | | |
| | | | Construction Machinery & Heavy Trucks 0.3% | | | | |
| | 31,900 | | | Morita Holdings Corp. (Japan) | | | 495,828 | |
| | | | | | | | |
| | | | Consumer Electronics 2.3% | | | | |
| | 85,300 | | | Sony Corp. (Japan) | | | 3,173,213 | |
| | 486,318 | | | Sprue Aegis plc (United Kingdom) | | | 1,352,207 | |
| | | | | | | | |
| | | | 4,525,420 | |
| | | | | | | | |
| | | | Consumer Finance 1.7% | | | | |
| | 6,063 | | | Discover Financial Services | | | 390,942 | |
| | 17,985 | | | Encore Capital Group, Inc.* | | | 796,736 | |
| | 24,452 | | | PRA Group, Inc.* | | | 700,550 | |
| | 132,300 | | | SLM Corp.* | | | 1,517,481 | |
| | | | | | | | |
| | | | 3,405,709 | |
| | | | | | | | |
| | | | Data Processing & Outsourced Services 4.1% | | | | |
| | 12,200 | | | MasterCard, Inc., Class A | | | 1,722,640 | |
| | 59,376 | | | PayPal Holdings, Inc.* | | | 3,801,845 | |
| | 15,775 | | | Visa, Inc., Class A | | | 1,660,161 | |
| | 7,742 | | | Wirecard AG (Germany) | | | 708,323 | |
| | | | | | | | |
| | | | 7,892,969 | |
| | | | | | | | |
| | | | | | | | |
| Shares | | | | | Value | |
| | | | | | | |
| | | | Diversified Banks 0.1% | | | | |
| | 8,000 | | | HDFC Bank Ltd. (India) | | $ | 220,459 | |
| | | | | | | | |
| | | | Drug Retail 1.0% | | | | |
| | 26,225 | | | Walgreens Boots Alliance, Inc. | | | 2,025,095 | |
| | | | | | | | |
| | | | Education Services 1.1% | | | | |
| | 173,400 | | | Kroton Educacional S.A. (Brazil) | | | 1,097,728 | |
| | 31,283 | | | TAL Education Group ADR (China) | | | 1,054,550 | |
| | | | | | | | |
| | | | 2,152,278 | |
| | | | | | | | |
| | | | Electrical Components & Equipment 0.6% | | | | |
| | 753,789 | | | Enphase Energy, Inc.* | | | 1,145,759 | |
| | | | | | | | |
| | | | Electronic Equipment & Instruments 3.6% | | | | |
| | 15,019 | | | Barco N.V. (Belgium) | | | 1,620,485 | |
| | 895,907 | | | Catapult Group International Ltd.* (Australia) | | | 913,574 | |
| | 840,000 | | | Eroad Ltd.* (New Zealand) | | | 1,334,811 | |
| | 110,767 | | | Evertz Technologies Ltd. (Canada) | | | 1,545,545 | |
| | 842 | | | GEA (France) | | | 88,300 | |
| | 2,900 | | | KEYENCE Corp. (Japan) | | | 1,539,880 | |
| | | | | | | | |
| | | | 7,042,595 | |
| | | | | | | | |
| | | | Fertilizers & Agricultural Chemicals 0.5% | | | | |
| | 8,500 | | | Monsanto Co. | | | 1,018,470 | |
| | | | | | | | |
| | | | Food Retail 2.5% | | | | |
| | 1,044,704 | | | Majestic Wine plc (United Kingdom) | | | 4,945,156 | |
| | | | | | | | |
| | | | Health Care Distributors 0.3% | | | | |
| | 3,573 | | | McKesson Corp. | | | 548,849 | |
| | | | | | | | |
| | | | Health Care Equipment 3.6% | | | | |
| | 175,500 | | | Accuray, Inc.* | | | 702,000 | |
| | 27,426 | | | bioMérieux (France) | | | 2,232,407 | |
| | 35,760 | | | DiaSorin S.p.A. (Italy) | | | 3,188,876 | |
| | 40,400 | | | Nihon Kohden Corp. (Japan) | | | 873,164 | |
| | | | | | | | |
| | | | 6,996,447 | |
| | | | | | | | |
| | | | Health Care Facilities 0.8% | | | | |
| | 74,000 | | | Japan Animal Referral Medical Center Co. Ltd.* (Japan) | | | 1,459,285 | |
| | | | | | | | |
| | | | Health Care Services 0.8% | | | | |
| | 63,816 | | | BML, Inc. (Japan) | | | 1,365,076 | |
| | 5,111 | | | MEDNAX, Inc.* | | | 220,386 | |
| | | | | | | | |
| | | | 1,585,462 | |
| | | | | | | | |
| | | | Health Care Supplies 5.2% | | | | |
| | 614,279 | | | Advanced Medical Solutions Group plc (United Kingdom) | | | 2,385,029 | |
| | 29,673 | | | Guerbet (France) | | | 2,763,558 | |
| | 74,700 | | | Menicon Co. Ltd. (Japan) | | | 2,954,144 | |
| | 976,000 | | | Shandong Weigao Group Medical Polymer Co. Ltd., Class H (China) | | | 690,931 | |
| | 378,467 | | | Tristel plc (United Kingdom) | | | 1,331,257 | |
| | | | | | | | |
| | | | 10,124,919 | |
| | | | | | | | |
| | | | Health Care Technology 4.8% | | | | |
| | 148,186 | | | Computer Programs and Systems, Inc. | | | 4,378,896 | |
| | 96,612 | | | Nexus AG (Germany) | | | 3,025,923 | |
| | 43,980 | | | RaySearch Laboratories AB* (Sweden) | | | 936,848 | |
| | 23,570 | | | Software Service, Inc. (Japan) | | | 1,049,417 | |
| | | | | | | | |
| | | | | | | 9,391,084 | |
| | | | | | | | |
| | | | Home Entertainment Software 3.9% | | | | |
| | 9,000 | | | Electronic Arts, Inc.* | | | 1,062,540 | |
| | 11,700 | | | Nintendo Co. Ltd. (Japan) | | | 4,321,280 | |
| | 22,079 | | | Take-Two Interactive Software, Inc.* | | | 2,257,136 | |
| | | | | | | | |
| | | | | | | 7,640,956 | |
| | | | | | | | |
81
| | |
| WASATCH WORLD INNOVATORS FUND (WAGTX / WIGTX) | | |
|
|
|
Schedule of Investments (continued)
| | | | | | | | |
| Shares | | | | | Value | |
| | | | | | | |
| | | | Home Improvement Retail 1.5% | | | | |
| | 94,400 | | | Arcland Sakamoto Co. Ltd. (Japan) | | $ | 1,421,977 | |
| | 6,046 | | | Home Depot, Inc. (The) | | | 988,884 | |
| | 6,439,800 | | | PT Ace Hardware Indonesia Tbk (Indonesia) | | | 580,916 | |
| | | | | | | | |
| | | | | | | 2,991,777 | |
| | | | | | | | |
| | | | Household Appliances 2.5% | | | | |
| | 74,000 | | | SodaStream International Ltd.* (Israel) | | | 4,917,300 | |
| | | | | | | | |
| | | | Housewares & Specialties 0.0% | | | | |
| | 47,522 | | | OurPet’s Co.* | | | 85,540 | |
| | | | | | | | |
| | | | Hypermarkets & Super Centers 3.0% | | | | |
| | 36,075 | | | Costco Wholesale Corp. | | | 5,926,762 | |
| | | | | | | | |
| | | | Industrial Machinery 3.1% | | | | |
| | 26,000 | | | Iwaki Co. Ltd. (Japan) | | | 688,327 | |
| | 132,518 | | | Kornit Digital Ltd.* (Israel) | | | 2,027,525 | |
| | 165,898 | | | Porvair plc (United Kingdom) | | | 1,067,056 | |
| | 1,005,392 | | | Skellerup Holdings Ltd. (New Zealand) | | | 1,227,269 | |
| | 9,000 | | | SLM Solutions Group AG* (Germany) | | | 378,681 | |
| | 27,000 | | | va-Q-tec AG* (Germany) | | | 726,780 | |
| | | | | | | | |
| | | | | | | 6,115,638 | |
| | | | | | | | |
| | | | Internet & Direct Marketing Retail 3.2% | | | | |
| | 792 | | | Amazon.com, Inc.* | | | 761,389 | |
| | 461,655 | | | AO World plc* (United Kingdom) | | | 689,759 | |
| | 187,582 | | | ePrice S.p.A. (Italy) | | | 680,629 | |
| | 160,000 | | | Kogan.com Ltd. (Australia) | | | 483,190 | |
| | 4,290 | | | Netflix, Inc.* | | | 777,992 | |
| | 171,261 | | | Ocado Group plc* (United Kingdom) | | | 671,716 | |
| | 780 | | | Priceline Group, Inc. (The)* | | | 1,428,040 | |
| | 37,642 | | | Sportamore AB* (Sweden) | | | 657,414 | |
| | 100 | | | Vipshop Holdings Ltd. ADR* (China) | | | 879 | |
| | | | | | | | |
| | | | | | | 6,151,008 | |
| | | | | | | | |
| | | | Internet Software & Services 3.5% | | | | |
| | 11,238 | | | Alibaba Group Holding Ltd., ADR* (China) | | | 1,940,915 | |
| | 2,538 | | | Alphabet, Inc., Class A* | | | 2,471,301 | |
| | 8,218 | | | Facebook, Inc.* | | | 1,404,210 | |
| | 1,400,000 | | | nearmap Ltd.* (Australia) | | | 719,295 | |
| | 4,600 | | | Tencent Holdings Ltd. (China) | | | 197,977 | |
| | | | | | | | |
| | | | | | | 6,733,698 | |
| | | | | | | | |
| | | | IT Consulting & Other Services 1.6% | | | | |
| | 43,086 | | | Cognizant Technology Solutions Corp., Class A | | | 3,125,458 | |
| | | | | | | | |
| | | | Leisure Facilities 0.4% | | | | |
| | 587,500 | | | Goals Soccer Centres plc* (United Kingdom) | | | 755,760 | |
| | | | | | | | |
| | | | Leisure Products 3.7% | | | | |
| | 63,000 | | | Bandai Namco Holdings, Inc. (Japan) | | | 2,161,120 | |
| | 150,000 | | | KMC Kuei Meng International, Inc. (Taiwan) | | | 648,002 | |
| | 1,281,224 | | | Photo-Me International plc (United Kingdom) | | | 2,987,300 | |
| | 10,000 | | | Shimano, Inc. (Japan) | | | 1,332,148 | |
| | | | | | | | |
| | | | | | | 7,128,570 | |
| | | | | | | | |
| | | | Life Sciences Tools & Services 0.8% | | | | |
| | 497,724 | | | Horizon Discovery Group plc* (United Kingdom) | | | 1,513,976 | |
| | | | | | | | |
| | | | | | | | |
| Shares | | | | | Value | |
| | | | | | | |
| | | | Movies & Entertainment 3.1% | | | | |
| | 82,577 | | | AFC Ajax N.V.* (Netherlands) | | $ | 1,005,257 | |
| | 168,000 | | | Borussia Dortmund GmbH & Co. KGaA (Germany) | | | 1,628,186 | |
| | 3,300 | | | Celtic plc* (United Kingdom) | | | 5,793 | |
| | 1,200,000 | | | Juventus Football Club S.p.A.* (Italy) | | | 1,121,860 | |
| | 8,000 | | | Toei Co. Ltd. (Japan) | | | 887,980 | |
| | 26,000 | | | Toho Co. Ltd. (Japan) | | | 906,910 | |
| | 5,233 | | | Walt Disney Co. (The) | | | 515,817 | |
| | | | | | | | |
| | | | | | | 6,071,803 | |
| | | | | | | | |
| | | | Multi-Utilities 1.1% | | | | |
| | 142,009 | | | Telecom Plus plc (United Kingdom) | | | 2,066,571 | |
| | | | | | | | |
| | | | Oil & Gas Refining & Marketing 0.1% | | | | |
| | 3,454 | | | World Fuel Services Corp. | | | 117,125 | |
| | | | | | | | |
| | | | Personal Products 0.7% | | | | |
| | 19,023 | | | Herbalife Ltd.* | | | 1,290,330 | |
| | 1,000 | | | USANA Health Sciences, Inc.* | | | 57,700 | |
| | | | | | | | |
| | | | | | | 1,348,030 | |
| | | | | | | | |
| | | | Pharmaceuticals 0.2% | | | | |
| | 10,047 | | | Novo Nordisk A/S, Class B (Denmark) | | | 480,309 | |
| | | | | | | | |
| | | | Publishing 2.4% | | | | |
| | 235,609 | | | New York Times Co. (The) | | | 4,617,936 | |
| | | | | | | | |
| | | | Real Estate Services 0.0% | | | | |
| | 128 | | | Jones Lang LaSalle, Inc. | | | 15,808 | |
| | | | | | | | |
| | | | Regional Banks 0.0% | | | | |
| | 100 | | | Metro Bank plc* (United Kingdom) | | | 4,529 | |
| | | | | | | | |
| | | | Restaurants 1.0% | | | | |
| | 60,000 | | | Shake Shack, Inc., Class A* | | | 1,993,800 | |
| | | | | | | | |
| | | | Semiconductors 1.4% | | | | |
| | 11,941 | | | Microchip Technology, Inc. | | | 1,072,063 | |
| | 238,000 | | | Taiwan Semiconductor Manufacturing Co. Ltd. (Taiwan) | | | 1,699,215 | |
| | | | | | | | |
| | | | | | | 2,771,278 | |
| | | | | | | | |
| | | | Soft Drinks 0.1% | | | | |
| | 62,352 | | | Reed’s, Inc.* | | | 137,174 | |
| | | | | | | | |
| | | | Specialized Consumer Services 0.4% | | | | |
| | 22,000 | | | Asante, Inc. (Japan) | | | 387,700 | |
| | 10,000 | | | San Holdings, Inc. (Japan) | | | 242,613 | |
| | 21,900 | | | Tear Corp. (Japan) | | | 166,987 | |
| | | | | | | | |
| | | | | | | 797,300 | |
| | | | | | | | |
| | | | Specialized Finance 0.2% | | | | |
| | 7,500 | | | Zenkoku Hosho Co. Ltd. (Japan) | | | 314,930 | |
| | | | | | | | |
| | | | Specialty Chemicals 0.1% | | | | |
| | 150,371 | | | Polygiene AB* (Sweden) | | | 212,313 | |
| | | | | | | | |
| | | | Specialty Stores 0.8% | | | | |
| | 40,000 | | | Asahi Co. Ltd. (Japan) | | | 473,495 | |
| | 10,468 | | | Fenix Outdoor International AG (Switzerland) | | | 1,052,596 | |
| | | | | | | | |
| | | | 1,526,091 | |
| | | | | | | | |
| | | | Systems Software 1.1% | | | | |
| | 12,892 | | | Check Point Software Technologies Ltd.* (Israel) | | | 1,469,946 | |
| | 68,000 | | | WANdisco plc* (United Kingdom) | | | 733,516 | |
| | | | | | | | |
| | | | 2,203,462 | |
| | | | | | | | |
82
| | | | | | | | |
| Shares | | | | | Value | |
| | | | | | | |
| | | | Technology Hardware, Storage & Peripherals 0.7% | | | | |
| | 241,619 | | | Xaar plc (United Kingdom) | | $ | 1,442,392 | |
| | | | | | | | |
| | | | Thrifts & Mortgage Finance 0.1% | | | | |
| | 9,900 | | | Housing Development Finance Corp. Ltd. (India) | | | 262,239 | |
| | | | | | | | |
| | | | Trading Companies & Distributors 0.1% | | | | |
| | 2,500 | | | Air Lease Corp. | | | 106,550 | |
| | | | | | | | |
| | |
| | | | Total Common Stocks
(cost $130,335,006) | | | 165,811,513 | |
| | | | | | | | |
| | |
| | | | LIMITED PARTNERSHIP INTEREST 0.1% | | | | |
| | |
| | | | Asset Management & Custody Banks 0.1% | | | | |
| | | | Greenspring Global Partners II-B, L.P.* *** † | | | 215,512 | |
| | | | | | | | |
| | |
| | | | Total Limited Partnership Interest
(cost $211,184) | | | 215,512 | |
| | | | | | | | |
| | |
| | | | EXCHANGE-TRADED FUNDS 0.1% | | | | |
| | |
| | | | Asset Management & Custody Banks 0.1% | | | | |
| | 1,500 | | | PowerShares Dynamic Pharmaceuticals Portfolio | | | 98,025 | |
| | | | | | | | |
| | |
| | | | Total Exchange-Traded Funds
(cost $89,935) | | | 98,025 | |
| | | | | | | | |
| | |
Principal
Amount | | | | | Value | |
| | | | | | | |
| | | | SHORT-TERM INVESTMENTS 15.4% | | | | |
| | |
| | | | Repurchase Agreement 15.4% | | | | |
| | $29,928,007 | | | Repurchase Agreement dated 9/29/17,
0.12% due 10/2/17 with Fixed Income
Clearing Corp. collateralized by $30,580,000 of United States Treasury Notes 2.250% due 2/15/27;
value: $30,527,066; repurchase
proceeds: $29,928,306 (cost $29,928,007) | | $ | 29,928,007 | |
| | | | | | | | |
| | |
| | | | Total Short-Term Investments
(cost $29,928,007) | | | 29,928,007 | |
| | | | | | | | |
| | |
| | | | Total Investments
(cost $160,564,132) 100.6% | | | 196,053,057 | |
| | | | | | | | |
| | |
| | | | Liabilities less Other Assets (0.6%) | | | (1,196,503 | ) |
| | | | | | | | |
| | |
| | | | NET ASSETS 100.0% | | $ | 194,856,554 | |
| | | | | | | | |
| |
| | | | *Non-income producing. ***Security was fair valued under procedures adopted by the Board of Trustees (see Note 12). †Security purchased in a private placement transaction or under Rule 144A of the Securities Act of 1933 (see Note 9). ADR American Depositary Receipt. See Notes to Financial Statements. | |
At September 30, 2017, Wasatch World Innovators Fund’s investments, excluding short-term investments, were in the following countries (unaudited):
| | | | |
| Country | | % | |
Australia | | | 1.3 | |
Belgium | | | 1.2 | |
Brazil | | | 0.8 | |
Canada | | | 0.9 | |
China | | | 2.3 | |
Denmark | | | 0.3 | |
France | | | 3.1 | |
Germany | | | 3.9 | |
India | | | 0.3 | |
Indonesia | | | 0.4 | |
Israel | | | 5.1 | |
Italy | | | 3.6 | |
Japan | | | 16.9 | |
Netherlands | | | 0.6 | |
New Zealand | | | 1.5 | |
Sweden | | | 1.1 | |
Switzerland | | | 0.6 | |
Taiwan | | | 1.4 | |
United Kingdom | | | 19.0 | |
United States | | | 35.7 | |
| | | | |
TOTAL | | | 100.0 | % |
| | | | |
83
| | |
| WASATCH-1ST SOURCE INCOME FUND (FMEQX) | | |
|
|
|
Schedule of Investments
| | | | | | | | |
Principal
Amount | | | | | Value | |
| | | | | | | |
| | | | CORPORATE BONDS 53.3% | | | | |
| | |
| | | | Automobile Manufacturers 1.4% | | | | |
| | $1,250,000 | | | Ford Motor Credit Co., LLC, 5.75%, 2/1/21 | | $ | 1,370,734 | |
| | | | | | | | |
| | | | Beverages-Non-Alcoholic 0.8% | | | | |
| | 750,000 | | | PepsiCo, Inc., 5.00%, 6/1/18 | | | 767,136 | |
| | | | | | | | |
| | | | Biotechnology 1.0% | | | | |
| | 1,000,000 | | | Roche Holdings, Inc., 2.25%, 9/30/19† | | | 1,006,220 | |
| | | | | | | | |
| | | | Computer Services 3.5% | | | | |
| | 1,350,000 | | | Apple, Inc., 1.70%, 2/22/19 | | | 1,353,240 | |
| | 2,000,000 | | | Hewlett Packard Enterprise Co.,
3.60%, 10/15/20 | | | 2,073,091 | |
| | | | | | | | |
| | | | 3,426,331 | |
| | | | | | | | |
| | | | Construction Machinery & Heavy Trucks 1.1% | | | | |
| | 1,000,000 | | | John Deere Capital Corp., 2.25%, 4/17/19 | | | 1,009,219 | |
| | | | | | | | |
| | | | Consumer Finance 1.0% | | | | |
| | 1,000,000 | | | American Express Credit Corp.,
2.25%, 8/15/19 MTN | | | 1,008,305 | |
| | | | | | | | |
| | | | Diversified Banks 8.1% | | | | |
| | 1,000,000 | | | Bank of America Corp.,
4.00%, 4/1/24 MTN | | | 1,056,453 | |
| | 1,200,000 | | | Citigroup, Inc., 3-month LIBOR + 0.55%, 1.867%, 8/25/36††† | | | 999,000 | |
| | 1,000,000 | | | Fulton Financial Corp., 3.60%, 3/16/22 | | | 1,010,609 | |
| | 1,000,000 | | | HSBC Holdings plc, 3-month LIBOR + 2.24%, 3.557%, 3/8/21††† (United Kingdom) | | | 1,052,350 | |
| | 1,250,000 | | | PNC Bank NA, 3.80%, 7/25/23 | | | 1,318,471 | |
| | 1,250,000 | | | Royal Bank of Canada,
2.20%, 9/23/19 (Canada) | | | 1,256,357 | |
| | 1,125,000 | | | US Bancorp, 3.00%, 3/15/22 MTN | | | 1,159,449 | |
| | | | | | | | |
| | | | 7,852,689 | |
| | | | | | | | |
| | | | Diversified Financial Services 4.0% | | | | |
| | 1,600,000 | | | General Electric Co., 4.65%, 10/17/21 MTN | | | 1,752,106 | |
| | 1,250,000 | | | General Electric Co., 3-month LIBOR + 3.33%, 5.00%, 1/21/21, Series D††† §§§ | | | 1,322,125 | |
| | 750,000 | | | New York Life Global Funding,
2.15%, 6/18/19† | | | 752,794 | |
| | | | | | | | |
| | | | 3,827,025 | |
| | | | | | | | |
| | | | E-Commerce/Products 1.3% | | | | |
| | 1,250,000 | | | Alibaba Group Holding Ltd.,
3.125%, 11/28/21 (Cayman Islands) | | | 1,277,781 | |
| | | | | | | | |
| | | | Enterprise Software & Services 1.2% | | | | |
| | 1,100,000 | | | CA, Inc., 3.60%, 8/15/22 | | | 1,127,480 | |
| | | | | | | | |
| | | | Insurance 5.2% | | | | |
| | 1,000,000 | | | Allstate Corp. (The), 3-month LIBOR + 1.935%, 3.25%, 5/15/67††† | | | 985,000 | |
| | 1,100,000 | | | Aspen Insurance Holdings Ltd.,
4.65%, 11/15/23 (Bermuda) | | | 1,177,204 | |
| | 1,200,000 | | | Athene Global Funding, 4.00%, 1/25/22† | | | 1,249,319 | |
| | 560,000 | | | Jackson National Life Global Funding,
4.70%, 6/1/18† | | | 570,833 | |
| | 1,175,000 | | | Lincoln National Corp., 3-month LIBOR + 2.358%, 3.672%, 5/17/66††† | | | 1,092,750 | |
| | | | | | | | |
| | | | 5,075,106 | |
| | | | | | | | |
| | | | Integrated Telecommunication Services 3.9% | | | | |
| | 1,250,000 | | | AT&T, Inc., 5.20%, 3/15/20 | | | 1,338,314 | |
| | 1,000,000 | | | Crown Castle Towers, LLC,
4.883%, 8/15/40† | | | 1,059,273 | |
| | 1,250,000 | | | Verizon Communications, Inc.,
5.15%, 9/15/23 | | | 1,401,209 | |
| | | | | | | | |
| | | | 3,798,796 | |
| | | | | | | | |
| | | | | | | | |
Principal
Amount | | | | | Value | |
| | | | | | | |
| | | | Investment Banking & Brokerage 7.9% | | | | |
| | $ 1,700,000 | | | Goldman Sachs Group, Inc. (The), 3-month LIBOR + 1.75%,
3.064%, 10/28/27 MTN††† | | $ | 1,769,547 | |
| | 1,250,000 | | | JPMorgan Chase & Co., 3-month LIBOR + 1.23%, 2.543%, 10/24/23††† | | | 1,277,092 | |
| | 1,000,000 | | | JPMorgan Chase & Co., 3.25%, 9/23/22 | | | 1,033,821 | |
| | 1,000,000 | | | JPMorgan Chase & Co., 3-month LIBOR + 3.47%, 7.90%, 4/30/18, Series 1††† §§§ | | | 1,030,000 | |
| | 1,250,000 | | | Morgan Stanley, 3-month LIBOR + 1.40%, 2.713%, 10/24/23 MTN††† | | | 1,278,413 | |
| | 1,200,000 | | | Morgan Stanley, 4.875%, 11/1/22 | | | 1,300,525 | |
| | | | | | | | |
| | | | 7,689,398 | |
| | | | | | | | |
| | |
| | | | Multimedia 0.9% | | | | |
| | 800,000 | | | NBCUniversal Media, LLC , 5.15%, 4/30/20 | | | 864,734 | |
| | | | | | | | |
| | |
| | | | Oil Companies—Integrated 1.6% | | | | |
| | 1,500,000 | | | BP Capital Markets plc, 3.245%, 5/6/22 (United Kingdom) | | | 1,553,854 | |
| | | | | | | | |
| | |
| | | | Pharmaceuticals 0.8% | | | | |
| | 575,000 | | | Pharmacia, LLC, 6.75%, 12/15/27 | | | 732,612 | |
| | | | | | | | |
| | |
| | | | Pipelines 1.0% | | | | |
| | 1,000,000 | | | Enterprise Products Operating, LLC, 3-month LIBOR + 2.778%,
4.093%, 6/1/67††† | | | 970,591 | |
| | | | | | | | |
| | |
| | | | Property & Casualty Insurance 0.9% | | | | |
| | 1,000,000 | | | XLIT Ltd., 3-month LIBOR + 2.458%, 3.761%, 10/30/17, Series E††† §§§ (Cayman Islands) | | | 911,670 | |
| | | | | | | | |
| | |
| | | | Residential REITs 2.5% | | | | |
| | 1,200,000 | | | AvalonBay Communities, Inc.,
4.20%, 12/15/23 MTN | | | 1,288,448 | |
| | 1,000,000 | | | EPR Properties, 5.75%, 8/15/22 | | | 1,106,780 | |
| | | | | | | | |
| | | | 2,395,228 | |
| | | | | | | | |
| | |
| | | | Semiconductor Equipment 1.1% | | | | |
| | 1,000,000 | | | Applied Materials, Inc., 4.30%, 6/15/21 | | | 1,072,897 | |
| | | | | | | | |
| | |
| | | | Semiconductors 1.5% | | | | |
| | 1,400,000 | | | QUALCOMM, Inc., 3-month LIBOR + 0.73%, 2.041%, 1/30/23††† | | | 1,407,027 | |
| | | | | | | | |
| | |
| | | | Super-Regional Banks—U.S. 1.4% | | | | |
| | 1,250,000 | | | Wells Fargo & Co., 4.125%, 8/15/23 | | | 1,323,292 | |
| | | | | | | | |
| | |
| | | | Trucking & Leasing 1.2% | | | | |
| | 1,000,000 | | | Aviation Capital Group Corp.,
6.75%, 4/6/21† | | | 1,130,328 | |
| | | | | | | | |
| | |
| | | | Total Corporate Bonds
(cost $51,058,721) | | | 51,598,453 | |
| | | | | | | | |
84
| | | | | | | | |
Principal
Amount | | | | | Value | |
| | | | | | | |
| | | | ASSET-BACKED SECURITIES 15.7% | | | | |
| | |
| | $ 913,223 | | | 2010 U-Haul S Fleet, LLC,
4.899%, 10/25/23, Series 2010-BT1A, Class 1† | | $ | 913,566 | |
| | 1,000,000 | | | Avis Budget Rental Car Funding AESOP, LLC, 2.50%, 7/20/21, Series 2015-1A, Class A† | | | 998,505 | |
| | 1,000,000 | | | Citibank Credit Card Issuance Trust, 1-month LIBOR + 0.77%, 2.007%, 5/14/29, Series 2017-A6, Class A6††† | | | 1,010,101 | |
| | 854,373 | | | DT Auto Owner Trust 2016-2,
2.92%, 5/15/20, Series 2016-2A, Class B† | | | 855,662 | |
| | 825,000 | | | Exeter Automobile Receivables Trust, 3.59%, 8/16/21, Series 2015-3A, Class B† | | | 831,256 | |
| | 1,290,361 | | | Fairway Outdoor Funding, LLC,
4.212%, 10/15/42, Series 2012-1A, Class A2† | | | 1,310,181 | |
| | 963,986 | | | Global SC Finance IV Ltd., 3.85%, 4/15/37, Series 2017-1A, Class A† | | | 977,054 | |
| | 1,000,000 | | | Hertz Vehicle Financing, LLC 2016-2, 2.95%, 3/25/22, Series 2016-2A, Class A† | | | 997,048 | |
| | 965,000 | | | HOA Funding, LLC, 5.50%, 8/20/44, Series 2015-1A, Class A2† | | | 958,506 | |
| | 1,000,000 | | | Scala Funding Co., LLC, 3.91%, 2/15/21, Series 2016-1, Class A*** † | | | 1,009,375 | |
| | 1,197,770 | | | Shenton Aircraft Investment I Ltd.,
4.75%, 10/15/42, Series 2015-1A, Class A† (Cayman Islands) | | | 1,254,174 | |
| | 888,280 | | | Spirit Master Funding, LLC,
5.05%, 7/20/40, Series 2014-1A, Class A1† | | | 912,997 | |
| | 1,519,000 | | | Wendys Funding, LLC, 3.371%, 6/15/45, Series 2015-1A, Class A2I† | | | 1,532,625 | |
| | 1,610,000 | | | World Financial Network Credit Card Master Trust, 3.14%, 1/17/23, Series 2012-A, Class A | | | 1,639,547 | |
| | | | | | | | |
| | |
| | | | Total Asset-Backed Securities
(cost $15,204,019) | | | 15,200,597 | |
| | | | | | | | |
| | |
| | | | MORTGAGE-BACKED SECURITIES 12.5% | | | | |
| | |
| | 1,039,475 | | | Federal Home Loan Mortgage Corp., 12-month LIBOR + 1.820%, 2.714%, 1/1/43, Series 840522††† | | | 1,077,186 | |
| | 1,384,384 | | | Federal Home Loan Mortgage Corp., 3.50%, 2/1/32, Series G18637 | | | 1,447,861 | |
| | 1,000,000 | | | Federal National Mortgage Assoc.,
2.42%, 4/1/22, Series AM8263 | | | 1,003,352 | |
| | 976,320 | | | Federal National Mortgage Assoc., 12-month LIBOR + 1.599%, 2.45%, 7/1/44, Series AL9645††† | | | 1,005,779 | |
| | 1,026,618 | | | Federal National Mortgage Assoc., 12-month LIBOR + 1.496%, 2.669%, 4/1/44, Series AL9804††† | | | 1,059,942 | |
| | 1,775,841 | | | Federal National Mortgage Assoc.,
3.00%, 3/1/29, Series AL4936 | | | 1,831,205 | |
| | 1,190,358 | | | Federal National Mortgage Assoc., 12-month LIBOR + 1.60%, 3.118%, 5/1/47, Series BH0393††† | | | 1,215,087 | |
| | 1,018,760 | | | Federal National Mortgage Assoc.,
3.50%, 6/1/32, Series AL2525 | | | 1,070,102 | |
| | 1,118,669 | | | Federal National Mortgage Assoc.,
3.50%, 9/1/32, Series AP8284 | | | 1,165,592 | |
| | 1,175,270 | | | Government National Mortgage Assoc., 3.87%, 10/15/36, Series AO0029 | | | 1,251,446 | |
| | | | | | | | |
| | |
| | | | Total Mortgage-Backed Securities
(cost $12,138,543) | | | 12,127,552 | |
| | | | | | | | |
| | | | | | | | |
Principal
Amount | | | | | Value | |
| | | | | | | |
| | | | U.S. TREASURY NOTES 6.7% | | | | |
| | |
| | $ 1,200,000 | | | U.S. Treasury Note, 2.25%, 7/31/18 | | $ | 1,208,813 | |
| | 1,100,000 | | | U.S. Treasury Note, 2.625%, 8/15/20 | | | 1,131,238 | |
| | 2,500,000 | | | U.S. Treasury Note, 3.625%, 8/15/19 | | | 2,599,707 | |
| | 1,500,000 | | | U.S. Treasury Note, 3.625%, 2/15/20 | | | 1,572,773 | |
| | | | | | | | |
| | |
| | | | Total U.S. Treasury Notes
(cost $6,523,361) | | | 6,512,531 | |
| | | | | | | | |
| | |
| | | | U.S. GOVERNMENT AGENCY SECURITIES 4.4% | | | | |
| | |
| | 1,050,000 | | | Federal Farm Credit Banks, 2.60%, 10/6/22 | | | 1,075,881 | |
| | 1,000,000 | | | Federal Farm Credit Banks, 4.95%, 12/16/19 | | | 1,071,090 | |
| | 1,000,000 | | | Tennessee Valley Authority, 3.875%, 2/15/21 | | | 1,066,156 | |
| | 1,000,000 | | | Tennessee Valley Authority, 6.25%, 12/15/17, Series E | | | 1,010,209 | |
| | | | | | | | |
| | |
| | | | Total U.S. Government Agency Securities
(cost $4,232,150) | | | 4,223,336 | |
| | | | | | | | |
| | |
| | | | MUNICIPAL BONDS 4.0% | | | | |
| | |
| | 730,000 | | | City of Dublin, Ohio, 5.00%, 12/1/22, Series B | | | 806,176 | |
| | 500,000 | | | Iowa Student Loan Liquidity Corp.,
2.86%, 12/1/22, Series A-2 | | | 499,655 | |
| | 1,325,000 | | | Municipal Electric Authority of Georgia, 4.03%, 1/1/20, Series A | | | 1,352,480 | |
| | 1,200,000 | | | State of New York Mortgage Agency, 3.653%, 4/1/23, Series 172 | | | 1,238,424 | |
| | | | | | | | |
| | |
| | | | Total Municipal Bonds
(cost $3,896,904) | | | 3,896,735 | |
| | | | | | | | |
| | |
| | | | U.S. TREASURY INFLATION-PROTECTED SECURITIES 2.1% | | | | |
| | |
| | 894,179 | | | Treasury Inflation-Protected Security, 2.00%, 1/15/26 | | | 1,005,618 | |
| | 969,136 | | | Treasury Inflation-Protected Security, 2.125%, 1/15/19 | | | 999,308 | |
| | | | | | | | |
| | |
| | | | Total U.S. Treasury Inflation-Protected Securities
(cost $2,011,215) | | | 2,004,926 | |
| | | | | | | | |
85
| | |
| WASATCH-1ST SOURCE INCOME FUND (FMEQX) | | SEPTEMBER 30, 2017 |
|
|
|
Schedule of Investments (continued)
| | | | | | | | |
Principal
Amount | | | | | Value | |
| | | | | | | |
| | | | SHORT-TERM INVESTMENTS 0.8% | | | | |
| | |
| | | | Repurchase Agreement 0.8% | | | | |
| | $ 779,866 | | | Repurchase Agreement dated 9/29/17,
0.12% due 10/2/17 with Fixed Income
Clearing Corp. collateralized by $800,000
of United States Treasury Notes 2.250%
due 2/15/27; value: $798,615; repurchase
proceeds: $779,874 (cost $779,866) | | $ | 779,866 | |
| | | | | | | | |
| | |
| | | | Total Short-Term Investments
(cost $779,866) | | | 779,866 | |
| | | | | | | | |
| | |
| | | | Total Investments
(cost $95,844,779) 99.5% | | | 96,343,996 | |
| | |
| | | | Other Assets less Liabilities 0.5% | | | 522,562 | |
| | | | | | | | |
| | |
| | | | NET ASSETS 100.0% | | $ | 96,866,558 | |
| | | | | | | | |
| |
| | | | | †Liquid security purchased in a private placement transaction or under Rule 144A of the Securities Act of 1933. ***Security was fair valued under procedures adopted by the Board of Trustees (see Note 12). †††Variable rate securities. §§§Perpetual maturity. Callable any time after first call date. Maturity date is next call date. LIBOR London Interbank Offered Rate. MTN Medium Term Note. See Notes to Financial Statements. | |
At September 30, 2017, Wasatch-1st Source Income Fund’s investments, excluding short-term investments, were in the following countries (unaudited):
| | | | |
| Country | | % | |
Bermuda | | | 1.3 | |
Canada | | | 1.3 | |
Cayman Islands | | | 3.6 | |
United Kingdom | | | 2.7 | |
United States | | | 91.1 | |
| | | | |
TOTAL | | | 100.0 | % |
| | | | |
86
| | |
| WASATCH-HOISINGTON U.S. TREASURY FUND (WHOSX) | | SEPTEMBER 30, 2017 |
|
|
|
Schedule of Investments
| | | | | | | | |
Principal
Amount | | | | | Value | |
| | | | | | | |
| | | | U.S. GOVERNMENT OBLIGATIONS 99.4% | | | | |
| | |
| | $146,300,000 | | | U.S. Treasury Bond, 2.25%, 8/15/46 | | $ | 128,635,417 | |
| | 66,500,000 | | | U.S. Treasury Bond, 2.50%, 2/15/45 | | | 62,021,641 | |
| | 8,200,000 | | | U.S. Treasury Bond, 2.50%, 5/15/46 | | | 7,619,594 | |
| | 8,000,000 | | | U.S. Treasury Bond, 3.125%, 8/15/44 | | | 8,439,687 | |
| | 14,100,000 | | | U.S. Treasury Bond, 3.75%, 11/15/43 | | | 16,527,844 | |
| | 39,000,000 | | | U.S. Treasury Strip, principal only, 8/15/40 | | | 20,387,677 | |
| | 81,000,000 | | | U.S. Treasury Strip, principal only, 5/15/44 | | | 37,398,422 | |
| | 175,700,000 | | | U.S. Treasury Strip, principal only, 8/15/45 | | | 77,642,176 | |
| | | | | | | | |
| | |
| | | | Total U.S. Government Obligations
(cost $376,059,411) | | | 358,672,458 | |
| | | | | | | | |
| | | | | | | | |
Principal
Amount | | | | | Value | |
| | | | | | | |
| | | | SHORT-TERM INVESTMENTS 0.5% | | | | |
| | |
| | | | Repurchase Agreement 0.5% | | | | |
| | $ 1,803,381 | | | Repurchase Agreement dated 9/29/17, 0.12% due 10/2/17 with Fixed Income Clearing Corp. collateralized by $1,815,000 of United States Treasury Notes 2.250% due 11/15/24; value $1,842,795; repurchase proceeds: $1,803,399 (cost $1,803,381) | | $ | 1,803,381 | |
| | | | | | | | |
| | |
| | | | Total Short-Term Investments
(cost $1,803,381) | | | 1,803,381 | |
| | | | | | | | |
| | |
| | | | Total Investments
(cost $377,862,792) 99.9% | | | 360,475,839 | |
| | |
| | | | Other Assets less Liabilities 0.1% | | | 389,925 | |
| | | | | | | | |
| | |
| | | | NET ASSETS 100.0% | | $ | 360,865,764 | |
| | | | | | | | |
| |
| | | | See Notes to Financial Statements. | |
87
Statements of Assets and Liabilities
| | | | | | | | | | | | |
| | | CORE
GROWTH
FUND | | | EMERGING
INDIA
FUND | | | EMERGING
MARKETS
SELECT
FUND | |
| | | | | | | | | | | | |
Assets: | |
Investments, at cost | |
Unaffiliated issuers | | $ | 971,086,223 | | | $ | 178,037,715 | | | $ | 33,701,376 | |
Repurchase agreements | | | 30,607,602 | | | | 3,284,123 | | | | — | |
| | | | | | | | | | | | |
| | $ | 1,001,693,825 | | | $ | 181,321,838 | | | $ | 33,701,376 | |
| | | | | | | | | | | | |
Investments, at market value | |
Unaffiliated issuers | | $ | 1,556,291,272 | | | $ | 230,551,773 | | | $ | 44,351,449 | |
Repurchase agreements | | | 30,607,602 | | | | 3,284,123 | | | | — | |
| | | | | | | | | | | | |
| | | 1,586,898,874 | | | | 233,835,896 | | | | 44,351,449 | |
Cash | | | — | | | | — | | | | 21,267 | |
Foreign currency on deposit (cost of $2, $85,527, $0, $205,307, $136,379,
$0, $824,731 and $316,767, respectively) | | | 2 | | | | 85,081 | | | | — | |
Receivable for investment securities sold | | | 9,212,274 | | | | — | | | | — | |
Capital shares receivable | | | 701,015 | | | | 846,550 | | | | 29,496 | |
Interest and dividends receivable | | | 517,568 | | | | 99,301 | | | | 24,003 | |
Prepaid expenses and other assets | | | 64,052 | | | | 30,310 | | | | 8,150 | |
| | | | | | | | | | | | |
Total Assets | | | 1,597,393,785 | | | | 234,897,138 | | | | 44,434,365 | |
| | | | | | | | | | | | |
Liabilities: | |
Payable for securities purchased | | | 685,542 | | | | — | | | | 25,235 | |
Capital shares payable | | | 674,752 | | | | 296,686 | | | | — | |
Payable to Trustees | | | 2,698 | | | | 259 | | | | 72 | |
Payable to Advisor | | | 1,232,078 | | | | 240,197 | | | | 26,492 | |
Accrued fund administration fees | | | 22,503 | | | | 2,882 | | | | 40 | |
Accrued expenses and other liabilities | | | 382,659 | | | | 126,315 | | | | 63,127 | |
Foreign capital gains taxes payable | | | 145,962 | | | | 2,542,300 | | | | 177,764 | |
Line of credit payable | | | — | | | | — | | | | — | |
| | | | | | | | | | | | |
Total Liabilities | | | 3,146,194 | | | | 3,208,639 | | | | 292,730 | |
| | | | | | | | | | | | |
Net Assets | | $ | 1,594,247,591 | | | $ | 231,688,499 | | | $ | 44,141,635 | |
| | | | | | | | | | | | |
Net Assets Consist of: | |
Capital stock | | $ | 236,089 | | | $ | 567,817 | | | $ | 41,841 | |
Paid-in-capital in excess of par | | | 941,428,642 | | | | 183,735,483 | | | | 43,072,219 | |
Undistributed net investment loss | | | (8,181,295 | ) | | | (2,249,623 | ) | | | (169,551 | ) |
Undistributed net realized gain (loss) on investments and foreign currency translations | | | 75,705,068 | | | | (334,530 | ) | | | (9,275,269 | ) |
Unrealized appreciation (depreciation) on: | | | | | | | | | | | | |
Investments | | | 585,059,087 | | | | 49,971,758 | | | | 10,472,309 | |
Foreign currency translations | | | — | | | | (2,406 | ) | | | 86 | |
| | | | | | | | | | | | |
Net Assets | | $ | 1,594,247,591 | | | $ | 231,688,499 | | | $ | 44,141,635 | |
| | | | | | | | | | | | |
Net Assets | |
Investor Class | | | 1,211,088,872 | | | | 207,949,077 | | | | 15,273,263 | |
Institutional Class | | | 383,158,719 | | | | 23,739,422 | | | | 28,868,372 | |
| | | |
Capital Stock Issued and Outstanding (Unlimited number of shares authorized,
$0.01 par value) | | | | | | | | | | | | |
Investor Class | | | 17,958,623 | | | | 50,986,675 | | | | 1,459,645 | |
Institutional Class | | | 5,650,304 | | | | 5,795,065 | | | | 2,724,422 | |
| | | |
NET ASSET VALUE, REDEMPTION PRICEAND OFFERING PRICE PER SHARE | | | | | | | | | | | | |
Investor Class | | $ | 67.44 | | | $ | 4.08 | | | $ | 10.46 | |
| | | | | | | | | | | | |
Institutional Class | | $ | 67.81 | | | $ | 4.10 | | | $ | 10.60 | |
| | | | | | | | | | | | |
See Notes to Financial Statements.
88
| | | | | | | | | | | | | | | | | | |
EMERGING
MARKETS
SMALL CAP
FUND | | | FRONTIER
EMERGING
SMALL COUNTRIES
FUND | | | GLOBAL
OPPORTUNITIES
FUND | | | INTERNATIONAL
GROWTH
FUND | | | INTERNATIONAL
OPPORTUNITIES
FUND | |
| | | | | | | | | | | | | | | | | | |
| | | | | | | | | | | | | | | | | | |
| | | | | | | | | | | | | | | | | | |
| $ | 438,405,639 | | | $ | 139,880,789 | | | $ | 65,507,888 | | | $ | 933,021,945 | | | $ | 373,980,301 | |
| | 114,452 | | | | 2,545,919 | | | | 170,608 | | | | — | | | | 6,840,234 | |
| | | | | | | | | | | | | | | | | | |
| $ | 438,520,091 | | | $ | 142,426,708 | | | $ | 65,678,496 | | | $ | 933,021,945 | | | $ | 380,820,535 | |
| | | | | | | | | | | | | | | | | | |
| | | | | | | | | | | | | | | | | | |
| $ | 642,139,569 | | | $ | 193,001,263 | | | $ | 103,116,066 | | | $ | 1,425,057,818 | | | $ | 487,600,677 | |
| | 114,452 | | | | 2,545,919 | | | | 170,608 | | | | — | | | | 6,840,234 | |
| | | | | | | | | | | | | | | | | | |
| | 642,254,021 | | | | 195,547,182 | | | | 103,286,674 | | | | 1,425,057,818 | | | | 494,440,911 | |
| | — | | | | 3,386,853 | | | | — | | | | — | | | | — | |
|
204,374 |
| | | 136,622 | | | | — | | | | 825,011 | | | | 317,256 | |
| | 2,061,346 | | | | 1,064,091 | | | | — | | | | 75,583,869 | | | | 6,968,228 | |
| | 255,254 | | | | 11,436 | | | | 1,437 | | | | 261,955 | | | | 274,801 | |
| | 818,231 | | | | 430,154 | | | | 84,559 | | | | 1,799,749 | | | | 580,404 | |
| | 36,394 | | | | 20,273 | | | | 17,130 | | | | 48,106 | | | | 22,402 | |
| | | | | | | | | | | | | | | | | | |
| | 645,629,620 | | | | 200,596,611 | | | | 103,389,800 | | | | 1,503,576,508 | | | | 502,604,002 | |
| | | | | | | | | | | | | | | | | | |
| | | | | | | | | | | | | | | | | | |
| | 961 | | | | 5,535 | | | | — | | | | 866,101 | | | | 160,740 | |
| | 549,097 | | | | 503,757 | | | | 740 | | | | 234,437 | | | | 214,131 | |
| | 1,266 | | | | 621 | | | | 210 | | | | 2,554 | | | | 1,060 | |
| | 897,733 | | | | 388,443 | | | | 103,366 | | | | 1,535,382 | | | | 717,203 | |
| | 12,007 | | | | 4,437 | | | | 1,160 | | | | 24,907 | | | | 7,085 | |
| | 248,660 | | | | 237,313 | | | | 75,990 | | | | 334,341 | | | | 221,672 | |
| | 194,004 | | | | 1,692,272 | | | | 211,637 | | | | 399,631 | | | | 608,007 | |
| | — | | | | — | | | | — | | | | 38,706,233 | | | | — | |
| | | | | | | | | | | | | | | | | | |
| | 1,903,728 | | | | 2,832,378 | | | | 393,103 | | | | 42,103,586 | | | | 1,929,898 | |
| | | | | | | | | | | | | | | | | | |
| $ | 643,725,892 | | | $ | 197,764,233 | | | $ | 102,996,697 | | | $ | 1,461,472,922 | | | $ | 500,674,104 | |
| | | | | | | | | | | | | | | | | | |
| | | | | | | | | | | | | | | | | | |
| $ | 2,149,596 | | | $ | 718,713 | | | $ | 274,160 | | | $ | 431,647 | | | $ | 1,437,149 | |
| | 458,776,588 | | | | 300,171,384 | | | | 56,869,006 | | | | 946,357,956 | | | | 361,894,975 | |
| | (5,165,459 | ) | | | (3,973,043 | ) | | | (963,398 | ) | | | (857,139 | ) | | | (3,176,874 | ) |
| | (15,576,774 | ) | | | (151,657,544 | ) | | | 9,419,032 | | | | 23,854,576 | | | | 27,512,252 | |
| | | | | | | | | | | | | | | | | | |
| | 203,539,926 | | | | 52,507,102 | | | | 37,396,541 | | | | 491,636,242 | | | | 113,012,369 | |
| | 2,015 | | | | (2,379 | ) | | | 1,356 | | | | 49,640 | | | | (5,767 | ) |
| | | | | | | | | | | | | | | | | | |
| $ | 643,725,892 | | | $ | 197,764,233 | | | $ | 102,996,697 | | | $ | 1,461,472,922 | | | $ | 500,674,104 | |
| | | | | | | | | | | | | | | | | | |
| | | | | | | | | | | | | | | | | | |
| | 390,903,365 | | | | 155,758,242 | | | | 95,847,331 | | | | 804,612,910 | | | | 265,879,437 | |
| | 252,822,527 | | | | 42,005,991 | | | | 7,149,366 | | | | 656,860,012 | | | | 234,794,667 | |
| | | | |
| | | | | | | | | | | | | | | | | | |
| | 130,654,192 | | | | 56,667,223 | | | | 25,513,094 | | | | 23,775,853 | | | | 76,626,747 | |
| | 84,305,436 | | | | 15,204,057 | | | | 1,902,876 | | | | 19,388,877 | | | | 67,088,109 | |
| | | | |
| | | | | | | | | | | | | | | | | | |
| $ | 2.99 | | | $ | 2.75 | | | $ | 3.76 | | | $ | 33.84 | | | $ | 3.47 | |
| | | | | | | | | | | | | | | | | | |
| $ | 3.00 | | | $ | 2.76 | | | $ | 3.76 | | | $ | 33.88 | | | $ | 3.50 | |
| | | | | | | | | | | | | | | | | | |
89
Statements of Assets and Liabilities (continued)
| | | | | | | | | | | | |
| | | LARGE CAP
VALUE
FUND | | | LONG/SHORT
FUND | | | MICRO
CAP
FUND | |
| | | | | | | | | | | | |
Assets: | | | | | | | | | | | | |
Investments, at cost | | | | | | | | | | | | |
Unaffiliated issuers | | $ | 146,135,164 | | | $ | 95,463,299 | | | $ | 181,184,148 | |
Repurchase agreements | | | 5,442,486 | | | | 35,132,336 | | | | 1,061,240 | |
| | | | | | | | | | | | |
| | $ | 151,577,650 | | | $ | 130,595,635 | | | $ | 182,245,388 | |
| | | | | | | | | | | | |
Investments, at market value | | | | | | | | | | | | |
Unaffiliated issuers | | $ | 175,777,825 | | | $ | 97,877,603 | | | $ | 304,343,107 | |
Repurchase agreements | | | 5,442,486 | | | | 35,132,336 | | | | 1,061,240 | |
| | | | | | | | | | | | |
| | | 181,220,311 | | | | 133,009,939 | | | | 305,404,347 | |
Cash | | | — | | | | — | | | | — | |
Foreign currency on deposit (cost of $0, $0, $323,568, $0, $0, $0, $16 and $0, respectively) | | | — | | | | — | | | | 323,491 | |
Receivable for investment securities sold | | | — | | | | 528,595 | | | | 6,701,459 | |
Receivable from broker for securities sold short | | | — | | | | 24,238,309 | | | | — | |
Capital shares receivable | | | 2,212 | | | | 2,363 | | | | 162,524 | |
Interest and dividends receivable | | | 266,641 | | | | 513,331 | | | | 54,666 | |
Prepaid expenses and other assets | | | 12,394 | | | | 11,499 | | | | 14,557 | |
| | | | | | | | | | | | |
Total Assets | | | 181,501,558 | | | | 158,304,036 | | | | 312,661,044 | |
| | | | | | | | | | | | |
Liabilities: | | | | | | | | | | | | |
Securities sold short, at value (proceeds of $0, $39,530,978, $0, $0, $0, $0, $0 and $0, respectively) | | | — | | | | 51,372,975 | | | | — | |
Payable for securities purchased | | | 612,223 | | | | 528,695 | | | | 434,025 | |
Capital shares payable | | | 286,657 | | | | 258,769 | | | | 187,486 | |
Dividends payable to shareholders | | | 7,742 | | | | — | | | | — | |
Payable to Trustees | | | 350 | | | | 324 | | | | 518 | |
Payable to Advisor | | | 110,788 | | | | 87,887 | | | | 368,952 | |
Accrued fund administration fees | | | 3,029 | | | | 6,979 | | | | 4,069 | |
Accrued expenses and other liabilities | | | 157,308 | | | | 94,702 | | | | 82,744 | |
Foreign capital gains taxes payable | | | — | | | | — | | | | — | |
Dividends payable on securities sold short | | | — | | | | 35,096 | | | | — | |
| | | | | | | | | | | | |
Total Liabilities | | | 1,178,097 | | | | 52,385,427 | | | | 1,077,794 | |
| | | | | | | | | | | | |
Net Assets | | $ | 180,323,461 | | | $ | 105,918,609 | | | $ | 311,583,250 | |
| | | | | | | | | | | | |
Net Assets Consist of: | | | | | | | | | | | | |
Capital stock | | $ | 181,597 | | | $ | 84,062 | | | $ | 378,616 | |
Paid-in-capital in excess of par | | | 129,990,606 | | | | 269,576,440 | | | | 156,943,289 | |
Undistributed net investment loss | | | (7,742 | ) | | | (455,640 | ) | | | (2,607,368 | ) |
Undistributed net realized gain (loss) on investments and foreign currency translations | | | 20,515,564 | | | | (153,858,560 | ) | | | 33,709,860 | |
Unrealized appreciation (depreciation) on: | | | | | | | | | | | | |
Investments | | | 29,642,661 | | | | 2,414,304 | | | | 123,158,959 | |
Securities sold short | | | — | | | | (11,841,997 | ) | | | — | |
Foreign currency translations | | | 775 | | | | — | | | | (106 | ) |
| | | | | | | | | | | | |
Net Assets | | $ | 180,323,461 | | | $ | 105,918,609 | | | $ | 311,583,250 | |
| | | | | | | | | | | | |
Net Assets | | | | | | | | | | | | |
Investor Class | | | 175,729,806 | | | | 79,840,934 | | | | 311,583,250 | |
Institutional Class | | | 4,593,655 | | | | 26,077,675 | | | | — | |
| | | |
Capital Stock Issued and Outstanding (Unlimited number of shares authorized, $0.01 par value) | | | | | | | | | | | | |
Investor Class | | | 17,696,551 | | | | 6,346,189 | | | | 37,861,629 | |
Institutional Class | | | 463,161 | | | | 2,059,982 | | | | — | |
| | | |
NET ASSET VALUE, REDEMPTION PRICEAND OFFERING PRICE PER SHARE | | | | | | | | | | | | |
Investor Class | | $ | 9.93 | | | $ | 12.58 | | | $ | 8.23 | |
| | | | | | | | | | | | |
Institutional Class | | $ | 9.92 | | | $ | 12.66 | | | $ | — | |
| | | | | | | | | | | | |
See Notes to Financial Statements.
90
| | | | | | | | | | | | | | | | | | |
MICRO CAP
VALUE
FUND | | | SMALL CAP
GROWTH
FUND | | | SMALL CAP
VALUE
FUND | | | STRATEGIC
INCOME
FUND | | | ULTRA
GROWTH
FUND | |
| | | | | | | | | | | | | | | | | | |
| | | | | | | | | | | | | | | | | | |
| | | | | | | | | | | | | | | | | | |
| | | | | | | | | | | | | | | | | | |
| $ | 134,982,417 | | | $ | 1,026,594,334 | | | $ | 275,874,294 | | | $ | 30,556,119 | | | $ | 73,167,213 | |
| | 14,565,031 | | | | 35,091,465 | | | | 3,047,345 | | | | 7,174,334 | | | | 807,568 | |
| | | | | | | | | | | | | | | | | | |
| $ | 149,547,448 | | | $ | 1,061,685,799 | | | $ | 278,921,639 | | | $ | 37,730,453 | | | $ | 73,974,781 | |
| | | | | | | | | | | | | | | | | | |
| | | | | | | | | | | | | | | | | | |
| $ | 202,408,384 | | | $ | 1,651,629,962 | | | $ | 368,437,014 | | | $ | 37,757,848 | | | $ | 107,444,433 | |
| | 14,565,031 | | | | 35,091,465 | | | | 3,047,345 | | | | 7,174,334 | | | | 807,568 | |
| | | | | | | | | | | | | | | | | | |
| | 216,973,415 | | | | 1,686,721,427 | | | | 371,484,359 | | | | 44,932,182 | | | | 108,252,001 | |
| | — | | | | — | | | | — | | | | 4,672 | | | | — | |
| | — | | | | — | | | | — | | | | 20 | | | | — | |
| | 548,641 | | | | 7,225,798 | | | | 3,576,973 | | | | 89,450 | | | | 3,387,676 | |
| | — | | | | — | | | | — | | | | — | | | | — | |
| | 261,410 | | | | 377,034 | | | | 97,550 | | | | 189 | | | | 8,925 | |
| | 89,118 | | | | 156,955 | | | | 302,621 | | | | 109,121 | | | | 3,626 | |
| | 112,190 | | | | 52,479 | | | | 19,288 | | | | 7,163 | | | | 10,343 | |
| | | | | | | | | | | | | | | | | | |
| | 217,984,774 | | | | 1,694,533,693 | | | | 375,480,791 | | | | 45,142,797 | | | | 111,662,571 | |
| | | | | | | | | | | | | | | | | | |
| | | | | | | | | | | | | | | | | | |
|
— |
| | | — | | | | — | | | | — | | | | — | |
| | 1,398,391 | | | | 678,926 | | | | 4,199,033 | | | | — | | | | 111,484 | |
| | 101,841 | | | | 1,056,821 | | | | 226,537 | | | | 29,682 | | | | 24,973 | |
| | — | | | | — | | | | — | | | | 1,336 | | | | — | |
| | 353 | | | | 3,251 | | | | 621 | | | | 92 | | | | 187 | |
| | 254,551 | | | | 1,319,408 | | | | 284,149 | | | | 17,046 | | | | 88,458 | |
| | 2,529 | | | | 26,750 | | | | 4,836 | | | | 38 | | | | 948 | |
| | 98,070 | | | | 503,489 | | | | 116,167 | | | | 49,901 | | | | 70,898 | |
| | 41,815 | | | | — | | | | — | | | | — | | | | — | |
| | — | | | | — | | | | — | | | | — | | | | — | |
| | | | | | | | | | | | | | | | | | |
| | 1,897,550 | | | | 3,588,645 | | | | 4,831,343 | | | | 98,095 | | | | 296,948 | |
| | | | | | | | | | | | | | | | | | |
| $ | 216,087,224 | | | $ | 1,690,945,048 | | | $ | 370,649,448 | | | $ | 45,044,702 | | | $ | 111,365,623 | |
| | | | | | | | | | | | | | | | | | |
| | | | | | | | | | | | | | | | | | |
| $ | 621,029 | | | $ | 369,421 | | | $ | 466,483 | | | $ | 38,233 | | | $ | 51,055 | |
| | 133,859,058 | | | | 926,908,268 | | | | 263,832,369 | | | | 43,609,145 | | | | 69,079,343 | |
| | (1,095,632 | ) | | | (9,822,810 | ) | | | (127,730 | ) | | | (69,552 | ) | | | (903,987 | ) |
| | 15,318,328 | | | | 152,006,179 | | | | 13,915,606 | | | | (5,734,891 | ) | | | 12,127,740 | |
| | | | | | | | | | | | | | | | | | |
| | 67,384,152 | | | | 621,483,352 | | | | 92,562,720 | | | | 7,201,729 | | | | 31,011,472 | |
| | — | | | | — | | | | — | | | | — | | | | — | |
| | 289 | | | | 638 | | | | — | | | | 38 | | | | — | |
| | | | | | | | | | | | | | | | | | |
| $ | 216,087,224 | | | $ | 1,690,945,048 | | | $ | 370,649,448 | | | $ | 45,044,702 | | | $ | 111,365,623 | |
| | | | | | | | | | | | | | | | | | |
| | | | | | | | | | | | | | | | | | |
| | 216,087,224 | | | | 1,182,572,507 | | | | 320,978,066 | | | | 45,044,702 | | | | 111,365,623 | |
| | — | | | | 508,372,541 | | | | 49,671,382 | | | | — | | | | — | |
| | | | |
|
|
| | | | | | | | | | | | | | | | |
| | 62,102,919 | | | | 25,864,169 | | | | 40,426,435 | | | | 3,823,302 | | | | 5,105,548 | |
| | — | | | | 11,077,901 | | | | 6,221,882 | | | | — | | | | — | |
| | | | |
| | | | | | | | | | | | | | | | | | |
| $ | 3.48 | | | $ | 45.72 | | | $ | 7.94 | | | $ | 11.78 | | | $ | 21.81 | |
| | | | | | | | | | | | | | | | | | |
| $ | — | | | $ | 45.89 | | | $ | 7.98 | | | $ | — | | | $ | — | |
| | | | | | | | | | | | | | | | | | |
91
| | |
| WASATCH FUNDS | | SEPTEMBER 30, 2017 |
|
|
|
Statements of Assets and Liabilities (continued)
| | | | | | | | | | | | |
| | | WORLD
INNOVATORS
FUND | | | INCOME
FUND | | | U.S.
TREASURY
FUND | |
| | | | | | | | | | | | |
Assets: | | | | | | | | | | | | |
Investments, at cost | | | | | | | | | | | | |
Unaffiliated issuers | | $ | 130,636,125 | | | $ | 95,064,913 | | | $ | 376,059,411 | |
Repurchase agreements | | | 29,928,007 | | | | 779,866 | | | | 1,803,381 | |
| | | | | | | | | | | | |
| | $ | 160,564,132 | | | $ | 95,844,779 | | | $ | 377,862,792 | |
| | | | | | | | | | | | |
Investments, at market value | |
Unaffiliated issuers | | $ | 166,125,050 | | | $ | 95,564,130 | | | $ | 358,672,458 | |
Repurchase agreements | | | 29,928,007 | | | | 779,866 | | | | 1,803,381 | |
| | | | | | | | | | | | |
| | | 196,053,057 | | | | 96,343,996 | | | | 360,475,839 | |
Cash | | | — | | | | — | | | | 3,081,974 | |
Foreign currency on deposit (cost of $714,263, $0 and $0, respectively) | | | 714,722 | | | | — | | | | — | |
Receivable for investment securities sold | | | 1,835,086 | | | | 1,288,113 | | | | — | |
Capital shares receivable | | | 29,124 | | | | 170,118 | | | | 239,408 | |
Interest and dividends receivable | | | 217,404 | | | | 709,790 | | | | 941,835 | |
Prepaid expenses and other assets | | | 13,354 | | | | 6,628 | | | | 21,545 | |
| | | | | | | | | | | | |
Total Assets | | | 198,862,747 | | | | 98,518,645 | | | | 364,760,601 | |
| | | | | | | | | | | | |
Liabilities: | |
Payable for securities purchased | | | 3,621,750 | | | | 1,462,936 | | | | 3,081,974 | |
Capital shares payable | | | 28,221 | | | | 31,503 | | | | 450,511 | |
Dividends payable to shareholders | | | — | | | | 49,078 | | | | 103,269 | |
Payable to Trustees | | | 345 | | | | 183 | | | | 643 | |
Payable to Advisor | | | 233,013 | | | | 43,734 | | | | 150,503 | |
Accrued fund administration fees | | | 2,691 | | | | 876 | | | | 5,113 | |
Accrued expenses and other liabilities | | | 120,173 | | | | 63,777 | | | | 102,824 | |
| | | | | | | | | | | | |
Total Liabilities | | | 4,006,193 | | | | 1,652,087 | | | | 3,894,837 | |
| | | | | | | | | | | | |
Net Assets | | $ | 194,856,554 | | | $ | 96,866,558 | | | $ | 360,865,764 | |
| | | | | | | | | | | | |
Net Assets Consist of: | |
Capital stock | | $ | 85,638 | | | $ | 95,696 | | | $ | 221,097 | |
Paid-in-capital in excess of par | | | 142,306,955 | | | | 96,396,119 | | | | 393,379,144 | |
Undistributed net investment income (loss) | | | (41,744 | ) | | | 4,835 | | | | 36,338 | |
Undistributed net realized gain (loss) on investments and foreign currency translations | | | 17,297,868 | | | | (129,309 | ) | | | (15,383,862 | ) |
Unrealized appreciation (depreciation) on: | | | | | | | | | | | | |
Investments | | | 35,205,722 | | | | 499,217 | | | | (17,386,953 | ) |
Foreign currency translations | | | 2,115 | | | | — | | | | — | |
| | | | | | | | | | | | |
Net Assets | | $ | 194,856,554 | | | $ | 96,866,558 | | | $ | 360,865,764 | |
| | | | | | | | | | | | |
Net Assets | |
Investor Class | | | 191,020,527 | | | | 96,866,558 | | | | 360,865,764 | |
Institutional Class | | | 3,836,027 | | | | — | | | | — | |
| | | |
Capital Stock Issued and Outstanding (Unlimited number of shares authorized,
$0.01 par value) | | | | | | | | | | | | |
Investor Class | | | 8,396,024 | | | | 9,569,601 | | | | 22,109,744 | |
Institutional Class | | | 167,768 | | | | — | | | | — | |
|
NET ASSET VALUE, REDEMPTION PRICEAND OFFERING PRICE PER SHARE | |
Investor Class | | $ | 22.75 | | | $ | 10.12 | | | $ | 16.32 | |
| | | | | | | | | | | | |
Institutional Class | | $ | 22.87 | | | $ | — | | | $ | — | |
| | | | | | | | | | | | |
See Notes to Financial Statements.
92
(This page intentionally left blank.)
93
Statements of Operations
| | | | | | | | | | | | |
| | | CORE
GROWTH
FUND | | | EMERGING
INDIA
FUND | | | EMERGING
MARKETS
SELECT
FUND | |
| | | | | | | | | | | | |
Investment Income: | |
Interest | | $ | 36,762 | | | $ | 5,980 | 1 | | $ | 494 | |
Dividends2 | | | | | | | | | | | | |
Unaffiliated issuers | | | 6,123,883 | | | | 1,138,240 | | | | 439,605 | |
| | | | | | | | | | | | |
Total investment income | | | 6,160,645 | | | | 1,144,220 | | | | 440,099 | |
| | | | | | | | | | | | |
Expenses: | |
Investment advisory fees | | | 14,488,481 | | | | 1,790,300 | | | | 389,827 | |
Shareholder servicing fees — Investor Class | | | 1,395,864 | | | | 225,456 | | | | 38,513 | |
Shareholder servicing fees — Institutional Class | | | 6,999 | | | | 2,032 | | | | 3,286 | |
Fund administration fees | | | 246,657 | | | | 24,406 | | | | 6,633 | |
Fund accounting fees | | | 147,063 | | | | 37,398 | | | | 22,843 | |
Reports to shareholders — Investor Class | | | 150,955 | | | | 31,127 | | | | 9,655 | |
Reports to shareholders — Institutional Class | | | 48,537 | | | | 4,600 | | | | 4,714 | |
Custody fees | | | 80,819 | | | | 204,718 | | | | 57,053 | |
Federal and state registration fees — Investor Class | | | 50,316 | | | | 26,850 | | | | 14,073 | |
Federal and state registration fees — Institutional Class | | | 29,726 | | | | 17,551 | | | | 16,399 | |
Legal fees | | | 114,881 | | | | 10,706 | | | | 3,486 | |
Trustees’ fees | | | 207,541 | | | | 14,818 | | | | 5,527 | |
Interest | | | 45,488 | | | | 4,461 | | | | 4,642 | |
Audit fees | | | 38,781 | | | | 33,403 | | | | 34,674 | |
Other expenses | | | 70,554 | | | | 37,999 | | | | 27,856 | |
| | | | | | | | | | | | |
Total expenses before reimbursement | | | 17,122,662 | | | | 2,465,825 | | | | 639,181 | |
Reimbursement of expenses by Advisor | | | (136,395 | ) | | | (30,597 | ) | | | (128,774 | ) |
| | | | | | | | | | | | |
Net Expenses | | | 16,986,267 | | | | 2,435,228 | | | | 510,407 | |
| | | | | | | | | | | | |
Net Investment Loss | | | (10,825,622 | ) | | | (1,291,008 | ) | | | (70,308 | ) |
| | | | | | | | | | | | |
Realized Gain (Loss): | |
Investments sold | | | 76,987,749 | | | | 601,850 | | | | (538,785 | ) |
Foreign currency forward exchange contracts | | | — | | | | — | | | | — | |
Foreign currency transactions | | | (15,586 | ) | | | (263,963 | ) | | | (30,520 | ) |
Foreign capital gains taxes | | | — | | | | — | | | | — | |
| | | | | | | | | | | | |
Net realized gain (loss) | | | 76,972,163 | | | | 337,887 | | | | (569,305 | ) |
| | | | | | | | | | | | |
Change in Unrealized Appreciation (Depreciation): | |
Investments | | | 186,614,227 | | | | 27,864,822 | | | | 5,620,261 | |
Foreign currency translations | | | — | | | | (14,940 | ) | | | 1,595 | |
Deferred foreign capital gains taxes | | | (145,962 | ) | | | (1,385,595 | ) | | | 45,211 | |
| | | | | | | | | | | | |
Net change in unrealized appreciation (depreciation) | | | 186,468,265 | | | | 26,464,287 | | | | 5,667,067 | |
| | | | | | | | | | | | |
Net gain (loss) on investments | | | 263,440,428 | | | | 26,802,174 | | | | 5,097,762 | |
| | | | | | | | | | | | |
Net Increase (Decrease) in Net Assets Resulting from Operations | | $ | 252,614,806 | | | $ | 25,511,166 | | | $ | 5,027,454 | |
| | | | | | | | | | | | |
| 1 | Net of $34, $4, $1,586, and $1 in foreign withholding taxes, respectively. |
| 2 | Net of $38,943, $2,329, $39,195, $850,501, $645,664, $31,792, $1,779,998 and $1,021,480 in foreign withholding taxes, respectively. |
See Notes to Financial Statements.
94
| | |
| | FOR THE YEAR ENDED SEPTEMBER 30, 2017 |
|
|
|
| | | | | | | | | | | | | | | | | | |
EMERGING
MARKETS
SMALL CAP
FUND | | | FRONTIER
EMERGING
SMALL COUNTRIES
FUND | | | GLOBAL
OPPORTUNITIES
FUND | | | INTERNATIONAL
GROWTH
FUND | | | INTERNATIONAL
OPPORTUNITIES
FUND | |
| | | | | | | | | | | | | | | | | | |
| | | | | | | | | | | | | | | | | | |
| $ | 4,157 | 1 | | $ | 141,725 | 1 | | $ | 472 | | | $ | 9,194 | 1 | | $ | — | |
| | | | | | | | | | | | | | | | | | |
| | 10,475,655 | | | | 5,683,722 | | | | 559,482 | | | | 16,402,749 | | | | 8,084,882 | |
| | | | | | | | | | | | | | | | | | |
| | 10,479,812 | | | | 5,825,447 | | | | 559,954 | | | | 16,411,943 | | | | 8,084,882 | |
| | | | | | | | | | | | | | | | | | |
| | | | | | | | | | | | | | | | | | |
| | 11,169,632 | | | | 5,710,221 | | | | 1,401,649 | | | | 17,177,482 | | | | 9,872,954 | |
| | 778,659 | | | | 857,713 | | | | 124,527 | | | | 883,930 | | | | 1,067,642 | |
| | 4,770 | | | | 2,353 | | | | 1,754 | | | | 3,269 | | | | 140,081 | |
| | 115,046 | | | | 55,337 | | | | 19,039 | | | | 233,773 | | | | 95,911 | |
| | 90,913 | | | | 54,190 | | | | 33,343 | | | | 152,540 | | | | 83,622 | |
| | 62,137 | | | | 74,393 | | | | 16,933 | | | | 86,912 | | | | 86,445 | |
| | 10,695 | | | | 8,606 | | | | 5,135 | | | | 99,287 | | | | 48,211 | |
| | 720,646 | | | | 690,838 | | | | 47,946 | | | | 405,754 | | | | 485,820 | |
| | 33,268 | | | | 52,217 | | | | 20,099 | | | | 36,816 | | | | 38,560 | |
| | 21,535 | | | | 31,392 | | | | 16,621 | | | | 36,507 | | | | 25,342 | |
| | 54,716 | | | | 29,572 | | | | 8,616 | | | | 114,461 | | | | 69,860 | |
| | 110,032 | | | | 65,291 | | | | 19,075 | | | | 203,855 | | | | 94,136 | |
| | 56,281 | | | | 84,931 | | | | 17,888 | | | | 51,897 | | | | 43,459 | |
| | 61,274 | | | | 50,089 | | | | 34,482 | | | | 34,578 | | | | 40,956 | |
| | 136,644 | | | | 86,796 | | | | 34,766 | | | | 92,778 | | | | 67,040 | |
| | | | | | | | | | | | | | | | | | |
| | 13,426,248 | | | | 7,853,939 | | | | 1,801,873 | | | | 19,613,839 | | | | 12,260,039 | |
| | (452,003 | ) | | | (555,297 | ) | | | (33,503 | ) | | | (95,402 | ) | | | (142,523 | ) |
| | | | | | | | | | | | | | | | | | |
| | 12,974,245 | | | | 7,298,642 | | | | 1,768,370 | | | | 19,518,437 | | | | 12,117,516 | |
| | | | | | | | | | | | | | | | | | |
| | (2,494,433 | ) | | | (1,473,195 | ) | | | (1,208,416 | ) | | | (3,106,494 | ) | | | (4,032,634 | ) |
| | | | | | | | | | | | | | | | | | |
| | | | | | | | | | | | | | | | | | |
| | 73,026,817 | | | | (3,028,046 | ) | | | 10,630,585 | | | | 32,736,843 | | | | 78,102,933 | |
| | — | | | | 35 | | | | — | | | | — | | | | — | |
| | (342,025 | ) | | | (801,051 | ) | | | (76,203 | ) | | | (458,056 | ) | | | (762,093 | ) |
| | (1,414,073 | ) | | | (4,286,656 | ) | | | (43,042 | ) | | | — | | | | (798,441 | ) |
| | | | | | | | | | | | | | | | | | |
| | 71,270,719 | | | | (8,115,718 | ) | | | 10,511,340 | | | | 32,278,787 | | | | 76,542,399 | |
| | | | | | | | | | | | | | | | | | |
| | | | | | | | | | | | | | | | | | |
| | (11,347,996 | ) | | | 142,118 | | | | 3,143,510 | | | | 127,075,087 | | | | (41,579,884 | ) |
| | (7,969 | ) | | | 11,574 | | | | (5,114 | ) | | | 60,450 | | | | (9,765 | ) |
| | 2,003,504 | | | | 2,633,664 | | | | 299,943 | | | | (225,107 | ) | | | 451,702 | |
| | | | | | | | | | | | | | | | | | |
| | (9,352,461 | ) | | | 2,787,356 | | | | 3,438,339 | | | | 126,910,430 | | | | (41,137,947 | ) |
| | | | | | | | | | | | | | | | | | |
| | 61,918,258 | | | | (5,328,362 | ) | | | 13,949,679 | | | | 159,189,217 | | | | 35,404,452 | |
| | | | | | | | | | | | | | | | | | |
| $ | 59,423,825 | | | $ | (6,801,557 | ) | | $ | 12,741,263 | | | $ | 156,082,723 | | | $ | 31,371,818 | |
| | | | | | | | | | | | | | | | | | |
95
Statements of Operations (continued)
| | | | | | | | | | | | |
| | | LARGE CAP
VALUE
FUND | | | LONG/SHORT
FUND | | | MICRO
CAP
FUND | |
| | | | | | | | | | | | |
Investment Income: | | | | | | | | | | | | |
Interest | | $ | 2,858 | | | $ | — | | | $ | 3,051 | |
Dividends2 | | | | | | | | | | | | |
Unaffiliated issuers | | | 5,662,303 | | | | 2,717,613 | | | | 883,108 | |
Non-cash dividends | | | — | | | | — | | | | — | |
| | | | | | | | | | | | |
Total investment income | | | 5,665,161 | | | | 2,717,613 | | | | 886,159 | |
| | | | | | | | | | | | |
Expenses: | | | | | | | | | | | | |
Investment advisory fees | | | 1,682,721 | | | | 1,875,518 | | | | 4,397,861 | |
Shareholder servicing fees — Investor Class | | | 280,393 | | | | 217,335 | | | | 163,545 | |
Shareholder servicing fees — Institutional Class | | | 1,535 | | | | 3,996 | | | | — | |
Fund administration fees | | | 31,816 | | | | 28,972 | | | | 47,340 | |
Fund accounting fees | | | 29,173 | | | | 26,805 | | | | 41,410 | |
Reports to shareholders — Investor Class | | | 41,139 | | | | 23,934 | | | | 24,217 | |
Reports to shareholders — Institutional Class | | | 10,979 | | | | 8,950 | | | | — | |
Custody fees | | | 10,021 | | | | 13,310 | | | | 37,564 | |
Federal and state registration fees — Investor Class | | | 20,974 | | | | 27,742 | | | | 21,045 | |
Federal and state registration fees — Institutional Class | | | 11,696 | | | | 17,756 | | | | — | |
Legal fees | | | 40,797 | | | | 17,794 | | | | 20,615 | |
Trustees’ fees | | | 28,601 | | | | 31,205 | | | | 40,934 | |
Dividends on securities sold short | | | — | | | | 1,020,089 | | | | — | |
Interest | | | 5,771 | | | | 487,198 | | | | 9,164 | |
Audit fees | | | 33,403 | | | | 33,403 | | | | 31,960 | |
Other expenses | | | 27,776 | | | | 20,497 | | | | 26,731 | |
| | | | | | | | | | | | |
Total expenses before reimbursement | | | 2,256,795 | | | | 3,854,504 | | | | 4,862,386 | |
Reimbursement of expenses by Advisor | | | (199,214 | ) | | | (60,547 | ) | | | — | |
| | | | | | | | | | | | |
Net Expenses | | | 2,057,581 | | | | 3,793,957 | | | | 4,862,386 | |
| | | | | | | | | | | | |
Net Investment Income (Loss) | | | 3,607,580 | | | | (1,076,344 | ) | | | (3,976,227 | ) |
| | | | | | | | | | | | |
Realized Gain (Loss): | | | | | | | | | | | | |
Investments sold | | | 25,169,764 | | | | 23,313,928 | | | | 39,189,501 | |
Affiliated issuers | | | — | | | | — | | | | — | |
Foreign currency transactions | | | 271 | | | | — | | | | (15,790 | ) |
Options written | | | 99,363 | | | | — | | | | — | |
Short positions | | | — | | | | (18,701,895 | ) | | | — | |
| | | | | | | | | | | | |
Net realized gain | | | 25,269,398 | | | | 4,612,033 | | | | 39,173,711 | |
| | | | | | | | | | | | |
Change in Unrealized Appreciation (Depreciation): | | | | | | | | | | | | |
Investments | | | (811,691 | ) | | | (2,651,163 | ) | | | 28,515,825 | |
Affiliated issuers | | | — | | | | — | | | | — | |
Foreign currency translations | | | 775 | | | | — | | | | (190 | ) |
Short positions | | | — | | | | (502,851 | ) | | | — | |
Deferred foreign capital gains taxes | | | — | | | | — | | | | — | |
| | | | | | | | | | | | |
Net change in unrealized appreciation (depreciation) | | | (810,916 | ) | | | (3,154,014 | ) | | | 28,515,635 | |
| | | | | | | | | | | | |
Net gain on investments | | | 24,458,482 | | | | 1,458,019 | | | | 67,689,346 | |
| | | | | | | | | | | | |
Net Increase in Net Assets Resulting from Operations | | $ | 28,066,062 | | | $ | 381,675 | | | $ | 63,713,119 | |
| | | | | | | | | | | | |
| 2 | Net of $153,387, $31,085, $22,632, $42,311, $0, $0, $11,467 and $3,636 in foreign withholding taxes, respectively. |
See Notes to Financial Statements.
96
| | |
| | FOR THE YEAR ENDED SEPTEMBER 30, 2017 |
|
|
|
| | | | | | | | | | | | | | | | | | |
MICRO CAP
VALUE
FUND | | | SMALL CAP
GROWTH
FUND | | | SMALL CAP
VALUE
FUND | | | STRATEGIC
INCOME
FUND | | | ULTRA
GROWTH
FUND | |
| | | | | | | | | | | | | | | | | | |
| | | | | | | | | | | | | | | | | | |
| $ | 21,216 | | | $ | 15,941 | | | $ | 6,643 | | | $ | 6,104 | | | $ | 13,305 | |
| | | | | | | | | | | | | | | | | | |
| | 1,958,490 | | | | 6,775,148 | | | | 4,189,916 | | | | 1,011,227 | | | | 230,926 | |
| | — | | | | — | | | | — | | | | 171,765 | | | | — | |
| | | | | | | | | | | | | | | | | | |
| | 1,979,706 | | | | 6,791,089 | | | | 4,196,559 | | | | 1,189,096 | | | | 244,231 | |
| | | | | | | | | | | | | | | | | | |
| | | | | | | | | | | | | | | | | | |
| | 2,999,126 | | | | 17,365,396 | | | | 3,335,640 | | | | 343,567 | | | | 1,006,432 | |
| | 217,495 | | | | 2,220,633 | | | | 333,402 | | | | 83,779 | | | | 137,077 | |
| | — | | | | 12,799 | | | | 2,661 | | | | — | | | | — | |
| | 32,323 | | | | 295,261 | | | | 56,801 | | | | 8,348 | | | | 17,127 | |
| | 38,236 | | | | 177,231 | | | | 45,121 | | | | 16,252 | | | | 25,655 | |
| | 31,022 | | | | 162,275 | | | | 34,686 | | | | 12,203 | | | | 16,549 | |
| | — | | | | 63,117 | | | | 7,089 | | | | — | | | | — | |
| | 40,628 | | | | 313,526 | | | | 21,505 | | | | 3,589 | | | | 10,144 | |
| | 20,889 | | | | 56,052 | | | | 30,208 | | | | 19,572 | | | | 18,618 | |
| | — | | | | 26,156 | | | | 14,624 | | | | — | | | | — | |
| | 14,041 | | | | 139,686 | | | | 25,629 | | | | 3,660 | | | | 7,439 | |
| | 27,419 | | | | 270,313 | | | | 47,311 | | | | 7,813 | | | | 14,772 | |
| | — | | | | — | | | | — | | | | — | | | | — | |
| | 5,943 | | | | 83,159 | | | | 10,901 | | | | 1,485 | | | | 3,522 | |
| | 58,304 | | | | 54,354 | | | | 34,460 | | | | 30,903 | | | | 34,621 | |
| | 35,828 | | | | 96,517 | | | | 27,526 | | | | 6,630 | | | | 17,272 | |
| | | | | | | | | | | | | | | | | | |
| | 3,521,254 | | | | 21,336,475 | | | | 4,027,564 | | | | 537,801 | | | | 1,309,228 | |
| | — | | | | (233,805 | ) | | | (40,673 | ) | | | (70,046 | ) | | | — | |
| | | | | | | | | | | | | | | | | | |
| | 3,521,254 | | | | 21,102,670 | | | | 3,986,891 | | | | 467,755 | | | | 1,309,228 | |
| | | | | | | | | | | | | | | | | | |
| | (1,541,548 | ) | | | (14,311,581 | ) | | | 209,668 | | | | 721,341 | | | | (1,064,997 | ) |
| | | | | | | | | | | | | | | | | | |
| | | | | | | | | | | | | | | | | | |
| | 19,903,205 | | | | 172,290,112 | | | | 27,354,516 | | | | 2,718,988 | | | | 11,888,435 | |
| | — | | | | (24,952,162 | ) | | | — | | | | — | | | | — | |
| | (12,201 | ) | | | (58,798 | ) | | | 3,999 | | | | 523 | | | | 4,037 | |
| | — | | | | — | | | | — | | | | — | | | | — | |
| | — | | | | — | | | | — | | | | — | | | | — | |
| | | | | | | | | | | | | | | | | | |
| | 19,891,004 | | | | 147,279,152 | | | | 27,358,515 | | | | 2,719,511 | | | | 11,892,472 | |
| | | | | | | | | | | | | | | | | | |
| | | | | | | | | | | | | | | | | | |
| | 22,199,503 | | | | 66,430,493 | | | | 33,444,338 | | | | 2,097,274 | | | | 9,619,456 | |
| | — | | | | 30,950,488 | | | | — | | | | — | | | | — | |
| | 93 | | | | 6,868 | | | | (12 | ) | | | 56 | | | | (9 | ) |
| | — | | | | — | | | | — | | | | — | | | | — | |
| | (41,815 | ) | | | — | | | | — | | | | — | | | | — | |
| | | | | | | | | | | | | | | | | | |
| | 22,157,781 | | | | 97,387,849 | | | | 33,444,326 | | | | 2,097,330 | | | | 9,619,447 | |
| | | | | | | | | | | | | | | | | | |
| | 42,048,785 | | | | 244,667,001 | | | | 60,802,841 | | | | 4,816,841 | | | | 21,511,919 | |
| | | | | | | | | | | | | | | | | | |
| $ | 40,507,237 | | | $ | 230,355,420 | | | $ | 61,012,509 | | | $ | 5,538,182 | | | $ | 20,446,922 | |
| | | | | | | | | | | | | | | | | | |
97
| | |
| WASATCH FUNDS | | FOR THE YEAR ENDED SEPTEMBER 30, 2017 |
|
|
|
Statements of Operations (continued)
| | | | | | | | | | | | |
| | | WORLD
INNOVATORS
FUND | | | INCOME
FUND | | | U.S.
TREASURY
FUND | |
| | | | | | | | | | | | |
Investment Income: | | | | | | | | | | | | |
Interest | | $ | 19,551 | | | $ | 2,489,228 | 1 | | $ | 9,534,563 | |
Dividends2 | | | | | | | | | | | | |
Unaffiliated issuers | | | 2,188,360 | | | | 43,140 | | | | — | |
Non-cash dividends | | | 130,345 | | | | — | | | | — | |
| | | | | | | | | | | | |
Total investment income | | | 2,338,256 | | | | 2,532,368 | | | | 9,534,563 | |
| | | | | | | | | | | | |
Expenses: | | | | | | | | | | | | |
Investment advisory fees | | | 2,774,058 | | | | 539,755 | | | | 1,727,013 | |
Shareholder servicing fees — Investor Class | | | 323,101 | | | | 34,447 | | | | 399,689 | |
Shareholder servicing fees — Institutional Class | | | 1,506 | | | | — | | | | — | |
Fund administration fees | | | 31,458 | | | | 16,700 | | | | 58,667 | |
Fund accounting fees | | | 44,299 | | | | 33,136 | | | | 35,828 | |
Reports to shareholders — Investor Class | | | 28,279 | | | | 10,133 | | | | 39,013 | |
Reports to shareholders — Institutional Class | | | 5,559 | | | | — | | | | — | |
Custody fees | | | 54,007 | | | | 14,022 | | | | 10,552 | |
Federal and state registration fees — Investor Class | | | 23,718 | | | | 19,331 | | | | 67,504 | |
Federal and state registration fees — Institutional Class | | | 16,587 | | | | — | | | | — | |
Legal fees | | | 13,829 | | | | 7,276 | | | | 25,921 | |
Trustees’ fees | | | 28,086 | | | | 14,846 | | | | 56,922 | |
Interest | | | 5,817 | | | | 3,063 | | | | 11,277 | |
Audit fees | | | 34,014 | | | | 37,703 | | | | 30,903 | |
Other expenses | | | 21,143 | | | | 8,099 | | | | 20,050 | |
| | | | | | | | | | | | |
Total expenses before reimbursement | | | 3,405,461 | | | | 738,511 | | | | 2,483,339 | |
Reimbursement of expenses by Advisor | | | (32,700 | ) | | | — | | | | — | |
| | | | | | | | | | | | |
Net Expenses | | | 3,372,761 | | | | 738,511 | | | | 2,483,339 | |
| | | | | | | | | | | | |
Net Investment Income (Loss) | | | (1,034,505 | ) | | | 1,793,857 | | | | 7,051,224 | |
| | | | | | | | | | | | |
Realized Gain (Loss): | | | | | | | | | | | | |
Investments sold | | | 21,262,458 | | | | (98,032 | ) | | | (15,383,863 | ) |
Foreign currency forward exchange contracts | | | 624,745 | | | | — | | | | — | |
Foreign currency transactions | | | (68,106 | ) | | | — | | | | — | |
| | | | | | | | | | | | |
Net realized gain (loss) | | | 21,819,097 | | | | (98,032 | ) | | | (15,383,863 | ) |
| | | | | | | | | | | | |
Change in Unrealized Appreciation (Depreciation): | | | | | | | | | | | | |
Investments | | | 15,295,625 | | | | (999,732 | ) | | | (39,287,510 | ) |
Foreign currency forward exchange contracts | | | 113,367 | | | | — | | | | — | |
Foreign currency translations | | | 6,132 | | | | — | | | | — | |
| | | | | | | | | | | | |
Net change in unrealized appreciation (depreciation) | | | 15,415,124 | | | | (999,732 | ) | | | (39,287,510 | ) |
| | | | | | | | | | | | |
Net gain (loss) on investments | | | 37,234,221 | | | | (1,097,764 | ) | | | (54,671,373 | ) |
| | | | | | | | | | | | |
Net Increase (Decrease) in Net Assets Resulting from Operations | | $ | 36,199,716 | | | $ | 696,093 | | | $ | (47,620,149 | ) |
| | | | | | | | | | | | |
| 1 | Net of $457 in foreign withholding taxes. |
| 2 | Net of $148,488, $0 and $0 in foreign withholding taxes, respectively. |
See Notes to Financial Statements.
98
(This page intentionally left blank.)
99
Statements of Changes in Net Assets
| | | | | | | | | | | | | | | | |
| | |
CORE GROWTH
FUND | | | EMERGING INDIA
FUND | |
| | | Year Ended
September 30, 2017 | | | Year Ended
September 30, 2016 | | | Year Ended
September 30, 2017 | | | Year Ended
September 30, 20161 | |
| | | | | | | | | | | | | | | | |
Operations: | | | | | | | | | | | | | | | | |
Net investment income (loss) | | $ | (10,825,622 | ) | | $ | (7,219,134 | ) | | $ | (1,291,008 | ) | | $ | (780,023 | ) |
Net realized gain (loss) on investments, foreign
currency translations and foreign capital gains taxes | | | 76,972,163 | | | | 6,560,806 | | | | 337,887 | | | | 75,863 | |
Change in unrealized appreciation (depreciation) on
investments, foreign currency translations
and deferred capital gains taxes | | | 186,468,265 | | | | 127,845,697 | | | | 26,464,287 | | | | 9,007,373 | |
| | | | | | | | | | | | | | | | |
Net increase (decrease) in net assets resulting from operations | | | 252,614,806 | | | | 127,187,369 | | | | 25,511,166 | | | | 8,303,213 | |
| | | | |
Dividends paid from: | | | | | | | | | | | | | | | | |
Investor Class | | | | | | | | | | | | | | | | |
Net investment income | | | — | | | | — | | | | — | | | | — | |
Net realized gains | | | (1,693,023 | ) | | | (119,772,338 | ) | | | (681,183 | ) | | | (958,580 | ) |
| | | | | | | | | | | | | | | | |
| | | (1,693,023 | ) | | | (119,772,338 | ) | | | (681,183 | ) | | | (958,580 | ) |
Institutional Class | | | | | | | | | | | | | | | | |
Net investment income | | | (131,773 | ) | | | — | | | | — | | | | — | |
Net realized gains | | | (427,998 | ) | | | (18,740,216 | ) | | | (138,465 | ) | | | — | |
| | | | | | | | | | | | | | | | |
| | | (559,771 | ) | | | (18,740,216 | ) | | | (138,465 | ) | | | — | |
| | | | |
Capital share transactions: | | | | | | | | | | | | | | | | |
Investor Class | | | | | | | | | | | | | | | | |
Shares sold | | | 158,213,538 | | | | 235,595,333 | | | | 173,266,065 | | | | 29,211,166 | |
Shares issued to holders in reinvestment of dividends | | | 1,656,949 | | | | 117,452,918 | | | | 675,573 | | | | 881,647 | |
Shares redeemed | | | (224,407,684 | ) | | | (270,607,879 | ) | | | (58,350,522 | ) | | | (27,875,778 | ) |
Redemption fees | | | 18,973 | | | | 57,589 | | | | 197,218 | | | | 16,274 | |
| | | | | | | | | | | | | | | | |
Net increase (decrease) | | | (64,518,224 | ) | | | 82,497,961 | | | | 115,788,334 | | | | 2,233,309 | |
| | | | | | | | | | | | | | | | |
Institutional Class | | | | | | | | | | | | | | | | |
Shares sold | | | 136,598,360 | | | | 102,256,296 | | | | 21,762,904 | | | | 8,344,245 | |
Shares issued to holders in reinvestment of dividends | | | 533,314 | | | | 17,489,140 | | | | 63,166 | | | | — | |
Shares redeemed | | | (62,595,979 | ) | | | (22,196,227 | ) | | | (12,400,532 | ) | | | — | |
Redemption fees | | | 7,603 | | | | 9,043 | | | | 11,033 | | | | — | |
| | | | | | | | | | | | | | | | |
Net increase (decrease) | | | 74,543,298 | | | | 97,558,252 | | | | 9,436,571 | | | | 8,344,245 | |
| | | | | | | | | | | | | | | | |
Total increase (decrease) in net assets | | | 260,387,086 | | | | 168,731,028 | | | | 149,916,423 | | | | 17,922,187 | |
| | | | |
Net assets: | | | | | | | | | | | | | | | | |
Beginning of period | | | 1,333,860,505 | | | | 1,165,129,477 | | | | 81,772,076 | | | | 63,849,889 | |
| | | | | | | | | | | | | | | | |
End of period | | $ | 1,594,247,591 | | | $ | 1,333,860,505 | | | $ | 231,688,499 | | | $ | 81,772,076 | |
| | | | | | | | | | | | | | | | |
Undistributed net investment loss included
in net assets at end of period | | $ | (8,181,295 | ) | | $ | (5,575,059 | ) | | $ | (2,249,623 | ) | | $ | (1,649,540 | ) |
| | | | | | | | | | | | | | | | |
| | | | |
Capital share transactions — shares: | | | | | | | | | | | | | | | | |
Investor Class | | | | | | | | | | | | | | | | |
Shares sold | | | 2,604,740 | | | | 4,389,841 | | | | 45,211,975 | | | | 9,619,706 | |
Shares issued to holders in reinvestment of dividends | | | 28,319 | | | | 2,179,898 | | | | 229,008 | | | | 291,936 | |
Shares redeemed | | | (3,700,842 | ) | | | (5,086,949 | ) | | | (15,673,561 | ) | | | (9,479,876 | ) |
| | | | | | | | | | | | | | | | |
Net increase (decrease) in shares outstanding | | | (1,067,783 | ) | | | 1,482,790 | | | | 29,767,422 | | | | 431,766 | |
| | | | | | | | | | | | | | | | |
Institutional Class | | | | | | | | | | | | | | | | |
Shares sold | | | 2,250,747 | | | | 1,883,923 | | | | 5,981,814 | | | | 2,879,575 | |
Shares issued to holders in reinvestment of dividends | | | 9,075 | | | | 323,513 | | | | 21,340 | | | | — | |
Shares redeemed | | | (1,003,821 | ) | | | (410,462 | ) | | | (3,087,664 | ) | | | — | |
| | | | | | | | | | | | | | | | |
Net increase (decrease) in shares outstanding | | | 1,256,001 | | | | 1,796,974 | | | | 2,915,490 | | | | 2,879,575 | |
| | | | | | | | | | | | | | | | |
| 1 | Institutional class inception date was February 1, 2016. |
See Notes to Financial Statements.
100
| | | | | | | | | | | | | | | | | | | | | | |
EMERGING MARKETS SELECT FUND | | | EMERGING MARKETS SMALL CAP FUND | | | FRONTIER EMERGING SMALL COUNTRIES FUND | |
Year Ended
September 30, 2017 | | | Year Ended
September 30, 2016 | | | Year Ended
September 30, 2017 | | | Year Ended
September 30, 20161 | | | Year Ended
September 30, 2017 | | | Year Ended
September 30, 20161 | |
| | | | | | | | | | | | | | | | | | | | | | |
| | | | | | | | | | | | | | | | | | | | | | |
| $ | (70,308 | ) | | $ | 39,611 | | | $ | (2,494,433 | ) | | $ | (5,703,812 | ) | | $ | (1,473,195 | ) | | $ | 3,750,574 | |
| (569,305 | ) | | | (1,295,442 | ) | | | 71,270,719 | | | | (57,152,827 | ) | | | (8,115,718 | ) | | | (122,596,395 | ) |
| 5,667,067 | | | | 5,180,985 | | | | (9,352,461 | ) | | | 150,259,510 | | | | 2,787,356 | | | | 71,170,573 | |
| | | | | | | | | | | | | | | | | | | | | | |
| 5,027,454 | | | | 3,925,154 | | | | 59,423,825 | | | | 87,402,871 | | | | (6,801,557 | ) | | | (47,675,248 | ) |
| | | | | |
| | | | | | | | | | | | | | | | | | | | | | |
| | | | | | | | | | | | | | | | | | | | | | |
| | — | | | | — | | | | — | | | | (132,483 | ) | | | — | | | | (1,618,755 | ) |
| | — | | | | — | | | | — | | | | — | | | | — | | | | — | |
| | | | | | | | | | | | | | | | | | | | | | |
| | — | | | | — | | | | — | | | | (132,483 | ) | | | — | | | | (1,618,755 | ) |
| | | | | | | | | | | | | | | | | | | | | | |
| | — | | | | — | | | | — | | | | — | | | | — | | | | — | |
| | — | | | | — | | | | — | | | | — | | | | — | | | | — | |
| | | | | | | | | | | | | | | | | | | | | | |
| | — | | | | — | | | | — | | | | — | | | | — | | | | — | |
| | | | | |
| | | | | | | | | | | | | | | | | | | | | | |
| | | | | | | | | | | | | | | | | | | | | | |
| | 5,170,460 | | | | 5,021,512 | | | | 71,727,934 | | | | 135,426,837 | | | | 50,572,101 | | | | 256,042,228 | |
| | — | | | | — | | | | — | | | | 117,400 | | | | — | | | | 1,545,813 | |
| | (3,358,306 | ) | | | (13,057,233 | ) | | | (390,658,618 | ) | | | (508,099,796 | ) | | | (329,333,843 | ) | | | (796,859,735 | ) |
| | 4,694 | | | | 1,244 | | | | 14,789 | | | | 6,249 | | | | 8,464 | | | | 47,252 | |
| | | | | | | | | | | | | | | | | | | | | | |
| | 1,816,848 | | | | (8,034,477 | ) | | | (318,915,895 | ) | | | (372,549,310 | ) | | | (278,753,278 | ) | | | (539,224,442 | ) |
| | | | | | | | | | | | | | | | | | | | | | |
| | | | | | | | | | | | | | | | | | | | | | |
| | 4,104,118 | | | | 6,298,780 | | | | 148,425,692 | | | | 163,579,317 | | | | 17,267,589 | | | | 156,914,661 | |
| | — | | | | — | | | | — | | | | — | | | | — | | | | — | |
| | (5,462,642 | ) | | | (1,330,793 | ) | | | (80,570,428 | ) | | | (24,306,522 | ) | | | (111,498,183 | ) | | | (18,521,165 | ) |
| | 1,073 | | | | — | | | | 1,856 | | | | 242 | | | | 712 | | | | 839 | |
| | | | | | | | | | | | | | | | | | | | | | |
| | (1,357,451 | ) | | | 4,967,987 | | | | 67,857,120 | | | | 139,273,037 | | | | (94,229,882 | ) | | | 138,394,335 | |
| | | | | | | | | | | | | | | | | | | | | | |
| | 5,486,851 | | | | 858,664 | | | | (191,634,950 | ) | | | (146,005,885 | ) | | | (379,784,717 | ) | | | (450,124,110 | ) |
| | | | | |
| | | | | | | | | | | | | | | | | | | | | | |
| | 38,654,784 | | | | 37,796,120 | | | | 835,360,842 | | | | 981,366,727 | | | | 577,548,950 | | | | 1,027,673,060 | |
| | | | | | | | | | | | | | | | | | | | | | |
| $ | 44,141,635 | | | $ | 38,654,784 | | | $ | 643,725,892 | | | $ | 835,360,842 | | | $ | 197,764,233 | | | $ | 577,548,950 | |
| | | | | | | | | | | | | | | | | | | | | | |
$ | (169,551 | ) | | $ | (157,877 | ) | | $ | (5,165,459 | ) | | $ | (7,177,380 | ) | | $ | (3,973,043 | ) | | $ | (5,926,809 | ) |
| | | | | | | | | | | | | | | | | | | | | | |
| | | | | |
| | | | | | | | | | | | | | | | | | | | | | |
| | | | | | | | | | | | | | | | | | | | | | |
| | 533,891 | | | | 607,896 | | | | 27,967,821 | | | | 55,771,862 | | | | 20,091,652 | | | | 96,401,830 | |
| | — | | | | — | | | | — | | | | 48,512 | | | | — | | | | 574,652 | |
| | (363,175 | ) | | | (1,537,017 | ) | | | (150,247,286 | ) | | | (213,187,447 | ) | | | (130,050,975 | ) | | | (300,906,259 | ) |
| | | | | | | | | | | | | | | | | | | | | | |
| | 170,716 | | | | (929,121 | ) | | | (122,279,465 | ) | | | (157,367,073 | ) | | | (109,959,323 | ) | | | (203,929,777 | ) |
| | | | | | | | | | | | | | | | | | | | | | |
| | | | | | | | | | | | | | | | | | | | | | |
| | 414,375 | | | | 735,711 | | | | 53,895,941 | | | | 69,868,540 | | | | 6,898,616 | | | | 60,003,922 | |
| | — | | | | — | | | | — | | | | — | | | | — | | | | — | |
| | (561,923 | ) | | | (154,025 | ) | | | (29,814,247 | ) | | | (9,644,798 | ) | | | (44,682,757 | ) | | | (7,015,724 | ) |
| | | | | | | | | | | | | | | | | | | | | | |
| | (147,548 | ) | | | 581,686 | | | | 24,081,694 | | | | 60,223,742 | | | | (37,784,141 | ) | | | 52,988,198 | |
| | | | | | | | | | | | | | | | | | | | | | |
101
Statements of Changes in Net Assets (continued)
| | | | | | | | | | | | | | | | |
| | | GLOBAL OPPORTUNITIES
FUND | | | INTERNATIONAL GROWTH
FUND | |
| | | Year Ended
September 30, 2017 | | | Year Ended
September 30, 20161 | | | Year Ended
September 30, 2017 | | | Year Ended
September 30, 20161 | |
| | | | | | | | | | | | | | | | |
Operations: | | | | | | | | | | | | | | | | |
Net investment income (loss) | | $ | (1,208,416 | ) | | $ | (1,517,910 | ) | | $ | (3,106,494 | ) | | $ | (4,748,463 | ) |
Net realized gain (loss) on investments, foreign currency translations and foreign capital gains taxes | | | 10,511,340 | | | | 8,430,816 | | | | 32,278,787 | | | | 55,136,808 | |
Net realized gain on options written | | | — | | | | — | | | | — | | | | — | |
Net realized loss on short positions | | | — | | | | — | | | | — | | | | — | |
Change in unrealized appreciation (depreciation) on
investments, foreign currency translations
and deferred capital gains taxes | | | 3,438,339 | | | | 14,070,421 | | | | 126,910,430 | | | | 116,091,330 | |
| | | | | | | | | | | | | | | | |
Net increase in net assets resulting from operations | | | 12,741,263 | | | | 20,983,327 | | | | 156,082,723 | | | | 166,479,675 | |
| | | | |
Dividends paid from: | | | | | | | | | | | | | | | | |
Investor Class | | | | | | | | | | | | | | | | |
Net investment income | | | (141,725 | ) | | | (427,375 | ) | | | — | | | | — | |
Net realized gains | | | (7,610,212 | ) | | | (19,259,921 | ) | | | (29,626,224 | ) | | | — | |
| | | | | | | | | | | | | | | | |
| | | (7,751,937 | ) | | | (19,687,296 | ) | | | (29,626,224 | ) | | | — | |
Institutional Class | | | | | | | | | | | | | | | | |
Net investment income | | | (20,477 | ) | | | — | | | | (393,058 | ) | | | — | |
Net realized gains | | | (396,985 | ) | | | — | | | | (17,283,293 | ) | | | — | |
| | | | | | | | | | | | | | | | |
| | | (417,462 | ) | | | — | | | | (17,676,351 | ) | | | — | |
| | | | |
Capital share transactions: | | | | | | | | | | | | | | | | |
Investor Class | | | | | | | | | | | | | | | | |
Shares sold | | | 9,564,866 | | | | 21,166,046 | | | | 106,544,800 | | | | 222,578,093 | |
Shares issued to holders in reinvestment of dividends | | | 7,688,280 | | | | 19,452,688 | | | | 28,617,516 | | | | — | |
Shares redeemed | | | (76,357,387 | ) | | | (46,667,870 | ) | | | (330,404,896 | ) | | | (726,095,437 | ) |
Redemption fees | | | 3,721 | | | | 12,452 | | | | 16,380 | | | | 11,556 | |
| | | | | | | | | | | | | | | | |
Net decrease | | | (59,100,520 | ) | | | (6,036,684 | ) | | | (195,226,200 | ) | | | (503,505,788 | ) |
| | | | | | | | | | | | | | | | |
Institutional Class | | | | | | | | | | | | | | | | |
Shares sold | | | 1,731,118 | | | | 5,065,715 | | | | 219,622,439 | | | | 483,795,090 | |
Shares issued to holders in reinvestment of dividends | | | 338,803 | | | | — | | | | 16,749,716 | | | | — | |
Shares redeemed | | | (837,522 | ) | | | — | | | | (142,642,997 | ) | | | (8,682,445 | ) |
Redemption fees | | | — | | | | — | | | | 5,704 | | | | 2,492 | |
| | | | | | | | | | | | | | | | |
Net increase (decrease) | | | 1,232,399 | | | | 5,065,715 | | | | 93,734,862 | | | | 475,115,137 | |
| | | | | | | | | | | | | | | | |
Total increase (decrease) in net assets | | | (53,296,257 | ) | | | 325,062 | | | | 7,288,810 | | | | 138,089,024 | |
| | | | |
Net assets: | | | | | | | | | | | | | | | | |
Beginning of period | | | 156,292,954 | | | | 155,967,892 | | | | 1,454,184,112 | | | | 1,316,095,088 | |
| | | | | | | | | | | | | | | | |
End of period | | $ | 102,996,697 | | | $ | 156,292,954 | | | $ | 1,461,472,922 | | | $ | 1,454,184,112 | |
| | | | | | | | | | | | | | | | |
Undistributed net investment loss included
in net assets at end of period | | $ | (963,398 | ) | | $ | (1,429,652 | ) | | $ | (857,139 | ) | | $ | (1,771,842 | ) |
| | | | | | | | | | | | | | | | |
| | | | |
Capital share transactions — shares: | | | | | | | | | | | | | | | | |
Investor Class | | | | | | | | | | | | | | | | |
Shares sold | | | 2,822,944 | | | | 6,694,423 | | | | 3,614,830 | | | | 7,681,730 | |
Shares issued to holders in reinvestment of dividends | | | 2,606,197 | | | | 5,704,601 | | | | 1,081,948 | | | | — | |
Shares redeemed | | | (22,787,072 | ) | | | (13,949,592 | ) | | | (10,993,871 | ) | | | (24,818,248 | ) |
| | | | | | | | | | | | | | | | |
Net decrease in shares outstanding | | | (17,357,931 | ) | | | (1,550,568 | ) | | | (6,297,093 | ) | | | (17,136,518 | ) |
| | | | | | | | | | | | | | | | |
Institutional Class | | | | | | | | | | | | | | | | |
Shares sold | | | 515,951 | | | | 1,518,647 | | | | 7,190,613 | | | | 16,466,250 | |
Shares issued to holders in reinvestment of dividends | | | 114,848 | | | | — | | | | 633,020 | | | | — | |
Shares redeemed | | | (246,570 | ) | | | — | | | | (4,615,613 | ) | | | (285,393 | ) |
| | | | | | | | | | | | | | | | |
Net increase (decrease) in shares outstanding | | | 384,229 | | | | 1,518,647 | | | | 3,208,020 | | | | 16,180,857 | |
| | | | | | | | | | | | | | | | |
| 1 | Institutional class inception date was February 1, 2016. |
See Notes to Financial Statements.
102
| | | | | | | | | | | | | | | | | | | | | | |
INTERNATIONAL OPPORTUNITIES
FUND | | | LARGE CAP VALUE
FUND | | | LONG/SHORT
FUND | |
Year Ended
September 30, 2017 | | | Year Ended
September 30, 20161 | | | Year Ended
September 30, 2017 | | | Year Ended
September 30, 2016 | | | Year Ended
September 30, 2017 | | | Year Ended
September 30, 2016 | |
| | | | | | | | | | | | | | | | | | | | | | |
| | | | | | | | | | | | | | | | | | | | | | |
| $ | (4,032,634 | ) | | $ | (1,149,686 | ) | | $ | 3,607,580 | | | $ | 3,669,068 | | | $ | (1,076,344 | ) | | $ | 45,073 | |
|
76,542,399 |
| | | (6,218,080 | ) | | | 25,170,035 | | | | 5,613,690 | | | | 23,313,928 | | | | (125,012,468 | ) |
| | — | | | | — | | | | 99,363 | | | | 132,873 | | | | — | | | | — | |
| | — | | | | — | | | | — | | | | — | | | | (18,701,895 | ) | | | (24,738,165 | ) |
| | (41,137,947 | ) | |
|
123,227,456 |
| | | (810,916 | ) | | | 19,112,212 | | | | (3,154,014 | ) | | | 196,133,025 | |
| | | | | | | | | | | | | | | | | | | | | | |
| | 31,371,818 | | | | 115,859,690 | | | | 28,066,062 | | | | 28,527,843 | | | | 381,675 | | | | 46,427,465 | |
| | | | | |
| | | | | | | | | | | | | | | | | | | | | | |
| | | | | | | | | | | | | | | | | | | | | | |
| | — | | | | — | | | | (3,557,468 | ) | | | (3,733,214 | ) | | | — | | | | (364,125 | ) |
| | — | | | | (22,512,072 | ) | | | (6,413,391 | ) | | | (20,730,247 | ) | | | (42,943 | ) | | | (49,332,592 | ) |
| | | | | | | | | | | | | | | | | | | | | | |
| | — | | | | (22,512,072 | ) | | | (9,970,859 | ) | | | (24,463,461 | ) | | | (42,943 | ) | | | (49,696,717 | ) |
| | | | | | | | | | | | | | | | | | | | | | |
| | — | | | | — | | | | (75,697 | ) | | | (60,085 | ) | | | — | | | | (479,596 | ) |
| | — | | | | — | | | | (63,659 | ) | | | (252,053 | ) | | | (18,132 | ) | | | (22,243,655 | ) |
| | | | | | | | | | | | | | | | | | | | | | |
| | — | | | | — | | | | (139,356 | ) | | | (312,138 | ) | | | (18,132 | ) | | | (22,723,251 | ) |
| | | | | |
| | | | | | | | | | | | | | | | | | | | | | |
| | | | | | | | | | | | | | | | | | | | | | |
| | 244,935,438 | | | | 151,939,973 | | | | 7,997,702 | | | | 9,656,161 | | | | 14,964,816 | | | | 64,920,986 | |
| | — | | | | 22,015,075 | | | | 9,870,606 | | | | 24,129,587 | | | | 42,349 | | | | 49,262,675 | |
| | (503,406,532 | ) | | | (184,742,350 | ) | | | (49,536,033 | ) | | | (91,876,593 | ) | | | (119,778,795 | ) | | | (527,803,631 | ) |
| | 13,213 | | | | 18,842 | | | | 1,840 | | | | 1,216 | | | | 4,131 | | | | 15,132 | |
| | | | | | | | | | | | | | | | | | | | | | |
| | (258,457,881 | ) | | | (10,768,460 | ) | | | (31,665,885 | ) | | | (58,089,629 | ) | | | (104,767,499 | ) | | | (413,604,838 | ) |
| | | | | | | | | | | | | | | | | | | | | | |
| | | | | | | | | | | | | | | | | | | | | | |
| | 81,335,149 | | | | 153,515,811 | | | | 4,408,174 | | | | 3,327,996 | | | | 31,752,233 | | | | 41,876,317 | |
| | — | | | | — | | | | 137,747 | | | | 309,072 | | | | 18,116 | | | | 22,325,848 | |
| | (33,966,318 | ) | | | (9,205,095 | ) | | | (3,793,616 | ) | | | (1,601,692 | ) | | | (69,587,600 | ) | | | (401,523,032 | ) |
| | 3,525 | | | | 2,811 | | | | 1,100 | | | | 1,120 | | | | 15,367 | | | | 101,712 | |
| | | | | | | | | | | | | | | | | | | | | | |
| | 47,372,356 | | | | 144,313,527 | | | | 753,405 | | | | 2,036,496 | | | | (37,801,884 | ) | | | (337,219,155 | ) |
| | | | | | | | | | | | | | | | | | | | | | |
| | (179,713,707 | ) | | | 226,892,685 | | | | (12,956,633 | ) | | | (52,300,889 | ) | | | (142,248,783 | ) | | | (776,816,496 | ) |
| | | | | |
| | | | | | | | | | | | | | | �� | | | | | | | |
| | 680,387,811 | | | | 453,495,126 | | | | 193,280,094 | | | | 245,580,983 | | | | 248,167,392 | | | | 1,024,983,888 | |
| | | | | | | | | | | | | | | | | | | | | | |
| $ | 500,674,104 | | | $ | 680,387,811 | | | $ | 180,323,461 | | | $ | 193,280,094 | | | $ | 105,918,609 | | | $ | 248,167,392 | |
| | | | | | | | | | | | | | | | | | | | | | |
$ |
(3,176,874 |
) | | $ | (237,268 | ) | | $ | (7,742 | ) | | $ | (3,731 | ) | | $ | (455,640 | ) | | $ | (145,368 | ) |
| | | | | | | | | | | | | | | | | | | | | | |
| | | | | |
| | | | | | | | | | | | | | | | | | | | | | |
| | | | | | | | | | | | | | | | | | | | | | |
| | 78,958,491 | | | | 52,855,854 | | | | 843,060 | | | | 1,120,728 | | | | 1,146,753 | | | | 5,339,083 | |
| | — | | | | 7,862,527 | | | | 1,045,628 | | | | 2,807,480 | | | | 3,177 | | | | 4,332,689 | |
| | (161,991,381 | ) | | | (66,779,782 | ) | | | (5,213,402 | ) | | | (10,503,774 | ) | | | (9,381,896 | ) | | | (44,954,538 | ) |
| | | | | | | | | | | | | | | | | | | | | | |
| | (83,032,890 | ) | | | (6,061,401 | ) | | | (3,324,714 | ) | | | (6,575,566 | ) | | | (8,231,966 | ) | | | (35,282,766 | ) |
| | | | | | | | | | | | | | | | | | | | | | |
| | | | | | | | | | | | | | | | | | | | | | |
| | 25,860,622 | | | | 55,197,121 | | | | 460,307 | | | | 365,881 | | | | 2,406,680 | | | | 3,395,227 | |
| | — | | | | — | | | | 14,478 | | | | 35,987 | | | | 1,353 | | | | 1,961,850 | |
| | (10,875,848 | ) | | | (3,093,786 | ) | | | (409,841 | ) | | | (176,253 | ) | | | (5,398,348 | ) | | | (33,338,059 | ) |
| | | | | | | | | | | | | | | | | | | | | | |
| | 14,984,774 | | | | 52,103,335 | | | | 64,944 | | | | 225,615 | | | | (2,990,315 | ) | | | (27,980,982 | ) |
| | | | | | | | | | | | | | | | | | | | | | |
103
Statements of Changes in Net Assets (continued)
| | | | | | | | | | | | | | | | |
| | | MICRO CAP
FUND | | | MICRO CAP VALUE
FUND | |
| | | Year Ended
September 30, 2017 | | | Year Ended
September 30, 2016 | | | Year Ended
September 30, 2017 | | | Year Ended
September 30, 2016 | |
| | | | | | | | | | | | | | | | |
Operations: | | | | | | | | | | | | | | | | |
Net investment income (loss) | | $ | (3,976,227 | ) | | $ | (3,020,820 | ) | | $ | (1,541,548 | ) | | $ | (987,743 | ) |
Net realized gain (loss) on investments, foreign
currency translations and foreign capital gains taxes | | | 39,173,711 | | | | 17,504,026 | | | | 19,891,004 | | | | 2,306,799 | |
Change in unrealized appreciation on
investments, foreign currency translations and deferred foreign capital gains taxes | | | 28,515,635 | | | | 25,086,105 | | | | 22,157,781 | | | | 18,406,751 | |
| | | | | | | | | | | | | | | | |
Net increase in net assets resulting from operations | | | 63,713,119 | | | | 39,569,311 | | | | 40,507,237 | | | | 19,725,807 | |
| | | | |
Dividends paid from: | | | | | | | | | | | | | | | | |
Investor Class | | | | | | | | | | | | | | | | |
Net investment income | | | (194,392 | ) | | | — | | | | (119,575 | ) | | | — | |
Net realized gains | | | (22,635,465 | ) | | | (40,544,074 | ) | | | (2,945,428 | ) | | | (17,904,955 | ) |
Return of capital | | | — | | | | — | | | | — | | | | — | |
| | | | | | | | | | | | | | | | |
| | | (22,829,857 | ) | | | (40,544,074 | ) | | | (3,065,003 | ) | | | (17,904,955 | ) |
Institutional Class | | | | | | | | | | | | | | | | |
Net investment income | | | — | | | | — | | | | — | | | | — | |
Net realized gains | | | — | | | | — | | | | — | | | | — | |
| | | | | | | | | | | | | | | | |
| | | — | | | | — | | | | — | | | | — | |
| | | | |
Capital share transactions: | | | | | | | | | | | | | | | | |
Investor Class | | | | | | | | | | | | | | | | |
Shares sold | | | 8,493,440 | | | | 6,546,097 | | | | 29,303,153 | | | | 36,255,073 | |
Shares issued to holders in reinvestment of dividends | | | 21,444,591 | | | | 38,421,674 | | | | 3,005,231 | | | | 17,528,757 | |
Shares redeemed | | | (36,929,156 | ) | | | (39,615,512 | ) | | | (32,783,681 | ) | | | (30,678,179 | ) |
Redemption fees | | | 190 | | | | 2,584 | | | | 3,915 | | | | 21,005 | |
| | | | | | | | | | | | | | | | |
Net increase (decrease) | | | (6,990,935 | ) | | | 5,354,843 | | | | (471,382 | ) | | | 23,126,656 | |
| | | | | | | | | | | | | | | | |
Institutional Class | | | | | | | | | | | | | | | | |
Shares sold | | | — | | | | — | | | | — | | | | — | |
Shares issued to holders in reinvestment of dividends | | | — | | | | — | | | | — | | | | — | |
Shares redeemed | | | — | | | | — | | | | — | | | | — | |
Redemption fees | | | — | | | | — | | | | — | | | | — | |
| | | | | | | | | | | | | | | | |
Net increase | | | — | | | | — | | | | — | | | | — | |
| | | | | | | | | | | | | | | | |
Total increase (decrease) in net assets | | | 33,892,327 | | | | 4,380,080 | | | | 36,970,852 | | | | 24,947,508 | |
| | | | |
Net assets: | | | | | | | | | | | | | | | | |
Beginning of period | | | 277,690,923 | | | | 273,310,843 | | | | 179,116,372 | | | | 154,168,864 | |
| | | | | | | | | | | | | | | | |
End of period | | $ | 311,583,250 | | | $ | 277,690,923 | | | $ | 216,087,224 | | | $ | 179,116,372 | |
| | | | | | | | | | | | | | | | |
Undistributed net investment income (loss) included
in net assets at end of period | | $ | (2,607,368 | ) | | $ | (1,971,779 | ) | | $ | (1,095,632 | ) | | $ | (689,111 | ) |
| | | | | | | | | | | | | | | | |
| | | | |
Capital share transactions — shares: | | | | | | | | | | | | | | | | |
Investor Class | | | | | | | | | | | | | | | | |
Shares sold | | | 1,187,956 | | | | 973,225 | | | | 9,461,106 | | | | 13,603,287 | |
Shares issued to holders in reinvestment of dividends | | | 3,309,350 | | | | 5,777,695 | | | | 1,029,189 | | | | 6,565,078 | |
Shares redeemed | | | (5,256,054 | ) | | | (6,040,054 | ) | | | (10,751,970 | ) | | | (11,446,018 | ) |
| | | | | | | | | | | | | | | | |
Net increase (decrease) in shares outstanding | | | (758,748 | ) | | | 710,866 | | | | (261,675 | ) | | | 8,722,347 | |
| | | | | | | | | | | | | | | | |
Institutional Class | | | | | | | | | | | | | | | | |
Shares sold | | | — | | | | — | | | | — | | | | — | |
Shares issued to holders in reinvestment of dividends | | | — | | | | — | | | | — | | | | — | |
Shares redeemed | | | — | | | | — | | | | — | | | | — | |
| | | | | | | | | | | | | | | | |
Net increase in shares outstanding | | | — | | | | — | | | | — | | | | — | |
| | | | | | | | | | | | | | | | |
| 1 | Institutional class inception date was February 1, 2016. |
See Notes to Financial Statements.
104
| | | | | | | | | | | | | | | | | | | | | | |
SMALL CAP GROWTH
FUND | | | SMALL CAP VALUE
FUND | | | STRATEGIC INCOME
FUND | |
Year Ended
September 30, 2017 | | | Year Ended
September 30, 20161 | | | Year Ended
September 30, 2017 | | | Year Ended
September 30, 2016 | | | Year Ended
September 30, 2017 | | | Year Ended
September 30, 2016 | |
| | | | | | | | | | | | | | | | | | | | | | |
| | | | | | | | | | | | | | | | | | | | | | |
| $ | (14,311,581 | ) | | $ | (14,924,154 | ) | | $ | 209,668 | | | $ | 682,252 | | | $ | 721,341 | | | $ | 1,690,915 | |
|
147,279,152 |
| | | 162,637,861 | | | | 27,358,515 | | | | 16,775,143 | | | | 2,719,511 | | | | (7,539,689 | ) |
| 97,387,849 | | | | 67,189,440 | | | | 33,444,326 | | | | 18,262,012 | | | | 2,097,330 | | | | 9,420,214 | |
| | | | | | | | | | | | | | | | | | | | | | |
| | 230,355,420 | | | | 214,903,147 | | | | 61,012,509 | | | | 35,719,407 | | | | 5,538,182 | | | | 3,571,440 | |
| | | | | |
| | | | | | | | | | | | | | | | | | | | | | |
| | | | | | | | | | | | | | | | | | | | | | |
| | — | | | | — | | | | (204,563 | ) | | | (1,366,134 | ) | | | (516,716 | ) | | | (1,501,048 | ) |
| | (114,348,061 | ) | | | (322,361,340 | ) | | | — | | | | — | | | | — | | | | (2,658,712 | ) |
| | — | | | | — | | | | — | | | | — | | | | — | | | | (287,336 | ) |
| | | | | | | | | | | | | | | | | | | | | | |
| | (114,348,061 | ) | | | (322,361,340 | ) | | | (204,563 | ) | | | (1,366,134 | ) | | | (516,716 | ) | | | (4,447,096 | ) |
| | | | | | | | | | | | | | | | | | | | | | |
| | — | | | | — | | | | (86,356 | ) | | | (98,715 | ) | | | — | | | | — | |
| | (29,795,156 | ) | | | — | | | | — | | | | — | | | | — | | | | — | |
| | | | | | | | | | | | | | | | | | | | | | |
| | (29,795,156 | ) | | | — | | | | (86,356 | ) | | | (98,715 | ) | | | — | | | | — | |
| | | | | |
| | | | | | | | | | | | | | | | | | | | | | |
| | | | | | | | | | | | | | | | | | | | | | |
| | 101,783,116 | | | | 209,117,699 | | | | 58,194,449 | | | | 35,656,524 | | | | 3,250,647 | | | | 5,689,341 | |
| | 111,807,878 | | | | 309,835,993 | | | | 197,942 | | | | 1,301,422 | | | | 509,614 | | | | 4,380,286 | |
| | (631,140,322 | ) | | | (844,914,263 | ) | | | (61,034,771 | ) | | | (56,085,285 | ) | | | (18,849,418 | ) | | | (42,746,118 | ) |
| | 21,451 | | | | 67,941 | | | | 8,744 | | | | 1,743 | | | | 561 | | | | 3,056 | |
| | | | | | | | | | | | | | | | | | | | | | |
| | (417,527,877 | ) | | | (325,892,630 | ) | | | (2,633,636 | ) | | | (19,125,596 | ) | | | (15,088,596 | ) | | | (32,673,435 | ) |
| | | | | | | | | | | | | | | | | | | | | | |
| | | | | | | | | | | | | | | | | | | | | | |
| | 231,976,705 | | | | 334,206,662 | | | | 25,348,797 | | | | 5,124,166 | | | | — | | | | — | |
| | 27,104,939 | | | | — | | | | 85,869 | | | | 98,258 | | | | — | | | | — | |
| | (119,228,883 | ) | | | (19,042,923 | ) | | | (6,422,594 | ) | | | (3,397,604 | ) | | | — | | | | — | |
| | 7,043 | | | | 369 | | | | 299 | | | | 79 | | | | — | | | | — | |
| | | | | | | | | | | | | | | | | | | | | | |
| | 139,859,804 | | | | 315,164,108 | | | | 19,012,371 | | | | 1,824,899 | | | | — | | | | — | |
| | | | | | | | | | | | | | | | | | | | | | |
| | (191,455,870 | ) | | | (118,186,715 | ) | | | 77,100,325 | | | | 16,953,861 | | | | (10,067,130 | ) | | | (33,549,091 | ) |
| | | | | |
| | | | | | | | | | | | | | | | | | | | | | |
| | 1,882,400,918 | | | | 2,000,587,633 | | | | 293,549,123 | | | | 276,595,262 | | | | 55,111,832 | | | | 88,660,923 | |
| | | | | | | | | | | | | | | | | | | | | | |
| $ | 1,690,945,048 | | | $ | 1,882,400,918 | | | $ | 370,649,448 | | | $ | 293,549,123 | | | $ | 45,044,702 | | | $ | 55,111,832 | |
| | | | | | | | | | | | | | | | | | | | | | |
$ |
(9,822,810 |
) | | $ | (10,697,296 | ) | | $ | (127,730 | ) | | $ | 223,317 | | | $ | (69,552 | ) | | $ | (159,843 | ) |
| | | | | | | | | | | | | | | | | | | | | | |
| | | | | |
| | | | | | | | | | | | | | | | | | | | | | |
| | | | | | | | | | | | | | | | | | | | | | |
| | 2,390,725 | | | | 5,131,888 | | | | 8,126,959 | | | | 6,099,737 | | | | 289,909 | | | | 548,323 | |
| | 2,797,995 | | | | 7,380,562 | | | | 27,919 | | | | 216,904 | | | | 46,032 | | | | 425,080 | |
| | (14,822,528 | ) | | | (20,536,916 | ) | | | (8,511,232 | ) | | | (9,526,792 | ) | | | (1,699,886 | ) | | | (4,239,042 | ) |
| | | | | | | | | | | | | | | | | | | | | | |
| | (9,633,808 | ) | | | (8,024,466 | ) | | | (356,354 | ) | | | (3,210,151 | ) | | | (1,363,945 | ) | | | (3,265,639 | ) |
| | | | | | | | | | | | | | | | | | | | | | |
| | | | | | | | | | | | | | | | | | | | | | |
| | 5,418,588 | | | | 8,204,969 | | | | 3,512,510 | | | | 902,562 | | | | — | | | | — | |
| | 676,777 | | | | — | | | | 12,060 | | | | 16,322 | | | | — | | | | — | |
| | (2,764,509 | ) | | | (457,924 | ) | | | (886,905 | ) | | | (553,403 | ) | | | — | | | | — | |
| | | | | | | | | | | | | | | | | | | | | | |
| | 3,330,856 | | | | 7,747,045 | | | | 2,637,665 | | | | 365,481 | | | | — | | | | — | |
| | | | | | | | | | | | | | | | | | | | | | |
105
Statements of Changes in Net Assets (continued)
| | | | | | | | | | | | | | | | |
| | | ULTRA GROWTH
FUND | | | WORLD INNOVATORS
FUND | |
| | | Year Ended
September 30, 2017 | | | Year Ended
September 30, 2016 | | | Year Ended
September 30, 2017 | | | Year Ended
September 30, 20161 | |
| | | | | | | | | | | | | | | | |
Operations: | |
Net investment income (loss) | | $ | (1,064,997 | ) | | $ | (982,316 | ) | | $ | (1,034,505 | ) | | $ | (1,240,640 | ) |
Net realized gain (loss) on investments, foreign currency translations and foreign capital gains taxes | | | 11,892,472 | | | | 7,330,801 | | | | 21,819,097 | | | | 11,692,010 | |
Change in unrealized appreciation (depreciation) on investments, foreign currency translations and deferred capital gains taxes | | | 9,619,447 | | | | 11,054,954 | | | | 15,415,124 | | | | 6,110,487 | |
| | | | | | | | | | | | | | | | |
Net increase (decrease) in net assets resulting from operations | | | 20,446,922 | | | | 17,403,439 | | | | 36,199,716 | | | | 16,561,857 | |
|
Dividends paid from: | |
Investor Class | | | | | | | | | | | | | | | | |
Net investment income | | | (520,867 | ) | | | — | | | | — | | | | — | |
Net realized gains | | | (9,189,783 | ) | | | (8,679,065 | ) | | | (6,256,560 | ) | | | (24,130,023 | ) |
| | | | | | | | | | | | | | | | |
| | | (9,710,650 | ) | | | (8,679,065 | ) | | | (6,256,560 | ) | | | (24,130,023 | ) |
Institutional Class | | | | |
Net investment income | | | — | | | | — | | | | — | | | | — | |
Net realized gains | | | — | | | | — | | | | (128,118 | ) | | | | |
| | | | | | | | | | | | | | | | |
| | | — | | | | — | | | | (128,118 | ) | | | — | |
|
Capital share transactions: | |
Investor Class | | | | |
Shares sold | | | 4,951,716 | | | | 4,877,275 | | | | 18,432,994 | | | | 59,829,188 | |
Shares issued to holders in reinvestment of dividends | | | 9,435,416 | | | | 8,403,349 | | | | 6,041,921 | | | | 22,861,112 | |
Shares redeemed | | | (15,159,900 | ) | | | (16,619,659 | ) | | | (56,466,951 | ) | | | (67,566,485 | ) |
Redemption fees | | | 215 | | | | 1,273 | | | | 2,501 | | | | 1,953 | |
| | | | | | | | | | | | | | | | |
Net increase (decrease) | | | (772,553 | ) | | | (3,337,762 | ) | | | (31,989,535 | ) | | | 15,125,768 | |
| | | | | | | | | | | | | | | | |
Institutional Class | | | | |
Shares sold | | | — | | | | — | | | | 5,854,133 | | | | 5,998,939 | |
Shares issued to holders in reinvestment of dividends | | | — | | | | — | | | | 128,118 | | | | — | |
Shares redeemed | | | — | | | | — | | | | (8,754,213 | ) | | | (25,551 | ) |
| | | | | | | | | | | | | | | | |
Net increase (decrease) | | | — | | | | — | | | | (2,771,962 | ) | | | 5,973,388 | |
| | | | | | | | | | | | | | | | |
Total increase (decrease) in net assets | | | 9,963,719 | | | | 5,386,612 | | | | (4,946,459 | ) | | | 13,530,990 | |
|
Net assets: | |
Beginning of period | | | 101,401,904 | | | | 96,015,292 | | | | 199,803,013 | | | | 186,272,023 | |
| | | | | | | | | | | | | | | | |
End of period | | $ | 111,365,623 | | | $ | 101,401,904 | | | $ | 194,856,554 | | | $ | 199,803,013 | |
| | | | | | | | | | | | | | | | |
Undistributed net investment income (loss) included in net assets at end of period | | $ | (903,987 | ) | | $ | (1,199,720 | ) | | $ | (41,744 | ) | | $ | (456,077 | ) |
| | | | | | | | | | | | | | | | |
| | | | |
Capital share transactions — shares: | | | | | | | | | | | | | | | | |
Investor Class | | | | | | | | | | | | | | | | |
Shares sold | | | 254,111 | | | | 273,554 | | | | 909,168 | | | | 3,189,238 | |
Shares issued to holders in reinvestment of dividends | | | 538,244 | | | | 459,702 | | | | 326,414 | | | | 1,198,171 | |
Shares redeemed | | | (784,313 | ) | | | (952,369 | ) | | | (2,869,552 | ) | | | (3,591,062 | ) |
| | | | | | | | | | | | | | | | |
Net increase (decrease) in shares outstanding | | | 8,042 | | | | (219,113 | ) | | | (1,633,970 | ) | | | 796,347 | |
| | | | | | | | | | | | | | | | |
Institutional Class | | | | | | | | | | | | | | | | |
Shares sold | | | — | | | | — | | | | 299,276 | | | | 309,990 | |
Shares issued to holders in reinvestment of dividends | | | — | | | | — | | | | 6,903 | | | | — | |
Shares redeemed | | | — | | | | — | | | | (447,088 | ) | | | (1,313 | ) |
| | | | | | | | | | | | | | | | |
Net increase (decrease) in shares outstanding | | | — | | | | — | | | | (140,909 | ) | | | 308,677 | |
| | | | | | | | | | | | | | | | |
| 1 | Institutional class inception date was February 1, 2016. |
See Notes to Financial Statements.
106
| | | | | | | | | | | | | | |
INCOME
FUND | | | U.S. TREASURY
FUND | |
Year Ended
September 30, 2017 | | | Year Ended
September 30, 2016 | | | Year Ended
September 30, 2017 | | | Year Ended
September 30, 2016 | |
| | | | | | | | | | | | | | |
| | | | | | | | | | | | | | |
| $ | 1,793,857 | | | $ | 1,951,379 | | | $ | 7,051,224 | | | $ | 7,963,623 | |
| (98,032 | ) | | | 125,294 | | | | (15,383,863 | ) | | | 23,928,544 | |
| (999,732 | ) | | | 544,033 | | | | (39,287,510 | ) | | | 24,193,265 | |
| | | | | | | | | | | | | | |
| 696,093 | | | | 2,620,706 | | | | (47,620,149 | ) | | | 56,085,432 | |
| | | |
| | | | | | | | | | | | | | |
| | | | | | | | | | | | | | |
| | (1,793,675 | ) | | | (1,963,364 | ) | | | (7,013,012 | ) | | | (7,944,602 | ) |
| | (124,947 | ) | | | — | | | | (23,928,558 | ) | | | (15,905,989 | ) |
| | | | | | | | | | | | | | |
| | (1,918,622 | ) | | | (1,963,364 | ) | | | (30,941,570 | ) | | | (23,850,591 | ) |
| | | | | | | | | | | | | | |
| | — | | | | — | | | | — | | | | — | |
| | — | | | | — | | | | — | | | | — | |
| | | | | | | | | | | | | | |
| | — | | | | — | | | | — | | | | — | |
| | | |
| | | | | | | | | | | | | | |
| | | | | | | | | | | | | | |
| | 19,939,924 | | | | 27,381,821 | | | | 172,273,407 | | | | 288,787,957 | |
| | 1,297,779 | | | | 1,491,903 | | | | 29,434,378 | | | | 22,804,737 | |
| | (22,860,288 | ) | | | (38,794,414 | ) | | | (251,422,062 | ) | | | (182,878,814 | ) |
| | 5,601 | | | | 10,533 | | | | 130,945 | | | | 201,177 | |
| | | | | | | | | | | | | | |
| | (1,616,984 | ) | | | (9,910,157 | ) | | | (49,583,332 | ) | | | 128,915,057 | |
| | | | | | | | | | | | | | |
| | | | | | | | | | | | | | |
| | — | | | | — | | | | — | | | | — | |
| | — | | | | — | | | | — | | | | — | |
| | — | | | | — | | | | — | | | | — | |
| | | | | | | | | | | | | | |
| | — | | | | — | | | | — | | | | — | |
| | | | | | | | | | | | | | |
| | (2,839,513 | ) | | | (9,252,815 | ) | | | (128,145,051 | ) | | | 161,149,898 | |
| | | |
| | | | | | | | | | | | | | |
| | 99,706,071 | | | | 108,958,886 | | | | 489,010,815 | | | | 327,860,917 | |
| | | | | | | | | | | | | | |
| $ | 96,866,558 | | | $ | 99,706,071 | | | $ | 360,865,764 | | | $ | 489,010,815 | |
| | | | | | | | | | | | | | |
$ | 4,835 | | | $ | 10,454 | | | $ | 36,338 | | | $ | (1,860 | ) |
| | | | | | | | | | | | | | |
| | | |
| | | | | | | | | | | | | | |
| | | | | | | | | | | | | | |
| | 1,972,799 | | | | 2,685,166 | | | | 10,519,433 | | | | 15,149,367 | |
| | 128,472 | | | | 146,414 | | | | 1,897,444 | | | | 1,296,239 | |
| | (2,260,040 | ) | | | (3,804,979 | ) | | | (14,924,367 | ) | | | (9,625,892 | ) |
| | | | | | | | | | | | | | |
| | (158,769 | ) | | | (973,399 | ) | | | (2,507,490 | ) | | | 6,819,714 | |
| | | | | | | | | | | | | | |
| | | | | | | | | | | | | | |
| | — | | | | — | | | | — | | | | — | |
| | — | | | | — | | | | — | | | | — | |
| | — | | | | — | | | | — | | | | — | |
| | | | | | | | | | | | | | |
| | — | | | | — | | | | — | | | | — | |
| | | | | | | | | | | | | | |
107
Financial Highlights
| | | | | | | | | | | | | | | | | | | | | | | | | | | | | | | | |
| | | | | | Income (Loss) from
Investment Operations | | | | | | | | | Less Distributions | | | | |
| | | Net Asset
Value
Beginning
of Period | | | Net
Investment
Income (Loss) | | | Net Realized
and Unrealized
Gains (Losses)
on Investments | | | Total from
Investment
Operations | | | Redemption
Fees
(See Note 2) | | | Dividends
from Net
Investment
Income | | | Distributions
from Net
Realized
Gains | | | Total
Distributions | |
Core Growth Fund — Investor Class | | | | | | | | | | | | | | | | | | | | | | | | | | | | | |
Year ended 9/30/17 | | $ | 56.90 | | | | (0.50 | ) | | | 11.13 | | | | 10.63 | | | | — | 4 | | | — | | | | (0.09 | ) | | | (0.09 | ) |
Year ended 9/30/1619 | | $ | 57.83 | | | | (0.30 | ) | | | 6.09 | | | | 5.79 | | | | — | 4 | | | — | | | | (6.72 | ) | | | (6.72 | ) |
Year ended 9/30/15 | | $ | 53.46 | | | | (0.14 | )12 | | | 5.95 | | | | 5.81 | | | | — | 4 | | | — | | | | (1.44 | ) | | | (1.44 | ) |
Year ended 9/30/14 | | $ | 52.49 | | | | (0.39 | ) | | | 2.12 | | | | 1.73 | | | | — | 4 | | | — | | | | (0.76 | ) | | | (0.76 | ) |
Year ended 9/30/13 | | $ | 41.41 | | | | (0.12 | ) | | | 11.19 | | | | 11.07 | | | | 0.01 | | | | — | | | | — | | | | — | |
Core Growth Fund — Institutional Class | | | | | | | | | | | | | | | | | | | | | | | | | | | | | |
Year ended 9/30/17 | | $ | 57.16 | | | | (0.30 | ) | | | 11.07 | | | | 10.77 | | | | — | 4 | | | (0.03 | ) | | | (0.09 | ) | | | (0.12 | ) |
Year ended 9/30/1619 | | $ | 57.99 | | | | (0.14 | ) | | | 6.03 | | | | 5.89 | | | | — | 4 | | | — | | | | (6.72 | ) | | | (6.72 | ) |
Year ended 9/30/15 | | $ | 53.58 | | | | 0.06 | | | | 5.79 | | | | 5.85 | | | | — | 4 | | | — | | | | (1.44 | ) | | | (1.44 | ) |
Year ended 9/30/14 | | $ | 52.57 | | | | (0.23 | ) | | | 2.00 | | | | 1.77 | | | | — | 4 | | | — | | | | (0.76 | ) | | | (0.76 | ) |
Year ended 9/30/13 | | $ | 41.44 | | | | (0.07 | ) | | | 11.20 | | | | 11.13 | | | | — | 4 | | | — | | | | — | | | | — | |
Emerging India Fund — Investor Class | | | | | | | | | | | | | | | | | | | | | | | | | | | | | |
Year ended 9/30/17 | | $ | 3.39 | | | | 0.02 | 20 | | | 0.70 | | | | 0.72 | | | | — | 4 | | | — | | | | (0.03 | ) | | | (0.03 | ) |
Year ended 9/30/1619 | | $ | 3.07 | | | | (0.03 | ) | | | 0.39 | | | | 0.36 | | | | — | 4 | | | — | | | | (0.04 | ) | | | (0.04 | ) |
Year ended 9/30/15 | | $ | 2.73 | | | | (0.04 | ) | | | 0.38 | | | | 0.34 | | | | — | 4 | | | — | 4 | | | — | | | | — | 4 |
Year ended 9/30/14 | | $ | 1.78 | | | | (— | )4 | | | 0.95 | | | | 0.95 | | | | — | 4 | | | — | | | | — | | | | — | |
Year ended 9/30/13 | | $ | 2.02 | | | | (0.01 | ) | | | (0.23 | ) | | | (0.24 | ) | | | — | 4 | | | — | | | | — | | | | — | |
Emerging India Fund — Institutional Class | | | | | | | | | | | | | | | | | | | | | | | | | |
Year ended 9/30/17 | | $ | 3.40 | | | | 0.02 | 20 | | | 0.71 | | | | 0.73 | | | | — | 4 | | | — | | | | (0.03 | ) | | | (0.03 | ) |
Period ended 9/30/1617 19 | | $ | 2.82 | | | | (0.01 | ) | | | 0.59 | | | | 0.58 | | | | — | | | | — | | | | — | | | | — | |
Emerging Markets Select Fund — Investor Class | | | | | | | | | | | | | | | | | | | | | | | | | |
Year ended 9/30/17 | | $ | 9.23 | | | | (0.03 | ) | | | 1.26 | | | | 1.23 | | | | — | 4 | | | — | | | | — | | | | — | |
Year ended 9/30/1619 | | $ | 8.35 | | | | (0.05 | ) | | | 0.93 | | | | 0.88 | | | | — | 4 | | | — | | | | — | | | | — | |
Year ended 9/30/15 | | $ | 10.31 | | | | (0.04 | ) | | | (1.89 | ) | | | (1.93 | ) | | | — | 4 | | | (0.03 | ) | | | — | | | | (0.03 | ) |
Year ended 9/30/14 | | $ | 9.56 | | | | (0.01 | ) | | | 0.77 | | | | 0.76 | | | | — | 4 | | | (0.01 | ) | | | — | | | | (0.01 | ) |
Year ended 9/30/1310 | | $ | 10.00 | | | | — | 4 | | | (0.44 | ) | | | (0.44 | ) | | | — | 4 | | | — | | | | — | | | | — | |
Emerging Markets Select Fund — Institutional Class | | | | | | | | | | | | | | | | | | | | | | | | | |
Year ended 9/30/17 | | $ | 9.32 | | | | (0.01 | ) | | | 1.29 | | | | 1.28 | | | | — | 4 | | | — | | | | — | | | | — | |
Year ended 9/30/1619 | | $ | 8.41 | | | | 0.04 | | | | 0.87 | | | | 0.91 | | | | — | | | | — | | | | — | | | | — | |
Year ended 9/30/15 | | $ | 10.37 | | | | (0.03 | ) | | | (1.88 | ) | | | (1.91 | ) | | | — | 4 | | | (0.05 | ) | | | — | | | | (0.05 | ) |
Year ended 9/30/14 | | $ | 9.61 | | | | — | 4 | | | 0.78 | | | | 0.78 | | | | — | 4 | | | (0.02 | ) | | | — | | | | (0.02 | ) |
Year ended 9/30/1311 | | $ | 10.00 | | | | (— | )4 | | | (0.39 | ) | | | (0.39 | ) | | | — | 4 | | | — | | | | — | | | | — | |
Emerging Markets Small Cap Fund — Investor Class | | | | | | | | | | | | | | | | | | | | | | | | | |
Year ended 9/30/17 | | $ | 2.67 | | | | (0.04 | ) | | | 0.36 | | | | 0.32 | | | | — | 4 | | | — | | | | — | | | | — | |
Year ended 9/30/1619 | | $ | 2.39 | | | | (0.04 | ) | | | 0.32 | | | | 0.28 | | | | — | 4 | | | — | 4 | | | — | | | | — | 4 |
Year ended 9/30/15 | | $ | 2.74 | | | | (0.03 | ) | | | (0.32 | ) | | | (0.35 | ) | | | — | 4 | | | — | 4 | | | — | | | | — | 4 |
Year ended 9/30/14 | | $ | 2.67 | | | | (0.01 | ) | | | 0.14 | | | | 0.13 | | | | — | 4 | | | — | | | | (0.06 | ) | | | (0.06 | ) |
Year ended 9/30/13 | | $ | 2.66 | | | | 0.01 | | | | 0.01 | | | | 0.02 | | | | — | 4 | | | (0.01 | ) | | | — | | | | (0.01 | ) |
Emerging Markets Small Cap Fund — Institutional Class | | | | | | | | | | | | | | | | | | | | | | | | | |
Year ended 9/30/17 | | $ | 2.67 | | | | 0.01 | | | | 0.32 | | | | 0.33 | | | | — | 4 | | | — | | | | — | | | | — | |
Period ended 9/30/1617 19 | | $ | 2.31 | | | | (— | )4 | | | 0.36 | | | | 0.36 | | | | — | | | | — | | | | — | | | | — | |
Frontier Emerging Small Countries Fund — Investor Class | | | | | | | | | | | | | | | | | | | | | | | | | |
Year ended 9/30/17 | | $ | 2.63 | | | | (0.08 | ) | | | 0.20 | | | | 0.12 | | | | — | 4 | | | — | | | | — | | | | — | |
Year ended 9/30/1619 | | $ | 2.77 | | | | 0.02 | | | | (0.16 | ) | | | (0.14 | ) | | | — | 4 | | | — | 4 | | | — | | | | — | 4 |
Year ended 9/30/15 | | $ | 3.32 | | | | 0.02 | | | | (0.50 | ) | | | (0.48 | ) | | | — | 4 | | | (0.02 | ) | | | (0.05 | ) | | | (0.07 | ) |
Year ended 9/30/14 | | $ | 2.97 | | | | 0.03 | | | | 0.33 | | | | 0.36 | | | | — | 4 | | | (0.01 | ) | | | — | | | | (0.01 | ) |
Year ended 9/30/13 | | $ | 2.41 | | | | 0.01 | | | | 0.55 | | | | 0.56 | | | | — | 4 | | | — | 4 | | | — | 4 | | | — | 4 |
Frontier Emerging Small Countries Fund — Institutional Class | | | | | | | | | | | | | | | | | | | | | |
Year ended 9/30/17 | | $ | 2.64 | | | | (0.06 | ) | | | 0.18 | | | | 0.12 | | | | — | 4 | | | — | | | | — | | | | — | |
Period ended 9/30/1617 19 | | $ | 2.58 | | | | 0.02 | | | | 0.04 | | | | 0.06 | | | | — | 4 | | | — | | | | — | | | | — | |
Global Opportunities Fund — Investor Class | | | | | | | | | | | | | | | | | | | | | |
Year ended 9/30/17 | | $ | 3.52 | | | | (0.07 | ) | | | 0.58 | | | | 0.51 | | | | — | 4 | | | — | 4 | | | (0.27 | ) | | | (0.27 | ) |
Year ended 9/30/1619 | | $ | 3.51 | | | | (0.04 | ) | | | 0.51 | | | | 0.47 | | | | — | 4 | | | (0.01 | ) | | | (0.45 | ) | | | (0.46 | ) |
Year ended 9/30/15 | | $ | 4.28 | | | | (0.05 | ) | | | (0.08 | ) | | | (0.13 | ) | | | — | 4 | | | (0.01 | ) | | | (0.63 | ) | | | (0.64 | ) |
Year ended 9/30/14 | | $ | 4.58 | | | | (0.05 | ) | | | 0.23 | | | | 0.18 | | | | — | 4 | | | — | 4 | | | (0.48 | ) | | | (0.48 | ) |
Year ended 9/30/13 | | $ | 4.15 | | | | (0.02 | ) | | | 0.93 | | | | 0.91 | | | | — | 4 | | | — | | | | (0.48 | ) | | | (0.48 | ) |
Global Opportunities Fund — Institutional Class | | | | | | | | | | | | | | | | | | | | | |
Year ended 9/30/17 | | $ | 3.52 | | | | (0.02 | ) | | | 0.54 | | | | 0.52 | | | | — | | | | (0.01 | ) | | | (0.27 | ) | | | (0.28 | ) |
Period ended 9/30/1617 19 | | $ | 3.09 | | | | (— | )4 | | | 0.43 | | | | 0.43 | | | | — | | | | — | | | | — | | | | — | |
See Notes to Financial Highlights and Notes to Financial Statements.
108
| | |
| | (for a share outstanding throughout each period) |
|
|
|
| | | | | | | | | | | | | | | | | | | | | | | | | | | | | | |
| | | | | | |
Ratios to Average Net Assets | | | Supplemental Data | |
Net Asset
Value
End of
Period | | | Total Return (%)1 | | | Expenses
Net of
Waivers and
Reimbursements (%)2 | | | Expenses
Before
Waivers and
Reimbursements (%)2 | | | Net Investment
Income Net of
Waivers and
Reimbursements (%)2 | | | Net Investment
Income Before
Waivers and
Reimbursements (%)2 | | | Net Assets
End of
Period
(000s) | | | Portfolio
Turnover
Rate1 3 | |
| | | | | | | | | | | | | | | | | | | | | | | | | | | | | | |
| $ | 67.44 | | | | 18.69 | | | | 1.21 | 5 | | | 1.21 | 5 | | | (0.78 | ) | | | (0.78 | ) | | $ | 1,211,089 | | | | 26% | |
| $ | 56.90 | | | | 10.69 | | | | 1.21 | 5 | | | 1.21 | 5 | | | (0.62 | ) | | | (0.62 | ) | | $ | 1,082,679 | | | | 18% | |
| $ | 57.83 | | | | 10.87 | | | | 1.17 | 5 | | | 1.17 | 5 | | | (0.29 | )12 | | | (0.29 | )12 | | $ | 1,014,515 | | | | 39% | |
| $ | 53.46 | | | | 3.26 | | | | 1.18 | 5 | | | 1.18 | 5 | | | (0.64 | ) | | | (0.64 | ) | | $ | 859,086 | | | | 26% | |
| $ | 52.49 | | | | 26.76 | | | | 1.21 | 5 | | | 1.21 | 5 | | | (0.39 | ) | | | (0.39 | ) | | $ | 924,304 | | | | 16% | |
| | | | | | | | | | | | | | | | | | | | | | | | | | | | | | |
| $ | 67.81 | | | | 18.87 | | | | 1.05 | 5 | | | 1.10 | 5 | | | (0.63 | ) | | | (0.67 | ) | | $ | 383,159 | | | | 26% | |
| $ | 57.16 | | | | 10.83 | | | | 1.07 | 5 | | | 1.09 | 5 | | | (0.48 | ) | | | (0.50 | ) | | $ | 251,181 | | | | 18% | |
| $ | 57.99 | | | | 10.94 | | | | 1.12 | 5 | | | 1.13 | 5 | | | (0.29 | )12 | | | (0.30 | )12 | | $ | 150,614 | | | | 39% | |
| $ | 53.58 | | | | 3.31 | | | | 1.13 | 5 | | | 1.19 | 5 | | | (0.59 | ) | | | (0.65 | )5 | | $ | 49,369 | | | | 26% | |
| $ | 52.57 | | | | 26.86 | | | | 1.12 | 5 | | | 1.32 | 5 | | | (0.32 | ) | | | (0.52 | )5 | | $ | 19,971 | | | | 16% | |
| | | | | | | | | | | | | | | | | | | | | | | | | | | | | | |
| $ | 4.08 | | | | 21.65 | | | | 1.73 | 5 | | | 1.73 | 5 | | | (0.92 | ) | | | (0.92 | ) | | $ | 207,949 | | | | 17% | |
| $ | 3.39 | | | | 11.98 | | | | 1.82 | 5 | | | 1.96 | 5 | | | (1.18 | ) | | | (1.32 | ) | | $ | 71,973 | | | | 42% | |
| $ | 3.07 | | | | 12.51 | | | | 1.95 | 5 | | | 2.12 | 5 | | | (1.38 | ) | | | (1.55 | ) | | $ | 63,850 | | | | 36% | |
| $ | 2.73 | | | | 53.37 | | | | 1.96 | 5 | | | 2.58 | 5 | | | (0.76 | ) | | | (1.38 | ) | | $ | 44,150 | | | | 13% | |
| $ | 1.78 | | | | (11.88 | ) | | | 1.95 | 5 | | | 2.99 | 5 | | | (0.99 | ) | | | (2.03 | ) | | $ | 15,938 | | | | 40% | |
| | | | | | | | | | | | | | | | | | | | | | | | | | | | | | |
| $ | 4.10 | | | | 21.89 | | | | 1.50 | 5 | | | 1.67 | 5 | | | (0.77 | ) | | | (0.94 | ) | | $ | 23,739 | | | | 17% | |
| $ | 3.40 | | | | 20.57 | | | | 1.50 | 5 | | | 2.00 | 5 | | | (0.70 | ) | | | (1.20 | ) | | $ | 9,799 | | | | 42% | |
| | | | | | | | | | | | | | | | | | | | | | | | | | | | | | |
| $ | 10.46 | | | | 13.33 | | | | 1.51 | 6 | | | 1.90 | 6 | | | (0.38 | ) | | | (0.76 | ) | | $ | 15,273 | | | | 55% | |
| $ | 9.23 | | | | 10.54 | | | | 1.58 | 6 | | | 1.98 | 6 | | | (0.15 | ) | | | (0.55 | ) | | $ | 11,892 | | | | 62% | |
| $ | 8.35 | | | | (18.81 | ) | | | 1.70 | 6 | | | 2.00 | 6 | | | (0.23 | ) | | | (0.53 | ) | | $ | 18,527 | | | | 46% | |
| $ | 10.31 | | | | 7.92 | | | | 1.69 | 5 | | | 1.88 | 5 | | | (0.09 | ) | | | (0.28 | ) | | $ | 26,502 | | | | 59% | |
| $ | 9.56 | | | | (4.40 | ) | | | 1.69 | 5 | | | 2.40 | 5 | | | 0.04 | | | | (0.67 | ) | | $ | 29,374 | | | | 43% | |
| | | | | | | | | | | | | | | | | | | | | | | | | | | | | | |
| $ | 10.60 | | | | 13.73 | | | | 1.21 | 6 | | | 1.52 | 6 | | | (0.09 | ) | | | (0.39 | ) | | $ | 28,868 | | | | 55% | |
| $ | 9.32 | | | | 10.82 | | | | 1.29 | 6 | | | 1.59 | 6 | | | 0.29 | | | | (0.01 | ) | | $ | 26,763 | | | | 62% | |
| $ | 8.41 | | | | (18.67 | ) | | | 1.51 | 6 | | | 1.77 | 6 | | | (0.06 | ) | | | (0.32 | ) | | $ | 19,270 | | | | 46% | |
| $ | 10.37 | | | | 8.13 | | | | 1.51 | 5 | | | 1.71 | 5 | | | 0.05 | | | | (0.15 | ) | | $ | 32,306 | | | | 59% | |
| $ | 9.61 | | | | (3.90 | ) | | | 1.50 | 5 | | | 2.21 | 5 | | | (0.18 | ) | | | (0.89 | ) | | $ | 28,861 | | | | 43% | |
| | | | | | | | | | | | | | | | | | | | | | | | | | | | | | |
| $ | 2.99 | | | | 11.99 | | | | 1.96 | 6 | | | 2.02 | 6 | | | (0.49 | ) | | | (0.56 | ) | | $ | 390,903 | | | | 58% | |
| $ | 2.67 | | | | 11.73 | | | | 1.96 | 6 | | | 2.00 | 6 | | | (0.75 | ) | | | (0.79 | ) | | $ | 674,632 | | | | 42% | |
| $ | 2.39 | | | | (12.65 | ) | | | 1.95 | 5 | | | 2.01 | 5 | | | (0.63 | ) | | | (0.69 | ) | | $ | 981,367 | | | | 59% | |
| $ | 2.74 | | | | 4.90 | | | | 1.95 | 5 | | | 2.02 | 5 | | | (0.28 | ) | | | (0.35 | ) | | $ | 1,457,882 | | | | 55% | |
| $ | 2.67 | | | | 0.85 | | | | 1.95 | 5 | | | 2.06 | 5 | | | 0.21 | | | | 0.09 | | | $ | 1,785,681 | | | | 41% | |
| | | | | | | | | | | | | | | | | | | | | | | | | | | | | | |
| $ | 3.00 | | | | 12.36 | | | | 1.81 | 6 | | | 1.88 | 6 | | | (0.05 | ) | | | (0.12 | ) | | $ | 252,823 | | | | 58% | |
| $ | 2.67 | | | | 15.58 | | | | 1.80 | 6 | | | 1.81 | 6 | | | (0.03 | ) | | | (0.04 | ) | | $ | 160,729 | | | | 42% | |
| | | | | | | | | | | | | | | | | | | | | | | | | | | | | | |
| $ | 2.75 | | | | 4.56 | | | | 2.28 | 6 | | | 2.46 | 6 | | | (0.48 | ) | | | (0.67 | ) | | $ | 155,758 | | | | 59% | |
| $ | 2.63 | | | | (4.89 | ) | | | 2.25 | 5 | | | 2.39 | 5 | | | 0.35 | | | | 0.21 | | | $ | 437,850 | | | | 80% | |
| $ | 2.77 | | | | (14.88 | ) | | | 2.25 | 5 | | | 2.28 | 5 | | | 0.39 | | | | 0.36 | | | $ | 1,027,673 | | | | 34% | |
| $ | 3.32 | | | | 11.97 | | | | 2.24 | 5 | | | 2.24 | 5 | | | 0.79 | | | | 0.79 | | | $ | 1,324,694 | | | | 22% | |
| $ | 2.97 | | | | 22.88 | | | | 2.25 | 5 | | | 2.43 | 5 | | | 0.81 | | | | 0.63 | | | $ | 730,694 | | | | 13% | |
| | | | | | | | | | | | | | | | | | | | | | | | | | | | | | |
| $ | 2.76 | | | | 4.55 | | | | 2.08 | 6 | | | 2.17 | 6 | | | (0.34 | ) | | | (0.44 | ) | | $ | 42,006 | | | | 59% | |
| $ | 2.64 | | | | 2.33 | | | | 2.06 | 6 | | | 2.06 | 6 | | | 1.40 | | | | 1.40 | | | $ | 139,699 | | | | 80% | |
| | | | | | | | | | | | | | | | | | | | | | | | | | | | | | |
| $ | 3.76 | | | | 16.61 | | | | 1.59 | 6 | | | 1.59 | 6 | | | (1.09 | ) | | | (1.09 | ) | | $ | 95,847 | | | | 27% | |
| $ | 3.52 | | | | 13.73 | | | | 1.62 | 6 | | | 1.62 | 6 | | | (0.98 | ) | | | (0.98 | ) | | $ | 150,945 | | | | 44% | |
| $ | 3.51 | | | | (3.88 | ) | | | 1.81 | 5 | | | 1.81 | 5 | | | (1.10 | ) | | | (1.10 | ) | | $ | 155,968 | | | | 54% | |
| $ | 4.28 | | | | 3.94 | | | | 1.78 | 5 | | | 1.78 | 5 | | | (0.83 | ) | | | (0.83 | ) | | $ | 192,664 | | | | 42% | |
| $ | 4.58 | | | | 24.23 | | | | 1.80 | 5 | | | 1.80 | 5 | | | (0.70 | ) | | | (0.70 | ) | | $ | 220,460 | | | | 43% | |
| | | | | | | | | | | | | | | | | | | | | | | | | | | | | | |
| $ | 3.76 | | | | 16.92 | | | | 1.36 | 6 | | | 1.93 | 6 | | | (0.85 | ) | | | (1.41 | ) | | $ | 7,149 | | | | 27% | |
| $ | 3.52 | | | | 13.92 | | | | 1.35 | 5 | | | 2.32 | 5 | | | (0.57 | ) | | | (1.54 | ) | | $ | 5,348 | | | | 44% | |
109
Financial Highlights (continued)
| | | | | | | | | | | | | | | | | | | | | | | | | | | | | | | | |
| | | | | | Income (Loss) from
Investment Operations | | | | | | | | | Less Distributions | | | | |
| | | Net Asset
Value
Beginning
of Period | | | Net
Investment
Income (Loss) | | | Net Realized
and Unrealized
Gains (Losses)
on Investments | | | Total from
Investment
Operations | | | Redemption
Fees
(See Note 2) | | | Dividends
from Net
Investment
Income | | | Distributions
from Net
Realized
Gains | | | Total
Distributions | |
International Growth Fund — Investor Class | | | | | | | | | | | | | | | | | | | | | | | | | |
Year ended 9/30/17 | | $ | 31.43 | | | | (0.13 | ) | | | 3.61 | | | | 3.48 | | | | — | 4 | | | — | | | | (1.07 | ) | | | (1.07 | ) |
Year ended 9/30/1619 | | $ | 27.88 | | | | (0.22 | ) | | | 3.77 | | | | 3.55 | | | | — | 4 | | | — | | | | — | | | | — | |
Year ended 9/30/15 | | $ | 26.78 | | | | (0.09 | ) | | | 1.39 | | | | 1.30 | | | | — | 4 | | | (0.01 | ) | | | (0.19 | ) | | | (0.20 | ) |
Year ended 9/30/14 | | $ | 28.76 | | | | (0.02 | ) | | | (1.24 | ) | | | (1.26 | ) | | | — | 4 | | | — | | | | (0.72 | ) | | | (0.72 | ) |
Year ended 9/30/13 | | $ | 22.44 | | | | 0.07 | | | | 6.32 | | | | 6.39 | | | | 0.01 | | | | (0.08 | ) | | | — | | | | (0.08 | ) |
International Growth Fund — Institutional Class | | | | | | | | | | | | | | | | | | | | | | | | | |
Year ended 9/30/17 | | $ | 31.46 | | | | (0.05 | ) | | | 3.56 | | | | 3.51 | | | | — | 4 | | | (0.02 | ) | | | (1.07 | ) | | | (1.09 | ) |
Period ended 9/30/1617 19 | | $ | 28.46 | | | | 0.01 | | | | 2.99 | | | | 3.00 | | | | — | 4 | | | — | | | | — | | | | — | |
International Opportunities Fund — Investor Class | | | | | | | | | | | | | | | | | | | | | | | | | |
Year ended 9/30/17 | | $ | 3.21 | | | | (0.04 | ) | | | 0.30 | | | | 0.26 | | | | — | 4 | | | — | | | | — | | | | — | |
Year ended 9/30/1619 | | $ | 2.74 | | | | (0.01 | ) | | | 0.61 | | | | 0.60 | | | | — | 4 | | | — | | | | (0.13 | ) | | | (0.13 | ) |
Year ended 9/30/15 | | $ | 3.09 | | | | (0.01 | ) | | | (0.04 | ) | | | (0.05 | ) | | | — | 4 | | | — | | | | (0.30 | ) | | | (0.30 | ) |
Year ended 9/30/14 | | $ | 2.94 | | | | (0.01 | ) | | | 0.33 | | | | 0.32 | | | | — | 4 | | | — | | | | (0.17 | ) | | | (0.17 | ) |
Year ended 9/30/13 | | $ | 2.41 | | | | (— | )4 | | | 0.53 | | | | 0.53 | | | | — | 4 | | | — | | | | — | | | | — | |
International Opportunities Fund — Institutional Class | | | | | | | | | | | | | | | | | | | | | | | | | |
Year ended 9/30/17 | | $ | 3.23 | | | | (0.01 | ) | | | 0.28 | | | | 0.27 | | | | — | 4 | | | — | | | | — | | | | — | |
Period ended 9/30/1617 19 | | $ | 2.71 | | | | 0.01 | | | | 0.51 | | | | 0.52 | | | | — | 4 | | | — | | | | — | | | | — | |
Large Cap Value Fund — Investor Class | | | | | | | | | | | | | | | | | | | | | | | | | |
Year ended 9/30/17 | | $ | 9.02 | | | | 0.19 | | | | 1.23 | | | | 1.42 | | | | — | 4 | | | (0.19 | ) | | | (0.32 | ) | | | (0.51 | ) |
Year ended 9/30/1619 | | $ | 8.84 | | | | 0.16 | | | | 1.01 | | | | 1.17 | | | | — | 4 | | | (0.16 | ) | | | (0.83 | ) | | | (0.99 | ) |
Year ended 9/30/15 | | $ | 12.69 | | | | 0.15 | | | | (0.69 | ) | | | (0.54 | ) | | | — | 4 | | | (0.16 | ) | | | (3.15 | ) | | | (3.31 | ) |
Year ended 9/30/14 | | $ | 16.57 | | | | 0.21 | | | | 1.49 | | | | 1.70 | | | | — | 4 | | | (0.22 | ) | | | (5.36 | ) | | | (5.58 | ) |
Year ended 9/30/13 | | $ | 14.31 | | | | 0.22 | | | | 2.37 | | | | 2.59 | | | | — | 4 | | | (0.20 | ) | | | (0.13 | ) | | | (0.33 | ) |
Large Cap Value Fund — Institutional Class | | | | | | | | | | | | | | | | | | | | | | | | | |
Year ended 9/30/17 | | $ | 9.01 | | | | 0.18 | | | | 1.25 | | | | 1.43 | | | | — | 4 | | | (0.20 | ) | | | (0.32 | ) | | | (0.52 | ) |
Year ended 9/30/1619 | | $ | 8.84 | | | | 0.29 | | | | 0.88 | | | | 1.17 | | | | — | 4 | | | (0.17 | ) | | | (0.83 | ) | | | (1.00 | ) |
Year ended 9/30/15 | | $ | 12.69 | | | | (0.04 | ) | | | (0.49 | ) | | | (0.53 | ) | | | — | 4 | | | (0.17 | ) | | | (3.15 | ) | | | (3.32 | ) |
Year ended 9/30/14 | | $ | 16.57 | | | | 0.20 | | | | 1.52 | | | | 1.72 | | | | — | 4 | | | (0.24 | ) | | | (5.36 | ) | | | (5.60 | ) |
Year ended 9/30/13 | | $ | 14.31 | | | | 0.22 | | | | 2.39 | | | | 2.61 | | | | — | 4 | | | (0.22 | ) | | | (0.13 | ) | | | (0.35 | ) |
Long/Short Fund — Investor Class | | | | | | | | | | | | | | | | | | | | | | | | | |
Year ended 9/30/17 | | $ | 12.63 | | | | (0.14 | ) | | | 0.09 | | | | (0.05 | ) | | | — | 4 | | | — | | | | — | 4 | | | — | 4 |
Year ended 9/30/1619 | | $ | 12.36 | | | | (0.08 | ) | | | 1.60 | | | | 1.52 | | | | — | 4 | | | (0.01 | ) | | | (1.24 | ) | | | (1.25 | ) |
Year ended 9/30/15 | | $ | 16.29 | | | | 0.02 | | | | (3.00 | ) | | | (2.98 | ) | | | — | 4 | | | (0.14 | ) | | | (0.81 | ) | | | (0.95 | ) |
Year ended 9/30/14 | | $ | 15.82 | | | | 0.17 | | | | 0.65 | | | | 0.82 | | | | — | 4 | | | — | | | | (0.35 | ) | | | (0.35 | ) |
Year ended 9/30/13 | | $ | 13.66 | | | | (0.04 | ) | | | 2.23 | | | | 2.19 | | | | — | 4 | | | — | | | | (0.03 | ) | | | (0.03 | ) |
Long/Short Fund — Institutional Class | | | | | | | | | | | | | | | | | | | | | | | | | |
Year ended 9/30/17 | | $ | 12.67 | | | | (0.12 | ) | | | 0.10 | | | | (0.02 | ) | | | 0.01 | | | | — | | | | — | 4 | | | — | 4 |
Year ended 9/30/1619 | | $ | 12.38 | | | | 0.21 | | | | 1.33 | | | | 1.54 | | | | 0.02 | | | | (0.03 | ) | | | (1.24 | ) | | | (1.27 | ) |
Year ended 9/30/15 | | $ | 16.32 | | | | 0.06 | | | | (3.02 | ) | | | (2.96 | ) | | | — | 4 | | | (0.17 | ) | | | (0.81 | ) | | | (0.98 | ) |
Year ended 9/30/14 | | $ | 15.83 | | | | 0.18 | | | | 0.66 | | | | 0.84 | | | | — | 4 | | | — | | | | (0.35 | ) | | | (0.35 | ) |
Period ended 9/30/1311 | | $ | 13.80 | | | | (0.01 | ) | | | 2.07 | | | | 2.06 | | | | — | 4 | | | — | | | | (0.03 | ) | | | (0.03 | ) |
Micro Cap Fund | | | | | | | | | | | | | | | | | | | | | | | | | |
Year ended 9/30/17 | | $ | 7.19 | | | | (0.11 | ) | | | 1.75 | | | | 1.64 | | | | — | 4 | | | (0.01 | ) | | | (0.59 | ) | | | (0.60 | ) |
Year ended 9/30/1619 | | $ | 7.21 | | | | (0.08 | ) | | | 1.15 | | | | 1.07 | | | | — | 4 | | | — | | | | (1.09 | ) | | | (1.09 | ) |
Year ended 9/30/15 | | $ | 7.36 | | | | (0.08 | )13 | | | 0.28 | | | | 0.20 | | | | — | 4 | | | — | 4 | | | (0.35 | ) | | | (0.35 | ) |
Year ended 9/30/14 | | $ | 7.42 | | | | (0.14 | ) | | | 0.08 | | | | (0.06 | ) | | | — | 4 | | | — | | | | — | | | | — | |
Year ended 9/30/13 | | $ | 5.71 | | | | (0.10 | ) | | | 1.81 | | | | 1.71 | | | | — | 4 | | | — | | | | — | | | | — | |
Micro Cap Value Fund | | | | | | | | | | | | | | | | | | | | | | | | | |
Year ended 9/30/17 | | $ | 2.87 | | | | (0.02 | ) | | | 0.68 | | | | 0.66 | | | | — | 4 | | | — | 4 | | | (0.05 | ) | | | (0.05 | ) |
Year ended 9/30/1619 | | $ | 2.87 | | | | (0.02 | ) | | | 0.34 | | | | 0.32 | | | | — | 4 | | | — | | | | (0.32 | ) | | | (0.32 | ) |
Year ended 9/30/15 | | $ | 3.02 | | | | (0.02 | )14 | | | 0.31 | | | | 0.29 | | | | — | 4 | | | — | | | | (0.44 | ) | | | (0.44 | ) |
Year ended 9/30/14 | | $ | 3.45 | | | | (0.04 | ) | | | 0.18 | | | | 0.14 | | | | — | 4 | | | — | | | | (0.57 | ) | | | (0.57 | ) |
Year ended 9/30/13 | | $ | 2.85 | | | | (0.03 | ) | | | 0.91 | | | | 0.88 | | | | — | 4 | | | — | | | | (0.28 | ) | | | (0.28 | ) |
See Notes to Financial Highlights and Notes to Financial Statements.
110
| | |
| | (for a share outstanding throughout each period) |
|
|
|
| | | | | | | | | | | | | | | | | | | | | | | | | | | | | | |
| | | | | | |
Ratios to Average Net Assets | | | Supplemental Data | |
Net Asset
Value
End of
Period | | | Total Return (%)1 | | | Expenses
Net of
Waivers and
Reimbursements (%)2 | | | Expenses
Before
Waivers and
Reimbursements (%)2 | | | Net Investment
Income Net of
Waivers and
Reimbursements (%)2 | | | Net Investment
Income Before
Waivers and
Reimbursements (%)2 | | | Net Assets
End of
Period
(000s) | | | Portfolio
Turnover
Rate1 3 | |
| | | | | | | | | | | | | | | | | | | | | | | | | | | | | | |
| $ | 33.84 | | | | 12.04 | | | | 1.46 | 5 | | | 1.46 | 5 | | | (0.28 | ) | | | (0.28 | ) | | $ | 804,613 | | | | 31% | |
| $ | 31.43 | | | | 12.73 | | | | 1.48 | 5 | | | 1.48 | 5 | | | (0.41 | ) | | | (0.41 | ) | | $ | 945,168 | | | | 50% | |
| $ | 27.88 | | | | 4.83 | | | | 1.50 | 5 | | | 1.50 | 5 | | | (0.32 | ) | | | (0.32 | ) | | $ | 1,316,095 | | | | 46% | |
| $ | 26.78 | | | | (4.53 | ) | | | 1.46 | 5 | | | 1.46 | 5 | | | (0.06 | ) | | | (0.06 | ) | | $ | 1,421,086 | | | | 42% | |
| $ | 28.76 | | | | 28.63 | | | | 1.49 | 5 | | | 1.49 | 5 | | | 0.25 | | | | 0.25 | | | $ | 1,326,931 | | | | 44% | |
| | | | | | | | | | | | | | | | | | | | | | | | | | | | | | |
| $ | 33.88 | | | | 12.16 | | | | 1.35 | 5 | | | 1.37 | 5 | | | (0.14 | ) | | | (0.16 | ) | | $ | 656,860 | | | | 31% | |
| $ | 31.46 | | | | 10.54 | | | | 1.35 | 5 | | | 1.36 | 5 | | | 0.07 | | | | 0.06 | | | $ | 509,016 | | | | 50% | |
| | | | | | | | | | | | | | | | | | | | | | | | | | | | | | |
| $ | 3.47 | | | | 8.10 | | | | 2.24 | 6 | | | 2.24 | 6 | | | (0.88 | ) | | | (0.88 | ) | | $ | 265,879 | | | | 59% | |
| $ | 3.21 | | | | 22.73 | | | | 2.25 | 5 | | | 2.29 | 5 | | | (0.35 | ) | | | (0.39 | ) | | $ | 512,252 | | | | 41% | |
| $ | 2.74 | | | | (1.44 | ) | | | 2.25 | 5 | | | 2.43 | 5 | | | (0.36 | ) | | | (0.54 | ) | | $ | 453,495 | | | | 25% | |
| $ | 3.09 | | | | 11.53 | | | | 2.25 | 5 | | | 2.41 | 5 | | | (0.40 | ) | | | (0.56 | ) | | $ | 339,659 | | | | 38% | |
| $ | 2.94 | | | | 21.99 | | | | 2.25 | 5 | | | 2.42 | 5 | | | (0.03 | ) | | | (0.20 | ) | | $ | 278,216 | | | | 49% | |
| | | | | | | | | | | | | | | | | | | | | | | | | | | | | | |
| $ | 3.50 | | | | 8.36 | | | | 1.96 | 6 | | | 2.04 | 6 | | | (0.39 | ) | | | (0.47 | ) | | $ | 234,795 | | | | 59% | |
| $ | 3.23 | | | | 19.19 | | | | 1.95 | 5 | | | 2.04 | 5 | | | 0.64 | | | | 0.55 | | | $ | 168,136 | | | | 41% | |
| | | | | | | | | | | | | | | | | | | | | | | | | | | | | | |
| $ | 9.93 | | | | 16.11 | | | | 1.10 | 5 | | | 1.19 | 5 | | | 1.93 | | | | 1.84 | | | $ | 175,730 | | | | 44% | |
| $ | 9.02 | | | | 13.92 | | | | 1.10 | 5 | | | 1.17 | 5 | | | 1.70 | | | | 1.63 | | | $ | 189,691 | | | | 26% | |
| $ | 8.84 | | | | (6.61 | ) | | | 1.10 | 5 | | | 1.12 | 5 | | | 1.34 | | | | 1.32 | | | $ | 244,056 | | | | 39% | |
| $ | 12.69 | | | | 11.78 | | | | 1.11 | 5 8 | | | 1.12 | 5 8 | | | 1.38 | | | | 1.37 | | | $ | 409,169 | | | | 53% | |
| $ | 16.57 | | | | 18.40 | | | | 1.10 | 5 | | | 1.16 | 5 | | | 1.27 | | | | 1.21 | | | $ | 786,910 | | | | 47% | |
| | | | | | | | | | | | | | | | | | | | | | | | | | | | | | |
| $ | 9.92 | | | | 16.31 | | | | 0.95 | 5 | | | 2.31 | 5 | | | 2.05 | | | | 0.70 | | | $ | 4,594 | | | | 44% | |
| $ | 9.01 | | | | 13.97 | | | | 0.96 | 5 | | | 1.72 | 5 | | | 1.76 | | | | 1.00 | | | $ | 3,589 | | | | 26% | |
| $ | 8.84 | | | | (6.50 | ) | | | 0.98 | 5 | | | 1.44 | 5 | | | 1.40 | | | | 0.94 | | | $ | 1,525 | | | | 39% | |
| $ | 12.69 | | | | 11.95 | | | | 0.98 | 5 | | | 1.25 | 5 | | | 1.52 | | | | 1.25 | | | $ | 8,068 | | | | 53% | |
| $ | 16.57 | | | | 18.54 | | | | 0.98 | 5 | | | 1.35 | 5 | | | 1.37 | | | | 1.00 | | | $ | 15,444 | | | | 47% | |
| | | | | | | | | | | | | | | | | | | | | | | | | | | | | | |
| $ | 12.58 | | | | (0.37 | ) | | | 2.31 | 6 7 | | | 2.31 | 6 7 | | | (0.71 | ) | | | (0.71 | ) | | $ | 79,841 | | | | 40% | |
| $ | 12.63 | | | | 13.38 | | | | 1.83 | 6 7 | | | 1.83 | 6 7 | | | (0.06 | ) | | | (0.06 | ) | | $ | 184,158 | | | | 47% | |
| $ | 12.36 | | | | (19.33 | ) | | | 1.61 | 7 | | | 1.61 | 7 | | | 0.12 | | | | 0.12 | | | $ | 616,192 | | | | 44% | |
| $ | 16.29 | | | | 5.21 | | | | 1.53 | 7 9 | | | 1.53 | 7 9 | | | 1.05 | | | | 1.05 | | | $ | 1,696,707 | | | | 47% | |
| $ | 15.82 | | | | 16.09 | | | | 1.51 | 7 | | | 1.51 | 7 | | | (0.22 | ) | | | (0.22 | ) | | $ | 1,479,371 | | | | 47% | |
| | | | | | | | | | | | | | | | | | | | | | | | | | | | | | |
| $ | 12.66 | | | | (0.05 | ) | | | 2.03 | 6 7 | | | 2.15 | 6 7 | | | (0.44 | ) | | | (0.55 | ) | | $ | 26,078 | | | | 40% | |
| $ | 12.67 | | | | 13.71 | | | | 1.52 | 6 7 | | | 1.57 | 6 7 | | | 0.18 | | | | 0.13 | | | $ | 64,009 | | | | 47% | |
| $ | 12.38 | | | | (19.19 | ) | | | 1.47 | 7 | | | 1.47 | 7 | | | 0.25 | | | | 0.25 | | | $ | 408,792 | | | | 44% | |
| $ | 16.32 | | | | 5.33 | | | | 1.42 | 7 | | | 1.42 | 7 | | | 1.18 | | | | 1.18 | | | $ | 1,022,568 | | | | 47% | |
| $ | 15.83 | | | | 14.99 | | | | 1.39 | 7 | | | 1.40 | 7 | | | (0.16 | ) | | | (0.17 | ) | | $ | 824,780 | | | | 47% | |
| | | | | | | | | | | | | | | | | | | | | | | | | | | | | | |
| $ | 8.23 | | | | 25.10 | | | | 1.75 | 5 | | | 1.75 | 5 | | | (1.43 | ) | | | (1.43 | ) | | $ | 311,583 | | | | 31% | |
| $ | 7.19 | | | | 16.04 | | | | 1.92 | 5 | | | 1.92 | 5 | | | (1.14 | ) | | | (1.14 | ) | | $ | 277,691 | | | | 32% | |
| $ | 7.21 | | | | 2.45 | | | | 1.90 | 5 | | | 1.90 | 5 | | | (0.85 | )13 | | | (0.85 | )13 | | $ | 273,311 | | | | 31% | |
| $ | 7.36 | | | | (0.81 | ) | | | 1.97 | | | | 1.97 | | | | (1.67 | ) | | | (1.67 | ) | | $ | 293,815 | | | | 26% | |
| $ | 7.42 | | | | 29.95 | | | | 2.13 | 5 | | | 2.13 | 5 | | | (1.28 | ) | | | (1.28 | ) | | $ | 323,175 | | | | 17% | |
| | | | | | | | | | | | | | | | | | | | | | | | | | | | | | |
| $ | 3.48 | | | | 23.29 | | | | 1.85 | 5 | | | 1.85 | 5 | | | (0.81 | ) | | | (0.81 | ) | | $ | 216,087 | | | | 57% | |
| $ | 2.87 | | | | 12.04 | | | | 1.95 | 5 | | | 2.04 | 5 | | | (0.59 | ) | | | (0.68 | ) | | $ | 179,116 | | | | 73% | |
| $ | 2.87 | | | | 9.99 | | | | 1.96 | 6 | | | 2.02 | 6 | | | (0.55 | )14 | | | (0.61 | )14 | | $ | 154,169 | | | | 53% | |
| $ | 3.02 | | | | 3.26 | | | | 2.03 | 5 | | | 2.09 | 5 | | | (1.31 | ) | | | (1.37 | ) | | $ | 158,800 | | | | 71% | |
| $ | 3.45 | | | | 33.92 | | | | 2.25 | 5 | | | 2.25 | 5 | | | (0.92 | ) | | | (0.92 | ) | | $ | 166,487 | | | | 66% | |
111
Financial Highlights (continued)
| | | | | | | | | | | | | | | | | | | | | | | | | | | | | | | | | | | | |
| | | | | | Income (Loss) from
Investment Operations | | | | | | | | | Less Distributions | | | | |
| | | Net Asset
Value
Beginning
of Period | | | Net
Investment
Income (Loss) | | | Net Realized
and Unrealized
Gains (Losses)
on Investments | | | Total from
Investment
Operations | | | Redemption
Fees
(See Note 2) | | | Dividends
from Net
Investment
Income | | | Distributions
from Net
Realized
Gains | | | Return of
Capital
Distribution | | | Total
Distributions | |
Small Cap Growth Fund — Investor Class | | | | | | | | | | | | | | | | | | | | | | | | | |
Year ended 9/30/17 | | $ | 43.52 | | | | (0.53 | ) | | | 6.24 | | | | 5.71 | | | | — | 4 | | | — | | | | (3.51 | ) | | | — | | | | (3.51 | ) |
Year ended 9/30/1619 | | $ | 45.97 | | | | (0.47 | ) | | | 5.65 | | | | 5.18 | | | | — | 4 | | | — | | | | (7.63 | ) | | | — | | | | (7.63 | ) |
Year ended 9/30/15 | | $ | 50.25 | | | | (0.40 | ) | | | 0.93 | | | | 0.53 | | | | — | 4 | | | — | | | | (4.81 | ) | | | — | | | | (4.81 | ) |
Year ended 9/30/14 | | $ | 51.31 | | | | (0.41 | ) | | | 1.03 | | | | 0.62 | | | | — | 4 | | | — | | | | (1.68 | ) | | | — | | | | (1.68 | ) |
Year ended 9/30/13 | | $ | 43.82 | | | | (0.15 | ) | | | 10.53 | | | | 10.38 | | | | — | 4 | | | — | | | | (2.89 | ) | | | — | | | | (2.89 | ) |
Small Cap Growth Fund — Institutional Class | | | | | | | | | | | | | | | | | | | | | | | | | |
Year ended 9/30/17 | | $ | 43.58 | | | | (0.17 | ) | | | 5.99 | | | | 5.82 | | | | — | 4 | | | — | | | | (3.51 | ) | | | — | | | | (3.51 | ) |
Year ended 9/30/1617 19 | | $ | 37.58 | | | | (0.07 | ) | | | 6.07 | | | | 6.00 | | | | — | 4 | | | — | | | | — | | | | — | | | | — | |
Small Cap Value Fund — Investor Class | | | | | | | | | | | | | | | | | | | | | | | | | |
Year ended 9/30/17 | | $ | 6.61 | | | | — | 4 | | | 1.33 | | | | 1.33 | | | | — | 4 | | | — | 4 | | | — | | | | — | | | | — | |
Year ended 9/30/1619 | | $ | 5.86 | | | | 0.01 | | | | 0.77 | | | | 0.78 | | | | — | 4 | | | (0.03 | ) | | | — | | | | — | | | | (0.03 | ) |
Year ended 9/30/15 | | $ | 5.69 | | | | 0.05 | 15 | | | 0.12 | | | | 0.17 | | | | — | 4 | | | — | | | | — | | | | — | | | | — | |
Year ended 9/30/14 | | $ | 5.12 | | | | (0.02 | ) | | | 0.59 | | | | 0.57 | | | | — | 4 | | | — | | | | — | | | | — | | | | — | |
Year ended 9/30/13 | | $ | 3.81 | | | | (0.01 | ) | | | 1.32 | | | | 1.31 | | | | — | 4 | | | — | | | | — | | | | — | | | | — | |
Small Cap Value Fund — Institutional Class | | | | | | | | | | | | | | | | | | | | | | | | | |
Year ended 9/30/17 | | $ | 6.65 | | | | 0.01 | | | | 1.34 | | | | 1.35 | | | | — | 4 | | | (0.02 | ) | | | — | | | | — | | | | (0.02 | ) |
Year ended 9/30/1619 | | $ | 5.88 | | | | 0.02 | | | | 0.78 | | | | 0.80 | | | | — | 4 | | | (0.03 | ) | | | — | | | | — | | | | (0.03 | ) |
Year ended 9/30/15 | | $ | 5.72 | | | | 0.05 | 15 | | | 0.11 | | | | 0.16 | | | | — | 4 | | | — | | | | — | | | | — | | | | — | |
Year ended 9/30/14 | | $ | 5.14 | | | | (0.03 | ) | | | 0.61 | | | | 0.58 | | | | — | | | | — | | | | — | | | | — | | | | — | |
Year ended 9/30/13 | | $ | 3.82 | | | | (0.01 | ) | | | 1.33 | | | | 1.32 | | | | — | 4 | | | — | | | | — | | | | — | | | | — | |
Strategic Income Fund | | | | | | | | | | | | | | | | | | | | | | | | | |
Year ended 9/30/17 | | $ | 10.62 | | | | 0.16 | | | | 1.12 | | | | 1.28 | | | | — | 4 | | | (0.12 | ) | | | — | | | | — | | | | (0.12 | ) |
Year ended 9/30/1619 | | $ | 10.49 | | | | 0.26 | | | | 0.49 | | | | 0.75 | | | | — | 4 | | | (0.23 | ) | | | (0.35 | ) | | | (0.04 | ) | | | (0.62 | ) |
Year ended 9/30/15 | | $ | 12.63 | | | | 0.30 | | | | (1.38 | ) | | | (1.08 | ) | | | — | 4 | | | (0.44 | ) | | | (0.62 | ) | | | — | | | | (1.06 | ) |
Year ended 9/30/14 | | $ | 11.08 | | | | 0.32 | | | | 1.74 | | | | 2.06 | | | | — | 4 | | | (0.35 | ) | | | (0.16 | ) | | | — | | | | (0.51 | ) |
Year ended 9/30/13 | | $ | 9.30 | | | | 0.33 | | | | 1.78 | | | | 2.11 | | | | — | 4 | | | (0.33 | ) | | | — | | | | — | | | | (0.33 | ) |
Ultra Growth Fund | | | | | | | | | | | | | | | | | | | | | | | | | |
Year ended 9/30/17 | | $ | 19.89 | | | | (0.20 | ) | | | 4.12 | | | | 3.92 | | | | — | 4 | | | (0.11 | ) | | | (1.89 | ) | | | — | | | | (2.00 | ) |
Year ended 9/30/1619 | | $ | 18.06 | | | | (0.18 | ) | | | 3.66 | | | | 3.48 | | | | — | 4 | | | — | | | | (1.65 | ) | | | — | | | | (1.65 | ) |
Year ended 9/30/15 | | $ | 23.67 | | | | (0.26 | ) | | | 1.54 | | | | 1.28 | | | | — | 4 | | | (0.01 | ) | | | (6.88 | ) | | | — | | | | (6.89 | ) |
Year ended 9/30/14 | | $ | 24.57 | | | | (0.06 | ) | | | 0.80 | | | | 0.74 | | | | — | 4 | | | — | | | | (1.64 | ) | | | — | | | | (1.64 | ) |
Year ended 9/30/13 | | $ | 22.83 | | | | (0.15 | ) | | | 4.96 | | | | 4.81 | | | | — | 4 | | | — | | | | (3.07 | ) | | | — | | | | (3.07 | ) |
World Innovators Fund — Investor Class | | | | | | | | | | | | | | | | | | | | | | | | | |
Year ended 9/30/17 | | $ | 19.32 | | | | (0.13 | ) | | | 4.26 | | | | 4.13 | | | | — | 4 | | | — | | | | (0.70 | ) | | | — | | | | (0.70 | ) |
Year ended 9/30/1619 | | $ | 20.17 | | | | (0.12 | ) | | | 1.90 | | | | 1.78 | | | | — | 4 | | | — | | | | (2.63 | ) | | | — | | | | (2.63 | ) |
Year ended 9/30/15 | | $ | 22.62 | | | | (0.21 | ) | | | 0.30 | | | | 0.09 | | | | — | 4 | | | — | | | | (2.54 | ) | | | — | | | | (2.54 | ) |
Year ended 9/30/14 | | $ | 23.15 | | | | (0.24 | ) | | | 0.91 | | | | 0.67 | | | | — | 4 | | | — | | | | (1.20 | ) | | | — | | | | (1.20 | ) |
Year ended 9/30/13 | | $ | 18.55 | | | | (0.12 | ) | | | 4.72 | | | | 4.60 | | | | — | 4 | | | — | | | | — | | | | — | | | | — | |
World Innovators Fund — Institutional Class | | | | | | | | | | | | | | | | | | | | | | | | | |
Year ended 9/30/17 | | $ | 19.36 | | | | (0.09 | ) | | | 4.30 | | | | 4.21 | | | | — | | | | — | | | | (0.70 | ) | | | — | | | | (0.70 | ) |
Period ended 9/30/1617 19 | | $ | 17.54 | | | | (— | )4 | | | 1.82 | | | | 1.82 | | | | — | | | | — | | | | — | | | | — | | | | — | |
Income Fund | | | | | | | | | | | | | | | | | | | | | | | | | |
Year ended 9/30/17 | | $ | 10.25 | | | | 0.19 | | | | (0.12 | ) | | | 0.07 | | | | — | 4 | | | (0.19 | ) | | | (0.01 | ) | | | — | | | | (0.20 | ) |
Year ended 9/30/1619 | | $ | 10.18 | | | | 0.19 | | | | 0.07 | | | | 0.26 | | | | — | 4 | | | (0.19 | ) | | | — | | | | — | | | | (0.19 | ) |
Year ended 9/30/15 | | $ | 10.15 | | | | 0.16 | | | | 0.03 | | | | 0.19 | | | | — | 4 | | | (0.16 | ) | | | — | | | | — | | | | (0.16 | ) |
Year ended 9/30/14 | | $ | 10.13 | | | | 0.17 | | | | 0.02 | | | | 0.19 | | | | — | 4 | | | (0.17 | ) | | | — | | | | — | | | | (0.17 | ) |
Year ended 9/30/13 | | $ | 10.44 | | | | 0.17 | | | | (0.31 | ) | | | (0.14 | ) | | | — | | | | (0.17 | ) | | | — | | | | — | | | | (0.17 | ) |
U.S. Treasury Fund | | | | | | | | | | | | | | | | | | | | | | | | | |
Year ended 9/30/17 | | $ | 19.86 | | | | 0.35 | | | | (2.23 | ) | | | (1.88 | ) | | | 0.01 | | | | (0.35 | ) | | | (1.32 | ) | | | — | | | | (1.67 | ) |
Year ended 9/30/1619 | | $ | 18.42 | | | | 0.37 | | | | 2.29 | | | | 2.66 | | | | 0.01 | | | | (0.36 | ) | | | (0.87 | ) | | | — | | | | (1.23 | ) |
Year ended 9/30/15 | | $ | 17.08 | | | | 0.38 | | | | 1.33 | | | | 1.71 | | | | 0.01 | | | | (0.38 | ) | | | — | | | | — | | | | (0.38 | ) |
Year ended 9/30/14 | | $ | 15.33 | | | | 0.45 | | | | 1.75 | | | | 2.20 | | | | — | 4 | | | (0.45 | ) | | | — | | | | — | | | | (0.45 | ) |
Year ended 9/30/13 | | $ | 18.75 | | | | 0.44 | | | | (3.08 | ) | | | (2.64 | ) | | | 0.01 | | | | (0.44 | ) | | | (0.35 | ) | | | — | | | | (0.79 | ) |
See Notes to Financial Highlights and Notes to Financial Statements.
112
| | |
| | (for a share outstanding throughout each period) |
|
|
|
| | | | | | | | | | | | | | | | | | | | | | | | | | | | | | |
| | | | | | |
Ratios to Average Net Assets | | | Supplemental Data | |
Net Asset
Value
End of
Period | | | Total Return (%)1 | | | Expenses
Net of
Waivers and
Reimbursements (%)2 | | | Expenses
Before
Waivers and
Reimbursements (%)2 | | | Net Investment
Income Net of
Waivers and
Reimbursements (%)2 | | | Net Investment
Income Before
Waivers and
Reimbursements (%)2 | | | Net Assets
End of
Period
(000s) | | | Portfolio
Turnover
Rate1 3 | |
| | | | | | | | | | | | | | | | | | | | | | | | | | | | | | |
| $ | 45.72 | | | | 14.29 | | | | 1.27 | 5 | | | 1.27 | 5 | | | (0.88 | ) | | | (0.88 | ) | | $ | 1,182,573 | | | | 19% | |
| $ | 43.52 | | | | 11.87 | | | | 1.29 | 5 | | | 1.29 | 5 | | | (0.79 | ) | | | (0.79 | ) | | $ | 1,544,796 | | | | 20% | |
| $ | 45.97 | | | | 0.39 | | | | 1.22 | 5 | | | 1.22 | 5 | | | (0.75 | ) | | | (0.75 | ) | | $ | 2,000,588 | | | | 31% | |
| $ | 50.25 | | | | 1.09 | | | | 1.21 | 5 | | | 1.21 | 5 | | | (0.75 | ) | | | (0.75 | ) | | $ | 2,219,638 | | | | 23% | |
| $ | 51.31 | | | | 25.34 | | | | 1.23 | 5 | | | 1.23 | 5 | | | (0.42 | ) | | | (0.42 | ) | | $ | 2,487,031 | | | | 10% | |
| | | | | | | | | | | | | | | | | | | | | | | | | | | | | | |
| $ | 45.89 | | | | 14.54 | | | | 1.05 | 5 | | | 1.11 | 5 | | | (0.66 | ) | | | (0.72 | ) | | $ | 508,373 | | | | 19% | |
| $ | 43.58 | | | | 15.97 | | | | 1.05 | 5 | | | 1.11 | 5 | | | (0.63 | ) | | | (0.69 | ) | | $ | 337,605 | | | | 20% | |
| | | | | | | | | | | | | | | | | | | | | | | | | | | | | | |
| $ | 7.94 | | | | 20.20 | | | | 1.21 | 5 | | | 1.21 | 5 | | | 0.04 | | | | 0.04 | | | $ | 320,978 | | | | 37% | |
| $ | 6.61 | | | | 13.37 | | | | 1.24 | 5 | | | 1.24 | 5 | | | 0.23 | | | | 0.23 | | | $ | 269,710 | | | | 57% | |
| $ | 5.86 | | | | 2.99 | | | | 1.21 | 5 | | | 1.21 | 5 | | | 0.82 | 15 | | | 0.82 | 15 | | $ | 257,655 | | | | 57% | |
| $ | 5.69 | | | | 11.13 | | | | 1.20 | 5 | | | 1.20 | 5 | | | (0.52 | ) | | | (0.52 | ) | | $ | 265,521 | | | | 50% | |
| $ | 5.12 | | | | 34.38 | | | | 1.26 | 5 | | | 1.27 | 5 | | | (0.21 | ) | | | (0.22 | ) | | $ | 201,581 | | | | 40% | |
| | | | | | | | | | | | | | | | | | | | | | | | | | | | | | |
| $ | 7.98 | | | | 20.28 | | | | 1.05 | 5 | | | 1.16 | 5 | | | 0.21 | | | | 0.11 | | | $ | 49,671 | | | | 37% | |
| $ | 6.65 | | | | 13.54 | | | | 1.08 | 5 | | | 1.20 | 5 | | | 0.40 | | | | 0.28 | | | $ | 23,839 | | | | 57% | |
| $ | 5.88 | | | | 2.97 | | | | 1.15 | 5 | | | 1.20 | 5 | | | 0.92 | 15 | | | 0.87 | 15 | | $ | 18,941 | | | | 57% | |
| $ | 5.72 | | | | 11.28 | | | | 1.15 | 5 | | | 1.44 | 5 | | | (0.49 | ) | | | (0.78 | ) | | $ | 10,436 | | | | 50% | |
| $ | 5.14 | | | | 34.55 | | | | 1.15 | 5 | | | 1.46 | 5 | | | (0.11 | ) | | | (0.42 | ) | | $ | 9,359 | | | | 40% | |
| | | | | | | | | | | | | | | | | | | | | | | | | | | | | | |
| $ | 11.78 | | | | 12.09 | | | | 0.95 | 5 | | | 1.10 | 5 | | | 1.12 | | | | 0.98 | | | $ | 45,045 | | | | 34% | |
| $ | 10.62 | | | | 7.38 | | | | 0.95 | 5 | | | 1.04 | 5 | | | 2.50 | | | | 2.41 | | | $ | 55,112 | | | | 45% | |
| $ | 10.49 | | | | (9.54 | ) | | | 0.95 | 5 | | | 0.95 | 5 | | | 2.51 | | | | 2.51 | | | $ | 88,661 | | | | 78% | |
| $ | 12.63 | | | | 18.94 | | | | 0.95 | 5 | | | 0.96 | 5 | | | 2.59 | | | | 2.58 | | | $ | 94,958 | | | | 69% | |
| $ | 11.08 | | | | 23.01 | | | | 0.95 | 5 | | | 1.06 | 5 | | | 3.16 | | | | 3.05 | | | $ | 66,579 | | | | 54% | |
| | | | | | | | | | | | | | | | | | | | | | | | | | | | | | |
| $ | 21.81 | | | | 22.13 | | | | 1.30 | 5 | | | 1.30 | 5 | | | (1.06 | ) | | | (1.06 | ) | | $ | 111,366 | | | | 34% | |
| $ | 19.89 | | | | 20.08 | | | | 1.33 | 5 | | | 1.33 | 5 | | | (1.03 | ) | | | (1.03 | ) | | $ | 101,402 | | | | 28% | |
| $ | 18.06 | | | | 4.02 | | | | 1.31 | 5 | | | 1.31 | 5 | | | (1.06 | ) | | | (1.06 | ) | | $ | 96,015 | | | | 38% | |
| $ | 23.67 | | | | 2.66 | | | | 1.26 | 5 | | | 1.26 | 5 | | | (1.00 | ) | | | (1.00 | ) | | $ | 102,834 | | | | 38% | |
| $ | 24.57 | | | | 24.52 | | | | 1.29 | 5 | | | 1.29 | 5 | | | (0.64 | ) | | | (0.64 | ) | | $ | 151,697 | | | | 25% | |
| | | | | | | | | | | | | | | | | | | | | | | | | | | | | | |
| $ | 22.75 | | | | 22.23 | | | | 1.83 | 5 | | | 1.83 | 5 | | | (0.57 | ) | | | (0.57 | ) | | $ | 191,021 | | | | 91% | |
| $ | 19.32 | | | | 8.97 | | | | 1.78 | 5 | | | 1.78 | 5 | | | (0.66 | ) | | | (0.66 | ) | | $ | 193,826 | | | | 112% | |
| $ | 20.17 | | | | 0.32 | | | | 1.76 | 5 | | | 1.76 | 5 | | | (0.76 | ) | | | (0.76 | ) | | $ | 186,272 | | | | 100% | |
| $ | 22.62 | | | | 2.69 | | | | 1.73 | 5 | | | 1.73 | 5 | | | (0.89 | ) | | | (0.89 | ) | | $ | 253,311 | | | | 111% | |
| $ | 23.15 | | | | 24.80 | | | | 1.77 | 5 | | | 1.79 | 5 | | | (0.84 | ) | | | (0.86 | ) | | $ | 266,911 | | | | 84% | |
| | | | | | | | | | | | | | | | | | | | | | | | | | | | | | |
| $ | 22.87 | | | | 22.55 | | | | 1.55 | 5 | | | 2.22 | 5 | | | (0.29 | ) | | | (0.96 | ) | | $ | 3,836 | | | | 91% | |
| $ | 19.36 | | | | 10.38 | | | | 1.55 | 5 | | | 3.69 | 5 | | | (0.01 | ) | | | (2.15 | ) | | $ | 5,977 | | | | 112% | |
| | | | | | | | | | | | | | | | | | | | | | | | | | | | | | |
| $ | 10.12 | | | | 0.68 | | | | 0.75 | 5 | | | 0.75 | 5 | | | 1.83 | | | | 1.83 | | | $ | 96,867 | | | | 75% | |
| $ | 10.25 | | | | 2.58 | | | | 0.73 | 5 | | | 0.73 | 5 | | | 1.85 | | | | 1.85 | | | $ | 99,706 | | | | 37% | |
| $ | 10.18 | | | | 1.87 | | | | 0.72 | 5 | | | 0.72 | 5 | | | 1.57 | | | | 1.57 | | | $ | 108,959 | | | | 44% | |
| $ | 10.15 | | | | 1.91 | | | | 0.70 | 5 | | | 0.70 | 5 | | | 1.66 | | | | 1.66 | | | $ | 116,752 | | | | 13% | |
| $ | 10.13 | | | | (1.34 | ) | | | 0.71 | | | | 0.71 | | | | 1.67 | | | | 1.67 | | | $ | 130,285 | | | | 35% | |
| | | | | | | | | | | | | | | | | | | | | | | | | | | | | | |
| $ | 16.32 | | | | (8.86 | ) | | | 0.72 | 5 | | | 0.72 | 5 | | | 2.04 | | | | 2.04 | | | $ | 360,866 | | | | 20% | |
| $ | 19.86 | | | | 15.49 | | | | 0.69 | 5 18 | | | 0.73 | 5 | | | 1.97 | 18 | | | 1.93 | | | $ | 489,011 | | | | 59% | |
| $ | 18.42 | | | | 10.09 | | | | 0.67 | 5 | | | 0.67 | 5 | | | 2.12 | | | | 2.12 | | | $ | 327,861 | | | | 131% | |
| $ | 17.08 | | | | 14.54 | | | | 0.70 | 5 | | | 0.70 | 5 | | | 2.77 | | | | 2.77 | | | $ | 224,664 | | | | 28% | |
| $ | 15.33 | | | | (14.43 | ) | | | 0.71 | 5 | | | 0.71 | 5 | | | 2.46 | | | | 2.46 | | | $ | 193,231 | | | | 34% | |
113
Notes to Financial Highlights
| 1 | Not annualized for periods less than one year. |
| 2 | Annualized for periods less than one year. |
| 3 | Portfolio turnover is calculated on the basis of the Fund as a whole without distinguishing between the classes of shares issued. |
| 4 | Represents amounts less than $0.005 per share. |
| 5 | Includes interest expense of less than 0.005%. |
| 6 | Includes interest expenses of more than 0.005%. |
| 7 | Includes interest expense and dividend payments for securities sold short. The ratios excluding such expenses are listed below: |
| | | | | | | | | | | | |
| | | Expenses Net of
Waivers and
Reimbursements2 | | Expenses Before
Waivers and
Reimbursements2 | | |
Long/Short Fund — Investor Class | | | | | | | | | | | | |
Year ended 9/30/17 | | | | 1.42 | % | | | | 1.42 | % | | |
Year ended 9/30/16 | | | | 1.42 | % | | | | 1.42 | % | | |
Year ended 9/30/15 | | | | 1.30 | % | | | | 1.30 | % | | |
Year ended 9/30/14 | | | | 1.27 | % | | | | 1.27 | % | | |
Year ended 9/30/13 | | | | 1.28 | % | | | | 1.28 | % | | |
| | | |
Long/Short Fund — Institutional Class | | | | | | | | | | | | |
Year ended 9/30/17 | | | | 1.15 | % | | | | 1.27 | % | | |
Year ended 9/30/16 | | | | 1.17 | % | | | | 1.22 | % | | |
Year ended 9/30/15 | | | | 1.16 | % | | | | 1.16 | % | | |
Year ended 9/30/14 | | | | 1.16 | % | | | | 1.16 | % | | |
Period ended 9/30/1311 | | | | 1.17 | % | | | | 1.18 | % | | |
8 Includes extraordinary expenses of 0.01% (see Note 7). 9 Includes extraordinary expenses of less than 0.01% (see Note 7). 10 Fund inception date was December 13, 2012. 11 Institutional class inception date was December 13, 2012. 12 Investment income per share reflects a large, non-recurring dividend which amounted to $0.17 and $0.08 per share for the Investor Class and Institutional Class, respectively. Excluding this non-recurring dividend, income (loss) to average net assets would have been as follows: |
| | | |
| | | Net Investment
Income (Loss)
Net of
Waivers and
Reimbursements | | Net Investment
Income (Loss)
Before
Waivers and
Reimbursements | | |
Core Growth Fund — Investor Class | | | | (0.58 | )% | | | | (0.58 | )% | | |
Core Growth Fund — Institutional Class | | | | (0.59 | )% | | | | (0.60 | )% | | |
13 Investment income per share reflects a large, non-recurring dividend which amounted to $0.04 per share. Excluding this non-recurring dividend, the ratio of net investment income (loss) to average net assets would have been (1.40)%. 14 Investment income per share reflects a large, non-recurring dividend which amounted to $0.01 per share. Excluding this non-recurring dividend, the ratio of net investment income (loss) to average net assets would have been (1.04)% for Net Investment Income Net of Waivers and Reimbursements and (1.10)% for Net Investment Income Before Waivers and Reimbursements. 15 Investment income per share reflects a large, non-recurring dividend which amounted to $0.05 and $0.05 per share for the Investor Class and Institutional Class, respectively. Excluding this non-recurring dividend, the ratio of net investment income (loss) to average net assets would have been as follows: |
| | | | | | | | | | | | |
| | | |
| | | Net Investment
Income (Loss)
Net of
Waivers and
Reimbursements | | Net Investment
Income (Loss)
Before
Waivers and
Reimbursements | | |
Small Cap Value Fund — Investor Class | | | | (0.00 | )%16 | | | | (0.00 | )%16 | | |
Small Cap Value Fund — Institutional Class | | | | 0.10 | % | | | | 0.05 | % | | |
16 Amount is less than 0.005%. 17 Institutional class inception date was February 1, 2016. 18Includes reimbursement by Hoisington Investment Management Co., the Sub-Advisor, for proxy statement expenses which amounted to $0.01 per share. |
114
| | | | | | | | | | | | |
19Includes a non-recurring offer to reimburse prior period custody and fund accounting out-of-pocket expenses (see Note 7 “Custodian Out-of-Pocket Expense Reimbursement”). Excluding this non-recurring reimbursement, the ratio of expenses to average net assets would have been as follows: |
| | | | | | | | | | | | |
| | | |
| | | Expenses Net of
Waivers and
Reimbursements
(%) | | Expenses Before
Waivers and
Reimbursements
(%) | | |
Core Growth Fund — Investor Class | | | | 1.21 | | | | | 1.21 | | | |
Core Growth Fund — Institutional Class | | | | 1.07 | | | | | 1.09 | | | |
Emerging India Fund — Investor Class | | | | 1.84 | | | | | 1.98 | | | |
Emerging India Fund — Institutional Class | | | | 1.56 | | | | | 2.06 | | | |
Emerging Markets Select Fund — Investor Class | | | | 1.60 | | | | | 2.00 | | | |
Emerging Markets Select Fund — Institutional Class | | | | 1.33 | | | | | 1.63 | | | |
Emerging Markets Small Cap Fund — Investor Class | | | | 1.97 | | | | | 2.01 | | | |
Emerging Markets Small Cap Fund — Institutional Class | | | | 1.82 | | | | | 1.83 | | | |
Frontier Emerging Small Countries Fund — Investor Class | | | | 2.25 | | | | | 2.39 | | | |
Frontier Emerging Small Countries Fund — Institutional Class | | | | 2.08 | | | | | 2.08 | | | |
Global Opportunities Fund — Investor Class | | | | 1.64 | | | | | 1.64 | | | |
Global Opportunities Fund — Institutional Class | | | | 1.42 | | | | | 2.39 | | | |
International Growth Fund — Investor Class | | | | 1.48 | | | | | 1.48 | | | |
International Growth Fund — Institutional Class | | | | 1.36 | | | | | 1.37 | | | |
International Opportunities Fund — Investor Class | | | | 2.26 | | | | | 2.30 | | | |
International Opportunities Fund — Institutional Class | | | | 1.97 | | | | | 2.06 | | | |
Large Cap Value Fund — Investor Class | | | | 1.10 | | | | | 1.17 | | | |
Large Cap Value Fund — Institutional Class | | | | 0.96 | | | | | 1.72 | | | |
Long/Short Fund — Investor Class | | | | 1.83 | | | | | 1.83 | | | |
Long/Short Fund — Institutional Class | | | | 1.52 | | | | | 1.57 | | | |
Micro Cap Fund | | | | 1.92 | | | | | 1.92 | | | |
Micro Cap Value Fund | | | | 1.96 | | | | | 2.05 | | | |
Small Cap Growth Fund — Investor Class | | | | 1.29 | | | | | 1.29 | | | |
Small Cap Growth Fund — Institutional Class | | | | 1.05 | | | | | 1.11 | | | |
Small Cap Value Fund — Investor Class | | | | 1.24 | | | | | 1.24 | | | |
Small Cap Value Fund — Institutional Class | | | | 1.08 | | | | | 1.20 | | | |
Strategic Income Fund | | | | 0.95 | | | | | 1.04 | | | |
Ultra Growth Fund | | | | 1.34 | | | | | 1.34 | | | |
World Innovators Fund — Investor Class | | | | 1.79 | | | | | 1.79 | | | |
World Innovators Fund — Institutional Class | | | | 1.63 | | | | | 3.77 | | | |
Income Fund | | | | 0.73 | | | | | 0.73 | | | |
U.S. Treasury Fund | | | | 0.69 | | | | | 0.73 | | | |
| 20 | Per share amounts do not correlate to amounts reported in the statement of operations due to timing of share activity. |
See Notes to Financial Statements.
115
Notes to Financial Statements
1. ORGANIZATION
Wasatch Funds Trust (the “Trust”) is a Massachusetts business trust registered under the Investment Company Act of 1940, as amended (the “1940 Act”), as an open-end management investment company and consists of 19 series or funds (each a “Fund” and collectively the “Funds”). The Core Growth Fund, Emerging India Fund, Emerging Markets Select Fund, Emerging Markets Small Cap Fund, Frontier Emerging Small Countries Fund, Global Opportunities Fund, International Growth Fund, International Opportunities Fund, Large Cap Value Fund, Long/Short Fund, Micro Cap Fund, Micro Cap Value Fund, Small Cap Growth Fund, Small Cap Value Fund, Strategic Income Fund, Ultra Growth Fund, World Innovators Fund, Wasatch-1st Source Income Fund (“Income Fund”) (sub-advised), and Wasatch-Hoisington U.S. Treasury Fund (“U.S. Treasury Fund”) (sub-advised) are each diversified funds. Each Fund maintains its own investment objective(s).
On November 9, 2011, the Trust re-designated the shares of the Funds into Investor Class shares effective January 31, 2012, and authorized and designated a new Institutional Class of shares in the Funds. Currently 13 funds offer Institutional Class shares: Core Growth Fund, Large Cap Value Fund and Small Cap Value Fund, which commenced operations on January 31, 2012, Emerging Markets Select Fund and Long/Short Fund, which commenced operations on December 13, 2012 and Emerging India Fund, Emerging Markets Small Cap Fund, Frontier Emerging Small Countries Fund, Global Opportunities Fund, International Growth Fund, International Opportunities Fund, Small Cap Growth Fund and World Innovators Fund, which commenced operations on February 1, 2016. Each class of shares for each Fund has identical rights and privileges except with respect to purchase minimums, distribution and service charges, shareholder services, voting rights on matters affecting a single class of shares, and the exchange and conversion features. The Funds have entered into an investment advisory agreement with Wasatch Advisors, Inc. (the “Advisor” or “Wasatch”) as investment advisor.
The Core Growth, Emerging India, Emerging Markets Select, Emerging Markets Small Cap, Frontier Emerging Small Countries, Global Opportunities, International Growth, International Opportunities, Large Cap Value, Long/Short, Micro Cap, Micro Cap Value, Small Cap Growth, Small Cap Value, Strategic Income, Ultra Growth and World Innovators Funds are referred to herein as the “Equity Funds.”
2. SIGNIFICANT ACCOUNTING POLICIES
The following is a summary of significant policies related to investments of the Funds held at September 30, 2017. These policies are in conformity with accounting principles generally accepted in the United States of America (“U.S. GAAP”).
Valuation of Securities — All investments in securities are recorded at their estimated fair value as described in Note 12.
Foreign Currency Translations — Values of investments denominated in foreign currencies are converted into U.S. dollars using the current exchange rates each business day (generally 4:00 p.m. Eastern Time). Purchases and sales of investments and dividend income are translated into U.S. dollars using the current prevailing exchange rate on the transaction date. The effect of changes in foreign exchange rates on realized and unrealized gains or losses on securities is reflected as a component of such gains or losses. Transactions in foreign denominated assets may involve greater risks than domestic transactions.
Investment in Securities and Related Investment Income — Security transactions are accounted for on the trade date. Gains or losses on securities sold are determined on the identified cost basis. Dividend income and distributions to shareholders are recorded on the ex-dividend date except that certain dividends from foreign securities may be recorded after the ex-dividend date based on when the Fund is informed of the dividend. Interest income and estimated expenses are accrued daily. Bond discount and premiums are amortized using the interest method. To the extent dividends received include return of capital or capital gain distributions, such distributions are recorded as a reduction to cost of the related security or as realized gain or loss.
Expenses — The Funds contract for various services on a collective basis. Most expenses are directly attributable to each Fund and therefore are charged accordingly. Expenses that are not directly attributable to one or more Funds are allocated among applicable Funds on an equitable and consistent basis considering such things as the nature and type of expense and the relative net assets of the Funds.
Use of Management Estimates — The preparation of financial statements in conformity with U.S. GAAP requires management to make estimates and assumptions that affect the reported amounts of assets and liabilities at the date of the financial statements and the reported changes in net assets during the reporting period. Actual results could differ from those estimates.
Guarantees and Indemnifications — In the normal course of business, the Funds enter into contracts that contain a variety of representations and warranties which provide general indemnifications. The maximum exposure under these arrangements is unknown, as this would involve future claims that may be made against the Funds and/or their affiliates that have not yet occurred. Based on experience, however, the risk of loss is expected to be remote.
Redemption Fees — The Funds deduct a fee of 2.00% from redemption proceeds on shares of the Funds held 60 days or less. Redemption fees retained by the Funds are credited to additional paid-in capital.
New Accounting Pronouncements — In October 2016, the Securities and Exchange Commission (“SEC”) issued a new rule, Investment Company Reporting Modernization, which, among other provisions, amends Regulation S-X to require standardized, enhanced disclosures, particularly related to derivatives, in investment company financial statements. Compliance with the guidance is effective for financial statements filed with the SEC on or after August 1, 2017. The adoption had no effect on the Funds’ net assets or results of operations but additional disclosures were required.
116
Other — Income, expenses, and realized and unrealized gains or losses on investments are generally allocated to each class of shares based on its relative net assets, except that each class separately bears expenses related specifically to that class, such as certain shareholder servicing fees.
3. SECURITIESAND OTHER INVESTMENTS
Repurchase Agreements — The Funds may engage in repurchase transactions. Under the terms of a typical repurchase agreement, a fund takes possession of an underlying debt obligation subject to an obligation of the seller to repurchase and the fund to resell the obligation at an agreed upon price and time. The market value of the collateral must be at least equal at all times to the total amount of the repurchase obligation, including interest. Generally, in the event of counterparty default, the fund has the right to use the collateral to offset losses incurred. Refer to Note 13 (Offsetting) for more information about the offsetting of assets and liabilities.
Short Sales — The Long/Short Fund and to a lesser extent the other Equity Funds may enter into short sales whereby a fund sells a security it generally does not own (the security is borrowed), in anticipation of a decline in the security’s price. The initial amount of a short sale is recorded as a liability which is marked-to-market daily. Fluctuations in the value of the short liability are recorded as unrealized gains or losses. If a Fund shorts a security when also holding a long position in the security (a “short against the box”), as the security’s price declines, the short position increases in value, offsetting the long position’s decrease in value. The opposite effect occurs if the security’s price rises. A Fund realizes a gain or loss upon closing of the short sale (returning the security to the counterparty by way of purchase or delivery of a long position owned). Possible losses from short sales may be unlimited, whereas losses from security purchases cannot exceed the total amount invested. The Funds are liable to the buyer for any dividends payable on securities while those securities are in a short position. These dividends are an expense of the Funds. The Funds designate collateral consisting of cash, U.S. government securities or other liquid assets sufficient to collateralize the market value of short positions. Refer to Note 13 (Offsetting) for more information about the offsetting of assets and liabilities.
Participation Notes — The Frontier Emerging Small Countries and the Global Opportunities Funds may invest in Participation Notes (P-Notes). P-Notes are promissory notes that are designed to offer a return linked to the performance of a particular underlying equity security or market. P-Notes are issued by banks or broker-dealers and allow a fund to gain exposure to common stocks in markets in which the fund is currently not approved to directly invest, or in markets that prohibit direct investment by foreign purchasers (e.g., Saudi Arabia). While the holder of a P-Note is entitled to receive from the bank or broker-dealer any dividends or other distributions paid on the underlying securities, the holder is not entitled to the same rights as an owner of the underlying securities, such as voting rights. Income received from P-Notes is recorded as dividend income in the
Statement of Operations. P-Notes are considered general unsecured contractual obligations of the bank or broker-dealer. Risks associated with P-Notes include the possible failure of a counterparty (i.e., the issuing bank or broker-dealer) to perform in accordance with the terms of the agreement, inability to transfer or liquidate the notes, potential delays or an inability to redeem the notes before maturity under certain market conditions, and limited legal recourse against the issuer of the underlying common stock.
4. FINANCIAL DERIVATIVE INSTRUMENTS
Foreign Currency Contracts — The Funds may enter into foreign currency contracts to settle planned purchases or sales of securities or to protect against a possible loss resulting from adverse change in the relationship between the U.S. dollar and a foreign currency involved in an underlying transaction. Foreign currency contracts are agreements between two parties to buy and sell a currency at a set price on a future date. The market value of a foreign currency contract fluctuates with changes in currency exchange rates. Foreign currency contracts are marked-to-market daily and the change in market value is recorded by a fund as unrealized appreciation or depreciation. When a foreign currency contract is closed, the fund records a realized gain or loss equal to the difference between the value at the time it was opened and the value at the time it was closed. These contracts may involve market risk in excess of the unrealized gain or loss reflected in the Schedule of Investments. In addition, a fund could be exposed to credit risk if a counterparty is unable or unwilling to meet the terms of the contracts or if the value of the currency changes unfavorably. In connection with these contracts, the Funds may segregate cash and/or securities in a sufficient amount as collateral in accordance with the terms of the respective contracts.
Options Transactions — The Equity Funds and the Income Fund may buy and sell put and call options and write covered put and call options, including over-the-counter options, on portfolio securities where the completion of the obligation is dependent upon the credit standing of another party. Options are a type of derivative financial instrument. The Funds may invest in derivative financial instruments, including options, in order to manage risk or gain exposure to various other investments or markets. The risk in writing a call option is that a fund gives up the opportunity for profit if the market price of the security increases. The risk in writing a put option is that a fund may incur a loss if the market price of the security decreases and the option is exercised. The risk in buying an option is that a fund pays a premium whether or not the option is exercised. A fund also has the additional risk of not being able to enter into a closing transaction if a liquid secondary market does not exist. Possible losses from uncovered written options may be unlimited. Option contracts are valued daily and unrealized appreciation or depreciation is recorded. A fund will realize a gain or loss upon expiration or closing of the option transaction. When an option is exercised, the proceeds on sales for a written call option, the purchase cost for a written put option, or the cost of a security for a purchased
117
Notes to Financial Statements (continued)
put or call option is adjusted by the amount of premium received or paid. The Funds designate collateral consisting of cash, U.S. government securities or other liquid assets
sufficient to collateralize the market value of written options. Refer to Note 13 (Offsetting) for more information about the offsetting of assets and liabilities.
5. PURCHASESAND SALESOF SECURITIES
Cost of investment securities purchased and proceeds from sales of investment securities, excluding U.S. government and short-term securities, for the year ended September 30, 2017 are summarized below:
| | | | | | | | | | | | | | | | | | | | | | | | |
| | | Core
Growth
Fund | | | Emerging
India
Fund | | | Emerging
Markets
Select
Fund | | | Emerging
Markets
Small Cap
Fund | | | Frontier
Emerging
Small Countries
Fund | | | Global
Opportunities
Fund | |
Purchases | | $ | 425,970,892 | | | $ | 148,995,622 | | | $ | 22,708,188 | | | $ | 392,297,126 | | | $ | 184,516,757 | | | $ | 30,382,593 | |
Sales | | | 355,502,608 | | | | 24,170,331 | | | | 21,380,037 | | | | 654,564,667 | | | | 527,683,286 | | | | 94,034,620 | |
| | | | | | |
| | | International
Growth
Fund | | | International
Opportunities
Fund | | | Large Cap
Value
Fund | | | Long/Short
Fund | | | Micro
Cap
Fund | | | Micro Cap
Value
Fund | |
Purchases | | $ | 422,608,328 | | | $ | 330,112,306 | | | $ | 80,424,246 | | | $ | 59,365,577 | | | $ | 84,319,890 | | | $ | 102,994,323 | |
Sales | | | 585,624,794 | | | | 538,260,811 | | | | 115,140,965 | | | | 192,856,970 | | | | 112,595,280 | | | | 106,891,388 | |
| | | | | | |
| | | Small Cap
Growth
Fund | | | Small Cap
Value
Fund | | | Strategic
Income
Fund | | | Ultra
Growth
Fund | | | World
Innovators
Fund | | | Income
Fund | |
Purchases | | $ | 323,840,058 | | | $ | 156,361,320 | | | $ | 13,807,923 | | | $ | 34,264,977 | | | $ | 145,003,475 | | | $ | 54,968,232 | |
Sales | | | 748,947,573 | | | | 120,232,192 | | | | 24,625,064 | | | | 44,069,203 | | | | 175,211,034 | | | | 57,280,148 | |
Purchases and sales of U.S. government securities in the Income Fund were $16,827,236 and $15,650,916, respectively. Purchases and sales of U.S. government securities in the U.S. Treasury Fund were $68,678,611 and $145,019,366, respectively.
6. FEDERAL INCOME TAX INFORMATION
It is each Fund’s policy to comply with the requirements under Subchapter M of the Internal Revenue Code applicable to regulated investment companies and to distribute substantially all taxable income to shareholders. The Funds are no longer subject to examination by tax authorities for years prior to 2014. At this time, management believes there are no uncertain tax positions which, based on their technical merit, would not be sustained upon examination and for which it is reasonably possible that the total of amounts of unrecognized tax benefits will significantly change in the next 12 months. Accordingly, no provision for federal income or excise taxes has been made.
As of September 30, 2017, the cost and unrealized appreciation (depreciation) of securities on a tax basis were as follows:
| | | | | | | | | | | | | | | | | | | | | | | | | | | | |
| | | Core
Growth
Fund | | | Emerging
India
Fund | | | Emerging
Markets
Select
Fund | | | Emerging
Markets
Small Cap
Fund | | | Frontier
Emerging
Small
Countries
Fund | | | Global
Opportunities
Fund | | | International
Growth
Fund | |
Cost | | $ | 1,001,872,245 | | | $ | 183,366,115 | | | $ | 34,110,114 | | | $ | 446,534,266 | | | $ | 142,534,926 | | | $ | 65,829,298 | | | $ | 933,639,077 | |
| | | | |
Gross appreciation | | $ | 606,999,092 | | | $ | 52,368,691 | | | $ | 10,937,667 | | | $ | 215,033,819 | | | $ | 55,070,630 | | | $ | 39,214,711 | | | $ | 520,205,749 | |
Gross (depreciation) | | | (21,972,463 | ) | | | (1,898,910 | ) | | | (696,332 | ) | | | (19,314,064 | ) | | | (2,058,374 | ) | | | (1,757,335 | ) | | | (28,787,008 | ) |
| | | | |
Net appreciation | | $ | 585,026,629 | | | $ | 50,469,781 | | | $ | 10,241,335 | | | $ | 195,719,755 | | | $ | 53,012,256 | | | $ | 37,457,376 | | | $ | 491,418,741 | |
| | | | |
| | | | | | | |
| | | International
Opportunities
Fund | | | Large Cap
Value
Fund | | | Long/Short
Fund | | | Micro
Cap
Fund | | | Micro Cap
Value
Fund | | | Small Cap
Growth
Fund | | | Small Cap
Value
Fund | |
Cost | | $ | 381,689,145 | | | $ | 153,312,083 | | | $ | 91,018,495 | | | $ | 183,868,106 | | | $ | 150,382,151 | | | $ | 1,061,222,573 | | | $ | 279,228,973 | |
| | | | |
Gross appreciation | | $ | 126,404,221 | | | $ | 29,560,285 | | | $ | 19,389,841 | | | $ | 128,746,806 | | | $ | 69,959,303 | | | $ | 682,616,031 | | | $ | 100,706,110 | |
Gross (depreciation) | | | (13,652,455 | ) | | | (1,652,057 | ) | | | (28,771,372 | ) | | | (6,609,355 | ) | | | (3,368,039 | ) | | | (57,117,176 | ) | | | (8,450,724 | ) |
| | | | |
Net appreciation (depreciation) | | $ | 112,751,766 | | | $ | 27,908,228 | | | $ | (9,381,531 | ) | | $ | 122,137,451 | | | $ | 66,591,264 | | | $ | 625,498,855 | | | $ | 92,255,386 | |
| | | | |
118
| | | | | | | | | | | | | | | | | | | | | | | | | | | | |
| | | | | | | |
| | | Strategic
Income
Fund | | | Ultra
Growth
Fund | | | World
Innovators
Fund | | | Income
Fund | | | U.S.
Treasury
Fund | | | | | | | |
Cost | | $ | 38,708,014 | | | $ | 73,636,519 | | | $ | 161,516,712 | | | $ | 95,882,918 | | | $ | 379,030,354 | | | | | | | | | |
| | | | | | | | | | | | |
Gross appreciation | | $ | 7,101,941 | | | $ | 43,836,268 | | | $ | 37,419,019 | | | $ | 673,104 | | | $ | 2,697,229 | | | | | | | | | |
Gross (depreciation) | | | (877,773 | ) | | | (9,220,786 | ) | | | (2,882,673 | ) | | | (212,026 | ) | | | (21,251,744 | ) | | | | | | | | |
| | | | | | | | | | | | |
Net appreciation (depreciation) | | $ | 6,224,168 | | | $ | 34,615,482 | | | $ | 34,536,346 | | | $ | 461,078 | | | $ | (18,554,515 | ) | | | | | | | | |
| | | | | | | | | | | | |
The difference between book-basis and tax-basis unrealized gains are primarily attributable to the tax deferral of losses on wash sales, unrealized appreciation on passive foreign investment companies (PFICs), partnership adjustments and other temporary tax adjustments.
The components of accumulated earnings on a tax basis as of September 30, 2017 were as follows:
| | | | | | | | | | | | | | | | | | | | |
| | | Core
Growth
Fund | | | Emerging
India
Fund | | | Emerging
Markets
Select
Fund | | | Emerging
Markets
Small Cap
Fund | | | Frontier
Emerging
Small
Countries
Fund | |
Undistributed capital gains | | $ | 75,883,488 | | | $ | 787,257 | | | $ | — | | | $ | — | | | $ | — | |
| | | | |
Accumulated earnings | | | 75,883,488 | | | | 787,257 | | | | — | | | | — | | | | — | |
Accumulated capital and other losses | | | (8,181,295 | ) | | | (1,275,315 | ) | | | (8,972,241 | ) | | | (12,728,970 | ) | | | (155,473,065 | ) |
Other undistributed ordinary losses | | | — | | | | (51,818 | ) | | | (63,841 | ) | | | — | | | | (49,304 | ) |
Net unrealized appreciation (depreciation) | | | 584,880,667 | | | | 47,925,075 | | | | 10,063,657 | | | | 195,528,680 | | | | 52,396,505 | |
| | | | |
Total accumulated earnings | | $ | 652,582,860 | | | $ | 47,385,199 | | | $ | 1,027,575 | | | $ | 182,799,710 | | | $ | (103,125,864 | ) |
| | | | |
| | | | | |
| | | Global
Opportunities
Fund | | | International
Growth
Fund | | | International
Opportunities
Fund | | | Large Cap
Value
Fund | | | Long/Short
Fund | |
Undistributed ordinary income | | $ | — | | | $ | — | | | $ | — | | | $ | 1,830,955 | | | $ | — | |
Undistributed capital gains | | | 9,603,116 | | | | 24,471,708 | | | | 28,380,862 | | | | 20,419,042 | | | | — | |
| | | | |
Accumulated earnings | | | 9,603,116 | | | | 24,471,708 | | | | 28,380,862 | | | | 22,249,997 | | | | — | |
Accumulated capital and other losses | | | (991,409 | ) | | | (879,707 | ) | | | (3,171,871 | ) | | | — | | | | (154,360,362 | ) |
Other undistributed ordinary losses | | | (5,271 | ) | | | — | | | | (5,332 | ) | | | (7,742 | ) | | | — | |
Net unrealized appreciation (depreciation) | | | 37,247,095 | | | | 491,091,318 | | | | 112,138,321 | | | | 27,909,003 | | | | (9,381,531 | ) |
| | | | |
Total accumulated earnings | | $ | 45,853,531 | | | $ | 514,683,319 | | | $ | 137,341,980 | | | $ | 50,151,258 | | | $ | (163,741,893 | ) |
| | | | |
| | | | | |
| | | Micro
Cap
Fund | | | Micro Cap
Value
Fund | | | Small Cap
Growth
Fund | | | Small Cap
Value
Fund | | | Strategic
Income
Fund | |
Undistributed capital gains | | $ | 34,731,157 | | | $ | 16,153,031 | | | $ | 147,990,677 | | | $ | 14,222,940 | | | $ | — | |
| | | | |
Accumulated earnings | | | 34,731,157 | | | | 16,153,031 | | | | 147,990,677 | | | | 14,222,940 | | | | — | |
Accumulated capital and other losses | | | (2,607,368 | ) | | | (1,095,632 | ) | | | (9,822,810 | ) | | | (127,730 | ) | | | (4,821,855 | ) |
Other undistributed ordinary losses | | | — | | | | — | | | | — | | | | — | | | | (5,027 | ) |
Net unrealized appreciation (depreciation) | | | 122,137,556 | | | | 66,549,739 | | | | 625,499,492 | | | | 92,255,386 | | | | 6,224,206 | |
| | | | |
Total accumulated earnings | | $ | 154,261,345 | | | $ | 81,607,138 | | | $ | 763,667,359 | | | $ | 106,350,596 | | | $ | 1,397,324 | |
| | | | |
| | | | | |
| | | Ultra
Growth
Fund | | | World
Innovators
Fund | | | Income
Fund | | | U.S.
Treasury
Fund | | | | |
Undistributed ordinary income | | $ | — | | | $ | 2,192,392 | | | $ | 53,913 | | | $ | 139,607 | | | | | |
Undistributed capital gains | | | 8,610,144 | | | | 15,733,299 | | | | — | | | | — | | | | | |
| | | | | | | | |
Accumulated earnings | | | 8,610,144 | | | | 17,925,691 | | | | 53,913 | | | | 139,607 | | | | | |
Accumulated capital and other losses | | | (990,401 | ) | | | — | | | | (91,170 | ) | | | (14,216,300 | ) | | | | |
Other undistributed ordinary losses | | | — | | | | — | | | | (49,078 | ) | | | (103,269 | ) | | | | |
Net unrealized appreciation (depreciation) | | | 34,615,482 | | | | 34,538,270 | | | | 461,078 | | | | (18,554,515 | ) | | | | |
| | | | | | | | |
Total accumulated earnings | | $ | 42,235,225 | | | $ | 52,463,961 | | | $ | 374,743 | | | $ | (32,734,477 | ) | | | | |
| | | | | | | | |
119
Notes to Financial Statements (continued)
Dividends from net investment income and net realized gains, if any, are declared and paid at least annually for all Funds, except for dividends from net investment income in four funds. The Income Fund declares and pays dividends monthly. The Large Cap Value, Strategic Income and U.S. Treasury Funds declare and pay dividends quarterly. The amount of dividends and distributions from net investment income and net realized gains are determined in accordance with federal income tax regulations, which may differ from U.S. GAAP. The Funds may utilize earnings and profits distributed to shareholders on redemption of shares as part of the dividends paid deduction (tax equalization).
To the extent these book and tax differences are permanent in nature, such amounts are reclassified at the end of the fiscal year among additional paid-in capital, undistributed net investment income (loss), and undistributed net realized gain (loss) on investments and foreign currency translations. The reclassifications generally relate to the tax treatment of net operating losses, the netting of net operating loss to short-term gains, investments in REITs and partnerships, redemptions in-kind, distribution reclassifications, foreign capital gain taxes, Section 988 currency gains and losses, PFICs, paydown gains and losses, non-REIT return of capital dividends and equalization. These reclassifications have no impact on the net asset values of the Funds.
Accordingly, at September 30, 2017, reclassifications were recorded as follows:
| | | | | | | | | | | | | | | | | | | | |
| | | Core
Growth
Fund | | | Emerging
India
Fund | | | Emerging
Markets
Select
Fund | | | Emerging
Markets
Small Cap
Fund | | | Frontier
Emerging
Small Countries
Fund | |
Increase (decrease) paid-in-capital in excess of par | | $ | (7,299,325 | ) | | $ | (866,285 | ) | | $ | (89,154 | ) | | $ | (2,613,712 | ) | | $ | (8,514,633 | ) |
Increase (decrease) undistributed net investment income | | | 8,351,159 | | | | 690,925 | | | | 58,634 | | | | 4,506,354 | | | | 3,426,961 | |
Increase (decrease) undistributed net realized gain (loss) | | | (1,051,834 | ) | | | 175,360 | | | | 30,520 | | | | (1,892,642 | ) | | | 5,087,672 | |
| | | | | |
| | | Global
Opportunities
Fund | | | International
Growth
Fund | | | International
Opportunities
Fund | | | Large Cap
Value
Fund | | | Long/Short
Fund | |
Increase (decrease) paid-in-capital in excess of par | | $ | (1,447,975 | ) | | $ | (4,479,253 | ) | | $ | 42,056,842 | | | $ | 1,635,086 | | | $ | (890,511 | ) |
Increase (decrease) undistributed net investment income | | | 1,836,872 | | | | 4,414,255 | | | | 1,093,028 | | | | 21,574 | | | | 766,072 | |
Increase (decrease) undistributed net realized gain (loss) | | | (388,897 | ) | | | 64,998 | | | | (43,149,870 | ) | | | (1,656,660 | ) | | | 124,439 | |
| | | | | |
| | | Micro
Cap
Fund | | | Micro Cap
Value
Fund | | | Small Cap
Growth
Fund | | | Small Cap
Value
Fund | | | Strategic
Income
Fund | |
Increase (decrease) paid-in-capital in excess of par | | $ | (3,356,428 | ) | | $ | (987,490 | ) | | $ | (15,301,417 | ) | | $ | (23 | ) | | $ | 38,056 | |
Increase (decrease) undistributed net investment income | | | 3,535,030 | | | | 1,254,602 | | | | 15,186,067 | | | | (269,796 | ) | | | (114,334 | ) |
Increase (decrease) undistributed net realized gain (loss) | | | (178,602 | ) | | | (267,112 | ) | | | 1,550,820 | | | | 269,819 | | | | 76,278 | |
| | | | | |
| | | Ultra
Growth
Fund | | | World
Innovators
Fund | | | Income
Fund | | | U.S.
Treasury
Fund | | | | |
Increase (decrease) paid-in-capital in excess of par | | $ | (637,853 | ) | | $ | 1 | | | $ | 1 | | | $ | (1 | ) | | | | |
Increase (decrease) undistributed net investment income | | | 1,881,597 | | | | 1,448,838 | | | | (5,801 | ) | | | (14 | ) | | | | |
Increase (decrease) undistributed net realized gain (loss) | | | 112,301 | | | | (1,372,750 | ) | | | 5,800 | | | | 15 | | | | | |
Capital loss carryforwards are available through the date specified below to offset future realized net capital gains for federal income tax purposes. Future capital loss carryover utilization in any given year may be subject to Internal Revenue Code limitations. To the extent future gains are offset by capital loss carryforwards, such gains will not be distributed.
Under the Regulated Investment Company Modernization Act of 2010, a Fund will be permitted to carry forward capital losses incurred in taxable years beginning after December 22, 2010 for an unlimited period. Post-enactment losses that are carried forward will retain their character as either short-term or long-term capital losses rather than being considered all short-term as under previous law.
Capital loss carryforwards as of September 30, 2017 are as follows:
| | | | | | | | |
| | | Non-expiring | |
| Fund | | Short Term | | | Long Term | |
Emerging Markets Select Fund | | $ | 7,798,666 | | | $ | 1,152,970 | |
Emerging Markets Small Cap Fund | | | 11,373,715 | | | | — | |
Frontier Emerging Small Countries Fund | | | 97,765,929 | | | | 53,783,397 | |
Long/Short Fund | | | 26,195,256 | | | | 127,709,466 | |
Strategic Income Fund | | | 4,757,330 | | | | — | |
Income Fund | | | 91,170 | | | | — | |
U.S. Treasury Fund | | | 10,816,652 | | | | 3,399,648 | |
120
During the tax year ended September 30, 2017, the Funds used capital loss carryforwards in the following amounts:
| | | | |
| Fund | | Amount Used | |
Emerging Markets Small Cap Fund | | $ | 66,457,413 | |
International Opportunities Fund | | | 5,672,021 | |
Small Cap Value Fund | | | 12,686,827 | |
Strategic Income Fund | | | 2,392,583 | |
The Funds have elected to defer losses incurred from November 1, 2016 through September 30, 2017 in accordance with federal income tax rules. These losses are treated as having arisen on the first day of the following fiscal year. The Funds have elected to defer losses as follows:
| | | | | | | | |
| Fund | | Post-October
Capital Losses | | | Late-Year Ordinary
Losses | |
Core Growth Fund | | $ | — | | | $ | 8,181,295 | |
Emerging India Fund | | | — | | | | 1,275,315 | |
Emerging Markets Select Fund | | | — | | | | 20,605 | |
Emerging Markets Small Cap Fund | | | — | | | | 1,355,255 | |
Frontier Emerging Small Countries Fund | | | — | | | | 3,923,739 | |
Global Opportunities Fund | | | 79,288 | | | | 912,121 | |
International Growth Fund | | | — | | | | 879,707 | |
International Opportunities Fund | | | — | | | | 3,171,871 | |
Long/Short Fund | | | — | | | | 455,640 | |
Micro Cap Fund | | | — | | | | 2,607,368 | |
Micro Cap Value Fund | | | — | | | | 1,095,632 | |
Small Cap Growth Fund | | | — | | | | 9,822,810 | |
Small Cap Value Fund | | | — | | | | 127,730 | |
Strategic Income Fund | | | — | | | | 64,525 | |
Ultra Growth Fund | | | 86,414 | | | | 903,987 | |
The tax character of distributions paid during the year ended September 30, 2017 was as follows:
| | | | | | | | | | | | | | | | | | | | |
| | | | | |
| 2017 | | Core
Growth
Fund | | | Emerging
India
Fund | | | Emerging
Markets
Select
Fund | | | Emerging
Markets
Small Cap
Fund | | | Frontier
Emerging
Small Countries
Fund | |
Ordinary Income | | $ | — | | | $ | — | | | $ | — | | | $ | — | | | $ | — | |
Capital Gain | | | 2,252,794 | | | | 819,648 | | | | — | | | | — | | | | — | |
| | | | |
Total | | $ | 2,252,794 | | | $ | 819,648 | | | $ | — | | | $ | — | | | $ | — | |
| | | | |
| | | | | |
| 2017 | | Global
Opportunities
Fund | | | International
Growth
Fund | | | International
Opportunities
Fund | | | Large Cap
Value
Fund | | | Long/Short
Fund | |
Ordinary Income | | $ | — | | | $ | — | | | $ | — | | | $ | 3,653,028 | | | $ | — | |
Capital Gain | | | 8,169,399 | | | | 47,302,575 | | | | — | | | | 6,457,187 | | | | 61,075 | |
| | | | |
Total | | $ | 8,169,399 | | | $ | 47,302,575 | | | $ | — | | | $ | 10,110,215 | | | $ | 61,075 | |
| | | | |
| | | | | |
2017 | | Micro
Cap
Fund | | | Micro Cap
Value
Fund | | | Small Cap
Growth
Fund | | | Small Cap
Value
Fund | | | Strategic
Income
Fund | |
Ordinary Income | | $ | — | | | $ | — | | | $ | — | | | $ | 225,614 | | | $ | 516,716 | |
Capital Gain | | | 22,829,857 | | | | 3,065,003 | | | | 144,143,218 | | | | 65,305 | | | | — | |
| | | | |
Total | | $ | 22,829,857 | | | $ | 3,065,003 | | | $ | 144,143,218 | | | $ | 290,919 | | | $ | 516,716 | |
| | | | |
| | | | | |
| 2017 | | Ultra
Growth
Fund | | | World
Innovators
Fund | | | Income
Fund | | | U.S.
Treasury
Fund | | | | |
Ordinary Income | | $ | — | | | $ | — | | | $ | 1,793,676 | | | $ | 7,013,026 | | | | | |
Capital Gain | | | 9,710,650 | | | | 6,384,678 | | | | 124,946 | | | | 23,928,544 | | | | | |
| | | | | | | | |
Total | | $ | 9,710,650 | | | $ | 6,384,678 | | | $ | 1,918,622 | | | $ | 30,941,570 | | | | | |
| | | | | | | | |
121
Notes to Financial Statements (continued)
The tax character of distributions paid during the year ended September 30, 2016 was as follows:
| | | | | | | | | | | | | | | | | | | | |
| | | | | |
| 2016 | | Core
Growth
Fund | | | Emerging
India
Fund | | | Emerging
Markets
Select
Fund | | | Emerging
Markets
Small Cap
Fund | | | Frontier
Emerging
Small Countries
Fund | |
Ordinary Income | | $ | — | | | $ | — | | | $ | — | | | $ | 132,483 | | | $ | 1,618,755 | |
Capital Gains | | | 138,512,554 | | | | 958,580 | | | | — | | | | — | | | | — | |
| | | | |
Total | | $ | 138,512,554 | | | $ | 958,580 | | | $ | — | | | $ | 132,483 | | | $ | 1,618,755 | |
| | | | |
| | | | | |
| 2016 | | Global
Opportunities
Fund | | | International
Growth
Fund | | | International
Opportunities
Fund | | | Large Cap
Value
Fund | | | Long/Short
Fund | |
Ordinary Income | | $ | — | | | $ | — | | | $ | — | | | $ | 3,793,299 | | | $ | 2,216,991 | |
Capital Gains | | | 19,687,296 | | | | — | | | | 22,512,072 | | | | 20,982,300 | | | | 70,202,977 | |
| | | | |
Total | | $ | 19,687,296 | | | $ | — | | | $ | 22,512,072 | | | $ | 24,775,599 | | | $ | 72,419,968 | |
| | | | |
| | | | | |
| 2016 | | Micro
Cap
Fund | | | Micro Cap
Value
Fund | | | Small Cap
Growth
Fund | | | Small Cap
Value
Fund | | | Strategic
Income
Fund | |
Ordinary Income | | $ | — | | | $ | 2,417,065 | | | $ | — | | | $ | 1,464,849 | | | $ | 1,474,213 | |
Capital Gains | | | 40,544,074 | | | | 15,487,890 | | | | 322,361,340 | | | | — | | | | 2,685,547 | |
Return of Capital | | | — | | | | — | | | | — | | | | — | | | | 287,336 | |
| | | | |
Total | | $ | 40,544,074 | | | $ | 17,904,955 | | | $ | 322,361,340 | | | $ | 1,464,849 | | | $ | 4,447,096 | |
| | | | |
| | | | | |
| 2016 | | Ultra
Growth
Fund | | | World
Innovators
Fund | | | Income
Fund | | | U.S.
Treasury
Fund | | | | |
Ordinary Income | | $ | — | | | $ | — | | | $ | 1,963,364 | | | $ | 7,944,602 | | | | | |
Capital Gains | | | 8,679,065 | | | | 24,130,023 | | | | — | | | | 15,905,989 | | | | | |
| | | | | | | | |
Total | | $ | 8,679,065 | | | $ | 24,130,023 | | | $ | 1,963,364 | | | $ | 23,850,591 | | | | | |
| | | | | | | | |
The tax character of distributions paid may differ from that shown in the Statements of Changes in Net Assets due to short-term gains being treated as ordinary income for tax purposes.
EU Reclaims — As a result of several court cases in certain countries across the European Union, the Emerging Markets Small Cap Fund, Global Opportunities Fund, International Growth Fund, International Opportunities Fund, Large Cap Value Fund and World Innovators Fund filed tax reclaims for previously withheld taxes on dividends earned in Finland and Poland (EU Reclaims). These additional filings are subject to various administrative proceedings by the local jurisdictions’ tax authorities within the European Union, as well as a number of related judicial proceedings. Income recognized, if any, for EU reclaims is reflected as dividend income in the Statements of Operations and related receivables, if any, are reflected as interest and dividends receivable in the Statements of Assets and Liabilities. When uncertainty exists as to the ultimate resolution of these proceedings, the likelihood of receipt of these EU reclaims and the potential timing of payment, no amounts are reflected in the financial statements.
7. RELATED PARTY TRANSACTIONS
Investment Advisory Fees, Expense Limitations — As the Funds’ investment advisor, the Advisor receives a monthly fee calculated on average daily net assets. The Advisor has contractually agreed to waive its fees and/or reimburse certain Funds should a Fund’s operating expenses exceed a specified annual limitation through at least January 31, 2019. If operating expenses are less than the specified expense limit for the Fund, the Advisor shall be entitled to recoup the fees waived or reduced to the extent that the operating expenses and the amounts reimbursed do not exceed such expense limit for the Fund, under the period of the agreement (currently through January 31, 2019). Such reimbursement shall be paid only while the expense limitation agreement is in effect and only if such amount paid, together with all other amounts reimbursed under this agreement in the fiscal year, do not cause the Fund to exceed the expense limitation. All amounts not recovered at the end of the period expire on January 31, 2019. Ordinary operating expenses exclude any interest, dividend expense on short sales/interest expense, taxes, brokerage commissions, other investment-related costs and extraordinary expenses, such as litigation and other expenses not incurred in the ordinary course of the Funds’ business. In late October 2013, it was discovered that the Large Cap Value Fund and Long/Short Fund had a 12b-1 receivable on the books which dated back to 2008 prior to the conversion of the 1st Source Funds to Wasatch Funds. It was
122
determined that the amount should be written off as an extraordinary expense and posted to other expenses. The balance for the Large Cap Value Fund was $70,993 and for the Long/Short Fund was $8,622. The impact of these write-offs is reflected in the Financial Highlights. Investment advisory fees and fees waived, if any, for the year ended September 30, 2017 are disclosed in the Statements of Operations. Investment advisory fee and expense limitation annual rates are shown below.
| | | | | | | | | | | | | | | | | | | | |
| Fund | | Advisory
Fee | | | Expense
Limitation
Investor Class | | | Expense
Limitation
Institutional Class | | | Contractual Expense
Limitation/
Reimbursement
Recoverable
Expiration Date | | | Reimbursement
Recoverable | |
Core Growth Fund | | | 1.00% | | | | 1.50% | | | | 1.05% | | | | 1/31/2019 | | | $ | 136,395 | |
Emerging India Fund | | | 1.25% | | | | 1.75% | | | | 1.50% | | | | 1/31/2019 | | | | 30,597 | |
Emerging Markets Select Fund | | | 1.00% | | | | 1.50% | | | | 1.20% | | | | 1/31/2019 | | | | 128,774 | |
Emerging Markets Small Cap Fund | | | 1.65% | | | | 1.95% | | | | 1.80% | | | | 1/31/2019 | | | | 452,003 | |
Frontier Emerging Small Countries Fund | | | 1.75% | | | | 2.25% | | | | 2.05% | | | | 1/31/2019 | | | | 555,297 | |
Global Opportunities Fund | | | 1.25% | | | | 1.75% | | | | 1.35% | | | | 1/31/2019 | | | | 33,503 | |
International Growth Fund | | | 1.25% | | | | 1.75% | | | | 1.35% | | | | 1/31/2019 | | | | 95,402 | |
International Opportunities Fund | | | 1.75% | | | | 2.25% | | | | 1.95% | | | | 1/31/2019 | | | | 162,344 | |
Large Cap Value Fund | | | 0.90% | | | | 1.10% | | | | 0.95% | | | | 1/31/2019 | | | | 165,537 | |
Long/Short Fund | | | 1.10% | | | | 1.60% | | | | 1.15% | | | | 1/31/2019 | | | | 60,547 | |
Micro Cap Fund1 | | | 1.50% | | | | 1.95% | | | | N/A | | | | 1/31/2019 | | | | — | |
Micro Cap Value Fund1 | | | 1.50% | | | | 1.95% | | | | N/A | | | | 1/31/2019 | | | | — | |
Small Cap Growth Fund | | | 1.00% | | | | 1.50% | | | | 1.05% | | | | 1/31/2019 | | | | 233,805 | |
Small Cap Value Fund | | | 1.00% | | | | 1.50% | | | | 1.05% | | | | 1/31/2019 | | | | 40,673 | |
Strategic Income Fund | | | 0.70% | | | | 0.95% | | | | N/A | | | | 1/31/2019 | | | | 70,046 | |
Ultra Growth Fund | | | 1.00% | | | | 1.50% | | | | N/A | | | | 1/31/2019 | | | | — | |
World Innovators Fund | | | 1.50% | | | | 1.95% | | | | 1.55% | | | | 1/31/2019 | | | | 32,700 | |
Income Fund | | | 0.55% | | | | N/A | | | | N/A | | | | N/A | | | | N/A | |
U.S. Treasury Fund | | | 0.50% | | | | 0.75% | | | | N/A | | | | 1/31/2019 | | | | — | |
| 1 | Effective January 31, 2017, the management fee was reduced from 1.75% to 1.50%. |
Affiliated Trades — Certain Funds are permitted to purchase or sell securities from or to certain related affiliated funds under specified conditions outlined in the procedures adopted by the Board of Trustees (the “Board”). The procedures have been designed to ensure that any purchase or sale of securities by the Funds from or to another fund (or funds) that are, or could be, considered an affiliate by virtue of having a common investment advisor (or affiliated investment advisors), common Trustees and/or common officers complies with Rule 17a-7 of the 1940 Act. Further, each transaction is effected at the current market price, as that term is defined under the procedures. During the year ended September 30, 2017, the Funds below engaged in purchases or sales of securities pursuant to Rule 17a-7 of the 1940 Act.
| | | | | | | | |
| Fund | | Purchases | | | Sales | |
Emerging Markets Small Cap Fund | | $ | — | | | $ | 2,985,676 | |
International Opportunities Fund | | | 2,985,676 | | | | — | |
In-Kind Transaction — In April 2017, the Wasatch International Opportunities Fund had a large in-kind redemption with an affiliated person. The transaction was effected consistent with the Funds’ Procedures for Effecting In-Kind Redemptions and was approved in advance by the independent trustees of the Wasatch Funds Trust.
Compensation — Officers serve in that capacity without compensation from the Trust. Beginning in the calendar year of 2017, the Funds’ method of compensating Trustees is to pay each Independent Trustee a retainer of $120,000 per year for services rendered and a fee of $24,000 for each Board of Trustees meeting attended in person or telephonically. In addition, each Independent Trustee receives a fee of $24,000 for attendance at an executive session held with respect to the contract renewal process for the Funds. In addition, the Chairman of the Board receives an additional fee of $30,000 a year as Chairman and $6,000 for attendance in person or telephonically at a Board meeting; the Chairman of the Audit Committee and the Chairman of the Nominating Committee each receive an additional $18,000 per year as Chairman and $3,600 for attendance in person or telephonically at a Board meeting. Additionally, each Independent Trustee is entitled to reimbursement of expenses related to his or her duties as a Trustee of the Funds. The 2017 calendar year compensation is an increase of approximately 15% from the previous calendar year.
Payments by Advisor — During the 2013 and 2014 fiscal years, the Advisor paid certain audit, legal and/or printing fees of the Core Growth, Emerging Markets Small Cap, Large Cap Value, Long/Short (Institutional Class), Small Cap Growth, Small Cap Value, Strategic Income and World Innovators Funds. The Advisor does not intend to be reimbursed for these amounts.
On February 20, 2013, the Advisor discovered a trade error involving the Frontier Emerging Small Countries Fund. The Advisor reimbursed the Fund $4,421.
On October 16, 2014, the Advisor discovered a trade error involving the Ultra Growth Fund. The Advisor reimbursed the Fund $12,267. On August 2, 2016, the Advisor discovered a trade error involving the Small Cap Growth Fund. The Advisor reimbursed the Fund $12,890.
123
Notes to Financial Statements (continued)
The impact of the payments detailed above is reflected in the net expense ratios in the Financial Highlights.
Payments by Sub-Advisor — In June 2016, the Funds filed a proxy statement with the Securities and Exchange Commission to inform shareholders about a Special Meeting of Shareholders of the Wasatch-Hoisington U.S. Treasury Fund. The purpose of the Shareholder Meeting was to ask shareholders to approve a new Sub-Advisory Agreement between Wasatch Advisors, Inc. and Hoisington Investment Management Company (HIMCO) with respect to the Wasatch-Hoisington U.S. Treasury Fund. HIMCO the Sub-Advisor for the Fund, reimbursed the Wasatch-Hoisington U.S. Treasury Fund for the costs associated with the proxy statement filing. The Sub-Advisor does not intend to be reimbursed for this amount.
Transfer Agent Intermediary Fees Reimbursed to the Advisor — Each Fund paid fees to, and reimbursed certain out-of-pocket expenses of, the Funds’ transfer agent during the period. In addition, the Advisor and the Funds’ distributor have entered into selling dealer agreements and service agreements with certain financial services companies, broker-dealers, banks, advisors, retirement service providers or other authorized agents or organizations (each an “Intermediary,” together, “Intermediaries”) to accept purchase, exchange and redemption orders on the Funds’ behalf. For Investor Class shares of the Funds, some Intermediaries do not charge investors a direct transaction fee, but instead charge a fee for accounting and shareholder services that the agent provided to Fund shareholders on the Funds’ behalf. Those services typically included recordkeeping, transaction processing for shareholders’ accounts, communication of tax information, income distribution and other services. Generally, the fee was either a per account charge based on the number of accounts to which the Intermediary provided such services, or was a percentage (as of September 30, 2017 up to 0.40% annually) of the average value of Fund Investor Class shares held in such accounts. The Advisor paid the Intermediary fees and the Funds reimbursed the Advisor for the portion of such fees, which is intended to compensate the Intermediary for provision of services of the type that would be provided by the Funds’ transfer agent or other service providers if the shares were registered on the books of the Funds’ transfer agent. Institutional Class shares of the Funds do not reimburse the Advisor for payments to Intermediaries. The Funds’ reimbursement of expenses incurred for services provided by Intermediaries are included in “Shareholder servicing fees—Investor Class” in the Statements of Operations.
Custodian Out-of-Pocket Expense Reimbursement — In September 2016, State Street Bank and Trust Company (“SSB”), the Funds’ custodian, provided each Fund with an offer to reimburse the Fund for certain out-of-pocket expenses it charged the Fund between 2003 and 2015. The incorrect charges were due to inaccurate billing rates used by SSB for certain out-of-pocket expenses. SSB made the reimbursements in May 2017.
10% Shareholders — As of September 30, 2017, the Funds had individual shareholder accounts and/or omnibus shareholder accounts (comprised of a group of individual shareholders), which individually amounted to more than 10% of the total shares outstanding of the Fund as detailed below:
| | | | | | | | |
| Fund | | Number of
Accounts | | | Percent of Shares
Outstanding | |
Core Growth Fund | | | 2 | | | | 50.49 | % |
Emerging India Fund | | | 2 | | | | 69.56 | % |
Emerging Markets Select Fund | | | 2 | | | | 61.32 | % |
Emerging Markets Small Cap Fund | | | 3 | | | | 62.64 | % |
Frontier Emerging Small Countries Fund | | | 2 | | | | 71.97 | % |
Global Opportunities Fund | | | 3 | | | | 51.73 | % |
International Growth Fund | | | 2 | | | | 58.67 | % |
International Opportunities Fund | | | 3 | | | | 67.30 | % |
Large Cap Value Fund | | | 2 | | | | 77.53 | % |
Long/Short Fund | | | 2 | | | | 65.25 | % |
Micro Cap Fund | | | 2 | | | | 26.16 | % |
Micro Cap Value Fund | | | 2 | | | | 52.38 | % |
Small Cap Growth Fund | | | 2 | | | | 51.08 | % |
Small Cap Value Fund | | | 2 | | | | 43.66 | % |
Strategic Income Fund | | | 3 | | | | 52.93 | % |
Ultra Growth Fund | | | 2 | | | | 29.35 | % |
World Innovators Fund | | | 3 | | | | 56.87 | % |
Income Fund | | | 1 | | | | 87.47 | % |
U.S. Treasury Fund | | | 3 | | | | 59.53 | % |
124
Affiliated Interests — As of September 30, 2017, Wasatch Advisors, Inc. and its affiliates, and the retirement plans of Wasatch Advisors, Inc. and its affiliates, held shares of the Funds which may be redeemed at any time as detailed below:
| | | | | | | | |
| | | Number of
Accounts* | | | Percent of Shares
Outstanding | |
Core Growth Fund | | | 18 | | | | 1.08 | % |
Emerging India Fund | | | 26 | | | | 10.72 | % |
Emerging Markets Select Fund | | | 15 | | | | 20.97 | % |
Emerging Markets Small Cap Fund | | | 16 | | | | 1.51 | % |
Frontier Emerging Small Countries Fund | | | 17 | | | | 0.67 | % |
Global Opportunities Fund | | | 18 | | | | 11.05 | % |
International Growth Fund | | | 16 | | | | 0.85 | % |
International Opportunities Fund | | | 19 | | | | 2.37 | % |
Large Cap Value Fund | | | 11 | | | | 2.73 | % |
Long/Short Fund | | | 5 | | | | 0.60 | % |
Micro Cap Fund | | | 10 | | | | 1.05 | % |
Micro Cap Value Fund | | | 10 | | | | 2.33 | % |
Small Cap Growth Fund | | | 18 | | | | 3.09 | % |
Small Cap Value Fund | | | 9 | | | | 1.65 | % |
Strategic Income Fund | | | 6 | | | | 23.23 | % |
Ultra Growth Fund | | | 7 | | | | 3.27 | % |
World Innovators Fund | | | 9 | | | | 2.37 | % |
Income Fund | | | 3 | | | | 0.02 | % |
U.S. Treasury Fund | | | 10 | | | | 0.98 | % |
| * | Multiple accounts with the same beneficial owner are treated as one account |
8. TRANSACTIONSWITH AFFILIATES
If a Fund’s holding represents ownership of 5% or more of the voting securities of a company, the company is deemed to be an affiliate as defined by the 1940 Act. The following Funds conducted transactions during the year ended September 30, 2017 with an “affiliated company” as so defined:
| | | | | | | | | | | | | | | | | | | | | | | | | | | | |
| | | Share Activity | | | Dividends
Credited to
Income for the period ended
9/30/2017 | | | Gain (Loss)
Realized on
Sale of Shares
for the period ended
9/30/2017 | | | Change in
Unrealized
Appreciation
for the period ended
9/30/2017 | |
| | | Balance
9/30/2016 | | | Purchases/
Additions | | | Sales/
Reductions | | | Balance
9/30/2017 | | | | |
Small Cap Growth Fund | | | | | | | | | | | | | | | | | | | | | | | | | |
Blue Nile, Inc.* | | | 828,553 | | | | — | | | | 828,553 | | | | — | | | $ | — | | | $ | 4,523,310 | | | $ | 392,806 | |
Chefs’ Warehouse, Inc. (The)* | | | 1,897,093 | | | | — | | | | 952,705 | | | | 944,388 | | | | — | | | | (8,229,386 | ) | | | 18,678,752 | |
Papa Murphy’s Holdings, Inc.* | | | 1,042,768 | | | | — | | | | 1,042,768 | | | | — | | | | — | | | | (11,753,461 | ) | | | 9,395,266 | |
Zumiez, Inc.* | | | 1,265,079 | | | | — | | | | 1,265,079 | | | | — | | | | — | | | | (9,492,625 | ) | | | 2,483,664 | |
| * | This security was deemed to no longer meet the criteria of an affiliated company at the reporting date. For financial statement purposes, the total amount of the gain (loss) realized on sale of shares and the total change in unrealized appreciation for the period ended September 30, 2017 is included in the Statement of Operations even though the securities were not affiliated companies as of year end. |
9. RESTRICTED SECURITIES
The Funds may own investments that were purchased through private placement transactions or under Rule 144A of the Securities Act of 1933 (the “Securities Act”) and cannot be sold without prior registration under the Securities Act or may be limited due to certain restrictions. These securities are generally deemed to be illiquid and are valued at fair value as determined by a designated Pricing Committee of the Advisor (“Pricing Committee”), comprised of personnel of the Advisor, with oversight by the Board of Trustees and in accordance with Board-approved Pricing Policies and Procedures. If and when such securities are registered, the costs of registering such securities are paid by the issuer. At September 30, 2017, the Funds held the following restricted securities:
| | | | | | | | | | | | | | | | | | |
| | | Security
Type | | Acquisition
Date | | | Cost | | | Fair
Value | | | Value as a Percent
of Net Assets | |
Core Growth Fund | | | | | | | | | | | | | | | | | | |
DocuSign, Inc., Series F Pfd. | | Preferred Stock | | | 4/30/15 | | | $ | 4,000,004 | | | $ | 4,024,495 | | | | 0.25 | % |
|
| |
Emerging India Fund | | | | | | | | | | | | | | | | | | |
ICICI Lombard General Insurance Co. Ltd. | | Common Stock | | | 9/14/17 | | | $ | 1,560,450 | | | $ | 1,521,247 | | | | 0.66 | % |
|
| |
125
Notes to Financial Statements (continued)
| | | | | | | | | | | | | | | | | | |
| | | Security
Type | | Acquisition
Date | | | Cost | | | Fair
Value | | | Value as a Percent
of Net Assets | |
Micro Cap Value Fund | | | | | | | | | | | | | | | | | | |
Acetylon Pharmaceuticals, Inc. | | Right | | | 12/21/16 | | | $ | — | | | $ | 326,356 | | | | 0.15 | % |
Acetylon Pharmaceuticals, Inc. | | Right | | | 12/21/16 | | | | — | | | | — | | | | 0.00 | % |
Regenacy Pharmaceuticals, LLC | | LLC Membership Interest | | | 12/21/16 | | | | 30,001 | | | | 51,476 | | | | 0.02 | % |
Synergetics USA, Inc. | | Right | | | 10/14/15 | | | | 71,250 | | | | 18,750 | | | | 0.01 | % |
Vertex Energy, Inc. | | Warrants | | | 6/22/15 | | | | 95,000 | | | | 2,500 | | | | 0.00 | % |
Vertex Energy, Inc., Pfd. Series B | | Convertible Preferred Stock | | | 6/22/15 - 7/10/17 | | | | 1,652,801 | | | | 1,460,260 | | | | 0.68 | % |
| | | | | | | | | | |
| | | | | | | | $ | 1,849,052 | | | $ | 1,859,342 | | | | 0.86 | % |
|
| |
Small Cap Growth Fund | | | | | | | | | | | | | | | | | | |
DataStax, Inc., Series E Pfd. | | Preferred Stock | | | 8/12/14 | | | $ | 8,000,002 | | | $ | 6,397,861 | | | | 0.38 | % |
DocuSign, Inc., Series B Pfd. | | Preferred Stock | | | 3/3/14 | | | | 437,257 | | | | 639,616 | | | | 0.04 | % |
DocuSign, Inc., Series B-1 Pfd. | | Preferred Stock | | | 3/3/14 | | | | 130,983 | | | | 191,601 | | | | 0.01 | % |
DocuSign, Inc., Series D Pfd. | | Preferred Stock | | | 3/3/14 | | | | 313,930 | | | | 459,215 | | | | 0.03 | % |
DocuSign, Inc., Series E Pfd. | | Preferred Stock | | | 3/3/14 | | | | 8,117,819 | | | | 11,874,700 | | | | 0.70 | % |
DocuSign, Inc., Series F Pfd. | | Preferred Stock | | | 4/30/15 | | | | 2,999,984 | | | | 3,018,352 | | | | 0.18 | % |
Drilling Info Holdings, Inc., Series B Pfd. | | Preferred Stock | | | 9/5/13 | | | | 12,287,381 | | | | 11,697,096 | | | | 0.69 | % |
ForeScout Technologies, Inc., Series G | | Preferred Stock | | | 11/25/15 | | | | 6,000,003 | | | | 9,116,040 | | | | 0.54 | % |
Greenspring Global Partners II-B, L.P. | | LP Interest | | | 10/10/03 - 3/31/17 | | | | 2,109,731 | | | | 2,155,108 | | | | 0.13 | % |
Greenspring Global Partners III-B, L.P. | | LP Interest | | | 3/16/06 - 6/29/17 | | | | 781,848 | | | | 1,090,237 | | | | 0.06 | % |
Nanosys, Inc., Series D Pfd. | | Preferred Stock | | | 11/8/05 | | | | 2,000,000 | | | | 1,275,390 | | | | 0.08 | % |
Nanosys, Inc., Series E Pfd. | | Preferred Stock | | | 8/13/10 | | | | 184,939 | | | | 204,305 | | | | 0.01 | % |
| | | | | | | | | | | | | | | | | | |
| | | | | | | | $ | 43,363,877 | | | $ | 48,119,521 | | | | 2.85 | % |
|
| |
Strategic Income Fund | | | | | | | | | | | | | | | | | | |
Star Asia Capital Corp Ltd. | | Common Stock | | | 2/22/07 - 5/11/15 | | | $ | 572,598 | | | $ | 885,728 | | | | 1.97 | % |
|
| |
Ultra Growth Fund | | | | | | | | | | | | | | | | | | |
Data Sciences International, Inc., Series B Pfd. | | Preferred Stock | | | 1/20/06 | | | $ | 399,811 | | | $ | 265,717 | | | | 0.24 | % |
Drilling Info Holdings, Inc., Series B Pfd. | | Preferred Stock | | | 9/5/13 | | | | 920,553 | | | | 876,330 | | | | 0.79 | % |
Greenspring Global Partners II-B, L.P. | | LP Interest | | | 10/10/03 - 3/31/17 | | | | 1,900,859 | | | | 1,939,589 | | | | 1.74 | % |
Greenspring Global Partners III-B, L.P. | | LP Interest | | | 3/16/06 - 6/29/17 | | | | 782,860 | | | | 1,090,237 | | | | 0.98 | % |
Nanosys, Inc., Series D Pfd. | | Preferred Stock | | | 11/8/05 | | | | 500,001 | | | | 318,848 | | | | 0.29 | % |
Nanosys, Inc., Series E Pfd. | | Preferred Stock | | | 8/13/10 | | | | 46,235 | | | | 51,077 | | | | 0.04 | % |
| | | | | | | | | | | | | | | | | | |
| | | | | | | | $ | 4,550,319 | | | $ | 4,541,798 | | | | 4.08 | % |
|
| |
World Innovators Fund | | | | | | | | | | | | | | | | | | |
Greenspring Global Partners II-B, L.P. | | LP Interest | | | 10/10/13 - 3/31/17 | | | $ | 211,184 | | | $ | 215,512 | | | | 0.11 | % |
|
| |
10. LINEOF CREDIT
Effective May 19, 2017, the Funds in the Trust renewed and amended agreements for two open lines of credit totaling $300,000,000, one of which is $100,000,000 committed, and the other of which is $200,000,000 uncommitted, with State Street Bank and Trust Company (together, the “Line”). The agreements, as amended, have no change in the committed, uncommitted and total amounts available on the Line. The Funds incur commitment fees on the undrawn portion of the committed part of the Line, and interest expense to the extent of amounts drawn (borrowed) under the entire Line. Interest is based on the higher of (a) the federal-funds rate in effect on the date of borrowing, plus a margin, or (b) the overnight London Interbank Offered Rate (LIBOR) in effect on the date of borrowing, plus a margin. Commitment fees are pro-rated among the Funds based upon relative average net assets. Interest expense is charged directly to a Fund based upon actual amounts borrowed by that Fund.
For the year ended September 30, 2017, the following Funds had borrowings:
| | | | | | | | | | | | | | | | | | | | |
| Funds Utilizing the Line of Credit | | Average Daily
Borrowings | | | Number of
Days
Outstanding | | | Interest
Expense | | | Weighted
Average
Annualized
Interest Rate | | | Balance at
9/30/2017 | |
Emerging India Fund | | $ | 598,372 | | | | 11 | | | $ | 391 | | | | 2.14 | % | | $ | — | |
Emerging Markets Select Fund | | | 637,492 | | | | 100 | | | | 3,619 | | | | 2.04 | % | | | — | |
Emerging Markets Small Cap Fund | | | 4,683,122 | | | | 122 | | | | 35,030 | | | | 2.21 | % | | | — | |
Frontier Emerging Small Countries Fund | | | 7,937,905 | | | | 170 | | | | 75,908 | | | | 2.03 | % | | | — | |
Global Opportunities Fund | | | 2,214,538 | | | | 118 | | | | 14,376 | | | | 1.98 | % | | | — | |
International Growth Fund | | | 11,287,079 | | | | 12 | | | | 9,209 | | | | 2.45 | % | | | 38,706,233 | |
International Opportunities Fund | | | 9,553,479 | | | | 29 | | | | 16,705 | | | | 2.17 | % | | | — | |
126
| | | | | | | | | | | | | | | | | | | | |
| Funds Utilizing the Line of Credit (continued) | | Average Daily
Borrowings | | | Number of
Days
Outstanding | | | Interest
Expense | | | Weighted
Average
Annualized
Interest Rate | | | Balance
at
9/30/2017 | |
Micro Cap Fund | | $ | 527,905 | | | | 19 | | | $ | 670 | | | | 2.41 | % | | $ | — | |
Small Cap Growth Fund | | | 7,924,502 | | | | 64 | | | | 28,313 | | | | 2.01 | % | | | — | |
Small Cap Value Fund | | | 2,587,257 | | | | 3 | | | | 474 | | | | 2.20 | % | | | — | |
Ultra Growth Fund | | | 683,058 | | | | 8 | | | | 373 | | | | 2.46 | % | | | — | |
Income Fund | | | 284,968 | | | | 1 | | | | 18 | | | | 2.24 | % | | | — | |
11. PRINCIPAL RISKS
Market and Credit Risk — In the normal course of business the Funds trade financial instruments and enter into financial transactions where risk of loss exists due to changes in the market (market risk) or the failure of the other party to a transaction to perform (credit risk). Similar to credit risk, the Funds may be exposed to counterparty risk, or the risk that an institution or other entity with which the Funds have unsettled or open transactions will default. The potential loss could exceed the value of the financial assets recorded in the financial statements. Financial assets, which potentially expose the Funds to credit risk, consist principally of cash due from counterparties and investments. The extent of the Funds’ exposure to credit and counterparty risks with respect to these financial assets approximates their carrying value as recorded in the Funds’ Statements of Assets and Liabilities.
Inflation Risk — Inflation risk is the possibility that inflation will reduce the purchasing power of a currency, and subsequently reduce the value of a security or asset, and may result in rising interest rates. Inflation is the overall upward price movement of goods and services in an economy that causes the value of a currency to decline.
Interest Rate Risk — Interest rate risk is the risk that fixed-income securities will decline in value because of changes in interest rates. A rise in interest rates typically causes a decline in values. Interest rate risk should be modest for shorter-term securities, moderate for intermediate-term securities and high for longer-term securities. Generally, an increase in the average maturity of a fund will make it more sensitive to interest rate risk. The interest rate is the amount charged, expressed as a percentage of principal, by a lender to a borrower for the use of assets.
Foreign Currency Risk — If a fund invests directly in foreign currencies or in securities that trade in, and receive revenues in, foreign currencies, or in derivatives that provide exposure to foreign currencies, it will be subject to the risk that those currencies will decline in value relative to the U.S. dollar. This also includes the risk associated with higher transaction costs, delayed settlements, currency controls and adverse economic developments related to foreign investments.
Region Risk — The Funds, except the U.S. Treasury Fund, invest in equity and fixed-income securities of non-U.S. issuers. Because certain foreign markets are illiquid, market prices may not necessarily represent realizable value. Although the Funds maintain diversified investment portfolios, political or economic developments within a particular country or region may have an adverse effect on the ability of domiciled issuers to meet their obligations. These
risks are exaggerated for securities of issuers tied economically to emerging and frontier market countries. Additionally, political or economic developments may have an adverse effect on the liquidity and volatility of portfolio securities and currency holdings. For example, after the date of this report, there has been significant political upheaval in Zimbabwe, and as a result the Pricing Committee has applied a discount to the Zimbabwe assets held by the Frontier Emerging Small Countries Fund.
India Region Risk — The securities markets in the India region (India, Bangladesh, Pakistan and Sri Lanka) are substantially smaller, less liquid and more volatile than the major securities markets in the United States and the securities industries in these countries are comparatively underdeveloped. Financial intermediaries may not perform as well as their counterparts in the United States or in other countries with more developed securities markets. In some cases, physical delivery of securities in small lots has been required in India and shortages of vault capacity and trained personnel has existed among qualified custodial Indian banks. A fund may be unable to sell securities when the registration process is incomplete and may experience delays in receipt of dividends. If trading volume is limited by operational difficulties, the ability of the fund to invest may be impaired and the fund’s ability to buy or sell Indian securities may be impaired if the fund’s ability to transact is denied, delayed, suspended or not renewed by local regulators. In recent years, exchange-listed companies in the information-technology sector and related industries (such as software) have grown so as to represent a significant portion of the total capitalization of the Indian market. The value of these companies will generally fluctuate in response to technological and regulatory developments. In addition, governmental actions can have a significant effect on economic conditions in the India region, which could adversely affect the value and liquidity of investments. Although the governments of India, Bangladesh, Pakistan and Sri Lanka have recently begun to institute economic reform policies, there can be no assurance that they will continue to pursue such policies or, if they do, that such policies will succeed. The region is an uncertain tax environment and it is difficult to know and predict the potential implications of future tax developments. Religious, cultural and military disputes persist in India, and between India and Pakistan (as well as sectarian groups within each country). The longstanding border dispute with Pakistan remains unresolved. In recent years, terrorists believed to be based in Pakistan struck Mumbai (India’s financial capital), further damaging relations between the two countries. If the Indian government is unable to control the violence and disruption associated
127
Notes to Financial Statements (continued)
with these tensions (including both domestic and external sources of terrorism), the result may be military conflict, which could destabilize the economy of India. Both India and Pakistan have tested nuclear arms, and the threat of deployment of such weapons could hinder development of the Indian economy, and escalating tensions could impact the broader region, including China.
Liquidity Risk — The trading market for a particular security may be less liquid than it appears and the market prices may not represent realizable value. This may be likely when a fund has a proportionately large investment in securities with small market capitalizations or securities in foreign markets that trade infrequently. Reduced liquidity will have an adverse impact on a fund’s ability to sell such securities quickly at the currently marked price if necessary to meet redemptions.
Shareholder Concentration Risk — A significant portion of the net assets of the Frontier Emerging Small Countries Fund is owned by a group of shareholders advised by a common investment advisor. The Emerging Markets Select Fund also has a significant portion of net assets concentrated in relatively few related accounts. In the event of significant redemption activity by these shareholders, the Funds could experience a loss when selling portfolio securities to meet such redemption requests. The Funds could be forced to sell portfolio securities at unfavorable prices in an effort to generate sufficient cash to pay redeeming shareholders. Fund expenses may increase and performance may be materially affected.
12. FAIR VALUE MEASUREMENTSAND INVESTMENTS
The fair value of a financial instrument is the amount that would be received to sell an asset or paid to transfer a liability in an orderly transaction between market participants at the measurement date. The Funds use various methods to measure the fair value of their investments on a recurring basis. U.S. GAAP established a hierarchy that prioritizes inputs to valuation methods. The three levels of inputs are:
| | • | | Level 1 — Unadjusted quoted prices in active markets for identical assets or liabilities that the Funds have the ability to access. |
| | • | | Level 2 — Observable inputs other than quoted prices included in Level 1 that are observable for the asset or liability, either directly or indirectly. The inputs may include quoted prices for the identical investment on an inactive market, prices for similar investments, interest rates, prepayment speeds, credit risk, yield curves, default rates and similar data. |
| | • | | Level 3 — Unobservable inputs for the asset or liability, to the extent relevant observable inputs are not available, representing the Funds’ own assumptions about the assumptions a market participant would use in valuing the asset or liability, and would be based on the best information available. |
The availability of observable inputs can vary from security to security and is affected by a wide variety of factors,
including, for example, the type of security, whether a security is new and not yet established in the marketplace, the liquidity of markets, and other characteristics particular to the security. To the extent that valuation is based on models or inputs that are less observable or unobservable in the market, the determination of fair value requires more judgment. Accordingly, the degree of judgment exercised in determining fair value is greatest for instruments categorized in Level 3.
Equity Securities (common and preferred stock) — Securities are valued as of the close of the New York Stock Exchange (“NYSE”) (generally 4:00 p.m. Eastern Time) on the valuation date. Equity securities and listed warrants are valued using a commercial pricing service at the last quoted sales price taken from the primary market in which each security trades and, with respect to equity securities traded on the NASDAQ exchange, such securities are valued using the NASDAQ Official Closing Price (“NOCP”) or the last sales price if no NOCP is available. If there are no sales on the primary exchange or market on a day, then the security shall be valued at the mean of the last bid and ask price on the primary exchange or market as provided by a pricing service. If the mean cannot be calculated or there is no trade activity on a day, then the security shall be valued at the previous trading day’s price as provided by a pricing service. In some instances, particularly on foreign exchanges, an official close or evaluated price may be used if the pricing service is unable to provide the last trade or most recent mean price. To the extent that these securities are actively traded and valuation adjustments are not applied, they are categorized in Level 1 of the fair value hierarchy. Additionally, a fund’s investments are valued at fair value by the Pricing Committee if the Advisor determines that an event impacting the value of an investment occurred between the closing time of a security’s primary market or exchange (for example, a foreign exchange or market) and the time the fund’s share price is calculated. Significant events include, but are not limited to the following: significant fluctuations in domestic markets, foreign markets or foreign currencies; occurrences not directly tied to the securities markets such as natural disasters, armed conflicts or significant governmental actions; and major announcements affecting a single issuer or an entire market or market sector. In responding to a significant event, the Pricing Committee determines the fair value of affected securities by considering factors including, but not limited to: index options and futures traded subsequent to the close; American Depositary Receipts (“ADRs”), Global Depositary Receipts (“GDRs”) or other related receipts; currency spot or forward markets that trade after pricing of the foreign exchange; other derivative securities traded after the close such as Standard & Poor’s Depositary Receipts (“SPDRs”) and other exchange-traded funds (“ETFs”); and alternative market quotes on the affected securities. When applicable, the Funds use a systematic fair valuation model provided by an independent third party to assist in adjusting the valuation of foreign securities. When a Fund uses this fair value pricing method, the values assigned to the Fund’s foreign securities may not be the quoted or published prices of the investments on their primary markets or exchanges, and the securities are categorized in Level 2 of the
128
fair value hierarchy. These valuation procedures apply equally to long or short equity positions in a fund.
Participation Notes — Investments are valued at the market price of the underlying security. Counterparty risk is regularly reviewed and considered for valuation.
Corporate Debt Securities — Investments are valued at current market value by a pricing service, or by using the last sale or bid price based on observable inputs. Observable inputs may include benchmark yields, reported trades, broker/dealer quotes, issuer spreads, two-sided markets, benchmark securities, bids, offers and reference data including market research publications. Although most corporate bonds are categorized in Level 2 of the fair value hierarchy, in instances where observable inputs are not available, they are categorized as Level��3.
Short-Term Notes — Investments maturing in 60 days or less at the time of purchase, are generally valued at amortized cost, unless it is determined that the amortized cost method would not represent fair value, in which case the securities are marked-to-market. To the extent the inputs are observable and timely, the values would be categorized in Level 2 of the fair value hierarchy.
Asset-Backed Securities — Investments are priced using the closing bid as supplied by a pricing service based on observable inputs. Observable inputs may include benchmark yields, reported trades, broker/dealer quotes, issuer spreads, two-sided markets, benchmark securities, bids, offers and reference data including market research publications, new issue data, monthly payment information and collateral performance. Although most asset-backed securities are categorized in Level 2 of the fair value hierarchy, in instances where observable inputs are not available, they are categorized as Level 3.
U.S. Government Issuers — Investments are priced using the closing bid as supplied by a pricing service based on observable inputs. Observable inputs may include benchmark yields, reported trades, broker/dealer quotes, issuer spreads, two-sided markets, benchmark securities, bids, offers and reference data including market research publications. Although most U.S. government bonds are categorized in Level 2 of the fair value hierarchy, in instances where observable inputs are not available, they are categorized as Level 3.
Derivative Instruments — Listed derivatives that are actively traded are valued based on quoted prices from the exchange and categorized in Level 1 of the fair value hierarchy. Exchange-traded options are valued at the last sale price in the market where they are principally traded. If there are no sales on the primary exchange or market on a given day, then the option is valued at the mean of the last bid price and ask price on the primary exchange or market as provided by a pricing service. Forward foreign currency contracts are valued at the market rate provided by the pricing service and categorized as Level 2.
Restricted Securities — If market quotations are not readily available for the Funds’ investments in securities such as restricted securities, private placements, securities for which trading has been halted or other illiquid securities, these investments are valued at fair value in accordance with Board-approved Pricing Policies and Procedures by the Pricing Committee with oversight by the Board of Trustees. Fair value is defined as the price that would be received upon the sale of an asset, or paid to transfer a liability, in an orderly transaction between market participants at the measurement date under current market conditions. For each applicable investment that is fair valued, the Pricing Committee considers, to the extent applicable, various factors including, but not limited to, the financial condition of the company or limited partnership, operating results, prices paid in follow-on rounds, comparable companies in the public market, the nature and duration of the restrictions for holding the securities, a stated net asset value (NAV) for the partnership, if applicable, and other relevant factors. Depending on the relative significance of valuation inputs, these instruments may be classified in either Level 2 or Level 3 of the fair value hierarchy.
When the last day of the reporting period is a non-business day, certain foreign markets may be open on days the NYSE is closed, which could result in differences between the value of a fund’s portfolio securities on the last business day and the last calendar day of the reporting period. Any significant security valuation changes due to an open foreign market are adjusted and reflected by the fund for financial reporting purposes.
The following is a summary of the fair valuations according to the inputs used as of September 30, 2017 in valuing the Funds’ assets and liabilities:
| | | | | | | | | | | | | | | | | | |
| Fund | | Category | | Quoted Prices
in Active Markets
for Identical
Investments
(Level 1) | | | Significant Other
Observable Inputs
(Level 2) | | | Significant
Unobservable
Inputs
(Level 3) | | | Value at
9/30/2017 | |
Core Growth Fund | | | | | | | | | | | | | | | | |
Assets | | | | | | | | | | | | | | | | | | |
Common Stocks | | | | $ | 1,552,266,777 | | | $ | — | | | $ | — | | | $ | 1,552,266,777 | |
Preferred Stocks | | | | | — | | | | — | | | | 4,024,495 | | | | 4,024,495 | |
Short-Term Investments | | | | | — | | | | 30,607,602 | | | | — | | | | 30,607,602 | |
| | | | | | |
| | $ | 1,552,266,777 | | | $ | 30,607,602 | | | $ | 4,024,495 | | | $ | 1,586,898,874 | |
| | | | |
129
Notes to Financial Statements (continued)
| | | | | | | | | | | | | | | | | | |
| Fund | | Category | | Quoted Prices
in Active Markets
for Identical
Investments
(Level 1) | | | Significant Other
Observable Inputs
(Level 2) | | | Significant
Unobservable
Inputs
(Level 3) | | | Value at
9/30/2017 | |
Emerging India Fund | | | | | | | | | | | | | | | | | | |
Assets | | | | | | | | | | | | | | | | |
Common Stocks | | Property & Casualty Insurance | | $ | 768,127 | | | $ | — | | | $ | 1,521,247 | | | $ | 2,289,374 | |
| | Other | | | 228,262,399 | | | | — | | | | — | | | | 228,262,399 | |
Short-Term Investments | | | | | — | | | | 3,284,123 | | | | — | | | | 3,284,123 | |
| | | | | | |
| | | | $ | 229,030,526 | | | $ | 3,284,123 | | | $ | 1,521,247 | | | $ | 233,835,896 | |
| | | | | | |
Emerging Markets Select Fund | | | | | | | | | | | | | | | | | | |
Assets | |
Common Stocks | | Health Care Facilities | | $ | 1,963,639 | | | $ | 446,105 | | | $ | — | | | $ | 2,409,744 | |
| | Other | | | 40,938,077 | | | | — | | | | — | | | | 40,938,077 | |
Preferred Stocks | | | | | 1,003,628 | �� | | | — | | | | — | | | | 1,003,628 | |
| | | | | | |
| | | | $ | 43,905,344 | | | $ | 446,105 | | | $ | — | | | $ | 44,351,449 | |
| | | | | | |
Emerging Markets Small Cap Fund | | | | | | | | | | | | | | | | | | |
Assets | |
Common Stocks | | Consumer Finance | | $ | 40,256,276 | | | $ | 16,007,088 | | | $ | — | | | $ | 56,263,364 | |
| | Hotels, Resorts & Cruise Lines | | | 6,387,288 | | | | 9,279,992 | | | | — | | | | 15,667,280 | |
| | Pharmaceuticals | | | 10,759,735 | | | | — | | | | 16,664 | | | | 10,776,399 | |
| | Specialty Chemicals | | | 4,230,117 | | | | 9,919,697 | | | | — | | | | 14,149,814 | |
| | Other | | | 536,717,031 | | | | — | | | | — | | | | 536,717,031 | |
Preferred Stocks | | | | | 8,396,001 | | | | — | | | | — | | | | 8,396,001 | |
Warrants | | | | | 169,680 | | | | — | | | | — | | | | 169,680 | |
Short-Term Investments | | | | | — | | | | 114,452 | | | | — | | | | 114,452 | |
| | | | | | |
| | | | $ | 606,916,128 | | | $ | 35,321,229 | | | $ | 16,664 | | | $ | 642,254,021 | |
| | | | | | |
Frontier Emerging Small Countries Fund | | | | | | | | | | | | | | | | | | |
Assets | | | | | | | | | | | | | | | | | | |
Common Stocks | | Consumer Finance | | $ | 2,965,334 | | | $ | 4,039,340 | | | $ | — | | | $ | 7,004,674 | |
| | Packaged Foods & Meats | | | 8,754,750 | | | | 3,452,086 | | | | — | | | | 12,206,836 | |
| | Wireless Telecommunication Services | | | 6,020,925 | | | | 2,406,145 | | | | — | | | | 8,427,070 | |
| | Other | | | 158,314,036 | | | | — | | | | — | | | | 158,314,036 | |
Preferred Stocks | | | | | 7,048,647 | | | | — | | | | — | | | | 7,048,647 | |
Short-Term Investments | | | | | — | | | | 2,545,919 | | | | — | | | | 2,545,919 | |
| | | | | | |
| | | | $ | 183,103,692 | | | $ | 12,443,490 | | | $ | — | | | $ | 195,547,182 | |
| | | | | | |
Global Opportunities Fund | | | | | | | | | | | | | | | | | | |
Assets | | | | | | | | | | | | | | | | | | |
Common Stocks | | Consumer Finance | | $ | 4,103,871 | | | $ | 1,410,644 | | | $ | — | | | $ | 5,514,515 | |
| | Specialty Chemicals | | | 967,228 | | | | 1,394,100 | | | | — | | | | 2,361,328 | |
| | Other | | | 95,208,120 | | | | — | | | | — | | | | 95,208,120 | |
Warrants | | | | | 32,103 | | | | — | | | | — | | | | 32,103 | |
Short-Term Investments | | | | | — | | | | 170,608 | | | | — | | | | 170,608 | |
| | | | | | |
| | | | $ | 100,311,322 | | | $ | 2,975,352 | | | $ | — | | | $ | 103,286,674 | |
| | | | | | |
International Growth Fund | | | | | | | | | | | | | | | | | | |
Assets | | | | | | | | | | | | | | | | | | |
Common Stocks | | Hotels, Resorts & Cruise Lines | | $ | 13,896,719 | | | $ | 21,287,401 | | | $ | — | | | $ | 35,184,120 | |
| | Specialty Chemicals | | | 45,924,195 | | | | 21,024,656 | | | | — | | | | 66,948,851 | |
| | Other | | | 1,322,924,847 | | | | — | | | | — | | | | 1,322,924,847 | |
| | | | | | |
| | | | $ | 1,382,745,761 | | | $ | 42,312,057 | | | $ | — | | | $ | 1,425,057,818 | |
| | | | | | |
130
| | | | | | | | | | | | | | | | | | |
| Fund | | Category | | Quoted Prices
in Active Markets
for Identical
Investments
(Level 1) | | | Significant Other
Observable Inputs
(Level 2) | | | Significant
Unobservable
Inputs
(Level 3) | | | Value at
9/30/2017 | |
International Opportunities Fund | | | | | | | | | | | | | | | | | | |
Assets | | | | | | | | | | | | | | | | | | |
Common Stocks | | Advertising | | $ | 3,445,314 | | | $ | 2,657,030 | | | $ | — | | | $ | 6,102,344 | |
| | Food Retail | | | 21,289,381 | | | | 4,072,621 | | | | — | | | | 25,362,002 | |
| | Health Care Facilities | | | — | | | | 3,311,468 | | | | — | | | | 3,311,468 | |
| | Other | | | 452,824,863 | | | | — | | | | — | | | | 452,824,863 | |
Short-Term Investments | | | | | — | | | | 6,840,234 | | | | — | | | | 6,840,234 | |
| | | | | | |
| | | | $ | 477,559,558 | | | $ | 16,881,353 | | | $ | — | | | $ | 494,440,911 | |
| | | | | | |
Large Cap Value Fund | | | | | | | | | | | | | | | | | | |
Assets | | | | | | | | | | | | | | | | | | |
Common Stocks | | | | $ | 175,777,825 | | | $ | — | | | $ | — | | | $ | 175,777,825 | |
Short-Term Investments | | | | | — | | | | 5,442,486 | | | | — | | | | 5,442,486 | |
| | | | | | |
| | | | $ | 175,777,825 | | | $ | 5,442,486 | | | $ | — | | | $ | 181,220,311 | |
| | | | | | |
Long/Short Fund | | | | | | | | | | | | | | | | | | |
Assets | | | | | | | | | | | | | | | | | | |
Common Stocks | | | | $ | 95,178,237 | | | $ | — | | | $ | — | | | $ | 95,178,237 | |
Limited Partnership Interest | | | | | 2,699,366 | | | | — | | | | — | | | | 2,699,366 | |
Short-Term Investments | | | | | — | | | | 35,132,336 | | | | — | | | | 35,132,336 | |
| | | | | | |
| | | | $ | 97,877,603 | | | $ | 35,132,336 | | | $ | — | | | $ | 133,009,939 | |
| | | | | | |
Liabilities | | | | | | |
Securities Sold Short | | | | $ | (51,372,975 | ) | | $ | — | | | $ | — | | | $ | (51,372,975 | ) |
| | | | | | |
| | | | $ | (51,372,975 | ) | | $ | — | | | $ | — | | | $ | (51,372,975 | ) |
| | | | | | |
Micro Cap Fund | | | | | | | | | | | | | | | | | | |
Assets | | | | | | | | | | | | | | | | | | |
Common Stocks | | | | $ | 304,343,107 | | | $ | — | | | $ | — | | | $ | 304,343,107 | |
Short-Term Investments | | | | | — | | | | 1,061,240 | | | | — | | | | 1,061,240 | |
| | | | | | |
| | | | $ | 304,343,107 | | | $ | 1,061,240 | | | $ | — | | | $ | 305,404,347 | |
| | | | | | |
Micro Cap Value Fund | | | | | | | | | | | | | | | | | | |
Assets | | | | | | | | | | | | | | | | | | |
Common Stocks | | | | $ | 200,549,042 | | | $ | — | | | $ | — | | | $ | 200,549,042 | |
Convertible Preferred Stocks | | | | | — | | | | — | | | | 1,460,260 | | | | 1,460,260 | |
Rights | | | | | — | | | | — | | | | 345,106 | | | | 345,106 | |
Limited Liability Company Membership Interest | | | | | — | | | | — | | | | 51,476 | | | | 51,476 | |
Warrants | | | | | — | | | | — | | | | 2,500 | | | | 2,500 | |
Short-Term Investments | | | | | — | | | | 14,565,031 | | | | — | | | | 14,565,031 | |
| | | | | | |
| | | | $ | 200,549,042 | | | $ | 14,565,031 | | | $ | 1,859,342 | | | $ | 216,973,415 | |
| | | | | | |
Small Cap Growth Fund | | | | | | | | | | | | | | | | | | |
Assets | | | | | | | | | | | | | | | | | | |
Common Stocks | | | | $ | 1,603,510,441 | | | $ | — | | | $ | — | | | $ | 1,603,510,441 | |
Preferred Stocks | | | | | — | | | | — | | | | 44,874,176 | | | | 44,874,176 | |
Limited Partnership Interest1 | | | | | — | | | | — | | | | — | | | | 3,245,345 | |
Short-Term Investments | | | | | — | | | | 35,091,465 | | | | — | | | | 35,091,465 | |
| | | | | | |
| | | | $ | 1,603,510,441 | | | $ | 35,091,465 | | | $ | 44,874,176 | | | $ | 1,686,721,427 | |
| | | | | | |
Small Cap Value Fund | | | | | | | | | | | | | | | | | | |
Assets | | | | | | | | | | | | | | | | | | |
Common Stocks | | | | $ | 363,192,608 | | | $ | — | | | $ | — | | | $ | 363,192,608 | |
Limited Partnership Interest | | | | | 5,244,406 | | | | — | | | | — | | | | 5,244,406 | |
Short-Term Investments | | | | | — | | | | 3,047,345 | | | | — | | | | 3,047,345 | |
| | | | | | |
| | | | $ | 368,437,014 | | | $ | 3,047,345 | | | $ | — | | | $ | 371,484,359 | |
| | | | | | |
| 1 | Certain investments measured at fair value using the net asset value per share (or its equivalent) practical expedient have not been classified in the fair value levels. The fair value amounts presented in the table are intended to permit reconciliation to the amounts presented in the Schedule of Investments. |
131
Notes to Financial Statements (continued)
| | | | | | | | | | | | | | | | | | |
| Fund | | Category | | Quoted Prices
in Active Markets
for Identical
Investments
(Level 1) | | | Significant Other
Observable Inputs
(Level 2) | | | Significant
Unobservable
Inputs
(Level 3) | | | Value at
9/30/2017 | |
Strategic Income Fund | | | | | | | | | | | | | | | | | | |
Assets | | | | | | | | | | | | | | | | | | |
Common Stocks | | Diversified REITs | | $ | 447,239 | | | $ | — | | | $ | 885,728 | | | $ | 1,332,967 | |
| | Other | | | 32,587,583 | | | | — | | | | — | | | | 32,587,583 | |
Limited Partnership Interest | | | | | 3,835,719 | | | | — | | | | — | | | | 3,835,719 | |
Limited Liability Company Membership Interest | | | | | 1,579 | | | | — | | | | — | | | | 1,579 | |
Short-Term Investments | | | | | — | | | | 7,174,334 | | | | — | | | | 7,174,334 | |
| | | | | | | | | | | | | | | | | | |
| | | | $ | 36,872,120 | | | $ | 7,174,334 | | | $ | 885,728 | | | $ | 44,932,182 | |
| | | | | | |
Ultra Growth Fund | | | | | | | | | | | | | | | | | | |
Assets | | | | | | | | | | | | | | | | | | |
Common Stocks | | | | $ | 102,902,635 | | | $ | — | | | $ | — | | | $ | 102,902,635 | |
Preferred Stocks | | | | | — | | | | — | | | | 1,511,972 | | | | 1,511,972 | |
Limited Partnership Interest1 | | | | | — | | | | — | | | | — | | | | 3,029,826 | |
Short-Term Investments | | | | | — | | | | 807,568 | | | | — | | | | 807,568 | |
| | | | | | | | | | | | | | | | | | |
| | | | $ | 102,902,635 | | | $ | 807,568 | | | $ | 1,511,972 | | | $ | 108,252,001 | |
| | | | | | |
World Innovators Fund | | | | | | | | | | | | | | | | | | |
Assets | | | | | | | | | | | | | | | | | | |
Common Stocks | | | | $ | 165,811,513 | | | $ | — | | | $ | — | | | $ | 165,811,513 | |
Limited Partnership Interest1 | | | | | — | | | | — | | | | — | | | | 215,512 | |
Exchange-Traded Funds | | | | | 98,025 | | | | — | | | | — | | | | 98,025 | |
Short-Term Investments | | | | | — | | | | 29,928,007 | | | | — | | | | 29,928,007 | |
| | | | | | | | | | | | | | | | | | �� |
| | | | $ | 165,909,538 | | | $ | 29,928,007 | | | | — | | | $ | 196,053,057 | |
| | | | | | |
Income Fund | | | | | | | | | | | | | | | | | | |
Assets | | | | | | | | | | | | | | | | | | |
Corporate Bonds | | | | $ | — | | | $ | 51,598,453 | | | $ | — | | | $ | 51,598,453 | |
Asset-Backed Securities | | | | | — | | | | 14,191,222 | | | | 1,009,375 | | | | 15,200,597 | |
Mortgage-Backed Securities | | | | | — | | | | 12,127,552 | | | | — | | | | 12,127,552 | |
U.S. Treasury Notes | | | | | — | | | | 6,512,531 | | | | — | | | | 6,512,531 | |
U.S. Government Agency Securities | | | | | — | | | | 4,223,336 | | | | — | | | | 4,223,336 | |
Municipal Bonds | | | | | — | | | | 3,896,735 | | | | — | | | | 3,896,735 | |
U.S. Treasury Inflation-Protected Securities | | | | | — | | | | 2,004,926 | | | | — | | | | 2,004,926 | |
Short-Term Investments | | | | | — | | | | 779,866 | | | | — | | | | 779,866 | |
| | | | | | | | | | | | | | | | | | |
| | | | $ | — | | | $ | 95,334,621 | | | $ | 1,009,375 | | | $ | 96,343,996 | |
| | | | | | |
U.S. Treasury Fund | | | | | | | | | | | | | | | | | | |
Assets | | | | | | | | | | | | | | | | | | |
U.S. Government Obligations | | | | $ | — | | | $ | 358,672,458 | | | $ | — | | | $ | 358,672,458 | |
Short-Term Investments | | | | | — | | | | 1,803,381 | | | | — | | | | 1,803,381 | |
| | | | | | | | | | | | | | | | | | |
| | | | $ | — | | | $ | 360,475,839 | | | $ | — | | | $ | 360,475,839 | |
| | | | | | |
| 1 | Certain investments measured at fair value using the net asset value per share (or its equivalent) practical expedient have not been classified in the fair value levels. The fair value amounts presented in the table are intended to permit reconciliation to the amounts presented in the Schedule of Investments. |
| | | | | | | | | | | | | | | | |
| Fund | | Fair Value
at 9/30/2017 | | | Unfunded Commitments | | | Redemption
Frequency (if currently
eligible) | | | Redemption Notice Period | |
Small Cap Growth Fund | | | | | | | | | | | | | | | | |
Limited Partnership Interests1 | | $ | 3,245,345 | | | $ | — | | | | — | | | | — | |
Ultra Growth Fund | | | | | | | | | | | | | | | | |
Limited Partnership Interests1 | | $ | 3,029,826 | | | $ | — | | | | — | | | | — | |
World Innovators Fund | | | | | | | | | | | | | | | | |
Limited Partnership Interests1 | | $ | 215,512 | | | $ | — | | | | — | | | | — | |
| 1 | The fair values of these limited partnership interests have been estimated using the net asset value of the Fund’s Limited Partner’s Capital Account. These limited partnership interests can never be redeemed. Distributions from each limited partnership will be received as the underlying investments are liquidated. It is estimated that the underlying assets of the limited partnerships will be liquidated over the next one to five years. The final purchase commitments were made on March 31, 2017 for Greenspring Global Partners II-B, L.P. and June 29, 2017 for Greenspring Global Partners III-B, L.P. |
132
If the securities of an Asset Class are all the same level, the asset class is shown in total. If the securities of an Asset Class cross levels, the level with the smallest number of categories and with multiple levels within a category is displayed by category. The remaining categories that do not cross levels are combined into the “Other” category.
The valuation techniques used by the Funds to measure fair value for the year ended September 30, 2017 maximized the use of observable inputs and minimized the use of unobservable inputs.
The Funds’ policy is to recognize transfers between levels at the end of the reporting period. The table below shows the significant transfers between Level 1 and Level 2 due to fair valuation in certain foreign markets pursuant to a systematic valuation model.
| | | | | | | | |
| Fund | | Transfers Out
Of Level 1 at
Market Value | | | Transfers Into
Level 2 at
Market Value | |
Frontier Emerging Small Countries Fund | | $ | 3,452,086 | | | $ | 3,452,086 | |
| | |
| Fund | | Transfers Out
Of Level 2 at
Market Value | | | Transfers Into
Level 1 at
Market Value | |
Frontier Emerging Small Countries Fund | | $ | 13,325,506 | | | $ | 13,325,506 | |
International Opportunities Fund | | | 7,163,175 | | | | 7,163,175 | |
Small Cap Growth Fund | | | 32,432,542 | | | | 32,432,542 | |
There were transfers of $670,810 in the Emerging India Fund and $1,124,558 in the Global Opportunities Fund from Level 3 to Level 1 due to a change in pricing strategy on a private company that came public. This transfer amount represents the beginning of the period value for ICICI Prudential Life Insurance Co. Ltd., which transferred to Level 1 during the period in order to properly represent the activity on the Level 3 Rollforward presented below.
There were transfers of $572,597 in the Strategic Income Fund from Level 1 to Level 3 due to a reincorporation. This transfer amount represents the value for Star Asia Capital Corp Ltd., which transferred to Level 3 during the period in order to properly represent the activity on the Level 3 Rollforward presented below.
There were transfers out of Level 3 of $3,635,554 in the Small Cap Growth Fund, $3,388,501 in the Ultra Growth Fund and $247,043 in the World Innovators Fund due to a change that eliminates the requirement to categorize within the fair value hierarchy investments whose fair values are measured at net asset value per share (or its equivalent) using the practical expedient. This transfer amount represents the beginning of the period value for Greenspring Global Partners II-B, L.P. and Greenspring Global Partners III-B, L.P, which transferred during the period in order to properly represent the activity on the Level 3 Rollforward presented below.
The following is a reconciliation of the fair valuations using significant unobservable inputs (Level 3) for the Funds during the year ended September 30, 2017:
| | | | | | | | | | | | | | | | | | | | | | | | | | | | | | | | | | | | | | | | |
| Fund | | Market Value
Beginning
Balance
9/30/2016 | | | Purchases
at Cost | | | Sales
(Proceeds) | | | Accrued
Discounts
(Premiums) | | | Realized
Gain/
(Loss) | | | Change in
Unrealized
Appreciation
(Depreciation) | | | Transfers
in at
Market
Value | | | Transfers
out at
Market
Value | | | Market
Value
Ending
Balance
9/30/2017 | | | Net Change in
Unrealized
Appreciation
(Depreciation) on
Investments Held
at 9/30/2017 | |
Core Growth Fund | | | | | | | | | | | | | | | | | | | | | | | | | | | | | | | | | | | | | | | | |
Preferred Stocks | | $ | 3,257,725 | | | $ | — | | | $ | — | | | $ | — | | | $ | — | | | $ | 766,770 | | | $ | — | | | $ | — | | | $ | 4,024,495 | | | $ | 766,770 | |
Warrants | | | 193,457 | | | | — | | | | (1,463 | ) | | | — | | | | 1,463 | | | | (193,457 | ) | | | — | | | | — | | | | — | | | | — | |
| | | | |
| | | 3,451,182 | | | | — | | | | (1,463 | ) | | | — | | | | 1,463 | | | | 573,313 | | | | — | | | | — | | | | 4,024,495 | | | | 766,770 | |
| | | | |
Emerging India Fund | | | | | | | | | | | | | | | | | | | | | | | | | | | | | | | | | | | | | | | | |
Common Stocks | | | 670,810 | | | | 1,560,450 | | | | — | | | | — | | | | — | | | | (39,203 | ) | | | — | | | | (670,810 | ) | | | 1,521,247 | | | | (39,203 | ) |
| | | | |
| | | 670,810 | | | | 1,560,450 | | | | — | | | | — | | | | — | | | | (39,203 | ) | | | — | | | | (670,810 | ) | | | 1,521,247 | | | | (39,203 | ) |
| | | | |
Emerging Markets Small Cap Fund | | | | | | | | | | | | | | | | | | | | | | | | | | | | | | | | | | | | | | | | |
Common Stocks | | | 16,783 | | | | — | | | | — | | | | — | | | | — | | | | (119 | ) | | | — | | | | — | | | | 16,664 | | | | (119 | ) |
| | | | |
| | | 16,783 | | | | — | | | | — | | | | — | | | | — | | | | (119 | ) | | | — | | | | — | | | | 16,664 | | | | (119 | ) |
| | | | |
Global Opportunities Fund | | | | | | | | | | | | | | | | | | | | | | | | | | | | | | | | | | | | | | | | |
Common Stocks | | | 1,124,588 | | | | — | | | | — | | | | — | | | | — | | | | — | | | | — | | | | (1,124,588 | ) | | | — | | | | — | |
| | | | |
| | | 1,124,588 | | | | — | | | | — | | | | — | | | | — | | | | — | | | | — | | | | (1,124,588 | ) | | | — | | | | — | |
| | | | |
Micro Cap Fund | | | | | | | | | | | | | | | | | | | | | | | | | | | | | | | | | | | | | | | | |
Warrants | | | 16,031 | | | | — | | | | (169 | ) | | | — | | | | (1,941 | ) | | | (13,921 | ) | | | — | | | | — | | | | — | | | | — | |
| | | | |
| | | 16,031 | | | | — | | | | (169 | ) | | | — | | | | (1,941 | ) | | | (13,921 | ) | | | — | | | | — | | | | — | | | | — | |
| | | | |
133
Notes to Financial Statements (continued)
| | | | | | | | | | | | | | | | | | | | | | | | | | | | | | | | | | | | | | | | |
| Fund | | Market Value
Beginning
Balance
9/30/2016 | | | Purchases
at Cost | | | Sales
(Proceeds) | | | Accrued
Discounts
(Premiums) | | | Realized
Gain/
(Loss) | | | Change in
Unrealized
Appreciation
(Depreciation) | | | Transfers
in at
Market
Value | | | Transfers
out at
Market
Value | | | Market
Value
Ending
Balance
9/30/2017 | | | Net Change in
Unrealized
Appreciation
(Depreciation) on
Investments Held
at 9/30/2017 | |
Micro Cap Value Fund | | | | | | | | | | | | | | | | | | | | | | | | | | | | | | | | | | | | | | | | |
Convertible Preferred Stocks | | $ | 1,387,781 | | | $ | 101,057 | | | $ | — | | | $ | — | | | $ | — | | | $ | (28,578 | ) | | $ | — | | | $ | — | | | $ | 1,460,260 | | | $ | (28,578 | ) |
Rights | | | 37,500 | | | | — | | | | — | | | | — | | | | — | | | | 307,606 | | | | — | | | | — | | | | 345,106 | | | | 307,606 | |
Limited Liability Company Membership Interest | | | — | | | | 30,001 | | | | — | | | | — | | | | — | | | | 21,475 | | | | — | | | | — | | | | 51,476 | | | | 21,475 | |
Preferred Stocks | | | 1,379,998 | | | | — | | | | (809,588 | ) | | | — | | | | 309,589 | | | | (879,999 | ) | | | — | | | | — | | | | — | | | | (879,999 | ) |
Warrants | | | 25,000 | | | | — | | | | — | | | | — | | | | — | | | | (22,500 | ) | | | — | | | | — | | | | 2,500 | | | | (22,500 | ) |
| | | | |
| | | 2,830,279 | | | | 131,058 | | | | (809,588 | ) | | | — | | | | 309,589 | | | | (601,996 | ) | | | — | | | | — | | | | 1,859,342 | | | | (601,996 | ) |
| | | | |
Small Cap Growth Fund | | | | | | | | | | | | | | | | | | | | | | | | | | | | | | | | | | | | | | | | |
Preferred Stocks | | | 37,948,338 | | | | — | | | | (3,062,620 | ) | | | — | | | | — | | | | 9,988,458 | | | | — | | | | — | | | | 44,874,176 | | | | 9,988,458 | |
Limited Partnership Interest | | | 3,635,554 | | | | — | | | | — | | | | — | | | | — | | | | — | | | | — | | | | (3,635,554 | ) | | | — | | | | — | |
Warrants | | | 484,816 | | | | — | | | | (3,833 | ) | | | — | | | | (3,545 | ) | | | (477,438 | ) | | | — | | | | — | | | | — | | | | — | |
| | | | |
| | | 42,068,708 | | | | — | | | | (3,066,453 | ) | | | — | | | | (3,545 | ) | | | 9,511,020 | | | | — | | | | (3,635,554 | ) | | | 44,874,176 | | | | 9,988,458 | |
| | | | |
Small Cap Value Fund | | | | | | | | | | | | | | | | | | | | | | | | | | | | | | | | | | | | | | | | |
Warrants | | | 108,300 | | | | — | | | | (819 | ) | | | — | | | | 819 | | | | (108,300 | ) | | | — | | | | — | | | | — | | | | — | |
| | | | |
| | | 108,300 | | | | — | | | | (819 | ) | | | — | | | | 819 | | | | (108,300 | ) | | | — | | | | — | | | | — | | | | — | |
| | | | |
Strategic Income Fund | | | | | | | | | | | | | | | | | | | | | | | | | | | | | | | | | | | | | | | | |
Common Stocks | | | — | | | | — | | | | — | | | | — | | | | — | | | | 313,131 | | | | 572,597 | | | | — | | | | 885,728 | | | | 313,130 | |
Corporate Bonds | | | 314 | | | | — | | | | (340 | ) | | | — | | | | (151,652 | ) | | | 151,678 | | | | — | | | | — | | | | — | | | | — | |
| | | | |
| | | 314 | | | | — | | | | (340 | ) | | | — | | | | (151,652 | ) | | | 464,809 | | | | 572,597 | | | | — | | | | 885,728 | | | | 313,130 | |
| | | | |
Ultra Growth Fund | | | | | | | | | | | | | | | | | | | | | | | | | | | | | | | | | | | | | | | | |
Preferred Stocks | | | 1,251,300 | | | | — | | | | (229,447 | ) | | | — | | | | — | | | | 490,119 | | | | — | | | | — | | | | 1,511,972 | | | | 490,119 | |
Limited Partnership Interest | | | 3,388,501 | | | | — | | | | — | | | | — | | | | — | | | | — | | | | — | | | | (3,388,501 | ) | | | — | | | | — | |
Warrants | | | 20,924 | | | | — | | | | (181 | ) | | | — | | | | (845 | ) | | | (19,898 | ) | | | — | | | | — | | | | — | | | | — | |
| | | | |
| | | 4,660,725 | | | | — | | | | (229,628 | ) | | | — | | | | (845 | ) | | | 470,221 | | | | — | | | | (3,388,501 | ) | | | 1,511,972 | | | | 490,119 | |
| | | | |
World Innovators Fund | | | | | | | | | | | | | | | | | | | | | | | | | | | | | | | | | | | | | | | | |
Limited Partnership Interest | | | 247,043 | | | | — | | | | — | | | | — | | | | — | | | | — | | | | — | | | | (247,043 | ) | | | — | | | | — | |
| | | | |
| | | 247,043 | | | | — | | | | — | | | | — | | | | — | | | | — | | | | — | | | | (247,043 | ) | | | — | | | | — | |
| | | | |
Income Fund | | | | | | | | | | | | | | | | | | | | | | | | | | | | | | | | | | | | | | | | |
Asset-Backed Securities | | | — | | | | 1,000,000 | | | | — | | | | — | | | | — | | | | 9,375 | | | | — | | | | — | | | | 1,009,375 | | | | 9,375 | |
| | | | |
| | | — | | | | 1,000,000 | | | | — | | | | — | | | | — | | | | 9,375 | | | | — | | | | — | | | | 1,009,375 | | | | 9,375 | |
| | | | |
QUANTITATIVE INFORMATION ABOUT LEVEL 3 FAIR VALUE MEASUREMENTS
| | | | | | | | | | | | | | |
| Fund | | Description | | Fair Value
at 9/30/2017 | | | Valuation Technique | | Unobservable Input | | Range
(Average) | |
Core Growth Fund | | Direct Venture Capital Investments: Systems Software | | $ | 4,024,495 | | | Market comparable companies | | EV/R* multiple Discount for lack of marketability | |
| 6.1 - 10.0 (8.3)
20% |
|
Emerging India Fund | | Common Stock: Property & Casualty Insurance | | $ | 1,521,247 | | | Discount to market | | Discount for lack of marketability | | | 4% | |
Micro Cap Value Fund | | Rights: Pharmaceuticals | | $ | 326,356 | | | Probability of receipt | | Probability of receipt | | | 50% | |
Micro Cap Value Fund | | Private Investment in a Public Equity: Oil & Gas Refining & Marketing | | $ | 1,460,260 | | | Bond model with call option | | Bond model with call option | | | 100% | |
Small Cap Growth Fund | | Direct Venture Capital Investments: Biotechnology | | $ | 1,479,695 | | | Market comparable companies | | EV/R* multiple Discount for lack of marketability | |
| 1.1 - 12.1 (5.3)
20% |
|
Small Cap Growth Fund | | Direct Venture Capital Investments: Computer Services Software & Systems | | $ | 6,397,861 | | | Liquidation preference | | Probability weighting | | | 80% | |
134
| | | | | | | | | | | | | | |
| Fund | | Description | | Fair Value
at 9/30/2017 | | | Valuation Technique | | Unobservable Input | | Range
(Average) | |
Small Cap Growth Fund | | Direct Venture Capital Investments: Oil & Gas Equipment & Services | | $ | 11,697,096 | | | Market comparable companies | | EV/R* multiple
Discount for lack of marketability | |
| 1.4 - 9.2 (5.7)
20% |
|
Small Cap Growth Fund | | Direct Venture Capital Investments: Systems Software | | $ | 16,183,484 | | | Market comparable companies | | EV/R* multiple
Discount for lack of marketability | |
| 6.1 - 10.0 (8.3)
20% |
|
Small Cap Growth Fund | | Direct Venture Capital Investments: Systems Software | | $ | 9,116,040 | | | Market comparable companies | | EV/R* multiple
Discount for lack of marketability | |
| 3.7 - 7.9 (5.9)
20% |
|
Strategic Income Fund | | Common Stock: Diversified REITs | | $ | 885,728 | | | Last trade | | Last trade | | | 100% | |
Ultra Growth Fund | | Direct Venture Capital Investments: Biotechnology | | $ | 369,925 | | | Market comparable companies | | EV/R* multiple
Discount for lack of marketability | |
| 1.1 - 12.1 (5.3)
20% |
|
Ultra Growth Fund | | Direct Venture Capital Investments: Health Care Technology | | $ | 265,717 | | | Probability of completion of repurchase | | Discount to repurchase amount | | | 20% | |
Ultra Growth Fund | | Direct Venture Capital Investments: Oil & Gas Equipment & Services | | $ | 876,330 | | | Market comparable companies | | EV/R* multiple
Discount for lack of marketability | |
| 1.4 - 9.2 (5.7)
20% |
|
Income Fund | | Asset-Backed Security | | $ | 1,009,375 | | | Broker bid | | Broker bid | | | 100% | |
| * | Enterprise-Value-To-Revenue Multiple — (“EV/R”) is a measure of the value of a stock that compares a company’s enterprise value to its revenue. |
Changes in EV/R multiples may change the fair value of an investment. Generally, a decrease in this multiple will result in a decrease in the fair value of an investment.
The Funds’ other Level 3 investments have been valued using observable inputs, unadjusted third-party transactions and quotations or unadjusted historical third party information. No unobservable inputs internally developed by the Funds have been applied to these investments, thus they have been excluded from the above table.
13. OFFSETTING
Each Fund is party to various netting arrangements. The FASB requires disclosure about certain netting arrangements and similar agreements to enable users of a Fund’s financial statements to evaluate the effect or potential effect of netting arrangements on the Fund’s financial position. The scope of the disclosure is limited to derivative instruments, repurchase agreements and reverse repurchase agreements, and securities borrowing and securities lending transactions.
The following tables present information about financial instruments that were subject to enforceable netting arrangements as of September 30, 2017:
REPURCHASE AGREEMENTS
| | | | | | | | | | | | | | | | | | |
| | | Gross Amounts Not Offset in the Statements of Assets and Liabilities | |
| Fund | | Counterparty | | Gross Asset Amounts
Presented in Statements
of Assets and Liabilities | | | Financial
Instrument | | | Collateral
Received1 | | | Net Amount
(Not Less
Than 0) | |
Core Growth Fund | | Fixed Income Clearing Corp. | | $ | 30,607,602 | | | $ | — | | | $ | (30,607,602 | ) | | $ | — | |
Emerging India Fund | | Fixed Income Clearing Corp. | | | 3,284,123 | | | | — | | | | (3,284,123 | ) | | | — | |
Emerging Markets Small Cap Fund | | Fixed Income Clearing Corp. | | | 114,452 | | | | — | | | | (114,452 | ) | | | — | |
Frontier Emerging Small Countries Fund | | Fixed Income Clearing Corp. | | | 2,545,919 | | | | — | | | | (2,545,919 | ) | | | — | |
Global Opportunities Fund | | Fixed Income Clearing Corp. | | | 170,608 | | | | — | | | | (170,608 | ) | | | — | |
International Opportunities Fund | | Fixed Income Clearing Corp. | | | 6,840,234 | | | | — | | | | (6,840,234 | ) | | | — | |
Large Cap Value Fund | | Fixed Income Clearing Corp. | | | 5,442,486 | | | | — | | | | (5,442,486 | ) | | | — | |
Long/Short Fund | | Fixed Income Clearing Corp. | | | 35,132,336 | | | | — | | | | (35,132,336 | ) | | | — | |
Micro Cap Fund | | Fixed Income Clearing Corp. | | | 1,061,240 | | | | — | | | | (1,061,240 | ) | | | — | |
Micro Cap Value Fund | | Fixed Income Clearing Corp. | | | 14,565,031 | | | | — | | | | (14,565,031 | ) | | | — | |
Small Cap Growth Fund | | Fixed Income Clearing Corp. | | | 35,091,465 | �� | | | — | | | | (35,091,465 | ) | | | — | |
Small Cap Value Fund | | Fixed Income Clearing Corp. | | | 3,047,345 | | | | — | | | | (3,047,345 | ) | | | — | |
Strategic Income Fund | | Fixed Income Clearing Corp. | | | 7,174,334 | | | | — | | | | (7,174,334 | ) | | | — | |
Ultra Growth Fund | | Fixed Income Clearing Corp. | | | 807,568 | | | | — | | | | (807,568 | ) | | | — | |
World Innovators Fund | | Fixed Income Clearing Corp. | | | 29,928,007 | | | | — | | | | (29,928,007 | ) | | | — | |
Income Fund | | Fixed Income Clearing Corp. | | | 779,866 | | | | — | | | | (779,866 | ) | | | — | |
U.S. Treasury Fund | | Fixed Income Clearing Corp. | | | 1,803,381 | | | | — | | | | (1,803,381 | ) | | | — | |
| 1 | Repurchase agreements are classified as short-term investments in the Statements of Assets and Liabilities. The market value of the collateral received is greater than the amounts indicated in the table. For further information, see Note 3 — Securities and Other Investments “Repurchase Agreements” and the Schedules of Investments. |
135
Notes to Financial Statements (continued)
SECURITIES BORROWEDFOR SHORT SALES
| | | | | | | | | | | | | | | | | | |
| | | | | Gross Amounts Not Offset in the Statements of Assets and Liabilities | |
| Fund | | Counterparty | | Gross Liability Amounts
Presented in Statements
of Assets and Liabilities | | | Financial
Instrument | | | Collateral
Received1 | | | Net Amount
(Not Less Than 0) | |
Long/Short Fund | | JPMorgan Chase | | $ | 51,372,975 | | | $ | — | | | $ | (51,372,975 | ) | | $ | — | |
| 1 | The market value of the collateral received is greater than the amounts indicated in the table. For further information, see Note 3 — Securities and Other Investments “Short Sales” and the Schedule of Investments. |
14. FAIR VALUEOF DERIVATIVE INSTRUMENTS*
The following is a summary of the fair valuations of the Funds’ derivative instruments categorized by risk exposure:
WASATCH LARGE CAP VALUE FUND
The Effect of Derivative Instruments on the Statement of Operations for the year ended September 30, 2017:
| | | | | | | | | | | | | | | | | | | | | | | | |
| | | Derivatives not accounted for as hedging instruments under Statement 133 | |
| | | Interest Rate
Contracts | | | Foreign Exchange
Contracts | | | Credit
Contracts | | | Equity
Contracts | | | Other
Contracts | | | Total | |
Realized Gain on Derivatives Recognized in Income | | | | | | | | | | | | | | | | | | | | | | | | |
Realized gain options written | | $ | — | | | $ | — | | | $ | — | | | $ | 99,363 | | | $ | — | | | $ | 99,363 | |
| | | | |
WASATCH WORLD INNOVATORS FUND
The Effect of Derivative Instruments on the Statement of Operations for the period ended September 30, 2017:
| | | | | | | | | | | | | | | | | | | | | | | | |
| | | Derivatives not accounted for as hedging instruments under Statement 133 | |
| | | Interest Rate
Contracts | | | Foreign Exchange
Contracts | | | Credit
Contracts | | | Equity
Contracts | | | Other
Contracts | | | Total | |
Realized Gain on Derivatives Recognized in Income | | | | | | | | | | | | | | | | | | | | | | | | |
Realized gain foreign currency forward exchange contracts | | $ | — | | | $ | 624,745 | | | $ | — | | | $ | — | | | $ | — | | | $ | 624,745 | |
| | | | |
Net Change in Unrealized Appreciation (Depreciation)
on Derivatives Recognized in Income | | | | | | | | | | | | | | | | | | | | | | | | |
Change in unrealized appreciation (depreciation)
foreign currency forward exchange contracts | | $ | — | | | $ | 113,367 | | | $ | — | | | $ | — | | | $ | — | | | $ | 113,367 | |
| | | | |
For the year ended September 30, 2017, the average monthly balance of outstanding derivative financial instruments was as follows:
| | | | |
| | | Large Cap
Value Fund | |
Option contracts: | | | | |
Average number of call contracts written | | | 25 | |
Average value of call contracts written | | $ | 7,896 | |
| |
| | | World
Innovators Fund | |
Forward currency contracts: | | | | |
Average number of contracts — U.S. dollars purchased | | | — | 1 |
Average U.S. dollar amounts | | $ | 337,949 | |
Average number of contracts — U.S. dollars sold | | | 1 | |
Average U.S. dollar amounts sold | | $ | 7,758,933 | |
| * | See Note 4 — Financial Derivative Instruments for additional information. |
| 1 | Amount represents less than 0.5. |
15. SUBSEQUENT EVENTS
To provide the Wasatch Large Cap Value Fund with greater flexibility to invest in foreign securities in order to take advantage of investment opportunities that may arise in the larger global investment universe, the Funds’ Board of Trustees approved a change to the Fund’s name and to certain investment strategies of the Fund. The name of the Fund changed from Wasatch Large Cap
136
| | |
| | SEPTEMBER 30, 2017 (UNAUDITED) |
|
|
|
Value Fund to Wasatch Global Value Fund effective October 31, 2017. Additionally, the Fund’s Board of Trustees approved a change to certain of the Fund’s principal investment strategies; The Fund’s investment strategy changed from “under normal market conditions, we will invest at least 80% of the Fund’s net assets (plus borrowings for investment purposes) in the equity securities of companies with market capitalizations of over $5 billion at the time of purchase” to “under normal market conditions, we will invest the Fund’s net assets primarily in the equity securities of foreign and domestic companies of all market capitalizations.” In addition, the Fund’s previous investment strategy provided that the Fund may invest up to 20% of its total assets at the time of purchase in securities issued by foreign companies in developed or emerging markets. Under the new investment strategy, the Fund will typically invest in securities issued by companies domiciled in at least three countries, including the United States. Furthermore, the Fund may now invest a significant portion of its total assets in companies domiciled in foreign countries (under normal market conditions, we expect at least 40% of its assets to be invested outside the United States, or if conditions are not favorable, 30% of its assets to be invested outside the United States). The Fund may also invest a significant amount of its total assets (5% to 50%) under normal market conditions at the time of purchase in securities issued by companies domiciled in emerging and frontier markets.
At a meeting held on November 7-8, 2017, the Board of Trustees of Wasatch Funds Trust (the “Trust”) approved the reorganization of the Wasatch Long/Short Fund (the “Long/Short Fund”) with and into the Wasatch Global Value Fund (the “Global Value Fund”), each a series of the Trust (the “Reorganization”). In order for the Reorganization to occur, it must be approved by the shareholders of the Long/Short Fund. The Board of Trustees of the Trust (the “Board”) therefore called for a special meeting of the Shareholders of the Long/Short Fund (“Meeting”) to vote on the Reorganization. The Meeting is expected to be held in March 2018, and, if approved, it is anticipated that the Reorganization will be consummated approximately one month after the Meeting. More information about the proposed Reorganization and Meeting will be provided in the proxy solicitation materials for the Reorganization.
137
| | |
| WASATCH FUNDS | | SEPTEMBER 30, 2017 |
|
|
|
Report of Independent Registered Public Accounting Firm
To the Board of Trustees of
Wasatch Funds Trust and Shareholders of
| | |
| Wasatch Core Growth Fund® | | Wasatch Micro Cap Fund® |
| Wasatch Emerging India Fund® | | Wasatch Micro Cap Value Fund® |
| Wasatch Emerging Markets Select Fund® | | Wasatch Small Cap Growth Fund® |
| Wasatch Emerging Markets Small Cap Fund® | | Wasatch Small Cap Value Fund® |
| Wasatch Frontier Emerging Small Countries Fund® | | Wasatch Strategic Income Fund® |
| Wasatch Global Opportunities Fund® | | Wasatch Ultra Growth Fund® |
| Wasatch International Growth Fund® | | Wasatch World Innovators Fund® |
| Wasatch International Opportunities Fund® | | Wasatch-1st Source Income Fund® |
| Wasatch Large Cap Value Fund® | | Wasatch-Hoisington U.S. Treasury Fund® |
| Wasatch Long/Short Fund® | | |
In our opinion, the accompanying statements of assets and liabilities, including the schedules of investments, and the related statements of operations and of changes in net assets and the financial highlights present fairly, in all material respects, the financial position of Wasatch Core Growth Fund®, Wasatch Emerging India Fund®, Wasatch Emerging Markets Select Fund®, Wasatch Emerging Markets Small Cap Fund®, Wasatch Frontier Emerging Small Countries Fund®, Wasatch Global Opportunities Fund®, Wasatch International Growth Fund®, Wasatch International Opportunities Fund®, Wasatch Large Cap Value Fund®, Wasatch Long/Short Fund®, Wasatch Micro Cap Fund®, Wasatch Micro Cap Value Fund®, Wasatch Small Cap Growth Fund®, Wasatch Small Cap Value Fund®, Wasatch Strategic Income Fund®, Wasatch Ultra Growth Fund®, Wasatch World Innovators Fund®, Wasatch-1st Source Income Fund®, and Wasatch-Hoisington U.S. Treasury Fund® (constituting the Wasatch Funds Trust, hereafter referred to as the “Funds”) at September 30, 2017, the results of each of their operations for the year then ended, the changes in each of their net assets for each of the two years in the period then ended and the financial highlights for each of the periods indicated therein, in conformity with accounting principles generally accepted in the United States of America. These financial statements and financial highlights (hereafter referred to as “financial statements”) are the responsibility of the Funds’ management. Our responsibility is to express an opinion on these financial statements based on our audits. We conducted our audits of these financial statements in accordance with the standards of the Public Company Accounting Oversight Board (United States). Those standards require that we plan and perform the audit to obtain reasonable assurance about whether the financial statements are free of material misstatement. An audit includes examining, on a test basis, evidence supporting the amounts and disclosures in the financial statements, assessing the accounting principles used and significant estimates made by management, and evaluating the overall financial statement presentation. We believe that our audits, which included confirmation of securities as of September 30, 2017 by correspondence with the custodian and brokers, provide a reasonable basis for our opinion.
/s/ PricewaterhouseCoopers LLP
Kansas City, Missouri
November 22, 2017
138
| | |
| WASATCH FUNDS | | SEPTEMBER 30, 2017 (UNAUDITED) |
|
|
|
Supplemental Information
MANAGEMENTOFTHE TRUST
Management Information. The business affairs of Wasatch Funds are overseen by its Board of Trustees. The Board consists of five Independent Trustees and one Interested Trustee. Three of the Independent Trustees and the Interested Trustee were elected by shareholders to serve until their successors are qualified, appointed or elected in accordance with the Trust’s Declaration of Trust and By-Laws. Two Independent Trustees have been appointed by the elected Independent Trustees to serve until his or her successor is qualified, appointed or elected in accordance with the Trust’s Declaration of Trust and By-Laws.
The Trustees and executive officers of Wasatch Funds and their principal occupations for at least the last five years are set forth below. The Advisor retains proprietary rights to the Trust name.
| | | | | | | | | | | | |
Name, Address and Age | | Position(s)
Held with
Wasatch Funds | | Term of Office1 and Length of
Time Served | | Principal Occupation(s)
during Past 5 Years | | Number of
Portfolios
in Fund
Complex
Overseen
by Trustee | | | Other Directorships
Held by Trustees
during Past 5 Years2 |
Independent Trustees | | | | | | | | | | | | |
| | | | | |
James U. Jensen, J.D., MBA 505 Wakara Way 3rd Floor Salt Lake City, UT 84108 Age 73 | | Trustee and Chairman of the Board | | Indefinite Served as Chairman of the Board since 2004 and Trustee since 1986 | | Chief Executive Officer of Clearwater Law & Governance Group (an operating law firm board governance consulting company) April 2008 to present; Co-Founder and Chairman of the Board of Intelisum, Inc. (a company pursuing computer and measurement technology and products) 2001 - 2008; Consultant on corporate growth and technology transfer since 2004; Vice President, Corporate Development, Legal Affairs and General Counsel, and Secretary, NPS Pharmaceuticals, Inc. from 1991 to 2004. | | | 19 | | | Director and Board Chairman of Agricon Global Corporation (formerly known as Bayhill Capital Corporation (telephone communications) from December 2007 to February 2014; Trustee, Northern Lights Fund Trust III (30 portfolios) since 2012. |
| | | | | |
D. James Croft, Ph.D. 505 Wakara Way 3rd Floor Salt Lake City, UT 84108 Age 75 | | Trustee and Chairman of the Governance and Nominating Committee | | Indefinite Served as Trustee since 2005 | | Consultant to the mortgage industry on issues of mortgage quality, identification of mortgage fraud, strategic planning and client development since 2004; Founder & Executive Director, Mortgage Asset Research Institute, from 1990 to 2004. | | | 19 | | | None. |
| | | | | |
Miriam M. Allison 505 Wakara Way 3rd Floor Salt Lake City, UT 84108 Age 70 | | Trustee and Chairman of the Audit Committee | | Indefinite Served as Trustee since 2010 | | Rancher since 2004. From 2001 to 2005, Chairman of UMB Fund Services, Inc. | | | 19 | | | Director, Northwestern Mutual Series Fund, Inc. (27 portfolios) since 2006. |
| | | | | |
Heikki Rinne, MBA, Ph.D. 505 Wakara Way 3rd Floor Salt Lake City, UT 84108 Age 65 | | Trustee | | Indefinite Served as Trustee since October 2012 | | Chief Executive Officer of the Halton Group Ltd. (an indoor environmental control manufacturing and technology company), from 2002 to 2016. | | | 19 | | | Director, Halton Group Ltd. since 2016. |
| | | | | |
Kristen M. Fletcher 505 Wakara Way 3rd Floor Salt Lake City, UT 84108 Age 64 | | Trustee | | Indefinite Served as Trustee since October 2014 | | Director, Youth Sports Alliance since 2015; Director, Utah Symphony/Utah Opera since 2005; Trustee, Woodlands Commercial Bank (a/k/a Lehman Brothers Commercial Bank) 2009 - 2012; Chairman and CEO, ABN AMRO, Inc. and U.S. Country Representative, ABN AMRO Bank, NV from 2002 - 2004. | | | 19 | | | Director, Youth Sports Alliance since 2015; Trustee, Woodlands Commercial Bank (a/k/a Lehman Brothers Commercial Bank) 2009 - 2012; Director Utah Symphony/Utah Opera since 2005. |
|
|
139
Supplemental Information (continued)
| | | | | | | | | | | | |
Name, Address and Age | | Position(s)
Held with
Wasatch Funds | | Term of Office1 and Length of
Time Served | | Principal Occupation(s)
during Past 5 Years | | Number of
Portfolios
in Fund
Complex
Overseen
by Trustee | | | Other Directorships
Held by Trustees
during Past 5 Years2 |
Interested Trustee | | | | | | | | | | | | |
| | | | | |
Samuel S. Stewart, Jr.3 Ph.D. CFA 505 Wakara Way 3rd Floor Salt Lake City, UT 84108 Age 75 | | President and Trustee | | Indefinite Served as President and Trustee since 1986 | | Chairman of the Board for the Advisor since 1975; Chief Investment Officer of the Advisor from 2004 to June 2009; Director of Research of the Advisor from 1975 to 2004; Chairman of the Board of Wasatch Funds from 1986 to 2004. | | | 19 | | | None. |
|
|
| 1 | A Trustee may serve until his/her death, resignation, removal or retirement. Each Independent Trustee shall retire as Trustee at the end of the calendar year in which he/she attains the age of 75 years. |
| 2 | Directorships are those held by a Trustee in any company with a class of securities registered pursuant to Section 12 of the Securities Exchange Act of 1934 or subject to the requirements of Section 15(d) of the Securities Exchange Act or any company registered as an investment company under the 1940 Act. |
| 3 | Dr. Stewart is an Interested Trustee because he serves as the Chairman of the Board of the Advisor and is an employee of the Advisor. |
| | | | | | |
Name, Address
and Age | | Position(s)
Held with
Trust | | Term of Office and
Length of Time Served | | Principal Occupation(s)
during Past 5 Years |
Officers | | | | | | |
| | | |
Russell L. Biles 505 Wakara Way 3rd Floor Salt Lake City, UT 84108 Age 49 | | Chief Compliance Officer, Vice President and Secretary | | Indefinite Served as Chief Compliance Officer and Vice President since February 2007 and Secretary since November 2008 | | Chief Compliance Officer and Vice President for Wasatch Funds since February 2007; Secretary for Wasatch Funds since November 2008; Counsel for the Advisor since October 2006. |
| | | |
Cindy B. Firestone, CPA 505 Wakara Way 3rd Floor Salt Lake City, UT 84108 Age 59 | | Treasurer | | Indefinite Served as Treasurer since May 2009 | | Treasurer for Wasatch Funds since May 2009; Assistant Treasurer for Wasatch Funds from November 2008 to May 2009; Internal Auditor for the Advisor from December 2002 to August 2011. |
| | | |
David Corbett 505 Wakara Way 3rd Floor Salt Lake City, UT 84108 Age 44 | | Assistant Vice President | | Indefinite Served as Assistant Vice President since August 2012 | | Assistant Vice President for Wasatch Funds since August 2012; Director of Mutual Fund Services for the Advisor since June 2007. |
| | | |
Cheryl Reich 505 Wakara Way 3rd Floor Salt Lake City, UT 84108 Age 34 | | Assistant Secretary | | Indefinite Served as Assistant Secretary since February 2017 | | Assistant Secretary for Wasatch Funds since February 2017; Compliance Associate for the Advisor since September 2012; Branch Manager for Investment Planning Counsel Corp. from November 2009 to August 2012. |
|
|
Additional information about the Funds’ trustees is provided in the Statement of Additional Information and is available without charge, upon request, by calling 800.551.1700.
140
| | |
| | SEPTEMBER 30, 2017 (UNAUDITED) |
|
|
|
ADDITIONAL TAX INFORMATION
The Funds hereby designate the following amounts or maximum amounts allowable as long term capital gain dividends for the purpose of the dividends paid deduction. The amounts designated here include the utilization of earnings and profits distributed to shareholders on the redemption of shares.
| | | | |
| Fund | | Amount | |
Core Growth Fund | | $ | 2,252,794 | |
Emerging India Fund | | | 819,648 | |
Global Opportunities Fund | | | 8,169,399 | |
International Growth Fund | | | 47,302,575 | |
Large Cap Value Fund | | | 7,957,722 | |
Long/Short Fund | | | 61,075 | |
Micro Cap Fund | | | 22,829,857 | |
Micro Cap Value Fund | | | 3,065,003 | |
Small Cap Growth Fund | | | 144,143,218 | |
Small Cap Value Fund | | | 65,305 | |
Ultra Growth Fund | | | 9,710,650 | |
World Innovators Fund | | | 6,384,678 | |
Income Fund | | | 124,946 | |
U.S. Treasury Fund | | | 23,928,544 | |
For the fiscal year ended September 30, 2017, certain dividends paid by each Fund may be subject to a maximum tax rate of 20% as provided for by the Jobs and Growth Tax Relief Reconciliation Act of 2003. To the extent dividends are paid during the calendar year 2017, complete information will be reported on shareholders’ 2017 Form 1099-DIV.
The amount designated as qualified dividend income for the year ended September 30, 2016 will be at the highest amount permitted by law.
Corporate shareholders should note for the year ended September 30, 2017, the percentage of the Funds’ investment income (i.e., net investment income plus short-term capital gains) that qualified for the corporate dividends received deductions are as follows:
| | | | |
| Fund | | Percentage | |
Large Cap Value Fund | | | 69 | % |
Small Cap Value Fund | | | 78 | % |
Strategic Income Fund | | | 72 | % |
Income Fund | | | 2 | % |
PROXY VOTING POLICIES, PROCEDURESAND RECORD
A description of the policies and procedures that Wasatch Advisors uses to vote proxies related to the Funds’ portfolio securities is set forth in the Funds’ Statement of Additional Information which is available without charge, upon request, on the Funds’ website at www.WasatchFunds.com or by calling 800.551.1700 and on the Securities and Exchange Commission’s (SEC) website at www.sec.gov.
Wasatch Funds’ proxy voting record is available without charge on the Funds’ website at www.WasatchFunds.com and on the SEC’s website at www.sec.gov no later than August 31 for the prior 12 months ending June 30.
QUARTERLY PORTFOLIO HOLDINGS DISCLOSUREON FORM N-Q
The Funds file their complete schedules of investments with the SEC for their first and third quarters of each fiscal year on Form N-Q. The Funds’ Form N-Q filings are available on the SEC’s website at www.sec.gov, and may be reviewed and copied at the SEC’s Public Reference Room in Washington, D.C. (information on the operation of the Public Reference room may be obtained by calling 800.SEC.0330).
141
| | |
| WASATCH FUNDS | | SEPTEMBER 30, 2017 (UNAUDITED) |
|
|
|
Service Providers
INVESTMENT ADVISOR
Wasatch Advisors, Inc.
505 Wakara Way, 3rd Floor
Salt Lake City, UT 84108
SUB-ADVISORFORTHE WASATCH-1ST SOURCE INCOME FUND
1st Source Corporation Investment Advisors, Inc.
100 North Michigan Street
South Bend, IN 46601
SUB-ADVISORFORTHE WASATCH-HOISINGTON U.S. TREASURY FUND
Hoisington Investment Management Co.
6836 Bee Caves Road
Building 2, Suite 100
Austin, TX 78746
ADMINISTRATORAND FUND ACCOUNTANT
State Street Bank and Trust Company
801 Pennsylvania Avenue
Kansas City, MO 64105
DISTRIBUTOR
ALPS Distributors, Inc.
1290 Broadway, Suite 1100
Denver, CO 80203
TRANSFER AGENT
UMB Fund Services, Inc.
235 West Galena Street
Milwaukee, WI 53212
CUSTODIAN
State Street Bank and Trust Company
801 Pennsylvania Avenue
Kansas City, MO 64105
LEGAL COUNSELTO WASATCH FUNDSANDINDEPENDENT TRUSTEES
Chapman and Cutler, LLP
111 West Monroe Street
Chicago, IL 60603
INDEPENDENT REGISTERED PUBLIC ACCOUNTING FIRM
PricewaterhouseCoopers LLP
1100 Walnut Street, Suite 1300
Kansas City, MO 64106
TELEPHONE
800.551.1700
M - F, 7:00 a.m. to 7:00 p.m. Central Time
Automated Line, 24 Hours
U.S. MAIL
Wasatch Funds
P.O. Box 2172
Milwaukee, WI 53201-2172
OVERNIGHT DELIVERY
Wasatch Funds
235 West Galena Street
Milwaukee, WI 53212
ONLINE
www.WasatchFunds.com
shareholderservice@wasatchfunds.com
142

2017 Annual Report www.WasatchFunds.com 800.551.700 Mix Paper from responsible FSC C132107
Item 2. Code of Ethics.
| (a) | Wasatch Funds Trust (the “Registrant”) has adopted a Code of Ethics that applies to the Registrant’s principal executive officer and principal financial officer. |
| (b) | No disclosures are required by this Item 2(b). |
| (c) | There have been no amendments to the Registrant’s Code of Ethics during the reporting period for this form N-CSR. |
| (d) | There have been no waivers granted by the Registrant to individuals covered by the Registrant’s Code of Ethics during the reporting period for this Form N-CSR. |
| (f) | A copy of the Registrant’s Code of Ethics is attached as an exhibit to this Form N-CSR. |
Item 3. Audit Committee Financial Expert.
| (a) (1) | The Board of Trustees of the Registrant has determined that the Registrant has at least one member serving on the Registrant’s Audit Committee that possesses the attributes identified in Instruction 2(b) of Item 3 to Form N-CSR to qualify as “audit committee financial expert.” |
| | (2) | The name of the audit committee financial expert is Miriam M. Allison. Ms. Allison is deemed to be “independent” as that term is defined in Item 3(a)(2) of Form N-CSR. |
Item 4. Principal Accountant Fees and Services.
| (a) | Audit Fees - The aggregate fees billed for professional services rendered by the independent registered public accounting firm for the audit of the Registrant’s annual financial statements or services normally provided in connection with statutory and regulatory filings or engagements for the last two fiscal years ended September 30, 2017 and 2016 were $500,030 and $503,459, respectively. |
| (b) | Audit Related Fees – During the fiscal years ended September 30, 2017 and 2016, the Registrant was not billed any fees by the independent registered public accounting firm for assurance and related services rendered by the independent registered public accounting firm to the Registrant that are reasonably related to the performance of the audit of the Registrant’s financial statements and are not reported under paragraph (a) of this Item 4. |
During the fiscal years ended September 30, 2017 and 2016, no fees for assurance and related services that relate directly to the operations and financial reporting of the Registrant were billed by the independent registered public accounting firm to the Registrant’s investment adviser (the “Advisor”) or any other entity controlling, controlled by, or under common control with the Advisor that provides ongoing services to the Registrant.
| (c) | Tax Fees - The aggregate fees billed for professional services rendered by the independent registered public accounting firm to the Registrant for tax compliance, tax advice, tax planning and tax return preparation for the last two fiscal years ended September 30, 2017 and 2016 were $105,500 and $101,430, respectively. These services consisted of the independent registered public accounting firm reviewing the Registrant’s excise tax returns, distribution requirements and RIC tax returns, as well as consultations regarding the liquidation of a series of the Trust. |
During the fiscal years ended September 30, 2017 and 2016, no fees for tax compliance, tax advice or tax planning services that relate directly to the operations and financial reporting of the Registrant were billed by the independent registered public accounting firm to the Advisor or any other entity controlling, controlled by, or under common control with the Advisor that provides ongoing services to the Registrant.
| (d) | All Other Fees – The aggregate fees billed for products and services provided by the independent registered public accounting firm to the Registrant, other than the services reported in paragraph (a) – (c) of this Item 4, for the fiscal years ended September 30, 2017 and 2016 were $107,193 and $0, respectively. The fees for September 30, 2017 are related to the filing for EU reclaims and advice regarding foreign capital gain tax accruals. |
During the fiscal years ended September 30, 2017 and 2016, no fees for other services that relate directly to the operations and financial reporting of the Registrant were billed by the independent registered public accounting firm to the Advisor or any other entity controlling, controlled by, or under common control with the Advisor that provides ongoing services to the Registrant.
| (e) | Pre-Approval Policies and Procedures |
(1) Pursuant to the registrant’s Audit Committee Charter, the Audit Committee shall evaluate the independence of the independent public accountants, including evaluating whether the independent public accountants provide audit services or consulting services to the Registrant or consulting services to the Advisor, and to receive the specific representations of the independent registered public accounting firm as to their independence. Specifically, the Audit Committee will be responsible for evaluating the provision of non-audit services to the Registrant as required by Section 201 of the Sarbanes-Oxley Act, any pre-approval requests submitted by the independent registered public accounting firm as required by Section 202 of the Sarbanes-Oxley Act or as otherwise required under Section 2-01 of Regulation S-X, and shall monitor the conflict of interest requirements in Section 206 of the Sarbanes-Oxley Act, and the prohibitions on improper influence on the conduct of audits in Section 303 of the Sarbanes-Oxley Act. The Audit Committee shall pre-approve any engagement of the independent registered public accounting firm to provide any services (other than prohibited non-audit services) including the fees and other compensation to be paid to the independent registered public accounting firm.
The independent registered public accounting firm is authorized by the Audit Committee to provide non-audit services to the extent allowable under the Sarbanes-Oxley Act of 2002 for the Registrant provided that (i) the fees payable with respect to such services do not exceed $5,000 in any calendar quarter and (ii) such fees are ratified by the Audit Committee at its next meeting. The fees payable with respect to non-audit services may be increased by the affirmative vote of a majority of the members of the Audit Committee.
(2) There were no pre-approval requirements waived for the services provided to the Registrant described in paragraphs (b)-(d) of Item 4 by the Audit Committee pursuant to paragraph (c)(7)(i)(C) of Rule 2-01 of Regulation S-X (the “De Minimis Rule”). There were no fees billed for services provided to the Advisor described in paragraphs (b)-(d) of Item 4 that were required to be pre-approved by the Audit Committee as described in paragraph (e)(1) of Item 4.
| (f) | No disclosures are required by this Item 4(f). |
| (g) | For the fiscal years ended September 30, 2017 and 2016, the aggregate non-audit fees billed by the independent registered public accounting firm for services rendered to the Registrant and the Advisor and any entity controlling, controlled by, or under common control with the Advisor that provided ongoing services to the Registrant were approximately $107,193 and $0, respectively. |
| (h) | No disclosures are required by this Item 4(h). |
Item 5. Audit Committee of Listed Registrants.
Not applicable.
Item 6. Schedule of Investments.
| (a) | Schedule of Investments is included as a part of the report to shareholders filed under Item 1 of this Form N-CSR. |
Item 7. Disclosure of Proxy Voting Policies and Procedures for Closed-End Management Investment Companies.
Not applicable.
Item 8. Portfolio Managers of Closed-End Investment Companies.
Not applicable.
Item 9. Purchases of Equity Securities by Closed-End Management Investment Company and Affiliated Purchasers.
Not applicable.
Item 10. Submission of Matters to a Vote of Security Holders.
There have been no material changes to the procedures by which shareholders may recommend nominees to the Registrant’s board of trustees, where those changes were implemented after the Registrant last provided disclosure in response to this item.
Item 11. Controls and Procedures.
| (a) | The Registrant’s principal executive and principal financial officers have concluded that the Registrant’s disclosure controls and procedures (as defined in Rule 30a-3(c) under the Investment Company Act of 1940, as amended (the “1940 Act”)) are effective, as of a date within 90 days of the filing date of this Form N-CSR based on their evaluation of these controls and procedures required by Rule 30a-3(b) under the 1940 Act) and Rules 13a-15(b) or 15d-15(b) under the Securities Exchange Act of 1934). |
| (b) | There were no changes in the Registrant’s internal control over financial reporting (as defined in Rule 30a-3(d) under the 1940 Act) that occurred during the Registrant’s second fiscal quarter of the period covered by this report that has materially affected, or is reasonably likely to materially affect, the Registrant’s internal control over financial reporting. |
Item 12. Disclosure of Securities Lending Activities for Closed-End Management Investment Companies.
Item 13. Exhibits.
| (a)(1) | Code of Ethics is attached hereto. |
| (a)(2) | The certifications required by Rule 30a-2(a) of the 1940 Act are attached hereto. |
| (b) | The certifications required by Rule 30a-2(b) of the 1940 Act and Section 906 of the Sarbanes-Oxley Act of 2002 are attached hereto. |
SIGNATURES
Pursuant to the requirements of the Securities Exchange Act of 1934 and the Investment Company Act of 1940, the Registrant has duly caused this report to be signed on its behalf by the undersigned, thereunto duly authorized.
WASATCH FUNDS TRUST
| | |
By: | | /s/ Samuel S. Stewart, Jr. |
| | Samuel S. Stewart, Jr. |
| | President (principal executive officer) of Wasatch Funds Trust |
| |
Date: | | December 6, 2017 |
Pursuant to the requirements of the Securities Exchange Act of 1934 and the Investment Company Act of 1940, this report has been signed below by the following persons on behalf of the Registrant and in the capacities and on the dates indicated.
| | |
By: | | /s/ Samuel S. Stewart, Jr. |
| | Samuel S. Stewart, Jr. |
| | President (principal executive officer) of Wasatch Funds Trust |
| |
Date: | | December 6, 2017 |
| | |
By: | | /s/ Cindy B. Firestone |
| | Cindy B. Firestone |
| | Treasurer (principal financial officer) of Wasatch Funds Trust |
| |
Date: | | December 6, 2017 |