UNITED STATES
SECURITIES AND EXCHANGE COMMISSION
Washington, D.C. 20549
FORM N-CSR
CERTIFIED SHAREHOLDER REPORT OF REGISTERED
MANAGEMENT INVESTMENT COMPANIES
Investment Company Act file number: 811-04920
WASATCH FUNDS TRUST
(Exact name of registrant as specified in charter)
505 Wakara Way, 3rd Floor
Salt Lake City, UT 84108
(Address of principal executive offices)(Zip code)
| | |
| (Name and Address of Agent for Service) | | Copy to: |
| |
Samuel S. Stewart, Jr. Wasatch Advisors, Inc. 505 Wakara Way, 3rd Floor Salt Lake City, UT 84108 | | Eric F. Fess, Esq. Chapman & Cutler LLP 111 West Monroe Street Chicago, IL 60603 |
Registrant’s telephone number, including area code: (801) 533-0777
Date of fiscal year end: September 30
Date of reporting period: September 30, 2015
Item 1: Report to Shareholders.
2015 Annual Report September 30, 2015 Wasatch Funds EQUITY FUNDS/ Wasatch Core Growth Fund. Wasatch Emerging India Fund. Wasatch Emerging Markets Select Fund. Wasatch Emerging Markets Small Cap Fund. Wasatch Frontier Emerging Small Countries Fund. Wasatch Global Opportunities Fund. Wasatch Heritage Growth Fund. Wasatch International Growth Fund. Wasatch International Opportunities Fund. Wasatch Large Cap Value Fund. Wasatch Long/Short Fund. Wasatch Micro Cap Fund. Wasatch Micro Cap Value Fund . Wasatch Small Cap Growth Fund. Wasatch Small Cap Value Fund. Wasatch Strategic Income Fund. Wasatch Ultra Growth Fund. Wasatch World Innovators Fund BOND FUNDS/ Wasatch-1st Source Income Fund. Wasatch-Hoisington U.S. Treasury Fund
Wasatch Funds
Salt Lake City, Utah
www.WasatchFunds.com
800.551.1700
This material must be accompanied or preceded by a prospectus.
Please read the prospectus carefully before you invest.
Wasatch Funds are distributed by ALPS Distributors, Inc.
1
| | | | |
| LETTERTO SHAREHOLDERS — AIR POCKETS! | | |
| |
| | |
| | |
| | |

Samuel S. Stewart, Jr. PhD, CFA President of
Wasatch Funds | | DEAR FELLOW SHAREHOLDERS: Following a long quiet period during which stock prices around the world mostly moved upward, the latter part of the fiscal year was characterized by wild swings and an overall decline in stock prices. In my last quarterly message, I described why we might have entered a new era for the global economy that could make stock prices prone to periodic “air pockets.” And, in fact, market behavior during the most recent quarter was consistent with the possibility of having entered this new economic era. The setup for a possible new era has been fostered by the persistence of slow economic growth around the world since the end of the Global Financial Crisis. This slow growth has continued in the face of massive central-bank stimulus far beyond historical experience. But how could so much stimulus result in so little growth? As I’ve suggested before, much of the answer lies in demographics. With the aging of the global population, people’s needs turn from investments in homes and cars toward savings to generate retirement income. As there’s less demand for investments and more supply of savings, interest rates inevitably drop. Central-bank stimulus has the effect of further adding to the supply of savings, leading to even lower rates. |
A lengthy period of low interest rates promotes a lengthy period of high stock prices. The reason stock prices are bid up is that when interest rates are low, stocks are viewed as more attractive. So there’s a rush to buy. Prices will probably stop rising when investors view future stock returns as likely to be more in line with low interest rates.
An unfortunate side effect of high stock prices is increased volatility. The higher the multiple of earnings for which a stock sells, the more volatile the price may be. We experienced such volatility during the most recent quarter as investors feared that a slowdown in China would lead to lower earnings around the globe.
Above all else, air pockets in stock prices are disconcerting. We’d like to avoid them if we could. However, the only sure method of avoiding air pockets is to exit the market entirely — which is not an attractive alternative considering the paltry returns on cash these days.
If the new era has truly moved us beyond the interest-rate cycles that have characterized recorded economic history, there’s one big positive: The economy will be steadier without the booms and busts typical of powerful interest-rate movements. So we may be in for more economic stability, but less stock-price stability.
ECONOMY
Pundits tagged China’s troubles as the main culprit behind market volatility during the latest quarter. And there’s no doubt that growth in the Chinese economy is now slowing. Several years ago, China’s inflation-adjusted gross domestic product (GDP) growth had been as high as 10%. But for 2015, China’s GDP growth is expected to be under 7%.
While growth anywhere near 7% is still attractive compared to most developed markets, many countries and companies around the world had been counting on much higher demand from China in order to meet their own growth projections. For example, South Korea’s exports dropped over 8% in September versus a year earlier following a 15% fall in August — due, in part, to the deceleration in China’s economy. Other victims of weaker-than-expected Chinese demand were commodity exporters like Brazil, which saw its currency decline to the lowest level against the dollar in two decades and its credit rating downgraded by Standard & Poor’s to “junk” status.
In the United States, the news was generally more positive — not because of particularly good economic data, but because expectations had been low. Inflation-adjusted GDP growth for the second calendar quarter was revised to 3.9% from an earlier estimate of 2.3%. Nevertheless, full-year growth for 2015 is still expected to come in below 3%.
Other economic news in the U.S. mostly focused on the Federal Reserve’s (Fed’s) interest-rate policy and on the employment situation. Because the economy has shown modest growth, there’s been some pressure on the Fed to raise interest rates. However, some fear that higher rates would further strengthen the dollar, which could hurt U.S. exports and make dollar-denominated debt more expensive for fragile emerging markets. At its September policy meeting, the Fed cited global economic challenges in its decision to leave short-term interest rates unchanged. Taken together, recent economic data has been entirely consistent with what I’ve postulated as a “lower for longer” interest-rate scenario.
MARKETS
As we ponder what’s in store for the financial markets, let’s first summarize current conditions: The U.S. is doing reasonably well compared to its developed-market peers, but stock valuations are generally high. The outlook for both Europe and Japan is mixed — with some relatively attractive company fundamentals and more-reasonable stock valuations, but with economies still at risk of slipping back into recession.
Among emerging markets, China’s economic growth is slowing and the Chinese government seems to be mishandling conditions related to investor confidence by directly manipulating stock prices and currency exchange rates. Moreover, China’s slowdown is having real effects on other economies, particularly those in the emerging universe.
As we search for attractive investments in the current environment, it’s possible that we’ll be more successful by taking advantage of opportunities from periodic air pockets in stock prices than by waiting for a crash to create the elusive bargains that may never arrive. The recent air pockets triggered by headline concerns regarding China may have offered some of the best buying opportunities we’ll see this year — not necessarily for Chinese shares, but for stocks around the world.
2
| | |
| | SEPTEMBER 30, 2015 (UNAUDITED) |
|
|
|
Paradoxically, the slowdown in China could actually improve investment prospects in some other areas, as production costs decline with less competition for commodities like steel, copper and oil. Moreover, still-abundant Chinese capital may also flow to these areas as investment opportunities diminish within China itself.
While our crystal ball is especially cloudy due to the uncertainty of a possible new era, the silver lining is that mixed markets generally have provided a good environment for bottom-up stock pickers like the portfolio managers and analysts at Wasatch Advisors. So far this year, we’ve continued our efforts at tire-kicking around the globe — visiting companies in Canada, Mexico, the United Kingdom, France, Germany, Italy, Spain, Sweden, Switzerland, Egypt, Ethiopia, Israel, Kenya, South Africa, Tanzania, Tunisia, the United Arab Emirates, China, Hong Kong, Malaysia, Pakistan, the Philippines, South Korea, Taiwan, Thailand, Vietnam, Australia, Japan and New Zealand.
WASATCH
Almost 20 years ago, we — at small, Salt Lake City-based Wasatch Advisors — became global investors. One of the reasons, even back then, was we were beginning to see that, despite their size, our U.S. small-cap companies were being affected by international competitors. Fortunately, our stepped-up global research efforts gave us a ringside seat to witness the massive progress made by emerging economies over the last two decades.
I recall my first trip to Beijing. There were few paved roads, and bicycles were the primary means of transportation. Current visitors to Beijing find little remaining evidence of that era, even though it was less than 20 years ago.
One result of being global investors has been that our broad perspective has helped us more readily anticipate trouble spots. For example, our emerging-market portfolios have been underweight in China as we’ve worried about excessive stock valuations in the face of an economy in transition from export-led growth to consumer-led growth.
Our bottom-up analyses of companies around the world also helped us identify Japan as having a potentially rewarding investment environment. And despite stock-market volatility similar to most countries, Japan’s Nikkei 225 was one of the few stock-market indices that were still positive (on a total-return basis) for the year to date through September 30, 2015.
As for our outlook, we believe opportunities in emerging markets have narrowed — with the best opportunities being in places like India, Mexico and Taiwan, where the political environments are fairly good and the economies are not overly dependent on commodity exports. Naturally, our outlook is being reflected in our emerging-market-focused portfolios and in our other international portfolios that include some emerging-market exposure. This means we’re increasing our country concentrations among emerging markets — but we’re still maintaining broad diversification across companies.
With sincere thanks for your continued investment and for your trust,

Sam Stewart
Information in this report regarding market or economic trends, or the factors influencing historical or future performance, reflects the opinions of management as of the date of this report. These statements should not be relied upon for any other purpose. Past performance is no guarantee of future results, and there is no guarantee that the market forecasts discussed will be realized.
CFA® is a trademark owned by CFA Institute.
Wasatch Advisors is the investment advisor to Wasatch Funds.
The financial crisis of 2007-08, also known as the Global Financial Crisis and 2008 financial crisis, is considered by many economists to have been the worst financial crisis since the Great Depression of the 1930s.
Gross domestic product (GDP) is a basic measure of a country’s economic performance, and is the market value of all final goods and services made within the borders of a country in a year.
A credit rating is an assessment of the credit worthiness of individuals, corporations and countries. It is based upon the history of borrowing and repayment, as well as the availability of assets and extent of liabilities. Ratings are issued by S&P or Moody’s and typically range from AAA (highest) to D (lowest). Ratings and credit quality may change over time. For information on the rating agency’s methodology visit: http://www.standardandpoors.com/home/en/us and http://www.moodys.com.
Valuation is the process of determining the current worth of an asset or company.
The Nikkei 225 Stock Index is a price-weighted index of the 225 top Japanese companies (called the First Section) that are listed on the Tokyo Stock Exchange (TSE).
You cannot invest directly in this or any index.
3
| | |
| WASATCH CORE GROWTH FUND (WGROX / WIGRX) — Management Discussion | | SEPTEMBER 30, 2015 (UNAUDITED) |
|
|
|
The Wasatch Core Growth Fund is managed by a team of Wasatch portfolio managers led by JB Taylor and Paul Lambert.
| | | | |

JB Taylor Lead Portfolio Manager | | 
Paul Lambert Portfolio Manager | | OVERVIEW The Wasatch Core Growth Fund — Investor Class returned 10.87% for the 12 months ended September 30, 2015, outperforming the Russell 2000 Index, which |
returned 1.25%, and the Russell 2000 Growth Index, which returned 4.04%.
In the most recent quarter, markets saw a dramatic reversal of fortune after enjoying a long-running string of success. Weak economic data from China stoked fears of a contagion affecting a fragile U.S. economy. Adding to the market woes was the sudden emergence of pharmaceutical pricing as a potential hot button in the upcoming election. This news had an immediate impact on the Russell 2000 and Russell 2000 Growth indices, given their large and growing weight in biotech and the long run of outperformance from that industry. The indices and the biotech industry were all down double-digits in the most recent quarter, with the indices giving back most of the gains earned in the previous three quarters. However, biotech still delivered a double-digit return for the 12-month period.
The energy sector was, by far, the biggest detractor from performance for both the Fund and the Russell 2000 Index over the past year. Unlike biotech, energy has suffered a prolonged period of underperformance, and the average energy stock in the Index was down -55%. The sector represents less than 4% of the Index, but the steep drop in stock prices magnified its impact. The Fund was underweight in energy and our stocks were down significantly less, so the sector aided performance relative to the Index.
With scientific knowledge exploding and technology increasingly changing the way we conduct business and interact with the world, it is not surprising that two of the best-performing sectors for the Index and the Fund were health care and information technology. The Fund’s outperformance was even more broad-based, as the financials, industrials and consumer-discretionary sectors were also areas of strength. Together, these five sectors make up the majority of our holdings and we are pleased to report that the Fund outperformed the Index in all of them.
DETAILSOFTHE YEAR
Merger and acquisition activity increased significantly during the period after several years of anemic deal flow. The Fund saw four of its holdings acquired at significant premiums: Polypore International, Inc., Life Time Fitness, Inc., Dealertrack Technologies, Inc. and IPC Healthcare, Inc. We worked diligently to redeploy the proceeds from these transactions into new opportunities like fast casual
restaurant chain Zoe’s Kitchen, Inc., discount retailer Five Below, Inc. and growing regional banks like Eagle Bancorp, Inc. and South State Corp.
Transportation provided an interesting contrast in performance among its sub-industries. Trucking stocks were down double-digits on worries of a weakening U.S. economy. Airline stocks, by contrast, were up over 80% during the period. This radical divergence in price performance doesn’t make much sense to us, especially given the tailwind that lower fuel prices provided to both industries. Our view is that the trucking stocks are becoming even more interesting long-run investments as the well-run public trucking companies continue to gain share from the large number of small truckers. The Fund was overweight in these industries, owning two truckers and two small-cap airlines. While, on average, our positions in Knight Transportation, Inc., Spirit Airlines, Inc. and Old Dominion Freight Line, Inc. fell, our large holding in Allegiant Travel Co. significantly improved our returns and was the Fund’s top contributor to performance. Allegiant’s “ultra low cost carrier” business model continues to take market share, and the company benefits from lower oil prices disproportionately compared to its competitors.
A handful of holdings experienced stock-price declines due to weak earnings. Retailers Mattress Firm Holding Corp. and Zumiez, Inc. traded down after management reported lower-than-expected earnings. Despite the short-term weakness, our theses for owning both companies remain intact. Online photo library Shutterstock, Inc. also guided lower due to competitive pressures, and it also experienced some management turnover. We thought the sell-off was overdone and added to our position opportunistically during the period.
OUTLOOK
We believe the U.S economy remains stuck in a low-growth pattern. Our discussions with companies owned in the Fund suggest a U.S. economy that is decelerating but not in decline. Given the severity of the 2008 downturn, this has been a very disappointing recovery and suggests a stock market vulnerable to a growth shock or a significant rise in interest rates. Conversely, such a low-growth backdrop can create opportunity for growth investors, as companies enjoying strong organic growth stand out in a low-growth environment. The Fund’s companies have delivered consistent mid-teens sales growth to drive earnings. We believe this kind of sustainable organic growth has the potential to provide better long-run returns versus larger companies, which have been far more dependent on short-lived sources of earnings growth such as cost cutting and stock repurchases.
Thank you for the opportunity to manage your assets.
| | Current and future holdings are subject to risk. |
4
| | |
| WASATCH CORE GROWTH FUND (WGROX / WIGRX) — Portfolio Summary | | SEPTEMBER 30, 2015 (UNAUDITED) |
|
|
|
AVERAGE ANNUAL TOTAL RETURNS
| | | | | | | | | | | | |
| | | 1 YEAR | | | 5 YEARS | | | 10 YEARS | |
Core Growth (WGROX) — Investor | | | 10.87% | | | | 14.94% | | | | 7.36% | |
Core Growth (WIGRX) — Institutional | | | 10.94% | | | | 15.01% | | | | 7.39% | |
Russell 2000® Index | | | 1.25% | | | | 11.73% | | | | 6.55% | |
Russell 2000® Growth Index | | | 4.04% | | | | 13.26% | | | | 7.67% | |
Data shows past performance, which is not indicative of future performance. Current performance may be lower or higher than the performance quoted. To obtain the most recent month-end performance data available, please visit www.WasatchFunds.com. The Advisor may absorb certain Fund expenses, without which total return would have been lower. Investment returns and principal value will fluctuate and shares, when redeemed, may be worth more or less than their original cost.
As of the January 31, 2015 prospectus, the Total Annual Fund Operating Expenses for the Wasatch Core Growth Fund — Investor Class: 1.18% / Institutional Class: 1.18%, Net: 1.12%. The expense ratio shown elsewhere in this report may be different. Net expenses are based on Fund expenses, net of waivers and reimbursements. See the prospectus for additional information regarding Fund expenses.
Wasatch Funds will deduct a 2.00% redemption proceeds fee on Fund shares held 60 days or less. Performance data does not reflect the deduction of fees, including sales charges, or the taxes you would pay on fund distributions or the redemption of fund shares. Fees and taxes, if reflected, would reduce the performance quoted. Wasatch does not charge any sales fees. For more complete information including charges, risks and expenses, read the prospectus carefully.
Performance for the Institutional Class prior to 1/31/2012 is based on the performance of the Investor Class. Performance of the Fund’s Institutional Class prior to 1/31/2012 uses the actual expenses of the Fund’s Investor Class without any adjustments. For any such period of time, the performance of the Fund’s Institutional Class would have been substantially similar to, yet higher than, the performance of the Fund’s Investor Class, because the shares of both classes are invested in the same portfolio of securities, but the classes bear different expenses.
Investing in small cap funds will be more volatile and loss of principal could be greater than investing in large cap or more diversified funds. Investing in foreign securities, especially in emerging markets, entails special risks, such as currency fluctuations and political uncertainties, which are described in more detail in the prospectus.
TOP 10 EQUITY HOLDINGS*
| | | | |
| Company | | % of Net
Assets | |
| Allegiant Travel Co. | | | 3.6% | |
| Cimpress N.V. | | | 2.9% | |
| Tyler Technologies, Inc. | | | 2.7% | |
| Credit Acceptance Corp. | | | 2.7% | |
| SEI Investments Co. | | | 2.6% | |
| | | | |
| Company | | % of Net
Assets | |
| Cornerstone OnDemand, Inc. | | | 2.5% | |
| Waste Connections, Inc. | | | 2.4% | |
| Spirit Airlines, Inc. | | | 2.4% | |
| ICON plc (Ireland) | | | 2.2% | |
| Seattle Genetics, Inc. | | | 2.2% | |
| * | As of September 30, 2015, there were 67 holdings in the Fund. Foreign currency contracts, written options and repurchase agreements, if any, are not included in the number of holdings. Portfolio holdings are subject to change at any time. References to specific securities should not be construed as recommendations by the Funds or their Advisor. Current and future holdings are subject to risk. |
SECTOR BREAKDOWN**
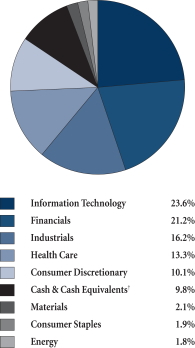
| ** | Excludes securities sold short and options written, if any. |
| † | Also includes Other Assets & Liabilities. |
GROWTHOFA HYPOTHETICAL $10,000 INVESTMENT
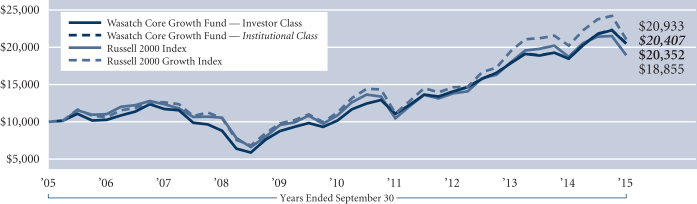
Past performance does not predict future performance. The graph above does not reflect the deduction of fees, sales charges, or taxes that you would pay on fund distributions or the redemption of fund shares. Wasatch does not charge any sales fees. The Russell 2000 Index is an unmanaged total return index of the smallest 2,000 companies in the Russell 3000 Index, as ranked by total market capitalization. The Russell 2000 Index is widely regarded in the industry as accurately capturing the universe of small company stocks. The Russell 2000 Growth Index is an unmanaged total return index that measures the performance of those Russell 2000 Index companies with higher price-to-book ratios and higher forecasted growth values. You cannot invest directly in these or any indices.
5
| | |
| WASATCH EMERGING INDIA FUND (WAINX) — Management Discussion | | SEPTEMBER 30, 2015 (UNAUDITED) |
|
|
|
The Wasatch Emerging India Fund is managed by a team of Wasatch portfolio managers led by Ajay Krishnan.
| | |

Ajay Krishnan, CFA Lead Portfolio Manager | | OVERVIEW The Wasatch Emerging India Fund gained 12.51% in the 12 months ended September 30, 2015. The Fund outperformed its benchmark, the MSCI India Investable Market Index, which declined -4.29%. After sweeping into power in 2014 on a tide of optimism, Prime Minister Narendra Modi and his Bharatiya Janata Party (BJP) faced the realities inherent in governing a diverse nation |
of 1.2 billion people. Key elements of their reform agenda stalled in the upper house of parliament, where the BJP lacks a majority. Given the strong gains in Indian equities during the run-up to Mr. Modi’s election, investors seemed to adopt a wait-and-see attitude for most of the fiscal year.
As the price of oil continued its retreat from the highs of 2013, India remained one of the world’s greatest beneficiaries. Because India imports about 80% of its oil, crude’s steep decline has brought down the country’s inflation rate, as well as its current-account and fiscal deficits. The improved backdrop helped put India’s currency on firmer footing and boosted inflows of foreign capital. Those improvements, in turn, enabled the Reserve Bank of India (RBI) to implement a series of interest-rate cuts to stimulate economic growth. The RBI also was able to relax limits on foreign ownership of India’s debt that were designed to protect its currency from foreign-capital outflows.
During the latter part of the year, weak economic data in China weighed on world stock markets and raised concerns about the health of the global economy. In addition, fears of weaker Chinese demand for oil and other natural resources sent commodity prices lower. These developments impacted India much less than its emerging-market peers. Shipments to China account for less than 10% of India’s exports, the lowest among major Asian economies. Also, as a significant importer of commodities, India has been benefiting from lower prices for oil, industrial commodities and agricultural products.
Our focus on what we believe are high-quality, long-duration businesses helped the Fund post returns ahead of the Index in every sector in which it held investments. With energy stocks faring poorly this year, our lack of investments in the energy sector also helped Fund performance.
DETAILSOFTHE YEAR
Our strongest contributor to Fund performance for the year was Marksans Pharma Ltd. This manufacturer of branded and generic drugs exports its products to the U.S., Europe and other countries. The company is one of only a few in India with the technology to manufacture the soft-gelatin capsules commonly known as softgels or liquid gels. Marksans has been benefiting from its new-product offerings, as well as from increased consumer demand for softgel formulations.
Another strong stock in the Fund was Amara Raja Batteries Ltd. The company makes lead-acid storage batteries for industrial and automotive applications. Lower prices for lead and other commodities have been helping Amara Raja by reducing its cost of raw materials.
Our greatest detractor from Fund performance for the year was online travel agency MakeMyTrip Ltd. Although aggressive discounting by a competitor has resulted in slowing sales growth and wider-than-expected losses for MakeMyTrip, it remains India’s leading online travel agency both in airline-ticket sales and hotel bookings. We believe the company’s margins will expand once competition abates, and we continue to own it in the Fund.
Kaveri Seed Co. Ltd., our second-largest detractor, produces and sells agricultural seeds in India. Citing drought conditions and other seasonal factors, the company reported a 5.4% year-over-year drop in consolidated earnings per share and a 20% decrease in sales in its most-recent quarter. Although the company’s share price declined on the news, we consider these normal fluctuations in the company’s business. Going forward, we think Kaveri’s shift from regular varietals to higher-yielding hybrid seeds presents attractive long-term prospects.
OUTLOOK
According to government data, India’s consumer-price index rose just 3.66% in August as oil dipped below $40 per barrel and global food prices fell. Additionally, a recent study found that Indians are spending a smaller share of their earnings on food and more on discretionary consumer items. Over a longer horizon, we believe affordable food costs will continue to play a key role in India’s transition from an agricultural to a consumer economy. Agriculture now accounts for just 18% of India’s economy, compared to approximately 50% in the 1950s.
We expect additional improvements in farming to drive a shift in agricultural acreage away from food production, and toward cash crops such as cotton. Already a large grower of cotton, India has a natural cost advantage over other major producers. As electric-power and transportation infrastructure in rural India improve, we believe the country’s cotton industry holds the promise of future inroads into textile manufacturing.
In the meantime, we look for government spending on infrastructure projects to kick-start a new cycle of capital investment. While the jobs those projects create would provide much of the immediate benefit, we expect the expansion in discretionary incomes to fuel increased demand for consumer goods and services. The final phase of the cycle — though still at least 12 to 18 months away in our view — would be higher capital expenditures and additional job creation from companies seeking to meet increased consumer demand.
Thank you for the opportunity to manage your assets.
| | Current and future holdings are subject to risk. |
6
| | |
| WASATCH EMERGING INDIA FUND (WAINX) — Portfolio Summary | | SEPTEMBER 30, 2015 (UNAUDITED) |
|
|
|
AVERAGE ANNUAL TOTAL RETURNS
| | | | | | | | | | | | | | | |
| | | 1 YEAR | | 5 YEARS | | SINCE INCEPTION 4/26/11 |
Emerging India | | | | 12.51% | | | N/A | | | | 10.40% | |
MSCI India IMI | | | | -4.29% | | | N/A | | | | -1.29% | |
Data shows past performance, which is not indicative of future performance. Current performance may be lower or higher than the performance quoted. To obtain the most recent month-end performance data available, please visit www.WasatchFunds.com. The Advisor may absorb certain Fund expenses, without which total return would have been lower. Investment returns and principal value will fluctuate and shares, when redeemed, may be worth more or less than their original cost.
As of the January 31, 2015 prospectus, the Total Annual Fund Operating Expenses for the Wasatch Emerging India Fund are 2.57%. The Net Expenses are 1.95%. The expense ratio shown elsewhere in this report may be different. Net Expenses are based on Fund expenses, net of waivers and reimbursements. See the prospectus for additional information regarding Fund expenses.
Wasatch Funds will deduct a 2.00% redemption proceeds fee on Fund shares held 60 days or less. Performance data does not reflect the deduction of fees, including sales charges, or the taxes you would pay on fund distributions or the redemption of fund shares. Fees and taxes, if reflected, would reduce the performance quoted. Wasatch does not charge any sales fees. For more complete information including charges, risks and expenses, read the prospectus carefully.
Investing in small cap funds will be more volatile and loss of principal could be greater than investing in large cap or more diversified funds. Investing in foreign securities, especially in emerging markets, entails special risks, such as currency fluctuations and political uncertainties, which are described in more detail in the prospectus.
TOP 10 EQUITY HOLDINGS*
| | | | |
| Company | | % of Net
Assets | |
| Marksans Pharma Ltd. (India) | | | 4.1% | |
| Glenmark Pharmaceuticals Ltd. (India) | | | 3.4% | |
| Cognizant Technology Solutions Corp., Class A | | | 3.1% | |
| Natco Pharma Ltd. (India) | | | 3.1% | |
| HCL Technologies Ltd. (India) | | | 2.9% | |
| | | | |
| Company | | % of Net
Assets | |
| Bajaj Finance Ltd. (India) | | | 2.7% | |
| Repco Home Finance Ltd. (India) | | | 2.7% | |
| MakeMyTrip Ltd. (India) | | | 2.5% | |
| Lupin Ltd. (India) | | | 2.3% | |
| Caplin Point Laboratories Ltd. (India) | | | 2.3% | |
| * | As of September 30, 2015, there were 76 holdings in the Fund. Foreign currency contracts, written options and repurchase agreements, if any, are not included in the number of holdings. Portfolio holdings are subject to change at any time. References to specific securities should not be construed as recommendations by the Funds or their Advisor. Current and future holdings are subject to risk. |
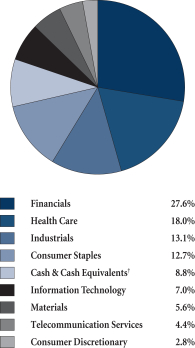
SECTOR BREAKDOWN**
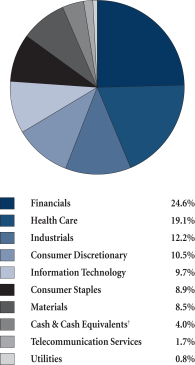
| ** | Excludes securities sold short and options written, if any. |
| † | Also includes Other Assets & Liabilities. |
GROWTHOFA HYPOTHETICAL $10,000 INVESTMENT
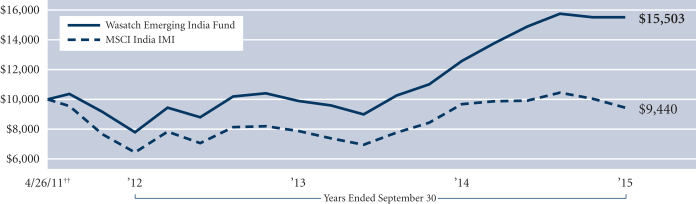
Past performance does not predict future performance. The graph above does not reflect the deduction of fees, sales charges, or taxes that you would pay on fund distributions or the redemption of fund shares. Wasatch does not charge any sales fees. ††Inception: April 26, 2011. The MSCI India IMI (Investable Market Index) is designed to measure the performance of the large-, mid- and small-cap segments of the Indian market. The Index covers approximately 99% of the free-float adjusted market capitalization of the Indian equity universe. You cannot invest directly in this or any index.
7
| | |
| WASATCH EMERGING MARKETS SELECT FUND (WAESX / WIESX) — Management Discussion | | SEPTEMBER 30, 2015 (UNAUDITED) |
|
|
|
The Wasatch Emerging Markets Select Fund is managed by a team of Wasatch portfolio managers led by Ajay Krishnan and Roger Edgley.
| | | | |
Ajay Krishnan, CFA Lead Portfolio Manager | | 
Roger Edgley, CFA Portfolio Manager | | OVERVIEW For the 12 months ended September 30, 2015, the Wasatch Emerging Markets Select Fund — Investor Class declined -18.81%. The Fund fell slightly less than its benchmark, the |
MSCI Emerging Markets Index, which lost -19.28%.
In stark contrast to data showing healthy employment gains and steady growth in the U.S., progress in most of the world’s other developed economies remained anemic. Japan slipped into and out of recession, while Europe also continued to tread a path between recession and expansion. China lowered its growth target for 2015 to around 7%, down from the 7.4% growth recorded in 2014 — the country’s weakest expansion in over 20 years. During the Fund’s fiscal year, weaker conditions in these major importing countries created headwinds for exporters in emerging markets.
As the year progressed, investors focused increasingly on China. Stock markets in Shanghai and Hong Kong surged for much of the year, fueled largely by speculation and a sharp increase in the outstanding balance of margin loans. The Fund failed to benefit from most of the gains in these markets, due to a scarcity of companies with the quality metrics and fundamental growth characteristics we seek.
In August, however, weak economic data in China raised concerns about the health of the global economy and sent Chinese and world equity markets lower. Because China is a large consumer of oil and other natural resources, the impact of falling demand from China was felt especially hard in commodity-exporting countries such as Brazil.
In this environment, our focus on what we believe are high-quality, long-duration businesses serving secular demand growth in their home countries helped the Fund decline slightly less than its benchmark during the year. Because these companies tend to be driven largely by political and economic progress in the countries in which they operate, they also tend to be less sensitive to global economic developments.
DETAILSOFTHE YEAR
Our strongest contributor to Fund performance for the year was Grupo Aeroportuario del Pacifico S.A.B. de C.V. The company develops, operates and maintains airports in Mexico under contracts with the government. Grupo Aeroportuario has been benefiting from increasing air travel in Mexico as it adds capacity to its existing airports at favorable costs per passenger.
Indian drug maker Lupin Ltd. was our second-largest contributor. The company markets its branded and generic
pharmaceuticals primarily in India, the U.S. and Japan. Lupin’s stock rebounded from weakness in July after the company announced it had agreed to acquire U.S. peer GAVIS Pharmaceuticals, LLC.* The acquisition is expected to broaden Lupin’s U.S. pipeline and to be accretive to earnings in its first full year.
Our greatest detractor from Fund performance for the year was Qualicorp S.A. The company offers insurance and benefits packages to corporations and affinity groups in Brazil. Qualicorp’s share price slumped on speculation that Brazil’s government is considering measures to stimulate sales of individual health-insurance plans. With general investment conditions in Brazil deteriorating, we sold the stock to seek better opportunities elsewhere.
International Container Terminal Services, Inc. (ICTSI) was our second-largest detractor. Based in the Philippines, ICTSI holds concessions to develop and operate shipping terminals and ports throughout the world. Slowing global trade has impacted both the company and its stock price.
OUTLOOK
We expect worsening political situations and low commodity prices to impact business conditions in a number of countries — and to bring about a narrowing of opportunities in emerging markets. While companies linked to the commodity supply chain are likely to suffer, we believe others will do well. For example, net importers of oil such as India and the Philippines stand to benefit from the falling price of crude. We believe well-situated businesses in these and other countries with stable or improving government policies have the potential to generate attractive investment returns over time.
Even in countries where the investment backdrop is unfavorable, we do not anticipate completely liquidating the Fund’s holdings as we did in Russia last year. For two main reasons, this is especially true in major emerging markets such as Brazil and South Africa. First, we view the poor investment environments in these countries as less dire and more temporary. Second, we think the companies in the Fund are likely to hold their own and benefit significantly when conditions improve.
As far as China is concerned, we believe it remains an attractive place to invest. While geographic regions tied to mining, heavy industry and manufacturing have been slowing, the rest of the country has been experiencing robust growth. Overall, China continues to be both a manufacturing powerhouse and a world leader in innovation. On the negative side, overinvestment has resulted in intense competition in a number of industries. As a result, competitive advantages have been more fleeting and long-duration growth companies have been less common in China than in other countries.
Thank you for the opportunity to manage your assets.
| * | As of September 30, 2015, the Wasatch Emerging Markets Select Fund was not invested in privately held GAVIS Pharmaceuticals, LLC. |
| | Current and future holdings are subject to risk. |
8
| | |
| WASATCH EMERGING MARKETS SELECT FUND (WAESX / WIESX) — Portfolio Summary | | SEPTEMBER 30, 2015 (UNAUDITED) |
|
|
|
AVERAGE ANNUAL TOTAL RETURNS
| | | | | | | | | | | | | | | |
| | | 1 YEAR | | 5 YEARS | | SINCE INCEPTION 12/13/12 |
Emerging Markets Select (WAESX) — Investor | | | | -18.81% | | | N/A | | | | -6.10% | |
Emerging Markets Select (WIESX) — Institutional | | | | -18.67% | | | N/A | | | | -5.76% | |
MSCI Emerging Markets Index | | | | -19.28% | | | N/A | | | | -6.98% | |
Data shows past performance, which is not indicative of future performance. Current performance may be lower or higher than the performance quoted. To obtain the most recent month-end performance data available, please visit www.WasatchFunds.com. The Advisor may absorb certain Fund expenses, without which total return would have been lower. Investment returns and principal value will fluctuate and shares, when redeemed, may be worth more or less than their original cost.
As of the January 31, 2015 prospectus, the Total Annual Fund Operating Expenses for the Wasatch Emerging Markets Select Fund are Investor Class — Gross: 1.88%, Net: 1.69% / Institutional Class — Gross: 1.71%, Net: 1.51%. The expense ratio shown elsewhere in this report may be different. Net Expenses are based on Fund expenses, net of waivers and reimbursements. See the prospectus for additional information regarding Fund expenses.
Wasatch Funds will deduct a 2.00% redemption proceeds fee on Fund shares held 60 days or less. Performance data does not reflect the deduction of fees, including sales charges, or the taxes you would pay on fund distributions or the redemption of fund shares. Fees and taxes, if reflected, would reduce the performance quoted. Wasatch does not charge any sales fees. For more complete information including charges, risks and expenses, read the prospectus carefully.
Investing in foreign securities, especially in emerging markets, entails special risks, such as currency fluctuations and political uncertainties, which are described in more detail in the prospectus. Investing in small cap funds will be more volatile and loss of principal could be greater than investing in large cap or more diversified funds. Being non-diversified, the Fund can invest a larger portion of its assets in the securities of a limited number of companies than a diversified fund. Non-diversification increases the risk of loss to the Fund if the values of these securities decline.
TOP 10 EQUITY HOLDINGS*
| | | | |
| Company | | % of Net
Assets | |
| Grupo Aeroportuario del Pacifico S.A.B. de C.V., Class B (Mexico) | | | 5.4% | |
| Glenmark Pharmaceuticals Ltd. (India) | | | 5.1% | |
| Lupin Ltd. (India) | | | 4.6% | |
| HCL Technologies Ltd. (India) | | | 4.2% | |
| Asian Paints Ltd. (India) | | | 3.7% | |
| | | | |
| Company | | % of Net
Assets | |
| Universal Robina Corp. (Philippines) | | | 3.7% | |
| Medytox, Inc. (Korea) | | | 3.6% | |
| Grupo Financiero Interacciones S.A. de C.V., Class O (Mexico) | | | 3.5% | |
| Axis Bank Ltd. (India) | | | 3.5% | |
| Gentera S.A.B. de C.V. (Mexico) | | | 3.4% | |
| * | As of September 30, 2015, there were 33 holdings in the Fund. Foreign currency contracts, written options and repurchase agreements, if any, are not included in the number of holdings. Portfolio holdings are subject to change at any time. References to specific securities should not be construed as recommendations by the Funds or their Advisor. Current and future holdings are subject to risk. |
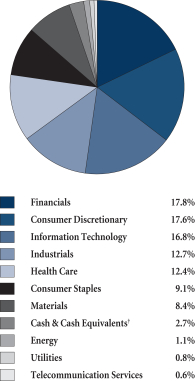
SECTOR BREAKDOWN**
| ** | Excludes securities sold short and options written, if any. |
| † | Also includes Other Assets & Liabilities. |
GROWTHOFA HYPOTHETICAL $10,000 INVESTMENT
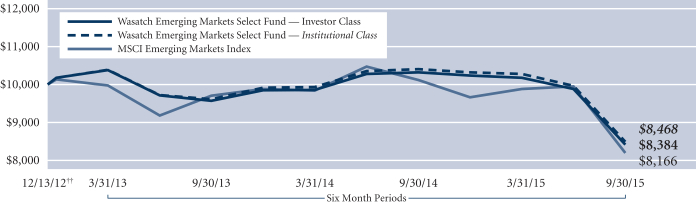
Past performance does not predict future performance. The graph above does not reflect the deduction of fees, sales charges, or taxes that you would pay on fund distributions or the redemption of fund shares. Wasatch does not charge any sales fees. ††Inception: December 13, 2012. The MSCI Emerging Markets Index is a free float-adjusted market capitalization index designed to measure the equity market performance of emerging markets. You cannot invest directly in this or any index.
9
| | |
| WASATCH EMERGING MARKETS SMALL CAP FUND (WAEMX) — Management Discussion | | SEPTEMBER 30, 2015 (UNAUDITED) |
|
|
|
The Wasatch Emerging Markets Small Cap Fund is managed by a team of Wasatch portfolio managers led by Roger Edgley, Andrey Kutuzov and Scott Thomas.
| | | | |
Roger Edgley, CFA Lead Portfolio Manager | | 
Andrey Kutuzov, CFA Associate Portfolio
Manager | | 
Scott Thomas, CFA Associate Portfolio
Manager |
OVERVIEW
The Wasatch Emerging Markets Small Cap Fund declined -12.65% for the fiscal year ended September 30, 2015, and outperformed its benchmark, the MSCI Emerging Markets Small Cap Index, which decreased -15.23%.
This has been one of the most difficult periods for emerging markets we can think of. Perceptions of the challenges within emerging markets (both political and economic) have clearly caused broad outflows in bonds and equities, and have caused investors to question the whole basis for emerging markets as an asset class. While the classification brackets are subject to change and the logic can be questioned, emerging markets are still a huge chunk of the world’s economy and population.
DETAILSOFTHE YEAR
While China continues to dominate the conversation in emerging markets, there are interesting developments in other markets as well, and we are finding many attractive opportunities. However, we believe opportunities in emerging markets have narrowed — with the best opportunities being in places like India, Korea, Mexico and Taiwan, where the political and macro environments are fairly good and the economies are not overly dependent on commodity exports.
Returns from the Fund’s holdings in India, up more than 20%, significantly outperformed the benchmark’s holdings, which were up just over 4%. The Fund is also significantly overweight here at approximately 18%, while the benchmark is at approximately 10%. India is one of the fastest-growing economies in the world. Currently, we view India as one of the most attractive of the emerging markets. India’s economy and financial markets are well-positioned and the reforms and new initiatives taking place under Prime Minister Narendra Modi seem to be positive. As a significant importer of oil, India stands to benefit from the lower price of crude. In addition, we believe favorable demographics and an expanding middle class will likely drive increasing consumer demand. Lower inflation should also contribute to currency stability.
The number of interesting and high-quality potential investments in India is broad-based. Wasatch’s investment team has been investing in India for over 10 years. On
average, team members visit India two times per year and meet approximately 50 companies each visit. As a result, the Fund has been and we expect will continue to be overweight relative to the Index. Five of the Fund’s top 10 contributors for the year were from India, with Britannia Industries Ltd., which manufactures and sells bakery and dairy products, as the top contributor.
Korea is another market where we believe we can find attractive small-cap investments in the current environment. Performance was only slightly positive for the year and the Fund was underweight versus the benchmark, detracting slightly from performance relative to the Index. Korea has a supportive macro environment with moderate gross domestic product (GDP) growth, a strong current-account position, currency stability versus the U.S. dollar, and a central bank that has provided stimulus to the economy. Corporate governance has been improving and a next generation of entrepreneurs has created a new class of companies. This has been particularly evident in health care, e-commerce and technology. Companies have been increasingly focusing on returns on capital and becoming more shareholder-friendly. We have been increasing our position in Korea over the past year. Hanssem Co. Ltd., which specializes in kitchen furnishings, was one of the Fund’s top contributors for the year.
We have spent and will continue to spend time in China, and we have visited many Chinese companies. We have had challenges finding companies that meet our investment criteria. As a result, we’re comfortable with a portfolio weighting in China well below the benchmark weighting. The Fund’s holdings in China underperformed those in the benchmark and detracted from performance. Biostime International Holdings Ltd., China Animal Healthcare Ltd. and China Singyes Solar Technologies Holdings Ltd. were notable detractors.
OUTLOOK
We expect weak commodity prices and difficult political situations to pose additional challenges for a number of emerging markets, including Brazil, Indonesia, Russia, South Africa and Turkey. The Fund currently holds no investments in Russia, and we’ve recently reduced exposure to each of the other countries mentioned.
As we have said, we see a “narrowing” of the investable markets we believe are attractive in emerging markets. However, we are finding many companies with attractive stock valuations. Given the relatively full valuations around the world, we believe companies with the best prospects for top-line and bottom-line growth are the most likely to be rewarded in the stock market. If we choose individual companies and countries correctly, we believe we can structure a sound and well-diversified portfolio for the Fund, even within a narrower set of countries. Our outlook is brighter for India, Korea, Taiwan and Mexico. We believe favorable demographics and expanding middle classes are likely to drive increasing consumer demand in each of these countries.
We thank our shareholders for their support through a difficult period.
| | Current and future holdings are subject to risk. |
10
| | |
| WASATCH EMERGING MARKETS SMALL CAP FUND (WAEMX) — Portfolio Summary | | SEPTEMBER 30, 2015 (UNAUDITED) |
|
|
|
AVERAGE ANNUAL TOTAL RETURNS
| | | | | | | | | | | | | | | |
| | | 1 YEAR | | 5 YEARS | | SINCE INCEPTION 10/1/07 |
Emerging Markets Small Cap | | | | -12.65% | | | | | 0.73% | | | | | 2.72% | |
MSCI Emerging Markets Small Cap Index | | | | -15.23% | | | | | -2.43% | | | | | -1.06% | |
MSCI Emerging Markets Index | | | | -19.28% | | | | | -3.58% | | | | | -2.80% | |
Data shows past performance, which is not indicative of future performance. Current performance may be lower or higher than the performance quoted. To obtain the most recent month-end performance data available, please visit www.WasatchFunds.com. The Advisor may absorb certain Fund expenses, without which total return would have been lower. Investment returns and principal value will fluctuate and shares, when redeemed, may be worth more or less than their original cost.
As of the January 31, 2015 prospectus, the Total Annual Fund Operating Expenses for the Wasatch Emerging Markets Small Cap Fund are 2.02%. The Net Expenses are 1.95%. The expense ratio shown elsewhere in this report may be different. Net Expenses are based on Fund expenses, net of waivers and reimbursements. See the prospectus for additional information regarding Fund expenses.
Wasatch Funds will deduct a 2.00% redemption proceeds fee on Fund shares held 60 days or less. Performance data does not reflect the deduction of fees, including sales charges, or the taxes you would pay on fund distributions or the redemption of fund shares. Fees and taxes, if reflected, would reduce the performance quoted. Wasatch does not charge any sales fees. For more complete information including charges, risks and expenses, read the prospectus carefully.
Investing in foreign securities, especially in emerging markets, entails special risks, such as currency fluctuations and political uncertainties, which are described in more detail in the prospectus. Investing in small cap funds will be more volatile and loss of principal could be greater than investing in large cap or more diversified funds.
TOP 10 EQUITY HOLDINGS*
| | | | |
| Company | | % of Net
Assets | |
| Poya Co. Ltd. (Taiwan) | | | 1.8% | |
| BGF Retail Co. Ltd. (Korea) | | | 1.8% | |
| D&L Industries, Inc. (Philippines) | | | 1.8% | |
| Medytox, Inc. (Korea) | | | 1.7% | |
| Hanssem Co. Ltd. (Korea) | | | 1.7% | |
| | | | |
| Company | | % of Net
Assets | |
| Britannia Industries Ltd. (India) | | | 1.6% | |
| Marksans Pharma Ltd. (India) | | | 1.6% | |
| Grupo Aeroportuario del Centro Norte S.A.B. de C.V. (Mexico) | | | 1.6% | |
| Voltronic Power Technology Corp. (Taiwan) | | | 1.5% | |
| Security Bank Corp. (Philippines) | | | 1.4% | |
| * | As of September 30, 2015, there were 121 holdings in the Fund. Foreign currency contracts, written options and repurchase agreements, if any, are not included in the number of holdings. Portfolio holdings are subject to change at any time. References to specific securities should not be construed as recommendations by the Funds or their Advisor. Current and future holdings are subject to risk. |
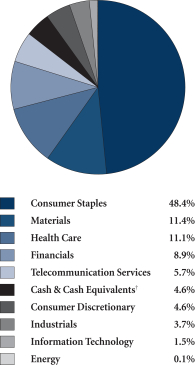
SECTOR BREAKDOWN**
| ** | Excludes securities sold short and options written, if any. |
| † | Also includes Other Assets & Liabilities. |
GROWTHOFA HYPOTHETICAL $10,000 INVESTMENT
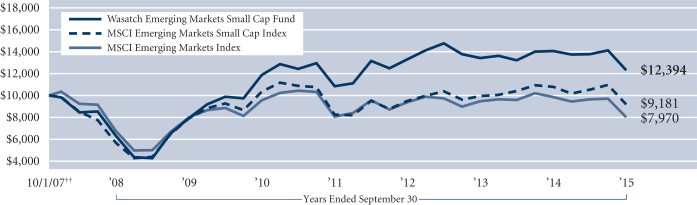
Past performance does not predict future performance. The graph above does not reflect the deduction of fees, sales charges, or taxes that you would pay on fund distributions or the redemption of fund shares. Wasatch does not charge any sales fees. ††Inception: October 1, 2007. The MSCI Emerging Markets and Emerging Markets Small Cap indices are free float-adjusted market capitalization indices designed to measure the equity market performance of emerging markets. You cannot invest directly in these or any indices.
11
| | |
| WASATCH FRONTIER EMERGING SMALL COUNTRIES FUND (WAFMX) — Management Discussion | | SEPTEMBER 30, 2015 (UNAUDITED) |
|
|
|
The Wasatch Frontier Emerging Small Countries Fund is managed by a team of Wasatch portfolio managers led by Laura Geritz.
| | |

Laura Geritz, CFA Lead Portfolio Manager | | OVERVIEW The Wasatch Frontier Emerging Small Countries Fund declined -14.88% for the fiscal year ended September 30, 2015, and outperformed the MSCI Frontier Emerging Markets Index, which fell
-24.82%. The past year was one of the most challenging periods for frontier markets we have encountered. The tailspin in China’s stock market and its currency devaluation forced the world |
to come to grips with China’s economic slowdown and the possibility of slower global growth.
DETAILSOFTHE YEAR
Given the broader downturn in the market, most sectors detracted from the performance of the Fund and the benchmark over the past 12 months. Health care was an exception for the Fund. We were overweight in health care and our holdings had a positive return, while the benchmark’s group had a negative return. One of the largest detractors from the Fund’s absolute performance was the financials sector. Our financial stocks were down double-digits, but slightly outperformed those in the Index. The Fund’s lower average weighting of 13.2% compared to 51.1% for the benchmark added significantly to relative outperformance. We have historically been underweight in financials, whereas over half the benchmark is in financials.
Within financials, the following holdings weighed on the Fund’s performance: Zenith Bank plc, Kenya Commercial Bank Ltd., and Guaranty Trust Bank plc. However, The Bank for Foreign Trade of Vietnam JSC was up nicely during the period after the Vietnamese government announced it would lift foreign ownership limits. As a country, we believe Vietnam has attractive macroeconomic characteristics for growth and the potential to benefit from a favorable environment, including the Trans-Pacific Partnership agreement. We believe this Vietnamese bank will continue to be a significant beneficiary.
The consumer-staples sector detracted from the Fund’s absolute performance mainly due to several breweries, including East African Breweries Ltd., which was impacted by regulatory pressure in Tanzania; Nigerian Breweries plc; and Guinness Nigeria plc.
We consider East African Breweries to be one of the highest-quality sub-Saharan African companies. It is the dominant beer and spirits company in Kenya, and has significant market share in neighboring Tanzania and Uganda. The company’s high barriers to entry in distribution and brand recognition pose a significant moat to competitors. The company has been one of the largest beneficiaries in East Africa as consumers in the region gravitate toward branded alcoholic beverages.
Our exposure to the materials sector hurt the Fund’s absolute performance. However, performance relative to the Index in the sector was helped by the better overall return of our materials stocks. The Fund benefited from strong results in some of its materials holdings in Bangladesh led by Berger Paints Bangladesh Ltd., the leading producer of paints in the country with a dominant market position, a strong distribution network, and an established and well-known brand that has been around since the nation’s inception in 1970. Given these dynamics, we believe it is one of Bangladesh’s best companies and, internally at Wasatch, we consider it to be one of the “World’s Best Growth Companies.”
On a country basis, Bangladesh was the main source of strength for the Fund. The Fund was significantly overweight in Bangladesh compared to the benchmark and our holdings had a positive return, while the benchmark’s holdings were down. Our performance in Bangladesh was largely due to our holdings in Olympic Industries Ltd., a biscuit manufacturer; Square Pharmaceuticals Ltd., a manufacturer of generic pharmaceuticals; and Marico Bangladesh Ltd., a fast-moving consumer-goods company. Pakistan also contributed to performance relative to the Index. The Fund was overweight in Pakistan and our holdings outperformed, helped by two cement companies — Lucky Cement Ltd. and Kohat Cement Co. Ltd.
Our holdings in Kenya and Nigeria were sources of weakness in the Fund during the 12-month period. The Fund’s performance in Kenya was hurt most by East African Breweries, which is our largest Kenyan holding. The company continues to face regulatory pressure from authorities in neighboring Tanzania due to its virtual monopoly. Nigeria was the Fund’s largest detractor from absolute performance as the country continues to confront Boko Haram. However, Nigeria also underwent a presidential election that saw the first truly democratic transition in the government since the country’s independence in 1960 — one of the many positive macro developments we witnessed in frontier markets during this year. Many frontier markets remain bright spots of positive change and growth in a growth-challenged world.
OUTLOOK
As the world adjusts to the new normal of China’s slowing growth, various markets that relied on China will have to make major structural changes to their economies. Many frontier markets have been relatively immune to this phenomenon as illustrated by Bangladesh — its companies and by extension its economy are largely driven by local demand.
We are firmly committed to our approach of finding the World’s Best Growth Companies, and we believe that the long-tail, durable growth we have been able to find in frontier markets is attractive.
Thank you for trusting us as stewards of your hard-earned capital.
| | Current and future holdings are subject to risk. |
12
| | |
| WASATCH FRONTIER EMERGING SMALL COUNTRIES FUND (WAFMX) — Portfolio Summary | | SEPTEMBER 30, 2015 (UNAUDITED) |
|
|
|
AVERAGE ANNUAL TOTAL RETURNS
| | | | | | | | | | | | | | | |
| | | 1 YEAR | | 5 YEARS | | SINCE INCEPTION 1/31/12 |
Frontier Emerging Small Countries | | | | -14.88% | | | N/A | | | | 9.97% | |
MSCI Frontier Emerging Markets Index | | | | -24.82% | | | N/A | | | | 2.19% | |
MSCI Frontier Markets Index | | | | -24.19% | | | N/A | | | | 6.65% | |
Data shows past performance, which is not indicative of future performance. Current performance may be lower or higher than the performance quoted. To obtain the most recent month-end performance data available, please visit www.WasatchFunds.com. The Advisor may absorb certain Fund expenses, without which total return would have been lower. Investment returns and principal value will fluctuate and shares, when redeemed, may be worth more or less than their original cost.
As of the January 31, 2015 prospectus, the Total Annual Fund Operating Expenses for the Wasatch Frontier Emerging Small Countries Fund are 2.24%. The expense ratio shown elsewhere in this report may be different. See the prospectus for additional information regarding Fund expenses.
Wasatch Funds will deduct a 2.00% redemption proceeds fee on Fund shares held 60 days or less. Performance data does not reflect the deduction of fees, including sales charges, or the taxes you would pay on fund distributions or the redemption of fund shares. Fees and taxes, if reflected, would reduce the performance quoted. Wasatch does not charge any sales fees. For more complete information including charges, risks and expenses, read the prospectus carefully.
Investing in small cap funds will be more volatile and loss of principal could be greater than investing in large cap or more diversified funds. Investing in foreign securities, especially in frontier and emerging markets, entails special risks, such as currency fluctuations and political uncertainties, which are described in more detail in the prospectus.
TOP 10 EQUITY HOLDINGS*
| | | | |
| Company | | % of Net
Assets | |
| Square Pharmaceuticals Ltd. (Bangladesh) | | | 3.9% | |
| Vietnam Dairy Products JSC (Vietnam) | | | 3.9% | |
| East African Breweries Ltd. (Kenya) | | | 3.2% | |
| Nestlé Nigeria plc (Nigeria) | | | 3.1% | |
Tanzania Breweries Ltd. (Tanzania,
United Republic of) | | | 3.1% | |
| | | | |
| Company | | % of Net
Assets | |
| Lucky Cement Ltd. (Pakistan) | | | 3.0% | |
| Nigerian Breweries plc (Nigeria) | | | 3.0% | |
| Kuwait Foods Americana (Kuwait) | | | 2.6% | |
| Bank for Foreign Trade of Vietnam JSC (Vietnam) | | | 2.4% | |
| Olympic Industries Ltd. (Bangladesh) | | | 2.3% | |
| * | As of September 30, 2015, there were 125 holdings in the Fund. Foreign currency contracts, written options and repurchase agreements, if any, are not included in the number of holdings. Portfolio holdings are subject to change at any time. References to specific securities should not be construed as recommendations by the Funds or their Advisor. Current and future holdings are subject to risk. |
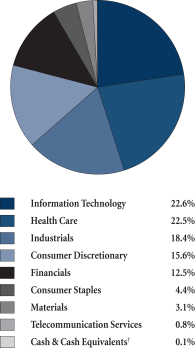
SECTOR BREAKDOWN**
| ** | Excludes securities sold short and options written, if any. |
| † | Also includes Other Assets & Liabilities. |
GROWTHOFA HYPOTHETICAL $10,000 INVESTMENT
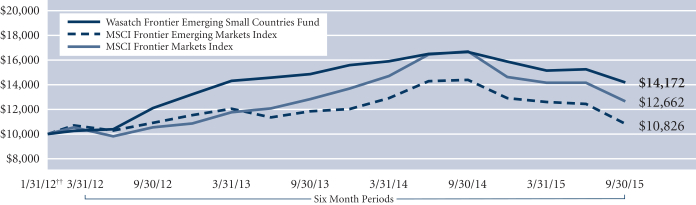
Past performance does not predict future performance. The graph above does not reflect the deduction of fees, sales charges, or taxes that you would pay on fund distributions or the redemption of fund shares. Wasatch does not charge any sales fees. ††Inception: January 31, 2012. The MSCI Frontier Emerging Markets and MSCI Frontier Markets indices are free float-adjusted market capitalization indices designed to measure the equity market performance of the global frontier and emerging markets. You cannot invest directly in these or any indices.
13
| | |
| WASATCH GLOBAL OPPORTUNITIES FUND (WAGOX) — Management Discussion | | SEPTEMBER 30, 2015 (UNAUDITED) |
|
|
|
The Wasatch Global Opportunities Fund is managed by a team of Wasatch portfolio managers led by JB Taylor and Ajay Krishnan.
| | | | |
JB Taylor Lead Portfolio Manager | |
Ajay Krishnan, CFA Lead Portfolio Manager | | OVERVIEW The Wasatch Global Opportunities Fund fell -3.88%
during the 12 months ended September 30, 2015, performing roughly in line with the benchmark MSCI AC |
World Small Cap Index, which declined -3.28%.
We’ve all heard the expression, “When America sneezes, the world catches a cold.” It seems the same can now be said about China. That should come as no surprise because China is the second-largest economy in the world, as measured by gross-domestic product (GDP).
During the latter part of the Fund’s fiscal year, global stock markets declined significantly. While the news coming out of China reflected real economic concerns, the main triggers for the declines mostly had to do with ill-conceived government actions: China’s leadership initially encouraged excessive speculation in Chinese shares through massive openings of brokerage accounts, lower margin requirements and monetary stimulus by the People’s Bank of China (the country’s central bank).
Once Chinese markets turned down, the government’s first response was to intervene to support stock prices — a strategy that was soon abandoned, creating even more uncertainty. Next came the government’s effort to intentionally devalue the Chinese yuan against other major currencies. In yet another flip-flop, the central bank later cut its holdings of dollar-denominated U.S. Treasury securities and used the proceeds to prop up the yuan.
So if ill-conceived government actions were the main triggers that set off stock-market avalanches around the world, what have been the underlying conditions that have made markets vulnerable in the first place? We believe these conditions have included slower economic growth, which depresses corporate prospects, and central-bank policies that have encouraged investors to put their money into riskier assets.
DETAILSOFTHE YEAR
Our greatest detractor from Fund performance for the year was Qualicorp S.A. The company offers insurance and benefits packages to corporations and affinity groups in Brazil. Qualicorp’s share price slumped on speculation that Brazil’s government is considering measures to stimulate sales of individual health-insurance plans. With general investment conditions in Brazil deteriorating, we sold the stock to seek better opportunities elsewhere.
Another large detractor from Fund performance was online travel agency MakeMyTrip Ltd. Although aggressive
discounting by a competitor has resulted in slowing sales growth and wider-than-expected losses for MakeMyTrip, it remains India’s leading online travel agency both in airline-ticket sales and hotel bookings. We believe the company’s margins will expand once competition abates, and we continue to own it in the Fund.
On the positive side of the ledger, our top contributor was Allegiant Travel Co., which rebounded from its low several months ago. Over the past year, the stock has been on a roller coaster, but has ultimately climbed higher. Early in the period, Allegiant rose based on good revenue and earnings growth, partially due to the lower price of oil. Then, the stock declined due to a backup in the price of crude and the threat of a pilot strike. More recently, the stock has recovered its losses as oil has shown some renewed weakness, and as investors have recognized Allegiant’s competitive advantages and ability to work through its labor disputes.
Medytox, Inc., a Korean health-care company, was also a strong contributor to performance for the year. Medytox develops dermal fillers and biopharmaceuticals for cosmetic applications, and therapeutic applications for the treatment of muscular disorders. The company’s stock soared on optimism that its second-generation botulinum toxin may offer an attractive alternative to BOTOX® Cosmetic for reducing wrinkles and aging of the face.
OUTLOOK
Regarding ongoing events in China, we think there are a few red flags. First, if China’s economic growth is slowing more than previously expected, this will adversely affect many companies in developed and emerging markets — although some other companies will benefit as production costs decline due to less competition for oil and minerals. Second, the possibility that China will resume its devaluation of the yuan could lead to competitive currency devaluations as other countries seek to maintain export competitiveness. Third, the recent rout in commodity prices could continue because demand growth is slowing, and modern technology is making it increasingly easy to scale production up and down.
Based on the macro themes described above, we believe opportunities in emerging markets have narrowed — with the best opportunities being in places like India, Mexico and Taiwan, where the political environments are fairly good and the economies are not overly dependent on commodity exports.
In developed markets, where we invest the majority of the Fund’s assets, we have the largest weighting in the United States, although the weighting is significantly below that of the benchmark. We continue to look for new opportunities in the U.S. due to the relative strength of the economy and the prevalence of companies that are performing well. But our U.S. weighting has been held back by the generally high valuations we’ve been finding. Among other developed markets, our largest weightings are in Japan, the United Kingdom and Germany — where stocks are generally less well-researched than those in the U.S.
Thank you for the opportunity to manage your assets.
| | Current and future holdings are subject to risk. |
14
| | |
| WASATCH GLOBAL OPPORTUNITIES FUND (WAGOX) — Portfolio Summary | | SEPTEMBER 30, 2015 (UNAUDITED) |
|
|
|
AVERAGE ANNUAL TOTAL RETURNS
| | | | | | | | | | | | | | | |
| | | 1 YEAR | | 5 YEARS | | SINCE INCEPTION 11/17/08 |
Global Opportunities | | | | -3.88% | | | 8.54% | | | | 17.70% | |
MSCI AC World Small Cap Index | | | | -3.28% | | | 8.14% | | | | 15.37% | |
Data shows past performance, which is not indicative of future performance. Current performance may be lower or higher than the performance quoted. To obtain the most recent month-end performance data available, please visit www.WasatchFunds.com. The Advisor may absorb certain Fund expenses, without which total return would have been lower. Investment returns and principal value will fluctuate and shares, when redeemed, may be worth more or less than their original cost.
As of the January 31, 2015 prospectus, the Total Annual Fund Operating Expenses for the Wasatch Global Opportunities Fund are 1.78%. The expense ratio shown elsewhere in this report may be different. See the prospectus for additional information regarding Fund expenses.
Wasatch Funds will deduct a 2.00% redemption proceeds fee on Fund shares held 60 days or less. Performance data does not reflect the deduction of fees, including sales charges, or the taxes you would pay on fund distributions or the redemption of fund shares. Fees and taxes, if reflected, would reduce the performance quoted. Wasatch does not charge any sales fees. For more complete information including charges, risks and expenses, read the prospectus carefully.
Investing in small and micro cap funds will be more volatile and loss of principal could be greater than investing in large cap or more diversified funds. Investing in foreign securities, especially in emerging markets, entails special risks, such as currency fluctuations and political uncertainties, which are described in more detail in the prospectus.
TOP 10 EQUITY HOLDINGS*
| | | | |
| Company | | % of Net
Assets | |
| SMS Co. Ltd. (Japan) | | | 3.2% | |
| Allegiant Travel Co. | | | 3.2% | |
| Patrizia Immobilien AG (Germany) | | | 2.8% | |
| Medytox, Inc. (Korea) | | | 2.4% | |
| TWi Pharmaceuticals, Inc. (Taiwan) | | | 2.4% | |
| | | | |
| Company | | % of Net
Assets | |
| Cornerstone OnDemand, Inc. | | | 2.3% | |
| Knight Transportation, Inc. | | | 2.0% | |
| IPG Photonics Corp. | | | 2.0% | |
| Rightmove plc (United Kingdom) | | | 2.0% | |
| Next Co. Ltd. (Japan) | | | 1.9% | |
| * | As of September 30, 2015, there were 87 holdings in the Fund. Foreign currency contracts, written options and repurchase agreements, if any, are not included in the number of holdings. Portfolio holdings are subject to change at any time. References to specific securities should not be construed as recommendations by the Funds or their Advisor. Current and future holdings are subject to risk. |
SECTOR BREAKDOWN**
| ** | Excludes securities sold short and options written, if any. |
| † | Also includes Other Assets & Liabilities. |
GROWTHOFA HYPOTHETICAL $10,000 INVESTMENT
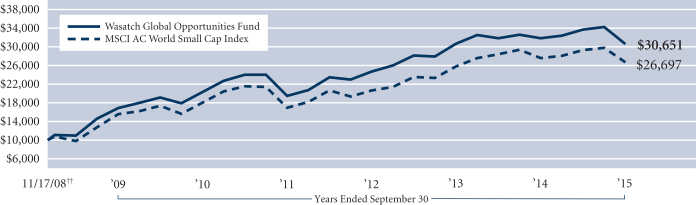
Past performance does not predict future performance. The graph above does not reflect the deduction of fees, sales charges, or taxes that you would pay on fund distributions or the redemption of fund shares. Wasatch does not charge any sales fees. ††Inception: November 17, 2008. The MSCI AC (All Country) World Small Cap Index is a free float-adjusted market capitalization index designed to measure the performance of small capitalization securities in developed and emerging markets. You cannot invest directly in this or any index.
15
| | |
| WASATCH INTERNATIONAL GROWTH FUND (WAIGX) — Management Discussion | | SEPTEMBER 30, 2015 (UNAUDITED) |
|
|
|
The Wasatch International Growth Fund is managed by a team of Wasatch portfolio managers led by Roger Edgley, Linda Lasater and Kabir Goyal.
| | | | |
Roger Edgley, CFA Lead Portfolio Manager | | 
Linda Lasater, CFA Associate Portfolio Manager | | 
Kabir Goyal, CFA Associate Portfolio Manager |
OVERVIEW
The Wasatch International Growth Fund gained 4.83% for the 12 months ended September 30, 2015. Over the same period, the Fund’s benchmark, the MSCI AC World Ex-U.S.A. Small Cap Index, declined -6.42%.
Over the past 12 months, the financial markets faced growing uncertainties. Central bank policy moves, especially those in the U.S. and China, weighed heavily on the markets. In the latter part of the period, investors were particularly concerned about the slowdown in China’s economy, China’s surprise devaluation of the yuan and the Volkswagen emission scandal. Our core and largest-weighted markets including Japan, the United Kingdom (U.K.) and Europe have been experiencing mixed macro developments, but we remain optimistic given the positive advances we have been seeing at a company level. We believe we have populated the Fund with high-quality long-duration growth companies that have the ability to grow over a full market cycle, despite any macroeconomic challenges they may face. Market weakness provided us with opportunities to strengthen positions in our highest-conviction stocks and upgrade the quality of our portfolio with new investments.
DETAILSOFTHE YEAR
Japan contributed the most to the Fund’s performance over the past 12 months. Relative to the Index, the Fund was overweight in Japan and our holdings significantly outperformed. The extent of the economic recovery in Japan continues to be debatable, but the overall trend has been positive. The fundamental changes taking place across corporate Japan have resulted in an increased pool of interesting companies that fit our investment criteria. We believe our focus on companies with experienced, high-caliber leadership, innovative or proprietary products or platforms, and outstanding business models has the potential to continue to drive outperformance relative to the benchmark. Two of the Fund’s top 10 contributors to performance were from Japan — Ryohin Keikaku Co. Ltd., which sells knitwear, food and household items, and Nihon M&A Center, Inc., which provides merger and acquisition advisory services to small and medium-size enterprises.
In the U.K., solid domestic demand has been supported by economic data including inflation, employment and wage-growth numbers. There is concern that the strengthening currency could dampen economic activity, particularly for exporters. While a broad-based economic recovery is favorable for companies in general, we believe our holdings are market leaders in their respective categories and are capable of driving organic growth over the long term. For example, Domino’s Pizza Group plc, another of the Fund’s top contributors for the year, continues to grow organically through innovation and strong execution. The company is leveraging the Internet and technology to drive the customer proposition and efficiencies throughout the organization. This is resulting in strong same-store sales, margin expansion and cash generation.
Finally, in Europe, the economic recovery is becoming more entrenched. Growth across the eurozone has been improving, corporate earnings are rising and government debt ratios appear to have stabilized. The recovery has been driven not only by Germany and France, but also by peripheral countries like Spain, Italy and Portugal. Furthermore, with improving consumer sentiment and lower oil prices, household spending and retail sales have started to trend positively, which should further support the economic trajectory.
Germany was a top-contributing country within the Fund led by Patrizia Immobilien AG. Patrizia continues to transform itself from a pure residential property owner in Germany to a pan-European full-service real estate asset manager.
Detractors from performance were also broad-based across geographies and sectors. We sold companies that fell short of our expectations. Among them were several energy holdings. We have kept holdings that, in our opinion, are high-quality companies and leaders in their respective industries. We remain constructive on their prospects over the long term.
OUTLOOK
We are excited about the quality of the companies in the Fund and the opportunities we see for them. Many of our companies offer services that are in high demand that allow them to execute their strategies throughout any economic environment. Furthermore, we believe that improving economic conditions in Japan, Europe and the U.K. are providing a broader pool of investment candidates.
In Japan, we believe the fundamental corporate changes from governance and management perspectives will help drive long-term growth for our companies and increase shareholder value. In Europe, we are seeing a more cyclical recovery, but because the environment has been difficult for such a long period of time, particularly in the peripheral countries, the competitive landscape has improved and the high-quality companies we target have been reaping the benefits of their discipline and strong execution. Finally, in the U.K., the recovery is further along than in other developed regions. We are starting to see compelling opportunities in certain sectors, particularly industrials, which have been impacted by currency and exposure to emerging markets.
Thank you for the opportunity to manage your assets.
| | Current and future holdings are subject to risk. |
16
| | |
| WASATCH INTERNATIONAL GROWTH FUND (WAIGX) — Portfolio Summary | | SEPTEMBER 30, 2015 (UNAUDITED) |
|
|
|
AVERAGE ANNUAL TOTAL RETURNS
| | | | | | | | | | | | | | | |
| | | 1 YEAR | | 5 YEARS | | 10 YEARS |
International Growth | | | | 4.83% | | | | | 9.13% | | | | | 8.06% | |
MSCI AC World Ex-U.S.A. Small Cap Index | | | | -6.42% | | | | | 3.85% | | | | | 5.13% | |
MSCI World Ex-U.S.A. Small Cap Index | | | | -3.71% | | | | | 5.74% | | | | | 4.23% | |
Data shows past performance, which is not indicative of future performance. Current performance may be lower or higher than the performance quoted. To obtain the most recent month-end performance data available, please visit www.WasatchFunds.com. The Advisor may absorb certain Fund expenses, without which total return would have been lower. Investment returns and principal value will fluctuate and shares, when redeemed, may be worth more or less than their original cost.
As of the January 31, 2015 prospectus, the Total Annual Fund Operating Expenses for the Wasatch International Growth Fund are 1.46%. The expense ratio shown elsewhere in this report may be different. See the prospectus for additional information regarding Fund expenses.
Wasatch Funds will deduct a 2.00% redemption proceeds fee on Fund shares held 60 days or less. Performance data does not reflect the deduction of fees, including sales charges, or the taxes you would pay on fund distributions or the redemption of fund shares. Fees and taxes, if reflected, would reduce the performance quoted. Wasatch does not charge any sales fees. For more complete information including charges, risks and expenses, read the prospectus carefully.
Investing in foreign securities, especially in frontier and emerging markets, entails special risks, such as currency fluctuations and political uncertainties, which are described in more detail in the prospectus. Investing in small cap funds will be more volatile and loss of principal could be greater than investing in large cap or more diversified funds.
TOP 10 EQUITY HOLDINGS*
| | | | |
| Company | | % of Net
Assets | |
| Patrizia Immobilien AG (Germany) | | | 3.2% | |
| Domino’s Pizza Group plc (United Kingdom) | | | 2.9% | |
| Domino’s Pizza Enterprises Ltd. (Australia) | | | 2.8% | |
| Nihon M&A Center, Inc. (Japan) | | | 2.8% | |
| Ai Holdings Corp. (Japan) | | | 2.5% | |
| | | | |
| Company | | % of Net
Assets | |
| Rightmove plc (United Kingdom) | | | 2.4% | |
| SMS Co. Ltd. (Japan) | | | 2.3% | |
| Abcam plc (United Kingdom) | | | 2.2% | |
| CTS Eventim AG & Co KGaA (Germany) | | | 2.0% | |
| Medytox, Inc. (Korea) | | | 2.0% | |
| * | As of September 30, 2015, there were 83 holdings in the Fund. Foreign currency contracts, written options and repurchase agreements, if any, are not included in the number of holdings. Portfolio holdings are subject to change at any time. References to specific securities should not be construed as recommendations by the Funds or their Advisor. Current and future holdings are subject to risk. |
SECTOR BREAKDOWN**
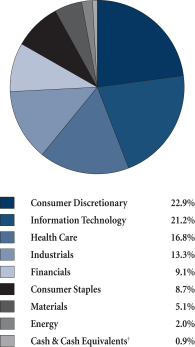
| ** | Excludes securities sold short and options written, if any. |
| † | Also includes Other Assets & Liabilities. |
GROWTHOFA HYPOTHETICAL $10,000 INVESTMENT
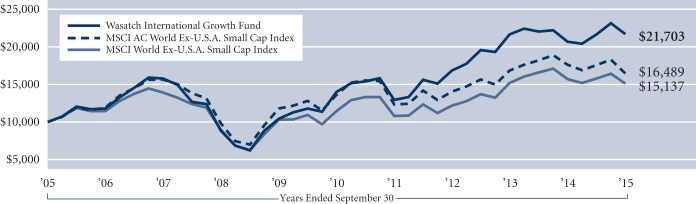
Past performance does not predict future performance. The graph above does not reflect the deduction of fees, sales charges, or taxes that you would pay on fund distributions or the redemption of fund shares. Wasatch does not charge any sales fees. The MSCI AC (All Country) World Ex-U.S.A. Small Cap Index is a free float-adjusted market capitalization index designed to measure the performance of small capitalization securities in developed markets, excluding the United States, and in emerging markets. The MSCI World Ex-U.S.A. Small Cap Index is a free float-adjusted market capitalization index designed to measure the performance of small capitalization securities in developed markets, excluding the United States. You cannot invest directly in these or any indices.
17
| | |
| WASATCH INTERNATIONAL OPPORTUNITIES FUND (WAIOX) — Management Discussion | | SEPTEMBER 30, 2015 (UNAUDITED) |
|
|
|
The Wasatch International Opportunities Fund is managed by a team of Wasatch portfolio managers led by Laura Geritz and Jared Whatcott.
| | | | |
Laura Geritz, CFA Portfolio Manager | | 
Jared Whatcott, CFA Associate Portfolio Manager | | OVERVIEW The Wasatch International Opportunities
Fund fell -1.44% for the 12-month period ended September 30, 2015. Over the same time
period, the
Fund’s benchmark,
the MSCI AC |
World Ex-U.S.A. Small Cap Index, lost -6.42%.
Late in the Fund’s fiscal year, just as concerns over Greece began to subside, and developed markets began to take comfort in improving economic data from Europe, China’s muddled handling of its currency and stock markets left global investors disconcerted about the country’s future prospects, its policy responses, and its impact on world economics. The U.S. Federal Reserve’s decision to leave interest rates unchanged, despite reasonably strong domestic economic indicators, further upset global markets and revived debate on the timing of U.S. rate increases. Emerging markets bore the brunt of these concerns, as global investors are estimated to have sold $19 billion worth of emerging-market equities in the third calendar quarter of 2015, the worst sell-off since 2008. As a result, developed-country stocks in the Index held up much better over the latest three-month period than emerging-market stocks, but lagged the more insulated frontier stocks.
DETAILSOFTHE YEAR
Given recent increases to our company weights in Japan, the Fund ended the fiscal year with nearly half of its invested assets in developed markets, which is still well under the Index weight of over 78%. As we’ve continued to find and add what we consider to be high-quality, undiscovered micro-cap companies with strong market positions in less-traveled parts of the globe, the portion of the Fund invested in frontier markets has crept up to 10%. The remainder of the Fund is invested in strong, growing companies in the emerging world that we believe have the potential to outperform over time.
The biggest contributor from a country perspective was Japan. Our Japanese holdings significantly outperformed those in the Index. The latest trip to Japan by several members of the international team resulted in us increasing our exposure to Japan, including adding to some companies that we believe are high-quality innovators like Next Co. Ltd., a top online real estate company taking share in a resurgent Japanese market, and SMS Co Ltd., a website operator for senior-care recruitment that also has the potential to disrupt the enterprise resource planning (ERP) systems for nursing facilities in the country. This proved to be beneficial as both
Next and SMS made notable contributions to the Fund’s performance for the 12-month period.
Our decision to remain underweight in China turned out to be a plus. With stocks in Hong Kong and China in free-fall, we benefited from our smaller weight in a few select companies.
By the end of the period, the Fund had eliminated its holdings in Canada. Our lack of exposure to Canada contributed to relative performance. Canada was a weak-performing country within the benchmark, mainly due to the energy and materials sectors, where prices have been hit on concerns of lower demand from China coupled with excess supply.
Malaysia and Indonesia detracted significantly from the Fund’s performance. In Malaysia, the Fund’s overweight position was detrimental and we underperformed the Index in this country. In Indonesia, our stocks underperformed those in the Index and an overweight position hurt.
On a sector basis, the consumer-discretionary sector contributed the most to the Fund’s performance versus the Index. Besides Japanese company Next, which we already mentioned, we also saw strong performance from Poya Co. Ltd., an operator of department stores in Taiwan.
Industrials also contributed favorably to the Fund’s performance over the fiscal year. Electrical-equipment providers Amara Raja Batteries Ltd., a battery producer in India, and Voltronic Power Technology Corp., a Taiwanese power-product manufacturer, were two of the Fund’s top contributors.
The health-care sector detracted from the Fund’s performance — weighed down by Indonesian pharmaceutical company PT Kimia Farma Persero Tbk. Nevertheless, we are excited about the opportunities we see for our health-care holdings over the coming years.
Finally, the financials sector detracted the most from the Fund’s performance. Relative to the Index, the Fund’s performance in the sector was hurt by a substantially underweight position and the underperformance of our financial stocks.
OUTLOOK
From a valuation perspective, the Fund is now near the most attractive levels on a price-to-book and price-to-sales basis we’ve seen in the last three or four years. We are cognizant of equity valuations and expect to trim positions as prices rise and reduce our projected-return calculations. We also expect to add to positions when we see our favorite long-term holdings pull back.
While we can’t know what surprises the global markets have in store for us, we do have confidence that our investment process will continue to point us to companies that have the potential to thrive over time. We are optimistic about the positioning of the Fund, and excited about the great opportunities we have continued to uncover as we have traveled the globe in search of emerging World’s Best Growth Companies.
Thank you for the privilege of managing your money.
| | Current and future holdings are subject to risk. |
18
| | |
| WASATCH INTERNATIONAL OPPORTUNITIES FUND (WAIOX) — Portfolio Summary | | SEPTEMBER 30, 2015 (UNAUDITED) |
|
|
|
AVERAGE ANNUAL TOTAL RETURNS
| | | | | | | | | | | | | | | |
| | | 1 YEAR | | 5 YEARS | | 10 YEARS |
International Opportunities | | | | -1.44% | | | | | 7.98% | | | | | 8.72% | |
MSCI AC World Ex-U.S.A. Small Cap Index | | | | -6.42% | | | | | 3.85% | | | | | 5.13% | |
MSCI World Ex-U.S.A. Small Cap Index | | | | -3.71% | | | | | 5.74% | | | | | 4.23% | |
Data shows past performance, which is not indicative of future performance. Current performance may be lower or higher than the performance quoted. To obtain the most recent month-end performance data available, please visit www.WasatchFunds.com. The Advisor may absorb certain Fund expenses, without which total return would have been lower. Investment returns and principal value will fluctuate and shares, when redeemed, may be worth more or less than their original cost.
As of the January 31, 2015 prospectus, the Total Annual Fund Operating Expenses for the Wasatch International Opportunities Fund are 2.41%. The Net Expenses are 2.25%. The expense ratio shown elsewhere in this report may be different. Net Expenses are based on Fund expenses, net of waivers and reimbursements. See the prospectus for additional information regarding Fund expenses.
Wasatch Funds will deduct a 2.00% redemption proceeds fee on Fund shares held 60 days or less. Performance data does not reflect the deduction of fees, including sales charges, or the taxes you would pay on fund distributions or the redemption of fund shares. Fees and taxes, if reflected, would reduce the performance quoted. Wasatch does not charge any sales fees. For more complete information including charges, risks and expenses, read the prospectus carefully.
Investing in foreign securities, especially in frontier and emerging markets, entails special risks, such as currency fluctuations and political uncertainties, which are described in more detail in the prospectus. Investing in micro cap funds will be more volatile and loss of principal could be greater than investing in large cap or more diversified funds.
TOP 10 EQUITY HOLDINGS*
| | | | |
| Company | | % of Net
Assets | |
| Next Co. Ltd. (Japan) | | | 2.4% | |
| Ikyu Corp. (Japan) | | | 2.1% | |
| Gurunavi, Inc. (Japan) | | | 2.1% | |
| Jalux, Inc. (Japan) | | | 1.8% | |
| Pepsi-Cola Products Philippines, Inc. (Philippines) | | | 1.7% | |
| | | | |
| Company | | % of Net
Assets | |
| Doutor Nichires Holdings Co. Ltd. (Japan) | | | 1.7% | |
| Axial Retailing, Inc. (Japan) | | | 1.6% | |
| Voltronic Power Technology Corp. (Taiwan) | | | 1.5% | |
Famous Brands Ltd. (South Africa) | | | 1.5% | |
| Wawel S.A. (Poland) | | | 1.5% | |
| * | As of September 30, 2015, there were 164 holdings in the Fund. Foreign currency contracts, written options and repurchase agreements, if any, are not included in the number of holdings. Portfolio holdings are subject to change at any time. References to specific securities should not be construed as recommendations by the Funds or their Advisor. Current and future holdings are subject to risk. |
SECTOR BREAKDOWN**
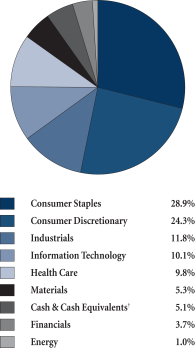
| ** | Excludes securities sold short and options written, if any. |
| † | Also includes Other Assets & Liabilities. |
GROWTHOFA HYPOTHETICAL $10,000 INVESTMENT
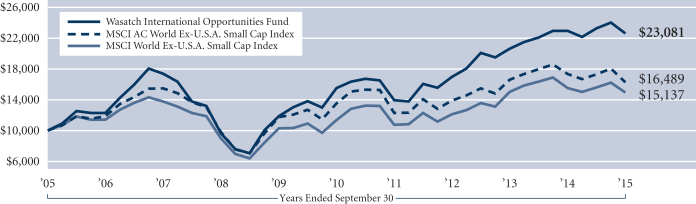
Past performance does not predict future performance. The graph above does not reflect the deduction of fees, sales charges, or taxes that you would pay on fund distributions or the redemption of fund shares. Wasatch does not charge any sales fees. The MSCI AC (All Country) World Ex-U.S.A. Small Cap Index is a free float-adjusted market capitalization index designed to measure the performance of small capitalization securities in developed markets, excluding the United States, and in emerging markets. The MSCI World Ex-U.S.A. Small Cap Index is a free float-adjusted market capitalization index designed to measure the performance of small capitalization securities in developed markets, excluding the United States. You cannot invest directly in these or any indices.
19
| | |
| WASATCH LARGE CAP VALUE FUND (FMIEX / WILCX) — Management Discussion | | SEPTEMBER 30, 2015 (UNAUDITED) |
|
|
|
The Wasatch Large Cap Value Fund is managed by a team of Wasatch portfolio managers led by David Powers.
| | |

David Powers, CFA Lead Portfolio Manager | | OVERVIEW The Wasatch Large Cap Value Fund — Investor Class lost -6.61% and lagged the -4.42% decline of the Russell 1000 Value Index for the 12 months ended September 30, 2015. The Fund’s holdings in the financials and energy sectors were among the biggest detractors from performance relative to the Index. The U.S. Federal Reserve (Fed) has appeared poised to begin a tightening cycle for some time, as the economy |
continues to display modest growth, with improvements in key indicators in areas such as employment and housing. In addition, consumers have been supported by declining energy costs. However, wage gains have been well below levels of past recoveries, and market expectations for the timing of the first Fed rate hike have been consistently pushed back. Longer-term U.S. Treasury yields declined over the period.
Against a weakening global economic backdrop, most leading central banks overseas engaged in extraordinary efforts to stimulate growth. The period also saw elevated geopolitical and macroeconomic uncertainty, with the continued threat in Iraq and Syria from militant fundamentalists with territorial ambitions and ongoing strife in Ukraine. Markets were rattled in mid-2015 by the prospect of Greece leaving the European Union. The Greece crisis was replaced in headlines late in the period by China’s devaluation of the yuan, which sparked fears over the prospect of a global currency war and contributed to further financial market volatility.
DETAILSOFTHE YEAR
The leading individual contributor to the Fund’s performance in the 12-month period was consumer electronics icon Apple, Inc. Apple shares benefited from new products and a successful iPhone update cycle. In addition, China has become a sizable and growing market for the company’s products. Apple continues to use its enormous cash reserves to support shareholder-friendly measures such as dividend increases and share buybacks. Within health care, medical device manufacturer Medtronic plc was a standout performer. Medtronic has a number of enormous, established business lines including pacemakers, spinal and cardiovascular implants, and insulin pumps. The company is at the forefront of researching and developing new therapies, and has benefited in recent quarters from increased utilization rates in the wake of the Affordable Care Act. Another significant contributor was real estate investment trust (REIT) EPR Properties. EPR holds entertainment- and leisure-related properties including theaters, casinos and golf courses, and has shown the ability to consistently identify attractive investment opportunities. Shares for EPR and other REITs benefited over the period as expectations eased with respect to the ultimate upward trajectory for interest rates.
The great majority of the Fund’s leading detractors for the period came from the energy sector, led by integrated oil and gas giants Chevron Corp. and Suncor Energy, Inc. One of the Fund’s standouts from last year, LyondellBasell Industries N.V. lagged badly in the most recent 12-month period. Lyondell is a petrochemical refiner and manufacturer of specialized plastics used in a wide range of products. Lyondell uses natural gas in its production process. Most of its competitors rely on oil-based manufacturing and benefited over the period from falling input costs. Eaton Corp. plc was another leading detractor, as industrial stocks were hampered by a slowing global growth outlook. Eaton is a provider of electrical and mechanical systems with substantial cyclical exposure to European markets. We view the stock as inexpensive at current levels and we added to the position on weakness. Eastman Chemical Co. is a commodity and specialty chemical company with a vast line of products used in a wide variety of industrial production processes, ranging from adhesives to plastics to paint additives. The company’s results are heavily tied to the overall global economic climate, and have suffered from softening demand outside the U.S., especially in China. The rise in the dollar has also weighed on the company’s results.
OUTLOOK
Developments around China and emerging markets more broadly have contributed to an investor preference for domestically oriented stocks. This has not been helpful to the Fund’s recent results, as we have seen better value and stronger balance sheets in companies with exposure to international markets.
There is a tremendous amount of stimulus in the global economic system, yet growth remains weak, contributing to the ongoing elevated levels of market volatility. If the overall commodities complex and in particular oil prices stabilize, we could see a recovery in market sentiment.
In the meantime, with the Fed likely on hold for a bit longer, cyclical stocks stand to benefit from reduced concern over higher interest rates, while the earnings outlook for lender-focused franchises within financials would be constrained. More broadly, stocks in aggregate are not inexpensive in view of lowered growth prospects, and we do not see a compelling case to heavily weight any particular segment of the market.
Against this backdrop, the Fund continues to display a higher quality profile than would likely be seen at the earlier stages of a market cycle, with a tilt toward companies featuring larger market capitalizations, higher profitability and stronger balance sheets. The broad emphasis on quality we are seeing in the Fund is an outcome of applying our value-based process, and we believe it has the Fund well-positioned for the longer term.
We thank you for your continued investment.
| | Current and future holdings are subject to risk. |
20
| | |
| WASATCH LARGE CAP VALUE FUND (FMIEX / WILCX) — Portfolio Summary | | SEPTEMBER 30, 2015 (UNAUDITED) |
|
|
|
AVERAGE ANNUAL TOTAL RETURNS
| | | | | | | | | | | | |
| | | 1 YEAR | | | 5 YEARS | | | 10 YEARS | |
Large Cap Value (FMIEX) — Investor | | | -6.61% | | | | 7.52% | | | | 5.47% | |
Large Cap Value (WILCX) — Institutional | | | -6.50% | | | | 7.62% | | | | 5.52% | |
Russell 1000® Value Index | | | -4.42% | | | | 12.29% | | | | 5.71% | |
Data shows past performance, which is not indicative of future performance. Current performance may be lower or higher than the performance quoted. To obtain the most recent month-end performance data available, please visit www.WasatchFunds.com. The Advisor may absorb certain Fund expenses, without which total return would have been lower. Investment returns and principal value will fluctuate and shares, when redeemed, may be worth more or less than their original cost.
As of the January 31, 2015 prospectus, the Total Annual Fund Operating Expenses for the Wasatch Large Cap Value Fund are Investor Class — Gross: 1.12%, Net: 1.10% / Institutional Class — Gross: 1.25%, Net: 0.98%. The expense ratio shown elsewhere in this report may be different. Net Expenses are based on Fund expenses, net of waivers and reimbursements. See the prospectus for additional information regarding Fund expenses.
Wasatch Funds will deduct a 2.00% redemption proceeds fee on Fund shares held 60 days or less. Performance data does not reflect the deduction of fees, including sales charges, or the taxes you would pay on fund distributions or the redemption of fund shares. Fees and taxes, if reflected, would reduce the performance quoted. Wasatch does not charge any sales fees. For more complete information including charges, risks and expenses, read the prospectus carefully.
Performance for the Institutional Class prior to 1/31/2012 is based on the performance of the Investor Class. Performance of the Fund’s Institutional Class prior to 1/31/2012 uses the actual expenses of the Fund’s Investor Class without any adjustments. For any such period of time, the performance of the Fund’s Institutional Class would have been substantially similar to, yet higher than, the performance of the Fund’s Investor Class, because the shares of both classes are invested in the same portfolio of securities, but the classes bear different expenses.
Investments in value stocks can perform differently from the market as a whole and from other types of stocks and can continue to be undervalued by the market for long periods of time. Loss of principal is a risk of investing.
TOP 10 EQUITY HOLDINGS*
| | | | |
| Company | | % of Net
Assets | |
| General Electric Co. | | | 4.9% | |
| Johnson & Johnson | | | 4.7% | |
| Citigroup, Inc. | | | 4.5% | |
| JPMorgan Chase & Co. | | | 4.3% | |
| Wells Fargo & Co. | | | 4.3% | |
| | | | |
| Company | | % of Net
Assets | |
| American International Group, Inc. | | | 4.3% | |
| Cisco Systems, Inc. | | | 4.3% | |
| Pfizer, Inc. | | | 4.2% | |
| Procter & Gamble Co. (The) | | | 3.8% | |
| Duke Energy Corp. | | | 3.6% | |
| * | As of September 30, 2015, there were 34 holdings in the Fund. Foreign currency contracts, written options and repurchase agreements, if any, are not included in the number of holdings. Portfolio holdings are subject to change at any time. References to specific securities should not be construed as recommendations by the Funds or their Advisor. Current and future holdings are subject to risk. |
SECTOR BREAKDOWN**
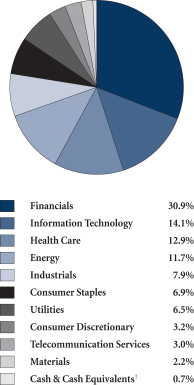
| ** | Excludes securities sold short and options written, if any. |
| † | Also includes Other Assets & Liabilities. |
GROWTHOFA HYPOTHETICAL $10,000 INVESTMENT
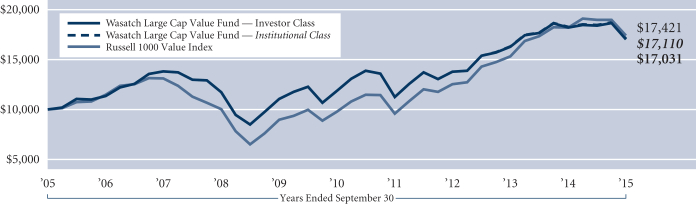
Past performance does not predict future performance. The graph above does not reflect the deduction of fees, sales charges, or taxes that you would pay on fund distributions or the redemption of fund shares. Wasatch does not charge any sales fees. The Russell 1000 Value Index measures the performance of Russell 1000 Index companies with lower price-to-book ratios and lower forecasted growth values. You cannot invest directly in these or any indices.
21
| | |
| WASATCH LONG/SHORT FUND (FMLSX / WILSX) — Management Discussion | | SEPTEMBER 30, 2015 (UNAUDITED) |
|
|
|
The Wasatch Long/Short Fund is managed by a team of Wasatch portfolio managers led by Michael Shinnick and Ralph Shive.
| | | | |

Michael Shinnick Lead Portfolio Manager | | 
Ralph Shive, CFA Portfolio Manager | | OVERVIEW The period saw the world’s leading central banks engage in extraordinary efforts to stimulate growth against the backdrop of a weakening global economy and heightened geopolitical risks. |
The prospect of Greece leaving the European Union dominated headlines for much of the period, but was replaced in August by China’s efforts to maintain acceptable growth rates. China’s devaluation of the yuan sparked fears over the prospect of a global currency war breaking out among export-focused economies, leading to elevated financial market volatility. After stabilizing and gaining in the first half of 2015, oil prices resumed their declines in the wake of China’s concerns.
In the U.S., where the Federal Reserve has appeared poised to begin a tightening cycle, the economy continued to display modest growth, with improvements in key indicators in areas such as employment and housing. In addition, consumers continued to benefit from declining energy costs. However, wage gains have remained well below levels of past recoveries.
For the 12 months ended September 30, 2015, the Wasatch Long/Short Fund — Investor Class lost -19.33% and lagged the -0.61% return of the S&P 500 Index. The most significant detractor from the Fund’s performance relative to the Index was overweight exposure to cyclical areas of the market that suffered from the deteriorating global growth outlook, in particular energy-related issues. The short side of the Fund’s portfolio contributed positively to performance, as our short positions were down an average of -4.6%.
DETAILSOFTHE YEAR
Leading contributors within the long portfolio included a pair of retailers, Target Corp. and Chico’s FAS, Inc. Within information technology, consumer-electronics icon Apple, Inc. and electronic-transaction processor Global Payments, Inc. provided positive contributions. Real estate investment trusts were one of the better performing areas of the market and Iron Mountain, Inc., Investors Real Estate Trust and American Campus Communities, Inc. all added to performance in the Fund’s long portfolio.
During the period, we moved aggressively to increase the short portfolio and we expect to continue to see more short opportunities as valuations are high in many areas of the market. Short positions that worked well for the Fund included computer-networking company Arista Networks, Inc., specialty grocery store chain Sprouts Farmers Market,
Inc., apparel retailer Men’s Wearhouse, Inc., and luxury-brand retailer Tiffany & Co.
On the downside, our two largest oil and gas exploration and production positions, Denbury Resources, Inc. and Bill Barrett Corp., were the leading detractors for the 12-month period. Both saw their shares suffer severely as oil prices dropped more than 50% during the year on both oversupply from OPEC and demand concerns stemming largely from slowing growth in China. We continue to believe that Denbury Resources, Bill Barrett, and Unit Corp., another leading detractor from the energy sector, have the financial wherewithal to navigate the downturn and generate strong cash flows until commodity prices recover. Outside of energy, significant detractors included low-cost retailing giant Wal-Mart Stores, Inc., semiconductor and mobile-technology company QUALCOMM, Inc., and computer-technology multinational Oracle Corp. We continue to hold these companies based on their below-market valuations and ability to generate steady cash flows to provide strong dividends and major share buyback programs.
With respect to recent changes in the Fund, we have eliminated a number of long positions with gains, including Apple, CNA Financial Corp., Ventas, Inc. and Plum Creek Timber Co., Inc. On the buy side, a significant new position was taken in Whole Foods Market, Inc. We believed the stock had fallen to an attractive valuation, not only on an absolute basis but also relative to its more highly levered peer Kroger Co., which we continue to hold in the short portfolio.
OUTLOOK
The macroeconomic backdrop has been much as we expected, featuring sluggish growth and very low interest rates supported by global quantitative easing. This has led us to maintain a preference for companies displaying high cash earnings yields and/or substantial tangible assets. While we retain our conviction in the soundness of this focus, the Fund’s performance has been disappointing in recent quarters for our shareholders and for us as managers.
While we understand and share this frustration, our disappointment has recently changed to excitement based on the observation that our energy-related stocks have been trading at multi-decade lows in relation to the overall market. As a result, we believe the potential is there for extraordinary returns on many of these issues once commodity prices return to more normal levels. Together, we believe our energy and deep value holdings are composed of attractive companies trading at historically low valuations. Finally, we expect to continue to see abundant opportunities to short stocks, and have moved aggressively to take advantage.
We remain confident that the Long/Short Fund is well-positioned to over time play a valuable role in our shareholders’ investment portfolios.
Thank you for your continued confidence and investment in the Fund.
| | Current and future holdings are subject to risk. |
22
| | |
| WASATCH LONG/SHORT FUND (FMLSX / WILSX) — Portfolio Summary | | SEPTEMBER 30, 2015 (UNAUDITED) |
|
|
|
AVERAGE ANNUAL TOTAL RETURNS
| | | | | | | | | | | | |
| | | 1 YEAR | | | 5 YEARS | | | 10 YEARS | |
Long/Short (FMLSX) — Investor | | | -19.33% | | | | 2.78% | | | | 3.79% | |
Long/Short (WILSX) — Institutional | | | -19.19% | | | | 2.85% | | | | 3.82% | |
S&P 500® Index | | | -0.61% | | | | 13.34% | | | | 6.80% | |
Citigroup U.S. Domestic 3-Month Treasury Bills Index | | | 0.02% | | | | 0.06% | | | | 1.26% | |
Data shows past performance, which is not indicative of future performance. Current performance may be lower or higher than the performance quoted. To obtain the most recent month-end performance data available, please visit www.WasatchFunds.com. The Advisor may absorb certain Fund expenses, without which total return would have been lower. Investment returns and principal value will fluctuate and shares, when redeemed, may be worth more or less than their original cost.
As of the January 31, 2015 prospectus, the Total Annual Fund Operating Expenses for the Wasatch Long/Short Fund are — Investor Class: 1.53% / Institutional Class: 1.42%, Net: 1.42%. The expense ratio shown elsewhere in this report may be different. Net Expenses are based on Fund expenses, net of waivers and reimbursements. Expenses include dividend expense on short sales and interest expense. See the prospectus for additional information regarding Fund expenses.
Wasatch Funds will deduct a 2.00% redemption proceeds fee on Fund shares held 60 days or less. Performance data does not reflect the deduction of fees, including sales charges, or the taxes you would pay on fund distributions or the redemption of fund shares. Fees and taxes, if reflected, would reduce the performance quoted. Wasatch does not charge any sales fees. For more complete information including charges, risks and expenses, read the prospectus carefully.
Performance for the Institutional Class prior to 12/13/2012 is based on the performance of the Investor Class. Performance of the Fund’s Institutional Class prior to 12/13/2012 uses the actual expenses of the Fund’s Investor Class without any adjustments. For any such period of time, the performance of the Fund’s Institutional Class would have been substantially similar to, yet higher than, the performance of the Fund’s Investor Class, because the shares of both classes are invested in the same portfolio of securities, but the classes bear different expenses.
The Fund makes short sales of securities, which involve the risk that losses may exceed the original amount invested. Equity investing involves risks, including potential loss of the principal amount invested.
TOP 10 EQUITY HOLDINGS*
| | | | |
| Company | | % of Net
Assets | |
| Iron Mountain, Inc. | | | 5.0% | |
| Wal-Mart Stores, Inc. | | | 4.5% | |
| Loews Corp. | | | 4.4% | |
| QUALCOMM, Inc. | | | 4.4% | |
| Oracle Corp. | | | 4.0% | |
| | | | |
| Company | | % of Net
Assets | |
| Express Scripts Holding Co. | | | 3.6% | |
| Mosaic Co. (The) | | | 3.5% | |
| EMC Corp. | | | 3.5% | |
| Verizon Communications, Inc. | | | 3.2% | |
| Halliburton Co. | | | 3.2% | |
| * | As of September 30, 2015, there were 40 long and 17 short holdings in the Fund. Foreign currency contracts, written options and repurchase agreements, if any, are not included in the number of holdings. Portfolio holdings are subject to change at any time. References to specific securities should not be construed as recommendations by the Funds or their Advisor. Current and future holdings are subject to risk. |
SECTOR BREAKDOWN**
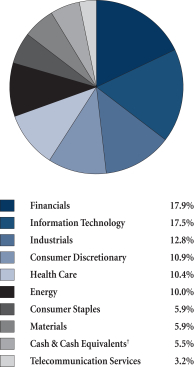
| ** | Excludes securities sold short and options written, if any. |
| † | Also includes Other Assets & Liabilities. |
GROWTHOFA HYPOTHETICAL $10,000 INVESTMENT
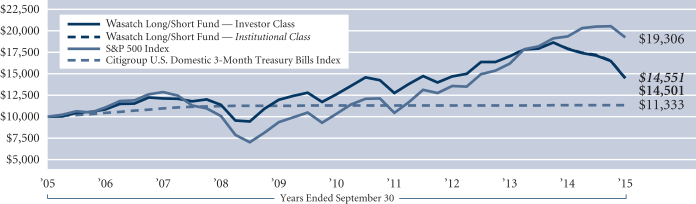
Past performance does not predict future performance. The graph above does not reflect the deduction of fees, sales charges, or taxes that you would pay on fund distributions or the redemption of fund shares. Wasatch does not charge any sales fees. The S&P 500 Index includes 500 of the United States’ largest stocks from a broad variety of industries. The Index is unmanaged and is a commonly used measure of common stock total return performance. The Citigroup U.S. Domestic 3-Month Treasury Bills Index tracks the performance of U.S. Treasury bills with a remaining maturity of three months. U.S. Treasury bills, which are short-term loans to the U.S. government, are full-faith-and-credit obligations of the U.S. Treasury and are generally regarded as being free of any risk of default. You cannot invest directly in these or any indices.
23
| | |
| WASATCH MICRO CAP FUND (WMICX) — Management Discussion | | SEPTEMBER 30, 2015 (UNAUDITED) |
|
|
|
The Wasatch Micro Cap Fund is managed by a team of Wasatch portfolio managers led by Dan Chace.
| | |

Dan Chace, CFA Lead Portfolio Manager | | OVERVIEW The Wasatch Micro Cap Fund gained 2.45% during the 12 months ended September 30, 2015. The Fund finished ahead of its benchmark, the Russell Microcap Index, which rose 1.65%. After lagging during the previous fiscal year, small-company stocks and micro caps outperformed the stocks of larger companies. Both the Index and the Fund carried gains of approximately 17% into the final quarter of the fiscal year. At that |
time, we noted our concerns about overvaluation in the markets. “For equity markets, valuations remain elevated,” we wrote in our June 30, 2015 commentary. “Unlike the Internet bubble — when reasonably valued stocks unrelated to the bubble were relatively plentiful — today the overvaluation is more widespread.”
Over the following three months, those concerns came to the forefront of investors’ attention. Alongside a multi-year run in equities and lofty valuations, stocks corrected sharply. Though slowing economic growth in China had been hanging over the market for some time, China’s surprise devaluation of the yuan on August 11th rattled investors. The move sparked fears that China’s slowdown was worse than believed and raised doubts about the Chinese government’s ability and confidence to manage it. Micro-cap stocks sold off along with other risk assets, although both the Index and the Fund held on to enough of their earlier gains to finish in positive territory for the fiscal year.
Aside from China, conflicting signals from the U.S. Federal Reserve (Fed) provided an additional source of uncertainty. That the Fed will increase rates is widely expected. The timing of that increase and whether the economy is strong enough to withstand it is a question mark, however. While the U.S. economy has improved — with unemployment declining and the housing market doing better — corporate-profit growth has been slowing.
Looking past the macroeconomic issues and into the Fund, our bottom-up approach focuses on investing in companies that we believe can grow earnings over the next three to five years at a steady clip, regardless of what the macro environment looks like. We believe this approach is particularly timely given the uncertainty embedded in today’s global economy.
DETAILSOFTHE YEAR
Our strongest contributor to performance for the year was Cempra, Inc., a clinical-stage pharmaceutical company developing antibiotics for the treatment of bacterial infectious diseases. Cempra’s share price rose on optimism surrounding its lead drug candidate, Solithromycin, which is currently in Phase 3 development for the treatment of community-acquired bacterial pneumonia. In addition, the U.S. Food and Drug Administration granted Fast Track designation to the drug, a positive sign.
Technology company Ellie Mae, Inc. was our second-largest contributor. The company provides on-demand software and services for the U.S. residential-mortgage industry. Ellie Mae’s strong operating performance in the depressed originations market of 2014 confirmed its position as the software provider of choice for mortgage lenders. The company’s rapidly expanding customer base has driven upward revisions in its revenue guidance for 2015.
Our greatest detractor from Fund performance for the year was online travel agency MakeMyTrip Ltd. Although aggressive discounting by a competitor has resulted in slowing sales growth and wider-than-expected losses for MakeMyTrip, it remains India’s leading online agency both in airline-ticket sales and hotel bookings. We believe the company’s margins will expand once competition abates, and we continue to own it in the Fund.
Oil prices weakened further during the fiscal year, impacting the bottom lines of crude producers. These included Comstock Resources, Inc. and Northern Oil and Gas, Inc., two other detractors from Fund performance. We liquidated the Fund’s position in Comstock early in the year because we expected its highly levered business model to face difficulties in an environment of low energy prices. Since then, the company’s stock price has declined significantly. Northern Oil and Gas, which we believed was better positioned to ride out crude’s steep drop, was sold later in the year when oil prices showed few signs of near-term recovery.
OUTLOOK
Looking forward, we don’t expect any immediate improvement in the global economic environment or the volatility in equities. Although we think moderate growth in both the U.S. economy and employment will persist, we are cognizant of the challenges emerging around the world.
One issue confronting investors has been the strength of the U.S. dollar and the exceptional weakness of some currencies, especially in emerging markets. The fear is that a debt crisis may emerge somewhere in the world, especially in countries and companies that have borrowed heavily in dollars. Continued weakness in commodities also appears to reflect expectations of slowing global growth. And expanding high-yield spreads suggest increased stress in the U.S. economy.
Consequently, we have been working to position the Fund toward stable growth companies that we believe are likely to be more insulated from macroeconomic headwinds. These include companies operating in growth markets, and companies with innovative products and services that have the potential to expand despite the uncertainty. We continue to screen for new ideas that fit these characteristics. As a result, the Fund’s portfolio turnover is likely to increase somewhat in the coming quarters.
Thank you for the opportunity to manage your assets.
| | Current and future holdings are subject to risk. |
24
| | |
| WASATCH MICRO CAP FUND (WMICX) — Portfolio Summary | | SEPTEMBER 30, 2015 (UNAUDITED) |
|
|
|
AVERAGE ANNUAL TOTAL RETURNS
| | | | | | | | | | | | | | | |
| | | 1 YEAR | | 5 YEARS | | 10 YEARS |
Micro Cap | | | | 2.45% | | | | | 11.17% | | | | | 5.06% | |
Russell Microcap® Index | | | | 1.65% | | | | | 12.35% | | | | | 4.88% | |
Russell 2000® Index | | | | 1.25% | | | | | 11.73% | | | | | 6.55% | |
Data shows past performance, which is not indicative of future performance. Current performance may be lower or higher than the performance quoted. To obtain the most recent month-end performance data available, please visit www.WasatchFunds.com. The Advisor may absorb certain Fund expenses, without which total return would have been lower. Investment returns and principal value will fluctuate and shares, when redeemed, may be worth more or less than their original cost.
As of the January 31, 2015 prospectus, the Total Annual Fund Operating Expenses for the Wasatch Micro Cap Fund are 1.90%. The expense ratio shown elsewhere in this report may be different. See the prospectus for additional information regarding Fund expenses.
Wasatch Funds will deduct a 2.00% redemption proceeds fee on Fund shares held 60 days or less. Performance data does not reflect the deduction of fees, including sales charges, or the taxes you would pay on fund distributions or the redemption of fund shares. Fees and taxes, if reflected, would reduce the performance quoted. Wasatch does not charge any sales fees. For more complete information including charges, risks and expenses, read the prospectus carefully.
Investing in micro cap funds will be more volatile and loss of principal could be greater than investing in large cap or more diversified funds. Investing in foreign securities, especially in emerging markets, entails special risks, such as currency fluctuations and political uncertainties, which are described in more detail in the prospectus.
TOP 10 EQUITY HOLDINGS*
| | | | |
| Company | | % of Net
Assets | |
| LGI Homes, Inc. | | | 2.6% | |
| Ultimate Software Group, Inc. | | | 2.6% | |
| Tyler Technologies, Inc. | | | 2.5% | |
| City Union Bank Ltd. (India) | | | 2.2% | |
| CareTrust REIT, Inc. | | | 2.1% | |
| | | | |
| Company | | % of Net
Assets | |
| SPS Commerce, Inc. | | | 2.1% | |
| ICON plc (Ireland) | | | 2.0% | |
| Natco Pharma Ltd. (India) | | | 1.9% | |
| Ensign Group, Inc. (The) | | | 1.9% | |
| Installed Building Products, Inc. | | | 1.9% | |
| * | As of September 30, 2015, there were 90 holdings in the Fund. Foreign currency contracts, written options and repurchase agreements, if any, are not included in the number of holdings. Portfolio holdings are subject to change at any time. References to specific securities should not be construed as recommendations by the Funds or their Advisor. Current and future holdings are subject to risk. |
SECTOR BREAKDOWN**
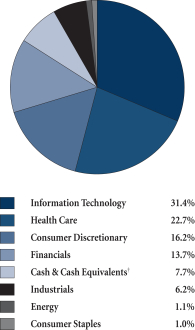
| ** | Excludes securities sold short and options written, if any. |
| † | Also includes Other Assets & Liabilities. |
GROWTHOFA HYPOTHETICAL $10,000 INVESTMENT
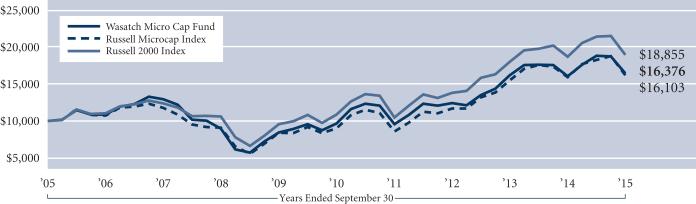
Past performance does not predict future performance. The graph above does not reflect the deduction of fees, sales charges, or taxes that you would pay on fund distributions or the redemption of fund shares. Wasatch does not charge any sales fees. The Russell Microcap Index is an unmanaged total return index of the smallest 1,000 securities in the small-cap Russell 2000 Index along with the next smallest 1,000 companies, based on a ranking of all U.S. equities by market capitalization. The Russell 2000 Index is an unmanaged total return index of the smallest 2,000 companies in the Russell 3000 Index, as ranked by total market capitalization. The Russell 2000 Index is widely regarded in the industry as accurately capturing the universe of small company stocks. You cannot invest directly in these or any indices.
25
| | |
| WASATCH MICRO CAP VALUE FUND (WAMVX) — Management Discussion | | SEPTEMBER 30, 2015 (UNAUDITED) |
|
|
|
The Wasatch Micro Cap Value Fund is managed by a team of Wasatch portfolio managers led by Brian Bythrow.
| | |

Brian Bythrow, CFA Lead Portfolio Manager | | OVERVIEW The Wasatch Micro Cap Value Fund gained 9.99% in the 12 months ended September 30, 2015. The Fund outperformed its benchmark, the Russell Microcap Index, which rose 1.65%. With respect to market environment and investor risk appetite, the Fund’s fiscal year broke down roughly into three phases: (1) the first quarter, (2) the two middle quarters, and (3) the final quarter. |
During the first quarter, investors demonstrated a robust appetite for risk and drove the Index to a double-digit gain. The biotechnology component of the Index, which serves as a reasonable proxy for risk-taking, surged about 24%. The Fund lagged its benchmark during this period, as the higher-quality, less-speculative companies we seek to own in the Fund did not seem as exciting to investors.
Over the following two quarters, the environment for equities remained positive, but less aggressively so. The Index posted low-single-digit gains in each quarter, and the returns of its red-hot biotechnology component cooled to the mid-teens. As risk appetite moderated, the Fund began to outperform.
In the final quarter of the fiscal year, stocks fell as investors became risk-averse. Weak manufacturing data in China raised doubts about the health of the global economy and weighed on world equity markets. Conflicting signals from the U.S. Federal Reserve (Fed) on when it would start raising interest rates added to the uncertain environment. The Index suffered a double-digit loss for the three months, while its biotechnology stocks declined approximately -29% as a group. The Fund fell much less than the Index during this period, finishing substantially ahead of its benchmark for the full year.
We believe the Fund’s performance over the past 12 months is a direct reflection of our investment approach. When selecting investments for the Fund, we seek innovative micro-cap companies that can differentiate themselves from competitors and gain market share — even under difficult business conditions. At the same time, we generally seek to avoid commodity producers and cyclicals. As the year progressed, investor appetite for risk subsided and our greater focus on innovators and defensive growers increasingly benefited the Fund.
In addition, the Fund’s value mandate largely prevented us from owning the biotechnology stocks that added volatility to the Index. Over the fiscal year, biotechnology stocks represented about 11% of the Index, but less than 3% of the Fund. Nevertheless, our health-care stocks outgained the health-care positions in the Index and were the Fund’s greatest source of outperformance relative to its benchmark. The information-technology sector was another area in which the Fund outperformed significantly.
DETAILSOFTHE YEAR
Our strongest contributor to Fund performance for the year was Nobilis Health Corp. In connection with its physician partners, Nobilis develops, owns and operates outpatient-surgery centers in the Dallas and Houston markets. The company began the fiscal year largely unnoticed by investors, with its shares listed only on the Toronto Stock Exchange. When Nobilis received its U.S. listing, however, analyst coverage increased and the company’s stock price rose. Solid operating results and the company’s attractive valuation relative to its peers also helped lift the stock.
Another health-care company, iRadimed Corp., was our second-best contributor. iRadimed makes non-magnetic intravenous (IV) equipment for use in magnetic-resonance imaging (MRI). The exit of its main competitor left iRadimed as the dominant player in the markets it serves. With the stock more than tripling in price during the fiscal year, we trimmed the Fund’s position.
Our greatest detractor from Fund performance for the year was MusclePharm Corp. The company sells sports-nutrition products in the U.S. and internationally. MusclePharm’s share price declined as the company reported wider-than-expected losses. When higher spending to support the company’s ambitious marketing initiatives further delayed its move to profitability, we sold the stock to seek better opportunities elsewhere.
Emerald Oil, Inc. and Comstock Resources, Inc. were our second- and third-largest detractors, respectively. Because small, leveraged energy companies such as these require high oil prices to remain profitable, both were hurt by steep declines in the price of crude. We sold the Fund’s holdings of both companies when it became apparent that OPEC had no immediate plans to address the global oversupply of oil. Since then, the stocks of both companies have declined significantly.
OUTLOOK
Given the high level of global economic uncertainty, we believe world stock markets are likely to remain volatile in the near term. With corporate-earnings growth slowing in the U.S. and equity valuations high by historical standards, we’ve been trimming holdings we consider most vulnerable to bouts of market weakness.
While much attention has been focused on China, recent manufacturing data in the U.S. has been soft as well. We believe sluggishness in both countries may reflect broader weakness in the global economy. The Fed’s reluctance to normalize interest rates is another reason for caution, in our view.
Europe appears to be a pocket of strength, and we continue to research companies there. To the extent that fresh economic weakness in the U.S. causes the greenback to depreciate, we believe emerging markets would stand to benefit from inflows of foreign capital. Meanwhile, we would view a further downturn in global equities as an opportunity to reinvest the Fund’s substantial cash position at more-attractive valuations.
Thank you for the opportunity to manage your assets.
| | Current and future holdings are subject to risk. |
26
| | |
| WASATCH MICRO CAP VALUE FUND (WAMVX) — Portfolio Summary | | SEPTEMBER 30, 2015 (UNAUDITED) |
|
|
|
AVERAGE ANNUAL TOTAL RETURNS
| | | | | | | | | | | | |
| | | 1 YEAR | | | 5 YEARS | | | 10 YEARS | |
Micro Cap Value | | | 9.99% | | | | 12.74% | | | | 9.52% | |
Russell Microcap® Index | | | 1.65% | | | | 12.35% | | | | 4.88% | |
Russell 2000® Index | | | 1.25% | | | | 11.73% | | | | 6.55% | |
Data shows past performance, which is not indicative of future performance. Current performance may be lower or higher than the performance quoted. To obtain the most recent month-end performance data available, please visit www.WasatchFunds.com. The Advisor may absorb certain Fund expenses, without which total return would have been lower. Investment returns and principal value will fluctuate and shares, when redeemed, may be worth more or less than their original cost.
As of the January 31, 2015 prospectus, the Total Annual Fund Operating Expenses for the Wasatch Micro Cap Value Fund are 2.02%. The Net Expenses are 1.95%. The expense ratio shown elsewhere in this report may be different. Net Expenses are based on Fund expenses, net of waivers and reimbursements. See the prospectus for additional information regarding Fund expenses.
Wasatch Funds will deduct a 2.00% redemption proceeds fee on Fund shares held 60 days or less. Performance data does not reflect the deduction of fees, including sales charges, or the taxes you would pay on fund distributions or the redemption of fund shares. Fees and taxes, if reflected, would reduce the performance quoted. Wasatch does not charge any sales fees. For more complete information including charges, risks and expenses, read the prospectus carefully.
Investing in micro cap funds will be more volatile and loss of principal could be greater than investing in large cap or more diversified funds. Investments in value stocks can perform differently from the market as a whole and from other types of stocks and can continue to be undervalued by the market for long periods of time. Investing in foreign securities, especially in emerging markets, entails special risks, such as currency fluctuations and political uncertainties, which are described in more detail in the prospectus.
TOP 10 EQUITY HOLDINGS*
| | | | |
| Company | | % of Net
Assets | |
| Synergetics USA, Inc. | | | 1.6% | |
| LHC Group, Inc. | | | 1.6% | |
| Atlas Financial Holdings, Inc. | | | 1.4% | |
| Allegiant Travel Co. | | | 1.4% | |
| Marksans Pharma Ltd. (India) | | | 1.3% | |
| | | | |
| Company | | % of Net
Assets | |
| LGI Homes, Inc. | | | 1.3% | |
| EPAM Systems, Inc. | | | 1.3% | |
| AVG Technologies N.V. | | | 1.2% | |
| Nobilis Health Corp. PIPE | | | 1.2% | |
| Kingstone Cos., Inc. | | | 1.2% | |
| * | As of September 30, 2015, there were 114 holdings in the Fund. Foreign currency contracts, written options and repurchase agreements, if any, are not included in the number of holdings. Portfolio holdings are subject to change at any time. References to specific securities should not be construed as recommendations by the Funds or their Advisor. Current and future holdings are subject to risk. |
SECTOR BREAKDOWN**
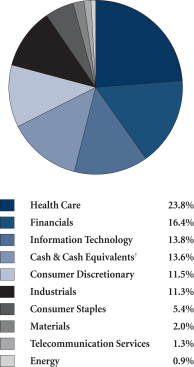
| ** | Excludes securities sold short and options written, if any. |
| † | Also includes Other Assets & Liabilities. |
GROWTHOFA HYPOTHETICAL $10,000 INVESTMENT
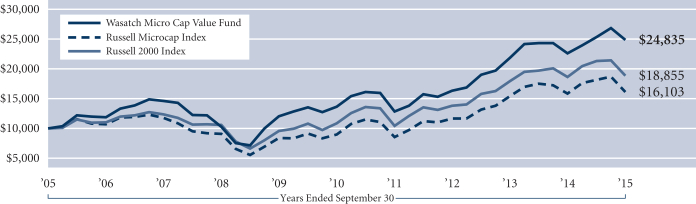
Past performance does not predict future performance. The graph above does not reflect the deduction of fees, sales charges, or taxes that you would pay on fund distributions or the redemption of fund shares. Wasatch does not charge any sales fees. The Russell Microcap Index is an unmanaged total return index of the smallest 1,000 securities in the small-cap Russell 2000 Index along with the next smallest 1,000 companies, based on a ranking of all U.S. equities by market capitalization. The Russell 2000 Index is an unmanaged total return index of the smallest 2,000 companies in the Russell 3000 Index, as ranked by total market capitalization. The Russell 2000 Index is widely regarded in the industry as accurately capturing the universe of small company stocks. You cannot invest directly in these or any indices.
27
| | |
| WASATCH SMALL CAP GROWTH FUND (WAAEX) — Management Discussion | | SEPTEMBER 30, 2015 (UNAUDITED) |
|
|
|
The Wasatch Small Cap Growth Fund is managed by a team of Wasatch portfolio managers led by Jeff Cardon and JB Taylor.
| | | | |

Jeff Cardon, CFA Lead Portfolio Manager | |
JB Taylor Portfolio Manager | | OVERVIEW The Wasatch Small Cap Growth Fund returned 0.39% for the 12 months ended September 30 2015, underperforming the Russell 2000 Growth Index, which returned |
4.04%. The Russell 2000 Index returned 1.25%.
In the most recent quarter, markets saw a dramatic reversal of fortune after enjoying a long running string of success. Weak economic data from China stoked fears of a contagion affecting a fragile U.S. economy. Adding to the market woes was the sudden emergence of pharmaceutical pricing as a potential hot button in the upcoming election. This news had an immediate impact on the Russell 2000 Growth Index given its large biotech weighting and long string of outperformance from that industry. Both the Index and the biotech industry were down double digits in the quarter, but biotech stocks still delivered double-digit returns for the 12-month period.
The energy sector was, by far, the biggest detractor from performance for both the Fund and the Index over the past year. Unlike biotech, energy has suffered a prolonged period of underperformance, and it was down over 50% for the year. Energy represents a much smaller weight in the small cap indices and the Fund, but the magnitude of the decline was meaningful to performance.
With scientific knowledge exploding and technology increasingly changing the way we conduct business and interact with the world, it is not surprising that two of the best performing sectors for the Index and the Fund were health care and information technology. Stock selection in the industrials sector was strong, making it the largest contributor to the Fund’s performance relative to the Index.
DETAILSOFTHE YEAR
IPC Healthcare, Inc. was a large contributor to performance over the past year. The stock gained over 40% on the announcement that the company would be acquired by Team Health Holdings, Inc.* for $1.6 billion in cash.
Transportation provided an interesting contrast in performance among its sub-industries. Trucking stocks in the Russell 2000 Growth Index were down -24% for the 12 months on worries of a weakening U.S. economy. Airline stocks, by contrast, were up 85% during the period. This radical divergence in price performance doesn’t make much sense to us, especially given the tailwind that lower fuel prices provided to both industries. Our view is that the trucking stocks are becoming even more interesting long run investments as the well run public trucking companies continue to gain share from the large number of small
truckers. We own two transportation stocks among our top 10 holdings. Knight Transportation, Inc. is a trucking company that we believe is superbly run and has the potential to be one of the market share winners. Allegiant Travel Co. is an ultra-low cost airline taking market share from higher cost competitors. Knight Transportation was down -12% during the period while Allegiant Travel was up 78% and was the Fund’s biggest contributor to performance.
Two retailers were among our worst performers. Zumiez, Inc. and Mattress Firm Holding Corp. both wrestled with earnings weakness during the period. Zumiez is a specialty retailer of action sports apparel and equipment. The company experienced weak demand during the important back-to-school season, but we believe that Zumiez is an extremely well-run company that should grow earnings at a 15-plus% clip over the next five years. Mattress Firm is the leading specialty retailer of mattresses in the country and is taking share from furniture and department stores. The company cited weakness in the oil patch states as contributing to lower forward guidance, but our long-term thesis remains intact.
Two other retailers in the Fund, Monro Muffler Brake, Inc. and O’Reilly Automotive, Inc. were up significantly. Broadly speaking, both companies serve the automobile parts and service industry. This industry is far less cyclical than the typical retailer, and this stable demand profile was attractive to investors in a time of rising economic concerns.
The Fund’s international holdings performed similarly to our domestic holdings, with most of the weakness resulting from our energy-related holdings. On the positive side, German online pet supplies retailer zooplus AG and Indian bank HDFC Bank Ltd. were the largest international contributors to performance.
OUTLOOK
We believe the U.S economy remains stuck in a low-growth pattern. Our discussions with companies owned in the Fund suggest a U.S. economy that is decelerating but not in decline. Given the severity of the 2008 downturn, this has been a very disappointing recovery and suggests a stock market vulnerable to a growth shock or a significant rise in interest rates. Conversely, such a low growth backdrop can create opportunity for growth investors, as companies enjoying strong organic growth stand out in a low growth environment. The Fund’s companies have delivered consistent mid-teens sales growth to drive earnings. We believe this kind of sustainable organic growth has the potential to provide better long run returns versus larger companies, which have been far more dependent on short-lived sources of earnings growth such as cost cutting and stock repurchases.
Thank you for the opportunity to manage your assets.
| * | As of September 30, 2015, the Wasatch Small Cap Growth Fund was not invested in Team Health Holdings, Inc. |
| | Current and future holdings are subject to risk. |
28
| | |
| WASATCH SMALL CAP GROWTH FUND (WAAEX) — Portfolio Summary | | SEPTEMBER 30, 2015 (UNAUDITED) |
|
|
|
AVERAGE ANNUAL TOTAL RETURNS
| | | | | | | | | | | | | | | |
| | | 1 YEAR | | 5 YEARS | | 10 YEARS |
Small Cap Growth | | | | 0.39% | | | | | 11.20% | | | | | 6.90% | |
Russell 2000® Growth Index | | | | 4.04% | | | | | 13.26% | | | | | 7.67% | |
Russell 2000® Index | | | | 1.25% | | | | | 11.73% | | | | | 6.55% | |
Data shows past performance, which is not indicative of future performance. Current performance may be lower or higher than the performance quoted. To obtain the most recent month-end performance data available, please visit www.WasatchFunds.com. The Advisor may absorb certain Fund expenses, without which total return would have been lower. Investment returns and principal value will fluctuate and shares, when redeemed, may be worth more or less than their original cost.
As of the January 31, 2015 prospectus, the Total Annual Fund Operating Expenses for the Wasatch Small Cap Growth Fund are 1.21%. The expense ratio shown elsewhere in this report may be different. Expenses include direct expenses paid to the Advisor as well as indirect expenses incurred by the Fund as a result of its investments in other investment companies (each an “Acquired Fund”), before any expense reimbursements by the Advisor. See the prospectus for additional information regarding Fund expenses.
Wasatch Funds will deduct a 2.00% redemption proceeds fee on Fund shares held 60 days or less. Performance data does not reflect the deduction of fees, including sales charges, or the taxes you would pay on fund distributions or the redemption of fund shares. Fees and taxes, if reflected, would reduce the performance quoted. Wasatch does not charge any sales fees. For more complete information including charges, risks and expenses, read the prospectus carefully.
Investing in small cap funds will be more volatile and loss of principal could be greater than investing in large cap or more diversified funds. Investing in foreign securities, especially in emerging markets, entails special risks, such as currency fluctuations and political uncertainties, which are described in more detail in the prospectus.
TOP 10 EQUITY HOLDINGS*
| | | | |
| Company | | % of Net
Assets | |
| Ultimate Software Group, Inc. | | | 5.4% | |
| Knight Transportation, Inc. | | | 3.3% | |
| Cornerstone OnDemand, Inc. | | | 3.2% | |
| Allegiant Travel Co. | | | 2.8% | |
| ICON plc (Ireland) | | | 2.7% | |
| | | | |
| Company | | % of Net
Assets | |
| ExamWorks Group, Inc. | | | 2.2% | |
| Monro Muffler Brake, Inc. | | | 2.1% | |
| O’Reilly Automotive, Inc. | | | 2.0% | |
| Seattle Genetics, Inc. | | | 1.9% | |
| FleetMatics Group plc | | | 1.9% | |
| * | As of September 30, 2015, there were 101 holdings in the Fund. Foreign currency contracts, written options and repurchase agreements, if any, are not included in the number of holdings. Portfolio holdings are subject to change at any time. References to specific securities should not be construed as recommendations by the Funds or their Advisor. Current and future holdings are subject to risk. |
SECTOR BREAKDOWN**
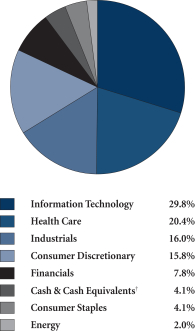
| ** | Excludes securities sold short and options written, if any. |
| † | Also includes Other Assets & Liabilities. |
GROWTHOFA HYPOTHETICAL $10,000 INVESTMENT
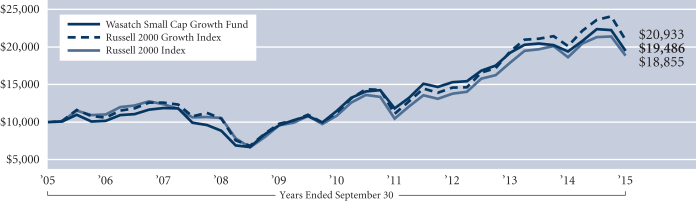
Past performance does not predict future performance. The graph above does not reflect the deduction of fees, sales charges, or taxes that you would pay on fund distributions or the redemption of fund shares. Wasatch does not charge any sales fees. The Russell 2000 Growth Index is an unmanaged total return index that measures the performance of those Russell 2000 Index companies with higher price-to-book ratios and higher forecasted growth values. The Russell 2000 Index is an unmanaged total return index of the smallest 2,000 companies in the Russell 3000 Index, as ranked by total market capitalization. The Russell 2000 Index is widely regarded in the industry as accurately capturing the universe of small company stocks. You cannot invest directly in these or any indices.
29
| | |
| WASATCH SMALL CAP VALUE FUND (WMCVX / WICVX) — Management Discussion | | SEPTEMBER 30, 2015 (UNAUDITED) |
|
|
|
The Wasatch Small Cap Value Fund is managed by a team of Wasatch portfolio managers led by Jim Larkins.
| | |

Jim Larkins Lead Portfolio Manager | | OVERVIEW Small-cap value stocks finished the 12-month period ended September 30, 2015 with a loss of -1.60%, as gauged by the Fund’s benchmark, the Russell 2000 Value Index. The Wasatch Small Cap Value Fund — Investor Class returned 2.99%, outperforming the benchmark by a wide margin. The Fund has also outpaced the benchmark in the three-, five- and 10-year periods. We believe there are three important |
reasons for this strong long-term track record. First, we have maintained our longstanding discipline of buying what we consider to be high-quality companies at value prices through our “Fallen Angels” strategy, which seeks to identify growth companies that temporarily fall into value territory due to short-term factors. This approach has helped us capture meaningful upside in a number of stocks over time, especially since we invested at valuations we saw as attractively low. Second, we have taken steps to concentrate the Fund by targeting a total number of holdings between 50 and 60 stocks. We believe this puts us in the best position to capitalize on the potential outperformance of our best ideas, as we have found that smaller positions usually have little impact on overall performance — either positively or negatively. Third, but not least, we have been very aggressive in selling positions when our investment thesis has proven incorrect. We believe these aspects of our approach have helped put the Fund in a strong position to capture opportunities within the small-cap asset class.
DETAILSOFTHE YEAR
Consistent with our bottom-up approach, stock selection was the primary driver of the Fund’s outperformance of the Index over the past 12 months. Our results were particularly strong within two traditional growth sectors — information technology and consumer discretionary — which help illustrate the potential benefits of our emphasis on faster-growing companies within the value universe. In the consumer-discretionary sector, Skechers, Inc. delivered a substantial gain and was the leading contributor to the Fund’s performance. We started buying the stock four years ago when Skechers was struggling with inventory problems after its Shape-Ups product line went from boom to bust. The stock was deeply depressed at the time, but we saw the potential for the company to exit the down cycle and resume its growth with higher profit margins. This thesis has indeed come to fruition, and we have elected to hold a significant position, rather than selling, since the company’s results have continued to accelerate. Within information technology, our top performers included software company Ebix, Inc., business-services provider Cimpress N.V. (formerly known as Vistaprint) and outsourcing company EPAM Systems, Inc.
Outside of these two sectors, home health care company LHC Group, Inc. was a substantial contributor to the Fund’s results. The Fund had owned the stock in the past, and we decided to visit LHC Group’s headquarters in the autumn of 2014 as part of a routine trip to see other companies in the area. While there, we learned that LHC was just completing four years of heavy system and process implementations that had weighed on profits and growth. We reinitiated a position soon after our visit on the belief that these investments would soon pay off. The profits and growth we expected have indeed come through, as home health care is taking market share by reducing costs for consumers. We have added to our position as the company’s fundamentals have improved, and LHC Group is now among the largest investments in the Fund.
On the negative side, our positions in the energy sector detracted from the Fund’s results. Energy stocks came under broad-based pressure due to uncertainty about the direction of oil prices, weighing on our positions in Northern Oil and Gas, Inc., Comstock Resources, Inc. and Ultra Petroleum Corp. We sold all three stocks due to weak market outlooks and high debt levels.
In terms of portfolio activity, we maintained our longstanding approach of rotating into areas where we saw value and taking profits in stocks where risks were rising. This strategy led us to increase our weighting in the financials sector, which has long been our largest sector underweight versus the benchmark. We believe many regional banks are now in a stronger position to generate growth than they were just two to three years ago, yet this hasn’t been fully reflected in their valuations. We therefore began boosting the Fund’s weighting in this group during the latter half of the period, increasing our existing positions and adding new banks to the portfolio. At the same time as we raised the Fund’s weighting in financials, we sought to take profits in areas where we no longer saw as favorable of a risk/reward profile, such as energy and industrials.
OUTLOOK
We hold a fairly cautious outlook on the broader market, since recent events have raised some legitimate questions about the direction of global growth. We are therefore keeping a close eye on economic developments and the possible impact they may have on our current and prospective holdings. We believe our disciplined approach, together with our emphasis on companies with solid balance sheets, long-run revenue opportunities and healthy competitive positions, have the potential to continue to add value even if broader market conditions remain volatile in the months ahead.
Thank you for the opportunity to manage your assets.
| | Current and future holdings are subject to risk. |
30
| | |
| WASATCH SMALL CAP VALUE FUND (WMCVX / WICVX) — Portfolio Summary | | SEPTEMBER 30, 2015 (UNAUDITED) |
|
|
|
AVERAGE ANNUAL TOTAL RETURNS
| | | | | | | | | | | | | | | |
| | | 1 YEAR | | 5 YEARS | | 10 YEARS |
Small Cap Value (WMCVX) — Investor | | | | 2.99% | | | | | 13.73% | | | | | 6.48% | |
Small Cap Value (WICVX) — Institutional | | | | 2.97% | | | | | 13.84% | | | | | 6.53% | |
Russell 2000® Value Index | | | | -1.60% | | | | | 10.17% | | | | | 5.35% | |
Russell 2000® Index | | | | 1.25% | | | | | 11.73% | | | | | 6.55% | |
Data shows past performance, which is not indicative of future performance. Current performance may be lower or higher than the performance quoted. To obtain the most recent month-end performance data available, please visit www.WasatchFunds.com. The Advisor may absorb certain Fund expenses, without which total return would have been lower. Investment returns and principal value will fluctuate and shares, when redeemed, may be worth more or less than their original cost.
As of the January 31, 2015 prospectus, the Total Annual Fund Operating Expenses for the Wasatch Small Cap Value Fund are Investor Class — 1.20% / Institutional Class — Gross: 1.44%, Net: 1.15%. The expense ratio shown elsewhere in this report may be different. Net Expenses are based on Fund expenses, net of waivers and reimbursements. See the prospectus for additional information regarding Fund expenses.
Wasatch Funds will deduct a 2.00% redemption proceeds fee on Fund shares held 60 days or less. Performance data does not reflect the deduction of fees, including sales charges, or the taxes you would pay on fund distributions or the redemption of fund shares. Fees and taxes, if reflected, would reduce the performance quoted. Wasatch does not charge any sales fees. For more complete information including charges, risks and expenses, read the prospectus carefully.
Performance for the Institutional Class prior to 1/31/2012 is based on the performance of the Investor Class. Performance of the Fund’s Institutional Class prior to 1/31/2012 uses the actual expenses of the Fund’s Investor Class without any adjustments. For any such period of time, the performance of the Fund’s Institutional Class would have been substantially similar to, yet higher than, the performance of the Fund’s Investor Class, because the shares of both classes are invested in the same portfolio of securities, but the classes bear different expenses.
Investing in small cap funds will be more volatile and loss of principal could be greater than investing in large cap or more diversified funds. Investments in value stocks can perform differently from the market as a whole and from other types of stocks and can continue to be undervalued by the market for long periods of time. Investing in foreign securities, especially in emerging markets, entails special risks, such as currency fluctuations and political uncertainties, which are described in more detail in the prospectus.
TOP 10 EQUITY HOLDINGS*
| | | | |
| Company | | % of Net
Assets | |
| Skechers U.S.A., Inc., Class A | | | 3.6% | |
| LHC Group, Inc. | | | 3.5% | |
| AVG Technologies N.V. | | | 3.5% | |
| Ensign Group, Inc. (The) | | | 3.1% | |
| Allegiant Travel Co. | | | 3.0% | |
| | | | |
| Company | | % of Net
Assets | |
| CareTrust REIT, Inc. | | | 2.8% | |
| LGI Homes, Inc. | | | 2.8% | |
| Customers Bancorp, Inc. | | | 2.7% | |
Nu Skin Enterprises, Inc. Class A | | | 2.7% | |
| Pinnacle Financial Partners, Inc. | | | 2.7% | |
| * | As of September 30, 2015, there were 57 holdings in the Fund. Foreign currency contracts, written options and repurchase agreements, if any, are not included in the number of holdings. Portfolio holdings are subject to change at any time. References to specific securities should not be construed as recommendations by the Funds or their Advisor. Current and future holdings are subject to risk. |
SECTOR BREAKDOWN**
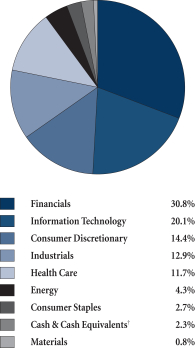
| ** | Excludes securities sold short and options written, if any. |
| † | Also includes Other Assets & Liabilities. |
GROWTHOFA HYPOTHETICAL $10,000 INVESTMENT
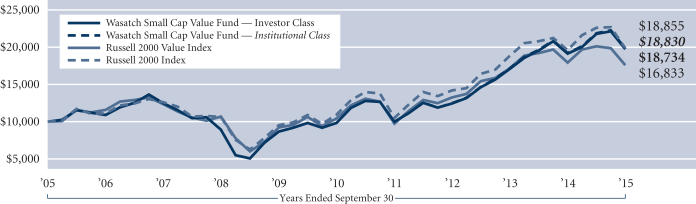
Past performance does not predict future performance. The graph above does not reflect the deduction of fees, sales charges, or taxes that you would pay on fund distributions or the redemption of fund shares. Wasatch does not charge any sales fees. The Russell 2000 Value Index measures the performance of those Russell 2000 Index companies with lower price-to-book ratios and lower forecasted growth values. The Russell 2000 Index is an unmanaged total return index of the smallest 2,000 companies in the Russell 3000 Index, as ranked by total market capitalization. The Russell 2000 Index is widely regarded in the industry as accurately capturing the universe of small company stocks. You cannot invest directly in these or any indices.
31
| | |
| WASATCH STRATEGIC INCOME FUND (WASIX) — Management Discussion | | SEPTEMBER 30, 2015 (UNAUDITED) |
|
|
|
The Wasatch Strategic Income Fund is managed by a team of Wasatch portfolio managers led by Sam Stewart.
| | |
Samuel S. Stewart, Jr. PhD, CFA Lead Portfolio Manager | | OVERVIEW Over the past few years, I’ve often commented that the performance of the Wasatch Strategic Income Fund
was too good to continue as we enjoyed a near uninterrupted run
of positive results and, as of June 30, 2015, trailing three-year returns of over 15% annualized. Referring to the
quarter ended June 30, I said, “While [the loss we experienced for the quarter] was disappointing, it wasn’t unexpected”. . . after a long string of |
positive results. Sadly, last quarter’s loss was a mere prelude to the final three months of the Fund’s fiscal year, which ended September 30, 2015, and may best be described as a disaster.
The last two quarters of the Fund’s fiscal year resulted in disappointing annual performance. The Fund’s -9.54% loss for the 12-month period caused it to fall short of the S&P 500’s -0.61% return (our stock benchmark) and the 2.94% gain of the Barclays Capital U.S. Aggregate Bond Index (our bond benchmark) for the year.
In over 40 years of managing money, I don’t think I’ve ever seen a quarter as bad as the last three-month period was for the Fund. While the Fund’s -11.55% loss was bad, I have seen quarters with greater losses. What made the last three months unprecedented was that almost every stock in the portfolio declined in price. Visa, Inc. was virtually alone as a stock that made a positive contribution to the Fund’s return.
DETAILSOFTHE YEAR
Along with Visa, CVS Health Corp. was one of the bright spots for the year. Each company contributed 0.74 of a percentage point to the Fund’s overall return. We sold CVS, a pharmaceutical services provider, when we felt the stock had become overpriced compared to our estimate of fair value.
The most straightforward explanation for the Fund’s performance would be that most of our holdings suffered a business reversal during the year. However, that simply did not happen. We can identify a couple of our holdings that suffered genuine business reversals. For example, the prospects for shipping-container lessor TAL International Group, Inc. dimmed due to China weakness sparking fears of a decline in global trade. TAL’s 64% stock-price decline seems like an over-reaction to me, especially given that nearly all of TAL’s containers are on long-term leases. Nonetheless, the company’s stock decline was almost certainly due to weaker business prospects.
On the other hand, we can also identify several holdings that had positive business developments. For example, the business prospects for NorthStar Realty Finance Corp. actually brightened during the year as the company made progress toward spinning off its European holdings. However, NorthStar’s 23% stock-price decline over the past 12 months did not reflect this improvement.
Most companies in the Fund, as expected, had a year of business as usual.
One way to assess the evolution of our companies’ business prospects is to see what happened to analysts’ earnings estimates. As expected, some estimates fell, while others rose. This made no difference to the market, which marked down almost all of our stocks.
Another way is to examine our companies’ actions regarding dividends. If a company were facing business uncertainty, it would be unusual for it to increase its dividend. Yet, on average, our companies significantly increased their dividends.
Excessively high valuation could be one possible cause for the meltdowns in many of our stocks. If stocks are richly priced, it doesn’t take much to send them into a downward spiral. However, excessive valuation didn’t seem to be the problem. As of June 30, the Fund’s forward price-to-earnings ratio (P/E) was 12, well below the market’s P/E of 15.
I have pondered the question of what did actually happen at length and discussed it with peers. My conclusion is that over the past three months our dividend-oriented portfolio — heavy with financial stocks — acted as a canary in the coal mine for a potential recession. I believe that the unanticipated slowing in China further heightened fears of a potential recession.
OUTLOOK
Should we be worried? Perhaps. But given the solid operating performance of most of our holdings, I believe we should give more weight to what actually happened than to fears of what might happen.
Although I certainly don’t know what the future will bring, I can say that both the continued steady performance of the general economy and our companies is inconsistent with the dire forecast embedded in our results of the last three months.
To keep things in perspective, our three-year track record remains on or above target. As of September 30, 2015, the Fund’s three-year average annual return was 9.79%. It lies between the 12.40% return of our stock benchmark and the 1.71% return of our bond benchmark. This is right on our goal.
As a reminder, the bulk of my personal retirement savings are invested in the Wasatch Strategic Income Fund alongside of yours. The recent poor results have weighed on me personally as I’m sure they have on you. I will continue to be vigilant in overseeing our holdings and replacing more risky securities with those I believe are less risky. I don’t want to give back any more of the gains we’ve accumulated over the past three years.
I’m deeply appreciative that you’ve entrusted your hard-earned savings into my care. I will do all in my power to ensure that they have found a good home.
| | Current and future holdings are subject to risk. |
32
| | |
| WASATCH STRATEGIC INCOME FUND (WASIX) — Portfolio Summary | | SEPTEMBER 30, 2015 (UNAUDITED) |
|
|
|
AVERAGE ANNUAL TOTAL RETURNS
| | | | | | | | | | | | |
| | | 1 YEAR | | | 5 YEARS | | | SINCE INCEPTION 2/1/06 | |
Strategic Income | | | -9.54% | | | | 11.56% | | | | 6.26% | |
S&P 500® Index | | | -0.61% | | | | 13.34% | | | | 6.53% | |
Barclays Capital U.S. Aggregate Bond Index | | | 2.94% | | | | 3.10% | | | | 4.74% | |
Data shows past performance, which is not indicative of future performance. Current performance may be lower or higher than the performance quoted. To obtain the most recent month-end performance data available, please visit www.WasatchFunds.com. The Advisor may absorb certain Fund expenses, without which total return would have been lower. Investment returns and principal value will fluctuate and shares, when redeemed, may be worth more or less than their original cost.
As of the January 31, 2015 prospectus, the Total Annual Fund Operating Expenses for the Wasatch Strategic Income Fund are 1.02%. The Net Expenses are 1.01%. The expense ratio shown elsewhere in this report may be different. Expenses include direct expenses paid to the Advisor as well as indirect expenses incurred by the Fund as a result of its investments in other investment companies (each an “Acquired Fund”), before any expense reimbursements by the Advisor. Net Expenses are based on Fund expenses, net of waivers and reimbursements. See the prospectus for additional information regarding Fund expenses.
Wasatch Funds will deduct a 2.00% redemption proceeds fee on Fund shares held 60 days or less. Performance data does not reflect the deduction of fees, including sales charges, or the taxes you would pay on fund distributions or the redemption of fund shares. Fees and taxes, if reflected, would reduce the performance quoted. Wasatch does not charge any sales fees. For more complete information including charges, risks and expenses, read the prospectus carefully.
The Fund has a concentration in the financials sector. Investing in concentrated funds can be more volatile and loss of principal could be greater than investing in more diversified funds. The financials sector can be significantly affected by various market factors, which are described in more detail in the prospectus.
With respect to the Fund’s assets invested in fixed income securities, you are subject, but not limited to, the same interest rate, inflation and credit risk associated with the underlying fixed-income securities owned by the Fund. Return of principal is not guaranteed. Investing in small cap funds will be more volatile and loss of principal could be greater than investing in large cap or more diversified funds. Investing in foreign securities, especially in emerging markets, entails special risks, such as currency fluctuations and political uncertainties, which are described in more detail in the prospectus.
TOP 10 EQUITY HOLDINGS*
| | | | |
| Company | | % of Net
Assets | |
| MFA Financial, Inc. | | | 4.6% | |
| NorthStar Realty Finance Corp. | | | 4.2% | |
| Blackstone Group L.P. | | | 3.9% | |
| Medallion Financial Corp. | | | 3.8% | |
| CBS Corp., Class B | | | 3.8% | |
| | | | |
| Company | | % of Net
Assets | |
| KKR & Co. L.P. | | | 3.8% | |
| Suncor Energy, Inc. (Canada) | | | 3.7% | |
| Starwood Property Trust, Inc. | | | 3.7% | |
| Magellan Midstream Partners L.P. | | | 3.4% | |
| Nu Skin Enterprises, Inc. Class A | | | 3.2% | |
| * | As of September 30, 2015, there were 39 holdings in the Fund. Foreign currency contracts, written options and repurchase agreements, if any, are not included in the number of holdings. Portfolio holdings are subject to change at any time. References to specific securities should not be construed as recommendations by the Funds or their Advisor. Current and future holdings are subject to risk. |
SECTOR BREAKDOWN**
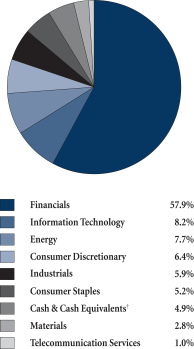
| ** | Excludes securities sold short and options written, if any. |
| † | Also includes Other Assets & Liabilities. |
GROWTHOFA HYPOTHETICAL $10,000 INVESTMENT
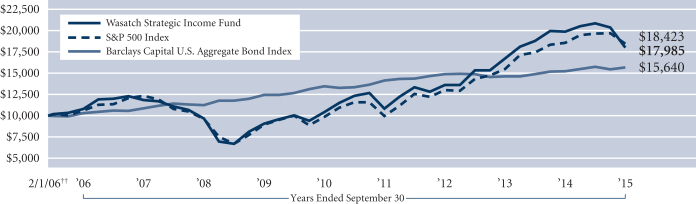
Past performance does not predict future performance. The graph above does not reflect the deduction of fees, sales charges, or taxes that you would pay on fund distributions or the redemption of fund shares. Wasatch does not charge any sales fees. ††Inception: February 1, 2006. The S&P 500 Index represents 500 of the United States’ largest stocks from a broad variety of industries. The Index is unmanaged and is a commonly used measure of common stock total return performance. The Barclays Capital U.S. Aggregate Bond Index covers the U.S. investment grade fixed rate bond market, including government and corporate securities, agency mortgage pass-through securities, and asset-backed securities. You cannot invest directly in these or any indices.
33
| | |
| WASATCH ULTRA GROWTH FUND (WAMCX) — Management Discussion | | SEPTEMBER 30, 2015 (UNAUDITED) |
|
|
|
The Wasatch Ultra Growth Fund is managed by a team of Wasatch portfolio managers led by John Malooly.
| | |

John Malooly, CFA Lead Portfolio Manager | | OVERVIEW Low interest rates, benign inflation and an improving U.S. economy provided a favorable environment for equities for most of the Fund’s fiscal year, which ended September 30, 2015. For the 12-month period, the Wasatch Ultra Growth Fund gained 4.02%. The Fund performed in line with its benchmark, the Russell 2000 Growth Index, which rose 4.04%. Although the large-cap averages |
finished slightly down for the year, small-cap stocks eked out gains. Given the slow pace of economic expansion, investors likely viewed small companies as the only attractive source of earnings growth. In addition, small companies tend to be more focused on domestic markets and may have been perceived as somewhat insulated from international events and less sensitive to currency fluctuations.
These perceptions were tested during the latter part of the year when weak economic data from China raised doubts about the health of the global economy. China’s surprise move in August to devalue its currency seemed to be the tipping point that unnerved investors. Small-cap stocks sold off along with the rest of the market, but the major small-cap averages — as well as the
Fund — held on to enough of their earlier gains to finish the year in the plus column.
Stocks of health-care and information-technology companies benefiting from growth and innovation have driven the Index for several years. Health-care companies have developed new treatments with improved outcomes at lower cost. Information-technology companies have been helping their customers do things “better, faster and cheaper”. While health care and information technology continue to represent a substantial part of our opportunity set, we’ve also added a number of consumer companies that we believe offer attractive long-term prospects.
We generally seek consumer companies that either benefit from using the Internet themselves, or sell products that are not economical to distribute via e-commerce. In what proved to be a volatile year for equities, we were pleased that our consumer-discretionary stocks were the Fund’s top-performing group. We attribute their strong gains to the in-depth analysis and deep due-diligence of the Wasatch investment team.
DETAILSOFTHE YEAR
Our strongest contributor to performance for the year was Cempra, Inc., a clinical-stage pharmaceutical company developing antibiotics for the treatment of bacterial infectious diseases. We locked in profits when Cempra’s share price rose on optimism surrounding its lead drug candidate, Solithromycin, which is in Phase 3 development for the treatment of community-acquired bacterial pneumonia.
FleetMatics Group Ltd. was our second-best contributor. The company offers solutions to help service and distribution industries manage commercial vehicle fleets and improve the productivity of their mobile workforces. FleetMatics has been benefiting from better-than-expected earnings driven in part by new products it was able to introduce with minimal disruption of its business.
Our greatest detractor from Fund performance for the year was online travel agency MakeMyTrip Ltd. Although aggressive discounting by a competitor resulted in slowing sales growth and wider-than-expected losses, MakeMyTrip remains India’s leading online travel agency both in airline-ticket sales and hotel bookings. We believe the company’s margins will expand once competition abates, and we continue to own it in the Fund.
Application-software provider Amber Road, Inc. was our second-greatest detractor. The company provides global trade management (GTM) solutions in the U.S. and internationally. Amber Road’s shares tumbled after it lost a large customer that had the scale to bring its GTM services in-house. When the company was unable to replace the lost business and continued to execute poorly, we sold the stock to seek better opportunities elsewhere.
OUTLOOK
We expect volatility in world financial markets to continue. Absent other developments, investors are likely to remain focused on China and the Federal Reserve for direction. Though this year’s moves in Chinese equities have been exaggerated in relation to the fundamentals, limitations in the government’s ability to control China’s economy and stock market are becoming apparent.
With the Federal Reserve delaying a much-anticipated interest-rate hike, U.S. monetary policy is still a source of uncertainty. Although equity investors typically regard interest-rate hikes negatively, current thinking appears to have shifted toward viewing the Fed’s hesitation as reflecting fragility in the U.S. and global economies. Whether investors would actually welcome an increase in rates remains to be seen.
While we are aware of the macro environment, we believe the key long-term driver of markets and stock prices is earnings growth and we are focusing our attention here. We are striving to create and maintain a portfolio of companies that have the characteristics to capture market share. We expect several major investment trends to persist and present opportunities for bottom-up stock picking.
First, we think recent increases to the minimum wage will reinforce demand for technologies to replace human capital. Second, we anticipate a continued favorable environment for medical-device, pharmaceutical and biotechnology companies whose products enable health-care providers to bring down costs with better outcomes for patients. Third, we believe the stocks of innovative companies using disruptive technologies to take market share from competitors have the potential to perform well over time.
Thank you for the opportunity to manage your assets.
| | Current and future holdings are subject to risk. |
34
| | |
| WASATCH ULTRA GROWTH FUND (WAMCX) — Portfolio Summary | | SEPTEMBER 30, 2015 (UNAUDITED) |
|
|
|
AVERAGE ANNUAL TOTAL RETURNS
| | | | | | | | | | | | | | | |
| | | 1 YEAR | | 5 YEARS | | 10 YEARS |
Ultra Growth | | | | 4.02% | | | | | 10.16% | | | | | 5.01% | |
Russell 2000® Growth Index | | | | 4.04% | | | | | 13.26% | | | | | 7.67% | |
Data shows past performance, which is not indicative of future performance. Current performance may be lower or higher than the performance quoted. To obtain the most recent month-end performance data available, please visit www.WasatchFunds.com. The Advisor may absorb certain Fund expenses, without which total return would have been lower. Investment returns and principal value will fluctuate and shares, when redeemed, may be worth more or less than their original cost.
As of the January 31, 2015 prospectus, the Total Annual Fund Operating Expenses for the Wasatch Ultra Growth Fund are 1.49%. The expense ratio shown elsewhere in this report may be different. Expenses include direct expenses paid to the Advisor as well as indirect expenses incurred by the Fund as a result of its investments in other investment companies (each an “Acquired Fund”), before any expense reimbursements by the Advisor. See the prospectus for additional information regarding Fund expenses.
Wasatch Funds will deduct a 2.00% redemption proceeds fee on Fund shares held 60 days or less. Performance data does not reflect the deduction of fees, including sales charges, or the taxes you would pay on fund distributions or the redemption of fund shares. Fees and taxes, if reflected, would reduce the performance quoted. Wasatch does not charge any sales fees. For more complete information including charges, risks and expenses, read the prospectus carefully.
Investing in small cap funds will be more volatile and loss of principal could be greater than investing in large cap or more diversified funds. Investing in foreign securities, especially in emerging markets, entails special risks, such as currency fluctuations and political uncertainties, which are described in more detail in the prospectus.
TOP 10 EQUITY HOLDINGS*
| | | | |
| Company | | % of Net
Assets | |
| FleetMatics Group plc | | | 3.1% | |
| Greenspring Global Partners II-B, L.P. | | | 3.0% | |
| LGI Homes, Inc. | | | 2.6% | |
| Ultimate Software Group, Inc. | | | 2.6% | |
| Cornerstone OnDemand, Inc. | | | 2.6% | |
| | | | |
| Company | | % of Net
Assets | |
| Balchem Corp. | | | 2.5% | |
| AtriCure, Inc. | | | 2.4% | |
| Seattle Genetics, Inc. | | | 2.3% | |
| Proto Labs, Inc. | | | 2.0% | |
| SPS Commerce, Inc. | | | 2.0% | |
| * | As of September 30, 2015, there were 93 holdings in the Fund. Foreign currency contracts, written options and repurchase agreements, if any, are not included in the number of holdings. Portfolio holdings are subject to change at any time. References to specific securities should not be construed as recommendations by the Funds or their Advisor. Current and future holdings are subject to risk. |
SECTOR BREAKDOWN**
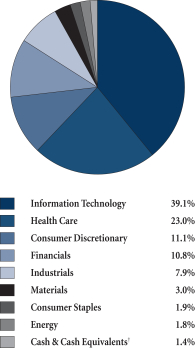
| ** | Excludes securities sold short and options written, if any. |
| † | Also includes Other Assets & Liabilities. |
GROWTHOFA HYPOTHETICAL $10,000 INVESTMENT
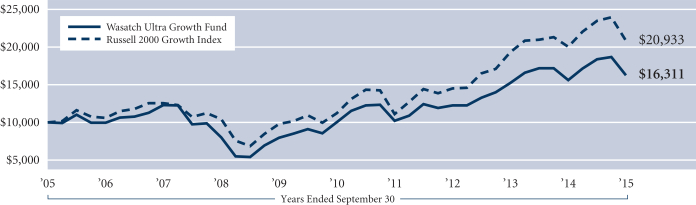
Past performance does not predict future performance. The graph above does not reflect the deduction of fees, sales charges, or taxes that you would pay on fund distributions or the redemption of fund shares. Wasatch does not charge any sales fees. The Russell 2000 Growth Index is an unmanaged total return index that measures the performance of those Russell 2000 Index companies with higher price-to-book ratios and higher forecasted growth values. The Russell 2000 Index is an unmanaged total return index of the smallest 2,000 companies in the Russell 3000 Index, as ranked by total market capitalization. You cannot invest directly in these or any indices.
35
| | |
| WASATCH WORLD INNOVATORS FUND (WAGTX) — Management Discussion | | SEPTEMBER 30, 2015 (UNAUDITED) |
|
|
|
The Wasatch World Innovators Fund is managed by a team of Wasatch portfolio managers led by Sam Stewart and Josh Stewart.
| | | | |
Samuel S. Stewart, Jr. PhD, CFA Lead Portfolio Manager | | 
Josh Stewart Portfolio Manager | | OVERVIEW The Wasatch World Innovators Fund returned 0.32% for the fiscal year ended September 30, 2015 and outperformed the -6.21% loss of the MSCI All Country World Investable Market Index. Global |
equity markets moved from relative stability during most of the Fund’s fiscal year to broad-based volatility and ultimately a moderate sell-off late in the year.
We think the high valuations of many global assets are the root causes for stalling equity prices. High valuations make investors jittery and magnify every little piece of information that emanates from the U.S. Federal Reserve, China or whatever the headline du jour might be. The good news about flat and down market periods is that as long as companies execute their strategies and grow profits, then these periods mean better prices for investors.
DETAILSOFTHE YEAR
In the Fund, we’ve seen dramatic improvements in the prices we’re paying for our companies. Not only has our weighted-average price-to-earnings (P/E) multiple dropped from about 27 times trailing earnings the previous year to 21 times, but that more-recent figure puts us below the benchmark’s P/E of 22 times — which is the first time we’ve had a below-benchmark P/E since we implemented the World Innovators strategy. Unfortunately, some of the P/E improvements have come from falling share prices. But we’ve also rotated into some less-expensive stocks as we’ve been on red alert since about mid-2014 when international markets first started hinting at danger and investor sentiment began moving toward “risk-off” defensive behavior.
Additions to the Fund and weighting changes in existing investments have favored companies that reflect classic quality characteristics — strong returns on investment, positive free cash flow and net-cash balance sheets. We continue to execute our strategy of investing in innovative companies taking market share. But recently when given the option between a rapid sales grower relying on external funding and a moderate grower chipping away market share one customer at a time funded with internal cash flow, we’ve favored the latter. As a result, we’re glad to report that along with better valuations, we’ve maintained or improved upon our quality metrics.
At the company level, long-term holding Abcam plc (United Kingdom) was the Fund’s top contributor to performance for the fiscal year. The stock continued to rise and recover from its sell-off the previous year. Abcam is like the
Amazon.com* for antibodies and other consumables used by life-science research labs around the world. Abcam has consistently grown sales at double-digit rates. In 2014, however, after a year of British pound strengthening, the company — which is based in Cambridge, England — reported the first single-digit annual sales growth in its history, mostly due to currency-translation effects. As other investors sold on disappointment over growth that was down from double digits, we rightly chose to add to our position, focusing on the business quality and potential to gain market share over the long run.
Another strong contributor to performance for the year was MarketAxess Holdings, Inc., a longstanding financial position in the Fund. MarketAxess enables computerized, networked trading. Until recently, financial instruments were traded via auctions, either on the floor of an exchange or, less formally, over the phone. MarketAxess has established a centralized system to modernize trading and permit the electronic submission of trades. While we continue to be impressed with the company, we exited our position on valuation concerns.
Foremost among our mistakes for the fiscal year were our investments in Ocwen Financial Corp. and its sister company Altisource Portfolio Solutions S.A. Ocwen grew dramatically in the wake of the 2007–2009 mortgage crisis by buying mortgage-servicing rights from banks that wanted to exit the servicing business. Eventually, Ocwen became the largest servicer of subprime mortgages in the U.S. And for homeowners unable or unwilling to make mortgage payments, Ocwen would outsource to Altisource much of the work required to deal with the situations. The stocks of both companies declined on charges of improprieties related to refinancings and widespread conflicts of interest. We sold the stocks when it appeared to us that the companies were not likely to resolve their challenges anytime soon.
Another poor performer for year was Kroton Educacional S.A., the largest private for-profit school operator in Brazil. The company made progress integrating the recently acquired second-largest player Anhanguera Educacional. But Brazil’s well-reported economic problems overwhelmed Kroton’s integration progress as investors became concerned about reductions in government support for education.
OUTLOOK
As always, we remain aware of macro themes that cause swings in investor sentiment. But above all, we spend our time focused on uncovering what we believe are the best companies — big and small — from around the world. And we invest the Fund’s assets in the ones we think the market has temporarily underpriced. We’re extremely pleased both as managers and shareholders that our strategy has delivered on Wasatch’s long-term goal to outperform in tough markets.
Finally, thank you for the opportunity you’ve given us to manage your savings, which we’ll do our best to protect and grow.
| * | As of September 30, 2015, the Wasatch World Innovators Fund held 1.3% of its net assets in Amazon.com, Inc. |
| | Current and future holdings are subject to risk. |
36
| | |
| WASATCH WORLD INNOVATORS FUND (WAGTX) — Portfolio Summary | | SEPTEMBER 30, 2015 (UNAUDITED) |
|
|
|
AVERAGE ANNUAL TOTAL RETURNS
| | | | | | | | | | | | | | | |
| | | 1 YEAR | | 5 YEARS | | 10 YEARS |
World Innovators | | | | 0.32% | | | | | 11.81% | | | | | 7.91% | |
MSCI AC World IMI | | | | -6.21% | | | | | 6.99% | | | | | 4.84% | |
Data shows past performance, which is not indicative of future performance. Current performance may be lower or higher than the performance quoted. To obtain the most recent month-end performance data available, please visit www.WasatchFunds.com. The Advisor may absorb certain Fund expenses, without which total return would have been lower. Investment returns and principal value will fluctuate and shares, when redeemed, may be worth more or less than their original cost.
As of the January 31, 2015 prospectus, the Total Annual Fund Operating Expenses for the Wasatch World Innovators Fund are 1.74%. The expense ratio shown elsewhere in this report may be different. Expenses include direct expenses paid to the Advisor as well as indirect expenses incurred by the Fund as a result of its investments in other investment companies (each an “Acquired Fund”), before any expense reimbursements by the Advisor. See the prospectus for additional information regarding Fund expenses.
Wasatch Funds will deduct a 2.00% redemption proceeds fee on Fund shares held 60 days or less. Performance data does not reflect the deduction of fees, including sales charges, or the taxes you would pay on fund distributions or the redemption of fund shares. Fees and taxes, if reflected, would reduce the performance quoted. Wasatch does not charge any sales fees. For more complete information including charges, risks and expenses, read the prospectus carefully.
Investing in small cap funds will be more volatile and loss of principal could be greater than investing in large cap or more diversified funds. Investing in foreign securities, especially in emerging markets, entails special risks, such as currency fluctuations and political uncertainties, which are described in more detail in the prospectus.
TOP 10 EQUITY HOLDINGS*
| | | | |
| Company | | % of Net
Assets | |
| Mekonomen AB (Sweden) | | | 3.8% | |
| Abcam plc (United Kingdom) | | | 3.2% | |
| Discover Financial Services | | | 3.1% | |
| Cognizant Technology Solutions Corp., Class A | | | 3.1% | |
| Capital One Financial Corp. | | | 2.9% | |
| | | | |
| Company | | % of Net
Assets | |
| Advanced Medical Solutions Group plc (United Kingdom) | | | 2.8% | |
| Take-Two Interactive Software, Inc. | | | 2.8% | |
| Activision Blizzard, Inc. | | | 2.8% | |
| DiaSorin S.p.A. (Italy) | | | 2.3% | |
| World Fuel Services Corp. | | | 2.2% | |
| * | As of September 30, 2015, there were 82 holdings in the Fund. Foreign currency contracts, written options and repurchase agreements, if any, are not included in the number of holdings. Portfolio holdings are subject to change at any time. References to specific securities should not be construed as recommendations by the Funds or their Advisor. Current and future holdings are subject to risk. |
SECTOR BREAKDOWN**
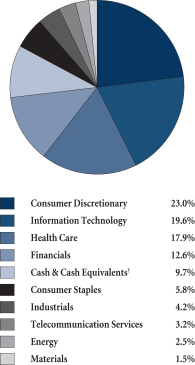
| ** | Excludes securities sold short and options written, if any. |
| † | Also includes Other Assets & Liabilities. |
GROWTHOFA HYPOTHETICAL $10,000 INVESTMENT
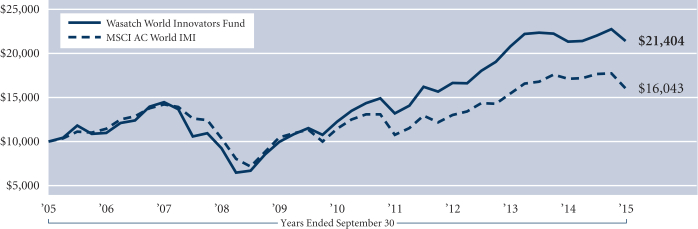
Past performance does not predict future performance. The graph above does not reflect the deduction of fees, sales charges, or taxes that you would pay on fund distributions or the redemption of fund shares. Wasatch does not charge any sales fees. The MSCI AC World IMI (All Country World Investable Market Index) is designed to measure the equity market performance of large, mid and small cap securities across developed and emerging markets throughout the world. You cannot invest directly in this or any index.
37
| | |
| WASATCH-1ST SOURCE INCOME FUND (FMEQX) — Management Discussion | | SEPTEMBER 30, 2015 (UNAUDITED) |
|
|
|
| | |

Paul Gifford, CFA Lead Portfolio Manager | | OVERVIEW The Wasatch-1st Source Income Fund returned 1.87% for the year ended September 30, 2015. During
this time, the Barclays Capital U.S. Government/Credit Bond Index returned 2.68%. Longer-term U.S. Treasuries continued their excellent performance in 2015 as the yield on the 10-year Treasury note declined 0.45 of a percentage point and the yield on the 30-year Treasury bond declined 0.34 of |
a percentage point. In 2015, the Federal Reserve (Fed) met every six weeks to decide whether to maintain or raise the federal funds target rate (target rate), which added volatility and resulted in a yield on the two-year U.S. Treasury note that ended the 12-month period higher by 0.06 of a percentage point.
DETAILSOFTHE YEAR
Meetings of the Fed and the Federal Open Market Committee (FOMC) controlled the direction of the bond markets for what felt like the third consecutive year. Every meeting was drafted as the most important Fed meeting to date and every meeting came back with no change in the 0% to 0.25% target rate, a range it has been in since December 2008.
Central banks around the globe continued to push easy monetary policy. The Fed ended its third round of quantitative easing in October 2014 after buying more than $3.5 trillion in U.S. Treasuries and agency mortgage-backed securities (MBS) since 2009. Still, the Fed plans to remain “broadly accommodative” by reinvesting proceeds from Treasury securities that have matured and prepayments from agency mortgage-backed securities. The European Central Bank (ECB) began a bond-buying program in March 2015 with similar intent to drive investors into riskier assets by keeping bond yields low for an extended period of time and with the additional goal of driving up inflation.
The year 2015 will be known as a year of negative bond yields as illustrated by the target rates and government bonds that fell below zero percent over the past 12 months. The ECB’s target rate of 0.05% has been maintained there since September 2014 and with the bond-buying program it has driven France’s 5-year bond to a yield as low as -0.023%, Germany’s 7-year bond to a yield of -0.097% and the Netherlands 5-year bond to a yield of -0.008%. The target rate of Japan’s central bank was between 0% and 0.10% and Japan’s 5-year bond reached a negative yield of -0.003%. Sweden’s central bank had a target rate of -0.35% and its 5-year bond dropped to -0.081%. The target rate in Switzerland is -0.75% and its 10-year bond yield was as low as -0.299%. Yields have risen from these levels, but continued to remain among the lowest of all major sovereign nations.
In the latter part of the 12-month period, investors fled emerging-market bonds as China devalued its currency and its growth outlook weakened. U.S. Treasury yields declined and the Fed pointed to emerging markets as a reason for the
hesitant decision to keep rates in the 0% to 0.25% range. The International Monetary Fund recommended throughout the year that central banks around the developed world, specifically the Fed, refrain from increasing their benchmark interest rate as this would likely increase corporate failures in emerging economies.
OUTLOOK
We believe the Fed needs to provide a methodical plan for raising rates. Given the stable and growing domestic economy, we think the Fed should move away from its zero-interest rate policy (even if that means a 0.125% increase to a target rate of 0.25%). We also think the first rate increase should take place between December 2015 and March 2016.
For the Fund, we will continue to focus on three major areas of the fixed-income market, but we will add to other fixed-income areas where we believe we can pick up yield, add diversification, and improve the Fund’s long-term return potential.
U.S. Treasuries and government agency bonds have been at the core of the Fund as they have provided price stability and liquidity. These securities provide the Fund with the highest credit quality at Aaa/AA+ by Moody’s and S&P. We have used callable agency bonds to pick up additional yield relative to their benchmark Treasury maturity or more importantly to their benchmark bullet agency maturity. As of September 30, 2015, 22% of the Fund was allocated to these securities — a notable year-over-year decline as we have found other fixed-income segments more attractive.
The Fund’s largest exposure was to corporate bonds, which ended the year at 46% of total assets. This was a slight increase over last year, largely due to increased allocation to strong BBB credits. We believe that in this modestly growing economy, lower-rated investment-grade bonds should be an outperforming part of the corporate bond sector. With a 12% allocation, the Fund is underweight in BBB credits relative to the benchmark’s 14.6% weight, but we expect to increase the Fund’s weighting in that segment as opportunities arise. The average credit rating on our corporate bonds is A2/A.
Agency mortgage-backed securities are the Fund’s third-largest fixed-income sector and ended the fiscal year at around 18% of the Fund — down slightly from the previous year. We like the additional government-guaranteed yield that this sector provides, but are being defensive by owning MBS with a high weighted-average coupon.
We expect to continue to utilize taxable municipals, commercial MBS, agency-backed securities, and preferred stocks to provide yield and diversification for the Fund.
Thank you for entrusting us to manage your assets.
38
| | |
| WASATCH-1ST SOURCE INCOME FUND (FMEQX) — Portfolio Summary | | SEPTEMBER 30, 2015 (UNAUDITED) |
|
|
|
AVERAGE ANNUAL TOTAL RETURNS
| | | | | | | | | | | | |
| | | 1 YEAR | | | 5 YEARS | | | 10 YEARS | |
Income | | | 1.87% | | | | 1.56% | | | | 3.21% | |
Barclays Capital U.S. Intermediate Government/Credit Bond Index | | | 2.68% | | | | 2.42% | | | | 4.17% | |
Data shows past performance, which is not indicative of future performance. Current performance may be lower or higher than the performance quoted. To obtain the most recent month-end performance data available, please visit www.WasatchFunds.com. The Advisor may absorb certain Fund expenses, without which total return would have been lower. Investment returns and principal value will fluctuate and shares, when redeemed, may be worth more or less than their original cost.
As of the January 31, 2015 prospectus, the Total Annual Fund Operating Expenses for the Wasatch-1st Source Income Fund are 0.71%. The expense ratio shown elsewhere in this report may be different. Expenses include direct expenses paid to the Advisor as well as indirect expenses incurred by the Fund as a result of its investments in other investment companies (each an “Acquired Fund”). See the prospectus for additional information regarding Fund expenses.
Wasatch Funds will deduct a 2.00% redemption proceeds fee on Fund shares held 60 days or less. Performance data does not reflect the deduction of fees, including sales charges, or the taxes you would pay on fund distributions or the redemption of fund shares. Fees and taxes, if reflected, would reduce the performance quoted. Wasatch does not charge any sales fees. For more complete information including charges, risks and expenses, read the prospectus carefully.
Investments in fixed income funds are subject to the same interest rate, inflation, credit and other risks associated with the underlying bonds. Return of principal is not guaranteed.
TOP 10 FIXED INCOME HOLDINGS*
| | | | | | | | |
| Holding | | Maturity
Date | | | % of Net
Assets | |
| U.S. Treasury Note, 3.625% | | | 8/15/19 | | | | 4.1% | |
| U.S. Treasury Note, 3.250% | | | 12/31/16 | | | | 3.0% | |
Federal Home Loan Bank,
Series 0000, 1.750% | | | 11/8/22 | | | | 1.8% | |
| Federal Farm Credit Banks, 2.290% | | | 4/14/22 | | | | 1.8% | |
| U.S. Treasury Note, 3.625% | | | 2/15/20 | | | | 1.5% | |
| Citibank Credit Card Issuance Trust, Series 2007-A8, Class A8, 5.650% | | | 9/20/19 | | | | 1.5% | |
| | | | | | | | |
| Holding | | Maturity
Date | | | % of Net
Assets | |
| Federal National Mortgage Assoc., Series AL2525, 3.500% | | | 6/1/32 | | | | 1.5% | |
| Federal Home Loan Mortgage Corp., 2.500% | | | 5/27/16 | | | | 1.4% | |
| BB&T Corp., MTN, 2.150% | | | 3/22/17 | | | | 1.4% | |
| Federal Farm Credit Banks, 1.970% | | | 4/21/21 | | | | 1.4% | |
| * | As of September 30, 2015, there were 146 holdings in the Fund. Repurchase agreements, if any, are not included in the number of holdings. Portfolio holdings are subject to change at any time. References to specific securities should not be construed as recommendations by the Funds or their Advisor. Current and future holdings are subject to risk. |
INVESTMENTS & CASH**
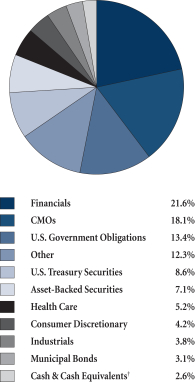
| ** | Excludes options written, if any. |
| † | Also includes Other Assets & Liabilities. |
GROWTHOFA HYPOTHETICAL $10,000 INVESTMENT
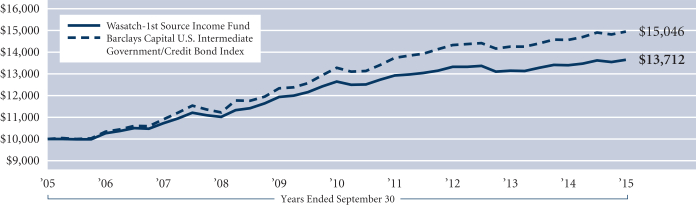
Past performance does not predict future performance. The graph above does not reflect the deduction of fees, sales charges, or taxes that you would pay on fund distributions or the redemption of fund shares. Wasatch does not charge any sales fees. The Barclays Capital U.S. Intermediate Government/Credit Bond Index is an unmanaged index considered representative of the performance of government and corporate bonds with maturities of less than 10 years. You cannot invest directly in this or any index.
39
| | |
| WASATCH-HOISINGTON U.S. TREASURY FUND (WHOSX) — Management Discussion | | SEPTEMBER 30, 2015 (UNAUDITED) |
|
|
|
| | |

Van Hoisington Lead Portfolio Manager | | OVERVIEW A sharp slowdown in economic activity and continuing signs of global turmoil led to a solid rally in the long end of the U.S. Treasury bond market over the summer quarter. Wage growth eased as employment gains slowed substantially. In addition, commodity prices fell and inflationary pressures lessened in the face of tepid demand growth. The 30-year Treasury bond yield closed the 12-month period |
ended September 30, 2015 at 2.85%, down from 3.12% on June 30, 2015. On September 30, 2014, the long Treasury yield stood at 3.20%.
For the Wasatch-Hoisington U.S. Treasury Fund’s fiscal year ended September 30, 2015, the Fund returned 10.09% compared to a return of 2.94% for its benchmark, the Barclays Capital U.S. Aggregate Bond Index.
DETAILSOFTHE YEAR
The Atlanta Federal Reserve Bank’s tracking model, in early October, indicates that real gross domestic product (GDP) grew at slightly less than a 1% annual rate in the third calendar quarter of 2015, compared to the final official estimate of 3.9% for the second quarter. Although third-quarter numbers will undergo many more revisions, a pattern of weakness is apparent in a variety of different developments. In the September meeting, the Federal Open Market Committee (FOMC) lowered its nominal and inflation projections for 2015, 2016 and 2017. At the end of 2014, the FOMC was expecting nominal GDP to grow by 4.1% for the 2015 calendar year. With almost nine months of actual data, the Fed estimates the figure will be 2.5%. In 2014, the actual growth in nominal GDP was 3.9%, down from 4.1% in 2013.
As the Fund’s fiscal year was ending, faltering in the labor markets was quite pronounced. Nonfarm payroll jobs increased by an average 167,000 per month in the third calendar quarter, down from an average monthly gain of 213,000 in the first half of 2015. For the first nine months of 2015, the average monthly job gain was 198,000, or 62,000 per month less than in 2014. A new cycle low in the unemployment rate has little meaning since the labor force participation rate is at a four-decade low.
Growth in the high-value-added industrial sector fell 1.1% over the first eight months of 2015, with the non-automotive sector contracting 1.5%. Even though September production had not been reported as this commentary was being written, complete results are likely to worsen as manufacturing and mining job losses in the final two months of the third quarter offset construction gains that moderated significantly in recent months.
OUTLOOK
The domestic and global economies continue to be hampered by the serious structural impediment to growth emanating from extreme over-indebtedness. Estimates
indicate that public and private debt is presently $60 trillion greater than in 2008. Over this same time, global GDP gained only $12 trillion. Public and private debt relative to GDP is above the deleterious impact range of 250% to 275% in the United States, China, the eurozone, the United Kingdom, Canada, Australia and Japan.
Important cyclical U.S. indicators now also signal softer growth. Cumulative inventory investment in the past six months reached the highest level in 17 years. The highly prescient real after-tax corporate profits fell 1.6% over the past eight quarters. Such a drop has regularly presaged severe slumps in economic activity and often recessions since 1948. Both top-line and core durable goods indicators fell sharply over the past 12 months, which along with poorer profits, point to a decline in capital spending. Although consumer spending has remained firm thus far in 2015, increasing consumer borrowing rather than better income was the sustaining factor. The household saving rate recently dropped to 4.6%, a level at or below that of the economy when it entered the last two recessions as well as the Great Depression in 1929. The trade sector, reflecting poor business conditions in major foreign trading partners and a strong dollar, has pared U.S. growth this year. Given the long lags involved, the highly potent foreign trade multiplier could remain negative for another two years. Although petroleum-drilling activity has fallen sharply, production of oil and gas continued to increase until recently. Thus, the main production declines in this sector lie ahead.
The weakness in top-line growth evident thus far in 2015 is likely to persist. Both the growth in real GDP and the rate of increase in the major price indices are likely to be slower than in 2014 and support a downward trend in long-term Treasury bond yields. Long-term government bond yields in the United States remain higher than in Europe and Japan.
On an annual basis, the 30-year Treasury bond yield has moved in the same direction as the inflation rate almost 80% of the time. At the close of the Fund’s fiscal year, the bond yield was slightly higher than on December 31, 2014. Thus, value-oriented and patient investors who are prepared for the volatility inherent in the long end of the Treasury bond market are presented with an opportunity to add to their positions in this market as new funds become available.
Thank you for the opportunity to manage your assets.
40
| | |
| WASATCH-HOISINGTON U.S. TREASURY FUND (WHOSX) — Portfolio Summary | | SEPTEMBER 30, 2015 (UNAUDITED) |
|
|
|
AVERAGE ANNUAL TOTAL RETURNS
| | | | | | | | | | | | |
| | | 1 YEAR | | | 5 YEARS | | | 10 YEARS | |
U.S. Treasury | | | 10.09% | | | | 7.03% | | | | 7.59% | |
Barclays Capital U.S. Aggregate Bond Index | | | 2.94% | | | | 3.10% | | | | 4.64% | |
Data shows past performance, which is not indicative of future performance. Current performance may be lower or higher than the performance quoted. To obtain the most recent month-end performance data available, please visit www.WasatchFunds.com. The Advisor may absorb certain Fund expenses, without which total return would have been lower. Investment returns and principal value will fluctuate and shares, when redeemed, may be worth more or less than their original cost.
As of the January 31, 2015 prospectus, the Total Annual Fund Operating Expenses for the
Wasatch-Hoisington U.S. Treasury Fund are 0.70%. The expense ratio shown elsewhere in this report may be different. See the prospectus for additional information regarding Fund expenses.
Wasatch Funds will deduct a 2.00% redemption proceeds fee on Fund shares held 60 days or less. Performance data does not reflect the deduction of fees, including sales charges, or the taxes you would pay on fund distributions or the redemption of fund shares. Fees and taxes, if reflected, would reduce the performance quoted. Wasatch does not charge any sales fees. For more complete information including charges, risks and expenses, read the prospectus carefully.
Investments in fixed income funds are subject to the same interest rate, inflation, credit and other risks associated with the underlying bonds. Return of principal is not guaranteed.
TOP U.S. TREASURY HOLDINGS*
| | | | | | | | |
| Holding | | Maturity
Date | | | % of Net
Assets | |
| U.S. Treasury Bond, 2.500% | | | 2/15/45 | | | | 39.0% | |
| U.S. Treasury Bond, 2.875% | | | 8/15/45 | | | | 13.7% | |
| U.S. Treasury Bond, 2.875% | | | 5/15/43 | | | | 13.5% | |
| U.S. Treasury Bond, 3.125% | | | 8/15/44 | | | | 12.4% | |
| | | | | | | | |
| Holding | | Maturity
Date | | | % of Net
Assets | |
| U.S. Treasury Strip, principal only | | | 5/15/44 | | | | 9.9% | |
| U.S. Treasury Bond, 3.750% | | | 11/15/43 | | | | 6.5% | |
| U.S. Treasury Bond, 3.125% | | | 2/15/42 | | | | 2.6% | |
| U.S. Treasury Bond, 2.750% | | | 11/15/42 | | | | 0.6% | |
| * | As of September 30, 2015, there were 8 holdings in the Fund. Repurchase agreements, if any, are not included in the number of holdings. Portfolio holdings are subject to change at any time. References to specific securities should not be construed as recommendations by the Funds or their Advisor. Current and future holdings are subject to risk. |
INVESTMENTS & CASH
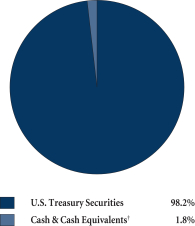
| † | Also includes Other Assets & Liabilities. |
GROWTHOFA HYPOTHETICAL $10,000 INVESTMENT
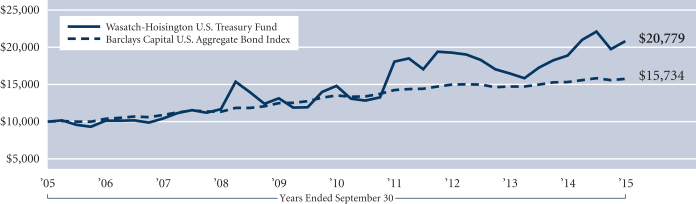
Past performance does not predict future performance. The graph above does not reflect the deduction of fees, sales charges, or taxes that you would pay on fund distributions or the redemption of fund shares. Wasatch does not charge any sales fees. The Barclays Capital U.S. Aggregate Bond Index covers the U.S. investment grade fixed rate bond market, including government and corporate securities, agency mortgage pass-through securities, and asset-backed securities. You cannot invest directly in this or any index.
41
| | |
| WASATCH FUNDS MANAGEMENT DISCUSSIONS — Definitions of Financial Terms | | SEPTEMBER 30, 2015 (UNAUDITED) |
|
|
|
The Patient Protection and Affordable Care Act (PPACA), commonly called the Affordable Care Act (ACA) or “ObamaCare,” is a United States federal statute signed into law by President Barack Obama on March 23, 2010.
An asset-backed security is backed by a loan, lease or receivables against assets other than real estate and mortgage-backed securities. For investors, asset-backed securities are an alternative to investing in corporate debt.
A bullet bond is a debt instrument whose entire face value is paid at once on the maturity date. Bullet bonds are non-callable. Bullet bonds cannot be redeemed early by an issuer, so they pay a relatively low rate of interest because of the issuer’s exposure to interest-rate risk. Both corporations and governments issue bullet bonds. Bullet bonds come in a variety of maturities, from short- to long-term.
A Consumer Price Index (CPI) is an inflationary indicator that measures the change in the cost of a fixed basket of products and services, including housing, electricity, food, and transportation.
A corporate bond is a debt security issued by a corporation for the purpose of raising money to expand its business.
A credit rating is an assessment of the credit worthiness of individuals and corporations. It is based upon the history of borrowing and repayment, as well as the availability of assets and extent of liabilities. Ratings are issued by S&P or Moody’s and typically range from AAA (highest) to D (lowest). The credit quality of the investments in a Fund’s portfolio does not apply to the safety or stability of the Fund. Ratings and portfolio credit quality may change over time. Unrated securities do not necessarily indicate low quality. The Funds themselves have not been rated by an independent rating agency. For information on the rating agency’s methodology visit: http://www.standardandpoors.com/home/en/us and http://www.moodys.com.
Earnings growth is a measure of growth in a company’s net income over a specific period, often one year.
Earnings-per-share or EPS is the portion of a company’s profit allocated to each outstanding share of common stock. EPS growth rates help investors identify companies that are increasing or decreasing in profitability.
The Federal Funds Target Rate (also known as the Fed Funds Target Rate) is set by a committee within the Federal Reserve system called The Federal Open Market Committee (FOMC). The FOMC usually meets every six weeks, and it is at these meetings that the FOMC votes on whether or not to make changes to the Federal Funds Target Rate.
The Federal Open Market Committee (FOMC), a compo-nent of the Federal Reserve system, is charged under United States law with overseeing the nation’s open market operations. Open market operations are the means of imple-menting monetary policy by which a central bank controls the short term interest rate and the supply of base money in an economy, and thus indirectly the total money supply.
Government agency bonds are debt securities issued by a U.S. government-sponsored agency.
The Great Recession was the steep decline in economic activity during the late 2000s, which is generally considered the largest downturn since the Great Depression. The term “Great Recession” applies to the U.S. recession, which officially lasted from December 2007 to June 2009, and the ensuing global recession in 2009. The economic slump began when the bubble in the U.S. housing market burst and large amounts of mortgage-backed securities and derivatives lost significant value.
Gross domestic product (GDP) is a basic measure of a country’s economic performance and is the market value of all final goods and services made within the borders of a country in a year.
The high-yield spread is the percentage difference in current yields of various classes of high-yield bonds (often junk bonds) compared against investment-grade corporate bonds, Treasury bonds or another benchmark bond measure.
An initial public offering (IPO) is a company’s first sale of stock to the public.
The International Monetary Fund (IMF) is an international organization established in 1945 that aims to promote international trade and monetary cooperation, and stabilization of the world’s currencies. The IMF maintains a monetary pool from which member nations can draw in order to correct a deficit in their balance of payments. It is a specialized agency of the United Nations.
Mortgage-backed securities are debt issues backed by a pool of mortgages. Investors receive payments from the interest and principal payments made on the underlying mortgages. Agency mortgage-backed securities are issued by government-sponsored enterprises such as Ginnie Mae, Fannie Mae or Freddie Mac. Commercial mortgage-backed securities are mortgages backed by commercial rather than residential real estate.
OPEC is an acronym for the Organization of Petroleum Exporting Countries. OPEC was founded in 1960. It is a collective of countries that export large amounts of petroleum and was formed to establish oil-exporting policies and set prices.
The price-to-book ratio is used to compare a company’s book value to its current market price.
The price-to-earnings (P/E) multiple, also known as the P/E ratio, is the price of a stock divided by its earnings per share.
The price-to-sales ratio is a stock’s capitalization divided by the company’s sales over the trailing 12 months. The value is the same whether the calculation is done for the whole company or on a per-share basis.
Quantitative easing is a government monetary policy used to increase the money supply by buying government
42
| | |
| WASATCH FUNDS MANAGEMENT DISCUSSIONS —Definitions of Financial Terms (continued) | | SEPTEMBER 30, 2015 (UNAUDITED) |
|
|
|
securities or other securities from the market. Quantitative easing increases the money supply by flooding financial institutions with capital in an effort to promote increased lending and liquidity.
Return on assets (ROA) measures a company’s profitability by showing how many dollars of earnings a company derives from each dollar of assets it controls.
Return on capital is a measure of how effectively a company uses the money, owned or borrowed, that has been invested in its operations.
“Risk-off” is when investors become more cautious and take money out of the market, not being willing to risk it, thus risk off.
The S&P 500 Index includes 500 of the United States’ largest stocks from a broad variety of industries. The Index is unmanaged but is a commonly used measure of common stock total return performance.
The Toronto Stock Exchange (TSX) is the largest stock exchange in Canada. The exchange was established in 1852 and formally incorporated in 1878. The exchange is located on Bay Street in Toronto and is owned and operated by the TMX Group.
The Trans-Pacific Partnership agreement is a free trade agreement currently being negotiated by nine countries: The United States, Australia, Brunei Darussalam, Chile, Malaysia, New Zealand, Peru, Singapore and Vietnam.
Valuation is the process of determining the current worth of an asset or company.
The weighted average coupon (WAC) is the weighted-average gross interest rates of the pool of mortgages that underlie a mortgage-backed security (MBS) at the time the securities were issued. A mortgage-backed security’s current WAC can differ from its original WAC as the underlying mortgages pay down at different speeds. In the weighted-average calculation, the principal balance of each underlying mortgage is used as the weighting factor.
World’s Best Growth Companies are defined by Wasatch as companies that we believe possess an identifiable, sustain-
able competitive advantage, are well managed, underfollowed, undervalued and are producing above average earnings growth relative to their industry and country of origin.
Pertaining to the use of MSCI information. Source: MSCI. The MSCI information may only be used for your internal use, may not be reproduced or redisseminated in any form and may not be used as a basis for or a component of any financial instruments or products or indices. None of the MSCI information is intended to constitute investment advice or a recommendation to make (or refrain from making) any kind of investment decision and may not be relied on as such. Historical data and analysis should not be taken as an indication or guarantee of any future performance analysis, forecast or prediction. The MSCI information is provided on an “as is” basis and the user of this information assumes the entire risk of any use made of this information. MSCI, each of its affiliates and each other person involved in or related to compiling, computing or creating any MSCI information (collectively, the “MSCI Parties”) expressly disclaims all warranties (including, without limitation, any warranties or originality, accuracy, completeness, timeliness, non-infringement, merchantability and fitness for a particular purpose) with respect to this information. Without limiting any of the foregoing, in no event shall any MSCI Party have any liability for any direct, indirect, special, incidental, punitive, consequential (including, without limitation, lost profits) or any other damages. (www.msci.com)
Pertaining to the use of Russell information. Frank Russell Company is the source and owner of the Russell Index data contained or reflected in this material and all trademarks and copyrights related thereto. This is a presentation of Wasatch Advisors, Inc. The presentation may contain confidential information and unauthorized use, disclosure, copying, dissemination or redistribution is strictly prohibited. Frank Russell Company is not responsible for the formatting or configuration of this material or for any inaccuracy in Wasatch Advisors, Inc.’s presentation thereof.
43
| | |
| WASATCH FUNDS — OPERATING EXPENSES (UNAUDITED) | | |
|
|
|
EXPENSE EXAMPLE
As a shareholder of Wasatch Funds, you incur two types of costs: (1) transaction costs, including redemption fees and (2) ongoing costs, including management fees and other fund expenses. This example is intended to help you understand your ongoing costs (in dollars) of investing in a Wasatch Fund and to compare these costs with the ongoing costs of investing in other mutual funds.
The example is based on an investment of $1,000.00 invested at the beginning of the period and held for the entire six-month period ended September 30, 2015.
ACTUAL EXPENSES
The first line of the table below provides information about actual account values and actual expenses, based upon the actual total return of the fund during the most recent six-month period ended September 30, 2015. You may use the information in this line, together with the amount you invested, to estimate the expenses you paid over the period. Simply divide your account value by $1,000.00 (for example, an $8,600.00 account value divided by $1,000.00 = 8.6), then multiply the result by the number in the first line under the heading entitled “Expenses Paid During Period” to estimate the expenses you paid on your account during this period.
In addition, the Funds charge a $12.50 IRA annual maintenance fee and a $15.00 fee for redemptions paid by wire. To the extent these fees apply to your account, your expenses paid during the period would be higher and your ending account value would be lower than the amounts shown in the table below.
HYPOTHETICAL EXAMPLEFOR COMPARISON PURPOSES
The second line of the table on the next page provides information about hypothetical account values and hypothetical expenses based on a fund’s actual expense ratio and
an assumed rate of return of 5% per year before expenses, which is not the fund’s actual return. The hypothetical account values and expenses may not be used to estimate the actual ending account balance or expenses you paid for the period. You may use this information to compare the ongoing costs of investing in a Wasatch Fund and other funds. To do so, compare this 5% hypothetical example with the 5% hypothetical examples that appear in the shareholder reports of other funds.
In addition, the Funds charge a $12.50 IRA annual maintenance fee and a $15.00 fee for redemptions paid by wire. To the extent these fees apply to your account, your expe-nses paid during the period would be higher and your ending account value would be lower than the amounts shown in the table on the next page. If another fund’s fees differ from those listed above, your expenses paid and your ending account value could be higher or lower than those of other funds.
Please note that the expenses shown in the table are meant to highlight your ongoing costs only and do not reflect any transactional costs, such as redemption fees. Therefore, the second line of the table is useful in comparing ongoing costs only, and will not help you determine the relative total costs of owning different funds. In addition, if these transactional costs were included, your costs would have been higher.
A Fund’s annualized expense ratio may vary as a result of various factors including expenses that are not reimbursable under the contractual agreement between the Fund and the Advisor such as interest, taxes, brokerage commissions, other investment related costs, dividend expense on short sales, and extraordinary expenses. The Long/Short Fund — Investor Class and the Income Fund have no contractual limitation on expenses.
44
| | |
| | SEPTEMBER 30, 2015 (UNAUDITED) |
|
|
|
| | | | | | | | | | | | | | | | |
| | | Account Value | | | Expenses Paid
During Period* | | | Annualized
Expense
Ratio* | |
| Fund/Class and Return | | Beginning of Period
April 1, 2015 | | | End of Period
September 30, 2015 | | | |
Core Growth Fund — Investor Class | | | | | | | | | | | | | | | | |
Actual | | | $1,000.00 | | | | $940.80 | | | | $5.69 | | | | 1.17% | |
Hypothetical (5% before expenses) | | | $1,000.00 | | | | $1,019.20 | | | | $5.92 | | | | 1.17% | |
Core Growth Fund — Institutional Class | | | | | | | | | | | | | | | | |
Actual | | | $1,000.00 | | | | $940.90 | | | | $5.45 | | | | 1.12% | |
Hypothetical (5% before expenses) | | | $1,000.00 | | | | $1,019.45 | | | | $5.67 | | | | 1.12% | |
Emerging India Fund | | | | | | | | | | | | | | | | |
Actual | | | $1,000.00 | | | | $984.00 | | | | $9.70 | | | | 1.95% | |
Hypothetical (5% before expenses) | | | $1,000.00 | | | | $1,015.29 | | | | $9.85 | | | | 1.95% | |
Emerging Markets Select Fund — Investor Class | | | | | | | | | | | | | | | | |
Actual | | | $1,000.00 | | | | $823.50 | | | | $7.77 | | | | 1.70% | |
Hypothetical (5% before expenses) | | | $1,000.00 | | | | $1,016.55 | | | | $8.59 | | | | 1.70% | |
Emerging Markets Select Fund — Institutional Class | | | | | | | | | | | | | | | | |
Actual | | | $1,000.00 | | | | $823.70 | | | | $6.90 | | | | 1.51% | |
Hypothetical (5% before expenses) | | | $1,000.00 | | | | $1,017.50 | | | | $7.64 | | | | 1.51% | |
Emerging Markets Small Cap Fund | | | | | | | | | | | | | | | | |
Actual | | | $1,000.00 | | | | $891.80 | | | | $9.25 | | | | 1.95% | |
Hypothetical (5% before expenses) | | | $1,000.00 | | | | $1,015.29 | | | | $9.85 | | | | 1.95% | |
Frontier Emerging Small Countries Fund | | | | | | | | | | | | | | | | |
Actual | | | $1,000.00 | | | | $935.80 | | | | $10.97 | | | | 2.26% | |
Hypothetical (5% before expenses) | | | $1,000.00 | | | | $1,013.74 | | | | $11.41 | | | | 2.26% | |
Global Opportunities Fund | | | | | | | | | | | | | | | | |
Actual | | | $1,000.00 | | | | $909.30 | | | | $8.62 | | | | 1.80% | |
Hypothetical (5% before expenses) | | | $1,000.00 | | | | $1,016.04 | | | | $9.10 | | | | 1.80% | |
International Growth Fund | | | | | | | | | | | | | | | | |
Actual | | | $1,000.00 | | | | $1,000.70 | | | | $7.47 | | | | 1.49% | |
Hypothetical (5% before expenses) | | | $1,000.00 | | | | $1,017.60 | | | | $7.54 | | | | 1.49% | |
International Opportunities Fund | | | | | | | | | | | | | | | | |
Actual | | | $1,000.00 | | | | $971.60 | | | | $11.12 | | | | 2.25% | |
Hypothetical (5% before expenses) | | | $1,000.00 | | | | $1,013.79 | | | | $11.36 | | | | 2.25% | |
Large Cap Value Fund — Investor Class | | | | | | | | | | | | | | | | |
Actual | | | $1,000.00 | | | | $924.50 | | | | $5.31 | | | | 1.10% | |
Hypothetical (5% before expenses) | | | $1,000.00 | | | | $1,019.55 | | | | $5.57 | | | | 1.10% | |
Large Cap Value Fund — Institutional Class | | | | | | | | | | | | | | | | |
Actual | | | $1,000.00 | | | | $925.10 | | | | $4.83 | | | | 1.00% | |
Hypothetical (5% before expenses) | | | $1,000.00 | | | | $1,020.06 | | | | $5.06 | | | | 1.00% | |
Long/Short Fund — Investor Class | | | | | | | | | | | | | | | | |
Actual | | | $1,000.00 | | | | $843.70 | | | | $7.63 | | | | 1.65% | |
Hypothetical (5% before expenses) | | | $1,000.00 | | | | $1,016.80 | | | | $8.34 | | | | 1.65% | |
Long/Short Fund — Institutional Class | | | | | | | | | | | | | | | | |
Actual | | | $1,000.00 | | | | $844.50 | | | | $6.89 | | | | 1.49% | |
Hypothetical (5% before expenses) | | | $1,000.00 | | | | $1,017.60 | | | | $7.54 | | | | 1.49% | |
Micro Cap Fund | | | | | | | | | | | | | | | | |
Actual | | | $1,000.00 | | | | $873.90 | | | | $8.93 | | | | 1.90% | |
Hypothetical (5% before expenses) | | | $1,000.00 | | | | $1,015.54 | | | | $9.60 | | | | 1.90% | |
Micro Cap Value Fund | | | | | | | | | | | | | | | | |
Actual | | | $1,000.00 | | | | $979.50 | | | | $9.68 | | | | 1.95% | |
Hypothetical (5% before expenses) | | | $1,000.00 | | | | $1,015.29 | | | | $9.85 | | | | 1.95% | |
Small Cap Growth Fund | | | | | | | | | | | | | | | | |
Actual | | | $1,000.00 | | | | $871.00 | | | | $5.72 | | | | 1.22% | |
Hypothetical (5% before expenses) | | | $1,000.00 | | | | $1,018.95 | | | | $6.17 | | | | 1.22% | |
45
| | |
| WASATCH FUNDS — OPERATING EXPENSES (continued) | | SEPTEMBER 30, 2015 (UNAUDITED) |
|
|
|
| | | | | | | | | | | | | | | | |
| | | Account Value | | | Expenses Paid
During Period* | | | Annualized
Expense
Ratio* | |
| Fund/Class and Return | | Beginning of Period
April 1, 2015 | | | End of Period
September 30, 2015 | | | |
Small Cap Value Fund — Investor Class | | | | | | | | | | | | | | | | |
Actual | | | $1,000.00 | | | | $909.90 | | | | $5.79 | | | | 1.21% | |
Hypothetical (5% before expenses) | | | $1,000.00 | | | | $1,019.00 | | | | $6.12 | | | | 1.21% | |
Small Cap Value Fund — Institutional Class | | | | | | | | | | | | | | | | |
Actual | | | $1,000.00 | | | | $910.40 | | | | $5.51 | | | | 1.15% | |
Hypothetical (5% before expenses) | | | $1,000.00 | | | | $1,019.30 | | | | $5.82 | | | | 1.15% | |
Strategic Income Fund | | | | | | | | | | | | | | | | |
Actual | | | $1,000.00 | | | | $862.50 | | | | $4.48 | | | | 0.96% | |
Hypothetical (5% before expenses) | | | $1,000.00 | | | | $1,020.26 | | | | $4.86 | | | | 0.96% | |
Ultra Growth Fund | | | | | | | | | | | | | | | | |
Actual | | | $1,000.00 | | | | $884.00 | | | | $6.19 | | | | 1.31% | |
Hypothetical (5% before expenses) | | | $1,000.00 | | | | $1,018.50 | | | | $6.63 | | | | 1.31% | |
World Innovators Fund | | | | | | | | | | | | | | | | |
Actual | | | $1,000.00 | | | | $971.60 | | | | $8.65 | | | | 1.75% | |
Hypothetical (5% before expenses) | | | $1,000.00 | | | | $1,016.29 | | | | $8.85 | | | | 1.75% | |
Income Fund | | | | | | | | | | | | | | | | |
Actual | | | $1,000.00 | | | | $1,002.00 | | | | $3.66 | | | | 0.73% | |
Hypothetical (5% before expenses) | | | $1,000.00 | | | | $1,021.41 | | | | $3.70 | | | | 0.73% | |
U.S. Treasury Fund | | | | | | | | | | | | | | | | |
Actual | | | $1,000.00 | | | | $941.30 | | | | $3.41 | | | | 0.70% | |
Hypothetical (5% before expenses) | | | $1,000.00 | | | | $1,021.56 | | | | $3.55 | | | | 0.70% | |
*Expenses are equal to a fund’s annualized expense ratio as indicated above multiplied by the average account value over the period, multiplied by the number of days in the most recent fiscal half-year divided by the number of days in the full fiscal year (183/365).
46
| | |
| WASATCH CORE GROWTH FUND (WGROX / WIGRX) — Schedule of Investments | | SEPTEMBER 30, 2015 |
|
|
|
| | | | | | | | |
| Shares | | | | | Value | |
| | | | | | | |
| | | | COMMON STOCKS 89.8% | | | | |
| | |
| | | | Airlines 5.9% | | | | |
| | 191,656 | | | Allegiant Travel Co. | | $ | 41,445,610 | |
| | 583,686 | | | Spirit Airlines, Inc.* | | | 27,608,348 | |
| | | | | | | | |
| | | | | | | 69,053,958 | |
| | | | | | | | |
| | | | Apparel Retail 0.6% | | | | |
| | 485,770 | | | Zumiez, Inc.* | | | 7,592,585 | |
| | | | | | | | |
| | | | Application Software 7.4% | | | | |
| | 225,201 | | | ANSYS, Inc.* | | | 19,849,216 | |
| | 200,845 | | | Globant S.A.* (Luxembourg) | | | 6,143,849 | |
| | 207,328 | | | Tyler Technologies, Inc.* | | | 30,956,144 | |
| | 113,932 | | | Ultimate Software Group, Inc.* | | | 20,394,967 | |
| | 431,531 | | | Zendesk, Inc.* | | | 8,505,476 | |
| | | | | | | | |
| | | | | | | 85,849,652 | |
| | | | | | | | |
| | | | Asset Management & Custody Banks 3.7% | | | | |
| | 623,385 | | | SEI Investments Co. | | | 30,065,859 | |
| | 801,433 | | | WisdomTree Investments, Inc. | | | 12,927,114 | |
| | | | | | | | |
| | | | | | | 42,992,973 | |
| | | | | | | | |
| | | | Automotive Retail 1.1% | | | | |
| | 184,053 | | | Monro Muffler Brake, Inc. | | | 12,432,780 | |
| | | | | | | | |
| | | | Biotechnology 4.2% | | | | |
| | 1,908,420 | | | Abcam plc (United Kingdom) | | | 16,786,812 | |
| | 1,326,004 | | | Sangamo BioSciences, Inc.* | | | 7,478,663 | |
| | 651,027 | | | Seattle Genetics, Inc.* | | | 25,103,601 | |
| | | | | | | | |
| | | | | | | 49,369,076 | |
| | | | | | | | |
| | | | Building Products 1.0% | | | | |
| | 359,052 | | | Trex Co., Inc.* | | | 11,967,203 | |
| | | | | | | | |
| | | | Consumer Finance 5.1% | | | | |
| | 157,107 | | | Credit Acceptance Corp.* | | | 30,929,655 | |
| | 1,856,400 | | | Mahindra & Mahindra Financial Services Ltd. (India) | | | 6,801,205 | |
| | 402,155 | | | PRA Group, Inc.* | | | 21,282,042 | |
| | | | | | | | |
| | | | | | | 59,012,902 | |
| | | | | | | | |
| | | | Data Processing & Outsourced Services 0.8% | | | | |
| | 256,790 | | | ExlService Holdings, Inc.* | | | 9,483,255 | |
| | | | | | | | |
| | | | Distributors 1.0% | | | | |
| | 163,176 | | | Pool Corp. | | | 11,797,625 | |
| | | | | | | | |
| | | | Diversified Banks 1.9% | | | | |
| | 6,656,038 | | | City Union Bank Ltd. (India) | | | 9,336,311 | |
| | 1,100,909 | | | Yes Bank Ltd. (India) | | | 12,301,102 | |
| | | | | | | | |
| | | | | | | 21,637,413 | |
| | | | | | | | |
| | | | Diversified Capital Markets 1.8% | | | | |
| | 628,720 | | | HFF, Inc., Class A | | | 21,225,587 | |
| | | | | | | | |
| | | | Diversified Support Services 2.0% | | | | |
| | 726,462 | | | Copart, Inc.* | | | 23,900,600 | |
| | | | | | | | |
| | | | Environmental & Facilities Services 2.4% | | | | |
| | 567,199 | | | Waste Connections, Inc. | | | 27,554,527 | |
| | | | | | | | |
| | | | Food Distributors 0.7% | | | | |
| | 179,301 | | | United Natural Foods, Inc.* | | | 8,697,891 | |
| | | | | | | | |
| | | | Health Care Facilities 1.8% | | | | |
| | 496,969 | | | Ensign Group, Inc. (The) | | | 21,185,788 | |
| | | | | | | | |
| | | | Health Care REITs 1.3% | | | | |
| | 1,326,731 | | | CareTrust REIT, Inc. | | | 15,058,397 | |
| | | | | | | | |
| | | | | | | | |
| Shares | | | | | Value | |
| | | | | | | |
| | | | Health Care Services 3.4% | | | | |
| | 508,666 | | | ExamWorks Group, Inc.* | | $ | 14,873,394 | |
| | 319,161 | | | MEDNAX, Inc.* | | | 24,508,373 | |
| | | | | | | | |
| | | | | | | 39,381,767 | |
| | | | | | | | |
| | | | Homebuilding 1.3% | | | | |
| | 589,986 | | | Installed Building Products, Inc.* | | | 14,914,846 | |
| | | | | | | | |
| | | | Homefurnishing Retail 1.4% | | | | |
| | 379,827 | | | Mattress Firm Holding Corp.* | | | 15,861,576 | |
| | | | | | | | |
| | | | Internet Retail 1.7% | | | | |
| | 155,634 | | | Blue Nile, Inc.* | | | 5,219,965 | |
| | 454,756 | | | MakeMyTrip Ltd.* (India) | | | 6,252,895 | |
| | 236,771 | | | Wayfair, Inc., Class A* | | | 8,301,191 | |
| | | | | | | | |
| | | | | | | 19,774,051 | |
| | | | | | | | |
| | | | Internet Software & Services 7.2% | | | | |
| | 448,282 | | | Cimpress N.V.* | | | 34,118,743 | |
| | 870,722 | | | Cornerstone OnDemand, Inc.* | | | 28,733,826 | |
| | 444,943 | | | Envestnet, Inc.* | | | 13,334,942 | |
| | 268,137 | | | Shutterstock, Inc.* | | | 8,108,463 | |
| | | | | | | | |
| | | | | | | 84,295,974 | |
| | | | | | | | |
| | | | IT Consulting & Other Services 3.0% | | | | |
| | 335,413 | | | EPAM Systems, Inc.* | | | 24,994,977 | |
| | 151,928 | | | Luxoft Holding, Inc.* | | | 9,615,523 | |
| | | | | | | | |
| | | | | | | 34,610,500 | |
| | | | | | | | |
| | | | Life Sciences Tools & Services 3.9% | | | | |
| | 1,147,000 | | | Divi’s Laboratories Ltd. (India) | | | 19,616,242 | |
| | 358,224 | | | ICON plc* (Ireland) | | | 25,423,157 | |
| | | | | | | | |
| | | | | | | 45,039,399 | |
| | | | | | | | |
| | | | Oil & Gas Equipment & Services 1.0% | | | | |
| | 107,359 | | | Dril-Quip, Inc.* | | | 6,250,441 | |
| | 298,022 | | | TGS-NOPEC Geophysical Co. ASA (Norway) | | | 5,501,789 | |
| | | | | | | | |
| | | | | | | 11,752,230 | |
| | | | | | | | |
| | | | Oil & Gas Refining & Marketing 0.7% | | | | |
| | 244,641 | | | World Fuel Services Corp. | | | 8,758,148 | |
| | | | | | | | |
| | | | Personal Products 1.2% | | | | |
| | 336,654 | | | Nu Skin Enterprises, Inc., Class A | | | 13,897,077 | |
| | | | | | | | |
| | | | Regional Banks 6.9% | | | | |
| | 346,902 | | | Eagle Bancorp, Inc.* | | | 15,784,041 | |
| | 340,636 | | | Independent Bank Corp. | | | 15,703,319 | |
| | 204,209 | | | South State Corp. | | | 15,697,546 | |
| | 340,992 | | | Texas Capital Bancshares, Inc.* | | | 17,874,801 | |
| | 444,763 | | | Webster Financial Corp. | | | 15,846,906 | |
| | | | | | | | |
| | | | | | | 80,906,613 | |
| | | | | | | | |
| | | | Research & Consulting Services 1.6% | | | | |
| | 274,977 | | | CEB, Inc. | | | 18,791,928 | |
| | | | | | | | |
| | | | Restaurants 1.4% | | | | |
| | 410,739 | | | Zoe’s Kitchen, Inc.* | | | 16,220,083 | |
| | | | | | | | |
| | | | Semiconductors 3.3% | | | | |
| | 250,484 | | | Cavium, Inc.* | | | 15,372,203 | |
| | 301,196 | | | Monolithic Power Systems, Inc. | | | 15,421,235 | |
| | 183,180 | | | Power Integrations, Inc. | | | 7,724,701 | |
| | | | | | | | |
| | | | | | | 38,518,139 | |
| | | | | | | | |
| | | | Specialized Consumer Services 0.4% | | | | |
| | 533,899 | | | LifeLock, Inc.* | | | 4,676,955 | |
| | | | | | | | |
| | | | Specialized Finance 0.6% | | | | |
| | 230,065 | | | CRISIL Ltd. (India) | | | 6,458,380 | |
| | | | | | | | |
47
| | |
| WASATCH CORE GROWTH FUND (WGROX / WIGRX) — Schedule of Investments (continued) | | SEPTEMBER 30, 2015 |
|
|
|
| | | | | | | | |
| Shares | | | | | Value | |
| | | | | | | |
| | | | Specialty Chemicals 2.1% | | | | |
| | 406,646 | | | Balchem Corp. | | $ | 24,711,877 | |
| | | | | | | | |
| | | | Specialty Stores 1.2% | | | | |
| | 322,333 | | | Five Below, Inc.* | | | 10,823,942 | |
| | 88,512 | | | Hibbett Sports, Inc.* | | | 3,098,805 | |
| | | | | | | | |
| | | | | | | 13,922,747 | |
| | | | | | | | |
| | | | Systems Software 1.5% | | | | |
| | 852,032 | | | Infoblox, Inc.* | | | 13,615,471 | |
| | 137,467 | | | Qualys, Inc.* | | | 3,912,311 | |
| | | | | | | | |
| | | | | | | 17,527,782 | |
| | | | | | | | |
| | | | Trucking 3.3% | | | | |
| | 627,240 | | | Knight Transportation, Inc. | | | 15,053,760 | |
| | 375,268 | | | Old Dominion Freight Line, Inc.* | | | 22,891,348 | |
| | | | | | | | |
| | | | | | | 37,945,108 | |
| | | | | | | | |
| | |
| | | | Total Common Stocks
(cost $774,625,411) | | | 1,046,777,392 | |
| | | | | | | | |
| | |
| | | | PREFERRED STOCKS 0.4% | | | | |
| | |
| | | | Systems Software 0.4% | | | | |
| | 209,500 | | | DocuSign, Inc., Series F Pfd.* *** † | | | 4,000,004 | |
| | | | | | | | |
| | |
| | | | Total Preferred Stocks
(cost $4,000,004) | | | 4,000,004 | |
| | | | | | | | |
| | |
Principal
Amount | | | | | Value | |
| | | | | | | |
| | | | SHORT-TERM INVESTMENTS 10.2% | | | | |
| | |
| | | | Repurchase Agreement 10.2% | | | | |
| | $119,120,957 | | | Repurchase Agreement dated 9/30/15, 0.00% due 10/1/15 with State Street Bank and Trust Co. collateralized by $121,660,000 of United States Treasury Notes 1.375% due 9/30/20; value $121,507,925; repurchase proceeds: $119,120,957 (cost $119,120,957) | | $ | 119,120,957 | |
| | | | | | | | |
| | |
| | | | Total Short-Term Investments
(cost $119,120,957) | | | 119,120,957 | |
| | | | | | | | |
| | |
| | | | Total Investments
(cost $897,746,372) 100.4%§ | | | 1,169,898,353 | |
| | |
| | | | Liabilities less Other Assets (0.4%) | | | (4,768,876 | ) |
| | | | | | | | |
| | |
| | | | NET ASSETS 100.0% | | $ | 1,165,129,477 | |
| | | | | | | | |
| |
| | | | *Non-income producing. ***Security was fair valued under procedures adopted by the Board of Trustees (see Note 13). †Security purchased in a private placement transaction or under Rule 144A of the Securities Act of 1933 (see Note 9). §The aggregate amount of foreign securities fair valued pursuant to a systematic valuation model as a percent of net assets was 6.59%. REIT Real Estate Investment Trust. See Notes to Financial Statements. | |
At September 30, 2015, Wasatch Core Growth Fund’s investments, excluding short-term investments, were in the following countries (unaudited):
| | | | |
| Country | | % | |
India | | | 5.8 | |
Ireland | | | 2.4 | |
Luxembourg | | | 0.6 | |
Norway | | | 0.5 | |
United Kingdom | | | 1.6 | |
United States | | | 89.1 | |
| | | | |
TOTAL | | | 100.0 | % |
| | | | |
48
| | |
| WASATCH EMERGING INDIA FUND (WAINX) — Schedule of Investments | | SEPTEMBER 30, 2015 |
|
|
|
| | | | | | | | |
| Shares | | | | | Value | |
| | | | | | | |
| | | | COMMON STOCKS 96.0% | | | | |
| | |
| | | | Agricultural Products 0.7% | | | | |
| | 65,011 | | | Kaveri Seed Co. Ltd. (India) | | $ | 422,481 | |
| | | | | | | | |
| | | | Air Freight & Logistics 1.2% | | | | |
| | 6,779 | | | Blue Dart Express Ltd. (India) | | | 777,263 | |
| | | | | | | | |
| | | | Apparel, Accessories & Luxury Goods 0.8% | | | | |
| | 2,393 | | | Page Industries Ltd. (India) | | | 481,980 | |
| | | | | | | | |
| | | | Auto Parts & Equipment 3.1% | | | | |
| | 2,393 | | | Bosch Ltd. (India) | | | 707,684 | |
| | 12,480 | | | WABCO India Ltd. (India) | | | 1,303,410 | |
| | | | | | | | |
| | | | | | | 2,011,094 | |
| | | | | | | | |
| | | | Building Products 1.3% | | | | |
| | 68,965 | | | Kajaria Ceramics Ltd. (India) | | | 839,600 | |
| | | | | | | | |
| | | | Cable & Satellite 0.9% | | | | |
| | 364,854 | | | Dish TV India Ltd.* (India) | | | 593,146 | |
| | | | | | | | |
| | | | Commodity Chemicals 3.3% | | | | |
| | 198,207 | | | Berger Paints India Ltd. (India) | | | 665,325 | |
| | 131,101 | | | Gulf Oil Lubricants India Ltd. (India) | | | 958,691 | |
| | 48,959 | | | Supreme Industries Ltd. (India) | | | 462,535 | |
| | | | | | | | |
| | | | | | | 2,086,551 | |
| | | | | | | | |
| | | | Construction Machinery & Heavy Trucks 2.0% | | | | |
| | 4,603 | | | Eicher Motors Ltd. (India) | | | 1,251,508 | |
| | | | | | | | |
| | | | Consumer Finance 8.8% | | | | |
| | 21,982 | | | Bajaj Finance Ltd. (India) | | | 1,728,880 | |
| | 157,533 | | | Mahindra & Mahindra Financial Services Ltd. (India) | | | 577,146 | |
| | 153,115 | | | Repco Home Finance Ltd. (India) | | | 1,722,978 | |
| | 39,469 | | | Shriram City Union Finance Ltd. (India) | | | 1,018,803 | |
| | 94,327 | | | SKS Microfinance Ltd.* (India) | | | 585,019 | |
| | | | | | | | |
| | | | | | | 5,632,826 | |
| | | | | | | | |
| | | | Data Processing & Outsourced Services 1.1% | | | | |
| | 351,140 | | | Vakrangee Ltd. (India) | | | 685,728 | |
| | | | | | | | |
| | | | Department Stores 0.2% | | | | |
| | 18,683 | | | V-Mart Retail Ltd. (India) | | | 140,891 | |
| | | | | | | | |
| | | | Diversified Banks 7.1% | | | | |
| | 181,253 | | | Axis Bank Ltd. (India) | | | 1,380,534 | |
| | 336,065 | | | City Union Bank Ltd. (India) | | | 471,393 | |
| | 511,048 | | | DCB Bank Ltd.* (India) | | | 1,115,440 | |
| | 10,096 | | | HDFC Bank Ltd. ADR (India) | | | 616,765 | |
| | 66,069 | | | IndusInd Bank Ltd. (India) | | | 949,341 | |
| | | | | | | | |
| | | | | | | 4,533,473 | |
| | | | | | | | |
| | | | Diversified Chemicals 1.6% | | | | |
| | 17,868 | | | BASF India Ltd. (India) | | | 297,192 | |
| | 81,789 | | | Pidilite Industries Ltd. (India) | | | 710,539 | |
| | | | | | | | |
| | | | | | | 1,007,731 | |
| | | | | | | | |
| | | | Diversified Real Estate Activities 0.4% | | | | |
| | 243,649 | | | Delta Corp. Ltd. (India) | | | 286,007 | |
| | | | | | | | |
| | | | Electric Utilities 0.8% | | | | |
| | 358,259 | | | OPG Power Ventures plc* (India) | | | 512,284 | |
| | | | | | | | |
| | | | Electrical Components & Equipment 2.7% | | | | |
| | 82,147 | | | Amara Raja Batteries Ltd. (India) | | | 1,296,795 | |
| | 28,872 | | | V-Guard Industries Ltd. (India) | | | 398,698 | |
| | | | | | | | |
| | | | | | | 1,695,493 | |
| | | | | | | | |
| | | | | | | | |
| Shares | | | | | Value | |
| | | | | | | |
| | | | Fertilizers & Agricultural Chemicals 2.7% | | | | |
| | 13,992 | | | Bayer CropScience Ltd. (India) | | $ | 778,695 | |
| | 137,686 | | | UPL Ltd. (India) | | | 966,496 | |
| | | | | | | | |
| | | | | | | 1,745,191 | |
| | | | | | | | |
| | | | Health Care Facilities 1.0% | | | | |
| | 27,806 | | | Apollo Hospitals Enterprise Ltd. (India) | | | 610,381 | |
| | | | | | | | |
| | | | Heavy Electrical Equipment 0.6% | | | | |
| | 88,044 | | | TD Power Systems Ltd. (India) | | | 403,755 | |
| | | | | | | | |
| | | | Housewares & Specialties 1.7% | | | | |
| | 128,196 | | | LA Opala RG Ltd. (India) | | | 1,088,407 | |
| | | | | | | | |
| | | | Industrial Machinery 3.4% | | | | |
| | 38,563 | | | AIA Engineering Ltd. (India) | | | 585,542 | |
| | 42,652 | | | Cummins India Ltd. (India) | | | 706,014 | |
| | 8,219 | | | FAG Bearings India Ltd. (India) | | | 507,345 | |
| | 21,018 | | | SKF India Ltd. (India) | | | 404,992 | |
| | | | | | | | |
| | | | | | | 2,203,893 | |
| | | | | | | | |
| | | | Internet Retail 2.5% | | | | |
| | 117,549 | | | MakeMyTrip Ltd.* (India) | | | 1,616,299 | |
| | | | | | | | |
| | | | Internet Software & Services 0.2% | | | | |
| | 8,055 | | | Just Dial Ltd. (India) | | | 121,451 | |
| | | | | | | | |
| | | | IT Consulting & Other Services 8.5% | | | | |
| | 32,002 | | | Cognizant Technology Solutions Corp., Class A* | | | 2,003,645 | |
| | 123,905 | | | HCL Technologies Ltd. (India) | | | 1,863,607 | |
| | 92,762 | | | Persistent Systems Ltd. (India) | | | 941,060 | |
| | 70,162 | | | Tech Mahindra Ltd. (India) | | | 599,098 | |
| | | | | | | | |
| | | | | | | 5,407,410 | |
| | | | | | | | |
| | | | Life & Health Insurance 2.2% | | | | |
| | 179,375 | | | Max India Ltd. (India) | | | 1,398,249 | |
| | | | | | | | |
| | | | Life Sciences Tools & Services 1.7% | | | | |
| | 64,340 | | | Divi’s Laboratories Ltd. (India) | | | 1,100,357 | |
| | 4,043 | | | Syngene International Ltd.* (India) | | | 19,833 | |
| | | | | | | | |
| | | | | | | 1,120,190 | |
| | | | | | | | |
| | | | Marine Ports & Services 0.9% | | | | |
| | 204,923 | | | Gujarat Pipavav Port Ltd.* (India) | | | 579,094 | |
| | | | | | | | |
| | | | Packaged Foods & Meats 2.9% | | | | |
| | 29,011 | | | Britannia Industries Ltd. (India) | | | 1,367,636 | |
| | 3,132 | | | GlaxoSmithKline Consumer Healthcare Ltd. (India) | | | 288,570 | |
| | 1,920 | | | Nestlé India Ltd. (India) | | | 186,450 | |
| | | | | | | | |
| | | | | | | 1,842,656 | |
| | | | | | | | |
| | | | Personal Products 5.4% | | | | |
| | 126,612 | | | Bajaj Corp. Ltd. (India) | | | 865,143 | |
| | 31,526 | | | Colgate-Palmolive India Ltd. (India) | | | 463,571 | |
| | 271,006 | | | Dabur India Ltd. (India) | | | 1,140,637 | |
| | 35,954 | | | Godrej Consumer Products Ltd. (India) | | | 668,549 | |
| | 3,062 | | | Procter & Gamble Hygiene & Health Care Ltd. (India) | | | 294,829 | |
| | | | | | | | |
| | | | | | | 3,432,729 | |
| | | | | | | | |
| | | | Pharmaceuticals 16.4% | | | | |
| | 66,895 | | | Caplin Point Laboratories Ltd. (India) | | | 1,471,993 | |
| | 76,523 | | | Cipla Ltd. (India) | | | 743,760 | |
| | 134,902 | | | Glenmark Pharmaceuticals Ltd. (India) | | | 2,164,651 | |
| | 48,094 | | | Lupin Ltd. (India) | | | 1,493,875 | |
| | 1,657,210 | | | Marksans Pharma Ltd. (India) | | | 2,622,602 | |
| | 52,599 | | | Natco Pharma Ltd. (India) | | | 1,976,000 | |
| | | | | | | | |
| | | | | | | 10,472,881 | |
| | | | | | | | |
49
| | |
| WASATCH EMERGING INDIA FUND (WAINX) — Schedule of Investments (continued) | | SEPTEMBER 30, 2015 |
|
|
|
| | | | | | | | |
Shares | | | | | Value | |
| | | | | | | |
| | | | Publishing 0.4% | | | | |
| | 52,664 | | | D.B. Corp. Ltd. (India) | | $ | 262,483 | |
| | | | | | | | |
| | | | Restaurants 0.9% | | | | |
| | 22,222 | | | Jubilant Foodworks Ltd. (India) | | | 546,055 | |
| | | | | | | | |
| | | | Specialized Finance 2.1% | | | | |
| | 26,910 | | | Credit Analysis & Research Ltd. (India) | | | 459,309 | |
| | 10,586 | | | CRISIL Ltd. (India) | | | 297,170 | |
| | 9,241 | | | ICRA Ltd. (India) | | | 576,549 | |
| | | | | | | | |
| | | | | | | 1,333,028 | |
| | | | | | | | |
| | | | Specialty Chemicals 0.9% | | | | |
| | 44,918 | | | Asian Paints Ltd. (India) | | | 576,652 | |
| | | | | | | | |
| | | | Thrifts & Mortgage Finance 3.9% | | | | |
| | 199,915 | | | Gruh Finance Ltd. (India) | | | 814,005 | |
| | 26,528 | | | Housing Development Finance Corp. Ltd. (India) | | | 491,194 | |
| | 66,170 | | | Indiabulls Housing Finance Ltd. (India) | | | 802,730 | |
| | 54,403 | | | LIC Housing Finance Ltd. (India) | | | 389,811 | |
| | | | | | | | |
| | | | | | | 2,497,740 | |
| | | | | | | | |
| | | | Wireless Telecommunication Services 1.7% | | | | |
| | 470,157 | | | Idea Cellular Ltd. (India) | | | 1,067,015 | |
| | | | | | | | |
| | |
| | | | Total Common Stocks
(cost $46,237,158) | | | 61,283,615 | |
| | | | | | | | |
| | |
| | | | CORPORATE BONDS 0.0% | | | | |
| | |
| | | | Air Freight & Logistics 0.0% | | | | |
| | 532,980 | | | Blue Dart Express Ltd., 9.30%, 11/20/17 (India) | | | 8,688 | |
| | 304,560 | | | Blue Dart Express Ltd., 9.40%, 11/20/18 (India) | | | 4,779 | |
| | 228,420 | | | Blue Dart Express Ltd., 9.50%, 11/20/19 (India) | | | 3,591 | |
| | | | | | | | |
| | | | | | | 17,058 | |
| | | | | | | | |
| | |
| | | | Total Corporate Bonds
(cost $9,200) | | | 17,058 | |
| | | | | | | | |
| | | | | | | | |
Principal
Amount | | | | | Value | |
| | | | | | | |
| | | | SHORT-TERM INVESTMENTS 3.6% | | | | |
| | |
| | | | Repurchase Agreement 3.6% | | | | |
| | $ 2,268,300 | | | Repurchase Agreement dated 9/30/15, 0.00% due 10/1/15 with State Street Bank and Trust Co. collateralized by $2,240,000 of United States Treasury Notes 2.125% due 1/31/21; value: $2,317,889; repurchase proceeds: $2,268,300 (cost $2,268,300) | | $ | 2,268,300 | |
| | | | | | | | |
| | |
| | | | Total Short-Term Investments
(cost $2,268,300) | | | 2,268,300 | |
| | | | | | | | |
| | |
| | | | Total Investments
(cost $48,514,658) 99.6%§ | | | 63,568,973 | |
| | |
| | | | Other Assets less Liabilities 0.4% | | | 280,916 | |
| | | | | | | | |
| | |
| | | | NET ASSETS 100.0% | | $ | 63,849,889 | |
| | | | | | | | |
| |
| | | | *Non-income producing. §The aggregate amount of foreign securities fair valued pursuant to a systematic valuation model as a percent of net assets was 86.34%. ADR American Depositary Receipt. See Notes to Financial Statements. | |
At September 30, 2015, Wasatch Emerging India Fund’s investments, excluding short-term investments, were in the following countries (unaudited):
| | | | |
| Country | | % | |
India | | | 96.7 | |
United States | | | 3.3 | |
| | | | |
TOTAL | | | 100.0 | % |
| | | | |
50
| | |
| WASATCH EMERGING MARKETS SELECT FUND (WAESX / WIESX) — Schedule of Investments | | SEPTEMBER 30, 2015 |
|
|
|
| | | | | | | | |
| Shares | | | | | Value | |
| | | | | | | |
| | | | COMMON STOCKS 91.2% | | | | |
| | |
| | | | Airport Services 5.4% | | | | |
| | 235,624 | | | Grupo Aeroportuario del Pacifico S.A.B. de C.V., Class B (Mexico) | | $ | 2,046,810 | |
| | | | | | | | |
| | | | Asset Management & Custody Banks 1.5% | | | | |
| | 612,262 | | | Value Partners Group Ltd. (Hong Kong) | | | 579,966 | |
| | | | | | | | |
| | | | Biotechnology 3.6% | | | | |
| | 3,717 | | | Medytox, Inc. (Korea) | | | 1,344,576 | |
| | | | | | | | |
| | | | Construction & Engineering 3.1% | | | | |
| | 105,662 | | | Promotora y Operadora de Infraestructura S.A.B. de C.V.* (Mexico) | | | 1,156,380 | |
| | | | | | | | |
| | | | Consumer Finance 5.4% | | | | |
| | 9,223 | | | Bajaj Finance Ltd. (India) | | | 725,387 | |
| | 797,806 | | | Gentera S.A.B. de C.V. (Mexico) | | | 1,302,152 | |
| | | | | | | | |
| | | | | | | 2,027,539 | |
| | | | | | | | |
| | | | Diversified Banks 9.9% | | | | |
| | 171,598 | | | Axis Bank Ltd. (India) | | | 1,306,995 | |
| | 244,801 | | | Kasikornbank Public Co. Ltd. (Thailand) | | | 1,151,949 | |
| | 327,999 | | | National Bank of Ras Al-Khaimah PSC
(United Arab Emirates) | | | 629,644 | |
| | 1,105,612 | | | PT Bank Rakyat Indonesia Persero Tbk (Indonesia) | | | 654,628 | |
| | | | | | | | |
| | | | | | | 3,743,216 | |
| | | | | | | | |
| | | | Diversified Capital Markets 3.5% | | | | |
| | 229,933 | | | Grupo Financiero Interacciones S.A. de C.V., Class O (Mexico) | | | 1,309,842 | |
| | | | | | | | |
| | | | Drug Retail 1.9% | | | | |
| | 72,393 | | | Raia Drogasil S.A. (Brazil) | | | 711,662 | |
| | | | | | | | |
| | | | Fertilizers & Agricultural Chemicals 1.9% | | | | |
| | 102,225 | | | UPL Ltd. (India) | | | 717,575 | |
| | | | | | | | |
| | | | Food Retail 5.6% | | | | |
| | 57,477 | | | BIM Birlesik Magazalar A.S. (Turkey) | | | 1,018,550 | |
| | 174,165 | | | President Chain Store Corp. (Taiwan) | | | 1,086,212 | |
| | | | | | | | |
| | | | | | | 2,104,762 | |
| | | | | | | | |
| | | | Health Care Facilities 4.8% | | | | |
| | 2,274,287 | | | Bangkok Dusit Medical Services Public Co. Ltd. (Thailand) | | | 1,159,232 | |
| | 257,748 | | | Life Healthcare Group Holdings Ltd.
(South Africa) | | | 663,000 | |
| | | | | | | | |
| | | | | | | 1,822,232 | |
| | | | | | | | |
| | | | Industrial Machinery 1.4% | | | | |
| | 133,315 | | | Weg S.A. (Brazil) | | | 517,855 | |
| | | | | | | | |
| | | | Internet Retail 1.1% | | | | |
| | 25,264 | | | Vipshop Holdings Ltd. ADR* (China) | | | 424,435 | |
| | | | | | | | |
| | | | Internet Software & Services 2.8% | | | | |
| | 11,798 | | | MercadoLibre, Inc. (Brazil) | | | 1,074,326 | |
| | | | | | | | |
| | | | IT Consulting & Other Services 4.2% | | | | |
| | 105,047 | | | HCL Technologies Ltd. (India) | | | 1,579,971 | |
| | | | | | | | |
| | | | Life & Health Insurance 3.3% | | | | |
| | 124,123 | | | Discovery Ltd. (South Africa) | | | 1,234,821 | |
| | | | | | | | |
| | | | Marine Ports & Services 3.2% | | | | |
| | 760,493 | | | International Container Terminal Services, Inc. (Philippines) | | | 1,219,877 | |
| | | | | | | | |
| | | | Multi-Line Insurance 1.2% | | | | |
| | 72,772 | | | BB Seguridade Participacoes S.A. (Brazil) | | | 453,933 | |
| | | | | | | | |
| | | | | | | | |
| Shares | | | | | Value | |
| | | | | | | |
| | | | Multi-Sector Holdings 2.9% | | | | |
| | 40,461 | | | GT Capital Holdings, Inc. (Philippines) | | $ | 1,097,557 | |
| | | | | | | | |
| | | | Packaged Foods & Meats 5.2% | | | | |
| | 335,136 | | | Universal Robina Corp. (Philippines) | | | 1,377,910 | |
| | 400,901 | | | Vitasoy International Holdings Ltd. (Hong Kong) | | | 598,863 | |
| | | | | | | | |
| | | | | | | 1,976,773 | |
| | | | | | | | |
| | | | Pharmaceuticals 9.6% | | | | |
| | 120,185 | | | Glenmark Pharmaceuticals Ltd. (India) | | | 1,928,501 | |
| | 55,363 | | | Lupin Ltd. (India) | | | 1,719,661 | |
| | | | | | | | |
| | | | | | | 3,648,162 | |
| | | | | | | | |
| | | | Restaurants 1.6% | | | | |
| | 207,500 | | | Alsea S.A.B. de C.V. (Mexico) | | | 611,748 | |
| | | | | | | | |
| | | | Specialty Chemicals 3.7% | | | | |
| | 108,426 | | | Asian Paints Ltd. (India) | | | 1,391,959 | |
| | | | | | | | |
| | | | Wireless Telecommunication Services 4.4% | | | | |
| | 422,626 | | | Idea Cellular Ltd. (India) | | | 959,144 | |
| | 1,568,887 | | | PT Tower Bersama Infrastructure Tbk* (Indonesia) | | | 701,589 | |
| | | | | | | | |
| | | | | | | 1,660,733 | |
| | | | | | | | |
| | |
| | | | Total Common Stocks
(cost $34,714,915) | | | 34,456,710 | |
| | | | | | | | |
| | |
Principal
Amount | | | | | Value | |
| | | | | | | |
| | | | SHORT-TERM INVESTMENTS 9.3% | | | | |
| | |
| | | | Repurchase Agreement 9.3% | | | | |
| | $3,519,811 | | | Repurchase Agreement dated 9/30/15, 0.00% due 10/1/15 with State Street Bank and Trust Co. collateralized by $3,470,000 of United States Treasury Bonds 2.125% due 1/31/21; value: $3,590,659; repurchase proceeds: $3,519,811 (cost $3,519,811) | | $ | 3,519,811 | |
| | | | | | | | |
| | |
| | | | Total Short-Term Investments
(cost $3,519,811) | | | 3,519,811 | |
| | | | | | | | |
| | |
| | | | Total Investments
(cost $38,234,726) 100.5%§ | | | 37,976,521 | |
| | |
| | | | Liabilities less Other Assets (0.5%) | | | (180,401 | ) |
| | | | | | | | |
| | |
| | | | NET ASSETS 100.0% | | $ | 37,796,120 | |
| | | | | | | | |
| |
| | | | *Non-income producing. §The aggregate amount of foreign securities fair valued pursuant to a systematic valuation model as a percent of net assets was 62.67%. ADR American Depositary Receipt. See Notes to Financial Statements. | |
51
| | |
| WASATCH EMERGING MARKETS SELECT FUND (WAESX / WIESX) — Schedule of Investments (continued) | | SEPTEMBER 30, 2015 |
|
|
|
At September 30, 2015, Wasatch Emerging Markets Select Fund’s investments, excluding short-term investments, were in the following countries (unaudited):
| | | | |
| Country | | % | |
Brazil | | | 8.0 | |
China | | | 1.2 | |
Hong Kong | | | 3.4 | |
India | | | 30.0 | |
Indonesia | | | 3.9 | |
Korea | | | 3.9 | |
Mexico | | | 18.7 | |
Philippines | | | 10.7 | |
South Africa | | | 5.5 | |
Taiwan | | | 3.2 | |
Thailand | | | 6.7 | |
Turkey | | | 3.0 | |
United Arab Emirates | | | 1.8 | |
| | | | |
TOTAL | | | 100.0 | % |
| | | | |
52
| | |
| WASATCH EMERGING MARKETS SMALL CAP FUND (WAEMX) — Schedule of Investments | | SEPTEMBER 30, 2015 |
|
|
|
| | | | | | | | |
| Shares | | | | | Value | |
| | | | | | | |
| | | | COMMON STOCKS 97.3% | | | | |
| | |
| | | | Airport Services 2.4% | | | | |
| | 3,069,798 | | | Grupo Aeroportuario del Centro Norte S.A.B. de C.V.* (Mexico) | | $ | 15,232,618 | |
| | 1,060,525 | | | TAV Havalimanlari Holding A.S. (Turkey) | | | 8,328,652 | |
| | | | | | | | |
| | | | | | | 23,561,270 | |
| | | | | | | | |
| | | | Apparel, Accessories & Luxury Goods 0.9% | | | | |
| | 2,943,743 | | | China Lilang Ltd. (China) | | | 2,524,388 | |
| | 748,198 | | | Makalot Industrial Co. Ltd. (Taiwan) | | | 6,174,359 | |
| | | | | | | | |
| | | | | | | 8,698,747 | |
| | | | | | | | |
| | | | Application Software 0.4% | | | | |
| | 348,865 | | | Linx S.A. (Brazil) | | | 3,859,320 | |
| | | | | | | | |
| | | | Asset Management & Custody Banks 2.1% | | | | |
| | 701,115 | | | CETIP S.A. — Mercados Organizados (Brazil) | | | 5,799,438 | |
| | 4,256,545 | | | Peregrine Holdings Ltd. (South Africa) | | | 8,886,373 | |
| | 6,692,422 | | | Value Partners Group Ltd. (Hong Kong) | | | 6,339,409 | |
| | | | | | | | |
| | | | | | | 21,025,220 | |
| | | | | | | | |
| | | | Auto Parts & Equipment 0.7% | | | | |
| | 630,430 | | | Cub Elecparts, Inc. (Taiwan) | | | 7,371,724 | |
| | | | | | | | |
| | | | Automotive Retail 0.4% | | | | |
| | 312,824 | | | Kolao Holdings (Korea) | | | 3,588,451 | |
| | | | | | | | |
| | | | Biotechnology 3.3% | | | | |
| | 123,049 | | | Cell Biotech Co. Ltd. (Korea) | | | 6,244,494 | |
| | 98,699 | | | China Biologic Products, Inc.* (China) | | | 8,865,144 | |
| | 46,650 | | | Medytox, Inc. (Korea) | | | 16,875,020 | |
| | | | | | | | |
| | | | | | | 31,984,658 | |
| | | | | | | | |
| | | | Building Products 1.4% | | | | |
| | 11,705,625 | | | China Lesso Group Holdings Ltd. (China) | | | 9,400,910 | |
| | 377,556 | | | Kajaria Ceramics Ltd. (India) | | | 4,596,479 | |
| | | | | | | | |
| | | | | | | 13,997,389 | |
| | | | | | | | |
| | | | Casinos & Gaming 0.4% | | | | |
| | 46,709,540 | | | Melco Crown Philippines Resorts Corp.* (Philippines) | | | 3,734,140 | |
| | | | | | | | |
| | | | Catalog Retail 0.2% | | | | |
| | 395,221 | | | Momo.com, Inc. (Taiwan) | | | 2,342,788 | |
| | | | | | | | |
| | | | Commodity Chemicals 1.1% | | | | |
| | 3,174,592 | | | Berger Paints India Ltd. (India) | | | 10,656,204 | |
| | | | | | | | |
| | | | Construction Materials 0.9% | | | | |
| | 12,600,770 | | | Dongpeng Holdings Co. Ltd. (China) | | | 4,229,259 | |
| | 521,333 | | | Siam City Cement Public Co. Ltd. (Thailand) | | | 4,883,681 | |
| | | | | | | | |
| | | | | | | 9,112,940 | |
| | | | | | | | |
| | | | Consumer Finance 7.5% | | | | |
| | 79,659 | | | Bajaj Finance Ltd. (India) | | | 6,265,164 | |
| | 5,101,495 | | | Credito Real S.A.B. de C.V. (Mexico) | | | 9,957,416 | |
| | 1,798,760 | | | Mahindra & Mahindra Financial Services Ltd. (India) | | | 6,590,032 | |
| | 915,120 | | | Repco Home Finance Ltd. (India) | | | 10,297,695 | |
| | 357,046 | | | Shriram City Union Finance Ltd. (India) | | | 9,216,336 | |
| | 1,061,173 | | | SKS Microfinance Ltd.* (India) | | | 6,581,424 | |
| | 12,308,649 | | | Srisawad Power 1979 Public Co. Ltd. (Thailand) | | | 12,462,952 | |
| | 5,523,225 | | | Unifin Financiera SAPI de C.V. SOFOM* (Mexico) | | | 12,291,749 | |
| | | | | | | | |
| | | | | | | 73,662,768 | |
| | | | | | | | |
| | | | | | | | |
| Shares | | | | | Value | |
| | | | | | | |
| | | | Department Stores 1.8% | | | | |
| | 1,793,636 | | | Poya Co. Ltd. (Taiwan) | | $ | 17,895,191 | |
| | | | | | | | |
| | | | Diversified Banks 1.8% | | | | |
| | 8,929,023 | | | EastWest Banking Corp.* (Philippines) | | | 3,822,317 | |
| | 4,784,684 | | | Security Bank Corp. (Philippines) | | | 14,063,833 | |
| | | | | | | | |
| | | | | | | 17,886,150 | |
| | | | | | | | |
| | | | Diversified Capital Markets 0.7% | | | | |
| | 1,220,809 | | | Grupo Financiero Interacciones S.A. de C.V., Class O (Mexico) | | | 6,954,491 | |
| | | | | | | | |
| | | | Diversified Chemicals 1.2% | | | | |
| | 1,409,818 | | | Pidilite Industries Ltd. (India) | | | 12,247,752 | |
| | | | | | | | |
| | | | Diversified Support Services 1.0% | | | | |
| | 93,979 | | | KEPCO Plant Service & Engineering Co. Ltd. (Korea) | | | 9,619,057 | |
| | | | | | | | |
| | | | Drug Retail 1.2% | | | | |
| | 1,828,461 | | | Clicks Group Ltd. (South Africa) | | | 11,865,452 | |
| | | | | | | | |
| | | | Electrical Components & Equipment 2.6% | | | | |
| | 638,767 | | | Amara Raja Batteries Ltd. (India) | | | 10,083,746 | |
| | 1,154,710 | | | Voltronic Power Technology Corp. (Taiwan) | | | 15,026,390 | |
| | | | | | | | |
| | | | | | | 25,110,136 | |
| | | | | | | | |
| | | | Electronic Components 1.1% | | | | |
| | 560,200 | | | Partron Co. Ltd. (Korea) | | | 4,465,220 | |
| | 3,236,066 | | | Sunny Optical Technology Group Co. Ltd. (China) | | | 6,474,302 | |
| | | | | | | | |
| | | | | | | 10,939,522 | |
| | | | | | | | |
| | | | Electronic Equipment & Instruments 1.8% | | | | |
| | 4,568,461 | | | Chroma ATE, Inc. (Taiwan) | | | 7,819,262 | |
| | 3,181,614 | | | PAX Global Technology Ltd. (China) | | | 3,316,986 | |
| | 6,130,144 | | | Wasion Group Holdings Ltd. (China) | | | 6,357,158 | |
| | | | | | | | |
| | | | | | | 17,493,406 | |
| | | | | | | | |
| | | | Electronic Manufacturing Services 0.5% | | | | |
| | 6,604,722 | | | Hana Microelectronics Public Co. Ltd. (Thailand) | | | 5,140,747 | |
| | | | | | | | |
| | | | Fertilizers & Agricultural Chemicals 2.3% | | | | |
| | 204,903 | | | Bayer CropScience Ltd. (India) | | | 11,403,446 | |
| | 1,540,823 | | | UPL Ltd. (India) | | | 10,815,904 | |
| | | | | | | | |
| | | | | | | 22,219,350 | |
| | | | | | | | |
| | | | Food Retail 1.8% | | | | |
| | 102,618 | | | BGF Retail Co. Ltd. (Korea) | | | 17,527,452 | |
| | | | | | | | |
| | | | Footwear 0.5% | | | | |
| | 115,405 | | | CCC S.A. (Poland) | | | 4,983,786 | |
| | | | | | | | |
| | | | Gas Utilities 0.8% | | | | |
| | 12,389,006 | | | Towngas China Co. Ltd. (China) | | | 7,647,127 | |
| | | | | | | | |
| | | | General Merchandise Stores 0.9% | | | | |
| | 1,347,760 | | | Taiwan FamilyMart Co. Ltd. (Taiwan) | | | 8,415,980 | |
| | | | | | | | |
| | | | Health Care Equipment 1.5% | | | | |
| | 199,850 | | | InBody Co. Ltd. (Korea) | | | 6,589,827 | |
| | 144,643 | | | Osstem Implant Co. Ltd.* (Korea) | | | 7,987,989 | |
| | | | | | | | |
| | | | | | | 14,577,816 | |
| | | | | | | | |
| | | | Health Care Facilities 1.0% | | | | |
| | 5,936,931 | | | Phoenix Healthcare Group Co. Ltd. (China) | | | 9,690,822 | |
| | | | | | | | |
53
| | |
| WASATCH EMERGING MARKETS SMALL CAP FUND (WAEMX) — Schedule of Investments (continued) | | |
|
|
|
| | | | | | | | |
| Shares | | | | | Value | |
| | | | | | | |
| | | | Health Care Supplies 0.3% | | | | |
| | 376,477 | | | Access Bio, Inc. KDR* (Korea) | | $ | 2,985,494 | |
| | | | | | | | |
| | | | Highways & Railtracks 1.4% | | | | |
| | 8,456,968 | | | PT Jasa Marga Persero Tbk (Indonesia) | | | 2,794,175 | |
| | 16,633,890 | | | Yuexiu Transport Infrastructure Ltd. (China) | | | 10,542,290 | |
| | | | | | | | |
| | | | | | | 13,336,465 | |
| | | | | | | | |
| | | | Home Furnishings 2.6% | | | | |
| | 67,809 | | | Hanssem Co. Ltd. (Korea) | | | 16,418,163 | |
| | 9,269,014 | | | Man Wah Holdings Ltd. (Hong Kong) | | | 9,068,295 | |
| | | | | | | | |
| | | | | | | 25,486,458 | |
| | | | | | | | |
| | | | Home Improvement Retail 0.4% | | | | |
| | 18,963,386 | | | Home Product Center Public Co. Ltd. (Thailand) | | | 3,578,983 | |
| | | | | | | | |
| | | | Hotels, Resorts & Cruise Lines 1.6% | | | | |
| | 24,003,460 | | | Bloomberry Resorts Corp. (Philippines) | | | 2,681,657 | |
| | 16,457,575 | | | Minor International Public Co. Ltd. (Thailand) | | | 13,036,376 | |
| | | | | | | | |
| | | | | | | 15,718,033 | |
| | | | | | | | |
| | | | Hypermarkets & Super Centers 2.2% | | | | |
| | 191,366 | | | Al Meera Consumer Goods Co. (Qatar) | | | 13,144,322 | |
| | 5,118,152 | | | Robinsons Retail Holdings, Inc. (Philippines) | | | 8,005,726 | |
| | | | | | | | |
| | | | | | | 21,150,048 | |
| | | | | | | | |
| | | | Industrial Machinery 0.7% | | | | |
| | 387,502 | | | Cummins India Ltd. (India) | | | 6,414,280 | |
| | | | | | | | |
| | | | Internet Retail 1.7% | | | | |
| | 776,331 | | | B2W Cia Digital* (Brazil) | | | 2,900,457 | |
| | 1,294,374 | | | Interpark Holdings Corp. (Korea) | | | 14,007,826 | |
| | | | | | | | |
| | | | | | | 16,908,283 | |
| | | | | | | | |
| | | | Internet Software & Services 1.9% | | | | |
| | 404,236 | | | Addcn Technology Co. Ltd. (Taiwan) | | | 3,634,486 | |
| | 961,876 | | | PChome Online, Inc. (Taiwan) | | | 11,089,294 | |
| | 580,512 | | | SouFun Holdings Ltd. ADR (China) | | | 3,831,379 | |
| | | | | | | | |
| | | | | | | 18,555,159 | |
| | | | | | | | |
| | | | IT Consulting & Other Services 3.0% | | | | |
| | 829,087 | | | EOH Holdings Ltd. (South Africa) | | | 8,902,854 | |
| | 541,230 | | | Mindtree Ltd. (India) | | | 12,512,279 | |
| | 819,689 | | | Persistent Systems Ltd. (India) | | | 8,315,651 | |
| | | | | | | | |
| | | | | | | 29,730,784 | |
| | | | | | | | |
| | | | Leisure Products 1.7% | | | | |
| | 1,024,647 | | | Giant Manufacturing Co. Ltd. (Taiwan) | | | 7,471,360 | |
| | 1,779,274 | | | Merida Industry Co. Ltd. (Taiwan) | | | 9,608,244 | |
| | | | | | | | |
| | | | | | | 17,079,604 | |
| | | | | | | | |
| | | | Life & Health Insurance 0.9% | | | | |
| | 1,147,051 | | | Max India Ltd. (India) | | | 8,941,399 | |
| | | | | | | | |
| | | | Life Sciences Tools & Services 0.2% | | | | |
| | 313,617 | | | Syngene International Ltd.* (India) | | | 1,538,462 | |
| | | | | | | | |
| | | | Marine Ports & Services 2.1% | | | | |
| | 1,833,292 | | | Gujarat Pipavav Port Ltd.* (India) | | | 5,180,718 | |
| | 5,510,332 | | | International Container Terminal Services, Inc. (Philippines) | | | 8,838,910 | |
| | 6,868,874 | | | Westports Holdings Berhad (Malaysia) | | | 6,637,574 | |
| | | | | | | | |
| | | | | | | 20,657,202 | |
| | | | | | | | |
| | | | Movies & Entertainment 0.7% | | | | |
| | 95,132 | | | Loen Entertainment, Inc. (Korea) | | | 6,439,524 | |
| | | | | | | | |
| | | | | | | | |
| Shares | | | | | Value | |
| | | | | | | |
| | | | Oil & Gas Equipment & Services 0.6% | | | | |
| | 3,654,528 | | | Gulf Marine Services plc (United Arab Emirates) | | $ | 6,359,327 | |
| | | | | | | | |
| | | | Oil & Gas Exploration & Production 0.5% | | | | |
| | 683,603 | | | Parex Resources, Inc.* (Colombia) | | | 4,732,321 | |
| | | | | | | | |
| | | | Other Diversified Financial Services 0.8% | | | | |
| | 490,434 | | | PSG Group Ltd. (South Africa) | | | 7,876,153 | |
| | | | | | | | |
| | | | Packaged Foods & Meats 4.0% | | | | |
| | 333,662 | | | Britannia Industries Ltd. (India) | | | 15,729,485 | |
| | 3,463,586 | | | Namchow Chemical Industrial Co. Ltd. (Taiwan) | | | 7,432,345 | |
| | 1,394,616 | | | Ulker Biskuvi Sanayi A.S. (Turkey) | | | 8,828,852 | |
| | 4,901,610 | | | Vitasoy International Holdings Ltd. (Hong Kong) | | | 7,321,995 | |
| | | | | | | | |
| | | | | | | 39,312,677 | |
| | | | | | | | |
| | | | Pharmaceuticals 6.2% | | | | |
| | 13,017,213 | | | China Animal Healthcare Ltd.* *** (China) | | | 873,390 | |
| | 692,700 | | | Glenmark Pharmaceuticals Ltd. (India) | | | 11,115,135 | |
| | 1,957,282 | | | Lee’s Pharmaceutical Holdings Ltd. (China) | | | 2,532,584 | |
| | 9,906,602 | | | Marksans Pharma Ltd. (India) | | | 15,677,599 | |
| | 349,737 | | | Natco Pharma Ltd. (India) | | | 13,138,662 | |
| | 1,674,834 | | | TTY Biopharm Co. Ltd. (Taiwan) | | | 4,888,490 | |
| | 1,888,936 | | | TWi Pharmaceuticals, Inc.* (Taiwan) | | | 12,314,651 | |
| | | | | | | | |
| | | | | | | 60,540,511 | |
| | | | | | | | |
| | | | Property & Casualty Insurance 0.3% | | | | |
| | 1,975,993 | | | Qualitas Controladora S.A.B. de C.V.* ** (Mexico) | | | 2,713,702 | |
| | | | | | | | |
| | | | Real Estate Development 0.6% | | | | |
| | 3,560,478 | | | Corporation Inmobiliaria Vesta S.A.B. de C.V. (Mexico) | | | 5,567,225 | |
| | | | | | | | |
| | | | Real Estate Operating Companies 1.1% | | | | |
| | 6,536,992 | | | Parque Arauco S.A. (Chile) | | | 11,220,438 | |
| | | | | | | | |
| | | | Regional Banks 1.0% | | | | |
| | 2,351,224 | | | Bank of Chongqing Co. Ltd. (China) | | | 1,625,715 | |
| | 1,493,986 | | | Banregio Grupo Financiero S.A.B. de C.V. (Mexico) | | | 7,957,131 | |
| | | | | | | | |
| | | | | | | 9,582,846 | |
| | | | | | | | |
| | | | Reinsurance 0.5% | | | | |
| | 13,550,909 | | | Thaire Life Assurance Public Co. Ltd. (Thailand) | | | 4,928,282 | |
| | | | | | | | |
| | | | Research & Consulting Services 0.2% | | | | |
| | 294,272 | | | Sporton International, Inc. (Taiwan) | | | 1,711,044 | |
| | | | | | | | |
| | | | Restaurants 0.9% | | | | |
| | 3,165,085 | | | Alsea S.A.B. de C.V. (Mexico) | | | 9,331,243 | |
| | | | | | | | |
| | | | Semiconductor Equipment 2.6% | | | | |
| | 199,047 | | | Hermes Microvision, Inc. (Taiwan) | | | 7,587,470 | |
| | 152,285 | | | ISC Co. Ltd. (Korea) | | | 3,267,221 | |
| | 312,442 | | | Koh Young Technology, Inc. (Korea) | | | 9,061,933 | |
| | 17,600,316 | | | Xinyi Solar Holdings Ltd. (China) | | | 6,063,032 | |
| | | | | | | | |
| | | | | | | 25,979,656 | |
| | | | | | | | |
| | | | Semiconductors 3.0% | | | | |
| | 1,038,226 | | | ASPEED Technology, Inc. (Taiwan) | | | 9,220,397 | |
| | 527,412 | | | eMemory Technology, Inc. (Taiwan) | | | 5,219,946 | |
| | 121,204 | | | LEENO Industrial, Inc. (Korea) | | | 4,528,699 | |
| | 1,122,831 | | | Silergy Corp. (Taiwan) | | | 10,972,227 | |
| | | | | | | | |
| | | | | | | 29,941,269 | |
| | | | | | | | |
54
| | | | | | | | |
| Shares | | | | | Value | |
| | | | | | | |
| | | | Specialized Finance 0.5% | | | | |
| | 2,902,713 | | | Chailease Holding Co. Ltd. (Taiwan) | | $ | 4,563,973 | |
| | | | | | | | |
| | | | Specialty Chemicals 2.8% | | | | |
| | 81,543,000 | | | D&L Industries, Inc. (Philippines) | | | 17,462,205 | |
| | 277,348 | | | Frutarom Industries Ltd. (Israel) | | | 10,492,115 | |
| | | | | | | | |
| | | | | | | 27,954,320 | |
| | | | | | | | |
| | | | Specialty Stores 0.9% | | | | |
| | 89,012 | | | Hotel Shilla Co. Ltd. (Korea) | | | 8,675,904 | |
| | | | | | | | |
| | | | Systems Software 0.5% | | | | |
| | 173,166 | | | Tata Elxsi Ltd. (India) | | | 4,981,547 | |
| | | | | | | | |
| | | | Technology Hardware, Storage & Peripherals 1.8% | | | | |
| | 1,219,533 | | | Ennoconn Corp. (Taiwan) | | | 11,826,723 | |
| | 911,433 | | | TSC Auto ID Technology Co. Ltd. (Taiwan) | | | 6,093,299 | |
| | | | | | | | |
| | | | | | | 17,920,022 | |
| | | | | | | | |
| | | | Textiles 1.3% | | | | |
| | 799,009 | | | Eclat Textile Co. Ltd. (Taiwan) | | | 12,687,188 | |
| | | | | | | | |
| | | | Trading Companies &
Distributors 1.0% | | | | |
| | 415,395 | | | iMarketKorea, Inc. (Korea) | | | 10,320,405 | |
| | | | | | | | |
| | | | Wireless Telecommunication
Services 0.6% | | | | |
| | 12,273,101 | | | PT Tower Bersama Infrastructure Tbk* (Indonesia) | | | 5,488,394 | |
| | | | | | | | |
| | |
| | | | Total Common Stocks
(cost $891,437,088) | | | 954,718,481 | |
| | | | | | | | |
| | |
| | | | WARRANTS 0.0% | | | | |
| | |
| | | | Consumer Finance 0.0% | | | | |
| | 587,195 | | | Srisawad Power 1979 Public Co. Ltd., expiring 6/11/20* (Thailand) | | | 132,663 | |
| | | | | | | | |
| | | | Hotels, Resorts & Cruise Lines 0.0% | | | | |
| | 967,830 | | | Minor International Public Co. Ltd., expiring 11/3/17* (Thailand) | | | 78,930 | |
| | | | | | | | |
| | |
| | | | Total Warrants
(cost $0) | | | 211,593 | |
| | | | | | | | |
| | |
| | | | Total Investments
(cost $891,437,088) 97.3%§ | | | 954,930,074 | |
| | |
| | | | Other Assets less Liabilities 2.7% | | | 26,436,653 | |
| | | | | | | | |
| | |
| | | | NET ASSETS 100.0% | | $ | 981,366,727 | |
| | | | | | | | |
| |
| | | | *Non-income producing. **Common units. ***Security was fair valued under procedures adopted by the Board of Trustees (see Note 13). §The aggregate amount of foreign securities fair valued pursuant to a systematic valuation model as a percent of net assets was 80.57%. ADR American Depositary Receipt. KDR Korean Depositary Receipt. See Notes to Financial Statements. | |
At September 30, 2015, Wasatch Emerging Markets Small Cap Fund’s investments, excluding short-term investments, were in the following countries (unaudited):
| | | | |
| Country | | % | |
Brazil | | | 1.3 | |
Chile | | | 1.2 | |
China | | | 8.8 | |
Colombia | | | 0.5 | |
Hong Kong | | | 2.4 | |
India | | | 21.2 | |
Indonesia | | | 0.9 | |
Israel | | | 1.1 | |
Korea | | | 15.6 | |
Malaysia | | | 0.7 | |
Mexico | | | 7.3 | |
Philippines | | | 6.1 | |
Poland | | | 0.5 | |
Qatar | | | 1.4 | |
South Africa | | | 3.9 | |
Taiwan | | | 20.0 | |
Thailand | | | 4.6 | |
Turkey | | | 1.8 | |
United Arab Emirates | | | 0.7 | |
| | | | |
TOTAL | | | 100.0 | % |
| | | | |
55
| | |
| WASATCH FRONTIER EMERGING SMALL COUNTRIES FUND (WAFMX) — Schedule of Investments | | |
|
|
|
| | | | | | | | |
| Shares | | | | | Value | |
| | | | | | | |
| | | | COMMON STOCKS 93.4% | | | | |
| | |
| | | | Advertising 0.0% | | | | |
| | 110,600 | | | Wpp Scangroup Ltd. (Kenya) | | $ | 31,691 | |
| | | | | | | | |
| | | | Agricultural & Farm Machinery 0.5% | | | | |
| | 894,400 | | | Millat Tractors Ltd. (Pakistan) | | | 5,345,430 | |
| | | | | | | | |
| | | | Air Freight & Logistics 1.3% | | | | |
| | 5,440,896 | | | Agility Public Warehousing Co. KSC (Kuwait) | | | 10,090,441 | |
| | 3,381,784 | | | Aramex PJSC (United Arab Emirates) | | | 2,906,045 | |
| | | | | | | | |
| | | | | | | 12,996,486 | |
| | | | | | | | |
| | | | Automobile Manufacturers 0.4% | | | | |
| | 403,600 | | | Indus Motor Co. Ltd. (Pakistan) | | | 3,876,477 | |
| | | | | | | | |
| | | | Brewers 14.7% | | | | |
| | 1,321,873 | | | Carlsberg Brewery Malaysia Berhad (Malaysia) | | | 3,596,623 | |
| | 7,270,554 | | | Delta Corp. Ltd. (Zimbabwe) | | | 6,034,560 | |
| | 12,426,342 | | | East African Breweries Ltd. (Kenya) | | | 33,174,931 | |
| | 4,825,690 | | | Florida Ice & Farm Co. S.A.***
(Costa Rica) | | | 6,201,817 | |
| | 262,581 | | | Guinness Anchor Berhad (Malaysia) | | | 822,606 | |
| | 1,074,765 | | | Guinness Ghana Breweries Ltd.* (Ghana) | | | 624,333 | |
| | 10,748,081 | | | Guinness Nigeria plc (Nigeria) | | | 8,431,898 | |
| | 2,256,243 | | | Lion Brewery Ceylon plc (Sri Lanka) | | | 9,900,005 | |
| | 303,177 | | | Murree Brewery Co. Ltd. (Pakistan) | | | 3,168,885 | |
| | 5,600 | | | Namibia Breweries Ltd. (Namibia) | | | 8,089 | |
| | 41,600,816 | | | Nigerian Breweries plc (Nigeria) | | | 30,472,354 | |
| | 140,000 | | | Phoenix Beverages Ltd. (Mauritius) | | | 1,581,028 | |
| | 1,216 | | | Societe de Limonaderies et Brasseries
(Ivory Coast) | | | 347,888 | |
| | 79,340 | | | Societe Des Brasseries du Maroc (Morocco) | | | 15,075,771 | |
| | 4,522,446 | | | Tanzania Breweries Ltd.
(Tanzania, United Republic of) | | | 31,615,248 | |
| | 6,852 | | | Union de Cervecerias Peruanas Backus y Johnston S.A.A. (Peru) | | | 27,731 | |
| | | | | | | | |
| | | | | | | 151,083,767 | |
| | | | | | | | |
| | | | Commodity Chemicals 2.0% | | | | |
| | 138,050 | | | Berger Paints Bangladesh Ltd. (Bangladesh) | | | 3,811,109 | |
| | 6,300,185 | | | Chevron Lubricants Lanka plc‡‡
(Sri Lanka) | | | 16,534,452 | |
| | 27,000 | | | Paints & Chemical Industries Co. S.A.E. (Egypt) | | | 155,171 | |
| | | | | | | | |
| | | | | | | 20,500,732 | |
| | | | | | | | |
| | | | Construction Materials 7.7% | | | | |
| | 3,629,560 | | | Bamburi Cement Co. Ltd. (Kenya) | | | 5,823,936 | |
| | 610,981 | | | Heidelberger Cement Bangladesh Ltd. (Bangladesh) | | | 5,011,312 | |
| | 5,457,592 | | | Kohat Cement Co. Ltd. (Pakistan) | | | 9,951,388 | |
| | 18,685,462 | | | Lafarge Africa plc (Nigeria) | | | 9,162,695 | |
| | 3,450,000 | | | Lafarge Cement Zambia plc (Zambia) | | | 6,623,539 | |
| | 6,165,336 | | | Lucky Cement Ltd. (Pakistan) | | | 30,981,588 | |
| | 565,333 | | | Siam City Cement Public Co. Ltd. (Thailand) | | | 5,295,859 | |
| | 1,710,600 | | | Tanzania Portland Cement Co. Ltd.* (Tanzania, United Republic of) | | | 2,684,692 | |
| | 11,548,669 | | | Tokyo Cement Co. Lanka plc‡‡ (Sri Lanka) | | | 4,086,578 | |
| | | | | | | | |
| | | | | | | 79,621,587 | |
| | | | | | | | |
| | | | Consumer Finance 0.8% | | | | |
| | 15,260,188 | | | Letshego Holdings Ltd. (Botswana) | | | 4,482,299 | |
| | 24,753,100 | | | People’s Leasing & Finance plc
(Sri Lanka) | | | 3,860,283 | |
| | | | | | | | |
| | | | | | | 8,342,582 | |
| | | | | | | | |
| | | | Department Stores 0.1% | | | | |
| | 2,951,376 | | | Parkson Retail Asia Ltd. (Malaysia) | | | 663,114 | |
| | | | | | | | |
| | | | | | | | |
| Shares | | | | | Value | |
| | | | | | | |
| | | | Distillers & Vintners 2.2% | | | | |
| | 1,104,832 | | | Distell Group Ltd. (South Africa) | | $ | 13,914,573 | |
| | 4,230,100 | | | Distilleries Co. of Sri Lanka plc (Sri Lanka) | | | 8,243,294 | |
| | | | | | | | |
| | | | | | | 22,157,867 | |
| | | | | | | | |
| | | | Diversified Banks 7.1% | | | | |
| | 12,895,610 | | | Bank for Foreign Trade of Vietnam JSC (Vietnam) | | | 24,679,113 | |
| | 10,426,300 | | | Barclays Bank of Kenya Ltd. (Kenya) | | | 1,314,491 | |
| | 2,422,735 | | | BBVA Banco Continental S.A. (Peru) | | | 2,269,119 | |
| | 120,144 | | | BLOM Bank SAL (Lebanon) | | | 1,129,354 | |
| | 659,681 | | | BLOM Bank SAL GDR (Lebanon) | | | 6,334,337 | |
| | 4,578,100 | | | CAL Bank Ltd. (Ghana) | | | 1,020,054 | |
| | 20,087,183 | | | Commercial Bank of Ceylon plc (Sri Lanka) | | | 22,638,334 | |
| | 1,126,700 | | | Ghana Commercial Bank Ltd. (Ghana) | | | 1,108,768 | |
| | 1,039,300 | | | Hatton National Bank plc (Sri Lanka) | | | 1,574,028 | |
| | 9,370,595 | | | Kenya Commercial Bank Ltd. (Kenya) | | | 4,212,819 | |
| | 2,337,427 | | | MCB Bank Ltd. (Pakistan) | | | 5,101,061 | |
| | 285,948 | | | Military Commercial Joint Stock Bank (Vietnam) | | | 191,134 | |
| | 202,000 | | | National Microfinance Bank plc
(Tanzania, United Republic of) | | | 264,657 | |
| | 126,092,227 | | | Stanbic Bank Uganda Ltd. (Uganda) | | | 1,127,043 | |
| | | | | | | | |
| | | | | | | 72,964,312 | |
| | | | | | | | |
| | | | Food Retail 1.4% | | | | |
| | 1,500,000 | | | Cargills Ceylon plc (Sri Lanka) | | | 1,804,671 | |
| | 7,807,103 | | | Choppies Enterprises Ltd. (Botswana) | | | 3,106,837 | |
| | 24,353,700 | | | OK Zimbabwe (Zimbabwe) | | | 1,461,222 | |
| | 3,588,143 | | | Philippine Seven Corp. (Philippines) | | | 7,486,813 | |
| | | | | | | | |
| | | | | | | 13,859,543 | |
| | | | | | | | |
| | | | Footwear 0.1% | | | | |
| | 76,514 | | | Bata Shoe Co. Bangladesh Ltd. (Bangladesh) | | | 1,351,723 | |
| | | | | | | | |
| | | | Health Care Facilities 1.1% | | | | |
| | 273,000 | | | Al Noor Hospitals Group plc (United Kingdom) | | | 3,449,807 | |
| | 653,429 | | | NMC Health plc (United Arab Emirates) | | | 8,253,706 | |
| | | | | | | | |
| | | | | | | 11,703,513 | |
| | | | | | | | |
| | | | Hotels, Resorts & Cruise Lines 0.5% | | | | |
| | 5,403,866 | | | Central Plaza Hotel Public Co. Ltd. (Thailand) | | | 5,583,275 | |
| | | | | | | | |
| | | | Household Products 1.1% | | | | |
| | 25,907 | | | Colgate Palmolive Pakistan Ltd. (Pakistan) | | | 335,277 | |
| | 1,038,070 | | | Unilever Ghana Ltd.* (Ghana) | | | 2,122,949 | |
| | 38,054,859 | | | Unilever Nigeria plc (Nigeria) | | | 8,880,613 | |
| | | | | | | | |
| | | | | | | 11,338,839 | |
| | | | | | | | |
| | | | Hypermarkets & Super Centers 1.8% | | | | |
| | 245,043 | | | PriceSmart, Inc. (Costa Rica) | | | 18,951,626 | |
| | | | | | | | |
| | | | Industrial Conglomerates 0.5% | | | | |
| | 4,298,185 | | | Hemas Holdings plc (Sri Lanka) | | | 2,585,603 | |
| | 3,684,458 | | | Innscor Africa Ltd. (Zimbabwe) | | | 2,173,830 | |
| | | | | | | | |
| | | | | | | 4,759,433 | |
| | | | | | | | |
| | | | Industrial Gases 0.2% | | | | |
| | 106,525 | | | Linde Bangladesh Ltd. (Bangladesh) | | | 1,794,249 | |
| | | | | | | | |
| | | | Integrated Telecommunication Services 1.6% | | | | |
| | 379,784 | | | Sonatel (Senegal) | | | 16,750,726 | |
| | | | | | | | |
| | | | Life & Health Insurance 0.2% | | | | |
| | 3,450,849 | | | Enterprise Group Ltd. (Ghana) | | | 2,013,758 | |
| | | | | | | | |
56
| | | | | | | | |
| Shares | | | | | Value | |
| | | | | | | |
| | | | Marine Ports & Services 1.5% | | | | |
| | 450,953 | | | DP World Ltd. (United Arab Emirates) | | $ | 9,590,109 | |
| | 3,791,066 | | | International Container Terminal Services, Inc. (Philippines) | | | 6,081,102 | |
| | | | | | | | |
| | | | | | | 15,671,211 | |
| | | | | | | | |
| | | | Multi-Line Insurance 0.8% | | | | |
| | 1,285,510 | | | Bao Viet Holdings (Vietnam) | | | 2,672,009 | |
| | 3,161,249 | | | Botswana Insurance Holdings Ltd. (Botswana) | | | 4,420,861 | |
| | 2,824 | | | Wafa Assurance (Morocco) | | | 1,058,502 | |
| | | | | | | | |
| | | | | | | 8,151,372 | |
| | | | | | | | |
| | | | Oil & Gas Refining & Marketing 0.1% | | | | |
| | 124,955 | | | Attock Petroleum Ltd. (Pakistan) | | | 599,627 | |
| | | | | | | | |
| | | | Packaged Foods & Meats 18.3% | | | | |
| | 10,448,645 | | | Agthia Group PJSC (United Arab Emirates) | | | 22,834,367 | |
| | 27,765,415 | | | Cadbury Nigeria plc (Nigeria) | | | 3,204,881 | |
| | 15,581 | | | Centrale Laitiere* (Morocco) | | | 1,830,989 | |
| | 6,651,700 | | | Dairibord Holdings Ltd.* *** (Zimbabwe) | | | 553,421 | |
| | 281,032 | | | Delice Holding (Tunisia) | | | 2,104,296 | |
| | 104,300 | | | Dutch Lady Milk Industries Berhad (Malaysia) | | | 1,116,887 | |
| | 134,189 | | | Edita Food Industries-REG S GDR* (Egypt) | | | 2,430,829 | |
| | 1,638,172 | | | FAN Milk Ltd. (Ghana) | | | 3,193,784 | |
| | 2,382,300 | | | Grupo Herdez S.A.B. de C.V. (Mexico) | | | 6,299,848 | |
| | 19,241,094 | | | Juhayna Food Industries (Egypt) | | | 19,732,439 | |
| | 7,049 | | | Ledo dd (Croatia) | | | 8,757,460 | |
| | 517,172 | | | National Foods Holdings (Zimbabwe) | | | 1,550,223 | |
| | 480,831 | | | Nestlé Lanka plc (Sri Lanka) | | | 6,975,963 | |
| | 74,400 | | | Nestlé Malaysia Berhad (Malaysia) | | | 1,220,324 | |
| | 7,307,628 | | | Nestlé Nigeria plc (Nigeria) | | | 31,941,858 | |
| | 31,286 | | | Nestlé Pakistan Ltd. (Pakistan) | | | 3,015,854 | |
| | 6,069,937 | | | Olympic Industries Ltd. (Bangladesh) | | | 23,615,755 | |
| | 6,238,929 | | | PT Indofood CBP Sukses Makmur Tbk (Indonesia) | | | 5,290,686 | |
| | 27,790 | | | Rafhan Maize Products Co. Ltd. (Pakistan) | | | 2,367,370 | |
| | 8,953,150 | | | Vietnam Dairy Products JSC (Vietnam) | | | 39,858,934 | |
| | | | | | | | |
| | | | | | | 187,896,168 | |
| | | | | | | | |
| | | | Personal Products 1.0% | | | | |
| | 464,396 | | | Marico Bangladesh Ltd. (Bangladesh) | | | 10,252,240 | |
| | | | | | | | |
| | | | Pharmaceuticals 9.5% | | | | |
| | 3,089,170 | | | Abbott Laboratories Pakistan Ltd. (Pakistan) | | | 19,367,374 | |
| | 1,007,563 | | | DHG Pharmaceutical JSC (Vietnam) | | | 2,980,889 | |
| | 1,213,542 | | | Egyptian International Pharmaceutical Industrial Co. (Egypt) | | | 12,243,832 | |
| | 52,471 | | | GlaxoSmithKline Bangladesh Ltd. (Bangladesh) | | | 1,417,114 | |
| | 15,978,026 | | | GlaxoSmithKline Consumer Nigeria plc (Nigeria) | | | 2,963,705 | |
| | 1,854,050 | | | GlaxoSmithKline Pakistan Ltd. (Pakistan) | | | 3,797,364 | |
| | 226,144 | | | Hikma Pharmaceuticals plc (United Kingdom) | | | 7,813,927 | |
| | 1,513,628 | | | Searle Company Ltd. (The)* (Pakistan) | | | 5,839,451 | |
| | 12,554,179 | | | Square Pharmaceuticals Ltd. (Bangladesh) | | | 40,370,301 | |
| | 300,000 | | | Traphaco JSC (Vietnam) | | | 1,080,717 | |
| | | | | | | | |
| | | | | | | 97,874,674 | |
| | | | | | | | |
| | | | Restaurants 2.6% | | | | |
| | 3,522,202 | | | Kuwait Foods Americana (Kuwait) | | | 26,617,268 | |
| | | | | | | | |
| | | | Soft Drinks 1.2% | | | | |
| | 39,139,610 | | | Pepsi-Cola Products Philippines, Inc. (Philippines) | | | 3,433,299 | |
| | 804,830 | | | Societe Frigorifique et Brasserie de Tunis (Tunisia) | | | 9,198,992 | |
| | | | | | | | |
| | | | | | | 12,632,291 | |
| | | | | | | | |
| | | | | | | | |
| Shares | | | | | Value | |
| | | | | | | |
| | | | Specialty Chemicals 0.9% | | | | |
| | 3,698,992 | | | Akzo Nobel Pakistan Ltd.†† (Pakistan) | | $ | 8,603,542 | |
| | 863,988 | | | Chemical and Allied Products plc (Nigeria) | | | 164,767 | |
| | | | | | | | |
| | | | | | | 8,768,309 | |
| | | | | | | | |
| | | | Steel 0.6% | | | | |
| | 4,877,505 | | | Hoa Phat Group JSC (Vietnam) | | | 6,608,047 | |
| | | | | | | | |
| | | | Technology Distributors 1.5% | | | | |
| | 7,747,718 | | | FPT Corp. (Vietnam) | | | 15,346,564 | |
| | | | | | | | |
| | | | Tobacco 6.0% | | | | |
| | 598,500 | | | British American Tobacco Bangladesh Co. Ltd. (Bangladesh) | | | 22,668,689 | |
| | 1,341,941 | | | British American Tobacco Kenya Ltd. (Kenya) | | | 10,253,608 | |
| | 1,257,442 | | | Ceylon Tobacco Co. plc (Sri Lanka) | | | 8,503,085 | |
| | 629,487 | | | Eastern Co. (Egypt) | | | 17,283,850 | |
| | 307,345 | | | Pakistan Tobacco Co. Ltd. (Pakistan) | | | 2,980,901 | |
| | | | | | | | |
| | | | | | | 61,690,133 | |
| | | | | | | | |
| | | | Wireless Telecommunication Services 4.1% | | | | |
| | 103,918,426 | | | Dialog Axiata plc (Sri Lanka) | | | 8,103,603 | |
| | 14,570,739 | | | Econet Wireless Zimbabwe Ltd. (Zimbabwe) | | | 3,890,387 | |
| | 5,042,489 | | | GrameenPhone Ltd. (Bangladesh) | | | 18,490,747 | |
| | 81,157,938 | | | Safaricom Ltd. (Kenya) | | | 11,768,075 | |
| | | | | | | | |
| | | | | | | 42,252,812 | |
| | | | | | | | |
| | |
| | | | Total Common Stocks
(cost $970,220,337) | | | 960,051,446 | |
| | | | | | | | |
| | |
| | | | PARTICIPATION NOTES 2.0% | | | | |
| | |
| | | | Health Care Facilities 0.4% | | | | |
| | 137,695 | | | Mouwasat Medical Services Co., HSBC Bank plc, 3/5/2018 (Saudi Arabia) | | | 4,516,095 | |
| | | | | | | | |
| | | | Hypermarkets & Super
Centers 0.7% | | | | |
| | 305,376 | | | Abdullah Al Othaim Markets, HSBC Bank, 7/31/17, Series 0012 (Saudi Arabia) | | | 7,471,035 | |
| | | | | | | | |
| | | | Restaurants 0.9% | | | | |
| | 350,052 | | | Herfy Food Services Co., HSBC Bank, 7/6/17, Series 0000 (Saudi Arabia) | | | 8,797,387 | |
| | | | | | | | |
| | |
| | | | Total Participation Notes
(cost $23,765,157) | | | 20,784,517 | |
| | | | | | | | |
57
| | |
| WASATCH FRONTIER EMERGING SMALL COUNTRIES FUND (WAFMX) — Schedule of Investments (continued) | | SEPTEMBER 30, 2015 |
|
|
|
| | | | | | | | |
Principal
Amount | | | | | Value | |
| | | | | | | |
| | | | SHORT-TERM INVESTMENTS 2.3% | |
| | |
| | | | Repurchase Agreement 2.3% | | | | |
| | $23,472,377 | | | Repurchase Agreement dated 9/30/15, 0.00% due 10/1/15 with State Street Bank and Trust Co. collateralized by $23,975,000 of United States Treasury Notes 1.375% due 9/30/20; value: $23,945,031; repurchase proceeds: $23,472,377 (cost $23,472,377) | | $ | 23,472,377 | |
| | | | | | | | |
| | |
| | | | Total Short-Term Investments
(cost $23,472,377) | | | 23,472,377 | |
| | | | | | | | |
| | |
| | | | Total Investments
(cost $1,017,457,871) 97.7%§ | | | 1,004,308,340 | |
| | |
| | | | Other Assets less Liabilities 2.3% | | | 23,364,720 | |
| | | | | | | | |
| | |
| | | | NET ASSETS 100.0% | | $ | 1,027,673,060 | |
| | | | | | | | |
| |
| | | | *Non-income producing. ***Security was fair valued under procedures adopted by the Board of Trustees (see Note 13). ‡‡Affiliated company (see Note 8). §The aggregate amount of foreign securities fair valued pursuant to a systematic valuation model as a percent of net assets was 48.89%. GDR Global Depositary Receipt. See Notes to Financial Statements. | |
At September 30, 2015, Wasatch Frontier Emerging Small Countries Fund’s investments, excluding short-term investments, were in the following countries (unaudited):
| | | | |
| Country | | % | |
Bangladesh | | | 13.1 | |
Botswana | | | 1.2 | |
Costa Rica | | | 2.6 | |
Croatia | | | 0.9 | |
Egypt | | | 5.3 | |
Ghana | | | 1.0 | |
Indonesia | | | 0.5 | |
Ivory Coast | | | <0.1 | |
Kenya | | | 6.8 | |
Kuwait | | | 3.8 | |
Lebanon | | | 0.8 | |
Malaysia | | | 0.8 | |
Mauritius | | | 0.2 | |
Mexico | | | 0.6 | |
Morocco | | | 1.8 | |
Namibia | | | <0.1 | |
Nigeria | | | 9.7 | |
Pakistan | | | 10.7 | |
Peru | | | 0.2 | |
Philippines | | | 1.7 | |
Saudi Arabia | | | 2.1 | |
Senegal | | | 1.7 | |
South Africa | | | 1.4 | |
Sri Lanka | | | 9.7 | |
Tanzania, United Republic of | | | 3.5 | |
Thailand | | | 1.1 | |
Tunisia | | | 1.2 | |
Uganda | | | 0.1 | |
United Arab Emirates | | | 4.5 | |
United Kingdom | | | 1.2 | |
Vietnam | | | 9.5 | |
Zambia | | | 0.7 | |
Zimbabwe | | | 1.6 | |
| | | | |
TOTAL | | | 100.0 | % |
| | | | |
58
| | |
| WASATCH GLOBAL OPPORTUNITIES FUND (WAGOX) — Schedule of Investments | | SEPTEMBER 30, 2015 |
|
|
|
| | | | | | | | |
| Shares | | | | | Value | |
| | | | | | | |
| | | | COMMON STOCKS 99.9% | | | | |
| | |
| | | | Air Freight & Logistics 0.8% | | | | |
| | 62,245 | | | Echo Global Logistics, Inc.* | | $ | 1,220,002 | |
| | | | | | | | |
| | | | Airlines 4.7% | | | | |
| | 22,923 | | | Allegiant Travel Co. | | | 4,957,099 | |
| | 49,710 | | | Spirit Airlines, Inc.* | | | 2,351,283 | |
| | | | | | | | |
| | | | | | | 7,308,382 | |
| | | | | | | | |
| | | | Airport Services 1.8% | | | | |
| | 560,425 | | | Grupo Aeroportuario del Centro Norte S.A.B. de C.V.* (Mexico) | | | 2,780,880 | |
| | | | | | | | |
| | | | Apparel, Accessories & Luxury Goods 1.3% | | | | |
| | 74,245 | | | Salvatore Ferragamo Italia S.p.A. (Italy) | | | 1,979,635 | |
| | | | | | | | |
| | | | Application Software 4.4% | | | | |
| | 52,118 | | | Aveva Group plc (United Kingdom) | | | 1,608,187 | |
| | 37,445 | | | Globant S.A.* (Luxembourg) | | | 1,145,443 | |
| | 16,139 | | | Ultimate Software Group, Inc.* | | | 2,889,042 | |
| | 61,740 | | | Zendesk, Inc.* | | | 1,216,895 | |
| | | | | | | | |
| | | | | | | 6,859,567 | |
| | | | | | | | |
| | | | Auto Parts & Equipment 1.5% | | | | |
| | 72,700 | | | Cub Elecparts, Inc. (Taiwan) | | | 850,093 | |
| | 28,420 | | | Linamar Corp. (Canada) | | | 1,487,786 | |
| | | | | | | | |
| | | | | | | 2,337,879 | |
| | | | | | | | |
| | | | Biotechnology 6.0% | | | | |
| | 184,331 | | | Abcam plc (United Kingdom) | | | 1,621,409 | |
| | 10,379 | | | Medytox, Inc. (Korea) | | | 3,754,466 | |
| | 240,087 | | | Sangamo BioSciences, Inc.* | | | 1,354,091 | |
| | 68,094 | | | Seattle Genetics, Inc.* | | | 2,625,704 | |
| | | | | | | | |
| | | | | | | 9,355,670 | |
| | | | | | | | |
| | | | Building Products 0.9% | | | | |
| | 43,651 | | | Trex Co., Inc.* | | | 1,454,888 | |
| | | | | | | | |
| | | | Construction & Engineering 0.9% | | | | |
| | 132,203 | | | Promotora y Operadora de Infraestructura S.A.B. de C.V.* (Mexico) | | | 1,446,848 | |
| | | | | | | | |
| | | | Consumer Finance 6.3% | | | | |
| | 9,823 | | | Bajaj Finance Ltd. (India) | | | 772,577 | |
| | 886,812 | | | Credito Real S.A.B. de C.V. (Mexico) | | | 1,730,935 | |
| | 127,860 | | | Mahindra & Mahindra Financial Services Ltd. (India) | | | 468,435 | |
| | 36,114 | | | PRA Group, Inc.* | | | 1,911,153 | |
| | 45,561 | | | Shriram City Union Finance Ltd. (India) | | | 1,176,054 | |
| | 2,362,250 | | | Srisawad Power 1979 Public Co. Ltd. (Thailand) | | | 2,391,863 | |
| | 616,897 | | | Unifin Financiera SAPI de C.V. SOFOM* (Mexico) | | | 1,372,883 | |
| | | | | | | | |
| | | | | | | 9,823,900 | |
| | | | | | | | |
| | | | Diversified Chemicals 0.6% | | | | |
| | 104,535 | | | Pidilite Industries Ltd. (India) | | | 908,145 | |
| | | | | | | | |
| | | | Diversified Real Estate Activities 2.8% | | | | |
| | 184,954 | | | Patrizia Immobilien AG* (Germany) | | | 4,419,536 | |
| | | | | | | | |
| | | | Diversified Support Services 1.0% | | | | |
| | 47,176 | | | Copart, Inc.* | | | 1,552,090 | |
| | | | | | | | |
| | | | Drug Retail 1.2% | | | | |
| | 16,470 | | | Cosmos Pharmaceutical Corp. (Japan) | | | 1,938,588 | |
| | | | | | | | |
| | | | Electrical Components & Equipment 0.6% | | | | |
| | 77,386 | | | Voltronic Power Technology Corp. (Taiwan) | | | 1,007,034 | |
| | | | | | | | |
| | | | | | | | |
| Shares | | | | | Value | |
| | | | | | | |
| | | | Electronic Manufacturing Services 2.0% | | | | |
| | 40,042 | | | IPG Photonics Corp.* | | $ | 3,041,991 | |
| | | | | | | | |
| | | | Fertilizers & Agricultural Chemicals 0.7% | | | | |
| | 162,976 | | | UPL Ltd. (India) | | | 1,144,020 | |
| | | | | | | | |
| | | | General Merchandise Stores 1.1% | | | | |
| | 34,592 | | | Seria Co. Ltd. (Japan) | | | 1,707,823 | |
| | | | | | | | |
| | | | Health Care Facilities 2.3% | | | | |
| | 41,464 | | | Apollo Hospitals Enterprise Ltd. (India) | | | 910,193 | |
| | 38,581 | | | Ensign Group, Inc. (The) | | | 1,644,708 | |
| | 393,090 | | | Life Healthcare Group Holdings Ltd. (South Africa) | | | 1,011,138 | |
| | | | | | | | |
| | | | | | | 3,566,039 | |
| | | | | | | | |
| | | | Health Care Services 1.0% | | | | |
| | 53,669 | | | ExamWorks Group, Inc.* | | | 1,569,282 | |
| | | | | | | | |
| | | | Health Care Supplies 1.0% | | | | |
| | 5,083 | | | Sartorius Stedim Biotech (France) | | | 1,512,354 | |
| | | | | | | | |
| | | | Health Care Technology 1.4% | | | | |
| | 109,180 | | | M3, Inc. (Japan) | | | 2,170,798 | |
| | | | | | | | |
| | | | Homefurnishing Retail 0.7% | | | | |
| | 27,797 | | | Mattress Firm Holding Corp.* | | | 1,160,803 | |
| | | | | | | | |
| | | | Household Products 1.0% | | | | |
| | 69,255 | | | Pigeon Corp. (Japan) | | | 1,619,009 | |
| | | | | | | | |
| | | | Industrial Machinery 0.7% | | | | |
| | 423,132 | | | Rotork plc (United Kingdom) | | | 1,057,322 | |
| | | | | | | | |
| | | | Internet Retail 3.3% | | | | |
| | 103,825 | | | MakeMyTrip Ltd.* (India) | | | 1,427,594 | |
| | 57,480 | | | Vipshop Holdings Ltd. ADR* (China) | | | 965,664 | |
| | 34,078 | | | Wayfair, Inc., Class A* | | | 1,194,775 | |
| | 52,917 | | | Yoox S.p.A.* (Italy) | | | 1,592,717 | |
| | | | | | | | |
| | | | | | | 5,180,750 | |
| | | | | | | | |
| | | | Internet Software & Services 12.0% | | | | |
| | 17,301 | | | Cimpress N.V.* | | | 1,316,779 | |
| | 108,034 | | | Cornerstone OnDemand, Inc.* | | | 3,565,122 | |
| | 112,431 | | | Dip Corp. (Japan) | | | 1,854,543 | |
| | 69,435 | | | Envestnet, Inc.* | | | 2,080,967 | |
| | 101,598 | | | Gurunavi, Inc. (Japan) | | | 1,678,503 | |
| | 20,415 | | | MercadoLibre, Inc. (Brazil) | | | 1,858,990 | |
| | 294,571 | | | SMS Co. Ltd. (Japan) | | | 4,983,965 | |
| | 20,745 | | | SPS Commerce, Inc.* | | | 1,408,378 | |
| | | | | | | | |
| | | | | | | 18,747,247 | |
| | | | | | | | |
| | | | IT Consulting & Other Services 1.7% | | | | |
| | 100,927 | | | HCL Technologies Ltd. (India) | | | 1,518,003 | |
| | 128,081 | | | Tech Mahindra Ltd. (India) | | | 1,093,657 | |
| | | | | | | | |
| | | | | | | 2,611,660 | |
| | | | | | | | |
| | | | Leisure Products 1.3% | | | | |
| | 362,478 | | | Merida Industry Co. Ltd. (Taiwan) | | | 1,957,415 | |
| | | | | | | | |
| | | | Life & Health Insurance 0.7% | | | | |
| | 134,822 | | | Max India Ltd. (India) | | | 1,050,953 | |
| | | | | | | | |
| | | | Life Sciences Tools & Services 1.3% | | | | |
| | 73,631 | | | Fluidigm Corp.* | | | 597,147 | |
| | 7,320 | | | Syngene International Ltd.* (India) | | | 35,909 | |
| | 9,841 | | | Tecan Group AG (Switzerland) | | | 1,384,580 | |
| | | | | | | | |
| | | | | | | 2,017,636 | |
| | | | | | | | |
| | | | Marine Ports & Services 1.4% | | | | |
| | 1,314,633 | | | International Container Terminal Services, Inc. (Philippines) | | | 2,108,752 | |
| | | | | | | | |
59
| | |
| WASATCH GLOBAL OPPORTUNITIES FUND (WAGOX) — Schedule of Investments (continued) | | SEPTEMBER 30, 2015 |
|
|
|
| | | | | | | | |
| Shares | | | | | Value | |
| | | | | | | |
| | | | Packaged Foods & Meats 1.4% | | | | |
| | 44,700 | | | Calbee, Inc. (Japan) | | $ | 1,447,215 | |
| | 7,661 | | | GlaxoSmithKline Consumer Healthcare Ltd. (India) | | | 705,853 | |
| | | | | | | | |
| | | | | | | 2,153,068 | |
| | | | | | | | |
| | | | Personal Products 0.7% | | | | |
| | 26,255 | | | Nu Skin Enterprises, Inc., Class A | | | 1,083,806 | |
| | | | | | | | |
| | | | Pharmaceuticals 9.5% | | | | |
| | 72,918 | | | Caplin Point Laboratories Ltd. (India) | | | 1,604,526 | |
| | 39,356 | | | Intra-Cellular Therapies, Inc.* | | | 1,575,814 | |
| | 36,801 | | | Ipsen S.A. (France) | | | 2,282,183 | |
| | 62,818 | | | Lupin Ltd. (India) | | | 1,951,225 | |
| | 1,705,607 | | | Marksans Pharma Ltd. (India) | | | 2,699,192 | |
| | 28,009 | | | Natco Pharma Ltd. (India) | | | 1,052,222 | |
| | 567,238 | | | TWi Pharmaceuticals, Inc.* (Taiwan) | | | 3,698,028 | |
| | | | | | | | |
| | | | | | | 14,863,190 | |
| | | | | | | | |
| | | | Publishing 3.8% | | | | |
| | 371,200 | | | Next Co. Ltd. (Japan) | | | 2,937,588 | |
| | 54,939 | | | Rightmove plc (United Kingdom) | | | 3,039,307 | |
| | | | | | | | |
| | | | | | | 5,976,895 | |
| | | | | | | | |
| | | | Regional Banks 2.7% | | | | |
| | 19,467 | | | Signature Bank* | | | 2,677,880 | |
| | 28,888 | | | Texas Capital Bancshares, Inc.* | | | 1,514,309 | |
| | | | | | | | |
| | | | | | | 4,192,189 | |
| | | | | | | | |
| | | | Restaurants 2.6% | | | | |
| | 207,063 | | | Domino’s Pizza Group plc (United Kingdom) | | | 2,786,869 | |
| | 32,415 | | | Zoe’s Kitchen, Inc.* | | | 1,280,068 | |
| | | | | | | | |
| | | | | | | 4,066,937 | |
| | | | | | | | |
| | | | Semiconductor Equipment 0.3% | | | | |
| | 13,400 | | | Hermes Microvision, Inc. (Taiwan) | | | 510,794 | |
| | | | | | | | |
| | | | Semiconductors 2.3% | | | | |
| | 26,309 | | | Cavium, Inc.* | | | 1,614,583 | |
| | 9,523 | | | U-Blox AG* (Switzerland) | | | 1,916,780 | |
| | | | | | | | |
| | | | | | | 3,531,363 | |
| | | | | | | | |
| | | | Specialty Chemicals 1.8% | | | | |
| | 74,943 | | | Frutarom Industries Ltd. (Israel) | | | 2,835,104 | |
| | | | | | | | |
| | | | Trading Companies &
Distributors 2.6% | | | | |
| | 167,400 | | | MISUMI Group, Inc. (Japan) | | | 1,728,421 | |
| | 99,934 | | | MonotaRO Co. Ltd. (Japan) | | | 2,290,502 | |
| | | | | | | | |
| | | | | | | 4,018,923 | |
| | | | | | | | |
| | | | Trucking 3.1% | | | | |
| | 127,966 | | | Knight Transportation, Inc. | | | 3,071,184 | |
| | 28,499 | | | Old Dominion Freight Line, Inc.* | | | 1,738,439 | |
| | | | | | | | |
| | | | | | | 4,809,623 | |
| | | | | | | | |
| | | | Wireless Telecommunication Services 0.7% | | | | |
| | 2,597,842 | | | PT Tower Bersama Infrastructure Tbk* (Indonesia) | | | 1,161,726 | |
| | | | | | | | |
| | |
| | | | Total Common Stocks
(cost $135,542,502) | | | 155,820,516 | |
| | | | | | | | |
| | | | | | | | |
| Shares | | | | | Value | |
| | | | | | | |
| | | | WARRANTS 0.0% | | | | |
| | |
| | | | Consumer Finance 0.0% | | | | |
| | 96,800 | | | Srisawad Power 1979 Public Co. Ltd., expiring 6/11/20* (Thailand) | | $ | 21,870 | |
| | | | | | | | |
| | |
| | | | Total Warrants
(cost $0) | | | 21,870 | |
| | | | | | | | |
| | |
Principal
Amount | | | | | Value | |
| | | | | | | |
| | | | SHORT-TERM INVESTMENTS 0.5% | | | | |
| | |
| | | | Repurchase Agreement 0.5% | | | | |
| | $685,704 | | | Repurchase Agreement dated 9/30/15, 0.00% due 10/1/15 with State Street Bank and Trust Co. collateralized by $680,000 of United States Treasury Bonds 2.125% due 1/31/21; value: $703,645; repurchase proceeds: $685,704 (cost $685,704) | | $ | 685,704 | |
| | | | | | | | |
| | |
| | | | Total Short-Term Investments
(cost $685,704) | | | 685,704 | |
| | | | | | | | |
| | |
| | | | Total Investments
(cost $136,228,206) 100.4%§ | | | 156,528,090 | |
| | |
| | | | Liabilities less Other Assets (0.4%) | | | (560,198 | ) |
| | | | | | | | |
| | |
| | | | NET ASSETS 100.0% | | $ | 155,967,892 | |
| | | | | | | | |
| |
| | | | *Non-income producing. §The aggregate amount of foreign securities fair valued pursuant to a systematic valuation model as a percent of net assets was 54.37%. ADR American Depositary Receipt. See Notes to Financial Statements. | |
At September 30, 2015, Wasatch Global Opportunities Fund’s investments, excluding short-term investments, were in the following countries (unaudited):
| | | | |
| Country | | % | |
Brazil | | | 1.2 | |
Canada | | | 1.0 | |
China | | | 0.6 | |
France | | | 2.4 | |
Germany | | | 2.8 | |
India | | | 11.9 | |
Indonesia | | | 0.7 | |
Israel | | | 1.8 | |
Italy | | | 2.3 | |
Japan | | | 15.6 | |
Korea | | | 2.4 | |
Luxembourg | | | 0.7 | |
Mexico | | | 4.7 | |
Philippines | | | 1.4 | |
South Africa | | | 0.7 | |
Switzerland | | | 2.1 | |
Taiwan | | | 5.2 | |
Thailand | | | 1.6 | |
United Kingdom | | | 6.5 | |
United States | | | 34.4 | |
| | | | |
TOTAL | | | 100.0 | % |
| | | | |
60
| | |
| WASATCH INTERNATIONAL GROWTH FUND (WAIGX) — Schedule of Investments | | SEPTEMBER 30, 2015 |
|
|
|
| | | | | | | | |
| Shares | | | | | Value | |
| | | | | | | |
| | | | COMMON STOCKS 99.1% | | | | |
| | |
| | | | Aerospace & Defense 0.7% | | | | |
| | 2,572,058 | | | Senior plc (United Kingdom) | | $ | 9,796,645 | |
| | | | | | | | |
| | | | Apparel, Accessories & Luxury
Goods 2.2% | | | | |
| | 767,100 | | | Moncler S.p.A. (Italy) | | | 13,732,642 | |
| | 562,882 | | | Salvatore Ferragamo Italia S.p.A. (Italy) | | | 15,008,430 | |
| | | | | | | | |
| | | | | | | 28,741,072 | |
| | | | | | | | |
| | | | Application Software 3.4% | | | | |
| | 697,722 | | | Aveva Group plc (United Kingdom) | | | 21,529,368 | |
| | 1,258,856 | | | Computer Modelling Group Ltd. (Canada) | | | 10,674,179 | |
| | 3,703,489 | | | Diligent Corp.* (New Zealand) | | | 12,295,086 | |
| | | | | | | | |
| | | | | | | 44,498,633 | |
| | | | | | | | |
| | | | Asset Management & Custody
Banks 1.9% | | | | |
| | 301,356 | | | Alaris Royalty Corp. (Canada) | | | 6,080,346 | |
| | 14,699,844 | | | ARA Asset Management Ltd. (Singapore) | | | 13,623,868 | |
| | 5,961,167 | | | Value Partners Group Ltd. (Hong Kong) | | | 5,646,726 | |
| | | | | | | | |
| | | | | | | 25,350,940 | |
| | | | | | | | |
| | | | Auto Parts & Equipment 1.3% | | | | |
| | 326,269 | | | Linamar Corp. (Canada) | | | 17,080,165 | |
| | | | | | | | |
| | | | Biotechnology 4.1% | | | | |
| | 3,263,052 | | | Abcam plc (United Kingdom) | | | 28,702,403 | |
| | 71,085 | | | Medytox, Inc. (Korea) | | | 25,714,057 | |
| | | | | | | | |
| | | | | | | 54,416,460 | |
| | | | | | | | |
| | | | Consumer Finance 0.6% | | | | |
| | 291,067 | | | Shriram City Union Finance Ltd. (India) | | | 7,513,237 | |
| | | | | | | | |
| | | | Data Processing & Outsourced
Services 1.0% | | | | |
| | 341,300 | | | GMO Payment Gateway, Inc. (Japan) | | | 13,210,602 | |
| | | | | | | | |
| | | | Diversified Real Estate Activities 3.2% | | | | |
| | 1,769,716 | | | Patrizia Immobilien AG* (Germany) | | | 42,287,943 | |
| | | | | | | | |
| | | | Diversified Support Services 1.5% | | | | |
| | 194,381 | | | KEPCO Plant Service & Engineering Co. Ltd. (Korea) | | | 19,895,529 | |
| | | | | | | | |
| | | | Drug Retail 3.2% | | | | |
| | 137,024 | | | Ain Pharmaciez, Inc. (Japan) | | | 6,997,393 | |
| | 176,937 | | | Cosmos Pharmaceutical Corp. (Japan) | | | 20,826,227 | |
| | 328,473 | | | Sugi Holdings Co. Ltd. (Japan) | | | 14,749,729 | |
| | | | | | | | |
| | | | | | | 42,573,349 | |
| | | | | | | | |
| | | | Electrical Components &
Equipment 2.6% | | | | |
| | 1,458,482 | | | Amara Raja Batteries Ltd. (India) | | | 23,023,986 | |
| | 867,309 | | | Voltronic Power Technology Corp. (Taiwan) | | | 11,286,404 | |
| | | | | | | | |
| | | | | | | 34,310,390 | |
| | | | | | | | |
| | | | Electronic Equipment &
Instruments 4.8% | | | | |
| | 1,310,013 | | | Ai Holdings Corp. (Japan) | | | 32,443,256 | |
| | 1,707,279 | | | Halma plc (United Kingdom) | | | 18,672,242 | |
| | 406,625 | | | Renishaw plc (United Kingdom) | | | 12,428,673 | |
| | | | | | | | |
| | | | 63,544,171 | |
| | | | | | | | |
| | | | Forest Products 0.5% | | | | |
| | 192,008 | | | Stella-Jones, Inc. (Canada) | | | 6,183,284 | |
| | | | | | | | |
| | | | | | | | |
| Shares | | | | | Value | |
| | | | | | | |
| | | | General Merchandise Stores 4.0% | | | | |
| | 2,564,292 | | | B&M European Value Retail S.A. (United Kingdom) | | $ | 12,655,087 | |
| | 102,769 | | | Ryohin Keikaku Co. Ltd. (Japan) | | | 20,935,130 | |
| | 381,295 | | | Seria Co. Ltd. (Japan) | | | 18,824,709 | |
| | | | | | | | |
| | | | 52,414,926 | |
| | | | | | | | |
| | | | Health Care Supplies 1.8% | | | | |
| | 78,649 | | | Sartorius Stedim Biotech (France) | | | 23,400,571 | |
| | | | | | | | |
| | | | Health Care Technology 3.4% | | | | |
| | 1,580,907 | | | EMIS Group plc (United Kingdom) | | | 25,117,570 | |
| | 987,356 | | | M3, Inc. (Japan) | | | 19,631,343 | |
| | | | | | | | |
| | | | 44,748,913 | |
| | | | | | | | |
| | | | Household Products 1.5% | | | | |
| | 845,951 | | | Pigeon Corp. (Japan) | | | 19,776,221 | |
| | | | | | | | |
| | | | Human Resource & Employment
Services 0.4% | | | | |
| | 162,865 | | | Benefit One, Inc. (Japan) | | | 2,761,851 | |
| | 342,043 | | | Pasona Group, Inc. (Japan) | | | 2,893,384 | |
| | | | | | | | |
| | | | 5,655,235 | |
| | | | | | | | |
| | | | Hypermarkets & Super Centers 0.8% | | | | |
| | 1,789,702 | | | Distribuidora Internacional de Alimentacion S.A.* (Spain) | | | 10,830,596 | |
| | | | | | | | |
| | | | Industrial Machinery 1.1% | | | | |
| | 6,026,591 | | | Rotork plc (United Kingdom) | | | 15,059,241 | |
| | | | | | | | |
| | | | Internet Retail 1.5% | | | | |
| | 633,915 | | | Yoox S.p.A.* (Italy) | | | 19,079,832 | |
| | | | | | | | |
| | | | Internet Software & Services 9.3% | | | | |
| | 1,305,775 | | | Auto Trader Group plc* (United Kingdom) | | | 6,719,970 | |
| | 631,990 | | | carsales.com Ltd. (Australia) | | | 4,350,884 | |
| | 225,177 | | | Criteo S.A. ADR* (France) | | | 8,453,144 | |
| | 1,064,944 | | | Dip Corp. (Japan) | | | 17,566,185 | |
| | 922,507 | | | Gurunavi, Inc. (Japan) | | | 15,240,760 | |
| | 1,293,400 | | | Infomart Corp. (Japan) | | | 14,670,083 | |
| | 902,936 | | | Kakaku.com, Inc. (Japan) | | | 14,671,402 | |
| | 1,774,700 | | | SMS Co. Ltd. (Japan) | | | 30,026,864 | |
| | 52,237 | | | XING AG (Germany) | | | 11,220,140 | |
| | | | | | | | |
| | | | 122,919,432 | |
| | | | | | | | |
| | | | Investment Banking &
Brokerage 0.8% | | | | |
| | 255,437 | | | Avanza Bank Holding AB (Sweden) | | | 10,470,196 | |
| | | | | | | | |
| | | | Leisure Products 0.6% | | | | |
| | 1,330,952 | | | Merida Industry Co. Ltd. (Taiwan) | | | 7,187,264 | |
| | | | | | | | |
| | | | Life & Health Insurance 2.0% | | | | |
| | 1,470,248 | | | Discovery Ltd. (South Africa) | | | 14,626,571 | |
| | 1,555,458 | | | Max India Ltd. (India) | | | 12,124,980 | |
| | | | | | | | |
| | | | 26,751,551 | |
| | | | | | | | |
| | | | Life Sciences Tools & Services 2.3% | | | | |
| | 634,676 | | | Divi’s Laboratories Ltd. (India) | | | 10,854,366 | |
| | 133,065 | | | Tecan Group AG (Switzerland) | | | 18,721,583 | |
| | | | | | | | |
| | | | 29,575,949 | |
| | | | | | | | |
| | | | Marine Ports & Services 0.4% | | | | |
| | 3,169,344 | | | International Container Terminal Services, Inc. (Philippines) | | | 5,083,822 | |
| | | | | | | | |
| | | | Movies & Entertainment 2.0% | | | | |
| | 711,588 | | | CTS Eventim AG & Co KGaA (Germany) | | | 26,385,062 | |
| | | | | | | | |
61
| | |
| WASATCH INTERNATIONAL GROWTH FUND (WAIGX) — Schedule of Investments (continued) | | SEPTEMBER 30, 2015 |
|
|
|
| | | | | | | | |
| Shares | | | | | Value | |
| | | | | | | |
| | | | Oil & Gas Equipment & Services 1.4% | | | | |
| | 304,639 | | | Pason Systems, Inc. (Canada) | | $ | 4,277,075 | |
| | 223,197 | | | ShawCor Ltd. (Canada) | | | 4,673,740 | |
| | 502,358 | | | TGS-NOPEC Geophysical Co. ASA (Norway) | | | 9,274,040 | |
| | | | | | | | |
| | | | | | | 18,224,855 | |
| | | | | | | | |
| | | | Oil & Gas Storage &
Transportation 0.6% | | | | |
| | 155,504 | | | Gaztransport Et Technigaz S.A. (France) | | | 8,065,158 | |
| | | | | | | | |
| | | | Packaged Foods & Meats 3.1% | | | | |
| | 509,619 | | | Calbee, Inc. (Japan) | | | 16,499,517 | |
| | 16,513,449 | | | Vitasoy International Holdings Ltd. (Hong Kong) | | | 24,667,688 | |
| | | | | | | | |
| | | | | | | 41,167,205 | |
| | | | | | | | |
| | | | Pharmaceuticals 5.2% | | | | |
| | 1,027,700 | | | Glenmark Pharmaceuticals Ltd. (India) | | | 16,490,579 | |
| | 347,594 | | | Ipsen S.A. (France) | | | 21,555,750 | |
| | 5,777,068 | | | Lee’s Pharmaceutical Holdings Ltd. (China) | | | 7,475,118 | |
| | 174,894 | | | Sawai Pharmaceutical Co. Ltd. (Japan) | | | 10,180,912 | |
| | 2,038,839 | | | TWi Pharmaceuticals, Inc.* (Taiwan) | | | 13,291,923 | |
| | | | | | | | |
| | | | | | | 68,994,282 | |
| | | | | | | | |
| | | | Property & Casualty Insurance 0.6% | | | | |
| | 5,374,656 | | | Qualitas Controladora S.A.B. de C.V.* ** (Mexico) | | | 7,381,207 | |
| | | | | | | | |
| | | | Publishing 4.2% | | | | |
| | 2,899,971 | | | Next Co. Ltd. (Japan) | | | 22,949,675 | |
| | 581,010 | | | Rightmove plc (United Kingdom) | | | 32,142,334 | |
| | | | | | | | |
| | | | | | | 55,092,009 | |
| | | | | | | | |
| | | | Research & Consulting Services 3.3% | | | | |
| | 66,832 | | | Bertrandt AG (Germany) | | | 6,976,963 | |
| | 844,025 | | | Nihon M&A Center, Inc. (Japan) | | | 36,902,224 | |
| | | | | | | | |
| | | | | | | 43,879,187 | |
| | | | | | | | |
| | | | Restaurants 6.1% | | | | |
| | 244,000 | | | Create Restaurants Holdings, Inc. (Japan) | | | 5,055,174 | |
| | 1,303,573 | | | Domino’s Pizza Enterprises Ltd. (Australia) | | | 37,053,710 | |
| | 2,831,329 | | | Domino’s Pizza Group plc (United Kingdom) | | | 38,106,961 | |
| | | | | | | | |
| | | | | | | 80,215,845 | |
| | | | | | | | |
| | | | Semiconductor Equipment 1.4% | | | | |
| | 246,490 | | | Hermes Microvision, Inc. (Taiwan) | | | 9,395,949 | |
| | 412,791 | | | ISC Co. Ltd. (Korea) | | | 8,856,286 | |
| | | | | | | | |
| | | | | | | 18,252,235 | |
| | | | | | | | |
| | | | Semiconductors 1.2% | | | | |
| | 79,855 | | | U-Blox AG* (Switzerland) | | | 16,073,135 | |
| | | | | | | | |
| | | | Specialty Chemicals 4.7% | | | | |
| | 428,291 | | | Chr. Hansen Holding A/S (Denmark) | | | 23,947,873 | |
| | 177,246 | | | Frutarom Industries Ltd. (Israel) | | | 6,705,242 | |
| | 2,037,410 | | | Hexpol AB (Sweden) | | | 22,754,689 | |
| | 79,970 | | | SK Kaken Co. Ltd. (Japan) | | | 7,809,861 | |
| | | | | | | | |
| | | | | | | 61,217,665 | |
| | | | | | | | |
| | | | Textiles 1.2% | | | | |
| | 956,274 | | | Eclat Textile Co. Ltd. (Taiwan) | | | 15,184,345 | |
| | | | | | | | |
| | | | | | | | |
| Shares | | | | | Value | |
| | | | | | | |
| | | | Trading Companies &
Distributors 3.2% | | | | |
| | 1,713,915 | | | MISUMI Group, Inc. (Japan) | | $ | 17,696,338 | |
| | 1,055,976 | | | MonotaRO Co. Ltd. (Japan) | | | 24,203,128 | |
| | | | | | | | |
| | | | | | | 41,899,466 | |
| | | | | | | | |
| | |
| | | | Total Common Stocks
(cost $1,055,659,080) | | | 1,304,387,825 | |
| | | | | | | | |
| | |
Principal
Amount | | | | | Value | |
| | | | | | | |
| | | | SHORT-TERM INVESTMENTS 0.9% | | | | |
| | |
| | | | Repurchase Agreement 0.9% | | | | |
| | $12,275,005 | | | Repurchase Agreement dated 9/30/15, 0.00% due 10/1/15 with State Street Bank and Trust Co. collateralized by $12,540,000 of United States Treasury Notes 1.375% due 9/30/20; value: $12,524,325; repurchase proceeds: $12,275,005 (cost $12,275,005) | | $ | 12,275,005 | |
| | | | | | | | |
| | |
| | | | Total Short-Term Investments
(cost $12,275,005) | | | 12,275,005 | |
| | | | | | | | |
| | |
| | | | Total Investments
(cost $1,067,934,085) 100.0%§ | | | 1,316,662,830 | |
| | |
| | | | Liabilities less Other Assets (<0.1%) | | | (567,742 | ) |
| | | | | | | | |
| | |
| | | | NET ASSETS 100.0% | | $ | 1,316,095,088 | |
| | | | | | | | |
| |
| | | | *Non-income producing. **Common units. §The aggregate amount of foreign securities fair valued pursuant to a systematic valuation model as a percent of net assets was 90.63%. ADR American Depositary Receipt. See Notes to Financial Statements. | |
At September 30, 2015, Wasatch International Growth Fund’s investments, excluding short-term investments, were in the following countries (unaudited):
| | | | |
| Country | | % | |
Australia | | | 3.2 | |
Canada | | | 3.8 | |
China | | | 0.6 | |
Denmark | | | 1.8 | |
France | | | 4.7 | |
Germany | | | 6.7 | |
Hong Kong | | | 2.3 | |
India | | | 5.4 | |
Israel | | | 0.5 | |
Italy | | | 3.7 | |
Japan | | | 31.2 | |
Korea | | | 4.2 | |
Mexico | | | 0.6 | |
New Zealand | | | 0.9 | |
Norway | | | 0.7 | |
Philippines | | | 0.4 | |
Singapore | | | 1.0 | |
South Africa | | | 1.1 | |
Spain | | | 0.8 | |
Sweden | | | 2.5 | |
Switzerland | | | 2.7 | |
Taiwan | | | 4.3 | |
United Kingdom | | | 16.9 | |
| | | | |
TOTAL | | | 100.0 | % |
| | | | |
62
| | |
| WASATCH INTERNATIONAL OPPORTUNITIES FUND (WAIOX) — Schedule of Investments | | SEPTEMBER 30, 2015 |
|
|
|
| | | | | | | | |
| Shares | | | | | Value | |
| | | | | | | |
| | | | COMMON STOCKS 94.9% | | | | |
| | |
| | | | Aerospace & Defense 0.2% | | | | |
| | 25,705 | | | Avon Rubber plc (United Kingdom) | | $ | 355,505 | |
| | 110,720 | | | SWISSPORT Tanzania Ltd.*
(Tanzania, United Republic of) | | | 379,319 | |
| | | | | | | | |
| | | | 734,824 | |
| | | | | | | | |
| | | | Air Freight & Logistics 1.6% | | | | |
| | 338,660 | | | Allcargo Global Logistics Ltd. (India) | | | 1,545,802 | |
| | 832,296 | | | Freightways Ltd. (New Zealand) | | | 2,959,156 | |
| | 12,834 | | | ID Logistics Group* (France) | | | 1,665,725 | |
| | 104,300 | | | Yusen Logistics Co. Ltd. (Japan) | | | 1,072,427 | |
| | | | | | | | |
| | | | 7,243,110 | |
| | | | | | | | |
| | | | Apparel Retail 0.5% | | | | |
| | 804,622 | | | Apranga PVA (Lithuania) | | | 2,408,792 | |
| | | | | | | | |
| | | | Apparel, Accessories & Luxury Goods 1.5% | | | | |
| | 117,976 | | | Delta-Galil Industries Ltd. (Israel) | | | 3,537,382 | |
| | 388,488 | | | Makalot Industrial Co. Ltd. (Taiwan) | | | 3,205,922 | |
| | | | | | | | |
| | | | 6,743,304 | |
| | | | | | | | |
| | | | Application Software 0.8% | | | | |
| | 204,775 | | | Linx S.A. (Brazil) | | | 2,265,324 | |
| | 233,075 | | | Logo Yazilim Sanayi Ve Ticaret AS (Turkey) | | | 1,266,607 | |
| | | | | | | | |
| | | | 3,531,931 | |
| | | | | | | | |
| | | | Asset Management & Custody Banks 0.4% | | | | |
| | 923,100 | | | Peregrine Holdings Ltd. (South Africa) | | | 1,927,153 | |
| | | | | | | | |
| | | | Auto Parts & Equipment 0.4% | | | | |
| | 450,000 | | | Hu Lane Associate, Inc. (Taiwan) | | | 1,726,330 | |
| | | | | | | | |
| | | | Automotive Retail 0.3% | | | | |
| | 59,200 | | | Mekonomen AB (Sweden) | | | 1,370,790 | |
| | | | | | | | |
| | | | Brewers 4.0% | | | | |
| | 362,475 | | | Carlsberg Brewery Malaysia Berhad (Malaysia) | | | 986,241 | |
| | 17,933,940 | | | International Breweries plc (Nigeria) | | | 1,621,951 | |
| | 64,408 | | | Kopparbergs Bryggeri AB (Sweden) | | | 1,444,703 | |
| | 197,574 | | | Olvi Oyj, Class A (Finland) | | | 4,875,264 | |
| | 160,100 | | | Royal UNIBREW A/S (Denmark) | | | 5,992,478 | |
| | 290,700 | | | Sechaba Breweries Ltd. (Botswana) | | | 784,999 | |
| | 1,227,502 | | | Turk Tuborg Bira ve Malt Sanayii A.S.* (Turkey) | | | 2,445,231 | |
| | | | | | | | |
| | | | 18,150,867 | |
| | | | | | | | |
| | | | Building Products 0.1% | | | | |
| | 1,111,666 | | | PT Surya Toto Indonesia Tbk (Indonesia) | | | 508,407 | |
| | | | | | | | |
| | | | Cable & Satellite 0.2% | | | | |
| | 5,000,000 | | | Hum Network Ltd. (Pakistan) | | | 784,324 | |
| | | | | | | | |
| | | | Commodity Chemicals 4.0% | | | | |
| | 967,254 | | | Berger Paints India Ltd. (India) | | | 3,246,797 | |
| | 400,083 | | | Gulf Oil Lubricants India Ltd. (India) | | | 2,925,653 | |
| | 141,954 | | | SAMHWA Paints Industrial Co. Ltd. (Korea) | | | 1,717,304 | |
| | 134,965 | | | Sniezka S.A. (Poland) | | | 1,841,830 | |
| | 350,857 | | | Supreme Industries Ltd. (India) | | | 3,314,688 | |
| | 155,700 | | | Tikkurila Oyj (Finland) | | | 2,586,736 | |
| | 1,273,500 | | | Yung Chi Paint & Varnish Manufacturing Co. Ltd. (Taiwan) | | | 2,459,776 | |
| | | | | | | | |
| | | | 18,092,784 | |
| | | | | | | | |
| | | | | | | | |
| Shares | | | | | Value | |
| | | | | | | |
| | | | Communications Equipment 0.2% | | | | |
| | 6,700 | | | Ericsson Nikola Tesla (Croatia) | | $ | 1,028,371 | |
| | | | | | | | |
| | | | Construction Materials 0.4% | | | | |
| | 144,928 | | | Misr Cement Co. (Egypt) | | | 1,573,282 | |
| | | | | | | | |
| | | | Consumer Finance 0.6% | | | | |
| | 54,600 | | | KRUK S.A. (Poland) | | | 2,505,255 | |
| | | | | | | | |
| | | | Data Processing & Outsourced Services 0.1% | | | | |
| | 663,646 | | | My EG Services Berhad (Malaysia) | | | 425,335 | |
| | | | | | | | |
| | | | Department Stores 0.5% | | | | |
| | 1,883,557 | | | Parkson Retail Asia Ltd. (Malaysia) | | | 423,197 | |
| | 195,251 | | | Poya Co. Ltd. (Taiwan) | | | 1,948,028 | |
| | | | | | | | |
| | | | 2,371,225 | |
| | | | | | | | |
| | | | Distillers & Vintners 1.9% | | | | |
| | 2,015,680 | | | Capevin Holdings Ltd. (South Africa) | | | 1,402,077 | |
| | 73 | | | Grand Marnier (France) | | | 399,733 | |
| | 35,911 | | | Jinro Distillers Co. Ltd. (Korea) | | | 1,199,760 | |
| | 39,621 | | | Laurent-Perrier (France) | | | 3,416,989 | |
| | 51,794 | | | Muhak Co. Ltd.* (Korea) | | | 2,057,027 | |
| | | | | | | | |
| | | | 8,475,586 | |
| | | | | | | | |
| | | | Diversified Banks 0.8% | | | | |
| | 6,220,800 | | | CRDB Bank plc
(Tanzania, United Republic of) | | | 1,051,200 | |
| | 1,714,801 | | | Hatton National Bank plc (Sri Lanka) | | | 2,597,080 | |
| | | | | | | | |
| | | | 3,648,280 | |
| | | | | | | | |
| | | | Diversified Support Services 1.1% | | | | |
| | 193,263 | | | Credit Corp. Group Ltd. (Australia) | | | 1,388,004 | |
| | 181,400 | | | Prestige International, Inc. (Japan) | | | 1,803,661 | |
| | 422,800 | | | Vicom Ltd. (Singapore) | | | 1,781,891 | |
| | | | | | | | |
| | | | 4,973,556 | |
| | | | | | | | |
| | | | Drug Retail 1.5% | | | | |
| | 1,330,808 | | | Green Cross Health Ltd. (New Zealand) | | | 1,893,294 | |
| | 94,400 | | | Kusuri No Aoki Co. Ltd. (Japan) | | | 4,993,951 | |
| | | | | | | | |
| | | | 6,887,245 | |
| | | | | | | | |
| | | | Electrical Components & Equipment 2.6% | | | | |
| | 309,840 | | | Amara Raja Batteries Ltd. (India) | | | 4,891,217 | |
| | 535,720 | | | Voltronic Power Technology Corp. (Taiwan) | | | 6,971,393 | |
| | | | | | | | |
| | | | 11,862,610 | |
| | | | | | | | |
| | | | Electronic Equipment & Instruments 1.0% | | | | |
| | 42,100 | | | Isra Vision AG (Germany) | | | 2,354,488 | |
| | 450,000 | | | Smart Metering Systems plc (United Kingdom) | | | 2,294,692 | |
| | | | | | | | |
| | | | 4,649,180 | |
| | | | | | | | |
| | | | Fertilizers & Agricultural Chemicals 0.2% | | | | |
| | 256,787 | | | Rallis India Ltd. (India) | | | 857,548 | |
| | | | | | | | |
| | | | Food Distributors 0.5% | | | | |
| | 8,606,200 | | | Premier Marketing Public Co. Ltd. (Thailand) | | | 2,347,469 | |
| | | | | | | | |
63
| | |
| WASATCH INTERNATIONAL OPPORTUNITIES FUND (WAIOX) — Schedule of Investments (continued) | | |
|
|
|
| | | | | | | | |
| Shares | | | | | Value | |
| | | | | | | |
| | | | Food Retail 6.7% | | | | |
| | 9,805,820 | | | 7-Eleven Malaysia Holdings Berhad, Class B (Malaysia) | | $ | 3,300,671 | |
| | 220,344 | | | Axial Retailing, Inc. (Japan) | | | 7,238,437 | |
| | 5,543,800 | | | BreadTalk Group Ltd. (Singapore) | | | 4,418,832 | |
| | 3,345,000 | | | Choppies Enterprises Ltd. (Botswana) | | | 1,331,143 | |
| | 4,415,100 | | | Convenience Retail Asia Ltd. (Hong Kong) | | | 2,270,928 | |
| | 25,300 | | | Daikokutenbussan Co. Ltd. (Japan) | | | 869,619 | |
| | 2,432,810 | | | Philippine Seven Corp. (Philippines) | | | 5,076,162 | |
| | 90,070 | | | Rami Levi Chain Stores Hashikma Marketing 2006 Ltd. (Israel) | | | 3,846,860 | |
| | 3,399,000 | | | Sheng Siong Group Ltd. (Singapore) | | | 1,972,081 | |
| | | | | | | | |
| | | | 30,324,733 | |
| | | | | | | | |
| | | | General Merchandise Stores 1.1% | | | | |
| | 98,972 | | | Seria Co. Ltd. (Japan) | | | 4,886,293 | |
| | | | | | | | |
| | | | Health Care Distributors 0.0% | | | | |
| | 1,478,600 | | | PT Enseval Putera Megatrading Tbk (Indonesia) | | | 211,950 | |
| | | | | | | | |
| | | | Health Care Equipment 0.3% | | | | |
| | 55,000 | | | Vieworks Co. Ltd. (Korea) | | | 1,547,779 | |
| | | | | | | | |
| | | | Health Care Facilities 6.4% | | | | |
| | 35,536,611 | | | Asiri Hospital Holdings plc (Sri Lanka) | | | 5,397,344 | |
| | 538,000 | | | Capio AB* (Sweden) | | | 3,248,581 | |
| | 211,422 | | | Instituto de Diagnostico S.A. (Chile) | | | 868,593 | |
| | 366,900 | | | MD Medical Group Investments plc GDR (Russia) | | | 1,779,465 | |
| | 430,957 | | | NMC Health plc (United Arab Emirates) | | | 5,443,579 | |
| | 515,356 | | | Raffles Medical Group Ltd. (Singapore) | | | 1,635,989 | |
| | 8,846,957 | | | Religare Health Trust** (Singapore) | | | 5,909,811 | |
| | 1,882,978 | | | Shifa International Hospitals Ltd. (Pakistan) | | | 4,780,500 | |
| | | | | | | | |
| | | | | | | 29,063,862 | |
| | | | | | | | |
| | | | Health Care Technology 1.0% | | | | |
| | 147,600 | | | EMIS Group plc (United Kingdom) | | | 2,345,080 | |
| | 109,300 | | | Nexus AG (Germany) | | | 2,185,149 | |
| | | | | | | | |
| | | | | | | 4,530,229 | |
| | | | | | | | |
| | | | Home Improvement Retail 0.8% | | | | |
| | 46,159 | | | Arcland Sakamoto Co. Ltd. (Japan) | | | 994,181 | |
| | 333,400 | | | DCM Holdings Co. Ltd. (Japan) | | | 2,439,201 | |
| | | | | | | | |
| | | | | | | 3,433,382 | |
| | | | | | | | |
| | | | Household Products 0.7% | | | | |
| | 5,076,580 | | | DSG International Thailand Public Co. Ltd. (Thailand) | | | 665,781 | |
| | 493,300 | | | Jyothy Laboratories Ltd. (India) | | | 2,401,716 | |
| | | | | | | | |
| | | | | | | 3,067,497 | |
| | | | | | | | |
| | | | Human Resource & Employment Services 0.7% | | | | |
| | 685,000 | | | 104 Corp. (Taiwan) | | | 3,005,004 | |
| | | | | | | | |
| | | | Industrial Conglomerates 0.7% | | | | |
| | 57,383,777 | | | Expolanka Holdings plc (Sri Lanka) | | | 3,330,127 | |
| | | | | | | | |
| | | | Industrial Machinery 1.1% | | | | |
| | 461,712 | | | CKD Corp. (Japan) | | | 3,817,502 | |
| | 79,300 | | | Yushin Precision Equipment Co. Ltd. (Japan) | | | 1,350,129 | |
| | | | | | | | |
| | | | | | | 5,167,631 | |
| | | | | | | | |
| | | | Internet Retail 3.8% | | | | |
| | 440,700 | | | Ikyu Corp. (Japan) | | | 9,614,279 | |
| | 591,286 | | | Trade Me Group Ltd. (New Zealand) | | | 1,387,658 | |
| | 2,161,368 | | | Webjet Ltd. (Australia) | | | 6,411,234 | |
| | | | | | | | |
| | | | | | | 17,413,171 | |
| | | | | | | | |
| | | | | | | | |
| Shares | | | | | Value | |
| | | | | | | |
| | | | Internet Software & Services 7.1% | | | | |
| | 246,064 | | | Addcn Technology Co. Ltd. (Taiwan) | | $ | 2,212,361 | |
| | 201,400 | | | Dip Corp. (Japan) | | | 3,322,081 | |
| | 580,799 | | | Gurunavi, Inc. (Japan) | | | 9,595,394 | |
| | 215,600 | | | Infomart Corp. (Japan) | | | 2,445,392 | |
| | 272,980 | | | PChome Online, Inc. (Taiwan) | | | 3,147,137 | |
| | 345,900 | | | SMS Co. Ltd. (Japan) | | | 5,852,421 | |
| | 26,252 | | | XING AG (Germany) | | | 5,638,745 | |
| | | | | | | | |
| | | | | | | 32,213,531 | |
| | | | | | | | |
| | | | IT Consulting & Other Services 0.8% | | | | |
| | 349,494 | | | EOH Holdings Ltd. (South Africa) | | | 3,752,916 | |
| | | | | | | | |
| | | | Leisure Products 0.7% | | | | |
| | 175,368 | | | Samchuly Bicycle Co. Ltd. (Korea) | | | 3,053,870 | |
| | | | | | | | |
| | | | Marine 0.3% | | | | |
| | 6,906,640 | | | 2GO Group, Inc.* (Philippines) | | | 1,167,361 | |
| | | | | | | | |
| | | | Marine Ports & Services 0.7% | | | | |
| | 1,255,700 | | | Asian Terminals, Inc. (Philippines) | | | 310,298 | |
| | 272,600 | | | Gateway Distriparks Ltd. (India) | | | 1,497,141 | |
| | 32,469 | | | Piraeus Port Authority S.A. (Greece) | | | 545,578 | |
| | 38,367 | | | Thessaloniki Port Authority S.A. (Greece) | | | 992,602 | |
| | | | | | | | |
| | | | | | | 3,345,619 | |
| | | | | | | | |
| | | | Multi-Line Insurance 0.7% | | | | |
| | 1,379,800 | | | Botswana Insurance Holdings Ltd. (Botswana) | | | 1,929,587 | |
| | 8,160,671 | | | British-American Investments Co. Kenya Ltd. (Kenya) | | | 1,309,448 | |
| | | | | | | | |
| | | | | | | 3,239,035 | |
| | | | | | | | |
| | | | Multi-Sector Holdings 0.0% | | | | |
| | 109,305 | | | Sefalana Holding Co. Ltd. (Botswana) | | | 135,310 | |
| | | | | | | | |
| | | | Office Services & Supplies 0.6% | | | | |
| | 2,301,800 | | | Riverstone Holdings Ltd. (Singapore) | | | 2,585,838 | |
| | | | | | | | |
| | | | Oil & Gas Refining & Marketing 1.0% | | | | |
| | 64,100 | | | BP Castrol KK (Japan) | | | 637,097 | |
| | 9,294 | | | Hankook Shell Oil Co. Ltd. (Korea) | | | 4,046,639 | |
| | | | | | | | |
| | | | | | | 4,683,736 | |
| | | | | | | | |
| | | | Packaged Foods & Meats 9.6% | | | | |
| | 71,120 | | | Agro Tech Foods Ltd. (India) | | | 639,257 | |
| | 7,950 | | | Atlantic Grupa (Croatia) | | | 975,433 | |
| | 1,293,927 | | | Cloetta AB, Class B* (Sweden) | | | 3,694,294 | |
| | 1,262,907 | | | Clover Industries Ltd. (South Africa) | | | 1,692,593 | |
| | 81,100 | | | Dutch Lady Milk Industries Berhad (Malaysia) | | | 868,452 | |
| | 744,300 | | | Grupo Herdez S.A.B. de C.V. (Mexico) | | | 1,968,256 | |
| | 38,600 | | | Kotobuki Spirits Co. Ltd. (Japan) | | | 1,269,934 | |
| | 20,245 | | | Kri-Kri Milk Industry S.A. (Greece) | | | 40,706 | |
| | 283,061 | | | Pinar Sut Mamulleri Sanayii A.S. (Turkey) | | | 1,871,387 | |
| | 7,503,000 | | | PT Tiga Pilar Sejahtera Food Tbk (Indonesia) | | | 743,604 | |
| | 3,626,000 | | | PT Ultrajaya Milk Industry & Trading Co. Tbk* (Indonesia) | | | 983,228 | |
| | 46,454,981 | | | RFM Corp. (Philippines) | | | 3,976,240 | |
| | 105,800 | | | Rokko Butter Co. Ltd. (Japan) | | | 1,627,521 | |
| | 11,374 | | | S&B Foods, Inc. (Japan) | | | 461,613 | |
| | 2,363,435 | | | TAT Gida Sanayi A.S.* (Turkey) | | | 4,998,682 | |
| | 269,681 | | | Vigor Alimentos S.A. (Brazil) | | | 621,757 | |
| | 3,743,120 | | | Vitasoy International Holdings Ltd. (Hong Kong) | | | 5,591,450 | |
| | 188,100 | | | Warabeya Nichiyo Co. Ltd. (Japan) | | | 3,275,233 | |
| | 1,100,000 | | | Watt’s Alimentos S.A. (Chile) | | | 1,469,521 | |
| | 19,788 | | | Wawel S.A. (Poland) | | | 6,627,033 | |
| | | | | | | | |
| | | | | | | 43,396,194 | |
| | | | | | | | |
64
| | | | | | | | |
| Shares | | | | | Value | |
| | | | | | | |
| | | | Personal Products 1.1% | | | | |
| | 5,826,550 | | | Karex Berhad (Malaysia) | | $ | 4,307,461 | |
| | 104,832 | | | Sarantis S.A. (Greece) | | | 818,547 | |
| | | | | | | | |
| | | | | | | 5,126,008 | |
| | | | | | | | |
| | | | Pharmaceuticals 2.0% | | | | |
| | 2,572,177 | | | Lee’s Pharmaceutical Holdings Ltd. (China) | | | 3,328,215 | |
| | 50,179,400 | | | PT Kimia Farma Persero Tbk (Indonesia) | | | 2,194,391 | |
| | 7,837,000 | | | PT Tempo Scan Pacific Tbk (Indonesia) | | | 819,285 | |
| | 175,500 | | | Renata Ltd. (Bangladesh) | | | 2,818,606 | |
| | | | | | | | |
| | | | | | | 9,160,497 | |
| | | | | | | | |
| | | | Publishing 2.9% | | | | |
| | 846,129 | | | Morningstar Japan KK (Japan) | | | 2,016,864 | |
| | 1,389,979 | | | Next Co. Ltd. (Japan) | | | 10,999,960 | |
| | | | | | | | |
| | | | | | | 13,016,824 | |
| | | | | | | | |
| | | | Real Estate Services 0.2% | | | | |
| | 106,700 | | | Century 21 Real Estate of Japan Ltd. (Japan) | | | 972,554 | |
| | | | | | | | |
| | | | Regional Banks 0.4% | | | | |
| | 302,800 | | | Banregio Grupo Financiero S.A.B. de C.V. (Mexico) | | | 1,612,746 | |
| | | | | | | | |
| | | | Research & Consulting Services 0.3% | | | | |
| | 28,401 | | | Nihon M&A Center, Inc. (Japan) | | | 1,241,741 | |
| | | | | | | | |
| | | | Restaurants 10.8% | | | | |
| | 10,800 | | | Amiyaki Tei Co. Ltd. (Japan) | | | 424,136 | |
| | 68,048 | | | AmRest Holdings SE* (Poland) | | | 2,933,695 | |
| | 29,500 | | | B-R31 Ice Cream Co. Ltd. (Japan) | | | 1,026,366 | |
| | 5,908,278 | | | Berjaya Food Berhad (Malaysia) | | | 2,889,791 | |
| | 932,500 | | | Collins Foods Ltd. (Australia) | | | 2,128,681 | |
| | 165,980 | | | Domino’s Pizza Enterprises Ltd. (Australia) | | | 4,717,937 | |
| | 497,300 | | | Doutor Nichires Holdings Co. Ltd. (Japan) | | | 7,625,068 | |
| | 450,900 | | | Fairwood Holdings Ltd. (Hong Kong) | | | 1,276,368 | |
| | 696,953 | | | Famous Brands Ltd. (South Africa) | | | 6,796,155 | |
| | 137,600 | | | Hiday Hidaka Corp. (Japan) | | | 3,488,721 | |
| | 153,972,000 | | | Hop Hing Group Holdings Ltd. (China) | | | 2,292,455 | |
| | 107,000 | | | KFC Holdings Japan Ltd. (Japan) | | | 2,011,409 | |
| | 30,000 | | | Kura Corp. (Japan) | | | 952,130 | |
| | 1,867,437 | | | Restaurant Brands New Zealand Ltd. (New Zealand) | | | 4,705,042 | |
| | 13,900 | | | Saint Marc Holdings Co. Ltd. (Japan) | | | 424,847 | |
| | 2,269,963 | | | Spur Corp. Ltd. (South Africa) | | | 5,404,869 | |
| | | | | | | | |
| | | | | | | 49,097,670 | |
| | | | | | | | |
| | | | Soft Drinks 2.6% | | | | |
| | 1,987,900 | | | Corp. Lindley S.A.* (Peru) | | | 1,596,756 | |
| | 89,370,320 | | | Pepsi-Cola Products Philippines, Inc. (Philippines) | | | 7,839,502 | |
| | 2,429,313 | | | Seven-Up Bottling Co. plc (Nigeria) | | | 2,316,418 | |
| | | | | | | | |
| | | | | | | 11,752,676 | |
| | | | | | | | |
| | | | Specialized Finance 0.1% | | | | |
| | 17,121 | | | Korea Ratings Corp. (Korea) | | | 595,111 | |
| | | | | | | | |
| | | | Specialized REITs 0.5% | | | | |
| | 1,932,270 | | | National Storage REIT (Australia) | | | 2,073,624 | |
| | | | | | | | |
| | | | Specialty Chemicals 0.8% | | | | |
| | 6,229,947 | | | Chemical and Allied Products plc (Nigeria) | | | 1,188,086 | |
| | 673,719 | | | DuluxGroup Ltd. (Australia) | | | 2,543,654 | |
| | | | | | | | |
| | | | | | | 3,731,740 | |
| | | | | | | | |
| | | | | | | | |
| Shares | | | | | Value | |
| | | | | | | |
| | | | Specialty Stores 0.9% | | | | |
| | 165,300 | | | Komehyo Co. Ltd. (Japan) | | $ | 3,956,621 | |
| | | | | | | | |
| | | | Tobacco 0.3% | | | | |
| | 5,249 | | | Karelia Tobacco Co., Inc. S.A. (Greece) | | | 1,423,893 | |
| | | | | | | | |
| | | | Trading Companies & Distributors 1.8% | | | | |
| | 442,100 | | | Jalux, Inc. (Japan) | | | 8,320,492 | |
| | | | | | | | |
| | |
| | | | Total Common Stocks
(cost $399,414,814) | | | 430,464,823 | |
| | | | | | | | |
| | |
Principal
Amount | | | | | Value | |
| | | | SHORT-TERM INVESTMENTS 5.1% | | | | |
| | |
| | | | Repurchase Agreement 5.1% | | | | |
| | $23,124,583 | | | Repurchase Agreement dated 9/30/15, 0.00% due 10/1/15 with State Street Bank and Trust Co. collateralized by $22,795,000 of United States Treasury Notes 2.125% due 1/31/21; value: $23,587,628; repurchase proceeds: $23,124,583 (cost $23,124,583) | | $ | 23,124,583 | |
| | | | | | | | |
| | |
| | | | Total Short-Term Investments
(cost $23,124,583) | | | 23,124,583 | |
| | | | | | | | |
| | |
| | | | Total Investments
(cost $422,539,397) 100.0%§ | | | 453,589,406 | |
| | |
| | | | Liabilities less Other Assets (<0.1%) | | | (94,280 | ) |
| | | | | | | | |
| | |
| | | | NET ASSETS 100.0% | | $ | 453,495,126 | |
| | | | | | | | |
| |
| | | | *Non-income producing. **Common units. §The aggregate amount of foreign securities fair valued pursuant to a systematic valuation model as a percent of net assets was 74.29%. GDR Global Depositary Receipt. REIT Real Estate Investment Trust. See Notes to Financial Statements. | |
65
| | |
| WASATCH INTERNATIONAL OPPORTUNITIES FUND (WAIOX) — Schedule of Investments (continued) | | SEPTEMBER 30, 2015 |
|
|
|
At September 30, 2015, Wasatch International Opportunities Fund’s investments, excluding short-term investments, were in the following countries (unaudited):
| | | | |
| Country | | % | |
Australia | | | 4.5 | |
Bangladesh | | | 0.6 | |
Botswana | | | 1.0 | |
Brazil | | | 0.7 | |
Chile | | | 0.5 | |
China | | | 1.3 | |
Croatia | | | 0.5 | |
Denmark | | | 1.4 | |
Egypt | | | 0.4 | |
Finland | | | 1.7 | |
France | | | 1.3 | |
Germany | | | 2.4 | |
Greece | | | 0.9 | |
Hong Kong | | | 2.1 | |
India | | | 4.9 | |
Indonesia | | | 1.3 | |
Israel | | | 1.7 | |
Japan | | | 25.8 | |
Kenya | | | 0.3 | |
Korea | | | 3.3 | |
Lithuania | | | 0.6 | |
Malaysia | | | 3.1 | |
Mexico | | | 0.8 | |
New Zealand | | | 2.5 | |
Nigeria | | | 1.2 | |
Pakistan | | | 1.3 | |
Peru | | | 0.4 | |
Philippines | | | 4.3 | |
Poland | | | 3.2 | |
Russia | | | 0.4 | |
Singapore | | | 4.2 | |
South Africa | | | 4.9 | |
Sri Lanka | | | 2.6 | |
Sweden | | | 2.3 | |
Taiwan | | | 5.7 | |
Tanzania, United Republic of | | | 0.3 | |
Thailand | | | 0.7 | |
Turkey | | | 2.4 | |
United Arab Emirates | | | 1.3 | |
United Kingdom | | | 1.2 | |
| | | | |
TOTAL | | | 100.0 | % |
| | | | |
66
| | |
| WASATCH LARGE CAP VALUE FUND (FMIEX / WILCX) — Schedule of Investments | | SEPTEMBER 30, 2015 |
|
|
|
| | | | | | | | |
| Shares | | | | | Value | |
| | | | | | | |
| | | | COMMON STOCKS 99.3% | | | | |
| | |
| | | | Communications Equipment 4.3% | | | | |
| | 400,808 | | | Cisco Systems, Inc. | | $ | 10,521,210 | |
| | | | | | | | |
| | | | Computer & Electronics Retail 1.0% | | | | |
| | 61,716 | | | GameStop Corp., Class A | | | 2,543,316 | |
| | | | | | | | |
| | | | Department Stores 2.1% | | | | |
| | 102,533 | | | Macy’s, Inc. | | | 5,261,994 | |
| | | | | | | | |
| | | | Diversified Banks 13.2% | | | | |
| | 224,762 | | | Citigroup, Inc. | | | 11,150,443 | |
| | 174,400 | | | JPMorgan Chase & Co. | | | 10,633,168 | |
| | 206,130 | | | Wells Fargo & Co. | | | 10,584,775 | |
| | | | | | | | |
| | | | | | | 32,368,386 | |
| | | | | | | | |
| | | | Diversified Chemicals 2.2% | | | | |
| | 83,692 | | | Eastman Chemical Co. | | | 5,416,546 | |
| | | | | | | | |
| | | | Diversified REITs 1.5% | | | | |
| | 199,306 | | | Select Income REIT | | | 3,788,807 | |
| | | | | | | | |
| | | | Electric Utilities 6.6% | | | | |
| | 123,760 | | | Duke Energy Corp. | | | 8,903,295 | |
| | 265,964 | | | Great Plains Energy, Inc. | | | 7,186,347 | |
| | | | | | | | |
| | | | | | | 16,089,642 | |
| | | | | | | | |
| | | | Electrical Components & Equipment 3.0% | | | | |
| | 143,841 | | | Eaton Corp. plc | | | 7,379,043 | |
| | | | | | | | |
| | | | Health Care Equipment 2.0% | | | | |
| | 73,926 | | | Medtronic plc | | | 4,948,606 | |
| | | | | | | | |
| | | | Household Products 3.8% | | | | |
| | 130,147 | | | Procter & Gamble Co. (The) | | | 9,362,775 | |
| | | | | | | | |
| | | | Hypermarkets & Super Centers 3.1% | | | | |
| | 116,419 | | | Wal-Mart Stores, Inc. | | | 7,548,608 | |
| | | | | | | | |
| | | | Industrial Conglomerates 4.8% | | | | |
| | 472,357 | | | General Electric Co. | | | 11,912,844 | |
| | | | | | | | |
| | | | Integrated Oil & Gas 8.5% | | | | |
| | 90,218 | | | Chevron Corp. | | | 7,116,396 | |
| | 126,820 | | | Royal Dutch Shell plc ADR (Netherlands) | | | 6,010,000 | |
| | 286,841 | | | Suncor Energy, Inc. (Canada) | | | 7,664,391 | |
| | | | | | | | |
| | | | | | | 20,790,787 | |
| | | | | | | | |
| | | | Integrated Telecommunication Services 3.0% | | | | |
| | 169,279 | | | Verizon Communications, Inc. | | | 7,365,329 | |
| | | | | | | | |
| | | | Investment Banking & Brokerage 2.7% | | | | |
| | 38,075 | | | Goldman Sachs Group, Inc. (The) | | | 6,615,912 | |
| | | | | | | | |
| | | | Multi-Line Insurance 4.3% | | | | |
| | 186,193 | | | American International Group, Inc. | | | 10,579,486 | |
| | | | | | | | |
| | | | Oil & Gas Equipment & Services 2.2% | | | | |
| | 151,565 | | | Halliburton Co. | | | 5,357,823 | |
| | | | | | | | |
| | | | Oil & Gas Exploration & Production 1.0% | | | | |
| | 387,624 | | | Encana Corp. (Canada) | | | 2,496,299 | |
| | | | | | | | |
| | | | Other Diversified Financial Services 2.8% | | | | |
| | 175,469 | | | Voya Financial, Inc. | | | 6,802,933 | |
| | | | | | | | |
| | | | Pharmaceuticals 10.9% | | | | |
| | 123,070 | | | Johnson & Johnson | | | 11,488,585 | |
| | 325,228 | | | Pfizer, Inc. | | | 10,215,411 | |
| | 24,513 | | | Shire plc ADR (Ireland) | | | 5,030,803 | |
| | | | | | | | |
| | | | | | | 26,734,799 | |
| | | | | | | | |
| | | | | | | | |
| Shares | | | | | Value | |
| | | | | | | |
| | | | Regional Banks 3.2% | | | | |
| | 89,049 | | | PNC Financial Services Group, Inc. | | $ | 7,943,171 | |
| | | | | | | | |
| | | | Semiconductors 1.8% | | | | |
| | 145,389 | | | Intel Corp. | | | 4,382,025 | |
| | | | | | | | |
| | | | Specialized REITs 3.2% | | | | |
| | 152,020 | | | EPR Properties | | | 7,839,671 | |
| | | | | | | | |
| | | | Systems Software 4.5% | | | | |
| | 124,252 | | | Microsoft Corp. | | | 5,499,394 | |
| | 152,084 | | | Oracle Corp. | | | 5,493,274 | |
| | | | | | | | |
| | | | | | | 10,992,668 | |
| | | | | | | | |
| | | | Technology Hardware, Storage &
Peripherals 3.6% | | | | |
| | 61,979 | | | Apple, Inc. | | | 6,836,284 | |
| | 74,910 | | | Hewlett-Packard Co. | | | 1,918,445 | |
| | | | | | | | |
| | | | | | | 8,754,729 | |
| | | | | | | | |
| | |
| | | | Total Common Stocks
(cost $232,455,269) | | | 243,797,409 | |
| | | | | | | | |
| | |
Principal Amount | | | | | Value | |
| | | | | | | |
| | | | SHORT-TERM INVESTMENTS 0.6% | | | | |
| | |
| | | | Repurchase Agreement 0.6% | | | | |
| | $1,470,547 | | | Repurchase Agreement dated 9/30/15, 0.00% due 10/1/15 with State Street Bank and Trust Co. collateralized by $1,450,000 of United States Treasury Notes 2.125% due 1/31/21; value: $1,500,419; repurchase proceeds: $1,470,547 (cost $1,470,547) | | $ | 1,470,547 | |
| | | | | | | | |
| | |
| | | | Total Short-Term Investments
(cost $1,470,547) | | | 1,470,547 | |
| | | | | | | | |
| | |
| | | | Total Investments
(cost $233,925,816) 99.9% | | | 245,267,956 | |
| | |
| | | | Other Assets less Liabilities 0.1% | | | 313,027 | |
| | | | | | | | |
| | |
| | | | NET ASSETS 100.0% | | $ | 245,580,983 | |
| | | | | | | | |
| |
| | | | ADR American Depositary Receipt. REIT Real Estate Investment Trust. See Notes to Financial Statements. | |
At September 30, 2015, Wasatch Large Cap Value Fund’s investments, excluding short-term investments, were in the following countries (unaudited):
| | | | |
| Country | | % | |
Canada | | | 4.2 | |
Ireland | | | 2.0 | |
Netherlands | | | 2.5 | |
United States | | | 91.3 | |
| | | | |
TOTAL | | | 100.0 | % |
| | | | |
67
| | |
| WASATCH LONG/SHORT FUND (FMLSX / WILSX) — Schedule of Investments | | |
|
|
|
| | | | | | | | |
| Shares | | | | | Value | |
| | | | | | | |
| | | | COMMON STOCKS 94.5% | | | | |
| | |
| | | | Advertising 2.6% | | | | |
| | 1,384,935 | | | Interpublic Group of Cos., Inc. (The)†† | | $ | 26,493,807 | |
| | | | | | | | |
| | | | Air Freight & Logistics 1.6% | | | | |
| | 166,306 | | | United Parcel Service, Inc., Class B†† | | | 16,412,739 | |
| | | | | | | | |
| | | | Airlines 3.0% | | | | |
| | 569,406 | | | United Continental Holdings, Inc.* †† | | | 30,206,988 | |
| | | | | | | | |
| | | | Automobile Manufacturers 1.8% | | | | |
| | 613,738 | | | General Motors Co.†† | | | 18,424,415 | |
| | | | | | | | |
| | | | Automotive Retail 2.4% | | | | |
| | 739,844 | | | CST Brands, Inc.†† | | | 24,903,149 | |
| | | | | | | | |
| | | | Communications Equipment 6.6% | | | | |
| | 842,156 | | | Cisco Systems, Inc.†† | | | 22,106,595 | |
| | 846,249 | | | QUALCOMM, Inc.†† | | | 45,468,959 | |
| | | | | | | | |
| | | | | | | 67,575,554 | |
| | | | | | | | |
| | | | Diversified Banks 1.5% | | | | |
| | 307,920 | | | Citigroup, Inc.†† | | | 15,275,911 | |
| | | | | | | | |
| | | | Diversified REITs 1.5% | | | | |
| | 1,916,168 | | | Investors Real Estate Trust | | | 14,831,140 | |
| | | | | | | | |
| | | | Electrical Components & Equipment 1.1% | | | | |
| | 257,147 | | | Emerson Electric Co. | | | 11,358,183 | |
| | | | | | | | |
| | | | Environmental & Facilities Services 1.7% | | | | |
| | 434,257 | | | Republic Services, Inc.†† | | | 17,891,388 | |
| | | | | | | | |
| | | | Fertilizers & Agricultural Chemicals 3.5% | | | | |
| | 1,160,945 | | | Mosaic Co. (The)†† | | | 36,116,999 | |
| | | | | | | | |
| | | | Food Retail 1.4% | | | | |
| | 465,927 | | | Whole Foods Market, Inc. | | | 14,746,590 | |
| | | | | | | | |
| | | | General Merchandise Stores 2.7% | | | | |
| | 357,669 | | | Target Corp.†† | | | 28,134,243 | |
| | | | | | | | |
| | | | Health Care Equipment 3.2% | | | | |
| | 263,000 | | | Medtronic plc | | | 17,605,220 | |
| | 157,900 | | | Stryker Corp. | | | 14,858,390 | |
| | | | | | | | |
| | | | | | | 32,463,610 | |
| | | | | | | | |
| | | | Health Care Services 3.6% | | | | |
| | 457,298 | | | Express Scripts Holding Co.* †† | | | 37,022,846 | |
| | | | | | | | |
| | | | Hypermarkets & Super
Centers 4.5% | | | | |
| | 707,327 | | | Wal-Mart Stores, Inc.†† | | | 45,863,083 | |
| | | | | | | | |
| | | | Insurance Brokers 1.6% | | | | |
| | 185,255 | | | Aon plc | | | 16,415,446 | |
| | | | | | | | |
| | | | Integrated Telecommunication Services 3.2% | | | | |
| | 762,463 | | | Verizon Communications, Inc.†† | | | 33,174,765 | |
| | | | | | | | |
| | | | Marine 3.0% | | | | |
| | 501,310 | | | Kirby Corp.* †† | | | 31,056,154 | |
| | | | | | | | |
| | | | Multi-Line Insurance 4.4% | | | | |
| | 1,260,041 | | | Loews Corp.†† | | | 45,537,882 | |
| | | | | | | | |
| | | | Oil & Gas Drilling 1.4% | | | | |
| | 1,231,945 | | | Unit Corp.* | | | 13,871,701 | |
| | | | | | | | |
| | | | Oil & Gas Equipment &
Services 3.2% | | | | |
| | 915,919 | | | Halliburton Co.†† | | | 32,377,737 | |
| | | | | | | | |
| | | | | | | | |
| Shares | | | | | Value | |
| | | | | | | |
| | | | Oil & Gas Exploration & Production 5.5% | | | | |
| | 5,653,316 | | | Bill Barrett Corp.* †† ‡‡ | | $ | 18,655,943 | |
| | 7,307,093 | | | Denbury Resources, Inc.†† | | | 17,829,307 | |
| | 1,563,523 | | | Southwestern Energy Co.* †† | | | 19,841,107 | |
| | | | | | | | |
| | | | | | | 56,326,357 | |
| | | | | | | | |
| | | | Pharmaceuticals 3.6% | | | | |
| | 208,035 | | | Novartis AG ADR (Switzerland) | | | 19,122,577 | |
| | 435,500 | | | Zoetis, Inc.†† | | | 17,933,890 | |
| | | | | | | | |
| | | | | | | 37,056,467 | |
| | | | | | | | |
| | | | Property & Casualty
Insurance 0.5% | | | | |
| | 140,553 | | | XL Group plc | | | 5,104,885 | |
| | | | | | | | |
| | | | Residential REITs 2.0% | | | | |
| | 554,435 | | | American Campus Communities, Inc.†† | | | 20,092,724 | |
| | | | | | | | |
| | | | Restaurants 1.3% | | | | |
| | 136,491 | | | McDonald’s Corp.†† | | | 13,448,458 | |
| | | | | | | | |
| | | | Specialized REITs 6.5% | | | | |
| | 1,650,742 | | | Iron Mountain, Inc.†† | | | 51,206,017 | |
| | 721,074 | | | Outfront Media, Inc. | | | 14,998,339 | |
| | | | | | | | |
| | | | | | | 66,204,356 | |
| | | | | | | | |
| | | | Steel 2.4% | | | | |
| | 1,405,583 | | | Steel Dynamics, Inc. | | | 24,147,916 | |
| | | | | | | | |
| | | | Systems Software 6.7% | | | | |
| | 616,256 | | | Microsoft Corp.†† | | | 27,275,490 | |
| | 1,137,706 | | | Oracle Corp.†† | | | 41,093,941 | |
| | | | | | | | |
| | | | | | | 68,369,431 | |
| | | | | | | | |
| | | | Technology Hardware, Storage & Peripherals 4.2% | | | | |
| | 1,483,691 | | | EMC Corp.†† | | | 35,845,974 | |
| | 1,909,991 | | | Silicon Graphics International Corp.* ‡‡ | | | 7,506,265 | |
| | | | | | | | |
| | | | | | | 43,352,239 | |
| | | | | | | | |
| | | | Trading Companies & Distributors 2.3% | | | | |
| | 1,622,225 | | | NOW, Inc.* †† | | | 24,008,930 | |
| | | | | | | | |
| | |
| | | | Total Common Stocks
(cost $1,182,218,410) | | | 968,266,093 | |
| | | | | | | | |
| | |
Principal
Amount | | | | | Value | |
| | | | | | | |
| | | | SHORT-TERM INVESTMENTS 5.1% | |
| | |
| | | | Repurchase Agreement 5.1% | | | | |
| | $52,286,876 | | | Repurchase Agreement dated 9/30/15, 0.00% due 10/1/15 with State Street Bank and Trust Co. collateralized by $51,545,000 of United States Treasury Notes 2.125% due 1/31/21; value: $53,337,323; repurchase proceeds: $52,286,876 (cost $52,286,876) | | $ | 52,286,876 | |
| | | | | | | | |
| | |
| | | | Total Short-Term Investments
(cost $52,286,876) | | | 52,286,876 | |
| | | | | | | | |
| | |
| | | | Total Investments
(cost $1,234,505,286) 99.6% | | | 1,020,552,969 | |
| | |
| | | | Other Assets less Liabilities 0.4% | | | 4,430,919 | |
| | | | | | | | |
| | |
| | | | NET ASSETS 100.0% | | $ | 1,024,983,888 | |
| | | | | | | | |
68
| | | | | | | | |
| Shares | | | | | Value | |
| | | | | | | |
| | | | SECURITIES SOLD SHORT 25.7% | | | | |
| | |
| | | | Apparel Retail 1.5% | | | | |
| | 361,998 | | | Men’s Wearhouse, Inc. (The) | | $ | 15,392,155 | |
| | | | | | | | |
| | | | Communications Equipment 1.1% | | | | |
| | 181,413 | | | Arista Networks, Inc.* | | | 11,100,662 | |
| | | | | | | | |
| | | | Data Processing & Outsourced Services 1.9% | | | | |
| | 421,139 | | | Syntel, Inc.* | | | 19,081,808 | |
| | | | | | | | |
| | | | Department Stores 2.3% | | | | |
| | 2,564,476 | | | JC Penney Co., Inc.* | | | 23,823,982 | |
| | | | | | | | |
| | | | Diversified Support Services 0.4% | | | | |
| | 113,967 | | | Healthcare Services Group, Inc. | | | 3,840,688 | |
| | | | | | | | |
| | | | Electric Utilities 1.3% | | | | |
| | 459,746 | | | Exelon Corp. | | | 13,654,456 | |
| | | | | | | | |
| | | | Food Distributors 2.0% | | | | |
| | 518,380 | | | Sysco Corp. | | | 20,201,269 | |
| | | | | | | | |
| | | | Food Retail 2.3% | | | | |
| | 650,642 | | | Kroger Co. (The) | | | 23,468,657 | |
| | | | | | | | |
| | | | Health Care Equipment 2.0% | | | | |
| | 66,850 | | | Inogen, Inc.* | | | 3,245,567 | |
| | 536,522 | | | Zeltiq Aesthetics, Inc.* | | | 17,184,800 | |
| | | | | | | | |
| | | | | | | 20,430,367 | |
| | | | | | | | |
| | | | Health Care Technology 1.3% | | | | |
| | 572,767 | | | Veeva Systems, Inc., Class A* | | | 13,408,475 | |
| | | | | | | | |
| | | | Home Entertainment Software 1.8% | | | | |
| | 267,767 | | | Electronic Arts, Inc.* | | | 18,141,214 | |
| | | | | | | | |
| | | | Housewares & Specialties 2.6% | | | | |
| | 544,222 | | | Jarden Corp.* | | | 26,601,571 | |
| | | | | | | | |
| | | | Oil & Gas Exploration & Production 0.4% | | | | |
| | 412,944 | | | Synergy Resources Corp.* | | | 4,046,851 | |
| | | | | | | | |
| | | | Property & Casualty Insurance 1.3% | | | | |
| | 355,987 | | | First American Financial Corp. | | | 13,908,412 | |
| | | | | | | | |
| | | | Specialized REITs 1.9% | | | | |
| | 225,804 | | | American Tower Corp. | | | 19,866,236 | |
| | | | | | | | |
| | | | Specialty Stores 1.6% | | | | |
| | 208,462 | | | Tiffany & Co. | | | 16,097,436 | |
| | | | | | | | |
| | |
| | | | Total Securities Sold Short
(proceeds $274,609,852) | | | 263,064,239 | |
| | | | | | | | |
| |
| | | | *Non-income producing. ††All or a portion of this security has been designated as collateral for short sales (see Note 3). ‡‡Affiliated company (see Note 8). ADR American Depositary Receipt. REIT Real Estate Investment Trust. See Notes to Financial Statements. | |
At September 30, 2015, Wasatch Long/Short Fund’s investments, excluding short-term investments and securities sold short, were in the following countries (unaudited):
| | | | |
| Country | | % | |
Switzerland | | | 2.0 | |
United States | | | 98.0 | |
| | | | |
TOTAL | | | 100.0 | % |
| | | | |
At September 30, 2015, Wasatch Long/Short Fund’s securities sold short were in the following country (unaudited):
| | | | |
| Country | | % | |
United States | | | 100.0 | |
| | | | |
TOTAL | | | 100.0 | % |
| | | | |
69
| | |
| WASATCH MICRO CAP FUND (WMICX) — Schedule of Investments | | |
|
|
|
| | | | | | | | |
| Shares | | | | | Value | |
| | | | | | | |
| | | | COMMON STOCKS 92.3% | | | | |
| | |
| | | | Air Freight & Logistics 0.8% | | | | |
| | 117,168 | | | Echo Global Logistics, Inc.* | | $ | 2,296,493 | |
| | | | | | | | |
| | | | Apparel Retail 1.0% | | | | |
| | 167,365 | | | Zumiez, Inc.* | | | 2,615,915 | |
| | | | | | | | |
| | | | Apparel, Accessories & Luxury Goods 1.8% | | | | |
| | 10,155 | | | Page Industries Ltd. (India) | | | 2,045,342 | |
| | 166,409 | | | Superior Uniform Group, Inc. | | | 2,983,713 | |
| | | | | | | | |
| | | | | | | 5,029,055 | |
| | | | | | | | |
| | | | Application Software 11.1% | | | | |
| | 349,990 | | | Diligent Corp.* (New Zealand) | | | 1,161,920 | |
| | 58,097 | | | Ellie Mae, Inc.* | | | 3,867,517 | |
| | 249,716 | | | Exa Corp.* | | | 2,579,566 | |
| | 114,622 | | | Globant S.A.* (Luxembourg) | | | 3,506,287 | |
| | 35,826 | | | Interactive Intelligence Group, Inc.* | | | 1,064,391 | |
| | 120,179 | | | PROS Holdings, Inc.* | | | 2,660,763 | |
| | 46,417 | | | Tyler Technologies, Inc.* | | | 6,930,522 | |
| | 39,117 | | | Ultimate Software Group, Inc.* | | | 7,002,334 | |
| | 110,814 | | | Workiva, Inc.* | | | 1,683,265 | |
| | | | | | | | |
| | | | | | | 30,456,565 | |
| | | | | | | | |
| | | | Asset Management & Custody Banks 2.3% | | | | |
| | 15,534 | | | Diamond Hill Investment Group, Inc. | | | 2,889,945 | |
| | 137,477 | | | Pzena Investment Management, Inc., Class A | | | 1,223,545 | |
| | 188,366 | | | Silvercrest Asset Management Group, Inc. | | | 2,036,237 | |
| | | | | | | | |
| | | | | | | 6,149,727 | |
| | | | | | | | |
| | | | Automotive Retail 1.5% | | | | |
| | 61,597 | | | Monro Muffler Brake, Inc. | | | 4,160,877 | |
| | | | | | | | |
| | | | Biotechnology 3.3% | | | | |
| | 278,787 | | | Abcam plc (United Kingdom) | | | 2,452,262 | |
| | 148,904 | | | Argos Therapeutics, Inc.* | | | 722,184 | |
| | 176,227 | | | ChemoCentryx, Inc.* | | | 1,066,173 | |
| | 250,157 | | | Cytokinetics, Inc.* | | | 1,673,550 | |
| | 48,381 | | | Esperion Therapeutics, Inc.* | | | 1,141,308 | |
| | 129,918 | | | Inovio Pharmaceuticals, Inc.* | | | 750,926 | |
| | 210,359 | | | Sangamo BioSciences, Inc.* | | | 1,186,425 | |
| | | | | | | | |
| | | | | | | 8,992,828 | |
| | | | | | | | |
| | | | Data Processing & Outsourced Services 1.5% | | | | |
| | 114,225 | | | ExlService Holdings, Inc.* | | | 4,218,329 | |
| | | | | | | | |
| | | | Diversified Banks 2.2% | | | | |
| | 4,218,211 | | | City Union Bank Ltd. (India) | | | 5,916,813 | |
| | | | | | | | |
| | | | Diversified Capital Markets 0.8% | | | | |
| | 63,723 | | | HFF, Inc., Class A | | | 2,151,289 | |
| | | | | | | | |
| | | | Electronic Equipment & Instruments 0.9% | | | | |
| | 21,086 | | | Mesa Laboratories, Inc. | | | 2,348,980 | |
| | | | | | | | |
| | | | Electronic Manufacturing Services 1.0% | | | | |
| | 36,316 | | | IPG Photonics Corp.* | | | 2,758,927 | |
| | | | | | | | |
| | | | Environmental & Facilities Services 0.7% | | | | |
| | 185,549 | | | Heritage-Crystal Clean, Inc.* | | | 1,905,588 | |
| | | | | | | | |
| | | | Food Distributors 1.0% | | | | |
| | 185,952 | | | Chefs’ Warehouse, Inc. (The)* | | | 2,633,080 | |
| | | | | | | | |
| | | | General Merchandise Stores 0.2% | | | | |
| | 33,986 | | | Ollie’s Bargain Outlet Holdings, Inc.* | | | 549,554 | |
| | | | | | | | |
| | | | | | | | |
| Shares | | | | | Value | |
| | | | | | | |
| | | | Health Care Equipment 4.6% | | | | |
| | 76,423 | | | Abaxis, Inc. | | $ | 3,361,848 | |
| | 209,478 | | | AtriCure, Inc.* | | | 4,589,663 | |
| | 46,813 | | | Entellus Medical, Inc.* | | | 843,570 | |
| | 151,770 | | | Novadaq Technologies, Inc.* (Canada) | | | 1,582,961 | |
| | 71,920 | | | Oxford Immunotec Global plc* | | | 970,920 | |
| | 142,380 | | | Tandem Diabetes Care, Inc.* | | | 1,254,368 | |
| | | | | | | | |
| | | | | | | 12,603,330 | |
| | | | | | | | |
| | | | Health Care Facilities 1.9% | | | | |
| | 123,265 | | | Ensign Group, Inc. (The) | | | 5,254,787 | |
| | | | | | | | |
| | | | Health Care REITs 2.1% | | | | |
| | 510,134 | | | CareTrust REIT, Inc. | | | 5,790,021 | |
| | | | | | | | |
| | | | Health Care Services 0.3% | | | | |
| | 31,782 | | | ExamWorks Group, Inc.* | | | 929,306 | |
| | | | | | | | |
| | | | Health Care Technology 0.4% | | | | |
| | 52,886 | | | HealthStream, Inc.* | | | 1,153,444 | |
| | | | | | | | |
| | | | Homebuilding 4.4% | | | | |
| | 199,825 | | | Installed Building Products, Inc.* | | | 5,051,576 | |
| | 259,888 | | | LGI Homes, Inc.* | | | 7,066,355 | |
| | | | | | | | |
| | | | | | | 12,117,931 | |
| | | | | | | | |
| | | | Industrial Machinery 2.4% | | | | |
| | 191,470 | | | Arcam AB* (Sweden) | | | 3,370,193 | |
| | 46,181 | | | Proto Labs, Inc.* | | | 3,094,127 | |
| | | | | | | | |
| | | | | | | 6,464,320 | |
| | | | | | | | |
| | | | Internet Retail 1.3% | | | | |
| | 258,154 | | | MakeMyTrip Ltd.* (India) | | | 3,549,618 | |
| | | | | | | | |
| | | | Internet Software & Services 7.1% | | | | |
| | 55,331 | | | Cornerstone OnDemand, Inc.* | | | 1,825,923 | |
| | 167,950 | | | Envestnet, Inc.* | | | 5,033,461 | |
| | 173,301 | | | Reis, Inc. | | | 3,925,268 | |
| | 174,000 | | | SMS Co. Ltd. (Japan) | | | 2,943,976 | |
| | 83,193 | | | SPS Commerce, Inc.* | | | 5,647,973 | |
| | | | | | | | |
| | | | | | | 19,376,601 | |
| | | | | | | | |
| | | | Leisure Products 1.3% | | | | |
| | 117,222 | | | Malibu Boats, Inc.* | | | 1,638,764 | |
| | 144,993 | | | MCBC Holdings, Inc.* | | | 1,879,109 | |
| | | | | | | | |
| | | | | | | 3,517,873 | |
| | | | | | | | |
| | | | Life Sciences Tools & Services 2.4% | | | | |
| | 122,614 | | | Fluidigm Corp.* | | | 994,400 | |
| | 76,996 | | | ICON plc* (Ireland) | | | 5,464,406 | |
| | | | | | | | |
| | | | | | | 6,458,806 | |
| | | | | | | | |
| | | | Managed Health Care 2.0% | | | | |
| | 79,148 | | | HealthEquity, Inc.* | | | 2,338,823 | |
| | 417,436 | | | Trupanion, Inc.* | | | 3,151,642 | |
| | | | | | | | |
| | | | | | | 5,490,465 | |
| | | | | | | | |
| | | | Oil & Gas Equipment & Services 0.8% | | | | |
| | 157,619 | | | Pason Systems, Inc. (Canada) | | | 2,212,942 | |
| | | | | | | | |
| | | | Oil & Gas Refining & Marketing 0.3% | | | | |
| | 384,242 | | | Amyris, Inc.* | | | 772,326 | |
| | | | | | | | |
| | | | Pharmaceuticals 7.8% | | | | |
| | 14,323 | | | Aerie Pharmaceuticals, Inc.* | | | 254,090 | |
| | 96,749 | | | Akorn, Inc.* | | | 2,757,830 | |
| | 165,043 | | | Auris Medical Holding AG* (Switzerland) | | | 587,553 | |
| | 163,308 | | | Cardiovascular Systems, Inc.* | | | 2,586,799 | |
| | 127,152 | | | Cempra, Inc.* | | | 3,539,912 | |
| | 111,933 | | | Egalet Corp.* | | | 1,475,277 | |
| | 68,934 | | | Intra-Cellular Therapies, Inc.* | | | 2,760,117 | |
| | 139,989 | | | Natco Pharma Ltd. (India) | | | 5,259,003 | |
| | 65,582 | | | Phibro Animal Health Corp., Class A | | | 2,074,359 | |
| | | | | | | | |
| | | | | | | 21,294,940 | |
| | | | | | | | |
70
| | | | | | | | |
| Shares | | | | | Value | |
| | | | | | | |
| | |
| | | | Publishing 1.5% | | | | |
| | 523,000 | | | Next Co. Ltd. (Japan) | | $ | 4,138,897 | |
| | | | | | | | |
| | | | Regional Banks 4.8% | | | | |
| | 282,404 | | | Avenue Financial Holdings, Inc.* | | | 3,727,733 | |
| | 125,319 | | | Customers Bancorp, Inc.* | | | 3,220,698 | |
| | 199,010 | | | People’s Utah Bancorp | | | 3,245,853 | |
| | 60,017 | | | Pinnacle Financial Partners, Inc. | | | 2,965,440 | |
| | | | | | | | |
| | | | | | | 13,159,724 | |
| | | | | | | | |
| | | | Research & Consulting
Services 1.0% | | | | |
| | 175,257 | | | Franklin Covey Co.* | | | 2,814,627 | |
| | | | | | | | |
| | | | Restaurants 1.2% | | | | |
| | 83,103 | | | Zoe’s Kitchen, Inc.* | | | 3,281,737 | |
| | | | | | | | |
| | | | Semiconductor Equipment 1.3% | | | | |
| | 364,281 | | | PDF Solutions, Inc.* | | | 3,642,810 | |
| | | | | | | | |
| | | | Semiconductors 2.1% | | | | |
| | 55,867 | | | NVE Corp. | | | 2,711,784 | |
| | 69,423 | | | Power Integrations, Inc. | | | 2,927,568 | |
| | | | | | | | |
| | | | | | | 5,639,352 | |
| | | | | | | | |
| | | | Specialty Stores 2.0% | | | | |
| | 205,890 | | | DavidsTea, Inc.* (Canada) | | | 3,224,237 | |
| | 60,752 | | | Hibbett Sports, Inc.* | | | 2,126,928 | |
| | | | | | | | |
| | | | | | | 5,351,165 | |
| | | | | | | | |
| | | | Systems Software 4.8% | | | | |
| | 116,402 | | | AVG Technologies N.V.* | | | 2,531,744 | |
| | 70,258 | | | FleetMatics Group plc* | | | 3,448,965 | |
| | 260,782 | | | Infoblox, Inc.* | | | 4,167,296 | |
| | 283,766 | | | TubeMogul, Inc.* | | | 2,985,218 | |
| | | | | | | | |
| | | | | | | 13,133,223 | |
| | | | | | | | |
| | | | Technology Hardware, Storage & Peripherals 1.5% | | | | |
| | 290,211 | | | Intevac, Inc.* | | | 1,334,970 | |
| | 1,129,520 | | | USA Technologies, Inc.* | | | 2,812,505 | |
| | | | | | | | |
| | | | | | | 4,147,475 | |
| | | | | | | | |
| | | | Thrifts & Mortgage Finance 1.6% | | | | |
| | 1,050,006 | | | Gruh Finance Ltd. (India) | | | 4,275,369 | |
| | | | | | | | |
| | | | Trading Companies & Distributors 0.6% | | | | |
| | 163,840 | | | CAI International, Inc.* | | | 1,651,507 | |
| | | | | | | | |
| | | | Trucking 0.7% | | | | |
| | 61,233 | | | Saia, Inc.* | | | 1,895,161 | |
| | | | | | | | |
| | |
| | | | Total Common Stocks
(cost $182,746,791) | | | 252,301,777 | |
| | | | | | | | |
| | | | | | | | |
Principal
Amount | | | | | Value | |
| | | | | | | |
| | | | SHORT-TERM INVESTMENTS 3.2% | | | | |
| | |
| | | | Repurchase Agreement 3.2% | | | | |
| | $8,784,540 | | | Repurchase Agreement dated 9/30/15, 0.00% due 10/1/15 with State Street Bank and Trust Co. collateralized by $8,660,000 of United States Treasury Bonds 2.125% due 1/31/21; value: $8,961,126; repurchase proceeds: $8,784,540 (cost $8,784,540) | | $ | 8,784,540 | |
| | | | | | | | |
| | |
| | | | Total Short-Term Investments
(cost $8,784,540) | | | 8,784,540 | |
| | | | | | | | |
| | |
| | | | Total Investments
(cost $191,531,331) 95.5%§ | | | 261,086,317 | |
| | |
| | | | Other Assets less Liabilities 4.5% | | | 12,224,526 | |
| | | | | | | | |
| | |
| | | | NET ASSETS 100.0% | | $ | 273,310,843 | |
| | | | | | | | |
| |
| | | | *Non-income producing. §The aggregate amount of foreign securities fair valued pursuant to a systematic valuation model as a percent of net assets was 11.55%. REIT Real Estate Investment Trust. See Notes to Financial Statements. | |
At September 30, 2015, Wasatch Micro Cap Fund’s investments, excluding short-term investments, were in the following countries (unaudited):
| | | | |
| Country | | % | |
Canada | | | 2.8 | |
India | | | 8.3 | |
Ireland | | | 2.2 | |
Japan | | | 2.8 | |
Luxembourg | | | 1.4 | |
New Zealand | | | 0.5 | |
Sweden | | | 1.3 | |
Switzerland | | | 0.2 | |
United Kingdom | | | 1.0 | |
United States | | | 79.5 | |
| | | | |
TOTAL | | | 100.0 | % |
| | | | |
71
| | |
| WASATCH MICRO CAP VALUE FUND (WAMVX) — Schedule of Investments | | |
|
|
|
| | | | | | | | |
| Shares | | | | | Value | |
| | | | | | | |
| | | | COMMON STOCKS 84.4% | | | | |
| | |
| | | | Advertising 0.6% | | | | |
| | 305,000 | | | InternetQ plc* (United Kingdom) | | $ | 1,000,703 | |
| | | | | | | | |
| | | | Airlines 1.4% | | | | |
| | 10,000 | | | Allegiant Travel Co. | | | 2,162,500 | |
| | | | | | | | |
| | | | Alternative Carriers 1.3% | | | | |
| | 100,000 | | | inContact, Inc.* | | | 751,000 | |
| | 220,000 | | | ORBCOMM, Inc.* | | | 1,227,600 | |
| | | | | | | | |
| | | | | | | 1,978,600 | |
| | | | | | | | |
| | | | Application Software 2.6% | | | | |
| | 66,000 | | | Ebix, Inc. | | | 1,647,360 | |
| | 37,000 | | | ESI Group* (France) | | | 1,031,935 | |
| | 42,000 | | | Globant S.A.* (Luxembourg) | | | 1,284,780 | |
| | | | | | | | |
| | | | | | | 3,964,075 | |
| | | | | | | | |
| | | | Asset Management & Custody Banks 1.3% | | | | |
| | 97,000 | | | Medallion Financial Corp. | | | 735,260 | |
| | 15,221 | | | River and Mercantile Group plc (United Kingdom) | | | 53,965 | |
| | 55,759 | | | Silvercrest Asset Management Group, Inc. | | | 602,755 | |
| | 6,000 | | | Virtus Investment Partners, Inc. | | | 603,000 | |
| | | | | | | | |
| | | | | | | 1,994,980 | |
| | | | | | | | |
| | | | Auto Parts & Equipment 1.3% | | | | |
| | 30,000 | | | Gentherm, Inc.* | | | 1,347,600 | |
| | 56,920 | | | Unique Fabricating, Inc. | | | 631,812 | |
| | | | | | | | |
| | | | | | | 1,979,412 | |
| | | | | | | | |
| | | | Automotive Retail 1.4% | | | | |
| | 53,000 | | | Mekonomen AB (Sweden) | | | 1,227,228 | |
| | 45,985 | | | Yellow Hat Ltd. (Japan) | | | 997,030 | |
| | | | | | | | |
| | | | | | | 2,224,258 | |
| | | | | | | | |
| | | | Biotechnology 1.6% | | | | |
| | 130,000 | | | Abcam plc (United Kingdom) | | | 1,143,504 | |
| | 80,000 | | | Sangamo BioSciences, Inc.* | | | 451,200 | |
| | 40,000 | | | Vitrolife AB (Sweden) | | | 809,084 | |
| | | | | | | | |
| | | | | | | 2,403,788 | |
| | | | | | | | |
| | | | Brewers 1.2% | | | | |
| | 900,000 | | | Turk Tuborg Bira ve Malt Sanayii A.S.* (Turkey) | | | 1,792,835 | |
| | | | | | | | |
| | | | Building Products 2.1% | | | | |
| | 29,000 | | | Caesarstone Sdot-Yam Ltd. (Israel) | | | 881,600 | |
| | 29,000 | | | Patrick Industries, Inc.* | | | 1,145,210 | |
| | 34,000 | | | Trex Co., Inc.* | | | 1,133,220 | |
| | | | | | | | |
| | | | | | | 3,160,030 | |
| | | | | | | | |
| | | | Commercial Printing 0.6% | | | | |
| | 150,000 | | | InnerWorkings, Inc.* | | | 937,500 | |
| | | | | | | | |
| | | | Commodity Chemicals 0.9% | | | | |
| | 111,000 | | | Trecora Resources* | | | 1,378,620 | |
| | | | | | | | |
| | | | Communications Equipment 1.7% | | | | |
| | 180,000 | | | ShoreTel, Inc.* | | | 1,344,600 | |
| | 245,000 | | | Telit Communications plc* (United Kingdom) | | | 1,253,039 | |
| | | | | | | | |
| | | | | | | 2,597,639 | |
| | | | | | | | |
| | | | Construction & Engineering 0.7% | | | | |
| | 55,643 | | | NV5 Holdings, Inc.* | | | 1,032,734 | |
| | | | | | | | |
| | | | Construction Materials 0.6% | | | | |
| | 2,706,000 | | | Dongpeng Holdings Co. Ltd. (China) | | | 908,228 | |
| | | | | | | | |
| | | | Consumer Finance 0.6% | | | | |
| | 24,000 | | | Encore Capital Group, Inc.* | | | 888,000 | |
| | | | | | | | |
| | | | | | | | |
| Shares | | | | | Value | |
| | | | | | | |
| | | | Diversified Banks 0.9% | | | | |
| | 1,000,000 | | | City Union Bank Ltd. (India) | | $ | 1,402,683 | |
| | | | | | | | |
| | | | Electrical Components & Equipment 0.3% | | | | |
| | 500,000 | | | Revolution Lighting Technologies, Inc.* | | | 475,000 | |
| | | | | | | | |
| | | | Electronic Equipment & Instruments 1.1% | | | | |
| | 58,000 | | | Optex Co. Ltd. (Japan) | | | 1,072,121 | |
| | 86,000 | | | SuperCom Ltd.* (Israel) | | | 688,000 | |
| | | | | | | | |
| | | | | | | 1,760,121 | |
| | | | | | | | |
| | | | Electronic Manufacturing Services 1.0% | | | | |
| | 86,000 | | | Fabrinet* | | | 1,576,380 | |
| | | | | | | | |
| | | | Environmental & Facilities Services 0.6% | | | | |
| | 305,000 | | | Hudson Technologies, Inc.* | | | 905,850 | |
| | | | | | | | |
| | | | Food Distributors 0.7% | | | | |
| | 76,000 | | | Chefs’ Warehouse, Inc. (The)* | | | 1,076,160 | |
| | | | | | | | |
| | | | General Merchandise Stores 0.8% | | | | |
| | 26,000 | | | Seria Co. Ltd. (Japan) | | | 1,283,632 | |
| | | | | | | | |
| | | | Health Care Distributors 0.5% | | | | |
| | 2,300,000 | | | Universal Health International Group Holding Ltd. (China) | | | 759,523 | |
| | | | | | | | |
| | | | Health Care Equipment 2.6% | | | | |
| | 75,000 | | | AtriCure, Inc.* | | | 1,643,250 | |
| | 340,000 | | | Bovie Medical Corp.* | | | 673,200 | |
| | 70,000 | | | iRadimed Corp.* | | | 1,705,200 | |
| | | | | | | | |
| | | | | | | 4,021,650 | |
| | | | | | | | |
| | | | Health Care Facilities 2.1% | | | | |
| | 42,000 | | | Ensign Group, Inc. (The) | | | 1,790,460 | |
| | 2,199,943 | | | Religare Health Trust** (Singapore) | | | 1,469,573 | |
| | | | | | | | |
| | | | | | | 3,260,033 | |
| | | | | | | | |
| | | | Health Care REITs 0.9% | | | | |
| | 120,000 | | | CareTrust REIT, Inc. | | | 1,362,000 | |
| | | | | | | | |
| | | | Health Care Services 4.5% | | | | |
| | 34,000 | | | Air Methods Corp.* | | | 1,159,060 | |
| | 900,000 | | | GHP Specialty Care AB* (Sweden) | | | 687,232 | |
| | 55,000 | | | LHC Group, Inc.* | | | 2,462,350 | |
| | 73,000 | | | National Research Corp., Class A | | | 871,620 | |
| | 350,000 | | | Nobilis Health Corp. PIPE* | | | 1,820,461 | |
| | | | | | | | |
| | | | | | | 7,000,723 | |
| | | | | | | | |
| | | | Health Care Supplies 2.7% | | | | |
| | 150,000 | | | Cerus Corp.* | | | 681,000 | |
| | 15,000 | | | Guerbet (France) | | | 1,067,361 | |
| | 375,000 | | | Synergetics USA, Inc.* | | | 2,463,750 | |
| | | | | | | | |
| | | | | | | 4,212,111 | |
| | | | | | | | |
| | | | Health Care Technology 2.0% | | | | |
| | 90,000 | | | Nexus AG (Germany) | | | 1,799,299 | |
| | 32,000 | | | Software Service, Inc. (Japan) | | | 1,259,010 | |
| | | | | | | | |
| | | | | | | 3,058,309 | |
| | | | | | | | |
| | | | Home Improvement Retail 1.0% | | | | |
| | 41,000 | | | Hornbach Baumarkt AG (Germany) | | | 1,534,248 | |
| | | | | | | | |
| | | | Homebuilding 2.4% | | | | |
| | 64,000 | | | Installed Building Products, Inc.* | | | 1,617,920 | |
| | 74,000 | | | LGI Homes, Inc.* | | | 2,012,060 | |
| | | | | | | | |
| | | | | | | 3,629,980 | |
| | | | | | | | |
72
| | | | | | | | |
| Shares | | | | | Value | |
| | | | | | | |
| | | | Homefurnishing Retail 1.4% | | | | |
| | 47,000 | | | Kirkland’s, Inc. | | $ | 1,012,380 | |
| | 53,000 | | | Select Comfort Corp.* | | | 1,159,640 | |
| | | | | | | | |
| | | | | | | 2,172,020 | |
| | | | | | | | |
| | | | Hotel & Resort REITs 0.7% | | | | |
| | 90,000 | | | Summit Hotel Properties, Inc. | | | 1,050,300 | |
| | | | | | | | |
| | | | Human Resource & Employment Services 0.4% | | | | |
| | 169,999 | | | Creek & River Co. Ltd. (Japan) | | | 603,796 | |
| | | | | | | | |
| | | | Industrial Machinery 2.3% | | | | |
| | 67,000 | | | CKD Corp. (Japan) | | | 553,966 | |
| | 31,000 | | | Hy-Lok Corp. (Korea) | | | 893,516 | |
| | 42,000 | | | John Bean Technologies Corp. | | | 1,606,500 | |
| | 33,000 | | | Yushin Precision Equipment Co. Ltd. (Japan) | | | 561,844 | |
| | | | | | | | |
| | | | | | | 3,615,826 | |
| | | | | | | | |
| | | | Internet Software & Services 0.7% | | | | |
| | 134,600 | | | IntraLinks Holdings, Inc.* | | | 1,115,834 | |
| | | | | | | | |
| | | | IT Consulting & Other Services 2.6% | | | | |
| | 26,000 | | | EPAM Systems, Inc.* | | | 1,937,520 | |
| | 96,000 | | | Perficient, Inc.* | | | 1,481,280 | |
| | 500,000 | | | Sysorex Global Holdings Corp.* | | | 515,000 | |
| | | | | | | | |
| | | | | | | 3,933,800 | |
| | | | | | | | |
| | | | Leisure Products 1.4% | | | | |
| | 36,700 | | | Malibu Boats, Inc.* | | | 513,066 | |
| | 52,000 | | | MCBC Holdings, Inc.* | | | 673,920 | |
| | 67,000 | | | Nautilus, Inc.* | | | 1,005,000 | |
| | | | | | | | |
| | | | | | | 2,191,986 | |
| | | | | | | | |
| | | | Life Sciences Tools & Services 1.1% | | | | |
| | 41,000 | | | INC Research Holdings, Inc., Class A* | | | 1,640,000 | |
| | | | | | | | |
| | | | Mortgage REITs 1.7% | | | | |
| | 260,000 | | | Arbor Realty Trust, Inc.†† | | | 1,653,600 | |
| | 51,000 | | | Colony Capital, Inc., Class A | | | 997,560 | |
| | | | | | | | |
| | | | | | | 2,651,160 | |
| | | | | | | | |
| | | | Packaged Foods & Meats 2.1% | | | | |
| | 30,400 | | | John B. Sanfilippo & Son, Inc. | | | 1,558,304 | |
| | 3,000,000 | | | Kawan Food BHD (Malaysia) | | | 1,647,642 | |
| | | | | | | | |
| | | | | | | 3,205,946 | |
| | | | | | | | |
| | | | Personal Products 0.8% | | | | |
| | 30,000 | | | Nu Skin Enterprises, Inc., Class A | | | 1,238,400 | |
| | | | | | | | |
| | | | Pharmaceuticals 5.5% | | | | |
| | 29,000 | | | Cempra, Inc.* | | | 807,360 | |
| | 20,000 | | | Intra-Cellular Therapies, Inc.* | | | 800,800 | |
| | 700,000 | | | Lee’s Pharmaceutical Holdings Ltd. (China) | | | 905,750 | |
| | 1,300,000 | | | Marksans Pharma Ltd. (India) | | | 2,057,303 | |
| | 160,000 | | | Moberg Pharma AB* (Sweden) | | | 917,214 | |
| | 48,000 | | | Natco Pharma Ltd. (India) | | | 1,803,229 | |
| | 190,000 | | | TWi Pharmaceuticals, Inc.* (Taiwan) | | | 1,238,678 | |
| | | | | | | | |
| | | | | | | 8,530,334 | |
| | | | | | | | |
| | | | Property & Casualty Insurance 3.3% | | | | |
| | 140,000 | | | 1347 Property Insurance Holdings, Inc.* | | | 1,022,000 | |
| | 120,000 | | | Atlas Financial Holdings, Inc.* | | | 2,220,000 | |
| | 208,365 | | | Kingstone Cos., Inc. | | | 1,806,525 | |
| | | | | | | | |
| | | | | | | 5,048,525 | |
| | | | | | | | |
| | | | Regional Banks 4.8% | | | | |
| | 107,000 | | | Blue Hills Bancorp, Inc. | | | 1,481,950 | |
| | 68,000 | | | Customers Bancorp, Inc.* | | | 1,747,600 | |
| | 51,000 | | | First of Long Island Corp. (The) | | | 1,378,530 | |
| | 111,000 | | | Investar Holding Corp. | | | 1,719,390 | |
| | 69,000 | | | People’s Utah Bancorp | | | 1,125,390 | |
| | | | | | | | |
| | | | | | | 7,452,860 | |
| | | | | | | | |
| | | | | | | | |
| Shares | | | | | Value | |
| | | | | | | |
| | | | Research & Consulting Services 0.8% | | | | |
| | 75,000 | | | Franklin Covey Co.* | | $ | 1,204,500 | |
| | | | | | | | |
| | | | Residential REITs 0.4% | | | | |
| | 50,000 | | | Bluerock Residential Growth REIT, Inc. | | | 599,000 | |
| | | | | | | | |
| | | | Restaurants 0.6% | | | | |
| | 400,000 | | | Collins Foods Ltd. (Australia) | | | 913,107 | |
| | | | | | | | |
| | | | Semiconductor Equipment 0.3% | | | | |
| | 49,000 | | | PDF Solutions, Inc.* | | | 490,000 | |
| | | | | | | | |
| | | | Semiconductors 1.5% | | | | |
| | 302,724 | | | GigOptix, Inc.* | | | 529,767 | |
| | 140,000 | | | Pixelworks, Inc.* | | | 505,400 | |
| | 96,000 | | | Tower Semiconductor Ltd.* (Israel) | | | 1,235,520 | |
| | | | | | | | |
| | | | | | | 2,270,687 | |
| | | | | | | | |
| | | | Soft Drinks 0.7% | | | | |
| | 12,000,000 | | | Pepsi-Cola Products Philippines, Inc. (Philippines) | | | 1,052,632 | |
| | | | | | | | |
| | | | Specialty Chemicals 0.5% | | | | |
| | 70,000 | | | Ferro Corp.* | | | 766,500 | |
| | | | | | | | |
| | | | Systems Software 1.2% | | | | |
| | 85,000 | | | AVG Technologies N.V.* | | | 1,848,750 | |
| | | | | | | | |
| | | | Technology Hardware, Storage & Peripherals 1.2% | | | | |
| | 28,000 | | | KONA I Co. Ltd. (Korea) | | | 1,042,222 | |
| | 300,000 | | | USA Technologies, Inc.* | | | 747,000 | |
| | | | | | | | |
| | | | | | | 1,789,222 | |
| | | | | | | | |
| | | | Textiles 0.5% | | | | |
| | 2,022,000 | | | Best Pacific International Holdings Ltd. (China) | | | 834,869 | |
| | | | | | | | |
| | | | Thrifts & Mortgage Finance 1.8% | | | | |
| | 39,000 | | | Anchor BanCorp Wisconsin, Inc.* | | | 1,661,010 | |
| | 9,000 | | | BofI Holding, Inc.* | | | 1,159,470 | |
| | | | | | | | |
| | | | | | | 2,820,480 | |
| | | | | | | | |
| | | | Trading Companies & Distributors 0.6% | | | | |
| | 40,000 | | | iMarketKorea, Inc. (Korea) | | | 993,792 | |
| | | | | | | | |
| | | | Trucking 1.5% | | | | |
| | 58,000 | | | Roadrunner Transportation Systems, Inc.* | | | 1,067,200 | |
| | 42,000 | | | Saia, Inc.* | | | 1,299,900 | |
| | | | | | | | |
| | | | | | | 2,367,100 | |
| | | | | | | | |
| | |
| | | | Total Common Stocks (cost $104,236,134) | | | 130,123,731 | |
| | | | | | | | |
| | |
| | | | PREFERRED STOCKS 2.0% | | | | |
| | |
| | | | Oil & Gas Refining & Marketing 0.8% | | | | |
| | 500,000 | | | Vertex Energy, Inc., Pfd.* *** † | | | 1,310,000 | |
| | | | | | | | |
| | | | Pharmaceuticals 1.2% | | | | |
| | 105,263 | | | Acetylon Pharmaceuticals, Inc., Series B Pfd.* *** † | | | 1,801,050 | |
| | | | | | | | |
| | |
| | | | Total Preferred Stocks
(cost $1,954,999) | | | 3,111,050 | |
| | | | | | | | |
| | |
| | | | WARRANTS 0.0% | | | | |
| | |
| | | | Oil & Gas Refining & Marketing 0.0% | | | | |
| | 250,000 | | | Vertex Energy, Inc., expiring 12/24/20* *** † | | | 42,019 | |
| | | | | | | | |
| | |
| | | | Total Warrants
(cost $95,000) | | | 42,019 | |
| | | | | | | | |
73
| | |
| WASATCH MICRO CAP VALUE FUND (WAMVX) — Schedule of Investments (continued) | | SEPTEMBER 30, 2015 |
|
|
|
| | | | | | | | |
Principal
Amount | | | | | Value | |
| | | | | | | |
| | | | SHORT-TERM INVESTMENTS 12.9% | |
| | |
| | | | Repurchase Agreement 12.9% | | | | |
| | $19,808,193 | | | Repurchase Agreement dated 9/30/15, 0.00% due 10/1/15 with State Street Bank and Trust Co. collateralized by $20,230,000 of United States Treasury Notes 1.375% due 9/30/20; value: $20,204,713; repurchase proceeds: $19,808,193††
(cost $19,808,193) | | $ | 19,808,193 | |
| | | | | | | | |
| | |
| | | | Total Short-Term Investments
(cost $19,808,193) | | | 19,808,193 | |
| | | | | | | | |
| | |
| | | | Total Investments
(cost $126,094,326) 99.3%§ | | | 153,084,993 | |
| | |
| | | | Other Assets less Liabilities 0.7% | | | 1,083,871 | |
| | | | | | | | |
| | |
| | | | NET ASSETS 100.0% | | $ | 154,168,864 | |
| | | | | | | | |
| |
| | | | *Non-income producing. **Common units. ***Security was fair valued under procedures adopted by the Board of Trustees (see Note 13). †Security purchased in a private placement transaction or under Rule 144A of the Securities Act of 1933 (see Note 9). ††All or a portion of this security has been designated as collateral for forward foreign currency exchange contracts. As of September 30, 2015, the contracts were no longer held; therefore, the collateral will be subsequently released. §The aggregate amount of foreign securities fair valued pursuant to a systematic valuation model as a percent of net assets was 21.37%. PIPE Private Investment in a Public Equity. REIT Real Estate Investment Trust. See Notes to Financial Statements. | |
At September 30, 2015, Wasatch Micro Cap Value Fund’s investments, excluding short-term investments, were in the following countries (unaudited):
| | | | |
| Country | | % | |
Australia | | | 0.7 | |
China | | | 2.6 | |
France | | | 1.6 | |
Germany | | | 2.5 | |
India | | | 3.9 | |
Israel | | | 2.1 | |
Japan | | | 4.8 | |
Korea | | | 2.2 | |
Luxembourg | | | 1.0 | |
Malaysia | | | 1.2 | |
Philippines | | | 0.8 | |
Singapore | | | 1.1 | |
Sweden | | | 2.7 | |
Taiwan | | | 0.9 | |
Turkey | | | 1.3 | |
United Kingdom | | | 2.6 | |
United States | | | 68.0 | |
| | | | |
TOTAL | | | 100.0 | % |
| | | | |
74
| | |
| WASATCH SMALL CAP GROWTH FUND (WAAEX) — Schedule of Investments | | SEPTEMBER 30, 2015 |
|
|
|
| | | | | | | | |
| Shares | | | | | Value | |
| | | | | | | |
| | | | COMMON STOCKS 93.8% | | | | |
| | |
| | | | Aerospace & Defense 1.6% | | | | |
| | 684,060 | | | HEICO Corp., Class A | | $ | 31,063,165 | |
| | | | | | | | |
| | | | Air Freight & Logistics 2.9% | | | | |
| | 36,319,023 | | | Aramex PJSC (United Arab Emirates) | | | 31,209,777 | |
| | 1,357,122 | | | Echo Global Logistics, Inc.* | | | 26,599,591 | |
| | | | | | | | |
| | | | | | | 57,809,368 | |
| | | | | | | | |
| | | | Airlines 2.8% | | | | |
| | 257,301 | | | Allegiant Travel Co. | | | 55,641,341 | |
| | | | | | | | |
| | | | Apparel Retail 1.0% | | | | |
| | 1,309,779 | | | Zumiez, Inc.* | | | 20,471,846 | |
| | | | | | | | |
| | | | Application Software 8.0% | | | | |
| | 206,316 | | | Globant S.A.* (Luxembourg) | | | 6,311,206 | |
| | 286,105 | | | HubSpot, Inc.* | | | 13,266,689 | |
| | 325,401 | | | Paylocity Holding Corp.* | | | 9,758,776 | |
| | 608,498 | | | Ultimate Software Group, Inc.* | | | 108,927,227 | |
| | 1,070,236 | | | Zendesk, Inc.* | | | 21,094,352 | |
| | | | | | | | |
| | | | | | | 159,358,250 | |
| | | | | | | | |
| | | | Automotive Retail 4.1% | | | | |
| | 621,656 | | | Monro Muffler Brake, Inc. | | | 41,992,863 | |
| | 162,913 | | | O’Reilly Automotive, Inc.* | | | 40,728,250 | |
| | | | | | | | |
| | | | | | | 82,721,113 | |
| | | | | | | | |
| | | | Biotechnology 5.5% | | | | |
| | 2,124,073 | | | Abcam plc (United Kingdom) | | | 18,683,735 | |
| | 1,162,454 | | | Argos Therapeutics, Inc.* ‡‡ | | | 5,637,902 | |
| | 1,357,191 | | | ChemoCentryx, Inc.* | | | 8,211,006 | |
| | 360,606 | | | Esperion Therapeutics, Inc.* | | | 8,506,695 | |
| | 533,310 | | | Exact Sciences Corp.* | | | 9,594,247 | |
| | 286,136 | | | Flexion Therapeutics, Inc.* | | | 4,251,981 | |
| | 987,182 | | | Inovio Pharmaceuticals, Inc.* | | | 5,705,912 | |
| | 2,064,571 | | | Sangamo BioSciences, Inc.* | | | 11,644,180 | |
| | 996,987 | | | Seattle Genetics, Inc.* | | | 38,443,819 | |
| | | | | | | | |
| | | | | | | 110,679,477 | |
| | | | | | | | |
| | | | Consumer Finance 0.6% | | | | |
| | 3,305,639 | | | Mahindra & Mahindra Financial Services Ltd. (India) | | | 12,110,713 | |
| | | | | | | | |
| | | | Data Processing & Outsourced Services 1.5% | | | | |
| | 822,058 | | | ExlService Holdings, Inc.* | | | 30,358,602 | |
| | | | | | | | |
| | | | Diversified Banks 2.6% | | | | |
| | 565,550 | | | HDFC Bank Ltd. ADR (India) | | | 34,549,449 | |
| | 1,566,515 | | | Yes Bank Ltd. (India) | | | 17,503,591 | |
| | | | | | | | |
| | | | | | | 52,053,040 | |
| | | | | | | | |
| | | | Diversified Capital Markets 0.7% | | | | |
| | 437,341 | | | HFF, Inc., Class A | | | 14,764,632 | |
| | | | | | | | |
| | | | Diversified Support Services 1.8% | | | | |
| | 1,124,516 | | | Copart, Inc.* | | | 36,996,576 | |
| | | | | | | | |
| | | | Drug Retail 0.7% | | | | |
| | 119,229 | | | Cosmos Pharmaceutical Corp. (Japan) | | | 14,033,754 | |
| | | | | | | | |
| | | | Electronic Manufacturing Services 1.7% | | | | |
| | 438,553 | | | IPG Photonics Corp.* | | | 33,316,871 | |
| | | | | | | | |
| | | | Environmental & Facilities Services 0.1% | | | | |
| | 103,023 | | | Tetra Tech, Inc. | | | 2,504,489 | |
| | | | | | | | |
| | | | Food Distributors 1.3% | | | | |
| | 1,897,093 | | | Chefs’ Warehouse, Inc. (The)* ‡‡ | | | 26,862,837 | |
| | | | | | | | |
| | | | | | | | |
| Shares | | | | | Value | |
| | | | | | | |
| | | | Health Care Equipment 2.1% | | | | |
| | 597,388 | | | Abaxis, Inc. | | $ | 26,279,098 | |
| | 117,978 | | | DexCom, Inc.* | | | 10,129,591 | |
| | 593,260 | | | Tandem Diabetes Care, Inc.* | | | 5,226,621 | |
| | | | | | | | |
| | | | | | | 41,635,310 | |
| | | | | | | | |
| | | | Health Care Facilities 1.3% | | | | |
| | 594,026 | | | Ensign Group, Inc. (The) | | | 25,323,328 | |
| | | | | | | | |
| | | | Health Care Services 2.2% | | | | |
| | 1,517,267 | | | ExamWorks Group, Inc.* | | | 44,364,887 | |
| | | | | | | | |
| | | | Homefurnishing Retail 1.6% | | | | |
| | 751,690 | | | Mattress Firm Holding Corp.* | | | 31,390,574 | |
| | | | | | | | |
| | | | Industrial Machinery 1.2% | | | | |
| | 371,805 | | | Proto Labs, Inc.* | | | 24,910,935 | |
| | | | | | | | |
| | | | Internet Retail 4.7% | | | | |
| | 828,553 | | | Blue Nile, Inc.* ‡‡ | | | 27,789,668 | |
| | 2,036,490 | | | MakeMyTrip Ltd.* (India) | | | 28,001,737 | |
| | 678,309 | | | Wayfair, Inc., Class A* | | | 23,781,514 | |
| | 113,995 | | | zooplus AG* (Germany) | | | 14,427,411 | |
| | | | | | | | |
| | | | | | | 94,000,330 | |
| | | | | | | | |
| | | | Internet Software & Services 7.8% | | | | |
| | 500,859 | | | Angie’s List, Inc.* | | | 2,524,330 | |
| | 138,930 | | | Cimpress N.V.* | | | 10,573,962 | |
| | 1,926,066 | | | Cornerstone OnDemand, Inc.* | | | 63,560,178 | |
| | 278,678 | | | Demandware, Inc.* | | | 14,402,079 | |
| | 1,044,959 | | | Envestnet, Inc.* | | | 31,317,421 | |
| | 305,818 | | | Shutterstock, Inc.* | | | 9,247,936 | |
| | 356,041 | | | SPS Commerce, Inc.* | | | 24,171,624 | |
| | | | | | | | |
| | | | | | | 155,797,530 | |
| | | | | | | | |
| | | | IT Consulting & Other Services 1.0% | | | | |
| | 300,808 | | | Luxoft Holding, Inc.* | | | 19,038,138 | |
| | | | | | | | |
| | | | Life Sciences Tools & Services 5.5% | | | | |
| | 143,081 | | | Bio-Techne Corp. | | | 13,229,269 | |
| | 2,003,520 | | | Divi’s Laboratories Ltd. (India) | | | 34,264,632 | |
| | 1,233,101 | | | Fluidigm Corp.* | | | 10,000,449 | |
| | 752,549 | | | ICON plc* (Ireland) | | | 53,408,402 | |
| | | | | | | | |
| | | | | | | 110,902,752 | |
| | | | | | | | |
| | | | Managed Health Care 1.2% | | | | |
| | 612,868 | | | HealthEquity, Inc.* | | | 18,110,249 | |
| | 804,065 | | | Trupanion, Inc.* | | | 6,070,691 | |
| | | | | | | | |
| | | | | | | 24,180,940 | |
| | | | | | | | |
| | | | Oil & Gas Drilling 0.1% | | | | |
| | 343,142 | | | Seadrill Ltd.* | | | 2,024,538 | |
| | | | | | | | |
| | | | Oil & Gas Equipment & Services 0.9% | | | | |
| | 156,123 | | | Dril-Quip, Inc.* | | | 9,089,481 | |
| | 110,894 | | | Exterran Holdings, Inc. | | | 1,996,092 | |
| | 78,835 | | | Oceaneering International, Inc. | | | 3,096,639 | |
| | 414,825 | | | RPC, Inc. | | | 3,671,201 | |
| | | | | | | | |
| | | | | | | 17,853,413 | |
| | | | | | | | |
| | | | Oil & Gas Exploration & Production 0.4% | | | | |
| | 456,863 | | | EP Energy Corp., Class A* | | | 2,352,844 | |
| | 450,479 | | | Northern Oil and Gas, Inc.* | | | 1,991,117 | |
| | 437,069 | | | WPX Energy, Inc.* | | | 2,893,397 | |
| | | | | | | | |
| | | | | | | 7,237,358 | |
| | | | | | | | |
| | | | Packaged Foods & Meats 1.3% | | | | |
| | 286,067 | | | GlaxoSmithKline Consumer Healthcare Ltd. (India) | | | 26,357,039 | |
| | | | | | | | |
75
| | |
| WASATCH SMALL CAP GROWTH FUND (WAAEX) — Schedule of Investments (continued) | | |
|
|
|
| | | | | | | | |
| Shares | | | | | Value | |
| | | | | | | |
| | | | Personal Products 0.7% | | | | |
| | 945,654 | | | Colgate-Palmolive India Ltd. (India) | | $ | 13,905,268 | |
| | | | | | | | |
| | | | Pharmaceuticals 2.6% | | | | |
| | 1,363,036 | | | Auris Medical Holding AG* (Switzerland) | | | 4,852,408 | |
| | 922,297 | | | Cempra, Inc.* | | | 25,676,749 | |
| | 518,229 | | | Intra-Cellular Therapies, Inc.* | | | 20,749,889 | |
| | | | | | | | |
| | | | | | | 51,279,046 | |
| | | | | | | | |
| | | | Regional Banks 3.6% | | | | |
| | 344,973 | | | Bank of Hawaii Corp. | | | 21,902,336 | |
| | 563,318 | | | Eagle Bancorp, Inc.* | | | 25,630,969 | |
| | 653,991 | | | Glacier Bancorp, Inc. | | | 17,258,822 | |
| | 150,488 | | | Texas Capital Bancshares, Inc.* | | | 7,888,581 | |
| | | | | | | | |
| | | | | | | 72,680,708 | |
| | | | | | | | |
| | | | Research & Consulting Services 0.8% | | | | |
| | 721,261 | | | Stantec, Inc. (Canada) | | | 15,795,616 | |
| | | | | | | | |
| | | | Restaurants 3.3% | | | | |
| | 1,491,986 | | | Jubilant Foodworks Ltd. (India) | | | 36,662,175 | |
| | 883,565 | | | Papa Murphy’s Holdings, Inc.* ‡‡ | | | 12,970,734 | |
| | 416,860 | | | Zoe’s Kitchen, Inc.* | | | 16,461,802 | |
| | | | | | | | |
| | | | | | | 66,094,711 | |
| | | | | | | | |
| | | | Semiconductors 4.3% | | | | |
| | 538,853 | | | Cavium, Inc.* | | | 33,069,408 | |
| | 327,364 | | | Monolithic Power Systems, Inc. | | | 16,761,037 | |
| | 715,110 | | | Power Integrations, Inc. | | | 30,156,189 | |
| | 161,235 | | | Silicon Laboratories, Inc.* | | | 6,697,702 | |
| | | | | | | | |
| | | | | | | 86,684,336 | |
| | | | | | | | |
| | | | Specialty Stores 1.1% | | | | |
| | 481,752 | | | Five Below, Inc.* | | | 16,177,232 | |
| | 147,974 | | | Hibbett Sports, Inc.* | | | 5,180,570 | |
| | | | | | | | |
| | | | | | | 21,357,802 | |
| | | | | | | | |
| | | | Systems Software 4.4% | | | | |
| | 754,194 | | | FleetMatics Group plc* | | | 37,023,383 | |
| | 1,229,162 | | | Infoblox, Inc.* | | | 19,642,009 | |
| | 585,371 | | | Qualys, Inc.* | | | 16,659,659 | |
| | 711,894 | | | TubeMogul, Inc.* | | | 7,489,125 | |
| | 426,883 | | | VASCO Data Security International, Inc.* | | | 7,274,086 | |
| | | | | | | | |
| | | | | | | 88,088,262 | |
| | | | | | | | |
| | | | Trading Companies & Distributors 1.5% | | | | |
| | 475,868 | | | MSC Industrial Direct Co., Inc., Class A | | | 29,042,224 | |
| | | | | | | | |
| | | | Trucking 3.3% | | | | |
| | 2,749,883 | | | Knight Transportation, Inc.†† | | | 65,997,192 | |
| | | | | | | | |
| | |
| | | | Total Common Stocks
(cost $1,411,949,047) | | | 1,876,688,311 | |
| | | | | | | | |
| | |
| | | | PREFERRED STOCKS 1.8% | | | | |
| | |
| | | | Biotechnology 0.0% | | | | |
| | 677,966 | | | Nanosys, Inc., Series D Pfd.* *** † | | | 136,135 | |
| | 161,519 | | | Nanosys, Inc., Series E Pfd.* *** † | | | 135,886 | |
| | | | | | | | |
| | | | | | | 272,021 | |
| | | | | | | | |
| | | | Oil & Gas Equipment & Services 0.6% | | | | |
| | 5,818,582 | | | Drilling Info Holdings, Inc., Series B Pfd.* *** † | | | 12,432,564 | |
| | | | | | | | |
| | | | | | | | |
| Shares | | | | | Value | |
| | | | | | | |
| | | | Systems Software 1.2% | | | | |
| | 1,114,610 | | | DataStax, Inc., Series E Pfd.* *** † | | $ | 8,000,002 | |
| | 33,296 | | | DocuSign, Inc., Series B Pfd. * *** † | | | 635,724 | |
| | 9,974 | | | DocuSign, Inc., Series B-1 Pfd. * *** † | | | 190,435 | |
| | 23,905 | | | DocuSign, Inc., Series D Pfd. * *** † | | | 456,420 | |
| | 618,152 | | | DocuSign, Inc., Series E Pfd. * *** † | | | 11,802,438 | |
| | 157,124 | | | DocuSign, Inc., Series F Pfd.* *** † | | | 2,999,984 | |
| | | | | | | | |
| | | | | | | 24,085,003 | |
| | | | | | | | |
| | |
| | | | Total Preferred Stocks
(cost $37,534,915) | | | 36,789,588 | |
| | | | | | | | |
| |
| | | | LIMITED PARTNERSHIP INTEREST 0.3% | |
| | |
| | | | Asset Management & Custody Banks 0.3% | | | | |
| | | | Greenspring Global Partners II-B, L.P.* *** † | | | 3,165,480 | |
| | | | Greenspring Global Partners III-B, L.P.* *** † | | | 1,662,383 | |
| | | | | | | | |
| | | | | | | 4,827,863 | |
| | | | | | | | |
| | |
| | | | Total Limited Partnership Interest
(cost $4,715,091) | | | 4,827,863 | |
| | | | | | | | |
| | |
Principal
Amount | | | | | Value | |
| | | | | | | |
| | | | SHORT-TERM INVESTMENTS 4.4% | |
| | |
| | | | Repurchase Agreement 4.4% | | | | |
| | $87,423,697 | | | Repurchase Agreement dated 9/30/15, 0.00% due 10/1/15 with State Street Bank and Trust Co. collateralized by $89,165,000 of United States Treasury Notes 2.125% due 1/31/21; value: $3,492,356; United States Treasury Notes 1.375% due 9/30/20; value: $85,682,763; repurchase proceeds: $87,423,697†† (cost $87,423,697) | | $ | 87,423,697 | |
| | | | | | | | |
| | |
| | | | Total Short-Term Investments
(cost $87,423,697) | | | 87,423,697 | |
| | | | | | | | |
| | |
| | | | Total Investments
(cost $1,541,622,750) 100.3%§ | | | 2,005,729,459 | |
| | |
| | | | Liabilities less Other Assets (0.3%) | | | (5,141,826 | ) |
| | | | | | | | |
| | |
| | | | NET ASSETS 100.0% | | $ | 2,000,587,633 | |
| | | | | | | | |
| |
| | | | *Non-income producing. ***Security was fair valued under procedures adopted by the Board of Trustees (see Note 13). †Security purchased in a private placement transaction or under Rule 144A of the Securities Act of 1933 (see Note 9). ††All or a portion of this security has been designated as collateral for purchase commitments (see Note 10). ‡‡Affiliated company (see Note 8). §The aggregate amount of foreign securities fair valued pursuant to a systematic valuation model as a percent of net assets was 9.64%. ADR American Depositary Receipt. See Notes to Financial Statements. | |
76
At September 30, 2015, Wasatch Small Cap Growth Fund’s investments, excluding short-term investments, were in the following countries (unaudited):
| | | | |
| Country | | % | |
Canada | | | 0.8 | |
Germany | | | 0.8 | |
India | | | 10.6 | |
Ireland | | | 2.8 | |
Japan | | | 0.7 | |
Luxembourg | | | 0.3 | |
Switzerland | | | 0.3 | |
United Arab Emirates | | | 1.6 | |
United Kingdom | | | 1.0 | |
United States | | | 81.1 | |
| | | | |
TOTAL | | | 100.0 | % |
| | | | |
77
| | |
| WASATCH SMALL CAP VALUE FUND (WMCVX / WICVX) — Schedule of Investments | | |
|
|
|
| | | | | | | | |
| Shares | | | | | Value | |
| | | | | | | |
| | | | COMMON STOCKS 96.4% | | | | |
| | |
| | | | Aerospace & Defense 2.7% | | | | |
| | 162,809 | | | HEICO Corp., Class A | | $ | 7,393,157 | |
| | | | | | | | |
| | | | Airlines 3.0% | | | | |
| | 38,734 | | | Allegiant Travel Co. | | | 8,376,228 | |
| | | | | | | | |
| | | | Application Software 3.6% | | | | |
| | 239,377 | | | Ebix, Inc. | | | 5,974,850 | |
| | 134,602 | | | Globant S.A.* (Luxembourg) | | | 4,117,475 | |
| | | | | | | | |
| | | | | | | 10,092,325 | |
| | | | | | | | |
| | | | Asset Management & Custody Banks 1.1% | | | | |
| | 29,100 | | | Virtus Investment Partners, Inc. | | | 2,924,550 | |
| | | | | | | | |
| | | | Auto Parts & Equipment 2.0% | | | | |
| | 107,006 | | | Dorman Products, Inc.* | | | 5,445,535 | |
| | | | | | | | |
| | | | Building Products 1.0% | | | | |
| | 88,463 | | | Caesarstone Sdot-Yam Ltd. (Israel) | | | 2,689,275 | |
| | | | | | | | |
| | | | Computer & Electronics Retail 1.0% | | | | |
| | 68,516 | | | GameStop Corp., Class A | | | 2,823,544 | |
| | | | | | | | |
| | | | Consumer Finance 4.1% | | | | |
| | 24,029 | | | Credit Acceptance Corp.* | | | 4,730,589 | |
| | 64,997 | | | PRA Group, Inc.* | | | 3,439,641 | |
| | 122,543 | | | Shriram City Union Finance Ltd. (India) | | | 3,163,171 | |
| | | | | | | | |
| | | | | | | 11,333,401 | |
| | | | | | | | |
| | | | Diversified Banks 2.5% | | | | |
| | 2,552,010 | | | City Union Bank Ltd. (India) | | | 3,579,661 | |
| | 307,077 | | | Yes Bank Ltd. (India) | | | 3,431,151 | |
| | | | | | | | |
| | | | | | | 7,010,812 | |
| | | | | | | | |
| | | | Diversified Support Services 1.6% | | | | |
| | 136,892 | | | Copart, Inc.* | | | 4,503,747 | |
| | | | | | | | |
| | | | Electronic Manufacturing Services 1.8% | | | | |
| | 271,187 | | | Fabrinet* | | | 4,970,858 | |
| | | | | | | | |
| | | | Fertilizers & Agricultural Chemicals 0.8% | | | | |
| | 380,259 | | | Intrepid Potash, Inc.* | | | 2,106,635 | |
| | | | | | | | |
| | | | Footwear 4.9% | | | | |
| | 61,940 | | | Deckers Outdoor Corp.* | | | 3,596,236 | |
| | 74,811 | | | Skechers U.S.A., Inc., Class A* | | | 10,030,659 | |
| | | | | | | | |
| | | | | | | 13,626,895 | |
| | | | | | | | |
| | | | Health Care Facilities 3.1% | | | | |
| | 201,641 | | | Ensign Group, Inc. (The) | | | 8,595,956 | |
| | | | | | | | |
| | | | Health Care REITs 2.8% | | | | |
| | 684,712 | | | CareTrust REIT, Inc. | | | 7,771,481 | |
| | | | | | | | |
| | | | Health Care Services 4.7% | | | | |
| | 98,051 | | | Air Methods Corp.* | | | 3,342,559 | |
| | 218,495 | | | LHC Group, Inc.* | | | 9,782,021 | |
| | | | | | | | |
| | | | | | | 13,124,580 | |
| | | | | | | | |
| | | | Homebuilding 2.8% | | | | |
| | 281,870 | | | LGI Homes, Inc.* | | | 7,664,045 | |
| | | | | | | | |
| | | | Homefurnishing Retail 3.7% | | | | |
| | 232,187 | | | Kirkland’s, Inc. | | | 5,001,308 | |
| | 237,961 | | | Select Comfort Corp.* | | | 5,206,587 | |
| | | | | | | | |
| | | | | | | 10,207,895 | |
| | | | | | | | |
| | | | Hotel & Resort REITs 2.6% | | | | |
| | 607,299 | | | Summit Hotel Properties, Inc. | | | 7,087,179 | |
| | | | | | | | |
| | | | | | | | |
| Shares | | | | | Value | |
| | | | | | | |
| | | | Internet Software & Services 2.3% | | | | |
| | 84,138 | | | Cimpress N.V.* | | $ | 6,403,743 | |
| | | | | | | | |
| | | | IT Consulting & Other Services 3.5% | | | | |
| | 53,755 | | | EPAM Systems, Inc.* | | | 4,005,823 | |
| | 89,041 | | | Luxoft Holding, Inc.* | | | 5,635,405 | |
| | | | | | | | |
| | | | | | | 9,641,228 | |
| | | | | | | | |
| | | | Life Sciences Tools & Services 1.0% | | | | |
| | 38,026 | | | ICON plc* (Ireland) | | | 2,698,705 | |
| | | | | | | | |
| | | | Mortgage REITs 6.2% | | | | |
| | 949,169 | | | Arbor Realty Trust, Inc. | | | 6,036,715 | |
| | 273,865 | | | Colony Capital, Inc., Class A | | | 5,356,800 | |
| | 858,899 | | | MFA Financial, Inc. | | | 5,849,102 | |
| | | | | | | | |
| | | | | | | 17,242,617 | |
| | | | | | | | |
| | | | Oil & Gas Equipment & Services 0.8% | | | | |
| | 169,223 | | | Geospace Technologies Corp.* | | | 2,336,970 | |
| | | | | | | | |
| | | | Oil & Gas Exploration & Production 0.8% | | | | |
| | 1,086,218 | | | Gran Tierra Energy, Inc.* (Colombia) | | | 2,313,644 | |
| | | | | | | | |
| | | | Oil & Gas Refining & Marketing 1.4% | | | | |
| | 105,136 | | | World Fuel Services Corp. | | | 3,763,869 | |
| | | | | | | | |
| | | | Personal Products 2.7% | | | | |
| | 180,055 | | | Nu Skin Enterprises, Inc., Class A | | | 7,432,670 | |
| | | | | | | | |
| | | | Pharmaceuticals 2.9% | | | | |
| | 154,636 | | | Egalet Corp.* | | | 2,038,103 | |
| | 3,707,803 | | | Marksans Pharma Ltd. (India) | | | 5,867,748 | |
| | | | | | | | |
| | | | | | | 7,905,851 | |
| | | | | | | | |
| | | | Regional Banks 11.5% | | | | |
| | 239,208 | | | Avenue Financial Holdings, Inc.* | | | 3,157,546 | |
| | 293,901 | | | Customers Bancorp, Inc.* | | | 7,553,256 | |
| | 116,419 | | | MidSouth Bancorp, Inc. | | | 1,362,102 | |
| | 178,417 | | | People’s Utah Bancorp | | | 2,909,981 | |
| | 150,328 | | | Pinnacle Financial Partners, Inc. | | | 7,427,706 | |
| | 88,551 | | | Prosperity Bancshares, Inc. | | | 4,348,740 | |
| | 141,617 | | | Webster Financial Corp. | | | 5,045,814 | |
| | | | | | | | |
| | | | | | | 31,805,145 | |
| | | | | | | | |
| | | | Research & Consulting Services 1.2% | | | | |
| | 214,023 | | | Franklin Covey Co.* | | | 3,437,209 | |
| | | | | | | | |
| | | | Semiconductor Equipment 1.6% | | | | |
| | 435,382 | | | PDF Solutions, Inc.* | | | 4,353,820 | |
| | | | | | | | |
| | | | Semiconductors 2.5% | | | | |
| | 202,284 | | | Diodes, Inc.* | | | 4,322,809 | |
| | 378,402 | | | Sigma Designs, Inc.* | | | 2,607,190 | |
| | | | | | | | |
| | | | | | | 6,929,999 | |
| | | | | | | | |
| | | | Systems Software 3.5% | | | | |
| | 443,264 | | | AVG Technologies N.V.* | | | 9,640,992 | |
| | | | | | | | |
| | | | Technology Distributors 1.3% | | | | |
| | 351,561 | | | Electro Rent Corp. | | | 3,649,203 | |
| | | | | | | | |
| | | | Trucking 3.4% | | | | |
| | 133,864 | | | Knight Transportation, Inc. | | | 3,212,736 | |
| | 39,252 | | | Old Dominion Freight Line, Inc.* | | | 2,394,372 | |
| | 81,510 | | | Saia, Inc.* | | | 2,522,734 | |
| | 82,761 | | | Universal Truckload Services, Inc. | | | 1,288,589 | |
| | | | | | | | |
| | | | | | | 9,418,431 | |
| | | | | | | | |
| | |
| | | | Total Common Stocks
(cost $224,021,507) | | | 266,722,194 | |
| | | | | | | | |
78
| | | | | | | | |
| Shares | | | | | Value | |
| | | | | | | |
| | | | LIMITED PARTNERSHIP INTEREST 1.3% | | | | |
| | |
| | | | Oil & Gas Storage & Transportation 1.3% | | | | |
| | 119,053 | | | Delek Logistics Partners L.P. | | $ | 3,595,401 | |
| | | | | | | | |
| | |
| | | | Total Limited Partnership Interest
(cost $5,184,560) | | | 3,595,401 | |
| | | | | | | | |
| | |
Principal
Amount | | | | | Value | |
| | | | | | | |
| | | | SHORT-TERM INVESTMENTS 3.1% | | | | |
| | |
| | | | Repurchase Agreement 3.1% | | | | |
| | $8,564,540 | | | Repurchase Agreement dated 9/30/15, 0.00% due 10/1/15 with State Street Bank and Trust Co. collateralized by $8,445,000 of United States Treasury Notes 2.125% due 1/31/21; value: $8,738,650; repurchase proceeds: $8,564,540 (cost $8,564,540) | | $ | 8,564,540 | |
| | | | | | | | |
| | |
| | | | Total Short-Term Investments
(cost $8,564,540) | | | 8,564,540 | |
| | | | | | | | |
| | |
| | | | Total Investments
(cost $237,770,607) 100.8%§ | | | 278,882,135 | |
| | |
| | | | Liabilities less Other Assets (0.8%) | | | (2,286,873 | ) |
| | | | | | | | |
| | |
| | | | NET ASSETS 100.0% | | $ | 276,595,262 | |
| | | | | | | | |
| |
| | | | *Non-income producing. §The aggregate amount of foreign securities fair valued pursuant to a systematic valuation model as a percent of net assets was 5.80%. REIT Real Estate Investment Trust. See Notes to Financial Statements. | |
At September 30, 2015, Wasatch Small Cap Value Fund’s investments, excluding short-term investments, were in the following countries (unaudited):
| | | | |
| Country | | % | |
Colombia | | | 0.9 | |
India | | | 5.9 | |
Ireland | | | 1.0 | |
Israel | | | 1.0 | |
Luxembourg | | | 1.5 | |
United States | | | 89.7 | |
| | | | |
TOTAL | | | 100.0 | % |
| | | | |
79
| | |
| WASATCH STRATEGIC INCOME FUND (WASIX) — Schedule of Investments | | |
|
|
|
| | | | | | | | |
| Shares | | | | | Value | |
| | | | | | | |
| | | | COMMON STOCKS 83.1% | | | | |
| | |
| | | | Asset Management & Custody Banks 11.2% | | | | |
| | 162,237 | | | American Capital Senior Floating Ltd. | | $ | 1,799,208 | |
| | 17,000 | | | Ameriprise Financial, Inc. | | | 1,855,210 | |
| | 101,500 | | | FS Investment Corp. | | | 945,980 | |
| | 449,050 | | | Medallion Financial Corp. | | | 3,403,799 | |
| | 134,379 | | | NorthStar Asset Management Group, Inc. | | | 1,929,683 | |
| | | | | | | | |
| | | | | | | 9,933,880 | |
| | | | | | | | |
| | | | Automotive Retail 0.5% | | | | |
| | 8,300 | | | Penske Automotive Group, Inc. | | | 402,052 | |
| | | | | | | | |
| | | | Broadcasting 3.8% | | | | |
| | 85,100 | | | CBS Corp., Class B | | | 3,395,490 | |
| | | | | | | | |
| | | | Cable & Satellite 2.1% | | | | |
| | 32,700 | | | Comcast Corp., Class A | | | 1,859,976 | |
| | | | | | | | |
| | | | Consumer Finance 6.2% | | | | |
| | 37,030 | | | Capital One Financial Corp. | | | 2,685,416 | |
| | 53,200 | | | Discover Financial Services | | | 2,765,868 | |
| | | | | | | | |
| | | | | | | 5,451,284 | |
| | | | | | | | |
| | | | Data Processing & Outsourced Services 6.3% | | | | |
| | 30,200 | | | MasterCard, Inc., Class A | | | 2,721,624 | |
| | 40,440 | | | Visa, Inc., Class A | | | 2,817,050 | |
| | | | | | | | |
| | | | | | | 5,538,674 | |
| | | | | | | | |
| | | | Diversified REITs 4.8% | | | | |
| | 303,100 | | | NorthStar Realty Finance Corp. | | | 3,743,285 | |
| | 355,714 | | | Star Asia Financial Ltd.* *** † | | | 533,571 | |
| | | | | | | | |
| | | | | | | 4,276,856 | |
| | | | | | | | |
| | | | Fertilizers & Agricultural Chemicals 2.8% | | | | |
| | 29,000 | | | Monsanto Co. | | | 2,474,860 | |
| | | | | | | | |
| | | | Integrated Oil & Gas 3.7% | | | | |
| | 123,785 | | | Suncor Energy, Inc. (Canada) | | | 3,306,307 | |
| | | | | | | | |
| | | | Integrated Telecommunication Services 1.0% | | | | |
| | 20,200 | | | Verizon Communications, Inc. | | | 878,902 | |
| | | | | | | | |
| | | | Mortgage REITs 25.1% | | | | |
| | 60,000 | | | American Capital Mortgage Investment Corp. | | | 884,400 | |
| | 264,000 | | | Capstead Mortgage Corp. | | | 2,610,960 | |
| | 130,491 | | | Colony Capital, Inc., Class A | | | 2,552,404 | |
| | 183,200 | | | Great Ajax Corp. | | | 2,266,184 | |
| | 600,000 | | | MFA Financial, Inc. | | | 4,086,000 | |
| | 150,000 | | | New Residential Investment Corp. | | | 1,965,000 | |
| | 159,200 | | | Starwood Property Trust, Inc. | | | 3,266,784 | |
| | 289,000 | | | Two Harbors Investment Corp. | | | 2,548,980 | |
| | 153,568 | | | ZAIS Financial Corp. | | | 2,057,811 | |
| | | | | | | | |
| | | | | | | 22,238,523 | |
| | | | | | | | |
| | | | Office REITs 2.0% | | | | |
| | 85,000 | | | Gramercy Property Trust, Inc. | | | 1,765,450 | |
| | | | | | | | |
| | | | Oil & Gas Exploration & Production 0.6% | | | | |
| | 98,492 | | | Evolution Petroleum Corp. | | | 546,631 | |
| | | | | | | | |
| | | | Personal Products 5.2% | | | | |
| | 33,274 | | | Herbalife Ltd.* | | | 1,813,433 | |
| | 68,500 | | | Nu Skin Enterprises, Inc., Class A | | | 2,827,680 | |
| | | | | | | | |
| | | | | | | 4,641,113 | |
| | | | | | | | |
| | | | | | | | |
| Shares | | | | | Value | |
| | | | | | | |
| | | | Railroads 2.1% | | | | |
| | 32,600 | | | Canadian National Railway Co. (Canada) | | $ | 1,848,846 | |
| | | | | | | | |
| | | | Technology Hardware, Storage & Peripherals 1.9% | | | | |
| | 15,600 | | | Apple, Inc. | | | 1,720,680 | |
| | | | | | | | |
| | | | Trading Companies & Distributors 3.8% | | | | |
| | 114,200 | | | TAL International Group, Inc.* | | | 1,561,114 | |
| | 8,430 | | | W.W. Grainger, Inc. | | | 1,812,534 | |
| | | | | | | | |
| | | | | | | 3,373,648 | |
| | | | | | | | |
| | |
| | | | Total Common Stocks
(cost $76,674,884) | | | 73,653,172 | |
| | | | | | | | |
| | |
| | | | EXCHANGE-TRADED FUNDS 0.9% | | | | |
| | |
| | | | Asset Management & Custody Banks 0.9% | | | | |
| | 12,500 | | | PowerShares Dynamic Pharmaceuticals Portfolio | | | 829,375 | |
| | | | | | | | |
| | |
| | | | Total Exchange-Traded Funds
(cost $360,108) | | | 829,375 | |
| | | | | | | | |
| | |
| | | | LIMITED PARTNERSHIP INTEREST 11.1% | | | | |
| | |
| | | | Asset Management & Custody Banks 7.7% | | | | |
| | 109,500 | | | Blackstone Group L.P. | | | 3,467,865 | |
| | 201,000 | | | KKR & Co. L.P. | | | 3,372,780 | |
| | | | | | | | |
| | | | | | | 6,840,645 | |
| | | | | | | | |
| | | | Oil & Gas Storage & Transportation 3.4% | | | | |
| | 49,582 | | | Magellan Midstream Partners L.P. | | | 2,980,374 | |
| | | | | | | | |
| | |
| | | | Total Limited Partnership Interest
(cost $11,432,482) | | | 9,821,019 | |
| | | | | | | | |
| | |
Principal
Amount | | | | | Value | |
| | | | | | | |
| | | | CORPORATE BONDS 0.0% | | | | |
| | |
| | | | Gold 0.0% | | | | |
| | $206,604 | | | Redcorp Ventures Ltd., 13.00%, 7/11/12, Series D* *** † §§ (Canada) | | $ | 804 | |
| | | | | | | | |
| | |
| | | | Total Corporate Bonds
(cost $152,583) | | | 804 | |
| | | | | | | | |
80
| | | | | | | | |
| Principal
Amount |
| | | | | Value | |
| | | | | | | |
| | | | SHORT-TERM INVESTMENTS 3.4% | | | | |
| | |
| | | | Repurchase Agreement 3.4% | | | | |
| | $ 3,032,863 | | | Repurchase Agreement dated 9/30/15, 0.00% due 10/1/15 with State Street Bank and Trust Co. collateralized by $2,990,000 of United States Treasury Notes 2.125% due 1/31/21; value: $3,093,968; repurchase proceeds: $3,032,863 (cost $3,032,863) | | $ | 3,032,863 | |
| | | | | | | | |
| | |
| | | | Total Short-Term Investments
(cost $3,032,863) | | | 3,032,863 | |
| | | | | | | | |
| | |
| | | | Total Investments
(cost $91,652,920) 98.5% | | | 87,337,233 | |
| | |
| | | | Other Assets less Liabilities 1.5% | | | 1,323,690 | |
| | | | | | | | |
| | |
| | | | NET ASSETS 100.0% | | $ | 88,660,923 | |
| | | | | | | | |
| |
| | | | *Non-income producing. ***Security was fair valued under procedures adopted by the Board of Trustees (see Note 13). †Security purchased in a private placement transaction or under Rule 144A of the Securities Act of 1933 (see Note 9). §§In default. REIT Real Estate Investment Trust. See Notes to Financial Statements. | |
At September 30, 2015, Wasatch Strategic Income Fund’s investments, excluding short-term investments, were in the following countries (unaudited):
| | | | |
| Country | | % | |
Canada | | | 6.1 | |
United States | | | 93.9 | |
| | | | |
TOTAL | | | 100.0 | % |
| | | | |
81
| | |
| WASATCH ULTRA GROWTH FUND (WAMCX) — Schedule of Investments | | |
|
|
|
| | | | | | | | |
| Shares | | | | | Value | |
| | | | | | | |
| | | | COMMON STOCKS 92.2% | | | | |
| | |
| | | | Air Freight & Logistics 1.1% | | | | |
| | 56,079 | | | Echo Global Logistics, Inc.* | | $ | 1,099,148 | |
| | | | | | | | |
| | | | Application Software 8.8% | | | | |
| | 94,652 | | | Exa Corp.* | | | 977,755 | |
| | 37,296 | | | Globant S.A.* (Luxembourg) | | | 1,140,885 | |
| | 24,367 | | | Interactive Intelligence Group, Inc.* | | | 723,944 | |
| | 44,694 | | | Paylocity Holding Corp.* | | | 1,340,373 | |
| | 24,323 | | | QLIK Technologies, Inc.* | | | 886,573 | |
| | 14,001 | | | Ultimate Software Group, Inc.* | | | 2,506,319 | |
| | 42,128 | | | Zendesk, Inc.* | | | 830,343 | |
| | | | | | | | |
| | | | | | | 8,406,192 | |
| | | | | | | | |
| | | | Biotechnology 7.9% | | | | |
| | 83,574 | | | Argos Therapeutics, Inc.* | | | 405,334 | |
| | 19,052 | | | Bellicum Pharmaceuticals, Inc.* | | | 276,825 | |
| | 84,974 | | | ChemoCentryx, Inc.* | | | 514,093 | |
| | 226,041 | | | Cytokinetics, Inc.* | | | 1,512,214 | |
| | 17,871 | | | Esperion Therapeutics, Inc.* | | | 421,577 | |
| | 16,638 | | | Exact Sciences Corp.* | | | 299,318 | |
| | 5,060 | | | Flexion Therapeutics, Inc.* | | | 75,192 | |
| | 95,791 | | | Inovio Pharmaceuticals, Inc.* | | | 553,672 | |
| | 244,503 | | | Sangamo BioSciences, Inc.* | | | 1,378,997 | |
| | 56,318 | | | Seattle Genetics, Inc.* | | | 2,171,622 | |
| | | | | | | | |
| | | | | | | 7,608,844 | |
| | | | | | | | |
| | | | Building Products 1.3% | | | | |
| | 15,795 | | | Caesarstone Sdot-Yam Ltd. (Israel) | | �� | 480,168 | |
| | 22,323 | | | Trex Co., Inc.* | | | 744,026 | |
| | | | | | | | |
| | | | | | | 1,224,194 | |
| | | | | | | | |
| | | | Diversified Banks 2.9% | | | | |
| | 1,048,081 | | | City Union Bank Ltd. (India) | | | 1,470,125 | |
| | 122,051 | | | Yes Bank Ltd. (India) | | | 1,363,748 | |
| | | | | | | | |
| | | | | | | 2,833,873 | |
| | | | | | | | |
| | | | Electronic Manufacturing Services 1.9% | | | | |
| | 23,441 | | | IPG Photonics Corp.* | | | 1,780,813 | |
| | | | | | | | |
| | | | Environmental & Facilities Services 1.3% | | | | |
| | 25,556 | | | Waste Connections, Inc. | | | 1,241,511 | |
| | | | | | | | |
| | | | Food Distributors 0.6% | | | | |
| | 43,002 | | | Chefs’ Warehouse, Inc. (The)* | | | 608,908 | |
| | | | | | | | |
| | | | Footwear 1.9% | | | | |
| | 13,890 | | | Skechers U.S.A., Inc., Class A* | | | 1,862,371 | |
| | | | | | | | |
| | | | General Merchandise Stores 0.2% | | | | |
| | 11,965 | | | Ollie’s Bargain Outlet Holdings, Inc.* | | | 193,474 | |
| | | | | | | | |
| | | | Health Care Equipment 6.0% | | | | |
| | 103,505 | | | AtriCure, Inc.* | | | 2,267,794 | |
| | 49,546 | | | Entellus Medical, Inc.* | | | 892,819 | |
| | 88,590 | | | Novadaq Technologies, Inc.* (Canada) | | | 923,994 | |
| | 73,852 | | | Oxford Immunotec Global plc* | | | 997,002 | |
| | 71,967 | | | Tandem Diabetes Care, Inc.* | | | 634,029 | |
| | | | | | | | |
| | | | | | | 5,715,638 | |
| | | | | | | | |
| | | | Homebuilding 3.4% | | | | |
| | 28,692 | | | Installed Building Products, Inc.* | | | 725,334 | |
| | 92,322 | | | LGI Homes, Inc.* | | | 2,510,235 | |
| | | | | | | | |
| | | | | | | 3,235,569 | |
| | | | | | | | |
| | | | Industrial Machinery 3.2% | | | | |
| | 63,000 | | | Arcam AB* (Sweden) | | | 1,108,906 | |
| | 29,136 | | | Proto Labs, Inc.* | | | 1,952,112 | |
| | | | | | | | |
| | | | | | | 3,061,018 | |
| | | | | | | | |
| | | | | | | | |
| Shares | | | | | Value | |
| | | | | | | |
| | | | Internet Retail 1.9% | | | | |
| | 91,178 | | | MakeMyTrip Ltd.* (India) | | $ | 1,253,698 | |
| | 16,655 | | | Wayfair, Inc., Class A* | | | 583,924 | |
| | | | | | | | |
| | | | | | | 1,837,622 | |
| | | | | | | | |
| | | | Internet Software & Services 11.3% | | | | |
| | 21,769 | | | Cimpress N.V.* | | | 1,656,838 | |
| | 75,169 | | | Cornerstone OnDemand, Inc.* | | | 2,480,577 | |
| | 37,418 | | | Cvent, Inc.* | | | 1,259,490 | |
| | 27,424 | | | Demandware, Inc.* | | | 1,417,272 | |
| | 46,829 | | | Reis, Inc. | | | 1,060,677 | |
| | 44,595 | | | SciQuest, Inc.* | | | 445,950 | |
| | 19,192 | | | Shutterstock, Inc.* | | | 580,366 | |
| | 28,084 | | | SPS Commerce, Inc.* | | | 1,906,623 | |
| | 91,388 | | | Xtera Communications, Inc.* *** † | | | 914 | |
| | | | | | | | |
| | | | | | | 10,808,707 | |
| | | | | | | | |
| | | | IT Consulting & Other Services 1.7% | | | | |
| | 16,311 | | | Cognizant Technology Solutions Corp., Class A* | | | 1,021,231 | |
| | 9,668 | | | Luxoft Holding, Inc.* | | | 611,888 | |
| | | | | | | | |
| | | | | | | 1,633,119 | |
| | | | | | | | |
| | | | Life Sciences Tools & Services 1.6% | | | | |
| | 46,713 | | | Fluidigm Corp.* | | | 378,842 | |
| | 16,347 | | | ICON plc* (Ireland) | | | 1,160,147 | |
| | | | | | | | |
| | | | | | | 1,538,989 | |
| | | | | | | | |
| | | | Managed Health Care 1.4% | | | | |
| | 26,757 | | | HealthEquity, Inc.* | | | 790,669 | |
| | 71,667 | | | Trupanion, Inc.* | | | 541,086 | |
| | | | | | | | |
| | | | | | | 1,331,755 | |
| | | | | | | | |
| | | | Oil & Gas Equipment & Services 0.2% | | | | |
| | 2,358 | | | Core Laboratories N.V. | | | 235,328 | |
| | | | | | | | |
| | | | Oil & Gas Exploration & Production 0.2% | | | | |
| | 18,589 | | | EP Energy Corp., Class A* | | | 95,733 | |
| | 20,479 | | | WPX Energy, Inc.* | | | 135,571 | |
| | | | | | | | |
| | | | | | | 231,304 | |
| | | | | | | | |
| | | | Oil & Gas Refining & Marketing 0.3% | | | | |
| | 144,050 | | | Amyris, Inc.* | | | 289,541 | |
| | | | | | | | |
| | | | Packaged Foods & Meats 1.3% | | | | |
| | 13,674 | | | GlaxoSmithKline Consumer Healthcare Ltd. (India) | | | 1,259,866 | |
| | | | | | | | |
| | | | Pharmaceuticals 5.5% | | | | |
| | 20,530 | | | Aerie Pharmaceuticals, Inc.* | | | 364,202 | |
| | 112,091 | | | Auris Medical Holding AG* (Switzerland) | | | 399,044 | |
| | 71,810 | | | Cardiovascular Systems, Inc.* | | | 1,137,470 | |
| | 30,172 | | | Cempra, Inc.* | | | 839,989 | |
| | 86,868 | | | Egalet Corp.* | | | 1,144,920 | |
| | 34,900 | | | Intra-Cellular Therapies, Inc.* | | | 1,397,396 | |
| | | | | | | | |
| | | | | | | 5,283,021 | |
| | | | | | | | |
| | | | Regional Banks 2.4% | | | | |
| | 83,652 | | | Avenue Financial Holdings, Inc.* | | | 1,104,206 | |
| | 45,797 | | | Customers Bancorp, Inc.* | | | 1,176,983 | |
| | | | | | | | |
| | | | | | | 2,281,189 | |
| | | | | | | | |
| | | | Restaurants 1.9% | | | | |
| | 46,033 | | | Jubilant Foodworks Ltd. (India) | | | 1,131,157 | |
| | 16,943 | | | Zoe’s Kitchen, Inc.* | | | 669,079 | |
| | | | | | | | |
| | | | | | | 1,800,236 | |
| | | | | | | | |
| | | | Semiconductor Equipment 1.8% | | | | |
| | 174,405 | | | PDF Solutions, Inc.* | | | 1,744,050 | |
| | | | | | | | |
82
| | | | | | | | |
| Shares | | | | | Value | |
| | | | | | | |
| | | | Semiconductors 4.8% | |
| | 22,558 | | | Cavium, Inc.* | | $ | 1,384,384 | |
| | 20,591 | | | Monolithic Power Systems, Inc. | | | 1,054,259 | |
| | 14,675 | | | NVE Corp. | | | 712,325 | |
| | 34,760 | | | Power Integrations, Inc. | | | 1,465,829 | |
| | | | | | | | |
| | | | | | | 4,616,797 | |
| | | | | | | | |
| | | | Specialized Consumer Services 0.5% | |
| | 52,963 | | | LifeLock, Inc.* | | | 463,956 | |
| | | | | | | | |
| | | | Specialized Finance 0.7% | | | | |
| | 22,618 | | | CRISIL Ltd. (India) | | | 634,932 | |
| | | | | | | | |
| | | | Specialty Chemicals 3.0% | | | | |
| | 39,512 | | | Balchem Corp. | | | 2,401,144 | |
| | 468,099 | | | EcoSynthetix, Inc.* (Canada) | | | 462,424 | |
| | | | | | | | |
| | | | | | | 2,863,568 | |
| | | | | | | | |
| | | | Specialty Stores 1.3% | | | | |
| | 48,380 | | | DavidsTea, Inc.* (Canada) | | | 757,631 | |
| | 15,224 | | | Five Below, Inc.* | | | 511,222 | |
| | | | | | | | |
| | | | | | | 1,268,853 | |
| | | | | | | | |
| | | | Systems Software 8.4% | | | | |
| | 61,254 | | | FleetMatics Group plc* | | | 3,006,959 | |
| | 85,126 | | | Infoblox, Inc.* | | | 1,360,314 | |
| | 5,798 | | | NetSuite, Inc.* | | | 486,452 | |
| | 49,946 | | | Qualys, Inc.* | | | 1,421,463 | |
| | 126,699 | | | TubeMogul, Inc.* | | | 1,332,873 | |
| | 28,472 | | | VASCO Data Security International, Inc.* | | | 485,163 | |
| | | | | | | | |
| | | | | | | 8,093,224 | |
| | | | | | | | |
| | | | Technology Hardware, Storage & Peripherals 0.5% | | | | |
| | 105,948 | | | Intevac, Inc.* | | | 487,361 | |
| | | | | | | | |
| | | | Trucking 1.0% | | | | |
| | 38,441 | | | Knight Transportation, Inc. | | | 922,584 | |
| | | | | | | | |
| | |
| | | | Total Common Stocks
(cost $74,414,576) | | | 88,497,555 | |
| | | | | | | | |
| | |
| | | | PREFERRED STOCKS 1.7% | | | | |
| | |
| | | | Biotechnology 0.1% | | | | |
| | 169,492 | | | Nanosys, Inc., Series D Pfd.* *** † | | | 34,034 | |
| | 40,380 | | | Nanosys, Inc., Series E Pfd.* *** † | | | 33,972 | |
| | | | | | | | |
| | | | | | | 68,006 | |
| | | | | | | | |
| | | | Health Care Technology 0.6% | | | | |
| | 253,064 | | | Data Sciences International, Inc., Series B Pfd.* *** † | | | 574,126 | |
| | | | | | | | |
| | | | Oil & Gas Equipment & Services 1.0% | | | | |
| | 435,920 | | | Drilling Info Holdings, Inc., Series B Pfd.* *** † | | | 931,430 | |
| | | | | | | | |
| | |
| | | | Total Preferred Stocks
(cost $2,171,238) | | | 1,573,562 | |
| | | | | | | | |
| | | | | | | | |
| Shares | | | | | Value | |
| | | | | | | |
| | | | LIMITED PARTNERSHIP INTEREST 4.7% | | | | |
| | |
| | | | Asset Management & Custody Banks 4.7% | | | | |
| | | | Greenspring Global Partners II-B, L.P.* *** † | | $ | 2,848,919 | |
| | | | Greenspring Global Partners III-B, L.P.* *** † | | | 1,662,383 | |
| | | | | | | | |
| | | | | | | 4,511,302 | |
| | | | | | | | |
| | |
| | | | Total Limited Partnership Interest
(cost $4,393,786) | | | 4,511,302 | |
| | | | | | | | |
| | |
Principal Amount | | | | | Value | |
| | | | | | | |
| | | | SHORT-TERM INVESTMENTS 1.6% | | | | |
| | |
| | | | Repurchase Agreement 1.6% | | | | |
| | $1,582,068 | | | Repurchase Agreement dated 9/30/15, 0.00% due 10/1/15 with State Street Bank and Trust Co. collateralized by $1,620,000 of United States Treasury Notes 1.375% due 9/30/20; value: $1,617,975; repurchase proceeds: $1,582,068†† (cost $1,582,068) | | $ | 1,582,068 | |
| | | | | | | | |
| | |
| | | | Total Short-Term Investments
(cost $1,582,068) | | | 1,582,068 | |
| | | | | | | | |
| | |
| | | | Total Investments
(cost $82,561,668) 100.2%§ | | | 96,164,487 | |
| | |
| | | | Liabilities less Other Assets (0.2%) | | | (149,195 | ) |
| | | | | | | | |
| | |
| | | | NET ASSETS 100.0% | | $ | 96,015,292 | |
| | | | | | | | |
| |
| | | | *Non-income producing. ***Security was fair valued under procedures adopted by the Board of Trustees (see Note 13). †Security purchased in a private placement transaction or under Rule 144A of the Securities Act of 1933 (see Note 9). ††All or a portion of this security has been designated as collateral for purchase commitments (see Note 10). §The aggregate amount of foreign securities fair valued pursuant to a systematic valuation model as a percent of net assets was 5.95%. See Notes to Financial Statements. | |
At September 30, 2015, Wasatch Ultra Growth Fund’s investments, excluding short-term investments, were in the following countries (unaudited):
| | | | |
| Country | | % | |
Canada | | | 2.3 | |
India | | | 7.5 | |
Ireland | | | 1.2 | |
Israel | | | 0.5 | |
Luxembourg | | | 1.2 | |
Sweden | | | 1.2 | |
Switzerland | | | 0.4 | |
United States | | | 85.7 | |
| | | | |
TOTAL | | | 100.0 | % |
| | | | |
83
| | |
| WASATCH WORLD INNOVATORS FUND (WAGTX) — Schedule of Investments | | |
|
|
|
| | | | | | | | |
| Shares | | | | | Value | |
| | | | | | | |
| | | | COMMON STOCKS 90.2% | | | | |
| | |
| | | | Aerospace & Defense 1.9% | | | | |
| | 252,743 | | | Avon Rubber plc (United Kingdom) | | $ | 3,495,484 | |
| | | | | | | | |
| | | | Alternative Carriers 2.1% | | | | |
| | 767,227 | | | Gamma Communications plc (United Kingdom) | | | 3,979,933 | |
| | | | | | | | |
| | | | Application Software 0.3% | | | | |
| | 11,723 | | | Cresco Ltd. (Japan) | | | 165,975 | |
| | 44,534 | | | Fukui Computer Holdings, Inc. (Japan) | | | 306,068 | |
| | | | | | | | |
| | | | | | | 472,043 | |
| | | | | | | | |
| | | | Asset Management & Custody Banks 2.9% | | | | |
| | 34,290 | | | Ameriprise Financial, Inc. | | | 3,742,068 | |
| | 122,075 | | | NorthStar Asset Management Group, Inc. | | | 1,752,997 | |
| | | | | | | | |
| | | | | | | 5,495,065 | |
| | | | | | | | |
| | | | Automotive Retail 5.9% | | | | |
| | 303,000 | | | Mekonomen AB (Sweden) | | | 7,016,038 | |
| | 40,000 | | | Penske Automotive Group, Inc. | | | 1,937,600 | |
| | 95,876 | | | Yellow Hat Ltd. (Japan) | | | 2,078,749 | |
| | | | | | | | |
| | | | | | | 11,032,387 | |
| | | | | | | | |
| | | | Biotechnology 5.1% | | | | |
| | 683,945 | | | Abcam plc (United Kingdom) | | | 6,016,105 | |
| | 180,800 | | | Bioventix plc (United Kingdom) | | | 3,023,032 | |
| | 64,655 | | | OPKO Health, Inc.* | | | 543,749 | |
| | | | | | | | |
| | | | | | | 9,582,886 | |
| | | | | | | | |
| | | | Broadcasting 2.9% | | | | |
| | 90,100 | | | CBS Corp., Class B | | | 3,594,990 | |
| | 70,152 | | | Discovery Communications, Inc.* | | | 1,826,057 | |
| | | | | | | | |
| | | | | | | 5,421,047 | |
| | | | | | | | |
| | | | Cable & Satellite 1.6% | | | | |
| | 51,182 | | | Comcast Corp., Class A | | | 2,911,232 | |
| | | | | | | | |
| | | | Communications Equipment 0.3% | | | | |
| | 18,223 | | | EVS Broadcast Equipment S.A. (Belgium) | | | 470,755 | |
| | | | | | | | |
| | | | Computer & Electronics Retail 0.2% | | | | |
| | 69,467 | | | FTGroup Co. Ltd. (Japan) | | | 373,264 | |
| | | | | | | | |
| | | | Construction Machinery & Heavy Trucks 0.3% | | | | |
| | 53,594 | | | Morita Holdings Corp. (Japan) | | | 494,914 | |
| | | | | | | | |
| | | | Consumer Electronics 1.9% | | | | |
| | 741,454 | | | Sprue Aegis plc (United Kingdom) | | | 3,545,568 | |
| | | | | | | | |
| | | | Consumer Finance 8.9% | | | | |
| | 74,500 | | | Capital One Financial Corp. | | | 5,402,740 | |
| | 111,000 | | | Discover Financial Services | | | 5,770,890 | |
| | 49,000 | | | Encore Capital Group, Inc.* | | | 1,813,000 | |
| | 35,300 | | | PRA Group, Inc.* | | | 1,868,076 | |
| | 232,000 | | | SLM Corp.* | | | 1,716,800 | |
| | | | | | | | |
| | | | | | | 16,571,506 | |
| | | | | | | | |
| | | | Data Processing & Outsourced Services 4.1% | | | | |
| | 42,150 | | | MasterCard, Inc., Class A | | | 3,798,558 | |
| | 54,980 | | | Visa, Inc., Class A | | | 3,829,907 | |
| | | | | | | | |
| | | | | | | 7,628,465 | |
| | | | | | | | |
| | | | Education Services 1.6% | | | | |
| | 644,000 | | | Kroton Educacional S.A. (Brazil) | | | 1,248,363 | |
| | 53,415 | | | TAL Education Group ADR* (China) | | | 1,717,292 | |
| | | | | | | | |
| | | | | | | 2,965,655 | |
| | | | | | | | |
| | | | | | | | |
| Shares | | | | | Value | |
| | | | | | | |
| | | | Fertilizers & Agricultural Chemicals 1.5% | | | | |
| | 33,200 | | | Monsanto Co. | | $ | 2,833,288 | |
| | | | | | | | |
| | | | Food Retail 1.9% | | | | |
| | 49,469 | | | Arcs Co. Ltd. (Japan) | | | 932,214 | |
| | 441,449 | | | Majestic Wine plc (United Kingdom) | | | 2,518,545 | |
| | | | | | | | |
| | | | | | | 3,450,759 | |
| | | | | | | | |
| | | | Health Care Distributors 0.7% | | | | |
| | 38,577 | | | Dvx, Inc. (Japan) | | | 340,328 | |
| | 5,000 | | | McKesson Corp. | | | 925,150 | |
| | | | | | | | |
| | | | | | | 1,265,478 | |
| | | | | | | | |
| | | | Health Care Equipment 2.9% | | | | |
| | 95,600 | | | DiaSorin S.p.A. (Italy) | | | 4,182,963 | |
| | 121,416 | | | Nikkiso Co. Ltd. (Japan) | | | 812,685 | |
| | 72 | | | Sorin S.p.A.* (Italy) | | | 208 | |
| | 20,002 | | | Techno Medica Co. Ltd. (Japan) | | | 413,330 | |
| | | | | | | | |
| | | | | | | 5,409,186 | |
| | | | | | | | |
| | | | Health Care Services 0.5% | | | | |
| | 34,286 | | | BML, Inc. (Japan) | | | 954,938 | |
| | | | | | | | |
| | | | Health Care Supplies 2.8% | | | | |
| | 2,273,388 | | | Advanced Medical Solutions Group plc (United Kingdom) | | | 5,280,365 | |
| | | | | | | | |
| | | | Health Care Technology 2.6% | | | | |
| | 64,002 | | | Computer Programs and Systems, Inc. | | | 2,696,404 | |
| | 55,451 | | | Software Service, Inc. (Japan) | | | 2,181,668 | |
| | | | | | | | |
| | | | | | | 4,878,072 | |
| | | | | | | | |
| | | | Home Entertainment Software 5.6% | | | | |
| | 169,692 | | | Activision Blizzard, Inc.†† | | | 5,241,786 | |
| | 183,127 | | | Take-Two Interactive Software, Inc.* | | | 5,261,239 | |
| | | | | | | | |
| | | | | | | 10,503,025 | |
| | | | | | | | |
| | | | Home Improvement Retail 0.5% | | | | |
| | 39,599 | | | Arcland Sakamoto Co. Ltd. (Japan) | | | 852,891 | |
| | | | | | | | |
| | | | Homebuilding 0.3% | | | | |
| | 7,886 | | | Token Corp. (Japan) | | | 593,354 | |
| | | | | | | | |
| | | | Household Appliances 0.5% | | | | |
| | 65,953 | | | SodaStream International Ltd.* (Israel) | | | 907,513 | |
| | | | | | | | |
| | | | Human Resource & Employment Services 0.9% | | | | |
| | 241,646 | | | Creek & River Co. Ltd. (Japan) | | | 858,270 | |
| | 65,323 | | | WDB Holdings Co. Ltd. (Japan) | | | 756,865 | |
| | | | | | | | |
| | | | | | | 1,615,135 | |
| | | | | | | | |
| | | | Hypermarkets & Super Centers 1.1% | | | | |
| | 14,216 | | | Costco Wholesale Corp. | | | 2,055,207 | |
| | | | | | | | |
| | | | Industrial Machinery 1.2% | | | | |
| | 26,314 | | | Arcam AB* (Sweden) | | | 463,170 | |
| | 53,797 | | | Fukushima Industries Corp. (Japan) | | | 1,090,974 | |
| | 44,406 | | | SLM Solutions Group AG* (Germany) | | | 730,415 | |
| | | | | | | | |
| | | | | | | 2,284,559 | |
| | | | | | | | |
| | | | Internet Retail 3.9% | | | | |
| | 4,748 | | | Amazon.com, Inc.* | | | 2,430,454 | |
| | 62,573 | | | Oisix, Inc.* (Japan) | | | 1,136,340 | |
| | 2,325 | | | Priceline Group, Inc. (The)* | | | 2,875,699 | |
| | 68,009 | | | Rakuten, Inc. (Japan) | | | 869,756 | |
| | | | | | | | |
| | | | | | | 7,312,249 | |
| | | | | | | | |
| | | | Internet Software & Services 3.3% | | | | |
| | 20,800 | | | Alibaba Group Holding Ltd. ADR* (China) | | | 1,226,576 | |
| | 6,015 | | | Alphabet, Inc., Class A* | | | 3,839,796 | |
| | 292,017 | | | NetGem S.A. (France) | | | 717,609 | |
84
| | | | | | | | |
| Shares | | | | | Value | |
| | | | | | | |
| | | | Internet Software & Services (continued) | | | | |
| | 6,528 | | | Xtera Communications, Inc.* *** † | | $ | 65 | |
| | 13,744 | | | Zillow Group, Inc., Class A* | | | 394,865 | |
| | | | | | | | |
| | | | | | | 6,178,911 | |
| | | | | | | | |
| | | | IT Consulting & Other Services 3.1% | | | | |
| | 91,614 | | | Cognizant Technology Solutions Corp., Class A* | | | 5,735,952 | |
| | | | | | | | |
| | | | Leisure Products 1.8% | | | | |
| | 1,383,283 | | | Photo-Me International plc (United Kingdom) | | | 3,288,953 | |
| | | | | | | | |
| | | | Life Sciences Tools & Services 1.3% | | | | |
| | 17,490 | | | Tecan Group AG (Switzerland) | | | 2,460,756 | |
| | | | | | | | |
| | | | Movies & Entertainment 0.5% | | | | |
| | 22,331 | | | Viacom, Inc., Class B | | | 963,583 | |
| | | | | | | | |
| | | | Oil & Gas Equipment & Services 0.3% | | | | |
| | 5,100 | | | Core Laboratories N.V. | | | 508,980 | |
| | | | | | | | |
| | | | Oil & Gas Refining & Marketing 2.2% | | | | |
| | 115,900 | | | World Fuel Services Corp. | | | 4,149,220 | |
| | | | | | | | |
| | | | Personal Products 2.9% | | | | |
| | 33,601 | | | Herbalife Ltd.* | | | 1,831,254 | |
| | 85,200 | | | Nu Skin Enterprises, Inc., Class A | | | 3,517,056 | |
| | | | | | | | |
| | | | | | | 5,348,310 | |
| | | | | | | | |
| | | | Pharmaceuticals 1.8% | | | | |
| | 19,163 | | | Valeant Pharmaceuticals International, Inc.* (Canada) | | | 3,418,296 | |
| | | | | | | | |
| | | | Publishing 0.9% | | | | |
| | 80,871 | | | New York Times Co. (The) | | | 955,087 | |
| | 81,433 | | | Next Co. Ltd. (Japan) | | | 644,441 | |
| | | | | | | | |
| | | | | | | 1,599,528 | |
| | | | | | | | |
| | | | Real Estate Services 0.6% | | | | |
| | 27,774 | | | Century 21 Real Estate of Japan Ltd. (Japan) | | | 253,156 | |
| | 6,500 | | | Jones Lang LaSalle, Inc. | | | 934,505 | |
| | | | | | | | |
| | | | | | | 1,187,661 | |
| | | | | | | | |
| | | | Semiconductors 1.6% | | | | |
| | 137,000 | | | ARM Holdings plc (United Kingdom) | | | 1,968,829 | |
| | 250,000 | | | Taiwan Semiconductor Manufacturing Co. Ltd. (Taiwan) | | | 1,001,919 | |
| | | | | | | | |
| | | | | | | 2,970,748 | |
| | | | | | | | |
| | | | Specialty Stores 0.6% | | | | |
| | 26,706 | | | Fenix Outdoor International AG (Sweden) | | | 1,061,045 | |
| | | | | | | | |
| | | | Systems Software 0.9% | | | | |
| | 21,000 | | | Check Point Software Technologies Ltd.* (Israel) | | | 1,665,930 | |
| | | | | | | | |
| | | | Technology Hardware, Storage & Peripherals 0.5% | | | | |
| | 6,814 | | | Apple, Inc. | | | 751,584 | |
| | 156,800 | | | Asetek A/S* (Norway) | | | 199,558 | |
| | | | | | | | |
| | | | | | | 951,142 | |
| | | | | | | | |
| | | | Wireless Telecommunication Services 1.0% | | | | |
| | 146,600 | | | MTN Group Ltd. (South Africa) | | | 1,885,037 | |
| | | | | | | | |
| | |
| | | | Total Common Stocks
(cost $154,031,350) | | | 168,010,275 | |
| | | | | | | | |
| | | | | | | | |
| Shares | | | | | Value | |
| | | | | | | |
| | | | LIMITED PARTNERSHIP INTEREST 0.1% | |
| | |
| | | | Asset Management & Custody Banks 0.1% | | | | |
| | | | Greenspring Global Partners II-B, L.P.* *** † | | $ | 316,546 | |
| | | | | | | | |
| | |
| | | | Total Limited Partnership Interest
(cost $321,292) | | | 316,546 | |
| | | | | | | | |
| | |
Principal
Amount | | | | | Value | |
| | | | SHORT-TERM INVESTMENTS 7.8% | | | | |
| | |
| | | | Repurchase Agreement 7.8% | | | | |
| | $14,459,758 | | | Repurchase Agreement dated 9/30/15, 0.00% due 10/1/15 with State Street Bank and Trust Co. collateralized by $14,255,000 of United States Treasury Notes 2.125% due 1/31/21; value: $14,750,675; repurchase proceeds: $14,459,758†† (cost $14,459,758) | | $ | 14,459,758 | |
| | | | | | | | |
| | |
| | | | Total Short-Term Investments
(cost $14,459,758) | | | 14,459,758 | |
| | | | | | | | |
| | |
| | | | Total Investments
(cost $168,812,400) 98.1%§ | | | 182,786,579 | |
| | |
| | | | Other Assets less Liabilities 1.9% | | | 3,485,444 | |
| | | | | | | | |
| | |
| | | | NET ASSETS 100.0% | | $ | 186,272,023 | |
| | | | | | | | |
| |
| | | | *Non-income producing. ***Security was fair valued under procedures adopted by the Board of Trustees (see Note 13). †Security purchased in a private placement transaction or under Rule 144A of the Securities Act of 1933 (see Note 9). ††All or a portion of this security has been designated as collateral for purchase commitments (see Note 10). §The aggregate amount of foreign securities fair valued pursuant to a systematic valuation model as a percent of net assets was 29.86%. ADR American Depositary Receipt. See Notes to Financial Statements. | |
At September 30, 2015, Wasatch World Innovators Fund’s investments, excluding short-term investments, were in the following countries (unaudited):
| | | | |
| Country | | % | |
Belgium | | | 0.3 | |
Brazil | | | 0.7 | |
Canada | | | 2.0 | |
China | | | 1.8 | |
France | | | 0.4 | |
Germany | | | 0.4 | |
Israel | | | 1.5 | |
Italy | | | 2.5 | |
Japan | | | 9.6 | |
Norway | | | 0.1 | |
South Africa | | | 1.1 | |
Sweden | | | 5.1 | |
Switzerland | | | 1.5 | |
Taiwan | | | 0.6 | |
United Kingdom | | | 19.7 | |
United States | | | 52.7 | |
| | | | |
TOTAL | | | 100.0 | % |
| | | | |
85
| | |
| WASATCH-1ST SOURCE INCOME FUND (FMEQX) — Schedule of Investments | | |
|
|
|
| | | | | | | | |
Principal
Amount | | | | | Value | |
| | | | | | | |
| | | | ASSET-BACKED SECURITIES 7.1% | | | | |
| | |
| | $1,000,000 | | | Avis Budget Rental Car Funding AESOP, LLC, 2.50%, 7/20/21, Series 2015-1A, Class A | | $ | 1,008,636 | |
| | 500,000 | | | Avis Budget Rental Car Funding AESOP, LLC, 2.63%, 12/20/21, Series 2015-2A, Class A | | | 505,601 | |
| | 1,500,000 | | | Citibank Credit Card Issuance Trust,
5.65%, 9/20/19, Series 2007-A8, Class A8 | | | 1,630,432 | |
| | 267,685 | | | Cronos Containers Program I Ltd.,
3.27%, 11/18/29, Series 2014-2A, Class A (Bermuda) | | | 272,314 | |
| | 1,250,000 | | | GE Capital Credit Card Master Note Trust,
2.22%, 1/15/22, Series 2012-2, Class A | | | 1,270,256 | |
| | 1,000,000 | | | Hertz Vehicle Financing, LLC,
1.83%, 8/25/19, Series 2013-1A, Class A2 | | | 996,879 | |
| | 585,000 | | | World Financial Network Credit Card Master Trust, 1.76%, 5/17/21, Series 2012-B, Class A | | | 590,414 | |
| | 1,400,000 | | | World Financial Network Credit Card Master Trust, 3.14%, 1/17/23, Series 2012-A, Class A | | | 1,465,342 | |
| | | | | | | | |
| | |
| | | | Total Asset-Backed Securities
(cost $7,754,133) | | | 7,739,874 | |
| | | | | | | | |
| | |
| | | | COLLATERALIZED MORTGAGE OBLIGATIONS 18.1% | | | | |
| | |
| | 1,000,000 | | | Banc of America Commercial Mortgage Trust, 5.784%, 4/10/49, Series 2007-2, Class A4††† | | | 1,037,615 | |
| | 336,426 | | | Federal Home Loan Mortgage Corp.,
1.50%, 9/15/22, Series 3760, Class BA | | | 337,730 | |
| | 656,598 | | | Federal Home Loan Mortgage Corp.,
1.50%, 7/15/23, Series 4221, Class HJ | | | 658,685 | |
| | 40,921 | | | Federal Home Loan Mortgage Corp.,
1.50%, 4/15/24, Series 3780, Class TA | | | 41,275 | |
| | 60,701 | | | Federal Home Loan Mortgage Corp.,
2.431%, 12/1/32, Series 847527††† | | | 64,722 | |
| | 60,043 | | | Federal Home Loan Mortgage Corp.,
2.472%, 5/1/31, Series 847292††† | | | 63,417 | |
| | 13,802 | | | Federal Home Loan Mortgage Corp.,
2.48%, 8/1/33, Series 847281††† | | | 14,338 | |
| | 168,782 | | | Federal Home Loan Mortgage Corp.,
3.022%, 1/1/25, Series 775629††† | | | 176,987 | |
| | 104,620 | | | Federal Home Loan Mortgage Corp.,
3.063%, 5/1/25, Series 775617††† | | | 111,008 | |
| | 363,738 | | | Federal Home Loan Mortgage Corp.,
3.50%, 6/15/25, Series 4057, Class VB | | | 389,356 | |
| | 710,000 | | | Federal Home Loan Mortgage Corp.,
3.50%, 7/15/45, Series 4495, Class JC | | | 705,951 | |
| | 468,743 | | | Federal Home Loan Mortgage Corp.,
4.00%, 11/15/38, Series 3740, Class AB | | | 495,473 | |
| | 39,119 | | | Federal Home Loan Mortgage Corp.,
5.50%, 10/1/25, Series C90925 | | | 43,338 | |
| | 160,545 | | | Federal Home Loan Mortgage Corp.,
5.50%, 8/1/29, Series C46102 | | | 179,845 | |
| | 254,464 | | | Federal National Mortgage Assoc.,
2.034%, 12/1/35, Series 848390††† | | | 266,893 | |
| | 367,789 | | | Federal National Mortgage Assoc.,
2.055%, 1/1/35, Series 825245††† | | | 388,113 | |
| | 91,411 | | | Federal National Mortgage Assoc.,
2.16%, 11/1/34, Series 782320††† | | | 96,803 | |
| | 1,000,000 | | | Federal National Mortgage Assoc.,
2.42%, 4/1/22 | | | 1,021,423 | |
| | 74,607 | | | Federal National Mortgage Assoc.,
2.434%, 2/1/21, Series 313380††† | | | 76,344 | |
| | | | | | | | |
Principal
Amount | | | | | Value | |
| | | | | | | |
| | | | COLLATERALIZED MORTGAGE OBLIGATIONS (continued) | | | | |
| | $ 49,824 | | | Federal National Mortgage Assoc.,
2.758%, 1/1/18, Series 57735††† | | $ | 49,960 | |
| | 1,029,134 | | | Federal National Mortgage Assoc.,
3.00%, 1/1/28, Series AB7546 | | | 1,076,639 | |
| | 112,968 | | | Federal National Mortgage Assoc.,
3.50%, 6/25/23, Series 2003-46, Class LD | | | 117,811 | |
| | 1,495,374 | | | Federal National Mortgage Assoc.,
3.50%, 6/1/32, Series AL2525 | | | 1,589,619 | |
| | 953,659 | | | Federal National Mortgage Assoc.,
3.50%, 5/1/33, Series AB9412 | | | 1,009,610 | |
| | 104,110 | | | Federal National Mortgage Assoc.,
3.875%, 1/25/39, Series 2009-2, Class WJ | | | 110,144 | |
| | 11,064 | | | Federal National Mortgage Assoc.,
4.00%, 10/25/32, Series 2003-28, Class GA | | | 11,113 | |
| | 512,000 | | | Federal National Mortgage Assoc.,
4.00%, 9/25/33, Series 2014-67, Class VK | | | 558,985 | |
| | 57,293 | | | Federal National Mortgage Assoc.,
4.079%, 7/1/19, Series 070377††† | | | 59,779 | |
| | 784,404 | | | Federal National Mortgage Assoc.,
4.55%, 10/1/33 | | | 800,349 | |
| | 186,031 | | | Federal National Mortgage Assoc.,
5.50%, 5/25/23, Series 2003-42, Class EK | | | 205,370 | |
| | 346,169 | | | Federal National Mortgage Assoc.,
8.206%, 11/25/44, Series 2014-73, Class US††† | | | 352,377 | |
| | 394,003 | | | Government National Mortgage Assoc.,
1.625%, 9/20/34, Series 81054††† | | | 410,554 | |
| | 196,072 | | | Government National Mortgage Assoc.,
1.75%, 1/20/30, Series 80364††† | | | 203,444 | |
| | 469,449 | | | Government National Mortgage Assoc.,
1.75%, 6/20/30, Series 80416††† | | | 482,491 | |
| | 134,618 | | | Government National Mortgage Assoc.,
2.125%, 7/20/34, Series 80987††† | | | 139,663 | |
| | 297,874 | | | Government National Mortgage Assoc.,
3.00%, 8/20/38, Series 2010-47, Class CG | | | 303,164 | |
| | 222,123 | | | Government National Mortgage Assoc.,
3.00%, 12/20/38, Series 2010-89, Class PA | | | 224,973 | |
| | 565,068 | | | Government National Mortgage Assoc.,
3.00%, 5/20/39, Series 2010-68, Class YE | | | 585,984 | |
| | 259,874 | | | Government National Mortgage Assoc.,
3.50%, 1/20/37, Series 2009-31, Class PD | | | 261,685 | |
| | 587,736 | | | Government National Mortgage Assoc.,
3.50%, 7/20/40, Series 2012-10, Class LA | | | 619,276 | |
| | 58,122 | | | Government National Mortgage Assoc.,
4.00%, 6/20/38, Series 2009-69, Class WC | | | 58,843 | |
| | 404,204 | | | Government National Mortgage Assoc.,
4.00%, 9/20/38, Series 2009-108, Class WG | | | 421,267 | |
| | 346,066 | | | Government National Mortgage Assoc.,
4.00%, 3/20/39, Series 2009-31, Class TA | | | 363,779 | |
| | 352,484 | | | Government National Mortgage Assoc.,
4.00%, 4/16/39, Series 2009-110, Class AB | | | 377,839 | |
| | 309,087 | | | Government National Mortgage Assoc.,
4.00%, 8/20/39, Series 2009-69, Class PV | | | 332,819 | |
| | 186,589 | | | Government National Mortgage Assoc.,
4.50%, 2/20/38, Series 2009-55, Class NP | | | 199,454 | |
| | 304,658 | | | Government National Mortgage Assoc.,
4.50%, 3/20/39, Series 2009-14, Class AG | | | 330,015 | |
| | 268,545 | | | Government National Mortgage Assoc.,
5.00%, 7/20/34, Series 2004-105, Class MC | | | 278,789 | |
| | 34,837 | | | Government National Mortgage Assoc.,
5.00%, 8/20/39, Series 004513 | | | 36,766 | |
| | 460,861 | | | Government National Mortgage Assoc.,
8.268%, 4/20/45, Series 2015-53, Class US, INV FL††† | | | 474,381 | |
| | 982,431 | | | LB-UBS Commercial Mortgage Trust,
5.858%, 7/15/40, Series 2007-C6, Class A4††† | | | 1,024,116 | |
86
| | | | | | | | |
Principal
Amount | | | | | Value | |
| | | | | | | |
| | | | COLLATERALIZED MORTGAGE OBLIGATIONS (continued) | | | | |
| | $ 330,343 | | | RBSCF Trust, 6.15%, 2/16/51, Series 2010-RR3, Class WBTA††† | | $ | 338,215 | |
| | 200,000 | | | RBSCF Trust, 5.692%, 4/16/49, Series 2010-RR4, Class MSCA††† | | | 207,695 | |
| | | | | | | | |
| | |
| | | | Total Collateralized Mortgage Obligations
(cost $19,512,085) | | | 19,786,284 | |
| | | | | | | | |
| | |
| | | | CORPORATE BONDS 45.3% | | | | |
| | |
| | | | Aerospace & Defense 0.9% | | | | |
| | 1,000,000 | | | Lockheed Martin Corp., 3.35%, 9/15/21 | | | 1,036,200 | |
| | | | | | | | |
| | | | Air Freight & Logistics 0.6% | | | | |
| | 620,000 | | | United Parcel Service, Inc., 5.50%, 1/15/18 | | | 681,002 | |
| | | | | | | | |
| | | | Automotive Retail 0.7% | | | | |
| | 775,000 | | | AutoZone, Inc., 5.50%, 11/15/15 | | | 779,231 | |
| | | | | | | | |
| | | | Beverages — Non-alcoholic 1.2% | | | | |
| | 500,000 | | | PepsiAmericas, Inc., 5.00%, 5/15/17 | | | 530,860 | |
| | 750,000 | | | PepsiCo, Inc., 5.00%, 6/1/18 | | | 820,970 | |
| | | | | | | | |
| | | | | | | 1,351,830 | |
| | | | | | | | |
| | | | Cable & Satellite 0.7% | | | | |
| | 750,000 | | | DIRECTV Holdings, LLC / DIRECTV Financing Co., Inc., 5.20%, 3/15/20 | | | 819,275 | |
| | | | | | | | |
| | | | Construction Machinery & Heavy Trucks 1.4% | | | | |
| | 500,000 | | | Caterpillar Financial Services Corp.,
5.85%, 9/1/17 MTN | | | 542,802 | |
| | 1,000,000 | | | John Deere Capital Corp., 2.25%, 4/17/19 | | | 1,016,295 | |
| | | | | | | | |
| | | | | | | 1,559,097 | |
| | | | | | | | |
| | | | Consumer Finance 0.9% | | | | |
| | 1,000,000 | | | American Express Credit Corp.,
2.25%, 8/15/19 MTN | | | 1,003,500 | |
| | | | | | | | |
| | | | Cosmetics & Toiletries 0.4% | | | | |
| | 337,806 | | | Procter & Gamble — ESOP,
9.36%, 1/1/21, Series A | | | 406,829 | |
| | | | | | | | |
| | | | Diversified Banks 5.6% | | | | |
| | 750,000 | | | Bank of America Corp., 2.60%, 1/15/19 | | | 757,620 | |
| | 500,000 | | | Bank of America Corp., 3.75%, 7/12/16, Series 1 | | | 509,962 | |
| | 500,000 | | | Bank of America Corp., 5.875%, 1/5/21 | | | 572,614 | |
| | 1,250,000 | | | Goldman Sachs Group, Inc. (The),
4.00%, 3/3/24 | | | 1,286,577 | |
| | 1,000,000 | | | US Bancorp, 2.20%, 11/15/16 MTN | | | 1,014,545 | |
| | 1,125,000 | | | US Bancorp, 3.00%, 3/15/22 MTN | | | 1,151,608 | |
| | 700,000 | | | Wachovia Corp., 5.75%, 2/1/18 MTN | | | 765,975 | |
| | | | | | | | |
| | | | | | | 6,058,901 | |
| | | | | | | | |
| | | | Diversified Financial Services 3.4% | | | | |
| | 1,000,000 | | | General Electric Capital Corp.,
4.65%, 10/17/21 MTN | | | 1,124,788 | |
| | 1,350,000 | | | General Electric Capital Corp.,
5.40%, 2/15/17 MTN | | | 1,427,614 | |
| | 1,000,000 | | | General Electric Capital Corp.,
5.625%, 5/1/18 MTN | | | 1,107,060 | |
| | | | | | | | |
| | | | | | | 3,659,462 | |
| | | | | | | | |
| | | | Diversified Financial Services 1.5% | | | | |
| | 750,000 | | | Franklin Resources, Inc., 4.625%, 5/20/20 | | | 833,701 | |
| | 750,000 | | | New York Life Global Funding,
2.15%, 6/18/19 | | | 756,425 | |
| | | | | | | | |
| | | | | | | 1,590,126 | |
| | | | | | | | |
| | | | | | | | |
Principal
Amount | | | | | Value | |
| | | | | | | |
| | | | CORPORATE BONDS (continued) | | | | |
| | | | Electric Utilities 1.0% | | | | |
| | $ 1,000,000 | | | TECO Finance, Inc., 6.572%, 11/1/17 | | $ | 1,099,459 | |
| | | | | | | | |
| | | | Enterprise Software & Services 2.1% | | | | |
| | 1,000,000 | | | CA, Inc., 5.375%, 12/1/19 | | | 1,094,864 | |
| | 1,250,000 | | | Oracle Corp., 2.50%, 10/15/22 | | | 1,221,192 | |
| | | | | | | | |
| | | | | | | 2,316,056 | |
| | | | | | | | |
| | | | Finance — Auto Loans 0.4% | | | | |
| | 400,000 | | | Ford Motor Credit Co., LLC,
6.625%, 8/15/17 | | | 431,823 | |
| | | | | | | | |
| | | | Finance — Credit Card 1.0% | | | | |
| | 975,000 | | | American Express Co., 6.15%, 8/28/17 | | | 1,057,865 | |
| | | | | | | | |
| | | | Finance — Other Services 0.5% | | | | |
| | 500,000 | | | Sun Canada Financial Co., 7.25%, 12/15/15 | | | 506,456 | |
| | | | | | | | |
| | | | Financial Services 0.5% | | | | |
| | 500,000 | | | Northern Trust Corp., 3.95%, 10/30/25 | | | 523,660 | |
| | | | | | | | |
| | | | Instruments — Scientific 0.7% | | | | |
| | 700,000 | | | Thermo Fisher Scientific, Inc.,
4.70%, 5/1/20 | | | 759,438 | |
| | | | | | | | |
| | | | Integrated Telecommunication
Services 0.9% | | | | |
| | 66,549 | | | Ameritech Capital Funding, 9.10%, 6/1/16 | | | 69,500 | |
| | 870,000 | | | AT&T, Inc., 5.50%, 2/1/18 | | | 942,682 | |
| | | | | | | | |
| | | | | | | 1,012,182 | |
| | | | | | | | |
| | | | Investment Banking & Brokerage 1.0% | | | | |
| | 1,000,000 | | | Morgan Stanley, 5.50%, 7/24/20 MTN | | | 1,122,653 | |
| | | | | | | | |
| | | | Medical Instruments 1.1% | | | | |
| | 1,100,000 | | | Medtronic, Inc., 4.45%, 3/15/20 | | | 1,209,505 | |
| | | | | | | | |
| | | | Medical — Health Maintenance Organizations 2.0% | | | | |
| | 1,000,000 | | | Anthem, Inc., 4.35%, 8/15/20 | | | 1,072,435 | |
| | 1,000,000 | | | Coventry Health Care, Inc., 5.95%, 3/15/17 | | | 1,063,265 | |
| | | | | | | | |
| | | | | | | 2,135,700 | |
| | | | | | | | |
| | | | Movies & Entertainment 1.3% | | | | |
| | 1,000,000 | | | Walt Disney Co. (The), 2.75%, 8/16/21 | | | 1,024,832 | |
| | 350,000 | | | Walt Disney Co. (The), 6.00%, 7/17/17, Series C MTN | | | 381,630 | |
| | | | | | | | |
| | | | | | | 1,406,462 | |
| | | | | | | | |
| | | | Multimedia 0.8% | | | | |
| | 800,000 | | | NBCUniversal Media, LLC, 5.15%, 4/30/20 | | | 902,999 | |
| | | | | | | | |
| | | | Office Furnishings 0.5% | | | | |
| | 500,000 | | | Steelcase, Inc., 6.375%, 2/15/21 | | | 557,660 | |
| | | | | | | | |
| | | | Oil Companies — Integrated 2.7% | | | | |
| | 750,000 | | | ConocoPhillips, 5.75%, 2/1/19 | | | 842,579 | |
| | 1,000,000 | | | Exxon Mobil Corp., 1.819%, 3/15/19 | | | 1,008,341 | |
| | 1,000,000 | | | Phillips 66, 4.30%, 4/1/22 | | | 1,047,816 | |
| | | | | | | | |
| | | | | | | 2,898,736 | |
| | | | | | | | |
| | | | Other Diversified Financial Services 1.3% | | | | |
| | 1,350,000 | | | JPMorgan Chase & Co., 4.35%, 8/15/21 | | | 1,454,859 | |
| | | | | | | | |
| | | | Pharmaceuticals 2.2% | | | | |
| | 745,000 | | | AstraZeneca plc, 5.90%, 9/15/17 (United Kingdom) | | | 811,716 | |
| | 725,000 | | | Pharmacia Corp., 6.50%, 12/1/18 | | | 833,278 | |
| | 575,000 | | | Pharmacia Corp., 6.75%, 12/15/27 | | | 730,346 | |
| | | | | | | | |
| | | | | | | 2,375,340 | |
| | | | | | | | |
87
| | |
| WASATCH-1ST SOURCE INCOME FUND (FMEQX) — Schedule of Investments (continued) | | |
|
|
|
| | | | | | | | |
Principal
Amount | | | | | Value | |
| | | | | | | |
| | | | CORPORATE BONDS (continued) | | | | |
| | |
| | | | Railroads 1.0% | | | | |
| | $ 1,000,000 | | | Union Pacific Corp., 5.70%, 8/15/18 | | $ | 1,120,274 | |
| | | | | | | | |
| | | | Regional Banks 3.3% | | | | |
| | 1,500,000 | | | BB&T Corp., 2.15%, 3/22/17 MTN | | | 1,519,780 | |
| | 1,200,000 | | | Fifth Third Bancorp, 5.45%, 1/15/17 | | | 1,255,583 | |
| | 750,000 | | | SunTrust Banks, Inc., 3.50%, 1/20/17 | | | 768,412 | |
| | | | | | | | |
| | | | | | | 3,543,775 | |
| | | | | | | | |
| | | | Restaurants 0.5% | | | | |
| | 500,000 | | | Yum! Brands, Inc., 5.30%, 9/15/19 | | | 552,364 | |
| | | | | | | | |
| | | | Semiconductor Equipment 0.9% | | | | |
| | 250,000 | | | Applied Materials, Inc., 2.65%, 6/15/16 | | | 253,444 | |
| | 700,000 | | | Applied Materials, Inc., 4.30%, 6/15/21 | | | 750,934 | |
| | | | | | | | |
| | | | | | | 1,004,378 | |
| | | | | | | | |
| | | | Specialty Chemicals 1.3% | | | | |
| | 1,150,000 | | | Lubrizol Corp., 8.875%, 2/1/19 | | | 1,406,450 | |
| | | | | | | | |
| | | | Steel 1.0% | | | | |
| | 1,000,000 | | | Nucor Corp., 5.75%, 12/1/17 | | | 1,078,185 | |
| | | | | | | | |
| | |
| | | | Total Corporate Bonds
(cost $49,055,977) | | | 49,421,732 | |
| | | | | | | | |
| | |
| | | | MUNICIPAL BONDS 3.1% | | | | |
| | |
| | 650,000 | | | Arizona State Transportation Board Highway Revenue, 5.00%, 7/1/23 | | | 672,529 | |
| | 695,000 | | | City of Westminster, Colorado 2.415%, 12/1/19, Series B | | | 700,748 | |
| | 595,609 | | | Minnesota Housing Finance Agency,
2.70%, 9/1/41 | | | 594,787 | |
| | 415,000 | | | Richmond Joint Powers Financing Authority, 8.25%, 7/1/19, Class B | | | 462,252 | |
| | 500,000 | | | State of Louisiana, 5.00%, 7/15/26, Series C | | | 588,380 | |
| | 310,000 | | | Township of Robbinsville,
4.00%, 7/15/23, Series B | | | 331,932 | |
| | | | | | | | |
| | |
| | | | Total Municipal Bonds
(cost $3,234,327) | | | 3,350,628 | |
| | | | | | | | |
| | |
| Shares | | | | | Value | |
| | | | | | | |
| | | | EXCHANGE-TRADED FUNDS 0.8% | | | | |
| | |
| | | | Asset Management & Custody Banks 0.8% | | | | |
| | 9,000 | | | iShares S&P U.S. Preferred Stock Index Fund ETF | | $ | 347,400 | |
| | 25,000 | | | Market Vectors Preferred Securities
ex Financials ETF | | | 489,750 | |
| | | | | | | | |
| | | | | | | 837,150 | |
| | | | | | | | |
| | |
| | | | Total Exchange-Traded Funds
(cost $881,693) | | | 837,150 | |
| | | | | | | | |
| | | | | | | | |
Principal
Amount | | | | | Value | |
| | | | | | | |
| | | | U.S. GOVERNMENT AGENCY SECURITIES 13.4% | | | | |
| | |
| | $1,500,000 | | | Federal Farm Credit Banks, 1.97%, 4/21/21 | | $ | 1,506,212 | |
| | 2,000,000 | | | Federal Farm Credit Banks, 2.29%, 4/14/22 | | | 2,000,208 | |
| | 1,000,000 | | | Federal Farm Credit Banks, 2.35%, 4/14/22 | | | 1,000,233 | |
| | 1,050,000 | | | Federal Farm Credit Banks, 2.60%, 10/6/22 | | | 1,079,148 | |
| | 1,000,000 | | | Federal Home Loan Bank, 1.04%, 5/29/18 | | | 996,766 | |
| | 1,000,000 | | | Federal Home Loan Bank, 1.15%, 11/28/17 | | | 1,004,356 | |
| | 1,000,000 | | | Federal Home Loan Bank, 1.50%, 12/30/22## | | | 1,001,639 | |
| | 2,000,000 | | | Federal Home Loan Bank, 1.75%, 11/8/22, Series 0000## | | | 2,001,502 | |
| | 1,500,000 | | | Federal Home Loan Mortgage Corp.,
2.50%, 5/27/16 | | | 1,521,280 | |
| | 420,143 | | | New Valley Generation IV, 4.687%, 1/15/22 | | | 459,469 | |
| | 800,000 | | | Tennessee Valley Authority, 3.875%, 2/15/21 | | | 887,020 | |
| | 1,000,000 | | | Tennessee Valley Authority, 6.25%, 12/15/17, Series E | | | 1,116,232 | |
| | | | | | | | |
| | |
| | | | Total U.S. Government Agency Securities
(cost $14,454,286) | | | 14,574,065 | |
| | | | | | | | |
| | |
| | | | U.S. TREASURY NOTES 8.6% | | | | |
| | |
| | 3,125,000 | | | U.S. Treasury Note, 3.25%, 12/31/16 | | | 3,232,828 | |
| | 4,100,000 | | | U.S. Treasury Note, 3.625%, 8/15/19 | | | 4,477,860 | |
| | 1,500,000 | | | U.S. Treasury Note, 3.625%, 2/15/20 | | | 1,647,872 | |
| | | | | | | | |
| | |
| | | | Total U.S. Treasury Notes
(cost $9,228,304) | | | 9,358,560 | |
| | | | | | | | |
| | |
| Shares | | | | | Value | |
| | | | | | | |
| | | | PREFERRED STOCKS 1.0% | | | | |
| | |
| | | | Consumer Finance 0.3% | | | | |
| | 12,000 | | | Capital One Financial Corp., 6.70%, Series D Pfd.§§§ | | $ | 318,000 | |
| | | | | | | | |
| | | | Diversified Banks 0.7% | | | | |
| | 20,000 | | | Bank of America Corp., 6.625%, Series W Pfd.§§§ | | | 515,200 | |
| | 12,000 | | | Citigroup, Inc., 6.875%, Series L Pfd.§§§ | | | 319,320 | |
| | | | | | | | |
| | | | | | | 834,520 | |
| | | | | | | | |
| | |
| | | | Total Preferred Stocks
(cost $1,145,092) | | | 1,152,520 | |
| | | | | | | | |
88
| | | | | | | | |
Principal
Amount | | | | | Value | |
| | | | | | | |
| | | | SHORT-TERM INVESTMENTS 1.9% | | | | |
| | |
| | | | Repurchase Agreement 1.9% | | | | |
| | $2,029,446 | | | Repurchase Agreement dated 9/30/15, 0.00% due 10/1/15 with State Street Bank and Trust Co. collateralized by $2,005,000 of United States Treasury Notes 2.125% due 1/31/21; value: $2,074,718; repurchase proceeds: $2,029,446 (cost $2,029,446) | | $ | 2,029,446 | |
| | | | | | | | |
| | |
| | | | Total Short-Term Investments (cost $2,029,446) | | | 2,029,446 | |
| | | | | | | | |
| | |
| | | | Total Investments
(cost $107,295,343) 99.3% | | | 108,250,259 | |
| | |
| | | | Other Assets less Liabilities 0.7% | | | 708,627 | |
| | | | | | | | |
| | |
| | | | NET ASSETS 100.0% | | $ | 108,958,886 | |
| | | | | | | | |
| |
| | | | †††Variable rate securities. §§§Perpetual maturity. Callable any time after first call date. Maturity date is next call date. ##Step bond. The rate shown is as of September 30, 2015 and will reset at a future date. ESOP Employee Stock Ownership Plan. ETF Exchange-Traded Fund. MTN Medium Term Note. See Notes to Financial Statements. | |
At September 30, 2015, Wasatch-1st Source Income Fund’s investments, excluding short-term investments, were in the following countries (unaudited):
| | | | |
| Country | | % | |
Bermuda | | | 0.2 | |
United Kingdom | | | 0.8 | |
United States | | | 99.0 | |
| | | | |
TOTAL | | | 100.0 | % |
| | | | |
89
| | |
| WASATCH-HOISINGTON U.S. TREASURY FUND (WHOSX) — Schedule of Investments | | SEPTEMBER 30, 2015 |
|
|
|
| | | | | | | | |
Principal
Amount | | | | | Value | |
| | | | | | | |
| | | | U.S. GOVERNMENT OBLIGATIONS 98.2% | |
| | |
| | $139,000,000 | | | U.S. Treasury Bond, 2.50%, 2/15/45 | | $ | 127,963,261 | |
| | 2,000,000 | | | U.S. Treasury Bond, 2.75%, 11/15/42 | | | 1,947,188 | |
| | 44,400,000 | | | U.S. Treasury Bond, 2.875%, 5/15/43 | | | 44,257,787 | |
| | 45,000,000 | | | U.S. Treasury Bond, 2.875%, 8/15/45 | | | 44,977,725 | |
| | 8,000,000 | | | U.S. Treasury Bond, 3.125%, 2/15/42 | | | 8,419,376 | |
| | 39,000,000 | | | U.S. Treasury Bond, 3.125%, 8/15/44 | | | 40,817,985 | |
| | 18,100,000 | | | U.S. Treasury Bond, 3.75%, 11/15/43 | | | 21,310,397 | |
| | 77,000,000 | | | U.S. Treasury Strip, principal only, 5/15/44 | | | 32,389,665 | |
| | | | | | | | |
| | |
| | | | Total U.S. Government Obligations
(cost $324,376,092) | | | 322,083,384 | |
| | | | | | | | |
| | | | | | | | |
Principal
Amount | | | | | Value | |
| | | | | | | |
| | | | SHORT-TERM INVESTMENTS 1.4% | | | | |
| | |
| | | | Repurchase Agreement 1.4% | | | | |
| | $4,582,570 | | | Repurchase Agreement dated 9/30/15, 0.00% due 10/1/15 with State Street Bank and Trust Co. collateralized by $4,685,000 of United States Treasury Notes 1.375% due 9/30/20; value: $4,679,144; repurchase proceeds: $4,582,570 (cost $4,582,570) | | $ | 4,582,570 | |
| | | | | | | | |
| | |
| | | | Total Short-Term Investments
(cost $4,582,570) | | | 4,582,570 | |
| | | | | | | | |
| | |
| | | | Total Investments
(cost $328,958,662) 99.6% | | | 326,665,954 | |
| | |
| | | | Other Assets less Liabilities 0.4% | | | 1,194,963 | |
| | | | | | | | |
| | |
| | | | NET ASSETS 100.0% | | $ | 327,860,917 | |
| | | | | | | | |
| |
| | | | See Notes to Financial Statements. | |
90
(This page intentionally left blank.)
91
| | |
| WASATCH FUNDS — Statements of Assets and Liabilities | | |
|
|
|
| | | | | | | | | | | | |
| | | CORE
GROWTH
FUND | | |
EMERGING
INDIA
FUND | | | EMERGING
MARKETS
SELECT FUND | |
| | | | | | | | | | | | |
Assets: | | | | | | | | | | | | |
Investments, at cost | | | | | | | | | | | | |
Unaffiliated issuers | | $ | 778,625,415 | | | $ | 46,246,358 | | | $ | 34,714,915 | |
Affiliated issuers1 | | | — | | | | — | | | | — | |
Repurchase agreements | | | 119,120,957 | | | | 2,268,300 | | | | 3,519,811 | |
| | | | | | | | | | | | |
| | $ | 897,746,372 | | | $ | 48,514,658 | | | $ | 38,234,726 | |
| | | | | | | | | | | | |
Investments, at market value | | | | | | | | | | | | |
Unaffiliated issuers | | $ | 1,050,777,396 | | | $ | 61,300,673 | | | $ | 34,456,710 | |
Affiliated issuers1 | | | — | | | | — | | | | — | |
Repurchase agreements | | | 119,120,957 | | | | 2,268,300 | | | | 3,519,811 | |
| | | | | | | | | | | | |
| | | 1,169,898,353 | | | | 63,568,973 | | | | 37,976,521 | |
Cash | | | 2,658,212 | | | | — | | | | — | |
Foreign currency on deposit (cost of $0, $944,650, $0, $562,822, $16,570,230, $48, $226,054 and $445,053, respectively) | | | — | | | | 948,708 | | | | — | |
Receivable for investment securities sold | | | 7,836,963 | | | | — | | | | — | |
Capital shares receivable | | | 752,399 | | | | 9,228 | | | | 6,777 | |
Interest and dividends receivable | | | 404,489 | | | | 22,916 | | | | 21,053 | |
Prepaid expenses and other assets | | | 31,325 | | | | 12,022 | | | | 7,608 | |
| | | | | | | | | | | | |
Total Assets | | | 1,181,581,741 | | | | 64,561,847 | | | | 38,011,959 | |
| | | | | | | | | | | | |
Liabilities: | | | | | | | | | | | | |
Bank overdraft of foreign currency (cost of $0, $0, $62, $0, $0, $0, $0 and $0, respectively) | | | — | | | | — | | | | 63 | |
Payable for securities purchased | | | 13,392,860 | | | | — | | | | — | |
Capital shares payable | | | 437,981 | | | | 38,029 | | | | 38,130 | |
Payable to Advisor | | | 984,712 | | | | 64,423 | | | | 24,888 | |
Accrued fund administration fees | | | 16,715 | | | | 587 | | | | 267 | |
Accrued expenses and other liabilities | | | 212,364 | | | | 48,028 | | | | 36,463 | |
Foreign capital gains taxes payable | | | 1,407,632 | | | | 560,851 | | | | 116,028 | |
Line of credit payable | | | — | | | | — | | | | — | |
Other payables | | | — | | | | 40 | | | | — | |
| | | | | | | | | | | | |
Total Liabilities | | | 16,452,264 | | | | 711,958 | | | | 215,839 | |
| | | | | | | | | | | | |
Net Assets | | $ | 1,165,129,477 | | | $ | 63,849,889 | | | $ | 37,796,120 | |
| | | | | | | | | | | | |
Net Assets Consist of: | | | | | | | | | | | | |
Capital stock | | $ | 201,409 | | | $ | 207,875 | | | $ | 45,083 | |
Paid-in-capital in excess of par | | | 767,762,103 | | | | 49,754,741 | | | | 45,905,172 | |
Undistributed net investment income (loss) | | | (8,200,589 | ) | | | (1,394,746 | ) | | | (277,867 | ) |
Undistributed net realized gain (loss) on investments and foreign currency translations | | | 134,621,429 | | | | 784,327 | | | | (7,500,611 | ) |
Net unrealized appreciation (depreciation) on investments and foreign currency translations | | | 270,745,125 | | | | 14,497,692 | | | | (375,657 | ) |
| | | | | | | | | | | | |
Net Assets | | $ | 1,165,129,477 | | | $ | 63,849,889 | | | $ | 37,796,120 | |
| | | | | | | | | | | | |
Net Assets | | | | | | | | | | | | |
Investor Class | | | 1,014,515,147 | | | | 63,849,889 | | | | 18,526,614 | |
Institutional Class | | | 150,614,330 | | | | — | | | | 19,269,506 | |
| | | |
Capital Stock Issued and Outstanding (Unlimited number of shares authorized,
$.01 par value) | | | | | | | | | | | | |
Investor Class | | | 17,543,616 | | | | 20,787,487 | | | | 2,218,050 | |
Institutional Class | | | 2,597,329 | | | | — | | | | 2,290,284 | |
| | | |
NET ASSET VALUE, REDEMPTION PRICEAND OFFERING PRICE PER SHARE | | | | | | | | | | | | |
Investor Class | | $ | 57.83 | | | $ | 3.07 | | | $ | 8.35 | |
| | | | | | | | | | | | |
Institutional Class | | $ | 57.99 | | | $ | — | | | $ | 8.41 | |
| | | | | | | | | | | | |
| 1 | See Note 8 for information on affiliated issuers. |
See Notes to Financial Statements.
92
| | | | | | | | | | | | | | | | | | |
EMERGING
MARKETS
SMALL CAP
FUND | | | FRONTIER
EMERGING
SMALL COUNTRIES
FUND | | | GLOBAL
OPPORTUNITIES
FUND | | | INTERNATIONAL
GROWTH
FUND | | | INTERNATIONAL
OPPORTUNITIES
FUND | |
| | | | | | | | | | | | | | | | | | |
| | | | | | | | | | | | | | | | | | |
| | | | | | | | | | | | | | | | | | |
| $ | 891,437,088 | | | $ | 962,323,198 | | | $ | 135,542,502 | | | $ | 1,055,659,080 | | | $ | 399,414,814 | |
| | — | | | | 31,662,296 | | | | — | | | | — | | | | — | |
| | — | | | | 23,472,377 | | | | 685,704 | | | | 12,275,005 | | | | 23,124,583 | |
| | | | | | | | | | | | | | | | | | |
| $ | 891,437,088 | | | $ | 1,017,457,871 | | | $ | 136,228,206 | | | $ | 1,067,934,085 | | | $ | 422,539,397 | |
| | | | | | | | | | | | | | | | | | |
| | | | | | | | | | | | | | | | | | |
| $ | 954,930,074 | | | $ | 951,611,391 | | | $ | 155,842,386 | | | $ | 1,304,387,825 | | | $ | 430,464,823 | |
| | — | | | | 29,224,572 | | | | — | | | | — | | | | — | |
| | — | | | | 23,472,377 | | | | 685,704 | | | | 12,275,005 | | | | 23,124,583 | |
| | | | | | | | | | | | | | | | | | |
| | 954,930,074 | | | | 1,004,308,340 | | | | 156,528,090 | | | | 1,316,662,830 | | | | 453,589,406 | |
| | — | | | | 5,309,168 | | | | 1,204,075 | | | | — | | | | — | |
| | | | |
| | 562,822 | | | | 16,566,410 | | | | 47 | | | | 224,951 | | | | 445,046 | |
| | 29,472,237 | | | | 21,354,383 | | | | 7,518 | | | | 2,871,599 | | | | 17,947 | |
| | 315,902 | | | | 852,989 | | | | 20,778 | | | | 501,262 | | | | 675,442 | |
| | 625,153 | | | | 2,316,337 | | | | 95,739 | | | | 2,394,584 | | | | 1,103,831 | |
| | 38,892 | | | | 28,536 | | | | 13,536 | | | | 36,623 | | | | 17,935 | |
| | | | | | | | | | | | | | | | | | |
| | 985,945,080 | | | | 1,050,736,163 | | | | 157,869,783 | | | | 1,322,691,849 | | | | 455,849,607 | |
| | | | | | | | | | | | | | | | | | |
| | | | | | | | | | | | | | | | | | |
| | — | | | | — | | | | — | | | | — | | | | — | |
| | 636,378 | | | | 10,462,108 | | | | 1,204,110 | | | | 3,000,052 | | | | 1,266,549 | |
| | 627,049 | | | | 2,322,889 | | | | 22,875 | | | | 1,722,486 | | | | 123,464 | |
| | 1,301,907 | | | | 1,445,768 | | | | 199,012 | | | | 1,356,021 | | | | 595,212 | |
| | 14,377 | | | | 15,173 | | | | 2,165 | | | | 19,889 | | | | 6,194 | |
| | 333,563 | | | | 579,748 | | | | 64,739 | | | | 498,313 | | | | 234,519 | |
| | 870,195 | | | | 8,237,417 | | | | 408,990 | | | | — | | | | 128,543 | |
| | 794,884 | | | | — | | | | — | | | | — | | | | — | |
| | — | | | | — | | | | — | | | | — | | | | — | |
| | | | | | | | | | | | | | | | | | |
| | 4,578,353 | | | | 23,063,103 | | | | 1,901,891 | | | | 6,596,761 | | | | 2,354,481 | |
| | | | | | | | | | | | | | | | | | |
| $ | 981,366,727 | | | $ | 1,027,673,060 | | | $ | 155,967,892 | | | $ | 1,316,095,088 | | | $ | 453,495,126 | |
| | | | | | | | | | | | | | | | | | |
| | | | | | | | | | | | | | | | | | |
| $ | 4,103,007 | | | $ | 3,705,563 | | | $ | 444,216 | | | $ | 472,095 | | | $ | 1,657,210 | |
| | 954,585,806 | | | | 1,081,050,861 | | | | 119,321,339 | | | | 1,088,806,978 | | | | 399,145,296 | |
| | (13,624,992 | ) | | | 1,547,031 | | | | (2,258,540 | ) | | | (4,649,406 | ) | | | (710,582 | ) |
| | (26,331,986 | ) | | | (37,177,189 | ) | | | 18,571,740 | | | | (17,218,701 | ) | | | 22,486,109 | |
| | | | |
| | 62,634,892 | | | | (21,453,206 | ) | | | 19,889,137 | | | | 248,684,122 | | | | 30,917,093 | |
| | | | | | | | | | | | | | | | | | |
| $ | 981,366,727 | | | $ | 1,027,673,060 | | | $ | 155,967,892 | | | $ | 1,316,095,088 | | | $ | 453,495,126 | |
| | | | | | | | | | | | | | | | | | |
| | | | | | | | | | | | | | | | | | |
| | 981,366,727 | | | | 1,027,673,060 | | | | 155,967,892 | | | | 1,316,095,088 | | | | 453,495,126 | |
| | — | | | | — | | | | — | | | | — | | | | — | |
| | | | |
| | | | | | | | | | | | | | | | | | |
| | 410,300,730 | | | | 370,556,323 | | | | 44,421,593 | | | | 47,209,464 | | | | 165,721,038 | |
| | — | | | | — | | | | — | | | | — | | | | — | |
| | | | |
| | | | | | | | | | | | | | | | | | |
| $ | 2.39 | | | $ | 2.77 | | | $ | 3.51 | | | $ | 27.88 | | | $ | 2.74 | |
| | | | | | | | | | | | | | | | | | |
| $ | — | | | $ | — | | | $ | — | | | $ | — | | | $ | — | |
| | | | | | | | | | | | | | | | | | |
93
| | |
| WASATCH FUNDS — Statements of Assets and Liabilities (continued) | | |
|
|
|
| | | | | | | | | | | | |
| | | LARGE CAP
VALUE FUND | | | LONG/SHORT
FUND | | | MICRO
CAP
FUND | |
| | | | | | | | | | | | |
Assets: | | | | | | | | | | | | |
Investments, at cost | | | | | | | | | | | | |
Unaffiliated issuers | | $ | 232,455,269 | | | $ | 1,083,841,914 | | | $ | 182,746,791 | |
Affiliated issuers1 | | | — | | | | 98,376,496 | | | | — | |
Repurchase agreements | | | 1,470,547 | | | | 52,286,876 | | | | 8,784,540 | |
| | | | | | | | | | | | |
| | $ | 233,925,816 | | | $ | 1,234,505,286 | | | $ | 191,531,331 | |
| | | | | | | | | | | | |
Investments, at market value | | | | | | | | | | | | |
Unaffiliated issuers | | $ | 243,797,409 | | | $ | 942,103,885 | | | $ | 252,301,777 | |
Affiliated issuers1 | | | — | | | | 26,162,208 | | | | — | |
Repurchase agreements | | | 1,470,547 | | | | 52,286,876 | | | | 8,784,540 | |
| | | | | | | | | | | | |
| | | 245,267,956 | | | | 1,020,552,969 | | | | 261,086,317 | |
Cash | | | — | | | | 71,756 | | | | 95,019 | |
Foreign currency on deposit (cost of $0, $0, $16,958, $9,481, $7, $0, $20 and $0, respectively) | | | — | | | | — | | | | 17,045 | |
Receivable for investment securities sold | | | 2,427,229 | | | | 11,034,011 | | | | 14,383,490 | |
Receivable from broker for securities sold short | | | — | | | | 270,028,416 | | | | — | |
Capital shares receivable | | | 10,596 | | | | 190,630 | | | | 2,752 | |
Interest and dividends receivable | | | 250,273 | | | | 1,648,581 | | | | 94,479 | |
Prepaid expenses and other assets | | | 13,468 | | | | 46,171 | | | | 13,971 | |
| | | | | | | | | | | | |
Total Assets | | | 247,969,522 | | | | 1,303,572,534 | | | | 275,693,073 | |
| | | | | | | | | | | | |
Liabilities: | | | | | | | | | | | | |
Securities sold short, at value (proceeds of $0, $274,609,852, $0, $0, $0, $0, $0 and $0, respectively) | | | — | | | | 263,064,239 | | | | — | |
Payable for securities purchased | | | 647,864 | | | | 1,588,215 | | | | 1,881,384 | |
Capital shares payable | | | 1,383,954 | | | | 12,237,731 | | | | 27,082 | |
Dividends payable to shareholders | | | 15,547 | | | | — | | | | — | |
Payable to Advisor | | | 189,260 | | | | 1,022,006 | | | | 413,606 | |
Accrued fund administration fees | | | 4,048 | | | | 17,813 | | | | 3,917 | |
Accrued expenses and other liabilities | | | 147,866 | | | | 315,873 | | | | 56,241 | |
Foreign capital gains taxes payable | | | — | | | | — | | | | — | |
Dividends payable on securities sold short | | | — | | | | 342,769 | | | | — | |
| | | | | | | | | | | | |
Total Liabilities | | | 2,388,539 | | | | 278,588,646 | | | | 2,382,230 | |
| | | | | | | | | | | | |
Net Assets | | $ | 245,580,983 | | | $ | 1,024,983,888 | | | $ | 273,310,843 | |
| | | | | | | | | | | | |
Net Assets Consist of: | | | | | | | | | | | | |
Capital stock | | $ | 277,694 | | | $ | 828,922 | | | $ | 379,095 | |
Paid-in-capital in excess of par | | | 215,231,768 | | | | 1,163,478,575 | | | | 163,760,254 | |
Undistributed net investment income (loss) | | | (17,753 | ) | | | 330,202 | | | | (764,789 | ) |
Undistributed net realized gain (loss) on investments, options and foreign currency translations | | | 18,747,134 | | | | 62,752,893 | | | | 40,379,170 | |
Net unrealized appreciation (depreciation) on investments and foreign currency translations | | | 11,342,140 | | | | (202,406,704 | ) | | | 69,557,113 | |
| | | | | | | | | | | | |
Net Assets | | $ | 245,580,983 | | | $ | 1,024,983,888 | | | $ | 273,310,843 | |
| | | | | | | | | | | | |
Net Assets | | | | | | | | | | | | |
Investor Class | | | 244,055,823 | | | | 616,191,755 | | | | 273,310,843 | |
Institutional Class | | | 1,525,160 | | | | 408,792,133 | | | | — | |
| | | |
Capital Stock Issued and Outstanding (Unlimited number of shares authorized,
$.01 par value) | | | | | | | | | | | | |
Investor Class | | | 27,596,831 | | | | 49,860,921 | | | | 37,909,511 | |
Institutional Class | | | 172,602 | | | | 33,031,279 | | | | — | |
| | | |
NET ASSET VALUE, REDEMPTION PRICEAND OFFERING PRICE PER SHARE | | | | | | | | | | | | |
Investor Class | | $ | 8.84 | | | $ | 12.36 | | | $ | 7.21 | |
| | | | | | | | | | | | |
Institutional Class | | $ | 8.84 | | | $ | 12.38 | | | $ | — | |
| | | | | | | | | | | | |
| 1 | See Note 8 for information on affiliated issuers. |
See Notes to Financial Statements.
94
| | | | | | | | | | | | | | | | | | |
MICRO CAP
VALUE FUND | | | SMALL CAP
GROWTH FUND | | | SMALL CAP
VALUE FUND | | | STRATEGIC
INCOME
FUND | | | ULTRA
GROWTH
FUND | |
| | | | | | | | | | | | | | | | | | |
| | | | | | | | | | | | | | | | | | |
| | | | | | | | | | | | | | | | | | |
| $ | 106,286,133 | | | $ | 1,361,180,905 | | | $ | 229,206,067 | | | $ | 88,620,057 | | | $ | 80,979,600 | |
| | — | | | | 93,018,148 | | | | — | | | | — | | | | — | |
| | 19,808,193 | | | | 87,423,697 | | | | 8,564,540 | | | | 3,032,863 | | | | 1,582,068 | |
| | | | | | | | | | | | | | | | | | |
| $ | 126,094,326 | | | $ | 1,541,622,750 | | | $ | 237,770,607 | | | $ | 91,652,920 | | | $ | 82,561,668 | |
| | | | | | | | | | | | | | | | | | |
| | | | | | | | | | | | | | | | | | |
| $ | 133,276,800 | | | $ | 1,845,044,621 | | | $ | 270,317,595 | | | $ | 84,304,370 | | | $ | 94,582,419 | |
| | — | | | | 73,261,141 | | | | — | | | | — | | | | — | |
| | 19,808,193 | | | | 87,423,697 | | | | 8,564,540 | | | | 3,032,863 | | | | 1,582,068 | |
| | | | | | | | | | | | | | | | | | |
| | 153,084,993 | | | | 2,005,729,459 | | | | 278,882,135 | | | | 87,337,233 | | | | 96,164,487 | |
| | 800,328 | | | | — | | | | — | | | | 7,453 | | | | — | |
| 9,407 | | | | 7 | | | | — | | | | 24 | | | | — | |
| | 907,711 | | | | 196,666 | | | | 3,496,717 | | | | 1,532,871 | | | | 190,929 | |
| | — | | | | — | | | | — | | | | — | | | | — | |
| | 28,552 | | | | 1,735,259 | | | | 181,223 | | | | 7,125 | | | | 42 | |
| | 120,207 | | | | 220,056 | | | | 486,439 | | | | 609,366 | | | | 4,118 | |
| | 13,982 | | | | 52,077 | | | | 17,584 | | | | 11,731 | | | | 9,988 | |
| | | | | | | | | | | | | | | | | | |
| | 154,965,180 | | | | 2,007,933,524 | | | | 283,064,098 | | | | 89,505,803 | | | | 96,369,564 | |
| | | | | | | | | | | | | | | | | | |
| | | | | | | | | | | | | | | | | | |
| — | | | | — | | | | — | | | | — | | | | — | |
| | 139,096 | | | | — | | | | 5,734,251 | | | | 461,608 | | | | 187,927 | |
| | 225,372 | | | | 1,251,227 | | | | 156,841 | | | | 271,739 | | | | 31,499 | |
| | — | | | | — | | | | — | | | | 19,568 | | | | — | |
| | 218,345 | | | | 1,725,694 | | | | 236,463 | | | | 53,907 | | | | 83,350 | |
| | 2,149 | | | | 30,496 | | | | 3,927 | | | | 1,091 | | | | 1,211 | |
| | 52,383 | | | | 697,857 | | | | 82,165 | | | | 36,967 | | | | 50,285 | |
| | 158,971 | | | | 3,640,617 | | | | 255,189 | | | | — | | | | — | |
| | — | | | | — | | | | — | | | | — | | | | — | |
| | | | | | | | | | | | | | | | | | |
| | 796,316 | | | | 7,345,891 | | | | 6,468,836 | | | | 844,880 | | | | 354,272 | |
| | | | | | | | | | | | | | | | | | |
| $ | 154,168,864 | | | $ | 2,000,587,633 | | | $ | 276,595,262 | | | $ | 88,660,923 | | | $ | 96,015,292 | |
| | | | | | | | | | | | | | | | | | |
| | | | | | | | | | | | | | | | | | |
| $ | 536,422 | | | $ | 435,224 | | | $ | 472,117 | | | $ | 84,529 | | | $ | 53,166 | |
| | 112,275,909 | | | | 1,249,827,151 | | | | 264,748,765 | | | | 91,574,762 | | | | 74,870,115 | |
| | 22,777 | | | | (12,167,564 | ) | | | 1,323,863 | | | | 98,362 | | | | 1,796,075 | |
|
14,513,847 |
| | | 303,652,607 | | | | (30,805,865 | ) | | | 1,219,047 | | | | 7,143,798 | |
| 26,819,909 | | | | 458,840,215 | | | | 40,856,382 | | | | (4,315,777 | ) | | | 12,152,138 | |
| | | | | | | | | | | | | | | | | | |
| $ | 154,168,864 | | | $ | 2,000,587,633 | | | $ | 276,595,262 | | | $ | 88,660,923 | | | $ | 96,015,292 | |
| | | | | | | | | | | | | | | | | | |
| | | | | | | | | | | | | | | | | | |
| | 154,168,864 | | | | 2,000,587,633 | | | | 257,654,762 | | | | 88,660,923 | | | | 96,015,292 | |
| | — | | | | — | | | | 18,940,500 | | | | — | | | | — | |
| | | | |
| | | | | | | | | | | | | | | | | | |
| | 53,642,247 | | | | 43,522,443 | | | | 43,992,940 | | | | 8,452,886 | | | | 5,316,619 | |
| | — | | | | — | | | | 3,218,736 | | | | — | | | | — | |
| | | | |
| | | | | | | | | | | | | | | | | | |
| $ | 2.87 | | | $ | 45.97 | | | $ | 5.86 | | | $ | 10.49 | | | $ | 18.06 | |
| | | | | | | | | | | | | | | | | | |
| $ | — | | | $ | — | | | $ | 5.88 | | | $ | — | | | $ | — | |
| | | | | | | | | | | | | | | | | | |
95
| | |
| WASATCH FUNDS — Statements of Assets and Liabilities (continued) | | SEPTEMBER 30, 2015 |
|
|
|
| | | | | | | | | | | | |
| | | WORLD
INNOVATORS
FUND | | | INCOME
FUND | | | U.S.
TREASURY
FUND | |
| | | | | | | | | | | | |
Assets: | | | | | | | | | | | | |
Investments, at cost | | | | | | | | | | | | |
Unaffiliated issuers | | $ | 154,352,642 | | | $ | 105,265,897 | | | $ | 324,376,092 | |
Repurchase agreements | | | 14,459,758 | | | | 2,029,446 | | | | 4,582,570 | |
| | | | | | | | | | | | |
| | $ | 168,812,400 | | | $ | 107,295,343 | | | $ | 328,958,662 | |
| | | | | | | | | | | | |
Investments, at market value | | | | | | | | | | | | |
Unaffiliated issuers | | $ | 168,326,821 | | | $ | 106,220,813 | | | $ | 322,083,384 | |
Repurchase agreements | | | 14,459,758 | | | | 2,029,446 | | | | 4,582,570 | |
| | | | | | | | | | | | |
| | | 182,786,579 | | | | 108,250,259 | | | | 326,665,954 | |
Foreign currency on deposit (cost of $177, $0 and $0, respectively) | | | 177 | | | | — | | | | — | |
Receivable for investment securities sold | | | 3,606,131 | | | | — | | | | — | |
Capital shares receivable | | | 20,864 | | | | 84,099 | | | | 324,134 | |
Interest and dividends receivable | | | 191,197 | | | | 754,789 | | | | 1,555,944 | |
Prepaid expenses and other assets | | | 14,377 | | | | 6,072 | | | | 26,127 | |
| | | | | | | | | | | | |
Total Assets | | | 186,619,325 | | | | 109,095,219 | | | | 328,572,159 | |
| | | | | | | | | | | | |
Liabilities: | | | | | | | | | | | | |
Payable for securities purchased | | | 487 | | | | — | | | | — | |
Capital shares payable | | | 34,223 | | | | 23,198 | | | | 430,642 | |
Dividends payable to shareholders | | | — | | | | 28,542 | | | | 74,461 | |
Payable to Advisor | | | 236,323 | | | | 48,601 | | | | 132,029 | |
Accrued fund administration fees | | | 2,839 | | | | 1,384 | | | | 4,489 | |
Accrued expenses and other liabilities | | | 73,430 | | | | 34,608 | | | | 69,621 | |
| | | | | | | | | | | | |
Total Liabilities | | | 347,302 | | | | 136,333 | | | | 711,242 | |
| | | | | | | | | | | | |
Net Assets | | $ | 186,272,023 | | | $ | 108,958,886 | | | $ | 327,860,917 | |
| | | | | | | | | | | | |
Net Assets Consist of: | | | | | | | | | | | | |
Capital stock | | $ | 92,336 | | | $ | 107,018 | | | $ | 177,975 | |
Paid-in-capital in excess of par | | | 155,962,612 | | | | 107,911,937 | | | | 314,090,542 | |
Undistributed net investment income (loss) | | | (854,667 | ) | | | 33,864 | | | | (20,881 | ) |
Undistributed net realized gain (loss) on investments and foreign currency translations | | | 17,274,408 | | | | (48,849 | ) | | | 15,905,989 | |
Net unrealized appreciation (depreciation) on investments and foreign currency translations | | | 13,797,334 | | | | 954,916 | | | | (2,292,708 | ) |
| | | | | | | | | | | | |
Net Assets | | $ | 186,272,023 | | | $ | 108,958,886 | | | $ | 327,860,917 | |
| | | | | | | | | | | | |
Net Assets | | | | | | | | | | | | |
Investor Class | | | 186,272,023 | | | | 108,958,886 | | | | 327,860,917 | |
| | | |
Capital Stock Issued and Outstanding (Unlimited number of shares authorized,
$.01 par value) | | | | | | | | | | | | |
Investor Class | | | 9,233,647 | | | | 10,701,769 | | | | 17,797,520 | |
| | | |
NET ASSET VALUE, REDEMPTION PRICE AND OFFERING PRICE PER SHARE | | | | | | | | | | | | |
Investor Class | | $ | 20.17 | | | $ | 10.18 | | | $ | 18.42 | |
| | | | | | | | | | | | |
See Notes to Financial Statements.
96
(This page intentionally left blank.)
97
| | |
| WASATCH FUNDS — Statements of Operations | | |
|
|
|
| | | | | | | | | | | | |
| | | CORE
GROWTH
FUND | | | EMERGING
INDIA
FUND | | | EMERGING
MARKETS
SELECT
FUND | |
| | | | | | | | | | | | |
Investment Income: | | | | | | | | | | | | |
Interest | | $ | — | | | $ | 2,335 | 1 | | $ | — | |
Dividends2 | | | | | | | | | | | | |
Unaffiliated issuers | | | 9,449,153 | | | | 366,099 | | | | 804,291 | |
Affiliated issuers3 | | | — | | | | — | | | | — | |
| | | | | | | | | | | | |
Total investment income | | | 9,449,153 | | | | 368,434 | | | | 804,291 | |
| | | | | | | | | | | | |
Expenses: | | | | | | | | | | | | |
Investment advisory fees | | | 10,688,626 | | | | 961,961 | | | | 691,808 | |
Shareholder servicing fees — Investor Class | | | 1,094,792 | | | | 134,643 | | | | 72,121 | |
Shareholder servicing fees — Institutional Class | | | 13,028 | | | | — | | | | 14,059 | |
Fund administration fees | | | 147,653 | | | | 8,872 | | | | 7,599 | |
Fund accounting fees | | | 94,841 | | | | 29,882 | | | | 20,203 | |
Reports to shareholders — Investor Class | | | 88,219 | | | | 16,676 | | | | 7,019 | |
Reports to shareholders — Institutional Class | | | 15,305 | | | | — | | | | 8,333 | |
Custody fees | | | 112,966 | | | | 131,963 | | | | 77,877 | |
Federal and state registration fees — Investor Class | | | 22,039 | | | | 20,458 | | | | 16,082 | |
Federal and state registration fees — Institutional Class | | | 11,723 | | | | — | | | | 15,056 | |
Legal fees | | | 42,470 | | | | 2,200 | | | | 5,704 | |
Trustees’ fees | | | 84,337 | | | | 4,843 | | | | 5,038 | |
Interest | | | 20,393 | | | | 3,092 | | | | 3,208 | |
Audit fees | | | 30,051 | | | | 27,651 | | | | 64,648 | |
Other expenses | | | 51,447 | | | | 20,568 | | | | 27,704 | |
| | | | | | | | | | | | |
Total expenses before reimbursement | | | 12,517,890 | | | | 1,362,809 | | | | 1,036,459 | |
Reimbursement of expenses by Advisor | | | (8,615 | ) | | | (109,168 | ) | | | (154,653 | ) |
| | | | | | | | | | | | |
Net Expenses | | | 12,509,275 | | | | 1,253,641 | | | | 881,806 | |
| | | | | | | | | | | | |
Net Investment Income (Loss) | | | (3,060,122 | ) | | | (885,207 | ) | | | (77,515 | ) |
| | | | | | | | | | | | |
Realized and Unrealized Gain (Loss): | | | | | | | | | | | | |
Net realized gain (loss) on investments and foreign currency translations | | | | | | | | | | | | |
Unaffiliated issuers | | | 134,651,115 | | | | 1,404,976 | | | | (4,968,701 | ) |
Realized foreign capital gains taxes | | | — | | | | — | | | | — | |
Change in unrealized appreciation (depreciation)
on investments and foreign currency translations | | | (39,221,978 | ) | | | 4,977,535 | | | | (4,671,524 | ) |
Change in deferred foreign capital gains taxes | | | (1,407,632 | ) | | | (21,244 | ) | | | 45,707 | |
| | | | | | | | | | | | |
Net gain (loss) on investments | | | 94,021,505 | | | | 6,361,267 | | | | (9,594,518 | ) |
| | | | | | | | | | | | |
Net Increase (Decrease) in Net Assets Resulting from Operations | | $ | 90,961,383 | | | $ | 5,476,060 | | | $ | (9,672,033 | ) |
| | | | | | | | | | | | |
| 1 | Net of $70 in foreign withholding taxes. |
| 2 | Net of $143,550, $0, $80,620, $1,829,756, $3,082,611, $66,972, $1,300,311 and $885,149 in foreign withholding taxes, respectively. |
| 3 | See Note 8 for information on affiliated issuers. |
See Notes to Financial Statements.
98
| | | | | | | | | | | | | | | | | | |
EMERGING
MARKETS
SMALL CAP
FUND | | | FRONTIER
EMERGING
SMALL COUNTRIES
FUND | | | GLOBAL
OPPORTUNITIES
FUND | | | INTERNATIONAL
GROWTH
FUND | | | INTERNATIONAL
OPPORTUNITIES
FUND | |
| | | | | | | | | | | | | | | | | | |
| | | | | | | | | | | | | | | | | | |
| $ | — | | | $ | 138 | | | $ | — | | | $ | — | | | $ | — | |
| | | | | | | | | | | | | | | | | | |
| 16,879,768
|
| | | 30,649,549 | | | | 1,281,472 | | | | 15,894,595 | | | | 7,561,590 | |
| | — | | | | 1,198,405 | | | | — | | | | — | | | | — | |
| | | | | | | | | | | | | | | | | | |
| | 16,879,768 | | | | 31,848,092 | | | | 1,281,472 | | | | 15,894,595 | | | | 7,561,590 | |
| | | | | | | | | | | | | | | | | | |
| | | | | | | | | | | | | | | | | | |
| | 22,227,159 | | | | 21,121,963 | | | | 2,712,557 | | | | 16,864,727 | | | | 7,807,882 | |
| | 1,259,742 | | | | 2,487,124 | | | | 245,257 | | | | 1,949,944 | | | | 1,166,698 | |
| | — | | | | — | | | | — | | | | — | | | | — | |
| | 174,414 | | | | 165,977 | | | | 24,877 | | | | 185,816 | | | | 55,361 | |
| | 124,148 | | | | 124,992 | | | | 34,307 | | | | 125,970 | | | | 64,688 | |
| | 98,693 | | | | 140,605 | | | | 26,532 | | | | 164,811 | | | | 79,362 | |
| | — | | | | — | | | | — | | | | — | | | | — | |
| | 1,321,413 | | | | 3,178,498 | | | | 117,443 | | | | 495,832 | | | | 408,008 | |
| | 33,694 | | | | 58,878 | | | | 19,435 | | | | 70,192 | | | | 24,465 | |
| | — | | | | — | | | | — | | | | — | | | | — | |
| | 46,044 | | | | 43,440 | | | | 6,403 | | | | 46,719 | | | | 13,354 | |
| | 116,557 | | | | 109,007 | | | | 15,928 | | | | 114,556 | | | | 30,701 | |
| | 46,103 | | | | 31,258 | | | | 8,614 | | | | 49,639 | | | | 8,019 | |
| | 27,651 | | | | 37,764 | | | | 29,716 | | | | 27,651 | | | | 30,179 | |
| | 114,926 | | | | 42,226 | | | | 28,807 | | | | 81,471 | | | | 40,196 | |
| | | | | | | | | | | | | | | | | | |
| | 25,590,544 | | | | 27,541,732 | | | | 3,269,876 | | | | 20,177,328 | | | | 9,728,913 | |
| | (777,036 | ) | | | (353,665 | ) | | | — | | | | — | | | | (711,799 | ) |
| | | | | | | | | | | | | | | | | | |
| | 24,813,508 | | | | 27,188,067 | | | | 3,269,876 | | | | 20,177,328 | | | | 9,017,114 | |
| | | | | | | | | | | | | | | | | | |
| | (7,933,740 | ) | | | 4,660,025 | | | | (1,988,404 | ) | | | (4,282,733 | ) | | | (1,455,524 | ) |
| | | | | | | | | | | | | | | | | | |
| | | | | | | | | | | | | | | | | | |
| | | | | | | | | | | | | | | | | | |
| | (8,663,125 | ) | | | (36,935,977 | ) | | | 21,415,472 | | | | (14,432,781 | ) | | | 22,684,497 | |
| | (1,595,031 | ) | | | (272,291 | ) | | | (225,021 | ) | | | (1,355,001 | ) | | | — | |
| | (137,918,497 | ) | | | (155,547,957 | ) | | | (24,967,008 | ) | |
|
76,535,745 |
| | | (30,512,597 | ) |
| | 3,183,240 | | | | (931,594 | ) | | | 23,374 | | | | 826,499 | | | | 297,563 | |
| | | | | | | | | | | | | | | | | | |
| | (144,993,413 | ) | | | (193,687,819 | ) | | | (3,753,183 | ) | | | 61,574,462 | | | | (7,530,537 | ) |
| | | | | | | | | | | | | | | | | | |
| $ | (152,927,153 | ) | | $ | (189,027,794 | ) | | $ | (5,741,587 | ) | | $ | 57,291,729 | | | $ | (8,986,061 | ) |
| | | | | | | | | | | | | | | | | | |
99
| | |
| WASATCH FUNDS — Statements of Operations (continued) | | |
|
|
|
| | | | | | | | | | | | |
| | | LARGE CAP
VALUE
FUND | | | LONG/SHORT
FUND | | | MICRO
CAP
FUND | |
| | | | | | | | | | | | |
Investment Income: | | | | | | | | | | | | |
Dividends1 | | | | | | | | | | | | |
Unaffiliated issuers | | $ | 8,045,769 | | | $ | 36,253,587 | | | $ | 3,256,608 | |
| | | | | | | | | | | | |
Total investment income | | | 8,045,769 | | | | 36,253,587 | | | | 3,256,608 | |
| | | | | | | | | | | | |
Expenses: | | | | | | | | | | | | |
Investment advisory fees | | | 2,966,653 | | | | 23,062,568 | | | | 5,403,854 | |
Shareholder servicing fees — Investor Class | | | 474,117 | | | | 1,747,766 | | | | 211,185 | |
Shareholder servicing fees — Institutional Class | | | 3,391 | | | | 18,754 | | | | — | |
Fund administration fees | | | 45,100 | | | | 296,746 | | | | 42,534 | |
Fund accounting fees | | | 33,851 | | | | 170,441 | | | | 39,638 | |
Reports to shareholders — Investor Class | | | 34,225 | | | | 139,386 | | | | 19,305 | |
Reports to shareholders — Institutional Class | | | 3,042 | | | | 36,152 | | | | — | |
Custody fees | | | 8,949 | | | | 85,491 | | | | 35,339 | |
Federal and state registration fees — Investor Class | | | 19,364 | | | | 57,748 | | | | 19,453 | |
Federal and state registration fees — Institutional Class | | | 9,945 | | | | 31,450 | | | | — | |
Legal fees | | | 13,403 | | | | 88,815 | | | | 10,753 | |
Trustees’ fees | | | 31,792 | | | | 210,310 | | | | 26,028 | |
Dividends on securities sold short | | | — | | | | 4,873,643 | | | | — | |
Interest | | | 7,926 | | | | 1,611,675 | | | | 5,974 | |
Audit fees | | | 32,203 | | | | 30,297 | | | | 26,574 | |
Other expenses | | | 22,776 | | | | 91,875 | | | | 29,902 | |
| | | | | | | | | | | | |
Total expenses before reimbursement | | | 3,706,737 | | | | 32,553,117 | | | | 5,870,539 | |
Reimbursement of expenses by Advisor | | | (78,001 | ) | | | — | | | | — | |
| | | | | | | | | | | | |
Net Expenses | | | 3,628,736 | | | | 32,553,117 | | | | 5,870,539 | |
| | | | | | | | | | | | |
Net Investment Income (Loss) | | | 4,417,033 | | | | 3,700,470 | | | | (2,613,931 | ) |
| | | | | | | | | | | | |
Realized and Unrealized Gain (Loss): | | | | | | | | | | | | |
Net realized gain (loss) on investments and foreign currency translations | | | | | | | | | | | | |
Unaffiliated issuers | | | 23,888,706 | | | | 126,017,493 | | | | 42,447,306 | |
Affiliated issuers | | | — | | | | (12,793,567 | ) | | | — | |
Net realized gain (loss) on options written | | | — | | | | (1,377,491 | ) | | | — | |
Net realized loss on short positions | | | — | | | | (2,298,097 | ) | | | — | |
Realized foreign capital gains taxes | | | — | | | | — | | | | — | |
Change in unrealized appreciation (depreciation) on
investments, options, securities sold short and foreign currency translations | | | (44,068,657 | ) | | | (484,033,257 | ) | | | (31,053,244 | ) |
Change in deferred foreign capital gains taxes | | | — | | | | — | | | | 470,871 | |
| | | | | | | | | | | | |
Net gain (loss) on investments | | | (20,179,951 | ) | | | (374,484,919 | ) | | | 11,864,933 | |
| | | | | | | | | | | | |
Net Increase (Decrease) in Net Assets Resulting from Operations | | $ | (15,762,918 | ) | | $ | (370,784,449 | ) | | $ | 9,251,002 | |
| | | | | | | | | | | | |
| 1 | Net of $77,086, $104,106, $31,243, $37,595, $95,490, $0, $25,428 and $0 in foreign withholding taxes, respectively. |
See Notes to Financial Statements.
100
| | | | | | | | | | | | | | | | | | |
MICRO CAP
VALUE
FUND | | | SMALL CAP
GROWTH
FUND | | | SMALL CAP
VALUE
FUND | | | STRATEGIC
INCOME
FUND | | | ULTRA
GROWTH
FUND | |
| | | | | | | | | | | | | | | | | | |
| | | | | | | | | | | | | | | | | | |
| | | | | | | | | | | | | | | | | | |
| $ | 2,235,759 | | | $ | 10,871,749 | | | $ | 5,928,453 | | | $ | 3,972,665 | | | $ | 273,323 | |
| | | | | | | | | | | | | | | | | | |
| | 2,235,759 | | | | 10,871,749 | | | | 5,928,453 | | | | 3,972,665 | | | | 273,323 | |
| | | | | | | | | | | | | | | | | | |
| | | | | | | | | | | | | | | | | | |
| | 2,788,024 | | | | 22,985,458 | | | | 2,919,175 | | | | 802,258 | | | | 1,082,388 | |
| | 197,877 | | | | 3,405,167 | | | | 327,860 | | | | 154,858 | | | | 170,974 | |
| | — | | | | — | | | | 4,168 | | | | — | | | | — | |
| | 21,950 | | | | 316,556 | | | | 40,237 | | | | 15,787 | | | | 14,910 | |
| | 32,961 | | | | 191,610 | | | | 35,568 | | | | 18,686 | | | | 25,533 | |
| | 22,467 | | | | 211,918 | | | | 28,757 | | | | 16,812 | | | | 15,754 | |
| | — | | | | — | | | | 3,314 | | | | — | | | | — | |
| | 41,847 | | | | 396,862 | | | | 33,230 | | | | 5,121 | | | | 17,774 | |
| | 18,733 | | | | 56,608 | | | | 28,109 | | | | 21,864 | | | | 17,554 | |
| | — | | | | — | | | | 10,330 | | | | — | | | | — | |
| | 6,256 | | | | 81,546 | | | | 12,142 | | | | 4,043 | | | | 3,754 | |
| | 13,468 | | | | 195,054 | | | | 24,209 | | | | 9,560 | | | | 9,075 | |
| | — | | | | — | | | | — | | | | — | | | | — | |
| | 8,139 | | | | 48,245 | | | | 5,884 | | | | 2,516 | | | | 2,021 | |
| | 30,421 | | | | 29,574 | | | | 30,051 | | | | 29,716 | | | | 35,574 | |
| | 23,136 | | | | 100,042 | | | | 28,220 | | | | 10,461 | | | | 27,050 | |
| | | | | | | | | | | | | | | | | | |
| | 3,205,279 | | | | 28,018,640 | | | | 3,531,254 | | | | 1,091,682 | | | | 1,422,361 | |
| | (90,485 | ) | | | — | | | | (9,265 | ) | | | (387 | ) | | | — | |
| | | | | | | | | | | | | | | | | | |
| | 3,114,794 | | | | 28,018,640 | | | | 3,521,989 | | | | 1,091,295 | | | | 1,422,361 | |
| | | | | | | | | | | | | | | | | | |
| | (879,035 | ) | | | (17,146,891 | ) | | | 2,406,464 | | | | 2,881,370 | | | | (1,149,038 | ) |
| | | | | | | | | | | | | | | | | | |
| | | | | | | | | | | | | | | | | | |
| | | | |
| | 18,698,763 | | | | 339,817,590 | | | | 10,286,478 | | | | 3,027,134 | | | | 9,017,957 | |
| | — | | | | — | | | | — | | | | — | | | | — | |
| | 272,422 | | | | — | | | | — | | | | — | | | | — | |
| | — | | | | — | | | | — | | | | — | | | | — | |
| | (100,772 | ) | | | — | | | | (34,167 | ) | | | — | | | | — | |
| | | | |
| | (2,846,124 | ) | | | (286,889,716 | ) | | | (5,535,405 | ) | | | (15,972,843 | ) | | | (3,043,910 | ) |
| | (114,088 | ) | | | (3,640,617 | ) | | | (134,463 | ) | | | — | | | | — | |
| | | | | | | | | | | | | | | | | | |
| | 15,910,201 | | | | 49,287,257 | | | | 4,582,443 | | | | (12,945,709 | ) | | | 5,974,047 | |
| | | | | | | | | | | | | | | | | | |
| $ | 15,031,166 | | | $ | 32,140,366 | | | $ | 6,988,907 | | | $ | (10,064,339 | ) | | $ | 4,825,009 | |
| | | | | | | | | | | | | | | | | | |
101
| | |
| WASATCH FUNDS — Statements of Operations (continued) | | SEPTEMBER 30, 2015 |
|
|
|
| | | | | | | | | | | | |
| | | WORLD INNOVATORS FUND | | | INCOME FUND | | | U.S. TREASURY FUND | |
| | | | | | | | | | | | |
Investment Income: | | | | | | | | | | | | |
Interest | | $ | — | | | $ | 2,391,128 | | | $ | 8,700,522 | |
Dividends1 | | | | | | | | | | | | |
Unaffiliated issuers | | | 2,143,061 | | | | 118,755 | | | | — | |
| | | | | | | | | | | | |
Total investment income | | | 2,143,061 | | | | 2,509,883 | | | | 8,700,522 | |
| | | | | | | | | | | | |
Expenses: | | | | | | | | | | | | |
Investment advisory fees | | | 3,196,182 | | | | 601,316 | | | | 1,561,066 | |
Shareholder servicing fees — Investor Class | | | 320,819 | | | | 52,465 | | | | 313,537 | |
Fund administration fees | | | 29,274 | | | | 15,057 | | | | 43,167 | |
Fund accounting fees | | | 33,817 | | | | 36,487 | | | | 28,934 | |
Reports to shareholders — Investor Class | | | 25,495 | | | | 5,177 | | | | 25,582 | |
Custody fees | | | 41,469 | | | | 11,484 | | | | 10,487 | |
Federal and state registration fees — Investor Class | | | 26,065 | | | | 17,657 | | | | 32,230 | |
Legal fees | | | 7,569 | | | | 3,846 | | | | 10,693 | |
Trustees’ fees | | | 19,400 | | | | 9,659 | | | | 24,142 | |
Interest | | | 4,204 | | | | 2,390 | | | | 6,149 | |
Audit fees | | | 27,651 | | | | 27,897 | | | | 27,651 | |
Other expenses | | | 23,068 | | | | 7,408 | | | | 11,085 | |
| | | | | | | | | | | | |
Net Expenses | | | 3,755,013 | | | | 790,843 | | | | 2,094,723 | |
| | | | | | | | | | | | |
Net Investment Income (Loss) | | | (1,611,952 | ) | | | 1,719,040 | | | | 6,605,799 | |
| | | | | | | | | | | | |
Realized and Unrealized Gain (Loss): | | | | | | | | | | | | |
Net realized gain on investments and foreign currency translations | | | | | | | | | | | | |
Unaffiliated issuers | | | 20,035,191 | | | | 407,021 | | | | 40,074,870 | |
Change in unrealized depreciation on investments and foreign currency translations | | | (17,578,392 | ) | | | (23,148 | ) | | | (26,646,790 | ) |
| | | | | | | | | | | | |
Net gain on investments | | | 2,456,799 | | | | 383,873 | | | | 13,428,080 | |
| | | | | | | | | | | | |
Net Increase in Net Assets Resulting from Operations | | $ | 844,847 | | | $ | 2,102,913 | | | $ | 20,033,879 | |
| | | | | | | | | | | | |
| 1 | Net of $86,027, $0 and $0 in foreign withholding taxes, respectively. |
See Notes to Financial Statements.
102
(This page intentionally left blank.)
103
| | |
| WASATCH FUNDS — Statements of Changes in Net Assets | | |
|
|
|
| | | | | | | | | | | | | | | | |
| | | CORE GROWTH FUND | | | EMERGING INDIA FUND | |
| | | Year Ended September 30, 2015 | | | Year Ended September 30, 2014 | | | Year Ended September 30, 2015 | | | Year Ended September 30, 2014 | |
| | | | | | | | | | | | | | | | |
Operations: | | | | | | | | | | | | | | | | |
Net investment income (loss) | | $ | (3,060,122 | ) | | $ | (6,177,677 | ) | | $ | (885,207 | ) | | $ | (176,149 | ) |
Net realized gain (loss) on investments, foreign currency translations and foreign capital gains taxes | | | 134,651,115 | | | | 27,736,790 | | | | 1,404,976 | | | | 364,946 | |
Change in unrealized appreciation (depreciation) on investments, foreign currency translations
and deferred capital gains taxes | | | (40,629,610 | ) | | | 10,095,753 | | | | 4,956,291 | | | | 9,544,806 | |
| | | | | | | | | | | | | | | | |
Net increase (decrease) in net assets resulting from operations | | | 90,961,383 | | | | 31,654,866 | | | | 5,476,060 | | | | 9,733,603 | |
| | | | |
Dividends paid from: | | | | | | | | | | | | | | | | |
Investor Class | | | | | | | | | | | | | | | | |
Net investment income | | | — | | | | — | | | | (29,439 | ) | | | — | |
Net realized gains | | | (22,822,588 | ) | | | (13,292,735 | ) | | | — | | | | — | |
| | | | | | | | | | | | | | | | |
| | | (22,822,588 | ) | | | (13,292,735 | ) | | | (29,439 | ) | | | — | |
Institutional Class | | | | | | | | | | | | | | | | |
Net investment income | | | — | | | | — | | | | — | | | | — | |
Net realized gains | | | (1,317,073 | ) | | | (446,532 | ) | | | — | | | | — | |
| | | | | | | | | | | | | | | | |
| | | (1,317,073 | ) | | | (446,532 | ) | | | — | | | | — | |
| | | | |
Capital share transactions: | | | | | | | | | | | | | | | | |
Investor Class | | | | | | | | | | | | | | | | |
Shares sold | | | 257,284,741 | | | | 115,859,006 | | | | 53,513,984 | | | | 24,342,312 | |
Shares issued to holders in reinvestment of dividends | | | 22,299,104 | | | | 12,976,194 | | | | 28,983 | | | | — | |
Shares redeemed | | | (190,917,065 | ) | | | (211,661,828 | ) | | | (39,349,330 | ) | | | (5,867,945 | ) |
Redemption fees | | | 32,774 | | | | 25,585 | | | | 59,862 | | | | 4,219 | |
| | | | | | | | | | | | | | | | |
Net increase (decrease) | | | 88,699,554 | | | | (82,801,043 | ) | | | 14,253,499 | | | | 18,478,586 | |
| | | | | | | | | | | | | | | | |
Institutional Class | | | | | | | | | | | | | | | | |
Shares sold | | | 105,047,781 | | | | 35,358,853 | | | | — | | | | — | |
Shares issued to holders in reinvestment of dividends | | | 1,317,073 | | | | 440,938 | | | | — | | | | — | |
Shares redeemed | | | (5,212,229 | ) | | | (6,736,116 | ) | | | — | | | | — | |
Redemption fees | | | 561 | | | | 1,298 | | | | — | | | | — | |
| | | | | | | | | | | | | | | | |
Net increase (decrease) | | | 101,153,186 | | | | 29,064,973 | | | | — | | | | — | |
| | | | | | | | | | | | | | | | |
Total increase (decrease) in net assets | | | 256,674,462 | | | | (35,820,471 | ) | | | 19,700,120 | | | | 28,212,189 | |
| | | | |
Net assets: | | | | | | | | | | | | | | | | |
Beginning of period | | | 908,455,015 | | | | 944,275,486 | | | | 44,149,769 | | | | 15,937,580 | |
| | | | | | | | | | | | | | | | |
End of period | | $ | 1,165,129,477 | | | $ | 908,455,015 | | | $ | 63,849,889 | | | $ | 44,149,769 | |
| | | | | | | | | | | | | | | | |
Undistributed net investment income (loss) included
in net assets at end of period | | $ | (8,200,589 | ) | | $ | (5,205,477 | ) | | $ | (1,394,746 | ) | | $ | (374,508 | ) |
| | | | | | | | | | | | | | | | |
| | | | |
Capital share transactions — shares: | | | | | | | | | | | | | | | | |
Investor Class | | | | | | | | | | | | | | | | |
Shares sold | | | 4,323,060 | | | | 2,145,922 | | | | 17,696,899 | | | | 9,809,678 | |
Shares issued to holders in reinvestment of dividends | | | 385,598 | | | | 235,867 | | | | 10,029 | | | | — | |
Shares redeemed | | | (3,235,178 | ) | | | (3,921,819 | ) | | | (13,093,287 | ) | | | (2,585,822 | ) |
| | | | | | | | | | | | | | | | |
Net increase (decrease) in shares outstanding | | | 1,473,480 | | | | (1,540,030 | ) | | | 4,613,641 | | | | 7,223,856 | |
| | | | | | | | | | | | | | | | |
Institutional Class | | | | | | | | | | | | | | | | |
Shares sold | | | 1,739,883 | | | | 657,897 | | | | — | | | | — | |
Shares issued to holders in reinvestment of dividends | | | 22,720 | | | | 7,998 | | | | — | | | | — | |
Shares redeemed | | | (86,771 | ) | | | (124,326 | ) | | | — | | | | — | |
| | | | | | | | | | | | | | | | |
Net increase (decrease) in shares outstanding | | | 1,675,832 | | | | 541,569 | | | | — | | | | — | |
| | | | | | | | | | | | | | | | |
See Notes to Financial Statements.
104
| | | | | | | | | | | | | | | | | | | | | | |
EMERGING MARKETS SELECT FUND | | | EMERGING MARKETS SMALL CAP FUND | | | FRONTIER EMERGING SMALL COUNTRIES FUND | |
Year Ended September 30, 2015 | | | Year Ended September 30, 2014 | | | Year Ended September 30, 2015 | | | Year Ended September 30, 2014 | | | Year Ended September 30, 2015 | | | Year Ended September 30, 2014 | |
| | | | | | | | | | | | | | | | | | | | | | |
| | | | | | | | | | | | | | | | | | | | | | |
| $ | (77,515 | ) | | $ | (13,125 | ) | | $ | (7,933,740 | ) | | $ | (4,636,032 | ) | | $ | 4,660,025 | | | $ | 8,757,360 | |
| (4,968,701 | ) | | | (599,872 | ) | | | (10,258,156 | ) | | | 7,560,059 | | | | (37,208,268 | ) | | | 16,000,201 | |
| (4,625,817 | ) | | | 5,414,601 | | | | (134,735,257 | ) | | | 71,426,344 | | | | (156,479,551 | ) | | | 90,644,068 | |
| | | | | | | | | | | | | | | | | | | | | | |
| | (9,672,033 | ) | | | 4,801,604 | | | | (152,927,153 | ) | | | 74,350,371 | | | | (189,027,794 | ) | | | 115,401,629 | |
| | | | | |
| | | | | | | | | | | | | | | | | | | | | | |
| | | | | | | | | | | | | | | | | | | | | | |
| | (85,929 | ) | | | (21,719 | ) | | | (1,814,628 | ) | | | — | | | | (6,526,410 | ) | | | (1,526,061 | ) |
| | — | | | | — | | | | — | | | | (38,681,435 | ) | | | (19,311,554 | ) | | | — | |
| | | | | | | | | | | | | | | | | | | | | | |
| | (85,929 | ) | | | (21,719 | ) | | | (1,814,628 | ) | | | (38,681,435 | ) | | | (25,837,964 | ) | | | (1,526,061 | ) |
| | | | | | | | | | | | | | | | | | | | | | |
| | (151,968 | ) | | | (64,529 | ) | | | — | | | | — | | | | — | | | | — | |
| | — | | | | — | | | | — | | | | — | | | | — | | | | — | |
| | | | | | | | | | | | | | | | | | | | | | |
| | (151,968 | ) | | | (64,529 | ) | | | — | | | | — | | | | — | | | | — | |
| | | | | |
| | | | | | | | | | | | | | | | | | | | | | |
| | | | | | | | | | | | | | | | | | | | | | |
| | 7,293,767 | | | | 11,991,899 | | | | 180,971,456 | | | | 347,159,450 | | | | 490,118,465 | | | | 717,734,281 | |
| | 85,177 | | | | 21,418 | | | | 1,494,676 | | | | 32,124,819 | | | | 24,103,894 | | | | 1,410,893 | |
| | (10,592,721 | ) | | | (17,169,685 | ) | | | (504,253,544 | ) | | | (742,856,437 | ) | | | (596,403,419 | ) | | | (239,125,817 | ) |
| | 596 | | | | 1,504 | | | | 14,069 | | | | 103,958 | | | | 25,583 | | | | 105,062 | |
| | | | | | | | | | | | | | | | | | | | | | |
| | (3,213,181 | ) | | | (5,154,864 | ) | | | (321,773,343 | ) | | | (363,468,210 | ) | | | (82,155,477 | ) | | | 480,124,419 | |
| | | | | | | | | | | | | | | | | | | | | | |
| | | | | | | | | | | | | | | | | | | | | | |
| | 3,739,143 | | | | 4,995,578 | | | | — | | | | — | | | | — | | | | — | |
| | 151,968 | | | | 63,952 | | | | — | | | | — | | | | — | | | | — | |
| | (11,784,081 | ) | | | (4,047,799 | ) | | | — | | | | — | | | | — | | | | — | |
| | 4,245 | | | | 82 | | | | — | | | | — | | | | — | | | | — | |
| | | | | | | | | | | | | | | | | | | | | | |
| | (7,888,725 | ) | | | 1,011,813 | | | | — | | | | — | | | | — | | | | — | |
| | | | | | | | | | | | | | | | | | | | | | |
| | (21,011,836 | ) | | | 572,305 | | | | (476,515,124 | ) | | | (327,799,274 | ) | | | (297,021,235 | ) | | | 593,999,987 | |
| | | | | |
| | | | | | | | | | | | | | | | | | | | | | |
| | 58,807,956 | | | | 58,235,651 | | | | 1,457,881,851 | | | | 1,785,681,125 | | | | 1,324,694,295 | | | | 730,694,308 | |
| | | | | | | | | | | | | | | | | | | | | | |
| $ | 37,796,120 | | | $ | 58,807,956 | | | $ | 981,366,727 | | | $ | 1,457,881,851 | | | $ | 1,027,673,060 | | | $ | 1,324,694,295 | |
| | | | | | | | | | | | | | | | | | | | | | |
$ | (277,867 | ) | | $ | (45,607 | ) | | $ | (13,624,992 | ) | | $ | (10,619,495 | ) | | $ | 1,547,031 | | | $ | 6,400,383 | |
| | | | | | | | | | | | | | | | | | | | | | |
| | | | | |
| | | | | | | | | | | | | | | | | | | | | | |
| | | | | | | | | | | | | | | | | | | | | | |
| | 723,608 | | | | 1,205,798 | | | | 67,698,717 | | | | 129,784,853 | | | | 162,889,608 | | | | 227,204,205 | |
| | 8,392 | | | | 2,201 | | | | 561,908 | | | | 12,214,760 | | | | 7,800,613 | | | | 458,082 | |
| | (1,085,598 | ) | | | (1,710,416 | ) | | | (190,175,016 | ) | | | (279,567,746 | ) | | | (198,903,713 | ) | | | (75,182,416 | ) |
| | | | | | | | | | | | | | | | | | | | | | |
| | (353,598 | ) | | | (502,417 | ) | | | (121,914,391 | ) | | | (137,568,133 | ) | | | (28,213,492 | ) | | | 152,479,871 | |
| | | | | | | | | | | | | | | | | | | | | | |
| | | | | | | | | | | | | | | | | | | | | | |
| | 363,354 | | | | 500,828 | | | | — | | | | — | | | | — | | | | — | |
| | 14,899 | | | | 6,539 | | | | — | | | | — | | | | — | | | | — | |
| | (1,202,260 | ) | | | (395,228 | ) | | | — | | | | — | | | | — | | | | — | |
| | | | | | | | | | | | | | | | | | | | | | |
| | (824,007 | ) | | | 112,139 | | | | — | | | | — | | | | — | | | | — | |
| | | | | | | | | | | | | | | | | | | | | | |
105
| | |
| WASATCH FUNDS — Statements of Changes in Net Assets (continued) | | |
|
|
|
| | | | | | | | | | | | | | | | |
| | | GLOBAL OPPORTUNITIES
FUND | | | INTERNATIONAL GROWTH FUND | |
| | | Year Ended
September 30, 2015 | | | Year Ended
September 30, 2014 | | | Year Ended
September 30, 2015 | | | Year Ended
September 30, 2014 | |
| | | | | | | | | | | | | | | | |
Operations: | | | | | | | | | | | | | | | | |
Net investment income (loss) | | $ | (1,988,404 | ) | | $ | (1,764,940 | ) | | $ | (4,282,733 | ) | | $ | (877,249 | ) |
Net realized gain (loss) on investments, foreign
currency translations and foreign capital gains taxes | | | 21,190,451 | | | | 26,427,867 | | | | (15,787,782 | ) | | | 15,327,889 | |
Net realized gain (loss) on options written | | | — | | | | — | | | | — | | | | — | |
Net realized loss on short positions | | | — | | | | — | | | | — | | | | — | |
Change in unrealized appreciation (depreciation) on
investments, options, securities sold short, foreign currency translations and deferred capital gains taxes | | | (24,943,634 | ) | | | (16,328,571 | ) | | | 77,362,244 | | | | (88,535,593 | ) |
| | | | | | | | | | | | | | | | |
Net increase (decrease) in net assets resulting from operations | | | (5,741,587 | ) | | | 8,334,356 | | | | 57,291,729 | | | | (74,084,953 | ) |
| | | | |
Dividends paid from: | | | | | | | | | | | | | | | | |
Investor Class | | | | | | | | | | | | | | | | |
Net investment income | | | (470,408 | ) | | | (189,507 | ) | | | (284,964 | ) | | | — | |
Net realized gains | | | (26,548,276 | ) | | | (23,360,745 | ) | | | (8,896,949 | ) | | | (35,584,097 | ) |
| | | | | | | | | | | | | | | | |
| | | (27,018,684 | ) | | | (23,550,252 | ) | | | (9,181,913 | ) | | | (35,584,097 | ) |
Institutional Class | | | | | | | | | | | | | | | | |
Net investment income | | | — | | | | — | | | | — | | | | — | |
Net realized gains | | | — | | | | — | | | | — | | | | — | |
| | | | | | | | | | | | | | | | |
| | | — | | | | — | | | | — | | | | — | |
| | | | |
Capital share transactions: | | | | | | | | | | | | | | | | |
Investor Class | | | | | | | | | | | | | | | | |
Shares sold | | | 24,113,199 | | | | 38,477,656 | | | | 304,243,470 | | | | 813,164,902 | |
Shares issued to holders in reinvestment of dividends | | | 26,821,337 | | | | 23,300,598 | | | | 8,765,593 | | | | 32,446,727 | |
Shares redeemed | | | (54,874,473 | ) | | | (74,373,069 | ) | | | (466,136,694 | ) | | | (641,869,274 | ) |
Redemption fees | | | 3,950 | | | | 14,624 | | | | 26,761 | | | | 81,566 | |
| | | | | | | | | | | | | | | | |
Net increase (decrease) | | | (3,935,987 | ) | | | (12,580,191 | ) | | | (153,100,870 | ) | | | 203,823,921 | |
| | | | | | | | | | | | | | | | |
Institutional Class | | | | | | | | | | | | | | | | |
Shares sold | | | — | | | | — | | | | — | | | | — | |
Shares issued to holders in reinvestment of dividends | | | — | | | | — | | | | — | | | | — | |
Shares redeemed | | | — | | | | — | | | | — | | | | — | |
Redemption fees | | | — | | | | — | | | | — | | | | — | |
| | | | | | | | | | | | | | | | |
Net increase (decrease) | | | — | | | | — | | | | — | | | | — | |
| | | | | | | | | | | | | | | | |
Total increase (decrease) in net assets | | | (36,696,258 | ) | | | (27,796,087 | ) | | | (104,991,054 | ) | | | 94,154,871 | |
| | | | |
Net assets: | | | | | | | | | | | | | | | | |
Beginning of period | | | 192,664,150 | | | | 220,460,237 | | | | 1,421,086,142 | | | | 1,326,931,271 | |
| | | | | | | | | | | | | | | | |
End of period | | $ | 155,967,892 | | | $ | 192,664,150 | | | $ | 1,316,095,088 | | | $ | 1,421,086,142 | |
| | | | | | | | | | | | | | | | |
Undistributed net investment income (loss) included
in net assets at end of period | | $ | (2,258,540 | ) | | $ | (1,357,807 | ) | | $ | (4,649,406 | ) | | $ | (2,419,315 | ) |
| | | | | | | | | | | | | | | | |
| | | | |
Capital share transactions — shares: | | | | | | | | | | | | | | | | |
Investor Class | | | | | | | | | | | | | | | | |
Shares sold | | | 6,305,552 | | | | 8,688,395 | | | | 10,961,555 | | | | 28,317,499 | |
Shares issued to holders in reinvestment of dividends | | | 7,229,471 | | | | 5,368,811 | | | | 333,419 | | | | 1,128,974 | |
Shares redeemed | | | (14,099,286 | ) | | | (17,155,917 | ) | | | (17,143,695 | ) | | | (22,521,529 | ) |
| | | | | | | | | | | | | | | | |
Net increase (decrease) in shares outstanding | | | (564,263 | ) | | | (3,098,711 | ) | | | (5,848,721 | ) | | | 6,924,944 | |
| | | | | | | | | | | | | | | | |
Institutional Class | | | | | | | | | | | | | | | | |
Shares sold | | | — | | | | — | | | | — | | | | — | |
Shares issued to holders in reinvestment of dividends | | | — | | | | — | | | | — | | | | — | |
Shares redeemed | | | — | | | | — | | | | — | | | | — | |
| | | | | | | | | | | | | | | | |
Net increase (decrease) in shares outstanding | | | — | | | | — | | | | — | | | | — | |
| | | | | | | | | | | | | | | | |
See Notes to Financial Statements.
106
| | | | | | | | | | | | | | | | | | | | | | |
INTERNATIONAL OPPORTUNITIES
FUND | | | LARGE CAP VALUE
FUND | | | LONG/SHORT
FUND | |
Year Ended
September 30, 2015 | | | Year Ended
September 30, 2014 | | | Year Ended
September 30, 2015 | | | Year Ended
September 30, 2014 | | | Year Ended
September 30, 2015 | | | Year Ended
September 30, 2014 | |
| | | | | | | | | | | | | | | | | | | | | | |
| $ | (1,455,524 | ) | | $ | (1,305,624 | ) | | $ | 4,417,033 | | | $ | 8,534,068 | | | $ | 3,700,470 | | | $ | 29,098,226 | |
| 22,684,497 | | | | 35,150,911 | | | | 23,888,706 | | | | 154,870,921 | | | | 113,223,926 | | | | 171,383,910 | |
| | — | | | | — | | | | — | | | | — | | | | (1,377,491 | ) | | | 5,865,618 | |
| | — | | | | — | | | | — | | | | — | | | | (2,298,097 | ) | | | (37,870,789 | ) |
| (30,215,034 | ) | | | 906,191 | | | | (44,068,657 | ) | | | (83,122,286 | ) | | | (484,033,257 | ) | | | (43,861,459 | ) |
| | | | | | | | | | | | | | | | | | | | | | |
| | (8,986,061 | ) | | | 34,751,478 | | | | (15,762,918 | ) | | | 80,282,703 | | | | (370,784,449 | ) | | | 124,615,506 | |
| | | | | |
| | | | | | | | | | | | | | | | | | | | | | |
| | | | | | | | | | | | | | | | | | | | | | |
| | — | | | | — | | | | (4,717,198 | ) | | | (8,959,912 | ) | | | (13,117,322 | ) | | | — | |
| | (32,985,697 | ) | | | (18,321,459 | ) | | | (90,487,206 | ) | | | (220,160,713 | ) | | | (75,718,399 | ) | | | (35,737,283 | ) |
| | | | | | | | | | | | | | | | | | | | | | |
| | (32,985,697 | ) | | | (18,321,459 | ) | | | (95,204,404 | ) | | | (229,120,625 | ) | | | (88,835,721 | ) | | | (35,737,283 | ) |
| | | | | | | | | | | | | | | | | | | | | | |
| | — | | | | — | | | | (58,397 | ) | | | (170,579 | ) | | | (10,613,371 | ) | | | — | |
| | — | | | | — | | | | (1,885,955 | ) | | | (3,657,318 | ) | | | (50,288,258 | ) | | | (19,002,705 | ) |
| | | | | | | | | | | | | | | | | | | | | | |
| | — | | | | — | | | | (1,944,352 | ) | | | (3,827,897 | ) | | | (60,901,629 | ) | | | (19,002,705 | ) |
| | | | | |
| | | | | | | | | | | | | | | | | | | | | | |
| | | | | | | | | | | | | | | | | | | | | | |
| | 185,060,513 | | | | 101,294,846 | | | | 12,556,127 | | | | 37,422,394 | | | | 230,166,705 | | | | 799,289,456 | |
| | 32,189,321 | | | | 17,919,621 | | | | 94,061,044 | | | | 224,799,356 | | | | 86,127,189 | | | | 32,545,875 | |
| | (61,450,925 | ) | | | (74,216,881 | ) | | | (160,845,016 | ) | | | (489,674,350 | ) | | | (1,090,754,118 | ) | | | (659,696,589 | ) |
| | 8,758 | | | | 15,807 | | | | 3,511 | | | | 17,989 | | | | 43,449 | | | | 24,288 | |
| | | | | | | | | | | | | | | | | | | | | | |
| | 155,807,667 | | | | 45,013,393 | | | | (54,224,334 | ) | | | (227,434,611 | ) | | | (774,416,775 | ) | | | 172,163,030 | |
| | | | | | | | | | | | | | | | | | | | | | |
| | | | | | | | | | | | | | | | | | | | | | |
| | — | | | | — | | | | 213,244 | | | | 612,575 | | | | 168,746,062 | | | | 322,177,847 | |
| | — | | | | — | | | | 1,934,190 | | | | 3,810,756 | | | | 58,822,477 | | | | 18,483,415 | |
| | — | | | | — | | | | (6,667,455 | ) | | | (9,439,909 | ) | | | (626,995,982 | ) | | | (167,604,694 | ) |
| | — | | | | — | | | | — | | | | 27 | | | | 74,853 | | | | 29,540 | |
| | | | | | | | | | | | | | | | | | | | | | |
| | — | | | | — | | | | (4,520,021 | ) | | | (5,016,551 | ) | | | (399,352,590 | ) | | | 173,086,108 | |
| | | | | | | | | | | | | | | | | | | | | | |
| | 113,835,909 | | | | 61,443,412 | | | | (171,656,029 | ) | | | (385,116,981 | ) | | | (1,694,291,164 | ) | | | 415,124,656 | |
| | | | | |
| | | | | | | | | | | | | | | | | | | | | | |
| | 339,659,217 | | | | 278,215,805 | | | | 417,237,012 | | | | 802,353,993 | | | | 2,719,275,052 | | | | 2,304,150,396 | |
| | | | | | | | | | | | | | | | | | | | | | |
| $ | 453,495,126 | | | $ | 339,659,217 | | | $ | 245,580,983 | | | $ | 417,237,012 | | | $ | 1,024,983,888 | | | $ | 2,719,275,052 | |
| | | | | | | | | | | | | | | | | | | | | | |
$ |
(710,582 |
) | | $ | (20,725 | ) | | $ | (17,753 | ) | | $ | (22,352 | ) | | $ | 330,202 | | | $ | 20,796,346 | |
| | | | | | | | | | | | | | | | | | | | | | |
| | | | | |
| | | | | | | | | | | | | | | | | | | | | | |
| | | | | | | | | | | | | | | | | | | | | | |
| | 65,274,231 | | | | 33,826,542 | | | | 1,202,742 | | | | 2,671,871 | | | | 15,339,817 | | | | 49,006,963 | |
| | 12,055,926 | | | | 6,265,602 | | | | 9,575,413 | | | | 18,290,490 | | | | 5,703,787 | | | | 2,006,527 | |
| | (21,478,869 | ) | | | (24,700,939 | ) | | | (15,418,721 | ) | | | (36,210,359 | ) | | | (75,345,316 | ) | | | (40,344,871 | ) |
| | | | | | | | | | | | | | | | | | | | | | |
| | 55,851,288 | | | | 15,391,205 | | | | (4,640,566 | ) | | | (15,247,998 | ) | | | (54,301,712 | ) | | | 10,668,619 | |
| | | | | | | | | | | | | | | | | | | | | | |
| | | | | | | | | | | | | | | | | | | | | | |
| | — | | | | — | | | | 21,708 | | | | 43,989 | | | | 11,145,839 | | | | 19,643,613 | |
| | — | | | | — | | | | 196,684 | | | | 310,272 | | | | 3,892,950 | | | | 1,138,141 | |
| | — | | | | — | | | | (681,797 | ) | | | (650,406 | ) | | | (44,674,081 | ) | | | (10,209,928 | ) |
| | | | | | | | | | | | | | | | | | | | | | |
| | — | | | | — | | | | (463,405 | ) | | | (296,145 | ) | | | (29,635,292 | ) | | | 10,571,826 | |
| | | | | | | | | | | | | | | | | | | | | | |
107
| | |
| WASATCH FUNDS — Statements of Changes in Net Assets (continued) | | |
|
|
|
| | | | | | | | | | | | | | | | |
| | | MICRO CAP FUND | | | MICRO CAP VALUE FUND | |
| | | Year Ended September 30, 2015 | | | Year Ended September 30, 2014 | | | Year Ended September 30, 2015 | | | Year Ended September 30, 2014 | |
| | | | | | | | | | | | | | | | |
Operations: | | | | | | | | | | | | | | | | |
Net investment income (loss) | | $ | (2,613,931 | ) | | $ | (5,477,220 | ) | | $ | (879,035 | ) | | $ | (2,353,762 | ) |
Net realized gain on investments, foreign
currency translations and foreign capital gains taxes | | | 42,447,306 | | | | 37,100,367 | | | | 18,597,991 | | | | 20,469,961 | |
Net realized gain on options written | | | — | | | | — | | | | 272,422 | | | | 1,322,199 | |
Change in unrealized appreciation (depreciation) on investments, options, foreign currency translations and deferred capital gains taxes | | | (30,582,373 | ) | | | (32,943,005 | ) | | | (2,960,212 | ) | | | (13,401,279 | ) |
| | | | | | | | | | | | | | | | |
Net increase (decrease) in net assets resulting from operations | | | 9,251,002 | | | | (1,319,858 | ) | | | 15,031,166 | | | | 6,037,119 | |
| | | | |
Dividends paid from: | | | | | | | | | | | | | | | | |
Investor Class | | | | | | | | | | | | | | | | |
Net investment income | | | (57,541 | ) | | | — | | | | — | | | | — | |
Net realized gains | | | (13,743,034 | ) | | | — | | | | (21,640,698 | ) | | | (28,293,837 | ) |
| | | | | | | | | | | | | | | | |
| | | (13,800,575 | ) | | | — | | | | (21,640,698 | ) | | | (28,293,837 | ) |
| | | | |
Capital share transactions: | | | | | | | | | | | | | | | | |
Investor Class | | | | | | | | | | | | | | | | |
Shares sold | | | 8,870,349 | | | | 19,894,352 | | | | 18,213,412 | | | | 30,540,367 | |
Shares issued to holders in reinvestment of dividends | | | 13,148,507 | | | | — | | | | 21,205,896 | | | | 27,559,024 | |
Shares redeemed | | | (37,976,905 | ) | | | (47,941,399 | ) | | | (37,443,746 | ) | | | (43,540,916 | ) |
Redemption fees | | | 3,154 | | | | 7,491 | | | | 2,428 | | | | 11,225 | |
| | | | | | | | | | | | | | | | |
Net increase (decrease) | | | (15,954,895 | ) | | | (28,039,556 | ) | | | 1,977,990 | | | | 14,569,700 | |
| | | | | | | | | | | | | | | | |
Institutional Class | | | | | | | | | | | | | | | | |
Shares sold | | | — | | | | — | | | | — | | | | — | |
Shares redeemed | | | — | | | | — | | | | — | | | | — | |
Redemption fees | | | — | | | | — | | | | — | | | | — | |
| | | | | | | | | | | | | | | | |
Net increase | | | — | | | | — | | | | — | | | | — | |
| | | | | | | | | | | | | | | | |
Total increase (decrease) in net assets | | | (20,504,468 | ) | | | (29,359,414 | ) | | | (4,631,542 | ) | | | (7,687,018 | ) |
| | | | |
Net assets: | | | | | | | | | | | | | | | | |
Beginning of period | | | 293,815,311 | | | | 323,174,725 | | | | 158,800,406 | | | | 166,487,424 | |
| | | | | | | | | | | | | | | | |
End of period | | $ | 273,310,843 | | | $ | 293,815,311 | | | $ | 154,168,864 | | | $ | 158,800,406 | |
| | | | | | | | | | | | | | | | |
Undistributed net investment income (loss) included in net assets at end of period | | $ | (764,789 | ) | | $ | (4,090,280 | ) | | $ | 22,777 | | | $ | (680,747 | ) |
| | | | | | | | | | | | | | | | |
| | | | |
Capital share transactions — shares: | | | | | | | | | | | | | | | | |
Investor Class | | | | | | | | | | | | | | | | |
Shares sold | | | 1,119,278 | | | | 2,556,405 | | | | 6,134,016 | | | | 9,343,898 | |
Shares issued to holders in reinvestment of dividends | | | 1,700,971 | | | | — | | | | 7,655,558 | | | | 8,612,195 | |
Shares redeemed | | | (4,853,557 | ) | | | (6,167,148 | ) | | | (12,687,971 | ) | | | (13,712,525 | ) |
| | | | | | | | | | | | | | | | |
Net increase (decrease) in shares outstanding | | | (2,033,308 | ) | | | (3,610,743 | ) | | | 1,101,603 | | | | 4,243,568 | |
| | | | | | | | | | | | | | | | |
Institutional Class | | | | | | | | | | | | | | | | |
Shares sold | | | — | | | | — | | | | — | | | | — | |
Shares redeemed | | | — | | | | — | | | | — | | | | — | |
| | | | | | | | | | | | | | | | |
Net increase in shares outstanding | | | — | | | | — | | | | — | | | | — | |
| | | | | | | | | | | | | | | | |
See Notes to Financial Statements.
108
| | | | | | | | | | | | | | | | | | | | | | |
SMALL CAP GROWTH FUND | | | SMALL CAP VALUE FUND | | | STRATEGIC INCOME FUND | |
Year Ended September 30, 2015 | | | Year Ended September 30, 2014 | | | Year Ended September 30, 2015 | | | Year Ended September 30, 2014 | | | Year Ended September 30, 2015 | | | Year Ended September 30, 2014 | |
| | | | | | | | | | | | | | | | | | | | | | |
| | | | | | | | | | | | | | | | | | | | | | |
| $ | (17,146,891 | ) | | $ | (18,534,122 | ) | | $ | 2,406,464 | | | $ | (1,310,821 | ) | | $ | 2,881,370 | | | $ | 2,015,317 | |
| 339,817,590 | | | | 224,696,107 | | | | 10,252,311 | | | | 26,792,880 | | | | 3,027,134 | | | | 6,566,435 | |
| | — | | | | — | | | | — | | | | — | | | | — | | | | — | |
| (290,530,333 | ) | | | (173,771,617 | ) | | | (5,669,868 | ) | | | (4,346,303 | ) | | | (15,972,843 | ) | | | 3,882,627 | |
| | | | | | | | | | | | | | | | | | | | | | |
| | 32,140,366 | | | | 32,390,368 | | | | 6,988,907 | | | | 21,135,756 | | | | (10,064,339 | ) | | | 12,464,379 | |
| | | | | |
| | | | | | | | | | | | | | | | | | | | | | |
| | | | | | | | | | | | | | | | | | | | | | |
| | — | | | | — | | | | — | | | | — | | | | (4,052,160 | ) | | | (2,306,293 | ) |
| | (210,961,388 | ) | | | (82,224,931 | ) | | | — | | | | — | | | | (5,830,282 | ) | | | (993,476 | ) |
| | | | | | | | | | | | | | | | | | | | | | |
| | (210,961,388 | ) | | | (82,224,931 | ) | | | — | | | | — | | | | (9,882,442 | ) | | | (3,299,769 | ) |
| | | | | |
| | | | | | | | | | | | | | | | | | | | | | |
| | | | | | | | | | | | | | | | | | | | | | |
| | 306,525,902 | | | | 342,634,806 | | | | 42,777,490 | | | | 99,914,166 | | | | 67,443,100 | | | | 34,399,605 | |
| | 202,491,582 | | | | 77,677,538 | | | | — | | | | — | | | | 9,799,845 | | | | 3,262,457 | |
| | (549,309,702 | ) | | | (637,938,505 | ) | | | (57,465,289 | ) | | | (56,117,629 | ) | | | (63,607,687 | ) | | | (18,452,922 | ) |
| | 63,180 | | | | 67,655 | | | | 12,491 | | | | 35,940 | | | | 14,686 | | | | 4,988 | |
| | | | | | | | | | | | | | | | | | | | | | |
| | (40,229,038 | ) | | | (217,558,506 | ) | | | (14,675,308 | ) | | | 43,832,477 | | | | 13,649,944 | | | | 19,214,128 | |
| | | | | | | | | | | | | | | | | | | | | | |
| | | | | | | | | | | | | | | | | | | | | | |
| | — | | | | — | | | | 11,214,884 | | | | 409,846 | | | | — | | | | — | |
| | — | | | | — | | | | (2,892,431 | ) | | | (361,935 | ) | | | — | | | | — | |
| | — | | | | — | | | | 2,995 | | | | — | | | | — | | | | — | |
| | | | | | | | | | | | | | | | | | | | | | |
| | — | | | | — | | | | 8,325,448 | | | | 47,911 | | | | — | | | | — | |
| | | | | | | | | | | | | | | | | | | | | | |
| | (219,050,060 | ) | | | (267,393,069 | ) | | | 639,047 | | | | 65,016,144 | | | | (6,296,837 | ) | | | 28,378,738 | |
| | | | | |
| | | | | | | | | | | | | | | | | | | | | | |
| | 2,219,637,693 | | | | 2,487,030,762 | | | | 275,956,215 | | | | 210,940,071 | | | | 94,957,760 | | | | 66,579,022 | |
| | | | | | | | | | | | | | | | | | | | | | |
| $ | 2,000,587,633 | | | $ | 2,219,637,693 | | | $ | 276,595,262 | | | $ | 275,956,215 | | | $ | 88,660,923 | | | $ | 94,957,760 | |
| | | | | | | | | | | | | | | | | | | | | | |
$ | (12,167,564 | ) | | $ | (11,643,426 | ) | | $ | 1,323,863 | | | $ | (1,019,565 | ) | | $ | 98,362 | | | $ | (126,326 | ) |
| | | | | | | | | | | | | | | | | | | | | | |
| | | | | |
| | | | | | | | | | | | | | | | | | | | | | |
| | | | | | | | | | | | | | | | | | | | | | |
| | 5,977,502 | | | | 6,608,019 | | | | 6,914,700 | | | | 16,975,454 | | | | 5,399,978 | | | | 2,774,574 | |
| | 4,103,173 | | | | 1,486,367 | | | | — | | | | — | | | | 806,797 | | | | 269,033 | |
| | (10,734,199 | ) | | | (12,384,521 | ) | | | (9,548,655 | ) | | | (9,716,502 | ) | | | (5,270,070 | ) | | | (1,537,984 | ) |
| | | | | | | | | | | | | | | | | | | | | | |
| | (653,524 | ) | | | (4,290,135 | ) | | | (2,633,955 | ) | | | 7,258,952 | | | | 936,705 | | | | 1,505,623 | |
| | | | | | | | | | | | | | | | | | | | | | |
| | | | | | | | | | | | | | | | | | | | | | |
| | — | | | | — | | | | 1,844,006 | | | | 67,540 | | | | — | | | | — | |
| | — | | | | — | | | | (450,381 | ) | | | (63,395 | ) | | | — | | | | — | |
| | | | | | | | | | | | | | | | | | | | | | |
| | — | | | | — | | | | 1,393,625 | | | | 4,145 | | | | — | | | | — | |
| | | | | | | | | | | | | | | | | | | | | | |
109
| | |
| WASATCH FUNDS — Statements of Changes in Net Assets (continued) | | |
|
|
|
| | | | | | | | | | | | | | | | |
| | | ULTRA GROWTH
FUND | | | WORLD INNOVATORS
FUND | |
| | | Year Ended
September 30, 2015 | | | Year Ended
September 30, 2014 | | | Year Ended
September 30, 2015 | | | Year Ended
September 30, 2014 | |
| | | | | | | | | | | | | | | | |
Operations: | | | | | | | | | | | | | | | | |
Net investment income (loss) | | $ | (1,149,038 | ) | | $ | (1,339,513 | ) | | $ | (1,611,952 | ) | | $ | (2,638,098 | ) |
Net realized gain (loss) on investments, foreign currency translations and foreign capital gains taxes | | | 9,017,957 | | | | 31,334,090 | | | | 20,035,191 | | | | 27,258,295 | |
Change in unrealized appreciation (depreciation) on investments, foreign currency translations and deferred capital gains taxes | | | (3,043,910 | ) | | | (21,390,497 | ) | | | (17,578,392 | ) | | | (17,034,854 | ) |
| | | | | | | | | | | | | | | | |
Net increase in net assets resulting from operations | | | 4,825,009 | | | | 8,604,080 | | | | 844,847 | | | | 7,585,343 | |
| | | | |
Dividends paid from: | | | | | | | | | | | | | | | | |
Investor Class | | | | | | | | | | | | | | | | |
Net investment income | | | (50,881 | ) | | | — | | | | — | | | | — | |
Net realized gains | | | (29,102,465 | ) | | | (10,009,711 | ) | | | (25,428,998 | ) | | | (14,888,675 | ) |
| | | | | | | | | | | | | | | | |
| | | (29,153,346 | ) | | | (10,009,711 | ) | | | (25,428,998 | ) | | | (14,888,675 | ) |
| | | | |
Capital share transactions: | | | | | | | | | | | | | | | | |
Investor Class | | | | | | | | | | | | | | | | |
Shares sold | | | 4,721,549 | | | | 7,691,766 | | | | 23,707,197 | | | | 94,143,976 | |
Shares issued to holders in reinvestment of dividends | | | 28,117,008 | | | | 9,777,591 | | | | 23,823,818 | | | | 13,963,650 | |
Shares redeemed | | | (15,331,162 | ) | | | (64,930,348 | ) | | | (89,996,316 | ) | | | (114,430,418 | ) |
Redemption fees | | | 2,527 | | | | 2,841 | | | | 10,860 | | | | 25,794 | |
| | | | | | | | | | | | | | | | |
Net increase (decrease) | | | 17,509,922 | | | | (47,458,150 | ) | | | (42,454,441 | ) | | | (6,296,998 | ) |
| | | | | | | | | | | | | | | | |
Total increase (decrease) in net assets | | | (6,818,415 | ) | | | (48,863,781 | ) | | | (67,038,592 | ) | | | (13,600,330 | ) |
| | | | |
Net assets: | | | | | | | | | | | | | | | | |
Beginning of period | | | 102,833,707 | | | | 151,697,488 | | | | 253,310,615 | | | | 266,910,945 | |
| | | | | | | | | | | | | | | | |
End of period | | $ | 96,015,292 | | | $ | 102,833,707 | | | $ | 186,272,023 | | | $ | 253,310,615 | |
| | | | | | | | | | | | | | | | |
Undistributed net investment income (loss) included in net assets at end of period | | $ | 1,796,075 | | | $ | 1,162,957 | | | $ | (854,667 | ) | | $ | (1,855,109 | ) |
| | | | | | | | | | | | | | | | |
| | | | |
Capital share transactions — shares: | | | | | | | | | | | | | | | | |
Investor Class | | | | | | | | | | | | | | | | |
Shares sold | | | 228,979 | | | | 306,155 | | | | 1,119,343 | | | | 3,997,947 | |
Shares issued to holders in reinvestment of dividends | | | 1,481,402 | | | | 391,104 | | | | 1,171,279 | | | | 595,464 | |
Shares redeemed | | | (738,870 | ) | | | (2,526,727 | ) | | | (4,257,523 | ) | | | (4,922,563 | ) |
| | | | | | | | | | | | | | | | |
Net increase (decrease) in shares outstanding | | | 971,511 | | | | (1,829,468 | ) | | | (1,966,901 | ) | | | (329,152 | ) |
| | | | | | | | | | | | | | | | |
See Notes to Financial Statements.
110
| | | | | | | | | | | | | | |
INCOME
FUND | | | U.S. TREASURY
FUND | |
Year Ended
September 30, 2015 | | | Year Ended
September 30, 2014 | | | Year Ended
September 30, 2015 | | | Year Ended
September 30, 2014 | |
| | | | | | | | | | | | | | |
| | | | | | | | | | | | | | |
| $ | 1,719,040 | | | $ | 2,020,770 | | | $ | 6,605,799 | | | $ | 5,436,735 | |
| 407,021 | | | | 79,678 | | | | 40,074,870 | | | | (5,386,264 | ) |
| (23,148 | ) | | | 132,168 | | | | (26,646,790 | ) | | | 26,028,553 | |
| | | | | | | | | | | | | | |
| | 2,102,913 | | | | 2,232,616 | | | | 20,033,879 | | | | 26,079,024 | |
| | | |
| | | | | | | | | | | | | | |
| | | | | | | | | | | | | | |
| | (1,693,986 | ) | | | (2,049,307 | ) | | | (6,608,427 | ) | | | (5,436,357 | ) |
| | — | | | | — | | | | — | | | | — | |
| | | | | | | | | | | | | | |
| | (1,693,986 | ) | | | (2,049,307 | ) | | | (6,608,427 | ) | | | (5,436,357 | ) |
| | | |
| | | | | | | | | | | | | | |
| | | | | | | | | | | | | | |
| | 19,309,510 | | | | 15,034,005 | | | | 263,443,321 | | | | 80,288,379 | |
| | 1,594,129 | | | | 1,993,127 | | | | 6,348,154 | | | | 5,215,126 | |
| | (29,108,583 | ) | | | (30,750,807 | ) | | | (180,211,720 | ) | | | (74,727,614 | ) |
| | 2,724 | | | | 7,237 | | | | 192,080 | | | | 14,175 | |
| | | | | | | | | | | | | | |
| | (8,202,220 | ) | | | (13,716,438 | ) | | | 89,771,835 | | | | 10,790,066 | |
| | | | | | | | | | | | | | |
| | (7,793,293 | ) | | | (13,533,129 | ) | | | 103,197,287 | | | | 31,432,733 | |
| | | |
| | | | | | | | | | | | | | |
| | 116,752,179 | | | | 130,285,308 | | | | 224,663,630 | | | | 193,230,897 | |
| | | | | | | | | | | | | | |
| $ | 108,958,886 | | | $ | 116,752,179 | | | $ | 327,860,917 | | | $ | 224,663,630 | |
| | | | | | | | | | | | | | |
$ | 33,864 | | | $ | 6,356 | | | $ | (20,881 | ) | | $ | 22,071 | |
| | | | | | | | | | | | | | |
| | | |
| | | | | | | | | | | | | | |
| | | | | | | | | | | | | | |
| | 1,896,861 | | | | 1,477,971 | | | | 14,002,689 | | | | 5,015,853 | |
| | 156,439 | | | | 196,157 | | | | 341,021 | | | | 324,073 | |
| | (2,856,744 | ) | | | (3,026,250 | ) | | | (9,698,391 | ) | | | (4,794,925 | ) |
| | | | | | | | | | | | | | |
| | (803,444 | ) | | | (1,352,122 | ) | | | 4,645,319 | | | | 545,001 | |
| | | | | | | | | | | | | | |
111
| | |
| WASATCH FUNDS — Financial Highlights | | |
|
|
|
| | | | | | | | | | | | | | | | | | | | | | | | | | | | | | | | |
| | | | | | Income (Loss) from
Investment Operations | | | | | | | | | Less Distributions | | | | |
| | | Net Asset
Value
Beginning
of Period | | | Net
Investment
Income (Loss) | | | Net Realized
and Unrealized
Gains (Losses)
on Investments | | | Total from
Investment
Operations | | | Redemption
Fees
(See Note 2) | | | Dividends
from Net
Investment
Income | | | Distributions
from Net
Realized
Gains | | | Total
Distributions | |
Core Growth Fund — Investor Class | | | | | | | | | | | | | | | | | | | | | |
Year ended 9/30/15 | | $ | 53.46 | | | | (0.14 | )15 | | | 5.95 | | | | 5.81 | | | | — | 4 | | | — | | | | (1.44 | ) | | | (1.44 | ) |
Year ended 9/30/14 | | $ | 52.49 | | | | (0.39 | ) | | | 2.12 | | | | 1.73 | | | | — | 4 | | | — | | | | (0.76 | ) | | | (0.76 | ) |
Year ended 9/30/13 | | $ | 41.41 | | | | (0.12 | ) | | | 11.19 | | | | 11.07 | | | | 0.01 | | | | — | | | | — | | | | — | |
Year ended 9/30/12 | | $ | 32.63 | | | | (0.26 | ) | | | 9.04 | | | | 8.78 | | | | — | 4 | | | — | | | | — | | | | — | |
Year ended 9/30/11 | | $ | 29.95 | | | | (0.19 | ) | | | 2.87 | | | | 2.68 | | | | — | 4 | | | — | | | | — | | | | — | |
Core Growth Fund — Institutional Class | | | | | | | | | | | | | | | | | | | | | |
Year ended 9/30/15 | | $ | 53.58 | | | | 0.06 | | | | 5.79 | | | | 5.85 | | | | — | 4 | | | — | | | | (1.44 | ) | | | (1.44 | ) |
Year ended 9/30/14 | | $ | 52.57 | | | | (0.23 | ) | | | 2.00 | | | | 1.77 | | | | — | 4 | | | — | | | | (0.76 | ) | | | (0.76 | ) |
Year ended 9/30/13 | | $ | 41.44 | | | | (0.07 | ) | | | 11.20 | | | | 11.13 | | | | — | 4 | | | — | | | | — | | | | — | |
Period ended 9/30/128 | | $ | 38.32 | | | | (0.16 | ) | | | 3.28 | | | | 3.12 | | | | — | | | | — | | | | — | | | | — | |
Emerging India Fund | | | | | | | | | | | | | | | | | | | | | | | | | | | | | | | | |
Year ended 9/30/15 | | $ | 2.73 | | | | (0.04 | ) | | | 0.38 | | | | 0.34 | | | | — | 4 | | | — | 4 | | | — | | | | — | 4 |
Year ended 9/30/14 | | $ | 1.78 | | | | (— | )4 | | | 0.95 | | | | 0.95 | | | | — | 4 | | | — | | | | — | | | | — | |
Year ended 9/30/13 | | $ | 2.02 | | | | (0.01 | ) | | | (0.23 | ) | | | (0.24 | ) | | | — | 4 | | | — | | | | — | | | | — | |
Year ended 9/30/12 | | $ | 1.83 | | | | (0.01 | ) | | | 0.21 | | | | 0.20 | | | | — | 4 | | | (0.01 | ) | | | — | | | | (0.01 | ) |
Period ended 9/30/1110 | | $ | 2.00 | | | | — | 4 | | | (0.17 | ) | | | (0.17 | ) | | | — | 4 | | | — | | | | — | | | | — | |
Emerging Markets Select Fund — Investor Class | | | | | | | | | | | | | | | | | | | | | | | | | |
Year ended 9/30/15 | | $ | 10.31 | | | | (0.04 | ) | | | (1.89 | ) | | | (1.93 | ) | | | — | 4 | | | (0.03 | ) | | | — | | | | (0.03 | ) |
Year ended 9/30/14 | | $ | 9.56 | | | | (0.01 | ) | | | 0.77 | | | | 0.76 | | | | — | 4 | | | (0.01 | ) | | | — | | | | (0.01 | ) |
Period ended 9/30/1313 | | $ | 10.00 | | | | — | 4 | | | (0.44 | ) | | | (0.44 | ) | | | — | 4 | | | — | | | | — | | | | — | |
Emerging Markets Select Fund — Institutional Class | | | | | | | | | | | | | | | | | | | | | | | | | |
Year ended 9/30/15 | | $ | 10.37 | | | | (0.03 | ) | | | (1.88 | ) | | | (1.91 | ) | | | — | 4 | | | (0.05 | ) | | | — | | | | (0.05 | ) |
Year ended 9/30/14 | | $ | 9.61 | | | | — | 4 | | | 0.78 | | | | 0.78 | | | | — | 4 | | | (0.02 | ) | | | — | | | | (0.02 | ) |
Period ended 9/30/1314 | | $ | 10.00 | | | | (— | )4 | | | (0.39 | ) | | | (0.39 | ) | | | — | 4 | | | — | | | | — | | | | — | |
Emerging Markets Small Cap Fund | | | | | | | | | | | | | | | | | | | | | |
Year ended 9/30/15 | | $ | 2.74 | | | | (0.03 | ) | | | (0.32 | ) | | | (0.35 | ) | | | — | 4 | | | — | 4 | | | — | | | | — | 4 |
Year ended 9/30/14 | | $ | 2.67 | | | | (0.01 | ) | | | 0.14 | | | | 0.13 | | | | — | 4 | | | — | | | | (0.06 | ) | | | (0.06 | ) |
Year ended 9/30/13 | | $ | 2.66 | | | | 0.01 | | | | 0.01 | | | | 0.02 | | | | — | 4 | | | (0.01 | ) | | | — | | | | (0.01 | ) |
Year ended 9/30/12 | | $ | 2.16 | | | | 0.01 | | | | 0.49 | | | | 0.50 | | | | — | 4 | | | — | | | | — | | | | — | |
Year ended 9/30/11 | | $ | 2.37 | | | | — | 4 | | | (0.21 | ) | | | (0.21 | ) | | | — | 4 | | | — | 4 | | | — | | | | — | 4 |
Frontier Emerging Small Countries Fund | | | | | | | | | | | | | | | | | |
Year ended 9/30/15 | | $ | 3.32 | | | | 0.02 | | | | (0.50 | ) | | | (0.48 | ) | | | — | 4 | | | (0.02 | ) | | | (0.05 | ) | | | (0.07 | ) |
Year ended 9/30/14 | | $ | 2.97 | | | | 0.03 | | | | 0.33 | | | | 0.36 | | | | — | 4 | | | (0.01 | ) | | | — | | | | (0.01 | ) |
Year ended 9/30/13 | | $ | 2.41 | | | | 0.01 | | | | 0.55 | | | | 0.56 | | | | — | 4 | | | — | 4 | | | — | 4 | | | — | 4 |
Period ended 9/30/129 | | $ | 2.00 | | | | 0.01 | | | | 0.40 | | | | 0.41 | | | | — | 4 | | | — | | | | — | | | | — | |
Global Opportunities Fund | | | | | | | | | | | | | | | | | | | | | | | | | | | | | | | | |
Year ended 9/30/15 | | $ | 4.28 | | | | (0.05 | ) | | | (0.08 | ) | | | (0.13 | ) | | | — | 4 | | | (0.01 | ) | | | (0.63 | ) | | | (0.64 | ) |
Year ended 9/30/14 | | $ | 4.58 | | | | (0.05 | ) | | | 0.23 | | | | 0.18 | | | | — | 4 | | | — | 4 | | | (0.48 | ) | | | (0.48 | ) |
Year ended 9/30/13 | | $ | 4.15 | | | | (0.02 | ) | | | 0.93 | | | | 0.91 | | | | — | 4 | | | — | | | | (0.48 | ) | | | (0.48 | ) |
Year ended 9/30/12 | | $ | 3.68 | | | | (0.03 | ) | | | 0.93 | | | | 0.90 | | | | — | 4 | | | — | | | | (0.43 | ) | | | (0.43 | ) |
Year ended 9/30/11 | | $ | 3.97 | | | | (0.02 | ) | | | (0.13 | ) | | | (0.15 | ) | | | — | 4 | | | — | | | | (0.14 | ) | | | (0.14 | ) |
International Growth Fund | | | | | | | | | | | | | | | | | | | | | | | | | | | | | | | | |
Year ended 9/30/15 | | $ | 26.78 | | | | (0.09 | ) | | | 1.39 | | | | 1.30 | | | | — | 4 | | | (0.01 | ) | | | (0.19 | ) | | | (0.20 | ) |
Year ended 9/30/14 | | $ | 28.76 | | | | (0.02 | ) | | | (1.24 | ) | | | (1.26 | ) | | | — | 4 | | | — | | | | (0.72 | ) | | | (0.72 | ) |
Year ended 9/30/13 | | $ | 22.44 | | | | 0.07 | | | | 6.32 | | | | 6.39 | | | | 0.01 | | | | (0.08 | ) | | | — | | | | (0.08 | ) |
Year ended 9/30/12 | | $ | 17.21 | | | | 0.09 | | | | 5.14 | | | | 5.23 | | | | — | 4 | | | — | | | | — | | | | — | |
Year ended 9/30/11 | | $ | 18.66 | | | | — | 4 | | | (1.46 | ) | | | (1.46 | ) | | | 0.01 | | | | — | | | | — | | | | — | |
International Opportunities Fund | | | | | | | | | | | | | | | | | | | | | |
Year ended 9/30/15 | | $ | 3.09 | | | | (0.01 | ) | | | (0.04 | ) | | | (0.05 | ) | | | — | 4 | | | — | | | | (0.30 | ) | | | (0.30 | ) |
Year ended 9/30/14 | | $ | 2.94 | | | | (0.01 | ) | | | 0.33 | | | | 0.32 | | | | — | 4 | | | — | | | | (0.17 | ) | | | (0.17 | ) |
Year ended 9/30/13 | | $ | 2.41 | | | | (— | )4 | | | 0.53 | | | | 0.53 | | | | — | 4 | | | — | | | | — | | | | — | |
Year ended 9/30/12 | | $ | 2.24 | | | | — | 4 | | | 0.44 | | | | 0.44 | | | | — | 4 | | | — | | | | (0.27 | ) | | | (0.27 | ) |
Year ended 9/30/11 | | $ | 2.57 | | | | (0.01 | ) | | | (0.25 | ) | | | (0.26 | ) | | | — | 4 | | | — | | | | (0.07 | ) | | | (0.07 | ) |
Large Cap Value Fund — Investor Class | | | | | | | | | | | | | | | | | | | | | | | | | |
Year ended 9/30/15 | | $ | 12.69 | | | | 0.15 | | | | (0.69 | ) | | | (0.54 | ) | | | — | 4 | | | (0.16 | ) | | | (3.15 | ) | | | (3.31 | ) |
Year ended 9/30/14 | | $ | 16.57 | | | | 0.21 | | | | 1.49 | | | | 1.70 | | | | — | 4 | | | (0.22 | ) | | | (5.36 | ) | | | (5.58 | ) |
Year ended 9/30/13 | | $ | 14.31 | | | | 0.22 | | | | 2.37 | | | | 2.59 | | | | — | 4 | | | (0.20 | ) | | | (0.13 | ) | | | (0.33 | ) |
Year ended 9/30/12 | | $ | 11.85 | | | | 0.20 | | | | 2.46 | | | | 2.66 | | | | — | 4 | | | (0.20 | ) | | | — | | | | (0.20 | ) |
Year ended 9/30/11 | | $ | 12.64 | | | | 0.17 | | | | (0.79 | ) | | | (0.62 | ) | | | — | 4 | | | (0.17 | ) | | | — | | | | (0.17 | ) |
See Notes to Financial Highlights and Notes to Financial Statements.
112
| | |
| | (for a share outstanding throughout each period) |
|
|
|
| | | | | | | | | | | | | | | | | | | | | | | | | | | | | | |
| | | | | | | Ratios to Average Net Assets | | | Supplemental Data | |
Net Asset
Value
End of
Period | | | Total Return (%)1 | | | Expenses
Net of
Waivers and
Reimbursements (%)2 | | | Expenses
Before
Waivers and
Reimbursements (%)2 | | | Net Investment
Income Net of
Waivers and
Reimbursements (%)2 | | | Net Investment
Income Before
Waivers and
Reimbursements (%)2 | | | Net Assets
End of
Period
(000s) | | | Portfolio
Turnover
Rate1 3 | |
| | | | | | | | | | | | | | | | | | | | | | | | | | | | | | |
| $ | 57.83 | | | | 10.87 | | | | 1.17 | 5 | | | 1.17 | 5 | | | (0.29 | )15 | | | (0.29 | )15 | | $ | 1,014,515 | | | | 39% | |
| $ | 53.46 | | | | 3.26 | | | | 1.18 | 5 | | | 1.18 | 5 | | | (0.64 | ) | | | (0.64 | ) | | $ | 859,086 | | | | 26% | |
| $ | 52.49 | | | | 26.76 | | | | 1.21 | 5 | | | 1.21 | 5 | | | (0.39 | ) | | | (0.39 | ) | | $ | 924,304 | | | | 16% | |
| $ | 41.41 | | | | 26.91 | | | | 1.23 | 5 | | | 1.23 | 5 | | | (0.70 | ) | | | (0.70 | ) | | $ | 581,371 | | | | 28% | |
| $ | 32.63 | | | | 8.95 | | | | 1.22 | | | | 1.22 | | | | (0.57 | ) | | | (0.57 | ) | | $ | 433,294 | | | | 27% | |
| | | | | | | | | | | | | | | | | | | | | | | | | | | | | | |
| $ | 57.99 | | | | 10.94 | | | | 1.12 | 5 | | | 1.13 | 5 | | | (0.29 | )15 | | | (0.30 | )15 | | $ | 150,614 | | | | 39% | |
| $ | 53.58 | | | | 3.31 | | | | 1.13 | 5 | | | 1.19 | 5 | | | (0.59 | ) | | | (0.65 | )5 | | $ | 49,369 | | | | 26% | |
| $ | 52.57 | | | | 26.86 | | | | 1.12 | 5 | | | 1.32 | 5 | | | (0.32 | ) | | | (0.52 | )5 | | $ | 19,971 | | | | 16% | |
| $ | 41.44 | | | | 8.14 | | | | 1.12 | 5 | | | 1.55 | 5 | | | (0.62 | ) | | | (1.05 | ) | | $ | 9,101 | | | | 28% | |
| | | | | | | | | | | | | | | | | | | | | | | | | | | | | | |
| $ | 3.07 | | | | 12.51 | | | | 1.95 | 5 | | | 2.12 | 5 | | | (1.38 | ) | | | (1.55 | ) | | $ | 63,850 | | | | 36% | |
| $ | 2.73 | | | | 53.37 | | | | 1.96 | 5 | | | 2.58 | 5 | | | (0.76 | ) | | | (1.38 | ) | | $ | 44,150 | | | | 13% | |
| $ | 1.78 | | | | (11.88 | ) | | | 1.95 | 5 | | | 2.99 | 5 | | | (0.99 | ) | | | (2.03 | ) | | $ | 15,938 | | | | 40% | |
| $ | 2.02 | | | | 11.42 | | | | 1.95 | 5 | | | 3.41 | 5 | | | (0.65 | ) | | | (2.11 | ) | | $ | 13,658 | | | | 17% | |
| $ | 1.83 | | | | (8.50 | ) | | | 1.95 | | | | 4.85 | | | | (0.07 | ) | | | (2.97 | ) | | $ | 10,580 | | | | 2% | |
| | | | | | | | | | | | | | | | | | | | | | | | | | | | | | |
| $ | 8.35 | | | | (18.81 | ) | | | 1.70 | 6 | | | 2.00 | 6 | | | (0.23 | ) | | | (0.53 | ) | | $ | 18,527 | | | | 46% | |
| $ | 10.31 | | | | 7.92 | | | | 1.69 | 5 | | | 1.88 | 5 | | | (0.09 | ) | | | (0.28 | ) | | $ | 26,502 | | | | 59% | |
| $ | 9.56 | | | | (4.40 | ) | | | 1.69 | 5 | | | 2.40 | 5 | | | 0.04 | | | | (0.67 | ) | | $ | 29,374 | | | | 43% | |
| | | | | | | | | | | | | | | | | | | | | | | | | | | | | | |
| $ | 8.41 | | | | (18.67 | ) | | | 1.51 | 6 | | | 1.77 | 6 | | | (0.06 | ) | | | (0.32 | ) | | $ | 19,270 | | | | 46% | |
| $ | 10.37 | | | | 8.13 | | | | 1.51 | 5 | | | 1.71 | 5 | | | 0.05 | | | | (0.15 | ) | | $ | 32,306 | | | | 59% | |
| $ | 9.61 | | | | (3.90 | ) | | | 1.50 | 5 | | | 2.21 | 5 | | | (0.18 | ) | | | (0.89 | ) | | $ | 28,861 | | | | 43% | |
| | | | | | | | | | | | | | | | | | | | | | | | | | | | | | |
| $ | 2.39 | | | | (12.65 | ) | | | 1.95 | 5 | | | 2.01 | 5 | | | (0.63 | ) | | | (0.69 | ) | | $ | 981,367 | | | | 59% | |
| $ | 2.74 | | | | 4.90 | | | | 1.95 | 5 | | | 2.02 | 5 | | | (0.28 | ) | | | (0.35 | ) | | $ | 1,457,882 | | | | 55% | |
| $ | 2.67 | | | | 0.85 | | | | 1.95 | 5 | | | 2.06 | 5 | | | 0.21 | | | | 0.09 | | | $ | 1,785,681 | | | | 41% | |
| $ | 2.66 | | | | 23.15 | | | | 1.95 | 5 | | | 2.13 | 5 | | | 0.29 | | | | 0.11 | | | $ | 1,482,265 | | | | 39% | |
| $ | 2.16 | | | | (8.85 | ) | | | 1.96 | | | | 2.19 | | | | 0.22 | | | | (0.01 | ) | | $ | 774,198 | | | | 48% | |
| | | | | | | | | | | | | | | | | | | | | | | | | | | | | | |
| $ | 2.77 | | | | (14.88 | ) | | | 2.25 | 5 | | | 2.28 | 5 | | | 0.39 | | | | 0.36 | | | $ | 1,027,673 | | | | 34% | |
| $ | 3.32 | | | | 11.97 | | | | 2.24 | 5 | | | 2.24 | 5 | | | 0.79 | | | | 0.79 | | | $ | 1,324,694 | | | | 22% | |
| $ | 2.97 | | | | 22.88 | | | | 2.25 | 5 | | | 2.43 | 5 | | | 0.81 | | | | 0.63 | | | $ | 730,694 | | | | 13% | |
| $ | 2.41 | | | | 20.50 | | | | 2.25 | 5 | | | 3.64 | 5 | | | 1.31 | | | | (0.08 | ) | | $ | 33,045 | | | | 5% | |
| | | | | | | | | | | | | | | | | | | | | | | | | | | | | | |
| $ | 3.51 | | | | (3.88 | ) | | | 1.81 | 5 | | | 1.81 | 5 | | | (1.10 | ) | | | (1.10 | ) | | $ | 155,968 | | | | 54% | |
| $ | 4.28 | | | | 3.94 | | | | 1.78 | 5 | | | 1.78 | 5 | | | (0.83 | ) | | | (0.83 | ) | | $ | 192,664 | | | | 42% | |
| $ | 4.58 | | | | 24.23 | | | | 1.80 | 5 | | | 1.80 | 5 | | | (0.70 | ) | | | (0.70 | ) | | $ | 220,460 | | | | 43% | |
| $ | 4.15 | | | | 26.69 | | | | 1.84 | 5 | | | 1.84 | 5 | | | (0.61 | ) | | | (0.61 | ) | | $ | 153,582 | | | | 38% | |
| $ | 3.68 | | | | (4.21 | ) | | | 1.94 | | | | 1.94 | | | | (0.41 | ) | | | (0.41 | ) | | $ | 199,855 | | | | 59% | |
| | | | | | | | | | | | | | | | | | | | | | | | | | | | | | |
| $ | 27.88 | | | | 4.83 | | | | 1.50 | 5 | | | 1.50 | 5 | | | (0.32 | ) | | | (0.32 | ) | | $ | 1,316,095 | | | | 46% | |
| $ | 26.78 | | | | (4.53 | ) | | | 1.46 | 5 | | | 1.46 | 5 | | | (0.06 | ) | | | (0.06 | ) | | $ | 1,421,086 | | | | 42% | |
| $ | 28.76 | | | | 28.63 | | | | 1.49 | 5 | | | 1.49 | 5 | | | 0.25 | | | | 0.25 | | | $ | 1,326,931 | | | | 44% | |
| $ | 22.44 | | | | 30.39 | | | | 1.57 | 6 | | | 1.57 | 6 | | | 0.51 | | | | 0.51 | | | $ | 434,824 | | | | 44% | |
| $ | 17.21 | | | | (7.77 | ) | | | 1.66 | | | | 1.66 | | | | (0.01 | ) | | | (0.01 | ) | | $ | 281,481 | | | | 70% | |
| | | | | | | | | | | | | | | | | | | | | | | | | | | | | | |
| $ | 2.74 | | | | (1.44 | ) | | | 2.25 | 5 | | | 2.43 | 5 | | | (0.36 | ) | | | (0.54 | ) | | $ | 453,495 | | | | 25% | |
| $ | 3.09 | | | | 11.53 | | | | 2.25 | 5 | | | 2.41 | 5 | | | (0.40 | ) | | | (0.56 | ) | | $ | 339,659 | | | | 38% | |
| $ | 2.94 | | | | 21.99 | | | | 2.25 | 5 | | | 2.42 | 5 | | | (0.03 | ) | | | (0.20 | ) | | $ | 278,216 | | | | 49% | |
| $ | 2.41 | | | | 22.33 | | | | 2.25 | 6 | | | 2.48 | 6 | | | (0.16 | ) | | | (0.39 | ) | | $ | 194,563 | | | | 41% | |
| $ | 2.24 | | | | (10.49 | ) | | | 2.25 | | | | 2.55 | | | | (0.58 | ) | | | (0.88 | ) | | $ | 151,569 | | | | 108% | |
| | | | | | | | | | | | | | | | | | | | | | | | | | | | | | |
| $ | 8.84 | | | | (6.61 | ) | | | 1.10 | 5 | | | 1.12 | 5 | | | 1.34 | | | | 1.32 | | | $ | 244,056 | | | | 39% | |
| $ | 12.69 | | | | 11.78 | | | | 1.11 | 5 11 | | | 1.12 | 5 11 | | | 1.38 | | | | 1.37 | | | $ | 409,169 | | | | 53% | |
| $ | 16.57 | | | | 18.40 | | | | 1.10 | 5 | | | 1.16 | 5 | | | 1.27 | | | | 1.21 | | | $ | 786,910 | | | | 47% | |
| $ | 14.31 | | | | 22.50 | | | | 1.10 | 5 | | | 1.15 | 5 | | | 1.42 | | | | 1.37 | | | $ | 1,298,365 | | | | 14% | |
| $ | 11.85 | | | | (5.08 | ) | | | 1.10 | | | | 1.11 | | | | 1.24 | | | | 1.23 | | | $ | 1,546,471 | | | | 26% | |
113
| | |
| WASATCH FUNDS — Financial Highlights (continued) | | |
|
|
|
| | | | | | | | | | | | | | | | | | | | | | | | | | | | | | | | |
| | | | | | Income (Loss) from
Investment Operations | | | | | | | | | Less Distributions | | | | |
| | | Net Asset
Value
Beginning
of Period | | | Net
Investment
Income (Loss) | | | Net Realized
and Unrealized
Gains (Losses)
on Investments | | | Total from
Investment
Operations | | | Redemption
Fees
(See Note 2) | | | Dividends
from Net
Investment
Income | | | Distributions
from Net
Realized
Gains | | | Total
Distributions | |
Large Cap Value Fund — Institutional Class | | | | | | | | | | | | | | | | | | | | | | | | | |
Year ended 9/30/15 | | $ | 12.69 | | | | (0.04 | ) | | | (0.49 | ) | | | (0.53 | ) | | | — | 4 | | | (0.17 | ) | | | (3.15 | ) | | | (3.32 | ) |
Year ended 9/30/14 | | $ | 16.57 | | | | 0.20 | | | | 1.52 | | | | 1.72 | | | | — | 4 | | | (0.24 | ) | | | (5.36 | ) | | | (5.60 | ) |
Year ended 9/30/13 | | $ | 14.31 | | | | 0.22 | | | | 2.39 | | | | 2.61 | | | | — | 4 | | | (0.22 | ) | | | (0.13 | ) | | | (0.35 | ) |
Period ended 9/30/128 | | $ | 13.77 | | | | 0.12 | | | | 0.57 | | | | 0.69 | | | | — | 4 | | | (0.15 | ) | | | — | | | | (0.15 | ) |
Long/Short Fund — Investor Class | | | | | | | | | | | | | | | | | | | | | |
Year ended 9/30/15 | | $ | 16.29 | | | | 0.02 | | | | (3.00 | ) | | | (2.98 | ) | | | — | 4 | | | (0.14 | ) | | | (0.81 | ) | | | (0.95 | ) |
Year ended 9/30/14 | | $ | 15.82 | | | | 0.17 | | | | 0.65 | | | | 0.82 | | | | — | 4 | | | — | | | | (0.35 | ) | | | (0.35 | ) |
Year ended 9/30/13 | | $ | 13.66 | | | | (0.04 | ) | | | 2.23 | | | | 2.19 | | | | — | 4 | | | — | | | | (0.03 | ) | | | (0.03 | ) |
Year ended 9/30/12 | | $ | 11.85 | | | | (0.02 | ) | | | 1.83 | | | | 1.81 | | | | — | 4 | | | — | | | | — | | | | — | |
Year ended 9/30/11 | | $ | 11.74 | | | | (0.04 | ) | | | 0.16 | | | | 0.12 | | | | — | 4 | | | (0.01 | ) | | | — | | | | (0.01 | ) |
Long/Short Fund — Institutional Class | | | | | | | | | | | | | | | | | | | | | |
Year ended 9/30/15 | | $ | 16.32 | | | | 0.06 | | | | (3.02 | ) | | | (2.96 | ) | | | — | 4 | | | (0.17 | ) | | | (0.81 | ) | | | (0.98 | ) |
Year ended 9/30/14 | | $ | 15.83 | | | | 0.18 | | | | 0.66 | | | | 0.84 | | | | — | 4 | | | — | | | | (0.35 | ) | | | (0.35 | ) |
Period ended 9/30/1314 | | $ | 13.80 | | | | (0.01 | ) | | | 2.07 | | | | 2.06 | | | | — | 4 | | | — | | | | (0.03 | ) | | | (0.03 | ) |
Micro Cap Fund | | | | | | | | | | | | | | | | | | | | | |
Year ended 9/30/15 | | $ | 7.36 | | | | (0.08 | )16 | | | 0.28 | | | | 0.20 | | | | — | 4 | | | — | 4 | | | (0.35 | ) | | | (0.35 | ) |
Year ended 9/30/14 | | $ | 7.42 | | | | (0.14 | ) | | | 0.08 | | | | (0.06 | ) | | | — | 4 | | | — | | | | — | | | | — | |
Year ended 9/30/13 | | $ | 5.71 | | | | (0.10 | ) | | | 1.81 | | | | 1.71 | | | | — | 4 | | | — | | | | — | | | | — | |
Year ended 9/30/12 | | $ | 4.40 | | | | (0.09 | ) | | | 1.40 | | | | 1.31 | | | | — | 4 | | | — | | | | — | | | | — | |
Year ended 9/30/11 | | $ | 4.44 | | | | (0.06 | ) | | | 0.02 | | | | (0.04 | ) | | | — | 4 | | | — | | | | — | | | | — | |
Micro Cap Value Fund | | | | | | | | | | | | | | | | | | | | | |
Year ended 9/30/15 | | $ | 3.02 | | | | (0.02 | )17 | | | 0.31 | | | | 0.29 | | | | — | 4 | | | — | | | | (0.44 | ) | | | (0.44 | ) |
Year ended 9/30/14 | | $ | 3.45 | | | | (0.04 | ) | | | 0.18 | | | | 0.14 | | | | — | 4 | | | — | | | | (0.57 | ) | | | (0.57 | ) |
Year ended 9/30/13 | | $ | 2.85 | | | | (0.03 | ) | | | 0.91 | | | | 0.88 | | | | — | 4 | | | — | | | | (0.28 | ) | | | (0.28 | ) |
Year ended 9/30/12 | | $ | 2.24 | | | | (0.04 | ) | | | 0.65 | | | | 0.61 | | | | — | 4 | | | — | | | | — | | | | — | |
Year ended 9/30/11 | | $ | 2.38 | | | | (0.04 | ) | | | (0.10 | ) | | | (0.14 | ) | | | — | 4 | | | — | | | | — | | | | — | |
Small Cap Growth Fund | | | | | | | | | | | | | | | | | | | | | |
Year ended 9/30/15 | | $ | 50.25 | | | | (0.40 | ) | | | 0.93 | | | | 0.53 | | | | — | 4 | | | — | | | | (4.81 | ) | | | (4.81 | ) |
Year ended 9/30/14 | | $ | 51.31 | | | | (0.41 | ) | | | 1.03 | | | | 0.62 | | | | — | 4 | | | — | | | | (1.68 | ) | | | (1.68 | ) |
Year ended 9/30/13 | | $ | 43.82 | | | | (0.15 | ) | | | 10.53 | | | | 10.38 | | | | — | 4 | | | — | | | | (2.89 | ) | | | (2.89 | ) |
Year ended 9/30/12 | | $ | 35.37 | | | | (0.29 | ) | | | 10.40 | | | | 10.11 | | | | — | 4 | | | — | | | | (1.66 | ) | | | (1.66 | ) |
Year ended 9/30/11 | | $ | 34.24 | | | | (0.13 | ) | | | 1.26 | | | | 1.13 | | | | — | 4 | | | — | | | | — | | | | — | |
Small Cap Value Fund — Investor Class | | | | | | | | | | | | | | | | | | | | | |
Year ended 9/30/15 | | $ | 5.69 | | | | 0.05 | 18 | | | 0.12 | | | | 0.17 | | | | — | 4 | | | — | | | | — | | | | — | |
Year ended 9/30/14 | | $ | 5.12 | | | | (0.02 | ) | | | 0.59 | | | | 0.57 | | | | — | 4 | | | — | | | | — | | | | — | |
Year ended 9/30/13 | | $ | 3.81 | | | | (0.01 | ) | | | 1.32 | | | | 1.31 | | | | — | 4 | | | — | | | | — | | | | — | |
Year ended 9/30/12 | | $ | 3.12 | | | | (0.03 | ) | | | 0.72 | | | | 0.69 | | | | — | 4 | | | — | | | | — | | | | — | |
Year ended 9/30/11 | | $ | 3.08 | | | | (0.02 | ) | | | 0.06 | | | | 0.04 | | | | — | 4 | | | — | | | | — | | | | — | |
Small Cap Value Fund — Institutional Class | | | | | | | | | | | | | | | | | | | | | |
Year ended 9/30/15 | | $ | 5.72 | | | | 0.05 | 18 | | | 0.11 | | | | 0.16 | | | | — | 4 | | | — | | | | — | | | | — | |
Year ended 9/30/14 | | $ | 5.14 | | | | (0.03 | ) | | | 0.61 | | | | 0.58 | | | | — | | | | — | | | | — | | | | — | |
Year ended 9/30/13 | | $ | 3.82 | | | | (0.01 | ) | | | 1.33 | | | | 1.32 | | | | — | 4 | | | — | | | | — | | | | — | |
Period ended 9/30/128 | | $ | 3.68 | | | | (0.01 | ) | | | 0.15 | | | | 0.14 | | | | — | | | | — | | | | — | | | | — | |
Strategic Income Fund | | | | | | | | | | | | | | | | | | | | | |
Year ended 9/30/15 | | $ | 12.63 | | | | 0.30 | | | | (1.38 | ) | | | (1.08 | ) | | | — | 4 | | | (0.44 | ) | | | (0.62 | ) | | | (1.06 | ) |
Year ended 9/30/14 | | $ | 11.08 | | | | 0.32 | | | | 1.74 | | | | 2.06 | | | | — | 4 | | | (0.35 | ) | | | (0.16 | ) | | | (0.51 | ) |
Year ended 9/30/13 | | $ | 9.30 | | | | 0.33 | | | | 1.78 | | | | 2.11 | | | | — | 4 | | | (0.33 | ) | | | — | | | | (0.33 | ) |
Year ended 9/30/12 | | $ | 7.57 | | | | 0.16 | | | | 1.77 | | | | 1.93 | | | | — | 4 | | | (0.20 | ) | | | — | | | | (0.20 | ) |
Year ended 9/30/11 | | $ | 7.51 | | | | 0.25 | | | | 0.06 | | | | 0.31 | | | | — | 4 | | | (0.25 | ) | | | — | | | | (0.25 | ) |
Ultra Growth Fund | | | | | | | | | | | | | | | | | | | | | |
Year ended 9/30/15 | | $ | 23.67 | | | | (0.26 | ) | | | 1.54 | | | | 1.28 | | | | — | 4 | | | (0.01 | ) | | | (6.88 | ) | | | (6.89 | ) |
Year ended 9/30/14 | | $ | 24.57 | | | | (0.06 | ) | | | 0.80 | | | | 0.74 | | | | — | 4 | | | — | | | | (1.64 | ) | | | (1.64 | ) |
Year ended 9/30/13 | | $ | 22.83 | | | | (0.15 | ) | | | 4.96 | | | | 4.81 | | | | — | 4 | | | — | | | | (3.07 | ) | | | (3.07 | ) |
Year ended 9/30/12 | | $ | 20.11 | | | | (0.08 | ) | | | 3.98 | | | | 3.90 | | | | — | 4 | | | — | | | | (1.18 | ) | | | (1.18 | ) |
Year ended 9/30/11 | | $ | 19.80 | | | | (0.17 | ) | | | 0.48 | | | | 0.31 | | | | — | 4 | | | — | | | | — | | | | — | |
World Innovators Fund | | | | | | | | | | | | | | | | | | | | | |
Year ended 9/30/15 | | $ | 22.62 | | | | (0.21 | ) | | | 0.30 | | | | 0.09 | | | | — | 4 | | | — | | | | (2.54 | ) | | | (2.54 | ) |
Year ended 9/30/14 | | $ | 23.15 | | | | (0.24 | ) | | | 0.91 | | | | 0.67 | | | | — | 4 | | | — | | | | (1.20 | ) | | | (1.20 | ) |
Year ended 9/30/13 | | $ | 18.55 | | | | (0.12 | ) | | | 4.72 | | | | 4.60 | | | | — | 4 | | | — | | | | — | | | | — | |
Year ended 9/30/12 | | $ | 14.71 | | | | (0.12 | ) | | | 3.96 | | | | 3.84 | | | | — | 4 | | | — | | | | — | | | | — | |
Year ended 9/30/11 | | $ | 13.65 | | | | (0.13 | ) | | | 1.19 | | | | 1.06 | | | | — | 4 | | | — | | | | — | | | | — | |
See Notes to Financial Highlights and Notes to Financial Statements.
114
| | |
| | (for a share outstanding throughout each period) |
|
|
|
| | | | | | | | | | | | | | | | | | | | | | | | | | | | | | |
| | | | | | | Ratios to Average Net Assets | | | Supplemental Data | |
Net Asset
Value
End of
Period | | | Total Return (%)1 | | | Expenses
Net of
Waivers and
Reimbursements (%)2 | | | Expenses
Before
Waivers and
Reimbursements (%)2 | | | Net Investment
Income Net of
Waivers and
Reimbursements (%)2 | | | Net Investment
Income Before
Waivers and
Reimbursements (%)2 | | | Net Assets
End of
Period
(000s) | | | Portfolio
Turnover
Rate1 3 | |
| | | | | | | | | | | | | | | | | | | | | | | | | | | | | | |
| $ | 8.84 | | | | (6.50 | ) | | | 0.98 | 5 | | | 1.44 | 5 | | | 1.40 | | | | 0.94 | | | $ | 1,525 | | | | 39% | |
| $ | 12.69 | | | | 11.95 | | | | 0.98 | 5 | | | 1.25 | 5 | | | 1.52 | | | | 1.25 | | | $ | 8,068 | | | | 53% | |
| $ | 16.57 | | | | 18.54 | | | | 0.98 | 5 | | | 1.35 | 5 | | | 1.37 | | | | 1.00 | | | $ | 15,444 | | | | 47% | |
| $ | 14.31 | | | | 5.02 | | | | 0.98 | 5 | | | 1.31 | 5 | | | 1.44 | | | | 1.11 | | | $ | 15,511 | | | | 14% | |
| | | | | | | | | | | | | | | | | | | | | | | | | | | | | | |
| $ | 12.36 | | | | (19.33 | ) | | | 1.61 | 7 | | | 1.61 | 7 | | | 0.12 | | | | 0.12 | | | $ | 616,192 | | | | 44% | |
| $ | 16.29 | | | | 5.21 | | | | 1.53 | 7 12 | | | 1.53 | 7 12 | | | 1.05 | | | | 1.05 | | | $ | 1,696,707 | | | | 47% | |
| $ | 15.82 | | | | 16.09 | | | | 1.51 | 7 | | | 1.51 | 7 | | | (0.22 | ) | | | (0.22 | ) | | $ | 1,479,371 | | | | 47% | |
| $ | 13.66 | | | | 15.27 | | | | 1.51 | 7 | | | 1.51 | 7 | | | (0.20 | ) | | | (0.20 | ) | | $ | 1,537,220 | | | | 71% | |
| $ | 11.85 | | | | 0.98 | | | | 1.63 | 7 | | | 1.63 | 7 | | | (0.44 | ) | | | (0.44 | ) | | $ | 833,298 | | | | 82% | |
| | | | | | | | | | | | | | | | | | | | | | | | | | | | | | |
| $ | 12.38 | | | | (19.19 | ) | | | 1.47 | 7 | | | 1.47 | 7 | | | 0.25 | | | | 0.25 | | | $ | 408,792 | | | | 44% | |
| $ | 16.32 | | | | 5.33 | | | | 1.42 | 7 | | | 1.42 | 7 | | | 1.18 | | | | 1.18 | | | $ | 1,022,568 | | | | 47% | |
| $ | 15.83 | | | | 14.99 | | | | 1.39 | 7 | | | 1.40 | 7 | | | (0.16 | ) | | | (0.17 | ) | | $ | 824,780 | | | | 47% | |
| | | | | | | | | | | | | | | | | | | | | | | | | | | | | | |
| $ | 7.21 | | | | 2.45 | | | | 1.90 | 5 | | | 1.90 | 5 | | | (0.85 | )16 | | | (0.85 | )16 | | $ | 273,311 | | | | 31% | |
| $ | 7.36 | | | | (0.81 | ) | | | 1.97 | | | | 1.97 | | | | (1.67 | ) | | | (1.67 | ) | | $ | 293,815 | | | | 26% | |
| $ | 7.42 | | | | 29.95 | | | | 2.13 | 5 | | | 2.13 | 5 | | | (1.28 | ) | | | (1.28 | ) | | $ | 323,175 | | | | 17% | |
| $ | 5.71 | | | | 29.77 | | | | 2.14 | 5 | | | 2.14 | 5 | | | (1.50 | ) | | | (1.50 | ) | | $ | 289,449 | | | | 25% | |
| $ | 4.40 | | | | (0.90 | ) | | | 2.14 | | | | 2.14 | | | | (1.05 | ) | | | (1.05 | ) | | $ | 253,415 | | | | 30% | |
| | | | | | | | | | | | | | | | | | | | | | | | | | | | | | |
| $ | 2.87 | | | | 9.99 | | | | 1.96 | 6 | | | 2.02 | 6 | | | (0.55 | )17 | | | (0.61 | )17 | | $ | 154,169 | | | | 53% | |
| $ | 3.02 | | | | 3.26 | | | | 2.03 | 5 | | | 2.09 | 5 | | | (1.31 | ) | | | (1.37 | ) | | $ | 158,800 | | | | 71% | |
| $ | 3.45 | | | | 33.92 | | | | 2.25 | 5 | | | 2.25 | 5 | | | (0.92 | ) | | | (0.92 | ) | | $ | 166,487 | | | | 66% | |
| $ | 2.85 | | | | 27.23 | | | | 2.25 | 5 | | | 2.31 | 5 | | | (1.27 | ) | | | (1.33 | ) | | $ | 138,299 | | | | 78% | |
| $ | 2.24 | | | | (5.88 | ) | | | 2.25 | | | | 2.28 | | | | (1.21 | ) | | | (1.24 | ) | | $ | 142,795 | | | | 94% | |
| | | | | | | | | | | | | | | | | | | | | | | | | | | | | | |
| $ | 45.97 | | | | 0.39 | | | | 1.22 | 5 | | | 1.22 | 5 | | | (0.75 | ) | | | (0.75 | ) | | $ | 2,000,588 | | | | 31% | |
| $ | 50.25 | | | | 1.09 | | | | 1.21 | 5 | | | 1.21 | 5 | | | (0.75 | ) | | | (0.75 | ) | | $ | 2,219,638 | | | | 23% | |
| $ | 51.31 | | | | 25.34 | | | | 1.23 | 5 | | | 1.23 | 5 | | | (0.42 | ) | | | (0.42 | ) | | $ | 2,487,031 | | | | 10% | |
| $ | 43.82 | | | | 29.41 | | | | 1.24 | 5 | | | 1.24 | 5 | | | (0.73 | ) | | | (0.73 | ) | | $ | 1,824,781 | | | | 20% | |
| $ | 35.37 | | | | 3.30 | | | | 1.23 | | | | 1.23 | | | | (0.32 | ) | | | (0.32 | ) | | $ | 1,297,982 | | | | 23% | |
| | | | | | | | | | | | | | | | | | | | | | | | | | | | | | |
| $ | 5.86 | | | | 2.99 | | | | 1.21 | 5 | | | 1.21 | 5 | | | 0.82 | 18 | | | 0.82 | 18 | | $ | 257,655 | | | | 57% | |
| $ | 5.69 | | | | 11.13 | | | | 1.20 | 5 | | | 1.20 | 5 | | | (0.52 | ) | | | (0.52 | ) | | $ | 265,521 | | | | 50% | |
| $ | 5.12 | | | | 34.38 | | | | 1.26 | 5 | | | 1.27 | 5 | | | (0.21 | ) | | | (0.22 | ) | | $ | 201,581 | | | | 40% | |
| $ | 3.81 | | | | 22.12 | | | | 1.46 | 5 | | | 1.46 | 5 | | | (0.73 | ) | | | (0.73 | ) | | $ | 166,330 | | | | 55% | |
| $ | 3.12 | | | | 1.30 | | | | 1.78 | | | | 1.78 | | | | (0.65 | ) | | | (0.65 | ) | | $ | 169,401 | | | | 46% | |
| | | | | | | | | | | | | | | | | | | | | | | | | | | | | | |
| $ | 5.88 | | | | 2.97 | | | | 1.15 | 5 | | | 1.20 | 5 | | | 0.92 | 18 | | | 0.87 | 18 | | $ | 18,941 | | | | 57% | |
| $ | 5.72 | | | | 11.28 | | | | 1.15 | 5 | | | 1.44 | 5 | | | (0.49 | ) | | | (0.78 | ) | | $ | 10,436 | | | | 50% | |
| $ | 5.14 | | | | 34.55 | | | | 1.15 | 5 | | | 1.46 | 5 | | | (0.11 | ) | | | (0.42 | ) | | $ | 9,359 | | | | 40% | |
| $ | 3.82 | | | | 3.80 | | | | 1.15 | 5 | | | 1.66 | 5 | | | (0.42 | ) | | | (0.93 | ) | | $ | 7,243 | | | | 55% | |
| | | | | | | | | | | | | | | | | | | | | | | | | | | | | | |
| $ | 10.49 | | | | (9.54 | ) | | | 0.95 | 5 | | | 0.95 | 5 | | | 2.51 | | | | 2.51 | | | $ | 88,661 | | | | 78% | |
| $ | 12.63 | | | | 18.94 | | | | 0.95 | 5 | | | 0.96 | 5 | | | 2.59 | | | | 2.58 | | | $ | 94,958 | | | | 69% | |
| $ | 11.08 | | | | 23.01 | | | | 0.95 | 5 | | | 1.06 | 5 | | | 3.16 | | | | 3.05 | | | $ | 66,579 | | | | 54% | |
| $ | 9.30 | | | | 25.61 | | | | 0.95 | 5 | | | 1.14 | 5 | | | 1.74 | | | | 1.55 | | | $ | 44,635 | | | | 57% | |
| $ | 7.57 | | | | 3.94 | | | | 0.95 | | | | 1.21 | | | | 2.99 | | | | 2.73 | | | $ | 24,057 | | | | 62% | |
| | | | | | | | | | | | | | | | | | | | | | | | | | | | | | |
| $ | 18.06 | | | | 4.02 | | | | 1.31 | 5 | | | 1.31 | 5 | | | (1.06 | ) | | | (1.06 | ) | | $ | 96,015 | | | | 38% | |
| $ | 23.67 | | | | 2.66 | | | | 1.26 | 5 | | | 1.26 | 5 | | | (1.00 | ) | | | (1.00 | ) | | $ | 102,834 | | | | 38% | |
| $ | 24.57 | | | | 24.52 | | | | 1.29 | 5 | | | 1.29 | 5 | | | (0.64 | ) | | | (0.64 | ) | | $ | 151,697 | | | | 25% | |
| $ | 22.83 | | | | 20.13 | | | | 1.32 | 5 | | | 1.32 | 5 | | | (0.35 | ) | | | (0.35 | ) | | $ | 143,259 | | | | 43% | |
| $ | 20.11 | | | | 1.57 | | | | 1.42 | | | | 1.42 | | | | (0.51 | ) | | | (0.51 | ) | | $ | 134,203 | | | | 60% | |
| | | | | | | | | | | | | | | | | | | | | | | | | | | | | | |
| $ | 20.17 | | | | 0.32 | | | | 1.76 | 5 | | | 1.76 | 5 | | | (0.76 | ) | | | (0.76 | ) | | $ | 186,272 | | | | 100% | |
| $ | 22.62 | | | | 2.69 | | | | 1.73 | 5 | | | 1.73 | 5 | | | (0.89 | ) | | | (0.89 | ) | | $ | 253,311 | | | | 111% | |
| $ | 23.15 | | | | 24.80 | | | | 1.77 | 5 | | | 1.79 | 5 | | | (0.84 | ) | | | (0.86 | ) | | $ | 266,911 | | | | 84% | |
| $ | 18.55 | | | | 26.10 | | | | 1.85 | 5 | | | 1.85 | 5 | | | (0.99 | ) | | | (0.99 | ) | | $ | 167,934 | | | | 66% | |
| $ | 14.71 | | | | 7.77 | | | | 1.95 | | | | 1.95 | | | | (0.84 | ) | | | (0.84 | ) | | $ | 72,493 | | | | 85% | |
115
| | |
| WASATCH FUNDS — Financial Highlights (continued) | | |
|
|
|
| | | | | | | | | | | | | | | | | | | | | | | | | | | | | | | | |
| | | | | | Income (Loss) from
Investment Operations | | | | | | | | | Less Distributions | | | | |
| | | Net Asset
Value
Beginning
of Period | | | Net
Investment
Income (Loss) | | | Net Realized
and Unrealized
Gains (Losses)
on Investments | | | Total from
Investment
Operations | | | Redemption
Fees
(See Note 2) | | | Dividends
from Net
Investment
Income | | | Distributions
from Net
Realized
Gains | | | Total
Distributions | |
Income Fund | | | | | | | | | | | | | | | | | | | | | | | | | | | | | | | | |
Year ended 9/30/15 | | $ | 10.15 | | | | 0.16 | | | | 0.03 | | | | 0.19 | | | | — | 4 | | | (0.16 | ) | | | — | | | | (0.16 | ) |
Year ended 9/30/14 | | $ | 10.13 | | | | 0.17 | | | | 0.02 | | | | 0.19 | | | | — | 4 | | | (0.17 | ) | | | — | | | | (0.17 | ) |
Year ended 9/30/13 | | $ | 10.44 | | | | 0.17 | | | | (0.31 | ) | | | (0.14 | ) | | | — | | | | (0.17 | ) | | | — | | | | (0.17 | ) |
Year ended 9/30/12 | | $ | 10.32 | | | | 0.20 | | | | 0.12 | | | | 0.32 | | | | — | 4 | | | (0.20 | ) | | | — | | | | (0.20 | ) |
Year ended 9/30/11 | | $ | 10.34 | | | | 0.25 | | | | (0.02 | ) | | | 0.23 | | | | — | 4 | | | (0.25 | ) | | | — | | | | (0.25 | ) |
U.S. Treasury Fund | | | | | | | | | | | | | | | | | | | | | | | | | | | | | | | | |
Year ended 9/30/15 | | $ | 17.08 | | | | 0.38 | | | | 1.33 | | | | 1.71 | | | | 0.01 | | | | (0.38 | ) | | | — | | | | (0.38 | ) |
Year ended 9/30/14 | | $ | 15.33 | | | | 0.45 | | | | 1.75 | | | | 2.20 | | | | — | 4 | | | (0.45 | ) | | | — | | | | (0.45 | ) |
Year ended 9/30/13 | | $ | 18.75 | | | | 0.44 | | | | (3.08 | ) | | | (2.64 | ) | | | 0.01 | | | | (0.44 | ) | | | (0.35 | ) | | | (0.79 | ) |
Year ended 9/30/12 | | $ | 18.75 | | | | 0.42 | | | | 0.77 | | | | 1.19 | | | | 0.01 | | | | (0.42 | ) | | | (0.78 | ) | | | (1.20 | ) |
Year ended 9/30/11 | | $ | 17.17 | | | | 0.52 | | | | 2.63 | | | | 3.15 | | | | 0.02 | | | | (0.52 | ) | | | (1.07 | ) | | | (1.59 | ) |
See Notes to Financial Highlights and Notes to Financial Statements.
116
| | |
| | (for a share outstanding throughout each period) |
|
|
|
| | | | | | | | | | | | | | | | | | | | | | | | | | | | | | |
| | | | | | | Ratios to Average Net Assets | | | Supplemental Data | |
Net Asset
Value
End of
Period | | | Total Return (%)1 | | | Expenses
Net of
Waivers and
Reimbursements (%)2 | | | Expenses
Before
Waivers and
Reimbursements (%)2 | | | Net Investment
Income Net of
Waivers and
Reimbursements��(%)2 | | | Net Investment
Income Before
Waivers and
Reimbursements (%)2 | | | Net Assets
End of
Period
(000s) | | | Portfolio
Turnover
Rate1 3 | |
| | | | | | | | | | | | | | | | | | | | | | | | | | | | | | |
| $ | 10.18 | | | | 1.87 | | | | 0.72 | 5 | | | 0.72 | 5 | | | 1.57 | | | | 1.57 | | | $ | 108,959 | | | | 44% | |
| $ | 10.15 | | | | 1.91 | | | | 0.70 | 5 | | | 0.70 | 5 | | | 1.66 | | | | 1.66 | | | $ | 116,752 | | | | 13% | |
| $ | 10.13 | | | | (1.34 | ) | | | 0.71 | | | | 0.71 | | | | 1.67 | | | | 1.67 | | | $ | 130,285 | | | | 35% | |
| $ | 10.44 | | | | 3.16 | | | | 0.70 | 5 | | | 0.70 | 5 | | | 1.97 | | | | 1.97 | | | $ | 139,186 | | | | 48% | |
| $ | 10.32 | | | | 2.26 | | | | 0.71 | | | | 0.71 | | | | 2.42 | | | | 2.42 | | | $ | 135,617 | | | | 43% | |
| | | | | | | | | | | | | | | | | | | | | | | | | | | | | | |
| $ | 18.42 | | | | 10.09 | | | | 0.67 | 5 | | | 0.67 | 5 | | | 2.12 | | | | 2.12 | | | $ | 327,861 | | | | 131% | |
| $ | 17.08 | | | | 14.54 | | | | 0.70 | 5 | | | 0.70 | 5 | | | 2.77 | | | | 2.77 | | | $ | 224,664 | | | | 28% | |
| $ | 15.33 | | | | (14.43 | ) | | | 0.71 | 5 | | | 0.71 | 5 | | | 2.46 | | | | 2.46 | | | $ | 193,231 | | | | 34% | |
| $ | 18.75 | | | | 6.66 | | | | 0.72 | 5 | | | 0.72 | 5 | | | 2.33 | | | | 2.33 | | | $ | 271,495 | | | | 13% | |
| $ | 18.75 | | | | 22.06 | | | | 0.75 | | | | 0.76 | | | | 3.44 | | | | 3.43 | | | $ | 187,368 | | | | 44% | |
117
| | |
| WASATCH FUNDS — Notes to Financial Highlights | | SEPTEMBER 30, 2015 |
|
|
|
| 1 | Not annualized for periods less than one year. |
| 2 | Annualized for periods less than one year. |
| 3 | Portfolio turnover is calculated on the basis of the Fund as a whole without distinguishing between the classes of shares issued. |
| 4 | Represents amounts less than $.005 per share. |
| 5 | Includes interest expense of less than 0.005%. |
| 6 | Includes interest expenses of more than 0.005%. |
| 7 | Includes interest expense and dividend payments for securities sold short. The ratios excluding such expenses are listed below: |
| | | | | | | | | | |
| | | Expenses Net of
Waivers and
Reimbursements2 | | Expenses Before
Waivers and
Reimbursements2 |
Long/Short Fund — Investor Class | | | | | | | | | | |
Year ended 9/30/15 | | | | 1.30% | | | | | 1.30% | |
Year ended 9/30/14 | | | | 1.27% | | | | | 1.27% | |
Year ended 9/30/13 | | | | 1.28% | | | | | 1.28% | |
Year ended 9/30/12 | | | | 1.27% | | | | | 1.27% | |
Year ended 9/30/11 | | | | 1.30% | | | | | 1.30% | |
| | |
Long/Short Fund — Institutional Class | | | | | | | | | | |
Year ended 9/30/15 | | | | 1.16% | | | | | 1.16% | |
Year ended 9/30/14 | | | | 1.16% | | | | | 1.16% | |
Period ended 9/30/1314 | | | | 1.17% | | | | | 1.18% | |
| 8 | Institutional class inception date was January 31, 2012. |
| 9 | Fund inception date was January 31, 2012. |
| 10 | Fund inception date was April 26, 2011. |
| 11 | Includes extraordinary expenses of 0.01% (see Note 7). |
| 12 | Includes extraordinary expenses of less than 0.01% (see Note 7). |
| 13 | Fund inception date was December 13, 2012. |
| 14 | Institutional class inception date was December 13, 2012. |
| 15 | Investment Income per share reflects a large, non-recurring dividend which amounted to $0.17 and $0.08 per share for the Investor Class and Institutional Class, respectively. Excluding this non-recurring dividend, the ratio of net investment income (loss) to average net assets would have been as follows: |
| | | | | | | | | | |
| | | Investor Class | | Institutional Class |
Net Investment Income | | | | | | | | | | |
Net of Waivers and Reimbursements | | | | (0.58 | )% | | | | (0.59 | )% |
| | |
Net Investment Income | | | | | | | | | | |
Before Waivers and Reimbursements | | | | (0.58 | )% | | | | (0.60 | )% |
| 16 | Investment Income per share reflects a large, non-recurring dividend which amounted to $0.04 per share. Excluding this non-recurring dividend, the ratio of net investment income (loss) to average net assets would have been (1.40)%. |
| 17 | Investment Income per share reflects a large, non-recurring dividend which amounted to $0.01. Excluding this non-recurring dividend, the ratio of net investment income (loss) to average net assets would have been (1.04)% for Net Investment Income Net of Waivers and Reimbursements and (1.10)% for Net Investment Income Before Waivers and Reimbursements. |
| 18 | Investment Income per share reflects a large, non-recurring dividend which amounted to $0.05 and $0.05 per share for the Investor Class and Institutional Class, respectively. Excluding this non-recurring dividend, the ratio of net investment income (loss) to average net assets would have been as follows: |
| | | | | | | | | | |
| | | Investor Class | | Institutional Class |
Net Investment Income | | | | | | | | | | |
Net of Waivers and Reimbursements | | | | (0.00 | )%19 | | | | 0.10% | |
| | |
Net Investment Income | | | | | | | | | | |
Before Waivers and Reimbursements | | | | (0.00 | )%19 | | | | 0.05% | |
| 19 | Amount is less than 0.005%. |
See Notes to Financial Statements.
118
| | |
| WASATCH FUNDS — Notes to Financial Statements | | SEPTEMBER 30, 2015 |
|
|
|
1. ORGANIZATION
Wasatch Funds Trust (the “Trust”) is a Massachusetts business trust registered under the Investment Company Act of 1940, as amended (the “1940 Act”), as an open-end management investment company and consists of 19 series or funds (each a “Fund” and collectively the “Funds”). The Core Growth Fund, Emerging India Fund, Emerging Markets Small Cap Fund, Frontier Emerging Small Countries Fund, Global Opportunities Fund, International Growth Fund, International Opportunities Fund, Large Cap Value Fund, Long/Short Fund, Micro Cap Fund, Micro Cap Value Fund, Small Cap Growth Fund, Small Cap Value Fund, Strategic Income Fund, Ultra Growth Fund, World Innovators Fund, Wasatch-1st Source Income Fund (“Income Fund”) (sub-advised), and Wasatch-Hoisington U.S. Treasury Fund (“U.S. Treasury Fund”) (sub-advised) are each diversified funds. The Emerging Markets Select Fund is a non-diversified fund. Each Fund maintains its own investment objective(s). The Heritage Growth Fund was liquidated on April 30, 2015.
On November 9, 2011, the Trust re-designated the shares of the Funds into Investor Class shares effective January 31, 2012, and authorized and designated a new Institutional Class of shares in the Funds. Currently five funds offer Institutional Class shares: Core Growth Fund, Large Cap Value Fund and Small Cap Value Fund, which commenced operations on January 31, 2012, as well as the Emerging Markets Select Fund and Long/Short Fund, which commenced operations on December 13, 2012. Each class of shares for each Fund has identical rights and privileges except with respect to purchase minimums, distribution and service charges, shareholder services, voting rights on matters affecting a single class of shares, and the exchange and conversion features. The Funds have entered into an investment advisory agreement with Wasatch Advisors, Inc. (the “Advisor” or “Wasatch”) as investment advisor.
The Core Growth, Emerging India, Emerging Markets Select, Emerging Markets Small Cap, Frontier Emerging Small Countries, Global Opportunities, International Growth, International Opportunities, Large Cap Value, Long/Short, Micro Cap, Micro Cap Value, Small Cap Growth, Small Cap Value, Strategic Income, Ultra Growth and World Innovators Funds are referred to herein as the “Equity Funds.”
2. SIGNIFICANT ACCOUNTING POLICIES
The following is a summary of significant policies related to investments of the Funds held at September 30, 2015. These policies are in conformity with accounting principles generally accepted in the United States of America (“U.S. GAAP”).
Valuation of Securities — All investments in securities are recorded at their estimated fair value as described in Note 14.
Foreign Currency Translations — Values of investments denominated in foreign currencies are converted into U.S. dollars using the current exchange rates each business day
(generally 2:00 p.m. Eastern Time). Purchases and sales of investments and dividend income are translated into U.S. dollars using the current prevailing exchange rate on the transaction date. The effect of changes in foreign exchange rates on realized and unrealized gains or losses on securities is reflected as a component of such gains or losses. Transactions in foreign denominated assets may involve greater risks than domestic transactions.
Investment in Securities and Related Investment Income — Security transactions are accounted for on the trade date. Gains or losses on securities sold are determined on the identified cost basis. Dividend income and distributions to shareholders are recorded on the ex-dividend date except that certain dividends from foreign securities may be recorded after the ex-dividend date based on when the Fund is informed of the dividend. Interest income and estimated expenses are accrued daily. Bond discount and premiums are amortized using the interest method. To the extent dividends received include return of capital or capital gain distributions; such distributions are recorded as a reduction to cost of the related security or as realized gain/loss.
Expenses — The Funds contract for various services on a collective basis. Most expenses are directly attributable to each Fund and therefore are charged accordingly. Expenses that are not directly attributable to one or more Funds are allocated among applicable Funds on an equitable and consistent basis considering such things as the nature and type of expense and the relative net assets of the Funds.
Use of Management Estimates — The preparation of financial statements in conformity with U.S. GAAP requires management to make estimates and assumptions that affect the reported amounts of assets and liabilities at the date of the financial statements and the reported changes in net assets during the reporting period. Actual results could differ from those estimates.
Guarantees and Indemnifications — In the normal course of business, the Funds enter into contracts that contain a variety of representations and warranties which provide general indemnifications. The maximum exposure under these arrangements is unknown, as this would involve future claims that may be made against the Funds and/or their affiliates that have not yet occurred. Based on experience, however, the risk of loss is expected to be remote.
Redemption Fees — The Funds deduct a fee of 2.00% from redemption proceeds on shares of the Funds held 60 days or less. Redemption fees retained by the Funds are credited to additional paid-in capital.
New Accounting Pronouncements — In May 2015, the Financial Accounting Standards Board (“FASB”) issued ASU 2015-07 entitled Fair Value Measurement (Topic 820) — Disclosures for Investments in Certain Entities That Calculate Net Asset Value per Share (or Its Equivalent) which is intended to address the diversity in practice of how investments measured at net asset value with redemption dates in the future (including periodic redemption dates) are categorized within the fair value hierarchy. The FASB guidance allows reporting entities to exclude investments measured at net asset value (NAV) per share under the existing practical
119
| | |
| WASATCH FUNDS — Notes to Financial Statements (continued) | | |
|
|
|
expedient in ASC 820 from the fair value hierarchy. ASU 2015-07 is effective for interim and annual reporting periods in fiscal years that begin after December 15, 2015. At this time, management is evaluating the implications of ASU 2015-07 and its impact to financial statements.
Other — Income, expenses, and realized and unrealized gains or losses on investments are generally allocated to each class of shares based on its relative net assets, except that each class separately bears expenses related specifically to that class, such as certain shareholder servicing fees.
3. SECURITIESAND OTHER INVESTMENTS
Repurchase Agreements — The Funds may engage in repurchase transactions. Under the terms of a typical repurchase agreement, a fund takes possession of an underlying debt obligation subject to an obligation of the seller to repurchase and the fund to resell the obligation at an agreed upon price and time. The market value of the collateral must be at least equal at all times to the total amount of the repurchase obligation, including interest. Generally, in the event of counterparty default, the fund has the right to use the collateral to offset losses incurred. Refer to Note 15 (Offsetting) for more information about the offsetting of assets and liabilities.
Short Sales — The Long/Short Fund and to a lesser extent the other Equity Funds may enter into short sales whereby a fund sells a security it generally does not own (the security is borrowed), in anticipation of a decline in the security’s price. The initial amount of a short sale is recorded as a liability which is marked-to-market daily. Fluctuations in the value of the short liability are recorded as unrealized gains or losses. If a Fund shorts a security when also holding a long position in the security (a “short against the box”), as the security’s price declines, the short position increases in value, offsetting the long position’s decrease in value. The opposite effect occurs if the security’s price rises. A Fund realizes a gain or loss upon closing of the short sale (returning the security to the counterparty by way of purchase or delivery of a long position owned). Possible losses from short sales may be unlimited, whereas losses from security purchases cannot exceed the total amount invested. The Funds are liable to the buyer for any dividends payable on securities while those securities are in a short position. These dividends are an expense of the Funds. The Funds designate collateral consisting of cash, U.S. government securities or other liquid assets sufficient to collateralize the market value of short positions. Refer to Note 15 (Offsetting) for more information about the offsetting of assets and liabilities.
Participation Notes — The Frontier Emerging Small Countries and the Global Opportunities Funds may invest in Participation Notes (P-Notes). P-Notes are promissory notes that are designed to offer a return linked to the performance of a particular underlying equity security or market. P-Notes are issued by banks or broker-dealers and allow a fund to gain exposure to common stocks in markets where direct investment is not allowed, such as Saudi Arabia.
While the holder of a P-Note is entitled to receive from the bank or broker-dealer any dividends or other distributions paid on the underlying securities, the holder is not entitled to the same rights as an owner of the underlying securities, such as voting rights. Income received from P-Notes is recorded as dividend income in the Statement of Operations. P-Notes are considered general unsecured contractual obligations of the bank or broker-dealer. Risks associated with P-Notes include the possible failure of a counterparty (i.e., the issuing bank or broker-dealer) to perform in accordance with the terms of the agreement, inability to transfer or liquidate the notes, potential delays or an inability to redeem the notes before maturity under certain market conditions, and limited legal recourse against the issuer of the underlying common stock.
4. FINANCIAL DERIVATIVE INSTRUMENTS
Foreign Currency Contracts — The Funds may enter into foreign currency contracts to settle planned purchases or sales of securities or to protect against a possible loss resulting from the adverse change in the relationship between the U.S. dollar and a foreign currency involved in an underlying transaction. Foreign currency contracts are agreements between two parties to buy and sell a currency at a set price on a future date. The market value of a foreign currency contract fluctuates with changes in currency exchange rates. Foreign currency contracts are marked-to-market daily and the change in market value is recorded by a fund as unrealized appreciation or depreciation. When a foreign currency contract is closed, the fund records a realized gain or loss equal to the difference between the value at the time it was opened and the value at the time it was closed. These contracts may involve market risk in excess of the unrealized gain or loss reflected in the Schedule of Investments. In addition, a fund could be exposed to credit risk if a counterparty is unable or unwilling to meet the terms of the contracts or if the value of the currency changes unfavorably. In connection with these contracts, the Funds may segregate cash and/or securities in a sufficient amount as collateral in accordance with the terms of the respective contracts.
Options Transactions — The Equity Funds and the Income Fund may buy and sell put and call options and write covered put and call options, including over-the-counter options, on portfolio securities where the completion of the obligation is dependent upon the credit standing of another party. Options are a type of derivative financial instrument. The Funds may invest in derivative financial instruments, including options, in order to manage risk or gain exposure to various other investments or markets. The risk in writing a call option is that a fund gives up the opportunity for profit if the market price of the security increases. The risk in writing a put option is that a fund may incur a loss if the market price of the security decreases and the option is exercised. The risk in buying an option is that a fund pays a premium whether or not the option is exercised. A fund also has the additional risk of not being able to enter into a closing transaction if a liquid secondary market does
120
not exist. Possible losses from uncovered written options may be unlimited. Option contracts are valued daily and unrealized appreciation or depreciation is recorded. A fund will realize a gain or loss upon expiration or closing of the option transaction. When an option is exercised, the proceeds on sales for a written call option, the purchase cost for a written put option, or the cost of a security for a purchased
put or call option is adjusted by the amount of premium received or paid. The Funds designate collateral consisting of cash, U.S. government securities or other liquid assets sufficient to collateralize the market value of written options. Refer to Note 15 (Offsetting) for more information about the offsetting of assets and liabilities.
Options written activity during the year ended September 30, 2015 was as follows:
| | | | | | | | | | | | | | | | | | | | | | | | |
| | | Options
Outstanding at
9/30/2014 | | | Written | | | Closed | | | Exercised | | | Expired | | | Options
Outstanding at
9/30/2015 | |
Long/Short Fund | | | | | | | | | | | | | | | | | | | | | | | | |
Premium amount | | $ | 2,054,471 | | | $ | — | | | $ | (2,054,471 | ) | | $ | — | | | $ | — | | | $ | — | |
Number of contracts | | | 5,066 | | | | — | | | | (5,066 | ) | | | — | | | | — | | | | — | |
Micro Cap Value Fund | | | | | | | | | | | | | | | | | | | | | | | | |
Premium amount | | $ | 206,836 | | | $ | 125,104 | | | $ | (36,230 | ) | | $ | (132,836 | ) | | $ | (162,874 | ) | | $ | — | |
Number of contracts | | | 830 | | | | 500 | | | | (150 | ) | | | (650 | ) | | | (530 | ) | | | — | |
5. PURCHASESAND SALESOF SECURITIES
Cost of investment securities purchased and proceeds from sales of investment securities, excluding U.S. government and short-term securities for the year ended September 30, 2015 are summarized below:
| | | | | | | | | | | | | | | | | | | | | | | | |
| | | Core
Growth
Fund | | | Emerging
India
Fund | | | Emerging
Markets
Select
Fund | | | Emerging
Markets
Small Cap
Fund | | | Frontier
Emerging
Small Countries
Fund | | | Global
Opportunities
Fund | |
Purchases | | $ | 451,294,768 | | | $ | 37,620,078 | | | $ | 24,310,992 | | | $ | 738,417,559 | | | $ | 401,931,377 | | | $ | 96,900,557 | |
Sales | | | 393,210,334 | | | | 21,977,747 | | | | 38,355,298 | | | | 1,054,161,691 | | | | 512,834,090 | | | | 127,943,051 | |
| | | | | | |
| | | International
Growth
Fund | | | International
Opportunities
Fund | | | Large Cap
Value
Fund | | | Long/Short
Fund | | | Micro
Cap
Fund | | | Micro Cap
Value
Fund | |
Purchases | | $ | 611,944,738 | | | $ | 204,803,852 | | | $ | 124,709,761 | | | $ | 785,799,825 | | | $ | 91,109,836 | | | $ | 78,691,903 | |
Sales | | | 762,823,175 | | | | 97,850,185 | | | | 272,077,992 | | | | 1,687,098,128 | | | | 131,846,384 | | | | 109,058,498 | |
| | | | | | |
| | | Small Cap
Growth
Fund | | | Small Cap
Value
Fund | | | Strategic
Income
Fund | | | Ultra
Growth
Fund | | | World
Innovators
Fund | | | Income
Fund | |
Purchases | | $ | 697,047,054 | | | $ | 161,996,178 | | | $ | 92,976,277 | | | $ | 40,315,726 | | | $ | 193,788,887 | | | $ | 31,822,371 | |
Sales | | | 979,580,846 | | | | 171,676,165 | | | | 84,273,085 | | | | 51,547,618 | | | | 277,982,757 | | | | 25,776,841 | |
Purchases and sales of U.S. government securities in the Income Fund were $15,780,254 and $29,089,124, respectively. Purchases and sales of U.S. government securities in the U.S. Treasury Fund were $486,172,009 and $401,985,531, respectively.
6. FEDERAL INCOME TAX INFORMATION
It is each Fund’s policy to comply with the requirements under Subchapter M of the Internal Revenue Code applicable to regulated investment companies and to distribute substantially all taxable income to shareholders. The Funds are no longer subject to examination by tax authorities for years prior to 2012. At this time, management believes there are no uncertain tax positions which, based on their technical merit, would not be sustained upon examination and for which it is reasonably possible that the total of amounts of unrecognized tax benefits will significantly change in the next 12 months. Accordingly, no provision for federal income or excise taxes has been made.
121
| | |
| WASATCH FUNDS — Notes to Financial Statements (continued) | | |
|
|
|
As of September 30, 2015 the cost and unrealized appreciation (depreciation) of securities on a tax basis were as follows:
| | | | | | | | | | | | | | | | | | | | | | | | | | | | |
| | | Core
Growth
Fund | | | Emerging
India
Fund | | | Emerging
Markets
Select
Fund | | | Emerging
Markets
Small Cap
Fund | | | Frontier
Emerging
Small
Countries
Fund | | | Global
Opportunities
Fund | | | International
Growth
Fund | |
Cost | | $ | 898,369,790 | | | $ | 49,778,772 | | | $ | 38,486,886 | | | $ | 902,332,541 | | | $ | 1,017,541,133 | | | $ | 136,859,070 | | | $ | 1,068,073,673 | |
| | | | |
Gross appreciation | | $ | 337,260,147 | | | $ | 15,971,440 | | | $ | 4,324,783 | | | $ | 165,941,231 | | | $ | 143,205,416 | | | $ | 30,764,580 | | | $ | 331,735,932 | |
Gross (depreciation) | | | (65,731,584 | ) | | | (2,181,239 | ) | | | (4,835,148 | ) | | | (113,343,698 | ) | | | (156,438,209 | ) | | | (11,095,560 | ) | | | (83,146,775 | ) |
| | | | |
Net appreciation (depreciation) | | $ | 271,528,563 | | | $ | 13,790,201 | | | $ | (510,365 | ) | | $ | 52,597,533 | | | $ | (13,232,793 | ) | | $ | 19,669,020 | | | $ | 248,589,157 | |
| | | | |
| | | | | | | |
| | | International
Opportunities
Fund | | | Large Cap
Value
Fund | | | Long/Short
Fund | | | Micro
Cap
Fund | | | Micro Cap
Value
Fund | | | Small Cap
Growth
Fund | | | Small Cap
Value
Fund | |
Cost | | $ | 422,565,340 | | | $ | 235,316,189 | | | $ | 966,653,534 | | | $ | 191,696,207 | | | $ | 126,185,836 | | | $ | 1,541,486,221 | | | $ | 238,877,257 | |
| | | | |
Gross appreciation | | $ | 75,526,286 | | | $ | 27,807,519 | | | $ | 124,220,055 | | | $ | 89,261,293 | | | $ | 34,967,922 | | | $ | 643,520,107 | | | $ | 59,040,101 | |
Gross (depreciation) | | | (44,502,220 | ) | | | (17,855,752 | ) | | | (333,384,859 | ) | | | (19,871,183 | ) | | | (8,068,765 | ) | | | (179,276,869 | ) | | | (19,035,223 | ) |
| | | | |
Net appreciation (depreciation) | | $ | 31,024,066 | | | $ | 9,951,767 | | | $ | (209,164,804 | ) | | $ | 69,390,110 | | | $ | 26,899,157 | | | $ | 464,243,238 | | | $ | 40,004,878 | |
| | | | |
| | | | | | | |
| | | Strategic
Income
Fund | | | Ultra
Growth
Fund | | | World
Innovators
Fund | | | Income
Fund | | | U.S.
Treasury
Fund | | | | | | | |
Cost | | $ | 92,968,748 | | | $ | 81,192,824 | | | $ | 169,912,041 | | | $ | 107,334,866 | | | $ | 328,958,662 | | | | | | | | | |
| | | | | | | | | | | | |
Gross appreciation | | $ | 5,882,175 | | | $ | 28,476,779 | | | $ | 23,222,303 | | | $ | 1,238,952 | | | $ | 5,340,761 | | | | | | | | | |
Gross (depreciation) | | | (11,513,690 | ) | | | (13,505,116 | ) | | | (10,347,765 | ) | | | (323,559 | ) | | | (7,633,469 | ) | | | | | | | | |
| | | | | | | | | | | | |
Net appreciation (depreciation) | | $ | (5,631,515 | ) | | $ | 14,971,663 | | | $ | 12,874,538 | | | $ | 915,393 | | | $ | (2,292,708 | ) | | | | | | | | |
| | | | | | | | | | | | |
The difference between book-basis and tax-basis unrealized gains is primarily attributable to the tax deferral of losses on wash sales, unrealized appreciation on passive foreign investment companies and other temporary tax adjustments.
The components of accumulated earnings on a tax basis as of September 30, 2015 were as follows:
| | | | | | | | | | | | | | | | | | | | |
| | | Core
Growth
Fund | | | Emerging
India
Fund | | | Emerging
Markets
Select
Fund | | | Emerging
Markets
Small Cap
Fund | | | Frontier
Emerging
Small Countries
Fund | |
Undistributed ordinary income | | $ | — | | | $ | — | | | $ | — | | | $ | — | | | $ | 1,618,530 | |
Undistributed capital gains | | | 134,683,253 | | | | 958,577 | | | | — | | | | — | | | | — | |
| | | | |
Accumulated earnings | | | 134,683,253 | | | | 958,577 | | | | — | | | | — | | | | 1,618,530 | |
Accumulated capital and other losses | | | (7,638,995 | ) | | | (240,970 | ) | | | (7,449,963 | ) | | | (29,088,292 | ) | | | (37,177,189 | ) |
Other undistributed ordinary losses | | | — | | | | (63,912 | ) | | | (76,355 | ) | | | — | | | | (59,868 | ) |
Net unrealized appreciation (depreciation)* | | | 270,121,707 | | | | 13,233,578 | | | | (627,816 | ) | | | 51,766,205 | | | | (21,464,836 | ) |
| | | | |
Total accumulated earnings | | $ | 397,165,965 | | | $ | 13,887,273 | | | $ | (8,154,134 | ) | | $ | 22,677,913 | | | $ | (57,083,363 | ) |
| | | | |
| | | | | |
| | | Global
Opportunities
Fund | | | International
Growth
Fund | | | International
Opportunities
Fund | | | Large Cap
Value
Fund | | | Long/Short
Fund | |
Undistributed ordinary income | | $ | — | | | $ | — | | | $ | — | | | $ | — | | | $ | 672,971 | |
Undistributed capital gains | | | 18,765,769 | | | | — | | | | 22,512,052 | | | | 20,137,507 | | | | 69,510,993 | |
| | | | |
Accumulated earnings | | | 18,765,769 | | | | — | | | | 22,512,052 | | | | 20,137,507 | | | | 70,183,964 | |
Accumulated capital and other losses | | | (1,814,716 | ) | | | (21,731,308 | ) | | | (699,607 | ) | | | (2,206 | ) | | | — | |
Other undistributed ordinary losses | | | (6,989 | ) | | | — | | | | (9,926 | ) | | | (15,547 | ) | | | (342,769 | ) |
Net unrealized appreciation (depreciation)* | | | 19,258,273 | | | | 248,547,323 | | | | 30,890,101 | | | | 9,951,767 | | | | (209,164,804 | ) |
| | | | |
Total accumulated earnings | | $ | 36,202,337 | | | $ | 226,816,015 | | | $ | 52,692,620 | | | $ | 30,071,521 | | | $ | (139,323,609 | ) |
| | | | |
122
| | | | | | | | | | | | | | | | | | | | |
| | | Micro
Cap
Fund | | | Micro Cap
Value
Fund | | | Small Cap
Growth
Fund | | | Small Cap
Value
Fund | | | Strategic
Income
Fund | |
Undistributed ordinary income | | $ | — | | | $ | 1,928,982 | | | $ | — | | | $ | 1,281,073 | | | $ | — | |
Undistributed capital gains | | | 40,544,046 | | | | 12,699,325 | | | | 305,128,196 | | | | — | | | | 2,658,710 | |
| | | | |
Accumulated earnings | | | 40,544,046 | | | | 14,628,307 | | | | 305,128,196 | | | | 1,281,073 | | | | 2,658,710 | |
Accumulated capital and other losses | | | (765,970 | ) | | | — | | | | (15,398,444 | ) | | | (29,656,425 | ) | | | — | |
Other undistributed ordinary losses | | | — | | | | — | | | | — | | | | — | | | | (25,473 | ) |
Net unrealized appreciation (depreciation)* | | | 69,393,419 | | | | 26,728,226 | | | | 460,595,506 | | | | 39,749,732 | | | | (5,631,604 | ) |
| | | | |
Total accumulated earnings | | $ | 109,171,495 | | | $ | 41,356,533 | | | $ | 750,325,258 | | | $ | 11,374,380 | | | $ | (2,998,367 | ) |
| | | | |
| | | | | |
| | | Ultra
Growth
Fund | | | World
Innovators
Fund | | | Income
Fund | | | U.S.
Treasury
Fund | | | | |
Undistributed ordinary income | | $ | — | | | $ | — | | | $ | 62,406 | | | $ | 53,580 | | | | | |
Undistributed capital gains | | | 7,303,385 | | | | 18,376,506 | | | | — | | | | 15,905,989 | | | | | |
| | | | | | | | |
Accumulated earnings | | | 7,303,385 | | | | 18,376,506 | | | | 62,406 | | | | 15,959,569 | | | | | |
Accumulated capital and other losses | | | (1,183,037 | ) | | | (1,024,842 | ) | | | (9,326 | ) | | | — | | | | | |
Other undistributed ordinary losses | | | — | | | | — | | | | (28,542 | ) | | | (74,461 | ) | | | | |
Net unrealized appreciation (depreciation)* | | | 14,971,663 | | | | 12,865,412 | | | | 915,393 | | | | (2,292,708 | ) | | | | |
| | | | | | | | |
Total accumulated earnings | | $ | 21,092,011 | | | $ | 30,217,076 | | | $ | 939,931 | | | $ | 13,592,400 | | | | | |
| | | | | | | | |
| * | On investments, securities sold short, derivatives and foreign currency denominated assets and liabilities. |
Dividends from net investment income and net realized gains, if any, are declared and paid at least annually for all Funds, except for dividends from net investment income in four funds. The Income Fund declares and pays dividends monthly. The Large Cap Value, Strategic Income and U.S. Treasury Funds declare and pay dividends quarterly. The amount of dividends and distributions from net investment income and net realized gains are determined in accordance with federal income tax regulations, which may differ from U.S. GAAP. The Funds may utilize earnings and profits distributed to shareholders on redemption of shares as part of the dividends paid deduction (tax equalization).
To the extent these book and tax differences are permanent in nature, such amounts are reclassified at the end of the fiscal year among additional paid-in capital, undistributed net investment income (loss), and undistributed net realized gain (loss) on investments, options and foreign currency translations.
Accordingly, at September 30, 2015, reclassifications were recorded as follows:
| | | | | | | | | | | | | | | | | | | | |
| | | Core
Growth
Fund | | | Emerging
India
Fund | | | Emerging
Markets
Select
Fund | | | Emerging
Markets
Small Cap
Fund | | | Frontier
Emerging
Small Countries
Fund | |
Increase (decrease) paid-in-capital in excess of par | | $ | (97,162 | ) | | $ | — | | | $ | (8,600 | ) | | $ | (2,741,657 | ) | | $ | — | |
Increase (decrease) undistributed net investment income | | | 65,010 | | | | (105,592 | ) | | | 83,152 | | | | 6,742,871 | | | | (2,986,967 | ) |
Increase (decrease) undistributed net realized gain (loss) | | | 32,152 | | | | 105,592 | | | | (74,552 | ) | | | (4,001,214 | ) | | | 2,986,967 | |
| | | | | |
| | | Global
Opportunities
Fund | | | International
Growth
Fund | | | International
Opportunities
Fund | | | Large Cap
Value
Fund | | | Long/Short
Fund | |
Increase (decrease) paid-in-capital in excess of par | | $ | (266,571 | ) | | $ | (2,453,565 | ) | | $ | (1,006,274 | ) | | $ | 3,675,046 | | | $ | 45,462,046 | |
Increase (decrease) undistributed net investment income | | | 1,558,079 | | | | 2,337,606 | | | | 765,667 | | | | 363,161 | | | | (435,921 | ) |
Increase (decrease) undistributed net realized gain (loss) | | | (1,291,508 | ) | | | 115,959 | | | | 240,607 | | | | (4,038,207 | ) | | | (45,026,125 | ) |
| | | | | |
| | | Micro
Cap
Fund | | | Micro Cap
Value
Fund | | | Small Cap
Growth
Fund | | | Small Cap
Value
Fund | | | Strategic
Income
Fund | |
Increase (decrease) paid-in-capital in excess of par | | $ | (5,952,755 | ) | | $ | — | | | $ | (16,539,077 | ) | | $ | — | | | $ | (12 | ) |
Increase (decrease) undistributed net investment income | | | 5,996,963 | | | | 1,582,559 | | | | 16,622,753 | | | | (63,036 | ) | | | 1,395,478 | |
Increase (decrease) undistributed net realized gain (loss) | | | (44,208 | ) | | | (1,582,559 | ) | | | (49,072 | ) | | | 63,036 | | | | (1,395,466 | ) |
| | | | | |
| | | Ultra
Growth
Fund | | | World
Innovators
Fund | | | Income
Fund | | | U.S.
Treasury
Fund | | | | |
Increase (decrease) paid-in-capital in excess of par | | $ | (1,477,849 | ) | | $ | (2,439,603 | ) | | $ | — | | | $ | 12,011,190 | | | | | |
Increase (decrease) undistributed net investment income | | | 1,833,037 | | | | 2,612,394 | | | | 2,454 | | | | (40,324 | ) | | | | |
Increase (decrease) undistributed net realized gain (loss) | | | (338,991 | ) | | | (154,377 | ) | | | (2,454 | ) | | | (11,970,866 | ) | | | | |
123
| | |
| WASATCH FUNDS — Notes to Financial Statements (continued) | | |
|
|
|
Capital loss carryforwards are available through the date specified below to offset future realized net capital gains for federal income tax purposes. Future capital loss carryover utilization in any given year may be subject to Internal Revenue Code limitations. To the extent future gains are offset by capital loss carryforwards, such gains will not be distributed.
On December 22, 2010, The Regulated Investment Company Modernization Act of 2010 (the “Modernization Act”) was signed by the President of the United States of America. Under the Modernization Act, a Fund will be permitted to carry forward capital losses incurred in taxable years beginning after December 22, 2010 for an unlimited period. Post-enactment losses that are carried forward will retain their character as either short-term or long-term capital losses rather than being considered all short-term as under previous law. However, any losses incurred during those future taxable years will be required to be utilized prior to the losses incurred in pre-enactment taxable years, which carry an expiration date. As a result of this ordering rule, pre-enactment capital loss carryforwards may be more likely to expire unused.
Capital loss carryforwards as of September 30, 2015 are as follows:
| | | | | | | | | | | | | | | | | | | | |
| | | | | | | | | | | | Non-expiring | |
| Fund | | 2016 | | | 2017 | | | 2018 | | | Short Term | | | Long Term | |
Emerging Markets Select Fund | | $ | — | | | $ | — | | | $ | — | | | $ | 6,196,368 | | | $ | 1,160,824 | |
Emerging Markets Small Cap Fund | | | — | | | | — | | | | — | | | | 21,052,031 | | | | — | |
Small Cap Value Fund | | | — | | | | — | | | | 20,161,340 | | | | — | | | | — | |
The Funds have elected to defer losses incurred from November 1, 2014 through September 30, 2015 in accordance with federal income tax rules. These losses are treated as having arisen on the first day of the following fiscal year. The Funds have elected to defer losses as follows:
| | | | | | | | |
| Fund | | Post-October
Capital Losses | | | Late-Year Ordinary
Losses | |
Core Growth Fund | | $ | — | | | $ | 7,638,995 | |
Emerging India Fund | | | — | | | | 240,970 | |
Emerging Markets Select Fund | | | — | | | | 92,771 | |
Emerging Markets Small Cap Fund | | | — | | | | 8,036,261 | |
Frontier Emerging Small Countries Fund | | | 37,177,189 | | | | — | |
Global Opportunities Fund | | | — | | | | 1,814,716 | |
International Growth Fund | | | 17,079,113 | | | | 4,652,195 | |
International Opportunities Fund | | | — | | | | 699,607 | |
Large Cap Value Fund | | | — | | | | 2,206 | |
Micro Cap Fund | | | — | | | | 765,970 | |
Small Cap Growth Fund | | | — | | | | 15,398,444 | |
Small Cap Value Fund | | | 9,495,085 | | | | — | |
Ultra Growth Fund | | | — | | | | 1,183,037 | |
World Innovators Fund | | | — | | | | 1,024,842 | |
Income Fund | | | 9,326 | | | | — | |
During the tax year ended September 30, 2015, the Funds used capital loss carryforwards in the following amounts:
| | | | |
| Fund | | Amount Used | |
Emerging India Fund | | $ | 698,466 | |
Small Cap Value Fund | | | 20,270,083 | |
Income Fund | | | 348,245 | |
U.S. Treasury Fund | | | 11,690,902 | |
The tax character of distributions paid during the year ended September 30, 2015 was as follows:
| | | | | | | | | | | | | | | | | | | | |
| 2015 | | Core Growth Fund | | | Emerging India Fund | | | Emerging Markets Select Fund | | | Emerging Markets Small Cap Fund | | | Frontier Emerging Small Countries Fund | |
Ordinary Income | | $ | — | | | $ | 29,439 | | | $ | 237,897 | | | $ | 1,814,628 | | | $ | 11,253,991 | |
Capital Gain | | | 24,139,661 | | | | — | | | | — | | | | — | | | | 14,583,973 | |
| | | | |
Total | | $ | 24,139,661 | | | $ | 29,439 | | | $ | 237,897 | | | $ | 1,814,628 | | | $ | 25,837,964 | |
| | | | |
124
| | | | | | | | | | | | | | | | | | | | |
| 2015 | | Global Opportunities Fund | | | International Growth Fund | | | International Opportunities Fund | | | Large Cap Value Fund | | | Long/Short Fund | |
Ordinary Income | | $ | — | | | $ | — | | | $ | — | | | $ | 9,564,501 | | | $ | 23,730,693 | |
Capital Gain | | | 27,018,684 | | | | 9,181,913 | | | | 32,985,697 | | | | 87,584,255 | | | | 126,006,657 | |
| | | | |
Total | | $ | 27,018,684 | | | $ | 9,181,913 | | | $ | 32,985,697 | | | $ | 97,148,756 | | | $ | 149,737,350 | |
| | | | |
| | | | | |
| 2015 | | Micro Cap Fund | | | Micro Cap Value Fund | | | Small Cap Growth Fund | | | Small Cap Value Fund | | | Strategic Income Fund | |
Ordinary Income | | $ | — | | | $ | — | | | $ | — | | | $ | — | | | $ | 2,614,478 | |
Capital Gain | | | 13,800,575 | | | | 21,640,698 | | | | 210,961,388 | | | | — | | | | 7,267,964 | |
| | | | |
Total | | $ | 13,800,575 | | | $ | 21,640,698 | | | $ | 210,961,388 | | | $ | — | | | $ | 9,882,442 | |
| | | | |
| | | | | |
| 2015 | | Ultra Growth Fund | | | World Innovators Fund | | | Income Fund | | | U.S. Treasury Fund | | | | |
Ordinary Income | | $ | — | | | $ | — | | | $ | 1,693,986 | | | $ | 6,608,427 | | | | | |
Capital Gain | | | 29,153,346 | | | | 25,428,998 | | | | — | | | | — | | | | | |
| | | | | | | | |
Total | | $ | 29,153,346 | | | $ | 25,428,998 | | | $ | 1,693,986 | | | $ | 6,608,427 | | | | | |
| | | | | | | | |
The tax character of distributions paid during the year ended September 30, 2014 was as follows:
| | | | | | | | | | | | | | | | | | | | |
| 2014 | | Core Growth Fund | | | Emerging India Fund | | | Emerging Markets Select Fund | | | Emerging Markets Small Cap Fund | | | Frontier Emerging Small Countries Fund | |
Ordinary Income | | $ | — | | | $ | — | | | $ | 86,248 | | | $ | — | | | $ | 1,526,061 | |
Capital Gain | | | 13,739,267 | | | | — | | | | — | | | | 38,681,425 | | | | — | |
| | | | |
Total | | $ | 13,739,267 | | | $ | — | | | $ | 86,248 | | | $ | 38,681,425 | | | $ | 1,526,061 | |
| | | | |
| | | | | |
| 2014 | | Global Opportunities Fund | | | International Growth Fund | | | International Opportunities Fund | | | Large Cap Value Fund | | | Long/Short Fund | |
Ordinary Income | | $ | — | | | $ | — | | | $ | — | | | $ | 11,919,583 | | | $ | 14,828,654 | |
Capital Gain | | | 23,550,252 | | | | 35,584,097 | | | | 18,321,459 | | | | 221,028,939 | | | | 39,911,334 | |
| | | | |
Total | | $ | 23,550,252 | | | $ | 35,584,097 | | | $ | 18,321,459 | | | $ | 232,948,522 | | | $ | 54,739,988 | |
| | | | |
| | | | | |
| 2014 | | Micro Cap Fund | | | Micro Cap Value Fund | | | Small Cap Growth Fund | | | Small Cap Value Fund | | | Strategic Income Fund | |
Ordinary Income | | $ | — | | | $ | 3,014,418 | | | $ | 12,739,948 | | | $ | — | | | $ | 2,280,004 | |
Capital Gain | | | — | | | | 25,279,419 | | | | 69,484,983 | | | | — | | | | 1,019,765 | |
| | | | |
Total | | $ | — | | | $ | 28,293,837 | | | $ | 82,224,931 | | | $ | — | | | $ | 3,299,769 | |
| | | | |
| | | | | |
| 2014 | | Ultra Growth Fund | | | World Innovators Fund | | | Income Fund | | | U.S. Treasury Fund | | | | |
Ordinary Income | | $ | — | | | $ | — | | | $ | 2,049,307 | | | $ | 5,436,357 | | | | | |
Capital Gain | | | 10,009,711 | | | | 14,888,675 | | | | — | | | | — | | | | | |
| | | | | | | | |
Total | | $ | 10,009,711 | | | $ | 14,888,675 | | | $ | 2,049,307 | | | $ | 5,436,357 | | | | | |
| | | | | | | | |
The tax character of distributions paid may differ from that shown in the Statements of Changes in Net Assets due to short-term gains being treated as ordinary income for tax purposes.
125
| | |
| WASATCH FUNDS — Notes to Financial Statements (continued) | | |
|
|
|
7. RELATED PARTY TRANSACTIONS
Investment Advisory Fees, Expense Limitations — As the Funds’ investment advisor, the Advisor receives a monthly fee calculated on average daily net assets. The Advisor has contractually agreed to waive its fees and/or reimburse certain Funds should a Fund’s operating expenses exceed a specified annual limitation through at least January 31, 2016. If operating expenses are less than the specified expense limit for the Fund, the Advisor shall be entitled to recoup the fees waived or reduced to the extent that the operating expenses and the amounts reimbursed do not exceed such expense limit for the Fund, under the period of the agreement (currently through January 31, 2016). Such reimbursement shall be paid only while the expense limitation agreement is in effect and only if such amount paid, together with all other amounts reimbursed under this agreement in the fiscal year, do not cause the Fund to exceed the expense limitation. All amounts not recovered at the end of the period expire on January 31, 2016. Ordinary operating expenses exclude any interest, dividend expense on short sales/interest expense, taxes, brokerage commissions, other investment-related costs and extraordinary expenses, such as litigation and other expenses not incurred in the ordinary course of the Funds’ business. In late October 2013, it was discovered that the Long/Short Fund and Large Cap Value Fund had a 12b-1 receivable on the books which dated back to 2008 prior to the conversion of the 1st Source Funds to Wasatch Funds. It was determined that the amount should be written off as an extraordinary expense and posted to other expenses. The balance for the Large Cap Value Fund was $70,993 and the Long/Short Fund was $8,622. The impact of these write-offs is reflected in the Financial Highlights. Investment advisory fees and fees waived, if any, for the year ended September 30, 2015 are disclosed in the Statements of Operations. Investment advisory fee and expense limitation annual rates are shown below.
| | | | | | | | | | | | | | | | | | | | |
| Fund | | Advisory Fee | | | Expense Limitation Investor Class | | | Expense Limitation Institutional Class | | | Contractual Expense Limitation/ Reimbursement Recoverable Expiration Date | | | Reimbursement Recoverable | |
Core Growth Fund | | | 1.00% | | | | 1.50% | | | | 1.12% | | | | 1/31/2016 | | | $ | 28,565 | |
Emerging India Fund | | | 1.50% | | | | 1.95% | | | | N/A | | | | 1/31/2016 | | | | 212,496 | |
Emerging Markets Select Fund | | | 1.25% | | | | 1.69% | | | | 1.50% | | | | 1/31/2016 | | | | 250,974 | |
Emerging Markets Small Cap Fund | | | 1.75% | | | | 1.95% | | | | N/A | | | | 1/31/2016 | | | | 1,933,325 | |
Frontier Emerging Small Countries Fund | | | 1.75% | | | | 2.25% | | | | N/A | | | | 1/31/2016 | | | | 373,661 | |
Global Opportunities Fund | | | 1.50% | | | | 1.95% | | | | N/A | | | | 1/31/2016 | | | | — | |
International Growth Fund | | | 1.25% | | | | 1.75% | | | | N/A | | | | 1/31/2016 | | | | — | |
International Opportunities Fund | | | 1.95% | | | | 2.25% | | | | N/A | | | | 1/31/2016 | | | | 1,107,582 | |
Large Cap Value Fund | | | 0.90% | | | | 1.10% | | | | 0.98% | | | | 1/31/2016 | | | | 96,154 | |
Long/Short Fund | | | 1.10% | | | | N/A | | | | 1.17% | | | | 1/31/2016 | | | | — | |
Micro Cap Fund | | | 1.75% | | | | 1.95% | | | | N/A | | | | 1/31/2016 | | | | — | |
Micro Cap Value Fund | | | 1.75% | | | | 1.95% | | | | N/A | | | | 1/31/2016 | | | | 186,841 | |
Small Cap Growth Fund | | | 1.00% | | | | 1.50% | | | | N/A | | | | 1/31/2016 | | | | — | |
Small Cap Value Fund | | | 1.00% | | | | 1.50% | | | | 1.15% | | | | 1/31/2016 | | | | 27,728 | |
Strategic Income Fund | | | 0.70% | | | | 0.95% | | | | N/A | | | | 1/31/2016 | | | | 10,415 | |
Ultra Growth Fund | | | 1.00% | | | | 1.50% | | | | N/A | | | | 1/31/2016 | | | | — | |
World Innovators Fund | | | 1.50% | | | | 1.95% | | | | N/A | | | | 1/31/2016 | | | | — | |
Income Fund | | | 0.55% | | | | N/A | | | | N/A | | | | N/A | | | | N/A | |
U.S. Treasury Fund | | | 0.50% | | | | 0.75% | | | | N/A | | | | 1/31/2016 | | | | — | |
Affiliated Trades — Certain Funds are permitted to purchase or sell securities from or to certain related affiliated funds under specified conditions outlined in the procedures adopted by the Board of Trustees (the “Board”). The procedures have been designed to ensure that any purchase or sale of securities by the Funds from or to another fund (or funds) that are, or could be, considered an affiliate by virtue of having a common investment advisor (or affiliated investment advisors), common Trustees and/or common officers complies with Rule 17a-7 of the 1940 Act. Further, each transaction is effected at the current market price, as that term is defined under the procedures. During the year ended September 30, 2015, the Funds had no purchases or sales of securities pursuant to Rule 17a-7 of the 1940 Act.
Institutional Class Legal Fees — As disclosed in the annual report dated September 30, 2011, the Board approved a multi-class plan pursuant to which the Board has established and designated two classes for each series known as Investor Class shares and Institutional Class shares. The Advisor paid the legal costs associated with the establishment and designation of the new share classes for existing funds.
Payments by Advisor — During the 2012 fiscal year, the Advisor discovered a trade allocation error involving several of the Wasatch Funds. In August 2012, the Advisor reimbursed the Global Opportunities Fund $1,167, the Micro Cap Fund $1,074, the Micro Cap Value Fund $1,282, the Small Cap Growth Fund $46,199, the Ultra Growth Fund $940 and the World Innovators Fund $437 as reimbursement for the error plus interest.
During the 2013 and 2014 fiscal years, the Advisor paid certain audit, legal and/or printing fees of the Core Growth, Emerging Markets Small Cap, Large Cap Value, Long/Short (Institutional Class), Small Cap Growth, Small Cap Value, Strategic Income and World Innovators Funds. The Advisor does not intend to be reimbursed for these amounts.
126
On February 20, 2013, the Advisor discovered a trade error involving the Frontier Emerging Small Countries Fund. The Advisor reimbursed the Fund $4,421. On October 16, 2014, the Advisor discovered a trade error involving the Ultra Growth Fund. The Advisor reimbursed the Fund $12,267.
The impact of the payments detailed above is reflected in the net expense ratios in the Financial Highlights.
10% Shareholders — As of September 30, 2015, the Funds had individual shareholder accounts and/or omnibus shareholder accounts (comprised of a group of individual shareholders), which individually amounted to more than 10% of the total shares outstanding of the Fund as detailed below:
| | | | | | | | |
| Fund | | Number of
Accounts | | | Percent of Shares
Outstanding | |
Core Growth Fund | | | 2 | | | | 53.45 | % |
Emerging India Fund | | | 2 | | | | 57.50 | % |
Emerging Markets Select Fund | | | 2 | | | | 76.76 | % |
Emerging Markets Small Cap Fund | | | 2 | | | | 57.72 | % |
Frontier Emerging Small Countries Fund | | | 2 | | | | 80.33 | % |
Global Opportunities Fund | | | 2 | | | | 62.38 | % |
International Growth Fund | | | 3 | | | | 64.57 | % |
International Opportunities Fund | | | 2 | | | | 73.97 | % |
Large Cap Value Fund | | | 2 | | | | 71.41 | % |
Long/Short Fund | | | 2 | | | | 78.11 | % |
Micro Cap Fund | | | 2 | | | | 26.50 | % |
Micro Cap Value Fund | | | 2 | | | | 47.45 | % |
Small Cap Growth Fund | | | 2 | | | | 53.50 | % |
Small Cap Value Fund | | | 2 | | | | 39.71 | % |
Strategic Income Fund | | | 2 | | | | 42.72 | % |
Ultra Growth Fund | | | 2 | | | | 27.91 | % |
World Innovators Fund | | | 2 | | | | 36.51 | % |
Income Fund | | | 1 | | | | 85.45 | % |
U.S. Treasury Fund | | | 4 | | | | 67.08 | % |
Affiliated Interests — As of September 30, 2015, Wasatch Advisors, Inc. and its affiliates, and the retirement plans of Wasatch Advisors, Inc. and its affiliates, held shares of the Funds which may be redeemed at any time as detailed below:
| | | | | | | | |
| Fund | | Number of
Accounts* | | | Percent of Shares
Outstanding | |
Core Growth Fund | | | 18 | | | | 0.70 | % |
Emerging India Fund | | | 21 | | | | 14.65 | % |
Emerging Markets Select Fund | | | 16 | | | | 12.58 | % |
Emerging Markets Small Cap Fund | | | 16 | | | | 0.64 | % |
Frontier Emerging Small Countries Fund | | | 23 | | | | 0.67 | % |
Global Opportunities Fund | | | 21 | | | | 2.92 | % |
International Growth Fund | | | 14 | | | | 0.52 | % |
International Opportunities Fund | | | 25 | | | | 2.10 | % |
Large Cap Value Fund | | | 11 | | | | 0.46 | % |
Long/Short Fund | | | 10 | | | | 0.37 | % |
Micro Cap Fund | | | 12 | | | | 0.86 | % |
Micro Cap Value Fund | | | 14 | | | | 2.38 | % |
Small Cap Growth Fund | | | 21 | | | | 1.66 | % |
Small Cap Value Fund | | | 10 | | | | 1.53 | % |
Strategic Income Fund | | | 9 | | | | 10.35 | % |
Ultra Growth Fund | | | 7 | | | | 2.23 | % |
World Innovators Fund | | | 8 | | | | 1.86 | % |
Income Fund | | | 3 | | | | 0.01 | % |
U.S. Treasury Fund | | | 6 | | | | 0.66 | % |
| * | Multiple accounts with the same beneficial owner are treated as one account. |
127
| | |
| WASATCH FUNDS — Notes to Financial Statements (continued) | | |
|
|
|
8. TRANSACTIONSWITH AFFILIATES
If a Fund’s holding represents ownership of 5% or more of the voting securities of a company, the company is deemed to be an affiliate as defined by the 1940 Act. The following Funds conducted transactions during the year ended September 30, 2015 with an “affiliated company” as so defined:
| | | | | | | | | | | | | | | | | | | | | | | | |
| | | Share Activity | | | Dividends
Credited to
Income for the
period ended
9/30/2015 | | | Gain (Loss)
Realized on
Sale of Shares
for the
period ended
9/30/2015 | |
| | | Balance
9/30/2014 | | | Purchases/
Additions | | | Sales/
Reductions | | | Balance
9/30/2015 | | | |
Frontier Emerging Small Countries Fund | | | | | | | | | | | | | | | | | | | | | | | | |
Akzo Nobel Pakistan Ltd. | | | — | | | | 3,698,992 | | | | — | | | | 3,698,992 | | | $ | 153,471 | | | $ | — | |
Chevron Lubricants Lanka plc | | | 5,300,185 | | | | 1,000,000 | | | | — | | | | 6,300,185 | | | | 942,680 | | | | — | |
Tokyo Cement Co. Lanka plc | | | — | | | | 11,548,669 | | | | — | | | | 11,548,669 | | | | 102,254 | | | | — | |
|
| |
International Growth Fund | | | | | | | | | | | | | | | | | | | | | | | | |
Diligent Corp.* | | | 4,679,359 | | | | — | | | | 975,870 | | | | 3,703,489 | | | $ | — | | | $ | (2,352,767 | ) |
|
| |
Long/Short Fund | | | | | | | | | | | | | | | | | | | | | | | | |
Bill Barrett Corp. | | | 3,843,259 | | | | 2,483,757 | | | | 673,700 | | | | 5,653,316 | | | $ | — | | | $ | (8,578,276 | ) |
Silicon Graphics International Corp.** | | | 2,820,938 | | | | — | | | | 910,947 | | | | 1,909,991 | | | | — | | | | (4,215,291 | ) |
|
| |
Micro Cap Fund | | | | | | | | | | | | | | | | | | | | | | | | |
Goldwater Bank, N.A.* | | | 154,000 | | | | — | | | | 154,000 | | | | — | | | $ | — | | | $ | (1,532,300 | ) |
|
| |
Small Cap Growth Fund | | | | | | | | | | | | | | | | | | | | | | | | |
Argos Therapeutics, Inc. | | | 642,332 | | | | 520,122 | | | | — | | | | 1,162,454 | | | $ | — | | | $ | — | |
Blue Nile, Inc. | | | 786,591 | | | | 41,962 | | | | — | | | | 828,553 | | | | — | | | | — | |
Cempra, Inc.* | | | 1,752,428 | | | | — | | | | 830,131 | | | | 922,297 | | | | — | | | | 21,214,115 | |
Chefs’ Warehouse, Inc. (The) | | | 1,423,495 | | | | 473,598 | | | | — | | | | 1,897,093 | | | | — | | | | — | |
Echo Global Logistics, Inc.* | | | 1,383,181 | | | | 192,631 | | | | 218,690 | | | | 1,357,122 | | | | — | | | | 1,266,682 | |
IPC Healthcare, Inc.* | | | 1,030,019 | | | | — | | | | 1,030,019 | | | | — | | | | — | | | | 14,824,512 | |
Knight Transportation, Inc.* | | | 4,784,182 | | | | 97,390 | | | | 2,131,689 | | | | 2,749,883 | | | | 710,444 | | | | 24,811,133 | |
Papa Murphy’s Holdings, Inc. | | | — | | | | 883,565 | | | | — | | | | 883,565 | | | | — | | | | — | |
SciQuest, Inc.* | | | 1,615,954 | | | | — | | | | 1,615,954 | | | | — | | | | — | | | | (3,969,271 | ) |
| * | This security was deemed to no longer meet the criteria of an affiliated company at the reporting date. |
| ** | On September 1, 2015, a Schedule 13D was filed for Silicon Graphics International Corp. (“the Company”) on behalf of the Advisor and the Wasatch Long/Short Fund, including the portfolio managers Michael L. Shinnick and Ralph C. Shive (“Reporting Persons”). |
9. RESTRICTED SECURITIES
The Funds may own investments that were purchased through private placement transactions or under Rule 144A of the Securities Act of 1933 (the “Securities Act”) and cannot be sold without prior registration under the Securities Act or may be limited due to certain restrictions. These securities are generally deemed to be illiquid and are valued at fair value as determined by a designated Pricing Committee of the Advisor (“Pricing Committee”), comprised of personnel of the Advisor, with oversight by the Board of Trustees and in accordance with Board-approved Pricing Policies and Procedures. If and when such securities are registered, the costs of registering such securities are paid by the issuer. At September 30, 2015 the Funds held the following restricted securities:
| | | | | | | | | | | | | | | | |
| | | Security
Type | | Acquisition
Date | | Cost | | | Fair
Value | | | Value as Percent
of Net Assets | |
Core Growth Fund | | | | | | | | | | | | | | | | |
DocuSign, Inc., Series F | | Preferred Stock | | 4/30/15 | | $ | 4,000,004 | | | $ | 4,000,004 | | | | 0.34 | % |
| | | | | | | | |
| | | | | | $ | 4,000,004 | | | $ | 4,000,004 | | | | 0.34 | % |
|
| |
Micro Cap Value Fund | | | | | | | | | | | | | | | | |
Acetylon Pharmaceuticals, Inc., Series B | | Preferred Stock | | 2/3/11 - 5/25/12 | | $ | 499,999 | | | $ | 1,801,050 | | | | 1.17 | % |
Vertex Energy, Inc. | | Preferred Stock | | 6/22/15 | | | 1,455,000 | | | | 1,310,000 | | | | 0.85 | % |
Vertex Energy, Inc. | | Warrants | | 6/22/15 | | | 95,000 | | | | 42,019 | | | | 0.03 | % |
| | | | | | | | |
| | | | | | $ | 2,049,999 | | | $ | 3,153,069 | | | | 2.05 | % |
128
| | | | | | | | | | | | | | | | |
| | | Security
Type | | Acquisition
Date | | Cost | | | Fair
Value | | | Value as Percent
of Net Assets | |
Small Cap Growth Fund | | | | | | | | | | | | | | | | |
DataStax, Inc., Series E | | Preferred Stock | | 8/12/14 | | $ | 8,000,002 | | | $ | 8,000,002 | | | | 0.40 | % |
DocuSign, Inc., Series B | | Preferred Stock | | 3/3/14 | | | 437,257 | | | | 635,724 | | | | 0.03 | % |
DocuSign, Inc., Series B-1 | | Preferred Stock | | 3/3/14 | | | 130,983 | | | | 190,435 | | | | 0.01 | % |
DocuSign, Inc., Series D | | Preferred Stock | | 3/3/14 | | | 313,930 | | | | 456,420 | | | | 0.02 | % |
DocuSign, Inc., Series E | | Preferred Stock | | 3/3/14 | | | 8,117,819 | | | | 11,802,438 | | | | 0.59 | % |
DocuSign, Inc., Series F | | Preferred Stock | | 4/30/15 | | | 2,999,984 | | | | 2,999,984 | | | | 0.15 | % |
Drilling Info Holdings, Inc., Series B | | Preferred Stock | | 9/5/13 | | | 15,350,001 | | | | 12,432,564 | | | | 0.62 | % |
Greenspring Global Partners II-B, L.P. | | LP Interest | | 10/10/03 - 7/16/15 | | | 3,212,943 | | | | 3,165,480 | | | | 0.16 | % |
Greenspring Global Partners III-B, L.P. | | LP Interest | | 3/16/06 - 2/23/15 | | | 1,502,148 | | | | 1,662,383 | | | | 0.08 | % |
Nanosys, Inc., Series D | | Preferred Stock | | 11/8/05 | | | 2,000,000 | | | | 136,135 | | | | 0.01 | % |
Nanosys, Inc., Series E | | Preferred Stock | | 8/13/10 | | | 184,939 | | | | 135,886 | | | | 0.01 | % |
| | | | | | | | |
| | | | | | $ | 42,250,006 | | | $ | 41,617,451 | | | | 2.08 | % |
|
| |
Strategic Income Fund | | | | | | | | | | | | | | | | |
Redcorp Ventures Ltd. | | Corporate Bonds | | 7/5/07 | | $ | 152,583 | | | $ | 804 | | | | 0.00 | % |
Star Asia Financial Ltd. | | Common Stock | | 2/22/07 - 5/11/15 | | | 572,597 | | | | 533,571 | | | | 0.60 | % |
| | | | | | | | |
| | | | | | $ | 725,180 | | | $ | 534,375 | | | | 0.60 | % |
|
| |
Ultra Growth Fund | | | | | | | | | | | | | | | | |
Data Sciences International, Inc., Series B | | Preferred Stock | | 1/20/06 | | $ | 475,001 | | | $ | 574,126 | | | | 0.60 | % |
Drilling Info Holdings, Inc., Series B | | Preferred Stock | | 9/5/13 | | | 1,150,001 | | | | 931,430 | | | | 0.97 | % |
Greenspring Global Partners II-B, L.P. | | LP Interest | | 10/10/03 - 7/16/15 | | | 2,891,638 | | | | 2,848,919 | | | | 2.97 | % |
Greenspring Global Partners III-B, L.P. | | LP Interest | | 3/16/06 - 2/23/15 | | | 1,502,148 | | | | 1,662,383 | | | | 1.73 | % |
Nanosys, Inc., Series D | | Preferred Stock | | 11/8/05 | | | 500,001 | | | | 34,034 | | | | 0.03 | % |
Nanosys, Inc., Series E | | Preferred Stock | | 8/13/10 | | | 46,235 | | | | 33,972 | | | | 0.04 | % |
Xtera Communications, Inc. | | Common Stock | | 9/3/03 | | | 99,065 | | | | 914 | | | | 0.00 | % |
| | | | | | | | | | | | | | | | |
| | | | | | $ | 6,664,089 | | | $ | 6,085,778 | | | | 6.34 | % |
|
| |
World Innovators Fund | | | | | | | | | | | | | | | | |
Greenspring Global Partners II-B, L.P. | | LP Interest | | 10/10/03 - 7/16/15 | | $ | 321,292 | | | $ | 316,546 | | | | 0.17 | % |
Xtera Communications, Inc. | | Common Stock | | 9/3/03 | | | 7,076 | | | | 65 | | | | 0.00 | % |
| | | | | | | | | | | | | | | | |
| | | | | | $ | 328,368 | | | $ | 316,611 | | | | 0.17 | % |
10. PURCHASE COMMITMENTS
In September 2003, the Small Cap Growth, Ultra Growth and World Innovators Funds entered into subscription agreements to acquire limited partnership interests in Greenspring Global Partners II-B, L.P. The remaining commitment amounts at September 30, 2015 were $50,000, $45,000 and $5,000, respectively.
In December 2005, the Small Cap Growth and Ultra Growth Funds entered into subscription agreements to acquire limited partnership interests in Greenspring Global Partners III-B, L.P. The remaining commitment amounts at September 30, 2015 were $60,000 per Fund.
Securities held by the Funds have been designated to meet these purchase commitments as indicated in the Schedules of Investments.
11. LINEOF CREDIT
Effective May 22, 2015, the Funds in the Trust renewed and amended agreements for two open lines of credit totaling $300,000,000, one of which is $200,000,000 uncommitted, and the other of which is $100,000,000 committed, with State Street Bank and Trust Company (together, the “Line”). The agreements, as amended, have no change in the total amounts available on the Line, an increase of $100,000,000 uncommitted and a decrease of $100,000,000 committed. The Funds incur commitment fees on the undrawn portion of the committed part of the Line, and interest expense to the extent of amounts drawn (borrowed) under the entire Line. Interest is based on the higher of (a) the federal funds rate in effect on the date of borrowing, plus a margin, or (b) the overnight London Interbank Offered Rate (LIBOR) in effect on the date of borrowing, plus a margin. Commitment fees are pro-rated among the Funds based upon relative average net assets. Interest expense is charged directly to a Fund based upon actual amounts borrowed by that Fund.
129
| | |
| WASATCH FUNDS — Notes to Financial Statements (continued) | | |
|
|
|
For the year ended September 30, 2015, the following Funds had borrowings:
| | | | | | | | | | | | | | | | | | | | |
| | | Average Daily Borrowings | | | Number of Days Outstanding | | | Interest Expense | | | Weighted Average Annualized Interest Rate | | | Balance at 9/30/2015 | |
Emerging India Fund | | $ | 965,544 | | | | 53 | | | $ | 1,998 | | | | 1.41 | % | | $ | — | |
Emerging Markets Select Fund | | | 909,729 | | | | 48 | | | | 1,743 | | | | 1.44 | % | | | — | |
Emerging Markets Small Cap Fund | | | 5,175,050 | | | | 74 | | | | 14,672 | | | | 1.38 | % | | | 794,884 | |
Frontier Emerging Small Countries Fund | | | 9,586,973 | | | | 16 | | | | 6,020 | | | | 1.41 | % | | | — | |
Global Opportunities Fund | | | 1,789,895 | | | | 73 | | | | 5,015 | | | | 1.38 | % | | | — | |
International Growth Fund | | | 15,860,562 | | | | 35 | | | | 21,274 | | | | 1.38 | % | | | — | |
International Opportunities Fund | | | 1,011,490 | | | | 3 | | | | 121 | | | | 1.44 | % | | | — | |
Large Cap Value Fund | | | 4,731,183 | | | | 10 | | | | 1,804 | | | | 1.37 | % | | | — | |
Strategic Income Fund | | | 1,605,177 | | | | 6 | | | | 390 | | | | 1.46 | % | | | — | |
Ultra Growth Fund | | | 156,417 | | | | 4 | | | | 25 | | | | 1.45 | % | | | — | |
Income Fund | | | 480,646 | | | | 15 | | | | 275 | | | | 1.37 | % | | | — | |
12. PRINCIPAL RISKS
Market and Credit Risk — In the normal course of business the Funds trade financial instruments and enter into financial transactions where risk of loss exists due to changes in the market (market risk) or the failure of the other party to a transaction to perform (credit risk). Similar to credit risk, the Funds may be exposed to counterparty risk, or the risk that an institution or other entity with which the Funds have unsettled or open transactions will default. The potential loss could exceed the value of the financial assets recorded in the financial statements. Financial assets, which potentially expose the Funds to credit risk, consist principally of cash due from counterparties and investments. The extent of the Funds’ exposure to credit and counterparty risks with respect to these financial assets approximates their carrying value as recorded in the Funds’ Statements of Assets and Liabilities.
Non-Diversification Risk — A non-diversified fund can invest a larger portion of its assets in the stocks of a limited number of companies than a diversified fund, which means it may have more exposure to the price movements of a single security or small group of securities than funds that diversify their investments among many companies. The Emerging Markets Select Fund is non-diversified.
Inflation Risk — Inflation risk is the possibility that inflation will reduce the purchasing power of a currency, and subsequently reduce the value of a security or asset, and may result in rising interest rates. Inflation is the overall upward price movement of goods and services in an economy that causes the value of a currency to decline.
Interest Rate Risk — Interest rate risk is the risk that fixed income securities will decline in value because of changes in interest rates. A rise in interest rates typically causes a fall in values. Interest rate risk should be modest for shorter-term securities, moderate for intermediate-term securities and high for longer-term securities. Generally, an increase in the average maturity of a fund will make it more sensitive to interest rate risk. The interest rate is the amount charged, expressed as a percentage of principal, by a lender to a borrower for the use of assets.
Foreign Currency Risk — If a fund invests directly in foreign currencies or in securities that trade in, and receive
revenues in, foreign currencies, or in derivatives that provide exposure to foreign currencies, it will be subject to the risk that those currencies will decline in value relative to the U.S. dollar. This also includes the risk associated with higher transaction costs, delayed settlements, currency controls and adverse economic developments related to foreign investments.
Region Risk — The Funds, except the U.S. Treasury Fund, invest in equity and fixed income securities of non-U.S. issuers. Because certain foreign markets are illiquid, market prices may not necessarily represent realizable value. Although the Funds maintain diversified investment portfolios, political or economic developments within a particular country or region may have an adverse effect on the ability of domiciled issuers to meet their obligations. These risks are exaggerated for securities of issuers tied economically to emerging and frontier market countries. Additionally, political or economic developments may have an adverse effect on the liquidity and volatility of portfolio securities and currency holdings.
Shareholder Concentration Risk — A significant portion of the net assets of the Frontier Emerging Small Countries Fund and International Opportunities Fund are owned by a group of shareholders advised by a common investment advisor. If these shareholders simultaneously redeems on the advice of their investment advisor, Fund expenses may increase and performance may be materially affected. However, the Advisor has contractually agreed to waive its fees and/or reimburse both the Frontier Emerging Small Countries Fund and the International Opportunities Fund should their operating expenses exceed 2.25% through at least January 31, 2016. The Emerging Markets Select Fund also has a significant portion of net assets concentrated in relatively few related accounts. The Advisor has contractually agreed to waive its fees and/or reimburse the Emerging Markets Select Fund should the operating expenses exceed 1.69% for the Investor Class and 1.50% for the Institutional Class through at least January 31, 2016.
13. FAIR VALUE MEASUREMENTSAND INVESTMENTS
The fair value of a financial instrument is the amount that would be received to sell an asset or paid to transfer a liability in an orderly transaction between market participants at the measurement date. The Funds use various methods to
130
measure the fair value of their investments on a recurring basis. U.S. GAAP established a hierarchy that prioritizes inputs to valuation methods. The three levels of inputs are:
| | • | | Level 1 — Unadjusted quoted prices in active markets for identical assets or liabilities that the Funds have the ability to access. |
| | • | | Level 2 — Observable inputs other than quoted prices included in Level 1 that are observable for the asset or liability, either directly or indirectly. The inputs may include quoted prices for the identical investment on an inactive market, prices for similar investments, interest rates, prepayment speeds, credit risk, yield curves, default rates and similar data. |
| | • | | Level 3 — Unobservable inputs for the asset or liability, to the extent relevant observable inputs are not available, representing the Funds’ own assumptions about the assumptions a market participant would use in valuing the asset or liability, and would be based on the best information available. |
The availability of observable inputs can vary from security to security and is affected by a wide variety of factors, including, for example, the type of security, whether a security is new and not yet established in the marketplace, the liquidity of markets, and other characteristics particular to the security. To the extent that valuation is based on models or inputs that are less observable or unobservable in the market, the determination of fair value requires more judgment. Accordingly, the degree of judgment exercised in determining fair value is greatest for instruments categorized in Level 3.
Equity Securities (common and preferred stock) — Securities are valued as of the close of the New York Stock Exchange (“NYSE”)(generally 4:00 p.m. Eastern Time) on the valuation date. Equity securities and listed warrants are valued using a commercial pricing service at the last quoted sales price taken from the primary market in which each security trades and, with respect to equity securities traded on the National Association of Securities Dealer Automated Quotation system (“NASDAQ”), such securities are valued using the NASDAQ Official Closing Price (“NOCP”) or last sales price if no NOCP is available. If there are no sales on the primary exchange or market on a day, then the security shall be valued at the mean of the last bid and ask price on the primary exchange or market as provided by a pricing service. If the mean cannot be calculated or there is no trade activity on a day, then the security shall be valued at the previous trading day’s price as provided by a pricing service. In some instances, particularly on foreign exchanges, an official close or evaluated price may be used if the pricing service is unable to provide the last trade or most recent mean price. To the extent that these securities are actively traded and valuation adjustments are not applied, they are categorized in Level 1 of the fair value hierarchy. Additionally, a fund’s investments are valued at fair value by the Pricing Committee if the Advisor determines that an event impacting the value of an investment occurred between the closing time of a security’s primary
market or exchange (for example, a foreign exchange or market) and the time the fund’s share price is calculated. Significant events include, but are not limited to the following: significant fluctuations in domestic markets, foreign markets or foreign currencies; occurrences not directly tied to the securities markets such as natural disasters, armed conflicts or significant governmental actions; and major announcements affecting a single issuer or an entire market or market sector. In responding to a significant event, the Pricing Committee determines the fair value of affected securities by considering factors including, but not limited to: index options and futures traded subsequent to the close; American Depositary Receipts (“ADRs”), Global Depositary Receipts (“GDRs”) or other related receipts; currency spot or forward markets that trade after pricing of the foreign exchange; other derivative securities traded after the close such as Standard & Poor’s Depositary Receipts (“SPDRs”) and other exchange-traded funds (“ETFs”); and alternative market quotes on the affected securities. When applicable, the Funds use a systematic fair valuation model provided by an independent third party to assist in adjusting the valuation of foreign securities. When a Fund uses this fair value pricing method, the values assigned to the Fund’s foreign securities may not be the quoted or published prices of the investments on their primary markets or exchanges, and the securities are categorized in Level 2 of the fair value hierarchy. These valuation procedures apply equally to long or short equity positions in a fund.
Participation Notes — Investments are valued at the market price of the underlying security. Counterparty risk is regularly reviewed and considered for valuation.
Corporate Debt Securities — Investments are valued at current market value by a pricing service, or by using the last sale or bid price based on observable inputs. Observable inputs may include benchmark yields, reported trades, broker/dealer quotes, issuer spreads, two-sided markets, benchmark securities, bids, offers and reference data including market research publications. Although most corporate bonds are categorized in Level 2 of the fair value hierarchy, in instances where observable inputs are not available, they are categorized as Level 3.
Short-Term Notes — Investments maturing in 60 days or less at the time of purchase, are generally valued at amortized cost, unless it is determined that the amortized cost method would not represent fair value, in which case the securities are marked-to-market. To the extent the inputs are observable and timely, the values would be categorized in Level 2 of the fair value hierarchy.
Asset-Backed Securities — Investments are priced using the closing bid as supplied by a pricing service based on observable inputs. Observable inputs may include benchmark yields, reported trades, broker/dealer quotes, issuer spreads, two-sided markets, benchmark securities, bids, offers and reference data including market research publications, new issue data, monthly payment information and collateral performance. Although most asset-backed securities are categorized in Level 2 of the fair value hierarchy, in instances where observable inputs are not available, they are categorized as Level 3.
131
| | |
| WASATCH FUNDS — Notes to Financial Statements (continued) | | |
|
|
|
U.S. Government Issuers — Investments are priced using the closing bid as supplied by a pricing service based on observable inputs. Observable inputs may include benchmark yields, reported trades, broker/dealer quotes, issuer spreads, two-sided markets, benchmark securities, bids, offers and reference data including market research publications. Although most U.S. government bonds are categorized in Level 2 of the fair value hierarchy, in instances where observable inputs are not available, they are categorized as Level 3.
Derivative Instruments — Listed derivatives that are actively traded are valued based on quoted prices from the exchange and are categorized in Level 1 of the fair value hierarchy. Exchange-traded options are valued at the last sale price in the market where they are principally traded. If there are no sales on the primary exchange or market on a given day, then the option is valued at the mean of the last bid price and ask price on the primary exchange or market as provided by a pricing service. Forward foreign currency contracts are valued at the market rate provided by the pricing service.
Restricted Securities — If market quotations are not readily available for the Funds’ investments in securities such as restricted securities, private placements, securities for which trading has been halted or other illiquid securities, these investments are valued at fair value in accordance with
Board-approved Pricing Policies and Procedures by the Pricing Committee with oversight by the Board of Trustees. Fair value is defined as the price that would be received upon the sale of an asset, or paid to transfer a liability, in an orderly transaction between market participants at the measurement date under current market conditions. For each applicable investment that is fair valued, the Pricing Committee considers, to the extent applicable, various factors including, but not limited to, the financial condition of the company or limited partnership, operating results, prices paid in follow-on rounds, comparable companies in the public market, the nature and duration of the restrictions for holding the securities, a stated net asset value (NAV) for the partnership, if applicable, and other relevant factors. Depending on the relative significance of valuation inputs, these instruments may be classified in either Level 2 or Level 3 of the fair value hierarchy.
When the last day of the reporting period is a non- business day, certain foreign markets may be open on days the NYSE is closed, which could result in differences between the value of a fund’s portfolio securities on the last business day and the last calendar day of the reporting period. Any significant security valuation changes due to an open foreign market are adjusted and reflected by the fund for financial reporting purposes.
The following is a summary of the fair valuations according to the inputs used as of September 30, 2015 in valuing the Funds’ assets and liabilities:
| | | | | | | | | | | | | | | | | | |
| Fund | | Category | | Quoted Prices in Active Markets for Identical Investments (Level 1) | | | Significant Other Observable Inputs (Level 2) | | | Significant Unobservable Inputs (Level 3) | | | Value at 9/30/2015 | |
| | | | | | | | | | | | | | | | | | |
Core Growth Fund | | | | | | | | | | | | | |
Assets | | | | | | | | | | | | | | | | | | |
Common Stocks | | Biotechnology | | $ | 32,582,264 | | | $ | 16,786,812 | | | $ | — | | | $ | 49,369,076 | |
| | Consumer Finance | | | 52,211,697 | | | | 6,801,205 | | | | — | | | | 59,012,902 | |
| | Diversified Banks | | | — | | | | 21,637,413 | | | | — | | | | 21,637,413 | |
| | Life Sciences Tools & Services | | | 25,423,157 | | | | 19,616,242 | | | | — | | | | 45,039,399 | |
| | Oil & Gas Equipment & Services | | | 6,250,441 | | | | 5,501,789 | | | | — | | | | 11,752,230 | |
| | Specialized Finance | | | — | | | | 6,458,380 | | | | — | | | | 6,458,380 | |
| | Other | | | 853,507,992 | | | | — | | | | — | | | | 853,507,992 | |
Preferred Stocks | | | | | — | | | | — | | | | 4,000,004 | | | | 4,000,004 | |
Short-Term Investments | | | | | — | | | | 119,120,957 | | | | — | | | | 119,120,957 | |
| | | | | | |
| | | | $ | 969,975,551 | | | $ | 195,922,798 | | | $ | 4,000,004 | | | $ | 1,169,898,353 | |
| | | | | | |
Emerging India Fund | | | | | | | | | | | | | | | | | | |
Assets | | | | | | | | | | | | | | | | | | |
Common Stocks | | Commodity Chemicals | | $ | 958,691 | | | $ | 1,127,860 | | | $ | — | | | $ | 2,086,551 | |
| | Department Stores | | | 140,891 | | | | — | | | | — | | | | 140,891 | |
| | Diversified Banks | | | 616,765 | | | | 3,916,708 | | | | — | | | | 4,533,473 | |
| | Electric Utilities | | | 512,284 | | | | — | | | | — | | | | 512,284 | |
| | Internet Retail | | | 1,616,299 | | | | — | | | | — | | | | 1,616,299 | |
| | IT Consulting & Other Services | | | 2,003,645 | | | | 3,403,765 | | | | — | | | | 5,407,410 | |
| | Life Sciences Tools & Services | | | 19,833 | | | | 1,100,357 | | | | — | | | | 1,120,190 | |
| | Packaged Foods & Meats | | | 288,570 | | | | 1,554,086 | | | | — | | | | 1,842,656 | |
| | Other | | | — | | | | 44,023,861 | | | | — | | | | 44,023,861 | |
Corporate Bonds | | | | | — | | | | 17,058 | | | | — | | | | 17,058 | |
Short-Term Investments | | | | | — | | | | 2,268,300 | | | | — | | | | 2,268,300 | |
| | | | | | |
| | | | $ | 6,156,978 | | | $ | 57,411,995 | | | $ | — | | | $ | 63,568,973 | |
| | | | | | |
132
| | | | | | | | | | | | | | | | | | |
| Fund | | Category | | Quoted Prices in Active Markets for Identical Investments (Level 1) | | | Significant Other Observable Inputs (Level 2) | | | Significant Unobservable Inputs (Level 3) | | | Value at 9/30/2015 | |
| | | | | | | | | | | | | | | | | | |
Emerging Markets Select Fund | | | | | | | | | | | | | | | | | | |
Assets | | | | | | | | | | | | | | | | | | |
Common Stocks | | Airport Services | | $ | 2,046,810 | | | $ | — | | | $ | — | | | $ | 2,046,810 | |
| | Construction & Engineering | | | 1,156,380 | | | | — | | | | — | | | | 1,156,380 | |
| | Consumer Finance | | | 1,302,152 | | | | 725,387 | | | | — | | | | 2,027,539 | |
| | Diversified Capital Markets | | | 1,309,842 | | | | — | | | | — | | | | 1,309,842 | |
| | Drug Retail | | | 711,662 | | | | — | | | | — | | | | 711,662 | |
| | Industrial Machinery | | | 517,855 | | | | — | | | | — | | | | 517,855 | |
| | Internet Retail | | | 424,435 | | | | — | | | | — | | | | 424,435 | |
| | Internet Software & Services | | | 1,074,326 | | | | — | | | | — | | | | 1,074,326 | |
| | Multi-Line Insurance | | | 453,933 | | | | — | | | | — | | | | 453,933 | |
| | Restaurants | | | 611,748 | | | | — | | | | — | | | | 611,748 | |
| | Other | | | — | | | | 24,122,180 | | | | — | | | | 24,122,180 | |
Short-Term Investments | | | | | — | | | | 3,519,811 | | | | — | | | | 3,519,811 | |
| | | | | | |
| | | | $ | 9,609,143 | | | $ | 28,367,378 | | | $ | — | | | $ | 37,976,521 | |
| | | | | | |
Emerging Markets Small Cap Fund | | | | | | | | | | | | | | | | | | |
Assets | | | | | | | | | | | | | | | | | | |
Common Stocks | | Airport Services | | $ | 15,232,618 | | | $ | 8,328,652 | | | $ | — | | | $ | 23,561,270 | |
| | Application Software | | | 3,859,320 | | | | — | | | | — | | | | 3,859,320 | |
| | Asset Management & Custody Banks | | | 5,799,438 | | | | 15,225,782 | | | | — | | | | 21,025,220 | |
| | Biotechnology | | | 8,865,144 | | | | 23,119,514 | | | | — | | | | 31,984,658 | |
| | Consumer Finance | | | 22,249,165 | | | | 51,413,603 | | | | — | | | | 73,662,768 | |
| | Diversified Capital Markets | | | 6,954,491 | | | | — | | | | — | | | | 6,954,491 | |
| | Internet Retail | | | 2,900,457 | | | | 14,007,826 | | | | — | | | | 16,908,283 | |
| | Internet Software & Services | | | 3,831,379 | | | | 14,723,780 | | | | — | | | | 18,555,159 | |
| | Life Sciences Tools & Services | | | 1,538,462 | | | | — | | | | — | | | | 1,538,462 | |
| | Oil & Gas Equipment & Services | | | 6,359,327 | | | | — | | | | — | | | | 6,359,327 | |
| | Oil & Gas Exploration & Production | | | 4,732,321 | | | | — | | | | — | | | | 4,732,321 | |
| | Pharmaceuticals | | | — | | | | 59,667,121 | | | | 873,390 | | | | 60,540,511 | |
| | Property & Casualty Insurance | | | 2,713,702 | | | | — | | | | — | | | | 2,713,702 | |
| | Real Estate Development | | | 5,567,225 | | | | — | | | | — | | | | 5,567,225 | |
| | Real Estate Operating Companies | | | 11,220,438 | | | | — | | | | — | | | | 11,220,438 | |
| | Regional Banks | | | 7,957,131 | | | | 1,625,715 | | | | — | | | | 9,582,846 | |
| | Restaurants | | | 9,331,243 | | | | — | | | | — | | | | 9,331,243 | |
| | Other | | | — | | | | 646,621,237 | | | | — | | | | 646,621,237 | |
Warrants | | | | | 211,593 | | | | — | | | | — | | | | 211,593 | |
| | | | | | |
| | | | $ | 119,323,454 | | | $ | 834,733,230 | | | $ | 873,390 | | | $ | 954,930,074 | |
| | | | | | |
133
| | |
| WASATCH FUNDS — Notes to Financial Statements (continued) | | |
|
|
|
| | | | | | | | | | | | | | | | | | |
| Fund | | Category | | Quoted Prices in Active Markets for Identical Investments (Level 1) | | | Significant Other Observable Inputs (Level 2) | | | Significant Unobservable Inputs (Level 3) | | | Value at 9/30/2015 | |
| | | | | | | | | | | | | | | | | | |
Frontier Emerging Small Countries Fund | | | | | | | | | | | | | | | | | | |
Assets | | | | | | | | | | | | | | | | | | |
Common Stocks | | Advertising | | $ | 31,691 | | | $ | — | | | $ | — | | | $ | 31,691 | |
| | Brewers | | | 61,739,665 | | | | 89,344,102 | | | | — | | | | 151,083,767 | |
| | Commodity Chemicals | | | 155,171 | | | | 20,345,561 | | | | — | | | | 20,500,732 | |
| | Construction Materials | | | 60,151,721 | | | | 19,469,866 | | | | — | | | | 79,621,587 | |
| | Consumer Finance | | | 4,482,299 | | | | 3,860,283 | | | | — | | | | 8,342,582 | |
| | Department Stores | | | 663,114 | | | | — | | | | — | | | | 663,114 | |
| | Diversified Banks | | | 14,908,575 | | | | 58,055,737 | | | | — | | | | 72,964,312 | |
| | Food Retail | | | 13,859,543 | | | | — | | | | — | | | | 13,859,543 | |
| | Footwear | | | 1,351,723 | | | | — | | | | — | | | | 1,351,723 | |
| | Household Products | | | 11,003,562 | | | | 335,277 | | | | — | | | | 11,338,839 | |
| | Hypermarkets & Super Centers | | | 18,951,626 | | | | — | | | | — | | | | 18,951,626 | |
| | Industrial Conglomerates | | | 4,759,433 | | | | — | | | | — | | | | 4,759,433 | |
| | Industrial Gases | | | 1,794,249 | | | | — | | | | — | | | | 1,794,249 | |
| | Integrated Telecommunication Services | | | 16,750,726 | | | | — | | | | — | | | | 16,750,726 | |
| | Life & Health Insurance | | | 2,013,758 | | | | — | | | | — | | | | 2,013,758 | |
| | Multi-Line Insurance | | | 1,058,502 | | | | 7,092,870 | | | | — | | | | 8,151,372 | |
| | Packaged Foods & Meats | | | 51,495,971 | | | | 136,400,197 | | | | — | | | | 187,896,168 | |
| | Personal Products | | | 10,252,240 | | | | — | | | | — | | | | 10,252,240 | |
| | Pharmaceuticals | | | 81,723,465 | | | | 16,151,209 | | | | — | | | | 97,874,674 | |
| | Soft Drinks | | | 12,632,291 | | | | — | | | | — | | | | 12,632,291 | |
| | Specialty Chemicals | | | 8,768,309 | | | | — | | | | — | | | | 8,768,309 | |
| | Tobacco | | | 39,021,444 | | | | 22,668,689 | | | | — | | | | 61,690,133 | |
| | Wireless Telecommunication Services | | | 22,381,134 | | | | 19,871,678 | | | | — | | | | 42,252,812 | |
| | Other | | | — | | | | 126,505,765 | | | | — | | | | 126,505,765 | |
Participation Notes | | | | | — | | | | 20,784,517 | | | | — | | | | 20,784,517 | |
Short-Term Investments | | | | | — | | | | 23,472,377 | | | | — | | | | 23,472,377 | |
| | | | | | |
| | | | $ | 439,950,212 | | | $ | 564,358,128 | | | $ | — | | | $ | 1,004,308,340 | |
| | | | | | |
Global Opportunities Fund | | | | | | | | | | | | | | | | | | |
Assets | | | | | | | | | | | | | | | | | | |
Common Stocks | | Air Freight & Logistics | | $ | 1,220,002 | | | $ | — | | | $ | — | | | $ | 1,220,002 | |
| | Airlines | | | 7,308,382 | | | | — | | | | — | | | | 7,308,382 | |
| | Airport Services | | | 2,780,880 | | | | — | | | | — | | | | 2,780,880 | |
| | Application Software | | | 5,251,380 | | | | 1,608,187 | | | | — | | | | 6,859,567 | |
| | Auto Parts & Equipment | | | 1,487,786 | | | | 850,093 | | | | — | | | | 2,337,879 | |
| | Biotechnology | | | 3,979,795 | | | | 5,375,875 | | | | — | | | | 9,355,670 | |
| | Building Products | | | 1,454,888 | | | | — | | | | — | | | | 1,454,888 | |
| | Construction & Engineering | | | 1,446,848 | | | | — | | | | — | | | | 1,446,848 | |
| | Consumer Finance | | | 5,014,971 | | | | 4,808,929 | | | | — | | | | 9,823,900 | |
| | Diversified Support Services | | | 1,552,090 | | | | — | | | | — | | | | 1,552,090 | |
| | Electronic Manufacturing Services | | | 3,041,991 | | | | — | | | | — | | | | 3,041,991 | |
| | Health Care Facilities | | | 1,644,708 | | | | 1,921,331 | | | | — | | | | 3,566,039 | |
| | Health Care Services | | | 1,569,282 | | | | — | | | | — | | | | 1,569,282 | |
| | Homefurnishing Retail | | | 1,160,803 | | | | — | | | | — | | | | 1,160,803 | |
| | Internet Retail | | | 3,588,033 | | | | 1,592,717 | | | | — | | | | 5,180,750 | |
| | Internet Software & Services | | | 10,230,236 | | | | 8,517,011 | | | | — | | | | 18,747,247 | |
| | Life Sciences Tools & Services | | | 633,056 | | | | 1,384,580 | | | | — | | | | 2,017,636 | |
| | Packaged Foods & Meats | | | 705,853 | | | | 1,447,215 | | | | — | | | | 2,153,068 | |
| | Personal Products | | | 1,083,806 | | | | — | | | | — | | | | 1,083,806 | |
| | Pharmaceuticals | | | 1,575,814 | | | | 13,287,376 | | | | — | | | | 14,863,190 | |
| | Regional Banks | | | 4,192,189 | | | | — | | | | — | | | | 4,192,189 | |
| | Restaurants | | | 1,280,068 | | | | 2,786,869 | | | | — | | | | 4,066,937 | |
| | Semiconductors | | | 1,614,583 | | | | 1,916,780 | | | | — | | | | 3,531,363 | |
| | Trucking | | | 4,809,623 | | | | — | | | | — | | | | 4,809,623 | |
| | Other | | | — | | | | 41,696,486 | | | | — | | | | 41,696,486 | |
Warrants | | | | | 21,870 | | | | — | | | | — | | | | 21,870 | |
Short-Term Investments | | | | | — | | | | 685,704 | | | | — | | | | 685,704 | |
| | | | | | |
| | $ | 68,648,937 | | | $ | 87,879,153 | | | $ | — | | | $ | 156,528,090 | |
| | | | | | |
134
| | | | | | | | | | | | | | | | | | |
| Fund | | Category | | Quoted Prices in Active Markets for Identical Investments (Level 1) | | | Significant Other Observable Inputs (Level 2) | | | Significant Unobservable Inputs (Level 3) | | | Value at 9/30/2015 | |
| | | | | | | | | | | | | | | | | | |
International Growth Fund | | | | | | | | | | | | | | | | | | |
Assets | | | | | | | | | | | | | | | | | | |
Common Stocks | | Application Software | | $ | 10,674,179 | | | $ | 33,824,454 | | | $ | — | | | $ | 44,498,633 | |
| | Asset Management & Custody Banks | | | 19,704,214 | | | | 5,646,726 | | | | — | | | | 25,350,940 | |
| | Auto Parts & Equipment | | | 17,080,165 | | | | — | | | | — | | | | 17,080,165 | |
| | Forest Products | | | 6,183,284 | | | | — | | | | — | | | | 6,183,284 | |
| | Health Care Technology | | | 25,117,570 | | | | 19,631,343 | | | | — | | | | 44,748,913 | |
| | Internet Software & Services | | | 8,453,144 | | | | 114,466,288 | | | | — | | | | 122,919,432 | |
| | Oil & Gas Equipment & Services | | | 8,950,815 | | | | 9,274,040 | | | | — | | | | 18,224,855 | |
| | Oil & Gas Storage & Transportation | | | 8,065,158 | | | | — | | | | — | | | | 8,065,158 | |
| | Property & Casualty Insurance | | | 7,381,207 | | | | — | | | | — | | | | 7,381,207 | |
| | Other | | | — | | | | 1,009,935,238 | | | | — | | | | 1,009,935,238 | |
Short-Term Investments | | | | | — | | | | 12,275,005 | | | | — | | | | 12,275,005 | |
| | | | | | |
| | $ | 111,609,736 | | | $ | 1,205,053,094 | | | $ | — | | | $ | 1,316,662,830 | |
| | | | | | |
International Opportunities Fund | | | | | | | | | | | | | | | | | | |
Assets | | | | | | | | | | | | | | | | | | |
Common Stocks | | Aerospace & Defense | | $ | 734,824 | | | $ | — | | | $ | — | | | $ | 734,824 | |
| | Air Freight & Logistics | | | 1,665,725 | | | | 5,577,385 | | | | — | | | | 7,243,110 | |
| | Apparel Retail | | | 2,408,792 | | | | — | | | | — | | | | 2,408,792 | |
| | Application Software | | | 3,531,931 | | | | — | | | | — | | | | 3,531,931 | |
| | Brewers | | | 9,550,197 | | | | 8,600,670 | | | | — | | | | 18,150,867 | |
| | Building Products | | | 508,407 | | | | — | | | | — | | | | 508,407 | |
| | Commodity Chemicals | | | 2,925,653 | | | | 15,167,131 | | | | — | | | | 18,092,784 | |
| | Communications Equipment | | | 1,028,371 | | | | — | | | | — | | | | 1,028,371 | |
| | Construction Materials | | | 1,573,282 | | | | — | | | | — | | | | 1,573,282 | |
| | Department Stores | | | 423,197 | | | | 1,948,028 | | | | — | | | | 2,371,225 | |
| | Distillers & Vintners | | | 1,599,493 | | | | 6,876,093 | | | | — | | | | 8,475,586 | |
| | Diversified Banks | | | 3,648,280 | | | | — | | | | — | | | | 3,648,280 | |
| | Drug Retail | | | 1,893,294 | | �� | | 4,993,951 | | | | — | | | | 6,887,245 | |
| | Electronic Equipment & Instruments | | | 2,294,692 | | | | 2,354,488 | | | | — | | | | 4,649,180 | |
| | Food Retail | | | 6,407,305 | | | | 23,917,428 | | | | — | | | | 30,324,733 | |
| | Health Care Distributors | | | 211,950 | | | | — | | | | — | | | | 211,950 | |
| | Health Care Facilities | | | 2,648,058 | | | | 26,415,804 | | | | — | | | | 29,063,862 | |
| | Health Care Technology | | | 2,345,080 | | | | 2,185,149 | | | | — | | | | 4,530,229 | |
| | Industrial Conglomerates | | | 3,330,127 | | | | — | | | | — | | | | 3,330,127 | |
| | Marine | | | 1,167,361 | | | | — | | | | — | | | | 1,167,361 | |
| | Marine Ports & Services | | | 1,807,439 | | | | 1,538,180 | | | | — | | | | 3,345,619 | |
| | Multi-Line Insurance | | | 1,309,448 | | | | 1,929,587 | | | | — | | | | 3,239,035 | |
| | Multi-Sector Holdings | | | 135,310 | | | | — | | | | — | | | | 135,310 | |
| | Office Services & Supplies | | | 2,585,838 | | | | — | | | | — | | | | 2,585,838 | |
| | Packaged Foods & Meats | | | 5,722,725 | | | | 37,673,469 | | | | — | | | | 43,396,194 | |
| | Personal Products | | | 818,547 | | | | 4,307,461 | | | | — | | | | 5,126,008 | |
| | Pharmaceuticals | | | 2,818,606 | | | | 6,341,891 | | | | — | | | | 9,160,497 | |
| | Regional Banks | | | 1,612,746 | | | | — | | | | — | | | | 1,612,746 | |
| | Restaurants | | | 10,306,069 | | | | 38,791,601 | | | | — | | | | 49,097,670 | |
| | Soft Drinks | | | 11,752,676 | | | | — | | | | — | | | | 11,752,676 | |
| | Specialized Finance | | | 595,111 | | | | — | | | | — | | | | 595,111 | |
| | Specialty Chemicals | | | 1,188,086 | | | | 2,543,654 | | | | — | | | | 3,731,740 | |
| | Other | | | — | | | | 148,754,233 | | | | — | | | | 148,754,233 | |
Short-Term Investments | | | | | — | | | | 23,124,583 | | | | — | | | | 23,124,583 | |
| | | | | | |
| | | | $ | 90,548,620 | | | $ | 363,040,786 | | | $ | — | | | $ | 453,589,406 | |
| | | | | | |
Large Cap Value Fund | | | | | | | | | | | | | | | | | | |
Assets | | | | | | | | | | | | | | | | | | |
Common Stocks | | | | $ | 243,797,409 | | | $ | — | | | $ | — | | | $ | 243,797,409 | |
Short-Term Investments | | | | | — | | | | 1,470,547 | | | | — | | | | 1,470,547 | |
| | | | | | |
| | | | $ | 243,797,409 | | | $ | 1,470,547 | | | $ | — | | | $ | 245,267,956 | |
| | | | | | |
135
| | |
| WASATCH FUNDS — Notes to Financial Statements (continued) | | |
|
|
|
| | | | | | | | | | | | | | | | | | |
| Fund | | Category | | Quoted Prices in Active Markets for Identical Investments (Level 1) | | | Significant Other Observable Inputs (Level 2) | | | Significant Unobservable Inputs (Level 3) | | | Value at 9/30/2015 | |
| | | | | | | | | | | | | | | | | | |
Long/Short Fund | | | | | | | | | | | | | | | | | | |
Assets | | | | | | | | | | | | | | | | | | |
Common Stocks | | | | $ | 968,266,093 | | | $ | — | | | $ | — | | | $ | 968,266,093 | |
Short-Term Investments | | | | | — | | | | 52,286,876 | | | | — | | | | 52,286,876 | |
| | | | | | |
| | | | $ | 968,266,093 | | | $ | 52,286,876 | | | $ | — | | | $ | 1,020,552,969 | |
| | | | | | |
Liabilities | | | | | | | | | | | | | | | | | | |
Securities Sold Short | | | | $ | (263,064,239 | ) | | $ | — | | | $ | — | | | $ | (263,064,239 | ) |
| | | | | | |
| | | | $ | (263,064,239 | ) | | $ | — | | | $ | — | | | $ | (263,064,239 | ) |
| | | | | | |
Micro Cap Fund | | | | | | | | | | | | | | | | | | |
Assets | | | | | | | | | | | | | | | | | | |
Common Stocks | | Apparel, Accessories & Luxury Goods | | $ | 2,983,713 | | | $ | 2,045,342 | | | $ | — | | | $ | 5,029,055 | |
| | Application Software | | | 29,294,645 | | | | 1,161,920 | | | | — | | | | 30,456,565 | |
| | Biotechnology | | | 6,540,566 | | | | 2,452,262 | | | | — | | | | 8,992,828 | |
| | Diversified Banks | | | — | | | | 5,916,813 | | | | — | | | | 5,916,813 | |
| | Industrial Machinery | | | 3,094,127 | | | | 3,370,193 | | | | — | | | | 6,464,320 | |
| | Internet Software & Services | | | 16,432,625 | | | | 2,943,976 | | | | — | | | | 19,376,601 | |
| | Pharmaceuticals | | | 16,035,937 | | | | 5,259,003 | | | | — | | | | 21,294,940 | |
| | Publishing | | | — | | | | 4,138,897 | | | | — | | | | 4,138,897 | |
| | Thrifts & Mortgage Finance | | | — | | | | 4,275,369 | | | | — | | | | 4,275,369 | |
| | Other | | | 146,356,389 | | | | — | | | | — | | | | 146,356,389 | |
Short-Term Investments | | | | | — | | | | 8,784,540 | | | | — | | | | 8,784,540 | |
| | | | | | |
| | | | $ | 220,738,002 | | | $ | 40,348,315 | | | $ | — | | | $ | 261,086,317 | |
| | | | | | |
Micro Cap Value Fund | | | | | | | | | | | | | | | | | | |
Assets | | | | | | | | | | | | | | | | | | |
Common Stocks | | Advertising | | $ | — | | | $ | 1,000,703 | | | $ | — | | | $ | 1,000,703 | |
| | Application Software | | | 2,932,140 | | | | 1,031,935 | | | | — | | | | 3,964,075 | |
| | Asset Management & Custody Banks | | | 1,941,015 | | | | 53,965 | | | | — | | | | 1,994,980 | |
| | Automotive Retail | | | — | | | | 2,224,258 | | | | — | | | | 2,224,258 | |
| | Biotechnology | | | 451,200 | | | | 1,952,588 | | | | — | | | | 2,403,788 | |
| | Construction Materials | | | — | | | | 908,228 | | | | — | | | | 908,228 | |
| | Diversified Banks | | | — | | | | 1,402,683 | | | | — | | | | 1,402,683 | |
| | Electronic Equipment & Instruments | | | 688,000 | | | | 1,072,121 | | | | — | | | | 1,760,121 | |
| | General Merchandise Stores | | | — | | | | 1,283,632 | | | | — | | | | 1,283,632 | |
| | Health Care Distributors | | | — | | | | 759,523 | | | | — | | | | 759,523 | |
| | Health Care Facilities | | | 1,790,460 | | | | 1,469,573 | | | | — | | | | 3,260,033 | |
| | Health Care Services | | | 5,180,262 | | | | 1,820,461 | | | | — | | | | 7,000,723 | |
| | Health Care Supplies | | | 3,144,750 | | | | 1,067,361 | | | | — | | | | 4,212,111 | |
| | Health Care Technology | | | — | | | | 3,058,309 | | | | — | | | | 3,058,309 | |
| | Home Improvement Retail | | | — | | | | 1,534,248 | | | | — | | | | 1,534,248 | |
| | Human Resource & Employment Services | | | — | | | | 603,796 | | | | — | | | | 603,796 | |
| | Industrial Machinery | | | 1,606,500 | | | | 2,009,326 | | | | — | | | | 3,615,826 | |
| | Packaged Foods & Meats | | | 1,558,304 | | | | 1,647,642 | | | | — | | | | 3,205,946 | |
| | Pharmaceuticals | | | 1,608,160 | | | | 6,922,174 | | | | — | | | | 8,530,334 | |
| | Restaurants | | | — | | | | 913,107 | | | | — | | | | 913,107 | |
| | Technology Hardware, Storage & Peripherals | | | 747,000 | | | | 1,042,222 | | | | — | | | | 1,789,222 | |
| | Trading Companies & Distributors | | | — | | | | 993,792 | | | | — | | | | 993,792 | |
| | Other | | | 73,704,293 | | | | — | | | | — | | | | 73,704,293 | |
Preferred Stocks | | | | | — | | | | — | | | | 3,111,050 | | | | 3,111,050 | |
Warrants | | | | | — | | | | — | | | | 42,019 | | | | 42,019 | |
Short-Term Investments | | | | | — | | | | 19,808,193 | | | | — | | | | 19,808,193 | |
| | | | | | |
| | $ | 95,352,084 | | | $ | 54,579,840 | | | $ | 3,153,069 | | | $ | 153,084,993 | |
| | | | | | |
136
| | | | | | | | | | | | | | | | | | |
| Fund | | Category | | Quoted Prices in Active Markets for Identical Investments (Level 1) | | | Significant Other Observable Inputs (Level 2) | | | Significant Unobservable Inputs (Level 3) | | | Value at 9/30/2015 | |
| | | | | | | | | | | | | | | | | | |
Small Cap Growth Fund | | | | | | | | | | | | | | | | | | |
Assets | | | | | | | | | | | | | | | | | | |
Common Stocks | | Air Freight & Logistics | | $ | 26,599,591 | | | $ | 31,209,777 | | | $ | — | | | $ | 57,809,368 | |
| | Biotechnology | | | 91,995,742 | | | | 18,683,735 | | | | — | | | | 110,679,477 | |
| | Consumer Finance | | | — | | | | 12,110,713 | | | | — | | | | 12,110,713 | |
| | Diversified Banks | | | 34,549,449 | | | | 17,503,591 | | | | — | | | | 52,053,040 | |
| | Drug Retail | | | — | | | | 14,033,754 | | | | — | | | | 14,033,754 | |
| | Internet Retail | | | 79,572,919 | | | | 14,427,411 | | | | — | | | | 94,000,330 | |
| | Life Sciences Tools & Services | | | 76,638,120 | | | | 34,264,632 | | | | — | | | | 110,902,752 | |
| | Personal Products | | | — | | | | 13,905,268 | | | | — | | | | 13,905,268 | |
| | Restaurants | | | 29,432,536 | | | | 36,662,175 | | | | — | | | | 66,094,711 | |
| | Other | | | 1,345,098,898 | | | | — | | | | — | | | | 1,345,098,898 | |
Preferred Stocks | | | | | — | | | | — | | | | 36,789,588 | | | | 36,789,588 | |
Limited Partnership Interest | | | | | — | | | | — | | | | 4,827,863 | | | | 4,827,863 | |
Short-Term Investments | | | | | — | | | | 87,423,697 | | | | — | | | | 87,423,697 | |
| | | | | | |
| | $ | 1,683,887,255 | | | $ | 280,224,753 | | | $ | 41,617,451 | | | $ | 2,005,729,459 | |
| | | | | | |
Small Cap Value Fund | | | | | | | | | | | | | | | | | | |
Assets | | | | | | | | | | | | | | | | | | |
Common Stocks | | Consumer Finance | | $ | 8,170,230 | | | $ | 3,163,171 | | | $ | — | | | $ | 11,333,401 | |
| | Diversified Banks | | | — | | | | 7,010,812 | | | | — | | | | 7,010,812 | |
| | Pharmaceuticals | | | 2,038,103 | | | | 5,867,748 | | | | — | | | | 7,905,851 | |
| | Other | | | 240,472,130 | | | | — | | | | — | | | | 240,472,130 | |
Limited Partnership Interest | | | | | 3,595,401 | | | | — | | | | — | | | | 3,595,401 | |
Short-Term Investments | | | | | — | | | | 8,564,540 | | | | — | | | | 8,564,540 | |
| | | | | | |
| | $ | 254,275,864 | | | $ | 24,606,271 | | | $ | — | | | $ | 278,882,135 | |
| | | | | | |
Strategic Income Fund | | | | | | | | | | | | | | | | | | |
Assets | | | | | | | | | | | | | | | | | | |
Common Stocks | | Diversified REITs | | $ | 3,743,285 | | | $ | 533,571 | | | $ | — | | | $ | 4,276,856 | |
| | Other | | | 69,376,316 | | | | — | | | | — | | | | 69,376,316 | |
Exchange-Traded Funds | | | | | 829,375 | | | | — | | | | — | | | | 829,375 | |
Limited Partnership Interest | | | | | 9,821,019 | | | | — | | | | — | | | | 9,821,019 | |
Corporate Bonds | | | | | — | | | | — | | | | 804 | | | | 804 | |
Short-Term Investments | | | | | — | | | | 3,032,863 | | | | — | | | | 3,032,863 | |
| | | | | | |
| | | | $ | 83,769,995 | | | $ | 3,566,434 | | | $ | 804 | | | $ | 87,337,233 | |
| | | | | | |
Ultra Growth Fund | | | | | | | | | | | | | | | | | | |
Assets | | | | | | | | | | | | | | | | | | |
Common Stocks | | Diversified Banks | | $ | — | | | $ | 2,833,873 | | | $ | — | | | $ | 2,833,873 | |
| | Industrial Machinery | | | 1,952,112 | | | | 1,108,906 | | | | — | | | | 3,061,018 | |
| | Internet Software & Services | | | 10,807,793 | | | | — | | | | 914 | | | | 10,808,707 | |
| | Restaurants | | | 669,079 | | | | 1,131,157 | | | | — | | | | 1,800,236 | |
| | Specialized Finance | | | — | | | | 634,932 | | | | — | | | | 634,932 | |
| | Other | | | 69,358,789 | | | | — | | | | — | | | | 69,358,789 | |
Preferred Stocks | | | | | — | | | | — | | | | 1,573,562 | | | | 1,573,562 | |
Limited Partnership Interest | | | | | — | | | | — | | | | 4,511,302 | | | | 4,511,302 | |
Short-Term Investments | | | | | — | | | | 1,582,068 | | | | — | | | | 1,582,068 | |
| | | | | | |
| | | | $ | 82,787,773 | | | $ | 7,290,936 | | | $ | 6,085,778 | | | $ | 96,164,487 | |
| | | | | | |
137
| | |
| WASATCH FUNDS — Notes to Financial Statements (continued) | | |
|
|
|
| | | | | | | | | | | | | | | | | | |
| Fund | | Category | | Quoted Prices in Active Markets for Identical Investments (Level 1) | | | Significant Other Observable Inputs (Level 2) | | | Significant Unobservable Inputs (Level 3) | | | Value at 9/30/2015 | |
| | | | | | | | | | | | | | | | | | |
World Innovators Fund | | | | | | | | | | | | | | | | | | |
Assets | | | | | | | | | | | | | | | | | | |
Common Stocks | | Alternative Carriers | | $ | — | | | $ | 3,979,933 | | | $ | — | | | $ | 3,979,933 | |
| | Application Software | | | — | | | | 472,043 | | | | — | | | | 472,043 | |
| | Automotive Retail | | | 1,937,600 | | | | 9,094,787 | | | | — | | | | 11,032,387 | |
| | Biotechnology | | | 3,566,781 | | | | 6,016,105 | | | | — | | | | 9,582,886 | |
| | Communications Equipment | | | — | | | | 470,755 | | | | — | | | | 470,755 | |
| | Computer & Electronics Retail | | | — | | | | 373,264 | | | | — | | | | 373,264 | |
| | Construction Machinery & Heavy Trucks | | | — | | | | 494,914 | | | | — | | | | 494,914 | |
| | Consumer Electronics | | | — | | | | 3,545,568 | | | | — | | | | 3,545,568 | |
| | Food Retail | | | — | | | | 3,450,759 | | | | — | | | | 3,450,759 | |
| | Health Care Distributors | | | 925,150 | | | | 340,328 | | | | — | | | | 1,265,478 | |
| | Health Care Equipment | | | — | | | | 5,409,186 | | | | — | | | | 5,409,186 | |
| | Health Care Services | | | — | | | | 954,938 | | | | — | | | | 954,938 | |
| | Health Care Technology | | | 2,696,404 | | | | 2,181,668 | | | | — | | | | 4,878,072 | |
| | Home Improvement Retail | | | — | | | | 852,891 | | | | — | | | | 852,891 | |
| | Homebuilding | | | — | | | | 593,354 | | | | — | | | | 593,354 | |
| | Human Resource & Employment Services | | | — | | | | 1,615,135 | | | | — | | | | 1,615,135 | |
| | Industrial Machinery | | | 730,415 | | | | 1,554,144 | | | | — | | | | 2,284,559 | |
| | Internet Retail | | | 5,306,153 | | | | 2,006,096 | | | | — | | | | 7,312,249 | |
| | Internet Software & Services | | | 5,461,237 | | | | 717,609 | | | | 65 | | | | 6,178,911 | |
| | Leisure Products | | | — | | | | 3,288,953 | | | | — | | | | 3,288,953 | |
| | Life Sciences Tools & Services | | | — | | | | 2,460,756 | | | | — | | | | 2,460,756 | |
| | Publishing | | | 955,087 | | | | 644,441 | | | | — | | | | 1,599,528 | |
| | Real Estate Services | | | 934,505 | | | | 253,156 | | | | — | | | | 1,187,661 | |
| | Semiconductors | | | — | | | | 2,970,748 | | | | — | | | | 2,970,748 | |
| | Wireless Telecommunication Services | | | — | | | | 1,885,037 | | | | — | | | | 1,885,037 | |
| | Other | | | 89,870,310 | | | | — | | | | — | | | | 89,870,310 | |
Limited Partnership Interest | | | | | — | | | | — | | | | 316,546 | | | | 316,546 | |
Short-Term Investments | | | | | — | | | | 14,459,758 | | | | — | | | | 14,459,758 | |
| | | | | | |
| | | | $ | 112,383,642 | | | $ | 70,086,326 | | | $ | 316,611 | | | $ | 182,786,579 | |
| | | | | | |
Income Fund | | | | | | | | | | | | | | |
Assets | | | | | | | | | | | | | | | | | | |
Asset-Backed Securities | | | | $ | — | | | $ | 7,739,874 | | | $ | — | | | $ | 7,739,874 | |
Collateralized Mortgage Obligations | | | | | — | | | | 19,786,284 | | | | — | | | | 19,786,284 | |
Corporate Bonds | | | | | — | | | | 49,421,732 | | | | — | | | | 49,421,732 | |
Municipal Bonds | | | | | — | | | | 3,350,628 | | | | — | | | | 3,350,628 | |
Exchange-Traded Funds | | | | | 837,150 | | | | — | | | | — | | | | 837,150 | |
U.S. Government Agency Securities | | | | | — | | | | 14,574,065 | | | | — | | | | 14,574,065 | |
U.S. Treasury Notes | | | | | — | | | | 9,358,560 | | | | — | | | | 9,358,560 | |
Preferred Stocks | | | | | 1,152,520 | | | | — | | | | — | | | | 1,152,520 | |
Short-Term Investments | | | | | — | | | | 2,029,446 | | | | — | | | | 2,029,446 | |
| | | | | | |
| | | | $ | 1,989,670 | | | $ | 106,260,589 | | | $ | — | | | $ | 108,250,259 | |
| | | | | | |
U.S. Treasury Fund | | | | | | | | | | | | | | | | | | |
Assets | | | | | | | | | | | | | | | | | | |
U.S. Government Obligations | | | | $ | — | | | $ | 322,083,384 | | | $ | — | | | $ | 322,083,384 | |
Short-Term Investments | | | | | — | | | | 4,582,570 | | | | — | | | | 4,582,570 | |
| | | | | | |
| | | | $ | — | | | $ | 326,665,954 | | | $ | — | | | $ | 326,665,954 | |
| | | | | | |
If the securities of an Asset Class are all the same level, the asset class is shown in total. If the securities of an Asset Class cross levels, the level with the smallest number of categories and with multiple levels within a category is displayed by category. The remaining categories that do not cross levels are combined into the “Other” category.
138
The valuation techniques used by the Funds to measure fair value for the year ended September 30, 2015 maximized the use of observable inputs and minimized the use of unobservable inputs.
The Funds’ policy is to recognize transfers between levels at the end of the reporting period. The table below shows the significant transfers between Level 1 and Level 2 due to fair valuation in certain foreign markets pursuant to a systematic valuation model.
| | | | | | | | |
| Fund | | Transfers Out Of Level 1 at Market Value | | | Transfers Into Level 2 at Market Value | |
Core Growth Fund | | $ | 66,993,719 | | | $ | 66,993,719 | |
Emerging India Fund | | | 44,986,684 | | | | 44,986,684 | |
Emerging Markets Select Fund | | | 18,624,412 | | | | 18,624,412 | |
Emerging Markets Small Cap Fund | | | 463,183,239 | | | | 463,183,239 | |
Frontier Emerging Small Countries Fund | | | 414,157,588 | | | | 414,157,588 | |
Global Opportunities Fund | | | 36,253,872 | | | | 36,253,872 | |
International Growth Fund | | | 807,257,387 | | | | 807,257,387 | |
International Opportunities Fund | | | 204,196,988 | | | | 204,196,988 | |
Micro Cap Fund | | | 21,110,708 | | | | 21,110,708 | |
Micro Cap Value Fund | | | 15,021,712 | | | | 15,021,712 | |
Small Cap Growth Fund | | | 175,668,738 | | | | 175,668,738 | |
Small Cap Value Fund | | | 7,010,812 | | | | 7,010,812 | |
Ultra Growth Fund | | | 4,599,961 | | | | 4,599,961 | |
World Innovators Fund | | | 19,817,960 | | | | 19,817,960 | |
There was a transfer of $873,390 from Level 1 to Level 3 in the Emerging Markets Small Cap Fund. A holding was suspended from trading by the Hong Kong Exchange due to their inability to publish the 2014 annual report as required by the exchange listing rules. As of September 30, 2015, the security remains halted. There was a transfer of $971,041 from Level 3 to Level 2 in the Micro Cap Value Fund due to a change in pricing strategy on a PIPE. This transfer amount represents the beginning of the period value for Nobilis Health Corp. PIPE, which transferred to Level 2 during the period in order to properly represent the activity on the Level 3 rollforward presented below.
The following is a reconciliation of the fair valuations using significant observable inputs (Level 3) for the Funds during the year ended September 30, 2015:
| | | | | | | | | | | | | | | | | | | | | | | | | | | | | | | | | | | | | | | | |
| Fund | | Market Value Beginning Balance 9/30/2014 | | | Purchases at Cost | | | Sales (Proceeds) | | | Accrued Discounts (Premiums) | | | Realized Gain/ (Loss) | | | Change in Unrealized Appreciation (Depreciation) | | | Transfers in at Market Value | | | Transfers out at Market Value | | | Market Value Ending Balance 9/30/2015 | | | Net Change in Unrealized Appreciation (Depreciation) on Investments Held at 9/30/2015 | |
Core Growth Fund | |
Preferred Stocks | | $ | — | | | $ | 4,000,004 | | | $ | — | | | $ | — | | | $ | — | | | $ | — | | | $ | — | | | $ | — | | | $ | 4,000,004 | | | $ | — | |
| | | | |
| | | — | | | | 4,000,004 | | | | — | | | | — | | | | — | | | | — | | | | — | | | | — | | | | 4,000,004 | | | | — | |
| | | | |
Emerging Markets Small Cap Fund | | | | | | | | | | | | | | | | | | | | | | | | | | | | | | | | | | | | | | | | |
Common Stocks | | | — | | | | — | | | | — | | | | — | | | | — | | | | — | | | | 873,390 | | | | — | | | | 873,390 | | | | — | |
| | | | |
| | | — | | | | — | | | | — | | | | — | | | | — | | | | — | | | | 873,390 | | | | — | | | | 873,390 | | | | — | |
| | | | |
Micro Cap Fund | |
Common Stocks | | | 32,340 | | | | — | | | | (7,700 | ) | | | — | | | | (1,532,300 | ) | | | 1,507,660 | | | | — | | | | — | | | | — | | | | — | |
| | | | |
| | | 32,340 | | | | — | | | | (7,700 | ) | | | — | | | | (1,532,300 | ) | | | 1,507,660 | | | | — | | | | — | | | | — | | | | — | |
| | | | |
Micro Cap Value Fund | |
Common Stocks | | | 1,186,508 | | | | — | | | | (139,318 | ) | | | — | | | | (779,686 | ) | | | 703,537 | | | | — | | | | (971,041 | ) | | | — | | | | — | |
Preferred Stocks | | | 1,366,314 | | | | 1,455,000 | | | | — | | | | — | | | | — | | | | 289,736 | | | | — | | | | — | | | | 3,111,050 | | | | 289,736 | |
Warrants | | | 4,150 | | | | 95,000 | | | | — | | | | — | | | | — | | | | (57,131 | ) | | | — | | | | — | | | | 42,019 | | | | (52,981 | ) |
| | | | |
| | | 2,556,972 | | | | 1,550,000 | | | | (139,318 | ) | | | — | | | | (779,686 | ) | | | 936,142 | | | | — | | | | (971,041 | ) | | | 3,153,069 | | | | 236,755 | |
| | | | |
Small Cap Growth Fund | |
Preferred Stocks | | | 32,900,050 | | | | 2,999,984 | | | | — | | | | — | | | | — | | | | 889,554 | | | | — | | | | — | | | | 36,789,588 | | | | 889,554 | |
Limited Partnership Interest | | | 4,515,675 | | | | 115,000 | | | | (768,900 | ) | | | — | | | | 734,297 | | | | 231,791 | | | | — | | | | — | | | | 4,827,863 | | | | 231,791 | |
| | | | |
| | | 37,415,725 | | | | 3,114,984 | | | | (768,900 | ) | | | — | | | | 734,297 | | | | 1,121,345 | | | | — | | | | — | | | | 41,617,451 | | | | 1,121,345 | |
| | | | |
Strategic Income Fund | |
Corporate Bonds | | | 1,125 | | | | — | | | | — | | | | — | | | | — | | | | (321 | ) | | | — | | �� | | — | | | | 804 | | | | (321 | ) |
| | | | |
| | | 1,125 | | | | — | | | | — | | | | — | | | | — | | | | (321 | ) | | | — | | | | — | | | | 804 | | | | (321 | ) |
| | | | |
139
| | |
| WASATCH FUNDS — Notes to Financial Statements (continued) | | |
|
|
|
| | | | | | | | | | | | | | | | | | | | | | | | | | | | | | | | | | | | | | | | |
| Fund | | Market Value Beginning Balance 9/30/2014 | | | Purchases at Cost | | | Sales (Proceeds) | | | Accrued Discounts (Premiums) | | | Realized Gain/ (Loss) | | | Change in Unrealized Appreciation (Depreciation) | | | Transfers in at Market Value | | | Transfers out at Market Value | | | Market Value Ending Balance 9/30/2015 | | | Net Change in Unrealized Appreciation (Depreciation) on Investments Held at 9/30/2015 | |
Ultra Growth Fund | |
Common Stocks | | $ | 914 | | | $ | — | | | $ | — | | | $ | — | | | $ | — | | | $ | — | | | $ | — | | | $ | — | | | $ | 914 | | | $ | — | |
Preferred Stocks | | | 2,018,982 | | | | — | | | | (195 | ) | | | — | | | | (999,805 | ) | | | 554,580 | | | | — | | | | — | | | | 1,573,562 | | | | (442,979 | ) |
Limited Partnership Interest | | | 4,198,989 | | | | 105,000 | | | | (716,593 | ) | | | — | | | | 700,397 | | | | 223,509 | | | | — | | | | — | | | | 4,511,302 | | | | 223,509 | |
| | | | |
| | | 6,218,885 | | | | 105,000 | | | | (716,788 | ) | | | — | | | | (299,408 | ) | | | 778,089 | | | | — | | | | — | | | | 6,085,778 | | | | (219,470 | ) |
| | | | |
World Innovators Fund | |
Common Stocks | | | 65 | | | | — | | | | — | | | | — | | | | — | | | | — | | | | — | | | | — | | | | 65 | | | | — | |
Limited Partnership Interest | | | 316,673 | | | | 10,000 | | | | (52,306 | ) | | | — | | | | 33,892 | | | | 8,287 | | | | — | | | | — | | | | 316,546 | | | | 8,287 | |
| | | | |
| | | 316,738 | | | | 10,000 | | | | (52,306 | ) | | | — | | | | 33,892 | | | | 8,287 | | | | — | | | | — | | | | 316,611 | | | | 8,287 | |
| | | | |
QUANTITATIVE INFORMATION ABOUT LEVEL 3 FAIR VALUE MEASUREMENTS
| | | | | | | | | | | | | | |
| Fund | | Description | | Fair Value at 9/30/2015 | | | Valuation Technique | | Unobservable Input | | Range
(Average) | |
Emerging Markets Small Cap Fund | | Common Stock: Pharmaceuticals | | $ | 873,390 | | | Discount on last trade | | Discount for lack of marketability | | | 90% | |
Micro Cap Value Fund | | Direct Venture Capital Investments: Pharmaceuticals | | $ | 1,801,050 | | | Probability of warrant exercise Probability of no warrant exercise | | Exercise price Remaining value | |
| *
* |
|
Micro Cap Value Fund | | Warrant in Public Equity: Oil & Gas Refining & Marketing | | $ | 42,019 | | | Discount to cost | | Cost Discount for lack of marketability | |
| 50%
12% |
|
Small Cap Growth Fund | | Direct Venture Capital Investments: Biotechnology | | $ | 272,022 | | | Market comparable companies | | EV/R** multiple Discount for lack of marketability | |
| 1.1 -2.5(1.7)
20% |
|
Small Cap Growth Fund | | Direct Venture Capital Investments: Oil & Gas Equipment & Services | | $ | 12,432,564 | | | Market comparable companies | | EV/R** multiple Discount for lack of marketability | |
| 2.7 -10.5(5.6)
20% |
|
Ultra Growth Fund | | Direct Venture Capital Investments: Biotechnology | | $ | 68,006 | | | Market comparable companies | | EV/R** multiple Discount for lack of marketability | |
| 1.1 -2.5(1.7)
20% |
|
Ultra Growth Fund | | Direct Venture Capital Investments: Health Care Technology | | $ | 574,126 | | | Probability of strategic buyer† Probability of financial buyer† | | Offer proceeds Offer proceeds | |
| 100%
100% |
|
Ultra Growth Fund | | Direct Venture Capital Investments: Oil & Gas Equipment & Services | | $ | 931,430 | | | Market comparable companies | | EV/R** multiple Discount for lack of marketability | |
| 2.7 - 10.5(5.6)
20% |
|
| * | The exercise price of the warrant will be within a range; the actual price is not set at this time. As such, this valuation is directionally sensitive to the determination of the exercise price within the range. |
| ** | Enterprise-Value-To-Revenue Multiple (“EV/R”) — A measure of the value of a stock that compares a company’s enterprise value to its revenue. |
| † | The valuation is sensitive to the adjustment of the probabilities between a strategic and financial buyer. |
Changes in EV/R multiples may change the fair value of an investment. Generally, a decrease in this multiple will result in a decrease in the fair value of an investment.
The Funds’ other Level 3 investments have been valued using observable inputs, unadjusted third-party transactions and quotations, unadjusted historical third party information or the unadjusted NAV of an investment in private investment companies. No unobservable inputs internally developed by the Funds have been applied to these investments, thus they have been excluded from the above table.
14. OFFSETTING
Each Fund is party to various netting arrangements. The FASB requires disclosure about certain netting arrangements and similar agreements to enable users of a Fund’s financial statements to evaluate the effect or potential effect of netting arrangements on the Fund’s financial position. The scope of the disclosure is limited to derivative instruments, repurchase agreements and reverse repurchase agreements, and securities borrowing and securities lending transactions.
140
The following tables present information about financial instruments that were subject to enforceable netting arrangements as of September 30, 2015:
REPURCHASE AGREEMENTS
| | | | | | | | | | | | | | | | | | |
| | | | | Gross Amounts Not Offset in the Statements of Assets and Liabilities | |
| Fund | | Counterparty | | Gross Asset Amounts
Presented in Statements
of Assets and Liabilities | | | Financial
Instrument | | | Collateral
Received1 | | | Net Amount
(Not Less
Than 0) | |
Core Growth Fund | | State Street Bank and Trust Co. | | $ | 119,120,957 | | | $ | — | | | $ | (119,120,957 | ) | | $ | — | |
Emerging India Fund | | State Street Bank and Trust Co. | | | 2,268,300 | | | | — | | | | (2,268,300 | ) | | | — | |
Emerging Markets Select Fund | | State Street Bank and Trust Co. | | | 3,519,811 | | | | — | | | | (3,519,811 | ) | | | — | |
Frontier Emerging Small Countries Fund | | State Street Bank and Trust Co. | | | 23,472,377 | | | | — | | | | (23,472,377 | ) | | | — | |
Global Opportunities Fund | | State Street Bank and Trust Co. | | | 685,704 | | | | — | | | | (685,704 | ) | | | — | |
International Growth Fund | | State Street Bank and Trust Co. | | | 12,275,005 | | | | — | | | | (12,275,005 | ) | | | — | |
International Opportunities Fund | | State Street Bank and Trust Co. | | | 23,124,583 | | | | — | | | | (23,124,583 | ) | | | — | |
Large Cap Value Fund | | State Street Bank and Trust Co. | | | 1,470,547 | | | | — | | | | (1,470,547 | ) | | | — | |
Long/Short Fund | | State Street Bank and Trust Co. | | | 52,286,876 | | | | — | | | | (52,286,876 | ) | | | — | |
Micro Cap Fund | | State Street Bank and Trust Co. | | | 8,784,540 | | | | — | | | | (8,784,540 | ) | | | — | |
Micro Cap Value Fund | | State Street Bank and Trust Co. | | | 19,808,193 | | | | — | | | | (19,808,193 | ) | | | — | |
Small Cap Growth Fund | | State Street Bank and Trust Co. | | | 87,423,697 | | | | — | | | | (87,423,697 | ) | | | — | |
Small Cap Value Fund | | State Street Bank and Trust Co. | | | 8,564,540 | | | | — | | | | (8,564,540 | ) | | | — | |
Strategic Income Fund | | State Street Bank and Trust Co. | | | 3,032,863 | | | | — | | | | (3,032,863 | ) | | | — | |
Ultra Growth Fund | | State Street Bank and Trust Co. | | | 1,582,068 | | | | — | | | | (1,582,068 | ) | | | — | |
World Innovators Fund | | State Street Bank and Trust Co. | | | 14,459,758 | | | | — | | | | (14,459,758 | ) | | | — | |
Income Fund | | State Street Bank and Trust Co. | | | 2,029,446 | | | | — | | | | (2,029,446 | ) | | | — | |
U.S. Treasury Fund | | State Street Bank and Trust Co. | | | 4,582,570 | | | | — | | | | (4,582,570 | ) | | | — | |
| | |
SECURITIES BORROWEDFOR SHORT SALES | | | | | | | | | |
| | | | | Gross Amounts Not Offset in the Statements of Assets and Liabilities | |
| Fund | | Counterparty | | Gross Liability Amounts Presented in Statements of Assets and Liabilities | | | Financial Instrument | | | Collateral Pledged2 | | | Net Amount (Not Less Than 0) | |
Long/Short Fund | | JPMorgan Chase | | $ | 263,064,239 | | | $ | — | | | $ | (263,064,239 | ) | | $ | — | |
| 1 | Repurchase agreements are classified as short-term investments in the Statements of Assets and Liabilities. The market value of the collateral received is greater than the amounts indicated in the table. For further information, see Note 3 and the Schedules of Investments. |
| 2 | The market value of the collateral received is greater than the amounts indicated in the table. For further information, see Note 3 — Securities and Other Investments “Short Sales” and the Schedules of Investments. |
15. FAIR VALUEOF DERIVATIVE INSTRUMENTS*
The following is a summary of the fair valuations of the Funds’ derivative instruments categorized by risk exposure:
WASATCH LONG/SHORT FUND
The Effect of Derivative Instruments on the Statement of Operations for the year ended September 30, 2015:
| | | | | | | | | | | | | | | | | | | | | | | | |
| | | Derivatives not accounted for as hedging instruments under Statement 133 | |
| | | Interest Rate
Contracts | | | Foreign Exchange
Contracts | | | Credit
Contracts | | | Equity
Contracts | | | Other
Contracts | | | Total | |
Realized Gain (Loss) on Derivatives Recognized in Income | | | | | | | | | | | | | | | | | | | | | | | | |
Net realized gain (loss) on options written | | $ | — | | | $ | — | | | $ | — | | | $ | (1,377,491 | ) | | $ | — | | | $ | (1,377,491 | ) |
| | | | |
Net Change in Unrealized Appreciation (Depreciation) on Derivatives Recognized in Income | | | | | | | | | | | | | | | | | | | | | | | | |
Change in unrealized appreciation (depreciation) on investments, options, securities sold short and foreign currency translations | | $ | — | | | $ | — | | | $ | — | | | $ | 1,010,459 | | | $ | — | | | $ | 1,010,459 | |
| | | | |
141
| | |
| WASATCH FUNDS — Notes to Financial Statements (continued) | | SEPTEMBER 30, 2015 |
|
|
|
WASATCH MICRO CAP VALUE FUND
The Effect of Derivative Instruments on the Statement of Operations for the year ended September 30, 2015:
| | | | | | | | | | | | | | | | | | | | | | | | |
| | | Derivatives not accounted for as hedging and non-hedging instruments under Statement 133 | |
| | | Interest Rate
Contracts | | | Foreign Exchange
Contracts | | | Credit
Contracts | | | Equity
Contracts | | | Other
Contracts | | | Total | |
Realized Gain (Loss) on Derivatives Recognized in Income | | | | | | | | | | | | | | | | | | | | | | | | |
Net realized gain (loss) on options written | | $ | — | | | $ | — | | | $ | — | | | $ | 272,422 | | | $ | — | | | $ | 272,422 | |
Net realized gain (loss) on investments and foreign currency translations | | | — | | | | 414,810 | 1 | | | — | | | | — | | | | — | | | | 414,810 | |
| | | | |
| | $ | — | | | $ | 414,810 | | | $ | — | | | $ | 272,422 | | | $ | — | | | $ | 687,232 | |
| | | | |
Net Change in Unrealized Appreciation (Depreciation) on Derivatives Recognized in Income | | | | | | | | | | | | | | | | | | | | | | | | |
Change in unrealized appreciation (depreciation) on investments, options, securities sold short and foreign
currency translations | | $ | — | | | $ | — | | | $ | — | | | $ | (10,336 | ) | | $ | — | | | $ | (10,336 | ) |
| | | | |
| * | See Note 4 — Financial Derivative Instruments for additional information. |
| 1 | Derivative accounted for as hedging instrument under Statement 133. |
For the year ended September 30, 2015, the average monthly balance of outstanding derivative financial instruments was as follows:
| | | | |
| | | Micro Cap Value Fund | |
Forward currency contracts: | | | | |
Average number of contracts — U.S. dollars purchased | | | — | 1 |
Average U.S. dollar amounts purchased | | $ | 959,279 | |
Average number of contracts — U.S. dollars sold | | | — | 1 |
Average U.S. dollar amounts sold | | $ | 994,554 | |
Option contracts: | | | | |
Average number of call contracts written | | | 130 | |
Average value of call contracts written | | $ | 30,544 | |
| 1 | Amount represents less than 0.05. |
16. SUBSEQUENT EVENTS
Management has evaluated the possibility of subsequent events and has determined that there are no additional events that would require adjustment to or additional disclosure in the Funds’ financial statements.
142
| | |
| WASATCH FUNDS — Report of Independent Registered Public Accounting Firm | | SEPTEMBER 30, 2015 |
|
|
|
To the Board of Trustees and Shareholders of
Wasatch Funds Trust:
In our opinion, the accompanying statements of assets and liabilities, including the schedules of investments, and the related statements of operations and of changes in net assets and the financial highlights present fairly, in all material respects, the financial position of Wasatch Core Growth Fund, Wasatch Emerging India Fund, Wasatch Emerging Markets Select Fund, Wasatch Emerging Markets Small Cap Fund, Wasatch Frontier Emerging Small Countries Fund, Wasatch Global Opportunities Fund, Wasatch International Growth Fund, Wasatch International Opportunities Fund, Wasatch Large Cap Value Fund, Wasatch Long/Short Fund, Wasatch Micro Cap Fund, Wasatch Micro Cap Value Fund, Wasatch Small Cap Growth Fund, Wasatch Small Cap Value Fund, Wasatch Strategic Income Fund, Wasatch Ultra Growth Fund, Wasatch World Innovators Fund, Wasatch-1st Source Income Fund, and Wasatch-Hoisington U.S. Treasury Fund (hereafter referred to as the “Funds”) at September 30, 2015, the results of each of their operations for the year then ended, the changes in each of their net assets for each of the two years in the period then ended and the financial highlights for each of the periods indicated, in conformity with accounting principles generally accepted in the United States of America. These financial statements and financial highlights (hereafter referred to as “financial statements”) are the responsibility of the Fund’s management; our responsibility is to express an opinion on these financial statements based on our audits. We conducted our audits of these financial statements in accordance with the standards of the Public Company Accounting Oversight Board (United States). Those standards require that we plan and perform the audit to obtain reasonable assurance about whether the financial statements are free of material misstatement. An audit includes examining, on a test basis, evidence supporting the amounts and disclosures in the financial statements, assessing the accounting principles used and significant estimates made by management, and evaluating the overall financial statement presentation. We believe that our audits, which included confirmation of securities at September 30, 2015 by correspondence with the custodian and brokers, provide a reasonable basis for our opinion.
Kansas City, Missouri
November 24, 2015
143
| | |
| WASATCH FUNDS — Supplemental Information | | |
|
|
|
MANAGEMENTOFTHE COMPANY
Management Information. The business affairs of Wasatch Funds are overseen by its Board of Trustees. The Board consists of five Independent Trustees and one Interested Trustee. Three of the Independent Trustees and the Interested Trustee were elected by shareholders to serve until their successors are qualified, appointed or elected in accordance with the Trust’s Declaration of Trust and By-Laws. Two Independent Trustees have been appointed by the elected Independent Trustees to serve until his or her successor is qualified, appointed or elected in accordance with the Trust’s Declaration of Trust and By-Laws.
The Trustees and executive officers of Wasatch Funds and their principal occupations for at least the last five years are set forth below. The Advisor retains proprietary rights to the Trust name.
| | | | | | | | | | |
Name, Address and Age | | Position(s) Held with
Wasatch Funds | | Term of Office1 and Length of Time Served | | Principal Occupation(s) during Past 5 Years | | Number of
Portfolios
in Fund
Complex
Overseen
by Trustee | | Other Directorships Held by Trustee during Past 5 Years2 |
Independent Trustees | | | | | | | | | | |
| | | | | |
James U. Jensen, J.D., MBA 505 Wakara Way 3rd Floor Salt Lake City, UT 84108 Age 71 | | Trustee and Chairman of the Board | | Indefinite Served as Chairman of the Board since 2004 and Trustee since 1986 | | Chief Executive Officer of Clearwater Law & Governance Group (an operating law firm board governance consulting company) April 2008 to present; Co-Founder and Chairman of the Board of Intelisum, Inc. (a company pursuing computer and measurement technology and products) 2001 - 2008; Consultant on corporate growth and technology transfer since 2004; Vice President, Corporate Development, Legal Affairs and General Counsel, and Secretary, NPS Pharmaceuticals, Inc. from 1991 to 2004. | | 19 | | Director and Board Chairman of Agricon Global Corporation (formerly known as Bayhill Capital Corporation (telephone communications) since December 2007 to February 2014; Trustee, Northern Lights Fund Trust III (30 portfolios) since 2012. |
| | | | | |
D. James Croft, Ph.D. 505 Wakara Way 3rd Floor Salt Lake City, UT 84108 Age 73 | | Trustee and Chairman of the Governance and Nominating Committee | | Indefinite Served as Trustee since 2005 | | Consultant to the mortgage industry on issues of mortgage quality, identification of mortgage fraud, strategic planning and client development since 2004; Founder & Executive Director, Mortgage Asset Research Institute, from 1990 to 2004. | | 19 | | None. |
| | | | | |
Miriam M. Allison 505 Wakara Way 3rd Floor Salt Lake City, UT 84108 Age 68 | | Trustee and Chairman of the Audit Committee | | Indefinite Served as Trustee since 2010 | | Rancher since 2004. From 2001 to 2005, Chairman of UMB Fund Services, Inc. | | 19 | | Director, Northwestern Mutual Series Fund, Inc. (27 portfolios) since 2006. |
| | | | | |
Heikki Rinne 505 Wakara Way 3rd Floor Salt Lake City, UT 84108 Age 63 | | Trustee | | Indefinite Served as Trustee since October 2012 | | Chief Executive Officer of the Halton Group Ltd. (an indoor environmental control manufacturing and technology company) since 2002. | | 19 | | None. |
| | | | | |
Kristen M. Fletcher 505 Wakara Way 3rd Floor Salt Lake City, UT 84108 Age 62 | | Trustee | | Indefinite Served as Trustee since October 2014 | | Trustee, Youth Sports Alliance since 2015; Director, Utah Symphony/Utah Opera since 2005; Director, Woodlands Commercial Bank 2009 - 2012; Chairman and CEO, ABN AMRO, Inc. and U.S. Country Representative, ABN AMRO Bank, NV from 2002 - 2004. | | 19 | | Trustee, Youth Sports Alliance since 2015; Director Utah Symphony/Utah Opera since 2005; Director, Woodlands Commercial Bank 2009 - 2012. |
|
|
Interested Trustee | | | | | | | | | | |
| | | | | |
Samuel S. Stewart, Jr., Ph.D. CFA3 505 Wakara Way 3rd Floor Salt Lake City, UT 84108 Age 73 | | President and Trustee | | Indefinite Served as President and Trustee since 1986 | | Chairman of the Board for the Advisor since 1975; Chief Investment Officer of the Advisor from 2004 to June 2009; Director of Research of the Advisor from 1975 to 2004; Chairman of the Board of Wasatch Funds from 1986 to 2004. | | 19 | | None. |
|
|
| 1 | A Trustee may serve until his/her death, resignation, removal or retirement. Each Independent Trustee shall retire as Trustee at the end of the calendar year in which he/she attains the age of 75 years. |
| 2 | Directorships are those held by a Trustee in any company with a class of securities registered pursuant to Section 12 of the Securities Exchange Act of 1934 or subject to the requirements of Section 15(d) of the Securities Exchange Act or any company registered as an investment company under the 1940 Act. |
| 3 | Dr. Stewart is an Interested Trustee because he serves as the Chairman of the Board of the Advisor. |
144
| | |
| | SEPTEMBER 30, 2015 (UNAUDITED) |
|
|
|
| | | | | | |
Name, Address and Age | | Position(s) Held with Trust | | Term of Office and Length of Time Served | | Principal Occupation(s) during Past 5 Years |
Officers | | | | | | |
| | | |
Daniel D. Thurber 505 Wakara Way 3rd Floor Salt Lake City, UT 84108 Age 46 | | Vice President | | Indefinite Served as Vice President since February 2007 | | General Counsel, Chief Compliance Officer and Director of Compliance for the Advisor since 2006. |
| | | |
Russell L. Biles 505 Wakara Way 3rd Floor Salt Lake City, UT 84108 Age 48 | | Chief Compliance Officer, Vice President and Secretary | | Indefinite Served as Chief Compliance Officer and Vice President since February 2007 and Secretary since November 2008 | | Chief Compliance Officer and Vice President for Wasatch Funds since February 2007; Secretary for Wasatch Funds since November 2008; Counsel for the Advisor since October 2006. |
| | | |
Cindy B. Firestone CPA 505 Wakara Way 3rd Floor Salt Lake City, UT 84108 Age 58 | | Treasurer | | Indefinite Served as Treasurer since May 2009 | | Treasurer for Wasatch Funds since May 2009; Assistant Treasurer for Wasatch Funds from November 2008 to May 2009; Internal Auditor for the Advisor from December 2002 to August 2011. |
| | | |
David Corbett 505 Wakara Way 3rd Floor Salt Lake City, UT 84108 Age 43 | | Assistant Vice President | | Indefinite Served as Assistant Vice President since August 2012 | | Assistant Vice President for Wasatch Funds since August 2012; Director of Mutual Fund Services for the Advisor since June 2007. |
|
|
Additional information about the Funds’ trustees is provided in the Statement of Additional Information and is available without charge, upon request, by calling 800.551.1700.
ADDITIONAL TAX INFORMATION
The Funds hereby designate the following amounts or maximum amounts allowable as long term capital gain dividends for the purpose of the dividends paid deduction. The amounts designated here include the utilization of earnings and profits distributed to shareholders on the redemption of shares.
| | | | |
| Fund | | Amount | |
Core Growth Fund | | $ | 24,139,661 | |
Frontier Emerging Small Countries Fund | | | 14,583,973 | |
Global Opportunities Fund | | | 27,018,684 | |
International Growth Fund | | | 9,181,913 | |
International Opportunities Fund | | | 32,985,697 | |
Large Cap Value Fund | | | 91,295,666 | |
Long/Short Fund | | | 171,032,782 | |
Micro Cap Fund | | | 13,800,575 | |
Micro Cap Value Fund | | | 21,640,698 | |
Small Cap Growth Fund | | | 210,961,388 | |
Strategic Income Fund | | | 7,267,964 | |
Ultra Growth Fund | | | 29,153,346 | |
World Innovators Fund | | | 25,428,998 | |
U.S. Treasury Fund | | | 11,970,866 | |
For the fiscal year ended September 30, 2015, certain dividends paid by each Fund may be subject to a maximum tax rate of 20% as provided for by the Jobs and Growth Tax Relief Reconciliation Act of 2003. To the extent dividends are paid during the calendar year 2015, complete information will be reported on shareholders’ 2015 Form 1099-DIV.
The amount designated as qualified dividend income for the year ended September 30, 2015 will be at the highest amount permitted by law.
Corporate shareholders should note for the year ended September 30, 2015, the percentage of the Funds’ investment income (i.e., net investment income plus short-term capital gains) that qualified for the corporate dividends received deductions are as follows:
| | | | |
| Fund | | Percentage | |
Emerging Markets Select Fund | | | 1 | % |
Frontier Emerging Small Countries Fund | | | 2 | % |
Large Cap Value Fund | | | 92 | % |
Long/Short Fund | | | 100 | % |
Strategic Income Fund | | | 53 | % |
Income Fund | | | 3 | % |
The Funds may elect to pass-through to shareholders the income tax credit for taxes paid to foreign countries. The foreign taxes paid eligible for pass-through on September 30, 2015 are as follows:
| | | | |
| Fund | | Amount | |
Frontier Emerging Small Countries Fund | | $ | 3,040,779 | |
If elected, the pass-through of the foreign tax credit will affect only those persons who are shareholders on the dividend record date in December 2015. These shareholders will receive more detailed information along with their 2015 Form 1099-DIV.
145
| | |
| WASATCH FUNDS — Supplemental Information (continued) | | SEPTEMBER 30, 2015 (UNAUDITED) |
|
|
|
PROXY VOTING POLICIES, PROCEDURESAND RECORD
A description of the policies and procedures that Wasatch Advisors uses to vote proxies related to the Funds’ portfolio securities is set forth in the Funds’ Statement of Additional Information which is available without charge, upon request, on the Funds’ website at www.WasatchFunds.com or by calling 800.551.1700 and on the Securities and Exchange Commission’s (SEC) website at www.sec.gov.
Wasatch Funds’ proxy voting record is available without charge on the Funds’ website at www.WasatchFunds.com and the SEC’s website at www.sec.gov no later than August 31 for the prior 12 months ending June 30.
QUARTERLY PORTFOLIO HOLDINGS DISCLOSUREON FORM N-Q
The Funds file their complete schedules of investments with the SEC for their first and third quarters of each fiscal year on Form N-Q. The Funds’ Form N-Q filings are available on the SEC’s website at www.sec.gov, and may be viewed at the SEC’s Public Reference Room in Washington, D.C. (information on the operation of the Public Reference room may be obtained by calling 800.SEC.0330).
146
| | |
| WASATCH FUNDS — Service Providers | | SEPTEMBER 30, 2015 (UNAUDITED) |
|
|
|
INVESTMENT ADVISOR
Wasatch Advisors, Inc.
505 Wakara Way, 3rd Floor
Salt Lake City, UT 84108
SUB-ADVISORFORTHE WASATCH-1ST SOURCE INCOME FUND
1st Source Corporation Investment Advisors, Inc.
100 North Michigan Street
South Bend, IN 46601
SUB-ADVISORFORTHE U.S. TREASURY FUND
Hoisington Investment Management Co.
6836 Bee Caves Road
Building 2, Suite 100
Austin, TX 78746
ADMINISTRATORAND FUND ACCOUNTANT
State Street Bank and Trust Company
801 Pennsylvania Avenue
Kansas City, MO 64105
DISTRIBUTOR
ALPS Distributors, Inc.
1290 Broadway, Suite 1100
Denver, CO 80203
TRANSFER AGENT
UMB Fund Services, Inc.
235 West Galena Street
Milwaukee, WI 53212
CUSTODIAN
State Street Bank and Trust Company
801 Pennsylvania Avenue
Kansas City, MO 64105
LEGAL COUNSELTO WASATCH FUNDSANDINDEPENDENT TRUSTEES
Chapman and Cutler, LLP
111 West Monroe Street
Chicago, IL 60603
INDEPENDENT REGISTERED PUBLIC ACCOUNTING FIRM
PricewaterhouseCoopers LLP
1100 Walnut Street, Suite 1300
Kansas City, MO 64106
TELEPHONE
800.551.1700
M - F, 7:00 a.m. to 7:00 p.m. CT
Automated Line, 24 Hours
U.S. MAIL
Wasatch Funds
P.O. Box 2172
Milwaukee, WI 53201-2172
OVERNIGHT DELIVERY
Wasatch Funds
235 West Galena Street
Milwaukee, WI 53212
ONLINE
www.WasatchFunds.com
shareholderservice@wasatchfunds.com
147
Wasatch Funds 2015 Annual Report www.WasatchFunds.com 800.551.1700 MIX Paper from responsible sources FSC C101537
Item 2: Code of Ethics.
| (a) | Wasatch Funds Trust (the “Registrant”) has adopted a Code of Ethics that applies to the Registrant’s principal executive officer and principal financial officer. |
| (b) | No disclosures are required by this Item 2(b). |
| (c) | There have been no amendments to the Registrant’s Code of Ethics during the reporting period for this form N-CSR. |
| (d) | There have been no waivers granted by the Registrant to individuals covered by the Registrant’s Code of Ethics during the reporting period for this Form N-CSR. |
| (f) | A copy of the Registrant’s Code of Ethics is attached as an exhibit to this Form N-CSR. |
Item 3: Audit Committee Financial Expert.
| (a) | | (1) | The Board of Trustees of the Registrant has determined that the Registrant has at least one member serving on the Registrant’s Audit Committee that possesses the attributes identified in Instruction 2(b) of Item 3 to Form N-CSR to qualify as “audit committee financial expert.” |
| | (2) | The name of the audit committee financial expert is Miriam M. Allison. Ms. Allison is deemed to be “independent” as that term is defined in Item 3(a)(2) of Form N-CSR. |
Item 4. Principal Accountant Fees and Services.
| (a) | Audit Fees - The aggregate fees billed for professional services rendered by the independent registered public accounting firm for the audit of the Registrant’s annual financial statements or services normally provided in connection with statutory and regulatory filings or engagements for the last two fiscal years ended September 30, 2015 and 2014 were $426,189 and $484,862, respectively. |
| (b) | Audit Related Fees – During the fiscal years ended September 30, 2015 and 2014, the Registrant was not billed any fees by the independent registered public accounting firm for assurance and related services rendered by the independent registered public accounting firm to the Registrant that are reasonably related to the performance of the audit of the Registrant’s financial statements and are not reported under paragraph (a) of this Item 4. |
During the fiscal years ended September 30, 2015 and 2014, no fees for assurance and related services that relate directly to the operations and financial reporting of the Registrant were billed by the independent registered public accounting firm to the Registrant’s investment adviser (the “Advisor”) or any other entity controlling, controlled by, or under common control with the Advisor that provides ongoing services to the Registrant.
| (c) | Tax Fees - The aggregate fees billed for professional services rendered by the independent registered public accounting firm to the Registrant for tax compliance, tax advice, tax planning and tax return preparation for the last two fiscal years ended September 30, 2015 and 2014 were $105,965 and $106,750, respectively. These services consisted of the independent registered public accounting firm reviewing the Registrant’s excise tax returns, distribution requirements and RIC tax returns, as well as consultations regarding the liquidation of a series of the Trust. |
During the fiscal years ended September 30, 2015 and 2014, no fees for tax compliance, tax advice or tax planning services that relate directly to the operations and financial reporting of the Registrant were billed by the independent registered public accounting firm to the Advisor or any other entity controlling, controlled by, or under common control with the Advisor that provides ongoing services to the Registrant.
| (d) | All Other Fees – The aggregate fees billed for products and services provided by the independent registered public accounting firm to the Registrant, other than the services reported in paragraph (a) – (c) of this Item 4, for the fiscal years ended September 30, 2015 and 2014 were $0 and $1,772, respectively. |
During the fiscal years ended September 30, 2015 and 2014, no fees for other services that relate directly to the operations and financial reporting of the Registrant were billed by the independent registered public accounting firm to the Advisor or any other entity controlling, controlled by, or under common control with the Advisor that provides ongoing services to the Registrant.
| (e) | Pre-Approval Policies and Procedures |
(1) Pursuant to the registrant’s Audit Committee Charter, the Audit Committee shall evaluate the independence of the independent public accountants, including evaluating whether the independent public accountants provide audit services or consulting services to the Registrant or consulting services to the Advisor, and to receive the specific representations of the independent registered public accounting firm as to their independence. Specifically, the Audit Committee will be responsible for evaluating the provision of non-audit services to the Registrant as required by Section 201 of the Sarbanes-Oxley Act, any pre-approval requests submitted by the independent registered public accounting firm as required by Section 202 of the Sarbanes-Oxley Act or as otherwise required under Section 2-01 of Regulation S-X, and shall monitor the conflict of interest requirements in Section 206 of the Sarbanes-Oxley Act, and the prohibitions on improper influence on the conduct of audits in Section 303 of the Sarbanes-Oxley Act. The Audit Committee shall pre-approve any engagement of the independent registered public accounting firm to provide any services (other than prohibited non-audit services) including the fees and other compensation to be paid to the independent registered public accounting firm.
The independent registered public accounting firm is authorized by the Audit Committee to provide non-audit services to the extent allowable under the Sarbanes-Oxley Act of 2002 for the Registrant provided that (i) the fees payable with respect to such services do not exceed $5,000 in any calendar quarter and (ii) such fees are ratified by the Audit Committee at its next meeting. The fees payable with respect to non-audit services may be increased by the affirmative vote of a majority of the members of the Audit Committee.
(2) There were no pre-approval requirements waived for the services provided to the Registrant described in paragraphs (b)-(d) of Item 4 by the Audit Committee pursuant to paragraph (c)(7)(i)(C) of Rule 2-01 of Regulation S-X (the “De Minimis Rule”). There were no fees billed for services provided to the Advisor described in paragraphs (b)-(d) of Item 4 that were required to be pre-approved by the Audit Committee as described in paragraph (e)(1) of Item 4.
| (f) | No disclosures are required by this Item 4(f). |
| (g) | For the fiscal years ended September 30, 2015 and 2014, the aggregate non-audit fees billed by the independent registered public accounting firm for services rendered to the Registrant and the Advisor and any entity controlling, controlled by, or under common control with the Advisor that provided ongoing services to the Registrant were approximately $0 and $1,772, respectively. |
| (h) | No disclosures are required by this Item 4(h). |
Item 5. Audit Committee of Listed Registrants.
Not applicable.
Item 6. Schedule of Investments.
| (a) | Schedule of Investments is included as a part of the report to shareholders filed under Item 1 of this Form N-CSR. |
Item 7. Disclosure of Proxy Voting Policies and Procedures for Closed-End Management Investment Companies.
Not applicable.
Item 8. Portfolio Managers of Closed-End Investment Companies.
Not applicable.
Item 9. Purchases of Equity Securities by Closed-End Management Investment Company and Affiliated Purchasers.
Not applicable.
Item 10. Submission of Matters to a Vote of Security Holders.
There have been no material changes to the procedures by which shareholders may recommend nominees to the Registrant’s board of trustees, where those changes were implemented after the Registrant last provided disclosure in response to this item.
Item 11. Controls and Procedures.
| (a) | The Registrant’s principal executive and principal financial officers have concluded that the Registrant’s disclosure controls and procedures (as defined in Rule 30a-3(c) under the Investment Company Act of 1940, as amended (the “1940 Act”)) are effective, as of a date within 90 days of the filing date of this Form N-CSR based on their evaluation of these controls and procedures required by Rule 30a-3(b) under the 1940 Act) and Rules 13a-15(b) or 15d-15(b) under the Securities Exchange Act of 1934). |
| (b) | There were no changes in the Registrant’s internal control over financial reporting (as defined in Rule 30a-3(d) under the 1940 Act) that occurred during the Registrant’s second fiscal quarter of the period covered by this report that has materially affected, or is reasonably likely to materially affect, the Registrant’s internal control over financial reporting. |
Item 12. Exhibits.
| (a)(1) | Code of Ethics is attached hereto. |
| (a)(2) | The certifications required by Rule 30a-2(a) of the 1940 Act are attached hereto. |
| (b) | The certifications required by Rule 30a-2(b) of the 1940 Act and Section 906 of the Sarbanes-Oxley Act of 2002 are attached hereto. |
SIGNATURES
Pursuant to the requirements of the Securities Exchange Act of 1934 and the Investment Company Act of 1940, the Registrant has duly caused this report to be signed on its behalf by the undersigned, thereunto duly authorized.
WASATCH FUNDS TRUST
| | |
| By: | | /s/ Samuel S. Stewart, Jr. |
| | Samuel S. Stewart, Jr. |
| | President (principal executive officer) of Wasatch Funds Trust |
| |
| Date: | | December 3, 2015 |
Pursuant to the requirements of the Securities Exchange Act of 1934 and the Investment Company Act of 1940, this report has been signed below by the following persons on behalf of the Registrant and in the capacities and on the dates indicated.
| | |
| By: | | /s/ Samuel S. Stewart, Jr. |
| | Samuel S. Stewart, Jr. |
| | President (principal executive officer) of Wasatch Funds Trust |
| |
| Date: | | December 3, 2015 |
| |
| By: | | /s/ Cindy B. Firestone |
| | Cindy B. Firestone |
| | Treasurer (principal financial officer) of Wasatch Funds Trust |
| |
| Date: | | December 3, 2015 |