UNITED STATES
SECURITIES AND EXCHANGE COMMISSION
Washington, D.C. 20549
FORM N-CSR
CERTIFIED SHAREHOLDER REPORT OF REGISTERED
MANAGEMENT INVESTMENT COMPANIES
Investment Company Act file number: 811-04920
WASATCH FUNDS TRUST
(Exact name of registrant as specified in charter)
150 Social Hall Avenue
4th Floor
Salt Lake City, Utah 84111
(Address of principal executive offices)(Zip code)
| | |
(Name and Address of Agent for Service) | | Copy to: |
Samuel S. Stewart, Jr. Wasatch Funds Trust 150 Social Hall Avenue, 4th Floor Salt Lake City, Utah 84111 | | Eric F. Fess, Esq. Chapman & Cutler LLP 111 West Monroe Street Chicago, IL 60603 |
Registrant’s telephone number, including area code: (801) 533-0777
Date of fiscal year end: September 30
Date of reporting period: September 30, 2012
Item 1: Report to Shareholders.
Annual Report
September 30, 2012
Equity Funds
Wasatch Core Growth Fund Wasatch Emerging India Fund
Wasatch Emerging Markets Small Cap Fund Wasatch Frontier Emerging Small Countries Fund Wasatch Global Opportunities Fund Wasatch Heritage Growth Fund Wasatch International Growth Fund Wasatch International Opportunities Fund Wasatch Large Cap Value Fund Wasatch Long/Short Fund Wasatch Micro Cap Fund Wasatch Micro Cap Value Fund Wasatch Small Cap Growth Fund Wasatch Small Cap Value Fund Wasatch Strategic Income Fund Wasatch Ultra Growth Fund Wasatch World Innovators Fund
Bond Funds
Wasatch-1st Source Income Fund Wasatch-Hoisington U.S. Treasury Fund
Wasatch funds
Wasatch Funds
Salt Lake City, Utah
www.wasatchfunds.com
800.551.1700
This material must be accompanied or preceded by a prospectus.
Please read the prospectus carefully before you invest.
Wasatch Funds are distributed by ALPS Distributors, Inc.
1
| | |
| LETTERTO SHAREHOLDERS —“NERVOUSLY BULLISH — Why Have I Raised The Caution Flag Even Higher?” | | |
|
|
|
| | |

Samuel S. Stewart, Jr. PhD, CFA President of
Wasatch Funds | | DEAR FELLOW SHAREHOLDERS: Regular readers of my commentaries know that my outlook has evolved over the past few years.
I was bullish regarding the investment potential for stocks shortly after the 2009 market lows when overall stock valuations were compelling and investors were fearful. As the market has rallied since 2009, my optimism has waned. I’ve gone from bullish to cautiously bullish to nervously bullish. So why have I raised the caution flag even higher from previous commentaries? There are three main reasons: (1) most stocks have become more expensive; (2) the current actions of the U.S. Federal Reserve (Fed) aren’t likely to improve economic conditions in the short term and pose an inflationary threat in the long term; and (3) I’m disappointed by our politicians’ continued refusal to work together to deal with our most critical challenges. While I’m less bullish on the overall stock market, I still believe it’s a stock picker’s environment where we can continue to uncover some of the “World’s Best Growth Companies” that have the potential to outperform the overall economy. At Wasatch, we always look for healthy, innovative and well-managed companies that are growing much faster than the overall economy—we just have to find them and then buy them at the right price. |
ECONOMY
After the financial crisis in 2008 and early 2009, the Fed started on a path of “quantitative easing” (QE) by buying government securities to support bond prices and lower interest rates in an effort to stimulate the economy. The first massive purchase of securities was known as QE1. Most reasonable institutional investors considered QE1 to be a prudent response to the crisis. Although QE1 helped to bolster asset prices (stocks, bonds and commodities), economic conditions didn’t improve as much as hoped and unemployment remained stubbornly high. The Fed’s second round of quantitative easing (QE2) and so-called “Operation Twist”—the simultaneous sale of short-term Treasuries and purchase of long-term Treasuries in an effort to lower long-term rates—was met with increasing skepticism among institutional investors. But there was still some sympathy for the Fed’s predicament in trying to meet its dual mandate of promoting maximum employment and stable prices, especially with the concerns surrounding the earthquake and nuclear crisis in Japan.
Now we have come to a third round of quantitative easing (QE3) and a commitment from the Fed to keep interest rates at extremely low levels at least through mid-2015. Fed Chairman Ben Bernanke argues that, in the absence of reasonable fiscal policies coming from our politicians, QE3 is the best alternative. I strongly disagree. If I were in Chairman Bernanke’s shoes, I’d issue a statement that the Fed has already done what it can to put the economy on the right track, and that it’s now time for the Executive Branch and Congress to take the lead in tackling the critical fiscal issues of taxes, spending, debt, deficits, infrastructure, education and employment.
I believe the Fed is out of ammunition primarily because low interest rates alone can’t stimulate the economy and bring down unemployment. As I see it, the problems in our economy have more to do with confidence and demand. An entrepreneur recently told me that when he was young and inexperienced he had no trouble getting financing. Now, even though he’s older and has a successful track record, banks are unwilling to lend. In addition to the challenges in obtaining financing, companies are faced with weak demand from customers who are dealing with their own economic problems. Ironically, announcing QE3 may have actually scared some businesspeople more as they could view the Fed’s action as a sign that conditions are getting weaker.
The main beneficiaries of low interest rates have been large companies that are able to refinance their debt, and large banks that pay little or nothing on deposits and earn a modest spread by investing in Treasuries. Stock, bond and commodity prices have also benefited in general, partially due to the perception that the Fed has been targeting asset prices as a way to improve confidence in the economy.
Unfortunately, many people haven’t participated in these asset-price improvements because they’ve mostly stayed out of the markets after the devastation in 2008 and early 2009. There have been stronger flows into intermediate- and longer-term fixed-income investments, however. I just hope that investors understand the price risks in these investments when interest rates eventually rise.
Political gridlock in Washington is about as bad as I’ve ever seen during my career. And we’re fast approaching the “fiscal cliff” in which tax cuts are set to expire and federal spending is scheduled to be reduced. Although taxes and spending need to be dealt with comprehensively over the long term, the automatic tax increases and spending reductions aren’t what the economy needs right now. I’m cautiously optimistic that the ideologues on both sides of the aisle will get their acts together and initiate a compromise because the political fallout of inaction would be enormous. After we get past the fiscal cliff, I believe that two of the most pressing issues we face today are infrastructure and education. If we’re not strong in both of these areas, we won’t be able to effectively compete on a global basis, grow our economy, employ our people, and pay off our debts.
MARKETS
Despite the challenges in the economy, the overall stock market and most of the companies in our portfolios advanced strongly during the 12 months ended September 30, 2012. Including reinvested dividends, the S&P 500 Index was up 30.20% for the 12 months. Anticipation of QE3 probably played a role in this market advance. But in many cases, I believe that company fundamentals also played a role. Indeed, when I speak to the managements of many of the companies we own, I’m impressed by their resilience. I often hear that our companies are doing well by providing cost-effective products and services to their struggling customers. So the recurring theme seems to be efficiency. Companies that help their customers be efficient and save money are typically the ones we find most attractive as investments.
2
This focus on efficiency often leads us to companies that are front and center in the information-related economy. For example, technology tends to be less capital intensive than manufacturing. And if a technology company is successful, its cash flows and profits can be enormous relative to the cost of starting the business. I believe the high level of cash being generated by some companies, particularly tech companies, is responsible for a good portion of the stock buybacks we’re seeing today. Buying back stock may be especially attractive to companies because buybacks tend to be more discretionary than increasing a dividend, which establishes an expectation of a commitment going forward. Look at a company like tech giant Apple. The shares currently trade at just 14 times (forward) estimated earnings, so buying back stock is a good way for Apple to increase shareholder value during periods when the company’s excess cash isn’t needed for continuing operations, new ventures or acquisitions.
WASATCH
Like many of the technology companies in which we often invest, our business at Wasatch Advisors isn’t capital intensive. Our people are our most important assets. That’s why we invest heavily in their education and training, give them the resources they need to succeed, and try to create a stimulating work environment.
A further aspect of getting the most from our people—and therefore offering high value to our investors—is our willingness to expand our research and to carefully launch additional investment products. From the outside, it may be difficult to discern the reasons for our product launches. Sometimes we launch products that fall into broader categories, but with a finer focus. A good example is our Wasatch Emerging Markets Small Cap Fund, which at the point of its inception in 2007 was one of the few no-load emerging markets mutual funds focused on small cap stocks. At other times we launch products that may appear to be very specialized. These products play key roles in supporting Wasatch’s overall “Multiple Eyes® ” deep due diligence—where all company research from around the world is shared internally.
Another important point is that our investment products aren’t training grounds for inexperienced analysts. Our products are launched when we see opportunities in the financial markets to generate attractive returns, and when we have the talent on staff to take advantage of these opportunities. I believe this product launch philosophy helps us retain our investment professionals, enhances their skills, and generates more outstanding investment ideas for the firm as a whole. Clearly, this philosophy benefits our people. But more importantly, I believe it benefits our shareholders who understand our vision and invest with us.
With sincere thanks for your continued investment,

Sam Stewart
Information in this report regarding market or economic trends or the factors influencing historical or future performance reflects the opinions of management as of the date of this report. These statements should not be relied upon for any other purpose. Past performance is no guarantee of future results, and there is no guarantee that the market forecasts discussed will be realized.
Someone who is “bullish” or “a bull” is optimistic with regard to the stock market’s prospects.
World’s Best Growth Companies (WBGCs) are defined by Wasatch as companies that we believe possess an identifiable, sustainable competitive advantage, are well managed, undervalued and are producing above average earnings growth relative to their industry and country of origin.
Quantitative easing is a government monetary policy used to increase the money supply by buying government securities or other securities from the market. Quantitative easing increases the money supply by flooding financial institutions with capital in an effort to promote increased lending and liquidity.
QE2 is the nickname for the second round of quantitative easing announced by Fed chairman Ben Bernanke in November 2010 whereby the Fed would buy billions of dollars in long-term U.S. Treasury securities in an effort to jump start the sluggish economic recovery.
QE3 is the nickname for the third round of quantitative easing launched by the Fed whereby the Fed will purchase $40 billion of mortgage-backed securities on a monthly basis in an effort to support the economic recovery.
The S&P 500 Index includes 500 of the United States’ largest stocks from a broad variety of industries. The Index is unmanaged but is a commonly used measure of common stock total return performance. One cannot invest directly in an index.
As of September 30, 2012, the Wasatch World Innovators Fund had 3.9% of its net assets invested in Apple, Inc.
Fund holdings are subject to change at any time. References to individual companies should not be construed as recommendations to buy or sell shares in those companies.
The investment objective of the Wasatch Emerging Markets Small Cap Fund is long-term growth of capital.
Multiple Eyes® is a Wasatch term used to describe the firm’s collaborative culture and research process.
CFA® is a trademark owned by CFA Institute.
MSCI benchmark data used in this report was provided by MSCI. MSCI makes no express or implied warranties or representations and shall have no liability whatsoever with respect to any MSCI data contained herein. The MSCI data may not be further redistributed or used to create indices or financial products. This report was not approved or produced by MSCI.
3
| | |
| WASATCH CORE GROWTH FUND (WGROX / WIGRX) — Management Discussion | | SEPTEMBER 30, 2012 |
|
|
|
The Wasatch Core Growth Fund is managed by a team of Wasatch portfolio managers led by JB Taylor and Paul Lambert.
| | | | |

JB Taylor Portfolio Manager | | 
Paul Lambert Portfolio Manager | | OVERVIEW During the 12 months ended September 30, 2012, the Wasatch Core Growth Fund—Investor Class gained 26.91% and the Russell 2000 Index rose 31.91%. The strong |
market return for the 12 months is somewhat misleading, considering that it sold off precipitously in the summer of 2011, creating a temporary low “starting point” for the period. If we go back 18 months, the Index has only returned 0.94% on an annualized basis, while the Fund has returned 8.40%. These performance patterns are consistent with the strategy we pursue. The Fund will often keep pace with or slightly lag the Index in strong up markets. But over longer periods (which inevitably include market sell-offs), we hope to outperform.
Given the economy has not improved markedly since the September low of 2011, we believe the strong market has been driven by momentum buying. The Federal Reserve began flooding the market with liquidity in the aftermath of the 2008 financial crisis and has consistently telegraphed a short- and medium-term future of near-zero interest rates. With rates low, investors looking for attractive returns are pushed further out on the risk spectrum. This has benefited equities in general and higher-risk stocks in particular. In the “risk-on” environment, the Fund posted a substantial gain during the year but trailed the benchmark. The steady and consistent growth stocks we own are typically not the stocks that lead the market when risk appetites are elevated.
DETAILSOFTHE YEAR
While the gains in the Fund were broad-based, a number of our consumer discretionary and industrial stocks did especially well. Big winners in these sectors included Hibbett Sports, Inc. and InnerWorkings, Inc. Hibbett operates a chain of athletic apparel and equipment stores. The demand for everyday sporting goods has held up in the slow economy.
At the same time, management has remained disciplined about cutting costs.
InnerWorkings is an outsourced print management company. By leveraging a sophisticated database that tracks printing capacity around the world, it is able to find the most cost-effective solutions for its global customers. InnerWorkings continues to add large multinational clients, and quarterly revenue growth (year-over-year) has averaged more than 25% for the last nine quarters.
Our lack of exposure to biotechnology companies was a sector-related headwind for the Fund. Biotechnology stocks accounted for more than one-quarter of the weight of the Russell 2000’s health care sector and they were up approximately
50%, on average. We generally avoid these companies because they are highly speculative. We also do not own domestic banks, which rallied hard and represent a meaningful portion of the Index’s weight in financials. Moreover, some of the financial stocks we owned performed poorly, including DFC Global Corp., a consumer finance company impacted by regulatory uncertainty in the United Kingdom.
We believe U.S. banks still have weak growth prospects and opaque balance sheets. We have found more attractive banks overseas. For example, we own Yes Bank Ltd. in India and Banco Daycoval in Brazil. Both stocks were up sharply during the third quarter of 2012.
ANSYS, Inc., a global leader in simulation software, was another strong performer in the third quarter. In the second quarter, the company’s exposure to an uncertain environment in Europe and, specifically, the auto sector, hung over the stock. In August, these fears proved to be unfounded when ANSYS reported another record quarter of strong revenue and earnings growth.
Two stocks that lagged in the quarter were Allegiant Travel Co. and Polypore International, Inc. Higher oil prices weighed on Allegiant Travel, a discount airline. While it’s true that higher fuel prices will hurt future earnings potential, we believe any impact will be overpowered over the long run by Allegiant’s strong organic growth.
Polypore makes filtration membranes used in lead-acid car batteries and in the lithium batteries of electric vehicles (EVs). The stock was affected for the quarter and the year by disappointing sales of the Chevy Volt and Nissan Leaf, the first real entrants into the EV market. Despite recent selling pressure, our long-term outlook on Polypore remains positive. The timing may be uncertain, but we believe that EVs will begin to steadily take market share. Furthermore, lithium batteries are increasingly being used in high-growth areas of the consumer electronics market, such as smart phones and tablet computers.
OUTLOOK
Over the remainder of 2012 and into 2013, our portfolio companies are on track to deliver high-teens earnings growth on low-to-mid-teens sales growth. The Fund’s price-to-earnings (P/E) ratio was 22.2 times trailing 12-month earnings on September 30, which appears reasonable relative to our projected earnings growth. A metric we follow is EBIT ROA, which is earnings before interest and taxes divided by total assets (excluding cash and intangibles). This metric is a rough measure of the cash a business can generate in relation to its assets and, for us, a measure of business-model quality. The Fund’s weighted-average EBIT ROA is greater than 30% and more than four times higher than that of the Russell 2000 Index.
We believe a portfolio of companies with what we consider to be industry-best management teams, defensible business models, strong cash flows and above-average revenue and earnings growth will continue to be well positioned for solid absolute and relative returns.
Thank you for the opportunity to manage your assets.
| Current | and future holdings are subject to risk. |
4
| | |
| WASATCH CORE GROWTH FUND (WGROX / WIGRX) — Portfolio Summary | | SEPTEMBER 30, 2012 |
|
|
|
AVERAGE ANNUAL TOTAL RETURNS
| | | | | | | | | | | | |
| | | 1 YEAR | | | 5 YEARS | | | 10 YEARS | |
Core Growth (WGROX) — Investor | | | 26.91% | | | | 3.68% | | | | 9.65% | |
Core Growth (WIGRX) — Institutional | | | 27.00% | | | | 3.69% | | | | 9.66% | |
Russell 2000® Index | | | 31.91% | | | | 2.21% | | | | 10.17% | |
Russell 2000® Growth Index | | | 31.18% | | | | 2.96% | | | | 10.55% | |
Data shows past performance, which is not indicative of future performance. Current performance may be lower or higher than the performance quoted. To obtain the most recent month-end performance data available, please visit www.wasatchfunds.com. The Advisor may absorb certain Fund expenses, without which total return would have been lower. Investment returns and principal value will fluctuate and shares, when redeemed, may be worth more or less than their original cost.
As of the January 31, 2012 Prospectus, the Total Annual Fund Operating Expenses for the Wasatch Core Growth Fund — Investor Class: 1.31% / Institutional Class: 1.23%, Net: 1.21%. The expense ratio shown elsewhere in this report may be different. Expenses include direct expenses paid to the Advisor as well as indirect expenses incurred by the Fund as a result of its investments in other investment companies (each an “Acquired Fund”), before any expense reimbursements by the Advisor. Net expenses are based on Fund expenses, net of waivers and reimbursements. See the prospectus for additional information regarding Fund expenses.
Wasatch Funds will deduct a 2.00% redemption proceeds fee on Fund shares held 60 days or less. Performance data does not reflect the deduction of fees or taxes, which if reflected, would reduce the performance quoted. For more complete information including charges, risks and expenses, read the prospectus carefully.
Performance for the Institutional Class prior to January 31, 2012 is based on the performance of the Investor Class. Performance of the Fund’s Institutional Class prior to January 31, 2012 uses the actual expenses of the Fund’s Investor Class without any adjustments. For any such period of time, the performance of the Fund’s Institutional Class would have been substantially similar to, yet higher than, the performance of the Fund’s Investor Class, because the shares of both classes are invested in the same portfolio of securities, but the classes bear different expenses.
Investing in small cap funds will be more volatile and loss of principal could be greater than investing in large cap or more diversified funds.
TOP 10 EQUITY HOLDINGS*
| | | | |
| Company | | % of Net
Assets | |
| Copart, Inc. | | | 5.3% | |
| Life Time Fitness, Inc. | | | 3.8% | |
| Alliance Data Systems Corp. | | | 3.2% | |
| IDEX Corp. | | | 3.1% | |
| Polypore International, Inc. | | | 3.1% | |
| | | | |
| Company | | % of Net
Assets | |
| MEDNAX, Inc. | | | 3.0% | |
| MSC Industrial Direct Co., Inc., Class A | | | 2.9% | |
| ANSYS, Inc. | | | 2.7% | |
| Waste Connections, Inc. | | | 2.6% | |
| DFC Global Corp. | | | 2.4% | |
| * | As of September 30, 2012, there were 59 holdings in the Fund. Foreign currency contracts, written options and repurchase agreements, if any, are not included in the number of holdings. Portfolio holdings are subject to change at any time. References to specific securities should not be construed as recommendations by the Funds or their Advisor. Current and future holdings are subject to risk. |
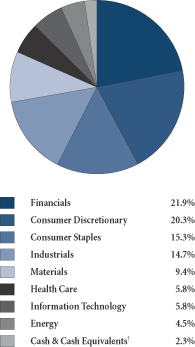
SECTOR BREAKDOWN**
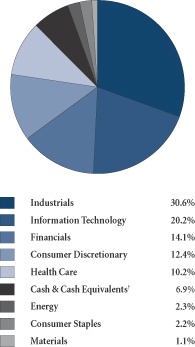
| ** | Excludes securities sold short and options written, if any. |
| † | Also includes Other Assets & Liabilities. |
GROWTHOFA HYPOTHETICAL $10,000 INVESTMENT
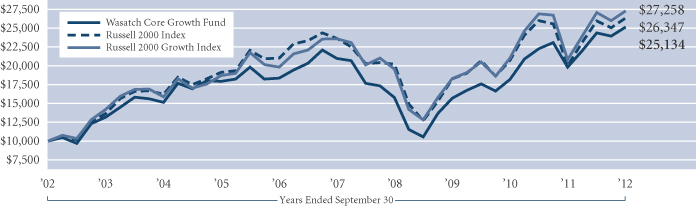
Past performance does not predict future performance and the graph above does not reflect the deduction of taxes you would pay on fund distributions or the redemption of fund shares. Performance shown in the chart above does not include any applicable sales charges and fees. Wasatch does not charge any sales fees. The Russell 2000 Index is an unmanaged total return index of the smallest 2,000 companies in the Russell 3000 Index, as ranked by total market capitalization. The Russell 2000 Index is widely regarded in the industry as accurately capturing the universe of small company stocks. The Russell 2000 Growth Index is an unmanaged total return index that measures the performance of those Russell 2000 Index companies with higher price-to-book ratios and higher forecasted growth values. You cannot invest directly in these or any indices.
5
| | |
| WASATCH EMERGING INDIA FUND (WAINX) — Management Discussion | | SEPTEMBER 30, 2012 |
|
|
|
The Wasatch Emerging India Fund is managed by a team of Wasatch portfolio managers led by Ajay Krishnan and Roger Edgley.
| | | | |

Ajay Krishnan, CFA Portfolio Manager | | 
Roger D. Edgley, CFA Portfolio Manager | | OVERVIEW The Wasatch Emerging India Fund gained 11.42% in the 12 months ended September 30, 2012. The Fund outperformed its benchmark, the MSCI India Investable Market |
Index (IMI), which rose 6.04%.
It was a volatile 12 months for the India market overall. The fourth quarter of last year was weak, but the market soared in the first quarter of 2012 rebounding from the prior year’s decline. The market then declined again in the second quarter followed by a strong third quarter. We are pleased with the Fund’s performance during the year. It slightly outperformed the benchmark in periods of strength, and as we would expect, the Fund outperformed when the market was weak, as our quality-focused style provided some insulation. Again, we do not expect to outperform in every market environment. The Fund’s pattern has been to accumulate alpha on the downside, participate somewhat on strong up days, and outperform over a complete market cycle.
DETAILSOFTHE YEAR
Our stock picking added value in most sectors, but was particularly strong in industrials, information technology, health care and financials. Our weakest performance over the past 12 months came from the utilities sector.
The Fund’s investments in the financials sector are geared to India’s rising consumers. The top contributor for the year, Gruh Finance Ltd., provides home loans to individuals and families. Mahindra & Mahindra Financial Services Ltd., another top contributor, makes vehicle and home loans to retail customers. Other top contributors included: Amara Raja Batteries Ltd., Jubilant Foodworks Ltd., and Godrej Consumer Products Ltd. Amara Raja is a manufacturer of lead acid storage batteries for industrial and automotive applications. Jubilant Foodworks owns the franchise rights for Dunkin Donuts and Domino’s Pizza. India’s rising consumer class drives the company’s growth. It is one of the few publicly listed restaurant companies in the country. Godrej, a consumer products company, also benefits from the rise of the middle class population. This group accounts for some 300 million people, all of whom have more money to spend than before. Businesses that do a good job of catering to growing consumer appetites can experience healthy levels of earnings growth. India is distinct from many other emerging markets in that its own consumers drive fully 65% of its economic activity. Typically, developing market economies
are largely export-driven. We have tried to focus the portfolio on companies that can benefit from domestic Indian demand.
Indraprastha Gas Ltd. (IGL) is one of India’s leading natural gas distributors. The stock was the Fund’s largest detractor from performance for the year. In the June quarter, the government’s newly formed regulatory body overstepped its purview and put a cap on the prices that IGL could charge its customers. This caused the stock to correct over 40% in the quarter. The cap has since been overturned by the courts but the stock has not fully recovered. This regulatory overhang also impacted Gujarat Gas Co. Ltd., a gas distributor in the state of Gujarat, and Petronet LNG Ltd., a liquefied natural gas distributor. While we believe the long-term prospects of these companies are attractive, we have reduced our exposure to salute the lack of visibility and predictability that comes with a regulatory overhang. We generally avoid companies and industries where the threat of government intervention is high. Consequently, we have stayed away from investing in infrastructure-related companies in areas like mining, real estate and power generation.
MakeMyTrip Ltd. was another significant detractor. The company is India’s largest Internet-based travel service provider. Turmoil in the aviation market and appreciation of the rupee, which hurt demand for overseas travel, impacted the stock. We remain optimistic about the prospects for MakeMyTrip since we believe it is a direct beneficiary of the growing travel market in India.
OUTLOOK
In the last couple of months India’s government has moved forward on several key policy initiatives, including allowing foreign direct investment in retail, aviation and broadcasting. The government has also provided clearer guidelines on land acquisition, which will help to move forward several infrastructure-related investments and also make it easier for corporations to proceed with their expansion plans. It also tackled some issues facing India’s power grid by recapitalizing the loans of state electricity boards, the primary distributors of power in the country, and by issuing guidelines on coal block pricing, which will enable investment in new, much needed infrastructure. We believe all of this bodes well for India’s long term economic prospects.
The Fund is broadly positioned across sectors. In terms of immediate outlook, we see a market where sentiment has been weak due to concerns over food inflation, interest rates and growth. This has allowed us to build positions in companies we feel positive about. In some areas of the portfolio we are acquiring names at attractive valuations. Our focus is to continue to invest for the long term. The Indian market is prone to dramatic sentiment shifts and we believe this presents opportunities for disciplined, long-term investors.
Thank you for the opportunity to manage your assets.
| Current | and future holdings are subject to risk. |
6
| | |
| WASATCH EMERGING INDIA FUND (WAINX) — Portfolio Summary | | SEPTEMBER 30, 2012 |
|
|
|
AVERAGE ANNUAL TOTAL RETURNS
| | | | | | | | |
| | | 1 YEAR | | 5 YEARS | | SINCE INCEPTION 4/26/11 | |
Emerging India | | 11.42% | | N/A | | | 1.36% | |
MSCI India IMI | | 6.04% | | N/A | | | -13.49% | |
Data shows past performance, which is not indicative of future performance. Current performance may be lower or higher than the performance quoted. To obtain the most recent month-end performance data available, please visit www.wasatchfunds.com. The Advisor may absorb certain Fund expenses, without which total return would have been lower. Investment returns and principal value will fluctuate and shares, when redeemed, may be worth more or less than their original cost.
As of the January 31, 2012 prospectus, the Total Annual Fund Operating Expenses for the Wasatch Emerging India Fund are 4.85%. The Net Expenses are 1.95%. The expense ratio shown elsewhere in this report may be different. Net Expenses are based on Fund expenses, net of waivers and reimbursements. See the prospectus for additional information regarding Fund expenses.
Wasatch Funds will deduct a 2.00% redemption proceeds fee on Fund shares held 60 days or less. Performance data does not reflect the deduction of fees or taxes, which if reflected, would reduce the performance quoted. For more complete information including charges, risks and expenses, read the prospectus carefully.
Investing in small or micro cap funds will be more volatile and loss of principal could be greater than investing in large cap or more diversified funds. Investing in foreign securities, especially in emerging markets, entails special risks, such as unstable currencies, highly volatile securities markets and political and social instability, which are described in more detail in the prospectus. The Fund is non-diversified, meaning that it can invest a larger portion of its assets in the stocks of a limited number of companies than a diversified fund. Non-diversification increases the risk of loss to the Fund if the values of these securities decline.
TOP 10 EQUITY HOLDINGS*
| | | | |
| Company | | % of Net
Assets | |
| Jubilant Foodworks Ltd. (India) | | | 3.5% | |
| Gruh Finance Ltd. (India) | | | 3.4% | |
| Mahindra & Mahindra Financial Services Ltd. (India) | | | 3.1% | |
| Amara Raja Batteries Ltd. (India) | | | 2.9% | |
| LIC Housing Finance Ltd. (India) | | | 2.8% | |
| | | | |
| Company | | % of Net
Assets | |
Cognizant Technology Solutions Corp., Class A | | | 2.7% | |
| Housing Development Finance Corp. Ltd. (India) | | | 2.6% | |
| Godrej Consumer Products Ltd. (India) | | | 2.6% | |
| WABCO India Ltd. (India) | | | 2.5% | |
| City Union Bank Ltd. (India) | | | 2.5% | |
| * | As of September 30, 2012, there were 60 holdings in the Fund. Foreign currency contracts, written options and repurchase agreements, if any, are not included in the number of holdings. Portfolio holdings are subject to change at any time. References to specific securities should not be construed as recommendations by the Funds or their Advisor. Current and future holdings are subject to risk. |
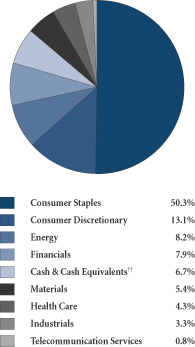
SECTOR BREAKDOWN**
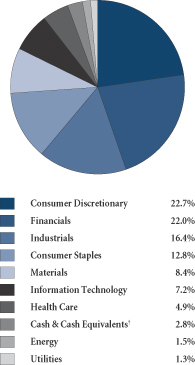
| ** | Excludes securities sold short and options written, if any. |
| † | Also includes Other Assets & Liabilities. |
GROWTHOFA HYPOTHETICAL $10,000 INVESTMENT
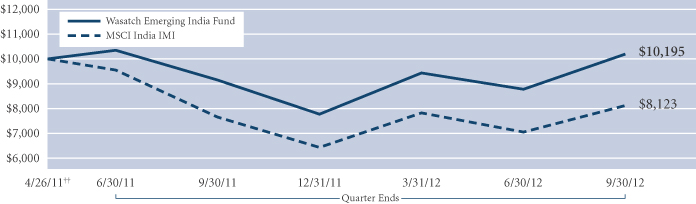
Past performance does not predict future performance and the graph above does not reflect the deduction of taxes you would pay on fund distributions or the redemption of fund shares. Performance shown in the chart above does not include any applicable sales charges and fees. Wasatch does not charge any sales fees. ††Inception: April 26, 2011. The MSCI India Investable Market Index (IMI) covers all investable large, mid and small cap securities across India, targeting approximately 99% of the Indian market’s free-float adjusted market capitalization. You cannot invest directly in this or any index.
7
| | |
| WASATCH EMERGING MARKETS SMALL CAP FUND (WAEMX) — Management Discussion | | SEPTEMBER 30, 2012 |
|
|
|
The Wasatch Emerging Markets Small Cap Fund is managed by a team of Wasatch portfolio managers led by Roger Edgley and Laura Geritz.
| | | | |
Roger D. Edgley, CFA Portfolio Manager | | 
Laura Geritz, CFA Portfolio Manager | | OVERVIEW The Wasatch Emerging Markets Small Cap Fund gained 23.15% in the 12 months ended September 30, 2012. The Fund outperformed the MSCI Emerging Markets Small |
Cap Index, which rose 15.52%.
It was a strong 12 months for emerging markets overall, with some volatility along the way. The fourth quarter of last year was solid, but the year 2011 overall was pretty dismal with the Fund outperforming nicely in this down market. The market soared in the first quarter of 2012 rebounding from the prior year’s steep decline. Emerging markets then retreated in the spring on concerns about Europe’s debt crisis and slowing economic growth around the world. The market resumed its upward trajectory in the final months of the period as central banks stepped in to support the global economy.
We are pleased with the Fund’s performance during the year. The Fund significantly outperformed the benchmark in a strong market overall. However, it also outperformed when the market was weak in the second quarter of 2012, and we believe our quality-focused style helped to mitigate the downside.
We have also been pleased with the Fund’s risk-adjusted returns and feel that we have not been taking on more than market risk to achieve these returns. We continue to manage the Fund in a risk conscious way. One of the things that may not be appreciated about this strategy is the amount of in-built diversification coming from broad exposure across stocks, sectors, countries and currencies.
DETAILSOFTHE YEAR
During the year, our stock picking added value in the majority of countries and was particularly strong in the Philippines and India, where we are overweight, as well as in South Africa, Malaysia and Chile. While our stocks provided positive performance in Taiwan, they were not as strong as those in the Index and we were underweight. Our stocks in China also underperformed those in the Index and provided negative performance.
We are finding many exciting long-run growth stories in India, and the Fund is overweight in Indian stocks relative to the benchmark (almost double). Our stocks were up over 19% while those in the benchmark were down. In the Philippines we are also overweight versus the benchmark, and our stocks were up over 80% for the year while those in the benchmark were up close to 40%.
In China, our weighting is less than half that of the benchmark and our stocks underperformed. Chinese stocks have clearly been in a bear market—whether one considers the domestic Shanghai market or Chinese stocks listed on other exchanges such as the U.S. and Hong Kong for example. The poor sentiment around Chinese stocks is based on some real and justified concerns investors have regarding corporate behavior, and the quality of the economic and political system. We have been underweight in China for the past few years and expect to continue to be underweight—a function reflecting the difficulty of finding companies that meet our quality criteria.
Our best-performing stocks were broadly based in countries and sectors. Mr Price Group, the top contributor, is a South Africa-based fashion retailer, Security Bank Corp. is a Philippines bank, Koza Altin Isletmeleri A.S. is a mineral exploration company based in Istanbul, Turkey and Coastal Energy Co. is an oil and gas exploration company with assets in Thailand and Malaysia.
The same can be said of the Fund’s bottom performers. Indraprastha Gas Ltd. is an Indian natural gas distributor, Highland Gold Mining Ltd. is based in Russia, and Hiwin Technologies Corp. manufactures components primarily in Taiwan. The risks tended to be more stock specific on these companies.
OUTLOOK
The past year has also demonstrated the importance of smaller countries like the Philippines, Thailand and Chile and has emphasized that the Fund’s performance goes beyond the BRIC (Brazil, Russia, India and China) countries. The long-term attraction of emerging markets is about much more than the BRICs. Our outlook for emerging markets in general is positive. We believe we have constructed a high-quality portfolio that has the potential to deliver better-than-market earnings-per-share growth. This gives us confidence that the Fund is positioned for continued strong performance, both in absolute terms and relative to the benchmark. We continue to believe smaller companies will be a key part of positive change across many sectors and countries.
Thank you for the opportunity to manage your assets.
| Current | and future holdings are subject to risk. |
8
| | |
| WASATCH EMERGING MARKETS SMALL CAP FUND (WAEMX) — Portfolio Summary | | SEPTEMBER 30, 2012 |
|
|
|
AVERAGE ANNUAL TOTAL RETURNS
| | | | | | | | | | | | |
| | | 1 YEAR | | | 5 YEARS | | | SINCE INCEPTION 10/1/07 | |
Emerging Markets Small Cap | | | 23.15% | | | | 6.05% | | | | 6.05% | |
MSCI Emerging Markets Small Cap Index | | | 15.52% | | | | -1.04% | | | | -1.04% | |
MSCI Emerging Markets Index | | | 16.93% | | | | -1.28% | | | | -1.28% | |
Data shows past performance, which is not indicative of future performance. Current performance may be lower or higher than the performance quoted. To obtain the most recent month-end performance data available, please visit www.wasatchfunds.com. The Advisor may absorb certain Fund expenses, without which total return would have been lower. Investment returns and principal value will fluctuate and shares, when redeemed, may be worth more or less than their original cost.
As of the January 31, 2012 prospectus, the Total Annual Fund Operating Expenses for the Wasatch Emerging Markets Small Cap Fund are 2.19%. The Net Expenses are 1.95%. The expense ratio shown elsewhere in this report may be different. Net Expenses are based on Fund expenses, net of waivers and reimbursements. See the prospectus for additional information regarding Fund expenses.
Wasatch Funds will deduct a 2.00% redemption proceeds fee on Fund shares held 60 days or less. Performance data does not reflect the deduction of fees or taxes, which if reflected, would reduce the performance quoted. For more complete information including charges, risks and expenses, read the prospectus carefully.
Investing in foreign securities, especially in emerging markets, entails special risks, such as currency fluctuations and political uncertainties, which are described in more detail in the prospectus. Investing in small cap funds will be more volatile and loss of principal could be greater than investing in large cap or more diversified funds.
TOP 10 EQUITY HOLDINGS*
| | | | |
| Company | | % of Net
Assets | |
Security Bank Corp. (Philippines) | | | 1.9% | |
Siam Makro Public Co. Ltd. (Thailand) | | | 1.7% | |
Colgate-Palmolive India Ltd. (India) | | | 1.6% | |
Home Product Center Public Co. Ltd. (Thailand) | | | 1.6% | |
PT Holcim Indonesia Tbk (Indonesia) | | | 1.6% | |
Mahindra & Mahindra Financial Services Ltd. (India) | | | 1.6% | |
| | | | |
| Company | | % of Net
Assets | |
Universal Robina Corp. (Philippines) | | | 1.6% | |
Bata India Ltd. (India) | | | 1.6% | |
Mr Price Group Ltd. (South Africa) | | | 1.6% | |
International Container Terminal Services, Inc. (Philippines) | | | 1.5% | |
| * | As of September 30, 2012, there were 97 holdings in the Fund. Foreign currency contracts, written options and repurchase agreements, if any, are not included in the number of holdings. Portfolio holdings are subject to change at any time. References to specific securities should not be construed as recommendations by the Funds or their Advisor. Current and future holdings are subject to risk. |
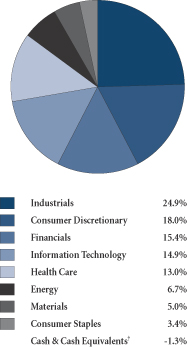
SECTOR BREAKDOWN**
| ** | Excludes securities sold short and options written, if any. |
| † | Also includes Other Assets & Liabilities. |
GROWTHOFA HYPOTHETICAL $10,000 INVESTMENT

Past performance does not predict future performance and the graph above does not reflect the deduction of taxes you would pay on fund distributions or the redemption of fund shares. Performance shown in the chart above does not include any applicable sales charges and fees. Wasatch does not charge any sales fees. ††Inception: October 1, 2007. The MSCI Emerging Markets and Small Cap indices are free float-adjusted market capitalization indices that are designed to measure equity market performance in the global emerging markets. You cannot invest directly in these or any indices.
9
| | |
| WASATCH FRONTIER EMERGING SMALL COUNTRIES FUND (WAFMX) — Management Discussion | | SEPTEMBER 30, 2012 |
|
|
|
The Wasatch Frontier Emerging Small Countries Fund is managed by a team of Wasatch portfolio managers led by Laura Geritz.
| | |
Laura Geritz, CFA Portfolio Manager | | OVERVIEW The Wasatch Frontier Emerging Small Countries Fund gained 20.50% since its inception on January 31, 2012 through September 30, 2012. The Fund outperformed the MSCI Frontier Emerging Markets Index, which rose 9.10% during the same period. The Fund slightly lagged the benchmark during the first quarter of 2012 due to high cash levels in an up market as we carefully invested the Fund’s assets. The Fund made up significant ground |
providing positive performance during the second quarter while the market was down, and significantly outperformed in the strong third quarter.
With the continued risks facing the world’s economy, including muddling growth in the U.S., a struggling Europe, which is now hampering global growth, and an uncertain future for China, we continue to invest in companies that we consider to be high quality with strong cash flow characteristics and balance sheets that have the potential to do relatively well in any economic environment.
Our strategy of investing in frontier and emerging small countries isn’t without risks and we believe individual countries will witness setbacks. This is why country diversification is extremely important as a risk management tool. The Fund’s diversification is not driven by sectors as you would see in more global products. We attempt to protect investors from the risk of having one country go astray through broad country selection. Domestic economic opportunities may be one of the prime reasons frontier emerging small countries also offer low correlation with other markets and may enhance portfolio diversification for investors.
We believe that the investment potential has moved on from large emerging markets such as Korea and Taiwan, and Brazil, Russia, India and China (collectively known as the BRICs), to smaller emerging countries including Peru, Colombia, Egypt, the Philippines, Thailand, Indonesia and the Czech Republic, and to frontier countries such as Kenya, Ghana, Nigeria, Bangladesh, Pakistan, Vietnam and Sri Lanka, to name a few. This isn’t to say that investment returns won’t be strong in the large emerging countries. It is simply to point to a subset of the emerging world that is as yet undiscovered by many investors. A key attribute that makes this set of frontier and emerging small countries interesting for us is the low coverage in the universe of companies we are researching—lose to 20% of the Fund’s holdings have no analyst coverage.
DETAILSOFTHE PERIOD
Our overweight position in Nigeria’s strong-performing market added significantly to outperformance relative to our benchmark since the Fund’s inception. Our average
weighting of over 15% compared to the market’s roughly 5%, with stocks providing performance of over 37% added nicely to performance relative to the benchmark. Our stock picking added value in the majority of countries and was particularly strong in the Philippines, Pakistan, Thailand, Malaysia, Sri Lanka and Indonesia. While our stocks provided positive performance in Colombia, they were not as strong as those in the Index and we were significantly underweight. Our stocks in Brazil (due to Argentinian exposure), Namibia and Morocco also provided negative performance but did not significantly detract from the Fund’s overall performance.
Our top-contributing stocks were heavily weighted in the consumer staples and consumer discretionary sectors and included Cadbury Nigeria plc, Unilever Pakistan Ltd., Arwana Citramulia, an Indonesian producer of ceramic tiles, Unilever Nigeria plc, and Oishi Group Public Co. Ltd., a Japanese restaurant company in Thailand.
The Fund’s bottom performers included Arcos Dorados Holdings, Inc., a McDonald’s franchise in Latin America, Singer Bangladesh Ltd., Brasseries du Maroc, a beverage distributor in Casablanca, Morocco, and Petrominerales Ltd., a Latin American oil and gas exploration and production company. The risks tended to be more stock specific on these companies.
OUTLOOK
In order to unearth these interesting investments, we have ventured to Ghana and Kenya and three times to Nigeria in the last year. The team has also visited Myanmar, Cambodia, Laos, Bangladesh, Sri Lanka, Thailand, Pakistan, Egypt, Morocco, Mexico, Turkey, Brazil, Peru, India, Hong Kong, Germany, London, Taiwan, the Philippines and Singapore. As this report was being written, some team members were en route to Japan and others were visiting companies in South Africa. Clearly, we believe firmly in deep due diligence across the globe in order to populate this Fund with solid investments.
We believe the quality of the companies we have found in these regions of the world is outstanding, and management also has been outstanding. Growth appears to be abundant and valuations lower than what we have seen in emerging markets, especially when we incorporate high dividend yields. In addition, stocks in frontier and emerging small countries appear to be reasonably valued relative to their quality and growth prospects.
Thank you for the opportunity to manage your assets.
| Current | and future holdings are subject to risk. |
10
| | |
| WASATCH FRONTIER EMERGING SMALL COUNTRIES FUND (WAFMX) — Portfolio Summary | | SEPTEMBER 30, 2012 |
|
|
|
AVERAGE ANNUAL TOTAL RETURNS
| | | | | | | | |
| | | 1 YEAR | | 5 YEARS | | SINCE INCEPTION*
1/31/12 | |
Frontier Emerging Small Countries | | N/A | | N/A | | | 20.50% | |
MSCI Frontier Emerging Markets Index | | N/A | | N/A | | | 9.10% | |
MSCI Frontier Markets Index | | N/A | | N/A | | | 5.48% | |
Data shows past performance, which is not indicative of future performance. Current performance may be lower or higher than the performance quoted. To obtain the most recent month-end performance data available, please visit www.wasatchfunds.com. The Advisor may absorb certain Fund expenses, without which total return would have been lower. Investment returns and principal value will fluctuate and shares, when redeemed, may be worth more or less than their original cost.
As of the Fund’s January 31, 2012 inception and prospectus, the estimated Total Annual Fund Operating Expenses for the Wasatch Frontier Emerging Small Countries Fund are 3.65%. The Net Expenses are 2.25%. The expense ratio shown elsewhere in this report may be different. Net Expenses are based on Fund expenses, net of waivers and reimbursements. See the prospectus for additional information regarding Fund expenses.
Wasatch Funds will deduct a 2.00% redemption proceeds fee on Fund shares held 60 days or less. Performance data does not reflect the deduction of fees or taxes, which if reflected, would reduce the performance quoted. For more complete information including charges, risks and expenses, read the prospectus carefully.
Investing in small cap funds will be more volatile and loss of principal could be greater than investing in large cap or more diversified funds. Investing in foreign securities, especially in frontier and emerging markets, entails special risks, such as unstable currencies, highly volatile securities markets and political and social instability, which are described in more detail in the prospectus. Being non-diversified, the Fund can invest a larger portion of its assets in the stocks of a limited number of companies than a diversified fund. Non-diversification increases the risk of loss to the Fund if the values of these securities decline.
TOP 10 EQUITY HOLDINGS**
| | | | |
| Company | | % of Net
Assets | |
| Unilever Nigeria plc (Nigeria) | | | 4.0% | |
| East African Breweries Ltd. (Kenya) | | | 3.4% | |
| Nestlé Nigeria plc (Nigeria) | | | 3.3% | |
| Ceylon Tobacco Co. plc (Sri Lanka) | | | 3.1% | |
| Ecopetrol S.A. (Colombia) | | | 2.9% | |
| | | | |
| Company | | % of Net
Assets | |
| NagaCorp Ltd. (Cambodia) | | | 2.8% | |
| Unilever Pakistan Ltd. (Pakistan) | | | 2.5% | |
| British American Tobacco Kenya Ltd. (Kenya) | | | 2.3% | |
| Nigerian Breweries plc (Nigeria) | | | 2.3% | |
| Lion Brewery Ceylon plc (Sri Lanka) | | | 2.2% | |
| ** | As of September 30, 2012, there were 99 holdings in the Fund. Foreign currency contracts, written options and repurchase agreements, if any, are not included in the number of holdings. Portfolio holdings are subject to change at any time. References to specific securities should not be construed as recommendations by the Funds or their Advisor. Current and future holdings are subject to risk. |
SECTOR BREAKDOWN†
| † | Excludes securities sold short and options written, if any. |
| †† | Also includes Other Assets & Liabilities. |
GROWTHOFA HYPOTHETICAL $10,000 INVESTMENT

Past performance does not predict future performance and the graph above does not reflect the deduction of taxes you would pay on fund distributions or the redemption of fund shares. Performance shown in the chart above does not include any applicable sales charges and fees. Wasatch does not charge any sales fees. ‡Inception: January 31, 2012. The MSCI Frontier Emerging Markets and MSCI Frontier Markets indices are free float-adjusted market capitalization indices designed to measure equity market performance in the global frontier and emerging markets. You cannot invest directly in these or any indices.
11
| | |
| WASATCH GLOBAL OPPORTUNITIES FUND (WAGOX) — Management Discussion | | SEPTEMBER 30, 2012 |
|
|
|
The Wasatch Global Opportunities Fund is managed by a team of Wasatch portfolio managers led by JB Taylor, Ajay Krishnan and Roger Edgley.
| | | | |
JB Taylor Portfolio Manager | |
Ajay Krishnan, CFA Portfolio Manager | |
Roger D. Edgley, CFA Portfolio Manager |
OVERVIEW
The Wasatch Global Opportunities Fund gained 26.69% in the 12 months ended September 30, 2012 and outperformed the MSCI AC World Small Cap Index, which rose 22.04%.
It was a good year for the global small cap market, but not without some volatility. The market soared from October through March, rebounding from a steep decline in the third quarter of 2011. Small caps then retreated in the spring on concerns about Europe’s debt crisis and slowing economic growth around the world. The market resumed its upward trajectory in the final months of the period as central banks stepped in to support the global economy.
We are pleased with the Fund’s performance during the year. The Fund kept pace with the benchmark when the market was strong. More importantly, the Fund outperformed when the market was weak, and we believe our quality-focused style provided some insulation. Experience has shown that the long-run power of compounding is greatly enhanced if losses can be mitigated in down markets.
DETAILSOFTHE YEAR
During the year, our stock picking added value in the majority of countries in which the Fund invested, and was particularly strong in Japan. One of our best-performers was MonotaRO Co. Ltd., an Internet-based distributor of maintenance, repair and operations supplies to Japanese manufacturers. The company’s broad product line makes it a convenient, one-stop shop for purchasing managers who need to order supplies quickly. With monthly sales growth consistently above 20% (year-over-year), we believe MonotaRO is one of the few genuine organic growth stories in Japan.
Ultimate Software Group, Inc. and Life Healthcare Group Holdings Ltd. were also strong performers. Ultimate Software is a U.S. company that provides payroll processing software over the Internet, a delivery model known as “Software-as-a-Service” (SaaS). This has several advantages over traditional, on-premise software, including ease-of-use for customers and a recurring revenue stream for Ultimate. Life Healthcare operates a network of private hospitals in South Africa and is benefiting from positive industry
dynamics. South Africa’s population is aging, the public health care system is underfunded and understaffed, and tax reform is making private health care more affordable.
Immunodiagnostic Systems Holdings plc and Polypore International, Inc. were the Fund’s biggest detractors. United Kingdom-based Immunodiagnostic Systems develops medical diagnostic tests. Competition for its main product, a Vitamin D test, has intensified, and the company has not expanded its product portfolio quickly enough to offset the weakness. Polypore is a U.S. manufacturer of filtration membranes used in lead-acid car batteries and in the lithium batteries of electric vehicles (EVs). The stock was impacted by disappointing sales of the Chevy Volt and Nissan Leaf, the first real entrants in the EV market.
We are finding many exciting long-run growth stories in India, and the Fund is overweight versus the benchmark. While this was a headwind during the year, it was a tailwind in the third quarter of 2012 when India was one of the best-performing small cap markets in the world. Our Indian stocks gained more than 17% during the quarter, and beat the broad Indian small cap market and the Index. One of our biggest winners was Mahindra & Mahindra Financial Services Ltd., a rapidly growing finance company that does most of its lending in rural India.
Two strong performers in the third quarter were Semen Gresik and Indocement Tunggal Prakarsa, cement producers based in Indonesia. Both companies have seen an increase in volumes and have raised prices because the cost of coal, an energy source in cement production, has dropped.
Our domestic health care holdings are concentrated in consistent, stable service providers—companies like IPC The Hospitalist Co., Inc., a physicians’ network, and Covance, Inc., a contract research organization. These stocks lagged in the third-quarter rally when investors gravitated toward more speculative health care stocks in areas like biotechnology and health care technology. We tend to be underinvested here because companies typically lack the dependable earnings streams we find attractive.
OUTLOOK
The Global Opportunities Fund consists of what we believe are the best ideas Wasatch has to offer around the world. In emerging markets, we own stocks that are growing fast yet are still trading at attractive price-to-earnings (P/E) multiples. In developed markets, we have identified numerous companies whose unique characteristics allow them to thrive despite weakness in their domestic economies. Some are market leaders that are taking share from competitors. Others deliver products and services that make their customers more efficient. These companies have the potential for sustainable revenue and earnings growth.
We believe we have constructed a very high-quality portfolio that is trading at a market P/E multiple and we expect it to deliver better-than-market earnings-per-share growth. This gives us confidence that the Fund is positioned for continued strong performance, both in absolute and relative terms.
Thank you for the opportunity to manage your assets.
| Current | and future holdings are subject to risk. |
12
| | |
| WASATCH GLOBAL OPPORTUNITIES FUND (WAGOX) — Portfolio Summary | | SEPTEMBER 30, 2012 |
|
|
|
AVERAGE ANNUAL TOTAL RETURNS
| | | | | | | | | | |
| | | 1 YEAR | | | 5 YEARS | | SINCE INCEPTION 11/17/08 | |
Global Opportunities | | | 26.69% | | | N/A | | | 26.30% | |
MSCI AC World Small Cap Index | | | 22.04% | | | N/A | | | 20.64% | |
S&P Global SmallCap Index | | | 21.73% | | | N/A | | | 19.43% | |
Data shows past performance, which is not indicative of future performance. Current performance may be lower or higher than the performance quoted. To obtain the most recent month-end performance data available, please visit www.wasatchfunds.com. The Advisor may absorb certain Fund expenses, without which total return would have been lower. Investment returns and principal value will fluctuate and shares, when redeemed, may be worth more or less than their original cost.
As of the January 31, 2012 prospectus, the Total Annual Fund Operating Expenses for the Wasatch Global Opportunities Fund are 1.79%. The expense ratio shown elsewhere in this report may be different. See the prospectus for additional information regarding Fund expenses.
Wasatch Funds will deduct a 2.00% redemption proceeds fee on Fund shares held 60 days or less. Performance data does not reflect the deduction of fees or taxes, which if reflected, would reduce the performance quoted. For more complete information including charges, risks and expenses, read the prospectus carefully.
Investing in small and micro cap funds will be more volatile and loss of principal could be greater than investing in large cap or more diversified funds. Investing in foreign securities, especially in emerging markets, entails special risks, such as currency fluctuations and political uncertainties, which are described in more detail in the prospectus. Being non-diversified, the Fund can invest a larger portion of its assets in the securities of a limited number of companies than a diversified fund. Non-diversification increases the risk of loss to the Fund if the values of these securities decline.
TOP 10 EQUITY HOLDINGS*
| | | | |
| Company | | % of Net
Assets | |
| MonotaRO Co. Ltd. (Japan) | | | 2.9% | |
| Wirecard AG (Germany) | | | 2.2% | |
| Elekta AB, Class B (Sweden) | | | 1.9% | |
| Abcam plc (United Kingdom) | | | 1.8% | |
| Rotork plc (United Kingdom) | | | 1.7% | |
Multiplan Empreendimentos Imobiliarios S.A. (Brazil) | | | 1.6% | |
| | | | |
| Company | | % of Net
Assets | |
| Ultimate Software Group, Inc. | | | 1.6% | |
| Copart, Inc. | | | 1.5% | |
Aberdeen Asset Management plc
(United Kingdom) | | | 1.5% | |
| Castrol India Ltd. (India) | | | 1.5% | |
| * | As of September 30, 2012, there were 97 holdings in the Fund. Foreign currency contracts, written options and repurchase agreements, if any, are not included in the number of holdings. Portfolio holdings are subject to change at any time. References to specific securities should not be construed as recommendations by the Funds or their Advisor. Current and future holdings are subject to risk. |
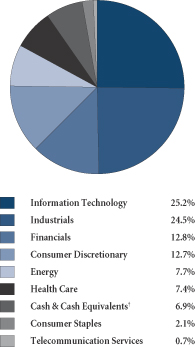
SECTOR BREAKDOWN**
| ** | Excludes securities sold short and options written, if any. |
| † | Also includes Other Assets & Liabilities. |
GROWTHOFA HYPOTHETICAL $10,000 INVESTMENT
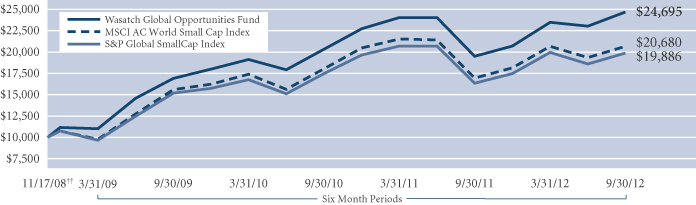
Past performance does not predict future performance and the graph above does not reflect the deduction of taxes you would pay on fund distributions or the redemption of fund shares. Performance shown in the chart above does not include any applicable sales charges and fees. Wasatch does not charge any sales fees. ††Inception: November 17, 2008. The MSCI AC (All Country) World Small Cap Index is an unmanaged index and includes reinvestment of all dividends of issuers located in countries throughout the world representing developed and emerging markets, including securities of U.S. issuers, with market capitalizations between US $200 million and $1.5 billion. The S&P Global SmallCap Index is an unmanaged index and includes reinvestment of all dividends of issuers located across developed and emerging markets, including the United States, that fall in the bottom 15% of their country’s market cap range. You cannot invest directly in these or any indices.
13
| | |
| WASATCH HERITAGE GROWTH FUND (WAHGX) — Management Discussion | | SEPTEMBER 30, 2012 |
|
|
|
The Wasatch Heritage Growth Fund is managed by a team of Wasatch portfolio managers led by Chris Bowen and Ryan Snow.
| | | | |

Chris Bowen Portfolio Manager | | 
Ryan Snow Portfolio Manager | | OVERVIEW The stock market showed continued resilience over the past year with positive performance across each market sector. The Wasatch Heritage Growth Fund gained |
19.76% for the 12-month period ended September 30, 2012, but underperformed its benchmark, the Russell Midcap Growth Index, which added 26.69%.
We continue to see economic pressures on most industries and especially on consumers. Consumer spending continues to be hampered by high unemployment, stagnant real incomes and tight credit markets. These conditions make near-term robust growth for many companies increasingly difficult.
Although we feel that the Fund’s primary attribute is its potential to outperform during weak markets when investors seek the safety of higher quality companies—thus seeking to minimize risk through loss avoidance—we would have expected the Fund to have performed better during the recent strong market environment. Our below benchmark exposure to the consumer discretionary, health care and materials sectors, in particular, hurt performance.
During this time of mixed economic signals, our primary focus continues to be on finding a handful of special businesses that we believe can grow their earnings in spite of the challenging economic backdrop. We believe the companies in which we strive to invest can achieve this because they have unique products or services that offer significant value to customers. They also have strong, disciplined management teams that can guide them through difficult periods and seize opportunities. Strong financial models that won’t leave them susceptible during disruptions in external funding markets also support the type of companies we like to own. We view these as critical drivers of rewarding equity investing, in combination with maintaining a disciplined approach toward equity valuation. We don’t know if the market’s next move will be up or down, but as long as our portfolio companies continue to exhibit the characteristics that caused us to invest in the first place, we are willing to be patient investors.
DETAILSOFTHE YEAR
The Fund’s top contributor for the year was Ross Stores, Inc., a discount apparel and home fashion products retailer with over 1,100 stores, primarily in the southern United States. As would be expected, Ross has performed well during the economic downturn as value-conscious consumers have flocked to its stores. Accordingly, it has been able to demonstrate impressive same stores growth as earnings per
share and margins have also increased. Ross has implemented better inventory controls, allowing it to provide merchandise to the right demographic markets while also preventing cash from being tied up.
Ultra Petroleum Corp., an oil and natural gas exploration and production company, and CARBO Ceramics, Inc. were two of the Fund’s biggest detractors from performance during the year. Falling natural gas prices weighed heavily on their stock prices as new discoveries and warmer-than-normal weather last winter contributed to a natural gas supply glut. Low prices have caused many drillers to shut down production. This was a significant negative for CARBO, which manufactures a specialized proppant used in the hydraulic fracturing of oil and gas wells.
We continue to view both holdings as attractive investments. We believe that the current inexpensive price of natural gas will spur efforts to use it as a replacement for oil in certain applications, which would boost revenue and earnings opportunities for the two companies.
OUTLOOK
In our view, overall company earnings reports don’t seem to support the recent strength of the equity markets. We are concerned that stimulus efforts by many of the world’s central banks have artificially inflated asset prices, somewhat detaching valuations from companies’ underlying fundamental performance. At this time, we believe it is particularly prudent to be disciplined about portfolio valuation. Our ongoing research continues to demonstrate to us that the Fund holds companies with the right mix of growth prospects and appropriate valuation.
The unprecedented amount of fiscal stimulus combined with policymakers’ lack of urgency and desire to address global debt concerns, creates an extremely uncertain environment for investors. We envision that the economic environment will continue to be sluggish for a prolonged period with little cushion to absorb economic shocks. We believe these conditions create a stock picker’s market, meaning that we think company-by-company stock selection will provide the best chance for long-term success.
While actually finding companies in which to invest requires an extraordinary amount of diligence—and many more rejections than actual investments—our approach to keeping companies that we believe are high quality in the Fund is quite simple. We strive to understand the companies we hold and assess their values better than others do. When a company, through either fundamental deterioration or valuation appreciation, no longer meets our minimum expectations, we will most likely sell it.
As we continue to be disciplined in adhering to our investment process for buying and selling stocks, we believe the Fund will have the potential to provide the long-run results we expect.
Thank you for the opportunity to manage your assets.
| | Current and future holdings are subject to risk. |
14
| | |
| WASATCH HERITAGE GROWTH FUND (WAHGX) — Portfolio Summary | | SEPTEMBER 30, 2012 |
|
|
|
AVERAGE ANNUAL TOTAL RETURNS
| | | | | | |
| | | 1 YEAR | | 5 YEARS | | SINCE INCEPTION 6/18/04 |
Heritage Growth | | 19.76% | | 2.91% | | 5.31% |
Russell Midcap® Growth Index | | 26.69% | | 2.54% | | 7.15% |
S&P 500 Index | | 30.20% | | 1.05% | | 5.10% |
Data shows past performance, which is not indicative of future performance. Current performance may be lower or higher than the performance quoted. To obtain the most recent month-end performance data available, please visit www.wasatchfunds.com. The Advisor may absorb certain Fund expenses, without which total return would have been lower. Investment returns and principal value will fluctuate and shares, when redeemed, may be worth more or less than their original cost.
As of the January 31, 2012 prospectus, the Total Annual Fund Operating Expenses for the Wasatch Heritage Growth Fund are 1.04%. The Net Expenses are 0.95%. The expense ratio shown elsewhere in this report may be different. Net Expenses are based on Fund expenses, net of waivers and reimbursements. See the prospectus for additional information regarding Fund expenses.
Wasatch Funds will deduct a 2.00% redemption proceeds fee on Fund shares held 60 days or less. Performance data does not reflect the deduction of fees or taxes, which if reflected, would reduce the performance quoted. For more complete information including charges, risks and expenses, read the prospectus carefully.
Investing in mid cap funds will be more volatile and loss of principal could be greater than investing in large cap funds. Equity investing involves risks including potential loss of the principal amount invested. Investing in foreign securities, especially in emerging markets, entails special risks, such as currency fluctuations and political uncertainties, which are described in more detail in the prospectus.
TOP TEN EQUITY HOLDINGS*
| | | | |
| Company | | % of Net
Assets | |
| Cognizant Technology Solutions Corp., Class A | | | 5.5% | |
| MSC Industrial Direct Co., Inc., Class A | | | 4.7% | |
| IHS, Inc., Class A | | | 4.2% | |
| Amphenol Corp., Class A | | | 3.6% | |
| Copart, Inc. | | | 3.5% | |
| | | | |
| Company | | % of Net
Assets | |
| ANSYS, Inc. | | | 3.0% | |
| Tim Hortons, Inc. (Canada) | | | 2.9% | |
| Ross Stores, Inc. | | | 2.9% | |
| LKQ Corp. | | | 2.9% | |
| Microchip Technology, Inc. | | | 2.8% | |
| * | As of September 30, 2012, there were 45 holdings in the Fund. Foreign currency contracts, written options and repurchase agreements, if any, are not included in the number of holdings. Portfolio holdings are subject to change at any time. References to specific securities should not be construed as recommendations by the Funds or their Advisor. Current and future holdings are subject to risk. |
SECTOR BREAKDOWN**
| ** | Excludes securities sold short and options written, if any. |
| † | Also includes Other Assets & Liabilities. |
GROWTHOFA HYPOTHETICAL $10,000 INVESTMENT
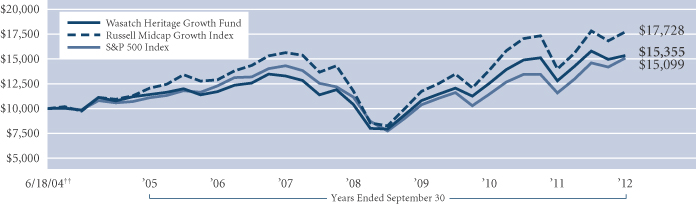
Past performance does not predict future performance and the graph above does not reflect the deduction of taxes you would pay on fund distributions or the redemption of fund shares. Performance shown in the chart above does not include any applicable sales charges and fees. Wasatch does not charge any sales fees. ††Inception: June 18, 2004. The Russell Midcap Growth Index measures the performance of those Russell Midcap Index companies with higher price-to-book ratios and higher forecasted growth values. The stocks in the Russell Midcap Growth Index are also members of the Russell 1000 Growth Index. The S&P 500 Index represents 500 of the United States’ largest stocks from a broad variety of industries. The index is unmanaged, and a common measure of common stock total return performance. You cannot invest directly in these or any indices.
15
| | |
| WASATCH INTERNATIONAL GROWTH FUND (WAIGX) — Management Discussion | | SEPTEMBER 30, 2012 |
|
|
|
The Wasatch International Growth Fund is managed by a team of Wasatch portfolio managers led by Roger Edgley.
| | |
Roger D. Edgley, CFA Portfolio Manager | | OVERVIEW The Wasatch International Growth Fund gained 30.39% in the 12 months ended September 30, 2012. The Fund outperformed the MSCI AC World Ex-U.S.A. Small Cap Index, which rose 13.44%. We are pleased with the Fund’s outperformance during the year, especially on a risk-adjusted basis. We believe our quality-focused style helped to insulate the Fund when the market was weak. |
Experience has shown that the long-run power of compounding is significant if losses can be mitigated in down markets. We should also note that the Fund outperformed during the strong first and third quarters of 2012 when investors were in “risk-on” mode.
DETAILSOFTHE YEAR
During the year, our stock picking added value in the majority of countries in which the Fund was invested, and was particularly strong in Japan. While we were significantly underweight in Japan, our stocks were up approximately 38% while those in the Index were down. Growth can be harder to come by in the developed world. That said, we have identified companies in several markets, including Japan, that have been growing much faster than their domestic economies—companies whose unique characteristics are allowing them to thrive in spite of economic conditions. Some are market leaders that are taking share from competitors. Others deliver products and services that make their customers more efficient. These companies have the potential for sustainable revenue and earnings growth.
Other markets that added significantly to the Fund’s outperformance of the Index included Hong Kong, Turkey, the Philippines, Indonesia and India, all markets where we are overweight and our stocks outperformed. In a handful of markets where we held close to or less than 1% of the total portfolio, our stock picks were weak. These markets included United Arab Emirates, Mexico, Ireland, Bermuda and Colombia, none of which detracted significantly from performance.
One of our best-performing stocks was MonotaRO Co. Ltd., an Internet-based distributor of maintenance, repair and operations (MRO) supplies to Japanese manufacturers and, in our view, one of the few genuine organic growth stocks in Japan. The company’s broad product line makes it a convenient, one-stop shop for busy purchasing managers who need to order supplies quickly. The company has had monthly sales growth consistently above 20% (year-over-year). Other top contributors included Rotork plc, a United Kingdom industrial company, Galaxy Entertainment Group Ltd., a developer and operator of entertainment and resort properties out of Hong Kong, and Gruh Finance Ltd., an Indian finance company.
Immunodiagnostic Systems Holdings plc, a United Kingdom based company that develops and markets medical diagnostic tests for the health care industry, was the Fund’s largest detractor. Competition for its main product, a Vitamin D test, has intensified, and the company has not expanded its product portfolio quickly enough to offset the weakness. Other holdings that detracted from performance included Start Today Co. Ltd., a Japanese e-commerce company, Seven Group Holdings Ltd., an Australian investment group, and Dewan Housing Finance Corp. Ltd., an Indian financial company.
OUTLOOK
The Fund continues to be broadly positioned across countries and sectors, which we believe has helped on the risk side, although the key to providing the long-term results we seek is the effort of our team to identify long duration growth businesses. As always, we will search for attractive opportunities that fit our investment criteria by doing our own company specific due diligence.
We believe we are maintaining a high-quality portfolio with close to a market price-to-earnings (P/E) multiple which we believe has the potential to deliver better-than-market earnings-per-share growth. Despite poor economic sentiment and difficult market conditions, we have a high degree of confidence in the Fund’s positioning.
Thank you for the opportunity to manage your assets.
| | Current and future holdings are subject to risk. |
16
| | |
| WASATCH INTERNATIONAL GROWTH FUND (WAIGX) — Portfolio Summary | | SEPTEMBER 30, 2012 |
|
|
|
AVERAGE ANNUAL TOTAL RETURNS
| | | | | | | | | | | | |
| | | 1 YEAR | | | 5 YEARS | | | 10 YEARS | |
International Growth | | | 30.39% | | �� | | 1.29% | | | | 13.45% | |
MSCI AC World Ex-U.S.A. Small Cap Index | | | 13.44% | | | | -2.19% | | | | 13.15% | |
MSCI World Ex-U.S.A. Small Cap Index | | | 12.82% | | | | -2.62% | | | | 11.55% | |
Data shows past performance, which is not indicative of future performance. Current performance may be lower or higher than the performance quoted. To obtain the most recent month-end performance data available, please visit www.wasatchfunds.com. The Advisor may absorb certain Fund expenses, without which total return would have been lower. Investment returns and principal value will fluctuate and shares, when redeemed, may be worth more or less than their original cost.
As of the January 31, 2012 prospectus, the Total Annual Fund Operating Expenses for the Wasatch International Growth Fund are 1.57%. The expense ratio shown elsewhere in this report may be different. See the prospectus for additional information regarding Fund expenses.
Wasatch Funds will deduct a 2.00% redemption proceeds fee on Fund shares held 60 days or less. Performance data does not reflect the deduction of fees or taxes, which if reflected, would reduce the performance quoted. For more complete information including charges, risks and expenses, read the prospectus carefully.
Investing in foreign securities, especially in emerging markets, entails special risks, such as currency fluctuations and political uncertainties, which are described in more detail in the prospectus. Investing in small cap funds will be more volatile and loss of principal could be greater than investing in large cap or more diversified funds.
TOP 10 EQUITY HOLDINGS*
| | | | |
| Company | | % of Net
Assets | |
| MonotaRO Co. Ltd. (Japan) | | | 3.2% | |
| Elekta AB, Class B (Sweden) | | | 2.9% | |
| Rotork plc (United Kingdom) | | | 2.8% | |
| Wirecard AG (Germany) | | | 2.6% | |
| First Pacific Co. Ltd. (Hong Kong) | | | 2.5% | |
| Abcam plc (United Kingdom) | | | 2.2% | |
| | | | |
| Company | | % of Net
Assets | |
| Oxford Instruments plc. (United Kingdom) | | | 1.9% | |
| Mahindra & Mahindra Financial Services Ltd. (India) | | | 1.9% | |
| Multiplan Empreendimentos Imobiliarios S.A. (Brazil) | | | 1.7% | |
| Security Bank Corp. (Philippines) | | | 1.6% | |
| * | As of September 30, 2012, there were 78 holdings in the Fund. Foreign currency contracts, written options and repurchase agreements, if any, are not included in the number of holdings. Portfolio holdings are subject to change at any time. References to specific securities should not be construed as recommendations by the Funds or their Advisor. Current and future holdings are subject to risk. |
SECTOR BREAKDOWN**
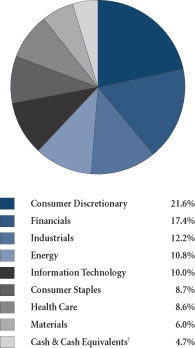
| ** | Excludes securities sold short and options written, if any. |
| † | Also includes Other Assets & Liabilities. |
GROWTHOFA HYPOTHETICAL $10,000 INVESTMENT
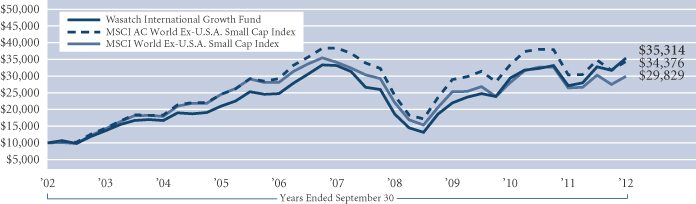
Past performance does not predict future performance and the graph above does not reflect the deduction of taxes you would pay on fund distributions or the redemption of fund shares. Performance shown in the chart above does not include any applicable sales charges and fees. Wasatch does not charge any sales fees. The MSCI AC (All Country) World Ex-U.S.A. Small Cap Index is an unmanaged index and includes reinvestment of all dividends of issuers located in countries throughout the world representing developed and emerging markets, excluding securities of U.S. issuers. This index is a free float-adjusted market capitalization index designed to measure the performance of small capitalization securities. The MSCI World Ex-U.S.A. Small Cap Index is a free float-adjusted market capitalization weighted index designed to measure the equity market performance of developed markets, excluding the United States. You cannot invest directly in these or any indices.
17
| | |
| WASATCH INTERNATIONAL OPPORTUNITIES FUND (WAIOX) — Management Discussion | | SEPTEMBER 30, 2012 |
|
|
|
The Wasatch International Opportunities Fund is managed by a team of Wasatch portfolio managers led by Roger Edgley and Laura Geritz.
| | | | |
Roger D. Edgley, CFA Portfolio Manager | |
Laura Geritz, CFA Portfolio Manager | | OVERVIEW The Wasatch International Opportunities Fund gained 22.33% in the 12 months ended September 30, 2012. The Fund outperformed the MSCI AC World Ex-U.S.A. Small |
Cap Index, which rose 13.44%.
We are pleased with the Fund’s outperformance during the year and believe that our focus on high quality companies helped to mitigate the downside when the market was weak. We are also pleased that the Fund outperformed during the strong first and third quarters of 2012.
DETAILSOFTHE YEAR
During the year, our stock picking added value in the majority of countries in which the Fund was invested, and was particularly strong in Japan. While we were significantly underweight in Japan, our stocks were up over 50% while those in the Index were down. Other markets that added significantly to relative outperformance included Malaysia, Singapore, Indonesia, the Philippines, Turkey and India, all markets where we are overweight and our stocks outperformed. In New Zealand, Russia, Ireland, Poland, Norway and Israel our stocks were down, however, none of these markets detracted significantly from performance.
One of our best-performing stocks was MonotaRO Co. Ltd., an Internet-based distributor of maintenance, repair and operations (MRO) supplies to Japanese manufacturers and, in our view, one of the few genuine organic growth stocks in Japan. The company’s broad product line makes it a convenient, one-stop shop for busy purchasing managers who need to order supplies quickly. The company has monthly sales growth consistently above 20% (year-over-year). Other top performers include Coastal Energy Co., an oil and gas exploration company with assets in Thailand and Malaysia, Webjet Ltd., an e-commerce travel company based in Australia, Amara Raja Batteries Ltd., an Indian industrial company, and CDON Group AB, an e-commerce company based in Sweden.
Immunodiagnostic Systems Holdings plc, a United Kingdom based company that develops and markets medical diagnostic tests for the health care industry, was the Fund’s largest detractor. Competition for its main product, a Vitamin D test, has intensified, and the company has not expanded its product portfolio quickly enough to offset the weakness. Other holdings that detracted from performance include Dewan Housing Finance Corp. Ltd., an Indian financial company, Craneware plc, a business and technological consultant to the health care industry in the United
Kingdom, and Shaft Sinkers Holdings plc, a South African mining and engineering company.
OUTLOOK
We believe our overweight in the consumer staples sector will continue to provide the Fund with defensive characteristics. In addition, the valuations of our portfolio companies still look reasonable provided global growth doesn’t collapse. We feel we are maintaining a high-quality portfolio with close to a market price-to-earnings (P/E) multiple which we believe has the potential to deliver better-than-market earnings-per-share growth. As always, we will search for attractive opportunities that fit our investment criteria by doing our own company specific due diligence as we canvas the globe.
Thank you for the opportunity to manage your assets.
| Current | and future holdings are subject to risk. |
18
| | |
| WASATCH INTERNATIONAL OPPORTUNITIES FUND (WAIOX) — Portfolio Summary | | SEPTEMBER 30, 2012 |
|
|
|
AVERAGE ANNUAL TOTAL RETURNS
| | | | | | | | | | | | |
| | | 1 YEAR | | | 5 YEARS | | | SINCE INCEPTION
1/27/05 | |
International Opportunities | | | 22.33% | | | | -0.51% | | | | 8.61% | |
MSCI AC World Ex-U.S.A. Small Cap Index | | | 13.44% | | | | -2.19% | | | | 6.32% | |
MSCI World Ex-U.S.A. Small Cap Index | | | 12.82% | | | | -2.62% | | | | 4.53% | |
Data shows past performance, which is not indicative of future performance. Current performance may be lower or higher than the performance quoted. To obtain the most recent month-end performance data available, please visit www.wasatchfunds.com. The Advisor may absorb certain Fund expenses, without which total return would have been lower. Investment returns and principal value will fluctuate and shares, when redeemed, may be worth more or less than their original cost.
As of the January 31, 2012 prospectus, the Total Annual Fund Operating Expenses for the Wasatch International Opportunities Fund are 2.55%. The Net Expenses are 2.25%. The expense ratio shown elsewhere in this report may be different. Net Expenses are based on Fund expenses, net of waivers and reimbursements. See the prospectus for additional information regarding Fund expenses.
Wasatch Funds will deduct a 2.00% redemption proceeds fee on Fund shares held 60 days or less. Performance data does not reflect the deduction of fees or taxes, which if reflected, would reduce the performance quoted. For more complete information including charges, risks and expenses, read the prospectus carefully.
Investing in foreign securities, especially in emerging markets, entails special risks, such as currency fluctuations and political uncertainties, which are described in more detail in the prospectus. Investing in small cap funds will be more volatile and loss of principal could be greater than investing in large cap or more diversified funds.
TOP 10 EQUITY HOLDINGS*
| | | | |
| Company | | % of Net
Assets | |
| MonotaRO Co. Ltd. (Japan) | | | 3.0% | |
| Super Group Ltd. (Singapore) | | | 2.6% | |
| Wirecard AG(Germany) | | | 2.2% | |
| Abcam plc (United Kingdom) | | | 2.1% | |
| Webjet Ltd. (Australia) | | | 1.9% | |
| | | | |
| Company | | % of Net
Assets | |
| Toridoll.corp (Japan) | | | 1.9% | |
| PT Mitra Adiperkasa Tbk (Indonesia) | | | 1.8% | |
| KPJ Healthcare Berhad (Malaysia) | | | 1.8% | |
| Cosmos Pharmaceutical Corp. (Japan) | | | 1.8% | |
| Berger Paints India Ltd. (India) | | | 1.8% | |
| * | As of September 30, 2012, there were 86 holdings in the Fund. Foreign currency contracts, written options and repurchase agreements, if any, are not included in the number of holdings. Portfolio holdings are subject to change at any time. References to specific securities should not be construed as recommendations by the Funds or their Advisor. Current and future holdings are subject to risk. |
SECTOR BREAKDOWN**
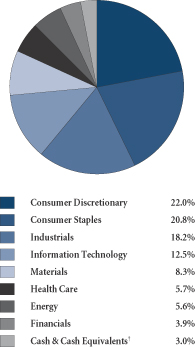
| ** | Excludes securities sold short and options written, if any. |
| † | Also includes Other Assets & Liabilities. |
GROWTHOFA HYPOTHETICAL $10,000 INVESTMENT
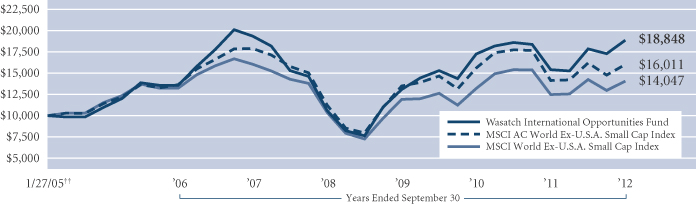
Past performance does not predict future performance and the graph above does not reflect the deduction of taxes you would pay on fund distributions or the redemption of fund shares. Performance shown in the chart above does not include any applicable sales charges and fees. Wasatch does not charge any sales fees. ††Inception: January 27, 2005. The MSCI AC (All Country) World Ex-U.S.A. Small Cap Index is an unmanaged index and includes reinvestment of all dividends of issuers located in countries throughout the world representing developed and emerging markets, excluding securities of U.S. issuers. This index is a free float-adjusted market capitalization index designed to measure the performance of small capitalization securities. The MSCI World Ex-U.S.A. Small Cap Index is a free float-adjusted market capitalization weighted index designed to measure the equity market performance of developed markets, excluding the United States. You cannot invest directly in these or any indices.
19
| | |
| WASATCH LARGE CAP VALUE FUND (FMIEX / WILCX) — Management Discussion | | SEPTEMBER 30, 2012 |
|
|
|
The Wasatch Large Cap Value Fund is managed by a team of Wasatch portfolio managers led by Ralph Shive and Michael Shinnick.
| | | | |

Ralph C. Shive, CFA Portfolio Manager | | 
Michael L. Shinnick Portfolio Manager | | OVERVIEW The Wasatch Large Cap Value Fund—Investor Class returned 22.50% during the 12 months ended September 30, 2012 and lagged the 30.92% return for the Russell 1000 Value Index. |
Throughout the fiscal year, markets bounced in response to headlines concerning the European debt crisis. Clear signs of slowing growth in China overhung investor sentiment, while U.S. economic data fluctuated throughout the year, raising concerns over domestic growth as well. In addition, the political stalemate over U.S. fiscal matters reached crisis stage before being papered over sufficiently to prevent a default on Treasury debt. Nonetheless, stocks powered higher for much of the period, supported in large part by anticipation that the Federal Reserve (Fed) would do whatever was necessary to avoid recession. Given the level of macro uncertainty and with U.S. gross domestic product (GDP) growth at precariously low levels, it was somewhat surprising to see the markets at period end approach levels last seen before the financial crisis.
DETAILSOFTHE YEAR
The Fund’s performance relative to its benchmark for the 12 months was disappointing, due in part to sluggish returns within our industrials stocks. We continue to believe that companies we consider to be high quality, such as farm equipment manufacturer Deere & Co., consumer electronics firm Emerson Electric Co. and defense contractor Raytheon Co. have significant growth potential barring a new recession. The consumer discretionary sector suffered from our overall failure to identify winning consumer trends, and in particular from our exposure to retailer Best Buy, Inc. Seemingly underpriced stocks such as Hewlett-Packard Co. in information technology and Ultra Petroleum Corp. in energy turned out to be “value traps” and also detracted from performance.
On the plus side, a strengthening in housing drove Weyerhaeuser Co. and The Home Depot, Inc. to produce strong returns for the year. In addition, the stock of low-cost retailer Wal-Mart Stores, Inc. escaped its trading range to reach all-time highs. Insurance stocks such as The Allstate Corp. and MetLife, Inc. also broke out of the doldrums to be strong performers. Pharmaceuticals as a group were strong, including our holdings of Merck & Co., Inc. and Pfizer, Inc. Strong individual company execution drove performance for stocks such as oil and gas drillers National Oilwell Varco, Inc. and Ensco plc, as well as for drugstore chain CVS Caremark Corp.
With respect to the most recent quarter, two stocks that hindered returns were Intel Corp. and McKesson Corp. We consider both to be high-quality holdings that came under profit-taking on soft earnings reports. The revenue growth of chipmaker Intel has finally experienced an impact from slowing PC sales, and we believe some investors are worried the company’s high margins may come under pressure going forward. While Intel’s earnings growth may be modest in 2013, we think the stock has a strong long-term outlook with a dividend yield of nearly 4% and a valuation of around 10 times earnings. McKesson is a dominant provider of medical supplies and pharmaceutical products to the health care sector. Last quarter’s earnings came in slightly under expectations and that, combined with the fact that the stock price has rebounded from recession lows, spurred some investors to take gains. While health care regulation may impact the company’s profitability, with aging baby boomers in the pipeline we’re confident in future revenue growth for the company.
Strong performers for the quarter included a pair of tech companies, Symantec Corp. and Computer Sciences Corp. Price strength in both cases was primarily driven by the arrival of a new CEO, and also reflected a bounce back after weak performance. In addition, the stock of information technology firm Harris Corp., which we view as trading at inexpensive levels, continued to strengthen. In the energy space, we had several companies rebound after a tough second quarter. National Oilwell Varco, Ensco and Halliburton Co. all rose from what we viewed as extremely low valuations. The housing theme gathered strength in the quarter and our position in Weyerhaeuser was a major beneficiary. Finally, we saw good performance from Barrick Gold Corp., whose stock rallied along with the prospect of further quantitative easing. In our opinion, the Fed’s continued printing of money is bullish for gold miners.
OUTLOOK
It appears that significantly slower growth is indeed the “new normal” stocks will have to deal with for some time. U.S. companies have done an excellent job of driving efficiencies and expanding earnings as a whole. However, this trend feels a bit tired in the fourth year of the recovery. We suspect that for stocks to have further strong appreciation we will need believable fiscal reform to inspire investor confidence. Whoever wins the presidency will face the same fiscal problems that have been swept under the rug for many years. Our hope is that recommendations to deal with the federal budget deficit similar to those made by the Simpson-Bowles commission* can be quickly adopted by the newly elected Congress.
We continue to look for modestly priced companies that can provide significant cash distributions to shareholders. Thank you for the opportunity to manage your assets.
| * | The National Commission on Fiscal Responsibility and Reform, often called the Simpson-Bowles commission after its co-chairs, was created in 2010 by U.S. President Barack Obama to identify policies to improve the fiscal situation in the medium term and to achieve fiscal sustainability over the long run. |
| | Current and future holdings are subject to risk. |
20
| | |
| WASATCH LARGE CAP VALUE FUND (FMIEX / WILCX) — Portfolio Summary | | SEPTEMBER 30, 2012 |
|
|
|
AVERAGE ANNUAL TOTAL RETURNS
| | | | | | |
| | | 1 YEAR | | 5 YEARS | | 10 YEARS |
Large Cap Value (FMIEX) — Investor | | 22.50% | | -0.07% | | 9.56% |
Large Cap Value (WILCX) — Institutional | | 22.60% | | -0.06% | | 9.57% |
Russell 1000® Value Index | | 30.92% | | -0.90% | | 8.17% |
Data shows past performance, which is not indicative of future performance. Current performance may be lower or higher than the performance quoted. To obtain the most recent month-end performance data available, please visit www.wasatchfunds.com. The Advisor may absorb certain Fund expenses, without which total return would have been lower. Investment returns and principal value will fluctuate and shares, when redeemed, may be worth more or less than their original cost.
As of the January 31, 2012 prospectus, the Total Annual Fund Operating Expenses for the Wasatch Large Cap Value Fund — Investor Class: 1.11%, Net: 1.10% / Institutional Class: 0.98%. The expense ratio shown elsewhere in this report may be different. Net Expenses are based on Fund expenses, net of waivers and reimbursements. See the prospectus for additional information regarding Fund expenses.
Wasatch Funds will deduct a 2.00% redemption proceeds fee on Fund shares held 60 days or less. Performance data does not reflect the deduction of fees or taxes, which if reflected, would reduce the performance quoted. For more complete information including charges, risks and expenses, read the prospectus carefully.
Performance for the Institutional Class prior to January 31, 2012 is based on the performance of the Investor Class. Performance of the Fund’s Institutional Class prior to January 31, 2012 uses the actual expenses of the Fund’s Investor Class without any adjustments. For any such period of time, the performance of the Fund’s Institutional Class would have been substantially similar to, yet higher than, the performance of the Fund’s Investor Class, because the shares of both classes are invested in the same portfolio of securities, but the classes bear different expenses.
Investments in value stocks can perform differently from the market as a whole and other types of stocks and can continue to be undervalued by the market for long periods of time. Loss of principal is a risk of investing.
TOP 10 EQUITY HOLDINGS*
| | | | |
| Company | | % of Net
Assets | |
| JPMorgan Chase & Co. | | | 2.5% | |
| Marathon Oil Corp. | | | 2.2% | |
| Intel Corp. | | | 2.0% | |
| Travelers Cos., Inc. (The) | | | 2.0% | |
| Wal-Mart Stores, Inc. | | | 2.0% | |
| | | | |
| Company | | % of Net
Assets | |
| Medtronic, Inc. | | | 1.9% | |
| Merck & Co., Inc. | | | 1.9% | |
| Microsoft Corp. | | | 1.9% | |
| Harris Corp. | | | 1.9% | |
| PNC Financial Services Group, Inc. | | | 1.8% | |
| * | As of September 30, 2012, there were 69 holdings in the Fund. Foreign currency contracts, written options and repurchase agreements, if any, are not included in the number of holdings. Portfolio holdings are subject to change at any time. References to specific securities should not be construed as recommendations by the Funds or their Advisor. Current and future holdings are subject to risk. |
SECTOR BREAKDOWN**
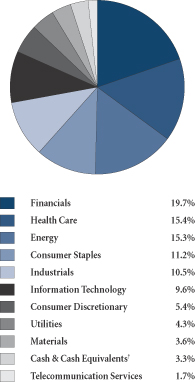
| ** | Excludes securities sold short and options written, if any. |
| † | Also includes Other Assets & Liabilities. |
GROWTHOFA HYPOTHETICAL $10,000 INVESTMENT
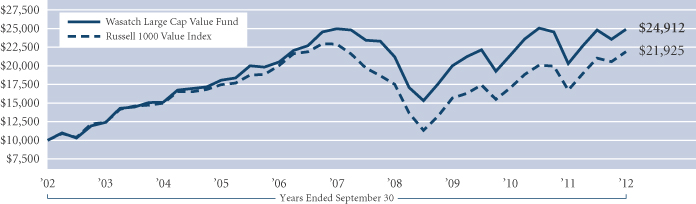
Past performance does not predict future performance and the graph above does not reflect the deduction of taxes you would pay on fund distributions or the redemption of fund shares. Performance shown in the chart above does not include any applicable sales charges and fees. Wasatch does not charge any sales fees. The Russell 1000 Value Index measures the performance of Russell 1000 Index companies with lower price-to-book ratios and lower forecasted growth values. You cannot invest directly in these or any indices.
21
| | |
| WASATCH LONG/SHORT FUND (FMLSX) — Management Discussion | | SEPTEMBER 30, 2012 |
|
|
|
The Wasatch Long/Short Fund is managed by a team of Wasatch portfolio managers led by Michael Shinnick and Ralph Shive.
| | | | |
Michael L. Shinnick Portfolio Manager | |
Ralph C. Shive, CFA Portfolio Manager | | OVERVIEW The Wasatch Long/Short Fund gained 15.27% for the 12 months ended September 30, 2012, while the S&P 500 Index gained 30.20%. As we will discuss further below, the Fund had varying |
levels of net long exposure during the period that were far less than 100%, so the Fund’s comparison to the long-only S&P 500 benchmark should also be evaluated in that context.
Throughout the fiscal year, markets responded in both directions to headlines concerning the European debt crisis. Clear signs of slowing growth in China pressured market sentiment, while U.S. data was mixed, raising concerns about domestic growth. Nonetheless, stocks powered higher for much of the period, supported in large part by anticipation that the Federal Reserve would do whatever was necessary to avoid recession. Given the level of macro uncertainty, and with U.S. gross domestic product (GDP) growth at precariously low levels, it was somewhat surprising at period end to see the markets approach levels last seen before the financial crisis.
DETAILSOFTHE YEAR
In a strong year for stocks, the Fund captured more than half of the market’s upside. The biggest detractors from performance versus the Index were our cash and short positions, both of which hindered the Fund in such a significant up market. Our short positions rose less than the market for the 12-month period. On the long side of the portfolio, health care and financials detracted as the companies we owned lagged their peers. We are generally satisfied with the companies we hold in these sectors based on such important gauges as free cash flow and the value of their underlying assets.
As always, our goal has been to capture upside without having large exposures to companies that have more aggressive valuation characteristics. This held back performance early in the fiscal period, when financials were the strongest group. Our holdings in the sector rose nicely, but not as much as the broader group, which was led by more leveraged companies such as real estate investment trusts. Biotechnology was the strongest industry within health care for the 12 months. We do not have any exposure to this group given typical valuation characteristics.
A top contributor for the 12 months was customer management solutions firm Convergys Corp., as the company’s strategy to sell assets and focus on steady share buy backs was rewarded. Internet content delivery firm Akamai
Technologies, Inc. was another leading contributor. We bought Akamai shares opportunistically last fall on an unmerited decline due to concerns about competition and pricing that were more than offset by steady increases in volume.
In the most recent quarter, the Fund performed more in line with the gain of the S&P 500, while carrying an approximately 70% net long exposure. The sector with the largest positive contribution to relative return was energy. In particular, our allocation to energy services rebounded along with oil prices. Four of the top 10 Fund holdings were energy related and gained more than the strong-performing energy sector. Our positive views on ongoing offshore drilling activity and rates were confirmed as reflected in the performance of Ensco plc and Noble Corp. Patterson-UTI Energy, Inc. and Halliburton Co. benefited as land rig utilization and pricing held up better than expected with activity levels remaining strong in North American liquid basins. Other holdings that contributed positively included technology firm Silicon Graphics International Corp. and fertilizer company, The Mosaic Co. The recovery in Silicon Graphics was a welcome development and we see additional upside in 2013 as the new management team executes on their strategy with a particular focus on cost discipline and better working capital management. Mosaic benefited as expected from the continued demand for fertilizer globally with particular emphasis on North American demand in the current environment of high corn prices.
Health care continued to be a challenging sector for the Fund. We are underweight and the performance of our names lagged in the quarter. Results were mixed on the short side of the portfolio, although as a group the shorts were up less than the market.
OUTLOOK
We have maintained a lower-than-normal short exposure over the past couple of years. This is due to our view that we are in a steady, albeit slow, recovery and that there have been and will be concerted monetary policy efforts to bolster or inflate asset prices. We are prepared to pivot and meaningfully increase short exposure if and when growth turns negative or the likely effect of further monetary policy actions comes to be viewed as limited or even harmful. We share concerns regarding long-term, macro consequences of these central bank actions, particularly as fiscal imbalances persist and in many countries are growing. However, we do not believe it is prudent to simply go short in the face of such strong policy measures. On the long side, we seek companies that we believe are attractively valued through the lens of high free cash flow yields or discounts to book value.
Thank you for the opportunity to invest your assets.
| Current | and future holdings are subject to risk. |
22
| | |
| WASATCH LONG/SHORT FUND (FMLSX) — Portfolio Summary | | SEPTEMBER 30, 2012 |
|
|
|
AVERAGE ANNUAL TOTAL RETURNS
| | | | | | | | | | | | |
| | | 1 YEAR | | | 5 YEARS | | | SINCE INCEPTION
8/1/03 | |
Long/Short | | | 15.27% | | | | 3.91% | | | | 5.92% | |
S&P 500 Index | | | 30.20% | | | | 1.05% | | | | 6.31% | |
Citigroup U.S. Domestic 3-Month Treasury Bills Index | | | 0.05% | | | | 0.64% | | | | 1.77% | |
Data shows past performance, which is not indicative of future performance. Current performance may be lower or higher than the performance quoted. To obtain the most recent month-end performance data available, please visit www.wasatchfunds.com. The Advisor may absorb certain Fund expenses, without which total return would have been lower. Investment returns and principal value will fluctuate and shares, when redeemed, may be worth more or less than their original cost.
As of the January 31, 2012 prospectus, the Total Annual Fund Operating Expenses for the Wasatch Long/Short Fund are 1.63%. The expense ratio shown elsewhere in this report may be different. Expenses include dividend expense on short sales and interest expense. See the prospectus for additional information regarding Fund expenses.
Wasatch Funds will deduct a 2.00% redemption proceeds fee on Fund shares held 60 days or less. Performance data does not reflect the deduction of fees or taxes, which if reflected, would reduce the performance quoted. For more complete information including charges, risks and expenses, read the prospectus carefully.
The Fund makes short sales of securities which involve the risk that losses may exceed the original amount invested. Equity investing involves risks, including potential loss of the principal amount invested. Being non-diversified, the Fund can invest a larger portion of its assets in the securities of a limited number of companies than a diversified fund. Non-diversification increases the risk of loss to the Fund if the values of these securities decline.
TOP 10 EQUITY HOLDINGS*
| | | | |
| Company | | % of Net
Assets | |
| Loews Corp. | | | 3.9% | |
| Mosaic Co. (The) | | | 3.8% | |
| Ensco plc, Class A | | | 3.5% | |
| Patterson-UTI Energy, Inc. | | | 3.2% | |
| Cisco Systems, Inc. | | | 2.5% | |
| | | | |
| Company | | % of Net
Assets | |
| Noble Corp. | | | 2.4% | |
| Denbury Resources, Inc. | | | 2.4% | |
| Convergys Corp. | | | 2.2% | |
| Halliburton Co. | | | 2.2% | |
| CNA Financial Corp. | | | 2.1% | |
| * | As of September 30, 2012, there were 53 long and 14 short holdings in the Fund. Foreign currency contracts, written options and repurchase agreements, if any, are not included in the number of holdings. Portfolio holdings are subject to change at any time. References to specific securities should not be construed as recommendations by the Funds or their Advisor. Current and future holdings are subject to risk. |
SECTOR BREAKDOWN**
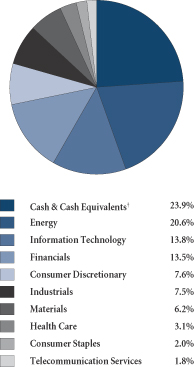
| ** | Excludes securities sold short and options written, if any. |
| † | Also includes Other Assets & Liabilities. |
GROWTHOFA HYPOTHETICAL $10,000 INVESTMENT
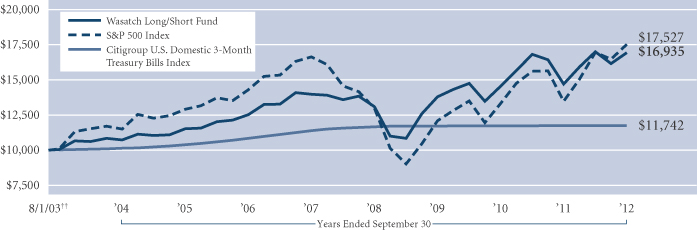
Past performance does not predict future performance and the graph above does not reflect the deduction of taxes you would pay on fund distributions or the redemption of fund shares. Performance shown in the chart above does not include any applicable sales charges and fees. Wasatch does not charge any sales fees. ††Inception: August 1, 2003. The S&P 500 Index includes 500 of the United States’ largest stocks from a broad variety of industries. The Index is unmanaged but is a commonly used measure of common stock total return performance. The Citigroup U.S. Domestic 3-Month Treasury Bills Index tracks the performance of U.S. Treasury bills with a remaining maturity of three months. U.S. Treasury bills, which are short-term loans to the U.S. government, are full-faith-and-credit obligations of the U.S. Treasury and are generally regarded as being free of any risk of default. You cannot invest directly in these or any indices.
23
| | |
| WASATCH MICRO CAP FUND (WMICX) — Management Discussion | | SEPTEMBER 30, 2012 |
|
|
|
The Wasatch Micro Cap Fund is managed by a team of Wasatch portfolio managers led by Daniel Chace.
| | |

Daniel Chace, CFA Portfolio Manager | | OVERVIEW During the 12 months ended September 30, 2012, the Wasatch Micro Cap Fund gained 29.77% and the Russell Microcap Index rose 36.25%. We are pleased that the Fund generated such a strong return, although it was disappointing to lag the benchmark. A few of our stocks had challenges, but our underperformance was also a function of what we didn’t own. As discussed in more detail below, |
there were significant gains in segments of the micro cap market where we are underinvested. These areas include companies that we tend to avoid because they are speculative, lack long-term growth, or often operate with significant leverage or financing requirements.
As investors who emphasize quality and balance sheet strength, we don’t think the types of stocks that led the market this year will make good long-term investments. Our goal is to capture earnings growth of small, dynamic, high-quality companies over long periods of time. However, the Federal Reserve has been flooding the financial system with liquidity, and low interest rates are pushing investors into riskier assets. When liquidity is flowing and risk appetites are high, stocks with less-attractive profiles can post exceptional short-term gains.
DETAILSOFTHE YEAR
Many large companies have cash on hand and are looking for ways to boost growth in the low-growth environment. One avenue they are pursuing is acquisitions, and buyouts added a significant amount to the Fund’s return this year. MEDTOX Scientific, LMA International and Peet’s Coffee & Tea are just a few of our portfolio companies that were acquired. As long-term investors, we buy stocks based on companies’ growth prospects, not because we think they will get taken over. However, buyouts do occur and frequently benefit performance when they do.
In addition to all of the acquisition activity, we had some successful stocks like Hibbett Sports that are larger weights in the Fund. Hibbett is a chain of athletic apparel and equipment stores that had a strong year in terms of same-store sales growth and margin expansion. Looking ahead, we think the company has a lot of headroom for further growth. Hibbett currently has about 840 stores, and management plans to increase the store base to 1,300 over the next few years.
As previously noted, the outsized gains enjoyed by certain segments of the market were a headwind for our relative performance. Many stocks in these areas had sharp bounces off of inexpensive valuations, particularly in the latter stage of the micro cap rally. This dynamic was especially pronounced in biotechnology and banks, two areas where we are underweight relative to the Russell Microcap Index. For
example, biotechnology stocks in the Index gained nearly 70%, and commercial banks were up over 45%. We are not especially active in the biotechnology space because these companies tend to have binary outcomes—they either win big or lose big depending on clinical trial results and FDA* decisions. In addition, their financial profiles are not attractive to us. Within the financials sector, banks were able to post sharp share-price gains despite the tepid environment for loan growth and, in our view, their weak balance sheets.
During the year, there were only a handful of names in the Fund that subtracted a meaningful amount from return. The biggest detractor was DFC Global, a consumer finance company with operations in North America and Europe. The stock was impacted by regulatory uncertainty in the United Kingdom, as well as moderately slowing growth in the U.K. business. We think investors overreacted to these developments, and our long-term outlook on DFC Global remains positive.
Wasatch casts a wide net when looking for interesting companies. Approximately 18% of the market value of the Fund’s investments, excluding short-term investments, is invested in foreign-listed stocks. While these stocks performed in line with our U.S. stocks for the full year, they had a strong third quarter of 2012. The acquisition of LMA International, a Netherlands-based health care company, contributed to this strong result, as did our position in Wirecard. Based in Germany, Wirecard is one of the leading processors of online payment transactions in Europe and is capitalizing on the trend toward e-commerce.
Tangoe, which provides telecommunications expense management solutions, was one of our weakest names during the quarter. The stock fell sharply in August following an analyst report questioning its business model. We met with management and feel comfortable with our investment. While it may take time for the company to recover from the negative publicity, we remain excited about its growth prospects and the stock.
OUTLOOK
Like many investors, we have been surprised by the strength in the stock market this year given all of the uncertainty in the world. Housing has shown some improvement, but most of the economic data has been uninspiring. The presidential election and “fiscal cliff” of spending cuts and tax increases are looming. Overseas, Europe’s debt problems are far from resolved, China’s economy continues to slow and the Middle East remains volatile.
In the short run, the market’s liquidity-fueled strength may continue to be a headwind for our relative performance. However, we believe that our focus on companies with long-term, quality earnings growth makes us well positioned to perform in the micro cap market. Over the longer-term, we are confident that the fundamental strength of our portfolio companies has the potential to be rewarded.
Thank you for the opportunity to manage your assets.
| * | U.S. Food and Drug Administration. |
| | Current and future holdings are subject to risk. |
24
| | |
| WASATCH MICRO CAP FUND (WMICX) — Portfolio Summary | | SEPTEMBER 30, 2012 |
|
|
|
AVERAGE ANNUAL TOTAL RETURNS
| | | | | | | | | | | | |
| | | 1 YEAR | | | 5 YEARS | | | 10 YEARS | |
Micro Cap | | | 29.77% | | | | -0.76% | | | | 9.99% | |
Russell Microcap® Index | | | 36.25% | | | | -0.12% | | | | 9.23% | |
Data shows past performance, which is not indicative of future performance. Current performance may be lower or higher than the performance quoted. To obtain the most recent month-end performance data available, please visit www.wasatchfunds.com. The Advisor may absorb certain Fund expenses, without which total return would have been lower. Investment returns and principal value will fluctuate and shares, when redeemed, may be worth more or less than their original cost.
As of the January 31, 2012 prospectus, the Total Annual Fund Operating Expenses for the Wasatch Micro Cap Fund are 2.16%. The expense ratio shown elsewhere in this report may be different. Expenses include direct expenses paid to the Advisor as well as indirect expenses incurred by the Fund as a result of its investments in other investment companies (each an “Acquired Fund”), before any expense reimbursements by the Advisor. See the prospectus for additional information regarding Fund expenses.
Wasatch Funds will deduct a 2.00% redemption proceeds fee on Fund shares held 60 days or less. Performance data does not reflect the deduction of fees or taxes, which if reflected, would reduce the performance quoted. For more complete information including charges, risks and expenses, read the prospectus carefully.
Investing in micro cap funds will be more volatile and loss of principal could be greater than investing in large cap or more diversified funds. Investing in foreign securities, especially in emerging markets, entails special risks, such as currency fluctuations and political uncertainties, which are described in more detail in the prospectus.
TOP 10 EQUITY HOLDINGS*
| | | | |
| Company | | % of Net
Assets | |
Gordmans Stores, Inc. | | | 2.8% | |
Hibbett Sports, Inc. | | | 2.5% | |
OPNET Technologies, Inc. | | | 2.5% | |
Ultimate Software Group, Inc. | | | 2.3% | |
Power Integrations, Inc. | | | 2.2% | |
| | | | |
| Company | | % of Net
Assets | |
DealerTrack Holdings, Inc. | | | 2.1% | |
DFC Global Corp. | | | 1.9% | |
Interactive Intelligence Group, Inc. | | | 1.9% | |
InnerWorkings, Inc. | | | 1.8% | |
LMA International N.V. (Singapore) | | | 1.8% | |
| * | As of September 30, 2012, there were 93 holdings in the Fund. Foreign currency contracts, written options and repurchase agreements, if any, are not included in the number of holdings. Portfolio holdings are subject to change at any time. References to specific securities should not be construed as recommendations by the Funds or their Advisor. Current and future holdings are subject to risk. |
SECTOR BREAKDOWN**
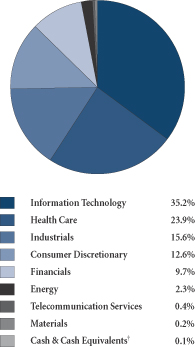
| ** | Excludes securities sold short and options written, if any. |
| † | Also includes Other Assets & Liabilities. |
GROWTHOFA HYPOTHETICAL $10,000 INVESTMENT
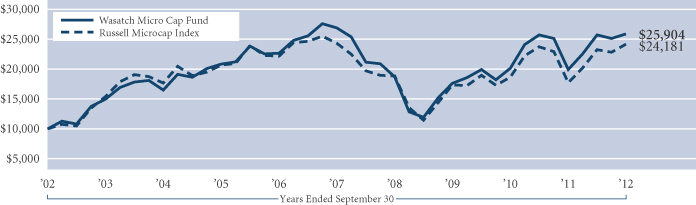
Past performance does not predict future performance and the graph above does not reflect the deduction of taxes you would pay on fund distributions or the redemption of fund shares. Performance shown in the chart above does not include any applicable sales charges and fees. Wasatch does not charge any sales fees. The Russell Microcap Index is an unmanaged total return index of the smallest 1,000 securities in the small-cap Russell 2000 Index along with the next smallest 1,000 companies, based on a ranking of all U.S. equities by market capitalization. No data was available for the Index prior to June 30, 2000. Data for the Index from June 30, 2000 until its official start date of July 1, 2005 was from a paper portfolio. You cannot invest directly in this or any index.
25
| | |
| WASATCH MICRO CAP VALUE FUND (WAMVX) — Management Discussion | | SEPTEMBER 30, 2012 |
|
|
|
The Wasatch Micro Cap Value Fund is managed by a team of Wasatch portfolio managers led by Brian Bythrow.
| | |

Brian Bythrow, CFA Portfolio Manager | | OVERVIEW The 12-month period began with a healthy rally in the U.S. equity markets. During late 2011 and early 2012, investors were willing to overlook the significant challenges facing the U.S. economy and focus instead on modest improvement in consumer confidence and signs of revival in the job market. Then, for much of the late spring and summer, equities dipped as investors renewed their concern about stubbornly |
slow gross domestic product (GDP) growth and Europe’s ongoing debt crisis. After bottoming near the end of July and early August, the markets then began to regain a positive tone, despite little change in the macroeconomic environment. This was sparked in large part by the expectation that the U.S. Federal Reserve (Fed) would address any slowing with some form of stimulus. When that expectation was met in mid-September by a new round of quantitative easing, the markets responded with a resounding rally to end the period.
In this environment, the Wasatch Micro Cap Value Fund returned 27.23% for the 12 months ended September 30, 2012. Although this was a strong absolute return, it lagged that of our benchmark, the Russell Microcap Index, which returned 36.25%. The main factor in our underperformance was our underweighting in small banks, which we’ve generally avoided due to what we see as weak fundamentals. This helped our performance in past periods, as the markets largely shared our view. After years of raising capital and aggressively writing down assets, though, the banks have seen their stocks rebound sharply now that their financial results compare favorably to earlier periods. We believe this is a matter of optics more than a true turnaround—even very small improvements can look good relative to previously dismal results. While we own some carefully selected small banks, at this point we anticipate we’ll continue to be underweight in the industry.
DETAILSOFTHE YEAR
Our strongest contributor to performance for the year was money manager Virtus Investment Partners, Inc. Virtus is gaining market share thanks to the quality of its investment managers and its skill in fund marketing and distribution. Although the stock’s price-to-earnings multiple has expanded considerably, we believe the company is still reasonably valued. Its weighting in the portfolio grew a bit larger than we felt was prudent, so we sold some of our position.
NorthStar Realty Finance Corp., which invests in distressed commercial real estate debt, also made a strong contribution to performance. By buying debt at a discount to its original value, NorthStar has been able to obtain a healthy yield that is particularly attractive to investors in today’s environment where low yields prevail. Even after its recent
strong performance, NorthStar’s valuation is still below book value.
Our greatest detractor from performance for the year was India’s Indraprastha Gas Ltd., which distributes compressed natural gas (CNG) in its home market, where it is widely used as a motor vehicle fuel. The company’s stock was punished after the Indian government imposed price caps on CNG, an issue that is now in the courts. The situation could take years to resolve, and in the meantime it crimps Indraprastha’s potential profits, so we have chosen to exit the stock.
In contrast, we still have confidence in another of our major detractors, DFC Global Corp. This specialty finance company offers short-term loans and secured credit services to credit-challenged consumers. Demand for DFC’s financial products has remained strong, as these borrowers find it difficult to get credit from other sources, allowing the company to post solid financial results. DFC saw its stock punished during the year, apparently due to concerns that its industry may face tighter regulations in the U.S. and the United Kingdom. We believe the company should be able to withstand increased regulatory pressure if it materializes, though, and continue to hold the stock at what we feel is a reasonable valuation.
Among the more intriguing additions to the portfolio during the year was Lithia Motors, Inc., which operates auto dealerships primarily in smaller and more rural markets. Part of the General Motors* bailout plan involved shutting down a number of smaller dealerships, reducing competition for the larger dealerships that remained, like Lithia. Another factor in Lithia’s favor is that many of its dealerships focus on Chrysler products at a time when that automaker is experiencing a renaissance. This holding has not yet had significant impact on the Fund’s performance, but given Lithia’s still-modest valuation we believe it has good potential going forward.
OUTLOOK
The outlook remains mixed. GDP growth can’t seem to gain any traction, yet the Fed’s backstop against economic softness is helping to buoy the equity markets. A number of significant concerns remain on the horizon, including the uncertain outcome of November’s elections and the possibility of reaching the “fiscal cliff”—which combines stiff government spending cuts with a number of tax increases—if Congress does not act before the end of the year.
In this changeable environment, we will continue to focus on investing in companies that we believe can grow regardless of what is or isn’t happening in the economy. While we are prepared for a tepid economic environment, the portfolio’s positioning is not truly defensive. We consider this approach to be reasonable, given the Fed’s demonstrated willingness to act decisively to help keep the U.S. economy afloat.
Thank you for the opportunity to manage your assets.
| * | As of September 30, 2012, the Wasatch Micro Cap Value Fund was not invested in General Motors Co. |
| | Current and future holdings are subject to risk. |
26
| | |
| WASATCH MICRO CAP VALUE FUND (WAMVX) — Portfolio Summary | | SEPTEMBER 30, 2012 |
|
|
|
AVERAGE ANNUAL TOTAL RETURNS
| | | | | | | | | | | | |
| | | 1 YEAR | | | 5 YEARS | | | SINCE INCEPTION
7/28/03 | |
Micro Cap Value | | | 27.23% | | | | 2.26% | | | | 10.58% | |
Russell Microcap® Index | | | 36.25% | | | | -0.12% | | | | 5.89% | |
Data shows past performance, which is not indicative of future performance. Current performance may be lower or higher than the performance quoted. To obtain the most recent month-end performance data available, please visit www.wasatchfunds.com. The Advisor may absorb certain Fund expenses, without which total return would have been lower. Investment returns and principal value will fluctuate and shares, when redeemed, may be worth more or less than their original cost.
As of the January 31, 2012 prospectus, the Total Annual Fund Operating Expenses for the Wasatch Micro Cap Value Fund are 2.37%. The Net Expenses are 2.34%. The expense ratio shown elsewhere in this report may be different. Expenses include direct expenses paid to the Advisor as well as indirect expenses incurred by the Fund as a result of its investments in other investment companies (each an “Acquired Fund”), before any expense reimbursements by the Advisor. Net Expenses are based on Fund expenses, net of waivers and reimbursements. See the prospectus for additional information regarding Fund expenses.
Wasatch Funds will deduct a 2.00% redemption proceeds fee on Fund shares held 60 days or less. Performance data does not reflect the deduction of fees or taxes, which if reflected, would reduce the performance quoted. For more complete information including charges, risks and expenses, read the prospectus carefully.
Investing in micro cap funds will be more volatile and loss of principal could be greater than investing in large cap or more diversified funds. Investing in foreign securities, especially in emerging markets, entails special risks, such as currency fluctuations and political uncertainties, which are described in more detail in the prospectus.
TOP 10 EQUITY HOLDINGS*
| | | | |
| Company | | % of Net
Assets | |
| Virtus Investment Partners, Inc. | | | 2.1% | |
| BofI Holding, Inc. | | | 2.1% | |
| Colony Financial, Inc. | | | 2.0% | |
| First Cash Financial Services, Inc. | | | 2.0% | |
| NorthStar Realty Finance Corp. | | | 1.8% | |
| | | | |
| Company | | % of Net
Assets | |
| Sartorius Stedim Biotech (France) | | | 1.6% | |
| OPNET Technologies, Inc. | | | 1.6% | |
| City Union Bank Ltd. (India) | | | 1.6% | |
| Beacon Roofing Supply, Inc. | | | 1.6% | |
| Encore Capital Group, Inc. | | | 1.5% | |
| * | As of September 30, 2012, there were 101 holdings in the Fund. Foreign currency contracts, written options and repurchase agreements, if any, are not included in the number of holdings. Portfolio holdings are subject to change at any time. References to specific securities should not be construed as recommendations by the Funds or their Advisor. Current and future holdings are subject to risk. |
SECTOR BREAKDOWN**
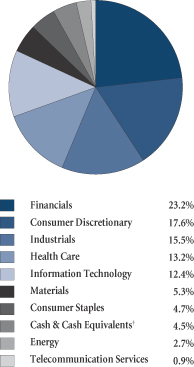
| ** | Excludes securities sold short and options written, if any. |
| † | Also includes Other Assets & Liabilities. |
GROWTHOFA HYPOTHETICAL $10,000 INVESTMENT
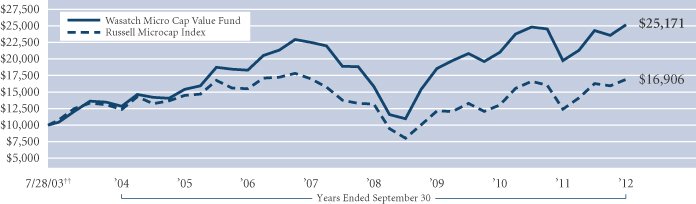
Past performance does not predict future performance and the graph above does not reflect the deduction of taxes you would pay on fund distributions or the redemption of fund shares. Performance shown in the chart above does not include any applicable sales charges and fees. Wasatch does not charge any sales fees. ††Inception: July 28, 2003. The Russell Microcap Index is an unmanaged total return index of the smallest 1,000 securities in the small-cap Russell 2000 Index along with the next smallest 1,000 companies, based on a ranking of all U.S. equities by market capitalization. No data was available for the Index prior to June 30, 2000. Data for the Index from June 30, 2000 until its official start date of July 1, 2005 was from a paper portfolio. You cannot invest directly in this or any index.
27
| | |
| WASATCH SMALL CAP GROWTH FUND (WAAEX) — Management Discussion | | SEPTEMBER 30, 2012 |
|
|
|
The Wasatch Small Cap Growth Fund is managed by a team of Wasatch portfolio managers led by Jeff Cardon.
| | |

Jeff Cardon, CFA Portfolio Manager | | OVERVIEW The Wasatch Small Cap Growth Fund gained 29.41% in the 12 months ended September 30, 2012. The Fund trailed the Russell 2000 Growth Index, which rose 31.18%, and the Russell 2000 Index, which was up 31.91%. It should be noted that this period’s strong absolute returns are more of a reflection of a very weak market late in the summer of 2011, resulting in an easy comparison off that low base. |
Longer time frames are more instructive. The average annual three-year return of the Fund is 16.98%, which compares to 14.19% for the Russell 2000 Growth Index and 12.99% for the Russell 2000 Index. The five-year return is an even better barometer of how the market has performed, since this time frame includes the financial crisis year of 2008. The Fund’s five-year average annual return is 5.26%, while the returns for the Russell 2000 Growth and Russell 2000 indices are 2.96% and 2.21%, respectively.
Through May of this year, the Fund’s performance relative to the indices benefited from the “flight to quality” that began during the financial crisis in the second half of 2008. We have been underperforming somewhat since May of 2012 due to investors’ increased risk appetite in response to very accommodative monetary and fiscal policies in the United States. If we enter a phase where economic growth does speed up, this appetite for risk could last for a period of time. Under this scenario, we would expect to underperform the indices. To be sure, faster economic growth would be good for our country and would most likely be good for the absolute returns of the Fund.
DETAILSOFTHE YEAR
The tough economic conditions of the past five years have made businesses very careful about where they spend their money. This cautiousness is playing into a long-standing theme in the Fund: investing in companies that offer products and services with compelling economic paybacks. Several of these stocks had significant gains during the year, including Ultimate Software, NetSuite and Concur Technologies. All are fast-growing companies that have delivered an attractive return on investment to their customers by offering productivity-enhancing software accessible over the Internet cloud.
Biotechnology stocks tend to outperform in buoyant markets, and this period was no exception. Their strength was a headwind for the Fund, as we find it difficult to invest heavily in this industry due to the inherent riskiness of these companies’ business models. We have been successful over the years investing in companies that provide products and services to the biotech and pharmaceutical industries. One such example is ICON plc, a contract research organization that conducts clinical research studies. ICON was a top contributor in the Fund.
Polypore International was the biggest detractor during the year. Polypore makes filtration membranes used in batteries, including the lithium batteries used in electric vehicles. The stock was impacted by disappointing sales of the Chevy Volt and Nissan Leaf. While the timing is uncertain, we believe meaningful adoption of electric and hybrid cars is inevitable and that this will become an important market for Polypore.
During the third quarter of 2012, one of our best-performing stocks was Peet’s Coffee & Tea, a coffee producer and marketer. The company is being acquired by a German conglomerate. Although the acquisition premium is high, we are disappointed with the sale because we feel Peet’s is a classic Wasatch investment, with solid and stable long-run growth prospects and an outstanding management team.
Wirecard and Yes Bank were also strong performers. Based in Germany, Wirecard is one of the leading processors of online payment transactions in Europe and is capitalizing on growth in Internet commerce. Yes Bank is an Indian bank that is growing at a much faster rate than the U.S. banking industry. Our stock picking in international markets was good in both the quarter and the year.
Small cap trucking stocks were weak in the third quarter. Two laggards in the Fund were Knight Transportation and J.B. Hunt Transport Services. The poor performance of trucking stocks is an anomaly given that the stock market is signaling a stronger economy and the trucking industry is a direct beneficiary of increased economic activity. Demand and pricing in the industry are still soft, a reminder that a stronger economy is being anticipated by the market but not yet a reality to many economically sensitive industries.
OUTLOOK
As previously noted, a risk to our relative performance is acceleration in economic growth, creating an environment in which low-quality companies can thrive. In our view, any benefit from the Federal Reserve’s latest round of quantitative easing will be short lived given the massive amount of debt burdening our economy. Moreover, every dollar of government spending produces negligible economic growth1—a poor return on investment. This deficit spending saddles the economy with future interest payments on the debt, adding one more burden to an unbalanced budget. While economic activity may improve in the near term, we think that long-run real growth will be muted. Companies that are prepared to compete and thrive in such an environment should be the best performers in the market. We remain steadfast in our commitment to investing in quality growth stocks.
Thank you for the opportunity to manage your assets.
| 1 | Robert Barro. Macroeconomics: A Modern Approach (Thomson/Southwestern, 2008, p. 307.) Roberto Perotti of Università Bocconi and the Centre for Capital Economic Policy Research: Estimating the Effects of Fiscal Policy in OECD Countries. Source: Hoisington Investment Management Quarterly Review, June 2009. |
| | Current and future holdings are subject to risk. |
28
| | |
| WASATCH SMALL CAP GROWTH FUND (WAAEX) — Portfolio Summary | | SEPTEMBER 30, 2012 |
|
|
|
AVERAGE ANNUAL TOTAL RETURNS
| | | | | | |
| | | 1 YEAR | | 5 YEARS | | 10 YEARS |
Small Cap Growth | | 29.41% | | 5.26% | | 10.55% |
Russell 2000® Growth Index | | 31.18% | | 2.96% | | 10.55% |
Russell 2000® Index | | 31.91% | | 2.21% | | 10.17% |
Data shows past performance, which is not indicative of future performance. Current performance may be lower or higher than the performance quoted. To obtain the most recent month-end performance data available, please visit www.wasatchfunds.com. The Advisor may absorb certain Fund expenses, without which total return would have been lower. Investment returns and principal value will fluctuate and shares, when redeemed, may be worth more or less than their original cost.
As of the January 31, 2012 prospectus, the Total Annual Fund Operating Expenses for the Wasatch Small Cap Growth Fund are 1.24%. The expense ratio shown elsewhere in this report may be different. Expenses include direct expenses paid to the Advisor as well as indirect expenses incurred by the Fund as a result of its investments in other investment companies (each an “Acquired Fund”), before any expense reimbursements by the Advisor. See the prospectus for additional information regarding Fund expenses.
Wasatch Funds will deduct a 2.00% redemption proceeds fee on Fund shares held 60 days or less. Performance data does not reflect the deduction of fees or taxes, which if reflected, would reduce the performance quoted. For more complete information including charges, risks and expenses, read the prospectus carefully.
Investing in small cap funds will be more volatile and loss of principal could be greater than investing in large cap or more diversified funds. Investing in foreign securities, especially in emerging markets, entails special risks, such as currency fluctuations and political uncertainties, which are described in more detail in the prospectus.
TOP 10 EQUITY HOLDINGS*
| | | | |
| Company | | % of Net
Assets | |
| Ultimate Software Group, Inc. | | | 3.9% | |
| Knight Transportation, Inc. | | | 3.7% | |
| Life Time Fitness, Inc. | | | 2.6% | |
| Hibbett Sports, Inc. | | | 2.4% | |
| Power Integrations, Inc. | | | 2.1% | |
| | | | |
| Company | | % of Net
Assets | |
| MSC Industrial Direct Co., Inc., Class A | | | 2.0% | |
| Wirecard AG (Germany) | | | 2.0% | |
| RealPage, Inc. | | | 1.9% | |
| Yes Bank Ltd. (India) | | | 1.8% | |
| Syntel, Inc. | | | 1.7% | |
| * | As of September 30, 2012, there were 89 holdings in the Fund. Foreign currency contracts, written options and repurchase agreements, if any, are not included in the number of holdings. Portfolio holdings are subject to change at any time. References to specific securities should not be construed as recommendations by the Funds or their Advisor. Current and future holdings are subject to risk. |
SECTOR BREAKDOWN**
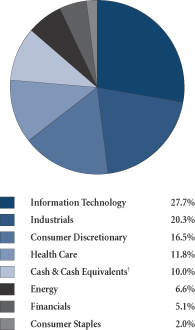
| ** | Excludes securities sold short and options written, if any. |
| † | Also includes Other Assets & Liabilities. |
GROWTHOFA HYPOTHETICAL $10,000 INVESTMENT
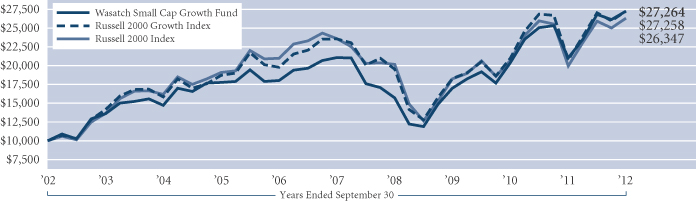
Past performance does not predict future performance and the graph above does not reflect the deduction of taxes you would pay on fund distributions or the redemption of fund shares. Performance shown in the chart above does not include any applicable sales charges and fees. Wasatch does not charge any sales fees. The Russell 2000 Growth Index is an unmanaged total return index that measures the performance of those Russell 2000 Index companies with higher price-to-book ratios and higher forecasted growth values. The Russell 2000 Index is an unmanaged total return index of the smallest 2,000 companies in the Russell 3000 Index, as ranked by total market capitalization. The Russell 2000 Index is widely regarded in the industry as accurately capturing the universe of small company stocks. You cannot invest directly in these or any indices.
29
| | |
| WASATCH SMALL CAP VALUE FUND (WMCVX / WICVX) — Management Discussion | | SEPTEMBER 30, 2012 |
|
|
|
The Wasatch Small Cap Value Fund is managed by a team of Wasatch portfolio managers led by Jim Larkins.
| | |

Jim Larkins, MBA Portfolio Manager | | OVERVIEW Although the past year was characterized by a great deal of uncertainty surrounding the U.S. economic outlook and the debt crisis in Europe, the stock market in general—and small cap value stocks in particular—performed well. The Russell 2000 Value Index gained 32.63% in the 12-month period ended September 30, 2012. The Fund’s Investor Class shares also delivered a strong absolute return, gaining 22.12%. |
DETAILSOFTHE YEAR
The primary cause of the Fund’s performance shortfall relative to the Index was its underweight position in the financials sector. The Fund’s average weighting in financials was well under half of that of the benchmark, a difference that cost us some performance in 2012 after helping in the prior three years. Compared to the Index, our position in financials was more heavily weighted to consumer finance, with a focus on stocks such as DFC Global Corp. At the same time, we were conservative relative to the Index with regard to our weighting in commercial banks in a reflection of our view that banks would struggle to increase loans in the weak economic environment. While loan growth was indeed slow, bank stocks rose significantly during the past year. We also avoided real estate investment trusts (REITs) due to our concerns about their elevated debt, low historical yields and expensive valuations. However, REITs have performed well since the U.S. Federal Reserve’s low interest rate policy has compelled investors to seek yield outside of the bond market. Although we remain on the lookout for investments in the REIT space, we continue to find their valuations unappealing.
The leading contributor to the Fund’s performance was Lumber Liquidators. The stock has performed well since we added it to the portfolio in mid-2011 when the company’s difficulty installing a new computer system temporarily weighed on the stock. The resolution of these problems enabled the stock to recover, and the rally subsequently continued on the strength of improving earnings and the ongoing rebound in the housing market. We see Lumber Liquidators as a prime example of a “Fallen Angel,” our term for a growth stock that has fallen into value territory due to short-term developments. Lumber Liquidators wasn’t the only retail stock to add value for the Fund: Chico’s FAS, Rue21 and Big 5 Sporting Goods all made meaningful contributions during the past year.
Outside of retail, the Fund’s top contributors were Copart, Portfolio Recovery Associates and The Corporate Executive Board.
Our stock selection process was less effective in the information technology sector, where our positions in semiconductor stocks such as BCD Semiconductor Manufacturing weighed on performance. We reduced our
position in this area during the year, as it is becoming clear that the dominance of Apple’s iPad and iPhone are reducing the business opportunities for companies outside of Apple’s “ecosystem.”* The Fund’s performance in health care also lagged that of the benchmark due largely to CorVel and Questcor Pharmaceuticals. However, we offset some of the shortfall via our position in Ensign Group, a well-managed company in the assisted-living space. Our stock picks in energy also hurt performance, as natural gas related stocks such as Ultra Petroleum were pressured by the commodity’s price weakness. We continue to hold Ultra Petroleum believing it is well positioned to take advantage of an eventual rebound in natural gas prices.
Our portfolio activity during the past year reflected our persistent search for Fallen Angels and “Undiscovered Gems,” the phrase we use to describe companies with little or no coverage by Wall Street analysts and whose current valuations do not reflect what we believe is their true worth. During the final three months of the period, in fact, we added more of these types of stocks than at any other time this year. We also continued to add “Orphaned IPOs,” a category that focuses on initial public offerings (IPOs) that came to the market and after the initial hype faded became attractively priced. The past two years saw a strong IPO market, which made an increasing number of good businesses available to value investors as some of these stocks were forgotten or overly punished if they stumbled early in their public life cycle.
OUTLOOK
The 12-month performance of the U.S. stock market sheds some light on the process of small cap value investing. On one hand, the macroeconomic picture has been very challenging, with concerns about the European debt crisis and slowing global growth weighing on the market from time to time. At the same time, however, the U.S. stock market and the Wasatch Small Cap Value Fund have delivered solid returns. We believe this illustrates the importance of staying focused on the fundamentals and valuations of individual companies, rather than joining the “crowd” by trying to guess the next headline out of Europe.
If anything, market volatility is positive for the Fund in that it provides us with opportunities to make additional long-term investments in companies we find attractive. What’s more, the increased number of Initial Public Offerings (IPOs) in the past year has created a much wider opportunity set for small cap value investors like us. As we look to the remainder of 2012 and beyond, we are confident that we have constructed a portfolio of attractively priced investments in companies that have the potential to weather the storms that may be ahead.
Thank you for your continued investment in the Fund.
| * | As of September 30, 2012, the Wasatch Small Cap Value Fund was not invested in Apple, Inc. |
| | Current and future holdings are subject to risk. |
30
| | |
| WASATCH SMALL CAP VALUE FUND (WMCVX / WICVX) — Portfolio Summary | | SEPTEMBER 30, 2012 |
|
|
|
AVERAGE ANNUAL TOTAL RETURNS
| | | | | | | | | | | | |
| | | 1 YEAR | | | 5 YEARS | | | 10 YEARS | |
Small Cap Value (WMCVX) — Investor | | | 22.12% | | | | -0.07% | | | | 9.63% | |
Small Cap Value (WICVX) — Institutional | | | 22.44% | | | | -0.02% | | | | 9.66% | |
Russell 2000® Value Index | | | 32.63% | | | | 1.35% | | | | 9.68% | |
Russell 2000® Index | | | 31.91% | | | | 2.21% | | | | 10.17% | |
Data shows past performance, which is not indicative of future performance. Current performance may be lower or higher than the performance quoted. To obtain the most recent month-end performance data available, please visit www.wasatchfunds.com. The Advisor may absorb certain Fund expenses, without which total return would have been lower. Investment returns and principal value will fluctuate and shares, when redeemed, may be worth more or less than their original cost.
As of the January 31, 2012 prospectus, the Total Annual Fund Operating Expenses for the Wasatch Small Cap Value Fund —Investor Class: 1.32% / Institutional Class: 1.23%, Net: 1.19%. The expense ratio shown elsewhere in this report may be different. Expenses include direct expenses paid to the Advisor as well as indirect expenses incurred by the Fund as a result of its investments in other investment companies (each an “Acquired Fund”), before any expense reimbursements by the Advisor. Net Expenses are based on Fund expenses, net of waivers and reimbursements. See the prospectus for additional information regarding Fund expenses.
Wasatch Funds will deduct a 2.00% redemption proceeds fee on Fund shares held 60 days or less. Performance data does not reflect the deduction of fees or taxes, which if reflected, would reduce the performance quoted. For more complete information including charges, risks and expenses, read the prospectus carefully.
Performance for the Institutional Class prior to 1/31/2012 is based on the performance of the Investor Class. Performance of the Fund’s Institutional Class prior to 1/31/2012 uses the actual expenses of the Fund’s Investor Class without any adjustments. For any such period of time, the performance of the Fund’s Institutional Class would have been substantially similar to, yet higher than, the performance of the Fund’s Investor Class, because the shares of both classes are invested in the same portfolio of securities, but the classes bear different expenses.
Investing in small cap funds will be more volatile and loss of principal could be greater than investing in large cap or more diversified funds. Investing in foreign securities, especially in emerging markets, entails special risks, such as currency fluctuations and political uncertainties, which are described in more detail in the prospectus.
TOP 10 EQUITY HOLDINGS*
| | | | |
| Company | | % of Net
Assets | |
| Copart, Inc. | | | 4.1% | |
| Polypore International, Inc. | | | 2.9% | |
| Chico’s FAS, Inc. | | | 2.6% | |
| Yes Bank Ltd. (India) | | | 2.5% | |
| DFC Global Corp. | | | 2.4% | |
| | | | |
| Company | | % of Net
Assets | |
| Portfolio Recovery Associates, Inc. | | | 2.3% | |
| Beacon Roofing Supply, Inc. | | | 2.3% | |
| ICON plc ADR (Ireland) | | | 2.2% | |
| rue21, Inc. | | | 2.1% | |
| Syntel, Inc. | | | 2.1% | |
| * | As of September 30, 2012, there were 64 holdings in the Fund. Foreign currency contracts, written options and repurchase agreements, if any, are not included in the number of holdings. Portfolio holdings are subject to change at any time. References to specific securities should not be construed as recommendations by the Funds or their Advisor. Current and future holdings are subject to risk. |
SECTOR BREAKDOWN**
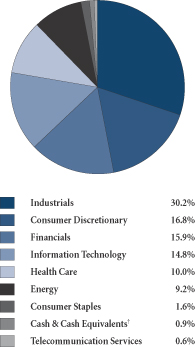
| ** | Excludes securities sold short and options written, if any. |
| † | Also includes Other Assets & Liabilities. |
GROWTHOFA HYPOTHETICAL $10,000 INVESTMENT
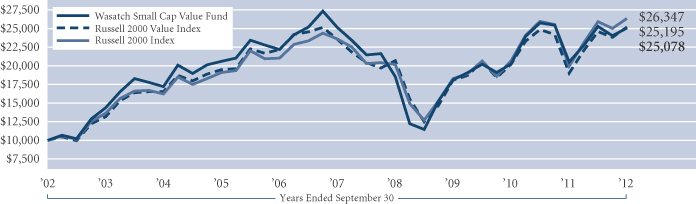
Past performance does not predict future performance and the graph above does not reflect the deduction of taxes you would pay on fund distributions or the redemption of fund shares. Performance shown in the chart above does not include any applicable sales charges and fees. Wasatch does not charge any sales fees. The Russell 2000 Value Index measures the performance of those Russell 2000 Index companies with lower price-to-book ratios and lower forecasted growth values. The Russell 2000 Index is an unmanaged total return index of the smallest 2,000 companies in the Russell 3000 Index, as ranked by total market capitalization. The Russell 2000 Index is widely regarded in the industry as accurately capturing the universe of small company stocks. You cannot invest directly in these or any indices.
31
| | |
| WASATCH STRATEGIC INCOME FUND (WASIX) — Management Discussion | | SEPTEMBER 30, 2012 |
|
|
|
The Wasatch Strategic Income Fund is managed by a team of Wasatch portfolio managers led by Sam Stewart.
| | |
Samuel S. Stewart, Jr. PhD, CFA Portfolio Manager | | OVERVIEW The Wasatch Strategic Income Fund concluded the third quarter and fiscal year on September 30, 2012 with solid results. For the quarter, the Fund’s 6.11% return kept pace with the 6.35% return of the S&P 500 Index and outperformed the 1.58% return of the Barclays Capital U.S. Aggregate Bond Index. Over the last year, the Fund’s 25.61% return fell short of the S&P 500’s 30.20% return but exceeded the 5.16% return of the Bond Index. |
For the quarter and the year, I was pleased the Fund’s return fell between our stock and bond benchmarks.
I have spent a large portion of my time during the last year thinking about risk. The Strategic Income Fund should first and foremost be a protector of capital. I feel that the Fund is in a better place to achieve that mandate than it was a year ago as I have removed several non-dividend paying stocks from the portfolio. I also believe I have increased the quality of the companies held in the Fund.
Every company in the portfolio is now a dividend payer, which I believe will lessen volatility in our current low yield environment. The Fund likely will not outperform stocks during strong markets but it should remain in the ballpark and provide the potential for an attractive risk-adjusted return. I continue to try to structure the Fund to protect us during weak markets.
The year was filled with plenty of global economic turmoil, with policy makers either sitting on their hands or implementing largely ineffective stimulus programs. In spite of the uncertainty, equity market returns were robust as corporate balance sheets strengthened through earnings growth and cost-cutting measures. Nonetheless, my optimism about the market has waned as stock valuations have increased. Further, as ever rising gold prices remind us, all of the stimulus provides an ever-increasing amount of tinder should an inflationary spark get ignited.
Certainly, investing opportunities are available, but I think that it has become even more of a careful stock-picker’s environment. I believe that the market will recognize those companies that set themselves apart through outstanding management and growth that surpasses that of the economy. Ultimately, the key is to not overpay for these companies, so market valuation must be judged to be attractive as well.
DETAILSOFTHE YEAR
Our high weighting of financial stocks paid off over the last 12 months with several winners, including NorthStar Realty Finance Corp., Visa, Inc., Colony Financial, Inc., MasterCard, Inc. and KKR Financial Holdings, LLC. The Fund’s financial holdings vastly outperformed their counterparts in the S&P 500 Index. Even though Visa and MasterCard are classified as technology companies, they benefit as financial transactions are increasingly conducted
via credit and debit cards instead of cash. Financials generally did well because the economy is slowly beginning to perform better. Credit is being extended and companies are breathing a little easier than they were at the start of the year.
Unfortunately, we had a few stumbles as well. Discoveries of shale gas have been so prevalent that the beneficiaries of increased drilling actually suffered. This is because many well owners shut down production due to low gas prices, hurting companies with exposure to natural gas like Helmerich & Payne, Inc. and CARBO Ceramics, Inc. Ultra Petroleum Corp., an owner of gas properties also suffered due to low gas prices. Ultra was one of our few holdings that did not pay a dividend, so I decided to sell the stock.
The Fund also underperformed the S&P 500 in the consumer discretionary sector, due to our small weight and poor performance from Best Buy Co., Inc. The consumer electronics retailer is transitioning from its traditional big box store concept by decreasing the square footage of its stores and becoming more price competitive. Although its earnings results have been disappointing, the stock seems inexpensive and the company continues to generate substantial cash flow which management is using to buy back shares. I believe this strategy makes sense, so we continue to hold Best Buy.
OUTLOOK
The economy continues to muddle along. My assessment is that the Federal Reserve’s third round of quantitative easing will be ineffective at creating the jobs needed to appreciably decrease the unemployment rate. Hopefully, it will be equally ineffective in spurring inflation. I’m convinced that the economic environment will remain sluggish for a prolonged period—certainly measured in years rather than months. In the meantime, many companies continue to add value through innovation and efficiency. The number of enticing investment opportunities has decreased, but I am working toward discovering those that merit a position in the Fund.
I am happy to report that as of September 30, 2012, the Wasatch Strategic Income Fund achieved a three-year, five-star rating—the highest designation from mutual fund evaluator Morningstar—based on a Morningstar risk-adjusted return compared to 373 funds in its mid-cap blend category. The Fund’s five-year rating is four stars. It was rated against 316 mid-cap blend funds.*
Thank you for the opportunity to manage your assets.
| * | For each fund with at least a three-year history, Morningstar calculates a Morningstar Rating™ based on a Morningstar Risk-Adjusted Return measure that accounts for variation in a fund’s monthly performance (including the effects of sales charges, loads, and redemption fees), placing more emphasis on downward variations and rewarding consistent performance. The top 10% of the funds in each category receive 5 stars, the next 22.5% receive 4 stars, the next 35% receive 3 stars, the next 22.5% receive 2 stars, and the bottom 10% receive 1 star. (Each share class is counted as a fraction of one fund within this scale and rated separately, which may cause slight variations in the distribution percentages.) Past performance is not indicative of future results. |
| © | 2012 Morningstar, Inc. All rights reserved. The information contained herein (1) is proprietary to Morningstar and/or its content providers; (2) may not be copied or distributed; and (3) is not warranted to be accurate, complete, or timely. Neither Morningstar nor its content providers are responsible for any damages or losses arising from any use of this information. |
| | Current and future holdings are subject to risk. |
32
| | |
| WASATCH STRATEGIC INCOME FUND (WASIX) — Portfolio Summary | | SEPTEMBER 30, 2012 |
|
|
|
AVERAGE ANNUAL TOTAL RETURNS
| | | | | | | | | | | | |
| | | 1 YEAR | | | 5 YEARS | | | SINCE INCEPTION 2/1/06 | |
Strategic Income | | | 25.61% | | | | 2.85% | | | | 4.71% | |
S&P 500 Index | | | 30.20% | | | | 1.05% | | | | 3.98% | |
Barclays Capital U.S. Aggregate Bond Index | | | 5.16% | | | | 6.53% | | | | 6.13% | |
Data shows past performance, which is not indicative of future performance. Current performance may be lower or higher than the performance quoted. To obtain the most recent month-end performance data available, please visit www.wasatchfunds.com. The Advisor may absorb certain Fund expenses, without which total return would have been lower. Investment returns and principal value will fluctuate and shares, when redeemed, may be worth more or less than their original cost.
As of the January 31, 2012 prospectus, the Total Annual Fund Operating Expenses for the Wasatch Strategic Income Fund are 1.76%. The Net Expenses are 1.50%. The expense ratio shown elsewhere in this report may be different. Expenses include direct expenses paid to the Advisor as well as indirect expenses incurred by the Fund as a result of its investments in other investment companies (each an “Acquired Fund”), before any expense reimbursements by the Advisor. Net Expenses are based on Fund expenses, net of waivers and reimbursements. See the prospectus for additional information regarding Fund expenses.
Wasatch Funds will deduct a 2.00% redemption proceeds fee on Fund shares held 60 days or less. Performance data does not reflect the deduction of fees or taxes, which if reflected, would reduce the performance quoted. For more complete information including charges, risks and expenses, read the prospectus carefully.
With respect to the Fund’s assets invested in fixed income securities, you are subject, but not limited to, the same interest rate, inflation and credit risk associated with the underlying fixed-income securities owned by the Fund. Return of principal is not guaranteed. Equity investing involves risks, including potential loss of the principal amount invested. Investing in foreign securities, especially in emerging markets, entails special risks, such as currency fluctuations and political uncertainties, which are described in more detail in the prospectus.
TOP 10 EQUITY HOLDINGS*
| | | | |
| Company | | % of Net
Assets | |
| Herbalife Ltd. | | | 6.1% | |
| Capital One Financial Corp. | | | 5.2% | |
| CapitalSource, Inc. | | | 4.6% | |
| Colony Financial, Inc. | | | 4.2% | |
| Canadian National Railway Co. (Canada) | | | 4.1% | |
| | | | |
| Company | | % of Net
Assets | |
| Visa, Inc., Class A | | | 4.0% | |
| Och-Ziff Capital Management Group, LLC | | | 4.0% | |
| MasterCard, Inc., Class A | | | 4.0% | |
| KKR Financial Holdings, LLC | | | 4.0% | |
| Best Buy Co., Inc. | | | 3.9% | |
| * | As of September 30, 2012, there were 32 holdings in the Fund. Foreign currency contracts, written options and repurchase agreements, if any, are not included in the number of holdings. Portfolio holdings are subject to change at any time. References to specific securities should not be construed as recommendations by the Funds or their Advisor. Current and future holdings are subject to risk. |
SECTOR BREAKDOWN**
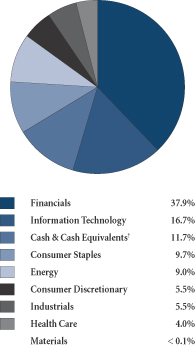
| ** | Excludes securities sold short and options written, if any. |
| † | Also includes Other Assets & Liabilities. |
GROWTHOFA HYPOTHETICAL $10,000 INVESTMENT
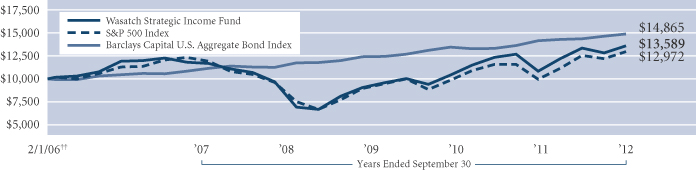
Past performance does not predict future performance and the graph above does not reflect the deduction of taxes you would pay on fund distributions or the redemption of fund shares. Performance shown in the chart above does not include any applicable sales charges and fees. Wasatch does not charge any sales fees. ††Inception: February 1, 2006. The S&P 500 Index represents 500 of the United States’ largest stocks from a broad variety of industries. The Index is unmanaged, and a common measure of common stock total return performance. The Barclays Capital U.S. Aggregate Bond Index covers the U.S. investment grade fixed rate bond market, including government and corporate securities, agency mortgage pass-through securities, and asset-backed securities. To be included in the index the security must meet the following criteria: must have at least one year to final maturity, regardless of call features; must have at least $100 million par amount outstanding; must be rated investment grade or better by Moody’s Investors Service, Standard & Poor’s, or Fitch Investor’s Service; must be fixed rate, although it can carry a coupon that steps up or changes to a predetermined schedule; must be dollar-denominated and nonconvertible. All corporate and asset-backed securities must be registered with the SEC and must be publicly issued. You cannot invest directly in these or any indices.
33
| | |
| WASATCH ULTRA GROWTH FUND (WAMCX) — Management Discussion | | SEPTEMBER 30, 2012 |
|
|
|
The Wasatch Ultra Growth Fund is managed by a team of Wasatch portfolio managers led by Paul Lambert, John Malooly and Ajay Krishnan.
| | | | |
Paul Lambert Portfolio Manager | | 
John Malooly, CFA Portfolio Manager | |
Ajay Krishnan, CFA Portfolio Manager |
OVERVIEW
The past 12 months have been a period of significant volatility. Economic uncertainty in the U.S. and around the globe made investors wary, while stimulus measures in the U.S. and bailout plans in Europe often buoyed their confidence. Over the year’s first half, U.S. equities posted substantial gains, inspired by modest signs of improvement in the domestic economy. In the second half of the period, the strain of slow growth in the U.S. and the debt crisis in Europe kept the major stock indices in the doldrums for most of the spring and summer. Late in the summer, however, the markets began to regain a positive tone, even though little about the macroeconomic backdrop had changed. In mid-September, when the Federal Reserve announced a new round of quantitative easing, investors responded enthusiastically.
In this environment, the Wasatch Ultra Growth Fund gained 20.13% for the 12 months ended September 30, 2012. Although this was a strong absolute return, the Fund placed well behind our benchmark, the Russell 2000 Growth Index, which returned 31.18% for the 12-month period. No single factor was responsible for the Fund’s underperformance. Some individual stock selections that performed strongly at the end of the previous period pulled back considerably at the start of this one. Also, our position in international stocks—particularly in India—hurt our results relative to the Index as a number of those markets lagged the U.S market over the year.
DETAILSOFTHE YEAR
The greatest contributor to our performance for the year was Ultimate Software Group, Inc., a provider of payroll and other human resources management solutions that help customers improve efficiency and reduce costs. Ultimate has made a successful transition from a traditional software company to a more sophisticated, cloud-based “Software as a Service” (SaaS) business. The company has attained good market share, and appears to be positioned to experience better profit margins going forward.
The tepid economy has made it difficult for many larger companies to achieve growth organically. In these conditions, they often look toward acquiring smaller, nimbler
companies with innovative products that offer the potential for faster growth. Indeed, four of our top 10 contributors were acquired by other parties during the year, including ISTA Pharmaceuticals, Inc., a maker of prescription eye- and nasal-care drugs that was purchased by Bausch & Lomb.*
Our greatest detractor from performance for the year was Polypore International, Inc., a maker of membranes used in a wide range of batteries, including those used to power hybrid and all-electric cars. Polypore has proven to be a volatile stock. In recent months, it was hurt by an inventory-driven production shutdown for one of the vehicles using its battery separator material. Despite this setback, we continue to be excited about the long-term outlook for Polypore. It has a steadier business serving more established end markets for its products, while car-related sales—which account for only about 10% of its current revenues—offer significant opportunities for growth.
At times our pursuit of companies offering innovative products with strong growth potential can mean investing in them early in their development. That can be beneficial in the long run, but it can also involve considerable volatility. This was the case with Amyris, Inc., another detractor from performance. Amyris has created a novel process using yeast to make a variety of specialty chemicals. Some of the commercial applications for the company’s products involve large end markets, giving Amyris substantial growth potential. Further, its products could in some applications replace more expensive chemicals derived from petroleum. The Fund’s position in the company is small, as we are mindful of its dynamic growth potential and the many challenges it faces as it works to bring products to market.
OUTLOOK
Although the Fund’s underperformance this year was disappointing, we remain enthusiastic about the companies in our portfolio. This is naturally tempered by concerns over slowing global gross domestic product (GDP) growth and the continued high level of unemployment in the U.S. Economic uncertainty at home is exacerbated by the as-yet unknown outcome of the November elections, and what measures, if any, will be taken to avert the “fiscal cliff”—the combination of automatic spending cuts and tax increases that will begin in 2013 if Congress does not act.
In this thoroughly unpredictable environment, we are continuing to focus on identifying companies that are able to produce useful, distinctive, and innovative products; that can gain market share even in times of low growth; that can maintain clean balance sheets; and that are led by skilled, experienced management teams. We think such companies can potentially weather uncertain conditions better than their competitors. We believe the Fund currently holds a strong assortment of such companies.
Thank you for the opportunity to manage your assets.
| * | As of September 30, 2012, the Wasatch Ultra Growth Fund did not own shares of Bausch & Lomb, Inc. |
| | Current and future holdings are subject to risk. |
34
| | |
| WASATCH ULTRA GROWTH FUND (WAMCX) — Portfolio Summary | | SEPTEMBER 30, 2012 |
|
|
|
AVERAGE ANNUAL TOTAL RETURNS
| | | | | | | | | | | | |
| | | 1 YEAR | | | 5 YEARS | | | 10 YEARS | |
Ultra Growth | | | 20.13% | | | | -0.09% | | | | 8.12% | |
Russell 2000® Growth Index | | | 31.18% | | | | 2.96% | | | | 10.55% | |
Data shows past performance, which is not indicative of future performance. Current performance may be lower or higher than the performance quoted. To obtain the most recent month-end performance data available, please visit www.wasatchfunds.com. The Advisor may absorb certain Fund expenses, without which total return would have been lower. Investment returns and principal value will fluctuate and shares, when redeemed, may be worth more or less than their original cost.
As of the January 31, 2012 prospectus, the Total Annual Fund Operating Expenses for the Wasatch Ultra Growth Fund are 1.43%. The expense ratio shown elsewhere in this report may be different. Expenses include direct expenses paid to the Advisor as well as indirect expenses incurred by the Fund as a result of its investments in other investment companies (each an “Acquired Fund”), before any expense reimbursements by the Advisor. See the prospectus for additional information regarding Fund expenses.
Wasatch Funds will deduct a 2.00% redemption proceeds fee on Fund shares held 60 days or less. Performance data does not reflect the deduction of fees or taxes, which if reflected, would reduce the performance quoted. For more complete information including charges, risks and expenses, read the prospectus carefully.
Investing in small cap funds will be more volatile and loss of principal could be greater than investing in large cap or more diversified funds. Investing in foreign securities, especially in emerging markets, entails special risks, such as currency fluctuations and political uncertainties, which are described in more detail in the prospectus.
TOP 10 EQUITY HOLDINGS*
| | | | |
| Company | | % of Net
Assets | |
| Polypore International, Inc. | | | 3.4% | |
| Greenspring Global Partners II-B, L.P. | | | 3.1% | |
| Yes Bank Ltd. (India) | | | 2.8% | |
| OPNET Technologies, Inc. | | | 2.7% | |
Cognizant Technology Solutions Corp.,
Class A | | | 2.4% | |
| | | | |
| Company | | % of Net
Assets | |
| DFC Global Corp. | | | 2.3% | |
| IDEX Corp. | | | 2.2% | |
| Ultimate Software Group, Inc. | | | 2.0% | |
| Tangoe, Inc. | | | 1.8% | |
| SPS Commerce, Inc. | | | 1.6% | |
| * | As of September 30, 2012, there were 98 holdings in the Fund. Foreign currency contracts, written options and repurchase agreements, if any, are not included in the number of holdings. Portfolio holdings are subject to change at any time. References to specific securities should not be construed as recommendations by the Funds or their Advisor. Current and future holdings are subject to risk. |
SECTOR BREAKDOWN**
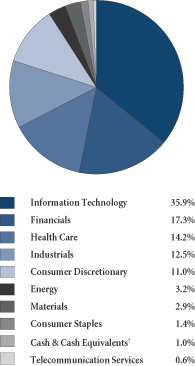
| ** | Excludes securities sold short and options written, if any. |
| †Also | includes Other Assets & Liabilities. |
GROWTHOFA HYPOTHETICAL $10,000 INVESTMENT
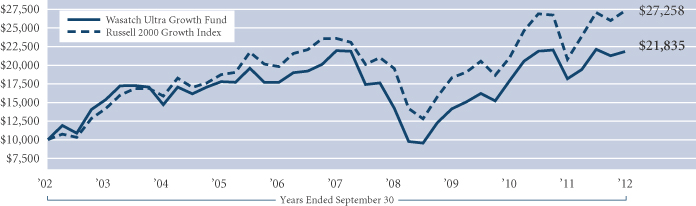
Past performance does not predict future performance and the graph above does not reflect the deduction of taxes you would pay on fund distributions or the redemption of fund shares. Performance shown in the chart above does not include any applicable sales charges and fees. Wasatch does not charge any sales fees. The Russell 2000 Growth Index is an unmanaged total return index that measures the performance of those Russell 2000 Index companies with higher price-to-book ratios and higher forecasted growth values. The Russell 2000 Index is an unmanaged total return index of the smallest 2,000 companies in the Russell 3000 Index, as ranked by total market capitalization. You cannot invest directly in these or any indices.
35
| | |
| WASATCH WORLD INNOVATORS FUND (WAGTX) — Management Discussion | | SEPTEMBER 30, 2012 |
|
|
|
The Wasatch World Innovators Fund is managed by a team of Wasatch portfolio managers led by Sam Stewart and Josh Stewart.
| | | | |
Samuel S. Stewart, Jr. PhD, CFA Portfolio Manager | | 
Josh Stewart Portfolio Manager | | OVERVIEW The Wasatch World Innovators Fund returned 26.10% for the 12 months ended September 30, 2012, and outperformed the 21.13% return of the MSCI AC World IMI.* Notably, we believe we |
were able to generate outperformance through stock selection and not by taking on excess risk.
We believe the Fund’s strong performance reflects the effectiveness of our approach, which is to seek out what we believe are the World’s Best Growth Companies® with a particular emphasis on those with innovative business models and rising market share. An important benefit of emphasizing innovators is that such companies tend to maintain steady growth when the economy slows and investor sentiment flags. We believe this has enabled the Fund to outperform in unsteady or falling markets.
DETAILSOFTHE YEAR
Over the past year, the stocks that contributed the most to the Fund’s performance tended to be those with the largest weights, including Apple, Inc., Google, Inc. and eBay, Inc. The numbers tell the story: over the last 12 months, this group of companies reported sales growth of 48%, 30% and 30%, respectively, and earnings per share (EPS) growth of 68%, 22% and 115%, respectively. Coming into the annual period, Apple was trading at 13 times trailing 12-month earnings per share, Google at 17 times, and eBay at 21 times. We saw this as an opportunity to own three of the world’s best technology companies, which are rapidly taking market share in huge, global industries, at price-to-earnings (P/E) ratios well below their growth rates. Even after their exceptional performance of the past 12 months, these companies trade at roughly the same P/E ratios they did at the beginning of the year. We continue to hold all three stocks in the Fund.
Other top performers for the year included electronic payment network operators MasterCard, Inc. and Visa, Inc., as well as health care companies Bio-Reference Laboratories, Inc., Sartorius Stedim Biotech and Sartorius AG. These companies faced the same tough economic conditions as peers in their sectors, but their innovative products and services fueled market share gains and growth that was far higher than their peers. As a result, their stock prices received a two-pronged lift from earnings growth and expanded valuation multiples as investors rewarded them for bucking broader sector trends.
The largest detractors included VeriFone Systems, Inc., Zipcar, Inc., Arcos Dorados Holdings, Inc., and Quality
Systems, Inc. We remain invested in VeriFone, a provider of technology that enables electronic payment transactions. While market participants fear that the business might become extinct at the hands of new electronic payment methods, we believe demand for the company’s services should increase over time given that cash payments around the globe are decreasing in favor of electronic payment methods. In contrast, we exited our small investment in Zipcar after a call with company management left us with more questions than answers about the strength of the business. We remain intrigued by what is clearly an innovative business model, but we have put it on our list of innovators to track rather than own for now. We added to our position in Arcos, the McDonald’s franchisee in Latin America, with valuation even more attractive and the same disruptive fast-food business model and powerful brand. We eliminated our position in Quality Systems, which sells enterprise software to health care providers, as we feel the company no longer offers solutions that compete with newer innovators.
OUTLOOK
Our prognosis for the global economy has been consistent since the financial crisis. We expect a slow recovery and unusually choppy stock markets as the world suffers from a long and painful debt hangover with no easy cure. We believe innovators will navigate their way through this malaise. These special companies consistently sell more than their peers, and they do it in spite of charging premium prices and making above-average profits on what they are selling. At the close of September, the weighted average sales and earnings per share increases for the portfolio were 22% and 22%, respectively, and the weighted average return on assets was 14%. This compares to the benchmark’s scorecard of 10%, 10% and 8% for these same metrics.
We think the lead our companies have on their competitors should increase at an accelerated rate as corporate customers become more open to change when business is slow and they need to be more productive, offer a better service than ever, and do it for less financial reward than in the past just to survive. Innovators, in turn, should get into a virtuous circle as they take market share, grow cash flows, and have the capital to reinvest in the business, while entrenched legacy competitors see cash flows and access to capital dry up. In short, we are optimistic that the Fund has the potential to deliver satisfying returns despite the slow-growth economy.
Two years into our themed investment approach of seeking out innovators, we are pleased with the results. We are confident that the innovative companies the Fund holds are the right place to be invested in good and bad economic times.
Thank you for the opportunity to invest your assets.
| *MSCI | All Country World Investable Markets Index. |
| Current | and future holdings are subject to risk. |
36
| | |
| WASATCH WORLD INNOVATORS FUND (WAGTX) — Portfolio Summary | | SEPTEMBER 30, 2012 |
|
|
|
AVERAGE ANNUAL TOTAL RETURNS
| | | | | | | | | | | | |
| | | 1 YEAR | | | 5 YEARS | | | 10 YEARS | |
World Innovators | | | 26.10% | | | | 2.87% | | | | 12.97% | |
MSCI AC World IMI | | | 21.13% | | | | -1.71% | | | | 9.04% | |
Data shows past performance, which is not indicative of future performance. Current performance may be lower or higher than the performance quoted. To obtain the most recent month-end performance data available, please visit www.wasatchfunds.com. The Advisor may absorb certain Fund expenses, without which total return would have been lower. Investment returns and principal value will fluctuate and shares, when redeemed, may be worth more or less than their original cost.
As of the January 31, 2012 prospectus, the Total Annual Fund Operating Expenses for the Wasatch World Innovators Fund are 1.97%. The expense ratio shown elsewhere in this report may be different. Expenses include direct expenses paid to the Advisor as well as indirect expenses incurred by the Fund as a result of its investments in other investment companies (each an “Acquired Fund”), before any expense reimbursements by the Advisor. See the prospectus for additional information regarding Fund expenses.
Wasatch Funds will deduct a 2.00% redemption proceeds fee on Fund shares held 60 days or less. Performance data does not reflect the deduction of fees or taxes, which if reflected, would reduce the performance quoted. For more complete information including charges, risks and expenses, read the prospectus carefully.
Investing in concentrated funds will be more volatile and loss of principal could be greater than investing in more diversified funds. Investing in foreign securities, especially in emerging markets, entails special risks, such as currency fluctuations and political uncertainties, which are described in more detail in the prospectus.
TOP 10 EQUITY HOLDINGS*
| | | | |
| Company | | % of Net
Assets | |
| eBay, Inc. | | | 4.5% | |
| Herbalife Ltd. | | | 4.3% | |
| Google, Inc., Class A | | | 4.1% | |
| Apple, Inc. | | | 3.9% | |
| DiaSorin S.p.A. (Italy) | | | 3.5% | |
| | | | |
| Company | | % of Net
Assets | |
| Check Point Software Technologies Ltd. (Israel) | | | 3.1% | |
| VeriFone Systems, Inc. | | | 3.1% | |
| Visa, Inc., Class A | | | 3.0% | |
| MasterCard, Inc., Class A | | | 3.0% | |
| EMC Corp. | | | 2.9% | |
| * | As of September 30, 2012, there were 62 holdings in the Fund. Foreign currency contracts, written options and repurchase agreements, if any, are not included in the number of holdings. Portfolio holdings are subject to change at any time. References to specific securities should not be construed as recommendations by the Funds or their Advisor. Current and future holdings are subject to risk. |
SECTOR BREAKDOWN**
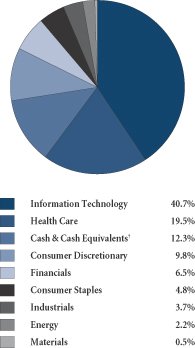
| ** | Excludes securities sold short and options written, if any. |
| † | Also includes Other Assets & Liabilities. |
GROWTHOFA HYPOTHETICAL $10,000 INVESTMENT
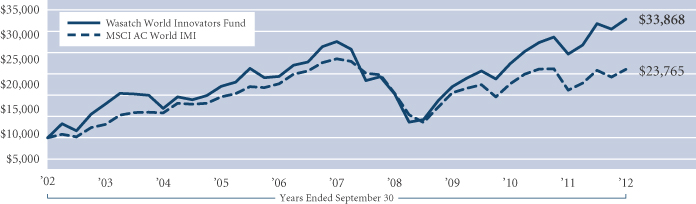
Past performance does not predict future performance and the graph above does not reflect the deduction of taxes you would pay on fund distributions or the redemption of fund shares. Performance shown in the chart above does not include any applicable sales charges and fees. Wasatch does not charge any sales fees. The MSCI All Country World Investable Markets Index (AC World IMI) is a free float-adjusted market capitalization weighted index designed to measure the equity market performance of large, mid, and small cap companies across developed and emerging markets throughout the world. You cannot invest directly in this or any index.
37
| | |
| WASATCH-1ST SOURCE INCOME FUND (FMEQX) — Management Discussion | | SEPTEMBER 30, 2012 |
|
|
|
| | |

Paul W. Gifford, CFA Portfolio Manager | | OVERVIEW The Wasatch-1st Source Income returned 3.16% for the 12 months ended September 30, 2012. During this time, the Barclays Capital U.S. Intermediate Government/Credit Bond Index returned 4.40%. The modest drop in U.S. Treasury yields during the year enhanced the returns of the Fund and the Index. The yield on the five-year Treasury note fell from 0.95% to 0.62% and the yield on the 10-year Treasury |
bond fell from 1.92% to 1.63%. The yields of both Treasuries reached record lows during July and rose as the third quarter of 2012 ended.
DETAILSOFTHE YEAR
We think the positive returns produced over the past year are good given the low level of interest rates. Interest rates were also less volatile in the past 12 months than they were for the year ended September 30, 2011. The interest rate on the 10-year Treasury, for the year ended September 30, 2011, was twice as volatile as it was for the year ended September 30, 2012. The trend of less volatility in interest rates is a more current market-driven event.
The slow growth economy we are currently experiencing contributed to less volatility in interest rates. Over the past 12 months, the U.S. economy grew around 2% and appears to be on that same path through year-end 2012. Slow economic growth has allowed interest rates to remain relatively steady. We do not see any catalyst that would promote higher economic growth in the U.S., especially since we face the “fiscal cliff”—the expiration of tax cuts and spending cuts that will be automatically imposed if Congress does not act before the end of the year—which could shrink our economy by 4% in 2013. Europe’s economy is also shrinking and the region is a large importer of our goods and services. We are also seeing a significant economic slowdown in China. The U.S. has benefited from tremendous export growth to China for several years.
In response to slow domestic growth and weakening international economies the Federal Reserve (Fed) made its third and most decisive move to maintain low interest rates and prop up the U.S. economy by announcing another round of quantitative easing (QE). First, the Fed stated its intention to keep short-term interest rates near zero until at least mid-2015. Second, this version of QE entails purchasing $40 billion per month of mortgage-backed securities until further notice. Mortgage rates fell quickly given this new level of demand for the securities. “Don’t fight the Fed” seems to be the adage investors have accepted and this mindset has led to a lower level of volatility in bonds.
Non-Treasury securities, whether fixed income or equity, have benefited from the Fed’s actions. The Fed is pursuing a path that forces investors into riskier assets to obtain a reasonable rate of return. The fixed income market has seen this in the credit sector. The extra spread earned over Treas-
uries has shrunk over the past year and added to fixed income returns. The lower the credit quality, the more the spread tightened versus Treasuries. In fact, yields on junk bonds reached a record low during the third quarter of 2012, a clear result of the low interest rate environment we are in. It appears the Fed will continue to favor debtors over savers for many years to come.
OUTLOOK
As mentioned above, you don’t “fight the Fed” and to a certain extent we didn’t. Two of our major focuses for the Fund during the year were to increase corporate bond exposure and reduce exposure to bonds maturing in less than three years. During the year, we increased the Fund’s corporate bond weighting from about 35% to over 38%. In those trades, we reduced the number of top rated bonds to target “A” rated bonds with a small increase in “BBB” bonds.* These bonds saw a tightening of credit spreads greater than those of the top-rated bonds, although the Fund does not have as much exposure to BBB bonds as the Index and that held down performance on a relative basis.
In the last year, we increased the weighting of bonds with duration of three to seven years from 36% to 50%. This was done mainly by reducing the Fund’s holdings in bonds maturing in less than three years. The three to seven year part of the yield curve is relatively steep and offers the opportunity to “roll down the curve” and add return to the portfolio. As long as the Fed keeps its current stance the Fund can invest in this manner.
As we go into 2013, while we are not “fighting the Fed,” we are watching carefully for changes that warrant a reduction in corporate bonds in particular or duration in the portfolio. Slowing global economies would increase pressure on corporate earnings and credit quality. The low level of interest rates provides less of a cushion against rising rates and falling prices than just a couple of years ago. Basically, the Fund is taking similar levels of interest rate risk but receiving less in the form of return. This is true for all bond funds—it is not unique to this Fund. Watching for and taking action when appropriate to protect principal will be the challenges we face going forward.
Thank you for the opportunity to manage your assets.
| * | Ratings are issued by S&P or Moody’s and typically range from AAA (highest) to D (lowest). The credit quality of the investments in the Fund’s portfolio does not apply to the safety or stability of the Fund. Ratings and portfolio credit quality may change over time. Unrated securities do not necessarily indicate low quality. The Fund itself has not been rated by an independent rating agency. For information on the rating agency’s methodology visit: http://www.standardandpoors.com/home/en/us and http://www.moodys.com. |
38
| | |
WASATCH-1ST SOURCE INCOME FUND (FMEQX) —
Portfolio Summary | | SEPTEMBER 30, 2012 |
|
|
|
AVERAGE ANNUAL TOTAL RETURNS
| | | | | | |
| | | 1 YEAR | | 5 YEARS | | 10 YEARS |
Income | | 3.16% | | 4.51% | | 3.60% |
Barclays Capital U.S. Intermediate Government/Credit Bond Index | | 4.40% | | 5.71% | | 4.76% |
Data shows past performance, which is not indicative of future performance. Current performance may be lower or higher than the performance quoted. To obtain the most recent month-end performance data available, please visit www.wasatchfunds.com. The Advisor may absorb certain Fund expenses, without which total return would have been lower. Investment returns and principal value will fluctuate and shares, when redeemed, may be worth more or less than their original cost.
As of the January 31, 2012 prospectus, the Total Annual Fund Operating Expenses for the Wasatch-1st Source Income Fund are 0.72%. The expense ratio shown elsewhere in this report may be different. Expenses include direct expenses paid to the Advisor as well as indirect expenses incurred by the Fund as a result of its investments in other investment companies (each an “Acquired Fund”). See the prospectus for additional information regarding Fund expenses.
Wasatch Funds will deduct a 2.00% redemption proceeds fee on Fund shares held 60 days or less. Performance data does not reflect the deduction of fees or taxes, which if reflected, would reduce the performance quoted. For more complete information including charges, risks and expenses, read the prospectus carefully.
Investments in fixed income funds are subject to the same interest rate, inflation, credit and other risks associated with the underlying bonds. Return of principal is not guaranteed.
TOP 10 HOLDINGS*
| | | | | | | | |
| Holding | | Maturity
Date | | | % of Net
Assets | |
| U.S. Treasury Note, 3.625% | | | 8/15/19 | | | | 5.5% | |
| U.S. Treasury Note, 3.250% | | | 12/31/16 | | | | 3.3% | |
| General Electric Capital Corp., MTN, 5.400% | | | 2/15/17 | | | | 2.0% | |
| Federal National Mortgage Assoc., 2.625% | | | 11/20/14 | | | | 1.7% | |
| Federal Home Loan Mortgage Corp., 2.500% | | | 5/27/16 | | | | 1.5% | |
| Federal National Mortgage Assoc., 4.875% | | | 12/15/16 | | | | 1.5% | |
| | | | | | | | |
| Holding | | Maturity
Date | | | % of Net
Assets | |
| Government National Mortgage Assoc., Series 2010-129, Class NU, 3.500% | | | 6/20/39 | | | | 1.4% | |
| Government National Mortgage Assoc., Series 2010-117, Class GD, 3.000% | | | 10/20/39 | | | | 1.3% | |
| Citibank Credit Card Issuance Trust, Series 2007-A8, Class A8, 5.650% | | | 9/20/19 | | | | 1.3% | |
| U.S. Treasury Bond, 1.625% | | | 1/15/18 | | | | 1.2% | |
| * | As of September 30, 2012, there were 165 holdings in the Fund. Repurchase agreements, if any, are not included in the number of holdings. Portfolio holdings are subject to change at any time. References to specific securities should not be construed as recommendations by the Funds or their Advisor. Current and future holdings are subject to risk. |
INVESTMENTS & CASH
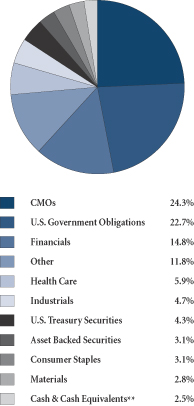
| ** | Also includes Other Assets & Liabilities. |
GROWTHOFA HYPOTHETICAL $10,000 INVESTMENT
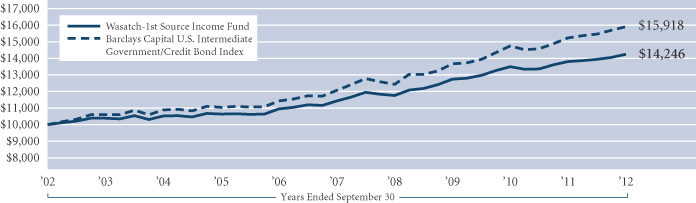
Past performance does not predict future performance and the graph above does not reflect the deduction of taxes you would pay on fund distributions or the redemption of fund shares. Performance shown in the chart above does not include any applicable sales charges and fees. Wasatch does not charge any sales fees. The Barclays Capital U.S. Intermediate Government/Credit Bond Index is an unmanaged index considered representative of the performance of government and corporate bonds with maturities of less than 10 years. You cannot invest directly in this or any index.
39
| | |
| WASATCH-HOISINGTON U.S. TREASURY FUND (WHOSX) — Management Discussion | | SEPTEMBER 30, 2012 |
|
|
|
| | |

Van R. Hoisington Portfolio Manager | | OVERVIEW U.S. economic conditions steadily eroded over the Fund’s fiscal year (the 12 months ended September 30, 2012). The growth rate of real gross domestic product (GDP) fell from 2.7% in the second half of 2011 to 1.6% in the first half of 2012. The manufacturing sector, which paced the economy over the prior four quarters, declined sharply in the third quarter of 2012 due to major decreases in new domestic and foreign |
orders. Even though the U.S. Federal Reserve’s (Fed’s) adoption of the third round of quantitative easing raised inflationary concerns, the 30-year Treasury bond yield closed the fiscal year at 2.82%, down 2.91% on September 30, 2012. This produced a small capital gain that boosted the return of the Wasatch-Hoisington U.S. Treasury Fund above the interest rate on its investments.
DETAILSOFTHE YEAR
For the fiscal year, the Fund gained 6.66% and outperformed the 5.16% return of the Barclays Capital U.S. Aggregate Bond Index. The long duration strategy of the Fund—investing in bonds with maturities of 20 years or longer—added to the gains achieved over the prior 3-, 5- and 10-year periods.
During the third quarter of 2012, the 30-year Treasury bond yield registered a minimal net change going from 2.75% to 2.82%. This slight change masked a great deal of interim volatility that occurred in the long-term Treasury bond market during the quarter. From the high yield (on September 7, 2012) to the low yield (on July 26, 2012), the bellwether Treasury bond yield diverged by 0.68 of a percentage point. Much of this volatility resulted from speculation concerning the Fed’s plans and then the official announcement of QE3 on September 11. In this market, the Fund returned -0.56% for the quarter, following a nearly 14% return in the prior quarter.
OUTLOOK
Entering the last three months of 2012, economic conditions are extremely fragile. Manufacturing is contracting and the only issue is the degree of the downturn underway. International trade is declining, with the result that weaknesses in different parts of the world are reinforcing domestic deterioration in economies continents away. A highly relevant question is: How can the U.S. escape a wider slump when real income and the personal saving rate are both slowing in the face of an interim upturn in the inflation rate? In the face of worsening shorter-term cyclical indicators, aggregate indebtedness, the dominant force in the global economy, has continued to move upward. While announcements of new government initiatives have boosted the equity markets, their effectiveness will wear off as debt levels continue to move further into uncharted waters. Indeed, the result of these latest programs in the U.S. and Europe will be like numerous previous efforts. Markets for stocks and commodities have improved but governments
have not been able to use this additional time to address underlying debt imbalances. Thus, these latest government actions do not change the extreme over-indebtedness of major global economies. Instead, more precious time and political good will has been wasted while weak and divided governments continue to prove incapable of making critically needed structural reforms.
Long-term Treasury bond yields rose from their lows of the year, reached at approximately the same time as new policy initiatives in the U.S. and Europe were leaked into the market place. Among many assurances that efforts this time are truly different, we discern no meaningful differences. Our long-standing assessment that the U.S. and other major economies face years of difficult economic conditions along with extremely low Treasury bond yields has not changed. Open-ended quantitative easing (QE) is not substantively different from earlier QEs except that the name is slightly altered and government intrusion into the private domestic economy will accelerate. Importantly, we think the enactment of QE3 is a tacit admission by the Fed that earlier efforts failed. The outcome anticipated for QE3 is no different from that of earlier QEs.
As commodity prices rose initially in all the QE programs, long-term Treasury bond yields also increased. However, higher yields eventually reversed and generally continued to ratchet downward, reaching near or record lows. Our analysis indicates that the longer-term trend in Treasury bond yields reflects the detrimental impact of the Fed’s actions and the ever-bulging indebtedness of the U.S. The Fed’s actions may be politically necessary due to numerous demands to improve the clearly depressed state of economic conditions. As long as the Fed tries untested and theoretically unsound policies, the result will be equally as dismal as that of prior QEs. Fundamentals will not improve until the extreme over-indebtedness of the U.S. economy is addressed and this is in the realm of fiscal, not monetary policy. The Fed, as we all do, wishes it still had viable options, but it does not. Thus, our recommendation is that it would be better for the Fed to put pressure on fiscal authorities to take badly needed actions than to do additional harm. But, we believe that until the debt issues are addressed, the multi-year trend in long-term Treasury bond yields will remain downward and we expect to continue to maintain our long duration strategy. However, we continue to advise shareholders that such Fed interference in the economy will produce considerable Treasury market volatility. For investors who can patiently persevere through this volatility, the potential for positive returns from long-term U.S. Treasury bonds still lies ahead.
Thank you for the opportunity to invest your assets.
40
| | |
| WASATCH-HOISINGTON U.S. TREASURY FUND (WHOSX) — Portfolio Summary | | SEPTEMBER 30, 2012 |
|
|
|
AVERAGE ANNUAL TOTAL RETURNS
| | | | | | | | | | | | |
| | | 1 YEAR | | | 5 YEARS | | | 10 YEARS | |
U.S. Treasury | | | 6.66% | | | | 13.13% | | | | 8.82% | |
Barclays Capital U.S. Aggregate Bond Index | | | 5.16% | | | | 6.53% | | | | 5.32% | |
Data shows past performance, which is not indicative of future performance. Current performance may be lower or higher than the performance quoted. To obtain the most recent month-end performance data available, please visit www.wasatchfunds.com. The Advisor may absorb certain Fund expenses, without which total return would have been lower. Investment returns and principal value will fluctuate and shares, when redeemed, may be worth more or less than their original cost.
As of the January 31, 2012 prospectus, the Total Annual Fund Operating Expenses for the Wasatch- Hoisington U.S. Treasury Fund are 0.76%. The Net Expenses are 0.75%. The expense ratio shown elsewhere in this report may be different. Net Expenses are based on Fund expenses, net of waivers and reimbursements. See the prospectus for additional information regarding Fund expenses.
Wasatch Funds will deduct a 2.00% redemption proceeds fee on Fund shares held 60 days or less. Performance data does not reflect the deduction of fees or taxes, which if reflected, would reduce the performance quoted. For more complete information including charges, risks and expenses, read the prospectus carefully.
Investments in fixed income funds are subject to the same interest rate, inflation, credit and other risks associated with the underlying bonds. Return of principal is not guaranteed.
TOP 10 HOLDINGS*
| | | | | | | | |
| Holding | | Maturity
Date | | | % of Net
Assets | |
| U.S. Treasury Strip, principal only | | | 5/15/30 | | | | 13.6% | |
| U.S. Treasury Bond, 3.125% | | | 11/15/41 | | | | 12.0% | |
| U.S. Treasury Strip, principal only | | | 2/15/31 | | | | 11.9% | |
| U.S. Treasury Bond, 3.000% | | | 5/15/42 | | | | 10.7% | |
| U.S. Treasury Strip, principal only | | | 2/15/37 | | | | 10.1% | |
| | | | | | | | |
| Holding | | Maturity
Date | | | % of Net
Assets | |
| U.S. Treasury Strip, principal only | | | 5/15/39 | | | | 9.3% | |
| U.S. Treasury Bond, 4.500% | | | 5/15/38 | | | | 4.9% | |
| U.S. Treasury Strip, principal only | | | 5/15/40 | | | | 4.2% | |
| U.S. Treasury Bond, 3.500% | | | 2/15/39 | | | | 4.1% | |
| U.S. Treasury Bond, 4.250% | | | 11/15/40 | | | | 3.3% | |
| * | As of September 30, 2012, there were 17 holdings in the Fund. Repurchase agreements, if any, are not included in the number of holdings. Portfolio holdings are subject to change at any time. References to specific securities should not be construed as recommendations by the Funds or their Advisor. Current and future holdings are subject to risk. |
INVESTMENTS & CASH
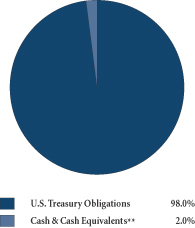
| **Also | includes Other Assets & Liabilities. |
GROWTHOFA HYPOTHETICAL $10,000 INVESTMENT
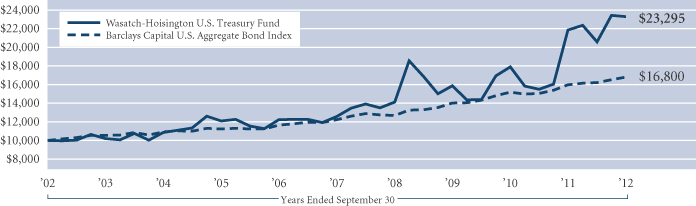
Past performance does not predict future performance and the graph above does not reflect the deduction of taxes you would pay on fund distributions or the redemption of fund shares. Performance shown in the chart above does not include any applicable sales charges and fees. Wasatch does not charge any sales fees. The Barclays Capital U.S. Aggregate Bond Index covers the U.S. investment grade fixed rate bond market, including government and corporate securities, agency mortgage pass-through securities, and asset-backed securities. To be included in the index the security must meet the following criteria: must have at least one year to final maturity, regardless of call features; must have at least $100 million par amount outstanding; must be rated investment grade or better by Moody’s Investors Service, Standard & Poor’s, or Fitch Investor’s Service; must be fixed rate, although it can carry a coupon that steps up or changes to a predetermined schedule; must be dollar-denominated and nonconvertible. All corporate and asset-backed securities must be registered with the SEC and must be publicly issued. You cannot invest directly in this or any index.
41
| | | | |
| WASATCH FUNDS MANAGEMENT DISCUSSIONS — Definitions of Financial Terms | | SEPTEMBER 30, 2012 |
|
|
|
Alpha is a risk-adjusted measure of the so-called “excess return” on an investment. It is a common measure of assessing an active manager’s performance as it is the return in excess of a benchmark index or “risk-free” investment. The difference between the fair and actually expected rates of return on a stock is called the stock’s alpha.
A bear market is a general decline in the stock market over a period of time.
Beta is a quantitative measure of the volatility of a given stock relative to the overall market. A beta above one is more volatile than the overall market, while a beta below one is less volatile.
Someone who is “bullish” or “a bull” is optimistic with regard to the stock market’s prospects.
A bull market is defined as a prolonged period in which investment prices rise faster than their historical average. Bull markets can happen as the result of an economic recovery, an economic boom, or investor psychology.
The “cloud” is the Internet. Cloud-computing is a model for delivering information technology services in which resources are retrieved from the Internet through web-based tools and applications rather than from a direct connection to a server.
A corporate bond is a debt security issued by a corporation for the purpose of raising money to expand its business.
Correlation, in the financial world, is a statistical measure of how asset classes, securities, markets, or countries move in relation to each other.
Dividend yield is a company’s annual dividend payments divided by its market capitalization, or the dividend per share divided by the price per share. For example, a company whose stock sells for $30 per share that pays an annual dividend of $3 per share has a dividend yield of 10%.
Earnings growth is a measure of growth in a company’s net income over a specific period, often one year.
Earnings-per-share or EPS is the portion of a company’s profit allocated to each outstanding share of common stock. EPS growth rates help investors identify companies that are increasing or decreasing in profitability.
Gross domestic product (GDP) is a basic measure of a country’s economic performance and is the market value of all final goods and services made within the borders of a country in a year.
An initial public offering (IPO) is a company’s first sale of stock to the public.
Mortgage-backed securities are debt issues backed by a pool of mortgages. Investors receive payments from the interest and principal payments made on the underlying mortgages.
The price-to-earnings or P/E ratio (also known as the P/E multiple) is the price of a stock divided by its earnings per share.
Quantitative easing is a government monetary policy used to increase the money supply by buying government securities or other securities from the market. Quantitative easing increases the money supply by flooding financial institutions with capital in an effort to promote increased lending and liquidity.
QE3 is the nickname for the third round of quantitative easing launched by the Federal Reserve (Fed) whereby the Fed will purchase $40 billion of mortgage-backed securities on a monthly basis in an effort to support the economic recovery.
Return on assets (ROA) measures a company’s profitability by showing how many dollars of earnings a company derives from each dollar of assets it controls.
Return on investment (ROI) is a performance measure used to evaluate the efficiency of an investment or to compare the efficiency of a number of investments. ROI is calculated by dividing the return of an investment by the cost of the investment. The result is expressed as a percentage or ratio.
“Risk-on” is when investors are seeking the potentially higher returns of riskier assets and put money back in the market willing to risk the money, thus risk on.
The S&P 500 Index includes 500 of the United States’ largest stocks from a broad variety of industries. The Index is unmanaged but is a commonly used measure of common stock total return performance.
Valuation is the process of determining the current worth of an asset or company.
World’s Best Growth Companies (WBGCs)® are defined by Wasatch as companies outside the United States that we believe possess an identifiable, sustainable competitive advantage, are well managed, undervalued and are producing above average earnings growth relative to their industry and country of origin.
42
| | |
| WASATCH FUNDS — OPERATING EXPENSES (UNAUDITED) | | SEPTEMBER 30, 2012 |
|
|
|
EXPENSE EXAMPLE
As a shareholder of Wasatch Funds, you incur two types of costs: (1) transaction costs, including redemption fees and (2) ongoing costs, including management fees and other fund expenses. This example is intended to help you understand your ongoing costs (in dollars) of investing in a Wasatch Fund and to compare these costs with the ongoing costs of investing in other mutual funds.
The example is based on an investment of $1,000.00 invested at the beginning of the period and held for the entire six month period ended September 30, 2012.
ACTUAL EXPENSES
The first line of the table below provides information about actual account values and actual expenses, based upon the actual total return of the fund during the most recent six month period ended September 30, 2012. You may use the information in this line, together with the amount you invested, to estimate the expenses you paid over the period. Simply divide your account value by $1,000.00 (for example, an $8,600.00 account value divided by $1,000.00 = 8.6), then multiply the result by the number in the first line under the heading entitled “Expenses Paid During Period” to estimate the expenses you paid on your account during this period.
In addition, the Funds charge a $15.00 IRA distribution fee, a $12.50 IRA annual maintenance fee and a $15.00 fee for redemptions paid by wire. To the extent these fees apply to your account, your expenses paid during the period would be higher and your ending account value would be lower than the amounts shown in the table below.
HYPOTHETICAL EXAMPLEFOR COMPARISON PURPOSES
The second line of the table below provides information about hypothetical account values and hypothetical expenses
based on a fund’s actual expense ratio and an assumed rate of return of 5% per year before expenses, which is not the fund’s actual return. The hypothetical account values and expenses may not be used to estimate the actual ending account balance or expenses you paid for the period. You may use this information to compare the ongoing costs of investing in a Wasatch Fund and other funds. To do so, compare this 5% hypothetical example with the 5% hypothetical examples that appear in the shareholder reports of other funds.
In addition, the Funds charge a $15.00 IRA distribution fee, a $12.50 IRA annual maintenance fee and a $15.00 fee for redemptions paid by wire. To the extent these fees apply to your account, your expenses paid during the period would be higher and your ending account value would be lower than the amounts shown in the table below. If another fund’s fees differ from those listed above, your expenses paid and your ending account value could be higher or lower than those of other funds.
Please note that the expenses shown in the table are meant to highlight your ongoing costs only and do not reflect any transactional costs, such as redemption fees. Therefore, the second line of the table is useful in comparing ongoing costs only, and will not help you determine the relative total costs of owning different funds. In addition, if these transactional costs were included, your costs would have been higher.
A Fund’s annualized expense ratio may vary as a result of various factors including expenses that are not reimbursable under the contractual agreement between the Fund and the Advisor such as interest, taxes, brokerage commissions, other investment related costs, dividend expense on short sales, and extraordinary expenses. The Long/Short and Income funds have no contractual limitation on expenses.
43
| | |
| WASATCH FUNDS — OPERATING EXPENSES (UNAUDITED) (continued) | | SEPTEMBER 30, 2012 |
|
|
|
| | | | | | | | | | | | | | | | |
| | | Account Value | | | Expenses Paid
During Period* | | | Annualized
Expense
Ratio* | |
| Fund/Class and Return | | Beginning of Period
April 1, 2012 | | | End of Period
September 30, 2012 | | | |
Core Growth Fund — Investor Class | | | | | | | | | | | | | | | | |
Actual | | | $1,000.00 | | | | $1,031.60 | | | | $6.25 | | | | 1.23% | |
Hypothetical (5% before expenses) | | | $1,000.00 | | | | $1,018.85 | | | | $6.21 | | | | 1.23% | |
Core Growth Fund — Institutional Class | | | | | | | | | | | | | | | | |
Actual | | | $1,000.00 | | | | $1,032.10 | | | | $5.69 | | | | 1.12% | |
Hypothetical (5% before expenses) | | | $1,000.00 | | | | $1,019.40 | | | | $5.65 | | | | 1.12% | |
Emerging India Fund | | | | | | | | | | | | | | | | |
Actual | | | $1,000.00 | | | | $1,080.20 | | | | $10.14 | | | | 1.95% | |
Hypothetical (5% before expenses) | | | $1,000.00 | | | | $1,015.25 | | | | $9.82 | | | | 1.95% | |
Emerging Markets Small Cap Fund | | | | | | | | | | | | | | | | |
Actual | | | $1,000.00 | | | | $1,011.40 | | | | $9.81 | | | | 1.95% | |
Hypothetical (5% before expenses) | | | $1,000.00 | | | | $1,015.25 | | | | $9.82 | | | | 1.95% | |
Frontier Emerging Small Countries Fund | | | | | | | | | | | | | | | | |
Actual | | | $1,000.00 | | | | $1,180.50 | | | | $12.27 | | | | 2.25% | |
Hypothetical (5% before expenses) | | | $1,000.00 | | | | $1,013.75 | | | | $11.33 | | | | 2.25% | |
Global Opportunities Fund | | | | | | | | | | | | | | | | |
Actual | | | $1,000.00 | | | | $1,050.60 | | | | $9.07 | | | | 1.77% | |
Hypothetical (5% before expenses) | | | $1,000.00 | | | | $1,016.15 | | | | $8.92 | | | | 1.77% | |
Heritage Growth Fund | | | | | | | | | | | | | | | | |
Actual | | | $1,000.00 | | | | $971.90 | | | | $4.68 | | | | 0.95% | |
Hypothetical (5% before expenses) | | | $1,000.00 | | | | $1,020.25 | | | | $4.80 | | | | 0.95% | |
International Growth Fund | | | | | | | | | | | | | | | | |
Actual | | | $1,000.00 | | | | $1,077.80 | | | | $8.05 | | | | 1.55% | |
Hypothetical (5% before expenses) | | | $1,000.00 | | | | $1,017.25 | | | | $7.82 | | | | 1.55% | |
International Opportunities Fund | | | | | | | | | | | | | | | | |
Actual | | | $1,000.00 | | | | $1,057.00 | | | | $11.57 | | | | 2.25% | |
Hypothetical (5% before expenses) | | | $1,000.00 | | | | $1,013.75 | | | | $11.33 | | | | 2.25% | |
Large Cap Value Fund — Investor Class | | | | | | | | | | | | | | | | |
Actual | | | $1,000.00 | | | | $1,003.40 | | | | $5.51 | | | | 1.10% | |
Hypothetical (5% before expenses) | | | $1,000.00 | | | | $1,019.50 | | | | $5.55 | | | | 1.10% | |
Large Cap Value Fund — Institutional Class | | | | | | | | | | | | | | | | |
Actual | | | $1,000.00 | | | | $1,004.00 | | | | $4.91 | | | | 0.98% | |
Hypothetical (5% before expenses) | | | $1,000.00 | | | | $1,020.10 | | | | $4.95 | | | | 0.98% | |
Long/Short Fund | | | | | | | | | | | | | | | | |
Actual | | | $1,000.00 | | | | $997.10 | | | | $7.69 | | | | 1.54% | |
Hypothetical (5% before expenses) | | | $1,000.00 | | | | $1,017.30 | | | | $7.77 | | | | 1.54% | |
Micro Cap Fund | | | | | | | | | | | | | | | | |
Actual | | | $1,000.00 | | | | $1,007.10 | | | | $10.64 | | | | 2.12% | |
Hypothetical (5% before expenses) | | | $1,000.00 | | | | $1,014.40 | | | | $10.68 | | | | 2.12% | |
Micro Cap Value Fund | | | | | | | | | | | | | | | | |
Actual | | | $1,000.00 | | | | $1,036.40 | | | | $11.45 | | | | 2.25% | |
Hypothetical (5% before expenses) | | | $1,000.00 | | | | $1,013.75 | | | | $11.33 | | | | 2.25% | |
Small Cap Growth Fund | | | | | | | | | | | | | | | | |
Actual | | | $1,000.00 | | | | $1,015.30 | | | | $6.30 | | | | 1.25% | |
Hypothetical (5% before expenses) | | | $1,000.00 | | | | $1,018.75 | | | | $6.31 | | | | 1.25% | |
Small Cap Value Fund — Investor Class** | | | | | | | | | | | | | | | | |
Actual | | | $1,000.00 | | | | $992.20 | | | | $6.38 | | | | 1.28% | |
Hypothetical (5% before expenses) | | | $1,000.00 | | | | $1,018.60 | | | | $6.46 | | | | 1.28% | |
Small Cap Value Fund — Institutional Class | | | | | | | | | | | | | | | | |
Actual | | | $1,000.00 | | | | $992.20 | | | | $5.73 | | | | 1.15% | |
Hypothetical (5% before expenses) | | | $1,000.00 | | | | $1,019.25 | | | | $5.81 | | | | 1.15% | |
Strategic Income Fund | | | | | | | | | | | | | | | | |
Actual | | | $1,000.00 | | | | $1,018.70 | | | | $4.79 | | | | 0.95% | |
Hypothetical (5% before expenses) | | | $1,000.00 | | | | $1,020.25 | | | | $4.80 | | | | 0.95% | |
Ultra Growth Fund | | | | | | | | | | | | | | | | |
Actual | | | $1,000.00 | | | | $986.60 | | | | $6.46 | | | | 1.30% | |
Hypothetical (5% before expenses) | | | $1,000.00 | | | | $1,018.50 | | | | $6.56 | | | | 1.30% | |
World Innovators Fund | | | | | | | | | | | | | | | | |
Actual | | | $1,000.00 | | | | $1,026.60 | | | | $9.32 | | | | 1.84% | |
Hypothetical (5% before expenses) | | | $1,000.00 | | | | $1,015.80 | | | | $9.27 | | | | 1.84% | |
Income Fund | | | | | | | | | | | | | | | | |
Actual | | | $1,000.00 | | | | $1,022.40 | | | | $3.59 | | | | 0.71% | |
Hypothetical (5% before expenses) | | | $1,000.00 | | | | $1,021.45 | | | | $3.59 | | | | 0.71% | |
U.S. Treasury Fund | | | | | | | | | | | | | | | | |
Actual | | | $1,000.00 | | | | $1,131.90 | | | | $3.78 | | | | 0.71% | |
Hypothetical (5% before expenses) | | | $1,000.00 | | | | $1,021.45 | | | | $3.59 | | | | 0.71% | |
*Expenses are equal to a fund’s annualized expense ratio as indicated above multiplied by the average account value over the period, multiplied by the number of days in the most recent fiscal half-year divided by the number of days in the full fiscal year (183/366).
**The expense limitation decreased from 1.95% to 1.50% on January 31, 2012.
44
| | |
| WASATCH CORE GROWTH FUND (WGROX / WIGRX) — Schedule of Investments | | SEPTEMBER 30, 2012 |
|
|
|
| | | | | | | | |
| Shares | | | | | Value | |
| | | | | | | |
| | | | COMMON STOCKS 92.3% | | | | |
| | |
| | | | Airlines 2.2% | | | | |
| | 203,151 | | | Allegiant Travel Co.* | | $ | 12,871,647 | |
| | | | | | | | |
| | | | Application Software 6.0% | | | | |
| | 215,701 | | | ANSYS, Inc.* ‡ | | | 15,832,454 | |
| | 185,032 | | | RealPage, Inc.* | | | 4,181,723 | |
| | 153,392 | | | Tyler Technologies, Inc.* | | | 6,752,316 | |
| | 86,250 | | | Ultimate Software Group, Inc.* | | | 8,806,125 | |
| | | | | | | | |
| | | | | | | 35,572,618 | |
| | | | | | | | |
| | | | Asset Management & Custody
Banks 3.8% | | | | |
| | 104,999 | | | Affiliated Managers Group, Inc.* | | | 12,914,877 | |
| | 445,332 | | | SEI Investments Co. | | | 9,552,371 | |
| | | | | | | | |
| | | | | | | 22,467,248 | |
| | | | | | | | |
| | | | Automobile Manufacturers 1.2% | | | | |
| | 231,863 | | | Tesla Motors, Inc.* | | | 6,788,949 | |
| | | | | | | | |
| | | | Automotive Retail 1.3% | | | | |
| | 226,026 | | | Monro Muffler Brake, Inc. | | | 7,953,855 | |
| | | | | | | | |
| | | | Commercial Printing 2.3% | | | | |
| | 1,045,087 | | | InnerWorkings, Inc.* | | | 13,607,033 | |
| | | | | | | | |
| | | | Consumer Electronics 0.6% | | | | |
| | 253,513 | | | Skullcandy, Inc.* | | | 3,485,804 | |
| | | | | | | | |
| | | | Consumer Finance 4.5% | | | | |
| | 837,842 | | | DFC Global Corp.* | | | 14,368,990 | |
| | 192,168 | | | First Cash Financial Services, Inc.* | | | 8,841,650 | |
| | 190,700 | | | Mahindra & Mahindra Financial Services Ltd. (India) | | | 3,250,161 | |
| | | | | | | | |
| | | | | | | 26,460,801 | |
| | | | | | | | |
| | | | Data Processing & Outsourced Services 6.4% | | | | |
| | 132,721 | | | Alliance Data Systems Corp.* ‡ | | | 18,839,746 | |
| | 294,450 | | | ExlService Holdings, Inc.* | | | 8,686,275 | |
| | 746,608 | | | Higher One Holdings, Inc.* | | | 10,064,276 | |
| | | | | | | | |
| | | | | | | 37,590,297 | |
| | | | | | | | |
| | | | Distributors 1.7% | | | | |
| | 239,077 | | | Pool Corp. | | | 9,940,822 | |
| | | | | | | | |
| | | | Diversified Banks 3.4% | | | | |
| | 7,941,426 | | | City Union Bank Ltd. (India) | | | 7,957,235 | |
| | 1,630,720 | | | Yes Bank Ltd. (India) | | | 11,848,961 | |
| | | | | | | | |
| | | | | | | 19,806,196 | |
| | | | | | | | |
| | | | Diversified Support Services 7.0% | | | | |
| | 1,128,212 | | | Copart, Inc.* | | | 31,285,319 | |
| | 97,185 | | | Portfolio Recovery Associates, Inc.* | | | 10,149,029 | |
| | | | | | | | |
| | | | | | | 41,434,348 | |
| | | | | | | | |
| | | | Electrical Components &
Equipment 3.0% | | | | |
| | 509,058 | | | Polypore International, Inc.* | | | 17,995,200 | |
| | | | | | | | |
| | | | Environmental & Facilities
Services 3.5% | | | | |
| | 204,490 | | | Tetra Tech, Inc.* | | | 5,369,908 | |
| | 504,185 | | | Waste Connections, Inc. | | | 15,251,596 | |
| | | | | | | | |
| | | | | | | 20,621,504 | |
| | | | | | | | |
| | | | General Merchandise Stores 0.9% | | | | |
| | 288,866 | | | Gordmans Stores, Inc.* | | | 5,329,578 | |
| | | | | | | | |
| | | | Health Care Distributors 1.8% | | | | |
| | 467,667 | | | PSS World Medical, Inc.* | | | 10,653,454 | |
| | | | | | | | |
| | | | Health Care Facilities 2.2% | | | | |
| | 428,676 | | | Ensign Group, Inc. (The) | | | 13,119,629 | |
| | | | | | | | |
| | | | | | | | |
| Shares | | | | | Value | |
| | | | | | | |
| | | | Health Care Services 4.2% | | | | |
| | 157,668 | | | IPC The Hospitalist Co., Inc.* | | $ | 7,205,428 | |
| | 238,850 | | | MEDNAX, Inc.* | | | 17,782,382 | |
| | | | | | | | |
| | | | | | | 24,987,810 | |
| | | | | | | | |
| | | | Home Improvement Retail 0.9% | | | | |
| | 106,280 | | | Lumber Liquidators Holdings, Inc.* ‡ | | | 5,386,270 | |
| | | | | | | | |
| | | | Industrial Machinery 4.4% | | | | |
| | 147,926 | | | Graco, Inc. | | | 7,437,719 | |
| | 444,145 | | | IDEX Corp. | | | 18,551,937 | |
| | | | | | | | |
| | | | | | | 25,989,656 | |
| | | | | | | | |
| | | | Internet Retail 0.4% | | | | |
| | 67,590 | | | Blue Nile, Inc.* | | | 2,506,913 | |
| | | | | | | | |
| | | | Internet Software & Services 3.9% | | | | |
| | 179,193 | | | Ancestry.com, Inc.* ‡ | | | 5,390,125 | |
| | 247,566 | | | DealerTrack Holdings, Inc.* | | | 6,894,713 | |
| | 318,585 | | | Vistaprint N.V.* | | | 10,879,678 | |
| | | | | | | | |
| | | | | | | 23,164,516 | |
| | | | | | | | |
| | | | Leisure Facilities 3.8% | | | | |
| | 490,285 | | | Life Time Fitness, Inc.* | | | 22,425,636 | |
| | | | | | | | |
| | | | Life Sciences Tools & Services 2.0% | | | | |
| | 278,130 | | | ICON plc ADR* (Ireland) | | | 6,778,028 | |
| | 68,040 | | | Techne Corp. | | | 4,894,798 | |
| | | | | | | | |
| | | | | | | 11,672,826 | |
| | | | | | | | |
| | | | Oil & Gas Equipment & Services 1.9% | | | | |
| | 45,991 | | | CARBO Ceramics, Inc. | | | 2,893,754 | |
| | 117,555 | | | Dril-Quip, Inc.* | | | 8,449,853 | |
| | | | | | | | |
| | | | | | | 11,343,607 | |
| | | | | | | | |
| | | | Oil & Gas Exploration &
Production 0.4% | | | | |
| | 320,020 | | | SandRidge Energy, Inc.* | | | 2,230,539 | |
| | | | | | | | |
| | | | Personal Products 2.2% | | | | |
| | 268,140 | | | Herbalife Ltd. | | | 12,709,836 | |
| | | | | | | | |
| | | | Real Estate Services 0.5% | | | | |
| | 158,871 | | | LPS Brasil — Consultoria de Imoveis S.A. (Brazil) | | | 2,860,344 | |
| | | | | | | | |
| | | | Research & Consulting Services 2.1% | | | | |
| | 192,613 | | | Corporate Executive Board Co. (The) | | | 10,329,835 | |
| | 108,563 | | | CRA International, Inc.* | | | 1,875,969 | |
| | | | | | | | |
| | | | | | | 12,205,804 | |
| | | | | | | | |
| | | | Semiconductors 3.9% | | | | |
| | 133,940 | | | Hittite Microwave Corp.* | | | 7,429,652 | |
| | 387,065 | | | Melexis N.V. (Belgium) | | | 6,542,162 | |
| | 108,525 | | | Power Integrations, Inc. | | | 3,302,416 | |
| | 151,643 | | | Silicon Laboratories, Inc.* | | | 5,574,397 | |
| | | | | | | | |
| | | | | | | 22,848,627 | |
| | | | | | | | |
| | | | Specialized Finance 1.2% | | | | |
| | 402,640 | | | CRISIL Ltd. (India) | | | 7,328,361 | |
| | | | | | | | |
| | | | Specialty Chemicals 1.1% | | | | |
| | 183,540 | | | Balchem Corp. | | | 6,741,424 | |
| | | | | | | | |
| | | | Specialty Stores 1.6% | | | | |
| | 156,551 | | | Hibbett Sports, Inc.* | | | 9,306,957 | |
| | | | | | | | |
| | | | Trading Companies &
Distributors 3.3% | | | | |
| | 255,043 | | | MSC Industrial Direct Co., Inc., Class A | | | 17,205,201 | |
| | 143,605 | | | Rush Enterprises, Inc., Class B* | | | 2,414,000 | |
| | | | | | | | |
| | | | | | | 19,619,201 | |
| | | | | | | | |
45
| | |
| WASATCH CORE GROWTH FUND (WGROX / WIGRX) — Schedule of Investments (continued) | | SEPTEMBER 30, 2012 |
|
|
|
| | | | | | | | |
Shares | | | | | Value | |
| | | | | | | |
| | | | Trucking 2.7% | | | | |
| | 496,240 | | | Knight Transportation, Inc. | | $ | 7,096,232 | |
| | 302,485 | | | Old Dominion Freight Line, Inc.* | | | 9,122,948 | |
| | | | | | | | |
| | | | | | | 16,219,180 | |
| | | | | | | | |
| | |
| | | | Total Common Stocks
(cost $381,279,463) | | | 545,246,490 | |
| | | | | | | | |
| | |
| | | | PREFERRED STOCKS 0.7% | | | | |
| | |
| | | | Regional Banks 0.7% | | | | |
| | 797,675 | | | Banco Daycoval S.A. Pfd. (Brazil) | | | 4,289,951 | |
| | | | | | | | |
| | |
| | | | Total Preferred Stocks
(cost $5,303,460) | | | 4,289,951 | |
| | | | | | | | |
| | |
Principal
Amount | | | | | Value | |
| | | | | | | |
| | |
| | | | SHORT-TERM INVESTMENTS 7.1% | | | | |
| | |
| | | | Repurchase Agreement 7.1% | | | | |
| | $41,733,232 | | | Repurchase Agreement dated 9/28/12, 0.01% due 10/1/12 with State Street Bank and Trust Co. collateralized by $31,310,000 of United States Treasury Bonds 4.500% due 08/15/39; value: $42,569,045; repurchase proceeds: $41,733,267‡ (cost $41,733,232) | | $ | 41,733,232 | |
| | | | | | | | |
| | |
| | | | Total Short-Term Investments
(cost $41,733,232) | | | 41,733,232 | |
| | | | | | | | |
| | |
| | | | Total Investments
(cost $428,316,155) 100.1% | | | 591,269,673 | |
| | |
| | | | Liabilities less Other Assets (0.1%) | | | (798,069 | ) |
| | | | | | | | |
| | |
| | | | NET ASSETS 100.0% | | $ | 590,471,604 | |
| | | | | | | | |
| | | | | | | | |
Number of
Contracts | | | | | Value | |
| | |
| | | | CALL OPTIONS WRITTEN 0.0% | | | | |
| | |
| | | | Application Software 0.0% | | | | |
| | 200 | | | ANSYS, Inc., expiring 10/20/12,
exercise price $75 | | $ | 16,000 | |
| | | | | | | | |
| | | | Data Processing & Outsourced Services 0.0% | | | | |
| | 50 | | | Alliance Data Systems Corp., expiring 10/20/12, exercise price $145 | | | 8,300 | |
| | | | | | | | |
| | | | Home Improvement Retail 0.0% | | | | |
| | 500 | | | Lumber Liquidators Holdings, Inc., expiring 11/17/12, exercise price $55 | | | 65,000 | |
| | | | | | | | |
| | | | Internet Software & Services 0.0% | | | | |
| | 300 | | | Ancestry.com, Inc., expiring 10/20/12, exercise price $32.5 | | | 23,400 | |
| | | | | | | | |
| | |
| | | | Total Call Options Written
(premium $150,916) | | | 112,700 | |
| | | | | | | | |
| |
| | | | *Non-income producing. ‡All or a portion of this security has been designated as collateral for call options written (see Notes 4 and 7). ADR American Depositary Receipt. See Notes to Financial Statements. | |
At September 30, 2012, Wasatch Core Growth Fund’s investments, excluding short-term investments and call options written, were in the following countries:
| | | | |
| Country | | % | |
Belgium | | | 1.2 | |
Brazil | | | 1.3 | |
India | | | 5.5 | |
Ireland | | | 1.2 | |
United States | | | 90.8 | |
| | | | |
TOTAL | | | 100.0 | % |
| | | | |
46
| | |
WASATCH EMERGING INDIA FUND
(WAINX) — Schedule of Investments | | SEPTEMBER 30, 2012 |
|
|
|
| | | | | | | | |
| Shares | | | | | Value | |
| | | | | | | |
| | | | COMMON STOCKS 97.1% | | | | |
| | |
| | | | Aerospace & Defense 1.0% | | | | |
| | 6,243 | | | Bharat Electronics Ltd. (India) | | $ | 142,744 | |
| | | | | | | | |
| | | | Air Freight & Logistics 1.1% | | | | |
| | 4,360 | | | Blue Dart Express Ltd. (India) | | | 143,823 | |
| | | | | | | | |
| | | | Apparel, Accessories & Luxury
Goods 3.4% | | | | |
| | 4,480 | | | Page Industries Ltd. (India) | | | 271,798 | |
| | 38,720 | | | Titan Industries Ltd. (India) | | | 192,334 | |
| | | | | | | | |
| | | | | | | 464,132 | |
| | | | | | | | |
| | | | Application Software 1.2% | | | | |
| | 2,775 | | | Oracle Financial Services Software Ltd.* (India) | | | 158,711 | |
| | | | | | | | |
| | | | Auto Parts & Equipment 5.7% | | | | |
| | 1,745 | | | Bosch Ltd. (India) | | | 293,783 | |
| | 47,995 | | | Exide Industries Ltd. (India) | | | 139,904 | |
| | 10,812 | | | WABCO India Ltd. (India) | | | 338,227 | |
| | | | | | | | |
| | | | | | | 771,914 | |
| | | | | | | | |
| | | | Automobile Manufacturers 1.1% | | | | |
| | 9,465 | | | Mahindra & Mahindra Ltd. (India) | | | 155,016 | |
| | | | | | | | |
| | | | Cable & Satellite 1.4% | | | | |
| | 120,082 | | | Dish TV India Ltd.* (India) | | | 188,051 | |
| | | | | | | | |
| | | | Commodity Chemicals 3.0% | | | | |
| | 94,334 | | | Berger Paints India Ltd. (India) | | | 263,713 | |
| | 25,870 | | | Castrol India Ltd. (India) | | | 152,807 | |
| | | | | | | | |
| | | | | | | 416,520 | |
| | | | | | | | |
| | | | Construction & Engineering 1.0% | | | | |
| | 30,426 | | | Engineers India Ltd. (India) | | | 136,137 | |
| | | | | | | | |
| | | | Construction & Farm Machinery & Heavy Trucks 1.9% | | | | |
| | 5,655 | | | Eicher Motors Ltd. (India) | | | 253,025 | |
| | | | | | | | |
| | | | Consumer Finance 3.1% | | | | |
| | 25,210 | | | Mahindra & Mahindra Financial Services Ltd. (India) | | | 429,662 | |
| | | | | | | | |
| | | | Diversified Banks 7.9% | | | | |
| | 335,360 | | | City Union Bank Ltd. (India) | | | 336,027 | |
| | 34,550 | | | IndusInd Bank Ltd. (India) | | | 233,194 | |
| | 568,255 | | | South Indian Bank Ltd. (India) | | | 245,639 | |
| | 36,360 | | | Yes Bank Ltd. (India) | | | 264,195 | |
| | | | | | | | |
| | | | | | | 1,079,055 | |
| | | | | | | | |
| | | | Diversified Chemicals 1.0% | | | | |
| | 10,605 | | | BASF India Ltd. (India) | | | 132,299 | |
| | | | | | | | |
| | | | Diversified Metals & Mining 0.9% | | | | |
| | 47,840 | | | Hindustan Zinc Ltd. (India) | | | 124,124 | |
| | | | | | | | |
| | | | Electrical Components &
Equipment 2.9% | | | | |
| | 94,578 | | | Amara Raja Batteries Ltd. (India) | | | 391,348 | |
| | | | | | | | |
| | | | Fertilizers & Agricultural
Chemicals 1.1% | | | | |
| | 56,390 | | | Rallis India Ltd. (India) | | | 156,571 | |
| | | | | | | | |
| | | | Footwear 2.4% | | | | |
| | 18,000 | | | Bata India Ltd. (India) | | | 333,586 | |
| | | | | | | | |
| | | | Gas Utilities 1.3% | | | | |
| | 28,173 | | | Gujarat Gas Co. Ltd. (India) | | | 182,942 | |
| | | | | | | | |
| | | | Heavy Electrical Equipment 1.8% | | | | |
| | 47,368 | | | TD Power Systems Ltd. (India) | | | 244,271 | |
| | | | | | | | |
| | | | | | | | |
| Shares | | | | | Value | |
| | | | | | | |
| | | | Household Appliances 2.4% | | | | |
| | 4,445 | | | Hawkins Cookers Ltd. (India) | | $ | 162,479 | |
| | 2,434 | | | TTK Prestige Ltd. (India) | | | 171,573 | |
| | | | | | | | |
| | | | | | | 334,052 | |
| | | | | | | | |
| | | | Industrial Machinery 5.3% | | | | |
| | 13,860 | | | AIA Engineering Ltd. (India) | | | 93,416 | |
| | 14,647 | | | Cummins India Ltd. (India) | | | 141,346 | |
| | 7,100 | | | FAG Bearings India Ltd. (India) | | | 242,278 | |
| | 10,065 | | | SKF India Ltd. (India) | | | 127,184 | |
| | 10,760 | | | Thermax Ltd. (India) | | | 114,689 | |
| | | | | | | | |
| | | | | | | 718,913 | |
| | | | | | | | |
| | | | Internet Retail 1.8% | | | | |
| | 14,737 | | | MakeMyTrip Ltd.* (India) | | | 250,971 | |
| | | | | | | | |
| | | | Internet Software & Services 1.0% | | | | |
| | 21,322 | | | Info Edge India Ltd. (India) | | | 140,435 | |
| | | | | | | | |
| | | | IT Consulting & Other Services 3.8% | | | | |
| | 7,235 | | | CMC Ltd. (India) | | | 151,566 | |
| | 5,234 | | | Cognizant Technology Solutions Corp., Class A* | | | 365,961 | |
| | | | | | | | |
| | | | | | | 517,527 | |
| | | | | | | | |
| | | | Life Sciences Tools & Services 1.3% | | | | |
| | 8,915 | | | Divi’s Laboratories Ltd. (India) | | | 182,999 | |
| | | | | | | | |
| | | | Oil & Gas Storage &
Transportation 1.5% | | | | |
| | 66,378 | | | Petronet LNG Ltd. (India) | | | 198,587 | |
| | | | | | | | |
| | | | Packaged Foods & Meats 3.1% | | | | |
| | 4,580 | | | GlaxoSmithKline Consumer Healthcare Ltd. (India) | | | 262,149 | |
| | 1,925 | | | Nestlé India Ltd. (India) | | | 161,496 | |
| | | | | | | | |
| | | | | | | 423,645 | |
| | | | | | | | |
| | | | Personal Products 7.9% | | | | |
| | 10,757 | | | Colgate-Palmolive India Ltd. (India) | | | 245,752 | |
| | 78,120 | | | Dabur India Ltd. (India) | | | 191,283 | |
| | 28,062 | | | Godrej Consumer Products Ltd. (India) | | | 355,929 | |
| | 45,175 | | | Marico Ltd. (India) | | | 171,210 | |
| | 2,435 | | | Procter & Gamble Hygiene & Health Care Ltd. (India) | | | 114,906 | |
| | | | | | | | |
| | | | | | | 1,079,080 | |
| | | | | | | | |
| | | | Pharmaceuticals 3.6% | | | | |
| | 8,160 | | | Cadila Healthcare Ltd. (India) | | | 135,059 | |
| | 18,935 | | | IPCA Laboratories Ltd. (India) | | | 175,547 | |
| | 15,520 | | | Lupin Ltd. (India) | | | 176,121 | |
| | | | | | | | |
| | | | | | | 486,727 | |
| | | | | | | | |
| | | | Publishing 0.9% | | | | |
| | 31,127 | | | D.B. Corp. Ltd. (India) | | | 119,740 | |
| | | | | | | | |
| | | | Research & Consulting Services 1.5% | | | | |
| | 14,249 | | | eClerx Services Ltd. (India) | | | 208,082 | |
| | | | | | | | |
| | | | Restaurants 3.5% | | | | |
| | 18,381 | | | Jubilant Foodworks Ltd.* (India) | | | 476,819 | |
| | | | | | | | |
| | | | Specialized Finance 2.2% | | | | |
| | 16,400 | | | CRISIL Ltd. (India) | | | 298,493 | |
| | | | | | | | |
| | | | Specialty Chemicals 2.0% | | | | |
| | 3,615 | | | Asian Paints Ltd. (India) | | | 270,373 | |
| | | | | | | | |
| | | | Steel 0.3% | | | | |
| | 9,680 | | | MOIL Ltd. (India) | | | 46,285 | |
| | | | | | | | |
| | | | Systems Software 1.2% | | | | |
| | 70,920 | | | KPIT Cummins Infosystems Ltd. (India) | | | 166,728 | |
| | | | | | | | |
47
| | |
WASATCH EMERGING INDIA FUND
(WAINX) — Schedule of Investments (continued) | | SEPTEMBER 30, 2012 |
|
|
|
| | | | | | | | |
| Shares | | | | | Value | |
| | | | | | | |
| | | | Thrifts & Mortgage Finance 8.8% | | | | |
| | 117,525 | | | Gruh Finance Ltd. (India) | | $ | 461,232 | |
| | 24,554 | | | Housing Development Finance Corp. Ltd. (India) | | | 358,825 | |
| | 71,601 | | | LIC Housing Finance Ltd. (India) | | | 383,627 | |
| | | | | | | | |
| | | | | | | 1,203,684 | |
| | | | | | | | |
| | | | Tobacco 1.8% | | | | |
| | 7,205 | | | VST Industries Ltd. (India) | | | 241,783 | |
| | | | | | | | |
| | |
| | | | Total Common Stocks (cost $12,025,826) | | | 13,268,854 | |
| | | | | | | | |
| | |
Principal
Amount | | | | | Value | |
| | | | | | | |
| | | | SHORT-TERM INVESTMENTS 1.5% | | | | |
| | |
| | | | Repurchase Agreement 1.5% | | | | |
| | $203,320 | | | Repurchase Agreement dated 9/28/12, 0.01% due 10/1/12 with State Street Bank and Trust Co. collateralized by $155,000 of United States Treasury Bonds 4.500% due 8/15/39; value: $210,738; repurchase proceeds: $203,321 (cost $203,320) | | $ | 203,320 | |
| | | | | | | | |
| | |
| | | | Total Short-Term Investments (cost $203,320) | | | 203,320 | |
| | | | | | | | |
| | |
| | | | Total Investments (cost $12,229,146) 98.6% | | | 13,472,174 | |
| | |
| | | | Other Assets less Liabilities 1.4% | | | 185,712 | |
| | | | | | | | |
| | |
| | | | NET ASSETS 100.0% | | $ | 13,657,886 | |
| | | | | | | | |
| |
| | | | *Non-income producing. See Notes to Financial Statements. | |
At September 30, 2012, Wasatch Emerging India Fund’s investments, excluding short-term investments, were in the following countries:
| | | | |
| Country | | % | |
India | | | 97.2 | |
United States | | | 2.8 | |
| | | | |
TOTAL | | | 100.0 | % |
| | | | |
48
| | |
WASATCH EMERGING MARKETS SMALL CAP FUND
(WAEMX) — Schedule of Investments | | SEPTEMBER 30, 2012 |
|
|
|
| | | | | | | | |
| Shares | | | | | Value | |
| | | | | | | |
| | |
| | | | COMMON STOCKS 95.6% | | | | |
| | |
| | | | Airport Services 1.1% | | | | |
| | 3,347,333 | | | TAV Havalimanlari Holding A.S. (Turkey) | | $ | 16,594,493 | |
| | | | | | | | |
| | | | Apparel Retail 3.4% | | | | |
| | 527,665 | | | Cia. Hering (Brazil) | | | 11,931,855 | |
| | 17,511,603 | | | Giordano International Ltd. (Hong Kong) | | | 14,724,362 | |
| | 1,522,952 | | | Mr Price Group Ltd. (South Africa) | | | 23,094,166 | |
| | | | | | | | |
| | | | | | | 49,750,383 | |
| | | | | | | | |
| | | | Apparel, Accessories & Luxury
Goods 2.3% | | | | |
| | 12,871 | | | LPP S.A. (Poland) | | | 13,679,285 | |
| | 29,716,828 | | | Trinity Ltd. (China) | | | 19,889,909 | |
| | | | | | | | |
| | | | | | | 33,569,194 | |
| | | | | | | | |
| | | | Asset Management & Custody
Banks 0.9% | | | | |
| | 960,886 | | | CETIP S.A. — Mercados Organizados (Brazil) | | | 12,611,110 | |
| | | | | | | | |
| | | | Brewers 1.0% | | | | |
| | 2,814,487 | | | Guinness Anchor Berhad (Malaysia) | | | 14,051,717 | |
| | | | | | | | |
| | | | Building Products 0.7% | | | | |
| | 6,312,598 | | | Dynasty Ceramic Public Co. Ltd.*** (Thailand) | | | 10,408,198 | |
| | | | | | | | |
| | | | Cable & Satellite 0.8% | | | | |
| | 56,607,012 | | | PT MNC Sky Vision Tbk* (Indonesia) | | | 12,273,725 | |
| | | | | | | | |
| | | | Catalog Retail 0.6% | | | | |
| | 86,300 | | | Hyundai Home Shopping Network Corp. (Korea) | | | 9,317,768 | |
| | | | | | | | |
| | | | Coal & Consumable Fuels 1.0% | | | | |
| | 16,311,073 | | | PT Harum Energy Tbk (Indonesia) | | | 10,055,938 | |
| | 15,135,033 | | | PT Resource Alam Indonesia Tbk (Indonesia) | | | 4,704,987 | |
| | | | | | | | |
| | | | | | | 14,760,925 | |
| | | | | | | | |
| | | | Commodity Chemicals 2.0% | | | | |
| | 5,050,049 | | | Berger Paints India Ltd. (India) | | | 14,117,541 | |
| | 2,715,428 | | | Castrol India Ltd. (India) | | | 16,039,276 | |
| | | | | | | | |
| | | | | | | 30,156,817 | |
| | | | | | | | |
| | | | Computer & Electronics Retail 1.1% | | | | |
| | 1,987,806 | | | M Video OJSC*** (Russia) | | | 16,587,446 | |
| | | | | | | | |
| | | | Computer Storage & Peripherals 0.9% | | | | |
| | 2,310,176 | | | Simplo Technology Co. Ltd. (Taiwan) | | | 13,831,030 | |
| | | | | | | | |
| | | | Construction & Farm Machinery &
Heavy Trucks 1.2% | | | | |
| | 821,235 | | | Turk Traktor ve Ziraat Makineleri A.S. (Turkey) | | | 17,611,780 | |
| | | | | | | | |
| | | | Construction Materials 2.6% | | | | |
| | 26,582,705 | | | Holcim Philippines, Inc. (Philippines) | | | 8,284,194 | |
| | 2,426,533 | | | Lafarge Malayan Cement Berhad (Malaysia) | | | 7,065,645 | |
| | 79,746,534 | | | PT Holcim Indonesia Tbk (Indonesia) | | | 23,748,968 | |
| | | | | | | | |
| | | | | | | 39,098,807 | |
| | | | | | | | |
| | | | Consumer Finance 1.6% | | | | |
| | 1,376,106 | | | Mahindra & Mahindra Financial Services Ltd. (India) | | | 23,453,417 | |
| | | | | | | | |
| | | | Department Stores 1.7% | | | | |
| | 4,800,087 | | | Golden Eagle Retail Group Ltd. (China) | | | 9,434,026 | |
| | 22,428,662 | | | PT Mitra Adiperkasa Tbk (Indonesia) | | | 14,999,314 | |
| | | | | | | | |
| | | | | | | 24,433,340 | |
| | | | | | | | |
| | | | | | | | |
| Shares | | | | | Value | |
| | | | | | | |
| | | | Distributors 1.1% | | | | |
| | 11,336,573 | | | Dah Chong Hong Holdings Ltd. (China) | | $ | 10,321,659 | |
| | 251,657 | | | Imperial Holdings Ltd. (South Africa) | | | 5,679,543 | |
| | | | | | | | |
| | | | | | | 16,001,202 | |
| | | | | | | | |
| | | | Diversified Banks 10.1% | | | | |
| | 533,774 | | | Capitec Bank Holdings Ltd. (South Africa) | | | 14,390,816 | |
| | 2,500,197 | | | IndusInd Bank Ltd. (India) | | | 16,874,967 | |
| | 879,846 | | | NOMOS-BANK, GDR* (Russia) | | | 10,998,075 | |
| | 29,681,945 | | | PT Bank Tabungan Pensiunan Nasional Tbk* (Indonesia) | | | 16,283,199 | |
| | 7,319,351 | | | Security Bank Corp. (Philippines) | | | 28,775,586 | |
| | 17,885,800 | | | Thanachart Capital Public Co. Ltd.*** (Thailand) | | | 21,935,963 | |
| | 16,199,146 | | | Turkiye Sinai Kalkinma Bankasi A.S. (Turkey) | | | 18,046,674 | |
| | 2,972,932 | | | Yes Bank Ltd. (India) | | | 21,601,596 | |
| | | | | | | | |
| | | | | | | 148,906,876 | |
| | | | | | | | |
| | | | Diversified Chemicals 1.1% | | | | |
| | 3,926,023 | | | Pidilite Industries Ltd. (India) | | | 15,515,774 | |
| | | | | | | | |
| | | | Diversified Metals & Mining 0.9% | | | | |
| | 42,100,416 | | | PT Vale Indonesia Tbk (Indonesia) | | | 12,977,662 | |
| | | | | | | | |
| | | | Drug Retail 1.4% | | | | |
| | 2,954,295 | | | Clicks Group Ltd. (South Africa) | | | 20,580,806 | |
| | | | | | | | |
| | | | Electronic Equipment &
Instruments 1.0% | | | | |
| | 6,969,452 | | | Chroma ATE, Inc. (Taiwan) | | | 14,669,527 | |
| | | | | | | | |
| | | | Environmental & Facilities
Services 1.2% | | | | |
| | 2,352,900 | | | Cleanaway Co. Ltd. (Taiwan) | | | 17,257,356 | |
| | | | | | | | |
| | | | Food Retail 1.3% | | | | |
| | 1,563,727 | | | Eurocash S.A. (Poland) | | | 19,258,805 | |
| | | | | | | | |
| | | | Footwear 1.9% | | | | |
| | 1,246,450 | | | Bata India Ltd. (India) | | | 23,099,913 | |
| | 5,524,634 | | | Daphne International Holdings Ltd. (China) | | | 5,507,392 | |
| | | | | | | | |
| | | | | | | 28,607,305 | |
| | | | | | | | |
| | | | General Merchandise Stores 0.9% | | | | |
| | 2,799,923 | | | Taiwan FamilyMart Co. Ltd. (Taiwan) | | | 13,993,168 | |
| | | | | | | | |
| | | | Gold 1.2% | | | | |
| | 824,699 | | | Koza Altin Isletmeleri A.S. (Turkey) | | | 17,732,005 | |
| | | | | | | | |
| | | | Health Care Facilities 2.6% | | | | |
| | 10,709,893 | | | KPJ Healthcare Berhad (Malaysia) | | | 21,374,235 | |
| | 4,297,390 | | | Life Healthcare Group Holdings Ltd. (South Africa) | | | 16,422,092 | |
| | | | | | | | |
| | | | | | | 37,796,327 | |
| | | | | | | | |
| | | | Health Care Supplies 1.0% | | | | |
| | 1,095,403 | | | St. Shine Optical Co. Ltd. (Taiwan) | | | 14,087,943 | |
| | | | | | | | |
| | | | Highways & Railtracks 1.6% | | | | |
| | 1,662,400 | | | Obrascon Huarte Lain Brasil S.A. (Brazil) | | | 15,256,268 | |
| | 14,557,755 | | | PT Jasa Marga Persero Tbk (Indonesia) | | | 8,898,941 | |
| | | | | | | | |
| | | | | | | 24,155,209 | |
| | | | | | | | |
| | | | Home Improvement Retail 2.4% | | | | |
| | 18,668,531 | | | Ace Hardware Indonesia Tbk (Indonesia) | | | 11,997,019 | |
| | 55,886,194 | | | Home Product Center Public Co. Ltd.*** (Thailand) | | | 23,785,222 | |
| | | | | | | | |
| | | | | | | 35,782,241 | |
| | | | | | | | |
| | | | Hotels, Resorts & Cruise Lines 1.1% | | | | |
| | 31,062,273 | | | Minor International Public Co. Ltd.*** (Thailand) | | | 15,541,228 | |
| | | | | | | | |
49
| | |
WASATCH EMERGING MARKETS SMALL CAP FUND
(WAEMX) — Schedule of Investments (continued) | | |
|
|
|
| | | | | | | | |
| Shares | | | | | Value | |
| | | | | | | |
| | | | Hypermarkets & Super Centers 3.6% | | | | |
| | 1,437,769 | | | O’Key Group S.A., GDR (Russia) | | $ | 13,802,582 | |
| | 19,529,701 | | | Puregold Price Club, Inc. (Philippines) | | | 13,904,641 | |
| | 1,891,230 | | | Siam Makro Public Co. Ltd.*** (Thailand) | | | 24,393,058 | |
| | 718,785 | | | Wumart Stores, Inc. (China) | | | 1,078,984 | |
| | | | | | | | |
| | | | | | | 53,179,265 | |
| | | | | | | | |
| | | | Industrial Machinery 1.0% | | | | |
| | 2,943,430 | | | Airtac International Group (Taiwan) | | | 14,760,578 | |
| | 74,135 | | | Hiwin Technologies Corp. (Taiwan) | | | 543,744 | |
| | | | | | | | |
| | | | | | | 15,304,322 | |
| | | | | | | | |
| | | | Internet Software & Services 1.2% | | | | |
| | 3,015,249 | | | PChome Online, Inc. (Taiwan) | | | 17,075,113 | |
| | | | | | | | |
| | | | IT Consulting & Other Services 1.3% | | | | |
| | 6,500,970 | | | Sonda S.A. (Chile) | | | 19,527,576 | |
| | | | | | | | |
| | | | Life & Health Insurance 1.7% | | | | |
| | 8,225,144 | | | Bangkok Life Assurance Public Co. Ltd. NVDR (Thailand) | | | 11,757,841 | |
| | 1,894,874 | | | Discovery Holdings Ltd. (South Africa) | | | 12,657,656 | |
| | | | | | | | |
| | | | | | | 24,415,497 | |
| | | | | | | | |
| | | | Life Sciences Tools & Services 0.9% | | | | |
| | 682,400 | | | Divi’s Laboratories Ltd. (India) | | | 14,007,669 | |
| | | | | | | | |
| | | | Managed Health Care 1.3% | | | | |
| | 2,028,575 | | | Qualicorp S.A.* (Brazil) | | | 19,817,829 | |
| | | | | | | | |
| | | | Marine Ports & Services 3.6% | | | | |
| | 871,759 | | | Global Ports Investments plc GDR (Russia) | | | 12,466,154 | |
| | 13,036,004 | | | International Container Terminal Services, Inc. (Philippines) | | | 22,000,112 | |
| | 1,328,440 | | | Santos Brasil Participacoes S.A.** (Brazil) | | | 19,008,146 | |
| | | | | | | | |
| | | | | | | 53,474,412 | |
| | | | | | | | |
| | | | Metal & Glass Containers 0.9% | | | | |
| | 6,102,000 | | | Taiwan Hon Chuan Enterprise Co. Ltd. (Taiwan) | | | 13,364,095 | |
| | | | | | | | |
| | | | Oil & Gas Exploration & Production 3.5% | | | | |
| | 5,671,248 | | | Afren plc* (Nigeria) | | | 12,832,639 | |
| | 790,424 | | | Coastal Energy Co.* (Thailand) | | | 14,696,588 | |
| | 1,971,080 | | | Gran Tierra Energy, Inc.* (Colombia) | | | 10,190,484 | |
| | 1,741,200 | | | Parex Resources, Inc.* (Colombia) | | | 8,554,133 | |
| | 533,265 | | | TransGlobe Energy Corp.* (Egypt) | | | 5,803,729 | |
| | | | | | | | |
| | | | | | | 52,077,573 | |
| | | | | | | | |
| | | | Other Diversified Financial Services 1.2% | | | | |
| | 565,096 | | | Intergroup Financial Services Corp. (Peru) | | | 18,365,620 | |
| | | | | | | | |
| | | | Packaged Foods & Meats 6.5% | | | | |
| | 2,670,762 | | | AVI Ltd. (South Africa) | | | 19,209,929 | |
| | 334,247 | | | GlaxoSmithKline Consumer Healthcare Ltd. (India) | | | 19,131,514 | |
| | 942,075 | | | Pinar Sut Mamulleri Sanayii A.S. (Turkey) | | | 7,871,397 | |
| | 4,921,291 | | | PT Mayora Indah Tbk (Indonesia) | | | 11,519,009 | |
| | 5,469,477 | | | Standard Foods Corp. (Taiwan) | | | 15,169,409 | |
| | 14,055,485 | | | Universal Robina Corp. (Philippines) | | | 23,451,079 | |
| | | | | | | | |
| | | | | | | 96,352,337 | |
| | | | | | | | |
| | | | Paper Packaging 0.7% | | | | |
| | 20,283,035 | | | Greatview Aseptic Packaging Co. Ltd. (China) | | | 11,012,300 | |
| | | | | | | | |
| | | | Personal Products 1.6% | | | | |
| | 1,047,100 | | | Colgate-Palmolive India Ltd. (India) | | | 23,921,803 | |
| | | | | | | | |
| | | | Railroads 1.0% | | | | |
| | 739,657 | | | Globaltrans Investment plc, GDR (Russia) | | | 15,370,072 | |
| | | | | | | | |
| | | | | | | | |
| Shares | | | | | Value | |
| | | | | | | |
| | | | Real Estate Operating
Companies 1.2% | | | | |
| | 8,577,400 | | | Parque Arauco S.A. (Chile) | | $ | 17,664,671 | |
| | | | | | | | |
| | | | Regional Banks 0.7% | | | | |
| | 2,789,600 | | | Banregio Grupo Financiero S.A.B. de C.V. (Mexico) | | | 10,533,794 | |
| | | | | | | | |
| | | | Restaurants 1.1% | | | | |
| | 637,270 | | | Jubilant Foodworks Ltd.* (India) | | | 16,531,324 | |
| | | | | | | | |
| | | | Retail REITs 0.1% | | | | |
| | 3,123,995 | | | CapitaMalls Malaysia Trust (Malaysia) | | | 1,809,086 | |
| | | | | | | | |
| | | | Specialized Finance 2.2% | | | | |
| | 8,276,390 | | | Bolsa Mexicana de Valores S.A.B. de C.V. (Mexico) | | | 17,152,139 | |
| | 8,527,000 | | | Chailease Holding Co. Ltd. (Taiwan) | | | 16,086,210 | |
| | | | | | | | |
| | | | | | | 33,238,349 | |
| | | | | | | | |
| | | | Specialty Stores 1.0% | | | | |
| | 21,921,000 | | | Sa Sa International Holdings Ltd.
(Hong Kong) | | | 14,983,016 | |
| | | | | | | | |
| | | | Systems Software 1.4% | | | | |
| | 1,023,800 | | | Totvs S.A. (Brazil) | | | 21,271,601 | |
| | | | | | | | |
| | | | Thrifts & Mortgage Finance 2.3% | | | | |
| | 3,789,600 | | | Gruh Finance Ltd. (India) | | | 14,872,447 | |
| | 3,491,395 | | | LIC Housing Finance Ltd. (India) | | | 18,706,384 | |
| | | | | | | | |
| | | | | | | 33,578,831 | |
| | | | | | | | |
| | | | Trading Companies &
Distributors 0.7% | | | | |
| | 11,996,075 | | | PT Hexindo Adiperkasa Tbk (Indonesia) | | | 10,404,119 | |
| | | | | | | | |
| | | | Trucking 1.2% | | | | |
| | 1,070,100 | | | Tegma Gestao Logistica (Brazil) | | | 17,671,764 | |
| | | | | | | | |
| | |
| | | | Total Common Stocks
(cost $1,185,206,210) | | | 1,416,325,622 | |
| | | | | | | | |
| | |
| | | | PREFERRED STOCKS 2.1% | | | | |
| | |
| | | | Construction & Farm Machinery & Heavy Trucks 1.3% | | | | |
| | 3,227,015 | | | Marcopolo S.A. Pfd. (Brazil) | | | 18,867,708 | |
| | | | | | | | |
| | | | Footwear 0.8% | | | | |
| | 1,828,420 | | | Alpargatas S.A. Pfd. (Brazil) | | | 12,855,550 | |
| | | | | | | | |
| | |
| | | | Total Preferred Stocks
(cost $23,529,234) | | | 31,723,258 | |
| | | | | | | | |
50
| | | | | | | | |
Principal
Amount | | | | | Value | |
| | | | | | | |
| |
| | | | SHORT-TERM INVESTMENTS 2.7% | |
| | |
| | | | Repurchase Agreement 2.7% | | | | |
| | $40,434,738 | | | Repurchase Agreement dated 9/28/12, 0.01% due 10/1/12 with State Street Bank and Trust Co. collateralized by $30,335,000 of United States Treasury Bonds 4.500% due 08/15/39; value: $41,243,436; repurchase proceeds: $40,434,772
(cost $40,434,738) | | $ | 40,434,738 | |
| | | | | | | | |
| | |
| | | | Total Short-Term Investments
(cost $40,434,738) | | | 40,434,738 | |
| | | | | | | | |
| | |
| | | | Total Investments
(cost $1,249,170,182) 100.4% | | | 1,488,483,618 | |
| | |
| | | | Liabilities less Other Assets (0.4%) | | | (6,218,925 | ) |
| | | | | | | | |
| | |
| | | | NET ASSETS 100.0% | | $ | 1,482,264,693 | |
| | | | | | | | |
| |
| | | | *Non-income producing. **Common units. ***Security was fair valued under procedures adopted by the Board of Trustees (see Note 15). GDR Global Depositary Receipt. NVDR Non-Voting Depositary Receipt. REIT Real Estate Investment Trust. See Notes to Financial Statements. | |
At September 30, 2012, Wasatch Emerging Markets Small Cap Fund’s investments, excluding short-term investments, were in the following countries:
| | | | |
| Country | | % | |
Brazil | | | 10.3 | |
Chile | | | 2.6 | |
China | | | 3.9 | |
Colombia | | | 1.3 | |
Egypt | | | 0.4 | |
Hong Kong | | | 2.0 | |
India | | | 16.4 | |
Indonesia | | | 9.5 | |
Korea | | | 0.6 | |
Malaysia | | | 3.1 | |
Mexico | | | 1.9 | |
Nigeria | | | 0.9 | |
Peru | | | 1.3 | |
Philippines | | | 6.7 | |
Poland | | | 2.3 | |
Russia | | | 4.8 | |
South Africa | | | 7.7 | |
Taiwan | | | 10.4 | |
Thailand | | | 8.5 | |
Turkey | | | 5.4 | |
| | | | |
TOTAL | | | 100.0 | % |
| | | | |
51
| | |
| WASATCH FRONTIER EMERGING SMALL COUNTRIES FUND (WAFMX) — Schedule of Investments | | |
|
|
|
| | | | | | | | |
| Shares | | | | | Value | |
| | | | | | | |
| | | | COMMON STOCKS 93.2% | | | | |
| | |
| | | | Advertising 0.2% | | | | |
| | 110,600 | | | Scan Group Ltd. (Kenya) | | $ | 75,203 | |
| | | | | | | | |
| | | | Air Freight & Logistics 1.2% | | | | |
| | 727,242 | | | Aramex PJSC (United Arab Emirates) | | | 384,114 | |
| | | | | | | | |
| | | | Apparel Retail 2.8% | | | | |
| | 22,611 | | | Mr Price Group Ltd. (South Africa) | | | 342,875 | |
| | 832,198 | | | Padini Holdings Berhad (Malaysia) | | | 571,770 | |
| | | | | | | | |
| | | | | | | 914,645 | |
| | | | | | | | |
| | | | Auto Parts & Equipment 0.6% | | | | |
| | 462,773 | | | PT Astra Otoparts Tbk (Indonesia) | | | 187,382 | |
| | | | | | | | |
| | | | Automobile Manufacturers 0.4% | | | | |
| | 8,155 | | | Kolao Holdings (Korea) | | | 126,937 | |
| | | | | | | | |
| | | | Brewers 10.0% | | | | |
| | 296 | | | Brasseries Maroc (Morocco) | | | 63,440 | |
| | 4,973 | | | Carlsberg Brewery Malaysia Berhad, Class B (Malaysia) | | | 18,711 | |
| | 415,108 | | | East African Breweries Ltd. (Kenya) | | | 1,119,283 | |
| | 3,581 | | | Guinness Anchor Berhad (Malaysia) | | | 17,879 | |
| | 72,051 | | | Guinness Ghana Breweries Ltd.* (Ghana) | | | 94,009 | |
| | 283,319 | | | Guinness Nigeria plc (Nigeria) | | | 471,988 | |
| | 403,935 | | | Lion Brewery Ceylon plc (Sri Lanka) | | | 727,348 | |
| | 5,600 | | | Namibia Breweries Ltd. (Namibia) | | | 8,223 | |
| | 866,662 | | | Nigerian Breweries plc (Nigeria) | | | 755,249 | |
| | 6,852 | | | Union de Cervecerias Peruanas Backus y Johnston SAA (Peru) | | | 29,598 | |
| | | | | | | | |
| | | | | | | 3,305,728 | |
| | | | | | | | |
| | | | Building Products 1.6% | | | | |
| | 102,202 | | | Dynasty Ceramic Public Co. Ltd.*** (Thailand) | | | 168,510 | |
| | 3,454,681 | | | PT Arwana Citramulia Tbk (Indonesia) | | | 364,601 | |
| | | | | | | | |
| | | | | | | 533,111 | |
| | | | | | | | |
| | | | Casinos & Gaming 2.8% | | | | |
| | 1,658,812 | | | NagaCorp Ltd. (Cambodia) | | | 928,432 | |
| | | | | | | | |
| | | | Coal & Consumable Fuels 0.7% | | | | |
| | 53,700 | | | PT Indo Tambangraya Megah Tbk (Indonesia) | | | 236,516 | |
| | | | | | | | |
| | | | Commodity Chemicals 1.1% | | | | |
| | 30,300 | | | Berger Paints Bangladesh Ltd. (Bangladesh) | | | 187,315 | |
| | 27,000 | | | Paints & Chemical Industries Co. S.A.E. (Egypt) | | | 170,479 | |
| | | | | | | | |
| | | | | | | 357,794 | |
| | | | | | | | |
| | | | Construction Materials 2.8% | | | | |
| | 116,600 | | | Bamburi Cement Co. Ltd. (Kenya) | | | 233,747 | |
| | 479,505 | | | Diamond Building Products Public Co. Ltd.*** (Thailand) | | | 120,733 | |
| | 1,368,100 | | | Lafarge Republic, Inc. (Philippines) | | | 303,694 | |
| | 171,000 | | | PT Semen Gresik (Persero) Tbk (Indonesia) | | | 258,198 | |
| | | | | | | | |
| | | | | | | 916,372 | |
| | | | | | | | |
| | | | Consumer Finance 0.4% | | | | |
| | 39,026 | | | Aeon Credit Service M Berhad (Malaysia) | | | 134,321 | |
| | | | | | | | |
| | | | Department Stores 0.2% | | | | |
| | 114,700 | | | PT Mitra Adiperkasa Tbk (Indonesia) | | | 76,706 | |
| | | | | | | | |
| | | | | | | | |
| Shares | | | | | Value | |
| | | | | | | |
| | | | Diversified Banks 6.3% | | | | |
| | 1,011,300 | | | Barclays Bank of Kenya Ltd. (Kenya) | | $ | 173,687 | |
| | 128,075 | | | BBVA Banco Continental S.A. (Peru) | | | 329,864 | |
| | 1,379,400 | | | Equity Bank Ltd. (Kenya) | | | 371,937 | |
| | 53,230 | | | Guaranty Trust Bank plc GDR (Nigeria) | | | 330,026 | |
| | 115,050 | | | MCB Bank Ltd. (Pakistan) | | | 225,479 | |
| | 341,500 | | | PT Bank Rakyat Indonesia (Persero) Tbk (Indonesia) | | | 265,849 | |
| | 3,701,900 | | | Zenith Bank plc (Nigeria) | | | 383,824 | |
| | | | | | | | |
| | | | | | | 2,080,666 | |
| | | | | | | | |
| | | | Food Retail 3.6% | | | | |
| | 146,872 | | | CP ALL Public Co. Ltd.*** (Thailand) | | | 169,394 | |
| | 178,100 | | | Philippine Seven Corp. (Philippines) | | | 311,670 | |
| | 35,054 | | | Shoprite Holdings Ltd. (South Africa) | | | 710,240 | |
| | | | | | | | |
| | | | | | | 1,191,304 | |
| | | | | | | | |
| | | | Footwear 2.1% | | | | |
| | 25,700 | | | Bata Shoe Co. Bangladesh Ltd. (Bangladesh) | | | 152,456 | |
| | 110,340 | | | Forus S.A. (Chile) | | | 539,605 | |
| | | | | | | | |
| | | | | | | 692,061 | |
| | | | | | | | |
| | | | General Merchandise Stores 0.1% | | | | |
| | 5,941 | | | Aeon Co. M Berhad (Malaysia) | | | 21,381 | |
| | | | | | | | |
| | | | Health Care Facilities 0.2% | | | | |
| | 29,715 | | | KPJ Healthcare Berhad (Malaysia) | | | 59,304 | |
| | | | | | | | |
| | | | Home Improvement Retail 0.2% | | | | |
| | 80,606 | | | Ace Hardware Indonesia Tbk (Indonesia) | | | 51,800 | |
| | | | | | | | |
| | | | Household Appliances 0.3% | | | | |
| | 50,250 | | | Singer Bangladesh Ltd. (Bangladesh) | | | 102,790 | |
| | | | | | | | |
| | | | Household Products 4.9% | | | | |
| | 234,600 | | | DSG International Thailand Public Co. Ltd.*** (Thailand) | | | 76,218 | |
| | 6,769 | | | PT Unilever Indonesia Tbk (Indonesia) | | | 18,425 | |
| | 44,770 | | | Unilever Ghana Ltd. (Ghana) | | | 195,894 | |
| | 5,054,167 | | | Unilever Nigeria plc (Nigeria) | | | 1,327,760 | |
| | | | | | | | |
| | | | | | | 1,618,297 | |
| | | | | | | | |
| | | | Human Resource & Employment Services 0.3% | | | | |
| | 113,740 | | | JobStreet Corp. Berhad (Malaysia) | | | 86,705 | |
| | | | | | | | |
| | | | Hypermarkets & Super Centers 1.2% | | | | |
| | 6,000 | | | Almacenes Exito S.A. (Colombia) | | | 98,298 | |
| | 88 | | | Label Vie* (Morocco) | | | 15,143 | |
| | 3,750 | | | PriceSmart, Inc. | | | 283,950 | |
| | | | | | | | |
| | | | | | | 397,391 | |
| | | | | | | | |
| | | | Industrial Gases 0.7% | | | | |
| | 36,000 | | | Linde Bangladesh Ltd. (Bangladesh) | | | 235,208 | |
| | | | | | | | |
| | | | Integrated Oil & Gas 2.9% | | | | |
| | 321,300 | | | Ecopetrol S.A. (Colombia) | | | 945,708 | |
| | | | | | | | |
| | | | Marine Ports & Services 0.2% | | | | |
| | 370,600 | | | Asian Terminals, Inc. (Philippines) | | | 82,356 | |
| | | | | | | | |
| | | | Metal & Glass Containers 0.8% | | | | |
| | 76,400 | | | Nampak Ltd. (South Africa) | | | 262,990 | |
| | | | | | | | |
| | | | Oil & Gas Exploration &
Production 3.4% | | | | |
| | 67,269 | | | Afren plc* (Nigeria) | | | 152,213 | |
| | 26,204 | | | Gran Tierra Energy, Inc.* (Colombia) | | | 135,475 | |
| | 82,410 | | | Pakistan Oilfields Ltd. (Pakistan) | | | 376,191 | |
| | 18,803 | | | TransGlobe Energy Corp.* (Egypt) | | | 204,640 | |
| | 25,656 | | | Zhaikmunai L.P. GDR (Kazakhstan) | | | 261,691 | |
| | | | | | | | |
| | | | | | | 1,130,210 | |
| | | | | | | | |
52
| | | | | | | | |
| Shares | | | | | Value | |
| | | | | | | |
| | | | Oil & Gas Refining & Marketing 1.2% | | | | |
| | 267,840 | | | Chevron Lubricants Lanka plc (Sri Lanka) | | $ | 397,337 | |
| | | | | | | | |
| | | | Other Diversified Financial
Services 0.4% | | | | |
| | 4,567 | | | Intergroup Financial Services Corp. (Peru) | | | 148,427 | |
| | | | | | | | |
| | | | Packaged Foods & Meats 19.6% | | | | |
| | 217,533 | | | Alicorp S.A. (Peru) | | | 586,230 | |
| | 4,439,616 | | | Cadbury Nigeria plc* (Nigeria) | | | 677,761 | |
| | 1,756 | | | Centrale Laitiere (Morocco) | | | 268,607 | |
| | 208,197 | | | FAN Milk Ltd. (Ghana) | | | 312,806 | |
| | 113,100 | | | Grupo Herdez S.A.B. de C.V. (Mexico) | | | 291,580 | |
| | 364,531 | | | Juhayna Food Industries (Egypt) | | | 339,613 | |
| | 49,643 | | | Nestlé Lanka plc (Sri Lanka) | | | 479,457 | |
| | 302,001 | | | Nestlé Nigeria plc (Nigeria) | | | 1,096,893 | |
| | 5,426 | | | Nestlé Pakistan Ltd. (Pakistan) | | | 240,253 | |
| | 9,000 | | | Pinar Sut Mamulleri Sanayii A.S. (Turkey) | | | 75,199 | |
| | 369,000 | | | PT Indofood CBP Sukses Makmur Tbk (Indonesia) | | | 244,843 | |
| | 7,737 | | | Tiger Brands Ltd. (South Africa) | | | 254,335 | |
| | 8,166 | | | Unilever Pakistan Ltd. (Pakistan) | | | 835,066 | |
| | 102,308 | | | Universal Robina Corp. (Philippines) | | | 170,697 | |
| | 75,000 | | | Viet Nam Dairy Products JSC (Vietnam) | | | 420,158 | |
| | 29,000 | | | Vinacafe Bien Hoa JSC (Vietnam) | | | 201,341 | |
| | | | | | | | |
| | | | | | | 6,494,839 | |
| | | | | | | | |
| | | | Personal Products 1.0% | | | | |
| | 12,302 | | | Colgate-Palmolive Pakistan Ltd. (Pakistan) | | | 149,147 | |
| | 41,100 | | | Marico Bangladesh Ltd. (Bangladesh) | | | 188,836 | |
| | | | | | | | |
| | | | | | | 337,983 | |
| | | | | | | | |
| | | | Pharmaceuticals 4.1% | | | | |
| | 117,535 | | | Abbott Laboratories Pakistan Ltd. (Pakistan) | | | 262,231 | |
| | 46,540 | | | DHG Pharmaceutical JSC (Vietnam) | | | 162,673 | |
| | 26,900 | | | Egyptian International Pharmaceutical Industrial Co. (Egypt) | | | 163,339 | |
| | 2,034,614 | | | GlaxoSmithKline Consumer Nigeria plc* (Nigeria) | | | 465,912 | |
| | 630,500 | | | PT Kalbe Farma Tbk (Indonesia) | | | 309,650 | |
| | | | | | | | |
| | | | | | | 1,363,805 | |
| | | | | | | | |
| | | | Publishing 0.4% | | | | |
| | 56,105 | | | Nation Media Group Ltd. (Kenya) | | | 142,071 | |
| | | | | | | | |
| | | | Restaurants 3.1% | | | | |
| | 125,735 | | | Kuwait Foods Americana (Kuwait) | | | 715,801 | |
| | 32,852 | | | Oishi Group Public Co. Ltd.*** (Thailand) | | | 222,002 | |
| | 60,485 | | | PT Fastfood Indonesia Tbk (Indonesia) | | | 81,690 | |
| | | | | | | | |
| | | | | | | 1,019,493 | |
| | | | | | | | |
| | | | Soft Drinks 2.9% | | | | |
| | 34,760 | | | Coca-Cola Icecek A.S. (Turkey) | | | 650,570 | |
| | 3,295,773 | | | Pepsi-Cola Products Philippines, Inc.* (Philippines) | | | 319,188 | |
| | | | | | | | |
| | | | | | | 969,758 | |
| | | | | | | | |
| | | | Specialized Finance 0.8% | | | | |
| | 5,095,365 | | | Bolsa de Valores de Colombia (Colombia) | | | 83,477 | |
| | 73,500 | | | Bolsa Mexicana de Valores S.A.B. de C.V. (Mexico) | | | 152,323 | |
| | 1,825 | | | Philippine Stock Exchange, Inc. (Philippines) | | | 16,406 | |
| | | | | | | | |
| | | | | | | 252,206 | |
| | | | | | | | |
| | | | Tobacco 7.0% | | | | |
| | 59,600 | | | British American Tobacco Bangladesh Co. Ltd. (Bangladesh) | | | 529,275 | |
| | 152,628 | | | British American Tobacco Kenya Ltd. (Kenya) | | | 769,402 | |
| | 187,621 | | | Ceylon Tobacco Co. plc (Sri Lanka) | | | 1,013,161 | |
| | | | | | | | |
| | | | | | | 2,311,838 | |
| | | | | | | | |
| | | | | | | | |
| Shares | | | | | Value | |
| | | | | | | |
| | | | Wireless Telecommunication
Services 0.7% | | | | |
| | 12,698 | | | MTN Group Ltd. (South Africa) | | $ | 244,853 | |
| | | | | | | | |
| | |
| | | | Total Common Stocks
(cost $27,177,502) | | | 30,818,042 | |
| | | | | | | | |
| | |
Principal Amount | | | | | Value | |
| | |
| | | | SHORT-TERM INVESTMENTS 4.3% | | | | |
| | |
| | | | Repurchase Agreement 4.3% | | | | |
| | $1,416,788 | | | Repurchase Agreement dated 9/28/12, 0.01% due 10/1/12 with State Street Bank and Trust Co. collateralized by $1,065,000 of United States Treasury Bonds 4.500% due 8/15/39; value: $1,447,973; repurchase proceeds: $1,416,789 (cost $1,416,788) | | $ | 1,416,788 | |
| | | | | | | | |
| | |
| | | | Total Short-Term Investments
(cost $1,416,788) | | | 1,416,788 | |
| | | | | | | | |
| | |
| | | | Total Investments
(cost $28,594,290) 97.5% | | | 32,234,830 | |
| | |
| | | | Other Assets less Liabilities 2.5% | | | 810,419 | |
| | | | | | | | |
| | |
| | | | NET ASSETS 100.0% | | $ | 33,045,249 | |
| | | | | | | | |
| |
| | | | *Non-income producing. ***Security was fair valued under procedures adopted by the Board of Trustees (see Note 15). GDR Global Depositary Receipt. See Notes to Financial Statements. | |
At September 30, 2012, Wasatch Frontier Emerging Small Countries Fund’s investments, excluding short-term investments, were in the following countries:
| | | | |
| Country | | % | |
Bangladesh | | | 4.5 | |
Cambodia | | | 3.0 | |
Chile | | | 1.8 | |
Colombia | | | 4.1 | |
Egypt | | | 2.8 | |
Ghana | | | 2.0 | |
Indonesia | | | 6.8 | |
Kazakhstan | | | 0.8 | |
Kenya | | | 9.4 | |
Korea | | | 0.4 | |
Kuwait | | | 2.3 | |
Malaysia | | | 3.0 | |
Mexico | | | 1.4 | |
Morocco | | | 1.1 | |
Namibia | | | <0.1 | |
Nigeria | | | 18.4 | |
Pakistan | | | 6.8 | |
Peru | | | 3.6 | |
Philippines | | | 3.9 | |
South Africa | | | 5.9 | |
Sri Lanka | | | 8.5 | |
Thailand | | | 2.5 | |
Turkey | | | 2.4 | |
United Arab Emirates | | | 1.2 | |
United States | | | 0.9 | |
Vietnam | | | 2.5 | |
| | | | |
TOTAL | | | 100.0 | % |
| | | | |
53
| | |
WASATCH GLOBAL OPPORTUNITIES FUND
(WAGOX) — Schedule of Investments | | |
|
|
|
| | | | | | | | |
| Shares | | | | | Value | |
| | | | | | | |
| | | | COMMON STOCKS 101.3% | | | | |
| | |
| | | | Advertising 1.5% | | | | |
| | 138,619 | | | REA Group Ltd. (Australia) | | $ | 2,254,101 | |
| | | | | | | | |
| | | | Apparel Retail 0.9% | | | | |
| | 87,240 | | | Mr Price Group Ltd. (South Africa) | | | 1,322,914 | |
| | | | | | | | |
| | | | Apparel, Accessories & Luxury
Goods 1.7% | | | | |
| | 42,300 | | | Gerry Weber International AG (Germany) | | | 1,749,841 | |
| | 42,300 | | | Salvatore Ferragamo Italia S.p.A. (Italy) | | | 880,905 | |
| | | | | | | | |
| | | | | | | 2,630,746 | |
| | | | | | | | |
| | | | Application Software 1.6% | | | | |
| | 23,410 | | | Ultimate Software Group, Inc.* | | | 2,390,161 | |
| | | | | | | | |
| | | | Asset Management & Custody
Banks 4.9% | | | | |
| | 467,400 | | | Aberdeen Asset Management plc
(United Kingdom) | | | 2,348,486 | |
| | 13,902 | | | Affiliated Managers Group, Inc.* | | | 1,709,946 | |
| | 135,880 | | | CETIP S.A. — Mercados Organizados (Brazil) | | | 1,783,352 | |
| | 7,996 | | | Partners Group Holding AG (Switzerland) | | | 1,665,319 | |
| | | | | | | | |
| | | | | | | 7,507,103 | |
| | | | | | | | |
| | | | Automotive Retail 0.5% | | | | |
| | 22,275 | | | Monro Muffler Brake, Inc. | | | 783,857 | |
| | | | | | | | |
| | | | Biotechnology 1.8% | | | | |
| | 416,601 | | | Abcam plc (United Kingdom) | | | 2,703,183 | |
| | | | | | | | |
| | | | Casinos & Gaming 0.9% | | | | |
| | 2,596,800 | | | NagaCorp Ltd. (Cambodia) | | | 1,453,420 | |
| | | | | | | | |
| | | | Catalog Retail 0.5% | | | | |
| | 7,000 | | | Hyundai Home Shopping Network Corp. (Korea) | | | 755,786 | |
| | | | | | | | |
| | | | Coal & Consumable Fuels 0.6% | | | | |
| | 504,500 | | | PT Tambang Batubara Bukit Asam (Persero) Tbk (Indonesia) | | | 854,013 | |
| | | | | | | | |
| | | | Commercial Printing 1.0% | | | | |
| | 118,516 | | | InnerWorkings, Inc.* | | | 1,543,078 | |
| | | | | | | | |
| | | | Commodity Chemicals 1.5% | | | | |
| | 395,600 | | | Castrol India Ltd. (India) | | | 2,336,699 | |
| | | | | | | | |
| | | | Construction & Engineering 1.0% | | | | |
| | 216,015 | | | Kentz Corp. Ltd. (United Kingdom) | | | 1,503,348 | |
| | | | | | | | |
| | | | Construction Materials 2.0% | | | | |
| | 641,000 | | | PT Indocement Tunggal Prakarsa Tbk (Indonesia) | | | 1,363,046 | |
| | 1,137,000 | | | PT Semen Gresik (Persero) Tbk (Indonesia) | | | 1,716,787 | |
| | | | | | | | |
| | | | | | | 3,079,833 | |
| | | | | | | | |
| | | | Consumer Finance 2.9% | | | | |
| | 74,840 | | | DFC Global Corp.* | | | 1,283,506 | |
| | 26,150 | | | First Cash Financial Services, Inc.* | | | 1,203,161 | |
| | 120,002 | | | Mahindra & Mahindra Financial Services Ltd. (India) | | | 2,045,233 | |
| | | | | | | | |
| | | | | | | 4,531,900 | |
| | | | | | | | |
| | | | Data Processing & Outsourced Services 3.2% | | | | |
| | 25,600 | | | Syntel, Inc. | | | 1,597,696 | |
| | 145,491 | | | Wirecard AG (Germany) | | | 3,344,281 | |
| | | | | | | | |
| | | | | | | 4,941,977 | |
| | | | | | | | |
| | | | Department Stores 0.7% | | | | |
| | 1,700,000 | | | PT Mitra Adiperkasa Tbk (Indonesia) | | | 1,136,886 | |
| | | | | | | | |
| | | | | | | | |
| Shares | | | | | Value | |
| | | | | | | |
| | | | Distributors 0.9% | | | | |
| | 71,938 | | | LKQ Corp.* | | $ | 1,330,853 | |
| | | | | | | | |
| | | | Diversified Banks 2.5% | | | | |
| | 473,835 | | | Security Bank Corp. (Philippines) | | | 1,862,853 | |
| | 279,497 | | | Yes Bank Ltd. (India) | | | 2,030,851 | |
| | | | | | | | |
| | | | | | | 3,893,704 | |
| | | | | | | | |
| | | | Diversified Support Services 2.9% | | | | |
| | 85,562 | | | Copart, Inc.* | | | 2,372,634 | |
| | 20,488 | | | Portfolio Recovery Associates, Inc.* | | | 2,139,562 | |
| | | | | | | | |
| | | | | | | 4,512,196 | |
| | | | | | | | |
| | | | Drug Retail 1.2% | | | | |
| | 258,500 | | | Clicks Group Ltd. (South Africa) | | | 1,800,815 | |
| | | | | | | | |
| | | | Electrical Components &
Equipment 0.9% | | | | |
| | 38,904 | | | Polypore International, Inc.* | | | 1,375,256 | |
| | | | | | | | |
| | | | Electronic Equipment &
Instruments 1.3% | | | | |
| | 87,788 | | | Oxford Instruments plc (United Kingdom) | | | 1,949,562 | |
| | | | | | | | |
| | | | Environmental & Facilities
Services 0.9% | | | | |
| | 55,555 | | | Tetra Tech, Inc.* | | | 1,458,874 | |
| | | | | | | | |
| | | | Footwear 0.8% | | | | |
| | 66,170 | | | Bata India Ltd. (India) | | | 1,226,300 | |
| | | | | | | | |
| | | | General Merchandise Stores 0.9% | | | | |
| | 28,104 | | | Dollar Tree, Inc.* | | | 1,356,721 | |
| | | | | | | | |
| | | | Gold 1.5% | | | | |
| | 104,030 | | | Koza Altin Isletmeleri A.S. (Turkey) | | | 2,236,768 | |
| | | | | | | | |
| | | | Health Care Equipment 2.2% | | | | |
| | 79,000 | | | AtriCure, Inc.* | | | 587,760 | |
| | 216,708 | | | Elekta AB, Class B (Sweden) | | | 2,865,132 | |
| | | | | | | | |
| | | | | | | 3,452,892 | |
| | | | | | | | |
| | | | Health Care Facilities 1.5% | | | | |
| | 587,735 | | | Life Healthcare Group Holdings Ltd. (South Africa) | | | 2,245,977 | |
| | | | | | | | |
| | | | Health Care Services 3.4% | | | | |
| | 11,580 | | | Catamaran Corp.* (Canada) | | | 1,134,493 | |
| | 23,752 | | | CorVel Corp.* | | | 1,062,902 | |
| | 40,450 | | | IPC The Hospitalist Co., Inc.* | | | 1,848,565 | |
| | 14,900 | | | MEDNAX, Inc.* | | | 1,109,305 | |
| | | | | | | | |
| | | | | | | 5,155,265 | |
| | | | | | | | |
| | | | Health Care Technology 2.2% | | | | |
| | 22,500 | | | athenahealth, Inc.* | | | 2,064,825 | |
| | 22,410 | | | Computer Programs and Systems, Inc. | | | 1,244,875 | |
| | | | | | | | |
| | | | | | | 3,309,700 | |
| | | | | | | | |
| | | | Home Improvement Retail 1.2% | | | | |
| | 2,850,000 | | | Ace Hardware Indonesia Tbk (Indonesia) | | | 1,831,505 | |
| | | | | | | | |
| | | | Hypermarkets & Super Centers 1.0% | | | | |
| | 21,000 | | | PriceSmart, Inc. | | | 1,590,120 | |
| | | | | | | | |
| | | | Industrial Machinery 5.0% | | | | |
| | 32,370 | | | Andritz AG (Austria) | | | 1,834,965 | |
| | 31,170 | | | Graco, Inc. | | | 1,567,228 | |
| | 39,255 | | | IDEX Corp. | | | 1,639,681 | |
| | 72,855 | | | Rotork plc (United Kingdom) | | | 2,662,828 | |
| | | | | | | | |
| | | | | | | 7,704,702 | |
| | | | | | | | |
| | | | Internet Retail 1.9% | | | | |
| | 99,080 | | | MakeMyTrip Ltd.* (India) | | | 1,687,332 | |
| | 101,731 | | | Yoox S.p.A.* (Italy) | | | 1,303,331 | |
| | | | | | | | |
| | | | | | | 2,990,663 | |
| | | | | | | | |
54
| | | | | | | | |
| Shares | | | | | Value | |
| | | | | | | |
| | | | Internet Software & Services 2.5% | | | | |
| | 46,365 | | | Akamai Technologies, Inc.* | | $ | 1,773,925 | |
| | 121,768 | | | Envestnet, Inc.* | | | 1,424,686 | |
| | 20,415 | | | Vistaprint N.V.* | | | 697,172 | |
| | | | | | | | |
| | | | | | | 3,895,783 | |
| | | | | | | | |
| | | | Leisure Facilities 1.2% | | | | |
| | 40,380 | | | Life Time Fitness, Inc.* | | | 1,846,981 | |
| | | | | | | | |
| | | | Life & Health Insurance 1.0% | | | | |
| | 236,465 | | | Discovery Holdings Ltd. (South Africa) | | | 1,579,574 | |
| | | | | | | | |
| | | | Life Sciences Tools & Services 2.0% | | | | |
| | 41,835 | | | Covance, Inc.* | | | 1,953,276 | |
| | 15,490 | | | Techne Corp. | | | 1,114,351 | |
| | | | | | | | |
| | | | | | | 3,067,627 | |
| | | | | | | | |
| | | | Marine Ports & Services 2.4% | | | | |
| | 1,220,507 | | | International Container Terminal Services, Inc. (Philippines) | | | 2,059,779 | |
| | 110,400 | | | Santos Brasil Participacoes S.A.** (Brazil) | | | 1,579,672 | |
| | | | | | | | |
| | | | | | | 3,639,451 | |
| | | | | | | | |
| | | | Oil & Gas Equipment & Services 2.2% | | | | |
| | 6,900 | | | Core Laboratories N.V. | | | 838,212 | |
| | 28,950 | | | ShawCor Ltd., Class A (Canada) | | | 1,256,763 | |
| | 38,700 | | | TGS-NOPEC Geophysical Co. ASA (Norway) | | | 1,263,036 | |
| | | | | | | | |
| | | | | | | 3,358,011 | |
| | | | | | | | |
| | | | Oil & Gas Exploration &
Production 3.9% | | | | |
| | 486,000 | | | Afren plc* (Nigeria) | | | 1,099,698 | |
| | 100,000 | | | Coastal Energy Co.* (Thailand) | | | 1,859,330 | |
| | 202,252 | | | Gran Tierra Energy, Inc.* (Colombia) | | | 1,045,643 | |
| | 96,700 | | | Premier Oil plc* (United Kingdom) | | | 560,530 | |
| | 144,133 | | | Zhaikmunai L.P. GDR (Kazakhstan) | | | 1,470,157 | |
| | | | | | | | |
| | | | | | | 6,035,358 | |
| | | | | | | | |
| | | | Packaged Foods & Meats 1.3% | | | | |
| | 33,629 | | | GlaxoSmithKline Consumer Healthcare Ltd. (India) | | | 1,924,845 | |
| | | | | | | | |
| | | | Real Estate Operating Companies 1.6% | | | | |
| | 83,500 | | | Multiplan Empreendimentos Imobiliarios S.A. (Brazil) | | | 2,459,166 | |
| | | | | | | | |
| | | | Regional Banks 0.7% | | | | |
| | 15,265 | | | Signature Bank* | | | 1,023,976 | |
| | | | | | | | |
| | | | Research & Consulting Services 2.1% | | | | |
| | 178,675 | | | ALS Ltd. (Australia) | | | 1,594,752 | |
| | 17,504 | | | IHS, Inc., Class A* | | | 1,704,015 | |
| | | | | | | | |
| | | | | | | 3,298,767 | |
| | | | | | | | |
| | | | Restaurants 1.8% | | | | |
| | 14,028 | | | Peet’s Coffee & Tea, Inc.* | | | 1,028,813 | |
| | 103,600 | | | Toridoll.corp (Japan) | | | 1,681,112 | |
| | | | | | | | |
| | | | | | | 2,709,925 | |
| | | | | | | | |
| | | | Semiconductors 3.2% | | | | |
| | 28,534 | | | Hittite Microwave Corp.* | | | 1,582,781 | |
| | 43,000 | | | Microchip Technology, Inc. | | | 1,407,820 | |
| | 65,700 | | | Power Integrations, Inc. | | | 1,999,251 | |
| | | | | | | | |
| | | | | | | 4,989,852 | |
| | | | | | | | |
| | | | Specialized Finance 0.6% | | | | |
| | 47,000 | | | CRISIL Ltd. (India) | | | 855,437 | |
| | | | | | | | |
| | | | | | | | |
| Shares | | | | | Value | |
| | | | | | | |
| | | | Specialty Stores 2.6% | | | | |
| | 6,169 | | | Five Below, Inc.* | | $ | 241,085 | |
| | 34,618 | | | Hibbett Sports, Inc.* | | | 2,058,040 | |
| | 2,432,000 | | | Sa Sa International Holdings Ltd.
(Hong Kong) | | | 1,662,273 | |
| | | | | | | | |
| | | | | | | 3,961,398 | |
| | | | | | | | |
| | | | Systems Software 3.0% | | | | |
| | 49,279 | | | OPNET Technologies, Inc. | | | 1,678,935 | |
| | 29,201 | | | Sourcefire, Inc.* | | | 1,431,725 | |
| | 75,100 | | | Totvs S.A. (Brazil) | | | 1,560,361 | |
| | | | | | | | |
| | | | | | | 4,671,021 | |
| | | | | | | | |
| | | | Thrifts & Mortgage Finance 1.2% | | | | |
| | 339,030 | | | LIC Housing Finance Ltd. (India) | | | 1,816,473 | |
| | | | | | | | |
| | | | Trading Companies &
Distributors 4.4% | | | | |
| | 162,179 | | | MonotaRO Co. Ltd. (Japan) | | | 4,444,968 | |
| | 33,870 | | | MSC Industrial Direct Co., Inc., Class A | | | 2,284,870 | |
| | | | | | | | |
| | | | | | | 6,729,838 | |
| | | | | | | | |
| | | | Trucking 4.2% | | | | |
| | 26,700 | | | J.B. Hunt Transport Services, Inc. | | | 1,389,468 | |
| | 150,940 | | | Knight Transportation, Inc. | | | 2,158,442 | |
| | 51,352 | | | Old Dominion Freight Line, Inc.* | | | 1,548,776 | |
| | 85,700 | | | Tegma Gestao Logistica (Brazil) | | | 1,415,261 | |
| | | | | | | | |
| | | | | | | 6,511,947 | |
| | | | | | | | |
| | |
| | | | Total Common Stocks
(cost $114,197,139) | | | 155,526,308 | |
| | | | | | | | |
| | |
| | | | WARRANTS 0.0% | | | | |
| | |
| | | | Health Care Equipment 0.0% | | | | |
| | 40,000 | | | Cardica, Inc., expiring 9/29/14* *** † | | | 2,400 | |
| | | | | | | | |
| | | | Restaurants 0.0% | | | | |
| | 29,600 | | | KFC Holdings Malaysia Berhad, expiring 9/14/15* (Malaysia) | | | 9,200 | |
| | | | | | | | |
| | |
| | | | Total Warrants
(cost $5,000) | | | 11,600 | |
| | | | | | | | |
| | |
| | | | Total Investments
(cost $114,202,139) 101.3% | | | 155,537,908 | |
| | |
| | | | Liabilities less Other Assets (1.3%) | | | (1,955,946 | ) |
| | | | | | | | |
| | |
| | | | NET ASSETS 100.0% | | $ | 153,581,962 | |
| | | | | | | | |
| |
| | | | *Non-income producing. **Common units. ***Security was fair valued under procedures adopted by the Board of Trustees (see Note 15). †Security purchased in a private placement transaction or under Rule 144A of the Securities Act of 1933 (see Note 11). GDR Global Depositary Receipt. See Notes to Financial Statements. | |
55
| | |
WASATCH GLOBAL OPPORTUNITIES FUND
(WAGOX) — Schedule of Investments (continued) | | SEPTEMBER 30, 2012 |
|
|
|
At September 30, 2012, Wasatch Global Opportunities Fund’s investments were in the following countries:
| | | | |
| Country | | % | |
Australia | | | 2.5 | |
Austria | | | 1.2 | |
Brazil | | | 5.7 | |
Cambodia | | | 0.9 | |
Canada | | | 1.5 | |
Colombia | | | 0.7 | |
Germany | | | 3.3 | |
Hong Kong | | | 1.1 | |
India | | | 9.0 | |
Indonesia | | | 4.4 | |
Italy | | | 1.4 | |
Japan | | | 3.9 | |
Kazakhstan | | | 1.0 | |
Korea | | | 0.5 | |
Malaysia | | | <0.1 | |
Nigeria | | | 0.7 | |
Norway | | | 0.8 | |
Philippines | | | 2.5 | |
South Africa | | | 4.5 | |
Sweden | | | 1.8 | |
Switzerland | | | 1.1 | |
Thailand | | | 1.2 | |
Turkey | | | 1.4 | |
United Kingdom | | | 7.5 | |
United States | | | 41.4 | |
| | | | |
TOTAL | | | 100.0 | % |
| | | | |
56
| | |
WASATCH HERITAGE GROWTH FUND (WAHGX) — Schedule of Investments | | SEPTEMBER 30, 2012 |
|
|
|
| | | | | | | | |
| Shares | | | | | Value | |
| | | | | | | |
| | | | COMMON STOCKS 93.1% | | | | |
| | |
| | | | Aerospace & Defense 1.9% | | | | |
| | 15,030 | | | TransDigm Group, Inc.* | | $ | 2,132,306 | |
| | | | | | | | |
| | | | Air Freight & Logistics 3.3% | | | | |
| | 25,563 | | | CH Robinson Worldwide, Inc. | | | 1,496,714 | |
| | 61,612 | | | Expeditors International of Washington, Inc. | | | 2,240,212 | |
| | | | | | | | |
| | | | | | | 3,736,926 | |
| | | | | | | | |
| | | | Apparel Retail 3.9% | | | | |
| | 49,953 | | | Ross Stores, Inc. | | | 3,226,964 | |
| | 31,343 | | | Urban Outfitters, Inc.* | | | 1,177,243 | |
| | | | | | | | |
| | | | | | | 4,404,207 | |
| | | | | | | | |
| | | | Application Software 3.0% | | | | |
| | 45,279 | | | ANSYS, Inc.* | | | 3,323,479 | |
| | | | | | | | |
| | | | Asset Management & Custody
Banks 5.2% | |
| | 109,054 | | | CETIP S.A. — Mercados Organizados (Brazil) | | | 1,431,275 | |
| | 84,665 | | | SEI Investments Co. | | | 1,816,064 | |
| | 40,174 | | | T. Rowe Price Group, Inc. | | | 2,543,014 | |
| | | | | | | | |
| | | | | | | 5,790,353 | |
| | | | | | | | |
| | | | Automobile Manufacturers 1.3% | | | | |
| | 47,799 | | | Tesla Motors, Inc.* | | | 1,399,555 | |
| | | | | | | | |
| | | | Automotive Retail 0.7% | | | | |
| | 10,016 | | | O’Reilly Automotive, Inc.* | | | 837,538 | |
| | | | | | | | |
| | | | Communications Equipment 2.6% | |
| | 14,472 | | | F5 Networks, Inc.* | | | 1,515,218 | |
| | 58,715 | | | Riverbed Technology, Inc.* | | | 1,366,298 | |
| | | | | | | | |
| | | | | | | 2,881,516 | |
| | | | | | | | |
| | | | Data Processing & Outsourced
Services 2.7% | |
| | 21,369 | | | Alliance Data Systems Corp.* | | | 3,033,330 | |
| | | | | | | | |
| | | | Distributors 2.9% | | | | |
| | 172,816 | | | LKQ Corp.* | | | 3,197,096 | |
| | | | | | | | |
| | | | Diversified Support Services 3.5% | |
| | 142,057 | | | Copart, Inc.* | | | 3,939,241 | |
| | | | | | | | |
| | | | Electrical Components &
Equipment 2.2% | |
| | 68,339 | | | Polypore International, Inc.* | | | 2,415,784 | |
| | | | | | | | |
| | | | Electronic Components 3.6% | | | | |
| | 68,390 | | | Amphenol Corp., Class A | | | 4,026,803 | |
| | | | | | | | |
| | | | Electronic Manufacturing
Services 1.2% | |
| | 24,088 | | | IPG Photonics Corp.* | | | 1,380,242 | |
| | | | | | | | |
| | | | Environmental & Facilities
Services 1.1% | |
| | 14,058 | | | Stericycle, Inc.* | | | 1,272,530 | |
| | | | | | | | |
| | | | Health Care Equipment 2.0% | | | | |
| | 53,062 | | | St. Jude Medical, Inc. | | | 2,235,502 | |
| | | | | | | | |
| | | | Health Care Services 2.6% | | | | |
| | 29,331 | | | Catamaran Corp.* (Canada) | | | 2,873,558 | |
| | | | | | | | |
| | | | Health Care Supplies 1.0% | | | | |
| | 31,155 | | | Align Technology, Inc.* | | | 1,151,800 | |
| | | | | | | | |
| | | | Industrial Machinery 1.9% | | | | |
| | 52,177 | | | IDEX Corp. | | | 2,179,433 | |
| | | | | | | | |
| | | | | | | | |
| Shares | | | | | Value | |
| | | | | | | |
| | | | IT Consulting & Other Services 5.5% | | | | |
| | 88,205 | | | Cognizant Technology Solutions Corp.,
Class A* | | $ | 6,167,294 | |
| | | | | | | | |
| | | | Leisure Facilities 1.0% | | | | |
| | 25,474 | | | Life Time Fitness, Inc.* | | | 1,165,181 | |
| | | | | | | | |
| | | | Life Sciences Tools & Services 1.8% | |
| | 42,675 | | | Covance, Inc.* | | | 1,992,496 | |
| | | | | | | | |
| | | | Oil & Gas Equipment &
Services 3.6% | |
| | 22,870 | | | CARBO Ceramics, Inc. | | | 1,438,981 | |
| | 21,140 | | | Core Laboratories N.V. | | | 2,568,087 | |
| | | | | | | | |
| | | | | | | 4,007,068 | |
| | | | | | | | |
| | | | Oil & Gas Exploration &
Production 4.1% | |
| | 266,025 | | | SandRidge Energy, Inc.* | | | 1,854,194 | |
| | 123,678 | | | Ultra Petroleum Corp.* | | | 2,718,443 | |
| | | | | | | | |
| | | | | | | 4,572,637 | |
| | | | | | | | |
| | | | Personal Products 2.1% | | | | |
| | 50,289 | | | Herbalife Ltd. | | | 2,383,699 | |
| | | | | | | | |
| | | | Regional Banks 2.4% | | | | |
| | 40,344 | | | Signature Bank* | | | 2,706,275 | |
| | | | | | | | |
| | | | Research & Consulting Services 4.2% | |
| | 47,893 | | | IHS, Inc., Class A* | | | 4,662,384 | |
| | | | | | | | |
| | | | Restaurants 2.9% | | | | |
| | 62,830 | | | Tim Hortons, Inc. (Canada) | | | 3,269,045 | |
| | | | | | | | |
| | | | Semiconductors 6.6% | | | | |
| | 38,309 | | | Altera Corp. | | | 1,301,931 | |
| | 36,326 | | | Linear Technology Corp. | | | 1,156,983 | |
| | 97,141 | | | Microchip Technology, Inc. | | | 3,180,396 | |
| | 47,627 | | | Silicon Laboratories, Inc.* | | | 1,750,769 | |
| | | | | | | | |
| | | | | | | 7,390,079 | |
| | | | | | | | |
| | | | Specialized Finance 5.2% | |
| | 18,784 | | | IntercontinentalExchange, Inc.* | | | 2,505,973 | |
| | 52,435 | | | MSCI, Inc., Class A* | | | 1,876,649 | |
| | 405,779 | | | Power Finance Corp. Ltd. (India) | | | 1,454,019 | |
| | | | | | | | |
| | | | | | | 5,836,641 | |
| | | | | | | | |
| | | | Trading Companies &
Distributors 4.7% | |
| | 77,181 | | | MSC Industrial Direct Co., Inc., Class A | | | 5,206,630 | |
| | | | | | | | |
| | | | Trucking 1.7% | | | | |
| | 37,154 | | | J.B. Hunt Transport Services, Inc. | | | 1,933,494 | |
| | | | | | | | |
| | | | Wireless Telecommunication
Services 0.7% | |
| | 93,945 | | | NII Holdings, Inc.* | | | 737,468 | |
| | | | | | | | |
| | |
| | | | Total Common Stocks (cost $83,842,794) | | | 104,241,590 | |
| | | | | | | | |
57
| | |
| WASATCH HERITAGE GROWTH FUND (WAHGX) — Schedule of Investments (continued) | | SEPTEMBER 30, 2012 |
|
|
|
| | | | | | | | |
Principal
Amount | | | | | Value | |
| | | | | | | |
| | | | SHORT-TERM INVESTMENTS 7.0% | | | | |
| | |
| | | | Repurchase Agreement 7.0% | | | | |
| | $7,801,469 | | | Repurchase Agreement dated 9/28/12, 0.01% due 10/1/12 with State Street Bank and Trust Co. collateralized by $5,855,000 of United States Treasury Bonds 4.500% due 8/15/39; value: $7,960,452; repurchase proceeds: $7,801,476 (cost $7,801,469) | | $ | 7,801,469 | |
| | | | | | | | |
| | |
| | | | Total Short-Term Investments (cost $7,801,469) | | | 7,801,469 | |
| | | | | | | | |
| | |
| | | | Total Investments (cost $91,644,263) 100.1% | | | 112,043,059 | |
| | |
| | | | Liabilities less Other Assets (0.1%) | | | (90,757 | ) |
| | | | | | | | |
| | |
| | | | NET ASSETS 100.0% | | $ | 111,952,302 | |
| | | | | | | | |
| | |
| | | | *Non-income producing. See Notes to Financial Statements. | | | | |
At September 30, 2012, Wasatch Heritage Growth Fund’s investments, excluding short-term investments, were in the following countries:
| | | | |
| Country | | % | |
Brazil | | | 1.4 | |
Canada | | | 5.9 | |
India | | | 1.4 | |
United States | | | 91.3 | |
| | | | |
TOTAL | | | 100.0 | % |
| | | | |
58
| | |
| WASATCH INTERNATIONAL GROWTH FUND (WAIGX) — Schedule of Investments | | SEPTEMBER 30, 2012 |
|
|
|
| | | | | | | | |
| Shares | | | | | Value | |
| | | | | | | |
| | |
| | | | COMMON STOCKS 95.4% | | | | |
| | |
| | | | Advertising 1.6% | | | | |
| | 418,146 | | | REA Group Ltd. (Australia) | | $ | 6,799,525 | |
| | | | | | | | |
| | | | Apparel Retail 1.7% | | | | |
| | 163,120 | | | Cia. Hering (Brazil) | | | 3,688,560 | |
| | 310,160 | | | Truworths International Ltd.
(South Africa) | | | 3,509,083 | |
| | | | | | | | |
| | | | | | | 7,197,643 | |
| | | | | | | | |
| | | | Apparel, Accessories & Luxury
Goods 1.8% | | | | |
| | 204,133 | | | Salvatore Ferragamo Italia S.p.A. (Italy) | | | 4,251,108 | |
| | 5,686,627 | | | Trinity Ltd. (China) | | | 3,806,143 | |
| | | | | | | | |
| | | | | | | 8,057,251 | |
| | | | | | | | |
| | | | Application Software 1.4% | | | | |
| | 317,062 | | | Computer Modelling Group Ltd. (Canada) | | | 6,227,399 | |
| | | | | | | | |
| | | | Asset Management & Custody
Banks 3.7% | | | | |
| | 1,369,519 | | | Aberdeen Asset Management plc
(United Kingdom) | | | 6,881,249 | |
| | 332,875 | | | CETIP S.A. — Mercados Organizados (Brazil) | | | 4,368,805 | |
| | 22,589 | | | Partners Group Holding AG (Switzerland) | | | 4,704,589 | |
| | | | | | | | |
| | | | | | | 15,954,643 | |
| | | | | | | | |
| | | | Automotive Retail 0.9% | | | | |
| | 385,085 | | | ARB Corp. Ltd. (Australia) | | | 3,905,195 | |
| | | | | | | | |
| | | | Biotechnology 2.2% | | | | |
| | 1,492,453 | | | Abcam plc (United Kingdom) | | | 9,684,022 | |
| | | | | | | | |
| | | | Casinos & Gaming 3.9% | | | | |
| | 1,893,069 | | | Galaxy Entertainment Group Ltd.*
(Hong Kong) | | | 6,371,915 | |
| | 11,454,253 | | | NagaCorp Ltd. (Cambodia) | | | 6,410,907 | |
| | 2,011,947 | | | SJM Holdings Ltd. (Hong Kong) | | | 4,369,398 | |
| | | | | | | | |
| | | | | | | 17,152,220 | |
| | | | | | | | |
| | | | Catalog Retail 0.6% | |
| | 23,355 | | | Hyundai Home Shopping Network Corp. (Korea) | | | 2,521,628 | |
| | | | | | | | |
| | | | Coal & Consumable Fuels 1.9% | | | | |
| | 975,245 | | | PT Indo Tambangraya Megah Tbk (Indonesia) | | | 4,295,358 | |
| | 2,397,985 | | | PT Tambang Batubara Bukit Asam (Persero) Tbk (Indonesia) | | | 4,059,285 | |
| | | | | | | | |
| | | | | | | 8,354,643 | |
| | | | | | | | |
| | | | Commodity Chemicals 0.1% | | | | |
| | 103,010 | | | TSRC Corp. (Taiwan) | | | 228,415 | |
| | | | | | | | |
| | | | Construction & Engineering 1.0% | | | | |
| | 600,153 | | | Kentz Corp. Ltd. (United Kingdom) | | | 4,176,742 | |
| | | | | | | | |
| | | | Construction Materials 2.7% | | | | |
| | 2,946,071 | | | PT Indocement Tunggal Prakarsa Tbk (Indonesia) | | | 6,264,634 | |
| | 3,736,935 | | | PT Semen Gresik (Persero) Tbk (Indonesia) | | | 5,642,498 | |
| | | | | | | | |
| | | | | | | 11,907,132 | |
| | | | | | | | |
| | | | Consumer Finance 1.9% | | | | |
| | 481,100 | | | Mahindra & Mahindra Financial Services Ltd. (India) | | | 8,199,542 | |
| | | | | | | | |
| | | | | | | | |
| Shares | | | | | Value | |
| | | | | | | |
| | | | Data Processing & Outsourced Services 2.6% | | | | |
| | 487,591 | | | Wirecard AG (Germany) | | $ | 11,207,850 | |
| | | | | | | | |
| | | | Department Stores 1.8% | | | | |
| | 105,600 | | | Lojas Renner S.A. (Brazil) | | | 3,537,802 | |
| | 561,489 | | | Woolworths Holdings Ltd. (South Africa) | | | 4,108,217 | |
| | | | | | | | |
| | | | | | | 7,646,019 | |
| | | | | | | | |
| | | | Distributors 0.6% | | | | |
| | 2,717,607 | | | Dah Chong Hong Holdings Ltd. (China) | | | 2,474,311 | |
| | | | | | | | |
| | |
| | | | Diversified Banks 3.4% | | | | |
| | 2,019,000 | | | Metropolitan Bank & Trust (Philippines) | | | 4,476,987 | |
| | 6,196,519 | | | PT Bank Tabungan Pensiunan Nasional Tbk* (Indonesia) | | | 3,399,344 | |
| | 1,805,103 | | | Security Bank Corp. (Philippines) | | | 7,096,653 | |
| | | | | | | | |
| | | | | | | 14,972,984 | |
| | | | | | | | |
| | |
| | | | Drug Retail 1.3% | | | | |
| | 499,940 | | | Clicks Group Ltd. (South Africa) | | | 3,482,783 | |
| | 25,100 | | | Cosmos Pharmaceutical Corp. (Japan) | | | 2,304,905 | |
| | | | | | | | |
| | | | | | | 5,787,688 | |
| | | | | | | | |
| | |
| | | | Electronic Equipment &
Instruments 3.0% | | | | |
| | 722,915 | | | Halma plc (United Kingdom) | | | 4,949,369 | |
| | 369,967 | | | Oxford Instruments plc (United Kingdom) | | | 8,216,085 | |
| | | | | | | | |
| | | | | | | 13,165,454 | |
| | | | | | | | |
| | |
| | | | Fertilizers & Agricultural
Chemicals 0.7% | | | | |
| | 220,169 | | | Phosagro OAO GDR (Russia) | | | 2,952,466 | |
| | | | | | | | |
| | |
| | | | Food Retail 1.0% | | | | |
| | 102,270 | | | BIM Birlesik Magazalar A.S. (Turkey) | | | 4,272,525 | |
| | | | | | | | |
| | |
| | | | Gold 2.6% | | | | |
| | 259,500 | | | Alamos Gold, Inc. (Canada) | | | 5,044,037 | |
| | 288,789 | | | Koza Altin Isletmeleri A.S. (Turkey) | | | 6,209,305 | |
| | | | | | | | |
| | | | | | | 11,253,342 | |
| | | | | | | | |
| | |
| | | | Health Care Equipment 2.9% | | | | |
| | 940,107 | | | Elekta AB, Class B (Sweden) | | | 12,429,308 | |
| | | | | | | | |
| | |
| | | | Health Care Technology 2.5% | | | | |
| | 393,944 | | | EMIS Group plc (United Kingdom) | | | 5,121,882 | |
| | 2,922 | | | M3, Inc. (Japan) | | | 5,549,854 | |
| | | | | | | | |
| | | | | | | 10,671,736 | |
| | | | | | | | |
| | |
| | | | Hypermarkets & Super Centers 2.2% | | | | |
| | 806,760 | | | Big C Supercenter Public Co. Ltd.*** (Thailand) | | | 4,901,368 | |
| | 61,000 | | | PriceSmart, Inc. | | | 4,618,920 | |
| | | | | | | | |
| | | | | | | 9,520,288 | |
| | | | | | | | |
| | |
| | | | Industrial Machinery 4.1% | | | | |
| | 100,672 | | | Andritz AG (Austria) | | | 5,706,815 | |
| | 337,129 | | | Rotork plc (United Kingdom) | | | 12,321,963 | |
| | | | | | | | |
| | | | | | | 18,028,778 | |
| | | | | | | | |
| | |
| | | | Internet Retail 2.9% | | | | |
| | 173,889 | | | ASOS plc* (United Kingdom) | | | 6,170,230 | |
| | 205,656 | | | Start Today Co. Ltd. (Japan) | | | 2,949,984 | |
| | 287,401 | | | Yoox S.p.A.* (Italy) | | | 3,682,050 | |
| | | | | | | | |
| | | | | | | 12,802,264 | |
| | | | | | | | |
59
| | |
| WASATCH INTERNATIONAL GROWTH FUND (WAIGX) — Schedule of Investments (continued) | | |
|
|
|
| | | | | | | | |
| Shares | | | | | Value | |
| | | | | | | |
| | |
| | | | Internet Software & Services 2.9% | | | | |
| | 812,290 | | | carsales.com Ltd. (Australia) | | $ | 6,541,074 | |
| | 165,676 | | | Kakaku.com, Inc. (Japan) | | | 6,231,947 | |
| | | | | | | | |
| | | | | | | 12,773,021 | |
| | | | | | | | |
| | |
| | | | Life & Health Insurance 1.2% | | | | |
| | 1,015,816 | | | Bangkok Life Assurance Public Co. Ltd. NVDR (Thailand) | | | 1,452,109 | |
| | 539,825 | | | Discovery Holdings Ltd. (South Africa) | | | 3,606,002 | |
| | | | | | | | |
| | | | | | | 5,058,111 | |
| | | | | | | | |
| | | | Marine Ports & Services 2.1% | | | | |
| | 3,652,822 | | | International Container Terminal Services, Inc. (Philippines) | | | 6,164,657 | |
| | 219,200 | | | Santos Brasil Participacoes S.A.** (Brazil) | | | 3,136,450 | |
| | | | | | | | |
| | | | | | | 9,301,107 | |
| | | | | | | | |
| | | | Multi-Sector Holdings 2.5% | | | | |
| | 10,033,880 | | | First Pacific Co. Ltd. (Hong Kong) | | | 10,895,421 | |
| | | | | | | | |
| | | | Oil & Gas Drilling 1.0% | | | | |
| | 130,800 | | | Eurasia Drilling Co. Ltd., GDR (Russia) | | | 4,316,400 | |
| | | | | | | | |
| | | | Oil & Gas Equipment & Services 3.6% | | | | |
| | 32,975 | | | Core Laboratories N.V. | | | 4,005,803 | |
| | 117,740 | | | ShawCor Ltd., Class A (Canada) | | | 5,111,268 | |
| | 200,104 | | | TGS-NOPEC Geophysical Co. ASA (Norway) | | | 6,530,714 | |
| | | | | | | | |
| | | | | | | 15,647,785 | |
| | | | | | | | |
| | | | Oil & Gas Exploration &
Production 4.3% | | | | |
| | 1,782,000 | | | Afren plc* (Nigeria) | | | 4,032,228 | |
| | 215,923 | | | Coastal Energy Co.* (Thailand) | | | 4,014,721 | |
| | 528,422 | | | Gran Tierra Energy, Inc.* (Colombia) | | | 2,731,942 | |
| | 668,396 | | | Premier Oil plc* (United Kingdom) | | | 3,874,418 | |
| | 409,337 | | | Zhaikmunai L.P. GDR (Kazakhstan) | | | 4,175,237 | |
| | | | | | | | |
| | | | | | | 18,828,546 | |
| | | | | | | | |
| | | | Packaged Foods & Meats 1.5% | | | | |
| | 7,499,227 | | | Vitasoy International Holdings Ltd.
(Hong Kong) | | | 6,528,047 | |
| | | | | | | | |
| | | | Personal Products 1.5% | | | | |
| | 500,470 | | | Godrej Consumer Products Ltd. (India) | | | 6,347,795 | |
| | | | | | | | |
| | | | Pharmaceuticals 1.0% | | | | |
| | 9,199,540 | | | PT Kalbe Farma Tbk (Indonesia) | | | 4,518,060 | |
| | | | | | | | |
| | | | Publishing 1.6% | | | | |
| | 267,651 | | | Rightmove plc (United Kingdom) | | | 6,778,196 | |
| | | | | | | | |
| | | | Real Estate Operating
Companies 1.7% | | | | |
| | 250,000 | | | Multiplan Empreendimentos Imobiliarios S.A. (Brazil) | | | 7,362,773 | |
| | | | | | | | |
| | | | Research & Consulting Services 0.9% | | | | |
| | 459,345 | | | ALS Ltd. (Australia) | | | 4,099,854 | |
| | | | | | | | |
| | | | Restaurants 1.6% | | | | |
| | 421,204 | | | Toridoll.corp (Japan) | | | 6,834,855 | |
| | | | | | | | |
| | | | Soft Drinks 1.3% | | | | |
| | 291,939 | | | Coca-Cola Icecek A.S. (Turkey) | | | 5,463,947 | |
| | | | | | | | |
| | | | Specialized Finance 0.5% | | | | |
| | 273,400 | | | Oslo Bors VPS Holding ASA (Norway) | | | 2,387,064 | |
| | | | | | | | |
| | | | | | | | |
| Shares | | | | | Value | |
| | | | | | | |
| | | | Specialty Stores 2.7% | | | | |
| | 2,237,907 | | | L’Occitane International S.A. (Luxembourg) | | $ | 5,916,418 | |
| | 8,547,030 | | | Sa Sa International Holdings Ltd. (Hong Kong) | | | 5,841,900 | |
| | | | | | | | |
| | | | | | | 11,758,318 | |
| | | | | | | | |
| | | | Thrifts & Mortgage Finance 2.5% | | | | |
| | 1,383,955 | | | Gruh Finance Ltd. (India) | | | 5,431,390 | |
| | 1,007,833 | | | LIC Housing Finance Ltd. (India) | | | 5,399,822 | |
| | | | | | | | |
| | | | | | | 10,831,212 | |
| | | | | | | | |
| | | | Trading Companies &
Distributors 4.0% | | | | |
| | 506,957 | | | MonotaRO Co. Ltd. (Japan) | | | 13,894,569 | |
| | 475,926 | | | Seven Group Holdings Ltd. (Australia) | | | 3,367,618 | |
| | | | | | | | |
| | | | | | | 17,262,187 | |
| | | | | | | | |
| | |
| | | | Total Common Stocks
(cost $312,939,951) | | | 414,543,712 | |
| | | | | | | | |
| | |
Principal Amount | | | | | Value | |
| | | | SHORT-TERM INVESTMENTS 4.1% | | | | |
| | |
| | | | Repurchase Agreement 4.1% | | | | |
| | $17,951,553 | | | Repurchase Agreement dated 9/28/12, 0.01% due 10/1/12 with State Street Bank and Trust Co. collateralized by $13,470,000 of United States Treasury Bonds 4.500% due 8/15/39; value: $18,313,799; repurchase proceeds: $17,951,568 (cost $17,951,553) | | $ | 17,951,553 | |
| | | | | | | | |
| | |
| | | | Total Short-Term Investments
(cost $17,951,553) | | | 17,951,553 | |
| | | | | | | | |
| | |
| | | | Total Investments
(cost $330,891,504) 99.5% | | | 432,495,265 | |
| | |
| | | | Other Assets less Liabilities 0.5% | | | 2,329,052 | |
| | | | | | | | |
| | |
| | | | NET ASSETS 100.0% | | $ | 434,824,317 | |
| | | | | | | | |
| |
| | | | *Non-income producing. **Common units. ***Security was fair valued under procedures adopted by the Board of Trustees (see Note 15). GDR Global Depositary Receipt. NVDR Non-Voting Depositary Receipt. See Notes to Financial Statements. | |
60
At September 30, 2012, Wasatch International Growth Fund’s investments, excluding short-term investments, were in the following countries:
| | | | |
| Country | | % | |
Australia | | | 6.0 | |
Austria | | | 1.4 | |
Brazil | | | 5.3 | |
Cambodia | | | 1.5 | |
Canada | | | 4.0 | |
China | | | 1.5 | |
Colombia | | | 0.7 | |
Germany | | | 2.7 | |
Hong Kong | | | 8.2 | |
India | | | 6.1 | |
Indonesia | | | 6.8 | |
Italy | | | 1.9 | |
Japan | | | 9.1 | |
Kazakhstan | | | 1.0 | |
Korea | | | 0.6 | |
Luxembourg | | | 1.4 | |
Nigeria | | | 1.0 | |
Norway | | | 2.2 | |
Philippines | | | 4.3 | |
Russia | | | 1.8 | |
South Africa | | | 3.5 | |
Sweden | | | 3.0 | |
Switzerland | | | 1.1 | |
Taiwan | | | 0.1 | |
Thailand | | | 2.5 | |
Turkey | | | 3.8 | |
United Kingdom | | | 16.4 | |
United States | | | 2.1 | |
| | | | |
TOTAL | | | 100.0 | % |
| | | | |
61
| | |
WASATCH INTERNATIONAL OPPORTUNITIES FUND
(WAIOX) — Schedule of Investments | | |
|
|
|
| | | | | | | | |
| Shares | | | | | Value | |
| | | | | | | |
| | | | COMMON STOCKS 97.1% | | | | |
| | |
| | | | Apparel Retail 0.9% | | | | |
| | 2,435,225 | | | Padini Holdings Berhad (Malaysia) | | $ | 1,673,147 | |
| | | | | | | | |
| | | | Apparel, Accessories & Luxury
Goods 4.3% | | | | |
| | 36,908 | | | Gerry Weber International AG (Germany) | | | 1,526,788 | |
| | 36,300 | | | Page Industries Ltd. (India) | | | 2,202,294 | |
| | 515,100 | | | Restoque Comercio e Confeccoes de Roupas S.A. (Brazil) | | | 2,325,479 | |
| | 163,206 | | | Ted Baker plc (United Kingdom) | | | 2,369,709 | |
| | | | | | | | |
| | | | | | | 8,424,270 | |
| | | | | | | | |
| | | | Application Software 2.8% | | | | |
| | 163,000 | | | Computer Modelling Group Ltd. (Canada) | | | 3,201,475 | |
| | 1,539,295 | | | Technology One Ltd. (Australia) | | | 2,183,186 | |
| | | | | | | | |
| | | | | | | 5,384,661 | |
| | | | | | | | |
| | | | Auto Parts & Equipment 1.1% | | | | |
| | 69,407 | | | WABCO India Ltd. (India) | | | 2,171,231 | |
| | | | | | | | |
| | | | Biotechnology 2.1% | | | | |
| | 614,468 | | | Abcam plc (United Kingdom) | | | 3,987,075 | |
| | | | | | | | |
| | | | Brewers 1.9% | | | | |
| | 362,475 | | | Carlsberg Brewery Malaysia Berhad (Malaysia) | | | 1,363,802 | |
| | 102,990 | | | Olvi Oyj, Class A (Finland) | | | 2,404,439 | |
| | | | | | | | |
| | | | | | | 3,768,241 | |
| | | | | | | | |
| | | | Building Products 0.9% | | | | |
| | 1,069,151 | | | Dynasty Ceramic Public Co. Ltd.*** (Thailand) | | | 1,762,814 | |
| | | | | | | | |
| | | | Catalog Retail 0.8% | | | | |
| | 14,240 | | | Hyundai Home Shopping Network Corp. (Korea) | | | 1,537,486 | |
| | | | | | | | |
| | | | Coal & Consumable Fuels 0.6% | | | | |
| | 3,842,115 | | | PT Resource Alam Indonesia Tbk (Indonesia) | | | 1,194,388 | |
| | | | | | | | |
| | | | Commodity Chemicals 3.0% | | | | |
| | 1,224,627 | | | Berger Paints India Ltd. (India) | | | 3,423,476 | |
| | 130,700 | | | Tikkurila Oyj (Finland) | | | 2,486,485 | |
| | | | | | | | |
| | | | | | | 5,909,961 | |
| | | | | | | | |
| | | | Construction & Engineering 1.2% | | | | |
| | 190,615 | | | Kentz Corp. Ltd. (United Kingdom) | | | 1,326,578 | |
| | 144,478 | | | Lycopodium Ltd. (Australia) | | | 929,242 | |
| | | | | | | | |
| | | | | | | 2,255,820 | |
| | | | | | | | |
| | | | Construction & Farm Machinery & Heavy Trucks 1.1% | | | | |
| | 48,845 | | | Eicher Motors Ltd. (India) | | | 2,185,500 | |
| | | | | | | | |
| | | | Construction Materials 0.9% | | | | |
| | 6,997,973 | | | Diamond Building Products Public Co. Ltd.*** (Thailand) | | | 1,761,998 | |
| | | | | | | | |
| | | | Data Processing & Outsourced Services 2.9% | | | | |
| | 80,000 | | | GMO Payment Gateway, Inc. (Japan) | | | 1,449,795 | |
| | 183,361 | | | Wirecard AG (Germany) | | | 4,214,767 | |
| | | | | | | | |
| | | | | | | 5,664,562 | |
| | | | | | | | |
| | | | Department Stores 2.1% | | | | |
| | 517,057 | | | Parkson Retail Asia Ltd.* (Malaysia) | | | 611,527 | |
| | 5,159,900 | | | PT Mitra Adiperkasa Tbk (Indonesia) | | | 3,450,717 | |
| | | | | | | | |
| | | | | | | 4,062,244 | |
| | | | | | | | |
| | | | Diversified Banks 2.5% | | | | |
| | 4,170,000 | | | EastWest Banking Corp.* (Philippines) | | | 2,289,177 | |
| | 5,922,575 | | | South Indian Bank Ltd. (India) | | | 2,560,142 | |
| | | | | | | | |
| | | | | | | 4,849,319 | |
| | | | | | | | |
| | | | | | | | |
| Shares | | | | | Value | |
| | | | | | | |
| | | | Diversified Metals & Mining 0.6% | | | | |
| | 702,700 | | | Imdex Ltd. (Australia) | | $ | 1,197,430 | |
| | | | | | | | |
| | | | Diversified Support Services 0.5% | | | | |
| | 256,000 | | | Vicom Ltd. (Singapore) | | | 1,021,077 | |
| | | | | | | | |
| | | | Drug Retail 1.8% | | | | |
| | 37,353 | | | Cosmos Pharmaceutical Corp. (Japan) | | | 3,430,085 | |
| | | | | | | | |
| | | | Electrical Components &
Equipment 1.4% | | | | |
| | 648,140 | | | Amara Raja Batteries Ltd. (India) | | | 2,681,895 | |
| | | | | | | | |
| | | | Electronic Equipment &
Instruments 1.6% | | | | |
| | 143,460 | | | Oxford Instruments plc (United Kingdom) | | | 3,185,904 | |
| | | | | | | | |
| | | | Environmental & Facilities
Services 1.0% | | | | |
| | 465,656 | | | RPS Group plc (United Kingdom) | | | 1,872,681 | |
| | | | | | | | |
| | | | Food Retail 3.6% | | | | |
| | 1,609,000 | | | Philippine Seven Corp. (Philippines) | | | 2,815,701 | |
| | 3,230,000 | | | PT Sumber Alfaria Trijaya Tbk (Indonesia) | | | 1,856,322 | |
| | 75,942 | | | Rami Levi Chain Stores Hashikma Marketing 2006 Ltd. (Israel) | | | 2,325,942 | |
| | | | | | | | |
| | | | | | | 6,997,965 | |
| | | | | | | | |
| | | | Footwear 1.3% | | | | |
| | 139,320 | | | Bata India Ltd. (India) | | | 2,581,957 | |
| | | | | | | | |
| | | | Gold 1.5% | | | | |
| | 139,704 | | | Koza Altin Isletmeleri A.S. (Turkey) | | | 3,003,801 | |
| | | | | | | | |
| | | | Health Care Facilities 2.7% | | | | |
| | 1,719,730 | | | KPJ Healthcare Berhad (Malaysia) | | | 3,432,146 | |
| | 958,205 | | | Raffles Medical Group Ltd. (Singapore) | | | 1,899,215 | |
| | | | | | | | |
| | | | | | | 5,331,361 | |
| | | | | | | | |
| | | | Health Care Supplies 0.9% | | | | |
| | 19,706 | | | Sartorius Stedim Biotech (France) | | | 1,774,094 | |
| | | | | | | | |
| | | | Heavy Electrical Equipment 0.6% | | | | |
| | 216,583 | | | TD Power Systems Ltd. (India) | | | 1,116,894 | |
| | | | | | | | |
| | | | Home Improvement Retail 0.9% | | | | |
| | 93,613 | | | Cashbuild Ltd. (South Africa) | | | 1,746,417 | |
| | | | | | | | |
| | | | Household Appliances 1.3% | | | | |
| | 35,400 | | | TTK Prestige Ltd. (India) | | | 2,495,349 | |
| | | | | | | | |
| | | | Hypermarkets & Super Centers 1.0% | | | | |
| | 2,822,900 | | | Puregold Price Club, Inc. (Philippines) | | | 2,009,832 | |
| | | | | | | | |
| | | | Industrial Machinery 1.9% | | | | |
| | 61,700 | | | FAG Bearings India Ltd. (India) | | | 2,105,427 | |
| | 132,047 | | | SKF India Ltd. (India) | | | 1,668,581 | |
| | | | | | | | |
| | | | | | | 3,774,008 | |
| | | | | | | | |
| | | | Internet Retail 2.8% | | | | |
| | 864,000 | | | Webjet Ltd. (Australia) | | | 3,671,752 | |
| | 140,869 | | | Yoox S.p.A.* (Italy) | | | 1,804,749 | |
| | | | | | | | |
| | | | | | | 5,476,501 | |
| | | | | | | | |
| | | | Internet Software & Services 2.5% | | | | |
| | 76,000 | | | Kakaku.com, Inc. (Japan) | | | 2,858,760 | |
| | 354,930 | | | PChome Online, Inc. (Taiwan) | | | 2,009,940 | |
| | | | | | | | |
| | | | | | | 4,868,700 | |
| | | | | | | | |
| | | | IT Consulting & Other Services 2.6% | | | | |
| | 612,325 | | | EOH Holdings Ltd. (South Africa) | | | 2,874,263 | |
| | 15,625,000 | | | PT Astra Graphia Tbk (Indonesia) | | | 2,253,135 | |
| | | | | | | | |
| | | | | | | 5,127,398 | |
| | | | | | | | |
| | | | Marine Ports & Services 0.3% | | | | |
| | 222,475 | | | Veripos, Inc.* (Norway) | | | 621,580 | |
| | | | | | | | |
62
| | | | | | | | |
| Shares | | | | | Value | |
| | | | | | | |
| | | | Metal & Glass Containers 1.0% | | | | |
| | 119,158 | | | Winpak Ltd. (Canada) | | $ | 1,900,420 | |
| | | | | | | | |
| | | | Office Services & Supplies 1.0% | | | | |
| | 92,804 | | | Adel Kalemcilik Ticaret ve Sanayi AS (Turkey) | | | 1,866,160 | |
| | | | | | | | |
| | | | Oil & Gas Equipment & Services 0.5% | | | | |
| | 361,200 | | | Electromagnetic GeoServices AS* (Norway) | | | 886,175 | |
| | | | | | | | |
| | | | Oil & Gas Exploration &
Production 3.4% | | | | |
| | 766,591 | | | Afren plc* (Nigeria) | | | 1,734,607 | |
| | 99,210 | | | Coastal Energy Co.* (Thailand) | | | 1,844,641 | |
| | 269,711 | | | Gran Tierra Energy, Inc.* (Colombia) | | | 1,394,406 | |
| | 149,050 | | | TransGlobe Energy Corp.* (Egypt) | | | 1,622,168 | |
| | | | | | | | |
| | | | | | | 6,595,822 | |
| | | | | | | | |
| | | | Oil & Gas Refining & Marketing 1.2% | | | | |
| | 10,519 | | | Hankook Shell Oil Co. Ltd. (Korea) | | | 2,280,927 | |
| | | | | | | | |
| | | | Packaged Foods & Meats 10.2% | | | | |
| | 869,300 | | | Grupo Herdez S.A.B. de C.V. (Mexico) | | | 2,241,121 | |
| | 1,253,000 | | | Petra Foods Ltd. (Singapore) | | | 2,503,956 | |
| | 183,660 | | | Pinar Sut Mamulleri Sanayii A.S. (Turkey) | | | 1,534,549 | |
| | 4,799,000 | | | PT Nippon Indosari Corpindo Tbk (Indonesia) | | | 2,883,412 | |
| | 832,415 | | | Standard Foods Corp. (Taiwan) | | | 2,308,675 | |
| | 2,813,000 | | | Super Group Ltd. (Singapore) | | | 5,024,853 | |
| | 3,743,120 | | | Vitasoy International Holdings Ltd.
(Hong Kong) | | | 3,258,371 | |
| | | | | | | | |
| | | | | | | 19,754,937 | |
| | | | | | | | |
| | | | Photographic Products 0.6% | | | | |
| | 14,147,500 | | | PT Modern Internasional Tbk* (Indonesia) | | | 1,093,955 | |
| | | | | | | | |
| | | | Regional Banks 0.7% | | | | |
| | 345,400 | | | Banregio Grupo Financiero S.A.B. de C.V. (Mexico) | | | 1,304,263 | |
| | | | | | | | |
| | | | Research & Consulting Services 2.7% | | | | |
| | 125,187 | | | eClerx Services Ltd. (India) | | | 1,828,141 | |
| | 69,600 | | | Nihon M&A Center, Inc. (Japan) | | | 2,017,223 | |
| | 651,301 | | | Sporton International, Inc. (Taiwan) | | | 1,459,753 | |
| | | | | | | | |
| | | | | | | 5,305,117 | |
| | | | | | | | |
| | | | Restaurants 5.3% | | | | |
| | 313,067 | | | Domino’s Pizza Enterprises Ltd. (Australia) | | | 3,389,544 | |
| | 271,057 | | | Famous Brands Ltd. (South Africa) | | | 2,365,259 | |
| | 389,072 | | | Spur Corp. Ltd. (South Africa) | | | 1,030,226 | |
| | 222,595 | | | Toridoll.corp (Japan) | | | 3,612,037 | |
| | | | | | | | |
| | | | | | | 10,397,066 | |
| | | | | | | | |
| | | | Soft Drinks 1.4% | | | | |
| | 28,383,332 | | | Pepsi-Cola Products Philippines, Inc.* (Philippines) | | | 2,748,859 | |
| | | | | | | | |
| | | | Specialized Finance 0.8% | | | | |
| | 174,495 | | | Oslo Bors VPS Holding ASA (Norway) | | | 1,523,521 | |
| | | | | | | | |
| | | | Specialty Chemicals 1.2% | | | | |
| | 673,719 | | | DuluxGroup Ltd. (Australia) | | | 2,310,091 | |
| | | | | | | | |
| | | | Tires & Rubber 0.6% | | | | |
| | 199,183 | | | Goodyear India Ltd. (India) | | | 1,194,267 | |
| | | | | | | | |
| | | | Tobacco 0.9% | | | | |
| | 26,488 | | | Godfrey Phillips India Ltd. (India) | | | 1,760,175 | |
| | | | | | | | |
| | | | Trading Companies &
Distributors 4.7% | | | | |
| | 33,727 | | | Indutrade AB (Sweden) | | | 1,002,334 | |
| | 215,420 | | | MonotaRO Co. Ltd. (Japan) | | | 5,904,185 | |
| | 2,507,500 | | | PT Hexindo Adiperkasa Tbk (Indonesia) | | | 2,174,739 | |
| | | | | | | | |
| | | | | | | 9,081,258 | |
| | | | | | | | |
| | | | | | | | |
| Shares | | | | | Value | |
| | | | | | | |
| | | | Trucking 1.0% | | | | |
| | 113,766 | | | Tegma Gestao Logistica (Brazil) | | $ | 1,878,746 | |
| | | | | | | | |
| | |
| | | | Total Common Stocks
(cost $148,752,386) | | | 188,789,405 | |
| | | | | | | | |
| | |
Principal
Amount | | | | | Value | |
| | | | SHORT-TERM INVESTMENTS 4.0% | | | | |
| | |
| | | | Repurchase Agreement 4.0% | | | | |
| | $7,818,066 | | | Repurchase Agreement dated 9/28/12, 0.01% due 10/1/12 with State Street Bank and Trust Co. collateralized by $5,870,000 of United States Treasury Bonds 4.500% due 8/15/39; value: $7,980,846; repurchase proceeds: $ 7,818,073 (cost $7,818,066) | | $ | 7,818,066 | |
| | | | | | | | |
| | |
| | | | Total Short-Term Investments (cost $7,818,066) | | | 7,818,066 | |
| | | | | | | | |
| | |
| | | | Total Investments (cost $156,570,452) 101.1% | | | 196,607,471 | |
| | |
| | | | Liabilities less Other Assets (1.1%) | | | (2,044,243 | ) |
| | | | | | | | |
| | |
| | | | NET ASSETS 100.0% | | $ | 194,563,228 | |
| | | | | | | | |
| |
| | | | *Non-income producing. ***Security was fair valued under procedures adopted by the Board of Trustees (see Note 15). See Notes to Financial Statements. | |
At September 30, 2012, Wasatch International Opportunities Fund’s investments, excluding short-term investments, were in the following countries:
| | | | |
| Country | | % | |
Australia | | | 7.3 | |
Brazil | | | 2.2 | |
Canada | | | 2.7 | |
Colombia | | | 0.7 | |
Egypt | | | 0.9 | |
Finland | | | 2.6 | |
France | | | 0.9 | |
Germany | | | 3.0 | |
Hong Kong | | | 1.7 | |
India | | | 15.9 | |
Indonesia | | | 7.9 | |
Israel | | | 1.2 | |
Italy | | | 1.0 | |
Japan | | | 10.2 | |
Korea | | | 2.0 | |
Malaysia | | | 3.8 | |
Mexico | | | 1.9 | |
Nigeria | | | 0.9 | |
Norway | | | 1.6 | |
Philippines | | | 5.2 | |
Singapore | | | 5.5 | |
South Africa | | | 4.3 | |
Sweden | | | 0.5 | |
Taiwan | | | 3.1 | |
Thailand | | | 2.8 | |
Turkey | | | 3.4 | |
United Kingdom | | | 6.8 | |
| | | | |
TOTAL | | | 100.0 | % |
| | | | |
63
| | |
WASATCH LARGE CAP VALUE FUND
(FMIEX / WILCX) — Schedule of Investments | | |
|
|
|
| | | | | | | | |
| Shares | | | | | Value | |
| | | | | | | |
| | | | COMMON STOCKS 96.7% | | | | |
| | |
| | | | Aerospace & Defense 3.9% | | | | |
| | 266,000 | | | L-3 Communications Holdings, Inc. | | $ | 19,074,860 | |
| | 235,000 | | | Raytheon Co. | | | 13,432,600 | |
| | 344,000 | | | Rockwell Collins, Inc. | | | 18,452,160 | |
| | | | | | | | |
| | | | | | | 50,959,620 | |
| | | | | | | | |
| | | | Agricultural Products 1.3% | | | | |
| | 612,368 | | | Archer Daniels Midland Co. | | | 16,644,162 | |
| | | | | | | | |
| | | | Asset Management & Custody
Banks 3.0% | | | | |
| | 132,000 | | | BlackRock, Inc. | | | 23,535,600 | |
| | 335,000 | | | Northern Trust Corp. | | | 15,549,025 | |
| | | | | | | | |
| | | | | | | 39,084,625 | |
| | | | | | | | |
| | | | Auto Parts & Equipment 1.3% | | | | |
| | 632,000 | | | Johnson Controls, Inc. | | | 17,316,800 | |
| | | | | | | | |
| | | | Automobile Manufacturers 1.2% | | | | |
| | 1,618,000 | | | Ford Motor Co. | | | 15,953,480 | |
| | | | | | | | |
| | | | Communications Equipment 1.9% | | | | |
| | 480,000 | | | Harris Corp. | | | 24,585,600 | |
| | | | | | | | |
| | | | Computer & Electronics Retail 1.0% | | | | |
| | 771,000 | | | Best Buy Co., Inc. | | | 13,253,490 | |
| | | | | | | | |
| | | | Construction & Engineering 1.5% | | | | |
| | 362,200 | | | Fluor Corp. | | | 20,384,616 | |
| | | | | | | | |
| | | | Construction & Farm Machinery &
Heavy Trucks 1.4% | | | | |
| | 216,700 | | | Deere & Co. | | | 17,875,583 | |
| | | | | | | | |
| | | | Department Stores 1.2% | | | | |
| | 410,000 | | | Macy’s, Inc. | | | 15,424,200 | |
| | | | | | | | |
| | | | Diversified Chemicals 1.2% | | | | |
| | 327,875 | | | E.I. du Pont de Nemours and Co. | | | 16,482,276 | |
| | | | | | | | |
| | | | Drug Retail 3.0% | | | | |
| | 452,000 | | | CVS Caremark Corp. | | | 21,885,840 | |
| | 473,000 | | | Walgreen Co. | | | 17,236,120 | |
| | | | | | | | |
| | | | | | | 39,121,960 | |
| | | | | | | | |
| | | | Electric Utilities 3.0% | | | | |
| | 280,666 | | | Duke Energy Corp. | | | 18,187,157 | |
| | 303,000 | | | NextEra Energy, Inc. | | | 21,309,990 | |
| | | | | | | | |
| | | | | | | 39,497,147 | |
| | | | | | | | |
| | | | Electrical Components &
Equipment 1.4% | | | | |
| | 381,230 | | | Emerson Electric Co. | | | 18,401,972 | |
| | | | | | | | |
| | | | Electronic Components 0.8% | | | | |
| | 824,600 | | | Corning, Inc. | | | 10,843,490 | |
| | | | | | | | |
| | | | Environmental & Facilities
Services 1.3% | | | | |
| | 543,000 | | | Waste Management, Inc. | | | 17,419,440 | |
| | | | | | | | |
| | | | Fertilizers & Agricultural
Chemicals 0.2% | | | | |
| | 64,000 | | | Potash Corp. of Saskatchewan, Inc. (Canada) | | | 2,778,880 | |
| | | | | | | | |
| | | | Food Distributors 1.5% | | | | |
| | 631,000 | | | Sysco Corp. | | | 19,731,370 | |
| | | | | | | | |
| | | | Gold 1.6% | | | | |
| | 496,000 | | | Barrick Gold Corp. (Canada) | | | 20,712,960 | |
| | | | | | | | |
| | | | Health Care Distributors 1.6% | | | | |
| | 251,798 | | | McKesson Corp. | | | 21,662,182 | |
| | | | | | | | |
| | | | | | | | |
| Shares | | | | | Value | |
| | | | | | | |
| | | | Health Care Equipment 5.0% | | | | |
| | 210,285 | | | C.R. Bard, Inc. | | $ | 22,006,325 | |
| | 592,000 | | | Medtronic, Inc. | | | 25,527,040 | |
| | 277,000 | | | Zimmer Holdings, Inc. | | | 18,730,740 | |
| | | | | | | | |
| | | | | | | 66,264,105 | |
| | | | | | | | |
| | | | Home Improvement Retail 0.7% | | | | |
| | 302,000 | | | Lowe’s Cos., Inc. | | | 9,132,480 | |
| | | | | | | | |
| | | | Household Products 1.9% | | | | |
| | 60,255 | | �� | Energizer Holdings, Inc. | | | 4,495,626 | |
| | 234,000 | | | Kimberly-Clark Corp. | | | 20,072,520 | |
| | | | | | | | |
| | | | | | | 24,568,146 | |
| | | | | | | | |
| | | | Hypermarkets & Super Centers 2.0% | | | | |
| | 353,680 | | | Wal-Mart Stores, Inc. | | | 26,101,584 | |
| | | | | | | | |
| | | | Industrial Machinery 1.0% | | | | |
| | 158,000 | | | Parker Hannifin Corp. | | | 13,205,640 | |
| | | | | | | | |
| | | | Insurance Brokers 1.6% | | | | |
| | 613,000 | | | Marsh & McLennan Cos., Inc. | | | 20,799,090 | |
| | | | | | | | |
| | | | Integrated Oil & Gas 2.2% | |
| | 188,000 | | | Chevron Corp. | | | 21,913,280 | |
| | 77,000 | | | Occidental Petroleum Corp. | | | 6,626,620 | |
| | | | | | | | |
| | | | | | | 28,539,900 | |
| | | | | | | | |
| | | | Integrated Telecommunication Services 1.7% | | | | |
| | 577,760 | | | AT&T, Inc. | | | 21,781,552 | |
| | | | | | | | |
| | | | Internet Software & Services 0.6% | |
| | 165,000 | | | eBay, Inc.* | | | 7,987,650 | |
| | | | | | | | |
| | | | Investment Banking &
Brokerage 1.3% | | | | |
| | 152,450 | | | Goldman Sachs Group, Inc. (The) | | | 17,330,516 | |
| | | | | | | | |
| | | | Life & Health Insurance 2.9% | |
| | 635,350 | | | MetLife, Inc. | | | 21,894,161 | |
| | 831,610 | | | Unum Group | | | 15,983,544 | |
| | | | | | | | |
| | | | | | | 37,877,705 | |
| | | | | | | | |
| | | | Managed Health Care 1.5% | |
| | 345,000 | | | WellPoint, Inc. | | | 20,013,450 | |
| | | | | | | | |
| | | | Multi-Line Insurance 1.7% | | | | |
| | 558,809 | | | Loews Corp. | | | 23,056,459 | |
| | | | | | | | |
| | | | Oil & Gas Drilling 2.6% | | | | |
| | 321,210 | | | Ensco plc, Class A | | | 17,525,218 | |
| | 369,000 | | | Transocean Ltd. (Switzerland) | | | 16,564,410 | |
| | | | | | | | |
| | | | | | | 34,089,628 | |
| | | | | | | | |
| | | | Oil & Gas Equipment &
Services 2.9% | | | | |
| | 441,000 | | | Halliburton Co. | | | 14,857,290 | |
| | 287,000 | | | National Oilwell Varco, Inc. | | | 22,991,570 | |
| | | | | | | | |
| | | | | | | 37,848,860 | |
| | | | | | | | |
| | | | Oil & Gas Exploration &
Production 5.3% | | | | |
| | 268,000 | | | Anadarko Petroleum Corp. | | | 18,738,560 | |
| | 391,000 | | | ConocoPhillips | | | 22,357,380 | |
| | 957,000 | | | Marathon Oil Corp. | | | 28,298,490 | |
| | | | | | | | |
| | | | | | | 69,394,430 | |
| | | | | | | | |
| | | | Oil & Gas Storage &
Transportation 2.4% | | | | |
| | 601,000 | | | Spectra Energy Corp. | | | 17,645,360 | |
| | 393,000 | | | Williams Cos., Inc. (The) | | | 13,743,210 | |
| | | | | | | | |
| | | | | | | 31,388,570 | |
| | | | | | | | |
64
| | | | | | | | |
| | |
| Shares | | | | | Value | |
| | | | | | | |
| | | | Other Diversified Financial
Services 2.5% | | | | |
| | 798,000 | | | JPMorgan Chase & Co. | | $ | 32,303,040 | |
| | | | | | | | |
| | | | Packaged Foods & Meats 1.6% | | | | |
| | 370,000 | | | HJ Heinz Co. | | | 20,701,500 | |
| | | | | | | | |
| | | | Pharmaceuticals 7.2% | | | | |
| | 313,000 | | | Abbott Laboratories | | | 21,459,280 | |
| | 144,000 | | | Johnson & Johnson | | | 9,923,040 | |
| | 563,000 | | | Merck & Co., Inc. | | | 25,391,300 | |
| | 861,000 | | | Pfizer, Inc. | | | 21,395,850 | |
| | 398,342 | | | Teva Pharmaceutical Industries Ltd. ADR (Israel) | | | 16,495,342 | |
| | | | | | | | |
| | | | | | | 94,664,812 | |
| | | | | | | | |
| | | | Property & Casualty Insurance 3.6% | | | | |
| | 519,000 | | | Allstate Corp. (The) | | | 20,557,590 | |
| | 388,000 | | | Travelers Cos., Inc. (The) | | | 26,484,880 | |
| | | | | | | | |
| | | | | | | 47,042,470 | |
| | | | | | | | |
| | | | Regional Banks 1.8% | | | | |
| | 377,000 | | | PNC Financial Services Group, Inc. | | | 23,788,700 | |
| | | | | | | | |
| | | | Semiconductors 2.0% | | | | |
| | 1,170,000 | | | Intel Corp. | | | 26,535,600 | |
| | | | | | | | |
| | | | Specialized REITs 1.3% | | | | |
| | 649,000 | | | Weyerhaeuser Co. | | | 16,964,860 | |
| | | | | | | | |
| | | | Steel 0.5% | | | | |
| | 177,000 | | | Nucor Corp. | | | 6,772,020 | |
| | | | | | | | |
| | | | Systems Software 3.4% | | | | |
| | 827,000 | | | Microsoft Corp. | | | 24,628,060 | |
| | 1,095,000 | | | Symantec Corp.* | | | 19,710,000 | |
| | | | | | | | |
| | | | | | | 44,338,060 | |
| | | | | | | | |
| | | | Technology Distributors 0.9% | | | | |
| | 410,000 | | | Avnet, Inc.* | | | 11,926,900 | |
| | | | | | | | |
| | | | Water Utilities 1.3% | | | | |
| | 478,000 | | | American Water Works Co., Inc. | | | 17,714,680 | |
| | | | | | | | |
| | |
| | | | Total Common Stocks
(cost $1,009,578,172) | | | 1,270,266,260 | |
| | | | | | | | |
| | | | | | | | |
Principal
Amount | | | | | Value | |
| | | | | | | |
| |
| | | | SHORT-TERM INVESTMENTS 3.4% | |
| | |
| | | | Repurchase Agreement 3.4% | | | | |
| | $44,867,332 | | | Repurchase Agreement dated 9/28/12, 0.01% due 10/1/12 with State Street Bank and Trust Co. collateralized by $33,665,000 of United States Treasury Bonds 4.500% due 8/15/39; value: $45,770,900; repurchase proceeds: $44,867,369 (cost $44,867,332) | | $ | 44,867,332 | |
| | | | | | | | |
| | |
| | | | Total Short-Term Investments
(cost $44,867,332) | | | 44,867,332 | |
| | | | | | | | |
| | |
| | | | Total Investments
(cost $1,054,445,504) 100.1% | | | 1,315,133,592 | |
| | |
| | | | Liabilities less Other Assets (0.1%) | | | (1,257,913 | ) |
| | | | | | | | |
| | |
| | | | NET ASSETS 100.0% | | $ | 1,313,875,679 | |
| | | | | | | | |
| | |
| | | | *Non-income producing. ADR American Depositary Receipt. REIT Real Estate Investment Trust. See Notes to Financial Statements. | | | | |
At September 30, 2012, Wasatch Large Cap Value Fund’s investments, excluding short-term investments, were in the following countries:
| | | | |
| Country | | % | |
Canada | | | 1.9 | |
Israel | | | 1.3 | |
Switzerland | | | 1.3 | |
United States | | | 95.5 | |
| | | | |
TOTAL | | | 100.0 | % |
| | | | |
65
| | |
WASATCH LONG/SHORT FUND (FMLSX) — Schedule of Investments | | |
|
|
|
| | | | | | | | |
| Shares | | | | | Value | |
| | | | | | | |
| | | | COMMON STOCKS 76.0% | | | | |
| | |
| | | | Advertising 2.0% | | | | |
| | 2,737,667 | | | Interpublic Group of Cos., Inc. (The)‡ | | $ | 30,442,857 | |
| | | | | | | | |
| | | | Airlines 1.8% | | | | |
| | 3,211,600 | | | Southwest Airlines Co. | | | 28,165,732 | |
| | | | | | | | |
| | | | Apparel Retail 1.0% | | | | |
| | 855,194 | | | Chico’s FAS, Inc.‡ | | | 15,487,563 | |
| | | | | | | | |
| | | | Automobile Manufacturers 1.6% | | | | |
| | 1,071,500 | | | General Motors Co.* | | | 24,376,625 | |
| | | | | | | | |
| | | | Automotive Retail 0.9% | | | | |
| | 1,408,600 | | | Pep Boys — Manny, Moe & Jack (The) | | | 14,339,548 | |
| | | | | | | | |
| | | | Communications Equipment 3.9% | | | | |
| | 1,230,105 | | | Acme Packet, Inc.* ‡ | | | 21,034,795 | |
| | 2,040,600 | | | Cisco Systems, Inc.‡ | | | 38,955,054 | |
| | | | | | | | |
| | | | | | | 59,989,849 | |
| | | | | | | | |
| | | | Computer & Electronics Retail 0.7% | | | | |
| | 527,800 | | | GameStop Corp., Class A | | | 11,083,800 | |
| | | | | | | | |
| | | | Computer Hardware 1.7% | | | | |
| | 2,802,900 | | | Silicon Graphics International Corp.* ‡‡ | | | 25,506,390 | |
| | | | | | | | |
| | | | Construction & Engineering 1.3% | | | | |
| | 1,013,488 | | | Aegion Corp.* | | | 19,418,430 | |
| | | | | | | | |
| | | | Data Processing & Outsourced
Services 3.0% | | | | |
| | 2,189,000 | | | Convergys Corp. | | | 34,301,630 | |
| | 678,600 | | | Western Union Co. (The)‡ | | | 12,364,092 | |
| | | | | | | | |
| | | | | | | 46,665,722 | |
| | | | | | | | |
| | | | Electrical Components &
Equipment 0.7% | | | | |
| | 234,900 | | | Emerson Electric Co. | | | 11,338,623 | |
| | | | | | | | |
| | | | Electronic Equipment &
Instruments 0.6% | | | | |
| | 197,900 | | | Itron, Inc.* | | | 8,539,385 | |
| | | | | | | | |
| | | | Environmental & Facilities
Services 1.3% | | | | |
| | 722,352 | | | Republic Services, Inc.‡ | | | 19,871,904 | |
| | | | | | | | |
| | | | Fertilizers & Agricultural
Chemicals 3.8% | | | | |
| | 1,000,400 | | | Mosaic Co. (The)‡ | | | 57,633,044 | |
| | | | | | | | |
| | | | General Merchandise Stores 1.4% | | | | |
| | 344,000 | | | Target Corp.‡ | | | 21,833,680 | |
| | | | | | | | |
| | | | Gold 1.9% | | | | |
| | 1,508,300 | | | Yamana Gold, Inc. (Canada) | | | 28,823,613 | |
| | | | | | | | |
| | | | Health Care Equipment 1.7% | | | | |
| | 352,900 | | | Medtronic, Inc.‡ | | | 15,217,048 | |
| | 208,800 | | | Stryker Corp. | | | 11,621,808 | |
| | | | | | | | |
| | | | | | | 26,838,856 | |
| | | | | | | | |
| | | | Heavy Electrical Equipment 0.6% | | | | |
| | 336,200 | | | General Cable Corp.* | | | 9,877,556 | |
| | | | | | | | |
| | | | Hypermarkets & Super Centers 0.9% | | | | |
| | 187,900 | | | Wal-Mart Stores, Inc.‡ | | | 13,867,020 | |
| | | | | | | | |
| | | | Insurance Brokers 1.3% | | | | |
| | 377,000 | | | Aon plc | | | 19,713,330 | |
| | | | | | | | |
| | | | Integrated Telecommunication Services 0.7% | | | | |
| | 841,700 | | | Telefonica S.A., ADR (Spain) | | | 11,177,776 | |
| | | | | | | | |
| | | | | | | | |
| Shares | | | | | Value | |
| | | | | | | |
| | | | Internet Software & Services 1.7% | | | | |
| | 435,600 | | | Akamai Technologies, Inc.* ‡ | | $ | 16,666,056 | |
| | 181,225 | | | Ancestry.com, Inc.* | | | 5,451,248 | |
| | 254,022 | | | WebMD Health Corp.* | | | 3,563,929 | |
| | | | | | | | |
| | | | | | | 25,681,233 | |
| | | | | | | | |
| | | | Life & Health Insurance 3.0% | | | | |
| | 496,100 | | | MetLife, Inc. | | | 17,095,606 | |
| | 1,546,736 | | | Unum Group‡ | | | 29,728,266 | |
| | | | | | | | |
| | | | | | | 46,823,872 | |
| | | | | | | | |
| | | | Multi-Line Insurance 3.9% | | | | |
| | 1,465,171 | | | Loews Corp.‡ | | | 60,452,955 | |
| | | | | | | | |
| | | | Oil & Gas Drilling 10.5% | | | | |
| | 979,100 | | | Ensco plc, Class A‡ | | | 53,419,696 | |
| | 454,362 | | | Helmerich & Payne, Inc. | | | 21,632,175 | |
| | 1,048,644 | | | Noble Corp.* ‡ | | | 37,520,482 | |
| | 3,081,300 | | | Patterson-UTI Energy, Inc.‡ | | | 48,807,792 | |
| | | | | | | | |
| | | | | | | 161,380,145 | |
| | | | | | | | |
| | | | Oil & Gas Equipment & Services 2.2% | | | | |
| | 992,700 | | | Halliburton Co. | | | 33,444,063 | |
| | | | | | | | |
| | | | Oil & Gas Exploration &
Production 8.0% | | | | |
| | 205,014 | | | Anadarko Petroleum Corp. | | | 14,334,579 | |
| | 417,500 | | | ConocoPhillips | | | 23,872,650 | |
| | 2,291,600 | | | Denbury Resources, Inc.* | | | 37,032,256 | |
| | 354,370 | | | Devon Energy Corp.‡ | | | 21,439,385 | |
| | 490,380 | | | Energen Corp.‡ | | | 25,700,816 | |
| | | | | | | | |
| | | | | | | 122,379,686 | |
| | | | | | | | |
| | | | Other Diversified Financial
Services 1.4% | | | | |
| | 667,200 | | | Citigroup, Inc. | | | 21,830,784 | |
| | | | | | | | |
| | | | Personal Products 1.1% | | | | |
| | 1,102,509 | | | Avon Products, Inc. | | | 17,585,019 | |
| | | | | | | | |
| | | | Pharmaceuticals 1.3% | | | | |
| | 330,800 | | | Novartis AG ADR (Switzerland) | | | 20,264,808 | |
| | | | | | | | |
| | | | Property & Casualty Insurance 3.0% | | | | |
| | 367,103 | | | Allstate Corp. (The)‡ | | | 14,540,950 | |
| | 1,178,200 | | | CNA Financial Corp.‡ | | | 31,575,760 | |
| | | | | | | | |
| | | | | | | 46,116,710 | |
| | | | | | | | |
| | | | Regional Banks 0.8% | | | | |
| | 768,200 | | | Fifth Third Bancorp‡ | | | 11,914,782 | |
| | | | | | | | |
| | | | Research & Consulting Services 0.8% | | | | |
| | 939,500 | | | Resources Connection, Inc. | | | 12,316,845 | |
| | | | | | | | |
| | | | Semiconductors 0.0% | | | | |
| | 18,010 | | | Intel Corp. | | | 408,467 | |
| | | | | | | | |
| | | | Steel 0.5% | | | | |
| | 621,400 | | | Commercial Metals Co. | | | 8,202,480 | |
| | | | | | | | |
| | | | Systems Software 3.0% | | | | |
| | 918,500 | | | Microsoft Corp.‡ | | | 27,352,930 | |
| | 589,100 | | | Oracle Corp. | | | 18,550,759 | |
| | | | | | | | |
| | | | | | | 45,903,689 | |
| | | | | | | | |
| | | | Trucking 0.9% | | | | |
| | 949,900 | | | Knight Transportation, Inc. | | | 13,583,570 | |
| | | | | | | | |
| | | | Wireless Telecommunication
Services 1.1% | | | | |
| | 570,300 | | | Vodafone Group plc ADR (United Kingdom) | | | 16,250,698 | |
| | | | | | | | |
| | |
| | | | Total Common Stocks (cost $1,067,948,641) | | | 1,169,531,109 | |
| | | | | | | | |
66
| | | | | | | | |
Principal
Amount | | | | | Value | |
| | | | | | | |
| | | | SHORT-TERM INVESTMENTS 22.9% | | | | |
| | |
| | | | Repurchase Agreement 22.9% | | | | |
| | $351,350,087 | | | Repurchase Agreement dated 9/28/12, 0.01% due 10/1/12 with State Street Bank and Trust Co. collateralized by $263,595,000 of United States Treasury Bonds 4.500% due 8/15/39; value: $358,383,498; repurchase proceeds: $351,350,380‡ (cost $351,350,087) | | $ | 351,350,087 | |
| | | | | | | | |
| | |
| | | | Total Short-Term Investments
(cost $351,350,087) | | | 351,350,087 | |
| | | | | | | | |
| | |
| | | | Total Investments
(cost $1,419,298,728) 98.9% | | | 1,520,881,196 | |
| | |
| | | | Other Assets less Liabilities 1.1% | | | 16,338,489 | |
| | | | | | | | |
| | |
| | | | NET ASSETS 100.0% | | $ | 1,537,219,685 | |
| | | | | | | | |
| | |
Number of
Contracts | | | | | Value | |
| | | | | | | |
| | |
| | | | CALL OPTIONS WRITTEN 0.4% | | | | |
| | |
| | | | Advertising 0.0% | | | | |
| | 2,154 | | | Interpublic Group of Cos., expiring 10/20/12, exercise price $11 | | $ | 81,852 | |
| | 740 | | | Interpublic Group of Cos., expiring 1/19/13, exercise price $12 | | | 40,700 | |
| | | | | | | | |
| | | | | | | 122,552 | |
| | | | | | | | |
| | | | Apparel Retail 0.1% | | | | |
| | 3,386 | | | Chico’s FAS, Inc., expiring 1/19/13, exercise price $17.50 | | | 507,900 | |
| | 5,165 | | | Chico’s FAS, Inc., expiring 1/19/13, exercise price $19 | | | 439,025 | |
| | | | | | | | |
| | | | | | | 946,925 | |
| | | | | | | | |
| | | | Communications Equipment 0.1% | | | | |
| | 5,000 | | | Acme Packet, Inc., expiring 11/17/12, exercise price $17.50 | | | 650,000 | |
| | 4,000 | | | Acme Packet, Inc., expiring 1/19/13, exercise price $21 | | | 360,000 | |
| | | | | | | | |
| | | | | | | 1,010,000 | |
| | | | | | | | |
| | | | Fertilizers & Agricultural
Chemicals 0.0% | | | | |
| | 4,000 | | | Mosaic Co. (The), expiring 12/22/12, exercise price $62.50 | | | 408,000 | |
| | | | | | | | |
| | | | Internet Software & Services 0.1% | | | | |
| | 3,000 | | | Akamai Technologies, Inc., expiring 11/17/12, exercise price $33 | | | 1,815,000 | |
| | 1,356 | | | Akamai Technologies, Inc., expiring 11/17/12, exercise price $35 | | | 623,760 | |
| | | | | | | | |
| | | | | | | 2,438,760 | |
| | | | | | | | |
| | | | Oil & Gas Drilling 0.1% | | | | |
| | 3,150 | | | Ensco plc ADR, expiring 1/19/13, exercise price $57.50 | | | 645,750 | |
| | 2,000 | | | Ensco plc Class A, expiring 12/22/12, exercise price $55 | | | 540,000 | |
| | 2,000 | | | Noble Corp., expiring 12/22/12, exercise price $38 | | | 222,000 | |
| | | | | | | | |
Number of
Contracts | | | | | Value | |
| | 2,069 | | | Patterson-UTI Energy, Inc., expiring 1/19/13, exercise price $16 | | $ | 263,797 | |
| | | | | | | | |
| | | | | | | 1,671,547 | |
| | | | | | | | |
| | |
| | | | Total Call Options Written
(premium $8,653,127) | | | 6,597,784 | |
| | | | | | | | |
| | |
| Shares | | | | | Value | |
| | |
| | | | SECURITIES SOLD SHORT 10.4% | | | | |
| | |
| | | | Aerospace & Defense 0.5% | | | | |
| | 112,213 | | | Boeing Co. (The) | | $ | 7,812,269 | |
| | | | | | | | |
| | | | Application Software 0.3% | | | | |
| | 118,142 | | | Solera Holdings, Inc. | | | 5,182,889 | |
| | | | | | | | |
| | | | Automotive Retail 0.6% | | | | |
| | 300,000 | | | CarMax, Inc.* | | | 8,490,000 | |
| | | | | | | | |
| | | | Casinos & Gaming 0.7% | | | | |
| | 250,000 | | | Penn National Gaming, Inc.* | | | 10,775,000 | |
| | | | | | | | |
| | | | Diversified Chemicals 0.9% | | | | |
| | 449,500 | | | Dow Chemical Co. (The) | | | 13,017,520 | |
| | | | | | | | |
| | | | Electric Utilities 0.7% | | | | |
| | 315,500 | | | Exelon Corp. | | | 11,225,490 | |
| | | | | | | | |
| | | | Integrated Telecommunication
Services 1.0% | | | | |
| | 342,207 | | | Verizon Communications, Inc. | | | 15,594,373 | |
| | | | | | | | |
| | | | Oil & Gas Exploration &
Production 1.0% | | | | |
| | 223,400 | | | Range Resources Corp. | | | 15,608,958 | |
| | | | | | | | |
| | | | Packaged Foods & Meats 0.8% | | | | |
| | 300,000 | | | General Mills, Inc. | | | 11,955,000 | |
| | | | | | | | |
| | | | Restaurants 1.1% | | | | |
| | 317,600 | | | Starbucks Corp. | | | 16,118,200 | |
| | | | | | | | |
| | | | Retail REITs 0.9% | | | | |
| | 296,905 | | | Regency Centers Corp. | | | 14,468,181 | |
| | | | | | | | |
| | | | Specialty Stores 1.1% | | | | |
| | 162,300 | | | Tractor Supply Co. | | | 16,049,847 | |
| | | | | | | | |
| | | | Systems Software 0.5% | | | | |
| | 136,728 | | | CommVault Systems, Inc.* | | | 8,025,934 | |
| | | | | | | | |
| | | | Tires & Rubber 0.3% | | | | |
| | 427,490 | | | Goodyear Tire & Rubber Co. (The)* | | | 5,211,103 | |
| | | | | | | | |
| | |
| | | | Total Securities Sold Short
(proceeds $153,441,405) | | | 159,534,764 | |
| | | | | | | | |
| |
| | | | *Non-income producing. ‡All or a portion of this security has been designated as collateral for short sales and call options written (see Notes 3, 4 and 7). ‡‡Affiliated company (see Note 10). ADR American Depositary Receipt. REIT Real Estate Investment Trust. See Notes to Financial Statements. | |
67
| | |
| WASATCH LONG/SHORT FUND (FMLSX) — Schedule of Investments (continued) | | SEPTEMBER 30, 2012 |
|
|
|
At September 30, 2012, Wasatch Long/Short Fund’s investments, excluding short-term investments, call options written and securities sold short, were in the following countries:
| | | | |
| Country | | % | |
Canada | | | 2.5 | |
Spain | | | 0.9 | |
Switzerland | | | 1.7 | |
United Kingdom | | | 1.4 | |
United States | | | 93.5 | |
| | | | |
TOTAL | | | 100.0 | % |
| | | | |
68
| | |
| WASATCH MICRO CAP FUND (WMICX) — Schedule of Investments | | SEPTEMBER 30, 2012 |
|
|
|
| | | | | | | | |
| Shares | | | | | Value | |
| | | | COMMON STOCKS 99.2% | | | | |
| | |
| | | | Air Freight & Logistics 0.7% | | | | |
| | 1,335,381 | | | Goodpack Ltd. (Singapore) | | $ | 2,020,499 | |
| | | | | | | | |
| | | | Alternative Carriers 0.5% | | | | |
| | 204,379 | | | inContact, Inc.* | | | 1,332,551 | |
| | | | | | | | |
| | | | Apparel Retail 2.8% | | | | |
| | 167,159 | | | Body Central Corp.* | | | 1,746,811 | |
| | 128,785 | | | rue21, Inc.* | | | 4,011,653 | |
| | 18,937 | | | Tilly’s, Inc., Class A* | | | 347,115 | |
| | 75,400 | | | Zumiez, Inc.* | | | 2,090,842 | |
| | | | | | | | |
| | | | | | | 8,196,421 | |
| | | | | | | | |
| | | | Application Software 9.4% | | | | |
| | 257,970 | | | Exa Corp.* | | | 2,798,974 | |
| | 182,701 | | | Interactive Intelligence Group, Inc.* | | | 5,490,165 | |
| | 150,178 | | | PROS Holdings, Inc.* | | | 2,863,894 | |
| | 60,422 | | | RealPage, Inc.* | | | 1,365,537 | |
| | 333,506 | | | Tangoe, Inc.* | | | 4,378,934 | |
| | 85,793 | | | Tyler Technologies, Inc.* | | | 3,776,608 | |
| | 64,326 | | | Ultimate Software Group, Inc.* | | | 6,567,685 | |
| | | | | | | | |
| | | | | | | 27,241,797 | |
| | | | | | | | |
| | | | Asset Management & Custody
Banks 2.5% | | | | |
| | 37,422 | | | Diamond Hill Investment Group, Inc. | | | 2,869,519 | |
| | 49,840 | | | Virtus Investment Partners, Inc.* | | | 4,286,240 | |
| | | | | | | | |
| | | | | | | 7,155,759 | |
| | | | | | | | |
| | | | Automotive Retail 1.4% | | | | |
| | 116,260 | | | Monro Muffler Brake, Inc. | | | 4,091,189 | |
| | | | | | | | |
| | | | Biotechnology 2.1% | | | | |
| | 496,548 | | | Abcam plc (United Kingdom) | | | 3,221,932 | |
| | 258,770 | | | Exact Sciences Corp.* | | | 2,849,058 | |
| | 586,284 | | | NeurogesX, Inc.* | | | 123,119 | |
| | | | | | | | |
| | | | | | | 6,194,109 | |
| | | | | | | | |
| | | | Commercial Printing 1.8% | | | | |
| | 394,596 | | | InnerWorkings, Inc.* | | | 5,137,640 | |
| | | | | | | | |
| | | | Computer Storage & Peripherals 0.6% | | | | |
| | 290,211 | | | Intevac, Inc.* | | | 1,773,189 | |
| | | | | | | | |
| | | | Consumer Electronics 0.7% | | | | |
| | 137,391 | | | Skullcandy, Inc.* | | | 1,889,126 | |
| | | | | | | | |
| | | | Consumer Finance 2.9% | | | | |
| | 320,494 | | | DFC Global Corp.* | | | 5,496,472 | |
| | 169,972 | | | Regional Management Corp.* | | | 2,932,017 | |
| | | | | | | | |
| | | | | | | 8,428,489 | |
| | | | | | | | |
| | | | Data Processing & Outsourced Services 3.9% | | | | |
| | 120,511 | | | ExlService Holdings, Inc.* | | | 3,555,074 | |
| | 239,302 | | | Higher One Holdings, Inc.* | | | 3,225,791 | |
| | 199,802 | | | Wirecard AG (Germany) | | | 4,592,683 | |
| | | | | | | | |
| | | | | | | 11,373,548 | |
| | | | | | | | |
| | | | Diversified Banks 1.4% | | | | |
| | 4,154,569 | | | City Union Bank Ltd. (India) | | | 4,162,840 | |
| | | | | | | | |
| | | | Diversified Support Services 1.3% | | | | |
| | 132,803 | | | Encore Capital Group, Inc.* | | | 3,753,013 | |
| | | | | | | | |
| | | | Electronic Manufacturing
Services 0.9% | | | | |
| | 44,420 | | | IPG Photonics Corp.* | | | 2,545,266 | |
| | | | | | | | |
| | | | | | | | |
| Shares | | | | | Value | |
| | | | Environmental & Facilities
Services 2.1% | | | | |
| | 185,549 | | | Heritage-Crystal Clean, Inc.* | | $ | 3,683,148 | |
| | 594,574 | | | RPS Group plc (United Kingdom) | | | 2,391,137 | |
| | | | | | | | |
| | | | | | | 6,074,285 | |
| | | | | | | | |
| | | | General Merchandise Stores 2.8% | | | | |
| | 432,355 | | | Gordmans Stores, Inc.* | | | 7,976,950 | |
| | | | | | | | |
| | | | Health Care Distributors 1.6% | | | | |
| | 42,939 | | | MWI Veterinary Supply, Inc.* | | | 4,580,733 | |
| | | | | | | | |
| | | | Health Care Equipment 7.5% | | | | |
| | 75,688 | | | Abaxis, Inc.* | | | 2,718,713 | |
| | 413,346 | | | AtriCure, Inc.* | | | 3,075,294 | |
| | 1,091,986 | | | Cardica, Inc.* | | | 1,572,460 | |
| | 298,599 | | | Cardiovascular Systems, Inc.* | | | 3,451,805 | |
| | 10,276,429 | | | LMA International N.V. (Singapore) | | | 5,071,158 | |
| | 291,342 | | | Novadaq Technologies, Inc.* (Canada) | | | 3,012,476 | |
| | 123,741 | | | NuVasive, Inc.* | | | 2,834,906 | |
| | | | | | | | |
| | | | | | | 21,736,812 | |
| | | | | | | | |
| | | | Health Care Facilities 1.5% | | | | |
| | 145,553 | | | Ensign Group, Inc. (The) | | | 4,454,650 | |
| | | | | | | | |
| | | | Health Care Services 4.4% | | | | |
| | 124,443 | | | Bio-Reference Laboratories, Inc.* | | | 3,556,581 | |
| | 96,489 | | | CorVel Corp.* | | | 4,317,883 | |
| | 106,790 | | | IPC The Hospitalist Co., Inc.* | | | 4,880,303 | |
| | | | | | | | |
| | | | | | | 12,754,767 | |
| | | | | | | | |
| | | | Health Care Technology 2.1% | | | | |
| | 41,625 | | | Computer Programs and Systems, Inc. | | | 2,312,269 | |
| | 136,410 | | | HealthStream, Inc.* | | | 3,882,228 | |
| | | | | | | | |
| | | | | | | 6,194,497 | |
| | | | | | | | |
| | | | Human Resource & Employment Services 0.3% | | | | |
| | 216,181 | | | CTPartners Executive Search, Inc.* | | | 951,196 | |
| | | | | | | | |
| | | | Industrial Machinery 0.7% | | | | |
| | 59,567 | | | Proto Labs, Inc.* | | | 2,014,556 | |
| | | | | | | | |
| | | | Internet Retail 1.4% | | | | |
| | 190,380 | | | CafePress, Inc.* | | | 1,734,362 | |
| | 133,771 | | | MakeMyTrip Ltd.* (India) | | | 2,278,120 | |
| | | | | | | | |
| | | | | | | 4,012,482 | |
| | | | | | | | |
| | | | Internet Software & Services 9.3% | | | | |
| | 207,573 | | | Angie’s List, Inc.* | | | 2,196,122 | |
| | 217,595 | | | DealerTrack Holdings, Inc.* | | | 6,060,021 | |
| | 144,614 | | | E2open, Inc.* | | | 1,963,858 | |
| | 391,947 | | | Envestnet, Inc.* | | | 4,585,780 | |
| | 241,424 | | | SciQuest, Inc.* | | | 4,393,917 | |
| | 123,175 | | | SPS Commerce, Inc.* | | | 4,738,542 | |
| | 478,156 | | | TechTarget, Inc.* | | | 2,825,902 | |
| | | | | | | | |
| | | | | | | 26,764,142 | |
| | | | | | | | |
| | | | IT Consulting & Other Services 2.3% | | | | |
| | 250,492 | | | hiSoft Technology International Ltd. ADR* (China) | | | 2,587,582 | |
| | 392,834 | | | ServiceSource International, Inc.* | | | 4,030,477 | |
| | | | | | | | |
| | | | | | | 6,618,059 | |
| | | | | | | | |
| | | | Leisure Products 1.0% | | | | |
| | 339,569 | | | Black Diamond, Inc.* | | | 2,978,020 | |
| | | | | | | | |
| | | | Life Sciences Tools & Services 2.8% | | | | |
| | 118,621 | | | Fluidigm Corp.* | | | 2,016,557 | |
| | 187,499 | | | ICON plc ADR* (Ireland) | | | 4,569,350 | |
| | 188,440 | | | ShangPharma Corp. ADR* (China) | | | 1,435,913 | |
| | | | | | | | |
| | | | | | | 8,021,820 | |
| | | | | | | | |
69
| | |
| WASATCH MICRO CAP FUND (WMICX) — Schedule of Investments (continued) | | SEPTEMBER 30, 2012 |
|
|
|
| | | | | | | | |
| Shares | | | | | Value | |
| | | | Oil & Gas Equipment & Services 1.1% | | | | |
| | 180,915 | | | Pason Systems, Inc. (Canada) | | $ | 3,019,697 | |
| | | | | | | | |
| | | | Oil & Gas Exploration &
Production 1.2% | | | | |
| | 501,342 | | | Triangle Petroleum Corp.* | | | 3,589,609 | |
| | | | | | | | |
| | | | Pharmaceuticals 1.8% | | | | |
| | 322,840 | | | Akorn, Inc.* | | | 4,267,945 | |
| | 109,000 | | | Cempra, Inc.* | | | 812,050 | |
| | 34,625 | | | Horizon Pharma, Inc.* | | | 120,149 | |
| | | | | | | | |
| | | | | | | 5,200,144 | |
| | | | | | | | |
| | | | Regional Banks 1.3% | | | | |
| | 257,478 | | | BBCN Bancorp, Inc.* | | | 3,246,797 | |
| | 60,734 | | | Pacific Continental Corp. | | | 542,355 | |
| | | | | | | | |
| | | | | | | 3,789,152 | |
| | | | | | | | |
| | | | Research & Consulting Services 3.1% | | | | |
| | 128,331 | | | CRA International, Inc.* | | | 2,217,560 | |
| | 206,865 | | | eClerx Services Ltd. (India) | | | 3,020,907 | |
| | 275,714 | | | Resources Connection, Inc. | | | 3,614,611 | |
| | | | | | | | |
| | | | | | | 8,853,078 | |
| | | | | | | | |
| | | | Semiconductor Equipment 0.3% | | | | |
| | 300,450 | | | STR Holdings, Inc.* | | | 931,395 | |
| | | | | | | | |
| | | | Semiconductors 6.0% | | | | |
| | 225,226 | | | BCD Semiconductor Manufacturing Ltd. ADR* (China) | | | 808,561 | |
| | 172,735 | | | Melexis N.V. (Belgium) | | | 2,919,562 | |
| | 42,979 | | | NVE Corp.* | | | 2,543,927 | |
| | 602,132 | | | O2Micro International Ltd. ADR* (China) | | | 2,251,974 | |
| | 206,227 | | | Power Integrations, Inc. | | | 6,275,488 | |
| | 122,587 | | | Volterra Semiconductor Corp.* | | | 2,680,978 | |
| | | | | | | | |
| | | | | | | 17,480,490 | |
| | | | | | | | |
| | | | Specialized Finance 0.0% | | | | |
| | 154,000 | | | Goldwater Bank, N.A.* *** † ‡‡ | | | 13,860 | |
| | | | | | | | |
| | | | Specialty Chemicals 0.2% | | | | |
| | 197,100 | | | EcoSynthetix, Inc.* (Canada) | | | 657,568 | |
| | | | | | | | |
| | | | Specialty Stores 2.5% | | | | |
| | 121,855 | | | Hibbett Sports, Inc.* | | | 7,244,280 | |
| | | | | | | | |
| | | | Systems Software 2.5% | | | | |
| | 209,036 | | | OPNET Technologies, Inc. | | | 7,121,856 | |
| | | | | | | | |
| | | | Thrifts & Mortgage Finance 0.8% | | | | |
| | 583,865 | | | Gruh Finance Ltd. (India) | | | 2,291,403 | |
| | | | | | | | |
| | | | Trading Companies &
Distributors 2.8% | | | | |
| | 171,327 | | | CAI International, Inc.* | | | 3,515,630 | |
| | 266,752 | | | Rush Enterprises, Inc., Class B* | | | 4,484,101 | |
| | | | | | | | |
| | | | | | | 7,999,731 | |
| | | | | | | | |
| | | | Trucking 2.9% | | | | |
| | 245,292 | | | Marten Transport Ltd. | | | 4,309,781 | |
| | 132,415 | | | Old Dominion Freight Line, Inc.* | | | 3,993,636 | |
| | | | | | | | |
| | | | | | | 8,303,417 | |
| | | | | | | | |
| | |
| | | | Total Common Stocks
(cost $217,963,373) | | | 286,924,085 | |
| | | | | | | | |
| | |
| | | | PREFERRED STOCKS 0.8% | | | | |
| | |
| | | | Regional Banks 0.8% | | | | |
| | 434,600 | | | Banco Daycoval S.A. Pfd. (Brazil) | | | 2,337,309 | |
| | | | | | | | |
| | |
| | | | Total Preferred Stocks
(cost $1,639,882) | | | 2,337,309 | |
| | | | | | | | |
| | | | | | | | |
| Shares | | | | | Value | |
| | | | WARRANTS 0.0% | | | | |
| | |
| | | | Biotechnology 0.0% | | | | |
| | 145,349 | | | NeurogesX, Inc., expiring 7/22/16* *** † | | $ | 1,453 | |
| | | | | | | | |
| | | | Health Care Equipment 0.0% | | | | |
| | 322,500 | | | Cardica, Inc., expiring 9/29/14* *** † | | | 19,350 | |
| | | | | | | | |
| | |
| | | | Total Warrants
(cost $58,481) | | | 20,803 | |
| | | | | | | | |
| | |
Principal
Amount | | | | | Value | |
| | | | SHORT-TERM INVESTMENTS 1.5% | | | | |
| | |
| | | | Repurchase Agreement 1.5% | | | | |
| | $4,460,102 | | | Repurchase Agreement dated 9/28/12, 0.01% due 10/1/12 with State Street Bank and Trust Co. collateralized by $3,350,000 of United States Treasury Bonds 4.500% due 8/15/39; value: $4,554,657; repurchase proceeds: $4,460,105 (cost $4,460,102) | | $ | 4,460,102 | |
| | | | | | | | |
| | |
| | | | Total Short-Term Investments
(cost $4,460,102) | | | 4,460,102 | |
| | | | | | | | |
| | |
| | | | Total Investments
(cost $224,121,838) 101.5% | | | 293,742,299 | |
| | |
| | | | Liabilities less Other Assets (1.5%) | | | (4,293,250 | ) |
| | | | | | | | |
| | |
| | | | NET ASSETS 100.0% | | $ | 289,449,049 | |
| | | | | | | | |
| |
| | | | *Non-income producing. ***Security was fair valued under procedures adopted by the Board of Trustees (see Note 15). †Security purchased in a private placement transaction or under Rule 144A of the Securities Act of 1933 (see Note 11). ‡‡Affiliated company (see Note 10). ADR American Depositary Receipt. See Notes to Financial Statements. | |
At September 30, 2012, Wasatch Micro Cap Fund’s investments, excluding short-term investments, were in the following countries:
| | | | |
| Country | | % | |
Belgium | | | 1.0 | |
Brazil | | | 0.8 | |
Canada | | | 2.3 | |
China | | | 2.4 | |
Germany | | | 1.6 | |
India | | | 4.1 | |
Ireland | | | 1.6 | |
Singapore | | | 2.5 | |
United Kingdom | | | 1.9 | |
United States | | | 81.8 | |
| | | | |
TOTAL | | | 100.0 | % |
| | | | |
70
| | |
| WASATCH MICRO CAP VALUE FUND (WAMVX) — Schedule of Investments | | SEPTEMBER 30, 2012 |
|
|
|
| | | | | | | | |
| Shares | | | | | Value | |
| | | | | | | |
| | | | COMMON STOCKS 95.0% | | | | |
| | |
| | | | Aerospace & Defense 0.9% | | | | |
| | 115,000 | | | CPI Aerostructures, Inc.* | | $ | 1,246,600 | |
| | | | | | | | |
| | | | Airlines 1.3% | | | | |
| | 29,000 | | | Allegiant Travel Co.* | | | 1,837,440 | |
| | | | | | | | |
| | | | Alternative Carriers 0.9% | | | | |
| | 72,313 | | | inContact, Inc.* | | | 471,481 | |
| | 200,000 | | | ORBCOMM, Inc.* | | | 748,000 | |
| | | | | | | | |
| | | | | | | 1,219,481 | |
| | | | | | | | |
| | | | Apparel Retail 2.6% | | | | |
| | 93,000 | | | Body Central Corp.* | | | 971,850 | |
| | 2,300,000 | | | Padini Holdings Berhad (Malaysia) | | | 1,580,239 | |
| | 33,000 | | | rue21, Inc.* | | | 1,027,950 | |
| | | | | | | | |
| | | | | | | 3,580,039 | |
| | | | | | | | |
| | | | Apparel, Accessories & Luxury
Goods 0.6% | | | | |
| | 60,000 | | | Ted Baker plc (United Kingdom) | | | 871,185 | |
| | | | | | | | |
| | | | Application Software 5.0% | | | | |
| | 159,000 | | | American Software, Inc., Class A | | | 1,297,440 | |
| | 187,000 | | | ClickSoftware Technologies Ltd. (Israel) | | | 1,439,900 | |
| | 85,000 | | | Exa Corp.* | | | 922,250 | |
| | 60,820 | | | Interactive Intelligence Group, Inc.* | | | 1,827,641 | |
| | 23,000 | | | PROS Holdings, Inc.* | | | 438,610 | |
| | 73,000 | | | Tangoe, Inc.* | | | 958,490 | |
| | | | | | | | |
| | | | | | | 6,884,331 | |
| | | | | | | | |
| | | | Asset Management & Custody
Banks 2.1% | | | | |
| | 33,600 | | | Virtus Investment Partners, Inc.* | | | 2,889,600 | |
| | | | | | | | |
| | | | Auto Parts & Equipment 1.3% | | | | |
| | 59,000 | | | Dorman Products, Inc.* | | | 1,859,090 | |
| | | | | | | | |
| | | | Automotive Retail 2.8% | | | | |
| | 15,000 | | | Delticom AG (Germany) | | | 1,003,314 | |
| | 42,000 | | | Lithia Motors, Inc., Class A | | | 1,399,020 | |
| | 150,000 | | | Pep Boys — Manny, Moe & Jack (The) | | | 1,527,000 | |
| | | | | | | | |
| | | | | | | 3,929,334 | |
| | | | | | | | |
| | | | Casinos & Gaming 1.1% | | | | |
| | 2,700,000 | | | NagaCorp Ltd. (Cambodia) | | | 1,511,181 | |
| | | | | | | | |
| | | | Commercial Printing 2.6% | | | | |
| | 103,000 | | | Ennis, Inc. | | | 1,690,230 | |
| | 145,000 | | | InnerWorkings, Inc.* | | | 1,887,900 | |
| | | | | | | | |
| | | | | | | 3,578,130 | |
| | | | | | | | |
| | | | Communications Equipment 0.7% | | | | |
| | 100,000 | | | Alliance Fiber Optic Products, Inc.* ‡ | | | 899,000 | |
| | | | | | | | |
| | | | Construction & Engineering 1.7% | | | | |
| | 80,000 | | | Argan, Inc. | | | 1,396,000 | |
| | 37,500 | | | Michael Baker Corp.* | | | 894,750 | |
| | | | | | | | |
| | | | | | | 2,290,750 | |
| | | | | | | | |
| | | | Construction Materials 2.5% | | | | |
| | 113,000 | | | Caesar Stone Sdot Yam Ltd.* (Israel) | | | 1,593,300 | |
| | 7,600,000 | | | Diamond Building Products Public Co. Ltd.*** (Thailand) | | | 1,913,580 | |
| | | | | | | | |
| | | | | | | 3,506,880 | |
| | | | | | | | |
| | | | Consumer Finance 4.4% | | | | |
| | 109,000 | | | DFC Global Corp.* | | | 1,869,350 | |
| | 60,000 | | | First Cash Financial Services, Inc.* ‡ | | | 2,760,600 | |
| | 84,664 | | | Regional Management Corp.* | | | 1,460,454 | |
| | | | | | | | |
| | | | | | | 6,090,404 | |
| | | | | | | | |
| | | | | | | | |
| Shares | | | | | Value | |
| | | | | | | |
| | | | Data Processing & Outsourced Services 1.0% | | | | |
| | 97,000 | | | Higher One Holdings, Inc.* | | $ | 1,307,560 | |
| | | | | | | | |
| | | | Department Stores 0.6% | | | | |
| | 743,943 | | | Parkson Retail Asia Ltd.* (Malaysia) | | | 879,867 | |
| | | | | | | | |
| | | | Diversified Banks 2.6% | | | | |
| | 2,200,000 | | | City Union Bank Ltd. (India) | | | 2,204,380 | |
| | 2,200,000 | | | EastWest Banking Corp.* (Philippines) | | | 1,207,719 | |
| | 55,556 | | | Idaho Trust Bancorp* *** † | | | 182,779 | |
| | | | | | | | |
| | | | | | | 3,594,878 | |
| | | | | | | | |
| | | | Diversified Support Services 1.5% | | | | |
| | 75,000 | | | Encore Capital Group, Inc.* | | | 2,119,500 | |
| | | | | | | | |
| | | | Electrical Components &
Equipment 1.2% | | | | |
| | 27,000 | | | Franklin Electric Co., Inc. | | | 1,633,230 | |
| | | | | | | | |
| | | | Environmental & Facilities
Services 1.2% | | | | |
| | 82,000 | | | Heritage-Crystal Clean, Inc.* | | | 1,627,700 | |
| | | | | | | | |
| | | | Food Distributors 0.7% | | | | |
| | 60,000 | | | Chefs’ Warehouse, Inc. (The)* | | | 982,800 | |
| | | | | | | | |
| | | | Food Retail 0.3% | | | | |
| | 20,000 | | | Natural Grocers by Vitamin Cottage, Inc.* | | | 446,400 | |
| | | | | | | | |
| | | | General Merchandise Stores 1.2% | | | | |
| | 90,000 | | | Gordmans Stores, Inc.* | | | 1,660,500 | |
| | | | | | | | |
| | | | Health Care Equipment 3.4% | | | | |
| | 160,000 | | | AtriCure, Inc.* | | | 1,190,400 | |
| | 276,300 | | | Cardica, Inc.* | | | 397,872 | |
| | 73,000 | | | NuVasive, Inc.* | | | 1,672,430 | |
| | 450,000 | | | Solta Medical, Inc.* | | | 1,413,000 | |
| | | | | | | | |
| | | | | | | 4,673,702 | |
| | | | | | | | |
| | | | Health Care Facilities 3.3% | | | | |
| | 400,000 | | | CVS Group plc (United Kingdom) | | | 978,750 | |
| | 56,000 | | | Ensign Group, Inc. (The) | | | 1,713,880 | |
| | 900,000 | | | KPJ Healthcare Berhad (Malaysia) | | | 1,796,172 | |
| | | | | | | | |
| | | | | | | 4,488,802 | |
| | | | | | | | |
| | | | Health Care Services 3.6% | | | | |
| | 51,000 | | | Bio-Reference Laboratories, Inc.* | | | 1,457,580 | |
| | 28,846 | | | CorVel Corp.* | | | 1,290,859 | |
| | 39,000 | | | IPC The Hospitalist Co., Inc.* ‡ | | | 1,782,300 | |
| | 10,000 | | | National Research Corp. | | | 502,700 | |
| | | | | | | | |
| | | | | | | 5,033,439 | |
| | | | | | | | |
| | | | Health Care Supplies 1.8% | | | | |
| | 42,600 | | | Chembio Diagnostics, Inc.* | | | 204,480 | |
| | 25,000 | | | Sartorius Stedim Biotech (France) | | | 2,250,702 | |
| | | | | | | | |
| | | | | | | 2,455,182 | |
| | | | | | | | |
| | | | Home Improvement Retail 2.0% | | | | |
| | 32,000 | | | Lumber Liquidators Holdings, Inc.* ‡ | | | 1,621,760 | |
| | 2,150,000 | | | Siam Global House Public Co. Ltd.*** (Thailand) | | | 1,152,534 | |
| | | | | | | | |
| | | | | | | 2,774,294 | |
| | | | | | | | |
| | | | Hotels, Resorts & Cruise Lines 0.5% | | | | |
| | 81,000 | | | Orient-Express Hotels Ltd., Class A* | | | 720,900 | |
| | | | | | | | |
| | | | Household Appliances 0.9% | | | | |
| | 31,000 | | | SodaStream International Ltd.* (Israel) | | | 1,214,270 | |
| | | | | | | | |
| | | | Hypermarkets & Super Centers 1.3% | | | | |
| | 2,600,000 | | | Puregold Price Club, Inc. (Philippines) | | | 1,851,133 | |
| | | | | | | | |
| | | | Industrial Machinery 0.3% | | | | |
| | 20,000 | | | Hurco Cos., Inc.* | | | 457,600 | |
| | | | | | | | |
71
| | |
WASATCH MICRO CAP VALUE FUND
(WAMVX) — Schedule of Investments (continued) | | |
|
|
|
| | | | | | | | |
| Shares | | | | | Value | |
| | | | | | | |
| | | | Internet Retail 0.4% | | | | |
| | 59,745 | | | CafePress, Inc.* | | $ | 544,277 | |
| | | | | | | | |
| | | | Internet Software & Services 2.3% | | | | |
| | 120,000 | | | IntraLinks Holdings, Inc.* | | | 784,800 | |
| | 272,726 | | | iomart Group plc (United Kingdom) | | | 818,191 | |
| | 129,293 | | | Perficient, Inc.* | | | 1,560,566 | |
| | | | | | | | |
| | | | | | | 3,163,557 | |
| | | | | | | | |
| | | | Leisure Products 2.2% | | | | |
| | 138,000 | | | Black Diamond, Inc.* | | | 1,210,260 | |
| | 160,000 | | | Smith & Wesson Holding Corp.* | | | 1,761,600 | |
| | | | | | | | |
| | | | | | | 2,971,860 | |
| | | | | | | | |
| | | | Mortgage REITs 3.8% | | | | |
| | 143,000 | | | Colony Financial, Inc. | | | 2,785,640 | |
| | 395,000 | | | NorthStar Realty Finance Corp. | | | 2,512,200 | |
| | | | | | | | |
| | | | | | | 5,297,840 | |
| | | | | | | | |
| | | | Office REITs 1.5% | | | | |
| | 7,500,000 | | | Prosperity REIT (Hong Kong) | | | 2,089,190 | |
| | | | | | | | |
| | | | Oil & Gas Equipment & Services 0.6% | | | | |
| | 346,000 | | | Electromagnetic GeoServices AS* (Norway) | | | 848,883 | |
| | | | | | | | |
| | | | Oil & Gas Exploration &
Production 2.1% | | | | |
| | 1,100,000 | | | Emerald Oil, Inc.* | | | 913,000 | |
| | 82,000 | | | Evolution Petroleum Corp.* | | | 662,560 | |
| | 78,000 | | | Northern Oil and Gas, Inc.* | | | 1,325,220 | |
| | | | | | | | |
| | | | | | | 2,900,780 | |
| | | | | | | | |
| | | | Packaged Foods & Meats 2.4% | | | | |
| | 1,000,000 | | | Super Group Ltd. (Singapore) | | | 1,786,297 | |
| | 1,700,000 | | | Vitasoy International Holdings Ltd.
(Hong Kong) | | | 1,479,843 | |
| | | | | | | | |
| | | | | | | 3,266,140 | |
| | | | | | | | |
| | | | Pharmaceuticals 0.7% | | | | |
| | 70,000 | | | Torrent Pharmaceuticals Ltd. (India) | | | 930,325 | |
| | | | | | | | |
| | | | Regional Banks 4.3% | | | | |
| | 92,000 | | | Eagle Bancorp, Inc.* | | | 1,538,240 | |
| | 48,000 | | | First of Long Island Corp. (The) | | | 1,478,880 | |
| | 60,000 | | | Lakeland Financial Corp. | | | 1,656,000 | |
| | 120,000 | | | MetroCorp Bancshares, Inc.* | | | 1,270,800 | |
| | | | | | | | |
| | | | | | | 5,943,920 | |
| | | | | | | | |
| | | | Research & Consulting Services 1.0% | | | | |
| | 40,000 | | | Huron Consulting Group, Inc.* | | | 1,392,800 | |
| | | | | | | | |
| | | | Restaurants 1.3% | | | | |
| | 133,000 | | | Caribou Coffee Co., Inc.* | | | 1,826,090 | |
| | | | | | | | |
| | | | Semiconductors 1.5% | | | | |
| | 48,000 | | | Ceva, Inc.* | | | 690,240 | |
| | 65,000 | | | Volterra Semiconductor Corp.* | | | 1,421,550 | |
| | | | | | | | |
| | | | | | | 2,111,790 | |
| | | | | | | | |
| | | | Specialized Finance 0.0% | | | | |
| | 41,900 | | | Goldwater Bank, N.A.*** † | | | 3,771 | |
| | | | | | | | |
| | | | Specialty Chemicals 1.5% | | | | |
| | 75,000 | | | GSE Holding, Inc.* | | | 588,750 | |
| | 79,000 | | | KMG Chemicals, Inc. | | | 1,461,500 | |
| | | | | | | | |
| | | | | | | 2,050,250 | |
| | | | | | | | |
| | | | Steel 1.3% | | | | |
| | 34,000 | | | Haynes International, Inc.‡ | | | 1,773,100 | |
| | | | | | | | |
| | | | Systems Software 2.0% | | | | |
| | 10,000 | | | Infoblox, Inc.* | | | 232,500 | |
| | 65,000 | | | OPNET Technologies, Inc. | | | 2,214,550 | |
| | 25,000 | | | Proofpoint, Inc.* | | | 371,250 | |
| | | | | | | | |
| | | | | | | 2,818,300 | |
| | | | | | | | |
| | | | | | | | |
| Shares | | | | | Value | |
| | | | | | | |
| | | | Thrifts & Mortgage Finance 4.4% | | | | |
| | 200,000 | | | Beneficial Mutual Bancorp, Inc.* | | $ | 1,912,000 | |
| | 109,000 | | | BofI Holding, Inc.* | | | 2,839,450 | |
| | 100,000 | | | Ocean Shore Holding Co. | | | 1,344,000 | |
| | | | | | | | |
| | | | | | | 6,095,450 | |
| | | | | | | | |
| | | | Trading Companies &
Distributors 2.7% | | | | |
| | 77,000 | | | Beacon Roofing Supply, Inc.* | | | 2,194,500 | |
| | 77,000 | | | CAI International, Inc.* | | | 1,580,040 | |
| | | | | | | | |
| | | | | | | 3,774,540 | |
| | | | | | | | |
| | | | Trucking 1.1% | | | | |
| | 87,000 | | | Marten Transport Ltd. | | | 1,528,590 | |
| | | | | | | | |
| | |
| | | | Total Common Stocks (cost $100,763,046) | | | 131,446,655 | |
| | | | | | | | |
| | |
| | | | PREFERRED STOCKS 0.5% | | | | |
| | |
| | | | Pharmaceuticals 0.5% | | | | |
| | 105,263 | | | Acetylon Pharmaceuticals, Inc., Series B Pfd.*** † | | | 625,263 | |
| | | | | | | | |
| | |
| | | | Total Preferred Stocks (cost $499,999) | | | 625,263 | |
| | | | | | | | |
| | |
| | | | WARRANTS 0.0% | | | | |
| | |
| | | | Biotechnology 0.0% | | | | |
| | 30,399 | | | NeurogesX, Inc., expiring 12/28/12* *** † | | | — | |
| | 50,000 | | | NeurogesX, Inc., expiring 7/22/16* *** † | | | 500 | |
| | | | | | | | |
| | | | | | | 500 | |
| | | | | | | | |
| | | | Health Care Equipment 0.0% | | | | |
| | 110,500 | | | Cardica, Inc., expiring 9/29/14* *** † | | | 6,630 | |
| | | | | | | | |
| | |
| | | | Total Warrants (cost $23,862) | | | 7,130 | |
| | | | | | | | |
| | |
Principal
Amount | | | | | Value | |
| | | | | | | |
| | | | SHORT-TERM INVESTMENTS 2.6% | | | | |
| | |
| | | | Repurchase Agreement 2.6% | | | | |
| | $3,610,143 | | | Repurchase Agreement dated 9/28/12, 0.01% due 10/1/12 with State Street Bank and Trust Co. collateralized by $2,710,000 of United States Treasury Bonds 4.500% due 8/15/39; value: $3,684,513; repurchase proceeds: $3,610,146‡ (cost $3,610,143) | | $ | 3,610,143 | |
| | | | | | | | |
| | |
| | | | Total Short-Term Investments (cost $3,610,143) | | | 3,610,143 | |
| | | | | | | | |
| | |
| | | | Total Investments (cost $104,897,050) 98.1% | | | 135,689,191 | |
| | |
| | | | Other Assets less Liabilities 1.9% | | | 2,610,162 | |
| | | | | | | | |
| | |
| | | | NET ASSETS 100.0% | | $ | 138,299,353 | |
| | | | | | | | |
72
| | | | | | | | |
| | |
Number of
Contracts | | | | | Value | |
| | | | | | | |
| | | | CALL OPTIONS WRITTEN 0.1% | | | | |
| | |
| | | | Consumer Finance 0.0% | | | | |
| | 300 | | | First Cash Financial Services, Inc., expiring 10/20/12, exercise price $45 | | $ | 63,000 | |
| | | | | | | | |
| | | | Health Care Services 0.0% | | | | |
| | 125 | | | IPC The Hospitalist Co., Inc., expiring 10/20/12, exercise price $45 | | | 21,875 | |
| | | | | | | | |
| | | | Home Improvement Retail 0.1% | | | | |
| | 320 | | | Lumber Liquidators Holdings, Inc., expiring 10/20/12, exercise price $50 | | | 63,200 | |
| | | | | | | | |
| | | | Steel 0.0% | | | | |
| | 50 | | | Haynes International, Inc., expiring 10/20/12, exercise price $50 | | | 17,500 | |
| | | | | | | | |
| | |
| | | | Total Call Options Written (premium $255,255) | | | 165,575 | |
| | | | | | | | |
| | |
| Contracts | | | | | Net
Unrealized
Depreciation | |
| | | | | | | |
| | | | FORWARD FOREIGN CURRENCY EXCHANGE CONTRACTS SHORT 0.0% | | | | |
| | |
| | 2,600,000 EUR | | | USD, State Street Bank and Trust Co. Company, settlement date 12/11/12, (cost $3,330,990, value $3,346,831) | | $ | (15,841 | ) |
| | | | | | | | |
| | |
| | | | Total Forward Foreign Currency Exchange Contracts Short (cost $3,330,990, value $3,346,831) | | | (15,841 | ) |
| | | | | | | | |
| |
| | | | *Non-income producing. ***Security was fair valued under procedures adopted by the Board of Trustees (see Note 15). †Security purchased in a private placement transaction or under Rule 144A of the Securities Act of 1933 (see Note 11). ‡All or a portion of this security has been designated as collateral for forward foreign currency exchange contracts and call options written (see Notes 4 and 7). REIT Real Estate Investment Trust. See Notes to Financial Statements. | |
At September 30, 2012, Wasatch Micro Cap Value Fund’s investments, excluding short-term investments, call options written and forward foreign currency exchange contracts, were in the following countries:
| | | | |
| Country | | % | |
Cambodia | | | 1.2 | |
France | | | 1.7 | |
Germany | | | 0.8 | |
Hong Kong | | | 2.7 | |
India | | | 2.4 | |
Israel | | | 3.2 | |
Malaysia | | | 3.2 | |
Norway | | | 0.6 | |
Philippines | | | 2.3 | |
Singapore | | | 1.4 | |
Thailand | | | 2.3 | |
United Kingdom | | | 2.0 | |
United States | | | 76.2 | |
| | | | |
TOTAL | | | 100.0 | % |
| | | | |
73
| | |
| WASATCH SMALL CAP GROWTH FUND (WAAEX) — Schedule of Investments | | |
|
|
|
| | | | | | | | |
| Shares | | | | | Value | |
| | | | | | | |
| | | | COMMON STOCKS 89.5% | | | | |
| | |
| | | | Aerospace & Defense 1.5% | | | | |
| | 901,391 | | | HEICO Corp., Class A | | $ | 27,501,439 | |
| | | | | | | | |
| | | | Air Freight & Logistics 2.1% | | | | |
| | 36,319,023 | | | Aramex PJSC (United Arab Emirates) | | | 19,182,931 | |
| | 617,502 | | | HUB Group, Inc., Class A* | | | 18,327,459 | |
| | | | | | | | |
| | | | | | | 37,510,390 | |
| | | | | | | | |
| | | | Airlines 0.6% | | | | |
| | 164,502 | | | Allegiant Travel Co.* | | | 10,422,847 | |
| | | | | | | | |
| | | | Airport Services 1.0% | | | | |
| | 1,328,711 | | | Wesco Aircraft Holdings, Inc.* | | | 18,150,192 | |
| | | | | | | | |
| | | | Apparel Retail 3.4% | | | | |
| | 1,145,050 | | | Chico’s FAS, Inc. | | | 20,736,856 | |
| | 865,090 | | | rue21, Inc.* | | | 26,947,553 | |
| | 525,275 | | | Zumiez, Inc.* | | | 14,565,876 | |
| | | | | | | | |
| | | | | | | 62,250,285 | |
| | | | | | | | |
| | | | Application Software 8.3% | | | | |
| | 370,303 | | | Concur Technologies, Inc.* | | | 27,302,440 | |
| | 77,807 | | | FactSet Research Systems, Inc. | | | 7,502,151 | |
| | 1,530,380 | | | RealPage, Inc.* | | | 34,586,588 | |
| | 853,530 | | | Tangoe, Inc.* | | | 11,206,849 | |
| | 697,334 | | | Ultimate Software Group, Inc.* | | | 71,197,801 | |
| | | | | | | | |
| | | | | | | 151,795,829 | |
| | | | | | | | |
| | | | Automotive Retail 1.9% | | | | |
| | 572,906 | | | Monro Muffler Brake, Inc. | | | 20,160,562 | |
| | 175,496 | | | O’Reilly Automotive, Inc.* | | | 14,674,976 | |
| | | | | | | | |
| | | | | | | 34,835,538 | |
| | | | | | | | |
| | | | Biotechnology 3.7% | | | | |
| | 1,794,615 | | | Exact Sciences Corp.* | | | 19,758,711 | |
| | 398,079 | | | Myriad Genetics, Inc.* | | | 10,744,153 | |
| | 3,882,558 | | | NeurogesX, Inc.* ‡‡ | | | 815,337 | |
| | 1,126,565 | | | Sangamo Biosciences, Inc.* | | | 6,849,515 | |
| | 1,101,057 | | | Seattle Genetics, Inc.* | | | 29,673,486 | |
| | | | | | | | |
| | | | | | | 67,841,202 | |
| | | | | | | | |
| | | | Computer Storage & Peripherals 0.2% | | | | |
| | 125,140 | | | Fusion-io, Inc.* | | | 3,787,988 | |
| | | | | | | | |
| | | | Data Processing & Outsourced Services 5.5% | | | | |
| | 530,574 | | | ExlService Holdings, Inc.* | | | 15,651,933 | |
| | 1,182,343 | | | Higher One Holdings, Inc.* | | | 15,937,984 | |
| | 502,175 | | | Syntel, Inc. | | | 31,340,742 | |
| | 1,596,239 | | | Wirecard AG (Germany) | | | 36,691,420 | |
| | | | | | | | |
| | | | | | | 99,622,079 | |
| | | | | | | | |
| | | | Distributors 0.8% | | | | |
| | 800,043 | | | LKQ Corp.* | | | 14,800,795 | |
| | | | | | | | |
| | | | Diversified Banks 3.4% | | | | |
| | 761,965 | | | HDFC Bank Ltd. ADR (India) | | | 28,634,645 | |
| | 4,581,117 | | | Yes Bank Ltd. (India) | | | 33,286,815 | |
| | | | | | | | |
| | | | | | | 61,921,460 | |
| | | | | | | | |
| | | | Diversified Support Services 1.8% | | | | |
| | 1,124,516 | | | Copart, Inc.* | | | 31,182,829 | |
| | 66,375 | | | Ritchie Bros. Auctioneers, Inc. (Canada) | | | 1,276,391 | |
| | | | | | | | |
| | | | | | | 32,459,220 | |
| | | | | | | | |
| | | | Electrical Components &
Equipment 1.5% | | | | |
| | 786,145 | | | Polypore International, Inc.* | | | 27,790,226 | |
| | | | | | | | |
| | | | Electronic Manufacturing
Services 1.3% | | | | |
| | 423,810 | | | IPG Photonics Corp.* | | | 24,284,313 | |
| | | | | | | | |
| | | | | | | | |
| Shares | | | | | Value | |
| | | | | | | |
| | | | Environmental & Facilities
Services 1.6% | | | | |
| | 1,145,310 | | | Tetra Tech, Inc.* | | $ | 30,075,841 | |
| | | | | | | | |
| | | | Health Care Distributors 1.0% | | | | |
| | 171,381 | | | MWI Veterinary Supply, Inc.* | | | 18,282,925 | |
| | | | | | | | |
| | | | Health Care Equipment 1.4% | | | | |
| | 498,944 | | | Abaxis, Inc.* | | | 17,922,068 | |
| | 487,760 | | | DexCom, Inc.* | | | 7,331,033 | |
| | 24,690 | | | Zonare Medical Systems, Inc.* *** † | | | 247 | |
| | | | | | | | |
| | | | | | | 25,253,348 | |
| | | | | | | | |
| | | | Health Care Services 0.6% | | | | |
| | 142,820 | | | MEDNAX, Inc.* | | | 10,632,949 | |
| | | | | | | | |
| | | | Health Care Technology 0.4% | | | | |
| | 145,937 | | | Computer Programs and Systems, Inc. | | | 8,106,800 | |
| | | | | | | | |
| | | | Industrial Machinery 1.9% | | | | |
| | 484,674 | | | Graco, Inc. | | | 24,369,409 | |
| | 309,577 | | | Proto Labs, Inc.* | | | 10,469,894 | |
| | | | | | | | |
| | | | | | | 34,839,303 | |
| | | | | | | | |
| | | | Internet Retail 4.6% | | | | |
| | 164,346 | | | ASOS plc* (United Kingdom) | | | 5,831,609 | |
| | 654,903 | | | Blue Nile, Inc.* ‡‡ | | | 24,290,352 | |
| | 1,350,210 | | | MakeMyTrip Ltd.* (India) | | | 22,994,076 | |
| | 257,684 | | | Shutterfly, Inc.* | | | 8,019,126 | |
| | 934,433 | | | Yoox S.p.A.* (Italy) | | | 11,971,528 | |
| | 275,513 | | | zooplus AG* (Germany) | | | 11,478,763 | |
| | | | | | | | |
| | | | | | | 84,585,454 | |
| | | | | | | | |
| | | | Internet Software & Services 3.9% | | | | |
| | 1,186,018 | | | Angie’s List, Inc.* | | | 12,548,071 | |
| | 800,225 | | | DealerTrack Holdings, Inc.* | | | 22,286,266 | |
| | 26,366 | | | Millennial Media, Inc.* | | | 378,352 | |
| | 784,444 | | | SciQuest, Inc.* | | | 14,276,881 | |
| | 656,681 | | | Vistaprint N.V.* | | | 22,425,656 | |
| | | | | | | | |
| | | | | | | 71,915,226 | |
| | | | | | | | |
| | | | IT Consulting & Other Services 1.5% | | | | |
| | 275,737 | | | Cognizant Technology Solutions Corp.,
Class A* | | | 19,279,531 | |
| | 782,975 | | | ServiceSource International, Inc.* | | | 8,033,324 | |
| | | | | | | | |
| | | | | | | 27,312,855 | |
| | | | | | | | |
| | | | Leisure Facilities 2.6% | | | | |
| | 1,018,728 | | | Life Time Fitness, Inc.* | | | 46,596,619 | |
| | | | | | | | |
| | | | Life Sciences Tools & Services 4.2% | | | | |
| | 721,002 | | | Divi’s Laboratories Ltd. (India) | | | 14,800,055 | |
| | 868,644 | | | Fluidigm Corp.* | | | 14,766,948 | |
| | 1,103,068 | | | ICON plc ADR* (Ireland) | | | 26,881,767 | |
| | 287,547 | | | Techne Corp. | | | 20,686,131 | |
| | | | | | | | |
| | | | | | | 77,134,901 | |
| | | | | | | | |
| | | | Oil & Gas Equipment & Services 4.1% | | | | |
| | 334,085 | | | Dril-Quip, Inc.* | | | 24,014,030 | |
| | 1,058,711 | | | Pason Systems, Inc. (Canada) | | | 17,671,207 | |
| | 382,702 | | | ShawCor Ltd., Class A (Canada) | | | 16,613,662 | |
| | 496,825 | | | TGS-NOPEC Geophysical Co. ASA (Norway) | | | 16,214,677 | |
| | | | | | | | |
| | | | | | | 74,513,576 | |
| | | | | | | | |
| | | | Oil & Gas Exploration &
Production 2.5% | | | | |
| | 978,179 | | | Northern Oil and Gas, Inc.* | | | 16,619,261 | |
| | 3,387,260 | | | Premier Oil plc* (United Kingdom) | | | 19,634,561 | |
| | 784,115 | | | TransGlobe Energy Corp.* (Egypt) | | | 8,515,489 | |
| | | | | | | | |
| | | | | | | 44,769,311 | |
| | | | | | | | |
74
| | | | | | | | |
| Shares | | | | | Value | |
| | | | | | | |
| | | | Oil & Gas Refining & Marketing 0.0% | | | | |
| | 203,175 | | | Amyris, Inc.* | | $ | 698,922 | |
| | | | | | | | |
| | | | Packaged Foods & Meats 1.3% | | | | |
| | 2,461 | | | Annie’s, Inc.* | | | 110,351 | |
| | 411,088 | | | GlaxoSmithKline Consumer Healthcare Ltd. (India) | | | 23,529,712 | |
| | | | | | | | |
| | | | | | | 23,640,063 | |
| | | | | | | | |
| | | | Personal Products 0.7% | | | | |
| | 582,400 | | | Colgate-Palmolive India Ltd. (India) | | | 13,305,375 | |
| | | | | | | | |
| | | | Pharmaceuticals 0.3% | | | | |
| | 846,015 | | | Cempra, Inc.* | | | 6,302,812 | |
| | | | | | | | |
| | | | Research & Consulting Services 2.3% | | | | |
| | 1,740,892 | | | Resources Connection, Inc.‡ | | | 22,823,094 | |
| | 549,657 | | | Stantec, Inc. (Canada) | | | 18,677,345 | |
| | | | | | | | |
| | | | | | | 41,500,439 | |
| | | | | | | | |
| | | | Restaurants 0.9% | | | | |
| | 614,680 | | | Jubilant Foodworks Ltd.* (India) | | | 15,945,320 | |
| | | | | | | | |
| | | | Semiconductors 4.2% | | | | |
| | 400,771 | | | Hittite Microwave Corp.* | | | 22,230,767 | |
| | 1,259,149 | | | Power Integrations, Inc. | | | 38,315,904 | |
| | 424,490 | | | Silicon Laboratories, Inc.* | | | 15,604,253 | |
| | | | | | | | |
| | | | | | | 76,150,924 | |
| | | | | | | | |
| | | | Specialized Finance 1.4% | | | | |
| | 690,760 | | | MSCI, Inc., Class A* | | | 24,722,300 | |
| | | | | | | | |
| | | | Specialty Stores 2.4% | | | | |
| | 723,503 | | | Hibbett Sports, Inc.* | | | 43,012,253 | |
| | | | | | | | |
| | | | Systems Software 2.7% | | | | |
| | 447,134 | | | NetSuite, Inc.* | | | 28,527,149 | |
| | 433,812 | | | Sourcefire, Inc.* | | | 21,269,803 | |
| | | | | | | | |
| | | | | | | 49,796,952 | |
| | | | | | | | |
| | | | Trading Companies &
Distributors 2.0% | | | | |
| | 547,600 | | | MSC Industrial Direct Co., Inc., Class A | | | 36,941,096 | |
| | | | | | | | |
| | | | Trucking 4.0% | | | | |
| | 120,800 | | | J.B. Hunt Transport Services, Inc. | | | 6,286,432 | |
| | 4,655,806 | | | Knight Transportation, Inc.‡ ‡‡ | | | 66,578,026 | |
| | | | | | | | |
| | | | | | | 72,864,458 | |
| | | | | | | | |
| | |
| | | | Total Common Stocks
(cost $1,126,904,526) | | | 1,633,873,825 | |
| | | | | | | | |
| | |
| | | | PREFERRED STOCKS 0.1% | | | | |
| | |
| | | | Biotechnology 0.1% | | | | |
| | 677,966 | | | Nanosys, Inc., Series D Pfd.* *** † | | | 776,271 | |
| | 161,519 | | | Nanosys, Inc., Series E Pfd.* *** † | | | 184,939 | |
| | | | | | | | |
| | | | | | | 961,210 | |
| | | | | | | | |
| | |
| | | | Total Preferred Stocks
(cost $2,184,939) | | | 961,210 | |
| | | | | | | | |
| | |
| | | | LIMITED PARTNERSHIP INTEREST 0.4% | | | | |
| | |
| | | | Asset Management & Custody
Banks 0.4% | | | | |
| | | | Greenspring Global Partners II-B, L.P.*** † | | | 4,967,476 | |
| | | | Greenspring Global Partners III-B, L.P.*** † | | | 1,658,434 | |
| | | | | | | | |
| | | | | | | 6,625,910 | |
| | | | | | | | |
| | |
| | | | Total Limited Partnership Interest
(cost $5,878,853) | | | 6,625,910 | |
| | | | | | | | |
| | | | | | | | |
| Shares | | | | | Value | |
| | | | | | | |
| | | | WARRANTS 0.0% | | | | |
| | |
| | | | Biotechnology 0.0% | | | | |
| | 1,941,279 | | | NeurogesX, Inc., expiring 7/22/16* *** † | | $ | 19,413 | |
| | | | | | | | |
| | |
| | | | Total Warrants
(cost $242,660) | | | 19,413 | |
| | | | | | | | |
| | |
Principal
Amount | | | | | Value | |
| | | | SHORT-TERM INVESTMENTS 7.7% | | | | |
| | |
| | | | Repurchase Agreement 7.7% | | | | |
| | $140,939,232 | | | Repurchase Agreement dated 9/28/12, 0.01% due 10/1/12 with State Street Bank and Trust Co. collateralized by $105,740,000 of United States Treasury Bonds 4.500% due 8/15/39; value: $143,763,998; repurchase proceeds: $140,939,349‡ (cost $140,939,232) | | $ | 140,939,232 | |
| | | | | | | | |
| | |
| | | | Total Short-Term Investments
(cost $140,939,232) | | | 140,939,232 | |
| | | | | | | | |
| | |
| | | | Total Investments
(cost $1,276,150,210) 97.7% | | | 1,782,419,590 | |
| | |
| | | | Other Assets less Liabilities 2.3% | | | 42,361,709 | |
| | | | | | | | |
| | |
| | | | NET ASSETS 100.0% | | $ | 1,824,781,299 | |
| | | | | | | | |
| |
| | | | *Non-income producing. ***Security was fair valued under procedures adopted by the Board of Trustees (see Note 15). †Security purchased in a private placement transaction or under Rule 144A of the Securities Act of 1933 (see Note 11). ‡All or a portion of this security has been designated as collateral for purchase commitments (see Note 12). ‡‡Affiliated company (see Note 10). ADR American Depositary Receipt. See Notes to Financial Statements. | |
At September 30, 2012, Wasatch Small Cap Growth Fund’s investments, excluding short-term investments, were in the following countries:
| | | | |
| Country | | % | |
Canada | | | 3.3 | |
Egypt | | | 0.5 | |
Germany | | | 2.9 | |
India | | | 9.3 | |
Ireland | | | 1.6 | |
Italy | | | 0.7 | |
Norway | | | 1.0 | |
United Arab Emirates | | | 1.2 | |
United Kingdom | | | 1.6 | |
United States | | | 77.9 | |
| | | | |
TOTAL | | | 100.0 | % |
| | | | |
75
| | |
WASATCH SMALL CAP VALUE FUND
(WMCVX / WICVX) — Schedule of Investments | | |
|
|
|
| | | | | | | | |
| Shares | | | | | Value | |
| | | | | | | |
| | | | COMMON STOCKS 99.1% | | | | |
| | |
| | | | Aerospace & Defense 2.3% | | | | |
| | 118,818 | | | HEICO Corp., Class A | | $ | 3,625,137 | |
| | 10,041 | | | HEICO Corp. | | | 388,486 | |
| | | | | | | | |
| | | | | | | 4,013,623 | |
| | | | | | | | |
| | | | Agricultural Products 1.6% | | | | |
| | 154,985 | | | Darling International, Inc.* | | | 2,834,676 | |
| | | | | | | | |
| | | | Airlines 1.7% | | | | |
| | 45,780 | | | Allegiant Travel Co.* | | | 2,900,621 | |
| | | | | | | | |
| | | | Airport Services 1.9% | | | | |
| | 237,118 | | | Wesco Aircraft Holdings, Inc.* | | | 3,239,032 | |
| | | | | | | | |
| | | | Alternative Carriers 0.5% | | | | |
| | 250,844 | | | ORBCOMM, Inc.* | | | 938,157 | |
| | | | | | | | |
| | | | Apparel Retail 6.4% | | | | |
| | 288,532 | | | Body Central Corp.* | | | 3,015,159 | |
| | 245,578 | | | Chico’s FAS, Inc.‡ | | | 4,447,418 | |
| | 119,090 | | | rue21, Inc.* | | | 3,709,653 | |
| | | | | | | | |
| | | | | | | 11,172,230 | |
| | | | | | | | |
| | | | Application Software 1.6% | | | | |
| | 95,015 | | | Interactive Intelligence Group, Inc.* | | | 2,855,201 | |
| | | | | | | | |
| | | | Asset Management & Custody
Banks 1.7% | | | | |
| | 34,533 | | | Virtus Investment Partners, Inc.* | | | 2,969,838 | |
| | | | | | | | |
| | | | Auto Parts & Equipment 0.8% | | | | |
| | 41,983 | | | Dorman Products, Inc.* | | | 1,322,884 | |
| | | | | | | | |
| | | | Automotive Retail 1.0% | | | | |
| | 49,732 | | | Monro Muffler Brake, Inc. | | | 1,750,069 | |
| | | | | | | | |
| | | | Computer & Electronics Retail 1.2% | | | | |
| | 95,609 | | | GameStop Corp., Class A | | | 2,007,789 | |
| | | | | | | | |
| | | | Computer Storage & Peripherals 0.9% | | | | |
| | 257,483 | | | Intevac, Inc.* | | | 1,573,221 | |
| | | | | | | | |
| | | | Consumer Electronics 1.3% | | | | |
| | 170,116 | | | Skullcandy, Inc.* | | | 2,339,095 | |
| | | | | | | | |
| | | | Consumer Finance 2.4% | | | | |
| | 244,565 | | | DFC Global Corp.* | | | 4,194,290 | |
| | | | | | | | |
| | | | Data Processing & Outsourced Services 2.1% | | | | |
| | 59,193 | | | Syntel, Inc. | | | 3,694,235 | |
| | | | | | | | |
| | | | Diversified Banks 5.6% | | | | |
| | 2,876,000 | | | City Union Bank Ltd. (India) | | | 2,881,725 | |
| | 6,064,876 | | | South Indian Bank Ltd. (India) | | | 2,621,655 | |
| | 585,800 | | | Yes Bank Ltd. (India) | | | 4,256,476 | |
| | | | | | | | |
| | | | | | | 9,759,856 | |
| | | | | | | | |
| | | | Diversified Support Services 6.4% | | | | |
| | 254,985 | | | Copart, Inc.* | | | 7,070,734 | |
| | 38,914 | | | Portfolio Recovery Associates, Inc.* | | | 4,063,789 | |
| | | | | | | | |
| | | | | | | 11,134,523 | |
| | | | | | | | |
| | | | Electrical Components &
Equipment 2.9% | | | | |
| | 141,752 | | | Polypore International, Inc.* | | | 5,010,933 | |
| | | | | | | | |
| | | | Electronic Manufacturing
Services 3.1% | | | | |
| | 165,788 | | | Fabrinet* | | | 1,921,483 | |
| | 61,079 | | | IPG Photonics Corp.* ‡ | | | 3,499,827 | |
| | | | | | | | |
| | | | | | | 5,421,310 | |
| | | | | | | | |
| | | | Footwear 1.0% | | | | |
| | 86,200 | | | Skechers U.S.A., Inc., Class A* | | | 1,758,480 | |
| | | | | | | | |
| | | | | | | | |
| Shares | | | | | Value | |
| | | | | | | |
| | | | General Merchandise Stores 0.9% | | | | |
| | 87,110 | | | Gordmans Stores, Inc.* | | $ | 1,607,180 | |
| | | | | | | | |
| | | | Health Care Facilities 2.1% | | | | |
| | 118,210 | | | Ensign Group, Inc. (The) | | | 3,617,817 | |
| | | | | | | | |
| | | | Health Care Services 3.1% | | | | |
| | 47,302 | | | CorVel Corp.* | | | 2,116,764 | |
| | 44,457 | | | MEDNAX, Inc.* | | | 3,309,824 | |
| | | | | | | | |
| | | | | | | 5,426,588 | |
| | | | | | | | |
| | | | Health Care Supplies 1.8% | | | | |
| | 34,637 | | | Sartorius Stedim Biotech (France) | | | 3,118,303 | |
| | | | | | | | |
| | | | Industrial Machinery 1.1% | | | | |
| | 46,794 | | | IDEX Corp. | | | 1,954,585 | |
| | | | | | | | |
| | | | Internet Retail 1.0% | | | | |
| | 193,361 | | | CafePress, Inc.* | | | 1,761,519 | |
| | | | | | | | |
| | | | Internet Software & Services 2.9% | | | | |
| | 83,578 | | | Ancestry.com, Inc.* | | | 2,514,026 | |
| | 76,061 | | | Vistaprint N.V.* | | | 2,597,483 | |
| | | | | | | | |
| | | | | | | 5,111,509 | |
| | | | | | | | |
| | | | Leisure Facilities 2.0% | | | | |
| | 73,913 | | | Life Time Fitness, Inc.* | | | 3,380,781 | |
| | | | | | | | |
| | | | Life Sciences Tools & Services 2.2% | | | | |
| | 153,562 | | | ICON plc ADR* (Ireland) | | | 3,742,306 | |
| | | | | | | | |
| | | | Oil & Gas Drilling 1.0% | | | | |
| | 106,998 | | | Patterson-UTI Energy, Inc. | | | 1,694,848 | |
| | | | | | | | |
| | | | Oil & Gas Equipment & Services 2.4% | | | | |
| | 35,425 | | | CARBO Ceramics, Inc. | | | 2,228,941 | |
| | 58,525 | | | TGS-NOPEC Geophysical Co. ASA (Norway) | | | 1,910,057 | |
| | | | | | | | |
| | | | | | | 4,138,998 | |
| | | | | | | | |
| | | | Oil & Gas Exploration &
Production 4.0% | | | | |
| | 204,491 | | | Northern Oil and Gas, Inc.* | | | 3,474,302 | |
| | 158,638 | | | Ultra Petroleum Corp.* | | | 3,486,863 | |
| | | | | | | | |
| | | | | | | 6,961,165 | |
| | | | | | | | |
| | | | Oil & Gas Refining & Marketing 1.9% | | | | |
| | 90,914 | | | World Fuel Services Corp. | | | 3,237,448 | |
| | | | | | | | |
| | | | Pharmaceuticals 0.9% | | | | |
| | 81,670 | | | Questcor Pharmaceuticals, Inc.* | | | 1,510,895 | |
| | | | | | | | |
| | | | Property & Casualty Insurance 1.3% | | | | |
| | 32,939 | | | RLI Corp. | | | 2,195,714 | |
| | | | | | | | |
| | | | Regional Banks 3.8% | | | | |
| | 111,788 | | | Community Bank System, Inc. | | | 3,151,304 | |
| | 79,507 | | | Prosperity Bancshares, Inc. | | | 3,388,588 | |
| | | | | | | | |
| | | | | | | 6,539,892 | |
| | | | | | | | |
| | | | Research & Consulting Services 5.0% | | | | |
| | 35,995 | | | Corporate Executive Board Co. (The) | | | 1,930,412 | |
| | 80,621 | | | Franklin Covey Co.* | | | 967,452 | |
| | 86,827 | | | Huron Consulting Group, Inc.* | | | 3,023,316 | |
| | 67,943 | | | Resources Connection, Inc. | | | 890,733 | |
| | 853,740 | | | Sporton International, Inc. (Taiwan) | | | 1,913,477 | |
| | | | | | | | |
| | | | | | | 8,725,390 | |
| | | | | | | | |
| | | | Restaurants 1.2% | | | | |
| | 152,884 | | | Caribou Coffee Co., Inc.* | | | 2,099,097 | |
| | | | | | | | |
76
| | | | | | | | |
| | |
| Shares | | | | | Value | |
| | | | | | | |
| | | | Semiconductors 4.0% | | | | |
| | 345,807 | | | BCD Semiconductor Manufacturing Ltd. ADR* (China) | | $ | 1,241,447 | |
| | 356,915 | | | MaxLinear, Inc., Class A* | | | 2,387,762 | |
| | 484,693 | | | O2Micro International Ltd. ADR* (China) | | | 1,812,752 | |
| | 51,133 | | | Power Integrations, Inc. | | | 1,555,977 | |
| | | | | | | | |
| | | | | | | 6,997,938 | |
| | | | | | | | |
| | | | Thrifts & Mortgage Finance 1.1% | | | | |
| | 70,708 | | | BofI Holding, Inc.* | | | 1,841,943 | |
| | | | | | | | |
| | | | Trading Companies & Distributors 4.1% | | | | |
| | 139,467 | | | Beacon Roofing Supply, Inc.* | | | 3,974,810 | |
| | 45,238 | | | MSC Industrial Direct Co., Inc., Class A | | | 3,051,755 | |
| | | | | | | | |
| | | | | | | 7,026,565 | |
| | | | | | | | |
| | | | Trucking 4.9% | | | | |
| | 181,046 | | | Knight Transportation, Inc. | | | 2,588,958 | |
| | 174,244 | | | Marten Transport Ltd. | | | 3,061,467 | |
| | 93,922 | | | Old Dominion Freight Line, Inc.* | | | 2,832,687 | |
| | | | | | | | |
| | | | | | | 8,483,112 | |
| | | | | | | | |
| | |
| | | | Total Common Stocks
(cost $146,952,547) | | | 172,063,656 | |
| | | | | | | | |
| | |
Principal
Amount | | | | | Value | |
| | |
| | | | SHORT-TERM INVESTMENTS 1.4% | | | | |
| | |
| | | | Repurchase Agreement 1.4% | | | | |
| | $2,386,104 | | | Repurchase Agreement dated 9/28/12, 0.01% due 10/1/12 with State Street Bank and Trust Co. collateralized by $1,795,000 of United States Treasury Bonds 4.500% due 8/15/39; value: $2,440,480; repurchase proceeds: $2,386,106‡ (cost $2,386,104) | | $ | 2,386,104 | |
| | | | | | | | |
| | |
| | | | Total Short-Term Investments
(cost $2,386,104) | | | 2,386,104 | |
| | | | | | | | |
| | |
| | | | Total Investments
(cost $149,338,651) 100.5% | | | 174,449,760 | |
| | |
| | | | Liabilities less Other Assets (0.5%) | | | (876,226 | ) |
| | | | | | | | |
| | |
| | | | NET ASSETS 100.0% | | $ | 173,573,534 | |
| | | | | | | | |
| | | | | | | | |
Number of
Contracts | | | | | Value | |
| | |
| | | | CALL OPTIONS WRITTEN 0.0% | | | | |
| | |
| | | | Apparel Retail 0.0% | | | | |
| | 300 | | | Chico’s FAS, Inc., expiring 1/19/13, exercise price $19 | | $ | 25,500 | |
| | | | | | | | |
| | | | Electronic Manufacturing Services 0.0% | | | | |
| | 300 | | | IPG Photonics Corp., expiring 10/20/12, exercise price $65 | | | 6,000 | |
| | | | | | | | |
| | |
| | | | Total Call Options Written
(premium $134,261) | | | 31,500 | |
| | | | | | | | |
| |
| | | | *Non-income producing. ‡All or a portion of this security has been designated as collateral for call options written (see Note 4 and 7). ADR American Depositary Receipt. See Notes to Financial Statements. | |
At September 30, 2012, Wasatch Small Cap Value Fund’s investments, excluding short-term investments and call options written, were in the following countries:
| | | | |
| Country | | % | |
China | | | 1.8 | |
France | | | 1.8 | |
India | | | 5.7 | |
Ireland | | | 2.2 | |
Norway | | | 1.1 | |
Taiwan | | | 1.1 | |
United States | | | 86.3 | |
| | | | |
TOTAL | | | 100.0 | % |
| | | | |
77
| | |
| WASATCH STRATEGIC INCOME FUND (WASIX) — Schedule of Investments | | SEPTEMBER 30, 2012 |
|
|
|
| | | | | | | | |
| Shares | | | | | Value | |
| | | | | | | |
| | | | COMMON STOCKS 77.8% | | | | |
| | |
| | | | Asset Management & Custody
Banks 5.1% | | | | |
| | 4,900 | | | BlackRock, Inc. | | $ | 873,670 | |
| | 40,600 | | | PowerShares Dynamic Pharmaceuticals Portfolio | | | 1,401,106 | |
| | | | | | | | |
| | | | | | | 2,274,776 | |
| | | | | | | | |
| | | | Computer & Electronics Retail 3.9% | | | | |
| | 101,500 | | | Best Buy Co., Inc. | | | 1,744,785 | |
| | | | | | | | |
| | | | Consumer Finance 5.2% | | | | |
| | 41,030 | | | Capital One Financial Corp. | | | 2,339,120 | |
| | | | | | | | |
| | | | Data Processing & Outsourced Services 8.0% | | | | |
| | 3,950 | | | MasterCard, Inc., Class A | | | 1,783,346 | |
| | 13,435 | | | Visa, Inc., Class A | | | 1,804,052 | |
| | | | | | | | |
| | | | | | | 3,587,398 | |
| | | | | | | | |
| | | | Diversified REITs 0.6% | | | | |
| | 177,857 | | | Star Asia Financial Ltd.* † | | | 266,786 | |
| | | | | | | | |
| | | | Drug Retail 3.6% | | | | |
| | 43,500 | | | Walgreen Co. | | | 1,585,140 | |
| | | | | | | | |
| | | | Health Care Services 2.2% | | | | |
| | 14,240 | | | Chemed Corp. | | | 986,690 | |
| | | | | | | | |
| | | | Integrated Oil & Gas 4.5% | | | | |
| | 8,500 | | | Occidental Petroleum Corp. | | | 731,510 | |
| | 39,081 | | | Suncor Energy, Inc. (Canada) | | | 1,285,541 | |
| | | | | | | | |
| | | | | | | 2,017,051 | |
| | | | | | | | |
| | | | Mortgage REITs 12.0% | | | | |
| | 47,600 | | | American Capital Mortgage Investment Corp. | | | 1,196,188 | |
| | 94,991 | | | Colony Financial, Inc. | | | 1,850,424 | |
| | 23,600 | | | Hatteras Financial Corp. | | | 665,284 | |
| | 256,366 | | | NorthStar Realty Finance Corp. | | | 1,630,488 | |
| | | | | | | | |
| | | | | | | 5,342,384 | |
| | | | | | | | |
| | | | Oil & Gas Drilling 2.4% | | | | |
| | 22,400 | | | Helmerich & Payne, Inc. | | | 1,066,464 | |
| | | | | | | | |
| | | | Oil & Gas Equipment & Services 2.1% | | | | |
| | 15,100 | | | CARBO Ceramics, Inc. | | | 950,092 | |
| | | | | | | | |
| | | | Personal Products 6.1% | | | | |
| | 57,623 | | | Herbalife Ltd. | | | 2,731,330 | |
| | | | | | | | |
| | | | Pharmaceuticals 1.7% | | | | |
| | 18,875 | | | Teva Pharmaceutical Industries Ltd. ADR (Israel) | | | 781,614 | |
| | | | | | | | |
| | | | Railroads 4.1% | | | | |
| | 20,500 | | | Canadian National Railway Co. (Canada) | | | 1,813,859 | |
| | | | | | | | |
| | | | Regional Banks 4.5% | | | | |
| | 268,005 | | | CapitalSource, Inc. | | | 2,031,478 | |
| | | | | | | | |
| | | | Restaurants 1.6% | | | | |
| | 7,570 | | | McDonald’s Corp. | | | 694,547 | |
| | | | | | | | |
| | | | Semiconductors 8.7% | | | | |
| | 23,545 | | | Altera Corp. | | | 800,177 | |
| | 61,730 | | | Intel Corp. | | | 1,400,036 | |
| | 30,015 | | | Microchip Technology, Inc. | | | 982,691 | |
| | 20,700 | | | Xilinx, Inc. | | | 691,587 | |
| | | | | | | | |
| | | | | | | 3,874,491 | |
| | | | | | | | |
| | | | Trading Companies &
Distributors 1.5% | | | | |
| | 3,130 | | | W.W. Grainger, Inc. | | | 652,198 | |
| | | | | | | | |
| | |
| | | | Total Common Stocks
(cost $31,645,053) | | | 34,740,203 | |
| | | | | | | | |
| | | | | | | | |
| Shares | | | | | Value | |
| | | | | | | |
| | | | LIMITED LIABILITY COMPANY MEMBERSHIP INTEREST 10.5% | | | | |
| | |
| | | | Asset Management & Custody
Banks 4.2% | | | | |
| | 186,000 | | | Och-Ziff Capital Management Group, LLC | | $ | 1,796,760 | |
| | 77,279 | | | Star Asia SPV, LLC*** † | | | 99,690 | |
| | | | | | | | |
| | | | | | | 1,896,450 | |
| | | | | | | | |
| | | | Residential REITs 2.3% | | | | |
| | 69,000 | | | Apollo Global Management, LLC | | | 1,011,540 | |
| | | | | | | | |
| | | | Specialized Finance 4.0% | | | | |
| | 175,800 | | | KKR Financial Holdings, LLC | | | 1,766,790 | |
| | | | | | | | |
| | |
| | | | Total Limited Liability Company Membership Interest
(cost $4,464,758) | | | 4,674,780 | |
| | | | | | | | |
| | |
Principal
Amount | | | | | Value | |
| | |
| | | | CORPORATE BONDS 0.0% | | | | |
| | |
| | | | Gold 0.0% | | | | |
| | $210,762 | | | Redcorp Ventures Ltd., 13.00%, 7/11/12, Series D*** † §§ (Canada) | | $ | 4,073 | |
| | | | | | | | |
| | |
| | | | Total Corporate Bonds
(cost $155,655) | | | 4,073 | |
| | | | | | | | |
| | |
| | | | SHORT-TERM INVESTMENTS 11.7% | | | | |
| | |
| | | | Repurchase Agreement 11.7% | | | | |
| | 5,224,570 | | | Repurchase Agreement dated 9/28/12, 0.01% due 10/1/12 with State Street Bank and Trust Co. collateralized by $3,920,000 of United States Treasury Bonds 4.500% due 8/15/39; value: $5,329,628; repurchase proceeds: $5,224,574 (cost $5,224,570) | | | 5,224,570 | |
| | | | | | | | |
| | |
| | | | Total Short-Term Investments
(cost $5,224,570) | | | 5,224,570 | |
| | | | | | | | |
| | |
| | | | Total Investments
(cost $41,490,036) 100.0% | | | 44,643,626 | |
| | |
| | | | Liabilities less Other Assets (<0.1%) | | | (8,204 | ) |
| | | | | | | | |
| | |
| | | | NET ASSETS 100.0% | | $ | 44,635,422 | |
| | | | | | | | |
| |
| | | | *Non-income producing. ***Security was fair valued under procedures adopted by the Board of Trustees (see Note 15). †Security purchased in a private placement transaction or under Rule 144A of the Securities Act of 1933 (see Note 11). §§In default. ADR American Depositary Receipt. REIT Real Estate Investment Trust. See Notes to Financial Statements. | |
At September 30, 2012, Wasatch Strategic Income Fund’s investments, excluding short-term investments, were in the following countries:
| | | | |
| Country | | % | |
Canada | | | 7.9 | |
Israel | | | 2.0 | |
United States | | | 90.1 | |
| | | | |
TOTAL | | | 100.0 | % |
| | | | |
78
| | |
| WASATCH ULTRA GROWTH FUND (WAMCX) — Schedule of Investments | | SEPTEMBER 30, 2012 |
|
|
|
| | | | | | | | |
| Shares | | | | | Value | |
| | | | | | | |
| | | | COMMON STOCKS 94.0% | | | | |
| | |
| | | | Alternative Carriers 0.6% | | | | |
| | 123,515 | | | inContact, Inc.* | | $ | 805,318 | |
| | | | | | | | |
| | | | Apparel Retail 0.5% | | | | |
| | 74,268 | | | Body Central Corp.* | | | 776,101 | |
| | | | | | | | |
| | | | Application Software 9.1% | | | | |
| | 26,671 | | | Concur Technologies, Inc.* | | | 1,966,453 | |
| | 151,000 | | | Exa Corp.* | | | 1,638,350 | |
| | 67,108 | | | Interactive Intelligence Group, Inc.* | | | 2,016,595 | |
| | 83,700 | | | RealPage, Inc.* | | | 1,891,620 | |
| | 196,515 | | | Tangoe, Inc.* | | | 2,580,242 | |
| | 28,489 | | | Ultimate Software Group, Inc.* | | | 2,908,727 | |
| | | | | | | | |
| | | | | | | 13,001,987 | |
| | | | | | | | |
| | | | Asset Management & Custody
Banks 2.3% | | | | |
| | 65,616 | | | CETIP S.A. — Mercados Organizados (Brazil) | | | 861,175 | |
| | 65,938 | | | SEI Investments Co. | | | 1,414,370 | |
| | 12,430 | | | Virtus Investment Partners, Inc.* | | | 1,068,980 | |
| | | | | | | | |
| | | | | | | 3,344,525 | |
| | | | | | | | |
| | | | Auto Parts & Equipment 1.6% | | | | |
| | 73,475 | | | WABCO India Ltd. (India) | | | 2,298,488 | |
| | | | | | | | |
| | | | Biotechnology 3.6% | | | | |
| | 273,698 | | | Abcam plc (United Kingdom) | | | 1,775,934 | |
| | 123,471 | | | Exact Sciences Corp.* | | | 1,359,416 | |
| | 401,759 | | | NeurogesX, Inc.* | | | 84,369 | |
| | 22,554 | | | OncoGenex Pharmaceutical, Inc.* | | | 319,590 | |
| | 160,272 | | | Sangamo Biosciences, Inc.* | | | 974,454 | |
| | 22,494 | | | Seattle Genetics, Inc.* | | | 606,213 | |
| | | | | | | | |
| | | | | | | 5,119,976 | |
| | | | | | | | |
| | | | Building Products 0.6% | | | | |
| | 24,046 | | | Trex Co., Inc.* | | | 820,449 | |
| | | | | | | | |
| | | | Communications Equipment 0.9% | | | | |
| | 6,901 | | | F5 Networks, Inc.* | | | 722,535 | |
| | 26,205 | | | Riverbed Technology, Inc.* | | | 609,790 | |
| | | | | | | | |
| | | | | | | 1,332,325 | |
| | | | | | | | |
| | | | Computer Storage & Peripherals 1.0% | | | | |
| | 232,449 | | | Intevac, Inc.* | | | 1,420,263 | |
| | | | | | | | |
| | | | Construction Materials 1.2% | | | | |
| | 5,705,580 | | | PT Holcim Indonesia Tbk (Indonesia) | | | 1,699,154 | |
| | | | | | | | |
| | | | Consumer Finance 4.0% | | | | |
| | 192,187 | | | DFC Global Corp.* | | | 3,296,007 | |
| | 25,135 | | | First Cash Financial Services, Inc.* | | | 1,156,462 | |
| | 70,848 | | | Mahindra & Mahindra Financial Services Ltd. (India) | | | 1,207,485 | |
| | | | | | | | |
| | | | | | | 5,659,954 | |
| | | | | | | | |
| | | | Data Processing & Outsourced Services 2.9% | | | | |
| | 76,830 | | | ExlService Holdings, Inc.* | | | 2,266,485 | |
| | 54,690 | | | Higher One Holdings, Inc.* | | | 737,221 | |
| | 18,340 | | | Syntel, Inc. | | | 1,144,600 | |
| | | | | | | | |
| | | | | | | 4,148,306 | |
| | | | | | | | |
| | | | Distributors 0.9% | | | | |
| | 29,491 | | | Pool Corp. | | | 1,226,236 | |
| | | | | | | | |
| | | | Diversified Banks 4.8% | | | | |
| | 1,399,402 | | | City Union Bank Ltd. (India) | | | 1,402,188 | |
| | 124,650 | | | HDFC Bank Ltd. (India) | | | 1,483,417 | |
| | 551,800 | | | Yes Bank Ltd. (India) | | | 4,009,429 | |
| | | | | | | | |
| | | | | | | 6,895,034 | |
| | | | | | | | |
| | | | | | | | |
| Shares | | | | | Value | |
| | | | | | | |
| | | | Electrical Components &
Equipment 3.4% | | | | |
| | 137,791 | | | Polypore International, Inc.* | | $ | 4,870,912 | |
| | | | | | | | |
| | | | Electronic Manufacturing
Services 1.0% | | | | |
| | 26,171 | | | IPG Photonics Corp.* | | | 1,499,598 | |
| | | | | | | | |
| | | | Environmental & Facilities
Services 2.5% | | | | |
| | 75,200 | | | Heritage-Crystal Clean, Inc.* | | | 1,492,720 | |
| | 69,403 | | | Waste Connections, Inc. | | | 2,099,441 | |
| | | | | | | | |
| | | | | | | 3,592,161 | |
| | | | | | | | |
| | | | General Merchandise Stores 1.5% | | | | |
| | 116,134 | | | Gordmans Stores, Inc.* | | | 2,142,672 | |
| | | | | | | | |
| | | | Health Care Equipment 5.8% | | | | |
| | 257,530 | | | AtriCure, Inc.* | | | 1,916,023 | |
| | 686,100 | | | Cardica, Inc.* | | | 987,984 | |
| | 145,632 | | | Cardiovascular Systems, Inc.* | | | 1,683,506 | |
| | 181,600 | | | Novadaq Technologies, Inc.* (Canada) | | | 1,877,744 | |
| | 82,018 | | | NuVasive, Inc.* | | | 1,879,032 | |
| | 16,460 | | | Zonare Medical Systems, Inc.* *** † | | | 165 | |
| | | | | | | | |
| | | | | | | 8,344,454 | |
| | | | | | | | |
| | | | Health Care Services 0.8% | | | | |
| | 26,211 | | | IPC The Hospitalist Co., Inc.* | | | 1,197,843 | |
| | | | | | | | |
| | | | Health Care Technology 1.4% | | | | |
| | 36,130 | | | Computer Programs and Systems, Inc. | | | 2,007,021 | |
| | | | | | | | |
| | | | Industrial Machinery 3.3% | | | | |
| | 74,697 | | | IDEX Corp. | | | 3,120,094 | |
| | 47,159 | | | Proto Labs, Inc.* | | | 1,594,917 | |
| | | | | | | | |
| | | | | | | 4,715,011 | |
| | | | | | | | |
| | | | Internet Retail 3.9% | | | | |
| | 142,083 | | | CafePress, Inc.* | | | 1,294,376 | |
| | 17,100 | | | HomeAway, Inc.* | | | 400,995 | |
| | 131,151 | | | MakeMyTrip Ltd.* (India) | | | 2,233,502 | |
| | 52,153 | | | Shutterfly, Inc.* | | | 1,623,001 | |
| | | | | | | | |
| | | | | | | 5,551,874 | |
| | | | | | | | |
| | | | Internet Software & Services 6.7% | | | | |
| | 88,132 | | | Angie’s List, Inc.* | | | 932,437 | |
| | 12,408 | | | CoStar Group, Inc.* | | | 1,011,748 | |
| | 75,029 | | | E2open, Inc.* | | | 1,018,894 | |
| | 93,286 | | | SciQuest, Inc.* | | | 1,697,805 | |
| | 60,212 | | | SPS Commerce, Inc.* | | | 2,316,356 | |
| | 229,115 | | | TechTarget, Inc.* | | | 1,354,070 | |
| | 37,450 | | | Vistaprint N.V.* | | | 1,278,917 | |
| | 91,388 | | | Xtera Communications, Inc.* *** † | | | 914 | |
| | | | | | | | |
| | | | | | | 9,611,141 | |
| | | | | | | | |
| | | | IT Consulting & Other Services 4.0% | | | | |
| | 48,578 | | | Cognizant Technology Solutions Corp., Class A* | | | 3,396,574 | |
| | 21,402 | | | hiSoft Technology International Ltd. ADR* (China) | | | 221,082 | |
| | 200,973 | | | ServiceSource International, Inc.* | | | 2,061,983 | |
| | | | | | | | |
| | | | | | | 5,679,639 | |
| | | | | | | | |
| | | | Leisure Products 1.1% | | | | |
| | 171,626 | | | Black Diamond, Inc.* | | | 1,505,160 | |
| | | | | | | | |
| | | | Life Sciences Tools & Services 0.7% | | | | |
| | 42,629 | | | ICON plc ADR* (Ireland) | | | 1,038,869 | |
| | | | | | | | |
| | | | Oil & Gas Equipment & Services 1.0% | | | | |
| | 19,440 | | | Dril-Quip, Inc.* | | | 1,397,347 | |
| | | | | | | | |
79
| | |
WASATCH ULTRA GROWTH FUND
(WAMCX) — Schedule of Investments (continued) | | |
|
|
|
| | | | | | | | |
| Shares | | | | | Value | |
| | | | | | | |
| | | | Oil & Gas Exploration &
Production 1.9% | | | | |
| | 95,930 | | | Northern Oil and Gas, Inc.* | | $ | 1,629,851 | |
| | 47,200 | | | Ultra Petroleum Corp.* | | | 1,037,456 | |
| | | | | | | | |
| | | | | | | 2,667,307 | |
| | | | | | | | |
| | | | Oil & Gas Refining & Marketing 0.3% | | | | |
| | 133,460 | | | Amyris, Inc.* | | | 459,102 | |
| | | | | | | | |
| | | | Packaged Foods & Meats 1.4% | | | | |
| | 36,076 | | | GlaxoSmithKline Consumer Healthcare Ltd. (India) | | | 2,064,905 | |
| | | | | | | | |
| | | | Personal Products 0.0% | | | | |
| | 50,403 | | | Ophthonix, Inc.* *** † | | | 504 | |
| | | | | | | | |
| | | | Pharmaceuticals 1.1% | | | | |
| | 79,000 | | | Cempra, Inc.* | | | 588,550 | |
| | 282,846 | | | Horizon Pharma, Inc.* | | | 981,476 | |
| | | | | | | | |
| | | | | | | 1,570,026 | |
| | | | | | | | |
| | | | Restaurants 1.4% | | | | |
| | 76,550 | | | Jubilant Foodworks Ltd.* (India) | | | 1,985,772 | |
| | | | | | | | |
| | | | Semiconductors 5.7% | | | | |
| | 27,987 | | | Hittite Microwave Corp.* | | | 1,552,439 | |
| | 21,695 | | | NVE Corp.* | | | 1,284,127 | |
| | 60,834 | | | Power Integrations, Inc.†† | | | 1,851,178 | |
| | 49,222 | | | Silicon Laboratories, Inc.* | | | 1,809,401 | |
| | 74,370 | | | Volterra Semiconductor Corp.* | | | 1,626,472 | |
| | | | | | | | |
| | | | | | | 8,123,617 | |
| | | | | | | | |
| | | | Specialized Finance 1.2% | | | | |
| | 98,350 | | | CRISIL Ltd. (India) | | | 1,790,046 | |
| | | | | | | | |
| | | | Specialty Chemicals 1.7% | | | | |
| | 44,043 | | | Balchem Corp. | | | 1,617,700 | |
| | 247,500 | | | EcoSynthetix, Inc.* (Canada) | | | 825,713 | |
| | | | | | | | |
| | | | | | | 2,443,413 | |
| | | | | | | | |
| | | | Specialty Stores 0.2% | | | | |
| | 5,900 | | | Five Below, Inc.* | | | 230,572 | |
| | | | | | | | |
| | | | Systems Software 4.6% | | | | |
| | 18,772 | | | NetSuite, Inc.* | | | 1,197,654 | |
| | 115,454 | | | OPNET Technologies, Inc. | | | 3,933,518 | |
| | 29,052 | | | Sourcefire, Inc.* | | | 1,424,419 | |
| | | | | | | | |
| | | | | | | 6,555,591 | |
| | | | | | | | |
| | | | Thrifts & Mortgage Finance 0.7% | | | | |
| | 195,084 | | | LIC Housing Finance Ltd. (India) | | | 1,045,232 | |
| | | | | | | | |
| | | | Trading Companies &
Distributors 0.9% | | | | |
| | 20,029 | | | MSC Industrial Direct Co., Inc., Class A | | | 1,351,156 | |
| | | | | | | | |
| | | | Trucking 1.8% | | | | |
| | 94,774 | | | Knight Transportation, Inc. | | | 1,355,268 | |
| | 41,833 | | | Old Dominion Freight Line, Inc.* | | | 1,261,683 | |
| | | | | | | | |
| | | | | | | 2,616,951 | |
| | | | | | | | |
| | |
| | | | Total Common Stocks
(cost $114,287,305) | | | 134,606,012 | |
| | | | | | | | |
| | |
| | | | PREFERRED STOCKS 0.7% | | | | |
| | |
| | | | Biotechnology 0.1% | | | | |
| | 169,492 | | | Nanosys, Inc., Series D Pfd.* *** † | | | 194,068 | |
| | 40,380 | | | Nanosys, Inc., Series E Pfd.* *** † | | | 46,235 | |
| | | | | | | | |
| | | | | | | 240,303 | |
| | | | | | | | |
| | | | | | | | |
| Shares | | | | | Value | |
| | | | | | | |
| | |
| | | | Health Care Technology 0.6% | | | | |
| | 253,064 | | | Data Sciences International, Inc., Series B Pfd.* *** † | | $ | 807,502 | |
| | 243,902 | | | TherOx, Inc., Series I Pfd.* *** † | | | 14,634 | |
| | | | | | | | |
| | | | | | | 822,136 | |
| | | | | | | | |
| | |
| | | | Total Preferred Stocks
(cost $2,021,237) | | | 1,062,439 | |
| | | | | | | | |
| | |
| | | | LIMITED PARTNERSHIP INTEREST 4.3% | | | | |
| | |
| | | | Asset Management & Custody
Banks 4.3% | | | | |
| | | | Greenspring Global Partners II-B, L.P.*** † | | | 4,468,020 | |
| | | | Greenspring Global Partners III-B, L.P.*** † | | | 1,658,433 | |
| | | | | | | | |
| | | | | | | 6,126,453 | |
| | | | | | | | |
| | |
| | | | Total Limited Partnership Interest
(cost $5,424,467) | | | 6,126,453 | |
| | | | | | | | |
| | |
| | | | WARRANTS 0.0% | | | | |
| | |
| | | | Biotechnology 0.0% | | | | |
| | 43,605 | | | NeurogesX, Inc., expiring 7/22/16* *** † | | | 436 | |
| | | | | | | | |
| | |
| | | | Health Care Equipment 0.0% | | | | |
| | 165,000 | | | Cardica, Inc., expiring 9/29/14* *** † | | | 9,900 | |
| | | | | | | | |
| | |
| | | | Total Warrants
(cost $26,076) | | | 10,336 | |
| | | | | | | | |
| | |
Principal
Amount | | | | | Value | |
| | | | | | | |
| | |
| | | | SHORT-TERM INVESTMENTS 0.9% | | | | |
| | |
| | | | Repurchase Agreement 0.9% | | | | |
| | $1,319,049 | | | Repurchase Agreement dated 9/28/12, 0.01% due 10/1/12 with State Street Bank and Trust Co. collateralized by $990,000 of United States Treasury Bonds 4.500% due 8/15/39; value: $1,346,003; repurchase proceeds: $1,319,050†† (cost $1,319,049) | | $ | 1,319,049 | |
| | | | | | | | |
| | |
| | | | Total Short-Term Investments
(cost $1,319,049) | | | 1,319,049 | |
| | | | | | | | |
| | |
| | | | Total Investments
(cost $123,078,134) 99.9% | | | 143,124,289 | |
| | |
| | | | Other Assets less Liabilities 0.1% | | | 134,394 | |
| | | | | | | | |
| | |
| | | | NET ASSETS 100.0% | | $ | 143,258,683 | |
| | | | | | | | |
| |
| | | | *Non-income producing. ***Security was fair valued under procedures adopted by the Board of Trustees (see Note 15). †Security purchased in a private placement transaction or under Rule 144A of the Securities Act of 1933 (see Note 11). ††All or a portion of this security has been designated as collateral for purchase commitments (see Note 12). ADR American Depositary Receipt. See Notes to Financial Statements. | |
80
At September 30, 2012, Wasatch Ultra Growth Fund’s investments, excluding short-term investments, were in the following countries:
| | | | |
| Country | | % | |
Brazil | | | 0.6 | |
Canada | | | 1.9 | |
China | | | 0.2 | |
India | | | 13.8 | |
Indonesia | | | 1.2 | |
Ireland | | | 0.7 | |
United Kingdom | | | 1.2 | |
United States | | | 80.4 | |
| | | | |
TOTAL | | | 100.0 | % |
| | | | |
81
| | |
| WASATCH WORLD INNOVATORS FUND (WAGTX) — Schedule of Investments | | |
|
|
|
| | | | | | | | |
| Shares | | | | | Value | |
| | | | | | | |
| | |
| | | | COMMON STOCKS 85.6% | | | | |
| | |
| | | | Application Software 0.6% | | | | |
| | 35,641 | | | BasWare Oyj (Finland) | | $ | 1,031,512 | |
| | | | | | | | |
| | | | Asset Management & Custody
Banks 1.5% | | | | |
| | 43,500 | | | Ameriprise Financial, Inc. | | | 2,466,015 | |
| | | | | | | | |
| | | | Automotive Retail 0.9% | | | | |
| | 52,800 | | | Mekonomen AB (Sweden) | | | 1,565,142 | |
| | | | | | | | |
| | | | Biotechnology 3.4% | | | | |
| | 540,003 | | | Abcam plc (United Kingdom) | | | 3,503,897 | |
| | 83,960 | | | Myriad Genetics, Inc.* | | | 2,266,080 | |
| | | | | | | | |
| | | | | | | 5,769,977 | |
| | | | | | | | |
| | | | Cable & Satellite 1.5% | | | | |
| | 47,000 | | | DIRECTV* | | | 2,465,620 | |
| | | | | | | | |
| | | | Commercial Printing 1.6% | | | | |
| | 205,700 | | | InnerWorkings, Inc.* | | | 2,678,214 | |
| | | | | | | | |
| | | | Computer Hardware 4.4% | | | | |
| | 9,838 | | | Apple, Inc. | | | 6,564,504 | |
| | 81,978 | | | Silicon Graphics International Corp.* | | | 746,000 | |
| | | | | | | | |
| | | | | | | 7,310,504 | |
| | | | | | | | |
| | | | Computer Storage & Peripherals 2.9% | | | | |
| | 180,800 | | | EMC Corp.* | | | 4,930,416 | |
| | | | | | | | |
| | | | Data Processing & Outsourced Services 9.0% | | | | |
| | 11,075 | | | MasterCard, Inc., Class A | | | 5,000,141 | |
| | 185,800 | | | VeriFone Systems, Inc.* | | | 5,174,530 | |
| | 37,295 | | | Visa, Inc., Class A | | | 5,007,973 | |
| | | | | | | | |
| | | | | | | 15,182,644 | |
| | | | | | | | |
| | | | Diversified Support Services 0.6% | | | | |
| | 54,554 | | | Ritchie Bros. Auctioneers, Inc. (Canada) | | | 1,049,074 | |
| | | | | | | | |
| | | | Drug Retail 0.5% | | | | |
| | 24,207 | | | Walgreen Co. | | | 882,103 | |
| | | | | | | | |
| | | | Electronic Equipment &
Instruments 0.3% | | | | |
| | 12,419 | | | Hologram Industries (France) | | | 463,102 | |
| | | | | | | | |
| | | | Environmental & Facilities
Services 0.4% | | | | |
| | 39,500 | | | Park24 Co. Ltd. (Japan) | | | 646,529 | |
| | | | | | | | |
| | | | Health Care Equipment 6.6% | | | | |
| | 168,799 | | | DiaSorin S.p.A. (Italy) | | | 5,884,116 | |
| | 94,182 | | | Mindray Medical International Ltd. ADR (China) | | | 3,165,457 | |
| | 22,506 | | | STRATEC Biomedical AG (Germany) | | | 1,034,219 | |
| | 15,990 | | | Varian Medical Systems, Inc.* | | | 964,517 | |
| | | | | | | | |
| | | | | | | 11,048,309 | |
| | | | | | | | |
| | | | Health Care Services 1.3% | | | | |
| | 75,511 | | | Bio-Reference Laboratories, Inc.* | | | 2,158,104 | |
| | | | | | | | |
| | | | Health Care Supplies 2.2% | | | | |
| | 32,106 | | | Sartorius Stedim Biotech (France) | | | 2,890,442 | |
| | 685,382 | | | Shandong Weigao Group Medical Polymer Co. Ltd. (China) | | | 887,420 | |
| | | | | | | | |
| | | | | | | 3,777,862 | |
| | | | | | | | |
| | | | Home Entertainment Software 1.1% | | | | |
| | 167,940 | | | Activision Blizzard, Inc. | | | 1,894,363 | |
| | | | | | | | |
| | | | | | | | |
| Shares | | | | | Value | |
| | | | | | | |
| | | | Household Appliances 1.3% | | | | |
| | 34,773 | | | iRobot Corp.* | | $ | 791,434 | |
| | 35,300 | | | SodaStream International Ltd.* (Israel) | | | 1,382,701 | |
| | | | | | | | |
| | | | | | | 2,174,135 | |
| | | | | | | | |
| | | | Internet Retail 2.7% | | | | |
| | 11,366 | | | Amazon.com, Inc.* | | | 2,890,601 | |
| | 45,794 | | | ASOS plc* (United Kingdom) | | | 1,624,942 | |
| | | | | | | | |
| | | | | | | 4,515,543 | |
| | | | | | | | |
| | | | Internet Software & Services 10.4% | | | | |
| | 86,825 | | | Ancestry.com, Inc.* | | | 2,611,696 | |
| | 155,135 | | | eBay, Inc.* | | | 7,510,085 | |
| | 23,670 | | | Facebook, Inc.* | | | 512,456 | |
| | 9,165 | | | Google, Inc., Class A* | | | 6,914,993 | |
| | 6,528 | | | Xtera Communications, Inc.*** † | | | 65 | |
| | | | | | | | |
| | | | | | | 17,549,295 | |
| | | | | | | | |
| | | | IT Consulting & Other Services 1.8% | | | | |
| | 30,900 | | | Cognizant Technology Solutions Corp., Class A* | | | 2,160,528 | |
| | 3,810 | | | International Business Machines Corp. | | | 790,385 | |
| | | | | | | | |
| | | | | | | 2,950,913 | |
| | | | | | | | |
| | | | Leisure Products 0.5% | | | | |
| | 11,800 | | | Shimano, Inc. (Japan) | | | 858,402 | |
| | | | | | | | |
| | | | Life Sciences Tools & Services 1.5% | | | | |
| | 64,000 | | | Agilent Technologies, Inc. | | | 2,460,800 | |
| | | | | | | | |
| | | | Movies & Entertainment 0.6% | | | | |
| | 56,950 | | | DreamWorks Animation SKG, Inc.* | | | 1,095,149 | |
| | | | | | | | |
| | | | Oil & Gas Refining & Marketing 2.2% | | | | |
| | 105,900 | | | World Fuel Services Corp. | | | 3,771,099 | |
| | | | | | | | |
| | | | Personal Products 4.3% | | | | |
| | 151,101 | | | Herbalife Ltd. | | | 7,162,187 | |
| | | | | | | | |
| | | | Pharmaceuticals 2.7% | | | | |
| | 43,130 | | | Teva Pharmaceutical Industries Ltd. ADR (Israel) | | | 1,786,013 | |
| | 49,600 | | | Valeant Pharmaceuticals International, Inc.* (Canada) | | | 2,741,392 | |
| | | | | | | | |
| | | | | | | 4,527,405 | |
| | | | | | | | |
| | | | Real Estate Services 0.9% | | | | |
| | 34,800 | | | Zillow, Inc.* | | | 1,467,864 | |
| | | | | | | | |
| | | | Restaurants 2.3% | | | | |
| | 191,377 | | | Arcos Dorados Holdings, Inc., Class A (Brazil) | | | 2,952,947 | |
| | 2,891 | | | Chipotle Mexican Grill, Inc.* | | | 918,008 | |
| | | | | | | | |
| | | | | | | 3,870,955 | |
| | | | | | | | |
| | | | Semiconductors 6.5% | | | | |
| | 72,512 | | | Altera Corp. | | | 2,464,320 | |
| | 61,000 | | | ARM Holdings plc, ADR
(United Kingdom) | | | 1,706,780 | |
| | 114,000 | | | Intel Corp. | | | 2,585,520 | |
| | 180,000 | | | NVIDIA Corp.* | | | 2,401,200 | |
| | 52,700 | | | Xilinx, Inc. | | | 1,760,707 | |
| | | | | | | | |
| | | | | | | 10,918,527 | |
| | | | | | | | |
| | | | Specialized Finance 3.9% | | | | |
| | 14,958 | | | IntercontinentalExchange, Inc.* | | | 1,995,547 | |
| | 142,431 | | | MarketAxess Holdings, Inc. | | | 4,500,819 | |
| | | | | | | | |
| | | | | | | 6,496,366 | |
| | | | | | | | |
| | | | Specialty Chemicals 0.5% | | | | |
| | 29,300 | | | Novozymes A/S, Class B (Denmark) | | | 808,321 | |
| | | | | | | | |
82
| | | | | | | | |
Shares | | | | | Value | |
| | | | | | | |
| | | | Systems Software 3.1% | | | | |
| | 107,800 | | | Check Point Software Technologies Ltd.* (Israel) | | $ | 5,191,648 | |
| | | | | | | | |
| | | | Technology Distributors 0.5% | | | | |
| | 27,000 | | | SYNNEX Corp.* | | | 879,660 | |
| | | | | | | | |
| | | | Trading Companies &
Distributors 0.9% | | | | |
| | 38,100 | | | MonotaRO Co. Ltd. (Japan) | | | 1,044,237 | |
| | 6,200 | | | MSC Industrial Direct Co., Inc., Class A | | | 418,252 | |
| | | | | | | | |
| | | | | | | 1,462,489 | |
| | | | | | | | |
| | | | Trucking 0.2% | | | | |
| | 15,672 | | | Trancom Co. Ltd. (Japan) | | | 311,312 | |
| | | | | | | | |
| | |
| | | | Total Common Stocks
(cost $125,964,993) | | | 143,791,560 | |
| | | | | | | | |
| | |
| | | | PREFERRED STOCKS 1.8% | | | | |
| | |
| | | | Health Care Equipment 1.8% | | | | |
| | 37,037 | | | Sartorius AG Pfd. (Germany) | | | 2,948,957 | |
| | | | | | | | |
| | |
| | | | Total Preferred Stocks
(cost $1,559,980) | | | 2,948,957 | |
| | | | | | | | |
| | |
| | | | LIMITED PARTNERSHIP INTEREST 0.3% | | | | |
| | |
| | | | Asset Management & Custody
Banks 0.3% | | | | |
| | | | Greenspring Global Partners II-B, L.P.*** † | | | 496,747 | |
| | | | | | | | |
| | |
| | | | Total Limited Partnership Interest
(cost $454,387) | | | 496,747 | |
| | | | | | | | |
| | |
| | | | WARRANTS 0.0% | | | | |
| | |
| | | | Health Care Equipment 0.0% | | | | |
| | 71,500 | | | Cardica, Inc., expiring 9/29/14* *** † | | | 4,290 | |
| | | | | | | | |
| | |
| | | | Total Warrants
(cost $8,937) | | | 4,290 | |
| | | | | | | | |
| | | | | | | | |
Principal
Amount | | | | | Value | |
| | | | | | | |
| | | | SHORT-TERM INVESTMENTS 12.8% | | | | |
| | |
| | | | Repurchase Agreement 12.8% | | | | |
| | $21,497,002 | | | Repurchase Agreement dated 9/28/12, 0.01% due 10/1/12 with State Street Bank and Trust Co. collateralized by $16,130,000 of United States Treasury Bonds 4.500% due 8/15/39; value: $21,930,332; repurchase proceeds: $21,497,002†† (cost $21,497,020) | | $ | 21,497,002 | |
| | | | | | | | |
| | |
| | | | Total Short-Term Investments
(cost $21,497,002) | | | 21,497,002 | |
| | | | | | | | |
| | | | | | |
| | |
| | Total Investments
(cost $149,485,299) 100.5% | | | 168,738,556 | |
| | |
| | Liabilities less Other Assets (0.5%) | | | (804,646 | ) |
| | | | | | |
| | |
| | NET ASSETS 100.0% | | $ | 167,933,910 | |
| | | | | | |
| |
| | *Non-income producing. ***Security was fair valued under procedures adopted by the Board of Trustees (see Note 15). †Security purchased in a private placement transaction or under Rule 144A of the Securities Act of 1933 (see Note 11). ††All or a portion of this security has been designated as collateral for purchase commitments (see Note 12). ADR American Depositary Receipt. See Notes to Financial Statements. | |
At September 30, 2012, Wasatch World Innovators Fund’s investments, excluding short-term investments, were in the following countries:
| | | | |
| Country | | % | |
Brazil | | | 2.0 | |
Canada | | | 2.6 | |
China | | | 2.8 | |
Denmark | | | 0.5 | |
Finland | | | 0.7 | |
France | | | 2.3 | |
Germany | | | 2.7 | |
Israel | | | 5.7 | |
Italy | | | 4.0 | |
Japan | | | 1.9 | |
Sweden | | | 1.1 | |
United Kingdom | | | 4.6 | |
United States | | | 69.1 | |
| | | | |
TOTAL | | | 100.0 | % |
| | | | |
83
| | |
| WASATCH-1ST SOURCE INCOME FUND (FMEQX) — Schedule of Investments | | |
|
|
|
| | | | | | | | |
Principal Amount | | | | | Value | |
| | | | | | | |
| | | | ASSET BACKED SECURITIES 3.1% | | | | |
| | |
| | $1,500,000 | | | Citibank Credit Card Issuance Trust, 5.65%, 9/20/19, Series 2007-A8, Class A8 | | $ | 1,836,743 | |
| | 900,000 | | | Citibank Omni Master Trust,
4.90%, 11/15/18, Series 2009-A17,
Class A17† | | | 981,008 | |
| | 1,400,000 | | | World Financial Network Credit Card Master Trust, 3.14%, 1/17/23,
Series 2012-A, Class A | | | 1,513,978 | |
| | | | | | | | |
| | |
| | | | Total Asset Backed Securities
(cost $4,184,989) | | | 4,331,729 | |
| | | | | | | | |
| | |
| | | | COLLATERALIZED MORTGAGE OBLIGATIONS 24.3% | | | | |
| | |
| | 250,000 | | | Banc of America Merrill Lynch Commercial Mortgage, Inc.,
5.247%, 11/10/42, Series 2005-1,
Class A4††† | | | 255,377 | |
| | 24,329 | | | Banc of America Mortgage Securities, Inc., 2.912%, 2/25/33, Series 2003-A,
Class 3A1††† | | | 22,584 | |
| | 98,845 | | | Bear Stearns Commercial Mortgage Securities, 4.735%, 9/11/42,
Series 2005-PWR9, Class A2 | | | 101,377 | |
| | 119,896 | | | Countrywide Home Loan Mortgage Pass Through Trust, 4.50%, 8/25/19,
Series 2004-J7, Class 2A1 | | | 121,710 | |
| | 687,329 | | | Federal Home Loan Mortgage Corp., 1.50%, 9/15/22, Series 3760, Class BA | | | 693,679 | |
| | 337,791 | | | Federal Home Loan Mortgage Corp., 1.50%, 4/15/24, Series 3780, Class TA | | | 339,203 | |
| | 115,417 | | | Federal Home Loan Mortgage Corp., 2.358%, 5/1/31, Series 847292††† | | | 123,701 | |
| | 94,843 | | | Federal Home Loan Mortgage Corp., 2.455%, 12/1/32, Series 847527††† | | | 99,823 | |
| | 61,408 | | | Federal Home Loan Mortgage Corp., 2.54%, 11/1/35, Series 1M0010††† | | | 65,314 | |
| | 28,819 | | | Federal Home Loan Mortgage Corp., 2.861%, 8/1/33, Series 847281††† | | | 30,823 | |
| | 361,775 | | | Federal Home Loan Mortgage Corp., 3.456%, 1/1/25, Series 775629††† | | | 363,555 | |
| | 255,268 | | | Federal Home Loan Mortgage Corp., 3.658%, 5/1/25, Series 775617††† | | | 269,600 | |
| | 124,330 | | | Federal Home Loan Mortgage Corp., 4.00%, 6/15/17, Series 2714, Class BW | | | 124,494 | |
| | 337,052 | | | Federal Home Loan Mortgage Corp., 4.50%, 12/1/18, Series G11657 | | | 362,241 | |
| | 300,634 | | | Federal Home Loan Mortgage Corp., 5.50%, 5/15/15, Series 2808, Class VA | | | 316,310 | |
| | 94,490 | | | Federal Home Loan Mortgage Corp., 5.50%, 10/1/25, Series C90925 | | | 103,593 | |
| | 319,820 | | | Federal Home Loan Mortgage Corp., 5.50%, 8/1/29, Series C46102 | | | 350,631 | |
| | 333,397 | | | Federal National Mortgage Assoc.,
1.94%, 12/1/35, Series 848390††† | | | 347,773 | |
| | 378,727 | | | Federal National Mortgage Assoc.,
2.055%, 1/1/35, Series 825245††† | | | 398,516 | |
| | 174,305 | | | Federal National Mortgage Assoc.,
2.535%, 11/1/34, Series 782320††† | | | 186,545 | |
| | 16,544 | | | Federal National Mortgage Assoc.,
2.60%, 10/1/32, Series 659567††† | | | 16,600 | |
| | 181,087 | | | Federal National Mortgage Assoc.,
2.814%, 1/1/18, Series 57735††† | | | 187,424 | |
| | 186,474 | | | Federal National Mortgage Assoc.,
2.895%, 2/1/21, Series 313380††† | | | 194,844 | |
| | 299,650 | | | Federal National Mortgage Assoc.,
3.50%, 6/25/23, Series 2003-46, Class LD | | | 314,541 | |
| | | | | | | | |
Principal Amount | | | | | Value | |
| | | | | | | |
| | $ 339,171 | | | Federal National Mortgage Assoc.,
3.875%, 1/25/39, Series 2009-2, Class WJ | | $ | 365,860 | |
| | 214,803 | | | Federal National Mortgage Assoc.,
4.00%, 10/25/32, Series 2003-28, Class GA | | | 223,112 | |
| | 170,512 | | | Federal National Mortgage Assoc.,
4.066%, 7/1/19, Series 070377††† | | | 177,601 | |
| | 332,146 | | | Federal National Mortgage Assoc.,
4.50%, 5/1/19, Series 725445 | | | 359,467 | |
| | 309,456 | | | Federal National Mortgage Assoc.,
4.50%, 7/1/19, Series 725609 | | | 334,910 | |
| | 566,509 | | | Federal National Mortgage Assoc.,
4.50%, 6/25/29, Series 2005-121, Class V | | | 596,263 | |
| | 1,301,800 | | | Federal National Mortgage Assoc.,
5.00%, 7/25/23, Series 2005-4, Class VG | | | 1,345,505 | |
| | 250,000 | | | Federal National Mortgage Assoc.,
5.50%, 5/25/23, Series 2003-42, Class EK | | | 288,333 | |
| | 295,050 | | | Government National Mortgage Assoc., 1.625%, 1/20/30, Series 80364††† | | | 307,219 | |
| | 587,640 | | | Government National Mortgage Assoc., 1.625%, 9/20/34, Series 81054††† | | | 608,009 | |
| | 794,446 | | | Government National Mortgage Assoc., 1.75%, 6/20/30, Series 80416††† | | | 827,015 | |
| | 782,750 | | | Government National Mortgage Assoc., 2.125%, 7/20/34, Series 80987††† | | | 815,655 | |
| | 1,075,626 | | | Government National Mortgage Assoc., 2.50%, 5/20/40, Series 2012-94, Class GA | | | 1,122,400 | |
| | 956,165 | | | Government National Mortgage Assoc., 3.00%, 8/20/38, Series 2010-47, Class CG | | | 993,468 | |
| | 976,909 | | | Government National Mortgage Assoc., 3.00%, 12/20/38, Series 2010-89, Class PA | | | 1,009,176 | |
| | 1,508,079 | | | Government National Mortgage Assoc., 3.00%, 5/20/39, Series 2010-68, Class YE | | | 1,569,492 | |
| | 1,786,615 | | | Government National Mortgage Assoc., 3.00%, 10/20/39, Series 2010-117, Class GD | | | 1,863,580 | |
| | 1,142,801 | | | Government National Mortgage Assoc., 3.00%, 6/20/41, Series 2011-138, Class PN | | | 1,188,182 | |
| | 31,842 | | | Government National Mortgage Assoc., 3.25%, 7/20/37, Series 2010-33, Class AP | | | 31,851 | |
| | 1,517,836 | | | Government National Mortgage Assoc., 3.50%, 1/20/37, Series 2009-31, Class PD | | | 1,586,456 | |
| | 1,748,193 | | | Government National Mortgage Assoc., 3.50%, 6/20/39, Series 2010-129, Class NU | | | 1,880,316 | |
| | 669,089 | | | Government National Mortgage Assoc., 4.00%, 6/20/38, Series 2009-69, Class WC | | | 697,984 | |
| | 1,157,787 | | | Government National Mortgage Assoc., 4.00%, 9/20/38, Series 2009-108, Class WG | | | 1,245,230 | |
| | 1,031,612 | | | Government National Mortgage Assoc., 4.00%, 3/20/39, Series 2009-31, Class TA | | | 1,100,457 | |
| | 951,303 | | | Government National Mortgage Assoc., 4.00%, 4/16/39, Series 2009-110, Class AB | | | 996,443 | |
| | 1,054,368 | | | Government National Mortgage Assoc., 4.00%, 8/20/39, Series 2009-69, Class PV | | | 1,116,028 | |
| | 581,959 | | | Government National Mortgage Assoc., 4.50%, 8/15/24, Series 717874 | | | 636,284 | |
| | 766,104 | | | Government National Mortgage Assoc., 4.50%, 6/20/34, Series 2009-101, Class G | | | 798,820 | |
| | 686,881 | | | Government National Mortgage Assoc., 4.50%, 8/20/34, Series 2009-36, Class G | | | 715,426 | |
| | 721,870 | | | Government National Mortgage Assoc., 4.50%, 8/16/35, Series 2009-62, Class DT | | | 753,935 | |
| | 482,730 | | | Government National Mortgage Assoc., 4.50%, 2/20/38, Series 2009-55, Class NP | | | 534,625 | |
| | 752,322 | | | Government National Mortgage Assoc., 4.50%, 3/20/39, Series 2009-14, Class AG | | | 837,782 | |
| | 293,930 | | | Government National Mortgage Assoc., 4.658%, 12/16/30, Series 2005-12, Class C | | | 306,097 | |
| | 520,145 | | | Government National Mortgage Assoc., 5.00%, 9/16/31, Series 2009-38, Class A | | | 546,532 | |
84
| | | | | | | | |
Principal Amount | | | | | Value | |
| | | | | | | |
| | $ 500,000 | | | Government National Mortgage Assoc., 5.00%, 7/20/34, Series 2004-105, Class MC | | $ | 543,305 | |
| | 134,635 | | | Government National Mortgage Assoc., 5.00%, 8/20/39, Series 004513 | | | 143,077 | |
| | | | | | | | |
| | |
| | | | Total Collateralized Mortgage Obligations
(cost $33,197,361) | | | 33,856,153 | |
| | | | | | | | |
| | |
| | | | CORPORATE BONDS 38.3% | | | | |
| | |
| | | | Aerospace & Defense 0.7% | | | | |
| | 200,000 | | | General Dynamics Corp., 4.25%, 5/15/13 | | | 204,994 | |
| | 250,000 | | | Martin Marietta Corp., 7.375%, 4/15/13 | | | 258,881 | |
| | 500,000 | | | Raytheon Co., 1.625%, 10/15/15 | | | 512,215 | |
| | | | | | | | |
| | | | | | | 976,090 | |
| | | | | | | | |
| | | | Air Freight & Logistics 0.5% | | | | |
| | 620,000 | | | United Parcel Service, Inc., 5.50%, 1/15/18 | | | 753,875 | |
| | | | | | | | |
| | | | Automotive Retail 0.6% | | | | |
| | 775,000 | | | AutoZone, Inc., 5.50%, 11/15/15 | | | 877,705 | |
| | | | | | | | |
| | | | Beverages — Non-alcoholic 1.1% | | | | |
| | 500,000 | | | PepsiAmericas, Inc., 5.00%, 5/15/17 | | | 584,047 | |
| | 750,000 | | | PepsiCo, Inc., 5.00%, 6/1/18 | | | 891,406 | |
| | | | | | | | |
| | | | | | | 1,475,453 | |
| | | | | | | | |
| | | | Cable & Satellite 0.7% | | | | |
| | 800,000 | | | Comcast Corp., 4.95%, 6/15/16 | | | 908,178 | |
| | | | | | | | |
| | | | Commercial Banks — Non-U.S. 1.5% | | | | |
| | 1,100,000 | | | Royal Bank of Canada, 2.00%, 5/15/20 MTN## (Canada) | | | 1,087,336 | |
| | 1,000,000 | | | Toronto-Dominion Bank (The),
2.375%, 10/19/16 (Canada) | | | 1,051,842 | |
| | | | | | | | |
| | | | | | | 2,139,178 | |
| | | | | | | | |
| | | | Commercial Banks — Central U.S. 0.4% | | | | |
| | 600,000 | | | SunTrust Bank, 1.36%, 6/30/14††† | | | 593,273 | |
| | | | | | | | |
| | | | Commercial Banks — Southern
U.S. 0.6% | | | | |
| | 800,000 | | | BB&T Corp., 3.20%, 3/15/16 MTN | | | 859,221 | |
| | | | | | | | |
| | | | Computer Hardware 0.7% | | | | |
| | 900,000 | | | Hewlett-Packard Co., 2.125%, 9/13/15 | | | 913,325 | |
| | | | | | | | |
| | | | Construction & Farm Machinery & Heavy Trucks 0.4% | | | | |
| | 500,000 | | | Caterpillar Financial Services Corp.,
5.85%, 9/1/17 MTN | | | 604,920 | |
| | | | | | | | |
| | | | Cosmetics & Toiletries 0.4% | | | | |
| | 459,761 | | | Procter & Gamble — ESOP,
9.36%, 1/1/21, Series A | | | 622,761 | |
| | | | | | | | |
| | | | Distillers & Vintners 0.4% | | | | |
| | 504,000 | | | Diageo Capital plc, 7.375%, 1/15/14 (United Kingdom) | | | 547,307 | |
| | | | | | | | |
| | | | Diversified Banks 4.9% | | | | |
| | 1,250,000 | | | Bank of America Corp.,
7.375%, 5/15/14 MTN | | | 1,368,314 | |
| | 500,000 | | | Goldman Sachs Group, Inc. (The),
3.625%, 2/7/16 | | | 527,445 | |
| | 1,350,000 | | | JPMorgan Chase Bank NA,
5.875%, 6/13/16 | | | 1,552,423 | |
| | 500,000 | | | SouthTrust Corp., 5.80%, 6/15/14 | | | 538,403 | |
| | 1,125,000 | | | US Bancorp, 2.20%, 11/15/16 MTN | | | 1,180,937 | |
| | 750,000 | | | Wachovia Corp., 5.25%, 8/1/14 | | | 806,156 | |
| | 700,000 | | | Wachovia Corp., 5.75%, 2/1/18 MTN | | | 845,309 | |
| | | | | | | | |
| | | | | | | 6,818,987 | |
| | | | | | | | |
| | | | | | | | |
Principal Amount | | | | | Value | |
| | | | | | | |
| | | | Diversified Financial Services 2.8% | | | | |
| | $2,350,000 | | | General Electric Capital Corp.,
5.40%, 2/15/17 MTN | | $ | 2,713,103 | |
| | 1,000,000 | | | General Electric Capital Corp.,
5.625%, 5/1/18 | | | 1,179,300 | |
| | | | | | | | |
| | | | | | | 3,892,403 | |
| | | | | | | | |
| | | | Diversified Metals & Mining 0.3% | | | | |
| | 450,000 | | | Rio Tinto Alcan, Inc., 4.50%, 5/15/13 (Canada) | | | 460,246 | |
| | | | | | | | |
| | | | Drug Retail 0.3% | | | | |
| | 400,000 | | | Walgreen Co., 4.875%, 8/1/13 | | | 414,108 | |
| | | | | | | | |
| | | | Electric Utilities 0.2% | | | | |
| | 300,000 | | | Florida Power & Light Co., 4.85%, 2/1/13 | | | 304,392 | |
| | | | | | | | |
| | | | Electric — Integrated 0.5% | | | | |
| | 659,000 | | | Southern Co. (The), 2.375%, 9/15/15, Series A | | | 690,027 | |
| | | | | | | | |
| | | | Enterprise Software & Services 0.9% | | | | |
| | 1,000,000 | | | Oracle Corp., 5.75%, 4/15/18 | | | 1,240,943 | |
| | | | | | | | |
| | | | Finance — Auto Loans 0.4% | | | | |
| | 500,000 | | | PACCAR Financial Corp.,
1.05%, 6/5/15 MTN | | | 504,517 | |
| | | | | | | | |
| | | | Finance — Consumer Loans 0.7% | | | | |
| | 1,000,000 | | | John Deere Capital Corp.,
2.00%, 1/13/17 MTN | | | 1,041,682 | |
| | | | | | | | |
| | | | Finance — Credit Card 0.9% | | | | |
| | 975,000 | | | American Express Co., 6.15%, 8/28/17 | | | 1,186,023 | |
| | | | | | | | |
| | | | Finance — Other Services 0.4% | | | | |
| | 500,000 | | | Sun Canada Financial Co.,
7.25%, 12/15/15† | | | 566,669 | |
| | | | | | | | |
| | | | Footwear 0.5% | | | | |
| | 600,000 | | | Nike, Inc., 5.15%, 10/15/15 MTN | | | 675,017 | |
| | | | | | | | |
| | | | Health Care Equipment 0.2% | | | | |
| | 250,000 | | | Baxter International, Inc., 4.625%, 3/15/15 | | | 274,384 | |
| | | | | | | | |
| | | | Industrial Gases 0.5% | | | | |
| | 600,000 | | | Praxair, Inc., 4.625%, 3/30/15 | | | 659,983 | |
| | | | | | | | |
| | | | Instruments — Scientific 0.5% | | | | |
| | 700,000 | | | Thermo Fisher Scientific, Inc.,
3.20%, 3/1/16 | | | 746,359 | |
| | | | | | | | |
| | | | Integrated Telecommunication Services 1.6% | | | | |
| | 129,084 | | | Ameritech Capital Funding, 9.10%, 6/1/16 | | | 151,180 | |
| | 870,000 | | | AT&T, Inc., 5.50%, 2/1/18 | | | 1,055,384 | |
| | 300,000 | | | Verizon Communications, Inc.,
5.50%, 2/15/18 | | | 365,767 | |
| | 520,000 | | | Verizon Communications, Inc.,
5.55%, 2/15/16 | | | 601,654 | |
| | | | | | | | |
| | | | | | | 2,173,985 | |
| | | | | | | | |
| | | | Investment Banking &
Brokerage 0.5% | | | | |
| | 700,000 | | | Morgan Stanley, 3.80%, 4/29/16 | | | 723,338 | |
| | | | | | | | |
| | | | Life & Health Insurance 1.1% | | | | |
| | 850,000 | | | Prudential Financial, Inc., 6.20%, 1/15/15 | | | 940,892 | |
| | 480,000 | | | Prudential Holdings, LLC, 7.245%, 12/18/23, Series FSA† | | | 597,696 | |
| | | | | | | | |
| | | | | | | 1,538,588 | |
| | | | | | | | |
| | | | Medical Instruments 0.9% | | | | |
| | 1,100,000 | | | Medtronic, Inc., 4.45%, 3/15/20 | | | 1,278,474 | |
| | | | | | | | |
85
| | |
WASATCH-1ST SOURCE INCOME FUND
(FMEQX) — Schedule of Investments (continued) | | |
|
|
|
| | | | | | | | |
Principal Amount | | | | | Value | |
| | | | | | | |
| | | | Medical — Drugs 0.6% | | | | |
| | $ 575,000 | | | Pharmacia Corp., 6.75%, 12/15/27 | | $ | 778,505 | |
| | | | | | | | |
| | | | Medical — Health Maintenance Organizations 0.8% | | | | |
| | 1,000,000 | | | WellPoint, Inc., 4.35%, 8/15/20 | | | 1,097,103 | |
| | | | | | | | |
| | | | Movies & Entertainment 0.7% | | | | |
| | 300,000 | | | Walt Disney Co. (The), 2.75%, 8/16/21 | | | 315,776 | |
| | 250,000 | | | Walt Disney Co. (The), 4.50%, 12/15/13 MTN | | | 262,381 | |
| | 350,000 | | | Walt Disney Co. (The), 6.00%, 7/17/17, Series C MTN | | | 430,482 | |
| | | | | | | | |
| | | | | | | 1,008,639 | |
| | | | | | | | |
| | | | Oil Companies — Exploration & Production 0.5% | | | | |
| | 600,000 | | | Apache Finance Canada Corp.,
4.375%, 5/15/15 (Canada) | | | 656,446 | |
| | | | | | | | |
| | | | Oil Companies — Integrated 0.7% | | | | |
| | 750,000 | | | ConocoPhillips, 5.75%, 2/1/19 | | | 932,140 | |
| | | | | | | | |
| | | | Personal Products 0.5% | | | | |
| | 655,000 | | | Avon Products, Inc., 5.625%, 3/1/14 | | | 687,768 | |
| | | | | | | | |
| | | | Pharmaceuticals 2.9% | | | | |
| | 745,000 | | | AstraZeneca plc, 5.90%, 9/15/17
(United Kingdom) | | | 915,119 | |
| | 795,000 | | | Cardinal Health, Inc., 6.00%, 6/15/17 | | | 919,081 | |
| | 1,000,000 | | | Johnson & Johnson, 5.55%, 8/15/17 | | | 1,219,744 | |
| | 725,000 | | | Pharmacia Corp., 6.50%, 12/1/18 | | | 922,271 | |
| | | | | | | | |
| | | | | | | 3,976,215 | |
| | | | | | | | |
| | | | Property & Casualty Insurance 0.3% | | | | |
| | 435,000 | | | Allstate Corp. (The), 7.50%, 6/15/13 | | | 456,502 | |
| | | | | | | | |
| | | | Railroads 1.1% | | | | |
| | 300,000 | | | Burlington Northern Santa Fe, LLC,
4.30%, 7/1/13 | | | 308,513 | |
| | 1,000,000 | | | Union Pacific Corp., 5.70%, 8/15/18 | | | 1,217,930 | |
| | | | | | | | |
| | | | | | | 1,526,443 | |
| | | | | | | | |
| | | | Regional Banks 0.6% | | | | |
| | 700,000 | | | Fifth Third Bancorp, 5.45%, 1/15/17 | | | 788,150 | |
| | | | | | | | |
| | | | Semiconductor Equipment 0.2% | | | | |
| | 250,000 | | | Applied Materials, Inc., 2.65%, 6/15/16 | | | 264,365 | |
| | | | | | | | |
| | | | Soft Drinks 0.4% | | | | |
| | 600,000 | | | Bottling Group, LLC, 4.625%, 11/15/12 | | | 602,944 | |
| | | | | | | | |
| | | | Special Purpose Entity 0.4% | | | | |
| | 525,000 | | | Principal Life Global Funding I,
5.05%, 3/15/15† | | | 571,521 | |
| | | | | | | | |
| | | | Specialized Finance 0.4% | | | | |
| | 600,000 | | | CME Group, Inc., 5.40%, 8/1/13 | | | 624,817 | |
| | | | | | | | |
| | | | Specialty Chemicals 1.2% | | | | |
| | 1,150,000 | | | Lubrizol Corp., 8.875%, 2/1/19 | | | 1,625,474 | |
| | | | | | | | |
| | | | Steel 0.9% | | | | |
| | 1,000,000 | | | Nucor Corp., 5.75%, 12/1/17 | | | 1,215,172 | |
| | | | | | | | |
| | | | Total Corporate Bonds
(cost $51,028,388) | | | 53,273,615 | |
| | | | | | | | |
| | | | MUNICIPAL BONDS 1.4% | | | | |
| | |
| | 650,000 | | | Arizona State Transportation Board Highway Revenue, 5.00%, 7/1/23 | | | 736,840 | |
| | 625,000 | | | City of Liberty MO, 4.45%, 10/1/13 (NATL-RE) | | | 625,000 | |
| | 500,000 | | | Richmond Joint Powers Financing Authority, 8.25%, 7/1/19 Class B | | | 562,085 | |
| | | | | | | | |
| | |
| | | | Total Municipal Bonds
(cost $1,788,846) | | | 1,923,925 | |
| | | | | | | | |
| | | | | | | | |
| | |
| Shares | | | | | Value | |
| | | | | | | |
| | | | MUTUAL FUNDS 0.6% | | | | |
| | |
| | 49,453 | | | Eaton Vance Short Duration Diversified Income Fund | | $ | 871,362 | |
| | | | | | | | |
| | |
| | | | Total Mutual Funds
(cost $751,608) | | | 871,362 | |
| | | | | | | | |
| | |
| | | | EXCHANGE TRADED FUNDS 0.5% | | | | |
| | |
| | 6,000 | | | iShares iBoxx Investment Grade Corporate Bond Fund | | | 730,620 | |
| | | | | | | | |
| | |
| | | | Total Exchange Traded Funds
(cost $519,311) | | | 730,620 | |
| | | | | | | | |
| | |
Principal Amount | | | | | Value | |
| | | | U.S. GOVERNMENT AGENCY
SECURITIES 17.1% | | | | |
| | |
| | $1,000,000 | | | Federal Farm Credit Bank,
2.65%, 5/11/15 | | $ | 1,058,944 | |
| | 1,000,000 | | | Federal Farm Credit Bank,
3.85%, 2/11/15 | | | 1,082,112 | |
| | 1,000,000 | | | Federal Farm Credit Bank,
3.875%, 10/7/13 | | | 1,037,072 | |
| | 650,000 | | | Federal Farm Credit Bank,
4.875%, 4/1/14 | | | 694,773 | |
| | 1,415,000 | | | Federal Home Loan Bank,
3.625%, 3/10/17 | | | 1,586,876 | |
| | 1,150,000 | | | Federal Home Loan Mortgage Corp., 1.25%, 11/16/15 MTN | | | 1,151,055 | |
| | 2,000,000 | | | Federal Home Loan Mortgage Corp., 2.50%, 5/27/16 | | | 2,145,034 | |
| | 1,300,000 | | | Federal Home Loan Mortgage Corp., 3.00%, 7/28/14 | | | 1,362,625 | |
| | 700,000 | | | Federal Home Loan Mortgage Corp., 4.75%, 11/17/15 | | | 793,747 | |
| | 1,500,000 | | | Federal National Mortgage Assoc.,
1.125%, 12/28/16, Series 0001## | | | 1,503,489 | |
| | 1,525,000 | | | Federal National Mortgage Assoc.,
1.25%, 10/26/16, Series 4## | | | 1,526,011 | |
| | 1,050,000 | | | Federal National Mortgage Assoc.,
2.05%, 5/23/17 | | | 1,112,224 | |
| | 2,200,000 | | | Federal National Mortgage Assoc.,
2.625%, 11/20/14 | | | 2,309,787 | |
| | 1,800,000 | | | Federal National Mortgage Assoc.,
4.875%, 12/15/16 | | | 2,115,871 | |
| | 600,000 | | | Federal National Mortgage Assoc.,
5.24%, 8/7/18 | | | 624,383 | |
| | 579,429 | | | New Valley Generation IV,
4.687%, 1/15/22 | | | 663,047 | |
| | 800,000 | | | Tennessee Valley Authority,
3.875%, 2/15/21 | | | 939,447 | |
| | 1,000,000 | | | Tennessee Valley Authority,
6.25%, 12/15/17, Series E | | | 1,274,568 | |
| | 1,000,000 | | | Tennessee Valley Authority Generic Strip, 0.00%, 11/1/18, Series C### | | | 915,619 | |
| | | | | | | | |
| | |
| | | | Total U.S. Government Agency Securities
(cost $23,052,841) | | | 23,896,684 | |
| | | | | | | | |
86
| | | | | | | | |
Principal Amount | | | | | Value | |
| | | | | | | |
| | |
| | | | U.S. TREASURY INFLATION
PROTECTED BONDS 1.5% | | | | |
| | |
| | $ 354,302 | | | U.S. Treasury Bond, 0.125%, 1/15/22# | | $ | 386,742 | |
| | 1,421,745 | | | U.S. Treasury Bond, 1.625%, 1/15/18# | | | 1,663,553 | |
| | | | | | | | |
| | |
| | | | Total U.S. Treasury Inflation Protected Bonds
(cost $1,744,801) | | | 2,050,295 | |
| | | | | | | | |
| | |
| | | | U.S. TREASURY NOTES 9.8% | | | | |
| | |
| | 1,250,000 | | | U.S. Treasury Note, 2.75%, 12/31/17 | | | 1,383,594 | |
| | 4,125,000 | | | U.S. Treasury Note, 3.25%, 12/31/16 | | | 4,600,988 | |
| | 6,500,000 | | | U.S. Treasury Note, 3.625%, 8/15/19 | | | 7,634,451 | |
| | | | | | | | |
| | |
| | | | Total U.S. Treasury Notes
(cost $13,088,144) | | | 13,619,033 | |
| | | | | | | | |
| | |
| Shares | | | | | Value | |
| | | | PREFERRED STOCKS 0.8% | | | | |
| | |
| | | | Diversified Banks 0.5% | | | | |
| | 4,762 | | | Bank One Capital TR VI, 7.20%, Pfd. | | $ | 122,479 | |
| | 14,200 | | | Harris Preferred Capital Corp., 7.375%, Series A Pfd.§§§ | | | 363,804 | |
| | 10,000 | | | JPMorgan Chase Capital XIX,
6.625%, Series S Pfd. | | | 252,600 | |
| | | | | | | | |
| | | | | | | 738,883 | |
| | | | | | | | |
| | | | Electric Utilities 0.1% | | | | |
| | 5,000 | | | Entergy Texas, Inc., 7.875%, Pfd. | | | 143,900 | |
| | | | | | | | |
| | | | Investment Banking &
Brokerage 0.2% | | | | |
| | 10,000 | | | Morgan Stanley Cap TR VI, 6.60%, Pfd. | | | 251,300 | |
| | | | | | | | |
| | |
| | | | Total Preferred Stocks
(cost $1,104,494) | | | 1,134,083 | |
| | | | | | | | |
| | | | | | | | |
Principal
Amount | | | | | Value | |
| | | | SHORT-TERM INVESTMENTS 1.9% | | | | |
| | |
| | | | Repurchase Agreement 1.9% | | | | |
| | $2,584,527 | | | Repurchase Agreement dated 9/28/12, 0.01% due 10/1/12 with State Street Bank and Trust Co. collateralized by $1,940,000 of United States Treasury Bonds 4.500% due 08/15/39; value: $2,637,622; repurchase proceeds: $2,584,530 (cost $2,584,527) | | $ | 2,584,527 | |
| | | | | | | | |
| | |
| | | | Total Short-Term Investments
(cost $2,584,527) | | | 2,584,527 | |
| | | | | | | | |
| | |
| | | | Total Investments
(cost $133,045,310) 99.3% | | | 138,272,026 | |
| | |
| | | | Other Assets less Liabilities 0.7% | | | 914,153 | |
| | | | | | | | |
| | |
| | | | NET ASSETS 100.0% | | $ | 139,186,179 | |
| | | | | | | | |
| |
| | | | †Liquid security purchased in a private placement transaction or under Rule 144A of the Securities Act of 1933. †††Variable rate securities. §§§Perpetual maturity. Callable any time after first call date. Maturity date is next call date. #Treasury Inflation Protected Securities. A U.S. Treasury Note or Bond that offers protection from inflation by paying a fixed rate of interest on a principal amount that is adjusted for inflation based on the Consumer Price Index. ##Step bond. The rate shown is as of September 30, 2012 and will reset at a future date. ###Zero coupon bond. MTN Medium Term Note. NATL-RE National Public Finance Guarantee Corporation. See Notes to Financial Statements. | |
At September 30, 2012, Wasatch-1st Source Income Fund’s investments, excluding short-term investments, were in the following countries:
| | | | |
| Country | | % | |
Canada | | | 2.4 | |
United Kingdom | | | 1.1 | |
United States | | | 96.5 | |
| | | | |
TOTAL | | | 100.0 | % |
| | | | |
87
| | |
| WASATCH-HOISINGTON U.S. TREASURY FUND (WHOSX) — Schedule of Investments | | SEPTEMBER 30, 2012 |
|
|
|
| | | | | | | | |
Principal
Amount | | | | | Value | |
| | | �� | | | | |
| | | | U.S. GOVERNMENT OBLIGATIONS 98.0% | |
| | |
| | $28,000,000 | | | U.S. Treasury Bond, 3.00%, 5/15/42 | | $ | 29,032,500 | |
| | 30,500,000 | | | U.S. Treasury Bond, 3.125%, 11/15/41 | | | 32,492,016 | |
| | 8,000,000 | | | U.S. Treasury Bond, 3.125%, 2/15/42 | | | 8,510,000 | |
| | 9,700,000 | | | U.S. Treasury Bond, 3.50%, 2/15/39 | | | 11,135,299 | |
| | 3,000,000 | | | U.S. Treasury Bond, 3.875%, 8/15/40 | | | 3,665,157 | |
| | 4,035,000 | | | U.S. Treasury Bond, 4.25%, 5/15/39 | | | 5,228,476 | |
| | 6,900,000 | | | U.S. Treasury Bond, 4.25%, 11/15/40 | | | 8,959,222 | |
| | 1,400,000 | | | U.S. Treasury Bond, 4.375%, 2/15/38 | | | 1,842,968 | |
| | 1,040,000 | | | U.S. Treasury Bond, 4.375%, 5/15/40 | | | 1,375,888 | |
| | 10,000,000 | | | U.S. Treasury Bond, 4.50%, 5/15/38 | | | 13,417,190 | |
| | 6,000,000 | | | U.S. Treasury Bond, 4.50%, 8/15/39 | | | 8,075,628 | |
| | 6,260,000 | | | U.S. Treasury Bond, 4.75%, 2/15/41 | | | 8,772,802 | |
| | 58,400,000 | | | U.S. Treasury Strip, principal only, 5/15/30 | | | 37,027,294 | |
| | 52,300,000 | | | U.S. Treasury Strip, principal only, 2/15/31 | | | 32,393,365 | |
| | 54,837,000 | | | U.S. Treasury Strip, principal only, 2/15/37 | | | 27,374,521 | |
| | 55,000,000 | | | U.S. Treasury Strip, principal only, 5/15/39 | | | 25,251,710 | |
| | 26,000,000 | | | U.S. Treasury Strip, principal only, 5/15/40 | | | 11,505,156 | |
| | | | | | | | |
| | |
| | | | Total U.S. Government Obligations
(cost $227,356,461) | | | 266,059,192 | |
| | | | | | | | |
| | | | | | | | |
Principal
Amount | | | | | Value | |
| | | | | | | |
| | | | SHORT-TERM INVESTMENTS 1.7% | | | | |
| | |
| | | | Repurchase Agreement 1.7% | | | | |
| | $4,640,675 | | | Repurchase Agreement dated 9/28/12, 0.01% due 10/1/12 with State Street Bank and Trust Co. collateralized by $3,485,000 of United States Treasury Bonds 4.500% due 8/15/39; value: $4,738,203; repurchase proceeds: $4,640,679 (cost $4,640,675) | | $ | 4,640,675 | |
| | | | | | | | |
| | |
| | | | Total Short-Term Investments
(cost $4,640,675) | | | 4,640,675 | |
| | | | | | | | |
| | |
| | | | Total Investments
(cost $231,997,136) 99.7% | | | 270,699,867 | |
| | |
| | | | Other Assets less Liabilities 0.3% | | | 795,003 | |
| | | | | | | | |
| | |
| | | | NET ASSETS 100.0% | | $ | 271,494,870 | |
| | | | | | | | |
| |
| | | | See Notes to Financial Statements. | |
88
(This page intentionally left blank.)
89
| | |
| WASATCH FUNDS — Statements of Assets and Liabilities | | |
|
|
|
| | | | | | | | | | | | |
| | | CORE
GROWTH
FUND | | | EMERGING
INDIA
FUND | | | EMERGING MARKETS
SMALL CAP
FUND | |
| | | | | | | | | | | | |
Assets: | | | | | | | | | | | | |
Investments, at cost | | | | | | | | | | | | |
Unaffiliated issuers | | $ | 386,582,923 | | | $ | 12,025,826 | | | $ | 1,208,735,444 | |
Repurchase agreements | | | 41,733,232 | | | | 203,320 | | | | 40,434,738 | |
| | | | | | | | | | | | |
| | $ | 428,316,155 | | | $ | 12,229,146 | | | $ | 1,249,170,182 | |
| | | | | | | | | | | | |
Investments, at market value | | | | | | | | | | | | |
Unaffiliated issuers | | $ | 549,536,441 | | | $ | 13,268,854 | | | $ | 1,448,048,880 | |
Repurchase agreements | | | 41,733,232 | | | | 203,320 | | | | 40,434,738 | |
| | | | | | | | | | | | |
| | | 591,269,673 | | | | 13,472,174 | | | | 1,488,483,618 | |
Cash | | | — | | | | — | | | | — | |
Foreign currency on deposit (cost of $0, $192,316, $689,431, $71,281, $58,887,
$0, $243,179 and $15,831, respectively) | | | — | | | | 201,669 | | | | 690,110 | |
Receivable for investment securities sold | | | — | | | | — | | | | 4,587,352 | |
Capital shares receivable | | | 842,199 | | | | 93,835 | | | | 2,097,694 | |
Interest and dividends receivable | | | 25,755 | | | | 1,278 | | | | 359,041 | |
Prepaid expenses and other assets | | | 40,392 | | | | 8,724 | | | | 73,318 | |
| | | | | | | | | | | | |
Total Assets | | | 592,178,019 | | | | 13,777,680 | | | | 1,496,291,133 | |
| | | | | | | | | | | | |
Liabilities: | | | | | | | | | | | | |
Call options written at value (premiums of $150,916, $0, $0, $0, $0, $0, $0 and
$0, respectively) | | | 112,700 | | | | — | | | | — | |
Payable for securities purchased | | | — | | | | — | | | | 4,220,533 | |
Capital shares payable | | | 837,665 | | | | 100 | | | | 736,476 | |
Payable to Advisor | | | 480,317 | | | | 8,603 | | | | 1,847,270 | |
Accrued fund administration fees | | | 15,790 | | | | 342 | | | | 38,579 | |
Accrued expenses and other liabilities | | | 259,943 | | | | 45,835 | | | | 907,787 | |
Other payables | | | — | | | | 64,914 | | | | 6,275,795 | |
| | | | | | | | | | | | |
Total Liabilities | | | 1,706,415 | | | | 119,794 | | | | 14,026,440 | |
| | | | | | | | | | | | |
Net Assets | | $ | 590,471,604 | | | $ | 13,657,886 | | | $ | 1,482,264,693 | |
| | | | | | | | | | | | |
Net Assets Consist of: | | | | | | | | | | | | |
Capital stock | | $ | 142,576 | | | $ | 67,620 | | | $ | 5,564,135 | |
Paid-in-capital in excess of par | | | 465,848,849 | | | | 13,415,446 | | | | 1,308,598,652 | |
Undistributed net investment income (loss) | | | (3,010,195 | ) | | | (159,823 | ) | | | (376,915 | ) |
Undistributed net realized gain (loss) on investments, options and foreign currency translations | | | (35,501,360 | ) | | | (852,886 | ) | | | (64,553,470 | ) |
Net unrealized appreciation on investments, options and foreign
currency translations | | | 162,991,734 | | | | 1,187,529 | | | | 233,032,291 | |
| | | | | | | | | | | | |
Net Assets | | $ | 590,471,604 | | | $ | 13,657,886 | | | $ | 1,482,264,693 | |
| | | | | | | | | | | | |
Net Assets | | | | | | | | | | | | |
Investor Class | | | 581,370,672 | | | | 13,657,886 | | | | 1,482,264,693 | |
Institutional Class2 | | | 9,100,932 | | | | — | | | | — | |
| | | |
Capital Stock Issued and Outstanding (Unlimited number of shares authorized,
$.01 par value) | | | | | | | | | | | | |
Investor Class | | | 14,038,039 | | | | 6,762,007 | | | | 556,413,479 | |
Institutional Class2 | | | 219,591 | | | | — | | | | — | |
| | | |
NET ASSET VALUE, REDEMPTION PRICEAND OFFERING
PRICE PER SHARE | | | | | | | | | | | | |
Investor Class | | $ | 41.41 | | | $ | 2.02 | | | $ | 2.66 | |
| | | | | | | | | | | | |
Institutional Class2 | | $ | 41.44 | | | $ | — | | | $ | — | |
| | | | | | | | | | | | |
| 1 | Fund inception date was January 31, 2012. |
| 2 | Institutional Class inception date was January 31, 2012. |
| 3 | Prior period adjustment for dividends of $63,681 reclassed to return of capital. |
See Notes to Financial Statements.
90
| | | | | | | | | | | | | | | | | | |
FRONTIER EMERGING
SMALL COUNTRIES
FUND1 | | | GLOBAL
OPPORTUNITIES
FUND | | | HERITAGE GROWTH FUND | | | INTERNATIONAL
GROWTH
FUND | | | INTERNATIONAL
OPPORTUNITIES FUND | |
| | | | | | | | | | | | | | | | | | |
| | | | | | | | | | | | | | | | | | |
| | | | | | | | | | | | | | | | | | |
| $ | 27,177,502 | | | $ | 114,202,139 | | | $ | 83,842,794 | | | $ | 312,939,951 | | | $ | 148,752,386 | |
| | 1,416,788 | | | | — | | | | 7,801,469 | | | | 17,951,553 | | | | 7,818,066 | |
| | | | | | | | | | | | | | | | | | |
| $ | 28,594,290 | | | $ | 114,202,139 | | | $ | 91,644,263 | | | $ | 330,891,504 | | | $ | 156,570,452 | |
| | | | | | | | | | | | | | | | | | |
| | | | | | | | | | | | | | | | | | |
| $ | 30,818,042 | | | $ | 155,537,908 | | | $ | 104,241,590 | | | $ | 414,543,712 | | | $ | 188,789,405 | |
| | 1,416,788 | | | | — | | | | 7,801,469 | | | | 17,951,553 | | | | 7,818,066 | |
| | | | | | | | | | | | | | | | | | |
| | 32,234,830 | | | | 155,537,908 | | | | 112,043,059 | | | | 432,495,265 | | | | 196,607,471 | |
| | 164,510 | | | | — | | | | — | | | | — | | | | — | |
| | | | |
| | 71,370 | | | | 58,786 | | | | — | | | | 242,740 | | | | 15,935 | |
| | 76,467 | | | | 48 | | | | — | | | | 197,492 | | | | 953 | |
| | 944,895 | | | | 214,012 | | | | 12,350 | | | | 2,322,806 | | | | 95,295 | |
| | 49,606 | | | | 106,951 | | | | 38,599 | | | | 692,018 | | | | 317,011 | |
| | 32,949 | | | | 25,136 | | | | 15,672 | | | | 36,496 | | | | 12,948 | |
| | | | | | | | | | | | | | | | | | |
| | 33,574,627 | | | | 155,942,841 | | | | 112,109,680 | | | | 435,986,817 | | | | 197,049,613 | |
| | | | | | | | | | | | | | | | | | |
| | | | | | | | | | | | | | | | | | |
| | | | |
| | — | | | | — | | | | — | | | | — | | | | — | |
| | 383,448 | | | | 9 | | | | — | | | | 314 | | | | 1,619,030 | |
| | 2,420 | | | | 381,033 | | | | 21,219 | | | | 294,901 | | | | 118,692 | |
| | 17,027 | | | | 187,070 | | | | 52,079 | | | | 423,782 | | | | 289,673 | |
| | 739 | | | | 4,144 | | | | 3,114 | | | | 10,923 | | | | 5,124 | |
| | 63,138 | | | | 108,265 | | | | 80,966 | | | | 207,510 | | | | 223,712 | |
| | 62,606 | | | | 1,680,358 | | | | — | | | | 225,070 | | | | 230,154 | |
| | | | | | | | | | | | | | | | | | |
| | 529,378 | | | | 2,360,879 | | | | 157,378 | | | | 1,162,500 | | | | 2,486,385 | |
| | | | | | | | | | | | | | | | | | |
| $ | 33,045,249 | | | $ | 153,581,962 | | | $ | 111,952,302 | | | $ | 434,824,317 | | | $ | 194,563,228 | |
| | | | | | | | | | | | | | | | | | |
| | | | | | | | | | | | | | | | | | |
| $ | 136,872 | | | $ | 370,475 | | | $ | 87,438 | | | $ | 193,766 | | | $ | 806,174 | |
| | 29,208,331 | | | | 95,633,793 | | | | 87,913,430 | | | | 365,176,105 | | | | 161,274,100 | |
| | 65,934 | | | | (990,976 | ) | | | (335,233 | ) | | | 646,806 | | | | (309,387 | ) |
| | | | |
| | 57,215 | | | | 17,297,774 | | | | 3,887,445 | 3 | | | (32,554,799 | ) | | | (7,011,840 | ) |
| | | | |
| | 3,576,897 | | | | 41,270,896 | | | | 20,399,222 | 3 | | | 101,362,439 | | | | 39,804,181 | |
| | | | | | | | | | | | | | | | | | |
| $ | 33,045,249 | | | $ | 153,581,962 | | | $ | 111,952,302 | | | $ | 434,824,317 | | | $ | 194,563,228 | |
| | | | | | | | | | | | | | | | | | |
| | | | | | | | | | | | | | | | | | |
| | 33,045,249 | | | | 153,581,962 | | | | 111,952,302 | | | | 434,824,317 | | | | 194,563,228 | |
| | — | | | | — | | | | — | | | | — | | | | — | |
| | | | |
| | | | | | | | | | | | | | | | | | |
| | 13,687,191 | | | | 37,047,546 | | | | 8,743,751 | | | | 19,376,557 | | | | 80,617,428 | |
| | — | | | | — | | | | — | | | | — | | | | — | |
| | | | |
| | | | | | | | | | | | | | | | | | |
| $ | 2.41 | | | $ | 4.15 | | | $ | 12.80 | | | $ | 22.44 | | | $ | 2.41 | |
| | | | | | | | | | | | | | | | | | |
| $ | — | | | $ | — | | | $ | — | | | $ | — | | | $ | — | |
| | | | | | | | | | | | | | | | | | |
91
| | |
| WASATCH FUNDS — Statements of Assets and Liabilities (continued) | | |
|
|
|
| | | | | | | | | | | | |
| | | LARGE CAP
VALUE FUND | | | LONG/SHORT
FUND | | | MICRO
CAP
FUND | |
| | | | | | | | | | | | |
Assets: | | | | | | | | | | | | |
Investments, at cost | | | | | | | | | | | | |
Unaffiliated issuers | | $ | 1,009,578,172 | | | $ | 1,042,202,508 | | | $ | 218,121,736 | |
Affiliated issuers1 | | | — | | | | 25,746,133 | | | | 1,540,000 | |
Repurchase agreements | | | 44,867,332 | | | | 351,350,087 | | | | 4,460,102 | |
| | | | | | | | | | | | |
| | $ | 1,054,445,504 | | | $ | 1,419,298,728 | | | $ | 224,121,838 | |
| | | | | | | | | | | | |
Investments, at market value | | | | | | | | | | | | |
Unaffiliated issuers | | $ | 1,270,266,260 | | | $ | 1,144,024,719 | | | $ | 289,268,337 | |
Affiliated issuers1 | | | — | | | | 25,506,390 | | | | 13,860 | |
Repurchase agreements | | | 44,867,332 | | | | 351,350,087 | | | | 4,460,102 | |
| | | | | | | | | | | | |
| | | 1,315,133,592 | | | | 1,520,881,196 | | | | 293,742,299 | |
Foreign currency on deposit (cost of $0, $0, $0, $55,973, $0, $0, $0 and $0, respectively) | | | — | | | | — | | | | — | |
Receivable for investment securities sold | | | — | | | | 25,055,675 | | | | 1,363,302 | |
Receivable from broker for securities sold short | | | — | | | | 163,294,738 | | | | — | |
Capital shares receivable | | | 1,066,816 | | | | 4,380,080 | | | | 11,566 | |
Interest and dividends receivable | | | 1,666,792 | | | | 731,927 | | | | 40,073 | |
Prepaid expenses and other assets | | | 133,457 | | | | 58,783 | | | | 16,316 | |
| | | | | | | | | | | | |
Total Assets | | | 1,318,000,657 | | | | 1,714,402,399 | | | | 295,173,556 | |
| | | | | | | | | | | | |
Liabilities: | | | | | | | | | | | | |
Call options written at value (premiums of $0, $8,653,127, $0, $255,255, $0, $134,261, $0 and $0, respectively) | | | — | | | | 6,597,784 | | | | — | |
Securities sold short, at value (proceeds of $0, $153,441,405, $0, $0, $0, $0, $0 and
$0, respectively) | | | — | | | | 159,534,764 | | | | — | |
Bank overdraft of foreign currency (cost of $0, $0, $0, $0, $0, $0, $763 and $0, respectively) | | | — | | | | — | | | | — | |
Payable for securities purchased | | | — | | | | 8,112,732 | | | | — | |
Capital shares payable | | | 2,491,761 | | | | 968,302 | | | | 4,986,929 | |
Dividends payable to shareholders | | | 61,013 | | | | — | | | | — | |
Payable to Advisor | | | 876,968 | | | | 1,385,526 | | | | 474,341 | |
Accrued fund administration fees | | | 37,020 | | | | 40,075 | | | | 8,082 | |
Accrued expenses and other liabilities | | | 658,216 | | | | 399,691 | | | | 106,690 | |
Other payables | | | — | | | | 143,840 | | | | 148,465 | |
Unrealized depreciation on foreign currency contracts | | | — | | | | — | | | | — | |
| | | | | | | | | | | | |
Total Liabilities | | | 4,124,978 | | | | 177,182,714 | | | | 5,724,507 | |
| | | | | | | | | | | | |
Net Assets | | $ | 1,313,875,679 | | | $ | 1,537,219,685 | | | $ | 289,449,049 | |
| | | | | | | | | | | | |
Net Assets Consist of: | | | | | | | | | | | | |
Capital stock | | $ | 917,903 | | | $ | 1,124,947 | | | $ | 507,184 | |
Paid-in-capital in excess of par | | | 1,054,116,318 | | | | 1,441,558,615 | | | | 265,060,225 | |
Undistributed net investment income (loss) | | | (61,013 | ) | | | (1,627,098 | ) | | | (3,746,925 | ) |
Undistributed net realized gain (loss) on investments, options and foreign
currency translations | | | (1,785,617 | ) | | | (1,381,231 | ) | | | (41,843,447 | ) |
Net unrealized appreciation on investments, options and foreign currency translations | | | 260,688,088 | | | | 97,544,452 | | | | 69,472,012 | |
| | | | | | | | | | | | |
Net Assets | | $ | 1,313,875,679 | | | $ | 1,537,219,685 | | | $ | 289,449,049 | |
| | | | | | | | | | | | |
Net Assets | | | | | | | | | | | | |
Investor Class | | | 1,298,364,901 | | | | 1,537,219,685 | | | | 289,449,049 | |
Institutional Class2 | | | 15,510,778 | | | | — | | | | — | |
| | | |
Capital Stock Issued and Outstanding (Unlimited number of shares authorized,
$.01 par value) | | | | | | | | | | | | |
Investor Class | | | 90,706,459 | | | | 112,494,741 | | | | 50,718,370 | |
Institutional Class2 | | | 1,083,810 | | | | — | | | | — | |
| | | |
NET ASSET VALUE, REDEMPTION PRICEAND OFFERING
PRICE PER SHARE | | | | | | | | | | | | |
Investor Class | | $ | 14.31 | | | $ | 13.66 | | | $ | 5.71 | |
| | | | | | | | | | | | |
Institutional Class2 | | $ | 14.31 | | | $ | — | | | $ | — | |
| | | | | | | | | | | | |
| 1 | See Note 10 for information on affiliated issuers. |
| 2 | Institutional Class inception date January 31, 2012. |
| 3 | Prior period adjustment for dividends of $25,000 reclassed to return of capital. |
| 4 | Prior period adjustment for dividends of $109,634 reclassed to return of capital. |
See Notes to Financial Statements.
92
| | | | | | | | | | | | | | | | | | |
MICRO CAP
VALUE FUND | | | SMALL CAP
GROWTH FUND | | | SMALL CAP
VALUE FUND | | | STRATEGIC
INCOME
FUND | | | ULTRA
GROWTH
FUND | |
| | | | | | | | | | | | | | | | | | |
| | | | | | | | | | | | | | | | | | |
| | | | | | | | | | | | | | | | | | |
| $ | 101,286,907 | | | $ | 1,035,415,140 | | | $ | 146,952,547 | | | $ | 36,265,466 | | | $ | 121,759,085 | |
| | — | | | | 99,795,838 | | | | — | | | | — | | | | — | |
| | 3,610,143 | | | | 140,939,232 | | | | 2,386,104 | | | | 5,224,570 | | | | 1,319,049 | |
| | | | | | | | | | | | | | | | | | |
| $ | 104,897,050 | | | $ | 1,276,150,210 | | | $ | 149,338,651 | | | $ | 41,490,036 | | | $ | 123,078,134 | |
| | | | | | | | | | | | | | | | | | |
| | | | | | | | | | | | | | | | | | |
| $ | 132,079,048 | | | $ | 1,549,796,643 | | | $ | 172,063,656 | | | $ | 39,419,056 | | | $ | 141,805,240 | |
| | — | | | | 91,683,715 | | | | — | | | | — | | | | — | |
| | 3,610,143 | | | | 140,939,232 | | | | 2,386,104 | | | | 5,224,570 | | | | 1,319,049 | |
| | | | | | | | | | | | | | | | | | |
| | 135,689,191 | | | | 1,782,419,590 | | | | 174,449,760 | | | | 44,643,626 | | | | 143,124,289 | |
| | 56,068 | | | | — | | | | — | | | | — | | | | — | |
| | 3,525,268 | | | | 49,137,893 | | | | 62,751 | | | | 588,132 | | | | 557,644 | |
| | — | | | | — | | | | — | | | | — | | | | — | |
| | 85,700 | | | | 1,667,140 | | | | 8,017 | | | | 6,890 | | | | 14,248 | |
| | 99,145 | | | | 115,512 | | | | 169,387 | | | | 122,004 | | | | 3,446 | |
| | 13,463 | | | | 76,225 | | | | 22,132 | | | | 11,173 | | | | 13,366 | |
| | | | | | | | | | | | | | | | | | |
| | 139,468,835 | | | | 1,833,416,360 | | | | 174,712,047 | | | | 45,371,825 | | | | 143,712,993 | |
| | | | | | | | | | | | | | | | | | |
| | | | | | | | | | | | | | | | | | |
|
165,575 |
| | | — | | | | 31,500 | | | | — | | | | — | |
|
— |
| | | — | | | | — | | | | — | | | | — | |
| | — | | | | — | | | | — | | | | 771 | | | | — | |
| | 317,273 | | | | 3,552,617 | | | | 688,681 | | | | 588,404 | | | | — | |
| | 90,317 | | | | 1,101,999 | | | | 20,826 | | | | 71,203 | | | | 99,107 | |
| | — | | | | — | | | | — | | | | 7,153 | | | | — | |
| | 230,498 | | | | 1,505,564 | | | | 142,074 | | | | 21,040 | | | | 117,502 | |
| | 3,761 | | | | 49,345 | | | | 4,805 | | | | 1,222 | | | | 3,904 | |
| | 113,206 | | | | 823,807 | | | | 113,047 | | | | 46,610 | | | | 103,098 | |
| | 233,011 | | | | 1,601,729 | | | | 137,580 | | | | — | | | | 130,699 | |
| | 15,841 | | | | — | | | | — | | | | — | | | | — | |
| | | | | | | | | | | | | | | | | | |
| | 1,169,482 | | | | 8,635,061 | | | | 1,138,513 | | | | 736,403 | | | | 454,310 | |
| | | | | | | | | | | | | | | | | | |
| $ | 138,299,353 | | | $ | 1,824,781,299 | | | $ | 173,573,534 | | | $ | 44,635,422 | | | $ | 143,258,683 | |
| | | | | | | | | | | | | | | | | | |
| | | | | | | | | | | | | | | | | | |
| $ | 485,996 | | | $ | 416,393 | | | $ | 456,094 | | | $ | 47,993 | | | $ | 62,739 | |
| | 97,614,933 | | | | 1,227,896,226 | | | | 247,005,867 | | | | 46,268,352 | | | | 106,607,786 | |
| | (903,803 | ) | | | (8,456,437 | ) | | | (940,614 | ) | | | (218,387 | ) | | | 142,969 | |
|
10,472,323 |
3 | | | 100,256,797 | | | | (98,026,567 | ) | | | (4,616,156 | )4 | | | 16,529,719 | |
| | 30,629,904 | 3 | | | 504,668,320 | | | | 25,078,754 | | | | 3,153,620 | 4 | | | 19,915,470 | |
| | | | | | | | | | | | | | | | | | |
| $ | 138,299,353 | | | $ | 1,824,781,299 | | | $ | 173,573,534 | | | $ | 44,635,422 | | | $ | 143,258,683 | |
| | | | | | | | | | | | | | | | | | |
| | | | | | | | | | | | | | | | | | |
| | 138,299,353 | | | | 1,824,781,299 | | | | 166,330,134 | | | | 44,635,422 | | | | 143,258,683 | |
| | — | | | | — | | | | 7,243,400 | | | | — | | | | — | |
| | | | |
| | | | | | | | | | | | | | | | | | |
| | 48,599,604 | | | | 41,639,252 | | | | 43,710,864 | | | | 4,799,283 | | | | 6,273,943 | |
| | — | | | | — | | | | 1,898,544 | | | | — | | | | — | |
| | | | |
| | | | | | | | | | | | | | | | | | |
| $ | 2.85 | | | $ | 43.82 | | | $ | 3.81 | | | $ | 9.30 | | | $ | 22.83 | |
| | | | | | | | | | | | | | | | | | |
| $ | — | | | $ | — | | | $ | 3.82 | | | $ | — | | | $ | — | |
| | | | | | | | | | | | | | | | | | |
93
| | |
| WASATCH FUNDS — Statements of Assets and Liabilities (continued) | | SEPTEMBER 30, 2012 |
|
|
|
| | | | | | | | | | | | |
| | | WORLD
INNOVATORS
FUND | | | INCOME FUND | | | U.S. TREASURY
FUND | |
| | | | | | | | | | | | |
| | | | | | | | | | | | |
Assets: | | | | | | | | | | | | |
Investments, at cost | | | | | | | | | | | | |
Unaffiliated issuers | | $ | 127,988,297 | | | $ | 130,460,783 | | | $ | 227,356,461 | |
Repurchase agreements | | | 21,497,002 | | | | 2,584,527 | | | | 4,640,675 | |
| | | | | | | | | | | | |
| | $ | 149,485,299 | | | $ | 133,045,310 | | | $ | 231,997,136 | |
| | | | | | | | | | | | |
Investments, at market value | | | | | | | | | | | | |
Unaffiliated issuers | | $ | 147,241,554 | | | $ | 135,687,499 | | | $ | 266,059,192 | |
Repurchase agreements | | | 21,497,002 | | | | 2,584,527 | | | | 4,640,675 | |
| | | | | | | | | | | | |
| | | 168,738,556 | | | | 138,272,026 | | | | 270,699,867 | |
Receivable for investment securities sold | | | 206,538 | | | | — | | | | — | |
Capital shares receivable | | | 249,557 | | | | 86,794 | | | | 329,055 | |
Interest and dividends receivable | | | 42,267 | | | | 1,006,103 | | | | 1,210,416 | |
Prepaid expenses and other assets | | | 16,144 | | | | 18,933 | | | | 27,143 | |
| | | | | | | | | | | | |
Total Assets | | | 169,253,062 | | | | 139,383,856 | | | | 272,266,481 | |
| | | | | | | | | | | | |
Liabilities: | | | | | | | | | | | | |
Payable for securities purchased | | | 852,531 | | | | — | | | | — | |
Capital shares payable | | | 139,157 | | | | 35,820 | | | | 413,636 | |
Dividends payable to shareholders | | | — | | | | 38,635 | | | | 131,654 | |
Payable to Advisor | | | 206,602 | | | | 62,972 | | | | 110,114 | |
Accrued fund administration fees | | | 4,298 | | | | 3,899 | | | | 7,416 | |
Accrued expenses and other liabilities | | | 116,564 | | | | 56,351 | | | | 108,791 | |
| | | | | | | | | | | | |
Total Liabilities | | | 1,319,152 | | | | 197,677 | | | | 771,611 | |
| | | | | | | | | | | | |
Net Assets | | $ | 167,933,910 | | | $ | 139,186,179 | | | $ | 271,494,870 | |
| | | | | | | | | | | | |
Net Assets Consist of: | | | | | | | | | | | | |
Capital stock | | $ | 90,509 | | | $ | 133,308 | | | $ | 144,768 | |
Paid-in-capital in excess of par | | | 157,788,756 | | | | 134,570,025 | | | | 228,050,360 | |
Undistributed net investment income (loss) | | | (1,075,802 | ) | | | 36,983 | | | | 12,047 | |
Undistributed net realized gain (loss) on investments, options and foreign
currency translations | | | (8,120,714 | ) | | | (780,853 | ) | | | 4,584,964 | |
Net unrealized appreciation on investments, options and foreign currency translations | | | 19,251,161 | | | | 5,226,716 | | | | 38,702,731 | |
| | | | | | | | | | | | |
Net Assets | | $ | 167,933,910 | | | $ | 139,186,179 | | | $ | 271,494,870 | |
| | | | | | | | | | | | |
Net Assets | | | | | | | | | | | | |
Investor Class | | | 167,933,910 | | | | 139,186,179 | | | | 271,494,870 | |
Institutional Class1 | | | — | | | | — | | | | — | |
| | | |
Capital Stock Issued and Outstanding (Unlimited number of shares authorized,
$.01 par value) | | | | | | | | | | | | |
Investor Class | | | 9,050,914 | | | | 13,330,817 | | | | 14,476,799 | |
Institutional Class1 | | | — | | | | — | | | | — | |
| | | |
NET ASSET VALUE, REDEMPTION PRICEAND OFFERING
PRICE PER SHARE | | | | | | | | | | | | |
Investor Class | | $ | 18.55 | | | $ | 10.44 | | | $ | 18.75 | |
| | | | | | | | | | | | |
Institutional Class1 | | $ | — | | | $ | — | | | $ | — | |
| | | | | | | | | | | | |
| 1Institutional | Class inception date January 31, 2012. |
See Notes to Financial Statements.
94
(This page intentionally left blank.)
95
| | |
| WASATCH FUNDS — Statements of Operations | | |
|
|
|
| | | | | | | | | | | | |
| | | CORE
GROWTH
FUND | | | EMERGING INDIA
FUND | | | EMERGING MARKETS
SMALL CAP
FUND | |
| | | | | | | | | | | | |
Investment Income: | | | | | | | | | | | | |
Interest | | $ | 2,947 | | | $ | 40 | | | $ | 4,455 | |
Dividends2 | | | | | | | | | | | | |
Unaffiliated issuers | | | 2,733,654 | | | | 153,807 | | | | 25,304,880 | |
| | | | | | | | | | | | |
Total investment income | | | 2,736,601 | | | | 153,847 | | | | 25,309,335 | |
| | | | | | | | | | | | |
Expenses: | | | | | | | | | | | | |
Investment advisory fees | | | 5,199,168 | | | | 177,317 | | | | 19,749,590 | |
Shareholder servicing fees — Investor Class | | | 705,763 | | | | 54,634 | | | | 2,015,362 | |
Shareholder servicing fees — Institutional Class3 | | | 8,227 | | | | — | | | | — | |
Fund administration fees | | | 90,582 | | | | 2,071 | | | | 195,705 | |
Fund accounting fees | | | 63,760 | | | | 25,064 | | | | 138,317 | |
Reports to shareholders — Investor Class | | | 81,860 | | | | 3,270 | | | | 256,770 | |
Reports to shareholders — Institutional Class3 | | | 8,605 | | | | — | | | | — | |
Custody fees | | | 88,952 | | | | 38,298 | | | | 1,309,181 | |
Federal and state registration fees — Investor Class | | | 36,794 | | | | 14,212 | | | | 151,743 | |
Federal and state registration fees — Institutional Class3 | | | 9,240 | | | | — | | | | — | |
Legal fees | | | 19,129 | | | | 420 | | | | 40,318 | |
Trustees’ fees | | | 38,038 | | | | 841 | | | | 73,603 | |
Interest | | | 4,792 | | | | 285 | | | | 10,191 | |
Offering and organization costs | | | — | | | | 51,961 | | | | — | |
Audit fees | | | 24,631 | | | | 24,572 | | | | 22,631 | |
Other expenses | | | 32,283 | 4 | | | 10,463 | | | | 80,838 | |
| | | | | | | | | | | | |
Total expenses before reimbursement | | | 6,411,824 | | | | 403,408 | | | | 24,044,249 | |
Reimbursement of expenses by Advisor | | | (23,959 | ) | | | (172,611 | ) | | | (2,027,373 | ) |
| | | | | | | | | | | | |
Net Expenses | | | 6,387,865 | | | | 230,797 | | | | 22,016,876 | |
| | | | | | | | | | | | |
Net Investment Income (Loss) | | | (3,651,264 | ) | | | (76,950 | ) | | | 3,292,459 | |
| | | | | | | | | | | | |
Realized and Unrealized Gain (Loss): | | | | | | | | | | | | |
Net realized gain (loss) on investments and foreign currency translations | | | | | | | | | | | | |
Unaffiliated issuers | | | 46,892,618 | | | | (814,795 | ) | | | (45,748,158 | ) |
Net realized gain on options | | | 178,735 | | | | — | | | | — | |
Realized foreign capital gains taxes | | | — | | | | — | | | | (1,247,237 | ) |
Change in unrealized appreciation (depreciation) on
investments, options and foreign currency translations | | | 75,535,655 | | | | 2,257,287 | | | | 269,202,810 | |
Change in deferred foreign capital gains taxes | | | — | | | | (64,914 | ) | | | (4,422,791 | ) |
| | | | | | | | | | | | |
Net gain on investments | | | 122,607,008 | | | | 1,377,578 | | | | 217,784,624 | |
| | | | | | | | | | | | |
Net Increase in Net Assets Resulting from Operations | | $ | 118,955,744 | | | $ | 1,300,628 | | | $ | 221,077,083 | |
| | | | | | | | | | | | |
| 1 | Fund inception date was January 31, 2012. |
| 2 | Net of $91,916, $0, $2,699,630, $33,230, $161,071, $15,249, $665,994 and $361,652 in foreign withholding taxes, respectively. |
| 3 | Institutional Class inception date was January 31, 2012. |
| 4 | Includes class specific expenses of $475 for Investor Class and $803 for Institutional Class. |
See Notes to Financial Statements.
96
| | |
| | FOR THE YEAR ENDED SEPTEMBER 30, 2012 |
|
|
|
| | | | | | | | | | | | | | | | | | |
FRONTIER EMERGING
SMALL COUNTRIES
FUND1 | | | GLOBAL
OPPORTUNITIES
FUND | | | HERITAGE
GROWTH
FUND | | | INTERNATIONAL
GROWTH
FUND | | | INTERNATIONAL
OPPORTUNITIES
FUND | |
| | | | | | | | | | | | | | | | | | |
| | | | | | | | | | | | | | | | | | |
| $ | 79 | | | $ | 441 | | | $ | 777 | | | $ | 2,830 | | | $ | 1,139 | |
| | | | | | | | | | | | | | | | | | |
| | 344,999 | | | | 2,010,443 | | | | 663,666 | | | | 6,764,521 | | | | 3,677,549 | |
| | | | | | | | | | | | | | | | | | |
| | 345,078 | | | | 2,010,884 | | | | 664,443 | | | | 6,767,351 | | | | 3,678,688 | |
| | | | | | | | | | | | | | | | | | |
| | | | | | | | | | | | | | | | | | |
| | 169,562 | | | | 2,443,883 | | | | 697,750 | | | | 4,076,272 | | | | 3,433,363 | |
| | 42,664 | | | | 232,417 | | | | 197,060 | | | | 474,868 | | | | 514,011 | |
| | — | | | | — | | | | — | | | | — | | | | — | |
| | 1,629 | | | | 28,594 | | | | 17,327 | | | | 56,716 | | | | 30,694 | |
| | 16,635 | | | | 44,869 | | | | 21,840 | | | | 60,288 | | | | 48,003 | |
| | 1,805 | | | | 43,458 | | | | 17,765 | | | | 56,183 | | | | 81,387 | |
| | — | | | | — | | | | — | | | | — | | | | — | |
| | 30,861 | | | | 81,689 | | | | 8,177 | | | | 233,286 | | | | 159,983 | |
| | 4,311 | | | | 51,088 | | | | 23,992 | | | | 56,077 | | | | 29,608 | |
| | — | | | | — | | | | — | | | | — | | | | — | |
| | 1,189 | | | | 6,253 | | | | 3,834 | | | | 11,837 | | | | 6,568 | |
| | 274 | | | | 13,898 | | | | 6,865 | | | | 22,912 | | | | 12,829 | |
| | 71 | | | | 8,239 | | | | 880 | | | | 13,863 | | | | 3,470 | |
| | 52,775 | | | | — | | | | — | | | | — | | | | — | |
| | 21,641 | | | | 24,965 | | | | 22,632 | | | | 22,631 | | | | 24,131 | |
| | 9,749 | | | | 24,294 | | | | 13,704 | | | | 28,653 | | | | 25,197 | |
| | | | | | | | | | | | | | | | | | |
| | 353,166 | | | | 3,003,647 | | | | 1,031,826 | | | | 5,113,586 | | | | 4,369,244 | |
| | (135,086 | ) | | | — | | | | (84,000 | ) | | | — | | | | (404,202 | ) |
| | | | | | | | | | | | | | | | | | |
| | 218,080 | | | | 3,003,647 | | | | 947,826 | | | | 5,113,586 | | | | 3,965,042 | |
| | | | | | | | | | | | | | | | | | |
| | 126,998 | | | | (992,763 | ) | | | (283,383 | ) | | | 1,653,765 | | | | (286,354 | ) |
| | | | | | | | | | | | | | | | | | |
| | | | | | | | | | | | | | | | | | |
| | | | | | | | | | | | | | | | | | |
| | (2,599 | ) | | | 21,874,067 | | | | 4,240,086 | | | | (5,963,542 | ) | | | (7,280,313 | ) |
| | — | | | | — | | | | — | | | | — | | | | — | |
| | (1,278 | ) | | | — | | | | — | | | | (300,892 | ) | | | (2,273 | ) |
| | | | |
| | 3,639,503 | | | | 18,992,456 | | | | 11,559,865 | | | | 91,875,400 | | | | 42,133,713 | |
| | (62,606 | ) | | | (64,425 | ) | | | — | | | | (119,574 | ) | | | (224,669 | ) |
| | | | | | | | | | | | | | | | | | |
| | 3,573,020 | | | | 40,802,098 | | | | 15,799,951 | | | | 85,491,392 | | | | 34,626,458 | |
| | | | | | | | | | | | | | | | | | |
| $ | 3,700,018 | | | $ | 39,809,335 | | | $ | 15,516,568 | | | $ | 87,145,157 | | | $ | 34,340,104 | |
| | | | | | | | | | | | | | | | | | |
97
| | |
| WASATCH FUNDS — Statements of Operations (continued) | | |
|
|
|
| | | | | | | | | | | | |
| | | LARGE CAP
VALUE FUND | | | LONG/SHORT
FUND | | | MICRO CAP FUND | |
| | | | | | | | | | | | |
Investment Income: | | | | | | | | | | | | |
Interest | | $ | 5,366 | | | $ | 24,676 | | | $ | 607 | |
Dividends1 | | | | | | | | | | | | |
Unaffiliated issuers2 | | | 39,113,969 | | | | 15,023,241 | | | | 1,832,810 | |
Affiliated issuers | | | — | | | | — | | | | — | |
| | | | | | | | | | | | |
Total investment income | | | 39,119,335 | | | | 15,047,917 | | | | 1,833,417 | |
| | | | | | | | | | | | |
Expenses: | | | | | | | | | | | | |
Investment advisory fees | | | 13,989,937 | | | | 12,635,737 | | | | 5,616,266 | |
Shareholder servicing fees — Investor Class | | | 2,672,208 | | | | 1,094,212 | | | | 262,189 | |
Shareholder servicing fees — Institutional Class3 | | | 8,370 | | | | — | | | | — | |
Fund administration fees | | | 272,245 | | | | 199,456 | | | | 50,253 | |
Fund accounting fees | | | 161,063 | | | | 121,404 | | | | 45,860 | |
Reports to shareholders — Investor Class | | | 307,175 | | | | 220,899 | | | | 35,972 | |
Reports to shareholders — Institutional Class3 | | | 8,718 | | | | — | | | | — | |
Custody fees | | | 40,175 | | | | 47,322 | | | | 41,002 | |
Federal and state registration fees — Investor Class | | | 126,996 | | | | 121,350 | | | | 23,343 | |
Federal and state registration fees — Institutional Class3 | | | 9,274 | | | | — | | | | — | |
Legal fees | | | 58,280 | | | | 42,283 | | | | 10,690 | |
Trustees’ fees | | | 127,662 | | | | 77,216 | | | | 21,879 | |
Dividends on securities sold short | | | — | | | | 2,361,671 | | | | — | |
Interest | | | 15,387 | | | | 375,486 | | | | 2,693 | |
Audit fees | | | 24,631 | | | | 23,465 | | | | 22,632 | |
Other expenses | | | 79,720 | 4 | | | 31,401 | | | | 24,964 | |
| | | | | | | | | | | | |
Total expenses before reimbursement | | | 17,901,841 | | | | 17,351,902 | | | | 6,157,743 | |
Reimbursement of expenses by Advisor | | | (796,152 | ) | | | — | | | | — | |
| | | | | | | | | | | | |
Net Expenses | | | 17,105,689 | | | | 17,351,902 | | | | 6,157,743 | |
| | | | | | | | | | | | |
Net Investment Income (Loss) | | | 22,013,646 | | | | (2,303,985 | ) | | | (4,324,326 | ) |
| | | | | | | | | | | | |
Realized and Unrealized Gain (Loss): | | | | | | | | | | | | |
Net realized gain (loss) on investments and foreign currency translations | | | | | | | | | | | | |
Unaffiliated issuers | | | 20,729,577 | | | | 5,256,533 | | | | 28,221,257 | |
Affiliated issuers | | | — | | | | (2,809,326 | ) | | | — | |
Net realized gain on options | | | — | | | | 18,320,523 | | | | — | |
Net realized loss on short positions | | | — | | | | (15,284,249 | ) | | | — | |
Realized foreign capital gains taxes | | | — | | | | — | | | | — | |
Change in unrealized appreciation (depreciation) on investments, options and foreign currency translations | | | 272,440,099 | | | | 132,606,941 | | | | 48,720,617 | |
Change in deferred foreign capital gains taxes | | | — | | | | — | | | | (140,262 | ) |
| | | | | | | | | | | | |
Net gain on investments | | | 293,169,676 | | | | 138,090,422 | | | | 76,801,612 | |
| | | | | | | | | | | | |
Net Increase in Net Assets Resulting from Operations | | $ | 315,183,322 | | | $ | 135,786,437 | | | $ | 72,477,286 | |
| | | | | | | | | | | | |
| 1 | Net of $149,937, $127,267, $68,742, $60,999, $261,811, $48,053, $10,629 and $10,113 in foreign withholding taxes, respectively. |
| 2 | See Note 10 for information on affiliated issuers. |
| 3 | Institutional Class inception date was January 31, 2012. |
| 4 | Includes class specific expenses of $475 for Investor Class and $803 for Institutional Class. |
See Notes to Financial Statements.
98
| | |
| | FOR THE YEAR ENDED SEPTEMBER 30, 2012 |
|
|
|
| | | | | | | | | | | | | | | | | | |
MICRO CAP
VALUE FUND | | | SMALL CAP
GROWTH
FUND | | | SMALL CAP
VALUE FUND | | | STRATEGIC
INCOME
FUND | | | ULTRA
GROWTH
FUND | |
| | | | | | | | | | | | | | | | | | |
| | | | | | | | | | | | | | | | | | |
| $ | 1,083 | | | $ | 8,511 | | | $ | 619 | | | $ | 433 | | | $ | 97 | |
| | | | | | | | | | | | | | | | | | |
| | 1,413,305 | | | | 7,219,922 | | | | 1,315,470 | | | | 1,041,702 | | | | 1,401,530 | |
| | — | | | | 1,034,250 | | | | — | | | | — | | | | — | |
| | | | | | | | | | | | | | | | | | |
| | 1,414,388 | | | | 8,262,683 | | | | 1,316,089 | | | | 1,042,135 | | | | 1,401,627 | |
| | | | | | | | | | | | | | | | | | |
| | | | | | | | | | | | | | | | | | |
| | 2,817,933 | | | | 16,194,755 | | | | 2,101,313 | | | | 271,282 | | | | 1,449,184 | |
| | 283,399 | | | | 2,493,429 | | | | 308,717 | | | | 76,612 | | | | 233,502 | |
| | — | | | | — | | | | 8,213 | | | | — | | | | — | |
| | 25,274 | | | | 281,964 | | | | 31,484 | | | | 6,723 | | | | 25,311 | |
| | 35,099 | | | | 173,182 | | | | 32,547 | | | | 15,318 | | | | 34,650 | |
| | 33,330 | | | | 294,357 | | | | 31,605 | | | | 6,358 | | | | 25,057 | |
| | — | | | | — | | | | 8,257 | | | | — | | | | — | |
| | 37,303 | | | | 317,152 | | | | 21,775 | | | | 2,392 | | | | 52,180 | |
| | 33,198 | | | | 95,828 | | | | 22,307 | | | | 24,774 | | | | 27,127 | |
| | — | | | | — | | | | 9,180 | | | | — | | | | — | |
| | 5,387 | | | | 59,073 | | | | 6,709 | | | | 1,497 | | | | 5,429 | |
| | 11,590 | | | | 116,011 | | | | 14,088 | | | | 2,577 | | | | 11,278 | |
| | — | | | | — | | | | — | | | | — | | | | — | |
| | 2,240 | | | | 15,642 | | | | 1,707 | | | | 335 | | | | 3,768 | |
| | 22,631 | | | | 22,631 | | | | 24,631 | | | | 22,632 | | | | 22,631 | |
| | 25,517 | | | | 77,679 | | | | 21,128 | 4 | | | 11,100 | | | | 21,822 | |
| | | | | | | | | | | | | | | | | | |
| | 3,332,901 | | | | 20,141,703 | | | | 2,643,661 | | | | 441,600 | | | | 1,911,939 | |
| | (79,199 | ) | | | — | | | | (23,053 | ) | | | (73,097 | ) | | | — | |
| | | | | | | | | | | | | | | | | | |
| | 3,253,702 | | | | 20,141,703 | | | | 2,620,608 | | | | 368,503 | | | | 1,911,939 | |
| | | | | | | | | | | | | | | | | | |
| | (1,839,314 | ) | | | (11,879,020 | ) | | | (1,304,519 | ) | | | 673,632 | | | | (510,312 | ) |
| | | | | | | | | | | | | | | | | | |
| | | | | | | | | | | | | | | | | | |
| | | | | | | | | | | | | | | | | | |
| | 10,592,092 | | | | 105,991,142 | | | | 15,394,264 | | | | 2,327,909 | | | | 16,871,948 | |
| | — | | | | — | | | | — | | | | — | | | | — | |
| | 1,221,805 | | | | — | | | | — | | | | — | | | | — | |
| | — | | | | — | | | | — | | | | — | | | | — | |
| | (11,006 | ) | | | — | | | | — | | | | — | | | | — | |
| 25,101,766 | | | | 293,881,523 | | | | 21,133,466 | | | | 4,279,665 | | | | 10,086,534 | |
| | (232,858 | ) | | | (1,424,304 | ) | | | (137,580 | ) | | | — | | | | (130,699 | ) |
| | | | | | | | | | | | | | | | | | |
| | 36,671,799 | | | | 398,448,361 | | | | 36,390,150 | | | | 6,607,574 | | | | 26,827,783 | |
| | | | | | | | | | | | | | | | | | |
| $ | 34,832,485 | | | $ | 386,569,341 | | | $ | 35,085,631 | | | $ | 7,281,206 | | | $ | 26,317,471 | |
| | | | | | | | | | | | | | | | | | |
99
| | |
| WASATCH FUNDS — Statements of Operations (continued) | | FOR THE YEAR ENDED SEPTEMBER 30, 2012 |
|
|
|
| | | | | | | | | | | | |
| | | WORLD
INNOVATORS
FUND | | | INCOME
FUND | | | U.S.
TREASURY
FUND | |
| | | | | | | | | | | | |
Investment Income: | | | | | | | | | | | | |
Interest | | $ | 1,344 | | | $ | 3,605,026 | | | $ | 7,346,953 | |
Dividends1 | | | | | | | | | | | | |
Unaffiliated issuers | | | 989,483 | | | | 186,330 | | | | — | |
| | | | | | | | | | | | |
Total investment income | | | 990,827 | | | | 3,791,356 | | | | 7,346,953 | |
| | | | | | | | | | | | |
Expenses: | | | | | | | | | | | | |
Investment advisory fees | | | 1,721,858 | | | | 779,287 | | | | 1,207,718 | |
Shareholder servicing fees — Investor Class | | | 221,974 | | | | 59,020 | | | | 304,758 | |
Fund administration fees | | | 19,868 | | | | 24,733 | | | | 42,019 | |
Fund accounting fees | | | 31,626 | | | | 47,604 | | | | 29,855 | |
Reports to shareholders — Investor Class | | | 24,875 | | | | 5,936 | | | | 31,517 | |
Custody fees | | | 21,847 | | | | 14,591 | | | | 6,164 | |
Federal and state registration fees — Investor Class | | | 31,500 | | | | 18,792 | | | | 46,625 | |
Legal fees | | | 4,060 | | | | 5,333 | | | | 8,832 | |
Trustees’ fees | | | 7,116 | | | | 10,707 | | | | 16,662 | |
Interest | | | 954 | | | | 503 | | | | 830 | |
Audit fees | | | 23,465 | | | | 22,033 | | | | 21,891 | |
Other expenses | | | 15,452 | | | | 9,871 | | | | 11,768 | |
| | | | | | | | | | | | |
Total expenses before reimbursement | | | 2,124,595 | | | | 998,410 | | | | 1,728,639 | |
| | | | | | | | | | | | |
Net Expenses | | | 2,124,595 | | | | 998,410 | | | | 1,728,639 | |
| | | | | | | | | | | | |
Net Investment Income (Loss) | | | (1,133,768 | ) | | | 2,792,946 | | | | 5,618,314 | |
| | | | | | | | | | | | |
Realized and Unrealized Gain (Loss): | | | | | | | | | | | | |
Net realized gain on investments and foreign currency translations | | | | | | | | | | | | |
Unaffiliated issuers | | | 8,025,638 | | | | 642,885 | | | | 5,092,087 | |
Net realized loss on options | | | (33,758 | ) | | | — | | | | — | |
Change in unrealized appreciation (depreciation) on
investments, options and foreign currency translations | | | 16,559,256 | | | | 1,042,565 | | | | 5,530,925 | |
| | | | | | | | | | | | |
Net gain on investments | | | 24,551,136 | | | | 1,685,450 | | | | 10,623,012 | |
| | | | | | | | | | | | |
Net Increase in Net Assets Resulting from Operations | | $ | 23,417,368 | | | $ | 4,478,396 | | | $ | 16,241,326 | |
| | | | | | | | | | | | |
| 1 | Net of $57,424, $0 and $0 in foreign withholding taxes, respectively. |
See Notes to Financial Statements.
100
(This page intentionally left blank.)
101
| | |
| WASATCH FUNDS — Statements of Changes in Net Assets | | |
|
|
|
| | | | | | | | | | | | | | | | |
| | | CORE GROWTH FUND | | | EMERGING INDIA FUND | |
| | | Year Ended
September 30, 2012 | | | Year Ended
September 30, 2011 | | | Year Ended
September 30, 2012 | | | Period Ended
September 30, 20111 | |
| | | | | | | | | | | | | | | | |
Operations: | | | | | | | | | | | | | | | | |
Net investment income (loss) | | $ | (3,651,264 | ) | | $ | (2,710,160 | ) | | $ | (76,950 | ) | | $ | (2,931 | ) |
Net realized gain (loss) on investments, foreign currency translations and foreign capital gains taxes | | | 46,892,618 | | | | 35,854,115 | | | | (814,795 | ) | | | (79,340 | ) |
Net realized gain on options | | | 178,735 | | | | — | | | | — | | | | — | |
Change in unrealized appreciation (depreciation) on investments, options, foreign currency translations and deferred capital gains taxes | | | 75,535,655 | | | | 5,895,469 | | | | 2,192,373 | | | | (1,004,844 | ) |
| | | | | | | | | | | | | | | | |
Net increase (decrease) in net assets resulting from operations | | | 118,955,744 | | | | 39,039,424 | | | | 1,300,628 | | | | (1,087,115 | ) |
| | | | |
Dividends paid from: | | | | | | | | | | | | | | | | |
Investor Class | | | | | | | | | | | | | | | | |
Net investment income | | | — | | | | — | | | | (82,606 | ) | | | — | |
Net realized gains | | | — | | | | — | | | | — | | | | — | |
| | | | | | | | | | | | | | | | |
| | | — | | | | — | | | | (82,606 | ) | | | — | |
| | | | |
Capital share transactions: | | | | | | | | | | | | | | | | |
Investor Class | | | | | | | | | | | | | | | | |
Shares sold | | | 140,556,596 | | | | 83,103,061 | | | | 7,512,543 | | | | 13,493,360 | |
Shares issued to holders in reinvestment of dividends | | | — | | | | — | | | | 80,715 | | | | — | |
Shares redeemed | | | (110,766,693 | ) | | | (107,505,309 | ) | | | (5,765,833 | ) | | | (1,831,563 | ) |
Redemption fees | | | 22,639 | | | | 14,798 | | | | 32,138 | | | | 5,619 | |
| | | | | | | | | | | | | | | | |
Net increase (decrease) | | | 29,812,542 | | | | (24,387,450 | ) | | | 1,859,563 | | | | 11,667,416 | |
| | | | | | | | | | | | | | | | |
Institutional Class3 | | | | | | | | | | | | | | | | |
Shares sold | | | 8,421,536 | | | | — | | | | — | | | | — | |
Shares redeemed | | | (11,905 | ) | | | — | | | | — | | | | — | |
| | | | | | | | | | | | | | | | |
Net increase | | | 8,409,631 | | | | — | | | | — | | | | — | |
| | | | | | | | | | | | | | | | |
Total increase (decrease) in net assets | | | 157,177,917 | | | | 14,651,974 | | | | 3,077,585 | | | | 10,580,301 | |
| | | | |
Net assets: | | | | | | | | | | | | | | | | |
Beginning of period | | | 433,293,687 | | | | 418,641,713 | | | | 10,580,301 | | | | — | |
| | | | | | | | | | | | | | | | |
End of period | | $ | 590,471,604 | | | $ | 433,293,687 | | | $ | 13,657,886 | | | $ | 10,580,301 | |
| | | | | | | | | | | | | | | | |
Undistributed net investment income (loss) included in
net assets at end of period | | $ | (3,010,195 | ) | | $ | (29,933 | ) | | $ | (159,823 | ) | | $ | (5,463 | ) |
| | | | | | | | | | | | | | | | |
| | | | |
Capital share transactions — shares: | | | | | | | | | | | | | | | | |
Investor Class | | | | | | | | | | | | | | | | |
Shares sold | | | 3,632,220 | | | | 2,403,205 | | | | 4,213,059 | | | | 6,731,700 | |
Shares issued to holders in reinvestment of dividends | | | — | | | | — | | | | 52,755 | | | | — | |
Shares redeemed | | | (2,872,788 | ) | | | (3,103,065 | ) | | | (3,299,635 | ) | | | (935,872 | ) |
| | | | | | | | | | | | | | | | |
Net increase (decrease) in shares outstanding | | | 759,432 | | | | (699,860 | ) | | | 966,179 | | | | 5,795,828 | |
| | | | | | | | | | | | | | | | |
Institutional Class3 | | | | | | | | | | | | | | | | |
Shares sold | | | 219,890 | | | | — | | | | — | | | | — | |
Shares redeemed | | | (299 | ) | | | — | | | | — | | | | — | |
| | | | | | | | | | | | | | | | |
Net increase in shares outstanding | | | 219,591 | | | | — | | | | — | | | | — | |
| | | | | | | | | | | | | | | | |
| 1Fund | inception date was April 26, 2011. |
| 2 | Fund inception date was January 31, 2012. |
| 3 | Institutional Class inception date was January 31, 2012. |
See Notes to Financial Statements.
102
| | | | | | | | | | | | | | | | | | |
EMERGING MARKETS
SMALL CAP FUND | | | FRONTIER
EMERGING
SMALL COUNTRIES
FUND | | | GLOBAL
OPPORTUNITIES FUND | |
Year Ended
September 30, 2012 | | | Year Ended
September 30, 2011 | | | Period Ended September 30, 20122 | | | Year Ended
September 30, 2012 | | | Year Ended
September 30, 2011 | |
| | | | | | | | | | | | | | | | | | |
| | | | | | | | | | | | | | | | | | |
| $ | 3,292,459 | | | $ | 1,685,999 | | | $ | 126,998 | | | $ | (992,763 | ) | | $ | (1,160,375 | ) |
| (46,995,395 | ) | | | (7,427,647 | ) | | | (3,877 | ) | | | 21,874,067 | | | | 26,239,766 | |
| | — | | | | — | | | | — | | | | — | | | | — | |
| 264,780,019 | | | | (110,687,870 | ) | | | 3,576,897 | | | | 18,928,031 | | | | (29,345,661 | ) |
| | | | | | | | | | | | | | | | | | |
| 221,077,083 | | | | (116,429,518 | ) | | | 3,700,018 | | | | 39,809,335 | | | | (4,266,270 | ) |
| | | | |
| | | | | | | | | | | | | | | | | | |
| | | | | | | | | | | | | | | | | | |
| | — | | | | (86,408 | ) | | | — | | | | — | | | | — | |
| | — | | | | — | | | | — | | | | (18,174,913 | ) | | | (9,401,467 | ) |
| | | | | | | | | | | | | | | | | | |
| | — | | | | (86,408 | ) | | | — | | | | (18,174,913 | ) | | | (9,401,467 | ) |
| | | | |
| | | | | | | | | | | | | | | | | | |
| | | | | | | | | | | | | | | | | | |
| | 810,878,044 | | | | 1,008,804,331 | | | | 30,457,825 | | | | 29,847,635 | | | | 106,033,780 | |
| | — | | | | 80,915 | | | | — | | | | 18,021,095 | | | | 9,039,015 | |
| | (324,158,137 | ) | | | (565,437,338 | ) | | | (1,119,216 | ) | | | (115,783,494 | ) | | | (136,478,673 | ) |
| | 270,084 | | | | 514,482 | | | | 6,622 | | | | 7,511 | | | | 24,601 | |
| | | | | | | | | | | | | | | | | | |
| | 486,989,991 | | | | 443,962,390 | | | | 29,345,231 | | | | (67,907,253 | ) | | | (21,381,277 | ) |
| | | | | | | | | | | | | | | | | | |
| | | | | | | | | | | | | | | | | | |
| | — | | | | — | | | | — | | | | — | | | | — | |
| | — | | | | — | | | | — | | | | — | | | | — | |
| | | | | | | | | | | | | | | | | | |
| | — | | | | — | | | | — | | | | — | | | | — | |
| | | | | | | | | | | | | | | | | | |
| | 708,067,074 | | | | 327,446,464 | | | | 33,045,249 | | | | (46,272,831 | ) | | | (35,049,014 | ) |
| | | | |
| | | | | | | | | | | | | | | | | | |
| | 774,197,619 | | | | 446,751,155 | | | | — | | | | 199,854,793 | | | | 234,903,807 | |
| | | | | | | | | | | | | | | | | | |
| $ | 1,482,264,693 | | | $ | 774,197,619 | | | $ | 33,045,249 | | | $ | 153,581,962 | | | $ | 199,854,793 | |
| | | | | | | | | | | | | | | | | | |
$ | (376,915 | ) | | $ | (1,106,194 | ) | | $ | 65,934 | | | $ | (990,976 | ) | | $ | (689,992 | ) |
| | | | | | | | | | | | | | | | | | |
| | | | |
| | | | | | | | | | | | | | | | | | |
| | | | | | | | | | | | | | | | | | |
| | 331,129,894 | | | | 404,408,930 | | | | 14,198,947 | | | | 7,800,853 | | | | 24,718,548 | |
| | — | | | | 32,217 | | | | — | | | | 5,223,506 | | | | 2,126,627 | |
| | (133,758,992 | ) | | | (233,756,865 | ) | | | (511,756 | ) | | | (30,223,552 | ) | | | (31,791,124 | ) |
| | | | | | | | | | | | | | | | | | |
| | 197,370,902 | | | | 170,684,282 | | | | 13,687,191 | | | | (17,199,193 | ) | | | (4,945,949 | ) |
| | | | | | | | | | | | | | | | | | |
| | | | | | | | | | | | | | | | | | |
| | — | | | | — | | | | — | | | | — | | | | — | |
| | — | | | | — | | | | — | | | | — | | | | — | |
| | | | | | | | | | | | | | | | | | |
| | — | | | | — | | | | — | | | | — | | | | — | |
| | | | | | | | | | | | | | | | | | |
103
| | |
| WASATCH FUNDS — Statements of Changes in Net Assets (continued) | | |
|
|
|
| | | | | | | | | | | | | | | | |
| | | HERITAGE GROWTH FUND | | | INTERNATIONAL GROWTH FUND | |
| | | Year Ended
September 30, 2012 | | | Year Ended
September 30, 2011 | | | Year Ended
September 30, 2012 | | | Year Ended
September 30, 2011 | |
| | | | | | | | | | | | | | | | |
Operations: | | | | | | | | | | | | | | | | |
Net investment income (loss) | | $ | (283,383 | ) | | $ | (19,757 | ) | | $ | 1,653,765 | | | $ | (30,953 | ) |
Net realized gain (loss) on investments, foreign
currency translations and foreign capital gains taxes | | | 4,240,086 | | | | 8,331,814 | | | | (6,264,434 | ) | | | 38,507,204 | |
Net realized gain on options | | | — | | | | — | | | | — | | | | — | |
Net realized loss on short positions | | | — | | | | — | | | | — | | | | — | |
Change in unrealized appreciation (depreciation) on
investments, options, foreign currency translations and deferred capital gains taxes | | | 11,559,865 | | | | (6,110,436 | ) | | | 91,755,826 | | | | (67,796,279 | ) |
| | | | | | | | | | | | | | | | |
Net increase (decrease) in net assets resulting from operations | | | 15,516,568 | | | | 2,201,621 | | | | 87,145,157 | | | | (29,320,028 | ) |
| | | | |
Dividends paid from: | | | | | | | | | | | | | | | | |
Investor Class | | | | | | | | | | | | | | | | |
Net investment income | | | (106,542 | ) | | | (659,028 | ) | | | — | | | | — | |
Net realized gains | | | (990,738 | ) | | | — | | | | — | | | | — | |
| | | | | | | | | | | | | | | | |
| | | (1,097,280 | ) | | | (659,028 | ) | | | — | | | | — | |
Institutional Class1 | | | | | | | | | | | | | | | | |
Net investment income | | | — | | | | — | | | | — | | | | — | |
| | | | | | | | | | | | | | | | |
| | | — | | | | — | | | | — | | | | — | |
| | | | |
Capital share transactions: | | | | | | | | | | | | | | | | |
Investor Class | | | | | | | | | | | | | | | | |
Shares sold | | | 47,519,908 | | | | 7,731,214 | | | | 194,601,086 | | | | 242,214,904 | |
Shares issued to holders in reinvestment of dividends | | | 1,072,610 | | | | 632,899 | | | | — | | | | — | |
Shares redeemed | | | (23,637,012 | ) | | | (15,622,676 | ) | | | (128,450,040 | ) | | | (217,092,446 | ) |
Redemption fees | | | 16,594 | | | | 3,249 | | | | 47,000 | | | | 232,716 | |
| | | | | | | | | | | | | | | | |
Net increase (decrease) | | | 24,972,100 | | | | (7,255,314 | ) | | | 66,198,046 | | | | 25,355,174 | |
| | | | | | | | | | | | | | | | |
Institutional Class1 | | | | | | | | | | | | | | | | |
Shares sold | | | — | | | | — | | | | — | | | | — | |
Shares issued to holders in reinvestment of dividends | | | — | | | | — | | | | — | | | | — | |
Shares redeemed | | | — | | | | — | | | | — | | | | — | |
Redemption fees | | | — | | | | — | | | | — | | | | — | |
| | | | | | | | | | | | | | | | |
Net increase | | | — | | | | — | | | | — | | | | — | |
| | | | | | | | | | | | | | | | |
Total increase (decrease) in net assets | | | 39,391,388 | | | | (5,712,721 | ) | | | 153,343,203 | | | | (3,964,854 | ) |
| | | | |
Net assets: | | | | | | | | | | | | | | | | |
Beginning of period | | | 72,560,914 | | | | 78,273,635 | | | | 281,481,114 | | | | 285,445,968 | |
| | | | | | | | | | | | | | | | |
End of period | | $ | 111,952,302 | | | $ | 72,560,914 | | | $ | 434,824,317 | | | $ | 281,481,114 | |
| | | | | | | | | | | | | | | | |
Undistributed net investment income (loss) included in
net assets at end of period | | $ | (335,233 | ) | | $ | (58,288 | ) | | $ | 646,806 | | | $ | (521,786 | ) |
| | | | | | | | | | | | | | | | |
| | | | |
Capital share transactions — shares: | | | | | | | | | | | | | | | | |
Investor Class | | | | | | | | | | | | | | | | |
Shares sold | | | 3,844,702 | | | | 645,254 | | | | 9,794,216 | | | | 12,065,101 | |
Shares issued to holders in reinvestment of dividends | | | 90,592 | | | | 53,850 | | | | — | | | | — | |
Shares redeemed | | | (1,892,648 | ) | | | (1,314,925 | ) | | | (6,774,979 | ) | | | (11,007,778 | ) |
| | | | | | | | | | | | | | | | |
Net increase (decrease) in shares outstanding | | | 2,042,646 | | | | (615,821 | ) | | | 3,019,237 | | | | 1,057,323 | |
| | | | | | | | | | | | | | | | |
Institutional Class1 | | | | | | | | | | | | | | | | |
Shares sold | | | — | | | | — | | | | — | | | | — | |
Shares issued to holders in reinvestment of dividends | | | — | | | | — | | | | — | | | | — | |
Shares redeemed | | | — | | | | — | | | | — | | | | — | |
| | | | | | | | | | | | | | | | |
Net increase in shares outstanding | | | — | | | | — | | | | — | | | | — | |
| | | | | | | | | | | | | | | | |
| 1 | Institutional Class inception date was January 31, 2012. |
See Notes to Financial Statements.
104
| | | | | | | | | | | | | | | | | | | | | | |
INTERNATIONAL OPPORTUNITIES FUND | | | LARGE CAP VALUE FUND | | | LONG/SHORT FUND | |
Year Ended
September 30, 2012 | | | Year Ended
September 30, 2011 | | | Year Ended
September 30, 2012 | | | Year Ended
September 30, 2011 | | | Year Ended
September 30, 2012 | | | Year Ended
September 30, 2011 | |
| | | | | | | | | | | | | | | | | | | | | | |
| | | | | | | | | | | | | | | | | | | | | | |
| $ | (286,354 | ) | | $ | (990,926 | ) | | $ | 22,013,646 | | | $ | 21,749,846 | | | $ | (2,303,985 | ) | | $ | (2,610,066 | ) |
| (7,282,586 | ) | | | 25,669,103 | | | | 20,729,577 | | | | 42,167,738 | | | | 2,447,207 | | | | 2,210,569 | |
| | — | | | | — | | | | — | | | | — | | | | 18,320,523 | | | | 10,495,379 | |
| | — | | | | — | | | | — | | | | — | | | | (15,284,249 | ) | | | (7,636,158 | ) |
| 41,909,044 | | | | (42,181,041 | ) | | | 272,440,099 | | | | (152,130,438 | ) | | | 132,606,941 | | | | (54,385,836 | ) |
| | | | | | | | | | | | | | | | | | | | | | |
| 34,340,104 | | | | (17,502,864 | ) | | | 315,183,322 | | | | (88,212,854 | ) | | | 135,786,437 | | | | (51,926,112 | ) |
| | | | | |
| | | | | | | | | | | | | | | | | | | | | | |
| | | | | | | | | | | | | | | | | | | | | | |
| | — | | | | — | | | | (21,674,187 | ) | | | (21,370,753 | ) | | | — | | | | (300,223 | ) |
| | (17,671,323 | ) | | | (4,411,467 | ) | | | — | | | | — | | | | — | | | | — | |
| | | | | | | | | | | �� | | | | | | | | | | | |
| | (17,671,323 | ) | | | (4,411,467 | ) | | | (21,674,187 | ) | | | (21,370,753 | ) | | | — | | | | (300,223 | ) |
| | | | | | | | | | | | | | | | | | | | | | |
| | — | | | | — | | | | (144,308 | ) | | | — | | | | — | | | | — | |
| | | | | | | | | | | | | | | | | | | | | | |
| | — | | | | — | | | | (144,308 | ) | | | — | | | | — | | | | — | |
| | | | | |
| | | | | | | | | | | | | | | | | | | | | | |
| | | | | | | | | | | | | | | | | | | | | | |
| | 59,579,463 | | | | 74,164,386 | | | | 294,027,931 | | | | 594,644,079 | | | | 971,122,525 | | | | 775,781,045 | |
| | 17,496,781 | | | | 4,358,588 | | | | 20,774,043 | | | | 20,250,309 | | | | — | | | | 275,190 | |
| | (50,757,037 | ) | | | (57,233,455 | ) | | | (855,853,096 | ) | | | (579,983,268 | ) | | | (403,057,722 | ) | | | (190,889,262 | ) |
| | 6,619 | | | | 15,863 | | | | 37,526 | | | | 30,458 | | | | 70,010 | | | | 103,061 | |
| | | | | | | | | | | | | | | | | | | | | | |
| | 26,325,826 | | | | 21,305,382 | | | | (541,013,596 | ) | | | 34,941,578 | | | | 568,134,813 | | | | 585,270,034 | |
| | | | | | | | | | | | | | | | | | | | | | |
| | | | | | | | | | | | | | | | | | | | | | |
| | — | | | | — | | | | 22,986,777 | | | | — | | | | — | | | | — | |
| | — | | | | — | | | | 143,853 | | | | — | | | | — | | | | — | |
| | — | | | | — | | | | (8,077,111 | ) | | | — | | | | — | | | | — | |
| | — | | | | — | | | | 204 | | | | — | | | | — | | | | — | |
| | | | | | | | | | | | | | | | | | | | | | |
| | — | | | | — | | | | 15,053,723 | | | | — | | | | — | | | | — | |
| | | | | | | | | | | | | | | | | | | | | | |
| | 42,994,607 | | | | (608,949 | ) | | | (232,595,046 | ) | | | (74,642,029 | ) | | | 703,921,250 | | | | 533,043,699 | |
| | | | | |
| | | | | | | | | | | | | | | | | | | | | | |
| | 151,568,621 | | | | 152,177,570 | | | | 1,546,470,725 | | | | 1,621,112,754 | | | | 833,298,435 | | | | 300,254,736 | |
| | | | | | | | | | | | | | | | | | | | | | |
| $ | 194,563,228 | | | $ | 151,568,621 | | | $ | 1,313,875,679 | | | $ | 1,546,470,725 | | | $ | 1,537,219,685 | | | $ | 833,298,435 | |
| | | | | | | | | | | | | | | | | | | | | | |
$ | (309,387 | ) | | $ | (86,487 | ) | | $ | (61,013 | ) | | $ | 46,466 | | | $ | (1,627,098 | ) | | $ | — | |
| | | | | | | | | | | | | | | | | | | | | | |
| | | | | |
| | | | | | | | | | | | | | | | | | | | | | |
| | | | | | | | | | | | | | | | | | | | | | |
| | 26,671,654 | | | | 28,815,261 | | | | 21,836,354 | | | | 43,168,920 | | | | 72,737,699 | | | | 59,803,681 | |
| | 9,018,959 | | | | 1,689,375 | | | | 1,514,720 | | | | 1,494,620 | | | | — | | | | 21,072 | |
| | (22,822,982 | ) | | | (21,903,479 | ) | | | (63,107,087 | ) | | | (42,497,952 | ) | | | (30,538,577 | ) | | | (15,111,108 | ) |
| | | | | | | | | | | | | | | | | | | | | | |
| | 12,867,631 | | | | 8,601,157 | | | | (39,756,013 | ) | | | 2,165,588 | | | | 42,199,122 | | | | 44,713,645 | |
| | | | | | | | | | | | | | | | | | | | | | |
| | | | | | | | | | | | | | | | | | | | | | |
| | — | | | | — | | | | 1,654,533 | | | | — | | | | — | | | | — | |
| | — | | | | — | | | | 10,265 | | | | — | | | | — | | | | — | |
| | — | | | | — | | | | (580,988 | ) | | | — | | | | — | | | | — | |
| | | | | | | | | | | | | | | | | | | | | | |
| | — | | | | — | | | | 1,083,810 | | | | — | | | | — | | | | — | |
| | | | | | | | | | | | | | | | | | | | | | |
105
| | |
| WASATCH FUNDS — Statements of Changes in Net Assets (continued) | | |
|
|
|
| | | | | | | | | | | | | | | | |
| | | MICRO CAP FUND | | | MICRO CAP VALUE FUND | |
| | | Year Ended September 30, 2012 | | | Year Ended September 30, 2011 | | | Year Ended September 30, 2012 | | | Year Ended September 30, 2011 | |
| | | | | | | | | | | | | | | | |
Operations: | | | | | | | | | | | | | | | | |
Net investment income (loss) | | $ | (4,324,326 | ) | | $ | (3,350,720 | ) | | $ | (1,839,314 | ) | | $ | (2,322,268 | ) |
Net realized gain on investments, foreign
currency translations and foreign capital gains taxes | | | 28,221,257 | | | | 17,922,246 | | | | 10,581,086 | | | | 8,967,482 | |
Net realized gain on options | | | — | | | | — | | | | 1,221,805 | | | | 1,917,183 | |
Change in unrealized appreciation (depreciation) on
investments, options, foreign currency translations and deferred capital gains taxes | | | 48,580,355 | | | | (11,900,519 | ) | | | 24,868,908 | | | | (12,424,282 | ) |
| | | | | | | | | | | | | | | | |
Net increase (decrease) in net assets resulting from operations | | | 72,477,286 | | | | 2,671,007 | | | | 34,832,485 | | | | (3,861,885 | ) |
| | | | |
Dividends paid from: | | | | | | | | | | | | | | | | |
Investor Class | | | | | | | | | | | | | | | | |
Net investment income | | | — | | | | — | | | | — | | | | — | |
Net realized gains | | | — | | | | — | | | | — | | | | — | |
| | | | | | | | | | | | | | | | |
| | | — | | | | — | | | | — | | | | — | |
| | | | |
Capital share transactions: | | | | | | | | | | | | | | | | |
Investor Class | | | | | | | | | | | | | | | | |
Shares sold | | | 15,670,851 | | | | 27,569,041 | | | | 13,004,644 | | | | 20,267,692 | |
Shares issued to holders in reinvestment of dividends | | | — | | | | — | | | | — | | | | — | |
Shares redeemed | | | (52,115,506 | ) | | | (60,383,633 | ) | | | (52,353,934 | ) | | | (59,204,228 | ) |
Redemption fees | | | 1,236 | | | | 7,507 | | | | 21,250 | | | | 6,458 | |
| | | | | | | | | | | | | | | | |
Net increase (decrease) | | | (36,443,419 | ) | | | (32,807,085 | ) | | | (39,328,040 | ) | | | (38,930,078 | ) |
| | | | | | | | | | | | | | | | |
Institutional Class1 | | | | | | | | | | | | | | | | |
Shares sold | | | — | | | | — | | | | — | | | | — | |
Shares redeemed | | | — | | | | — | | | | — | | | | — | |
| | | | | | | | | | | | | | | | |
Net increase | | | — | | | | — | | | | — | | | | — | |
| | | | | | | | | | | | | | | | |
Total increase (decrease) in net assets | | | 36,033,867 | | | | (30,136,078 | ) | | | (4,495,555 | ) | | | (42,791,963 | ) |
| | | | |
Net assets: | | | | | | | | | | | | | | | | |
Beginning of period | | | 253,415,182 | | | | 283,551,260 | | | | 142,794,908 | | | | 185,586,871 | |
| | | | | | | | | | | | | | | | |
End of period | | $ | 289,449,049 | | | $ | 253,415,182 | | | $ | 138,299,353 | | | $ | 142,794,908 | |
| | | | | | | | | | | | | | | | |
Undistributed net investment income (loss) included in
net assets at end of period | | $ | (3,746,925 | ) | | $ | (6,014 | ) | | $ | (903,803 | ) | | $ | (1,171,883 | ) |
| | | | | | | | | | | | | | | | |
| | | | |
Capital share transactions — shares: | | | | | | | | | | | | | | | | |
Investor Class | | | | | | | | | | | | | | | | |
Shares sold | | | 2,907,199 | | | | 5,264,916 | | | | 5,091,102 | | | | 7,715,342 | |
Shares issued to holders in reinvestment of dividends | | | — | | | | — | | | | — | | | | — | |
Shares redeemed | | | (9,724,315 | ) | | | (11,582,929 | ) | | | (20,097,659 | ) | | | (22,141,027 | ) |
| | | | | | | | | | | | | | | | |
Net increase (decrease) in shares outstanding | | | (6,817,116 | ) | | | (6,318,013 | ) | | | (15,006,557 | ) | | | (14,425,685 | ) |
| | | | | | | | | | | | | | | | |
Institutional Class1 | | | | | | | | | | | | | | | | |
Shares sold | | | — | | | | — | | | | — | | | | — | |
Shares redeemed | | | — | | | | — | | | | — | | | | — | |
| | | | | | | | | | | | | | | | |
Net increase in shares outstanding | | | — | | | | — | | | | — | | | | — | |
| | | | | | | | | | | | | | | | |
| 1Institutional | Class inception date was January 31, 2012. |
See Notes to Financial Statements.
106
| | | | | | | | | | | | | | | | | | | | | | |
SMALL CAP GROWTH FUND | | | SMALL CAP VALUE FUND | | | STRATEGIC INCOME FUND | |
Year Ended
September 30, 2012 | | | Year Ended
September 30, 2011 | | | Year Ended
September 30, 2012 | | | Year Ended
September 30, 2011 | | | Year Ended
September 30, 2012 | | | Year Ended
September 30, 2011 | |
| | | | | | | | | | | | | | | | | | | | | | |
| | | | | | | | | | | | | | | | | | | | | | |
| $ | (11,879,020 | ) | | $ | (4,645,023 | ) | | $ | (1,304,519 | ) | | $ | (1,422,666 | ) | | $ | 673,632 | | | $ | 769,609 | |
| 105,991,142 | | | | 95,874,416 | | | | 15,394,264 | | | | 21,012,052 | | | | 2,327,909 | | | | 1,457,891 | |
| | — | | | | — | | | | — | | | | — | | | | — | | | | — | |
| 292,457,219 | | | | (70,410,040 | ) | | | 20,995,886 | | | | (10,544,351 | ) | | | 4,279,665 | | | | (1,868,864 | ) |
| | | | | | | | | | | | | | | | | | | | | | |
| 386,569,341 | | | | 20,819,353 | | | | 35,085,631 | | | | 9,045,035 | | | | 7,281,206 | | | | 358,636 | |
| | | | | |
| | | | | | | | | | | | | | | | | | | | | | |
| | | | | | | | | | | | | | | | | | | | | | |
| | — | | | | — | | | | — | | | | — | | | | (880,410 | ) | | | (762,128 | ) |
| | (62,046,614 | ) | | | — | | | | — | | | | — | | | | — | | | | — | |
| | | | | | | | | | | | | | | | | | | | | | |
| | (62,046,614 | ) | | | — | | | | — | | | | — | | | | (880,410 | ) | | | (762,128 | ) |
| | | | | |
| | | | | | | | | | | | | | | | | | | | | | |
| | | | | | | | | | | | | | | | | | | | | | |
| | 429,551,711 | | | | 472,872,914 | | | | 9,236,992 | | | | 22,166,451 | | | | 26,915,715 | | | | 12,790,479 | |
| | 60,087,427 | | | | — | | | | — | | | | — | | | | 858,788 | | | | 743,844 | |
| | (287,432,932 | ) | | | (305,913,508 | ) | | | (47,184,106 | ) | | | (73,383,270 | ) | | | (13,607,700 | ) | | | (8,596,748 | ) |
| | 70,038 | | | | 116,381 | | | | 4,318 | | | | 1,744 | | | | 10,489 | | | | 6,276 | |
| | | | | | | | | | | | | | | | | | | | | | |
| | 202,276,244 | | | | 167,075,787 | | | | (37,942,796 | ) | | | (51,215,075 | ) | | | 14,177,292 | | | | 4,943,851 | |
| | | | | | | | | | | | | | | | | | | | | | |
| | | | | | | | | | | | | | | | | | | | | | |
| | — | | | | — | | | | 7,200,668 | | | | — | | | | — | | | | — | |
| | — | | | | — | | | | (171,419 | ) | | | — | | | | — | | | | — | |
| | | | | | | | | | | | | | | | | | | | | | |
| | — | | | | — | | | | 7,029,249 | | | | — | | | | — | | | | — | |
| | | | | | | | | | | | | | | | | | | | | | |
| | 526,798,971 | | | | 187,895,140 | | | | 4,172,084 | | | | (42,170,040 | ) | | | 20,578,088 | | | | 4,540,359 | |
| | | | | |
| | | | | | | | | | | | | | | | | | | | | | |
| | 1,297,982,328 | | | | 1,110,087,188 | | | | 169,401,450 | | | | 211,571,490 | | | | 24,057,334 | | | | 19,516,975 | |
| | | | | | | | | | | | | | | | | | | | | | |
| $ | 1,824,781,299 | | | $ | 1,297,982,328 | | | $ | 173,573,534 | | | $ | 169,401,450 | | | $ | 44,635,422 | | | $ | 24,057,334 | |
| | | | | | | | | | | | | | | | | | | | | | |
$ | (8,456,437 | ) | | $ | 181,495 | | | $ | (940,614 | ) | | $ | (30,245 | ) | | $ | (218,387 | ) | | $ | (65,100 | ) |
| | | | | | | | | | | | | | | | | | | | | | |
| | | | | |
| | | | | | | | | | | | | | | | | | | | | | |
| | | | | | | | | | | | | | | | | | | | | | |
| | 10,467,614 | | | | 12,035,701 | | | | 2,544,182 | | | | 6,163,122 | | | | 3,066,868 | | | | 1,499,462 | |
| | 1,599,772 | | | | — | | | | — | | | | — | | | | 96,411 | | | | 90,253 | |
| | (7,122,232 | ) | | | (7,765,020 | ) | | | (13,060,631 | ) | | | (20,529,110 | ) | | | (1,543,697 | ) | | | (1,009,685 | ) |
| | | | | | | | | | | | | | | | | | | | | | |
| | 4,945,154 | | | | 4,270,681 | | | | (10,516,449 | ) | | | (14,365,988 | ) | | | 1,619,582 | | | | 580,030 | |
| | | | | | | | | | | | | | | | | | | | | | |
| | | | | | | | | | | | | | | | | | | | | | |
| | — | | | | — | | | | 1,943,378 | | | | — | | | | — | | | | — | |
| | — | | | | — | | | | (44,834 | ) | | | — | | | | — | | | | — | |
| | | | | | | | | | | | | | | | | | | | | | |
| | — | | | | — | | | | 1,898,544 | | | | — | | | | — | | | | — | |
| | | | | | | | | | | | | | | | | | | | | | |
107
| | |
| WASATCH FUNDS — Statements of Changes in Net Assets (continued) | | |
|
|
|
| | | | | | | | | | | | | | | | |
| | | ULTRA GROWTH FUND | | | WORLD INNOVATORS FUND | |
| | | Year Ended
September 30, 2012 | | | Year Ended
September 30, 2011 | | | Year Ended
September 30, 2012 | | | Year Ended
September 30, 2011 | |
| | | | | | | | | | | | | | | | |
Operations: | | | | | | | | | | | | | | | | |
Net investment income (loss) | | $ | (510,312 | ) | | $ | (961,454 | ) | | $ | (1,133,768 | ) | | $ | (623,127 | ) |
Net realized gain on investments and foreign currency translations | | | 16,871,948 | | | | 47,278,810 | | | | 8,025,638 | | | | 11,934,101 | |
Net realized loss on options | | | — | | | | — | | | | (33,758 | ) | | | — | |
Net realized gain on short positions | | | — | | | | — | | | | — | | | | 1,201 | |
Change in unrealized appreciation (depreciation) on
investments, options written, foreign currency translations and deferred capital gains taxes | | | 9,955,835 | | | | (34,096,952 | ) | | | 16,559,256 | | | | (6,461,019 | ) |
| | | | | | | | | | | | | | | | |
Net increase in net assets resulting from operations | | | 26,317,471 | | | | 12,220,404 | | | | 23,417,368 | | | | 4,851,156 | |
| | | | |
Dividends paid from: | | | | | | | | | | | | | | | | |
Investor Class | | | | | | | | | | | | | | | | |
Net investment income | | | — | | | | — | | | | — | | | | — | |
Net realized gains | | | (7,674,675 | ) | | | — | | | | — | | | | — | |
| | | | | | | | | | | | | | | | |
| | | (7,674,675 | ) | | | — | | | | — | | | | — | |
| | | | |
Capital share transactions: | | | | | | | | | | | | | | | | |
Investor Class | | | | | | | | | | | | | | | | |
Shares sold | | | 12,295,837 | | | | 52,244,137 | | | | 91,278,636 | | | | 16,841,982 | |
Shares issued to holders in reinvestment of dividends | | | 7,457,542 | | | | — | | | | — | | | | — | |
Shares redeemed | | | (29,345,914 | ) | | | (108,860,106 | ) | | | (19,268,178 | ) | | | (14,984,425 | ) |
Redemption fees | | | 5,828 | | | | 32,578 | | | | 13,117 | | | | 17,318 | |
| | | | | | | | | | | | | | | | |
Net increase (decrease) | | | (9,586,707 | ) | | | (56,583,391 | ) | | | 72,023,575 | | | | 1,874,875 | |
| | | | | | | | | | | | | | | | |
Total increase (decrease) in net assets | | | 9,056,089 | | | | (44,362,987 | ) | | | 95,440,943 | | | | 6,726,031 | |
| | | | |
Net assets: | | | | | | | | | | | | | | | | |
Beginning of period | | | 134,202,594 | | | | 178,565,581 | | | | 72,492,967 | | | | 65,766,936 | |
| | | | | | | | | | | | | | | | |
End of period | | $ | 143,258,683 | | | $ | 134,202,594 | | | $ | 167,933,910 | | | $ | 72,492,967 | |
| | | | | | | | | | | | | | | | |
Undistributed net investment income (loss) included in net assets at end of period | | $ | 142,969 | | | $ | 312,586 | | | $ | (1,075,802 | ) | | $ | (23,124 | ) |
| | | | | | | | | | | | | | | | |
| | | | |
Capital share transactions — shares: | | | | | | | | | | | | | | | | |
Investor Class | | | | | | | | | | | | | | | | |
Shares sold | | | 570,461 | | | | 2,402,075 | | | | 5,247,433 | | | | 1,075,228 | |
Shares issued to holders in reinvestment of dividends | | | 368,820 | | | | — | | | | — | | | | — | |
Shares redeemed | | | (1,339,149 | ) | | | (4,747,763 | ) | | | (1,125,535 | ) | | | (962,741 | ) |
| | | | | | | | | | | | | | | | |
Net increase (decrease) in shares outstanding | | | (399,868 | ) | | | (2,345,688 | ) | | | 4,121,898 | | | | 112,487 | |
| | | | | | | | | | | | | | | | |
See Notes to Financial Statements.
108
| | | | | | | | | | | | | | | | | | |
INCOME
FUND | | | U.S. TREASURY
FUND | | | | | |
Year Ended
September 30, 2012 | | | Year Ended
September 30, 2011 | | | Year Ended
September 30, 2012 | | | Year Ended
September 30, 2011 | | | | | |
| | | | | | | | | | | | | | | | | | |
| | | | | | | | | | | | | | | | | | |
| $ | 2,792,946 | | | $ | 3,218,588 | | | $ | 5,618,314 | | | $ | 5,592,630 | | | | | |
| | | | | |
| | 642,885 | | | | 1,612,886 | | | | 5,092,087 | | | | 8,827,015 | | | | | |
| | — | | | | — | | | | — | | | | — | | | | | |
| | — | | | | — | | | | — | | | | — | | | | | |
| | | | | |
| | 1,042,565 | | | | (2,067,301 | ) | | | 5,530,925 | | | | 19,561,036 | | | | | |
| | | | | | | | | | | | | | | | | | |
| | 4,478,396 | | | | 2,764,173 | | | | 16,241,326 | | | | 33,980,681 | | | | | |
| | | | | |
| | | | | | | | | | | | | | | | | | |
| | | | | | | | | | | | | | | | | | |
| | (2,775,995 | ) | | | (3,218,058 | ) | | | (5,618,367 | ) | | | (5,596,881 | ) | | | | |
| | — | | | | — | | | | (9,334,135 | ) | | | (10,250,028 | ) | | | | |
| | | | | | | | | | | | | | | | | | |
| | (2,775,995 | ) | | | (3,218,058 | ) | | | (14,952,502 | ) | | | (15,846,909 | ) | | | | |
| | | | | |
| | | | | | | | | | | | | | | | | | |
| | | | | | | | | | | | | | | | | | |
| | 48,029,640 | | | | 43,348,706 | | | | 202,065,443 | | | | 75,135,021 | | | | | |
| | 2,287,850 | | | | 2,645,734 | | | | 13,752,669 | | | | 14,324,462 | | | | | |
| | (48,462,084 | ) | | | (48,023,388 | ) | | | (133,158,322 | ) | | | (121,243,175 | ) | | | | |
| | 11,497 | | | | 4,599 | | | | 177,952 | | | | 163,643 | | | | | |
| | | | | | | | | | | | | | | | | | |
| | 1,866,903 | | | | (2,024,349 | ) | | | 82,837,742 | | | | (31,620,049 | ) | | | | |
| | | | | | | | | | | | | | | | | | |
| | 3,569,304 | | | | (2,478,234 | ) | | | 84,126,566 | | | | (13,486,277 | ) | | | | |
| | | | | |
| | | | | | | | | | | | | | | | | | |
| | 135,616,875 | | | | 138,095,109 | | | | 187,368,304 | | | | 200,854,581 | | | | | |
| | | | | | | | | | | | | | | | | | |
| $ | 139,186,179 | | | $ | 135,616,875 | | | $ | 271,494,870 | | | $ | 187,368,304 | | | | | |
| | | | | | | | | | | | | | | | | | |
| | | | | |
| $ | 36,983 | | | $ | 257,770 | | | $ | 12,047 | | | $ | 12,100 | | | | | |
| | | | | | | | | | | | | | | | | | |
| | | | | |
| | | | | | | | | | | | | | | | | | |
| | | | | | | | | | | | | | | | | | |
| | 4,642,038 | | | | 4,228,888 | | | | 11,006,306 | | | | 5,167,394 | | | | | |
| | 221,079 | | | | 258,544 | | | | 754,268 | | | | 1,036,188 | | | | | |
| | (4,677,451 | ) | | | (4,695,493 | ) | | | (7,277,900 | ) | | | (7,910,147 | ) | | | | |
| | | | | | | | | | | | | | | | | | |
| | 185,666 | | | | (208,061 | ) | | | 4,482,674 | | | | (1,706,565 | ) | | | | |
| | | | | | | | | | | | | | | | | | |
109
| | |
| WASATCH FUNDS — Financial Highlights | | |
|
|
|
| | | | | | | | | | | | | | | | | | | | | | | | | | | | | | | | |
| | | | | | Income (Loss) from
Investment Operations | | | | | | | | | Less Distributions | | | | |
| | | Net Asset
Value
Beginning
of Period | | | Net
Investment
Income (Loss) | | | Net Realized
and Unrealized
Gains (Losses)
on Investments | | | Total from
Investment
Operations | | | Redemption
Fees
(See Note 2) | | | Dividends
from Net
Investment
Income | | | Distributions
from Net
Realized
Gains | | | Total
Distributions | |
Core Growth Fund — Investor Class | | | | | | | | | | | | | | | | | | | | | | | | | | | | | | | | |
Year ended 9/30/12 | | $ | 32.63 | | | | (0.26 | ) | | | 9.04 | | | | 8.78 | | | | — | 4 | | | — | | | | — | | | | — | |
Year ended 9/30/11 | | $ | 29.95 | | | | (0.19 | ) | | | 2.87 | | | | 2.68 | | | | — | 4 | | | — | | | | — | | | | — | |
Year ended 9/30/10 | | $ | 25.88 | | | | 0.03 | | | | 4.05 | | | | 4.08 | | | | — | 4 | | | (0.01 | ) | | | — | | | | (0.01 | ) |
Year ended 9/30/09 | | $ | 26.38 | | | | — | 4 | | | (0.23 | ) | | | (0.23 | ) | | | — | 4 | | | (0.27 | ) | | | — | | | | (0.27 | ) |
Year ended 9/30/08 | | $ | 42.98 | | | | 0.19 | | | | (8.98 | ) | | | (8.79 | ) | | | — | 4 | | | — | | | | (7.81 | ) | | | (7.81 | ) |
Core Growth Fund — Institutional Class | | | | | | | | | | | | | | | | | | | | | | | | | | | | | | | | |
Period ended 9/30/129 | | $ | 38.32 | | | | (0.16 | ) | | | 3.28 | | | | 3.12 | | | | — | | | | — | | | | — | | | | — | |
Emerging India Fund | | | | | | | | | | | | | | | | | | | | | | | | | | | | | | | | |
Year ended 9/30/12 | | $ | 1.83 | | | | (0.01 | ) | | | 0.21 | | | | 0.20 | | | | — | 4 | | | (0.01 | ) | | | — | | | | (0.01 | ) |
Period ended 9/30/1111 | | $ | 2.00 | | | | — | 4 | | | (0.17 | ) | | | (0.17 | ) | | | — | 4 | | | — | | | | — | | | | — | |
Emerging Markets Small Cap Fund | | | | | | | | | | | | | | | | | | | | | | | | | | | | | | | | |
Year ended 9/30/12 | | $ | 2.16 | | | | 0.01 | | | | 0.49 | | | | 0.50 | | | | — | 4 | | | — | | | | — | | | | — | |
Year ended 9/30/11 | | $ | 2.37 | | | | — | 4 | | | (0.21 | ) | | | (0.21 | ) | | | — | 4 | | | — | 4 | | | — | | | | — | 4 |
Year ended 9/30/10 | | $ | 1.57 | | | | 0.01 | | | | 0.80 | | | | 0.81 | | | | — | 4 | | | (0.01 | ) | | | — | | | | (0.01 | ) |
Year ended 9/30/09 | | $ | 1.24 | | | | — | 4 | | | 0.33 | | | | 0.33 | | | | — | 4 | | | — | 4 | | | — | | | | — | 4 |
Period ended 9/30/088 | | $ | 2.00 | | | | — | | | | (0.76 | ) | | | (0.76 | ) | | | — | 4 | | | — | 4 | | | — | | | | — | 4 |
Frontier Emerging Small Countries Fund | | | | | | | | | | | | | | | | | | | | | | | | | | | | | | | | |
Period ended 9/30/1210 | | $ | 2.00 | | | | 0.01 | | | | 0.40 | | | | 0.41 | | | | — | 4 | | | — | | | | — | | | | — | |
Global Opportunities Fund | | | | | | | | | | | | | | | | | | | | | | | | | | | | | | | | |
Year ended 9/30/12 | | $ | 3.68 | | | | (0.03 | ) | | | 0.93 | | | | 0.90 | | | | — | 4 | | | — | | | | (0.43 | ) | | | (0.43 | ) |
Year ended 9/30/11 | | $ | 3.97 | | | | (0.02 | ) | | | (0.13 | ) | | | (0.15 | ) | | | — | 4 | | | — | | | | (0.14 | ) | | | (0.14 | ) |
Year ended 9/30/10 | | $ | 3.38 | | | | (0.02 | ) | | | 0.70 | | | | 0.68 | | | | — | 4 | | | (0.01 | ) | | | (0.08 | ) | | | (0.09 | ) |
Period ended 9/30/0914 | | $ | 2.00 | | | | (0.01 | ) | | | 1.39 | | | | 1.38 | | | | — | 4 | | | — | | | | — | | | | — | |
Heritage Growth Fund | | | | | | | | | | | | | | | | | | | | | | | | | | | | | | | | |
Year ended 9/30/12 | | $ | 10.83 | | | | (0.03 | ) | | | 2.16 | | | | 2.13 | | | | — | 4 | | | (0.02 | ) | | | (0.14 | ) | | | (0.16 | ) |
Year ended 9/30/11 | | $ | 10.70 | | | | — | 4 | | | 0.22 | | | | 0.22 | | | | — | 4 | | | (0.09 | ) | | | — | | | | (0.09 | ) |
Year ended 9/30/10 | | $ | 9.28 | | | | 0.09 | | | | 1.39 | | | | 1.48 | | | | — | 4 | | | (0.06 | ) | | | — | | | | (0.06 | ) |
Year ended 9/30/09 | | $ | 9.00 | | | | 0.06 | | | | 0.26 | | | | 0.32 | | | | — | 4 | | | (0.02 | ) | | | (0.02 | ) | | | (0.04 | ) |
Year ended 9/30/08 | | $ | 12.57 | | | | 0.06 | | | | (2.57 | ) | | | (2.51 | ) | | | — | 4 | | | — | | | | (1.06 | ) | | | (1.06 | ) |
International Growth Fund | | | | | | | | | | | | | | | | | | | | | | | | | | | | | | | | |
Year ended 9/30/12 | | $ | 17.21 | | | | 0.09 | | | | 5.14 | | | | 5.23 | | | | — | 4 | | | — | | | | — | | | | — | |
Year ended 9/30/11 | | $ | 18.66 | | | | — | 4 | | | (1.46 | ) | | | (1.46 | ) | | | 0.01 | | | | — | | | | — | | | | — | |
Year ended 9/30/10 | | $ | 13.91 | | | | 0.02 | | | | 4.73 | | | | 4.75 | | | | — | 4 | | | — | | | | — | | | | — | |
Year ended 9/30/09 | | $ | 11.83 | | | | (0.13 | ) | | | 2.24 | | | | 2.11 | | | | — | 4 | | | (0.03 | ) | | | — | | | | (0.03 | ) |
Year ended 9/30/08 | | $ | 24.42 | | | | (0.28 | ) | | | (9.19 | ) | | | (9.47 | ) | | | — | 4 | | | (0.68 | ) | | | (2.44 | ) | | | (3.12 | ) |
International Opportunities Fund | | | | | | | | | | | | | | | | | | | | | | | | | | | | | | | | |
Year ended 9/30/12 | | $ | 2.24 | | | | — | 4 | | | 0.44 | | | | 0.44 | | | | — | 4 | | | — | | | | (0.27 | ) | | | (0.27 | ) |
Year ended 9/30/11 | | $ | 2.57 | | | | (0.01 | ) | | | (0.25 | ) | | | (0.26 | ) | | | — | 4 | | | — | | | | (0.07 | ) | | | (0.07 | ) |
Year ended 9/30/10 | | $ | 1.97 | | | | (0.01 | ) | | | 0.63 | | | | 0.62 | | | | — | 4 | | | (0.02 | ) | | | — | | | | (0.02 | ) |
Year ended 9/30/09 | | $ | 1.60 | | | | 0.01 | | | | 0.36 | | | | 0.37 | | | | — | 4 | | | — | 4 | | | — | | | | — | |
Year ended 9/30/08 | | $ | 3.65 | | | | 0.07 | | | | (1.45 | ) | | | (1.38 | ) | | | — | 4 | | | (0.14 | ) | | | (0.53 | ) | | | (0.67 | ) |
Large Cap Value Fund — Investor Class | | | | | | | | | | | | | | | | | | | | | | | | | | | | | | | | |
Year ended 9/30/12 | | $ | 11.85 | | | | 0.20 | | | | 2.46 | | | | 2.66 | | | | — | 4 | | | (0.20 | ) | | | — | | | | (0.20 | ) |
Year ended 9/30/11 | | $ | 12.64 | | | | 0.17 | | | | (0.79 | ) | | | (0.62 | ) | | | — | 4 | | | (0.17 | ) | | | — | | | | (0.17 | ) |
Year ended 9/30/10 | | $ | 11.97 | | | | 0.17 | | | | 0.67 | | | | 0.84 | | | | — | 4 | | | (0.17 | ) | | | — | | | | (0.17 | ) |
Year ended 9/30/09 | | $ | 12.93 | | | | 0.20 | | | | (0.96 | ) | | | (0.76 | ) | | | — | 4 | | | (0.20 | ) | | | — | | | | (0.20 | ) |
Period ended 9/30/0815 | | $ | 14.44 | | | | 0.14 | 16 | | | (1.52 | ) | | | (1.38 | ) | | | — | | | | (0.13 | ) | | | — | | | | (0.13 | ) |
Year ended 3/31/08 | | $ | 14.80 | | | | 0.21 | | | | 0.31 | | | | 0.52 | | | | — | | | | (0.21 | ) | | | (0.67 | ) | | | (0.88 | ) |
Large Cap Value Fund — Institutional Class | | | | | | | | | | | | | | | | | | | | | | | | | | | | | | | | |
Period ended 9/30/129 | | $ | 13.77 | | | | 0.12 | | | | 0.57 | | | | 0.69 | | | | — | 4 | | | (0.15 | ) | | | — | | | | (0.15 | ) |
Long/Short Fund | | | | | | | | | | | | | | | | | | | | | | | | | | | | | | | | |
Year ended 9/30/12 | | $ | 11.85 | | | | (0.02 | ) | | | 1.83 | | | | 1.81 | | | | — | 4 | | | — | | | | — | | | | — | |
Year ended 9/30/11 | | $ | 11.74 | | | | (0.04 | ) | | | 0.16 | | | | 0.12 | | | | — | 4 | | | (0.01 | ) | | | — | | | | (0.01 | ) |
Year ended 9/30/10 | | $ | 11.13 | | | | (0.01 | ) | | | 0.62 | | | | 0.61 | | | | — | 4 | | | — | 4 | | | — | | | | — | 4 |
Year ended 9/30/09 | | $ | 10.81 | | | | 0.02 | | | | 0.50 | | | | 0.52 | | | | — | 4 | | | (0.05 | ) | | | (0.15 | ) | | | (0.20 | ) |
Period ended 9/30/0815 | | $ | 11.27 | | | | 0.05 | 16 | | | (0.46 | ) | | | (0.41 | ) | | | — | | | | (0.05 | ) | | | — | | | | (0.05 | ) |
Year ended 3/31/08 | | $ | 11.59 | | | | 0.27 | | | | 0.02 | | | | 0.29 | | | | — | | | | (0.28 | ) | | | (0.33 | ) | | | (0.61 | ) |
See Notes to Financial Highlights and Notes to Financial Statements.
110
| | |
| | (for a share outstanding throughout each period) |
|
|
|
| | | | | | | | | | | | | | | | | | | | | | | | | | | | | | |
| | | |
| | | | | | | Ratios to Average Net Assets | | | Supplemental Data | |
Net Asset
Value
End of
Period | | | Total Return (%)1 | | | Expenses Net of Waivers and
Reimbursements (%)2 | | | Expenses Before Waivers and
Reimbursements (%)2 | | | Net Investment
Income Net of
Waivers and
Reimbursements (%)2 | | | Net Investment
Income Before
Waivers and
Reimbursements (%)2 | | | Net Assets
End of
Period
(000’s) | | | Portfolio
Turnover
Rate1 3 | |
| | | | | | | | | | | | | | | | | | | | | | | | | | | | | | |
| $ | 41.41 | | | | 26.91 | | | | 1.23 | 5 | | | 1.23 | 5 | | | (0.70 | ) | | | (0.70 | ) | | $ | 581,371 | | | | 28% | |
| $ | 32.63 | | | | 8.95 | | | | 1.22 | | | | 1.22 | | | | (0.57 | ) | | | (0.57 | ) | | $ | 433,294 | | | | 27% | |
| $ | 29.95 | | | | 15.75 | | | | 1.29 | 12 | | | 1.29 | 12 | | | 0.02 | | | | 0.02 | | | $ | 418,642 | | | | 19% | |
| $ | 25.88 | | | | (0.45 | ) | | | 1.34 | | | | 1.34 | | | | 0.24 | | | | 0.24 | | | $ | 409,949 | | | | 30% | |
| $ | 26.38 | | | | (24.82 | ) | | | 1.21 | | | | 1.21 | | | | 0.52 | | | | 0.52 | | | $ | 645,769 | | | | 44% | |
| | | | | | | | | | | | | | | | | | | | | | | | | | | | | | |
| $ | 41.44 | | | | 8.14 | | | | 1.12 | 5 | | | 1.55 | 5 | | | (0.62 | ) | | | (1.05 | ) | | $ | 9,101 | | | | 28% | |
| | | | | | | | | | | | | | | | | | | | | | | | | | | | | | |
| $ | 2.02 | | | | 11.42 | | | | 1.95 | 5 | | | 3.41 | 5 | | | (0.65 | ) | | | (2.11 | ) | | $ | 13,658 | | | | 17% | |
| $ | 1.83 | | | | (8.50 | ) | | | 1.95 | | | | 4.85 | | | | (0.07 | ) | | | (2.97 | ) | | $ | 10,580 | | | | 2% | |
| | | | | | | | | | | | | | | | | | | | | | | | | | | | | | |
| $ | 2.66 | | | | 23.15 | | | | 1.95 | 5 | | | 2.13 | 5 | | | 0.29 | | | | 0.11 | | | $ | 1,482,265 | | | | 39% | |
| $ | 2.16 | | | | (8.85 | ) | | | 1.96 | | | | 2.19 | | | | 0.22 | | | | (0.01 | ) | | $ | 774,198 | | | | 48% | |
| $ | 2.37 | | | | 51.69 | | | | 2.06 | 13 | | | 2.39 | 13 | | | 0.82 | | | | 0.49 | | | $ | 446,751 | | | | 23% | |
| $ | 1.57 | | | | 26.80 | | | | 2.10 | | | | 3.03 | | | | 0.12 | | | | (0.81 | ) | | $ | 50,489 | | | | 78% | |
| $ | 1.24 | | | | (37.88 | ) | | | 2.10 | | | | 2.67 | | | | 0.27 | | | | (0.29 | ) | | $ | 36,176 | | | | 38% | |
| | | | | | | | | | | | | | | | | | | | | | | | | | | | | | |
| $ | 2.41 | | | | 20.50 | | | | 2.25 | 5 | | | 3.64 | 5 | | | 1.31 | | | | (0.08 | ) | | $ | 33,045 | | | | 5% | |
| | | | | | | | | | | | | | | | | | | | | | | | | | | | | | |
| $ | 4.15 | | | | 26.69 | | | | 1.84 | 5 | | | 1.84 | 5 | | | (0.61 | ) | | | (0.61 | ) | | $ | 153,582 | | | | 38% | |
| $ | 3.68 | | | | (4.21 | ) | | | 1.94 | | | | 1.94 | | | | (0.41 | ) | | | (0.41 | ) | | $ | 199,855 | | | | 59% | |
| $ | 3.97 | | | | 20.41 | | | | 2.25 | 13 | | | 2.33 | 13 | | | (0.73 | ) | | | (0.81 | ) | | $ | 234,904 | | | | 23% | |
| $ | 3.38 | | | | 69.00 | | | | 2.25 | | | | 2.61 | | | | (0.67 | ) | | | (1.03 | ) | | $ | 117,385 | | | | 22% | |
| | | | | | | | | | | | | | | | | | | | | | | | | | | | | | |
| $ | 12.80 | | | | 19.76 | | | | 0.95 | 5 | | | 1.03 | 5 | | | (0.28 | ) | | | (0.37 | ) | | $ | 111,952 | | | | 26% | |
| $ | 10.83 | | | | 2.01 | | | | 0.95 | | | | 1.04 | | | | (0.02 | ) | | | (0.11 | ) | | $ | 72,561 | | | | 35% | |
| $ | 10.70 | | | | 16.06 | | | | 0.96 | 12 | | | 1.11 | 12 | | | 0.81 | | | | 0.66 | | | $ | 78,274 | | | | 36% | |
| $ | 9.28 | | | | 3.74 | | | | 0.95 | | | | 1.21 | | | | 0.74 | | | | 0.48 | | | $ | 77,194 | | | | 33% | |
| $ | 9.00 | | | | (21.54 | ) | | | 0.95 | | | | 1.01 | | | | 0.44 | | | | 0.38 | | | $ | 95,414 | | | | 48% | |
| | | | | | | | | | | | | | | | | | | | | | | | | | | | | | |
| $ | 22.44 | | | | 30.39 | | | | 1.57 | 6 | | | 1.57 | 6 | | | 0.51 | | | | 0.51 | | | $ | 434,824 | | | | 44% | |
| $ | 17.21 | | | | (7.77 | ) | | | 1.66 | | | | 1.66 | | | | (0.01 | ) | | | (0.01 | ) | | $ | 281,481 | | | | 70% | |
| $ | 18.66 | | | | 34.15 | | | | 1.86 | 13 | | | 1.86 | 13 | | | 0.10 | | | | 0.10 | | | $ | 285,446 | | | | 44% | |
| $ | 13.91 | | | | 18.03 | | | | 1.94 | | | | 1.94 | | | | 0.03 | | | | 0.03 | | | $ | 173,226 | | | | 56% | |
| $ | 11.83 | | | | (44.01 | ) | | | 1.83 | | | | 1.83 | | | | (0.15 | ) | | | (0.15 | ) | | $ | 194,780 | | | | 44% | |
| | | | | | | | | | | | | | | | | | | | | | | | | | | | | | |
| $ | 2.41 | | | | 22.33 | | | | 2.25 | 5 | | | 2.48 | 5 | | | (0.16 | ) | | | (0.39 | ) | | $ | 194,563 | | | | 41% | |
| $ | 2.24 | | | | (10.49 | ) | | | 2.25 | | | | 2.55 | | | | (0.58 | ) | | | (0.88 | ) | | $ | 151,569 | | | | 108% | |
| $ | 2.57 | | | | 31.71 | | | | 2.26 | 12 | | | 2.62 | 12 | | | (0.60 | ) | | | (0.96 | ) | | $ | 152,178 | | | | 51% | |
| $ | 1.97 | | | | 23.60 | | | | 2.26 | 6 | | | 2.79 | 6 | | | (0.28 | ) | | | (0.81 | ) | | $ | 93,856 | | | | 69% | |
| $ | 1.60 | | | | (45.33 | ) | | | 2.25 | | | | 2.59 | | | | (0.09 | ) | | | (0.43 | ) | | $ | 55,691 | | | | 63% | |
| | | | | | | | | | | | | | | | | | | | | | | | | | | | | | |
| $ | 14.31 | | | | 22.50 | | | | 1.10 | 5 | | | 1.15 | 5 | | | 1.42 | | | | 1.37 | | | $ | 1,298,365 | | | | 14% | |
| $ | 11.85 | | | | (5.08 | ) | | | 1.10 | | | | 1.11 | | | | 1.24 | | | | 1.23 | | | $ | 1,546,471 | | | | 26% | |
| $ | 12.64 | | | | 7.07 | | | | 1.11 | 12 | | | 1.14 | 12 | | | 1.36 | | | | 1.33 | | | $ | 1,621,113 | | | | 17% | |
| $ | 11.97 | | | | (5.63 | ) | | | 1.10 | | | | 1.22 | | | | 1.93 | | | | 1.81 | | | $ | 1,385,508 | | | | 16% | |
| $ | 12.93 | | | | (9.65 | ) | | | 1.04 | | | | 1.29 | | | | 1.99 | | | | 1.74 | | | $ | 780,384 | | | | 5% | |
| $ | 14.44 | | | | 3.22 | | | | 1.13 | | | | 1.38 | | | | 1.43 | | | | 1.18 | | | $ | 447,674 | | | | 36% | |
| | | | | | | | | | | | | | | | | | | | | | | | | | | | | | |
| $ | 14.31 | | | | 5.02 | | | | 0.98 | 5 | | | 1.31 | 5 | | | 1.44 | | | | 1.11 | | | $ | 15,511 | | | | 14% | |
| | | | | | | | | | | | | | | | | | | | | | | | | | | | | | |
| $ | 13.66 | | | | 15.27 | | | | 1.51 | 7 | | | 1.51 | 7 | | | (0.20 | ) | | | (0.20 | ) | | $ | 1,537,220 | | | | 71% | |
| $ | 11.85 | | | | 0.98 | | | | 1.63 | 7 | | | 1.63 | 7 | | | (0.44 | ) | | | (0.44 | ) | | $ | 833,298 | | | | 82% | |
| $ | 11.74 | | | | 5.52 | | | | 1.71 | 13 7 | | | 1.71 | 13 7 | | | 0.03 | | | | 0.03 | | | $ | 300,255 | | | | 60% | |
| $ | 11.13 | | | | 5.35 | | | | 1.91 | 7 | | | 1.96 | 7 | | | 0.24 | | | | 0.19 | | | $ | 146,127 | | | | 167% | |
| $ | 10.81 | | | | (3.66 | ) | | | 1.77 | 7 | | | 2.02 | 7 | | | 0.95 | | | | 0.70 | | | $ | 122,114 | | | | 71% | |
| $ | 11.27 | | | | 2.34 | | | | 1.75 | 7 | | | 2.00 | 7 | | | 2.25 | | | | 2.00 | | | $ | 87,410 | | | | 179% | |
111
| | |
| WASATCH FUNDS — Financial Highlights (continued) | | |
|
|
|
| | | | | | | | | | | | | | | | | | | | | | | | | | | | | | | | |
| | | | | | Income (Loss) from
Investment Operations | | | | | | | | | Less Distributions | | | | |
| | | Net Asset
Value
Beginning
of Period | | | Net
Investment
Income (Loss) | | | Net Realized
and Unrealized
Gains (Losses)
on Investments | | | Total from
Investment
Operations | | | Redemption
Fees
(See Note 2) | | | Dividends
from Net
Investment
Income | | | Distributions
from Net
Realized
Gains | | | Total
Distributions | |
Micro Cap Fund | | | | | | | | | | | | | | | | | | | | | | | | | | | | | | | | |
Year ended 9/30/12 | | $ | 4.40 | | | | (0.09 | ) | | | 1.40 | | | | 1.31 | | | | — | 4 | | | — | | | | — | | | | — | |
Year ended 9/30/11 | | $ | 4.44 | | | | (0.06 | ) | | | 0.02 | | | | (0.04 | ) | | | — | 4 | | | — | | | | — | | | | — | |
Year ended 9/30/10 | | $ | 3.89 | | | | (0.05 | ) | | | 0.60 | | | | 0.55 | | | | — | 4 | | | — | | | | — | | | | — | |
Year ended 9/30/09 | | $ | 4.14 | | | | (0.03 | ) | | | (0.21 | ) | | | (0.24 | ) | | | — | 4 | | | (0.01 | ) | | | — | | | | (0.01 | ) |
Year ended 9/30/08 | | $ | 7.19 | | | | (0.07 | ) | | | (1.81 | ) | | | (1.88 | ) | | | — | 4 | | | — | | | | (1.17 | ) | | | (1.17 | ) |
Micro Cap Value Fund | | | | | | | | | | | | | | | | | | | | | | | | | | | | | | | | |
Year ended 9/30/12 | | $ | 2.24 | | | | (0.04 | ) | | | 0.65 | | | | 0.61 | | | | — | 4 | | | — | | | | — | | | | — | |
Year ended 9/30/11 | | $ | 2.38 | | | | (0.04 | ) | | | (0.10 | ) | | | (0.14 | ) | | | — | 4 | | | — | | | | — | | | | — | |
Year ended 9/30/10 | | $ | 2.11 | | | | (0.02 | ) | | | 0.30 | | | | 0.28 | | | | — | 4 | | | (0.01 | ) | | | — | | | | (0.01 | ) |
Year ended 9/30/09 | | $ | 1.80 | | | | (0.02 | ) | | | 0.33 | | | | 0.31 | | | | — | 4 | | | — | | | | — | | | | — | |
Year ended 9/30/08 | | $ | 2.98 | | | | (0.02 | ) | | | (0.75 | ) | | | (0.77 | ) | | | — | 4 | | | — | | | | (0.41 | ) | | | (0.41 | ) |
Small Cap Growth Fund | | | | | | | | | | | | | | | | | | | | | | | | | | | | | | | | |
Year ended 9/30/12 | | $ | 35.37 | | | | (0.29 | ) | | | 10.40 | | | | 10.11 | | | | — | 4 | | | — | | | | (1.66 | ) | | | (1.66 | ) |
Year ended 9/30/11 | | $ | 34.24 | | | | (0.13 | ) | | | 1.26 | | | | 1.13 | | | | — | 4 | | | — | | | | — | | | | — | |
Year ended 9/30/10 | | $ | 28.59 | | | | (0.22 | ) | | | 5.87 | | | | 5.65 | | | | — | 4 | | | — | | | | — | | | | — | |
Year ended 9/30/09 | | $ | 26.50 | | | | (0.12 | ) | | | 2.27 | | | | 2.15 | | | | — | 4 | | | — | | | | (0.06 | ) | | | (0.06 | ) |
Year ended 9/30/08 | | $ | 40.10 | | | | (0.16 | ) | | | (8.85 | ) | | | (9.01 | ) | | | — | 4 | | | — | | | | (4.59 | ) | | | (4.59 | ) |
Small Cap Value Fund — Investor Class | | | | | | | | | | | | | | | | | | | | | | | | | | | | | |
Year ended 9/30/12 | | $ | 3.12 | | | | (0.03 | ) | | | 0.72 | | | | 0.69 | | | | — | 4 | | | — | | | | — | | | | — | |
Year ended 9/30/11 | | $ | 3.08 | | | | (0.02 | ) | | | 0.06 | | | | 0.04 | | | | — | 4 | | | — | | | | — | | | | — | |
Year ended 9/30/10 | | $ | 2.75 | | | | (0.01 | ) | | | 0.34 | | | | 0.33 | | | | — | 4 | | | — | | | | — | | | | — | |
Year ended 9/30/09 | | $ | 2.82 | | | | (0.01 | ) | | | (0.06 | ) | | | (0.07 | ) | | | — | 4 | | | — | | | | — | | | | — | |
Year ended 9/30/08 | | $ | 5.22 | | | | 0.01 | | | | (1.11 | ) | | | (1.10 | ) | | | — | 4 | | | (0.01 | ) | | | (1.29 | ) | | | (1.30 | ) |
Small Cap Value Fund — Institutional Class | | | | | | | | | | | | | | | | | | | | | | | | | | | | | |
Period ended 9/30/129 | | $ | 3.68 | | | | (0.01 | ) | | | 0.15 | | | | 0.14 | | | | — | | | | — | | | | — | | | | — | |
Strategic Income Fund | | | | | | | | | | | | | | | | | | | | | | | | | | | | | | | | |
Year ended 9/30/12 | | $ | 7.57 | | | | 0.16 | | | | 1.77 | | | | 1.93 | | | | — | 4 | | | (0.20 | ) | | | — | | | | (0.20 | ) |
Year ended 9/30/11 | | $ | 7.51 | | | | 0.25 | | | | 0.06 | | | | 0.31 | | | | — | 4 | | | (0.25 | ) | | | — | | | | (0.25 | ) |
Year ended 9/30/10 | | $ | 6.77 | | | | 0.31 | | | | 0.70 | | | | 1.01 | | | | — | 4 | | | (0.27 | ) | | | — | | | | (0.27 | ) |
Year ended 9/30/09 | | $ | 7.62 | | | | 0.29 | | | | (0.85 | ) | | | (0.56 | ) | | | — | 4 | | | (0.29 | ) | | | — | | | | (0.29 | ) |
Year ended 9/30/08 | | $ | 11.00 | | | | 0.55 | | | | (2.29 | ) | | | (1.74 | ) | | | — | 4 | | | (0.50 | ) | | | (1.14 | ) | | | (1.64 | ) |
Ultra Growth Fund | | | | | | | | | | | | | | | | | | | | | | | | | | | | | | | | |
Year ended 9/30/12 | | $ | 20.11 | | | | (0.08 | ) | | | 3.98 | | | | 3.90 | | | | — | 4 | | | — | | | | (1.18 | ) | | | (1.18 | ) |
Year ended 9/30/11 | | $ | 19.80 | | | | (0.17 | ) | | | 0.48 | | | | 0.31 | | | | — | 4 | | | — | | | | — | | | | — | |
Year ended 9/30/10 | | $ | 15.66 | | | | (0.15 | ) | | | 4.29 | | | | 4.14 | | | | — | 4 | | | — | | | | — | | | | — | |
Year ended 9/30/09 | | $ | 15.76 | | | | (0.14 | ) | | | 0.04 | | | | (0.10 | ) | | | — | 4 | | | — | | | | — | | | | — | |
Year ended 9/30/08 | | $ | 27.78 | | | | (0.22 | ) | | | (8.28 | ) | | | (8.50 | ) | | | — | 4 | | | — | | | | (3.52 | ) | | | (3.52 | ) |
World Innovators Fund | | | | | | | | | | | | | | | | | | | | | | | | | | | | | | | | |
Year ended 9/30/12 | | $ | 14.71 | | | | (0.12 | ) | | | 3.96 | | | | 3.84 | | | | — | 4 | | | — | | | | — | | | | — | |
Year ended 9/30/11 | | $ | 13.65 | | | | (0.13 | ) | | | 1.19 | | | | 1.06 | | | | — | 4 | | | — | | | | — | | | | — | |
Year ended 9/30/10 | | $ | 11.12 | | | | (0.10 | ) | | | 2.65 | | | | 2.55 | | | | — | 4 | | | (0.02 | ) | | | — | | | | (0.02 | ) |
Year ended 9/30/09 | | $ | 10.31 | | | | (0.12 | ) | | | 0.93 | | | | 0.81 | | | | — | 4 | | | — | | | | — | | | | — | |
Year ended 9/30/08 | | $ | 17.69 | | | | (0.25 | ) | | | (5.65 | ) | | | (5.90 | ) | | | — | 4 | | | — | | | | (1.48 | ) | | | (1.48 | ) |
Wasatch-1st Source Income Fund | | | | | | | | | | | | | | | | | | | | | | | | | | | | | | | | |
Year ended 9/30/12 | | $ | 10.32 | | | | 0.20 | | | | 0.12 | | | | 0.32 | | | | — | 4 | | | (0.20 | ) | | | — | | | | (0.20 | ) |
Year ended 9/30/11 | | $ | 10.34 | | | | 0.25 | | | | (0.02 | ) | | | 0.23 | | | | — | 4 | | | (0.25 | ) | | | — | | | | (0.25 | ) |
Year ended 9/30/10 | | $ | 10.04 | | | | 0.29 | | | | 0.30 | | | | 0.59 | | | | — | 4 | | | (0.29 | ) | | | — | | | | (0.29 | ) |
Year ended 9/30/09 | | $ | 9.59 | | | | 0.33 | | | | 0.46 | | | | 0.79 | | | | — | 4 | | | (0.34 | ) | | | — | | | | (0.34 | ) |
Period ended 9/30/0815 | | $ | 9.95 | | | | 0.18 | 16 | | | (0.35 | ) | | | (0.17 | ) | | | — | | | | (0.19 | ) | | | — | | | | (0.19 | ) |
Year ended 3/31/08 | | $ | 9.73 | | | | 0.40 | | | | 0.24 | | | | 0.64 | | | | — | | | | (0.42 | ) | | | — | | | | (0.42 | ) |
U.S. Treasury Fund | | | | | | | | | | | | | | | | | | | | | | | | | | | | | | | | |
Year ended 9/30/12 | | $ | 18.75 | | | | 0.42 | | | | 0.77 | | | | 1.19 | | | | 0.01 | | | | (0.42 | ) | | | (0.78 | ) | | | (1.20 | ) |
Year ended 9/30/11 | | $ | 17.17 | | | | 0.52 | | | | 2.63 | | | | 3.15 | | | | 0.02 | | | | (0.52 | ) | | | (1.07 | ) | | | (1.59 | ) |
Year ended 9/30/10 | | $ | 16.29 | | | | 0.54 | | | | 1.35 | | | | 1.89 | | | | 0.01 | | | | (0.54 | ) | | | (0.48 | ) | | | (1.02 | ) |
Year ended 9/30/09 | | $ | 14.95 | | | | 0.55 | | | | 1.29 | | | | 1.84 | | | | 0.05 | | | | (0.55 | ) | | | — | | | | (0.55 | ) |
Year ended 9/30/08 | | $ | 13.84 | | | | 0.58 | | | | 1.10 | | | | 1.68 | | | | 0.01 | | | | (0.58 | ) | | | — | | | | (0.58 | ) |
112
| | |
| | (for a share outstanding throughout each period) |
|
|
|
| | | | | | | | | | | | | | | | | | | | | | | | | | | | | | |
| | | | | | | Ratios to Average Net Assets | | | Supplemental Data | |
Net Asset
Value
End of
Period | | | Total Return (%)1 | | | Expenses Net of Waivers and
Reimbursements (%)2 | | | Expenses Before Waivers and
Reimbursements (%)2 | | | Net Investment
Income Net of
Waivers and
Reimbursements (%)2 | | | Net Investment
Income Before
Waivers and
Reimbursements (%)2 | | | Net Assets
End of
Period
(000’s) | | | Portfolio
Turnover
Rate1 3 | |
| | | | | | | | | | | | | | | | | | | | | | | | | | | | | | |
| $ | 5.71 | | | | 29.77 | | | | 2.14 | 5 | | | 2.14 | 5 | | | (1.50 | ) | | | (1.50 | ) | | $ | 289,449 | | | | 25% | |
| $ | 4.40 | | | | (0.90 | ) | | | 2.14 | | | | 2.14 | | | | (1.05 | ) | | | (1.05 | ) | | $ | 253,415 | | | | 30% | |
| $ | 4.44 | | | | 14.14 | | | | 2.18 | 5 | | | 2.18 | 5 | | | (1.10 | ) | | | (1.10 | ) | | $ | 283,551 | | | | 34% | |
| $ | 3.89 | | | | (5.70 | ) | | | 2.24 | | | | 2.24 | | | | (0.96 | ) | | | (0.96 | ) | | $ | 272,537 | | | | 46% | |
| $ | 4.14 | | | | (30.46 | ) | | | 2.16 | | | | 2.16 | | | | (1.26 | ) | | | (1.26 | ) | | $ | 359,394 | | | | 54% | |
| | | | | | | | | | | | | | | | | | | | | | | | | | | | | | |
| $ | 2.85 | | | | 27.23 | | | | 2.25 | 5 | | | 2.31 | 5 | | | (1.27 | ) | | | (1.33 | ) | | $ | 138,299 | | | | 78% | |
| $ | 2.24 | | | | (5.88 | ) | | | 2.25 | | | | 2.28 | | | | (1.21 | ) | | | (1.24 | ) | | $ | 142,795 | | | | 94% | |
| $ | 2.38 | | | | 13.26 | | | | 2.26 | 12 | | | 2.37 | 12 | | | (1.32 | ) | | | (1.43 | ) | | $ | 185,587 | | | | 88% | |
| $ | 2.11 | | | | 17.22 | | | | 2.26 | 7 | | | 2.46 | 7 | | | (1.36 | ) | | | (1.56 | ) | | $ | 115,216 | | | | 145% | |
| $ | 1.80 | | | | (29.67 | ) | | | 2.25 | | | | 2.35 | | | | (1.21 | ) | | | (1.31 | ) | | $ | 97,912 | | | | 144% | |
| | | | | | | | | | | | | | | | | | | | | | | | | | | | | | |
| $ | 43.82 | | | | 29.41 | | | | 1.24 | 5 | | | 1.24 | 5 | | | (0.73 | ) | | | (0.73 | ) | | $ | 1,824,781 | | | | 20% | |
| $ | 35.37 | | | | 3.30 | | | | 1.23 | | | | 1.23 | | | | (0.32 | ) | | | (0.32 | ) | | $ | 1,297,982 | | | | 23% | |
| $ | 34.24 | | | | 19.76 | | | | 1.27 | 12 | | | 1.27 | 12 | | | (0.74 | ) | | | (0.74 | ) | | $ | 1,110,087 | | | | 17% | |
| $ | 28.59 | | | | 8.20 | | | | 1.29 | | | | 1.29 | | | | (0.60 | ) | | | (0.60 | ) | | $ | 809,318 | | | | 52% | |
| $ | 26.50 | | | | (25.42 | ) | | | 1.21 | | | | 1.21 | | | | (0.47 | ) | | | (0.47 | ) | | $ | 735,546 | | | | 51% | |
| | | | | | | | | | | | | | | | | | | | | | | | | | | | | | |
| $ | 3.81 | | | | 22.12 | | | | 1.46 | 5 | | | 1.46 | 5 | | | (0.73 | ) | | | (0.73 | ) | | $ | 166,330 | | | | 55% | |
| $ | 3.12 | | | | 1.30 | | | | 1.78 | | | | 1.78 | | | | (0.65 | ) | | | (0.65 | ) | | $ | 169,401 | | | | 46% | |
| $ | 3.08 | | | | 12.00 | | | | 1.85 | 12 | | | 1.85 | 12 | | | (0.23 | ) | | | (0.23 | ) | | $ | 211,571 | | | | 62% | |
| $ | 2.75 | | | | (2.48 | ) | | | 1.92 | | | | 1.92 | | | | (0.33 | ) | | | (0.33 | ) | | $ | 218,358 | | | | 89% | |
| $ | 2.82 | | | | (26.26 | ) | | | 1.76 | | | | 1.76 | | | | 0.15 | | | | 0.15 | | | $ | 336,914 | | | | 78% | |
| | | | | | | | | | | | | | | | | | | | | | | | | | | | | | |
| $ | 3.82 | | | | 3.80 | | | | 1.15 | 5 | | | 1.66 | 5 | | | (0.42 | ) | | | (0.93 | ) | | $ | 7,243 | | | | 55% | |
| | | | | | | | | | | | | | | | | | | | | | | | | | | | | | |
| $ | 9.30 | | | | 25.61 | | | | 0.95 | 5 | | | 1.14 | 5 | | | 1.74 | | | | 1.55 | | | $ | 44,635 | | | | 57% | |
| $ | 7.57 | | | | 3.94 | | | | 0.95 | | | | 1.21 | | | | 2.99 | | | | 2.73 | | | $ | 24,057 | | | | 62% | |
| $ | 7.51 | | | | 15.18 | | | | 0.99 | 13 7 | | | 1.33 | 13 7 | | | 4.35 | | | | 4.01 | | | $ | 19,517 | | | | 73% | |
| $ | 6.77 | | | | (6.49 | ) | | | 1.05 | 7 | | | 1.71 | 7 | | | 4.93 | | | | 4.27 | | | $ | 17,710 | | | | 84% | |
| $ | 7.62 | | | | (18.17 | ) | | | 0.97 | 7 | | | 1.46 | 7 | | | 5.96 | | | | 5.47 | | | $ | 21,889 | | | | 81% | |
| | | | | | | | | | | | | | | | | | | | | | | | | | | | | | |
| $ | 22.83 | | | | 20.13 | | | | 1.32 | 5 | | | 1.32 | 5 | | | (0.35 | ) | | | (0.35 | ) | | $ | 143,259 | | | | 43% | |
| $ | 20.11 | | | | 1.57 | | | | 1.42 | | | | 1.42 | | | | (0.51 | ) | | | (0.51 | ) | | $ | 134,203 | | | | 60% | |
| $ | 19.80 | | | | 26.44 | | | | 1.68 | 12 | | | 1.68 | 12 | | | (1.14 | ) | | | (1.14 | ) | | $ | 178,566 | | | | 45% | |
| $ | 15.66 | | | | (0.63 | ) | | | 1.75 | | | | 1.77 | | | | (1.12 | ) | | | (1.14 | ) | | $ | 121,284 | | | | 64% | |
| $ | 15.76 | | | | (35.09 | ) | | | 1.53 | | | | 1.53 | | | | (0.93 | ) | | | (0.93 | ) | | $ | 144,004 | | | | 84% | |
| | | | | | | | | | | | | | | | | | | | | | | | | | | | | | |
| $ | 18.55 | | | | 26.10 | | | | 1.85 | 5 | | | 1.85 | 5 | | | (0.99 | ) | | | (0.99 | ) | | $ | 167,934 | | | | 66% | |
| $ | 14.71 | | | | 7.77 | | | | 1.95 | | | | 1.95 | | | | (0.84 | ) | | | (0.84 | ) | | $ | 72,493 | | | | 85% | |
| $ | 13.65 | | | | 22.91 | | | | 1.96 | 12 | | | 2.05 | 12 | | | (0.74 | ) | | | (0.83 | ) | | $ | 65,767 | | | | 74% | |
| $ | 11.12 | | | | 7.86 | | | | 1.95 | | | | 2.14 | | | | (0.88 | ) | | | (1.07 | ) | | $ | 59,540 | | | | 41% | |
| $ | 10.31 | | | | (36.07 | ) | | | 1.92 | | | | 1.92 | | | | (1.24 | ) | | | (1.24 | ) | | $ | 82,164 | | | | 89% | |
| | | | | | | | | | | | | | | | | | | | | | | | | | | | | | |
| $ | 10.44 | | | | 3.16 | | | | 0.70 | 5 | | | 0.70 | 5 | | | 1.97 | | | | 1.97 | | | $ | 139,186 | | | | 48% | |
| $ | 10.32 | | | | 2.26 | | | | 0.71 | | | | 0.71 | | | | 2.42 | | | | 2.42 | | | $ | 135,617 | | | | 43% | |
| $ | 10.34 | | | | 5.95 | | | | 0.72 | 13 | | | 0.73 | 13 | | | 2.87 | | | | 2.86 | | | $ | 138,095 | | | | 51% | |
| $ | 10.04 | | | | 8.42 | | | | 0.84 | | | | 0.88 | | | | 3.44 | | | | 3.40 | | | $ | 114,496 | | | | 28% | |
| $ | 9.59 | | | | (1.69 | ) | | | 0.87 | | | | 1.12 | | | | 3.66 | | | | 3.41 | | | $ | 89,081 | | | | 15% | |
| $ | 9.95 | | | | 6.74 | | | | 0.95 | | | | 1.20 | | | | 4.05 | | | | 3.80 | | | $ | 86,981 | | | | 56% | |
| | | | | | | | | | | | | | | | | | | | | | | | | | | | | | |
| $ | 18.75 | | | | 6.66 | | | | 0.72 | 5 | | | 0.72 | 5 | | | 2.33 | | | | 2.33 | | | $ | 271,495 | | | | 13% | |
| $ | 18.75 | | | | 22.06 | | | | 0.75 | | | | 0.76 | | | | 3.44 | | | | 3.43 | | | $ | 187,368 | | | | 44% | |
| $ | 17.17 | | | | 12.65 | | | | 0.75 | 13 | | | 0.78 | 13 | | | 3.56 | | | | 3.53 | | | $ | 200,855 | | | | 49% | |
| $ | 16.29 | | | | 12.49 | | | | 0.75 | | | | 0.79 | | | | 3.34 | | | | 3.30 | | | $ | 154,099 | | | | 62% | |
| $ | 14.95 | | | | 12.33 | | | | 0.74 | | | | 0.74 | | | | 3.85 | | | | 3.85 | | | $ | 121,240 | | | | 31% | |
113
| | |
| WASATCH FUNDS — Notes to Financial Highlights | | SEPTEMBER 30, 2012 |
|
|
|
| 1 | Not annualized for periods less than one year. |
| 2 | Annualized for periods less than one year. |
| 3 | Portfolio turnover is calculated on the basis of the Fund as a whole without distinguishing between the classes of shares issued. |
| 4 | Represents amounts less than $.005 per share. |
| 5 | Includes interest expense of less than 0.01%. |
| 6 | Includes interest expenses of 0.01%. |
| 7 | Includes interest expense and dividend payments for securities sold short. The ratios excluding such expenses are listed below: |
| | | | | | | | | | |
| | | Expenses Net of
Waivers and
Reimbursements2 | | Expenses Before
Waivers and
Reimbursements2 |
Long/Short Fund | | | | | | | | | | |
Year ended 9/30/12 | | | | 1.27% | | | | | 1.27% | |
Year ended 9/30/11 | | | | 1.30% | | | | | 1.30% | |
Year ended 9/30/10 | | | | 1.34% | 13 | | | | 1.34% | 13 |
Year ended 9/30/09 | | | | 1.47% | | | | | 1.52% | |
Period ended 9/30/0815 | | | | 1.46% | | | | | 1.71% | |
Year ended 3/31/08 | | | | 1.57% | | | | | 1.82% | |
| | |
Micro Cap Value Fund | | | | | | | | | | |
Year ended 9/30/09 | | | | 2.25% | | | | | 2.45% | |
| | |
Strategic Income Fund | | | | | | | | | | |
Year ended 9/30/10 | | | | 0.95% | 13 | | | | 1.29% | 13 |
Year ended 9/30/09 | | | | 0.95% | | | | | 1.61% | |
Year ended 9/30/08 | | | | 0.95% | | | | | 1.44% | |
| 8 | Fund inception date was October 1, 2007. |
| 9 | Institutional class inception date was January 31, 2012. |
| 10 | Fund inception date was January 31, 2012. |
| 11 | Fund inception date was April 26, 2011. |
| 12 | Includes extraordinary expenses of 0.01% (see Note 9). |
| 13 | Includes extraordinary expenses of less than 0.01% (see Note 9). |
| 14 | Fund inception date was November 17, 2008. |
| 15 | Effective September 19, 2008, the Fund changed its fiscal year end to September 30. |
| 16 | Average shares method used in calculation. |
See Notes to Financial Statements.
114
| | |
| WASATCH FUNDS — Notes to Financial Statements | | SEPTEMBER 30, 2012 |
|
|
|
1. ORGANIZATION
Wasatch Funds Trust (the “Trust”) is a Massachusetts business trust registered under the Investment Company Act of 1940, as amended (the “1940 Act”), as an open-end management investment company and consists of 20 series or funds (each a “Fund” and collectively the “Funds”). The Core Growth Fund, Emerging Markets Small Cap Fund, Global Opportunities Fund, Heritage Growth Fund, International Growth Fund, International Opportunities Fund, Large Cap Value Fund, Micro Cap Fund, Micro Cap Value Fund, Small Cap Growth Fund, Small Cap Value Fund, Strategic Income Fund, Ultra Growth Fund, World Innovators Fund, Wasatch-1st Source Income Fund (“Income Fund”) (sub-advised), and Wasatch-Hoisington U.S. Treasury Fund (“U.S. Treasury Fund”) (sub-advised) are each diversified funds. The Emerging India Fund, Frontier Emerging Small Countries Fund, Long/Short Fund and Emerging Markets Select Fund are non-diversified funds. Each Fund maintains its own investment objective. On August 22, 2012, the Funds filed a post-effective registration statement pursuant to Rule 485(a)(2) under the 1940 Act for Wasatch Emerging Markets Select Fund (a new series of the Trust).
On November 9, 2011, the Trust re-designated the shares of the Funds into Investor Class shares effective January 31, 2012, and authorized and designated a new Institutional Class of shares in the Funds. Currently, only three funds offer Institutional Class shares: Wasatch Core Growth Fund, Wasatch Large Cap Value Fund and Wasatch Small Cap Value Fund, which commenced operations on January 31, 2012. On October 2, 2012, the Funds filed a post-effective registration statement pursuant to Rule 485(a)(2) under the 1940 Act for Long/Short Fund Institutional Class shares. Each class of shares for each Fund has identical rights and privileges except with respect to purchase minimums, distribution and service charges, shareholder services, voting rights on matters affecting a single class of shares, and exchange and conversion features. The Funds have entered into an investment advisory agreement with Wasatch Advisors, Inc. (the “Advisor” or “Wasatch”) as investment advisor.
The Core Growth, Emerging India, Emerging Markets Small Cap, Frontier Emerging Small Countries, Global Opportunities, Heritage Growth, International Growth, International Opportunities, Large Cap Value, Long/Short, Micro Cap, Micro Cap Value, Small Cap Growth, Small Cap Value, Strategic Income, Ultra Growth and World Innovators Funds are referred to herein as the “Equity Funds.” No shares of the Emerging Markets Select Fund or the Long/Short Fund Institutional Class shares were offered or outstanding during the fiscal year ended September 30, 2012.
2. SIGNIFICANT ACCOUNTING POLICIES
The following is a summary of significant policies related to investments of the Funds held at September 30, 2012. These policies are in conformity with accounting principles generally accepted in the United States of America (“U.S. GAAP”).
Valuation of Securities — All investments in securities are recorded at their estimated fair value as described in Note 15.
Foreign Currency Translations — Values of investments denominated in foreign currencies are converted into U.S. dollars using the current exchange rates each business day. Purchases and sales of investments and dividend income are translated into U.S. dollars using the current prevailing exchange rate on the transaction date. The effect of changes in foreign exchange rates on realized and unrealized gains or losses on securities is reflected as a component of such gains or losses. Transactions in foreign denominated assets may involve greater risks than domestic transactions.
At September 30, 2012, the foreign currencies held by the Funds were as follows (amounts in U.S. dollars):
| | | | | | | | |
| | | Cost of
Currency | | | Value of
Currency | |
Emerging India Fund | | | | | | | | |
Indian Rupee | | $ | 192,316 | | | $ | 201,669 | |
|
| |
Emerging Markets Small Cap Fund | | | | | | | | |
Brazilian Real | | $ | 42,322 | | | $ | 42,408 | |
Egyptian Pound | | | 1 | | | | 1 | |
Hong Kong Dollar | | | 579,048 | | | | 579,021 | |
Indian Rupee | | | 68,060 | | | | 68,679 | |
Moroccan Dirham | | | 0 | | | | 1 | |
| | | | | | | | |
| | $ | 689,431 | | | $ | 690,110 | |
| | | | | | | | |
|
| |
Frontier Emerging Small Countries Fund | | | | | | | | |
Bangladesh Taka | | $ | 11,168 | | | $ | 11,168 | |
Hong Kong Dollar | | | 21,282 | | | | 21,281 | |
Malaysian Ringgit | | | 5,256 | | | | 5,290 | |
Pakistan Rupee | | | 30 | | | | 31 | |
Sri Lanka Rupee | | | 41,827 | | | | 41,883 | |
| | | | | | | | |
| | $ | 79,563 | | | $ | 79,653 | |
| | | | | | | | |
|
| |
Global Opportunities Fund | | | | | | | | |
Australian Dollar | | $ | 4 | | | $ | 4 | |
Hong Kong Dollar | | | 39,486 | | | | 39,483 | |
Pound Sterling | | | 19,396 | | | | 19,298 | |
South Korean Won | | | 1 | | | | 1 | |
| | | | | | | | |
| | $ | 58,887 | | | $ | 58,786 | |
| | | | | | | | |
|
| |
International Growth Fund | | | | | | | | |
Australian Dollar | | $ | 36 | | | $ | 36 | |
Hong Kong Dollar | | | 158,891 | | | | 158,880 | |
Pound Sterling | | | 84,252 | | | | 83,824 | |
| | | | | | | | |
| | $ | 243,179 | | | $ | 242,740 | |
| | | | | | | | |
|
| |
International Opportunities Fund | | | | | | | | |
Malaysian Ringgit | | $ | 15,831 | | | $ | 15,935 | |
|
| |
Micro Cap Value Fund | | | | | | | | |
Hong Kong Dollar | | $ | 41,021 | | | $ | 41,018 | |
Malaysian Ringgit | | | 14,952 | | | | 15,050 | |
| | | | | | | | |
| | $ | 55,973 | | | $ | 56,068 | |
| | | | | | | | |
|
| |
Strategic Income Fund | | | | | | | | |
Hong Kong Dollar | | $ | 2 | | | $ | 2 | |
|
| |
115
| | |
| WASATCH FUNDS — Notes to Financial Statements (continued) | | |
|
|
|
Investment in Securities and Related Investment Income—Security transactions are accounted for on the trade date. Gains or losses on securities sold are determined on the identified cost basis. Dividend income and distributions to shareholders are recorded on the ex-dividend date except that certain dividends from foreign securities may be recorded after the ex-dividend date based on when the Fund is informed of the dividend. Interest income and estimated expenses are accrued daily. Bond discount and premiums are amortized using the interest method. To the extent dividends received from Limited Partnership and Real Estate Investment Trust securities include return of capital distributions; such distributions are recorded as income, and adjusted accordingly for tax purposes.
Expenses—The Funds contract for various services on a collective basis. Most expenses are directly attributable to each Fund and therefore are charged accordingly. Expenses that are not directly attributable to one or more Funds are allocated among applicable Funds on an equitable and consistent basis considering such things as the nature and type of expense and the relative net assets of the Funds.
Use of Management Estimates—The preparation of financial statements in conformity with U.S. GAAP requires management to make estimates and assumptions that affect the reported amounts of assets and liabilities at the date of the financial statements and the reported changes in net assets during the reporting period. Actual results could differ from those estimates.
Guarantees and Indemnifications—In the normal course of business, the Funds enter into contracts that contain a variety of representations and warranties which provide general indemnifications. The maximum exposure under these arrangements is unknown, as this would involve future claims that may be made against the Funds and/or their affiliates that have not yet occurred. Based on experience, however, the risk of loss is expected to be remote.
Redemption Fees—The Funds deduct a fee of 2.00% from redemption proceeds on shares of the Funds held 60 days or less. Redemption fees retained by the Funds are credited to additional paid-in capital.
New Accounting Pronouncements—In December 2011, the International Accounting Standards Board (“IASB”) and the Financial Accounting Standards Board (“FASB”) issued Accounting Standards Update (“ASU”) No. 2011-11 “Disclosures about Offsetting Assets and Liabilities.” These common disclosure requirements are intended to help investors and other financial statement users to better assess the effect or potential effect of offsetting arrangements on a fund’s financial position. They also improve transparency in the reporting of how companies mitigate credit risk, including disclosure of related collateral pledged or received. In addition, ASU 2011-11 facilitates comparison between those entities that prepare their financial statements on the basis of U.S. GAAP and those entities that prepare their financial statements on the basis of International Financial Reporting Standards (“IFRS”). ASU 2011-11 requires entities to disclose gross and net information about instruments and transactions eligible for offset in the statement of financial position; and disclose instruments and transactions subject to an agreement similar to a master netting agreement (agreement with a counterparty that mitigates its
credit exposure in the event of default). ASU 2011-11 is effective for fiscal years beginning on or after January 1, 2013, and interim periods within those annual periods. At this time, management is evaluating the implications of ASU 2011-11 and its impact on the financial statements.
Other—Income, expenses, and realized and unrealized gains or losses on investments are allocated to each class of shares based on its relative net assets, except that each class separately bears expenses related specifically to that class, such as certain shareholder servicing fees.
3. SECURITIESAND OTHER INVESTMENTS
Repurchase Agreements—The Funds may engage in repurchase transactions. Under the terms of a typical repurchase agreement, a fund takes possession of an underlying debt obligation subject to an obligation of the seller to repurchase and the fund to resell the obligation at an agreed upon price and time. The market value of the collateral must be at least equal at all times to the total amount of the repurchase obligation, including interest. Generally, in the event of counterparty default, the fund has the right to use the collateral to offset losses incurred.
Short Sales—The Long/Short Fund and to a lesser extent the other Equity Funds may enter into short sales whereby a fund sells a security it generally does not own (the security is borrowed), in anticipation of a decline in the security’s price. The initial amount of a short sale is recorded as a liability which is marked-to-market daily. Fluctuations in the value of the short liability are recorded as unrealized gains or losses. If a Fund shorts a security when also holding a long position in the security (a “short against the box”), as the security’s price declines, the short position increases in value, offsetting the long position’s decrease in value. The opposite effect occurs if the security’s price rises. A Fund realizes a gain or loss upon closing of the short sale (returning the security to the counterparty by way of purchase or delivery of a long position owned). Possible losses from short sales may be unlimited, whereas losses from security purchases cannot exceed the total amount invested. The Funds are liable to the buyer for any dividends payable on securities while those securities are in a short position. These dividends are an expense of the Funds. The Funds designate collateral consisting of cash, U.S. government securities or other liquid assets sufficient to collateralize the market value of short positions.
4. FINANCIAL DERIVATIVE INSTRUMENTS
Foreign Currency Contracts—The Funds may enter into foreign currency contracts to settle planned purchases or sales of securities or to protect against a possible loss resulting from the adverse change in the relationship between the U.S. dollar and a foreign currency involved in an underlying transaction. Foreign currency contracts are agreements between two parties to buy and sell a currency at a set price on a future date. The market value of a foreign currency contract fluctuates with changes in currency exchange rates. Foreign currency contracts are marked-to-market daily and the change in market value is recorded by a fund as unrealized appreciation
116
or depreciation. When a foreign currency contract is closed, the fund records a realized gain or loss equal to the difference between the value at the time it was opened and the value at the time it was closed. These contracts may involve market risk in excess of the unrealized gain or loss reflected on the Schedule of Investments. In addition, a fund could be exposed to credit risk if a counterparty is unable or unwilling to meet the terms of the contracts or if the value of the currency changes unfavorably. In connection with these contracts, the Funds may segregate cash and/or securities in a sufficient amount as collateral in accordance with the terms of the respective contracts.
Options Transactions—The Equity Funds and the Income Fund may buy and sell put and call options and write covered put and call options, including over-the-counter options, on portfolio securities where the completion of the obligation is dependent upon the credit standing of another party. Options are a type of derivative financial instrument. The Funds may invest in derivative financial instruments, including options, in order to manage risk or gain exposure to various other investments or markets. The risk in writing a call option is that a fund gives up the opportunity for profit if the market price of the security increases. The risk in writing a put option is that a fund may incur a loss if the market price of the security decreases and the option is exercised. The risk in buying an option is that a fund pays a premium whether or not the option is exercised. A fund also has the additional risk of not being able to enter into a closing transaction if a liquid secondary market does not exist. Possible losses from uncovered written options may be unlimited. Option contracts are
valued daily and unrealized appreciation or depreciation is recorded. A fund will realize a gain or loss upon expiration or closing of the option transaction. When an option is exercised, the proceeds on sales for a written call option, the purchase cost for a written put option, or the cost of a security for a purchased put or call option is adjusted by the amount of premium received or paid. The Funds designate collateral consisting of cash, U.S. government securities or other liquid assets sufficient to collateralize the market value of written options.
5. DISTRIBUTIONS
Dividends from net investment income and net realized gains, if any, are declared and paid at least annually for all Funds, except for dividends from net investment income in five funds. The Income Fund declares and pays dividends monthly. The Large Cap Value, Long/Short, Strategic Income, and U.S. Treasury Funds declare and pay dividends quarterly. The amount of dividends and distributions from net investment income and net realized gains are determined in accordance with federal income tax regulations, which may differ from U.S. GAAP. The Funds may utilize earnings and profits distributed to shareholders on redemption of shares as part of the dividends paid deduction (tax equalization).
To the extent these book and tax differences are permanent in nature, such amounts are reclassified at the end of the fiscal year among additional paid-in capital, undistributed net investment income (loss), and undistributed net realized gains (losses) on investments and foreign currency translations.
Accordingly, at September 30, 2012, reclassifications were recorded as follows:
| | | | | | | | | | | | | | | | | | | | |
| | | Core
Growth
Fund | | | Emerging
India
Fund | | | Emerging
Markets
Small Cap
Fund | | | Frontier
Emerging
Small Countries
Fund | | | Global
Opportunities
Fund | |
Increase (decrease) paid-in capital in excess of par | | $ | (678,310 | ) | | $ | (38,410 | ) | | $ | 1 | | | $ | (28 | ) | | $ | 3,939,290 | |
Increase (decrease) undistributed net investment income | | | 671,002 | | | | 5,196 | | | | (2,563,180 | ) | | | (61,064 | ) | | | 691,779 | |
Increase (decrease) undistributed net realized gain | | | 7,308 | | | | 33,214 | | | | 2,563,179 | | | | 61,092 | | | | (4,631,069 | ) |
| | | | | |
| | | Heritage
Growth
Fund | | | International
Growth
Fund | | | International
Opportunities
Fund | | | Large Cap
Value
Fund | | | Long/Short
Fund | |
Decrease paid-in capital in excess of par | | $ | (117,474 | ) | | $ | — | | | $ | (424,397 | ) | | $ | (351,570 | ) | | $ | (598,383 | ) |
Increase (decrease) undistributed net investment income | | | 112,980 | | | | (485,173 | ) | | | 63,454 | | | | (302,630 | ) | | | 676,887 | |
Increase (decrease) undistributed net realized gain (loss) | | | 4,494 | | | | 485,173 | | | | 360,943 | | | | 654,200 | | | | (78,504 | ) |
| | | | | |
| | | Micro
Cap
Fund | | | Micro Cap
Value
Fund | | | Small Cap
Growth
Fund | | | Small Cap
Value
Fund | | | Strategic
Income
Fund | |
Decrease paid-in capital in excess of par | | $ | (612,836 | ) | | $ | (1,725,094 | ) | | $ | (3,232,317 | ) | | $ | (497,914 | ) | | $ | (130,226 | ) |
Increase (decrease) undistributed net investment income | | | 583,415 | | | | 2,107,394 | | | | 3,241,088 | | | | 394,150 | | | | 53,491 | |
Increase (decrease) undistributed net realized gain (loss) | | | 29,421 | | | | (382,300 | ) | | | (8,771 | ) | | | 103,764 | | | | 76,735 | |
| | | | | |
| | | Ultra
Growth
Fund | | | World
Innovators
Fund | | | Income
Fund | | | U.S.
Treasury
Fund | | | | |
Decrease paid-in capital in excess of par | | $ | 378 | | | $ | (260,294 | ) | | $ | — | | | $ | — | | | | | |
Increase (decrease) undistributed net investment income | | | 340,695 | | | | 81,090 | | | | (237,738 | ) | | | — | | | | | |
Increase (decrease) undistributed net realized gain (loss) | | | (341,073 | ) | | | 179,204 | | | | 237,738 | | | | — | | | | | |
117
| | |
| WASATCH FUNDS — Notes to Financial Statements (continued) | | |
|
|
|
6. PURCHASESAND SALESOF SECURITIES
Cost of investment securities purchased and proceeds from sales of investment securities, excluding U.S. government and short-term securities for the year or period ended September 30, 2012 are summarized below:
| | | | | | | | | | | | | | | | | | | | | | | | | | | | |
| | | Core
Growth
Fund | | | Emerging
India
Fund | | | Emerging
Markets
Small Cap
Fund | | | Frontier
Emerging
Small
Countries
Fund1 | | | Global
Opportunities
Fund | | | Heritage
Growth
Fund | | | International
Growth
Fund | |
Purchases | | $ | 140,525,329 | | | $ | 3,312,122 | | | $ | 892,391,598 | | | $ | 27,860,375 | | | $ | 60,351,105 | | | $ | 44,074,587 | | | $ | 188,948,974 | |
Sales | | | 136,777,595 | | | | 1,958,475 | | | | 419,438,675 | | | | 740,052 | | | | 140,366,817 | | | | 24,149,529 | | | | 139,726,190 | |
| | | | | | | |
| | | International
Opportunities
Fund | | | Large Cap
Value
Fund | | | Long/Short
Fund | | | Micro
Cap
Fund | | | Micro Cap
Value
Fund | | | Small Cap
Growth
Fund | | | Small Cap
Value
Fund | |
Purchases | | $ | 87,312,263 | | | $ | 202,383,584 | | | $ | 1,038,065,075 | | | $ | 70,856,037 | | | $ | 104,986,461 | | | $ | 310,901,193 | | | $ | 96,471,749 | |
Sales | | | 68,391,747 | | | | 716,592,015 | | | | 642,726,377 | | | | 106,598,503 | | | | 126,480,516 | | | | 338,313,309 | | | | 127,689,941 | |
| | | | | | | |
| | | Strategic
Income
Fund | | | Ultra
Growth
Fund | | | World
Innovators
Fund | | | Income
Fund | | | | | | | | | | |
Purchases | | $ | 29,536,397 | | | $ | 62,329,474 | | | $ | 125,373,374 | | | $ | 35,244,338 | | | | | | | | | | | | | |
Sales | | | 19,023,719 | | | | 81,865,390 | | | | 67,771,576 | | | | 30,014,666 | | | | | | | | | | | | | |
| 1 Inception | date of the Fund was January 31, 2012. |
Purchases and sales of U.S. government securities in the Income Fund were $34,046,209 and $36,480,088, respectively. Purchases and sales of U.S. government securities in the U.S. Treasury Fund were $99,558,353 and $31,545,290, respectively.
7. OPTIONS CONTRACTS WRITTEN
Options written activity during the year ended September 30, 2012 was as follows:
| | | | | | | | | | | | | | | | | | | | | | | | |
| | | Options
Outstanding at
9/30/2011 | | | Written | | | Closed | | | Exercised | | | Expired | | | Options
Outstanding at
9/30/2012 | |
Core Growth Fund | | | | | | | | | | | | | | | | | | | | | | | | |
Premium amount | | $ | 178,735 | | | $ | 150,916 | | | $ | — | | | $ | — | | | $ | (178,735 | ) | | $ | 150,916 | |
Number of contracts | | | 500 | | | | 1,050 | | | | — | | | | — | | | | (500 | ) | | | 1,050 | |
Long/Short Fund | | | | | | | | | | | | | | | | | | | | | | | | |
Premium amount | | $ | 10,278,040 | | | $ | 20,406,764 | | | $ | (2,027,040 | ) | | $ | (8,805,335 | ) | | $ | (11,199,302 | ) | | $ | 8,653,127 | |
Number of contracts | | | 35,095 | | | | 100,961 | | | | (11,655 | ) | | | (40,650 | ) | | | (45,731 | ) | | | 38,020 | |
Micro Cap Value Fund | | | | | | | | | | | | | | | | | | | | | | | | |
Premium amount | | $ | 762,276 | | | $ | 2,003,640 | | | $ | (1,280,090 | ) | | $ | (933,997 | ) | | $ | (296,574 | ) | | $ | 255,255 | |
Number of contracts | | | 2,600 | | | | 9,906 | | | | (4,811 | ) | | | (5,717 | ) | | | (1,183 | ) | | | 795 | |
Small Cap Value Fund | | | | | | | | | | | | | | | | | | | | | | | | |
Premium amount | | $ | — | | | $ | 134,261 | | | $ | — | | | $ | — | | | $ | — | | | $ | 134,261 | |
Number of contracts | | | — | | | | 600 | | | | — | | | | — | | | | — | | | | 600 | |
World Innovators Fund | | | | | | | | | | | | | | | | | | | | | | | | |
Premium amount | | $ | — | | | $ | 7,710 | | | $ | — | | | $ | (6,168 | ) | | $ | (1,542 | ) | | $ | — | |
Number of contracts | | | — | | | | 15 | | | | — | | | | (12 | ) | | | (3 | ) | | | — | |
8. FEDERAL INCOME TAX INFORMATION
It is each Fund’s policy to comply with the requirements of the Internal Revenue Code applicable to regulated investment companies and to distribute substantially all taxable income to shareholders. The Funds are no longer subject to examination by tax authorities for years prior to 2009. At this time, management believes there are no uncertain tax positions which, based on their technical merit, would not be sustained upon examination and for which it is reasonably possible that the total of amounts of unrecognized tax benefits will significantly change in the next 12 months. Accordingly, no provision for federal income or excise taxes has been made.
118
As of September 30, 2012, the cost and unrealized appreciation (depreciation) of securities on a tax basis were as follows:
| | | | | | | | | | | | | | | | | | | | | | | | | | | | |
| | | Core
Growth
Fund | | | Emerging
India
Fund | | | Emerging
Markets
Small Cap
Fund | | | Frontier
Emerging
Small
Countries
Fund | | | Global
Opportunities
Fund | | | Heritage
Growth
Fund | | | International
Growth
Fund | |
Cost | | $ | 428,930,318 | | | $ | 12,300,426 | | | $ | 1,255,305,111 | | | $ | 28,594,190 | | | $ | 114,247,836 | | | $ | 92,100,572 | | | $ | 332,688,367 | |
| | | | |
Gross appreciation | | $ | 173,681,302 | | | $ | 1,796,753 | | | $ | 260,747,120 | | | $ | 3,860,312 | | | $ | 44,139,078 | | | $ | 25,139,794 | | | $ | 103,494,482 | |
Gross (depreciation) | | | (11,341,947 | ) | | | (625,005 | ) | | | (27,568,613 | ) | | | (219,672 | ) | | | (2,849,006 | ) | | | (5,197,307 | ) | | | (3,687,584 | ) |
| | | | |
Net appreciation (depreciation) | | $ | 162,339,355 | | | $ | 1,171,748 | | | $ | 233,178,507 | | | $ | 3,640,640 | | | $ | 41,290,072 | | | $ | 19,942,487 | | | $ | 99,806,898 | |
| | | | |
| | | | | | | | | | | | | | | | | | | | | | | | | | | | |
| | | | | | | |
| | | International
Opportunities
Fund | | | Large Cap
Value
Fund | | | Long/Short
Fund | | | Micro
Cap
Fund | | | Micro Cap
Value
Fund | | | Small Cap
Growth
Fund | | | Small Cap
Value
Fund | |
Cost | | $ | 156,641,979 | | | $ | 1,055,402,604 | | | $ | 1,424,494,609 | | | $ | 224,592,414 | | | $ | 106,102,585 | | | $ | 1,279,719,647 | | | $ | 150,640,784 | |
| | | | |
Gross appreciation | | $ | 45,854,611 | | | $ | 308,093,905 | | | $ | 117,043,028 | | | $ | 95,161,799 | | | $ | 32,238,600 | | | $ | 538,351,587 | | | $ | 34,003,699 | |
Gross (depreciation) | | | (5,889,119 | ) | | | (48,362,917 | ) | | | (20,656,441 | ) | | | (26,011,914 | ) | | | (2,651,994 | ) | | | (35,651,644 | ) | | | (10,194,723 | ) |
| | | | |
Net appreciation (depreciation) | | $ | 39,965,492 | | | $ | 259,730,988 | | | $ | 96,386,587 | | | $ | 69,149,885 | | | $ | 29,586,606 | | | $ | 502,699,943 | | | $ | 23,808,976 | |
| | | | |
| | | | | | | | | | | | | | | | | | | | | | | | | | | | |
| | | | | | | |
| | | Strategic
Income
Fund | | | Ultra
Growth
Fund | | | World
Innovators
Fund | | | Income
Fund | | | U.S.
Treasury
Fund | | | | | | | |
Cost | | $ | 41,742,608 | | | $ | 122,246,069 | | | $ | 149,931,120 | | | $ | 133,111,321 | | | $ | 232,504,249 | | | | | | | | | |
| | | | | | | | | | | | |
Gross appreciation | | $ | 4,732,585 | | | $ | 33,274,383 | | | $ | 21,969,820 | | | $ | 5,274,827 | | | $ | 38,469,031 | | | | | | | | | |
Gross (depreciation) | | | (1,831,567 | ) | | | (12,396,163 | ) | | | (3,162,384 | ) | | | (114,122 | ) | | | (273,413 | ) | | | | | | | | |
| | | | | | | | | | | | |
Net appreciation (depreciation) | | $ | 2,901,018 | | | $ | 20,878,220 | | | $ | 18,807,436 | | | $ | 5,160,705 | | | $ | 38,195,618 | | | | | | | | | |
| | | | | | | | | | | | |
The difference between book-basis and tax-basis unrealized gains is primarily attributable to the tax deferral of losses on wash sales, unrealized appreciation on passive foreign investment companies and other temporary tax adjustments.
The components of accumulated earnings on a tax basis as of September 30, 2012 were as follows:
| | | | | | | | | | | | | | | | | | | | |
| | | Core
Growth
Fund | | | Emerging
India
Fund | | | Emerging
Markets
Small Cap
Fund | | | Frontier
Emerging
Small
Countries
Fund | | | Global
Opportunities
Fund | |
Undistributed ordinary income | | $ | — | | | $ | — | | | $ | 5,219,469 | | | $ | 198,763 | | | $ | — | |
Undistributed capital gains | | | — | | | | — | | | | — | | | | — | | | | 17,205,439 | |
| | | | |
Accumulated earnings | | | — | | | | — | | | | 5,219,469 | | | | 198,763 | | | | 17,205,439 | |
Accumulated capital and other losses | | | (37,897,392 | ) | | | (859,376 | ) | | | (64,012,504 | ) | | | — | | | | (843,378 | ) |
Other undistributed ordinary losses | | | — | | | | (82,053 | ) | | | — | | | | (75,714 | ) | | | (9,566 | ) |
Net unrealized appreciation* | | | 162,377,571 | | | | 1,116,249 | | | | 226,894,941 | | | | 3,576,997 | | | | 41,225,199 | |
| | | | |
Total accumulated earnings | | $ | 124,480,179 | | | $ | 174,820 | | | $ | 168,101,906 | | | $ | 3,700,046 | | | $ | 57,577,694 | |
| | | | |
| | | | | | | | | | | | | | | | | | | | |
119
| | |
| WASATCH FUNDS — Notes to Financial Statements (continued) | | |
|
|
|
| | | | | | | | | | | | | | | | | | | | |
| | | Heritage
Growth
Fund | | | International
Growth
Fund | | | International
Opportunities
Fund | | | Large Cap
Value
Fund | | | Long/Short
Fund | |
Undistributed ordinary income | | $ | — | | | $ | 1,909,496 | | | $ | — | | | $ | — | | | $ | — | |
Undistributed capital gains | | | 4,136,609 | | | | — | | | | — | | | | — | | | | 3,814,650 | |
| | | | |
Accumulated earnings | | | 4,136,609 | | | | 1,909,496 | | | | — | | | | — | | | | 3,814,650 | |
Accumulated capital and other losses | | | (128,088 | ) | | | (32,020,626 | ) | | | (7,234,180 | ) | | | (828,517 | ) | | | (1,627,098 | ) |
Other undistributed ordinary losses | | | — | | | | — | | | | (16,820 | ) | | | (61,013 | ) | | | — | |
Net unrealized appreciation* | | | 19,942,913 | | | | 99,565,576 | | | | 39,733,954 | | | | 259,730,988 | | | | 92,348,571 | |
| | | | |
Total accumulated earnings | | $ | 23,951,434 | | | $ | 69,454,446 | | | $ | 32,482,954 | | | $ | 258,841,458 | | | $ | 94,536,123 | |
| | | | |
| | | | | | | | | | | | | | | | | | | | |
| | | Micro
Cap
Fund | | | Micro Cap
Value
Fund | | | Small Cap
Growth
Fund | | | Small Cap
Value
Fund | | | Strategic
Income
Fund | |
Undistributed ordinary income | | $ | — | | | $ | — | | | $ | — | | | $ | — | | | $ | — | |
Undistributed capital gains | | | — | | | | 11,281,937 | | | | 104,861,904 | | | | — | | | | — | |
| | | | |
Accumulated earnings | | | — | | | | 11,281,937 | | | | 104,861,904 | | | | — | | | | — | |
Accumulated capital and other losses | | | (45,119,796 | ) | | | (523,723 | ) | | | (9,492,107 | ) | | | (97,665,048 | ) | | | (4,565,592 | ) |
Other undistributed ordinary losses | | | — | | | | — | | | | — | | | | — | | | | (16,379 | ) |
Net unrealized appreciation* | | | 69,001,436 | | | | 29,440,210 | | | | 501,098,883 | | | | 23,776,621 | | | | 2,901,048 | |
| | | | |
Total accumulated earnings (deficit) | | $ | 23,881,640 | | | $ | 40,198,424 | | | $ | 596,468,680 | | | ($ | 73,888,427 | ) | | ($ | 1,680,923 | ) |
| | | | |
| | | | | | | | | | | | | | | | | | | | |
| | | Ultra
Growth
Fund | | | World
Innovators
Fund | | | Income
Fund | | | U.S.
Treasury
Fund | | | | |
Undistributed ordinary income | | $ | — | | | $ | — | | | $ | 75,618 | | | $ | 143,701 | | | | | |
Undistributed capital gains | | | 16,570,757 | | | | — | | | | — | | | | 5,092,077 | | | | | |
| | | | | | | | |
Accumulated earnings | | | 16,570,757 | | | | — | | | | 75,618 | | | | 5,235,778 | | | | | |
Accumulated capital and other losses | | | (730,134 | ) | | | (8,750,695 | ) | | | (714,842 | ) | | | — | | | | | |
Other undistributed ordinary losses | | | — | | | | — | | | | (38,635 | ) | | | (131,654 | ) | | | | |
Net unrealized appreciation* | | | 20,747,535 | | | | 18,805,340 | | | | 5,160,705 | | | | 38,195,618 | | | | | |
| | | | | | | | |
Total accumulated earnings | | $ | 36,588,158 | | | $ | 10,054,645 | | | $ | 4,482,846 | | | $ | 43,299,742 | | | | | |
| | | | | | | | |
| * | On investments, securities sold short, derivative and foreign currency denominated assets and liabilities. |
Capital loss carryforwards are available through the date specified below to offset future realized net capital gains for federal income tax purposes. Future capital loss carryover utilization in any given year may be subject to Internal Revenue Code limitations. To the extent future gains are offset by capital loss carryforwards, such gains will not be distributed.
Capital loss carryforwards as of September 30, 2012 are as follows:
| | | | | | | | | | | | | | | | | | |
| Fund | | 2014 | | | 2016 | | | 2017 | | | 2018 | | | |
Core Growth Fund | | $ | — | | | $ | — | | | $ | — | | | $ | 35,409,803 | | | |
Emerging Markets Small Cap Fund | | | — | | | | — | | | | 3,795,857 | | | | 6,828,580 | | | |
International Growth Fund | | | — | | | | — | | | | — | | | | 26,072,123 | | | |
Micro Cap Fund | | | — | | | | — | | | | — | | | | 41,372,871 | | | |
Small Cap Value Fund | | | — | | | | — | | | | 30,914,092 | | | | 63,852,620 | | | |
Strategic Income Fund | | | — | | | | — | | | | — | | | | 4,565,592 | | | |
World Innovators Fund | | | — | | | | — | | | | — | | | | 7,292,881 | | | |
Income Fund | | | 153,117 | | | | 561,725 | | | | — | | | | — | | | |
On December 22, 2010, the Regulated Investment Company Modernization Act of 2010 (the “Modernization Act”) was signed by the President of the United States of America. Under the Modernization Act, a Fund will be permitted to carry forward capital losses incurred in taxable years beginning after December 22, 2010 for an unlimited period. Post-enactment losses that are carried forward will retain their character as either short-term or long-term capital losses rather than being considered all short-term as under previous law. However, any losses incurred during those future taxable years will be required to be utilized prior to the losses incurred in pre-enactment taxable years, which carry an expiration date. As a result of this ordering rule, pre-enactment capital loss carryforwards may be more likely to expire unused.
120
Capital loss carryforwards as of September 30, 2012 with no expiration are as follows:
| | | | |
| Fund | | Short Term | |
Emerging India Fund | | $ | 93,466 | |
Emerging Markets Small Cap Fund | | | 12,120,230 | |
International Growth Fund | | | 417,006 | |
International Opportunities Fund | | | 6,940,313 | |
The Funds have elected to defer losses incurred from November 1, 2011 through September 30, 2012 in accordance with federal income tax rules. These losses are treated as having arisen on the first day of the following fiscal year. The Funds have elected to defer losses as follows:
| | | | | | | | |
| Fund | | Post-October
Capital Losses | | | Late-Year Ordinary
Losses | |
Core Growth Fund | | $ | — | | | $ | 2,487,589 | |
Emerging India Fund | | | 733,297 | | | | 32,613 | |
Emerging Markets Small Cap Fund | | | 41,267,837 | | | | — | |
Global Opportunities Fund | | | — | | | | 843,378 | |
Heritage Growth Fund | | | — | | | | 128,088 | |
International Growth Fund | | | 5,531,497 | | | | — | |
International Opportunities Fund | | | — | | | | 293,867 | |
Large Cap Value Fund | | | 828,517 | | | | — | |
Long/Short Fund | | | — | | | | 1,627,098 | |
Micro Cap Fund | | | — | | | | 3,746,925 | |
Micro Cap Value Fund | | | — | | | | 523,723 | |
Small Cap Growth Fund | | | — | | | | 9,492,107 | |
Small Cap Value Fund | | | 1,969,866 | | | | 928,470 | |
Ultra Growth Fund | | | — | | | | 730,134 | |
World Innovators Fund | | | 382,290 | | | | 1,075,524 | |
During the tax year ended September 30, 2012, the Funds used capital loss carryforwards in the following amounts:
| | | | |
| Fund | | Amount Used | |
Core Growth Fund | | $ | 45,997,138 | |
Large Cap Value Fund | | | 23,080,189 | |
Long/Short Fund | | | 3,699,489 | |
Micro Cap Fund | | | 28,091,429 | |
Micro Cap Value Fund | | | 298,445 | |
Small Cap Value Fund | | | 15,799,053 | |
Strategic Income Fund | | | 2,323,842 | |
World Innovators Fund | | | 8,422,188 | |
Income Fund | | | 568,391 | |
The tax character of distributions paid during the year ended September 30, 2012 was as follows:
| | | | | | | | | | | | | | | | | | | | |
| 2012 | | Core
Growth
Fund | | | Emerging
India Fund | | | Emerging
Markets
Small Cap
Fund | | | Frontier
Emerging
Small
Countries
Fund | | | Global
Opportunities
Fund | |
Ordinary income | | $ | — | | | $ | 82,637 | | | $ | — | | | $ | — | | | $ | — | |
Capital gain | | | — | | | | — | | | | — | | | | — | | | | 18,174,913 | |
| | | | |
Total | | $ | — | | | $ | 82,637 | | | $ | — | | | $ | — | | | $ | 18,174,913 | |
| | | | |
| | | | | |
| 2012 | | Heritage
Growth
Fund | | | International
Growth
Fund | | | International
Opportunities
Fund | | | Large Cap
Value Fund | | | Long/Short
Fund | |
Ordinary income | | $ | — | | | $ | — | | | $ | — | | | $ | 21,818,495 | | | $ | — | |
Capital gain | | | 1,097,280 | | | | — | | | | 17,671,323 | | | | — | | | | — | |
| | | | |
Total | | $ | 1,097,280 | | | $ | — | | | $ | 17,671,323 | | | $ | 21,818,495 | | | $ | — | |
| | | | |
121
| | |
| WASATCH FUNDS — Notes to Financial Statements (continued) | | |
|
|
|
| | | | | | | | | | | | | | | | | | | | |
| 2012 | | Micro
Cap Fund | | | Micro Cap
Value Fund | | | Small Cap
Growth Fund | | | Small Cap
Value Fund | | | Strategic
Income Fund | |
Ordinary income | | $ | — | | | $ | — | | | $ | — | | | $ | — | | | $ | 880,410 | |
Capital gain | | | — | | | | — | | | | 62,046,614 | | | | — | | | | — | |
| | | | |
Total | | $ | — | | | $ | — | | | $ | 62,046,614 | | | $ | — | | | $ | 880,410 | |
| | | | |
| | | | | |
| 2012 | | Ultra
Growth
Fund | | | World
Innovators
Fund | | | Income Fund | | | U.S.
Treasury
Fund | | | | |
Ordinary income | | $ | — | | | $ | — | | | $ | 2,775,995 | | | $ | 5,618,367 | | | | | |
Capital gain | | | 7,674,675 | | | | — | | | | — | | | | 9,334,135 | | | | | |
| | | | | | | | |
Total | | $ | 7,674,675 | | | $ | — | | | $ | 2,775,995 | | | $ | 14,952,502 | | | | | |
| | | | | | | | |
The tax character of distributions paid during the year ended September 30, 2011 was as follows:
| | | | | | | | | | | | | | | | | | | | | | | | |
| 2011 | | Core Growth
Fund | | | Emerging
India Fund | | | Emerging
Markets
Small Cap
Fund | | | Global
Opportunities
Fund | | | Heritage
Growth
Fund | | | International
Growth
Fund | |
Ordinary income | | $ | — | | | $ | — | | | $ | 86,408 | | | $ | 1,872,935 | | | $ | 653,414 | | | $ | — | |
Capital gain | | | — | | | | — | | | | — | | | | 7,528,532 | | | | 5,614 | | | | — | |
| | | | |
Total | | $ | — | | | $ | — | | | $ | 86,408 | | | $ | 9,401,467 | | | $ | 659,028 | | | $ | — | |
| | | | |
| | | | | | |
| 2011 | | International
Opportunities
Fund | | | Large Cap
Value Fund | | | Long/Short
Fund | | | Micro Cap Fund | | | Micro Cap Value Fund | | | Small Cap Growth Fund | |
Ordinary income | | $ | — | | | $ | 21,370,753 | | | $ | 300,223 | | | $ | — | | | $ | — | | | $ | — | |
Capital gain | | | 4,411,467 | | | | — | | | | — | | | | — | | | | — | | | | — | |
| | | | |
Total | | $ | 4,411,467 | | | $ | 21,370,753 | | | $ | 300,223 | | | $ | — | | | $ | — | | | $ | — | |
| | | | |
| | | | | | |
| 2011 | | Small Cap
Value Fund | | | Strategic
Income
Fund | | | Ultra
Growth
Fund | | | World
Innovators
Fund | | | Income
Fund | | | U.S.
Treasury
Fund | |
Ordinary income | | $ | — | | | $ | 762,128 | | | $ | — | | | $ | — | | | $ | 3,218,058 | | | $ | 5,596,881 | |
Capital gain | | | — | | | | — | | | | — | | | | — | | | | — | | | | 10,250,028 | |
| | | | |
Total | | $ | — | | | $ | 762,128 | | | $ | — | | | $ | — | | | $ | 3,218,058 | | | $ | 15,846,909 | |
| | | | |
The tax character of distributions paid may differ from that shown in the Statements of Changes in Net Assets due to short-term gains being treated as ordinary income for tax purposes.
9. RELATED PARTY TRANSACTIONS
Investment Advisory Fees, Expense Limitations—As the Funds’ investment advisor, the Advisor receives a monthly fee calculated on average daily net assets. The Advisor has contractually agreed to waive its fees and/or reimburse certain Funds should a Fund’s operating expenses exceed a specified annual limitation through at least January 31, 2013. If operating expenses are less than the specified expense limit for the Fund, the Advisor shall be entitled to reimbursement of the fees waived or reduced to the extent that the operating expenses and the amounts reimbursed do not exceed such expense limit for the Fund, under the period of the agreement (currently the period for the 12 months commencing January 31, 2012). Such reimbursement shall be paid only while the expense limitation agreement is in effect and only if such amount paid, together with all other amounts reimbursed under this agreement in the fiscal year, does not cause the Fund to exceed the expense limitation. All amounts not recovered at the end of the period expire on January 31, 2013. On November 9, 2011, the Board of Trustees and the Advisor agreed to a reduction in the advisory fee for Investor Class shares of the Wasatch Small Cap Value Fund from 1.50% to 1.00% effective January 31, 2012. Additionally, the Advisor and the Funds executed an amended and restated expense limitation agreement, wherein the Advisor contractually agreed to an expense limitation of 1.50% on Investor Class shares of the Wasatch Small Cap Value Fund effective January 31, 2012, and continuing through at least January 31, 2013. Ordinary operating expenses exclude any interest, taxes, brokerage commissions, other investment-related costs and extraordinary expenses, such as litigation and other expenses not incurred in the ordinary course of the Fund’s business. The costs of the Proxy Statement related to the identification and
122
shareholder approval of Trustee Nominees were treated as extraordinary expenses in the 2010 fiscal year. The impact of these payments is reflected in the net expense ratios in the Financial Highlights. Investment advisory fees and fees waived, if any, for the year ended September 30, 2012 are disclosed in the Statements of Operations. Investment advisory fee and expense limitation annual rates are shown below.
| | | | | | | | | | | | | | | | | | | | |
| Fund | | Advisory
Fee | | | Expense
Limitation
Investor
Class | | | Expense
Limitation
Institutional
Class | | | Contractual Expense
Limitation/
Reimbursement
Recoverable
Expiration Date | | | Reimbursement
Recoverable | |
Core Growth Fund | | | 1.00 | % | | | 1.50 | % | | | 1.12 | % | | | 01/31/2013 | | | $ | 23,959 | |
Emerging India Fund | | | 1.50 | % | | | 1.95 | % | | | N/A | | | | 01/31/2013 | | | | 91,889 | |
Emerging Markets Small Cap Fund | | | 1.75 | % | | | 1.95 | % | | | N/A | | | | 01/31/2013 | | | | 1,404,245 | |
Frontier Emerging Small Countries Fund | | | 1.75 | % | | | 2.25 | % | | | N/A | | | | 01/31/2013 | | | | 135,086 | |
Global Opportunities Fund | | | 1.50 | % | | | 1.95 | % | | | N/A | | | | 01/31/2013 | | | | — | |
Heritage Growth Fund | | | 0.70 | % | | | 0.95 | % | | | N/A | | | | 01/31/2013 | | | | 58,535 | |
International Growth Fund | | | 1.25 | % | | | 1.75 | % | | | N/A | | | | 01/31/2013 | | | | — | |
International Opportunities Fund | | | 1.95 | % | | | 2.25 | % | | | N/A | | | | 01/31/2013 | | | | 243,540 | |
Large Cap Value Fund | | | 0.90 | % | | | 1.10 | % | | | 0.98 | % | | | 01/31/2013 | | | | 555,728 | |
Long/Short Fund | | | 1.10 | % | | | — | | | | N/A | | | | N/A | | | | N/A | |
Micro Cap Fund | �� | | 1.95 | % | | | 2.25 | % | | | N/A | | | | 01/31/2013 | | | | — | |
Micro Cap Value Fund | | | 1.95 | % | | | 2.25 | % | | | N/A | | | | 01/31/2013 | | | | 34,847 | |
Small Cap Growth Fund | | | 1.00 | % | | | 1.50 | % | | | N/A | | | | 01/31/2013 | | | | — | |
Small Cap Value Fund | | | 1.00 | %1 | | | 1.50 | %2 | | | 1.15 | % | | | 01/31/2013 | | | | 23,053 | |
Strategic Income Fund | | | 0.70 | % | | | 0.95 | % | | | N/A | | | | 01/31/2013 | | | | 51,677 | |
Ultra Growth Fund | | | 1.00 | % | | | 1.50 | % | | | N/A | | | | 01/31/2013 | | | | — | |
World Innovators Fund | | | 1.50 | % | | | 1.95 | % | | | N/A | | | | 01/31/2013 | | | | — | |
Income Fund | | | 0.55 | % | | | — | | | | N/A | | | | N/A | | | | N/A | |
U.S. Treasury Fund | | | 0.50 | % | | | 0.75 | % | | | N/A | | | | 01/31/2013 | | | | — | |
| 1The | advisory fee decreased from 1.50% to 1.00% on 1/31/2012. |
| 2The | expense limitation was decreased from 1.95% to 1.50% on 1/31/2012. |
Affiliated Trades — Certain Funds are permitted to purchase or sell securities from or to certain related affiliated funds under specified conditions outlined in procedures adopted by the Board of Trustees. The procedures have been designed to ensure that any purchase or sale of securities by the Funds from or to another fund (or funds) that are, or could be, considered an affiliate by virtue of having a common investment advisor (or affiliated investment advisors), common Trustees and/or common officers complies with Rule 17a-7 of the 1940 Act. Further, each transaction is effected at the current market price, as that term is defined under the procedures. During the year ended September 30, 2012, the Funds below engaged in purchases and sales of securities pursuant to Rule 17a-7 of the 1940 Act:
| | | | | | | | |
| | | Purchases | | | Sales | |
Global Opportunities Fund | | $ | — | | | $ | 1,496,592 | |
International Growth Fund | | | 1,046,793 | | | | 1,786,358 | |
International Opportunities Fund | | | 2,485,615 | | | | — | |
Long/Short Fund | | | — | | | | 55,486,964 | |
Micro Cap Value Fund | | | — | | | | 249,458 | |
Affiliated Transaction — During the year ended September 30, 2012, the Large Cap Value Fund had an in-kind purchase of $4,255,413 from an affiliate.
Institutional Class Legal Fees — As disclosed in the annual report dated September 30, 2011, the Board approved a multi-class plan pursuant to which the Board has established and designated two classes for each series known as Institutional Class shares and Investor Class shares. The Advisor paid the legal costs associated with the establishment and designation of the new share classes.
Payments by Advisor — During the reporting period the Advisor discovered a trade allocation error involving several of the Wasatch Funds. In August 2012, the Advisor reimbursed the Global Opportunities Fund $1,167, the Micro Cap Fund $1,074, the Micro Cap Value Fund $1,282, the Small Cap Growth Fund $46,199, the Ultra Growth Fund $940 and the World Innovators Fund $437 as reimbursement for the error plus interest. The impact of these payments is reflected in the net expense ratios in the Financial Highlights.
123
| | |
| WASATCH FUNDS — Notes to Financial Statements (continued) | | |
|
|
|
10% Shareholders—As of September 30, 2012, the Funds had individual shareholder accounts and/or omnibus shareholder accounts (comprised of a group of individual shareholders), which individually amounted to more than 10% of the total shares outstanding of the fund as detailed below:
| | | | | | | | |
| | | Number of Accounts | | | % of Shares Outstanding | |
Core Growth Fund | | | 2 | | | | 50.47 | % |
Emerging India Fund | | | 2 | | | | 38.57 | % |
Emerging Markets Small Cap Fund | | | 2 | | | | 65.99 | % |
Frontier Emerging Small Countries Fund | | | 3 | | | | 69.08 | % |
Global Opportunities Fund | | | 2 | | | | 60.47 | % |
Heritage Growth Fund | | | 2 | | | | 49.29 | % |
International Growth Fund | | | 2 | | | | 50.62 | % |
International Opportunities Fund | | | 2 | | | | 62.16 | % |
Large Cap Value Fund | | | 3 | | | | 77.92 | % |
Long/Short Fund | | | 2 | | | | 66.50 | % |
Micro Cap Fund | | | 2 | | | | 30.48 | % |
Micro Cap Value Fund | | | 2 | | | | 51.67 | % |
Small Cap Growth Fund | | | 2 | | | | 48.14 | % |
Small Cap Value Fund | | | 2 | | | | 30.66 | % |
Strategic Income Fund | | | 3 | | | | 70.75 | % |
Ultra Growth Fund | | | 2 | | | | 48.29 | % |
World Innovators Fund | | | 2 | | | | 42.32 | % |
Income Fund | | | 2 | | | | 84.69 | % |
U.S. Treasury Fund | | | 2 | | | | 39.95 | % |
Affiliated Interests—As of September 30, 2012, Wasatch Advisors, Inc. and its affiliates, and the retirement plans of Wasatch Advisors, Inc. and its affiliates, held shares which may be redeemed at any time as detailed below:
| | | | | | | | |
| | | Number of Accounts* | | | % of Shares Outstanding | |
Core Growth Fund | | | 17 | | | | 0.55 | % |
Emerging India Fund | | | 18 | | | | 19.78 | % |
Emerging Markets Small Cap Fund | | | 23 | | | | 0.22 | % |
Frontier Emerging Small Countries Fund | | | 21 | | | | 12.44 | % |
Global Opportunities Fund | | | 24 | | | | 2.50 | % |
Heritage Growth Fund | | | 10 | | | | 3.35 | % |
International Growth Fund | | | 12 | | | | 0.54 | % |
International Opportunities Fund | | | 21 | | | | 3.27 | % |
Large Cap Value Fund | | | 13 | | | | 0.16 | % |
Long/Short Fund | | | 11 | | | | 0.17 | % |
Micro Cap Fund | | | 13 | | | | 0.65 | % |
Micro Cap Value Fund | | | 13 | | | | 1.80 | % |
Small Cap Growth Fund | | | 20 | | | | 1.41 | % |
Small Cap Value Fund | | | 10 | | | | 1.65 | % |
Strategic Income Fund | | | 5 | | | | 21.69 | % |
Ultra Growth Fund | | | 8 | | | | 1.08 | % |
World Innovators Fund | | | 9 | | | | 1.72 | % |
Income Fund | | | 2 | | | | 0.01 | % |
U.S. Treasury Fund | | | 6 | | | | 0.67 | % |
| * | Multiple accounts with the same beneficial owner are treated as one account. |
Payments by Former Service Provider—BISYS Fund Services, Inc. (“BISYS”) is a former service provider to the Large Cap Value Fund, Long/Short Fund, and Income Fund. In August 2010, these funds received a one-time payment from the BISYS Fair Fund (a fund established pursuant to a settlement between the SEC and BISYS that requires, among other things, a distribution of settlement monies from the Fair Fund to benefit affected mutual funds). The impact of these payments is reflected in the net expense ratios in the Financial Highlights.
124
10. TRANSACTIONSWITH AFFILIATES
If a Fund’s holding represents ownership of 5% or more of the voting securities of a company, the company is deemed to be an affiliate as defined by the 1940 Act. The following Funds conducted transactions during the year ended September 30, 2012 with an “affiliated company” as so defined:
| | | | | | | | | | | | | | | | | | | | | | | | |
| | | Share Activity | | | Dividends
Credited to
Income for the
period ended
9/30/12 | | | Gain (Loss)
Realized on
Sale of Shares
for the
period ended
9/30/12 | |
| | | Balance
9/30/11 | | | Purchases/
Additions | | | Sales/
Reductions | | | Balance
9/30/12 | | | |
Long/Short Fund | | | | | | | | | | | | | | | | | | | | | | | | |
Silicon Graphics International Corp.* | | | 1,447,300 | | | | 1,821,110 | | | | 465,510 | | | | 2,802,900 | | | $ | — | | | $ | (2,809,326 | ) |
|
| |
Micro Cap Fund | | | | | | | | | | | | | | | | | | | | | | | | |
Goldwater Bank, N.A. | | | 154,000 | | | | — | | | | — | | | | 154,000 | | | $ | — | | | $ | — | |
|
| |
Small Cap Growth Fund | | | | | | | | | | | | | | | | | | | | | | | | |
Blue Nile, Inc. | | | 462,294 | | | | 192,609 | | | | — | | | | 654,903 | | | $ | — | | | $ | — | |
Knight Transportation, Inc. | | | 4,139,457 | | | | 516,349 | | | | — | | | | 4,655,806 | | | | 1,034,250 | | | | — | |
NeurogesX, Inc. | | | 3,882,558 | | | | — | | | | — | | | | 3,882,558 | | | | — | | | | — | |
Power Integrations, Inc.** | | | 1,731,197 | | | | — | | | | 472,048 | | | | 1,259,149 | | | | 304,936 | | | | (379,532 | ) |
| * | On December 22, 2011, a Schedule 13D was filed for Silicon Graphics International Corp. (“the Company”) on behalf of the Advisor and the Wasatch Long/Short Fund, including the portfolio managers Michael L. Shinnick and Ralph C. Shive (“Reporting Persons”). |
| **No | longer affiliated as of September 30, 2012. |
11. RESTRICTED SECURITIES
The Funds may own investments that were purchased through private placement transactions or under Rule 144A of the Securities Act of 1933 (the “Securities Act”) and cannot be sold without prior registration under the Securities Act or may be limited due to certain restrictions. These securities are generally deemed to be illiquid and are valued at fair value as determined by a designated Pricing Committee, comprised of personnel of the Advisor, with oversight by the Board of Trustees and in accordance with Board-approved Pricing Policies and Procedures. If and when such securities are registered, the costs of registering such securities are paid by the issuer. At September 30, 2012, the Funds held the following restricted securities:
| | | | | | | | | | | | | | | | |
| | | Security
Type | | Acquisition Date | | Acquisition
Cost | | | Fair Value | | | Value as %
of Net Assets | |
Global Opportunities Fund | | | | | | | | | | | | | | | | |
Cardica, Inc. | | Warrants | | 9/25/09 | | $ | 5,000 | | | $ | 2,400 | | | | — | |
|
| |
| | | | | |
Micro Cap Fund | | | | | | | | | | | | | | | | |
Cardica, Inc. | | Warrants | | 9/25/09 | | $ | 40,312 | | | $ | 19,350 | | | | 0.01 | % |
Goldwater Bank, N.A. | | Common Stock | | 2/28/07 | | | 1,540,000 | | | | 13,860 | | | | — | |
NeurogesX, Inc. | | Warrants | | 7/21/11 | | | 18,169 | | | | 1,453 | | | | — | |
| | | | | | | | |
| | | | | | $ | 1,598,481 | | | $ | 34,663 | | | | 0.01 | % |
|
| |
Micro Cap Value Fund | | | | | | | | | | | | | | | | |
Acetylon Pharmaceuticals, Inc., Series B | | Preferred Stock | | 2/3/11 - 5/25/12 | | $ | 499,999 | | | $ | 625,263 | | | | 0.45 | % |
Cardica, Inc. | | Warrants | | 9/25/09 | | | 13,813 | | | | 6,630 | | | | 0.01 | % |
Goldwater Bank, N.A. | | Common Stock | | 2/28/07 | | | 419,000 | | | | 3,771 | | | | — | |
Idaho Trust Bancorp | | Common Stock | | 8/30/06 | | | 500,004 | | | | 182,779 | | | | 0.13 | % |
NeurogesX, Inc. | | Warrants | | 7/21/11 | | | 6,250 | | | | 500 | | | | — | |
NeurogesX, Inc. | | Warrants | | 12/28/07 | | | 3,800 | | | | — | | | | — | |
| | | | | | | | |
| | | | | | $ | 1,442,866 | | | $ | 818,943 | | | | 0.59 | % |
|
| |
Small Cap Growth Fund | | | | | | | | | | | | | | | | |
Greenspring Global Partners II-B, L.P. | | LP Interest | | 10/10/03 - 11/23/11 | | $ | 4,543,853 | | | $ | 4,967,476 | | | | 0.27 | % |
Greenspring Global Partners III-B, L.P. | | LP Interest | | 3/16/06 - 10/28/11 | | | 1,335,000 | | | | 1,658,434 | | | | 0.09 | % |
Nanosys, Inc., Series D | | Preferred Stock | | 11/8/05 | | | 2,000,000 | | | | 776,271 | | | | 0.05 | % |
Nanosys, Inc., Series E | | Preferred Stock | | 8/13/10 | | | 184,939 | | | | 184,939 | | | | 0.01 | % |
NeurogesX, Inc. | | Warrants | | 7/21/11 | | | 242,660 | | | | 19,413 | | | | — | |
Zonare Medical Systems, Inc. | | Common Stock | | 6/30/04 | | | 1,500,000 | | | | 247 | | | | — | |
| | | | | | | | |
| | | | | | $ | 9,806,452 | | | $ | 7,606,780 | | | | 0.42 | % |
125
| | |
| WASATCH FUNDS — Notes to Financial Statements (continued) | | |
|
|
|
| | | | | | | | | | | | | | | | |
| | | Security
Type | | Acquisition
Date | | Acquisition
Cost | | | Fair Value | | | Value as %
of Net Assets | |
Strategic Income Fund | | | | | | | | | | | | | | | | |
Redcorp Ventures Ltd., 13.00%, 7/11/12 | | Corporate Bonds | | 7/5/07 | | $ | 155,655 | | | $ | 4,073 | | | | 0.01 | % |
Star Asia Financial Ltd. | | Common Stock | | 2/22/07 - 3/19/10 | | | 305,812 | | | | 266,786 | | | | 0.60 | % |
Star Asia SPV, LLC | | LLC Membership Interest | | 3/19/10 | | | 457,316 | | | | 99,690 | | | | 0.22 | % |
| | | | | | | | |
| | | | | | $ | 918,783 | | | $ | 370,549 | | | | 0.83 | % |
|
| |
Ultra Growth Fund | | | | | | | | | | | | | | | | |
Cardica, Inc. | | Warrants | | 9/25/09 | | $ | 20,625 | | | $ | 9,900 | | | | 0.01 | % |
Data Sciences International, Inc., Series B | | Preferred Stock | | 1/20/06 | | | 475,001 | | | | 807,502 | | | | 0.56 | % |
Greenspring Global Partners II-B, L.P. | | LP Interest | | 10/10/03 - 11/23/11 | | | 4,089,467 | | | | 4,468,020 | | | | 3.12 | % |
Greenspring Global Partners III-B, L.P. | | LP Interest | | 3/16/06 - 10/28/11 | | | 1,335,000 | | | | 1,658,433 | | | | 1.16 | % |
Nanosys, Inc., Series D | | Preferred Stock | | 11/8/05 | | | 500,001 | | | | 194,068 | | | | 0.14 | % |
Nanosys, Inc., Series E | | Preferred Stock | | 8/13/10 | | | 46,235 | | | | 46,235 | | | | 0.03 | % |
NeurogesX, Inc. | | Warrants | | 7/21/11 | | | 5,451 | | | | 436 | | | | — | |
Ophthonix, Inc. | | Common Stock | | 9/23/05 | | | 499,998 | | | | 504 | | | | — | |
TherOx, Inc., Series I | | Preferred Stock | | 7/7/05 | | | 1,000,000 | | | | 14,634 | | | | 0.01 | % |
Xtera Communications, Inc. | | Common Stock | | 9/3/03 | | | 99,065 | | | | 914 | | | | — | |
Zonare Medical Systems, Inc. | | Common Stock | | 6/30/04 | | | 1,000,000 | | | | 165 | | | | — | |
| | | | | | | | |
| | | | | | $ | 9,070,843 | | | $ | 7,200,811 | | | | 5.03 | % |
|
| |
World Innovators Fund | | | | | | | | | | | | | | | | |
Cardica, Inc. | | Warrants | | 9/25/09 | | $ | 8,938 | | | $ | 4,290 | | | | — | |
Greenspring Global Partners II-B, L.P. | | LP Interest | | 10/10/03 - 11/23/11 | | | 454,387 | | | | 496,747 | | | | 0.30 | % |
Xtera Communications, Inc. | | Common Stock | | 9/3/03 | | | 7,076 | | | | 65 | | | | — | |
| | | | | | | | |
| | | | | | $ | 470,401 | | | $ | 501,102 | | | | 0.30 | % |
12. PURCHASE COMMITMENTS
In September 2003, the Small Cap Growth, Ultra Growth and World Innovators Funds entered into subscription agreements to acquire limited partnership interests in Greenspring Global Partners II-B, L.P. The remaining commitment amounts at September 30, 2012 were $400,000, $360,000 and $40,000, respectively.
In December 2005, the Small Cap Growth and Ultra Growth Funds entered into subscription agreements to acquire limited partnership interests in Greenspring Global Partners III-B, L.P. The remaining commitment amounts at September 30, 2012 were $165,000, per Fund.
Securities held by the Funds have been designated to meet these purchase commitments as indicated in the Schedules of Investments.
13. LINEOF CREDIT
The Equity Funds opened two lines of credit totaling $75,000,000, one of which is $25,000,000 uncommitted, and the other of which is $50,000,000 committed, with State Street Bank and Trust Company on June 4, 2007 (together, the “Line”). As of May 25, 2012, the Board approved use of the Line by all funds in the Trust. The Line is for temporary or emergency purposes such as to provide liquidity for shareholder redemptions. The Funds incur commitment fees on the undrawn portion of the committed part of the Line, and interest expense to the extent of amounts drawn (borrowed) under the entire Line. Interest is based on the higher of (a) the Federal Funds rate as in effect on the date of borrowing, plus a margin, or (b) the overnight London Interbank Offered Rate (LIBOR) as in effect on the date of borrowing, plus a margin. Commitment fees are pro-rated among the Funds based upon relative average net assets. Interest expense is charged directly to a fund based upon actual amounts borrowed by the Fund.
For the year ended September 30, 2012, the following Funds had borrowings:
| | | | | | | | | | | | | | | | | | | | |
| | | Average Daily
Borrowings | | | Number of
Days
Outstanding | | | Interest
Expense | | | Weighted
Average
Annualized
Interest Rate | | | Balance at
September 30, 2012 | |
Emerging India Fund | | | 237,979 | | | | 22 | | | | 167 | | | | 1.15 | % | | | — | |
Global Opportunities Fund | | | 3,487,563 | | | | 60 | | | | 6,674 | | | | 1.15 | % | | | 1,615,933 | |
International Growth Fund | | | 3,701,144 | | | | 93 | | | | 10,956 | | | | 1.15 | % | | | — | |
International Opportunities Fund | | | 4,451,737 | | | | 13 | | | | 1,852 | | | | 1.15 | % | | | — | |
Micro Cap Value Fund | | | 3,876,063 | | | | 7 | | | | 877 | | | | 1.16 | % | | | — | |
Small Cap Growth Fund | | | 2,333,727 | | | | 9 | | | | 666 | | | | 1.14 | % | | | — | |
Ultra Growth Fund | | | 864,899 | | | | 88 | | | | 2,423 | | | | 1.15 | % | | | — | |
126
14. PRINCIPAL RISKS
Market and Credit Risk—In the normal course of business the Funds trade financial instruments and enter into financial transactions where risk of potential loss exists due to changes in the market (market risk) or failure of the other party to a transaction to perform (credit risk). Similar to credit risk, the Funds may be exposed to counterparty risk, or the risk that an institution or other entity with which the Funds have unsettled or open transactions will default. The potential loss could exceed the value of the financial assets recorded in the financial statements. Financial assets, which potentially expose the Funds to credit risk, consist principally of cash due from counterparties and investments. The extent of the Funds’ exposure to credit and counterparty risks with respect to these financial assets approximates their carrying value as recorded in the Funds’ Statements of Assets and Liabilities.
Non-Diversification Risk—A non-diversified fund can invest a larger portion of its assets in the stocks of a limited number of companies than a diversified fund, which means it may have more exposure to the price movements of a single security or small group of securities than funds that diversify their investments among many companies.
Inflation Risk—Inflation risk is the possibility that inflation will reduce the purchasing power of a currency, and subsequently reduce the value of a security or asset, and may result in rising interest rates. Inflation is the overall upward price movement of goods and services in an economy that causes the value of a currency to decline.
Interest Rate Risk—Interest rate risk is the risk that fixed income securities will decline in value because of changes in interest rates. A rise in interest rates typically causes a fall in values. Interest rate risk should be modest for shorter-term securities, moderate for intermediate-term securities and high for longer-term securities. Generally, an increase in the average maturity of a fund will make it more sensitive to interest rate risk. The interest rate is the amount charged, expressed as a percentage of principal, by a lender to a borrower for the use of assets.
Foreign Currency Risk—If a fund invests directly in foreign currencies or in securities that trade in, and receive revenues in, foreign currencies, or in derivatives that provide exposure to foreign currencies, it will be subject to the risk that those currencies will decline in value relative to the U.S. dollar. This also includes the risk associated with higher transaction costs, delayed settlements, currency controls and adverse economic developments related to foreign investments.
Region Risk—The Funds invest in equity and fixed income securities of non-U.S. issuers. Although the Funds maintain diversified investment portfolios, political or economic developments within a particular country or region may have an adverse effect on the ability of domiciled issuers to meet their obligations. These risks are exaggerated for securities of issuers tied economically to emerging and frontier market countries. Additionally, political or economic developments may have an adverse effect on the liquidity and volatility of portfolio securities and currency holdings.
Shareholder Concentration Risk—A significant portion of the net assets of the International Opportunities Fund is owned by a group of shareholders advised by a common investment advisor. If this group of shareholders simultaneously redeems on the advice of their investment advisor, Fund expenses may increase and performance may be materially affected. However, the Advisor has contractually agreed to waive its fees and/or reimburse the International Opportunities Fund should its operating expenses exceed 2.25% through at least January 31, 2013.
15. SECURITIES VALUATION
Equity securities (common and preferred stock)—Securities are valued as of the close of the New York Stock Exchange (generally 4:00 p.m. Eastern Time) on the valuation date. Equity securities are valued using a commercial pricing service at the last quoted sales price taken from the primary market in which each security trades and, with respect to equity securities traded on NASDAQ, such securities are valued using the NASDAQ Official Closing Price (“NOCP”) or last sales price if no NOCP is available. If there are no sales on the primary exchange or market on a day, then the security shall be valued at the mean of the last bid and ask price on the primary exchange or market as provided by a Pricing Service. If the mean cannot be calculated or there is no trade activity on a day, then the security shall be valued at the previous trading day’s price as provided by a Pricing Service. In some instances, particularly on foreign exchanges, an official close or evaluated price may be used if the pricing service is unable to provide the last trade or most recent mean price. To the extent that these securities are actively traded and valuation adjustments are not applied, they are categorized in level 1 of the fair value hierarchy (see Note 16). Additionally, a fund’s investments are valued at fair value by the Pricing Committee if the Advisor determines that an event impacting the value of an investment occurred between the closing time of a security’s primary market or exchange (for example, a foreign exchange or market) and the time the fund’s share price is calculated. Significant events include, but are not limited to the following: significant fluctuations in domestic markets, foreign markets or foreign currencies; occurrences not directly tied to the securities markets such as natural disasters, armed conflicts or significant governmental actions; and major announcements affecting a single issuer or an entire market or market sector. In responding to a significant event, the Pricing Committee determines the fair value of affected securities by considering factors including, but not limited to: index options and futures traded subsequent to the close; American Depositary Receipts (“ADRs”), Global Depositary Receipts (“GDRs”) or other related receipts; currency spot or forward markets that trade after pricing of the foreign exchange; other derivative securities traded after the close such as Standard & Poor’s Depositary Receipts (“SPDRs”) and other exchange traded funds (“ETFs”); and alternative market quotes on the affected securities. When applicable, the Funds use a systematic fair valuation model provided by an independent third party to assist in adjusting the valuation of foreign securities. When a fund uses this fair value pricing method, the values assigned to the fund’s foreign securities may not be the quoted or published prices of the investments on their primary markets or exchanges and the securities are categorized in level 2 of the fair value hierarchy. These valuation procedures apply equally to long or short equity positions in a fund.
127
| | |
| WASATCH FUNDS — Notes to Financial Statements (continued) | | |
|
|
|
Corporate debt securities—Investments are valued at current market value by a commercial pricing service, or by using the last sale or bid price based on observable inputs. Observable inputs may include benchmark yields, reported trades, broker/dealer quotes, issuer spreads, two-sided markets, benchmark securities, bids, offers and reference data including market research publications. Although most corporate bonds are categorized in level 2 of the fair value hierarchy, in instances where observable inputs are not available, they are categorized as level 3.
Short-term notes—Investments maturing in 60 days or less at the time of purchase, are generally valued at amortized cost, unless it is determined that the amortized cost method would not represent fair value, in which case the securities are marked-to-market. To the extent the inputs are observable and timely, the values would be categorized in level 2 of the fair value hierarchy.
Asset-backed securities—Investments are priced using the closing bid as supplied by a commercial pricing service based on observable inputs. Observable inputs may include benchmark yields, reported trades, broker/dealer quotes, issuer spreads, two-sided markets, benchmark securities, bids, offers and reference data including market research publications, new issue data, monthly payment information and collateral performance. Although most asset-backed securities are categorized in level 2 of the fair value hierarchy, in instances where observable inputs are not available, they are categorized as level 3.
U.S. government issuers—Investments are priced using the closing bid as supplied by a commercial pricing service based on observable inputs. Observable inputs may include benchmark yields, reported trades, broker/dealer quotes, issuer spreads, two-sided markets, benchmark securities, bids, offers and reference data including market research publications. Although most U.S. government bonds are categorized in level 2 of the fair value hierarchy, in instances where observable inputs are not available, they are categorized as level 3.
Derivative instruments—Listed derivatives that are actively traded are valued based on quoted prices from the exchange and are categorized in level 1 of the fair value hierarchy. Exchange-traded options are valued at the last sale price in the market where they are principally traded. If there are no sales on the primary exchange or market on a given day, then the option is valued at the most recent bid price on the primary exchange or market as provided by a pricing service.
Restricted securities—If market quotations are not readily available for the Funds’ investments in securities such as restricted securities, private placements, securities for which trading has been halted or other illiquid securities, these investments are valued at fair value in accordance with Board-approved Pricing Policies and Procedures by the Pricing Committee of the Advisor (“Pricing Committee”) with oversight by the Board of Trustees. Fair value is defined as the price that would be received upon the sale of an asset, or paid to transfer a liability, in an orderly transaction between market participants at the measurement date under current market conditions. For each applicable investment that is fair valued, the Pricing Committee considers, to the extent applicable, various factors including, but not limited to, the financial condition of the company or limited partnership, operating results, prices paid in follow-on rounds, comparable companies in the public market, the nature and duration of the restrictions for holding the securities, a stated net asset value (NAV) for the partnership, if applicable, and other relevant factors. Depending on the relative significance of valuation inputs, these instruments may be classified in either level 2 or level 3 of the fair value hierarchy.
As of September 30, 2012, the aggregate amount of fair valued securities, excluding any foreign securities fair valued pursuant to a systematic fair valuation model, as a percentage of net assets for the Funds was as follows:
| | | | |
| | | % of Net Assets | |
Core Growth Fund | | | — | |
Emerging India Fund | | | — | |
Emerging Markets Small Cap Fund | | | 7.60 | % |
Frontier Emerging Small Countries Fund | | | 2.29 | % |
Global Opportunities Fund | | | <0.01 | % |
Heritage Growth Fund | | | — | |
International Growth Fund | | | 1.13 | % |
International Opportunities Fund | | | 1.81 | % |
Large Cap Value Fund | | | — | |
Long/Short Fund | | | — | |
Micro Cap Fund | | | 0.01 | % |
Micro Cap Value Fund | | | 2.81 | % |
Small Cap Growth Fund | | | 0.42 | % |
Small Cap Value Fund | | | — | |
Strategic Income Fund | | | 0.23 | % |
Ultra Growth Fund | | | 5.03 | % |
World Innovators Fund | | | 0.30 | % |
Income Fund | | | — | |
U.S. Treasury Fund | | | — | |
128
16. FAIR VALUE MEASUREMENTS
The Funds use various methods to measure the fair value of most of their investments on a recurring basis. U.S. GAAP established a hierarchy that prioritizes inputs to valuation methods. The three levels of inputs are:
| | Ÿ | | Level 1—Unadjusted quoted prices in active markets for identical assets or liabilities that the Funds have the ability to access. |
| | Ÿ | | Level 2—Observable inputs other than quoted prices included in level 1 that are observable for the asset or liability, either directly or indirectly. The inputs may include quoted prices for the identical investment on an inactive market, prices for similar investments, interest rates, prepayment speeds, credit risk, yield curves, default rates and similar data. |
| | Ÿ | | Level 3—Unobservable inputs for the asset or liability, to the extent relevant observable inputs are not available, representing the Funds’ own assumptions about the assumptions a market participant would use in valuing the asset or liability, and would be based on the best information available. |
The availability of observable inputs can vary from security to security and is affected by a wide variety of factors, including, for example, the type of security, whether a security is new and not yet established in the marketplace, the liquidity of markets, and other characteristics particular to the security. To the extent that valuation is based on models or inputs that are less observable or unobservable in the market, the determination of fair value requires more judgment. Accordingly, the degree of judgment exercised in determining fair value is greatest for instruments categorized in level 3.
The Funds’ policy is to recognize transfers between levels at the end of the reporting period.
The following is a summary of the fair valuations according to the inputs used as of September 30, 2012 in valuing the Funds’ assets and liabilities:
| | | | | | | | | | | | | | | | | | |
| Fund | | Category | | Quoted Prices in Active Markets
for Identical
Investments
(Level 1) | | | Significant Other
Observable Inputs
(Level 2) | | | Significant
Unobservable
Inputs
(Level 3) | | | Value at
9/30/12 | |
Core Growth Fund | | | | | | | | | | | | | | | | | | |
Assets | | | | | | | | | | | | | | | | | | |
Common Stocks | | | | $ | 545,246,490 | | | $ | — | | | $ | — | | | $ | 545,246,490 | |
Preferred Stocks | | | | | 4,289,951 | | | | — | | | | — | | | | 4,289,951 | |
Short-Term Investments | | | | | — | | | | 41,733,232 | | | | — | | | | 41,733,232 | |
| | | | | | |
| | | | $ | 549,536,441 | | | $ | 41,733,232 | | | $ | — | | | $ | 591,269,673 | |
| | | | | | |
Liabilities | | | | | | | | | | | | | | | | | | |
Equity Contracts | | | | $ | (112,700 | ) | | $ | — | | | $ | — | | | $ | (112,700 | ) |
| | | | | | |
| | | | $ | (112,700 | ) | | $ | — | | | $ | — | | | $ | (112,700 | ) |
| | | | | | |
Emerging India Fund | | | | | | | | | | | | | | | | | | |
Assets | | | | | | | | | | | | | | | | | | |
Common Stocks | | | | $ | 13,268,854 | | | $ | — | | | $ | — | | | $ | 13,268,854 | |
Short-Term Investments | | | | | — | | | | 203,320 | | | | — | | | | 203,320 | |
| | | | | | |
| | | | $ | 13,268,854 | | | $ | 203,320 | | | $ | — | | | $ | 13,472,174 | |
| | | | | | |
Emerging Markets Small Cap Fund | | | | | | | | | | | | | | | | | | |
Assets | | | | | | | | | | | | | | | | | | |
Common Stocks | | | | | | | | | | | | | | | | | | |
| | Building Products | | $ | — | | | $ | 10,408,198 | | | $ | — | | | $ | 10,408,198 | |
| | Computer & Electronics Retail | | | — | | | | 16,587,446 | | | | — | | | | 16,587,446 | |
| | Diversified Banks | | | 126,970,913 | | | | 21,935,963 | | | | — | | | | 148,906,876 | |
| | Home Improvement Retail | | | 11,997,019 | | | | 23,785,222 | | | | — | | | | 35,782,241 | |
| | Hotels, Resort & Cruise Lines | | | — | | | | 15,541,228 | | | | — | | | | 15,541,228 | |
| | Hypermarkets & Super Centers | | | 28,786,207 | | | | 24,393,058 | | | | — | | | | 53,179,265 | |
| | Other | | | 1,135,920,368 | | | | — | | | | — | | | | 1,135,920,368 | |
Preferred Stocks | | | | | 31,723,258 | | | | — | | | | — | | | | 31,723,258 | |
Short-Term Investments | | | | | — | | | | 40,434,738 | | | | — | | | | 40,434,738 | |
| | | | | | |
| | | | $ | 1,335,397,765 | | | $ | 153,085,853 | | | $ | — | | | $ | 1,488,483,618 | |
| | | | | | |
129
| | |
| WASATCH FUNDS — Notes to Financial Statements (continued) | | |
|
|
|
| | | | | | | | | | | | | | | | | | |
| Fund | | Category | | Quoted Prices in Active Markets
for Identical
Investments
(Level 1) | | | Significant Other
Observable Inputs
(Level 2) | | | Significant
Unobservable
Inputs
(Level 3) | | | Value at
9/30/12 | |
Frontier Emerging Small Countries Fund | | | | | | | | | | | | | | | | | | |
Assets | | | | | | | | | | | | | | | | | | |
Common Stocks | | | | | | | | | | | | | | | | | | |
| | Building Products | | $ | 364,601 | | | $ | 168,510 | | | $ | — | | | $ | 533,111 | |
| | Construction Materials | | | 795,639 | | | | 120,733 | | | | — | | | | 916,372 | |
| | Food Retail | | | 1,021,910 | | | | 169,394 | | | | — | | | | 1,191,304 | |
| | Household Products | | | 1,542,079 | | | | 76,218 | | | | — | | | | 1,618,297 | |
| | Restaurants | | | 797,491 | | | | 222,002 | | | | — | | | | 1,019,493 | |
| | Other | | | 25,539,465 | | | �� | — | | | | — | | | | 25,539,465 | |
Short-Term Investments | | | | | — | | | | 1,416,788 | | | | — | | | | 1,416,788 | |
| | | | | | |
| | | | $ | 30,061,185 | | | $ | 2,173,645 | | | $ | — | | | $ | 32,234,830 | |
| | | | | | |
Global Opportunities Fund | | | | | | | | | | | | | | | | | | |
Assets | | | | | | | | | | | | | | | | | | |
Common Stocks | | | | $ | 155,526,308 | | | $ | — | | | $ | — | | | $ | 155,526,308 | |
Warrants | | | | | 9,200 | | | | — | | | | 2,400 | | | | 11,600 | |
| | | | | | |
| | | | $ | 155,535,508 | | | $ | — | | | $ | 2,400 | | | $ | 155,537,908 | |
| | | | | | |
Heritage Growth Fund | | | | | | | | | | | | | | | | | | |
Assets | | | | | | | | | | | | | | | | | | |
Common Stocks | | | | $ | 104,241,590 | | | $ | — | | | $ | — | | | $ | 104,241,590 | |
Short-Term Investments | | | | | — | | | | 7,801,469 | | | | — | | | | 7,801,469 | |
| | | | | | |
| | | | $ | 104,241,590 | | | $ | 7,801,469 | | | $ | — | | | $ | 112,043,059 | |
| | | | | | |
International Growth Fund | | | | | | | | | | | | | | | | | | |
Assets | | | | | | | | | | | | | | | | | | |
Common Stocks | | | | | | | | | | | | | | | | | | |
| | Hypermarkets & Super Centers | | $ | 4,618,920 | | | $ | 4,901,368 | | | $ | — | | | $ | 9,520,288 | |
| | Other | | | 405,023,424 | | | | — | | | | — | | | | 405,023,424 | |
Short-Term Investments | | | | | — | | | | 17,951,553 | | | | — | | | | 17,951,553 | |
| | | | | | |
| | | | $ | 409,642,344 | | | $ | 22,852,921 | | | $ | — | | | $ | 432,495,265 | |
| | | | | | |
International Opportunities Fund | | | | | | | | | | | | | | | | | | |
Assets | | | | | | | | | | | | | | | | | | |
Common Stocks | | | | | | | | | | | | | | | | | | |
| | Building Products | | $ | — | | | $ | 1,762,814 | | | $ | — | | | $ | 1,762,814 | |
| | Construction Materials | | | — | | | | 1,761,998 | | | | — | | | | 1,761,998 | |
| | Other | | | 185,264,593 | | | | — | | | | — | | | | 185,264,593 | |
Short-Term Investments | | | | | — | | | | 7,818,066 | | | | — | | | | 7,818,066 | |
| | | | | | |
| | | | $ | 185,264,593 | | | $ | 11,342,878 | | | $ | — | | | $ | 196,607,471 | |
| | | | | | |
Large Cap Value Fund | | | | | | | | | | | | | | | | | | |
Assets | | | | | | | | | | | | | | | | | | |
Common Stocks | | | | $ | 1,270,266,260 | | | $ | — | | | $ | — | | | $ | 1,270,266,260 | |
Short-Term Investments | | | | | — | | | | 44,867,332 | | | | — | | | | 44,867,332 | |
| | | | | | |
| | | | $ | 1,270,266,260 | | | $ | 44,867,332 | | | $ | — | | | $ | 1,315,133,592 | |
| | | | | | |
Long/Short Fund | | | | | | | | | | | | | | | | | | |
Assets | | | | | | | | | | | | | | | | | | |
Common Stocks | | | | $ | 1,169,531,109 | | | $ | — | | | $ | — | | | $ | 1,169,531,109 | |
Short-Term Investments | | | | | — | | | | 351,350,087 | | | | — | | | | 351,350,087 | |
| | | | | | |
| | | | $ | 1,169,531,109 | | | $ | 351,350,087 | | | $ | — | | | $ | 1,520,881,196 | |
| | | | | | |
Liabilities | | | | | | | | | | | | | | | | | | |
Equity Contracts | | | | $ | (6,597,784 | ) | | $ | — | | | $ | — | | | $ | (6,597,784 | ) |
Securities Sold Short | | | | | (159,534,764 | ) | | | — | | | | — | | | | (159,534,764 | ) |
| | | | | | |
| | | | $ | (166,132,548 | ) | | $ | — | | | $ | — | | | $ | (166,132,548 | ) |
| | | | | | |
130
| | | | | | | | | | | | | | | | | | |
| Fund | | Category | | Quoted Prices in Active Markets
for Identical
Investments
(Level 1) | | | Significant Other
Observable Inputs
(Level 2) | | | Significant
Unobservable
Inputs
(Level 3) | | | Value at
9/30/12 | |
Micro Cap Fund | | | | | | | | | | | | | | | | | | |
Assets | | | | | | | | | | | | | | | | | | |
Common Stocks | | | | | | | | | | | | | | | | | | |
| | Specialized Finance | | $ | — | | | $ | — | | | $ | 13,860 | | | $ | 13,860 | |
| | Other | | | 286,910,225 | | | | — | | | | — | | | | 286,910,225 | |
Preferred Stocks | | | | | 2,337,309 | | | | — | | | | — | | | | 2,337,309 | |
Warrants | | | | | — | | | | — | | | | 20,803 | | | | 20,803 | |
Short-Term Investments | | | | | — | | | | 4,460,102 | | | | — | | | | 4,460,102 | |
| | | | | | |
| | | | $ | 289,247,534 | | | $ | 4,460,102 | | | $ | 34,663 | | | $ | 293,742,299 | |
| | | | | | |
Micro Cap Value Fund | | | | | | | | | | | | | | | | | | |
Assets | | | | | | | | | | | | | | | | | | |
Common Stocks | | | | | | | | | | | | | | | | | | |
| | Construction Materials | | $ | 1,593,300 | | | $ | 1,913,580 | | | $ | — | | | $ | 3,506,880 | |
| | Diversified Banks | | | 3,412,099 | | | | — | | | | 182,779 | | | | 3,594,878 | |
| | Home Improvement Retail | | | 1,621,760 | | | | 1,152,534 | | | | — | | | | 2,774,294 | |
| | Specialized Finance | | | — | | | | — | | | | 3,771 | | | | 3,771 | |
| | Other | | | 121,566,832 | | | | — | | | | — | | | | 121,566,832 | |
Preferred Stocks | | | | | — | | | | — | | | | 625,263 | | | | 625,263 | |
Warrants | | | | | — | | | | — | | | | 7,130 | | | | 7,130 | |
Short-Term Investments | | | | | — | | | | 3,610,143 | | | | — | | | | 3,610,143 | |
| | | | | | |
| | | | $ | 128,193,991 | | | $ | 6,676,257 | | | $ | 818,943 | | | $ | 135,689,191 | |
| | | | | | |
Liabilities | | | | | | | | | | | | | | | | | | |
Equity Contracts | | | | $ | (165,575 | ) | | $ | — | | | $ | — | | | $ | (165,575 | ) |
Foreign Currency Exchange Contracts | | | | | — | | | | (15,841 | ) | | | — | | | | (15,841 | ) |
| | | | | | |
| | | | $ | (165,575 | ) | | $ | (15,841 | ) | | $ | — | | | $ | (181,416 | ) |
| | | | | | |
Small Cap Growth Fund | | | | | | | | | | | | | | | | | | |
Assets | | | | | | | | | | | | | | | | | | |
Common Stocks | | | | | | | | | | | | | | | | | | |
| | Health Care Equipment | | $ | 25,253,101 | | | $ | — | | | $ | 247 | | | $ | 25,253,348 | |
| | Other | | | 1,608,620,477 | | | | — | | | | — | | | | 1,608,620,477 | |
Preferred Stocks | | | | | — | | | | — | | | | 961,210 | | | | 961,210 | |
Limited Partnership Interest | | | | | — | | | | — | | | | 6,625,910 | | | | 6,625,910 | |
Warrants | | | | | — | | | | — | | | | 19,413 | | | | 19,413 | |
Short-Term Investments | | | | | — | | | | 140,939,232 | | | | — | | | | 140,939,232 | |
| | | | | | |
| | | | $ | 1,633,873,578 | | | $ | 140,939,232 | | | $ | 7,606,780 | | | $ | 1,782,419,590 | |
| | | | | | |
Small Cap Value Fund | | | | | | | | | | | | | | | | | | |
Assets | | | | | | | | | | | | | | | | | | |
Common Stocks | | | | $ | 172,063,656 | | | $ | — | | | $ | — | | | $ | 172,063,656 | |
Short-Term Investments | | | | | — | | | | 2,386,104 | | | | — | | | | 2,386,104 | |
| | | | | | |
| | | | $ | 172,063,656 | | | $ | 2,386,104 | | | $ | — | | | $ | 174,449,760 | |
| | | | | | |
Liabilities | | | | | | | | | | | | | | | | | | |
Equity Contracts | | | | $ | (31,500 | ) | | $ | — | | | $ | — | | | $ | (31,500 | ) |
| | | | | | |
| | | | $ | (31,500 | ) | | $ | — | | | $ | — | | | $ | (31,500 | ) |
| | | | | | |
Strategic Income Fund | | | | | | | | | | | | | | | | | | |
Assets | | | | | | | | | | | | | | | | | | |
Common Stocks | | | | | | | | | | | | | | | | | | |
| | Diversified REITs | | $ | — | | | $ | 266,786 | | | $ | — | | | $ | 266,786 | |
| | Other | | | 34,473,417 | | | | — | | | | — | | | | 34,473,417 | |
Limited Liability Company Membership Interest | | | | | 4,575,090 | | | | — | | | | 99,690 | | | | 4,674,780 | |
Corporate Bonds | | | | | — | | | | — | | | | 4,073 | | | | 4,073 | |
Short-Term Investments | | | | | — | | | | 5,224,570 | | | | — | | | | 5,224,570 | |
| | | | | | |
| | | | $ | 39,048,507 | | | $ | 5,491,356 | | | $ | 103,763 | | | $ | 44,643,626 | |
| | | | | | |
131
| | |
| WASATCH FUNDS — Notes to Financial Statements (continued) | | |
|
|
|
| | | | | | | | | | | | | | | | | | |
| Fund | | Category | | Quoted Prices in Active Markets
for Identical
Investments
(Level 1) | | | Significant Other
Observable Inputs
(Level 2) | | | Significant
Unobservable
Inputs
(Level 3) | | | Value at
9/30/12 | |
Ultra Growth Fund | | | | | | | | | | | | | | | | | | |
Assets | | | | | | | | | | | | | | | | | | |
Common Stocks | | | | | | | | | | | | | | | | | | |
| | Health Care Equipment | | $ | 8,344,289 | | | $ | — | | | $ | 165 | | | $ | 8,344,454 | |
| | Internet Software & Services | | | 9,610,227 | | | | — | | | | 914 | | | | 9,611,141 | |
| | Personal Products | | | — | | | | — | | | | 504 | | | | 504 | |
| | Other | | | 116,649,913 | | | | — | | | | — | | | | 116,649,913 | |
Preferred Stocks | | | | | — | | | | — | | | | 1,062,439 | | | | 1,062,439 | |
Limited Partnership Interest | | | | | — | | | | — | | | | 6,126,453 | | | | 6,126,453 | |
Warrants | | | | | — | | | | — | | | | 10,336 | | | | 10,336 | |
Short-Term Investments | | | | | — | | | | 1,319,049 | | | | — | | | | 1,319,049 | |
| | | | | | |
| | | | $ | 134,604,429 | | | $ | 1,319,049 | | | $ | 7,200,811 | | | $ | 143,124,289 | |
| | | | | | |
World Innovators Fund | | | | | | | | | | | | | | | | | | |
Assets | | | | | | | | | | | | | | | | | | |
Common Stocks | | Internet Software & Services | | $ | 17,549,230 | | | $ | — | | | $ | 65 | | | $ | 17,549,295 | |
| | Other | | | 126,242,265 | | | | — | | | | — | | | | 126,242,265 | |
Preferred Stocks | | | | | 2,948,957 | | | | — | | | | — | | | | 2,948,957 | |
Limited Partnership Interest | | | | | — | | | | — | | | | 496,747 | | | | 496,747 | |
Warrants | | | | | — | | | | — | | | | 4,290 | | | | 4,290 | |
Short-Term Investments | | | | | — | | | | 21,497,002 | | | | — | | | | 21,497,002 | |
| | | | | | |
| | | | $ | 146,740,452 | | | $ | 21,497,002 | | | $ | 501,102 | | | $ | 168,738,556 | |
| | | | | | |
Wasatch-1st Source Income Fund | | | | | | | | | | | | | | | | | | |
Assets | | | | | | | | | | | | | | | | | | |
Asset Backed Securities | | | | $ | — | | | $ | 4,331,729 | | | $ | — | | | $ | 4,331,729 | |
Collateralized Mortgage Obligations | | | | | — | | | | 33,856,153 | | | | — | | | | 33,856,153 | |
Corporate Bonds | | | | | — | | | | 53,273,615 | | | | — | | | | 53,273,615 | |
Municipal Bonds | | | | | — | | | | 1,923,925 | | | | — | | | | 1,923,925 | |
Mutual Funds | | | | | 871,362 | | | | — | | | | — | | | | 871,362 | |
Exchange Traded Funds | | | | | 730,620 | | | | — | | | | — | | | | 730,620 | |
U.S. Government Agency Securities | | | | | — | | | | 23,896,684 | | | | — | | | | 23,896,684 | |
U.S. Treasury Inflation Protected Bonds | | | | | — | | | | 2,050,295 | | | | — | | | | 2,050,295 | |
U.S. Treasury Notes | | | | | — | | | | 13,619,033 | | | | — | | | | 13,619,033 | |
Preferred Stocks | | | | | 1,134,083 | | | | — | | | | — | | | | 1,134,083 | |
Short-Term Investments | | | | | — | | | | 2,584,527 | | | | — | | | | 2,584,527 | |
| | | | | | |
| | | | $ | 2,736,065 | | | $ | 135,535,961 | | | $ | — | | | $ | 138,272,026 | |
| | | | | | |
U.S. Treasury Fund | | | | | | | | | | | | | | | | | | |
Assets | | | | | | | | | | | | | | | | | | |
U.S. Government Obligations | | | | $ | — | | | $ | 266,059,192 | | | $ | — | | | $ | 266,059,192 | |
Short-Term Investments | | | | | — | | | | 4,640,675 | | | | — | | | | 4,640,675 | |
| | | | | | |
| | | | $ | — | | | $ | 270,699,867 | | | $ | — | | | $ | 270,699,867 | |
| | | | | | |
If the securities of an Asset Class are all the same level, the asset class is shown in total. If the securities of an Asset Class cross levels, the level with the smallest number of categories and with multiple levels within a category is displayed by category. The remaining categories that do not cross levels are combined into the Other category.
The valuation techniques used by the Funds to measure fair value for the year ended September 30, 2012 maximized the use of observable inputs and minimized the use of unobservable inputs.
132
The table below shows the significant transfers between level 1 and level 2 due to fair valuation in certain foreign markets.
| | | | | | | | |
| Fund | | Transfers out
of Level 2 at
Market Value | | | Transfers into
Level 1 at
Market Value | |
Core Growth Fund | | $ | 29,598,520 | | | $ | 29,598,520 | |
Emerging India Fund | | | 10,092,460 | | | | 10,092,460 | |
Emerging Markets Small Cap Fund | | | 690,278,264 | | | | 690,278,264 | |
Global Opportunities Fund | | | 43,125,508 | | | | 43,125,508 | |
Heritage Growth Fund | | | 1,454,019 | | | | 1,454,019 | |
International Growth Fund | | | 261,741,030 | | | | 261,741,030 | |
International Opportunities Fund | | | 110,902,603 | | | | 110,902,603 | |
Micro Cap Fund | | | 27,400,718 | | | | 27,400,718 | |
Micro Cap Value | | | 9,705,991 | | | | 9,705,991 | |
Small Cap Growth Fund | | | 176,566,126 | | | | 176,566,126 | |
Small Cap Value Fund | | | 12,445,217 | | | | 12,445,217 | |
Ultra Growth Fund | | | 10,911,897 | | | | 10,911,897 | |
World Innovators Fund | | | 23,189,299 | | | | 23,189,299 | |
The following is a reconciliation of the fair valuations using significant unobservable inputs (level 3) for the Funds during the year ended September 30, 2012:
| | | | | | | | | | | | | | | | | | | | | | | | | | | | | | | | | | | | | | | | |
| Fund | | Market Value
Beginning
Balance
9/30/2011 | | | Purchases
at Cost | | | Sales
(Proceeds) | | | Accrued
Discounts
(Premiums) | | | Realized
Gain/ (Loss) | | | Change in
Unrealized
Appreciation
(Depreciation) | | | Transfers in at
Market Value | | | Transfers out at
Market Value | | | Market Value
Ending Balance
9/30/2012 | | | Net Change in
Unrealized
Appreciation
(Depreciation) on
Investments Held
at 9/30/2012 | |
Global Opportunities Fund | | | | | | | | | | | | | | | | | | | | | | | | | | | | | | | | | | | | | | | | |
Warrants | | $ | 27,200 | | | $ | — | | | $ | — | | | $ | — | | | $ | — | | | $ | (24,800 | ) | | $ | — | | | $ | — | | | $ | 2,400 | | | $ | (24,800 | ) |
| | | | |
Micro Cap Fund | | | | | | | | | | | | | | | | | | | | | | | | | | | | | | | | | | | | | | | | |
Common Stocks | | | 55,440 | | | | — | | | | — | | | | — | | | | — | | | | (41,580 | ) | | | — | | | | — | | | | 13,860 | | | | (41,580 | ) |
Warrants | | | 220,511 | | | | — | | | | — | | | | — | | | | (19,380 | ) | | | (181,781 | ) | | | 1,453 | | | | — | | | | 20,803 | | | | (199,950 | ) |
| | | | |
| | | 275,951 | | | | — | | | | — | | | | — | | | | (19,380 | ) | | | (223,361 | ) | | | 1,453 | | | | — | | | | 34,663 | | | | (223,361 | ) |
| | | | |
Micro Cap Value Fund | | | | | | | | | | | | | | | | | | | | | | | | | | | | | | | | | | | | | | | | |
Common Stocks | | | 200,085 | | | | — | | | | — | | | | — | | | | — | | | | (13,535 | ) | | | — | | | | — | | | | 186,550 | | | | (13,535 | ) |
Preferred Stocks | | | 249,997 | | | | 250,002 | | | | — | | | | — | | | | — | | | | 125,264 | | | | — | | | | — | | | | 625,263 | | | | 125,264 | |
Warrants | | | 75,721 | | | | — | | | | — | | | | — | | | | (9,302 | ) | | | (59,789 | ) | | | 500 | | | | — | | | | 7,130 | | | | (68,510 | ) |
| | | | |
| | | 525,803 | | | | 250,002 | | | | — | | | | — | | | | (9,302 | ) | | | 51,940 | | | | 500 | | | | — | | | | 818,943 | | | | 51,940 | |
| | | | |
Small Cap Growth Fund | | | | | | | | | | | | | | | | | | | | | | | | | | | | | | | | | | | | | | | | |
Common Stocks | | | 247 | | | | — | | | | — | | | | — | | | | (406,537 | ) | | | 406,537 | | | | — | | | | — | | | | 247 | | | | — | |
Preferred Stocks | | | 8,424,480 | | | | — | | | | (7,254,247 | ) | | | — | | | | — | | | | (209,023 | ) | | | — | | | | — | | | | 961,210 | | | | — | |
Limited Partnership Interest | | | 6,271,172 | | | | 160,000 | | | | — | | | | — | | | | — | | | | 194,738 | | | | — | | | | — | | | | 6,625,910 | | | | 194,738 | |
Warrants | | | — | | | | — | | | | — | | | | — | | | | — | | | | — | | | | 19,413 | | | | — | | | | 19,413 | | | | — | |
| | | | |
| | | 14,695,899 | | | | 160,000 | | | | (7,254,247 | ) | | | — | | | | (406,537 | ) | | | 392,252 | | | | 19,413 | | | | — | | | | 7,606,780 | | | | 601,275 | |
| | | | |
Strategic Income Fund | | | | | | | | | | | | | | | | | | | | | | | | | | | | | | | | | | | | | | | | |
Limited Liability Company Membership Interest | | | 154,558 | | | | — | | | | (52,550 | ) | | | — | | | | — | | | | (2,318 | ) | | | — | | | | — | | | | 99,690 | | | | (2,318 | ) |
Corporate Bonds | | | 5,054 | | | | — | | | | (2,886 | ) | | | (100 | ) | | | 681 | | | | 1,324 | | | | — | | | | — | | | | 4,073 | | | | (812 | ) |
| | | | |
| | | 159,612 | | | | — | | | | (55,436 | ) | | | (100 | ) | | | 681 | | | | (994 | ) | | | — | | | | — | | | | 103,763 | | | | (3,130 | ) |
| | | | |
Ultra Growth Fund | | | | | | | | | | | | | | | | | | | | | | | | | | | | | | | | | | | | | | | | |
Common Stocks | | | 1,583 | | | | — | | | | — | | | | — | | | | — | | | | — | | | | — | | | | — | | | | 1,583 | | | | — | |
Preferred Stocks | | | 1,255,122 | | | | — | | | | — | | | | — | | | | — | | | | (192,683 | ) | | | — | | | | — | | | | 1,062,439 | | | | (192,683 | ) |
Limited Partnership Interest | | | 5,786,902 | | | | 150,000 | | | | — | | | | — | | | | — | | | | 189,551 | | | | — | | | | — | | | | 6,126,453 | | | | 189,551 | |
Warrants | | | 112,200 | | | | — | | | | — | | | | — | | | | — | | | | (102,300 | ) | | | 436 | | | | — | | | | 10,336 | | | | (102,300 | ) |
| | | | |
| | | 7,155,807 | | | | 150,000 | | | | — | | | | — | | | | — | | | | (105,432 | ) | | | 436 | | | | — | | | | 7,200,811 | | | | (105,432 | ) |
| | | | |
World Innovators Fund | | | | | | | | | | | | | | | | | | | | | | | | | | | | | | | | | | | | | | | | |
Common Stocks | | | 65 | | | | — | | | | — | | | | — | | | | — | | | | — | | | | — | | | | — | | | | 65 | | | | — | |
Limited Partnership Interest | | | 484,252 | | | | 10,000 | | | | — | | | | — | | | | — | | | | 2,495 | | | | — | | | | — | | | | 496,747 | | | | 2,495 | |
Warrants | | | 48,620 | | | | — | | | | — | | | | — | | | | — | | | | (44,330 | ) | | | — | | | | — | | | | 4,290 | | | | (44,330 | ) |
| | | | |
| | | 532,937 | | | | 10,000 | | | | — | | | | — | | | | — | | | | (41,835 | ) | | | — | | | | — | | | | 501,102 | | | | (41,835 | ) |
| | | | |
Income Fund | | | | | | | | | | | | | | | | | | | | | | | | | | | | | | | | | | | | | | | | |
U.S. Government Agency Securities | | $ | 674,288 | | | $ | — | | | $ | (41,920 | ) | | $ | (1,600 | ) | | $ | (1,397 | ) | | $ | 33,676 | | | $ | — | | | $ | 663,047 | | | $ | — | | | $ | 33,676 | |
| | | | |
133
| | |
| WASATCH FUNDS — Notes to Financial Statements (continued) | | |
|
|
|
17. FAIR VALUEOF DERIVATIVE INSTRUMENTS*
The following is a summary of the fair valuations of the Funds’ derivative instruments categorized by risk exposure:
WASATCH CORE GROWTH FUND
Fair Values of Derivative Instruments on the Statement of Assets and Liabilities as of September 30, 2012:
| | | | | | | | | | | | | | | | | | | | | | | | |
| | | Derivatives not accounted for as hedging instruments under Statement 133 | |
| | | Interest Rate
Contracts | | | Foreign Exchange
Contracts | | | Credit
Contracts | | | Equity
Contracts | | | Other
Contracts | | | Total | |
Liabilities Derivatives | | | | | | | | | | | | | | | | | | | | | | | | |
Call options written at value | | $ | — | | | $ | — | | | $ | — | | | $ | 112,700 | | | $ | — | | | $ | 112,700 | |
| | | | |
The Effect of Derivative Instruments on the Statement of Operations for the Year Ended September 30, 2012:
| | | | | | | | | | | | | | | | | | | | | | | | |
| | | Derivatives not accounted for as hedging instruments under Statement 133 | |
| | | Interest Rate
Contracts | | | Foreign Exchange
Contracts | | | Credit
Contracts | | | Equity
Contracts | | | Other
Contracts | | | Total | |
Realized Gain (Loss) on Derivatives Recognized in Income | | | | | | | | | | | | | | | | | | | | | | | | |
Net realized gain on options | | $ | — | | | $ | — | | | $ | — | | | $ | 178,735 | | | $ | — | | | $ | 178,735 | |
| | | | |
Net Change in Unrealized Appreciation (Depreciation) on Derivatives Recognized in Income | | | | | | | | | | | | | | | | | | | | | | | | |
Change in unrealized appreciation (depreciation) on investments, options and foreign currency translations | | $ | — | | | $ | — | | | $ | — | | | $ | (38,216 | ) | | $ | — | | | $ | (38,216 | ) |
| | | | |
LONG/SHORT FUND
Fair Values of Derivative Instruments on the Statement of Assets and Liabilities as of September 30, 2012:
| | | | | | | | | | | | | | | | | | | | | | | | |
| | | Derivatives not accounted for as hedging instruments under Statement 133 | |
| | | Interest Rate
Contracts | | | Foreign Exchange
Contracts | | | Credit
Contracts | | | Equity
Contracts | | | Other
Contracts | | | Total | |
Liabilities Derivatives | | | | | | | | | | | | | | | | | | | | | | | | |
Call options written at value | | $ | — | | | $ | — | | | $ | — | | | $ | 6,597,784 | | | $ | — | | | $ | 6,597,784 | |
| | | | |
The Effect of Derivative Instruments on the Statement of Operations for the Year Ended September 30, 2012:
| | | | | | | | | | | | | | | | | | | | | | | | |
| | | Derivatives not accounted for as hedging instruments under Statement 133 | |
| | | Interest Rate
Contracts | | | Foreign Exchange
Contracts | | | Credit
Contracts | | | Equity
Contracts | | | Other
Contracts | | | Total | |
Realized Gain (Loss) on Derivatives Recognized in Income | | | | | | | | | | | | | | | | | | | | | | | | |
Net realized gain on options | | $ | — | | | $ | — | | | $ | — | | | $ | 18,320,523 | | | $ | — | | | $ | 18,320,523 | |
| | | | |
Net Change in Unrealized Appreciation (Depreciation) on Derivatives Recognized in Income | | | | | | | | | | | | | | | | | | | | | | | | |
Change in unrealized appreciation (depreciation) on investments, options and foreign currency translations | | $ | — | | | $ | — | | | $ | — | | | $ | (2,170,388 | ) | | $ | — | | | $ | (2,170,388 | ) |
| | | | |
134
WASATCH MICRO CAP VALUE FUND
Fair Values of Derivative Instruments on the Statement of Assets and Liabilities as of September 30, 2012:
| | | | | | | | | | | | | | | | | | | | | | | | |
| | | Derivatives not accounted for as hedging instruments under Statement 133 | |
| | | Interest Rate
Contracts | | | Foreign Exchange
Contracts | | | Credit
Contracts | | | Equity
Contracts | | | Other
Contracts | | | Total | |
Liabilities Derivatives | | | | | | | | | | | | | | | | | | | | | | | | |
Call options written at value | | $ | — | | | $ | — | | | $ | — | | | $ | 165,575 | | | $ | — | | | $ | 165,575 | |
Unrealized depreciation on foreign currency exchange contracts | | | — | | | | 15,841 | | | | — | | | | — | | | | — | | | | 15,841 | |
| | | | |
| | $ | — | | | $ | 15,841 | | | $ | — | | | $ | 165,575 | | | $ | — | | | $ | 181,416 | |
| | | | |
The Effect of Derivative Instruments on the Statement of Operations for the Year Ended September 30, 2012:
| | | | | | | | | | | | | | | | | | | | | | | | |
| | | Derivatives not accounted for as hedging instruments under Statement 133 | |
| | | Interest Rate
Contracts | | | Foreign Exchange
Contracts | | | Credit
Contracts | | | Equity
Contracts | | | Other
Contracts | | | Total | |
Realized Gain (Loss) on Derivatives Recognized in Income | | | | | | | | | | | | | | | | | | | | | | | | |
Net realized gain (loss) on investments and foreign currency translations | | $ | — | | | $ | 460,207 | | | $ | — | | | $ | — | | | $ | — | | | $ | 460,207 | |
Net realized gain on options | | | — | | | | — | | | | — | | | | 1,221,805 | | | | — | | | | 1,221,805 | |
| | | | |
| | $ | — | | | $ | 460,207 | | | $ | — | | | $ | 1,221,805 | | | $ | — | | | $ | 1,682,012 | |
| | | | |
Net Change in Unrealized Appreciation (Depreciation) on Derivatives Recognized in Income | | | | | | | | | | | | | | | | | | | | | | | | |
Change in unrealized appreciation (depreciation) on investments, options and foreign currency translations | | $ | — | | | $ | (254,511 | ) | | $ | — | | | $ | (280,526 | ) | | $ | — | | | $ | (535,037 | ) |
| | | | |
WASATCH SMALL CAP VALUE FUND
Fair Values of Derivative Instruments on the Statement of Assets and Liabilities as of September 30, 2012:
| | | | | | | | | | | | | | | | | | | | | | | | |
| | | Derivatives not accounted for as hedging instruments under Statement 133 | |
| | | Interest Rate
Contracts | | | Foreign Exchange
Contracts | | | Credit
Contracts | | | Equity
Contracts | | | Other
Contracts | | | Total | |
Liabilities Derivatives | | | | | | | | | | | | | | | | | | | | | | | | |
Call options written at value | | $ | — | | | $ | — | | | $ | — | | | $ | 31,500 | | | $ | — | | | $ | 31,500 | |
| | | | |
The Effect of Derivative Instruments on the Statement of Operations for the Year Ended September 30, 2012:
| | | | | | | | | | | | | | | | | | | | | | | | |
| | | Derivatives not accounted for as hedging instruments under Statement 133 | |
| | | Interest Rate
Contracts | | | Foreign Exchange
Contracts | | | Credit
Contracts | | | Equity
Contracts | | | Other
Contracts | | | Total | |
Net Change in Unrealized Appreciation (Depreciation) on Derivatives Recognized in Income | | | | | | | | | | | | | | | | | | | | | | | | |
Change in unrealized appreciation (depreciation) on investments, options and foreign currency translations | | $ | — | | | $ | — | | | $ | — | | | $ | (102,761 | ) | | $ | — | | | $ | (102,761 | ) |
| | | | |
135
| | |
| WASATCH FUNDS — Notes to Financial Statements (continued) | | SEPTEMBER 30, 2012 |
|
|
|
WASATCH WORLD INNOVATORS FUND
The Effect of Derivative Instruments on the Statement of Operations for the Year Ended September 30, 2012:
| | | | | | | | | | | | | | | | | | | | | | | | |
| | | Derivatives not accounted for as hedging instruments under Statement 133 | |
| | | Interest Rate
Contracts | | | Foreign Exchange
Contracts | | | Credit
Contracts | | | Equity
Contracts | | | Other
Contracts | | | Total | |
Realized Gain (Loss) on Derivatives Recognized in Income | | | | | | | | | | | | | | | | | | | | | | | | |
Net realized gain (loss) on investments and foreign currency translations | | $ | — | | | $ | — | | | $ | — | | | $ | (33,758 | ) | | $ | — | | | $ | (33,758 | ) |
| | | | |
Net Change in Unrealized Appreciation (Depreciation) on Derivatives Recognized in Income | | | | | | | | | | | | | | | | | | | | | | | | |
Change in unrealized appreciation (depreciation) on investments, options and foreign currency translations | | $ | — | | | $ | — | | | $ | — | | | $ | 24,057 | | | $ | — | | | $ | 24,057 | |
| | | | |
| * | See Note 4 — Financial Derivative Instruments for additional information. |
For the year ended September 30, 2012, the average monthly balance of derivative financial instruments was as follows:
| | | | | | | | | | | | | | | | | | | | |
| | | Core
Growth
Fund | | | Long/Short
Fund | | | Micro Cap
Value
Fund | | | Small Cap
Value
Fund | | | World
Innovators
Fund | |
Forward currency contracts: | | | | | | | | | | | | | | | | | | | | |
Average number of contracts — U.S. dollars purchased | | | — | | | | — | | | | 1 | | | | — | | | | — | |
Average U.S. dollar amounts purchased | | $ | — | | | $ | — | | | $ | 4,275,809 | | | $ | — | | | $ | — | |
Option contracts: | | | | | | | | | | | | | | | | | | | | |
Average number of put contracts purchased | | | — | | | | — | | | | — | | | | — | | | | 75 | |
Average number of call contracts purchased | | | — | | | | — | | | | — | | | | — | | | | 13 | |
Average number of call contracts written | | | 171 | | | | 24,086 | | | | 924 | | | | 89 | | | | — | |
Average value of put contracts purchased | | $ | — | | | $ | — | | | $ | — | | | $ | — | | | $ | 283 | |
Average value of call contracts purchased | | $ | — | | | $ | — | | | $ | — | | | $ | — | | | $ | 12,557 | |
Average value of call contracts written | | $ | 16,475 | | | $ | 5,867,310 | | | $ | 243,035 | | | $ | 10,938 | | | $ | — | |
18. SUBSEQUENT EVENTS
On October 2, 2012, the Funds filed a post-effective registration statement pursuant to Rule 485(a)(2) under the 1940 Act for the Institutional Class shares of the Wasatch Long/Short Fund.
The Frontier Emerging Small Countries Fund had substantial inflows in October 2012 resulting in a net asset value of approximately $128,000,000 as of month-end. A significant portion of the net assets of the Frontier Emerging Small Countries Fund is owned by a group of shareholders advised by a common investment advisor. If this group of shareholders simultaneously redeems on the advice of their investment advisor, Fund expenses may increase and performance may be materially affected. However, the Advisor has contractually agreed to waive its fees and/or reimburse the Frontier Emerging Small Countries Fund should its operating expenses exceed 2.25% through at least January 31, 2013.
136
| | |
| WASATCH FUNDS — Report of Independent Registered Public Accounting Firm | | SEPTEMBER 30, 2012 |
|
|
|
To the Board of Trustees
and Shareholders of
Wasatch Funds Trust:
In our opinion, the accompanying statements of assets and liabilities, including the schedules of investments, and the related statements of operations and of changes in net assets and the financial highlights present fairly, in all material respects, the financial position of each of the funds constituting the Wasatch Funds Trust (hereafter referred to as the “Funds”) at September 30, 2012, the results of each of their operations for the year then ended, the changes in each of their net assets for each of the two years in the period then ended (except for the Wasatch Frontier Emerging Small Countries Fund, which the results of operations and the changes in net assets are for the period January 31, 2012 (commencement of operations) through September 30, 2012, and the Wasatch Emerging India Fund, which the changes in net assets are for the period April 26, 2011 (commencement of operations) through September 30, 2012), and the financial highlights for each of the periods indicated (except for the Wasatch Large Cap Value Fund (formerly Wasatch-1st Source Income Equity Fund), Wasatch-1st Source Income Fund, and Wasatch Long/Short Fund (formerly Wasatch-1st Source Long/Short Fund), and the financial highlights for the Wasatch Large Cap Value Fund, Wasatch 1st-Source Income Fund, and Wasatch Long/Short Fund for the four years in the period then ended), in conformity with accounting principles generally accepted in the United States of America. These financial statements and financial highlights (hereafter referred to as “financial statements”) are the responsibility of the Funds’ management; our responsibility is to express an opinion on these financial statements based on our audits. We conducted our audits of these financial statements in accordance with the standards of the Public Company Accounting Oversight Board (United States). Those standards require that we plan and perform the audit to obtain reasonable assurance about whether the financial statements are free of material misstatement. An audit includes examining, on a test basis, evidence supporting the amounts and disclosures in the financial statements, assessing the accounting principles used and significant estimates made by management, and evaluating the overall financial statement presentation. We believe that our audits, which included confirmation of securities at September 30, 2012 by correspondence with the custodian and brokers, provide a reasonable basis for our opinion. The financial statements of the Wasatch Large Cap Value Fund, Wasatch-1st Source Income Fund, and Wasatch Long/Short Fund as of September 30, 2008 and the financial highlights for the six months then ended were audited by other auditors, whose report dated November 26, 2008 expressed an unqualified opinion on those statements. The financial statements of the Wasatch Large Cap Value Fund, Wasatch-1st Source Income Fund, and Wasatch Long/Short Fund as of March 31, 2008 and the financial highlights the year then ended, were audited by other auditors whose report dated May 22, 2008 expressed an unqualified opinion on those statements.
PricewaterhouseCoopers LLP
Kansas City, Missouri
November 27, 2012
137
| | |
| WASATCH FUNDS — Supplemental Information | | |
|
|
|
MANAGEMENTOFTHE COMPANY
Management Information. The business affairs of Wasatch Funds are overseen by its Board of Trustees. The Board consists of five Independent Trustees and one Interested Trustee. Four of the Independent Trustees and the Interested Trustee were elected by shareholders to serve until their successors are qualified, appointed or elected in accordance with the Trust’s Declaration of Trust and By-Laws. One Interested Trustee has been appointed by the elected Independent Trustees to serve until his successor is qualified, appointed or elected in accordance with the Trust’s Declaration of Trust and By-Laws.
The trustees and executive officers of Wasatch Funds and their principal occupations for at least the last five years are set forth below.
| | | | | | | | | | |
Name, Address and Age | | Position(s)
Held with
Wasatch Funds | | Term of Office1
and Length of
Time Served | | Principal Occupation(s)
during Past 5 Years | | Number of
Portfolios
in Fund
Complex
Overseen
by Trustee | | Other Directorships
Held by Trustees
during Past 5 Years2 |
Independent Trustees | | | | | | | | | | |
| | | | | |
James U. Jensen, J.D., MBA 150 Social Hall Ave. 4th Floor Salt Lake City, UT 84111 Age 68 | | Trustee and Chairman of the Board | | Indefinite Served as Chairman of the Board since 2004 and Trustee since 1986 | | Chief Executive Officer of Clearwater Law & Governance Group (an operating law firm board governance consulting company) April 2008 to present; Co-Founder and Chairman of the Board of Intelisum, Inc. (a company pursuing computer and measurement technology and products) 2001 - 2008; Consultant on corporate growth and technology transfer since 2004; Vice President, Corporate Development, Legal Affairs and General Counsel, and Secretary, NPS Pharmaceuticals, Inc. from 1991 to 2004. | | 20 | | Director and Board Chairman of Bayhill Capital Corporation (telephone communications) since December 2007. |
| | | | | |
William R. Swinyard, Ph.D. 150 Social Hall Ave. 4th Floor Salt Lake City, UT 84111 Age 72 | | Trustee and Chairman of the Audit Committee | | Indefinite Served as Chairman of the Audit Committee since 2004 and Trustee since 1986 | | Retired Professor of Business Management and Holder of the
Fred G. Meyer Chair of Marketing (Emeritus), Brigham Young University, from 1978 to 2007. | | 20 | | None |
| | | | | |
D. James Croft, Ph.D. 150 Social Hall Ave. 4th Floor Salt Lake City, UT 84111 Age 70 | | Trustee | | Indefinite Served as Chairman of the Governance and Nominating Committee since November 2011 and Trustee since 2005 | | Consultant to the mortgage industry on issues of mortgage quality, identification of mortgage fraud, strategic planning and client development since 2004; Founder & Executive Director, Mortgage Asset Research Institute, from 1990 to 2004. | | 20 | | None |
| | | | | |
Miriam M. Allison3 150 Social Hall Ave. 4th Floor Salt Lake City, UT 84111 Age 65 | | Trustee | | Indefinite Served as Trustee since 2010 | | Rancher since 2004. From 2001 to 2005, Chairman of UMB Fund Services, Inc. | | 20 | | Director, Northwestern Mutual Series Fund, Inc. (28 portfolios) since 2006. |
| | | | | |
Heikki Rinne, Ph.D. 150 Social Hall Ave. 4th Floor Salt Lake City, Utah 84111 Age 60 | | Trustee | | Indefinite Served as Trustee since October 2012 | | Chief Executive Officer of the Halton Group Ltd. (an indoor environmental control manufacturing and technology company) since 2002 | | 20 | | Director, Touchfon International, through 2009; Director, Infostar Group, through 2009 |
|
|
Interested Trustee | | | | | | | | | | |
| | | | | |
Samuel S. Stewart, Jr., Ph.D. CFA4 150 Social Hall Ave. 4th Floor Salt Lake City, UT 84111 Age 70 | | President and Trustee | | Indefinite Served as President and Trustee since 1986 | | Chairman of the Board for the Advisor since 1975; Chief Investment Officer of the Advisor from 2004 to June 2009; Director of Research of the Advisor from 1975 to 2004; Chairman of the Board of Wasatch Funds from 1986 to 2004. | | 20 | | None |
|
|
| 1 | A Trustee may serve until his/her death, resignation, removal or retirement. Each Independent Trustee shall retire as Trustee at the end of the calendar year in which he/she attains the age of 75 years. |
138
| | |
| | SEPTEMBER 30, 2012 (UNAUDITED) |
|
|
|
| 2 | Directorships are those held by a Trustee in any company with a class of securities registered pursuant to Section 12 of the Securities Exchange Act of 1934 or subject to the requirements of Section 15(d) of the Securities Exchange Act or any company registered as an investment company under the 1940 Act. |
| 3 | Ms. Allison previously owned shares of UMB Financial Corp., the parent company of UMB Fund Services, Inc., the Funds’ transfer agent. Ms. Allison no longer owns such shares. |
| 4 | Dr. Stewart is an Interested Trustee because he serves as the Chairman of the Board of the Advisor. |
| | | | | | |
Name, Address
and Age | | Position(s)
Held with Wasatch Funds | | Term of Office and
Length of Time Served | | Principal Occupation(s)
during Past 5 Years |
Officers | | | | | | |
| | | |
Daniel D. Thurber 150 Social Hall Ave. 4th Floor Salt Lake City, UT 84111 Age 43 | | Vice President | | Indefinite Served as Vice President since February 2007 | | General Counsel, Chief Compliance Officer and Director of Compliance for the Advisor since 2006; Chief Compliance Officer and Secretary for Wasatch Funds from May 2006 to February 2007. |
| | | |
Russell L. Biles 150 Social Hall Ave. 4th Floor Salt Lake City, UT 84111 Age 44 | | Chief Compliance Officer, Vice President and Secretary | | Indefinite Served as Chief Compliance Officer and Vice President since February 2007 and Secretary since November 2008 | | Chief Compliance Officer and Vice President for Wasatch Funds since February 2007; Secretary for Wasatch Funds since November 2008; Counsel for the Advisor since October 2006; Senior Compliance Administrator for the Advisor from October 2005 to October 2006. |
| | | |
Cindy B. Firestone CPA 150 Social Hall Ave. 4th Floor Salt Lake City, UT 84111 Age 54 | | Treasurer | | Indefinite Served as Treasurer since May 2009 | | Treasurer for Wasatch Funds since May 2009; Assistant Treasurer for Wasatch Funds from November 2008 to May 2009; Internal Auditor for the Advisor from December 2002 to August 2011. |
|
|
Additional information about the Funds’ trustees is provided in the Statement of Additional Information and is available without charge, upon request, by calling 800.551.1700.
ADDITIONAL TAX INFORMATION:
The Funds hereby designate the following amounts or maximum amounts allowable as long term capital gain dividends for the purpose of the dividends paid deduction. The amounts designated here include the utilization of earnings and profits distributed to shareholders on the redemption of shares.
| | | | |
| | | Amount | |
Global Opportunities Fund | | $ | 22,775,242 | |
Heritage Growth Fund | | | 1,097,280 | |
International Opportunities Fund | | | 17,671,323 | |
Small Cap Growth Fund | | | 62,046,614 | |
Ultra Growth Fund | | | 7,674,675 | |
U.S. Treasury Fund | | | 9,334,135 | |
For the fiscal year ended September 30, 2012, certain dividends paid by each Fund may be subject to a maximum
tax rate of 15% as provided for by the Jobs and Growth Tax Relief Reconciliation Act of 2003. To the extent dividends are paid during the calendar year 2012, complete information will be reported on shareholders’ 2012 Form 1099-DIV.
The amount designated as qualified dividend income for the year ended September 30, 2012 will be at the highest amount permitted by law.
Corporate shareholders should note for the year ended September 30, 2012, the percentage of the Funds’ investment income (i.e., net investment income plus short-term capital gains) that qualified for the corporate dividends received deductions are as follows:
| | | | |
| | | Percentage | |
Large Cap Value Fund | | | 100 | % |
Strategic Income Fund | | | 45 | % |
Income Fund | | | 3 | % |
139
| | |
WASATCH FUNDS — Supplemental Information (continued) | | SEPTEMBER 30, 2012 (UNAUDITED) |
|
|
|
PROXY VOTING POLICIES, PROCEDURESAND RECORD
A description of the policies and procedures that Wasatch Advisors uses to vote proxies related to the Funds’ portfolio securities is set forth in the Funds’ Statement of Additional Information which is available without charge, upon request, on the Funds’ website at www.wasatchfunds.com or by calling 800.551.1700 and on the Securities and Exchange Commission’s (SEC) website at www.sec.gov.
Wasatch Funds’ proxy voting record is available on the Funds’ website at www.wasatchfunds.com and the SEC’s website at www.sec.gov no later than August 31 for the prior 12 months ending June 30.
QUARTERLY PORTFOLIO HOLDINGS DISCLOSUREON FORM N-Q
The Funds file their complete schedules of investments with the SEC for their first and third fiscal quarters of each fiscal year, commencing with the quarter ended December 31, 2004, on Form N-Q. The Funds’ Form N-Q is available on the SEC’s website at www.sec.gov, and may be viewed at the SEC’s Public Reference Room in Washington, D.C. (information on the operation of the Public Reference Room may be obtained by calling 800.SEC.0330).
INVESTMENT ADVISOR
Wasatch Advisors, Inc.
150 Social Hall Avenue, 4th Floor
Salt Lake City, UT 84111
SUB-ADVISORFORTHE WASATCH-1ST SOURCE INCOME FUND
1st Source Corporation Investment Advisors, Inc.
100 North Michigan Street
South Bend, IN 46601
SUB-ADVISORFORTHE U.S. TREASURY FUND
Hoisington Investment Management Co.
6836 Bee Caves Rd.
Building 2, Suite 100
Austin, TX 78746
ADMINISTRATORAND FUND ACCOUNTANT
State Street Bank and Trust Company
801 Pennsylvania Avenue
Kansas City, MO 64105
DISTRIBUTOR
ALPS Distributors, Inc.
1290 Broadway, Suite 1100
Denver, CO 80203
TRANSFER AGENT
UMB Fund Services, Inc.
803 West Michigan Street, Suite A
Milwaukee, WI 53233-2301
CUSTODIAN
State Street Bank and Trust Company
801 Pennsylvania Avenue
Kansas City, MO 64105
LEGAL COUNSELTO WASATCH FUNDSANDINDEPENDENT TRUSTEES
Chapman and Cutler, LLP
111 West Monroe Street
Chicago, IL 60603
INDEPENDENT REGISTERED PUBLIC ACCOUNTING FIRM
PricewaterhouseCoopers LLP
1100 Walnut, Suite 1300
Kansas City, MO 64106
140
| | |
| WASATCH FUNDS — Guide to Understanding Financial Statements | | SEPTEMBER 30, 2012 (UNAUDITED) |
|
|
|
Wasatch Funds provides reports to shareholders twice a year. The annual report is for the Funds’ fiscal year which ends September 30. The semi-annual report is for the six months or period ending March 31. Additionally, the Funds’ schedules of investments for the first and third quarters of each fiscal year are available to shareholders as described on page 140. These reports provide shareholders with important information that will help them evaluate the management and performance of their investments. It is the desire of Wasatch Funds to help shareholders stay in tune with their investments. If you have any questions about the information in this report, a shareholder services representative will be happy to assist you when you call 800.551.1700.
SCHEDULEOF INVESTMENTS
The holdings of each Wasatch Fund are detailed in the “Schedule of Investments.” This section provides a snapshot of the securities each Fund was invested in on the last day of the reporting period. The Wasatch Equity Funds invest primarily in Common Stocks of companies which are grouped together by industry. The Wasatch-1st Source Income Fund invests primarily in fixed income securities. The U.S. Treasury Fund invests primarily in U.S. Treasury securities. The Equity Funds will typically have only minor holdings in Short-Term Investments. At times the Funds may take temporary defensive positions by increasing cash or holdings in Short-Term Investments. Please see the prospectus under “Additional Information about the Funds.”
STATEMENTSOF ASSETSAND LIABILITIES
These financial statements show the Assets and Liabilities of a Fund on the last day of the reporting period. A Fund’s Assets include the value of securities owned, amounts receivable for purchases of Fund shares (capital shares receivable), securities sold, interest and dividends, prepaid expenses and other assets. Liabilities are amounts owed for shareholder redemptions (capital shares payable), securities purchased, investment advisory fees (payable to Advisor) and other payables. Totaling up the assets and subtracting the liabilities results in a Fund’s Net Assets.
Net Assets consist of capital stock, paid-in capital in excess of par, undistributed net investment income or loss, undistributed net realized gain or loss on investments and net unrealized appreciation or depreciation on investments. Capital stock is stock authorized by a company’s charter and having par value, stated value or no par value. Par value is set by the company issuing the shares and has no relation to Net Asset Value. The par value of one share of each Wasatch Fund is $.01. Paid-in capital in excess of par is capital received from shareholders in exchange for Fund shares that exceeds the par value of the shares. For example, if you bought one share of a Fund for $10, $.01 would show as “Capital stock” on the books of the Fund, and $9.99 would be accounted for under “Paid-in capital in excess of par.” Undistributed net investment income or loss is the amount of net investment income or loss of a Fund since inception that has not been paid to shareholders as a dividend.
Undistributed net realized gain (loss) on investments is the amount of net realized gains or losses generated by a Fund since inception that have not been distributed to shareholders in the form of a capital gain distribution. A gain or loss is realized when a security is sold by a Fund. Net unrealized appreciation (depreciation) on investments is the change in value from the purchase price of securities a Fund continues to hold.
The number of shares a Fund is authorized to sell can be found under Capital Stock Issued and Outstanding. Issued and outstanding indicates the number of shares owned by shareholders.
Net Asset Value (NAV), Redemption Price and Offering Price Per Share shows the value of one outstanding share of a Fund on the date of the report. A Fund’s share price (NAV) is calculated by dividing the value of all securities and other assets owned by a Fund, less the liabilities charged to that Fund, by the number of Fund shares outstanding. The share price is calculated at the close of business of the New York Stock Exchange on each day the Exchange is open for trading. Please see Wasatch Funds’ prospectus for more information about how share prices are calculated. Information about how the share price is affected by a Fund’s operation can be found under “Financial Highlights” on page 142.
STATEMENTSOF OPERATIONS
Statements of Operations show investment income and expenses for each Fund as well as realized gains or losses from securities sold and the appreciation or depreciation in the value of a Fund’s holdings during the reporting period.
Investment Income shows Interest and Dividends earned from interest-bearing and dividend-paying securities in a Fund’s portfolio.
Expenses show the various fees and expenses paid out of a Fund’s assets such as the fee paid to Wasatch Advisors, the Funds’ investment advisor. Additional fees include shareholder servicing, fund administration and accounting, custody of fund assets, federal and state registration, legal counsel, auditing and trustees’ fees and other expenses. The Funds pay for printing and mailing statements, prospectuses, annual reports and semi-annual reports to shareholders.
Net Investment Income (Loss) is the amount of dividends and interest income earned on securities held by a Fund, less the Fund’s expenses.
Net realized gain (loss) on investments and foreign currency translations is the net gain or loss on securities a Fund has sold. Change in unrealized appreciation (depreciation) on investments and foreign currency translations is the change in value of securities a Fund continues to hold.
Net gain (loss) on investments is the result of changes in the market value of securities a Fund has sold and securities it continues to hold.
STATEMENTSOF CHANGESIN NET ASSETS
Net Assets are a Fund’s remaining assets after taking into consideration any liabilities. Statements of Changes in Net
141
| | |
WASATCH FUNDS — Guide to Understanding Financial Statements (continued) | | SEPTEMBER 30, 2012 (UNAUDITED) |
|
|
|
Assets show the increase or decrease in a Fund’s net assets during the reporting period. Investment operations, dividends and capital share transactions affect a Fund’s net assets. Operations is a summary of the Statements of Operations. It includes investment income or loss, net realized gain or loss on investments and foreign currency translations a Fund has sold as well as appreciation or depreciation in the value of investments a Fund continues to hold.
Dividends are distributed by Wasatch Funds to sharehold-ers when Fund investments have earned income in excess of net expenses or when capital gains in excess of capital losses are realized from the sale of securities. Most shareholders choose to reinvest their dividends and capital gain distribu- tions. Each Fund is required by Internal Revenue Code regulations to distribute substantially all of its net investment income and capital gains to shareholders in order to retain its status as a “regulated investment company.”
Capital share transactions are any transactions involving shares of a Fund, including the selling of Fund shares, shares issued by a Fund to shareholders for the reinvestment of dividends, and share redemptions.
FINANCIAL HIGHLIGHTS
The Financial Highlights contain important historical operating information that you may find useful in making decisions or understanding the performance of your investment.
Net Asset Value (NAV) is defined under “Statements of Assets and Liabilities” on page 141. The difference between the Net asset value, beginning of period and the Net asset value, end of period in the Financial Highlights is the change in value of a Fund’s shares over the reporting period, but not its total return.
Income (loss) from investment operations shows how the share price was affected by a Fund’s operations on a per share basis. Net investment income (loss) is the per share
amount of dividends and interest income earned on securities held by a Fund, less the Fund’s expenses. Net realized and unrealized gains (losses) on investments is the per share increase or decrease in the value of securities a Fund holds or has sold during the reporting period. Gains or (losses) are realized when securities are sold. Gains or (losses) are unrealized when securities increase or decrease in value but are not sold.
Distributions are the per share amount a Fund paid to shareholders from net investment income and net realized gains.
Total return is the percentage increase or decrease in the value of an investment over a stated period of time. A total return percentage includes both changes in unrealized and realized gains and income. For the purposes of calculating total return, it is assumed that dividends and distributions are reinvested at the share price on the ex-dividend date of the distribution. A FUND’S TOTAL RETURN CANNOT BE COMPUTED DIRECTLY FROM THE FINANCIAL HIGHLIGHTS.
Ratios to Average Net Assets and Supplemental Data are provided to help you better understand your investment. Net assets, end of period, are the net assets of a Fund on the reporting date. Ratio of expenses to average net assets shows the total of a Fund’s operating expenses divided by its average net assets for the stated period before and after waivers and reimbursements by the Advisor, if any. Ratio of net investment income (loss) to average net assets shows a Fund’s net investment income (loss) divided by its average net assets for the stated period before and after waivers and reimbursements by the Advisor, if any. Portfolio turnover rate measures a Fund’s buying and selling activity during the reporting period. It is computed by dividing total purchases or sales, whichever is less, by the average monthly market value of a Fund’s portfolio securities. This calculation does not include securities with a maturity date of less than 12 months.
TELEPHONE
800.551.1700
M - F, 7:00 a.m. to 7:00 p.m. CT
Automated Line, 24 Hours
U.S. MAIL
Wasatch Funds
P.O. Box 2172
Milwaukee, WI 53201-2172
OVERNIGHT MAIL
Wasatch Funds
803 West Michigan Street, Suite A
Milwaukee, WI 53233-2301
ONLINE
www.wasatchfunds.com
shareholderservice@wasatchfunds.com
142

Annual Report
www.WasatchFunds.com
800.551.1700
Wasatch funds
Item 2: Code of Ethics.
| (a) | Wasatch Funds Trust (the “Registrant”) has adopted a Code of Ethics that applies to the Registrant’s principal executive officer and principal financial officer. |
| (b) | No disclosures are required by this Item 2(b). |
| (c) | There have been no amendments to the Registrant’s Code of Ethics during the reporting period for this Form N-CSR. |
| (d) | There have been no waivers granted by the Registrant to individuals covered by the Registrant’s Code of Ethics during the reporting period for this Form N-CSR. |
| (f) | A copy of the Registrant’s Code of Ethics is attached as an exhibit to this Form N-CSR. |
Item 3: Audit Committee Financial Expert.
| (a) | (1) | The Board of Trustees of the Registrant has determined that the Registrant has at least one member serving on the Registrant’s Audit Committee that possesses the attributes identified in Instruction 2(b) of Item 3 to Form N-CSR to qualify as “audit committee financial expert.” |
| | (2) | The name of the audit committee financial expert is Miriam M. Allison. Ms. Allison is deemed to be “independent” as that term is defined in Item 3(a)(2) of Form N-CSR. |
Item 4. Principal Accountant Fees and Services.
(a) Audit Fees - The aggregate fees billed for professional services rendered by the independent registered public accounting firm for the audit of the Registrant’s annual financial statements or services normally provided in connection with statutory and regulatory filings or engagements for the last two fiscal years ended September 30, 2012 and September 30, 2011 were $328,600 and $330,435, respectively.
(b) Audit Related Fees – During the fiscal years ended September 30, 2012 and September 30, 2011, the Registrant was not billed any fees by the independent registered public accounting firm for assurance and related services rendered by the independent registered public accounting firm to the Registrant that are reasonably related to the performance of the audit of the Registrant’s financial statements and are not reported under paragraph (a) of this Item 4.
During the fiscal years ended September 30, 2012 and 2011, no fees for assurance and related services that relate directly to the operations and financial reporting of the Registrant were billed by the independent registered public accounting firm to the Registrant’s investment adviser or any other entity controlling, controlled by, or under common control with the investment adviser that provides ongoing services to the Registrant.
(c) Tax Fees - The aggregate fees billed for professional services rendered by the independent registered public accounting firm to the Registrant for tax compliance, tax advice, tax planning and tax return preparation for the last two fiscal years ended September 30, 2012 and September 30, 2011 were $84,550 and $80,265, respectively. These services consisted of the independent registered public accounting firm reviewing the Registrant’s excise tax returns, distribution requirements and RIC tax returns, as well as consultations regarding the tax consequences of specific investments.
During the fiscal years ended September 30, 2012 and 2011, no fees for tax compliance, tax advice or tax planning services that relate directly to the operations and financial reporting of the Registrant were billed by the independent registered public accounting firm to the Registrant’s investment adviser or any other entity controlling, controlled by, or under common control with the investment adviser that provides ongoing services to the Registrant.
(d) All Other Fees –During the fiscal years ended September 30, 2012 and 2011, there were no fees billed for products and services provided by the independent registered public accounting firm to the Registrant, other than the services reported in paragraph (a) – (c) of this Item 4.
During the fiscal years ended September 30, 2012 and 2011, no fees for other services that relate directly to the operations and financial reporting of the Registrant were billed by the independent registered public accounting firm to the Registrant’s investment adviser or any other entity controlling, controlled by, or under common control with the investment adviser that provides ongoing services to the Registrant.
| (e) | Pre-Approval Policies and Procedures |
(1) Pursuant to the registrant’s Audit Committee Charter, the Audit Committee shall evaluate the independence of the independent public accountants, including evaluating whether the independent public accountants provide audit services or consulting services to the Registrant or consulting services to the investment adviser, and to receive the specific representations of the independent registered public accounting firm as to their independence. Specifically, the Audit Committee will be responsible for evaluating the provision of non-audit services to the Registrant as required by Section 201 of the Sarbanes-Oxley Act, any pre-approval requests submitted by the independent registered public accounting firm as required by Section 202 of the Sarbanes-Oxley Act or as otherwise required under Section 2-01 of Regulation S-X, and shall monitor the conflict of interest requirements in Section 206 of the Sarbanes-Oxley Act, and the prohibitions on improper influence on the conduct of audits in Section 303 of the Sarbanes-Oxley Act. The Audit Committee shall pre-approve any engagement of the independent registered public accounting firm to provide any services (other than prohibited non-audit services) including the fees and other compensation to be paid to the independent registered public accounting firm.
The independent registered public accounting firm is authorized by the Audit Committee to provide non-audit services to the extent allowable under the Sarbanes-Oxley Act of 2002 for the Registrant provided that (i) the fees payable with respect to such services do not exceed $5,000 in any calendar quarter and (ii) such fees are ratified by the Audit Committee at its next meeting. The fees payable with respect to non-audit services may be increased by the affirmative vote of a majority of the members of the Audit Committee.
(2) There were no pre-approval requirements waived for the services provided to the Registrant described in paragraphs (b)-(d) of Item 4 by the Audit Committee pursuant to paragraph (c)(7)(i)(C) of Rule 2-01 of Regulation S-X (the “De Minimis Rule”). There were no fees billed for services provided to the investment adviser described in paragraphs (b)-(d) of Item 4 that were required to be pre-approved by the Audit Committee as described in paragraph (e)(1) of Item 4.
| (f) | No disclosures are required by this Item 4(f). |
(g) The independent registered public accounting firm did not bill the Registrant or the Registrant’s investment adviser for any other ongoing non-audit services for the fiscal years ended September 30, 2012 and 2011 for the Registrant.
| (h) | No disclosures are required by this Item 4(h). |
Item 5. Audit Committee of Listed Registrants.
Not applicable.
Item 6. Schedule of Investments.
| (a) | Schedule of Investments is included as a part of the report to shareholders filed under Item 1 of this Form N-CSR. |
Item 7. Disclosure of Proxy Voting Policies and Procedures for Closed-End Management Investment Companies.
Not applicable.
Item 8. Portfolio Managers of Closed-End Investment Companies.
Not applicable.
Item 9. Purchases of Equity Securities by Closed-End Management Investment Company and Affiliated Purchasers.
Not applicable.
Item 10. Submission of Matters to a Vote of Security Holders.
Shareholders may submit for the Governance and Nominating Committee’s (the “Committee”) consideration, recommendations regarding potential Trustee nominees. Any shareholder submissions must conform to the policies and procedures governing such nominations as established by the Committee and published on the Investor Education tab of the Registrant’s website www.wasatchfunds.com.
Item 11. Controls and Procedures.
| (a) | The Registrant’s principal executive and principal financial officers have concluded that the Registrant’s disclosure controls and procedures (as defined in Rule 30a-3(c) under the Investment Company Act of 1940, as amended (the “1940 Act”)) are effective, as of a date within 90 days of the filing date of this Form N-CSR based on their evaluation of these controls and procedures required by Rule 30a-3(b) under the 1940 Act) and Rules 13a-15(b) or 15d-15(b) under the Securities Exchange Act of 1934). |
| (b) | There were no changes in the Registrant’s internal control over financial reporting (as defined in Rule 30a-3(d) under the 1940 Act) that occurred during the Registrant’s second fiscal quarter of the period covered by this report that has materially affected, or is reasonably likely to materially affect, the Registrant’s internal control over financial reporting. |
Item 12. Exhibits.
| (a) | (1) | Code of Ethics is attached hereto. |
| | (2) | The certifications required by Rule 30a-2(a) of the 1940 Act are attached hereto. |
(b) The certifications required by Rule 30a-2(b) of the 1940 Act and Section 906 of the Sarbanes-Oxley Act of 2002 are attached hereto.
SIGNATURES
Pursuant to the requirements of the Securities Exchange Act of 1934 and the Investment Company Act of 1940, the Registrant has duly caused this report to be signed on its behalf by the undersigned, thereunto duly authorized.
| | |
| WASATCH FUNDS TRUST |
| |
| By: | | /s/ Samuel S. Stewart, Jr. |
| | Samuel S. Stewart, Jr. |
| | President (principal executive officer) of Wasatch Funds Trust |
| |
| Date: | | December 6, 2012 |
Pursuant to the requirements of the Securities Exchange Act of 1934 and the Investment Company Act of 1940, this report has been signed below by the following persons on behalf of the Registrant and in the capacities and on the dates indicated.
| | |
| |
| By: | | /s/ Samuel S. Stewart, Jr. |
| | Samuel S. Stewart, Jr. |
| | President (principal executive officer) of Wasatch Funds Trust |
| |
| Date: | | December 6, 2012 |
| |
| By: | | /s/ Cindy B. Firestone |
| | Cindy B. Firestone |
| | Treasurer (principal financial officer) of Wasatch Funds Trust |
| |
| Date: | | December 6, 2012 |