UNITED STATES
SECURITIES AND EXCHANGE COMMISSION
Washington, D.C. 20549
FORM N-CSR
CERTIFIED SHAREHOLDER REPORT OF REGISTERED
MANAGEMENT INVESTMENT COMPANIES
Investment Company Act file number: 811-04920
WASATCH FUNDS TRUST
(Exact name of registrant as specified in charter)
150 Social Hall Avenue
4th Floor
Salt Lake City, Utah 84111
(Address of principal executive offices)(Zip code)
| | |
| (Name and Address of Agent for Service) | | Copy to: |
| |
Samuel S. Stewart, Jr. Wasatch Funds Trust 150 Social Hall Avenue, 4th Floor Salt Lake City, Utah 84111 | | Eric F. Fess, Esq. Chapman & Cutler LLP 111 West Monroe Street Chicago, IL 60603 |
Registrant’s telephone number, including area code: (801) 533-0777
Date of fiscal year end: September 30
Date of reporting period: September 30, 2011
Item 1: Report to Shareholders.
Wasatch Funds
Salt Lake City, Utah
www.wasatchfunds.com
800.551.1700
This material must be accompanied or preceded by a prospectus.
Please read the prospectus carefully before you invest.
Wasatch Funds are distributed by ALPS Distributors, Inc.
1
| | |
LETTERTO SHAREHOLDERS — “VOLATILE TIMESINA RESTRAINED RECOVERY” | | |
|
|
|
| | |

Samuel S. Stewart, Jr. PhD, CFA President of
Wasatch Funds | | DEAR FELLOW SHAREHOLDERS: ECONOMY At this time last year, I was able to report that the S&P 500 was up about 10% over the prior 12 months. This year, the S&P 500 is only up by about 1% for the prior 12 months—and what a roller coaster ride we’ve had to take just to arrive at that small market increase. The final quarter of our reporting year featured intense volatility in the U.S. and foreign stock markets. Headlines increased concern and speculation about the status of the global economic recovery. Standard & Poor’s reduced its long-term credit rating on the United States to ‘AA+’ from ‘AAA.’ There were daily reports of further deterioration in the sovereign debt status of Greece, reflected in the rising interest costs the country is forced to pay on its borrowings, and speculation of a default. The absence of a clear, quick response to the situation by politicians in Europe has heightened the uncertainty. We’ve seen ripple effects on credit, currency, and stock markets around the world as a result. While these headlines certainly reflect stress in the credit markets, they can also distract from the under- |
lying economic strength that continues in the U.S. and in many countries around the world. There has been some good news too.
In my last quarterly commentary, I talked about the large emerging markets like China, India and Brazil tapping on the brakes in response to inflation concerns and the sharply rising commodity prices we all witnessed at the beginning of the year. As intended, these slowdown measures led to declines in commodity prices, including agricultural, energy, and mineral commodities. I believe this will help moderate the risk of rising inflation dampening the sluggish recovery that continues around the world.
Meanwhile, I believe fiscal policy in the U.S. will be more important to the economy than whatever remaining bullets the Federal Reserve (Fed) has left in its monetary arsenal. Will there be higher taxes implemented to help finance the stimulus programs that the Administration wants? Will there be new spending or regulatory reform programs that can be implemented in spite of the political uncertainty in Washington? The Fed’s recently announced “Operation Twist1” is probably harmless and may have some small effect on housing demand by producing marginally lower mortgage rates, but I think it is probably the wrong medicine.
I believe the real problem with the U.S. economy is not interest rates. The real problem is lack of jobs. Adjustments to the fiscal mix are likely to be far more important in helping the slow-growth recovery generate adequate job growth.
I have to recall my two-year-old analogy of crossing a white water river and then having to climb a steep riverbank to describe our economic situation. I reported that last year we seemed to have finally made it to the top of the riverbank yet we saw a long, dusty uphill road we’d have to walk to make it back to town. This year, we’re still on that dusty road, but we haven’t made it back to town yet.
MARKETS
The signs of economic stress I mentioned were mirrored in the weak performance of stocks during the quarter: the S&P 500 was down 13.87% during the period. However, we have always felt this recovery would be weak and we were not particularly surprised by the downdraft. There is certainly a feeling of two steps forward, one step back to the markets this year, and the steps backward can certainly be frightening. But the wheels of the global economy are not falling off. My feeling is that markets have been driven more this year by political headlines than underlying economic fundamentals, and investors need to be cautious to avoid getting whipsawed by overreacting to either market weakness or euphoria.
I have mentioned in recent interviews that I thought it was wise for investors to “lean against the wind.” By this I mean it is probably wise to lean a little bit against the widespread pessimism that occurs when you get economic headwinds like we are seeing now. It is my belief that when either the market or economy weakens, it is likely to strengthen before long. And when it strengthens, it is likely to weaken before long. So, “leaning against the wind” of excessive optimism by being a little bit cautious during those times is also a good idea.
With this advice in mind, my outlook for the stock market remains anchored to my view of the economy. I believe there will likely be continued slow, restrained growth in the U.S. and around the world, and the U.S. stock market is unlikely to see the kind of outsized performance we saw in the first quarter of this year. Yet, there are still great companies we see around the world, with healthy balance sheets, strong business models, innovative approaches, and rising earnings growth. I believe it will remain a stock picker’s market for some time.
While we expect the coming months to be challenging, we think those who are willing to be disciplined by monitoring valuations and maintaining solid research will fare the best. Thorough, hands-on research and attention to valuation has always been our focus at Wasatch, and it served us well during previous extreme global economic periods, including the 2008 credit crisis and the Internet bubble in the late 1990s.
WASATCH
Wasatch has completed a successful year. We are pleased that so many of our funds finished this difficult 12-month period well ahead of their benchmarks, even if for many of them that meant less negative performance than their comparative indices. Our international funds continued to perform extremely well, both in developed and emerging markets, by focusing on strong companies and in-country visits to meet with management teams—many of whom say we are the first U.S. managers ever to have visited their offices.
2
I would also like to highlight two of our long-standing Small Cap funds, led by two of our senior managers, Jeff Cardon and JB Taylor. As you can see from the table below, both the Wasatch Small Cap Growth Fund (WAAEX) and Wasatch Core Growth Fund (WGROX) have received high rankings for their total returns against their respective Morningstar peer group for many years. We have always employed a “multiple eyes” team approach at Wasatch and the performance of these two flagship funds represents the fine work and research of many analysts and other portfolio managers here at Wasatch. We are especially pleased that these funds have weathered the volatility of the past five years so well.
MORNINGSTAR TOTAL RETURN SMALL GROWTH CATEGORY PEER RANKINGSASOF 9/30/11
| | | | | | | | |
| | | 1 Year | | 3 Year | | 5 Year | | 10 Year |
Wasatch Small Cap Growth Fund (WAAEX) | | Top 21%
(out of 745 funds) | | Top 1%
(out of 661 funds) | | Top 13%
(out of 564 funds) | | Top 20%
(out of 358 funds) |
Wasatch Core Growth Fund (WGROX) | | Top 4%
(out of 745 funds) | | Top 8%
(out of 661 funds) | | Top 33%
(out of 564 funds) | | Top 44%
(out of 358 funds) |
Past performance is not a guarantee of future results.
In late-breaking news—S&P Capital IQ, a division of Standard & Poor’s, announced the winners of its Mutual Fund Excellence Award. One of just 30 recipients, the Wasatch Heritage Growth Fund won the Silver Medal in the Domestic Equity Multi-Cap category. According to S&P Capital IQ, the Fund demonstrated a consistent highest overall five-star quantitative ranking in its category based on the firm’s proprietary, holdings-based research and rankings of over 19,000 funds for the 12 months ended August 31, 2011.
We thank you for the opportunity to manage your assets and remind you to please visit our website at www.WasatchFunds.com for regular updates, news items about our funds, and quarterly commentaries.
Sincerely,

Samuel S. Stewart, Jr.
President of Wasatch Funds
Information in this report regarding market or economic trends or the factors influencing historical or future performance reflects the opinions of management as of the date of this report. These statements should not be relied upon for any other purpose. Past performance is no guarantee of future results, and there is no guarantee that the market forecasts discussed will be realized.
The primary investment objective of WAAEX, WGROX and WAHGX is long-term growth of capital. Income is a secondary objective, but only when consistent with long-term growth of capital. Currently, we do not expect the investments of these Funds to generate substantial income.
¹Operation Twist: A new measure from the U.S. central bank meant to stimulate the economy by selling short-term Treasuries in exchange for the same amount of longer-term bonds.
The Morningstar percentile rank is the rank of a fund among its category peers, which rank is based on a comparison of a fund’s total return performance against its peers over a given time period. © 2011 Morningstar, Inc. All rights reserved. The information contained herein (1) is proprietary to Morningstar and/or its content providers; (2) may not be copied or distributed; and (3) is not warranted to be accurate, complete, or timely. Neither Morningstar nor its content providers are responsible for any damages or losses arising from any use of this information.
Standard & Poor’s Equity Research Services is a separate unit of Standard & Poor’s Financial Services, LLC, which is a subsidiary of The McGraw-Hill Companies, Inc. The S&P Capital IQ Mutual Fund Awards is an annual awards program managed by the equity research unit of S&P Capital IQ and is based on proprietary, quantitative research methodology. The awards recognize those U.S. mutual funds that have achieved the highest overall ranking on the most consistent basis during the measurement year August 31, 2010 through August 31, 2011, except for the New and Notable category. Among the factors the research process seeks to identify are consistently strong performance; high quality holdings as measured by S&P STARS equity research, S&P Credit Ratings and S&P Quality Rankings; and favorable cost factors. Additional information about the awards program, the selection methodology, and the award recipients is available at www.spfundawards.com.
CFA® is a trademark owned by CFA Institute.
3
| | |
| WASATCH CORE GROWTH FUND (WGROX) — Management Discussion | | SEPTEMBER 30, 2011 |
|
|
|
The Wasatch Core Growth Fund is managed by a team of Wasatch portfolio managers led by JB Taylor and Paul Lambert.
| | | | |

JB Taylor Portfolio Manager | | 
Paul Lambert Portfolio Manager | | OVERVIEW The Wasatch Core Growth Fund returned 8.95% during the 12 months ended September 30, 2011, outperforming the Russell 2000 Index, which returned -3.53%. |
The Fund generated a positive return in every quarter of the period except for the volatile third quarter of 2011. During the third quarter, the Fund returned -14.18% but did better than the -21.87% return of the Russell 2000 Index.
We attribute the Fund’s outperformance in the quarter and year to the earnings growth of our portfolio companies. Our companies recently reported two of the best back-to-back quarters of operating results that we have seen for a long time, especially considering the numbers were not due to easy comparisons from the prior year. We believe our companies have defensible business models and are led by experienced management teams. Overall, they have continued to post strong growth in an economic environment that remains tough.
DETAILSOFTHE YEAR
During the year, our stock picking added value in every sector and was especially strong in industrials and consumer discretionary. Two of the best-performing stocks in the Fund were Polypore and Aaron’s. Polypore is an industrial company that makes polymer-based filtration membranes used in batteries. Its core market, which is lead-acid batteries for cars, is doing well amid strong demand from Asia. Polypore also produces membranes used in lithium batteries, and that segment of the business is ramping up. Aaron’s offers appliances, TVs and furniture on a rent-to-own basis. The company is benefiting from the scarcity of credit available to lower-income consumers, which makes rent-to-own transactions a valuable financing option.
Herbalife, a global marketer of nutritional products, was another top performer. Herbalife is experiencing strong growth as health and weight management remain top-of-mind issues for people around the world. The company is also rapidly expanding its network of distributors, who are attracted by the opportunity to earn income on their own sales as well as the sales of distributors they recruit.
On the negative side, Emeritus and Resources Connection were big detractors. Emeritus operates senior assisted-living facilities, and its stock was hurt by concerns that the weak economy would impact occupancies. Resources Connection is a staffing firm that provides high-level accounting and finance professionals on a temporary basis. The company is sensitive to the level of overall business activity, and activity has remained sluggish coming out of the recession.
The fiscal year ended on a negative note, as the debate over the trajectory of the U.S. recovery shifted in favor of those anticipating a weaker economy. Investors were also worried about the sovereign debt crisis in Europe. While we were disappointed by the third-quarter losses, the Fund performed as expected in the volatile environment. The steady and consistent growth companies held in the Fund are the types of stocks that typically outperform when risk appetites are low.
Positive contributors during the quarter included O’Reilly Automotive, an auto parts retailer; Waste Connections, a provider of waste disposal services; and Petrohawk Energy, a natural gas producer. O’Reilly and Waste Connections benefit from stable demand dynamics and performed well as investors searched for safe havens in the storm. Petrohawk announced that it was being acquired at a substantial premium.
IDEX Corp., a manufacturer of valves, pumps and other industrial products, was our largest detractor. Industrial stocks in general were weak given the concerns about the economy. We believe IDEX’s stock performed slightly worse than most industrials due to the resignation of its well-respected CEO. We ramped up our background work on the new CEO and went to visit the company. Based on our due diligence, we concluded that a change in leadership did not change our positive outlook on IDEX.
Other laggards during the quarter included asset managers SEI Investments and Affiliated Managers Group, which are sensitive to volatile market moves. Our experience has shown that a basket of high-quality asset managers tends to fall in-step with the indices when markets decline, but has handily outperformed in rising markets, leading to the potential for outstanding performance over the long term. Current and future holdings are subject to risk.
OUTLOOK
We expect the earnings growth of our companies to moderate, but remain strong, over the next several quarters. On September 30, the Fund’s price-to-earnings (P/E) ratio was 18.7 times trailing 12-month earnings. This is in line with historical averages and appears reasonable relative to the earnings growth we are expecting. Another statistic we follow is “earnings before interest and taxes-return on assets” (EBIT-ROA). The EBIT-ROA of the Fund is over 30% and exceeds that of the Russell 2000 Index by more than four times. Our companies are simply much better than average at utilizing their assets to generate cash.
We think the economy will struggle to grow at a normal rate for some time given the serious problems facing the United States. In the low-growth environment we envision, we believe the quality and earnings growth of our companies will continue to stand out.
Thank you for the opportunity to manage your assets.
4
| | |
| WASATCH CORE GROWTH FUND (WGROX) — Portfolio Summary | | SEPTEMBER 30, 2011 |
|
|
|
AVERAGE ANNUAL TOTAL RETURNS
| | | | | | | | | | | | |
| | | 1 YEAR | | | 5 YEARS | | | 10 YEARS | |
Core Growth | | | 8.95% | | | | 1.52% | | | | 5.50% | |
Russell 2000® Index | | | -3.53% | | | | -1.02% | | | | 6.12% | |
Russell 2000® Growth Index | | | -1.12% | | | | 0.96% | | | | 5.45% | |
Data shows past performance, which is not indicative of future performance. Current performance may be lower or higher than the performance quoted. To obtain the most recent month-end performance data available, please visit www.wasatchfunds.com. The Advisor may absorb certain Fund expenses, without which total return would have been lower. Investment returns and principal value will fluctuate and shares, when redeemed, may be worth more or less than their original cost.
As of the January 31, 2011 prospectus, the Total Annual Fund Operating Expenses for the Wasatch Core Growth Fund are 1.41%. The expense ratio shown elsewhere in this report may be different. Expenses include direct expenses paid to the Advisor as well as indirect expenses incurred by the Fund as a result of its investments in other investment companies (each an “Acquired Fund”), before any expense reimbursements by the Advisor. The Net Expense includes any reimbursement by the Advisor. See the prospectus for additional information regarding Fund expenses.
Wasatch Funds will deduct a 2.00% redemption proceeds fee on Fund shares held 60 days or less. Performance data does not reflect the deduction of fees or taxes, which if reflected, would reduce the performance quoted. For more complete information including charges, risks and expenses, read the prospectus carefully.
Investing in small cap funds will be more volatile and loss of principal could be greater than investing in large cap or more diversified funds.
TOP 10 EQUITY HOLDINGS*
| | | | |
| Company | | % of Net
Assets | |
| Copart, Inc. | | | 5.5% | |
| DFC Global Corp. | | | 3.8% | |
| Life Time Fitness, Inc. | | | 3.4% | |
Waste Connections, Inc. | | | 3.2% | |
IDEX Corp. | | | 3.2% | |
| | | | |
| Company | | % of Net
Assets | |
| Alliance Data Systems Corp. | | | 3.2% | |
| Polypore International, Inc. | | | 3.2% | |
| MEDNAX, Inc. | | | 3.1% | |
| Herbalife Ltd. | | | 3.0% | |
| Monro Muffler Brake, Inc. | | | 2.7% | |
| * | As of September 30, 2011, there were 60 holdings in the Fund. Foreign currency contracts, written options and repurchase agreements, if any, are not included in the number of holdings. Portfolio holdings are subject to change at any time. References to specific securities should not be construed as recommendations by the Funds or their Advisor. Current and future holdings are subject to risk. |
SECTOR BREAKDOWN**
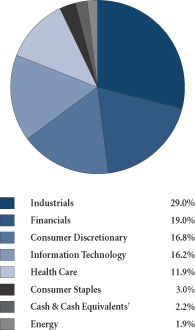
| ** | Excludes securities sold short and options written, if any. |
| †Also | includes Other Assets & Liabilities. |
GROWTHOFA HYPOTHETICAL $10,000 INVESTMENT
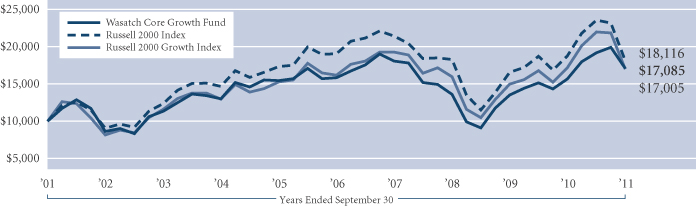
Past performance does not predict future performance and the graph above does not reflect the deduction of taxes you would pay on fund distributions or the redemption of fund shares. Performance shown in the chart above does not include any applicable sales charges and fees. Wasatch does not charge any sales fees. The Russell 2000 Index is an unmanaged total return index of the smallest 2,000 companies in the Russell 3000 Index, as ranked by total market capitalization. The Russell 2000 Index is widely regarded in the industry as accurately capturing the universe of small company stocks. The Russell 2000 Growth Index is an unmanaged total return index that measures the performance of those Russell 2000 Index companies with higher price-to-book ratios and higher forecasted growth values. You cannot invest directly in these or any indices.
5
| | |
| WASATCH EMERGING INDIA FUND (WAINX) — Management Discussion | | SEPTEMBER 30, 2011 |
|
|
|
The Wasatch Emerging India Fund is managed by a team of Wasatch portfolio managers led by Roger Edgley and Ajay Krishnan.
| | | | |

Roger D. Edgley, CFA Portfolio Manager | | 
Ajay Krishnan, CFA Portfolio Manager | | OVERVIEW Since the Wasatch Emerging India Fund’s inception on April 26 through September 30, 2011, the Fund returned -8.50% compared to the MSCI India IMI, which returned |
-23.40%. Relative performance has been encouraging but it is tough to have lost money for our shareholders coming out of the chute.
Investors’ concerns regarding the Indian markets centered on inflation and government policy paralysis stemming from corruption charges. The central bank has raised interest rates 10 times since March 2010 and this along with input cost inflation has impacted companies’ margins leading to slower earnings growth. Since June 2011, concerns of European contagion have hurt companies that have significant export-related revenues. Most of the companies in the portfolio are geared to the growth in the domestic Indian market and we feel they are relatively insulated. A silver lining to the eurozone led global slowdown might be lower commodity prices, including oil, of which India is a major importer.
DETAILSOFTHE PERIOD
We have focused mostly on investing in companies that we believe have strong balance sheets and solid cash flow. We have avoided companies tied to large infrastructure projects, which have seen a significant slowdown because of increased borrowing costs and lack of clarity on certain policy issues such as land acquisition reforms. In addition, there are ongoing delays because of corruption charges against certain government appointees. Also, in our estimation significant capacity has been added to certain segments of the infrastructure food chain and price competition is looming. The infrastructure story garners a lot of attention in the investing press but when viewed within the framework of investing in businesses with reasonable returns on capital we think it falls short and are content to look for opportunities elsewhere.
With the 20% plus decline in the Indian market, we feel that valuations are attractive if one takes a longer view. The companies held by the Fund have reported healthy top and bottom line growth and while earnings estimates have come down growth still looks solid. For our portfolio companies trailing 12-month sales growth was approximately 33%, earnings growth was approximately 32%, and we estimate earnings growth of about 19% going forward.
The Fund has been consciously positioned to exploit what we believe are the most exciting sectors of India’s economy.
Over 40% of the portfolio is in companies that we feel can benefit from growing consumption by the middle class. This goes beyond consumer discretionary companies and includes those that may benefit from household formation, consumers’ willingness and ability to borrow money, and demand for better health care.
During the period, we outperformed in almost every sector except consumer staples. Detractors included Procter & Gamble Hygiene & Health Care and Zydus Wellness. We remain confident in the long-term prospects of both companies. Current and future holdings are subject to risk.
Also interesting to us is the prospect of strong rural growth driven by a good monsoon season, increased minimum support prices for agriculture, and job creation under rural employment programs. Seventy-two percent of India’s population is in rural areas.
OUTLOOK
The Indian market has experienced a significant shift in investment flows from foreign institutional investors. It has swung from an inflow of US$43 billion (2009 and 2010) to a net outflow of US$560 million. We believe that as companies continue to report stronger growth relative to the rest of the world some of the outflows will reverse and provide an uplift for the market. Ongoing concerns about Europe and China could lead to increased appetite for Indian stocks.
Macroeconomic factors are improving. We are likely at the end of the rate increase cycle, so borrowing costs should ease. Commodity-driven inflationary pressures are expected to ease because of the global slowdown.
The Indian rupee has depreciated significantly over the last few months and this is a better time to be buying Indian assets. While we are not currency experts, it seems logical to assume that the currency should trade within its historical range (i.e., reverse the 14% depreciation).
In addition, the government has made progress on a couple of key initiatives. The land acquisition reforms bill was passed, providing a framework for corporations to compensate land-owners appropriately. The proposed Lokpal Bill has a strong anti-corruption focus designed to stem leakages in the system and should contribute to broad economic growth.
Despite the outperformance by the Fund relative to the Index since inception, we don’t feel that the portfolio is overvalued and there are a couple of industries that could benefit from rerating in the medium term. We continue to be bullish on banking and information technology (IT) services to name a couple. Our focus remains on earnings growth and it has been heartening to see that our list of companies has seen much lower revisions in earnings estimates (-0.7% versus -8.0% for the broader index).
As always, we continue to leverage our collective investment experience with the entire Wasatch domestic and international teams. As a result, we have been able to learn from our successes in the U.S. and emerging markets and apply the knowledge gained to the Emerging India Fund.
Thank you for the opportunity to invest your assets.
| | CFA® is a trademark owned by CFA Institute. |
6
| | |
| WASATCH EMERGING INDIA FUND (WAINX) — Portfolio Summary | | SEPTEMBER 30, 2011 |
|
|
|
AVERAGE ANNUAL TOTAL RETURNS
| | | | | | | | |
| | | 1 YEAR | | 5 YEARS | | SINCE INCEPTION*
4/26/11 | |
Emerging India | | N/A | | N/A | | | -8.50% | |
MSCI India IMI | | N/A | | N/A | | | -23.40% | |
Data shows past performance, which is not indicative of future performance. Current performance may be lower or higher than the performance quoted. To obtain the most recent month-end performance data available, please visit www.wasatchfunds.com. The Advisor may absorb certain Fund expenses, without which total return would have been lower. Investment returns and principal value will fluctuate and shares, when redeemed, may be worth more or less than their original cost.
As of the April 12, 2011 prospectus, the Total Annual Fund Operating Expenses for the Wasatch Emerging India Fund are 2.69%. The Net Expenses are 1.95%. The expense ratio shown elsewhere in this report may be different. Net Expenses are based on Fund expenses, net of waivers and reimbursements. See the prospectus for additional information regarding Fund expenses.
Wasatch Funds will deduct a 2.00% redemption proceeds fee on Fund shares held 60 days or less. Performance data does not reflect the deduction of fees or taxes, which if reflected, would reduce the performance quoted. For more complete information including charges, risks and expenses, read the prospectus carefully.
Investing in small, micro and mid cap funds will be more volatile and loss of principal could be greater than investing in large cap or more diversified funds. Investing in foreign securities, especially in emerging markets, entails special risks, such as unstable currencies, highly volatile securities markets and political and social instability, which are described in more detail in the prospectus. The Fund is non-diversified, meaning that it can invest a larger portion of its assets in the securities of a limited number of companies than a diversified fund. Non-diversification increases the risk of loss to the Fund if the values of these securities decline.
TOP 10 EQUITY HOLDINGS**
| | | | |
| Company | | % of Net
Assets | |
| Cognizant Technology Solutions Corp., Class A | | | 3.9% | |
| Housing Development Finance Corp. Ltd. (India) | | | 3.2% | |
| Gruh Finance Ltd. (India) | | | 3.1% | |
| Mahindra & Mahindra Financial Services Ltd. (India) | | | 2.8% | |
| | | | |
| Company | | % of Net
Assets | |
| LIC Housing Finance Ltd. (India) | | | 2.7% | |
| Indraprastha Gas Ltd. (India) | | | 2.7% | |
| City Union Bank Ltd. (India) | | | 2.7% | |
| Yes Bank Ltd. (India) | | | 2.6% | |
| VIP Industries Ltd. (India) | | | 2.4% | |
| Crisil Ltd. (India) | | | 2.3% | |
| ** | As of September 30, 2011, there were 67 holdings in the Fund. Foreign currency contracts, written options and repurchase agreements, if any, are not included in the number of holdings. Portfolio holdings are subject to change at any time. References to specific securities should not be construed as recommendations by the Funds or their Advisor. Current and future holdings are subject to risk. |
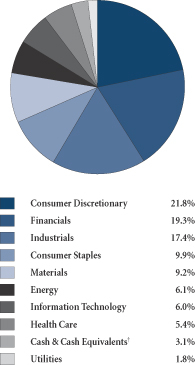
SECTOR BREAKDOWN†
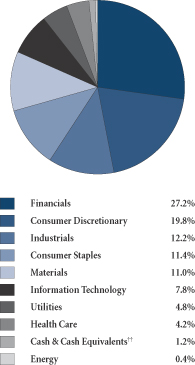
| † | Excludes securities sold short and options written, if any. |
| †† | Also includes Other Assets & Liabilities. |
GROWTHOFA HYPOTHETICAL $10,000 INVESTMENT
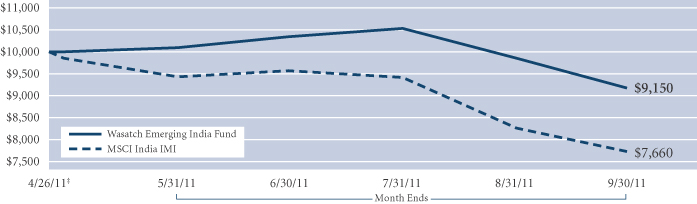
Past performance does not predict future performance and the graph above does not reflect the deduction of taxes you would pay on fund distributions or the redemption of fund shares. Performance shown in the chart above does not include any applicable sales charges and fees. Wasatch does not charge any sales fees. ‡Inception: April 26, 2011. The MSCI India Investable Market Index (IMI) covers all investable large, mid and small cap securities across India, targeting approximately 99% of the Indian market’s free-float adjusted market capitalization. You cannot invest directly in this or any index.
7
| | |
| WASATCH EMERGING MARKETS SMALL CAP FUND (WAEMX) — Management Discussion | | SEPTEMBER 30, 2011 |
|
|
|
The Wasatch Emerging Markets Small Cap Fund is managed by a team of Wasatch portfolio managers led by Roger Edgley and Laura Geritz.
| | | | |
Roger D. Edgley, CFA Portfolio Manager | | 
Laura Geritz, CFA Portfolio Manager | | OVERVIEW The Wasatch Emerging Markets Small Cap Fund returned -8.85% for the trailing 12 months compared to -20.89% for the MSCI Emerging Markets Small Cap Index (the benchmark) and |
-16.15% for the MSCI Emerging Markets Index.
We are pleased with the Fund’s broad-based outperformance in most of the markets where we held meaningful weights. In markets where we were significantly overweight, notably Indonesia, Brazil, and India, we outperformed by a wide margin. We also outperformed in China, which is nearly 16% of the benchmark, where we were significantly underweight at about 4%. The main market where we underperformed was Korea, down nearly 25% in the Fund. We outperformed in every sector except for materials where the Fund was down nearly 24%, while the benchmark was down over 16%.
DETAILSOFTHE YEAR
In this shareholder report, we focus on the Philippines, one of the smaller emerging economies that doesn’t get many headlines. The purpose is to illustrate the Fund’s broad reach, the team’s experience and focus on deep due diligence, and outline why the economics make this country attractive today especially for investors focused on its domestic growth.
When I first visited the Philippines in the mid-1990s, it was still recovering from the Marcos era, corruption was endemic, infrastructure was weak, and capital was fleeing the country. Its international reserves could not cover its external debt position, which contributed to low confidence in the currency.
There have been a number of significant changes since then. The most significant is coverage of the external debt position. Today, the Philippines has US$76 billion in gross international reserves, higher than net foreign debt and means the central bank has more scope to lower rates. The Philippine peso has been a strengthening currency, with inflows into the country, and since 2002 the Philippines has been running current account surpluses. The national savings rate is estimated to be at 31% and the consumer is very under-geared. Consumer debt to gross domestic product (GDP) is 7%, the lowest ratio in Asia, with seven out of 10 Filipinos not possessing credit cards. GDP growth for 2011 is estimated to be 5%. It is also noteworthy that GDP growth was positive in 2008. The banking system appears to be healthy and there has been a pick-up in loan growth reflecting higher levels of confidence.
Another forgotten, or ignored, aspect is the country’s size and demographic structure. The population is estimated to be 94 million people (12th largest in the world) and it is forecast to grow to 192 million by 2040. Forty-six percent of the population is less than 20 years old, a major factor that can support sustained GDP growth. Another positive for the country is remittances, the money sent home by migrant workers. With 10 million Filipinos working abroad, remittances will reach close to US$20 billion in 2011. Remittances remain a stabilizing force for the economy and contribute to the low leverage in the financial system.
Exports to GDP are around 22% so growth is largely represented by domestic growth, which is clearly helped by foreign exchange earners like foreign workers, tourism, and the Business Process Outsourcing (BPO) industry, which has been growing more than 20% a year. Currently, we see the Philippines’ major weaknesses as being lack of investment in infrastructure and lack of initiative by the government in long-term projects.
Fund investments in the Philippines include International Container Terminal Services (ICTSI) and Security Bank. ICTSI is a global operator of container terminal ports, with a major terminal in Manila (40% of revenues), as well as operations in Brazil, Ecuador and China. Security Bank has high levels of profitability, its loan book is returning to growth, and we believe it is one of the best-capitalized banks in the emerging market bank universe.
For the third quarter, the Fund returned -16.60% versus -23.89% for the benchmark and -22.56% for the MSCI Emerging Markets Index. This quarter has clearly been a turbulent period for global markets, marked by high volatility, deep concern over the European currency bloc and its banks, and the potential impact on a global economic slowdown.
OUTLOOK
There is a good case that the present time represents opportunity for new investment, that fundamentals will matter again, and that for emerging economies with strong fundamentals, investment will return, both to the stock and bond markets. Sentiment is clearly poor, valuations look attractive, and there is scope for real interest rates to come down in Brazil, India and China. These countries have been battling inflationary forces, but now there are signs of inflation having peaked. A recent visit to Hong Kong and China reinforced the view that higher interest rates in China have been having a significant effect on the real estate market. Also, with food inflation decelerating and the evident global slowdown, there is scope to loosen credit in China. What is different today in comparison to 2008 is that we are seeing a partial withdrawal from emerging markets and other asset markets, in contrast to 2008 when there was wholesale selling.
We continue to be grateful for the support from our shareholders.
| | CFA® is a trademark owned by CFA Institute. |
8
| | |
| WASATCH EMERGING MARKETS SMALL CAP FUND (WAEMX) — Portfolio Summary | | SEPTEMBER 30, 2011 |
|
|
|
AVERAGE ANNUAL TOTAL RETURNS
| | | | | | | | | | |
| | | 1 YEAR | | | 5 YEARS | | SINCE INCEPTION
10/1/07 | |
Emerging Markets Small Cap | | | -8.85% | | | N/A | | | 2.16% | |
MSCI Emerging Markets Small Cap Index | | | -20.89% | | | N/A | | | -4.80% | |
MSCI Emerging Markets Index | | | -16.15% | | | N/A | | | -5.37% | |
Data shows past performance, which is not indicative of future performance. Current performance may be lower or higher than the performance quoted. To obtain the most recent month-end performance data available, please visit www.wasatchfunds.com. The Advisor may absorb certain Fund expenses, without which total return would have been lower. Investment returns and principal value will fluctuate and shares, when redeemed, may be worth more or less than their original cost.
As of the January 31, 2011 prospectus, the Total Annual Fund Operating Expenses for the Wasatch Emerging Markets Small Cap Fund are 2.39%. The Net Expenses are 1.95%. The expense ratio shown elsewhere in this report may be different. Net Expenses are based on Fund expenses, net of waivers and reimbursements. See the prospectus for additional information regarding Fund expenses.
Wasatch Funds will deduct a 2.00% redemption proceeds fee on Fund shares held 60 days or less. Performance data does not reflect the deduction of fees or taxes, which if reflected, would reduce the performance quoted. For more complete information including charges, risks and expenses, read the prospectus carefully.
Investing in foreign securities, especially in emerging markets, entails special risks, such as currency fluctuations and political uncertainties, which are described in more detail in the prospectus. Investing in small cap funds will be more volatile and loss of principal could be greater than investing in large cap or more diversified funds.
TOP 10 EQUITY HOLDINGS*
| | | | |
| Company | | % of Net
Assets | |
| Colgate-Palmolive India Ltd. (India) | | | 2.0% | |
| Bata India Ltd. (India) | | | 2.0% | |
| Mr Price Group Ltd. (South Africa) | | | 1.8% | |
Turk Traktor ve Ziraat Makineleri AS (Turkey) | | | 1.7% | |
PT Mitra Adiperkasa Tbk (Indonesia) | | | 1.6% | |
| | | | |
| Company | | % of Net
Assets | |
LIC Housing Finance Ltd. (India) | | | 1.6% | |
| Koza Altin Isletmeleri AS (Turkey) | | | 1.5% | |
Daum Communications Corp. (Korea) | | | 1.5% | |
Indraprastha Gas Ltd. (India) | | | 1.5% | |
Mahindra & Mahindra Financial Services Ltd. (India) | | | 1.5% | |
| * | As of September 30, 2011, there were 120 holdings in the Fund. Foreign currency contracts, written options and repurchase agreements, if any, are not included in the number of holdings. Portfolio holdings are subject to change at any time. References to specific securities should not be construed as recommendations by the Funds or their Advisor. Current and future holdings are subject to risk. |
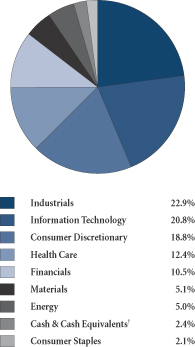
SECTOR BREAKDOWN**
| ** | Excludes securities sold short and options written, if any. |
| †Also | includes Other Assets & Liabilities. |
GROWTHOFA HYPOTHETICAL $10,000 INVESTMENT
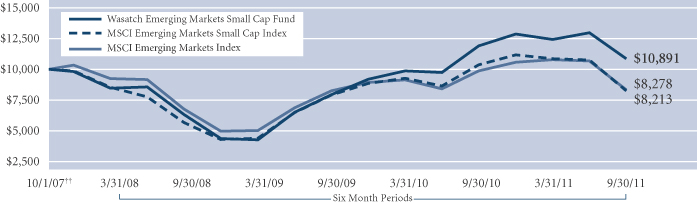
Past performance does not predict future performance and the graph above does not reflect the deduction of taxes you would pay on fund distributions or the redemption of fund shares. Performance shown in the chart above does not include any applicable sales charges and fees. Wasatch does not charge any sales fees. ††Inception: October 1, 2007. The MSCI Emerging Markets and Small Cap indices are free float-adjusted market capitalization indices that are designed to measure equity market performance in the global emerging markets. You cannot invest directly in these or any indices.
9
| | |
| WASATCH GLOBAL OPPORTUNITIES FUND (WAGOX) — Management Discussion | | SEPTEMBER 30, 2011 |
|
|
|
The Wasatch Global Opportunities Fund is managed by a team of Wasatch portfolio managers led by Roger Edgley and JB Taylor. Prior to June 30, 2011, the Fund was managed by a team of Wasatch portfolio managers led by Robert Gardiner and Blake Walker.
| | | | |
Roger D. Edgley, CFA Portfolio Manager | |
JB Taylor Portfolio Manager | | OVERVIEW During the 12 months ended September 30, 2011, the Wasatch Global Opportunities Fund returned -4.21% but outperformed the -6.15% return of the MSCI AC World Small Cap |
Index. Both the Fund and the Index were up significantly heading into the last three months of the period. However, a sharp sell-off in the global equity markets in the third quarter of 2011 erased those gains and then some. During the quarter, the Fund returned -18.94% and the Index returned -20.84%.
One of the key themes that defined the year was the generally strong performance of our Internet stocks. On a bottom-up basis, we have invested in companies that run their businesses over the Internet. We also own stocks of companies that enable e-commerce and communication. A number of these names had big gains in the quarter and the year, despite the difficult third-quarter environment. The Internet is transforming the global economy, and we believe it will be an important driver of growth going forward.
DETAILSOFTHE YEAR
The Fund’s U.S. holdings generated a positive return for the year, outperforming the U.S. piece of the MSCI AC World Small Cap Index and the Index as a whole. Top contributors in the portfolio included DFC Global, a provider of short-term consumer loans, and discount retailers Dollar Tree and Ross Stores. It was not surprising to see these stocks do well given the high level of unemployment and shrinking supply of consumer credit in the United States. Overseas, the European debt crisis put considerable pressure on the region’s equity markets, but our German stocks were up more than 15%. One of the Fund’s best-performing holdings was Gerry Weber, a German apparel company with plans to expand into China and India. Across the world, our stock picking was good in most of the big sectors, such as information technology, consumer discretionary and industrials. Top contributors in these sectors included GMO Payment Gateway, Start Today and MonotaRO—all Internet or Internet-related companies.
Australia and Canada were weak markets for the Fund, both in absolute terms and relative to the benchmark. The largest detractor in Australia was CSG Ltd., a provider of information technology and print management services. The company has been impacted by several events, such as
flooding at key locations and increased capital needs related to an acquisition. The disappointing results in Canada were driven by energy stocks like Petroamerica Oil and Pan Orient Energy. These oil and gas producers were hurt by a combination of falling commodity prices and company-specific developments. For example, Petroamerica Oil postponed exploration on a well in Colombia, and Pan Orient Energy lowered guidance for 2011 production volumes.
The weak and volatile third quarter of 2011 really dominated the year. During the quarter, stock prices plunged in nearly every country on worries that the global economy might be headed for another recession. The U.S. recovery lost momentum, Europe’s debt problems threatened to destabilize the global financial system, and Asia showed signs of slowing. As investors sought refuge from the storm, several of our U.S. consumer names with stable demand dynamics did well versus the broader market. For example, Dollar Tree and O’Reilly Automotive, an auto parts retailer, were both up during the quarter. NetLogic Microsystems was a positive contributor outside the consumer space. The company designs semiconductors that help route data over the Internet and was acquired at a sizable premium.
Some of our more economically sensitive stocks were very weak, reflecting investors’ fears about global growth. The biggest detractor in the quarter was RPS Group, a United Kingdom consulting firm. About half of the company’s profits are derived from its energy division, so the steep drop in oil prices that occurred over the summer was a major headwind for the stock. Other economically sensitive names that did poorly were Melexis, a Belgian designer of automotive semiconductors, and Moil Ltd., an Indian mining company. Most of our exposure to energy, materials and industrials comes from outside the United States, since this is where we are finding most of the interesting cyclical growth companies. However, on a global basis, the Fund has a fairly neutral weight in these sectors compared to the benchmark.
OUTLOOK
On September 30, the Fund had a higher earnings growth rate than the MSCI AC World Small Cap Index and a lower price-to-earnings (P/E) multiple. Furthermore, the downturn in the market has given us the chance to take a closer look at some great companies that we previously considered too expensive to own. We think valuations are particularly attractive in emerging markets, where country fundamentals remain strong.
We feel confident about how the Fund is positioned, and we are excited about its prospects. Wasatch has accumulated vast knowledge of small cap companies in both developed and emerging markets. By applying our knowledge to a global canvas of opportunity, we believe the Fund has the potential to deliver strong, long-term results.
Thank you for the trust you have placed in us.
| | CFA® is a trademark owned by CFA Institute. |
10
| | |
| WASATCH GLOBAL OPPORTUNITIES FUND (WAGOX) — Portfolio Summary | | SEPTEMBER 30, 2011 |
|
|
|
AVERAGE ANNUAL TOTAL RETURNS
| | | | | | | | | | |
| | | 1 YEAR | | | 5 YEARS | | SINCE INCEPTION
11/17/08 | |
Global Opportunities | | | -4.21% | | | N/A | | | 26.17% | |
MSCI AC World Small Cap Index | | | -6.15% | | | N/A | | | 20.18% | |
S&P Global SmallCap Index | | | -6.52% | | | N/A | | | 18.66% | |
MSCI AC World IMI | | | -6.04% | | | N/A | | | 12.80% | |
Data shows past performance, which is not indicative of future performance. Current performance may be lower or higher than the performance quoted. To obtain the most recent month-end performance data available, please visit www.wasatchfunds.com. The Advisor may absorb certain Fund expenses, without which total return would have been lower. Investment returns and principal value will fluctuate and shares, when redeemed, may be worth more or less than their original cost.
As of the January 31, 2011 prospectus, the Total Annual Fund Operating Expenses for the Wasatch Global Opportunities Fund are 1.88%. The expense ratio shown elsewhere in this report may be different. Net Expenses are based on Fund expenses, net of waivers and reimbursements. See the prospectus for additional information regarding Fund expenses.
Wasatch Funds will deduct a 2.00% redemption proceeds fee on Fund shares held 60 days or less. Performance data does not reflect the deduction of fees or taxes, which if reflected, would reduce the performance quoted. For more complete information including charges, risks and expenses, read the prospectus carefully.
Investing in small and micro cap funds will be more volatile and loss of principal could be greater than investing in large cap or more diversified funds. Investing in foreign securities, especially in emerging markets, entails special risks, such as currency fluctuations and political uncertainties, which are described in more detail in the prospectus. Being non-diversified, the Fund can invest a larger portion of its assets in the securities of a limited number of companies than a diversified fund. Non-diversification increases the risk of loss to the Fund if the values of these securities decline.
TOP 10 EQUITY HOLDINGS*
| | | | |
| Company | | % of Net
Assets | |
| Dollar Tree, Inc. | | | 2.5% | |
Wirecard AG (Germany) | | | 2.4% | |
RPS Group plc (United Kingdom) | | | 2.0% | |
Melexis N.V. (Belgium) | | | 1.9% | |
Ted Baker plc (United Kingdom) | | | 1.8% | |
| | | | |
| Company | | % of Net
Assets | |
Copart, Inc. | | | 1.3% | |
MonotaRO Co. Ltd. (Japan) | | | 1.3% | |
Gerry Weber International AG (Germany) | | | 1.3% | |
MSC Industrial Direct Co., Inc., Class A | | | 1.3% | |
Power Integrations, Inc. | | | 1.2% | |
| * | As of September 30, 2011, there were 190 holdings in the Fund. Foreign currency contracts, written options and repurchase agreements, if any, are not included in the number of holdings. Portfolio holdings are subject to change at any time. References to specific securities should not be construed as recommendations by the Funds or their Advisor. Current and future holdings are subject to risk. |
SECTOR BREAKDOWN**
| ** | Excludes securities sold short and options written, if any. |
| †Also | includes Other Assets & Liabilities. |
GROWTHOFA HYPOTHETICAL $10,000 INVESTMENT
Past performance does not predict future performance and the graph above does not reflect the deduction of taxes you would pay on fund distributions or the redemption of fund shares. Performance shown in the chart above does not include any applicable sales charges and fees. Wasatch does not charge any sales fees. ††Inception: November 17, 2008. The MSCI AC World Small Cap Index is an unmanaged index and includes reinvestment of all dividends of issuers located in countries throughout the world representing developed and emerging markets, including securities of U.S. issuers, with market capitalizations between US $200 million and $1.5 billion. The S&P Global SmallCap Index is an unmanaged index and includes reinvestment of all dividends of issuers located across developed and emerging markets, including the United States, that fall in the bottom 15% of their country’s market cap range. The MSCI AC World IMI (All Country World Investable Markets Index) is a free float-adjusted market capitalization weighted index designed to measure the equity market performance of large, mid, and small cap companies across developed and emerging markets throughout the world. You cannot invest directly in these or any indices.
11
| | |
| WASATCH HERITAGE GROWTH FUND (WAHGX) — Management Discussion | | SEPTEMBER 30, 2011 |
|
|
|
The Wasatch Heritage Growth Fund is managed by a team of Wasatch portfolio managers led by Chris Bowen and Ryan Snow.
| | | | |

Chris Bowen Portfolio Manager | | 
Ryan Snow Portfolio Manager | | OVERVIEW The Wasatch Heritage Growth Fund gained 2.01% for the 12-month period. The Fund outperformed the Russell Midcap Growth Index, which gained 0.80%. |
The stock market rose considerably during late 2010 and through the first half of 2011 buoyed by optimism about a recovering economy and strong corporate earnings results.
However, during the recently concluded quarter, global economic concerns gripped investors and they became less risk tolerant. Equity markets grew increasingly volatile and traded down on signs of a global economic slowdown, deepening European debt crisis and political concerns in the United States.
In spite of a slowing economic recovery, the overall business execution of our portfolio companies remains solid. In most cases, our holdings have continued to meet or exceed our expectations.
DETAILSOFTHE YEAR
Consumer sentiment and government austerity measures appear to be taking a toll on the stock market. While corporate earnings have held up fairly well, investors are pricing in slower rates of growth as global deleveraging takes place.
In a few instances, we have had to trim growth forecasts among the Fund’s holdings. However, an important benefit of investing in solid, stable companies is that their outlook is typically more predictable, which we believe helps to minimize the ebbs and flows of the stock market.
Despite the recent swoon in stock prices, several holdings in the Fund performed well over the last year, in particular Petrohawk Energy, Ross Stores and Herbalife.
Petrohawk was acquired by BHP Billiton at a significant premium, resulting in a large gain for the Fund. The Fund actually held both companies at the time—although BHP was a much smaller weight—and we think Petrohawk will be a beneficial pairing within BHP’s conglomerate of commodity holdings. The Fund continues to hold BHP.
Herbalife, a provider of health supplements, has continued to expand its reach globally and has been successful in implementing its daily consumption model, which generates a more predictable stream of recurring revenue.
Ross, a discount retailer, has performed particularly well during the recent period of elevated consumer financial stress. Store sales have been growing along with expanding profit margins.
Fund holdings that hurt performance were Power Finance, a provider of financing to power projects across
India, and Ultra Petroleum, an oil and natural gas exploration and production company.
We believe that Power Finance was impacted by broad issues in India such as high inflation and interest rates and narrow issues like concerns over the financial health of local power providers. Overall, however, the company has continued to produce good results by sustaining lending spreads and appears attractively valued.
We believe that the factors weighing on the stock price of Ultra Petroleum—such as ownership entitlements at some of its properties and a large exploration investment that hasn’t yielded production yet—do not cloud the long-term investment thesis of the company. The stock was also weak due to the downturn in commodity prices during the latest quarter.
We added a few new companies recently including IDEX Corp. IDEX manufactures an array of industrial pumps. Its diverse product line covers a myriad of applications including a device used in pumps on fire trucks. We have followed the company for some time, but only lately did the stock’s price become compelling enough to justify an investment.
We added to our position in Catalyst Health Solutions, a small, fast-growing pharmacy benefit manager. Catalyst was one of the Fund’s top gainers during the quarter after closing on its purchase of Walgreens Health Initiatives, Inc. and posting a second quarter revenue advance of 39%.
We sold two holdings during the quarter, Express Scripts and New York Community Bancorp. Both were sold because we were seeing more compelling growth companies at attractive valuations. Current and future holdings are subject to risk.
OUTLOOK
A few months ago, we thought many companies were exhibiting stellar growth, but valuations were too expensive. Since then the tables have turned. While the market pullback has made valuations more attractive, the slowing economy has meant that growth prospects have also pulled back.
While the Fund is not devoid of exposure to macroeconomic factors, at our core we are bottom up investors. Each company we research is ultimately chosen based on its own merits and growth outlook. Accordingly, we remain focused on identifying companies that we believe are high quality, whose individual characteristics should allow them to grow independently of broad economic trends.
We are pleased with the Fund’s current constitution. We are investing cautiously and closely monitoring each company, yet, overall, we remain optimistic about the future.
Thank you for the opportunity to invest your assets.
12
| | |
| WASATCH HERITAGE GROWTH FUND (WAHGX) — Portfolio Summary | | SEPTEMBER 30, 2011 |
|
|
|
AVERAGE ANNUAL TOTAL RETURNS
| | | | | | | | | | | | |
| | | 1 YEAR | | | 5 YEARS | | | SINCE INCEPTION
6/18/04 | |
Heritage Growth | | | 2.01% | | | | 1.82% | | | | 3.47% | |
Russell Midcap® Growth Index | | | 0.80% | | | | 1.64% | | | | 4.72% | |
S&P 500 Index | | | 1.14% | | | | -1.18% | | | | 2.05% | |
Data shows past performance, which is not indicative of future performance. Current performance may be lower or higher than the performance quoted. To obtain the most recent month-end performance data available, please visit www.wasatchfunds.com. The Advisor may absorb certain Fund expenses, without which total return would have been lower. Investment returns and principal value will fluctuate and shares, when redeemed, may be worth more or less than their original cost.
As of the January 31, 2011 prospectus, the Total Annual Fund Operating Expenses for the Wasatch Heritage Growth Fund are 1.10%. The Net Expenses are 0.95%. The expense ratio shown elsewhere in this report may be different. Net Expenses are based on Fund expenses, net of waivers and reimbursements. See the prospectus for additional information regarding Fund expenses.
Wasatch Funds will deduct a 2.00% redemption proceeds fee on Fund shares held 60 days or less. Performance data does not reflect the deduction of fees or taxes, which if reflected, would reduce the performance quoted. For more complete information including charges, risks and expenses, read the prospectus carefully.
Investing in mid cap funds will be more volatile and loss of principal could be greater than investing in large cap funds. Equity investing involves risks including potential loss of the principal amount invested.
TOP TEN EQUITY HOLDINGS*
| | | | |
| Company | | % of Net
Assets | |
Cognizant Technology Solutions Corp., Class A | | | 4.8% | |
IHS, Inc., Class A | | | 4.7% | |
Copart, Inc. | | | 4.6% | |
Linear Technology Corp. | | | 4.3% | |
Ross Stores, Inc. | | | 4.1% | |
| | | | |
| Company | | % of Net
Assets | |
Amphenol Corp., Class A | | | 3.8% | |
Tim Hortons, Inc. (Canada) | | | 3.7% | |
LKQ Corp. | | | 3.6% | |
ANSYS, Inc. | | | 3.5% | |
Altera Corp. | | | 3.2% | |
| * | As of September 30, 2011, there were 40 holdings in the Fund. Foreign currency contracts, written options and repurchase agreements, if any, are not included in the number of holdings. Portfolio holdings are subject to change at any time. References to specific securities should not be construed as recommendations by the Funds or their Advisor. Current and future holdings are subject to risk. |
SECTOR BREAKDOWN**
| ** | Excludes securities sold short and options written, if any. |
| †Also | includes Other Assets & Liabilities. |
GROWTHOFA HYPOTHETICAL $10,000 INVESTMENT
Past performance does not predict future performance and the graph above does not reflect the deduction of taxes you would pay on fund distributions or the redemption of fund shares. Performance shown in the chart above does not include any applicable sales charges and fees. Wasatch does not charge any sales fees. ††Inception: June 18, 2004. The Russell Midcap Growth Index measures the performance of those Russell Midcap Index companies with higher price-to-book ratios and higher forecasted growth values. The stocks in the Russell Midcap Growth Index are also members of the Russell 1000 Growth Index. The S&P 500 Index represents 500 of the United States’ largest stocks from a broad variety of industries. The index is unmanaged, and a common measure of common stock total return performance. You cannot invest directly in these or any indices.
13
| | |
| WASATCH INTERNATIONAL GROWTH FUND (WAIGX) — Management Discussion | | SEPTEMBER 30, 2011 |
|
|
|
The Wasatch International Growth Fund is managed by a team of Wasatch portfolio managers led by Roger Edgley.
| | |
Roger D. Edgley, CFA Portfolio Manager | | OVERVIEW For the trailing 12 months, the Wasatch International Growth Fund returned
-7.77%, slightly better than its benchmark, the MSCI AC World Ex-U.S.A. Small Cap Index, which returned -9.36%. By sector, we outperformed by a wide margin in consumer discretionary. The Fund had close performance relative to the Index in most sectors except industrials, which detracted the most. Industrials |
represent a wide range of cyclical companies. By country, Hong Kong was the largest area of outperformance helped by strong gains from SJM Holdings and Galaxy Entertainment. The Fund’s holdings were up over 44% in Japan with strong gains from Start Today and MonotaRO. Germany and Italy were other areas of outperformance for the Fund. Our companies in India were down less than those in the Index, however, our overweight in an underperforming country detracted from relative performance. Current and future holdings are subject to risk.
DETAILSOFTHE YEAR
I have spent close to six weeks this year in China and Hong Kong. As I grew up in Hong Kong, I continue to see with a long-term perspective the powerful effects of China’s changes, many impacting Hong Kong directly (e.g., the effect of 22 million mainland Chinese visitors each year). On my latest trip there was much to learn visually, from seeing hundreds of residential tower blocks as I entered Xian by train (one incomplete development had sixty housing blocks some 30 stories high), to walking around a department store and seeing hundreds of Italian-sounding yet unheard-of brand names and realizing that China’s breadth and depth in manufacturing has few precedents. It is clear to me that China’s product markets, from athletic shoes to construction equipment, are extremely competitive—with local companies, state-sponsored leaders, multinationals, and Hong Kong companies—all pursuing the growth and opportunity of China’s vibrant markets.
For many investors, China is a paradox. For all the high gross domestic product (GDP) growth and seeming opportunities, China is a hard place for investors, whether for public equity investors or the General Electrics of the world doing foreign direct investment. I want to highlight some of the challenges and how Wasatch is approaching them.
One of the most powerful insights to be gained traveling through China is a sense of scale. When one sees the Great Wall or the Forbidden City one realizes these constructions required millions of laborers, took decades to build, and represented an empire that saw itself as central and huge. What does that mean today? Scale economics for China—being a massive country—apply. There are around 120 cities with more than one million inhabitants, some like Shanghai have 20 million, and many second tier cities have four to five
million people. How much capital will it take for companies here to grow? Where will they obtain capital when state-owned banks are not friendly and control the banking sector? How many stores and distribution centers will they need? The sheer organizational and logistics challenges are great, in addition to dealing with local officials in different cities.
For smaller companies, a market this size presents unique challenges that do not exist for a small company in Finland or Thailand or Peru. Unless a company has scale or a special niche that can offer protection over a long period (e.g., proprietary software or a strong brand name), potential returns can get competed away fast. China can be regarded as hypercompetitive—many companies simply want to gain entry, hurting those already established. This is not unlike Japanese and Korean companies’ past obsession with market share at the expense of returns.
We believe much future growth for smaller companies will need to be financed by equity, so dilution is an ongoing challenge in general for China’s markets. Our preference is for companies focused on cash flow, which should allow for a virtuous reinvestment cycle and provide greater safety.
One of the biggest differences we see between China and India is the number of quality small companies. While in China state-owned companies and banks have taken a large role in the economy, in India it is much less this way. We see more sectors in India populated by high quality small companies—from banking to consumer staples to information technology (IT) consulting. Many of these companies have existed for decades and found competitive niches. Therefore, it may not surprise you that we currently hold a much larger percentage of the Fund in India compared to China.
The recent quarter was difficult and fearful for investors, with clear debt deflationary risks in developed markets, European fears badly hurting sentiment, and the risk of financial contagion. For emerging economies the risks have been inflationary. Global growth estimates have been coming down, which has begun to take pressure off emerging economies’ central banks that have been aiming to bring down inflation rates. Overall, we seem to be in a muddling through period in which sovereign debt issues and other economic developments around the world have created investor uncertainty.
OUTLOOK
We see some positive signs, even though Europe’s problems do not seem resolved. Yet, this does not seem like 2008 to us. Fundamentals in emerging economies still appear strong (countries like China, India and others are growing above 6%), there is scope for policy easing as inflation subsides, governments in these countries recognize the rebalancing needed to domestic growth, and value is appearing.
Thank you for the opportunity to manage your assets.
| | CFA® is a trademark owned by CFA Institute. |
14
| | |
| WASATCH INTERNATIONAL GROWTH FUND (WAIGX) — Portfolio Summary | | SEPTEMBER 30, 2011 |
|
|
|
AVERAGE ANNUAL TOTAL RETURNS
| | | | | | | | | | |
| | | | 1 YEAR | | | | 5 YEARS | | | SINCE INCEPTION
6/28/02 |
International Growth | | | -7.77% | | | | 1.84% | | | 9.90% |
MSCI AC World Ex-U.S.A. Small Cap Index | | | -9.36% | | | | 0.73% | | | 10.63% |
MSCI World Ex-U.S.A. Small Cap Index | | | -5.63% | | | | -1.21% | | | 9.14% |
Data shows past performance, which is not indicative of future performance. Current performance may be lower or higher than the performance quoted. To obtain the most recent month-end performance data available, please visit www.wasatchfunds.com. The Advisor may absorb certain Fund expenses, without which total return would have been lower. Investment returns and principal value will fluctuate and shares, when redeemed, may be worth more or less than their original cost.
As of the January 31, 2011 prospectus, the Total Annual Fund Operating Expenses for the Wasatch International Growth Fund are 1.61%. The expense ratio shown elsewhere in this report may be different. The Net Expense includes any reimbursement by the Advisor. See the prospectus for additional information regarding Fund expenses.
Wasatch Funds will deduct a 2.00% redemption proceeds fee on Fund shares held 60 days or less. Performance data does not reflect the deduction of fees or taxes, which if reflected, would reduce the performance quoted. For more complete information including charges, risks and expenses, read the prospectus carefully.
Investing in foreign securities, especially in emerging markets, entails special risks, such as currency fluctuations and political uncertainties, which are described in more detail in the prospectus. Investing in small cap funds will be more volatile and loss of principal could be greater than investing in large cap or more diversified funds.
TOP 10 EQUITY HOLDINGS*
| | | | |
| Company | | % of Net
Assets | |
| Rotork plc (United Kingdom) | | | 2.7% | |
| Wirecard AG (Germany) | | | 2.3% | |
| Mahindra & Mahindra Financial Services Ltd. (India) | | | 2.3% | |
| Gruh Finance Ltd. (India) | | | 2.2% | |
| Abcam plc (United Kingdom) | | | 2.0% | |
| | | | |
| Company | | % of Net
Assets | |
| First Pacific Co. Ltd. (Hong Kong) | | | 1.7% | |
| Start Today Co. Ltd. (Japan) | | | 1.7% | |
| SJM Holdings Ltd. (Hong Kong) | | | 1.7% | |
| PT Semen Gresik (Persero) Tbk (Indonesia) | | | 1.6% | |
| Immunodiagnostic Systems Holdings plc (United Kingdom) | | | 1.6% | |
| * | As of September 30, 2011, there were 103 holdings in the Fund. Foreign currency contracts, written options and repurchase agreements, if any, are not included in the number of holdings. Portfolio holdings are subject to change at any time. References to specific securities should not be construed as recommendations by the Funds or their Advisor. Current and future holdings are subject to risk. |
SECTOR BREAKDOWN**
| ** | Excludes securities sold short and options written, if any. |
| †Also | includes Other Assets & Liabilities. |
GROWTHOFA HYPOTHETICAL $10,000 INVESTMENT
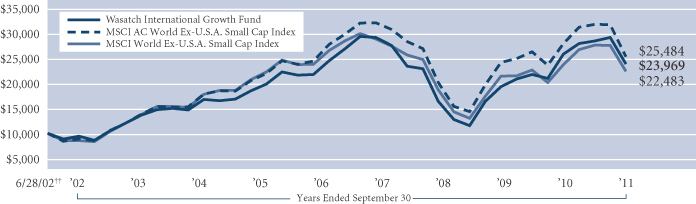
Past performance does not predict future performance and the graph above does not reflect the deduction of taxes you would pay on fund distributions or the redemption of fund shares. Performance shown in the chart above does not include any applicable sales charges and fees. Wasatch does not charge any sales fees. ††Inception: June 28, 2002. The MSCI AC World Ex-U.S.A. Small Cap Index is an unmanaged index and includes reinvestment of all dividends of issuers located in countries throughout the world representing developed and emerging markets, excluding securities of U.S. issuers. This index is a free float-adjusted market capitalization index designed to measure the performance of small capitalization securities. The MSCI World Ex-U.S.A. Small Cap Index is an unmanaged index that measures the performance of stocks with market capitalizations between US $200 million and $1.5 billion across 22 developed markets, excluding the United States. You cannot invest directly in these or any indices.
15
| | |
| WASATCH INTERNATIONAL OPPORTUNITIES FUND (WAIOX) — Management Discussion | | SEPTEMBER 30, 2011 |
|
|
|
The Wasatch International Opportunities Fund is managed by a team of Wasatch portfolio managers led by Roger Edgley and Laura Geritz. Prior to June 30, 2011, Blake Walker was a co-manager for the Fund with Mr. Edgley.
| | | | |
Roger D. Edgley, CFA Portfolio Manager | |
Laura Geritz, CFA Portfolio Manager | | OVERVIEW In the last year, the Wasatch International Opportunities Fund returned -10.49% versus -9.36% for its benchmark, the MSCI AC World Ex-U.S.A. Small Cap Index. In the |
last six months, investors have preferred the stocks of larger companies, affecting the performance of our stocks, which are smaller than those in the Index. In sector terms, we outperformed the Index in health care, information technology (IT), and financials. Our worst relative performance was in consumer staples. In energy and materials, investing in smaller companies below US$1 billion capitalization is a difficult exercise, and we are re-thinking our strategy there. In terms of countries, we did relatively well in Japan, Korea, Germany and the United Kingdom. The emerging markets were a drag on performance for the last quarter, however, we expect valuations and fundamentals to attract investors back.
DETAILSOFTHE YEAR
It might be worth discussing some things we have learned in the past five years. We believe the Fund was the first international micro cap fund launched, with a focus on companies with under $1 billion market capitalizations. What is exciting about this universe internationally is that it is much larger than the U.S. micro cap universe, and growing with initial public offerings, especially in emerging markets.
We have also learned that high quality companies still in their early growth phase tend to be in the consumer, health care, information technology and financials sectors. In many cases, these are companies oriented to domestic growth in their economies. The domestic growth prospects in many countries tend to be strong. Even in Japan, high smart phone penetration has meant high adoption of mobile Internet applications, where we do see some exciting growth companies. High quality micro cap companies are less available in the materials and energy sectors. World-class resources in coal or copper etc. are usually found in larger companies.
It is worth highlighting why the international team continues to be truly excited about the long-term opportunities for this Fund, despite these difficult equity markets. The same Wasatch team covers this Fund as our other international and emerging funds, so when we visit Brazil or Japan we have multiple eyes reviewing companies. The asset size of the Fund means it can take positions in companies larger funds cannot. We see many companies with market capitalizations of $100 to $300 million where the founders have
significant ownership, often over 50%, so the number of shares available to public investors is small. Analyst coverage is often limited or non-existent. Many of these companies have strong balance sheets. We believe the best companies are well-positioned for the long run in their chosen niches.
For example, Craneware, an Edinburgh-based software company that provides billing solutions for U.S. hospitals has shown substantial growth and progress in the last five years with high recurring revenues. The company has a market capitalization of US$250 million and the founders still own close to 50%. In Japan, MonotaRO is a distributor of industrial products using an online model. We see this company as having the potential to transform its industry. In 2010, MonotaRO grew revenues 24%. In Indonesia, we own Hexindo, which distributes Hitachi and John Deere equipment to the construction and agricultural industries. Although Hexindo has a US$700 million capitalization, Hitachi has the majority ownership so the number of public shares available is small.
During the third quarter, the Fund returned -16.10%, while the benchmark returned -20.04%. The Fund has been in existence for over five years and has top quartile performance in Morningstar’s Foreign Small/Mid Growth category, based on its total return over the last three- and five-year periods (out of 129 and 106 funds, respectively) as of September 30, 2011.* We will not be resting on our laurels, as these are difficult periods for investing, and the structural long term economic issues facing developed countries mean their markets will be challenging to all investors. Valuations look attractive to us. We do not see a repeat of 2008, however, even as we have seen across-the-board selling in a number of our markets. Our perspective is long term and we expect to be adding to positions at the present time.
OUTLOOK
Given what is happening in Europe, it is worth mentioning how the portfolio is positioned there. We have not been seeking broad growth companies, as we expect gross domestic product (GDP) growth across Europe to be constrained for many years. However, we believe there will continue to be small, exceptional companies (like Craneware) that should be able to outperform their economies by virtue of the innovation or efficiency they offer customers. The financials sector is underweight in the Fund. This is partly due to the lack of quality financial companies in the universe and because we do not own any European banks in the portfolio.
Thank you for the opportunity to manage your assets.
| | CFA® is a trademark owned by CFA Institute. |
| * | The Morningstar percentile ranking for the Wasatch International Opportunities Fund was derived using the total return of the performance figure associated with its 5-year period as of 9/30/11. The Fund was ranked against the following numbers of U.S.-domiciled Foreign Small/Mid Growth funds over the following time periods: 159 funds in the last year, 129 in the last three years, and 106 funds in the last five years. With respect to these Foreign Small/Mid Growth funds, the Fund received a percentile rank of 78, 7, and 12 for its 1-, 3-, and 5-year periods, respectively. The percentile rank is the rank of a fund among its category peers, which rank is based on a comparison of a fund’s total return performance against its peers over a given time period. Past performance is not indicative of future results. © 2011 Morningstar, Inc. All rights reserved. The information contained herein (1) is proprietary to Morningstar and/or its content providers; (2) may not be copied or distributed; and (3) is not warranted to be accurate, complete, or timely. Neither Morningstar nor its content providers are responsible for any damages or losses arising from any use of this information. |
16
| | |
| WASATCH INTERNATIONAL OPPORTUNITIES FUND (WAIOX) — Portfolio Summary | | SEPTEMBER 30, 2011 |
|
|
|
AVERAGE ANNUAL TOTAL RETURNS
| | | | | | | | | | | | |
| | | 1 YEAR | | | 5 YEARS | | | SINCE INCEPTION
1/27/05 | |
International Opportunities | | | -10.49% | | | | 2.60% | | | | 6.69% | |
MSCI AC World Ex-U.S.A. Small Cap Index | | | -9.36% | | | | 0.73% | | | | 5.30% | |
MSCI World Ex-U.S.A. Small Cap Index | | | -5.63% | | | | -1.21% | | | | 3.34% | |
Data shows past performance, which is not indicative of future performance. Current performance may be lower or higher than the performance quoted. To obtain the most recent month-end performance data available, please visit www.wasatchfunds.com. The Advisor may absorb certain Fund expenses, without which total return would have been lower. Investment returns and principal value will fluctuate and shares, when redeemed, may be worth more or less than their original cost.
As of the January 31, 2011 prospectus, the Total Annual Fund Operating Expenses for the Wasatch International Opportunities Fund are 2.62%. The Net Expenses are 2.26%. The expense ratio shown elsewhere in this report may be different. Net Expenses are based on Fund expenses, net of waivers and reimbursements. See the prospectus for additional information regarding Fund expenses.
Wasatch Funds will deduct a 2.00% redemption proceeds fee on Fund shares held 60 days or less. Performance data does not reflect the deduction of fees or taxes, which if reflected, would reduce the performance quoted. For more complete information including charges, risks and expenses, read the prospectus carefully.
Investing in foreign securities, especially in emerging markets, entails special risks, such as currency fluctuations and political uncertainties, which are described in more detail in the prospectus. Investing in small cap funds will be more volatile and loss of principal could be greater than investing in large cap or more diversified funds.
TOP 10 EQUITY HOLDINGS*
| | | | |
| Company | | % of Net
Assets | |
| Kakaku.com, Inc. (Japan) | | | 2.1% | |
| MonotaRO Co. Ltd. (Japan) | | | 2.0% | |
| PT Mitra Adiperkasa Tbk (Indonesia) | | | 1.8% | |
| Daum Communications Corp. (Korea) | | | 1.5% | |
| KPJ Healthcare Berhad (Malaysia) | | | 1.4% | |
| | | | |
| Company | | % of Net
Assets | |
| Olvi Oyj, Class A (Finland) | | | 1.4% | |
| PT Hexindo Adiperkasa Tbk (Indonesia) | | | 1.4% | |
| PT Resource Alam Indonesia Tbk (Indonesia) | | | 1.3% | |
| Tikkurila Oyj (Finland) | | | 1.3% | |
| Coastal Energy Co. (United Kingdom) | | | 1.3% | |
| * | As of September 30, 2011, there were 115 holdings in the Fund. Foreign currency contracts, written options and repurchase agreements, if any, are not included in the number of holdings. Portfolio holdings are subject to change at any time. References to specific securities should not be construed as recommendations by the Funds or their Advisor. Current and future holdings are subject to risk. |
SECTOR BREAKDOWN**
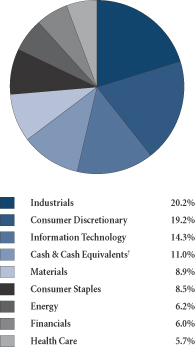
| ** | Excludes securities sold short and options written, if any. |
| †Also | includes Other Assets & Liabilities. |
GROWTHOFA HYPOTHETICAL $10,000 INVESTMENT
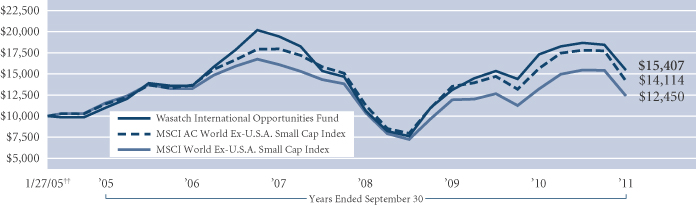
Past performance does not predict future performance and the graph above does not reflect the deduction of taxes you would pay on fund distributions or the redemption of fund shares. Performance shown in the chart above does not include any applicable sales charges and fees. Wasatch does not charge any sales fees. ††Inception: January 27, 2005. The Fund has changed its primary benchmark from the MSCI World Ex-U.S.A. Small Cap Index to the MSCI AC World Ex-U.S.A. Small Cap Index. The Advisor believes the MSCI AC World Ex-U.S.A. Small Cap Index more closely tracks the Fund’s foreign micro cap holdings. The MSCI AC World Ex-U.S.A. Small Cap Index is an unmanaged index and includes reinvestment of all dividends of issuers located in countries throughout the world representing developed and emerging markets, excluding securities of U.S. issuers. This index is a free float-adjusted market capitalization index designed to measure the performance of small capitalization securities. The MSCI World Ex-U.S.A. Small Cap Index is an unmanaged index that measures the performance of stocks with market capitalizations between US $200 million and $1.5 billion across 22 developed markets, excluding the United States. You cannot invest directly in these or any indices.
17
| | |
WASATCH LARGE CAP VALUE FUND (FMIEX) — Management Discussion (formerly Wasatch-1st Source Income Equity Fund) | | SEPTEMBER 30, 2011 |
|
|
|
The Wasatch Large Cap Fund is managed by a team of Wasatch portfolio managers led by Ralph Shive and Michael Shinnick.
| | | | |

Ralph C. Shive, CFA Portfolio Manager | | 
Michael L. Shinnick Portfolio Manager | | OVERVIEW The Wasatch Large Cap Value Fund returned
-5.08% during the 12 months ended September 30 2011, lagging the -1.89% return for the Russell 1000 Value Index. |
After a strong start, equity markets faltered over the second half of the fiscal period. Aftershocks have continued to be felt from the earthquake otherwise known as the Global Financial Crisis, primarily in the eurozone but also flowing into U.S. financial markets and global financial market psychology. While we have been appropriately skeptical about the sustainability of the recent government intervention-driven rebound, we did not anticipate the severity of recent events and ramifications for the U.S. stock market. It appears that the painful process of multiple countries adjusting to the need to live within their means has been overriding a muted recovery.
DETAILSOFTHE YEAR
The largest detractor from the Fund’s performance relative to the Index for the annual period was our overweight exposure to the information technology sector. Two notable laggards were mobile phone manufacturer Nokia, which we have sold, and information technology solutions vendor Computer Sciences, which we continue to hold based on what we believe is a reasonably healthy outlook for its business. We had difficulty in stock picking within the consumer discretionary sector as well, as exemplified by Best Buy. We thought Best Buy was inexpensive; however, investors viewed online competitors such as Amazon.com as presenting a structural issue and Best Buy’s valuation declined dramatically during the year. We continue to hold the stock and believe it can appreciate despite our modest outlook for consumer spending.
The largest contributors to performance versus the Index for the 12 months were an overweight exposure to energy and an underweight exposure to financials. Within energy, pipeline firm Williams Cos., Inc. was a standout. Williams decided to spin off its exploration and production operation from its pipeline business, news that was accompanied by a 60% dividend increase.
Other positive contributors included McKesson, a dominant provider of medical supplies and pharmaceutical products to the health care sector with consumer staples-type characteristics. Semiconductor manufacturer Intel added value as well. The stock had been hurt by a lack of
presence in the mobile phone market and a slowdown in the personal computer (PC) shipment outlook. We added to our Intel holdings several times and the stock performed well over the period.
With respect to the most recent quarter, declines were broad based, resulting in few positive performers to report. We were hurt, in particular, by being overweight relative to the Index in information technology, as exemplified by Hewlett-Packard. Management missteps and weakening PC shipments caused the stock to decline. We continue to hold HP but at a reduced level.
Another weak sector in the quarter was energy, as world gross domestic product (GDP) expectations shrank and a stronger dollar hurt commodity sectors. Marathon Oil was a leading detractor. At this point with a price-to-earnings ratio of six and a 3% dividend yield we see the stock as attractive and have maintained our position.
We had thought prices for defense-related stocks reflected much of the pessimism regarding future government budget cutting, but the group continued to weaken across the board. This included L-3 Communications, a manufacturer of a broad range of specialized communications, intelligence and avionic equipment for the defense industry around the world. We believe that management has room to take action to reduce costs equivalent to reduced orders should the feared budget cuts come about, and we continue to hold the stock.
Our underweighting of financials continued to help performance versus the Index, although several of our holdings there were hit hard in the quarter. A couple of our utilities holdings were among our top contributors, in particular, American Waterworks. The stock benefited from the stability of its business and attractive dividend yield, as well as the positive secular theme that water is an increasingly precious resource. Current and future holdings are subject to risk.
OUTLOOK
The recent correction has anticipated a lot of problems. Current stock valuations and yields look quite appealing to us in a zero interest rate world. We are hopeful that—at least in the U.S.—voters and politicians will begin to address structural budgetary issues. If Europe can stabilize and the U.S. can implement meaningful policy decisions, we think valuations are so low that significant price appreciation can ensue.
The biggest unknown is whether the U.S. will enter into a recession, as defined by a dramatic fall in corporate earnings. While global growth expectations have weakened, we don’t see it as likely that there will be a collapse in growth as in 2008. We have not had a long enough or strong enough recovery to have built up the excesses that usually precede recessions.
We are tracking our companies’ earnings and outlooks closely to see what they tell us about whether we are in a “soft patch” in a weak recovery or on the edge of recession. So far, despite an uptick in disappointments in the most recent quarter, earnings have remained fairly strong for most companies. We believe the Fund has the potential to provide positive returns as conditions stabilize.
Thank you for the opportunity to manage your assets.
| | CFA® is a trademark owned by CFA Institute. |
18
| | |
| WASATCH LARGE CAP VALUE FUND (FMIEX) — Portfolio Summary | | SEPTEMBER 30, 2011 |
|
|
|
AVERAGE ANNUAL TOTAL RETURNS
| | | | | | | | | | | | |
| | | 1 YEAR | | | 5 YEARS | | | 10 YEARS | |
Large Cap Value* | | | -5.08% | | | | -0.20% | | | | 6.05% | |
Russell 1000® Value Index | | | -1.89% | | | | -3.53% | | | | 3.36% | |
Data shows past performance, which is not indicative of future performance. Current performance may be lower or higher than the performance quoted. To obtain the most recent month-end performance data available, please visit www.wasatchfunds.com. The Advisor may absorb certain Fund expenses, without which total return would have been lower. Investment returns and principal value will fluctuate and shares, when redeemed, may be worth more or less than their original cost.
As of the January 31, 2011 prospectus, the Total Annual Fund Operating Expenses for the Wasatch Large Cap Value Fund are 1.13%. The Net Expenses are 1.10%. The expense ratio shown elsewhere in this report may be different. Net Expenses are based on Fund expenses, net of waivers and reimbursements. See the prospectus for additional information regarding Fund expenses.
Wasatch Funds will deduct a 2.00% redemption proceeds fee on Fund shares held 60 days or less. Performance data does not reflect the deduction of fees or taxes, which if reflected, would reduce the performance quoted. For more complete information including charges, risks and expenses, read the prospectus carefully.
Investments in value stocks can perform differently from the market as a whole and other types of stocks and can continue to be undervalued by the market for long periods of time. Loss of principal is a risk of investing.
| * | As of January 31, 2011, the Wasatch-1st Source Income Equity Fund changed its name to the Wasatch Large Cap Value Fund. |
TOP 10 EQUITY HOLDINGS**
| | | | |
| Company | | % of Net
Assets | |
| Intel Corp. | | | 2.2% | |
| Exxon Mobil Corp. | | | 2.2% | |
| ConocoPhillips | | | 2.1% | |
| Verizon Communications, Inc. | | | 2.0% | |
| Chevron Corp. | | | 1.8% | |
| | | | |
| Company | | % of Net
Assets | |
| JPMorgan Chase & Co. | | | 1.8% | |
| Wal-Mart Stores, Inc. | | | 1.8% | |
| Williams Cos., Inc. (The) | | | 1.8% | |
| AT&T, Inc. | | | 1.8% | |
| Barrick Gold Corp. (Canada) | | | 1.7% | |
| ** | As of September 30, 2011, there were 74 holdings in the Fund. Foreign currency contracts, written options and repurchase agreements, if any, are not included in the number of holdings. Portfolio holdings are subject to change at any time. References to specific securities should not be construed as recommendations by the Funds or their Advisor. Current and future holdings are subject to risk. |
SECTOR BREAKDOWN†
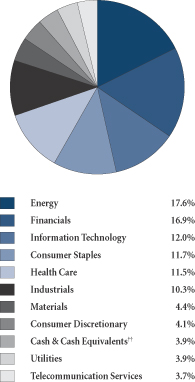
| † | Excludes securities sold short and options written, if any. |
| †† | Also includes Other Assets & Liabilities. |
GROWTHOFA HYPOTHETICAL $10,000 INVESTMENT
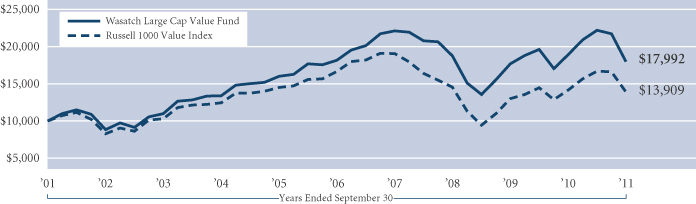
Past performance does not predict future performance and the graph above does not reflect the deduction of taxes you would pay on fund distributions or the redemption of fund shares. Performance shown in the chart above does not include any applicable sales charges and fees. Wasatch does not charge any sales fees. The Russell 1000 Value Index measures the performance of Russell 1000 Index companies with lower price-to-book ratios and lower forecasted growth values. You cannot invest directly in these or any indices.
19
| | |
WASATCH LONG/SHORT FUND (FMLSX) — Management Discussion (formerly Wasatch-1st Source Long/Short Fund) | | SEPTEMBER 30, 2011 |
|
|
|
The Wasatch Long/Short Fund is managed by a team of Wasatch portfolio managers led by Michael Shinnick and Ralph Shive.
| | | | |
Michael L. Shinnick Portfolio Manager | |
Ralph C. Shive, CFA Portfolio Manager | | OVERVIEW The Fund provided a positive return for the trailing 12-month period, which essentially matched the S&P 500 and exceeded the Citigroup U.S. Domestic 3-Month Treasury |
Bills Index. The first two quarters saw positive equity performance while returns were negative over the last two quarters. We believe the Federal Reserve’s (Fed) QE2 program was a key driver in the shift in performance trends. The Fed was active early in the period, which supported asset prices. As the Fed wound down its support and the European debt crisis emerged more fully, markets faltered.
DETAILSOFTHE YEAR
Both the long and short positions provided positive returns for the 12 months. Successful stock picks were the result of company-specific research ideas rather than any theme in the portfolio, and included computer systems manufacturer Silicon Graphics, storage solutions provider Iron Mountain, and mobile phone manufacturer Motorola Mobility. We built a position in Silicon Graphics beginning in late 2009, and we believe the company is well-positioned to continue to benefit from the trends toward cloud and open architecture computing. Iron Mountain has benefited from the strong cash flow inherent in its business. Motorola’s stock price rose dramatically as the result of a takeover offer by Google, inspired in large part by Motorola’s strong patent portfolio.
Detractors on the long side were also the result of company-specific ideas. These included call center outsourcing solutions firm Convergys, network management and security company Blue Coat Systems, and retailer Best Buy. Convergys, as a smaller cap stock, was particularly hard hit by investors’ flight to safety late in the period. We see tremendous value in the company given its cash balances and planned share buy backs. We believe the company’s balance sheet should backstop it at current levels and we added to our holdings on weakness.
Blue Coat is a technology company with significant web security and network optimization business lines. The company was a turnaround story. The stock moved up on news of a management change in 2010, but suffered in recent quarters as it became clear that it would take longer than initially expected to see a turnaround. As turnaround efforts stalled, the CEO was abruptly replaced and we took that as a signal to begin to reduce our position. In retrospect,
such a turnaround story should not have been a top holding; however, we still see value in the company and retain a smaller position.
Best Buy suffered from fears over consumer spending on discretionary items. The focus has changed for Best Buy, which is no longer a growth company, but more of a return on capital business with a primary focus on capital allocation. We have been encouraged by management plans to meaningfully increase share buy backs, and indeed earnings targets have been raised due to aggressive share buy backs over the trailing 12 months. Best Buy carries one of the more attractive valuations in the portfolio and we have added to the position on recent weakness.
On a sector level, long positions within energy added significantly to performance, while our selections within financials detracted. Within financials, we have carried a meaningful overweight to the insurance industry including Unum Group, Allstate, and Loews. Our view is that the business models for insurers are much more defensive than for banks that require daily access to liquidity and involve exposure to stressed lending portfolios. We believe that the discounts to book value at which these companies are trading will eventually close aiding performance relative to the S&P 500.
For the third quarter of 2011, the Fund lost money, although less than the S&P 500. The primary detractors were energy and cyclical exposures. We used the sell off in August and September to rotate some names on the long side in order to manage the Fund’s tax position. This involved selling some stocks at a loss and purchasing comparable names in order to maintain exposure to similar investment ideas. As an example, we sold Bluecoat while building Akamai Technologies back up to a top 10 holding. We believe Akamai has a superlative balance sheet and we have a great deal of confidence in its business model, which is based on delivering solutions for real time e-commerce and video over the Internet. Current and future holdings are subject to risk.
OUTLOOK
The Fund’s net long position continues to be 60% or higher. From an opportunity set standpoint, we see highly attractive valuations on the long side, and we are more interested in the long side than shorting opportunities at this time. However, we will maintain flexibility to change our stance as market conditions unfold.
Our outlook is for continued volatility in the financial markets as government debt concerns remain at the forefront in Europe. The recent decline in energy prices should provide some relief to U.S. consumers and we have been looking to increase exposure to consumer-related stocks. Examples include a new position in Advance Auto Parts and an increased weighting in Target. We believe the Fund is well positioned to benefit from future market advances while providing the potential for lower volatility.
Thank you for the opportunity to manage your assets.
| | CFA® is a trademark owned by CFA Institute. |
20
| | |
| WASATCH LONG/SHORT FUND (FMLSX) — Portfolio Summary | | SEPTEMBER 30, 2011 |
|
|
|
AVERAGE ANNUAL TOTAL RETURNS
| | | | | | | | | | | | |
| | | 1 YEAR | | | 5 YEARS | | | SINCE INCEPTION
8/1/03 | |
Long/Short* | | | 0.98% | | | | 3.26% | | | | 4.82% | |
S&P 500 Index | | | 1.14% | | | | -1.18% | | | | 3.71% | |
Citigroup U.S. Domestic 3-Month Treasury Bills Index | | | 0.11% | | | | 1.62% | | | | 1.98% | |
Data shows past performance, which is not indicative of future performance. Current performance may be lower or higher than the performance quoted. To obtain the most recent month-end performance data available, please visit www.wasatchfunds.com. The Advisor may absorb certain Fund expenses, without which total return would have been lower. Investment returns and principal value will fluctuate and shares, when redeemed, may be worth more or less than their original cost.
As of the January 31, 2011 prospectus, the Total Annual Fund Operating Expenses for the Wasatch Long/Short Fund are 1.71%. The expense ratio shown elsewhere in this report may be different. See the prospectus for additional information regarding Fund expenses.
Wasatch Funds will deduct a 2.00% redemption proceeds fee on Fund shares held 60 days or less. Performance data does not reflect the deduction of fees or taxes, which if reflected, would reduce the performance quoted. For more complete information including charges, risks and expenses, read the prospectus carefully.
The Fund makes short sales of securities which involve the risk that losses may exceed the original amount invested. Equity investing involves risks, including potential loss of the principal amount invested. Being non-diversified, the Fund can invest a larger portion of its assets in the securities of a limited number of companies than a diversified fund. Non-diversification increases the risk of loss to the Fund if the values of these securities decline.
| * | As of January 31, 2011, the Wasatch-1st Source Long/Short Fund changed its name to the Wasatch Long/Short Fund. |
TOP 10 EQUITY HOLDINGS**
| | | | |
| Company | | % of Net
Assets | |
| Wal-Mart Stores, Inc. | | | 4.7% | |
| Convergys Corp. | | | 4.2% | |
| Loews Corp. | | | 3.4% | |
| CNA Financial Corp. | | | 3.3% | |
| Best Buy Co., Inc. | | | 3.2% | |
| | | | |
| Company | | % of Net
Assets | |
| Unum Group | | | 3.2% | |
| Visa, Inc., Class A | | | 3.1% | |
| Newmont Mining Corp. | | | 3.0% | |
| Cisco Systems, Inc. | | | 2.8% | |
| Akamai Technologies, Inc. | | | 2.6% | |
| ** | As of September 30, 2011, there were 47 long and 14 short holdings in the Fund. Foreign currency contracts, written options and repurchase agreements, if any, are not included in the number of holdings. Portfolio holdings are subject to change at any time. References to specific securities should not be construed as recommendations by the Funds or their Advisor. Current and future holdings are subject to risk. |
SECTOR BREAKDOWN†
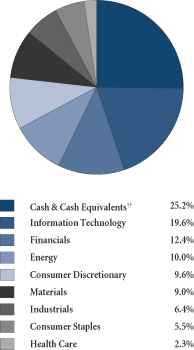
| † | Excludes securities sold short and options written, if any. |
| †† | Also includes Other Assets & Liabilities. |
GROWTHOFA HYPOTHETICAL $10,000 INVESTMENT
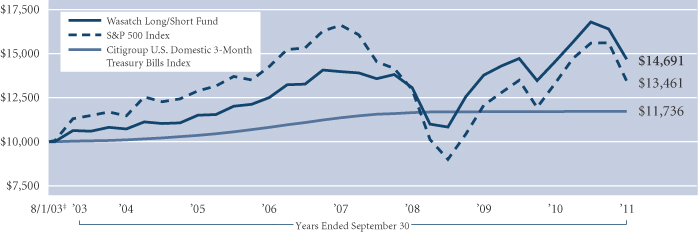
Past performance does not predict future performance and the graph above does not reflect the deduction of taxes you would pay on fund distributions or the redemption of fund shares. Performance shown in the chart above does not include any applicable sales charges and fees. Wasatch does not charge any sales fees. ‡Inception: August 1, 2003. The S&P 500 Index includes 500 of the United States’ largest stocks from a broad variety of industries. The Index is unmanaged but is a commonly used measure of common stock total return performance. The Citigroup U.S. Domestic 3-Month Treasury Bills Index tracks the performance of U.S. Treasury bills with a remaining maturity of three months. U.S. Treasury bills, which are short-term loans to the U.S. government, are full-faith-and-credit obligations of the U.S. Treasury and are generally regarded as being free of any risk of default. You cannot invest directly in these or any indices.
21
| | |
| WASATCH MICRO CAP FUND (WMICX) — Management Discussion | | SEPTEMBER 30, 2011 |
|
|
|
The Wasatch Micro Cap Fund is managed by a team of Wasatch portfolio managers led by Daniel Chace.
| | |

Daniel Chace, CFA Portfolio Manager | | OVERVIEW The Wasatch Micro Cap Fund returned -0.90% in the 12 months ended September 30, 2011, outperforming the -4.83% return of the Russell Microcap Index. The Fund had a strong gain heading into the final stretch of the annual period. However, that gain was erased in the third quarter when stock prices tumbled. During the quarter, the Fund returned -20.72% but was more resilient than the Index, |
which returned -22.68%.
Our relative outperformance over the year and the quarter was due in part to an increased focus on higher-growth companies. With the problems facing the United States, such as the large federal debt and high unemployment, our belief has been that economic growth would be below average for a while. We have also thought that investors would seek out growth in the challenging environment. Our expectations have been playing out, and our best-performing stocks have tended to be faster growers.
DETAILSOFTHE YEAR
Information technology (IT) was a key area of strength in the portfolio during the year, and OPNET Technologies was the top contributor in the Fund. OPNET provides products used to manage communication networks and software applications. The company has been investing in its application performance management (APM) business, and those investments are paying off. Sales bookings for APM products are accelerating, and operating margins are starting to expand. IPG Photonics and Interactive Intelligence are other rapidly growing technology companies whose stocks did exceptionally well.
Outside of technology, Hibbett Sports and Peet’s Coffee & Tea delivered strong gains. Hibbett, a sporting goods retailer, is benefiting from effective inventory management and innovations in athletic footwear that are fueling consumer demand. Peet’s sells specialty beverages in grocery stores and company-owned retail locations. Revenues have been growing at a healthy pace, led by strength in the grocery channel where Peet’s is increasing its presence in Target and Wal-Mart stores.*
Three of the largest detractors during the year were Big 5 Sporting Goods, Resources Connection and NuVasive. Same-store-sales growth at retailer Big 5 has been weak, reflecting the challenging economic backdrop. Resources Connection provides high-level accounting professionals on a temporary basis. Revenues have been increasing on a year-over-year basis, but margins are trending lower as the difference between bill rates and pay rates narrows. NuVasive, a medical device manufacturer, is facing several headwinds, including a difficult reimbursement environment and heightened competition. Despite the weakness in these
stocks, we remain comfortable with their risk-reward profiles and continue to own them.
During the third quarter, concerns about the European debt crisis and slowing global growth made investors very risk averse. Many of our stocks in economically sensitive areas of the market, like energy, materials and industrials, did poorly given the worries about the economy. For example, STR Holdings was the biggest detractor in the portfolio. This leading supplier of materials for solar panels reported results and guidance below expectations due to an oversupply of panels globally. CAI International, a container leasing and management company, and Vitran, a provider of trucking and logistics services, were also major detractors.
Other stocks lagged for company-specific reasons, such as Icon and Gordmans Stores. Icon is a contract research organization that runs clinical studies for biotechnology and pharmaceutical firms. The company is incurring up-front costs related to a large new strategic partnership, and these costs will impact near-term operating performance. Gordmans, a big-box discount retailer, reported flat same-store-sales growth and indicated that same-store-sales could remain flat for the rest of 2011. While this is disappointing, we think Gordmans has a differentiated retail concept that should drive strong growth for the company over time.
A number of our other holdings escaped the third quarter downturn in the market. One of them was NetLogic Microsystems, a semiconductor supplier that was acquired at a large premium. Akorn and Computer Programs and Systems also had positive returns. Both companies reported strong sales and earnings growth that beat expectations. Akorn is a generic drug manufacturer whose margins and product pipeline are starting to capture Wall Street’s attention. Computer Programs and Systems provides IT solutions to small hospitals and is benefiting from the government’s push for electronic medical records. Current and future holdings are subject to risk.
OUTLOOK
It is hard to feel positive about the economy right now. The lack of meaningful job creation has kept the unemployment rate stuck above 9% for the better part of two years. The housing market continues to bottom, and consumers are working to reduce their debt loads. The U.S. government and governments in Europe are also trying to get their finances in order.
Although it seems unlikely that a robust economic recovery is around the corner, we are optimistic about micro cap investing. The world is full of interesting micro cap companies that should be able to grow regardless of broad trends in the economy—companies that are well-managed, have unique products and services, and are small players in big markets. We are constantly searching for these types of names and are confident in our ability to find them. Evidence of this, our portfolio companies have been reporting strong earnings growth in the weak economy.
Thank you for the opportunity to manage your assets.
| | CFA® is a trademark owned by CFA Institute. |
| * | As of September 30, 2011, the Wasatch Micro Cap Fund was not invested in Target Corp. or Wal-Mart Stores, Inc. |
22
| | |
| WASATCH MICRO CAP FUND (WMICX) — Portfolio Summary | | SEPTEMBER 30, 2011 |
|
|
|
AVERAGE ANNUAL TOTAL RETURNS
| | | | | | | | | | | | |
| | | 1 YEAR | | | 5 YEARS | | | 10 YEARS | |
Micro Cap | | | -0.90% | | | | -2.51% | | | | 7.00% | |
Russell Microcap® Index | | | -4.83% | | | | -4.36% | | | | 5.28% | |
Russell 2000® Index | | | -3.53% | | | | -1.02% | | | | 6.12% | |
Data shows past performance, which is not indicative of future performance. Current performance may be lower or higher than the performance quoted. To obtain the most recent month-end performance data available, please visit www.wasatchfunds.com. The Advisor may absorb certain Fund expenses, without which total return would have been lower. Investment returns and principal value will fluctuate and shares, when redeemed, may be worth more or less than their original cost.
As of the January 31, 2011 prospectus, the Total Annual Fund Operating Expenses for the Wasatch Micro Cap Fund are 2.21%. The expense ratio shown elsewhere in this report may be different. Expenses include direct expenses paid to the Advisor as well as indirect expenses incurred by the Fund as a result of its investments in other investment companies (each an “Acquired Fund”), before any expense reimbursements by the Advisor. The Net Expense includes any reimbursement by the Advisor. See the prospectus for additional information regarding Fund expenses.
Wasatch Funds will deduct a 2.00% redemption proceeds fee on Fund shares held 60 days or less. Performance data does not reflect the deduction of fees or taxes, which if reflected, would reduce the performance quoted. For more complete information including charges, risks and expenses, read the prospectus carefully.
Investing in micro cap funds will be more volatile and loss of principal could be greater than investing in large cap or more diversified funds. Investing in foreign securities, especially in emerging markets, entails special risks, such as currency fluctuations and political uncertainties, which are described in more detail in the prospectus.
TOP 10 EQUITY HOLDINGS*
| | | | |
| Company | | % of Net
Assets | |
| CorVel Corp. | | | 3.5% | |
| Power Integrations, Inc. | | | 3.2% | |
| Hibbett Sports, Inc. | | | 2.7% | |
| DFC Global Corp. | �� | | 2.5% | |
| Interactive Intelligence Group, Inc. | | | 2.0% | |
| | | | |
| Company | | % of Net
Assets | |
| OPNET Technologies, Inc. | | | 1.7% | |
| Diamond Hill Investment Group, Inc. | | | 1.7% | |
| Peet’s Coffee & Tea, Inc. | | | 1.6% | |
| Wirecard AG (Germany) | | | 1.6% | |
| MEDTOX Scientific, Inc. | | | 1.6% | |
| * | As of September 30, 2011, there were 97 holdings in the Fund. Foreign currency contracts, written options and repurchase agreements, if any, are not included in the number of holdings. Portfolio holdings are subject to change at any time. References to specific securities should not be construed as recommendations by the Funds or their Advisor. Current and future holdings are subject to risk. |
SECTOR BREAKDOWN**
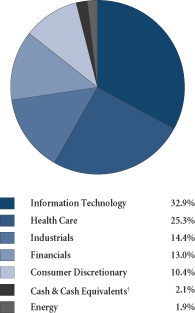
| ** | Excludes securities sold short and options written, if any. |
| †Also | includes Other Assets & Liabilities. |
GROWTHOFA HYPOTHETICAL $10,000 INVESTMENT
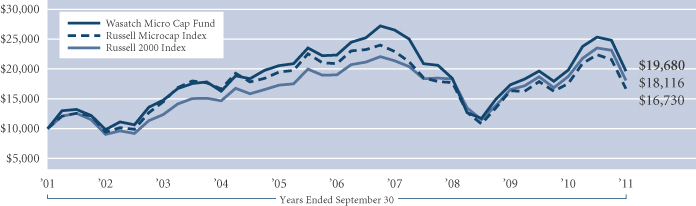
Past performance does not predict future performance and the graph above does not reflect the deduction of taxes you would pay on fund distributions or the redemption of fund shares. Performance shown in the chart above does not include any applicable sales charges and fees. Wasatch does not charge any sales fees. The Fund has changed its primary benchmark from the Russell 2000 Index to the Russell Microcap Index. The Advisor believes the Russell Microcap Index more closely tracks the Fund’s micro cap holdings. The Russell Microcap Index is an unmanaged total return index of the smallest 1,000 securities in the small-cap Russell 2000 Index along with the next smallest 1,000 companies, based on a ranking of all U.S. equities by market capitalization. No data was available for the Index prior to 6/30/00. Data for the Index from 6/30/00 until its official start date of July 1, 2005 was from a paper portfolio. The Russell 2000 Index is an unmanaged total return index of the smallest 2,000 companies in the Russell 3000 Index, as ranked by total market capitalization. The Russell 2000 Index is widely regarded in the industry as accurately capturing the universe of small company stocks. You cannot invest directly in these or any indices.
23
| | |
| WASATCH MICRO CAP VALUE FUND (WAMVX) — Management Discussion | | SEPTEMBER 30, 2011 |
|
|
|
The Wasatch Micro Cap Value Fund is managed by a team of Wasatch portfolio managers led by Brian Bythrow.
| | |

Brian Bythrow, CFA Portfolio Manager | | OVERVIEW Equity markets encountered a stiff headwind in the second and third quarters of 2011, after enjoying positive results in the final quarter of 2010 and first three months of 2011. The U.S. market succumbed to concerns about budget deficits, sluggish growth, and persistently high unemployment that crimped consumer spending. The global markets’ downturn was fueled by concerns that Greece’s debt crisis |
would reverberate across the eurozone. When there’s actual or perceived slowing in the economy, small- and micro-cap stocks tend to get hit harder than their larger counterparts. Emerging markets can also feel the pain, as investors retreat to more-established economies considered to be less volatile.
Against this difficult backdrop, for the third quarter of 2011 the Wasatch Micro Cap Value Fund returned -19.42%. While we do not find much comfort in outperformance in the face of such losses, this result did place the Fund ahead of the benchmark Russell Microcap Index, which returned -22.68% over the same period. Individual stock selection and our sensitivity to stock valuations both played roles in this outperformance. For the 12 months ended September 30, 2011, the Fund more closely tracked its benchmark, posting a return of -5.88% while the Russell Microcap Index returned -4.83%. Our international stocks contributed to underperformance for the year. Further, our valuation-sensitive approach hurt the Fund’s relative performance earlier in the year, when momentum-driven stocks outperformed.
DETAILSOFTHE YEAR
We base our investment approach on selecting individual stocks through fundamental research, with close attention to valuations, rather than trying to predict macroeconomic trends and pick stocks most likely to benefit from them. We look for companies that have strong balance sheets, offer niche-type products that can be hard to duplicate, and have the potential to grow and take market share even if the economic climate isn’t entirely favorable.
For example, our strongest-contributing stock for the year was OPNET Technologies, a provider of tools that help corporate information technology (IT) departments monitor and trouble-shoot issues in their cloud-based computing systems. The company has experienced good profitability and revenue growth largely because of the trend toward cloud computing and away from traditional computer networks—a shift that hasn’t really been slowed by economic concerns, as cloud systems offer the potential for greater efficiency and flexible capacity. With servers and other devices no longer in a fixed geographic location, IT managers need new tools to help them track down and correct network traffic-flow problems, and OPNET provides them.
In a similar vein, one of our top contributors for the most recent quarter was Fabrinet, a maker of optical components used in a range of communications and industrial devices. Many of the components Fabrinet makes are used in Internet applications on mobile devices, an area that has seen considerable growth despite the weak economic backdrop, and where we anticipate seeing continued expansion even if economic growth remains slow. The company’s share price took a dip earlier this year due to temporary concerns about inventory levels, giving us an opportunity to add it at what we believed was an attractive price.
A number of our holdings fall into an area we think of as alternative finance. These are companies that offer financial products to credit-constrained consumers who may have been closed out of traditional borrowing venues. Advance America Cash Advance Centers, First Cash Financial Services and DFC Global offer payday loans, operate pawn stores, and provide other loans to their customers. Demand for these financial services is driven not just by pressure on consumers, but also by a tougher regulatory environment for banks. Limitations on late fees and other charges may reduce banks’ willingness to work with higher-risk borrowers.
Of course, not every company can dodge the impact of economic doldrums. CAI International, which owns and leases intermodal shipping containers, was among our greatest detractors from performance for the quarter and year. It’s understandable that a company dependent on manufacturing and international trade would see its stock price suffer in the current environment, but at this point we believe the selling is overdone. At the quarter’s end, CAI’s stock price reflected a valuation below its liquidation value. We believe that in time investors will recognize that trade has not come to an absolute halt, and bring CAI’s share price up to a more rational level. In the meantime, the company has announced a share buyback. Current and future holdings are subject to risk.
OUTLOOK
The outlook for the next several months remains uncertain. Among the questions investors are eager to see answered is whether Europe will be able to achieve any resolution to the debt crisis emanating from Greece and threatening to bring down the entire region. On the domestic side, of course, there remain many questions regarding what, if any, actions the White House or Congress may take to spur economic growth and ease unemployment.
Despite the unclear prospects for global economies, we think the companies we own are for the most part in relatively healthy positions that should help them to withstand the current challenges. An area we’re beginning to pay a little more attention to is companies that offer “little luxuries,” such as Caribou Coffee Co. and Krispy Kreme Doughnuts. Such companies may find their appeal increasing as beleaguered consumers turn to their products for a little affordable enjoyment.
Thank you for the opportunity to manage your assets.
| | CFA® is a trademark owned by CFA Institute. |
24
| | |
| WASATCH MICRO CAP VALUE FUND (WAMVX) — Portfolio Summary | | SEPTEMBER 30, 2011 |
|
|
|
AVERAGE ANNUAL TOTAL RETURNS
| | | | | | | | | | | | |
| | | 1 YEAR | | | 5 YEARS | | | SINCE INCEPTION
7/28/03 | |
Micro Cap Value | | | -5.88% | | | | 1.54% | | | | 8.70% | |
Russell Microcap® Index | | | -4.83% | | | | -4.36% | | | | 2.67% | |
Russell 2000® Index | | | -3.53% | | | | -1.02% | | | | 5.30% | |
Data shows past performance, which is not indicative of future performance. Current performance may be lower or higher than the performance quoted. To obtain the most recent month-end performance data available, please visit www.wasatchfunds.com. The Advisor may absorb certain Fund expenses, without which total return would have been lower. Investment returns and principal value will fluctuate and shares, when redeemed, may be worth more or less than their original cost.
As of the January 31, 2011 prospectus, the Total Annual Fund Operating Expenses for the Wasatch Micro Cap Value Fund are 2.43%. The Net Expenses are 2.32%. The expense ratio shown elsewhere in this report may be different. Expenses include direct expenses paid to the Advisor as well as indirect expenses incurred by the Fund as a result of its investments in other investment companies (each an “Acquired Fund”), before any expense reimbursements by the Advisor. Net Expenses are based on Fund expenses, net of waivers and reimbursements. See the prospectus for additional information regarding Fund expenses.
Wasatch Funds will deduct a 2.00% redemption proceeds fee on Fund shares held 60 days or less. Performance data does not reflect the deduction of fees or taxes, which if reflected, would reduce the performance quoted. For more complete information including charges, risks and expenses, read the prospectus carefully.
Investing in micro cap funds will be more volatile and loss of principal could be greater than investing in large cap or more diversified funds. Investing in foreign securities, especially in emerging markets, entails special risks, such as currency fluctuations and political uncertainties, which are described in more detail in the prospectus.
TOP 10 EQUITY HOLDINGS*
| | | | |
| Company | | % of Net
Assets | |
| Virtus Investment Partners, Inc. | | | 2.6% | |
| First Cash Financial Services, Inc. | | | 2.4% | |
| DFC Global Corp. | | | 2.1% | |
| Encore Capital Group, Inc. | | | 2.1% | |
| Franklin Electric Co., Inc. | | | 1.7% | |
| | | | |
| Company | | % of Net
Assets | |
| Huron Consulting Group, Inc. | | | 1.7% | |
| Haynes International, Inc. | | | 1.6% | |
| Fundtech Ltd. (Israel) | | | 1.5% | |
| Caribou Coffee Co., Inc. | | | 1.4% | |
| Advance America Cash Advance Centers, Inc. | | | 1.3% | |
| * | As of September 30, 2011, there were 106 holdings in the Fund. Foreign currency contracts, written options and repurchase agreements, if any, are not included in the number of holdings. Portfolio holdings are subject to change at any time. References to specific securities should not be construed as recommendations by the Funds or their Advisor. Current and future holdings are subject to risk. |
SECTOR BREAKDOWN**
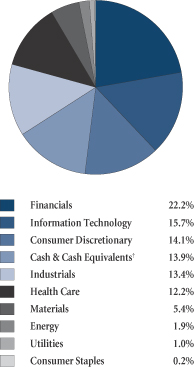
| ** | Excludes securities sold short and options written, if any. |
| †Also | includes Other Assets & Liabilities. |
GROWTHOFA HYPOTHETICAL $10,000 INVESTMENT
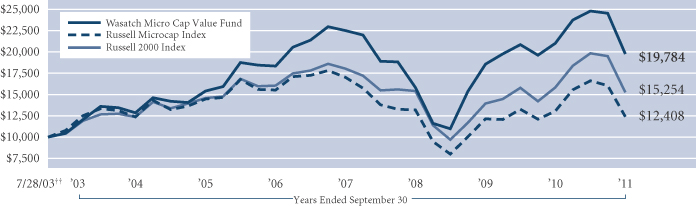
Past performance does not predict future performance and the graph above does not reflect the deduction of taxes you would pay on fund distributions or the redemption of fund shares. Performance shown in the chart above does not include any applicable sales charges and fees. Wasatch does not charge any sales fees. ††Inception: July 28, 2003. The Fund has changed its primary benchmark from the Russell 2000 Index to the Russell Microcap Index. The Advisor believes the Russell Microcap Index more closely tracks the Fund’s micro cap holdings. The Russell Microcap Index is an unmanaged total return index of the smallest 1,000 securities in the small-cap Russell 2000 Index along with the next smallest 1,000 companies, based on a ranking of all U.S. equities by market capitalization. No data was available for the Index prior to 6/30/00. Data for the Index from 6/30/00 until its official start date of July 1, 2005 was from a paper portfolio. The Russell 2000 Index is an unmanaged total return index of the smallest 2,000 companies in the Russell 3000 Index, as ranked by total market capitalization. The Russell 2000 Index is widely regarded in the industry as accurately capturing the universe of small company stocks. You cannot invest directly in these or any indices.
25
| | |
| WASATCH SMALL CAP GROWTH FUND (WAAEX) — Management Discussion | | SEPTEMBER 30, 2011 |
|
|
|
The Wasatch Small Cap Growth Fund is managed by a team of Wasatch portfolio managers led by Jeff Cardon.
| | |

Jeff Cardon, CFA Portfolio Manager | | OVERVIEW The Wasatch Small Cap Growth Fund gained 3.30% in the 12 months ended September 30, 2011. The Fund outperformed the Russell 2000 Growth Index, which returned -1.12%, and the Russell 2000 Index, which returned -3.53%. During the third quarter of 2011, the Fund’s total return was -16.91%. However, it was more resilient than the Russell 2000 Growth and Russell 2000 indices, which declined
-22.25% and -21.87%, respectively. |
For some time now, we have envisioned a discouragingly low-growth economic environment caused by excessive leverage. We have also believed that the types of companies we like to invest in—high-growth companies that are adding real value to the economy—would stand out in an environment where growth is hard to come by. These themes have been playing out, creating a favorable backdrop for our style of investing relative to the overall market.
DETAILSOFTHE YEAR
One of the most powerful long-term investment themes we have identified is the need for businesses to be more efficient as they compete in a lower-growth and more competitive global economy. Companies are clearly looking to increase productivity without increasing headcount. One of the best ways to accomplish this is to invest in technology-related products and services with compelling economic paybacks. Companies like Riverbed Technology, F5 Networks and Ultimate Software are benefiting from this focus on delivering efficiency. These stocks were top performers in the Fund during the year.
NetLogic Microsystems was another big winner in technology. On September 12, this fast-growing semiconductor supplier announced that it was being acquired by Broadcom,* a larger semiconductor company. Broadcom agreed to pay $50 a share in cash, which was a 57% premium over NetLogic’s prior day closing price. As noted above, we believe true growth is rare and prized in today’s economy. The premium Broadcom is paying for NetLogic is strong evidence of this. Hsu Fu Chi International and optionsXpress were other holdings that were recently acquired at premiums. LoopNet has also announced that it will be acquired before the end of the year. These stocks produced significant gains for the Fund.
Two of the biggest detractors in the portfolio were Vistaprint and STR Holdings. Vistaprint sells marketing products and services over the Internet. The company announced plans to make substantial investments in its business, and investors reacted negatively to the news because these investments will impact near-term operating results. We think Vistaprint’s long-term strategy makes sense and continue to own the stock. STR makes encapsulants, which are films that hold solar modules together and protect their
electrical circuitry. The company is being affected by rapidly declining pricing in the solar industry. We are careful about allocating capital to companies like STR that are in early-stage industries with unproven economics. We had less than a 1% weight in the stock coming into the year, and it is highly unlikely that we would invest further capital into a company at this early stage of development.
The third quarter of 2011 was the worst quarter for the U.S. stock market since the height of the financial crisis. Weak economic data, a political stalemate in Washington, and the lowering of the U.S. credit rating for the first time in history all added to the sense that the United States is unable to manage its finances. Overseas, the European debt crisis deepened, while China’s economy showed signs of slowing.
In this environment, some of our best-performing stocks compared to the broader market were those of stable growth companies with solid balance sheets. They included O’Reilly Automotive, Monro Muffler Brake and Peet’s Coffee & Tea. These three companies all enjoy stable or even counter-cyclical demand, something investors are obviously attracted to in times of economic uncertainty.
Not surprisingly, stocks in economically sensitive areas of the market, such as energy and transportation, were hard hit during the quarter. As a result of the pressure on these market segments, most of our favorite cyclical growth companies, such as Dril-Quip, Graco and Knight Transportation were all down significantly. We like the quality of these companies and our inclination is to buy quality companies when stock prices decline.
In fact, we have been spending cash aggressively during the market downturn. This is not a statement on where we see the direction of the market—we would never claim to have market timing expertise. Instead, we are always looking to invest in quality growth companies at reasonable valuations. Valuations were a concern for us at the beginning of 2011. Today, those worries have evaporated with the recent sell-off, and we have been increasing our weights in some of our favorite existing names and adding a few new names to the Fund.
OUTLOOK
Earnings have rebounded coming out of the recession, but the easy comparisons are behind us. As we return to a more normalized earnings environment, there will be greater visibility into companies’ true underlying growth rates. Our models suggest that our portfolio companies are on track to deliver mid-teens growth in the upcoming reporting season. These growth rates are in line with our long-run target and compare favorably to the estimated growth rate for the small cap market as a whole.** Between the growth prospects of our companies and their valuations, we believe the Fund is properly positioned for long-run success.
Thank you for the opportunity to manage your assets.
| | CFA® is a trademark owned by CFA Institute. |
| * | As of September 30, 2011, the Wasatch Small Cap Growth Fund was not invested in Broadcom Corp. |
| ** | The median estimated third-quarter earnings growth rate for the broad small cap market is 9.1% according to Bank of America-Merrill Lynch in a report dated September 27, 2011. |
26
| | |
| WASATCH SMALL CAP GROWTH FUND (WAAEX) — Portfolio Summary | | SEPTEMBER 30, 2011 |
|
|
|
AVERAGE ANNUAL TOTAL RETURNS
| | | | | | | | | | | | |
| | | 1 YEAR | | | 5 YEARS | | | 10 YEARS | |
Small Cap Growth | | | 3.30% | | | | 3.14% | | | | 6.90% | |
Russell 2000® Growth Index | | | -1.12% | | | | 0.96% | | | | 5.45% | |
Russell 2000® Index | | | -3.53% | | | | -1.02% | | | | 6.12% | |
Data shows past performance, which is not indicative of future performance. Current performance may be lower or higher than the performance quoted. To obtain the most recent month-end performance data available, please visit www.wasatchfunds.com. The Advisor may absorb certain Fund expenses, without which total return would have been lower. Investment returns and principal value will fluctuate and shares, when redeemed, may be worth more or less than their original cost.
As of the January 31, 2011 prospectus, the Total Annual Fund Operating Expenses for the Wasatch Small Cap Growth Fund are 1.28%. The expense ratio shown elsewhere in this report may be different. Expenses include direct expenses paid to the Advisor as well as indirect expenses incurred by the Fund as a result of its investments in other investment companies (each an “Acquired Fund”), before any expense reimbursements by the Advisor. The Net Expense includes any reimbursement by the Advisor. See the prospectus for additional information regarding Fund expenses.
Wasatch Funds will deduct a 2.00% redemption proceeds fee on Fund shares held 60 days or less. Performance data does not reflect the deduction of fees or taxes, which if reflected, would reduce the performance quoted. For more complete information including charges, risks and expenses, read the prospectus carefully.
Investing in small cap funds will be more volatile and loss of principal could be greater than investing in large cap or more diversified funds.
TOP 10 EQUITY HOLDINGS*
| | | | |
| Company | | % of Net
Assets | |
| Knight Transportation, Inc. | | | 4.3% | |
| Power Integrations, Inc. | | | 4.1% | |
| Ultimate Software Group, Inc. | | | 3.8% | |
| Peet’s Coffee & Tea, Inc. | | | 2.8% | |
| Life Time Fitness, Inc. | | | 2.7% | |
| | | | |
| Company | | % of Net
Assets | |
| Hibbett Sports, Inc. | | | 2.6% | |
| MSC Industrial Direct Co., Inc., Class A | | | 2.4% | |
| Wirecard AG (Germany) | | | 2.3% | |
| NetLogic Microsystems, Inc. | | | 2.1% | |
| Hittite Microwave Corp. | | | 2.0% | |
| * | As of September 30, 2011, there were 95 holdings in the Fund. Foreign currency contracts, written options and repurchase agreements, if any, are not included in the number of holdings. Portfolio holdings are subject to change at any time. References to specific securities should not be construed as recommendations by the Funds or their Advisor. Current and future holdings are subject to risk. |
SECTOR BREAKDOWN**
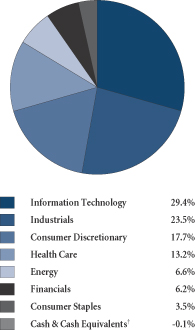
| ** | Excludes securities sold short and options written, if any. |
| †Also | includes Other Assets & Liabilities. |
GROWTHOFA HYPOTHETICAL $10,000 INVESTMENT
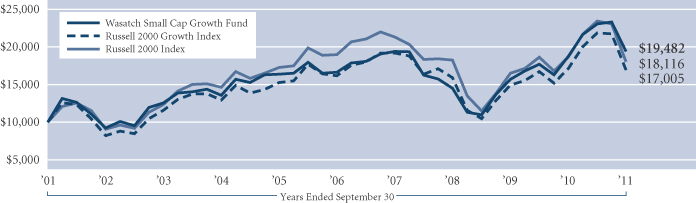
Past performance does not predict future performance and the graph above does not reflect the deduction of taxes you would pay on fund distributions or the redemption of fund shares. Performance shown in the chart above does not include any applicable sales charges and fees. Wasatch does not charge any sales fees. The Russell 2000 Growth Index is an unmanaged total return index that measures the performance of those Russell 2000 Index companies with higher price-to-book ratios and higher forecasted growth values. The Russell 2000 Index is an unmanaged total return index of the smallest 2,000 companies in the Russell 3000 Index, as ranked by total market capitalization. The Russell 2000 Index is widely regarded in the industry as accurately capturing the universe of small company stocks. You cannot invest directly in these or any indices.
27
| | |
| WASATCH SMALL CAP VALUE FUND (WMCVX) — Management Discussion | | SEPTEMBER 30, 2011 |
|
|
|
The Wasatch Small Cap Value Fund is managed by a team of Wasatch portfolio managers led by Jim Larkins.
| | |

Jim Larkins, MBA Portfolio Manager | | OVERVIEW The Wasatch Small Cap Value Fund returned -19.38% in the third quarter and outperformed the Russell 2000 Value Index, which returned -21.47%. For the 12-month period ended September 30, 2011, the Fund returned 1.30%. In comparison, the Index finished in the red with a return of -5.99%. Our stock picks outperformed the Index in every sector except materials |
during the past year. We believe the most important factor in our strong relative performance was our steady approach of seeking to buy quality stocks whose values don’t reflect their potential for growth. This strategy has multiple elements. First, we own companies that we believe have strong business models or hardy balance sheets. If a company doesn’t have one or both of these attributes, we don’t want to hold it in the Fund. Second, we avoid “deep-value” stocks in favor of those with identifiable catalysts for improving earnings growth. We believe this approach helps insulate the Fund against the broader macroeconomic factors that influence day-to-day market volatility.
Another notable benefit of investing in higher quality companies is that we can feel comfortable taking advantage of share price weakness to establish or add to existing positions at attractive levels. Our strategy of buying strong companies at a discount has been a key factor contributing to performance during the past year and over the longer-term, as it has often allowed us to capitalize on market volatility rather than be hurt by it.
DETAILSOFTHE YEAR
The Fund’s sector positioning played a key role in its outperformance. We have held an underweight in financials for several years, as we have had difficulty finding companies—particularly within the banking industry—that can deliver reliable growth. At the same time, we have capitalized on opportunities in other segments of the financial sector, such as consumer lending companies. This positioning helped performance in the past year, as bank stocks remained under severe pressure and our consumer finance holdings—Advance America Cash Advance Centers, DFC Global and United PanAm Financial—bucked the broader market trend and finished with returns of more than 50%.
Among individual stocks, our largest contributor for the 12-month period was Polycom. A “Fallen Angel” (our term for a one-time growth stock that stumbles and drops into value territory), Polycom has staged a strong rebound from its early-2009 lows. Another top performer was natural foods distributor Herbalife, whose share price rose over 80%. Improving fundamental strength in the company’s daily consumption model has enhanced its ability to sell products and recruit distributors. Our position in natural
gas producer Petrohawk Energy also helped performance. Petrohawk gained nearly 55% in the third quarter after being bid for by BHP Billiton,* which enabled its shares to finish the annual period with a gain north of 130%. Two other portfolio holdings—Volcom and Vital Images—also were acquired at a premium during the past year.
The Fund’s leading detractor was American Reprographics, a blueprint provider that gave back its first quarter gains on fears that construction activity will remain depressed. Our positions in Big 5 Sporting Goods, Karnataka Bank, and Icon also hurt performance relative to the Index over the past 12 months. Current and future holdings are subject to risk.
In terms of portfolio activity, we remained focused on selling positions that had become overvalued and buying into companies that had become more attractively valued. The information technology sector, in particular, continued to be a source of new opportunities for the Fund. We like the strong balance sheets we find among technology companies, as well as the continual opportunities for individual companies to generate organic revenue growth through innovation and the introduction of new products.
OUTLOOK
Despite the worries that continue to hang over the global financial markets, we believe the companies in the portfolio can continue to grow. The small cap space, in particular, holds opportunities in that stock prices have fallen sharply, but small companies are generally not as sensitive to macroeconomic factors—particularly the problems in Europe—as large companies. Rarely are the opportunities to find compelling values greater than during the times when fear is most rampant.
No matter what’s happening on the macro level, our primary focus will always be on the inner workings of the individual companies we hold in the portfolio. We believe this disciplined approach—highlighted by our focus on companies that we believe have solid balance sheets and/or strong business models—will continue to provide the potential for market-beating results.
Thank you for your continued investment in the Fund.
| * | As of September 30, 2011, the Wasatch Small Cap Value Fund was not invested in BHP Billiton Ltd. |
28
| | |
| WASATCH SMALL CAP VALUE FUND (WMCVX) — Portfolio Summary | | SEPTEMBER 30, 2011 |
|
|
|
AVERAGE ANNUAL TOTAL RETURNS
| | | | | | | | | | | | |
| | | 1 YEAR | | | 5 YEARS | | | 10 YEARS | |
Small Cap Value | | | 1.30% | | | | -1.56% | | | | 6.05% | |
Russell 2000® Value Index | | | -5.99% | | | | -3.08% | | | | 6.47% | |
Russell 2000® Index | | | -3.53% | | | | -1.02% | | | | 6.12% | |
Data shows past performance, which is not indicative of future performance. Current performance may be lower or higher than the performance quoted. To obtain the most recent month-end performance data available, please visit www.wasatchfunds.com. The Advisor may absorb certain Fund expenses, without which total return would have been lower. Investment returns and principal value will fluctuate and shares, when redeemed, may be worth more or less than their original cost.
As of the January 31, 2011 prospectus, the Total Annual Fund Operating Expenses for the Wasatch Small Cap Value Fund are 1.97%. The expense ratio shown elsewhere in this report may be different. Expenses include direct expenses paid to the Advisor as well as indirect expenses incurred by the Fund as a result of its investments in other investment companies (each an “Acquired Fund”), before any expense reimbursements by the Advisor. The Net Expense includes any reimbursement by the Advisor. See the prospectus for additional information regarding Fund expenses.
Wasatch Funds will deduct a 2.00% redemption proceeds fee on Fund shares held 60 days or less. Performance data does not reflect the deduction of fees or taxes, which if reflected, would reduce the performance quoted. For more complete information including charges, risks and expenses, read the prospectus carefully.
Investing in small cap funds will be more volatile and loss of principal could be greater than investing in large cap or more diversified funds.
TOP 10 EQUITY HOLDINGS*
| | | | |
| Company | | % of Net
Assets | |
| Copart, Inc. | | | 4.3% | |
| CorVel Corp. | | | 3.6% | |
| DFC Global Corp. | | | 2.6% | |
| Huron Consulting Group, Inc. | | | 2.5% | |
| HEICO Corp., Class A | | | 2.4% | |
| | | | |
| Company | | % of Net
Assets | |
| Allegiant Travel Co. | | | 2.1% | |
| Body Central Corp. | | | 2.0% | |
| Old Dominion Freight Line, Inc. | | | 2.0% | |
| Skechers U.S.A., Inc., Class A | | | 2.0% | |
| Corporate Executive Board Co. (The) | | | 2.0% | |
| * | As of September 30, 2011, there were 76 holdings in the Fund. Foreign currency contracts, written options and repurchase agreements, if any, are not included in the number of holdings. Portfolio holdings are subject to change at any time. References to specific securities should not be construed as recommendations by the Funds or their Advisor. Current and future holdings are subject to risk. |
SECTOR BREAKDOWN**
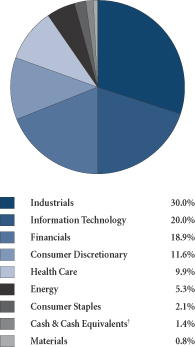
| ** | Excludes securities sold short and options written, if any. |
| †Also | includes Other Assets & Liabilities. |
GROWTHOFA HYPOTHETICAL $10,000 INVESTMENT
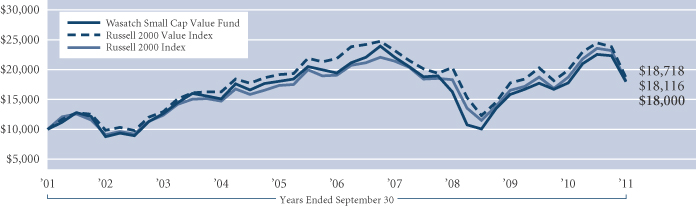
Past performance does not predict future performance and the graph above does not reflect the deduction of taxes you would pay on fund distributions or the redemption of fund shares. Performance shown in the chart above does not include any applicable sales charges and fees. Wasatch does not charge any sales fees. The Russell 2000 Value Index measures the performance of those Russell 2000 Index companies with lower price-to-book ratios and lower forecasted growth values. The Russell 2000 Index is an unmanaged total return index of the smallest 2,000 companies in the Russell 3000 Index, as ranked by total market capitalization. The Russell 2000 Index is widely regarded in the industry as accurately capturing the universe of small company stocks. You cannot invest directly in these or any indices.
29
| | |
| WASATCH STRATEGIC INCOME FUND (WASIX) — Management Discussion | | SEPTEMBER 30, 2011 |
|
|
|
The Wasatch Strategic Income Fund is managed by a team of Wasatch portfolio managers led by Sam Stewart.
| | |
Samuel S. Stewart, Jr. PhD, CFA Portfolio Manager | | OVERVIEW During the third quarter, the stock markets experienced a significant pullback due to investor anxiety surrounding global economic events. Lack of political resolve to make difficult decisions seemed to wear on the patience of investors more than underlying economic fundamentals. While this “kick-the-can-down-the-road” mentality from politicians brought uncertainty to the stock market, headlines read worse than the actual performance of the |
economy. In particular, the U.S. appears to be plugging along, albeit with a two steps forward, one step back tempo.
The Wasatch Strategic Income Fund’s two benchmarks outperformed the Fund during the quarter. The S&P 500 Index declined 13.87%, while the Barclays Capital U.S. Aggregate Bond Index was up 3.82% as investors fled to the perceived safety of fixed income products, primarily U.S. Treasuries.
Unfortunately, investors’ fear that we might face a re-run of 2008 hit financial companies especially hard and the Fund was stung by their sizable retreat. Even though the Fund’s financial holdings outperformed those in the benchmark, the Fund’s higher concentration in this sector contributed to the Fund’s 14.58% decline. I was disappointed with this quarter’s performance and am continuing to explore ideas to temper the Fund’s risk exposure.
Despite the setback in the quarter, over the last 1-, 3- and 5-year periods the Fund has performed as we would have expected, providing returns between those of stocks and bonds. Ideally, this sweet spot is where I want to be. It has often allowed the Fund to outperform stocks during bearish equity environments while providing a more compelling total return than bonds when stocks are in favor. During September, the Fund’s 30-day SEC yield was 3.13%,* which is especially attractive in a near zero interest rate environment.
DETAILSOFTHE YEAR
For the 12-months ended September 30, the Fund returned 3.94%, which outpaced the 1.14% appreciation of the S&P 500, and slightly trailed the 5.26% return of the Barclays Index.
Herbalife and Valeant Pharmaceuticals were the Fund’s top contributors during the last year. Herbalife, a nutritional supplement company, continued to implement its daily consumption model, which has boosted earnings and predictability based on its recurring revenue stream.
Valeant, a specialty pharmaceutical company, is one of the few companies in the Fund that does not currently pay a dividend. However, it has strong cash flow and I believe it should have the ability to pay a substantial dividend in the future. Investors have viewed favorably the company’s integration with Biovail and its attractive drug pipeline.
Another pharmaceutical company, Teva Pharmaceutical Industries, and NorthStar Realty Finance were the two
largest detractors from performance. Both Teva and NorthStar remain two of the Fund’s largest holdings. I think that investors put too much emphasis on short-term concerns at the expense of probable long-run successful business execution. Teva develops and produces generic drugs, which have been increasing as an overall percentage of prescriptions filled, while NorthStar continues to show signs of fundamental business strength and features a double-digit dividend yield.
A purchase during the third quarter was Whiting Petroleum, which the Fund previously held. Whiting Petroleum was sold when I thought it was fully valued. I bought back the stock for a price 30% below the price at which I sold. Whiting excels at developing oil and gas properties and trades at a discount to my estimate of net asset value.
As a strategic reminder, I divide the Fund’s holdings into three different buckets:
| | 1. | The first category consists of companies that are willing and able to pay growing dividends. McDonald’s is a poster child for this bucket, which contains about 60% of the Fund’s holdings. |
| | 2. | Another 30% or so goes into companies currently paying high dividends, but that have less potential to increase them in the future. This bucket includes many finance companies in the mortgage real estate investment trust and business development company space. |
| | 3. | Finally, the remaining allocation goes to companies like Valeant Pharmaceuticals that are currently paying small or no dividends but have strong cash flow that may allow them to pay significant dividends down the road. |
OUTLOOK
While I wish I had better news, I think that the economy is going to muddle along for a while. I sense that rather than several months, the malaise may last for a few years. That’s not to say there won’t be opportunities to make money, but investors will need to be cautious not to get whipsawed by the likely volatility and instead make it work for them. I have mentioned in previous commentary my recommendation for “leaning against the wind.” By this I mean it is probably wise to lean a little bit against the widespread pessimism that occurs when you get economic headwinds like we are seeing now.
In the environment described above, the Fund should provide some stability with its defensive positioning. I am not trying to hit the ball out of the park. The Fund should move runners around the bases by stringing together a lot of singles and not by swinging for the long ball.
I believe that there are still great companies with healthy balance sheets, strong business models, innovative approaches, rising earnings growth and stellar yields that will provide outstanding investment opportunities. I look forward to the challenge of finding companies that merit a place in the Fund.
Thank you for the opportunity to invest your assets.
| CFA® | is a trademark owned by CFA Institute. |
| * | The 30-day yield for the Strategic Income Fund is subsidized due to the Advisor’s contractual agreement to reimburse the Fund for certain expenses. Without this expense waiver the Fund’s yield would be lower. |
30
| | |
| WASATCH STRATEGIC INCOME FUND (WASIX) — Portfolio Summary | | SEPTEMBER 30, 2011 |
|
|
|
AVERAGE ANNUAL TOTAL RETURNS
| | | | | | | | | | | | |
| | | 1 YEAR | | | 5 YEARS | | | SINCE INCEPTION
2/1/06 | |
Strategic Income | | | 3.94% | | | | 0.11% | | | | 1.40% | |
S&P 500 Index | | | 1.14% | | | | -1.18% | | | | -0.06% | |
Barclays Capital U.S. Aggregate Bond Index | | | 5.26% | | | | 6.53% | | | | 6.30% | |
Data shows past performance, which is not indicative of future performance. Current performance may be lower or higher than the performance quoted. To obtain the most recent month-end performance data available, please visit www.wasatchfunds.com. The Advisor may absorb certain Fund expenses, without which total return would have been lower. Investment returns and principal value will fluctuate and shares, when redeemed, may be worth more or less than their original cost.
As of the January 31, 2011 prospectus, the Total Annual Fund Operating Expenses for the Wasatch Strategic Income Fund are 1.96%. The Net Expenses are 1.62%. The expense ratio shown elsewhere in this report may be different. Expenses include direct expenses paid to the Advisor as well as indirect expenses incurred by the Fund as a result of its investments in other investment companies (each an “Acquired Fund”), before any expense reimbursements by the Advisor. Net Expenses are based on Fund expenses, net of waivers and reimbursements. See the prospectus for additional information regarding Fund expenses.
Wasatch Funds will deduct a 2.00% redemption proceeds fee on Fund shares held 60 days or less. Performance data does not reflect the deduction of fees or taxes, which if reflected, would reduce the performance quoted. For more complete information including charges, risks and expenses, read the prospectus carefully.
With respect to the Fund’s assets invested in fixed income securities, you are subject, but not limited to, the same interest rate, inflation and credit risk associated with the underlying fixed-income securities owned by the Fund. Return of principal is not guaranteed. Equity investing involves risks, including potential loss of the principal amount invested. Investing in foreign securities, especially in emerging markets, entails special risks, such as currency fluctuations and political uncertainties, which are described in more detail in the prospectus.
TOP 10 EQUITY HOLDINGS*
| | | | |
| Company | | % of Net
Assets | |
| CapitalSource, Inc. | | | 4.9% | |
| Visa, Inc., Class A | | | 4.7% | |
| MasterCard, Inc., Class A | | | 4.6% | |
| Capital One Financial Corp. | | | 3.5% | |
| NorthStar Realty Finance Corp. | | | 3.5% | |
| | | | |
| Company | | % of Net
Assets | |
| Solar Senior Capital Ltd. | | | 3.5% | |
| Intel Corp. | | | 3.3% | |
| Herbalife Ltd. | | | 3.1% | |
| Two Harbors Investment Corp. | | | 3.0% | |
| Ares Capital Corp. | | | 3.0% | |
| * | As of September 30, 2011, there were 45 holdings in the Fund. Foreign currency contracts, written options and repurchase agreements, if any, are not included in the number of holdings. Portfolio holdings are subject to change at any time. References to specific securities should not be construed as recommendations by the Funds or their Advisor. Current and future holdings are subject to risk. |
SECTOR BREAKDOWN**
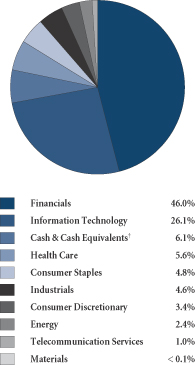
| ** | Excludes securities sold short and options written, if any. |
| †Also | includes Other Assets & Liabilities. |
GROWTHOFA HYPOTHETICAL $10,000 INVESTMENT
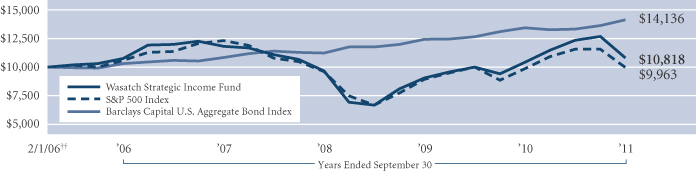
Past performance does not predict future performance and the graph above does not reflect the deduction of taxes you would pay on fund distributions or the redemption of fund shares. Performance shown in the chart above does not include any applicable sales charges and fees. Wasatch does not charge any sales fees. ††Inception: February 1, 2006. The S&P 500 Index represents 500 of the United States’ largest stocks from a broad variety of industries. The Index is unmanaged, and a common measure of common stock total return performance. The Barclays Capital U.S. Aggregate Bond Index covers the U.S. investment grade fixed rate bond market, including government and corporate securities, agency mortgage pass-through securities, and asset-backed securities. To be included in the index the security must meet the following criteria: must have at least one year to final maturity, regardless of call features; must have at least $100 million par amount outstanding; must be rated investment grade or better by Moody’s Investors Service, Standard & Poor’s, or Fitch Investor’s Service; must be fixed rate, although it can carry a coupon that steps up or changes to a predetermined schedule; must be dollar-denominated and nonconvertible. All corporate and asset-backed securities must be registered with the SEC and must be publicly issued. You cannot invest directly in these or any indices.
31
| | |
| WASATCH ULTRA GROWTH FUND (WAMCX) — Management Discussion | | SEPTEMBER 30, 2011 |
|
|
|
The Wasatch Ultra Growth Fund is managed by a team of Wasatch portfolio managers led by Ajay Krishnan.
| | |
Ajay Krishnan, CFA Portfolio Manager | | OVERVIEW After positive results in the fourth quarter of 2010 and first of 2011, this year’s second and third quarters have been marked by negative returns in the equity markets in the U.S. and around the world. Concerns about the Greek debt crisis and its potential to resound across Europe drove down international markets, while continued sluggish economic growth in the U.S. further dimmed investors’ interest in U.S. stocks. |
In these changing and unusually challenging conditions, the Wasatch Ultra Growth Fund recorded a return of -17.51% for the third quarter, which placed it ahead of the Russell 2000 Growth Index, which posted a -22.25% return for the same period. For the 12-month period ended September 30, 2011, the Fund returned 1.57%, while the Russell 2000 Growth Index returned -1.12%.
Although we don’t like to overemphasize outperformance in the wake of recent losses, we believe our recent results illustrate the benefits of our bottom-up investment approach. In the current risk-averse environment, we believe our careful focus on identifying companies with the potential to generate strong earnings growth allowed the Fund to outperform the broader small cap market. Finding such companies is proving more elusive in the current climate, and despite the recent market downturn, they are not always available at valuations we find reasonable.
DETAILSOFTHE YEAR
Sluggish economic growth around the globe has, understandably, made it more difficult for companies to produce the high level of earnings growth we target. Companies that do are not only interesting to us, but also to other investors and corporate suitors. That’s why we’re not surprised that two of our top contributors in the last 12 months—NetLogic Microsystems and Petrohawk Energy—were acquired during the period. With many companies sitting on significant stockpiles of cash and organic growth difficult to generate in the slow-growing economy, we anticipate that we may see other fast-growing companies acquired in the months ahead.
While the market selloff in the second half of the year was at times painful, it did afford us a number of opportunities to add new stocks to the portfolio and, in the process, upgrade its overall growth profile. Some of these new holdings have already begun to contribute positively to results.
One of these is Tangoe, which provides software and related services to help companies manage their mobile communications equipment and expenses. In an era when most companies work with a number of different telecommunications providers, Tangoe helps clients avoid inefficiencies and redundancies—and the accompanying costs—that can creep into their telecom budgets. Tangoe has done a good job of demonstrating to corporate
information technology (IT) managers the return on investment its services can provide. We have met with Tangoe’s management team and have been impressed with their thoughtful, conservative, and knowledgeable approach to their industry.
One of our greatest detractors from performance for the year was NuVasive, a maker of devices used in minimally invasive spinal surgeries. While there has been considerable market enthusiasm for the company’s products, which can reduce costs and improve outcomes from back surgery, the company has had to contend with some insurers’ reluctance to pay for elective back surgeries. A weak job market has also affected demand for such surgeries, as many employees are reluctant to risk missing work even for an abbreviated recovery period. Finally, late in the year, NuVasive received a generally negative decision in a patent infringement case, and is now obliged to pay royalties to a competitor.
For the year, our position in international stocks—particularly those from India and China—had negative impact on the Fund’s overall performance. In the global climate of economic uncertainty, investors grew nervous about markets they perceived as being potentially more volatile, and withdrew assets from them. Despite this recent setback, for the long term we believe these markets have the potential to offer the higher rates of growth we seek, and we intend to keep a significant weighting in them.
OUTLOOK
We anticipate that the next few quarters could present significant challenges. Perhaps the greatest near-term risk is the situation in Europe. It remains to be seen how well other European Union members will deal with Greece’s difficulties, and what the global repercussions of their actions or inactions will be. In the U.S., unemployment appears likely to remain high, suggesting consumer spending will stay under pressure. There are some indications, however, that consumers are weary of cutting back and may be willing to start spending a little more on smaller luxuries, perhaps allowing companies providing those goods to experience a greater degree of growth. On the whole, however, we anticipate consumer spending to remain tepid.
Even in this difficult climate, we have a great deal of confidence in the earnings growth potential of the companies held by the Fund. For the past quarter, we had anticipated growth of about 19%, but it actually reached nearly 23%. Although in some cases company valuations may be a bit stretched, we don’t think they are too far out of line, particularly in light of our strong earnings growth outlook. We will, of course, continue to monitor valuations and adjust positions when we believe it’s appropriate. Our emphasis remains on identifying companies that have the potential to produce high rates of earnings growth, and whose stocks are available at prices that leave room for appreciation over time.
Thank you for the opportunity to manage your assets.
CFA® is a trademark owned by CFA Institute.
32
| | |
| WASATCH ULTRA GROWTH FUND (WAMCX) — Portfolio Summary | | SEPTEMBER 30, 2011 |
|
|
|
AVERAGE ANNUAL TOTAL RETURNS
| | | | | | | | | | | | |
| | | 1 YEAR | | | 5 YEAR | | | 10 YEAR | |
Ultra Growth | | | 1.57% | | | | 0.52% | | | | 5.08% | |
Russell 2000® Growth Index | | | -1.12% | | | | 0.96% | | | | 5.45% | |
Data shows past performance, which is not indicative of future performance. Current performance may be lower or higher than the performance quoted. To obtain the most recent month-end performance data available, please visit www.wasatchfunds.com. The Advisor may absorb certain Fund expenses, without which total return would have been lower. Investment returns and principal value will fluctuate and shares, when redeemed, may be worth more or less than their original cost.
As of the January 31, 2011 prospectus, the Total Annual Fund Operating Expenses for the Wasatch Ultra Growth Fund are 1.46%. The expense ratio shown elsewhere in this report may be different. Expenses include direct expenses paid to the Advisor as well as indirect expenses incurred by the Fund as a result of its investments in other investment companies (each an “Acquired Fund”), before any expense reimbursements by the Advisor. Net Expenses are based on Fund expenses, net of waivers and reimbursements. See the prospectus for additional information regarding Fund expenses.
Wasatch Funds will deduct a 2.00% redemption proceeds fee on Fund shares held 60 days or less. Performance data does not reflect the deduction of fees or taxes, which if reflected, would reduce the performance quoted. For more complete information including charges, risks and expenses, read the prospectus carefully.
Investing in small cap funds will be more volatile and loss of principal could be greater than investing in large cap or more diversified funds.
TOP 10 EQUITY HOLDINGS*
| | | | |
| Company | | % of Net
Assets | |
| Cognizant Technology Solutions Corp., Class A | | | 4.3% | |
| Power Integrations, Inc. | | | 3.7% | |
| Greenspring Global Partners II-B, L.P. | | | 3.3% | |
| Silicon Laboratories, Inc. | | | 2.7% | |
| Hittite Microwave Corp. | | | 2.5% | |
| | | | |
| Company | | % of Net
Assets | |
| MSCI, Inc., Class A | | | 2.1% | |
| MakeMyTrip Ltd. (India) | | | 2.0% | |
| Dollar Tree, Inc. | | | 2.0% | |
| DFC Global Corp. | | | 1.9% | |
| GlaxoSmithKline Consumer Healthcare Ltd. (India) | | | 1.8% | |
| * | As of September 30, 2011, there were 103 holdings in the Fund. Foreign currency contracts, written options and repurchase agreements, if any, are not included in the number of holdings. Portfolio holdings are subject to change at any time. References to specific securities should not be construed as recommendations by the Funds or their Advisor. Current and future holdings are subject to risk. |
SECTOR BREAKDOWN**
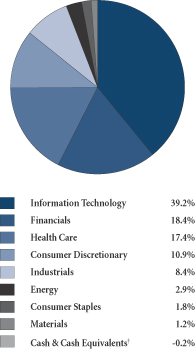
| ** | Excludes securities sold short and options written, if any. |
| †Also | includes Other Assets & Liabilities. |
GROWTHOFA HYPOTHETICAL $10,000 INVESTMENT
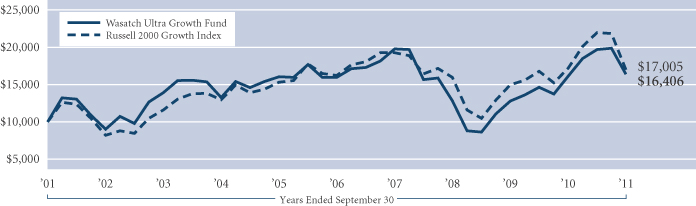
Past performance does not predict future performance and the graph above does not reflect the deduction of taxes you would pay on fund distributions or the redemption of fund shares. Performance shown in the chart above does not include any applicable sales charges and fees. Wasatch does not charge any sales fees. The Russell 2000 Growth Index is an unmanaged total return index that measures the performance of those Russell 2000 Index companies with higher price-to-book ratios and higher forecasted growth values. The Russell 2000 Index is an unmanaged total return index of the smallest 2,000 companies in the Russell 3000 Index, as ranked by total market capitalization. You cannot invest directly in these or any indices.
33
| | |
WASATCH WORLD INNOVATORS FUND (WAGTX) — Management Discussion (formerly Wasatch Global Science & Technology Fund) | | SEPTEMBER 30, 2011 |
|
|
|
The Wasatch World Innovators Fund is managed by a team of Wasatch portfolio managers led by Sam Stewart.
| | |
Samuel S. Stewart, Jr. PhD, CFA Portfolio Manager | | OVERVIEW The Wasatch World Innovators Fund returned 7.77% during the 12 months ended September 30, 2011, soundly outperforming the -6.04% return of the MSCI AC World IMI and the -4.72% return of the Russell 2000 Technology Index. We believe this strong performance reflects our approach, which seeks out the best growth companies in the world and has a specific focus on finding companies whose innovative business models are reshaping the |
industries in which they compete.
During the annual period, we refined the investment strategy that powers the Fund—a shift that is reflected in the name “World Innovators.” One of the important takeaways from the financial crisis of 2008 to 2009 was that being “growth investors” was just not good enough. There is real, healthy growth, and there is growth driven by acquisitions and financial wizardry. We spent a great deal of time this year on the definition of the type of growth company we want to own. The businesses we buy must sell products and services that customers can’t live without today and that will be just as important to them in five years. Company leadership must be as obsessed with execution and industrial innovations—sourcing, logistics, manufacturing, customer service, branding—as they are with developing innovative products. And these companies must exhibit consistent market share gains that tend to accelerate during economic downturns, which suggest the innovations the companies are working on have real world impact. We believe we have populated the portfolio with companies that are changing the game in the industries in which they compete, and this was reflected in our 12-month performance results.
DETAILSOFTHE YEAR
Our top five contributors for the annual period were Start Today (Japan), Daum Communications (Korea), Apple, Alliance Data Systems and OPNET Technologies. The common ground among the Fund’s winners was that the market was surprised by how mildly affected they were by the sluggish economy—exactly as we expected our innovators to perform. As a result, a number of Fund holdings were lifted by two factors: first, better-than-expected earnings growth; and second, expanded valuation multiples that reflected investors’ appreciation for stellar performance. We sold Daum as we deemed its valuation as being too high, but we continue to own the rest of the companies on our list of top contributors. It’s worth mentioning that none of our big winners were driven by some sort of one-time event, none were acquired, and none won a court decision or had one hot new product. Instead, they simply executed their business models.
Our two largest detractors, Netflix and Akamai Technologies, are companies that we believe to have great future prospects. What we got wrong was paying too high a valuation when we added them to the Fund. We don’t classify either as broken investments at this point, and we continue to hold them in the portfolio. Teva Pharmaceutical Industries, our third-largest detractor, fell victim to some bad news regarding trial results during the past year. We continue to believe in the longer-term theme of globalization/democratization of Western medical solutions, and generic drug makers should benefit from the trend toward increased volumes without the price pressure risk faced by pure branded drug-makers. Our fourth-largest detractor, BCD Semiconductor Manufacturing, is a recent initial public offering (IPO) that was hit hard in the late summer downturn due to its status as a newly public company in a cyclical industry.
In terms of performance specific to the third quarter, very few of our holdings finished the period with positive absolute returns given how poorly the market performed during the period. That said, Apple (our largest position) gained nearly 14%, and several of our Asian investments—including Daum Communications in Korea and MonotaRO, Start Today and Trancom in Japan—also experienced decent share price increases. In the aggregate, our holdings declined far less than the market as a whole. We were not surprised by this development, as it is part of our thesis that the gap between the performance of world innovators and the rest of the market should widen when stocks decline. Notable third-quarter detractors were Netflix, Altera, Diagnosticos da America (Brazil), Valeant Pharmaceuticals, and DiaSorin (Italy). Current and future holdings are subject to risk.
OUTLOOK
Our prognosis for the global economy has been consistent since the financial crisis: we expect a slow recovery and unusually choppy stock markets as the world copes with a long and painful debt hangover with no easy cure. However, we believe innovators will be the exception. Most of the companies in the portfolio have reported rapid sales growth and increased cash flows over the past three years in the face of a dismal economy. We believe their lead over their competitors should increase at an accelerated rate for two important reasons: customers are more open to trying new, innovative ideas in order to survive, and innovators will get into a virtuous circle as they take market share, increase their cash flows, and reinvest capital in their businesses. At the same time, their entrenched legacy competition will find that access to easy money has dried up as banks look less kindly on deteriorating financials. In short, we are optimistic that we can continue to deliver strong performance despite the slow-growth economy.
Thank you for the opportunity to manage your assets.
CFA® is a trademark owned by CFA Institute.
34
| | |
| WASATCH WORLD INNOVATORS FUND (WAGTX) — Portfolio Summary | | SEPTEMBER 30, 2011 |
|
|
|
AVERAGE ANNUAL TOTAL RETURNS
| | | | | | | | | | | | |
| | | 1 YEAR | | | 5 YEAR | | | 10 YEAR | |
World Innovators* | | | 7.77% | | | | 3.75% | | | | 8.11% | |
MSCI AC World IMI | | | -6.04% | | | | -1.26% | | | | 5.24% | |
Russell 2000 Technology Index | | | -4.72% | | | | 2.66% | | | | 4.52% | |
Data shows past performance, which is not indicative of future performance. Current performance may be lower or higher than the performance quoted. To obtain the most recent month-end performance data available, please visit www.wasatchfunds.com. The Advisor may absorb certain Fund expenses, without which total return would have been lower. Investment returns and principal value will fluctuate and shares, when redeemed, may be worth more or less than their original cost.
As of the January 31, 2011 prospectus, the Total Annual Fund Operating Expenses for the Wasatch World Innovators Fund are 2.05%. The Net Expenses are 1.96%. The expense ratio shown elsewhere in this report may be different. Expenses include direct expenses paid to the Advisor as well as indirect expenses incurred by the Fund as a result of its investments in other investment companies (each an “Acquired Fund”), before any expense reimbursements by the Advisor. Net Expenses are based on Fund expenses, net of waivers and reimbursements. See the prospectus for additional information regarding Fund expenses.
Wasatch Funds will deduct a 2.00% redemption proceeds fee on Fund shares held 60 days or less. Performance data does not reflect the deduction of fees or taxes, which if reflected, would reduce the performance quoted. For more complete information including charges, risks and expenses, read the prospectus carefully.
Investing in concentrated funds will be more volatile and loss of principal could be greater than investing in more diversified funds. Investing in foreign securities, especially in emerging markets, entails special risks, such as currency fluctuations and political uncertainties, which are described in more detail in the prospectus.
| * | As of April 1, 2011, the Wasatch Global Science & Technology Fund changed its name to the Wasatch World Innovators Fund. |
TOP 10 EQUITY HOLDINGS**
| | | | |
| Company | | % of Net
Assets | |
| Apple, Inc. | | | 3.9% | |
| Visa, Inc., Class A | | | 3.5% | |
| MasterCard, Inc., Class A | | | 3.3% | |
| Google, Inc., Class A | | | 3.2% | |
| DiaSorin S.p.A. (Italy) | | | 2.6% | |
| Altera Corp. | | | 2.3% | |
| | | | |
| Company | | % of Net
Assets | |
| Wirecard AG (Germany) | | | 2.3% | |
| Teva Pharmaceutical Industries Ltd. ADR (Israel) | | | 2.2% | |
| Sartorius Stedim Biotech (France) | | | 2.1% | |
| Intel Corp. | | | 2.1% | |
| ** | As of September 30, 2011, there were 91 holdings in the Fund. Foreign currency contracts, written options and repurchase agreements, if any, are not included in the number of holdings. Portfolio holdings are subject to change at any time. References to specific securities should not be construed as recommendations by the Funds or their Advisor. Current and future holdings are subject to risk. |
SECTOR BREAKDOWN†
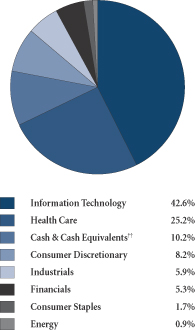
| † | Excludes securities sold short and options written, if any. |
| †† | Also includes Other Assets & Liabilities. |
GROWTHOFA HYPOTHETICAL $10,000 INVESTMENT
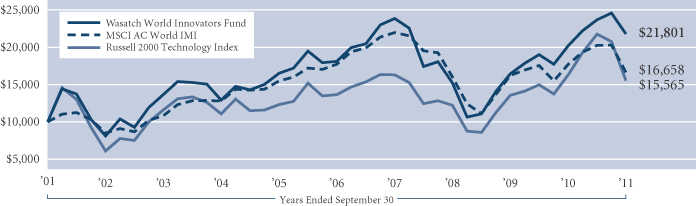
Past performance does not predict future performance and the graph above does not reflect the deduction of taxes you would pay on fund distributions or the redemption of fund shares. Performance shown in the chart above does not include any applicable sales charges and fees. Wasatch does not charge any sales fees. The Fund has changed its primary benchmark from the Russell 2000 Technology Index to the MSCI AC World IMI. The Advisor believes the MSCI AC World IMI more accurately reflects the securities in which the Fund will invest. The MSCI AC World IMI (All Country World Investable Markets Index) is a free float-adjusted market capitalization weighted index designed to measure the equity market performance of large, mid, and small cap companies across developed and emerging markets throughout the world. The Russell 2000 Technology Index is a capitalization-weighted index of companies that serve the electronics and computer industries or that manufacture products based on the latest applied science. You cannot invest directly in these or any indices.
35
| | |
| WASATCH-1ST SOURCE INCOME FUND (FMEQX) — Management Discussion | | SEPTEMBER 30, 2011 |
|
|
|
| | |

Paul W. Gifford, CFA Portfolio Manager | | OVERVIEW The Wasatch-1st Source Income Fund returned 1.47% for the third quarter of 2011. During this time, the Barclays Capital U.S. Intermediate Government/Credit Bond Index returned 2.39%. Fund and Index returns were positive due to the drop in interest rates experienced during the quarter. Yields on U.S. Treasury securities fell by 0.21 percentage points for two-year bonds and 1.24 percentage |
points for 10-year bonds. For the 12-month period, the Fund returned 2.26% and the Index returned 3.40%.
DETAILSOFTHE YEAR
The 12 months ended September 30, 2011 were generally positive for bonds. The early part of the period saw interest rates rising and negative returns, followed by several months of little change in rates. The last quarter was very good for bond performance and largely contributed to the positive returns over the past 12 months. A year ago, the economy appeared to be strengthening, unemployment was falling and inflation appeared to be rising. We ended the year with concerns of a “double-dip” recession, European sovereign debt viability and a downgrade of the United States’ credit rating. The year was quite the roller coaster ride.
The Fund produced a positive return for the 12-month period. Relative to the Index, performance was strong early in the year and fell late in the year. We generally maintained a defensive stance during the year by keeping the Fund’s effective duration shorter than the Index and owning fewer bonds below investment grade quality (those rated below BBB). Generally, longer duration bonds help performance during a period of falling interest rates, however, in a rising rate environment longer duration bonds likely will hurt performance. The effective duration of the Fund was between 2.9 and 3.3 during the year, while the benchmark’s duration was between 3.9 and 4.0. The Fund’s longest duration of the year was 3.3 in June of 2011, but it was not long enough to keep up with the Index’s performance.
U.S. Treasuries, despite the credit downgrade, performed well and earned most of their return in the latest quarter. The Treasury market also benefited from sovereign debt issues in Europe. Europe is entangled in a severe credit crisis focused on five of the 17 countries in the European Union (E.U.). Greece continues to dominate headlines and has for almost a year. The country is broke. Germany and France as leaders of the E.U. are now trying to contain the problems in Greece to avoid damaging all of Europe. Corporate bonds did well until the latest quarter when interest rate spreads between corporate bonds and U.S. Treasuries increased due to the slowing U.S. economy and European debt issues. The Fund also has a significant weighting in U.S. mortgage-backed securities that, like corporate bonds, underperformed late in the year. The drop in interest rates raised concerns about a possible refinancing wave and thus kept price appreciation for mortgage-backed securities to a minimum.
The Fund did not see dramatic changes during the latest quarter, but the fixed income markets did. Most notable was the spectacular drop in yields in the U.S. Treasury market. The drop continues to re-emphasize, that despite our domestic economic and fiscal issues, the world still considers the U.S. Treasury market a safe haven for investments. The dramatic drop in Treasury yields hurt the Fund’s performance relative to the Index in two ways. First, as mentioned earlier, the Fund’s duration is shorter than the benchmark’s. In the declining rate environment, reducing our interest rate risk actually worked against us. Second, the Fund has been traditionally underweight in Treasuries and was in this case. This hurt relative performance, as Treasury performance was so strong. We favor other higher yield investment grade bonds over the long run.
During the quarter, the Federal Reserve (Fed) informed the market that it would be selling shorter maturity bonds and buying longer maturity bonds in an effort to lower interest rates and improve economic growth. The yield curve responded favorably to the announcement and did flatten as longer maturity bonds saw yields fall more than shorter maturity bonds. The yield curve was still positively sloped and we took advantage of this with several trades. The trades were focused on staying in the same type of bonds—we improved yields by selling shorter maturity bonds and buying the same bonds with slightly longer maturities. The spread between corporate bonds and Treasury bonds increased so we picked up yield two ways—by extending maturities and by the widening of the Treasury spread relative to corporate bonds.
We found opportunities to improve yields by executing trades to extend the maturities of corporate bonds such as BB&T and Cardinal Health, government agency bonds with trades in Federal Home Loan Mortgage Corp. and finally by trading U.S. Treasury securities. We also saw opportunities in the corporate bond market and bought or added to names such as Berkshire Hathaway, Fifth Third Bancorp, Medtronic, WellPoint and US Bancorp by purchasing bonds with maturities of three to six years.
OUTLOOK
In the latest quarter, the Fed stated that it would hold short-term rates low until mid-2013. We anticipate little upward pressure on yields and will likely continue to implement trades similar to those recently completed.
Thank you for the opportunity to manage your assets.
CFA® is a trademark owned by CFA Institute.
36
| | |
| WASATCH-1ST SOURCE INCOME FUND (FMEQX) — Portfolio Summary | | SEPTEMBER 30, 2011 |
|
|
|
AVERAGE ANNUAL TOTAL RETURNS
| | | | | | | | | | | | |
| | | 1 YEAR | | | 5 YEARS | | | 10 YEARS | |
Income | | | 2.26% | | | | 4.77% | | | | 4.02% | |
Barclays Capital U.S. Intermediate Government/Credit Bond Index | | | 3.40% | | | | 5.92% | | | | 5.12% | |
Data shows past performance, which is not indicative of future performance. Current performance may be lower or higher than the performance quoted. To obtain the most recent month-end performance data available, please visit www.wasatchfunds.com. The Advisor may absorb certain Fund expenses, without which total return would have been lower. Investment returns and principal value will fluctuate and shares, when redeemed, may be worth more or less than their original cost.
As of the January 31, 2011 prospectus, the Total Annual Fund Operating Expenses for the Wasatch-1st Source Income Fund are 0.74%. The expense ratio shown elsewhere in this report may be different. Expenses include direct expenses paid to the Advisor as well as indirect expenses incurred by the Fund as a result of its investments in other investment companies (each an “Acquired Fund”). See the prospectus for additional information regarding Fund expenses.
Wasatch Funds will deduct a 2.00% redemption proceeds fee on Fund shares held 60 days or less. Performance data does not reflect the deduction of fees or taxes, which if reflected, would reduce the performance quoted. For more complete information including charges, risks and expenses, read the prospectus carefully.
Investments in fixed income funds are subject to the same interest rate, inflation, credit and other risks associated with the underlying bonds. Return of principal is not guaranteed.
TOP 10 HOLDINGS*
| | | | | | | | |
| Holding | | Maturity
Date | | | % of Net
Assets | |
| U.S. Treasury Bond, 3.25% | | | 12/31/16 | | | | 5.6% | |
| U.S. Treasury Note, 3.625% | | | 8/15/19 | | | | 4.7% | |
| Federal National Mortgage Assoc., 2.625% | | | 11/20/14 | | | | 1.7% | |
| U.S. Treasury Bond, 1.625% | | | 1/15/18 | | | | 1.6% | |
| Federal National Mortgage Assoc., 4.875% | | | 12/15/16 | | | | 1.6% | |
| Federal Home Loan Mortgage Corp., MTN, 1.125% | | | 8/24/16 | | | | 1.5% | |
| | | | | | | | |
| Holding | | Maturity
Date | | | % of Net
Assets | |
| Citibank Credit Card Issuance Trust, Series 2007-A8, Class A8, 5.65% | | | 9/20/19 | | | | 1.3% | |
| Federal Home Loan Bank, 5.00% | | | 9/14/12 | | | | 1.2% | |
| Federal Home Loan Mortgage Corp., 2.52% | | | 12/9/14 | | | | 1.2% | |
| Government National Mortgage Assoc., Series 2009-31, Class TA, 4.00% | | | 3/20/39 | | | | 1.1% | |
| * | As of September 30, 2011, there were 169 holdings in the Fund. Repurchase agreements, if any, are not included in the number of holdings. Portfolio holdings are subject to change at any time. References to specific securities should not be construed as recommendations by the Funds or their Advisor. Current and future holdings are subject to risk. |
INVESTMENTS & CASH
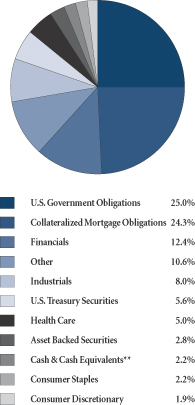
| ** | Also includes Other Assets & Liabilities. |
GROWTHOFA HYPOTHETICAL $10,000 INVESTMENT
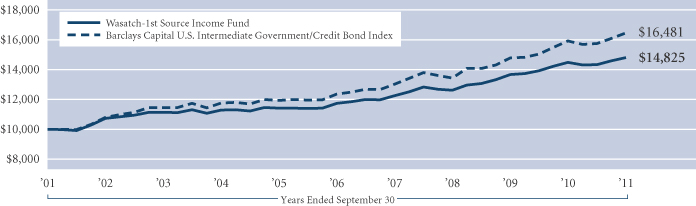
Past performance does not predict future performance and the graph above does not reflect the deduction of taxes you would pay on fund distributions or the redemption of fund shares. Performance shown in the chart above does not include any applicable sales charges and fees. Wasatch does not charge any sales fees. The Barclays Capital U.S. Intermediate Government/Credit Bond Index is an unmanaged index considered representative of the performance of government and corporate bonds with maturities of less than 10 years. You cannot invest directly in this or any index.
37
| | |
| WASATCH-HOISINGTON U.S. TREASURY FUND (WHOSX) — Management Discussion | | SEPTEMBER 30, 2011 |
|
|
|
| | |

Van R. Hoisington Portfolio Manager | | OVERVIEW Although the credit rating of the U.S. Government was downgraded in the summer quarter, Treasury investors responded to signs of persistent economic weakness like a broad measure of unemployment that surged in September to its highest level of 2011. On September 30, 2011, the 30-year Treasury bond yield was 2.91%, the lowest quarterly close since December 2008’s 2.68%. |
DETAILSOFTHE YEAR
During the third quarter of 2011, the yield on the 30-year Treasury bond dropped a very sharp 1.46 percentage points, resulting in substantial capital gains on the long-dated Treasury securities (maturities longer than 20 years) held by the Fund. The Fund surged 36.15% compared to a 3.82% gain for the Barclays Capital U.S. Aggregate Bond Index. Once again, the Fund continued to exhibit strong negative correlation with the S&P 500 Index, which fell 13.87% in the third quarter.
For the fiscal year ended September 30, 2011, the Fund earned 22.06%, far more than the 5.26% return for the Barclays Aggregate Bond Index. A year ago, the 30-year Treasury bond yield stood at 3.69%, or 0.78 percentage points higher that at the end of September. The S&P 500 rose a meager 1.14% for the past 12 months.
OUTLOOK
Negative economic growth will probably be registered in the U.S. during the fourth quarter of 2011, and in subsequent quarters in 2012. This contraction will be influenced by three current cyclical developments: declining productivity, elevated inventory investment, and contracting real wage income.
In the last half of 2010, real gross domestic product (GDP) grew about 2.5%. The consensus forecast for 2011 was for growth to accelerate to 3% to 4% due to the massive easing of Fed policy (QE2), Social Security tax cuts, and other fiscal stimuli. Surprisingly, real GDP growth slowed to less than 1% in the first half of 2011. When growth slows abruptly and it is markedly at variance to expectation, businesses find they have more employees than desired. Normally, firms are reluctant to resort to layoffs, but failure to do so means unit labor costs rise swiftly as output per man-hour (productivity) falls. This was exactly the experience in the first half of 2011. In the very broad, non-farm business sector, productivity did decrease at a 0.7% annual rate. Accordingly, unit labor costs surged at a 4.8% rate over the same time period, exceeding the rise in consumer prices.
Historically, a sustained and meaningful drop in productivity and a parallel rise in unit labor costs have been precursors to increased layoffs as businesses struggle to restore margins and profitability. Once these job losses commence, broad negative ramifications are felt throughout the economy.
Inventory investment, the most volatile component of the economy, has contributed substantially to the recovery since 2009. From the second quarter of 2009 to the second quarter of 2011, real inventory investment accounted for 35% of the rise in real GDP over that period. Now inventory investment accounts for 1.18% of real GDP, which is 0.18% above the average since 1990. As firms move to rebalance inventories, the stage is set for a slowdown in production, requiring further need to pare staffing levels.
Real average hourly earnings have fallen by 2.2% over the 12 months ended August 2011. Real disposable income (a broader measure of income) was lower in August than last December. Initially, consumers responded to this lack of income growth by cutting their saving rate back but now an evident slowdown in spending has occurred. Real spending expanded by only 0.7% in the second quarter, and remains sluggish in the third quarter. This lack of real income growth will contribute to the negative changes in GDP in coming quarters. The QE2 expansion in the Fed’s balance sheet backfired as the boost in stock prices (a positive for some consumers) was more than offset by the negative impact of food and fuel inflation on the average family budget.
During the latter part of the 19th and early 20th centuries the construction of the Trans-Continental railroads created an excessive debt accumulation that resulted in a period of low interest rates when the long treasury yield averaged less than 2.25% for more than a decade. The highly indebted Japanese economy has seen its 30-year bond yield average about 2% or less since 1998.
In view of the United States’ extreme over-indebtedness, we believe that 2% is an attainable level for the long Treasury bond yield. In previous historic cases, yields tended to remain close to their record lows for an extended period of time, coinciding with a long period of deleveraging. Presently, the U.S. is in its fifth year of deleveraging, and patient investors in the long end of the Treasury market have been financially rewarded. We continue to hold positions in 30-year treasury debt, but remain increasingly wary of the potential for further adverse meddling by Federal Reserve authorities.
Thank you for the opportunity to manage your assets.
38
| | |
| WASATCH-HOISINGTON U.S. TREASURY FUND (WHOSX) — Portfolio Summary | | SEPTEMBER 30, 2011 |
|
|
|
AVERAGE ANNUAL TOTAL RETURNS
| | | | | | | | | | | | |
| | | 1 YEAR | | | 5 YEARS | | | 10 YEARS | |
U.S. Treasury | | | 22.06% | | | | 12.27% | | | | 9.68% | |
Barclays Capital U.S. Aggregate Bond Index | | | 5.26% | | | | 6.53% | | | | 5.66% | |
Data shows past performance, which is not indicative of future performance. Current performance may be lower or higher than the performance quoted. To obtain the most recent month-end performance data available, please visit www.wasatchfunds.com. The Advisor may absorb certain Fund expenses, without which total return would have been lower. Investment returns and principal value will fluctuate and shares, when redeemed, may be worth more or less than their original cost.
As of the January 31, 2011 prospectus, the Total Annual Fund Operating Expenses for the Wasatch-Hoisington U.S. Treasury Fund are 0.78%. The Net Expenses are 0.75%. The expense ratio shown elsewhere in this report may be different. Expenses include direct expenses paid to the Advisor, before any expense reimbursements by the Advisor. Net Expenses are based on Fund expenses, net of waivers and reimbursements. See the prospectus for additional information regarding Fund expenses.
Wasatch Funds will deduct a 2.00% redemption proceeds fee on Fund shares held 60 days or less. Performance data does not reflect the deduction of fees or taxes, which if reflected, would reduce the performance quoted. For more complete information including charges, risks and expenses, read the prospectus carefully.
Investments in fixed income funds are subject to the same interest rate, inflation, credit and other risks associated with the underlying bonds. Return of principal is not guaranteed.
TOP 10 HOLDINGS*
| | | | | | | | |
| Holding | | Maturity
Date | | | % of Net
Assets | |
| U.S. Treasury Strip, principal only | | | 5/15/30 | | | | 15.1% | |
| U.S. Treasury Strip, principal only | | | 2/15/31 | | | | 14.1% | |
| U.S. Treasury Strip, principal only | | | 2/15/37 | | | | 10.6% | |
| U.S. Treasury Bond, 4.25% | | | 11/15/40 | | | | 10.4% | |
| U.S. Treasury Bond, 4.75% | | | 2/15/37 | | | | 8.1% | |
| | | | | | | | |
| Holding | | Maturity
Date | | | % of Net
Assets | |
| U.S. Treasury Bond, 4.50% | | | 5/15/38 | | | | 7.0% | |
| U.S. Treasury Strip, principal only | | | 5/15/39 | | | | 6.9% | |
| U.S. Treasury Bond, 3.50% | | | 2/15/39 | | | | 5.8% | |
| U.S. Treasury Strip, principal only | | | 5/15/40 | | | | 5.8% | |
| U.S. Treasury Bond, 4.25% | | | 5/15/39 | | | | 4.3% | |
| * | As of September 30, 2011, there were 15 holdings in the Fund. Repurchase agreements, if any, are not included in the number of holdings. Portfolio holdings are subject to change at any time. References to specific securities should not be construed as recommendations by the Funds or their Advisor. Current and future holdings are subject to risk. |
INVESTMENTS & CASH
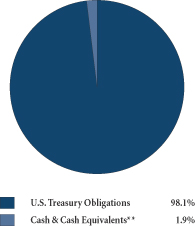
| **Also | includes Other Assets & Liabilities. |
GROWTHOFA HYPOTHETICAL $10,000 INVESTMENT
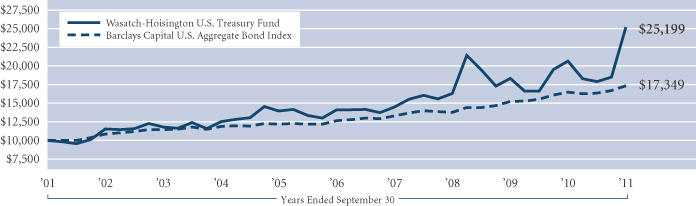
Past performance does not predict future performance and the graph above does not reflect the deduction of taxes you would pay on fund distributions or the redemption of fund shares. Performance shown in the chart above does not include any applicable sales charges and fees. Wasatch does not charge any sales fees. The Barclays Capital U.S. Aggregate Bond Index covers the U.S. investment grade fixed rate bond market, including government and corporate securities, agency mortgage pass-through securities, and asset-backed securities. To be included in the index the security must meet the following criteria: must have at least one year to final maturity, regardless of call features; must have at least $100 million par amount outstanding; must be rated investment grade or better by Moody’s Investors Service, Standard & Poor’s, or Fitch Investor’s Service; must be fixed rate, although it can carry a coupon that steps up or changes to a predetermined schedule; must be dollar-denominated and nonconvertible. All corporate and asset-backed securities must be registered with the SEC and must be publicly issued. You cannot invest directly in this or any index.
39
| | | | |
| WASATCH FUNDS MANAGEMENT DISCUSSIONS — Definitions of Financial Terms | | SEPTEMBER 30, 2011 |
|
|
|
Corporate bonds are debt securities issued by a corporation for the purpose of raising money to expand its business.
Credit Ratings. An obligation rated ‘AAA’ by Standard & Poor’s has the highest rating assigned by S&P. The obligor’s capacity to meet its financial commitment on the obligation is extremely strong. An obligation rated ‘AA’ differs from the highest rated obligations only to a small degree. The obligor’s capacity to meet its financial commitment on the obligation is very strong.
Credit Risk is the risk that the issuer of a debt security will fail to repay principal and interest on the security when due.
Dividend yield is a company’s annual dividend payments divided by its market capitalization, or the dividend per share divided by the price per share.
Earnings growth is a measure of growth in a company’s net income over a specific period, often one year.
Effective duration is a measure of the responsiveness of a bond’s price to market interest rate changes. For example, if the interest rate increased 1%, a bond with an effective duration of five years would experience a decline in price of 5%.
Government agency bonds are debt securities issued by a U.S. government-sponsored agency.
Gross domestic product (GDP) is a basic measure of a country’s economic performance and is the market value of all final goods and services made within the borders of a country in a year.
Inflation Risk is the possibility that inflation will reduce the purchasing power of a currency, and subsequently reduce the value of a security or asset, and may result in rising interest rates. Inflation is the overall upward price movement of goods and services in an economy that causes the value of a currency to decline.
An initial public offering (IPO) is a company’s first sale of stock to the public.
Interest Rate Risk is the risk that a debt security’s value will decline due to changes in market interest rates. The interest rate is the amount charged, expressed as a percentage of principal, by a lender to a borrower for the use of assets.
Mortgage-backed securities are debt issues backed by a pool of mortgages. Investors receive payments from the interest and principal payments made on the underlying mortgages.
Multiple Eyes is a Wasatch term used to describe the firm’s collaborative culture and research process.
The price-to-earnings or P/E ratio, also known as the P/E multiple, is the price of a stock divided by its earnings per share.
Quantitative easing is a government monetary policy used to increase the money supply by buying government securities or other securities from the market. Quantitative easing increases the money supply by flooding financial institutions with capital in an effort to promote increased lending and liquidity. QE2 is the nickname for the second round of quantitative easing announced by Federal Reserve (Fed) chairman Ben Bernanke in November 2010 whereby the Fed would buy billions of dollars in long-term U.S. Treasury securities in an effort to jump start the sluggish economic recovery.
Return on equity (ROE) measures a company’s efficiency at generating profits from shareholders’ equity.
The S&P 500 Index includes 500 of the United States’ largest stocks from a broad variety of industries. The Index is unmanaged but is a commonly used measure of common stock total return performance.
The 30-day current net SEC yield is the net investment income per share for a 30 day period divided by the maximum offering price per share on the calculation date. The figure is compounded and annualized. The 30-day yield unsubsidized is calculated in the absence of temporary expense waivers or reimbursements thus resulting in a lower yield.
Sovereign debt is government debt. Under the doctrine of sovereign immunity, creditors cannot force the repayment of sovereign debt. It is subject to compulsory rescheduling, interest rate reduction, or even repudiation. The only recourse available to creditors is threat of the loss of credibility and lowering of the country’s sovereign debt rating, which may make future borrowing more difficult.
Valuation is the process of determining the current worth of an asset or company.
Yield is generally defined as the return an investor will receive by holding a bond to maturity.
40
| | |
| WASATCH FUNDS — OPERATING EXPENSES (UNAUDITED) | | SEPTEMBER 30, 2011 |
|
|
|
EXPENSE EXAMPLE
As a shareholder of Wasatch Funds, you incur two types of costs: (1) transaction costs, including redemption fees and (2) ongoing costs, including management fees and other fund expenses. This example is intended to help you understand your ongoing costs (in dollars) of investing in a Wasatch Fund and to compare these costs with the ongoing costs of investing in other mutual funds.
The example is based on an investment of $1,000.00 invested at the beginning of the period and held for the entire six month period ended September 30, 2011.
ACTUAL EXPENSES
The first line of the table below provides information about actual account values and actual expenses, based upon the actual total return of the fund during the most recent six month period ended September 30, 2011. You may use the information in this line, together with the amount you invested, to estimate the expenses you paid over the period. Simply divide your account value by $1,000.00 (for example, an $8,600.00 account value divided by $1,000.00 = 8.6), then multiply the result by the number in the first line under the heading entitled “Expenses Paid During Period” to estimate the expenses you paid on your account during this period.
In addition, the Funds charge a $15.00 IRA distribution fee, a $12.50 IRA annual maintenance fee and a $15.00 fee for redemptions paid by wire. To the extent these fees apply to your account, your expenses paid during the period would be higher and your ending account value would be lower than the amounts shown in the table below.
HYPOTHETICAL EXAMPLEFOR COMPARISON PURPOSES
The second line of the table below provides information about hypothetical account values and hypothetical expenses
based on a fund’s actual expense ratio and an assumed rate of return of 5% per year before expenses, which is not the fund’s actual return. The hypothetical account values and expenses may not be used to estimate the actual ending account balance or expenses you paid for the period. You may use this information to compare the ongoing costs of investing in a Wasatch Fund and other funds. To do so, compare this 5% hypothetical example with the 5% hypothetical examples that appear in the shareholder reports of other funds.
In addition, the Funds charge a $15.00 IRA distribution fee, a $12.50 IRA annual maintenance fee and a $15.00 fee for redemptions paid by wire. To the extent these fees apply to your account, your expenses paid during the period would be higher and your ending account value would be lower than the amounts shown in the table below. If another fund’s fees differ from those listed above, your expenses paid and your ending account value could be higher or lower than those of other funds.
Please note that the expenses shown in the table are meant to highlight your ongoing costs only and do not reflect any transactional costs, such as redemption fees. Therefore, the second line of the table is useful in comparing ongoing costs only, and will not help you determine the relative total costs of owning different funds. In addition, if these transactional costs were included, your costs would have been higher.
A Fund’s annualized expense ratio may vary as a result of various factors including expenses that are not reimbursable under the contractual agreement between the Fund and the Advisor such as interest, taxes, brokerage commissions, other investment related costs, dividend expense on short sales, and extraordinary expenses. The Long/Short and Income funds have no contractual limitation on expenses.
41
| | |
| WASATCH FUNDS — OPERATING EXPENSES (UNAUDITED) (continued) | | SEPTEMBER 30, 2011 |
|
|
|
| | | | | | | | | | | | | | | | |
| | | Account Value | | | Expenses
Paid
During Period* | | | Annualized
Expense
Ratio* | |
| Fund/Class and Return | | Beginning of Period
April 1, 2011 | | | End of Period
September 30, 2011 | | | |
Core Growth Fund | | | | | | | | | | | | | | | | |
Actual | | | $1,000.00 | | | | $889.10 | | | | $5.68 | | | | 1.20% | |
Hypothetical (5% before expenses) | | | $1,000.00 | | | | $1,019.05 | | | | $6.07 | | | | 1.20% | |
Emerging India Fund | | | | | | | | | | | | | | | | |
Actual | | | $1,000.00 | | | | $915.00 | | | | $8.08 | | | | 1.95% | |
Hypothetical (5% before expenses) | | | $1,000.00 | | | | $1,013.29 | | | | $8.55 | | | | 1.95% | |
Emerging Markets Small Cap Fund | | | | | | | | | | | | | | | | |
Actual | | | $1,000.00 | | | | $871.00 | | | | $9.15 | | | | 1.95% | |
Hypothetical (5% before expenses) | | | $1,000.00 | | | | $1,015.29 | | | | $9.85 | | | | 1.95% | |
Global Opportunities Fund | | | | | | | | | | | | | | | | |
Actual | | | $1,000.00 | | | | $810.60 | | | | $8.31 | | | | 1.83% | |
Hypothetical (5% before expenses) | | | $1,000.00 | | | | $1,015.89 | | | | $9.25 | | | | 1.83% | |
Heritage Growth Fund | | | | | | | | | | | | | | | | |
Actual | | | $1,000.00 | | | | $860.90 | | | | $4.43 | | | | 0.95% | |
Hypothetical (5% before expenses) | | | $1,000.00 | | | | $1,020.31 | | | | $4.81 | | | | 0.95% | |
International Growth Fund | | | | | | | | | | | | | | | | |
Actual | | | $1,000.00 | | | | $838.30 | | | | $7.37 | | | | 1.60% | |
Hypothetical (5% before expenses) | | | $1,000.00 | | | | $1,017.05 | | | | $8.09 | | | | 1.60% | |
International Opportunities Fund | | | | | | | | | | | | | | | | |
Actual | | | $1,000.00 | | | | $829.60 | | | | $10.32 | | | | 2.25% | |
Hypothetical (5% before expenses) | | | $1,000.00 | | | | $1,013.79 | | | | $11.36 | | | | 2.25% | |
Large Cap Value Fund | | | | | | | | | | | | | | | | |
Actual | | | $1,000.00 | | | | $810.30 | | | | $4.99 | | | | 1.10% | |
Hypothetical (5% before expenses) | | | $1,000.00 | | | | $1,019.55 | | | | $5.57 | | | | 1.10% | |
Long/Short Fund | | | | | | | | | | | | | | | | |
Actual | | | $1,000.00 | | | | $874.10 | | | | $7.56 | | | | 1.61% | |
Hypothetical (5% before expenses) | | | $1,000.00 | | | | $1,017.00 | | | | $8.14 | | | | 1.61% | |
Micro Cap Fund | | | | | | | | | | | | | | | | |
Actual | | | $1,000.00 | | | | $776.00 | | | | $9.53 | | | | 2.14% | |
Hypothetical (5% before expenses) | | | $1,000.00 | | | | $1,014.34 | | | | $10.81 | | | | 2.14% | |
Micro Cap Value Fund | | | | | | | | | | | | | | | | |
Actual | | | $1,000.00 | | | | $797.20 | | | | $10.14 | | | | 2.25% | |
Hypothetical (5% before expenses) | | | $1,000.00 | | | | $1,013.79 | | | | $11.36 | | | | 2.25% | |
Small Cap Growth Fund | | | | | | | | | | | | | | | | |
Actual | | | $1,000.00 | | | | $840.50 | | | | $5.72 | | | | 1.24% | |
Hypothetical (5% before expenses) | | | $1,000.00 | | | | $1,018.85 | | | | $6.28 | | | | 1.24% | |
Small Cap Value Fund | | | | | | | | | | | | | | | | |
Actual | | | $1,000.00 | | | | $798.00 | | | | $7.84 | | | | 1.74% | |
Hypothetical (5% before expenses) | | | $1,000.00 | | | | $1,016.34 | | | | $8.80 | | | | 1.74% | |
Strategic Income Fund | | | | | | | | | | | | | | | | |
Actual | | | $1,000.00 | | | | $877.40 | | | | $4.47 | | | | 0.95% | |
Hypothetical (5% before expenses) | | | $1,000.00 | | | | $1,020.31 | | | | $4.81 | | | | 0.95% | |
Ultra Growth Fund | | | | | | | | | | | | | | | | |
Actual | | | $1,000.00 | | | | $832.00 | | | | $6.02 | | | | 1.31% | |
Hypothetical (5% before expenses) | | | $1,000.00 | | | | $1,018.50 | | | | $6.63 | | | | 1.31% | |
World Innovators Fund | | | | | | | | | | | | | | | | |
Actual | | | $1,000.00 | | | | $919.40 | | | | $9.38 | | | | 1.95% | |
Hypothetical (5% before expenses) | | | $1,000.00 | | | | $1,015.29 | | | | $9.85 | | | | 1.95% | |
Income Fund | | | | | | | | | | | | | | | | |
Actual | | | $1,000.00 | | | | $1,033.40 | | | | $3.47 | | | | 0.68% | |
Hypothetical (5% before expenses) | | | $1,000.00 | | | | $1,021.66 | | | | $3.45 | | | | 0.68% | |
U.S. Treasury Fund | | | | | | | | | | | | | | | | |
Actual | | | $1,000.00 | | | | $1,409.50 | | | | $4.53 | | | | 0.75% | |
Hypothetical (5% before expenses) | | | $1,000.00 | | | | $1,021.31 | | | | $3.80 | | | | 0.75% | |
*Expenses are equal to a fund’s annualized expense ratio as indicated above multiplied by the average account value over the period, multiplied by the number of days in the most recent fiscal half-year divided by the number of days in the full fiscal year (183/365), except for Emerging India Fund’s actual return information, which has 158 days in the most recent fiscal period due to its inception date of April 26, 2011.
42
| | |
| WASATCH CORE GROWTH FUND (WGROX) — Schedule of Investments | | SEPTEMBER 30, 2011 |
|
|
|
| | | | | | | | |
| Shares | | | | | Value | |
| | | | | | | |
| | |
| | | | COMMON STOCKS 97.0% | | | | |
| | |
| | | | Airlines 2.3% | | | | |
| | 214,419 | | | Allegiant Travel Co.* | | $ | 10,105,567 | |
| | | | | | | | |
| | | | Apparel Retail 0.7% | | | | |
| | 162,193 | | | Body Central Corp.* | | | 2,945,425 | |
| | | | | | | | |
| | | | Application Software 4.5% | | | | |
| | 169,044 | | | ANSYS, Inc.* | | | 8,289,918 | |
| | 220,550 | | | Tyler Technologies, Inc.* | | | 5,575,504 | |
| | 120,600 | | | Ultimate Software Group, Inc.* | | | 5,634,432 | |
| | | | | | | | |
| | | | | | | 19,499,854 | |
| | | | | | | | |
| | | | Asset Management & Custody
Banks 1.9% | | | | |
| | 104,999 | | | Affiliated Managers Group, Inc.* | | | 8,195,172 | |
| | | | | | | | |
| | | | Automotive Retail 3.8% | | | | |
| | 353,263 | | | Monro Muffler Brake, Inc. | | | 11,647,081 | |
| | 69,269 | | | O’Reilly Automotive, Inc.* | | | 4,615,394 | |
| | | | | | | | |
| | | | | | | 16,262,475 | |
| | | | | | | | |
| | | | Commercial Printing 1.5% | | | | |
| | 806,363 | | | InnerWorkings, Inc.* | | | 6,321,886 | |
| | | | | | | | |
| | | | Consumer Finance 6.7% | | | | |
| | 750,553 | | | DFC Global Corp.* | | | 16,399,583 | |
| | 253,870 | | | First Cash Financial Services, Inc.* ‡ | | | 10,649,846 | |
| | 135,000 | | | Mahindra & Mahindra Financial Services Ltd. (India) | | | 1,799,381 | |
| | | | | | | | |
| | | | | | | 28,848,810 | |
| | | | | | | | |
| | | | Data Processing & Outsourced Services 3.2% | | | | |
| | 147,669 | | | Alliance Data Systems Corp.* | | | 13,688,916 | |
| | | | | | | | |
| | | | Distributors 4.5% | | | | |
| | 451,525 | | | LKQ Corp.* | | | 10,908,844 | |
| | 321,199 | | | Pool Corp. | | | 8,408,990 | |
| | | | | | | | |
| | | | | | | 19,317,834 | |
| | | | | | | | |
| | | | Diversified Banks 1.8% | | | | |
| | 1,413,720 | | | Yes Bank Ltd. (India) | | | 7,761,477 | |
| | | | | | | | |
| | | | Diversified Support Services 7.2% | | | | |
| | 604,567 | | | Copart, Inc.* | | | 23,650,661 | |
| | 320,469 | | | Higher One Holdings, Inc.* | | | 5,214,031 | |
| | 158,871 | | | LPS Brasil—Consultoria de Imoveis S.A. (Brazil) | | | 2,553,964 | |
| | | | | | | | |
| | | | | | | 31,418,656 | |
| | | | | | | | |
| | | | Electrical Components &
Equipment 3.2% | | | | |
| | 242,040 | | | Polypore International, Inc.* | | | 13,680,101 | |
| | | | | | | | |
| | | | Environmental & Facilities
Services 4.0% | | | | |
| | 185,395 | | | Tetra Tech, Inc.* | | | 3,474,302 | |
| | 412,395 | | | Waste Connections, Inc. | | | 13,947,199 | |
| | | | | | | | |
| | | | | | | 17,421,501 | |
| | | | | | | | |
| | | | Health Care Distributors 2.1% | | | | |
| | 467,667 | | | PSS World Medical, Inc.* | | | 9,208,363 | |
| | | | | | | | |
| | | | Health Care Facilities 2.6% | | | | |
| | 408,754 | | | Emeritus Corp.* | | | 5,763,432 | |
| | 236,367 | | | Ensign Group, Inc. (The) | | | 5,462,441 | |
| | | | | | | | |
| | | | | | | 11,225,873 | |
| | | | | | | | |
| | | | | | | | |
| Shares | | | | | Value | |
| | | | | | | |
| | | | Health Care Services 5.0% | | | | |
| | 113,417 | | | Catalyst Health Solutions, Inc.* | | $ | 6,543,027 | |
| | 57,580 | | | IPC The Hospitalist Co., Inc.* | | | 2,055,030 | |
| | 211,509 | | | MEDNAX, Inc.* | | | 13,248,924 | |
| | | | | | | | |
| | | | | | | 21,846,981 | |
| | | | | | | | |
| | |
| | | | Home Improvement Retail 0.5% | | | | |
| | 154,025 | | | Lumber Liquidators Holdings, Inc.* | | | 2,325,778 | |
| | | | | | | | |
| | |
| | | | Homefurnishing Retail 2.0% | | | | |
| | 343,477 | | | Aaron’s, Inc. | | | 8,672,794 | |
| | | | | | | | |
| | |
| | | | Industrial Machinery 4.2% | | | | |
| | 130,720 | | | Graco, Inc. | | | 4,462,781 | |
| | 444,145 | | | IDEX Corp. | | | 13,839,558 | |
| | | | | | | | |
| | | | | | | 18,302,339 | |
| | | | | | | | |
| | |
| | | | Internet Retail 0.5% | | | | |
| | 67,590 | | | Blue Nile, Inc.* | | | 2,384,575 | |
| | | | | | | | |
| | |
| | | | Internet Software & Services 2.0% | | | | |
| | 247,566 | | | DealerTrack Holdings, Inc.* | | | 3,879,359 | |
| | 178,350 | | | Vistaprint N.V.* | | | 4,820,801 | |
| | | | | | | | |
| | | | | | | 8,700,160 | |
| | | | | | | | |
| | |
| | | | IT Consulting & Other Services 1.2% | | | | |
| | 84,025 | | | Cognizant Technology Solutions Corp., Class A* | | | 5,268,368 | |
| | | | | | | | |
| | |
| | | | Leisure Facilities 3.4% | | | | |
| | 400,023 | | | Life Time Fitness, Inc.* | | | 14,740,848 | |
| | | | | | | | |
| | |
| | | | Life Sciences Tools & Services 2.1% | | | | |
| | 278,130 | | | ICON plc ADR* (Ireland) | | | 4,472,330 | |
| | 68,040 | | | Techne Corp. | | | 4,627,401 | |
| | | | | | | | |
| | | | | | | 9,099,731 | |
| | | | | | | | |
| | |
| | | | Oil & Gas Equipment & Services 1.5% | | | | |
| | 117,555 | | | Dril-Quip, Inc.* | | | 6,337,390 | |
| | | | | | | | |
| | |
| | | | Oil & Gas Exploration &
Production 0.4% | | | | |
| | 320,020 | | | SandRidge Energy, Inc.* | | | 1,779,311 | |
| | | | | | | | |
| | |
| | | | Personal Products 3.0% | | | | |
| | 243,942 | | | Herbalife Ltd. | | | 13,075,291 | |
| | | | | | | | |
| | |
| | | | Real Estate Services 0.8% | | | | |
| | 694,982 | | | China Real Estate Information Corp., ADR* (China) | | | 3,419,311 | |
| | | | | | | | |
| | |
| | | | Regional Banks 1.7% | | | | |
| | 7,941,426 | | | City Union Bank Ltd. (India) | | | 7,177,491 | |
| | | | | | | | |
| | |
| | | | Research & Consulting Services 2.8% | | | | |
| | 98,125 | | | Corporate Executive Board Co. (The) | | | 2,924,125 | |
| | 262,493 | | | CRA International, Inc.* | | | 5,252,485 | |
| | 405,052 | | | Resources Connection, Inc. | | | 3,961,408 | |
| | | | | | | | |
| | | | | | | 12,138,018 | |
| | | | | | | | |
| | |
| | | | Semiconductors 5.4% | | | | |
| | 133,940 | | | Hittite Microwave Corp.* | | | 6,522,878 | |
| | 387,065 | | | Melexis N.V. (Belgium) | | | 4,717,528 | |
| | 378,644 | | | Micrel, Inc. | | | 3,585,759 | |
| | 108,525 | | | Power Integrations, Inc. | | | 3,321,950 | |
| | 151,643 | | | Silicon Laboratories, Inc.* | | | 5,081,557 | |
| | | | | | | | |
| | | | | | | 23,229,672 | |
| | | | | | | | |
43
| | | | |
| WASATCH CORE GROWTH FUND (WGROX) — Schedule of Investments (continued) | | SEPTEMBER 30, 2011 |
|
|
|
| | | | | | | | |
Shares | | | | | Value | |
| | | | | | | |
| | |
| | | | Specialized Finance 5.4% | | | | |
| | 402,640 | | | Crisil Ltd. (India) | | $ | 6,920,722 | |
| | 344,680 | | | MSCI, Inc., Class A* | | | 10,454,144 | |
| | 97,185 | | | Portfolio Recovery Associates, Inc.* | | | 6,046,851 | |
| | | | | | | | |
| | | | | | | 23,421,717 | |
| | | | | | | | |
| | |
| | | | Specialty Stores 1.4% | | | | |
| | 180,640 | | | Hibbett Sports, Inc.* | | | 6,121,890 | |
| | | | | | | | |
| | | | Trading Companies &
Distributors 2.4% | | | | |
| | 151,922 | | | MSC Industrial Direct Co., Inc., Class A | | | 8,577,516 | |
| | 143,605 | | | Rush Enterprises, Inc., Class B* | | | 1,675,870 | |
| | | | | | | | |
| | | | | | | 10,253,386 | |
| | | | | | | | |
| | | | Trucking 1.3% | | | | |
| | 201,657 | | | Old Dominion Freight Line, Inc.* | | | 5,842,003 | |
| | | | | | | | |
| | |
| | | | Total Common Stocks
(cost $330,950,822) | | | 420,038,964 | |
| | | | | | | | |
| | |
| | | | PREFERRED STOCKS 0.8% | | | | |
| | | | Regional Banks 0.8% | | | | |
| | 797,675 | | | Banco Daycoval S.A. Pfd. (Brazil) | | | 3,615,162 | |
| | | | | | | | |
| | |
| | | | Total Preferred Stocks
(cost $5,303,460) | | | 3,615,162 | |
| | | | | | | | |
| | |
Principal
Amount | | | | | Value | |
| | |
| | | | SHORT-TERM INVESTMENTS 4.5% | | | | |
| | |
| | | | Repurchase Agreement 4.5% | | | | |
| | $19,396,554 | | | Repurchase Agreement dated 9/30/11, 0.01% due 10/3/11 with State Street Bank and Trust Co. collateralized by $19,910,000 of United States Treasury Notes 1.375% due 9/30/18; value: $19,785,563; repurchase proceeds: $19,396,570‡ (cost $19,396,554) | | $ | 19,396,554 | |
| | | | | | | | |
| | |
| | | | Total Short-Term Investments
(cost $19,396,554) | | | 19,396,554 | |
| | | | | | | | |
| | |
| | | | Total Investments
(cost $355,650,836) 102.3%§ | | | 443,050,680 | |
| | |
| | | | Liabilities less Other Assets (2.3%) | | | (9,756,993 | ) |
| | | | | | | | |
| | |
| | | | NET ASSETS 100.0% | | $ | 433,293,687 | |
| | | | | | | | |
| | | | | | | | |
Number of
Contracts | | | | | Value | |
| | | | | | | |
| | |
| | | | CALL OPTIONS WRITTEN 0.0% | | | | |
| | |
| | | | Consumer Finance 0.0% | | | | |
| | 500 | | | First Cash Financial Services, Inc., expiring 12/17/11, exercise price $45 | | $ | 122,500 | |
| | | | | | | | |
| | |
| | | | Total Call Options Written
(premium $178,735) | | | 122,500 | |
| | | | | | | | |
| |
| | | | *Non-income producing. ‡All or a portion of this security has been designated as collateral for call options written (see Notes 4 and 7, respectively). §The aggregate amount of foreign securities fair valued pursuant to a systematic valuation model as a percent of net assets was 4.95%. ADR American Depositary Receipt. See Notes to Financial Statements. | |
At September 30, 2011, Wasatch Core Growth Fund’s investments, excluding short-term investments and options written, were in the following countries:
| | | | |
| Country | | % | |
Belgium | | | 1.1 | |
Brazil | | | 1.5 | |
China | | | 0.8 | |
India | | | 5.6 | |
Ireland | | | 1.0 | |
United States | | | 90.0 | |
| | | | |
TOTAL | | | 100.0 | % |
| | | | |
44
| | |
| WASATCH EMERGING INDIA FUND (WAINX) — Schedule of Investments | | SEPTEMBER 30, 2011 |
|
|
|
| | | | | | | | |
| Shares | | | | | Value | |
| | | | | | | |
| | | | COMMON STOCKS 98.7% | | | | |
| | |
| | | | Aerospace & Defense 0.9% | | | | |
| | 3,075 | | | Bharat Electronics Ltd. (India) | | $ | 95,925 | |
| | | | | | | | |
| | | | Air Freight & Logistics 1.1% | | | | |
| | 3,700 | | | Blue Dart Express Ltd. (India) | | | 120,472 | |
| | | | | | | | |
| | | | Apparel, Accessories & Luxury
Goods 5.7% | | | | |
| | 4,080 | | | Page Industries Ltd. (India) | | | 210,182 | |
| | 33,120 | | | Titan Industries Ltd. (India) | | | 140,042 | |
| | 13,730 | | | VIP Industries Ltd. (India) | | | 255,223 | |
| | | | | | | | |
| | | | | | | 605,447 | |
| | | | | | | | |
| | | | Application Software 1.0% | | | | |
| | 2,775 | | | Oracle Financial Services Software Ltd.* (India) | | | 107,422 | |
| | | | | | | | |
| | | | Auto Parts & Equipment 5.0% | | | | |
| | 1,585 | | | Bosch Ltd. (India) | | | 227,448 | |
| | 39,395 | | | Exide Industries Ltd. (India) | | | 102,792 | |
| | 7,685 | | | WABCO-TVS India Ltd. (India) | | | 200,348 | |
| | | | | | | | |
| | | | | | | 530,588 | |
| | | | | | | | |
| | | | Automobile Manufacturers 1.2% | | | | |
| | 7,865 | | | Mahindra & Mahindra Ltd. (India) | | | 128,354 | |
| | | | | | | | |
| | | | Building Products 0.7% | | | | |
| | 28,690 | | | Sintex Industries Ltd. (India) | | | 74,184 | |
| | | | | | | | |
| | | | Cable & Satellite 1.4% | | | | |
| | 91,900 | | | Dish TV India Ltd.* (India) | | | 144,789 | |
| | | | | | | | |
| | | | Commodity Chemicals 3.2% | | | | |
| | 67,915 | | | Berger Paints India Ltd. (India) | | | 137,069 | |
| | 10,335 | | | Castrol India Ltd. (India) | | | 100,629 | |
| | 5,905 | | | Kansai Nerolac Paints Ltd. (India) | | | 100,941 | |
| | | | | | | | |
| | | | | | | 338,639 | |
| | | | | | | | |
| | | | Construction & Farm Machinery & Heavy Trucks 1.5% | | | | |
| | 4,955 | | | Eicher Motors Ltd. (India) | | | 161,796 | |
| | | | | | | | |
| | | | Consumer Finance 3.7% | | | | |
| | 22,010 | | | Mahindra & Mahindra Financial Services Ltd. (India) | | | 293,366 | |
| | 8,245 | | | Shriram Transport Finance Co., Ltd. (India) | | | 102,019 | |
| | | | | | | | |
| | | | | | | 395,385 | |
| | | | | | | | |
| | | | Diversified Banks 4.8% | | | | |
| | 6,015 | | | Bank of Baroda (India) | | | 92,948 | |
| | 311,080 | | | South Indian Bank Ltd. (India) | | | 141,002 | |
| | 50,245 | | | Yes Bank Ltd. (India) | | | 275,850 | |
| | | | | | | | |
| | | | | | | 509,800 | |
| | | | | | | | |
| | | | Diversified Chemicals 2.9% | | | | |
| | 8,405 | | | BASF India Ltd. (India) | | | 103,076 | |
| | 61,420 | | | Pidilite Industries Ltd. (India) | | | 203,235 | |
| | | | | | | | |
| | | | | | | 306,311 | |
| | | | | | | | |
| | | | Diversified Metals & Mining 0.9% | | | | |
| | 39,040 | | | Hindustan Zinc Ltd. (India) | | | 94,009 | |
| | | | | | | | |
| | | | Electrical Components &
Equipment 1.2% | | | | |
| | 30,630 | | | Amara Raja Batteries Ltd. (India) | | | 131,069 | |
| | | | | | | | |
| | | | Fertilizers & Agricultural
Chemicals 1.6% | | | | |
| | 47,390 | | | Rallis India Ltd. (India) | | | 166,664 | |
| | | | | | | | |
| | | | Footwear 2.0% | | | | |
| | 16,000 | | | Bata India Ltd. (India) | | | 211,525 | |
| | | | | | | | |
| | | | | | | | |
| Shares | | | | | Value | |
| | | | | | | |
| | | | Gas Utilities 4.8% | | | | |
| | 25,373 | | | Gujarat Gas Co., Ltd. (India) | | $ | 222,262 | |
| | 32,905 | | | Indraprastha Gas Ltd. (India) | | | 285,311 | |
| | | | | | | | |
| | | | | | | 507,573 | |
| | | | | | | | |
| | | | Industrial Machinery 4.9% | | | | |
| | 13,860 | | | AIA Engineering Ltd. (India) | | | 86,902 | |
| | 12,047 | | | Cummins India Ltd. (India) | | | 101,796 | |
| | 6,100 | | | FAG Bearings India Ltd. (India) | | | 145,578 | |
| | 8,065 | | | SKF India Ltd. (India) | | | 110,238 | |
| | 8,560 | | | Thermax Ltd. (India) | | | 76,622 | |
| | | | | | | | |
| | | | | | | 521,136 | |
| | | | | | | | |
| | | | Internet Retail 2.0% | | | | |
| | 9,740 | | | MakeMyTrip Ltd.* (India) | | | 215,059 | |
| | | | | | | | |
| | | | Internet Software & Services 1.0% | | | | |
| | 7,175 | | | Info Edge India Ltd. (India) | | | 101,764 | |
| | | | | | | | |
| | | | IT Consulting & Other Services 4.8% | | | | |
| | 6,005 | | | CMC Ltd. (India) | | | 101,283 | |
| | 6,495 | | | Cognizant Technology Solutions Corp., Class A* | | | 407,236 | |
| | | | | | | | |
| | | | | | | 508,519 | |
| | | | | | | | |
| | | | Life Sciences Tools & Services 1.4% | | | | |
| | 9,715 | | | Divi’s Laboratories Ltd. (India) | | | 144,334 | |
| | | | | | | | |
| | | | Oil & Gas Exploration &
Production 0.4% | | | | |
| | 7,655 | | | Selan Exploration Technology Ltd. (India) | | | 45,983 | |
| | | | | | | | |
| | | | Packaged Foods & Meats 4.2% | | | | |
| | 4,130 | | | GlaxoSmithKline Consumer Healthcare Ltd. (India) | | | 199,859 | |
| | 1,645 | | | Nestle India Ltd. (India) | | | 142,150 | |
| | 8,815 | | | Zydus Wellness Ltd. (India) | | | 96,037 | |
| | | | | | | | |
| | | | | | | 438,046 | |
| | | | | | | | |
| | | | Personal Products 5.6% | | | | |
| | 7,595 | | | Colgate-Palmolive India Ltd. (India) | | | 150,620 | |
| | 65,920 | | | Dabur India Ltd. (India) | | | 138,219 | |
| | 15,360 | | | Godrej Consumer Products Ltd. (India) | | | 124,759 | |
| | 37,575 | | | Marico Ltd. (India) | | | 110,498 | |
| | 1,855 | | | Procter & Gamble Hygiene and Health Care Ltd. (India) | | | 72,270 | |
| | | | | | | | |
| | | | | | | 596,366 | |
| | | | | | | | |
| | | | Pharmaceuticals 2.9% | | | | |
| | 6,360 | | | Cadila Healthcare Ltd. (India) | | | 98,549 | |
| | 14,935 | | | IPCA Laboratories Ltd. (India) | | | 77,187 | |
| | 13,120 | | | Lupin Ltd. (India) | | | 126,379 | |
| | | | | | | | |
| | | | | | | 302,115 | |
| | | | | | | | |
| | | | Publishing 1.1% | | | | |
| | 27,765 | | | D.B. Corp. Ltd. (India) | | | 114,240 | |
| | | | | | | | |
| | | | Regional Banks 2.7% | | | | |
| | 310,415 | | | City Union Bank Ltd. (India) | | | 280,554 | |
| | | | | | | | |
| | | | Research & Consulting Services 1.8% | | | | |
| | 12,515 | | | eClerx Services Ltd. (India) | | | 184,346 | |
| | | | | | | | |
| | | | Restaurants 1.3% | | | | |
| | 8,690 | | | Jubilant Foodworks Ltd.* (India) | | | 140,865 | |
| | | | | | | | |
| | | | Specialized Finance 4.8% | | | | |
| | 14,000 | | | Crisil Ltd. (India) | | | 240,637 | |
| | 148,335 | | | IFCI Ltd. (India) | | | 91,930 | |
| | 27,765 | | | Power Finance Corp. Ltd. (India) | | | 84,632 | |
| | 26,895 | | | Rural Electrification Corp., Ltd. (India) | | | 93,637 | |
| | | | | | | | |
| | | | | | | 510,836 | |
| | | | | | | | |
45
| | |
| WASATCH EMERGING INDIA FUND (WAINX) — Schedule of Investments (continued) | | SEPTEMBER 30, 2011 |
|
|
|
| | | | | | | | |
Shares | | | | | Value | |
| | | | | | | |
| | | | Specialty Chemicals 2.0% | | | | |
| | 3,215 | | | Asian Paints Ltd. (India) | | $ | 207,024 | |
| | | | | | | | |
| | | | Steel 0.5% | | | | |
| | 9,680 | | | MOIL Ltd. (India) | | | 55,178 | |
| | | | | | | | |
| | | | Systems Software 1.0% | | | | |
| | 35,460 | | | KPIT Cummins Infosystems Ltd. (India) | | | 108,624 | |
| | | | | | | | |
| | | | Thrifts & Mortgage Finance 11.1% | | | | |
| | 47,360 | | | Dewan Housing Finance Corp. Ltd. (India) | | | 226,086 | |
| | 32,985 | | | Gruh Finance Ltd. (India) | | | 330,019 | |
| | 25,710 | | | Housing Development Finance Corp. Ltd. (India) | | | 335,279 | |
| | 67,220 | | | LIC Housing Finance Ltd. (India) | | | 287,124 | |
| | | | | | | | |
| | | | | | | 1,178,508 | |
| | | | | | | | |
| | | | Tobacco 1.6% | | | | |
| | 6,205 | | | VST Industries Ltd. (India) | | | 166,344 | |
| | | | | | | | |
| | |
| | | | Total Common Stocks
(cost $11,453,759) | | | 10,449,793 | |
| | | | | | | | |
| | | | | | | | |
Principal
Amount | | | | | Value | |
| | | | | | | |
| | | | SHORT-TERM INVESTMENTS 2.4% | | | | |
| | |
| | | | Repurchase Agreement 2.4% | | | | |
| | $252,073 | | | Repurchase Agreement dated 9/30/11, 0.01% due 10/3/11 with State Street Bank and Trust Co. collateralized by $230,000 of United States Treasury Notes 3.125% due 5/15/19; value: $258,463; repurchase proceeds: $252,073 (cost $252,073) | | $ | 252,073 | |
| | | | | | | | |
| | |
| | | | Total Short-Term Investments
(cost $252,073) | | | 252,073 | |
| | | | | | | | |
| | |
| | | | Total Investments
(cost $11,705,832) 101.1%§ | | | 10,701,866 | |
| | |
| | | | Liabilities less Other Assets (1.1%) | | | (121,565 | ) |
| | | | | | | | |
| | |
| | | | NET ASSETS 100.0% | | $ | 10,580,301 | |
| | | | | | | | |
| |
| | | | *Non-income producing. §The aggregate amount of foreign securities fair valued pursuant to a systematic valuation model as a percent of net assets was 85.60%. See Notes to Financial Statements. | |
At September 30, 2011, Wasatch Emerging India Fund’s investments, excluding short-term investments, were in the following countries:
| | | | |
| Country | | % | |
India | | | 96.1 | |
United States | | | 3.9 | |
| | | | |
TOTAL | | | 100.0 | % |
| | | | |
46
| | |
| WASATCH EMERGING MARKETS SMALL CAP FUND (WAEMX) — Schedule of Investments | | SEPTEMBER 30, 2011 |
|
|
|
| | | | | | | | |
| Shares | | | | | Value | |
| | | | | | | |
| | |
| | | | COMMON STOCKS 94.9% | | | | |
| | |
| | | | Air Freight & Logistics 0.3% | | | | |
| | 67,280 | | | Blue Dart Express Ltd. (India) | | $ | 2,190,631 | |
| | | | | | | | |
| | | | Airport Services 1.0% | | | | |
| | 1,914,713 | | | TAV Havalimanlari Holding AS* (Turkey) | | | 7,567,129 | |
| | | | | | | | |
| | | | Apparel Retail 4.7% | | | | |
| | 527,665 | | | Cia. Hering (Brazil) | | | 8,837,087 | |
| | 15,991,000 | | | Giordano International Ltd. (China) | | | 10,441,526 | |
| | 1,678,335 | | | Mr Price Group Ltd. (South Africa) | | | 13,956,746 | |
| | 13,150,000 | | | Padini Holdings Berhad (Malaysia) | | | 3,538,003 | |
| | | | | | | | |
| | | | | | | 36,773,362 | |
| | | | | | | | |
| | | | Apparel, Accessories & Luxury
Goods 2.5% | | | | |
| | 12,320 | | | LPP S.A. (Poland) | | | 7,287,238 | |
| | 1,185,707 | | | Ports Design Ltd. (China) | | | 1,835,521 | |
| | 939,500 | | | Restoque Comercio e Confeccoes de Roupas S.A.* (Brazil) | | | 10,444,455 | |
| | | | | | | | |
| | | | | | | 19,567,214 | |
| | | | | | | | |
| | | | Asset Management & Custody
Banks 1.2% | | | | |
| | 711,421 | | | CETIP S.A. (Brazil) | | | 8,914,099 | |
| | | | | | | | |
| | | | Auto Parts & Equipment 1.9% | | | | |
| | 2,243,410 | | | Exide Industries Ltd. (India) | | | 5,853,657 | |
| | 506,541 | | | Thai Stanley Electric Public Co. Ltd. NVDR (Thailand) | | | 2,642,871 | |
| | 193,459 | | | Thai Stanley Electric Public Co. Ltd.*** (Thailand) | | | 1,009,369 | |
| | 192,628 | | | WABCO-TVS India Ltd. (India) | | | 5,021,822 | |
| | | | | | | | |
| | | | | | | 14,527,719 | |
| | | | | | | | |
| | | | Brewers 0.7% | | | | |
| | 1,681,020 | | | Guinness Anchor Berhad (Malaysia) | | | 5,209,254 | |
| | | | | | | | |
| | | | Building Products 1.9% | | | | |
| | 4,967,983 | | | Dynasty Ceramic Public Co. Ltd.*** (Thailand) | | | 8,150,784 | |
| | 22,992,370 | | | Home Product Center Public Co. Ltd.*** (Thailand) | | | 6,915,833 | |
| | | | | | | | |
| | | | | | | 15,066,617 | |
| | | | | | | | |
| | | | Catalog Retail 0.6% | | | | |
| | 43,300 | | | Hyundai Home Shopping Network Corp. (Korea) | | | 5,023,557 | |
| | | | | | | | |
| | | | Coal & Consumable Fuels 2.0% | | | | |
| | 10,678,020 | | | PT Harum Energy Tbk (Indonesia) | | | 8,513,699 | |
| | 12,686,205 | | | PT Resource Alam Indonesia Tbk (Indonesia) | | | 6,710,109 | |
| | | | | | | | |
| | | | | | | 15,223,808 | |
| | | | | | | | |
| | | | Commodity Chemicals 2.2% | | | | |
| | 3,183,429 | | | Berger Paints India Ltd. (India) | | | 6,424,905 | |
| | 765,576 | | | Castrol India Ltd. (India) | | | 7,454,217 | |
| | 173,061 | | | Kansai Nerolac Paints Ltd. (India) | | | 2,958,333 | |
| | | | | | | | |
| | | | | | | 16,837,455 | |
| | | | | | | | |
| | | | Computer & Electronics Retail 0.6% | | | | |
| | 733,226 | | | M Video OJSC*** (Russia) | | | 4,859,382 | |
| | | | | | | | |
| | | | Computer Storage & Peripherals 0.9% | | | | |
| | 1,125,028 | | | Simplo Technology Co. Ltd. (Taiwan) | | | 6,909,867 | |
| | | | | | | | |
| | | | Construction & Farm Machinery & Heavy Trucks 1.7% | | | | |
| | 687,535 | | | Turk Traktor ve Ziraat Makineleri AS (Turkey) | | | 13,132,599 | |
| | | | | | | | |
| | | | | | | | |
| Shares | | | | | Value | |
| | | | | | | |
| | |
| | | | Construction Materials 2.5% | | | | |
| | 967,849 | | | Adana Cimento Sanayii Turk Anonim Sirketi, Class A (Turkey) | | $ | 2,115,214 | |
| | 10,576 | | | Holcim Maroc S.A. (Morocco) | | | 2,444,495 | |
| | 24,944,405 | | | Holcim Philippines, Inc. (Philippines) | | | 4,827,616 | |
| | 50,453,192 | | | PT Holcim Indonesia Tbk (Indonesia) | | | 10,114,521 | |
| | | | | | | | |
| | | | | | | 19,501,846 | |
| | | | | | | | |
| | | | Consumer Finance 2.0% | | | | |
| | 3,180,820 | | | Banco Compartamos S.A.B. de C.V. (Mexico) | | | 4,305,076 | |
| | 846,166 | | | Mahindra & Mahindra Financial Services Ltd. (India) | | | 11,278,331 | |
| | | | | | | | |
| | | | | | | 15,583,407 | |
| | | | | | | | |
| | | | Department Stores 0.9% | | | | |
| | 314,300 | | | Marisa Lojas S.A. (Brazil) | | | 3,634,853 | |
| | 38,987,011 | | | PT Ramayana Lestari Sentosa Tbk (Indonesia) | | | 3,029,743 | |
| | | | | | | | |
| | | | | | | 6,664,596 | |
| | | | | | | | |
| | | | Distillers & Vintners 0.1% | | | | |
| | 77,255 | | | Distell Group Ltd. (South Africa) | | | 662,428 | |
| | | | | | | | |
| | | | Distributors 1.2% | | | | |
| | 8,886,300 | | | Dah Chong Hong Holdings Ltd. (Hong Kong) | | | 9,087,295 | |
| | | | | | | | |
| | | | Diversified Banks 6.1% | | | | |
| | 1,895,655 | | | Allahabad Bank Ltd. (India) | | | 6,071,601 | |
| | 372,472 | | | Capitec Bank Holdings Ltd. (South Africa) | | | 8,876,912 | |
| | 29,681,945 | | | PT Bank Tabungan Pensiunan Nasional Tbk* (Indonesia) | | | 11,128,738 | |
| | 4,143,023 | | | Security Bank Corp. (Philippines) | | | 8,193,973 | |
| | 4,648,647 | | | Turkiye Sinai Kalkinma Bankasi AS (Turkey) | | | 4,975,372 | |
| | 1,475,225 | | | Yes Bank Ltd. (India) | | | 8,099,146 | |
| | | | | | | | |
| | | | | | | 47,345,742 | |
| | | | | | | | |
| | | | Diversified Chemicals 1.1% | | | | |
| | 2,479,610 | | | Pidilite Industries Ltd. (India) | | | 8,204,876 | |
| | | | | | | | |
| | | | Diversified Metals & Mining 0.3% | | | | |
| | 27,000,000 | | | PT Borneo Lumbung Energi & Metal Tbk* (Indonesia) | | | 2,694,066 | |
| | | | | | | | |
| | | | Diversified Support Services 0.4% | | | | |
| | 126,000 | | | KEPCO Plant Service & Engineering Co. Ltd. (Korea) | | | 3,187,408 | |
| | | | | | | | |
| | | | Electronic Components 0.6% | | | | |
| | 616,748 | | | Partron Co. Ltd. (Korea) | | | 4,776,339 | |
| | | | | | | | |
| | | | Electronic Equipment &
Instruments 1.6% | | | | |
| | 3,682,872 | | | Chroma ATE, Inc. (Taiwan) | | | 7,546,407 | |
| | 4,248,863 | | | Test Research, Inc. (Taiwan) | | | 4,810,038 | |
| | | | | | | | |
| | | | | | | 12,356,445 | |
| | | | | | | | |
| | | | Food Retail 0.6% | | | | |
| | 636,745 | | | Eurocash S.A. (Poland) | | | 4,541,999 | |
| | | | | | | | |
| | | | Footwear 2.3% | | | | |
| | 1,151,525 | | | Bata India Ltd. (India) | | | 15,223,488 | |
| | 1,066,610 | | | Forus S.A. (Chile) | | | 2,362,696 | |
| | | | | | | | |
| | | | | | | 17,586,184 | |
| | | | | | | | |
| | | | Gas Utilities 1.5% | | | | |
| | 1,308,125 | | | Indraprastha Gas Ltd. (India) | | | 11,342,414 | |
| | | | | | | | |
| | | | General Merchandise Stores 3.0% | | | | |
| | 2,299,495 | | | Clicks Group Ltd. (South Africa) | | | 10,693,471 | |
| | 26,117,331 | | | PT Mitra Adiperkasa Tbk (Indonesia) | | | 12,645,783 | |
| | | | | | | | |
| | | | | | | 23,339,254 | |
| | | | | | | | |
47
| | |
| WASATCH EMERGING MARKETS SMALL CAP FUND (WAEMX) — Schedule of Investments (continued) | | |
|
|
|
| | | | | | | | |
| Shares | | | | | Value | |
| | | | | | | |
| | | | Gold 1.5% | | | | |
| | 986,499 | | | Koza Altin Isletmeleri AS (Turkey) | | $ | 11,761,483 | |
| | | | | | | | |
| | | | Health Care Facilities 2.2% | | | | |
| | 7,151,758 | | | KPJ Healthcare Berhad (Malaysia) | | | 8,912,714 | |
| | 3,482,285 | | | Life Healthcare Group Holdings Ltd. (South Africa) | | | 8,345,245 | |
| | | | | | | | |
| | | | | | | 17,257,959 | |
| | | | | | | | |
| | | | Health Care Services 1.6% | | | | |
| | 642,200 | | | Diagnosticos da America S.A. (Brazil) | | | 5,475,221 | |
| | 593,400 | | | Fleury S.A. (Brazil) | | | 7,099,918 | |
| | | | | | | | |
| | | | | | | 12,575,139 | |
| | | | | | | | |
| | | | Health Care Supplies 1.1% | | | | |
| | 710,500 | | | St. Shine Optical Co. Ltd. (Taiwan) | | | 8,672,810 | |
| | | | | | | | |
| | | | Highways & Railtracks 2.0% | | | | |
| | 285,600 | | | Obrascon Huarte Lain Brasil S.A. (Brazil) | | | 9,197,675 | |
| | 14,557,755 | | | PT Jasa Marga (Indonesia) | | | 6,516,149 | |
| | | | | | | | |
| | | | | | | 15,713,824 | |
| | | | | | | | |
| | | | Home Improvement Retail 0.7% | | | | |
| | 13,575,250 | | | Ace Hardware Indonesia (Indonesia) | | | 5,074,509 | |
| | | | | | | | |
| | | | Homefurnishing Retail 1.1% | | | | |
| | 977,800 | | | Lewis Group Ltd. (South Africa) | | | 8,475,726 | |
| | | | | | | | |
| | | | Household Appliances 0.4% | | | | |
| | 66,455 | | | TTK Prestige Ltd. (India) | | | 3,489,114 | |
| | | | | | | | |
| | | | | | | | |
| | | | Human Resource & Employment Services 0.2% | | | | |
| | 1,979,800 | | | Jobstreet Corp. Berhad (Malaysia) | | | 1,475,935 | |
| | | | | | | | |
| | | | Hypermarkets & Super Centers 2.9% | | | | |
| | 2,722,779 | | | Big C Supercenter Public Co. Ltd.*** (Thailand) | | | 9,850,745 | |
| | 1,316,130 | | | Siam Makro Public Co. Ltd.*** (Thailand) | | | 9,230,058 | |
| | 1,664,428 | | | Wumart Stores, Inc. (China) | | | 3,289,450 | |
| | | | | | | | |
| | | | | | | 22,370,253 | |
| | | | | | | | |
| | | | Industrial Gases 0.5% | | | | |
| | 70,000 | | | OCI Materials Co. Ltd. (Korea) | | | 4,036,071 | |
| | | | | | | | |
| | | | Industrial Machinery 1.2% | | | | |
| | 119,154 | | | Cummins India Ltd. (India) | | | 1,006,838 | |
| | 362,600 | | | Hy-Lok Corp. (Korea) | | | 4,671,278 | |
| | 292,718 | | | SKF India Ltd. (India) | | | 4,001,060 | |
| | | | | | | | |
| | | | | | | 9,679,176 | |
| | | | | | | | |
| | | | Internet Software & Services 1.8% | | | | |
| | 95,370 | | | Daum Communications Corp. (Korea) | | | 11,436,217 | |
| | 5,390,000 | | | Pacific Online Ltd. (China) | | | 2,825,582 | |
| | | | | | | | |
| | | | | | | 14,261,799 | |
| | | | | | | | |
| | | | IT Consulting & Other Services 0.2% | | | | |
| | 15,599,500 | | | PT Astra Graphia Tbk (Indonesia) | | | 1,737,837 | |
| | | | | | | | |
| | | | Life & Health Insurance 1.1% | | | | |
| | 6,298,479 | | | Bangkok Life Assurance Public Co. Ltd. NVDR (Thailand) | | | 8,608,073 | |
| | | | | | | | |
| | | | Marine Ports & Services 3.3% | | | | |
| | 501,000 | | | Global Ports Investment Ltd., GDR (Cyprus) | | | 7,765,500 | |
| | 9,206,279 | | | International Container Terminal Services, Inc. (Philippines) | | | 9,766,750 | |
| | 627,240 | | | Santos Brasil Participacoes S.A.** (Brazil) | | | 8,026,532 | |
| | | | | | | | |
| | | | | | | 25,558,782 | |
| | | | | | | | |
| | | | | | | | |
| Shares | | | | | Value | |
| | | | | | | |
| | | | Oil & Gas Exploration &
Production 4.1% | | | | |
| | 3,477,580 | | | Afren plc* (Nigeria) | | $ | 4,378,767 | |
| | 717,410 | | | Bankers Petroleum Ltd.* (Albania) | | | 2,413,664 | |
| | 571,940 | | | Coastal Energy Co.* (United Kingdom) | | | 5,277,924 | |
| | 928,461 | | | Exillon Energy plc* (United Arab Emirates) | | | 2,923,428 | |
| | 1,569,480 | | | Gran Tierra Energy, Inc.* (Colombia) | | | 7,486,420 | |
| | 5,946,374 | | | PetroNeft Resources plc*
(United Kingdom) | | | 2,070,801 | |
| | 533,265 | | | Transglobe Energy Corp.* (Canada) | | | 4,326,403 | |
| | 418,450 | | | Zhaikmunai L.P. GDR* (Kazakhstan) | | | 3,078,719 | |
| | | | | | | | |
| | | | | | | 31,956,126 | |
| | | | | | | | |
| | | | Other Diversified Financial
Services 1.0% | | | | |
| | 342,830 | | | Intergroup Financial Services Corp. (Peru) | | | 7,987,939 | |
| | | | | | | | |
| | | | Packaged Foods & Meats 3.6% | | | | |
| | 80,000 | | | GlaxoSmithKline Consumer Healthcare Ltd. (India) | | | 3,871,363 | |
| | 1,836,749 | | | Hsu Fu Chi International Ltd. (China) | | | 5,908,847 | |
| | 61,700 | | | Nestle Malaysia Berhad (Malaysia) | | | 925,934 | |
| | 1,040,130 | | | Pinar Sut Mamulleri Sanayii A.S. (Turkey) | | | 8,148,626 | |
| | 5,613,795 | | | PT Mayora Indah Tbk (Indonesia) | | | 8,077,383 | |
| | 634,274 | | | Universal Robina Corp. (Philippines) | | | 599,384 | |
| | | | | | | | |
| | | | | | | 27,531,537 | |
| | | | | | | | |
| | | | Personal Products 2.1% | | | | |
| | 794,800 | | | Colgate-Palmolive India Ltd. (India) | | | 15,762,016 | |
| | 211,565 | | | PT Mandom Indonesia Tbk (Indonesia) | | | 204,585 | |
| | | | | | | | |
| | | | | | | 15,966,601 | |
| | | | | | | | |
| | | | Pharmaceuticals 0.4% | | | | |
| | 9,625 | | | Pharmstandard* *** (Russia) | | | 643,123 | |
| | 127,560 | | | Pharmstandard GDR* (Russia) | | | 2,420,142 | |
| | | | | | | | |
| | | | | | | 3,063,265 | |
| | | | | | | | |
| | | | Railroads 1.0% | | | | |
| | 567,521 | | | Globaltrans Investment plc GDR (Russia) | | | 7,711,521 | |
| | | | | | | | |
| | | | Regional Banks 0.8% | | | | |
| | 43,613,415 | | | PT Bank Tabungan Negara Tbk (Indonesia) | | | 5,930,878 | |
| | | | | | | | |
| | | | Restaurants 1.9% | | | | |
| | 5,997,873 | | | Ajisen China Holdings Ltd. (China) | | | 6,859,656 | |
| | 7,430,965 | | | KFC Holdings Malaysia Berhad (Malaysia) | | | 7,656,873 | |
| | | | | | | | |
| | | | | | | 14,516,529 | |
| | | | | | | | |
| | | | Semiconductors 0.8% | | | | |
| | 3,069,053 | | | Sporton International, Inc. (Taiwan) | | | 6,348,379 | |
| | | | | | | | |
| | | | Specialized Finance 2.5% | | | | |
| | 3,720,190 | | | Bolsa Mexicana de Valores S.A.B. de C.V. (Mexico) | | | 5,142,501 | |
| | 667,814 | | | JSE Ltd. (South Africa) | | | 5,321,500 | |
| | 688,530 | | | Warsaw Stock Exchange (Poland) | | | 8,806,347 | |
| | | | | | | | |
| | | | | | | 19,270,348 | |
| | | | | | | | |
| | | | Specialty Chemicals 0.8% | | | | |
| | 149,715 | | | Akzo Nobel India Ltd. (India) | | | 2,837,965 | |
| | 237,118 | | | Clariant Chemicals India Ltd. (India) | | | 3,468,997 | |
| | | | | | | | |
| | | | | | | 6,306,962 | |
| | | | | | | | |
| | | | Steel 0.3% | | | | |
| | 384,010 | | | MOIL Ltd. (India) | | | 2,188,945 | |
| | | | | | | | |
| | | | Thrifts & Mortgage Finance 4.0% | | | | |
| | 2,001,354 | | | Dewan Housing Finance Corp. Ltd. (India) | | | 9,554,028 | |
| | 880,654 | | | Gruh Finance Ltd. (India) | | | 8,811,036 | |
| | 2,960,335 | | | LIC Housing Finance Ltd. (India) | | | 12,644,800 | |
| | | | | | | | |
| | | | | | | 31,009,864 | |
| | | | | | | | |
48
| | | | | | | | |
| Shares | | | | | Value | |
| | | | | | | |
| | | | Trading Companies &
Distributors 2.1% | | | | |
| | 395,535 | | | iMarketKorea, Inc. (Korea) | | $ | 5,136,286 | |
| | 13,262,987 | | | PT Hexindo Adiperkasa Tbk (Indonesia) | | | 11,015,968 | |
| | | | | | | | |
| | | | | | | 16,152,254 | |
| | | | | | | | |
| | | | Trucking 0.9% | | | | |
| | 623,100 | | | Tegma Gestao Logistica (Brazil) | | | 6,777,521 | |
| | | | | | | | |
| | | | Water Utilities 0.4% | | | | |
| | 16,888,165 | | | Thai Tap Water Supply Public Co. Ltd.*** (Thailand) | | | 2,743,614 | |
| | | | | | | | |
| | |
| | | | Total Common Stocks
(cost $761,711,497) | | | 734,887,765 | |
| | | | | | | | |
| | |
| | | | PREFERRED STOCKS 2.0% | | | | |
| | | | Construction & Farm Machinery & Heavy Trucks 1.4% | | | | |
| | 2,889,115 | | | Marcopolo S.A. Pfd. (Brazil) | | | 10,629,109 | |
| | | | | | | | |
| | |
| | | | Diversified Banks 0.6% | | | | |
| | 249,900 | | | Banco ABC Brasil S.A. Pfd. (Brazil) | | | 1,261,825 | |
| | 849,800 | | | Banco Industrial e Comercial S.A.
(Bic Banco) Pfd. (Brazil) | | | 3,352,983 | |
| | | | | | | | |
| | | | | | | 4,614,808 | |
| | | | | | | | |
| | |
| | | | Total Preferred Stocks
(cost $18,200,912) | | | 15,243,917 | |
| | | | | | | | |
| | |
Principal
Amount | | | | | Value | |
| | |
| | | | SHORT-TERM INVESTMENTS 3.4% | | | | |
| | |
| | | | Repurchase Agreement 3.4% | | | | |
| | $26,363,875 | | | Repurchase Agreement dated 9/30/11, 0.01% due 10/3/11 with State Street Bank and Trust Co. collateralized by $27,065,000 of United States Treasury Notes 1.375% due 9/30/18; value: $26,895,844; repurchase proceeds: $26,363,897 (cost $26,363,875) | | $ | 26,363,875 | |
| | | | | | | | |
| | |
| | | | Total Short-Term Investments
(cost $26,363,875) | | | 26,363,875 | |
| | | | | | | | |
| | |
| | | | Total Investments
(cost $806,276,284) 100.3%§ | | | 776,495,557 | |
| | | | | | | | |
| | |
| | | | Liabilities less Other Assets (0.3%) | | | (2,297,938 | ) |
| | | | | | | | |
| | |
| | | | NET ASSETS 100.0% | | $ | 774,197,619 | |
| | | | | | | | |
| |
| | | | *Non-income producing. **Common units. ***Security was fair valued under procedures adopted by the Board of Trustees (see Note 15). §The aggregate amount of foreign securities fair valued pursuant to a systematic valuation model as a percent of net assets was 72.72%. GDR Global Depositary Receipt. NVDR Non-Voting Depositary Receipt. See Notes to Financial Statements. | |
At September 30, 2011, Wasatch Emerging Markets Small Cap Fund’s investments, excluding short-term investments, were in the following countries:
| | | | |
| Country | | % | |
Albania | | | 0.3 | |
Brazil | | | 11.1 | |
Canada | | | 0.6 | |
Chile | | | 0.3 | |
China | | | 4.2 | |
Colombia | | | 1.0 | |
Cyprus | | | 1.0 | |
Hong Kong | | | 1.2 | |
India | | | 21.0 | |
Indonesia | | | 12.4 | |
Kazakhstan | | | 0.4 | |
Korea | | | 5.1 | |
Malaysia | | | 3.7 | |
Mexico | | | 1.3 | |
Morocco | | | 0.3 | |
Nigeria | | | 0.6 | |
Peru | | | 1.1 | |
Philippines | | | 3.1 | |
Poland | | | 2.7 | |
Russia | | | 2.1 | |
South Africa | | | 7.5 | |
Taiwan | | | 4.6 | |
Thailand | | | 6.6 | |
Turkey | | | 6.4 | |
United Arab Emirates | | | 0.4 | |
United Kingdom | | | 1.0 | |
| | | | |
TOTAL | | | 100.0 | % |
| | | | |
49
| | |
| WASATCH GLOBAL OPPORTUNITIES FUND (WAGOX) — Schedule of Investments | | |
|
|
|
| | | | | | | | |
| Shares | | | | | Value | |
| | | | | | | |
| | |
| | | | COMMON STOCKS 97.6% | | | | |
| | |
| | | | Advertising 0.3% | | | | |
| | 11,553 | | | 1000mercis (France) | | $ | 574,158 | |
| | | | | | | | |
| | | | Air Freight & Logistics 1.1% | | | | |
| | 3,359,260 | | | Aramex PJSC (United Arab Emirates) | | | 1,629,260 | |
| | 407,600 | | | Goodpack Ltd. (Singapore) | | | 472,403 | |
| | | | | | | | |
| | | | | | | 2,101,663 | |
| | | | | | | | |
| | | | Apparel Retail 1.7% | | | | |
| | 17,250 | | | Jos. A. Bank Clothiers, Inc.* | | | 804,367 | |
| | 87,240 | | | Mr Price Group Ltd. (South Africa) | | | 725,473 | |
| | 123,125 | | | Truworths International Ltd.
(South Africa) | | | 1,073,945 | |
| | 47,560 | | | Zumiez, Inc.* | | | 832,776 | |
| | | | | | | | |
| | | | | | | 3,436,561 | |
| | | | | | | | |
| | | | Apparel, Accessories & Luxury
Goods 4.8% | | | | |
| | 28,200 | | | Carter’s, Inc.* | | | 861,228 | |
| | 90,000 | | | Gerry Weber International AG (Germany) | | | 2,571,616 | |
| | 30,500 | | | Gildan Activewear, Inc. (Canada) | | | 788,120 | |
| | 36,000 | | | LG Fashion Corp. (Korea) | | | 1,219,394 | |
| | 935 | | | LPP S.A. (Poland) | | | 553,049 | |
| | 337,400 | | | Ted Baker plc (United Kingdom) | | | 3,640,391 | |
| | | | | | | | |
| | | | | | | 9,633,798 | |
| | | | | | | | |
| | | | Application Software 1.3% | | | | |
| | 29,500 | | | Fidessa Group plc (United Kingdom) | | | 724,900 | |
| | 20,550 | | | Interactive Intelligence Group, Inc.* | | | 557,932 | |
| | 1,626 | | | SimCorp A/S (Denmark) | | | 234,253 | |
| | 23,410 | | | Ultimate Software Group, Inc.* | | | 1,093,715 | |
| | | | | | | | |
| | | | | | | 2,610,800 | |
| | | | | | | | |
| | | | Asset Management & Custody
Banks 1.4% | | | | |
| | 15,850 | | | Affiliated Managers Group, Inc.* | | | 1,237,093 | |
| | 577,500 | | | ARA Asset Management Ltd. (Singapore) | | | 520,257 | |
| | 66,500 | | | SEI Investments Co. | | | 1,022,770 | |
| | | | | | | | |
| | | | | | | 2,780,120 | |
| | | | | | | | |
| | | | Auto Parts & Equipment 0.5% | | | | |
| | 354,525 | | | Exide Industries Ltd. (India) | | | 925,051 | |
| | | | | | | | |
| | |
| | | | Automotive Retail 0.8% | | | | |
| | 22,275 | | | Monro Muffler Brake, Inc. | | | 734,407 | |
| | 13,100 | | | O’Reilly Automotive, Inc.* | | | 872,853 | |
| | | | | | | | |
| | | | | | | 1,607,260 | |
| | | | | | | | |
| | | | Biotechnology 1.4% | | | | |
| | 392,125 | | | Abcam plc (United Kingdom) | | | 2,220,902 | |
| | 1,695,471 | | | Sino Biopharmaceutical Ltd. (China) | | | 479,206 | |
| | | | | | | | |
| | | | | | | 2,700,108 | |
| | | | | | | | |
| | | | Catalog Retail 0.4% | | | | |
| | 7,000 | | | Hyundai Home Shopping Network Corp. (Korea) | | | 812,122 | |
| | | | | | | | |
| | | | Coal & Consumable Fuels 0.3% | | | | |
| | 362,500 | | | PT Tambang Batubara Bukit Asam Tbk (Indonesia) | | | 684,970 | |
| | | | | | | | |
| | | | Commercial Printing 0.6% | | | | |
| | 162,490 | | | InnerWorkings, Inc.* | | | 1,273,922 | |
| | | | | | | | |
| | | | Commodity Chemicals 1.0% | | | | |
| | 394,365 | | | Berger Paints India Ltd. (India) | | | 795,921 | |
| | 76,210 | | | Tikkurila Oyj (Finland) | | | 1,300,127 | |
| | | | | | | | |
| | | | | | | 2,096,048 | |
| | | | | | | | |
| | | | | | | | |
| Shares | | | | | Value | |
| | | | | | | |
| | | | Communications Equipment 0.5% | | | | |
| | 31,105 | | | Polycom, Inc.* | | $ | 571,399 | |
| | 18,000 | | | Riverbed Technology, Inc.* | | | 359,280 | |
| | | | | | | | |
| | | | | | | 930,679 | |
| | | | | | | | |
| | | | Computer Hardware 0.3% | | | | |
| | 194,700 | | | Advantech Co. Ltd. (Taiwan) | | | 511,444 | |
| | | | | | | | |
| | | | Construction & Engineering 1.0% | | | | |
| | 216,015 | | | Kentz Corp. Ltd. (Ireland) | | | 1,521,283 | |
| | 79,500 | | | Lycopodium Ltd. (Australia) | | | 431,112 | |
| | | | | | | | |
| | | | | | | 1,952,395 | |
| | | | | | | | |
| | | | Construction Materials 0.3% | | | | |
| | 595,000 | | | PT Semen Gresik (Persero) Tbk (Indonesia) | | | 556,892 | |
| | | | | | | | |
| | | | Consumer Finance 2.6% | | | | |
| | 304,000 | | | Banco Compartamos S.A.B. de C.V. (Mexico) | | | 411,448 | |
| | 50,024 | | | DFC Global Corp.* | | | 1,093,025 | |
| | 32,100 | | | First Cash Financial Services, Inc.* | | | 1,346,595 | |
| | 173,870 | | | Mahindra & Mahindra Financial Services Ltd. (India) | | | 2,317,469 | |
| | | | | | | | |
| | | | | | | 5,168,537 | |
| | | | | | | | |
| | | | Data Processing & Outsourced Services 3.0% | | | | |
| | 265 | | | GMO Payment Gateway, Inc. (Japan) | | | 1,239,483 | |
| | 311,100 | | | Wirecard AG (Germany) | | | 4,779,621 | |
| | | | | | | | |
| | | | | | | 6,019,104 | |
| | | | | | | | |
| | | | Distributors 0.8% | | | | |
| | 68,605 | | | LKQ Corp.* | | | 1,657,497 | |
| | | | | | | | |
| | | | Diversified Banks 0.9% | | | | |
| | 22,100 | | | Axis Bank Ltd. (India) | | | 461,965 | |
| | 15,000 | | | Bank of Baroda (India) | | | 231,790 | |
| | 5,150 | | | HDFC Bank Ltd. ADR (India) | | | 150,122 | |
| | 183,000 | | | Yes Bank Ltd. (India) | | | 1,004,690 | |
| | | | | | | | |
| | | | | | | 1,848,567 | |
| | | | | | | | |
| | | | Diversified Chemicals 0.7% | | | | |
| | 423,735 | | | Pidilite Industries Ltd. (India) | | | 1,402,113 | |
| | | | | | | | |
| | | | Diversified Metals & Mining 0.2% | | | | |
| | 11,000 | | | Inmet Mining Corp. (Canada) | | | 469,480 | |
| | | | | | | | |
| | | | Diversified Support Services 1.8% | | | | |
| | 68,725 | | | Copart, Inc.* | | | 2,688,522 | |
| | 48,000 | | | Prestige International, Inc. (Japan) | | | 421,325 | |
| | 23,300 | | | Ritchie Bros. Auctioneers, Inc. (Canada) | | | 470,427 | |
| | | | | | | | |
| | | | | | | 3,580,274 | |
| | | | | | | | |
| | | | Drug Retail 0.4% | | | | |
| | 37,635 | | | Create SD Holdings Co. Ltd. (Japan) | | | 878,280 | |
| | | | | | | | |
| | | | Electrical Components &
Equipment 0.2% | | | | |
| | 7,745 | | | Polypore International, Inc.* | | | 437,747 | |
| | | | | | | | |
| | | | Electronic Equipment &
Instruments 0.4% | | | | |
| | 90,475 | | | Viscom AG* (Germany) | | | 816,855 | |
| | | | | | | | |
| | | | Electronic Manufacturing
Services 0.2% | | | | |
| | 9,955 | | | IPG Photonics Corp.* | | | 432,445 | |
| | | | | | | | |
| | | | Environmental & Facilities
Services 2.6% | | | | |
| | 1,541,050 | | | RPS Group plc (United Kingdom) | | | 3,934,666 | |
| | 70,205 | | | Tetra Tech, Inc.* | | | 1,315,642 | |
| | | | | | | | |
| | | | | | | 5,250,308 | |
| | | | | | | | |
50
| | | | | | | | |
| Shares | | | | | Value | |
| | | | | | | |
| | | | Food Retail 0.8% | | | | |
| | 1,137,600 | | | BreadTalk Group Ltd. (Singapore) | | $ | 409,989 | |
| | 20,200 | | | Daikokutenbussan Co. Ltd. (Japan) | | | 693,834 | |
| | 31,000 | | | Shoprite Holdings Ltd. (South Africa) | | | 435,570 | |
| | | | | | | | |
| | | | | | | 1,539,393 | |
| | | | | | | | |
| | | | Footwear 0.7% | | | | |
| | 441,000 | | | Anta Sports Products Ltd. (China) | | | 509,571 | |
| | 66,170 | | | Bata India Ltd. (India) | | | 874,786 | |
| | | | | | | | |
| | | | | | | 1,384,357 | |
| | | | | | | | |
| | | | General Merchandise Stores 3.6% | | | | |
| | 298,500 | | | Clicks Group Ltd. (South Africa) | | | 1,388,131 | |
| | 65,400 | | | Dollar Tree, Inc.* | | | 4,912,194 | |
| | 1,700,000 | | | PT Mitra Adiperkasa Tbk (Indonesia) | | | 823,125 | |
| | | | | | | | |
| | | | | | | 7,123,450 | |
| | | | | | | | |
| | | | Gold 1.0% | | | | |
| | 95,500 | | | Koza Altin Isletmeleri AS (Turkey) | | | 1,138,594 | |
| | 129,865 | | | Medusa Mining Ltd. (Australia) | | | 854,132 | |
| | | | | | | | |
| | | | | | | 1,992,726 | |
| | | | | | | | |
| | | | Health Care Equipment 2.7% | | | | |
| | 79,000 | | | AtriCure, Inc.* | | | 769,460 | |
| | 80,000 | | | Cardica, Inc. PIPE* *** | | | 155,200 | |
| | 36,500 | | | Cyberonics, Inc.* | | | 1,032,950 | |
| | 29,400 | | | DiaSorin S.p.A. (Italy) | | | 1,089,822 | |
| | 89,514 | | | Immunodiagnostic Systems Holdings plc (United Kingdom) | | | 1,443,060 | |
| | 3,901,161 | | | LMA International N.V. (Singapore) | | | 866,244 | |
| | | | | | | | |
| | | | | | | 5,356,736 | |
| | | | | | | | |
| | | | Health Care Facilities 1.0% | | | | |
| | 53,261 | | | AmSurg Corp.* | | | 1,198,372 | |
| | 300,000 | | | Life Healthcare Group Holdings Ltd. (South Africa) | | | 718,946 | |
| | | | | | | | |
| | | | | | | 1,917,318 | |
| | | | | | | | |
| | | | Health Care Services 3.0% | | | | |
| | 26,480 | | | Catalyst Health Solutions, Inc.* | | | 1,527,631 | |
| | 18,314 | | | CorVel Corp.* | | | 778,345 | |
| | 200,500 | | | Diagnosticos da America S.A. (Brazil) | | | 1,709,408 | |
| | 36,375 | | | IPC The Hospitalist Co., Inc.* | | | 1,298,224 | |
| | 9,900 | | | MEDNAX, Inc.* | | | 620,136 | |
| | | | | | | | |
| | | | | | | 5,933,744 | |
| | | | | | | | |
| | | | Health Care Technology 1.0% | | | | |
| | 22,500 | | | athenahealth, Inc.* | | | 1,339,875 | |
| | 10,600 | | | Computer Programs and Systems, Inc. | | | 701,190 | |
| | | | | | | | |
| | | | | | | 2,041,065 | |
| | | | | | | | |
| | | | Home Improvement Retail 0.8% | | | | |
| | 2,850,000 | | | Ace Hardware Indonesia (Indonesia) | | | 1,065,347 | |
| | 138,200 | | | Swedol AB, Class B (Sweden) | | | 511,167 | |
| | | | | | | | |
| | | | | | | 1,576,514 | |
| | | | | | | | |
| | | | Homefurnishing Retail 0.8% | | | | |
| | 42,600 | | | Aaron’s, Inc. | | | 1,075,650 | |
| | 66,000 | | | Lewis Group Ltd. (South Africa) | | | 572,098 | |
| | | | | | | | |
| | | | | | | 1,647,748 | |
| | | | | | | | |
| | | | Human Resource & Employment Services 0.5% | | | | |
| | 175,300 | | | Michael Page International plc
(United Kingdom) | | | 1,002,761 | |
| | | | | | | | |
| | | | | | | | |
| Shares | | | | | Value | |
| | | | | | | |
| | | | Industrial Machinery 2.4% | | | | |
| | 4,100 | | | Burckhardt Compression Holding AG (Switzerland) | | $ | 809,607 | |
| | 31,996 | | | Graco, Inc. | | | 1,092,343 | |
| | 39,255 | | | IDEX Corp. | | | 1,223,186 | |
| | 2,200 | | | Rational AG (Germany) | | | 495,949 | |
| | 28,400 | | | Rotork plc (United Kingdom) | | | 686,061 | |
| | 41,100 | | | Weg S.A. (Brazil) | | | 409,795 | |
| | | | | | | | |
| | | | | | | 4,716,941 | |
| | | | | | | | |
| | | | Internet Retail 0.7% | | | | |
| | 41,500 | | | Start Today Co. Ltd. (Japan) | | | 900,383 | |
| | 40,000 | | | Yoox S.p.A.* (Italy) | | | 515,006 | |
| | | | | | | | |
| | | | | | | 1,415,389 | |
| | | | | | | | |
| | | | Internet Software & Services 2.7% | | | | |
| | 46,365 | | | Akamai Technologies, Inc.* | | | 921,736 | |
| | 12,100 | | | Daum Communications Corp. (Korea) | | | 1,450,962 | |
| | 106,512 | | | Envestnet, Inc.* | | | 1,065,120 | |
| | 66,600 | | | Neurones (France) | | | 678,639 | |
| | 1,353,880 | | | Pacific Online Ltd. (China) | | | 709,740 | |
| | 20,415 | | | Vistaprint N.V.* | | | 551,817 | |
| | | | | | | | |
| | | | | | | 5,378,014 | |
| | | | | | | | |
| | | | Investment Banking &
Brokerage 0.2% | | | | |
| | 390 | | | GCA Savvian Group Corp. (Japan) | | | 472,814 | |
| | | | | | | | |
| | | | IT Consulting & Other Services 1.3% | | | | |
| | 47,175 | | | Alten Ltd. (France) | | | 1,279,220 | |
| | 960,000 | | | CSE Global Ltd. (Singapore) | | | 601,713 | |
| | 1,675 | | | Future Architect, Inc. (Japan) | | | 719,085 | |
| | | | | | | | |
| | | | | | | 2,600,018 | |
| | | | | | | | |
| | | | Leisure Facilities 0.7% | | | | |
| | 40,380 | | | Life Time Fitness, Inc.* | | | 1,488,003 | |
| | | | | | | | |
| | | | Life Sciences Tools & Services 3.4% | | | | |
| | 55,400 | | | CMIC Co. Ltd. (Japan) | | | 989,223 | |
| | 41,835 | | | Covance, Inc.* | | | 1,901,400 | |
| | 641 | | | EPS Co. Ltd. (Japan) | | | 1,458,194 | |
| | 89,700 | | | ICON plc ADR* (Ireland) | | | 1,442,376 | |
| | 15,490 | | | Techne Corp. | | | 1,053,475 | |
| | | | | | | | |
| | | | | | | 6,844,668 | |
| | | | | | | | |
| | | | Oil & Gas Equipment & Services 2.4% | | | | |
| | 6,900 | | | Core Laboratories N.V. | | | 619,827 | |
| | 12,810 | | | Dril-Quip, Inc.* | | | 690,587 | |
| | 42,300 | | | Gulf Island Fabrication, Inc. | | | 874,764 | |
| | 26,900 | | | Pason Systems, Inc. (Canada) | | | 344,428 | |
| | 25,300 | | | Petrofac Ltd. (United Kingdom) | | | 469,709 | |
| | 4,600 | | | Schoeller-Bleckmann Oilfield Equipment AG (Austria) | | | 315,052 | |
| | 28,950 | | | ShawCor Ltd., Class A (Canada) | | | 677,068 | |
| | 38,700 | | | TGS-NOPEC Geophysical Co. ASA (Norway) | | | 722,172 | |
| | | | | | | | |
| | | | | | | 4,713,607 | |
| | | | | | | | |
| | | | Oil & Gas Exploration &
Production 2.3% | | | | |
| | 486,000 | | | Afren plc* (Nigeria) | | | 611,943 | |
| | 100,000 | | | Coastal Energy Co.* (United Kingdom) | | | 922,811 | |
| | 55,600 | | | Gran Tierra Energy, Inc.* (Colombia) | | | 265,212 | |
| | 57,030 | | | Northern Oil and Gas, Inc.* | | | 1,105,812 | |
| | 27,500 | | | Petrominerales Ltd. (Colombia) | | | 544,554 | |
| | 96,700 | | | Premier Oil plc* (United Kingdom) | | | 521,769 | |
| | 83,000 | | | Westfire Energy Ltd.* (Canada) | | | 335,893 | |
| | 45,000 | | | Zhaikmunai L.P. GDR* (Kazakhstan) | | | 331,085 | |
| | | | | | | | |
| | | | | | | 4,639,079 | |
| | | | | | | | |
51
| | |
| WASATCH GLOBAL OPPORTUNITIES FUND (WAGOX) — Schedule of Investments (continued) | | |
|
|
|
| | | | | | | | |
| Shares | | | | | Value | |
| | | | | | | |
| | | | Other Diversified Financial
Services 0.4% | | | | |
| | 31,513 | | | Intergroup Financial Services Corp. (Peru) | | $ | 734,253 | |
| | | | | | | | |
| | |
| | | | Packaged Foods & Meats 0.8% | | | | |
| | 5,500 | | | GlaxoSmithKline Consumer Healthcare Ltd. (India) | | | 266,156 | |
| | 418,291 | | | Hsu Fu Chi International Ltd. (China) | | | 1,345,648 | |
| | | | | | | | |
| | | | | | | 1,611,804 | |
| | | | | | | | |
| | | | Personal Products 0.1% | | | | |
| | 11,105 | | | Natura Cosmeticos S.A. (Brazil) | | | 189,475 | |
| | | | | | | | |
| | | | Precious Metals & Minerals 0.3% | | | | |
| | 18,800 | | | Pan American Silver Corp. (Canada) | | | 510,164 | |
| | | | | | | | |
| | |
| | | | Property & Casualty Insurance 0.5% | | | | |
| | 502,725 | | | Beazley plc (United Kingdom) | | | 910,011 | |
| | | | | | | | |
| | | | Regional Banks 0.5% | | | | |
| | 8,500 | | | Canadian Western Bank (Canada) | | | 209,824 | |
| | 15,265 | | | Signature Bank* | | | 728,599 | |
| | | | | | | | |
| | | | | | | 938,423 | |
| | | | | | | | |
| | | | Research & Consulting Services 3.7% | | | | |
| | 12,000 | | | Bertrandt AG (Germany) | | | 573,025 | |
| | 10,375 | | | Bureau Veritas S.A. (France) | | | 748,955 | |
| | 5,525 | | | Campbell Brothers Ltd. (Australia) | | | 221,189 | |
| | 74,730 | | | CRA International, Inc.* | | | 1,495,347 | |
| | 61,100 | | | Huron Consulting Group, Inc.* | | | 1,902,043 | |
| | 22,605 | | | IHS, Inc., Class A* | | | 1,691,080 | |
| | 150 | | | Nihon M&A Center, Inc. (Japan) | | | 858,056 | |
| | | | | | | | |
| | | | | | | 7,489,695 | |
| | | | | | | | |
| | | | Restaurants 1.0% | | | | |
| | 387,000 | | | Ajisen China Holdings Ltd. (China) | | | 442,605 | |
| | 1,035,000 | | | KFC Holdings Malaysia Berhad (Malaysia) | | | 1,066,465 | |
| | 12,059 | | | Tim Hortons, Inc. (Canada) | | | 564,636 | |
| | | | | | | | |
| | | | | | | 2,073,706 | |
| | | | | | | | |
| | | | Semiconductor Equipment 0.5% | | | | |
| | 29,720 | | | Eugene Technology Co. Ltd. (Korea) | | | 335,181 | |
| | 30,133 | | | Koh Young Technology, Inc. (Korea) | | | 589,557 | |
| | | | | | | | |
| | | | | | | 924,738 | |
| | | | | | | | |
| | | | Semiconductors 8.9% | | | | |
| | 10,505 | | | BCD Semiconductor Manufacturing Ltd. ADR* (China) | | | 52,525 | |
| | 24,950 | | | Hittite Microwave Corp.* | | | 1,215,065 | |
| | 74,900 | | | Linear Technology Corp. | | | 2,070,985 | |
| | 315,100 | | | Melexis N.V. (Belgium) | | | 3,840,423 | |
| | 171,500 | | | Micrel, Inc. | | | 1,624,105 | |
| | 43,000 | | | Microchip Technology, Inc. | | | 1,337,730 | |
| | 35,665 | | | NetLogic Microsystems, Inc.* | | | 1,715,843 | |
| | 553,314 | | | O2Micro International Ltd. ADR* (China) | | | 2,307,319 | |
| | 80,100 | | | Power Integrations, Inc. | | | 2,451,861 | |
| | 584,535 | | | Sporton International, Inc. (Taiwan) | | | 1,209,119 | |
| | | | | | | | |
| | | | | | | 17,824,975 | |
| | | | | | | | |
| | | | Specialized Finance 2.9% | | | | |
| | 18,000 | | | Crisil Ltd. (India) | | | 309,390 | |
| | 181,585 | | | JSE Ltd. (South Africa) | | | 1,446,967 | |
| | 45,605 | | | MSCI, Inc., Class A* | | | 1,383,200 | |
| | 139,395 | | | Oslo Bors VPS Holding ASA (Norway) | | | 1,648,599 | |
| | 16,300 | | | Portfolio Recovery Associates, Inc.* | | | 1,014,186 | |
| | | | | | | | |
| | | | | | | 5,802,342 | |
| | | | | | | | |
| | | | | | | | |
| Shares | | | | | Value | |
| | | | | | | |
| | | | Specialty Chemicals 0.9% | | | | |
| | 21,870 | | | C. Uyemura & Co. Ltd. (Japan) | | $ | 792,678 | |
| | 2,091,000 | | | EcoGreen Fine Chemical Group Ltd.
(Hong Kong) | | | 448,152 | |
| | 15,700 | | | TechnoSemiChem Co. Ltd. (Korea) | | | 530,445 | |
| | | | | | | | |
| | | | | | | 1,771,275 | |
| | | | | | | | |
| | | | Specialty Stores 1.1% | | | | |
| | 34,618 | | | Hibbett Sports, Inc.* | | | 1,173,204 | |
| | 503,315 | | | L’Occitane International S.A.* (Luxembourg) | | | 1,015,061 | |
| | | | | | | | |
| | | | | | | 2,188,265 | |
| | | | | | | | |
| | | | Steel 0.7% | | | | |
| | 116,500 | | | Ferrexpo plc (United Kingdom) | | | 477,341 | |
| | 12,845 | | | Haynes International, Inc. | | | 558,115 | |
| | 75,272 | | | MOIL Ltd. (India) | | | 429,068 | |
| | | | | | | | |
| | | | | | | 1,464,524 | |
| | | | | | | | |
| | | | Systems Software 1.7% | | | | |
| | 17,620 | | | NetSuite, Inc.* | | | 475,916 | |
| | 63,500 | | | OPNET Technologies, Inc. | | | 2,216,785 | |
| | 29,201 | | | Sourcefire, Inc.* | | | 781,419 | |
| | | | | | | | |
| | | | | | | 3,474,120 | |
| | | | | | | | |
| | | | Thrifts & Mortgage Finance 1.1% | | | | |
| | 18,475 | | | Home Capital Group, Inc. (Canada) | | | 774,305 | |
| | 23,000 | | | Housing Development Finance Corp. Ltd. (India) | | | 299,939 | |
| | 264,500 | | | LIC Housing Finance Ltd. (India) | | | 1,129,788 | |
| | | | | | | | |
| | | | | | | 2,204,032 | |
| | | | | | | | |
| | | | Trading Companies &
Distributors 5.6% | | | | |
| | 85,779 | | | Indutrade AB (Sweden) | | | 2,056,812 | |
| | 23,500 | | | MISUMI Group, Inc. (Japan) | | | 522,911 | |
| | 263,460 | | | MonotaRO Co. Ltd. (Japan) | | | 2,649,488 | |
| | 45,520 | | | MSC Industrial Direct Co., Inc., Class A | | | 2,570,059 | |
| | 88,605 | | | Richelieu Hardware Ltd. (Canada) | | | 2,114,834 | |
| | 7,780 | | | Thermador Groupe (France) | | | 1,226,863 | |
| | | | | | | | |
| | | | | | | 11,140,967 | |
| | | | | | | | |
| | | | Trucking 3.4% | | | | |
| | 36,600 | | | J.B. Hunt Transport Services, Inc. | | | 1,321,992 | |
| | 154,855 | | | Knight Transportation, Inc. | | | 2,061,120 | |
| | 45,685 | | | Old Dominion Freight Line, Inc.* | | | 1,323,495 | |
| | 128,000 | | | Tegma Gestao Logistica (Brazil) | | | 1,392,269 | |
| | 39,000 | | | Trancom Co. Ltd. (Japan) | | | 793,679 | |
| | | | | | | | |
| | | | | | | 6,892,555 | |
| | | | | | | | |
| | |
| | | | Total Common Stocks
(cost $172,500,661) | | | 195,078,867 | |
| | | | | | | | |
| | |
| | | | WARRANTS 0.0% | | | | |
| | |
| | | | Health Care Equipment 0.0% | | | | |
| | 40,000 | | | Cardica, Inc., expiring 9/29/14* *** † | | | 27,200 | |
| | | | | | | | |
| | |
| | | | Restaurants 0.0% | | | | |
| | 29,600 | | | KFC Holdings Malaysia Berhad, expiring 9/14/15* (Malaysia) | | | 9,643 | |
| | | | | | | | |
| | |
| | | | Total Warrants
(cost $5,000) | | | 36,843 | |
| | | | | | | | |
52
| | | | | | | | |
| | |
Principal
Amount | | | | | Value | |
| | | | | | | |
| | |
| | | | SHORT-TERM INVESTMENTS 1.7% | | | | |
| | |
| | | | Repurchase Agreement 1.7% | | | | |
| | $3,428,764 | | | Repurchase Agreement dated 9/30/11, 0.01% due 10/3/11 with State Street Bank and Trust Co. collateralized by $3,520,000 of United States Treasury Notes 1.375% due 9/30/18; value: $3,498,000; repurchase proceeds: $3,428,767 (cost $3,428,764) | | $ | 3,428,764 | |
| | | | | | | | |
| | |
| | | | Total Short-Term Investments
(cost $3,428,764) | | | 3,428,764 | |
| | | | | | | | |
| | |
| | | | Total Investments
(cost $175,934,425) 99.3%§ | | | 198,544,474 | |
| | |
| | | | Other Assets less Liabilities 0.7% | | | 1,310,319 | |
| | | | | | | | |
| | |
| | | | NET ASSETS 100.0% | | $ | 199,854,793 | |
| | | | | | | | |
| |
| | | | *Non-income producing. ***Security was fair valued under procedures adopted by the Board of Trustees (see Note 15). †Security purchased in a private placement transaction or under Rule 144A of the Securities Act of 1933 (see Note 11). §The aggregate amount of foreign securities fair valued pursuant to a systematic valuation model as a percent of net assets was 46.04%. ADR American Depositary Receipt. GDR Global Depositary Receipt. PIPE Private Investment in a Public Equity. See Notes to Financial Statements. | |
At September 30, 2011, Wasatch Global Opportunities Fund’s investments, excluding short-term investments, were in the following countries:
| | | | |
| Country | | % | |
Australia | | | 0.8 | |
Austria | | | 0.2 | |
Belgium | | | 2.0 | |
Brazil | | | 1.9 | |
Canada | | | 3.7 | |
China | | | 3.0 | |
Colombia | | | 0.4 | |
Denmark | | | 0.1 | |
Finland | | | 0.7 | |
France | | | 2.3 | |
Germany | | | 4.7 | |
Hong Kong | | | 0.2 | |
India | | | 5.4 | |
Indonesia | | | 1.6 | |
Ireland | | | 1.5 | |
Italy | | | 0.8 | |
Japan | | | 6.9 | |
Kazakhstan | | | 0.2 | |
Korea | | | 2.5 | |
Luxembourg | | | 0.5 | |
Malaysia | | | 0.6 | |
Mexico | | | 0.2 | |
Nigeria | | | 0.3 | |
Norway | | | 1.2 | |
Peru | | | 0.4 | |
Poland | | | 0.3 | |
Singapore | | | 1.5 | |
South Africa | | | 3.3 | |
Sweden | | | 1.3 | |
Switzerland | | | 0.4 | |
Taiwan | | | 0.9 | |
Turkey | | | 0.6 | |
United Arab Emirates | | | 0.8 | |
United Kingdom | | | 8.7 | |
United States | | | 40.1 | |
| | | | |
TOTAL | | | 100.0 | % |
| | | | |
53
| | |
| WASATCH HERITAGE GROWTH FUND (WAHGX) — Schedule of Investments | | |
|
|
|
| | | | | | | | |
| Shares | | | | | Value | |
| | | | | | | |
| | |
| | | | COMMON STOCKS 96.1% | | | | |
| | |
| | | | Aerospace & Defense 2.1% | | | | |
| | 18,510 | | | TransDigm Group, Inc.* | | $ | 1,511,712 | |
| | | | | | | | |
| | | | Air Freight & Logistics 3.5% | | | | |
| | 19,630 | | | C.H. Robinson Worldwide, Inc. | | | 1,344,066 | |
| | 29,835 | | | Expeditors International of
Washington, Inc. | | | 1,209,809 | |
| | | | | | | | |
| | | | | | | 2,553,875 | |
| | | | | | | | |
| | | | Apparel Retail 4.1% | | | | |
| | 38,165 | | | Ross Stores, Inc. | | | 3,003,204 | |
| | | | | | | | |
| | | | Application Software 3.5% | | | | |
| | 51,680 | | | ANSYS, Inc.* | | | 2,534,387 | |
| | | | | | | | |
| | | | Asset Management & Custody
Banks 3.0% | | | | |
| | 59,010 | | | SEI Investments Co. | | | 907,574 | |
| | 26,140 | | | T. Rowe Price Group, Inc. | | | 1,248,708 | |
| | | | | | | | |
| | | | | | | 2,156,282 | |
| | | | | | | | |
| | | | Automotive Retail 1.2% | | | | |
| | 12,733 | | | O’Reilly Automotive, Inc.* | | | 848,400 | |
| | | | | | | | |
| | | | Data Processing & Outsourced Services 2.4% | | | | |
| | 18,595 | | | Alliance Data Systems Corp.* | | | 1,723,757 | |
| | | | | | | | |
| | | | Distributors 3.6% | | | | |
| | 108,390 | | | LKQ Corp.* | | | 2,618,702 | |
| | | | | | | | |
| | | | Diversified Metals & Mining 0.9% | | | | |
| | 11,790 | | | BHP Billiton plc ADR (United Kingdom) | | | 625,813 | |
| | | | | | | | |
| | | | Diversified Support Services 4.6% | | | | |
| | 85,720 | | | Copart, Inc.* | | | 3,353,366 | |
| | | | | | | | |
| | | | Electronic Components 3.8% | | | | |
| | 68,390 | | | Amphenol Corp., Class A | | | 2,788,260 | |
| | | | | | | | |
| | | | Environmental & Facilities
Services 1.6% | | | | |
| | 14,465 | | | Stericycle, Inc.* | | | 1,167,615 | |
| | | | | | | | |
| | | | Health Care Equipment 3.0% | | | | |
| | 60,950 | | | St. Jude Medical, Inc. | | | 2,205,780 | |
| | | | | | | | |
| | | | Health Care Services 3.1% | | | | |
| | 38,367 | | | Catalyst Health Solutions, Inc.* | | | 2,213,392 | |
| | | | | | | | |
| | | | Industrial Machinery 2.2% | | | | |
| | 52,155 | | | IDEX Corp. | | | 1,625,150 | |
| | | | | | | | |
| | | | IT Consulting & Other Services 4.8% | | | | |
| | 55,990 | | | Cognizant Technology Solutions Corp., Class A* | | | 3,510,573 | |
| | | | | | | | |
| | | | Life Sciences Tools & Services 3.1% | | | | |
| | 49,420 | | | Covance, Inc.* | | | 2,246,139 | |
| | | | | | | | |
| | | | Multi-Line Insurance 1.0% | | | | |
| | 27,165 | | | HCC Insurance Holdings, Inc. | | | 734,813 | |
| | | | | | | | |
| | | | Oil & Gas Equipment & Services 2.3% | | | | |
| | 18,405 | | | Core Laboratories N.V. | | | 1,653,321 | |
| | | | | | | | |
| | | | Oil & Gas Exploration &
Production 3.1% | | | | |
| | 135,671 | | | SandRidge Energy, Inc.* | | | 754,331 | |
| | 54,515 | | | Ultra Petroleum Corp.* | | | 1,511,156 | |
| | | | | | | | |
| | | | | | | 2,265,487 | |
| | | | | | | | |
| | | | Personal Products 1.2% | | | | |
| | 15,858 | | | Herbalife Ltd. | | | 849,989 | |
| | | | | | | | |
| | | | | | | | |
| Shares | | | | | Value | |
| | | | | | | |
| | | | Pharmaceuticals 1.1% | | | | |
| | 21,235 | | | Teva Pharmaceutical Industries Ltd. ADR (Israel) | | $ | 790,367 | |
| | | | | | | | |
| | | | Regional Banks 2.1% | | | | |
| | 31,825 | | | Signature Bank* | | | 1,519,007 | |
| | | | | | | | |
| | | | Research & Consulting Services 4.7% | | | | |
| | 45,500 | | | IHS, Inc., Class A* | | | 3,403,855 | |
| | | | | | | | |
| | | | Restaurants 3.7% | | | | |
| | 58,655 | | | Tim Hortons, Inc. (Canada) | | | 2,714,553 | |
| | | | | | | | |
| | | | Semiconductors 11.5% | | | | |
| | 73,395 | | | Altera Corp. | | | 2,314,145 | |
| | 112,500 | | | Linear Technology Corp. | | | 3,110,625 | |
| | 56,785 | | | Microchip Technology, Inc. | | | 1,766,581 | |
| | 33,690 | | | Silicon Laboratories, Inc.* | | | 1,128,952 | |
| | | | | | | | |
| | | | | | | 8,320,303 | |
| | | | | | | | |
| | | | Specialized Finance 6.1% | | | | |
| | 149,700 | | | BM&F BOVESPA S.A. (Brazil) | | | 701,606 | |
| | 12,138 | | | IntercontinentalExchange, Inc.* | | | 1,435,440 | |
| | 52,435 | | | MSCI, Inc., Class A* | | | 1,590,354 | |
| | 234,410 | | | Power Finance Corp. Ltd. (India) | | | 714,515 | |
| | | | | | | | |
| | | | | | | 4,441,915 | |
| | | | | | | | |
| | | | Trading Companies &
Distributors 4.4% | | | | |
| | 42,645 | | | Fastenal Co. | | | 1,419,226 | |
| | 31,185 | | | MSC Industrial Direct Co., Inc., Class A | | | 1,760,705 | |
| | | | | | | | |
| | | | | | | 3,179,931 | |
| | | | | | | | |
| | | | Trucking 2.4% | | | | |
| | 48,983 | | | J.B. Hunt Transport Services, Inc. | | | 1,769,266 | |
| | | | | | | | |
| | | | Wireless Telecommunication
Services 2.0% | | | | |
| | 52,808 | | | NII Holdings, Inc.* | | | 1,423,176 | |
| | | | | | | | |
| | |
| | | | Total Common Stocks
(cost $60,959,143) | | | 69,752,390 | |
| | | | | | | | |
| | |
Principal
Amount | | | | | Value | |
| | | | | | | |
| | |
| | | | SHORT-TERM INVESTMENTS 3.9% | | | | |
| | |
| | | | Repurchase Agreement 3.9% | | | | |
| | $2,841,875 | | | Repurchase Agreement dated 9/30/11, 0.01% due 10/3/11 with State Street Bank and Trust Co. collateralized by $2,580,000 of United States Treasury Notes 3.125% due 5/15/19; value: $2,899,275; repurchase proceeds: $2,841,878 (cost $2,841,875) | | $ | 2,841,875 | |
| | | | | | | | |
| | |
| | | | Total Short-Term Investments
(cost $2,841,875) | | | 2,841,875 | |
| | | | | | | | |
| | |
| | | | Total Investments
(cost $63,801,018) 100.0%§ | | | 72,594,265 | |
| | |
| | | | Liabilities less Other Assets (<0.1%) | | | (33,351 | ) |
| | | | | | | | |
| | |
| | | | NET ASSETS 100.0% | | $ | 72,560,914 | |
| | | | | | | | |
| |
| | | | *Non-income producing. §The aggregate amount of foreign securities fair valued pursuant to a systematic valuation model as a percent of net assets was 0.98%. ADR American Depositary Receipt. See Notes to Financial Statements. | |
54
At September 30, 2011, Wasatch Heritage Growth Fund’s investments, excluding short-term investments, were in the following countries:
| | | | |
| Country | | % | |
Brazil | | | 1.0 | |
Canada | | | 3.9 | |
India | | | 1.0 | |
Israel | | | 1.1 | |
United Kingdom | | | 0.9 | |
United States | | | 92.1 | |
| | | | |
TOTAL | | | 100.0 | % |
| | | | |
55
| | |
| WASATCH INTERNATIONAL GROWTH FUND (WAIGX) — Schedule of Investments | | |
|
|
|
| | | | | | | | |
| Shares | | | | | Value | |
| | | | | | | |
| | | | COMMON STOCKS 98.6% | | | | |
| | |
| | | | Aerospace & Defense 0.7% | | | | |
| | 110,491 | | | Kongsberg Gruppen ASA (Norway) | | $ | 1,918,673 | |
| | | | | | | | |
| | | | Agricultural Products 0.9% | | | | |
| | 1,229,400 | | | PT Astra Agro Lestari Tbk (Indonesia) | | | 2,664,271 | |
| | | | | | | | |
| | | | Apparel Retail 2.2% | | | | |
| | 204,220 | | | Cia. Hering (Brazil) | | | 3,420,181 | |
| | 310,160 | | | Truworths International Ltd.
(South Africa) | | | 2,705,340 | |
| | | | | | | | |
| | | | | | | 6,125,521 | |
| | | | | | | | |
| | | | Application Software 2.5% | | | | |
| | 194,662 | | | Computer Modelling Group Ltd. (Canada) | | | 2,490,581 | |
| | 103,855 | | | Fidessa Group plc (United Kingdom) | | | 2,552,015 | |
| | 13,407 | | | SimCorp A/S (Denmark) | | | 1,931,505 | |
| | | | | | | | |
| | | | | | | 6,974,101 | |
| | | | | | | | |
| | | | Asset Management & Custody Banks 3.6% | | | | |
| | 1,012,665 | | | Aberdeen Asset Management plc
(United Kingdom) | | | 2,721,691 | |
| | 220,645 | | | CETIP S.A. (Brazil) | | | 2,764,680 | |
| | 15,070 | | | Partners Group Holding AG (Switzerland) | | | 2,488,346 | |
| | 20,210 | | | VZ Holding AG (Switzerland) | | | 2,029,838 | |
| | | | | | | | |
| | | | | | | 10,004,555 | |
| | | | | | | | |
| | | | Auto Parts & Equipment 1.1% | | | | |
| | 21,195 | | | Bosch Ltd. (India) | | | 3,041,485 | |
| | | | | | | | |
| | | | Automotive Retail 1.1% | | | | |
| | 380,415 | | | ARB Corp. Ltd. (Australia) | | | 2,983,481 | |
| | | | | | | | |
| | | | Biotechnology 2.0% | | | | |
| | 983,250 | | | Abcam plc (United Kingdom) | | | 5,568,892 | |
| | | | | | | | |
| | | | Brewers 1.1% | | | | |
| | 275,590 | | | Anadolu Efes Biracilik ve Malt Sanayii A.S. (Turkey) | | | 3,186,899 | |
| | | | | | | | |
| | | | Casinos & Gaming 3.1% | | | | |
| | 2,846,430 | | | Galaxy Entertainment Group Ltd.*
(Hong Kong) | | | 4,114,132 | |
| | 2,626,370 | | | SJM Holdings Ltd. (Hong Kong) | | | 4,652,897 | |
| | | | | | | | |
| | | | | | | 8,767,029 | |
| | | | | | | | |
| | | | Catalog Retail 1.4% | | | | |
| | 32,755 | | | Hyundai Home Shopping Network Corp. (Korea) | | | 3,800,153 | |
| | | | | | | | |
| | | | Coal & Consumable Fuels 3.1% | | | | |
| | 2,503,700 | | | PT Harum Energy Tbk (Indonesia) | | | 1,996,226 | |
| | 809,245 | | | PT Indo Tambangraya Megah (Indonesia) | | | 3,565,980 | |
| | 1,721,385 | | | PT Tambang Batubara Bukit Asam Tbk (Indonesia) | | | 3,252,681 | |
| | | | | | | | |
| | | | | | | 8,814,887 | |
| | | | | | | | |
| | | | Commodity Chemicals 0.8% | | | | |
| | 1,030,100 | | | TSRC Corp. (Taiwan) | | | 2,247,939 | |
| | | | | | | | |
| | | | Construction & Engineering 1.3% | | | | |
| | 516,640 | | | Kentz Corp. Ltd. (Ireland) | | | 3,638,432 | |
| | | | | | | | |
| | | | Construction Materials 3.1% | | | | |
| | 2,545,000 | | | PT Indocement Tunggal Prakarsa Tbk (Indonesia) | | | 4,007,503 | |
| | 4,900,335 | | | PT Semen Gresik (Persero) Tbk (Indonesia) | | | 4,586,483 | |
| | | | | | | | |
| | | | | | | 8,593,986 | |
| | | | | | | | |
| | | | | | | | |
| Shares | | | | | Value | |
| | | | | | | |
| | | | Consumer Finance 3.0% | | | | |
| | 1,567,200 | | | Banco Compartamos S.A.B. de C.V. (Mexico) | | $ | 2,121,125 | |
| | 481,100 | | | Mahindra & Mahindra Financial Services Ltd. (India) | | | 6,412,459 | |
| | | | | | | | |
| | | | | | | 8,533,584 | |
| | | | | | | | |
| | | | Data Processing & Outsourced Services 3.7% | | | | |
| | 825 | | | GMO Payment Gateway, Inc. (Japan) | | | 3,858,767 | |
| | 425,418 | | | Wirecard AG (Germany) | | | 6,535,959 | |
| | | | | | | | |
| | | | | | | 10,394,726 | |
| | | | | | | | |
| | | | Department Stores 1.6% | | | | |
| | 87,500 | | | Lojas Renner S.A. (Brazil) | | | 2,363,037 | |
| | 193,700 | | | Marisa Lojas S.A. (Brazil) | | | 2,240,124 | |
| | | | | | | | |
| | | | | | | 4,603,161 | |
| | | | | | | | |
| | | | Distributors 1.4% | | | | |
| | 3,910,607 | | | Dah Chong Hong Holdings Ltd.
(Hong Kong) | | | 3,999,059 | |
| | | | | | | | |
| | | | Diversified Banks 2.8% | | | | |
| | 688,805 | | | Allahabad Bank Ltd. (India) | | | 2,206,177 | |
| | 300,017 | | | Bank of N.T. Butterfield & Son Ltd. (The)* (Bermuda) | | | 414,023 | |
| | 10,147,710 | | | PT Bank Tabungan Pensiunan Nasional Tbk* (Indonesia) | | | 3,804,710 | |
| | 737,793 | | | Security Bank Corp. (Philippines) | | | 1,459,190 | |
| | | | | | | | |
| | | | | | | 7,884,100 | |
| | | | | | | | |
| | | | Electronic Components 0.9% | | | | |
| | 314,122 | | | Partron Co. Ltd. (Korea) | | | 2,432,684 | |
| | | | | | | | |
| | | | Electronic Equipment & Instruments 2.6% | | | | |
| | 1,462,520 | | | Chroma ATE, Inc. (Taiwan) | | | 2,996,784 | |
| | 550,463 | | | Halma plc (United Kingdom) | | | 2,700,425 | |
| | 121,085 | | | Oxford Instruments plc (United Kingdom) | | | 1,523,993 | |
| | | | | | | | |
| | | | | | | 7,221,202 | |
| | | | | | | | |
| | | | Fertilizers & Agricultural Chemicals 0.6% | | | | |
| | 500,900 | | | Rallis India Ltd. (India) | | | 1,761,598 | |
| | | | | | | | |
| | | | Food Retail 3.5% | | | | |
| | 102,270 | | | BIM Birlesik Magazalar AS (Turkey) | | | 2,820,666 | |
| | 1,682,000 | | | CP ALL Public Co. Ltd.*** (Thailand) | | | 2,597,265 | |
| | 263,590 | | | Eurocash S.A. (Poland) | | | 1,880,228 | |
| | 182,500 | | | Shoprite Holdings Ltd. (South Africa) | | | 2,564,244 | |
| | | | | | | | |
| | | | | | | 9,862,403 | |
| | | | | | | | |
| | | | General Merchandise Stores 0.8% | | | | |
| | 499,940 | | | Clicks Group Ltd. (South Africa) | | | 2,324,899 | |
| | | | | | | | |
| | | | Gold 2.1% | | | | |
| | 320,450 | | | Koza Altin Isletmeleri AS (Turkey) | | | 3,820,548 | |
| | 319,665 | | | Medusa Mining Ltd. (Australia) | | | 2,102,461 | |
| | | | | | | | |
| | | | | | | 5,923,009 | |
| | | | | | | | |
| | | | Health Care Equipment 4.1% | | | | |
| | 78,298 | | | DiaSorin S.p.A. (Italy) | | | 2,902,413 | |
| | 106,780 | | | Elekta AB, Class B (Sweden) | | | 4,045,256 | |
| | 276,896 | | | Immunodiagnostic Systems Holdings plc (United Kingdom) | | | 4,463,855 | |
| | | | | | | | |
| | | | | | | 11,411,524 | |
| | | | | | | | |
| | | | Health Care Services 0.6% | | | | |
| | 180,645 | | | Diagnosticos da America S.A. (Brazil) | | | 1,540,130 | |
| | | | | | | | |
56
| | | | | | | | |
| Shares | | | | | Value | |
| | | | | | | |
| | | | Health Care Supplies 1.0% | | | | |
| | 224,005 | | | St. Shine Optical Co. Ltd. (Taiwan) | | $ | 2,734,346 | |
| | | | | | | | |
| | | | Health Care Technology 0.2% | | | | |
| | 317,236 | | | RaySearch Laboratories AB (Sweden) | | | 649,953 | |
| | | | | | | | |
| | | | Human Resource & Employment Services 0.9% | | | | |
| | 444,845 | | | Michael Page International plc
(United Kingdom) | | | 2,544,627 | |
| | | | | | | | |
| | | | Hypermarkets & Super Centers 1.0% | | | | |
| | 262,100 | | | Big C Supercenter Public Co. Ltd. NVDR (Thailand) | | | 948,252 | |
| | 544,660 | | | Big C Supercenter Public Co. Ltd.*** (Thailand) | | | 1,970,526 | |
| | | | | | | | |
| | | | | | | 2,918,778 | |
| | | | | | | | |
| | | | Industrial Gases 0.6% | | | | |
| | 30,690 | | | OCI Materials Co. Ltd. (Korea) | | | 1,769,529 | |
| | | | | | | | |
| | | | Industrial Machinery 4.6% | | | | |
| | 46,490 | | | Andritz AG (Austria) | | | 3,801,030 | |
| | 73,740 | | | Konecranes Oyj (Finland) | | | 1,488,238 | |
| | 316,429 | | | Rotork plc (United Kingdom) | | | 7,643,996 | |
| | | | | | | | |
| | | | | | | 12,933,264 | |
| | | | | | | | |
| | | | Internet Retail 3.6% | | | | |
| | 421,846 | | | CDON Group AB* (Sweden) | | | 1,556,661 | |
| | 216,030 | | | Start Today Co. Ltd. (Japan) | | | 4,686,982 | |
| | 303,814 | | | Yoox S.p.A.* (Italy) | | | 3,911,654 | |
| | | | | | | | |
| | | | | | | 10,155,297 | |
| | | | | | | | |
| | | | Internet Software & Services 1.4% | | | | |
| | 97,800 | | | Kakaku.com, Inc. (Japan) | | | 4,019,710 | |
| | | | | | | | |
| | |
| | | | IT Consulting & Other Services 0.4% | | | | |
| | 1,873,000 | | | CSE Global Ltd. (Singapore) | | | 1,173,967 | |
| | | | | | | | |
| | | | Marine Ports & Services 2.2% | | | | |
| | 3,999,600 | | | International Container Terminal Services, Inc. (Philippines) | | | 4,243,092 | |
| | 146,800 | | | Santos Brasil Participacoes S.A.** (Brazil) | | | 1,878,539 | |
| | | | | | | | |
| | | | | | | 6,121,631 | |
| | | | | | | | |
| | | | Multi-Sector Holdings 1.7% | | | | |
| | 5,453,990 | | | First Pacific Co. Ltd. (Hong Kong) | | | 4,813,825 | |
| | | | | | | | |
| | | | Oil & Gas Equipment & Services 2.0% | | | | |
| | 16,025 | | | Core Laboratories N.V. | | | 1,439,526 | |
| | 107,135 | | | ShawCor Ltd., Class A (Canada) | | | 2,505,618 | |
| | 90,140 | | | TGS-NOPEC Geophysical Co. ASA (Norway) | | | 1,682,083 | |
| | | | | | | | |
| | | | | | | 5,627,227 | |
| | | | | | | | |
| | | | Oil & Gas Exploration &
Production 3.8% | | | | |
| | 1,174,300 | | | Afren plc* (Nigeria) | | | 1,478,610 | |
| | 341,056 | | | Exillon Energy plc* (United Arab Emirates) | | | 1,073,877 | |
| | 378,245 | | | Gran Tierra Energy, Inc.* (Colombia) | | | 1,804,229 | |
| | 82,030 | | | Petrominerales Ltd. (Colombia) | | | 1,624,356 | |
| | 1,878,918 | | | PetroNeft Resources plc*
(United Kingdom) | | | 654,326 | |
| | 274,496 | | | Premier Oil plc* (United Kingdom) | | | 1,481,112 | |
| | 148,940 | | | Transglobe Energy Corp.* (Canada) | | | 1,208,357 | |
| | 182,385 | | | Zhaikmunai L.P. GDR* (Kazakhstan) | | | 1,341,886 | |
| | | | | | | | |
| | | | | | | 10,666,753 | |
| | | | | | | | |
| | | | | | | | |
| Shares | | | | | Value | |
| | | | | | | |
| | | | Packaged Foods & Meats 1.9% | | | | |
| | 62,642 | | | GlaxoSmithKline Consumer Healthcare Ltd. (India) | | $ | 3,031,374 | |
| | 537,580 | | | Hsu Fu Chi International Ltd. (China) | | | 1,729,402 | |
| | 836,637 | | | Vitasoy International Holdings Ltd. (Hong Kong) | | | 533,577 | |
| | | | | | | | |
| | | | | | | 5,294,353 | |
| | | | | | | | |
| | | | Personal Products 0.5% | | | | |
| | 175,205 | | | Godrej Consumer Products Ltd. (India) | | | 1,423,077 | |
| | | | | | | | |
| | | | Pharmaceuticals 1.2% | | | | |
| | 9,376,810 | | | PT Kalbe Farma Tbk (Indonesia) | | | 3,433,031 | |
| | | | | | | | |
| | | | Precious Metals & Minerals 0.6% | | | | |
| | 63,878 | | | Pan American Silver Corp. (Canada) | | | 1,733,419 | |
| | | | | | | | |
| | | | Publishing 2.2% | | | | |
| | 260,045 | | | REA Group Ltd. (Australia) | | | 2,926,804 | |
| | 177,420 | | | Rightmove plc (United Kingdom) | | | 3,297,422 | |
| | | | | | | | |
| | | | | | | 6,224,226 | |
| | | | | | | | |
| | | | Research & Consulting Services 2.3% | | | | |
| | 147,525 | | | AF AB, Class B (Sweden) | | | 2,155,994 | |
| | 107,815 | | | Campbell Brothers Ltd. (Australia) | | | 4,316,280 | |
| | | | | | | | |
| | | | | | | 6,472,274 | |
| | | | | | | | |
| | | | Specialized Finance 1.4% | | | | |
| | 238,245 | | | JSE Ltd. (South Africa) | | | 1,898,464 | |
| | 175,900 | | | Oslo Bors VPS Holding ASA (Norway) | | | 2,080,337 | |
| | | | | | | | |
| | | | | | | 3,978,801 | |
| | | | | | | | |
| | | | Specialty Chemicals 1.0% | | | | |
| | 86,560 | | | TechnoSemiChem Co. Ltd. (Korea) | | | 2,924,545 | |
| | | | | | | | |
| | | | Specialty Stores 1.5% | | | | |
| | 1,332,970 | | | L’Occitane International S.A.* (Luxembourg) | | | 2,688,267 | |
| | 2,575,000 | | | Sa Sa International Holdings Ltd.
(Hong Kong) | | | 1,526,963 | |
| | | | | | | | |
| | | | | | | 4,215,230 | |
| | | | | | | | |
| | | | Steel 0.6% | | | | |
| | 297,423 | | | MOIL Ltd. (India) | | | 1,695,379 | |
| | | | | | | | |
| | | | Thrifts & Mortgage Finance 4.1% | | | | |
| | 725,370 | | | Dewan Housing Finance Corp. Ltd. (India) | | | 3,462,758 | |
| | 631,569 | | | Gruh Finance Ltd. (India) | | | 6,318,914 | |
| | 44,355 | | | Home Capital Group, Inc. (Canada) | | | 1,858,962 | |
| | | | | | | | |
| | | | | | | 11,640,634 | |
| | | | | | | | |
| | | | Trading Companies &
Distributors 2.2% | | | | |
| | 178,555 | | | iMarketKorea, Inc. (Korea) | | | 2,318,656 | |
| | 379,880 | | | MonotaRO Co. Ltd. (Japan) | | | 3,820,267 | |
| | | | | | | | |
| | | | | | | 6,138,923 | |
| | | | | | | | |
| | |
| | | | Total Common Stocks
(cost $267,943,775) | | | 277,525,182 | |
| | | | | | | | |
| | |
| | | | PREFERRED STOCKS 0.6% | | | | |
| | |
| | | | Diversified Banks 0.6% | | | | |
| | 190,000 | | | Banco do Estado do Rio Grande do Sul S.A., Series B Pfd. (Brazil) | | | 1,620,901 | |
| | 74,058 | | | Bank of N.T. Butterfield & Son Ltd. (The) Pfd.* *** (Bermuda) | | | 102,200 | |
| | | | | | | | |
| | | | | | | 1,723,101 | |
| | | | | | | | |
| | |
| | | | Total Preferred Stocks
(cost $1,560,191) | | | 1,723,101 | |
| | | | | | | | |
57
| | |
| WASATCH INTERNATIONAL GROWTH FUND (WAIGX) — Schedule of Investments (continued) | | SEPTEMBER 30, 2011 |
|
|
|
| | | | | | | | |
| | |
Principal
Amount | | | | | Value | |
| | | | | | | |
| | |
| | | | SHORT-TERM INVESTMENTS 0.5% | | | | |
| | |
| | | | Repurchase Agreement 0.5% | | | | |
| | $1,274,075 | | | Repurchase Agreement dated 9/30/11, 0.01% due 10/3/11 with State Street Bank and Trust Co. collateralized by $1,310,000 of United States Treasury Notes 1.375% due 9/30/18; value: $1,301,813; repurchase proceeds: $1,274,076 (cost $1,274,075) | | $ | 1,274,075 | |
| | | | | | | | |
| | |
| | | | Total Short-Term Investments
(cost $1,274,075) | | | 1,274,075 | |
| | | | | | | | |
| | |
| | | | Total Investments
(cost $270,778,041) 99.7%§ | | | 280,522,358 | |
| | |
| | | | Other Assets less Liabilities 0.3% | | | 958,756 | |
| | | | | | | | |
| | |
| | | | NET ASSETS 100.0% | | $ | 281,481,114 | |
| | | | | | | | |
| |
| | | | *Non-income producing. **Common units. ***Security was fair valued under procedures adopted by the Board of Trustees (see Note 15). §The aggregate amount of foreign securities fair valued pursuant to a systematic valuation model as a percent of net assets was 79.09%. GDR Global Depositary Receipt. NVDR Non-Voting Depositary Receipt. See Notes to Financial Statements. | |
At September 30, 2011, Wasatch International Growth Fund’s investments, excluding short-term investments, were in the following countries:
| | | | |
| Country | | % | |
Australia | | | 4.4 | |
Austria | | | 1.4 | |
Bermuda | | | 0.2 | |
Brazil | | | 5.7 | |
Canada | | | 3.5 | |
China | | | 0.6 | |
Colombia | | | 1.2 | |
Denmark | | | 0.7 | |
Finland | | | 0.5 | |
Germany | | | 2.3 | |
Hong Kong | | | 7.0 | |
India | | | 10.5 | |
Indonesia | | | 9.8 | |
Ireland | | | 1.3 | |
Italy | | | 2.4 | |
Japan | | | 5.9 | |
Kazakhstan | | | 0.5 | |
Korea | | | 4.8 | |
Luxembourg | | | 1.0 | |
Mexico | | | 0.8 | |
Nigeria | | | 0.5 | |
Norway | | | 2.0 | |
Philippines | | | 2.0 | |
Poland | | | 0.7 | |
Singapore | | | 0.4 | |
South Africa | | | 3.4 | |
Sweden | | | 3.0 | |
Switzerland | | | 1.6 | |
Taiwan | | | 2.9 | |
Thailand | | | 2.0 | |
Turkey | | | 3.5 | |
United Arab Emirates | | | 0.4 | |
United Kingdom | | | 12.6 | |
United States | | | 0.5 | |
| | | | |
TOTAL | | | 100.0 | % |
| | | | |
58
| | |
| WASATCH INTERNATIONAL OPPORTUNITIES FUND (WAIOX) — Schedule of Investments | | SEPTEMBER 30, 2011 |
|
|
|
| | | | | | | | |
| Shares | | | | | Value | |
| | | | | | | |
| | |
| | | | COMMON STOCKS 89.0% | | | | |
| | |
| | | | Advertising 0.6% | | | | |
| | 19,406 | | | 1000mercis (France) | | $ | 964,435 | |
| | | | | | | | |
| | | | Agricultural Products 0.5% | | | | |
| | 2,250,000 | | | PT Sampoerna Agro Tbk (Indonesia) | | | 735,013 | |
| | | | | | | | |
| | | | Air Freight & Logistics 1.8% | | | | |
| | 3,570,901 | | | Aramex PJSC (United Arab Emirates) | | | 1,731,908 | |
| | 927,084 | | | Goodpack Ltd. (Singapore) | | | 1,074,477 | |
| | | | | | | | |
| | | | | | | 2,806,385 | |
| | | | | | | | |
| | | | Apparel Retail 1.7% | | | | |
| | 60,000 | | | Cia. Hering (Brazil) | | | 1,004,852 | |
| | 1,415,905 | | | IT Ltd. (Hong Kong) | | | 875,735 | |
| | 2,435,225 | | | Padini Holdings Berhad (Malaysia) | | | 655,196 | |
| | | | | | | | |
| | | | | | | 2,535,783 | |
| | | | | | | | |
| | | | Apparel, Accessories & Luxury
Goods 4.8% | | | | |
| | 235,108 | | | China Lilang Ltd. (China) | | | 229,530 | |
| | 36,908 | | | Gerry Weber International AG (Germany) | | | 1,054,591 | |
| | 44,909 | | | LG Fashion Corp. (Korea) | | | 1,521,159 | |
| | 142,870 | | | Lovable Lingerie Ltd. (India) | | | 1,322,117 | |
| | 188,003 | | | Ports Design Ltd. (China) | | | 291,036 | |
| | 145,300 | | | Restoque Comercio e Confeccoes de Roupas S.A.* (Brazil) | | | 1,615,305 | |
| | 109,025 | | | Ted Baker plc (United Kingdom) | | | 1,176,330 | |
| | | | | | | | |
| | | | | | | 7,210,068 | |
| | | | | | | | |
| | | | Application Software 0.5% | | | | |
| | 774,240 | | | Technology One Ltd. (Australia) | | | 794,114 | |
| | | | | | | | |
| | | | Auto Parts & Equipment 1.2% | | | | |
| | 69,407 | | | WABCO-TVS India Ltd. (India) | | | 1,809,444 | |
| | | | | | | | |
| | | | Biotechnology 1.1% | | | | |
| | 291,620 | | | Abcam plc (United Kingdom) | | | 1,651,666 | |
| | | | | | | | |
| | | | Brewers 1.9% | | | | |
| | 362,475 | | | Carlsberg Brewery Malaysia Berhad (Malaysia) | | | 728,616 | |
| | 102,990 | | | Olvi Oyj, Class A (Finland) | | | 2,109,561 | |
| | | | | | | | |
| | | | | | | 2,838,177 | |
| | | | | | | | |
| | | | Building Products 0.9% | | | | |
| | 816,500 | | | Dynasty Ceramic Public Co. Ltd.*** (Thailand) | | | 1,339,601 | |
| | | | | | | | |
| | | | Catalog Retail 1.1% | | | | |
| | 14,240 | | | Hyundai Home Shopping Network Corp. (Korea) | | | 1,652,089 | |
| | | | | | | | |
| | | | Coal & Consumable Fuels 1.3% | | | | |
| | 3,842,115 | | | PT Resource Alam Indonesia Tbk (Indonesia) | | | 2,032,208 | |
| | | | | | | | |
| | | | Commodity Chemicals 2.8% | | | | |
| | 848,568 | | | Berger Paints India Ltd. (India) | | | 1,712,609 | |
| | 114,465 | | | Tikkurila Oyj (Finland) | | | 1,952,749 | |
| | 48,810 | | | Tokai Carbon Korea Co. Ltd. (Korea) | | | 531,473 | |
| | | | | | | | |
| | | | | | | 4,196,831 | |
| | | | | | | | |
| | | | Computer Hardware 0.5% | | | | |
| | 276,006 | | | Advantech Co. Ltd. (Taiwan) | | | 725,021 | |
| | | | | | | | |
| | | | Construction & Engineering 2.0% | | | | |
| | 190,615 | | | Kentz Corp. Ltd. (Ireland) | | | 1,342,404 | |
| | 144,478 | | | Lycopodium Ltd. (Australia) | | | 783,474 | |
| | 499,660 | | | Shaft Sinkers Holdings plc* (South Africa) | | | 969,734 | |
| | | | | | | | |
| | | | | | | 3,095,612 | |
| | | | | | | | |
| | | | | | | | |
| Shares | | | | | Value | |
| | | | | | | |
| | | | Construction & Farm Machinery & Heavy Trucks 1.9% | | | | |
| | 32,345 | | | Eicher Motors Ltd. (India) | | $ | 1,056,164 | |
| | 18,305 | | | Faiveley Transport (France) | | | 1,102,640 | |
| | 68,308 | | | VST Tillers Tractors Ltd. (India) | | | 734,293 | |
| | | | | | | | |
| | | | | | | 2,893,097 | |
| | | | | | | | |
| | | | Construction Materials 0.9% | | | | |
| | 6,997,973 | | | Diamond Building Products Public Co. Ltd.*** (Thailand) | | | 1,339,487 | |
| | | | | | | | |
| | | | Data Processing & Outsourced Services 1.1% | | | | |
| | 108,185 | | | Wirecard AG (Germany) | | | 1,662,113 | |
| | | | | | | | |
| | | | Distributors 0.7% | | | | |
| | 2,382,000 | | | PT Sumber Alfaria Trijaya Tbk (Indonesia) | | | 995,708 | |
| | | | | | | | |
| | | | Diversified Banks 1.1% | | | | |
| | 3,713,575 | | | South Indian Bank Ltd. (India) | | | 1,683,238 | |
| | | | | | | | |
| | | | Diversified Metals & Mining 0.4% | | | | |
| | 580,000 | | | Metorex Ltd.* (South Africa) | | | 573,987 | |
| | | | | | | | |
| | | | Electrical Components &
Equipment 0.6% | | | | |
| | 204,900 | | | Amara Raja Batteries Ltd. (India) | | | 876,787 | |
| | | | | | | | |
| | | | Electronic Equipment &
Instruments 1.5% | | | | |
| | 39,500 | | | Beijer Electronics AB (Sweden) | | | 330,449 | |
| | 7,155 | | | Honeywell Automation India Ltd. (India) | | | 382,023 | |
| | 121,960 | | | Oxford Instruments plc (United Kingdom) | | | 1,535,006 | |
| | | | | | | | |
| | | | | | | 2,247,478 | |
| | | | | | | | |
| | | | Environmental & Facilities
Services 0.8% | | | | |
| | 465,656 | | | RPS Group plc (United Kingdom) | | | 1,188,930 | |
| | | | | | | | |
| | | | Food Retail 0.4% | | | | |
| | 1,595,676 | | | BreadTalk Group Ltd. (Singapore) | | | 575,078 | |
| | | | | | | | |
| | | | Footwear 1.7% | | | | |
| | 616,979 | | | Anta Sports Products Ltd. (China) | | | 712,912 | |
| | 139,320 | | | Bata India Ltd. (India) | | | 1,841,850 | |
| | | | | | | | |
| | | | | | | 2,554,762 | |
| | | | | | | | |
| | | | General Merchandise Stores 1.8% | | | | |
| | 5,701,500 | | | PT Mitra Adiperkasa Tbk (Indonesia) | | | 2,760,616 | |
| | | | | | | | |
| | | | Gold 1.9% | | | | |
| | 475,755 | | | Highland Gold Mining Ltd.*
(United Kingdom) | | | 1,190,843 | |
| | 139,704 | | | Koza Altin Isletmeleri AS (Turkey) | | | 1,665,614 | |
| | | | | | | | |
| | | | | | | 2,856,457 | |
| | | | | | | | |
| | | | Health Care Equipment 1.2% | | | | |
| | 117,472 | | | Immunodiagnostic Systems Holdings plc (United Kingdom) | | | 1,893,773 | |
| | | | | | | | |
| | | | Health Care Facilities 1.9% | | | | |
| | 1,719,730 | | | KPJ Healthcare Berhad (Malaysia) | | | 2,143,174 | |
| | 469,385 | | | Raffles Medical Group Ltd. (Singapore) | | | 801,730 | |
| | | | | | | | |
| | | | | | | 2,944,904 | |
| | | | | | | | |
| | | | Health Care Supplies 0.8% | | | | |
| | 19,706 | | | Sartorius Stedim Biotech (France) | | | 1,195,797 | |
| | | | | | | | |
| | | | Health Care Technology 0.6% | | | | |
| | 107,351 | | | Craneware plc (United Kingdom) | | | 982,148 | |
| | | | | | | | |
| | | | Homefurnishing Retail 0.5% | | | | |
| | 81,205 | | | Lewis Group Ltd. (South Africa) | | | 703,898 | |
| | | | | | | | |
59
| | |
| WASATCH INTERNATIONAL OPPORTUNITIES FUND (WAIOX) — Schedule of Investments (continued) | | |
|
|
|
| | | | | | | | |
| Shares | | | | | Value | |
| | | | | | | |
| | | | Industrial Gases 0.4% | | | | |
| | 102,640 | | | SOL S.p.A. (Italy) | | $ | 662,841 | |
| | | | | | | | |
| | | | Industrial Machinery 3.7% | | | | |
| | 3,726 | | | Burckhardt Compression Holding AG (Switzerland) | | | 735,755 | |
| | 39,200 | | | FAG Bearings India Ltd. (India) | | | 935,516 | |
| | 134,855 | | | Hy-Lok Corp. (Korea) | | | 1,737,301 | |
| | 26,256 | | | Kennametal India Ltd. (India) | | | 421,457 | |
| | 132,047 | | | SKF India Ltd. (India) | | | 1,804,904 | |
| | | | | | | | |
| | | | | | | 5,634,933 | |
| | | | | | | | |
| | | | Internet Retail 2.4% | | | | |
| | 289,320 | | | CDON Group AB* (Sweden) | | | 1,067,624 | |
| | 45,752 | | | Start Today Co. Ltd. (Japan) | | | 992,635 | |
| | 117,608 | | | Yoox S.p.A.* (Italy) | | | 1,514,222 | |
| | | | | | | | |
| | | | | | | 3,574,481 | |
| | | | | | | | |
| | | | Internet Software & Services 4.0% | | | | |
| | 18,647 | | | Daum Communications Corp. (Korea) | | | 2,236,040 | |
| | 76,000 | | | Kakaku.com, Inc. (Japan) | | | 3,123,701 | |
| | 1,446,680 | | | Pacific Online Ltd. (China) | | | 758,388 | |
| | | | | | | | |
| | | | | | | 6,118,129 | |
| | | | | | | | |
| | | | IT Consulting & Other Services 3.9% | | | | |
| | 73,692 | | | CMC Ltd. (India) | | | 1,242,916 | |
| | 1,299,538 | | | CSE Global Ltd. (Singapore) | | | 814,530 | |
| | 580,525 | | | EOH Holdings Ltd. (South Africa) | | | 1,630,189 | |
| | 279,000 | | | HiQ International AB* (Sweden) | | | 1,039,109 | |
| | 3,935,000 | | | PT Astra Graphia Tbk (Indonesia) | | | 438,373 | |
| | 130,420 | | | SMS Management & Technology Ltd. (Australia) | | | 680,487 | |
| | | | | | | | |
| | | | | | | 5,845,604 | |
| | | | | | | | |
| | | | Oil & Gas Equipment & Services 0.6% | | | | |
| | 71,134 | | | Pason Systems, Inc. (Canada) | | | 910,800 | |
| | | | | | | | |
| | | | Oil & Gas Exploration &
Production 4.3% | | | | |
| | 766,591 | | | Afren plc* (Nigeria) | | | 965,247 | |
| | 205,905 | | | Coastal Energy Co.* (United Kingdom) | | | 1,900,113 | |
| | 190,095 | | | Exillon Energy plc* (United Arab Emirates) | | | 598,549 | |
| | 269,711 | | | Gran Tierra Energy, Inc.* (Colombia) | | | 1,286,521 | |
| | 1,497,446 | | | PetroNeft Resources plc* (United Kingdom) | | | 521,480 | |
| | 149,050 | | | Transglobe Energy Corp.* (Canada) | | | 1,209,249 | |
| | | | | | | | |
| | | | | | | 6,481,159 | |
| | | | | | | | |
| | | | Packaged Foods & Meats 5.1% | | | | |
| | 455,000 | | | Biostime International Holdings Ltd. (China) | | | 756,137 | |
| | 400,000 | | | Grupo Herdez S.A.B. (Mexico) | | | 707,402 | |
| | 183,660 | | | Pinar Sut Mamulleri Sanayii A.S. (Turkey) | | | 1,438,836 | |
| | 2,642,000 | | | PT Nippon Indosari Corpindo Tbk (Indonesia) | | | 889,175 | |
| | 594,537 | | | Standard Foods Corp. (Taiwan) | | | 1,603,366 | |
| | 1,269,000 | | | Super Group Ltd. (Singapore) | | | 1,518,496 | |
| | 421,363 | | | Vitasoy International Holdings Ltd. (Hong Kong) | | | 268,730 | |
| | 58,000 | | | Zydus Wellness Ltd. (India) | | | 631,893 | |
| | | | | | | | |
| | | | | | | 7,814,035 | |
| | | | | | | | |
| | | | | | | | |
| Shares | | | | | Value | |
| | | | | | | |
| | | | Regional Banks 0.7% | | | | |
| | 42,577 | | | Canadian Western Bank (Canada) | | $ | 1,051,021 | |
| | | | | | | | |
| | | | Research & Consulting Services 1.9% | | | | |
| | 90,200 | | | AF AB, Class B (Sweden) | | | 1,318,222 | |
| | 19,573 | | | Bertrandt AG (Germany) | | | 934,652 | |
| | 45,987 | | | eClerx Services Ltd. (India) | | | 677,388 | |
| | | | | | | | |
| | | | | | | 2,930,262 | |
| | | | | | | | |
| | | | Restaurants 2.1% | | | | |
| | 136,000 | | | Famous Brands Ltd. (South Africa) | | | 715,685 | |
| | 1,115,444 | | | KFC Holdings Malaysia Berhad (Malaysia) | | | 1,149,355 | |
| | 72,900 | | | S&P Syndicate Public Co. Ltd.*** (Thailand) | | | 164,163 | |
| | 16,665 | | | Shinsegae Food Co. Ltd. (Korea) | | | 1,092,235 | |
| | | | | | | | |
| | | | | | | 3,121,438 | |
| | | | | | | | |
| | | | Semiconductor Equipment 0.7% | | | | |
| | 55,410 | | | Koh Young Technology, Inc. (Korea) | | | 1,084,106 | |
| | | | | | | | |
| | | | Semiconductors 2.1% | | | | |
| | 81,192 | | | Hana Micron, Inc. (Korea) | | | 553,498 | |
| | 104,408 | | | Melexis N.V. (Belgium) | | | 1,272,519 | |
| | 638,531 | | | Sporton International, Inc. (Taiwan) | | | 1,320,811 | |
| | | | | | | | |
| | | | | | | 3,146,828 | |
| | | | | | | | |
| | | | Specialized Finance 2.5% | | | | |
| | 84,107 | | | JSE Ltd. (South Africa) | | | 670,210 | |
| | 132,600 | | | Oslo Bors VPS Holding ASA (Norway) | | | 1,568,235 | |
| | 117,770 | | | Warsaw Stock Exchange (Poland) | | | 1,506,287 | |
| | | | | | | | |
| | | | | | | 3,744,732 | |
| | | | | | | | |
| | | | Specialty Chemicals 2.0% | | | | |
| | 656,385 | | | DuluxGroup Ltd. (Australia) | | | 1,589,233 | |
| | 44,609 | | | TechnoSemiChem Co. Ltd. (Korea) | | | 1,507,175 | |
| | | | | | | | |
| | | | | | | 3,096,408 | |
| | | | | | | | |
| | | | Steel 0.5% | | | | |
| | 127,344 | | | MOIL Ltd. (India) | | | 725,890 | |
| | | | | | | | |
| | | | Thrifts & Mortgage Finance 1.7% | | | | |
| | 346,704 | | | Dewan Housing Finance Corp. Ltd. (India) | | | 1,655,089 | |
| | 23,629 | | | Home Capital Group, Inc. (Canada) | | | 990,315 | |
| | | | | | | | |
| | | | | | | 2,645,404 | |
| | | | | | | | |
| | | | Tires & Rubber 0.8% | | | | |
| | 199,183 | | | Goodyear India Ltd. (India) | | | 1,202,491 | |
| | | | | | | | |
| | | | Tobacco 0.6% | | | | |
| | 13,669 | | | Godfrey Phillips India Ltd. (India) | | | 937,025 | |
| | | | | | | | |
| | | | Trading Companies & Distributors 5.7% | | | | |
| | 94,628 | | | iMarketKorea, Inc. (Korea) | | | 1,228,808 | |
| | 33,727 | | | Indutrade AB (Sweden) | | | 808,707 | |
| | 305,460 | | | MonotaRO Co. Ltd. (Japan) | | | 3,071,861 | |
| | 2,507,500 | | | PT Hexindo Adiperkasa Tbk (Indonesia) | | | 2,082,679 | |
| | 8,779 | | | Thermador Groupe (France) | | | 1,384,399 | |
| | | | | | | | |
| | | | | | | 8,576,454 | |
| | | | | | | | |
| | | | Trucking 0.8% | | | | |
| | 113,766 | | | Tegma Gestao Logistica (Brazil) | | | 1,237,444 | |
| | | | | | | | |
| | |
| | | | Total Common Stocks
(cost $136,677,745) | | | 134,856,190 | |
| | | | | | | | |
60
| | | | | | | | |
Principal
Amount | | | | | Value | |
| | | | | | | |
| | |
| | | | SHORT-TERM INVESTMENTS 5.9% | | | | |
| | |
| | | | Repurchase Agreement 5.9% | | | | |
| | $8,991,949 | | | Repurchase Agreement dated 9/30/11, 0.01% due 10/3/11 with State Street Bank and Trust Co. collateralized by $8,165,000 of United States Treasury Notes 3.125% due 5/15/19; value: $9,175,419; repurchase proceeds: $8,991,956 (cost $8,991,949) | | $ | 8,991,949 | |
| | | | | | | | |
| | |
| | | | Total Short-Term Investments
(cost $8,991,949) | | | 8,991,949 | |
| | | | | | | | |
| | |
| | | | Total Investments
(cost $145,669,694) 94.9%§ | | | 143,848,139 | |
| | |
| | | | Other Assets less Liabilities 5.1% | | | 7,720,482 | |
| | | | | | | | |
| | |
| | | | NET ASSETS 100.0% | | $ | 151,568,621 | |
| | | | | | | | |
| |
| | | | *Non-income producing. ***Security was fair valued under procedures adopted by the Board of Trustees (see Note 15). §The aggregate amount of foreign securities fair valued pursuant to a systematic valuation model as a percent of net assets was 74.38%.
See Notes to Financial Statements. | |
At September 30, 2011, Wasatch International Opportunities Fund’s investments, excluding short-term investments, were in the following countries:
| | | | |
| Country | | % | |
Australia | | | 2.9 | |
Belgium | | | 0.9 | |
Brazil | | | 2.9 | |
Canada | | | 3.1 | |
China | | | 2.0 | |
Colombia | | | 1.0 | |
Finland | | | 3.0 | |
France | | | 3.4 | |
Germany | | | 2.7 | |
Hong Kong | | | 0.9 | |
India | | | 16.1 | |
Indonesia | | | 7.4 | |
Ireland | | | 1.0 | |
Italy | | | 1.6 | |
Japan | | | 5.3 | |
Korea | | | 9.7 | |
Malaysia | | | 3.5 | |
Mexico | | | 0.5 | |
Nigeria | | | 0.7 | |
Norway | | | 1.2 | |
Poland | | | 1.1 | |
Singapore | | | 3.6 | |
South Africa | | | 3.9 | |
Sweden | | | 3.4 | |
Switzerland | | | 0.5 | |
Taiwan | | | 2.7 | |
Thailand | | | 2.1 | |
Turkey | | | 2.3 | |
United Arab Emirates | | | 1.7 | |
United Kingdom | | | 8.9 | |
| | | | |
TOTAL | | | 100.0 | % |
| | | | |
61
| | |
WASATCH LARGE CAP VALUE FUND (FMIEX) — Schedule of Investments (formerly Wasatch-1st Source Income Equity Fund) | | |
|
|
|
| | | | | | | | |
| Shares | | | | | Value | |
| | | | | | | |
| | |
| | | | COMMON STOCKS 96.2% | | | | |
| | |
| | | | Aerospace & Defense 4.2% | | | | |
| | 355,000 | | | L-3 Communications Holdings, Inc. | | $ | 21,999,350 | |
| | 523,245 | | | Raytheon Co. | | | 21,385,023 | |
| | 398,000 | | | Rockwell Collins, Inc. | | | 20,998,480 | |
| | | | | | | | |
| | | | | | | 64,382,853 | |
| | | | | | | | |
| | | | Agricultural Products 1.6% | | | | |
| | 1,006,000 | | | Archer Daniels Midland Co. | | | 24,958,860 | |
| | | | | | | | |
| | | | Asset Management & Custody
Banks 2.4% | | | | |
| | 130,400 | | | BlackRock, Inc. | | | 19,300,504 | |
| | 495,000 | | | Northern Trust Corp. | | | 17,315,100 | |
| | | | | | | | |
| | | | | | | 36,615,604 | |
| | | | | | | | |
| | | | Auto Parts & Equipment 1.2% | | | | |
| | 730,000 | | | Johnson Controls, Inc. | | | 19,250,100 | |
| | | | | | | | |
| | | | Coal & Consumable Fuels 0.6% | | | | |
| | 487,350 | | | Cameco Corp. (Canada) | | | 8,928,252 | |
| | | | | | | | |
| | | | Communications Equipment 1.3% | | | | |
| | 575,083 | | | Harris Corp. | | | 19,650,586 | |
| | | | | | | | |
| | | | Computer & Electronics Retail 1.3% | | | | |
| | 891,000 | | | Best Buy Co., Inc. | | | 20,760,300 | |
| | | | | | | | |
| | | | Computer Hardware 1.0% | | | | |
| | 714,000 | | | Hewlett-Packard Co. | | | 16,029,300 | |
| | | | | | | | |
| | | | Construction & Engineering 1.1% | | | | |
| | 376,200 | | | Fluor Corp. | | | 17,512,110 | |
| | | | | | | | |
| | | | Construction & Farm Machinery & Heavy Trucks 1.0% | | | | |
| | 250,000 | | | Deere & Co. | | | 16,142,500 | |
| | | | | | | | |
| | | | Data Processing & Outsourced Services 1.1% | | | | |
| | 625,000 | | | Computer Sciences Corp. | | | 16,781,250 | |
| | | | | | | | |
| | | | Diversified Chemicals 0.9% | | | | |
| | 340,925 | | | E.I. du Pont de Nemours and Co. | | | 13,626,772 | |
| | | | | | | | |
| | | | Drug Retail 1.9% | | | | |
| | 700,000 | | | CVS Caremark Corp. | | | 23,506,000 | |
| | 191,570 | | | Walgreen Co. | | | 6,300,737 | |
| | | | | | | | |
| | | | | | | 29,806,737 | |
| | | | | | | | |
| | | | Electric Utilities 2.5% | | | | |
| | 973,000 | | | Duke Energy Corp. | | | 19,450,270 | |
| | 350,000 | | | NextEra Energy, Inc. | | | 18,907,000 | |
| | | | | | | | |
| | | | | | | 38,357,270 | |
| | | | | | | | |
| | | | Electrical Components &
Equipment 1.2% | | | | |
| | 440,000 | | | Emerson Electric Co. | | | 18,176,400 | |
| | | | | | | | |
| | | | Electronic Components 0.7% | | | | |
| | 857,300 | | | Corning, Inc. | | | 10,596,228 | |
| | | | | | | | |
| | | | Environmental & Facilities
Services 1.5% | | | | |
| | 725,190 | | | Waste Management, Inc. | | | 23,612,186 | |
| | | | | | | | |
| | | | Food Distributors 1.4% | | | | |
| | 841,440 | | | Sysco Corp. | | | 21,793,296 | |
| | | | | | | | |
| | | | Gold 1.7% | | | | |
| | 573,000 | | | Barrick Gold Corp. (Canada) | | | 26,730,450 | |
| | | | | | | | |
| | | | Health Care Distributors 1.5% | | | | |
| | 326,000 | | | McKesson Corp. | | | 23,700,200 | |
| | | | | | | | |
| | | | | | | | |
| Shares | | | | | Value | |
| | | | | | | |
| | | | Health Care Equipment 3.6% | | | | |
| | 196,000 | | | C. R. Bard, Inc. | | $ | 17,157,840 | |
| | 640,305 | | | Medtronic, Inc. | | | 21,283,738 | |
| | 313,405 | | | Zimmer Holdings, Inc.* | | | 16,767,168 | |
| | | | | | | | |
| | | | | | | 55,208,746 | |
| | | | | | | | |
| | | | Home Improvement Retail 1.5% | | | | |
| | 686,000 | | | Home Depot, Inc. (The) | | | 22,548,820 | |
| | | | | | | | |
| | | | Household Products 1.5% | | | | |
| | 330,000 | | | Kimberly-Clark Corp. | | | 23,433,300 | |
| | | | | | | | |
| | | | Hypermarkets & Super Centers 1.8% | | | | |
| | 534,280 | | | Wal-Mart Stores, Inc. | | | 27,729,132 | |
| | | | | | | | |
| | | | Industrial Machinery 1.3% | | | | |
| | 312,000 | | | Parker Hannifin Corp. | | | 19,696,560 | |
| | | | | | | | |
| | | | Insurance Brokers 1.4% | | | | |
| | 811,290 | | | Marsh & McLennan Cos., Inc. | | | 21,531,637 | |
| | | | | | | | |
| | | | Integrated Oil & Gas 6.1% | | | | |
| | 308,000 | | | Chevron Corp. | | | 28,496,160 | |
| | 502,000 | | | ConocoPhillips | | | 31,786,640 | |
| | 467,000 | | | Exxon Mobil Corp. | | | 33,918,210 | |
| | | | | | | | |
| | | | | | | 94,201,010 | |
| | | | | | | | |
| | | | Integrated Telecommunication Services 3.7% | | | | |
| | 951,200 | | | AT&T, Inc. | | | 27,128,224 | |
| | 833,000 | | | Verizon Communications, Inc. | | | 30,654,400 | |
| | | | | | | | |
| | | | | | | 57,782,624 | |
| | | | | | | | |
| | | | Investment Banking &
Brokerage 1.0% | | | | |
| | 159,000 | | | Goldman Sachs Group, Inc. (The) | | | 15,033,450 | |
| | | | | | | | |
| | | | Life & Health Insurance 2.2% | | | | |
| | 734,000 | | | MetLife, Inc. | | | 20,559,340 | |
| | 610,000 | | | Unum Group | | | 12,785,600 | |
| | | | | | | | |
| | | | | | | 33,344,940 | |
| | | | | | | | |
| | | | Multi-Line Insurance 2.0% | | | | |
| | 766,420 | | | Genworth Financial, Inc., Class A* | | | 4,399,251 | |
| | 773,370 | | | Loews Corp. | | | 26,719,933 | |
| | | | | | | | |
| | | | | | | 31,119,184 | |
| | | | | | | | |
| | | | Oil & Gas Drilling 2.6% | | | | |
| | 466,000 | | | Ensco plc ADR (United Kingdom) | | | 18,840,380 | |
| | 446,750 | | | Transocean Ltd. (Switzerland) | | | 21,327,845 | |
| | | | | | | | |
| | | | | | | 40,168,225 | |
| | | | | | | | |
| | | | Oil & Gas Equipment & Services 1.9% | | | | |
| | 294,195 | | | National Oilwell Varco, Inc. | | | 15,068,668 | |
| | 239,000 | | | Schlumberger Ltd. | | | 14,275,470 | |
| | | | | | | | |
| | | | | | | 29,344,138 | |
| | | | | | | | |
| | | | Oil & Gas Exploration &
Production 3.3% | | | | |
| | 270,000 | | | Anadarko Petroleum Corp. | | | 17,023,500 | |
| | 835,895 | | | Marathon Oil Corp. | | | 18,038,614 | |
| | 558,000 | | | Ultra Petroleum Corp.* | | | 15,467,760 | |
| | | | | | | | |
| | | | | | | 50,529,874 | |
| | | | | | | | |
| | | | Oil & Gas Storage &
Transportation 3.2% | | | | |
| | 900,000 | | | Spectra Energy Corp. | | | 22,077,000 | |
| | 1,130,000 | | | Williams Cos., Inc. (The) | | | 27,504,200 | |
| | | | | | | | |
| | | | | | | 49,581,200 | |
| | | | | | | | |
62
| | | | | | | | |
Shares | | | | | Value | |
| | | | | | | |
| | | | Other Diversified Financial
Services 2.6% | | | | |
| | 1,989,500 | | | Bank of America Corp. | | $ | 12,175,740 | |
| | 922,000 | | | JPMorgan Chase & Co. | | | 27,770,640 | |
| | | | | | | | |
| | | | | | | 39,946,380 | |
| | | | | | | | |
| | | | Packaged Foods & Meats 1.4% | | | | |
| | 423,575 | | | HJ Heinz Co. | | | 21,382,066 | |
| | | | | | | | |
| | | | Personal Products 0.9% | | | | |
| | 702,325 | | | Avon Products, Inc. | | | 13,765,570 | |
| | | | | | | | |
| | | | Pharmaceuticals 6.4% | | | | |
| | 519,000 | | | Abbott Laboratories | | | 26,541,660 | |
| | 390,000 | | | Johnson & Johnson | | | 24,846,900 | |
| | 792,000 | | | Merck & Co., Inc. | | | 25,906,320 | |
| | 1,214,000 | | | Pfizer, Inc. | | | 21,463,520 | |
| | | | | | | | |
| | | | | | | 98,758,400 | |
| | | | | | | | |
| | | | Property & Casualty Insurance 2.8% | | | | |
| | 737,860 | | | Allstate Corp. (The) | | | 17,479,904 | |
| | 538,000 | | | Travelers Cos., Inc. (The) | | | 26,216,740 | |
| | | | | | | | |
| | | | | | | 43,696,644 | |
| | | | | | | | |
| | | | Regional Banks 1.3% | | | | |
| | 435,000 | | | PNC Financial Services Group, Inc. | | | 20,962,650 | |
| | | | | | | | |
| | | | Semiconductors 3.4% | | | | |
| | 1,619,000 | | | Intel Corp. | | | 34,533,270 | |
| | 663,630 | | | Texas Instruments, Inc. | | | 17,685,740 | |
| | | | | | | | |
| | | | | | | 52,219,010 | |
| | | | | | | | |
| | | | Soft Drinks 1.2% | | | | |
| | 300,000 | | | PepsiCo, Inc. | | | 18,570,000 | |
| | | | | | | | |
| | | | Specialized Finance 0.4% | | | | |
| | 260,715 | | | NYSE Euronext | | | 6,059,017 | |
| | | | | | | | |
| | | | Specialized REITs 0.9% | | | | |
| | 864,000 | | | Weyerhaeuser Co. | | | 13,435,200 | |
| | | | | | | | |
| | | | Steel 1.8% | | | | |
| | 185,580 | | | Cliffs Natural Resources, Inc. | | | 9,496,129 | |
| | 564,000 | | | Nucor Corp. | | | 17,844,960 | |
| | | | | | | | |
| | | | | | | 27,341,089 | |
| | | | | | | | |
| | | | Systems Software 3.0% | | | | |
| | 955,300 | | | Microsoft Corp. | | | 23,777,417 | |
| | 1,435,340 | | | Symantec Corp.* | | | 23,396,042 | |
| | | | | | | | |
| | | | | | | 47,173,459 | |
| | | | | | | | |
| | | | Technology Distributors 1.5% | | | | |
| | 909,000 | | | Avnet, Inc.* | | | 23,706,720 | |
| | | | | | | | |
| | | | Water Utilities 1.4% | | | | |
| | 708,085 | | | American Water Works Co., Inc. | | | 21,370,005 | |
| | | | | | | | |
| | |
| | | | Total Common Stocks
(cost $1,498,801,626) | | | 1,487,050,304 | |
| | | | | | | | |
| | | | | | | | |
Principal
Amount | | | | | Value | |
| | | | | | | |
| | | | SHORT-TERM INVESTMENTS 3.6% | | | | |
| | |
| | | | Repurchase Agreement 3.6% | | | | |
| | $56,097,106 | | | Repurchase Agreement dated 9/30/11, 0.01% due 10/3/11 with State Street Bank and Trust Co. collateralized by $57,580,000 of United States Treasury Notes 1.375% due 9/30/18; value: $57,220,125; repurchase proceeds: $56,097,153 (cost $56,097,106) | | $ | 56,097,106 | |
| | | | | | | | |
| | |
| | | | Total Short-Term Investments
(cost $56,097,106) | | | 56,097,106 | |
| | | | | | | | |
| | |
| | | | Total Investments
(cost $1,554,898,732) 99.8% | | | 1,543,147,410 | |
| | |
| | | | Other Assets less Liabilities 0.2% | | | 3,323,315 | |
| | | | | | | | |
| | |
| | | | NET ASSETS 100.0% | | $ | 1,546,470,725 | |
| | | | | | | | |
| | |
| | | | *Non-income producing. ADR American Depositary Receipt. REIT Real Estate Investment Trust. See Notes to Financial Statements. | | | | |
At September 30, 2011, Wasatch Large Cap Value Fund’s investments, excluding short-term investments, were in the following countries:
| | | | |
| Country | | % | |
Canada | | | 2.4 | |
Switzerland | | | 1.4 | |
United Kingdom | | | 1.3 | |
United States | | | 94.9 | |
| | | | |
TOTAL | | | 100.0 | % |
| | | | |
63
| | |
WASATCH LONG/SHORT FUND (FMLSX) — Schedule of Investments (formerly Wasatch-1st Source Long/Short Fund) | | |
|
|
|
| | | | | | | | |
| Shares | | | | | Value | |
| | | | | | | |
| | | | COMMON STOCKS 74.3% | | | | |
| | |
| | | | Agricultural Products 0.8% | | | | |
| | 270,000 | | | Archer Daniels Midland Co.‡ | | $ | 6,698,700 | |
| | | | | | | | |
| | | | Apparel Retail 0.7% | | | | |
| | 550,000 | | | Chico’s FAS, Inc.‡ | | | 6,286,500 | |
| | | | | | | | |
| | | | Apparel, Accessories & Luxury
Goods 1.8% | | | | |
| | 500,000 | | | Carter’s, Inc.* ‡ | | | 15,270,000 | |
| | | | | | | | |
| | | | Automotive Retail 2.1% | | | | |
| | 150,000 | | | Advance Auto Parts, Inc.‡ | | | 8,715,000 | |
| | 880,000 | | | Pep Boys—Manny, Moe, & Jack (The)‡ | | | 8,685,600 | |
| | | | | | | | |
| | | | | | | 17,400,600 | |
| | | | | | | | |
| | | | Coal & Consumable Fuels 0.4% | | | | |
| | 100,000 | | | CONSOL Energy, Inc.‡ | | | 3,393,000 | |
| | | | | | | | |
| | | | Communications Equipment 3.5% | | | | |
| | 400,000 | | | Blue Coat Systems, Inc.* ‡ | | | 5,552,000 | |
| | 1,500,000 | | | Cisco Systems, Inc.‡ | | | 23,235,000 | |
| | | | | | | | |
| | | | | | | 28,787,000 | |
| | | | | | | | |
| | | | Computer & Electronics Retail 3.2% | | | | |
| | 1,150,000 | | | Best Buy Co., Inc.‡ | | | 26,795,000 | |
| | | | | | | | |
| | | | Computer Hardware 2.1% | | | | |
| | 1,447,300 | | | Silicon Graphics International Corp.* ‡ | | | 17,251,816 | |
| | | | | | | | |
| | | | Computer Storage & Peripherals 0.3% | | | | |
| | 200,000 | | | Electronics for Imaging, Inc.* ‡ | | | 2,694,000 | |
| | | | | | | | |
| | | | Construction & Engineering 0.9% | | | | |
| | 641,514 | | | Insituform Technologies, Inc., Class A* ‡ | | | 7,428,732 | |
| | | | | | | | |
| | | | Data Processing & Outsourced Services 7.2% | | | | |
| | 3,700,000 | | | Convergys Corp.* ‡ | | | 34,706,000 | |
| | 300,000 | | | Visa, Inc., Class A‡ | | | 25,716,000 | |
| | | | | | | | |
| | | | | | | 60,422,000 | |
| | | | | | | | |
| | | | Environmental & Facilities
Services 2.8% | | | | |
| | 500,000 | | | Republic Services, Inc.‡ | | | 14,030,000 | |
| | 275,000 | | | Waste Management, Inc.‡ | | | 8,954,000 | |
| | | | | | | | |
| | | | | | | 22,984,000 | |
| | | | | | | | |
| | | | Fertilizers & Agricultural
Chemicals 1.0% | | | | |
| | 140,000 | | | Monsanto Co.‡ | | | 8,405,600 | |
| | | | | | | | |
| | | | General Merchandise Stores 1.5% | | | | |
| | 250,000 | | | Target Corp.‡ | | | 12,260,000 | |
| | | | | | | | |
| | | | Gold 6.4% | | | | |
| | 125,000 | | | Agnico-Eagle Mines Ltd. (Canada) | | | 7,440,000 | |
| | 400,000 | | | Newmont Mining Corp.‡ | | | 25,160,000 | |
| | 1,500,000 | | | Yamana Gold, Inc.‡ (Canada) | | | 20,490,000 | |
| | | | | | | | |
| | | | | | | 53,090,000 | |
| | | | | | | | |
| | | | Health Care Equipment 2.3% | | | | |
| | 200,000 | | | Medtronic, Inc.‡ | | | 6,648,000 | |
| | 1,600,000 | | | Symmetry Medical, Inc.* ‡ | | | 12,352,000 | |
| | | | | | | | |
| | | | | | | 19,000,000 | |
| | | | | | | | |
| | | | Heavy Electrical Equipment 0.2% | | | | |
| | 87,300 | | | General Cable Corp.* ‡ | | | 2,038,455 | |
| | | | | | | | |
| | | | Hypermarkets & Super Centers 4.7% | | | | |
| | 750,000 | | | Wal-Mart Stores, Inc.‡ | | | 38,925,000 | |
| | | | | | | | |
| | | | | | | | |
| Shares | | | | | Value | |
| | | | | | | |
| | | | Integrated Oil & Gas 0.9% | | | | |
| | 120,000 | | | ConocoPhillips‡ | | $ | 7,598,400 | |
| | | | | | | | |
| | | | Internet Software & Services 2.6% | | | | |
| | 1,090,231 | | | Akamai Technologies, Inc.* | | | 21,673,792 | |
| | | | | | | | |
| | | | Life & Health Insurance 3.2% | | | | |
| | 1,275,000 | | | Unum Group‡ | | | 26,724,000 | |
| | | | | | | | |
| | | | Multi-Line Insurance 3.4% | | | | |
| | 825,000 | | | Loews Corp.‡ | | | 28,503,750 | |
| | | | | | | | |
| | | | Oil & Gas Drilling 3.0% | | | | |
| | 325,000 | | | Ensco plc ADR (United Kingdom) | | | 13,139,750 | |
| | 400,000 | | | Noble Corp.* | | | 11,740,000 | |
| | | | | | | | |
| | | | | | | 24,879,750 | |
| | | | | | | | |
| | | | Oil & Gas Exploration &
Production 5.7% | | | | |
| | 336,809 | | | Devon Energy Corp.‡ | | | 18,672,691 | |
| | 125,000 | | | Energen Corp. | | | 5,111,250 | |
| | 300,000 | | | Range Resources Corp.‡ | | | 17,538,000 | |
| | 500,000 | | | Rex Energy Corp.* ‡ | | | 6,325,000 | |
| | | | | | | | |
| | | | | | | 47,646,941 | |
| | | | | | | | |
| | | | Property & Casualty Insurance 4.1% | | | | |
| | 285,000 | | | Allstate Corp. (The)‡ | | | 6,751,650 | |
| | 1,210,000 | | | CNA Financial Corp.‡ | | | 27,188,700 | |
| | | | | | | | |
| | | | | | | 33,940,350 | |
| | | | | | | | |
| | | | Regional Banks 1.4% | | | | |
| | 615,000 | | | Fifth Third Bancorp | | | 6,211,500 | |
| | 1,200,000 | | | Huntington Bancshares, Inc. | | | 5,760,000 | |
| | | | | | | | |
| | | | | | | 11,971,500 | |
| | | | | | | | |
| | | | Research & Consulting Services 1.2% | | | | |
| | 1,000,000 | | | Resources Connection, Inc.‡ | | | 9,780,000 | |
| | | | | | | | |
| | | | Semiconductors 1.0% | | | | |
| | 400,000 | | | Intel Corp.‡ | | | 8,532,000 | |
| | | | | | | | |
| | | | Steel 1.7% | | | | |
| | 440,000 | | | Nucor Corp.‡ | | | 13,921,600 | |
| | | | | | | | |
| | | | Systems Software 2.9% | | | | |
| | 650,000 | | | Microsoft Corp.‡ | | | 16,178,500 | |
| | 265,000 | | | Oracle Corp.‡ | | | 7,616,100 | |
| | | | | | | | |
| | | | | | | 23,794,600 | |
| | | | | | | | |
| | | | Trucking 1.3% | | | | |
| | 835,000 | | | Knight Transportation, Inc.‡ | | | 11,113,850 | |
| | | | | | | | |
| | |
| | | | Total Common Stocks
(cost $667,067,853) | | | 619,210,936 | |
| | | | | | | | |
| | |
| | | | PREFERRED STOCKS 0.4% | | | | |
| | |
| | | | Cable & Satellite 0.2% | | | | |
| | 75,000 | | | Comcast Corp., 7.00%, Series B Pfd. | | | 1,921,500 | |
| | | | | | | | |
| | | | Specialized REITs 0.2% | | | | |
| | 75,000 | | | Public Storage, 6.625% Series M Pfd.§§§ | | | 1,905,000 | |
| | | | | | | | |
| | |
| | | | Total Preferred Stocks
(cost $3,094,882) | | | 3,826,500 | |
| | | | | | | | |
64
| | | | | | | | |
Principal
Amount | | | | | Value | |
| | | | | | | |
| | |
| | | | SHORT-TERM INVESTMENTS 23.2% | | | | |
| | |
| | | | Repurchase Agreement 23.2% | | | | |
| | $193,085,310 | | | Repurchase Agreement dated 9/30/11, 0.01% due 10/3/11 with State Street Bank and Trust Co. collateralized by $184,280,000 of United States Treasury Notes 2.375% due 6/30/18; value: $196,949,250; repurchase proceeds: $193,085,471‡ (cost $193,085,310) | | $ | 193,085,310 | |
| | | | | | | | |
| | |
| | | | Total Short-Term Investments
(cost $193,085,310) | | | 193,085,310 | |
| | | | | | | | |
| | |
| | | | Total Investments
(cost $863,248,045) 97.9% | | | 816,122,746 | |
| | |
| | | | Other Assets less Liabilities 2.1% | | | 17,175,689 | |
| | | | | | | | |
| | |
| | | | NET ASSETS 100.0% | | $ | 833,298,435 | |
| | | | | | | | |
| | |
Number of
Contracts | | | | | Value | |
| | | | | | | |
| | |
| | | | CALL OPTIONS WRITTEN 0.7% | | | | |
| | |
| | | | Coal & Consumable Fuels 0.0% | | | | |
| | 1,000 | | | CONSOL Energy, Inc., expiring 10/22/11, exercise price $55 | | $ | 7,000 | |
| | | | | | | | |
| | | | Communications Equipment 0.0% | | | | |
| | 6,545 | | | Cisco Systems, Inc., expiring 10/22/11, exercise price $16 | | | 248,710 | |
| | | | | | | | |
| | | | Computer Hardware 0.1% | | | | |
| | 9,000 | | | Silicon Graphics International Corp., expiring 12/17/11, exercise price $16 | | | 450,000 | |
| | | | | | | | |
| | | | Data Processing & Outsourced Services 0.2% | | | | |
| | 2,000 | | | Visa, Inc., Class A , expiring 12/17/11, exercise price $90 | | | 960,000 | |
| | 1,000 | | | Visa, Inc., Class A, expiring 1/21/12, exercise price $92.50 | | | 475,000 | |
| | | | | | | | |
| | | | | | | 1,435,000 | |
| | | | | | | | |
| | | | Fertilizers & Agricultural
Chemicals 0.0% | | | | |
| | 1,400 | | | Monsanto Co., expiring 1/21/12, exercise price $67.50 | | | 406,000 | |
| | | | | | | | |
| | | | Gold 0.1% | | | | |
| | 1,500 | | | Newmont Mining Corp., expiring 12/17/11, exercise price $65 | | | 636,000 | |
| | 1,500 | | | Newmont Mining Corp., expiring 1/21/12, exercise price $70 | | | 502,500 | |
| | 5,500 | | | Yamana Gold, Inc., expiring 10/22/11, exercise price $16 | | | 77,000 | |
| | | | | | | | |
| | | | | | | 1,215,500 | |
| | | | | | | | |
| | | | Oil & Gas Exploration &
Production 0.2% | | | | |
| | 2,000 | | | Range Resources Corp., expiring 12/17/11, exercise price $62.50 | | | 1,240,000 | |
| | 1,000 | | | Range Resources Corp., expiring 12/17/11, exercise price $67.50 | | | 430,000 | |
| | | | | | | | |
| | | | | | | 1,670,000 | |
| | | | | | | | |
| | | | | | | | |
Number of
Contracts | | | | | Value | |
| | | | | | | |
| | | | Systems Software 0.1% | | | | |
| | 2,650 | | | Oracle Corp., expiring 1/21/12, exercise price $30 | | $ | 620,100 | |
| | | | | | | | |
| | |
| | | | Total Call Options Written (premium $10,278,040) | | | 6,052,310 | |
| | | | | | | | |
| | |
| Shares | | | | | Value | |
| | | | | | | |
| | |
| | | | SECURITIES SOLD SHORT 11.4% | | | | |
| | |
| | | | Aerospace & Defense 0.8% | | | | |
| | 112,213 | | | Boeing Co. (The) | | $ | 6,790,008 | |
| | | | | | | | |
| | | | Application Software 0.8% | | | | |
| | 58,300 | | | Salesforce.com, Inc.* | | | 6,662,524 | |
| | | | | | | | |
| | | | Cable & Satellite 1.3% | | | | |
| | 235,000 | | | Charter Communications, Inc.* | | | 11,007,400 | |
| | | | | | | | |
| | | | Casinos & Gaming 1.0% | | | | |
| | 250,000 | | | Penn National Gaming, Inc.* | | | 8,322,500 | |
| | | | | | | | |
| | | | Commercial Printing 0.2% | | | | |
| | 138,472 | | | R.R. Donnelley & Sons Co. | | | 1,955,225 | |
| | | | | | | | |
| | | | Health Care Supplies 0.4% | | | | |
| | 200,000 | | | Align Technology, Inc.* | | | 3,034,000 | |
| | | | | | | | |
| | | | Homebuilding 0.8% | | | | |
| | 500,000 | | | Lennar Corp., Class A | | | 6,770,000 | |
| | | | | | | | |
| | | | Motorcycle Manufacturers 0.7% | | | | |
| | 167,808 | | | Harley-Davidson, Inc. | | | 5,760,849 | |
| | | | | | | | |
| | | | Office REITs 0.6% | | | | |
| | 90,000 | | | Digital Realty Trust, Inc. | | | 4,964,400 | |
| | | | | | | | |
| | | | Packaged Foods & Meats 2.9% | | | | |
| | 200,000 | | | General Mills, Inc. | | | 7,694,000 | |
| | 150,000 | | | Hershey Co. (The) | | | 8,886,000 | |
| | 150,000 | | | Kellogg Co. | | | 7,978,500 | |
| | | | | | | | |
| | | | | | | 24,558,500 | |
| | | | | | | | |
| | |
| | | | Retail REITs 0.9% | | | | |
| | 200,000 | | | Regency Centers Corp. | | | 7,066,000 | |
| | | | | | | | |
| | |
| | | | Systems Software 1.0% | | | | |
| | 200,000 | | | Red Hat, Inc.* | | | 8,452,000 | |
| | | | | | | | |
| | |
| | | | Total Securities Sold Short
(proceeds $103,180,486) | | | 95,343,406 | |
| | | | | | | | |
| |
| | | | *Non-income producing. ‡All or a portion of this security has been designated as collateral for call options written and short sales (see Notes 7, 4 and 3 respectively). §§§Perpetual Maturity. Callable any time after first call date. Maturity date is next call date. ADR American Depositary Receipt. REIT Real Estate Investment Trust. See Notes to Financial Statements. | |
65
| | |
WASATCH LONG/SHORT FUND (FMLSX) — Schedule of Investments (formerly Wasatch-1st Source Long/Short Fund) (continued) | | SEPTEMBER 30, 2011 |
|
|
|
At September 30, 2011, Wasatch Long/Short Fund’s investments, excluding short-term investments, options written and securities sold short, were in the following countries:
| | | | |
| Country | | % | |
Canada | | | 4.5 | |
United Kingdom | | | 2.1 | |
United States | | | 93.4 | |
| | | | |
TOTAL | | | 100.0 | % |
| | | | |
66
| | |
| WASATCH MICRO CAP FUND (WMICX) — Schedule of Investments | | SEPTEMBER 30, 2011 |
|
|
|
| | | | | | | | |
| Shares | | | | | Value | |
| | | | | | | |
| | | | COMMON STOCKS 97.0% | | | | |
| | |
| | | | Advertising 0.7% | | | | |
| | 162,155 | | | ReachLocal, Inc.* | | $ | 1,762,625 | |
| | | | | | | | |
| | | | Air Freight & Logistics 1.1% | | | | |
| | 2,356,075 | | | Goodpack Ltd. (Singapore) | | | 2,730,657 | |
| | | | | | | | |
| | | | Apparel Retail 1.7% | | | | |
| | 167,159 | | | Body Central Corp.* | | | 3,035,607 | |
| | 75,400 | | | Zumiez, Inc.* | | | 1,320,254 | |
| | | | | | | | |
| | | | | | | 4,355,861 | |
| | | | | | | | |
| | | | Application Software 7.3% | | | | |
| | 245,629 | | | Convio, Inc.* | | | 2,065,740 | |
| | 189,938 | | | Interactive Intelligence Group, Inc.* | | | 5,156,817 | |
| | 60,422 | | | RealPage, Inc.* | | | 1,235,630 | |
| | 320,567 | | | Tangoe, Inc.* | | | 3,625,613 | |
| | 124,895 | | | Tyler Technologies, Inc.* | | | 3,157,345 | |
| | 72,460 | | | Ultimate Software Group, Inc.* | | | 3,385,331 | |
| | | | | | | | |
| | | | | | | 18,626,476 | |
| | | | | | | | |
| | | | Asset Management & Custody
Banks 3.8% | | | | |
| | 60,127 | | | Diamond Hill Investment Group, Inc. | | | 4,172,212 | |
| | 60,282 | | | Virtus Investment Partners, Inc.* | | | 3,232,321 | |
| | 62,107 | | | Westwood Holdings Group, Inc. | | | 2,145,797 | |
| | | | | | | | |
| | | | | | | 9,550,330 | |
| | | | | | | | |
| | | | Automotive Retail 1.5% | | | | |
| | 116,260 | | | Monro Muffler Brake, Inc. | | | 3,833,092 | |
| | | | | | | | |
| | | | Biotechnology 3.0% | | | | |
| | 150,102 | | | 3SBio, Inc. ADR* (China) | | | 1,790,717 | |
| | 614,227 | | | Abcam plc (United Kingdom) | | | 3,478,834 | |
| | 258,770 | | | Exact Sciences Corp.* | | | 1,715,645 | |
| | 295,586 | | | NeurogesX, Inc.* | | | 263,072 | |
| | 290,698 | | | NeurogesX, Inc. PIPE* *** | | | 258,721 | |
| | | | | | | | |
| | | | | | | 7,506,989 | |
| | | | | | | | |
| | | | Commercial Printing 0.7% | | | | |
| | 211,913 | | | InnerWorkings, Inc.* | | | 1,661,398 | |
| | | | | | | | |
| | | | Computer Storage & Peripherals 1.1% | | | | |
| | 383,850 | | | Intevac, Inc.* | | | 2,683,112 | |
| | | | | | | | |
| | | | Consumer Finance 2.5% | | | | |
| | 292,537 | | | DFC Global Corp.* | | | 6,391,934 | |
| | | | | | | | |
| | | | Data Processing & Outsourced Services 1.6% | | | | |
| | 266,630 | | | Wirecard AG (Germany) | | | 4,096,401 | |
| | | | | | | | |
| | | | Diversified Banks 0.7% | | | | |
| | 167,403 | | | Encore Bancshares, Inc.* | | | 1,784,516 | |
| | | | | | | | |
| | | | Diversified Support Services 2.0% | | | | |
| | 160,195 | | | Higher One Holdings, Inc.* | | | 2,606,373 | |
| | 300,450 | | | STR Holdings, Inc.* | | | 2,436,649 | |
| | | | | | | | |
| | | | | | | 5,043,022 | |
| | | | | | | | |
| | | | Electronic Manufacturing
Services 2.1% | | | | |
| | 178,475 | | | Fabrinet* | | | 3,337,482 | |
| | 44,420 | | | IPG Photonics Corp.* | | | 1,929,605 | |
| | | | | | | | |
| | | | | | | 5,267,087 | |
| | | | | | | | |
| | | | Environmental & Facilities
Services 1.9% | | | | |
| | 185,549 | | | Heritage-Crystal Clean, Inc.* | | | 3,369,570 | |
| | 594,574 | | | RPS Group plc (United Kingdom) | | | 1,518,088 | |
| | | | | | | | |
| | | | | | | 4,887,658 | |
| | | | | | | | |
| | | | General Merchandise Stores 1.4% | | | | |
| | 300,176 | | | Gordmans Stores, Inc.* | | | 3,593,107 | |
| | | | | | | | |
| | | | | | | | |
| Shares | | | | | Value | |
| | | | | | | |
| | | | Health Care Distributors 1.4% | | | | |
| | 50,901 | | | MWI Veterinary Supply, Inc.* | | $ | 3,503,007 | |
| | | | | | | | |
| | | | Health Care Equipment 7.0% | | | | |
| | 138,142 | | | Abaxis, Inc.* | | | 3,164,833 | |
| | 367,533 | | | AtriCure, Inc.* | | | 3,579,772 | |
| | 317,686 | | | Cardica, Inc.* | | | 616,311 | |
| | 341,000 | | | Cardica, Inc. PIPE* *** | | | 661,540 | |
| | 212,726 | | | Cardiovascular Systems, Inc.* | | | 2,422,949 | |
| | 12,711,735 | | | LMA International N.V. (Singapore) | | | 2,822,611 | |
| | 92,795 | | | NuVasive, Inc.* | | | 1,584,011 | |
| | 170,090 | | | Synovis Life Technologies, Inc.* | | | 2,840,503 | |
| | | | | | | | |
| | | | | | | 17,692,530 | |
| | | | | | | | |
| | | | Health Care Services 6.6% | | | | |
| | 154,347 | | | Bio-Reference Laboratories, Inc.* | | | 2,841,528 | |
| | 206,869 | | | CorVel Corp.* | | | 8,791,933 | |
| | 129,790 | | | Healthways, Inc.* | | | 1,275,836 | |
| | 106,790 | | | IPC The Hospitalist Co., Inc.* | | | 3,811,335 | |
| | | | | | | | |
| | | | | | | 16,720,632 | |
| | | | | | | | |
| | | | Health Care Technology 1.4% | | | | |
| | 41,625 | | | Computer Programs and Systems, Inc. | | | 2,753,494 | |
| | 65,940 | | | HealthStream, Inc.* | | | 846,010 | |
| | | | | | | | |
| | | | | | | 3,599,504 | |
| | | | | | | | |
| | | | Human Resource & Employment Services 0.4% | | | | |
| | 216,181 | | | CTPartners Executive Search Inc.* | | | 1,044,154 | |
| | | | | | | | |
| | | | Internet Software & Services 5.7% | | | | |
| | 217,595 | | | DealerTrack Holdings, Inc.* | | | 3,409,714 | |
| | 240,229 | | | Envestnet, Inc.* | | | 2,402,290 | |
| | 195,045 | | | SciQuest, Inc.* | | | 2,913,972 | |
| | 214,655 | | | SPS Commerce, Inc.* | | | 3,496,730 | |
| | 398,145 | | | TechTarget, Inc.* | | | 2,273,408 | |
| | | | | | | | |
| | | | | | | 14,496,114 | |
| | | | | | | | |
| | | | IT Consulting & Other Services 2.5% | | | | |
| | 2,040,773 | | | CSG Ltd. (Australia) | | | 2,097,667 | |
| | 296,083 | | | hiSoft Technology International Ltd. ADR* (China) | | | 2,602,570 | |
| | 128,490 | | | ServiceSource International, Inc.* | | | 1,697,353 | |
| | | | | | | | |
| | | | | | | 6,397,590 | |
| | | | | | | | |
| | | | Life Sciences Tools & Services 4.0% | | | | |
| | 118,621 | | | Fluidigm Corp.* | | | 1,652,390 | |
| | 187,499 | | | ICON plc ADR* (Ireland) | | | 3,014,984 | |
| | 302,929 | | | MEDTOX Scientific, Inc. | | | 3,965,341 | |
| | 188,440 | | | ShangPharma Corp. ADR* (China) | | | 1,571,590 | |
| | | | | | | | |
| | | | | | | 10,204,305 | |
| | | | | | | | |
| | | | Oil & Gas Equipment & Services 0.9% | | | | |
| | 180,915 | | | Pason Systems, Inc. (Canada) | | | 2,316,435 | |
| | | | | | | | |
| | | | Oil & Gas Exploration &
Production 1.0% | | | | |
| | 820,710 | | | Ithaca Energy, Inc.* (Canada) | | | 1,285,934 | |
| | 368,795 | | | Triangle Petroleum Corp.* | | | 1,323,974 | |
| | | | | | | | |
| | | | | | | 2,609,908 | |
| | | | | | | | |
| | | | Pharmaceuticals 1.9% | | | | |
| | 483,245 | | | Akorn, Inc.* | | | 3,774,144 | |
| | 281,301 | | | ISTA Pharmaceuticals, Inc.* | | | 970,488 | |
| | | | | | | | |
| | | | | | | 4,744,632 | |
| | | | | | | | |
| | | | Regional Banks 3.2% | | | | |
| | 3,424,569 | | | City Union Bank Ltd. (India) | | | 3,095,139 | |
| | 349,902 | | | First California Financial Group, Inc.* | | | 1,053,205 | |
| | 352,730 | | | Nara Bancorp, Inc.* | | | 2,141,071 | |
| | 253,381 | | | Pacific Continental Corp. | | | 1,796,471 | |
| | | | | | | | |
| | | | | | | 8,085,886 | |
| | | | | | | | |
67
| | |
| WASATCH MICRO CAP FUND (WMICX) — Schedule of Investments (continued) | | SEPTEMBER 30, 2011 |
|
|
|
| | | | | | | | |
| Shares | | | | | Value | |
| | | | | | | |
| | | | Research & Consulting Services 3.6% | | | | |
| | 128,331 | | | CRA International, Inc.* | | $ | 2,567,903 | |
| | 206,865 | | | eClerx Services Ltd. (India) | | | 3,047,121 | |
| | 348,835 | | | Resources Connection, Inc. | | | 3,411,606 | |
| | | | | | | | |
| | | | | | | 9,026,630 | |
| | | | | | | | |
| | | | Restaurants 1.6% | | | | |
| | 74,550 | | | Peet’s Coffee & Tea, Inc.* | | | 4,147,962 | |
| | | | | | | | |
| | | | Semiconductors 9.9% | | | | |
| | 225,226 | | | BCD Semiconductor Manufacturing Ltd. ADR* (China) | | | 1,126,130 | |
| | 265,807 | | | Melexis N.V. (Belgium) | | | 3,239,642 | |
| | 288,385 | | | Micrel, Inc. | | | 2,731,006 | |
| | 68,507 | | | NetLogic Microsystems, Inc.* | | | 3,295,872 | |
| | 31,355 | | | NVE Corp.* | | | 1,901,994 | |
| | 651,392 | | | O2Micro International Ltd. ADR* (China) | | | 2,716,305 | |
| | 280,293 | | | Pericom Semiconductor Corp.* | | | 2,076,971 | |
| | 264,483 | | | Power Integrations, Inc. | | | 8,095,824 | |
| | | | | | | | |
| | | | | | | 25,183,744 | |
| | | | | | | | |
| | | | Specialized Finance 0.9% | | | | |
| | 96,620 | | | Encore Capital Group, Inc.* | | | 2,111,147 | |
| | 154,000 | | | Goldwater Bank, N.A.* *** † ‡‡ | | | 55,440 | |
| | | | | | | | |
| | | | | | | 2,166,587 | |
| | | | | | | | |
| | | | Specialty Stores 3.5% | | | | |
| | 322,805 | | | Big 5 Sporting Goods Corp. | | | 1,962,654 | |
| | 200,622 | | | Hibbett Sports, Inc.* | | | 6,799,080 | |
| | | | | | | | |
| | | | | | | 8,761,734 | |
| | | | | | | | |
| | | | Systems Software 2.6% | | | | |
| | 340,500 | | | DemandTec, Inc.* | | | 2,226,870 | |
| | 124,270 | | | OPNET Technologies, Inc. | | | 4,338,266 | |
| | | | | | | | |
| | | | | | | 6,565,136 | |
| | | | | | | | |
| | | | Thrifts & Mortgage Finance 1.1% | | | | |
| | 578,300 | | | Dewan Housing Finance Corp. Ltd. (India) | | | 2,760,678 | |
| | 11,285 | | | Gruh Finance Ltd. (India) | | | 112,908 | |
| | | | | | | | |
| | | | | | | 2,873,586 | |
| | | | | | | | |
| | | | Trading Companies &
Distributors 1.9% | | | | |
| | 200,328 | | | CAI International, Inc.* | | | 2,347,844 | |
| | 220,363 | | | Rush Enterprises, Inc., Class B* | | | 2,571,636 | |
| | | | | | | | |
| | | | | | | 4,919,480 | |
| | | | | | | | |
| | | | Trucking 2.8% | | | | |
| | 178,330 | | | Marten Transport, Ltd. | | | 3,074,409 | |
| | 110,422 | | | Old Dominion Freight Line, Inc.* | | | 3,198,925 | |
| | 201,253 | | | Vitran Corp., Inc.* (Canada) | | | 794,950 | |
| | | | | | | | |
| | | | | | | 7,068,284 | |
| | | | | | | | |
| | |
| | | | Total Common Stocks
(cost $225,476,733) | | | 245,902,105 | |
| | | | | | | | |
| | |
| | | | PREFERRED STOCKS 0.8% | | | | |
| | |
| | | | Regional Banks 0.8% | | | | |
| | 434,600 | | | Banco Daycoval S.A. Pfd. (Brazil) | | | 1,969,661 | |
| | | | | | | | |
| | |
| | | | Total Preferred Stocks
(cost $1,639,882) | | | 1,969,661 | |
| | | | | | | | |
| | | | | | | | |
| Shares | | | | | Value | |
| | | | | | | |
| | |
| | | | WARRANTS 0.1% | | | | |
| | |
| | | | Biotechnology 0.0% | | | | |
| | 145,349 | | | NeurogesX, Inc., expiring 7/22/16* *** † | | $ | 18,169 | |
| | | | | | | | |
| | | | Health Care Equipment 0.1% | | | | |
| | 121,124 | | | Cardica, Inc., expiring 6/7/12* *** † | | | 1,211 | |
| | 322,500 | | | Cardica, Inc., expiring 9/29/14* *** † | | | 219,300 | |
| | | | | | | | |
| | | | | | | 220,511 | |
| | | | | | | | |
| | |
| | | | Total Warrants
(cost $77,861) | | | 238,680 | |
| | | | | | | | |
| | |
Principal
Amount | | | | | Value | |
| | | | | | | |
| | | | SHORT-TERM INVESTMENTS 2.1% | | | | |
| | |
| | | | Repurchase Agreement 2.1% | | | | |
| | $5,277,785 | | | Repurchase Agreement dated 9/30/11, 0.01% due 10/3/11 with State Street Bank and Trust Co. collateralized by $5,420,000 of United States Treasury Notes 1.375% due 9/30/18; value: $5,386,125; repurchase proceeds: $5,277,790 (cost $5,277,785) | | $ | 5,277,785 | |
| | | | | | | | |
| | |
| | | | Total Short-Term Investments
(cost $5,277,785) | | | 5,277,785 | |
| | | | | | | | |
| | |
| | | | Total Investments
(cost $232,472,261) 100.0%§ | | | 253,388,231 | |
| | |
| | | | Other Assets less Liabilities <0.1% | | | 26,951 | |
| | | | | | | | |
| | |
| | | | NET ASSETS 100.0% | | $ | 253,415,182 | |
| | | | | | | | |
| |
| | | | *Non-income producing. ***Security was fair valued under procedures adopted by the Board of Trustees (see Note 15). †Security purchased in a private placement transaction or under Rule 144A of the Securities Act of 1933 (see Note 11). ‡‡Affiliated company (see Note 10). §The aggregate amount of foreign securities fair valued pursuant to a systematic valuation model as a percent of net assets was 11.40%. ADR American Depositary Receipt. PIPE Private Investment in a Public Equity. See Notes to Financial Statements. | |
At September 30, 2011, Wasatch Micro Cap Fund’s investments, excluding short-term investments, were in the following countries:
| | | | |
| Country | | % | |
Australia | | | 0.8 | |
Belgium | | | 1.3 | |
Brazil | | | 0.8 | |
Canada | | | 1.8 | |
China | | | 4.0 | |
Germany | | | 1.7 | |
India | | | 3.6 | |
Ireland | | | 1.2 | |
Singapore | | | 2.2 | |
United Kingdom | | | 2.0 | |
United States | | | 80.6 | |
| | | | |
TOTAL | | | 100.0 | % |
| | | | |
68
| | |
| WASATCH MICRO CAP VALUE FUND (WAMVX) — Schedule of Investments | | SEPTEMBER 30, 2011 |
|
|
|
| | | | | | | | |
| Shares | | | | | Value | |
| | | | | | | |
| | |
| | | | COMMON STOCKS 85.3% | | | | |
| | |
| | | | Air Freight & Logistics 0.6% | | | | |
| | 1,800,000 | | | Aramex PJSC (United Arab Emirates) | | $ | 873,010 | |
| | | | | | | | |
| | | | Airlines 1.3% | | | | |
| | 40,000 | | | Allegiant Travel Co.* | | | 1,885,200 | |
| | | | | | | | |
| | | | Apparel Retail 1.8% | | | | |
| | 88,000 | | | Body Central Corp.* | | | 1,598,080 | |
| | 3,600,000 | | | Padini Holdings Berhad (Malaysia) | | | 968,579 | |
| | | | | | | | |
| | | | | | | 2,566,659 | |
| | | | | | | | |
| | | | Apparel, Accessories & Luxury
Goods 3.5% | | | | |
| | 30,000 | | | LG Fashion Corp. (Korea) | | | 1,016,161 | |
| | 80,000 | | | Maidenform Brands, Inc.* ‡ | | | 1,872,800 | |
| | 155,000 | | | Ted Baker plc (United Kingdom) | | | 1,672,379 | |
| | 1,000,000 | | | Zhulian Corp. Berhad (Malaysia) | | | 492,633 | |
| | | | | | | | |
| | | | | | | 5,053,973 | |
| | | | | | | | |
| | | | Application Software 4.4% | | | | |
| | 201,591 | | | Clicksoftware Technologies Ltd. (Israel) | | | 1,570,394 | |
| | 80,000 | | | Convio, Inc.* | | | 672,800 | |
| | 94,000 | | | Fundtech Ltd. (Israel) | | | 2,169,520 | |
| | 70,000 | | | Interactive Intelligence Group, Inc.* | | | 1,900,500 | |
| | | | | | | | |
| | | | | | | 6,313,214 | |
| | | | | | | | |
| | | | Asset Management & Custody Banks 3.4% | | | | |
| | 60,000 | | | Solar Capital Ltd. | | | 1,207,800 | |
| | 69,000 | | | Virtus Investment Partners, Inc.* ‡ | | | 3,699,780 | |
| | | | | | | | |
| | | | | | | 4,907,580 | |
| | | | | | | | |
| | | | Automotive Retail 0.9% | | | | |
| | 15,000 | | | Delticom AG (Germany) | | | 1,299,066 | |
| | | | | | | | |
| | | | Biotechnology 0.1% | | | | |
| | 100,000 | | | NeurogesX, Inc. PIPE*** | | | 89,000 | |
| | | | | | | | |
| | | | Commercial Printing 1.3% | | | | |
| | 230,000 | | | InnerWorkings, Inc.* | | | 1,803,200 | |
| | | | | | | | |
| | | | Communications Equipment 0.7% | | | | |
| | 90,800 | | | Digi International, Inc.* | | | 998,800 | |
| | | | | | | | |
| | | | Computer Hardware 0.7% | | | | |
| | 80,000 | | | Silicon Graphics International Corp.* | | | 953,600 | |
| | | | | | | | |
| | | | Computer Storage & Peripherals 1.1% | | | | |
| | 120,000 | | | Electronics for Imaging, Inc.* | | | 1,616,400 | |
| | | | | | | | |
| | | | Construction Materials 0.8% | | | | |
| | 6,000,000 | | | Diamond Building Products Public Co. Ltd.*** (Thailand) | | | 1,148,464 | |
| | | | | | | | |
| | | | Consumer Finance 5.8% | | | | |
| | 260,000 | | | Advance America Cash Advance
Centers, Inc. | | | 1,913,600 | |
| | 136,000 | | | DFC Global Corp.* | | | 2,971,600 | |
| | 80,000 | | | First Cash Financial Services, Inc.* ‡ | | | 3,356,000 | |
| | | | | | | | |
| | | | | | | 8,241,200 | |
| | | | | | | | |
| | | | Department Stores 0.8% | | | | |
| | 14,000,000 | | | PT Ramayana Lestari Sentosa Tbk (Indonesia) | | | 1,087,962 | |
| | | | | | | | |
| | | | Diversified Banks 0.1% | | | | |
| | 55,556 | | | Idaho Trust Bancorp*** † | | | 185,001 | |
| | | | | | | | |
| | | | Diversified Chemicals 0.8% | | | | |
| | 42,000 | | | LSB Industries, Inc.* | | | 1,204,140 | |
| | | | | | | | |
| | | | | | | | |
| Shares | | | | | Value | |
| | | | | | | |
| | | | Diversified REITs 0.6% | | | | |
| | 95,000 | | | Hamborner REIT AG (Germany) | | $ | 816,726 | |
| | | | | | | | |
| | | | Diversified Support Services 1.0% | | | | |
| | 85,000 | | | Higher One Holdings, Inc.* | | | 1,382,950 | |
| | | | | | | | |
| | | | Education Services 1.0% | | | | |
| | 83,000 | | | Bridgepoint Education, Inc.* | | | 1,447,520 | |
| | | | | | | | |
| | | | Electrical Components & Equipment 1.7% | | | | |
| | 67,000 | | | Franklin Electric Co., Inc.‡ | | | 2,430,760 | |
| | | | | | | | |
| | | | Electronic Equipment & Instruments 0.8% | | | | |
| | 140,000 | | | GSI Group, Inc.* | | | 1,075,200 | |
| | | | | | | | |
| | | | Electronic Manufacturing Services 1.9% | | | | |
| | 75,000 | | | Fabrinet* | | | 1,402,500 | |
| | 132,000 | | | TTM Technologies, Inc.* ‡ | | | 1,255,320 | |
| | | | | | | | |
| | | | | | | 2,657,820 | |
| | | | | | | | |
| | | | Environmental & Facilities Services 1.1% | | | | |
| | 89,900 | | | Heritage-Crystal Clean, Inc.* | | | 1,632,584 | |
| | | | | | | | |
| | | | Footwear 1.0% | | | | |
| | 100,000 | | | Skechers U.S.A., Inc., Class A* | | | 1,403,000 | |
| | | | | | | | |
| | | | Gas Utilities 1.0% | | | | |
| | 170,000 | | | Indraprastha Gas Ltd. (India) | | | 1,474,026 | |
| | | | | | | | |
| | | | General Merchandise Stores 0.5% | | | | |
| | 64,261 | | | Gordmans Stores, Inc.* | | | 769,204 | |
| | | | | | | | |
| | | | Gold 0.5% | | | | |
| | 300,000 | | | Highland Gold Mining Ltd. (United Kingdom) | | | 750,918 | |
| | | | | | | | |
| | | | Health Care Equipment 3.8% | | | | |
| | 340,000 | | | Alphatec Holdings, Inc.* | | | 717,400 | |
| | 160,000 | | | AtriCure, Inc.* | | | 1,558,400 | |
| | 180,000 | | | Cardica, Inc. PIPE* *** | | | 349,200 | |
| | 70,000 | | | NuVasive, Inc.* | | | 1,194,900 | |
| | 500,000 | | | Solta Medical, Inc.* | | | 625,000 | |
| | 31,154 | | | Symmetry Medical, Inc.* | | | 240,509 | |
| | 20,000 | | | Zoll Medical Corp.* ‡ | | | 754,800 | |
| | | | | | | | |
| | | | | | | 5,440,209 | |
| | | | | | | | |
| | | | Health Care Facilities 1.2% | | | | |
| | 500,000 | | | CVS Group plc* (United Kingdom) | | | 773,771 | |
| | 800,000 | | | KPJ Healthcare Berhad (Malaysia) | | | 996,982 | |
| | | | | | | | |
| | | | | | | 1,770,753 | |
| | | | | | | | |
| | | | Health Care Services 3.2% | | | | |
| | 84,000 | | | Bio-Reference Laboratories, Inc.* | | | 1,546,440 | |
| | 19,407 | | | CorVel Corp.* | | | 824,798 | |
| | 210,000 | | | MedQuist Holdings, Inc.* | | | 1,587,600 | |
| | 100,000 | | | Servizi Italia S.p.A. (Italy) | | | 672,700 | |
| | | | | | | | |
| | | | | | | 4,631,538 | |
| | | | | | | | |
| | | | Health Care Supplies 1.3% | | | | |
| | 30,000 | | | Sartorius Stedim Biotech (France) | | | 1,820,456 | |
| | | | | | | | |
| | | | Health Care Technology 1.6% | | | | |
| | 69,687 | | | MedAssets, Inc.* | | | 669,692 | |
| | 70,000 | | | Transcend Services, Inc.* | | | 1,577,800 | |
| | | | | | | | |
| | | | | | | 2,247,492 | |
| | | | | | | | |
| | | | Hotels, Resorts & Cruise Lines 0.5% | | | | |
| | 100,000 | | | Orient-Express Hotels Ltd., Class A* | | | 691,000 | |
| | | | | | | | |
69
| | |
| WASATCH MICRO CAP VALUE FUND (WAMVX) — Schedule of Investments (continued) | | |
|
|
|
| | | | | | | | |
| Shares | | | | | Value | |
| | | | | | | |
| | | | Industrial Machinery 1.3% | | | | |
| | 95,000 | | | Gencor Industries, Inc.* | | $ | 695,400 | |
| | 60,355 | | | Hurco Cos., Inc.* | | | 1,225,207 | |
| | | | | | | | |
| | | | | | | 1,920,607 | |
| | | | | | | | |
| | | | Internet Software & Services 1.6% | | | | |
| | 65,000 | | | DealerTrack Holdings, Inc.* | | | 1,018,550 | |
| | 176,100 | | | Perficient, Inc.* | | | 1,289,052 | |
| | | | | | | | |
| | | | | | | 2,307,602 | |
| | | | | | | | |
| | | | IT Consulting & Other Services 1.7% | | | | |
| | 115,000 | | | Atea ASA (Norway) | | | 917,733 | |
| | 119,200 | | | Virtusa Corp.* | | | 1,573,440 | |
| | | | | | | | |
| | | | | | | 2,491,173 | |
| | | | | | | | |
| | | | Life Sciences Tools & Services 0.8% | | | | |
| | 82,163 | | | MEDTOX Scientific, Inc. | | | 1,075,514 | |
| | | | | | | | |
| | | | Metal & Glass Containers 1.1% | | | | |
| | 160,000 | | | Myers Industries, Inc. | | | 1,624,000 | |
| | | | | | | | |
| | | | Mortgage REITs 1.7% | | | | |
| | 100,000 | | | Colony Financial, Inc. | | | 1,292,000 | |
| | 328,224 | | | NorthStar Realty Finance Corp. | | | 1,083,139 | |
| | | | | | | | |
| | | | | | | 2,375,139 | |
| | | | | | | | |
| | | | Oil & Gas Equipment & Services 1.7% | | | | |
| | 101,950 | | | Matrix Service Co.* | | | 867,595 | |
| | 140,000 | | | Tesco Corp.* | | | 1,624,000 | |
| | | | | | | | |
| | | | | | | 2,491,595 | |
| | | | | | | | |
| | | | Oil & Gas Exploration & Production 0.1% | | | | |
| | 48,950 | | | Triangle Petroleum Corp.* | | | 175,731 | |
| | | | | | | | |
| | | | Other Diversified Financial Services 0.5% | | | | |
| | 64,955 | | | Hypoport AG* (Germany) | | | 686,015 | |
| | | | | | | | |
| | | | Personal Products 0.2% | | | | |
| | 22,862 | | | Atrium Innovations, Inc.* (Canada) | | | 288,989 | |
| | | | | | | | |
| | | | Regional Banks 4.6% | | | | |
| | 1,800,000 | | | City Union Bank Ltd. (India) | | | 1,626,847 | |
| | 200,000 | | | First California Financial Group, Inc.* | | | 602,000 | |
| | 50,000 | | | First of Long Island Corp. (The) | | | 1,133,000 | |
| | 75,000 | | | Lakeland Financial Corp. | | | 1,549,500 | |
| | 110,000 | | | OBA Financial Services, Inc.* | | | 1,612,600 | |
| | | | | | | | |
| | | | | | | 6,523,947 | |
| | | | | | | | |
| | | | Research & Consulting Services 1.7% | | | | |
| | 76,000 | | | Huron Consulting Group, Inc.* | | | 2,365,880 | |
| | | | | | | | |
| | | | Restaurants 2.3% | | | | |
| | 170,000 | | | Caribou Coffee Co., Inc.* | | | 2,009,400 | |
| | 144,000 | | | Krispy Kreme Doughnuts, Inc.* | | | 982,080 | |
| | 140,000 | | | Oishi Group Public Co. Ltd.*** (Thailand) | | | 343,413 | |
| | | | | | | | |
| | | | | | | 3,334,893 | |
| | | | | | | | |
| | | | Semiconductor Equipment 0.6% | | | | |
| | 40,000 | | | Koh Young Technology, Inc. (Korea) | | | 782,607 | |
| | | | | | | | |
| | | | Specialized Finance 2.1% | | | | |
| | 135,000 | | | Encore Capital Group, Inc.* ‡ | | | 2,949,750 | |
| | 41,900 | | | Goldwater Bank, N.A.*** † | | | 15,084 | |
| | | | | | | | |
| | | | | | | 2,964,834 | |
| | | | | | | | |
| | | | Specialty Chemicals 0.4% | | | | |
| | 50,000 | | | KMG Chemicals, Inc. | | | 616,000 | |
| | | | | | | | |
| | | | Specialty Stores 1.1% | | | | |
| | 204,500 | | | easyhome Ltd. (Canada) | | | 1,405,532 | |
| | 5,000 | | | Teavana Holdings, Inc.* | | | 101,700 | |
| | | | | | | | |
| | | | | | | 1,507,232 | |
| | | | | | | | |
| | | | | | | | |
| Shares | | | | | Value | |
| | | | | | | |
| | | | Steel 1.6% | | | | |
| | 54,000 | | | Haynes International, Inc.‡ | | $ | 2,346,300 | |
| | | | | | | | |
| | | | Systems Software 2.3% | | | | |
| | 175,000 | | | DemandTec, Inc.* | | | 1,144,500 | |
| | 1,400,000 | | | GuestLogix, Inc.* (Canada) | | | 672,883 | |
| | 43,000 | | | OPNET Technologies, Inc.‡ | | | 1,501,130 | |
| | | | | | | | |
| | | | | | | 3,318,513 | |
| | | | | | | | |
| | | | Textiles 0.7% | | | | |
| | 1,100,000 | | | S. Kumars Nationwide Ltd. (India) | | | 931,507 | |
| | | | | | | | |
| | | | Thrifts & Mortgage Finance 3.0% | | | | |
| | 34,701 | | | Beneficial Mutual Bancorp, Inc.* | | | 258,522 | |
| | 300 | | | BofI Holding, Inc.* | | | 4,038 | |
| | 240,000 | | | Dewan Housing Finance Corp. Ltd. (India) | | | 1,145,708 | |
| | 130,000 | | | Ocean Shore Holding Co. | | | 1,392,300 | |
| | 110,000 | | | Oritani Financial Corp. | | | 1,414,600 | |
| | | | | | | | |
| | | | | | | 4,215,168 | |
| | | | | | | | |
| | | | Trading Companies & Distributors 2.4% | | | | |
| | 80,000 | | | Beacon Roofing Supply, Inc.* | | | 1,279,200 | |
| | 123,000 | | | CAI International, Inc.* | | | 1,441,560 | |
| | 58,000 | | | iMarketKorea, Inc. (Korea) | | | 753,169 | |
| | | | | | | | |
| | | | | | | 3,473,929 | |
| | | | | | | | |
| | | | Trucking 1.0% | | | | |
| | 79,868 | | | Marten Transport, Ltd. | | | 1,376,924 | |
| | | | | | | | |
| | |
| | | | Total Common Stocks (cost $116,580,936) | | | 121,862,724 | |
| | | | | | | | |
| | |
| | | | PREFERRED STOCKS 0.7% | | | | |
| | |
| | | | Diversified Banks 0.5% | | | | |
| | 150,000 | | | Banco ABC Brasil S.A. Pfd. (Brazil) | | | 757,398 | |
| | | | | | | | |
| | | | Pharmaceuticals 0.2% | | | | |
| | 52,631 | | | Acetylon Pharmaceuticals, Inc., Series B, Pfd.*** † | | | 249,997 | |
| | | | | | | | |
| | |
| | | | Total Preferred Stocks (cost $1,205,488) | | | 1,007,395 | |
| | | | | | | | |
| | |
| | | | WARRANTS 0.1% | | | | |
| | |
| | | | Biotechnology 0.0% | | | | |
| | 30,399 | | | NeurogesX, Inc., expiring 12/28/12* *** † | | | — | |
| | 50,000 | | | NeurogesX, Inc., expiring 7/22/16* *** † | | | 6,250 | |
| | | | | | | | |
| | | | | | | 6,250 | |
| | | | | | | | |
| | | | Health Care Equipment 0.1% | | | | |
| | 58,140 | | | Cardica, Inc., expiring 7/7/12* *** † | | | 581 | |
| | 110,500 | | | Cardica, Inc., expiring 9/29/14* *** † | | | 75,140 | |
| | | | | | | | |
| | | | | | | 75,721 | |
| | | | | | | | |
| | |
| | | | Total Warrants
(cost $33,165) | | | 81,971 | |
| | | | | | | | |
70
| | | | | | | | |
Principal
Amount | | | | | Value | |
| | | | | | | |
| | |
| | | | SHORT-TERM INVESTMENTS 13.1% | | | | |
| | |
| | | | Repurchase Agreement 13.1% | | | | |
| | $18,645,998 | | | Repurchase Agreement dated 9/30/11, 0.01% due 10/3/11 with State Street Bank and Trust Co. collateralized by $19,140,000 of United States Treasury Notes 1.375% due 9/30/18; value: $19,020,375; repurchase proceeds: $18,646,014‡ (cost $18,645,998) | | $ | 18,645,998 | |
| | | | | | | | |
| | |
| | | | Total Short-Term Investments
(cost $18,645,998) | | | 18,645,998 | |
| | | | | | | | |
| | |
| | | | Total Investments
(cost $136,465,587) 99.2%§ | | | 141,598,088 | |
| | |
| | | | Other Assets less Liabilities 0.8% | | | 1,196,820 | |
| | | | | | | | |
| | |
| | | | NET ASSETS 100.0% | | $ | 142,794,908 | |
| | | | | | | | |
| | |
Number of
Contracts | | | | | Value | |
| | | | | | | |
| | | | CALL OPTIONS WRITTEN 0.3% | | | | |
| | |
| | | | Apparel, Accessories & Luxury Goods 0.0% | | | | |
| | 109 | | | Maidenform Brands, Inc., expiring 10/22/11, exercise price $25 | | $ | 9,265 | |
| | | | | | | | |
| | | | Consumer Finance 0.2% | | | | |
| | 800 | | | First Cash Financial Services, Inc., expiring 12/17/11, exercise price $45 | | | 196,000 | |
| | | | | | | | |
| | | | Electronic Manufacturing
Services 0.1% | | | | |
| | 1,320 | | | TTM Technologies, Inc., expiring 12/17/11, exercise price $10 | | | 145,200 | |
| | | | | | | | |
| | | | Steel 0.0% | | | | |
| | 212 | | | Haynes International, Inc., expiring 10/22/11, exercise price $60 | | | 10,600 | |
| | | | | | | | |
| | | | Systems Software 0.0% | | | | |
| | 159 | | | OPNET Technologies, Inc., expiring 10/22/11, exercise price $35 | | | 31,005 | |
| | | | | | | | |
| | |
| | | | Total Call Options Written
(premium $762,276) | | | 392,070 | |
| | | | | | | | |
| | | | | | | | |
| Contracts | | | | | Net
Unrealized
Appreciation | |
| | | | | | | |
| | |
| | | | FORWARD FOREIGN CURRENCY EXCHANGE CONTRACTS
SHORT 0.2% | | | | |
| | |
| | 4,100,000 EUR | | | USD, State Street Bank and Trust Co., settlement date 12/8/11,
(cost $5,753,018; value $5,514,347) | | $ | 238,671 | |
| | | | | | | | |
| | |
| | | | Total Forward Foreign Currency Exchange Contracts Short
(cost $5,753,018; value $5,514,347) | | | 238,671 | |
| | | | | | | | |
| |
| | | | *Non-income producing. ***Security was fair valued under procedures adopted by the Board of Trustees (see Note 15). †Security purchased in a private placement transaction or under Rule 144A of the Securities Act of 1933 (see Note 11). ‡All or a portion of this security has been designated as collateral for call options written and forward foreign currency exchange contracts (See Notes 7 and 4, respectively). §The aggregate amount of foreign securities fair valued pursuant to a systematic valuation model as a percent of net assets was 13.03%. PIPE Private Investment in a Public Equity. REIT Real Estate Investment Trust. See Notes to Financial Statements. | |
At September 30, 2011, Wasatch Micro Cap Value Fund’s investments, excluding short-term investments, options written and forward foreign currency exchange contracts, were in the following countries:
| | | | |
| Country | | % | |
Brazil | | | 0.6 | |
Canada | | | 1.9 | |
France | | | 1.5 | |
Germany | | | 2.3 | |
India | | | 4.2 | |
Indonesia | | | 0.9 | |
Israel | | | 3.0 | |
Italy | | | 0.6 | |
Korea | | | 2.1 | |
Malaysia | | | 2.0 | |
Norway | | | 0.7 | |
Thailand | | | 1.2 | |
United Arab Emirates | | | 0.7 | |
United Kingdom | | | 2.6 | |
United States | | | 75.7 | |
| | | | |
TOTAL | | | 100.0 | % |
| | | | |
71
| | |
| WASATCH SMALL CAP GROWTH FUND (WAAEX) — Schedule of Investments | | |
|
|
|
| | | | | | | | |
| Shares | | | | | Value | |
| | | | | | | |
| | | | COMMON STOCKS 98.9% | | | | |
| | |
| | | | Aerospace & Defense 2.7% | | | | |
| | 258,890 | | | HEICO Corp. | | $ | 12,747,744 | |
| | 681,160 | | | HEICO Corp., Class A | | | 22,927,845 | |
| | | | | | | | |
| | | | | | | 35,675,589 | |
| | | | | | | | |
| | | | Air Freight & Logistics 2.4% | | | | |
| | 36,319,023 | | | Aramex PJSC (United Arab Emirates) | | | 17,614,936 | |
| | 467,141 | | | HUB Group, Inc., Class A* | | | 13,206,076 | |
| | | | | | | | |
| | | | | | | 30,821,012 | |
| | | | | | | | |
| | | | Apparel Retail 1.5% | | | | |
| | 923,960 | | | Chico’s FAS, Inc. | | | 10,560,863 | |
| | 536,833 | | | Zumiez, Inc.* | | | 9,399,946 | |
| | | | | | | | |
| | | | | | | 19,960,809 | |
| | | | | | | | |
| | | | Application Software 6.4% | | | | |
| | 441,142 | | | Concur Technologies, Inc.* | | | 16,419,305 | |
| | 77,807 | | | FactSet Research Systems, Inc. | | | 6,922,489 | |
| | 539,736 | | | RealPage, Inc.* | | | 11,037,601 | |
| | 1,048,186 | | | Ultimate Software Group, Inc.* | | | 48,971,250 | |
| | | | | | | | |
| | | | | | | 83,350,645 | |
| | | | | | | | |
| | | | Asset Management & Custody
Banks 0.6% | | | | |
| | 289,855 | | | Waddell & Reed Financial, Inc., Class A | | | 7,249,274 | |
| | | | | | | | |
| | | | Automotive Retail 3.1% | | | | |
| | 572,906 | | | Monro Muffler Brake, Inc. | | | 18,888,711 | |
| | 316,533 | | | O’Reilly Automotive, Inc.* | | | 21,090,594 | |
| | | | | | | | |
| | | | | | | 39,979,305 | |
| | | | | | | | |
| | | | Biotechnology 2.8% | | | | |
| | 1,794,615 | | | Exact Sciences Corp.* | | | 11,898,297 | |
| | 398,079 | | | Myriad Genetics, Inc.* | | | 7,460,000 | |
| | 3,882,558 | | | NeurogesX, Inc. PIPE* *** ‡‡ | | | 3,455,477 | |
| | 645,125 | | | Sangamo BioSciences, Inc.* | | | 2,806,294 | |
| | 595,265 | | | Seattle Genetics, Inc.* | | | 11,345,751 | |
| | | | | | | | |
| | | | | | | 36,965,819 | |
| | | | | | | | |
| | | | Computer & Electronics Retail 0.3% | | | | |
| | 378,592 | | | hhgregg, Inc.* | | | 3,691,272 | |
| | | | | | | | |
| | | | Computer Storage & Peripherals 0.2% | | | | |
| | 125,140 | | | Fusion-io, Inc.* | | | 2,377,660 | |
| | | | | | | | |
| | | | Data Processing & Outsourced Services 2.9% | | | | |
| | 180,730 | | | Syntel, Inc. | | | 7,805,729 | |
| | 1,911,100 | | | Wirecard AG (Germany) | | | 29,361,406 | |
| | | | | | | | |
| | | | | | | 37,167,135 | |
| | | | | | | | |
| | | | Distributors 1.2% | | | | |
| | 619,623 | | | LKQ Corp.* | | | 14,970,092 | |
| | | | | | | | |
| | | | Diversified Banks 3.2% | | | | |
| | 761,965 | | | HDFC Bank Ltd. ADR (India) | | | 22,211,280 | |
| | 3,615,495 | | | Yes Bank Ltd. (India) | | | 19,849,461 | |
| | | | | | | | |
| | | | | | | 42,060,741 | |
| | | | | | | | |
| | | | Diversified Support Services 3.4% | | | | |
| | 562,258 | | | Copart, Inc.* | | | 21,995,533 | |
| | 811,790 | | | Higher One Holdings, Inc.* | | | 13,207,823 | |
| | 147,960 | | | Ritchie Bros. Auctioneers, Inc. (Canada) | | | 2,987,312 | |
| | 661,495 | | | STR Holdings, Inc.* | | | 5,364,725 | |
| | | | | | | | |
| | | | | | | 43,555,393 | |
| | | | | | | | |
| | | | Electrical Components &
Equipment 1.7% | | | | |
| | 396,050 | | | Polypore International, Inc.* | | | 22,384,746 | |
| | | | | | | | |
| | | | | | | | |
| Shares | | | | | Value | |
| | | | | | | |
| | | | Environmental & Facilities
Services 1.8% | | | | |
| | 2,232,175 | | | RPS Group plc (United Kingdom) | | $ | 5,699,272 | |
| | 939,995 | | | Tetra Tech, Inc.* | | | 17,615,506 | |
| | | | | | | | |
| | | | | | | 23,314,778 | |
| | | | | | | | |
| | | | Health Care Distributors 1.4% | | | | |
| | 264,672 | | | MWI Veterinary Supply, Inc.* | | | 18,214,727 | |
| | | | | | | | |
| | | | Health Care Equipment 1.4% | | | | |
| | 548,950 | | | Abaxis, Inc.* | | | 12,576,444 | |
| | 487,760 | | | DexCom, Inc.* | | | 5,853,120 | |
| | 24,690 | | | Zonare Medical Systems, Inc.* *** † | | | 247 | |
| | | | | | | | |
| | | | | | | 18,429,811 | |
| | | | | | | | |
| | | | Health Care Services 0.7% | | | | |
| | 142,820 | | | MEDNAX, Inc.* | | | 8,946,245 | |
| | | | | | | | |
| | | | Health Care Technology 1.9% | | | | |
| | 158,814 | | | athenahealth, Inc.* | | | 9,457,374 | |
| | 239,773 | | | Computer Programs and Systems, Inc. | | | 15,860,984 | |
| | | | | | | | |
| | | | | | | 25,318,358 | |
| | | | | | | | |
| | | | Industrial Machinery 1.6% | | | | |
| | 947,579 | | | AIA Engineering Ltd. (India) | | | 5,941,284 | |
| | 437,445 | | | Graco, Inc. | | | 14,934,372 | |
| | | | | | | | |
| | | | | | | 20,875,656 | |
| | | | | | | | |
| | | | Internet Retail 3.6% | | | | |
| | 462,294 | | | Blue Nile, Inc.* | | | 16,309,732 | |
| | 257,684 | | | Shutterfly, Inc.* | | | 10,611,427 | |
| | 947,283 | | | Yoox S.p.A.* (Italy) | | | 12,196,422 | |
| | 125,282 | | | zooplus AG* (Germany) | | | 7,459,011 | |
| | | | | | | | |
| | | | | | | 46,576,592 | |
| | | | | | | | |
| | | | Internet Software &
Services 4.5% | | | | |
| | 800,225 | | | DealerTrack Holdings, Inc.* | | | 12,539,526 | |
| | 1,065,447 | | | LoopNet, Inc.* | | | 18,251,107 | |
| | 663,972 | | | SciQuest, Inc.* | | | 9,919,742 | |
| | 656,681 | | | Vistaprint N.V.* | | | 17,750,087 | |
| | | | | | | | |
| | | | | | | 58,460,462 | |
| | | | | | | | |
| | | | IT Consulting & Other Services 1.7% | | | | |
| | 275,737 | | | Cognizant Technology Solutions Corp., Class A* | | | 17,288,710 | |
| | 408,065 | | | ServiceSource International, Inc.* | | | 5,390,538 | |
| | | | | | | | |
| | | | | | | 22,679,248 | |
| | | | | | | | |
| | | | Leisure Facilities 2.7% | | | | |
| | 955,913 | | | Life Time Fitness, Inc.* | | | 35,225,394 | |
| | | | | | | | |
| | | | Life Sciences Tools & Services 4.6% | | | | |
| | 408,905 | | | Divi’s Laboratories Ltd. (India) | | | 6,075,017 | |
| | 709,685 | | | Fluidigm Corp.* | | | 9,885,912 | |
| | 1,256,063 | | | ICON plc ADR* (Ireland) | | | 20,197,493 | |
| | 342,988 | | | Techne Corp. | | | 23,326,614 | |
| | | | | | | | |
| | | | | | | 59,485,036 | |
| | | | | | | | |
| | | | Oil & Gas Equipment & Services 3.6% | | | | |
| | 334,085 | | | Dril-Quip, Inc.* | | | 18,010,522 | |
| | 903,720 | | | Pason Systems, Inc. (Canada) | | | 11,571,230 | |
| | 354,385 | | | ShawCor Ltd., Class A (Canada) | | | 8,288,174 | |
| | 455,035 | | | TGS-NOPEC Geophysical Co. ASA (Norway) | | | 8,491,309 | |
| | | | | | | | |
| | | | | | | 46,361,235 | |
| | | | | | | | |
72
| | | | | | | | |
| Shares | | | | | Value | |
| | | | | | | |
| | | | Oil & Gas Exploration &
Production 2.8% | | | | |
| | 423,425 | | | GMX Resources, Inc.* | | $ | 961,175 | |
| | 529,065 | | | Northern Oil and Gas, Inc.* | | | 10,258,570 | |
| | 3,387,260 | | | Premier Oil plc* (United Kingdom) | | | 18,276,808 | |
| | 784,115 | | | Transglobe Energy Corp.* (Canada) | | | 6,288,602 | |
| | | | | | | | |
| | | | | | | 35,785,155 | |
| | | | | | | | |
| | | | Oil & Gas Refining & Marketing 0.3% | | | | |
| | 203,175 | | | Amyris, Inc.* | | | 4,112,262 | |
| | | | | | | | |
| | | | Packaged Foods & Meats 2.6% | | | | |
| | 411,088 | | | GlaxoSmithKline Consumer Healthcare Ltd. (India) | | | 19,893,386 | |
| | 4,409,719 | | | Hsu Fu Chi International Ltd. (China) | | | 14,186,128 | |
| | | | | | | | |
| | | | | | | 34,079,514 | |
| | | | | | | | |
| | | | Personal Products 0.9% | | | | |
| | 582,400 | | | Colgate-Palmolive India Ltd. (India) | | | 11,549,821 | |
| | | | | | | | |
| | | | Pharmaceuticals 0.2% | | | | |
| | 793,037 | | | ISTA Pharmaceuticals, Inc.* | | | 2,735,978 | |
| | | | | | | | |
| | | | Research & Consulting Services 2.9% | | | | |
| | 431,808 | | | CRA International, Inc.* | | | 8,640,478 | |
| | 1,455,778 | | | Resources Connection, Inc.‡ | | | 14,237,509 | |
| | 676,759 | | | Stantec, Inc.* (Canada) | | | 15,105,261 | |
| | | | | | | | |
| | | | | | | 37,983,248 | |
| | | | | | | | |
| | | | Restaurants 2.8% | | | | |
| | 643,848 | | | Peet’s Coffee & Tea, Inc.* | | | 35,823,703 | |
| | | | | | | | |
| | | | Semiconductors 9.9% | | | | |
| | 538,860 | | | Hittite Microwave Corp.* | | | 26,242,482 | |
| | 553,580 | | | NetLogic Microsystems, Inc.* | | | 26,632,734 | |
| | 1,601,763 | | | O2Micro International Ltd. ADR* (China) | | | 6,679,352 | |
| | 1,731,197 | | | Power Integrations, Inc.‡‡ | | | 52,991,940 | |
| | 492,359 | | | Silicon Laboratories, Inc.* | | | 16,498,950 | |
| | | | | | | | |
| | | | | | | 129,045,458 | |
| | | | | | | | |
| | | | Specialized Finance 1.9% | | | | |
| | 806,325 | | | MSCI, Inc., Class A* | | | 24,455,837 | |
| | | | | | | | |
| | | | Specialty Stores 2.6% | | | | |
| | 981,036 | | | Hibbett Sports, Inc.* | | | 33,247,310 | |
| | | | | | | | |
| | | | Systems Software 3.1% | | | | |
| | 681,347 | | | NetSuite, Inc.* | | | 18,403,182 | |
| | 836,530 | | | Sourcefire, Inc.* | | | 22,385,543 | |
| | | | | | | | |
| | | | | | | 40,788,725 | |
| | | | | | | | |
| | | | Trading Companies &
Distributors 2.4% | | | | |
| | 547,600 | | | MSC Industrial Direct Co., Inc., Class A | | | 30,917,496 | |
| | | | | | | | |
| | | | Trucking 4.6% | | | | |
| | 120,800 | | | J.B. Hunt Transport Services, Inc. | | | 4,363,296 | |
| | 4,139,457 | | | Knight Transportation, Inc.‡ ‡‡ | | | 55,096,173 | |
| | 3,375 | | | Zipcar, Inc.* | | | 60,750 | |
| | | | | | | | |
| | | | | | | 59,520,219 | |
| | | | | | | | |
| | |
| | | | Total Common Stocks
(cost $1,070,883,124) | | | 1,284,141,760 | |
| | | | | | | | |
| | |
| | | | PREFERRED STOCKS 0.7% | | | | |
| | |
| | | | Biotechnology 0.1% | | | | |
| | 677,966 | | | Nanosys, Inc., Series D Pfd.* *** † | | | 776,271 | |
| | 161,519 | | | Nanosys, Inc., Series E Pfd.* *** † | | | 184,939 | |
| | | | | | | | |
| | | | | | | 961,210 | |
| | | | | | | | |
| | | | Internet Software & Services 0.6% | | | | |
| | 63,097 | | | Angies List, Series C Pfd.* *** † | | | 4,463,305 | |
| | 42,410 | | | Angies List, Series D Pfd.* *** † | | | 2,999,965 | |
| | | | | | | | |
| | | | | | | 7,463,270 | |
| | | | | | | | |
| | | | | | | | |
| Shares | | | | | Value | |
| | | | | | | |
| | |
| | | | Total Preferred Stocks
(cost $9,439,187) | | $ | 8,424,480 | |
| | | | | | | | |
| | |
| | | | LIMITED PARTNERSHIP INTEREST 0.5% | | | | |
| | |
| | | | Asset Management & Custody
Banks 0.5% | | | | |
| | | | Greenspring Global Partners II-B, L.P.*** † | | | 4,842,592 | |
| | | | Greenspring Global Partners III-B, L.P.*** † | | | 1,428,580 | |
| | | | | | | | |
| | | | | | | 6,271,172 | |
| | | | | | | | |
| | |
| | | | Total Limited Partnership Interest
(cost $5,718,853) | | | 6,271,172 | |
| | | | | | | | |
| | |
| | | | WARRANTS 0.0% | | | | |
| | |
| | | | Biotechnology 0.0% | | | | |
| | 1,941,279 | | | NeurogesX, Inc., expiring 7/22/16* *** † | | | 242,660 | |
| | | | | | | | |
| | |
| | | | Total Warrants
(cost $242,660) | | | 242,660 | |
| | | | | | | | |
| | |
| | | | RIGHTS 0.0% | | | | |
| | |
| | | | Life Sciences Tools & Services 0.0% | | | | |
| | 208,525 | | | Valera Pharmaceuticals, Inc. Ureteral Stent CSR* *** † | | | — | |
| | | | | | | | |
| | | | Pharmaceuticals 0.0% | | | | |
| | 208,525 | | | Valera Pharmaceuticals, Inc. VP003 (Octreotide Implant) CSR* *** † | | | — | |
| | | | | | | | |
| | |
| | | | Total Rights
(cost $406,537) | | | — | |
| | | | | | | | |
| | |
Principal
Amount | | | | | Value | |
| | | | | | | |
| | | | SHORT-TERM INVESTMENTS 0.7% | | | | |
| | |
| | | | Repurchase Agreement 0.7% | | | | |
| | $9,350,040 | | | Repurchase Agreement dated 9/30/11, 0.01% due 10/3/11 with State Street Bank and Trust Co. collateralized by $9,020,000 of United States Treasury Notes 1.375% due 9/30/18; value: $4,506,656; United States Treasury Notes 2.125% due 11/30/14; value: $84,700; United States Treasury Notes 3.125% due 5/15/19; value: $4,950,119; repurchase proceeds: $9,350,048‡
(cost $9,350,040) | | $ | 9,350,040 | |
| | | | | | | | |
| | |
| | | | Total Short-Term Investments
(cost $9,350,040) | | | 9,350,040 | |
| | | | | | | | |
| | |
| | | | Total Investments
(cost $1,096,040,401) 100.8%§ | | | 1,308,430,112 | |
| | |
| | | | Liabilities less Other Assets (0.8%) | | | (10,447,784 | ) |
| | | | | | | | |
| | |
| | | | NET ASSETS 100.0% | | $ | 1,297,982,328 | |
| | | | | | | | |
| |
| | | | *Non-income producing. ***Security was fair valued under procedures adopted by the Board of Trustees (see Note 15). †Security purchased in a private placement transaction or under Rule 144A of the Securities Act of 1933 (see Note 11). ‡All or a portion of this security has been designated as collateral for purchase commitments (see Note 12). ‡‡Affiliated company (see Note 10). §The aggregate amount of foreign securities fair valued pursuant to a systematic valuation model as a percent of net assets was 10.97%. ADR American Depositary Receipt. PIPE Private Investment in a Public Equity. See Notes to Financial Statements. | |
73
| | |
| WASATCH SMALL CAP GROWTH FUND (WAAEX) — Schedule of Investments (continued) | | SEPTEMBER 30, 2011 |
|
|
|
At September 30, 2011, Wasatch Small Cap Growth Fund’s investments, excluding short-term investments, were in the following countries:
| | | | |
| Country | | % | |
Canada | | | 3.4 | |
China | | | 1.6 | |
Germany | | | 2.8 | |
India | | | 6.6 | |
Ireland | | | 1.6 | |
Italy | | | 0.9 | |
Norway | | | 0.7 | |
United Arab Emirates | | | 1.4 | |
United Kingdom | | | 1.8 | |
United States | | | 79.2 | |
| | | | |
TOTAL | | | 100.0 | % |
| | | | |
74
| | |
| WASATCH SMALL CAP VALUE FUND (WMCVX) — Schedule of Investments | | SEPTEMBER 30, 2011 |
|
|
|
| | | | | | | | |
| Shares | | | | | Value | |
| | | | | | | |
| | |
| | | | COMMON STOCKS 98.6% | | | | |
| | |
| | | | Aerospace & Defense 2.4% | | | | |
| | 122,655 | | | HEICO Corp., Class A | | $ | 4,128,567 | |
| | | | | | | | |
| | |
| | | | Airlines 2.1% | | | | |
| | 75,273 | | | Allegiant Travel Co.* | | | 3,547,617 | |
| | | | | | | | |
| | |
| | | | Airport Services 1.2% | | | | |
| | 182,935 | | | Wesco Aircraft Holdings, Inc.* | | | 1,999,480 | |
| | | | | | | | |
| | |
| | | | Apparel Retail 4.0% | | | | |
| | 188,251 | | | Body Central Corp.* | | | 3,418,638 | |
| | 289,735 | | | Chico’s FAS, Inc. | | | 3,311,671 | |
| | | | | | | | |
| | | | | | | 6,730,309 | |
| | | | | | | | |
| | |
| | | | Apparel, Accessories & Luxury Goods 1.6% | | | | |
| | 114,565 | | | Maidenform Brands, Inc.* | | | 2,681,967 | |
| | | | | | | | |
| | |
| | | | Application Software 0.5% | | | | |
| | 57,093 | | | Ebix, Inc.* | | | 839,267 | |
| | | | | | | | |
| | |
| | | | Asset Management & Custody Banks 1.2% | | | | |
| | 555 | | | Solar Capital Ltd. | | | 11,172 | |
| | 38,390 | | | Virtus Investment Partners, Inc.* | | | 2,058,472 | |
| | | | | | | | |
| | | | | | | 2,069,644 | |
| | | | | | | | |
| | |
| | | | Automotive Retail 0.7% | | | | |
| | 36,126 | | | Monro Muffler Brake, Inc. | | | 1,191,074 | |
| | | | | | | | |
| | |
| | | | Communications Equipment 2.1% | | | | |
| | 115,925 | | | Finisar Corp.* | | | 2,033,325 | |
| | 79,568 | | | Polycom, Inc.* | | | 1,461,664 | |
| | | | | | | | |
| | | | | | | 3,494,989 | |
| | | | | | | | |
| | |
| | | | Computer Storage & Peripherals 1.0% | | | | |
| | 244,565 | | | Intevac, Inc.* | | | 1,709,509 | |
| | | | | | | | |
| | |
| | | | Construction & Engineering 1.1% | | | | |
| | 103,690 | | | MYR Group, Inc.* | | | 1,829,092 | |
| | | | | | | | |
| | |
| | | | Consumer Finance 4.4% | | | | |
| | 402,660 | | | Advance America Cash Advance Centers, Inc. | | | 2,963,578 | |
| | 201,877 | | | DFC Global Corp.* | | | 4,411,012 | |
| | | | | | | | |
| | | | | | | 7,374,590 | |
| | | | | | | | |
| | |
| | | | Data Processing & Outsourced Services 0.6% | | | | |
| | 24,990 | | | Syntel, Inc. | | | 1,079,318 | |
| | | | | | | | |
| | |
| | | | Diversified Banks 1.9% | | | | |
| | 511,305 | | | Karnataka Bank Ltd. (India) | | | 870,384 | |
| | 5,356,975 | | | South Indian Bank Ltd. (India) | | | 2,428,136 | |
| | | | | | | | |
| | | | | | | 3,298,520 | |
| | | | | | | | |
| | |
| | | | Diversified Support Services 4.8% | | | | |
| | 186,895 | | | Copart, Inc.* | | | 7,311,333 | |
| | 105,585 | | | STR Holdings, Inc.* | | | 856,294 | |
| | | | | | | | |
| | | | | | | 8,167,627 | |
| | | | | | | | |
| | |
| | | | Education Services 1.4% | | | | |
| | 135,676 | | | Bridgepoint Education, Inc.* | | | 2,366,189 | |
| | | | | | | | |
| | |
| | | | Electronic Components 0.7% | | | | |
| | 709,920 | | | Polytronics Technology Corp. (Taiwan) | | | 1,113,244 | |
| | | | | | | | |
| | | | | | | | |
| Shares | | | | | Value | |
| | | | | | | |
| | |
| | | | Electronic Manufacturing Services 2.6% | | | | |
| | 129,750 | | | Fabrinet* | | $ | 2,426,325 | |
| | 215,845 | | | TTM Technologies, Inc.* | | | 2,052,686 | |
| | | | | | | | |
| | | | | | | 4,479,011 | |
| | | | | | | | |
| | |
| | | | Environmental & Facilities Services 0.8% | | | | |
| | 522,751 | | | RPS Group plc (United Kingdom) | | | 1,334,707 | |
| | | | | | | | |
| | |
| | | | Footwear 2.0% | | | | |
| | 239,525 | | | Skechers U.S.A., Inc., Class A* | | | 3,360,536 | |
| | | | | | | | |
| | |
| | | | Health Care Facilities 1.1% | | | | |
| | 126,961 | | | Emeritus Corp.* | | | 1,790,150 | |
| | | | | | | | |
| | |
| | | | Health Care Services 6.0% | | | | |
| | 183,159 | | | Addus HomeCare Corp.* | | | 749,120 | |
| | 143,682 | | | CorVel Corp.* | | | 6,106,485 | |
| | 52,025 | | | MEDNAX, Inc.* | | | 3,258,846 | |
| | | | | | | | |
| | | | | | | 10,114,451 | |
| | | | | | | | |
| | |
| | | | Health Care Supplies 1.0% | | | | |
| | 29,005 | | | Sartorius Stedim Biotech (France) | | | 1,760,077 | |
| | | | | | | | |
| | |
| | | | Heavy Electrical Equipment 1.1% | | | | |
| | 77,263 | | | General Cable Corp.* | | | 1,804,091 | |
| | | | | | | | |
| | |
| | | | Home Improvement Retail 1.2% | | | | |
| | 134,580 | | | Lumber Liquidators Holdings, Inc.* | | | 2,032,158 | |
| | | | | | | | |
| | |
| | | | Internet Software & Services 1.5% | | | | |
| | 96,340 | | | Vistaprint N.V.* | | | 2,604,070 | |
| | | | | | | | |
| | |
| | | | IT Consulting & Other Services 1.3% | | | | |
| | 2,164,635 | | | CSG Ltd. (Australia) | | | 2,224,982 | |
| | | | | | | | |
| | |
| | | | Life Sciences Tools & Services 1.8% | | | | |
| | 193,829 | | | ICON plc ADR* (Ireland) | | | 3,116,770 | |
| | | | | | | | |
| | |
| | | | Mortgage REITs 2.6% | | | | |
| | 338,855 | | | MFA Financial, Inc. | | | 2,378,762 | |
| | 173,650 | | | Redwood Trust, Inc. | | | 1,939,671 | |
| | | | | | | | |
| | | | | | | 4,318,433 | |
| | | | | | | | |
| | |
| | | | Office Services & Supplies 0.7% | | | | |
| | 370,820 | | | American Reprographics Co.* | | | 1,245,955 | |
| | | | | | | | |
| | |
| | | | Oil & Gas Equipment & Services 1.4% | | | | |
| | 110,160 | | | Tesco Corp.* | | | 1,277,856 | |
| | 58,525 | | | TGS-NOPEC Geophysical Co. ASA (Norway) | | | 1,092,122 | |
| | | | | | | | |
| | | | | | | 2,369,978 | |
| | | | | | | | |
| | |
| | | | Oil & Gas Exploration & Production 2.4% | | | | |
| | 132,085 | | | Northern Oil and Gas, Inc.* | | | 2,561,128 | |
| | 55,240 | | | Ultra Petroleum Corp.* | | | 1,531,253 | |
| | | | | | | | |
| | | | | | | 4,092,381 | |
| | | | | | | | |
| | |
| | | | Oil & Gas Refining & Marketing 1.5% | | | | |
| | 75,385 | | | World Fuel Services Corp. | | | 2,461,320 | |
| | | | | | | | |
| | |
| | | | Personal Products 2.1% | | | | |
| | 31,118 | | | Atrium Innovations, Inc.* (Canada) | | | 393,350 | |
| | 57,893 | | | Herbalife Ltd. | | | 3,103,065 | |
| | | | | | | | |
| | | | | | | 3,496,415 | |
| | | | | | | | |
| | |
| | | | Property & Casualty Insurance 1.5% | | | | |
| | 113,565 | | | Tower Group, Inc. | | | 2,596,096 | |
| | | | | | | | |
75
| | |
| WASATCH SMALL CAP VALUE FUND (WMCVX) — Schedule of Investments (continued) | | SEPTEMBER 30, 2011 |
|
|
|
| | | | | | | | |
Shares | | | | | Value | |
| | | | | | | |
| | | | Regional Banks 4.6% | | | | |
| | 2,876,000 | | | City Union Bank Ltd. (India) | | $ | 2,599,340 | |
| | 78,074 | | | Community Bank System, Inc. | | | 1,771,499 | |
| | 217,252 | | | Nara Bancorp, Inc.* | | | 1,318,720 | |
| | 63,330 | | | Prosperity Bancshares, Inc. | | | 2,069,624 | |
| | | | | | | | |
| | | | | | | 7,759,183 | |
| | | | | | | | |
| | | | Research & Consulting Services 6.8% | | | | |
| | 111,387 | | | Corporate Executive Board Co. (The) | | | 3,319,333 | |
| | 97,510 | | | CRA International, Inc.* | | | 1,951,175 | |
| | 136,840 | | | Huron Consulting Group, Inc.* | | | 4,259,829 | |
| | 208,380 | | | Resources Connection, Inc. | | | 2,037,956 | |
| | | | | | | | |
| | | | | | | 11,568,293 | |
| | | | | | | | |
| | | | Semiconductors 9.7% | | | | |
| | 295,033 | | | BCD Semiconductor Manufacturing Ltd. ADR* (China) | | | 1,475,165 | |
| | 178,395 | | | MaxLinear, Inc., Class A* | | | 1,152,432 | |
| | 343,073 | | | Micrel, Inc. | | | 3,248,901 | |
| | 355,175 | | | O2Micro International Ltd. ADR* (China) | | | 1,481,080 | |
| | 360,037 | | | Pericom Semiconductor Corp.* | | | 2,667,874 | |
| | 76,625 | | | Power Integrations, Inc. | | | 2,345,491 | |
| | 655,000 | | | Sporton International, Inc. (Taiwan) | | | 1,354,877 | |
| | 66,765 | | | Standard Microsystems Corp.* | | | 1,295,241 | |
| | 79,832 | | | Supertex, Inc.* | | | 1,381,093 | |
| | | | | | | | |
| | | | | | | 16,402,154 | |
| | | | | | | | |
| | | | Specialized Finance 1.7% | | | | |
| | 46,720 | | | Portfolio Recovery Associates, Inc.* | | | 2,906,918 | |
| | | | | | | | |
| | | | Specialty Stores 0.8% | | | | |
| | 225,460 | | | Big 5 Sporting Goods Corp. | | | 1,370,797 | |
| | | | | | | | |
| | | | Steel 0.7% | | | | |
| | 29,197 | | | Haynes International, Inc. | | | 1,268,610 | |
| | | | | | | | |
| | | | Thrifts & Mortgage Finance 1.0% | | | | |
| | 134,445 | | | Oritani Financial Corp. | | | 1,728,963 | |
| | | | | | | | |
| | | | Trading Companies &
Distributors 3.7% | | | | |
| | 111,630 | | | Beacon Roofing Supply, Inc.* | | | 1,784,964 | |
| | 131,415 | | | Interline Brands, Inc.* | | | 1,691,311 | |
| | 49,225 | | | MSC Industrial Direct Co., Inc., Class A | | | 2,779,243 | |
| | | | | | | | |
| | | | | | | 6,255,518 | |
| | | | | | | | |
| | | | Trucking 5.3% | | | | |
| | 134,680 | | | Knight Transportation, Inc. | | | 1,792,591 | |
| | 178,084 | | | Marten Transport, Ltd. | | | 3,070,168 | |
| | 117,149 | | | Old Dominion Freight Line, Inc.* | | | 3,393,807 | |
| | 176,176 | | | Vitran Corp., Inc.* (Canada) | | | 695,895 | |
| | | | | | | | |
| | | | | | | 8,952,461 | |
| | | | | | | | |
| | |
| | | | Total Common Stocks
(cost $162,938,792) | | | 167,035,481 | |
| | | | | | | | |
| | | | | | | | |
Principal
Amount | | | | | Value | |
| | | | | | | |
| | |
| | | | SHORT-TERM INVESTMENTS 2.3% | | | | |
| | |
| | | | Repurchase Agreement 2.3% | | | | |
| | $3,880,430 | | | Repurchase Agreement dated 9/30/11, 0.01% due 10/3/11 with State Street Bank and Trust Co. collateralized by $3,985,000 of United States Treasury Notes 1.375% due 9/30/18; value: $3,960,094; repurchase proceeds: $3,880,433 (cost $3,880,430) | | $ | 3,880,430 | |
| | | | | | | | |
| | |
| | | | Total Short-Term Investments
(cost $3,880,430) | | | 3,880,430 | |
| | | | | | | | |
| | |
| | | | Total Investments
(cost $166,819,222) 100.9%§ | | | 170,915,911 | |
| | |
| | | | Liabilities less Other Assets (0.9%) | | | (1,514,461 | ) |
| | | | | | | | |
| | |
| | | | NET ASSETS 100.0% | | $ | 169,401,450 | |
| | | | | | | | |
| |
| | | | *Non-income producing. §The aggregate amount of foreign securities fair valued pursuant to a systematic valuation model as a percent of net assets was 8.72%. ADR American Depositary Receipt. REIT Real Estate Investment Trust. See Notes to Financial Statements. | |
At September 30, 2011, Wasatch Small Cap Value Fund’s investments, excluding short-term investments, were in the following countries:
| | | | |
| Country | | % | |
Australia | | | 1.3 | |
Canada | | | 0.6 | |
China | | | 1.8 | |
France | | | 1.0 | |
India | | | 3.5 | |
Ireland | | | 1.9 | |
Norway | | | 0.7 | |
Taiwan | | | 1.5 | |
United Kingdom | | | 0.8 | |
United States | | | 86.9 | |
| | | | |
TOTAL | | | 100.0 | % |
| | | | |
76
| | |
| WASATCH STRATEGIC INCOME FUND (WASIX) — Schedule of Investments | | SEPTEMBER 30, 2011 |
|
|
|
| | | | | | | | |
| Shares | | | | | Value | |
| | | | | | | |
| | | | COMMON STOCKS 88.4% | | | | |
| | |
| | | | Asset Management & Custody
Banks 9.9% | | | | |
| | 52,513 | | | Ares Capital Corp. | | $ | 723,104 | |
| | 3,330 | | | BlackRock, Inc. | | | 492,873 | |
| | 16,264 | | | Solar Capital Ltd. | | | 327,394 | |
| | 59,103 | | | Solar Senior Capital Ltd. | | | 844,582 | |
| | | | | | | | |
| | | | | | | 2,387,953 | |
| | | | | | | | |
| | | | Computer & Electronics Retail 1.9% | | | | |
| | 19,500 | | | Best Buy Co., Inc. | | | 454,350 | |
| | | | | | | | |
| | | | Consumer Finance 3.5% | | | | |
| | 21,400 | | | Capital One Financial Corp. | | | 848,082 | |
| | | | | | | | |
| | | | Data Processing & Outsourced Services 11.5% | | | | |
| | 3,500 | | | MasterCard, Inc., Class A | | | 1,110,060 | |
| | 13,235 | | | Visa, Inc., Class A | | | 1,134,504 | |
| | 33,943 | | | Wirecard AG (Germany) | | | 521,487 | |
| | | | | | | | |
| | | | | | | 2,766,051 | |
| | | | | | | | |
| | | | Distributors 0.4% | | | | |
| | 3,800 | | | Pool Corp. | | | 99,484 | |
| | | | | | | | |
| | | | Diversified REITs 1.0% | | | | |
| | 177,857 | | | Star Asia Finance Ltd.* † | | | 231,214 | |
| | | | | | | | |
| | | | Health Care Services 0.6% | | | | |
| | 2,735 | | | Chemed Corp. | | | 150,316 | |
| | | | | | | | |
| | | | Hypermarkets & Super Centers 1.8% | | | | |
| | 8,185 | | | Wal-Mart Stores, Inc. | | | 424,802 | |
| | | | | | | | |
| | | | Investment Banking &
Brokerage 1.7% | | | | |
| | 4,385 | | | Goldman Sachs Group, Inc. (The) | | | 414,602 | |
| | | | | | | | |
| | | | IT Consulting & Other Services 1.2% | | | | |
| | 1,625 | | | International Business Machines Corp. | | | 284,424 | |
| | | | | | | | |
| | | | Mortgage REITs 16.1% | | | | |
| | 22,000 | | | American Capital Agency Corp. | | | 596,200 | |
| | 58,807 | | | Capstead Mortgage Corp. | | | 678,633 | |
| | 53,425 | | | Colony Financial, Inc. | | | 690,251 | |
| | 256,366 | | | NorthStar Realty Finance Corp. | | | 846,008 | |
| | 30,735 | | | Redwood Trust, Inc. | | | 343,310 | |
| | 82,604 | | | Two Harbors Investment Corp. | | | 729,393 | |
| | | | | | | | |
| | | | | | | 3,883,795 | |
| | | | | | | | |
| | | | Multi-Line Insurance 1.9% | | | | |
| | 13,500 | | | Loews Corp. | | | 466,425 | |
| | | | | | | | |
| | | | Oil & Gas Exploration &
Production 2.4% | | | | |
| | 13,400 | | | Ultra Petroleum Corp.* | | | 371,448 | |
| | 5,600 | | | Whiting Petroleum Corp.* | | | 196,448 | |
| | | | | | | | |
| | | | | | | 567,896 | |
| | | | | | | | |
| | | | Personal Products 3.1% | | | | |
| | 13,780 | | | Herbalife Ltd. | | | 738,608 | |
| | | | | | | | |
| | | | Pharmaceuticals 5.0% | | | | |
| | 18,875 | | | Teva Pharmaceutical Industries Ltd. ADR (Israel) | | | 702,528 | |
| | 13,167 | | | Valeant Pharmaceuticals International, Inc. (Canada) | | | 488,759 | |
| | | | | | | | |
| | | | | | | 1,191,287 | |
| | | | | | | | |
| | | | | | | | |
| Shares | | | | | Value | |
| | | | | | | |
| | | | Railroads 2.0% | | | | |
| | 7,410 | | | Canadian National Railway Co. (Canada) | | $ | 493,358 | |
| | | | | | | | |
| | | | Regional Banks 4.9% | | | | |
| | 190,675 | | | CapitalSource, Inc. | | | 1,170,744 | |
| | | | | | | | |
| | | | Restaurants 1.1% | | | | |
| | 3,070 | | | McDonald’s Corp. | | | 269,607 | |
| | | | | | | | |
| | | | Semiconductors 13.4% | | | | |
| | 17,345 | | | Altera Corp. | | | 546,888 | |
| | 36,830 | | | Intel Corp. | | | 785,584 | |
| | 15,070 | | | Linear Technology Corp. | | | 416,685 | |
| | 16,815 | | | Microchip Technology, Inc. | | | 523,115 | |
| | 33,365 | | | Taiwan Semiconductor Manufacturing Co. Ltd. ADR (Taiwan) | | | 381,362 | |
| | 20,700 | | | Xilinx, Inc. | | | 568,008 | |
| | | | | | | | |
| | | | | | | 3,221,642 | |
| | | | | | | | |
| | | | Specialized Finance 1.5% | | | | |
| | 1,500 | | | CME Group, Inc. | | | 369,600 | |
| | | | | | | | |
| | | | Trading Companies &
Distributors 2.5% | | | | |
| | 4,030 | | | W.W. Grainger, Inc. | | | 602,646 | |
| | | | | | | | |
| | | | Wireless Telecommunication
Services 1.0% | | | | |
| | 10,590 | | | America Movil S.A.B. de C.V., Series L, ADR (Mexico) | | | 233,827 | |
| | | | | | | | |
| | |
| | | | Total Common Stocks
(cost $21,706,082) | | | 21,270,713 | |
| | | | | | | | |
| | |
| | | | PREFERRED STOCKS 0.1% | | | | |
| | |
| | | | Diversified Banks 0.1% | | | | |
| | 3,803 | | | Bank of N.T. Butterfield & Son Ltd. (The), Pfd.* *** (Bermuda) | | | 5,248 | |
| | | | | | | | |
| | |
| | | | Total Preferred Stocks
(cost $4,601) | | | 5,248 | |
| | | | | | | | |
| | |
| | | | LIMITED LIABILITY COMPANY MEMBERSHIP INTEREST 2.6% | | | | |
| | |
| | | | Asset Management & Custody
Banks 0.7% | | | | |
| | 77,279 | | | Star Asia SPV, LLC* *** † | | | 154,558 | |
| | | | | | | | |
| | |
| | | | Specialized Finance 1.9% | | | | |
| | 62,655 | | | KKR Financial Holdings, LLC | | | 465,527 | |
| | | | | | | | |
| | |
| | | | Total Limited Liability Company Membership Interest
(cost $1,056,339) | | | 620,085 | |
| | | | | | | | |
| | |
| | | | LIMITED PARTNERSHIP INTEREST 1.7% | | | | |
| | |
| | | | Asset Management & Custody
Banks 1.7% | | | | |
| | 39,600 | | | KKR & Co. L.P. | | | 411,840 | |
| | | | | | | | |
| | |
| | | | Total Limited Partnership Interest
(cost $472,215) | | | 411,840 | |
| | | | | | | | |
77
| | |
| WASATCH STRATEGIC INCOME FUND (WASIX) — Schedule of Investments (continued) | | SEPTEMBER 30, 2011 |
|
|
|
| | | | | | | | |
Principal
Amount | | | | | Value | |
| | | | | | | |
| | |
| | | | CORPORATE BONDS 0.0% | | | | |
| | |
| | | | Gold 0.0% | | | | |
| | $213,749 | | | Redcorp Ventures Ltd., 13.00%, 7/11/12, Series D*** † §§(Canada) | | $ | 5,054 | |
| | | | | | | | |
| | |
| | | | Total Corporate Bonds
(cost $157,961) | | | 5,054 | |
| | | | | | | | |
| | |
| Shares | | | | | Value | |
| | |
| | | | MUTUAL FUNDS 1.1% | | | | |
| | |
| | | | Asset Management & Custody
Banks 1.1% | | | | |
| | 7,800 | | | iPath US Treasury 10-year Bear ETN* | | $ | 267,774 | |
| | | | | | | | |
| | |
| | | | Total Mutual Funds
(cost $418,351) | | | 267,774 | |
| | | | | | | | |
| | |
Principal
Amount | | | | | Value | |
| | |
| | | | SHORT-TERM INVESTMENTS 5.7% | | | | |
| | |
| | | | Repurchase Agreement 5.7% | | | | |
| | $1,380,766 | | | Repurchase Agreement dated 9/30/11, 0.01% due 10/3/11 with State Street Bank and Trust Co. collateralized by $1,420,000 of United States Treasury Notes 1.375% due 9/30/18; value: $1,411,125; repurchase proceeds: $1,380,767 (cost $1,380,766) | | $ | 1,380,766 | |
| | | | | | | | |
| | |
| | | | Total Short-Term Investments
(cost $1,380,766) | | | 1,380,766 | |
| | | | | | | | |
| | |
| | | | Total Investments
(cost $25,196,315) 99.6%§ | | | 23,961,480 | |
| | |
| | | | Other Assets less Liabilities 0.4% | | | 95,854 | |
| | | | | | | | |
| | |
| | | | NET ASSETS 100.0% | | $ | 24,057,334 | |
| | | | | | | | |
| |
| | | | *Non-income producing. ***Security was fair valued under procedures adopted by the Board of Trustees (see Note 15). †Security purchased in a private placement transaction or under Rule 144A of the Securities Act of 1933 (see Note 11). §The aggregate amount of foreign securities fair valued pursuant to a systematic valuation model as a percent of net assets was 2.17%. §§In Default. ADR American Depositary Receipt. REIT Real Estate Investment Trust. See Notes to Financial Statements. | |
At September 30, 2011, Wasatch Strategic Income Fund’s investments, excluding short-term investments, were in the following countries:
| | | | |
| Country | | % | |
Bermuda | | | <0.1 | |
Canada | | | 4.4 | |
Germany | | | 2.3 | |
Israel | | | 3.1 | |
Mexico | | | 1.0 | |
Taiwan | | | 1.7 | |
United States | | | 87.5 | |
| | | | |
TOTAL | | | 100.0 | % |
| | | | |
78
| | |
| WASATCH ULTRA GROWTH FUND (WAMCX) — Schedule of Investments | | SEPTEMBER 30, 2011 |
|
|
|
| | | | | | | | |
| Shares | | | | | Value | |
| | | | | | | |
| | |
| | | | COMMON STOCKS 94.9% | | | | |
| | |
| | | | Advertising 0.7% | | | | |
| | 81,996 | | | ReachLocal, Inc.* | | $ | 891,296 | |
| | | | | | | | |
| | | | Air Freight & Logistics 1.0% | | | | |
| | 2,879,717 | | | Aramex PJSC (United Arab Emirates) | | | 1,396,679 | |
| | | | | | | | |
| | | | Apparel Retail 1.5% | | | | |
| | 107,781 | | | Body Central Corp.* | | | 1,957,303 | |
| | | | | | | | |
| | | | Application Software 6.6% | | | | |
| | 30,885 | | | Concur Technologies, Inc.* | | | 1,149,540 | |
| | 79,891 | | | Interactive Intelligence Group, Inc.* | | | 2,169,041 | |
| | 65,058 | | | RealPage, Inc.* | | | 1,330,436 | |
| | 162,278 | | | Tangoe, Inc.* | | | 1,835,364 | |
| | 50,795 | | | Ultimate Software Group, Inc.* | | | 2,373,142 | |
| | | | | | | | |
| | | | | | | 8,857,523 | |
| | | | | | | | |
| | | | Asset Management & Custody
Banks 1.1% | | | | |
| | 65,578 | | | CETIP S.A. (Brazil) | | | 821,692 | |
| | 12,430 | | | Virtus Investment Partners, Inc.* | | | 666,496 | |
| | | | | | | | |
| | | | | | | 1,488,188 | |
| | | | | | | | |
| | | | Auto Parts & Equipment 1.4% | | | | |
| | 73,475 | | | WABCO-TVS India Ltd. (India) | | | 1,915,497 | |
| | | | | | | | |
| | | | Biotechnology 3.4% | | | | |
| | 273,698 | | | Abcam plc (United Kingdom) | | | 1,550,160 | |
| | 223,125 | | | Exact Sciences Corp.* | | | 1,479,319 | |
| | 314,549 | | | NeurogesX, Inc.* | | | 279,949 | |
| | 87,210 | | | NeurogesX, Inc. PIPE* *** | | | 77,617 | |
| | 109,695 | | | Sangamo BioSciences, Inc.* | | | 477,173 | |
| | 38,210 | | | Seattle Genetics, Inc.* | | | 728,282 | |
| | | | | | | | |
| | | | | | | 4,592,500 | |
| | | | | | | | |
| | | | Communications Equipment 1.3% | | | | |
| | 9,705 | | | F5 Networks, Inc.* | | | 689,540 | |
| | 50,105 | | | Riverbed Technology, Inc.* | | | 1,000,096 | |
| | | | | | | | |
| | | | | | | 1,689,636 | |
| | | | | | | | |
| | | | Computer Storage & Peripherals 0.8% | | | | |
| | 10,187 | | | Fusion-io, Inc.* | | | 193,553 | |
| | 133,665 | | | Intevac, Inc.* | | | 934,318 | |
| | | | | | | | |
| | | | | | | 1,127,871 | |
| | | | | | | | |
| | | | Construction Materials 1.2% | | | | |
| | 8,197,000 | | | PT Holcim Indonesia Tbk (Indonesia) | | | 1,643,280 | |
| | | | | | | | |
| | | | Consumer Finance 3.5% | | | | |
| | 115,780 | | | DFC Global Corp.* | | | 2,529,793 | |
| | 159,270 | | | Mahindra & Mahindra Financial Services Ltd. (India) | | | 2,122,869 | |
| | | | | | | | |
| | | | | | | 4,652,662 | |
| | | | | | | | |
| | | | Data Processing & Outsourced Services 2.4% | | | | |
| | 31,000 | | | ExlService Holdings, Inc.* | | | 682,000 | |
| | 18,340 | | | Syntel, Inc. | | | 792,105 | |
| | 113,100 | | | Wirecard AG (Germany) | | | 1,737,625 | |
| | | | | | | | |
| | | | | | | 3,211,730 | |
| | | | | | | | |
| | | | Diversified Banks 3.3% | | | | |
| | 59,960 | | | Bank of Baroda (India) | | | 926,541 | |
| | 196,050 | | | HDFC Bank Ltd. (India) | | | 1,853,191 | |
| | 54,755 | | | HDFC Bank Ltd. ADR (India) | | | 1,596,108 | |
| | | | | | | | |
| | | | | | | 4,375,840 | |
| | | | | | | | |
| | | | Diversified Support Services 1.8% | | | | |
| | 68,990 | | | Higher One Holdings, Inc.* | | | 1,122,467 | |
| | 159,590 | | | STR Holdings, Inc.* | | | 1,294,275 | |
| | | | | | | | |
| | | | | | | 2,416,742 | |
| | | | | | | | |
| | | | | | | | |
| Shares | | | | | Value | |
| | | | | | | |
| | | | Electrical Components &
Equipment 1.3% | | | | |
| | 31,980 | | | Polypore International, Inc.* | | $ | 1,807,510 | |
| | | | | | | | |
| | | | Electronic Manufacturing
Services 1.7% | | | | |
| | 62,133 | | | Fabrinet* | | | 1,161,887 | |
| | 25,193 | | | IPG Photonics Corp.* | | | 1,094,384 | |
| | | | | | | | |
| | | | | | | 2,256,271 | |
| | | | | | | | |
| | | | Environmental & Facilities
Services 0.9% | | | | |
| | 40,878 | | | Heritage-Crystal Clean, Inc.* | | | 742,344 | |
| | 174,946 | | | RPS Group plc (United Kingdom) | | | 446,679 | |
| | | | | | | | |
| | | | | | | 1,189,023 | |
| | | | | | | | |
| | | | General Merchandise Stores 3.3% | | | | |
| | 34,932 | | | Dollar Tree, Inc.* | | | 2,623,742 | |
| | 146,347 | | | Gordmans Stores, Inc.* | | | 1,751,774 | |
| | | | | | | | |
| | | | | | | 4,375,516 | |
| | | | | | | | |
| | | | Health Care Equipment 7.4% | | | | |
| | 29,059 | | | Abaxis, Inc.* | | | 665,742 | |
| | 243,628 | | | AtriCure, Inc.* | | | 2,372,937 | |
| | 193,600 | | | Cardica, Inc.* †† | | | 375,584 | |
| | 330,000 | | | Cardica, Inc. PIPE* *** | | | 640,200 | |
| | 160,511 | | | Cardiovascular Systems, Inc.* | | | 1,828,220 | |
| | 37,755 | | | DiaSorin S.p.A. (Italy) | | | 1,399,532 | |
| | 63,899 | | | NuVasive, Inc.* | | | 1,090,756 | |
| | 89,610 | | | Synovis Life Technologies, Inc.* | | | 1,496,487 | |
| | 16,460 | | | Zonare Medical Systems, Inc.* *** † | | | 165 | |
| | | | | | | | |
| | | | | | | 9,869,623 | |
| | | | | | | | |
| | | | Health Care Services 0.7% | | | | |
| | 26,211 | | | IPC The Hospitalist Co., Inc.* | | | 935,471 | |
| | | | | | | | |
| | | | Health Care Technology 1.9% | | | | |
| | 21,550 | | | athenahealth, Inc.* | | | 1,283,302 | |
| | 19,926 | | | Computer Programs and Systems, Inc. | | | 1,318,105 | |
| | | | | | | | |
| | | | | | | 2,601,407 | |
| | | | | | | | |
| | | | Industrial Machinery 0.7% | | | | |
| | 159,500 | | | AIA Engineering Ltd. (India) | | | 1,000,059 | |
| | | | | | | | |
| | | | Internet Retail 3.3% | | | | |
| | 25,855 | | | HomeAway, Inc.* | | | 869,245 | |
| | 120,445 | | | MakeMyTrip Ltd.* (India) | | | 2,659,426 | |
| | 68,455 | | | Yoox S.p.A.* (Italy) | | | 881,369 | |
| | | | | | | | |
| | | | | | | 4,410,040 | |
| | | | | | | | |
| | | | Internet Software & Services 5.6% | | | | |
| | 132,684 | | | Envestnet, Inc.* | | | 1,326,840 | |
| | 6,160 | | | OpenTable, Inc.* | | | 283,422 | |
| | 75,041 | | | SciQuest, Inc.* | | | 1,121,112 | |
| | 127,631 | | | SPS Commerce, Inc.* | | | 2,079,109 | |
| | 235,787 | | | TechTarget, Inc.* | | | 1,346,344 | |
| | 52,135 | | | Vistaprint N.V.* | | | 1,409,209 | |
| | 91,388 | | | Xtera Communications, Inc.* *** † | | | 914 | |
| | | | | | | | |
| | | | | | | 7,566,950 | |
| | | | | | | | |
| | | | IT Consulting & Other Services 6.3% | | | | |
| | 91,056 | | | Cognizant Technology Solutions Corp., Class A* | | | 5,709,211 | |
| | 142,370 | | | hiSoft Technology International Ltd. ADR* (China) | | | 1,251,432 | |
| | 110,000 | | | ServiceSource International, Inc.* | | | 1,453,100 | |
| | | | | | | | |
| | | | | | | 8,413,743 | |
| | | | | | | | |
79
| | |
| WASATCH ULTRA GROWTH FUND (WAMCX) — Schedule of Investments (continued) | | |
|
|
|
| | | | | | | | |
| Shares | | | | | Value | |
| | | | | | | |
| | | | Life Sciences Tools & Services 2.5% | | | | |
| | 39,940 | | | Divi’s Laboratories Ltd. (India) | | $ | 593,380 | |
| | 58,391 | | | Fluidigm Corp.* | | | 813,387 | |
| | 55,138 | | | ICON plc ADR* (Ireland) | | | 886,619 | |
| | 81,853 | | | MEDTOX Scientific, Inc. | | | 1,071,456 | |
| | | | | | | | |
| | | | | | | 3,364,842 | |
| | | | | | | | |
| | | | Oil & Gas Equipment & Services 1.0% | | | | |
| | 25,415 | | | Dril-Quip, Inc.* | | | 1,370,123 | |
| | | | | | | | |
| | | | Oil & Gas Exploration &
Production 1.4% | | | | |
| | 46,915 | | | Northern Oil and Gas, Inc.* | | | 909,682 | |
| | 85,800 | | | Selan Exploration Technology Ltd. (India) | | | 515,396 | |
| | 117,580 | | | Triangle Petroleum Corp.* | | | 422,112 | |
| | | | | | | | |
| | | | | | | 1,847,190 | |
| | | | | | | | |
| | | | Oil & Gas Refining & Marketing 0.5% | | | | |
| | 30,000 | | | Amyris, Inc.* | | | 607,200 | |
| | | | | | | | |
| | | | Packaged Foods & Meats 1.8% | | | | |
| | 50,790 | | | GlaxoSmithKline Consumer Healthcare Ltd. (India) | | | 2,457,832 | |
| | | | | | | | |
| | | | Personal Products 0.0% | | | | |
| | 50,403 | | | Ophthonix, Inc.* *** † | | | 504 | |
| | | | | | | | |
| | | | Pharmaceuticals 0.5% | | | | |
| | 187,230 | | | ISTA Pharmaceuticals, Inc.* | | | 645,943 | |
| | | | | | | | |
| | | | Regional Banks 0.4% | | | | |
| | 642,935 | | | City Union Bank Ltd. (India) | | | 581,087 | |
| | | | | | | | |
| | | | Research & Consulting Services 2.6% | | | | |
| | 21,899 | | | CoStar Group, Inc.* | | | 1,138,091 | |
| | 120,139 | | | eClerx Services Ltd. (India) | | | 1,769,647 | |
| | 61,260 | | | Resources Connection, Inc. | | | 599,123 | |
| | | | | | | | |
| | | | | | | 3,506,861 | |
| | | | | | | | |
| | | | Restaurants 0.8% | | | | |
| | 19,605 | | | Peet’s Coffee & Tea, Inc.* | | | 1,090,822 | |
| | | | | | | | |
| | | | Semiconductors 9.9% | | | | |
| | 68,238 | | | Hittite Microwave Corp.* | | | 3,323,190 | |
| | 21,845 | | | NVE Corp.* | | | 1,325,118 | |
| | 32,917 | | | O2Micro International Ltd. ADR* (China) | | | 137,264 | |
| | 160,685 | | | Power Integrations, Inc.†† | | | 4,918,568 | |
| | 108,235 | | | Silicon Laboratories, Inc.* | | | 3,626,955 | |
| | | | | | | | |
| | | | | | | 13,331,095 | |
| | | | | | | | |
| | | | Specialized Finance 4.1% | | | | |
| | 98,350 | | | Crisil Ltd. (India) | | | 1,690,475 | |
| | 47,815 | | | ICRA Ltd. (India) | | | 915,918 | |
| | 93,190 | | | MSCI, Inc., Class A* | | | 2,826,453 | |
| | | | | | | | |
| | | | | | | 5,432,846 | |
| | | | | | | | |
| | | | Systems Software 4.6% | | | | |
| | 203,434 | | | DemandTec, Inc.* | | | 1,330,458 | |
| | 35,047 | | | NetSuite, Inc.* | | | 946,620 | |
| | 64,160 | | | OPNET Technologies, Inc. | | | 2,239,826 | |
| | 61,365 | | | Sourcefire, Inc.* | | | 1,642,127 | |
| | | | | | | | |
| | | | | | | 6,159,031 | |
| | | | | | | | |
| | | | Thrifts & Mortgage Finance 1.7% | | | | |
| | 538,625 | | | LIC Housing Finance Ltd. (India) | | | 2,300,687 | |
| | | | | | | | |
| | |
| | | | Total Common Stocks
(cost $117,216,696) | | | 127,338,423 | |
| | | | | | | | |
| | | | | | | | |
| Shares | | | | | Value | |
| | | | | | | |
| | |
| | | | PREFERRED STOCKS 0.9% | | | | |
| | |
| | | | Biotechnology 0.2% | | | | |
| | 169,492 | | | Nanosys, Inc., Series D Pfd.* *** † | | $ | 194,068 | |
| | 40,380 | | | Nanosys, Inc., Series E Pfd.* *** † | | | 46,235 | |
| | | | | | | | |
| | | | | | | 240,303 | |
| | | | | | | | |
| | | | Health Care Technology 0.7% | | | | |
| | 253,064 | | | Data Sciences International, Inc., Series B Pfd.* *** † | | | 807,502 | |
| | 243,902 | | | TherOx, Inc., Series I Pfd.* *** † | | | 207,317 | |
| | | | | | | | |
| | | | | | | 1,014,819 | |
| | | | | | | | |
| | |
| | | | Total Preferred Stocks
(cost $2,021,237) | | | 1,255,122 | |
| | | | | | | | |
| | |
| | | | LIMITED PARTNERSHIP INTEREST 4.3% | | | | |
| | |
| | | | Asset Management & Custody
Banks 4.3% | | | | |
| | | | Greenspring Global Partners II-B,
L.P.*** † | | | 4,358,322 | |
| | | | Greenspring Global Partners III-B,
L.P.*** † | | | 1,428,580 | |
| | | | | | | | |
| | | | | | | 5,786,902 | |
| | | | | | | | |
| | |
| | | | Total Limited Partnership Interest
(cost $5,274,467) | | | 5,786,902 | |
| | | | | | | | |
| | |
| | | | WARRANTS 0.1% | | | | |
| | |
| | | | Biotechnology 0.0% | | | | |
| | 43,605 | | | NeurogesX, Inc., expiring 7/22/16* *** † | | | 5,451 | |
| | | | | | | | |
| | | | Health Care Equipment 0.1% | | | | |
| | 165,000 | | | Cardica, Inc., expiring 9/29/14* *** † | | | 112,200 | |
| | | | | | | | |
| | |
| | | | Total Warrants
(cost $26,076) | | | 117,651 | |
| | | | | | | | |
80
| | | | | | | | |
Principal
Amount | | | | | Value | |
| | | | | | | |
| | |
| | | | SHORT-TERM INVESTMENTS 0.2% | | | | |
| | |
| | | | Repurchase Agreement 0.2% | | | | |
| | $272,371 | | | Repurchase Agreement dated 9/30/11, 0.01% due 10/3/11 with State Street Bank and Trust Co. collateralized by $220,000 of United States Treasury Bonds 4.25% due 11/15/40; value: $280,225; repurchase proceeds: $272,371†† (cost $272,371) | | $ | 272,371 | |
| | | | | | | | |
| | |
| | | | Total Short-Term Investments
(cost $272,371) | | | 272,371 | |
| | | | | | | | |
| | |
| | | | Total Investments
(cost $124,810,847) 100.4%§ | | | 134,770,469 | |
| | |
| | | | Liabilities less Other Assets (0.4%) | | | (567,875 | ) |
| | | | | | | | |
| | |
| | | | NET ASSETS 100.0% | | $ | 134,202,594 | |
| | | | | | | | |
| |
| | | | *Non-income producing. ***Security was fair valued under procedures adopted by the Board of Trustees (see Note 15). †Security purchased in a private placement transaction or under Rule 144A of the Securities Act of 1933 (see Note 11). ††All or a portion of this security has been designated as collateral for purchase commitments (see Note 12). §The aggregate amount of foreign securities fair valued pursuant to a systematic valuation model as a percent of net assets was 17.55%. ADR American Depositary Receipt. PIPE Private Investment in a Public Equity. See Notes to Financial Statements. | |
At September 30, 2011, Wasatch Ultra Growth Fund’s investments, excluding short-term investments, were in the following countries:
| | | | |
| Country | | % | |
Brazil | | | 0.6 | |
China | | | 1.0 | |
Germany | | | 1.3 | |
India | | | 17.0 | |
Indonesia | | | 1.2 | |
Ireland | | | 0.7 | |
Italy | | | 1.7 | |
United Arab Emirates | | | 1.0 | |
United Kingdom | | | 1.5 | |
United States | | | 74.0 | |
| | | | |
TOTAL | | | 100.0 | % |
| | | | |
81
| | |
WASATCH WORLD INNOVATORS FUND (WAGTX) — Schedule of Investments (formerly Wasatch Global Science & Technology Fund) | | |
|
|
|
| | | | | | | | |
| Shares | | | | | Value | |
| | | | | | | |
| | |
| | | | COMMON STOCKS 87.2% | | | | |
| | |
| | | | Advertising 1.2% | | | | |
| | 17,282 | | | 1000mercis (France) | | $ | 858,877 | |
| | | | | | | | |
| | | | Apparel Retail 0.3% | | | | |
| | 6,105 | | | Hennes & Mauritz AB, Class B (Sweden) | | | 184,080 | |
| | | | | | | | |
| | | | Apparel, Accessories & Luxury
Goods 0.5% | | | | |
| | 46,745 | | | WeSC AB* (Sweden) | | | 339,091 | |
| | | | | | | | |
| | | | Application Software 1.4% | | | | |
| | 7,085 | | | BasWare Oyj (Finland) | | | 167,242 | |
| | 14,560 | | | Fidessa Group plc (United Kingdom) | | | 357,781 | |
| | 30,785 | | | ORC Software AB (Sweden) | | | 208,195 | |
| | 2,185 | | | SimCorp A/S (Denmark) | | | 314,786 | |
| | | | | | | | |
| | | | | | | 1,048,004 | |
| | | | | | | | |
| | | | Asset Management & Custody
Banks 1.2% | | | | |
| | 32,087 | | | CETIP S.A. (Brazil) | | | 402,050 | |
| | 44,472 | | | Tata Investment Corp. Ltd. (India) | | | 449,489 | |
| | | | | | | | |
| | | | | | | 851,539 | |
| | | | | | | | |
| | | | Automotive Retail 0.9% | | | | |
| | 85,055 | | | Halfords Group plc (United Kingdom) | | | 387,476 | |
| | 8,630 | | | Mekonomen AB (Sweden) | | | 269,305 | |
| | | | | | | | |
| | | | | | | 656,781 | |
| | | | | | | | |
| | | | Biotechnology 2.8% | | | | |
| | 213,075 | | | Abcam plc (United Kingdom) | | | 1,206,806 | |
| | 42,825 | | | Myriad Genetics, Inc.* | | | 802,540 | |
| | | | | | | | |
| | | | | | | 2,009,346 | |
| | | | | | | | |
| | | | Commercial Printing 1.2% | | | | |
| | 115,104 | | | InnerWorkings, Inc.* | | | 902,415 | |
| | | | | | | | |
| | | | Communications Equipment 2.1% | | | | |
| | 6,400 | | | Acme Packet, Inc.* | | | 272,576 | |
| | 26,990 | | | Finisar Corp.* | | | 473,405 | |
| | 20,080 | | | JDS Uniphase Corp.* | | | 200,198 | |
| | 27,710 | | | Riverbed Technology, Inc.* | | | 553,091 | |
| | | | | | | | |
| | | | | | | 1,499,270 | |
| | | | | | | | |
| | | | Computer Hardware 4.9% | | | | |
| | 7,325 | | | Apple, Inc.* | | | 2,792,144 | |
| | 60,960 | | | Silicon Graphics International Corp.* | | | 726,643 | |
| | | | | | | | |
| | | | | | | 3,518,787 | |
| | | | | | | | |
| | | | Computer Storage & Peripherals 0.8% | | | | |
| | 28,400 | | | EMC Corp.* | | | 596,116 | |
| | | | | | | | |
| | | | Construction & Farm Machinery & Heavy Trucks 0.4% | | | | |
| | 33,838 | | | Takeuchi Manufacturing Co. Ltd.* (Japan) | | | 254,484 | |
| | | | | | | | |
| | | | Data Processing & Outsourced Services 9.9% | | | | |
| | 6,553 | | | Alliance Data Systems Corp.* | | | 607,463 | |
| | 7,475 | | | MasterCard, Inc., Class A | | | 2,370,771 | |
| | 29,795 | | | Visa, Inc., Class A | | | 2,554,027 | |
| | 108,930 | | | Wirecard AG (Germany) | | | 1,673,559 | |
| | | | | | | | |
| | | | | | | 7,205,820 | |
| | | | | | | | |
| | | | Diversified Support Services 1.3% | | | | |
| | 24,485 | | | Copart, Inc.* | | | 957,853 | |
| | | | | | | | |
| | | | | | | | |
| Shares | | | | | Value | |
| | | | | | | |
| | | | Electronic Equipment &
Instruments 0.9% | | | | |
| | 16,520 | | | Hologram Industries (France) | | $ | 352,764 | |
| | 14,650 | | | National Instruments Corp. | | | 334,899 | |
| | | | | | | | |
| | | | | | | 687,663 | |
| | | | | | | | |
| | | | Health Care Distributors 0.5% | | | | |
| | 18,880 | | | PSS World Medical, Inc.* | | | 371,747 | |
| | | | | | | | |
| | | | Health Care Equipment 5.0% | | | | |
| | 34,415 | | | Cyberonics, Inc.* | | | 973,944 | |
| | 50,365 | | | DiaSorin S.p.A. (Italy) | | | 1,866,970 | |
| | 11,800 | | | Mindray Medical International Ltd. ADR (China) | | | 278,598 | |
| | 9,200 | | | NuVasive, Inc.* | | | 157,044 | |
| | 9,185 | | | Stratec Biomedical Systems AG (Germany) | | | 360,048 | |
| | | | | | | | |
| | | | | | | 3,636,604 | |
| | | | | | | | |
| | | | Health Care Facilities 2.7% | | | | |
| | 811,773 | | | CVS Group plc* (United Kingdom) | | | 1,256,254 | |
| | 42,175 | | | VCA Antech, Inc.* | | | 673,956 | |
| | | | | | | | |
| | | | | | | 1,930,210 | |
| | | | | | | | |
| | | | Health Care Services 3.5% | | | | |
| | 40,888 | | | Bio-Reference Laboratories, Inc.* | | | 752,748 | |
| | 9,652 | | | CorVel Corp.* | | | 410,210 | |
| | 101,300 | | | Diagnosticos da America S.A. (Brazil) | | | 863,656 | |
| | 12,600 | | | Express Scripts, Inc.* | | | 467,082 | |
| | 5,212 | | | Servizi Italia S.p.A. (Italy) | | | 35,061 | |
| | | | | | | | |
| | | | | | | 2,528,757 | |
| | | | | | | | |
| | | | Health Care Supplies 2.3% | | | | |
| | 25,314 | | | Sartorius Stedim Biotech (France) | | | 1,536,101 | |
| | 128,000 | | | Shandong Weigao Group Medical Polymer Co. Ltd. (China) | | | 142,122 | |
| | | | | | | | |
| | | | | | | 1,678,223 | |
| | | | | | | | |
| | | | Health Care Technology 0.6% | | | | |
| | 215,873 | | | RaySearch Laboratories AB (Sweden) | | | 442,281 | |
| | | | | | | | |
| | | | Home Entertainment Software 0.2% | | | | |
| | 30,869 | | | UbiSoft Entertainment S.A.* (France) | | | 166,668 | |
| | | | | | | | |
| | | | Home Improvement Retail 0.2% | | | | |
| | 32,390 | | | Byggmax Group AB (Sweden) | | | 134,545 | |
| | | | | | | | |
| | | | Internet Retail 3.9% | | | | |
| | 5,080 | | | Amazon.com, Inc.* | | | 1,098,448 | |
| | 16,389 | | | ASOS plc* (United Kingdom) | | | 387,542 | |
| | 7,635 | | | Netflix, Inc.* | | | 863,977 | |
| | 8,638 | | | Start Today Co. Ltd. (Japan) | | | 187,410 | |
| | 5,010 | | | zooplus AG* (Germany) | | | 298,284 | |
| | | | | | | | |
| | | | | | | 2,835,661 | |
| | | | | | | | |
| | | | Internet Software & Services 6.7% | | | | |
| | 53,545 | | | Akamai Technologies, Inc.* | | | 1,064,474 | |
| | 25,985 | | | eBay, Inc.* | | | 766,298 | |
| | 4,560 | | | Google, Inc., Class A* | | | 2,345,573 | |
| | 24,325 | | | Vistaprint N.V.* | | | 657,505 | |
| | 6,528 | | | Xtera Communications, Inc.* *** † | | | 65 | |
| | | | | | | | |
| | | | | | | 4,833,915 | |
| | | | | | | | |
| | | | IT Consulting & Other Services 1.8% | | | | |
| | 12,900 | | | Cognizant Technology Solutions Corp., Class A* | | | 808,830 | |
| | 2,959 | | | International Business Machines Corp. | | | 517,914 | |
| | | | | | | | |
| | | | | | | 1,326,744 | |
| | | | | | | | |
82
| | | | | | | | |
| Shares | | | | | Value | |
| | | | | | | |
| | | | Life Sciences Tools & Services 1.7% | | | | |
| | 21,175 | | | Covance, Inc.* | | $ | 962,404 | |
| | 3,480 | | | Eurofins Scientific (France) | | | 264,150 | |
| | | | | | | | |
| | | | | | | 1,226,554 | |
| | | | | | | | |
| | | | Movies & Entertainment 1.3% | | | | |
| | 30,595 | | | CTS Eventim AG (Germany) | | | 915,242 | |
| | | | | | | | |
| | | | Oil & Gas Refining & Marketing 0.9% | | | | |
| | 20,300 | | | World Fuel Services Corp. | | | 662,795 | |
| | | | | | | | |
| | | | Other Diversified Financial
Services 0.4% | | | | |
| | 26,238 | | | Hypoport AG* (Germany) | | | 277,110 | |
| | | | | | | | |
| | | | Personal Products 1.7% | | | | |
| | 20,000 | | | Herbalife Ltd. | | | 1,072,000 | |
| | 11,475 | | | Natura Cosmeticos S.A. (Brazil) | | | 195,788 | |
| | | | | | | | |
| | | | | | | 1,267,788 | |
| | | | | | | | |
| | | | Pharmaceuticals 4.1% | | | | |
| | 43,130 | | | Teva Pharmaceutical Industries Ltd. ADR (Israel) | | | 1,605,299 | |
| | 37,700 | | | Valeant Pharmaceuticals International, Inc. (Canada) | | | 1,399,424 | |
| | | | | | | | |
| | | | | | | 3,004,723 | |
| | | | | | | | |
| | | | Research & Consulting Services 0.5% | | | | |
| | 7,195 | | | Bertrandt AG (Germany) | | | 343,576 | |
| | | | | | | | |
| | | | Semiconductors 11.5% | | | | |
| | 53,705 | | | Altera Corp. | | | 1,693,318 | |
| | 98,200 | | | BCD Semiconductor Manufacturing Ltd. ADR* (China) | | | 491,000 | |
| | 13,880 | | | Hittite Microwave Corp.* | | | 675,956 | |
| | 71,000 | | | Intel Corp. | | | 1,514,430 | |
| | 20,405 | | | Linear Technology Corp. | | | 564,198 | |
| | 34,725 | | | Microchip Technology, Inc. | | | 1,080,295 | |
| | 73,760 | | | Taiwan Semiconductor Manufacturing Co. Ltd. ADR (Taiwan) | | | 843,077 | |
| | 52,700 | | | Xilinx, Inc. | | | 1,446,088 | |
| | | | | | | | |
| | | | | | | 8,308,362 | |
| | | | | | | | |
| | | | Specialized Finance 3.1% | | | | |
| | 39,100 | | | Encore Capital Group, Inc.* | | | 854,335 | |
| | 6,475 | | | IntercontinentalExchange, Inc.* | | | 765,733 | |
| | 10,050 | | | Portfolio Recovery Associates, Inc.* | | | 625,311 | |
| | | | | | | | |
| | | | | | | 2,245,379 | |
| | | | | | | | |
| | | | Systems Software 2.3% | | | | |
| | 12,000 | | | Check Point Software Technologies Ltd.* (Israel) | | | 633,120 | |
| | 349,000 | | | GuestLogix, Inc.* (Canada) | | | 167,740 | |
| | 15,140 | | | Init Innovation In Traffic Systems AG (Germany) | | | 334,256 | |
| | 18,881 | | | Oracle Corp. | | | 542,640 | |
| | | | | | | | |
| | | | | | | 1,677,756 | |
| | | | | | | | |
| | | | Trading Companies &
Distributors 1.0% | | | | |
| | 75,150 | | | MonotaRO Co. Ltd. (Japan) | | | 755,747 | |
| | | | | | | | |
| | | | Trucking 1.5% | | | | |
| | 52,685 | | | Trancom Co. Ltd. (Japan) | | | 1,072,179 | |
| | | | | | | | |
| | |
| | | | Total Common Stocks
(cost $60,649,016) | | | 63,212,692 | |
| | | | | | | | |
| | | | | | | | |
| Shares | | | | | Value | |
| | | | | | | |
| | |
| | | | PREFERRED STOCKS 1.9% | | | | |
| | |
| | | | Health Care Equipment 1.9% | | | | |
| | 33,886 | | | Sartorius AG Pfd. (Germany) | | $ | 1,356,209 | |
| | | | | | | | |
| | |
| | | | Total Preferred Stocks
(cost $1,280,219) | | | 1,356,209 | |
| | | | | | | | |
| | |
| | | | LIMITED PARTNERSHIP INTEREST 0.6% | | | | |
| | |
| | | | Asset Management & Custody
Banks 0.6% | | | | |
| | | | Greenspring Global Partners II-B, L.P.*** † | | | 484,252 | |
| | | | | | | | |
| | |
| | | | Total Limited Partnership Interest
(cost $444,387) | | | 484,252 | |
| | | | | | | | |
| | |
| | | | WARRANTS 0.1% | | | | |
| | |
| | | | Health Care Equipment 0.1% | | | | |
| | 71,500 | | | Cardica, Inc., expiring 9/29/14* *** † | | | 48,620 | |
| | | | | | | | |
| | |
| | | | Total Warrants
(cost $8,937) | | | 48,620 | |
| | | | | | | | |
| | |
Number of
Contracts | | | | | Value | |
| | |
| | | | PUT OPTIONS PURCHASED 0.0% | | | | |
| | |
| | | | Apparel, Accessories & Luxury
Goods 0.0% | | | | |
| | 20,000 | | | Carters, Inc., expiring 12/17/11, exercise price $25 | | $ | 14,000 | |
| | | | | | | | |
| | | | Footwear 0.0% | | | | |
| | 10,000 | | | Steven Madden Ltd., expiring 3/17/12, exercise price $25 | | | 6,500 | |
| | | | | | | | |
| | |
| | | | Total Put Options Purchased (premium $44,557) | | | 20,500 | |
| | | | | | | | |
83
| | |
WASATCH WORLD INNOVATORS FUND (WAGTX) — Schedule of Investments (formerly Wasatch Global Science & Technology Fund) (continued) | | SEPTEMBER 30, 2011 |
|
|
|
| | | | | | | | |
| | |
Principal
Amount | | | | | Value | |
| | | | | | | |
| | |
| | | | SHORT-TERM INVESTMENTS 6.1% | | | | |
| | |
| | | | Repurchase Agreement 6.1% | | | | |
| | $4,434,458 | | | Repurchase Agreement dated 9/30/11, 0.01% due 10/3/11 with State Street Bank and Trust Co. collateralized by $4,030,000 of United States Treasury Notes 3.125% due 5/15/19; value: $4,528,713; repurchase proceeds: $4,434,461†† (cost $4,434,458) | | $ | 4,434,458 | |
| | | | | | | | |
| | |
| | | | Total Short-Term Investments
(cost $4,434,458) | | | 4,434,458 | |
| | | | | | | | |
| | |
| | | | Total Investments
(cost $66,861,574) 95.9%§ | | | 69,556,731 | |
| | |
| | | | Other Assets less Liabilities 4.1% | | | 2,936,236 | |
| | | | | | | | |
| | |
| | | | NET ASSETS 100.0% | | $ | 72,492,967 | |
| | | | | | | | |
| |
| | | | *Non-income producing. ***Security was fair valued under procedures adopted by the Board of Trustees (see Note 15). †Security purchased in a private placement transaction or under Rule 144A of the Securities Act of 1933 (see Note 11). ††All or a portion of this security has been designated as collateral for purchase commitments (see Note 12). §The aggregate amount of foreign securities fair valued pursuant to a systematic valuation model as a percent of net assets was 23.81%. ADR American Depositary Receipt. See Notes to Financial Statements. | |
At September 30, 2011, Wasatch World Innovators Fund’s investments, excluding short-term investments, were in the following countries:
| | | | |
| Country | | % | |
Brazil | | | 2.3 | |
Canada | | | 2.4 | |
China | | | 1.4 | |
Denmark | | | 0.5 | |
Finland | | | 0.3 | |
France | | | 4.9 | |
Germany | | | 8.5 | |
India | | | 0.7 | |
Israel | | | 3.4 | |
Italy | | | 2.9 | |
Japan | | | 3.5 | |
Sweden | | | 2.4 | |
Taiwan | | | 1.3 | |
United Kingdom | | | 5.5 | |
United States | | | 60.0 | |
| | | | |
TOTAL | | | 100.0 | % |
| | | | |
84
| | |
| WASATCH-1ST SOURCE INCOME FUND (FMEQX) — Schedule of Investments | | SEPTEMBER 30, 2011 |
|
|
|
| | | | | | | | |
Principal
Amount | | | | | Value | |
| | | | | | | |
| | | | ASSET BACKED SECURITIES 2.8% | | | | |
| | $1,500,000 | | | Citibank Credit Card Issuance Trust, 5.65%, 9/20/19, Series 2007-A8, Class A8 | | $ | 1,791,856 | |
| | 600,000 | | | Citibank Omni Master Trust, 4.90%, 11/15/18, Series 2009-A17, Class A17† | | | 653,272 | |
| | 1,310,000 | | | World Financial Network Credit Card Master Trust, 3.96%, 4/15/19,
Series 2010-A, Class A | | | 1,410,733 | |
| | | | | | | | |
| | | | Total Asset Backed Securities
(cost $3,831,503) | | | 3,855,861 | |
| | | | | | | | |
| | | | COLLATERALIZED MORTGAGE OBLIGATIONS 24.3% | | | | |
| | 250,000 | | | Banc of America Commercial Mortgage, Inc., 5.234%, 11/10/42, Series 2005-1, Class A4††† | | | 257,733 | |
| | 33,358 | | | Banc of America Mortgage Securities, Inc., 3.067%, 2/25/33, Series 2003-A, Class 3A1††† | | | 31,608 | |
| | 263,885 | | | Bear Stearns Commercial Mortgage Securities, 4.735%, 9/11/42, Series 2005-PWR9, Class A2 | | | 263,136 | |
| | 179,422 | | | Countrywide Home Loans, 4.50%, 8/25/19, Series 2004-J7, Class 2A1 | | | 181,951 | |
| | 942,660 | | | Federal Home Loan Mortgage Corp., 1.50%, 4/15/24, Series 3780, Class TA | | | 945,989 | |
| | 64,956 | | | Federal Home Loan Mortgage Corp., 2.29%, 11/1/35, Series 1M0010††† | | | 67,987 | |
| | 124,858 | | | Federal Home Loan Mortgage Corp., 2.484%, 5/1/31, Series 847292††† | | | 131,762 | |
| | 98,820 | | | Federal Home Loan Mortgage Corp., 2.572%, 12/1/32, Series 847527††† | | | 103,182 | |
| | 34,120 | | | Federal Home Loan Mortgage Corp., 2.753%, 8/1/33, Series 847281††† | | | 35,987 | |
| | 468,606 | | | Federal Home Loan Mortgage Corp., 3.779%, 1/1/25, Series 775629††† | | | 472,282 | |
| | 919,247 | | | Federal Home Loan Mortgage Corp., 4.00%, 6/15/17, Series 2714, Class BW | | | 934,025 | |
| | 297,606 | | | Federal Home Loan Mortgage Corp., 4.103%, 5/1/25, Series 775617††† | | | 310,221 | |
| | 959,467 | | | Federal Home Loan Mortgage Corp., 4.50%, 1/15/18, Series 2903, Class BA | | | 971,466 | |
| | 502,726 | | | Federal Home Loan Mortgage Corp., 4.50%, 12/1/18, Series G11657 | | | 537,250 | |
| | 116,882 | | | Federal Home Loan Mortgage Corp., 5.00%, 2/15/23, Series 2960, Class KP | | | 119,090 | |
| | 84,858 | | | Federal Home Loan Mortgage Corp., 5.125%, 6/15/18, Series R016, Class AM | | | 86,627 | |
| | 403,197 | | | Federal Home Loan Mortgage Corp., 5.50%, 5/15/15, Series 2808, Class VA | | | 435,218 | |
| | 142,670 | | | Federal Home Loan Mortgage Corp., 5.50%, 10/1/25, Series C90925 | | | 155,185 | |
| | 413,901 | | | Federal Home Loan Mortgage Corp., 5.50%, 8/1/29, Series C46102 | | | 450,854 | |
| | 449,774 | | | Federal National Mortgage Assoc., 2.082%, 12/1/35, Series 848390††† | | | 462,985 | |
| | 378,920 | | | Federal National Mortgage Assoc., 2.18%, 1/1/35, Series 825245††† | | | 391,834 | |
| | 212,682 | | | Federal National Mortgage Assoc., 2.285%, 11/1/34, Series 782320††† | | | 223,201 | |
| | 17,139 | | | Federal National Mortgage Assoc., 2.60%, 10/1/32, Series 659567††† | | | 17,734 | |
| | 214,351 | | | Federal National Mortgage Assoc., 2.815%, 1/1/18, Series 57735††† | | | 219,108 | |
| | 224,348 | | | Federal National Mortgage Assoc., 3.195%, 2/1/21, Series 313380††† | | | 228,420 | |
| | 427,204 | | | Federal National Mortgage Assoc., 3.50%, 6/25/23, Series 2003-46, Class LD | | | 449,584 | |
| | | | | | | | |
Principal
Amount | | | | | Value | |
| | | | | | | |
| $ | 478,218 | | | Federal National Mortgage Assoc., 3.875%, 1/25/39, Series 2009-2, Class WJ | | $ | 507,756 | |
| | 354,207 | | | Federal National Mortgage Assoc., 4.00%, 10/25/32, Series 2003-28, Class GA | | | 370,992 | |
| | 223,535 | | | Federal National Mortgage Assoc., 4.077%, 7/1/19, Series 070377††† | | | 228,193 | |
| | 474,561 | | | Federal National Mortgage Assoc., 4.50%, 5/1/19, Series 725445 | | | 508,494 | |
| | 460,342 | | | Federal National Mortgage Assoc., 4.50%, 7/1/19, Series 725609 | | | 493,258 | |
| | 588,927 | | | Federal National Mortgage Assoc., 4.50%, 6/25/29, Series 2005-121, Class V | | | 645,543 | |
| | 238,643 | | | Federal National Mortgage Assoc., 4.50%, 1/25/30, Series 2004-67, Class AC | | | 242,330 | |
| | 1,301,800 | | | Federal National Mortgage Assoc., 5.00%, 7/25/23, Series 2005-4, Class VG | | | 1,399,779 | |
| | 278,830 | | | Federal National Mortgage Assoc., 5.00%, 8/25/34, Series 2004-W10, Class A24 | | | 278,533 | |
| | 250,000 | | | Federal National Mortgage Assoc., 5.50%, 5/25/23, Series 2003-42, Class EK | | | 285,668 | |
| | 327,183 | | | Government National Mortgage Assoc., 2.25%, 1/20/30, Series 80364††† | | | 338,583 | |
| | 901,946 | | | Government National Mortgage Assoc., 2.25%, 7/20/34, Series 80987††† | | | 935,103 | |
| | 1,302,816 | | | Government National Mortgage Assoc., 3.00%, 12/20/38, Series 2010-89, Class PA | | | 1,349,688 | |
| | 485,989 | | | Government National Mortgage Assoc., 3.25%, 7/20/37, Series 2010-33, Class AP | | | 492,826 | |
| | 1,034,423 | | | Government National Mortgage Assoc., 4.00%, 6/20/37, Series 2008-30, Class AC | | | 1,086,714 | |
| | 1,031,897 | | | Government National Mortgage Assoc., 4.00%, 6/20/38, Series 2009-69, Class WC | | | 1,087,825 | |
| | 1,325,331 | | | Government National Mortgage Assoc., 4.00%, 9/20/38, Series 2009-108, Class WG | | | 1,411,394 | |
| | 1,432,348 | | | Government National Mortgage Assoc., 4.00%, 3/20/39, Series 2009-31, Class TA | | | 1,529,815 | |
| | 1,307,723 | | | Government National Mortgage Assoc., 4.00%, 4/16/39, Series 2009-110, Class AB | | | 1,380,893 | |
| | 755,487 | | | Government National Mortgage Assoc., 4.50%, 8/15/24, Series 717874 | | | 811,159 | |
| | 110,259 | | | Government National Mortgage Assoc., 4.50%, 1/20/31, Series 2005-38, Class A | | | 111,132 | |
| | 1,090,664 | | | Government National Mortgage Assoc., 4.50%, 6/20/34, Series 2009-101, Class G | | | 1,153,156 | |
| | 1,120,878 | | | Government National Mortgage Assoc., 4.50%, 8/20/34, Series 2009-36, Class G | | | 1,185,728 | |
| | 1,154,788 | | | Government National Mortgage Assoc., 4.50%, 8/16/35, Series 2009-62, Class DT | | | 1,206,403 | |
| | 638,013 | | | Government National Mortgage Assoc., 4.50%, 2/20/38, Series 2009-55, Class NP | | | 695,876 | |
| | 998,166 | | | Government National Mortgage Assoc., 4.50%, 3/20/39, Series 2009-14, Class AG | | | 1,093,370 | |
| | 619,549 | | | Government National Mortgage Assoc., 4.658%, 12/16/30, Series 2005-12, Class C | | | 655,463 | |
| | 914,017 | | | Government National Mortgage Assoc., 5.00%, 1/20/16, Series 2005-3, Class VA | | | 997,574 | |
| | 61,649 | | | Government National Mortgage Assoc., 5.00%, 12/20/29, Series 2004-101, Class MA | | | 61,796 | |
| | 957,488 | | | Government National Mortgage Assoc., 5.00%, 9/16/31, Series 2009-38, Class A | | | 1,015,389 | |
| | 500,000 | | | Government National Mortgage Assoc., 5.00%, 7/20/34, Series 2004-105, Class MC | | | 573,695 | |
| | 247,471 | | | Government National Mortgage Assoc., 5.00%, 8/20/39, Series 004513 | | | 265,082 | |
| | | | | | | | |
| | | | Total Collateralized Mortgage Obligations
(cost $31,954,318) | | | 32,883,629 | |
| | | | | | | | |
85
| | |
| WASATCH-1ST SOURCE INCOME FUND (FMEQX) — Schedule of Investments (continued) | | |
|
|
|
| | | | | | | | |
Principal
Amount | | | | | Value | |
| | | | | | | |
| | |
| | | | CORPORATE BONDS 35.3% | | | | |
| | |
| | | | Aerospace & Defense 1.1% | | | | |
| $ | 200,000 | | | General Dynamics Corp., 4.25%, 5/15/13 | | $ | 211,241 | |
| | 250,000 | | | Martin Marietta Corp., 7.375%, 4/15/13 | | | 272,403 | |
| | 1,000,000 | | | Raytheon Co., 1.625%, 10/15/15 | | | 997,168 | |
| | | | | | | | |
| | | | | | | 1,480,812 | |
| | | | | | | | |
| | | | Air Freight & Logistics 0.4% | | | | |
| | 500,000 | | | United Parcel Service, Inc., 3.875%, 4/1/14 | | | 536,940 | |
| | | | | | | | |
| | | | Automotive Retail 0.6% | | | | |
| | 775,000 | | | AutoZone, Inc., 5.50%, 11/15/15 | | | 852,284 | |
| | | | | | | | |
| | | | Beverages—Non-alcoholic 0.4% | | | | |
| | 500,000 | | | PepsiAmericas, Inc., 5.00%, 5/15/17 | | | 577,391 | |
| | | | | | | | |
| | | | Cable & Satellite 0.4% | | | | |
| | 550,000 | | | Comcast Corp., 5.30%, 1/15/14 | | | 596,254 | |
| | | | | | | | |
| | | | Commercial Banks—Southern U.S. 0.6% | | | | |
| | 800,000 | | | BB&T Corp., 3.20%, 3/15/16 MTN | | | 817,094 | |
| | | | | | | | |
| | | | Computer Hardware 0.7% | | | | |
| | 600,000 | | | Hewlett-Packard Co., 2.125%, 9/13/15 | | | 594,767 | |
| | 300,000 | | | Hewlett-Packard Co., 6.50%, 7/1/12 | | | 311,106 | |
| | | | | | | | |
| | | | | | | 905,873 | |
| | | | | | | | |
| | | | Construction & Farm Machinery & Heavy Trucks 1.2% | | | | |
| | 500,000 | | | Caterpillar Financial Services Corp.,
5.85%, 9/1/17 MTN | | | 593,290 | |
| | 550,000 | | | John Deere Capital Corp.,
4.90%, 9/9/13 MTN | | | 590,916 | |
| | 500,000 | | | PACCAR Financial Corp.,
1.95%, 12/17/12 MTN | | | 505,146 | |
| | | | | | | | |
| | | | | | | 1,689,352 | |
| | | | | | | | |
| | | | Consumer Finance 0.5% | | | | |
| | 700,000 | | | American Express Credit Corp.,
5.875%, 5/2/13 MTN | | | 742,354 | |
| | | | | | | | |
| | | | Distillers & Vintners 0.4% | | | | |
| | 504,000 | | | Diageo Capital plc, 7.375%, 1/15/14 (United Kingdom) | | | 572,509 | |
| | | | | | | | |
| | | | Diversified Banks 4.1% | | | | |
| | 1,000,000 | | | Bank of America Corp., 7.375%, 5/15/14 | | | 1,031,032 | |
| | 325,000 | | | HSBC Finance Corp., 6.375%, 10/15/11 | | | 325,469 | |
| | 950,000 | | | Royal Bank of Canada Certificate of Deposit, 2.25%, 3/15/13 (Canada) | | | 973,027 | |
| | 500,000 | | | SouthTrust Corp., 5.80%, 6/15/14 | | | 532,506 | |
| | 1,125,000 | | | US Bancorp, 4.20%, 5/15/14 | | | 1,207,335 | |
| | 750,000 | | | Wachovia Corp., 5.25%, 8/1/14 | | | 786,836 | |
| | 700,000 | | | Wells Fargo & Co., 0.343%, 1/24/12††† | | | 700,062 | |
| | | | | | | | |
| | | | | | | 5,556,267 | |
| | | | | | | | |
| | | | Diversified Metals & Mining 0.3% | | | | |
| | 450,000 | | | Rio Tinto Alcan, Inc., 4.50%, 5/15/13 (Canada) | | | 471,006 | |
| | | | | | | | |
| | | | Drug Retail 0.3% | | | | |
| | 400,000 | | | Walgreen Co., 4.875%, 8/1/13 | | | 429,758 | |
| | | | | | | | |
| | | | Electric Utilities 1.0% | | | | |
| | 350,000 | | | Energy East Corp., 6.75%, 6/15/12 | | | 362,502 | |
| | 300,000 | | | Florida Power & Light Co., 4.85%, 2/1/13 | | | 314,910 | |
| | 600,000 | | | Georgia Power Co., 5.125%, 11/15/12, Series K | | | 627,246 | |
| | | | | | | | |
| | | | | | | 1,304,658 | |
| | | | | | | | |
| | | | | | | | |
Principal
Amount | | | | | Value | |
| | | | | | | |
| | | | Finance—Investment Banking & Brokerage 0.3% | | | | |
| $ | 500,000 | | | MF Global Holdings Ltd., 6.25%, 8/8/16 | | $ | 472,245 | |
| | | | | | | | |
| | | | Finance—Other Services 0.4% | | | | |
| | 500,000 | | | Sun Canada Financial Co.,
7.25%, 12/15/15† | | | 574,203 | |
| | | | | | | | |
| | | | Footwear 0.5% | | | | |
| | 600,000 | | | Nike, Inc., 5.15%, 10/15/15 MTN | | | 685,334 | |
| | | | | | | | |
| | | | Health Care Equipment 0.2% | | | | |
| | 250,000 | | | Baxter International, Inc., 4.625%, 3/15/15 | | | 277,928 | |
| | | | | | | | |
| | | | Household Appliances 0.3% | | | | |
| | 350,000 | | | Whirlpool Corp., 8.00%, 5/1/12 | | | 363,456 | |
| | | | | | | | |
| | | | Industrial Conglomerates 3.6% | | | | |
| | 500,000 | | | 3M Co., 4.375%, 8/15/13 MTN | | | 536,166 | |
| | 1,250,000 | | | General Electric Capital Corp.,
3.75%, 11/14/14, Series A | | | 1,304,891 | |
| | 1,000,000 | | | General Electric Capital Corp.,
5.40%, 2/15/17 MTN | | | 1,090,158 | |
| | 1,000,000 | | | General Electric Capital Corp.,
5.90%, 5/13/14 | | | 1,093,224 | |
| | 740,000 | | | Tyco International Finance Ltd. S.A., 6.00%, 11/15/13 | | | 810,164 | |
| | | | | | | | |
| | | | | | | 4,834,603 | |
| | | | | | | | |
| | | | Industrial Gases 0.5% | | | | |
| | 600,000 | | | Praxair, Inc., 2.125%, 6/14/13 | | | 614,137 | |
| | | | | | | | |
| | | | Industrial Machinery 0.5% | | | | |
| | 600,000 | | | Parker Hannifin Corp., 4.875%, 2/15/13 | | | 633,244 | |
| | | | | | | | |
| | | | Instruments—Scientific 0.4% | | | | |
| | 600,000 | | | Thermo Fisher Scientific, Inc.,
2.15%, 12/28/12 | | | 609,865 | |
| | | | | | | | |
| | | | Integrated Oil & Gas 0.4% | | | | |
| | 500,000 | | | ConocoPhillips, 4.60%, 1/15/15 | | | 547,737 | |
| | | | | | | | |
| | | | Integrated Telecommunication Services 1.5% | | | | |
| | 149,929 | | | Ameritech Capital Funding, 9.10%, 6/1/16 | | | 178,100 | |
| | 870,000 | | | AT&T, Inc., 2.50%, 8/15/15 | | | 889,400 | |
| | 520,000 | | | Verizon Communications, Inc.,
5.55%, 2/15/16 | | | 593,257 | |
| | 300,000 | | | Verizon Global Funding Corp.,
4.375%, 6/1/13 | | | 316,559 | |
| | | | | | | | |
| | | | | | | 1,977,316 | |
| | | | | | | | |
| | | | Investment Banking &
Brokerage 0.4% | | | | |
| | 500,000 | | | Goldman Sachs Group, Inc. (The),
5.35%, 1/15/16 | | | 517,357 | |
| | | | | | | | |
| | | | Life & Health Insurance 1.5% | | | | |
| | 500,000 | | | Principal Life Income Funding Trusts, 5.30%, 4/24/13 MTN | | | 530,103 | |
| | 850,000 | | | Prudential Financial, Inc., 6.20%, 1/15/15 | | | 932,974 | |
| | 480,000 | | | Prudential Holdings, LLC, 7.245%, 12/18/23,
Series FSA† | | | 566,942 | |
| | | | | | | | |
| | | | | | | 2,030,019 | |
| | | | | | | | |
| | | | Medical Instruments 0.7% | | | | |
| | 800,000 | | | Medtronic, Inc., 4.75%, 9/15/15, Series B | | | 898,625 | |
| | | | | | | | |
| | | | Medical—Drugs 0.6% | | | | |
| | 575,000 | | | Pharmacia Corp., 6.75%, 12/15/27 | | | 759,661 | |
| | | | | | | | |
| | | | Medical—Health Maintenance Organizations 0.7% | | | | |
| | 1,000,000 | | | WellPoint, Inc., 2.375%, 2/15/17 | | | 988,892 | |
| | | | | | | | |
86
| | | | | | | | |
Principal
Amount | | | | | Value | |
| | | | | | | |
| | | | Movies & Entertainment 0.5% | | | | |
| $ | 250,000 | | | Walt Disney Co. (The), 4.50%, 12/15/13 | | $ | 270,056 | |
| | 350,000 | | | Walt Disney Co. (The), 6.00%, 7/17/17, Series C MTN | | | 419,780 | |
| | | | | | | | |
| | | | | | | 689,836 | |
| | | | | | | | |
| | | | Oil & Gas Exploration &
Production 0.2% | | | | |
| | 300,000 | | | Apache Corp., 6.25%, 4/15/12 | | | 308,179 | |
| | | | | | | | |
| | | | Other Diversified Financial
Services 1.3% | | | | |
| | 1,350,000 | | | Bear Stearns Cos., LLC (The),
5.70%, 11/15/14 | | | 1,455,868 | |
| | 260,000 | | | Source One Mortgage Services,
9.00%, 6/1/12, Series B | | | 268,877 | |
| | | | | | | | |
| | | | | | | 1,724,745 | |
| | | | | | | | |
| | | | Personal Products 0.5% | | | | |
| | 655,000 | | | Avon Products, Inc., 5.625%, 3/1/14 | | | 704,583 | |
| | | | | | | | |
| | | | Pharmaceuticals 2.9% | | | | |
| | 745,000 | | | AstraZeneca plc, 5.90%, 9/15/17
(United Kingdom) | | | 890,097 | |
| | 795,000 | | | Cardinal Health, Inc., 6.00%, 6/15/17 | | | 919,042 | |
| | 1,000,000 | | | Johnson & Johnson, 5.55%, 8/15/17 | | | 1,202,872 | |
| | 725,000 | | | Pharmacia Corp., 6.50%, 12/1/18 | | | 905,923 | |
| | | | | | | | |
| | | | | | | 3,917,934 | |
| | | | | | | | |
| | | | Property & Casualty Insurance 0.6% | | | | |
| | 435,000 | | | Allstate Corp. (The), 7.50%, 6/15/13 | | | 474,616 | |
| | 325,000 | | | Progressive Corp. (The),
6.375%, 1/15/12 | | | 329,042 | |
| | | | | | | | |
| | | | | | | 803,658 | |
| | | | | | | | |
| | | | Railroads 0.2% | | | | |
| | 300,000 | | | Burlington Northern Santa Fe, LLC,
4.30%, 7/1/13 | | | 316,154 | |
| | | | | | | | |
| | | | Regional Banks 0.5% | | | | |
| | 700,000 | | | Fifth Third Bancorp, 5.45%, 1/15/17 | | | 744,120 | |
| | | | | | | | |
| | | | Reinsurance 0.9% | | | | |
| | 1,150,000 | | | Berkshire Hathaway, Inc.,
3.20%, 2/11/15 | | | 1,209,077 | |
| | | | | | | | |
| | | | Semiconductor Equipment 0.2% | | | | |
| | 250,000 | | | Applied Material, Inc., 2.65%, 6/15/16 | | | 256,134 | |
| | | | | | | | |
| | | | Soft Drinks 0.5% | | | | |
| | 600,000 | | | Bottling Group, LLC, 4.625%, 11/15/12 | | | 626,835 | |
| | | | | | | | |
| | | | Special Purpose Entity 0.1% | | | | |
| | 88,000 | | | Targeted Return Index Fund, 6.814%, 1/15/12, Series 2002-10† ††† | | | 88,948 | |
| | | | | | | | |
| | | | Specialized Finance 0.5% | | | | |
| | 600,000 | | | CME Group, Inc., 5.40%, 8/1/13 | | | 642,186 | |
| | | | | | | | |
| | | | Steel 0.7% | | | | |
| | 950,000 | | | Nucor Corp., 5.00%, 12/1/12 | | | 994,632 | |
| | | | | | | | |
| | | | Systems Software 0.6% | | | | |
| | 750,000 | | | Oracle Corp., 3.75%, 7/8/14 | | | 807,712 | |
| | | | | | | | |
| | | | Transport—Rail 0.6% | | | | |
| | 700,000 | | | Union Pacific Corp., 5.375%, 5/1/14 | | | 772,211 | |
| | | | | | | | |
| | |
| | | | Total Corporate Bonds
(cost $46,390,293) | | | 47,924,118 | |
| | | | | | | | |
| | | | | | | | |
Principal
Amount | | | | | Value | |
| | | | | | | |
| | |
| | | | MUNICIPAL BONDS 1.4% | | | | |
| $ | 650,000 | | | Arizona State Transportation Board Highway Revenue, 5.00%, 7/1/23 | | $ | 728,969 | |
| | 625,000 | | | City of Liberty MO, 4.45%, 10/1/13 (NATL-RE) | | | 645,156 | |
| | 500,000 | | | Richmond, CA Joint Powers Financing Authority Revenue, 8.25%, 7/1/19 | | | 544,370 | |
| | | | | | | | |
| | |
| | | | Total Municipal Bonds
(cost $1,799,488) | | | 1,918,495 | |
| | | | | | | | |
| | |
| Shares | | | | | Value | |
| | |
| | | | MUTUAL FUNDS 0.5% | | | | |
| | 44,453 | | | Eaton Vance Short Duration Diversified Income Fund | | $ | 715,249 | |
| | | | | | | | |
| | |
| | | | Total Mutual Funds
(cost $666,443) | | | 715,249 | |
| | | | | | | | |
| | |
| | | | EXCHANGE TRADED FUNDS 0.5% | | | | |
| | 6,000 | | | iShares iBoxx Investment Grade Corporate Bond Fund | | | 674,040 | |
| | | | | | | | |
| | |
| | | | Total Exchange Traded Funds
(cost $519,311) | | | 674,040 | |
| | | | | | | | |
| | |
Principal
Amount | | | | | Value | |
| | |
| | | | U.S. GOVERNMENT AGENCY
SECURITIES 20.4% | | | | |
| | |
| | $1,000,000 | | | Federal Farm Credit Bank,
2.65%, 5/11/15 | | $ | 1,063,205 | |
| | 1,000,000 | | | Federal Farm Credit Bank,
3.85%, 2/11/15 | | | 1,101,210 | |
| | 1,000,000 | | | Federal Farm Credit Bank,
3.875%, 10/7/13 | | | 1,068,598 | |
| | 650,000 | | | Federal Farm Credit Bank,
4.875%, 4/1/14 | | | 719,371 | |
| | 1,000,000
| | | Federal Home Loan Bank,
1.00%, 7/28/16## | | | 1,000,418 | |
| | 1,000,000 | | | Federal Home Loan Bank,
2.00%, 7/17/14## | | | 1,005,369 | |
| | 1,550,000 | | | Federal Home Loan Bank,
5.00%, 9/14/12 | | | 1,617,566 | |
| | 2,000,000 | | | Federal Home Loan Mortgage Corp., 1.125%, 8/24/16 MTN## | | | 2,002,124 | |
| | 1,500,000 | | | Federal Home Loan Mortgage Corp., 2.52%, 12/9/14 | | | 1,583,653 | |
| | 1,300,000 | | | Federal Home Loan Mortgage Corp., 3.00%, 7/28/14 | | | 1,386,276 | |
| | 700,000 | | | Federal Home Loan Mortgage Corp., 4.75%, 11/17/15 | | | 804,560 | |
| | 700,000 | | | Federal Home Loan Mortgage Corp., 5.55%, 10/4/16 | | | 700,106 | |
| | 1,000,000 | | | Federal National Mortgage Assoc.,
1.00%, 11/9/15## | | | 1,000,969 | |
| | 1,000,000 | | | Federal National Mortgage Assoc.,
2.05%, 5/21/14## | | | 1,001,206 | |
| | 1,050,000 | | | Federal National Mortgage Assoc.,
2.05%, 5/23/17 | | | 1,079,303 | |
| | 1,000,000 | | | Federal National Mortgage Assoc.,
2.075%, 3/7/16 | | | 1,010,152 | |
| | 2,200,000 | | | Federal National Mortgage Assoc.,
2.625%, 11/20/14 | | | 2,331,853 | |
87
| | |
| WASATCH-1ST SOURCE INCOME FUND (FMEQX) — Schedule of Investments (continued) | | SEPTEMBER 30, 2011 |
|
|
|
| | | | | | | | |
Principal
Amount | | | | | Value | |
| | | | | | | |
| $ | 700,000 | | | Federal National Mortgage Assoc.,
3.00%, 12/29/16 | | $ | 711,547 | |
| | 1,800,000 | | | Federal National Mortgage Assoc.,
4.875%, 12/15/16 | | | 2,114,338 | |
| | 600,000 | | | Federal National Mortgage Assoc.,
5.24%, 8/7/18 | | | 649,022 | |
| | 621,349 | | | New Valley Generation IV,
4.687%, 1/15/22*** | | | 674,288 | |
| | 1,000,000 | | | Tennessee Valley Authority,
0.00%, 11/1/18, Series C### | | | 855,392 | |
| | 800,000 | | | Tennessee Valley Authority,
6.00%, 3/15/13, Series C | | | 863,422 | |
| | 1,000,000 | | | Tennessee Valley Authority,
6.25%, 12/15/17, Series E | | | 1,260,507 | |
| | | | | | | | |
| | |
| | | | Total U.S. Government Agency Securities
(cost $26,819,122) | | | 27,604,455 | |
| | | | | | | | |
| | |
| | | | U.S. TREASURY BONDS 5.6% | | | | |
| | 6,825,000 | | | U.S. Treasury Bond, 3.25%, 12/31/16 | | | 7,600,279 | |
| | | | | | | | |
| | |
| | | | Total U.S. Treasury Bonds
(cost $7,253,903) | | | 7,600,279 | |
| | | | | | | | |
| | |
| | | | U.S. TREASURY INFLATION PROTECTED BONDS 1.6% | | | | |
| | 1,941,066 | | | U.S. Treasury Bond, 1.625%, 1/15/18# | | | 2,171,719 | |
| | | | | | | | |
| | |
| | | | Total U.S. Treasury Inflation Protected Bonds
(cost $1,888,176) | | | 2,171,719 | |
| | | | | | | | |
| | |
| | | | U.S. TREASURY NOTES 4.7% | | | | |
| | 5,500,000 | | | U.S. Treasury Note, 3.625%, 8/15/19 | | | 6,333,591 | |
| | | | | | | | |
| | |
| | | | Total U.S. Treasury Notes
(cost $6,355,147) | | | 6,333,591 | |
| | | | | | | | |
| | |
| Shares | | | | | Value | |
| | |
| | | | PREFERRED STOCKS 0.7% | | | | |
| | |
| | | | Investment Banking &
Brokerage 0.3% | | | | |
| | 20,000 | | | Morgan Stanley Cap TR VI, 6.60%, Pfd. | | $ | 435,800 | |
| | | | | | | | |
| | | | Other Diversified Financial
Services 0.4% | | | | |
| | 20,000 | | | Bank One Capital TR VI, 7.20%, Pfd. | | | 517,200 | |
| | | | | | | | |
| | |
| | | | Total Preferred Stocks
(cost $972,581) | | | 953,000 | |
| | | | | | | | |
| | | | | | | | |
Principal
Amount | | | | | Value | |
| | | | | | | |
| | |
| | | | SHORT-TERM INVESTMENTS 1.4% | | | | |
| | |
| | | | Repurchase Agreement 1.4% | | | | |
| | $1,863,720 | | | Repurchase Agreement dated 9/30/11, 0.01% due 10/3/11 with State Street Bank and Trust Co. collateralized by $1,915,000 of United States Treasury Notes 1.375% due 9/30/18; value: $1,903,031; repurchase proceeds: $1,863,721 (cost $1,863,720) | | $ | 1,863,720 | |
| | | | | | | | |
| | |
| | | | Total Short-Term Investments
(cost $1,863,720) | | | 1,863,720 | |
| | | | | | | | |
| | |
| | | | Total Investments
(cost $130,314,005) 99.2% | | | 134,498,156 | |
| | |
| | | | Other Assets less Liabilities 0.8% | | | 1,118,719 | |
| | | | | | | | |
| | |
| | | | NET ASSETS 100.0% | | $ | 135,616,875 | |
| | | | | | | | |
| |
| | | | ***Security was fair valued under procedures adopted by the Board of Trustees (see Note 15). †Security purchased in a private placement transaction or under Rule 144A of the Securities Act of 1933 (see Note 11). †††Variable rate securities. #Treasury Inflation Protected Securities. A U.S. Treasury Note or Bond that offers protection from inflation by paying a fixed rate of interest on the principal amount that is adjusted for inflation based on the Consumer Price Index. ##Step Bond. The rate shown is as of September 30, 2011 and will reset at a future date. ###Zero Coupon Bond. MTN Medium Term Note. NATL-RE National Public Finance Guarantee Corporation. See Notes to Financial Statements. | |
At September 30, 2011, Wasatch-1st Source Income Fund’s investments, excluding short-term investments, were in the following countries:
| | | | |
| Country | | % | |
Canada | | | 1.1 | |
United Kingdom | | | 1.1 | |
United States | | | 97.8 | |
| | | | |
TOTAL | | | 100.0 | % |
| | | | |
88
| | |
| WASATCH-HOISINGTON U.S. TREASURY FUND (WHOSX) — Schedule of Investments | | SEPTEMBER 30, 2011 |
|
|
|
| | | | | | | | |
Principal
Amount | | | | | Value | |
| | | | | | | |
| | |
| | | | U.S. GOVERNMENT
OBLIGATIONS 98.1% | | | | |
| | |
| | $ 9,700,000 | | | U.S. Treasury Bond, 3.50%, 2/15/39 | | $ | 10,785,188 | |
| | 2,000,000 | | | U.S. Treasury Bond, 3.875%, 8/15/40 | | | 2,376,250 | |
| | 6,335,000 | | | U.S. Treasury Bond, 4.25%, 5/15/39 | | | 7,972,205 | |
| | 15,400,000 | | | U.S. Treasury Bond, 4.25%, 11/15/40 | | | 19,473,777 | |
| | 1,400,000 | | | U.S. Treasury Bond, 4.375%, 2/15/38 | | | 1,788,500 | |
| | 1,040,000 | | | U.S. Treasury Bond, 4.375%, 5/15/40 | | | 1,338,678 | |
| | 10,000,000 | | | U.S. Treasury Bond, 4.50%, 5/15/38 | | | 13,025,000 | |
| | 6,000,000 | | | U.S. Treasury Bond, 4.50%, 8/15/39 | | | 7,853,436 | |
| | 11,300,000 | | | U.S. Treasury Bond, 4.75%, 2/15/37 | | | 15,177,312 | |
| | 4,260,000 | | | U.S. Treasury Bond, 4.75%, 2/15/41 | | | 5,820,890 | |
| | 48,400,000 | | | U.S. Treasury Strip, principal only, 5/15/30 | | | 28,307,466 | |
| | 46,300,000 | | | U.S. Treasury Strip, principal only, 2/15/31 | | | 26,495,360 | |
| | 42,837,000 | | | U.S. Treasury Strip, principal only, 2/15/37 | | | 19,777,843 | |
| | 30,150,000 | | | U.S. Treasury Strip, principal only, 5/15/39 | | | 12,885,356 | |
| | 26,000,000 | | | U.S. Treasury Strip, principal only, 5/15/40 | | | 10,771,878 | |
| | | | | | | | |
| | |
| | | | Total U.S. Government Obligations
(cost $150,677,333) | | | 183,849,139 | |
| | | | | | | | |
| | | | | | | | |
Principal
Amount | | | | | Value | |
| | | | | | | |
| | |
| | | | SHORT-TERM INVESTMENTS 1.4% | | | | |
| | |
| | | | Repurchase Agreement 1.4% | | | | |
| | $ 2,591,994 | | | Repurchase Agreement dated 9/30/11, 0.01% due 10/3/11 with State Street Bank and Trust Co. collateralized by $2,665,000 of United States Treasury Notes 1.375% due 9/30/18; value: $2,648,344; repurchase proceeds: $2,591,996 (cost $2,591,994) | | $ | 2,591,994 | |
| | | | | | | | |
| | |
| | | | Total Short-Term Investments
(cost $2,591,994) | | | 2,591,994 | |
| | | | | | | | |
| | |
| | | | Total Investments
(cost $153,269,327) 99.5% | | | 186,441,133 | |
| | |
| | | | Other Assets less Liabilities 0.5% | | | 927,171 | |
| | | | | | | | |
| | |
| | | | NET ASSETS 100.0% | | $ | 187,368,304 | |
| | | | | | | | |
| |
| | | | See Notes to Financial Statements. | |
89
| | |
| WASATCH FUNDS — Statements of Assets and Liabilities | | |
|
|
|
| | | | | | | | | | | | |
| | | CORE GROWTH FUND | | | EMERGING
INDIA
FUND1 | | | EMERGING MARKETS
SMALL CAP FUND | |
| | | | | | | | | | | | |
Assets: | | | | | | | | | | | | |
Investments, at cost | | | | | | | | | | | | |
Unaffiliated issuers | | $ | 336,254,282 | | | $ | 11,453,759 | | | $ | 779,912,409 | |
Repurchase agreements | | | 19,396,554 | | | | 252,073 | | | | 26,363,875 | |
| | | | | | | | | | | | |
| | $ | 355,650,836 | | | $ | 11,705,832 | | | $ | 806,276,284 | |
| | | | | | | | | | | | |
Investments, at market value | | | | | | | | | | | | |
Unaffiliated issuers | | $ | 423,654,126 | | | $ | 10,449,793 | | | $ | 750,131,682 | |
Repurchase agreements | | | 19,396,554 | | | | 252,073 | | | | 26,363,875 | |
| | | | | | | | | | | | |
| | | 443,050,680 | | | | 10,701,866 | | | | 776,495,557 | |
Foreign currency on deposit (cost of $0, $41,624, $4,053,367, $1,893,557, $99,327, $390,425, $2,389,412 and $0, respectively) | | | — | | | | 41,095 | | | | 3,962,897 | |
Receivable for investment securities sold | | | 895,194 | | | | — | | | | 2,314,704 | |
Capital shares receivable | | | 446,122 | | | | 16,000 | | | | 1,443,902 | |
Interest and dividends receivable | | | 137,695 | | | | 7,710 | | | | 542,410 | |
Prepaid expenses and other assets | | | 24,821 | | | | 57,485 | | | | 46,511 | |
| | | | | | | | | | | | |
Total Assets | | | 444,554,512 | | | | 10,824,156 | | | | 784,805,981 | |
| | | | | | | | | | | | |
Liabilities: | | | | | | | | | | | | |
Call options written at value (premiums of $178,735, $0, $0, $0, $0, $0, $0 and $0, respectively) | | | 122,500 | | | | — | | | | — | |
Payable for securities purchased | | | 948,811 | | | | — | | | | 762,163 | |
Capital shares payable | | | 9,611,537 | | | | 183,000 | | | | 6,229,482 | |
Dividends payable to shareholders | | | — | | | | — | | | | — | |
Payable to Advisor | | | 377,780 | | | | 4,714 | | | | 1,154,117 | |
Accrued fund administration fees | | | 14,181 | | | | 340 | | | | 26,260 | |
Accrued expenses and other liabilities | | | 186,016 | | | | 55,801 | | | | 583,336 | |
Other payables | | | — | | | | — | | | | 1,853,004 | |
| | | | | | | | | | | | |
Total Liabilities | | | 11,260,825 | | | | 243,855 | | | | 10,608,362 | |
| | | | | | | | | | | | |
Net Assets | | $ | 433,293,687 | | | $ | 10,580,301 | | | $ | 774,197,619 | |
| | | | | | | | | | | | |
Net Assets Consist of: | | | | | | | | | | | | |
Capital stock | | $ | 132,786 | | | $ | 57,958 | | | $ | 3,590,426 | |
Paid-in-capital in excess of par | | | 428,314,776 | | | | 11,603,955 | | | | 823,582,369 | |
Undistributed net investment income (loss) | | | (29,933 | ) | | | (5,463 | ) | | | (1,106,194 | ) |
Undistributed net realized gain (loss) on investments and foreign currency translations | | | (82,580,021 | ) | | | (71,305 | ) | | | (20,121,254 | ) |
Net unrealized appreciation (depreciation) on investments, options written and foreign currency translations | | | 87,456,079 | | | | (1,004,844 | ) | | | (31,747,728 | ) |
| | | | | | | | | | | | |
Net Assets | | $ | 433,293,687 | | | $ | 10,580,301 | | | $ | 774,197,619 | |
| | | | | | | | | | | | |
Capital Stock, $.01 par value: | | | | | | | | | | | | |
Authorized | | | 10,000,000,000 | | | | 10,000,000,000 | | | | 10,000,000,000 | |
Issued and outstanding | | | 13,278,607 | | | | 5,795,828 | | | | 359,042,577 | |
| | | |
NET ASSET VALUE, REDEMPTION PRICE AND OFFERING
PRICE PER SHARE | | $ | 32.63 | | | $ | 1.83 | | | $ | 2.16 | |
| | | | | | | | | | | | |
| 1 | Fund inception date was April 26, 2011. |
| 2 | Formerly known as Wasatch-1st Source Income Equity Fund. |
See Notes to Financial Statements.
90
| | | | | | | | | | | | | | | | | | |
GLOBAL
OPPORTUNITIES
FUND | | | HERITAGE
GROWTH FUND | | | INTERNATIONAL
GROWTH FUND | | | INTERNATIONAL
OPPORTUNITIES
FUND | | | LARGE CAP
VALUE FUND2 | |
| | | | | | | | | | | | | | | | | | |
| | | | | | | | | | | | | | | | | | |
| | | | | | | | | | | | | | | | | | |
| $ | 172,505,661 | | | $ | 60,959,143 | | | $ | 269,503,966 | | | $ | 136,677,745 | | | $ | 1,498,801,626 | |
| | 3,428,764 | | | | 2,841,875 | | | | 1,274,075 | | | | 8,991,949 | | | | 56,097,106 | |
| | | | | | | | | | | | | | | | | | |
| $ | 175,934,425 | | | $ | 63,801,018 | | | $ | 270,778,041 | | | $ | 145,669,694 | | | $ | 1,554,898,732 | |
| | | | | | | | | | | | | | | | | | |
| | | | | | | | | | | | | | | | | | |
| $ | 195,115,710 | | | $ | 69,752,390 | | | $ | 279,248,283 | | | $ | 134,856,190 | | | $ | 1,487,050,304 | |
| | 3,428,764 | | | | 2,841,875 | | | | 1,274,075 | | | | 8,991,949 | | | | 56,097,106 | |
| | | | | | | | | | | | | | | | | | |
| | 198,544,474 | | | | 72,594,265 | | | | 280,522,358 | | | | 143,848,139 | | | | 1,543,147,410 | |
| | | | | | | | | | | | | | | | | | |
| | 1,628,034 | | | | 83,552 | | | | 373,977 | | | | 2,117,665 | | | | — | |
| | 18 | | | | — | | | | 1,277,775 | | | | 767,960 | | | | 10,414,005 | |
| | 34,327 | | | | 22,598 | | | | 307,176 | | | | 5,424,805 | | | | 880,534 | |
| | 207,260 | | | | 39,187 | | | | 510,414 | | | | 266,377 | | | | 2,169,884 | |
| | 40,930 | | | | 12,814 | | | | 38,191 | | | | 13,492 | | | | 186,891 | |
| | | | | | | | | | | | | | | | | | |
| | 200,455,043 | | | | 72,752,416 | | | | 283,029,891 | | | | 152,438,438 | | | | 1,556,798,724 | |
| | | | | | | | | | | | | | | | | | |
| | | | | | | | | | | | | | | | | | |
| — | | | | — | | | | — | | | | — | | | | — | |
| | 3 | | | | 91,381 | | | | 102,115 | | | | 310,867 | | | | 6,421,139 | |
| | 193,620 | | | | — | | | | 845,711 | | | | 138,330 | | | | 1,931,824 | |
| | — | | | | — | | | | — | | | | — | | | | 286,291 | |
| | 263,919 | | | | 44,632 | | | | 315,457 | | | | 213,981 | | | | 1,116,976 | |
| | 6,990 | | | | 2,392 | | | | 9,835 | | | | 4,954 | | | | 52,055 | |
| | 135,718 | | | | 53,097 | | | | 170,163 | | | | 196,200 | | | | 519,714 | |
| | — | | | | — | | | | 105,496 | | | | 5,485 | | | | — | |
| | | | | | | | | | | | | | | | | | |
| | 600,250 | | | | 191,502 | | | | 1,548,777 | | | | 869,817 | | | | 10,327,999 | |
| | | | | | | | | | | | | | | | | | |
| $ | 199,854,793 | | | $ | 72,560,914 | | | $ | 281,481,114 | | | $ | 151,568,621 | | | $ | 1,546,470,725 | |
| | | | | | | | | | | | | | | | | | |
| | | | | | | | | | | | | | | | | | |
| $ | 542,467 | | | $ | 67,011 | | | $ | 163,573 | | | $ | 677,498 | | | $ | 1,304,625 | |
| | 159,429,764 | | | | 63,079,231 | | | | 299,008,252 | | | | 135,501,347 | | | | 1,580,041,039 | |
| | (689,992 | ) | | | (58,288 | ) | | | (521,786 | ) | | | (86,487 | ) | | | 46,466 | |
| | | | |
| 18,229,689
|
| | | 697,284 | | | | (26,775,538 | ) | | | 17,581,126 | | | | (23,169,394 | ) |
| | | | |
| | 22,342,865 | | | | 8,775,676 | | | | 9,606,613 | | | | (2,104,863 | ) | | | (11,752,011 | ) |
| | | | | | | | | | | | | | | | | | |
| $ | 199,854,793 | | | $ | 72,560,914 | | | $ | 281,481,114 | | | $ | 151,568,621 | | | $ | 1,546,470,725 | |
| | | | | | | | | | | | | | | | | | |
| | | | | | | | | | | | | | | | | | |
| | 10,000,000,000 | | | | 10,000,000,000 | | | | 10,000,000,000 | | | | 10,000,000,000 | | | | 10,000,000,000 | |
| | 54,246,739 | | | | 6,701,105 | | | | 16,357,320 | | | | 67,749,797 | | | | 130,462,472 | |
| | | | |
| $ | 3.68 | | | $ | 10.83 | | | $ | 17.21 | | | $ | 2.24 | | | $ | 11.85 | |
| | | | | | | | | | | | | | | | | | |
91
| | |
| WASATCH FUNDS — Statements of Assets and Liabilities (continued) | | |
|
|
|
| | | | | | | | | | | | |
| | | LONG/SHORT
FUND1 | | | MICRO CAP FUND | | | MICRO CAP
VALUE FUND | |
| | | | | | | | | | | | |
Assets: | | | | | | | | | | | | |
Investments, at cost | | | | | | | | | | | | |
Unaffiliated issuers | | $ | 670,162,735 | | | $ | 225,654,476 | | | $ | 117,819,589 | |
Affiliated issuers3 | | | — | | | | 1,540,000 | | | | — | |
Repurchase agreements | | | 193,085,310 | | | | 5,277,785 | | | | 18,645,998 | |
| | | | | | | | | | | | |
| | $ | 863,248,045 | | | $ | 232,472,261 | | | $ | 136,465,587 | |
| | | | | | | | | | | | |
Investments, at market value | | | | | | | | | | | | |
Unaffiliated issuers | | $ | 623,037,436 | | | $ | 248,055,006 | | | $ | 122,952,090 | |
Affiliated issuers3 | | | — | | | | 55,440 | | | | — | |
Repurchase agreements | | | 193,085,310 | | | | 5,277,785 | | | | 18,645,998 | |
| | | | | | | | | | | | |
| | | 816,122,746 | | | | 253,388,231 | | | | 141,598,088 | |
Foreign currency on deposit (cost of $0, $9,583, $22, $0, $157,588, $0, $16,966, and $0, respectively) | | | — | | | | 9,583 | | | | 21 | |
Receivable for investment securities sold | | | 23,454,487 | | | | 1,297,930 | | | | 1,741,168 | |
Receivable from broker for securities sold short | | | 111,417,333 | | | | — | | | | — | |
Capital shares receivable | | | 1,810,076 | | | | 6,993 | | | | 13,571 | |
Interest and dividends receivable | | | 699,484 | | | | 109,699 | | | | 212,354 | |
Prepaid expenses and other assets | | | 39,822 | | | | 18,083 | | | | 29,997 | |
Unrealized appreciation on foreign currency exchange contracts | | | — | | | | — | | | | 238,671 | |
| | | | | | | | | | | | |
Total Assets | | | 953,543,948 | | | | 254,830,519 | | | | 143,833,870 | |
| | | | | | | | | | | | |
Liabilities: | | | | | | | | | | | | |
Call options written at value (premiums of $10,278,040, $0, $762,276, $0, $0, $0, $0 and $0, respectively) | | | 6,052,310 | | | | — | | | | 392,070 | |
Securities sold short, at value (proceeds of $103,180,486, $0, $0, $0, $0, $0, $0 and $0, respectively) | | | 95,343,406 | | | | — | | | | — | |
Bank overdraft of foreign currency (cost of $0, $0, $0, $0, $0, $60,813, $0, and $183,614, respectively) | | | — | | | | — | | | | — | |
Payable for securities purchased | | | 16,265,287 | | | | 713,287 | | | | 263,862 | |
Capital shares payable | | | 1,542,528 | | | | 150,554 | | | | 35,168 | |
Dividends payable to shareholders | | | — | | | | — | | | | — | |
Payable to Advisor | | | 764,058 | | | | 428,090 | | | | 234,697 | |
Accrued fund administration fees | | | 25,889 | | | | 8,561 | | | | 4,854 | |
Accrued expenses and other liabilities | | | 233,285 | | | | 106,642 | | | | 108,159 | |
Other payables | | | 18,750 | | | | 8,203 | | | | 152 | |
| | | | | | | | | | | | |
Total Liabilities | | | 120,245,513 | | | | 1,415,337 | | | | 1,038,962 | |
| | | | | | | | | | | | |
Net Assets | | $ | 833,298,435 | | | $ | 253,415,182 | | | $ | 142,794,908 | |
| | | | | | | | | | | | |
Net Assets Consist of: | | | | | | | | | | | | |
Capital stock | | $ | 702,956 | | | $ | 575,355 | | | $ | 636,062 | |
Paid-in-capital in excess of par | | | 874,444,176 | | | | 302,048,309 | | | | 138,518,001 | |
Undistributed net investment income (loss) | | | — | | | | (6,014 | ) | | | (1,171,883 | ) |
Undistributed net realized gain (loss) on investments and foreign currency translations | | | (6,786,208 | ) | | | (70,094,125 | ) | | | (923,268 | ) |
Net unrealized appreciation (depreciation) on investments, options written and foreign currency translations | | | (35,062,489 | ) | | | 20,891,657 | | | | 5,735,996 | |
| | | | | | | | | | | | |
Net Assets | | $ | 833,298,435 | | | $ | 253,415,182 | | | $ | 142,794,908 | |
| | | | | | | | | | | | |
Capital Stock, $.01 par value: | | | | | | | | | | | | |
Authorized | | | 10,000,000,000 | | | | 10,000,000,000 | | | | 10,000,000,000 | |
Issued and outstanding | | | 70,295,619 | | | | 57,535,486 | | | | 63,606,161 | |
| | | |
NET ASSET VALUE, REDEMPTION PRICE AND OFFERING
PRICE PER SHARE | | $ | 11.85 | | | $ | 4.40 | | | $ | 2.24 | |
| | | | | | | | | | | | |
| 1 | Formerly known as Wasatch-1st Source Long/Short Fund. |
| 2 | Formerly known as Wasatch Global Science & Technology Fund. |
| 3 | See Note 10 for information on affiliated issuers. |
See Notes to Financial Statements.
92
| | | | | | | | | | | | | | | | | | |
SMALL CAP
GROWTH
FUND | | | SMALL CAP
VALUE FUND | | | STRATEGIC
INCOME
FUND | | | ULTRA
GROWTH
FUND | | | WORLD
INNOVATORS
FUND2 | |
| | | | | | | | | | | | | | | | | | |
| | | | | | | | | | | | | | | | | | |
| | | | | | | | | | | | | | | | | | |
| $ | 973,333,088 | | | $ | 162,938,792 | | | $ | 23,815,549 | | | $ | 124,538,476 | | | $ | 62,427,116 | |
| | 113,357,273 | | | | — | | | | — | | | | — | | | | — | |
| | 9,350,040 | | | | 3,880,430 | | | | 1,380,766 | | | | 272,371 | | | | 4,434,458 | |
| | | | | | | | | | | | | | | | | | |
| $ | 1,096,040,401 | | | $ | 166,819,222 | | | $ | 25,196,315 | | | $ | 124,810,847 | | | $ | 66,861,574 | |
| | | | | | | | | | | | | | | | | | |
| | | | | | | | | | | | | | | | | | |
| $ | 1,187,536,482 | | | $ | 167,035,481 | | | $ | 22,580,714 | | | $ | 134,498,098 | | | $ | 65,122,273 | |
| | 111,543,590 | | | | — | | | | — | | | | — | | | | — | |
| | 9,350,040 | | | | 3,880,430 | | | | 1,380,766 | | | | 272,371 | | | | 4,434,458 | |
| | | | | | | | | | | | | | | | | | |
| | 1,308,430,112 | | | | 170,915,911 | | | | 23,961,480 | | | | 134,770,469 | | | | 69,556,731 | |
| — | | | | 149,247 | | | | — | | | | 17,159 | | | | — | |
| | 1,458,021 | | | | — | | | | 122,374 | | | | 21,015 | | | | 4,032,954 | |
| | — | | | | — | | | | — | | | | — | | | | — | |
| | 795,001 | | | | 60,857 | | | | 9,677 | | | | 23,260 | | | | 21,524 | |
| | 185,198 | | | | 164,365 | | | | 154,357 | | | | 9,942 | | | | 30,582 | |
| | 49,692 | | | | 16,416 | | | | 10,064 | | | | 21,167 | | | | 14,167 | |
| | — | | | | — | | | | — | | | | — | | | | — | |
| | | | | | | | | | | | | | | | | | |
| | 1,310,918,024 | | | | 171,306,796 | | | | 24,257,952 | | | | 134,863,012 | | | | 73,655,958 | |
| | | | | | | | | | | | | | | | | | |
| | | | | | | | | | | | | | | | | | |
| — | | | | — | | | | — | | | | — | | | | — | |
| — | | | | — | | | | — | | | | — | | | | — | |
| — | | | | — | | | | 60,835 | | | | — | | | | 183,682 | |
| | 9,682,304 | | | | 938,295 | | | | 61,781 | | | | 114 | | | | 797,891 | |
| | 1,336,352 | | | | 625,688 | | | | 34,500 | | | | 443,075 | | | | — | |
| | — | | | | — | | | | 5,726 | | | | — | | | | — | |
| | 1,115,809 | | | | 219,956 | | | | 8,193 | | | | 114,934 | | | | 103,153 | |
| | 42,832 | | | | 5,704 | | | | 791 | | | | 4,497 | | | | 2,304 | |
| | 580,974 | | | | 115,703 | | | | 28,792 | | | | 97,798 | | | | 75,961 | |
| | 177,425 | | | | — | | | | — | | | | — | | | | — | |
| | | | | | | | | | | | | | | | | | |
| | 12,935,696 | | | | 1,905,346 | | | | 200,618 | | | | 660,418 | | | | 1,162,991 | |
| | | | | | | | | | | | | | | | | | |
| $ | 1,297,982,328 | | | $ | 169,401,450 | | | $ | 24,057,334 | | | $ | 134,202,594 | | | $ | 72,492,967 | |
| | | | | | | | | | | | | | | | | | |
| | | | | | | | | | | | | | | | | | |
| $ | 366,941 | | | $ | 542,273 | | | $ | 31,797 | | | $ | 66,738 | | | $ | 49,290 | |
| | 1,028,901,751 | | | | 278,331,149 | | | | 32,237,482 | | | | 116,190,116 | | | | 86,066,694 | |
| | 181,495 | | | | (30,245 | ) | | | (65,100 | ) | | | 312,586 | | | | (23,124 | ) |
| | 56,321,040 | | | | (113,524,595 | ) | | | (6,911,166 | ) | | | 7,673,519 | | | | (16,291,798 | ) |
|
212,211,101 |
| | | 4,082,868 | | | | (1,235,679 | ) | | | 9,959,635 | | | | 2,691,905 | |
| | | | | | | | | | | | | | | | | | |
| $ | 1,297,982,328 | | | $ | 169,401,450 | | | $ | 24,057,334 | | | $ | 134,202,594 | | | $ | 72,492,967 | |
| | | | | | | | | | | | | | | | | | |
| | | | | | | | | | | | | | | | | | |
| | 10,000,000,000 | | | | 10,000,000,000 | | | | 10,000,000,000 | | | | 10,000,000,000 | | | | 10,000,000,000 | |
| | 36,694,098 | | | | 54,227,313 | | | | 3,179,701 | | | | 6,673,811 | | | | 4,929,016 | |
| | | | |
| $ | 35.37 | | | $ | 3.12 | | | $ | 7.57 | | | $ | 20.11 | | | $ | 14.71 | |
| | | | | | | | | | | | | | | | | | |
93
| | |
| WASATCH FUNDS — Statements of Assets and Liabilities (continued) | | SEPTEMBER 30, 2011 |
|
|
|
| | | | | | | | |
| | | INCOME
FUND | | | U.S.
TREASURY
FUND | |
| | | | | | | | |
Assets: | | | | | | | | |
Investments, at cost | | | | | | | | |
Unaffiliated issuers | | $ | 128,450,285 | | | $ | 150,677,333 | |
Repurchase agreements | | | 1,863,720 | | | | 2,591,994 | |
| | | | | | | | |
| | $ | 130,314,005 | | | $ | 153,269,327 | |
| | | | | | | | |
Investments, at market value | | | | | | | | |
Unaffiliated issuers | | $ | 132,634,436 | | | $ | 183,849,139 | |
Repurchase agreements | | | 1,863,720 | | | | 2,591,994 | |
| | | | | | | | |
| | | 134,498,156 | | | | 186,441,133 | |
Capital shares receivable | | | 208,483 | | | | 764,608 | |
Interest and dividends receivable | | | 1,059,608 | | | | 726,032 | |
Prepaid expenses and other assets | | | 17,635 | | | | 19,280 | |
| | | | | | | | |
Total Assets | | | 135,783,882 | | | | 187,951,053 | |
| | | | | | | | |
Liabilities: | | | | | | | | |
Capital shares payable | | | 12,819 | | | | 332,076 | |
Dividends payable to shareholders | | | 44,585 | | | | 101,845 | |
Payable to Advisor | | | 61,357 | | | | 78,170 | |
Accrued fund administration fees | | | 4,226 | | | | 5,571 | |
Accrued expenses and other liabilities | | | 44,020 | | | | 65,087 | |
| | | | | | | | |
Total Liabilities | | | 167,007 | | | | 582,749 | |
| | | | | | | | |
Net Assets | | $ | 135,616,875 | | | $ | 187,368,304 | |
| | | | | | | | |
Net Assets Consist of: | | | | | | | | |
Capital stock | | $ | 131,452 | | | $ | 99,941 | |
Paid-in-capital in excess of par | | | 132,704,978 | | | | 145,257,445 | |
Undistributed net investment income | | | 257,770 | | | | 12,100 | |
Undistributed net realized gain (loss) on investments | | | (1,661,476 | ) | | | 8,827,012 | |
Net unrealized appreciation (depreciation) on investments | | | 4,184,151 | | | | 33,171,806 | |
| | | | | | | | |
Net Assets | | $ | 135,616,875 | | | $ | 187,368,304 | |
| | | | | | | | |
Capital Stock, $.01 par value: | | | | | | | | |
Authorized | | | 10,000,000,000 | | | | 10,000,000,000 | |
Issued and outstanding | | | 13,145,151 | | | | 9,994,125 | |
| | |
NET ASSET VALUE, REDEMPTION PRICE AND OFFERING
PRICE PER SHARE | | $ | 10.32 | | | $ | 18.75 | |
| | | | | | | | |
See Notes to Financial Statements.
94
(This page intentionally left blank.)
95
| | |
| WASATCH FUNDS — Statements of Operations | | |
|
|
|
| | | | | | | | | | | | |
| | | CORE
GROWTH
FUND | | | EMERGING
INDIA
FUND1 | | | EMERGING MARKETS
SMALL CAP FUND | |
| | | | | | | | | | | | |
Investment Income: | | | | | | | | | | | | |
Interest | | $ | 1,821 | | | $ | 67 | | | $ | 6,353 | |
Dividends3 | | | | | | | | | | | | |
Unaffiliated issuers | | | 3,089,041 | | | | 78,499 | | | | 16,608,947 | |
| | | | | | | | | | | | |
Total investment income | | | 3,090,862 | | | | 78,566 | | | | 16,615,300 | |
| | | | | | | | | | | | |
Expenses: | | | | | | | | | | | | |
Investment advisory fees | | | 4,736,431 | | | | 62,656 | | | | 13,306,971 | |
Shareholder servicing fees | | | 602,281 | | | | 24,153 | | | | 1,584,701 | |
Fund administration fees | | | 88,299 | | | | 738 | | | | 141,423 | |
Fund accounting fees | | | 63,270 | | | | 8,328 | | | | 113,525 | |
Reports to shareholders | | | 78,565 | | | | 7,099 | | | | 249,594 | |
Custody fees | | | 80,488 | | | | 31,715 | | | | 997,186 | |
Federal and state registration fees | | | 34,326 | | | | 722 | | | | 168,412 | |
Legal fees | | | 22,982 | | | | 416 | | | | 36,177 | |
Trustees’ fees | | | 33,578 | | | | 150 | | | | 38,241 | |
Interest | | | 5,293 | | | | 55 | | | | 16,804 | |
Offering and organization costs | | | — | | | | 44,242 | | | | — | |
Audit fees | | | 22,260 | | | | 21,487 | | | | 22,831 | |
Other expenses | | | 33,249 | | | | 568 | | | | 24,043 | |
| | | | | | | | | | | | |
Total expenses before reimbursement | | | 5,801,022 | | | | 202,329 | | | | 16,699,908 | |
Reimbursement of expenses by Advisor | | | — | | | | (120,832 | ) | | | (1,770,607 | ) |
| | | | | | | | | | | | |
Net Expenses | | | 5,801,022 | | | | 81,497 | | | | 14,929,301 | |
| | | | | | | | | | | | |
Net Investment Income (Loss) | | | (2,710,160 | ) | | | (2,931 | ) | | | 1,685,999 | |
| | | | | | | | | | | | |
Realized and Unrealized Gain (Loss): | | | | | | | | | | | | |
Net realized gain (loss) on investments and foreign currency translations Unaffiliated issuers | | | 35,854,115 | | | | (79,340 | ) | | | (7,207,571 | ) |
Realized foreign capital gains taxes | | | — | | | | — | | | | (220,076 | ) |
Change in unrealized appreciation (depreciation) on investments, options written and foreign currency translations | | | 5,666,352 | | | | (1,004,844 | ) | | | (111,667,061 | ) |
Change in deferred foreign capital gains taxes | | | 229,117 | | | | — | | | | 979,191 | |
| | | | | | | | | | | | |
Net gain (loss) on investments | | | 41,749,584 | | | | (1,084,184 | ) | | | (118,115,517 | ) |
| | | | | | | | | | | | |
Net Increase (Decrease) in Net Assets Resulting from Operations | | $ | 39,039,424 | | | $ | (1,087,115 | ) | | $ | (116,429,518 | ) |
| | | | | | | | | | | | |
| 1 | Fund inception date was April 26, 2011. |
| 2 | Formerly known as Wasatch-1st Source Income Equity Fund. |
| 3 | Net of $42,627, $0, $1,640,519, $259,921, $13,381, $526,609, $244,503 and $123,016 in foreign withholding taxes, respectively. |
See Notes to Financial Statements.
96
| | |
| | FOR THE YEAR ENDED SEPTEMBER 30, 2011 |
|
|
|
| | | | | | | | | | | | | | | | | | |
GLOBAL
OPPORTUNITIES
FUND | | | HERITAGE
GROWTH
FUND | | | INTERNATIONAL
GROWTH FUND | | | INTERNATIONAL
OPPORTUNITIES
FUND | | | LARGE CAP
VALUE FUND2 | |
| | | | | | | | | | | | | | | | | | |
| | | | | | | | | | | | | | | | | | |
| $ | 1,314 | | | $ | 334 | | | $ | 1,413 | | | $ | 2,449 | | | $ | 4,435 | |
| | | | | | | | | | | | | | | | | | |
| | 4,376,895 | | | | 775,782 | | | | 5,542,923 | | | | 2,870,292 | | | | 41,136,655 | |
| | | | | | | | | | | | | | | | | | |
| | 4,378,209 | | | | 776,116 | | | | 5,544,336 | | | | 2,872,741 | | | | 41,141,090 | |
| | | | | | | | | | | | | | | | | | |
| | | | | | | | | | | | | | | | | | |
| | 4,702,941 | | | | 585,737 | | | | 4,499,785 | | | | 3,346,860 | | | | 15,849,492 | |
| | 323,745 | | | | 156,043 | | | | 440,275 | | | | 527,555 | | | | 2,364,465 | |
| | 53,237 | | | | 15,606 | | | | 62,733 | | | | 32,003 | | | | 328,537 | |
| | 84,444 | | | | 20,840 | | | | 65,746 | | | | 56,180 | | | | 192,959 | |
| | 78,943 | | | | 15,234 | | | | 61,808 | | | | 84,457 | | | | 314,813 | |
| | 142,473 | | | | 7,682 | | | | 279,300 | | | | 227,575 | | | | 45,225 | |
| | 39,052 | | | | 19,827 | | | | 53,977 | | | | 29,666 | | | | 92,466 | |
| | 14,286 | | | | 4,060 | | | | 17,639 | | | | 8,459 | | | | 87,129 | |
| | 18,322 | | | | 6,159 | | | | 22,121 | | | | 11,652 | | | | 127,965 | |
| | 3,457 | | | | 950 | | | | 17,455 | | | | 1,919 | | | | 19,785 | |
| | — | | | | — | | | | — | | | | — | | | | — | |
| | 22,409 | | | | 21,274 | | | | 22,407 | | | | 22,832 | | | | 21,549 | |
| | 55,275 | | | | 16,628 | | | | 32,043 | | | | 24,560 | | | | 95,977 | |
| | | | | | | | | | | | | | | | | | |
| | 5,538,584 | | | | 870,040 | | | | 5,575,289 | | | | 4,373,718 | | | | 19,540,362 | |
| | — | | | | (74,167 | ) | | | — | | | | (510,051 | ) | | | (149,118 | ) |
| | | | | | | | | | | | | | | | | | |
| | 5,538,584 | | | | 795,873 | | | | 5,575,289 | | | | 3,863,667 | | | | 19,391,244 | |
| | | | | | | | | | | | | | | | | | |
| | (1,160,375 | ) | | | (19,757 | ) | | | (30,953 | ) | | | (990,926 | ) | | | 21,749,846 | |
| | | | | | | | | | | | | | | | | | |
| | | | | | | | | | | | | | | | | | |
| | | | |
| | 26,274,240 | | | | 8,331,814 | | | | 38,668,065 | | | | 25,669,879 | | | | 42,167,738 | |
| | (34,474 | ) | | | — | | | | (160,861 | ) | | | (776 | ) | | | — | |
| | | | |
| | (29,451,559 | ) | | | (6,110,436 | ) | | | (68,334,935 | ) | | | (42,384,474 | ) | | | (152,130,438 | ) |
| | 105,898 | | | | — | | | | 538,656 | | | | 203,433 | | | | — | |
| | | | | | | | | | | | | | | | | | |
| | (3,105,895 | ) | | | 2,221,378 | | | | (29,289,075 | ) | | | (16,511,938 | ) | | | (109,962,700 | ) |
| | | | | | | | | | | | | | | | | | |
| $ | (4,266,270 | ) | | $ | 2,201,621 | | | $ | (29,320,028 | ) | | $ | (17,502,864 | ) | | $ | (88,212,854 | ) |
| | | | | | | | | | | | | | | | | | |
97
| | |
| WASATCH FUNDS — Statements of Operations (continued) | | |
|
|
|
| | | | | | | | | | | | |
| | | LONG/SHORT
FUND1 | | | MICRO CAP FUND | | | MICRO CAP
VALUE
FUND | |
| | | | | | | | | | | | |
Investment Income: | | | | | | | | | | | | |
Interest | | $ | 11,177 | | | $ | 1,766 | | | $ | 1,681 | |
Dividends3 | | | | | | | | | | | | |
Unaffiliated issuers | | | 7,068,251 | | | | 3,465,653 | | | | 1,973,263 | |
Affiliated issuers4 | | | — | | | | — | | | | — | |
| | | | | | | | | | | | |
Total investment income | | | 7,079,428 | | | | 3,467,419 | | | | 1,974,944 | |
| | | | | | | | | | | | |
Expenses: | | | | | | | | | | | | |
Investment advisory fees | | | 6,537,402 | | | | 6,207,681 | | | | 3,722,328 | |
Shareholder servicing fees | | | 606,209 | | | | 260,438 | | | | 336,885 | |
Fund administration fees | | | 109,761 | | | | 59,366 | | | | 35,651 | |
Fund accounting fees | | | 72,423 | | | | 52,295 | | | | 45,432 | |
Reports to shareholders | | | 124,825 | | | | 45,642 | | | | 43,820 | |
Custody fees | | | 35,479 | | | | 69,600 | | | | 61,816 | |
Federal and state registration fees | | | 122,254 | | | | 27,829 | | | | 29,447 | |
Legal fees | | | 21,406 | | | | 15,747 | | | | 9,775 | |
Trustees’ fees | | | 27,838 | | | | 23,314 | | | | 14,246 | |
Dividends on securities sold short | | | 1,638,420 | | | | — | | | | — | |
Interest | | | 353,451 | | | | 3,626 | | | | 2,232 | |
Audit fees | | | 21,274 | | | | 21,985 | | | | 21,985 | |
Other expenses | | | 18,752 | | | | 30,616 | | | | 25,322 | |
| | | | | | | | | | | | |
Total expenses before reimbursement | | | 9,689,494 | | | | 6,818,139 | | | | 4,348,939 | |
Reimbursement of expenses by Advisor | | | — | | | | — | | | | (51,727 | ) |
| | | | | | | | | | | | |
Net Expenses | | | 9,689,494 | | | | 6,818,139 | | | | 4,297,212 | |
| | | | | | | | | | | | |
Net Investment Income (Loss) | | | (2,610,066 | ) | | | (3,350,720 | ) | | | (2,322,268 | ) |
| | | | | | | | | | | | |
Realized and Unrealized Gain (Loss): | | | | | | | | | | | | |
Net realized gain on investments and foreign currency translations | | | | | | | | | | | | |
Unaffiliated issuers | | | 2,210,569 | | | | 17,922,246 | | | | 8,989,227 | |
Affiliated issuers4 | | | — | | | | — | | | | — | |
Net realized gain on options written | | | 10,495,379 | | | | — | | | | 1,917,183 | |
Net realized gain (loss) on short positions | | | (7,636,158 | ) | | | — | | | | — | |
Realized foreign capital gains taxes | | | — | | | | — | | | | (21,745 | ) |
Change in unrealized appreciation (depreciation) on investments, options written and foreign currency translations | | | (54,385,836 | ) | | | (12,096,567 | ) | | | (12,709,822 | ) |
Change in deferred foreign capital gains taxes | | | — | | | | 196,048 | | | | 285,540 | |
| | | | | | | | | | | | |
Net gain (loss) on investments | | | (49,316,046 | ) | | | 6,021,727 | | | | (1,539,617 | ) |
| | | | | | | | | | | | |
Net Increase (Decrease) in Net Assets Resulting from Operations | | $ | (51,926,112 | ) | | $ | 2,671,007 | | | $ | (3,861,885 | ) |
| | | | | | | | | | | | |
| 1 | Formerly known as Wasatch-1st Source Long/Short Fund. |
| 2 | Formerly known as Wasatch Global Science & Technology Fund. |
| 3 | Net of $19,875, $54,327, $106,279, $210,920, $57,849, $10,921, $16,589 and $64,428 in foreign withholding taxes, respectively. |
| 4 | See Note 10 for information on affiliated issuers. |
See Notes to Financial Statements.
98
| | |
| | FOR THE YEAR ENDED SEPTEMBER 30, 2011 |
|
|
|
| | | | | | | | | | | | | | | | | | |
SMALL CAP
GROWTH
FUND | | | SMALL CAP
VALUE
FUND | | | STRATEGIC
INCOME
FUND | | | ULTRA
GROWTH
FUND | | | WORLD
INNOVATORS
FUND2 | |
| | | | | | | | | | | | | | | | | | |
| | | | | | | | | | | | | | | | | | |
| $ | 9,380 | | | $ | 945 | | | $ | 155 | | | $ | 701 | | | $ | 378 | |
| | | | | | | | | | | | | | | | | | |
| | 10,940,306 | | | | 2,506,959 | | | | 1,014,811 | | | | 1,731,462 | | | | 825,444 | |
| | 2,105,556 | | | | — | | | | — | | | | — | | | | — | |
| | | | | | | | | | | | | | | | | | |
| | 13,055,242 | | | | 2,507,904 | | | | 1,014,966 | | | | 1,732,163 | | | | 825,822 | |
| | | | | | | | | | | | | | | | | | |
| | | | | | | | | | | | | | | | | | |
| | 14,425,804 | | | | 3,308,626 | | | | 180,477 | | | | 2,073,508 | | | | 1,113,952 | |
| | 1,876,078 | | | | 361,741 | | | | 48,401 | | | | 283,143 | | | | 151,271 | |
| | 268,383 | | | | 41,164 | | | | 4,791 | | | | 35,455 | | | | 13,842 | |
| | 168,169 | | | | 39,508 | | | | 17,771 | | | | 43,579 | | | | 31,032 | |
| | 302,559 | | | | 41,583 | | | | 3,846 | | | | 39,611 | | | | 22,186 | |
| | 284,281 | | | | 32,997 | | | | 2,436 | | | | 91,113 | | | | 24,726 | |
| | 101,207 | | | | 22,519 | | | | 21,158 | | | | 54,847 | | | | 20,523 | |
| | 67,486 | | | | 11,066 | | | | 961 | | | | 10,300 | | | | 3,719 | |
| | 92,608 | | | | 17,026 | | | | 1,621 | | | | 13,429 | | | | 5,193 | |
| | — | | | | — | | | | — | | | | — | | | | — | |
| | 17,317 | | | | 3,201 | | | | 426 | | | | 9,004 | | | | 814 | |
| | 21,985 | | | | 21,985 | | | | 21,274 | | | | 21,985 | | | | 21,549 | |
| | 74,388 | | | | 29,154 | | | | 7,919 | | | | 17,643 | | | | 40,142 | |
| | | | | | | | | | | | | | | | | | |
| | 17,700,265 | | | | 3,930,570 | | | | 311,081 | | | | 2,693,617 | | | | 1,448,949 | |
| | — | | | | — | | | | (65,724 | ) | | | — | | | | — | |
| | | | | | | | | | | | | | | | | | |
| | 17,700,265 | | | | 3,930,570 | | | | 245,357 | | | | 2,693,617 | | | | 1,448,949 | |
| | | | | | | | | | | | | | | | | | |
| | (4,645,023 | ) | | | (1,422,666 | ) | | | 769,609 | | | | (961,454 | ) | | | (623,127 | ) |
| | | | | | | | | | | | | | | | | | |
| | | | | | | | | | | | | | | | | | |
| | | | | | | | | | | | | | | | | | |
| | 90,881,840 | | | | 21,077,187 | | | | 1,457,891 | | | | 47,278,810 | | | | 11,934,101 | |
| | 4,992,576 | | | | — | | | | — | | | | — | | | | — | |
| | — | | | | — | | | | — | | | | — | | | | — | |
| | — | | | | — | | | | — | | | | — | | | | 1,201 | |
| | — | | | | (65,135 | ) | | | — | | | | — | | | | — | |
| (70,563,062 | ) | | | (10,950,278 | ) | | | (1,868,864 | ) | | | (34,131,645 | ) | | | (6,461,019 | ) |
| | 153,022 | | | | 405,927 | | | | — | | | | 34,693 | | | | — | |
| | | | | | | | | | | | | | | | | | |
| | 25,464,376 | | | | 10,467,701 | | | | (410,973 | ) | | | 13,181,858 | | | | 5,474,283 | |
| | | | | | | | | | | | | | | | | | |
| $ | 20,819,353 | | | $ | 9,045,035 | | | $ | 358,636 | | | $ | 12,220,404 | | | $ | 4,851,156 | |
| | | | | | | | | | | | | | | | | | |
99
| | |
| WASATCH FUNDS — Statements of Operations (continued) | | FOR THE YEAR ENDED SEPTEMBER 30, 2011 |
|
|
|
| | | | | | | | |
| | | INCOME
FUND | | | U.S.
TREASURY
FUND | |
| | | | | | | | |
Investment Income: | | | | | | | | |
Interest | | $ | 3,980,974 | | | $ | 6,812,657 | |
Dividends | | | | | | | | |
Unaffiliated issuers | | | 176,814 | | | | — | |
| | | | | | | | |
Total investment income | | | 4,157,788 | | | | 6,812,657 | |
| | | | | | | | |
Expenses: | | | | | | | | |
Investment advisory fees | | | 732,375 | | | | 813,351 | |
Shareholder servicing fees | | | 50,851 | | | | 246,377 | |
Fund administration fees | | | 24,892 | | | | 30,428 | |
Fund accounting fees | | | 45,821 | | | | 22,775 | |
Reports to shareholders | | | 5,185 | | | | 28,518 | |
Custody fees | | | 11,721 | | | | 4,174 | |
Federal and state registration fees | | | 19,773 | | | | 33,337 | |
Legal fees | | | 6,748 | | | | 8,212 | |
Trustees’ fees | | | 10,021 | | | | 12,073 | |
Audit fees | | | 21,274 | | | | 22,004 | |
Other expenses | | | 10,539 | | | | 11,726 | |
| | | | | | | | |
Total expenses before reimbursement | | | 939,200 | | | | 1,232,975 | |
Reimbursement of expenses by Advisor | | | — | | | | (12,948 | ) |
| | | | | | | | |
Net Expenses | | | 939,200 | | | | 1,220,027 | |
| | | | | | | | |
Net Investment Income | | | 3,218,588 | | | | 5,592,630 | |
| | | | | | | | |
Realized and Unrealized Gain (Loss): | | | | | | | | |
Net realized gain on investments
Unaffiliated issuers | | | 1,612,886 | | | | 8,827,015 | |
Change in unrealized appreciation (depreciation) on investments | | | (2,067,301 | ) | | | 19,561,036 | |
| | | | | | | | |
Net gain (loss) on investments | | | (454,415 | ) | | | 28,388,051 | |
| | | | | | | | |
Net Increase in Net Assets Resulting from Operations | | $ | 2,764,173 | | | $ | 33,980,681 | |
| | | | | | | | |
See Notes to Financial Statements.
100
(This page intentionally left blank.)
101
| | |
| WASATCH FUNDS — Statements of Changes in Net Assets | | |
|
|
|
| | | | | | | | | | | | |
| | | CORE GROWTH
FUND | | | EMERGING INDIA
FUND | |
| | | Year Ended
September 30, 2011 | | | Year Ended
September 30, 2010 | | | Period Ended
September 30, 20111 | |
| | | | | | | | | | | | |
Operations: | | | | | | | | | | | | |
Net investment income (loss) | | $ | (2,710,160 | ) | | $ | 62,960 | | | $ | (2,931 | ) |
Net realized gain (loss) on investments and foreign currency translations | | | 35,854,115 | | | | 995,642 | | | | (79,340 | ) |
Net realized gain on options written | | | — | | | | — | | | | — | |
Change in unrealized appreciation (depreciation) on
investments, options written and foreign currency translations | | | 5,895,469 | | | | 54,501,664 | | | | (1,004,844 | ) |
| | | | | | | | | | | | |
Net increase (decrease) in net assets resulting from operations | | | 39,039,424 | | | | 55,560,266 | | | | (1,087,115 | ) |
| | | |
Dividends paid from: | | | | | | | | | | | | |
Net investment income | | | — | | | | (87,230 | ) | | | — | |
Net realized gains | | | — | | | | — | | | | — | |
| | | | | | | | | | | | |
| | | — | | | | (87,230 | ) | | | — | |
| | | |
Capital share transactions: | | | | | | | | | | | | |
Shares sold | | | 83,103,061 | | | | 68,856,248 | | | | 13,493,360 | |
Shares issued to holders in reinvestment of dividends | | | — | | | | 84,321 | | | | — | |
Shares redeemed | | | (107,505,309 | ) | | | (115,743,132 | ) | | | (1,831,563 | ) |
Redemption fees | | | 14,798 | | | | 22,210 | | | | 5,619 | |
| | | | | | | | | | | | |
Net increase (decrease) | | | (24,387,450 | ) | | | (46,780,353 | ) | | | 11,667,416 | |
| | | | | | | | | | | | |
Total increase (decrease) in net assets | | | 14,651,974 | | | | 8,692,683 | | | | 10,580,301 | |
| | | |
Net assets: | | | | | | | | | | | | |
Beginning of period | | | 418,641,713 | | | | 409,949,030 | | | | — | |
| | | | | | | | | | | | |
End of period | | $ | 433,293,687 | | | $ | 418,641,713 | | | $ | 10,580,301 | |
| | | | | | | | | | | | |
Undistributed net investment income (loss) included in net assets
at end of period | | $ | (29,933 | ) | | $ | 2,636,473 | | | $ | (5,463 | ) |
| | | | | | | | | | | | |
| | | |
Capital share transactions — shares: | | | | | | | | | | | | |
Shares sold | | | 2,403,205 | | | | 2,422,565 | | | | 6,731,700 | |
Shares issued to holders in reinvestment of dividends | | | — | | | | 3,122 | | | | — | |
Shares redeemed | | | (3,103,065 | ) | | | (4,288,991 | ) | | | (935,872 | ) |
| | | | | | | | | | | | |
Net increase (decrease) in shares outstanding | | | (699,860 | ) | | | (1,863,304 | ) | | | 5,795,828 | |
| | | | | | | | | | | | |
| 1 | Fund inception date was April 26, 2011. |
See Notes to Financial Statements.
102
| | | | | | | | | | | | | | | | | | | | | | |
EMERGING MARKETS SMALL CAP
FUND | | | GLOBAL OPPORTUNITIES
FUND | | | HERITAGE GROWTH
FUND | |
Year Ended
September 30, 2011 | | | Year Ended
September 30, 2010 | | | Year Ended
September 30, 2011 | | | Year Ended
September 30, 2010 | | | Year Ended
September 30, 2011 | | | Year Ended
September 30, 2010 | |
| | | | | | | | | | | | | | | | | | | | | | |
| | | | | | | | | | | | | | | | | | | | | | |
| $ | 1,685,999 | | | $ | 1,225,201 | | | $ | (1,160,375 | ) | | $ | (1,210,183 | ) | | $ | (19,757 | ) | | $ | 627,348 | |
| | (7,427,647 | ) | | | 7,457,199 | | | | 26,239,766 | | | | 9,849,600 | | | | 8,331,814 | | | | 2,847,249 | |
| | — | | | | — | | | | — | | | | — | | | | — | | | | 630 | |
| | | | | |
| | (110,687,870 | ) | | | 70,751,669 | | | | (29,345,661 | ) | | | 24,919,757 | | | | (6,110,436 | ) | | | 8,005,190 | |
| | | | | | | | | | | | | | | | | | | | | | |
| | (116,429,518 | ) | | | 79,434,069 | | | | (4,266,270 | ) | | | 33,559,174 | | | | 2,201,621 | | | | 11,480,417 | |
| | | | | |
| | | | | | | | | | | | | | | | | | | | | | |
| | (86,408 | ) | | | (379,097 | ) | | | — | | | | (261,705 | ) | | | (659,028 | ) | | | (499,403 | ) |
| | — | | | | — | | | | (9,401,467 | ) | | | (3,194,663 | ) | | | — | | | | — | |
| | | | | | | | | | | | | | | | | | | | | | |
| | (86,408 | ) | | | (379,097 | ) | | | (9,401,467 | ) | | | (3,456,368 | ) | | | (659,028 | ) | | | (499,403 | ) |
| | | | | |
| | | | | | | | | | | | | | | | | | | | | | |
| | 1,008,804,331 | | | | 384,572,278 | | | | 106,033,780 | | | | 110,079,205 | | | | 7,731,214 | | | | 7,721,063 | |
| | 80,915 | | | | 369,142 | | | | 9,039,015 | | | | 3,250,108 | | | | 632,899 | | | | 482,444 | |
| | (565,437,338 | ) | | | (68,120,691 | ) | | | (136,478,673 | ) | | | (25,925,621 | ) | | | (15,622,676 | ) | | | (18,106,546 | ) |
| | 514,482 | | | | 386,082 | | | | 24,601 | | | | 12,260 | | | | 3,249 | | | | 1,849 | |
| | | | | | | | | | | | | | | | | | | | | | |
| | 443,962,390 | | | | 317,206,811 | | | | (21,381,277 | ) | | | 87,415,952 | | | | (7,255,314 | ) | | | (9,901,190 | ) |
| | | | | | | | | | | | | | | | | | | | | | |
| | 327,446,464 | | | | 396,261,783 | | | | (35,049,014 | ) | | | 117,518,758 | | | | (5,712,721 | ) | | | 1,079,824 | |
| | | | | |
| | | | | | | | | | | | | | | | | | | | | | |
| | 446,751,155 | | | | 50,489,372 | | | | 234,903,807 | | | | 117,385,049 | | | | 78,273,635 | | | | 77,193,811 | |
| | | | | | | | | | | | | | | | | | | | | | |
| $ | 774,197,619 | | | $ | 446,751,155 | | | $ | 199,854,793 | | | $ | 234,903,807 | | | $ | 72,560,914 | | | $ | 78,273,635 | |
| | | | | | | | | | | | | | | | | | | | | | |
| | | | | |
| $ | (1,106,194 | ) | | $ | (117,824 | ) | | $ | (689,992 | ) | | $ | (816,038 | ) | | $ | (58,288 | ) | | $ | 658,864 | |
| | | | | | | | | | | | | | | | | | | | | | |
| | | | | |
| | | | | | | | | | | | | | | | | | | | | | |
| | 404,408,930 | | | | 191,206,047 | | | | 24,718,548 | | | | 30,762,192 | | | | 645,254 | | | | 790,897 | |
| | 32,217 | | | | 210,938 | | | | 2,126,627 | | | | 947,553 | | | | 53,850 | | | | 50,677 | |
| | (233,756,865 | ) | | | (35,258,335 | ) | | | (31,791,124 | ) | | | (7,268,106 | ) | | | (1,314,925 | ) | | | (1,846,641 | ) |
| | | | | | | | | | | | | | | | | | | | | | |
| | 170,684,282 | | | | 156,158,650 | | | | (4,945,949 | ) | | | 24,441,639 | | | | (615,821 | ) | | | (1,005,067 | ) |
| | | | | | | | | | | | | | | | | | | | | | |
103
| | |
| WASATCH FUNDS — Statements of Changes in Net Assets (continued) | | |
|
|
|
| | | | | | | | | | | | | | | | |
| | | INTERNATIONAL GROWTH FUND | | | INTERNATIONAL OPPORTUNITIES
FUND | |
| | | Year Ended
September 30, 2011 | | | Year Ended
September 30, 2010 | | | Year Ended
September 30, 2011 | | | Year Ended
September 30, 2010 | |
| | | | | | | | | | | | | | | | |
Operations: | | | | | | | | | | | | | | | | |
Net investment income (loss) | | $ | (30,953 | ) | | $ | 192,038 | | | $ | (990,926 | ) | | $ | (746,874 | ) |
Net realized gain (loss) on investments and foreign
currency translations | | | 38,507,204 | | | | 13,757,148 | | | | 25,669,103 | | | | 15,112,361 | |
Net realized gain on options written | | | — | | | | — | | | | — | | | | — | |
Net realized loss on short positions | | | — | | | | — | | | | — | | | | — | |
Change in unrealized appreciation (depreciation) on
investments, options written and foreign currency translations | | | (67,796,279 | ) | | | 48,154,832 | | | | (42,181,041 | ) | | | 19,179,326 | |
| | | | | | | | | | | | | | | | |
Net increase (decrease) in net assets resulting from operations | | | (29,320,028 | ) | | | 62,104,018 | | | | (17,502,864 | ) | | | 33,544,813 | |
| | | | |
Dividends paid from: | | | | | | | | | | | | | | | | |
Net investment income | | | — | | | | — | | | | — | | | | (1,049,066 | ) |
Net realized gains | | | — | | | | — | | | | (4,411,467 | ) | | | — | |
| | | | | | | | | | | | | | | | |
| | | — | | | | — | | | | (4,411,467 | ) | | | (1,049,066 | ) |
| | | | |
Capital share transactions: | | | | | | | | | | | | | | | | |
Shares sold | | | 242,214,904 | | | | 92,481,514 | | | | 74,164,386 | | | | 56,143,842 | |
Shares issued to holders in reinvestment of dividends | | | — | | | | — | | | | 4,358,588 | | | | 1,032,263 | |
Shares redeemed | | | (217,092,446 | ) | | | (42,375,378 | ) | | | (57,233,455 | ) | | | (31,367,310 | ) |
Redemption fees | | | 232,716 | | | | 10,085 | | | | 15,863 | | | | 17,074 | |
| | | | | | | | | | | | | | | | |
Net increase (decrease) | | | 25,355,174 | | | | 50,116,221 | | | | 21,305,382 | | | | 25,825,869 | |
| | | | | | | | | | | | | | | | |
Total increase (decrease) in net assets | | | (3,964,854 | ) | | | 112,220,239 | | | | (608,949 | ) | | | 58,321,616 | |
| | | | |
Net assets: | | | | | | | | | | | | | | | | |
Beginning of period | | | 285,445,968 | | | | 173,225,729 | | | | 152,177,570 | | | | 93,855,954 | |
| | | | | | | | | | | | | | | | |
End of period | | $ | 281,481,114 | | | $ | 285,445,968 | | | $ | 151,568,621 | | | $ | 152,177,570 | |
| | | | | | | | | | | | | | | | |
Undistributed net investment income (loss) included in net assets at end of period | | $ | (521,786 | ) | | $ | 198,092 | | | $ | (86,487 | ) | | $ | (652,260 | ) |
| | | | | | | | | | | | | | | | |
| | | | |
Capital share transactions — shares: | | | | | | | | | | | | | | | | |
Shares sold | | | 12,065,101 | | | | 5,611,720 | | | | 28,815,261 | | | | 25,386,991 | |
Shares issued to holders in reinvestment of dividends | | | — | | | | — | | | | 1,689,375 | | | | 491,554 | |
Shares redeemed | | | (11,007,778 | ) | | | (2,767,634 | ) | | | (21,903,479 | ) | | | (14,333,524 | ) |
| | | | | | | | | | | | | | | | |
Net increase (decrease) in shares outstanding | | | 1,057,323 | | | | 2,844,086 | | | | 8,601,157 | | | | 11,545,021 | |
| | | | | | | | | | | | | | | | |
| 1 | Formerly known as Wasatch-1st Source Income Equity Fund. |
| 2 | Formerly known as Wasatch-1st Source Long/Short Fund. |
See Notes to Financial Statements.
104
| | | | | | | | | | | | | | | | | | | | | | |
LARGE CAP VALUE
FUND1 | | | LONG/SHORT
FUND2 | | | MICRO CAP
FUND | |
Year Ended
September 30, 2011 | | | Year Ended
September 30, 2010 | | | Year Ended
September 30, 2011 | | | Year Ended
September 30, 2010 | | | Year Ended
September 30, 2011 | | | Year Ended
September 30, 2010 | |
| | | | | | | | | | | | | | | | | | | | | | |
| | | | | | | | | | | | | | | | | | | | | | |
| $ | 21,749,846 | | | $ | 21,149,108 | | | $ | (2,610,066 | ) | | $ | 61,805 | | | $ | (3,350,720 | ) | | $ | (3,041,042 | ) |
| | | | | |
| | 42,167,738 | | | | 32,788,451 | | | | 2,210,569 | | | | 7,401,409 | | | | 17,922,246 | | | | (1,922,995 | ) |
| | — | | | | — | | | | 10,495,379 | | | | 4,803,888 | | | | — | | | | — | |
| | — | | | | — | | | | (7,636,158 | ) | | | (6,388,985 | ) | | | — | | | | — | |
| | | | | |
| | (152,130,438 | ) | | | 39,555,366 | | | | (54,385,836 | ) | | | 3,599,357 | | | | (11,900,519 | ) | | | 41,333,815 | |
| | | | | | | | | | | | | | | | | | | | | | |
| | | | | |
| | (88,212,854 | ) | | | 93,492,925 | | | | (51,926,112 | ) | | | 9,477,474 | | | | 2,671,007 | | | | 36,369,778 | |
| | | | | |
| | | | | | | | | | | | | | | | | | | | | | |
| | (21,370,753 | ) | | | (21,589,760 | ) | | | (300,223 | ) | | | (98,009 | ) | | | — | | | | — | |
| | — | | | | — | | | | — | | | | — | | | | — | | | | — | |
| | | | | | | | | | | | | | | | | | | | | | |
| | (21,370,753 | ) | | | (21,589,760 | ) | | | (300,223 | ) | | | (98,009 | ) | | | — | | | | — | |
| | | | | |
| | | | | | | | | | | | | | | | | | | | | | |
| | 594,644,079 | | | | 559,640,781 | | | | 775,781,045 | | | | 218,506,133 | | | | 27,569,041 | | | | 23,412,191 | |
| | 20,250,309 | | | | 19,988,994 | | | | 275,190 | | | | 86,180 | | | | — | | | | — | |
| | (579,983,268 | ) | | | (415,969,989 | ) | | | (190,889,262 | ) | | | (73,900,820 | ) | | | (60,383,633 | ) | | | (48,782,919 | ) |
| | 30,458 | | | | 42,087 | | | | 103,061 | | | | 56,794 | | | | 7,507 | | | | 14,832 | |
| | | | | | | | | | | | | | | | | | | | | | |
| | 34,941,578 | | | | 163,701,873 | | | | 585,270,034 | | | | 144,748,287 | | | | (32,807,085 | ) | | | (25,355,896 | ) |
| | | | | | | | | | | | | | | | | | | | | | |
| | (74,642,029 | ) | | | 235,605,038 | | | | 533,043,699 | | | | 154,127,752 | | | | (30,136,078 | ) | | | 11,013,882 | |
| | | | | |
| | | | | | | | | | | | | | | | | | | | | | |
| | 1,621,112,754 | | | | 1,385,507,716 | | | | 300,254,736 | | | | 146,126,984 | | | | 283,551,260 | | | | 272,537,378 | |
| | | | | | | | | | | | | | | | | | | | | | |
| $ | 1,546,470,725 | | | $ | 1,621,112,754 | | | $ | 833,298,435 | | | $ | 300,254,736 | | | $ | 253,415,182 | | | $ | 283,551,260 | |
| | | | | | | | | | | | | | | | | | | | | | |
| | | | | |
| $ | 46,466 | | | $ | (331,089 | ) | | $ | — | | | $ | 48,857 | | | $ | (6,014 | ) | | $ | (46,442 | ) |
| | | | | | | | | | | | | | | | | | | | | | |
| | | | | |
| | | | | | | | | | | | | | | | | | | | | | |
| | 43,168,920 | | | | 44,453,574 | | | | 59,803,681 | | | | 18,930,449 | | | | 5,264,916 | | | | 5,634,138 | |
| | 1,494,620 | | | | 1,621,951 | | | | 21,072 | | | | 7,406 | | | | — | | | | — | |
| | (42,497,952 | ) | | | (33,497,030 | ) | | | (15,111,108 | ) | | | (6,490,271 | ) | | | (11,582,929 | ) | | | (11,800,279 | ) |
| | | | | | | | | | | | | | | | | | | | | | |
| | 2,165,588 | | | | 12,578,495 | | | | 44,713,645 | | | | 12,447,584 | | | | (6,318,013 | ) | | | (6,166,141 | ) |
| | | | | | | | | | | | | | | | | | | | | | |
105
| | |
| WASATCH FUNDS — Statements of Changes in Net Assets (continued) | | |
|
|
|
| | | | | | | | | | | | | | | | |
| | | MICRO CAP VALUE
FUND | | | SMALL CAP GROWTH
FUND | |
| | | Year Ended
September 30, 2011 | | | Year Ended
September 30, 2010 | | | Year Ended
September 30, 2011 | | | Year Ended
September 30, 2010 | |
| | | | | | | | | | | | | | | | |
Operations: | | | | | | | | | | | | | | | | |
Net investment income (loss) | | $ | (2,322,268 | ) | | $ | (2,203,762 | ) | | $ | (4,645,023 | ) | | $ | (6,990,560 | ) |
Net realized gain on investments and foreign
currency translations | | | 8,967,482 | | | | 19,739,412 | | | | 95,874,416 | | | | 30,868,546 | |
Net realized gain on options written | | | 1,917,183 | | | | 866,253 | | | | — | | | | — | |
Net realized gain on short positions | | | — | | | | — | | | | — | | | | — | |
Change in unrealized appreciation (depreciation) on investments, options written and foreign
currency translations | | | (12,424,282 | ) | | | (1,084,802 | ) | | | (70,410,040 | ) | | | 148,574,152 | |
| | | | | | | | | | | | | | | | |
Net increase (decrease) in net assets resulting
from operations | | | (3,861,885 | ) | | | 17,317,101 | | | | 20,819,353 | | | | 172,452,138 | |
| | | | |
Dividends paid from: | | | | | | | | | | | | | | | | |
Net investment income | | | — | | | | (569,692 | ) | | | — | | | | — | |
Net realized gains | | | — | | | | — | | | | — | | | | — | |
| | | | | | | | | | | | | | | | |
| | | — | | | | (569,692 | ) | | | — | | | | — | |
| | | | |
Capital share transactions: | | | | | | | | | | | | | | | | |
Shares sold | | | 20,267,692 | | | | 100,096,662 | | | | 472,872,914 | | | | 328,975,735 | |
Shares issued to holders in reinvestment of dividends | | | — | | | | 551,439 | | | | — | | | | — | |
Shares redeemed | | | (59,204,228 | ) | | | (47,056,986 | ) | | | (305,913,508 | ) | | | (200,748,783 | ) |
Redemption fees | | | 6,458 | | | | 31,954 | | | | 116,381 | | | | 90,163 | |
| | | | | | | | | | | | | | | | |
Net increase (decrease) | | | (38,930,078 | ) | | | 53,623,069 | | | | 167,075,787 | | | | 128,317,115 | |
| | | | | | | | | | | | | | | | |
Total increase (decrease) in net assets | | | (42,791,963 | ) | | | 70,370,478 | | | | 187,895,140 | | | | 300,769,253 | |
| | | | |
Net assets: | | | | | | | | | | | | | | | | |
Beginning of period | | | 185,586,871 | | | | 115,216,393 | | | | 1,110,087,188 | | | | 809,317,935 | |
| | | | | | | | | | | | | | | | |
End of period | | $ | 142,794,908 | | | $ | 185,586,871 | | | $ | 1,297,982,328 | �� | | $ | 1,110,087,188 | |
| | | | | | | | | | | | | | | | |
Undistributed net investment income (loss) included in net assets at end of period | | $ | (1,171,883 | ) | | $ | (462,295 | ) | | $ | 181,495 | | | $ | (114,405 | ) |
| | | | | | | | | | | | | | | | |
| | | | |
Capital share transactions — shares: | | | | | | | | | | | | | | | | |
Shares sold | | | 7,715,342 | | | | 43,931,594 | | | | 12,035,701 | | | | 10,668,620 | |
Shares issued to holders in reinvestment of dividends | | | — | | | | 252,953 | | | | — | | | | — | |
Shares redeemed | | | (22,141,027 | ) | | | (20,736,580 | ) | | | (7,765,020 | ) | | | (6,554,978 | ) |
| | | | | | | | | | | | | | | | |
Net increase (decrease) in shares outstanding | | | (14,425,685 | ) | | | 23,447,967 | | | | 4,270,681 | | | | 4,113,642 | |
| | | | | | | | | | | | | | | | |
See Notes to Financial Statements.
106
| | | | | | | | | | | | | | | | | | | | | | |
SMALL CAP VALUE
FUND | | | STRATEGIC INCOME
FUND | | | ULTRA GROWTH
FUND | |
Year Ended
September 30, 2011 | | | Year Ended
September 30, 2010 | | | Year Ended
September 30, 2011 | | | Year Ended
September 30, 2010 | | | Year Ended
September 30, 2011 | | | Year Ended
September 30, 2010 | |
| | | | | | | | | | | | | | | | | | | | | | |
| | | | | | | | | | | | | | | | | | | | | | |
| $ | (1,422,666 | ) | | $ | (487,862 | ) | | $ | 769,609 | | | $ | 784,721 | | | $ | (961,454 | ) | | $ | (1,434,361 | ) |
| | | | | |
| | 21,012,052 | | | | 19,593,691 | | | | 1,457,891 | | | | 495,507 | | | | 47,278,810 | | | | 12,230,959 | |
| | — | | | | — | | | | — | | | | 18,481 | | | | — | | | | — | |
| | — | | | | — | | | | — | | | | 375,162 | | | | — | | | | — | |
| | | | | |
| | (10,544,351 | ) | | | 5,715,574 | | | | (1,868,864 | ) | | | 902,027 | | | | (34,096,952 | ) | | | 21,071,258 | |
| | | | | | | | | | | | | | | | | | | | | | |
| | | | | |
| | 9,045,035 | | | | 24,821,403 | | | | 358,636 | | | | 2,575,898 | | | | 12,220,404 | | | | 31,867,856 | |
| | | | | |
| | | | | | | | | | | | | | | | | | | | | | |
| | — | | | | — | | | | (762,128 | ) | | | (678,070 | ) | | | — | | | | — | |
| | — | | | | — | | | | — | | | | — | | | | — | | | | — | |
| | | | | | | | | | | | | | | | | | | | | | |
| | — | | | | — | | | | (762,128 | ) | | | (678,070 | ) | | | — | | | | — | |
| | | | | |
| | | | | | | | | | | | | | | | | | | | | | |
| | 22,166,451 | | | | 19,624,422 | | | | 12,790,479 | | | | 2,287,938 | | | | 52,244,137 | | | | 55,395,722 | |
| | — | | | | — | | | | 743,844 | | | | 660,289 | | | | — | | | | — | |
| | (73,383,270 | ) | | | (51,243,676 | ) | | | (8,596,748 | ) | | | (3,039,434 | ) | | | (108,860,106 | ) | | | (29,986,296 | ) |
| | 1,744 | | | | 11,670 | | | | 6,276 | | | | 307 | | | | 32,578 | | | | 4,063 | |
| | | | | | | | | | | | | | | | | | | | | | |
| | (51,215,075 | ) | | | (31,607,584 | ) | | | 4,943,851 | | | | (90,900 | ) | | | (56,583,391 | ) | | | 25,413,489 | |
| | | | | | | | | | | | | | | | | | | | | | |
| | (42,170,040 | ) | | | (6,786,181 | ) | | | 4,540,359 | | | | 1,806,928 | | | | (44,362,987 | ) | | | 57,281,345 | |
| | | | | |
| | | | | | | | | | | | | | | | | | | | | | |
| | 211,571,490 | | | | 218,357,671 | | | | 19,516,975 | | | | 17,710,047 | | | | 178,565,581 | | | | 121,284,236 | |
| | | | | | | | | | | | | | | | | | | | | | |
| $ | 169,401,450 | | | $ | 211,571,490 | | | $ | 24,057,334 | | | $ | 19,516,975 | | | $ | 134,202,594 | | | $ | 178,565,581 | |
| | | | | | | | | | | | | | | | | | | | | | |
| | | | | |
| $ | (30,245 | ) | | $ | 715,613 | | | $ | (65,100 | ) | | $ | 66,363 | | | $ | 312,586 | | | $ | (759,055 | ) |
| | | | | | | | | | | | | | | | | | | | | | |
| | | | | |
| | | | | | | | | | | | | | | | | | | | | | |
| | 6,163,122 | | | | 6,683,775 | | | | 1,499,462 | | | | 320,791 | | | | 2,402,075 | | | | 3,045,498 | |
| | — | | | | — | | | | 90,253 | | | | 93,068 | | | | — | | | | — | |
| | (20,529,110 | ) | | | (17,525,168 | ) | | | (1,009,685 | ) | | | (429,440 | ) | | | (4,747,763 | ) | | | (1,773,172 | ) |
| | | | | | | | | | | | | | | | | | | | | | |
| | (14,365,988 | ) | | | (10,841,393 | ) | | | 580,030 | | | | (15,581 | ) | | | (2,345,688 | ) | | | 1,272,326 | |
| | | | | | | | | | | | | | | | | | | | | | |
107
| | |
| WASATCH FUNDS — Statements of Changes in Net Assets (continued) | | |
|
|
|
| | | | | | | | | | | | | | | | |
| | | WORLD INNOVATORS
FUND1 | | | INCOME
FUND | |
| | | Year Ended
September 30, 2011 | | | Year Ended
September 30, 2010 | | | Year Ended
September 30, 2011 | | | Year Ended
September 30, 2010 | |
| | | | | | | | | | | | | | | | |
Operations: | | | | | | | | | | | | | | | | |
Net investment income (loss) | | $ | (623,127 | ) | | $ | (461,039 | ) | | $ | 3,218,588 | | | $ | 3,609,311 | |
Net realized gain on investments and foreign
currency translations | | | 11,934,101 | | | | 10,226,634 | | | | 1,612,886 | | | | 940,819 | |
Net realized gain on short positions | | | 1,201 | | | | — | | | | — | | | | — | |
Change in unrealized appreciation (depreciation) on
investments and foreign currency translations | | | (6,461,019 | ) | | | 2,966,542 | | | | (2,067,301 | ) | | | 2,872,059 | |
| | | | | | | | | | | | | | | | |
Net increase in net assets resulting from operations | | | 4,851,156 | | | | 12,732,137 | | | | 2,764,173 | | | | 7,422,189 | |
| | | | |
Dividends paid from: | | | | | | | | | | | | | | | | |
Net investment income | | | — | | | | (79,109 | ) | | | (3,218,058 | ) | | | (3,572,685 | ) |
Net realized gains | | | — | | | | — | | | | — | | | | — | |
| | | | | | | | | | | | | | | | |
| | | — | | | | (79,109 | ) | | | (3,218,058 | ) | | | (3,572,685 | ) |
| | | | |
Capital share transactions: | | | | | | | | | | | | | | | | |
Shares sold | | | 16,841,982 | | | | 6,840,235 | | | | 43,348,706 | | | | 45,774,175 | |
Shares issued to holders in reinvestment of dividends | | | — | | | | 77,070 | | | | 2,645,734 | | | | 2,972,350 | |
Shares redeemed | | | (14,984,425 | ) | | | (13,346,871 | ) | | | (48,023,388 | ) | | | (29,000,964 | ) |
Redemption fees | | | 17,318 | | | | 3,581 | | | | 4,599 | | | | 3,655 | |
| | | | | | | | | | | | | | | | |
Net increase (decrease) | | | 1,874,875 | | | | (6,425,985 | ) | | | (2,024,349 | ) | | | 19,749,216 | |
| | | | | | | | | | | | | | | | |
Total increase (decrease) in net assets | | | 6,726,031 | | | | 6,227,043 | | | | (2,478,234 | ) | | | 23,598,720 | |
| | | | |
Net assets: | | | | | | | | | | | | | | | | |
Beginning of period | | | 65,766,936 | | | | 59,539,893 | | | | 138,095,109 | | | | 114,496,389 | |
| | | | | | | | | | | | | | | | |
End of period | | $ | 72,492,967 | | | $ | 65,766,936 | | | $ | 135,616,875 | | | $ | 138,095,109 | |
| | | | | | | | | | | | | | | | |
Undistributed net investment income (loss) included in
net assets at end of period | | $ | (23,124 | ) | | $ | 35 | | | $ | 257,770 | | | $ | 23,571 | |
| | | | | | | | | | | | | | | | |
| | | | |
Capital share transactions — shares: | | | | | | | | | | | | | | | | |
Shares sold | | | 1,075,228 | | | | 551,173 | | | | 4,228,888 | | | | 4,502,902 | |
Shares issued to holders in reinvestment of dividends | | | — | | | | 6,565 | | | | 258,544 | | | | 292,433 | |
Shares redeemed | | | (962,741 | ) | | | (1,096,838 | ) | | | (4,695,493 | ) | | | (2,850,794 | ) |
| | | | | | | | | | | | | | | | |
Net increase (decrease) in shares outstanding | | | 112,487 | | | | (539,100 | ) | | | (208,061 | ) | | | 1,944,541 | |
| | | | | | | | | | | | | | | | |
| 1 | Formerly known as Wasatch Global Science & Technology Fund. |
See Notes to Financial Statements.
108
| | | | | | | | | | | | |
U.S. TREASURY
FUND | | | | | | | |
Year Ended
September 30, 2011 | | | Year Ended
September 30, 2010 | | | | | | | |
| | | | | | | | | | | | |
| | | | | | | | | | | | |
| $ | 5,592,630 | | | $ | 5,458,981 | | | | | | | |
| 8,827,015 | | | | 10,365,841 | | | | | | | |
| | — | | | | — | | | | | | | |
| 19,561,036 | | | | 4,266,518 | | | | | | | |
| | | | | | | | | | | | |
| | 33,980,681 | | | | 20,091,340 | | | | | | | |
| | | | |
| | | | | | | | | | | | |
| | (5,596,881 | ) | | | (5,454,808 | ) | | | | | | |
| | (10,250,028 | ) | | | (4,576,837 | ) | | | | | | |
| | | | | | | | | | | | |
| | (15,846,909 | ) | | | (10,031,645 | ) | | | | | | |
| | | | |
| | | | | | | | | | | | |
| | 75,135,021 | | | | 91,924,206 | | | | | | | |
| | 14,324,462 | | | | 9,249,903 | | | | | | | |
| | (121,243,175 | ) | | | (64,561,485 | ) | | | | | | |
| | 163,643 | | | | 83,717 | | | | | | | |
| | | | | | | | | | | | |
| | (31,620,049 | ) | | | 36,696,341 | | | | | | | |
| | | | | | | | | | | | |
| | (13,486,277 | ) | | | 46,756,036 | | | | | | | |
| | | | |
| | | | | | | | | | | | |
| | 200,854,581 | | | | 154,098,545 | | | | | | | |
| | | | | | | | | | | | |
| $ | 187,368,304 | | | $ | 200,854,581 | | | | | | | |
| | | | | | | | | | | | |
$ | 12,100 | | | $ | 16,351 | | | | | | | |
| | | | | | | | | | | | |
| | | | |
| | | | | | | | | | | | |
| | 5,167,394 | | | | 5,800,234 | | | | | | | |
| | 1,036,188 | | | | 614,469 | | | | | | | |
| | (7,910,147 | ) | | | (4,173,981 | ) | | | | | | |
| | | | | | | | | | | | |
| | (1,706,565 | ) | | | 2,240,722 | | | | | | | |
| | | | | | | | | | | | |
109
| | |
| WASATCH FUNDS — Financial Highlights | | |
|
|
|
| | | | | | | | | | | | | | | | | | | | |
| CORE GROWTH FUND | | Year Ended September 30 | |
| (for a share outstanding throughout each period) | | 2011 | | | 2010 | | | 2009 | | | 2008 | | | 2007 | |
| | | | | | | | | | | | | | | | | | | | |
Net asset value, beginning of period | | $ | 29.95 | | | $ | 25.88 | | | $ | 26.38 | | | $ | 42.98 | | | $ | 41.08 | |
| | | | | |
Income (loss) from investment operations: | | | | | | | | | | | | | | | | | | | | |
Net investment income (loss) | | | (0.19 | ) | | | 0.03 | | | | — | 1 | | | 0.19 | | | | (0.05 | ) |
Net realized and unrealized gains (losses) on investments | | | 2.87 | | | | 4.05 | | | | (0.23 | ) | | | (8.98 | ) | | | 5.65 | |
| | | | | | | | | | | | | | | | | | | | |
Total from investment operations | | | 2.68 | | | | 4.08 | | | | (0.23 | ) | | | (8.79 | ) | | | 5.60 | |
| | | | | |
Redemption fees (see Note 2) | | | — | 1 | | | — | 1 | | | — | 1 | | | — | 1 | | | — | 1 |
| | | | | |
Less distributions: | | | | | | | | | | | | | | | | | | | | |
Dividends from net investment income | | | — | | | | (0.01 | ) | | | (0.27 | ) | | | — | | | | (0.14 | ) |
Distributions from net realized gains | | | — | | | | — | | | | — | | | | (7.81 | ) | | | (3.56 | ) |
| | | | | | | | | | | | | | | | | | | | |
Total distributions | | | — | | | | (0.01 | ) | | | (0.27 | ) | | | (7.81 | ) | | | (3.70 | ) |
| | | | | | | | | | | | | | | | | | | | |
Net asset value, end of period | | $ | 32.63 | | | $ | 29.95 | | | $ | 25.88 | | | $ | 26.38 | | | $ | 42.98 | |
| | | | | | | | | | | | | | | | | | | | |
Total return | | | 8.95% | | | | 15.75% | | | | (0.45)% | | | | (24.82)% | | | | 14.28% | |
| | | | | |
Supplemental data and ratios: | | | | | | | | | | | | | | | | | | | | |
Net assets, end of period (in thousands) | | $ | 433,294 | | | $ | 418,642 | | | $ | 409,949 | | | $ | 645,769 | | | $ | 1,250,618 | |
Ratio of expenses to average net assets | | | 1.22% | | | | 1.29% | 2 | | | 1.34% | | | | 1.21% | | | | 1.18% | |
Ratio of net investment income (loss) to average net assets | | | (0.57)% | | | | 0.02% | | | | 0.24% | | | | 0.52% | | | | (0.09)% | |
Portfolio turnover rate | | | 27% | | | | 19% | | | | 30% | | | | 44% | | | | 54% | |
| | | | | |
| EMERGING INDIA FUND | | Period Ended
September 30 | | | | | | | | | | | | | |
| (for a share outstanding throughout each period) | | 20113 | | | | | | | | | | | | | |
Net asset value, beginning of period | | $ | 2.00 | | | | | | | | | | | | | | | | | |
| | | | | |
Income (loss) from investment operations: | | | | | | | | | | | | | | | | | | | | |
Net investment loss | | | — | 1 | | | | | | | | | | | | | | | | |
Net realized and unrealized losses on investments | | | (0.17 | ) | | | | | | | | | | | | | | | | |
| | | | | | | | | | | | | | | | | | | | |
Total from investment operations | | | (0.17 | ) | | | | | | | | | | | | | | | | |
| | | | | |
Redemption fees (see Note 2) | | | — | 1 | | | | | | | | | | | | | | | | |
| | | | | | | | | | | | | | | | | | | | |
Net asset value, end of period | | $ | 1.83 | | | | | | | | | | | | | | | | | |
| | | | | | | | | | | | | | | | | | | | |
Total return | | | (8.50)% | 4 | | | | | | | | | | | | | | | | |
Supplemental data and ratios: | | | | | | | | | | | | | | | | | | | | |
Net assets, end of period (in thousands) | | $ | 10,580 | | | | | | | | | | | | | | | | | |
Ratio of expenses to average net assets: | | | | | | | | | | | | | | | | | | | | |
Net of waivers and reimbursements | | | 1.95% | 5 | | | | | | | | | | | | | | | | |
Before waivers and reimbursements | | | 4.85% | 5 | | | | | | | | | | | | | | | | |
Ratio of net investment loss to average net assets: | | | | | | | | | | | | | | | | | | | | |
Net of waivers and reimbursements | | | (0.07)% | 5 | | | | | | | | | | | | | | | | |
Before waivers and reimbursements | | | (2.97)% | 5 | | | | | | | | | | | | | | | | |
Portfolio turnover rate | | | 2% | 4 | | | | | | | | | | | | | | | | |
| 1 | Represents amounts less than $.005 per share. |
| 2 | Includes extraordinary expenses of 0.01% (see Note 9). |
| 3 | Fund inception date was April 26, 2011. |
| 4 | Not annualized for periods less than one year. |
See Notes to Financial Statements.
110
| | | | | | | | | | | | | | | | |
| EMERGING MARKETS SMALL CAP FUND | | Year Ended September 30 | | | Period Ended
September 30 | |
| (for a share outstanding throughout each period) | | 2011 | | | 2010 | | | 2009 | | | 20081 | |
| | | | | | | | | | | | | | | | |
Net asset value, beginning of period | | $ | 2.37 | | | $ | 1.57 | | | $ | 1.24 | | | $ | 2.00 | |
| | | | |
Income (loss) from investment operations: | | | | | | | | | | | | | | | | |
Net investment income | | | — | 2 | | | 0.01 | | | | — | 2 | | | — | 2 |
Net realized and unrealized gains (losses) on investments | | | (0.21 | ) | | | 0.80 | | | | 0.33 | | | | (0.76 | ) |
| | | | | | | | | | | | | | | | |
Total from investment operations | | | (0.21 | ) | | | 0.81 | | | | 0.33 | | | | (0.76 | ) |
| | | | |
Redemption fees (see Note 2) | | | — | 2 | | | — | 2 | | | — | 2 | | | — | 2 |
| | | | |
Less distributions: | | | | | | | | | | | | | | | | |
Dividends from net investment income | | | — | 2 | | | (0.01 | ) | | | — | 2 | | | — | 2 |
| | | | | | | | | | | | | | | | |
Total distributions | | | — | 2 | | | (0.01 | ) | | | — | 2 | | | — | 2 |
| | | | | | | | | | | | | | | | |
Net asset value, end of period | | $ | 2.16 | | | $ | 2.37 | | | $ | 1.57 | | | $ | 1.24 | |
| | | | | | | | | | | | | | | | |
Total return | | | (8.85)% | | | | 51.69% | | | | 26.80% | | | | (37.88)% | 3 |
| | | | |
Supplemental data and ratios: | | | | | | | | | | | | | | | | |
Net assets, end of period (in thousands) | | $ | 774,198 | | | $ | 446,751 | | | $ | 50,489 | | | $ | 36,176 | |
Ratio of expenses to average net assets: | | | | | | | | | | | | | | | | |
Net of waivers and reimbursements | | | 1.96% | | | | 2.06% | 4 | | | 2.10% | | | | 2.10% | 5 |
Before waivers and reimbursements | | | 2.19% | | | | 2.39% | 4 | | | 3.03% | | | | 2.67% | 5 |
Ratio of net investment income (loss) to average net assets: | | | | | | | | | | | | | | | | |
Net of waivers and reimbursements | | | 0.22% | | | | 0.82% | | | | 0.12% | | | | 0.27% | 5 |
Before waivers and reimbursements | | | (0.01)% | | | | 0.49% | | | | (0.81)% | | | | (0.29)% | 5 |
Portfolio turnover rate | | | 48% | | | | 23% | | | | 78% | | | | 38% | 3 |
| | | |
| GLOBAL OPPORTUNITIES FUND | | Year Ended September 30 | | | Period Ended
September 30 | | | | |
| (for a share outstanding throughout each period) | | 2011 | | | 2010 | | | 20096 | | | | |
Net asset value, beginning of period | | $ | 3.97 | | | $ | 3.38 | | | $ | 2.00 | | | | | |
| | | | |
Income (loss) from investment operations: | | | | | | | | | | | | | | | | |
Net investment loss | | | (0.02 | ) | | | (0.02 | ) | | | (0.01 | ) | | | | |
Net realized and unrealized gains (losses) on investments | | | (0.13 | ) | | | 0.70 | | | | 1.39 | | | | | |
| | | | | | | | | | | | | | | | |
Total from investment operations | | | (0.15 | ) | | | 0.68 | | | | 1.38 | | | | | |
| | | | |
Redemption fees (see Note 2) | | | — | 2 | | | — | 2 | | | — | 2 | | | | |
| | | | |
Less distributions: | | | | | | | | | | | | | | | | |
Dividends from net investment income | | | — | | | | (0.01 | ) | | | — | | | | | |
Distributions from net realized gains | | | (0.14 | ) | | | (0.08 | ) | | | — | | | | | |
| | | | | | | | | | | | | | | | |
Total distributions | | | (0.14 | ) | | | (0.09 | ) | | | — | | | | | |
| | | | | | | | | | | | | | | | |
Net asset value, end of period | | $ | 3.68 | | | $ | 3.97 | | | $ | 3.38 | | | | | |
| | | | | | | | | | | | | | | | |
Total return | | | (4.21)% | | | | 20.41% | | | | 69.00% | 3 | | | | |
| | | | |
Supplemental data and ratios: | | | | | | | | | | | | | | | | |
Net assets, end of period (in thousands) | | $ | 199,855 | | | $ | 234,904 | | | $ | 117,385 | | | | | |
Ratio of expenses to average net assets: | | | | | | | | | | | | | | | | |
Net of waivers and reimbursements | | | 1.94% | | | | 2.25% | 4 | | | 2.25% | 5 | | | | |
Before waivers and reimbursements | | | 1.94% | | | | 2.33% | 4 | | | 2.61% | 5 | | | | |
Ratio of net investment loss to average net assets: | | | | | | | | | | | | | | | | |
Net of waivers and reimbursements | | | (0.41)% | | | | (0.73)% | | | | (0.67)% | 5 | | | | |
Before waivers and reimbursements | | | (0.41)% | | | | (0.81)% | | | | (1.03)% | 5 | | | | |
Portfolio turnover rate | | | 59% | | | | 23% | | | | 22% | 3 | | | | |
| 1 | Fund inception date was October 1, 2007. |
| 2 | Represents amounts less than $.005 per share. |
| 3 | Not annualized for periods less than one year. |
| 4 | Includes extraordinary expenses of less than 0.01% (see Note 9). |
| 6 | Fund inception date was November 17, 2008. |
See Notes to Financial Statements.
111
| | |
| WASATCH FUNDS — Financial Highlights (continued) | | |
|
|
|
| | | | | | | | | | | | | | | | | | | | |
| HERITAGE GROWTH FUND | | Year Ended September 30 | |
| (for a share outstanding throughout each period) | | 2011 | | | 2010 | | | 2009 | | | 2008 | | | 2007 | |
| | | | | | | | | | | | | | | | | | | | |
Net asset value, beginning of period | | $ | 10.70 | | | $ | 9.28 | | | $ | 9.00 | | | $ | 12.57 | | | $ | 11.40 | |
| | | | | |
Income (loss) from investment operations: | | | | | | | | | | | | | | | | | | | | |
Net investment income (loss) | | | — | 1 | | | 0.09 | | | | 0.06 | | | | 0.06 | | | | (0.01 | ) |
Net realized and unrealized gains (losses) on investments | | | 0.22 | | | | 1.39 | | | | 0.26 | | | | (2.57 | ) | | | 1.53 | |
| | | | | | | | | | | | | | | | | | | | |
Total from investment operations | | | 0.22 | | | | 1.48 | | | | 0.32 | | | | (2.51 | ) | | | 1.52 | |
| | | | | |
Redemption fees (see Note 2) | | | — | 1 | | | — | 1 | | | — | 1 | | | — | 1 | | | — | 1 |
| | | | | |
Less distributions: | | | | | | | | | | | | | | | | | | | | |
Dividends from net investment income | | | (0.09 | ) | | | (0.06 | ) | | | (0.02 | ) | | | — | | | | — | 1 |
Distributions from net realized gains | | | — | | | | — | | | | (0.02 | ) | | | (1.06 | ) | | | (0.35 | ) |
| | | | | | | | | | | | | | | | | | | | |
Total distributions | | | (0.09 | ) | | | (0.06 | ) | | | (0.04 | ) | | | (1.06 | ) | | | (0.35 | ) |
| | | | | | | | | | | | | | | | | | | | |
Net asset value, end of period | | $ | 10.83 | | | $ | 10.70 | | | $ | 9.28 | | | $ | 9.00 | | | $ | 12.57 | |
| | | | | | | | | | | | | | | | | | | | |
Total return | | | 2.01% | | | | 16.06% | | | | 3.74% | | | | (21.54)% | | | | 13.59% | |
| | | | | |
Supplemental data and ratios: | | | | | | | | | | | | | | | | | | | | |
Net assets, end of period (in thousands) | | $ | 72,561 | | | $ | 78,274 | | | $ | 77,194 | | | $ | 95,414 | | | $ | 208,918 | |
Ratio of expenses to average net assets: | | | | | | | | | | | | | | | | | | | | |
Net of waivers and reimbursements | | | 0.95% | | | | 0.96% | 2 | | | 0.95% | | | | 0.95% | | | | 0.95% | |
Before waivers and reimbursements | | | 1.04% | | | | 1.11% | 2 | | | 1.21% | | | | 1.01% | | | | 0.95% | |
Ratio of net investment income (loss) to average net assets: | | | | | | | | | | | | | | | | | | | | |
Net of waivers and reimbursements | | | (0.02)% | | | | 0.81% | | | | 0.74% | | | | 0.44% | | | | (0.06)% | |
Before waivers and reimbursements | | | (0.11)% | | | | 0.66% | | | | 0.48% | | | | 0.38% | | | | (0.06)% | |
Portfolio turnover rate | | | 35% | | | | 36% | | | | 33% | | | | 48% | | | | 56% | |
| |
| INTERNATIONAL GROWTH FUND | | Year Ended September 30 | |
| (for a share outstanding throughout each period) | | 2011 | | | 2010 | | | 2009 | | | 2008 | | | 2007 | |
Net asset value, beginning of period | | $ | 18.66 | | | $ | 13.91 | | | $ | 11.83 | | | $ | 24.42 | | | $ | 21.83 | |
| | | | | |
Income (loss) from investment operations: | | | | | | | | | | | | | | | | | | | | |
Net investment income (loss) | | | — | 1 | | | 0.02 | | | | (0.13 | ) | | | (0.28 | ) | | | 0.03 | |
Net realized and unrealized gains (losses) on investments | | | (1.46 | ) | | | 4.73 | | | | 2.24 | | | | (9.19 | ) | | | 6.61 | |
| | | | | | | | | | | | | | | | | | | | |
Total from investment operations | | | (1.46 | ) | | | 4.75 | | | | 2.11 | | | | (9.47 | ) | | | 6.64 | |
| | | | | |
Redemption fees (see Note 2) | | | 0.01 | | | | — | 1 | | | — | 1 | | | — | 1 | | | — | 1 |
| | | | | |
Less distributions: | | | | | | | | | | | | | | | | | | | | |
Dividends from net investment income | | | — | | | | — | | | | (0.03 | ) | | | (0.68 | ) | | | — | |
Distributions from net realized gains | | | — | | | | — | | | | — | | | | (2.44 | ) | | | (4.05 | ) |
| | | | | | | | | | | | | | | | | | | | |
Total distributions | | | — | | | | — | | | | (0.03 | ) | | | (3.12 | ) | | | (4.05 | ) |
| | | | | | | | | | | | | | | | | | | | |
Net asset value, end of period | | $ | 17.21 | | | $ | 18.66 | | | $ | 13.91 | | | $ | 11.83 | | | $ | 24.42 | |
| | | | | | | | | | | | | | | | | | | | |
Total return | | | (7.77)% | | | | 34.15% | | | | 18.03% | | | | (44.01)% | | | | 34.02% | |
| | | | | |
Supplemental data and ratios: | | | | | | | | | | | | | | | | | | | | |
Net assets, end of period (in thousands) | | $ | 281,481 | | | $ | 285,446 | | | $ | 173,226 | | | $ | 194,780 | | | $ | 534,903 | |
Ratio of expenses to average net assets | | | 1.66% | | | | 1.86% | 3 | | | 1.94% | | | | 1.83% | | | | 1.76% | |
Ratio of net investment income (loss) to average net assets | | | (0.01)% | | | | 0.10% | | | | 0.03% | | | | (0.15)% | | | | 0.11% | |
Portfolio turnover rate | | | 70% | | | | 44% | | | | 56% | | | | 44% | | | | 60% | |
| 1 | Represents amounts less than $.005 per share. |
| 2 | Includes extraordinary expenses of 0.01% (see Note 9). |
| 3 | Includes extraordinary expenses of less than 0.01% (see Note 9). |
See Notes to Financial Statements.
112
| | | | | | | | | | | | | | | | | | | | | | | | |
| INTERNATIONAL OPPORTUNITIES FUND | | Year Ended September 30 | | | | |
| (for a share outstanding throughout each period) | | 2011 | | | 2010 | | | 2009 | | | 2008 | | | 2007 | | | | |
| | | | | | | | | | | | | | | | | | | | | | | | |
Net asset value, beginning of period | | $ | 2.57 | | | $ | 1.97 | | | $ | 1.60 | | | $ | 3.65 | | | $ | 2.71 | | | | | |
| | | | | | |
Income (loss) from investment operations: | | | | | | | | | | | | | | | | | | | | | | | | |
Net investment income (loss) | | | (0.01 | ) | | | (0.01 | ) | | | 0.01 | | | | 0.07 | | | | (0.01 | ) | | | | |
Net realized and unrealized gains (losses) on investments | | | (0.25 | ) | | | 0.63 | | | | 0.36 | | | | (1.45 | ) | | | 1.13 | | | | | |
| | | | | | | | | | | | | | | | | | | | | | | | |
Total from investment operations | | | (0.26 | ) | | | 0.62 | | | | 0.37 | | | | (1.38 | ) | | | 1.12 | | | | | |
| | | | | | |
Redemption fees (see Note 2) | | | — | 1 | | | — | 1 | | | — | 1 | | | — | 1 | | | — | 1 | | | | |
| | | | | | |
Less distributions: | | | | | | | | | | | | | | | | | | | | | | | | |
Dividends from net investment income | | | — | | | | (0.02 | ) | | | — | 1 | | | (0.14 | ) | | | — | 1 | | | | |
Distributions from net realized gains | | | (0.07 | ) | | | — | | | | — | | | | (0.53 | ) | | | (0.18 | ) | | | | |
| | | | | | | | | | | | | | | | | | | | | | | | |
Total distributions | | | (0.07 | ) | | | (0.02 | ) | | | — | | | | (0.67 | ) | | | (0.18 | ) | | | | |
| | | | | | | | | | | | | | | | | | | | | | | | |
Net asset value, end of period | | $ | 2.24 | | | $ | 2.57 | | | $ | 1.97 | | | $ | 1.60 | | | $ | 3.65 | | | | | |
| | | | | | | | | | | | | | | | | | | | | | | | |
Total return | | | (10.49)% | | | | 31.71% | | | | 23.60% | | | | (45.33)% | | | | 42.73% | | | | | |
| | | | | | |
Supplemental data and ratios: | | | | | | | | | | | | | | | | | | | | | | | | |
Net assets, end of period (in thousands) | | $ | 151,569 | | | $ | 152,178 | | | $ | 93,856 | | | $ | 55,691 | | | $ | 56,433 | | | | | |
Ratio of expenses to average net assets: | | | | | | | | | | | | | | | | | | | | | | | | |
Net of waivers and reimbursements | | | 2.25% | | | | 2.26% | 2 | | | 2.26% | 3 | | | 2.25% | | | | 2.25% | | | | | |
Before waivers and reimbursements | | | 2.55% | | | | 2.62% | 2 | | | 2.79% | 3 | | | 2.59% | | | | 2.51% | | | | | |
Ratio of net investment loss to average net assets: | | | | | | | | | | | | | | | | | | | | | | | | |
Net of waivers and reimbursements | | | (0.58)% | | | | (0.60)% | | | | (0.28)% | | | | (0.09)% | | | | (0.18)% | | | | | |
Before waivers and reimbursements | | | (0.88)% | | | | (0.96)% | | | | (0.81)% | | | | (0.43)% | | | | (0.44)% | | | | | |
Portfolio turnover rate | | | 108% | | | | 51% | | | | 69% | | | | 63% | | | | 54% | | | | | |
| | | |
| LARGE CAP VALUE FUND4 | | Year Ended September 30 | | | Period Ended
September 30 | | | Year Ended March 31 | |
| (for a share outstanding throughout each period) | | 2011 | | | 2010 | | | 2009 | | | 20085 | | | 2008 | | | 2007 | |
Net asset value, beginning of period | | $ | 12.64 | | | $ | 11.97 | | | $ | 12.93 | | | $ | 14.44 | | | $ | 14.80 | | | $ | 14.14 | |
| | | | | | |
Income (loss) from investment operations: | | | | | | | | | | | | | | | | | | | | | | | | |
Net investment income | | | 0.17 | | | | 0.17 | | | | 0.20 | | | | 0.14 | 6 | | | 0.21 | | | | 0.22 | |
Net realized and unrealized gains (losses) on investments | | | (0.79 | ) | | | 0.67 | | | | (0.96 | ) | | | (1.52 | ) | | | 0.31 | | | | 1.66 | |
| | | | | | | | | | | | | | | | | | | | | | | | |
Total from investment operations | | | (0.62 | ) | | | 0.84 | | | | (0.76 | ) | | | (1.38 | ) | | | 0.52 | | | | 1.88 | |
| | | | | | |
Redemption fees (see Note 2) | | | — | 1 | | | — | 1 | | | — | 1 | | | — | | | | — | | | | — | |
| | | | | | |
Less distributions: | | | | | | | | | | | | | | | | | | | | | | | | |
Dividends from net investment income | | | (0.17 | ) | | | (0.17 | ) | | | (0.20 | ) | | | (0.13 | ) | | | (0.21 | ) | | | (0.21 | ) |
Distributions from net realized gains | | | — | | | | — | | | | — | | | | — | | | | (0.67 | ) | | | (1.01 | ) |
| | | | | | | | | | | | | | | | | | | | | | | | |
Total distributions | | | (0.17 | ) | | | (0.17 | ) | | | (0.20 | ) | | | (0.13 | ) | | | (0.88 | ) | | | (1.22 | ) |
| | | | | | | | | | | | | | | | | | | | | | | | |
Net asset value, end of period | | $ | 11.85 | | | $ | 12.64 | | | $ | 11.97 | | | $ | 12.93 | | | $ | 14.44 | | | $ | 14.80 | |
| | | | | | | | | | | | | | | | | | | | | | | | |
Total return | | | (5.08)% | | | | 7.07% | | | | (5.63)% | | | | (9.65)% | 7 | | | 3.22% | | | | 13.69% | |
| | | | | | |
Supplemental data and ratios: | | | | | | | | | | | | | | | | | | | | | | | | |
Net assets, end of period (in thousands) | | $ | 1,546,471 | | | $ | 1,621,113 | | | $ | 1,385,508 | | | $ | 780,384 | | | $ | 447,674 | | | $ | 167,133 | |
Ratio of expenses to average net assets: | | | | | | | | | | | | | | | | | | | | | | | | |
Net of waivers and reimbursements | | | 1.10% | | | | 1.11% | 2 | | | 1.10% | | | | 1.04% | 8 | | | 1.13% | | | | 1.15% | |
Before waivers and reimbursements | | | 1.11% | | | | 1.14% | 2 | | | 1.22% | | | | 1.29% | 8 | | | 1.38% | | | | 1.40% | |
Ratio of net investment income to average net assets: | | | | | | | | | | | | | | | | | | | | | | | | |
Net of waivers and reimbursements | | | 1.24% | | | | 1.36% | | | | 1.93% | | | | 1.99% | 8 | | | 1.43% | | | | 1.52% | |
Before waivers and reimbursements | | | 1.23% | | | | 1.33% | | | | 1.81% | | | | 1.74% | 8 | | | 1.18% | | | | 1.27% | |
Portfolio turnover rate | | | 26% | | | | 17% | | | | 16% | | | | 5% | 7 | | | 36% | | | | 26% | |
| 1 | Represents amounts less than $.005 per share. |
| 2 | Includes extraordinary expenses of 0.01% (see Note 9). |
| 3 | Includes interest expense of 0.01%. |
| 4 | Formerly known as Wasatch-1st Source Income Equity Fund. |
| 5 | Effective September 19, 2008, the Fund changed its fiscal year end to September 30. |
| 6 | Average shares method used in calculation. |
| 7 | Not annualized for periods less than one year. |
See Notes to Financial Statements.
113
| | |
| WASATCH FUNDS — Financial Highlights (continued) | | |
|
|
|
| | | | | | | | | | | | | | | | | | | | | | | | |
| LONG/SHORT FUND1 | | Year Ended September 30 | | | Period Ended
September 30 | | | Year Ended March 31 | |
| (for a share outstanding throughout each period) | | 2011 | | | 2010 | | | 2009 | | | 20082 | | | 2008 | | | 2007 | |
| | | | | | | | | | | | | | | | | | | | | | | | |
Net asset value, beginning of period | | $ | 11.74 | | | $ | 11.13 | | | $ | 10.81 | | | $ | 11.27 | | | $ | 11.59 | | | $ | 11.21 | |
| | | | | | |
Income (loss) from investment operations: | | | | | | | | | | | | | | | | | | | | | | | | |
Net investment income (loss) | | | (0.04 | ) | | | (0.01 | ) | | | 0.02 | | | | 0.05 | 3 | | | 0.27 | | | | 0.26 | |
Net realized and unrealized gains (losses) on investments | | | 0.16 | | | | 0.62 | | | | 0.50 | | | | (0.46 | ) | | | 0.02 | | | | 0.90 | |
| | | | | | | | | | | | | | | | | | | | | | | | |
Total from investment operations | | | 0.12 | | | | 0.61 | | | | 0.52 | | | | (0.41 | ) | | | 0.29 | | | | 1.16 | |
| | | | | | |
Redemption fees (see Note 2) | | | — | 4 | | | — | 4 | | | — | 4 | | | — | | | | — | | | | — | |
| | | | | | |
Less distributions: | | | | | | | | | | | | | | | | | | | | | | | | |
Dividends from net investment income | | | (0.01 | ) | | | — | 4 | | | (0.05 | ) | | | (0.05 | ) | | | (0.28 | ) | | | (0.28 | ) |
Distributions from net realized gains | | | — | | | | — | | | | (0.15 | ) | | | — | | | | (0.33 | ) | | | (0.50 | ) |
| | | | | | | | | | | | | | | | | | | | | | | | |
Total distributions | | | (0.01 | ) | | | — | 4 | | | (0.20 | ) | | | (0.05 | ) | | | (0.61 | ) | | | (0.78 | ) |
| | | | | | | | | | | | | | | | | | | | | | | | |
Net asset value, end of period | | $ | 11.85 | | | $ | 11.74 | | | $ | 11.13 | | | $ | 10.81 | | | $ | 11.27 | | | $ | 11.59 | |
| | | | | | | | | | | | | | | | | | | | | | | | |
Total return | | | 0.98% | | | | 5.52% | | | | 5.35% | | | | (3.66)% | 5 | | | 2.34% | | | | 10.44% | |
| | | | | | |
Supplemental data and ratios: | | | | | | | | | | | | | | | | | | | | | | | | |
Net assets, end of period (in thousands) | | $ | 833,298 | | | $ | 300,255 | | | $ | 146,127 | | | $ | 122,114 | | | $ | 87,410 | | | $ | 53,894 | |
Ratio of expenses to average net assets (including interest expense and dividend payments for securities sold short): | | | | | | | | | | | | | | | | | | | | | | | | |
Net of waivers and reimbursements | | | 1.63% | | | | 1.71% | 6 | | | 1.91% | | | | 1.77% | 7 | | | 1.75% | | | | 1.84% | |
Before waivers and reimbursements | | | 1.63% | | | | 1.71% | 6 | | | 1.96% | | | | 2.02% | 7 | | | 2.00% | | | | 2.09% | |
Ratio of expenses to average net assets (excluding interest expense and dividend payments for securities sold short): | | | | | | | | | | | | | | | | | | | | | | | | |
Net of waivers and reimbursements | | | 1.30% | | | | 1.34% | 6 | | | 1.47% | | | | 1.46% | 7 | | | 1.57% | | | | 1.56% | |
Before waivers and reimbursements | | | 1.30% | | | | 1.34% | 6 | | | 1.52% | | | | 1.71% | 7 | | | 1.82% | | | | 1.81% | |
Ratio of net investment income (loss) to average net assets: | | | | | | | | | | | | | | | | | | | | | | | | |
Net of waivers and reimbursements | | | (0.44)% | | | | 0.03% | | | | 0.24% | | | | 0.95% | 7 | | | 2.25% | | | | 2.40% | |
Before waivers and reimbursements | | | (0.44)% | | | | 0.03% | | | | 0.19% | | | | 0.70% | 7 | | | 2.00% | | | | 2.15% | |
Portfolio turnover rate | | | 82% | | | | 60% | | | | 167% | | | | 71% | 5 | | | 179% | | | | 172% | |
| | |
| MICRO CAP FUND | | Year Ended September 30 | | | | |
| (for a share outstanding throughout each period) | | 2011 | | | 2010 | | | 2009 | | | 2008 | | | 2007 | | | | |
Net asset value, beginning of period | | $ | 4.44 | | | $ | 3.89 | | | $ | 4.14 | | | $ | 7.19 | | | $ | 6.79 | | | | | |
| | | | | | |
Income (loss) from investment operations: | | | | | | | | | | | | | | | | | | | | | | | | |
Net investment loss | | | (0.06 | ) | | | (0.05 | ) | | | (0.03 | ) | | | (0.07 | ) | | | (0.09 | ) | | | | |
Net realized and unrealized gains (losses) on investments | | | 0.02 | | | | 0.60 | | | | (0.21 | ) | | | (1.81 | ) | | | 1.29 | | | | | |
| | | | | | | | | | | | | | | | | | | | | | | | |
Total from investment operations | | | (0.04 | ) | | | 0.55 | | | | (0.24 | ) | | | (1.88 | ) | | | 1.20 | | | | | |
| | | | | | |
Redemption fees (see Note 2) | | | — | 4 | | | — | 4 | | | — | 4 | | | — | 4 | | | — | 4 | | | | |
| | | | | | |
Less distributions: | | | | | | | | | | | | | | | | | | | | | | | | |
Dividends from net investment income | | | — | | | | — | | | | (0.01 | ) | | | — | | | | — | | | | | |
Distributions from net realized gains | | | — | | | | — | | | | — | | | | (1.17 | ) | | | (0.80 | ) | | | | |
| | | | | | | | | | | | | | | | | | | | | | | | |
Total distributions | | | — | | | | — | | | | (0.01 | ) | | | (1.17 | ) | | | (0.80 | ) | | | | |
| | | | | | | | | | | | | | | | | | | | | | | | |
Net asset value, end of period | | $ | 4.40 | | | $ | 4.44 | | | $ | 3.89 | | | $ | 4.14 | | | $ | 7.19 | | | | | |
| | | | | | | | | | | | | | | | | | | | | | | | |
Total return | | | (0.90)% | | | | 14.14% | | | | (5.70)% | | | | (30.46)% | | | | 18.72% | | | | | |
| | | | | | |
Supplemental data and ratios: | | | | | | | | | | | | | | | | | | | | | | | | |
Net assets, end of period (in thousands) | | $ | 253,415 | | | $ | 283,551 | | | $ | 272,537 | | | $ | 359,394 | | | $ | 631,417 | | | | | |
Ratio of expenses to average net assets | | | 2.14% | | | | 2.18% | 8 | | | 2.24% | | | | 2.16% | | | | 2.14% | | | | | |
Ratio of net investment loss to average net assets | | | (1.05)% | | | | (1.10)% | | | | (0.96)% | | | | (1.26)% | | | | (1.25)% | | | | | |
Portfolio turnover rate | | | 30% | | | | 34% | | | | 46% | | | | 54% | | | | 48% | | | | | |
| 1 | Formerly known as Wasatch-1st Source Long/Short Fund. |
| 2 | Effective September 19, 2008, the Fund changed its fiscal year end to September 30. |
| 3 | Average shares method used in calculation. |
| 4 | Represents amounts less than $.005 per share. |
| 5 | Not annualized for periods less than one year. |
| 6�� | Includes extraordinary expenses of less than 0.01% (see Note 9). |
| 8 | Includes interest expense of less than 0.01%. |
See Notes to Financial Statements.
114
| | | | | | | | | | | | | | | | | | | | |
| MICRO CAP VALUE FUND | | Year Ended September 30 | |
| (for a share outstanding throughout each period) | | 2011 | | | 2010 | | | 2009 | | | 2008 | | | 2007 | |
| | | | | | | | | | | | | | | | | | | | |
Net asset value, beginning of period | | $ | 2.38 | | | $ | 2.11 | | | $ | 1.80 | | | $ | 2.98 | | | $ | 2.93 | |
| | | | | |
Income (loss) from investment operations: | | | | | | | | | | | | | | | | | | | | |
Net investment loss | | | (0.04 | ) | | | (0.02 | ) | | | (0.02 | ) | | | (0.02 | ) | | | (0.03 | ) |
Net realized and unrealized gains (losses) on investments | | | (0.10 | ) | | | 0.30 | | | | 0.33 | | | | (0.75 | ) | | | 0.64 | |
| | | | | | | | | | | | | | | | | | | | |
Total from investment operations | | | (0.14 | ) | | | 0.28 | | | | 0.31 | | | | (0.77 | ) | | | 0.61 | |
| | | | | |
Redemption fees (see Note 2) | | | — | 1 | | | — | 1 | | | — | 1 | | | — | 1 | | | — | 1 |
| | | | | |
Less distributions: | | | | | | | | | | | | | | | | | | | | |
Dividends from net investment income | | | — | | | | (0.01 | ) | | | — | | | | — | | | | — | |
Distributions from net realized gains | | | — | | | | — | | | | — | | | | (0.41 | ) | | | (0.56 | ) |
| | | | | | | | | | | | | | | | | | | | |
Total distributions | | | — | | | | (0.01 | ) | | | — | | | | (0.41 | ) | | | (0.56 | ) |
| | | | | | | | | | | | | | | | | | | | |
Net asset value, end of period | | $ | 2.24 | | | $ | 2.38 | | | $ | 2.11 | | | $ | 1.80 | | | $ | 2.98 | |
| | | | | | | | | | | | | | | | | | | | |
Total return | | | (5.88)% | | | | 13.26% | | | | 17.22% | | | | (29.67)% | | | | 22.84% | |
| | | | | |
Supplemental data and ratios: | | | | | | | | | | | | | | | | | | | | |
Net assets, end of period (in thousands) | | $ | 142,795 | | | $ | 185,587 | | | $ | 115,216 | | | $ | 97,912 | | | $ | 120,039 | |
Ratio of expenses to average net assets (including dividend payments for securities sold short): | | | | | | | | | | | | | | | | | | | | |
Net of waivers and reimbursements | | | 2.25% | | | | 2.26% | 2 | | | 2.26% | | | | 2.25% | | | | 2.25% | |
Before waivers and reimbursements | | | 2.28% | | | | 2.37% | 2 | | | 2.46% | | | | 2.35% | | | | 2.30% | |
Ratio of expenses to average net assets (excluding dividend payments for securities sold short): | | | | | | | | | | | | | | | | | | | | |
Net of waivers and reimbursements | | | 2.25% | | | | 2.26% | 2 | | | 2.25% | | | | 2.25% | | | | 2.25% | |
Before waivers and reimbursements | | | 2.28% | | | | 2.37% | 2 | | | 2.45% | | | | 2.35% | | | | 2.30% | |
Ratio of net investment loss to average net assets: | | | | | | | | | | | | | | | | | | | | |
Net of waivers and reimbursements | | | (1.21)% | | | | (1.32)% | | | | (1.36)% | | | | (1.21)% | | | | (1.06)% | |
Before waivers and reimbursements | | | (1.24)% | | | | (1.43)% | | | | (1.56)% | | | | (1.31)% | | | | (1.11)% | |
Portfolio turnover rate | | | 94% | | | | 88% | | | | 145% | | | | 144% | | | | 105% | |
| |
| SMALL CAP GROWTH FUND | | Year Ended September 30 | |
| (for a share outstanding throughout each period) | | 2011 | | | 2010 | | | 2009 | | | 2008 | | | 2007 | |
Net asset value, beginning of period | | $ | 34.24 | | | $ | 28.59 | | | $ | 26.50 | | | $ | 40.10 | | | $ | 36.99 | |
| | | | | |
Income (loss) from investment operations: | | | | | | | | | | | | | | | | | | | | |
Net investment loss | | | (0.13 | ) | | | (0.22 | ) | | | (0.12 | ) | | | (0.16 | ) | | | (0.25 | ) |
Net realized and unrealized gains (losses) on investments | | | 1.26 | | | | 5.87 | | | | 2.27 | | | | (8.85 | ) | | | 6.28 | |
| | | | | | | | | | | | | | | | | | | | |
Total from investment operations | | | 1.13 | | | | 5.65 | | | | 2.15 | | | | (9.01 | ) | | | 6.03 | |
| | | | | |
Redemption fees (see Note 2) | | | — | 1 | | | — | 1 | | | — | 1 | | | — | 1 | | | — | 1 |
| | | | | |
Less distributions: | | | | | | | | | | | | | | | | | | | | |
Distributions from net realized gains | | | — | | | | — | | | | (0.06 | ) | | | (4.59 | ) | | | (2.92 | ) |
| | | | | | | | | | | | | | | | | | | | |
Total distributions | | | — | | | | — | | | | (0.06 | ) | | | (4.59 | ) | | | (2.92 | ) |
| | | | | | | | | | | | | | | | | | | | |
Net asset value, end of period | | $ | 35.37 | | | $ | 34.24 | | | $ | 28.59 | | | $ | 26.50 | | | $ | 40.10 | |
| | | | | | | | | | | | | | | | | | | | |
Total return | | | 3.30% | | | | 19.76% | | | | 8.20% | | | | (25.42 | )% | | | 16.94% | |
| | | | | |
Supplemental data and ratios: | | | | | | | | | | | | | | | | | | | | |
Net assets, end of period (in thousands) | | $ | 1,297,982 | | | $ | 1,110,087 | | | $ | 809,318 | | | $ | 735,546 | | | $ | 1,075,433 | |
Ratio of expenses to average net assets | | | 1.23% | | | | 1.27% | 3 | | | 1.29% | | | | 1.21% | | | | 1.19% | |
Ratio of net investment loss to average net assets | | | (0.32)% | | | | (0.74)% | | | | (0.60)% | | | | (0.47)% | | | | (0.52)% | |
Portfolio turnover rate | | | 23% | | | | 17% | | | | 52% | | | | 51% | | | | 43% | |
| 1 | Represents amounts less than $.005 per share. |
| 2 | Includes extraordinary expenses of 0.01% (see Note 9). |
| 3 | Includes extraordinary expenses of less than 0.01% (see Note 9). |
See Notes to Financial Statements.
115
| | |
| WASATCH FUNDS — Financial Highlights (continued) | | |
|
|
|
| | | | | | | | | | | | | | | | | | | | |
| SMALL CAP VALUE FUND | | Year Ended September 30 | |
| (for a share outstanding throughout each period) | | 2011 | | | 2010 | | | 2009 | | | 2008 | | | 2007 | |
| | | | | | | | | | | | | | | | | | | | |
Net asset value, beginning of period | | $ | 3.08 | | | $ | 2.75 | | | $ | 2.82 | | | $ | 5.22 | | | $ | 5.29 | |
| | | | | |
Income (loss) from investment operations: | | | | | | | | | | | | | | | | | | | | |
Net investment income (loss) | | | (0.02 | ) | | | (0.01 | ) | | | (0.01 | ) | | | 0.01 | | | | 0.01 | |
Net realized and unrealized gains (losses) on investments | | | 0.06 | | | | 0.34 | | | | (0.06 | ) | | | (1.11 | ) | | | 0.67 | |
| | | | | | | | | | | | | | | | | | | | |
Total from investment operations | | | 0.04 | | | | 0.33 | | | | (0.07 | ) | | | (1.10 | ) | | | 0.68 | |
| | | | | |
Redemption fees (see Note 2) | | | — | 1 | | | — | 1 | | | — | 1 | | | — | 1 | | | — | 1 |
| | | | | |
Less distributions: | | | | | | | | | | | | | | | | | | | | |
Dividends from net investment income | | | — | | | | — | | | | — | | | | (0.01 | ) | | | (0.04 | ) |
Distributions from net realized gains | | | — | | | | — | | | | — | | | | (1.29 | ) | | | (0.71 | ) |
| | | | | | | | | | | | | | | | | | | | |
Total distributions | | | — | | | | — | | | | — | | | | (1.30 | ) | | | (0.75 | ) |
| | | | | | | | | | | | | | | | | | | | |
Net asset value, end of period | | $ | 3.12 | | | $ | 3.08 | | | $ | 2.75 | | | $ | 2.82 | | | $ | 5.22 | |
| | | | | | | | | | | | | | | | | | | | |
Total return | | | 1.30% | | | | 12.00% | | | | (2.48)% | | | | (26.26)% | | | | 13.32% | |
| | | | | |
Supplemental data and ratios: | | | | | | | | | | | | | | | | | | | | |
Net assets, end of period (in thousands) | | $ | 169,401 | | | $ | 211,571 | | | $ | 218,358 | | | $ | 336,914 | | | $ | 660,637 | |
Ratio of expenses to average net assets | | | 1.78% | | | | 1.85% | 2 | | | 1.92% | | | | 1.76% | | | | 1.69% | |
Ratio of net investment income (loss) to average net assets | | | (0.65)% | | | | (0.23)% | | | | (0.33)% | | | | 0.15% | | | | 0.18% | |
Portfolio turnover rate | | | 46% | | | | 62% | | | | 89% | | | | 78% | | | | 84% | |
| |
| STRATEGIC INCOME FUND | | Year Ended September 30 | |
| (for a share outstanding throughout each period) | | 2011 | | | 2010 | | | 2009 | | | 2008 | | | 2007 | |
Net asset value, beginning of period | | $ | 7.51 | | | $ | 6.77 | | | $ | 7.62 | | | $ | 11.00 | | | $ | 10.48 | |
| | | | | |
Income (loss) from investment operations: | | | | | | | | | | | | | | | | | | | | |
Net investment income | | | 0.25 | | | | 0.31 | | | | 0.29 | | | | 0.55 | | | | 0.48 | |
Net realized and unrealized gains (losses) on investments | | | 0.06 | | | | 0.70 | | | | (0.85 | ) | | | (2.29 | ) | | | 0.54 | |
| | | | | | | | | | | | | | | | | | | | |
Total from investment operations | | | 0.31 | | | | 1.01 | | | | (0.56 | ) | | | (1.74 | ) | | | 1.02 | |
| | | | | |
Redemption fees (see Note 2) | | | — | 1 | | | — | 1 | | | — | 1 | | | — | 1 | | | 0.01 | |
| | | | | |
Less distributions: | | | | | | | | | | | | | | | | | | | | |
Dividends from net investment income | | | (0.25 | ) | | | (0.27 | ) | | | (0.29 | ) | | | (0.50 | ) | | | (0.47 | ) |
Distributions from net realized gains | | | — | | | | — | | | | — | | | | (1.14 | ) | | | (0.04 | ) |
| | | | | | | | | | | | | | | | | | | | |
Total distributions | | | (0.25 | ) | | | (0.27 | ) | | | (0.29 | ) | | | (1.64 | ) | | | (0.51 | ) |
| | | | | | | | | | | | | | | | | | | | |
Net asset value, end of period | | $ | 7.57 | | | $ | 7.51 | | | $ | 6.77 | | | $ | 7.62 | | | $ | 11.00 | |
| | | | | | | | | | | | | | | | | | | | |
Total return | | | 3.94% | | | | 15.18% | | | | (6.49)% | | | | (18.17)% | | | | 9.77% | |
| | | | | |
Supplemental data and ratios: | | | | | | | | | | | | | | | | | | | | |
Net assets, end of period (in thousands) | | $ | 24,057 | | | $ | 19,517 | | | $ | 17,710 | | | $ | 21,889 | | | $ | 23,621 | |
Ratio of expenses to average net assets (including interest expense and dividend payments for securities sold short): | | | | | | | | | | | | | | | | | | | | |
Net of waivers and reimbursements | | | 0.95% | | | | 0.99% | 3 | | | 1.05% | | | | 0.97% | | | | 1.05% | |
Before waivers and reimbursements | | | 1.21% | | | | 1.33% | 3 | | | 1.71% | | | | 1.46% | | | | 1.57% | |
Ratio of expenses to average net assets (excluding interest expense and dividend payments for securities sold short): | | | | | | | | | | | | | | | | | | | | |
Net of waivers and reimbursements | | | 0.95% | | | | 0.95% | 3 | | | 0.95% | | | | 0.95% | | | | 0.95% | |
Before waivers and reimbursements | | | 1.21% | | | | 1.29% | 3 | | | 1.61% | | | | 1.44% | | | | 1.47% | |
Ratio of net investment income to average net assets: | | | | | | | | | | | | | | | | | | | | |
Net of waivers and reimbursements | | | 2.99% | | | | 4.35% | | | | 4.93% | | | | 5.96% | | | | 4.14% | |
Before waivers and reimbursements | | | 2.73% | | | | 4.01% | | | | 4.27% | | | | 5.47% | | | | 3.62% | |
Portfolio turnover rate | | | 62% | | | | 73% | | | | 84% | | | | 81% | | | | 86% | |
| 1 | Represents amounts less than $.005 per share. |
| 2 | Includes extraordinary expenses of 0.01% (see Note 9). |
| 3 | Includes extraordinary expenses of less than 0.01% (see Note 9). |
See Notes to Financial Statements.
116
| | | | | | | | | | | | | | | | | | | | |
| ULTRA GROWTH FUND | | Year Ended September 30 | |
| (for a share outstanding throughout each period) | | 2011 | | | 2010 | | | 2009 | | | 2008 | | | 2007 | |
| | | | | | | | | | | | | | | | | | | | |
Net asset value, beginning of period | | $ | 19.80 | | | $ | 15.66 | | | $ | 15.76 | | | $ | 27.78 | | | $ | 24.09 | |
| | | | | |
Income (loss) from investment operations: | | | | | | | | | | | | | | | | | | | | |
Net investment loss | | | (0.17 | ) | | | (0.15 | ) | | | (0.14 | ) | | | (0.22 | ) | | | (0.33 | ) |
Net realized and unrealized gains (losses) on investments | | | 0.48 | | | | 4.29 | | | | 0.04 | | | | (8.28 | ) | | | 5.80 | |
| | | | | | | | | | | | | | | | | | | | |
Total from investment operations | | | 0.31 | | | | 4.14 | | | | (0.10 | ) | | | (8.50 | ) | | | 5.47 | |
| | | | | |
Redemption fees (see Note 2) | | | — | 1 | | | — | 1 | | | — | 1 | | | — | 1 | | | — | 1 |
| | | | | |
Less distributions: | | | | | | | | | | | | | | | | | | | | |
Distributions from net realized gains | | | — | | | | — | | | | — | | | | (3.52 | ) | | | (1.78 | ) |
| | | | | | | | | | | | | | | | | | | | |
Total distributions | | | — | | | | — | | | | — | | | | (3.52 | ) | | | (1.78 | ) |
| | | | | | | | | | | | | | | | | | | | |
Net asset value, end of period | | $ | 20.11 | | | $ | 19.80 | | | $ | 15.66 | | | $ | 15.76 | | | $ | 27.78 | |
| | | | | | | | | | | | | | | | | | | | |
Total return | | | 1.57% | | | | 26.44% | | | | (0.63)% | | | | (35.09)% | | | | 23.80% | |
| | | | | |
Supplemental data and ratios: | | | | | | | | | | | | | | | | | | | | |
Net assets, end of period (in thousands) | | $ | 134,203 | | | $ | 178,566 | | | $ | 121,284 | | | $ | 144,004 | | | $ | 268,633 | |
Ratio of expenses to average net assets | | | | | | | | | | | | | | | | | | | | |
Net of waivers and reimbursements | | | 1.42% | | | | 1.68% | 2 | | | 1.75% | | | | 1.53% | | | | 1.49% | |
Before waivers and reimbursements | | | 1.42% | | | | 1.68% | 2 | | | 1.77% | | | | 1.53% | | | | 1.49% | |
Ratio of net investment loss to average net assets | | | | | | | | | | | | | | | | | | | | |
Net of waivers and reimbursements | | | (0.51)% | | | | (1.14)% | | | | (1.12)% | | | | (0.93)% | | | | (1.12)% | |
Before waivers and reimbursements | | | (0.51)% | | | | (1.14)% | | | | (1.14)% | | | | (0.93)% | | | | (1.12)% | |
Portfolio turnover rate | | | 60% | | | | 45% | | | | 64% | | | | 84% | | | | 55% | |
| |
| WORLD INNOVATORS FUND3 | | Year Ended September 30 | |
| (for a share outstanding throughout each period) | | 2011 | | | 2010 | | | 2009 | | | 2008 | | | 2007 | |
Net asset value, beginning of period | | $ | 13.65 | | | $ | 11.12 | | | $ | 10.31 | | | $ | 17.69 | | | $ | 13.97 | |
| | | | | |
Income (loss) from investment operations: | | | | | | | | | | | | | | | | | | | | |
Net investment loss | | | (0.13 | ) | | | (0.10 | ) | | | (0.12 | ) | | | (0.25 | ) | | | (0.12 | ) |
Net realized and unrealized gains (losses) on investments | | | 1.19 | | | | 2.65 | | | | 0.93 | | | | (5.65 | ) | | | 4.43 | |
| | | | | | | | | | | | | | | | | | | | |
Total from investment operations | | | 1.06 | | | | 2.55 | | | | 0.81 | | | | (5.90 | ) | | | 4.31 | |
| | | | | |
Redemption fees (see Note 2) | | | — | 1 | | | — | 1 | | | — | 1 | | | — | 1 | | | — | 1 |
| | | | | |
Less distributions: | | | | | | | | | | | | | | | | | | | | |
Dividends from net investment income | | | — | | | | (0.02 | ) | | | — | | | | — | | | | — | |
Distributions from net realized gains | | | — | | | | — | | | | — | | | | (1.48 | ) | | | (0.59 | ) |
| | | | | | | | | | | | | | | | | | | | |
Total distributions | | | — | | | | (0.02 | ) | | | — | | | | (1.48 | ) | | | (0.59 | ) |
| | | | | | | | | | | | | | | | | | | | |
Net asset value, end of period | | $ | 14.71 | | | $ | 13.65 | | | $ | 11.12 | | | $ | 10.31 | | | $ | 17.69 | |
| | | | | | | | | | | | | | | | | | | | |
Total return | | | 7.77% | | | | 22.91% | | | | 7.86% | | | | (36.07)% | | | | 31.63% | |
| | | | | |
Supplemental data and ratios: | | | | | | | | | | | | | | | | | | | | |
Net assets, end of period (in thousands) | | $ | 72,493 | | | $ | 65,767 | | | $ | 59,540 | | | $ | 82,164 | | | $ | 204,142 | |
Ratio of expenses to average net assets: | | | | | | | | | | | | | | | | | | | | |
Net of waivers and reimbursements | | | 1.95% | | | | 1.96% | 2 | | | 1.95% | | | | 1.92% | | | | 1.85% | |
Before waivers and reimbursements | | | 1.95% | | | | 2.05% | 2 | | | 2.14% | | | | 1.92% | | | | 1.85% | |
Ratio of net investment loss to average net assets: | | | | | | | | | | | | | | | | | | | | |
Net of waivers and reimbursements | | | (0.84)% | | | | (0.74)% | | | | (0.88)% | | | | (1.24)% | | | | (0.97)% | |
Before waivers and reimbursements | | | (0.84)% | | | | (0.83)% | | | | (1.07)% | | | | (1.24)% | | | | (0.97)% | |
Portfolio turnover rate | | | 85% | | | | 74% | | | | 41% | | | | 89% | | | | 78% | |
| 1 | Represents amounts less than $.005 per share. |
| 2 | Includes extraordinary expenses of 0.01% (see Note 9). |
| 3 | Formerly known as Wasatch Global Science & Technology Fund. |
See Notes to Financial Statements.
117
| | |
| WASATCH FUNDS — Financial Highlights (continued) | | SEPTEMBER 30, 2011 |
|
|
|
| | | | | | | | | | | | | | | | | | | | | | | | |
| WASATCH-1ST SOURCE INCOME FUND | | Year Ended September 30 | | | Period Ended
September 30 | | | Year Ended March 31 | |
| (for a share outstanding throughout each period) | | 2011 | | | 2010 | | | 2009 | | | 20081 | | | 2008 | | | 2007 | |
| | | | | | | | | | | | | | | | | | | | | | | | |
Net asset value, beginning of period | | $ | 10.34 | | | $ | 10.04 | | | $ | 9.59 | | | $ | 9.95 | | | $ | 9.73 | | | $ | 9.63 | |
| | | | | | |
Income (loss) from investment operations: | | | | | | | | | | | | | | | | | | | | | | | | |
Net investment income | | | 0.25 | | | | 0.29 | | | | 0.33 | | | | 0.18 | 2 | | | 0.40 | | | | 0.38 | |
Net realized and unrealized gains (losses) on investments | | | (0.02 | ) | | | 0.30 | | | | 0.46 | | | | (0.35 | ) | | | 0.24 | | | | 0.13 | |
| | | | | | | | | | | | | | | | | | | | | | | | |
Total from investment operations | | | 0.23 | | | | 0.59 | | | | 0.79 | | | | (0.17 | ) | | | 0.64 | | | | 0.51 | |
| | | | | | |
Redemption fees (see Note 2) | | | — | 3 | | | — | 3 | | | — | 3 | | | — | | | | — | | | | — | |
| | | | | | |
Less distributions: | | | | | | | | | | | | | | | | | | | | | | | | |
Dividends from net investment income | | | (0.25 | ) | | | (0.29 | ) | | | (0.34 | ) | | | (0.19 | ) | | | (0.42 | ) | | | (0.41 | ) |
| | | | | | | | | | | | | | | | | | | | | | | | |
Total distributions | | | (0.25 | ) | | | (0.29 | ) | | | (0.34 | ) | | | (0.19 | ) | | | (0.42 | ) | | | (0.41 | ) |
| | | | | | | | | | | | | | | | | | | | | | | | |
Net asset value, end of period | | $ | 10.32 | | | $ | 10.34 | | | $ | 10.04 | | | $ | 9.59 | | | $ | 9.95 | | | $ | 9.73 | |
| | | | | | | | | | | | | | | | | | | | | | | | |
Total return | | | 2.26% | | | | 5.95% | | | | 8.42% | | | | (1.69)% | 4 | | | 6.74% | | | | 5.43% | |
| | | | | | |
Supplemental data and ratios: | | | | | | | | | | | | | | | | | | | | | | | | |
Net assets, end of period (in thousands) | | $ | 135,617 | | | $ | 138,095 | | | $ | 114,496 | | | $ | 89,081 | | | $ | 86,981 | | | $ | 78,921 | |
Ratio of expenses to average net assets: | | | | | | | | | | | | | | | | | | | | | | | | |
Net of waivers and reimbursements | | | 0.71% | | | | 0.72% | 5 | | | 0.84% | | | | 0.87% | 6 | | | 0.95% | | | | 0.92% | |
Before waivers and reimbursements | | | 0.71% | | | | 0.73% | 5 | | | 0.88% | | | | 1.12% | 6 | | | 1.20% | | | | 1.17% | |
Ratio of net investment income to average net assets: | | | | | | | | | | | | | | | | | | | | | | | | |
Net of waivers and reimbursements | | | 2.42% | | | | 2.87% | | | | 3.44% | | | | 3.66% | 6 | | | 4.05% | | | | 3.95% | |
Before waivers and reimbursements | | | 2.42% | | | | 2.86% | | | | 3.40% | | | | 3.41% | 6 | | | 3.80% | | | | 3.70% | |
Portfolio turnover rate | | | 43% | | | | 51% | | | | 28% | | | | 15% | 4 | | | 56% | | | | 59% | |
| | |
| U.S. TREASURY FUND | | Year Ended September 30 | | | | |
| (for a share outstanding throughout each period) | | 2011 | | | 2010 | | | 2009 | | | 2008 | | | 2007 | | | | |
Net asset value, beginning of period | | $ | 17.17 | | | $ | 16.29 | | | $ | 14.95 | | | $ | 13.84 | | | $ | 14.12 | | | | | |
| | | | | | |
Income (loss) from investment operations: | | | | | | | | | | | | | | | | | | | | | | | | |
Net investment income | | | 0.52 | | | | 0.54 | | | | 0.55 | | | | 0.58 | | | | 0.64 | | | | | |
Net realized and unrealized gains (losses) on investments | | | 2.63 | | | | 1.35 | | | | 1.29 | | | | 1.10 | | | | (0.29 | ) | | | | |
| | | | | | | | | | | | | | | | | | | | | | | | |
Total from investment operations | | | 3.15 | | | | 1.89 | | | | 1.84 | | | | 1.68 | | | | 0.35 | | | | | |
| | | | | | |
Redemption fees (see Note 2) | | | 0.02 | | | | 0.01 | | | | 0.05 | | | | 0.01 | | | | 0.01 | | | | | |
| | | | | | |
Less distributions: | | | | | | | | | | | | | | | | | | | | | | | | |
Dividends from net investment income | | | (0.52 | ) | | | (0.54 | ) | | | (0.55 | ) | | | (0.58 | ) | | | (0.64 | ) | | | | |
Distributions from net realized gains | | | (1.07 | ) | | | (0.48 | ) | | | — | | | | — | | | | — | | | | | |
| | | | | | | | | | | | | | | | | | | | | | | | |
Total distributions | | | (1.59 | ) | | | (1.02 | ) | | | (0.55 | ) | | | (0.58 | ) | | | (0.64 | ) | | | | |
| | | | | | | | | | | | | | | | | | | | | | | | |
Net asset value, end of period | | $ | 18.75 | | | $ | 17.17 | | | $ | 16.29 | | | $ | 14.95 | | | $ | 13.84 | | | | | |
| | | | | | | | | | | | | | | | | | | | | | | | |
Total return | | | 22.06% | | | | 12.65% | | | | 12.49% | | | | 12.33% | | | | 2.68% | | | | | |
| | | | | | |
Supplemental data and ratios: | | | | | | | | | | | | | | | | | | | | | | | | |
Net assets, end of period (in thousands) | | $ | 187,368 | | | $ | 200,855 | | | $ | 154,099 | | | $ | 121,240 | | | $ | 115,788 | | | | | |
Ratio of expenses to average net assets: | | | | | | | | | | | | | | | | | | | | | | | | |
Net of waivers and reimbursements | | | 0.75% | | | | 0.75% | 5 | | | 0.75% | | | | 0.74% | | | | 0.71% | | | | | |
Before waivers and reimbursements | | | 0.76% | | | | 0.78% | 5 | | | 0.79% | | | | 0.74% | | | | 0.71% | | | | | |
Ratio of net investment income to average net assets: | | | | | | | | | | | | | | | | | | | | | | | | |
Net of waivers and reimbursements | | | 3.44% | | | | 3.56% | | | | 3.34% | | | | 3.85% | | | | 4.23% | | | | | |
Before waivers and reimbursements | | | 3.43% | | | | 3.53% | | | | 3.30% | | | | 3.85% | | | | 4.23% | | | | | |
Portfolio turnover rate | | | 44% | | | | 49% | | | | 62% | | | | 31% | | | | 19% | | | | | |
| 1 | Effective September 19, 2008, the Fund changed its fiscal year end to September 30. |
| 2 | Average shares method used in calculation. |
| 3 | Represents amounts less than $.005 per share. |
| 4 | Not annualized for periods less than one year. |
| 5 | Includes extraordinary expenses of less than 0.01% (see Note 9). |
See Notes to Financial Statements.
118
| | |
| WASATCH FUNDS — Notes to Financial Statements | | SEPTEMBER 30, 2011 |
|
|
|
1. ORGANIZATION
Wasatch Funds Trust (the “Trust”) is a Massachusetts Business Trust registered under the Investment Company Act of 1940, as amended (the “1940 Act”), as an open-end management investment company and consists of 18 series or funds (each a “Fund” and collectively the “Funds”). The Core Growth Fund, Emerging Markets Small Cap Fund, Heritage Growth Fund, International Growth Fund, International Opportunities Fund, Large Cap Value Fund (formerly Wasatch-1st Source Income Equity Fund), Micro Cap Fund, Micro Cap Value Fund, Small Cap Growth Fund, Small Cap Value Fund, Strategic Income Fund, Ultra Growth Fund, World Innovators Fund (formerly Global Science & Technology Fund), Wasatch-1st Source Income Fund (“Income Fund”) (sub-advised), and Wasatch-Hoisington U.S. Treasury Fund (“U.S. Treasury Fund”) (sub-advised) are each diversified funds. The Emerging India Fund, Global Opportunities Fund and Long/Short Fund (formerly Wasatch-1st Source Long/Short Fund) are non-diversified funds. Each Fund maintains its own investment objective. The Funds have entered into an investment advisory agreement with Wasatch Advisors, Inc. (the “Advisor” or “Wasatch”) as investment advisor.
The Core Growth Fund, Emerging India Fund, Emerging Markets Small Cap Fund, Global Opportunities Fund, Heritage Growth Fund, International Growth Fund, International Opportunities Fund, Large Cap Value Fund, Long/Short Fund, Micro Cap Fund, Micro Cap Value Fund, Small Cap Growth Fund, Small Cap Value Fund, Strategic Income Fund, Ultra Growth Fund, and World Innovators Fund are referred to herein as the “Equity Funds.”
2. SIGNIFICANT ACCOUNTING POLICIES
The following is a summary of significant policies related to investments of the Funds held at September 30, 2011. These policies are in conformity with accounting principles generally accepted in the United States of America (“U.S. GAAP”).
Valuation of Securities — All investments in securities are recorded at their estimated fair value as described in Note 15.
Foreign Currency Translations — Values of investments denominated in foreign currencies are converted into U.S. dollars using the current exchange rates each business day. Purchases and sales of investments and dividend income are translated into U.S. dollars using the current prevailing exchange rate on the transaction date. The effect of changes in foreign exchange rates on realized and unrealized gains or losses on securities is reflected as a component of such gains or losses in the Statements of Operations. Transactions in foreign denominated assets may involve greater risks than domestic transactions.
At September 30, 2011, the foreign currencies held by the Funds were as follows (amounts in U.S. dollars):
| | | | | | | | |
| | | Cost of
Currency | | | Value of
Currency | |
Emerging India Fund | | | | | | | | |
Indian Rupee | | $ | 41,624 | | | $ | 41,095 | |
|
| |
Emerging Markets Small Cap Fund | | | | | | | | |
Brazilian Real | | $ | 2,317,469 | | | $ | 2,285,726 | |
Egyptian Pound | | | 826 | | | | 826 | |
Hong Kong Dollar | | | 263,032 | | | | 263,141 | |
Indian Rupee | | | 15,081 | | | | 15,066 | |
Indonesian Rupiah | | | 111,911 | | | | 112,214 | |
Malaysian Ringgit | | | 9,344 | | | | 9,302 | |
Moroccan Dirham | | | 18 | | | | 18 | |
New Taiwan Dollar | | | 1,335,631 | | | | 1,276,555 | |
South Korean Won | | | 55 | | | | 49 | |
| | | | | | | | |
| | $ | 4,053,367 | | | $ | 3,962,897 | |
| | | | | | | | |
|
| |
Global Opportunities Fund | | | | | | | | |
Australian Dollar | | $ | 5,409 | | | $ | 5,395 | |
Brazilian Real | | | 1,337,502 | | | | 1,115,202 | |
Egyptian Pound | | | 91 | | | | 91 | |
Hong Kong Dollar | | | 2,956 | | | | 2,957 | |
New Taiwan Dollar | | | 372,343 | | | | 352,660 | |
South African Rand | | | 175,248 | | | | 151,721 | |
South Korean Won | | | 8 | | | | 8 | |
| | | | | | | | |
| | $ | 1,893,557 | | | $ | 1,628,034 | |
| | | | | | | | |
|
| |
Heritage Growth Fund | | | | | | | | |
Brazilian Real | | $ | 99,327 | | | $ | 83,552 | |
|
| |
International Growth Fund | | | | | | | | |
Australian Dollar | | $ | 13,263 | | | $ | 13,234 | |
Brazilian Real | | | 12,791 | | | | 12,274 | |
Egyptian Pound | | | 375 | | | | 374 | |
Hong Kong Dollar | | | 46,331 | | | | 46,313 | |
New Taiwan Dollar | | | 317,632 | | | | 301,748 | |
South Korean Won | | | 33 | | | | 34 | |
| | | | | | | | |
| | $ | 390,425 | | | $ | 373,977 | |
| | | | | | | | |
|
| |
International Opportunities Fund | | | | | | | | |
Australian Dollar | | $ | 60 | | | $ | 56 | |
Brazilian Real | | | 2,221,648 | | | | 1,956,600 | |
Egyptian Pound | | | 97 | | | | 97 | |
Hong Kong Dollar | | | 23,332 | | | | 23,323 | |
Indian Rupee | | | 3 | | | | 3 | |
New Taiwan Dollar | | | 144,240 | | | | 137,554 | |
South Korean Won | | | 32 | | | | 32 | |
| | | | | | | | |
| | $ | 2,389,412 | | | $ | 2,117,665 | |
| | | | | | | | |
|
| |
Micro Cap Fund | | | | | | | | |
Indian Rupee | | $ | 9,583 | | | $ | 9,583 | |
|
| |
Micro Cap Value Fund | | | | | | | | |
South Korean Won | | $ | 22 | | | $ | 21 | |
|
| |
Small Cap Value Fund | | | | | | | | |
Australian Dollar | | $ | 1 | | | $ | 1 | |
New Taiwan Dollar | | | 157,587 | | | | 149,246 | |
| | | | | | | | |
| | $ | 157,588 | | | $ | 149,247 | |
| | | | | | | | |
|
| |
Ultra Growth Fund | | | | | | | | |
Indonesian Rupiah | | $ | 16,966 | | | $ | 17,159 | |
119
| | |
| WASATCH FUNDS — Notes to Financial Statements (continued) | | |
|
|
|
Investment in Securities and Related Investment Income — Security transactions are accounted for on the trade date. Gains or losses on securities sold are determined on the identified cost basis. Dividend income and distributions to shareholders are recorded on the ex-dividend date except that certain dividends from foreign securities may be recorded after the ex-dividend date based on when the Fund is informed of the dividend. Interest income and estimated expenses are accrued daily. Bond discount and premiums are amortized using the interest method. To the extent dividends received from Real Estate Investment Trust securities include return of capital distributions; such distributions are recorded as income, and adjusted accordingly for tax purposes.
Expenses — The Funds contract for various services on a collective basis. Most expenses are directly attributable to each Fund and therefore are charged accordingly. Expenses that are not directly attributable to one or more Funds are allocated among applicable Funds on an equitable and consistent basis considering such things as the nature and type of expense and the relative net assets of the Funds.
Use of Management Estimates — The preparation of financial statements in conformity with U.S. GAAP requires management to make estimates and assumptions that affect the reported amounts of assets and liabilities at the date of the financial statements and the reported changes in net assets during the reporting period. Actual results could differ from those estimates.
Guarantees and Indemnifications — In the normal course of business, the Funds enter into contracts that contain a variety of representations and warranties which provide general indemnifications. The maximum exposure under these arrangements is unknown, as this would involve future claims that may be made against the Funds and/or their affiliates that have not yet occurred. Based on experience, however, the risk of loss is expected to be remote.
Redemption Fees — The Funds deduct a fee of 2.00% from redemption proceeds on shares of the Funds held 60 days or less. Redemption fees retained by the Funds are credited to additional paid-in capital.
New Accounting Pronouncements — In April 2011, the Financial Accounting Standards Board (“FASB”) issued Accounting Standards Update (“ASU”) No. 2011-03 “Reconsideration of Effective Control of Repurchase Agreements.” ASU 2011-03 is an amendment to Topic 860 “Transfers and Servicing.” These amendments simplify the accounting for repurchase agreements by eliminating the requirement that the transferor demonstrate it has adequate collateral to fund substantially all the cost of purchasing replacement assets. As a result, more arrangements could be accounted for as secured borrowings rather than sales. The guidance applies to public and nonpublic companies and is effective for interim and annual reporting periods beginning on or after December 15, 2011. The guidance should be applied prospectively to transactions or modifications of existing transactions that occur on or after the effective date. At this time, management is evaluating the implications of ASU 2011-03 and its impact on the financial statements.
In May 2011, the FASB issued ASU No. 2011-04 “Amendments to Achieve Common Fair Value Measurement and Disclosure Requirements in U.S. GAAP and International Financial Reporting Standards (“IFRS”).” ASU 2011-04 includes common requirements for measurement of and disclosure about fair value between U.S. GAAP and IFRS. ASU 2011-04 will require reporting entities to disclose the following information for fair value measurements categorized within Level 3 of the fair value hierarchy: quantitative information about the unobservable inputs used in the fair value measurement, the valuation processes used by the reporting entity, and a narrative description of the sensitivity of the fair value measurement to changes in unobservable inputs and the interrelationships between those unobservable inputs. In addition, ASU 2011-04 will require reporting entities to make disclosures about amounts and reasons for all transfers in and out of Level 1 and Level 2 fair value measurements. The new and revised disclosures are effective for interim and annual reporting periods beginning after December 15, 2011. At this time, management is evaluating the implications of ASU 2011-04 and its impact on the financial statements.
3. SECURITIESAND OTHER INVESTMENTS
Repurchase Agreements — The Funds may engage in repurchase transactions. Under the terms of a typical repurchase agreement, a fund takes possession of an underlying debt obligation subject to an obligation of the seller to repurchase and the fund to resell the obligation at an agreed upon price and time. The market value of the collateral must be at least equal at all times to the total amount of the repurchase obligation, including interest. Generally, in the event of counterparty default, the fund has the right to use the collateral to offset losses incurred.
Short Sales — The Long/Short Fund, the Strategic Income Fund and to a lesser extent the other Equity Funds may enter into short sales whereby a fund sells a security it generally does not own (the security is borrowed), in anticipation of a decline in the security’s price. The initial amount of a short sale is recorded as a liability which is marked-tomarket daily. Fluctuations in the value of the short liability are recorded as unrealized gains or losses. If a Fund shorts a security when also holding a long position in the security (a “short against the box”), as the security’s price declines, the short position increases in value, offsetting the long position’s decrease in value. The opposite effect occurs if the security’s price rises. A Fund realizes a gain or loss upon closing of the short sale (returning the security to the counterparty by way of purchase or delivery of a long position owned). Possible losses from short sales may be unlimited, whereas losses from security purchases cannot exceed the total amount invested. The Funds are liable to the buyer for any dividends payable on securities while those securities are in a short position. These dividends are an expense of the Funds. The Funds designate collateral consisting of cash, U.S. government securities or other liquid assets sufficient to collateralize the market value of short positions.
120
4. FINANCIAL DERIVATIVE INSTRUMENTS
Foreign Currency Contracts — The Funds may enter into foreign currency contracts to settle planned purchases or sales of securities or to protect against a possible loss resulting from the adverse change in the relationship between the U.S. dollar and a foreign currency involved in an underlying transaction. Foreign currency contracts are agreements between two parties to buy and sell a currency at a set price on a future date. The market value of a foreign currency contract fluctuates with changes in currency exchange rates. Foreign currency contracts are marked-to-market daily and the change in market value is recorded by a fund as unrealized appreciation or depreciation. When a foreign currency contract is closed, the fund records a realized gain or loss equal to the difference between the value at the time it was opened and the value at the time it was closed. These contracts may involve market risk in excess of the unrealized gain or loss reflected on the Statements of Assets and Liabilities. In addition, a fund could be exposed to credit risk if a counterparty is unable or unwilling to meet the terms of the contracts or if the value of the currency changes unfavorably. In connection with these contracts, the Funds may segregate cash and/or securities in a sufficient amount as collateral in accordance with the terms of the respective contracts.
Options Transactions — The Equity Funds and the Income Fund may buy and sell put and call options and write covered put and call options, including over-the-counter options, on portfolio securities where the completion of the obligation is dependent upon the credit standing of another party. Options are a type of derivative financial instrument. The Funds may invest in derivative financial instruments, including options, in order to manage risk or gain exposure to various other investments or markets. The risk in writing a call option is that a fund gives up the opportunity for profit if the market price of the security increases. The risk in writing a put option
is that a fund may incur a loss if the market price of the security decreases and the option is exercised. The risk in buying an option is that a fund pays a premium whether or not the option is exercised. A fund also has the additional risk of not being able to enter into a closing transaction if a liquid secondary market does not exist. Option contracts are valued daily and unrealized appreciation or depreciation is recorded. A fund will realize a gain or loss upon expiration or closing of the option transaction. When an option is exercised, the proceeds on sales for a written call option, the purchase cost for a written put option, or the cost of a security for a purchased put or call option is adjusted by the amount of premium received or paid. The Funds designate collateral consisting of cash, U.S. government securities or other liquid assets sufficient to collateralize the market value of written options.
5. DISTRIBUTIONS
Dividends from net investment income and net realized gains, if any, are declared and paid at least annually for all Funds, except for dividends from net investment income in five funds. The Wasatch-1st Source Income Fund declares and pays dividends monthly. The Large Cap Value, Long/Short, Strategic Income, and U.S. Treasury Funds declare and pay dividends quarterly. The amount of dividends and distributions from net investment income and net realized gains are determined in accordance with federal income tax regulations, which may differ from GAAP. The Funds may utilize earnings and profits distributed to shareholders on redemption of shares as part of the dividends paid deduction (tax equalization).
To the extent these book and tax differences are permanent in nature, such amounts are reclassified at the end of the fiscal year among additional paid-in capital, undistributed net investment income (loss), and undistributed net realized gains (losses) on investments and foreign currency translations.
Accordingly, at September 30, 2011, reclassifications were recorded as follows:
| | | | | | | | | | | | | | | | | | | | | | | | |
| | | Core Growth Fund | | | Emerging
India
Fund | | | Emerging
Markets Small Cap
Fund | | | Global
Opportunities
Fund | | | Heritage
Growth
Fund | | | International
Growth Fund | |
Increase (decrease) paid-in capital in excess of par | | $ | (4,154,887 | ) | | $ | (5,503 | ) | | $ | (252 | ) | | $ | 5,689,581 | | | $ | (31,942 | ) | | $ | (1,047,329 | ) |
Increase (decrease) undistributed net investment income | | | 43,754 | | | | (2,532 | ) | | | (2,587,961 | ) | | | 1,286,421 | | | | (38,367 | ) | | | (688,925 | ) |
Increase (decrease) undistributed net realized gain | | | 4,111,133 | | | | 8,035 | | | | 2,588,213 | | | | (6,976,002 | ) | | | 70,309 | | | | 1,736,254 | |
| | | | | | |
| | | International
Opportunities
Fund | | | Large Cap
Value
Fund | | | Long/Short
Fund | | | Micro Cap Fund | | | Micro Cap
Value
Fund | | | Small Cap
Growth Fund | |
Increase (decrease) paid-in capital in excess of par | | $ | 1,618,457 | | | $ | — | | | $ | (2,564,839 | ) | | $ | (3,940,459 | ) | | $ | (2,840,632 | ) | | $ | (5,974,848 | ) |
Increase (decrease) undistributed net investment income | | | 1,556,699 | | | | (1,538 | ) | | | 2,861,432 | | | | 3,391,148 | | | | 1,612,680 | | | | 4,940,923 | |
Increase (decrease) undistributed net realized gain (loss) | | | (3,175,156 | ) | | | 1,538 | | | | (296,593 | ) | | | 549,311 | | | | 1,227,952 | | | | 1,033,925 | |
121
| | |
| WASATCH FUNDS — Notes to Financial Statements (continued) | | |
|
|
|
| | | | | | | | | | | | | | | | | | | | | | | | |
| | | Small Cap
Value Fund | | | Strategic
Income
Fund | | | Ultra Growth Fund | | | World
Innovators
Fund | | | Income
Fund | | | U.S. Treasury
Fund | |
Increase (decrease) paid-in capital in excess of par | | $ | (2,783,229 | ) | | $ | (836 | ) | | $ | (1,924,211 | ) | | $ | (673,119 | ) | | $ | 1 | | | $ | — | |
Increase (decrease) undistributed net investment income | | | 676,808 | | | | (138,944 | ) | | | 2,033,095 | | | | 599,968 | | | | 233,669 | | | | — | |
Increase (decrease) undistributed net realized gain (loss) | | | 2,106,421 | | | | 139,780 | | | | (108,884 | ) | | | 73,151 | | | | (233,670 | ) | | | — | |
6. PURCHASESAND SALESOF SECURITIES
Cost of investment securities purchased and proceeds from sales of investment securities, excluding U.S. government and short-term securities for the period ended September 30, 2011 are summarized below:
| | | | | | | | | | | | | | | | | | | | | | | | | | | | |
| | | Core
Growth
Fund | | | Emerging
India
Fund | | | Emerging
Markets
Small Cap
Fund | | | Global
Opportunities
Fund | | | Heritage
Growth
Fund | | | International
Growth
Fund | | | International
Opportunities
Fund | |
Purchases | | $ | 123,100,880 | | | $ | 11,693,479 | | | $ | 764,896,845 | | | $ | 157,718,406 | | | $ | 27,931,976 | | | $ | 262,896,764 | | | $ | 170,668,408 | |
Sales | | | 141,609,124 | | | | 168,415 | | | | 342,971,406 | | | | 184,502,259 | | | | 35,732,732 | | | | 227,686,028 | | | | 166,225,882 | |
| | | | | | | |
| | | Large Cap
Value
Fund | | | Long/Short
Fund | | | Micro
Cap
Fund | | | Micro Cap
Value
Fund | | | Small Cap
Growth
Fund | | | Small Cap
Value
Fund | | | Strategic
Income
Fund | |
Purchases | | $ | 441,924,332 | | | $ | 817,329,582 | | | $ | 92,604,360 | | | $ | 163,368,372 | | | $ | 498,869,717 | | | $ | 97,568,632 | | | $ | 19,675,443 | |
Sales | | | 438,727,762 | | | | 401,989,182 | | | | 127,069,232 | | | | 193,179,035 | | | | 314,911,285 | | | | 150,462,964 | | | | 14,847,012 | |
| | | | | | | |
| | | Ultra
Growth
Fund | | | World
Innovators
Fund | | | Income
Fund | | | | | | | | | | | | | |
Purchases | | $ | 108,246,073 | | | $ | 60,461,818 | | | $ | 20,782,533 | | | | | | | | | | | | | | | | | |
Sales | | | 146,422,677 | | | | 62,420,164 | | | | 9,836,476 | | | | | | | | | | | | | | | | | |
Purchases and sales of U.S. government securities in the Income Fund were $34,836,732 and $44,889,684, respectively. Purchases and sales of U.S. government securities in the U.S. Treasury Fund were $72,562,603 and $119,452,204, respectively.
7. OPTIONS CONTRACTS WRITTEN
Options written activity during the period ended September 30, 2011 was as follows:
| | | | | | | | | | | | | | | | | | | | | | | | | | |
| | | Options
Outstanding at
9/30/2010 | | | Written | | | Closed | | | Exercised | | | Expired | | | Options
Outstanding at
9/30/2011 | | | |
Core Growth Fund | | | | | | | | | | | | | | | | | | | | | | | | | | |
Premium amount | | $ | — | | | $ | 178,735 | | | $ | — | | | $ | — | | | $ | — | | | $ | 178,735 | | | |
Number of contracts | | | — | | | | 500 | | | | — | | | | — | | | | — | | | | 500 | | | |
Long/Short Fund | | | | | | | | | | | | | | | | | | | | | | | | | | |
Premium amount | | $ | 2,229,695 | | | $ | 22,319,134 | | | $ | (3,107,159 | ) | | $ | (5,180,756 | ) | | $ | (5,982,874 | ) | | $ | 10,278,040 | | | |
Number of contracts | | | 7,902 | | | | 83,705 | | | | (11,523 | ) | | | (20,962 | ) | | | (24,027 | ) | | | 35,095 | | | |
Micro Cap Value Fund | | | | | | | | | | | | | | | | | | | | | | | | | | |
Premium amount | | $ | 374,128 | | | $ | 3,064,015 | | | $ | (1,181,559 | ) | | $ | (704,951 | ) | | $ | (789,357 | ) | | $ | 762,276 | | | |
Number of contracts | | | 3,500 | | | | 18,354 | | | | (6,874 | ) | | | (6,848 | ) | | | (5,532 | ) | | | 2,600 | | | |
8. FEDERAL INCOME TAX INFORMATION
It is each Fund’s policy to comply with the requirements of the Internal Revenue Code applicable to regulated investment companies and to distribute substantially all taxable income to shareholders. The Funds are no longer subject to examination by tax authorities for years prior to 2008. At this time, management believes there are no uncertain tax positions which, based on their technical merit, would not be sustained upon examination and for which it is reasonably possible that the total of amounts of unrecognized tax benefits will significantly change in the next 12 months. Accordingly, no provision for federal income or excise taxes has been made.
122
On December 22, 2010, the Regulated Investment Company Modernization Act of 2010 (the “Modernization Act”) was signed by the President of the United States of America. The Modernization Act modernizes several tax provisions related to Regulated Investment Companies (“RICs”) and their shareholders. One key change made by the Modernization Act includes that capital losses will generally retain their character as short-term or long-term and may be carried forward indefinitely. Generally, the Modernization Act is effective for taxable years beginning after December 22, 2010.
As of September 30, 2011, the cost and unrealized appreciation (depreciation) of securities on a tax basis were as follows:
| | | | | | | | | | | | | | | | | | | | | | | | |
| | | Core Growth Fund | | | Emerging India Fund | | | Emerging
Markets
Small Cap
Fund | | | Global
Opportunities
Fund | | | Heritage
Growth
Fund | | | International
Growth Fund | |
Cost | | $ | 356,823,916 | | | $ | 11,793,932 | | | $ | 807,391,087 | | | $ | 176,384,603 | | | $ | 63,939,407 | | | $ | 271,481,456 | |
| | | | |
Gross appreciation | | $ | 116,293,995 | | | $ | 266,688 | | | $ | 70,081,233 | | | $ | 38,032,597 | | | $ | 12,793,707 | | | $ | 39,956,977 | |
Gross (depreciation) | | | (30,067,231 | ) | | | (1,358,754 | ) | | | (100,976,763 | ) | | | (15,872,726 | ) | | | (4,138,849 | ) | | | (30,916,075 | ) |
| | | | |
Net appreciation (depreciation) | | $ | 86,226,764 | | | $ | (1,092,066 | ) | | $ | (30,895,530 | ) | | $ | 22,159,871 | | | $ | 8,654,858 | | | $ | 9,040,902 | |
| | | | |
| | | | | | |
| | | International
Opportunities
Fund | | | Large Cap Value Fund | | | Long/Short Fund | | | Micro Cap Fund | | | Micro Cap
Value Fund | | | Small Cap Growth Fund | |
Cost | | $ | 145,820,848 | | | $ | 1,554,897,070 | | | $ | 866,334,746 | | | $ | 233,102,086 | | | $ | 137,082,489 | | | $ | 1,101,384,578 | |
| | | | |
Gross appreciation | | $ | 15,321,079 | | | $ | 151,063,510 | | | $ | 16,635,538 | | | $ | 58,376,124 | | | $ | 16,870,105 | | | $ | 311,038,562 | |
Gross (depreciation) | | | (17,293,788 | ) | | | (162,813,170 | ) | | | (66,847,538 | ) | | | (38,089,979 | ) | | | (12,354,506 | ) | | | (103,993,028 | ) |
| | | | |
Net appreciation (depreciation) | | $ | (1,972,709 | ) | | $ | (11,749,660 | ) | | $ | (50,212,000 | ) | | $ | 20,286,145 | | | $ | 4,515,599 | | | $ | 207,045,534 | |
| | | | |
| | | | | | |
| | | Small Cap
Value Fund | | | Strategic Income Fund | | | Ultra Growth Fund | | | World
Innovators Fund | | | Income Fund | | | U.S. Treasury Fund | |
Cost | | $ | 169,778,060 | | | $ | 25,325,210 | | | $ | 124,461,491 | | | $ | 67,442,311 | | | $ | 130,503,579 | | | $ | 153,776,440 | |
| | | | |
Gross appreciation | | $ | 20,304,987 | | | $ | 1,827,794 | | | $ | 27,273,541 | | | $ | 7,138,485 | | | $ | 4,254,941 | | | $ | 32,664,693 | |
Gross (depreciation) | | | (19,167,136 | ) | | | (3,191,524 | ) | | | (16,964,563 | ) | | | (5,024,065 | ) | | | (260,364 | ) | | | — | |
| | | | |
Net appreciation (depreciation) | | $ | 1,137,851 | | | $ | (1,363,730 | ) | | $ | 10,308,978 | | | $ | 2,114,420 | | | $ | 3,994,577 | | | $ | 32,664,693 | |
| | | | |
The difference between book-basis and tax-basis unrealized gains are primarily attributable to the tax deferral of losses on wash sales, unrealized appreciation on passive foreign investment companies and other temporary tax adjustments.
The components of accumulated earnings on a tax basis as of September 30, 2011 were as follows:
| | | | | | | | | | | | | | | | | | | | | | | | |
| | | Core Growth Fund | | | Emerging
India Fund | | | Emerging Markets
Small Cap Fund | | | Global
Opportunities
Fund | | | Heritage
Growth
Fund | | | International
Growth
Fund | |
Undistributed ordinary income | | $ | — | | | $ | 82,637 | | | $ | — | | | $ | — | | | $ | — | | | $ | — | |
Undistributed capital gains | | | — | | | | — | | | | — | | | | 18,174,884 | | | | 835,673 | | | | — | |
| | | | |
Accumulated earnings | | | — | | | | 82,637 | | | | — | | | | 18,174,884 | | | | 835,673 | | | | — | |
Accumulated capital and other losses | | | (81,436,874 | ) | | | (71,305 | ) | | | (20,112,645 | ) | | | (174,584 | ) | | | (58,288 | ) | | | (26,593,909 | ) |
Other undistributed ordinary losses | | | — | | | | — | | | | — | | | | (10,425 | ) | | | — | | | | — | |
Net unrealized appreciation (depreciation)* | | | 86,282,999 | | | | (1,092,944 | ) | | | (32,862,531 | ) | | | 21,892,687 | | | | 8,637,287 | | | | 8,903,198 | |
| | | | |
Total accumulated earnings (deficit) | | $ | 4,846,125 | | | $ | (1,081,612 | ) | | $ | (52,975,176 | ) | | $ | 39,882,562 | | | $ | 9,414,672 | | | $ | (17,690,711 | ) |
| | | | |
| | | | | | |
| | | International
Opportunities
Fund | | | Large Cap
Value Fund | | | Long/Short Fund | | | Micro
Cap
Fund | | | Micro Cap
Value
Fund | | | Small Cap
Growth
Fund | |
Undistributed ordinary income | | $ | — | | | $ | 332,757 | | | $ | — | | | $ | — | | | $ | — | | | $ | — | |
Undistributed capital gains | | | 17,671,310 | | | | — | | | | — | | | | — | | | | — | | | | 62,045,617 | |
| | | | |
Accumulated earnings | | | 17,671,310 | | | | 332,757 | | | | — | | | | — | | | | — | | | | 62,045,617 | |
Accumulated capital and other losses | | | — | | | | (23,171,056 | ) | | | (3,699,507 | ) | | | (69,481,010 | ) | | | (1,239,578 | ) | | | (198,905 | ) |
Other undistributed ordinary losses | | | (19,118 | ) | | | (286,291 | ) | | | — | | | | — | | | | — | | | | — | |
Net unrealized appreciation (depreciation)* | | | (2,262,416 | ) | | | (11,750,349 | ) | | | (38,149,190 | ) | | | 20,272,528 | | | | 4,880,423 | | | | 206,866,924 | |
| | | | |
Total accumulated earnings (deficit) | | $ | 15,389,776 | | | $ | (34,874,939 | ) | | $ | (41,848,697 | ) | | $ | (49,208,482 | ) | | $ | 3,640,845 | | | $ | 268,713,636 | |
| | | | |
123
| | |
| WASATCH FUNDS — Notes to Financial Statements (continued) | | |
|
|
|
| | | | | | | | | | | | | | | | | | | | | | | | |
| | | Small Cap
Value
Fund | | | Strategic
Income
Fund | | | Ultra
Growth
Fund | | | World
Innovators
Fund | | | Income Fund | | | U.S.
Treasury
Fund | |
Undistributed ordinary income | | $ | — | | | $ | 53,698 | | | $ | — | | | $ | — | | | $ | 347,355 | | | $ | 113,945 | |
Undistributed capital gains | | | — | | | | — | | | | 7,675,318 | | | | — | | | | — | | | | 9,334,125 | |
| | | | |
Accumulated earnings | | | — | | | | 53,698 | | | | 7,675,318 | | | | — | | | | 347,355 | | | | 9,448,070 | |
Accumulated capital and other losses | | | (110,596,002 | ) | | | (6,885,030 | ) | | | (38,569 | ) | | | (15,733,805 | ) | | | (1,516,902 | ) | | | — | |
Other undistributed ordinary losses | | | — | | | | (16,060 | ) | | | — | | | | — | | | | (44,585 | ) | | | (101,845 | ) |
Net unrealized appreciation (depreciation)* | | | 1,124,029 | | | | (1,364,553 | ) | | | 10,308,991 | | | | 2,110,788 | | | | 3,994,577 | | | | 32,664,693 | |
| | | | |
Total accumulated earnings (deficit) | | $ | (109,471,973 | ) | | $ | (8,211,945 | ) | | $ | 17,945,740 | | | $ | (13,623,017 | ) | | $ | 2,780,445 | | | $ | 42,010,918 | |
| | | | |
| *On | investments, securities sold short, derivative and foreign currency denominated assets and liabilities. |
Capital loss carryforwards are available through the date specified below to offset future realized net capital gains for federal income tax purposes. Future capital loss carryover utilization in any given year may be subject to Internal Revenue Code limitations. To the extent future gains are offset by capital loss carryforwards, such gains will not be distributed.
Capital loss carryforwards as of September 30, 2011 are as follows:
| | | | | | | | | | | | | | | | |
| Fund | | 2014 | | | 2016 | | | 2017 | | | 2018 | |
Core Growth Fund | | $ | — | | | $ | — | | | $ | — | | | $ | 81,406,941 | |
Emerging Markets Small Cap Fund | | | — | | | | — | | | | 3,795,857 | | | | 6,828,580 | |
International Growth Fund | | | — | | | | — | | | | — | | | | 26,072,123 | |
Large Cap Value Fund | | | — | | | | — | | | | — | | | | 23,171,056 | |
Long/Short Fund | | | — | | | | — | | | | 634,432 | | | | 3,065,075 | |
Micro Cap Fund | | | — | | | | — | | | | 20,111,960 | | | | 49,352,340 | |
Micro Cap Value Fund | | | — | | | | — | | | | 306,366 | | | | — | |
Small Cap Value Fund | | | — | | | | — | | | | 46,713,137 | | | | 63,852,620 | |
Strategic Income Fund | | | — | | | | — | | | | 239,302 | | | | 6,645,728 | |
World Innovators Fund | | | — | | | | — | | | | 650,448 | | | | 15,064,621 | |
Income Fund | | | 955,177 | | | | 561,725 | | | | — | | | | — | |
Capital loss carryforwards noted below may be available to offset future realized capital gains and thereby reduce future taxable gains distributions. Under the Modernization Act, a Fund will be permitted to carry forward capital losses incurred in taxable years beginning after December 22, 2010 for an unlimited period. Post-enactment losses that are carried forward will retain their character as either short-term or long-term capital losses rather than being considered all short-term as under previous law. However, any losses incurred during those future taxable years will be required to be utilized prior to the losses incurred in pre-enactment taxable years, which carry an expiration date. As a result of this ordering rule, pre-enactment capital loss carryforwards may be more likely to expire unused.
Capital loss carryforwards as of September 30, 2011 with no expiration are as follows:
| | | | |
| Fund | | Short Term | |
Emerging India Fund | | $ | 71,305 | |
Net capital losses incurred after October 31 and within the taxable year have been elected by the Funds to be treated as being incurred on the first business day of the Funds’ next taxable year. For the year ended September 30, 2011, the following Funds deferred to October 1, 2011 post October capital and currency losses as follows:
| | | | |
| Fund | | Capital Losses | |
Core Growth Fund | | $ | 29,933 | |
Emerging Markets Small Cap Fund | | | 9,488,208 | |
Global Opportunities Fund | | | 174,584 | |
Heritage Growth Fund | | | 58,288 | |
International Growth Fund | | | 521,786 | |
Micro Cap Fund | | | 16,710 | |
Micro Cap Value Fund | | | 933,212 | |
Small Cap Growth Fund | | | 198,905 | |
Small Cap Value Fund | | | 30,245 | |
Ultra Growth Fund | | | 38,569 | |
World Innovators Fund | | | 18,736 | |
124
During the tax year ended September 30, 2011, the Funds used capital loss carryforwards in the following amounts:
| | | | |
| Fund | | Amount Used | |
Core Growth Fund | | $ | 39,621,936 | |
Emerging Markets Small Cap Fund | | | 4,217,856 | |
Heritage Growth Fund | | | 7,509,279 | |
International Growth Fund | | | 39,147,511 | |
International Opportunities Fund | | | 136,323 | |
Large Cap Value Fund | | | 42,167,614 | |
Long/Short Fund | | | 5,417,851 | |
Micro Cap Fund | | | 16,305,404 | |
Micro Cap Value Fund | | | 11,553,397 | |
Small Cap Growth Fund | | | 33,681,395 | |
Small Cap Value Fund | | | 22,337,499 | |
Strategic Income Fund | | | 1,538,224 | |
Ultra Growth Fund | | | 39,273,897 | |
World Innovators Fund | | | 12,595,804 | |
Income Fund | | | 1,345,117 | |
The tax character of distributions paid during the year ended September 30, 2011 was as follows:
| | | | | | | | | | | | | | | | | | | | | | | | |
| 2011 | | Core
Growth
Fund | | | Emerging
India
Fund | | | Emerging
Markets
Small Cap
Fund | | | Global
Opportunities
Fund | | | Heritage
Growth
Fund | | | International
Growth
Fund | |
Ordinary income | | $ | — | | | $ | — | | | $ | 86,408 | | | $ | 1,872,935 | | | $ | 653,414 | | | $ | — | |
Capital gain | | | — | | | | — | | | | — | | | | 7,528,532 | | | | 5,614 | | | | — | |
| | | | |
Total | | $ | — | | | $ | — | | | $ | 86,408 | | | $ | 9,401,467 | | | $ | 659,028 | | | $ | — | |
| | | | |
| | | | | | |
| 2011 | | International
Opportunities
Fund | | | Large Cap
Value
Fund | | | Long/Short
Fund | | | Micro Cap
Fund | | | Micro Cap
Value
Fund | | | Small Cap
Growth
Fund | |
Ordinary income | | $ | — | | | $ | 21,370,753 | | | $ | 300,223 | | | $ | — | | | $ | — | | | $ | — | |
Capital gain | | | 4,411,467 | | | | — | | | | — | | | | — | | | | — | | | | — | |
| | | | |
Total | | $ | 4,411,467 | | | $ | 21,370,753 | | | $ | 300,223 | | | $ | — | | | $ | — | | | $ | — | |
| | | | |
| | | | | | |
| 2011 | | Small Cap
Value
Fund | | | Strategic
Income
Fund | | | Ultra
Growth
Fund | | | World
Innovators
Fund | | | Income
Fund | | | U.S.
Treasury
Fund | |
Ordinary income | | $ | — | | | $ | 762,128 | | | $ | — | | | $ | — | | | $ | 3,218,058 | | | $ | 5,596,881 | |
Capital gain | | | — | | | | — | | | | — | | | | — | | | | — | | | | 10,250,028 | |
| | | | |
Total | | $ | — | | | $ | 762,128 | | | $ | — | | | $ | — | | | $ | 3,218,058 | | | $ | 15,846,909 | |
| | | | |
The tax character of distributions paid during the year ended September 30, 2010 was as follows:
| | | | | | | | | | | | | | | | | | | | | | | | |
| 2010 | | Core
Growth
Fund | | | Emerging
Markets
Small Cap
Fund | | | Global
Opportunities
Fund | | | Heritage
Growth
Fund | | | International
Growth
Fund | | | International
Opportunities
Fund | |
Ordinary income | | $ | 87,230 | | | $ | 379,097 | | | $ | 3,456,368 | | | $ | 499,403 | | | $ | — | | | $ | 1,049,066 | |
Capital gain | | | — | | | | — | | | | — | | | | — | | | | — | | | | — | |
| | | | |
Total | | $ | 87,230 | | | $ | 379,097 | | | $ | 3,456,368 | | | $ | 499,403 | | | $ | — | | | $ | 1,049,066 | |
| | | | |
| | | | | | |
| 2010 | | Large Cap
Value
Fund | | | Long/Short
Fund | | | Micro Cap Fund | | | Micro Cap
Value
Fund | | | Small Cap
Growth
Fund | | | Small Cap
Value
Fund | |
Ordinary income | | $ | 21,589,760 | | | $ | 98,009 | | | $ | — | | | $ | 569,692 | | | $ | — | | | $ | — | |
Capital gain | | | — | | | | — | | | | — | | | | — | | | | — | | | | — | |
| | | | |
Total | | $ | 21,589,760 | | | $ | 98,009 | | | $ | — | | | $ | 569,692 | | | $ | — | | | $ | — | |
| | | | |
125
| | |
| WASATCH FUNDS — Notes to Financial Statements (continued) | | |
|
|
|
| | | | | | | | | | | | | | | | | | | | | | |
| | | | | | |
| 2010 | | Strategic
Income
Fund | | | Ultra
Growth
Fund | | | World
Innovators
Fund | | | Income
Fund | | | U.S.
Treasury
Fund | | | |
Ordinary income | | $ | 678,070 | | | $ | — | | | $ | 79,109 | | | $ | 3,572,685 | | | $ | 5,847,330 | | | |
Capital gain | | | — | | | | — | | | | — | | | | — | | | | 4,184,315 | | | |
| | | | | | |
Total | | $ | 678,070 | | | $ | — | | | $ | 79,109 | | | $ | 3,572,685 | | | $ | 10,031,645 | | | |
| | | | | | |
The tax character of distributions paid may differ from that shown in the Statements of Changes in Net Assets due to short-term gains being treated as ordinary income for tax purposes.
9. RELATED PARTY TRANSACTIONS
Investment Advisory Fees, Expense Limitations — As the Funds’ investment advisor, the Advisor receives a monthly fee calculated on average daily net assets. The Advisor has contractually agreed to waive its fees and/or reimburse certain Funds should a Fund’s operating expenses exceed a specified annual limitation through at least January 31, 2012. If operating expenses are less than the specified expense limit for the Fund, the Advisor shall be entitled to reimbursement of the fees waived or reduced to the extent that the operating expenses and the amount reimbursed do not exceed such expense limit for the Fund, under the period of the agreement (currently the period for the 22 months commencing April 1, 2010 or for the 12 months commencing January 31, 2011). Such reimbursement shall be paid only while the expense limitation agreement is in effect and only if such amount paid, together with all other amounts reimbursed under this agreement in the fiscal year, does not cause the Fund to exceed the expense limitation. All amounts not recovered at the end of the period expire on January 31, 2012. On November 9, 2011, the Board of Trustees and the Advisor agreed to a reduction in the advisory fee for the Wasatch Small Cap Value Fund from 1.50% to 1.00% effective January 31, 2012. Additionally, the Advisor and the Funds executed an amended and restated expense limitation agreement, wherein the Advisor contractually agreed to an expense limitation of 1.50% on the Wasatch Small Cap Value Fund effective January 31, 2012, and continuing through at least January 31, 2013. The current expense limit of 1.95% will remain in effect until January 31, 2012. Ordinary operating expenses exclude any interest, taxes, brokerage commissions, other investment-related costs and extraordinary expenses, such as litigation and other expenses not incurred in the ordinary course of the Funds’ business. The costs of the Proxy Statement related to the identification and shareholder approval of Trustee Nominees were treated as extraordinary expenses. The impact of these payments is reflected in the net expense ratios in the Financial Highlights. Investment advisory fees and fees waived, if any, for the year ended September 30, 2011 are disclosed in the Statements of Operations. Investment advisory fee and expense limitation annual rates are shown below.
| | | | | | | | | | | | | | | | |
| Fund | | Advisory
Fee | | | Expense
Limitation | | | Contractual Expense
Limitation/
Reimbursement
Recoverable
Commencement Date | | | Reimbursement
Recoverable | |
Core Growth Fund | | | 1.00 | % | | | 1.50 | % | | | 04/01/2010 | | | $ | — | |
Emerging India Fund | | | 1.50 | % | | | 1.95 | % | | | 04/26/2011 | | | | 120,832 | |
Emerging Markets Small Cap Fund | | | 1.75 | % | | | 1.95 | %1 | | | 04/01/2010 | | | | 2,181,291 | |
Global Opportunities Fund | | | 1.50 | %2 | | | 1.95 | %3 | | | 01/31/2011 | | | | — | |
Heritage Growth Fund | | | 0.70 | % | | | 0.95 | % | | | 04/01/2010 | | | | 124,162 | |
International Growth Fund | | | 1.25 | %4 | | | 1.75 | %5 | | | 01/31/2011 | | | | — | |
International Opportunities Fund | | | 1.95 | % | | | 2.25 | % | | | 04/01/2010 | | | | 733,882 | |
Large Cap Value Fund | | | 0.90 | % | | | 1.10 | % | | | 04/01/2010 | | | | 489,292 | |
Long/Short Fund | | | 1.10 | % | | | — | | | | N/A | | | | N/A | |
Micro Cap Fund | | | 1.95 | % | | | 2.25 | % | | | 04/01/2010 | | | | — | |
Micro Cap Value Fund | | | 1.95 | % | | | 2.25 | % | | | 04/01/2010 | | | | 215,171 | |
Small Cap Growth Fund | | | 1.00 | % | | | 1.50 | % | | | 04/01/2010 | | | | — | |
Small Cap Value Fund | | | 1.50 | % | | | 1.95 | % | | | 04/01/2010 | | | | — | |
Strategic Income Fund | | | 0.70 | % | | | 0.95 | % | | | 04/01/2010 | | | | 86,456 | |
Ultra Growth Fund | | | 1.00 | %6 | | | 1.50 | %7 | | | 01/31/2011 | | | | — | |
World Innovators Fund | | | 1.50 | % | | | 1.95 | % | | | 04/01/2010 | | | | 17,446 | |
Income Fund | | | 0.55 | % | | | — | | | | N/A | | | | N/A | |
U.S. Treasury Fund | | | 0.50 | % | | | 0.75 | % | | | 04/01/2010 | | | | 22,055 | |
| 1 The | expense limitation for the Emerging Markets Small Cap Fund decreased from 2.00% to 1.95% when average net assets reached $150 million. |
| 2 The | advisory fee decreased from 1.95% to 1.50% on 1/31/2011. |
| 3The | expense limitation decreased from 2.25% to 1.95% on 1/31/2011. |
| 4 The | advisory fee decreased from 1.50% to 1.25% on 1/31/2011. |
| 5 The | expense limitation decreased from 1.95% to 1.75% on 1/31/2011. |
| 6 The | advisory fee decreased from 1.25% to 1.00% on 1/31/2011. |
| 7 The | expense limitation was decreased from 1.75% to 1.50% on 1/31/2011. |
126
Affiliated Trades — Certain Funds are permitted to purchase or sell securities from or to certain related affiliated funds under specified conditions outlined in procedures adopted by the Board of Trustees. The procedures have been designed to ensure that any purchase or sale of securities by the Funds from or to another fund (or funds) that are, or could be, considered an affiliate by virtue of having a common investment advisor (or affiliated investment advisors), common Trustees and/or common officers complies with Rule 17a-7 of the 1940 Act. Further, each transaction is effected at the current market price, as that term is defined under the procedures. During the year ended September 30, 2011, the Funds below engaged in purchases and sales of securities pursuant to Rule 17a-7 of the 1940 Act:
| | | | | | | | |
| | | Purchases | | | Sales | |
Emerging Markets Small Cap Fund | | $ | 2,361,989 | | | $ | 513,952 | |
International Growth Fund | | | — | | | | 197,300 | |
International Opportunities | | | 513,952 | | | | — | |
Micro Cap Value Fund | | | — | | | | 2,502,269 | |
Ultra Growth Fund | | | 140,280 | | | | — | |
World Innovators Fund | | | 197,300 | | | | — | |
Affiliated Transaction — The Small Cap Growth Fund had an in-kind purchase of $21,330,593 from an affiliate.
10% Shareholders — As of September 30, 2011, the Funds had individual shareholder accounts and/or omnibus shareholder accounts (comprised of a group of individual shareholders), which individually amounted to more than 10% of the total shares outstanding of the fund as detailed below:
| | | | | | | | |
| | | Number of Accounts | | | % of Shares
Outstanding | |
Core Growth Fund | | | 2 | | | | 42.50 | % |
Emerging India Fund | | | 2 | | | | 45.24 | % |
Emerging Markets Small Cap Fund | | | 2 | | | | 72.96 | % |
Global Opportunities Fund | | | 2 | | | | 67.67 | % |
Heritage Growth Fund | | | 2 | | | | 41.34 | % |
International Growth Fund | | | 2 | | | | 47.76 | % |
International Opportunities Fund | | | 2 | | | | 69.77 | % |
Large Cap Value Fund | | | 3 | | | | 75.73 | % |
Long/Short Fund | | | 2 | | | | 60.41 | % |
Micro Cap Fund | | | 2 | | | | 29.77 | % |
Micro Cap Value Fund | | | 2 | | | | 48.55 | % |
Small Cap Growth Fund | | | 2 | | | | 51.95 | % |
Small Cap Value Fund | | | 2 | | | | 32.72 | % |
Strategic Income Fund | | | 3 | | | | 60.30 | % |
Ultra Growth Fund | | | 2 | | | | 48.29 | % |
World Innovators Fund | | | 2 | | | | 36.12 | % |
Income Fund | | | 2 | | | | 86.05 | % |
U.S. Treasury Fund | | | 2 | | | | 32.79 | % |
127
| | |
| WASATCH FUNDS — Notes to Financial Statements (continued) | | |
|
|
|
Affiliated Interests — As of September 30, 2011, Wasatch Advisors, Inc. and its affiliates, and the retirement plans of Wasatch Advisors, Inc. and its affiliates, held shares which may be redeemed at any time as detailed below:
| | | | | | | | |
| | | Number of Accounts | | | % of Shares Outstanding | |
Core Growth Fund | | | 10 | | | | 0.39 | % |
Emerging India Fund | | | 8 | | | | 14.66 | % |
Emerging Markets Small Cap Fund | | | 11 | | | | 0.45 | % |
Global Opportunities Fund | | | 16 | | | | 1.63 | % |
Heritage Growth Fund | | | 6 | | | | 1.68 | % |
International Growth Fund | | | 7 | | | | 0.56 | % |
International Opportunities Fund | | | 18 | | | | 1.77 | % |
Large Cap Value Fund | | | 6 | | | | 0.07 | % |
Long/Short Fund | | | 3 | | | | 0.12 | % |
Micro Cap Fund | | | 8 | | | | 0.52 | % |
Micro Cap Value Fund | | | 14 | | | | 1.28 | % |
Small Cap Growth Fund | | | 13 | | | | 0.94 | % |
Small Cap Value Fund | | | 7 | | | | 0.97 | % |
Strategic Income Fund | | | 2 | | | | 31.58 | % |
Ultra Growth Fund | | | 4 | | | | 0.96 | % |
World Innovators Fund | | | 4 | | | | 2.34 | % |
Income Fund | | | 2 | | | | 0.01 | % |
U.S. Treasury Fund | | | 3 | | | | 0.96 | % |
Payments by Former Service Provider — BISYS Fund Services, Inc. (“BISYS”) is a former service provider to the Large Cap Value Fund, Long/Short Fund, and Income Fund. In August 2010, these funds received a one-time payment from the BISYS Fair Fund (a fund established pursuant to a settlement between the SEC and BISYS that requires, among other things, a distribution of settlement monies from the fair fund to benefit affected mutual funds). The impact of these payments is reflected in the net expense ratios in the Financial Highlights.
10. TRANSACTIONSWITH AFFILIATES
If a Fund’s holding represents ownership of 5% or more of the voting securities of a company, the company is deemed to be an affiliate as defined by the 1940 Act. The following Funds conducted transactions during the year ended September 30, 2011 with an “affiliated company” as so defined:
| | | | | | | | | | | | | | | | | | | | | | | | |
| | | Share Activity | | | Dividends
Credited to
Income for the
Year ended
9/30/11 | | | Gain (Loss)
Realized on
Sale of Shares
for the
Year ended
9/30/11 | |
| | | Balance
9/30/10 | | | Purchases/
Additions | | | Sales/
Reductions | | | Balance
9/30/11 | | | |
Micro Cap Fund | | | | | | | | | | | | | | | | | | | | | | | | |
Goldwater Bank, N.A. | | | 154,000 | | | | — | | | | — | | | | 154,000 | | | $ | — | | | $ | — | |
|
| |
Small Cap Growth Fund | | | | | | | | | | | | | | | | | | | | | | | | |
Knight Transportation, Inc. | | | 1,349,737 | | | | 2,789,720 | | | | — | | | | 4,139,457 | | | $ | 1,800,201 | | | $ | — | |
NeurogesX, Inc. PIPE | | | — | | | | 3,882,558 | | | | — | | | | 3,882,558 | | | | — | | | | — | |
Peet’s Coffee & Tea, Inc. | | | 693,795 | | | | 229,148 | | | | 279,095 | | | | 643,848 | * | | | — | | | | 4,992,576 | |
Power Integrations, Inc. | | | 1,329,204 | | | | 401,993 | | | | — | | | | 1,731,197 | | | | 305,355 | | | | — | |
| *No | longer affiliated as of September 30, 2011. |
11. RESTRICTED SECURITIES
The Funds may own investments that were purchased through private placement transactions or under Rule 144A of the Securities Act of 1933 (the “Securities Act”) and cannot be sold without prior registration under the Securities Act or may be limited due to certain restrictions. These securities are generally deemed to be illiquid and are valued at fair value as determined by a designated Pricing Committee, comprised of personnel of the Advisor, with oversight by the Board of Trustees and in accordance
128
with Board-approved Pricing Policies and Procedures. If and when such securities are registered, the costs of registering such securities are paid by the issuer. At September 30, 2011, the Funds held the following restricted securities:
| | | | | | | | | | | | | | | | |
| | | Security
Type | | Acquisition
Date | | Acquisition
Cost | | | Fair
Value | | | Value as % of
Net Assets | |
Global Opportunities Fund | | | | | | | | | | | | | | | | |
| | | | | |
Cardica, Inc. | | Warrants | | 9/25/09 | | $ | 5,000 | | | $ | 27,200 | | | | 0.01 | % |
|
| |
Micro Cap Fund | | | | | | | | | | | | | | | | |
| | | | | |
Cardica, Inc. | | Warrants | | 6/7/07 | | $ | 19,380 | | | $ | 1,211 | | | | — | |
Cardica, Inc. | | Warrants | | 9/25/09 | | | 40,312 | | | | 219,300 | | | | 0.09 | % |
Goldwater Bank, N.A. | | Common Stock | | 2/28/07 | | | 1,540,000 | | | | 55,440 | | | | 0.02 | % |
NeurogesX, Inc. | �� | Warrants | | 7/21/11 | | | 18,169 | | | | 18,169 | | | | 0.01 | % |
| | | | | | | | |
| | | | | | $ | 1,617,861 | | | $ | 294,120 | | | | 0.12 | % |
|
| |
Micro Cap Value Fund | | | | | | | | | | | | | | | | |
| | | | | |
Acetylon Pharmaceuticals, Inc., Series B | | Preferred Stock | | 2/3/11 | | $ | 249,997 | | | $ | 249,997 | | | | 0.18 | % |
Cardica, Inc. | | Warrants | | 6/7/07 | | | 9,302 | | | | 581 | | | | — | |
Cardica, Inc. | | Warrants | | 9/25/09 | | | 13,813 | | | | 75,140 | | | | 0.05 | % |
Goldwater Bank, N.A. | | Common Stock | | 2/28/07 | | | 419,000 | | | | 15,084 | | | | 0.01 | % |
Idaho Trust Bancorp | | Common Stock | | 8/30/06 | | | 500,004 | | | | 185,001 | | | | 0.13 | % |
NeurogesX, Inc. | | Warrants | | 7/21/11 | | | 6,250 | | | | 6,250 | | | | — | |
NeurogesX, Inc. | | Warrants | | 12/28/07 | | | 3,800 | | | | — | | | | — | |
| | | | | | | | |
| | | | | | $ | 1,202,166 | | | $ | 532,053 | | | | 0.37 | % |
|
| |
Small Cap Growth Fund | | | | | | | | | | | | | | | | |
| | | | | |
Angies List, Series C | | Preferred Stock | | 9/3/10 | | $ | 4,254,284 | | | $ | 4,463,305 | | | | 0.34 | % |
Angies List, Series D | | Preferred Stock | | 3/15/11 | | | 2,999,964 | | | | 2,999,965 | | | | 0.23 | % |
Greenspring Global Partners II-B, L.P. | | LP Interest | | 10/10/03 - 5/12/11 | | | 4,443,853 | | | | 4,842,592 | | | | 0.37 | % |
Greenspring Global Partners III-B, L.P. | | LP Interest | | 3/16/06 - 2/4/11 | | | 1,275,000 | | | | 1,428,580 | | | | 0.11 | % |
Nanosys, Inc., Series D | | Preferred Stock | | 11/8/05 | | | 2,000,000 | | | | 776,271 | | | | 0.06 | % |
Nanosys, Inc., Series E | | Preferred Stock | | 8/13/10 | | | 184,939 | | | | 184,939 | | | | 0.01 | % |
NeurogesX, Inc. | | Warrants | | 7/21/11 | | | 242,660 | | | | 242,660 | | | | 0.02 | % |
Valera Pharmaceuticals, Inc. Ureteral Stent CSR | | Rights | | 2/1/06 - 2/2/06 | | | 162,615 | | | | — | | | | — | |
Valera Pharmaceuticals, Inc. VP003 (Octreotide Implant) CSR | | Rights | | 2/1/06 - 2/2/06 | | | 243,922 | | | | — | | | | — | |
Zonare Medical Systems, Inc. | | Common Stock | | 6/30/04 | | | 1,500,000 | | | | 247 | | | | — | |
| | | | | | | | |
| | | | | | $ | 17,307,237 | | | $ | 14,938,559 | | | | 1.14 | % |
|
| |
Strategic Income Fund | | | | | | | | | | | | | | | | |
| | | | | |
Redcorp Ventures Ltd., 13.00%, 7/11/12 | | Corporate Bonds | | 7/5/07 | | $ | 157,961 | | | $ | 5,054 | | | | 0.02 | % |
Star Asia Finance Ltd. | | Common Stock | | 2/22/07 - 3/19/10 | | | 305,812 | | | | 231,214 | | | | 0.96 | % |
Star Asia SPV, LLC | | LLC Membership Interest | | 3/19/10 | | | 509,866 | | | | 154,558 | | | | 0.64 | % |
| | | | | | | | |
| | | | | | $ | 973,639 | | | $ | 390,826 | | | | 1.62 | % |
|
| |
Ultra Growth Fund | | | | | | | | | | | | | | | | |
| | | | | |
Cardica, Inc. | | Warrants | | 9/25/09 | | $ | 20,625 | | | $ | 112,200 | | | | 0.08 | % |
Data Sciences International, Inc., Series B | | Preferred Stock | | 1/20/06 | | | 475,001 | | | | 807,502 | | | | 0.60 | % |
Greenspring Global Partners II-B, L.P. | | LP Interest | | 10/10/03 - 7/23/10 | | | 3,999,467 | | | | 4,358,322 | | | | 3.25 | % |
Greenspring Global Partners III-B, L.P. | | LP Interest | | 3/16/06 - 2/4/11 | | | 1,275,000 | | | | 1,428,580 | | | | 1.07 | % |
Nanosys, Inc., Series D | | Preferred Stock | | 11/8/05 | | | 500,001 | | | | 194,068 | | | | 0.15 | % |
Nanosys, Inc., Series E | | Preferred Stock | | 8/13/10 | | | 46,235 | | | | 46,235 | | | | 0.03 | % |
NeurogesX, Inc. | | Warrants | | 7/21/11 | | | 5,451 | | | | 5,451 | | | | — | |
Ophthonix, Inc. | | Common Stock | | 9/23/05 | | | 499,998 | | | | 504 | | | | — | |
TherOx, Inc., Series I | | Preferred Stock | | 7/7/05 | | | 1,000,000 | | | | 207,317 | | | | 0.15 | % |
Xtera Communications, Inc. | | Common Stock | | 9/3/03 | | | 99,065 | | | | 914 | | | | — | |
Zonare Medical Systems, Inc. | | Common Stock | | 6/30/04 | | | 1,000,000 | | | | 165 | | | | — | |
| | | | | | | | |
| | | | | | $ | 8,920,843 | | | $ | 7,161,258 | | | | 5.33 | % |
|
| |
World Innovators Fund | | | | | | | | | | | | | | | | |
| | | | | |
Cardica, Inc. | | Warrants | | 9/25/09 | | $ | 8,937 | | | $ | 48,620 | | | | 0.07 | % |
Greenspring Global Partners II-B, L.P. | | LP Interest | | 10/10/03 - 5/12/11 | | | 444,387 | | | | 484,252 | | | | 0.67 | % |
Xtera Communications, Inc. | | Common Stock | | 9/3/03 | | | 7,076 | | | | 65 | | | | — | |
| | | | | | | | |
| | | | | | $ | 460,400 | | | $ | 532,937 | | | | 0.74 | % |
129
| | |
| WASATCH FUNDS — Notes to Financial Statements (continued) | | |
|
|
|
12. PURCHASE COMMITMENTS
In September 2003, the Small Cap Growth, Ultra Growth and World Innovators Funds entered into subscription agreements to acquire limited partnership interests in Greenspring Global Partners II-B, L.P. The remaining commitment amounts at September 30, 2011 were $500,000, $450,000 and $50,000, respectively. Securities held by the Funds have been designated to meet these purchase commitments.
In December 2005, the Small Cap Growth and Ultra Growth Funds entered into subscription agreements to acquire limited partnership interests in Greenspring Global Partners III-B, L.P. The remaining commitment amounts at September 30, 2011 were $225,000 per Fund. Securities held by the Funds have been designated to meet these purchase commitments as indicated in the Schedules of Investments.
13. LINEOF CREDIT
The Equity Funds opened two lines of credit totaling $75,000,000, one of which is $25,000,000 uncommitted, and the other of which is $50,000,000 committed, with State Street Bank and Trust Company on June 4, 2007 (together, the “Line”). The Line is for temporary or emergency purposes such as to provide liquidity for shareholder redemptions. The Equity Funds incur commitment fees on the undrawn portion of the committed part of the Line, and interest expense to the extent of amounts drawn (borrowed) under the entire Line. Interest is based on the higher of (a) the Federal Funds rate as in effect on the date of borrowing, plus a margin, and (b) the overnight LIBOR rate as in effect on the date of borrowing, plus a margin. Commitment fees are pro-rated among the Equity Funds based upon relative average net assets. Interest expense is charged directly to a fund based upon actual amounts borrowed by the Fund.
For the year ended September 30, 2011, the following Funds had borrowings:
| | | | | | | | | | | | | | | | | | | | |
| | | Average Daily
Borrowings | | | Number of
Days
Outstanding | | | Interest
Expense | | | Weighted
Average
Annualized
Interest Rate | | | Balance at
September 30, 2011 | |
Emerging Markets Small Cap | | | 11,308,688 | | | | 22 | | | | 8,500 | | | | 1.23 | % | | | — | |
Global Opportunities | | | 2,104,362 | | | | 3 | | | | 198 | | | | 1.13 | % | | | — | |
International Growth | | | 8,512,121 | | | | 47 | | | | 13,512 | | | | 1.22 | % | | | — | |
Small Cap Growth | | | 4,413,335 | | | | 12 | | | | 1,696 | | | | 1.15 | % | | | — | |
Small Cap Value | | | 1,865,900 | | | | 10 | | | | 639 | | | | 1.23 | % | | | — | |
Strategic Income | | | 410,224 | | | | 12 | | | | 156 | | | | 1.14 | % | | | — | |
Ultra Growth | | | 2,137,132 | | | | 91 | | | | 6,479 | | | | 1.20 | % | | | — | |
14. PRINCIPAL RISKS
Market and Credit Risk — In the normal course of business the Funds trade financial instruments and enter into financial transactions where risk of potential loss exists due to changes in the market (market risk) or failure of the other party to a transaction to perform (credit risk). Similar to credit risk, the Funds may be exposed to counterparty risk, or the risk that an institution or other entity with which the Funds have unsettled or open transactions will default. The potential loss could exceed the value of the financial assets recorded in the financial statements. Financial assets, which potentially expose the Funds to credit risk, consist principally of cash due from counterparties and investments. The extent of the Funds’ exposure to credit and counterparty risks with respect to these financial assets approximates their carrying value as recorded in the Funds’ Statements of Assets and Liabilities.
Inflation Risk — Inflation risk is the possibility that inflation will reduce the purchasing power of a currency, and subsequently reduce the value of a security or asset, and may result in rising interest rates. Inflation is the overall upward price movement of goods and services in an economy that causes the value of a currency to decline.
Interest Rate Risk — Interest rate risk is the risk that fixed income securities will decline in value because of changes in interest rates. A rise in interest rates typically causes a fall in values. Interest rate risk should be modest for shorter-term securities, moderate for intermediate-term securities and high for longer-term securities. Generally, an increase in the average maturity of a fund will make it more sensitive to interest rate risk. The interest rate is the amount charged, expressed as a percentage of principal, by a lender to a borrower for the use of assets.
Foreign Currency Risk — If a fund invests directly in foreign currencies or in securities that trade in, and receive revenues in, foreign currencies, or in derivatives that provide exposure to foreign currencies, it will be subject to the risk that those currencies will decline in value relative to the U.S. dollar. This also includes the risk associated with higher transaction costs, delayed settlements, currency controls and adverse economic developments related to foreign investments.
Region Risk — The Funds invest in equity and fixed income securities of non-U.S. issuers. Although the Funds maintain diversified investment portfolios, political or economic developments within a particular country or region may have an adverse effect on the ability of domiciled issuers to meet their obligations. These risks are exaggerated for securities of issuers tied economically to emerging and frontier market countries. Additionally, political or economic developments may have an adverse effect on the liquidity and volatility of portfolio securities and currency holdings.
130
Shareholder Concentration Risk — A significant portion of the net assets of the International Opportunities Fund is owned by a group of shareholders advised by a common investment advisor. If this group of shareholders simultaneously redeems on the advice of their investment advisor, Fund expenses may increase and performance may be materially affected. However, the Advisor has contractually agreed to waive its fees and/or reimburse the International Opportunities Fund should its operating expenses exceed 2.25% through at least January 31, 2012.
15. SECURITIES VALUATION
Equity securities (common and preferred stock) — Securities are valued as of the close of the New York Stock Exchange (generally 4:00 p.m. Eastern Time) on the valuation date. Equity securities are valued using a commercial pricing service at the last quoted sales price taken from the primary market in which each security trades and, with respect to equity securities traded on NASDAQ, such securities are valued using the NASDAQ Official Closing Price (“NOCP”) or last sales price if no NOCP is available. If there are no sales on the primary exchange or market on a given day, then the security is valued at the most recent bid price on the primary exchange or market as provided by a pricing service. In some instances, particularly on foreign exchanges, an official close or evaluated price may be used if the pricing service is unable to provide the last trade or most recent bid price. To the extent that these securities are actively traded and valuation adjustments are not applied, they are categorized in level 1 of the fair value hierarchy (see Note 16). Additionally, a Fund’s investments are valued at fair value by the Pricing Committee if the Advisor determines that an event impacting the value of an investment occurred between the closing time of a security’s primary market or exchange (for example, a foreign exchange or market) and the time the Fund’s share price is calculated. Significant events include, but are not limited to the following: significant fluctuations in domestic markets, foreign markets or foreign currencies; occurrences not directly tied to the securities markets such as natural disasters, armed conflicts or significant governmental actions; and major announcements affecting a single issuer or an entire market or market sector. In responding to a significant event, the Pricing Committee determines the fair value of affected securities by considering factors including, but not limited to: index options and futures traded subsequent to the close; American Depositary Receipts (“ADRs”), Global Depositary Receipts (“GDRs”) or other related receipts; currency spot or forward markets that trade after pricing of the foreign exchange; other derivative securities traded after the close such as Standard & Poor’s Depositary Receipts (“SPDRs”) and other exchange traded funds (“ETFs”); and alternative market quotes on the affected securities. When applicable, the Funds use a systematic fair valuation model provided by an independent third party to assist in adjusting the valuation of foreign securities. When a Fund uses this fair value pricing method, the values assigned to the Fund’s foreign securities may not be the quoted or published prices of the investments on their primary markets or exchanges and the securities are categorized in level 2. These valuation procedures generally apply equally to long or short equity positions in a Fund. However, if there are no sales on the primary exchange or market on a given day for a short equity position, then the security is valued at the most recent ask price on the primary exchange or market as provided by a pricing service.
Corporate debt securities — Investments are valued at current market value by a commercial pricing service, or by using the last sale or bid price based on observable inputs. Observable inputs may include benchmark yields, reported trades, broker/dealer quotes, issuer spreads, two-sided markets, benchmark securities, bids, offers and reference data including market research publications. Although most corporate bonds are categorized in level 2 of the fair value hierarchy, in instances where observable inputs are not available, they are categorized as level 3.
Short-term notes — Investments maturing in 60 days or less at the time of purchase, are generally valued at amortized cost, unless it is determined that the amortized cost method would not represent fair value, in which case the securities are marked-to-market. To the extent the inputs are observable and timely, the values would be categorized in level 2 of the fair value hierarchy.
Asset-backed securities — Investments are priced using the closing bid as supplied by a commercial pricing service based on observable inputs. Observable inputs may include benchmark yields, reported trades, broker/dealer quotes, issuer spreads, two-sided markets, benchmark securities, bids, offers and reference data including market research publications, new issue data, monthly payment information and collateral performance. Although most asset-backed securities are categorized in level 2 of the fair value hierarchy, in instances where observable inputs are not available, they are categorized as level 3.
U.S. government issuers — Investments are priced using the closing bid as supplied by a commercial pricing service based on observable inputs. Observable inputs may include benchmark yields, reported trades, broker/dealer quotes, issuer spreads, two-sided markets, benchmark securities, bids, offers and reference data including market research publications. Although most U.S. government bonds are categorized in level 2 of the fair value hierarchy, in instances where observable inputs are not available, they are categorized as level 3.
Derivative instruments — Listed derivatives that are actively traded are valued based on quoted prices from the exchange and are categorized in level 1 of the fair value hierarchy. Exchange-traded options are valued at the last sale price in the market where they are principally traded. If there are no sales on the primary exchange or market on a given day, then the option is valued at the most recent bid price on the primary exchange or market as provided by a pricing service.
Restricted securities — If market quotations are not readily available for the Funds’ investments in securities such as restricted securities, private placements, securities for which trading has been halted or other illiquid securities, these investments are valued at fair value in accordance with Board-approved Pricing Policies and Procedures by the Joint Pricing Committee of the Advisor and the Funds (“Pricing Committee”) with oversight by the Board of Trustees. Fair value is defined as the price that would be
131
| | |
| WASATCH FUNDS — Notes to Financial Statements (continued) | | |
|
|
|
received upon the sale of an asset, or paid to transfer a liability, in an orderly transaction between market participants at the measurement date under current market conditions. For each applicable investment that is fair valued, the Pricing Committee considers, to the extent applicable, various factors including, but not limited to, the financial condition of the company or limited partnership, operating results, prices paid in follow-on rounds, comparable companies in the public market, the nature and duration of the restrictions for holding the securities, and other relevant factors. Depending on the relative significance of valuation inputs, these instruments may be classified in either level 2 or level 3 of the fair value hierarchy.
As of September 30, 2011, the aggregate amount of fair valued securities, excluding any foreign securities fair valued pursuant to a systematic fair valuation model, as a percentage of net assets for the Funds was as follows:
| | | | |
Core Growth Fund | | | — | |
Emerging India Fund | | | — | |
Emerging Markets Small Cap Fund | | | 5.61 | % |
Global Opportunities Fund | | | 0.09 | % |
Heritage Growth Fund | | | — | |
International Growth Fund | | | 1.66 | % |
International Opportunities Fund | | | 1.88 | % |
Large Cap Value Fund | | | — | |
Long/Short Fund | | | — | |
Micro Cap Fund | | | 0.48 | % |
Micro Cap Value Fund | | | 1.72 | % |
Small Cap Growth Fund | | | 1.42 | % |
Small Cap Value Fund | | | — | |
Strategic Income Fund | | | 0.69 | % |
Ultra Growth Fund | | | 5.87 | % |
World Innovators Fund | | | 0.74 | % |
Income Fund | | | 0.50 | % |
U.S. Treasury Fund | | | — | |
16. FAIR VALUE MEASUREMENTS
The Funds use various methods to measure the fair value of most of their investments on a recurring basis. U.S. GAAP established a hierarchy that prioritizes inputs to valuation methods. The three levels of inputs are:
| | Ÿ | | Level 1 — Unadjusted quoted prices in active markets for identical assets or liabilities that the Funds have the ability to access. |
| | Ÿ | | Level 2 — Observable inputs other than quoted prices included in level 1 that are observable for the asset or liability, either directly or indirectly. The inputs may include quoted prices for the identical investment on an inactive market, prices for similar investments, interest rates, prepayment speeds, credit risk, yield curves, default rates and similar data. |
| | Ÿ | | Level 3 — Unobservable inputs for the asset or liability, to the extent relevant observable inputs are not available, representing the Funds’ own assumptions about the assumptions a market participant would use in valuing the asset or liability, and would be based on the best information available. |
The availability of observable inputs can vary from security to security and is affected by a wide variety of factors, including, for example, the type of security, whether a security is new and not yet established in the marketplace, the liquidity of markets, and other characteristics particular to the security. To the extent that valuation is based on models or inputs that are less observable or unobservable in the market, the determination of fair value requires more judgment. Accordingly, the degree of judgment exercised in determining fair value is greatest for instruments categorized in level 3.
The Funds’ policy is to recognize transfers between levels at the end of the reporting period.
132
The following is a summary of the fair valuations according to the inputs used as of September 30, 2011 in valuing the Funds’ assets and liabilities:
| | | | | | | | | | | | | | | | | | |
| Fund | | Category | | Quoted Prices
in Active Markets
for Identical
Investments
(Level 1) | | | Significant Other
Observable Inputs
(Level 2) | | | Significant
Unobservable
Inputs
(Level 3) | | | Value at
9/30/11 | |
Core Growth Fund | | | | | | | | | | | | | | | | | | |
Assets | | | | | | | | | | | | | | | | | | |
Common Stocks | | Consumer Finance
| | $ | 27,049,429 | | | $ | 1,799,381 | | | $ | — | | | $ | 28,848,810 | |
| | Diversified Banks | | | — | | | | 7,761,477 | | | | — | | | | 7,761,477 | |
| | Regional Banks | | | — | | | | 7,177,491 | | | | — | | | | 7,177,491 | |
| | Semiconductors | | | 18,512,144 | | | | 4,717,528 | | | | — | | | | 23,229,672 | |
| | Other | | | 353,021,514 | | | | — | | | | — | | | | 353,021,514 | |
Preferred Stocks | | | | | 3,615,162 | | | | — | | | | — | | | | 3,615,162 | |
Short-Term Investments | | | | | — | | | | 19,396,554 | | | | — | | | | 19,396,554 | |
| | | | | | |
| | | | $ | 402,198,249 | | | $ | 40,852,431 | | | $ | — | | | $ | 443,050,680 | |
| | | | | | |
Liabilities | | | | | | | | | | | | | | | | | | |
Equity Contracts | | | | $ | (122,500 | ) | | $ | — | | | $ | — | | | $ | (122,500 | ) |
| | | | | | |
| | | | $ | (122,500 | ) | | $ | — | | | $ | — | | | $ | (122,500 | ) |
| | | | | | |
Emerging India Fund | | | | | | | | | | | | | | | | | | |
Assets | | | | | | | | | | | | | | | | | | |
Common Stocks | | Internet Retail | | $ | 215,059 | | | $ | — | | | $ | — | | | $ | 215,059 | |
| | IT Consulting &
Other Services | | | 407,236 | | | | 101,283 | | | | — | | | | 508,519 | |
| | Packaged Foods & Meats | | | 199,859 | | | | 238,187 | | | | — | | | | 438,046 | |
| | Specialized Finance | | | 240,637 | | | | 270,199 | | | | — | | | | 510,836 | |
| | Thrifts & Mortgage Finance | | | 330,019 | | | | 848,489 | | | | — | | | | 1,178,508 | |
| | Other | | | — | | | | 7,598,825 | | | | — | | | | 7,598,825 | |
Short-Term Investments | | | | | — | | | | 252,073 | | | | — | | | | 252,073 | |
| | | | | | |
| | | | $ | 1,392,810 | | | $ | 9,309,056 | | | $ | — | | | $ | 10,701,866 | |
| | | | | | |
Emerging Markets Small Cap Fund | | | | | | | | | | | | | | | | | | |
Assets | | | | | | | | | | | | | | | | | | |
Common Stocks | | Apparel Retail | | $ | 8,837,087 | | | $ | 27,936,275 | | | $ | — | | | $ | 36,773,362 | |
| | Apparel, Accessories & Luxury Goods | | | 10,444,455 | | | | 9,122,759 | | | | — | | | | 19,567,214 | |
| | Asset Management & Custody Banks | | | 8,914,099 | | | | — | | | | — | | | | 8,914,099 | |
| | Construction Materials | | | 2,444,495 | | | | 17,057,351 | | | | — | | | | 19,501,846 | |
| | Consumer Finance | | | 4,305,076 | | | | 11,278,331 | | | | — | | | | 15,583,407 | |
| | Department Stores | | | 3,634,853 | | | | 3,029,743 | | | | — | | | | 6,664,596 | |
| | Distillers & Vintners | | | 662,428 | | | | — | | | | — | | | | 662,428 | |
| | Footwear | | | 2,362,696 | | | | 15,223,488 | | | | — | | | | 17,586,184 | |
| | Health Care Services | | | 12,575,139 | | | | — | | | | — | | | | 12,575,139 | |
| | Highways & Railtracks | | | 9,197,675 | | | | 6,516,149 | | | | — | | | | 15,713,824 | |
| | Human Resource & Employment Services | | | 1,475,935 | | | | — | | | | — | | | | 1,475,935 | |
| | Marine Ports & Services | | | 15,792,032 | | | | 9,766,750 | | | | — | | | | 25,558,782 | |
| | Oil & Gas Exploration & Production | | | 21,575,212 | | | | 10,380,914 | | | | — | | | | 31,956,126 | |
| | Other Diversified Financial Services | | | 7,987,939 | | | | — | | | | — | | | | 7,987,939 | |
| | Packaged Foods & Meats | | | 9,780,210 | | | | 17,751,327 | | | | — | | | | 27,531,537 | |
| | Personal Products | | | 204,585 | | | | 15,762,016 | | | | — | | | | 15,966,601 | |
| | Specialized Finance | | | 5,142,501 | | | | 14,127,847 | | | | — | | | | 19,270,348 | |
| | Thrifts & Mortgage Finance | | | 8,811,036 | | | | 22,198,828 | | | | — | | | | 31,009,864 | |
| | Trucking | | | 6,777,521 | | | | — | | | | — | | | | 6,777,521 | |
| | Other | | | — | | | | 413,811,013 | | | | — | | | | 413,811,013 | |
Preferred Stocks | | | | | 15,243,917 | | | | — | | | | — | | | | 15,243,917 | |
Short-Term Investments | | | | | — | | | | 26,363,875 | | | | — | | | | 26,363,875 | |
| | | | | | |
| | | | $ | 156,168,891 | | | $ | 620,326,666 | | | $ | — | | | $ | 776,495,557 | |
| | | | | | |
133
| | |
| WASATCH FUNDS — Notes to Financial Statements (continued) | | |
|
|
|
| | | | | | | | | | | | | | | | | | |
| Fund | | Category | | Quoted Prices
in Active Markets
for Identical
Investments
(Level 1) | | | Significant Other
Observable Inputs
(Level 2) | | | Significant
Unobservable
Inputs
(Level 3) | | | Value at
9/30/11 | |
Global Opportunities Fund | | | | | | | | | | | | | | | | | | |
Assets | | | | | | | | | | | | | | | | | | |
Common Stocks | | Advertising | | $ | — | | | $ | 574,158 | | | $ | — | | | $ | 574,158 | |
| | Air Freight & Logistics | | | — | | | | 2,101,663 | | | | — | | | | 2,101,663 | |
| | Apparel Retail | | | 1,637,143 | | | | 1,799,418 | | | | — | | | | 3,436,561 | |
| | Apparel, Accessories & Luxury Goods | | | 1,649,348 | | | | 7,984,450 | | | | — | | | | 9,633,798 | |
| | Application Software | | | 2,376,547 | | | | 234,253 | | | | — | | | | 2,610,800 | |
| | Asset Management & Custody Banks | | | 2,259,863 | | | | 520,257 | | | | — | | | | 2,780,120 | |
| | Auto Parts & Equipment | | | — | | | | 925,051 | | | | — | | | | 925,051 | |
| | Biotechnology | | | — | | | | 2,700,108 | | | | — | | | | 2,700,108 | |
| | Catalog Retail | | | — | | | | 812,122 | | | | — | | | | 812,122 | |
| | Coal & Consumable Fuels | | | — | | | | 684,970 | | | | — | | | | 684,970 | |
| | Commodity Chemicals | | | — | | | | 2,096,048 | | | | — | | | | 2,096,048 | |
| | Computer Hardware | | | — | | | | 511,444 | | | | — | | | | 511,444 | |
| | Construction & Engineering | | | — | | | | 1,952,395 | | | | — | | | | 1,952,395 | |
| | Construction Materials | | | — | | | | 556,892 | | | | — | | | | 556,892 | |
| | Consumer Finance | | | 2,851,068 | | | | 2,317,469 | | | | — | | | | 5,168,537 | |
| | Data Processing & Outsourced Services | | | — | | | | 6,019,104 | | | | — | | | | 6,019,104 | |
| | Diversified Banks | | | 150,122 | | | | 1,698,445 | | | | — | | | | 1,848,567 | |
| | Diversified Chemicals | | | — | | | | 1,402,113 | | | | — | | | | 1,402,113 | |
| | Diversified Support Services | | | 3,158,949 | | | | 421,325 | | | | — | | | | 3,580,274 | |
| | Drug Retail | | | — | | | | 878,280 | | | | — | | | | 878,280 | |
| | Electronic Equipment & Instruments | | | — | | | | 816,855 | | | | — | | | | 816,855 | |
| | Environmental & Facilities Services | | | 1,315,642 | | | | 3,934,666 | | | | — | | | | 5,250,308 | |
| | Food Retail | | | — | | | | 1,539,393 | | | | — | | | | 1,539,393 | |
| | Footwear | | | — | | | | 1,384,357 | | | | — | | | | 1,384,357 | |
| | General Merchandise Stores | | | 4,912,194 | | | | 2,211,256 | | | | — | | | | 7,123,450 | |
| | Gold | | | — | | | | 1,992,726 | | | | — | | | | 1,992,726 | |
| | Health Care Equipment | | | 3,245,470 | | | | 2,111,266 | | | | — | | | | 5,356,736 | |
| | Health Care Facilities | | | 1,198,372 | | | | 718,946 | | | | — | | | | 1,917,318 | |
| | Home Improvement Retail | | | — | | | | 1,576,514 | | | | — | | | | 1,576,514 | |
| | Homefurnishing Retail | | | 1,075,650 | | | | 572,098 | | | | — | | | | 1,647,748 | |
| | Human Resource & Employment Services | | | — | | | | 1,002,761 | | | | — | | | | 1,002,761 | |
| | Industrial Machinery | | | 2,725,324 | | | | 1,991,617 | | | | — | | | | 4,716,941 | |
| | Internet Retail | | | — | | | | 1,415,389 | | | | — | | | | 1,415,389 | |
| | Internet Software & Services | | | 2,538,673 | | | | 2,839,341 | | | | — | | | | 5,378,014 | |
| | Investment Banking & Brokerage | | | — | | | | 472,814 | | | | — | | | | 472,814 | |
| | IT Consulting & Other Services | | | — | | | | 2,600,018 | | | | — | | | | 2,600,018 | |
| | Life Sciences Tools & Services | | | 4,397,251 | | | | 2,447,417 | | | | — | | | | 6,844,668 | |
| | Oil & Gas Equipment & Services | | | 3,206,674 | | | | 1,506,933 | | | | — | | | | 4,713,607 | |
| | Oil & Gas Exploration & Production | | | 3,174,282 | | | | 1,464,797 | | | | — | | | | 4,639,079 | |
| | Property & Casualty Insurance | | | — | | | | 910,011 | | | | — | | | | 910,011 | |
| | Research & Consulting Services | | | 5,088,470 | | | | 2,401,225 | | | | — | | | | 7,489,695 | |
| | Restaurants | | | 564,636 | | | | 1,509,070 | | | | — | | | | 2,073,706 | |
| | Semiconductor Equipment | | | — | | | | 924,738 | | | | — | | | | 924,738 | |
| | Semiconductors | | | 12,775,433 | | | | 5,049,542 | | | | — | | | | 17,824,975 | |
| | Specialized Finance | | | 4,355,375 | | | | 1,446,967 | | | | — | | | | 5,802,342 | |
| | Specialty Chemicals | | | — | | | | 1,771,275 | | | | — | | | | 1,771,275 | |
| | Specialty Stores | | | 1,173,204 | | | | 1,015,061 | | | | — | | | | 2,188,265 | |
| | Steel | | | 558,115 | | | | 906,409 | | | | — | | | | 1,464,524 | |
| | Thrifts & Mortgage Finance | | | 774,305 | | | | 1,429,727 | | | | — | | | | 2,204,032 | |
| | Trading Companies & Distributors | | | 5,911,756 | | | | 5,229,211 | | | | — | | | | 11,140,967 | |
134
| | | | | | | | | | | | | | | | | | |
| Fund | | Category | | Quoted Prices
in Active Markets
for Identical
Investments
(Level 1) | | | Significant Other
Observable Inputs
(Level 2) | | | Significant
Unobservable
Inputs
(Level 3) | | | Value at
9/30/11 | |
| | Trucking | | | 6,098,876 | | | | 793,679 | | | | — | | | | 6,892,555 | |
| | Other | | | 23,730,081 | | | | — | | | | — | | | | 23,730,081 | |
Warrants | | | | | 9,643 | | | | — | | | | 27,200 | | | | 36,843 | |
Short-Term Investments | | | | | — | | | | 3,428,764 | | | | — | | | | 3,428,764 | |
| | | | | | |
| | | | $ | 102,912,466 | | | $ | 95,604,808 | | | $ | 27,200 | | | $ | 198,544,474 | |
| | | | | | |
Heritage Growth Fund | | | | | | | | | | | | | | | | | | |
Assets | | | | | | | | | | | | | | | | | | |
Common Stocks | | Specialized Finance | | $ | 3,727,400 | | | $ | 714,515 | | | $ | — | | | $ | 4,441,915 | |
| | Other | | | 65,310,475 | | | | — | | | | — | | | | 65,310,475 | |
Short-Term Investments | | | | | — | | | | 2,841,875 | | | | — | | | | 2,841,875 | |
| | | | | | |
| | | | $ | 69,037,875 | | | $ | 3,556,390 | | | $ | — | | | $ | 72,594,265 | |
| | | | | | |
International Growth Fund | | | | | | | | | | | | | | | | | | |
Assets | | | | | | | | | | | | | | | | | | |
Common Stocks | | Apparel Retail | | $ | 3,420,181 | | | $ | 2,705,340 | | | $ | — | | | $ | 6,125,521 | |
| | Application Software | | | 5,042,596 | | | | 1,931,505 | | | | — | | | | 6,974,101 | |
| | Asset Management & Custody Banks | | | 2,764,680 | | | | 7,239,875 | | | | — | | | | 10,004,555 | |
| | Consumer Finance | | | 2,121,125 | | | | 6,412,459 | | | | — | | | | 8,533,584 | |
| | Department Stores | | | 4,603,161 | | | | — | | | | — | | | | 4,603,161 | |
| | Diversified Banks | | | 414,023 | | | | 7,470,077 | | | | — | | | | 7,884,100 | |
| | Health Care Equipment | | | 4,463,855 | | | | 6,947,669 | | | | — | | | | 11,411,524 | |
| | Health Care Services | | | 1,540,130 | | | | — | | | | — | | | | 1,540,130 | |
| | Marine Ports & Services | | | 1,878,539 | | | | 4,243,092 | | | | — | | | | 6,121,631 | |
| | Oil & Gas Equipment & Services | | | 3,945,144 | | | | 1,682,083 | | | | — | | | | 5,627,227 | |
| | Oil & Gas Exploration & Production | | | 5,291,268 | | | | 5,375,485 | | | | — | | | | 10,666,753 | |
| | Packaged Foods & Meats | | | 4,760,776 | | | | 533,577 | | | | — | | | | 5,294,353 | |
| | Precious Metals & Minerals | | | 1,733,419 | | | | — | | | | — | | | | 1,733,419 | |
| | Specialized Finance | | | 2,080,337 | | | | 1,898,464 | | | | — | | | | 3,978,801 | |
| | Thrifts & Mortgage Finance | | | 8,177,876 | | | | 3,462,758 | | | | — | | | | 11,640,634 | |
| | Other | | | — | | | | 175,385,688 | | | | — | | | | 175,385,688 | |
Preferred Stocks | | | | | 1,620,901 | | | | 102,200 | | | | — | | | | 1,723,101 | |
Short-Term Investments | | | | | — | | | | 1,274,075 | | | | — | | | | 1,274,075 | |
| | | | | | |
| | | | $ | 53,858,011 | | | $ | 226,664,347 | | | $ | — | | | $ | 280,522,358 | |
| | | | | | |
International Opportunities Fund | | | | | | | | | | | | | | | | | | |
Assets | | | | | | | | | | | | | | | | | | |
Common Stocks | | Apparel Retail | | $ | 1,004,852 | | | $ | 1,530,931 | | | $ | — | | | $ | 2,535,783 | |
| | Apparel, Accessories & Luxury Goods | | | 1,615,305 | | | | 5,594,763 | | | | — | | | | 7,210,068 | |
| | Construction & Engineering | | | 969,734 | | | | 2,125,878 | | | | — | | | | 3,095,612 | |
| | Electronic Equipment & Instruments | | | 330,449 | | | | 1,917,029 | | | | — | | | | 2,247,478 | |
| | Health Care Equipment | | | 1,893,773 | | | | — | | | | — | | | | 1,893,773 | |
| | Industrial Gases | | | 662,841 | | | | — | | | | — | | | | 662,841 | |
| | Oil & Gas Equipment & Services | | | 910,800 | | | | — | | | | — | | | | 910,800 | |
| | Oil & Gas Exploration & Production | | | 4,917,363 | | | | 1,563,796 | | | | — | | | | 6,481,159 | |
| | Packaged Foods & Meats | | | 707,402 | | | | 7,106,633 | | | | — | | | | 7,814,035 | |
| | Regional Banks | | | 1,051,021 | | | | — | | | | — | | | | 1,051,021 | |
| | Specialized Finance | | | 1,568,235 | | | | 2,176,497 | | | | — | | | | 3,744,732 | |
| | Thrifts & Mortgage Finance | | | 990,315 | | | | 1,655,089 | | | | — | | | | 2,645,404 | |
| | Trading Companies & Distributors | | | 1,384,399 | | | | 7,192,055 | | | | — | | | | 8,576,454 | |
| | Trucking | | | 1,237,444 | | | | — | | | | — | | | | 1,237,444 | |
| | Other | | | — | | | | 84,749,586 | | | | — | | | | 84,749,586 | |
Short-Term Investments | | | | | — | | | | 8,991,949 | | | | — | | | | 8,991,949 | |
| | | | | | |
| | | | $ | 19,243,933 | | | $ | 124,604,206 | | | $ | — | | | $ | 143,848,139 | |
| | | | | | |
135
| | |
| WASATCH FUNDS — Notes to Financial Statements (continued) | | |
|
|
|
| | | | | | | | | | | | | | | | | | |
| Fund | | Category | | Quoted Prices
in Active Markets
for Identical
Investments
(Level 1) | | | Significant Other
Observable Inputs
(Level 2) | | | Significant
Unobservable
Inputs
(Level 3) | | | Value at
9/30/11 | |
Large Cap Value Fund | | | | | | | | | | | | | | | | | | |
Assets | | | | | | | | | | | | | | | | | | |
Common Stocks | | | | | $1,487,050,304 | | | $ | — | | | $ | — | | | $ | 1,487,050,304 | |
Short-Term Investments | | | | | — | | | | 56,097,106 | | | | — | | | | 56,097,106 | |
| | | | | | |
| | | | | $1,487,050,304 | | | $ | 56,097,106 | | | $ | — | | | $ | 1,543,147,410 | |
| | | | | | |
Long/Short Fund | | | | | | | | | | | | | | | | | | |
Assets | | | | | | | | | | | | | | | | | | |
Common Stocks | | | | | $619,210,936 | | | $ | — | | | $ | — | | | $ | 619,210,936 | |
Preferred Stocks | | | | | 3,826,500 | | | | — | | | | — | | | | 3,826,500 | |
Short-Term Investments | | | | | — | | | | 193,085,310 | | | | — | | | | 193,085,310 | |
| | | | | | |
| | | | $ | 623,037,436 | | | $ | 193,085,310 | | | $ | — | | | $ | 816,122,746 | |
| | | | | | |
Liabilities | | | | | | | | | | | | | | | | | | |
Equity Contracts | | | | $ | (6,052,310 | ) | | $ | — | | | $ | — | | | $ | (6,052,310 | ) |
Securities Sold Short | | | | | (95,343,406 | ) | | | — | | | | — | | | | (95,343,406 | ) |
| | | | | | |
| | | | $ | (101,395,716 | ) | | $ | — | | | $ | — | | | $ | (101,395,716 | ) |
| | | | | | |
Micro Cap Fund | | | | | | | | | | | | | | | | | | |
Assets | | | | | | | | | | | | | | | | | | |
Common Stocks | | Air Freight & Logistics | | $ | — | | | $ | 2,730,657 | | | $ | — | | | $ | 2,730,657 | |
| | Biotechnology | | | 3,769,434 | | | | 3,737,555 | | | | — | | | | 7,506,989 | |
| | Data Processing & Outsourced Services | | | — | | | | 4,096,401 | | | | — | | | | 4,096,401 | |
| | Environmental & Facilities Services | | | 3,369,570 | | | | 1,518,088 | | | | — | | | | 4,887,658 | |
| | Health Care Equipment | | | 14,208,379 | | | | 3,484,151 | | | | — | | | | 17,692,530 | |
| | IT Consulting & Other Services | | | 4,299,923 | | | | 2,097,667 | | | | — | | | | 6,397,590 | |
| | Regional Banks | | | 4,990,747 | | | | 3,095,139 | | | | — | | | | 8,085,886 | |
| | Research & Consulting Services | | | 5,979,509 | | | | 3,047,121 | | | | — | | | | 9,026,630 | |
| | Semiconductors | | | 21,944,102 | | | | 3,239,642 | | | | — | | | | 25,183,744 | |
| | Specialized Finance | | | 2,111,147 | | | | — | | | | 55,440 | | | | 2,166,587 | |
| | Thrifts & Mortgage Finance | | | 112,908 | | | | 2,760,678 | | | | — | | | | 2,873,586 | |
| | Other | | | 155,253,847 | | | | — | | | | — | | | | 155,253,847 | |
Preferred Stocks | | | | | 1,969,661 | | | | — | | | | — | | | | 1,969,661 | |
Warrants | | | | | — | | | | 18,169 | | | | 220,511 | | | | 238,680 | |
Short-Term Investments | | | | | — | | | | 5,277,785 | | | | — | | | | 5,277,785 | |
| | | | | | |
| | | | $ | 218,009,227 | | | $ | 35,103,053 | | | $ | 275,951 | | | $ | 253,388,231 | |
| | | | | | |
Micro Cap Value Fund | | | | | | | | | | | | | | | | | | |
Assets | | | | | | | | | | | | | | | | | | |
Common Stocks | | Air Freight & Logistics | | $ | — | | | $ | 873,010 | | | $ | — | | | $ | 873,010 | |
| | Apparel Retail | | | 1,598,080 | | | | 968,579 | | | | — | | | | 2,566,659 | |
| | Apparel, Accessories & Luxury Goods | | | 1,872,800 | | | | 3,181,173 | | | | — | | | | 5,053,973 | |
| | Automotive Retail | | | — | | | | 1,299,066 | | | | — | | | | 1,299,066 | |
| | Biotechnology | | | — | | | | 89,000 | | | | — | | | | 89,000 | |
| | Construction Materials | | | — | | | | 1,148,464 | | | | — | | | | 1,148,464 | |
| | Department Stores | | | — | | | | 1,087,962 | | | | — | | | | 1,087,962 | |
| | Diversified Banks | | | — | | | | — | | | | 185,001 | | | | 185,001 | |
| | Gas Utilities | | | — | | | | 1,474,026 | | | | — | | | | 1,474,026 | |
| | Gold | | | — | | | | 750,918 | | | | — | | | | 750,918 | |
| | Health Care Equipment | | | 5,091,009 | | | | 349,200 | | | | — | | | | 5,440,209 | |
| | Health Care Facilities | | | 773,771 | | | | 996,982 | | | | — | | | | 1,770,753 | |
| | Health Care Supplies | | | — | | | | 1,820,456 | | | | — | | | | 1,820,456 | |
| | IT Consulting & Other Services | | | 1,573,440 | | | | 917,733 | | | | — | | | | 2,491,173 | |
| | Regional Banks | | | 4,897,100 | | | | 1,626,847 | | | | — | | | | 6,523,947 | |
| | Restaurants | | | 2,991,480 | | | | 343,413 | | | | — | | | | 3,334,893 | |
| | Semiconductor Equipment | | | — | | | | 782,607 | | | | — | | | | 782,607 | |
| | Specialized Finance | | | 2,949,750 | | | | — | | | | 15,084 | | | | 2,964,834 | |
| | Textiles | | | — | | | | 931,507 | | | | — | | | | 931,507 | |
| | Thrifts & Mortgage Finance | | | 3,069,460 | | | | 1,145,708 | | | | — | | | | 4,215,168 | |
136
| | | | | | | | | | | | | | | | | | |
| Fund | | Category | | Quoted Prices
in Active Markets
for Identical
Investments
(Level 1) | | | Significant Other
Observable Inputs
(Level 2) | | | Significant
Unobservable
Inputs
(Level 3) | | | Value at
9/30/11 | |
| | Trading Companies & Distributors | | | 2,720,760 | | | | 753,169 | | | | — | | | | 3,473,929 | |
| | Other | | | 73,585,169 | | | | — | | | | — | | | | 73,585,169 | |
Preferred Stocks | | | | | | | | | | | | | | | | | | |
| | Pharmaceuticals | | | — | | | | — | | | | 249,997 | | | | 249,997 | |
| | Other | | | 757,398 | | | | — | | | | — | | | | 757,398 | |
Warrants | | | | | — | | | | 6,250 | | | | 75,721 | | | | 81,971 | |
Short-Term Investments | | | | | — | | | | 18,645,998 | | | | — | | | | 18,645,998 | |
Foreign Currency Exchange Contracts | | | | | — | | | | 238,671 | | | | — | | | | 238,671 | |
| | | | | | |
| | | | $ | 101,880,217 | | | $ | 39,430,739 | | | $ | 525,803 | | | $ | 141,836,759 | |
| | | | | | |
Liabilities | | | | | | | | | | | | | | | | | | |
Equity Contracts | | | | $ | (392,070 | ) | | $ | — | | | $ | — | | | $ | (392,070 | ) |
| | | | | | |
| | | | $ | (392,070 | ) | | $ | — | | | $ | — | | | $ | (392,070 | ) |
| | | | | | |
Small Cap Growth Fund | | | | | | | | | | | | | | | | | | |
Assets | | | | | | | | | | | | | | | | | | |
Common Stocks | | Air Freight & Logistics | | $ | 13,206,076 | | | $ | 17,614,936 | | | $ | — | | | $ | 30,821,012 | |
| | Biotechnology | | | 33,510,342 | | | | 3,455,477 | | | | — | | | | 36,965,819 | |
| | Data Processing & Outsourced Services | | | 7,805,729 | | | | 29,361,406 | | | | — | | | | 37,167,135 | |
| | Diversified Banks | | | 22,211,280 | | | | 19,849,461 | | | | — | | | | 42,060,741 | |
| | Environmental & Facilities Services | | | 17,615,506 | | | | 5,699,272 | | | | — | | | | 23,314,778 | |
| | Health Care Equipment | | | 18,429,564 | | | | — | | | | 247 | | | | 18,429,811 | |
| | Industrial Machinery | | | 14,934,372 | | | | 5,941,284 | | | | — | | | | 20,875,656 | |
| | Internet Retail | | | 26,921,159 | | | | 19,655,433 | | | | — | | | | 46,576,592 | |
| | Life Sciences Tools & Services | | | 53,410,019 | | | | 6,075,017 | | | | — | | | | 59,485,036 | |
| | Oil & Gas Equipment & Services | | | 37,869,926 | | | | 8,491,309 | | | | — | | | | 46,361,235 | |
| | Oil & Gas Exploration & Production | | | 17,508,347 | | | | 18,276,808 | | | | — | | | | 35,785,155 | |
| | Personal Products | | | — | | | | 11,549,821 | | | | — | | | | 11,549,821 | |
| | Other | | | 874,748,969 | | | | — | | | | — | | | | 874,748,969 | |
Preferred Stocks | | | | | | | | | | | | | | | | | | |
| | Biotechnology | | | — | | | | — | | | | 961,210 | | | | 961,210 | |
| | Internet Software & Services | | | — | | | | — | | | | 7,463,270 | | | | 7,463,270 | |
Limited Partnership Interest | | | | | — | | | | — | | | | 6,271,172 | | | | 6,271,172 | |
Warrants | | | | | — | | | | 242,660 | | | | — | | | | 242,660 | |
Rights | | | | | — | | | | — | | | | — | | | | — | |
Short-Term Investments | | | | | — | | | | 9,350,040 | | | | — | | | | 9,350,040 | |
| | | | | | |
| | | | $ | 1,138,171,289 | | | $ | 155,562,924 | | | $ | 14,695,899 | | | $ | 1,308,430,112 | |
| | | | | | |
Small Cap Value Fund | | | | | | | | | | | | | | | | | | |
Assets | | | | | | | | | | | | | | | | | | |
Common Stocks | | Diversified Banks | | $ | — | | | $ | 3,298,520 | | | $ | — | | | $ | 3,298,520 | |
| | Electronic Components | | | — | | | | 1,113,244 | | | | — | | | | 1,113,244 | |
| | Environmental & Facilities Services | | | — | | | | 1,334,707 | | | | — | | | | 1,334,707 | |
| | Health Care Supplies | | | — | | | | 1,760,077 | | | | — | | | | 1,760,077 | |
| | IT Consulting & Other Services | | | — | | | | 2,224,982 | | | | — | | | | 2,224,982 | |
| | Oil & Gas Equipment & Services | | | 1,277,856 | | | | 1,092,122 | | | | — | | | | 2,369,978 | |
| | Regional Banks | | | 5,159,843 | | | | 2,599,340 | | | | — | | | | 7,759,183 | |
| | Semiconductors | | | 15,047,277 | | | | 1,354,877 | | | | — | | | | 16,402,154 | |
| | Other | | | 130,772,636 | | | | — | | | | — | | | | 130,772,636 | |
Short-Term Investments | | | | | — | | | | 3,880,430 | | | | — | | | | 3,880,430 | |
| | | | | | |
| | | | $ | 152,257,612 | | | $ | 18,658,299 | | | $ | — | | | $ | 170,915,911 | |
| | | | | | |
137
| | |
| WASATCH FUNDS — Notes to Financial Statements (continued) | | |
|
|
|
| | | | | | | | | | | | | | | | | | |
| Fund | | Category | | Quoted Prices
in Active Markets
for Identical
Investments
(Level 1) | | | Significant Other
Observable Inputs
(Level 2) | | | Significant
Unobservable
Inputs
(Level 3) | | | Value at
9/30/11 | |
Strategic Income Fund | | | | | | | | | | | | | | | | | | |
Assets | | | | | | | | | | | | | | | | | | |
Common Stocks | | Data Processing & Outsourced Services | | $ | 2,244,564 | | | $ | 521,487 | | | $ | — | | | $ | 2,766,051 | |
| | Diversified REITs | | | — | | | | 231,214 | | | | — | | | | 231,214 | |
| | Other | | | 18,273,448 | | | | — | | | | — | | | | 18,273,448 | |
Preferred Stocks | | | | | — | | | | 5,248 | | | | — | | | | 5,248 | |
Limited Liability Company Membership Interest | | | | | 465,527 | | | | — | | | | 154,558 | | | | 620,085 | |
Limited Partnership Interest | | | | | 411,840 | | | | — | | | | — | | | | 411,840 | |
Corporate Bonds | | | | | — | | | | — | | | | 5,054 | | | | 5,054 | |
Mutual Funds | | | | | 267,774 | | | | — | | | | — | | | | 267,774 | |
Short-Term Investments | | | | | — | | | | 1,380,766 | | | | — | | | | 1,380,766 | |
| | | | | | |
| | | | $ | 21,663,153 | | | $ | 2,138,715 | | | $ | 159,612 | | | $ | 23,961,480 | |
| | | | | | |
Ultra Growth Fund | | | | | | | | | | | | | | | | | | |
Assets | | | | | | | | | | | | | | | | | | |
Common Stocks | | Air Freight & Logistics | | $ | — | | | $ | 1,396,679 | | | $ | — | | | $ | 1,396,679 | |
| | Auto Parts & Equipment | | | — | | | | 1,915,497 | | | | — | | | | 1,915,497 | |
| | Biotechnology | | | 2,964,723 | | | | 1,627,777 | | | | — | | | | 4,592,500 | |
| | Construction Materials | | | — | | | | 1,643,280 | | | | — | | | | 1,643,280 | |
| | Consumer Finance | | | 2,529,793 | | | | 2,122,869 | | | | — | | | | 4,652,662 | |
| | Data Processing & Outsourced Services | | | 1,474,105 | | | | 1,737,625 | | | | — | | | | 3,211,730 | |
| | Diversified Banks | | | 1,596,108 | | | | 2,779,732 | | | | — | | | | 4,375,840 | |
| | Environmental & Facilities Services | | | 742,344 | | | | 446,679 | | | | — | | | | 1,189,023 | |
| | Health Care Equipment | | | 7,829,726 | | | | 2,039,732 | | | | 165 | | | | 9,869,623 | |
| | Industrial Machinery | | | — | | | | 1,000,059 | | | | — | | | | 1,000,059 | |
| | Internet Retail | | | 3,528,671 | | | | 881,369 | | | | — | | | | 4,410,040 | |
| | Internet Software & Services | | | 7,566,036 | | | | — | | | | 914 | | | | 7,566,950 | |
| | Life Sciences Tools & Services | | | 2,771,462 | | | | 593,380 | | | | — | | | | 3,364,842 | |
| | Oil & Gas Exploration & Production | | | 1,331,794 | | | | 515,396 | | | | — | | | | 1,847,190 | |
| | Personal Products | | | — | | | | — | | | | 504 | | | | 504 | |
| | Regional Banks | | | — | | | | 581,087 | | | | — | | | | 581,087 | |
| | Research & Consulting Services | | | 1,737,214 | | | | 1,769,647 | | | | — | | | | 3,506,861 | |
| | Specialized Finance | | | 4,516,928 | | | | 915,918 | | | | — | | | | 5,432,846 | |
| | Thrifts & Mortgage Finance | | | — | | | | 2,300,687 | | | | — | | | | 2,300,687 | |
| | Other | | | 64,480,523 | | | | — | | | | — | | | | 64,480,523 | |
Preferred Stocks | | | | | | | | | | | | | | | | | | |
| | Biotechnology | | | — | | | | — | | | | 240,303 | | | | 240,303 | |
| | Health Care Technology | | | — | | | | — | | | | 1,014,819 | | | | 1,014,819 | |
Limited Partnership Interest | | | | | — | | | | — | | | | 5,786,902 | | | | 5,786,902 | |
Warrants | | | | | — | | | | 5,451 | | | | 112,200 | | | | 117,651 | |
Short-Term Investments | | | | | — | | | | 272,371 | | | | — | | | | 272,371 | |
| | | | | | |
| | | | $ | 103,069,427 | | | $ | 24,545,235 | | | $ | 7,155,807 | | | $ | 134,770,469 | |
| | | | | | |
World Innovators Fund | | | | | | | | | | | | | | | | | | |
Assets | | | | | | | | | | | | | | | | | | |
Common Stocks | | Advertising | | $ | — | | | $ | 858,877 | | | $ | — | | | $ | 858,877 | |
| | Apparel Retail | | | — | | | | 184,080 | | | | — | | | | 184,080 | |
| | Apparel, Accessories & Luxury Goods | | | — | | | | 339,091 | | | | — | | | | 339,091 | |
| | Application Software | | | 357,781 | | | | 690,223 | | | | — | | | | 1,048,004 | |
| | Asset Management & Custody Banks | | | 402,050 | | | | 449,489 | | | | — | | | | 851,539 | |
| | Automotive Retail | | | — | | | | 656,781 | | | | — | | | | 656,781 | |
| | Biotechnology | | | 802,540 | | | | 1,206,806 | | | | — | | | | 2,009,346 | |
| | Construction & Farm Machinery & Heavy Trucks | | | — | | | | 254,484 | | | | — | | | | 254,484 | |
| | Data Processing & Outsourced Services | | | 5,532,261 | | | | 1,673,559 | | | | — | | | | 7,205,820 | |
138
| | | | | | | | | | | | | | | | | | |
| Fund | | Category | | Quoted Prices
in Active Markets
for Identical
Investments
(Level 1) | | | Significant Other
Observable Inputs
(Level 2) | | | Significant
Unobservable
Inputs
(Level 3) | | | Value at
9/30/11 | |
| | Electronic Equipment & Instruments | | | 334,899 | | | | 352,764 | | | | — | | | | 687,663 | |
| | Health Care Equipment | | | 1,409,586 | | | | 2,227,018 | | | | — | | | | 3,636,604 | |
| | Health Care Supplies | | | — | | | | 1,678,223 | | | | — | | | | 1,678,223 | |
| | Health Care Technology | | | — | | | | 442,281 | | | | — | | | | 442,281 | |
| | Home Entertainment Software | | | — | | | | 166,668 | | | | — | | | | 166,668 | |
| | Home Improvement Retail | | | — | | | | 134,545 | | | | — | | | | 134,545 | |
| | Internet Retail | | | 1,962,425 | | | | 873,236 | | | | — | | | | 2,835,661 | |
| | Internet Software & Services | | | 4,833,850 | | | | — | | | | 65 | | | | 4,833,915 | |
| | Life Sciences Tools & Services | | | 962,404 | | | | 264,150 | | | | — | | | | 1,226,554 | |
| | Movies & Entertainment | | | — | | | | 915,242 | | | | — | | | | 915,242 | |
| | Research & Consulting Services | | | — | | | | 343,576 | | | | — | | | | 343,576 | |
| | Systems Software | | | 1,343,500 | | | | 334,256 | | | | — | | | | 1,677,756 | |
| | Trading Companies & Distributors | | | — | | | | 755,747 | | | | — | | | | 755,747 | |
| | Trucking | | | — | | | | 1,072,179 | | | | — | | | | 1,072,179 | |
| | Other | | | 29,398,056 | | | | — | | | | — | | | | 29,398,056 | |
Preferred Stocks | | | | | — | | | | 1,356,209 | | | | — | | | | 1,356,209 | |
Limited Partnership Interest | | | | | — | | | | — | | | | 484,252 | | | | 484,252 | |
Warrants | | | | | — | | | | — | | | | 48,620 | | | | 48,620 | |
Equity Contracts | | | | | 20,500 | | | | — | | | | — | | | | 20,500 | |
Short-Term Investments | | | | | — | | | | 4,434,458 | | | | — | | | | 4,434,458 | |
| | | | | | |
| | | | $ | 47,359,852 | | | $ | 21,663,942 | | | $ | 532,937 | | | $ | 69,556,731 | |
| | | | | | |
Wasatch-1st Source Income Fund | | | | | | | | | | | | | | | | | | |
Assets | | | | | | | | | | | | | | | | | | |
Asset Backed Securities | | | | $ | — | | | $ | 3,855,861 | | | $ | — | | | $ | 3,855,861 | |
Collateralized Mortgage Obligations | | | | | — | | | | 32,883,629 | | | | — | | | | 32,883,629 | |
Corporate Bonds | | | | | — | | | | 47,924,118 | | | | — | | | | 47,924,118 | |
Municipal Bonds | | | | | — | | | | 1,918,495 | | | | — | | | | 1,918,495 | |
Mutual Funds | | | | | 715,249 | | | | — | | | | — | | | | 715,249 | |
Exchange Traded Funds | | | | | 674,040 | | | | — | | | | — | | | | 674,040 | |
U.S. Government Agency Securities | | | | | — | | | | 26,930,167 | | | | 674,288 | | | | 27,604,455 | |
U.S. Treasury Bonds | | | | | — | | | | 7,600,279 | | | | — | | | | 7,600,279 | |
U.S. Treasury Inflation Protected Bonds | | | | | — | | | | 2,171,719 | | | | — | | | | 2,171,719 | |
U.S. Treasury Notes | | | | | — | | | | 6,333,591 | | | | — | | | | 6,333,591 | |
Preferred Stocks | | | | | 953,000 | | | | — | | | | — | | | | 953,000 | |
Short-Term Investments | | | | | — | | | | 1,863,720 | | | | — | | | | 1,863,720 | |
| | | | | | |
| | | | $ | 2,342,289 | | | $ | 131,481,579 | | | $ | 674,288 | | | $ | 134,498,156 | |
| | | | | | |
U.S. Treasury Fund | | | | | | | | | | | | | | | | | | |
Assets | | | | | | | | | | | | | | | | | | |
U.S. Government Obligations | | | | $ | — | | | $ | 183,849,139 | | | $ | — | | | $ | 183,849,139 | |
Short-Term Investments | | | | | — | | | | 2,591,994 | | | | — | | | | 2,591,994 | |
| | | | | | |
| | | | $ | — | | | $ | 186,441,133 | | | $ | — | | | $ | 186,441,133 | |
| | | | | | |
The valuation techniques used by the Funds to measure fair value for the year ended September 30, 2011 maximized the use of observable inputs and minimized the use of unobservable inputs.
The Funds have recategorized securities that can be converted by the Funds at any time, without limitation, into securities with an active market price since they are not identical securities. This recategorization has resulted in significant transfers from level 1 to level 2. In addition, there were significant transfers due to fair valuation in certain foreign markets.
139
| | |
| WASATCH FUNDS — Notes to Financial Statements (continued) | | |
|
|
|
The following is a reconciliation of the fair valuations using significant unobservable inputs (level 3) for the Funds during the year ended September 30, 2011:
| | | | | | | | | | | | | | | | | | | | | | | | | | | | | | | | |
| Fund | | Market Value
Beginning
Balance
9/30/2010 | | | Purchases
at Cost/
Sales
(Proceeds) | | | Realized
Gain/(Loss) | | | Change in
Unrealized
Appreciation
(Depreciation) | | | Transfers
in at
Market Value | | | Transfers
out at
Market Value | | | Market Value
Ending Balance
9/30/2011 | | | Net Change in
Unrealized
Appreciation
(Depreciation) on
Investments Held
at 9/30/2011 | |
Emerging Markets Small Cap Fund | | | | | | | | | | | | | | | | | | | | | | | | | | | | | | | | |
Common Stocks | | $ | 298 | | | $ | 223 | | | $ | (197,401 | ) | | $ | 196,880 | | | $ | — | | | $ | — | | | $ | — | | | $ | — | |
| | | | |
Global Opportunities Fund | | | | | | | | | | | | | | | | | | | | | | | | | | | | | | | | |
Common Stocks | | | 21,790 | | | | 100 | | | | (156,407 | ) | | | 134,517 | | | | — | | | | — | | | | — | | | | — | |
Warrants | | | — | | | | — | | | | — | | | | — | | | | 27,200 | | | | — | | | | 27,200 | | | | — | |
| | | | |
| | | 21,790 | | | | 100 | | | | (156,407 | ) | | | 134,517 | | | | 27,200 | | | | — | | | | 27,200 | | | | — | |
| | | | |
International Opportunities Fund | | | | | | | | | | | | | | | | | | | | | | | | | | | | | | | | |
Common Stocks | | | 52,763 | | | | 762 | | | | (1,661,395 | ) | | | 1,607,870 | | | | — | | | | — | | | | — | | | | — | |
| | | | |
Micro Cap Fund | | | | | | | | | | | | | | | | | | | | | | | | | | | | | | | | |
Common Stocks | | | 281,050 | | | | — | | | | — | | | | (225,610 | ) | | | — | | | | — | | | | 55,440 | | | | (225,610 | ) |
Warrants | | | — | | | | — | | | | — | | | | — | | | | 220,511 | | | | — | | | | 220,511 | | | | — | |
| | | | |
| | | 281,050 | | | | — | | | | — | | | | (225,610 | ) | | | 220,511 | | | | — | | | | 275,951 | | | | (225,610 | ) |
| | | | |
Micro Cap Value Fund | | | | | | | | | | | | | | | | | | | | | | | | | | | | | | | | |
Common Stocks | | | 291,470 | | | | — | | | | — | | | | (91,385 | ) | | | — | | | | — | | | | 200,085 | | | | (91,385 | ) |
Preferred Stocks | | | — | | | | 249,997 | | | | — | | | | — | | | | — | | | | — | | | | 249,997 | | | | — | |
Warrants | | | — | | | | — | | | | — | | | | — | | | | 75,721 | | | | — | | | | 75,721 | | | | — | |
| | | | |
| | | 291,470 | | | | 249,997 | | | | — | | | | (91,385 | ) | | | 75,721 | | | | — | | | | 525,803 | | | | (91,385 | ) |
| | | | |
Small Cap Growth Fund | | | | | | | | | | | | | | | | | | | | | | | | | | | | | | | | |
Common Stocks | | | 279,065 | | | | — | | | | (769,098 | ) | | | 490,280 | | | | — | | | | — | | | | 247 | | | | (275,191 | ) |
Preferred Stocks | | | 7,832,752 | | | | 2,999,964 | | | | — | | | | (451,294 | ) | | | — | | | | (1,956,942 | ) | | | 8,424,480 | | | | 209,022 | |
Limited Partnership Interest | | | 5,253,847 | | | | 250,000 | | | | — | | | | 767,325 | | | | — | | | | — | | | | 6,271,172 | | | | 767,325 | |
Warrants | | | 11 | | | | — | | | | (11 | ) | | | — | | | | — | | | | — | | | | — | | | | — | |
Rights | | | 214,781 | | | | — | | | | — | | | | (214,781 | ) | | | — | | | | — | | | | — | | | | (214,781 | ) |
| | | | |
| | | 13,580,456 | | | | 3,249,964 | | | | (769,109 | ) | | | 591,530 | | | | — | | | | (1,956,942 | ) | | | 14,695,899 | | | | 486,375 | |
| | | | |
Strategic Income Fund | | | | | | | | | | | | | | | | | | | | | | | | | | | | | | | | |
Limited Liability Company Membership Interest | | | 225,655 | | | | (68,778 | ) | | | — | | | | (2,319 | ) | | | — | | | | — | | | | 154,558 | | | | (2,319 | ) |
Corporate Bonds | | | 23,692 | | | | (76,766 | ) | | | 3,710 | | | | 54,418 | | | | — | | | | — | | | | 5,054 | | | | (15,691 | ) |
| | | | |
| | | 249,347 | | | | (145,544 | ) | | | 3,710 | | | | 52,099 | | | | — | | | | — | | | | 159,612 | | | | (18,010 | ) |
| | | | |
Ultra Growth Fund | | | | | | | | | | | | | | | | | | | | | | | | | | | | | | | | |
Common Stocks | | | 186,132 | | | | — | | | | (230,906 | ) | | | 46,357 | | | | — | | | | — | | | | 1,583 | | | | (183,458 | ) |
Preferred Stocks | | | 1,477,072 | | | | — | | | | — | | | | (221,950 | ) | | | — | | | | — | | | | 1,255,122 | | | | (221,950 | ) |
Limited Partnership Interest | | | 4,831,951 | | | | 240,000 | | | | — | | | | 714,951 | | | | — | | | | — | | | | 5,786,902 | | | | 714,951 | |
Warrants | | | — | | | | — | | | | — | | | | — | | | | 112,200 | | | | — | | | | 112,200 | | | | — | |
| | | | |
| | | 6,495,155 | | | | 240,000 | | | | (230,906 | ) | | | 539,358 | | | | 112,200 | | | | — | | | | 7,155,807 | | | | 309,543 | |
| | | | |
World Innovators Fund | | | | | | | | | | | | | | | | | | | | | | | | | | | | | | | | |
Common Stocks | | | 65 | | | | — | | | | — | | | | — | | | | — | | | | — | | | | 65 | | | | — | |
Preferred Stocks | | | 770,952 | | | | (3,050,037 | ) | | | 2,036,945 | | | | 242,140 | | | | — | | | | — | | | | — | | | | — | |
Limited Partnership Interest | | | 421,896 | | | | 10,000 | | | | — | | | | 52,356 | | | | — | | | | — | | | | 484,252 | | | | 52,356 | |
Warrants | | | 8 | | | | (37,561 | ) | | | 37,553 | | | | — | | | | 48,620 | | | | — | | | | 48,620 | | | | — | |
| | | | |
| | | 1,192,921 | | | | (3,077,598 | ) | | | 2,074,498 | | | | 294,496 | | | | 48,620 | | | | — | | | | 532,937 | | | | 52,356 | |
| | | | |
Wasatch-1st Source Income Fund | | | | | | | | | | | | | | | | | | | | | | | | | | | | | | | | |
U.S. Government Agency Securities | | | $ — | | | $ | — | | | $ | — | | | $ | — | | | $ | 674,288 | | | $ | — | | | $ | 674,288 | | | $ | — | |
| | | | |
140
17. FAIR VALUEOF DERIVATIVE INSTRUMENTS*
The following is a summary of the fair valuations of the Funds’ derivative instruments categorized by risk exposure:
WASATCH CORE GROWTH FUND
Fair Values of Derivative Instruments on the Statement of Assets and Liabilities as of September 30, 2011:
| | | | | | | | | | | | | | | | | | | | | | | | |
| | | Derivatives not accounted for as hedging instruments under Statement 133 | |
| | | Interest Rate
Contracts | | | Foreign Exchange
Contracts | | | Credit
Contracts | | | Equity
Contracts | | | Other
Contracts | | | Total | |
Liabilities Derivatives | | | | | | | | | | | | | | | | | | | | | | | | |
Call options written at value | | $ | — | | | $ | — | | | $ | — | | | $ | 122,500 | | | $ | — | | | $ | 122,500 | |
| | | | |
The Effect of Derivative Instruments on the Statement of Operations for the Year Ended September 30, 2011:
| | | | | | | | | | | | | | | | | | | | | | | | |
| | | Derivatives not accounted for as hedging instruments under Statement 133 | |
| | | Interest Rate
Contracts | | | Foreign Exchange
Contracts | | | Credit
Contracts | | | Equity
Contracts | | | Other
Contracts | | | Total | |
Net Change in Unrealized Appreciation (Depreciation) on Derivatives Recognized in Income | | | | | | | | | | | | | | | | | | | | | | | | |
Change in unrealized appreciation (depreciation) on investments, options written and foreign currency translations | | $ | — | | | $ | — | | | $ | — | | | $ | 56,235 | | | $ | — | | | $ | 56,235 | |
| | | | |
WASATCH INTERNATIONAL OPPORTUNITIES FUND
The Effect of Derivative Instruments on the Statement of Operations for the Year Ended September 30, 2011:
| | | | | | | | | | | | | | | | | | | | | | | | |
| | | Derivatives not accounted for as hedging instruments under Statement 133 | |
| | | Interest Rate
Contracts | | | Foreign Exchange
Contracts | | | Credit
Contracts | | | Equity
Contracts | | | Other
Contracts | | | Total | |
Realized Gain (Loss) on Derivatives Recognized in Income | | | | | | | | | | | | | | | | | | | | | | | | |
Net realized gain (loss) on investments and foreign currency translations | | $ | — | | | $ | (42,292 | ) | | $ | — | | | $ | — | | | $ | — | | | $ | (42,292 | ) |
| | | | |
| | | | | | |
Net Change in Unrealized Appreciation (Depreciation) on Derivatives Recognized in Income | | | | | | | | | | | | | | | | | | | | | | | | |
Change in unrealized appreciation (depreciation) on investments, options written and foreign currency translations | | $ | — | | | $ | 95,860 | | | $ | — | | | $ | — | | | $ | — | | | $ | 95,860 | |
| | | | |
LONG/SHORT FUND
Fair Values of Derivative Instruments on the Statement of Assets and Liabilities as of September 30, 2011:
| | | | | | | | | | | | | | | | | | | | | | | | |
| | | Derivatives not accounted for as hedging instruments under Statement 133 | |
| | | Interest Rate
Contracts | | | Foreign Exchange
Contracts | | | Credit
Contracts | | | Equity
Contracts | | | Other
Contracts | | | Total | |
Liabilities Derivatives | | | | | | | | | | | | | | | | | | | | | | | | |
Call options written at value | | $ | — | | | $ | — | | | $ | — | | | $ | 6,052,310 | | | $ | — | | | $ | 6,052,310 | |
| | | | |
141
| | |
| WASATCH FUNDS — Notes to Financial Statements (continued) | | |
|
|
|
The Effect of Derivative Instruments on the Statement of Operations for the Year Ended September 30, 2011:
| | | | | | | | | | | | | | | | | | | | | | | | |
| | | Derivatives not accounted for as hedging instruments under Statement 133 | |
| | | Interest Rate
Contracts | | | Foreign Exchange
Contracts | | | Credit
Contracts | | | Equity
Contracts | | | Other
Contracts | | | Total | |
Realized Gain (Loss) on Derivatives Recognized in Income | | | | | | | | | | | | | | | | | | | | | | | | |
Net realized gain on written options | | $ | — | | | $ | — | | | $ | — | | | $ | 10,495,379 | | | $ | — | | | $ | 10,495,379 | |
| | | | |
| | | | | | |
Net Change in Unrealized Appreciation (Depreciation) on Derivatives Recognized in Income | | | | | | | | | | | | | | | | | | | | | | | | |
Change in unrealized appreciation (depreciation) on investments, options written and foreign currency translations | | $ | — | | | $ | — | | | $ | — | | | $ | 6,168,585 | | | $ | — | | | $ | 6,168,585 | |
| | | | |
WASATCH MICRO CAP VALUE FUND
Fair Values of Derivative Instruments on the Statement of Assets and Liabilities as of September 30, 2011:
| | | | | | | | | | | | | | | | | | | | | | | | |
| | | Derivatives not accounted for as hedging instruments under Statement 133 | |
| | | Interest Rate
Contracts | | | Foreign Exchange
Contracts | | | Credit
Contracts | | | Equity
Contracts | | | Other
Contracts | | | Total | |
Asset Derivatives | | | | | | | | | | | | | | | | | | | | | | | | |
Unrealized appreciation on foreign currency exchange contracts | | $ | — | | | $ | 238,671 | | | $ | — | | | $ | — | | | $ | — | | | $ | 238,671 | |
| | | | |
| | | | | | |
Liabilities Derivatives | | | | | | | | | | | | | | | | | | | | | | | | |
Call options written at value | | $ | — | | | $ | — | | | $ | — | | | $ | 392,070 | | | $ | — | | | $ | 392,070 | |
| | | | |
The Effect of Derivative Instruments on the Statement of Operations for the Year Ended September 30, 2011:
| | | | | | | | | | | | | | | | | | | | | | | | |
| | | Derivatives not accounted for as hedging instruments under Statement 133 | |
| | | Interest Rate
Contracts | | | Foreign Exchange
Contracts | | | Credit
Contracts | | | Equity
Contracts | | | Other
Contracts | | | Total | |
Realized Gain (Loss) on Derivatives Recognized in Income | | | | | | | | | | | | | | | | | | | | | | | | |
Net realized gain on investments and foreign currency translations | | $ | — | | | $ | (1,217,350 | ) | | $ | — | | | $ | — | | | $ | — | | �� | $ | (1,217,350 | ) |
Net realized gain on options written | | | — | | | | — | | | | — | | | | 1,917,183 | | | | — | | | | 1,917,183 | |
| | | | |
| | $ | — | | | $ | (1,217,350 | ) | | $ | — | | | $ | 1,917,183 | | | $ | — | | | $ | 699,833 | |
| | | | |
Net Change in Unrealized Appreciation (Depreciation) on Derivatives Recognized in Income | | | | | | | | | | | | | | | | | | | | | | | | |
Change in unrealized appreciation (depreciation) on investments, options written and foreign currency translations | | $ | — | | | $ | 238,671 | | | $ | — | | | $ | 445,078 | | | $ | — | | | $ | 683,749 | |
| | | | |
ULTRA GROWTH FUND
The Effect of Derivative Instruments on the Statement of Operations for the Year Ended September 30, 2011:
| | | | | | | | | | | | | | | | | | | | | | | | |
| | | Derivatives not accounted for as hedging instruments under Statement 133 | |
| | | Interest Rate
Contracts | | | Foreign Exchange
Contracts | | | Credit
Contracts | | | Equity
Contracts | | | Other
Contracts | | | Total | |
Realized Gain (Loss) on Derivatives Recognized in Income | | | | | | | | | | | | | | | | | | | | | | | | |
Net realized gain on investments and foreign currency translations | | $ | — | | | $ | — | | | $ | — | | | $ | (187,027 | ) | | $ | — | | | $ | (187,027 | ) |
| | | | |
142
WASATCH WORLD INNOVATORS FUND
Fair Values of Derivative Instruments on the Statement of Assets and Liabilities as of September 30, 2011:
| | | | | | | | | | | | | | | | | | | | | | | | |
| | | Derivatives not accounted for as hedging instruments under Statement 133 | |
| | | Interest
Rate
Contracts | | | Foreign
Exchange
Contracts | | | Credit
Contracts | | | Equity
Contracts | | | Other
Contracts | | | Total | |
Asset Derivatives | | | | | | | | | | | | | | | | | | | | | | | | |
Investments, at market value | | $ | — | | | $ | — | | | $ | — | | | $ | 20,500 | | | $ | — | | | $ | 20,500 | |
| | | | |
The Effect of Derivative Instruments on the Statement of Operations for the Year Ended September 30, 2011:
| | | | | | | | | | | | | | | | | | | | | | | | |
| | | Derivatives not accounted for as hedging instruments under Statement 133 | |
| | | Interest Rate
Contracts | | | Foreign Exchange
Contracts | | | Credit
Contracts | | | Equity
Contracts | | | Other
Contracts | | | Total | |
Realized Gain (Loss) on Derivatives Recognized in Income | | | | | | | | | | | | | | | | | | | | | | | | |
Net realized gain on investments and foreign currency translations | | $ | — | | | $ | — | | | $ | — | | | $ | (4,021 | ) | | $ | — | | | $ | (4,021 | ) |
| | | | |
Net Change in Unrealized Appreciation (Depreciation) on Derivatives Recognized in Income | | | | | | | | | | | | | | | | | | | | | | | | |
Change in unrealized appreciation (depreciation) on investments, options written and foreign currency translations | | $ | — | | | $ | — | | | $ | — | | | $ | (24,057 | ) | | $ | — | | | $ | (24,057 | ) |
| | | | |
| * | See Note 4 — Financial Derivative Instruments for additional information. |
For the year ended September 30, 2011, the average monthly balance of outstanding derivative financial instruments was as follows:
| | | | | | | | | | | | | | | | | | | | | | | | |
| | | Core
Growth
Fund | | | International
Opportunities
Fund | | | Long/Short
Fund | | | Micro Cap
Value
Fund | | | Ultra
Growth
Fund | | | World
Innovators
Fund | |
Forward currency exchange contracts: | | | | | | | | | | | | | | | | | | | | | | | | |
Average number of contracts — U.S. dollars purchased | | | — | | | | 2 | | | | — | | | | 1 | | | | — | | | | — | |
Average U.S. dollar amounts purchased | | $ | — | | | $ | 5,415,645 | | | $ | — | | | $ | 5,248,899 | | | $ | — | | | $ | — | |
Option contracts: | | | | | | | | | | | | | | | | | | | | | | | | |
Average number of put contracts purchased | | | — | | | | — | | | | — | | | | — | | | | — | | | | 121 | |
Average number of call contracts purchased | | | — | | | | — | | | | — | | | | — | | | | 83 | | | | — | |
Average number of call contracts written | | | 83 | | | | — | | | | 16,550 | | | | 1,274 | | | | — | | | | — | |
Average value of put contracts purchased | | $ | — | | | $ | — | | | $ | — | | | $ | — | | | $ | — | | | $ | 5,542 | |
Average value of call contracts purchased | | $ | — | | | $ | — | | | $ | — | | | $ | — | | | $ | 7,083 | | | $ | — | |
Average value of call contracts written | | $ | 30,208 | | | $ | — | | | $ | 4,914,330 | | | $ | 242,015 | | | $ | — | | | $ | — | |
18. SUBSEQUENT EVENTS
On November 17, 2011, the Funds filed a post-effective registration statement pursuant to Rule 485(a)(2) under the 1940 Act for Wasatch Frontier Emerging Small Countries Fund (a new series of the Trust).
On November 17, 2011, the Funds filed a post-effective registration statement pursuant to Rule 485(a)(2) for the Institutional Class shares of the Wasatch Core Growth Fund, the Wasatch Large Cap Value Fund and the Wasatch Small Cap Value Fund.
Currently, there are 19 series of the Trust authorized and outstanding (including the Wasatch Frontier Emerging Small Countries Fund). Consistent with the authority in the Declaration of Trust and Rule 18f-3 under the 1940 Act, the Board has approved a multi-class plan (the “Multi-Class Plan”) pursuant to which the Board has established and designated two classes for each series, known as Institutional Class shares and Investor Class shares. The number of authorized shares of each class is unlimited. However, only three series of the Trust (the Wasatch Core Growth Fund, the Wasatch Large Cap Value Fund and the Wasatch Small Cap Value Fund) currently offer Institutional Class Shares. Under the Multi-Class Plan, each class of shares of a series of the Trust shall represent interests in the same portfolio of investments of such series and, except as otherwise set forth in the Multi-Class Plan, shall differ solely with respect to: (i) distribution, service and other charges and expenses as set forth therein; (ii) the exclusive right of each class of shares to vote on matters submitted to shareholders that relate solely to that class or for which the interests of one class differ from the interests of another class or classes; (iii) such differences related to eligible investors as may be
143
| | |
| WASATCH FUNDS — Notes to Financial Statements (continued) | | SEPTEMBER 30, 2010 |
|
|
|
set forth in the prospectus and statement of additional information of the series, as amended or supplemented from time to time; (iv) the designation of each class of shares; and (v) conversion features. Accordingly, each class of shares represents an interest in the same portfolio of investments of a fund. Each class of shares has equal rights to voting, redemption, dividends and liquidation, except that each class bears different class expenses and each has exclusive voting rights with respect to matters that relate solely to that class or for which the interests of one class differ from the interests of another class. There are no conversion, preemptive or other subscription rights, except that shares of the Institutional Class, if available, held by any shareholder who is no longer eligible to hold such shares may be converted at the discretion of the Board or any authorized Fund officer, to shares of a class in which the shareholder is eligible on the basis of the relative net asset values of the purchase class and target class without the imposition of any sale load, fee or other charge. Affected shareholders will be notified prior to any such conversion. Shares of a class of a Fund may be exchanged for shares of the same class of another fund of the Trust, provided the shareholder meets the minimum purchase requirements of the fund into which you are exchanging. Similarly, shareholders of a class of shares of a fund of the Trust who are eligible to hold shares of another class in the same fund or another series of the Trust may exchange their shares for the other class on the basis of relative net assets provided the shareholder meets the minimum purchase requirements and any other eligibility requirements for the fund being purchased.
The Board of Trustees has the right to establish additional series and classes of shares in the future, to change those series or classes and to determine the preferences, voting powers, rights and privileges thereof. The Board of Trustees may also from time to time modify any of the relative rights, preferences, privileges, limitations, restrictions and other relative terms of a class of a series that have been established by the Trustees; divide or combine the issued or unissued shares of any class of a series into a greater or lesser number; classify or reclassify any issued or unissued shares of any class of a series into one or more classes of such series; combine two or more classes of a series into a single class of such series; in each case without any action or consent of the shareholders.
144
| | |
| WASATCH FUNDS — Report of Independent Registered Public Accounting Firm | | SEPTEMBER 30, 2011 |
|
|
|
To the Board of Trustees
and Shareholders of
Wasatch Funds Trust:
In our opinion, the accompanying statements of assets and liabilities, including the schedules of investments, and the related statements of operations and of changes in net assets and the financial highlights present fairly, in all material respects, the financial position of each of the funds constituting the Wasatch Funds Trust (hereafter referred to as the “Funds”) at September 30, 2011, the results of each of their operations for the year then ended and the changes in each of their net assets for each of the two years in the period then ended (except for the Wasatch Emerging India Fund, which the results of operations and the changes in net assets are for the period April 26, 2011 (commencement of operations) through September 30, 2011), the financial highlights for each of the periods indicated (except for the Wasatch Large Cap Value Fund (formerly Wasatch-1st Source Income Equity Fund), Wasatch-1st Source Income Fund, and Wasatch Long/Short Fund (formerly Wasatch-1st Source Long/Short Fund), and the financial highlights for the Wasatch Large Cap Value Fund, Wasatch 1st-Source Income Fund, and Wasatch Long/Short Fund for the three years in the period then ended, in conformity with accounting principles generally accepted in the United States of America. These financial statements and financial highlights (hereafter referred to as “financial statements”) are the responsibility of the Funds’ management; our responsibility is to express an opinion on these financial statements based on our audits. We conducted our audits of these financial statements in accordance with the standards of the Public Company Accounting Oversight Board (United States). Those standards require that we plan and perform the audit to obtain reasonable assurance about whether the financial statements are free of material misstatement. An audit includes examining, on a test basis, evidence supporting the amounts and disclosures in the financial statements, assessing the accounting principles used and significant estimates made by management, and evaluating the overall financial statement presentation. We believe that our audits, which included confirmation of securities at September 30, 2011 by correspondence with the custodian and brokers, provide a reasonable basis for our opinion. The financial statements of the Wasatch Large Cap Value Fund, Wasatch-1st Source Income Fund, and Wasatch Long/Short Fund as of September 30, 2008 and the financial highlights for the six months then ended were audited by other auditors, whose report dated November 26, 2008 expressed an unqualified opinion on those statements. The financial statements of the Wasatch Large Cap Value Fund, Wasatch-1st Source Income Fund, and Wasatch Long/Short Fund as of March 31, 2008 and the financial highlights for each of the two years in the period then ended, were audited by other auditors whose report dated May 22, 2008 expressed an unqualified opinion on those statements.
PricewaterhouseCoopers LLP
Kansas City, MO
November 23, 2011
145
| | |
| WASATCH FUNDS — Supplemental Information | | |
|
|
|
MANAGEMENTOFTHE COMPANY
Management Information. The business affairs of Wasatch Funds are supervised by its Board of Trustees. The Board consists of four trustees who are elected and serve until their successors are elected and qualified.
The trustees and executive officers of Wasatch Funds and their principal occupations for at least the last five years are set forth below.
| | | | | | | | | | |
| Name, Address and Age | | Position(s)
Held with
Wasatch Funds | | Term of Office1
and Length of
Time Served | | Principal Occupation(s)
During Past 5 Years | | Number of
Portfolios
in Fund
Complex
Overseen
by Trustee | | Other Directorships Held
by Trustee2 |
Independent Trustees | | | | | | | | | | |
| | | | | |
James U. Jensen, J.D., MBA c/o Wasatch Funds 150 Social Hall Ave. 4th Floor Salt Lake City, Utah 84111 Age 67 | | Trustee and Chairman of the Board | | Indefinite Served as Chairman of the Board since 2004 and Trustee since 1986 | | Chief Executive Officer of Clearwater Governance Group (an operating board governance consulting company) July 2008 to present; Co-Founder and Chairman of the Board of Intelisum, Inc. (a company pursuing computer and measurement technology and products) 2001 to 2008; Consultant on corporate growth and technology transfer since 2004; Vice President, Corporate Development, Legal Affairs and General Counsel, and Secretary, NPS Pharmaceuticals, Inc. from 1991 to 2004. | | 18 | | Private companies and foundations. Director of Cognigen Networks, Inc. (Internet and relationship enabled marketing company) since December 2007. Director of Bayhill Capital Corp. (telephone communications) since December 2007. |
| | | | | |
William R. Swinyard, Ph.D. c/o Wasatch Funds 150 Social Hall Ave. 4th Floor Salt Lake City, Utah 84111 Age 71 | | Trustee and Chairman of the Audit Committee | | Indefinite Served as Chairman of the Audit Committee since 2004 and Trustee since 1986 | | Professor of Business Management and Holder of the Fred G. Meyer Chair of Marketing (Emeritus), Brigham Young University since 1978. | | 18 | | None |
| | | | | |
D. James Croft, Ph.D. c/o Wasatch Funds 150 Social Hall Ave. 4th Floor Salt Lake City, Utah 84111 Age 69 | | Trustee | | Indefinite Served as Trustee since 2005 | | Consultant since 2004 and Founder & Executive Director, Mortgage Asset Research Institute from 1990 to 2004. | | 18 | | None |
| | | | | |
Miriam M. Allison3 150 Social Hall Ave. 4th Floor Salt Lake City, UT 84111 Age 64 | | Trustee | | Indefinite Served as Trustee since 2010 | | Rancher since 2004. From 2001 to 2005, Chairman of UMB Fund Services, Inc. | | 18 | | Director, Northwestern Mutual Series Fund, Inc. (27 portfolios) since 2006. |
|
|
Interested Trustee | | | | | | | | | | |
| | | | | |
Samuel S. Stewart, Jr., Ph.D. CFA4 150 Social Hall Ave. 4th Floor Salt Lake City, UT 84111 Age 69 | | President and Trustee | | Indefinite Served as President and Trustee since 1986 | | Chairman of the Board for the Advisor since 1975; Chief Investment Officer of the Advisor since 2004; Director of Research of the Advisor from 1975 to 2004; Chairman of the Board of Wasatch Funds from 1986 to 2004. | | 18 | | None |
|
|
| 1 | A Trustee may serve until his/her death, resignation, removal or retirement. Each Independent Trustee shall retire as Trustee at the end of the calendar year in which (s)he attains the age of 75 years. |
| 2 | Directorships are those held by a Trustee in any company with a class of securities registered pursuant to Section 12 of the Securities Exchange Act of 1934 or subject to the requirements of Section 15(d) of the Securities Exchange Act or any company registered as an investment company under the 1940 Act. |
| 3 | Ms. Allison previously owned shares of UMB Financial Corp., the parent company of UMB Fund Services, Inc., the Funds’ transfer agent. As of the date of this statement, Ms. Allison no longer owns such shares. |
| 4 | Mr. Stewart is an Interested Trustee because he serves as the Chairman of the Board of the Advisor. |
146
| | |
| | SEPTEMBER 30, 2011 (UNAUDITED) |
|
|
|
| | | | | | |
Name, Address
and Age | | Position(s)
Held with
Wasatch Funds | | Term of Office and
Length of Time Served | | Principal Occupation(s)
during Past 5 Years |
Officers | | | | | | |
| | | |
Daniel D. Thurber 150 Social Hall Ave. 4th Floor Salt Lake City, UT 84111 Age 42 | | Vice President | | Indefinite Served as Vice President since February 2007 | | General Counsel, Chief Compliance Officer and Director of Compliance for the Advisor since 2006; Chief Compliance Officer and Secretary for Wasatch Funds from May 2006 to February 2007; Associate and Partner at Dorsey & Whitney LLP from 2001 to 2006. |
| | | |
Russell L. Biles 150 Social Hall Ave. 4th Floor Salt Lake City, UT 84111 Age 43 | | Chief Compliance Officer, Vice President and Secretary | | Indefinite Served as Chief Compliance Officer and Vice President since February 2007 and Secretary since November 2008 | | Chief Compliance Officer and Vice President for Wasatch Funds since February 2007; Counsel for the Advisor since October 2006; Senior Compliance Administrator for the Advisor from October 2005 to October 2006; Attorney and Managing Member of Nicholls Nicholls Biles & Bower, LLC from 2002 to 2005. |
| | | |
Cindy B. Firestone, CPA 150 Social Hall Ave. 4th Floor Salt Lake City, UT 84111 Age 53 | | Treasurer | | Indefinite Served as Treasurer since May 2009 | | Treasurer for Wasatch Funds since May 2009, Assistant Treasurer for Wasatch Funds from November 2008 to May 2009; Internal Auditor for the Advisor, December 2002 to August 2011. |
|
|
Additional information about the Funds’ trustees is provided in the Statement of Additional Information and is available without charge, upon request, by calling 800.551.1700.
ADDITIONAL TAX INFORMATION:
The Funds hereby designate the following amounts or maximum amounts allowable as long term capital gain dividends for the purpose of the dividends paid deduction. The amounts designated here include the utilization of earnings and profits distributed to shareholders on the redemption of shares.
| | | | |
| | | Amount | |
Global Opportunities Fund | | $ | 13,642,551 | |
Heritage Growth Fund | | | 5,614 | |
International Opportunities Fund | | | 7,334,341 | |
U.S. Treasury Fund | | | 10,250,028 | |
For the fiscal year ended September 30, 2011, certain dividends paid by each Fund may be subject to a maximum tax rate of 15% as provided for by the Jobs and Growth Tax Relief Reconciliation Act of 2003. To the extent dividends are paid during the calendar year 2011, complete information will be reported on shareholders’ 2011 Form 1099-DIV.
The amount designated as qualified dividend income for the year ended September 30, 2011 will be at the highest amount permitted by law.
Corporate shareholders should note for the year ended September 30, 2011, the percentage of the Funds’ investment income (i.e., net investment income plus short-term capital gains) that qualified for the corporate dividends received deductions are as follows:
| | | | |
| | | Percentage | |
Global Opportunities Fund | | | 24 | % |
Heritage Growth Fund | | | 99 | % |
Large Cap Value Fund | | | 100 | % |
Long/Short Fund | | | 100 | % |
Strategic Income Fund | | | 57 | % |
Income Fund | | | 2 | % |
147
| | |
WASATCH FUNDS — Supplemental Information (continued) | | SEPTEMBER 30, 2011 (UNAUDITED) |
|
|
|
PROXY VOTING POLICIES, PROCEDURESAND RECORD
A description of the policies and procedures that Wasatch Advisors uses to vote proxies related to the Funds’ portfolio securities is set forth in the Funds’ Statement of Additional Information which is available without charge, upon request, on the Funds’ website at www.wasatchfunds.com or by calling 800.551.1700 and on the Securities and Exchange Commission’s (SEC) website at www.sec.gov.
Wasatch Funds’ proxy voting record is available on the Funds’ website at www.wasatchfunds.com and the SEC’s website at www.sec.gov no later than August 31 for the prior 12 months ending June 30.
QUARTERLY PORTFOLIO HOLDINGS DISCLOSUREON FORM N-Q
The Funds file their complete schedules of investments with the SEC for their first and third fiscal quarters of each fiscal year, commencing with the quarter ended December 31, 2004, on Form N-Q. The Funds’ Form N-Q is available on the SEC’s website at www.sec.gov, and may be viewed at the SEC’s Public Reference Room in Washington, D.C. (information on the operation of the Public Reference Room may be obtained by calling 800.SEC.0330).
INVESTMENT ADVISOR
Wasatch Advisors, Inc.
150 Social Hall Avenue, 4th Floor
Salt Lake City, UT 84111
SUB-ADVISORFORTHE U.S. TREASURY FUND
Hoisington Investment Management Co.
6836 Bee Caves Rd.
Building 2, Suite 100
Austin, TX 78746
SUB-ADVISORFORTHE WASATCH-1ST SOURCE INCOME FUND
1st Source Corporation Investment Advisors, Inc.
100 North Michigan Street
South Bend, IN 46601
ADMINISTRATORAND FUND ACCOUNTANT
State Street Bank and Trust Company
801 Pennsylvania Avenue
Kansas City, MO 64105
DISTRIBUTOR
ALPS Distributors, Inc.
1290 Broadway, Suite 1100
Denver, CO 80203
TRANSFER AGENT
UMB Fund Services, Inc.
803 West Michigan Street, Suite A
Milwaukee, WI 53233-2301
CUSTODIAN
State Street Bank and Trust Company
801 Pennsylvania Avenue
Kansas City, MO 64105
LEGAL COUNSELTO WASATCH FUNDSANDINDEPENDENT TRUSTEES
Chapman and Cutler, LLP
111 West Monroe Street
Chicago, IL 60603
INDEPENDENT REGISTERED PUBLIC ACCOUNTING FIRM
PricewaterhouseCoopers LLP
1100 Walnut, Suite 1300
Kansas City, MO 64106
148
| | |
| WASATCH FUNDS — Guide to Understanding Financial Statements | | SEPTEMBER 30, 2011 (UNAUDITED) |
|
|
|
Wasatch Funds provides reports to shareholders twice a year. The annual report is for the Funds’ fiscal year which ends September 30. The semi-annual report is for the six months or period ending March 31. Additionally, the Funds’ schedules of investments for the first and third quarters of each fiscal year are available to shareholders as described on page 148. These reports provide shareholders with important information that will help them evaluate the management and performance of their investments. It is the desire of Wasatch Funds to help shareholders stay in tune with their investments. If you have any questions about the information in this report, a shareholder services representative will be happy to assist you when you call 800.551.1700.
SCHEDULEOF INVESTMENTS
The holdings of each Wasatch Fund are detailed in the “Schedule of Investments.” This section provides a snapshot of the securities each Fund was invested in on the last day of the reporting period. The Wasatch Equity Funds invest primarily in Common Stocks of companies which are grouped together by industry. The U.S. Treasury Fund invests primarily in U.S. Treasury securities. The Wasatch-1st Source Income Fund invests primarily in fixed income securities. The Equity Funds will typically have only minor holdings in Short-Term Investments. At times the Funds may take temporary defensive positions by increasing cash or holdings in Short-Term Investments. Please see the prospectus under “Additional Information about the Funds.”
STATEMENTSOF ASSETSAND LIABILITIES
These financial statements show the Assets and Liabilities of a Fund on the last day of the reporting period. A Fund’s Assets include the value of securities owned, amounts receivable for purchases of Fund shares (capital shares receivable), securities sold, interest and dividends, prepaid expenses and other assets. Liabilities are amounts owed for shareholder redemptions (capital shares payable), securities purchased, investment advisory fees and other expenses. Totaling up the assets and subtracting the liabilities results in a Fund’s Net Assets.
Net Assets consist of capital stock, paid-in capital in excess of par, undistributed net investment income or loss, undistributed net realized gain or loss on investments and net unrealized appreciation or depreciation on investments. Capital stock is stock authorized by a company’s charter and having par value, stated value or no par value. Par value is set by the company issuing the shares and has no relation to Net Asset Value. The par value of one share of each Wasatch Fund is $.01. Paid-in capital in excess of par is capital received from shareholders in exchange for Fund shares that exceeds the par value of the shares. For example, if you bought one share of a Fund for $10, $.01 would show as “Capital stock” on the books of the Fund, and $9.99 would be accounted for under “Paid-in capital in excess of par.” Undistributed net investment income or loss is the amount of net investment income or loss of a Fund since inception that has not been paid to shareholders as a dividend.
Undistributed net realized gain (loss) on investments is the amount of net realized gains or losses generated by a Fund since inception that have not been distributed to shareholders in the form of a capital gain distribution. A gain or loss is realized when a security is sold by a Fund. Net unrealized appreciation (depreciation) on investments is the change in value from the purchase price of securities a Fund continues to hold.
The number of shares a Fund is authorized to sell can be found under Capital Stock, $.01 par value. Issued and outstanding indicates the number of shares owned by shareholders.
Net Asset Value (NAV), Redemption Price and Offering Price Per Share shows the value of one outstanding share of a Fund on the date of the report. A Fund’s share price (NAV) is calculated by dividing the value of all securities and other assets owned by a Fund, less the liabilities charged to that Fund, by the number of Fund shares outstanding. The share price is calculated at the close of business of the New York Stock Exchange on each day the Exchange is open for trading. Please see Wasatch Funds’ prospectus for more information about how share prices are calculated. Information about how the share price is affected by a Fund’s operation can be found under “Financial Highlights” on page 150.
STATEMENTSOF OPERATIONS
Statements of Operations show investment income and expenses for each Fund as well as realized gains or losses from securities sold and the appreciation or depreciation in the value of a Fund’s holdings during the reporting period.
Investment Income shows Interest and Dividends earned from interest-bearing and dividend-paying securities in a Fund’s portfolio.
Expenses show the various fees and expenses paid out of a Fund’s assets such as the fee paid to Wasatch Advisors, the Funds’ investment advisor. Additional fees include shareholder servicing, fund administration and accounting, custody of fund assets, federal and state registration, legal counsel, auditing and trustees’ fees and other expenses. The Funds pay for printing and mailing statements, prospectuses, annual reports and semi-annual reports to shareholders.
Net Investment Income (Loss) is the amount of dividends and interest income earned on securities held by a Fund, less the Fund’s expenses.
Net realized gain (loss) on investments and foreign currency translations is the net gain or loss on securities a Fund has sold. Change in unrealized appreciation (depreciation) on investments and foreign currency translations is the change in value of securities a Fund continues to hold.
Net gain (loss) on investments is the result of changes in the market value of securities a Fund has sold and securities it continues to hold.
STATEMENTSOF CHANGESIN NET ASSETS
Net Assets are a Fund’s remaining assets after taking into consideration any liabilities. Statements of Changes in Net
149
| | |
WASATCH FUNDS — Guide to Understanding Financial Statements (continued) | | SEPTEMBER 30, 2011 (UNAUDITED) |
|
|
|
Assets show the increase or decrease in a Fund’s net assets during the reporting period. Investment operations, dividends and capital share transactions affect a Fund’s net assets. Operations is a summary of the Statements of Operations. It includes investment income or loss, net realized gain or loss on investments and foreign currency translations a Fund has sold as well as appreciation or depreciation in the value of investments a Fund continues to hold.
Dividends are distributed by Wasatch Funds to sharehold-ers when Fund investments have earned income in excess of net expenses or when capital gains in excess of capital losses are realized from the sale of securities. Most shareholders choose to reinvest their dividends and capital gain distribu- tions. Each Fund is required by Internal Revenue Code regulations to distribute substantially all of its net investment income and capital gains to shareholders in order to retain its status as a “regulated investment company.”
Capital share transactions are any transactions involving shares of a Fund, including the selling of Fund shares, shares issued by a Fund to shareholders for the reinvestment of dividends, and share redemptions.
FINANCIAL HIGHLIGHTS
The Financial Highlights contain important historical operating information that you may find useful in making decisions or understanding the performance of your investment.
Net Asset Value (NAV) is defined under “Statements of Assets and Liabilities” on page 149. The difference between the Net asset value, beginning of period and the Net asset value, end of period in the Financial Highlights is the change in value of a Fund’s shares over the reporting period, but not its total return.
Income (loss) from investment operations shows how the share price was affected by a Fund’s operations on a per share basis. Net investment income (loss) is the per share
amount of dividends and interest income earned on securities held by a Fund, less the Fund’s expenses. Net realized and unrealized gains (losses) on securities is the per share increase or decrease in the value of securities a Fund holds or has sold during the reporting period. Gains or (losses) are realized when securities are sold. Gains or (losses) are unrealized when securities increase or decrease in value but are not sold.
Distributions are the per share amount that a Fund paid to shareholders from net investment income and net realized gains.
Total return is the percentage increase or decrease in the value of an investment over a stated period of time. A total return percentage includes both changes in unrealized and realized gains and income. For the purposes of calculating total return, it is assumed that dividends and distributions are reinvested at the share price on the ex-dividend date of the distribution. A FUND’S TOTAL RETURN CANNOT BE COMPUTED DIRECTLY FROM THE FINANCIAL HIGHLIGHTS.
Supplemental data and ratios are provided to help you better understand your investment. Net assets, end of period, are the net assets of a Fund on the reporting date. Ratio of expenses to average net assets shows the total of a Fund’s operating expenses divided by its average net assets for the stated period before and after waivers and reimbursements by the Advisor, if any. Ratio of net investment income (loss) to average net assets shows a Fund’s net investment income (loss) divided by its average net assets for the stated period before and after waivers and reimbursements by the Advisor, if any. Portfolio turnover rate measures a Fund’s buying and selling activity during the reporting period. It is computed by dividing total purchases or sales, whichever is less, by the average monthly market value of a Fund’s portfolio securities. This calculation does not include securities with a maturity date of less than 12 months.
TELEPHONE
800.551.1700
M - F, 7:00 a.m. to 7:00 p.m. CT
Automated Line, 24 Hours
U.S. MAIL
Wasatch Funds
P.O. Box 2172
Milwaukee, WI 53201-2172
OVERNIGHT MAIL
Wasatch Funds
803 West Michigan Street, Suite A
Milwaukee, WI 53233-2301
ONLINE
www.wasatchfunds.com
shareholderservice@wasatchfunds.com
150
Item 2: Code of Ethics.
| (a) | Wasatch Funds Trust (the “Registrant”) has adopted a Code of Ethics that applies to the Registrant’s principal executive officer and principal financial officer. |
| (b) | No disclosures are required by this Item 2(b). |
| (c) | There have been no amendments to the Registrant’s Code of Ethics during the reporting period for this Form N-CSR. |
| (d) | There have been no waivers granted by the Registrant to individuals covered by the Registrant’s Code of Ethics during the reporting period for this Form N-CSR. |
| (f) | A copy of the Registrant’s Code of Ethics is attached as an exhibit to this Form N-CSR. |
Item 3: Audit Committee Financial Expert.
| | | | |
(a) | | (1) | | The Board of Trustees of the Registrant has determined that the Registrant has at least one member serving on the Registrant’s Audit Committee that possesses the attributes identified in Instruction 2(b) of Item 3 to Form N-CSR to qualify as “audit committee financial expert.” |
| | |
| | (2) | | The name of the audit committee financial expert is Miriam M. Allison. Ms. Allison is deemed to be “independent” as that term is defined in Item 3(a)(2) of Form N-CSR. |
Item 4. Principal Accountant Fees and Services.
(a) Audit Fees - The aggregate fees billed for professional services rendered by the independent registered public accounting firm for the audit of the Registrant’s annual financial statements or services normally provided in connection with statutory and regulatory filings or engagements for the last two fiscal years ended September 30, 2011 and September 30, 2010 were $308,300 and $299,175, respectively.
(b) Audit Related Fees – During the fiscal years ended September 30, 2011 and September 30, 2010, the Registrant was not billed any fees by the independent registered public accounting firm for assurance and related services rendered by the independent registered public accounting firm to the Registrant that are reasonably related to the performance of the audit of the Registrant’s financial statements and are not reported under paragraph (a) of this Item 4.
During the fiscal years ended September 30, 2011 and 2010, no fees for assurance and related services that relate directly to the operations and financial reporting of the Registrant were billed by the independent registered public accounting firm to the Registrant’s investment adviser or any other entity controlling, controlled by, or under common control with the investment adviser that provides ongoing services to the Registrant.
(c) Tax Fees - The aggregate fees billed for professional services rendered by the independent registered public accounting firm to the Registrant for tax compliance, tax advice, tax planning and tax return preparation for the last two fiscal years ended September 30, 2011 and September 30, 2010 were $78,470 and $78,000, respectively. These services consisted of the independent registered public accounting firm reviewing the Registrant’s excise tax returns, distribution requirements and RIC tax returns, as well as consultations regarding the tax consequences of specific investments.
During the fiscal years ended September 30, 2011 and 2010, no fees for tax compliance, tax advice or tax planning services that relate directly to the operations and financial reporting of the Registrant were billed by the independent registered public accounting firm to the Registrant’s investment adviser or any other entity controlling, controlled by, or under common control with the investment adviser that provides ongoing services to the Registrant.
(d) All Other Fees –During the fiscal years ended September 30, 2011 and 2010, there were no fees billed for products and services provided by the independent registered public accounting firm to the Registrant, other than the services reported in paragraph (a) – (c) of this Item 4.
During the fiscal years ended September 30, 2011 and 2010, no fees for other services that relate directly to the operations and financial reporting of the Registrant were billed by the independent registered public accounting firm to the Registrant’s investment adviser or any other entity controlling, controlled by, or under common control with the investment adviser that provides ongoing services to the Registrant.
(e) Pre-Approval Policies and Procedures
(1) Pursuant to the registrant’s Audit Committee Charter, the Audit Committee shall evaluate the independence of the independent public accountants, including evaluating whether the independent public accountants provide audit services or consulting services to the Registrant or consulting services to the investment adviser, and to receive the specific representations of the independent registered public accounting firm as to their independence. Specifically, the Audit Committee will be responsible for evaluating the provision of non-audit services to the Registrant as required by Section 201 of the Sarbanes-Oxley Act, any pre-approval requests submitted by the independent registered public accounting firm as required by Section 202 of the Sarbanes-Oxley Act or as otherwise required under Section 2-01 of Regulation S-X, and shall monitor the conflict of interest requirements in Section 206 of the Sarbanes-Oxley Act, and the prohibitions on improper influence on the conduct of audits in Section 303 of the Sarbanes-Oxley Act. The Audit Committee shall pre-approve any engagement of the independent registered public accounting firm to provide any services (other than prohibited non-audit services) including the fees and other compensation to be paid to the independent registered public accounting firm.
The independent registered public accounting firm is authorized by the Audit Committee to provide non-audit services to the extent allowable under the Sarbanes-Oxley Act of 2002 for the Registrant provided that (i) the fees payable with respect to such services do not exceed $5,000 in any calendar quarter and (ii) such fees are ratified by the Audit Committee at its next meeting. The fees payable with respect to non-audit services may be increased by the affirmative vote of a majority of the members of the Audit Committee.
(2) There were no pre-approval requirements waived for the services provided to the Registrant described in paragraphs (b)-(d) of Item 4 by the Audit Committee pursuant to paragraph (c)(7)(i)(C) of Rule 2-01 of Regulation S-X (the “De Minimis Rule”). There were no fees billed for services provided to the investment adviser described in paragraphs (b)-(d) of Item 4 that were required to be pre-approved by the Audit Committee as described in paragraph (e)(1) of Item 4.
(f) No disclosures are required by this Item 4(f).
(g) The independent registered public accounting firm did not bill the Registrant or the Registrant’s investment adviser for any other ongoing non-audit services for the fiscal years ended September 30, 2011 and 2010 for the Registrant.
(h) No disclosures are required by this Item 4(h).
Item 5. Audit Committee of Listed Registrants.
Not applicable.
Item 6. Schedule of Investments.
| (a) | Schedule of Investments is included as a part of the report to shareholders filed under Item 1 of this Form N-CSR. |
Item 7. Disclosure of Proxy Voting Policies and Procedures for Closed-End Management Investment Companies.
Not applicable.
Item 8. Portfolio Managers of Closed-End Investment Companies.
Not applicable.
Item 9. Purchases of Equity Securities by Closed-End Management Investment Company and Affiliated Purchasers.
Not applicable.
Item 10. Submission of Matters to a Vote of Security Holders.
The Board of Trustees has not adopted formal procedures by which shareholders may recommend nominees to the Board.
Item 11. Controls and Procedures.
| (a) | The Registrant’s principal executive and principal financial officers have concluded that the Registrant’s disclosure controls and procedures (as defined in Rule 30a-3(c) under the Investment Company Act of 1940, as amended (the “1940 Act”) (17 CFR 270.30a-3(c)) are effective, as of a date within 90 days of the filing date of this Form N-CSR based on their evaluation of these controls and procedures required by Rule 30a-3(b) under the 1940 Act (17 CFR 270.30a-3(b)) and Rules 13a-15(b) or 15d-15(b) under the Securities Exchange Act of 1934 (17 CFR 240.13a-15(b) or 240.15d-15(b)). |
| (b) | There were no changes in the Registrant’s internal control over financial reporting (as defined in Rule 30a-3(d) under the 1940 Act (17 CFR 270.30a-3(d)) that occurred during the Registrant’s second fiscal quarter of the period covered by this report that has materially affected, or is reasonably likely to materially affect, the Registrant’s internal control over financial reporting. |
Item 12. Exhibits.
| | | | |
(a) | | (1) | | Code of Ethics is attached hereto. |
| | |
| | (2) | | The certifications required by Rule 30a-2(a) of the 1940 Act are attached hereto. |
| | |
| | (3) | | Not applicable. |
(b) The certifications required by Rule 30a-2(b) of the 1940 Act and Section 906 of the Sarbanes-Oxley Act of 2002 are attached hereto.
SIGNATURES
Pursuant to the requirements of the Securities Exchange Act of 1934 and the Investment Company Act of 1940, the Registrant has duly caused this report to be signed on its behalf by the undersigned, thereunto duly authorized.
WASATCH FUNDS TRUST
| | |
By: | | /s/ Samuel S. Stewart, Jr. |
| | Samuel S. Stewart, Jr. |
| | President (principal executive officer) of Wasatch Funds Trust |
| |
Date: | | December 2, 2011 |
Pursuant to the requirements of the Securities Exchange Act of 1934 and the Investment Company Act of 1940, this report has been signed below by the following persons on behalf of the Registrant and in the capacities and on the dates indicated.
| | |
By: | | /s/ Samuel S. Stewart, Jr. |
| | Samuel S. Stewart, Jr. |
| | President (principal executive officer) of Wasatch Funds Trust |
| |
Date: | | December 2, 2011 |
| | |
By: | | /s/ Cindy B. Firestone |
| | Cindy B. Firestone |
| | Treasurer (principal financial officer) of Wasatch Funds Trust |
| |
Date: | | December 2, 2011 |