UNITED STATES
SECURITIES AND EXCHANGE COMMISSION
Washington, D.C. 20549
FORM N-CSR
CERTIFIED SHAREHOLDER REPORT OF REGISTERED
MANAGEMENT INVESTMENT COMPANIES
Investment Company Act file number: 811-04920
WASATCH FUNDS TRUST
(Exact name of registrant as specified in charter)
150 Social Hall Avenue
4th Floor
Salt Lake City, Utah 84111
(Address of principal executive offices)(Zip code)
| | |
(Name and Address of Agent for Service) | | Copy to: |
Samuel S. Stewart, Jr. Wasatch Funds Trust 150 Social Hall Avenue, 4th Floor Salt Lake City, Utah 84111 | | Eric F. Fess, Esq. Chapman & Cutler LLP 111 West Monroe Street Chicago, IL 60603 |
Registrant’s telephone number, including area code: (801) 533-0777
Date of fiscal year end: September 30
Date of reporting period: September 30, 2010
| Item 1: | Report to Shareholders. |
Annual Report & Commentaries
September 30, 2010-11-30
WASATCH
FUNDS
Deeper, Disciplined Investing
Wasatch Core Growth Fund
Wasatch Emerging Markets Small Cap Fund
Wasatch Global Opportunities Fund
Wasatch Global Science & Technology Fund
Wasatch Heritage Growth Fund
Wasatch International Growth Fund
Wasatch International Opportunities Fund
Wasatch Micro Cap Fund
Wasatch Micro Cap Value Fund
Wasatch Small Cap Growth Fund
Wasatch Small Cap Value Fund
Wasatch Strategic Income Fund
Wasatch Ultra Growth Fund
Wasatch-1st Source Income Equity Fund
Wasatch-1st Source Long/Short Fund
Wasatch-Hoisington U.S. Treasury Fund
Wasatch-1st Source Income Fund
EQUITY FUNDS
BOND FUNDS (SUB-ADVISED)
September 30, 2010
Annual Report &
Commentaries
Annual Report & Commentaries
September 30, 2010-11-30
WASATCH
FUNDS
Deeper, Disciplined Investing
Thank you for your investment in Wasatch Funds. We hope this report
will be helpful to you in understanding each of the funds within the Wasatch family.
As a reminder, manager commentaries can always be found on our website
www.WasatchFunds.com approximately three weeks after the end of each calendar
quarter.
Who we are.
We are a research driven, employee owned firm managing no-load mutual funds. Located at the foot of the Wasatch
Mountains in Salt Lake City, Utah, we are far away from Wall Street and its herd mentality. Our portfolio managers
are independent, yet collaborative, thinkers who bring substantial experience to their funds.
Where we came from.
Founded in 1975, by Dr. Sam Stewart, we initially focused on growth investing in small companies. Using a fundamental,
bottom up research method we looked for market inefficiencies relative to the long term growth potential of
lesser known companies. Investing in small, harder to find companies required a disciplined, rigorous and independent
research process. Over time, Wasatch added more research professionals and began applying the same successful
process to investing in micro, value, international, and larger companies.
What we believe.
We believe in common sense investing, involving deep due diligence, cross-team collaboration, and commitment to
discipline, as we follow our central investment philosophy of:
“Earnings Growth Drives Stock Prices Over the Long Term”
What we do.
We utilize a proven and repeatable process to uncover interesting companies. We look deeper to find and understand
each company. We leverage portfolio managers from across the firm to fully vet each investment idea. We stay true
to our investment style. We close funds before they get too large in order to protect shareholders. We seek to deliver
above-average returns over the long-term, and we strive in every way to earn the trust of our shareholders.
If your have any questions please visit our website www.WasatchFunds.com or feel free to call
us Monday through Friday 7am – 7pm CT at 1.800.551.1700.
Investing in small cap funds will be volatile and loss of principle could be greater than investing in large cap or
more diversified funds. Investing in foreign securities, especially in emerging markets, entails special risks, such
as currency fluctuations and political uncertainties, which are described in more detail in the prospectus. An
investor should consider investment objectives, risks, charges and expenses carefully before investing. To obtain a
prospectus, which contains this and other information, visit www.wasatchfunds.com or call 800.551.1700. Please
read the prospectus carefully before investing. Wasatch Funds are distributed by ALPS Distributors, Inc.
What makes Wasatch different?
Deeper – We use an intensely thorough process to fully understand each investment.
Disciplined – We stick to our process and investment style regardless of market fads.
Collaborative – We work across portfolios to leverage valuable experience and research insights.
Independent – We do our own research to avoid getting caught in the herd.
Wasatch Funds
Salt Lake City, Utah
www.wasatchfunds.com
800.551.1700
This material must be accompanied or preceded by a prospectus.
Please read the prospectus carefully before you invest.
Wasatch Funds are distributed by ALPS Distributors, Inc.
1
| | |
| LETTERTO SHAREHOLDERS —“MOREOFTHE SAME” | | |
|
| |
| |
| | |

Samuel S. Stewart, Jr. PhD, CFA President of
Wasatch Funds | | DEAR FELLOW SHAREHOLDERS: ECONOMY Last year I used an analogy of crossing a white water river and then having to climb a steep riverbank to describe our economic situation. Well, we seem to have finally made it to the top of the riverbank. Unfortunately, what we can see from the top of the bank is that we have a long, dusty, uphill road still ahead to make it back to town. In my recent quarterly letters I have been discussing the long-term structural challenges that our economy faces — the most concerning being reduced access to credit, continuing high unemployment, and increasing government debt and regulatory burdens. Reflecting on these concerns, I would describe this quarter’s economic progress as just more of the same, as we have not seen a meaningful change in these metrics. I have expected them to be slow to improve, but for the moment it feels like we have paused at the top of the riverbank to catch our breath before beginning the long walk to town. There has been quite a bit of talk recently about a double-dip recession — sliding back down the riverbank. I am less concerned about such a risk and more focused on what it’s going to take to hike back to town. The |
government played an important role in keeping us from getting swept down the river at the height of the crisis, but now it is up to the people to get the economy restarted using our inherent ingenuity, entrepreneurial spirit, and hard work.
Outside of the U.S., I believe Europe is in an even tougher spot because the continent faces similar challenges to ours while also trying to tie disparate countries together with only a monetary union. It may be surprising to many, but emerging countries have best weathered the financial and economic storm and are positioned for continued growth. Although not considered “developed” economies, emerging countries were actually well ahead of the developed world in intelligent self-management — or perhaps more accurately, developed countries extended themselves beyond intelligent self-management.
Emerging economies are not getting everything right and have felt pain as well, but many are in better shape than developed countries. A recent Barron’s article noted that the U.K. and the U.S. have actually nationalized more companies during the financial crisis than were nationalized in Africa over the last nine years.1 Brazil’s and India’s banks have been solid throughout the financial crisis because those countries have regulations that limited the risk banks could undertake in the form of loan quality, leverage, and the like.
MARKET
The S&P 500 is up just over 10% for the past 12 months but, as market watchers know, it has not been a steady ride. Between February and April we saw the market rise almost 14% just to watch those gains and more vanish by the beginning of July. As people asked me about the falling market in May and June, I described the situation as “a change in perception, not a change in reality.” It appeared to me that the market had gotten ahead of the economic recovery as investors reacted to short-term data and chose not to acknowledge the longer-term challenges our economy faces. Events like the Greek financial crisis this spring caused investors to finally pause and at least temporarily consider these deeper issues.
Of the past year’s market gains, roughly 90% came in what was an unusually strong September — the S&P 500 gained about 9%. I am surprised to see just how momentum-driven the market remains. At times it feels to me like investors have failed to learn a lesson from the recent crisis, and that they remain incredibly shortsighted. As a result, the current market has created an interesting dichotomy — companies that are really doing well are getting all of the attention, while strong companies that are only firing on six of their eight cylinders are being overlooked. This makes it a good time to take some profits on stocks whose prices are moving up as well as to re-invest in forgotten companies that are well-positioned for the future but not yet firing on all cylinders.
We are also seeing a determined search for yield by investors, primarily through a continuing flight to bonds. This is partly driven by increased fear of the equity markets and partly by the investment needs of retiring baby boomers. As I’ve mentioned in recent quarters, I’m afraid that many of these bond investors are taking on more risk than they realize. Bond funds have been delivering unsustainably high returns as bond prices have been driven up by historically low interest rates and heavy demand. When interest rates begin to rise again we will likely see bond funds with negative returns.
In this quest for yield we are also seeing investors increasingly buying high yield bonds, perhaps without realizing the quality implications. I find this somewhat ironic since similar low-quality securities led to the financial crisis just two years ago. I’m concerned that new bond investors may not realize the risks they are accepting — interest rate risk and credit risk — because of the common misperception many investors have of all bonds being low risk by nature.
Meanwhile, blue chip stocks are being passed over despite offering attractive yields and trading at historically low valuations.
Given such incongruities, I expect that we will continue to experience a seesaw market, but overall I think the U.S. and European equity markets are likely to be sluggish over the next 12 months as we continue to work through our economic challenges.
WASATCH
Wasatch Funds had another successful year, with most of our funds outpacing their benchmark indices (please see individual fund performance on the following portfolio summary pages). I have been happy to report good years in 2009 and 2010, yet I can’t overlook the fact that we are still working to make up the ground lost in 2008. We have more work to do.
2
Our international team had a particularly strong year. All three international funds were ranked in the Top 1% of their respective Morningstar peer group based on total return for the year ended 9/30/10 (see chart below). The funds benefited from good stock picking, particularly in emerging markets, and an underweight position in Western Europe — where we simply hadn’t found as many interesting companies using our bottom-up investment process.
Time and again our portfolio managers return from trips abroad telling stories of small companies they visited which rarely, if ever, receive visits from U.S. investment firms. With decades of small cap experience and an expansive universe of relatively unknown small and micro cap companies around the world, we remain convinced that our hands-on deep due diligence approach gives Wasatch a significant investment advantage.
MORNINGSTAR TOTAL RETURN CATEGORY PEER RANKINGSASOF 9/30/10
| | | | | | |
| | | 1 Year | | 3 Year | | 5 Year |
Wasatch Emerging Markets Small Cap (WAEMX)
(Diversified Emerging Markets) | | Top 1%
(out of 379) | | Top 1%
(out of 268) | | n/a |
Wasatch International Growth (WAIGX)
(Foreign Small/Mid Growth) | | Top 1%
(out of 132) | | Top 12%
(out of 118) | | Top 29%
(out of 94) |
Wasatch International Opportunities (WAIOX)
(Foreign Small/Mid Growth) | | Top 1%
(out of 132) | | Top 9%
(out of 118) | | Top 3%
(out of 94) |
Past performance is not a guarantee of future results.
As I reflect on the past year, and look forward to the next, the Wasatch research commitment is as strong as ever, and I have seen continued progress across each of our key pillars:
| | Ÿ | | Deep Due Diligence — Someone is almost always on the road visiting companies. We increased our international travel this year. For example, team members returned from Brazil last week, others are in Canada this week, and another pair leaves for Malaysia and Indonesia next week. |
| | Ÿ | | Collaboration — Our collaborative culture is thriving. We continue to experiment with how best to integrate our domestic and international teams in order to tap into increasingly relevant global insights. |
| | Ÿ | | Discipline — Our research process remains consistent and I am pleased with the long-term perspective we have maintained through the recent short-term market swings. Our “high-end consulting” (a process of evaluating and critiquing each other’s portfolio) continues to be a great collaborative tool to help us tighten each fund’s adherence to its investment strategy “north star.” |
The Wasatch research team is comprised of bright and seasoned investors. Our success is driven by their passion, a proven investment approach, and our culture of collaboration. Our research teams are led by portfolio managers who understand and have a vested interest in how research works. For example, Roger Edgley, director of our international team, is a co-manager of all three international funds. Jeff Cardon, director of our domestic team, has been the portfolio manager on the Small Cap Growth Fund since its inception almost 24 years ago (he is also CEO of Wasatch Advisors, investment advisor to Wasatch Funds). In future letters, I think it would benefit shareholders to have greater exposure to the breadth and strength of our team. As such, I plan to ask others to join me in providing their perspectives on relevant topics. As a reminder, my quarterly letter, as well as a quarterly commentary from each portfolio manager, can be accessed online at www.WasatchFunds.com.
Thank you for the continued opportunity to manage your assets.
Sincerely,

Samuel S. Stewart, Jr.
President of Wasatch Funds
The investment objective of WAEMX, WAIGX, and WAIOX is long-term growth of capital.
The recent growth rate in the stock market has helped to produce short-term returns for some asset classes that are not typical and may not continue in the future. Because of ongoing market volatility, fund performance may be subject to substantial short-term changes.
Information in this report regarding market or economic trends or the factors influencing historical or future performance reflects the opinions of management as of the date of this report. These statements should not be relied upon for any other purpose. Past performance is no guarantee of future results, and there is no guarantee that the market forecasts discussed will be realized.
The Morningstar percentile rank is the rank of a fund among its category peers, which rank is based on a comparison of a fund’s total return performance against its peers over a given time period. © 2010 Morningstar, Inc. All rights reserved. The information contained herein (1) is proprietary to Morningstar and/or its content providers; (2) may not be copied or distributed; and (3) is not warranted to be accurate, complete, or timely. Neither Morningstar nor its content providers are responsible for any damages or losses arising from any use of this information.
CFA® is a trademark owned by CFA Institute.
1Barron’s, “The Final Frontier,” Vito J. Racanelli, 8/2/10.
3
| | |
| WASATCH CORE GROWTH FUND (WGROX) — Management Discussion | | SEPTEMBER 30, 2010 |
|
| |
| |
The Wasatch Core Growth Fund is managed by a team of Wasatch portfolio managers led by JB Taylor and Paul Lambert.
| | | | |

JB Taylor Portfolio Manager | | 
Paul Lambert Portfolio Manager | | OVERVIEW The Wasatch Core Growth Fund gained 9.19% in what was its strongest quarter since the third quarter of 2009. The Russell 2000 Index also had its best quarter in a year, rising |
11.29%. It was not unexpected that the Fund trailed the Index given our tendency to lag in rapidly rising markets. The stable and consistent growth companies in the portfolio are rarely the stocks to lead the market when optimism and appetite for risk increase. We expect our stocks to keep pace in such markets, as they have done on a year-to-date basis, and then continue to grow and outperform in less robust markets.
DETAILSOFTHE QUARTER
Our economy emerged from recession in June 2009 but is expanding at a slower rate than is typical of post-recessionary periods. We think the economy will remain sluggish given high unemployment, unprecedented levels of U.S. debt and rising taxes needed to pay for government spending. In such an environment, we believe companies with true growth prospects will command a premium.
We are already seeing some signs of this narrowing in the market, as information technology stocks, which make up less than 20% of the Russell 2000 Index, accounted for nearly 30% of the Index’s return this quarter. Fast-growing companies in the areas of cloud computing, security software and Internet retailing were some of the best performers. While we are interested in the underlying themes behind these fast-growing companies, the lofty price-to-earnings (P/E) multiples and fast-changing dynamics in technology make them less appropriate for our style, which is focused on steady, consistent growth at a reasonable price. Nonetheless, the market’s focus on growth bodes well for our companies, as we believe they will continue to grow at rates faster than the overall economy.
One of our best-performing stocks this quarter was Herbalife Ltd., a global marketer of nutritional products. The company reported the best quarterly results in its history, including a 4.3% increase in operating margin and a 72% increase in earnings. Herbalife has shifted its strategy from traditional multi-level marketing, where customers order from distributors on a monthly basis, to more of a retail approach that emphasizes daily consumption. There are several advantages to the new model, such as expanding the market to customers that are not willing to commit to becoming Herbalife distributors but are still interested in purchasing the company’s weight-loss products. Obesity is a growing problem around the world, and we expect the sales
of Herbalife’s healthy products will continue to benefit as people try to slim down.
MSCI, Inc. is another name that performed especially well. The company provides equity market indices and investment analytics, and its indices are linked to more than 250 exchange-traded funds (ETFs). Its shares were weak in the second quarter when a decline in the global equity markets implied a decline in ETF revenues. This quarter, global equities rallied sharply, and so did MSCI. Despite the stock’s volatility, there has been no change in the company’s growth trajectory over the two-quarter period. The business is showing good momentum, supported by solid demand for ETFs and risk management analytics.
Health care was the only sector in the Fund that had a negative return, where veterinary company VCA Antech, Inc. was a big detractor. In this economy, consumers are cutting back on what they are willing to spend to take care of their pets — they may skip a routine test or wait for a sick pet to recover versus taking it right to the vet. Demand had shown signs of stabilizing earlier in the year, but investors were disappointed with VCA Antech’s most recent revenues and earnings, prompting a sell-off in the stock. Long term, we think the business is very stable given the trend toward increasing pet ownership and higher spending per pet. Current and future holdings are subject to risk.
DETAILSOFTHE YEAR
Our foreign stocks were a key driver of the Fund’s strong performance during the 12 months ended September 30. Positions in several Indian and Brazilian banks did especially well, as robust economic growth in these countries is stimulating loan demand. Top domestic performers included O’Reilly Automotive, Inc. and Monro Muffler Brake, Inc., companies with steady revenue streams that sell less “discretionary” goods. Health care was the Fund’s weakest sector against the backdrop of regulatory reform in the United States.
OUTLOOK
As we look ahead, one question we are asking ourselves is: Does the narrowing of the market that we saw in the third quarter continue, with just a small slice of high-growth, high-P/E stocks driving returns? While this is certainly possible, we are comfortable with our holdings and would never stray from our valuation discipline by chasing hot stocks in a frothy market. We think a likely scenario is that the challenges facing the economy will make investors less optimistic — and less likely to aggressively bid up any segment of the market to lofty valuations. Our portfolio of steadily growing companies that we believe are reasonably valued has the potential to do well in such an environment.
Thank you for the opportunity to manage your assets.
4
| | |
| WASATCH CORE GROWTH FUND (WGROX) — Portfolio Summary | | SEPTEMBER 30, 2010 |
|
| |
| |
AVERAGE ANNUAL TOTAL RETURNS
| | | | | | | | | | | | |
| | | 1 YEAR | | | 5 YEARS | | | 10 YEARS | |
Core Growth | | | 15.75% | | | | 0.28% | | | | 6.76% | |
Russell 2000 Index | | | 13.35% | | | | 1.60% | | | | 4.00% | |
Russell 2000 Growth Index | | | 14.79% | | | | 2.35% | | | | -0.13% | |
Data shows past performance, which is not indicative of future performance. Current performance may be lower or higher than the performance quoted. To obtain the most recent month-end performance data available, please visit www.wasatchfunds.com. The Advisor may absorb certain Fund expenses, without which total return would have been lower. Investment returns and principal value will fluctuate and shares, when redeemed, may be worth more or less than their original cost.
As of the January 31, 2010 prospectus, the Total Annual Fund Operating Expenses for the Wasatch Core Growth Fund are 1.38%. The expense ratio shown elsewhere in this report may be different. Expenses include direct expenses paid to the Advisor as well as indirect expenses incurred by the Fund as a result of its investments in other investment companies (each an “Acquired Fund”), before any expense reimbursements by the Advisor. The Net Expense includes any reimbursement by the Advisor. See the prospectus for additional information regarding Fund expenses.
Wasatch Funds will deduct a 2.00% redemption proceeds fee on Fund shares held 60 days or less. Performance data does not reflect the deduction of fees or taxes, which if reflected, would reduce the performance quoted. For more complete information including charges, risks and expenses, read the prospectus carefully.
Investing in small cap funds will be more volatile and loss of principal could be greater than investing in large cap or more diversified funds.
TOP 10 EQUITY HOLDINGS*
| | | | |
| Company | | % of Net
Assets | |
| Copart, Inc. | | | 4.4% | |
| Life Time Fitness, Inc. | | | 3.8% | |
| Herbalife Ltd. | | | 3.6% | |
| Aaron’s, Inc. | | | 3.4% | |
| MEDNAX, Inc. | | | 3.2% | |
| | | | |
| Company | | % of Net
Assets | |
| LKQ Corp. | | | 3.1% | |
| O’Reilly Automotive, Inc. | | | 3.1% | |
| MSCI, Inc., Class A | | | 2.7% | |
| Alliance Data Systems Corp. | | | 2.7% | |
| IDEX Corp. | | | 2.5% | |
| * | As of September 30, 2010, there were 56 holdings in the Fund. Portfolio holdings are subject to change at any time. References to specific securities should not be construed as recommendations by the Funds or their Advisor. Current and future holdings are subject to risk. |
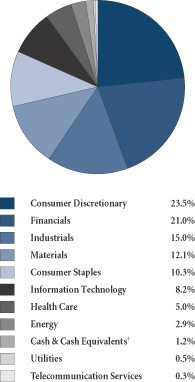
SECTOR BREAKDOWN**
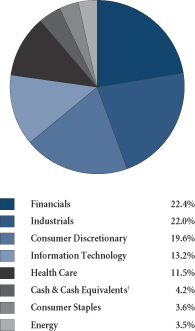
| ** | Excludes securities sold short and written options, if any. |
| † | Also includes Other Assets and Liabilities. |
GROWTHOFA HYPOTHETICAL $10,000 INVESTMENT
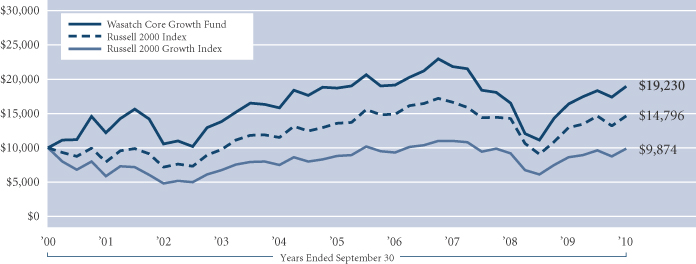
Past performance does not predict future performance and the graph above does not reflect the deduction of taxes that you would pay on fund distributions or the redemption of fund shares. Performance shown in the chart above does not include any applicable sales charges and fees. Wasatch does not charge any sales fees. The Russell 2000 Index is an unmanaged total return index of the smallest 2,000 companies in the Russell 3000 Index, as ranked by total market capitalization. The Russell 2000 Index is widely regarded in the industry as accurately capturing the universe of small company stocks. The Russell 2000 Growth Index is an unmanaged total return index that measures the performance of those Russell 2000 Index companies with higher price-to-book ratios and higher forecasted growth values. You cannot invest directly in these or any indices.
5
| | |
| WASATCH EMERGING MARKETS SMALL CAP FUND (WAEMX) — Management Discussion | | SEPTEMBER 30, 2010 |
|
| |
| |
The Wasatch Emerging Markets Small Cap Fund is managed by a team of Wasatch portfolio managers led by Roger Edgley and Laura Geritz.
| | | | |

Roger D. Edgley, CFA Portfolio Manager | | 
Laura Geritz, CFA Portfolio Manager | | OVERVIEW The Wasatch Emerging Markets Small Cap Fund gained 22.80% in the third quarter and outperformed the MSCI Emerging Markets Small Cap Index, which was up 20.48%. Performance for |
the quarter was strong as markets rebounded from a weaker second quarter. Overall, the gains within the Fund were broad based across markets, sectors and names. If there is a single element across the Fund’s top contributors this quarter, it is the presence of many consumer-oriented names.
Our philosophy is to invest broadly across the countries and sectors that are within its remit. It is important to note that the opportunities we favor go well beyond the BRIC countries (Brazil, Russia, India and China) — to countries like South Africa, Peru, Thailand, Egypt and Indonesia amongst others. Our job is to go where many do not — to invest in underfollowed countries and companies. Many of the countries that did well in the quarter were smaller ones that were well represented in the Fund. The top five contributors for the quarter were from the following countries: Brazil, India, Indonesia, Thailand and China.
DETAILSOFTHE QUARTER
Some interesting new names we added include Clicks Group Ltd. (South Africa), Diagnosticos da America S.A. (DASA) (Brazil), and Marisa Lojas S.A. (Brazil). Although emerging market small caps have had a year of strong returns, we are still able to find names that we believe have excellent long term prospects — companies that are well managed, financially well structured, and able to take advantage of the important changes in their economies. Clicks Group is a South African based retailer that includes a leading pharmacy chain and brand name stores like The Body Shop. We feel it is well placed with South African consumers and the pharmacy business should benefit as it takes market share from smaller “mom and pop” operators.
Two members of Wasatch’s team were in Brazil in September visiting companies including DASA and Marisa mentioned above. DASA is the largest clinical diagnostics and imaging laboratory group in Brazil (it would rate as one of the top five in the world). Health care trends in Brazil include a push toward efficiency as more members of the population enter private health care plans and increasing government spending.
Marisa is an apparel store chain with a focus on female buyers and “middle” consumers. We might compare Marisa to Old Navy or the Gap in the U.S. It has different kinds of formats so it is not just tied to malls, which have seen strong
growth in Brazil, but has street fronts, one of which we visited in Rio de Janeiro. Marisa has seen strong, same-store growth and sees attractive opportunities in other areas of Brazil.
Names that made significant contributions in the quarter included Cia. Hering (Brazil), LIC Housing Finance Ltd. (India), O-Net Communications Group Ltd. (China), and PT Jasa Marga (Indonesia). In terms of losers for the quarter, there were no significant “torpedoes”—the worst performing name was down about 25% and just 12 stocks had negative returns.
One of the most important trends we see across emerging economies is the growth of consumer spending as incomes and wealth grow significantly. This continues to be an important theme that cuts across many areas ranging from mortgage finance growth to health care spending to higher spending on apparel.
We have seen increased merger and acquisition activity and we expect to see more in the coming months. Two companies in the portfolio were impacted during the quarter. Another company purchased a controlling stake in Tivit Terceirizacao de Processos Servicos e Tecnologia S.A. (Brazil) and Dufry Group (Switzerland) acquired the assets of a South American company held in the portfolio. We sold both positions. A long-term holding we sold was Kingdee International Software Group Co. Ltd. (China), a Chinese software company, as its stock price reached a level we believed to be fully valued. Current and future holdings are subject to risk.
DETAILSOFTHE YEAR
The Wasatch Emerging Markets Small Cap Fund gained 51.69% over the past 12 months and outperformed the MSCI Emerging Markets Small Cap Index, which gained 32.32%. The top contributing countries were India, Indonesia, Brazil, China, Thailand and South Africa. Overall, our individual investments performed well for the year. There were few detractors. The top contributors came from a broad range of countries and sectors and included Cia. Hering, LIC Housing Finance Ltd., KPJ Healthcare Berhad (Malaysia) and PT Mayora Indah Tbk (Indonesia).
OUTLOOK
This has been a strong year of performance for small caps in emerging markets backed by strong asset flows from investors. We have some concern regarding global investors crowding into this segment of emerging markets with valuation levels looking — in some sectors and countries — closer to fair value. However, we still see attractive opportunities — it is a broad universe.
We remain grateful for the faith shown in us by our shareholders and we will continue to work hard to justify it. Emerging markets small caps are an exciting segment for us as an investment team and we possess long-term faith in its opportunities.
Thank you for the opportunity to manage your assets.
| | CFA® is a trademark owned by CFA Institute. |
6
| | |
| WASATCH EMERGING MARKETS SMALL CAP FUND (WAEMX) — Portfolio Summary | | SEPTEMBER 30, 2010 |
|
| |
| |
AVERAGE ANNUAL TOTAL RETURNS
| | | | | | | | | | |
| | | 1 YEAR | | | 5 YEARS | | SINCE INCEPTION
10/1/07 | |
Emerging Markets Small Cap | | | 51.69% | | | N/A | | | 6.11% | |
MSCI Emerging Markets Small Cap Index | | | 32.32% | | | N/A | | | 1.26% | |
MSCI Emerging Markets Index | | | 20.22% | | | N/A | | | -1.48% | |
Data shows past performance, which is not indicative of future performance. Current performance may be lower or higher than the performance quoted. To obtain the most recent month-end performance data available, please visit www.wasatchfunds.com. The Advisor may absorb certain Fund expenses, without which total return would have been lower. Investment returns and principal value will fluctuate and shares, when redeemed, may be worth more or less than their original cost.
As of the January 31, 2010 prospectus, the Total Annual Fund Operating Expenses for the Wasatch Emerging Markets Small Cap Fund are 3.03%. The Net Expenses are 2.05%. The expense ratio shown elsewhere in this report may be different. Expenses include direct expenses paid to the Advisor as well as indirect expenses incurred by the Fund as a result of its investments in other investment companies (each an “Acquired Fund”), before any expense reimbursements by the Advisor. Net Expenses are based on Fund expenses, net of waivers and reimbursements. See the prospectus for additional information regarding Fund expenses.
Wasatch Funds will deduct a 2.00% redemption proceeds fee on Fund shares held 60 days or less. Performance data does not reflect the deduction of fees or taxes, which if reflected, would reduce the performance quoted. For more complete information including charges, risks and expenses, read the prospectus carefully.
Investing in foreign securities, especially in emerging markets, entails special risks, such as currency fluctuations and political uncertainties, which are described in more detail in the prospectus. Investing in small cap funds will be more volatile and loss of principal could be greater than investing in large cap or more diversified funds. Being non-diversified, the Fund can invest a larger portion of its assets in the securities of a limited number of companies than a diversified fund. Non-diversification increases the risk of loss to the Fund if the values of these securities decline.
TOP 10 EQUITY HOLDINGS*
| | | | |
| Company | | % of Net
Assets | |
| LIC Housing Finance Ltd. (India) | | | 2.2% | |
| Mr Price Group Ltd. (South Africa) | | | 2.0% | |
| Bata India Ltd. (India) | | | 2.0% | |
| Exide Industries Ltd. (India) | | | 1.9% | |
| Mahindra & Mahindra Financial Services Ltd. (India) | | | 1.9% | |
| | | | |
| Company | | % of Net
Assets | |
| PT Holcim Indonesia Tbk (Indonesia) | | | 1.8% | |
| Cia. Hering (Brazil) | | | 1.7% | |
| Globaltrans Investment plc GDR (Russia) | | | 1.6% | |
| Allahabad Bank Ltd. (India) | | | 1.5% | |
| CETIP S.A. (Brazil) | | | 1.5% | |
| * | As of September 30, 2010, there were 164 holdings in the Fund. Portfolio holdings are subject to change at any time. References to specific securities should not be construed as recommendations by the Funds or their Advisor. Current and future holdings are subject to risk. |
SECTOR BREAKDOWN**
| ** | Excludes securities sold short and written options, if any. |
| † | Also includes Other Assets and Liabilities. |
GROWTHOFA HYPOTHETICAL $10,000 INVESTMENT
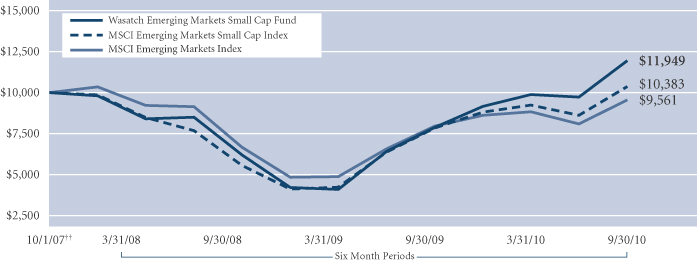
Past performance does not predict future performance and the graph above does not reflect the deduction of taxes that you would pay on fund distributions or the redemption of fund shares. Performance shown in the chart above does not include any applicable sales charges and fees. Wasatch does not charge any sales fees. ††Inception: October 1, 2007. The MSCI Emerging Markets and Small Cap indices are free float-adjusted market capitalization indices that are designed to measure equity market performance in the global emerging markets. You cannot invest directly in these or any indices.
7
| | |
| WASATCH GLOBAL OPPORTUNITIES FUND (WAGOX) — Management Discussion | | SEPTEMBER 30, 2010 |
|
| |
| |
The Wasatch Global Opportunities Fund is managed by a team of Wasatch portfolio managers led by Robert Gardiner and Blake Walker.
| | | | |

Robert Gardiner, CFA Portfolio Manager | | 
Blake H. Walker Portfolio Manager | | OVERVIEW The Global Opportunities Fund posted a strong gain during the third quarter in what was a positive environment for stock investing. Developed and emerging markets rallied as data |
coming out of the United States suggested the world’s largest economy would avoid a double-dip recession. Moreover, the Federal Reserve indicated that it was prepared to take additional steps to revive the U.S. economy, if needed.
Returns in the Fund were strong across geographies and sectors. We are pleased by the breadth of the good performance, since the Fund’s mandate gives us the flexibility to invest in companies of any size, in any country and in any type of business. That said, we are disappointed that we lagged the market indices. Our goal is to keep up with the market when stock prices are rising and provide the potential to outperform when they are falling.
DETAILSOFTHE QUARTER
Western Europe was a key area of strength in the Fund, and our investments in the region gained approximately 25%. Two of our best-performing stocks were Melexis N.V. (Belgium) and Wirecard AG (Germany), which are top-weighted holdings. Melexis designs semiconductors used in automotive electronics, and the company announced record revenues and earnings in July. Melexis is benefiting from Asia’s booming auto market and the rising chip content in cars, as high-tech features like adaptive cruise control become more prevalent. Wirecard is the leading processor of online payment transactions in Europe. The company has a history of strong growth — growing even throughout the recession — and should continue to thrive as it adds customers and expands geographically. Wirecard is one of several names in the Fund that is capitalizing on the migration from traditional “bricks and mortar” retailing to Internet retailing.
We also did well in emerging markets, including China, India and Brazil. Similar to last quarter, a number of our Chinese consumer stocks and Indian banks had substantial gains — names like Anta Sports Products Ltd. (China) and Allahabad Bank Ltd. (India). Strength in Brazil was driven by companies in a broad group of industries, from health care services to machinery to personal care products. We are excited about the growth we are seeing in emerging countries, but these markets have gotten a bit expensive.
Our U.S. holdings produced a strong gain but lagged the international piece of the portfolio. Major detractors included several semiconductor, business services and health
care companies whose operating performance and/or growth outlooks disappointed investors. For example, revenues for Supertex, Inc., a semiconductor manufacturer, came in below expectations due to a shortage in test and assembly capacity. CRA International, Inc., a consulting firm, beat second-quarter estimates but gave a cautious outlook for the rest of the year. Management cited the reluctance of corporations to spend on consulting services in the weak economy.
We faced some sector and industry headwinds in the quarter. Our big weighting in health care was a negative, as government reform in the United States has clouded the outlook for many health care companies. In addition, Americans are cutting back on medical services, as jobs losses lead to lost health insurance, and as more people opt for high-deductible plans. Our relatively low exposure to energy and metals and mining stocks also hurt performance. These areas of the market did especially well on rising commodity prices.
DETAILSOFTHE YEAR
Our investments in emerging markets gained more than 50% during the 12 months ended September 30. India was one of the best-performing countries in the Fund, where the list of top contributors was dominated by financial services companies. Although returns were positive in most developed markets, Australia was a notable exception. We have been upgrading the quality of our holdings in Australia following a recent trip to the country.
Performance was strong in most sectors, with consumer discretionary and information technology making the largest contributions to return. Top-performing holdings included ASOS plc (United Kingdom), an Internet retailer, and OPNET Technologies, Inc., a developer of network management software. The generally weak performance of our construction and engineering stocks limited gains in the industrials sector.
OUTLOOK
The U.S. recovery remains fragile, and investors are waiting to see if the Federal Reserve will step in to provide support. The outcome of the November U.S. elections is also of intense interest given its implications for taxes and regulation. Overseas, many emerging economies are growing rapidly but, like the United States, developed European countries are struggling with public deficits.
While uncertainty abounds, we aren’t spending our time trying to figure out if the economic and political landscape is going to get better or worse. Our job is to identify great companies whose individual characteristics should allow them to do well regardless of what is happening in the macro environment. If we can find these types of companies, and pay reasonable prices for them, we believe we can deliver strong results over time.
Thank you for the opportunity to manage your assets.
| | CFA® is a trademark owned by CFA Institute. |
8
| | |
| WASATCH GLOBAL OPPORTUNITIES FUND (WAGOX) — Portfolio Summary | | SEPTEMBER 30, 2010 |
|
| |
| |
AVERAGE ANNUAL TOTAL RETURNS
| | | | | | | | | | |
| | | 1 YEAR | | | 5 YEARS | | SINCE INCEPTION
11/17/08 | |
Global Opportunities | | | 20.41% | | | N/A | | | 46.18% | |
MSCI AC World Small Cap Index | | | 15.70% | | | N/A | | | 37.13% | |
S&P Global SmallCap Index | | | 15.18% | | | N/A | | | 34.76% | |
MSCI AC World Index | | | 8.42% | | | N/A | | | 22.70% | |
Data shows past performance, which is not indicative of future performance. Current performance may be lower or higher than the performance quoted. To obtain the most recent month-end performance data available, please visit www.wasatchfunds.com. The Advisor may absorb certain Fund expenses, without which total return would have been lower. Investment returns and principal value will fluctuate and shares, when redeemed, may be worth more or less than their original cost.
As of the January 31, 2010 prospectus, the Total Annual Fund Operating Expenses for the Wasatch Global Opportunities Fund are 2.61%. The Net Expenses are 2.25%. The expense ratio shown elsewhere in this report may be different. Expenses include direct expenses paid to the Advisor as well as indirect expenses incurred by the Fund as a result of its investments in other investment companies (each an “Acquired Fund”), before any expense reimbursements by the Advisor. Net Expenses are based on Fund expenses, net of waivers and reimbursements. See the prospectus for additional information regarding Fund expenses.
Wasatch Funds will deduct a 2.00% redemption proceeds fee on Fund shares held 60 days or less. Performance data does not reflect the deduction of fees or taxes, which if reflected, would reduce the performance quoted. For more complete information including charges, risks and expenses, read the prospectus carefully.
Investing in small and micro cap funds will be more volatile and loss of principal could be greater than investing in large cap or more diversified funds. Investing in foreign securities, especially in emerging markets, entails special risks, such as currency fluctuations and political uncertainties, which are described in more detail in the prospectus. Being non-diversified, the Fund can invest a larger portion of its assets in the securities of a limited number of companies than a diversified fund. Non-diversification increases the risk of loss to the Fund if the values of these securities decline.
TOP 10 EQUITY HOLDINGS*
| | | | |
| Company | | % of Net
Assets | |
| Melexis N.V. (Belgium) | | | 1.9% | |
| Wirecard AG (Germany) | | | 1.7% | |
| Dollar Tree, Inc. | | | 1.4% | |
| Ted Baker plc (United Kingdom) | | | 1.2% | |
| EPS Co. Ltd. (Japan) | | | 1.2% | |
| | | | |
| Company | | % of Net
Assets | |
| Power Integrations, Inc. | | | 1.1% | |
| Resources Connection, Inc. | | | 1.1% | |
| Richelieu Hardware Ltd. (Canada) | | | 1.0% | |
| O2Micro International Ltd. ADR (China) | | | 1.0% | |
| Indutrade AB (Sweden) | | | 0.9% | |
| * | As of September 30, 2010, there were 356 holdings in the Fund. Portfolio holdings are subject to change at any time. References to specific securities should not be construed as recommendations by the Funds or their Advisor. Current and future holdings are subject to risk. |
SECTOR BREAKDOWN**
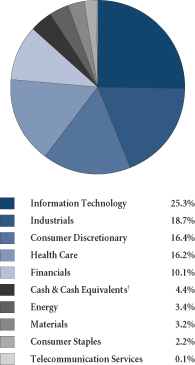
| ** | Excludes securities sold short and written options, if any. |
| † | Also includes Other Assets and Liabilities. |
GROWTHOFA HYPOTHETICAL $10,000 INVESTMENT
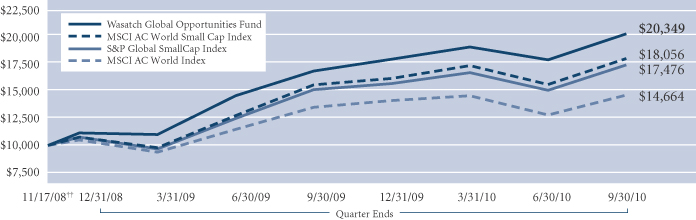
Past performance does not predict future performance and the graph above does not reflect the deduction of taxes that you would pay on fund distributions or the redemption of fund shares. Performance shown in the chart above does not include any applicable sales charges and fees. Wasatch does not charge any sales fees. ††Inception: November 17, 2008. The MSCI AC World Small Cap Index is an unmanaged index and includes reinvestment of all dividends of issuers located in countries throughout the world representing developed and emerging markets, including securities of U.S. issuers, with market capitalizations between US $200 million and $1.5 billion. The S&P Global SmallCap Index is an unmanaged index and includes reinvestment of all dividends of issuers located across developed and emerging markets, including the United States, who fall in the bottom 15% of their country’s market cap range. The MSCI AC World Index is an unmanaged index and includes reinvestment of all dividends of issuers located in countries throughout the world representing developed and emerging markets, including securities of U.S. issuers, of all capitalizations. You cannot invest directly in these or any indices.
9
| | |
| WASATCH GLOBAL SCIENCE & TECHNOLOGY FUND (WAGTX) — Management Discussion | | SEPTEMBER 30, 2010 |
|
| |
| |
The Wasatch Global Science & Technology Fund is managed by a team of Wasatch portfolio managers led by Sam Stewart.
| | |
Samuel S. Stewart, Jr. PhD, CFA Portfolio Manager | | OVERVIEW The Wasatch Global Science & Technology Fund returned 13.94% in the quarter, bringing its 12-month return to 22.91%. The companies we own in the Fund reported sales and earnings growth of 24% and 46%, respectively, significantly above the broader market average. DETAILSOFTHE QUARTER We made further progress toward reducing the number of portfolio hold- |
ings during the past three months. Fewer holdings will allow us to get more wood behind the arrow of our best ideas. A related goal was increasing the percentage of the portfolio invested in our highest conviction ideas. We are happy to report that our top 10 holdings now represent about 27% of the portfolio, up from approximately 19% at the beginning of the year. We believe that running a more concentrated portfolio will allow us to use our knowledge base more effectively for the benefit of our shareholders.
The stocks we sold during the quarter fell into three main categories. First were those where we thought the market had more than priced in strong business prospects, such as F5 Networks, Inc., Techne Corp., and NetLogic Microsystems, Inc. The second group included companies that became subject to new regulatory risk, including MEDNAX, Inc. and Korean company MegaStudy Co. Ltd. While these are great companies, we think the discounts offered in the stock prices are not enough to justify the current level of risk. We would love to come back to the stocks in these two groups sometime down the road if their prices become more reasonable. The final group is companies that we deemed good but not great. In most cases, we based our decision on some combination of the stocks’ lower-quality business models and less attractive end markets.
One of the clear highlights from the quarter was the first major payoff from our improved focus on our best ideas. Our top holding going into the quarter — Wirecard AG, a German company that provides payment services for online transactions — was also our top contributor thanks to its large position size and 59% price increase. Early in the year, Wirecard was one of our larger holdings with a 2% weighting. When an Internet rumor dragged down its stock price, our discussions with company management, several industry experts, and our own experienced research team gave us the confidence to add to our position. As a result, we came into the third quarter with a 4% weighting in the stock. While we have taken some profits following its strong rally, Wirecard remains our top pick based on our belief that it is an attractively priced way to ride the tailwind as more and more retail transactions occur online.
Another large holding that generated a strong return was Abcam plc, the Cambridge, England-based online antibody distributor. We’ve owned Abcam for years and consider it to
be similar to Amazon.com, except focused on supplies used in lab research. Abcam, which has been rapidly taking market share from the traditional paper-based catalogs in the industry, has generated high sales growth before, during, and after the recession. Abcam’s shares rose nearly 50% in the quarter.
Another recurring theme was our purchase of stocks that Wasatch owns currently or has owned at some point in the past, including NuVasive, Inc., Copart, Inc., VistaPrint N.V., and Japanese e-commerce company Start Today Co. Ltd. We love it when the market gives us a chance to buy companies we know well at discounted prices. Our long history with these companies means we are way up the information curve on day one of ownership, and we’ve already built up relationships and trust in senior management.
A key detractor was ICON plc, an Ireland-based contract research organization that reduced its earnings guidance to the low end of the previous range. Also weighing on performance were our holdings in Japanese software company Simplex Technology, Inc., veterinary services provider VCA Antech, Inc., and technology equipment company Intevac, Inc. Current and future holdings are subject to risk.
DETAILSOFTHE YEAR
The Fund’s one-year return of 22.91% is also an indication of the fundamental strengths of the underlying companies we have held in the portfolio. For the year, our companies generated 16% year-over-year sales growth and 39% growth in bottom-line earnings. A substantial contribution to performance came from our investments overseas, where on average about half of the Fund’s assets were invested. China and Brazil proved to be fertile ground for growth investments. Among U.S.-based companies, Akamai Technologies, Inc. and F5 Networks made the largest contributions to performance. The most significant detractors were Intevac and CVS Group plc (United Kingdom).
OUTLOOK
As the financial crisis and ensuing recession move further into the rear view mirror, we believe the market will value real growth above growth pretenders (companies enjoying high year-over-year growth mostly due to easy earnings comparisons). We continue to tune out most of the macroeconomic noise in order to spend our time in pursuit of under-appreciated growth companies. We are gratified that quarterly and annual data show that our portfolio holdings are achieving earnings growth and higher valuations — a potentially powerful combination.
As we continue the process of pruning the Fund’s holdings, we are increasingly satisfied that we have a portfolio of companies offering under-appreciated growth. Even as the market recognizes some of this growth potential, we continue to find ample opportunities for investing in attractively valued growth companies.
Thank you for the opportunity to manage your assets.
| | CFA® is a trademark owned by CFA Institute. |
10
| | |
| WASATCH GLOBAL SCIENCE & TECHNOLOGY FUND (WAGTX) — Portfolio Summary | | SEPTEMBER 30, 2010 |
|
| |
| |
AVERAGE ANNUAL TOTAL RETURNS
| | | | | | | | | | | | |
| | | 1 YEAR | | | 5 YEARS | | | SINCE INCEPTION 12/19/00 | |
Global Science & Technology | | | 22.91% | | | | 4.14% | | | | 5.07% | |
Russell 2000 Technology Index | | | 20.41% | | | | 5.77% | | | | -1.66% | |
Nasdaq Composite Index | | | 12.74% | | | | 2.86% | | | | -0.36% | |
Data shows past performance, which is not indicative of future performance. Current performance may be lower or higher than the performance quoted. To obtain the most recent month-end performance data available, please visit www.wasatchfunds.com. The Advisor may absorb certain Fund expenses, without which total return would have been lower. Investment returns and principal value will fluctuate and shares, when redeemed, may be worth more or less than their original cost.
As of the January 31, 2010 prospectus, the Total Annual Fund Operating Expenses for the Wasatch Global Science & Technology Fund are 2.15%. The Net Expenses are 1.96%. The expense ratio shown elsewhere in this report may be different. Expenses include direct expenses paid to the Advisor as well as indirect expenses incurred by the Fund as a result of its investments in other investment companies (each an “Acquired Fund”), before any expense reimbursements by the Advisor. Net Expenses are based on Fund expenses, net of waivers and reimbursements. See the prospectus for additional information regarding Fund expenses.
Wasatch Funds will deduct a 2.00% redemption proceeds fee on Fund shares held 60 days or less. Performance data does not reflect the deduction of fees or taxes, which if reflected, would reduce the performance quoted. For more complete information including charges, risks and expenses, read the prospectus carefully.
Investing in concentrated funds will be more volatile and loss of principal could be greater than investing in more diversified funds. Investing in foreign securities, especially in emerging markets, entails special risks, such as currency fluctuations and political uncertainties, which are described in more detail in the prospectus.
TOP 10 EQUITY HOLDINGS*
| | | | |
| Company | | % of Net
Assets | |
Wirecard AG (Germany) | | | 4.8% | |
DiaSorin S.p.A. (Italy) | | | 3.3% | |
Google, Inc., Class A | | | 2.8% | |
CVS Group plc (United Kingdom) | | | 2.7% | |
Xilinx, Inc. | | | 2.6% | |
| | | | |
| Company | | % of Net
Assets | |
| Altera Corp. | | | 2.5% | |
| International Business Machines Corp. | | | 2.4% | |
| Alliance Data Systems Corp. | | | 2.2% | |
| Pegasystems, Inc. | | | 2.1% | |
| Create SD Holdings Co. Ltd. (Japan) | | | 2.1% | |
| * | As of September 30, 2010, there were 77 holdings in the Fund. Portfolio holdings are subject to change at any time. References to specific securities should not be construed as recommendations by the Funds or their Advisor. Current and future holdings are subject to risk. |
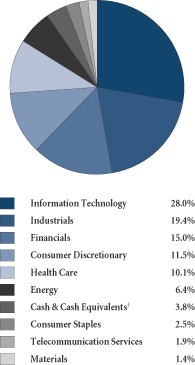
SECTOR BREAKDOWN**

| ** | Excludes securities sold short and written options, if any. |
| †Also | includes Other Assets and Liabilities. |
GROWTHOFA HYPOTHETICAL $10,000 INVESTMENT
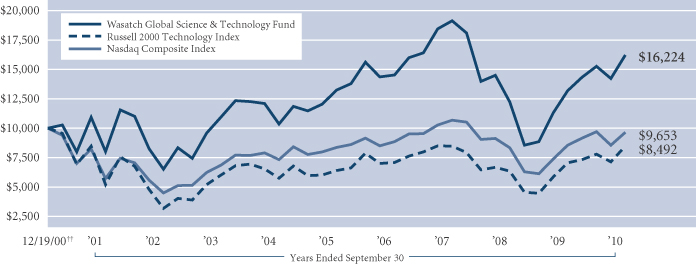
Past performance does not predict future performance and the graph above does not reflect the deduction of taxes that you would pay on fund distributions or the redemption of fund shares. Performance shown in the chart above does not include any applicable sales charges and fees. Wasatch does not charge any sales fees. ††Inception: December 19, 2000. The Russell 2000 Technology Index is a capitalization-weighted index of companies that serve the electronics and computer industries or that manufacture products based on the latest applied science. The Nasdaq Composite Index is unmanaged and measures all Nasdaq domestic and non-U.S. based common stocks listed on The Nasdaq Stock Market. The Index is market-value weighted. This means each company’s security affects the Index in proportion to its market value. The market value, the last sale price multiplied by total shares outstanding, is calculated throughout the trading day, and is related to the total value of the Index. Due to their number and size, technology stocks tend to dominate the direction of the Index. You cannot invest directly in these or any indices.
11
| | |
| WASATCH HERITAGE GROWTH FUND (WAHGX) — Management Discussion | | SEPTEMBER 30, 2010 |
|
| |
| |
The Wasatch Heritage Growth Fund is managed by a team of Wasatch portfolio managers led by Chris Bowen and Ryan Snow.
| | | | |

Chris Bowen Portfolio Manager | | 
Ryan Snow Portfolio Manager | | OVERVIEW Even in the face of a tepid economic environment, it was a rare September to remember for stocks. The market — as gauged by the S&P 500 Index — hadn’t closed a third quarter with a monthly gain this |
large (8.92%) since 1939. As investors latched onto the hope of a strengthening recovery, the Fund’s benchmark, the Russell Midcap Growth Index turned in a strong gain, led by consumer discretionary and economically sensitive producer durable stocks. Primarily due to its lower weights in cyclical stocks and the consumer-driven retail segment, the Fund trailed the benchmark for the quarter.
The Fund was unable to keep pace in a frothy environment after outperforming the benchmark during second quarter weakness. In particular, our cautiousness regarding consumers tempered our returns. Both high unemployment and excess valuations in the space have made it difficult to find attractively valued consumer oriented stocks.
We believe the quality of the Fund’s holdings constrained returns a bit as well, as investors bid up shares of many companies with volatile earnings as economic murkiness dissipated slightly. By and large, our companies were able to weather the challenges of the last two years reasonably well. As many formerly profitable companies saw earnings turn negative, even at the worst, many of our holdings at least sustained their level of earnings. This then transformed into fairly robust growth over the last several quarters, which we project will normalize in the future.
While we ideally would outperform the market during rallies, given the quality of our holdings, it is not surprising that the Fund would only keep pace or trail slightly during extremely bullish environments. Rallies are typically fueled by speculation, which tends to bode well for volatile companies that can showcase what are often temporary fundamental surprises or those stocks that have been beaten down the most in prior market declines.
DETAILSOFTHE QUARTER
Although we’ve always been diligent about investing in companies that meet our exacting standards, we’ve never been more pleased about the Fund’s composition than we are now. We have made an even more concerted effort to ensure that every company held in the Fund meets each appendage of what we call the three-legged stool — quality, valuation and momentum.
As our companies hopefully continue to perform steadily, meeting or exceeding our hurdle growth rate of 15%, we believe they will be rewarded in the market over the long-term.
The Fund’s performance was buoyed by strength in the information technology sector, where Cognizant Technology Solutions Corp., Altera Corp. and Amphenol Corp. were the highest contributors to performance.
Outside of technology, Herbalife Ltd., a provider of health foods primarily focused on weight management and nutritional supplements, was one of our top-performing stocks.
Copart, Inc. and Covance, Inc. both suffered what we believe to be temporary setbacks detracting from the quarter’s performance. They are both debt-free and hold significant amounts of cash, which should allow them flexibility as they focus on future business opportunities. Current and future holdings are subject to risk.
DETAILSOFTHE YEAR
As it did during the third quarter, information technology drove the Fund’s performance for the year, with Altera, Cognizant and F5 Networks, Inc. leading the way. The Fund returned 16.06% and trailed the 18.27% return of the benchmark.
In a strong market environment, Apollo Group, Inc., a for-profit higher education provider, accounted for most of the performance gap as it faced stiff regulatory challenges concerning the availability of student aid. As unexpected headwinds continued to mount, we recently sold the Fund’s stake in this long-time holding.
We also concentrated the Fund and, in our opinion, increased its overall quality by focusing on our top tier companies. During the year, we trimmed the Fund’s holdings from 54 to 42 and feel that the Fund is now better positioned to perform well.
OUTLOOK
Even though the recession officially ended in June 2009, high unemployment and increasing levels of public debt continue to put a damper on economic activity. Although it’s clear that the path to a more normal economic environment will be long and arduous, it doesn’t dampen our enthusiasm about the Fund’s prospects. With the luxury of being able to invest in a small portion of existing public companies, we can be selective and pinpoint companies that we believe will do well in spite of macro challenges.
Though we are pleased with the Fund’s current composition, we continue to screen for additional investment opportunities and visit management teams of both existing and prospective companies. A large amount of insight that can’t be gleaned merely from reviewing financial statements — especially regarding corporate culture — is gained by meeting with management teams face-to-face. Even visits with companies that we ultimately choose not to invest in are an invaluable comparison tool that can help strengthen our conviction about the companies that are held in the Fund.
In our view, the three legs of the stool seem properly balanced. We feel extremely positive about the quality and the earnings growth momentum of the Fund and that valuations are low enough to allow for satisfactory returns over time.
Thank you for the opportunity to manage your assets.
12
| | |
| WASATCH HERITAGE GROWTH FUND (WAHGX) — Portfolio Summary | | SEPTEMBER 30, 2010 |
|
| |
| |
AVERAGE ANNUAL TOTAL RETURNS
| | | | | | | | | | | | |
| | | 1 YEAR | | | 5 YEARS | | | SINCE INCEPTION
6/18/04 | |
Heritage Growth | | | 16.06% | | | | 1.91% | | | | 3.70% | |
Russell Midcap Growth Index | | | 18.27% | | | | 2.86% | | | | 5.36% | |
S&P 500 Index | | | 10.16% | | | | 0.64% | | | | 2.20% | |
Data shows past performance, which is not indicative of future performance. Current performance may be lower or higher than the performance quoted. To obtain the most recent month-end performance data available, please visit www.wasatchfunds.com. The Advisor may absorb certain Fund expenses, without which total return would have been lower. Investment returns and principal value will fluctuate and shares, when redeemed, may be worth more or less than their original cost.
As of the January 31, 2010 prospectus, the Total Annual Fund Operating Expenses for the Wasatch Heritage Growth Fund are 1.21%. The Net Expenses are 0.95%. The expense ratio shown elsewhere in this report may be different. Expenses include direct expenses paid to the Advisor as well as indirect expenses incurred by the Fund as a result of its investments in other investment companies (each an “Acquired Fund”), before any expense reimbursements by the Advisor. Net Expenses are based on Fund expenses, net of waivers and reimbursements. See the prospectus for additional information regarding Fund expenses.
Wasatch Funds will deduct a 2.00% redemption proceeds fee on Fund shares held 60 days or less. Performance data does not reflect the deduction of fees or taxes, which if reflected, would reduce the performance quoted. For more complete information including charges, risks and expenses, read the prospectus carefully.
Investing in mid cap funds will be more volatile and loss of principal could be greater than investing in large cap funds. Equity investing involves risks including potential loss of the principal amount invested.
TOP TEN EQUITY HOLDINGS*
| | | | |
| Company | | % of Net
Assets | |
| Altera Corp. | | | 6.0% | |
Cognizant Technology Solutions Corp., Class A | | | 4.8% | |
IHS, Inc., Class A | | | 4.1% | |
| Tim Hortons, Inc. (Canada) | | | 3.8% | |
| Ross Stores, Inc. | | | 3.7% | |
| | | | |
| Company | | % of Net
Assets | |
| Amphenol Corp., Class A | | | 3.7% | |
| Linear Technology Corp. | | | 3.7% | |
| Express Scripts, Inc. | | | 3.7% | |
| Copart, Inc. | | | 3.7% | |
| St. Jude Medical, Inc. | | | 3.4% | |
| * | As of September 30, 2010, there were 42 holdings in the Fund. Portfolio holdings are subject to change at any time. References to specific securities should not be construed as recommendations by the Funds or their Advisor. Current and future holdings are subject to risk. |
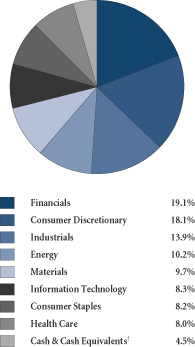
SECTOR BREAKDOWN**
| ** | Excludes securities sold short and written options, if any. |
| † | Also includes Other Assets and Liabilities. |
GROWTHOFA HYPOTHETICAL $10,000 INVESTMENT
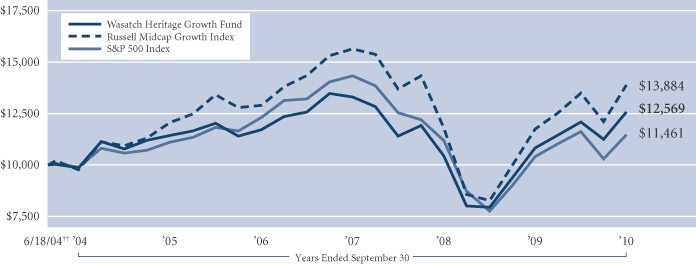
Past performance does not predict future performance and the graph above does not reflect the deduction of taxes that you would pay on fund distributions or the redemption of fund shares. Performance shown in the chart above does not include any applicable sales charges and fees. Wasatch does not charge any sales fees. ††Inception: June 18, 2004. The Russell Midcap Growth Index measures the performance of those Russell Midcap Index companies with higher price-to-book ratios and higher forecasted growth values. The stocks in the Russell Midcap Growth Index are also members of the Russell 1000 Growth Index. The S&P 500 Index represents 500 of the United States’ largest stocks from a broad variety of industries. The index is unmanaged, and a common measure of common stock total return performance. You cannot invest directly in these or any indices.
13
| | |
| WASATCH INTERNATIONAL GROWTH FUND (WAIGX) — Management Discussion | | SEPTEMBER 30, 2010 |
|
| |
| |
The Wasatch International Growth Fund is managed by a team of Wasatch portfolio managers led by Roger Edgley.
| | |
Roger D. Edgley, CFA Portfolio Manager | | OVERVIEW The Wasatch International Growth Fund returned 23.33% in the third quarter and outperformed the MSCI AC World Ex-U.S.A. Small Cap Index, which returned 18.43%. The Fund was helped by its exposure to Asia and Latin America, where markets performed well and economies are growing. In general, developed economies struggled in a more difficult credit and consumer environment against the |
more pro-growth emerging economies, and that is what is playing out today.
DETAILSOFTHE QUARTER
It is worth discussing in detail the top contributors for the quarter as they illustrate well our philosophy and some common elements across names. Among the top contributors to performance were Abcam plc (United Kingdom), Wirecard AG (Germany), Cia. Hering (Brazil) and Dah Chong Hong Holdings Ltd. (Hong Kong). All are companies we know well and that operate from a position of significant strength in their fields of business.
As a Cambridge-based online provider of antibodies for the research community worldwide, Abcam has been a big long-term winner for the Fund. We found Abcam when it was a tiny company. Now, its market capitalization is close to a billion dollars. We have cut back some of our position size owing to its weight in the Fund and valuation, but Abcam remains a prominent position.
Wirecard is a payment service provider in Europe, focused on enabling Internet payments and providing an extra layer of credit protection for merchants selling online. It therefore is a significant beneficiary of the growth of online transactions in Europe and is now starting to grow in Asia.
Cia. Hering is a brand name retailer in Brazil continuing to add stores in other regions. In a meeting with management (and a store visit) in the last few weeks, they stated that they believe it is possible to double the number of stores, with franchising being part of that growth. Our recent visit to Brazil reinforced our opinion of the opportunity there —Brazil to us seems to represent a combination of well-managed small companies within an economy showing highly supportive trends.
Dah Chong Hong (DCH) is a name we added that illustrates how we source our ideas in different ways. DCH has been the main distributor for Honda for 40 years. It is a company this portfolio manager learned about firsthand years ago when living in Hong Kong as the owner of a new Honda Civic bought from and serviced by a DCH dealer. At Wasatch, we were aware of DCH’s level of service and organization and knew that Honda chooses their distributors with care. Aside from representing some major car brands in Hong Kong, DCH has a growing portfolio of brands it represents in China. The stock is a relatively new listing, one
we thought was inexpensive — maybe being perceived as somewhat dull or just misunderstood. After good results were announced, with DCH’s China operations showing growth, the stock was significantly upgraded. The business has a long commercial history, so we think it can produce stable growth over a long period.
The worst performing names for the quarter generally had one thing in common: Japan. As an economy, Japan continues to struggle with deflation, low growth and a strong currency that makes it difficult for its exporters to remain competitive. Construction equipment firm Takeuchi Mfg. Co. Ltd. is one of our holdings that has been hurt by these factors. We have been underweight in Japan for a long time — we find it relatively unattractive from a bottom up stock perspective as well as from a top down economic view. Growing small companies thrive not only on growth in their own economies but from change — Japan in many areas is seeing little change and few opportunities. Zero-level interest rates indicate an economy ruled by continuing fears of deflation, lacking animal spirits. Current and future holdings are subject to risk.
DETAILSOFTHE YEAR
The Fund outperformed the Index over the past 12 months with strong performance from the United Kingdom, India, Brazil and Indonesia. Our U.K. investments in Abcam and online fashion retailer ASOS plc did especially well. We also had good results from our Indian financial companies, notably LIC Housing Finance Ltd. and Allahabad Bank Ltd. In Brazil, Cia. Hering was a top contributor as was cosmetics producer Natura Cosmeticos. Two cement producers, Semen Gresik and Indocement Tunggal Prakarsa, led the way in Indonesia. Japan was also weak over the 12-month period, with several Japanese holdings numbering among our largest detractors.
OUTLOOK
As 2010 draws to a close, we remain aware of global economic and trade tensions and how these can disrupt markets. For many of the small, generally domestically-oriented companies we invest in, we believe that conditions are supportive with tighter capital flows helping the higher quality companies on which we focus. With over 10,000 companies in our investable universe, there continue to be companies that stand out to us as long-term benefactors of growth throughout the world. We are confident that we can continue to build a portfolio of companies that exhibit higher quality and better growth prospects than the markets in general. We remain very grateful for all the support shown by shareholders.
Thank you for the opportunity to manage your assets.
| | CFA® is a trademark owned by CFA Institute. |
14
| | |
| WASATCH INTERNATIONAL GROWTH FUND (WAIGX) — Portfolio Summary | | SEPTEMBER 30, 2010 |
|
| |
| |
AVERAGE ANNUAL TOTAL RETURNS
| | | | | | | | | | | | |
| | | 1 YEAR | | | 5 YEARS | | | SINCE INCEPTION
6/28/02 | |
International Growth | | | 34.15% | | | | 6.99% | | | | 12.26% | |
MSCI AC World Ex-U.S.A. Small Cap Index | | | 15.59% | | | | 6.42% | | | | 13.33% | |
MSCI World Ex-U.S.A. Small Cap Index | | | 10.86% | | | | 2.74% | | | | 11.08% | |
Data shows past performance, which is not indicative of future performance. Current performance may be lower or higher than the performance quoted. To obtain the most recent month-end performance data available, please visit www.wasatchfunds.com. The Advisor may absorb certain Fund expenses, without which total return would have been lower. Investment returns and principal value will fluctuate and shares, when redeemed, may be worth more or less than their original cost.
As of the January 31, 2010 prospectus, the Total Annual Fund Operating Expenses for the Wasatch International Growth Fund are 1.94%. The expense ratio shown elsewhere in this report may be different. Expenses include direct expenses paid to the Advisor as well as indirect expenses incurred by the Fund as a result of its investments in other investment companies (each an “Acquired Fund”), before any expense reimbursements by the Advisor. The Net Expense includes any reimbursement by the Advisor. See the prospectus for additional information regarding Fund expenses.
Wasatch Funds will deduct a 2.00% redemption proceeds fee on Fund shares held 60 days or less. Performance data does not reflect the deduction of fees or taxes, which if reflected, would reduce the performance quoted. For more complete information including charges, risks and expenses, read the prospectus carefully.
Investing in foreign securities, especially in emerging markets, entails special risks, such as currency fluctuations and political uncertainties, which are described in more detail in the prospectus. Investing in small cap funds will be more volatile and loss of principal could be greater than investing in large cap or more diversified funds.
TOP 10 EQUITY HOLDINGS*
| | | | |
| Company | | % of Net
Assets | |
| LIC Housing Finance Ltd. (India) | | | 2.4% | |
| Abcam plc (United Kingdom) | | | 2.4% | |
| Rotork plc (United Kingdom) | | | 2.4% | |
| SJM Holdings Ltd. (Hong Kong) | | | 2.2% | |
| DiaSorin S.p.A. (Italy) | | | 2.1% | |
| Cia. Hering (Brazil) | | | 2.0% | |
| | | | |
| Company | | % of Net
Assets | |
| Wirecard AG (Germany) | | | 1.9% | |
| Mahindra & Mahindra Financial Services Ltd. (India) | | | 1.8% | |
| Anta Sports Products Ltd. (China) | | | 1.8% | |
| Dah Chong Hong Holdings Ltd. (Hong Kong) | | | 1.8% | |
| * | As of September 30, 2010, there were 111 holdings in the Fund. Portfolio holdings are subject to change at any time. References to specific securities should not be construed as recommendations by the Funds or their Advisor. Current and future holdings are subject to risk. |
SECTOR BREAKDOWN**
| ** | Excludes securities sold short and written options, if any. |
| † | Also includes Other Assets and Liabilities. |
GROWTHOFA HYPOTHETICAL $10,000 INVESTMENT
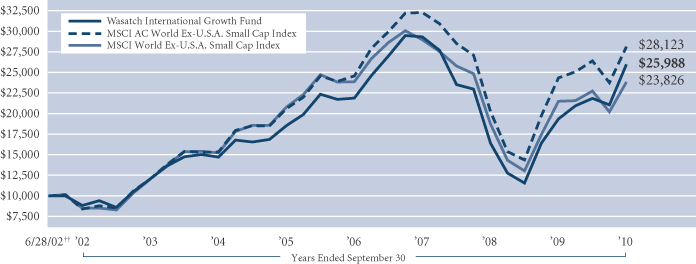
Past performance does not predict future performance and the graph above does not reflect the deduction of taxes that you would pay on fund distributions or the redemption of fund shares. Performance shown in the chart above does not include any applicable sales charges and fees. Wasatch does not charge any sales fees. ††Inception: June 28, 2002. The MSCI AC World Ex-U.S.A. Small Cap Index is an unmanaged index and includes reinvestment of all dividends of issuers located in countries throughout the world representing developed and emerging markets, excluding securities of U.S. issuers. This index is a free float-adjusted market capitalization index designed to measure the performance of small capitalization securities. The MSCI World Ex-U.S.A. Small Cap Index is an unmanaged index that measures the performance of stocks with market capitalizations between U.S. $200 million and $1.5 billion across 22 developed markets, excluding the United States. You cannot invest directly in these or any indices.
15
| | |
| WASATCH INTERNATIONAL OPPORTUNITIES FUND (WAIOX) — Management Discussion | | SEPTEMBER 30, 2010 |
|
| |
| |
The Wasatch International Opportunities Fund is managed by a team of Wasatch portfolio managers led by Roger Edgley and Blake Walker.
| | | | |
Roger D. Edgley, CFA Portfolio Manager | |
Blake H. Walker Portfolio Manager | | OVERVIEW The third quarter saw global equities stage a bit of a comeback, though volatility remained very much in evidence. Consumers in most developed markets were still keeping a close |
watch on their spending, but those in China and other emerging markets spent at a more robust pace.
The Wasatch International Opportunities Fund returned 20.09% during the quarter, placing it comfortably ahead of its benchmark, the MSCI World Ex-U.S.A. Small Cap Index, which returned 17.75% over the same period. With no single theme or trend driving the market, our individual stock selection was the main factor in the Fund’s outperformance for the period.
DETAILSOFTHE QUARTER
The absence of a single specific theme or trend driving the market is evident among our 10 top contributors to performance over the quarter, where nine different countries on four continents and 10 industries in four major market sectors were represented.
Germany’s Wirecard AG, a provider of credit-card processing and electronic payment systems, was our top contributor to performance for the quarter. Wirecard has benefited from the broad trend toward moving more transactions online, but its success is driven by more than that. We believe the company’s technology for handling transaction processing, currency conversion, and other banking services is world class, and it has already moved into many high-growth markets.
In another part of the world, Middle Eastern shipper Aramex PJSC was also a strong contributor. What’s been most important to Aramex’s performance has been its ability to continue to improve top-line growth. With some of the region’s debt problems nearing resolution, there are now signs of renewed growth — growth that Aramex appears well-positioned to capitalize on.
U.K.-based Abcam plc, which makes specialized antibodies used in medical research, exemplifies a quality shared by most of our top performers this quarter. Its strong returns for the period don’t result from a specific piece of good company news, or a positive development in its industry. Rather, they simply reflect the market’s recognition of the company’s success in executing its business plan. That may not sound as exciting as talking about a company that’s experienced a rapid, stupendous run-up based on a breakthrough development, but this more sustainable kind of performance is far more important to the
Fund’s long-term results. Finding the often overlooked companies that have the potential to produce returns in this way, over an extended period of time, is perhaps the greatest challenge we face as investment managers.
After being our strongest holding last quarter, Simplex Technology, Inc. was the greatest detractor from performance this period. The company preannounced that it would miss its earnings targets for the year, which sent its shares tumbling. While that news was disappointing, we believe the stock has been unfairly punished. Even though Simplex’s sales in its systems-integration services area haven’t been up to expectations, the company has still benefited from the high recurring revenues that flow from its work in developing electronic securities-trading platforms. In time, we think investors will once again recognize the company’s true value.
DETAILSOFTHE YEAR
For the 12 months ended September 30, 2010, the Fund returned 31.71%, reflecting significant outperformance over its benchmark index, which posted a return of 10.86%. As in the most recent quarter, strong individual stock selection was the main factor in our performance over the period.
Aramex was the top contributor for the year, followed closely by U.K.-based Internet retailer ASOS plc. ASOS’s positioning to benefit from shoppers’ growing preference for Internet-based transactions has allowed the company to post strong earnings despite tepid consumer spending in developed markets. Sports apparel maker China Hongxing Sports Ltd., the greatest detractor from performance for the year, stumbled while executing its plan to attract customers from China’s emerging consumer class. Disappointed, we sold our position. Current and future holdings are subject to risk.
OUTLOOK
With a great deal of investors’ cash still on the sidelines, an important question in coming months will be whether more of it will return to the global equity markets. Although the global economic outlook remains uncertain, there appears to be a consensus that governments around the world will take the steps they need to in order to avoid a double-dip recession. Our focus remains on identifying companies with strategic advantages that can allow them to succeed regardless of the macroeconomic climate.
We’re finding this environment to be very helpful for fundamentally driven stock-pickers like us. With no single trend driving the market, we’re able to uncover opportunities in a number of markets and a wide range of sectors — and get to them before they’re discovered by the broader investment community. Operating in the micro- and small-cap space is also helpful, as a number of the companies we’re most enthusiastic about aren’t big enough to be on most investors’ radar screens.
Thank you for the opportunity to manage your assets.
| | CFA® is a trademark owned by CFA Institute. |
16
| | |
| WASATCH INTERNATIONAL OPPORTUNITIES FUND (WAIOX) — Portfolio Summary | | SEPTEMBER 30, 2010 |
|
| |
| |
AVERAGE ANNUAL TOTAL RETURNS
| | | | | | | | | | | | |
| | | 1 YEAR | | | 5 YEARS | | | SINCE INCEPTION
1/27/05 | |
International Opportunities | | | 31.71% | | | | 9.47% | | | | 10.04% | |
MSCI World Ex-U.S.A. Small Cap Index | | | 10.86% | | | | 2.74% | | | | 5.00% | |
MSCI AC World Ex-U.S.A. Small Cap Index | | | 15.59% | | | | 6.42% | | | | 8.11% | |
Data shows past performance, which is not indicative of future performance. Current performance may be lower or higher than the performance quoted. To obtain the most recent month-end performance data available, please visit www.wasatchfunds.com. The Advisor may absorb certain Fund expenses, without which total return would have been lower. Investment returns and principal value will fluctuate and shares, when redeemed, may be worth more or less than their original cost.
As of the January 31, 2010 prospectus, the Total Annual Fund Operating Expenses for the Wasatch International Opportunities Fund are 2.81%. The Net Expenses are 2.28%. The expense ratio shown elsewhere in this report may be different. Expenses include direct expenses paid to the Advisor as well as indirect expenses incurred by the Fund as a result of its investments in other investment companies (each an “Acquired Fund”), before any expense reimbursements by the Advisor. Net Expenses are based on Fund expenses, net of waivers and reimbursements. See the prospectus for additional information regarding Fund expenses.
Wasatch Funds will deduct a 2.00% redemption proceeds fee on Fund shares held 60 days or less. Performance data does not reflect the deduction of fees or taxes, which if reflected, would reduce the performance quoted. For more complete information including charges, risks and expenses, read the prospectus carefully.
Investing in foreign securities, especially in emerging markets, entails special risks, such as currency fluctuations and political uncertainties, which are described in more detail in the prospectus. Investing in small cap funds will be more volatile and loss of principal could be greater than investing in large cap or more diversified funds.
TOP 10 EQUITY HOLDINGS*
| | | | |
| Company | | % of Net
Assets | |
| Aramex PJSC (United Arab Emirates) | | | 4.5% | |
| Wirecard AG (Germany) | | | 3.3% | |
| Daum Communications Corp. (Korea) | | | 2.1% | |
| China Automation Group Ltd. (China) | | | 1.8% | |
| EPS Co. Ltd. (Japan) | | | 1.8% | |
| | | | |
| Company | | % of Net
Assets | |
Raffles Medical Group Ltd. (Singapore) | | | 1.5% | |
Simplex Technology, Inc. (Japan) | | | 1.5% | |
Home Capital Group, Inc. (Canada) | | | 1.3% | |
Abcam plc (United Kingdom) | | | 1.2% | |
CSG Ltd. (Australia) | | | 1.2% | |
| * | As of September 30, 2010, there were 162 holdings in the Fund. Portfolio holdings are subject to change at any time. References to specific securities should not be construed as recommendations by the Funds or their Advisor. Current and future holdings are subject to risk. |
SECTOR BREAKDOWN**
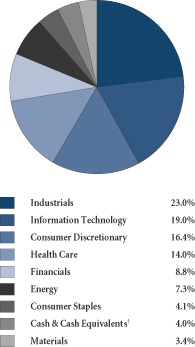
| ** | Excludes securities sold short and written options, if any. |
| † | Also includes Other Assets and Liabilities. |
GROWTHOFA HYPOTHETICAL $10,000 INVESTMENT
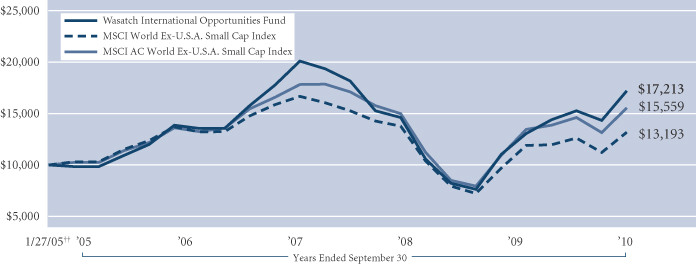
Past performance does not predict future performance and the graph above does not reflect the deduction of taxes that you would pay on fund distributions or the redemption of fund shares. Performance shown in the chart above does not include any applicable sales charges and fees. Wasatch does not charge any sales fees. ††Inception: January 27, 2005. The MSCI World Ex-U.S.A. Small Cap Index is an unmanaged index that measures the performance of stocks with market capitalizations between US $200 million and $1.5 billion across 22 developed markets, excluding the United States. The MSCI AC World Ex-U.S.A. Small Cap Index is an unmanaged index and includes reinvestment of all dividends of issuers located in countries throughout the world representing developed and emerging markets, excluding securities of U.S. issuers. This index is a free float-adjusted market capitalization index designed to measure the performance of small capitalization securities. You cannot invest directly in these or any indices.
17
| | |
| WASATCH MICRO CAP FUND (WMICX) — Management Discussion | | SEPTEMBER 30, 2010 |
|
| |
| |
The Wasatch Micro Cap Fund is managed by a team of Wasatch portfolio managers led by Daniel Chace.
| | |

Daniel Chace, CFA Portfolio Manager | | OVERVIEW The Wasatch Micro Cap Fund gained 10.45% during the third quarter. The Fund outperformed the Russell Microcap Index, which rose 7.81%, but trailed the Russell 2000 Index, which was up 11.29%. The U.S. stock market had its best quarter in a year. Worries about Europe’s sovereign debt problems subsided, as countries took steps to cut their budget deficits and strengthen |
their banking systems. In addition, the U.S. economy showed some modest improvement, which eased concerns about a double-dip recession. Nonetheless, the general consensus is that the economy will remain sluggish due to the serious issues facing our country, such as high unemployment and the large federal deficit.
DETAILSOFTHE QUARTER
Investors had strong appetites for stocks of companies showing good growth in the weak economy. As a result, the fastest-growing companies in the Fund were generally our best performers. This appreciation for growth also helps explain the strong performance of the international portion of the portfolio.* Small companies in the United States generate approximately 80% of their revenues domestically. Given the subdued outlook for the economy, it makes sense that investors would look overseas for growth, particularly in emerging countries.
During the quarter, one of our best-performing stocks was Abcam plc (United Kingdom). Abcam is an online supplier of antibodies used by medical researchers to study protein function in cells. Known as the “Amazon of antibodies,” the company reported a 25% increase in revenues and a 44% increase in earnings for its fiscal year ended June 30. We have been trimming our weight based on the stock’s valuation and expectations that revenue growth trends may begin to slow.
Other top performers included IPG Photonics Corp. and ArcSight, Inc. IPG Photonics makes fiber lasers that are used in a broad range of industrial applications. The company reported better-than-expected operating results and guidance in August, and the shares took off. Revenue growth was particularly strong in the Asia-Pacific region, with China accounting for more than 10% of total sales. ArcSight, a maker of security software, announced that it was being acquired by Hewlett-Packard.**
On the other hand, Peet’s Coffee & Tea, Inc., a specialty beverage company, was one of our worst-performing holdings. The stock gave back some of its gains from earlier in 2010 on speculation that Peet’s might be losing market share in the grocery channel. Rising coffee prices were another negative, although management announced a price increase in late September to offset the impact of coffee inflation. The recent weakness in the stock has not changed our thinking
on Peet’s. We believe it is a well-managed company with good headroom for growth, particularly in the grocery channel where it can expand distribution.
The fact that micro cap stocks trailed bigger small caps this quarter was a headwind for the Fund given our emphasis on the micro cap segment of the market. We think one of the main reasons micro caps underperformed is that growth trends have been better for the larger companies. Part of this is due to the slow pace of initial public offerings (IPOs) over the past several years — there have not been a lot of exciting new micro cap names coming to market to refresh the space. However, IPO activity is picking up in the United States and around the world. We are watching the new entrants carefully and have participated in several IPOs as we continue to increase the growth profile of the portfolio. For example, we bought RealPage, Inc., a rapidly growing software company, when it went public in August.
DETAILSOFTHE YEAR
Our international holdings were a key driver of returns during the 12 months ended September 30, gaining more than 40% overall.* In addition to Abcam, Goodpack Ltd. (Singapore) was one of our best-performing stocks. Goodpack, a container leasing company, has benefited from the rebound in global trade following the credit crisis. Our health care stocks also did well as a group, despite the uncertain regulatory environment.
The Fund’s focus on micro cap stocks weighed on results, as did a handful of names in the consumer staples and energy sectors. GMX Resources, Inc., an oil and gas producer, was one of our biggest laggards. We sold the stock in June because of the company’s deteriorating fundamentals.
OUTLOOK
As previously noted, the consensus view is that the U.S. economy will struggle to grow at a normal rate for a number of years. So we are continuing to look for rapidly growing companies like RealPage that should be able to thrive even in challenging times. We have incrementally been tilting the portfolio toward these types of companies for a while, and doing so has positively impacted performance.
Many of the fastest-growing stocks in the market have premium price-to-earnings (P/E) multiples, which is typical of an environment where growth is hard to come by. We are thus closely monitoring our high-growth holdings to ensure that their stocks prices are reasonable relative to their long-term prospects. Furthermore, a significant percentage of the Fund is invested in moderate growth and value-oriented names. These companies may lack the revenue momentum of our fastest growers, but they are solid businesses trading at good values. That said, when it comes to adding new stocks to the portfolio, we are maintaining our focus on growth.
Thank you for the opportunity to manage your assets.
| | CFA® is a trademark owned by CFA Institute. |
| * | Excludes American Depositary Receipts (ADRs — receipts issued by domestic banks for shares of foreign-based corporations that trade on U.S. stock exchanges) and foreign companies traded on U.S. stock exchanges. |
| ** | As of September 30, 2010, the Wasatch Micro Cap Fund was not invested in Hewlett-Packard Co. |
18
| | |
| WASATCH MICRO CAP FUND (WMICX) — Portfolio Summary | | SEPTEMBER 30, 2010 |
|
| |
| |
AVERAGE ANNUAL TOTAL RETURNS
| | | | | | | | | | | | |
| | | 1 YEAR | | | 5 YEARS | | | 10 YEARS | |
Micro Cap | | | 14.14% | | | | -0.73% | | | | 8.73% | |
Russell 2000 Index | | | 13.35% | | | | 1.60% | | | | 4.00% | |
Russell Microcap Index | | | 7.43% | | | | -2.09% | | | | 4.08% | |
Data shows past performance, which is not indicative of future performance. Current performance may be lower or higher than the performance quoted. To obtain the most recent month-end performance data available, please visit www.wasatchfunds.com. The Advisor may absorb certain Fund expenses, without which total return would have been lower. Investment returns and principal value will fluctuate and shares, when redeemed, may be worth more or less than their original cost.
As of the January 31, 2010 prospectus, the Total Annual Fund Operating Expenses for the Wasatch Micro Cap Fund are 2.24%. The expense ratio shown elsewhere in this report may be different. Expenses include direct expenses paid to the Advisor as well as indirect expenses incurred by the Fund as a result of its investments in other investment companies (each an “Acquired Fund”), before any expense reimbursements by the Advisor. The Net Expense includes any reimbursement by the Advisor. See the prospectus for additional information regarding Fund expenses.
Wasatch Funds will deduct a 2.00% redemption proceeds fee on Fund shares held 60 days or less. Performance data does not reflect the deduction of fees or taxes, which if reflected, would reduce the performance quoted. For more complete information including charges, risks and expenses, read the prospectus carefully.
Investing in micro cap funds will be more volatile and loss of principal could be greater than investing in large cap or more diversified funds. Investing in foreign securities, especially in emerging markets, entails special risks, such as currency fluctuations and political uncertainties, which are described in more detail in the prospectus.
TOP 10 EQUITY HOLDINGS*
| | | | |
| Company | | % of Net
Assets | |
| Power Integrations, Inc. | | | 3.0% | |
| CorVel Corp. | | | 2.5% | |
| Dollar Financial Corp. | | | 2.3% | |
| OPNET Technologies, Inc. | | | 2.2% | |
| Hibbett Sports, Inc. | | | 2.1% | |
| | | | |
| Company | | % of Net
Assets | |
| Abcam plc (United Kingdom) | | | 2.1% | |
| Micrel, Inc. | | | 2.0% | |
| O2Micro International Ltd. ADR (China) | | | 1.9% | |
| LMA International N.V. (Singapore) | | | 1.8% | |
| Diamond Hill Investment Group, Inc. | | | 1.8% | |
| * | As of September 30, 2010, there were 102 holdings in the Fund. Portfolio holdings are subject to change at any time. References to specific securities should not be construed as recommendations by the Funds or their Advisor. Current and future holdings are subject to risk. |
SECTOR BREAKDOWN**
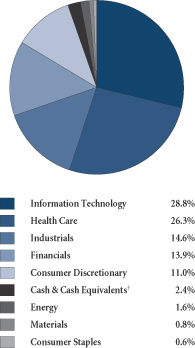
| ** | Excludes securities sold short and written options, if any. |
| † | Also includes Other Assets and Liabilities. |
GROWTHOFA HYPOTHETICAL $10,000 INVESTMENT
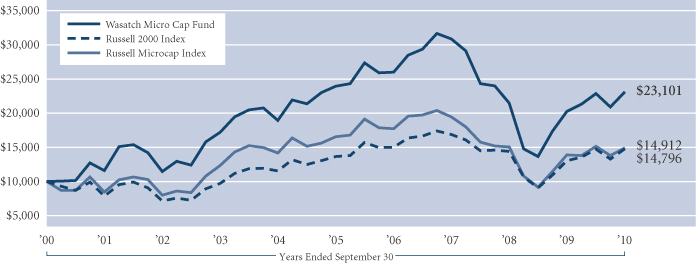
Past performance does not predict future performance and the graph above does not reflect the deduction of taxes that you would pay on fund distributions or the redemption of fund shares. Performance shown in the chart above does not include any applicable sales charges and fees. Wasatch does not charge any sales fees. The Russell 2000 Index is an unmanaged total return index of the smallest 2,000 companies in the Russell 3000 Index, as ranked by total market capitalization. The Russell 2000 Index is widely regarded in the industry as accurately capturing the universe of small company stocks. The Russell Microcap Index is an unmanaged total return index of the smallest 1,000 securities in the small-cap Russell 2000 Index along with the next smallest 1,000 companies, based on a ranking of all U.S. equities by market capitalization. No data was available for the Index prior to 6/30/00. Data for the Index from 6/30/00 until its official start date of July 1, 2005 was from a paper portfolio. You cannot invest directly in these or any indices.
19
| | |
| WASATCH MICRO CAP VALUE FUND (WAMVX) — Management Discussion | | SEPTEMBER 30, 2010 |
|
| |
| |
The Wasatch Micro Cap Value Fund is managed by a team of Wasatch portfolio managers led by Brian Bythrow.
| | |

Brian Bythrow, CFA Portfolio Manager | | OVERVIEW In the third quarter, the U.S. equity markets continued on a volatile path. In a welcome change, though, their overall direction shifted upward. At many points throughout the period, the equity indices swung up rapidly, then shot downward nearly as quickly. The precise factors driving these movements were often difficult to discern. For the quarter, the Wasatch Micro Cap Value Fund gained 7.21%. This placed it |
behind its benchmark, the Russell 2000 Index, which returned 11.29% over the same period.
The underperformance was partially the result of our focus on micro cap stocks, which over the quarter underperformed stocks on the larger end of the small cap spectrum. In addition, our cash position hurt performance in a period of positive equity returns. Although we are working to deploy these assets, the significant volatility among micro cap stocks makes it essential for us to wait until we can buy the companies we like at reasonable entry points.
DETAILSOFTHE QUARTER
Over the past quarter, a number of our holdings were hurt by speculation about and anticipation of government action that could have negative impact on their operations. For example, Lincoln Educational Services Corp., a for-profit provider of higher education, was the greatest detractor from performance for the period. It suffered, along with the rest of the for-profit education space, from fears that the Department of Education’s proposed “gainful employment” rules could reduce their eligibility for federal student loan programs. Students taking out those loans are responsible for the bulk of Lincoln’s revenues. We’ll be monitoring Lincoln, and the entire segment, carefully in coming months.
The potential for another government action — in this case, imposing a moratorium on home foreclosures —bruised another of our holdings, DJSP Enterprises, Inc. DJSP helps mortgage-issuing banks that are now overloaded with foreclosures by providing a specialized legal team to handle loan modifications, short sales, and foreclosure sales. Although a temporary halt to home foreclosures could interrupt DJSP’s business activity, there is already a significant inventory of bank-owned properties that must eventually be sold. In the meantime, however, even the possibility of a moratorium on foreclosures has been enough to dim investors’ interest in DJSP.
In the case of LHC Group, Inc., a provider of home health care services, the reason for its stock price decline was worry that health care reform, with its focus on cost-cutting, could hurt LHC Group’s earnings by reducing reimbursement rates paid to providers by government insurance programs.
Although we are concerned about this government headwind, we can’t lose sight of the many companies we’ve been
able to identify that have performed well despite the myriad challenges presented to them by the economic environment.
Our top contributor to performance for the quarter was Toronto-based easyhome Ltd., which rents furniture, appliances, and home electronics to consumers. The company is growing not only through its main rent-to-own home goods business, but also through the addition of in-store kiosks offering consumer loans. These stores-in-a-store have been tested in a number of markets, and after their success, they are now set for a chain-wide rollout. The loans offered are available to borrowers with a variety of credit profiles, making them attractive at a time when many consumers feel pinched, while also offering high margins to the lender.
Another consumer company that has done well despite pressures on discretionary spending is Germany’s Delticom AG, an online discount tire retailer that operates abroad as well as in the U.S. Although buying tires online may not seem entirely convenient, in a number of markets outside the U.S. it offers virtually the only means to purchase tires without paying the high markup traditionally charged by car dealerships. Delticom is now the largest tire dealer in Europe, and the second largest in the U.S. Although the company is maturing into the higher end of micro cap territory, it still offers good growth potential. Its valuation remains reasonable, but it’s not as low as it once was.
DETAILSOFTHE YEAR
For the 12 months ended September 30, 2010, the Wasatch Micro Cap Value Fund returned 13.26%, keeping closely on track with the Russell 2000 Index, which returned 13.35% over the same period. Our top contributor for the year was Sino Biopharmaceutical Ltd. (China). This company benefits from the rise of the Chinese consumer class by providing traditional medicines and more modern brand name drugs to that market.
The challenges at Lincoln Educational Services were sufficient to make it one of the largest detractors from performance for the year. Gas exploration and production company GMX Resources, Inc. was also among our weaker performers over the past 12 months, hurt by oversupply concerns in the natural gas industry. Current and future holdings are subject to risk.
OUTLOOK
At this point, it appears possible that there will be at least a partial change in leadership in the U.S. Congress. That could change the regulatory tone in Washington and in states across the country, perhaps alleviating some of the headwind now facing many companies and industries.
We’ll keep a careful eye on these developments as we look for opportunities to invest some of our cash. Right now, companies offering growth are generally pricey. We’re willing to exercise patience until we can buy selected companies at valuations that leave plenty of room for appreciation.
Thank you for the opportunity to manage your assets.
CFA® is a trademark owned by CFA Institute.
20
| | |
| WASATCH MICRO CAP VALUE FUND (WAMVX) — Portfolio Summary | | SEPTEMBER 30, 2010 |
|
| |
| |
AVERAGE ANNUAL TOTAL RETURNS
| | | | | | | | | | | | |
| | | 1 YEAR | | | 5 YEARS | | | SINCE INCEPTION
7/28/03 | |
Micro Cap Value | | | 13.26% | | | | 6.40% | | | | 10.90% | |
Russell 2000 Index | | | 13.35% | | | | 1.60% | | | | 6.59% | |
Russell Microcap Index | | | 7.43% | | | | -2.09% | | | | 3.76% | |
Data shows past performance, which is not indicative of future performance. Current performance may be lower or higher than the performance quoted. To obtain the most recent month-end performance data available, please visit www.wasatchfunds.com. The Advisor may absorb certain Fund expenses, without which total return would have been lower. Investment returns and principal value will fluctuate and shares, when redeemed, may be worth more or less than their original cost.
As of the January 31, 2010 prospectus, the Total Annual Fund Operating Expenses for the Wasatch Micro Cap Value Fund are 2.46%. The Net Expenses are 2.26%. The expense ratio shown elsewhere in this report may be different. Expenses include direct expenses paid to the Advisor as well as indirect expenses incurred by the Fund as a result of its investments in other investment companies (each an “Acquired Fund”), before any expense reimbursements by the Advisor. Net Expenses are based on Fund expenses, net of waivers and reimbursements. See the prospectus for additional information regarding Fund expenses.
Wasatch Funds will deduct a 2.00% redemption proceeds fee on Fund shares held 60 days or less. Performance data does not reflect the deduction of fees or taxes, which if reflected, would reduce the performance quoted. For more complete information including charges, risks and expenses, read the prospectus carefully.
Investing in micro cap funds will be more volatile and loss of principal could be greater than investing in large cap or more diversified funds. Investing in foreign securities, especially in emerging markets, entails special risks, such as currency fluctuations and political uncertainties, which are described in more detail in the prospectus.
TOP 10 EQUITY HOLDINGS*
| | | | |
| Company | | % of Net
Assets | |
| easyhome Ltd. (Canada) | | | 1.6% | |
| Solar Capital Ltd. | | | 1.4% | |
| Prestige Brands Holdings, Inc. | | | 1.3% | |
| Haynes International, Inc. | | | 1.3% | |
| Ace Hardware Indonesia (Indonesia) | | | 1.2% | |
| | | | |
| Company | | % of Net
Assets | |
| Karnataka Bank Ltd. (India) | | | 1.2% | |
| Dewan Housing Finance Corp. Ltd. (India) | | | 1.2% | |
| First Cash Financial Services, Inc. | | | 1.2% | |
| JDA Software Group, Inc. | | | 1.2% | |
| TTM Technologies, Inc. | | | 1.2% | |
| * | As of September 30, 2010, there were 119 holdings in the Fund. Portfolio holdings are subject to change at any time. References to specific securities should not be construed as recommendations by the Funds or their Advisor. Current and future holdings are subject to risk. |
SECTOR BREAKDOWN**
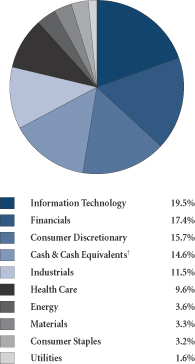
| ** | Excludes securities sold short and written options, if any. |
| † | Also includes Other Assets and Liabilities. |
GROWTHOFA HYPOTHETICAL $10,000 INVESTMENT
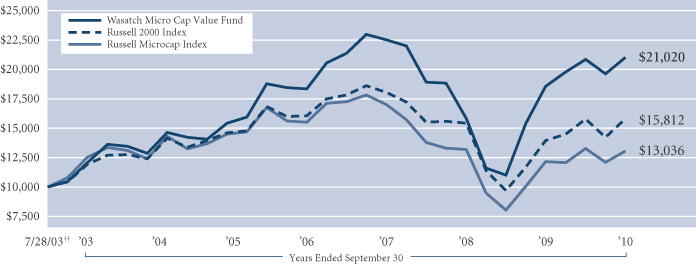
Past performance does not predict future performance and the graph above does not reflect the deduction of taxes that you would pay on fund distributions or the redemption of fund shares. Performance shown in the chart above does not include any applicable sales charges and fees. Wasatch does not charge any sales fees. ††Inception: July 28, 2003. The Russell 2000 Index is an unmanaged total return index of the smallest 2,000 companies in the Russell 3000 Index, as ranked by total market capitalization. The Russell 2000 Index is widely regarded in the industry as accurately capturing the universe of small company stocks. The Russell Microcap Index is an unmanaged total return index of the smallest 1,000 securities in the small-cap Russell 2000 Index along with the next smallest 1,000 companies, based on a ranking of all U.S. equities by market capitalization. No data was available for the Index prior to 6/30/00. Data for the Index from 6/30/00 until its official start date of July 1, 2005 was from a paper portfolio. You cannot invest directly in these or any indices.
21
| | |
| WASATCH SMALL CAP GROWTH FUND (WAAEX) — Management Discussion | | SEPTEMBER 30, 2010 |
|
| |
| |
The Wasatch Small Cap Growth Fund is managed by a team of Wasatch portfolio managers led by Jeff Cardon.
| | |

Jeff Cardon, CFA Portfolio Manager | | OVERVIEW The Wasatch Small Cap Growth Fund gained 15.33% in the third quarter. The Fund outperformed the Russell 2000 Growth Index, which rose 12.83%, and the Russell 2000 Index, which increased 11.29%. The small cap market was down slightly from July through August, as pessimism about the economy overshadowed better-than-expected corporate earnings. However, the market rallied in September on some |
encouraging economic data that eased concerns about a double-dip recession.
During the quarter, investors favored stocks of companies showing strong growth in the challenging economic environment. This benefited the Fund given the positive trends in revenues and earnings that we are seeing from many of our companies. Investors’ appetite for growth was particularly evident in the information technology portion of the portfolio, which was the main driver of our strong results. We are also finding a lot of growth outside the United States, and our international holdings produced an even bigger gain than our domestic holdings.
DETAILSOFTHE QUARTER
Some of the Fund’s best-performing stocks this quarter were stocks of companies related to “cloud computing” — computing in which products and services are provided over the Internet. They included Riverbed Technology, Inc. and F5 Networks, Inc., two companies that enable cloud computing. Riverbed is a leader in the wide area network (WAN) optimization market, while F5 Networks provides solutions that improve the performance of delivering Internet services. Ultimate Software Group, Inc., NetSuite, Inc. and Concur Technologies, Inc., which deliver software over the Internet or “cloud,” also had an especially good quarter. ArcSight, Inc. was another big winner in information technology. The company, a maker of security software, announced that it was being acquired by Hewlett-Packard.* The acquisition enhances Hewlett-Packard’s portfolio of security offerings at a time when increasing amounts of data are moving outside of corporate firewalls and into the cloud.
HDFC Bank Ltd., an Indian bank, was one of our best-performing stocks outside the information technology sector. The company reported strong quarterly operating results, including a 34% increase in earnings and a 40% increase in loans. Unlike many small U.S. banks, which are fighting for survival, HDFC is focused on growth and opportunity. At 1.1 billion, India’s population is more than three times greater than ours, yet Indian consumers buy just a fraction of the number of cars that Americans purchase each year. Mortgage debt represents only about 7% of India’s gross domestic product (GDP) but approximately 80% of U.S. GDP. These statistics highlight the untapped
market potential for financial services in India, where the economy is robust and incomes are rising.
VistaPrint N.V. and Resources Connection, Inc. are two stocks that lagged. VistaPrint uses the Internet to provide small businesses with a wide range of marketing products and services, such as brochures and logo design. Many small businesses are struggling in the weak economy, and the soft spending environment has been a headwind for the company. VistaPrint has also experienced a few operational missteps, including an advertising campaign that yielded disappointing results. Resources Connection is a staffing firm that provides high-level accounting and finance professionals on a temporary basis. With the recovery so fragile, corporations have been hesitant to move forward with projects. This has hurt the entire staffing industry. Despite recent weakness, we think VistaPrint and Resources Connection are both high-quality names with good business models, and our long-term outlook on them remains positive. Current and future holdings are subject to risk.
DETAILSOFTHE YEAR
Investors have been seeking growth for a while, so some of the same factors that drove performance in the third quarter also impacted the Fund during the last 12 months. Our information technology holdings did particularly well overall, led by strong gains from F5 Networks, Riverbed Technology and Ultimate Software Group. Other top performers included companies that are benefiting from favorable growth trends outside the United States, such as HDFC Bank and Bucyrus International, Inc., a manufacturer of mining equipment. On the negative side, business services stocks like Resources Connection tended to be weak. In addition, government reform of the health care sector weighed on many of our health care names.
OUTLOOK
We believe the serious issues facing the United States, including high unemployment and unprecedented levels of U.S. debt, will lead to a period of below-average growth for our economy. We also believe investors will reward companies producing real growth in an environment where growth is hard to come by. Our thoughts on this subject have been consistent for some time, and we think this is a long-run theme we may be talking about for years.
Given this view of the world, we are focused on capturing solid growth in the Fund. We are out in the field, researching new ideas and looking for growth wherever we can find it. Our goal is to identify quality companies that can increase their earnings by at least 15% annually over a five-year horizon. Our forecasts suggest that we are not only meeting this goal, but exceeding it, as the long-run projected growth rate for our companies is north of 20%. The level of growth we are seeing in the Fund makes us confident that it is well positioned for the future.
Thank you for the opportunity to manage your assets.
| | CFA® is a trademark owned by CFA Institute. |
| * | As of September 30, 2010, the Wasatch Small Cap Growth Fund was not invested in Hewlett-Packard Co. |
22
| | |
| WASATCH SMALL CAP GROWTH FUND (WAAEX) — Portfolio Summary | | SEPTEMBER 30, 2010 |
|
| |
| |
AVERAGE ANNUAL TOTAL RETURNS
| | | | | | | | | | | | |
| | | 1 YEAR | | | 5 YEARS | | | 10 YEARS | |
Small Cap Growth | | | 19.76% | | | | 2.76% | | | | 5.59% | |
Russell 2000 Growth Index | | | 14.79% | | | | 2.35% | | | | -0.13% | |
Russell 2000 Index | | | 13.35% | | | | 1.60% | | | | 4.00% | |
Data shows past performance, which is not indicative of future performance. Current performance may be lower or higher than the performance quoted. To obtain the most recent month-end performance data available, please visit www.wasatchfunds.com. The Advisor may absorb certain Fund expenses, without which total return would have been lower. Investment returns and principal value will fluctuate and shares, when redeemed, may be worth more or less than their original cost.
As of the January 31, 2010 prospectus, the Total Annual Fund Operating Expenses for the Wasatch Small Cap Growth Fund are 1.31%. The expense ratio shown elsewhere in this report may be different. Expenses include direct expenses paid to the Advisor as well as indirect expenses incurred by the Fund as a result of its investments in other investment companies (each an “Acquired Fund”), before any expense reimbursements by the Advisor. The Net Expense includes any reimbursement by the Advisor. See the prospectus for additional information regarding Fund expenses.
Wasatch Funds will deduct a 2.00% redemption proceeds fee on Fund shares held 60 days or less. Performance data does not reflect the deduction of fees or taxes, which if reflected, would reduce the performance quoted. For more complete information including charges, risks and expenses, read the prospectus carefully.
Investing in small cap funds will be more volatile and loss of principal could be greater than investing in large cap or more diversified funds.
TOP 10 EQUITY HOLDINGS*
| | | | |
| Company | | % of Net
Assets | |
| Power Integrations, Inc. | | | 3.8% | |
| Ultimate Software Group, Inc. | | | 3.7% | |
| Hibbett Sports, Inc. | | | 2.8% | |
| MSC Industrial Direct Co., Inc., Class A | | | 2.6% | |
| Cognizant Technology Solutions Corp., Class A | | | 2.6% | |
| | | | |
| Company | | % of Net
Assets | |
| HDFC Bank Ltd. ADR (India) | | | 2.5% | |
| MSCI, Inc., Class A | | | 2.4% | |
| Knight Transportation, Inc. | | | 2.4% | |
| Riverbed Technology, Inc. | | | 2.2% | |
| Peet’s Coffee & Tea, Inc. | | | 2.1% | |
| * | As of September 30, 2010, there were 102 holdings in the Fund. Portfolio holdings are subject to change at any time. References to specific securities should not be construed as recommendations by the Funds or their Advisor. Current and future holdings are subject to risk. |
SECTOR BREAKDOWN**

| ** | Excludes securities sold short and written options, if any. |
| † | Also includes Other Assets and Liabilities. |
GROWTHOFA HYPOTHETICAL $10,000 INVESTMENT
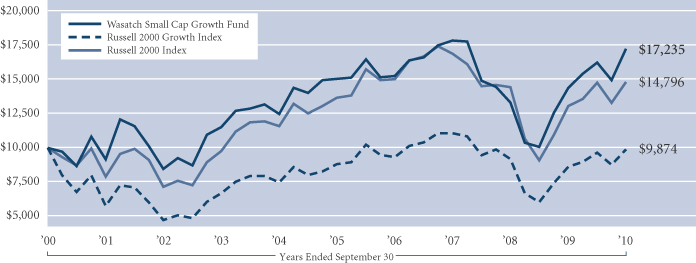
Past performance does not predict future performance and the graph above does not reflect the deduction of taxes that you would pay on fund distributions or the redemption of fund shares. Performance shown in the chart above does not include any applicable sales charges and fees. Wasatch does not charge any sales fees. The Russell 2000 Growth Index is an unmanaged total return index that measures the performance of those Russell 2000 Index companies with higher price-to-book ratios and higher forecasted growth values. The Russell 2000 Index is an unmanaged total return index of the smallest 2,000 companies in the Russell 3000 Index, as ranked by total market capitalization. The Russell 2000 Index is widely regarded in the industry as accurately capturing the universe of small company stocks. You cannot invest directly in these or any indices.
23
| | |
| WASATCH SMALL CAP VALUE FUND (WMCVX) — Management Discussion | | SEPTEMBER 30, 2010 |
|
| |
| |
The Wasatch Small Cap Value Fund is managed by a team of Wasatch portfolio managers led by Jim Larkins.
| | |

Jim Larkins, MBA Portfolio Manager | | OVERVIEW The U.S. stock market overcame a litany of investor concerns to finish the third quarter with a surprisingly strong return. Still, a look past the returns of the broad market indices reveals that a relatively small group of richly valued growth stocks drove the bulk of the gain. Conversely, investors showed little appreciation for the types of stocks in which we invest — those with robust cash flows, strong balance sheets, and |
attractive valuations. As would be expected, this environment dampened the Fund’s relative performance for the quarter.
It should come as no surprise that our response was to maintain the same value discipline that has worked so well for us over time. Experience has taught us that sticking to our process, regardless of short-term market activity, is the best way to maintain a steady course for the Fund.
DETAILSOFTHE QUARTER
The information technology sector was an area in which our value-oriented approach experienced underperformance. While no individual tech stock stood out as a significant underperformer, a handful of individual positions suffered losses in the low- to mid-teens. The largest area of weakness was the semiconductors and components group, where notable laggards were Standard Microsystems Corp. and Pericom Semiconductor Corp.
In terms of what worked, two of our top contributors were former “Fallen Angels” — our term for one-time growth stocks that have stumbled but have a clear path to resuming their growth. The first was a longtime holding that we have discussed quite a bit in past communications — natural foods company NBTY, Inc. When NBTY experienced difficulties in 2008, our due diligence showed that the company continued to feature strong cash flows, a compelling valuation, and the ability to benefit from the longer-term growth trends in vitamins and natural foods. During the quarter, private equity firm The Carlyle Group acquired NBTY.
OPNET Technologies, Inc., whose software provides corporations with a high return on investment by making networks more efficient, is another former Fallen Angel that energized our performance. We bought low in early 2009 when OPNET’s shares were under pressure from the broad market selloff, and the stock has since staged a powerful rebound.
We also generated strong returns from a number of the Fund’s “Undiscovered Gems” — the phrase we use to describe companies whose current valuations do not reflect what we believe is their true value. In some cases, this is due to a lack of coverage from major Wall Street firms. A prime example is CorVel Corp., a stock with no analyst coverage that Wasatch has owned on and off for 15 years. CorVel, a provider of services that help companies lower the cost of workmen’s compensation claims, reported robust growth in revenues and earnings — a development we anticipated. The
stock responded favorably as investors tried to play “catch-up” with the improving fundamental story.
Our positions in non-U.S. stocks also continued to add value for the Fund. The past quarter saw strong performance from our Indian financial stocks LIC Housing Finance Ltd. and City Union Bank Ltd., as well as from Goodpack Ltd., a Singapore-based company that operates the world’s largest fleet of medium-sized containers used to transport specialty cargo. Current and future holdings are subject to risk.
DETAILSOFTHE YEAR
The Wasatch Small Cap Value Fund returned 12.00% during the annual period and outpaced the 11.84% return of its benchmark, the Russell 2000 Value Index. We are gratified that the Fund outperformed even though the types of stocks in which we invest were out of favor for much of the year. We view this as evidence that it pays to focus on value and bottom-up stock picking, rather than trying to keep up with short-term market moves by chasing the winners.
OUTLOOK
Self-reflection helps us analyze our successes and mistakes to determine what’s working and what we can do better. Our most recent effort in this vein involved a rigorous analysis of the Small Cap Value strategy’s 12-year history. What we found was not particularly surprising, but it helps illustrate some of the factors that have driven our returns.
Since the Fund’s inception, the most important factor underlying our performance has been — by a substantial margin — our investments in Fallen Angels. As a “value manager within a growth shop,” we are well positioned to leverage the firm’s knowledge to capitalize on the frequent occasions when growth companies stumble and slip into our value universe.
We also have added quite a bit of value over the years via our investments in Undiscovered Gems. This universe has proven to be fertile ground for successful investments, since thin coverage on a stock enables those with an informational advantage to capitalize on inefficiencies. We believe our strong research capabilities provide such an advantage.
Taken together, these two strategies have accounted for the vast majority of our winners in the past 12 years. Notably, almost all of these top performers were stocks that at one time were held in Wasatch growth portfolios — illustrating the value of sharing ideas among our various investment teams.
Self-reflection is a continual process at Wasatch, where the opportunity to learn from the past helps us set a clear path for the future. We believe this approach provides us with the best chance to translate our research expertise into continued long-term performance.
Thank you for the opportunity to manage your assets.
24
| | |
| WASATCH SMALL CAP VALUE FUND (WMCVX) — Portfolio Summary | | SEPTEMBER 30, 2010 |
|
| |
| |
AVERAGE ANNUAL TOTAL RETURNS
| | | | | | | | | | | | |
| | | 1 YEAR | | | 5 YEARS | | | 10 YEARS | |
Small Cap Value | | | 12.00% | | | | -0.31% | | | | 7.69% | |
Russell 2000 Value Index | | | 11.84% | | | | 0.73% | | | | 7.72% | |
Russell 2000 Index | | | 13.35% | | | | 1.60% | | | | 4.00% | |
Data shows past performance, which is not indicative of future performance. Current performance may be lower or higher than the performance quoted. To obtain the most recent month-end performance data available, please visit www.wasatchfunds.com. The Advisor may absorb certain Fund expenses, without which total return would have been lower. Investment returns and principal value will fluctuate and shares, when redeemed, may be worth more or less than their original cost.
As of the January 31, 2010 prospectus, the Total Annual Fund Operating Expenses for the Wasatch Small Cap Value Fund are 1.97%. The expense ratio shown elsewhere in this report may be different. Expenses include direct expenses paid to the Advisor as well as indirect expenses incurred by the Fund as a result of its investments in other investment companies (each an “Acquired Fund”), before any expense reimbursements by the Advisor. The Net Expense includes any reimbursement by the Advisor. See the prospectus for additional information regarding Fund expenses.
Wasatch Funds will deduct a 2.00% redemption proceeds fee on Fund shares held 60 days or less. Performance data does not reflect the deduction of fees or taxes, which if reflected, would reduce the performance quoted. For more complete information including charges, risks and expenses, read the prospectus carefully.
Investing in small cap funds will be more volatile and loss of principal could be greater than investing in large cap or more diversified funds.
TOP 10 EQUITY HOLDINGS*
| | | | |
Company | | % of Net
Assets | |
| CorVel Corp. | | | 3.3% | |
| HEICO Corp., Class A | | | 2.7% | |
| Herbalife Ltd. | | | 2.2% | |
| Pericom Semiconductor Corp. | | | 2.1% | |
| Standard Microsystems Corp. | | | 2.0% | |
| | | | |
Company | | % of Net
Assets | |
| Solar Capital Ltd. | | | 2.0% | |
| Redwood Trust, Inc. | | | 2.0% | |
| OPNET Technologies, Inc. | | | 1.9% | |
| Copart, Inc. | | | 1.9% | |
| Marten Transport, Ltd. | | | 1.9% | |
| * | As of September 30, 2010, there were 89 holdings in the Fund. Portfolio holdings are subject to change at any time. References to specific securities should not be construed as recommendations by the Funds or their Advisor. Current and future holdings are subject to risk. |
SECTOR BREAKDOWN**
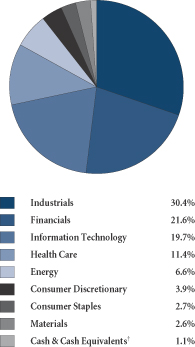
| ** | Excludes securities sold short and written options, if any. |
| † | Also includes Other Assets and Liabilities. |
GROWTHOFA HYPOTHETICAL $10,000 INVESTMENT
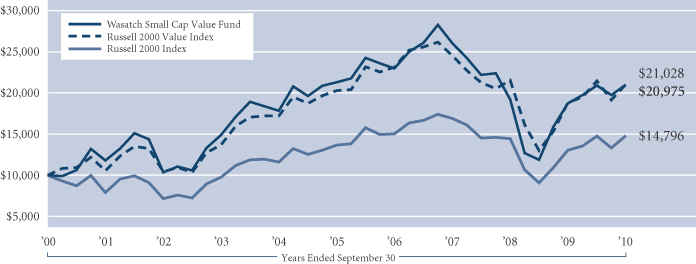
Past performance does not predict future performance and the graph above does not reflect the deduction of taxes that you would pay on fund distributions or the redemption of fund shares. Performance shown in the chart above does not include any applicable sales charges and fees. Wasatch does not charge any sales fees. The Russell 2000 Value Index measures the performance of those Russell 2000 Index companies with lower price-to-book ratios and lower forecasted growth values. The Russell 2000 Index is an unmanaged total return index of the smallest 2,000 companies in the Russell 3000 Index, as ranked by total market capitalization. The Russell 2000 Index is widely regarded in the industry as accurately capturing the universe of small company stocks. You cannot invest directly in these or any indices.
25
| | |
| WASATCH STRATEGIC INCOME FUND (WASIX) — Management Discussion | | SEPTEMBER 30, 2010 |
|
| |
| |
The Wasatch Strategic Income Fund is managed by a team of Wasatch portfolio managers led by Sam Stewart.
| | |
Samuel S. Stewart, Jr. PhD, CFA Portfolio Manager | | OVERVIEW The S&P 500 had its best September in 71 years, leading to an 11.29% gain for the quarter. The Strategic Income Fund’s 10.70% third quarter return nearly matched the S&P 500, and far outpaced the 2.48% return of the Barclays Capital U.S. Aggregate Bond Index. We continue to see significant swings in the equity markets as investors react to the news of the day. The market has become momentum driven, with companies that are doing really well |
getting the attention, while strong companies not quite firing on all cylinders are being overlooked.
The Wasatch Strategic Income Fund does not follow a momentum-driven investment mandate. My goal is to deliver long-term returns between those of stocks and bonds, while taking less risk than a typical equity fund. I continue to focus on what I consider to be high quality companies that are able and willing to pay growing dividends. These companies tend to be stable with healthy balance sheets and consistent cash flow, making them well positioned in the current economy. The Fund’s current subsidized SEC 30-day yield is 3.35% (2.50% unsubsidized), which is healthy in an environment brandishing yields on cash and bonds near historic lows. Dividends are good tools to help lessen downside risk in the Fund.
DETAILSOFTHE QUARTER
One positive indication that the Fund may be reducing its susceptibility to downside risk is that there were no significant stock declines during the quarter. The Fund’s largest detractor was Ultra Petroleum Corp., which slid 5%. Lower natural gas prices hurt the company slightly. However, Ultra Petroleum remains nicely profitable and has a competitive advantage as a low-cost operator in natural gas exploration and production.
Several stocks performed well, led by Herbalife Ltd., a provider of weight-loss and nutritional supplements. Herbalife has shifted from traditional multi-level marketing, where customers order monthly from distributors, to more of a retail approach emphasizing daily consumption. Advantages to the new model include expanding the market to customers that are not willing to commit to becoming Herbalife distributors but are still interested in purchasing the company’s products. The stock price was up dramatically over the past year and the company pays a solid, growing dividend.
Wirecard AG also appreciated nicely. Wirecard, a German-based international provider of electronic payment options, continues to capitalize on the personal credit megatrend. I initiated a position earlier this year after the stock price declined based on what I perceived to be a short-term concern. Wirecard’s stock moved up 59% this past quarter.
In my focus on owning high quality companies, capturing yield, and managing risk I sold a couple of companies that were not paying dividends, and took profits on others as their stock prices moved up. In doing so, the Fund’s cash position went from 3.1% to 7.3% in the quarter.
DETAILSOFTHE YEAR
Over the last 12 months, the Fund returned 15.18% and outpaced stocks and bonds by a significant margin. Despite being happy about delivering a solid return for the Fund’s shareholders, I am grappling with my belief that the Fund may still be taking on too much risk if it is able to deliver outsized returns. As the year went on, I believe the Fund became more conservative. However, as other investors also began seeking higher quality companies, the stock prices of many of the Fund’s holdings continued to move higher.
We outperformed in the financials sector, where the Fund is substantially overweight relative to the S&P 500, thanks to companies like Ares Capital Corp., a private equity firm, which was up 57% this year due to fundamental company strength and a high dividend yield.
The industrials sector was the biggest detractor for the Fund compared to the S&P 500. Although our holdings in this sector performed well, it was underweight relative to the Index because companies in this sector generally do not offer the characteristics I seek for this Fund.
OUTLOOK
I think we will likely continue to see the equity markets seesaw due to the shortsightedness of many investors. Overall, I expect the market to muddle through the year ahead as we tackle the large economic challenges of reduced credit, high unemployment, and increased government debt and regulation.
I plan to stay focused on high quality companies with the ability and willingness to provide growing dividends. Currently, I believe blue chip stocks are among the most attractive investment opportunities, as many investors are overlooking them. Blue chips are stable, high quality companies trading at low valuations and providing attractive yields.
I will continue to seek a lower beta for the Fund, but I am not ready to add fixed-income securities in any significant way. While many investors continue to flee to the perceived safety of bonds, chasing ever-diminishing yields, I believe that fixed income products have become overly popular. With little room left for interest rates to fall there is a good chance of future price depreciation for bonds, which may well overshadow the small interest earned.
Overall, the Fund has had a nice evolution this year and I believe that it remains well positioned for the current economic environment.
Thank you for the opportunity to manage your assets.
| CFA® | is a trademark owned by CFA Institute. |
26
| | |
| WASATCH STRATEGIC INCOME FUND (WASIX) — Portfolio Summary | | SEPTEMBER 30, 2010 |
|
| |
| |
AVERAGE ANNUAL TOTAL RETURNS
| | | | | | | | | | |
| | | 1 YEAR | | | 5 YEARS | | SINCE INCEPTION 2/1/06 | |
Strategic Income | | | 15.18% | | | N/A | | | 0.86% | |
S&P 500 Index | | | 10.16% | | | N/A | | | -0.32% | |
Barclays Capital U.S. Aggregate Bond Index | | | 8.16% | | | N/A | | | 6.53% | |
Data shows past performance, which is not indicative of future performance. Current performance may be lower or higher than the performance quoted. To obtain the most recent month-end performance data available, please visit www.wasatchfunds.com. The Advisor may absorb certain Fund expenses, without which total return would have been lower. Investment returns and principal value will fluctuate and shares, when redeemed, may be worth more or less than their original cost.
As of the January 31, 2010 prospectus, the Total Annual Fund Operating Expenses for the Wasatch Strategic Income Fund are 1.94%. The Net Expenses are 1.28%. The expense ratio shown elsewhere in this report may be different. Expenses include direct expenses paid to the Advisor as well as indirect expenses incurred by the Fund as a result of its investments in other investment companies (each an “Acquired Fund”), before any expense reimbursements by the Advisor. Net Expenses are based on Fund expenses, net of waivers and reimbursements. See the prospectus for additional information regarding Fund expenses.
Wasatch Funds will deduct a 2.00% redemption proceeds fee on Fund shares held 60 days or less. Performance data does not reflect the deduction of fees or taxes, which if reflected, would reduce the performance quoted. For more complete information including charges, risks and expenses, read the prospectus carefully.
With respect to the Fund’s assets invested in fixed income securities, you are subject, but not limited to, the same interest rate, inflation and credit risk associated with the underlying fixed-income securities owned by the Fund. Return of principal is not guaranteed. Equity investing involves risks, including potential loss of the principal amount invested. Investing in foreign securities, especially in emerging markets, entails special risks, such as currency fluctuations and political uncertainties, which are described in more detail in the prospectus.
TOP 10 EQUITY HOLDINGS*
| | | | |
| Company | | % of Net
Assets | |
| Capstead Mortgage Corp. | | | 7.3% | |
| Redwood Trust, Inc. | | | 6.5% | |
| Herbalife Ltd. | | | 4.1% | |
| Ares Capital Corp. | | | 3.8% | |
Teva Pharmaceutical Industries Ltd.
ADR (Israel) | | | 3.4% | |
| | | | |
| Company | | % of Net
Assets | |
| Solar Capital Ltd. | | | 3.4% | |
| Xilinx, Inc. | | | 2.9% | |
| MFA Financial, Inc. | | | 2.7% | |
| International Business Machines Corp. | | | 2.7% | |
| Wirecard AG (Germany) | | | 2.5% | |
| * | As of September 30, 2010, there were 51 holdings in the Fund. Portfolio holdings are subject to change at any time. References to specific securities should not be construed as recommendations by the Funds or their Advisor. Current and future holdings are subject to risk. |
SECTOR BREAKDOWN**
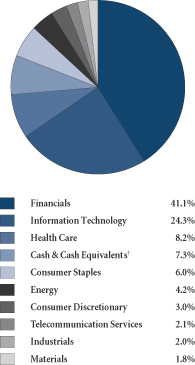
| ** | Excludes securities sold short and written options, if any. |
| † | Also includes Other Assets and Liabilities. |
GROWTHOFA HYPOTHETICAL $10,000 INVESTMENT
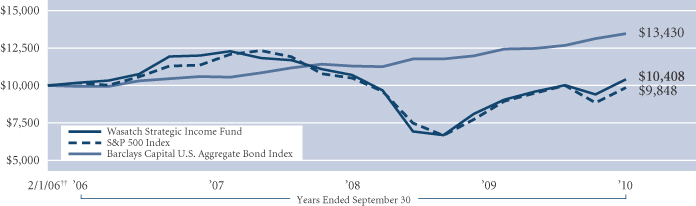
Past performance does not predict future performance and the graph above does not reflect the deduction of taxes that you would pay on fund distributions or the redemption of fund shares. Performance shown in the chart above does not include any applicable sales charges and fees. Wasatch does not charge any sales fees. ††Inception: February 1, 2006. The S&P 500 Index represents 500 of the United States’ largest stocks from a broad variety of industries. The Index is unmanaged, and a common measure of common stock total return performance. The Barclays Capital U.S. Aggregate Bond Index covers the U.S. investment grade fixed rate bond market, including government and corporate securities, agency mortgage pass-through securities, and asset-backed securities. To be included in the index the security must meet the following criteria: must have at least one year to final maturity, regardless of call features; must have at least $100 million par amount outstanding; must be rated investment grade or better by Moody’s Investors Service, Standard & Poor’s, or Fitch Investor’s Service; must be fixed rate, although it can carry a coupon that steps up or changes to a predetermined schedule; must be dollar-denominated and nonconvertible. All corporate and asset-backed securities must be registered with the SEC and must be publicly issued. You cannot invest directly in these or any indices.
27
| | |
| WASATCH ULTRA GROWTH FUND (WAMCX) — Management Discussion | | SEPTEMBER 30, 2010 |
|
| |
| |
The Wasatch Ultra Growth Fund is managed by a team of Wasatch portfolio managers led by Ajay Krishnan.
| | |

Ajay Krishnan, CFA Portfolio Manager | | OVERVIEW In the year’s third quarter, the U.S. equity markets remained turbulent, with major market indices frequently posting towering gains or steep losses, often for barely discernible reasons. Despite the strong returns recorded over the period, the market still seemed directionless
in many ways, with no strong theme driving performance. Over the three months, the Wasatch Ultra Growth Fund returned 17.65%, solidly outpacing the |
Russell 2000 Growth Index, which posted a 12.83% return for the third quarter.
Once again, our companies posted earnings growth that was stronger than we expected, and well ahead of the benchmark. Earnings growth remained somewhat difficult to find in the tepid economic environment, so companies that could produce it often posted healthy price-to-earnings ratios. Our investment approach remained consistent, even in the face of frequent market volatility. We kept our attention on identifying companies with hearty fundamentals and distinctive business themes.
DETAILSOFTHE QUARTER
Among the themes that have been shaping our investing over recent periods has been our view that, even as consumer spending remains weak, corporate spending appears to be on a more solid footing. After years of cautious spending, corporate cash balances have risen to record levels. That cash, along with the desire to improve their businesses’ return on investment, has given many companies the impetus to spend money upgrading their systems.
A number of our top contributors in the period reflected this theme, particularly within the information technology (IT) sector, which was our strongest area over the quarter. Cognizant Technology Solutions Corp., a longtime holding and long-term leading performer, had significant impact on the Fund’s performance for the third quarter. This IT outsourcing company is enjoying gains as companies invest in new tools to improve efficiency, and contract with consultants to help implement them. After such a long run of success, we are evaluating whether to trim our position.
Fellow top-five contributors in information technology included Riverbed Technology, Inc. and F5 Networks, Inc. Both companies are achieving strong earnings growth as corporations reinforce their IT infrastructure in an era increasingly defined by cloud-based computing and the heavier network traffic it involves.
With so much cash sitting on corporate balance sheets, we haven’t been surprised to see an uptick in corporate acquisition activity. The Fund has benefited from this trend, most recently through the acquisition of ArcSight, Inc. by computing giant Hewlett-Packard.* While we don’t select stocks based on a belief that they may be acquisition targets, the same qualities that attract us to a company can draw corporate suitors as well.
Although we have more faith in corporate expenditures than in consumer spending, we have been able to identify some companies that are doing well in the consumer discretionary area. One of these is a recent addition to the portfolio, value-oriented retailer Gordmans Stores, Inc. Gordmans focuses on offering brand-name fashions at discounted prices. It’s clear that consumers are still wary of overspending, but the worst of the job losses appears to be behind us, and those who have ridden this crisis out may be somewhat more willing to open their wallets for items they perceive to offer good value.
Our greatest detractor from performance over the quarter came from the health care sector, an area of the market that is facing considerable uncertainty from new health care reform provisions. ICON plc (Ireland), a provider of pharmaceutical development services, has been hit in recent months by concerns that drug companies under increasing price pressure may begin to slow their research and development efforts, reducing demand for ICON’s services. We believe this is probably just a temporary concern. Further, we’re encouraged by the fact that much of ICON’s business comes from outside the U.S. market.
DETAILSOFTHE YEAR
For the 12 months ended September 30, 2010, the Wasatch Ultra Growth Fund returned 26.44%, placing it well ahead of the Russell 2000 Growth Index, which returned 14.79% over the same period. F5 Networks, Cognizant Technology, and Riverbed Technology were also among our top contributors to performance for the one-year period. Interestingly, another technology stock, Silicon Laboratories, Inc., was our greatest detractor from performance. The company, along with many of its competitors, was hit by concerns that inventory levels in the semiconductor industry are uncomfortably high. Current and future holdings are subject to risk.
OUTLOOK
Even after some recent healthy spending, corporate balance sheets are still carrying huge levels of cash. We anticipate that the technology sector will continue to be one of the primary beneficiaries of renewed capital spending, though the pace could slow somewhat. Corporate acquisition activity should also remain an important factor in the equity markets.
In coming weeks, it will be interesting to see how the midterm elections in the U.S. play out. Should there be a change in control of the House or Senate, it could provide a catalyst for the market as many might expect this could lead to a looser regulatory environment going forward. That sentiment alone could drive the market, even if little actual change ultimately results.
Earnings growth continues to be highly valued in the equity markets. As a result, companies offering it — including a number of our holdings — have seen their prices move up substantially. We are keeping a careful eye on valuations, and are prepared to modify positions as we believe appropriate.
Thank you for the opportunity to manage your assets.
| | CFA® is a trademark owned by CFA Institute. |
| * | As of September 30, 2010, the Wasatch Ultra Growth Fund was not invested in Hewlett-Packard Co. |
28
| | |
| WASATCH ULTRA GROWTH FUND (WAMCX) — Portfolio Summary | | SEPTEMBER 30, 2010 |
|
| |
| |
AVERAGE ANNUAL TOTAL RETURNS
| | | | | | | | | | | | |
| | | 1 YEAR | | | 5 YEARS | | | 10 YEARS | |
Ultra Growth | | | 26.44% | | | | 0.11% | | | | 3.71% | |
Russell 2000 Growth Index | | | 14.79% | | | | 2.35% | | | | -0.13% | |
Data shows past performance, which is not indicative of future performance. Current performance may be lower or higher than the performance quoted. To obtain the most recent month-end performance data available, please visit www.wasatchfunds.com. The Advisor may absorb certain Fund expenses, without which total return would have been lower. Investment returns and principal value will fluctuate and shares, when redeemed, may be worth more or less than their original cost.
As of the January 31, 2010 prospectus, the Total Annual Fund Operating Expenses for the Wasatch Ultra Growth Fund are 1.82%. The Net Expenses are 1.80%. The expense ratio shown elsewhere in this report may be different. Expenses include direct expenses paid to the Advisor as well as indirect expenses incurred by the Fund as a result of its investments in other investment companies (each an “Acquired Fund”), before any expense reimbursements by the Advisor. Net Expenses are based on Fund expenses, net of waivers and reimbursements. See the prospectus for additional information regarding Fund expenses.
Wasatch Funds will deduct a 2.00% redemption proceeds fee on Fund shares held 60 days or less. Performance data does not reflect the deduction of fees or taxes, which if reflected, would reduce the performance quoted. For more complete information including charges, risks and expenses, read the prospectus carefully.
Investing in small cap funds will be more volatile and loss of principal could be greater than investing in large cap or more diversified funds.
TOP 10 EQUITY HOLDINGS*
| | | | |
| Company | | % of Net
Assets | |
| Cognizant Technology Solutions Corp., Class A | | | 4.3% | |
| Power Integrations, Inc. | | | 2.8% | |
| MSCI, Inc., Class A | | | 2.6% | |
| Riverbed Technology, Inc. | | | 2.5% | |
| Ultimate Software Group, Inc. | | | 2.4% | |
| | | | |
| Company | | % of Net
Assets | |
| Greenspring Global Partners II-B, L.P. | | | 2.1% | |
| Silicon Laboratories, Inc. | | | 2.1% | |
| LIC Housing Finance Ltd. (India) | | | 2.0% | |
| F5 Networks, Inc. | | | 1.7% | |
| Dollar Tree, Inc. | | | 1.6% | |
| * | As of September 30, 2010, there were 108 holdings in the Fund. Portfolio holdings are subject to change at any time. References to specific securities should not be construed as recommendations by the Funds or their Advisor. Current and future holdings are subject to risk. |
SECTOR BREAKDOWN**
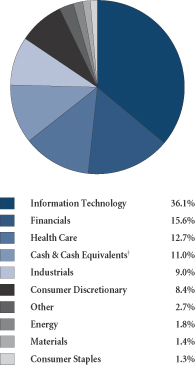
| ** | Excludes securities sold short and written options, if any. |
| † | Also includes Other Assets and Liabilities. |
GROWTHOFA HYPOTHETICAL $10,000 INVESTMENT
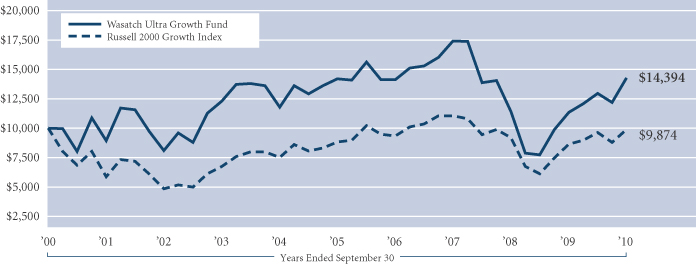
Past performance does not predict future performance and the graph above does not reflect the deduction of taxes that you would pay on fund distributions or the redemption of fund shares. Performance shown in the chart above does not include any applicable sales charges and fees. Wasatch does not charge any sales fees. The Russell 2000 Growth Index is an unmanaged total return index that measures the performance of those Russell 2000 Index companies with higher price-to-book ratios and higher forecasted growth values. The Russell 2000 Index is an unmanaged total return index of the smallest 2,000 companies in the Russell 3000 Index, as ranked by total market capitalization. You cannot invest directly in this or any index.
29
| | |
| WASATCH-1ST SOURCE INCOME EQUITY FUND (FMIEX) — Management Discussion | | SEPTEMBER 30, 2010 |
|
| |
| |
The Wasatch-1st Source Income Equity Fund is managed by a team of Wasatch portfolio managers led by Ralph Shive and Michael Shinnick.
| | | | |

Ralph C. Shive, CFA Portfolio Manager | | 
Michael L. Shinnick Portfolio Manager | | OVERVIEW Strong stock market performance in the quarter was reassuring following the second quarter’s correction, which was spurred partly by fears of a double dip recession. We believed such |
talk was premature, as it overlooked the continued improvements in economic data. That said, we sympathize with the view that the recovery will be relatively weak, as a result of debt overhang and excessive government intervention.
Robust mergers and acquisitions (M&A) activity contributed to the market’s positive tone in the quarter, as companies have been willing to pay significant premiums for strategic acquisitions. We believe this is an indication that valuations are inexpensive. We are also pleased to see M&A activity driven by public companies as strategic buyers, rather than leveraged private equity buyers.
DETAILSOFTHE QUARTER
The largest contributor to the quarter’s performance was Potash Corp. of Saskatchewan, Inc. The Canada-based producer of fertilizer was the subject of a takeover offer. We eliminated the position as a takeover battle emerged. Agriculture-related stocks benefited during the quarter as the drought in Russia drove wheat prices higher. Our holdings of food products giant Archer Daniels Midland Co. and agricultural machinery manufacturer Deere & Co. benefited from increased interest in agriculture stocks. We will continue to seek exposure to the “global demand for food” theme.
We added to our holdings of Canadian mining stocks Cameco Corp. and Barrick Gold Corp. We think companies with tangible assets in the ground represent good value, and this is also a theme we expect to pursue.
The rebound of stocks impacted by the disastrous oil spill in the Gulf of Mexico helped the Fund’s results in the quarter. In particular, Transocean Ltd., builder of the rig that collapsed, and Anadarko Petroleum Corp., which owned 25% of the affected well.
Besides Potash, we eliminated two other holdings. Waste management firm Republic Services, Inc. was sold when it met our price target. Aerospace and building giant United Technologies Corp. was sold as part of an effort to trim our significant exposure to the industrials sector. We added retailer Best Buy Co., Inc. based on its attractive valuation.
The quarter’s biggest disappointment was the collapse in valuation experienced by some of our large cap technology names. Hewlett-Packard Co. and Intel Corp. suffered from capital allocation concerns as both companies engaged in acquisitions outside their core businesses. In addition,
HP was impacted by management turmoil, while Intel as a leading chip provider to notebook computer manufacturers has been viewed as vulnerable to Apple’s iPad. Both HP and Intel have powerful global franchises, and we believe they are attractively valued. Accordingly, we added to Intel on weakness while maintaining our HP exposure.
Another detractor was McKesson Corp., a dominant provider of medical supplies and pharmaceutical products. We continue to hold the stock, as we like the hidden value of McKesson’s information technology group.
DETAILSOFTHE YEAR
For the 12 months ended September 30, 2010, the Fund provided a positive return but lagged the Russell 1000 Value Index. Contributions to performance came from the agriculture theme, as well as chemical products producer E. I. du Pont de Nemours and Co., electrical and machinery firms Emerson Electric Co. and Parker Hannifin Corp., and secure radio systems developer Harris Corp. Increasing demand from emerging markets is a long-term trend that has benefited industrial companies. Stocks with consumer staples characteristics such as Waste Management, Inc., food products distributor Sysco Corp. and H. J. Heinz Co. also performed well.
On the downside, exposure to the Gulf accident via Transocean and Anadarko detracted significantly, despite their rebound during the third quarter of 2010. The long-term outlook for the energy sector is supported by strong supply and demand fundamentals. Food distributor SUPERVALU, Inc. was hurt by aggressive competition from giant retailer Wal-Mart, which the Fund also holds. Finally, Nokia Corp. has been hurt by the success of Apple’s iPhone. Current and future holdings are subject to risk.
OUTLOOK
Structural headwinds remain in place, as the necessity of reducing debt across the economy will hinder growth and job creation for some time. At the same time, stocks seem attractively valued, assuming any sort of normal economic backdrop. In fact, stocks are as inexpensive as they have been since 1998, with many companies in a variety of sectors selling at P/E ratios of between 8 and 12.
The midterm election debates have highlighted our economic shortcomings, and could be the first step toward better policies. In our opinion, overindulgent government regulation is weighing on the economy, causing some company managements to hesitate in executing growth plans. It is possible that we will emerge from this election cycle with more positive growth-oriented policies that would help improve investor psychology.
For the Fund, we continue to emphasize strong dividend yields, attractive valuations and earnings growth potential. Our goal remains to invest in companies with the potential to do well for shareholders during bull markets, but with defensive characteristics that may allow them to hold up well during bear markets.
Thank you for the opportunity to manage your assets.
| | CFA® is a trademark owned by CFA Institute. |
30
| | |
| WASATCH-1ST SOURCE INCOME EQUITY FUND (FMIEX) — Portfolio Summary | | SEPTEMBER 30, 2010 |
|
| |
| |
AVERAGE ANNUAL TOTAL RETURNS
| | | | | | | | | | | | |
| | | 1 YEAR | | | 5 YEARS | | | 10 YEARS | |
Income Equity | | | 7.07% | | | | 3.45% | | | | 6.89% | |
Russell 1000 Value Index | | | 8.90% | | | | -0.48% | | | | 2.59% | |
Data shows past performance, which is not indicative of future performance. Current performance may be lower or higher than the performance quoted. To obtain the most recent month-end performance data available, please visit www.wasatchfunds.com. The Advisor may absorb certain Fund expenses, without which total return would have been lower. Investment returns and principal value will fluctuate and shares, when redeemed, may be worth more or less than their original cost.
As of the January 31, 2010 prospectus, the Total Annual Fund Operating Expenses for the Wasatch-1st Source Income Equity Fund are 1.18%. The Net Expenses are 1.10%. The expense ratio shown elsewhere in this report may be different. Expenses include direct expenses paid to the Advisor as well as indirect expenses incurred by the Fund as a result of its investments in other investment companies (each an “Acquired Fund”), before any expense reimbursements by the Advisor. Net Expenses are based on Fund expenses, net of waivers and reimbursements. See the prospectus for additional information regarding Fund expenses.
Wasatch Funds will deduct a 2.00% redemption proceeds fee on Fund shares held 60 days or less. Performance data does not reflect the deduction of fees or taxes, which if reflected, would reduce the performance quoted. For more complete information including charges, risks and expenses, read the prospectus carefully.
Investments in value stocks can perform differently from the market as a whole and other types of stocks and can continue to be undervalued by the market for long periods of time. Loss of principal is a risk of investing.
TOP 10 EQUITY HOLDINGS*
| | | | |
| Company | | % of Net
Assets | |
| Chevron Corp. | | | 1.8% | |
| Loews Corp. | | | 1.8% | |
| Exxon Mobil Corp. | | | 1.8% | |
| ConocoPhillips | | | 1.8% | |
| Harris Corp. | | | 1.8% | |
| | | | |
| Company | | % of Net
Assets | |
| McKesson Corp. | | | 1.8% | |
| Travelers Cos., Inc. | | | 1.7% | |
| Marathon Oil Corp. | | | 1.7% | |
| Archer Daniels Midland Co. | | | 1.7% | |
| Verizon Communications, Inc. | | | 1.7% | |
| * | As of September 30, 2010, there were 79 holdings in the Fund. Portfolio holdings are subject to change at any time. References to specific securities should not be construed as recommendations by the Funds or their Advisor. Current and future holdings are subject to risk. |
SECTOR BREAKDOWN**
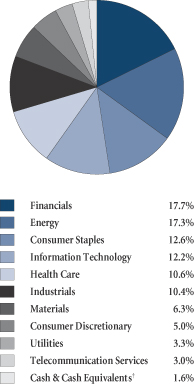
| ** | Excludes securities sold short and written options, if any. |
| † | Also includes Other Assets and Liabilities. |
GROWTHOFA HYPOTHETICAL $10,000 INVESTMENT
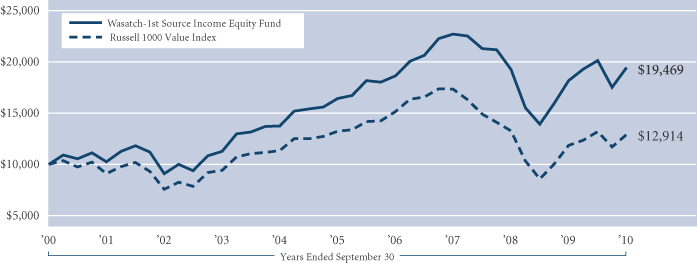
Past performance does not predict future performance and the graph above does not reflect the deduction of taxes that you would pay on fund distributions or the redemption of fund shares. Performance shown in the chart above does not include any applicable sales charges and fees. Wasatch does not charge any sales fees. The Russell 1000 Value Index measures the performance of Russell 1000 Index companies with lower price-to-book ratios and lower forecasted growth values. You cannot invest directly in these or any indices.
31
| | |
| WASATCH-1ST SOURCE LONG/SHORT FUND (FMLSX) — Management Discussion | | SEPTEMBER 30, 2010 |
|
| |
| |
The Wasatch-1st Source Long/Short Fund is managed by a team of Wasatch portfolio managers led by Michael Shinnick and Ralph Shive.
| | | | |
Michael L. Shinnick Portfolio Manager | |
Ralph C. Shive, CFA Portfolio Manager | | OVERVIEW After the second quarter correction, strong stock market performance in the third was reassuring. We expected the current economic recovery to be relatively weak by historical standards. |
Still, we believed that talk of a double dip recession overlooked improvements in economic data in the U.S. and around the world. As we expected, final demand has remained weak, due to high unemployment and consumers’ efforts to reduce debt.
The Fund captured 70% of the upside during the quarter. The environment for shorting was difficult, as investors willing to pay high prices for growth supported areas of the market we perceived as overvalued.
DETAILSOFTHE QUARTER
The Fund’s long positions generally worked well, in particular, some major positions in electronic commerce companies within the information technology space. Examples include Oracle Corp., TIBCO Software, Inc. and eBay, Inc. We also added new ecommerce positions during the quarter that contributed to performance, specifically Amazon.com, Inc. and network solutions provider Blue Coat Systems, Inc.
Increased positions in offshore drillers Ensco plc and Noble Corp. bounced back as the Gulf oil spill receded as an issue. Some of these gains were offset by covered calls as we intentionally mitigated the larger position sizes we built in these companies.
Two other new long positions that helped were retailer Best Buy Co., Inc. and storage solutions provider Iron Mountain, Inc. While both companies display modest growth compared with their history, they have strong balance sheets and now offer the opportunity for increased shareholder returns through dividends and share buybacks.
Long positions in medical technology companies hurt performance, principally, Medtronic, Inc. and Symmetry Medical, Inc. Lower numbers of patient procedures weighed down these companies’ results, reflecting the state of the economy and uncertainty regarding new health care guidelines. We believe they still have attractive products and business models, and we added to or maintained our positions.
The Fund’s short positions collectively did not add value for the quarter. We continue to have a lower-than-normal allocation to the short component of the portfolio given our view that most areas of the market still seem reasonably valued. In our judgment, investors “paying up” for increasingly scarce growth or yield are supporting pockets of overvalued stocks. In particular, the real estate investment trusts (REITs) space
was challenging, although we covered a short position in Duke Realty Corp. with a gain. We believe commercial real estate is overvalued in the public equity market relative to the private market. Moreover, real estate is much more highly valued based on cash flow and earnings than other dividend-paying segments of the equity market. We also covered some technology shorts with losses when our short cover disciplines were invoked due to stock price breakouts.
DETAILSOFTHE YEAR
Over the past 12 months, the Fund’s short positions detracted from performance, in particular our shorting of REITs. Among long positions, the Gulf oil spill had a severe impact on offshore drilling companies, including Transocean Ltd., builder of the rig that collapsed. We expect that the tangible assets, global scope of business activity and backlog of earnings power represented by the leading offshore drillers provide the potential to be rewarded over time.
On the positive side, our early identification of the cloud-computing theme within technology contributed significantly. Cloud computing utilizes the Internet to provide on-demand access to services and data storage. Top performers under this theme during the year were Akamai Technologies, Inc., TIBCO and Silicon Graphics International Corp. Current and future holdings are subject to risk.
While the Fund lagged the S&P 500 for the year, it is important to note that we have intentionally used covered calls and cash to preserve shareholders’ capital. While this capped some of the upside, we are willing to lag the S&P in some quarters if we can steadily compound capital over time. We believe the Fund’s absolute and relative performance since inception validates this approach.
OUTLOOK
We believe stocks are attractively valued overall, and expect to maintain a net long position, with a focus on what we consider to be high quality business models, good balance sheets and low valuations. This core position will be supplemented by ecommerce and energy services holdings, as well as continued use of covered calls, cash and selective short positions in an effort to preserve capital.
We believe the economic recovery is real and that a double dip recession is unlikely. At the same time, it will not be driven by traditional inputs of pent-up demand for housing and autos, as we work through the poor decisions of the past decade. Unemployment is likely to remain high and housing prices are unlikely to recover much, if at all. Consumers still have the means to purchase necessary items or those offering good value. Likewise, most businesses can and will continue to spend on necessary items or those that improve efficiency. Viewing the market through this lens, we expect to maintain our focus on the energy, insurance, consumer staples, technology software and networking, and health care groups.
Thank you for the opportunity to manage your assets.
| | CFA® is a trademark owned by CFA Institute. |
32
| | |
| WASATCH-1ST SOURCE LONG/SHORT FUND (FMLSX) — Portfolio Summary | | SEPTEMBER 30, 2010 |
|
| |
| |
AVERAGE ANNUAL TOTAL RETURNS
| | | | | | | | | | | | |
| | | 1 YEAR | | | 5 YEARS | | | SINCE INCEPTION
8/1/03 | |
Long/Short | | | 5.52% | | | | 4.80% | | | | 5.37% | |
S&P 500 Index | | | 10.16% | | | | 0.64% | | | | 4.07% | |
Citigroup U.S. Domestic 3-Month
Treasury Bills Index | | | 0.12% | | | | 2.48% | | | | 2.24% | |
Data shows past performance, which is not indicative of future performance. Current performance may be lower or higher than the performance quoted. To obtain the most recent month-end performance data available, please visit www.wasatchfunds.com. The Advisor may absorb certain Fund expenses, without which total return would have been lower. Investment returns and principal value will fluctuate and shares, when redeemed, may be worth more or less than their original cost.
As of the January 31, 2010 prospectus, the Total Annual Fund Operating Expenses for the Wasatch-1st Source Long/Short Fund are 1.91%. The expense ratio shown elsewhere in this report may be different. Expenses include direct expenses paid to the Advisor as well as indirect expenses incurred by the Fund as a result of its investments in other investment companies (each an “Acquired Fund”), before any expense reimbursements by the Advisor. Net Expenses are based on Fund expenses, net of waivers and reimbursements. See the prospectus for additional information regarding Fund expenses.
Wasatch Funds will deduct a 2.00% redemption proceeds fee on Fund shares held 60 days or less. Performance data does not reflect the deduction of fees or taxes, which if reflected, would reduce the performance quoted. For more complete information including charges, risks and expenses, read the prospectus carefully.
The Fund makes short sales of securities which involve the risk that losses may exceed the original amount invested. Equity investing involves risks, including potential loss of the principal amount invested. Being non-diversified, the Fund can invest a larger portion of its assets in the securities of a limited number of companies than a diversified fund. Non-diversification increases the risk of loss to the Fund if the values of these securities decline.
TOP 10 LONG EQUITY HOLDINGS*
| | | | |
| Company | | % of Net Assets | |
| Loews Corp. | | | 5.1% | |
| Devon Energy Corp. | | | 4.4% | |
| Iron Mountain, Inc. | | | 3.7% | |
| Best Buy Co., Inc. | | | 3.4% | |
| Noble Corp. | | | 3.4% | |
| | | | |
| Company | | % of Net Assets | |
| Ensco plc ADR (United Kingdom) | | | 3.3% | |
| Wal-Mart Stores, Inc. | | | 3.2% | |
| Allstate Corp. | | | 2.9% | |
| Oracle Corp. | | | 2.7% | |
| Blue Coat Systems, Inc. | | | 2.4% | |
| * | As of September 30, 2010, there were 59 long and 9 short holdings in the Fund. Portfolio holdings are subject to change at any time. References to specific securities should not be construed as recommendations by the Funds or their Advisor. Current and future holdings are subject to risk. |
SECTOR BREAKDOWN**
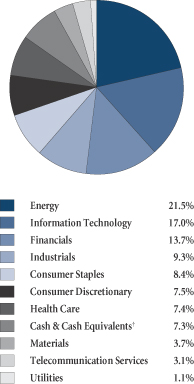
| ** | Excludes shorts and written options. |
| †Also | includes Other Assets and Liabilities. |
GROWTHOFA HYPOTHETICAL $10,000 INVESTMENT
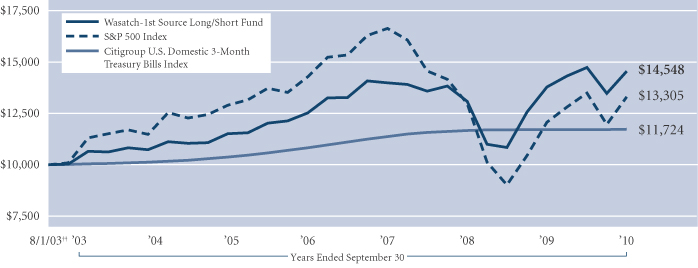
Past performance does not predict future performance and the graph above does not reflect the deduction of taxes that you would pay on fund distributions or the redemption of fund shares. Performance shown in the chart above does not include any applicable sales charges and fees. Wasatch does not charge any sales fees. ††Inception: August 1, 2003. The S&P 500 Index includes 500 of the United States’ largest stocks from a broad variety of industries. The Index is unmanaged but is a commonly used measure of common stock total return performance. The Citigroup U.S. Domestic 3-Month Treasury Bills Index tracks the performance of U.S. Treasury bills with a remaining maturity of three months. U.S. Treasury bills, which are short-term loans to the U.S. government, are full-faith-and-credit obligations of the U.S. Treasury and are generally regarded as being free of any risk of default. You cannot invest directly in these or any indices.
33
| | |
| WASATCH-HOISINGTON U.S. TREASURY FUND (WHOSX) — Management Discussion | | SEPTEMBER 30, 2010 |
|
| |
| |
| | |

Van R. Hoisington Portfolio Manager | | OVERVIEW Despite extreme economic intervention by federal authorities, real gross domestic product (GDP) has increased by a paltry 3% since the recession ended in June 2009, less than half the 6.6% average growth in the comparable periods of the prior 10 recoveries. Inventory investment, a trendless component of GDP, has accounted for nearly two-thirds of the entire rebound in economic activity from the worst |
economic contraction since World War II. Over the past four quarters, inventory investment has moved from contracting real GDP at a 5% annual rate to boosting it at a 2% annual rate. Real final sales (GDP less inventory investment) grew at a meager pace of 1.1%, less than one-fourth the average 4.5% rate of increase in the comparable rebounds. Whether measured by GDP or final sales, economic growth needs to expand at least at the pace of population growth to sustain a steady standard of living. In this rebound, per capita real final sales grew by 0.2%, much lower than the earlier 10 postwar expansions when growth in real per capita sales was a robust 3.2%. Thus, the U.S. standard of living has remained stagnant at a depressed level. We believe the upward inventory thrust is complete and probably over-extended.
Some of the lowest inflation rates in the past four to six decades reflected these depressed conditions. Consequently, for the latest quarter and past 12 months, a drop in yields on long-term Treasury bonds (maturities longer than 20 years) meant that the market value of the Fund increased, enhancing the coupon (interest) on the Treasury bonds held by the Fund.
DETAILSOFTHE QUARTER
For the quarter, the Fund returned 5.72%, versus 2.48% for the Barclays Capital U.S. Aggregate Bond Index. Over the quarter, the yield on the 30-year Treasury bond dropped to 3.68% from 3.88%, resulting in capital gains on the long dated Treasury securities held by the Fund. Year-to-date the Fund was up 24.45% compared with 7.94% for the Barclays and 3.89% for the S&P 500.*
DETAILSOFTHE YEAR
Over the past 12 months, the Fund gained 12.65% compared to a gain of 8.16% for the Barclays, and 10.16% for the S&P 500. Over the past year, the long Treasury bond yield decreased 0.37 percentage points. The Fund’s results have exceeded the Barclays by 1.94 and 2.42 percentage points, respectively, for the past five- and 10-year periods. Additionally, the Fund has outperformed the S&P 500 by 7.5 and 9.26 percentage points over the same time periods.
OUTLOOK
Going forward, the only hope for economic growth is proper monetary and fiscal policy. Unfortunately, monetary and fiscal policy has yet to contribute to sustainable growth.
The greatest probability is that new monetary and fiscal policies will not prove any more successful than prior ones. Instead, unintended consequences are likely to negatively impact economic output. Thus, our view is that economic conditions will remain depressed, with a greater than 50% probability of a relapse to negative growth. Moreover, policy makers are proposing actions that have never been tested, complicated by the fact that current economic circumstances have not existed for eight decades.
The problem with the U.S. economy appears to us to be fourfold: 1) The economy is grossly over-indebted, with many asset prices falling; 2) fiscal policy is counter-productive and debilitating to economic growth as government expenditure multipliers are near zero; 3) proposed tax increases are already curtailing economic activity and tax multipliers approach -3%; and 4) increased bureaucracy with many new and yet unwritten financial regulations from the Dodd-Frank bill, along with health care regulations, make business planning nearly impossible.
A number of articles have surfaced emphasizing the theme that the Treasury bond market is in a bubble, implying that yields are so low they can only go higher, with the result of substantial capital loss to those owning Treasury paper. It is true that psychology drives markets in the short run making anything possible, so interest rates may rise or fall, regardless of long-term fundamentals. Based on the Fisher equation (the long risk-free yield equals the real rate on long Treasury bonds plus the expected rate of inflation), Treasury bonds are not in a bubble.
The real rate on long Treasury bonds is volatile and not predictable over the short-run. However, it has averaged 2.1% over the long run and is mean reverting. Over time, long Treasury bond yields move in the direction of inflationary expectations. Inflationary expectations lag actual inflation by a considerable period of time, sometimes more than several years. In addition, inflation is a lagging indicator. If the low point in inflation is well down the road, as cyclical analysis would suggest, then the low in bond yields lies ahead. Long Treasuries thus have substantial fundamental or intrinsic value and do not meet the criteria of an asset in a bubble.
Currently, inflation is tracking at a 1% annual rate and long-term Treasury bond yields are around 3.7%. Thus, the real yield is 2.7%, or 0.6 percentage points above the 140-year mean. Thus, investors are still able to purchase long-term Treasury securities at prices not yet reflecting their positive long-run potential.
We appreciate your investment in the Wasatch-Hoisington U.S. Treasury Fund.
| * | The S&P 500 Index includes 500 of the United States’ largest stocks from a broad variety of industries. The Index is unmanaged but is a commonly used measure of common stock total return performance. You cannot invest in this or any index. |
34
| | |
| WASATCH-HOISINGTON U.S. TREASURY FUND (WHOSX) — Portfolio Summary | | SEPTEMBER 30, 2010 |
|
| |
| |
AVERAGE ANNUAL TOTAL RETURNS
| | | | | | | | | | | | |
| | | 1 YEAR | | | 5 YEARS | | | 10 YEARS | |
U.S. Treasury | | | 12.65% | | | | 8.14% | | | | 8.83% | |
Barclays Capital U.S. Aggregate Bond Index | | | 8.16% | | | | 6.20% | | | | 6.41% | |
Data shows past performance, which is not indicative of future performance. Current performance may be lower or higher than the performance quoted. To obtain the most recent month-end performance data available, please visit www.wasatchfunds.com. The Advisor may absorb certain Fund expenses, without which total return would have been lower. Investment returns and principal value will fluctuate and shares, when redeemed, may be worth more or less than their original cost.
As of the January 31, 2010 prospectus, the Total Annual Fund Operating Expenses for the Wasatch-Hoisington U.S. Treasury Fund are 0.79%. The Net Expenses are 0.75%. The expense ratio shown elsewhere in this report may be different. Expenses include direct expenses paid to the Advisor, before any expense reimbursements by the Advisor. Net Expenses are based on Fund expenses, net of waivers and reimbursements. See the prospectus for additional information regarding Fund expenses.
Wasatch Funds will deduct a 2.00% redemption proceeds fee on Fund shares held 60 days or less. Performance data does not reflect the deduction of fees or taxes, which if reflected, would reduce the performance quoted. For more complete information including charges, risks and expenses, read the prospectus carefully.
Investments in fixed income funds are subject to the same interest rate, inflation, credit and other risks associated with the underlying bonds. Return of principal is not guaranteed.
TOP 10 HOLDINGS*
| | | | | | | | |
| Holding | | Maturity
Date | | | % of Net
Assets | |
U.S. Treasury Strip, principal only | | | 2/15/31 | | | | 25.5% | |
U.S. Treasury Bond, 4.75% | | | 2/15/37 | | | | 13.1% | |
U.S. Treasury Strip, principal only | | | 5/15/39 | | | | 9.9% | |
U.S. Treasury Bond, 4.375% | | | 5/15/40 | | | | 9.2% | |
U.S. Treasury Bond, 4.50% | | | 2/15/36 | | | | 8.7% | |
| | | | | | | | |
| Holding | | Maturity
Date | | | % of Net
Assets | |
U.S. Treasury Strip, principal only | | | 2/15/37 | | | | 8.0% | |
U.S. Treasury Bond, 4.50% | | | 5/15/38 | | | | 5.7% | |
U.S. Treasury Bond, 3.875% | | | 8/15/40 | | | | 4.0% | |
U.S. Treasury Strip, principal only | | | 5/15/40 | | | | 4.0% | |
U.S. Treasury Bond, 4.25% | | | 5/15/39 | | | | 3.5% | |
| * | As of September 30, 2010, there were 14 holdings in the Fund. Portfolio holdings are subject to change at any time. References to specific securities should not be construed as recommendations by the Funds or their Advisor. Current and future holdings are subject to risk. |
INVESTMENTS & CASH
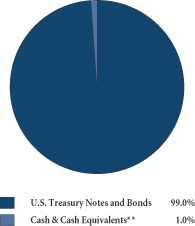
| **Also | includes Other Assets and Liabilities. |
GROWTHOFA HYPOTHETICAL $10,000 INVESTMENT
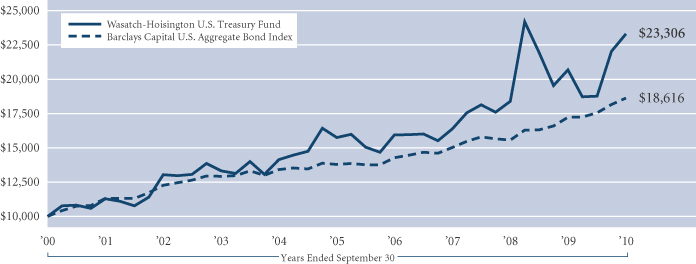
Past performance does not predict future performance and the graph above does not reflect the deduction of taxes that you would pay on fund distributions or the redemption of fund shares. Performance shown in the chart above does not include any applicable sales charges and fees. Wasatch does not charge any sales fees. The Barclays Capital U.S. Aggregate Bond Index covers the U.S. investment grade fixed rate bond market, including government and corporate securities, agency mortgage pass-through securities, and asset-backed securities. To be included in the index the security must meet the following criteria: must have at least one year to final maturity, regardless of call features; must have at least $100 million par amount outstanding; must be rated investment grade or better by Moody’s Investors Service, Standard & Poor’s, or Fitch Investor’s Service; must be fixed rate, although it can carry a coupon that steps up or changes to a predetermined schedule; must be dollar-denominated and nonconvertible. All corporate and asset-backed securities must be registered with the SEC and must be publicly issued. You cannot invest directly in this or any index.
35
| | |
| WASATCH-1ST SOURCE INCOME FUND (FMEQX) — Management Discussion | | SEPTEMBER 30, 2010 |
|
| |
| |
| | |

Paul W. Gifford, CFA Portfolio Manager | | OVERVIEW The Wasatch-1st Source Income Fund returned 1.82% during the third quarter of 2010. Over the same time period, the Barclays Capital U.S. Intermediate Government/Credit Bond Index returned 2.75%. Spreads versus U.S. Treasury securities on almost all corporate, agency and asset or mortgage-backed securities came in (tightened) providing additional return to the Fund. |
Yields on 10-year Treasury bonds ranged between 2.45% and 3.15% during the quarter. By quarter-end, the yield was at the low end of that range at 2.51%, the lowest since the financial crisis began to ease in March of 2009.
The Federal Reserve’s program of buying government bonds ended earlier this year and many thought that in the coming years the Fed would unwind its purchases made in 2008 and 2009. That sentiment changed in the third quarter as economic data pointed to a weaker recovery. Instead, the Fed announced plans to reinvest the interest and principal of the bonds owned back into the Treasury market. This helped push interest rates lower.
The Fed funds rate has been near zero since the end of 2008. The move to zero occurred amidst financial turmoil and economic collapse. Federal Reserve Chairman Ben Bernanke recently commented on the “unusual uncertain- ties” the economy is dealing with. As a result, the Fed is going to keep short-term interest rates low for much longer than we and many bond market participants had forecasted just six to eight months ago.
A PROFITABLE QUARTER
One of the consequences of the Federal Reserve’s strategy of keeping rates low for an extended period of time is that investors will be forced into assets other than cash. Low short-term rates have helped flood the bond market with hundreds of billions of dollars. Over $500 billion has flowed into bond funds since the beginning of 2009, while stock funds have seen net redemptions. This difference is opposite of historical flows, where stock funds used to garner the most assets.
Investors’ search for yield has benefited virtually every sector of the bond market, including even the riskiest fixed income assets, such as junk bonds and securities backed by subprime mortgages, that were eschewed just 18 months ago. Bond yields have plummeted due to increased demand. Bonds with longer maturities and higher yields have become more in favor, as noted above in our comments on 10-year Treasuries.
Given that the Fed has put raising interest rates on hold, we have taken opportunities to buy securities with slightly longer maturities and higher yields. We feel comfortable that the benefit of improved yields will not be offset by a significant increase in interest rates any time soon. Since most trades to extend maturities were to sell an entity’s short- maturity security and buy the same entity’s longer maturity
security, while not changing the Fund’s overall credit and sector mix. The net effect of our buying and selling was a modest increase in the Fund’s effective duration or interest rate risk.
Examples of trades made during the quarter included selling Pfizer bonds maturing in 2015 and buying Pharmacia bonds maturing in 2018 for a yield improvement of 1.25 percentage points. (Pfizer Inc. bought Pharmacia Corp. in 2003.) We also sold a credit card asset-backed bond with a one-year maturity and bought another bond with a four-year maturity to enhance yield by 1.80 percentage points.
One area of the investment grade bond market that is starting to see relative weakness is the mortgage segment. As yields have fallen, the prospect of a refinancing wave is limiting the price appreciation of mortgage-backed securities. Fifteen-year mortgage rates fell below 4% during the quarter and 30-year mortgages are in the low 4% range (Source: bankrate.com as of 9/30/10). Historically, this would have been an even bigger event for the bond market, but times have changed. While many borrowers would benefit from lower mortgage rates, fewer are eligible due to reduced income, job loss or a decrease in home value. Therefore, it is likely the refinancing wave will only impact mortgages created since 2008 and prior to 2004 and be much smaller than anticipated. We continue to monitor the prepayment speeds of mortgage-backed securities and have kept our weighting in this area basically unchanged during the quarter.
STRONG YEARFOR BONDS
The third quarter of 2010 continued the strong performance bonds have put in over the past 12 months. The investment grade bond market has benefited from cash flowing into bond funds, improved spreads and returns that have been higher than the income generated. The Fund has changed modestly versus a year ago. We increased the Fund’s weightings in Treasuries, corporate bonds and government agencies, and reduced exposure to asset-backed and mortgage-backed securities.
During the year, the Fund had a conservative bias with a shorter duration and lower exposure to BBB* credits than its benchmark, which hurt relative performance. We believe such a bias is warranted because the structural issues related to reducing debt within the economy will be played out over many years to come.
Thank you for allowing us the opportunity to be a trusted advisor for you.
| | CFA® is a trademark owned by CFA Institute. |
| * | According to Standard & Poor’s, a debt obligation rated ‘BBB’ exhibits adequate capacity to meet financial commitments, but is more subject to adverse economic conditions than securities rated ‘A’ or better. |
36
| | |
| WASATCH-1ST SOURCE INCOME FUND (FMEQX) — Portfolio Summary | | SEPTEMBER 30, 2010 |
|
| |
| |
AVERAGE ANNUAL TOTAL RETURNS
| | | | | | | | | | | | |
| | | 1 YEAR | | | 5 YEARS | | | 10 YEARS | |
Income | | | 5.95% | | | | 4.88% | | | | 4.96% | |
Barclays Capital U.S. Intermediate
Government/Credit Bond Index | | | 7.77% | | | | 5.94% | | | | 6.05% | |
Data shows past performance, which is not indicative of future performance. Current performance may be lower or higher than the performance quoted. To obtain the most recent month-end performance data available, please visit www.wasatchfunds.com. The Advisor may absorb certain Fund expenses, without which total return would have been lower. Investment returns and principal value will fluctuate and shares, when redeemed, may be worth more or less than their original cost.
As of the January 31, 2010 prospectus, the Total Annual Fund Operating Expenses for the Wasatch-1st Source Income Fund are 0.85%. The expense ratio shown elsewhere in this report may be different. Expenses include direct expenses paid to the Advisor as well as indirect expenses incurred by the Fund as a result of its investments in other investment companies (each an “Acquired Fund”), before any expense reimbursements by the Advisor. The Net Expense includes any reimbursement by the Advisor. See the prospectus for additional information regarding Fund expenses.
Wasatch Funds will deduct a 2.00% redemption proceeds fee on Fund shares held 60 days or less. Performance data does not reflect the deduction of fees or taxes, which if reflected, would reduce the performance quoted. For more complete information including charges, risks and expenses, read the prospectus carefully.
Investments in fixed income funds are subject to the same interest rate, inflation, credit and other risks associated with the underlying bonds. Return of principal is not guaranteed.
TOP 10 HOLDINGS*
| | | | | | | | |
| Holding | | Maturity
Date | | | % of Net
Assets | |
| U.S. Treasury Bond, 3.75% | | | 11/15/18 | | | | 7.6% | |
| U.S. Treasury Bond , 3.25% | | | 12/31/16 | | | | 3.2% | |
Federal Home Loan Mortgage
Corp., 4.75% | | | 11/17/15 | | | | 2.6% | |
| U.S. Treasury Bond, 1.625% | | | 1/15/18 | | | | 2.0% | |
| U.S. Treasury Bond, 4.25% | | | 8/15/15 | | | | 1.6% | |
Federal National Mortgage
Assoc., 4.875% | | | 12/15/16 | | | | 1.5% | |
| | | | | | | | |
| Holding | | Maturity
Date | | | % of Net
Assets | |
| Government National Mortgage Assoc., Series 2009-31, Class TA, 4.00% | | | 3/20/39 | | | | 1.5% | |
Federal National Mortgage
Assoc., 0.80% | | | 9/28/12 | | | | 1.5% | |
Federal National Mortgage
Assoc., 0.65% | | | 6/3/13 | | | | 1.5% | |
| Government National Mortgage Assoc., Series 2009-110, Class AB, 4.00% | | | 4/16/39 | | | | 1.3% | |
| * | As of September 30, 2010, there were 166 holdings in the Fund. Portfolio holdings are subject to change at any time. References to specific securities should not be construed as recommendations by the Funds or their Advisor. Current and future holdings are subject to risk. |
INVESTMENTS & CASH
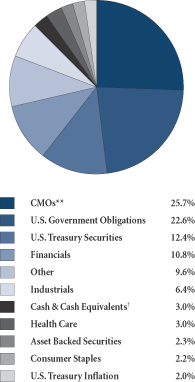
| ** | Collateralized Mortgage Obligations |
| † | Also includes Other Assets and Liabilities. |
GROWTHOFA HYPOTHETICAL $10,000 INVESTMENT
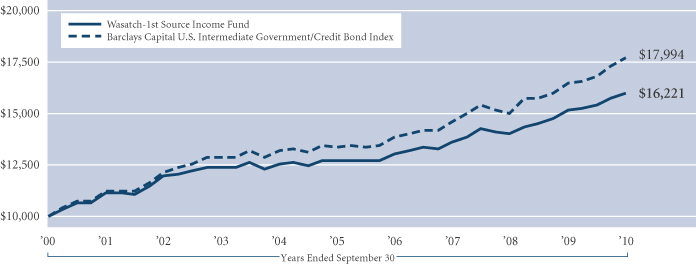
Past performance does not predict future performance and the graph above does not reflect the deduction of taxes that you would pay on fund distributions or the redemption of fund shares. Performance shown in the chart above does not include any applicable sales charges and fees. Wasatch does not charge any sales fees. The Barclays Capital U.S. Intermediate Government/Credit Bond Index is an unmanaged index considered representative of the performance of government and corporate bonds with maturities of less than 10 years. You cannot invest directly in this or any index.
37
| | |
| WASATCH FUNDS MANAGEMENT DISCUSSIONS — Definitions of Financial Terms |
|
| |
| |
Beta is a quantitative measure of the volatility of a given stock relative to the overall market, usually the S&P 500. Specifically, the performance the stock has experienced in the last five years as the S&P 500 moved up or down one percent. A beta above one is more volatile than the overall market, while a beta below one is less volatile.
A bear market is generally defined as a drop of 20% or more in stock prices over at least a two-month period.
A bull market is defined as a prolonged period in which investment prices rise faster than their historical average.
Corporate bonds are debt securities issued by a corporation for the purpose of raising money to expand its business.
Credit Risk is the risk that the issuer of a debt security will fail to repay principal and interest on the security when due.
Dividend yield is a company’s annual dividend payments divided by its market capitalization, or the dividend per share divided by the price per share.
Earnings growth is a measure of growth in a company’s net income over a specific period, often one year.
Effective duration is a measure of the responsiveness of a bond’s price to market interest rate changes. For example, if the interest rate increased 1%, a bond with an effective duration of five years would experience a decline in price of 5%.
Government agency bonds are debt securities issued by a U.S. government-sponsored agency.
The government expenditure multiplier captures the impact and the consequences of a change in government spending. When the government expenditure multiplier is zero it means that GDP is unchanged from where it started, but government spending has risen by $1 and private spending has fallen by $1.
Gross domestic product (GDP) is a basic measure of a country’s economic performance and is the market value of all final goods and services made within the borders of a country in a year.
Inflation Risk is the possibility that inflation will reduce the purchasing power of a currency, and subsequently reduce the value of a security or asset, and may result in rising interest rates. Inflation is the overall upward price movement of goods and services in an economy that causes the value of a currency to decline.
An initial public offering (IPO) is a company’s first sale of stock to the public.
Interest Rate Risk is the risk that a debt security’s value will decline due to changes in market interest rates. The interest rate is the amount charged, expressed as a percentage of principal, by a lender to a borrower for the use of assets.
The price-to-earnings or P/E ratio, also known as the P/E multiple, is the price of a stock divided by its earnings per share.
The S&P 500 Index includes 500 of the United States’ largest stocks from a broad variety of industries. The Index is unmanaged but is a commonly used measure of common stock total return performance.
The 30-day current net SEC yield is the net investment income per share for a 30 day period divided by the maximum offering price per share on the calculation date. The figure is compounded and annualized. The 30-day yield unsubsidized is calculated in the absence of temporary expense waivers or reimbursements thus resulting in a lower yield.
Sovereign debt is government debt. Under the doctrine of sovereign immunity, creditors cannot force the repayment of sovereign debt.
The tax multiplier is the ratio of change in aggregate output (or gross domestic product) to an autonomous change in taxes. A tax multiplier of -2 means that a $1 cut in taxes will boost GDP by $2.
Yield is generally defined as the return an investor will receive by holding a bond to maturity.
38
| | |
| WASATCH FUNDS — OPERATING EXPENSES (UNAUDITED) | | SEPTEMBER 30, 2010 |
|
| |
| |
EXPENSE EXAMPLE
As a shareholder of Wasatch Funds, you incur two types of costs: (1) transaction costs, including redemption fees and (2) ongoing costs, including management fees and other fund expenses. This example is intended to help you understand your ongoing costs (in dollars) of investing in a Wasatch Fund and to compare these costs with the ongoing costs of investing in other mutual funds.
The example is based on an investment of $1,000.00 invested at the beginning of the period and held for the entire six month period ended September 30, 2010.
ACTUAL EXPENSES
The first line of the table below provides information about actual account values and actual expenses, based upon the actual total return of the fund during the most recent six month period ended September 30. You may use the information in this line, together with the amount you invested, to estimate the expenses you paid over the period. Simply divide your account value by $1,000.00 (for example, an $8,600.00 account value divided by $1,000.00 = 8.6), then multiply the result by the number in the first line under the heading entitled “Expenses Paid During Period” to estimate the expenses you paid on your account during this period.
In addition, the Funds charge a $15.00 IRA distribution fee, a $12.50 IRA annual maintenance fee and a $15.00 fee for redemptions paid by wire. To the extent these fees apply to your account, your expenses paid during the period would be higher and your ending account value would be lower than the amounts shown in the table below.
HYPOTHETICAL EXAMPLEFOR COMPARISON PURPOSES
The second line of the table below provides information about hypothetical account values and hypothetical expenses
based on a fund’s actual expense ratio and an assumed rate of return of 5% per year before expenses, which is not the fund’s actual return. The hypothetical account values and expenses may not be used to estimate the actual ending account balance or expenses you paid for the period. You may use this information to compare the ongoing costs of investing in a Wasatch Fund and other funds. To do so, compare this 5% hypothetical example with the 5% hypothetical examples that appear in the shareholder reports of other funds.
In addition, the Funds charge a $15.00 IRA distribution fee, a $12.50 IRA annual maintenance fee and a $15.00 fee for redemptions paid by wire. To the extent these fees apply to your account, your expenses paid during the period would be higher and your ending account value would be lower than the amounts shown in the table below. If another fund’s fees differ from those listed above, your expenses paid and your ending account value could be higher or lower than those of other funds.
Please note that the expenses shown in the table are meant to highlight your ongoing costs only and do not reflect any transactional costs, such as redemption fees. Therefore, the second line of the table is useful in comparing ongoing costs only, and will not help you determine the relative total costs of owning different funds. In addition, if these transactional costs were included, your costs would have been higher.
A Fund’s annualized expense ratio may vary as a result of various factors including expenses that are not reimbursable under the contractual agreement between the Fund and the Advisor such as interest, taxes, brokerage commissions, other investment related costs, dividend expense on short sales, and extraordinary expenses. The Wasatch-1st Source Long/Short and Wasatch-1st Source Income funds have no contractual limitation on expenses.
39
| | |
| WASATCH FUNDS — OPERATING EXPENSES (UNAUDITED) (continued) | | SEPTEMBER 30, 2010 |
|
| |
| |
| | | | | | | | | | | | | | | | |
| | | Account Value | | | Expenses
Paid
During Period* | | | Annualized
Expense
Ratio* | |
| Fund/Class and Return | | Beginning of Period
April 1, 2010 | | | End of Period
September 30, 2010 | | | |
Core Growth Fund | | | | | | | | | | | | | | | | |
Actual | | | $1,000.00 | | | | $1,034.50 | | | | $6.17 | | | | 1.21% | |
Hypothetical (5% before expenses) | | | $1,000.00 | | | | $1,019.00 | | | | $6.12 | | | | 1.21% | |
|
| | |
Emerging Markets Small Cap Fund | | | | | | | | | | | | | | | | |
Actual | | | $1,000.00 | | | | $1,209.20 | | | | $11.35 | | | | 2.05% | |
Hypothetical (5% before expenses) | | | $1,000.00 | | | | $1,014.79 | | | | $10.35 | | | | 2.05% | |
|
| | |
Global Opportunities Fund | | | | | | | | | | | | | | | | |
Actual | | | $1,000.00 | | | | $1,064.30 | | | | $11.64 | | | | 2.25% | |
Hypothetical (5% before expenses) | | | $1,000.00 | | | | $1,013.79 | | | | $11.36 | | | | 2.25% | |
|
| | |
Global Science & Technology Fund | | | | | | | | | | | | | | | | |
Actual | | | $1,000.00 | | | | $1,063.10 | | | | $10.09 | | | | 1.95% | |
Hypothetical (5% before expenses) | | | $1,000.00 | | | | $1,015.29 | | | | $9.85 | | | | 1.95% | |
|
| | |
Heritage Growth Fund | | | | | | | | | | | | | | | | |
Actual | | | $1,000.00 | | | | $1,039.80 | | | | $4.86 | | | | 0.95% | |
Hypothetical (5% before expenses) | | | $1,000.00 | | | | $1,020.31 | | | | $4.81 | | | | 0.95% | |
|
| | |
International Growth Fund | | | | | | | | | | | | | | | | |
Actual | | | $1,000.00 | | | | $1,189.30 | | | | $10.15 | | | | 1.85% | |
Hypothetical (5% before expenses) | | | $1,000.00 | | | | $1,015.79 | | | | $9.35 | | | | 1.85% | |
|
| | |
International Opportunities Fund | | | | | | | | | | | | | | | | |
Actual | | | $1,000.00 | | | | $1,127.20 | | | | $12.00 | | | | 2.25% | |
Hypothetical (5% before expenses) | | | $1,000.00 | | | | $1,013.79 | | | | $11.36 | | | | 2.25% | |
|
| | |
Micro Cap Fund | | | | | | | | | | | | | | | | |
Actual | | | $1,000.00 | | | | $1,009.10 | | | | $10.98 | | | | 2.18% | |
Hypothetical (5% before expenses) | | | $1,000.00 | | | | $1,042.34 | | | | $33.42 | | | | 2.18% | |
|
| | |
Micro Cap Value Fund | | | | | | | | | | | | | | | | |
Actual | | | $1,000.00 | | | | $1,008.50 | | | | $11.33 | | | | 2.25% | |
Hypothetical (5% before expenses) | | | $1,000.00 | | | | $1,013.79 | | | | $11.36 | | | | 2.25% | |
|
| | |
Small Growth Fund | | | | | | | | | | | | | | | | |
Actual | | | $1,000.00 | | | | $1,061.70 | | | | $6.51 | | | | 1.26% | |
Hypothetical (5% before expenses) | | | $1,000.00 | | | | $1,018.75 | | | | $6.38 | | | | 1.26% | |
|
| | |
Small Cap Value Fund | | | | | | | | | | | | | | | | |
Actual | | | $1,000.00 | | | | $1,003.30 | | | | $9.04 | | | | 1.80% | |
Hypothetical (5% before expenses) | | | $1,000.00 | | | | $1,016.04 | | | | $9.10 | | | | 1.80% | |
|
| | |
Strategic Income Fund | | | | | | | | | | | | | | | | |
Actual | | | $1,000.00 | | | | $1,039.90 | | | | $4.96 | | | | 0.97% | |
Hypothetical (5% before expenses) | | | $1,000.00 | | | | $1,020.21 | | | | $4.91 | | | | 0.97% | |
|
| | |
Ultra Growth Fund | | | | | | | | | | | | | | | | |
Actual | | | $1,000.00 | | | | $1,104.30 | | | | $8.76 | | | | 1.66% | |
Hypothetical (5% before expenses) | | | $1,000.00 | | | | $1,016.75 | | | | $8.39 | | | | 1.66% | |
|
| | |
Wasatch-1st Source Income Equity Fund | | | | | | | | | | | | | | | | |
Actual | | | $1,000.00 | | | | $965.80 | | | | $5.42 | | | | 1.10% | |
Hypothetical (5% before expenses) | | | $1,000.00 | | | | $1,019.55 | | | | $5.57 | | | | 1.10% | |
|
| | |
Wasatch-1st Source Long/Short Fund | | | | | | | | | | | | | | | | |
Actual | | | $1,000.00 | | | | $986.90 | | | | $8.47 | | | | 1.70% | |
Hypothetical (5% before expenses) | | | $1,000.00 | | | | $1,016.55 | | | | $8.59 | | | | 1.70% | |
|
| | |
U.S. Treasury Fund | | | | | | | | | | | | | | | | |
Actual | | | $1,000.00 | | | | $1,242.30 | | | | $4.22 | | | | 0.75% | |
Hypothetical (5% before expenses) | | | $1,000.00 | | | | $1,021.31 | | | | $3.80 | | | | 0.75% | |
|
| | |
Wasatch-1st Source Income Fund | | | | | | | | | | | | | | | | |
Actual | | | $1,000.00 | | | | $1,040.50 | | | | $3.58 | | | | 0.70% | |
Hypothetical (5% before expenses) | | | $1,000.00 | | | | $1,021.56 | | | | $3.55 | | | | 0.70% | |
|
| | |
*Expenses are equal to a fund’s annualized expense ratio as indicated above multiplied by the average account value over the period, multiplied by the number of days in the most recent fiscal half-year divided by the number of days in the full fiscal year (183/365).
40
| | |
| WASATCH CORE GROWTH FUND (WGROX) — Schedule of Investments | | SEPTEMBER 30, 2010 |
|
| |
| |
| | | | | | | | |
| Shares | | | | | Value | |
| | | | | | | |
| | | | COMMON STOCKS 94.3% | | | | |
| | |
| | | | Airlines 2.1% | | | | |
| | 207,549 | | | Allegiant Travel Co. | | $ | 8,783,474 | |
| | | | | | | | |
| | | | Apparel, Accessories & Luxury Goods 1.3% | | | | |
| | 1,953,497 | | | Ports Design Ltd. (China) | | | 5,400,295 | |
| | | | | | | | |
| | | | Application Software 2.6% | | | | |
| | 115,838 | | | ANSYS, Inc.* | | | 4,894,155 | |
| | 299,300 | | | Tyler Technologies, Inc.* | | | 6,033,888 | |
| | | | | | | | |
| | | | | | | 10,928,043 | |
| | | | | | | | |
| | | | Asset Management & Custody Banks 5.8% | | | | |
| | 99,299 | | | Affiliated Managers Group, Inc.* | | | 7,746,315 | |
| | 429,109 | | | SEI Investments Co. | | | 8,728,077 | |
| | 359,342 | | | Solar Capital Ltd. | | | 7,707,885 | |
| | | | | | | | |
| | | | | | | 24,182,277 | |
| | | | | | | | |
| | | | Automotive Retail 5.1% | | | | |
| | 180,281 | | | Monro Muffler Brake, Inc. | | | 8,312,757 | |
| | 244,674 | | | O’Reilly Automotive, Inc.* | | | 13,016,657 | |
| | | | | | | | |
| | | | | | | 21,329,414 | |
| | | | | | | | |
| | | | Consumer Finance 4.6% | | | | |
| | 500,369 | | | Dollar Financial Corp.* | | | 10,442,701 | |
| | 310,510 | | | First Cash Financial Services, Inc.* | | | 8,616,652 | |
| | | | | | | | |
| | | | | | | 19,059,353 | |
| | | | | | | | |
| | | | Data Processing & Outsourced Services 2.7% | | | | |
| | 170,214 | | | Alliance Data Systems Corp.* | | | 11,108,166 | |
| | | | | | | | |
| | | | Distributors 3.1% | | | | |
| | 632,890 | | | LKQ Corp.* | | | 13,164,112 | |
| | | | | | | | |
| | | | Diversified Banks 1.9% | | | | |
| | 235,526 | | | Axis Bank Ltd. (India) | | | 8,028,116 | |
| | | | | | | | |
| | | | Diversified Support Services 5.4% | | | | |
| | 554,517 | | | Copart, Inc.* | | | 18,282,426 | |
| | 158,871 | | | LPS Brasil — Consultoria de Imoveis S.A. (Brazil) | | | 2,855,739 | |
| | 71,225 | | | Ritchie Bros. Auctioneers, Inc. (Canada) | | | 1,479,343 | |
| | | | | | | | |
| | | | | | | 22,617,508 | |
| | | | | | | | |
| | | | Electrical Components & Equipment 1.0% | | | | |
| | 137,720 | | | Polypore International, Inc.* | | | 4,153,635 | |
| | | | | | | | |
| | | | Environmental & Facilities Services 2.9% | | | | |
| | 102,895 | | | Tetra Tech, Inc.* | | | 2,157,708 | |
| | 251,405 | | | Waste Connections, Inc.* | | | 9,970,722 | |
| | | | | | | | |
| | | | | | | 12,128,430 | |
| | | | | | | | |
| | | | Health Care Distributors 2.2% | | | | |
| | 438,307 | | | PSS World Medical, Inc.* | | | 9,371,004 | |
| | | | | | | | |
| | | | Health Care Facilities 3.0% | | | | |
| | 475,469 | | | Emeritus Corp.* | | | 8,111,501 | |
| | 204,740 | | | VCA Antech, Inc.* | | | 4,317,967 | |
| | | | | | | | |
| | | | | | | 12,429,468 | |
| | | | | | | | |
| | | | Health Care Services 3.2% | | | | |
| | 251,014 | | | MEDNAX, Inc.* | | | 13,379,046 | |
| | | | | | | | |
| | | | Homefurnishing Retail 3.4% | | | | |
| | 767,922 | | | Aaron’s, Inc. | | | 14,168,161 | |
| | | | | | | | |
| | | | | | | | |
| Shares | | | | | Value | |
| | | | | | | |
| | | | Industrial Machinery 3.5% | | | | |
| | 130,720 | | | Graco, Inc. | | $ | 4,147,746 | |
| | 299,040 | | | IDEX Corp. | | | 10,618,910 | |
| | | | | | | | |
| | | | | | | 14,766,656 | |
| | | | | | | | |
| | | | Internet Software & Services 0.5% | | | | |
| | 117,346 | | | DealerTrack Holdings, Inc.* | | | 2,004,270 | |
| | | | | | | | |
| | | | IT Consulting & Other Services 1.6% | | | | |
| | 105,880 | | | Cognizant Technology Solutions Corp., Class A* | | | 6,826,084 | |
| | | | | | | | |
| | | | Leisure Facilities 3.8% | | | | |
| | 399,253 | | | Life Time Fitness, Inc.* | | | 15,758,516 | |
| | | | | | | | |
| | | | Leisure Products 1.5% | | | | |
| | 321,199 | | | Pool Corp. | | | 6,446,464 | |
| | | | | | | | |
| | | | Life Sciences Tools & Services 3.1% | | | | |
| | 352,645 | | | Pharmaceutical Product Development, Inc. | | | 8,742,070 | |
| | 68,040 | | | Techne Corp. | | | 4,200,109 | |
| | | | | | | | |
| | | | | | | 12,942,179 | |
| | | | | | | | |
| | | | Mortgage REITs 0.5% | | | | |
| | 156,636 | | | Redwood Trust, Inc. | | | 2,264,957 | |
| | | | | | | | |
| | | | Oil & Gas Equipment & Services 2.3% | | | | |
| | 116,215 | | | Dril-Quip, Inc.* | | | 7,218,114 | |
| | 234,730 | | | TETRA Technologies, Inc.* | | | 2,394,246 | |
| | | | | | | | |
| | | | | | | 9,612,360 | |
| | | | | | | | |
| | | | Oil & Gas Exploration & Production 1.2% | | | | |
| | 307,625 | | | Petrohawk Energy Corp.* | | | 4,965,067 | |
| | | | | | | | |
| | | | Personal Products 3.6% | | | | |
| | 251,280 | | | Herbalife Ltd. | | | 15,164,748 | |
| | | | | | | | |
| | | | Regional Banks 1.2% | | | | |
| | 5,142,805 | | | City Union Bank Ltd. (India) | | | 5,184,579 | |
| | | | | | | | |
| | | | Research & Consulting Services 3.2% | | | | |
| | 67,280 | | | Corporate Executive Board Co. (The) | | | 2,123,357 | |
| | 262,493 | | | CRA International, Inc.* | | | 4,737,998 | |
| | 462,567 | | | Resources Connection, Inc. | | | 6,364,922 | |
| | | | | | | | |
| | | | | | | 13,226,277 | |
| | | | | | | | |
| | | | Semiconductors 5.8% | | | | |
| | 133,940 | | | Hittite Microwave Corp.* | | | 6,382,241 | |
| | 387,065 | | | Melexis N.V.* (Belgium) | | | 5,863,774 | |
| | 378,644 | | | Micrel, Inc. | | | 3,733,430 | |
| | 88,525 | | | Power Integrations, Inc. | | | 2,814,210 | |
| | 151,643 | | | Silicon Laboratories, Inc.* | | | 5,557,716 | |
| | | | | | | | |
| | | | | | | 24,351,371 | |
| | | | | | | | |
| | | | Specialized Finance 5.2% | | | | |
| | 35,579 | | | Crisil Ltd. (India) | | | 4,760,230 | |
| | 344,680 | | | MSCI, Inc., Class A* | | | 11,446,823 | |
| | 86,745 | | | Portfolio Recovery Associates, Inc.* | | | 5,608,064 | |
| | | | | | | | |
| | | | | | | 21,815,117 | |
| | | | | | | | |
| | | | Specialty Stores 1.3% | | | | |
| | 226,475 | | | Hibbett Sports, Inc.* | | | 5,650,551 | |
| | | | | | | | |
| | | | Thrifts & Mortgage Finance 1.8% | | | | |
| | 451,400 | | | Housing Development Finance Corp. Ltd. (India) | | | 7,326,272 | |
| | | | | | | | |
| | | | Trading Companies & Distributors 2.3% | | | | |
| | 132,177 | | | MSC Industrial Direct Co., Inc., Class A | | | 7,142,845 | |
| | 171,458 | | | Rush Enterprises, Inc., Class B* | | | 2,357,547 | |
| | | | | | | | |
| | | | | | | 9,500,392 | |
| | | | | | | | |
41
| | |
| WASATCH CORE GROWTH FUND (WGROX) — Schedule of Investments (continued) | | SEPTEMBER 30, 2010 |
|
| |
| |
| | | | | | | | |
Shares | | | | | Value | |
| | | | | | | |
| | | | Trucking 1.6% | | | | |
| | 269,002 | | | Old Dominion Freight Line, Inc.* | | $ | 6,838,031 | |
| | | | | | | | |
| | |
| | | | Total Common Stocks
(cost $312,679,651) | | | 394,874,393 | |
| | | | | | | | |
| | |
| | | | PREFERRED STOCKS 1.5% | | | | |
| | |
| | | | Regional Banks 1.5% | | | | |
| | 938,675 | | | Banco Daycoval S.A. Pfd. (Brazil) | | | 6,172,869 | |
| | | | | | | | |
| | |
| | | | Total Preferred Stocks
(cost $6,577,985) | | | 6,172,869 | |
| | | | | | | | |
| | | | | | | | |
Principal
Amount | | | | | Value | |
| | | | | | | |
| | | | SHORT-TERM INVESTMENTS 4.0% | | | | |
| | |
| | | | Repurchase Agreement 4.0% | | | | |
| | $16,653,000 | | | Repurchase Agreement dated 9/30/10,
0.01% due 10/1/10 with State Street Bank and Trust Co. collateralized by $15,965,000 of United States Treasury Notes 4.625% due 2/29/12; value: $16,988,357; repurchase proceeds: $16,653,005
(cost $16,653,000) | | $ | 16,653,000 | |
| | | | | | | | |
| | |
| | | | Total Short-Term Investments
(cost $16,653,000) | | | 16,653,000 | |
| | | | | | | | |
| | |
| | | | Total Investments
(cost $335,910,636) 99.8% | | | 417,700,262 | |
| | |
| | | | Other Assets less Liabilities 0.2% | | | 941,451 | |
| | | | | | | | |
| | |
| | | | NET ASSETS 100.0% | | $ | 418,641,713 | |
| | | | | | | | |
| | |
| | | | *Non-income producing. REIT Real Estate Investment Trust. See Notes to Financial Statements. | | | | |
At September 30, 2010, Wasatch Core Growth Fund’s investments, excluding short-term investments, were in the following countries:
| | | | |
| Country | | % | |
Belgium | | | 1.5 | |
Brazil | | | 2.2 | |
Canada | | | 0.4 | |
China | | | 1.3 | |
India | | | 6.3 | |
United States | | | 88.3 | |
| | | | |
TOTAL | | | 100.0 | % |
| | | | |
42
| | |
| WASATCH EMERGING MARKETS SMALL CAP FUND (WAEMX) — Schedule of Investments | | SEPTEMBER 30, 2010 |
|
| |
| |
| | | | | | | | |
| Shares | | | | | Value | |
| | | | | | | |
| | | | COMMON STOCKS 95.3% | | | | |
| | |
| | | | Aerospace & Defense 0.3% | | | | |
| | 33,250 | | | Bharat Electronics Ltd. (India) | | $ | 1,281,163 | |
| | | | | | | | |
| | | | Air Freight & Logistics 0.9% | | | | |
| | 3,627,557 | | | Aramex PJSC* (United Arab Emirates) | | | 2,172,959 | |
| | 67,280 | | | Blue Dart Express Ltd. (India) | | | 1,684,358 | |
| | | | | | | | |
| | | | | | | 3,857,317 | |
| | | | | | | | |
| | | | Aluminum 0.2% | | | | |
| | 1,297,000 | | | Midas Holdings Ltd. (Singapore) | | | 980,709 | |
| | | | | | | | |
| | | | Apparel Retail 2.8% | | | | |
| | 1,149,485 | | | Mr Price Group Ltd. (South Africa) | | | 9,057,546 | |
| | 471,600 | | | Padini Holdings Berhad (Malaysia) | | | 696,630 | |
| | 277,510 | | | Truworths International Ltd. (South Africa) | | | 2,783,052 | |
| | | | | | | | |
| | | | | | | 12,537,228 | |
| | | | | | | | |
| | | | Apparel, Accessories & Luxury Goods 5.1% | | | | |
| | 3,631,995 | | | 361 Degrees International Ltd. (China) | | | 3,651,046 | |
| | 175,695 | | | Cia. Hering (Brazil) | | | 7,550,529 | |
| | 79,335 | | | LG Fashion Corp. (Korea) | | | 2,365,613 | |
| | 2,351,220 | | | Ports Design Ltd. (China) | | | 6,499,770 | |
| | 2,631,880 | | | Xtep International Holdings Ltd. (China) | | | 2,208,129 | |
| | 872,923 | | | Zhulian Corp. Bhd. (Malaysia) | | | 545,754 | |
| | | | | | | | |
| | | | | | | 22,820,841 | |
| | | | | | | | |
| | | | Asset Management & Custody Banks 1.5% | | | | |
| | 661,131 | | | CETIP S.A. (Brazil) | | | 6,513,740 | |
| | | | | | | | |
| | | | Auto Parts & Equipment 2.4% | | | | |
| | 2,338,815 | | | Exide Industries Ltd. (India) | | | 8,640,109 | |
| | 94,028 | | | WABCO-TVS India Ltd. (India) | | | 2,239,011 | |
| | | | | | | | |
| | | | | | | 10,879,120 | |
| | | | | | | | |
| | | | Brewers 0.3% | | | | |
| | 278,320 | | | Guinness Anchor Berhad (Malaysia) | | | 755,530 | |
| | 16,900 | | | PT Multi Bintang Indonesia Tbk (Indonesia) | | | 380,605 | |
| | 4,995 | | | Zwack Unicum Nyrt. (Hungary) | | | 407,435 | |
| | | | | | | | |
| | | | | | | 1,543,570 | |
| | | | | | | | |
| | | | Broadcasting 0.8% | | | | |
| | 2,736,745 | | | BEC World Public Co. Ltd. (Thailand) | | | 3,494,197 | |
| | | | | | | | |
| | | | Building Products 2.1% | | | | |
| | 108,365 | | | Blue Star Ltd. (India) | | | 1,167,453 | |
| | 3,229,760 | | | Dynasty Ceramic Public Co. Ltd. (Thailand) | | | 5,374,065 | |
| | 8,235,370 | | | Home Product Center Public Co. | | | | |
| | | | Ltd. (Thailand) | | | 2,984,813 | |
| | | | | | | | |
| | | | | | | 9,526,331 | |
| | | | | | | | |
| | | | Coal & Consumable Fuels 0.5% | | | | |
| | 335,780 | | | PT Indo Tambangraya Megah (Indonesia) | | | 1,565,092 | |
| | 341,400 | | | PT Tambang Batubara Bukit Asam Tbk (Indonesia) | | | 744,004 | |
| | | | | | | | |
| | | | | | | 2,309,096 | |
| | | | | | | | |
| | | | Commodity Chemicals 2.1% | | | | |
| | 1,350,764 | | | Berger Paints India Ltd. (India) | | | 3,290,111 | |
| | 337,520 | | | Castrol India Ltd. (India) | | | 3,819,493 | |
| | 54,061 | | | Kansai Nerolac Paints Ltd. (India) | | | 1,263,248 | |
| | 113,203 | | | Paints & Chemical Industries Co. S.A.E. (Egypt) | | | 1,153,306 | |
| | | | | | | | |
| | | | | | | 9,526,158 | |
| | | | | | | | |
| | | | | | | | |
| Shares | | | | | Value | |
| | | | | | | |
| | | | Communications Equipment 1.9% | | | | |
| | 324,460 | | | Dasan Networks, Inc.* (Korea) | | $ | 2,689,013 | |
| | 6,198,860 | | | O-Net Communications Group Ltd.* (China) | | | 4,345,985 | |
| | 192,910 | | | Ubiquoss, Inc. (Korea) | | | 1,344,998 | |
| | | | | | | | |
| | | | | | | 8,379,996 | |
| | | | | | | | |
| | | | Computer Hardware 0.2% | | | | |
| | 93,600 | | | Positivo Informatica S.A. (Brazil) | | | 939,315 | |
| | | | | | | | |
| | | | Computer Storage & Peripherals 0.7% | | | | |
| | 539,978 | | | Simplo Technology Co. Ltd. (Taiwan) | | | 3,076,552 | |
| | | | | | | | |
| | | | Construction & Engineering 0.2% | | | | |
| | 148,891 | | | Heerim Architects & Planners (Korea) | | | 1,038,091 | |
| | | | | | | | |
| | | | Construction & Farm Machinery & Heavy Trucks 1.0% | | | | |
| | 4,900,310 | | | International Mining Machinery Holdings | | | | |
| | | | Ltd.* (China) | | | 4,591,297 | |
| | | | | | | | |
| | | | Construction Materials 5.0% | | | | |
| | 393,216 | | | Adana Cimento Sanayii Turk Anonim | | | | |
| | | | Sirketi, Class A (Turkey) | | | 1,398,331 | |
| | 218,700 | | | Corp Moctezuma S.A.B de C.V. (Mexico) | | | 527,791 | |
| | 6,960 | | | Holcim Maroc S.A. (Morocco) | | | 2,145,049 | |
| | 8,049,000 | | | Holcim Philippines, Inc. (Philippines) | | | 2,017,523 | |
| | 47,955 | | | Misr Beni Suef Cement Co. (Egypt) | | | 1,540,659 | |
| | 30,172,900 | | | PT Holcim Indonesia Tbk* (Indonesia) | | | 8,198,239 | |
| | 1,049,280 | | | PT Semen Gresik (Persero) Tbk (Indonesia) | | | 1,163,907 | |
| | 230,960 | | | Ultra Tech Cement Ltd. (India) | | | 5,463,680 | |
| | | | | | | | |
| | | | | | | 22,455,179 | |
| | | | | | | | |
| | | | Consumer Finance 2.9% | | | | |
| | 648,805 | | | Banco Compartamos S.A. de C.V. (Mexico) | | | 4,119,763 | |
| | 599,326 | | | Mahindra & Mahindra Financial Services Ltd. (India) | | | 8,602,766 | |
| | | | | | | | |
| | | | | | | 12,722,529 | |
| | | | | | | | |
| | | | Department Stores 3.6% | | | | |
| | 94,995 | | | Lojas Renner S.A. (Brazil) | | | 3,251,924 | |
| | 308,400 | | | Marisa Lojas S.A. (Brazil) | | | 4,403,894 | |
| | 20,447,886 | | | PT Ramayana Lestari Sentosa Tbk (Indonesia) | | | 1,993,239 | |
| | 2,159,400 | | | Robinson Department Store Public Co. Ltd. (Thailand) | | | 1,629,333 | |
| | 1,228,490 | | | Woolworths Holdings Ltd. (South Africa) | | | 4,759,079 | |
| | | | | | | | |
| | | | | | | 16,037,469 | |
| | | | | | | | |
| | | | Distillers & Vintners 0.2% | | | | |
| | 77,255 | | | Distell Group Ltd. (South Africa) | | | 763,696 | |
| | | | | | | | |
| | | | Distributors 1.3% | | | | |
| | 4,869,200 | | | Dah Chong Hong Holdings Ltd. | | | | |
| | | | (Hong Kong) | | | 5,992,919 | |
| | | | | | | | |
| | | | Diversified Banks 6.2% | | | | |
| | 1,268,290 | | | Allahabad Bank Ltd. (India) | | | 6,575,012 | |
| | 827,080 | | | Asya Katilim Bankasi AS (Turkey) | | | 1,987,459 | |
| | 31,220,000 | | | Bank Pembangunan Daerah Jawa* (Indonesia) | | | 5,456,941 | |
| | 226,115 | | | Capitec Bank Holdings Ltd. (South Africa) | | | 4,826,486 | |
| | 664,904 | | | National Societe Generale Bank S.A.E. (Egypt) | | | 4,323,687 | |
| | 3,144,491 | | | PT Bank Tabungan Pensiunan Nasional Tbk* (Indonesia) | | | 4,298,352 | |
| | | | | | | | |
| | | | | | | 27,467,937 | |
| | | | | | | | |
43
| | |
| WASATCH EMERGING MARKETS SMALL CAP FUND (WAEMX) — Schedule of Investments (continued) | | |
|
| |
| |
| | | | | | | | |
| Shares | | | | | Value | |
| | | | | | | |
| | | | Diversified Metals & Mining 1.7% | | | | |
| | 76,900 | | | Assore Ltd. (South Africa) | | $ | 1,718,131 | |
| | 4,118,245 | | | Merafe Resources Ltd. (South Africa) | | | 855,509 | |
| | 14,130,855 | | | PT Timah Tbk (Indonesia) | | | 4,987,361 | |
| | | | | | | | |
| | | | | | | 7,561,001 | |
| | | | | | | | |
| | | | Education Services 0.3% | | | | |
| | 1,339,781 | | | Advtech Ltd. (South Africa) | | | 1,161,272 | |
| | | | | | | | |
| | | | Electrical Components & Equipment 1.0% | | | | |
| | 71,210 | | | Voltamp Transformers Ltd. (India) | | | 1,481,726 | |
| | 1,392,010 | | | Wasion Group Holdings Ltd. (China) | | | 1,067,423 | |
| | 631,240 | | | Zhuzhou CSR Times Electric Co. Ltd., Series H (China) | | | 2,029,750 | |
| | | | | | | | |
| | | | | | | 4,578,899 | |
| | | | | | | | |
| | | | Electronic Components 0.6% | | | | |
| | 180,835 | | | Partron Co. Ltd. (Korea) | | | 2,704,001 | |
| | | | | | | | |
| | | | Electronic Equipment & Instruments 1.1% | | | | |
| | 2,036,829 | | | Chroma ATE, Inc. (Taiwan) | | | 4,857,121 | |
| | | | | | | | |
| | | | Food Retail 1.8% | | | | |
| | 2,451,730 | | | CP ALL Public Co. Ltd. (Thailand) | | | 3,413,034 | |
| | 250,880 | | | Eurocash S.A. (Poland) | | | 2,270,856 | |
| | 153,935 | | | Shoprite Holdings Ltd. (South Africa) | | | 2,182,216 | |
| | | | | | | | |
| | | | | | | 7,866,106 | |
| | | | | | | | |
| | | | Footwear 3.2% | | | | |
| | 1,178,430 | | | Bata India Ltd. (India) | | | 8,822,162 | |
| | 725,165 | | | Daphne International Holdings Ltd. (China) | | | 857,006 | |
| | 235,100 | | | Grendene S.A. (Brazil) | | | 1,192,154 | |
| | 73,075 | | | NG2 S.A. (Poland) | | | 1,443,376 | |
| | 2,887,825 | | | Peak Sport Products Co. Ltd. (China) | | | 2,113,960 | |
| | | | | | | | |
| | | | | | | 14,428,658 | |
| | | | | | | | |
| | | | Gas Utilities 0.5% | | | | |
| | 325,625 | | | Indraprastha Gas Ltd. (India) | | | 2,224,700 | |
| | | | | | | | |
| | | | General Merchandise Stores 1.3% | | | | |
| | 922,505 | | | Clicks Group Ltd. (South Africa) | | | 5,841,651 | |
| | | | | | | | |
| | | | Gold 1.2% | | | | |
| | 492,599 | | | Koza Altin Isletmeleri AS (Turkey) | | | 5,578,389 | |
| | | | | | | | |
| | | | Health Care Facilities 0.6% | | | | |
| | 2,368,823 | | | KPJ Healthcare Berhad (Malaysia) | | | 2,670,393 | |
| | | | | | | | |
| | | | Health Care Services 0.9% | | | | |
| | 325,900 | | | Diagnosticos da America S.A. (Brazil) | | | 3,924,652 | |
| | | | | | | | |
| | | | Health Care Supplies 0.1% | | | | |
| | 154,960 | | | Shandong Weigao Group Medical Polymer | | | | |
| | | | Co. Ltd., Class H (China) | | | 439,359 | |
| | | | | | | | |
| | | | Highways & Railtracks 1.0% | | | | |
| | 12,867,545 | | | PT Jasa Marga (Indonesia) | | | 4,613,574 | |
| | | | | | | | |
| | | | Home Improvement Retail 0.5% | | | | |
| | 4,595,750 | | | Ace Hardware Indonesia (Indonesia) | | | 1,042,733 | |
| | 108,625 | | | Cashbuild Ltd. (South Africa) | | | 1,213,861 | |
| | | | | | | | |
| | | | | | | 2,256,594 | |
| | | | | | | | |
| | | | Homefurnishing Retail 0.6% | | | | |
| | 276,520 | | | Lewis Group Ltd. (South Africa) | | | 2,781,046 | |
| | | | | | | | |
| | | | Hotels, Resorts & Cruise Lines 0.6% | | | | |
| | 219,718 | | | City Lodge Hotels Ltd. (South Africa) | | | 2,483,632 | |
| | | | | | | | |
| | | | Human Resource & Employment Services 0.1% | | | | |
| | 657,300 | | | Jobstreet Corp. Berhad (Malaysia) | | | 485,469 | |
| | | | | | | | |
| | | | | | | | |
| Shares | | | | | Value | |
| | | | | | | |
| | | | Hypermarkets & Super Centers 1.0% | | | | |
| | 898,530 | | | Siam Makro Public Co. Ltd. (Thailand) | | $ | 4,440,840 | |
| | | | | | | | |
| | | | Industrial Gases 0.3% | | | | |
| | 1,249,700 | | | Yingde Gases Group Co.* (China) | | | 1,180,558 | |
| | | | | | | | |
| | | | Industrial Machinery 2.3% | | | | |
| | 207,057 | | | AIA Engineering Ltd. (India) | | | 1,843,169 | |
| | 2,719,170 | | | China Automation Group Ltd. (China) | | | 2,193,755 | |
| | 85,110 | | | Cummins India Ltd. (India) | | | 1,390,247 | |
| | 180,300 | | | King Slide Works Co. Ltd. (Taiwan) | | | 897,417 | |
| | 292,718 | | | SKF India Ltd. (India) | | | 3,836,896 | |
| | | | | | | | |
| | | | | | | 10,161,484 | |
| | | | | | | | |
| | | | Internet Software & Services 0.8% | | | | |
| | 22,415 | | | Daum Communications Corp.* (Korea) | | | 1,549,048 | |
| | 4,900,000 | | | Pacific Online (China) | | | 2,134,471 | |
| | | | | | | | |
| | | | | | | 3,683,519 | |
| | | | | | | | |
| | | | Investment Banking &
Brokerage 0.7% | | | | |
| | 546,160 | | | Egyptian Financial Group-Hermes Holding (Egypt) | | | 2,782,125 | |
| | 43,610 | | | Egyptian Financial Group-Hermes Holding GDR (Egypt) | | | 453,108 | |
| | | | | | | | |
| | | | | | | 3,235,233 | |
| | | | | | | | |
| | | | Life & Health Insurance 0.4% | | | | |
| | 162,800 | | | Amil Participacoes S.A. (Brazil) | | | 1,563,610 | |
| | | | | | | | |
| | | | Managed Health Care 0.5% | | | | |
| | 185,840 | | | OdontoPrev S.A. (Brazil) | | | 2,182,029 | |
| | | | | | | | |
| | | | Marine Ports & Services 2.3% | | | | |
| | 5,068,114 | | | International Container Terminal Services, Inc. (Philippines) | | | 4,434,672 | |
| | 363,020 | | | Novorossiysk Commercial Sea Trade Port GDR (Russia) | | | 3,441,430 | |
| | 230,025 | | | Santos Brasil Participacoes S.A.** (Brazil) | | | 2,483,564 | |
| | | | | | | | |
| | | | | | | 10,359,666 | |
| | | | | | | | |
| | | | Oil & Gas Equipment & Services 0.3% | | | | |
| | 603,810 | | | Renaissance Services S.A.O.G. (Oman) | | | 1,309,562 | |
| | | | | | | | |
| | | | Oil & Gas Exploration &
Production 1.8% | | | | |
| | 1,927,310 | | | Afren plc* (United Kingdom) | | | 3,347,154 | |
| | 166,155 | | | Gran Tierra Energy, Inc.* (Canada) | | | 1,282,716 | |
| | 180,505 | | | Pan Orient Energy Corp.* (Canada) | | | 1,308,655 | |
| | 1,624,250 | | | Petroneft Resources plc* (United | | | | |
| | | | Kingdom) | | | 1,160,468 | |
| | 129,690 | | | Selan Exploration Technology Ltd. (India) | | | 966,578 | |
| | | | | | | | |
| | | | | | | 8,065,571 | |
| | | | | | | | |
| | | | Other Diversified Financial
Services 1.1% | | | | |
| | 170,020 | | | Intergroup Financial Services Corp. (Peru) | | | 4,930,580 | |
| | | | | | | | |
| | | | Packaged Foods & Meats 4.3% | | | | |
| | 2,084,505 | | | Agthia Group PJSC (United Arab Emirates) | | | 1,282,702 | |
| | 209,055 | | | Dutch Lady Milk Industries Berhad (Malaysia) | | | 1,117,398 | |
| | 80,000 | | | Glaxo SmithKline Consumer Healthcare Ltd. (India) | | | 3,606,988 | |
| | 1,007,525 | | | Hsu Fu Chi International Ltd. (China) | | | 2,526,660 | |
| | 898,070 | | | MAMEE Double Decker Berhad (Malaysia) | | | 1,009,492 | |
| | 61,700 | | | Nestle Malaysia Berhad (Malaysia) | | | 839,456 | |
| | 479,590 | | | Pinar Sut Mamulleri Sanayii A.S. (Turkey) | | | 3,278,512 | �� |
| | 4,895,835 | | | PT Mayora Indah Tbk (Indonesia) | | | 5,622,668 | |
| | | | | | | | |
| | | | | | | 19,283,876 | |
| | | | | | | | |
| | | | Paper Products 0.2% | | | | |
| | 4,659,725 | | | NTPM Holdings Berhad (Malaysia) | | | 883,038 | |
| | | | | | | | |
44
| | | | | | | | |
| Shares | | | | | Value | |
| | | | | | | |
| | | | Personal Products 1.7% | | | | |
| | 322,700 | | | Colgate-Palmolive India Ltd. (India) | | $ | 6,249,687 | |
| | 401,960 | | | Dabur India Ltd. (India) | | | 958,496 | |
| | 211,565 | | | PT Mandom Indonesia Tbk (Indonesia) | | | 173,044 | |
| | | | | | | | |
| | | | | | | 7,381,227 | |
| | | | | | | | |
| | | | Pharmaceuticals 2.9% | | | | |
| | 46,974 | | | Daewoong Pharmaceutical Co. Ltd. (Korea) | | | 2,016,555 | |
| | 284,138 | | | Egyptian International Pharmaceutical Industries Co. (Egypt) | | | 1,796,263 | |
| | 572,600 | | | Genomma Lab Internacional S.A. de C.V., Class B* (Mexico) | | | 1,096,427 | |
| | 66,440 | | | Merck Ltd. (India) | | | 1,042,991 | |
| | 9,625 | | | Pharmstandard* *** (Russia) | | | 725,985 | |
| | 50,660 | | | Pharmstandard GDR* (Russia) | | | 1,132,251 | |
| | 18,037,000 | | | PT Kalbe Farma Tbk (Indonesia) | | | 5,153,429 | |
| | | | | | | | |
| | | | | | | 12,963,901 | |
| | | | | | | | |
| | | | Precious Metals & Minerals 0.4% | | | | |
| | 258,135 | | | Northam Platinum Ltd. (South Africa) | | | 1,700,806 | |
| | | | | | | | |
| | | | Railroads 1.6% | | | | |
| | 484,996 | | | Globaltrans Investment plc GDR (Russia) | | | 7,318,590 | |
| | | | | | | | |
| | | | Restaurants 0.9% | | | | |
| | 766,425 | | | Ajisen China Holdings Ltd. (China) | | | 1,199,129 | |
| | 898,955 | | | Alsea de Mexico S.A.B. de C.V. (Mexico) | | | 890,544 | |
| | 231,600 | | | FU JI Food & Catering Services Holdings Ltd.* *** (China) | | | 298 | |
| | 1,826,545 | | | KFC Holdings Malaysia Berhad (Malaysia) | | | 1,846,071 | |
| | 65,000 | | | PT Fastfood Indonesia (Indonesia) | | | 54,986 | |
| | | | | | | | |
| | | | | | | 3,991,028 | |
| | | | | | | | |
| | | | Semiconductor Equipment 0.3% | | | | |
| | 182,920 | | | Hanmi Semiconductor Co. Ltd. (Korea) | | | 1,264,117 | |
| | | | | | | | |
| | | | Semiconductors 1.9% | | | | |
| | 83,505 | | | Melfas, Inc.* (Korea) | | | 1,984,640 | |
| | 620,350 | | | Novatek Microelectronics Corp. Ltd. (Taiwan) | | | 1,757,309 | |
| | 129,060 | | | RichTek Technology Corp. (Taiwan) | | | 958,402 | |
| | 1,739,085 | | | Sporton International, Inc. (Taiwan) | | | 3,551,482 | |
| | | | | | | | |
| | | | | | | 8,251,833 | |
| | | | | | | | |
| | | | Soft Drinks 0.6% | | | | |
| | 221,985 | | | Coca-Cola Icecek A.S. (Turkey) | | | 2,713,116 | |
| | | | | | | | |
| | | | Specialized Finance 2.6% | | | | |
| | 1,167,790 | | | Bolsa Mexicana de Valores S.A.B. de C.V. (Mexico) | | | 1,945,970 | |
| | 14,281 | | | Crisil Ltd. (India) | | | 1,910,702 | |
| | 52,265 | | | ICRA Ltd. (India) | | | 1,439,832 | |
| | 592,314 | | | JSE Ltd. (South Africa) | | | 6,241,360 | |
| | | | | | | | |
| | | | | | | 11,537,864 | |
| | | | | | | | |
| | | | Specialty Chemicals 0.7% | | | | |
| | 149,715 | | | Akzo Nobel India Ltd. (India) | | | 3,089,423 | |
| | | | | | | | |
| | | | Steel 0.2% | | | | |
| | 340,199 | | | Ratnamani Metals & Tubes Ltd. (India) | | | 1,016,017 | |
| | | | | | | | |
| | | | Technology Distributors 0.8% | | | | |
| | 1,842,173 | | | WPG Holdings Co. Ltd. (Taiwan) | | | 3,655,866 | |
| | | | | | | | |
| | | | Thrifts & Mortgage Finance 4.3% | | | | |
| | 892,659 | | | Dewan Housing Finance Corp. Ltd. (India) | | | 5,673,604 | |
| | 445,061 | | | Gruh Finance Ltd. (India) | | | 4,098,503 | |
| | 300,595 | | | LIC Housing Finance Ltd. (India) | | | 9,626,265 | |
| | | | | | | | |
| | | | | | | 19,398,372 | |
| | | | | | | | |
| | | | | | | | |
| Shares | | | | | Value | |
| | | | | | | |
| | | | Tobacco 0.4% | | | | |
| | 29,905 | | | Eastern Tobacco (Egypt) | | $ | 667,123 | |
| | 2,520 | | | Philip Morris CR A.S. (Czech Republic) | | | 1,304,531 | |
| | | | | | | | |
| | | | | | | 1,971,654 | |
| | | | | | | | |
| | | | Trading Companies &
Distributors 0.4% | | | | |
| | 3,061,387 | | | PT Hexindo Adiperkasa Tbk (Indonesia) | | | 1,817,967 | |
| | | | | | | | |
| | | | Wireless Telecommunication Services 0.3% | | | | |
| | 22,473,300 | | | Safaricom Ltd. (Kenya) | | | 1,224,551 | |
| | | | | | | | |
| | |
| | | | Total Common Stocks
(cost $345,728,229) | | | 425,766,865 | |
| | | | | | | | |
| | |
| | | | PREFERRED STOCKS 3.2% | | | | |
| | |
| | | | Construction & Farm Machinery & Heavy Trucks 1.3% | | | | |
| | 1,805,770 | | | Marcopolo S.A. Pfd. (Brazil) | | | 5,969,488 | |
| | | | | | | | |
| | | | Diversified Banks 1.0% | | | | |
| | 488,300 | | | Banco Industrial e Comercial S.A. (Bic Banco) Pfd. (Brazil) | | | 4,453,503 | |
| | | | | | | | |
| | | | Office Services & Supplies 0.4% | | | | |
| | 92,900 | | | Contax Participacoes S.A. Pfd (Brazil) | | | 1,510,859 | |
| | | | | | | | |
| | | | Regional Banks 0.5% | | | | |
| | 328,455 | | | Banco Daycoval S.A. Pfd. (Brazil) | | | 2,159,970 | |
| | | | | | | | |
| | |
| | | | Total Preferred Stocks
(cost $12,586,598) | | | 14,093,820 | |
| | | | | | | | |
| | |
| | | | LIMITED PARTNERSHIP INTEREST 0.3% | | | | |
| | |
| | | | Oil & Gas Exploration &
Production 0.3% | | | | |
| | 176,955 | | | Zhaikmunai L.P. GDR* (Kazakhstan) | | | 1,415,640 | |
| | | | | | | | |
| | |
| | | | Total Limited Partnership Interest
(cost $1,213,856) | | | 1,415,640 | |
| | | | | | | | |
| | |
| | | | WARRANTS 0.0% | | | | |
| | |
| | | | Restaurants 0.0% | | | | |
| | 50,382 | | | KFC Holdings Malaysia Berhad, expiring 9/14/15* (Malaysia) | | | 20,074 | |
| | | | | | | | |
| | |
| | | | Total Warrants
(cost $0) | | | 20,074 | |
| | | | | | | | |
45
| | |
| WASATCH EMERGING MARKETS SMALL CAP FUND (WAEMX) — Schedule of Investments (continued) | | |
|
| |
| |
| | | | | | | | |
| | |
Principal
Amount | | | | | Value | |
| | | | | | | |
| | | | SHORT-TERM INVESTMENTS 3.3% | | | | |
| | |
| | | | Repurchase Agreement 3.3% | | | | |
| | $14,721,000 | | | Repurchase Agreement dated 9/30/10, 0.01% due 10/1/10 with State Street Bank and Trust Co. collateralized by $13,940,000 of United States Treasury Notes 3.125% due 5/15/19; value: $15,020,350; repurchase proceeds: $14,721,004 (cost $14,721,000) | | $ | 14,721,000 | |
| | | | | | | | |
| | |
| | | | Total Short-Term Investments (cost $14,721,000) | | | 14,721,000 | |
| | | | | | | | |
| | |
| | | | Total Investments
(cost $374,249,683) 102.1% | | | 456,017,399 | |
| | |
| | | | Liabilities less Other Assets (2.1)% | | | (9,266,244 | ) |
| | | | | | | | |
| | |
| | | | NET ASSETS 100.0% | | $ | 446,751,155 | |
| | | | | | | | |
| |
| | | | *Non-income producing. **Common units. ***Security was fair valued under procedures adopted by the Board of Trustees (see Note 15). GDR Global Depositary Receipt. See Notes to Financial Statements. | |
At September 30, 2010, Wasatch Emerging Markets Small Cap Fund’s investments, excluding short-term investments, were in the following countries:
| | | | |
| Country | | % | |
Brazil | | | 10.9 | |
Canada | | | 0.6 | |
China | | | 8.4 | |
Czech Republic | | | 0.3 | |
Egypt | | | 2.9 | |
Hong Kong | | | 1.4 | |
Hungary | | | 0.1 | |
India | | | 23.4 | |
Indonesia | | | 10.7 | |
Kazakhstan | | | 0.3 | |
Kenya | | | 0.3 | |
Korea | | | 3.8 | |
Malaysia | | | 2.5 | |
Mexico | | | 1.9 | |
Morocco | | | 0.5 | |
Oman | | | 0.3 | |
Peru | | | 1.1 | |
Philippines | | | 1.5 | |
Poland | | | 0.8 | |
Russia | | | 2.9 | |
Singapore | | | 0.2 | |
South Africa | | | 11.0 | |
Taiwan | | | 4.2 | |
Thailand | | | 4.8 | |
Turkey | | | 3.4 | |
United Arab Emirates | | | 0.8 | |
United Kingdom | | | 1.0 | |
| | | | |
TOTAL | | | 100.0 | % |
| | | | |
46
| | |
| WASATCH GLOBAL OPPORTUNITIES FUND (WAGOX) — Schedule of Investments | | SEPTEMBER 30, 2010 |
|
| |
| |
| | | | | | | | |
| Shares | | | | | Value | |
| | | | | | | |
| | | | COMMON STOCKS 95.0% | | | | |
| | |
| | | | Advertising 0.2% | | | | |
| | 10,900 | | | 1000mercis* (France) | | $ | 513,648 | |
| | | | | | | | |
| | | | Aerospace & Defense 0.2% | | | | |
| | 9,500 | | | Bharat Electronics Ltd. (India) | | | 366,047 | |
| | | | | | | | |
| | | | Air Freight & Logistics 1.1% | | | | |
| | 3,359,260 | | | Aramex PJSC* (United Arab Emirates) | | | 2,012,245 | |
| | 3,200 | | | Forward Air Corp. | | | 83,200 | |
| | 407,600 | | | Goodpack Ltd. (Singapore) | | | 591,622 | |
| | | | | | | | |
| | | | | | | 2,687,067 | |
| | | | | | | | |
| | | | Airlines 0.1% | | | | |
| | 6,900 | | | Allegiant Travel Co. | | | 292,008 | |
| | | | | | | | |
| | | | Aluminum 0.2% | | | | |
| | 665,000 | | | Midas Holdings Ltd. (Singapore) | | | 502,831 | |
| | | | | | | | |
| | | | Apparel Retail 0.9% | | | | |
| | 1,220 | | | Camaieu (France) | | | 265,947 | |
| | 16,250 | | | Jos. A. Bank Clothiers, Inc.* | | | 692,413 | |
| | 22,500 | | | Ross Stores, Inc. | | | 1,228,950 | |
| | | | | | | | |
| | | | | | | 2,187,310 | |
| | | | | | | | |
| | | | Apparel, Accessories & Luxury Goods 4.8% | | | | |
| | 491,000 | | | Anta Sports Products Ltd. (China) | | | 1,144,083 | |
| | 2,350 | | | Bijou Brigitte AG (Germany) | | | 332,158 | |
| | 75,670 | | | Billabong International Ltd. (Australia) | | | 581,921 | |
| | 375,000 | | | China Lilang Ltd. (China) | | | 628,278 | |
| | 6,700 | | | Fossil, Inc.* | | | 360,393 | |
| | 45,200 | | | Gerry Weber International AG (Germany) | | | 1,850,733 | |
| | 41,600 | | | Gildan Activewear, Inc.* (Canada) | | | 1,168,544 | |
| | 53,000 | | | Li Ning Co. Ltd. (China) | | | 160,859 | |
| | 18,953 | | | Odd Molly International AB (Sweden) | | | 303,140 | |
| | 546,500 | | | Ports Design Ltd. (China) | | | 1,510,758 | |
| | 327,400 | | | Ted Baker plc (United Kingdom) | | | 2,891,813 | |
| | 470,000 | | | Xtep International Holdings Ltd. (China) | | | 394,327 | |
| | | | | | | | |
| | | | | | | 11,327,007 | |
| | | | | | | | |
| | | | Application Software 2.5% | | | | |
| | 11,000 | | | Aveva Group plc (United Kingdom) | | | 252,700 | |
| | 76,620 | | | Convio, Inc.* | | | 706,436 | |
| | 11,900 | | | Ebix, Inc.* | | | 279,055 | |
| | 4,200 | | | FactSet Research Systems, Inc. | | | 340,746 | |
| | 226,000 | | | Kingdee International Software Group Co. Ltd. (China) | | | 106,020 | |
| | 36,041 | | | RealPage, Inc.* | | | 687,662 | |
| | 97,625 | | | SciQuest, Inc.* | | | 1,179,310 | |
| | 3,900 | | | SimCorp A/S (Denmark) | | | 620,966 | |
| | 48,700 | | | Sonic Solutions, Inc.* | | | 554,206 | |
| | 13,635 | | | Tyler Technologies, Inc.* | | | 274,882 | |
| | 20,500 | | | Ultimate Software Group, Inc.* | | | 792,120 | |
| | | | | | | | |
| | | | | | | 5,794,103 | |
| | | | | | | | |
| | | | Asset Management & Custody Banks 2.1% | | | | |
| | 525,000 | | | ARA Asset Management Ltd. (Singapore) | | | 486,739 | |
| | 6,500 | | | Bank of New York Mellon Corp. (The) | | | 169,845 | |
| | 52,029 | | | CETIP S.A. (Brazil) | | | 512,612 | |
| | 16,000 | | | Diamond Hill Investment Group, Inc. | | | 1,168,000 | |
| | 27,300 | | | Eaton Vance Corp. | | | 792,792 | |
| | 68,700 | | | SEI Investments Co. | | | 1,397,358 | |
| | 9,792 | | | T. Rowe Price Group, Inc. | | | 490,236 | |
| | | | | | | | |
| | | | | | | 5,017,582 | |
| | | | | | | | |
| | | | | | | | |
| Shares | | | | | Value | |
| | | | | | | |
| | | | Auto Parts & Equipment 0.5% | | | | |
| | 560,000 | | | Minth Group Ltd. (China) | | $ | 1,120,101 | |
| | 1,235,000 | | | Norstar Founders Group Ltd.* *** (Hong Kong) | | | 21,790 | |
| | | | | | | | |
| | | | | | | 1,141,891 | |
| | | | | | | | |
| | | | Automotive Retail 0.5% | | | | |
| | 64,000 | | | Halfords Group plc (United Kingdom) | | | 444,996 | |
| | 13,100 | | | O’Reilly Automotive, Inc.* | | | 696,920 | |
| | | | | | | | |
| | | | | | | 1,141,916 | |
| | | | | | | | |
| | | | Biotechnology 2.3% | | | | |
| | 40,000 | | | 3SBio, Inc. ADR* (China) | | | 519,200 | |
| | 61,825 | | | Abcam plc (United Kingdom) | | | 1,676,584 | |
| | 47,500 | | | China Nuokang Bio-Pharmaceutical, Inc. | | | | |
| | | | ADR* (China) | | | 237,500 | |
| | 96,000 | | | Myriad Genetics, Inc.* | | | 1,575,360 | |
| | 143,115 | | | Orexigen Therapeutics, Inc.* | | | 848,672 | |
| | 1,095,471 | | | Sino Biopharmaceutical Ltd. (China) | | | 441,899 | |
| | | | | | | | |
| | | | | | | 5,299,215 | |
| | | | | | | | |
| | | | Commodity Chemicals 0.1% | | | | |
| | 27,500 | | | Tokai Carbon Korea Co. Ltd. (Korea) | | | 324,381 | |
| | | | | | | | |
| | | | Communications Equipment 0.6% | | | | |
| | 3,240 | | | Calix, Inc.* | | | 46,526 | |
| | 621,480 | | | O-Net Communications Group Ltd.* | | | | |
| | | | (China) | | | 435,716 | |
| | 19,650 | | | Riverbed Technology, Inc.* | | | 895,647 | |
| | | | | | | | |
| | | | | | | 1,377,889 | |
| | | | | | | | |
| | | | Computer Hardware 0.6% | | | | |
| | 523,000 | | | Advantech Co. Ltd. (Taiwan) | | | 1,376,073 | |
| | | | | | | | |
| | | | Computer Storage & Peripherals 0.6% | | | | |
| | 66,500 | | | Intevac, Inc.* | | | 665,665 | |
| | 590 | | | Wacom Co. Ltd. (Japan) | | | 731,536 | |
| | | | | | | | |
| | | | | | | 1,397,201 | |
| | | | | | | | |
| | | | Construction & Engineering 1.1% | | | | |
| | 23,500 | | | Aecon Group, Inc. (Canada) | | | 273,237 | |
| | 340,000 | | | Ausenco Ltd. (Australia) | | | 931,707 | |
| | 45,700 | | | Heerim Architects & Planners (Korea) | | | 318,628 | |
| | 79,500 | | | Lycopodium Ltd. (Australia) | | | 299,934 | |
| | 5,900 | | | Outotec Oyj (Finland) | | | 249,656 | |
| | 195,000 | | | Rotary Engineering Ltd. (Singapore) | | | 137,814 | |
| | 33,500 | | | SWECO AB, Class B (Sweden) | | | 279,068 | |
| | | | | | | | |
| | | | | | | 2,490,044 | |
| | | | | | | | |
| | | | Construction Materials 0.5% | | | | |
| | 95,500 | | | Corp Moctezuma S.A.B de C.V. (Mexico) | | | 230,471 | |
| | 52,000 | | | Pretoria Portland Cement Co. Ltd. (South Africa) | | | 238,097 | |
| | 565,000 | | | PT Semen Gresik (Persero) Tbk (Indonesia) | | | 626,723 | |
| | | | | | | | |
| | | | | | | 1,095,291 | |
| | | | | | | | |
| | | | Consumer Finance 1.0% | | | | |
| | 76,000 | | | Banco Compartamos S.A. de C.V. (Mexico) | | | 482,583 | |
| | 33,616 | | | Dollar Financial Corp.* | | | 701,566 | |
| | 38,000 | | | First Cash Financial Services, Inc.* | | | 1,054,500 | |
| | | | | | | | |
| | | | | | | 2,238,649 | |
| | | | | | | | |
47
| | |
| WASATCH GLOBAL OPPORTUNITIES FUND (WAGOX) — Schedule of Investments (continued) | | |
|
| |
| |
| | | | | | | | |
| Shares | | | | | Value | |
| | | | | | | |
| | | | Data Processing & Outsourced Services 3.2% | | | | |
| | 59,200 | | | Cielo S.A. (Brazil) | | $ | 514,767 | |
| | 50,700 | | | DIBS Payment Services AB (Sweden) | | | 525,591 | |
| | 15,000 | | | Fidelity National Information Services, Inc. | | | 406,950 | |
| | 265 | | | GMO Payment Gateway, Inc. (Japan) | | | 550,476 | |
| | 56,300 | | | Redecard S.A. (Brazil) | | | 872,417 | |
| | 650 | | | SBI VeriTrans Co. Ltd. (Japan) | | | 341,839 | |
| | 4,850 | | | Syntel, Inc. | | | 215,825 | |
| | 299,600 | | | Wirecard AG (Germany) | | | 4,077,518 | |
| | | | | | | | |
| | | | | | | 7,505,383 | |
| | | | | | | | |
| | | | Department Stores 0.3% | | | | |
| | 1,846,100 | | | PCD Stores Ltd.* (China) | | | 582,906 | |
| | | | | | | | |
| | | | Distributors 0.5% | | | | |
| | 57,300 | | | LKQ Corp.* | | | 1,191,840 | |
| | | | | | | | |
| | | | Diversified Banks 1.1% | | | | |
| | 138,039 | | | Allahabad Bank Ltd. (India) | | | 715,616 | |
| | 22,100 | | | Axis Bank Ltd. (India) | | | 753,298 | |
| | 15,000 | | | Bank of Baroda (India) | | | 292,272 | |
| | 1,030 | | | HDFC Bank Ltd. ADR (India) | | | 189,901 | |
| | 81,800 | | | Union Bank of India Ltd. (India) | | | 706,409 | |
| | | | | | | | |
| | | | | | | 2,657,496 | |
| | | | | | | | |
| | | | Diversified Metals & Mining 0.6% | | | | |
| | 8,000 | | | BHP Billiton plc ADR (United Kingdom) | | | 511,360 | |
| | 13,000 | | | Hindustan Zinc Ltd. (India) | | | 312,509 | |
| | 11,100 | | | Inmet Mining Corp. (Canada) | | | 617,511 | |
| | | | | | | | |
| | | | | | | 1,441,380 | |
| | | | | | | | |
| | | | Diversified Support Services 1.6% | | | | |
| | 50,400 | | | Copart, Inc.* | | | 1,661,688 | |
| | 240 | | | Prestige International, Inc. (Japan) | | | 428,392 | |
| | 35,800 | | | Ritchie Bros. Auctioneers, Inc. (Canada) | | | 743,566 | |
| | 43,445 | | | STR Holdings, Inc.* | | | 935,805 | |
| | | | | | | | |
| | | | | | | 3,769,451 | |
| | | | | | | | |
| | | | Drug Retail 0.2% | | | | |
| | 26,635 | | | Create SD Holdings Co. Ltd. (Japan) | | | 581,040 | |
| | | | | | | | |
| | | | Education Services 0.8% | | | | |
| | 1,475 | | | Capella Education Co.* | | | 114,489 | |
| | 3,250 | | | MegaStudy Co. Ltd. (Korea) | | | 480,553 | |
| | 249,000 | | | Navitas Ltd. (Australia) | | | 1,021,105 | |
| | 1,500 | | | Strayer Education, Inc. | | | 261,750 | |
| | | | | | | | |
| | | | | | | 1,877,897 | |
| | | | | | | | |
| | | | Electrical Components & Equipment 0.6% | | | | |
| | 7,400 | | | Emerson Electric Co. | | | 389,684 | |
| | 12,200 | | | Harbin Electric, Inc.* | | | 218,258 | |
| | 13,000 | | | Voltamp Transformers Ltd. (India) | | | 270,502 | |
| | 157,000 | | | Zhuzhou CSR Times Electric Co. Ltd., Series H (China) | | | 504,833 | |
| | | | | | | | |
| | | | | | | 1,383,277 | |
| | | | | | | | |
| | | | Electronic Components 0.3% | | | | |
| | 14,284 | | | Amphenol Corp., Class A | | | 699,630 | |
| | | | | | | | |
| | | | Electronic Equipment & Instruments 0.5% | | | | |
| | 23,675 | | | CNB Technology, Inc. (Korea) | | | 132,883 | |
| | 600 | | | KEYENCE Corp. (Japan) | | | 130,530 | |
| | 10,200 | | | National Instruments Corp. | | | 333,132 | |
| | 78,675 | | | Viscom AG* (Germany) | | | 500,544 | |
| | | | | | | | |
| | | | | | | 1,097,089 | |
| | | | | | | | |
| | | | | | | | |
| Shares | | | | | Value | |
| | | | | | | |
| | | | Electronic Manufacturing Services 1.0% | | | | |
| | 28,000 | | | IPG Photonics Corp.* | | $ | 675,920 | |
| | 123,200 | | | TTM Technologies, Inc.* | | | 1,206,128 | |
| | 77,700 | | | Venture Corp. Ltd. (Singapore) | | | 579,842 | |
| | | | | | | | |
| | | | | | | 2,461,890 | |
| | | | | | | | |
| | | | Environmental & Facilities Services 1.0% | | | | |
| | 13,300 | | | Daiseki Co. Ltd. (Japan) | | | 250,466 | |
| | 391,500 | | | RPS Group plc (United Kingdom) | | | 1,149,588 | |
| | 44,900 | | | Tetra Tech, Inc.* | | | 941,553 | |
| | | | | | | | |
| | | | | | | 2,341,607 | |
| | | | | | | | |
| | | | Food Distributors 0.2% | | | | |
| | 7,400 | | | Shinsegae Food Co. Ltd. (Korea) | | | 541,250 | |
| | | | | | | | |
| | | | Food Retail 0.8% | | | | |
| | 1,137,600 | | | BreadTalk Group Ltd. (Singapore) | | | 497,090 | |
| | 20,200 | | | Daikokutenbussan Co. Ltd. (Japan) | | | 674,422 | |
| | 50,595 | | | QKL Stores, Inc.* (China) | | | 243,868 | |
| | 32,700 | | | Shoprite Holdings Ltd. (South Africa) | | | 463,562 | |
| | | | | | | | |
| | | | | | | 1,878,942 | |
| | | | | | | | |
| | | | Footwear 0.3% | | | | |
| | 217,000 | | | Daphne International Holdings Ltd. (China) | | | 256,452 | |
| | 700,000 | | | Peak Sport Products Co. Ltd. (China) | | | 512,418 | |
| | | | | | | | |
| | | | | | | 768,870 | |
| | | | | | | | |
| | | | General Merchandise Stores 1.7% | | | | |
| | 65,900 | | | Dollar Tree, Inc.* | | | 3,213,284 | |
| | 39,500 | | | Reject Shop Ltd. (The) (Australia) | | | 674,610 | |
| | | | | | | | |
| | | | | | | 3,887,894 | |
| | | | | | | | |
| | | | Gold 0.5% | | | | |
| | 55,000 | | | Koza Altin Isletmeleri AS (Turkey) | | | 622,842 | |
| | 31,900 | | | Petropavlovsk plc (United Kingdom) | | | 556,010 | |
| | | | | | | | |
| | | | | | | 1,178,852 | |
| | | | | | | | |
| | | | Health Care Distributors 0.2% | | | | |
| | 7,300 | | | MWI Veterinary Supply, Inc.* | | | 421,356 | |
| | | | | | | | |
| | | | Health Care Equipment 4.0% | | | | |
| | 34,800 | | | Abaxis, Inc.* | | | 803,880 | |
| | 83,000 | | | AtriCure, Inc.* | | | 659,020 | |
| | 40,250 | | | Audika S.A. (France) | | | 1,068,177 | |
| | 216,800 | | | Cardica, Inc.* | | | 470,456 | |
| | 80,000 | | | Cardica, Inc. PIPE* † | | | 173,600 | |
| | 66,100 | | | Cyberonics, Inc.* | | | 1,763,548 | |
| | 20,000 | | | DexCom, Inc.* | | | 264,400 | |
| | 28,400 | | | DiaSorin S.p.A. (Italy) | | | 1,165,752 | |
| | 900 | | | Edwards Lifesciences Corp.* | | | 60,345 | |
| | 300 | | | IDEXX Laboratories, Inc.* | | | 18,516 | |
| | 6,596,900 | | | LMA International N.V.* (Singapore) | | | 1,453,835 | |
| | 3,800 | | | NuVasive, Inc.* | | | 133,532 | |
| | 12,500 | | | St. Jude Medical, Inc.* | | | 491,750 | |
| | 14,100 | | | Stratec Biomedical Systems AG (Germany) | | | 580,116 | |
| | 23,500 | | | Synovis Life Technologies, Inc.* | | | 351,325 | |
| | | | | | | | |
| | | | | | | 9,458,252 | |
| | | | | | | | |
| | | | Health Care Facilities 1.3% | | | | |
| | 67,261 | | | AmSurg Corp.* | | | 1,175,722 | |
| | 97,000 | | | CVS Group plc* (United Kingdom) | | | 137,083 | |
| | 24,250 | | | NovaMed, Inc.* | | | 234,982 | |
| | 479,000 | | | Raffles Medical Group Ltd. (Singapore) | | | 804,461 | |
| | 16,000 | | | U.S. Physical Therapy, Inc.* | | | 267,520 | |
| | 18,000 | | | VCA Antech, Inc.* | | | 379,620 | |
| | | | | | | | |
| | | | | | | 2,999,388 | |
| | | | | | | | |
48
| | | | | | | | |
| Shares | | | | | Value | |
| | | | | | | |
| | | | Health Care Services 1.7% | | | | |
| | 22,000 | | | Bio-Reference Laboratories, Inc.* | | $ | 458,920 | |
| | 68,000 | | | Clarient, Inc.* | | | 229,840 | |
| | 18,314 | | | CorVel Corp.* | | | 777,429 | |
| | 24,500 | | | Diagnosticos da America S.A. (Brazil) | | | 295,041 | |
| | 15,000 | | | Fleury S.A. (Brazil) | | | 185,951 | |
| | 13,800 | | | Genoptix, Inc.* | | | 195,960 | |
| | 34,142 | | | Healthways, Inc.* | | | 397,413 | |
| | 27,100 | | | IPC The Hospitalist Co., Inc.* | | | 740,372 | |
| | 12,700 | | | LHC Group, Inc.* | | | 294,513 | |
| | 9,900 | | | MEDNAX, Inc.* | | | 527,670 | |
| | | | | | | | |
| | | | | | | 4,103,109 | |
| | | | | | | | |
| | | | Health Care Supplies 0.3% | | | | |
| | 12,800 | | | ICU Medical, Inc.* | | | 477,312 | |
| | 115,500 | | | Shandong Weigao Group Medical Polymer | | | | |
| | | | Co. Ltd., Class H (China) | | | 327,478 | |
| | | | | | | | |
| | | | | | | 804,790 | |
| | | | | | | | |
| | | | Health Care Technology 0.4% | | | | |
| | 27,000 | | | athenahealth, Inc.* | | | 891,540 | |
| | | | | | | | |
| | | | Home Entertainment Software 0.2% | | | | |
| | 176 | | | GameOn Co. Ltd. (Japan) | | | 125,451 | |
| | 5,500 | | | Perfect World Co. Ltd. ADR* (China) | | | 141,130 | |
| | 12,840 | | | Shanda Games Ltd. ADR* (China) | | | 68,822 | |
| | 2,800 | | | Shanda Interactive Entertainment Ltd. ADR* (China) | | | 109,620 | |
| | | | | | | | |
| | | | | | | 445,023 | |
| | | | | | | | |
| | | | Home Improvement Retail 1.0% | | | | |
| | 2,850,000 | | | Ace Hardware Indonesia (Indonesia) | | | 646,639 | |
| | 22,000 | | | Cashbuild Ltd. (South Africa) | | | 245,845 | |
| | 26,800 | | | Clas Ohlson AB (Sweden) | | | 494,135 | |
| | 19,500 | | | Lumber Liquidators Holdings, Inc.* | | | 479,115 | |
| | 73,100 | | | Swedol AB, Class B (Sweden) | | | 507,729 | |
| | | | | | | | |
| | | | | | | 2,373,463 | |
| | | | | | | | |
| | | | Homefurnishing Retail 0.3% | | | | |
| | 37,300 | | | Aaron’s, Inc. | | | 688,185 | |
| | | | | | | | |
| | | | Hotels, Resorts & Cruise Lines 0.3% | | | | |
| | 17,000 | | | City Lodge Hotels Ltd. (South Africa) | | | 192,163 | |
| | 200,000 | | | Webjet Ltd. (Australia) | | | 465,082 | |
| | | | | | | | |
| | | | | | | 657,245 | |
| | | | | | | | |
| | | | Human Resource & Employment Services 1.5% | | | | |
| | 380 | | | Benefit One, Inc. (Japan) | | | 291,800 | |
| | 8,000 | | | Brunel International N.V. (Netherlands) | | | 249,582 | |
| | 175,300 | | | Michael Page International plc (United Kingdom) | | | 1,268,421 | |
| | 35,700 | | | Robert Half International, Inc. | | | 928,200 | |
| | 173,900 | | | Sthree plc (United Kingdom) | | | 797,628 | |
| | | | | | | | |
| | | | | | | 3,535,631 | |
| | | | | | | | |
| | | | Industrial Gases 0.2% | | | | |
| | 415,000 | | | Yingde Gases Group Co.* (China) | | | 392,039 | |
| | | | | | | | |
| | | | Industrial Machinery 3.2% | | | | |
| | 108,500 | | | AIA Engineering Ltd. (India) | | | 965,840 | |
| | 4,100 | | | Burckhardt Compression Holding AG (Switzerland) | | | 909,256 | |
| | 1,021,000 | | | China Automation Group Ltd. (China) | | | 823,716 | |
| | 47,700 | | | China Valves Technology, Inc.* (China) | | | 370,152 | |
| | 10,000 | | | Danaher Corp. | | | 406,100 | |
| | 13,800 | | | Graco, Inc. | | | 437,874 | |
| | 57,500 | | | Hy-Lok Corp. (Korea) | | | 882,482 | |
| | 12,900 | | | IDEX Corp. | | | 458,079 | |
| | 7,500 | | | Konecranes Oyj (Finland) | | | 280,269 | |
| | 2,800 | | | Rational AG (Germany) | | | 592,786 | |
| | 28,400 | | | Rotork plc (United Kingdom) | | | 767,036 | |
| | 11,500 | | | Thermax Ltd. (India) | | | 204,740 | |
| | 41,100 | | | Weg S.A. (Brazil) | | | 448,849 | |
| | | | | | | | |
| | | | | | | 7,547,179 | |
| | | | | | | | |
| | | | | | | | |
| Shares | | | | | Value | |
| | | | | | | |
| | | | Insurance Brokers 0.5% | | | | |
| | 29,900 | | | Brown & Brown, Inc. | | $ | 603,681 | |
| | 38,700 | | | eHealth, Inc.* | | | 500,004 | |
| | | | | | | | |
| | | | | | | 1,103,685 | |
| | | | | | | | |
| | | | Internet Retail 1.6% | | | | |
| | 92,550 | | | ASOS plc* (United Kingdom) | | | 1,649,458 | |
| | 430 | | | Start Today Co. Ltd. (Japan) | | | 1,199,724 | |
| | 105,000 | | | Wotif.com Holdings Ltd. (Australia) | | | 494,415 | |
| | 40,000 | | | Yoox S.p.A.* (Italy) | | | 408,160 | |
| | | | | | | | |
| | | | | | | 3,751,757 | |
| | | | | | | | |
| | | | Internet Software & Services 1.8% | | | | |
| | 15,000 | | | Akamai Technologies, Inc.* | | | 752,700 | |
| | 17,100 | | | Daum Communications Corp.* (Korea) | | | 1,181,741 | |
| | 135 | | | Macromill, Inc. (Japan) | | | 216,711 | |
| | 4,800 | | | NetEase.com, Inc. ADR* (China) | | | 189,312 | |
| | 33,600 | | | Neurones (France) | | | 320,425 | |
| | 60,317 | | | SPS Commerce, Inc.* | | | 773,264 | |
| | 20,415 | | | VistaPrint N.V.* | | | 789,040 | |
| | | | | | | | |
| | | | | | | 4,223,193 | |
| | | | | | | | |
| | | | Investment Banking & Brokerage 0.3% | | | | |
| | 18,500 | | | Charles Schwab Corp. (The) | | | 257,150 | |
| | 180 | | | GCA Savvian Group Corp.* (Japan) | | | 172,291 | |
| | 20,400 | | | optionsXpress Holdings, Inc.* | | | 313,344 | |
| | | | | | | | |
| | | | | | | 742,785 | |
| | | | | | | | |
| | | | IT Consulting & Other Services 3.1% | | | | |
| | 44,375 | | | Alten Ltd. (France) | | | 1,437,300 | |
| | 9,600 | | | Cognizant Technology Solutions Corp., | | | | |
| | | | Class A* | | | 618,912 | |
| | 24,200 | | | Connecta AB (Sweden) | | | 268,793 | |
| | 960,000 | | | CSE Global Ltd. (Singapore) | | | 780,607 | |
| | 1,115,573 | | | CSG Ltd. (Australia) | | | 1,932,167 | |
| | 320 | | | Future Architect, Inc. (Japan) | | | 113,126 | |
| | 103,200 | | | HiQ International AB* (Sweden) | | | 521,166 | |
| | 7,200 | | | Infosys Technologies Ltd. ADR (India) | | | 484,632 | |
| | 5,100 | | | International Business Machines Corp. | | | 684,114 | |
| | 76,500 | | | SMS Management & Technology Ltd. (Australia) | | | 489,392 | |
| | | | | | | | |
| | | | | | | 7,330,209 | |
| | | | | | | | |
| | | | Leisure Products 0.1% | | | | |
| | 11,700 | | | Pool Corp. | | | 234,819 | |
| | | | | | | | |
| | | | Life Sciences Tools & Services 3.8% | | | | |
| | 2,770 | | | CMIC Co. Ltd. (Japan) | | | 873,060 | |
| | 27,000 | | | Covance, Inc.* | | | 1,263,330 | |
| | 1,070 | | | EPS Co. Ltd. (Japan) | | | 2,730,279 | |
| | 92,100 | | | ICON plc ADR* (Ireland) | | | 1,991,202 | |
| | 60,200 | | | LINICAL Co. Ltd. (Japan) | | | 216,352 | |
| | 34,200 | | | Pharmaceutical Product Development, Inc. | | | 847,818 | |
| | 4,200 | | | Techne Corp. | | | 259,266 | |
| | 11,000 | | | Waters Corp.* | | | 778,580 | |
| | | | | | | | |
| | | | | | | 8,959,887 | |
| | | | | | | | |
| | | | Managed Health Care 0.3% | | | | |
| | 3,600 | | | AMERIGROUP Corp.* | | | 152,892 | |
| | 53,200 | | | OdontoPrev S.A. (Brazil) | | | 624,645 | |
| | | | | | | | |
| | | | | | | 777,537 | |
| | | | | | | | |
| | | | Mortgage REITs 0.5% | | | | |
| | 9,500 | | | Annaly Capital Management, Inc. | | | 167,200 | |
| | 20,000 | | | Anworth Mortgage Asset Corp. | | | 142,600 | |
| | 32,600 | | | Capstead Mortgage Corp. | | | 354,362 | |
| | 28,800 | | | MFA Financial, Inc. | | | 219,744 | |
| | 13,200 | | | Redwood Trust, Inc. | | | 190,872 | |
| | | | | | | | |
| | | | | | | 1,074,778 | |
| | | | | | | | |
49
| | |
| WASATCH GLOBAL OPPORTUNITIES FUND (WAGOX) — Schedule of Investments (continued) | | |
|
| |
| |
| | | | | | | | |
| Shares | | | | | Value | |
| | | | | | | |
| | | | Multi-Line Insurance 0.3% | | | | |
| | 23,600 | | | HCC Insurance Holdings, Inc. | | $ | 615,724 | |
| | | | | | | | |
| | | | Oil & Gas Drilling 0.2% | | | | |
| | 18,000 | | | Ensign Energy Services, Inc. (Canada) | | | 220,643 | |
| | 36,900 | | | Phoenix Technology Income Fund** (Canada) | | | 355,982 | |
| | | | | | | | |
| | | | | | | 576,625 | |
| | | | | | | | |
| | | | Oil & Gas Equipment & Services 1.4% | | | | |
| | 951,000 | | | Anhui Tianda Oil Pipe Co. Ltd., Class H (China) | | | 443,677 | |
| | 2,400 | | | Core Laboratories N.V. | | | 211,296 | |
| | 37,800 | | | Gulf Island Fabrication, Inc. | | | 687,960 | |
| | 47,800 | | | Lamprell plc (United Arab Emirates) | | | 267,507 | |
| | 26,900 | | | Pason Systems, Inc. (Canada) | | | 319,296 | |
| | 25,300 | | | Petrofac Ltd. (United Kingdom) | | | 545,456 | |
| | 6,100 | | | Schoeller-Bleckmann Oilfield Equipment AG (Austria) | | | 398,189 | |
| | 33,100 | | | TGS-NOPEC Geophysical Co. ASA (Norway) | | | 475,634 | |
| | | | | | | | |
| | | | | | | 3,349,015 | |
| | | | | | | | |
| | | | Oil & Gas Exploration & Production 1.5% | | | | |
| | 471,000 | | | Afren plc* (United Kingdom) | | | 817,985 | |
| | 54,000 | | | Dragon Oil plc* (Ireland) | | | 373,304 | |
| | 41,600 | | | Gran Tierra Energy, Inc.* (Canada) | | | 321,152 | |
| | 105,000 | | | Pan Orient Energy Corp.* (Canada) | | | 761,246 | |
| | 436,000 | | | Petroneft Resources plc* (United Kingdom) | | | 311,506 | |
| | 24,175 | | | Premier Oil plc* (United Kingdom) | | | 627,872 | |
| | 52,000 | | | Selan Exploration Technology Ltd. (India) | | | 387,555 | |
| | | | | | | | |
| | | | | | | 3,600,620 | |
| | | | | | | | |
| | | | Other Diversified Financial Services 0.1% | | | | |
| | 104,000 | | | Count Financial Ltd. (Australia) | | | 121,423 | |
| | | | | | | | |
| | | | Packaged Foods & Meats 0.5% | | | | |
| | 5,500 | | | Glaxo SmithKline Consumer Healthcare Ltd. (India) | | | 247,981 | |
| | 268,291 | | | Hsu Fu Chi International Ltd. (China) | | | 672,817 | |
| | 18,500 | | | Zhongpin, Inc.* | | | 301,365 | |
| | | | | | | | |
| | | | | | | 1,222,163 | |
| | | | | | | | |
| | | | Personal Products 0.4% | | | | |
| | 21,000 | | | Atrium Innovations, Inc.* (Canada) | | | 300,218 | |
| | 11,105 | | | Natura Cosmeticos S.A. (Brazil) | | | 298,275 | |
| | 5,000 | | | Procter & Gamble Hygiene and Healthcare Ltd. (India) | | | 247,191 | |
| | | | | | | | |
| | | | | | | 845,684 | |
| | | | | | | | |
| | | | Pharmaceuticals 1.8% | | | | |
| | 143,000 | | | China Shineway Pharmaceutical Group Ltd. (China) | | | 504,968 | |
| | 31,297 | | | Daewoong Pharmaceutical Co. Ltd. (Korea) | | | 1,343,555 | |
| | 80,400 | | | Dechra Pharmaceuticals plc (United Kingdom) | | | 593,366 | |
| | 60,100 | | | Egyptian International Pharmaceutical Industries Co. (Egypt) | | | 379,940 | |
| | 45,200 | | | Medy-Tox, Inc.* (Korea) | | | 1,197,141 | |
| | 52,200 | | | Whanin Pharmaceutical Co. Ltd. (Korea) | | | 314,505 | |
| | | | | | | | |
| | | | | | | 4,333,475 | |
| | | | | | | | |
| | | | Property & Casualty Insurance 0.2% | | | | |
| | 252,725 | | | Beazley plc (United Kingdom) | | | 458,749 | |
| | | | | | | | |
| | | | | | | | |
| Shares | | | | | Value | |
| | | | | | | |
| | | | Regional Banks 0.8% | | | | |
| | 31,800 | | | Boston Private Financial Holdings, Inc. | | $ | 207,972 | |
| | 8,500 | | | Canadian Western Bank (Canada) | | | 204,921 | |
| | 6,000 | | | City National Corp. | | | 318,420 | |
| | 29,600 | | | First of Long Island Corp. (The) | | | 739,408 | |
| | 180 | | | Seven Bank Ltd. (Japan) | | | 322,372 | |
| | | | | | | | |
| | | | | | | 1,793,093 | |
| | | | | | | | |
| | | | Research & Consulting Services 3.9% | | | | |
| | 14,375 | | | Bureau Veritas S.A. (France) | | | 1,003,081 | |
| | 5,427 | | | Campbell Brothers Ltd. (Australia) | | | 173,171 | |
| | 68,100 | | | CRA International, Inc.* | | | 1,229,205 | |
| | 8,000 | | | Exponent, Inc.* | | | 268,720 | |
| | 56,600 | | | Huron Consulting Group, Inc.* | | | 1,244,634 | |
| | 17,000 | | | Intertek Group plc (United Kingdom) | | | 488,505 | |
| | 150 | | | Nihon M&A Center, Inc. (Japan) | | | 504,223 | |
| | 183,035 | | | Resources Connection, Inc. | | | 2,518,562 | |
| | 130 | | | SGS S.A. (Switzerland) | | | 210,203 | |
| | 32,000 | | | Stantec, Inc.* (Canada) | | | 846,935 | |
| | 20,030 | | | Verisk Analytics, Inc., Class A* | | | 561,040 | |
| | | | | | | | |
| | | | | | | 9,048,279 | |
| | | | | | | | |
| | | | Restaurants 1.0% | | | | |
| | 152,000 | | | Ajisen China Holdings Ltd. (China) | | | 237,815 | |
| | 740,000 | | | KFC Holdings Malaysia Berhad (Malaysia) | | | 747,911 | |
| | 29,800 | | | Tim Hortons, Inc. (Canada) | | | 1,085,018 | |
| | 185 | | | Toridoll.corporation (Japan) | | | 323,570 | |
| | | | | | | | |
| | | | | | | 2,394,314 | |
| | | | | | | | |
| | | | Semiconductor Equipment 1.0% | | | | |
| | 21,600 | | | Cabot Microelectronics Corp.* | | | 695,088 | |
| | 8,100 | | | Disco Corp. (Japan) | | | 465,768 | |
| | 24,000 | | | Eugene Technology Co. Ltd. (Korea) | | | 282,044 | |
| | 67,000 | | | Hanmi Semiconductor Co. Ltd. (Korea) | | | 463,021 | |
| | 39,600 | | | Koh Young Technology, Inc.* (Korea) | | | 553,931 | |
| | | | | | | | |
| | | | | | | 2,459,852 | |
| | | | | | | | |
| | | | Semiconductors 8.5% | | | | |
| | 44,300 | | | Advanced Analogic Technologies, Inc.* | | | 155,493 | |
| | 23,000 | | | Altera Corp. | | | 693,680 | |
| | 52,000 | | | CSR plc* (United Kingdom) | | | 293,134 | |
| | 16,269 | | | ELMOS Semiconductor AG* (Germany) | | | 175,096 | |
| | 24,750 | | | Hittite Microwave Corp.* | | | 1,179,338 | |
| | 24,400 | | | Linear Technology Corp. | | | 749,812 | |
| | 18,800 | | | Maxim Integrated Products, Inc. | | | 347,988 | |
| | 297,600 | | | Melexis N.V.* (Belgium) | | | 4,508,440 | |
| | 182,000 | | | Micrel, Inc. | | | 1,794,520 | |
| | 38,500 | | | Microchip Technology, Inc. | | | 1,210,825 | |
| | 379,599 | | | O2Micro International Ltd. ADR* (China) | | | 2,319,350 | |
| | 131,100 | | | PLX Technology, Inc.* | | | 474,582 | |
| | 80,100 | | | Power Integrations, Inc. | | | 2,546,379 | |
| | 31,525 | | | RichTek Technology Corp. (Taiwan) | | | 234,105 | |
| | 15,800 | | | Silicon Laboratories, Inc.* | | | 579,070 | |
| | 403,960 | | | Sporton International, Inc. (Taiwan) | | | 824,949 | |
| | 13,200 | | | Standard Microsystems Corp.* | | | 301,092 | |
| | 35,900 | | | Supertex, Inc.* | | | 794,108 | |
| | 52,500 | | | Taiwan Semiconductor Manufacturing Co. Ltd. ADR (Taiwan) | | | 532,350 | |
| | 14,400 | | | Volterra Semiconductor Corp.* | | | 309,888 | |
| | | | | | | | |
| | | | | | | 20,024,199 | |
| | | | | | | | |
| | | | Specialized Consumer Services 0.1% | | | | |
| | 165 | | | Best Bridal, Inc. (Japan) | | | 161,096 | |
| | 230 | | | NOVARESE, Inc. (Japan) | | | 120,683 | |
| | | | | | | | |
| | | | | | | 281,779 | |
| | | | | | | | |
50
| | | | | | | | |
| Shares | | | | | Value | |
| | | | | | | |
| | | | Specialized Finance 1.8% | | | | |
| | 142,000 | | | Bolsa Mexicana de Valores S.A.B. de C.V. (Mexico) | | $ | 236,625 | |
| | 3,025 | | | CBOE Holdings, Inc. | | | 60,621 | |
| | 1,800 | | | Crisil Ltd. (India) | | | 240,828 | |
| | 9,600 | | | IMAREX ASA* (Norway) | | | 73,420 | |
| | 1,600 | | | IntercontinentalExchange, Inc.* | | | 167,552 | |
| | 50,000 | | | JSE Ltd. (South Africa) | | | 526,862 | |
| | 28,400 | | | MSCI, Inc., Class A* | | | 943,164 | |
| | 16,500 | | | NASDAQ OMX Group, Inc. (The)* | | | 320,595 | |
| | 5,400 | | | NYSE Euronext | | | 154,278 | |
| | 45 | | | Osaka Securities Exchange Co. Ltd. (Japan) | | | 220,755 | |
| | 23,043 | | | Oslo Bors VPS Holding ASA (Norway) | | | 254,556 | |
| | 10,800 | | | Portfolio Recovery Associates, Inc.* | | | 698,220 | |
| | 9,300 | | | TMX Group, Inc. (Canada) | | | 285,494 | |
| | | | | | | | |
| | | | | | | 4,182,970 | |
| | | | | | | | |
| | | | Specialty Chemicals 0.9% | | | | |
| | 21,870 | | | C. Uyemura & Co. Ltd. (Japan) | | | 804,323 | |
| | 1,299,000 | | | EcoGreen Fine Chemical Group | | | | |
| | | | Ltd. (Hong Kong) | | | 426,901 | |
| | 80 | | | Japan Pure Chemical Co. Ltd. (Japan) | | | 233,843 | |
| | 42,600 | | | MEC Co. Ltd. (Japan) | | | 210,767 | |
| | 15,700 | | | TechnoSemiChem Co. Ltd. (Korea) | | | 362,122 | |
| | | | | | | | |
| | | | | | | 2,037,956 | |
| | | | | | | | |
| | | | Specialty Stores 1.3% | | | | |
| | 102,800 | | | Big 5 Sporting Goods Corp. | | | 1,379,576 | |
| | 75,188 | | | easyhome Ltd. (Canada) | | | 853,787 | |
| | 34,618 | | | Hibbett Sports, Inc.* | | | 863,719 | |
| | | | | | | | |
| | | | | | | 3,097,082 | |
| | | | | | | | |
| | | | Steel 0.2% | | | | |
| | 116,500 | | | Ferrexpo plc (United Kingdom) | | | 563,986 | |
| | | | | | | | |
| | | | Systems Software 1.4% | | | | |
| | 84,700 | | | OPNET Technologies, Inc. | | | 1,537,305 | |
| | 3,010 | | | Simplex Technology, Inc. (Japan) | | | 1,824,570 | |
| | | | | | | | |
| | | | | | | 3,361,875 | |
| | | | | | | | |
| | | | Textiles 0.2% | | | | |
| | 295,000 | | | S. Kumars Nationwide Ltd.* (India) | | | 507,477 | |
| | | | | | | | |
| | | | Thrifts & Mortgage Finance 1.2% | | | | |
| | 18,475 | | | Home Capital Group, Inc. (Canada) | | | 797,741 | |
| | 23,000 | | | Housing Development Finance Corp. | | | | |
| | | | Ltd. (India) | | | 373,293 | |
| | 39,900 | | | LIC Housing Finance Ltd. (India) | | | 1,277,759 | |
| | 22,100 | | | Washington Federal, Inc. | | | 337,246 | |
| | | | | | | | |
| | | | | | | 2,786,039 | |
| | | | | | | | |
| | | | Trading Companies & Distributors 4.0% | | | | |
| | 7,100 | | | Fastenal Co. | | | 377,649 | |
| | 30,380 | | | Houston Wire & Cable Co. | | | 304,711 | |
| | 74,979 | | | Indutrade AB (Sweden) | | | 2,070,906 | |
| | 23,500 | | | MISUMI Group, Inc. (Japan) | | | 492,663 | |
| | 32,500 | | | MSC Industrial Direct Co., Inc., Class A | | | 1,756,300 | |
| | 88,905 | | | Richelieu Hardware Ltd. (Canada) | | | 2,416,014 | |
| | 15,097 | | | Rush Enterprises, Inc., Class B* | | | 207,584 | |
| | 8,480 | | | Thermador Groupe (France) | | | 1,224,473 | |
| | 3,700 | | | W.W. Grainger, Inc. | | | 440,707 | |
| | | | | | | | |
| | | | | | | 9,291,007 | |
| | | | | | | | |
| | | | Trucking 0.5% | | | | |
| | 36,500 | | | Knight Transportation, Inc. | | | 705,545 | |
| | 10,800 | | | Old Dominion Freight Line, Inc.* | | | 274,536 | |
| | 14,600 | | | Universal Truckload Services, Inc.* | | | 228,636 | |
| | | | | | | | |
| | | | | | | 1,208,717 | |
| | | | | | | | |
| | | | | | | | |
| Shares | | | | | Value | |
| | | | | | | |
| | | | Wireless Telecommunication Services 0.1% | | | | |
| | 4,300 | | | NII Holdings, Inc.* | | $ | 176,730 | |
| | | | | | | | |
| | |
| | | | Total Common Stocks (cost $172,018,490) | | | 223,271,530 | |
| | | | | | | | |
| | |
| | | | PREFERRED STOCKS 0.4% | | | | |
| | |
| | | | Regional Banks 0.4% | | | | |
| | 127,000 | | | Banco Daycoval S.A. Pfd. (Brazil) | | | 835,171 | |
| | | | | | | | |
| | |
| | | | Total Preferred Stocks (cost $437,228) | | | 835,171 | |
| | | | | | | | |
| | |
| | | | LIMITED PARTNERSHIP INTEREST 0.2% | | | | |
| | |
| | | | Oil & Gas Exploration & Production 0.2% | | | | |
| | 45,000 | | | Zhaikmunai L.P. GDR* (Kazakhstan) | | | 360,000 | |
| | | | | | | | |
| | |
| | | | Total Limited Partnership Interest (cost $257,715) | | | 360,000 | |
| | | | | | | | |
| | |
| | | | WARRANTS 0.0% | | | | |
| | |
| | | | Health Care Equipment 0.0% | | | | |
| | 40,000 | | | Cardica, Inc., expiring 9/29/14* *** † | | | 28,800 | |
| | | | | | | | |
| | | | Restaurants 0.0% | | | | |
| | 29,600 | | | KFC Holdings Malaysia Berhad, expiring 9/14/15* (Malaysia) | | | 11,794 | |
| | | | | | | | |
| | |
| | | | Total Warrants
(cost $5,000) | | | 40,594 | |
| | | | | | | | |
| | |
Principal
Amount | | | | | Value | |
| | | | | | | |
| | | | SHORT-TERM INVESTMENTS 4.5% | | | | |
| | |
| | | | Repurchase Agreement 4.5% | | | | |
| | $10,658,000 | | | Repurchase Agreement dated 9/30/10, 0.01% due 10/1/10 with State Street Bank and Trust Co. collateralized by $10,090,000 of United States Treasury Notes 3.125% due 5/15/19; value: $10,871,975; repurchase proceeds: $10,658,003 (cost $10,658,000) | | $ | 10,658,000 | |
| | | | | | | | |
| | |
| | | | Total Short-Term Investments
(cost $10,658,000) | | | 10,658,000 | |
| | | | | | | | |
| | |
| | | | Total Investments
(cost $183,376,433) 100.1% | | | 235,165,295 | |
| | |
| | | | Liabilities less Other Assets (0.1)% | | | (261,488 | ) |
| | | | | | | | |
| | |
| | | | NET ASSETS 100.0% | | $ | 234,903,807 | |
| | | | | | | | |
| |
| | | | *Non-income producing. **Common units. ***Security was fair valued under procedures adopted by the Board of Trustees (see Note 15). †Security purchased in a private placement transaction or under Rule 144A of the Securities Act of 1933 (see Note 11). ADR American Depositary Receipt. GDR Global Depositary Receipt. PIPE Private Investment in a Public Equity. REIT Real Estate Investment Trust. See Notes to Financial Statements. | |
51
| | |
| WASATCH GLOBAL OPPORTUNITIES FUND (WAGOX) — Schedule of Investments (continued) | | SEPTEMBER 30, 2010 |
|
| |
| |
At September 30, 2010, Wasatch Global Opportunities Fund’s investments, excluding short-term investments, were in the following countries:
| | | | |
| Country | | % | |
Australia | | | 3.2 | |
Austria | | | 0.2 | |
Belgium | | | 2.0 | |
Brazil | | | 2.0 | |
Canada | | | 5.2 | |
China | | | 6.9 | |
Denmark | | | 0.3 | |
Egypt | | | 0.2 | |
Finland | | | 0.2 | |
France | | | 2.6 | |
Germany | | | 3.6 | |
Hong Kong | | | 0.2 | |
India | | | 3.8 | |
Indonesia | | | 0.6 | |
Ireland | | | 1.1 | |
Italy | | | 0.7 | |
Japan | | | 6.8 | |
Kazakhstan | | | 0.2 | |
Korea | | | 3.7 | |
Malaysia | | | 0.3 | |
Mexico | | | 0.4 | |
Netherlands | | | 0.1 | |
Norway | | | 0.4 | |
Singapore | | | 2.6 | |
South Africa | | | 0.7 | |
Sweden | | | 2.2 | |
Switzerland | | | 0.5 | |
Taiwan | | | 1.3 | |
Turkey | | | 0.3 | |
United Arab Emirates | | | 1.0 | |
United Kingdom | | | 7.5 | |
United States | | | 39.2 | |
| | | | |
TOTAL | | | 100.0 | % |
| | | | |
52
| | |
| WASATCH GLOBAL SCIENCE & TECHNOLOGY FUND (WAGTX) — Schedule of Investments | | SEPTEMBER 30, 2010 |
|
| |
| |
| | | | | | | | |
| Shares | | | | | Value | |
| | | | | | | |
| | | | COMMON STOCKS 96.2% | | | | |
| | |
| | | | Advertising 2.1% | | | | |
| | 28,640 | | | 1000mercis* (France) | | $ | 1,349,622 | |
| | | | | | | | |
| | | | Application Software 4.4% | | | | |
| | 8,795 | | | FactSet Research Systems, Inc. | | | 713,538 | |
| | 44,800 | | | Pegasystems, Inc. | | | 1,391,040 | |
| | 5,140 | | | SimCorp A/S (Denmark) | | | 818,401 | |
| | | | | | | | |
| | | | | | | 2,922,979 | |
| | | | | | | | |
| | | | Asset Management & Custody Banks 1.1% | | | | |
| | 74,787 | | | CETIP S.A. (Brazil) | | | 736,833 | |
| | | | | | | | |
| | | | Biotechnology 3.1% | | | | |
| | 44,620 | | | Abcam plc (United Kingdom) | | | 1,210,015 | |
| | 50,700 | | | Myriad Genetics, Inc.* | | | 831,987 | |
| | | | | | | | |
| | | | | | | 2,042,002 | |
| | | | | | | | |
| | | | Communications Equipment 2.3% | | | | |
| | 41,205 | | | Cisco Systems, Inc.* | | | 902,389 | |
| | 51,025 | | | Infinera Corp.* | | | 595,462 | |
| | | | | | | | |
| | | | | | | 1,497,851 | |
| | | | | | | | |
| | | | Computer Hardware 2.1% | | | | |
| | 4,800 | | | Apple, Inc.* | | | 1,362,000 | |
| | | | | | | | |
| | | | Computer Storage & Peripherals 1.0% | | | | |
| | 550 | | | Wacom Co. Ltd. (Japan) | | | 681,941 | |
| | | | | | | | |
| | | | Data Processing & Outsourced Services 8.7% | | | | |
| | 21,670 | | | Alliance Data Systems Corp.* | | | 1,414,184 | |
| | 63,600 | | | Cielo S.A. (Brazil) | | | 553,027 | |
| | 38,200 | | | Redecard S.A. (Brazil) | | | 591,942 | |
| | 231,900 | | | Wirecard AG (Germany) | | | 3,156,130 | |
| | | | | | | | |
| | | | | | | 5,715,283 | |
| | | | | | | | |
| | | | Diversified Support Services 1.0% | | | | |
| | 19,385 | | | Copart, Inc.* | | | 639,123 | |
| | | | | | | | |
| | | | Drug Retail 2.1% | | | | |
| | 63,035 | | | Create SD Holdings Co. Ltd. (Japan) | | | 1,375,103 | |
| | | | | | | | |
| | | | Education Services 1.5% | | | | |
| | 19,500 | | | Apollo Group, Inc., Class A* | | | 1,001,325 | |
| | | | | | | | |
| | | | Health Care Distributors 0.9% | | | | |
| | 26,300 | | | PSS World Medical, Inc.* | | | 562,294 | |
| | | | | | | | |
| | | | Health Care Equipment 9.3% | | | | |
| | 130,414 | | | Cardica, Inc.* | | | 282,998 | |
| | 48,200 | | | Cardica, Inc. PIPE* † | | | 104,594 | |
| | 47,200 | | | Cyberonics, Inc.* | | | 1,259,296 | |
| | 52,015 | | | DiaSorin S.p.A. (Italy) | | | 2,135,091 | |
| | 3,835,440 | | | LMA International N.V.* (Singapore) | | | 845,260 | |
| | 28,500 | | | Mindray Medical International Ltd. ADR (China) | | | 842,745 | |
| | 18,800 | | | NuVasive, Inc.* | | | 660,632 | |
| | | | | | | | |
| | | | | | | 6,130,616 | |
| | | | | | | | |
| | | | Health Care Facilities 5.2% | | | | |
| | 1,234,300 | | | CVS Group plc* (United Kingdom) | | | 1,744,344 | |
| | 401,500 | | | Raffles Medical Group Ltd. (Singapore) | | | 674,303 | |
| | 48,600 | | | VCA Antech, Inc.* | | | 1,024,974 | |
| | | | | | | | |
| | | | | | | 3,443,621 | |
| | | | | | | | |
| | | | Health Care Services 4.8% | | | | |
| | 29,450 | | | Bio-Reference Laboratories, Inc.* | | | 614,327 | |
| | 15,487 | | | CorVel Corp.* | | | 657,423 | |
| | 106,500 | | | Diagnosticos da America S.A. (Brazil) | | | 1,282,527 | |
| | 12,600 | | | Express Scripts, Inc.* | | | 613,620 | |
| | | | | | | | |
| | | | | | | 3,167,897 | |
| | | | | | | | |
| | | | Health Care Technology 1.1% | | | | |
| | 119,350 | | | RaySearch Laboratories AB (Sweden) | | | 738,823 | |
| | | | | | | | |
| | | | | | | | |
| Shares | | | | | Value | |
| | | | | | | |
| | | | Home Entertainment Software 2.5% | | | | |
| | 87,265 | | | Activision Blizzard, Inc. | | $ | 944,208 | |
| | 62,700 | | | UbiSoft Entertainment S.A.* (France) | | | 697,534 | |
| | | | | | | | |
| | | | | | | 1,641,742 | |
| | | | | | | | |
| | | | Home Improvement Retail 1.2% | | | | |
| | 96,100 | | | Byggmax Group AB* (Sweden) | | | 818,339 | |
| | | | | | | | |
| | | | Industrial Machinery 1.9% | | | | |
| | 23,700 | | | Rotork plc (United Kingdom) | | | 640,097 | |
| | 57,500 | | | Weg S.A. (Brazil) | | | 627,952 | |
| | | | | | | | |
| | | | | | | 1,268,049 | |
| | | | | | | | |
| | | | Internet Retail 1.1% | | | | |
| | 250 | | | Start Today Co. Ltd. (Japan) | | | 697,514 | |
| | | | | | | | |
| | | | Internet Software & Services 6.9% | | | | |
| | 12,300 | | | Akamai Technologies, Inc.* | | | 617,214 | |
| | 15,545 | | | Daum Communications Corp.* (Korea) | | | 1,074,278 | |
| | 3,530 | | | Google, Inc., Class A* | | | 1,856,039 | |
| | 9,300 | | | VistaPrint N.V.* | | | 359,445 | |
| | 6,528 | | | Xtera Communications, Inc.* *** † | | | 65 | |
| | 45,400 | | | Yahoo, Inc.* | | | 643,318 | |
| | | | | | | | |
| | | | | | | 4,550,359 | |
| | | | | | | | |
| | | | IT Consulting & Other Services 3.9% | | | | |
| | 15,300 | | | Cognizant Technology Solutions Corp., Class A* | | | 986,391 | |
| | 11,545 | | | International Business Machines Corp. | | | 1,548,646 | |
| | | | | | | | |
| | | | | | | 2,535,037 | |
| | | | | | | | |
| | | | Life Sciences Tools & Services 3.8% | | | | |
| | 14,890 | | | Covance, Inc.* | | | 696,703 | |
| | 247 | | | EPS Co. Ltd. (Japan) | | | 630,261 | |
| | 13,000 | | | Eurofins Scientific (France) | | | 667,510 | |
| | 23,330 | | | ICON plc ADR* (Ireland) | | | 504,395 | |
| | | | | | | | |
| | | | | | | 2,498,869 | |
| | | | | | | | |
| | | | Managed Health Care 1.5% | | | | |
| | 81,980 | | | OdontoPrev S.A. (Brazil) | | | 962,563 | |
| | | | | | | | |
| | | | Pharmaceuticals 2.0% | | | | |
| | 25,400 | | | Teva Pharmaceutical Industries Ltd. ADR (Israel) | | | 1,339,850 | |
| | | | | | | | |
| | | | Semiconductor Equipment 0.9% | | | | |
| | 32,203 | | | Tessera Technologies, Inc.* | | | 595,756 | |
| | | | | | | | |
| | | | Semiconductors 16.0% | | | | |
| | 54,500 | | | Altera Corp. | | | 1,643,720 | |
| | 13,880 | | | Hittite Microwave Corp.* | | | 661,382 | |
| | 67,000 | | | Intel Corp. | | | 1,288,410 | |
| | 18,140 | | | Linear Technology Corp. | | | 557,442 | |
| | 74,934 | | | Melexis N.V.* (Belgium) | | | 1,135,200 | |
| | 22,525 | | | Microchip Technology, Inc. | | | 708,411 | |
| | 98,129 | | | O2Micro International Ltd. ADR* (China) | | | 599,568 | |
| | 26,793 | | | Power Integrations, Inc. | | | 851,750 | |
| | 133,420 | | | Taiwan Semiconductor Manufacturing Co. Ltd. ADR (Taiwan) | | | 1,352,879 | |
| | 64,000 | | | Xilinx, Inc. | | | 1,703,040 | |
| | | | | | | | |
| | | | | | | 10,501,802 | |
| | | | | | | | |
| | | | Specialized Finance 0.6% | | | | |
| | 15,000 | | | ICRA Ltd. (India) | | | 413,230 | |
| | | | | | | | |
| | | | Systems Software 3.2% | | | | |
| | 349,000 | | | GuestLogix, Inc.* (Canada) | | | 399,689 | |
| | 31,835 | | | OPNET Technologies, Inc. | | | 577,805 | |
| | 19,675 | | | Oracle Corp. | | | 528,274 | |
| | 970 | | | Simplex Technology, Inc. (Japan) | | | 587,985 | |
| | | | | | | | |
| | | | | | | 2,093,753 | |
| | | | | | | | |
| | |
| | | | Total Common Stocks
(cost $53,920,804) | | | 63,284,176 | |
| | | | | | | | |
53
| | |
| WASATCH GLOBAL SCIENCE & TECHNOLOGY FUND (WAGTX) — Schedule of Investments (continued) | | |
|
| |
| |
| | | | | | | | |
| Shares | | | | | Value | |
| | | | | | | |
| | | | PREFERRED STOCKS 1.2% | | | | |
| | |
| | | | Computer Storage & Peripherals 1.2% | | | | |
| | 39,251 | | | BlueArc Corp., Series DD Pfd.* *** † | | $ | 120,108 | |
| | 39,251 | | | BlueArc Corp., Series DD-1 Pfd.* *** † | | | 126,781 | |
| | 69,363 | | | BlueArc Corp., Series FF Pfd.* *** † | | | 230,285 | |
| | 69,362 | | | BlueArc Corp., Series FF-1 Pfd.* *** † | | | 233,750 | |
| | 23,737 | | | BlueArc Corp., Series GG Pfd.* *** † | | | 60,028 | |
| | | | | | | | |
| | | | | | | 770,952 | |
| | | | | | | | |
| | |
| | | | Total Preferred Stocks (cost $1,013,092) | | | 770,952 | |
| | | | | | | | |
| |
| | | | LIMITED PARTNERSHIP INTEREST 0.6% | |
| | |
| | | | Other 0.6% | | | | |
| | | | Greenspring Global Partners II-B, L.P.*** † | | | 421,896 | |
| | | | | | | | |
| | |
| | | | Total Limited Partnership Interest
(cost $434,387) | | | 421,896 | |
| | | | | | | | |
| | |
| | | | WARRANTS 0.1% | | | | |
| | |
| | | | Computer Storage & Peripherals 0.0% | | | | |
| | 310 | | | BlueArc Corp., Series FF expiring 4/2/18* *** † | | | — | |
| | 309 | | | BlueArc Corp., Series FF-1 expiring 4/2/18* *** † | | | — | |
| | 3,240 | | | BlueArc Corp., Series GG expiring 7/14/15* *** † | | | 8 | |
| | | | | | | | |
| | | | | | | 8 | |
| | | | | | | | |
| | | | Health Care Equipment 0.1% | | | | |
| | 71,500 | | | Cardica, Inc., expiring 9/29/14* *** † | | | 51,480 | |
| | | | | | | | |
| | |
| | | | Total Warrants
(cost $8,946) | | | 51,488 | |
| | | | | | | | |
| | |
Principal
Amount | | | | | Value | |
| | | | | | | |
| | | | SHORT-TERM INVESTMENTS 1.8% | | | | |
| | |
| | | | Repurchase Agreement 1.8% | | | | |
| | $1,179,000 | | | Repurchase Agreement dated 9/30/10, 0.01% due 10/1/10 with State Street Bank and Trust Co. collateralized by $1,120,000 of United States Treasury Notes 3.125% due 5/15/19; value: $1,206,800; repurchase proceeds: $1,179,000†† (cost $1,179,000) | | $ | 1,179,000 | |
| | | | | | | | |
| | |
| | | | Total Short-Term Investments (cost $1,179,000) | | | 1,179,000 | |
| | | | | | | | |
| | |
| | | | Total Investments
(cost $56,556,229) 99.9% | | | 65,707,512 | |
| | |
| | | | Other Assets less Liabilities 0.1% | | | 59,424 | |
| | | | | | | | |
| | |
| | | | NET ASSETS 100.0% | | $ | 65,766,936 | |
| | | | | | | | |
| |
| | | | *Non-income producing. ***Security was fair valued under procedures adopted by the Board of Trustees (see Note 15). †Security purchased in a private placement transaction or under Rule 144A of the Securities Act of 1933 (see Note 11). ††All or a portion of this security has been designated as collateral for purchase commitments (see Note 12). ADR American Depositary Receipt. PIPE Private Investment in a Public Equity. See Notes to Financial Statements. | |
At September 30, 2010, Wasatch Global Science & Technology Fund’s investments, excluding short-term investments, were in the following countries:
| | | | |
| Country | | % | |
Belgium | | | 1.8 | |
Brazil | | | 7.4 | |
Canada | | | 0.6 | |
China | | | 2.2 | |
Denmark | | | 1.3 | |
France | | | 4.2 | |
Germany | | | 4.9 | |
India | | | 0.6 | |
Ireland | | | 0.8 | |
Israel | | | 2.1 | |
Italy | | | 3.3 | |
Japan | | | 6.1 | |
Korea | | | 1.7 | |
Singapore | | | 2.3 | |
Sweden | | | 2.4 | |
Taiwan | | | 2.1 | |
United Kingdom | | | 5.6 | |
United States | | | 50.6 | |
| | | | |
TOTAL | | | 100.0 | % |
| | | | |
54
| | |
| WASATCH HERITAGE GROWTH FUND (WAHGX) — Schedule of Investments | | SEPTEMBER 30, 2010 |
|
| |
| |
| | | | | | | | |
| Shares | | | | | Value | |
| | | | | | | |
| | | | COMMON STOCKS 96.2% | | | | |
| | |
| | | | Aerospace & Defense 1.6% | | | | |
| | 20,245 | | | TransDigm Group, Inc. | | $ | 1,256,202 | |
| | | | | | | | |
| | | | Air Freight & Logistics 3.8% | | | | |
| | 20,760 | | | C.H. Robinson Worldwide, Inc. | | | 1,451,539 | |
| | 33,665 | | | Expeditors International of Washington, Inc. | | | 1,556,333 | |
| | | | | | | | |
| | | | | | | 3,007,872 | |
| | | | | | | | |
| | | | Apparel Retail 3.7% | | | | |
| | 53,175 | | | Ross Stores, Inc. | | | 2,904,418 | |
| | | | | | | | |
| | | | Asset Management & Custody Banks 3.3% | | | | |
| | 62,505 | | | SEI Investments Co. | | | 1,271,352 | |
| | 26,900 | | | T. Rowe Price Group, Inc. | | | 1,346,748 | |
| | | | | | | | |
| | | | | | | 2,618,100 | |
| | | | | | | | |
| | | | Automotive Retail 1.0% | | | | |
| | 14,898 | | | O’Reilly Automotive, Inc.* | | | 792,574 | |
| | | | | | | | |
| | | | Communications Equipment 1.2% | | | | |
| | 8,815 | | | F5 Networks, Inc.* | | | 915,085 | |
| | | | | | | | |
| | | | Data Processing & Outsourced Services 5.7% | | | | |
| | 16,755 | | | Alliance Data Systems Corp.* | | | 1,093,431 | |
| | 36,525 | | | Paychex, Inc. | | | 1,004,072 | |
| | 153,330 | | | Redecard S.A. (Brazil) | | | 2,375,982 | |
| | | | | | | | |
| | | | | | | 4,473,485 | |
| | | | | | | | |
| | | | Diversified Metals & Mining 1.4% | | | | |
| | 16,580 | | | BHP Billiton plc ADR (United Kingdom) | | | 1,059,794 | |
| | | | | | | | |
| | | | Diversified Support Services 3.6% | | | | |
| | 86,665 | | | Copart, Inc.* | | | 2,857,345 | |
| | | | | | | | |
| | | | Education Services 3.0% | | | | |
| | 45,525 | | | Apollo Group, Inc., Class A* | | | 2,337,709 | |
| | | | | | | | |
| | | | Electronic Components 3.7% | | | | |
| | 59,235 | | | Amphenol Corp., Class A | | | 2,901,330 | |
| | | | | | | | |
| | | | Environmental & Facilities Services 1.6% | | | | |
| | 17,765 | | | Stericycle, Inc.* | | | 1,234,312 | |
| | | | | | | | |
| | | | Health Care Equipment 3.4% | | | | |
| | 67,690 | | | St. Jude Medical, Inc.* | | | 2,662,925 | |
| | | | | | | | |
| | | | Health Care Services 3.7% | | | | |
| | 59,485 | | | Express Scripts, Inc.* | | | 2,896,919 | |
| | | | | | | | |
| | | | IT Consulting & Other Services 4.7% | | | | |
| | 57,685 | | | Cognizant Technology Solutions Corp., Class A* | | | 3,718,952 | |
| | | | | | | | |
| | | | Life Sciences Tools & Services 1.9% | | | | |
| | 31,750 | | | Covance, Inc.* | | | 1,485,582 | |
| | | | | | | | |
| | | | Mortgage REITs 1.0% | | | | |
| | 45,419 | | | Annaly Capital Management, Inc. | | | 799,374 | |
| | | | | | | | |
| | | | Multi-Line Insurance 1.5% | | | | |
| | 44,255 | | | HCC Insurance Holdings, Inc. | | | 1,154,613 | |
| | | | | | | | |
| | | | Oil & Gas Equipment & Services 3.1% | | | | |
| | 27,140 | | | Core Laboratories N.V. | | | 2,389,406 | |
| | | | | | | | |
| | | | Oil & Gas Exploration & Production 3.4% | | | | |
| | 45,765 | | | Petrohawk Energy Corp.* | | | 738,647 | |
| | 45,395 | | | Ultra Petroleum Corp.* | | | 1,905,682 | |
| | | | | | | | |
| | | | | | | 2,644,329 | |
| | | | | | | | |
| | | | | | | | |
| Shares | | | | | Value | |
| | | | | | | |
| | | | Personal Products 2.5% | | | | |
| | 32,235 | | | Herbalife Ltd. | | $ | 1,945,382 | |
| | | | | | | | |
| | | | Pharmaceuticals 1.1% | | | | |
| | 16,745 | | | Teva Pharmaceutical Industries Ltd. ADR (Israel) | | | 883,299 | |
| | | | | | | | |
| | | | Research & Consulting Services 4.0% | | | | |
| | 46,575 | | | IHS, Inc., Class A* | | | 3,167,100 | |
| | | | | | | | |
| | | | Restaurants 3.8% | | | | |
| | 81,565 | | | Tim Hortons, Inc. (Canada) | | | 2,969,782 | |
| | | | | | | | |
| | | | Semiconductors 12.7% | | | | |
| | 155,550 | | | Altera Corp. | | | 4,691,388 | |
| | 94,385 | | | Linear Technology Corp. | | | 2,900,451 | |
| | 38,600 | | | Microchip Technology, Inc. | | | 1,213,970 | |
| | 30,730 | | | Silicon Laboratories, Inc.* | | | 1,126,255 | |
| | | | | | | | |
| | | | | | | 9,932,064 | |
| | | | | | | | |
| | | | Specialized Finance 4.9% | | | | |
| | 168,300 | | | BM&F BOVESPA S.A. (Brazil) | | | 1,405,812 | |
| | 11,163 | | | IntercontinentalExchange, Inc.* | | | 1,168,989 | |
| | 37,750 | | | MSCI, Inc., Class A* | | | 1,253,678 | |
| | | | | | | | |
| | | | | | | 3,828,479 | |
| | | | | | | | |
| | | | Thrifts & Mortgage Finance 4.3% | | | | |
| | 57,800 | | | Housing Development Finance Corp. Ltd. (India) | | | 938,100 | |
| | 148,395 | | | New York Community Bancorp, Inc. | | | 2,411,419 | |
| | | | | | | | |
| | | | | | | 3,349,519 | |
| | | | | | | | |
| | | | Trading Companies & Distributors 3.5% | | | | |
| | 23,170 | | | Fastenal Co. | | | 1,232,412 | |
| | 28,180 | | | MSC Industrial Direct Co., Inc., Class A | | | 1,522,847 | |
| | | | | | | | |
| | | | | | | 2,755,259 | |
| | | | | | | | |
| | | | Trucking 1.2% | | | | |
| | 26,605 | | | J.B. Hunt Transport Services, Inc. | | | 923,194 | |
| | | | | | | | |
| | | | Wireless Telecommunication Services 1.9% | | | | |
| | 35,965 | | | NII Holdings, Inc.* | | | 1,478,162 | |
| | | | | | | | |
| | |
| | | | Total Common Stocks
(cost $60,463,711) | | | 75,342,566 | |
| | | | | | | | |
55
| | |
| WASATCH HERITAGE GROWTH FUND (WAHGX) — Schedule of Investments (continued) | | SEPTEMBER 30, 2010 |
|
| |
| |
| | | | | | | | |
Principal
Amount | | | | | Value | |
| | | | | | | |
| | | | SHORT-TERM INVESTMENTS 3.6% | | | | |
| | |
| | | | Repurchase Agreement 3.6% | | | | |
| | $2,810,000 | | | Repurchase Agreement dated 9/30/10, 0.01% due 10/1/10 with State Street Bank and Trust Co. collateralized by $2,870,000 of United States Treasury Bills 0.19% due 3/31/11; value: $2,867,130; repurchase proceeds: $2,810,001 (cost $2,810,000) | | $ | 2,810,000 | |
| | | | | | | | |
| | |
| | | | Total Short-Term Investments
(cost $2,810,000) | | | 2,810,000 | |
| | | | | | | | |
| | |
| | | | Total Investments
(cost $63,273,711) 99.8% | | | 78,152,566 | |
| | |
| | | | Other Assets less Liabilities 0.2% | | | 121,069 | |
| | | | | | | | |
| | |
| | | | NET ASSETS 100.0% | | $ | 78,273,635 | |
| | | | | | | | |
| |
| | | | *Non-income producing. ADR American Depositary Receipt. REIT Real Estate Investment Trust. See Notes to Financial Statements. | |
At September 30, 2010, Wasatch Heritage Growth Fund’s investments, excluding short-term investments, were in the following countries:
| | | | |
| Country | | % | |
Brazil | | | 5.0 | |
Canada | | | 3.9 | |
India | | | 1.3 | |
Israel | | | 1.2 | |
United Kingdom | | | 1.4 | |
United States | | | 87.2 | |
| | | | |
TOTAL | | | 100.0 | % |
| | | | |
56
| | |
| WASATCH INTERNATIONAL GROWTH FUND (WAIGX) — Schedule of Investments | | SEPTEMBER 30, 2010 |
|
| |
| |
| | | | | | | | |
| Shares | | | | | Value | |
| | | | | | | |
| | | | COMMON STOCKS 93.9% | | | | |
| | |
| | | | Aerospace & Defense 2.4% | | | | |
| | 41,850 | | | Chemring Group plc (United Kingdom) | | $ | 1,975,393 | |
| | 129,431 | | | Kongsberg Gruppen ASA (Norway) | | | 2,584,682 | |
| | 81,700 | | | Ultra Electronics Holdings plc (United Kingdom) | | | 2,186,053 | |
| | | | | | | | |
| | | | | | | 6,746,128 | |
| | | | | | | | |
| | | | Agricultural Products 0.8% | | | | |
| | 963,000 | | | PT Astra Agro Lestari Tbk (Indonesia) | | | 2,233,513 | |
| | | | | | | | |
| | | | Air Freight & Logistics 0.5% | | | | |
| | 2,241,800 | | | Aramex PJSC* (United Arab Emirates) | | | 1,342,870 | |
| | | | | | | | |
| | | | Apparel Retail 0.9% | | | | |
| | 262,200 | | | Truworths International Ltd. (South Africa) | | | 2,629,513 | |
| | | | | | | | |
| | | | Apparel, Accessories & Luxury Goods 6.7% | | | | |
| | 2,181,699 | | | Anta Sports Products Ltd. (China) | | | 5,083,592 | |
| | 134,540 | | | Cia. Hering (Brazil) | | | 5,781,884 | |
| | 999,655 | | | Li Ning Co. Ltd. (China) | | | 3,034,021 | |
| | 1,359,735 | | | Ports Design Ltd. (China) | | | 3,758,885 | |
| | 75,525 | | | WeSC AB* (Sweden) | | | 1,409,299 | |
| | | | | | | | |
| | | | | | | 19,067,681 | |
| | | | | | | | |
| | | | Application Software 1.1% | | | | |
| | 20,152 | | | SimCorp A/S (Denmark) | | | 3,208,641 | |
| | | | | | | | |
| | | | Asset Management & Custody Banks 1.8% | | | | |
| | 346,770 | | | CETIP S.A. (Brazil) | | | 3,416,524 | |
| | 10,430 | | | Partners Group Holding AG (Switzerland) | | | 1,728,952 | |
| | | | | | | | |
| | | | | | | 5,145,476 | |
| | | | | | | | |
| | | | Automotive Retail 0.6% | | | | |
| | 226,020 | | | ARB Corp. Ltd. (Australia) | | | 1,646,554 | |
| | | | | | | | |
| | | | Biotechnology 2.4% | | | | |
| | 249,938 | | | Abcam plc (United Kingdom) | | | 6,777,876 | |
| | | | | | | | |
| | | | Brewers 0.7% | | | | |
| | 124,400 | | | Anadolu Efes Biracilik ve Malt Sanayii A.S. (Turkey) | | | 1,941,334 | |
| | | | | | | | |
| | | | Casinos & Gaming 2.2% | | | | |
| | 5,567,450 | | | SJM Holdings Ltd. (Hong Kong) | | | 6,350,049 | |
| | | | | | | | |
| | | | Coal & Consumable Fuels 2.6% | | | | |
| | 911,045 | | | PT Indo Tambangraya Megah (Indonesia) | | | 4,246,439 | |
| | 1,472,885 | | | PT Tambang Batubara Bukit Asam Tbk (Indonesia) | | | 3,209,817 | |
| | | | | | | | |
| | | | | | | 7,456,256 | |
| | | | | | | | |
| | | | Communications Equipment 0.5% | | | | |
| | 144,800 | | | O-Net Communications Group Ltd.* (China) | | | 101,518 | |
| | 177,885 | | | Ubiquoss, Inc. (Korea) | | | 1,240,242 | |
| | | | | | | | |
| | | | | | | 1,341,760 | |
| | | | | | | | |
| | | | Construction & Farm Machinery & Heavy Trucks 0.7% | | | | |
| | 25,904 | | | Demag Cranes AG* (Germany) | | | 992,893 | |
| | 97,000 | | | Takeuchi Manufacturing Co. Ltd.* (Japan) | | | 940,078 | |
| | | | | | | | |
| | | | | | | 1,932,971 | |
| | | | | | | | |
| | | | Construction Materials 3.5% | | | | |
| | 719,900 | | | Corp Moctezuma S.A.B de C.V. (Mexico) | | | 1,737,341 | |
| | 1,687,000 | | | PT Indocement Tunggal Prakarsa Tbk (Indonesia) | | | 3,477,961 | |
| | 4,232,935 | | | PT Semen Gresik (Persero) Tbk (Indonesia) | | | 4,695,356 | |
| | | | | | | | |
| | | | | | | 9,910,658 | |
| | | | | | | | |
| | | | | | | | |
| Shares | | | | | Value | |
| | | | | | | |
| | | | Consumer Finance 2.3% | | | | |
| | 243,300 | | | Banco Compartamos S.A. de C.V. (Mexico) | | $ | 1,544,899 | |
| | 358,900 | | | Mahindra & Mahindra Financial Services | | | | |
| | | | Ltd. (India) | | | 5,151,675 | |
| | | | | | | | |
| | | | | | | 6,696,574 | |
| | | | | | | | |
| | | | Data Processing & Outsourced Services 1.9% | | | | |
| | 407,798 | | | Wirecard AG (Germany) | | | 5,550,079 | |
| | | | | | | | |
| | | | Department Stores 1.5% | | | | |
| | 81,500 | | | Lojas Renner S.A. (Brazil) | | | 2,789,956 | |
| | 99,700 | | | Marisa Lojas S.A. (Brazil) | | | 1,423,697 | |
| | | | | | | | |
| | | | | | | 4,213,653 | |
| | | | | | | | |
| | | | Distributors 1.8% | | | | |
| | 4,110,887 | | | Dah Chong Hong Holdings Ltd. (Hong Kong) | | | 5,059,602 | |
| | | | | | | | |
| | | | Diversified Banks 4.1% | | | | |
| | 587,220 | | | Allahabad Bank Ltd. (India) | | | 3,044,239 | |
| | 1,042,917 | | | Bank of N.T. Butterfield & Son Ltd. (The) (Bermuda) | | | 1,480,942 | |
| | 12,366,000 | | | Bank Pembangunan Daerah Jawa* (Indonesia) | | | 2,161,452 | |
| | 461,000 | | | Commercial International Bank S.A.E (Egypt) | | | 3,441,507 | |
| | 1,261,285 | | | PT Bank Tabungan Pensiunan Nasional Tbk* (Indonesia) | | | 1,724,110 | |
| | | | | | | | |
| | | | | | | 11,852,250 | |
| | | | | | | | |
| | | | Diversified Metals & Mining 0.6% | | | | |
| | 28,420 | | | Inmet Mining Corp. (Canada) | | | 1,581,050 | |
| | | | | | | | |
| | | | Electrical Components & Equipment 1.2% | | | | |
| | 347,138 | | | Crompton Greaves Ltd. (India) | | | 2,403,352 | |
| | 1,390,925 | | | Wasion Group Holdings Ltd. (China) | | | 1,066,592 | |
| | | | | | | | |
| | | | | | | 3,469,944 | |
| | | | | | | | |
| | | | Electronic Components 0.4% | | | | |
| | 76,375 | | | Partron Co. Ltd. (Korea) | | | 1,142,025 | |
| | | | | | | | |
| | | | Electronic Equipment & Instruments 0.9% | | | | |
| | 1,091,000 | | | Chroma ATE, Inc. (Taiwan) | | | 2,601,652 | |
| | | | | | | | |
| | | | Environmental & Facilities Services 0.4% | | | | |
| | 55,045 | | | Daiseki Co. Ltd. (Japan) | | | 1,036,607 | |
| | | | | | | | |
| | | | Fertilizers & Agricultural Chemicals 0.5% | | | | |
| | 2,394 | | | Silvinit*** (Russia) | | | 1,560,980 | |
| | | | | | | | |
| | | | Food Retail 4.0% | | | | |
| | 85,690 | | | BIM Birlesik Magazalar AS (Turkey) | | | 2,470,348 | |
| | 1,682,000 | | | CP ALL Public Co. Ltd. (Thailand) | | | 2,341,499 | |
| | 31,530 | | | Magnit*** (Russia) | | | 3,687,995 | |
| | 210,450 | | | Shoprite Holdings Ltd. (South Africa) | | | 2,983,385 | |
| | | | | | | | |
| | | | | | | 11,483,227 | |
| | | | | | | | |
| | | | Gold 2.7% | | | | |
| | 641,910 | | | Centamin Egypt Ltd.* (United Kingdom) | | | 1,784,089 | |
| | 119,500 | | | Kingsgate Consolidated Ltd. (Australia) | | | 1,337,544 | |
| | 227,905 | | | Koza Altin Isletmeleri AS (Turkey) | | | 2,580,888 | |
| | 115,315 | | | Petropavlovsk plc (United Kingdom) | | | 2,009,915 | |
| | | | | | | | |
| | | | | | | 7,712,436 | |
| | | | | | | | |
| | | | Health Care Equipment 2.8% | | | | |
| | 146,143 | | | DiaSorin S.p.A. (Italy) | | | 5,998,818 | |
| | 49,761 | | | Stratec Biomedical Systems AG (Germany) | | | 2,047,315 | |
| | | | | | | | |
| | | | | | | 8,046,133 | |
| | | | | | | | |
57
| | |
| WASATCH INTERNATIONAL GROWTH FUND (WAIGX) — Schedule of Investments (continued) | | |
|
| |
| |
| | | | | | | | |
| Shares | | | | | Value | |
| | | | | | | |
| | | | Health Care Services 0.2% | | | | |
| | 35,300 | | | Fleury S.A. (Brazil) | | $ | 437,603 | |
| | | | | | | | |
| | | | Health Care Supplies 0.3% | | | | |
| | 258,815 | | | Shandong Weigao Group Medical Polymer Co. Ltd., Class H (China) | | | 733,820 | |
| | | | | | | | |
| | | | Health Care Technology 1.0% | | | | |
| | 458,244 | | | RaySearch Laboratories AB (Sweden) | | | 2,836,710 | |
| | | | | | | | |
| | | | Industrial Gases 0.6% | | | | |
| | 1,810,340 | | | Yingde Gases Group Co.* (China) | | | 1,710,179 | |
| | | | | | | | |
| | | | Industrial Machinery 6.8% | | | | |
| | 212,890 | | | AIA Engineering Ltd. (India) | | | 1,895,093 | |
| | 31,490 | | | Andritz AG (Austria) | | | 2,209,799 | |
| | 9,963 | | | Burckhardt Compression Holding AG (Switzerland) | | | 2,209,491 | |
| | 35,325 | | | Konecranes Oyj (Finland) | | | 1,320,069 | |
| | 248,414 | | | Rotork plc (United Kingdom) | | | 6,709,242 | |
| | 122,845 | | | Thermax Ltd. (India) | | | 2,187,070 | |
| | 272,700 | | | Weg S.A. (Brazil) | | | 2,978,129 | |
| | | | | | | | |
| | | | | | | 19,508,893 | |
| | | | | | | | |
| | | | Internet Retail 4.2% | | | | |
| | 257,440 | | | ASOS plc* (United Kingdom) | | | 4,588,184 | |
| | 1,158 | | | Start Today Co. Ltd. (Japan) | | | 3,230,886 | |
| | 406,944 | | | Yoox S.p.A.* (Italy) | | | 4,152,456 | |
| | | | | | | | |
| | | | | | | 11,971,526 | |
| | | | | | | | |
| | | | Internet Software & Services 0.9% | | | | |
| | 13,110 | | | Daum Communications Corp.* (Korea) | | | 906,001 | |
| | 193,000 | | | Net Entertainment NE AB* (Sweden) | | | 1,800,693 | |
| | | | | | | | |
| | | | | | | 2,706,694 | |
| | | | | | | | |
| | | | IT Consulting & Other Services 0.2% | | | | |
| | 283,000 | | | CSG Ltd. (Australia) | | | 490,155 | |
| | | | | | | | |
| | | | Life Sciences Tools & Services 0.7% | | | | |
| | 810 | | | EPS Co. Ltd. (Japan) | | | 2,066,846 | |
| | | | | | | | |
| | | | Oil & Gas Equipment & Services 2.6% | | | | |
| | 105,195 | | | Pason Systems, Inc. (Canada) | | | 1,248,639 | |
| | 103,655 | | | Petrofac Ltd. (United Kingdom) | | | 2,234,754 | |
| | 27,505 | | | Schoeller-Bleckmann Oilfield Equipment AG (Austria) | | | 1,795,443 | |
| | 150,340 | | | TGS-NOPEC Geophysical Co. ASA (Norway) | | | 2,160,325 | |
| | | | | | | | |
| | | | | | | 7,439,161 | |
| | | | | | | | |
| | | | Oil & Gas Exploration & Production 4.5% | | | | |
| | 1,579,875 | | | Afren plc* (United Kingdom) | | | 2,743,765 | |
| | 214,045 | | | Dragon Oil plc* (Ireland) | | | 1,479,699 | |
| | 171,555 | | | Gran Tierra Energy, Inc.* (Canada) | | | 1,324,405 | |
| | 246,960 | | | Pan Orient Energy Corp.* (Canada) | | | 1,790,451 | |
| | 2,426,050 | | | Petroneft Resources plc* | | | | |
| | | | (United Kingdom) | | | 1,733,325 | |
| | 107,274 | | | Premier Oil plc* (United Kingdom) | | | 2,786,114 | |
| | 272,815 | | | Salamander Energy plc* (United Kingdom) | | | 1,095,388 | |
| | | | | | | | |
| | | | | | | 12,953,147 | |
| | | | | | | | |
| | | | Packaged Foods & Meats 0.8% | | | | |
| | 27,477 | | | Glaxo SmithKline Consumer Healthcare Ltd. (India) | | | 1,238,865 | |
| | 460,114 | | | Hsu Fu Chi International Ltd. (China) | | | 1,153,869 | |
| | | | | | | | |
| | | | | | | 2,392,734 | |
| | | | | | | | |
| | | | Personal Products 1.9% | | | | |
| | 129,670 | | | Natura Cosmeticos S.A. (Brazil) | | | 3,482,872 | |
| | 31,655 | | | Oriflame Cosmetics S.A. (Sweden) | | | 2,030,357 | |
| | | | | | | | |
| | | | | | | 5,513,229 | |
| | | | | | | | |
| | | | | | | | |
| Shares | | | | | Value | |
| | | | | | | |
| | | | Pharmaceuticals 0.7% | | | | |
| | 6,529,390 | | | PT Kalbe Farma Tbk (Indonesia) | | $ | 1,865,540 | |
| | | | | | | | |
| | | | Precious Metals & Minerals 0.5% | | | | |
| | 206,030 | | | Northam Platinum Ltd. (South Africa) | | | 1,357,496 | |
| | | | | | | | |
| | | | Research & Consulting Services 2.0% | | | | |
| | 92,150 | | | AF AB, Class B (Sweden) | | | 1,699,052 | |
| | 125,379 | | | Campbell Brothers Ltd. (Australia) | | | 4,000,748 | |
| | | | | | | | |
| | | | | | | 5,699,800 | |
| | | | | | | | |
| | | | Semiconductor Equipment 0.5% | | | | |
| | 43,450 | | | Aixtron AG (Germany) | | | 1,290,431 | |
| | | | | | | | |
| | | | Semiconductors 0.6% | | | | |
| | 122,224 | | | Melexis N.V.* (Belgium) | | | 1,851,611 | |
| | | | | | | | |
| | | | Specialized Finance 4.2% | | | | |
| | 196,640 | | | BM&F BOVESPA S.A. (Brazil) | | | 1,642,536 | |
| | 128,845 | | | JSE Ltd. (South Africa) | | | 1,357,672 | |
| | 945 | | | Osaka Securities Exchange Co. Ltd. (Japan) | | | 4,635,849 | |
| | 302,035 | | | Rural Electrification Corp. Ltd. (India) | | | 2,300,467 | |
| | 296,000 | | | Singapore Exchange Ltd. (Singapore) | | | 2,028,969 | |
| | | | | | | | |
| | | | | | | 11,965,493 | |
| | | | | | | | |
| | | | Specialty Chemicals 0.9% | | | | |
| | 45,635 | | | Asian Paints Ltd. (India) | | | 2,709,613 | |
| | | | | | | | |
| | | | Specialty Stores 0.3% | | | | |
| | 270,100 | | | L’Occitane International S.A.* (Luxembourg) | | | 755,373 | |
| | | | | | | | |
| | | | Steel 0.5% | | | | |
| | 269,250 | | | Ferrexpo plc (United Kingdom) | | | 1,303,461 | |
| | | | | | | | |
| | | | Systems Software 1.2% | | | | |
| | 5,597 | | | Simplex Technology, Inc. (Japan) | | | 3,392,731 | |
| | | | | | | | |
| | | | Thrifts & Mortgage Finance 5.3% | | | | |
| | 608,370 | | | Dewan Housing Finance Corp. Ltd. (India) | | | 3,866,707 | |
| | 292,809 | | | Gruh Finance Ltd. (India) | | | 2,696,436 | |
| | 44,355 | | | Home Capital Group, Inc. (Canada) | | | 1,915,227 | |
| | 211,890 | | | LIC Housing Finance Ltd. (India) | | | 6,785,573 | |
| | | | | | | | |
| | | | | | | 15,263,943 | |
| | | | | | | | |
| | |
| | | | Total Common Stocks (cost $190,104,876) | | | 267,953,681 | |
| | | | | | | | |
| | |
| | | | PREFERRED STOCKS 1.2% | | | | |
| | |
| | | | Diversified Banks 0.7% | | | | |
| | 182,700 | | | Banco do Estado do Rio Grande do Sul S.A., Series B Pfd (Brazil) | | | 1,837,785 | |
| | 74,058 | | | Bank of N.T. Butterfield & Son Ltd. (The) Pfd.* (Bermuda) | | | 105,163 | |
| | | | | | | | |
| | | | | | | 1,942,948 | |
| | | | | | | | |
| | | | Regional Banks 0.5% | | | | |
| | 251,125 | | | Banco Daycoval S.A. Pfd. (Brazil) | | | 1,651,436 | |
| | | | | | | | |
| | |
| | | | Total Preferred Stocks
(cost $3,466,532) | | | 3,594,384 | |
| | | | | | | | |
| | |
| | | | LIMITED PARTNERSHIP INTEREST 0.4% | | | | |
| |
| | | | Oil & Gas Exploration &
Production 0.4% | |
| | 147,785 | | | Zhaikmunai L.P. GDR* (Kazakhstan) | | | 1,182,280 | |
| | | | | | | | |
| | |
| | | | Total Limited Partnership Interest
(cost $1,113,400) | | | 1,182,280 | |
| | | | | | | | |
58
| | | | | | | | |
Principal
Amount | | | | | Value | |
| | | | | | | |
| | | | SHORT-TERM INVESTMENTS 4.5% | | | | |
| | |
| | | | Repurchase Agreement 4.5% | | | | |
| | $12,766,000 | | | Repurchase Agreement dated 9/30/10, 0.01% due 10/1/10 with State Street Bank and Trust Co. collateralized by $12,240,000 of United States Treasury Notes 4.625% due 2/29/12; value: $13,024,584; repurchase proceeds: $12,766,004 (cost $12,766,000) | | $ | 12,766,000 | |
| | | | | | | | |
| | |
| | | | Total Short-Term Investments (cost $12,766,000) | | | 12,766,000 | |
| | | | | | | | |
| | |
| | | | Total Investments
(cost $207,450,808) 100.0% | | | 285,496,345 | |
| | |
| | | | Liabilities less Other Assets (<0.1)% | | | (50,377 | ) |
| | | | | | | | |
| | |
| | | | NET ASSETS 100.0% | | $ | 285,445,968 | |
| | | | | | | | |
| |
| | | | *Non-income producing. ***Security was fair valued under procedures adopted by the Board of Trustees (see Note 15). GDR Global Depositary Receipt. See Notes to Financial Statements. | |
At September 30, 2010, Wasatch International Growth Fund’s investments, excluding short-term investments, were in the following countries:
| | | | |
| Country | | % | |
Australia | | | 2.7 | |
Austria | | | 1.5 | |
Belgium | | | 0.7 | |
Bermuda | | | 0.6 | |
Brazil | | | 9.3 | |
Canada | | | 2.9 | |
China | | | 6.1 | |
Denmark | | | 1.2 | |
Egypt | | | 1.3 | |
Finland | | | 0.5 | |
Germany | | | 3.6 | |
Hong Kong | | | 4.2 | |
India | | | 12.6 | |
Indonesia | | | 8.7 | |
Ireland | | | 0.5 | |
Italy | | | 3.7 | |
Japan | | | 5.6 | |
Kazakhstan | | | 0.4 | |
Korea | | | 1.2 | |
Luxembourg | | | 0.3 | |
Mexico | | | 1.2 | |
Norway | | | 1.7 | |
Russia | | | 1.9 | |
Singapore | | | 0.7 | |
South Africa | | | 3.0 | |
Sweden | | | 3.6 | |
Switzerland | | | 1.4 | |
Taiwan | | | 1.0 | |
Thailand | | | 0.9 | |
Turkey | | | 2.6 | |
United Arab Emirates | | | 0.5 | |
United Kingdom | | | 13.9 | |
| | | | |
TOTAL | | | 100.0 | % |
| | | | |
59
| | |
| WASATCH INTERNATIONAL OPPORTUNITIES FUND (WAIOX) — Schedule of Investments | | |
|
| |
| |
| | | | | | | | |
| Shares | | | | | Value | |
| | | | | | | |
| | | | COMMON STOCKS 94.6% | | | | |
| | |
| | | | Advertising 0.7% | | | | |
| | 18,580 | | | 1000mercis* (France) | | $ | 875,558 | |
| | 15,390 | | | Tri-Stage, Inc.* (Japan) | | | 225,296 | |
| | | | | | | | |
| | | | | | | 1,100,854 | |
| | | | | | | | |
| | | | Aerospace & Defense 0.5% | | | | |
| | 16,165 | | | Chemring Group plc (United Kingdom) | | | 763,016 | |
| | | | | | | | |
| | | | Air Freight & Logistics 5.9% | | | | |
| | 11,390,631 | | | Aramex PJSC* (United Arab Emirates) | | | 6,823,152 | |
| | 1,039,183 | | | Goodpack Ltd. (Singapore) | | | 1,508,351 | |
| | 45,000 | | | Transat A.T., Inc.* (Canada) | | | 685,689 | |
| | | | | | | | |
| | | | | | | 9,017,192 | |
| | | | | | | | |
| | | | Aluminum 0.7% | | | | |
| | 1,505,419 | | | Midas Holdings Ltd. (Singapore) | | | 1,138,302 | |
| | | | | | | | |
| | | | Apparel, Accessories & Luxury Goods 6.6% | | | | |
| | 688,836 | | | Anta Sports Products Ltd. (China) | | | 1,605,061 | |
| | 844,641 | | | China Lilang Ltd. (China) | | | 1,415,119 | |
| | 20,000 | | | Cia. Hering (Brazil) | | | 859,504 | |
| | 18,454 | | | Gerry Weber International AG (Germany) | | | 755,607 | |
| | 35,472 | | | LG Fashion Corp. (Korea) | | | 1,057,705 | |
| | 12,704 | | | Odd Molly International AB (Sweden) | | | 203,192 | |
| | 634,715 | | | Ports Design Ltd. (China) | | | 1,754,622 | |
| | 169,901 | | | Ted Baker plc (United Kingdom) | | | 1,500,678 | |
| | 1,033,234 | | | Xtep International Holdings Ltd. (China) | | | 866,876 | |
| | | | | | | | |
| | | | | | | 10,018,364 | |
| | | | | | | | |
| | | | Application Software 1.1% | | | | |
| | 105,425 | | | ICSA India Ltd. (India) | | | 293,154 | |
| | 19,340 | | | ORC Software AB (Sweden) | | | 380,934 | |
| | 6,735 | | | SimCorp A/S (Denmark) | | | 1,072,360 | |
| | | | | | | | |
| | | | | | | 1,746,448 | |
| | | | | | | | |
| | | | Asset Management & Custody Banks 0.7% | | | | |
| | 57,042 | | | CETIP S.A. (Brazil) | | | 562,002 | |
| | 34,490 | | | Tata Investment Corp. Ltd. (India) | | | 442,878 | |
| | | | | | | | |
| | | | | | | 1,004,880 | |
| | | | | | | | |
| | | | Auto Parts & Equipment 1.2% | | | | |
| | 614,745 | | | Minth Group Ltd. (China) | | | 1,229,601 | |
| | 2,500,000 | | | Norstar Founders Group Ltd.* *** (Hong Kong) | | | 44,108 | |
| | 24,165 | | | WABCO-TVS India Ltd. (India) | | | 575,421 | |
| | | | | | | | |
| | | | | | | 1,849,130 | |
| | | | | | | | |
| | | | Automobile Manufacturers 0.8% | | | | |
| | 163,949 | | | Ghabbour Auto (Egypt) | | | 1,267,127 | |
| | | | | | | | |
| | | | Biotechnology 2.1% | | | | |
| | 29,961 | | | 3SBio, Inc. ADR* (China) | | | 388,894 | |
| | 68,724 | | | Abcam plc (United Kingdom) | | | 1,863,673 | |
| | 78,345 | | | China Nuokang Bio-Pharmaceutical, Inc. ADR* (China) | | | 391,725 | |
| | 1,339,247 | | | Sino Biopharmaceutical Ltd. (China) | | | 540,235 | |
| | | | | | | | |
| | | | | | | 3,184,527 | |
| | | | | | | | |
| | | | Building Products 0.3% | | | | |
| | 47,480 | | | Blue Star Ltd. (India) | | | 511,518 | |
| | | | | | | | |
| | | | Commodity Chemicals 0.4% | | | | |
| | 48,810 | | | Tokai Carbon Korea Co. Ltd. (Korea) | | | 575,746 | |
| | | | | | | | |
| | | | | | | | |
| Shares | | | | | Value | |
| | | | | | | |
| | | | Communications Equipment 1.2% | | | | |
| | 43,460 | | | Dasan Networks, Inc.* (Korea) | | $ | 360,182 | |
| | 1,564,398 | | | O-Net Communications Group Ltd.* (China) | | | 1,096,790 | |
| | 58,490 | | | Ubiquoss, Inc. (Korea) | | | 407,801 | |
| | | | | | | | |
| | | | | | | 1,864,773 | |
| | | | | | | | |
| | | | Computer Hardware 0.3% | | | | |
| | 147,915 | | | Advantech Co. Ltd. (Taiwan) | | | 389,181 | |
| | | | | | | | |
| | | | Computer Storage & Peripherals 0.6% | | | | |
| | 740 | | | Wacom Co. Ltd. (Japan) | | | 917,520 | |
| | | | | | | | |
| | | | Construction & Engineering 3.7% | | | | |
| | 57,100 | | | Aecon Group, Inc. (Canada) | | | 663,908 | |
| | 357,054 | | | Ausenco Ltd. (Australia) | | | 978,441 | |
| | 4,754,779 | | | Drake & Scull International
(United Arab Emirates) | | | 1,197,531 | |
| | 146,447 | | | Heerim Architects & Planners (Korea) | | | 1,021,051 | |
| | 84,383 | | | Lycopodium Ltd. (Australia) | | | 318,357 | |
| | 21,445 | | | Outotec Oyj (Finland) | | | 907,436 | |
| | 848,000 | | | Rotary Engineering Ltd. (Singapore) | | | 599,316 | |
| | | | | | | | |
| | | | | | | 5,686,040 | |
| | | | | | | | |
| | | | Construction & Farm Machinery & Heavy Trucks 0.8% | | | | |
| | 650,000 | | | International Mining Machinery Holdings Ltd.* (China) | | | 609,011 | |
| | 43,960 | | | VST Tillers Tractors Ltd. (India) | | | 534,153 | |
| | | | | | | | |
| | | | | | | 1,143,164 | |
| | | | | | | | |
| | | | Consumer Finance 0.9% | | | | |
| | 225,235 | | | Banco Compartamos S.A. de C.V. (Mexico) | | | 1,430,191 | |
| | | | | | | | |
| | | | Data Processing & Outsourced Services 4.1% | | | | |
| | 380 | | | GMO Payment Gateway, Inc. (Japan) | | | 789,362 | |
| | 1,032 | | | SBI VeriTrans Co. Ltd. (Japan) | | | 542,735 | |
| | 365,042 | | | Wirecard AG (Germany) | | | 4,968,175 | |
| | | | | | | | |
| | | | | | | 6,300,272 | |
| | | | | | | | |
| | | | Diversified Banks 0.8% | | | | |
| | 220,294 | | | Allahabad Bank Ltd. (India) | | | 1,142,038 | |
| | | | | | | | |
| | | | Diversified Support Services 0.2% | | | | |
| | 213 | | | Prestige International, Inc. (Japan) | | | 380,198 | |
| | | | | | | | |
| | | | Drug Retail 0.4% | | | | |
| | 27,625 | | | Create SD Holdings Co. Ltd. (Japan) | | | 602,637 | |
| | | | | | | | |
| | | | Education Services 0.4% | | | | |
| | 154,240 | | | China Education Alliance, Inc.* (China) | | | 637,011 | |
| | 1,040,150 | | | Oriental Century Ltd.* *** (China) | | | 7,905 | |
| | | | | | | | |
| | | | | | | 644,916 | |
| | | | | | | | |
| | | | Electrical Components & Equipment 2.8% | | | | |
| | 56,121 | | | Harbin Electric, Inc.* ‡ | | | 1,004,005 | |
| | 38,000 | | | Voltamp Transformers Ltd. (India) | | | 790,698 | |
| | 970,532 | | | Wasion Group Holdings Ltd. (China) | | | 744,225 | |
| | 520,155 | | | Zhuzhou CSR Times Electric Co. Ltd., Series H (China) | | | 1,672,556 | |
| | | | | | | | |
| | | | | | | 4,211,484 | |
| | | | | | | | |
| | | | Electronic Equipment & Instruments 0.6% | | | | |
| | 35,708 | | | CNB Technology, Inc. (Korea) | | | 200,422 | |
| | 25,174 | | | Smartrac N.V.* (Netherlands) | | | 681,800 | |
| | | | | | | | |
| | | | | | | 882,222 | |
| | | | | | | | |
60
| | | | | | | | |
| Shares | | | | | Value | |
| | | | | | | |
| | | | Environmental & Facilities Services 0.9% | | | | |
| | 30,100 | | | Daiseki Co. Ltd. (Japan) | | $ | 566,843 | |
| | 253,000 | | | RPS Group plc (United Kingdom) | | | 742,901 | |
| | | | | | | | |
| | | | | | | 1,309,744 | |
| | | | | | | | |
| | | | Food Distributors 0.5% | | | | |
| | 10,482 | | | Shinsegae Food Co. Ltd. (Korea) | | | 766,673 | |
| | | | | | | | |
| | | | Food Retail 1.4% | | | | |
| | 1,795,676 | | | BreadTalk Group Ltd. (Singapore) | | | 784,645 | |
| | 33,095 | | | Daikokutenbussan Co. Ltd. (Japan) | | | 1,104,951 | |
| | 49,337 | | | QKL Stores, Inc.* (China) | | | 237,804 | |
| | | | | | | | |
| | | | | | | 2,127,400 | |
| | | | | | | | |
| | | | Footwear 1.0% | | | | |
| | 1,286,616 | | | Daphne International Holdings Ltd. (China) | | | 1,520,533 | |
| | | | | | | | |
| | | | Health Care Equipment 2.5% | | | | |
| | 12,674 | | | Audika S.A. (France) | | | 336,350 | |
| | 43,264 | | | DiaSorin S.p.A. (Italy) | | | 1,775,883 | |
| | 1,546,660 | | | LMA International N.V.* (Singapore) | | | 340,855 | |
| | 21,624 | | | Mindray Medical International Ltd. ADR (China) | | | 639,422 | |
| | 16,450 | | | Stratec Biomedical Systems AG (Germany) | | | 676,801 | |
| | | | | | | | |
| | | | | | | 3,769,311 | |
| | | | | | | | |
| | | | Health Care Facilities 1.6% | | | | |
| | 74,207 | | | CVS Group plc* (United Kingdom) | | | 104,871 | |
| | 1,373,670 | | | Raffles Medical Group Ltd. (Singapore) | | | 2,307,022 | |
| | | | | | | | |
| | | | | | | 2,411,893 | |
| | | | | | | | |
| | | | Health Care Services 0.5% | | | | |
| | 59,300 | | | Fleury S.A. (Brazil) | | | 735,124 | |
| | | | | | | | |
| | | | Health Care Technology 0.6% | | | | |
| | 147,805 | | | RaySearch Laboratories AB (Sweden) | | | 914,971 | |
| | | | | | | | |
| | | | Home Improvement Retail 0.4% | | | | |
| | 56,895 | | | Cashbuild Ltd. (South Africa) | | | 635,789 | |
| | | | | | | | |
| | | | Hotels, Resorts & Cruise Lines 0.2% | | | | |
| | 28,310 | | | City Lodge Hotels Ltd. (South Africa) | | | 320,008 | |
| | | | | | | | |
| | | | Human Resource & Employment Services 0.6% | | | | |
| | 443 | | | Benefit One, Inc. (Japan) | | | 340,178 | |
| | 110,000 | | | Sthree plc (United Kingdom) | | | 504,537 | |
| | | | | | | | |
| | | | | | | 844,715 | |
| | | | | | | | |
| | | | Industrial Machinery 5.2% | | | | |
| | 48,385 | | | AIA Engineering Ltd. (India) | | | 430,711 | |
| | 6,250 | | | Burckhardt Compression Holding AG (Switzerland) | | | 1,386,061 | |
| | 3,446,877 | | | China Automation Group Ltd. (China) | | | 2,780,850 | |
| | 147,701 | | | China Valves Technology, Inc.* ‡ (China) | | | 1,146,160 | |
| | 55,026 | | | Hy-Lok Corp. (Korea) | | | 844,512 | |
| | 51,363 | | | SKF India Ltd. (India) | | | 673,257 | |
| | 108,600 | | | SmartHeat, Inc.* (China) | | | 677,664 | |
| | | | | | | | |
| | | | | | | 7,939,215 | |
| | | | | | | | |
| | | | Internet Retail 2.1% | | | | |
| | 66,082 | | | ASOS plc* (United Kingdom) | | | 1,177,736 | |
| | 586 | | | Start Today Co. Ltd. (Japan) | | | 1,634,973 | |
| | 35,000 | | | Yoox S.p.A.* (Italy) | | | 357,140 | |
| | | | | | | | |
| | | | | | | 3,169,849 | |
| | | | | | | | |
| | | | Internet Software & Services 2.1% | | | | |
| | 45,426 | | | Daum Communications Corp.* (Korea) | | | 3,139,284 | |
| | 290,500 | | | Vendtek Systems, Inc.* (Canada) | | | 129,694 | |
| | | | | | | | |
| | | | | | | 3,268,978 | |
| | | | | | | | |
| | | | | | | | |
| Shares | | | | | Value | |
| | | | | | | |
| | | | IT Consulting & Other Services 2.3% | | | | |
| | 26,124 | | | Alten Ltd. (France) | | $ | 846,153 | |
| | 1,109,408 | | | CSE Global Ltd. (Singapore) | | | 902,095 | |
| | 1,054,770 | | | CSG Ltd. (Australia) | | | 1,826,856 | |
| | | | | | | | |
| | | | | | | 3,575,104 | |
| | | | | | | | |
| | |
| | | | Life Sciences Tools & Services 3.3% | | | | |
| | 2,734 | | | CMIC Co. Ltd. (Japan) | | | 861,714 | |
| | 1,057 | | | EPS Co. Ltd. (Japan) | | | 2,697,107 | |
| | 21,965 | | | ICON plc ADR* (Ireland) | | | 474,883 | |
| | 63,720 | | | LINICAL Co. Ltd. (Japan) | | | 229,003 | |
| | 30,720 | | | MorphoSys AG* (Germany) | | | 697,662 | |
| | | | | | | | |
| | | | | | | 4,960,369 | |
| | | | | | | | |
| | | | Managed Health Care 0.5% | | | | |
| | 65,876 | | | OdontoPrev S.A. (Brazil) | | | 773,479 | |
| | | | | | | | |
| | | | Oil & Gas Drilling 0.4% | | | | |
| | 60,577 | | | Phoenix Technology Income Fund** (Canada) | | | 584,399 | |
| | | | | | | | |
| | | | Oil & Gas Equipment & Services 1.7% | | | | |
| | 1,432,000 | | | Anhui Tianda Oil Pipe Co. Ltd., Class H (China) | | | 668,081 | |
| | 116,425 | | | Lamprell plc (United Arab Emirates) | | | 651,558 | |
| | 131,141 | | | Maridive & Oil Services S.A.E. (Egypt) | | | 373,752 | |
| | 78,710 | | | Pason Systems, Inc. (Canada) | | | 934,268 | |
| | | | | | | | |
| | | | | | | 2,627,659 | |
| | | | | | | | |
| | | | Oil & Gas Exploration &
Production 4.7% | | | | |
| | 777,449 | | | Afren plc* (United Kingdom) | | | 1,350,193 | |
| | 100,565 | | | Dragon Oil plc* (Ireland) | | | 695,209 | |
| | 103,358 | | | Gran Tierra Energy, Inc.* (Canada) | | | 797,924 | |
| | 42,000 | | | Ithaca Energy, Inc.* (Canada) | | | 75,411 | |
| | 159,767 | | | Pan Orient Energy Corp.* (Canada) | | | 1,158,305 | |
| | 1,330,000 | | | Petroneft Resources plc*
(United Kingdom) | | | 950,237 | |
| | 42,059 | | | Premier Oil plc* (United Kingdom) | | | 1,092,354 | |
| | 69,105 | | | Selan Exploration Technology Ltd. (India) | | | 515,039 | |
| | 86,601 | | | Westfire Energy Ltd.* (Canada) | | | 473,202 | |
| | | | | | | | |
| | | | | | | 7,107,874 | |
| | | | | | | | |
| | | | Packaged Foods & Meats 0.9% | | | | |
| | 2,197,960 | | | Agthia Group PJSC (United Arab Emirates) | | | 1,352,517 | |
| | | | | | | | |
| | | | Personal Products 0.9% | | | | |
| | 50,252 | | | Atrium Innovations, Inc.* (Canada) | | | 718,408 | |
| | 14,191 | | | Procter & Gamble Hygiene and Healthcare Ltd. (India) | | | 701,576 | |
| | | | | | | | |
| | | | | | | 1,419,984 | |
| | | | | | | | |
| | | | Pharmaceuticals 3.0% | | | | |
| | 249,610 | | | China Shineway Pharmaceutical Group | | | | |
| | | | Ltd. (China) | | | 881,434 | |
| | 26,262 | | | Daewoong Pharmaceutical Co. Ltd. (Korea) | | | 1,127,406 | |
| | 54,619 | | | Dechra Pharmaceuticals | | | | |
| | | | plc (United Kingdom) | | | 403,098 | |
| | 699,600 | | | Genomma Lab Internacional S.A. de C.V., | | | | |
| | | | Class B* (Mexico) | | | 1,339,610 | |
| | 29,383 | | | Medy-Tox, Inc.* (Korea) | | | 778,221 | |
| | | | | | | | |
| | | | | | | 4,529,769 | |
| | | | | | | | |
| | |
| | | | Property & Casualty Insurance 0.6% | | | | |
| | 491,253 | | | Beazley plc (United Kingdom) | | | 891,727 | |
| | | | | | | | |
| | | | Regional Banks 0.8% | | | | |
| | 47,932 | | | Canadian Western Bank (Canada) | | | 1,155,560 | |
| | | | | | | | |
| | | | Research & Consulting Services 0.8% | | | | |
| | 368 | | | Nihon M&A Center, Inc. (Japan) | | | 1,237,027 | |
| | | | | | | | |
61
| | |
| WASATCH INTERNATIONAL OPPORTUNITIES FUND (WAIOX) — Schedule of Investments (continued) | | |
|
| |
| |
| | | | | | | | |
| Shares | | | | | Value | |
| | | | | | | |
| | | | Restaurants 1.3% | | | | |
| | 581,950 | | | FU JI Food & Catering Services Holdings Ltd.* *** (China) | | $ | 750 | |
| | 1,115,444 | | | KFC Holdings Malaysia Berhad (Malaysia) | | | 1,127,368 | |
| | 12,200 | | | Saint Marc Holdings Co. Ltd. (Japan) | | | 456,723 | |
| | 213 | | | Toridoll.corporation (Japan) | | | 372,543 | |
| | | | | | | | |
| | | | | | | 1,957,384 | |
| | | | | | | | |
| | | | Semiconductor Equipment 0.9% | | | | |
| | 53,230 | | | Koh Young Technology, Inc.* (Korea) | | | 744,590 | |
| | 76,665 | | | Suss Microtec AG* (Germany) | | | 616,222 | |
| | | | | | | | |
| | | | | | | 1,360,812 | |
| | | | | | | | |
| | | | Semiconductors 3.9% | | | | |
| | 78,200 | | | CSR plc* (United Kingdom) | | | 440,829 | |
| | 69,411 | | | Hana Micron, Inc.* (Korea) | | | 424,897 | |
| | 71,834 | | | Kontron AG (Germany) | | | 623,192 | |
| | 118,607 | | | Melexis N.V.* (Belgium) | | | 1,796,816 | |
| | 28,788 | | | Melfas, Inc.* (Korea) | | | 684,196 | |
| | 142,837 | | | O2Micro International Ltd. ADR* ‡ (China) | | | 872,734 | |
| | 509,858 | | | Sporton International, Inc. (Taiwan) | | | 1,041,210 | |
| | | | | | | | |
| | | | | | | 5,883,874 | |
| | | | | | | | |
| | | | Specialized Consumer Services 0.1% | | | | |
| | 185 | | | NOVARESE, Inc. (Japan) | | | 97,071 | |
| | | | | | | | |
| | | | Specialized Finance 2.1% | | | | |
| | 46,880 | | | IMAREX ASA* (Norway) | | | 358,535 | |
| | 87,519 | | | JSE Ltd. (South Africa) | | | 922,210 | |
| | 317 | | | Osaka Securities Exchange Co. Ltd. (Japan) | | | 1,555,094 | |
| | 32,625 | | | Oslo Bors VPS Holding ASA (Norway) | | | 360,408 | |
| | | | | | | | |
| | | | | | | 3,196,247 | |
| | | | | | | | |
| | | | Specialty Chemicals 1.4% | | | | |
| | 16,358 | | | C. Uyemura & Co. Ltd. (Japan) | | | 601,606 | |
| | 1,704,460 | | | EcoGreen Fine Chemical Group Ltd.
(Hong Kong) | | | 560,150 | |
| | 43,070 | | | TechnoSemiChem Co. Ltd. (Korea) | | | 993,415 | |
| | | | | | | | |
| | | | | | | 2,155,171 | |
| | | | | | | | |
| | | | Specialty Stores 0.8% | | | | |
| | 102,623 | | | easyhome Ltd. (Canada) | | | 1,165,322 | |
| | | | | | | | |
| | | | Steel 0.9% | | | | |
| | 85,490 | | | Ferrexpo plc (United Kingdom) | | | 413,864 | |
| | 297,572 | | | Ratnamani Metals & Tubes Ltd. (India) | | | 888,710 | |
| | | | | | | | |
| | | | | | | 1,302,574 | |
| | | | | | | | |
| | | | Systems Software 1.8% | | | | |
| | 482,839 | | | GuestLogix, Inc.* (Canada) | | | 552,967 | |
| | 3,685 | | | Simplex Technology, Inc. (Japan) | | | 2,233,735 | |
| | | | | | | | |
| | | | | | | 2,786,702 | |
| | | | | | | | |
| | | | Textiles 0.7% | | | | |
| | 625,952 | | | S. Kumars Nationwide Ltd.* (India) | | | 1,076,802 | |
| | | | | | | | |
| | | | Thrifts & Mortgage Finance 2.1% | | | | |
| | 195,961 | | | Dewan Housing Finance Corp. Ltd. (India) | | | 1,245,498 | |
| | 46,669 | | | Home Capital Group, Inc. (Canada) | | | 2,015,144 | |
| | | | | | | | |
| | | | | | | 3,260,642 | |
| | | | | | | | |
| | | | Tires & Rubber 0.0% | | | | |
| | 10,700 | | | Goodyear India Ltd. (India) | | | 64,293 | |
| | | | | | | | |
| | | | | | | | |
| Shares | | | | | Value | |
| | | | | | | |
| | | | Trading Companies &
Distributors 1.3% | | | | |
| | 35,328 | | | Indutrade AB (Sweden) | | $ | 975,753 | |
| | 19,730 | | | Richelieu Hardware Ltd. (Canada) | | | 536,167 | |
| | 2,997 | | | Thermador Groupe (France) | | | 432,753 | |
| | | | | | | | |
| | | | | | | 1,944,673 | |
| | | | | | | | |
| | |
| | | | Total Common Stocks
(cost $104,605,684) | | | 143,972,978 | |
| | | | | | | | |
| | |
| | | | PREFERRED STOCKS 0.9% | | | | |
| | |
| | | | Regional Banks 0.9% | | | | |
| | 201,410 | | | Banco Daycoval S.A. Pfd. (Brazil) | | | 1,324,503 | |
| | | | | | | | |
| | |
| | | | Total Preferred Stocks
(cost $660,188) | | | 1,324,503 | |
| | | | | | | | |
| | |
| | | | LIMITED PARTNERSHIP INTEREST 0.6% | | | | |
| | |
| | | | Oil & Gas Exploration & Production 0.6% | | | | |
| | 103,319 | | | Zhaikmunai L.P. GDR* (Kazakhstan) | | | 826,552 | |
| | | | | | | | |
| | |
| | | | Total Limited Partnership Interest
(cost $569,882) | | | 826,552 | |
| | | | | | | | |
| | |
| | | | WARRANTS 0.0% | | | | |
| | |
| | | | Restaurants 0.0% | | | | |
| | 44,618 | | | KFC Holdings Malaysia Berhad, expiring 9/14/15* (Malaysia) | | | 17,778 | |
| | | | | | | | |
| | |
| | | | Total Warrants
(cost $0) | | | 17,778 | |
| | | | | | | | |
| | |
Principal
Amount | | | | | Value | |
| | | | | | | |
| | |
| | | | SHORT-TERM INVESTMENTS 2.8% | | | | |
| | |
| | | | Repurchase Agreement 2.8% | | | | |
| | $4,292,000 | | | Repurchase Agreement dated 9/30/10, 0.01% due 10/1/10 with State Street Bank and Trust Co. collateralized by $4,385,000 of United States Treasury Bills 0.19% due 3/31/11; value: $4,380,615; repurchase proceeds: $4,292,001‡ (cost $4,292,000) | | $ | 4,292,000 | |
| | | | | | | | |
| | |
| | | | Total Short-Term Investments
(cost $4,292,000) | | | 4,292,000 | |
| | | | | | | | |
| | |
| | | | Total Investments
(cost $110,127,754) 98.9% | | | 150,433,811 | |
| | |
| | | | Other Assets less Liabilities 1.1% | | | 1,743,759 | |
| | | | | | | | |
| | |
| | | | NET ASSETS 100.0% | | $ | 152,177,570 | |
| | | | | | | | |
62
| | | | | | | | |
| Contracts | | | | | Net
Unrealized
Depreciation | |
| | | | | | | |
| | | | FORWARD FOREIGN CURRENCY EXCHANGE CONTRACTS SHORT 0.1% | | | | |
| | |
| | 174,940,000 JPY | | | USD, State Street Bank and Trust Co., settlement date 10/12/10,
(cost $2,000,000 value $2,095,860) | | $ | (95,860 | ) |
| | | | | | | | |
| | |
| | | | Total Forward Foreign Currency Exchange Contracts Short
(cost $2,000,000 value $2,095,860) | | | (95,860 | ) |
| | | | | | | | |
| |
| | | | *Non-income producing. **Common units. ***Security was fair valued under procedures adopted by the Board of Trustees (see Note 15). ‡All or a portion of this security has been designated as collateral for forward currency contracts (see Note 4). ADR American Depositary Receipt. GDR Global Depositary Receipt. See Notes to Financial Statements. | |
At September 30, 2010, Wasatch International Opportunities Fund’s investments, excluding short-term investments and forward foreign currency exchange contracts, were in the following countries:
| | | | |
| Country | | % | |
Australia | | | 2.1 | |
Belgium | | | 1.2 | |
Brazil | | | 2.9 | |
Canada | | | 8.0 | |
China | | | 15.3 | |
Denmark | | | 0.7 | |
Egypt | | | 1.1 | |
Finland | | | 0.6 | |
France | | | 1.7 | |
Germany | | | 5.7 | |
Hong Kong | | | 0.4 | |
India | | | 6.8 | |
Ireland | | | 0.8 | |
Italy | | | 1.5 | |
Japan | | | 11.9 | |
Kazakhstan | | | 0.6 | |
Korea | | | 9.0 | |
Malaysia | | | 0.8 | |
Mexico | | | 1.9 | |
Netherlands | | | 0.5 | |
Norway | | | 0.5 | |
Singapore | | | 5.2 | |
South Africa | | | 1.3 | |
Sweden | | | 1.7 | |
Switzerland | | | 0.9 | |
Taiwan | | | 1.0 | |
United Arab Emirates | | | 6.9 | |
United Kingdom | | | 8.3 | |
United States | | | 0.7 | |
| | | | |
TOTAL | | | 100.0 | % |
| | | | |
63
| | |
| WASATCH MICRO CAP FUND (WMICX) — Schedule of Investments | | |
|
| |
| |
| | | | | | | | |
| Shares | | | | | Value | |
| | | | | | | |
| | | | COMMON STOCKS 96.2% | | | | |
| | |
| | | | Advertising 0.0% | | | | |
| | 3,315 | | | ReachLocal, Inc.* | | $ | 45,760 | |
| | | | | | | | |
| | | | Air Freight & Logistics 1.5% | | | | |
| | 2,849,430 | | | Goodpack Ltd. (Singapore) | | | 4,135,885 | |
| | | | | | | | |
| | | | Apparel Retail 0.8% | | | | |
| | 108,475 | | | Zumiez, Inc.* | | | 2,295,331 | |
| | | | | | | | |
| | | | Apparel, Accessories & Luxury Goods 2.2% | | | | |
| | 1,418,075 | | | Ports Design Ltd. (China) | | | 3,920,161 | |
| | 126,927 | | | Volcom, Inc.* | | | 2,426,844 | |
| | | | | | | | |
| | | | | | | 6,347,005 | |
| | | | | | | | |
| | | | Application Software 7.1% | | | | |
| | 352,302 | | | Convio, Inc.* | | | 3,248,224 | |
| | 219,273 | | | Interactive Intelligence, Inc.* | | | 3,859,205 | |
| | 126,093 | | | RealPage, Inc.* | | | 2,405,854 | |
| | 114,136 | | | SciQuest, Inc.* | | | 1,378,763 | |
| | 154,645 | | | Tyler Technologies, Inc.* | | | 3,117,643 | |
| | 78,695 | | | Ultimate Software Group, Inc.* | | | 3,040,775 | |
| | 92,190 | | | VanceInfo Technologies, Inc. ADR* (China) | | | 2,981,425 | |
| | | | | | | | |
| | | | | | | 20,031,889 | |
| | | | | | | | |
| | | | Asset Management & Custody Banks 4.8% | | | | |
| | 70,541 | | | Diamond Hill Investment Group, Inc. | | | 5,149,493 | |
| | 97,009 | | | Solar Capital Ltd. | | | 2,080,843 | |
| | 490,346 | | | Treasury Group Ltd. (Australia) | | | 2,280,510 | |
| | 41,587 | | | Virtus Investment Partners, Inc.* | | | 1,258,423 | |
| | 84,097 | | | Westwood Holdings Group, Inc. | | | 2,845,001 | |
| | | | | | | | |
| | | | | | | 13,614,270 | |
| | | | | | | | |
| | | | Automotive Retail 1.3% | | | | |
| | 83,410 | | | Monro Muffler Brake, Inc. | | | 3,846,035 | |
| | | | | | | | |
| | | | Biotechnology 3.3% | | | | |
| | 204,295 | | | 3SBio, Inc. ADR* (China) | | | 2,651,749 | |
| | 219,914 | | | Abcam plc (United Kingdom) | | | 5,963,678 | |
| | 114,335 | | | Orexigen Therapeutics, Inc.* | | | 678,007 | |
| | | | | | | | |
| | | | | | | 9,293,434 | |
| | | | | | | | |
| | | | Computer Storage & Peripherals 1.0% | | | | |
| | 287,165 | | | Intevac, Inc.* | | | 2,874,522 | |
| | | | | | | | |
| | | | Construction & Engineering 0.4% | | | | |
| | 100,360 | | | Orion Marine Group, Inc.* | | | 1,245,468 | |
| | | | | | | | |
| | | | Consumer Finance 3.2% | | | | |
| | 318,341 | | | Dollar Financial Corp.* | | | 6,643,777 | |
| | 542,750 | | | United PanAm Financial Corp.* | | | 2,523,787 | |
| | | | | | | | |
| | | | | | | 9,167,564 | |
| | | | | | | | |
| | | | Data Processing & Outsourced Services 2.1% | | | | |
| | 93,380 | | | hiSoft Technology International Ltd. ADR* (China) | | | 2,296,214 | |
| | 266,630 | | | Wirecard AG (Germany) | | | 3,628,800 | |
| | | | | | | | |
| | | | | | | 5,925,014 | |
| | | | | | | | |
| | | | Diversified Banks 0.4% | | | | |
| | 167,403 | | | Encore Bancshares, Inc.* | | | 1,203,628 | |
| | | | | | | | |
| | | | Diversified Support Services 1.5% | | | | |
| | 204,615 | | | STR Holdings, Inc.* | | | 4,407,407 | |
| | | | | | | | |
| | | | Electronic Manufacturing Services 1.2% | | | | |
| | 137,145 | | | IPG Photonics Corp.* | | | 3,310,680 | |
| | | | | | | | |
| | | | | | | | |
| Shares | | | | | Value | |
| | | | | | | |
| | | | Environmental & Facilities Services 1.4% | | | | |
| | 246,550 | | | Heritage-Crystal Clean, Inc.* | | $ | 2,477,828 | |
| | 91,485 | | | US Ecology, Inc. | | | 1,463,760 | |
| | | | | | | | |
| | | | | | | 3,941,588 | |
| | | | | | | | |
| | | | Food Retail 0.6% | | | | |
| | 338,040 | | | QKL Stores, Inc.* (China) | | | 1,629,353 | |
| | | | | | | | |
| | | | General Merchandise Stores 0.6% | | | | |
| | 155,860 | | | Gordman Stores, Inc.* | | | 1,800,183 | |
| | | | | | | | |
| | | | Health Care Distributors 1.3% | | | | |
| | 63,736 | | | MWI Veterinary Supply, Inc.* | | | 3,678,842 | |
| | | | | | | | |
| | | | Health Care Equipment 6.9% | | | | |
| | 141,400 | | | Abaxis, Inc.* | | | 3,266,340 | |
| | 338,433 | | | AtriCure, Inc.* | | | 2,687,158 | |
| | 476,001 | | | Cardica, Inc.* | | | 1,032,922 | |
| | 341,000 | | | Cardica, Inc. PIPE* † | | | 739,970 | |
| | 273,165 | | | Cardiovascular Systems, Inc.* | | | 1,445,043 | |
| | 23,597,360 | | | LMA International N.V.* (Singapore) | | | 5,200,421 | |
| | 70,270 | | | NuVasive, Inc.* | | | 2,469,288 | |
| | 177,150 | | | Synovis Life Technologies, Inc.* | | | 2,648,392 | |
| | | | | | | | |
| | | | | | | 19,489,534 | |
| | | | | | | | |
| | | | Health Care Facilities 1.7% | | | | |
| | 132,776 | | | AmSurg Corp.* | | | 2,320,925 | |
| | 248,625 | | | NovaMed, Inc.* | | | 2,409,176 | |
| | | | | | | | |
| | | | | | | 4,730,101 | |
| | | | | | | | |
| | | | Health Care Services 6.2% | | | | |
| | 115,307 | | | Bio-Reference Laboratories, Inc.* | | | 2,405,304 | |
| | 669,825 | | | Clarient, Inc.* | | | 2,264,008 | |
| | 169,807 | | | CorVel Corp.* | | | 7,208,307 | |
| | 129,790 | | | Healthways, Inc.* | | | 1,510,756 | |
| | 108,855 | | | IPC The Hospitalist Co., Inc.* | | | 2,973,919 | |
| | 55,390 | | | LHC Group, Inc.* | | | 1,284,494 | |
| | | | | | | | |
| | | | | | | 17,646,788 | |
| | | | | | | | |
| | | | Health Care Technology 2.1% | | | | |
| | 75,185 | | | Computer Programs and Systems, Inc. | | | 3,200,626 | |
| | 428,045 | | | RaySearch Laboratories AB (Sweden) | | | 2,649,766 | |
| | | | | | | | |
| | | | | | | 5,850,392 | |
| | | | | | | | |
| | | | Industrial Machinery 1.3% | | | | |
| | 250,000 | | | AIA Engineering Ltd. (India) | | | 2,225,437 | |
| | 182,635 | | | China Valves Technology, Inc.* (China) | | | 1,417,247 | |
| | | | | | | | |
| | | | | | | 3,642,684 | |
| | | | | | | | |
| | | | Internet Software & Services 4.0% | | | | |
| | 92,675 | | | Constant Contact, Inc.* | | | 1,986,025 | |
| | 288,490 | | | DealerTrack Holdings, Inc.* | | | 4,927,409 | |
| | 261,275 | | | SPS Commerce, Inc.* | | | 3,349,546 | |
| | 232,605 | | | TechTarget, Inc.* | | | 1,221,176 | |
| | | | | | | | |
| | | | | | | 11,484,156 | |
| | | | | | | | |
| | | | IT Consulting & Other Services 0.6% | | | | |
| | 931,770 | | | CSG Ltd. (Australia) | | | 1,613,821 | |
| | | | | | | | |
| | | | Life Sciences Tools & Services 3.7% | | | | |
| | 1,348 | | | EPS Co. Ltd. (Japan) | | | 3,439,641 | |
| | 187,499 | | | ICON plc ADR* (Ireland) | | | 4,053,728 | |
| | 263,436 | | | MEDTOX Scientific, Inc.* | | | 3,063,761 | |
| | | | | | | | |
| | | | | | | 10,557,130 | |
| | | | | | | | |
| | | | Oil & Gas Equipment & Services 1.1% | | | | |
| | 252,800 | | | Pason Systems, Inc. (Canada) | | | 3,000,674 | |
| | | | | | | | |
| | | | Oil & Gas Exploration & Production 0.5% | | | | |
| | 820,710 | | | Ithaca Energy, Inc.* (Canada) | | | 1,473,590 | |
| | | | | | | | |
64
| | | | | | | | |
| Shares | | | | | Value | |
| | | | | | | |
| | | | Pharmaceuticals 1.1% | | | | |
| | 414,685 | | | Akorn, Inc.* | | $ | 1,675,327 | |
| | 106,000 | | | Alexza Pharmaceuticals, Inc.* | | | 336,020 | |
| | 326,809 | | | Alexza Pharmaceuticals, Inc. PIPE* † | | | 1,035,985 | |
| | | | | | | | |
| | | | | | | 3,047,332 | |
| | | | | | | | |
| | | | Regional Banks 1.9% | | | | |
| | 133,114 | | | Commonwealth Bankshares, Inc.* | | | 320,805 | |
| | 477,035 | | | First California Financial Group, Inc.* | | | 1,178,276 | |
| | 259,420 | | | Nara Bancorp, Inc.* | | | 1,831,505 | |
| | 217,791 | | | Pacific Continental Corp. | | | 1,971,009 | |
| | | | | | | | |
| | | | | | | 5,301,595 | |
| | | | | | | | |
| | | | Research & Consulting Services 3.3% | | | | |
| | 128,331 | | | CRA International, Inc.* | | | 2,316,374 | |
| | 316,350 | | | Resources Connection, Inc. | | | 4,352,976 | |
| | 99,395 | | | Stantec, Inc.* (Canada) | | | 2,625,022 | |
| | | | | | | | |
| | | | | | | 9,294,372 | |
| | | | | | | | |
| | | | Restaurants 1.5% | | | | |
| | 122,865 | | | Peet’s Coffee & Tea, Inc.* | | | 4,205,669 | |
| | | | | | | | |
| | | | Semiconductors 10.5% | | | | |
| | 265,807 | | | Melexis N.V.* (Belgium) | | | 4,026,797 | |
| | 566,885 | | | Micrel, Inc. | | | 5,589,486 | |
| | 79,482 | | | NetLogic Microsystems, Inc.* | | | 2,192,114 | |
| | 865,747 | | | O2Micro International Ltd. ADR* (China) | | | 5,289,714 | |
| | 280,293 | | | Pericom Semiconductor Corp.* | | | 2,435,746 | |
| | 264,483 | | | Power Integrations, Inc. | | | 8,407,915 | |
| | 87,470 | | | Supertex, Inc.* | | | 1,934,836 | |
| | | | | | | | |
| | | | | | | 29,876,608 | |
| | | | | | | | |
| | | | Specialized Finance 0.1% | | | | |
| | 154,000 | | | Goldwater Bank, N.A.* *** † | | | 281,050 | |
| | | | | | | | |
| | | | Specialty Chemicals 0.8% | | | | |
| | 461,662 | | | Neo Material Technologies, Inc.* (Canada) | | | 2,204,471 | |
| | | | | | | | |
| | | | Specialty Stores 4.4% | | | | |
| | 322,805 | | | Big 5 Sporting Goods Corp. | | | 4,332,043 | |
| | 197,015 | | | easyhome Ltd. (Canada) | | | 2,237,177 | |
| | 241,077 | | | Hibbett Sports, Inc.* | | | 6,014,871 | |
| | | | | | | | |
| | | | | | | 12,584,091 | |
| | | | | | | | |
| | | | Systems Software 2.4% | | | | |
| | 337,175 | | | OPNET Technologies, Inc. | | | 6,119,726 | |
| | 19,860 | | | Sourcefire, Inc.* | | | 572,763 | |
| | | | | | | | |
| | | | | | | 6,692,489 | |
| | | | | | | | |
| | | | Thrifts & Mortgage Finance 2.3% | | | | |
| | 578,300 | | | Dewan Housing Finance Corp. Ltd. (India) | | | 3,675,587 | |
| | 64,040 | | | Home Capital Group, Inc. (Canada) | | | 2,765,215 | |
| | | | | | | | |
| | | | | | | 6,440,802 | |
| | | | | | | | |
| | | | Trading Companies & | | | | |
| | | | Distributors 2.4% | | | | |
| | 259,162 | | | CAI International, Inc.* | | | 3,931,488 | |
| | 220,363 | | | Rush Enterprises, Inc., Class B* | | | 3,029,991 | |
| | | | | | | | |
| | | | | | | 6,961,479 | |
| | | | | | | | |
| | | | Trucking 2.7% | | | | |
| | 114,765 | | | Marten Transport, Ltd. | | | 2,660,253 | |
| | 110,422 | | | Old Dominion Freight Line, Inc.* | | | 2,806,927 | |
| | 210,433 | | | Vitran Corp., Inc.* (Canada) | | | 2,304,241 | |
| | | | | | | | |
| | | | | | | 7,771,421 | |
| | | | | | | | |
| | |
| | | | Total Common Stocks
(cost $241,608,384) | | | 272,944,107 | |
| | | | | | | | |
| | | | | | | | |
| Shares | | | | | Value | |
| | | | | | | |
| | | | PREFERRED STOCKS 1.2% | | | | |
| | |
| | | | Regional Banks 1.2% | | | | |
| | 504,600 | | | Banco Daycoval S.A. Pfd. (Brazil) | | $ | 3,318,326 | |
| | | | | | | | |
| | |
| | | | Total Preferred Stocks
(cost $1,912,500) | | | 3,318,326 | |
| | | | | | | | |
| | |
| | | | WARRANTS 0.1% | | | | |
| | |
| | | | Health Care Equipment 0.1% | | | | |
| | 121,124 | | | Cardica, Inc., expiring 6/7/12* *** † | | | — | |
| | 322,500 | | | Cardica, Inc., expiring 9/29/14* *** † | | | 232,200 | |
| | | | | | | | |
| | | | | | | 232,200 | |
| | | | | | | | |
| | | | Pharmaceuticals 0.0% | | | | |
| | 53,000 | | | Alexza Pharmaceuticals, Inc., expiring 8/10/15* *** † | | | — | |
| | 294,128 | | | Alexza Pharmaceuticals, Inc., expiring 10/5/16* *** † | | | 117,651 | |
| | | | | | | | |
| | | | | | | 117,651 | |
| | | | | | | | |
| | |
| | | | Total Warrants
(cost $96,458) | | | 349,851 | |
| | | | | | | | |
| | |
Principal
Amount | | | | | Value | |
| | | | | | | |
| | | | SHORT-TERM INVESTMENTS 2.3% | | | | |
| | |
| | | | Repurchase Agreement 2.3% | | | | |
| | $6,492,000 | | | Repurchase Agreement dated 9/30/10, 0.01% due 10/1/10 with State Street Bank and Trust Co. collateralized by $6,225,000 of United States Treasury Notes 4.625% due 2/29/12; value: $6,624,023; repurchase proceeds: $6,492,002 (cost $6,492,000) | | $ | 6,492,000 | |
| | | | | | | | |
| | |
| | | | Total Short-Term Investments
(cost $6,492,000) | | | 6,492,000 | |
| | | | | | | | |
| | |
| | | | Total Investments
(cost $250,109,342) 99.8% | | | 283,104,284 | |
| | |
| | | | Other Assets less Liabilities 0.2% | | | 446,976 | |
| | | | | | | | |
| | |
| | | | NET ASSETS 100.0% | | $ | 283,551,260 | |
| | | | | | | | |
| |
| | | | *Non-income producing. ***Security was fair valued under procedures adopted by the Board of Trustees (see Note 15). †Security purchased in a private placement transaction or under Rule 144A of the Securities Act of 1933 (see Note 11). ADR American Depositary Receipt. PIPE Private Investment in a Public Equity. See Notes to Financial Statements. | |
65
| | |
| WASATCH MICRO CAP FUND (WMICX) — Schedule of Investments (continued) | | SEPTEMBER 30, 2010 |
|
| |
| |
At September 30, 2010, Wasatch Micro Cap Fund’s investments, excluding short-term investments, were in the following countries:
| | | | |
| Country | | % | |
Australia | | | 1.4 | |
Belgium | | | 1.4 | |
Brazil | | | 1.2 | |
Canada | | | 6.0 | |
China | | | 7.3 | |
Germany | | | 1.3 | |
India | | | 2.1 | |
Ireland | | | 1.5 | |
Japan | | | 1.2 | |
Singapore | | | 3.4 | |
Sweden | | | 1.0 | |
United Kingdom | | | 2.2 | |
United States | | | 70.0 | |
| | | | |
TOTAL | | | 100.0 | % |
| | | | |
66
| | |
| WASATCH MICRO CAP VALUE FUND (WAMVX) — Schedule of Investments | | SEPTEMBER 30, 2010 |
|
| |
| |
| | | | | | | | |
| Shares | | | | | Value | |
| | | | | | | |
| | | | COMMON STOCKS 85.4% | | | | |
| | |
| | | | Air Freight & Logistics 1.5% | | | | |
| | 1,800,000 | | | Aramex PJSC* (United Arab Emirates) | | $ | 1,078,226 | |
| | 115,000 | | | Transat A.T., Inc.* (Canada) | | | 1,752,317 | |
| | | | | | | | |
| | | | | | | 2,830,543 | |
| | | | | | | | |
| | | | Airlines 1.0% | | | | |
| | 45,000 | | | Allegiant Travel Co. | | | 1,904,400 | |
| | | | | | | | |
| | | | Apparel Retail 1.1% | | | | |
| | 100,000 | | | Cache, Inc.* | | | 510,000 | |
| | 185,000 | | | Christopher & Banks Corp. | | | 1,463,350 | |
| | | | | | | | |
| | | | | | | 1,973,350 | |
| | | | | | | | |
| | | | Apparel, Accessories & Luxury
Goods 2.0% | | | | |
| | 60,000 | | | LG Fashion Corp. (Korea) | | | 1,789,081 | |
| | 200,000 | | | Ted Baker plc (United Kingdom) | | | 1,766,532 | |
| | 368,477 | | | Zhulian Corp. Bhd. (Malaysia) | | | 230,373 | |
| | | | | | | | |
| | | | | | | 3,785,986 | |
| | | | | | | | |
| | | | Application Software 4.4% | | | | |
| | 75,000 | | | Ebix, Inc.* | | | 1,758,750 | |
| | 350,000 | | | GSE Systems, Inc.* | | | 1,179,500 | |
| | 380,000 | | | ICSA India Ltd. (India) | | | 1,056,659 | |
| | 80,000 | | | Interactive Intelligence, Inc.* | | | 1,408,000 | |
| | 85,000 | | | JDA Software Group, Inc.* | | | 2,155,600 | |
| | 475,000 | | | Redknee Solutions, Inc.* (Canada) | | | 650,022 | |
| | | | | | | | |
| | | | | | | 8,208,531 | |
| | | | | | | | |
| | | | Asset Management & Custody
Banks 3.4% | | | | |
| | 125,000 | | | Solar Capital Ltd. | | | 2,681,250 | |
| | 360,000 | | | Treasury Group Ltd. (Australia) | | | 1,674,294 | |
| | 63,000 | | | Virtus Investment Partners, Inc.* | | | 1,906,380 | |
| | | | | | | | |
| | | | | | | 6,261,924 | |
| | | | | | | | |
| | | | Auto Parts & Equipment 0.7% | | | | |
| | 180,000 | | | Martinrea International, Inc.* (Canada) | | | 1,327,704 | |
| | | | | | | | |
| | | | Automotive Retail 1.0% | | | | |
| | 40,000 | | | Monro Muffler Brake, Inc.‡ | | | 1,844,400 | |
| | | | | | | | |
| | | | Biotechnology 1.4% | | | | |
| | 800,000 | | | Dyadic International, Inc.* | | | 1,152,000 | |
| | 380,372 | | | Luna Innovations, Inc.* | | | 768,351 | |
| | 85,000 | | | NeurogesX, Inc. PIPE* † | | | 587,350 | |
| | | | | | | | |
| | | | | | | 2,507,701 | |
| | | | | | | | |
| | | | Building Products 0.8% | | | | |
| | 155,000 | | | NCI Building Systems, Inc.* | | | 1,477,150 | |
| | | | | | | | |
| | | | Commercial Printing 0.0% | | | | |
| | 2,400 | | | Multi-Color Corp. | | | 35,744 | |
| | | | | | | | |
| | | | Communications Equipment 2.1% | | | | |
| | 60,000 | | | Blue Coat Systems, Inc.* ‡ | | | 1,443,600 | |
| | 170,000 | | | Dasan Networks, Inc.* (Korea) | | | 1,408,902 | |
| | 450,000 | | | UTStarcom, Inc.* | | | 976,500 | |
| | | | | | | | |
| | | | | | | 3,829,002 | |
| | | | | | | | |
| | | | Computer Hardware 0.8% | | | | |
| | 200,000 | | | Silicon Graphics International Corp.* | | | 1,552,000 | |
| | | | | | | | |
| | | | Computer Storage & Peripherals 0.9% | | | | |
| | 170,000 | | | Intevac, Inc.* | | | 1,701,700 | |
| | | | | | | | |
| | | | Construction & Engineering 1.1% | | | | |
| | 60,000 | | | Michael Baker Corp.* | | | 1,977,600 | |
| | | | | | | | |
| | | | | | | | |
| Shares | | | | | Value | |
| | | | | | | |
| | | | Consumer Finance 1.9% | | | | |
| | 300,000 | | | Advance America Cash Advance Centers, Inc. | | $ | 1,209,000 | |
| | 80,000 | | | First Cash Financial Services, Inc.* | | | 2,220,000 | |
| | | | | | | | |
| | | | | | | 3,429,000 | |
| | | | | | | | |
| | | | Data Processing & Outsourced Services 2.0% | | | | |
| | 200,000 | | | DJSP Enterprises, Inc.* | | | 712,000 | |
| | 345,000 | | | Online Resources Corp.* | | | 1,531,800 | |
| | 110,000 | | | Wirecard AG (Germany) | | | 1,497,086 | |
| | | | | | | | |
| | | | | | | 3,740,886 | |
| | | | | | | | |
| | | | Department Stores 0.7% | | | | |
| | 14,000,000 | | | PT Ramayana Lestari Sentosa Tbk (Indonesia) | | | 1,364,706 | |
| | | | | | | | |
| | | | Distillers & Vintners 0.6% | | | | |
| | 300,000 | | | Globus Spirits Ltd. (India) | | | 1,110,270 | |
| | | | | | | | |
| | | | Distributors 1.0% | | | | |
| | 28,000 | | | Delticom AG (Germany) | | | 1,890,887 | |
| | | | | | | | |
| | | | Diversified Banks 1.3% | | | | |
| | 55,556 | | | Idaho Trust Bancorp* *** † | | | 215,002 | |
| | 550,000 | | | Karnataka Bank Ltd. (India) | | | 2,225,214 | |
| | | | | | | | |
| | | | | | | 2,440,216 | |
| | | | | | | | |
| | | | Diversified Metals & Mining 0.7% | | | | |
| | 90,000 | | | Globe Specialty Metals, Inc.* ‡ | | | 1,263,600 | |
| | | | | | | | |
| | | | Education Services 1.4% | | | | |
| | 335,000 | | | China Education Alliance, Inc.* (China) | | | 1,383,550 | |
| | 86,000 | | | Lincoln Educational Services Corp.* | | | 1,239,260 | |
| | | | | | | | |
| | | | | | | 2,622,810 | |
| | | | | | | | |
| | | | Electrical Components &
Equipment 0.7% | | | | |
| | 1,600,000 | | | Wasion Group Holdings Ltd. (China) | | | 1,226,915 | |
| | | | | | | | |
| | | | Electronic Manufacturing
Services 1.2% | | | | |
| | 220,000 | | | TTM Technologies, Inc.* | | | 2,153,800 | |
| | | | | | | | |
| | | | Environmental & Facilities
Services 1.2% | | | | |
| | 100,000 | | | EnergySolutions, Inc. | | | 503,000 | |
| | 175,000 | | | Heritage-Crystal Clean, Inc.* | | | 1,758,750 | |
| | | | | | | | |
| | | | | | | 2,261,750 | |
| | | | | | | | |
| | | | Food Retail 0.6% | | | | |
| | 80,000 | | | Susser Holdings Corp.* | | | 1,120,000 | |
| | | | | | | | |
| | | | Gas Utilities 1.0% | | | | |
| | 275,000 | | | Indraprastha Gas Ltd. (India) | | | 1,878,825 | |
| | | | | | | | |
| | | | Health Care Distributors 0.7% | | | | |
| | 500,000 | | | Animal Health International, Inc.* | | | 1,375,000 | |
| | | | | | | | |
| | | | Health Care Equipment 3.9% | | | | |
| | 220,000 | | | AtriCure, Inc.* | | | 1,746,800 | |
| | 221,000 | | | Cardica, Inc. PIPE* † | | | 479,570 | |
| | 60,000 | | | Invacare Corp. | | | 1,590,600 | |
| | 700,000 | | | Solta Medical, Inc.* | | | 1,400,000 | |
| | 65,000 | | | Zoll Medical Corp.* | | | 2,097,550 | |
| | | | | | | | |
| | | | | | | 7,314,520 | |
| | | | | | | | |
| | | | Health Care Services 1.5% | | | | |
| | 52,000 | | | Bio-Reference Laboratories, Inc.* | | | 1,084,720 | |
| | 75,000 | | | LHC Group, Inc.* | | | 1,739,250 | |
| | | | | | | | |
| | | | | | | 2,823,970 | |
| | | | | | | | |
67
| | |
| WASATCH MICRO CAP VALUE FUND (WAMVX) — Schedule of Investments (continued) | | |
|
| |
| |
| | | | | | | | |
| Shares | | | | | Value | |
| | | | | | | |
| | | | Health Care Technology 0.5% | | | | |
| | 565,996 | | | iCAD, Inc.* | | $ | 996,153 | |
| | | | | | | | |
| | | | Home Furnishings 0.6% | | | | |
| | 92,000 | | | Hooker Furniture Corp. | | | 1,069,960 | |
| | | | | | | | |
| | | | Home Improvement Retail 2.0% | | | | |
| | 10,000,000 | | | Ace Hardware Indonesia (Indonesia) | | | 2,268,908 | |
| | 170,000 | | | Byggmax Group AB* (Sweden) | | | 1,447,633 | |
| | | | | | | | |
| | | | | | | 3,716,541 | |
| | | | | | | | |
| | | | Hotels, Resorts & Cruise Lines 0.8% | | | | |
| | 140,900 | | | Orient-Express Hotels Ltd., Class A* | | | 1,571,035 | |
| | | | | | | | |
| | | | Industrial Machinery 2.1% | | | | |
| | 170,000 | | | China Valves Technology, Inc.* (China) | | | 1,319,200 | |
| | 95,000 | | | Gencor Industries, Inc.* | | | 678,300 | |
| | 110,000 | | | Hurco Cos., Inc.* | | | 1,987,700 | |
| | | | | | | | |
| | | | | | | 3,985,200 | |
| | | | | | | | |
| | | | Internet Software & Services 1.8% | | | | |
| | 215,000 | | | InfoSpace, Inc.* | | | 1,861,900 | |
| | 255,000 | | | United Online, Inc. | | | 1,458,600 | |
| | | | | | | | |
| | | | | | | 3,320,500 | |
| | | | | | | | |
| | | | Investment Banking &
Brokerage 0.9% | | | | |
| | 345,000 | | | GFI Group, Inc. | | | 1,600,800 | |
| | | | | | | | |
| | | | IT Consulting & Other Services 1.1% | | | | |
| | 150,000 | | | Atea ASA (Norway) | | | 1,187,977 | |
| | 500,000 | | | CSG Ltd. (Australia) | | | 865,998 | |
| | | | | | | | |
| | | | | | | 2,053,975 | |
| | | | | | | | |
| | | | Oil & Gas Equipment & Services 1.5% | | | | |
| | 140,000 | | | TETRA Technologies, Inc.* | | | 1,428,000 | |
| | 155,000 | | | Willbros Group, Inc.* | | | 1,421,350 | |
| | | | | | | | |
| | | | | | | 2,849,350 | |
| | | | | | | | |
| | | | Oil & Gas Exploration &
Production 2.1% | | | | |
| | 367,535 | | | Abraxas Petroleum Corp.* | | | 1,043,799 | |
| | 230,000 | | | Pan Orient Energy Corp.* (Canada) | | | 1,667,492 | |
| | 160,000 | | | Selan Exploration Technology Ltd. (India) | | | 1,192,478 | |
| | | | | | | | |
| | | | | | | 3,903,769 | |
| | | | | | | | |
| | | | Personal Products 2.0% | | | | |
| | 90,000 | | | Atrium Innovations, Inc.* (Canada) | | | 1,286,650 | |
| | 250,000 | | | Prestige Brands Holdings, Inc.* | | | 2,472,500 | |
| | | | | | | | |
| | | | | | | 3,759,150 | |
| | | | | | | | |
| | | | Pharmaceuticals 1.5% | | | | |
| | 38,001 | | | Daewoong Pharmaceutical Co. Ltd. (Korea) | | | 1,631,352 | |
| | 180,000 | | | Whanin Pharmaceutical Co. Ltd. (Korea) | | | 1,084,499 | |
| | | | | | | | |
| | | | | | | 2,715,851 | |
| | | | | | | | |
| | | | Property & Casualty Insurance 0.6% | | | | |
| | 140,000 | | | SeaBright Holdings, Inc. | | | 1,128,400 | |
| | | | | | | | |
| | | | Regional Banks 4.9% | | | | |
| | 2,100,000 | | | City Union Bank Ltd. (India) | | | 2,117,058 | |
| | 300,000 | | | First California Financial Group, Inc.* | | | 741,000 | |
| | 85,000 | | | First of Long Island Corp. (The) | | | 2,123,300 | |
| | 50,000 | | | Lakeland Financial Corp. | | | 933,000 | |
| | 140,000 | | | OBA Financial Services, Inc.* | | | 1,552,600 | |
| | 80,000 | | | Tower Bancorp, Inc. | | | 1,621,600 | |
| | | | | | | | |
| | | | | | | 9,088,558 | |
| | | | | | | | |
| | | | Restaurants 0.8% | | | | |
| | 1,000,000 | | | Ajisen China Holdings Ltd. (China) | | | 1,564,574 | |
| | | | | | | | |
| | | | | | | | |
| Shares | | | | | Value | |
| | | | | | | |
| | | | Semiconductor Equipment 0.8% | | | | |
| | 100,000 | | | Koh Young Technology, Inc.* (Korea) | | $ | 1,398,816 | |
| | | | | | | | |
| | | | Semiconductors 1.8% | | | | |
| | 350,000 | | | PLX Technology, Inc.* | | | 1,267,000 | |
| | 88,000 | | | Standard Microsystems Corp.* | | | 2,007,280 | |
| | | | | | | | |
| | | | | | | 3,274,280 | |
| | | | | | | | |
| | | | Specialized Finance 0.8% | | | | |
| | 41,900 | | | Goldwater Bank, N.A.* *** † | | | 76,468 | |
| | 180,000 | | | Newstar Financial, Inc.* | | | 1,333,800 | |
| | | | | | | | |
| | | | | | | 1,410,268 | |
| | | | | | | | |
| | | | Specialty Chemicals 0.5% | | | | |
| | 200,000 | | | Neo Material Technologies, Inc.* (Canada) | | | 955,015 | |
| | | | | | | | |
| | | | Specialty Stores 2.3% | | | | |
| | 100,000 | | | Big 5 Sporting Goods Corp. | | | 1,342,000 | |
| | 260,000 | | | easyhome Ltd. (Canada) | | | 2,952,395 | |
| | | | | | | | |
| | | | | | | 4,294,395 | |
| | | | | | | | |
| | | | Steel 2.1% | | | | |
| | 70,000 | | | Haynes International, Inc. | | | 2,444,400 | |
| | 60,000 | | | Olympic Steel, Inc.‡ | | | 1,379,400 | |
| | | | | | | | |
| | | | | | | 3,823,800 | |
| | | | | | | | |
| | | | Systems Software 2.7% | | | | |
| | 1,400,000 | | | GuestLogix, Inc.* (Canada) | | | 1,603,338 | |
| | 97,000 | | | OPNET Technologies, Inc. | | | 1,760,550 | |
| | 2,600 | | | Simplex Technology, Inc. (Japan) | | | 1,576,041 | |
| | | | | | | | |
| | | | | | | 4,939,929 | |
| | | | | | | | |
| | | | Textiles 1.1% | | | | |
| | 1,200,000 | | | S. Kumars Nationwide Ltd.* (India) | | | 2,064,315 | |
| | | | | | | | |
| | | | Thrifts & Mortgage Finance 3.8% | | | | |
| | 350,000 | | | Dewan Housing Finance Corp. Ltd. (India) | | | 2,224,547 | |
| | 130,000 | | | Ocean Shore Holding Co. | | | 1,389,700 | |
| | 175,000 | | | Oritani Financial Corp. | | | 1,746,500 | |
| | 205,000 | | | Westfield Financial, Inc. | | | 1,599,000 | |
| | | | | | | | |
| | | | | | | 6,959,747 | |
| | | | | | | | |
| | | | Trading Companies &
Distributors 1.0% | | | | |
| | 100,000 | | | Interline Brands, Inc.* ‡ | | | 1,804,000 | |
| | | | | | | | |
| | | | Trucking 2.1% | | | | |
| | 70,000 | | | Marten Transport, Ltd. | | | 1,622,600 | |
| | 75,000 | | | USA Truck, Inc.* | | | 1,123,500 | |
| | 100,000 | | | Vitran Corp., Inc.* (Canada) | | | 1,095,000 | |
| | | | | | | | |
| | | | | | | 3,841,100 | |
| | | | | | | | |
| | | | Water Utilities 0.6% | | | | |
| | 1,700,000 | | | Sound Global Ltd.* (Singapore) | | | 1,111,027 | |
| | | | | | | | |
| | |
| | | | Total Common Stocks
(cost $139,969,050) | | | 158,435,398 | |
| | | | | | | | |
| | |
| | | | WARRANTS 0.0% | | | | |
| | |
| | | | Biotechnology 0.0% | | | | |
| | 30,399 | | | NeurogesX, Inc., expiring 12/28/12* *** † | | | — | |
| | | | | | | | |
| | | | Health Care Equipment 0.0% | | | | |
| | 58,140 | | | Cardica, Inc., expiring 6/7/12* *** † | | | — | |
| | 110,500 | | | Cardica, Inc., expiring 9/29/14* *** † | | | 79,560 | |
| | | | | | | | |
| | | | | | | 79,560 | |
| | | | | | | | |
| | |
| | | | Total Warrants
(cost $26,915) | | | 79,560 | |
| | | | | | | | |
68
| | | | | | | | |
Principal
Amount | | | | | Value | |
| | | | | | | |
| | | | SHORT-TERM INVESTMENTS 15.3% | | | | |
| | |
| | | | Repurchase Agreement 15.3% | | | | |
| | $28,445,000 | | | Repurchase Agreement dated 9/30/10, 0.01% due 10/1/10 with State Street Bank and Trust Co. collateralized by $26,930,000 of United States Treasury Notes 3.125% due 5/15/19; value: $29,017,075; repurchase proceeds: $28,445,000‡ (cost $28,445,000) | | $ | 28,445,000 | |
| | | | | | | | |
| | |
| | | | Total Short-Term Investments
(cost $28,445,000) | | | 28,445,000 | |
| | | | | | | | |
| | |
| | | | Total Investments
(cost $168,440,965) 100.7% | | | 186,959,958 | |
| | |
| | | | Liabilities less Other Assets (0.7)% | | | (1,373,087 | ) |
| | | | | | | | |
| | |
| | | | NET ASSETS 100.0% | | $ | 185,586,871 | |
| | | | | | | | |
| | |
Number of
Contracts | | | | | Value | |
| | | | | | | |
| | | | CALL OPTIONS WRITTEN 0.2% | | | | |
| | |
| | | | Automotive Retail 0.0% | | | | |
| | 400 | | | Monro Muffler Brake, Inc., expiring 10/16/10, exercise price $45 | | $ | 64,000 | |
| | | | | | | | |
| | | | Communications Equipment 0.0% | | | | |
| | 600 | | | Blue Coat Systems, Inc., expiring 10/16/10, exercise price $25 | | | 36,000 | |
| | | | | | | | |
| | | | Diversified Metals & Mining 0.1% | | | | |
| | 900 | | | Globe Specialty Metals, Inc., expiring 10/16/10, exercise price $12.50 | | | 144,000 | |
| | | | | | | | |
| | | | Steel 0.1% | | | | |
| | 400 | | | Olympic Steel, Inc., expiring 10/16/10, exercise price $20 | | | 106,000 | |
| | 200 | | | Olympic Steel, Inc., expiring 11/20/10, exercise price $22.50 | | | 39,000 | |
| | | | | | | | |
| | | | | | | 145,000 | |
| | | | | | | | |
| | | | Trading Companies &
Distributors 0.0% | | | | |
| | 1,000 | | | Interline Brands, Inc., expiring 10/16/10, exercise price $17.50 | | | 60,000 | |
| | | | | | | | |
| | |
| | | | Total Call Options Written (premium $374,128) | | | 449,000 | |
| | | | | | | | |
| |
| | | | *Non-income producing. ***Security was fair valued under procedures adopted by the Board of Trustees (see Note 15). †Security purchased in a private placement transaction or under Rule 144A of the Securities Act of 1933 (see Note 11). ‡All or a portion of this security has been designated as collateral for call options written (see Note 4). PIPE Private Investment in a Public Equity. See Notes to Financial Statements. | |
At September 30, 2010, Wasatch Micro Cap Value Fund’s investments, excluding short-term investments and options written, were in the following countries:
| | | | |
| Country | | % | |
Australia | | | 1.6 | |
Canada | | | 8.4 | |
China | | | 3.5 | |
Germany | | | 2.1 | |
India | | | 8.8 | |
Indonesia | | | 2.3 | |
Japan | | | 1.0 | |
Korea | | | 4.6 | |
Malaysia | | | 0.1 | |
Norway | | | 0.7 | |
Singapore | | | 0.7 | |
Sweden | | | 0.9 | |
United Arab Emirates | | | 0.7 | |
United Kingdom | | | 1.1 | |
United States | | | 63.5 | |
| | | | |
TOTAL | | | 100.0 | % |
| | | | |
69
| | |
| WASATCH SMALL CAP GROWTH FUND (WAAEX) — Schedule of Investments | | |
|
| |
| |
| | | | | | | | |
| Shares | | | | | Value | |
| | | | | | | |
| | | | COMMON STOCKS 96.9% | | | | |
| | |
| | | | Aerospace & Defense 2.1% | | | | |
| | 243,562 | | | HEICO Corp. | | $ | 11,116,170 | |
| | 344,538 | | | HEICO Corp., Class A | | | 11,738,409 | |
| | | | | | | | |
| | | | | | | 22,854,579 | |
| | | | | | | | |
| | | | Air Freight & Logistics 1.9% | | | | |
| | 35,694,386 | | | Aramex PJSC* (United Arab Emirates) | | | 21,381,449 | |
| | | | | | | | |
| | | | Aluminum 0.8% | | | | |
| | 11,305,282 | | | Midas Holdings Ltd. (Singapore) | | | 8,548,336 | |
| | | | | | | | |
| | | | Apparel Retail 1.0% | | | | |
| | 546,319 | | | Zumiez, Inc.* | | | 11,560,110 | |
| | | | | | | | |
| | | | Apparel, Accessories & Luxury Goods 1.9% | | | | |
| | 4,931,685 | | | Ports Design Ltd. (China) | | | 13,633,271 | |
| | 384,108 | | | Volcom, Inc.* | | | 7,344,145 | |
| | | | | | | | |
| | | | | | | 20,977,416 | |
| | | | | | | | |
| | | | Application Software 6.3% | | | | |
| | 161,820 | | | Concur Technologies, Inc.* | | | 8,000,381 | |
| | 76,162 | | | FactSet Research Systems, Inc. | | | 6,179,023 | |
| | 502,296 | | | RealPage, Inc.* | | | 9,583,807 | |
| | 444,472 | | | SciQuest, Inc.* | | | 5,369,222 | |
| | 1,061,964 | | | Ultimate Software Group, Inc.* | | | 41,034,289 | |
| | | | | | | | |
| | | | | | | 70,166,722 | |
| | | | | | | | |
| | | | Asset Management & Custody Banks 0.7% | | | | |
| | 284,740 | | | Waddell & Reed Financial, Inc., Class A | | | 7,790,486 | |
| | | | | | | | |
| | | | Automotive Retail 1.7% | | | | |
| | 349,275 | | | O’Reilly Automotive, Inc.* †† | | | 18,581,430 | |
| | | | | | | | |
| | | | Biotechnology 1.9% | | | | |
| | 541,521 | | | Myriad Genetics, Inc.* | | | 8,886,360 | |
| | 314,495 | | | Orexigen Therapeutics, Inc.* | | | 1,864,955 | |
| | 146,199 | | | Orexigen Therapeutics, Inc., Series C PIPE* † | | | 866,960 | |
| | 259,725 | | | Sangamo BioSciences, Inc.* | | | 890,857 | |
| | 469,510 | | | Seattle Genetics, Inc.* | | | 7,291,490 | |
| | 205,700 | | | ZymoGenetics, Inc.* | | | 2,005,575 | |
| | | | | | | | |
| | | | | | | 21,806,197 | |
| | | | | | | | |
| | | | Coal & Consumable Fuels 0.0% | | | | |
| | 28,490 | | | Amyris, Inc.* | | | 491,453 | |
| | | | | | | | |
| | | | Communications Equipment 3.5% | | | | |
| | 20,515 | | | Calix, Inc.* | | | 294,595 | |
| | 133,645 | | | F5 Networks, Inc.* | | | 13,873,688 | |
| | 531,200 | | | Riverbed Technology, Inc.* | | | 24,212,096 | |
| | | | | | | | |
| | | | | | | 38,380,379 | |
| | | | | | | | |
| | | | Computer & Electronics Retail 0.6% | | | | |
| | 250,578 | | | hhgregg, Inc.* | | | 6,204,311 | |
| | | | | | | | |
| | | | Construction & Farm Machinery & Heavy Trucks 1.2% | | | | |
| | 186,231 | | | Bucyrus International, Inc. | | | 12,915,120 | |
| | | | | | | | |
| | | | Data Processing & Outsourced Services 1.8% | | | | |
| | 1,483,625 | | | Wirecard AG (Germany) | | | 20,191,947 | |
| | | | | | | | |
| | | | Distributors 1.1% | | | | |
| | 594,933 | | | LKQ Corp.* | | | 12,374,606 | |
| | | | | | | | |
| | | | Diversified Banks 2.5% | | | | |
| | 148,711 | | | HDFC Bank Ltd. ADR (India) | | | 27,417,847 | |
| | | | | | | | |
| | | | | | | | |
| Shares | | | | | Value | |
| | | | | | | |
| | | | Diversified Support Services 3.1% | | | | |
| | 543,576 | | | Copart, Inc.* | | $ | 17,921,701 | |
| | 321,015 | | | Ritchie Bros. Auctioneers, Inc. (Canada) | | | 6,667,482 | |
| | 432,825 | | | STR Holdings, Inc.* | | | 9,323,050 | |
| | | | | | | | |
| | | | | | | 33,912,233 | |
| | | | | | | | |
| | | | Electrical Components & Equipment 0.5% | | | | |
| | 176,550 | | | Polypore International, Inc.* | | | 5,324,748 | |
| | | | | | | | |
| | | | Environmental & Facilities Services 2.0% | | | | |
| | 2,232,175 | | | RPS Group plc (United Kingdom) | | | 6,554,489 | |
| | 738,060 | | | Tetra Tech, Inc.* | | | 15,477,118 | |
| | | | | | | | |
| | | | | | | 22,031,607 | |
| | | | | | | | |
| | | | Health Care Distributors 1.4% | | | | |
| | 276,881 | | | MWI Veterinary Supply, Inc.* | | | 15,981,571 | |
| | | | | | | | |
| | | | Health Care Equipment 1.5% | | | | |
| | 493,194 | | | Abaxis, Inc.* | | | 11,392,781 | |
| | 413,221 | | | DexCom, Inc.* | | | 5,462,782 | |
| | 1,620,220 | | | Zonare Medical Systems, Inc.* *** † | | | 275,437 | |
| | | | | | | | |
| | | | | | | 17,131,000 | |
| | | | | | | | |
| | | | Health Care Services 1.1% | | | | |
| | 248,870 | | | Bio-Reference Laboratories, Inc.* | | | 5,191,428 | |
| | 139,085 | | | MEDNAX, Inc.* | | | 7,413,231 | |
| | 362,782 | | | TargetRX, Inc.* *** † | | | 3,628 | |
| | | | | | | | |
| | | | | | | 12,608,287 | |
| | | | | | | | |
| | | | Health Care Technology 2.6% | | | | |
| | 364,677 | | | athenahealth, Inc.* | | | 12,041,635 | |
| | 407,725 | | | Computer Programs and Systems, Inc. | | | 17,356,853 | |
| | | | | | | | |
| | | | | | | 29,398,488 | |
| | | | | | | | |
| | | | Human Resource & Employment Services 1.1% | | | | |
| | 1,728,523 | | | Michael Page International plc
(United Kingdom) | | | 12,507,100 | |
| | | | | | | | |
| | | | Industrial Machinery 2.0% | | | | |
| | 813,990 | | | AIA Engineering Ltd. (India) | | | 7,245,933 | |
| | 479,300 | | | Graco, Inc. | | | 15,208,189 | |
| | | | | | | | |
| | | | | | | 22,454,122 | |
| | | | | | | | |
| | | | Internet Retail 2.7% | | | | |
| | 182,174 | | | Blue Nile, Inc.* | | | 8,104,921 | |
| | 7,495 | | | MakeMyTrip Ltd.* (India) | | | 290,132 | |
| | 415,556 | | | Shutterfly, Inc.* | | | 10,800,301 | |
| | 1,920 | | | Start Today Co. Ltd. (Japan) | | | 5,356,909 | |
| | 569,408 | | | Yoox S.p.A.* (Italy) | | | 5,810,238 | |
| | | | | | | | |
| | | | | | | 30,362,501 | |
| | | | | | | | |
| | | | Internet Software & Services 4.3% | | | | |
| | 681,735 | | | DealerTrack Holdings, Inc.* | | | 11,644,034 | |
| | 1,145,360 | | | LoopNet, Inc.* | | | 13,561,062 | |
| | 55,500 | | | OpenTable, Inc.* | | | 3,778,440 | |
| | 484,670 | | | VistaPrint N.V.* | | | 18,732,496 | |
| | | | | | | | |
| | | | | | | 47,716,032 | |
| | | | | | | | |
| | | | Investment Banking & Brokerage 0.7% | | | | |
| | 492,015 | | | optionsXpress Holdings, Inc.* | | | 7,557,350 | |
| | | | | | | | |
| | | | IT Consulting & Other Services 2.6% | | | | |
| | 443,478 | | | Cognizant Technology Solutions Corp., Class A* | | | 28,591,027 | |
| | | | | | | | |
| | | | Leisure Facilities 1.8% | | | | |
| | 518,740 | | | Life Time Fitness, Inc.* | | | 20,474,668 | |
| | | | | | | | |
70
| | | | | | | | |
| Shares | | | | | Value | |
| | | | | | | |
| | | | Life Sciences Tools & Services 3.2% | | | | |
| | 408,905 | | | Divi’s Laboratories Ltd. (India) | | $ | 6,261,656 | |
| | 596,445 | | | ICON plc ADR* (Ireland) | | | 12,895,141 | |
| | 261,919 | | | Techne Corp. | | | 16,168,260 | |
| | | | | | | | |
| | | | | | | 35,325,057 | |
| | | | | | | | |
| | | | Mortgage REITs 0.9% | | | | |
| | 665,608 | | | Redwood Trust, Inc. | | | 9,624,692 | |
| | | | | | | | |
| | | | Oil & Gas Equipment & Services 3.5% | | | | |
| | 356,895 | | | Dril-Quip, Inc.* | | | 22,166,749 | |
| | 903,720 | | | Pason Systems, Inc. (Canada) | | | 10,726,933 | |
| | 455,035 | | | TGS-NOPEC Geophysical Co. ASA (Norway) | | | 6,538,670 | |
| | | | | | | | |
| | | | | | | 39,432,352 | |
| | | | | | | | |
| | | | Oil & Gas Exploration & Production 2.2% | | | | |
| | 413,670 | | | GMX Resources, Inc.* | | | 2,010,436 | |
| | 846,815 | | | Premier Oil plc* (United Kingdom) | | | 21,993,434 | |
| | | | | | | | |
| | | | | | | 24,003,870 | |
| | | | | | | | |
| | | | Other Diversified Financial Services 0.3% | | | | |
| | 2,661,038 | | | Count Financial Ltd. (Australia) | | | 3,106,839 | |
| | | | | | | | |
| | | | Packaged Foods & Meats 1.4% | | | | |
| | 349,703 | | | Glaxo SmithKline Consumer Healthcare Ltd. (India) | | | 15,767,181 | |
| | | | | | | | |
| | | | Pharmaceuticals 0.8% | | | | |
| | 656,923 | | | Alexza Pharmaceuticals, Inc.* | | | 2,082,446 | |
| | 409,401 | | | Alexza Pharmaceuticals, Inc. PIPE* † | | | 1,297,801 | |
| | 680,112 | | | Dechra Pharmaceuticals plc
(United Kingdom) | | | 5,019,348 | |
| | | | | | | | |
| | | | | | | 8,399,595 | |
| | | | | | | | |
| | | | Research & Consulting Services 3.4% | | | | |
| | 364,396 | | | CRA International, Inc.* | | | 6,577,348 | |
| | 1,399 | | | Exponent, Inc.* | | | 46,992 | |
| | 1,067,444 | | | Resources Connection, Inc.†† | | | 14,688,029 | |
| | 610,899 | | | Stantec, Inc.* (Canada) | | | 16,133,843 | |
| | | | | | | | |
| | | | | | | 37,446,212 | |
| | | | | | | | |
| | | | Restaurants 2.1% | | | | |
| | 693,795 | | | Peet’s Coffee & Tea, Inc.* ‡‡ | | | 23,748,603 | |
| | | | | | | | |
| | | | Semiconductors 8.7% | | | | |
| | 425,245 | | | Hittite Microwave Corp.* | | | 20,262,925 | |
| | 573,853 | | | NetLogic Microsystems, Inc.* | | | 15,826,866 | |
| | 1,455,475 | | | O2Micro International Ltd. ADR* (China) | | | 8,892,952 | |
| | 1,329,204 | | | Power Integrations, Inc. | | | 42,255,395 | |
| | 261,285 | | | Silicon Laboratories, Inc.* | | | 9,576,095 | |
| | | | | | | | |
| | | | | | | 96,814,233 | |
| | | | | | | | |
| | | | Specialized Finance 2.4% | | | | |
| | 789,810 | | | MSCI, Inc., Class A* | | | 26,229,590 | |
| | | | | | | | |
| | | | Specialty Stores 3.5% | | | | |
| | 565,985 | | | Big 5 Sporting Goods Corp. | | | 7,595,519 | |
| | 1,237,511 | | | Hibbett Sports, Inc.* | | | 30,875,899 | |
| | | | | | | | |
| | | | | | | 38,471,418 | |
| | | | | | | | |
| | | | Systems Software 2.8% | | | | |
| | 832,287 | | | NetSuite, Inc.* | | | 19,617,004 | |
| | 397,432 | | | Sourcefire, Inc.* | | | 11,461,939 | |
| | | | | | | | |
| | | | | | | 31,078,943 | |
| | | | | | | | |
| | | | Trading Companies & Distributors 2.6% | | | | |
| | 534,700 | | | MSC Industrial Direct Co., Inc., Class A | | | 28,895,188 | |
| | | | | | | | |
| | | | | | | | |
| Shares | | | | | Value | |
| | | | | | | |
| | | | Trucking 2.7% | | | | |
| | 115,170 | | | J.B. Hunt Transport Services, Inc. | | $ | 3,996,399 | |
| | 1,349,737 | | | Knight Transportation, Inc.†† | | | 26,090,416 | |
| | | | | | | | |
| | | | | | | 30,086,815 | |
| | | | | | | | |
| | |
| | | | Total Common Stocks
(cost $791,647,405) | | | 1,076,123,710 | |
| | | | | | | | |
| | |
| | | | PREFERRED STOCKS 0.8% | | | | |
| | |
| | | | Biotechnology 0.1% | | | | |
| | 677,966 | | | Nanosys, Inc., Series D Pfd.* *** † | | | 776,271 | |
| | 161,519 | | | Nanosys, Inc., Series E Pfd.* *** † | | | 184,939 | |
| | | | | | | | |
| | | | | | | 961,210 | |
| | | | | | | | |
| | | | Internet Software & Services 0.4% | | | | |
| | 63,097 | | | Angies List, Series C Pfd.* *** † | | | 4,254,284 | |
| | | | | | | | |
| | | | Life Sciences Tools & Services 0.3% | | | | |
| | 186,947 | | | Fluidigm Corp., Series E Pfd.* *** † | | | 2,617,258 | |
| | | | | | | | |
| | |
| | | | Total Preferred Stocks
(cost $9,056,481) | | | 7,832,752 | |
| | | | | | | | |
| | |
| | | | LIMITED PARTNERSHIP INTEREST 0.5% | | | | |
| | |
| | | | Other 0.5% | | | | |
| | | | Greenspring Global Partners II-B,
L.P.* *** † | | | 4,218,951 | |
| | | | Greenspring Global Partners III-B,
L.P.* *** † | | | 1,034,896 | |
| | | | | | | | |
| | | | | | | 5,253,847 | |
| | | | | | | | |
| | |
| | | | Total Limited Partnership Interest (cost $5,468,853) | | | 5,253,847 | |
| | | | | | | | |
| | |
| | | | WARRANTS 0.0% | | | | |
| | |
| | | | Health Care Equipment 0.0% | | | | |
| | 243,033 | | | Zonare Medical Systems, Inc., expiring 6/30/11* *** † | | | — | |
| | | | | | | | |
| | | | Life Sciences Tools & Services 0.0% | | | | |
| | 4,049 | | | Fluidigm Corp., expiring 8/18/19* *** † | | | 11 | |
| | | | | | | | |
| | | | Pharmaceuticals 0.0% | | | | |
| | 368,461 | | | Alexza Pharmaceuticals, Inc., expiring 10/5/16* *** † | | | 147,384 | |
| | | | | | | | |
| | |
| | | | Total Warrants
(cost $46,069) | | | 147,395 | |
| | | | | | | | |
| | |
| | | | RIGHTS 0.0% | | | | |
| | |
| | | | Life Sciences Tools & Services 0.0% | | | | |
| | 208,525 | | | Valera Pharmaceuticals, Inc. Ureteral Stent CSR* *** † | | | — | |
| | | | | | | | |
| | | | Pharmaceuticals 0.0% | | | | |
| | 208,525 | | | Valera Pharmaceuticals, Inc. VP003 (Octreotide Implant) CSR* *** † | | | 214,781 | |
| | | | | | | | |
| | |
| | | | Total Rights
(cost $406,537) | | | 214,781 | |
| | | | | | | | |
71
| | |
| WASATCH SMALL CAP GROWTH FUND (WAAEX) — Schedule of Investments (continued) | | SEPTEMBER 30, 2010 |
|
| |
| |
| | | | | | | | |
Principal
Amount | | | | | Value | |
| | | | | | | |
| | | | SHORT-TERM INVESTMENTS 2.0% | | | | |
| | |
| | | | Repurchase Agreement 2.0% | | | | |
| | $22,350,000 | | | Repurchase Agreement dated 9/30/10, 0.01% due 10/1/10 with State Street Bank and Trust Co. collateralized by $21,425,000 of United States Treasury Notes 4.625% due 2/29/12; value: $22,798,343; repurchase proceeds: $22,350,006†† (cost $22,350,000) | | $ | 22,350,000 | |
| | | | | | | | |
| | |
| | | | Total Short-Term Investments
(cost $22,350,000) | | | 22,350,000 | |
| | | | | | | | |
| | |
| | | | Total Investments
(cost $828,975,345) 100.2% | | | 1,111,922,485 | |
| | |
| | | | Liabilities less Other Assets (0.2)% | | | (1,835,297 | ) |
| | | | | | | | |
| | |
| | | | NET ASSETS 100.0% | | $ | 1,110,087,188 | |
| | | | | | | | |
| |
| | | | *Non-income producing. ***Security was fair valued under procedures adopted by the Board of Trustees (see Note 15). †Security purchased in a private placement transaction or under Rule 144A of the Securities Act of 1933 (see Note 11). ††All or a portion of this security has been designated as collateral for purchase commitments (see Note 12). ‡‡Affiliated company (see Note 10). ADR American Depositary Receipt. PIPE Private Investment in a Public Equity. REIT Real Estate Investment Trust. See Notes to Financial Statements. | |
At September 30, 2010, Wasatch Small Cap Growth Fund’s investments, excluding short-term investments, were in the following countries:
| | | | |
| Country | | % | |
Australia | | | 0.3 | |
Canada | | | 3.1 | |
China | | | 2.1 | |
Germany | | | 1.8 | |
India | | | 5.2 | |
Ireland | | | 1.2 | |
Italy | | | 0.5 | |
Japan | | | 0.5 | |
Norway | | | 0.6 | |
Singapore | | | 0.8 | |
United Arab Emirates | | | 2.0 | |
United Kingdom | | | 4.2 | |
United States | | | 77.7 | |
| | | | |
TOTAL | | | 100.0 | % |
| | | | |
72
| | |
| WASATCH SMALL CAP VALUE FUND (WMCVX) — Schedule of Investments | | SEPTEMBER 30, 2010 |
|
| |
| |
| | | | | | | | |
| Shares | | | | | Value | |
| | | | | | | |
| | | | COMMON STOCKS 98.9% | | | | |
| | |
| | | | Aerospace & Defense 2.7% | | | | |
| | 165,422 | | | HEICO Corp., Class A | | $ | 5,635,928 | |
| | | | | | | | |
| | | | Air Freight & Logistics 1.5% | | | | |
| | 2,202,481 | | | Goodpack Ltd. (Singapore) | | | 3,196,853 | |
| | | | | | | | |
| | | | Airlines 1.6% | | | | |
| | 78,743 | | | Allegiant Travel Co. | | | 3,332,404 | |
| | | | | | | | |
| | | | Apparel Retail 0.3% | | | | |
| | 27,786 | | | Zumiez, Inc.* | | | 587,952 | |
| | | | | | | | |
| | | | Apparel, Accessories & Luxury
Goods 1.0% | | | | |
| | 108,390 | | | Volcom, Inc.* | | | 2,072,417 | |
| | | | | | | | |
| | | | Application Software 0.7% | | | | |
| | 64,291 | | | Ebix, Inc.* | | | 1,507,624 | |
| | | | | | | | |
| | | | Asset Management & Custody
Banks 3.1% | | | | |
| | 118,885 | | | SEI Investments Co. | | | 2,418,121 | |
| | 194,887 | | | Solar Capital Ltd. | | | 4,180,326 | |
| | | | | | | | |
| | | | | | | 6,598,447 | |
| | | | | | | | |
| | | | Automotive Retail 1.2% | | | | |
| | 54,605 | | | Monro Muffler Brake, Inc. | | | 2,517,837 | |
| | | | | | | | |
| | | | Building Products 0.4% | | | | |
| | 97,055 | | | NCI Building Systems, Inc.* | | | 924,934 | |
| | | | | | | | |
| | | | Communications Equipment 2.0% | | | | |
| | 118,935 | | | Polycom, Inc.* | | | 3,244,547 | |
| | 449,360 | | | UTStarcom, Inc.* | | | 975,111 | |
| | | | | | | | |
| | | | | | | 4,219,658 | |
| | | | | | | | |
| | | | Computer Storage & Peripherals 1.0% | | | | |
| | 206,590 | | | Intevac, Inc.* | | | 2,067,966 | |
| | | | | | | | |
| | | | Construction & Engineering 2.2% | | | | |
| | 417,841 | | | Great Lakes Dredge & Dock Corp. | | | 2,427,656 | |
| | 139,080 | | | MYR Group, Inc.* | | | 2,279,521 | |
| | | | | | | | |
| | | | | | | 4,707,177 | |
| | | | | | | | |
| | | | Consumer Finance 4.0% | | | | |
| | 520,595 | | | Advance America Cash Advance Centers, Inc. | | | 2,097,998 | |
| | 185,813 | | | Dollar Financial Corp.* | | | 3,877,917 | |
| | 532,416 | | | United PanAm Financial Corp.* | | | 2,475,735 | |
| | | | | | | | |
| | | | | | | 8,451,650 | |
| | | | | | | | |
| | | | Data Processing & Outsourced Services 1.7% | | | | |
| | 141,515 | | | NeuStar, Inc., Class A* | | | 3,518,063 | |
| | | | | | | | |
| | | | Diversified Banks 1.3% | | | | |
| | 255,486 | | | Bank of N.T. Butterfield & Son Ltd. (The) (Bermuda) | | | 362,790 | |
| | 587,000 | | | Karnataka Bank Ltd. (India) | | | 2,374,911 | |
| | | | | | | | |
| | | | | | | 2,737,701 | |
| | | | | | | | |
| | | | Diversified Metals & Mining 0.6% | | | | |
| | 90,243 | | | Globe Specialty Metals, Inc.* | | | 1,267,012 | |
| | | | | | | | |
| | | | Diversified Support Services 1.9% | | | | |
| | 124,590 | | | Copart, Inc.* | | | 4,107,732 | |
| | | | | | | | |
| | | | Electrical Components &
Equipment 2.0% | | | | |
| | 98,793 | | | Harbin Electric, Inc.* | | | 1,767,407 | |
| | 116,255 | | | Voltamp Transformers Ltd. (India) | | | 2,419,014 | |
| | | | | | | | |
| | | | | | | 4,186,421 | |
| | | | | | | | |
| | | | | | | | |
| Shares | | | | | Value | |
| | | | | | | |
| | | | Electronic Manufacturing Services 1.4% | | | | |
| | 310,805 | | | TTM Technologies, Inc.* | | $ | 3,042,781 | |
| | | | | | | | |
| | | | Food Retail 0.5% | | | | |
| | 225,020 | | | QKL Stores, Inc.* (China) | | | 1,084,596 | |
| | | | | | | | |
| | | | General Merchandise Stores 0.5% | | | | |
| | 56,325 | | | 99 Cents Only Stores* | | | 1,068,165 | |
| | | | | | | | |
| | | | Health Care Facilities 2.9% | | | | |
| | 100,056 | | | AmSurg Corp.* | | | 1,748,979 | |
| | 158,447 | | | Emeritus Corp.* | | | 2,703,106 | |
| | 75,105 | | | VCA Antech, Inc.* | | | 1,583,964 | |
| | | | | | | | |
| | | | | | | 6,036,049 | |
| | | | | | | | |
| | | | Health Care Services 6.7% | | | | |
| | 303,310 | | | Addus HomeCare Corp.* | | | 1,210,207 | |
| | 166,719 | | | CorVel Corp.* | | | 7,077,221 | |
| | 157,765 | | | Healthways, Inc.* | | | 1,836,385 | |
| | 70,135 | | | LHC Group, Inc.* | | | 1,626,431 | |
| | 44,990 | | | MEDNAX, Inc.* | | | 2,397,967 | |
| | 4,195 | | | National Research Corp. | | | 109,405 | |
| | | | | | | | |
| | | | | | | 14,257,616 | |
| | | | | | | | |
| | | | Health Care Technology 0.7% | | | | |
| | 114,745 | | | Vital Images, Inc.* | | | 1,518,076 | |
| | | | | | | | |
| | | | Heavy Electrical Equipment 1.3% | | | | |
| | 99,520 | | | General Cable Corp.* | | | 2,698,982 | |
| | | | | | | | |
| | | | Industrial Machinery 1.1% | | | | |
| | 303,343 | | | China Valves Technology, Inc.* (China) | | | 2,353,942 | |
| | | | | | | | |
| | | | Internet Software & Services 2.3% | | | | |
| | 31,495 | | | SPS Commerce, Inc.* | | | 403,766 | |
| | 328,240 | | | United Online, Inc. | | | 1,877,533 | |
| | 69,235 | | | VistaPrint N.V.* | | | 2,675,932 | |
| | | | | | | | |
| | | | | | | 4,957,231 | |
| | | | | | | | |
| | | | Investment Banking & Brokerage 1.0% | | | | |
| | 136,670 | | | optionsXpress Holdings, Inc.* | | | 2,099,251 | |
| | | | | | | | |
| | | | IT Consulting & Other Services 0.7% | | | | |
| | 864,797 | | | CSG Ltd. (Australia) | | | 1,497,824 | |
| | | | | | | | |
| | | | Life Sciences Tools & Services 1.0% | | | | |
| | 88,690 | | | Pharmaceutical Product Development, Inc. | | | 2,198,625 | |
| | | | | | | | |
| | | | Mortgage REITs 3.7% | | | | |
| | 482,125 | | | MFA Financial, Inc. | | | 3,678,614 | |
| | 285,910 | | | Redwood Trust, Inc. | | | 4,134,258 | |
| | | | | | | | |
| | | | | | | 7,812,872 | |
| | | | | | | | |
| | | | Office Services & Supplies 1.3% | | | | |
| | 350,500 | | | American Reprographics Co.* | | | 2,751,425 | |
| | | | | | | | |
| | | | Oil & Gas Equipment & Services 2.1% | | | | |
| | 209,346 | | | TETRA Technologies, Inc.* | | | 2,135,329 | |
| | 82,695 | | | TGS-NOPEC Geophysical Co. ASA (Norway) | | | 1,188,294 | |
| | 115,410 | | | Willbros Group, Inc.* | | | 1,058,310 | |
| | | | | | | | |
| | | | | | | 4,381,933 | |
| | | | | | | | |
| | | | Oil & Gas Exploration & Production 4.6% | | | | |
| | 649,218 | | | Abraxas Petroleum Corp.* | | | 1,843,779 | |
| | 806,510 | | | Afren plc* (United Kingdom) | | | 1,400,664 | |
| | 122,075 | | | Northern Oil and Gas, Inc.* | | | 2,067,950 | |
| | 121,045 | | | Petrohawk Energy Corp.* | | | 1,953,666 | |
| | 41,670 | | | Ultra Petroleum Corp.* | | | 1,749,307 | |
| | 109,565 | | | VAALCO Energy, Inc.* | | | 628,903 | |
| | | | | | | | |
| | | | | | | 9,644,269 | |
| | | | | | | | |
73
| | |
| WASATCH SMALL CAP VALUE FUND (WMCVX) — Schedule of Investments (continued) | | SEPTEMBER 30, 2010 |
|
| |
| |
| | | | | | | | |
Shares | | | | | Value | |
| | | | | | | |
| | | | Personal Products 2.2% | | | | |
| | 75,490 | | | Herbalife Ltd. | | $ | 4,555,822 | |
| | | | | | | | |
| | | | Property & Casualty Insurance 2.0% | | | | |
| | 134,200 | | | SeaBright Holdings, Inc. | | | 1,081,652 | |
| | 132,815 | | | Tower Group, Inc. | | | 3,101,230 | |
| | | | | | | | |
| | | | | | | 4,182,882 | |
| | | | | | | | |
| | | | Regional Banks 4.5% | | | | |
| | 35,775 | | | City National Corp. | | | 1,898,579 | |
| | 2,233,000 | | | City Union Bank Ltd. (India) | | | 2,251,138 | |
| | 188,716 | | | Commonwealth Bankshares, Inc.* | | | 454,806 | |
| | 54,110 | | | Lakeland Financial Corp. | | | 1,009,693 | |
| | 257,672 | | | Nara Bancorp, Inc.* | | | 1,819,164 | |
| | 63,330 | | | Prosperity Bancshares, Inc. | | | 2,056,325 | |
| | | | | | | | |
| | | | | | | 9,489,705 | |
| | | | | | | | |
| | | | Research & Consulting Services 5.1% | | | | |
| | 107,847 | | | Corporate Executive Board Co. (The) | | | 3,403,651 | |
| | 97,510 | | | CRA International, Inc.* | | | 1,760,056 | |
| | 151,455 | | | Huron Consulting Group, Inc.* | | | 3,330,495 | |
| | 168,475 | | | Resources Connection, Inc. | | | 2,318,216 | |
| | | | | | | | |
| | | | | | | 10,812,418 | |
| | | | | | | | |
| | | | Semiconductors 8.0% | | | | |
| | 192,583 | | | Micrel, Inc. | | | 1,898,868 | |
| | 279,555 | | | O2Micro International Ltd. ADR* (China) | | | 1,708,081 | |
| | 509,012 | | | Pericom Semiconductor Corp.* | | | 4,423,314 | |
| | 76,625 | | | Power Integrations, Inc. | | | 2,435,909 | |
| | 188,060 | | | Standard Microsystems Corp.* | | | 4,289,649 | |
| | 93,737 | | | Supertex, Inc.* | | | 2,073,463 | |
| | | | | | | | |
| | | | | | | 16,829,284 | |
| | | | | | | | |
| | | | Specialty Stores 1.0% | | | | |
| | 157,270 | | | Big 5 Sporting Goods Corp. | | | 2,110,563 | |
| | | | | | | | |
| | | | Steel 2.0% | | | | |
| | 78,228 | | | Haynes International, Inc. | | | 2,731,722 | |
| | 501,000 | | | Ratnamani Metals & Tubes Ltd. (India) | | | 1,496,254 | |
| | | | | | | | |
| | | | | | | 4,227,976 | |
| | | | | | | | |
| | | | Systems Software 1.9% | | | | |
| | 226,580 | | | OPNET Technologies, Inc. | | | 4,112,427 | |
| | | | | | | | |
| | | | Thrifts & Mortgage Finance 2.0% | | | | |
| | 67,070 | | | LIC Housing Finance Ltd. (India) | | | 2,147,852 | |
| | 215,815 | | | Oritani Financial Corp. | | | 2,153,834 | |
| | | | | | | | |
| | | | | | | 4,301,686 | |
| | | | | | | | |
| | | | Trading Companies &
Distributors 4.3% | | | | |
| | 141,825 | | | Beacon Roofing Supply, Inc.* | | | 2,066,390 | |
| | 195,405 | | | Interline Brands, Inc.* | | | 3,525,106 | |
| | 66,085 | | | MSC Industrial Direct Co., Inc., Class A | | | 3,571,234 | |
| | | | | | | | |
| | | | | | | 9,162,730 | |
| | | | | | | | |
| | | | Trucking 4.9% | | | | |
| | 174,885 | | | Marten Transport, Ltd. | | | 4,053,834 | |
| | 145,109 | | | Old Dominion Freight Line, Inc.* | | | 3,688,671 | |
| | 244,011 | | | Vitran Corp., Inc.* (Canada) | | | 2,671,921 | |
| | | | | | | | |
| | | | | | | 10,414,426 | |
| | | | | | | | |
| | |
| | | | Total Common Stocks
(cost $194,209,229) | | | 209,241,332 | |
| | | | | | | | |
| | | | | | | | |
Principal
Amount | | | | | Value | |
| | | | | | | |
| | | | SHORT-TERM INVESTMENTS 1.0% | | | | |
| | |
| | | | Repurchase Agreement 1.0% | | | | |
| | $2,096,000 | | | Repurchase Agreement dated 9/30/10, 0.01% due 10/1/10 with State Street Bank and Trust Co. collateralized by $2,010,000 of United States Treasury Notes 4.625% due 2/29/12; value: $2,138,841; repurchase proceeds: $2,096,001 (cost $2,096,000) | | $ | 2,096,000 | |
| | | | | | | | |
| | |
| | | | Total Short-Term Investments
(cost $2,096,000) | | | 2,096,000 | |
| | | | | | | | |
| | |
| | | | Total Investments
(cost $196,305,229) 99.9% | | | 211,337,332 | |
| | |
| | | | Other Assets less Liabilities 0.1% | | | 234,158 | |
| | | | | | | | |
| | |
| | | | NET ASSETS 100.0% | | $ | 211,571,490 | |
| | | | | | | | |
| | |
| | | | *Non-income producing. ADR American Depositary Receipt. REIT Real Estate Investment Trust. See Notes to Financial Statements. | | | | |
At September 30, 2010, Wasatch Small Cap Value Fund’s investments, excluding short-term investments, were in the following countries:
| | | | |
| Country | | % | |
Australia | | | 0.7 | |
Bermuda | | | 0.2 | |
Canada | | | 1.3 | |
China | | | 2.4 | |
India | | | 5.1 | |
Norway | | | 0.6 | |
Singapore | | | 1.5 | |
United Kingdom | | | 0.7 | |
United States | | | 87.5 | |
| | | | |
TOTAL | | | 100.0 | % |
| | | | |
74
| | |
| WASATCH STRATEGIC INCOME FUND (WASIX) — Schedule of Investments | | SEPTEMBER 30, 2010 |
|
| |
| |
| | | | | | | | |
| Shares | | | | | Value | |
| | | | | | | |
| | | | COMMON STOCKS 85.5% | | | | |
| | |
| | | | Asset Management & Custody Banks 9.3% | | | | |
| | 47,284 | | | Ares Capital Corp. | | $ | 739,995 | |
| | 20,715 | | | SEI Investments Co. | | | 421,343 | |
| | 30,752 | | | Solar Capital Ltd. | | | 659,630 | |
| | | | | | | | |
| | | | | | | 1,820,968 | |
| | | | | | | | |
| | | | Computer & Electronics Retail 1.2% | | | | |
| | 5,600 | | | Best Buy Co., Inc. | | | 228,648 | |
| | | | | | | | |
| | | | Data Processing & Outsourced Services 9.3% | | | | |
| | 25,800 | | | Cielo S.A. (Brazil) | | | 224,341 | |
| | 13,200 | | | Fidelity National Information Services, Inc. | | | 358,116 | |
| | 1,965 | | | Mastercard, Inc., Class A | | | 440,160 | |
| | 3,060 | | | Paychex, Inc. | | | 84,120 | |
| | 14,100 | | | Redecard S.A. (Brazil) | | | 218,492 | |
| | 36,100 | | | Wirecard AG (Germany) | | | 491,316 | |
| | | | | | | | |
| | | | | | | 1,816,545 | |
| | | | | | | | |
| | | | Diversified Banks 0.7% | | | | |
| | 90,056 | | | Bank of N.T. Butterfield & Son Ltd. (The) (Bermuda) | | | 127,880 | |
| | | | | | | | |
| | | | Diversified REITs 2.1% | | | | |
| | 41,800 | | | CapLease, Inc. | | | 233,662 | |
| | 177,857 | | | Star Asia Finance Ltd.* † | | | 177,857 | |
| | | | | | | | |
| | | | | | | 411,519 | |
| | | | | | | | |
| | | | Diversified Support Services 0.5% | | | | |
| | 4,385 | | | Ritchie Bros. Auctioneers, Inc. (Canada) | | | 91,076 | |
| | | | | | | | |
| | | | Electronic Equipment &
Instruments 0.5% | | | | |
| | 3,150 | | | National Instruments Corp. | | | 102,879 | |
| | | | | | | | |
| | | | Fertilizers & Agricultural
Chemicals 1.6% | | | | |
| | 6,700 | | | Monsanto Co. | | | 321,131 | |
| | | | | | | | |
| | | | Health Care Services 0.4% | | | | |
| | 1,535 | | | Chemed Corp. | | | 87,449 | |
| | | | | | | | |
| | | | Hypermarkets & Super Centers 1.9% | | | | |
| | 6,785 | | | Wal-Mart Stores, Inc. | | | 363,133 | |
| | | | | | | | |
| | | | Investment Banking &
Brokerage 1.4% | | | | |
| | 1,900 | | | Goldman Sachs Group, Inc. (The) | | | 274,702 | |
| | | | | | | | |
| | | | IT Consulting & Other Services 2.7% | | | | |
| | 3,875 | | | International Business Machines Corp. | | | 519,792 | |
| | | | | | | | |
| | | | Leisure Products 0.4% | | | | |
| | 3,800 | | | Pool Corp. | | | 76,266 | |
| | | | | | | | |
| | | | Life Sciences Tools & Services 1.4% | | | | |
| | 5,350 | | | Eurofins Scientific (France) | | | 274,706 | |
| | | | | | | | |
| | | | Mortgage REITs 18.6% | | | | |
| | 56,600 | | | Anworth Mortgage Asset Corp. | | | 403,558 | |
| | 130,400 | | | Capstead Mortgage Corp. | | | 1,417,448 | |
| | 69,700 | | | MFA Financial, Inc. | | | 531,811 | |
| | 88,050 | | | Redwood Trust, Inc. | | | 1,273,203 | |
| | | | | | | | |
| | | | | | | 3,626,020 | |
| | | | | | | | |
| | | | Multi-Line Insurance 2.1% | | | | |
| | 10,955 | | | Loews Corp. | | | 415,195 | |
| | | | | | | | |
| | | | | | | | |
| Shares | | | | | Value | |
| | | | | | | |
| | | | Oil & Gas Exploration &
Production 3.2% | | | | |
| | 9,700 | | | Ultra Petroleum Corp.* | | $ | 407,206 | |
| | 2,200 | | | Whiting Petroleum Corp.* | | | 210,122 | |
| | | | | | | | |
| | | | | | | 617,328 | |
| | | | | | | | |
| | | | Personal Products 4.1% | | | | |
| | 13,250 | | | Herbalife Ltd. | | | 799,638 | |
| | | | | | | | |
| | | | Pharmaceuticals 6.4% | | | | |
| | 12,530 | | | Forest Laboratories, Inc.* | | | 387,553 | |
| | 12,665 | | | Teva Pharmaceutical Industries Ltd. ADR (Israel) | | | 668,079 | |
| | 7,658 | | | Valleant Pharmaceuticals International, Inc. (Canada) | | | 191,829 | |
| | | | | | | | |
| | | | | | | 1,247,461 | |
| | | | | | | | |
| | | | Property & Casualty Insurance 0.9% | | | | |
| | 12,335 | | | Old Republic International Corp. | | | 170,840 | |
| | | | | | | | |
| | | | Railroads 1.0% | | | | |
| | 3,000 | | | Canadian National Railway Co. (Canada) | | | 192,060 | |
| | | | | | | | |
| | | | Restaurants 1.4% | | | | |
| | 3,800 | | | McDonald’s Corp. | | | 283,138 | |
| | | | | | | | |
| | | | Semiconductors 11.8% | | | | |
| | 7,200 | | | Altera Corp. | | | 217,152 | |
| | 19,300 | | | Intel Corp. | | | 371,139 | |
| | 12,570 | | | Linear Technology Corp. | | | 386,276 | |
| | 9,715 | | | Microchip Technology, Inc. | | | 305,537 | |
| | 44,065 | | | Taiwan Semiconductor Manufacturing Co. Ltd. ADR (Taiwan) | | | 446,819 | |
| | 21,600 | | | Xilinx, Inc. | | | 574,776 | |
| | | | | | | | |
| | | | | | | 2,301,699 | |
| | | | | | | | |
| | | | Trading Companies & Distributors 0.5% | | | | |
| | 830 | | | W.W. Grainger, Inc. | | | 98,861 | |
| | | | | | | | |
| | | | Wireless Telecommunication Services 2.1% | | | | |
| | 7,745 | | | America Movil S.A.B. de C.V., Series L ADR (Mexico) | | | 413,041 | |
| | | | | | | | |
| | |
| | | | Total Common Stocks
(cost $15,517,211) | | | 16,681,975 | |
| | | | | | | | |
| | |
| | | | PREFERRED STOCKS 2.1% | | | | |
| | |
| | | | Diversified Banks 0.0% | | | | |
| | 3,803 | | | Bank of N.T. Butterfield & Son Ltd.
(The) Pfd.* (Bermuda) | | | 5,400 | |
| | | | | | | | |
| | | | Regional Banks 2.1% | | | | |
| | 62,700 | | | Banco Daycoval S.A. Pfd. (Brazil) | | | 412,325 | |
| | | | | | | | |
| | | | | | | | |
| | |
| | | | Total Preferred Stocks
(cost $340,844) | | | 417,725 | |
| | | | | | | | |
| | |
| | | | EXCHANGE TRADED FUNDS 1.8% | | | | |
| | |
| | | | Asset Management & Custody Banks 1.8% | | | | |
| | 11,310 | | | ProShares UltraShort 20+ Year Treasury* | | | 353,438 | |
| | | | | | | | |
| | |
| | | | Total Exchange Traded Funds
(cost $535,271) | | | 353,438 | |
| | | | | | | | |
75
| | |
| WASATCH STRATEGIC INCOME FUND (WASIX) — Schedule of Investments (continued) | | SEPTEMBER 30, 2010 |
|
| |
| |
| | | | | | | | |
| Shares | | | | | Value | |
| | | | | | | |
| | | | LIMITED LIABILITY COMPANY MEMBERSHIP INTEREST 1.2% | | | | |
| | |
| | | | Asset Management & Custody
Banks 1.2% | | | | |
| | 77,279 | | | Star Asia SPV, LLC* *** † | | $ | 225,655 | |
| | | | | | | | |
| | |
| | | | Total Limited Liability Company Membership Interest
(cost $578,644) | | | 225,655 | |
| | | | | | | | |
| | |
| | | | LIMITED PARTNERSHIP INTEREST 2.0% | | | | |
| | |
| | | | Asset Management & Custody
Banks 1.0% | | | | |
| | 17,700 | | | KKR & Co. L.P. | | | 187,620 | |
| | | | | | | | |
| | | | Oil & Gas Storage &
Transportation 1.0% | | | | |
| | 4,047 | | | Magellan Midstream Partners L.P. | | | 208,218 | |
| | | | | | | | |
| | |
| | | | Total Limited Partnership Interest
(cost $262,189) | | | 395,838 | |
| | | | | | | | |
| | |
Principal
Amount | | | | | Value | |
| | | | | | | |
| | | | CORPORATE BONDS 0.1% | | | | |
| | |
| | | | Gold 0.1% | | | | |
| | $244,116 | | | Redcorp Ventures Ltd., 13.00%,
7/11/12*** † §§ (Canada) | | $ | 23,692 | |
| | | | | | | | |
| | |
| | | | Total Corporate Bonds
(cost $231,017) | | | 23,692 | |
| | | | | | | | |
| | |
| | | | SHORT-TERM INVESTMENTS 7.0% | | | | |
| | |
| | | | Repurchase Agreement 7.0% | | | | |
| | $1,357,000 | | | Repurchase Agreement dated 9/30/10, 0.01% due 10/1/10 with State Street Bank and Trust Co. collateralized by $1,305,000 of United States Treasury Notes 4.625% due 2/29/12; value: $1,388,651; repurchase proceeds: $1,357,000 (cost $1,357,000) | | | 1,357,000 | |
| | | | | | | | |
| | |
| | | | Total Short-Term Investments
(cost $1,357,000) | | | 1,357,000 | |
| | | | | | | | |
| | |
| | | | Total Investments
(cost $18,822,176) 99.7% | | | 19,455,323 | |
| | |
| | | | Other Assets less Liabilities 0.3% | | | 61,652 | |
| | | | | | | | |
| | |
| | | | NET ASSETS 100.0% | | $ | 19,516,975 | |
| | | | | | | | |
| |
| | | | *Non-income producing. ***Security was fair valued under procedures adopted by the Board of Trustees (see Note 15). †Security purchased in a private placement transaction or under Rule 144A of the Securities Act of 1933 (see Note 11). §§In Default. ADR American Depositary Receipt. REIT Real Estate Investment Trust. See Notes to Financial Statements. | |
At September 30, 2010, Wasatch Strategic Income Fund’s investments, excluding short-term investments, were in the following countries:
| | | | |
| Country | | % | |
Bermuda | | | 0.7 | |
Brazil | | | 4.7 | |
Canada | | | 2.8 | |
France | | | 1.5 | |
Germany | | | 2.7 | |
Israel | | | 3.7 | |
Mexico | | | 2.3 | |
Taiwan | | | 2.5 | |
United States | | | 79.1 | |
| | | | |
TOTAL | | | 100.0 | % |
| | | | |
76
| | |
| WASATCH ULTRA GROWTH FUND (WAMCX) — Schedule of Investments | | SEPTEMBER 30, 2010 |
|
| |
| |
| | | | | | | | |
| Shares | | | | | Value | |
| | | | | | | |
| | | | COMMON STOCKS 85.4% | | | | |
| | |
| | | | Air Freight & Logistics 1.2% | | | | |
| | 2,843,500 | | | Aramex PJSC* (United Arab Emirates) | | $ | 1,703,297 | |
| | 16,323 | | | Blue Dart Express Ltd. (India) | | | 408,647 | |
| | | | | | | | |
| | | | | | | 2,111,944 | |
| | | | | | | | |
| | | | Aluminum 0.5% | | | | |
| | 1,164,000 | | | Midas Holdings Ltd. (Singapore) | | | 880,143 | |
| | | | | | | | |
| | | | Apparel Retail 0.0% | | | | |
| | 2,396 | | | Zumiez, Inc.* | | | 50,699 | |
| | | | | | | | |
| | | | Apparel, Accessories & Luxury Goods 1.2% | | | | |
| | 784,000 | | | Ports Design Ltd. (China) | | | 2,167,309 | |
| | | | | | | | |
| | | | Application Software 8.1% | | | | |
| | 14,455 | | | Concur Technologies, Inc.* | | | 714,655 | |
| | 219,095 | | | Convio, Inc.* | | | 2,020,056 | |
| | 51,386 | | | Interactive Intelligence, Inc.* | | | 904,394 | |
| | 19,000 | | | Pegasystems, Inc. | | | 589,950 | |
| | 131,588 | | | RealPage, Inc.* | | | 2,510,699 | |
| | 69,378 | | | SciQuest, Inc.* | | | 838,086 | |
| | 46,535 | | | SolarWinds, Inc.* | | | 803,194 | |
| | 108,560 | | | Ultimate Software Group, Inc.* | | | 4,194,758 | |
| | 56,240 | | | VanceInfo Technologies, Inc. ADR* (China) | | | 1,818,802 | |
| | | | | | | | |
| | | | | | | 14,394,594 | |
| | | | | | | | |
| | | | Asset Management & Custody Banks 1.9% | | | | |
| | 209,062 | | | CETIP S.A. (Brazil) | | | 2,059,767 | |
| | 38,823 | | | Westwood Holdings Group, Inc. | | | 1,313,382 | |
| | | | | | | | |
| | | | | | | 3,373,149 | |
| | | | | | | | |
| | | | Auto Parts & Equipment 0.8% | | | | |
| | 63,950 | | | WABCO-TVS India Ltd. (India) | | | 1,522,788 | |
| | | | | | | | |
| | | | Automotive Retail 0.9% | | | | |
| | 29,275 | | | O’Reilly Automotive, Inc.* | | | 1,557,430 | |
| | | | | | | | |
| | | | Biotechnology 1.6% | | | | |
| | 77,800 | | | Abcam plc (United Kingdom) | | | 2,109,798 | |
| | 81,595 | | | Orexigen Therapeutics, Inc.* | | | 483,859 | |
| | 49,695 | | | Sangamo BioSciences, Inc.* | | | 170,454 | |
| | | | | | | | |
| | | | | | | 2,764,111 | |
| | | | | | | | |
| | | | Communications Equipment 4.2% | | | | |
| | 29,660 | | | F5 Networks, Inc.* | | | 3,079,005 | |
| | 98,240 | | | Riverbed Technology, Inc.* | | | 4,477,779 | |
| | | | | | | | |
| | | | | | | 7,556,784 | |
| | | | | | | | |
| | | | Computer Storage & Peripherals 0.7% | | | | |
| | 127,565 | | | Intevac, Inc.* | | | 1,276,926 | |
| | | | | | | | |
| | | | Construction & Engineering 0.8% | | | | |
| | 63,000 | | | MYR Group, Inc.* | | | 1,032,570 | |
| | 31,895 | | | Orion Marine Group, Inc.* | | | 395,817 | |
| | | | | | | | |
| | | | | | | 1,428,387 | |
| | | | | | | | |
| | | | Construction & Farm Machinery & Heavy Trucks 0.7% | | | | |
| | 18,822 | | | Bucyrus International, Inc.†† | | | 1,305,306 | |
| | | | | | | | |
| | | | Construction Materials 1.0% | | | | |
| | 6,295,000 | | | PT Holcim Indonesia Tbk* (Indonesia) | | | 1,710,406 | |
| | | | | | | | |
| | | | Consumer Finance 3.2% | | | | |
| | 103,920 | | | Dollar Financial Corp.* | | | 2,168,810 | |
| | 70,300 | | | First Cash Financial Services, Inc.* | | | 1,950,825 | |
| | 117,000 | | | Mahindra & Mahindra Financial Services Ltd. (India) | | | 1,679,426 | |
| | | | | | | | |
| | | | | | | 5,799,061 | |
| | | | | | | | |
| | | | | | | | |
| Shares | | | | | Value | |
| | | | | | | |
| | | | Data Processing & Outsourced Services 2.5% | | | | |
| | 74,579 | | | hiSoft Technology International Ltd. ADR* (China) | | $ | 1,833,898 | |
| | 194,325 | | | Wirecard AG (Germany) | | | 2,644,738 | |
| | | | | | | | |
| | | | | | | 4,478,636 | |
| | | | | | | | |
| | | | Diversified Banks 4.6% | | | | |
| | 47,500 | | | Axis Bank Ltd. (India) | | | 1,619,080 | |
| | 109,580 | | | Bank of Baroda (India) | | | 2,135,146 | |
| | 45,210 | | | HDFC Bank Ltd. (India) | | | 2,503,226 | |
| | 10,951 | | | HDFC Bank Ltd. ADR (India) | | | 2,019,036 | |
| | | | | | | | |
| | | | | | | 8,276,488 | |
| | | | | | | | |
| | | | Diversified Support Services 2.1% | | | | |
| | 45,480 | | | Copart, Inc.* | | | 1,499,476 | |
| | 101,165 | | | STR Holdings, Inc.* | | | 2,179,094 | |
| | | | | | | | |
| | | | | | | 3,678,570 | |
| | | | | | | | |
| | | | Electronic Manufacturing
Services 1.5% | | | | |
| | 111,003 | | | IPG Photonics Corp.* | | | 2,679,612 | |
| | | | | | | | |
| | | | Environmental & Facilities
Services 0.6% | | | | |
| | 104,859 | | | Heritage-Crystal Clean, Inc.* | | | 1,053,833 | |
| | | | | | | | |
| | | | Food Retail 0.4% | | | | |
| | 132,395 | | | QKL Stores, Inc.* (China) | | | 638,144 | |
| | | | | | | | |
| | | | General Merchandise Stores 2.1% | | | | |
| | 57,022 | | | Dollar Tree, Inc.* | | | 2,780,393 | |
| | 77,455 | | | Gordman Stores, Inc.* | | | 894,605 | |
| | | | | | | | |
| | | | | | | 3,674,998 | |
| | | | | | | | |
| | | | Health Care Equipment 6.3% | | | | |
| | 48,630 | | | Abaxis, Inc.* | | | 1,123,353 | |
| | 295,583 | | | AtriCure, Inc.* | | | 2,346,929 | |
| | 258,600 | | | Cardica, Inc.* †† | | | 561,162 | |
| | 330,000 | | | Cardica, Inc. PIPE* † | | | 716,100 | |
| | 161,474 | | | Cardiovascular Systems, Inc.* | | | 854,197 | |
| | 56,445 | | | DexCom, Inc.* | | | 746,203 | |
| | 38,250 | | | DiaSorin S.p.A. (Italy) | | | 1,570,070 | |
| | 59,841 | | | NuVasive, Inc.* | | | 2,102,813 | |
| | 74,810 | | | Synovis Life Technologies, Inc.* | | | 1,118,410 | |
| | 1,080,146 | | | Zonare Medical Systems, Inc.* *** † | | | 183,625 | |
| | | | | | | | |
| | | | | | | 11,322,862 | |
| | | | | | | | |
| | | | Health Care Services 1.3% | | | | |
| | 39,360 | | | Bio-Reference Laboratories, Inc.* | | | 821,050 | |
| | 422,629 | | | Clarient, Inc.* | | | 1,428,486 | |
| | 108,917 | | | TargetRX, Inc.* *** † | | | 1,089 | |
| | | | | | | | |
| | | | | | | 2,250,625 | |
| | | | | | | | |
| | | | Health Care Technology 1.3% | | | | |
| | 22,850 | | | athenahealth, Inc.* | | | 754,507 | |
| | 35,795 | | | Computer Programs and Systems, Inc. | | | 1,523,793 | |
| | | | | | | | |
| | | | | | | 2,278,300 | |
| | | | | | | | |
| | | | Industrial Machinery 0.8% | | | | |
| | 159,500 | | | AIA Engineering Ltd. (India) | | | 1,419,829 | |
| | | | | | | | |
| | | | Internet Retail 1.2% | | | | |
| | 10,955 | | | MakeMyTrip Ltd.* (India) | | | 424,068 | |
| | 173,120 | | | Yoox S.p.A.* (Italy) | | | 1,766,516 | |
| | | | | | | | |
| | | | | | | 2,190,584 | |
| | | | | | | | |
77
| | |
| WASATCH ULTRA GROWTH FUND (WAMCX) — Schedule of Investments (continued) | | |
|
| |
| |
| | | | | | | | |
| Shares | | | | | Value | |
| | | | | | | |
| | | | Internet Software & Services 2.7% | | | | |
| | 27,020 | | | Constant Contact, Inc.* | | $ | 579,039 | |
| | 56,225 | | | DealerTrack Holdings, Inc.* | | | 960,323 | |
| | 6,915 | | | OpenTable, Inc.* | | | 470,773 | |
| | 122,815 | | | SPS Commerce, Inc.* | | | 1,574,488 | |
| | 34,170 | | | VistaPrint N.V.* | | | 1,320,670 | |
| | 91,388 | | | Xtera Communications, Inc.* *** † | | | 914 | |
| | | | | | | | |
| | | | | | | 4,906,207 | |
| | | | | | | | |
| | | | IT Consulting & Other Services 4.3% | | | | |
| | 119,621 | | | Cognizant Technology Solutions Corp., Class A* | | | 7,711,966 | |
| | | | | | | | |
| | | | Leisure Facilities 0.5% | | | | |
| | 24,509 | | | Life Time Fitness, Inc.* | | | 967,370 | |
| | | | | | | | |
| | | | Life Sciences Tools & Services 1.0% | | | | |
| | 39,940 | | | Divi’s Laboratories Ltd. (India) | | | 611,610 | |
| | 55,138 | | | ICON plc ADR* (Ireland) | | | 1,192,084 | |
| | | | | | | | |
| | | | | | | 1,803,694 | |
| | | | | | | | |
| | | | Oil & Gas Equipment & Services 0.9% | | | | |
| | 26,715 | | | Dril-Quip, Inc.* | | | 1,659,269 | |
| | | | | | | | |
| | |
| | | | Oil & Gas Exploration & Production 0.9% | | | | |
| | 61,820 | | | Petrohawk Energy Corp.* | | | 997,775 | |
| | 78,000 | | | Selan Exploration Technology Ltd. (India) | | | 581,333 | |
| | | | | | | | |
| | | | | | | 1,579,108 | |
| | | | | | | | |
| | | | Packaged Foods & Meats 0.9% | | | | |
| | 36,890 | | | Glaxo SmithKline Consumer Healthcare Ltd. (India) | | | 1,663,272 | |
| | | | | | | | |
| | | | Personal Products 0.0% | | | | |
| | 50,403 | | | Ophthonix, Inc.* *** † | | | 504 | |
| | | | | | | | |
| | | | Pharmaceuticals 0.4% | | | | |
| | 123,562 | | | Alexza Pharmaceuticals, Inc.* | | | 391,691 | |
| | 75,769 | | | Alexza Pharmaceuticals, Inc. PIPE* † | | | 240,188 | |
| | | | | | | | |
| | | | | | | 631,879 | |
| | | | | | | | |
| | | | Regional Banks 0.5% | | | | |
| | 835,360 | | | City Union Bank Ltd. (India) | | | 842,146 | |
| | | | | | | | |
| | | | Research & Consulting Services 2.2% | | | | |
| | 78,795 | | | eClerx Services Ltd. (India) | | | 1,017,049 | |
| | 118,600 | | | Resources Connection, Inc. | | | 1,631,936 | |
| | 48,100 | | | Stantec, Inc.* (Canada) | | | 1,270,321 | |
| | | | | | | | |
| | | | | | | 3,919,306 | |
| | | | | | | | |
| | | | Restaurants 0.7% | | | | |
| | 37,580 | | | Peet’s Coffee & Tea, Inc.* | | | 1,286,363 | |
| | | | | | | | |
| | | | Semiconductors 8.4% | | | | |
| | 50,298 | | | Hittite Microwave Corp.* | | | 2,396,700 | |
| | 59,495 | | | NetLogic Microsystems, Inc.* | | | 1,640,872 | |
| | 355,395 | | | O2Micro International Ltd. ADR* (China) | | | 2,171,463 | |
| | 159,280 | | | Power Integrations, Inc.†† | | | 5,063,511 | |
| | 102,235 | | | Silicon Laboratories, Inc.* | | | 3,746,913 | |
| | | | | | | | |
| | | | | | | 15,019,459 | |
| | | | | | | | |
| | | | Specialized Finance 3.4% | | | | |
| | 5,000 | | | Crisil Ltd. (India) | | | 668,966 | |
| | 27,365 | | | ICRA Ltd. (India) | | | 753,870 | |
| | 138,055 | | | MSCI, Inc., Class A* | | | 4,584,807 | |
| | | | | | | | |
| | | | | | | 6,007,643 | |
| | | | | | | | |
| | | | Specialty Stores 0.8% | | | | |
| | 60,245 | | | Hibbett Sports, Inc.* | | | 1,503,113 | |
| | | | | | | | |
| | | | | | | | |
| Shares | | | | | Value | |
| | | | | | | |
| | | | Systems Software 3.6% | | | | |
| | 80,742 | | | NetSuite, Inc.* | | $ | 1,903,089 | |
| | 141,435 | | | OPNET Technologies, Inc. | | | 2,567,045 | |
| | 69,465 | | | Sourcefire, Inc.* | | | 2,003,371 | |
| | | | | | | | |
| | | | | | | 6,473,505 | |
| | | | | | | | |
| | | | Thrifts & Mortgage Finance 2.0% | | | | |
| | 110,510 | | | LIC Housing Finance Ltd. (India) | | | 3,538,976 | |
| | | | | | | | |
| | | | Trucking 0.7% | | | | |
| | 61,915 | | | Knight Transportation, Inc. | | | 1,196,817 | |
| | | | | | | | |
| | |
| | | | Total Common Stocks
(cost $107,831,299) | | | 152,552,115 | |
| | | | | | | | |
| | |
| | | | PREFERRED STOCKS 0.8% | | | | |
| | |
| | | | Biotechnology 0.1% | | | | |
| | 169,492 | | | Nanosys, Inc., Series D Pfd.* *** † | | | 194,068 | |
| | 40,380 | | | Nanosys, Inc., Series E Pfd.* *** † | | | 46,235 | |
| | | | | | | | |
| | | | | | | 240,303 | |
| | | | | | | | |
| | | | Health Care Technology 0.7% | | | | |
| | 253,064 | | | Data Sciences International, Inc.
Series B Pfd.* *** † | | | 807,502 | |
| | 243,902 | | | TherOx, Inc., Series I Pfd.* *** † | | | 429,267 | |
| | | | | | | | |
| | | | | | | 1,236,769 | |
| | | | | | | | |
| | |
| | | | Total Preferred Stocks
(cost $2,021,237) | | | 1,477,072 | |
| | | | | | | | |
| | |
| | | | LIMITED PARTNERSHIP INTEREST 2.7% | | | | |
| | |
| | | | Other 2.7% | | | | |
| | | | Greenspring Global Partners II-B,
L.P.* *** † | | | 3,797,055 | |
| | | | Greenspring Global Partners III-B,
L.P.* *** † | | | 1,034,896 | |
| | | | | | | | |
| | | | | | | 4,831,951 | |
| | | | | | | | |
| | |
| | | | Total Limited Partnership Interest
(cost $5,034,467) | | | 4,831,951 | |
| | | | | | | | |
| | |
| | | | WARRANTS 0.1% | | | | |
| | |
| | | | Health Care Equipment 0.1% | | | | |
| | 165,000 | | | Cardica, Inc., expiring 9/29/14* *** † | | | 118,800 | |
| | 162,021 | | | Zonare Medical Systems, Inc.,
expiring 6/30/11* *** † | | | — | |
| | | | | | | | |
| | | | | | | 118,800 | |
| | | | | | | | |
| | | | Pharmaceuticals 0.0% | | | | |
| | 33,000 | | | Alexza Pharmaceuticals, Inc.,
expiring 8/10/15* *** † | | | — | |
| | 68,192 | | | Alexza Pharmaceuticals, Inc., expiring 10/5/16* *** † | | | 27,277 | |
| | | | | | | | |
| | | | | | | 27,277 | |
| | | | | | | | |
| | |
| | | | Total Warrants
(cost $29,149) | | | 146,077 | |
| | | | | | | | |
78
| | | | | | | | |
Principal
Amount | | | | | Value | |
| | | | | | | |
| | | | SHORT-TERM INVESTMENTS 10.3% | | | | |
| | |
| | | | Repurchase Agreement 10.3% | | | | |
| | $18,309,000 | | | Repurchase Agreement dated 9/30/10, 0.01% due 10/1/10 with State Street Bank and Trust Co. collateralized by $17,555,000 of United States Treasury Notes 4.625% due 2/29/12; value: $18,680,276; repurchase proceeds: $18,309,005†† (cost $18,309,000) | | $ | 18,309,000 | |
| | | | | | | | |
| | |
| | | | Total Short-Term Investments
(cost $18,309,000) | | | 18,309,000 | |
| | | | | | | | |
| | |
| | | | Total Investments
(cost $133,225,152) 99.3% | | | 177,316,215 | |
| | |
| | | | Other Assets less Liabilities 0.7% | | | 1,249,366 | |
| | | | | | | | |
| | |
| | | | NET ASSETS 100.0% | | $ | 178,565,581 | |
| | | | | | | | |
| |
| | | | *Non-income producing. ***Security was fair valued under procedures adopted by the Board of Trustees (see Note 15). †Security purchased in a private placement transaction or under Rule 144A of the Securities Act of 1933 (see Note 11). ††All or a portion of this security has been designated as collateral for purchase commitments (see Note 12). ADR American Depositary Receipt. PIPE Private Investment in a Public Equity. See Notes to Financial Statements. | |
At September 30, 2010, Wasatch Ultra Growth Fund’s investments, excluding short-term investments, were in the following countries:
| | | | |
| Country | | % | |
Brazil | | | 1.3 | |
Canada | | | 0.8 | |
China | | | 5.4 | |
Germany | | | 1.7 | |
India | | | 14.7 | |
Indonesia | | | 1.1 | �� |
Ireland | | | 0.7 | |
Italy | | | 2.1 | |
Singapore | | | 0.6 | |
United Arab Emirates | | | 1.1 | |
United Kingdom | | | 1.3 | |
United States | | | 69.2 | |
| | | | |
TOTAL | | | 100.0 | % |
| | | | |
79
| | |
| WASATCH-1ST SOURCE INCOME EQUITY FUND (FMIEX) — Schedule of Investments | | |
|
| |
| |
| | | | | | | | |
| Shares | | | | | Value | |
| | | | | | | |
| | | | COMMON STOCKS 98.3% | | | | |
| | |
| | | | Advertising 1.3% | | | | |
| | 552,840 | | | Omnicom Group, Inc. | | $ | 21,826,123 | |
| | | | | | | | |
| | | | Aerospace & Defense 2.3% | | | | |
| | 416,000 | | | Raytheon Co. | | | 19,015,360 | |
| | 310,000 | | | Rockwell Collins, Inc. | | | 18,057,500 | |
| | | | | | | | |
| | | | | | | 37,072,860 | |
| | | | | | | | |
| | | | Agricultural Products 1.7% | | | | |
| | 865,000 | | | Archer Daniels Midland Co. | | | 27,610,800 | |
| | | | | | | | |
| | | | Aluminum 1.0% | | | | |
| | 1,361,130 | | | Alcoa, Inc. | | | 16,483,285 | |
| | | | | | | | |
| | | | Asset Management & Custody
Banks 3.5% | | | | |
| | 707,000 | | | Federated Investors, Inc., Class B | | | 16,091,320 | |
| | 495,000 | | | Northern Trust Corp. | | | 23,878,800 | |
| | 622,000 | | | Waddell & Reed Financial, Inc., Class A | | | 17,017,920 | |
| | | | | | | | |
| | | | | | | 56,988,040 | |
| | | | | | | | |
| | | | Auto Parts & Equipment 1.0% | | | | |
| | 533,460 | | | Johnson Controls, Inc. | | | 16,270,530 | |
| | | | | | | | |
| | | | Coal & Consumable Fuels 1.1% | | | | |
| | 659,415 | | | Cameco Corp. (Canada) | | | 18,285,578 | |
| | | | | | | | |
| | | | Communications Equipment 2.5% | | | | |
| | 650,000 | | | Harris Corp. | | | 28,788,500 | |
| | 1,118,000 | | | Nokia OYJ ADR (Finland) | | | 11,213,540 | |
| | | | | | | | |
| | | | | | | 40,002,040 | |
| | | | | | | | |
| | | | Computer & Electronics Retail 0.6% | | | | |
| | 229,770 | | | Best Buy Co., Inc. | | | 9,381,509 | |
| | | | | | | | |
| | | | Computer Hardware 1.2% | | | | |
| | 480,000 | | | Hewlett-Packard Co. | | | 20,193,600 | |
| | | | | | | | |
| | | | Construction & Engineering 1.5% | | | | |
| | 502,000 | | | Fluor Corp. | | | 24,864,060 | |
| | | | | | | | |
| | | | Construction & Farm Machinery & Heavy Trucks 1.1% | | | | |
| | 250,000 | | | Deere & Co. | | | 17,445,000 | |
| | | | | | | | |
| | | | Data Processing & Outsourced Services 1.3% | | | | |
| | 440,000 | | | Computer Sciences Corp. | | | 20,240,000 | |
| | | | | | | | |
| | | | Diversified Chemicals 1.5% | | | | |
| | 556,555 | | | E.I. du Pont de Nemours and Co. | | | 24,833,484 | |
| | | | | | | | |
| | | | Diversified Metals & Mining 0.5% | | | | |
| | 435,000 | | | Anglo American plc ADR (United Kingdom) | | | 8,643,450 | |
| | | | | | | | |
| | | | Drug Retail 1.1% | | | | |
| | 526,435 | | | Walgreen Co. | | | 17,635,572 | |
| | | | | | | | |
| | | | Electric Utilities 2.2% | | | | |
| | 973,000 | | | Duke Energy Corp. | | | 17,231,830 | |
| | 350,000 | | | NextEra Energy, Inc. | | | 19,036,500 | |
| | | | | | | | |
| | | | | | | 36,268,330 | |
| | | | | | | | |
| | | | Electrical Components & Equipment 1.4% | | | | |
| | 440,000 | | | Emerson Electric Co. | | | 23,170,400 | |
| | | | | | | | |
| | | | Electronic Components 1.0% | | | | |
| | 857,300 | | | Corning, Inc. | | | 15,671,444 | |
| | | | | | | | |
| | | | Environmental & Facilities Services 1.5% | | | | |
| | 679,000 | | | Waste Management, Inc. | | | 24,267,460 | |
| | | | | | | | |
| | | | | | | | |
| Shares | | | | | Value | |
| | | | | | | |
| | | | Fertilizers & Agricultural Chemicals 0.9% | | | | |
| | 277,000 | | | Syngenta AG ADR (Switzerland) | | $ | 13,791,830 | |
| | | | | | | | |
| | | | Food Distributors 1.5% | | | | |
| | 841,440 | | | Sysco Corp. | | | 23,997,869 | |
| | | | | | | | |
| | | | Food Retail 1.0% | | | | |
| | 1,353,200 | | | SUPERVALU, Inc. | | | 15,602,396 | |
| | | | | | | | |
| | | | Gold 1.3% | | | | |
| | 453,520 | | | Barrick Gold Corp. (Canada) | | | 20,993,441 | |
| | | | | | | | |
| | | | Health Care Distributors 1.8% | | | | |
| | 460,000 | | | McKesson Corp. | | | 28,418,800 | |
| | | | | | | | |
| | | | Health Care Equipment 3.1% | | | | |
| | 196,000 | | | C. R. Bard, Inc. | | | 15,960,280 | |
| | 448,000 | | | Covidien plc | | | 18,005,120 | |
| | 325,000 | | | Zimmer Holdings, Inc.* | | | 17,007,250 | |
| | | | | | | | |
| | | | | | | 50,972,650 | |
| | | | | | | | |
| | | | Home Improvement Retail 1.7% | | | | |
| | 843,790 | | | Home Depot, Inc. (The) | | | 26,731,267 | |
| | | | | | | | |
| | | | Household Products 1.3% | | | | |
| | 330,000 | | | Kimberly-Clark Corp. | | | 21,466,500 | |
| | | | | | | | |
| | | | Hypermarkets & Super Centers 1.4% | | | | |
| | 423,050 | | | Wal-Mart Stores, Inc. | | | 22,641,636 | |
| | | | | | | | |
| | | | Industrial Machinery 1.5% | | | | |
| | 340,000 | | | Parker Hannifin Corp. | | | 23,820,400 | |
| | | | | | | | |
| | | | Insurance Brokers 1.2% | | | | |
| | 811,290 | | | Marsh & McLennan Cos., Inc. | | | 19,568,315 | |
| | | | | | | | |
| | | | Integrated Oil & Gas 7.1% | | | | |
| | 362,000 | | | Chevron Corp. | | | 29,340,100 | |
| | 502,000 | | | ConocoPhillips | | | 28,829,860 | |
| | 467,000 | | | Exxon Mobil Corp. | | | 28,855,930 | |
| | 835,895 | | | Marathon Oil Corp. | | | 27,668,124 | |
| | | | | | | | |
| | | | | | | 114,694,014 | |
| | | | | | | | |
| | | | Integrated Telecommunication Services 3.0% | | | | |
| | 768,430 | | | AT&T, Inc. | | | 21,977,098 | |
| | 833,000 | | | Verizon Communications, Inc. | | | 27,147,470 | |
| | | | | | | | |
| | | | | | | 49,124,568 | |
| | | | | | | | |
| | | | Investment Banking & Brokerage 1.0% | | | | |
| | 116,485 | | | Goldman Sachs Group, Inc. (The) | | | 16,841,401 | |
| | | | | | | | |
| | | | Life & Health Insurance 1.5% | | | | |
| | 631,000 | | | MetLife, Inc. | | | 24,261,950 | |
| | | | | | | | |
| | | | Multi-Line Insurance 1.8% | | | | |
| | 773,370 | | | Loews Corp. | | | 29,310,723 | |
| | | | | | | | |
| | | | Oil & Gas Drilling 2.8% | | | | |
| | 572,400 | | | Ensco plc ADR (United Kingdom) | | | 25,603,452 | |
| | 304,540 | | | Transocean Ltd.* | | | 19,578,877 | |
| | | | | | | | |
| | | | | | | 45,182,329 | |
| | | | | | | | |
| | | | Oil & Gas Equipment & Services 1.8% | | | | |
| | 145,000 | | | National Oilwell Varco, Inc. | | | 6,448,150 | |
| | 355,000 | | | Schlumberger Ltd. | | | 21,871,550 | |
| | | | | | | | |
| | | | | | | 28,319,700 | |
| | | | | | | | |
| | | | Oil & Gas Exploration & Production 2.0% | | | | |
| | 270,000 | | | Anadarko Petroleum Corp. | | | 15,403,500 | |
| | 401,590 | | | Ultra Petroleum Corp.* | | | 16,858,748 | |
| | | | | | | | |
| | | | | | | 32,262,248 | |
| | | | | | | | |
80
| | | | | | | | |
Shares | | | | | Value | |
| | | | | | | |
| | | | Oil & Gas Storage & Transportation 2.6% | | | | |
| | 900,000 | | | Spectra Energy Corp. | | $ | 20,295,000 | |
| | 1,130,000 | | | Williams Cos., Inc. (The) | | | 21,594,300 | |
| | | | | | | | |
| | | | | | | 41,889,300 | |
| | | | | | | | |
| | | | Other Diversified Financial Services 3.0% | | | | |
| | 1,704,000 | | | Bank of America Corp. | | | 22,339,440 | |
| | 697,000 | | | JPMorgan Chase & Co. | | | 26,534,790 | |
| | | | | | | | |
| | | | | | | 48,874,230 | |
| | | | | | | | |
| | | | Packaged Foods & Meats 2.4% | | | | |
| | 840,000 | | | ConAgra Foods, Inc. | | | 18,429,600 | |
| | 423,575 | | | HJ Heinz Co. | | | 20,064,748 | |
| | | | | | | | |
| | | | | | | 38,494,348 | |
| | | | | | | | |
| | | | Personal Products 1.0% | | | | |
| | 507,500 | | | Avon Products, Inc. | | | 16,295,825 | |
| | | | | | | | |
| | | | Pharmaceuticals 5.7% | | | | |
| | 385,000 | | | Abbott Laboratories | | | 20,112,400 | |
| | 440,000 | | | Eli Lilly and Co. | | | 16,073,200 | |
| | 334,000 | | | Johnson & Johnson | | | 20,694,640 | |
| | 589,000 | | | Merck & Co., Inc. | | | 21,681,090 | |
| | 830,000 | | | Pfizer, Inc. | | | 14,251,100 | |
| | | | | | | | |
| | | | | | | 92,812,430 | |
| | | | | | | | |
| | | | Property & Casualty Insurance 4.3% | | | | |
| | 737,860 | | | Allstate Corp. (The) | | | 23,279,483 | |
| | 1,375,000 | | | Old Republic International Corp. | | | 19,043,750 | |
| | 538,000 | | | Travelers Cos., Inc. (The) | | | 28,029,800 | |
| | | | | | | | |
| | | | | | | 70,353,033 | |
| | | | | | | | |
| | | | Railroads 1.1% | | | | |
| | 289,000 | | | Norfolk Southern Corp. | | | 17,198,390 | |
| | | | | | | | |
| | | | Semiconductors 3.0% | | | | |
| | 1,392,385 | | | Intel Corp. | | | 26,775,564 | |
| | 818,000 | | | Texas Instruments, Inc. | | | 22,200,520 | |
| | | | | | | | |
| | | | | | | 48,976,084 | |
| | | | | | | | |
| | | | Soft Drinks 1.2% | | | | |
| | 300,000 | | | PepsiCo, Inc. | | | 19,932,000 | |
| | | | | | | | |
| | | | Specialized Consumer Services 0.4% | | | | |
| | 500,000 | | | H&R Block, Inc. | | | 6,475,000 | |
| | | | | | | | |
| | | | Specialized Finance 1.3% | | | | |
| | 731,425 | | | NYSE Euronext | | | 20,896,812 | |
| | | | | | | | |
| | | | Steel 1.1% | | | | |
| | 472,090 | | | Nucor Corp. | | | 18,033,838 | |
| | | | | | | | |
| | | | Systems Software 1.9% | | | | |
| | 694,340 | | | Microsoft Corp. | | | 17,004,387 | |
| | 916,390 | | | Symantec Corp.* | | | 13,901,636 | |
| | | | | | | | |
| | | | | | | 30,906,023 | |
| | | | | | | | |
| | | | Technology Distributors 1.3% | | | | |
| | 780,000 | | | Avnet, Inc.* | | | 21,067,800 | |
| | | | | | | | |
| | | | Water Utilities 1.0% | | | | |
| | 708,085 | | | American Water Works Co., Inc. | | | 16,477,138 | |
| | | | | | | | |
| | |
| | | | Total Common Stocks
(cost $1,453,459,435) | | | 1,593,837,853 | |
| | | | | | | | |
| | | | | | | | |
Principal
Amount | | | | | Value | |
| | |
| | | | SHORT-TERM INVESTMENTS 2.1% | | | | |
| | |
| | | | Repurchase Agreement 2.1% | | | | |
| | $34,508,000 | | | Repurchase Agreement dated 9/30/10, 0.01% due 10/1/10 with State Street Bank and Trust Co. collateralized by $32,820,000 of United States Treasury Notes 2.625% due 4/30/16; value: $35,199,450; repurchase proceeds: $34,508,010 (cost $34,508,000) | | $ | 34,508,000 | |
| | | | | | | | |
| | |
| | | | Total Short-Term Investments
(cost $34,508,000) | | | 34,508,000 | |
| | | | | | | | |
| | |
| | | | Total Investments
(cost $1,487,967,435) 100.4% | | | 1,628,345,853 | |
| | |
| | | | Liabilities less Other Assets (0.4)% | | | (7,233,099 | ) |
| | | | | | | | |
| | |
| | | | NET ASSETS 100.0% | | $ | 1,621,112,754 | |
| | | | | | | | |
| | |
| | | | *Non-income producing. ADR American Depositary Receipt. See Notes to Financial Statements. | | | | |
At September 30, 2010, Wasatch-1st Source Income Equity Fund’s investments, excluding short-term investments, were in the following countries:
| | | | |
| Country | | % | |
Canada | | | 2.5 | |
Finland | | | 0.7 | |
Switzerland | | | 0.9 | |
United Kingdom | | | 2.1 | |
United States | | | 93.8 | |
| | | | |
TOTAL | | | 100.0 | % |
| | | | |
81
| | |
| WASATCH-1ST SOURCE LONG/SHORT FUND (FMLSX) — Schedule of Investments | | |
|
| |
| |
| | | | | | | | |
| Shares | | | | | Value | |
| | | | | | | |
| | | | COMMON STOCKS 90.8% | | | | |
| | |
| | | | Agricultural Products 1.9% | | | | |
| | 180,000 | | | Archer Daniels Midland Co.‡ | | $ | 5,745,600 | |
| | | | | | | | |
| | | | Application Software 1.2% | | | | |
| | 200,000 | | | TIBCO Software, Inc.* ‡ | | | 3,548,000 | |
| | | | | | | | |
| | | | Automotive Retail 1.3% | | | | |
| | 368,032 | | | Pep Boys — Manny, Moe, & Jack (The)‡ | | | 3,893,779 | |
| | | | | | | | |
| | | | Brewers 1.2% | | | | |
| | 75,000 | | | Molson Coors Brewing Co.‡ | | | 3,541,500 | |
| | | | | | | | |
| | | | Coal & Consumable Fuels 1.4% | | | | |
| | 101,100 | | | Alpha Natural Resources, Inc.* ‡ | | | 4,160,265 | |
| | | | | | | | |
| | | | Communications Equipment 5.5% | | | | |
| | 300,000 | | | Blue Coat Systems, Inc.* ‡ | | | 7,218,000 | |
| | 600,000 | | | Brocade Communications Systems, Inc.* | | | 3,504,000 | |
| | 130,000 | | | Cisco Systems, Inc.* ‡ | | | 2,847,000 | |
| | 135,000 | | | DG Fastchannel, Inc.* ‡ | | | 2,936,250 | |
| | | | | | | | |
| | | | | | | 16,505,250 | |
| | | | | | | | |
| | | | Computer & Electronics Retail 3.4% | | | | |
| | 250,000 | | | Best Buy Co., Inc.‡ | | | 10,207,500 | |
| | | | | | | | |
| | | | Computer Hardware 1.5% | | | | |
| | 565,000 | | | Silicon Graphics International Corp.* | | | 4,384,400 | |
| | | | | | | | |
| | | | Construction & Engineering 1.0% | | | | |
| | 60,000 | | | Fluor Corp.‡ | | | 2,971,800 | |
| | | | | | | | |
| | | | Diversified Support Services 3.7% | | | | |
| | 500,000 | | | Iron Mountain, Inc. | | | 11,170,000 | |
| | | | | | | | |
| | | | Electrical Components & Equipment 0.7% | | | | |
| | 50,000 | | | Thomas & Betts Corp.* ‡ | | | 2,051,000 | |
| | | | | | | | |
| | | | Environmental & Facilities Services 2.1% | | | | |
| | 100,000 | | | Republic Services, Inc.‡ | | | 3,049,000 | |
| | 90,000 | | | Waste Management, Inc.‡ | | | 3,216,600 | |
| | | | | | | | |
| | | | | | | 6,265,600 | |
| | | | | | | | |
| | | | Fertilizers & Agricultural Chemicals 1.0% | | | | |
| | 50,000 | | | Mosaic Co. (The)‡ | | | 2,938,000 | |
| | | | | | | | |
| | | | Food Distributors 1.0% | | | | |
| | 100,000 | | | Sysco Corp.‡ | | | 2,852,000 | |
| | | | | | | | |
| | | | Health Care Equipment 5.1% | | | | |
| | 150,000 | | | Medtronic, Inc.‡ | | | 5,037,000 | |
| | 50,000 | | | St. Jude Medical, Inc.* ‡ | | | 1,967,000 | |
| | 650,000 | | | Symmetry Medical, Inc.* | | | 6,266,000 | |
| | 65,000 | | | Zoll Medical Corp.* ‡ | | | 2,097,550 | |
| | | | | | | | |
| | | | | | | 15,367,550 | |
| | | | | | | | |
| | | | Health Care Services 1.3% | | | | |
| | 320,000 | | | Emdeon, Inc., Class A* ‡ | | | 3,897,600 | |
| | | | | | | | |
| | | | Heavy Electrical Equipment 1.8% | | | | |
| | 200,000 | | | General Cable Corp.* | | | 5,424,000 | |
| | | | | | | | |
| | | | Home Entertainment Software 1.1% | | | | |
| | 200,000 | | | Electronic Arts, Inc.* ‡ | | | 3,286,000 | |
| | | | | | | | |
| | | | Household Products 1.1% | | | | |
| | 50,000 | | | Clorox Co.‡ | | | 3,338,000 | |
| | | | | | | | |
| | | | Hypermarkets & Super Centers 3.2% | | | | |
| | 180,000 | | | Wal-Mart Stores, Inc.‡ | | | 9,633,600 | |
| | | | | | | | |
| | | | Insurance Brokers 0.8% | | | | |
| | 105,000 | | | Marsh & McLennan Cos., Inc.‡ | | | 2,532,600 | |
| | | | | | | | |
| | | | | | | | |
| Shares | | | | | Value | |
| | | | | | | |
| | | | Integrated Oil & Gas 2.2% | | | | |
| | 70,000 | | | ConocoPhillips | | $ | 4,020,100 | |
| | 75,000 | | | Marathon Oil Corp.‡ | | | 2,482,500 | |
| | | | | | | | |
| | | | | | | 6,502,600 | |
| | | | | | | | |
| | | | Integrated Telecommunication Services 3.1% | | | | |
| | 160,000 | | | AT&T, Inc.‡ | | | 4,576,000 | |
| | 144,000 | | | Verizon Communications, Inc.‡ | | | 4,692,960 | |
| | | | | | | | |
| | | | | | | 9,268,960 | |
| | | | | | | | |
| | | | Internet Retail 1.3% | | | | |
| | 25,000 | | | Amazon.com, Inc.* ‡ | | | 3,926,500 | |
| | | | | | | | |
| | | | Internet Software & Services 1.5% | | | | |
| | 100,000 | | | eBay, Inc.* ‡ | | | 2,440,000 | |
| | 350,000 | | | United Online, Inc. | | | 2,002,000 | |
| | | | | | | | |
| | | | | | | 4,442,000 | |
| | | | | | | | |
| | | | IT Consulting & Other Services 1.3% | | | | |
| | 250,000 | | | Saic, Inc.* | | | 3,995,000 | |
| | | | | | | | |
| | | | Life & Health Insurance 2.2% | | | | |
| | 300,000 | | | Unum Group‡ | | | 6,645,000 | |
| | | | | | | | |
| | | | Multi-Line Insurance 5.0% | | | | |
| | 400,000 | | | Loews Corp.‡ | | | 15,160,000 | |
| | | | | | | | |
| | | | Oil & Gas Drilling 9.9% | | | | |
| | 110,000 | | | Atwood Oceanics, Inc.* | | | 3,349,500 | |
| | 220,300 | | | Ensco plc ADR‡ (United Kingdom) | | | 9,854,019 | |
| | 300,000 | | | Noble Corp. | | | 10,137,000 | |
| | 190,000 | | | Patterson-UTI Energy, Inc.‡ | | | 3,245,200 | |
| | 50,000 | | | Transocean Ltd.* | | | 3,214,500 | |
| | | | | | | | |
| | | | | | | 29,800,219 | |
| | | | | | | | |
| | | | Oil & Gas Equipment & Services 1.1% | | | | |
| | 75,000 | | | Tidewater, Inc.‡ | | | 3,360,750 | |
| | | | | | | | |
| | | | Oil & Gas Exploration & Production 5.8% | | | | |
| | 205,000 | | | Devon Energy Corp.‡ | | | 13,271,700 | |
| | 110,000 | | | Range Resources Corp. | | | 4,194,300 | |
| | | | | | | | |
| | | | | | | 17,466,000 | |
| | | | | | | | |
| | | | Oil & Gas Storage & Transportation 1.1% | | | | |
| | 140,000 | | | Spectra Energy Corp.‡ | | | 3,157,000 | |
| | | | | | | | |
| | | | Pharmaceuticals 1.0% | | | | |
| | 50,000 | | | Johnson & Johnson‡ | | | 3,098,000 | |
| | | | | | | | |
| | | | Property & Casualty Insurance 4.3% | | | | |
| | 280,000 | | | Allstate Corp. (The)‡ | | | 8,834,000 | |
| | 150,000 | | | CNA Financial Corp.* ‡ | | | 4,198,500 | |
| | | | | | | | |
| | | | | | | 13,032,500 | |
| | | | | | | | |
| | | | Restaurants 0.9% | | | | |
| | 35,000 | | | McDonald’s Corp. | | | 2,607,850 | |
| | | | | | | | |
| | | | Semiconductors 2.3% | | | | |
| | 360,000 | | | Intel Corp.‡ | | | 6,922,800 | |
| | | | | | | | |
| | | | Steel 2.7% | | | | |
| | 100,000 | | | Nucor Corp.‡ | | | 3,820,000 | |
| | 300,000 | | | Steel Dynamics, Inc.‡ | | | 4,233,000 | |
| | | | | | | | |
| | | | | | | 8,053,000 | |
| | | | | | | | |
| | | | Systems Software 2.7% | | | | |
| | 300,000 | | | Oracle Corp.‡ | | | 8,055,000 | |
| | | | | | | | |
82
| | | | | | | | |
Shares | | | | | Value | |
| | | | | | | |
| | | | Water Utilities 1.1% | | | | |
| | 75,000 | | | Companhia de Saneamento Basico do | | | | |
| | | | Estado de Sao Paulo ADR (Brazil) | | $ | 3,413,250 | |
| | | | | | | | |
| | |
| | | | Total Common Stocks
(cost $248,124,243) | | | 272,620,473 | |
| | | | | | | | |
| | |
| | | | PREFERRED STOCKS 1.9% | | | | |
| | |
| | | | Cable & Satellite 0.6% | | | | |
| | 75,000 | | | Comcast Corp., 7.00%, Series B Pfd. | | | 1,959,750 | |
| | | | | | | | |
| | | | Specialized REITs 1.3% | | | | |
| | 75,000 | | | Public Storage, 6.625%, Series M Pfd.§§§ | | | 1,902,750 | |
| | 75,000 | | | Public Storage, 7.25%, Series K Pfd.§§§ | | | 1,898,250 | |
| | | | | | | | |
| | | | | | | 3,801,000 | |
| | | | | | | | |
| | |
| | | | Total Preferred Stocks
(cost $4,672,590) | | | 5,760,750 | |
| | | | | | | | |
| | |
Principal
Amount | | | | | Value | |
| | | | | | | |
| | | | SHORT-TERM INVESTMENTS 10.8% | | | | |
| | |
| | | | Repurchase Agreement 10.8% | | | | |
| | $32,403,000 | | | Repurchase Agreement dated 9/30/10, 0.01% due 10/1/10 with State Street Bank and Trust Co. collateralized by $30,820,000 of United States Treasury Notes 2.625% due 4/30/16; value: $33,054,450; repurchase proceeds: $32,403,009‡ (cost $32,403,000) | | $ | 32,403,000 | |
| | | | | | | | |
| | |
| | | | Total Short-Term Investments
(cost $32,403,000) | | | 32,403,000 | |
| | | | | | | | |
| | |
| | | | Total Investments
(cost $285,199,833) 103.5% | | | 310,784,223 | |
| | |
| | | | Liabilities less Other Assets (3.5)% | | | (10,529,487 | ) |
| | | | | | | | |
| | |
| | | | NET ASSETS 100.0% | | $ | 300,254,736 | |
| | | | | | | | |
| | |
Number of
Contracts | | | | | Value | |
| | | | | | | |
| | | | CALL OPTIONS WRITTEN 1.4% | | | | |
| | |
| | | | Application Software 0.3% | | | | |
| | 2,000 | | | TIBCO Software, Inc., expiring 11/20/10, exercise price $12.5 | | $ | 1,040,000 | |
| | | | | | | | |
| | | | Communications Equipment 0.3% | | | | |
| | 1,500 | | | Blue Coat Systems, Inc., expiring 1/22/11, exercise price $24 | | | 412,500 | |
| | 500 | | | DG Fastchannel, Inc., expiring 12/18/10, exercise price $17.50 | | | 245,000 | |
| | 850 | | | DG Fastchannel, Inc., expiring 12/18/10, exercise price $20 | | | 297,500 | |
| | | | | | | | |
| | | | | | | 955,000 | |
| | | | | | | | |
| | | | | | | | |
Number of
Contracts | | | | | Value | |
| | | | | | | |
| | | | Construction & Engineering 0.1% | | | | |
| | 600 | | | Fluor Corp., expiring 4/16/11, exercise price $49 | | $ | 318,000 | |
| | | | | | | | |
| | | | Fertilizers & Agricultural Chemicals 0.2% | | | | |
| | 500 | | | Mosaic Co. (The), expiring 12/18/10, exercise price $50 | | | 532,000 | |
| | | | | | | | |
| | | | Internet Retail 0.3% | | | | |
| | 150 | | | Amazon.com, Inc., expiring 10/16/10, exercise price $115 | | | 634,500 | |
| | 100 | | | Amazon.com, Inc., expiring 1/22/11, exercise price $135 | | | 282,000 | |
| | | | | | | | |
| | | | | | | 916,500 | |
| | | | | | | | |
| | | | Oil & Gas Drilling 0.1% | | | | |
| | 702 | | | Ensco plc, expiring 12/18/10, exercise price $45 | | | 193,050 | |
| | | | | | | | |
| | | | Systems Software 0.1% | | | | |
| | 1,000 | | | Oracle Corp., expiring 1/22/11, exercise price $26 | | | 218,000 | |
| | | | | | | | |
| | |
| | | | Total Call Options Written
(premium $2,229,695) | | | 4,172,550 | |
| | | | | | | | |
| | |
| Shares | | | | | Value | |
| | | | | | | |
| | | | SECURITIES SOLD SHORT 9.6% | |
| | |
| | | | Application Software 1.3% | | | | |
| | 80,000 | | | SAP AG ADR (Germany) | | $ | 3,944,800 | |
| | | | | | | | |
| | | | Diversified Chemicals 1.1% | | | | |
| | 115,000 | | | Dow Chemical Co. (The) | | | 3,157,900 | |
| | | | | | | | |
| | | | Motorcycle Manufacturers 0.2% | | | | |
| | 23,407 | | | Harley-Davidson, Inc. | | | 665,695 | |
| | | | | | | | |
| | | | Residential REITs 1.1% | | | | |
| | 31,250 | | | AvalonBay Communities, Inc. | | | 3,247,812 | |
| | | | | | | | |
| | | | Retail REITs 3.7% | | | | |
| | 40,000 | | | Federal Realty Investment Trust | | | 3,266,400 | |
| | 123,948 | | | Regency Centers Corp. | | | 4,892,228 | |
| | 33,227 | | | Simon Property Group, Inc. | | | 3,081,472 | |
| | | | | | | | |
| | | | | | | 11,240,100 | |
| | | | | | | | |
| | | | Specialized REITs 0.9% | | | | |
| | 75,000 | | | Plum Creek Timber Co., Inc. | | | 2,647,500 | |
| | | | | | | | |
| | | | Wireless Telecommunication Services 1.3% | | | | |
| | 75,000 | | | American Tower Corp., Class A* | | | 3,844,500 | |
| | | | | | | | |
| | |
| | | | Total Securities Sold Short
(proceeds $24,430,119) | | | 28,748,307 | |
| | | | | | | | |
| |
| | | | *Non-income producing. ‡All or a portion of this security has been designated as collateral for call options written and short sales (see Notes 4 and 3, respectively). §§§Perpetual Maturity. Callable any time after first call date. Maturity date is next call date. ADR American Depositary Receipt. REIT Real Estate Investment Trust. See Notes to Financial Statements. | |
83
| | |
| WASATCH-1ST SOURCE LONG/SHORT FUND (FMLSX) — Schedule of Investments (continued) | | SEPTEMBER 30, 2010 |
|
| |
| |
At September 30, 2010, Wasatch-1st Source Long/Short Fund’s investments, excluding short-term investments, options written and securities sold short, were in the following countries:
| | | | |
| Country | | % | |
Brazil | | | 1.2 | |
United Kingdom | | | 3.6 | |
United States | | | 95.2 | |
| | | | |
TOTAL | | | 100.0 | % |
| | | | |
84
| | |
| WASATCH-HOISINGTON U.S. TREASURY FUND (WHOSX) — Schedule of Investments | | SEPTEMBER 30, 2010 |
|
| |
| |
| | | | | | | | |
Principal
Amount | | | | | Value | |
| | | | | | | |
| | | | U.S. GOVERNMENT OBLIGATIONS 99.0% | | | | |
| | |
| | $ 6,000,000 | | | U.S. Treasury Bond, 3.50%, 2/15/39 | | $ | 5,805,000 | |
| | 7,800,000 | | | U.S. Treasury Bond, 3.875%, 8/15/40 | | | 8,063,250 | |
| | 6,335,000 | | | U.S. Treasury Bond, 4.25%, 5/15/39 | | | 6,964,541 | |
| | 1,400,000 | | | U.S. Treasury Bond, 4.375%, 2/15/38 | | | 1,577,625 | |
| | 16,420,000 | | | U.S. Treasury Bond, 4.375%, 5/15/40 | | | 18,441,795 | |
| | 15,200,000 | | | U.S. Treasury Bond, 4.50%, 2/15/36 | | | 17,477,629 | |
| | 10,000,000 | | | U.S. Treasury Bond, 4.50%, 5/15/38 | | | 11,501,560 | |
| | 4,500,000 | | | U.S. Treasury Bond, 4.50%, 8/15/39 | | | 5,152,500 | |
| | 2,000,000 | | | U.S. Treasury Bond, 4.625%, 2/15/40 | | | 2,336,876 | |
| | 22,000,000 | | | U.S. Treasury Bond, 4.75%, 2/15/37 | | | 26,300,318 | |
| | 109,000,000 | | | U.S. Treasury Strip, principal only, 2/15/31 | | | 51,247,331 | |
| | 44,837,000 | | | U.S. Treasury Strip, principal only, 2/15/37 | | | 16,156,878 | |
| | 62,151,000 | | | U.S. Treasury Strip, principal only, 5/15/39 | | | 19,915,293 | |
| | 26,000,000 | | | U.S. Treasury Strip, principal only, 5/15/40 | | | 7,997,210 | |
| | | | | | | | |
| | |
| | | | Total U.S. Government Obligations
(cost $185,327,036) | | | 198,937,806 | |
| | | | | | | | |
| | |
| | | | SHORT-TERM INVESTMENTS 0.7% | | | | |
| | |
| | | | Repurchase Agreement 0.7% | | | | |
| | 1,318,000 | | | Repurchase Agreement dated 9/30/10, 0.01% due 10/1/10 with State Street Bank and Trust Co. collateralized by $1,265,000 of United States Treasury Notes 4.625% due 2/29/12; value: $1,346,087; repurchase proceeds: $1,318,000 (cost $1,318,000) | | | 1,318,000 | |
| | | | | | | | |
| | |
| | | | Total Short-Term Investments
(cost $1,318,000) | | | 1,318,000 | |
| | | | | | | | |
| | |
| | | | Total Investments
(cost $186,645,036) 99.7% | | | 200,255,806 | |
| | |
| | | | Other Assets less Liabilities 0.3% | | | 598,775 | |
| | | | | | | | |
| | |
| | | | NET ASSETS 100.0% | | $ | 200,854,581 | |
| | | | | | | | |
| | |
| | | | See Notes to Financial Statements. | | | | |
85
| | |
| WASATCH-1ST SOURCE INCOME FUND (FMEQX) — Schedule of Investments | | |
|
| |
| |
| | | | | | | | |
Principal
Amount | | | | | Value | |
| | | | | | | |
| | | | ASSET BACKED SECURITIES 2.3% | | | | |
| | |
| | $1,500,000 | | | Citibank Credit Card Issuance Trust, 4.90%, 6/23/16, Series 2009-A4, Class A4 | | $ | 1,683,771 | |
| | 600,000 | | | Citibank Omni Master Trust, 4.90%, 11/15/18, Series 2009-A17, Class A17 | | | 649,325 | |
| | 850,000 | | | World Financial Network Credit Card Master Note Trust, 4.60%, 9/15/15, Series 2009-A, Class A | | | 879,675 | |
| | | | | | | | |
| | |
| | | | Total Asset Backed Securities
(cost $3,136,258) | | | 3,212,771 | |
| | | | | | | | |
| | |
| | | | COLLATERALIZED MORTGAGE OBLIGATIONS 25.7% | | | | |
| | |
| | 370,127 | | | ABN Amro Mortgage Corp., 5.50%, 2/25/18, Series 2003-13, Class A2 | | | 379,786 | |
| | 39,501 | | | Banc of America Mortgage Securities, Inc., 3.39038%, 2/25/33, Series 2003-A, Class 3A1††† | | | 35,086 | |
| | 250,000 | | | Banc of America Commercial Mortgage, Inc., 5.228493%, 11/10/42, Series 2005-1, Class A4††† | | | 264,153 | |
| | 345,665 | | | Bear Stearns Commercial Mortgage Securities, 4.735%, 9/11/42, Series 2005-PWR9, Class A2 | | | 348,320 | |
| | 42,275 | | | Credit Suisse First Boston Mortgage Securities Corp., 4.302%, 7/15/36, Series 2004-C3, Class A3 | | | 42,243 | |
| | 389,615 | | | Countrywide Home Loans, 4.50%, 8/25/19, Series 2004-J7, Class 2A1 | | | 397,027 | |
| | 153,017 | | | Federal Home Loan Mortgage Corp., 2.651%, 5/1/31, Series 847292††† | | | 160,154 | |
| | 111,373 | | | Federal Home Loan Mortgage Corp., 2.743%, 12/1/32, Series 847527††† | | | 116,223 | |
| | 40,242 | | | Federal Home Loan Mortgage Corp., 2.977%, 8/1/33, Series 847281††† | | | 42,277 | |
| | 362,462 | | | Federal Home Loan Mortgage Corp., 4.097%, 5/1/25, Series 775617††† | | | 376,164 | |
| | 286,155 | | | Federal Home Loan Mortgage Corp., 4.50%, 7/15/15, Series 2864, Class CV | | | 289,668 | |
| | 712,726 | | | Federal Home Loan Mortgage Corp., 4.50%, 12/1/18, Series G11657 | | | 757,033 | |
| | 112,054 | | | Federal Home Loan Mortgage Corp., 5.00%, 5/15/16, Series R007, Class AL | | | 113,040 | |
| | 283,138 | | | Federal Home Loan Mortgage Corp., 5.00%, 2/15/23, Series 2960, Class KP | | | 292,509 | |
| | 187,344 | | | Federal Home Loan Mortgage Corp., 5.125%, 6/15/18, Series R016, Class AM | | | 193,646 | |
| | 81,538 | | | Federal Home Loan Mortgage Corp., 5.50%, 10/15/14, Series R014, Class AL | | | 82,003 | |
| | 500,284 | | | Federal Home Loan Mortgage Corp., 5.50%, 5/15/15, Series 2808, Class VA | | | 550,747 | |
| | 210,114 | | | Federal Home Loan Mortgage Corp., 5.50%, 10/1/25, Series C90925 | | | 224,628 | |
| | 510,447 | | | Federal Home Loan Mortgage Corp., 5.50%, 8/1/29, Series C46102 | | | 546,308 | |
| | 82,690 | | | Federal Home Loan Mortgage Corp., 5.722%, 11/1/35, Series 1M0010††† | | | 86,244 | |
| | 179,286 | | | Federal Home Loan Mortgage Corp., 5.875%, 5/15/16, Series R007, Class AC | | | 181,069 | |
| | 219,929 | | | Federal National Mortgage Assoc., 2.178%, 11/1/34, Series 782320††† | | | 229,486 | |
| | 379,261 | | | Federal National Mortgage Assoc., 2.305%, 1/1/35, Series 825245††† | | | 391,432 | |
| | 246,432 | | | Federal National Mortgage Assoc., 3.054%, 1/1/18, Series 057735††† | | | 250,676 | |
| | 17,708 | | | Federal National Mortgage Assoc., 3.35%, 10/1/32, Series 659657††† | | | 18,241 | |
| | 261,136 | | | Federal National Mortgage Assoc., 3.525%, 2/1/21, Series 313380††† | | | 267,645 | |
| | | | | | | | |
Principal
Amount | | | | | Value | |
| | | | | | | |
| | $ 637,558 | | | Federal National Mortgage Assoc.,
3.875%, 1/25/39, Series 2009-2, Class WJ | | $ | 675,065 | |
| | 537,994 | | | Federal National Mortgage Assoc.,
4.00%, 10/25/32, Series 2003-28, Class GA | | | 565,284 | |
| | 269,974 | | | Federal National Mortgage Assoc.,
4.082%, 7/1/19, Series 070377††† | | | 275,216 | |
| | 277,007 | | | Federal National Mortgage Assoc.,
4.25%, 9/25/22, Series 2003-17, Class ED | | | 289,603 | |
| | 660,730 | | | Federal National Mortgage Assoc.,
4.50%, 5/1/19, Series 725445 | | | 701,804 | |
| | 656,468 | | | Federal National Mortgage Assoc.,
4.50%, 7/1/19, Series 725609 | | | 697,277 | |
| | 610,361 | | | Federal National Mortgage Assoc.,
4.50%, 6/25/29, Series 2005-121, Class V | | | 660,379 | |
| | 548,031 | | | Federal National Mortgage Assoc.,
4.50%, 1/25/30, Series 2004-67, Class AC | | | 562,525 | |
| | 1,301,800 | | | Federal National Mortgage Assoc.,
5.00%, 7/25/23, Series 2005-4, Class VG | | | 1,405,763 | |
| | 250,000 | | | Federal National Mortgage Assoc.,
5.50%, 5/25/23, Series 2003-42, Class EK | | | 291,050 | |
| | 76,465 | | | Federal National Mortgage Assoc.,
6.30%, 9/25/15, Series 2001-M2, Class C††† | | | 76,908 | |
| | 193,851 | | | First Horizon Asset Securities, Inc.,
5.75%, 2/25/33, Series 2002-9, Class 1A3 | | | 194,605 | |
| | 1,484,924 | | | Government National Mortgage Assoc., 3.00%, 12/20/38, Series 2010-89, Class PA | | | 1,542,638 | |
| | 803,932 | | | Government National Mortgage Assoc., 3.25%, 7/20/37, Series 2010-33, Class AP | | | 823,584 | |
| | 798,053 | | | Government National Mortgage Assoc., 3.387%, 6/16/30, Series 2006-19, Class A | | | 810,511 | |
| | 1,486,207 | | | Government National Mortgage Assoc., 4.00%, 6/20/37, Series 2008-30, Class AC | | | 1,544,455 | |
| | 1,446,113 | | | Government National Mortgage Assoc., 4.00%, 9/20/38, Series 2009-108, Class WG | | | 1,533,377 | |
| | 1,939,873 | | | Government National Mortgage Assoc., 4.00%, 3/20/39, Series 2009-31, Class TA | | | 2,040,903 | |
| | 1,731,917 | | | Government National Mortgage Assoc., 4.00%, 4/16/39, Series 2009-110, Class AB | | | 1,810,823 | |
| | 994,229 | | | Government National Mortgage Assoc., 4.50%, 8/15/24, Series 717874 | | | 1,055,924 | |
| | 303,482 | | | Government National Mortgage Assoc., 4.50%, 1/20/31, Series 2005-38, Class A | | | 309,264 | |
| | 1,299,833 | | | Government National Mortgage Assoc., 4.50%, 6/20/34, Series 2009-101, Class G | | | 1,367,074 | |
| | 1,338,430 | | | Government National Mortgage Assoc., 4.50%, 8/20/34, Series 2009-36, Class G | | | 1,437,787 | |
| | 1,709,803 | | | Government National Mortgage Assoc., 4.50%, 8/16/35, Series 2009-62, Class DT | | | 1,783,214 | |
| | 1,314,243 | | | Government National Mortgage Assoc., 4.50%, 3/20/39, Series 2009-14, Class AG | | | 1,396,923 | |
| | 650,000 | | | Government National Mortgage Assoc., 4.658%, 12/16/30, Series 2005-12, Class C | | | 710,770 | |
| | 325,790 | | | Government National Mortgage Assoc., 5.00%, 12/20/29, Series 2004-101, Class MA | | | 331,140 | |
| | 827,275 | | | Government National Mortgage Assoc., 5.00%, 5/20/31, Series 2004-19, Class PD | | | 854,939 | |
| | 1,331,586 | | | Government National Mortgage Assoc., 5.00%, 9/16/31, Series 2009-38, Class A | | | 1,400,224 | |
| | 684,195 | | | Government National Mortgage Assoc., 5.00%, 4/20/33, Series 2009-8, Class LA | | | 696,413 | |
| | 500,000 | | | Government National Mortgage Assoc., 5.00%, 7/20/34, Series 2004-105, Class MC | | | 548,064 | |
| | 409,449 | | | Government National Mortgage Assoc., 5.00%, 8/20/39, Series 004513 | | | 431,267 | |
| | 6,267 | | | LB-UBS Commercial Mortgage Trust, 4.187%, 8/15/29, Series 2004-C6, Class A2 | | | 6,272 | |
| | | | | | | | |
| | |
| | | | Total Collateralized Mortgage Obligations
(cost $34,510,833) | | | 35,466,853 | |
| | | | | | | | |
86
| | | | | | | | |
Principal
Amount | | | | | Value | |
| | | | | | | |
| | | | CORPORATE BONDS 28.8% | | | | |
| | |
| | | | Aerospace & Defense 0.4% | | | | |
| | $ 200,000 | | | General Dynamics Corp., 4.25%, 5/15/13 | | $ | 217,483 | |
| | 250,000 | | | Martin Marietta Corp., 7.375%, 4/15/13 | | | 285,386 | |
| | | | | | | | |
| | | | | | | 502,869 | |
| | | | | | | | |
| | | | Air Freight & Logistics 0.4% | | | | |
| | 500,000 | | | United Parcel Service, Inc., 3.875%, 4/1/14 | | | 545,896 | |
| | | | | | | | |
| | | | Automotive Retail 0.2% | | | | |
| | 300,000 | | | AutoZone, Inc., 5.50%, 11/15/15 | | | 334,944 | |
| | | | | | | | |
| | | | Biotechnology 0.2% | | | | |
| | 300,000 | | | Amgen, Inc., 4.85%, 11/18/14 | | | 339,227 | |
| | | | | | | | |
| | | | Cable & Satellite 0.4% | | | | |
| | 550,000 | | | Comcast Corp., 5.30%, 1/15/14 | | | 614,586 | |
| | | | | | | | |
| | | | Computer Hardware 0.7% | | | | |
| | 600,000 | | | Hewlett-Packard Co., 2.125%, 9/13/15 | | | 605,200 | |
| | 300,000 | | | Hewlett-Packard Co., 6.50%, 7/1/12 | | | 329,107 | |
| | | | | | | | |
| | | | | | | 934,307 | |
| | | | | | | | |
| | | | Construction & Farm Machinery & Heavy Trucks 1.0% | | | | |
| | 500,000 | | | Caterpillar Financial Services Corp.,
5.85%, 9/1/17 MTN | | | 587,764 | |
| | 250,000 | | | John Deere Capital Corp.,
4.90%, 9/9/13 MTN | | | 276,045 | |
| | 500,000 | | | PACCAR Financial Corp.,
1.95%, 12/17/12 MTN | | | 509,537 | |
| | | | | | | | |
| | | | | | | 1,373,346 | |
| | | | | | | | |
| | | | Consumer Finance 0.6% | | | | |
| | 700,000 | | | American Express Credit Corp.,
5.875%, 5/2/13 MTN | | | 770,417 | |
| | | | | | | | |
| | | | Distillers & Vintners 0.4% | | | | |
| | 504,000 | | | Diageo Capital plc, 7.375%, 1/15/14 (United Kingdom) | | | 597,082 | |
| | | | | | | | |
| | | | Diversified Banks 4.1% | | | | |
| | 1,000,000 | | | Bank of America Corp., 7.375%, 5/15/14 | | | 1,149,353 | |
| | 500,000 | | | HSBC Capital Funding L.P.,
4.61%, 6/27/13††† §§§ (Jersey, C.I.) | | | 477,036 | |
| | 325,000 | | | HSBC Finance Corp., 6.375%, 10/15/11 | | | 342,261 | |
| | 950,000 | | | Royal Bank of Canada Certificate of Deposit, 2.25%, 3/15/13 (Canada) | | | 978,651 | |
| | 500,000 | | | SouthTrust Corp., 5.80%, 6/15/14 | | | 548,334 | |
| | 650,000 | | | U.S. Bancorp, 4.20%, 5/15/14 | | | 712,301 | |
| | 750,000 | | | Wachovia Corp., 5.25%, 8/1/14 | | | 815,228 | |
| | 700,000 | | | Wells Fargo & Co., 0.58781%, 1/24/12††† | | | 697,266 | |
| | | | | | | | |
| | | | | | | 5,720,430 | |
| | | | | | | | |
| | | | Diversified Metals & Mining 0.4% | | | | |
| | 450,000 | | | Rio Tinto Alcan, Inc., 4.50%, 5/15/13 (Canada) | | | 480,764 | |
| | | | | | | | |
| | | | Drug Retail 0.7% | | | | |
| | 550,000 | | | CVS Caremark Corp., 5.75%, 8/15/11 | | | 573,072 | |
| | 400,000 | | | Walgreen Co., 4.875%, 8/1/13 | | | 443,759 | |
| | | | | | | | |
| | | | | | | 1,016,831 | |
| | | | | | | | |
| | | | Electric Utilities 1.0% | | | | |
| | 300,000 | | | Florida Power & Light Co., 4.85%, 2/1/13 | | | 326,530 | |
| | 600,000 | | | Georgia Power Co., 5.125%, 11/15/12, Series K | | | 650,726 | |
| | 350,000 | | | Energy East Corp., 6.75%, 6/15/12 | | | 378,994 | |
| | | | | | | | |
| | | | | | | 1,356,250 | |
| | | | | | | | |
| | | | | | | | |
Principal
Amount | | | | | Value | |
| | | | | | | |
| | | | Footwear 0.5% | | | | |
| | $ 600,000 | | | Nike, Inc., 5.15%, 10/15/15 MTN | | $ | 695,461 | |
| | | | | | | | |
| | | | Health Care Distributors 0.5% | | | | |
| | 650,000 | | | Cardinal Health, Inc., 5.50%, 6/15/13 | | | 713,176 | |
| | | | | | | | |
| | | | Health Care Equipment 0.2% | | | | |
| | 250,000 | | | Baxter International, Inc., 4.625%, 3/15/15 | | | 279,921 | |
| | | | | | | | |
| | | | Household Appliances 0.3% | | | | |
| | 350,000 | | | Whirlpool Corp., 8.00%, 5/1/12 | | | 381,398 | |
| | | | | | | | |
| | | | Industrial Conglomerates 3.6% | | | | |
| | 500,000 | | | 3M Co., 4.375%, 8/15/13 MTN | | | 550,833 | |
| | 1,250,000 | | | General Electric Capital Corp.,
3.75%, 11/14/14, Series A | | | 1,323,690 | |
| | 1,000,000 | | | General Electric Capital Corp.,
5.40%, 2/15/17 MTN | | | 1,101,397 | |
| | 1,000,000 | | | General Electric Capital Corp.,
5.90%, 5/13/14 | | | 1,132,604 | |
| | 740,000 | | | Tyco International Finance Ltd. S.A., 6.00%, 11/15/13 | | | 838,709 | |
| | | | | | | | |
| | | | | | | 4,947,233 | |
| | | | | | | | |
| | | | Industrial Gases 0.5% | | | | |
| | 600,000 | | | Praxair, Inc., 2.125%, 6/14/13 | | | 616,826 | |
| | | | | | | | |
| | | | Industrial Machinery 0.5% | | | | |
| | 600,000 | | | Parker Hannifin Corp., 4.875%, 2/15/13 | | | 653,056 | |
| | | | | | | | |
| | | | Integrated Oil & Gas 1.0% | | | | |
| | 500,000 | | | ConocoPhillips, 4.60%, 1/15/15 | | | 561,550 | |
| | 750,000 | | | Marathon Oil Canada Corp.,
8.375%, 5/1/12 (Canada) | | | 825,809 | |
| | | | | | | | |
| | | | | | | 1,387,359 | |
| | | | | | | | |
| | | | Integrated Telecommunication Services 1.0% | | | | |
| | 170,774 | | | Ameritech Capital Funding, 9.10%, 6/1/16 | | | 210,003 | |
| | 870,000 | | | AT&T, Inc., 2.50%, 8/15/15 | | | 886,517 | |
| | 300,000 | | | Verizon Global Funding Corp.,
4.375%, 6/1/13 | | | 325,081 | |
| | | | | | | | |
| | | | | | | 1,421,601 | |
| | | | | | | | |
| | | | Investment Banking & Brokerage 0.4% | | | | |
| | 500,000 | | | Goldman Sachs Group, Inc. (The),
5.35%, 1/15/16 | | | 549,708 | |
| | | | | | | | |
| | | | Life & Health Insurance 1.3% | | | | |
| | 500,000 | | | Principal Life Income Funding Trusts, 5.30%, 4/24/13 MTN | | | 541,022 | |
| | 600,000 | | | Prudential Financial, Inc., 6.20%, 1/15/15 | | | 675,803 | |
| | 480,000 | | | Prudential Holdings, LLC,
7.245%, 12/18/23, Series FSA | | | 568,800 | |
| | | | | | | | |
| | | | | | | 1,785,625 | |
| | | | | | | | |
| | | | Movies & Entertainment 0.2% | | | | |
| | 250,000 | | | Walt Disney Co. (The), 4.50%, 12/15/13 | | | 277,041 | |
| | | | | | | | |
| | | | Oil & Gas Exploration & Production 0.2% | | | | |
| | 300,000 | | | Apache Corp., 6.25%, 4/15/12 | | | 324,509 | |
| | | | | | | | |
| | | | Other Diversified Financial Services 1.3% | | | | |
| | 1,350,000 | | | Bear Stearns Co., LLC (The),
5.70%, 11/15/14 | | | 1,522,178 | |
| | 260,000 | | | Source One Mortgage Services,
9.00%, 6/1/12, Series B | | | 281,162 | |
| | | | | | | | |
| | | | | | | 1,803,340 | |
| | | | | | | | |
87
| | |
| WASATCH-1ST SOURCE INCOME FUND (FMEQX) — Schedule of Investments (continued) | | |
|
| |
| |
| | | | | | | | |
Principal
Amount | | | | | Value | |
| | | | | | | |
| | | | Personal Products 0.5% | | | | |
| | $ 655,000 | | | Avon Products, Inc., 5.625%, 3/1/14 | | $ | 743,274 | |
| | | | | | | | |
| | | | Pharmaceuticals 2.1% | | | | |
| | 600,000 | | | AstraZeneca plc, 5.90%, 9/15/17
(United Kingdom) | | | 722,218 | |
| | 1,000,000 | | | Johnson & Johnson, 5.55%, 8/15/17 | | | 1,206,314 | |
| | 725,000 | | | Pharmacia Corp., 6.50%, 12/1/18 | | | 907,929 | |
| | | | | | | | |
| | | | | | | 2,836,461 | |
| | | | | | | | |
| | | | Property & Casualty Insurance 1.1% | | | | |
| | 435,000 | | | Allstate Corp. (The), 7.50%, 6/15/13 | | | 500,525 | |
| | 650,000 | | | Berkshire Hathaway Finance Corp., 4.625%, 10/15/13 | | | 715,131 | |
| | 325,000 | | | Progressive Corp. (The), 6.375%, 1/15/12 | | | 343,898 | |
| | | | | | | | |
| | | | | | | 1,559,554 | |
| | | | | | | | |
| | | | Railroads 0.6% | | | | |
| | 300,000 | | | Burlington Northern Santa Fe, LLC,
4.30%, 7/1/13 | | | 323,079 | |
| | 500,000 | | | Union Pacific Corp., 6.125%, 1/15/12 | | | 530,706 | |
| | | | | | | | |
| | | | | | | 853,785 | |
| | | | | | | | |
| | | | Regional Banks 0.8% | | | | |
| | 800,000 | | | BB&T Corp., 4.75%, 10/1/12 | | | 847,180 | |
| | 200,000 | | | Fifth Third Bancorp, 5.45%, 1/15/17 | | | 209,816 | |
| | | | | | | | |
| | | | | | | 1,056,996 | |
| | | | | | | | |
| | | | Soft Drinks 0.5% | | | | |
| | 600,000 | | | Bottling Group, LLC, 4.625%, 11/15/12 | | | 645,870 | |
| | | | | | | | |
| | | | Special Purpose Entity 0.1% | | | | |
| | 162,000 | | | Targeted Return Index Fund,
6.814%, 1/15/12, Series 2002-10††† | | | 167,440 | |
| | | | | | | | |
| | | | Specialized Finance 0.5% | | | | |
| | 600,000 | | | CME Group, Inc., 5.40%, 8/1/13 | | | 671,128 | |
| | | | | | | | |
| | | | Systems Software 0.6% | | | | |
| | 750,000 | | | Oracle Corp., 3.75%, 7/8/14 | | | 817,354 | |
| | | | | | | | |
| | |
| | | | Total Corporate Bonds
(cost $37,404,533) | | | 39,775,065 | |
| | | | | | | | |
| | |
| | | | MUNICIPAL BONDS 0.9% | | | | |
| | |
| | 650,000 | | | Arizona State Transportation Board Highway Revenue, 5.00%, 7/1/23 | | | 728,592 | |
| | 500,000 | | | Richmond, CA Joint Powers Financing Authority Revenue, 8.25%, 7/1/19 | | | 536,880 | |
| | | | | | | | |
| | |
| | | | Total Municipal Bonds
(cost $1,153,126) | | | 1,265,472 | |
| | | | | | | | |
| | |
| Shares | | | | | Value | |
| | | | | | | |
| | | | MUTUAL FUNDS 0.6% | | | | |
| | |
| | | | Mutual Funds 0.6% | | | | |
| | 49,765 | | | Eaton Vance Short Duration Diversified Income Fund | | $ | 870,390 | |
| | | | | | | | |
| | |
| | | | Total Mutual Funds
(cost $751,526) | | | 870,390 | |
| | | | | | | | |
| | |
| | | | EXCHANGE TRADED FUNDS 1.0% | | | | |
| | |
| | 12,000 | | | iShares iBoxx Investment Grade Corporate Bond Fund | | | 1,357,080 | |
| | | | | | | | |
| | |
| | | | Total Exchange Traded Funds
(cost $1,069,331) | | | 1,357,080 | |
| | | | | | | | |
| | | | | | | | |
Principal
Amount | | | | | Value | |
| | | | | | | |
| | | | U.S. GOVERNMENT AGENCY SECURITIES 22.6% | | | | |
| | |
| | $1,000,000 | | | Federal Farm Credit Bank,
0.06%, 5/24/12 | | $ | 1,000,295 | |
| | 1,000,000 | | | Federal Farm Credit Bank,
2.65%, 5/11/15 | | | 1,052,881 | |
| | 1,000,000 | | | Federal Farm Credit Bank,
3.85%, 2/11/15 | | | 1,102,302 | |
| | 1,000,000 | | | Federal Farm Credit Bank,
3.875%, 10/7/13 | | | 1,090,607 | |
| | 650,000 | | | Federal Farm Credit Bank,
4.875%, 4/1/14 | | | 735,204 | |
| | 500,000 | | | Federal Farm Credit Bank,
4.875%, 1/17/17 | | | 580,981 | |
| | 1,000,000 | | | Federal Home Loan Bank,
1.25%, 4/15/14 | | | 1,005,525 | |
| | 1,000,000 | | | Federal Home Loan Bank,
2.00%, 7/17/14 | | | 1,021,913 | |
| | 400,000 | | | Federal Home Loan Bank,
5.00%, 12/16/11, Series WE11 | | | 422,224 | |
| | 1,550,000 | | | Federal Home Loan Bank,
5.00%, 9/14/12 | | | 1,680,597 | |
| | 1,000,000 | | | Federal Home Loan Mortgage Corp., 3.50%, 5/29/13 | | | 1,072,633 | |
| | 3,100,000 | | | Federal Home Loan Mortgage Corp., 4.75%, 11/17/15 | | | 3,583,287 | |
| | 1,400,000 | | | Federal Home Loan Mortgage Corp., 5.50%, 3/28/16 | | | 1,432,637 | |
| | 700,000 | | | Federal Home Loan Mortgage Corp., 5.55%, 10/4/16 | | | 733,616 | |
| | 2,000,000 | | | Federal National Mortgage Assoc.,
0.65%, 6/3/13 | | | 1,999,412 | |
| | 2,000,000 | | | Federal National Mortgage Assoc.,
0.80%, 9/28/12 | | | 2,002,022 | |
| | 1,000,000 | | | Federal National Mortgage Assoc.,
1.00%, 2/25/13 | | | 1,001,396 | |
| | 800,000 | | | Federal National Mortgage Assoc.,
1.50%, 9/23/14 | | | 801,267 | |
| | 1,000,000 | | | Federal National Mortgage Assoc.,
2.05%, 5/21/14 | | | 1,008,820 | |
| | 900,000 | | | Federal National Mortgage Assoc.,
2.375%, 3/23/12 | | | 906,697 | |
| | 600,000 | | | Federal National Mortgage Assoc.,
4.00%, 1/18/13 | | | 605,596 | |
| | 1,800,000 | | | Federal National Mortgage Assoc.,
4.875%, 12/15/16 | | | 2,100,515 | |
| | 600,000 | | | Federal National Mortgage Assoc.,
5.24%, 8/7/18 | | | 670,955 | |
| | 654,130 | | | New Valley Generation IV,
4.687%, 1/15/22*** | | | 704,694 | |
| | 1,000,000 | | | Tennessee Valley Authority,
0.00%, 11/1/18, Series C | | | 784,842 | |
| | 800,000 | | | Tennessee Valley Authority,
6.00%, 3/15/13, Series C | | | 902,289 | |
| | 1,000,000 | | | Tennessee Valley Authority,
6.25%, 12/15/17, Series E | | | 1,256,947 | |
| | | | | | | | |
| | |
| | | | Total U.S. Government Agency Securities
(cost $30,188,209) | | | 31,260,154 | |
| | | | | | | | |
| | |
| | | | U.S. TREASURY BONDS 12.4% | | | | |
| | |
| | 4,025,000 | | | U.S. Treasury Bond, 3.25%, 12/31/16 | | | 4,392,595 | |
| | 9,400,000 | | | U.S. Treasury Bond, 3.75%, 11/15/18 | | | 10,501,567 | |
| | 1,900,000 | | | U.S. Treasury Bond, 4.25%, 8/15/15 | | | 2,171,493 | |
| | | | | | | | |
| | |
| | | | Total U.S. Treasury Bonds
(cost $16,132,266) | | | 17,065,655 | |
| | | | | | | | |
88
| | | | | | | | |
Principal
Amount | | | | | Value | |
| | | | | | | |
| | |
| | | | U.S. TREASURY INFLATION PROTECTED BONDS 2.0% | | | | |
| | |
| | $2,549,568 | | | U.S. Treasury Bond, 1.625%, 1/15/18# | | $ | 2,766,082 | |
| | | | | | | | |
| | |
| | | | Total U.S. Treasury Inflation Protected Bonds
(cost $2,488,022) | | | 2,766,082 | |
| | | | | | | | |
| | |
| Shares | | | | | Value | |
| | | | | | | |
| | | | PREFERRED STOCKS 0.7% | | | | |
| | |
| | | | Investment Banking & Brokerage 0.2% | | | | |
| | 10,000 | | | Morgan Stanley Cap Tr VI,
6.60%, 2/1/46 Pfd. | | $ | 250,300 | |
| | | | | | | | |
| | | | Other Diversified Financial Services 0.5% | | | | |
| | 10,000 | | | Bank of America Corp., 8.20%,
5/1/13, Series H Pfd.§§§ | | | 260,600 | |
| | 20,000 | | | Bank One Capital TR VI,
7.20% Pfd. | | | 516,400 | |
| | | | | | | | |
| | | | | | | 777,000 | |
| | | | | | | | |
| | |
| | | | Total Preferred Stocks
(cost $981,266) | | | 1,027,300 | |
| | | | | | | | |
| | | | | | | | |
| | |
Principal
Amount | | | | | Value | |
| | | | | | | |
| | | | SHORT-TERM INVESTMENTS 2.2% | | | | |
| | |
| | | | Repurchase Agreement 2.2% | | | | |
| | $2,980,000 | | | Repurchase Agreement dated 9/30/10, 0.01% due 10/1/10 with State Street Bank and Trust Co. collateralized by $2,825,000 of United States Treasury Notes 3.125% due 5/15/19; value: $3,043,938; repurchase proceeds: $2,980,001 (cost $2,980,000) | | $ | 2,980,000 | |
| | | | | | | | |
| | |
| | | | Total Short-Term Investments
(cost $2,980,000) | | | 2,980,000 | |
| | | | | | | | |
| | |
| | | | Total Investments
(cost $130,795,370) 99.2% | | | 137,046,822 | |
| | |
| | | | Other Assets less Liabilities 0.8% | | | 1,048,287 | |
| | | | | | | | |
| | |
| | | | NET ASSETS 100.0% | | $ | 138,095,109 | |
| | | | | | | | |
| |
| | | | ***Security was fair valued under procedures adopted by the Board of Trustees (see Note 15). †††Variable Rate Securities. §§§Perpetual Maturity. Callable any time after first call date. #Treasury Inflation Protected Securities. A U.S. Treasury Note or Bond that offers protection from inflation by paying a fixed rate of interest on principal amount that is adjusted for inflation based on the Consumer Price Index. MTN Medium Term Note. See Notes to Financial Statements. | |
At September 30, 2010, Wasatch-1st Source Income Fund’s investments, excluding short-term investments, were in the following countries:
| | | | |
| Country | | % | |
Canada | | | 1.7 | |
Jersey, Channel Islands | | | 0.3 | |
United Kingdom | | | 1.0 | |
United States | | | 97.0 | |
| | | | |
TOTAL | | | 100.0 | % |
| | | | |
89
| | |
| WASATCH FUNDS — Statements of Assets and Liabilities | | |
|
| |
| |
| | | | | | | | | | | | |
| | | CORE
GROWTH
FUND | | | EMERGING MARKETS
SMALL CAP
FUND | | | GLOBAL
OPPORTUNITIES
FUND | |
| | | | | | | | | | | | |
Assets: | | | | | | | | | | | | |
Investments, at cost | | | | | | | | | | | | |
Unaffiliated issuers | | $ | 319,257,636 | | | $ | 359,528,683 | | | $ | 172,718,433 | |
Repurchase agreements | | | 16,653,000 | | | | 14,721,000 | | | | 10,658,000 | |
| | | | | | | | | | | | |
| | $ | 335,910,636 | | | $ | 374,249,683 | | | $ | 183,376,433 | |
| | | | | | | | | | | | |
Investments, at market value | | | | | | | | | | | | |
Unaffiliated issuers | | $ | 401,047,262 | | | $ | 441,296,399 | | | $ | 224,507,295 | |
Repurchase agreements | | | 16,653,000 | | | | 14,721,000 | | | | 10,658,000 | |
| | | | | | | | | | | | |
| | | 417,700,262 | | | | 456,017,399 | | | | 235,165,295 | |
Cash | | | 384 | | | | 898 | | | | 7,977 | |
Foreign currency on deposit (cost of $27, $1,442,861, $240,006, $27,769, $145,423, $108,078, $1,977,338, and $11, respectively) | | | 30 | | | | 1,460,799 | | | | 240,685 | |
Receivable for investment securities sold | | | 1,246,861 | | | | 998,178 | | | | 609,988 | |
Capital shares receivable | | | 281,377 | | | | 2,986,335 | | | | 172,847 | |
Interest and dividends receivable | | | 316,246 | | | | 262,128 | | | | 281,025 | |
Prepaid expenses and other assets | | | 27,908 | | | | 35,386 | | | | 26,046 | |
| | | | | | | | | | | | |
Total Assets | | | 419,573,068 | | | | 461,761,123 | | | | 236,503,863 | |
| | | | | | | | | | | | |
Liabilities: | | | | | | | | | | | | |
Payable for securities purchased | | | — | | | | 11,312,696 | | | | 886,061 | |
Capital shares payable | | | 147,161 | | | | 269,725 | | | | 140,497 | |
Payable to Advisor | | | 332,279 | | | | 316,352 | | | | 354,539 | |
Accrued fund administration fees | | | 7,429 | | | | 7,049 | | | | 4,055 | |
Accrued expenses and other liabilities | | | 215,369 | | | | 271,951 | | | | 109,006 | |
Other payables | | | 229,117 | | | | 2,832,195 | | | | 105,898 | |
Unrealized depreciation on foreign currency contracts | | | — | | | | — | | | | — | |
| | | | | | | | | | | | |
Total Liabilities | | | 931,355 | | | | 15,009,968 | | | | 1,600,056 | |
| | | | | | | | | | | | |
Net Assets | | $ | 418,641,713 | | | $ | 446,751,155 | | | $ | 234,903,807 | |
| | | | | | | | | | | | |
Net Assets Consist of: | | | | | | | | | | | | |
Capital stock | | $ | 139,785 | | | $ | 1,883,583 | | | $ | 591,927 | |
Paid-in capital in excess of par | | | 456,850,114 | | | | 381,327,074 | | | | 175,072,000 | |
Undistributed net investment income (loss) | | | 2,636,473 | | | | (117,824 | ) | | | (816,038 | ) |
Undistributed net realized gain (loss) on investments and foreign currency translations | | | (122,545,269 | ) | | | (15,281,820 | ) | | | 8,367,392 | |
Net unrealized appreciation on investments and foreign currency translations | | | 81,560,610 | | | | 78,940,142 | | | | 51,688,526 | |
| | | | | | | | | | | | |
Net Assets | | $ | 418,641,713 | | | $ | 446,751,155 | | | $ | 234,903,807 | |
| | | | | | | | | | | | |
Capital Stock, $.01 par value: | | | | | | | | | | | | |
Authorized | | | 10,000,000,000 | | | | 10,000,000,000 | | | | 10,000,000,000 | |
Issued and outstanding | | | 13,978,467 | | | | 188,358,295 | | | | 59,192,688 | |
| | | |
NET ASSET VALUE, REDEMPTION PRICEAND OFFERING
PRICE PER SHARE | | $ | 29.95 | | | $ | 2.37 | | | $ | 3.97 | |
| | | | | | | | | | | | |
See Notes to Financial Statements.
90
| | | | | | | | | | | | | | | | | | |
GLOBAL SCIENCE
& TECHNOLOGY
FUND | | | HERITAGE
GROWTH
FUND | | | INTERNATIONAL
GROWTH
FUND | | | INTERNATIONAL
OPPORTUNITIES
FUND | | | MICRO
CAP
FUND | |
| | | | | | | | | | | | | | | | | | |
| | | | | | | | | | | | | | | | | | |
| | | | | | | | | | | | | | | | | | |
| $ | 55,377,229 | | | $ | 60,463,711 | | | $ | 194,684,808 | | | $ | 105,835,754 | | | $ | 243,617,342 | |
| | 1,179,000 | | | | 2,810,000 | | | | 12,766,000 | | | | 4,292,000 | | | | 6,492,000 | |
| | | | | | | | | | | | | | | | | | | |
| $ | 56,556,229 | | | $ | 63,273,711 | | | $ | 207,450,808 | | | $ | 110,127,754 | | | $ | 250,109,342 | |
| | | | | | | | | | | | | | | | | | | |
| | | | | | | | | | | | | | | | | | |
| $ | 64,528,512 | | | $ | 75,342,566 | | | $ | 272,730,345 | | | $ | 146,141,811 | | | $ | 276,612,284 | |
| | 1,179,000 | | | | 2,810,000 | | | | 12,766,000 | | | | 4,292,000 | | | | 6,492,000 | |
| | | | | | | | | | | | | | | | | | | |
| | 65,707,512 | | | | 78,152,566 | | | | 285,496,345 | | | | 150,433,811 | | | | 283,104,284 | |
| | 943 | | | | 15,387 | | | | 920 | | | | 763 | | | | 477 | |
|
27,728 |
| | | 152,680 | | | | 108,537 | | | | 2,048,457 | | | | 11 | |
| | 673,019 | | | | — | | | | 252,938 | | | | 1,918,470 | | | | 1,203,983 | |
| | 3,728 | | | | 2,997 | | | | 1,560,849 | | | | 83,107 | | | | 23,621 | |
| | 29,490 | | | | 43,381 | | | | 337,136 | | | | 215,755 | | | | 181,914 | |
| | 14,491 | | | | 15,812 | | | | 23,481 | | | | 13,351 | | | | 20,667 | |
| | | | | | | | | | | | | | | | | | | |
| | 66,456,911 | | | | 78,382,823 | | | | 287,780,206 | | | | 154,713,714 | | | | 284,534,957 | |
| | | | | | | | | | | | | | | | | | | |
| | | | | | | | | | | | | | | | | | |
| | 514,816 | | | | — | | | | 1,151,887 | | | | 1,753,356 | | | | 189,504 | |
| | 22,899 | | | | 4,248 | | | | 104,889 | | | | 62,385 | | | | 37,865 | |
| | 78,022 | | | | 41,810 | | | | 316,021 | | | | 231,584 | | | | 438,320 | |
| | 1,161 | | | | 1,390 | | | | 4,681 | | | | 2,632 | | | | 5,012 | |
| | 73,077 | | | | 61,740 | | | | 112,616 | | | | 181,409 | | | | 108,745 | |
| | — | | | | — | | | | 644,144 | | | | 208,918 | | | | 204,251 | |
| | — | | | | — | | | | — | | | | 95,860 | | | | — | |
| | | | | | | | | | | | | | | | | | | |
| | 689,975 | | | | 109,188 | | | | 2,334,238 | | | | 2,536,144 | | | | 983,697 | |
| | | | | | | | | | | | | | | | | | | |
| $ | 65,766,936 | | | $ | 78,273,635 | | | $ | 285,445,968 | | | $ | 152,177,570 | | | $ | 283,551,260 | |
| | | | | | | | | | | | | | | | | | | |
| | | | | | | | | | | | | | | | | | |
| $ | 48,165 | | | $ | 73,169 | | | $ | 153,000 | | | $ | 591,486 | | | $ | 638,535 | |
| | 84,866,063 | | | | 70,360,329 | | | | 274,710,980 | | | | 112,663,520 | | | | 338,732,673 | |
| | 35 | | | | 658,864 | | | | 198,092 | | | | (652,260 | ) | | | (46,442 | ) |
| (28,300,251 | ) | | | (7,704,839 | ) | | | (67,018,996 | ) | | | (501,354 | ) | | | (88,565,682 | ) |
| | 9,152,924 | | | | 14,886,112 | | | | 77,402,892 | | | | 40,076,178 | | | | 32,792,176 | |
| | | | | | | | | | | | | | | | | | | |
| $ | 65,766,936 | | | $ | 78,273,635 | | | $ | 285,445,968 | | | $ | 152,177,570 | | | $ | 283,551,260 | |
| | | | | | | | | | | | | | | | | | | |
| | | | | | | | | | | | | | | | | | |
| | 10,000,000,000 | | | | 10,000,000,000 | | | | 10,000,000,000 | | | | 10,000,000,000 | | | | 10,000,000,000 | |
| | 4,816,529 | | | | 7,316,926 | | | | 15,299,997 | | | | 59,148,640 | | | | 63,853,499 | |
| | | | |
| $ | 13.65 | | | $ | 10.70 | | | $ | 18.66 | | | $ | 2.57 | | | $ | 4.44 | |
| | | | | | | | | | | | | | | | | | | |
91
| | |
| WASATCH FUNDS — Statements of Assets and Liabilities (continued) | | |
|
| |
| |
| | | | | | | | | | | | |
| | | MICRO CAP
VALUE
FUND | | | SMALL CAP
GROWTH
FUND | | | SMALL CAP
VALUE
FUND | |
| | | | | | | | | | | | |
Assets: | | | | | | | | | | | | |
Investments, at cost | | | | | | | | | | | | |
Unaffiliated issuers | | $ | 139,995,965 | | | $ | 787,375,000 | | | $ | 194,209,229 | |
Affiliated issuers* | | | — | | | | 19,250,345 | | | | — | |
Repurchase agreements | | | 28,445,000 | | | | 22,350,000 | | | | 2,096,000 | |
| | | | | | | | | | | | |
| | $ | 168,440,965 | | | $ | 828,975,345 | | | $ | 196,305,229 | |
| | | | | | | | | | | | |
Investments, at market value | | | | | | | | | | | | |
Unaffiliated issuers | | $ | 158,514,958 | | | $ | 1,065,823,882 | | | $ | 209,241,332 | |
Affiliated issuers* | | | — | | | | 23,748,603 | | | | — | |
Repurchase agreements | | | 28,445,000 | | | | 22,350,000 | | | | 2,096,000 | |
| | | | | | | | | | | | |
| | | 186,959,958 | | | | 1,111,922,485 | | | | 211,337,332 | |
Cash | | | 449 | | | | 299 | | | | 630 | |
Foreign currency on deposit (cost of $6,651, $0, $0, $9,490, $0, $0, $0, $0, and $0, respectively) | | | 6,684 | | | | — | | | | — | |
Receivable for investment securities sold | | | 226,868 | | | | — | | | | 2,751,397 | |
Receivable from broker for securities sold short | | | — | | | | — | | | | — | |
Capital shares receivable | | | 125,877 | | | | 1,184,165 | | | | 30,827 | |
Interest and dividends receivable | | | 126,838 | | | | 449,066 | | | | 229,970 | |
Prepaid expenses and other assets | | | 26,443 | | | | 53,626 | | | | 20,011 | |
| | | | | | | | | | | | |
Total Assets | | | 187,473,117 | | | | 1,113,609,641 | | | | 214,370,167 | |
| | | | | | | | | | | | |
Liabilities: | �� | | | | | | | | | | | |
Call options written at value (premiums of $374,128, $0, $0, $0, $0, $0, $2,229,695, $0, and $0, respectively) | | | 449,000 | | | | — | | | | — | |
Securities sold short, at value (proceeds of $0, $0, $0, $0, $0, $0, $24,430,119, $0, and $0, respectively) | | | — | | | | — | | | | — | |
Payable for securities purchased | | | 662,973 | | | | — | | | | 1,836,187 | |
Capital shares payable | | | 97,283 | | | | 1,861,685 | | | | 156,082 | |
Dividends payable to shareholders | | | — | | | | — | | | | — | |
Payable to Advisor | | | 258,622 | | | | 867,309 | | | | 251,734 | |
Accrued fund administration fees | | | 3,301 | | | | 19,358 | | | | 3,750 | |
Accrued expenses and other liabilities | | | 129,375 | | | | 443,654 | | | | 144,997 | |
Other payables | | | 285,692 | | | | 330,447 | | | | 405,927 | |
| | | | | | | | | | | | |
Total Liabilities | | | 1,886,246 | | | | 3,522,453 | | | | 2,798,677 | |
| | | | | | | | | | | | |
Net Assets | | $ | 185,586,871 | | | $ | 1,110,087,188 | | | $ | 211,571,490 | |
| | | | | | | | | | | | |
Net Assets Consist of: | | | | | | | | | | | | |
Capital stock | | $ | 780,318 | | | $ | 324,234 | | | $ | 685,933 | |
Paid-in capital in excess of par | | | 180,144,455 | | | | 867,843,519 | | | | 332,185,793 | |
Undistributed net investment income (loss) | | | (462,295 | ) | | | (114,405 | ) | | | 715,613 | |
Undistributed net realized gain (loss) on investments and foreign currency translations | | | (13,035,885 | ) | | | (40,587,301 | ) | | | (136,643,068 | ) |
Net unrealized appreciation on investments and foreign currency translations | | | 18,160,278 | | | | 282,621,141 | | | | 14,627,219 | |
| | | | | | | | | | | | |
Net Assets | | $ | 185,586,871 | | | $ | 1,110,087,188 | | | $ | 211,571,490 | |
| | | | | | | | | | | | |
Capital Stock, $.01 par value: | | | | | | | | | | | | |
Authorized | | | 10,000,000,000 | | | | 10,000,000,000 | | | | 10,000,000,000 | |
Issued and outstanding | | | 78,031,846 | | | | 32,423,417 | | | | 68,593,301 | |
| | | |
NET ASSET VALUE, REDEMPTION PRICEAND OFFERING
PRICE PER SHARE | | $ | 2.38 | | | $ | 34.24 | | | $ | 3.08 | |
| | | | | | | | | | | | |
| * | See Note 10 for information on affiliated issuers. |
See Notes to Financial Statements.
92
| | | | | | | | | | | | | | | | | | | | | | |
STRATEGIC
INCOME
FUND | | | ULTRA
GROWTH
FUND | | | INCOME
EQUITY
FUND | | | LONG/SHORT
FUND | | | U.S.
TREASURY
FUND | | | INCOME
FUND | |
| | | | | | | | | | | | | | | | | | | | | | |
| | | | | | | | | | | | | | | | | | | | | | |
| | | | | | | | | | | | | | | | | | | | | | |
| $ | 17,465,176 | | | $ | 114,916,152 | | | $ | 1,453,459,435 | | | $ | 252,796,833 | | | $ | 185,327,036 | | | $ | 127,815,370 | |
| | — | | | | — | | | | — | | | | — | | | | — | | | | — | |
| | 1,357,000 | | | | 18,309,000 | | | | 34,508,000 | | | | 32,403,000 | | | | 1,318,000 | | | | 2,980,000 | |
| | | | | | | | | | | | | | | | | | | | | | | |
| $ | 18,822,176 | | | $ | 133,225,152 | | | $ | 1,487,967,435 | | | $ | 285,199,833 | | | $ | 186,645,036 | | | $ | 130,795,370 | |
| | | | | | | | | | | | | | | | | | | | | | | |
| | | | | | | | | | | | | | | | | | | | | | |
| $ | 18,098,323 | | | $ | 159,007,215 | | | $ | 1,593,837,853 | | | $ | 278,381,223 | | | $ | 198,937,806 | | | $ | 134,066,822 | |
| | — | | | | — | | | | — | | | | — | | | | — | | | | — | |
| | 1,357,000 | | | | 18,309,000 | | | | 34,508,000 | | | | 32,403,000 | | | | 1,318,000 | | | | 2,980,000 | |
| | | | | | | | | | | | | | | | | | | | | | | |
| | 19,455,323 | | | | 177,316,215 | | | | 1,628,345,853 | | | | 310,784,223 | | | | 200,255,806 | | | | 137,046,822 | |
| | 730 | | | | 612 | | | | 974 | | | | 491 | | | | 531 | | | | 320 | |
| | | | | |
| | 9,490 | | | | — | | | | — | | | | — | | | | — | | | | — | |
| | — | | | | 974,371 | | | | — | | | | 1,635,055 | | | | — | | | | — | |
| | — | | | | — | | | | — | | | | 25,437,599 | | | | — | | | | — | |
| | 308 | | | | 766,691 | | | | 1,094,405 | | | | 353,503 | | | | 309,871 | | | | 85,682 | |
| | 97,279 | | | | 15,718 | | | | 2,525,639 | | | | 201,514 | | | | 874,758 | | | | 1,136,862 | |
| | 12,094 | | | | 35,188 | | | | 135,721 | | | | 25,430 | | | | 21,213 | | | | 19,488 | |
| | | | | | | | | | | | | | | | | | | | | | | |
| | 19,575,224 | | | | 179,108,795 | | | | 1,632,102,592 | | | | 338,437,815 | | | | 201,462,179 | | | | 138,289,174 | |
| | | | | | | | | | | | | | | | | | | | | | | |
| | | | | | | | | | | | | | | | | | | | | | |
| | | | | |
| | — | | | | — | | | | — | | | | 4,172,550 | | | | — | | | | — | |
| | | | | |
| | — | | | | — | | | | — | | | | 28,748,307 | | | | — | | | | — | |
| | 1 | | | | 88,440 | | | | 6,502,612 | | | | 4,242,233 | | | | — | | | | — | |
| | 8,895 | | | | 138,035 | | | | 2,587,373 | | | | 536,748 | | | | 293,276 | | | | 34,310 | |
| | 3,920 | | | | — | | | | 331,089 | | | | 10,700 | | | | 156,953 | | | | 44,198 | |
| | 15,128 | | | | 169,281 | | | | 990,926 | | | | 268,836 | | | | 81,089 | | | | 61,170 | |
| | 350 | | | | 3,003 | | | | 29,212 | | | | 5,449 | | | | 3,576 | | | | 2,473 | |
| | 29,955 | | | | 109,762 | | | | 548,626 | | | | 123,975 | | | | 72,704 | | | | 51,914 | |
| | — | | | | 34,693 | | | | — | | | | 74,281 | | | | — | | | | — | |
| | | | | | | | | | | | | | | | | | | | | | | |
| | 58,249 | | | | 543,214 | | | | 10,989,838 | | | | 38,183,079 | | | | 607,598 | | | | 194,065 | |
| | | | | | | | | | | | | | | | | | | | | | | |
| $ | 19,516,975 | | | $ | 178,565,581 | | | $ | 1,621,112,754 | | | $ | 300,254,736 | | | $ | 200,854,581 | | | $ | 138,095,109 | |
| | | | | | | | | | | | | | | | | | | | | | | |
| | | | | | | | | | | | | | | | | | | | | | |
| $ | 25,997 | | | $ | 90,195 | | | $ | 1,282,969 | | | $ | 255,820 | | | $ | 117,007 | | | $ | 133,532 | |
| | 27,300,267 | | | | 174,674,261 | | | | 1,545,121,117 | | | | 292,186,117 | | | | 176,860,428 | | | | 134,727,246 | |
| | 66,363 | | | | (759,055 | ) | | | (331,089 | ) | | | 48,857 | | | | 16,351 | | | | 23,571 | |
| | (8,508,837 | ) | | | (39,496,407 | ) | | | (65,338,670 | ) | | | (11,559,405 | ) | | | 10,250,025 | | | | (3,040,692 | ) |
| | 633,185 | | | | 44,056,587 | | | | 140,378,427 | | | | 19,323,347 | | | | 13,610,770 | | | | 6,251,452 | |
| | | | | | | | | | | | | | | | | | | | | | | |
| $ | 19,516,975 | | | $ | 178,565,581 | | | $ | 1,621,112,754 | | | $ | 300,254,736 | | | $ | 200,854,581 | | | $ | 138,095,109 | |
| | | | | | | | | | | | | | | | | | | | | | | |
| | | | | | | | | | | | | | | | | | | | | | |
| | 10,000,000,000 | | | | 10,000,000,000 | | | | 10,000,000,000 | | | | 10,000,000,000 | | | | 10,000,000,000 | | | | 10,000,000,000 | |
| | 2,599,671 | | | | 9,019,499 | | | | 128,296,884 | | | | 25,581,974 | | | | 11,700,690 | | | | 13,353,212 | |
| | | | | |
| $ | 7.51 | | | $ | 19.80 | | | $ | 12.64 | | | $ | 11.74 | | | $ | 17.17 | | | $ | 10.34 | |
| | | | | | | | | | | | | | | | | | | | | | | |
93
| | |
| WASATCH FUNDS — Statements of Operations | | |
|
| |
| |
| | | | | | | | | | | | |
| | | CORE
GROWTH
FUND | | | EMERGING MARKETS
SMALL CAP
FUND | | | GLOBAL
OPPORTUNITIES
FUND | |
| | | | | | | | | | | | |
Investment Income: | | | | | | | | | | | | |
Interest | | $ | 1,852 | | | $ | 1,111 | | | $ | 1,014 | |
Dividends1 | | | | | | | | | | | | |
Unaffiliated issuers | | | 5,165,362 | | | | 4,305,133 | | | | 2,515,918 | |
| | | | | | | | | | | | |
Total investment income | | | 5,167,214 | | | | 4,306,244 | | | | 2,516,932 | |
| | | | | | | | | | | | |
Expenses: | | | | | | | | | | | | |
Investment advisory fees | | | 3,962,235 | | | | 2,618,291 | | | | 3,222,553 | |
Shareholder servicing fees | | | 590,074 | | | | 370,544 | | | | 252,416 | |
Fund administration fees | | | 92,186 | | | | 34,789 | | | | 39,200 | |
Fund accounting fees | | | 65,283 | | | | 54,732 | | | | 75,992 | |
Reports to shareholders | | | 148,046 | | | | 75,066 | | | | 68,478 | |
Custody fees | | | 69,107 | | | | 278,472 | | | | 98,064 | |
Federal and state registration fees | | | 35,290 | | | | 72,898 | | | | 51,088 | |
Legal fees | | | 19,014 | | | | 6,036 | | | | 10,310 | |
Trustees’ fees | | | 26,787 | | | | 5,122 | | | | 8,907 | |
Interest | | | 9,034 | | | | 1,645 | | | | 2,811 | |
Audit fees and other expenses | | | 87,198 | | | | 59,358 | | | | 35,321 | |
| | | | | | | | | | | | |
Total expenses before reimbursement | | | 5,104,254 | | | | 3,576,953 | | | | 3,865,140 | |
Reimbursement of expenses by Advisor | | | — | | | | (495,910 | ) | | | (138,025 | ) |
| | | | | | | | | | | | |
Net Expenses | | | 5,104,254 | | | | 3,081,043 | | | | 3,727,115 | |
| | | | | | | | | | | | |
Net Investment Income (Loss) | | | 62,960 | | | | 1,225,201 | | | | (1,210,183 | ) |
| | | | | | | | | | | | |
Realized and Unrealized Gain (Loss): | | | | | | | | | | | | |
Net realized gain (loss) on investments and foreign
currency translations | | | | | | | | | | | | |
Unaffiliated issuers | | | 995,642 | | | | 7,609,300 | | | | 9,887,660 | |
Net realized gain on options written | | | — | | | | — | | | | — | |
Realized foreign capital gains taxes | | | — | | | | (152,101 | ) | | | (38,060 | ) |
Change in unrealized appreciation (depreciation) on
investments and foreign currency translations | | | 54,730,781 | | | | 73,583,864 | | | | 25,025,655 | |
Deferred foreign capital gains taxes | | | (229,117 | ) | | | (2,832,195 | ) | | | (105,898 | ) |
| | | | | | | | | | | | |
Net gain on investments | | | 55,497,306 | | | | 78,208,868 | | | | 34,769,357 | |
| | | | | | | | | | | | |
Net Increase in Net Assets Resulting from Operations | | $ | 55,560,266 | | | $ | 79,434,069 | | | $ | 33,559,174 | |
| | | | | | | | | | | | |
| 1Net | of $49,269, $323,610, $139,873, $36,294, $11,923, $258,548, $122,772, and $66,497 in foreign withholding taxes, respectively. |
See Notes to Financial Statements.
94
| | |
| | FOR THE YEAR ENDED SEPTEMBER 30, 2010 |
|
| |
| |
| | | | | | | | | | | | | | | | | | |
GLOBAL SCIENCE
& TECHNOLOGY
FUND | | | HERITAGE
GROWTH
FUND | | | INTERNATIONAL
GROWTH
FUND | | | INTERNATIONAL
OPPORTUNITIES
FUND | | | MICRO
CAP
FUND | |
| | | | | | | | | | | | | | | | | | |
| | | | | | | | | | | | | | | | | | |
| $ | 1,131 | | | $ | 230 | | | $ | 570 | | | $ | 903 | | | $ | 671 | |
| | | | | | | | | | | | | | | | | | |
| | 751,983 | | | | 1,364,945 | | | | 3,823,226 | | | | 2,054,622 | | | | 3,019,197 | |
| | | | | | | | | | | | | | | | | | | |
| | 753,114 | | | | 1,365,175 | | | | 3,823,796 | | | | 2,055,525 | | | | 3,019,868 | |
| | | | | | | | | | | | | | | | | | | |
| | | | | | | | | | | | | | | | | | |
| | 929,335 | | | | 539,144 | | | | 2,926,036 | | | | 2,415,521 | | | | 5,412,265 | |
| | 163,987 | | | | 170,868 | | | | 290,015 | | | | 423,029 | | | | 264,482 | |
| | 14,524 | | | | 17,974 | | | | 45,780 | | | | 29,152 | | | | 64,914 | |
| | 28,786 | | | | 22,695 | | | | 54,907 | | | | 54,175 | | | | 54,892 | |
| | 33,714 | | | | 30,080 | | | | 53,538 | | | | 104,110 | | | | 78,500 | |
| | 23,924 | | | | 9,319 | | | | 151,447 | | | | 137,380 | | | | 63,629 | |
| | 19,226 | | | | 19,133 | | | | 33,212 | | | | 30,062 | | | | 29,127 | |
| | 7,228 | | | | 4,344 | | | | 11,106 | | | | 7,617 | | | | 15,670 | |
| | 4,105 | | | | 5,205 | | | | 12,012 | | | | 7,173 | | | | 18,407 | |
| | 1,347 | | | | 1,708 | | | | 3,951 | | | | 2,515 | | | | 6,066 | |
| | 45,472 | | | | 33,023 | | | | 49,754 | | | | 38,393 | | | | 52,958 | |
| | | | | | | | | | | | | | | | | | | |
| | 1,271,648 | | | | 853,493 | | | | 3,631,758 | | | | 3,249,127 | | | | 6,060,910 | |
| | (57,495 | ) | | | (115,666 | ) | | | — | | | | (446,728 | ) | | | — | |
| | | | | | | | | | | | | | | | | | | |
| | 1,214,153 | | | | 737,827 | | | | 3,631,758 | | | | 2,802,399 | | | | 6,060,910 | |
| | | | | | | | | | | | | | | | | | | |
| | (461,039 | ) | | | 627,348 | | | | 192,038 | | | | (746,874 | ) | | | (3,041,042 | ) |
| | | | | | | | | | | | | | | | | | | |
| | | | | | | | | | | | | | | | | | |
| | | | | | | | | | | | | | | | | | |
| | 10,226,634 | | | | 2,847,249 | | | | 14,150,912 | | | | 15,208,761 | | | | (1,922,995 | ) |
| | — | | | | 630 | | | | — | | | | — | | | | — | |
| | — | | | | — | | | | (393,764 | ) | | | (96,400 | ) | | | — | |
|
2,966,542 |
| | | 8,005,190 | | | | 48,798,984 | | | | 19,388,244 | | | | 41,538,066 | |
| | — | | | | — | | | | (644,152 | ) | | | (208,918 | ) | | | (204,251 | ) |
| | | | | | | | | | | | | | | | | | | |
| | 13,193,176 | | | | 10,853,069 | | | | 61,911,980 | | | | 34,291,687 | | | | 39,410,820 | |
| | | | | | | | | | | | | | | | | | | |
| $ | 12,732,137 | | | $ | 11,480,417 | | | $ | 62,104,018 | | | $ | 33,544,813 | | | $ | 36,369,778 | |
| | | | | | | | | | | | | | | | | | | |
95
| | |
| WASATCH FUNDS — Statements of Operations (continued) | | |
|
| |
| |
| | | | | | | | | | | | |
| | | MICRO CAP
VALUE
FUND | | | SMALL CAP
GROWTH
FUND | | | SMALL CAP
VALUE
FUND | |
| | | | | | | | | | | | |
Investment Income: | | | | | | | | | | | | |
Interest | | $ | 2,872 | | | $ | 7,490 | | | $ | 688 | |
Dividends1 | | | | | | | | | | | | |
Unaffiliated issuers | | | 1,555,091 | | | | 5,072,715 | | | | 3,487,363 | |
| | | | | | | | | | | | |
Total investment income | | | 1,557,963 | | | | 5,080,205 | | | | 3,488,051 | |
| | | | | | | | | | | | |
Expenses: | | | | | | | | | | | | |
Investment advisory fees | | | 3,250,692 | | | | 9,481,597 | | | | 3,225,725 | |
Shareholder servicing fees | | | 372,246 | | | | 1,370,872 | | | | 418,770 | |
Fund administration fees | | | 39,302 | | | | 222,544 | | | | 50,220 | |
Fund accounting fees | | | 44,314 | | | | 141,280 | | | | 44,048 | |
Reports to shareholders | | | 86,271 | | | | 350,750 | | | | 96,509 | |
Custody fees | | | 53,324 | | | | 197,260 | | | | 36,179 | |
Federal and state registration fees | | | 41,339 | | | | 90,486 | | | | 23,828 | |
Legal fees | | | 10,040 | | | | 55,467 | | | | 11,962 | |
Trustees’ fees | | | 9,202 | | | | 57,757 | | | | 14,533 | |
Dividends on securities sold short | | | — | | | | — | | | | — | |
Interest | | | 3,019 | | | | 19,483 | | | | 4,807 | |
Audit fees and other expenses | | | 40,256 | | | | 83,269 | | | | 49,332 | |
| | | | | | | | | | | | |
Total expenses before reimbursement | | | 3,950,005 | | | | 12,070,765 | | | | 3,975,913 | |
Reimbursement of expenses by Advisor | | | (188,280 | ) | | | — | | | | — | |
Fair Fund reimbursement | | | — | | | | — | | | | — | |
| | | | | | | | | | | | |
Net Expenses | | | 3,761,725 | | | | 12,070,765 | | | | 3,975,913 | |
| | | | | | | | | | | | |
Net Investment Income (Loss) | | | (2,203,762 | ) | | | (6,990,560 | ) | | | (487,862 | ) |
| | | | | | | | | | | | |
Realized and Unrealized Gain (Loss): | | | | | | | | | | | | |
Net realized gain on investments and foreign currency translations | | | | | | | | | | | | |
Unaffiliated issuers | | | 19,739,412 | | | | 30,868,546 | | | | 19,593,691 | |
Net realized gain on options written | | | 866,253 | | | | — | | | | — | |
Net realized gain (loss) on short positions | | | — | | | | — | | | | — | |
Realized foreign capital gains taxes | | | — | | | | — | | | | — | |
Change in unrealized appreciation (depreciation) on
investments, options written and foreign currency translations | | | (799,110 | ) | | | 148,904,599 | | | | 6,121,502 | |
Deferred foreign capital gains taxes | | | (285,692 | ) | | | (330,447 | ) | | | (405,928 | ) |
| | | | | | | | | | | | |
Net gain on investments | | | 19,520,863 | | | | 179,442,698 | | | | 25,309,265 | |
| | | | | | | | | | | | |
Net Increase in Net Assets Resulting from Operations | | $ | 17,317,101 | | | $ | 172,452,138 | | | $ | 24,821,403 | |
| | | | | | | | | | | | |
| 1 | Net of $45,462, $138,933, $0, $7,572, $4,798, $176,645, $814, $0, and $(553) in foreign withholding taxes, respectively. |
See Notes to Financial Statements.
96
| | |
| | FOR THE YEAR ENDED SEPTEMBER 30, 2010 |
|
| |
| |
| | | | | | | | | | | | | | | | | | | | | | |
STRATEGIC
INCOME
FUND | | | ULTRA
GROWTH
FUND | | | INCOME
EQUITY
FUND | | | LONG/SHORT
FUND | | | U.S.
TREASURY
FUND | | | INCOME
FUND | |
| | | | | | | | | | | | | | | | | | | | | | |
| | | | | | | | | | | | | | | | | | | | | | |
| $ | 23,856 | | | $ | 346 | | | $ | 5,590 | | | $ | 4,612 | | | $ | 6,612,936 | | | $ | 4,336,273 | |
| | | | | | | | | | | | | | | | | | | | | | |
| | 940,019 | | | | 684,042 | | | | 38,337,627 | | | | 4,131,629 | | | | — | | | | 177,023 | |
| | | | | | | | | | | | | | | | | | | | | | | |
| | 963,875 | | | | 684,388 | | | | 38,343,217 | | | | 4,136,241 | | | | 6,612,936 | | | | 4,513,296 | |
| | | | | | | | | | | | | | | | | | | | | | | |
| | | | | | | | | | | | | | | | | | | | | | |
| | 126,217 | | | | 1,575,741 | | | | 13,994,494 | | | | 2,621,146 | | | | 766,374 | | | | 690,999 | |
| | 37,869 | | | | 254,299 | | | | 2,111,258 | | | | 280,731 | | | | 211,326 | | | | 50,667 | |
| | 4,188 | | | | 29,510 | | | | 363,664 | | | | 55,600 | | | | 35,327 | | | | 29,294 | |
| | 17,830 | | | | 37,388 | | | | 212,165 | | | | 42,268 | | | | 24,937 | | | | 48,982 | |
| | 4,245 | | | | 62,664 | | | | 464,437 | | | | 72,431 | | | | 39,686 | | | | 7,013 | |
| | 3,996 | | | | 56,962 | | | | 39,910 | | | | 17,763 | | | | 3,882 | | | | 14,864 | |
| | 18,857 | | | | 28,671 | | | | 131,217 | | | | 49,392 | | | | 57,024 | | | | 23,900 | |
| | 1,065 | | | | 7,048 | | | | 93,365 | | | | 12,306 | | | | 7,035 | | | | 6,913 | |
| | 1,195 | | | | 8,080 | | | | 97,701 | | | | 12,110 | | | | 9,881 | | | | 7,981 | |
| | 993 | | | | — | | | | — | | | | 710,156 | | | | — | | | | — | |
| | 6,108 | | | | 4,958 | | | | 31,617 | | | | 166,699 | | | | — | | | | — | |
| | 18,796 | | | | 53,428 | | | | 116,977 | | | | 34,467 | | | | 39,244 | | | | 32,456 | |
| | | | | | | | | | | | | | | | | | | | | | | |
| | 241,359 | | | | 2,118,749 | | | | 17,656,805 | | | | 4,075,069 | | | | 1,194,716 | | | | 913,069 | |
| | (62,205 | ) | | | — | | | | (447,505 | ) | | | — | | | | (40,761 | ) | | | — | |
| | — | | | | — | | | | (15,191 | ) | | | (633 | ) | | | — | | | | (9,084 | ) |
| | | | | | | | | | | | | | | | | | | | | | | |
| | 179,154 | | | | 2,118,749 | | | | 17,194,109 | | | | 4,074,436 | | | | 1,153,955 | | | | 903,985 | |
| | | | | | | | | | | | | | | | | | | | | | | |
| | 784,721 | | | | (1,434,361 | ) | | | 21,149,108 | | | | 61,805 | | | | 5,458,981 | | | | 3,609,311 | |
| | | | | | | | | | | | | | | | | | | | | | | |
| | | | | | | | | | | | | | | | | | | | | | |
| | | | | | | | | | | | | | | | | | | | | | |
| | 495,507 | | | | 12,230,959 | | | | 32,788,451 | | | | 7,401,409 | | | | 10,365,841 | | | | 940,819 | |
| | 18,481 | | | | — | | | | — | | | | 4,803,888 | | | | — | | | | — | |
| | 375,162 | | | | — | | | | — | | | | (6,388,985 | ) | | | — | | | | — | |
| | — | | | | — | | | | — | | | | — | | | | — | | | | — | |
| | | | | |
| | 902,027 | | | | 21,105,951 | | | | 39,555,366 | | | | 3,599,357 | | | | 4,266,518 | | | | 2,872,059 | |
| | — | | | | (34,693 | ) | | | — | | | | — | | | | — | | | | — | |
| | | | | | | | | | | | | | | | | | | | | | | |
| | 1,791,177 | | | | 33,302,217 | | | | 72,343,817 | | | | 9,415,669 | | | | 14,632,359 | | | | 3,812,878 | |
| | | | | | | | | | | | | | | | | | | | | | | |
| $ | 2,575,898 | | | $ | 31,867,856 | | | $ | 93,492,925 | | | $ | 9,477,474 | | | $ | 20,091,340 | | | $ | 7,422,189 | |
| | | | | | | | | | | | | | | | | | | | | | | |
97
| | |
| WASATCH FUNDS — Statements of Changes in Net Assets | | |
|
| |
| |
| | | | | | | | | | | | | | | | |
| | | CORE GROWTH
FUND | | | EMERGING MARKETS SMALL CAP
FUND | |
| | | Year Ended
September 30, 2010 | | | Year Ended
September 30, 2009 | | | Year Ended
September 30, 2010 | | | Year Ended
September 30, 2009 | |
| | | | | | | | | | | | | | | | |
Operations: | | | | | | | | | | | | | | | | |
Net investment income (loss) | | $ | 62,960 | | | $ | 948,569 | | | $ | 1,225,201 | | | $ | 31,806 | |
Net realized gain (loss) on investments and foreign
currency translations | | | 995,642 | | | | (113,256,495 | ) | | | 7,457,199 | | | | (19,252,248 | ) |
Net realized gain on options written | | | — | | | | — | | | | — | | | | — | |
Change in unrealized appreciation (depreciation) on
investments and foreign currency translations | | | 54,501,664 | | | | 63,460,370 | | | | 70,751,669 | | | | 25,172,055 | |
| | | | | | | | | | | | | | | | |
Net increase (decrease) in net assets resulting from operations | | | 55,560,266 | | | | (48,847,556 | ) | | | 79,434,069 | | | | 5,951,613 | |
| | | | |
Dividends paid from: | | | | | | | | | | | | | | | | |
Net investment income | | | (87,230 | ) | | | (5,739,872 | ) | | | (379,097 | ) | | | (29,720 | ) |
Net realized gains | | | — | | | | — | | | | — | | | | — | |
| | | | | | | | | | | | | | | | |
| | | (87,230 | ) | | | (5,739,872 | ) | | | (379,097 | ) | | | (29,720 | ) |
| | | | |
Capital share transactions: | | | | | | | | | | | | | | | | |
Shares sold | | | 68,856,248 | | | | 42,144,413 | | | | 384,572,278 | | | | 28,161,403 | |
Shares issued to holders in reinvestment of dividends | | | 84,321 | | | | 5,588,262 | | | | 369,142 | | | | 28,998 | |
Shares redeemed | | | (115,743,132 | ) | | | (229,016,912 | ) | | | (68,120,691 | ) | | | (19,915,682 | ) |
Redemption fees | | | 22,210 | | | | 51,587 | | | | 386,082 | | | | 116,524 | |
| | | | | | | | | | | | | | | | |
Net increase (decrease) | | | (46,780,353 | ) | | | (181,232,650 | ) | | | 317,206,811 | | | | 8,391,243 | |
| | | | | | | | | | | | | | | | |
Total increase (decrease) in net assets | | | 8,692,683 | | | | (235,820,078 | ) | | | 396,261,783 | | | | 14,313,136 | |
| | | | |
Net assets: | | | | | | | | | | | | | | | | |
Beginning of period | | | 409,949,030 | | | | 645,769,108 | | | | 50,489,372 | | | | 36,176,236 | |
| | | | | | | | | | | | | | | | |
End of period | | $ | 418,641,713 | | | $ | 409,949,030 | | | $ | 446,751,155 | | | $ | 50,489,372 | |
| | | | | | | | | | | | | | | | |
Undistributed net investment income (loss) included in
net assets at end of period | | $ | 2,636,473 | | | $ | 2,481,460 | | | $ | (117,824 | ) | | $ | 208,395 | |
| | | | | | | | | | | | | | | | |
| | | | |
Capital share transactions — shares: | | | | | | | | | | | | | | | | |
Shares sold | | | 2,422,565 | | | | 2,140,091 | | | | 191,206,047 | | | | 23,140,526 | |
Shares issued to holders in reinvestment of dividends | | | 3,122 | | | | 301,417 | | | | 210,938 | | | | 34,937 | |
Shares redeemed | | | (4,288,991 | ) | | | (11,075,467 | ) | | | (35,258,335 | ) | | | (20,231,688 | ) |
| | | | | | | | | | | | | | | | |
Net increase (decrease) in shares outstanding | | | (1,863,304 | ) | | | (8,633,959 | ) | | | 156,158,650 | | | | 2,943,775 | |
| | | | | | | | | | | | | | | | |
| 1Fund | inception date was November 17, 2008. |
See Notes to Financial Statements.
98
| | | | | | | | | | | | | | | | | | | | | | |
GLOBAL OPPORTUNITIES
FUND | | | GLOBAL SCIENCE & TECHNOLOGY
FUND | | | HERITAGE GROWTH
FUND | |
Year Ended
September 30, 2010 | | | Period Ended
September 30, 20091 | | | Year Ended
September 30, 2010 | | | Year Ended
September 30, 2009 | | | Year Ended
September 30, 2010 | | | Year Ended
September 30, 2009 | |
| | | | | | | | | | | | | | | | | | | | | | |
| | | | | | | | | | | | | | | | | | | | | | |
| $ | (1,210,183 | ) | | $ | (317,456 | ) | | $ | (461,039 | ) | | $ | (450,042 | ) | | $ | 627,348 | | | $ | 487,670 | |
|
9,849,600 |
| | | 3,153,157 | | | | 10,226,634 | | | | (31,796,292 | ) | | | 2,847,249 | | | | (10,184,195 | ) |
| | — | | | | — | | | | — | | | | — | | | | 630 | | | | 100,213 | |
|
24,919,757 |
| | | 26,768,769 | | | | 2,966,542 | | | | 29,182,459 | | | | 8,005,190 | | | | 7,714,994 | |
| | | | | | | | | | | | | | | | | | | | | | | |
|
33,559,174 |
| | | 29,604,470 | | | | 12,732,137 | | | | (3,063,875 | ) | | | 11,480,417 | | | | (1,881,318 | ) |
| | | | | |
| | | | | | | | | | | | | | | | | | | | | | |
| | (261,705 | ) | | | — | | | | (79,109 | ) | | | — | | | | (499,403 | ) | | | (167,143 | ) |
| | (3,194,663 | ) | | | — | | | | — | | | | — | | | | — | | | | (220,964 | ) |
| | | | | | | | | | | | | | | | | | | | | | | |
| | (3,456,368 | ) | | | — | | | | (79,109 | ) | | | — | | | | (499,403 | ) | | | (388,107 | ) |
| | | | | |
| | | | | | | | | | | | | | | | | | | | | | |
| | 110,079,205 | | | | 90,898,578 | | | | 6,840,235 | | | | 5,166,479 | | | | 7,721,063 | | | | 7,087,524 | |
| | 3,250,108 | | | | — | | | | 77,070 | | | | — | | | | 482,444 | | | | 374,358 | |
| | (25,925,621 | ) | | | (3,124,823 | ) | | | (13,346,871 | ) | | | (24,729,028 | ) | | | (18,106,546 | ) | | | (23,413,598 | ) |
| | 12,260 | | | | 6,824 | | | | 3,581 | | | | 2,298 | | | | 1,849 | | | | 915 | |
| | | | | | | | | | | | | | | | | | | | | | | |
| | 87,415,952 | | | | 87,780,579 | | | | (6,425,985 | ) | | | (19,560,251 | ) | | | (9,901,190 | ) | | | (15,950,801 | ) |
| | | | | | | | | | | | | | | | | | | | | | | |
| | 117,518,758 | | | | 117,385,049 | | | | 6,227,043 | | | | (22,624,126 | ) | | | 1,079,824 | | | | (18,220,226 | ) |
| | | | | |
| | | | | | | | | | | | | | | | | | | | | | |
| | 117,385,049 | | | | — | | | | 59,539,893 | | | | 82,164,019 | | | | 77,193,811 | | | | 95,414,037 | |
| | | | | | | | | | | | | | | | | | | | | | | |
| $ | 234,903,807 | | | $ | 117,385,049 | | | $ | 65,766,936 | | | $ | 59,539,893 | | | $ | 78,273,635 | | | $ | 77,193,811 | |
| | | | | | | | | | | | | | | | | | | | | | | |
$ |
(816,038 |
) | | $ | (352,634 | ) | | $ | 35 | | | $ | (367,611 | ) | | $ | 658,864 | | | $ | 499,398 | |
| | | | | | | | | | | | | | | | | | | | | | | |
| | | | | |
| | | | | | | | | | | | | | | | | | | | | | |
| | 30,762,192 | | | | 35,880,124 | | | | 551,173 | | | | 593,548 | | | | 790,897 | | | | 933,157 | |
| | 947,553 | | | | — | | | | 6,565 | | | | — | | | | 50,677 | | | | 55,297 | |
| | (7,268,106 | ) | | | (1,129,075 | ) | | | (1,096,838 | ) | | | (3,209,651 | ) | | | (1,846,641 | ) | | | (3,266,118 | ) |
| | | | | | | | | | | | | | | | | | | | | | | |
| | 24,441,639 | | | | 34,751,049 | | | | (539,100 | ) | | | (2,616,103 | ) | | | (1,005,067 | ) | | | (2,277,664 | ) |
| | | | | | | | | | | | | | | | | | | | | | | |
99
| | |
| WASATCH FUNDS — Statements of Changes in Net Assets (continued) | | |
|
| |
| |
| | | | | | | | | | | | | | | | |
| | | INTERNATIONAL GROWTH
FUND | | | INTERNATIONAL OPPORTUNITIES
FUND | |
| | | Year Ended
September 30, 2010 | | | Year Ended
September 30, 2009 | | | Year Ended
September 30, 2010 | | | Year Ended
September 30, 2009 | |
| | | | | | | | | | | | | | | | |
Operations: | | | | | | | | | | | | | | | | |
Net investment income (loss) | | $ | 192,038 | | | $ | 36,890 | | | $ | (746,874 | ) | | $ | (166,658 | ) |
Net realized gain (loss) on investments and foreign currency translations | | | 13,757,148 | | | | (54,621,834 | ) | | | 15,112,361 | | | | (11,970,363 | ) |
Net realized gain on options written | | | — | | | | — | | | | — | | | | — | |
Net realized loss on short positions | | | — | | | | — | | | | — | | | | — | |
Change in unrealized appreciation (depreciation) on investments, options and foreign currency translations | | | 48,154,832 | | | | 66,274,043 | | | | 19,179,326 | | | | 33,744,742 | |
| | | | | | | | | | | | | | | | |
Net increase (decrease) in net assets resulting from operations | | | 62,104,018 | | | | 11,689,099 | | | | 33,544,813 | | | | 21,607,721 | |
| | | | |
Dividends paid from: | | | | | | | | | | | | | | | | |
Net investment income | | | — | | | | (466,090 | ) | | | (1,049,066 | ) | | | (168,034 | ) |
Net realized gains | | | — | | | | — | | | | — | | | | — | |
| | | | | | | | | | | | | | | | |
| | | — | | | | (466,090 | ) | | | (1,049,066 | ) | | | (168,034 | ) |
| | | | |
Capital share transactions: | | | | | | | | | | | | | | | | |
Shares sold | | | 92,481,514 | | | | 23,024,110 | | | | 56,143,842 | | | | 31,749,891 | |
Shares issued to holders in reinvestment of dividends | | | — | | | | 447,546 | | | | 1,032,263 | | | | 163,313 | |
Shares redeemed | | | (42,375,378 | ) | | | (56,255,429 | ) | | | (31,367,310 | ) | | | (15,224,838 | ) |
Redemption fees | | | 10,085 | | | | 6,574 | | | | 17,074 | | | | 37,390 | |
| | | | | | | | | | | | | | | | |
Net increase (decrease) | | | 50,116,221 | | | | (32,777,199 | ) | | | 25,825,869 | | | | 16,725,756 | |
| | | | | | | | | | | | | | | | |
Total increase (decrease) in net assets | | | 112,220,239 | | | | (21,554,190 | ) | | | 58,321,616 | | | | 38,165,443 | |
| | | | |
Net assets: | | | | | | | | | | | | | | | | |
Beginning of period | | | 173,225,729 | | | | 194,779,919 | | | | 93,855,954 | | | | 55,690,511 | |
| | | | | | | | | | | | | | | | |
End of period | | $ | 285,445,968 | | | $ | 173,225,729 | | | $ | 152,177,570 | | | $ | 93,855,954 | |
| | | | | | | | | | | | | | | | |
Undistributed net investment income (loss) included in
net assets at end of period | | $ | 198,092 | | | $ | (815,682 | ) | | $ | (652,260 | ) | | $ | (726,819 | ) |
| | | | | | | | | | | | | | | | |
| | | | |
Capital share transactions — shares: | | | | | | | | | | | | | | | | |
Shares sold | | | 5,611,720 | | | | 2,074,040 | | | | 25,386,991 | | | | 24,187,957 | |
Shares issued to holders in reinvestment of dividends | | | — | | | | 50,513 | | | | 491,554 | | | | 133,863 | |
Shares redeemed | | | (2,767,634 | ) | | | (6,128,701 | ) | | | (14,333,524 | ) | | | (11,518,529 | ) |
| | | | | | | | | | | | | | | | |
Net increase (decrease) in shares outstanding | | | 2,844,086 | | | | (4,004,148 | ) | | | 11,545,021 | | | | 12,803,291 | |
| | | | | | | | | | | | | | | | |
See Notes to Financial Statements.
100
| | | | | | | | | | | | | | | | | | | | | | |
MICRO CAP
FUND | | | MICRO CAP VALUE
FUND | | | SMALL CAP GROWTH
FUND | |
Year Ended
September 30, 2010 | | | Year Ended
September 30, 2009 | | | Year Ended
September 30, 2010 | | | Year Ended
September 30, 2009 | | | Year Ended
September 30, 2010 | | | Year Ended
September 30, 2009 | |
| | | | | | | | | | | | | | | | | | | | | | |
| | | | | | | | | | | | | | | | | | | | | | |
| $ | (3,041,042 | ) | | $ | (2,204,100 | ) | | $ | (2,203,762 | ) | | $ | (946,261 | ) | | $ | (6,990,560 | ) | | $ | (3,485,220 | ) |
| | | | | |
| | (1,922,995 | ) | | | (70,477,941 | ) | | | 19,739,412 | | | | (22,748,259 | ) | | | 30,868,546 | | | | (66,580,850 | ) |
| | — | | | | — | | | | 866,253 | | | | 1,864,290 | | | | — | | | | — | |
| | — | | | | — | | | | — | | | | (106,661 | ) | | | — | | | | — | |
| | | | | |
| | 41,333,815 | | | | 35,754,956 | | | | (1,084,802 | ) | | | 30,662,023 | | | | 148,574,152 | | | | 108,446,873 | |
| | | | | | | | | | | | | | | | | | | | | | | |
| | | | | |
| | 36,369,778 | | | | (36,927,085 | ) | | | 17,317,101 | | | | 8,725,132 | | | | 172,452,138 | | | | 38,380,803 | |
| | | | | |
| | | | | | | | | | | | | | | | | | | | | | |
| | — | | | | (777,904 | ) | | | (569,692 | ) | | | — | | | | — | | | | — | |
| | — | | | | — | | | | — | | | | — | | | | — | | | | (1,539,215 | ) |
| | | | | | | | | | | | | | | | | | | | | | | |
| | — | | | | (777,904 | ) | | | (569,692 | ) | | | — | | | | — | | | | (1,539,215 | ) |
| | | | | |
| | | | | | | | | | | | | | | | | | | | | | |
| | 23,412,191 | | | | 20,400,999 | | | | 100,096,662 | | | | 37,751,896 | | | | 328,975,735 | | | | 230,991,699 | |
| | — | | | | 743,955 | | | | 551,439 | | | | — | | | | — | | | | 1,498,523 | |
| | (48,782,919 | ) | | | (70,303,414 | ) | | | (47,056,986 | ) | | | (29,184,165 | ) | | | (200,748,783 | ) | | | (195,651,102 | ) |
| | 14,832 | | | | 7,314 | | | | 31,954 | | | | 11,986 | | | | 90,163 | | | | 91,021 | |
| | | | | | | | | | | | | | | | | | | | | | | |
| | (25,355,896 | ) | | | (49,151,146 | ) | | | 53,623,069 | | | | 8,579,717 | | | | 128,317,115 | | | | 36,930,141 | |
| | | | | | | | | | | | | | | | | | | | | | | |
| | 11,013,882 | | | | (86,856,135 | ) | | | 70,370,478 | | | | 17,304,849 | | | | 300,769,253 | | | | 73,771,729 | |
| | | | | |
| | | | | | | | | | | | | | | | | | | | | | |
| | 272,537,378 | | | | 359,393,513 | | | | 115,216,393 | | | | 97,911,544 | | | | 809,317,935 | | | | 735,546,206 | |
| | | | | | | | | | | | | | | | | | | | | | | |
| $ | 283,551,260 | | | $ | 272,537,378 | | | $ | 185,586,871 | | | $ | 115,216,393 | | | $ | 1,110,087,188 | | | $ | 809,317,935 | |
| | | | | | | | | | | | | | | | | | | | | | | |
| | | | | |
| $ | (46,442 | ) | | $ | (15,825 | ) | | $ | (462,295 | ) | | $ | (218,261 | ) | | $ | (114,405 | ) | | $ | (70,280 | ) |
| | | | | | | | | | | | | | | | | | | | | | | |
| | | | | |
| | | | | | | | | | | | | | | | | | | | | | |
| | 5,634,138 | | | | 6,736,914 | | | | 43,931,594 | | | | 21,422,418 | | | | 10,668,620 | | | | 9,654,965 | |
| | — | | | | 265,698 | | | | 252,953 | | | | — | | | | — | | | | 73,746 | |
| | (11,800,279 | ) | | | (23,747,004 | ) | | | (20,736,580 | ) | | | (21,193,792 | ) | | | (6,554,978 | ) | | | (9,177,145 | ) |
| | | | | | | | | | | | | | | | | | | | | | | |
| | (6,166,141 | ) | | | (16,744,392 | ) | | | 23,447,967 | | | | 228,626 | | | | 4,113,642 | | | | 551,566 | |
| | | | | | | | | | | | | | | | | | | | | | | |
101
| | |
| WASATCH FUNDS — Statements of Changes in Net Assets (continued) | | |
|
| |
| |
| | | | | | | | | | | | | | | | |
| | | SMALL CAP VALUE
FUND | | | STRATEGIC INCOME
FUND | |
| | | Year Ended
September 30, 2010 | | | Year Ended
September 30, 2009 | | | Year Ended
September 30, 2010 | | | Year Ended
September 30, 2009 | |
| | | | | | | | | | | | | | | | |
Operations: | | | | | | | | | | | | | | | | |
Net investment income (loss) | | $ | (487,862 | ) | | $ | (624,791 | ) | | $ | 784,721 | | | $ | 775,469 | |
Net realized gain (loss) on investments and foreign
currency translations | | | 19,593,691 | | | | (116,514,917 | ) | | | 495,507 | | | | (7,385,813 | ) |
Net realized gain on options written | | | — | | | | 908,649 | | | | 18,481 | | | | 126,196 | |
Net realized gain (loss) on short positions | | | — | | | | — | | | | 375,162 | | | | (86,106 | ) |
Change in unrealized appreciation (depreciation) on
investments and foreign currency translations | | | 5,715,574 | | | | 73,490,647 | | | | 902,027 | | | | 4,615,332 | |
| | | | | | | | | | | | | | | | |
Net increase (decrease) in net assets resulting from operations | | | 24,821,403 | | | | (42,740,412 | ) | | | 2,575,898 | | | | (1,954,922 | ) |
| | | | |
Dividends paid from: | | | | | | | | | | | | | | | | |
Net investment income | | | — | | | | — | | | | (678,070 | ) | | | (784,968 | ) |
Net realized gains | | | — | | | | — | | | | — | | | | — | |
| | | | | | | | | | | | | | | | |
| | | — | | | | — | | | | (678,070 | ) | | | (784,968 | ) |
| | | | |
Capital share transactions: | | | | | | | | | | | | | | | | |
Shares sold | | | 19,624,422 | | | | 32,790,353 | | | | 2,287,938 | | | | 1,068,106 | |
Shares issued to holders in reinvestment of dividends | | | — | | | | — | | | | 660,289 | | | | 767,924 | |
Shares redeemed | | | (51,243,676 | ) | | | (108,614,115 | ) | | | (3,039,434 | ) | | | (3,276,167 | ) |
Redemption fees | | | 11,670 | | | | 7,697 | | | | 307 | | | | 894 | |
| | | | | | | | | | | | | | | | |
Net increase (decrease) | | | (31,607,584 | ) | | | (75,816,065 | ) | | | (90,900 | ) | | | (1,439,243 | ) |
| | | | | | | | | | | | | | | | |
Total increase (decrease) in net assets | | | (6,786,181 | ) | | | (118,556,477 | ) | | | 1,806,928 | | | | (4,179,133 | ) |
| | | | |
Net assets: | | | | | | | | | | | | | | | | |
Beginning of period | | | 218,357,671 | | | | 336,914,148 | | | | 17,710,047 | | | | 21,889,180 | |
| | | | | | | | | | | | | | | | |
End of period | | $ | 211,571,490 | | | $ | 218,357,671 | | | $ | 19,516,975 | | | $ | 17,710,047 | |
| | | | | | | | | | | | | | | | |
Undistributed net investment income (loss) included in
net assets at end of period | | $ | 715,613 | | | $ | 741,563 | | | $ | 66,363 | | | $ | 179,094 | |
| | | | | | | | | | | | | | | | |
| | | | |
Capital share transactions — shares: | | | | | | | | | | | | | | | | |
Shares sold | | | 6,683,775 | | | | 15,948,161 | | | | 320,791 | | | | 174,614 | |
Shares issued to holders in reinvestment of dividends | | | — | | | | — | | | | 93,068 | | | | 136,331 | |
Shares redeemed | | | (17,525,168 | ) | | | (56,145,733 | ) | | | (429,440 | ) | | | (567,847 | ) |
| | | | | | | | | | | | | | | | |
Net increase (decrease) in shares outstanding | | | (10,841,393 | ) | | | (40,197,572 | ) | | | (15,581 | ) | | | (256,902 | ) |
| | | | | | | | | | | | | | | | |
See Notes to Financial Statements.
102
| | | | | | | | | | | | | | | | | | | | | | |
ULTRA GROWTH
FUND | | | INCOME EQUITY
FUND | | | LONG/SHORT
FUND | |
Year Ended
September 30, 2010 | | | Year Ended
September 30, 2009 | | | Year Ended
September 30, 2010 | | | Year Ended
September 30, 2009 | | | Year Ended
September 30, 2010 | | | Year Ended
September 30, 2009 | |
| | | | | | | | | | | | | | | | | | | | | | |
| | | | | | | | | | | | | | | | | | | | | | |
| $ | (1,434,361 | ) | | $ | (1,104,391 | ) | | $ | 21,149,108 | | | $ | 19,219,640 | | | $ | 61,805 | | | $ | 254,370 | |
|
12,230,959 |
| | | (48,814,746 | ) | | | 32,788,451 | | | | (96,935,144 | ) | | | 7,401,409 | | | | (21,773,280 | ) |
| | — | | | | — | | | | — | | | | — | | | | 4,803,888 | | | | 1,315,878 | |
| | — | | | | 497,763 | | | | — | | | | — | | | | (6,388,985 | ) | | | 4,989,019 | |
|
21,071,258 |
| | | 41,929,072 | | | | 39,555,366 | | | | 140,074,504 | | | | 3,599,357 | | | | 21,481,141 | |
| | | | | | | | | | | | | | | | | | | | | | | |
�� |
31,867,856 |
| | | (7,492,302 | ) | | | 93,492,925 | | | | 62,359,000 | | | | 9,477,474 | | | | 6,267,128 | |
| | | | | |
| | | | | | | | | | | | | | | | | | | | | | |
| | — | | | | — | | | | (21,589,760 | ) | | | (19,218,020 | ) | | | (98,009 | ) | | | (556,325 | ) |
| | — | | | | — | | | | — | | | | — | | | | — | | | | (1,579,189 | ) |
| | | | | | | | | | | | | | | | | | | | | | | |
| | — | | | | — | | | | (21,589,760 | ) | | | (19,218,020 | ) | | | (98,009 | ) | | | (2,135,514 | ) |
| | | | | |
| | | | | | | | | | | | | | | | | | | | | | |
| | 55,395,722 | | | | 12,125,756 | | | | 559,640,781 | | | | 874,385,368 | | | | 218,506,133 | | | | 76,153,872 | |
| | — | | | | — | | | | 19,988,994 | | | | 17,197,096 | | | | 86,180 | | | | 1,826,247 | |
| | (29,986,296 | ) | | | (27,365,051 | ) | | | (415,969,989 | ) | | | (329,662,507 | ) | | | (73,900,820 | ) | | | (58,109,974 | ) |
| | 4,063 | | | | 12,255 | | | | 42,087 | | | | 62,658 | | | | 56,794 | | | | 11,260 | |
| | | | | | | | | | | | | | | | | | | | | | | |
| | 25,413,489 | | | | (15,227,040 | ) | | | 163,701,873 | | | | 561,982,615 | | | | 144,748,287 | | | | 19,881,405 | |
| | | | | | | | | | | | | | | | | | | | | | | |
| | 57,281,345 | | | | (22,719,342 | ) | | | 235,605,038 | | | | 605,123,595 | | | | 154,127,752 | | | | 24,013,019 | |
| | | | | |
| | | | | | | | | | | | | | | | | | | | | | |
| | 121,284,236 | | | | 144,003,578 | | | | 1,385,507,716 | | | | 780,384,121 | | | | 146,126,984 | | | | 122,113,965 | |
| | | | | | | | | | | | | | | | | | | | | | | |
| $ | 178,565,581 | | | $ | 121,284,236 | | | $ | 1,621,112,754 | | | $ | 1,385,507,716 | | | $ | 300,254,736 | | | $ | 146,126,984 | |
| | | | | | | | | | | | | | | | | | | | | | | |
$ |
(759,055 |
) | | $ | (398,577 | ) | | $ | (331,089 | ) | | $ | 123,618 | | | $ | 48,857 | | | $ | 97,087 | |
| | | | | | | | | | | | | | | | | | | | | | | |
| | | | | |
| | | | | | | | | | | | | | | | | | | | | | |
| | 3,045,498 | | | | 995,533 | | | | 44,453,574 | | | | 85,935,790 | | | | 18,930,449 | | | | 7,924,340 | |
| | — | | | | — | | | | 1,621,951 | | | | 1,663,444 | | | | 7,406 | | | | 209,877 | |
| | (1,773,172 | ) | | | (2,387,038 | ) | | | (33,497,030 | ) | | | (32,224,101 | ) | | | (6,490,271 | ) | | | (6,298,177 | ) |
| | | | | | | | | | | | | | | | | | | | | | | |
| | 1,272,326 | | | | (1,391,505 | ) | | | 12,578,495 | | | | 55,375,133 | | | | 12,447,584 | | | | 1,836,040 | |
| | | | | | | | | | | | | | | | | | | | | | | |
103
| | |
| WASATCH FUNDS — Statements of Changes in Net Assets (continued) | | SEPTEMBER 30, 2010 |
|
| |
| |
| | | | | | | | | | | | | | | | |
| | | U.S. TREASURY
FUND | | | INCOME
FUND | |
| | | Year Ended
September 30, 2010 | | | Year Ended
September 30, 2009 | | | Year Ended
September 30, 2010 | | | Year Ended
September 30, 2009 | |
| | | | | | | | | | | | | | | | |
Operations: | | | | | | | | | | | | | | | | |
Net investment income | | $ | 5,458,981 | | | $ | 5,036,394 | | | $ | 3,609,311 | | | $ | 3,368,363 | |
Net realized gain (loss) on investments and foreign currency translations | | | 10,365,841 | | | | 9,178,548 | | | | 940,819 | | | | (263,209 | ) |
Change in unrealized appreciation (depreciation) on investments and options written | | | 4,266,518 | | | | 2,499,959 | | | | 2,872,059 | | | | 4,892,799 | |
| | | | | | | | | | | | | | | | |
Net increase in net assets resulting from operations | | | 20,091,340 | | | | 16,714,901 | | | | 7,422,189 | | | | 7,997,953 | |
| | | | |
Dividends paid from: | | | | | | | | | | | | | | | | |
Net investment income | | | (5,454,808 | ) | | | (5,022,309 | ) | | | (3,572,685 | ) | | | (3,433,282 | ) |
Net realized gains | | | (4,576,837 | ) | | | — | | | | — | | | | — | |
| | | | | | | | | | | | | | | | |
| | | (10,031,645 | ) | | | (5,022,309 | ) | | | (3,572,685 | ) | | | (3,433,282 | ) |
| | | | |
Capital share transactions: | | | | | | | | | | | | | | | | |
Shares sold | | | 91,924,206 | | | | 148,148,779 | | | | 45,774,175 | | | | 50,831,732 | |
Shares issued to holders in reinvestment of dividends | | | 9,249,903 | | | | 4,584,510 | | | | 2,972,350 | | | | 2,876,487 | |
Shares redeemed | | | (64,561,485 | ) | | | (132,178,263 | ) | | | (29,000,964 | ) | | | (32,859,256 | ) |
Redemption fees | | | 83,717 | | | | 431,042 | | | | 3,655 | | | | 1,844 | |
| | | | | | | | | | | | | | | | |
Net increase | | | 36,696,341 | | | | 20,986,068 | | | | 19,749,216 | | | | 20,850,807 | |
| | | | | | | | | | | | | | | | |
Total increase in net assets | | | 46,756,036 | | | | 32,678,660 | | | | 23,598,720 | | | | 25,415,478 | |
| | | | |
Net assets: | | | | | | | | | | | | | | | | |
Beginning of period | | | 154,098,545 | | | | 121,419,885 | | | | 114,496,389 | | | | 89,080,911 | |
| | | | | | | | | | | | | | | | |
End of period | | $ | 200,854,581 | | | $ | 154,098,545 | | | $ | 138,095,109 | | | $ | 114,496,389 | |
| | | | | | | | | | | | | | | | |
Undistributed net investment income (loss) included in net assets at end of period | | $ | 16,351 | | | $ | 14,138 | | | $ | 23,571 | | | $ | (13,055 | ) |
| | | | | | | | | | | | | | | | |
| | | | |
Capital share transactions — shares: | | | | | | | | | | | | | | | | |
Shares sold | | | 5,800,234 | | | | 8,980,714 | | | | 4,502,902 | | | | 5,205,427 | |
Shares issued to holders in reinvestment of dividends | | | 614,469 | | | | 266,951 | | | | 292,433 | | | | 294,467 | |
Shares redeemed | | | (4,173,981 | ) | | | (7,910,125 | ) | | | (2,850,794 | ) | | | (3,381,592 | ) |
| | | | | | | | | | | | | | | | |
Net increase in shares outstanding | | | 2,240,722 | | | | 1,337,540 | | | | 1,944,541 | | | | 2,118,302 | |
| | | | | | | | | | | | | | | | |
See Notes to Financial Statements.
104
| | |
| WASATCH FUNDS — Financial Highlights | | SEPTEMBER 30, 2010 |
|
| |
| |
| | | | | | | | | | | | | | | | | | | | |
| CORE GROWTH FUND | | Year Ended September 30 | |
| (for a share outstanding throughout each period) | | 2010 | | | 2009 | | | 2008 | | | 2007 | | | 2006 | |
| | | | | | | | | | | | | | | | | | | | |
Net asset value, beginning of period | | $ | 25.88 | | | $ | 26.38 | | | $ | 42.98 | | | $ | 41.08 | | | $ | 43.92 | |
| | | | | |
Income (loss) from investment operations: | | | | | | | | | | | | | | | | | | | | |
Net investment income (loss) | | | 0.03 | | | | — | 1 | | | 0.19 | | | | (0.05 | ) | | | 0.17 | |
Net realized and unrealized gains (losses) on investments | | | 4.05 | | | | (0.23 | ) | | | (8.98 | ) | | | 5.65 | | | | 0.90 | |
| | | | | | | | | | | | | | | | | | | | |
Total from investment operations | | | 4.08 | | | | (0.23 | ) | | | (8.79 | ) | | | 5.60 | | | | 1.07 | |
| | | | | |
Redemption fees (see Note 2) | | | — | 1 | | | — | 1 | | | — | 1 | | | — | 1 | | | — | 1 |
| | | | | |
Less distributions: | | | | | | | | | | | | | | | | | | | | |
Dividends from net investment income | | | (0.01 | ) | | | (0.27 | ) | | | — | | | | (0.14 | ) | | | (0.63 | ) |
Distributions from net realized gains | | | — | | | | — | | | | (7.81 | ) | | | (3.56 | ) | | | (3.28 | ) |
| | | | | | | | | | | | | | | | | | | | |
Total distributions | | | (0.01 | ) | | | (0.27 | ) | | | (7.81 | ) | | | (3.70 | ) | | | (3.91 | ) |
| | | | | | | | | | | | | | | | | | | | |
Net asset value, end of period | | $ | 29.95 | | | $ | 25.88 | | | $ | 26.38 | | | $ | 42.98 | | | $ | 41.08 | |
| | | | | | | | | | | | | | | | | | | | |
Total return | | | 15.75% | | | | (0.45)% | | | | (24.82)% | | | | 14.28% | | | | 2.46% | |
| | | | | |
Supplemental data and ratios: | | | | | | | | | | | | | | | | | | | | |
Net assets, end of period (in thousands) | | $ | 418,642 | | | $ | 409,949 | | | $ | 645,769 | | | $ | 1,250,618 | | | $ | 1,381,027 | |
Ratio of expenses to average net assets | | | 1.29% | 2 | | | 1.34% | | | | 1.21% | | | | 1.18% | | | | 1.17% | |
Ratio of net investment income (loss) to average net assets | | | 0.02% | | | | 0.24% | | | | 0.52% | | | | (0.09)% | | | | 0.38% | |
Portfolio turnover rate | | | 19% | | | | 30% | | | | 44% | | | | 54% | | | | 42% | |
| | | | |
| EMERGING MARKETS SMALL CAP FUND | | Year Ended
September 30 | | | Period Ended
September 30 | | | | | | | |
| (for a share outstanding throughout each period) | | 2010 | | | 2009 | | | 20083 | | | | | | | |
Net asset value, beginning of period | | $ | 1.57 | | | $ | 1.24 | | | $ | 2.00 | | | | | | | | | |
| | | | | |
Income (loss) from investment operations: | | | | | | | | | | | | | | | | | | | | |
Net investment income | | | 0.01 | | | | — | 1 | | | — | 1 | | | | | | | | |
Net realized and unrealized gains (losses) on investments | | | 0.80 | | | | 0.33 | | | | (0.76 | ) | | | | | | | | |
| | | | | | | | | | | | | | | | | | | | |
Total from investment operations | | | 0.81 | | | | 0.33 | | | | (0.76 | ) | | | | | | | | |
| | | | | |
Redemption fees (see Note 2) | | | — | 1 | | | — | 1 | | | — | 1 | | | | | | | | |
| | | | | |
Less distributions: | | | | | | | | | | | | | | | | | | | | |
Dividends from net investment income | | | (0.01 | ) | | | — | 1 | | | — | 1 | | | | | | | | |
| | | | | | | | | | | | | | | | | | | | |
Total distributions | | | (0.01 | ) | | | — | 1 | | | — | 1 | | | | | | | | |
| | | | | | | | | | | | | | | | | | | | |
Net asset value, end of period | | $ | 2.37 | | | $ | 1.57 | | | $ | 1.24 | | | | | | | | | |
| | | | | | | | | | | | | | | | | | | | |
Total return | | | 51.69% | | | | 26.80% | | | | (37.88)% | 4 | | | | | | | | |
| | | | | |
Supplemental data and ratios: | | | | | | | | | | | | | | | | | | | | |
Net assets, end of period (in thousands) | | $ | 446,751 | | | $ | 50,489 | | | $ | 36,176 | | | | | | | | | |
Ratio of expenses to average net assets: | | | | | | | | | | | | | | | | | | | | |
Net of waivers and reimbursements | | | 2.06% | 5 | | | 2.10% | | | | 2.10% | 6 | | | | | | | | |
Before waivers and reimbursements | | | 2.39% | 5 | | | 3.03% | | | | 2.67% | 6 | | | | | | | | |
Ratio of net investment income (loss) to average net assets: | | | | | | | | | | | | | | | | | | | | |
Net of waivers and reimbursements | | | 0.82% | | | | 0.12% | | | | 0.27% | 6 | | | | | | | | |
Before waivers and reimbursements | | | 0.49% | | | | (0.81)% | | | | (0.29)% | 6 | | | | | | | | |
Portfolio turnover rate | | | 23% | | | | 78% | | | | 38% | 4 | | | | | | | | |
| 1 | Represents amounts less than $.005 per share. |
| 2 | Includes extraordinary expenses of 0.01% (see Note 9). |
| 3 | Fund inception date was October 1, 2007. |
| 4 | Not annualized for periods less than one year. |
| 5 | Includes extraordinary expenses of less than 0.01% (see Note 9). |
See Notes to Financial Statements.
105
| | |
| WASATCH FUNDS — Financial Highlights (continued) | | |
|
| |
| |
| | | | | | | | | | | | | | | | | | | | |
| GLOBAL OPPORTUNITIES FUND | | Year Ended
September 30 | | | Period Ended
September 30 | | | | | | | | | | |
| (for a share outstanding throughout each period) | | 2010 | | | 20091 | | | | | | | | | | |
| | | | | | | | | | | | | | | | | | | | |
Net asset value, beginning of period | | $ | 3.38 | | | $ | 2.00 | | | | | | | | | | | | | |
| | | | | |
Income (loss) from investment operations: | | | | | | | | | | | | | | | | | | | | |
Net investment loss | | | (0.02 | ) | | | (0.01 | ) | | | | | | | | | | | | |
Net realized and unrealized gains on investments | | | 0.70 | | | | 1.39 | | | | | | | | | | | | | |
| | | | | | | | | | | | | | | | | | | | |
Total from investment operations | | | 0.68 | | | | 1.38 | | | | | | | | | | | | | |
| | | | | |
Redemption fees (see Note 2) | | | — | 2 | | | — | 2 | | | | | | | | | | | | |
| | | | | |
Less distributions: | | | | | | | | | | | | | | | | | | | | |
Dividends from net investment income | | | (0.01 | ) | | | — | | | | | | | | | | | | | |
Distributions from net realized gains | | | (0.08 | ) | | | — | | | | | | | | | | | | | |
| | | | | | | | | | | | | | | | | | | | |
Total distributions | | | (0.09 | ) | | | — | | | | | | | | | | | | | |
| | | | | | | | | | | | | | | | | | | | |
Net asset value, end of period | | $ | 3.97 | | | $ | 3.38 | | | | | | | | | | | | | |
| | | | | | | | | | | | | | | | | | | | |
Total return | | | 20.41% | | | | 69.00% | 3 | | | | | | | | | | | | |
| | | | | |
Supplemental data and ratios: | | | | | | | | | | | | | | | | | | | | |
Net assets, end of period (in thousands) | | $ | 234,904 | | | $ | 117,385 | | | | | | | | | | | | | |
Ratio of expenses to average net assets: | | | | | | | | | | | | | | | | | | | | |
Net of waivers and reimbursements | | | 2.25% | 4 | | | 2.25% | 5 | | | | | | | | | | | | |
Before waivers and reimbursements | | | 2.33% | 4 | | | 2.61% | 5 | | | | | | | | | | | | |
Ratio of net investment loss to average net assets: | | | | | | | | | | | | | | | | | | | | |
Net of waivers and reimbursements | | | (0.73)% | | | | (0.67)% | 5 | | | | | | | | | | | | |
Before waivers and reimbursements | | | (0.81)% | | | | (1.03)% | 5 | | | | | | | | | | | | |
Portfolio turnover rate | | | 23% | | | | 22% | 3 | | | | | | | | | | | | |
| |
| GLOBAL SCIENCE & TECHNOLOGY FUND | | Year Ended September 30 | |
| (for a share outstanding throughout each period) | | 2010 | | | 2009 | | | 2008 | | | 2007 | | | 2006 | |
Net asset value, beginning of period | | $ | 11.12 | | | $ | 10.31 | | | $ | 17.69 | | | $ | 13.97 | | | $ | 12.98 | |
| | | | | |
Income (loss) from investment operations: | | | | | | | | | | | | | | | | | | | | |
Net investment loss | | | (0.10 | ) | | | (0.12 | ) | | | (0.25 | ) | | | (0.12 | ) | | | (0.14 | ) |
Net realized and unrealized gains (losses) on investments | | | 2.65 | | | | 0.93 | | | | (5.65 | ) | | | 4.43 | | | | 1.40 | |
| | | | | | | | | | | | | | | | | | | | |
Total from investment operations | | | 2.55 | | | | 0.81 | | | | (5.90 | ) | | | 4.31 | | | | 1.26 | |
| | | | | |
Redemption fees (see Note 2) | | | — | 2 | | | — | 2 | | | — | 2 | | | — | 2 | | | — | 2 |
| | | | | |
Less distributions: | | | | | | | | | | | | | | | | | | | | |
Dividends from net investment income | | | (0.02 | ) | | | — | | | | — | | | | — | | | | — | |
Distributions from net realized gains | | | — | | | | — | | | | (1.48 | ) | | | (0.59 | ) | | | (0.27 | ) |
| | | | | | | | | | | | | | | | | | | | |
Total distributions | | | (0.02 | ) | | | — | | | | (1.48 | ) | | | (0.59 | ) | | | (0.27 | ) |
| | | | | | | | | | | | | | | | | | | | |
Net asset value, end of period | | $ | 13.65 | | | $ | 11.12 | | | $ | 10.31 | | | $ | 17.69 | | | $ | 13.97 | |
| | | | | | | | | | | | | | | | | | | | |
Total return | | | 22.91% | | | | 7.86% | | | | (36.07)% | | | | 31.63% | | | | 9.81% | |
| | | | | |
Supplemental data and ratios: | | | | | | | | | | | | | | | | | | | | |
Net assets, end of period (in thousands) | | $ | 65,767 | | | $ | 59,540 | | | $ | 82,164 | | | $ | 204,142 | | | $ | 126,359 | |
Ratio of expenses to average net assets: | | | | | | | | | | | | | | | | | | | | |
Net of waivers and reimbursements | | | 1.96% | 6 | | | 1.95% | | | | 1.92% | | | | 1.85% | | | | 1.94% | |
Before waivers and reimbursements | | | 2.05% | 6 | | | 2.14% | | | | 1.92% | | | | 1.85% | | | | 1.94% | |
Ratio of net investment loss to average net assets: | | | | | | | | | | | | | | | | | | | | |
Net of waivers and reimbursements | | | (0.74)% | | | | (0.88)% | | | | (1.24)% | | | | (0.97)% | | | | (1.15)% | |
Before waivers and reimbursements | | | (0.83)% | | | | (1.07)% | | | | (1.24)% | | | | (0.97)% | | | | (1.15)% | |
Portfolio turnover rate | | | 74% | | | | 41% | | | | 89% | | | | 78% | | | | 58% | |
| 1 | Fund inception date was November 17, 2008. |
| 2 | Represents amounts less than $.005 per share. |
| 3 | Not annualized for periods less than one year. |
| 4 | Includes extraordinary expenses of less than 0.01% (see Note 9). |
| 6 | Includes extraordinary expenses of 0.01% (see Note 9). |
See Notes to Financial Statements.
106
| | | | | | | | | | | | | | | | | | | | |
| HERITAGE GROWTH FUND | | Year Ended September 30 | |
| (for a share outstanding throughout each period) | | 2010 | | | 2009 | | | 2008 | | | 2007 | | | 2006 | |
| | | | | | | | | | | | | | | | | | | | |
Net asset value, beginning of period | | $ | 9.28 | | | $ | 9.00 | | | $ | 12.57 | | | $ | 11.40 | | | $ | 11.43 | |
| | | | | |
Income (loss) from investment operations: | | | | | | | | | | | | | | | | | | | | |
Net investment income (loss) | | | 0.09 | | | | 0.06 | | | | 0.06 | | | | (0.01 | ) | | | — | 1 |
Net realized and unrealized gains (losses) on investments | | | 1.39 | | | | 0.26 | | | | (2.57 | ) | | | 1.53 | | | | 0.28 | |
| | | | | | | | | | | | | | | | | | | | |
Total from investment operations | | | 1.48 | | | | 0.32 | | | | (2.51 | ) | | | 1.52 | | | | 0.28 | |
| | | | | |
Redemption fees (see Note 2) | | | — | 1 | | | — | 1 | | | — | 1 | | | — | 1 | | | — | 1 |
| | | | | |
Less distributions: | | | | | | | | | | | | | | | | | | | | |
Dividends from net investment income | | | (0.06 | ) | | | (0.02 | ) | | | — | | | | — | 1 | | | (0.01 | ) |
Distributions from net realized gains | | | — | | | | (0.02 | ) | | | (1.06 | ) | | | (0.35 | ) | | | (0.30 | ) |
| | | | | | | | | | | | | | | | | | | | |
Total distributions | | | (0.06 | ) | | | (0.04 | ) | | | (1.06 | ) | | | (0.35 | ) | | | (0.31 | ) |
| | | | | | | | | | | | | | | | | | | | |
Net asset value, end of period | | $ | 10.70 | | | $ | 9.28 | | | $ | 9.00 | | | $ | 12.57 | | | $ | 11.40 | |
| | | | | | | | | | | | | | | | | | | | |
Total return | | | 16.06% | | | | 3.74% | | | | (21.54)% | | | | 13.59% | | | | 2.46% | |
| | | | | |
Supplemental data and ratios: | | | | | | | | | | | | | | | | | | | | |
Net assets, end of period (in thousands) | | $ | 78,274 | | | $ | 77,194 | | | $ | 95,414 | | | $ | 208,918 | | | $ | 244,380 | |
Ratio of expenses to average net assets: | | | | | | | | | | | | | | | | | | | | |
Net of waivers and reimbursements | | | 0.96% | 2 | | | 0.95% | | | | 0.95% | | | | 0.95% | | | | 0.95% | |
Before waivers and reimbursements | | | 1.11% | 2 | | | 1.21% | | | | 1.01% | | | | 0.95% | | | | 0.95% | |
Ratio of net investment income (loss) to average net assets: | | | | | | | | | | | | | | | | | | | | |
Net of waivers and reimbursements | | | 0.81% | | | | 0.74% | | | | 0.44% | | | | (0.06)% | | | | 0.01% | |
Before waivers and reimbursements | | | 0.66% | | | | 0.48% | | | | 0.38% | | | | (0.06)% | | | | 0.01% | |
Portfolio turnover rate | | | 36% | | | | 33% | | | | 48% | | | | 56% | | | | 54% | |
| |
| INTERNATIONAL GROWTH FUND | | Year Ended September 30 | |
| (for a share outstanding throughout each period) | | 2010 | | | 2009 | | | 2008 | | | 2007 | | | 2006 | |
Net asset value, beginning of period | | $ | 13.91 | | | $ | 11.83 | | | $ | 24.42 | | | $ | 21.83 | | | $ | 18.50 | |
| | | | | |
Income (loss) from investment operations: | | | | | | | | | | | | | | | | | | | | |
Net investment income (loss) | | | 0.02 | | | | (0.13 | ) | | | (0.28 | ) | | | 0.03 | | | | (0.09 | ) |
Net realized and unrealized gains (losses) on investments | | | 4.73 | | | | 2.24 | | | | (9.19 | ) | | | 6.61 | | | | 3.42 | |
| | | | | | | | | | | | | | | | | | | | |
Total from investment operations | | | 4.75 | | | | 2.11 | | | | (9.47 | ) | | | 6.64 | | | | 3.33 | |
| | | | | |
Redemption fees (see Note 2) | | | — | 1 | | | — | 1 | | | — | 1 | | | — | 1 | | | — | 1 |
| | | | | |
Less distributions: | | | | | | | | | | | | | | | | | | | | |
Dividends from net investment income | | | — | | | | (0.03 | ) | | | (0.68 | ) | | | — | | | | — | |
Distributions from net realized gains | | | — | | | | — | | | | (2.44 | ) | | | (4.05 | ) | | | — | 1 |
| | | | | | | | | | | | | | | | | | | | |
Total distributions | | | — | | | | (0.03 | ) | | | (3.12 | ) | | | (4.05 | ) | | | — | 1 |
| | | | | | | | | | | | | | | | | | | | |
Net asset value, end of period | | $ | 18.66 | | | $ | 13.91 | | | $ | 11.83 | | | $ | 24.42 | | | $ | 21.83 | |
| | | | | | | | | | | | | | | | | | | | |
Total return | | | 34.15% | | | | 18.03% | | | | (44.01)% | | | | 34.02% | | | | 18.00% | 3 |
| | | | | |
Supplemental data and ratios: | | | | | | | | | | | | | | | | | | | | |
Net assets, end of period (in thousands) | | $ | 285,446 | | | $ | 173,226 | | | $ | 194,780 | | | $ | 534,903 | | | $ | 383,135 | |
Ratio of expenses to average net assets | | | 1.86% | 4 | | | 1.94% | | | | 1.83% | | | | 1.76% | | | | 1.78% | |
Ratio of net investment income (loss) to average net assets | | | 0.10% | | | | 0.03% | | | | (0.15)% | | | | 0.11% | | | | (0.42)% | |
Portfolio turnover rate | | | 44% | | | | 56% | | | | 44% | | | | 60% | | | | 64% | |
| 1 | Represents amounts less than $.005 per share. |
| 2 | Includes extraordinary expenses of 0.01% (see Note 9). |
| 3 | In 2006, the Fund’s total return included a voluntary reimbursement by the Advisor for an amount relating to an incorrect settlement that had no impact on the total return. |
| 4 | Includes extraordinary expenses of less than 0.01% (see Note 9). |
See Notes to Financial Statements.
107
| | |
| WASATCH FUNDS — Financial Highlights (continued) | | |
|
| |
| |
| | | | | | | | | | | | | | | | | | | | |
| INTERNATIONAL OPPORTUNITIES FUND | | Year Ended September 30 | |
| (for a share outstanding throughout each period) | | 2010 | | | 2009 | | | 2008 | | | 2007 | | | 2006 | |
| | | | | | | | | | | | | | | | | | | | |
Net asset value, beginning of period | | $ | 1.97 | | | $ | 1.60 | | | $ | 3.65 | | | $ | 2.71 | | | $ | 2.19 | |
| | | | | |
Income (loss) from investment operations: | | | | | | | | | | | | | | | | | | | | |
Net investment income (loss) | | | (0.01 | ) | | | 0.01 | | | | 0.07 | | | | (0.01 | ) | | | (0.01 | ) |
Net realized and unrealized gains (losses) on investments | | | 0.63 | | | | 0.36 | | | | (1.45 | ) | | | 1.13 | | | | 0.53 | |
| | | | | | | | | | | | | | | | | | | | |
Total from investment operations | | | 0.62 | | | | 0.37 | | | | (1.38 | ) | | | 1.12 | | | | 0.52 | |
| | | | | |
Redemption fees (see Note 2) | | | — | 1 | | | — | 1 | | | — | 1 | | | — | 1 | | | — | 1 |
| | | | | |
Less distributions: | | | | | | | | | | | | | | | | | | | | |
Dividends from net investment income | | | (0.02 | ) | | | — | 1 | | | (0.14 | ) | | | — | 1 | | | — | |
Distributions from net realized gains | | | — | | | | — | | | | (0.53 | ) | | | (0.18 | ) | | | — | |
| | | | | | | | | | | | | | | | | | | | |
Total distributions | | | (0.02 | ) | | | — | | | | (0.67 | ) | | | (0.18 | ) | | | — | |
| | | | | | | | | | | | | | | | | | | | |
Net asset value, end of period | | $ | 2.57 | | | $ | 1.97 | | | $ | 1.60 | | | $ | 3.65 | | | $ | 2.71 | |
| | | | | | | | | | | | | | | | | | | | |
Total return | | | 31.71% | | | | 23.60% | | | | (45.33)% | | | | 42.73% | | | | 23.74% | |
| | | | | |
Supplemental data and ratios: | | | | | | | | | | | | | | | | | | | | |
Net assets, end of period (in thousands) | | $ | 152,178 | | | $ | 93,856 | | | $ | 55,691 | | | $ | 56,433 | | | $ | 36,839 | |
Ratio of expenses to average net assets: | | | | | | | | | | | | | | | | | | | | |
Net of waivers and reimbursements | | | 2.26% | 2 | | | 2.26% | 3 | | | 2.25% | | | | 2.25% | | | | 2.25% | |
Before waivers and reimbursements | | | 2.62% | 2 | | | 2.79% | 3 | | | 2.59% | | | | 2.51% | | | | 2.62% | |
Ratio of net investment loss to average net assets: | | | | | | | | | | | | | | | | | | | | |
Net of waivers and reimbursements | | | (0.60)% | | | | (0.28)% | | | | (0.09)% | | | | (0.18)% | | | | (0.29)% | |
Before waivers and reimbursements | | | (0.96)% | | | | (0.81)% | | | | (0.43)% | | | | (0.44)% | | | | (0.66)% | |
Portfolio turnover rate | | | 51% | | | | 69% | | | | 63% | | | | 54% | | | | 43% | |
| |
| MICRO CAP FUND | | Year Ended September 30 | |
| (for a share outstanding throughout each period) | | 2010 | | | 2009 | | | 2008 | | | 2007 | | | 2006 | |
Net asset value, beginning of period | | $ | 3.89 | | | $ | 4.14 | | | $ | 7.19 | | | $ | 6.79 | | | $ | 7.58 | |
| | | | | |
Income (loss) from investment operations: | | | | | | | | | | | | | | | | | | | | |
Net investment loss | | | (0.05 | ) | | | (0.03 | ) | | | (0.07 | ) | | | (0.09 | ) | | | (0.10 | ) |
Net realized and unrealized gains (losses) on investments | | | 0.60 | | | | (0.21 | ) | | | (1.81 | ) | | | 1.29 | | | | 0.65 | |
| | | | | | | | | | | | | | | | | | | | |
Total from investment operations | | | 0.55 | | | | (0.24 | ) | | | (1.88 | ) | | | 1.20 | | | | 0.55 | |
| | | | | |
Redemption fees (see Note 2) | | | — | 1 | | | — | 1 | | | — | 1 | | | — | 1 | | | — | 1 |
| | | | | |
Less distributions: | | | | | | | | | | | | | | | | | | | | |
Dividends from net investment income | | | — | | | | (0.01 | ) | | | — | | | | — | | | | — | |
Distributions from net realized gains | | | — | | | | — | | | | (1.17 | ) | | | (0.80 | ) | | | (1.34 | ) |
| | | | | | | | | | | | | | | | | | | | |
Total distributions | | | — | | | | (0.01 | ) | | | (1.17 | ) | | | (0.80 | ) | | | (1.34 | ) |
| | | | | | | | | | | | | | | | | | | | |
Net asset value, end of period | | $ | 4.44 | | | $ | 3.89 | | | $ | 4.14 | | | $ | 7.19 | | | $ | 6.79 | |
| | | | | | | | | | | | | | | | | | | | |
Total return | | | 14.14% | | | | (5.70)% | | | | (30.46)% | | | | 18.72% | | | | 8.51% | |
| | | | | |
Supplemental data and ratios: | | | | | | | | | | | | | | | | | | | | |
Net assets, end of period (in thousands) | | $ | 283,551 | | | $ | 272,537 | | | $ | 359,394 | | | $ | 631,417 | | | $ | 583,901 | |
Ratio of expenses to average net assets | | | 2.18% | 4 | | | 2.24% | | | | 2.16% | | | | 2.14% | | | | 2.14% | |
Ratio of net investment loss to average net assets | | | (1.10)% | | | | (0.96)% | | | | (1.26)% | | | | (1.25)% | | | | (1.39)% | |
Portfolio turnover rate | | | 34% | | | | 46% | | | | 54% | | | | 48% | | | | 46% | |
| 1 | Represents amounts less than $.005 per share. |
| 2 | Includes extraordinary expenses of 0.01% (see Note 9). |
| 3 | Includes interest expense of 0.01%. |
| 4 | Includes interest expense of less than 0.01%. |
See Notes to Financial Statements.
108
| | | | | | | | | | | | | | | | | | | | |
| MICRO CAP VALUE FUND | | Year Ended September 30 | |
| (for a share outstanding throughout each period) | | 2010 | | | 2009 | | | 2008 | | | 2007 | | | 2006 | |
| | | | | | | | | | | | | | | | | | | | |
Net asset value, beginning of period | | $ | 2.11 | | | $ | 1.80 | | | $ | 2.98 | | | $ | 2.93 | | | $ | 2.72 | |
| | | | | |
Income (loss) from investment operations: | | | | | | | | | | | | | | | | | | | | |
Net investment loss | | | (0.02 | ) | | | (0.02 | ) | | | (0.02 | ) | | | (0.03 | ) | | | (0.03 | ) |
Net realized and unrealized gains (losses) on investments | | | 0.30 | | | | 0.33 | | | | (0.75 | ) | | | 0.64 | | | | 0.50 | |
| | | | | | | | | | | | | | | | | | | | |
Total from investment operations | | | 0.28 | | | | 0.31 | | | | (0.77 | ) | | | 0.61 | | | | 0.47 | |
| | | | | |
Redemption fees (see Note 2) | | | — | 1 | | | — | 1 | | | — | 1 | | | — | 1 | | | — | 1 |
| | | | | |
Less distributions: | | | | | | | | | | | | | | | | | | | | |
Dividends from net investment income | | | (0.01 | ) | | | — | | | | — | | | | — | | | | — | |
Distributions from net realized gains | | | — | | | | — | | | | (0.41 | ) | | | (0.56 | ) | | | (0.26 | ) |
| | | | | | | | | | | | | | | | | | | | |
Total distributions | | | (0.01 | ) | | | — | | | | (0.41 | ) | | | (0.56 | ) | | | (0.26 | ) |
| | | | | | | | | | | | | | | | | | | | |
Net asset value, end of period | | $ | 2.38 | | | $ | 2.11 | | | $ | 1.80 | | | $ | 2.98 | | | $ | 2.93 | |
| | | | | | | | | | | | | | | | | | | | |
Total return | | | 13.26% | | | | 17.22% | | | | (29.67)% | | | | 22.84% | | | | 18.89% | |
| | | | | |
Supplemental data and ratios: | | | | | | | | | | | | | | | | | | | | |
Net assets, end of period (in thousands) | | $ | 185,587 | | | $ | 115,216 | | | $ | 97,912 | | | $ | 120,039 | | | $ | 95,508 | |
Ratio of expenses to average net assets (including dividend payments for securities sold short): | | | | | | | | | | | | | | | | | | | | |
Net of waivers and reimbursements | | | 2.26% | 2 | | | 2.26% | | | | 2.25% | | | | 2.25% | | | | 2.25% | |
Before waivers and reimbursements | | | 2.37% | 2 | | | 2.46% | | | | 2.35% | | | | 2.30% | | | | 2.33% | |
Ratio of expenses to average net assets (excluding dividend payments for securities sold short): | | | | | | | | | | | | | | | | | | | | |
Net of waivers and reimbursements | | | 2.26% | 2 | | | 2.25% | | | | 2.25% | | | | 2.25% | | | | 2.25% | |
Before waivers and reimbursements | | | 2.37% | 2 | | | 2.45% | | | | 2.35% | | | | 2.30% | | | | 2.33% | |
Ratio of net investment loss to average net assets: | | | | | | | | | | | | | | | | | | | | |
Net of waivers and reimbursements | | | (1.32)% | | | | (1.36)% | | | | (1.21)% | | | | (1.06)% | | | | (0.99)% | |
Before waivers and reimbursements | | | (1.43)% | | | | (1.56)% | | | | (1.31)% | | | | (1.11)% | | | | (1.07)% | |
Portfolio turnover rate | | | 88% | | | | 145% | | | | 144% | | | | 105% | | | | 95% | |
| |
| SMALL CAP GROWTH FUND | | Year Ended September 30 | |
| (for a share outstanding throughout each period) | | 2010 | | | 2009 | | | 2008 | | | 2007 | | | 2006 | |
Net asset value, beginning of period | | $ | 28.59 | | | $ | 26.50 | | | $ | 40.10 | | | $ | 36.99 | | | $ | 41.23 | |
| | | | | |
Income (loss) from investment operations: | | | | | | | | | | | | | | | | | | | | |
Net investment loss | | | (0.22 | ) | | | (0.12 | ) | | | (0.16 | ) | | | (0.25 | ) | | | (0.26 | ) |
Net realized and unrealized gains (losses) on investments | | | 5.87 | | | | 2.27 | | | | (8.85 | ) | | | 6.28 | | | | 0.84 | |
| | | | | | | | | | | | | | | | | | | | |
Total from investment operations | | | 5.65 | | | | 2.15 | | | | (9.01 | ) | | | 6.03 | | | | 0.58 | |
| | | | | |
Redemption fees (see Note 2) | | | — | 1 | | | — | 1 | | | — | 1 | | | — | 1 | | | — | 1 |
| | | | | |
Less distributions: | | | | | | | | | | | | | | | | | | | | |
Distributions from net realized gains | | | — | | | | (0.06 | ) | | | (4.59 | ) | | | (2.92 | ) | | | (4.82 | ) |
| | | | | | | | | | | | | | | | | | | | |
Total distributions | | | — | | | | (0.06 | ) | | | (4.59 | ) | | | (2.92 | ) | | | (4.82 | ) |
| | | | | | | | | | | | | | | | | | | | |
Net asset value, end of period | | $ | 34.24 | | | $ | 28.59 | | | $ | 26.50 | | | $ | 40.10 | | | $ | 36.99 | |
| | | | | | | | | | | | | | | | | | | | |
Total return | | | 19.76% | | | | 8.20% | | | | (25.42)% | | | | 16.94% | | | | 1.40% | |
| | | | | |
Supplemental data and ratios: | | | | | | | | | | | | | | | | | | | | |
Net assets, end of period (in thousands) | | $ | 1,110,087 | | | $ | 809,318 | | | $ | 735,546 | | | $ | 1,075,433 | | | $ | 1,234,978 | |
Ratio of expenses to average net assets | | | 1.27% | 3 | | | 1.29% | | | | 1.21% | | | | 1.19% | | | | 1.18% | 4 |
Ratio of net investment loss to average net assets: | | | (0.74)% | | | | (0.60)% | | | | (0.47)% | | | | (0.52)% | | | | (0.64)% | |
Portfolio turnover rate | | | 17% | | | | 52% | | | | 51% | | | | 43% | | | | 41% | |
| 1 | Represents amounts less than $.005 per share. |
| 2 | Includes extraordinary expenses of 0.01% (see Note 9). |
| 3 | Includes extraordinary expenses of less than 0.01% (see Note 9). |
| 4 | In 2006, the Fund received a reimbursement of investment advisory fees, which had an impact on the Fund’s expense ratio of less than 0.01%. |
See Notes to Financial Statements.
109
| | |
| WASATCH FUNDS — Financial Highlights (continued) | | |
|
| |
| |
| | | | | | | | | | | | | | | | | | | | |
| SMALL CAP VALUE FUND | | Year Ended September 30 | |
| (for a share outstanding throughout each period) | | 2010 | | | 2009 | | | 2008 | | | 2007 | | | 2006 | |
| | | | | | | | | | | | | | | | | | | | |
Net asset value, beginning of period | | $ | 2.75 | | | $ | 2.82 | | | $ | 5.22 | | | $ | 5.29 | | | $ | 5.67 | |
| | | | | |
Income (loss) from investment operations: | | | | | | | | | | | | | | | | | | | | |
Net investment income (loss) | | | (0.01 | ) | | | (0.01 | ) | | | 0.01 | | | | 0.01 | | | | 0.05 | |
Net realized and unrealized gains (losses) on investments | | | 0.34 | | | | (0.06 | ) | | | (1.11 | ) | | | 0.67 | | | | 0.36 | |
| | | | | | | | | | | | | | | | | | | | |
Total from investment operations | | | 0.33 | | | | (0.07 | ) | | | (1.10 | ) | | | 0.68 | | | | 0.41 | |
| | | | | |
Redemption fees (see Note 2) | | | — | 1 | | | — | 1 | | | — | 1 | | | — | 1 | | | — | 1 |
| | | | | |
Less distributions: | | | | | | | | | | | | | | | | | | | | |
Dividends from net investment income | | | — | | | | — | | | | (0.01 | ) | | | (0.04 | ) | | | (0.07 | ) |
Distributions from net realized gains | | | — | | | | — | | | | (1.29 | ) | | | (0.71 | ) | | | (0.72 | ) |
| | | | | | | | | | | | | | | | | | | | |
Total distributions | | | — | | | | — | | | | (1.30 | ) | | | (0.75 | ) | | | (0.79 | ) |
| | | | | | | | | | | | | | | | | | | | |
Net asset value, end of period | | $ | 3.08 | | | $ | 2.75 | | | $ | 2.82 | | | $ | 5.22 | | | $ | 5.29 | |
| | | | | | | | | | | | | | | | | | | | |
Total return | | | 12.00% | | | | (2.48)% | | | | (26.26)% | | | | 13.32% | | | | 7.88% | |
| | | | | |
Supplemental data and ratios: | | | | | | | | | | | | | | | | | | | | |
Net assets, end of period (in thousands) | | $ | 211,571 | | | $ | 218,358 | | | $ | 336,914 | | | $ | 660,637 | | | $ | 664,625 | |
Ratio of expenses to average net assets | | | 1.85% | 2 | | | 1.92% | | | | 1.76% | | | | 1.69% | | | | 1.68% | |
Ratio of net investment income (loss) to average net assets | | | (0.23)% | | | | (0.33)% | | | | 0.15% | | | | 0.18% | | | | 0.81% | |
Portfolio turnover rate | | | 62% | | | | 89% | | | | 78% | | | | 84% | | | | 40% | |
| |
| STRATEGIC INCOME FUND | | Year or Period Ended September 30 | |
| (for a share outstanding throughout each period) | | 2010 | | | 2009 | | | 2008 | | | 2007 | | | 20063 | |
Net asset value, beginning of period | | $ | 6.77 | | | $ | 7.62 | | | $ | 11.00 | | | $ | 10.48 | | | $ | 10.00 | |
| | | | | |
Income (loss) from investment operations: | | | | | | | | | | | | | | | | | | | | |
Net investment income | | | 0.31 | | | | 0.29 | | | | 0.55 | | | | 0.48 | | | | 0.31 | |
Net realized and unrealized gains (losses) on investments | | | 0.70 | | | | (0.85 | ) | | | (2.29 | ) | | | 0.54 | | | | 0.44 | |
| | | | | | | | | | | | | | | | | | | | |
Total from investment operations | | | 1.01 | | | | (0.56 | ) | | | (1.74 | ) | | | 1.02 | | | | 0.75 | |
| | | | | |
Redemption fees (see Note 2) | | | — | 1 | | | — | 1 | | | — | 1 | | | 0.01 | | | | — | 1 |
| | | | | |
Less distributions: | | | | | | | | | | | | | | | | | | | | |
Dividends from net investment income | | | (0.27 | ) | | | (0.29 | ) | | | (0.50 | ) | | | (0.47 | ) | | | (0.27 | ) |
Distributions from net realized gains | | | — | | | | — | | | | (1.14 | ) | | | (0.04 | ) | | | — | |
| | | | | | | | | | | | | | | | | | | | |
Total distributions | | | (0.27 | ) | | | (0.29 | ) | | | (1.64 | ) | | | (0.51 | ) | | | (0.27 | ) |
| | | | | | | | | | | | | | | | | | | | |
Net asset value, end of period | | $ | 7.51 | | | $ | 6.77 | | | $ | 7.62 | | | $ | 11.00 | | | $ | 10.48 | |
| | | | | | | | | | | | | | | | | | | | |
Total return | | | 15.18% | | | | (6.49)% | | | | (18.17)% | | | | 9.77% | | | | 7.58% | 4 |
| | | | | |
Supplemental data and ratios: | | | | | | | | | | | | | | | | | | | | |
Net assets, end of period (in thousands) | | $ | 19,517 | | | $ | 17,710 | | | $ | 21,889 | | | $ | 23,621 | | | $ | 12,732 | |
Ratio of expenses to average net assets (including interest expense and dividend payments for securities sold short): | | | | | | | | | | | | | | | | | | | | |
Net of waivers and reimbursements | | | 0.99% | 5 | | | 1.05% | | | | 0.97% | | | | 1.05% | | | | 0.95% | 6 |
Before waivers and reimbursements | | | 1.33% | 5 | | | 1.71% | | | | 1.46% | | | | 1.57% | | | | 2.66% | 6 |
Ratio of expenses to average net assets (excluding interest expense and dividend payments for securities sold short): | | | | | | | | | | | | | | | | | | | | |
Net of waivers and reimbursements | | | 0.95% | 5 | | | 0.95% | | | | 0.95% | | | | 0.95% | | | | 0.95% | 6 |
Before waivers and reimbursements | | | 1.29% | 5 | | | 1.61% | | | | 1.44% | | | | 1.47% | | | | 2.66% | 6 |
Ratio of net investment income to average net assets: | | | | | | | | | | | | | | | | | | | | |
Net of waivers and reimbursements | | | 4.35% | | | | 4.93% | | | | 5.96% | | | | 4.14% | | | | 5.40% | 6 |
Before waivers and reimbursements | | | 4.01% | | | | 4.27% | | | | 5.47% | | | | 3.62% | | | | 3.69% | 6 |
Portfolio turnover rate | | | 73% | | | | 84% | | | | 81% | | | | 86% | | | | 14% | 4 |
| 1 | Represents amounts less than $.005 per share. |
| 2 | Includes extraordinary expenses of 0.01% (see Note 9). |
| 3 | Fund inception date was February 1, 2006. |
| 4 | Not annualized for periods less than one year. |
| 5 | Includes extraordinary expenses of less than 0.01% (see Note 9). |
See Notes to Financial Statements.
110
| | | | | | | | | | | | | | | | | | | | | | | | |
| ULTRA GROWTH FUND | | Year Ended September 30 | | | | |
| (for a share outstanding throughout each period) | | 2010 | | | 2009 | | | 2008 | | | 2007 | | | 2006 | | | | |
| | | | | | | | | | | | | | | | | | | | | | | | |
Net asset value, beginning of period | | $ | 15.66 | | | $ | 15.76 | | | $ | 27.78 | | | $ | 24.09 | | | $ | 27.98 | | | | | |
| | | | | | |
Income (loss) from investment operations: | | | | | | | | | | | | | | | | | | | | | | | | |
Net investment loss | | | (0.15 | ) | | | (0.14 | ) | | | (0.22 | ) | | | (0.33 | ) | | | (0.34 | ) | | | | |
Net realized and unrealized gains (losses) on investments | | | 4.29 | | | | 0.04 | | | | (8.28 | ) | | | 5.80 | | | | 0.23 | | | | | |
Net increase from payment by affiliate | | | — | | | | — | | | | — | | | | — | | | | — | 1 | | | | |
| | | | | | | | | | | | | | | | | | | | | | | | |
Total from investment operations | | | 4.14 | | | | (0.10 | ) | | | (8.50 | ) | | | 5.47 | | | | (0.11 | ) | | | | |
| | | | | | |
Redemption fees (see Note 2) | | | — | 1 | | | — | 1 | | | — | 1 | | | — | 1 | | | — | 1 | | | | |
| | | | | | |
Less distributions: | | | | | | | | | | | | | | | | | | | | | | | | |
Distributions from net realized gains | | | — | | | | — | | | | (3.52 | ) | | | (1.78 | ) | | | (3.78 | ) | | | | |
| | | | | | | | | | | | | | | | | | | | | | | | |
Total distributions | | | — | | | | — | | | | (3.52 | ) | | | (1.78 | ) | | | (3.78 | ) | | | | |
| | | | | | | | | | | | | | | | | | | | | | | | |
Net asset value, end of period | | $ | 19.80 | | | $ | 15.66 | | | $ | 15.76 | | | $ | 27.78 | | | $ | 24.09 | | | | | |
| | | | | | | | | | | | | | | | | | | | | | | | |
Total return | | | 26.44% | | | | (0.63)% | | | | (35.09)% | | | | 23.80% | | | | (0.48)% | | | | | |
| | | | | | |
Supplemental data and ratios: | | | | | | | | | | | | | | | | | | | | | | | | |
Net assets, end of period (in thousands) | | $ | 178,566 | | | $ | 121,284 | | | $ | 144,004 | | | $ | 268,633 | | | $ | 306,406 | | | | | |
Ratio of expenses to average net assets: | | | | | | | | | | | | | | | | | | | | | | | | |
Net of waivers and reimbursements | | | 1.68% | 2 | | | 1.75% | | | | 1.53% | | | | 1.49% | | | | 1.48% | 3 | | | | |
Before waivers and reimbursements | | | 1.68% | 2 | | | 1.77% | | | | 1.53% | | | | 1.49% | | | | 1.48% | | | | | |
Ratio of net investment loss to average net assets: | | | | | | | | | | | | | | | | | | | | | | | | |
Net of waivers and reimbursements | | | (1.14)% | | | | (1.12)% | | | | (0.93)% | | | | (1.12)% | | | | (1.19)% | | | | | |
Before waivers and reimbursements | | | (1.14)% | | | | (1.14)% | | | | (0.93)% | | | | (1.12)% | | | | (1.19)% | | | | | |
Portfolio turnover rate | | | 45% | | | | 64% | | | | 84% | | | | 55% | | | | 76% | | | | | |
| | | |
WASATCH-1ST SOURCE
INCOME EQUITY FUND | | Year Ended September 30 | | | Period Ended
September 30 | | | Year Ended March 31 | |
| (for a share outstanding throughout each period) | | 2010 | | | 2009 | | | 20084 | | | 2008 | | | 2007 | | | 2006 | |
Net asset value, beginning of period | | $ | 11.97 | | | $ | 12.93 | | | $ | 14.44 | | | $ | 14.80 | | | $ | 14.14 | | | $ | 13.61 | |
| | | | | | |
Income (loss) from investment operations: | | | | | | | | | | | | | | | | | | | | | | | | |
Net investment income | | | 0.17 | | | | 0.20 | | | | 0.14 | 5 | | | 0.21 | | | | 0.22 | | | | 0.17 | |
Net realized and unrealized gains (losses) on investments | | | 0.67 | | | | (0.96 | ) | | | (1.52 | ) | | | 0.31 | | | | 1.66 | | | | 2.10 | |
| | | | | | | | | | | | | | | | | | | | | | | | |
Total from investment operations | | | 0.84 | | | | (0.76 | ) | | | (1.38 | ) | | | 0.52 | | | | 1.88 | | | | 2.27 | |
| | | | | | |
Redemption fees (see Note 2) | | | — | 1 | | | — | 1 | | | — | | | | — | | | | — | | | | — | |
| | | | | | |
Less distributions: | | | | | | | | | | | | | | | | | | | | | | | | |
Dividends from net investment income | | | (0.17 | ) | | | (0.20 | ) | | | (0.13 | ) | | | (0.21 | ) | | | (0.21 | ) | | | (0.18 | ) |
Distributions from net realized gains | | | — | | | | — | | | | — | | | | (0.67 | ) | | | (1.01 | ) | | | (1.56 | ) |
| | | | | | | | | | | | | | | | | | | | | | | | |
Total distributions | | | (0.17 | ) | | | (0.20 | ) | | | (0.13 | ) | | | (0.88 | ) | | | (1.22 | ) | | | (1.74 | ) |
| | | | | | | | | | | | | | | | | | | | | | | | |
Net asset value, end of period | | $ | 12.64 | | | $ | 11.97 | | | $ | 12.93 | | | $ | 14.44 | | | $ | 14.80 | | | $ | 14.14 | |
| | | | | | | | | | | | | | | | | | | | | | | | |
Total return | | | 7.07% | | | | (5.63)% | | | | (9.65)%6 | | | | 3.22% | | | | 13.69% | | | | 17.72% | |
| | | | | | |
Supplemental data and ratios: | | | | | | | | | | | | | | | | | | | | | | | | |
Net assets, end of period (in thousands) | | $ | 1,621,113 | | | $ | 1,385,508 | | | $ | 780,384 | | | $ | 447,674 | | | $ | 167,133 | | | $ | 129,508 | |
Ratio of expenses to average net assets: | | | | | | | | | | | | | | | | | | | | | | | | |
Net of waivers and reimbursements | | | 1.11% | 2 | | | 1.10% | | | | 1.04% | 7 | | | 1.13% | | | | 1.15% | | | | 1.19% | |
Before waivers and reimbursements | | | 1.14% | 2 | | | 1.22% | | | | 1.29% | 7 | | | 1.38% | | | | 1.40% | | | | 1.45% | |
Ratio of net investment income to average net assets: | | | | | | | | | | | | | | | | | | | | | | | | |
Net of waivers and reimbursements | | | 1.36% | | | | 1.93% | | | | 1.99% | 7 | | | 1.43% | | | | 1.52% | | | | 1.25% | |
Before waivers and reimbursements | | | 1.33% | | | | 1.81% | | | | 1.74% | 7 | | | 1.18% | | | | 1.27% | | | | 0.99% | |
Portfolio turnover rate | | | 17% | | | | 16% | | | | 5% | 6 | | | 36% | | | | 26% | | | | 37% | |
| 1 | Represents amounts less than $.005 per share. |
| 2 | Includes extraordinary expenses of 0.01% (see Note 9). |
| 3 | In 2006, the Fund received a reimbursement of investment advisory fees, which had an impact on the Fund’s expense ratio of less than 0.01%. |
| 4 | Effective September 19, 2008, the Fund changed its fiscal year end to September 30. |
| 5 | Average shares method used in calculation. |
| 6 | Not annualized for periods less than one year. |
See Notes to Financial Statements.
111
| | |
| WASATCH FUNDS — Financial Highlights (continued) | | |
|
| |
| |
| | | | | | | | | | | | | | | | | | | | | | | | |
WASATCH-1ST SOURCE
LONG/SHORT FUND | | Year Ended September 30 | | | Period Ended
September 30 | | | Year Ended March 31 | |
| (for a share outstanding throughout each period) | | 2010 | | | 2009 | | | 20081 | | | 2008 | | | 2007 | | | 2006 | |
| | | | | | | | | | | | | | | | | | | | | | | | |
Net asset value, beginning of period | | $ | 11.13 | | | $ | 10.81 | | | $ | 11.27 | | | $ | 11.59 | | | $ | 11.21 | | | $ | 10.69 | |
| | | | | | |
Income (loss) from investment operations: | | | | | | | | | | | | | | | | | | | | | | | | |
Net investment income (loss) | | | (0.01 | ) | | | 0.02 | | | | 0.05 | 2 | | | 0.27 | | | | 0.26 | | | | 0.21 | |
Net realized and unrealized gains (losses) on investments | | | 0.62 | | | | 0.50 | | | | (0.46 | ) | | | 0.02 | | | | 0.90 | | | | 0.71 | |
| | | | | | | | | | | | | | | | | | | | | | | | |
Total from investment operations | | | 0.61 | | | | 0.52 | | | | (0.41 | ) | | | 0.29 | | | | 1.16 | | | | 0.92 | |
| | | | | | |
Redemption fees (see Note 2) | | | — | 3 | | | — | 3 | | | — | | | | — | | | | — | | | | — | |
| | | | | | |
Less distributions: | | | | | | | | | | | | | | | | | | | | | | | | |
Dividends from net investment income | | | — | 3 | | | (0.05 | ) | | | (0.05 | ) | | | (0.28 | ) | | | (0.28 | ) | | | (0.20 | ) |
Distributions from net realized gains | | | — | | | | (0.15 | ) | | | — | | | | (0.33 | ) | | | (0.50 | ) | | | (0.20 | ) |
| | | | | | | | | | | | | | | | | | | | | | | | |
Total distributions | | | — | 3 | | | (0.20 | ) | | | (0.05 | ) | | | (0.61 | ) | | | (0.78 | ) | | | (0.40 | ) |
| | | | | | | | | | | | | | | | | | | | | | | | |
Net asset value, end of period | | $ | 11.74 | | | $ | 11.13 | | | $ | 10.81 | | | $ | 11.27 | | | $ | 11.59 | | | $ | 11.21 | |
| | | | | | | | | | | | | | | | | | | | | | | | |
Total return | | | 5.52% | | | | 5.35% | | | | (3.66)% | 4 | | | 2.34% | | | | 10.44% | | | | 8.80% | |
| | | | | | |
Supplemental data and ratios: | | | | | | | | | | | | | | | | | | | | | | | | |
Net assets, end of period (in thousands) | | $ | 300,255 | | | $ | 146,127 | | | $ | 122,114 | | | $ | 87,410 | | | $ | 53,894 | | | $ | 29,831 | |
Ratio of expenses to average net assets (including interest | | | | | | | | | | | | | | | | | | | | | | | | |
expense and dividend payments for securities sold short): | | | | | | | | | | | | | | | | | | | | | | | | |
Net of waivers and reimbursements | | | 1.71% | 5 | | | 1.91% | | | | 1.77% | 6 | | | 1.75% | | | | 1.84% | | | | 1.72% | |
Before waivers and reimbursements | | | 1.71% | 5 | | | 1.96% | | | | 2.02% | 6 | | | 2.00% | | | | 2.09% | | | | 1.98% | |
Ratio of expenses to average net assets (excluding interest | | | | | | | | | | | | | | | | | | | | | | | | |
expense and dividend payments for securities sold short): | | | | | | | | | | | | | | | | | | | | | | | | |
Net of waivers and reimbursements | | | 1.34% | 5 | | | 1.47% | | | | 1.46% | 6 | | | 1.57% | | | | 1.56% | | | | 1.63% | |
Before waivers and reimbursements | | | 1.34% | 5 | | | 1.52% | | | | 1.71% | 6 | | | 1.82% | | | | 1.81% | | | | 1.89% | |
Ratio of net investment income to average net assets: | | | | | | | | | | | | | | | | | | | | | | | | |
Net of waivers and reimbursements | | | 0.03% | | | | 0.24% | | | | 0.95% | 6 | | | 2.25% | | | | 2.40% | | | | 1.98% | |
Before waivers and reimbursements | | | 0.03% | | | | 0.19% | | | | 0.70% | 6 | | | 2.00% | | | | 2.15% | | | | 1.72% | |
Portfolio turnover rate | | | 60% | | | | 167% | | | | 71% | 4 | | | 179% | | | | 172% | | | | 123% | |
| | |
| U.S. TREASURY FUND | | Year Ended September 30 | | | | |
| (for a share outstanding throughout each period) | | 2010 | | | 2009 | | | 2008 | | | 2007 | | | 2006 | | | | |
Net asset value, beginning of period | | $ | 16.29 | | | $ | 14.95 | | | $ | 13.84 | | | $ | 14.12 | | | $ | 14.68 | | | | | |
| | | | | | |
Income (loss) from investment operations: | | | | | | | | | | | | | | | | | | | | | | | | |
Net investment income | | | 0.54 | | | | 0.55 | | | | 0.58 | | | | 0.64 | | | | 0.39 | | | | | |
Net realized and unrealized gains (losses) on investments | | | 1.35 | | | | 1.29 | | | | 1.10 | | | | (0.29 | ) | | | (0.24 | ) | | | | |
| | | | | | | | | | | | | | | | | | | | | | | | |
Total from investment operations | | | 1.89 | | | | 1.84 | | | | 1.68 | | | | 0.35 | | | | 0.15 | | | | | |
| | | | | | |
Redemption fees (see Note 2) | | | 0.01 | | | | 0.05 | | | | 0.01 | | | | 0.01 | | | | 0.01 | | | | | |
| | | | | | |
Less distributions: | | | | | | | | | | | | | | | | | | | | | | | | |
Dividends from net investment income | | | (0.54 | ) | | | (0.55 | ) | | | (0.58 | ) | | | (0.64 | ) | | | (0.72 | ) | | | | |
Distributions from net realized gains | | | (0.48 | ) | | | — | | | | — | | | | — | | | | — | | | | | |
| | | | | | | | | | | | | | | | | | | | | | | | |
Total distributions | | | (1.02 | ) | | | (0.55 | ) | | | (0.58 | ) | | | (0.64 | ) | | | (0.72 | ) | | | | |
| | | | | | | | | | | | | | | | | | | | | | | | |
Net asset value, end of period | | $ | 17.17 | | | $ | 16.29 | | | $ | 14.95 | | | $ | 13.84 | | | $ | 14.12 | | | | | |
| | | | | | | | | | | | | | | | | | | | | | | | |
Total return | | | 12.65% | | | | 12.49% | | | | 12.33% | | | | 2.68% | | | | 1.21% | | | | | |
| | | | | | |
Supplemental data and ratios: | | | | | | | | | | | | | | | | | | | | | | | | |
Net assets, end of period (in thousands) | | $ | 200,855 | | | $ | 154,099 | | | $ | 121,240 | | | $ | 115,788 | | | $ | 204,994 | | | | | |
Ratio of expenses to average net assets: | | | | | | | | | | | | | | | | | | | | | | | | |
Net of waivers and reimbursements | | | 0.75% | 5 | | | 0.75% | | | | 0.74% | | | | 0.71% | | | | 0.72% | | | | | |
Before waivers and reimbursements | | | 0.78% | 5 | | | 0.79% | | | | 0.74% | | | | 0.71% | | | | 0.72% | | | | | |
Ratio of net investment income to average net assets: | | | | | | | | | | | | | | | | | | | | | | | | |
Net of waivers and reimbursements | | | 3.56% | | | | 3.34% | | | | 3.85% | | | | 4.23% | | | | 4.21% | | | | | |
Before waivers and reimbursements | | | 3.53% | | | | 3.30% | | | | 3.85% | | | | 4.23% | | | | 4.21% | | | | | |
Portfolio turnover rate | | | 49% | | | | 62% | | | | 31% | | | | 19% | | | | 2% | | | | | |
| 1 | Effective September 19, 2008, the Fund changed its fiscal year end to September 30. |
| 2 | Average shares method used in calculation. |
| 3 | Represents amounts less than $.005 per share. |
| 4 | Not annualized for periods less than one year. |
| 5 | Includes extraordinary expenses of less than 0.01% (see Note 9). |
See Notes to Financial Statements.
112
| | | | | | | | | | | | | | | | | | | | | | | | |
WASATCH-1ST SOURCE
INCOME FUND | | Year Ended September 30 | | | Period Ended
September 30 | | | Year Ended March 31 | |
| (for a share outstanding throughout each period) | | 2010 | | | 2009 | | | 20081 | | | 2008 | | | 2007 | | | 2006 | |
| | | | | | | | | | | | | | | | | | | | | | | | |
Net asset value, beginning of period | | $ | 10.04 | | | $ | 9.59 | | | $ | 9.95 | | | $ | 9.73 | | | $ | 9.63 | | | $ | 9.88 | |
| | | | | | |
Income (loss) from investment operations: | | | | | | | | | | | | | | | | | | | | | | | | |
Net investment income | | | 0.29 | | | | 0.33 | | | | 0.18 | 2 | | | 0.40 | | | | 0.38 | | | | 0.33 | |
Net realized and unrealized gains (losses) on investments | | | 0.30 | | | | 0.46 | | | | (0.35 | ) | | | 0.24 | | | | 0.13 | | | | (0.18 | ) |
| | | | | | | | | | | | | | | | | | | | | | | | |
Total from investment operations | | | 0.59 | | | | 0.79 | | | | (0.17 | ) | | | 0.64 | | | | 0.51 | | | | 0.15 | |
| | | | | | |
Redemption fees (see Note 2) | | | — | 3 | | | — | 3 | | | — | | | | — | | | | — | | | | — | |
| | | | | | |
Less distributions: | | | | | | | | | | | | | | | | | | | | | | | | |
Dividends from net investment income | | | (0.29 | ) | | | (0.34 | ) | | | (0.19 | ) | | | (0.42 | ) | | | (0.41 | ) | | | (0.40 | ) |
| | | | | | | | | | | | | | | | | | | | | | | | |
Total distributions | | | (0.29 | ) | | | (0.34 | ) | | | (0.19 | ) | | | (0.42 | ) | | | (0.41 | ) | | | (0.40 | ) |
| | | | | | | | | | | | | | | | | | | | | | | | |
Net asset value, end of period | | $ | 10.34 | | | $ | 10.04 | | | $ | 9.59 | | | $ | 9.95 | | | $ | 9.73 | | | $ | 9.63 | |
| | | | | | | | | | | | | | | | | | | | | | | | |
Total return | | | 5.95% | | | | 8.42% | | | | (1.69)% | 4 | | | 6.74% | | | | 5.43% | | | | 1.52% | |
| | | | | | |
Supplemental data and ratios: | | | | | | | | | | | | | | | | | | | | | | | | |
Net assets, end of period (in thousands) | | $ | 138,095 | | | $ | 114,496 | | | $ | 89,081 | | | $ | 86,981 | | | $ | 78,921 | | | $ | 72,874 | |
Ratio of expenses to average net assets: | | | | | | | | | | | | | | | | | | | | | | | | |
Net of waivers and reimbursements | | | 0.72% | 5 | | | 0.84% | | | | 0.87% | 6 | | | 0.95% | | | | 0.92% | | | | 0.95% | |
Before waivers and reimbursements | | | 0.73% | 5 | | | 0.88% | | | | 1.12% | 6 | | | 1.20% | | | | 1.17% | | | | 1.21% | |
Ratio of net investment income to average net assets: | | | | | | | | | | | | | | | | | | | | | | | | |
Net of waivers and reimbursements | | | 2.87% | | | | 3.44% | | | | 3.66% | 6 | | | 4.05% | | | | 3.95% | | | | 3.36% | |
Before waivers and reimbursements | | | 2.86% | | | | 3.40% | | | | 3.41% | 6 | | | 3.80% | | | | 3.70% | | | | 3.10% | |
Portfolio turnover rate | | | 51% | | | | 28% | | | | 15% | 4 | | | 56% | | | | 59% | | | | 70% | |
| 1 | Effective September 19, 2008, the Fund changed its fiscal year end to September 30. |
| 2 | Average shares method used in calculation. |
| 3 | Represents amounts less than $.005 per share. |
| 4 | Not annualized for periods less than one year. |
| 5 | Includes extraordinary expenses of less than 0.01% (see Note 9). |
See Notes to Financial Statements.
113
| | |
| WASATCH FUNDS — Notes to Financial Statements | | |
|
| |
| |
1. ORGANIZATION
Wasatch Funds Trust is a Massachusetts Business Trust (formerly Wasatch Funds, Inc., a Minnesota corporation) registered under the Investment Company Act of 1940, as amended (the “1940 Act”), as an open-end management investment company and consists of 17 series or “funds” (each a “Fund” and collectively the “Funds”). The Core Growth Fund, Global Science & Technology Fund, Heritage Growth Fund, International Growth Fund, International Opportunities Fund, Micro Cap Fund, Micro Cap Value Fund, Small Cap Growth Fund, Small Cap Value Fund, Strategic Income Fund, Ultra Growth Fund, Wasatch-1st Source Income Equity Fund, Wasatch-Hoisington U.S. Treasury Fund (“U.S. Treasury Fund”) (sub-advised), and Wasatch-1st Source Income Fund (sub-advised) are each diversified funds. The Emerging Markets Small Cap Fund, Global Opportunities Fund, and Wasatch-1st Source Long/Short Fund are each non-diversified funds. Each Fund maintains its own investment objective. The Funds have entered into an investment advisory agreement with Wasatch Advisors, Inc. (the “Advisor” or “Wasatch”) as investment advisor.
The Core Growth Fund, Emerging Markets Small Cap Fund, Global Opportunities Fund, Global Science & Technology Fund, Heritage Growth Fund, International Growth Fund, International Opportunities Fund, Micro Cap Fund, Micro Cap Value Fund, Small Cap Growth Fund, Small Cap Value Fund, Strategic Income Fund, Ultra Growth Fund, Wasatch-1st Source Income Equity Fund, and Wasatch-1st Source Long/Short Fund are referred to herein as the “Equity Funds.”
1st Source Corporation Investment Advisors, Inc. (“1st Source”) signed an asset purchase agreement with Wasatch relating to the acquisition by Wasatch of certain 1st Source mutual fund advisor business assets related to its management of the 1st Source Monogram Income Fund, the 1st Source Monogram Income Equity Fund and the 1st Source Monogram Long/Short Fund.
At a Special Meeting of the Shareholders of the 1st Source Monogram Income Fund, a series of The Coventry Group, held on December 11, 2008, the shareholders of 1st Source Monogram Income Fund approved the acquisition of all of the assets of the 1st Source Monogram Income Fund by the Wasatch-1st Source Income Fund in exchange for shares of the Wasatch-1st Source Income Fund and the assumption of all liabilities of the 1st Source Monogram Income Fund by the Wasatch-1st Source Income Fund and the subsequent liquidation and dissolution of the 1st Source Monogram Income Fund.
At a Special Meeting of the Shareholders of the 1st Source Monogram Income Equity Fund, a series of The Coventry Group, held on December 11, 2008, the shareholders of 1st Source Monogram Income Equity Fund approved the acquisition of all of the assets of the 1st Source Monogram Income Equity Fund by the Wasatch-1st Source Income Equity Fund in exchange for shares of the Wasatch-1st Source Income Equity Fund and the assumption of all liabilities of the 1st Source Monogram Income Equity Fund
by the Wasatch-1st Source Income Equity Fund and the subsequent liquidation and dissolution of the 1st Source Monogram Income Equity Fund.
At a Special Meeting of the Shareholders of the 1st Source Monogram Long/Short Fund, a series of The Coventry Group, held on December 11, 2008, the shareholders of 1st Source Monogram Long/Short Fund approved the acquisition of all of the assets of the 1st Source Monogram Long/Short Fund by the Wasatch-1st Source Long/Short Fund in exchange for shares of the Wasatch-1st Source Long/Short Fund and the assumption of all liabilities of the 1st Source Monogram Long/Short Fund by the Wasatch-1st Source Long/Short Fund and the subsequent liquidation and dissolution of the 1st Source Monogram Long/Short Fund.
2. SIGNIFICANT ACCOUNTING POLICIES
The following is a summary of significant policies related to investments of the Funds held at September 30, 2010. These policies are in conformity with accounting principles generally accepted in the United States of America (“U.S. GAAP”).
Valuation of Securities — All investments in securities are recorded at their estimated fair value as described in Note 15.
Foreign Currency Translations — Values of investments denominated in foreign currencies are converted into U.S. dollars using the current exchange rates each business day. Purchases and sales of investments and dividend income are translated into U.S. dollars using the current prevailing exchange rate on the transaction date. The effect of changes in foreign exchange rates on realized and unrealized gains or losses on securities is reflected as a component of such gains or losses in the Statements of Operations. Transactions in foreign denominated assets may involve greater risks than domestic transactions.
At September 30, 2010, the foreign currencies held by the Funds were as follows (amounts in U.S. dollars):
| | | | | | | | |
| | | Cost of
Currency | | | Value of
Currency | |
Core Growth Fund | | | | | | | | |
South Korean Won | | $ | 27 | | | $ | 30 | |
|
| | |
Emerging Markets Small Cap Fund | | | | | | | | |
Brazilian Real | | $ | 23,457 | | | $ | 24,586 | |
Egyptian Pound | | | 5 | | | | 5 | |
Indian Rupee | | | 171,598 | | | | 171,598 | |
Malaysian Ringgit | | | 22,292 | | | | 22,292 | |
Moroccan Dirham | | | 6 | | | | 6 | |
New Taiwan Dollar | | | 1,225,501 | | | | 1,242,310 | |
South Korean Won | | | 2 | | | | 2 | |
| | | | | | | | |
| | $ | 1,442,861 | | | $ | 1,460,799 | |
| | | | | | | | |
|
| | |
Global Opportunities Fund | | | | | | | | |
Brazilian Real | | $ | 20,238 | | | $ | 20,238 | |
British Pound | | | 5,695 | | | | 5,686 | |
Canadian Dollar | | | 772 | | | | 771 | |
Egyptian Pound | | | 1 | | | | 1 | |
Japanese Yen | | | 2,705 | | | | 2,707 | |
Malaysian Ringgit | | | 4,498 | | | | 4,495 | |
New Taiwan Dollar | | | 206,095 | | | | 206,785 | |
South Korean Won | | | 2 | | | | 2 | |
| | | | | | | | |
| | $ | 240,006 | | | $ | 240,685 | |
| | | | | | | | |
114
| | | | | | | | |
| | | Cost of
Currency | | | Value of
Currency | |
Global Science & Technology Fund | | | | | | | | |
Brazilian Real | | $ | 21,742 | | | $ | 21,742 | |
British Pound | | | 6,027 | | | | 5,986 | |
| | | | | | | | |
| | $ | 27,769 | | | $ | 27,728 | |
| | | | | | | | |
|
| | |
Heritage Growth Fund | | | | | | | | |
Brazilian Real | | $ | 145,423 | | | $ | 152,680 | |
|
| | |
International Growth Fund | | | | | | | | |
Brazilian Real | | $ | 23,063 | | | $ | 23,161 | |
British Pound | | | 38,337 | | | | 38,082 | |
Egyptian Pound | | | 9 | | | | 9 | |
New Taiwan Dollar | | | 46,652 | | | | 47,267 | |
South Korean Won | | | 17 | | | | 18 | |
| | | | | | | | |
| | $ | 108,078 | | | $ | 108,537 | |
| | | | | | | | |
|
| | |
International Opportunities Fund | | | | | | | | |
Brazilian Real | | $ | 1,363,693 | | | $ | 1,434,068 | |
Canadian Dollar | | | 3,717 | | | | 3,714 | |
Egyptian Pound | | | 2 | | | | 2 | |
Indian Rupee | | | 575,759 | | | | 575,759 | |
New Taiwan Dollar | | | 34,145 | | | | 34,892 | |
South Korean Won | | | 22 | | | | 22 | |
| | | | | | | | |
| | $ | 1,977,338 | | | $ | 2,048,457 | |
| | | | | | | | |
|
| | |
Micro Cap Fund | | | | | | | | |
South Korean Won | | $ | 11 | | | $ | 11 | |
|
| | |
Micro Cap Value Fund | | | | | | | | |
Indian Rupee | | $ | 6,644 | | | $ | 6,676 | |
South Korean Won | | | 7 | | | | 8 | |
| | | | | | | | |
| | $ | 6,651 | | | $ | 6,684 | |
| | | | | | | | |
|
| | |
Strategic Income Fund | | | | | | | | |
Brazilian Real | | $ | 8,820 | | | $ | 8,820 | |
Canadian Dollar | | | 668 | | | | 668 | |
Hong Kong Dollar | | | 2 | | | | 2 | |
| | | | | | | | |
| | $ | 9,490 | | | $ | 9,490 | |
| | | | | | | | |
Investment in Securities and Related Investment Income — Security transactions are accounted for on the trade date for financial reporting purposes. Gains or losses on securities sold are determined on the identified cost basis. Dividend income and distributions to shareholders are recorded on the ex-dividend date except that certain dividends from foreign securities may be recorded after the ex-dividend date based on when the Fund is informed of the dividend. Interest income and estimated expenses are accrued daily. Bond discount and premiums are amortized using the interest method. To the extent dividends received from Real Estate Investment Trust securities include return of capital distributions; such distributions are recorded as income, and adjusted accordingly for tax purposes.
Federal Income Taxes — It is each Fund’s policy to comply with the requirements of the Internal Revenue Code applicable to regulated investment companies and to distribute substantially all taxable income to shareholders. The Funds are no longer subject to examination by tax authorities for years prior to 2007. At this time, management believes there are no uncertain tax positions which, based on their technical merit, would not be sustained upon
examination and for which it is reasonably possible that the total of amounts of unrecognized tax benefits will significantly change in the next 12 months. Accordingly, no provision for federal income or excise taxes has been made.
Expenses — The Funds contract for various services on a collective basis. Most expenses are directly attributable to each Fund and therefore are charged accordingly. Expenses that are not directly attributable to one or more Funds are allocated among applicable Funds on an equitable and consistent basis considering such things as the nature and type of expense and the relative net assets of the Funds.
Use of Management Estimates — The preparation of financial statements in conformity with U.S. GAAP requires management to make estimates and assumptions that affect the reported amounts of assets and liabilities at the date of the financial statements and the reported changes in net assets during the reporting period. Actual results could differ from those estimates.
Guarantees and Indemnifications — In the normal course of business, the Funds enter into contracts that contain a variety of representations and warranties which provide general indemnifications. The maximum exposure under these arrangements is unknown, as this would involve future claims that may be made against the Funds and/or its affiliates that have not yet occurred. Based on experience, however, the risk of loss is expected to be remote.
Redemption Fees — The Funds deduct a fee of 2.00% from redemption proceeds on shares of the Funds held 60 days or less. Redemption fees retained by the Funds are credited to additional paid-in capital.
3. SECURITIESAND OTHER INVESTMENTS
Repurchase Agreements — The Funds may engage in repurchase transactions. Under the terms of a typical repurchase agreement, a fund takes possession of an underlying debt obligation subject to an obligation of the seller to repurchase and the fund to resell the obligation at an agreed upon price and time. The market value of the collateral must be at least equal at all times to the total amount of the repurchase obligation, including interest. Generally, in the event of counterparty default, the fund has the right to use the collateral to offset losses incurred.
Short Sales — The Wasatch-1st Source Long/Short Fund, the Strategic Income Fund and to a lesser extent the other Equity Funds may enter into short sales whereby a fund sells a security it generally does not own (the security is borrowed), in anticipation of a decline in the security’s price. The initial amount of a short sale is recorded as a liability which is marked-to-market daily. Fluctuations in the value of the short liability are recorded as unrealized gains or losses. If a Fund shorts a security when also holding a long position in the security (a “short against the box”), as the security’s price declines, the short position increases in value, offsetting the long position’s decrease in value. The opposite effect occurs if the security’s price rises. A Fund realizes a gain or loss upon closing of the short sale (returning the security to the counterparty by way of purchase or delivery of a long position owned). Possible losses from short sales may be unlimited, whereas losses from purchases cannot exceed the total amount invested. The
115
| | |
| WASATCH FUNDS — Notes to Financial Statements (continued) | | |
|
| |
| |
Funds are liable to the buyer for any dividends payable on securities while those securities are in a short position. These dividends are an expense of the Funds. The Funds designate collateral consisting of cash, U.S. government securities or other liquid assets sufficient to collateralize the market value of short positions.
4. FINANCIAL DERIVATIVE INSTRUMENTS
Foreign Currency Contracts — The Funds may enter into foreign currency contracts to settle planned purchases or sales of securities or to protect against a possible loss resulting from the adverse change in the relationship between the U.S. dollar and a foreign currency involved in an underlying transaction. Foreign currency contracts are agreements between two parties to buy and sell a currency at a set price on a future date. The market value of a foreign currency contract fluctuates with changes in currency exchange rates. Foreign currency contracts are marked-to-market daily and the change in market value is recorded by a Fund as unrealized appreciation or depreciation. When a foreign currency contract is closed, the Fund records a realized gain or loss equal to the difference between the value at the time it was opened and the value at the time it was closed. These contracts may involve market risk in excess of the unrealized gain or loss reflected on the Statements of Assets and Liabilities. In addition, a Fund could be exposed to a credit risk if a counterparty is unable or unwilling to meet the terms of the contracts or if the value of the currency changes unfavorably. In connection with these contracts, the Funds may segregate cash and/or securities in a sufficient amount as collateral in accordance with the terms of the respective contracts.
Options Transactions — The Equity Funds and the Wasatch-1st Source Income Fund may buy and sell put and call options, write covered put and call options, including over-the-counter options, on portfolio securities where the completion of the obligation is dependent upon the credit standing of another party. Options are a type of derivative financial instrument. The Funds may invest in derivative financial instruments, including options, in order to manage risk or gain exposure to various other investments or
markets. The risk in writing a call option is that a Fund gives up the opportunity for profit if the market price of the security increases. The risk in writing a put option is that a Fund may incur a loss if the market price of the security decreases and the option is exercised. The risk in buying an option is that a Fund pays a premium whether or not the option is exercised. A Fund also has the additional risk of not being able to enter into a closing transaction if a liquid secondary market does not exist. Option contracts are valued daily and unrealized appreciation or depreciation is recorded. A Fund will realize a gain or loss upon expiration or closing of the option transaction. When an option is exercised, the proceeds on sales for a written call option, the purchase cost for a written put option, or the cost of a security for a purchased put or call option is adjusted by the amount of premium received or paid. The Funds designate collateral consisting of cash, U.S. government securities or other liquid assets sufficient to collateralize the market value of written options.
5. DISTRIBUTIONS
Dividends from net investment income and net realized gains, if any, are declared and paid at least annually for all Funds, except for dividends from net investment income in five funds. The Wasatch-1st Source Income Fund declares and pays dividends monthly. The Strategic Income, Wasatch-1st Source Income Equity, Wasatch-1st Source Long/Short, and U.S. Treasury Funds declare and pay dividends quarterly. The amount of dividends and distributions from net investment income and net realized gains are determined in accordance with federal income tax regulations, which may differ from GAAP. The Funds may utilize earnings and profits distributed to shareholders on redemption of shares as part of the dividends paid deduction (tax equalization).
To the extent these book and tax differences are permanent in nature, such amounts are reclassified at the end of the fiscal year among additional paid-in capital, undistributed net investment income (loss), and undistributed net realized gains (losses) on investments and foreign currency translations.
Accordingly, at September 30, 2010, reclassifications were recorded as follows:
| | | | | | | | | | | | | | | | | | | | | | | | |
| | | Core
Growth
Fund | | | Emerging
Markets
Small Cap
Fund | | | Global
Opportunities
Fund | | | Global
Science &
Technology
Fund | | | Heritage
Growth
Fund | | | International
Growth
Fund | |
Increase (decrease) paid-in capital in excess of par | | $ | (2,341,262 | ) | | $ | — | | | $ | 467,768 | | | $ | (678,115 | ) | | $ | (17,888 | ) | | $ | — | |
Increase (decrease) undistributed net investment income | | | 179,283 | | | | (1,172,323 | ) | | | 1,008,484 | | | | 907,794 | | | | 31,521 | | | | 821,736 | |
Increase (decrease) undistributed net realized gain (loss) | | | 2,161,979 | | | | 1,172,323 | | | | (1,476,252 | ) | | | (229,679 | ) | | | (13,633 | ) | | | (821,736 | ) |
116
| | | | | | | | | | | | | | | | | | | | | | | | |
| | | International
Opportunities
Fund | | | Micro
Cap
Fund | | | Micro Cap
Value
Fund | | | Small Cap
Growth
Fund | | | Small Cap
Value
Fund | | | Strategic
Income
Fund | |
Increase (decrease) paid-in capital in excess of par | | $ | (1,589,745 | ) | | $ | (3,198,371 | ) | | $ | (2,094,433 | ) | | $ | (7,708,185 | ) | | $ | (1,231,384 | ) | | $ | (3,313 | ) |
Increase (decrease) undistributed net investment income | | | 1,870,499 | | | | 3,010,425 | | | | 2,529,420 | | | | 6,946,435 | | | | 461,912 | | | | (219,382 | ) |
Increase (decrease) undistributed net realized gain (loss) | | | (280,754 | ) | | | 187,946 | | | | (434,987 | ) | | | 761,750 | | | | 769,472 | | | | 222,695 | |
| | | | | | |
| | | Ultra
Growth
Fund | | | Wasatch-1st
Source Income
Equity
Fund | | | Wasatch-1st
Source
Long/Short
Fund | | | U.S.
Treasury
Fund | | | Wasatch-1st
Source Income
Fund | | | | |
Increase (decrease) paid-in capital in excess of par | | $ | (1,091,075 | ) | | $ | (134,752 | ) | | $ | (293,567 | ) | | $ | 117,872 | | | $ | — | | | | | |
Increase (decrease) undistributed net investment income | | | 1,073,883 | | | | (14,055 | ) | | | (12,026 | ) | | | (1,960 | ) | | | — | | | | | |
Increase (decrease) undistributed net realized gain (loss) | | | 17,192 | | | | 148,807 | | | | 305,593 | | | | (115,912 | ) | | | — | | | | | |
6. PURCHASESAND SALESOF SECURITIES
Cost of investment securities purchased and proceeds from sales of investment securities, excluding U.S. government and short-term securities for the period ended September 30, 2010 are summarized below:
| | | | | | | | | | | | | | | | | | | | | | | | | | | | |
| | | Core
Growth
Fund | | | Emerging
Markets
Small Cap
Fund | | | Global
Opportunities
Fund | | | Global
Science &
Technology
Fund | | | Heritage
Growth
Fund | | | International
Growth
Fund | | | International
Opportunities
Fund | |
Purchases | | $ | 70,823,815 | | | $ | 344,127,321 | | | $ | 124,131,575 | | | $ | 42,755,969 | | | $ | 26,284,816 | | | $ | 126,031,473 | | | $ | 87,171,149 | |
Sales | | | 113,817,565 | | | | 33,969,459 | | | | 36,302,634 | | | | 44,019,324 | | | | 35,369,481 | | | | 83,983,607 | | | | 57,982,307 | |
| | | | | | | |
| | | Micro
Cap
Fund | | | Micro Cap
Value
Fund | | | Small Cap
Growth
Fund | | | Small Cap
Value
Fund | | | Strategic
Income
Fund | | | Ultra
Growth
Fund | | | Wasatch-1st
Source Income
Equity
Fund | |
Purchases | | $ | 91,493,603 | | | $ | 159,144,988 | | | $ | 325,948,623 | | | $ | 128,662,797 | | | $ | 14,444,443 | | | $ | 61,779,376 | | | $ | 456,465,207 | |
Sales | | | 114,185,307 | | | | 120,518,554 | | | | 151,611,324 | | | | 153,498,637 | | | | 12,067,635 | | | | 54,911,326 | | | | 250,177,866 | |
| | | | | | | |
| | | Wasatch-1st
Source
Long/Short
Fund | | | Wasatch-1st
Source Income
Fund | | | | | | | | | | | | | | | | |
Purchases | | $ | 259,449,578 | | | $ | 23,592,865 | | | | | | | | | | | | | | | | | | | | | |
Sales | | | 116,027,352 | | | | 25,764,880 | | | | | | | | | | | | | | | | | | | | | |
Purchases and sales of U.S. government securities in the U.S. Treasury Fund were $104,530,743 and $76,245,703, respectively. Purchases and sales of U.S. government securities in the Wasatch-1st Source Income Fund were $59,507,157 and $35,560,264, respectively.
117
| | |
| WASATCH FUNDS — Notes to Financial Statements (continued) | | |
|
| |
| |
7. OPTIONS CONTRACTS WRITTEN
Options written activity during the period ended September 30, 2010 was as follows:
| | | | | | | | | | | | | | | | | | | | | | | | |
| | | Options
Outstanding at
9/30/2009 | | | Written | | | Closed | | | Exercised | | | Expired | | | Options
Outstanding at
9/30/2010 | |
Heritage Growth Fund | | | | | | | | | | | | | | | | | | | | | | | | |
Premium amount | | $ | — | | | $ | 6,265 | | | $ | (6,265 | ) | | $ | — | | | $ | — | | | $ | — | |
Number of contracts | | | — | | | | 35 | | | | (35 | ) | | | — | | | | — | | | | — | |
Micro Cap Value Fund | | | | | | | | | | | | | | | | | | | | | | | | |
Premium amount | | $ | — | | | $ | 1,253,890 | | | $ | (104,235 | ) | | $ | (518,399 | ) | | $ | (257,128 | ) | | $ | 374,128 | |
Number of contracts | | | — | | | | 9,852 | | | | (600 | ) | | | (4,070 | ) | | | (1,682 | ) | | | 3,500 | |
Strategic Income Fund | | | | | | | | | | | | | | | | | | | | | | | | |
Premium amount | | $ | 20,877 | | | $ | 792 | | | $ | (11,373 | ) | | $ | (6,413 | ) | | $ | (3,883 | ) | | $ | — | |
Number of contracts | | | 273 | | | | 33 | | | | (158 | ) | | | (63 | ) | | | (85 | ) | | | — | |
Wasatch-1st Source Long/Short Fund | | | | | | | | | | | | | | | | | | | | | | | | |
Premium amount | | $ | 1,604,392 | | | $ | 6,762,713 | | | $ | (1,726,357 | ) | | $ | (2,285,848 | ) | | $ | (2,125,205 | ) | | $ | 2,229,695 | |
Number of contracts | | | 5,262 | | | | 27,551 | | | | (4,853 | ) | | | (9,508 | ) | | | (10,550 | ) | | | 7,902 | |
8. FEDERAL INCOME TAX INFORMATION
As of September 30, 2010, the cost and unrealized appreciation (depreciation) of securities on a tax basis were as follows:
| | | | | | | | | | | | | | | | | | | | | | | | |
| | | Core
Growth
Fund | | | Emerging
Markets
Small Cap
Fund | | | Global
Opportunities
Fund | | | Global
Science &
Technology
Fund | | | Heritage
Growth
Fund | | | International
Growth
Fund | |
Cost | | $ | 334,708,554 | | | $ | 374,881,331 | | | $ | 184,246,611 | | | $ | 56,545,657 | | | $ | 63,463,820 | | | $ | 209,392,376 | |
| | | | |
Gross appreciation | | $ | 108,323,458 | | | $ | 84,377,022 | | | $ | 54,636,518 | | | $ | 11,809,664 | | | $ | 16,486,748 | | | $ | 79,917,626 | |
Gross (depreciation) | | | (25,331,750 | ) | | | (3,240,954 | ) | | | (3,717,834 | ) | | | (2,647,809 | ) | | | (1,798,002 | ) | | | (3,813,657 | ) |
| | | | |
Net appreciation | | $ | 82,991,708 | | | $ | 81,136,068 | | | $ | 50,918,684 | | | $ | 9,161,855 | | | $ | 14,688,746 | | | $ | 76,103,969 | |
| | | | |
| | | | | | |
| | | International
Opportunities
Fund | | | Micro
Cap
Fund | | | Micro Cap
Value
Fund | | | Small Cap
Growth
Fund | | | Small Cap
Value
Fund | | | Strategic
Income
Fund | |
Cost | | $ | 110,909,698 | | | $ | 251,107,072 | | | $ | 169,667,458 | | | $ | 835,988,927 | | | $ | 199,307,038 | | | $ | 18,911,259 | |
| | | | |
Gross appreciation | | $ | 43,885,482 | | | $ | 63,975,943 | | | $ | 25,749,969 | | | $ | 323,900,149 | | | $ | 36,061,441 | | | $ | 2,013,380 | |
Gross (depreciation) | | | (4,361,369 | ) | | | (31,978,731 | ) | | | (8,457,469 | ) | | | (47,966,591 | ) | | | (24,031,147 | ) | | | (1,469,316 | ) |
| | | | |
Net appreciation | | $ | 39,524,113 | | | $ | 31,997,212 | | | $ | 17,292,500 | | | $ | 275,933,558 | | | $ | 12,030,294 | | | $ | 544,064 | |
| | | | |
| | | | | | |
| | | Ultra
Growth
Fund | | | Wasatch-1st
Source Income
Equity
Fund | | | Wasatch-1st
Source
Long/Short
Fund | | | U.S.
Treasury
Fund | | | Wasatch-1st
Source Income
Fund | | | | |
Cost | | $ | 134,064,760 | | | $ | 1,487,967,435 | | | $ | 287,914,348 | | | $ | 186,645,036 | | | $ | 130,974,043 | | | | | |
| | | | | | | | |
Gross appreciation | | $ | 49,112,711 | | | $ | 200,228,630 | | | $ | 27,841,298 | | | $ | 14,133,587 | | | $ | 6,137,182 | | | | | |
Gross (depreciation) | | | (5,861,256 | ) | | | (59,850,212 | ) | | | 4,971,423 | | | | (522,817 | ) | | | (64,403 | ) | | | | |
| | | | | | | | |
Net appreciation | | $ | 43,251,455 | | | $ | 140,378,418 | | | $ | 22,869,875 | | | $ | 13,610,770 | | | $ | 6,072,779 | | | | | |
| | | | | | | | |
118
The difference between book-basis and tax-basis unrealized gains are primarily attributable to the tax deferral of losses on wash sales, unrealized appreciation on passive foreign investment companies and other temporary tax adjustments.
The components of accumulated earnings on a tax basis as of September 30, 2010 were as follows:
| | | | | | | | | | | | | | | | | | | | | | | | |
| | | Core
Growth
Fund | | | Emerging
Markets
Small Cap
Fund | | | Global
Opportunities
Fund | | | Global
Science &
Technology
Fund | | | Heritage
Growth
Fund | | | International
Growth
Fund | |
Undistributed ordinary income | | $ | — | | | $ | 86,157 | | | $ | 1,878,076 | | | $ | — | | | $ | 658,864 | | | $ | 1,232,827 | |
Undistributed capital gains | | | — | | | | — | | | | 6,555,018 | | | | — | | | | — | | | | — | |
| | | | |
Accumulated earnings | | | — | | | | 86,157 | | | | 8,433,094 | | | | — | | | | 658,864 | | | | 1,232,827 | |
Accumulated capital and other losses | | | (121,110,878 | ) | | | (14,842,293 | ) | | | — | | | | (28,310,873 | ) | | | (7,514,729 | ) | | | (66,110,178 | ) |
Other undistributed ordinary losses | | | — | | | | — | | | | (11,284 | ) | | | — | | | | — | | | | — | |
Net unrealized appreciation* | | | 82,762,692 | | | | 78,296,634 | | | | 50,818,070 | | | | 9,163,581 | | | | 14,696,002 | | | | 75,459,340 | |
| | | | |
Total accumulated earnings (deficit) | | $ | (38,348,186 | ) | | $ | 63,540,498 | | | $ | 59,239,880 | | | $ | (19,147,292 | ) | | $ | 7,840,137 | | | $ | 10,581,989 | |
| | | | |
| | | | | | |
| | | International
Opportunities
Fund | | | Micro
Cap
Fund | | | Micro Cap
Value
Fund | | | Small Cap
Growth
Fund | | | Small Cap
Value
Fund | | | Strategic
Income
Fund | |
Undistributed ordinary income | | $ | — | | | $ | — | | | $ | — | | | $ | — | | | $ | — | | | $ | 89,709 | |
Undistributed capital gains | | | — | | | | — | | | | — | | | | — | | | | — | | | | — | |
| | | | |
Accumulated earnings | | | — | | | | — | | | | — | | | | — | | | | — | | | | 89,709 | |
Accumulated capital and other losses | | | (445,625 | ) | | | (87,613,431 | ) | | | (12,346,559 | ) | | | (33,688,124 | ) | | | (132,925,644 | ) | | | (8,427,740 | ) |
Other undistributed ordinary losses | | | (21,416 | ) | | | — | | | | — | | | | — | | | | — | | | | (15,360 | ) |
Net unrealized appreciation* | | | 39,389,605 | | | | 31,793,483 | | | | 17,008,657 | | | | 275,607,559 | | | | 11,625,410 | | | | 544,102 | |
| | | | |
Total accumulated earnings (deficit) | | $ | 38,922,564 | | | $ | (55,819,948 | ) | | $ | 4,662,098 | | | $ | 241,919,435 | | | $ | (121,300,234 | ) | | $ | (7,809,289 | ) |
| | | | |
| | | | | | |
| | | Ultra
Growth
Fund | | | Wasatch-1st
Source Income
Equity
Fund | | | Wasatch-1st
Source
Long/Short
Fund | | | U.S.
Treasury
Fund | | | Wasatch-1st
Source Income
Fund | | | | |
Undistributed ordinary income | | $ | — | | | $ | — | | | $ | 85,683 | | | $ | 173,304 | | | $ | 80,824 | | | | | |
Undistributed capital gains | | | — | | | | — | | | | — | | | | 10,250,025 | | | | — | | | | | |
| | | | | | | | |
Accumulated earnings | | | — | | | | — | | | | 85,683 | | | | 10,423,329 | | | | 80,824 | | | | | |
Accumulated capital and other losses | | | (39,415,853 | ) | | | (65,338,670 | ) | | | (8,871,016 | ) | | | — | | | | (2,862,019 | ) | | | | |
Other undistributed ordinary losses | | | — | | | | (331,089 | ) | | | (10,700 | ) | | | (156,953 | ) | | | (57,253 | ) | | | | |
Net unrealized appreciation* | | | 43,216,979 | | | | 140,378,427 | | | | 16,608,832 | | | | 13,610,770 | | | | 6,072,779 | | | | | |
| | | | | | | | |
Total accumulated earnings | | $ | 3,801,126 | | | $ | 74,708,668 | | | $ | 7,812,799 | | | $ | 23,877,146 | | | $ | 3,234,331 | | | | | |
| | | | | | | | |
| *On | investments, securities sold short, derivative and foreign currency denominated assets and liabilities. |
Capital loss carryforwards are available through the date specified below to offset future realized net capital gains for federal income tax purposes. Future capital loss carryover utilization in any given year may be subject to Internal Revenue Code limitations. To the extent future gains are offset by capital loss carryforwards, such gains will not be distributed.
Capital loss carryforwards as of September 30, 2010 are as follows:
| | | | | | | | | | | | | | | | | | | | |
| Fund | | 2013 | | | 2014 | | | 2016 | | | 2017 | | | 2018 | |
Core Growth Fund | | $ | — | | | $ | — | | | $ | — | | | $ | 23,065,472 | | | $ | 97,992,911 | |
Emerging Markets Small Cap Fund | | | — | | | | — | | | | — | | | | 8,013,713 | | | | 6,828,580 | |
Global Science & Technology Fund | | | — | | | | — | | | | — | | | | 13,246,252 | | | | 15,064,621 | |
Heritage Growth Fund | | | — | | | | — | | | | — | | | | 1,497,283 | | | | 6,017,446 | |
International Growth Fund | | | — | | | | — | | | | — | | | | 37,186,858 | | | | 28,923,320 | |
International Opportunities Fund | | | — | | | | — | | | | — | | | | 136,323 | | | | — | |
Micro Cap Fund | | | — | | | | — | | | | — | | | | 36,417,364 | | | | 49,352,340 | |
Micro Cap Value Fund | | | — | | | | — | | | | — | | | | 11,884,263 | | | | — | |
Small Cap Growth Fund | | | — | | | | — | | | | — | | | | 18,434,963 | | | | 15,177,683 | |
Small Cap Value Fund | | | — | | | | — | | | | — | | | | 69,050,636 | | | | 63,851,964 | |
Strategic Income Fund | | | — | | | | — | | | | — | | | | 1,777,526 | | | | 6,650,214 | |
Ultra Growth Fund | | | — | | | | — | | | | — | | | | 18,431,927 | | | | 20,927,202 | |
Wasatch-1st Source Income Equity Fund | | | 456,570 | | | | — | | | | 1,007,552 | | | | — | | | | 63,874,548 | |
Wasatch-1st Source Long/Short Fund | | | — | | | | — | | | | 1,392,157 | | | | 4,660,126 | | | | 2,818,733 | |
Wasatch-1st Source Income Fund | | | 917,303 | | | | 1,382,991 | | | | 561,725 | | | | — | | | | — | |
119
| | |
| WASATCH FUNDS — Notes to Financial Statements (continued) | | |
|
| |
| |
Net capital losses incurred after October 31 and within the taxable year have been elected by the Funds to be treated as being incurred on the first business day of the Funds’ next taxable year. For the year ended September 30, 2010, the following Funds deferred to October 1, 2010 post October capital and currency losses as follows:
| | | | |
| Fund | | Capital Losses | |
Core Growth Fund | | $ | 52,495 | |
International Opportunities Fund | | | 309,302 | |
Micro Cap Fund | | | 1,843,727 | |
Micro Cap Value Fund | | | 462,296 | |
Small Cap Growth Fund | | | 75,478 | |
Small Cap Value Fund | | | 23,044 | |
Ultra Growth Fund | | | 56,724 | |
During the tax year ended September 30, 2010, the Funds used capital loss carryforwards in the following amounts:
| | | | |
| Fund | | Amount Used | |
International Opportunities Fund | | $ | 6,170,670 | |
Micro Cap Value Fund | | | 5,752,405 | |
Wasatch-1st Source Income Fund | | | 311,342 | |
The tax character of distributions paid during the year ended September 30, 2010 was as follows:
| | | | | | | | | | | | | | | | | | | | | | | | |
| 2010 | | Core
Growth
Fund | | | Emerging
Markets
Small Cap
Fund | | | Global
Opportunities
Fund | | | Global
Science &
Technology
Fund | | | Heritage
Growth
Fund | | | International
Growth
Fund | |
Ordinary income | | $ | 87,230 | | | $ | 379,097 | | | $ | 3,456,368 | | | $ | 79,109 | | | $ | 499,403 | | | $ | — | |
Capital gain | | | — | | | | — | | | | — | | | | — | | | | — | | | | — | |
| | | | |
Total | | $ | 87,230 | | | $ | 379,097 | | | $ | 3,456,368 | | | $ | 79,109 | | | $ | 499,403 | | | $ | — | |
| | | | |
| | | | | | |
| 2010 | | International
Opportunities
Fund | | | Micro
Cap
Fund | | | Micro Cap
Value
Fund | | | Small Cap
Growth
Fund | | | Small Cap
Value
Fund | | | Strategic
Income
Fund | |
Ordinary income | | $ | 1,049,066 | | | $ | — | | | $ | 569,692 | | | $ | — | | | $ | — | | | $ | 678,070 | |
Capital gain | | | — | | | | — | | | | — | | | | — | | | | — | | | | — | |
| | | | |
Total | | $ | 1,049,066 | | | $ | — | | | $ | 569,692 | | | $ | — | | | $ | — | | | $ | 678,070 | |
| | | | |
| | | | | | |
| 2010 | | Ultra
Growth
Fund | | | Wasatch-1st
Source Income
Equity
Fund | | | Wasatch-1st
Source
Long/Short
Fund | | | U.S.
Treasury
Fund | | | Wasatch-1st
Source Income
Fund | | | | |
Ordinary income | | $ | — | | | $ | 21,589,760 | | | $ | 98,009 | | | $ | 5,847,330 | | | $ | 3,572,685 | | | | | |
Capital gain | | | — | | | | — | | | | — | | | | 4,184,315 | | | | — | | | | | |
| | | | | | | | |
Total | | $ | — | | | $ | 21,589,760 | | | $ | 98,009 | | | $ | 10,031,645 | | | $ | 3,572,685 | | | | | |
| | | | | | | | |
120
The tax character of distributions paid during the year or period ended September 30, 2009 was as follows:
| | | | | | | | | | | | | | | | | | | | | | | | |
| 2009 | | Core
Growth
Fund | | | Emerging
Markets
Small Cap
Fund | | | Global
Opportunities
Fund1 | | | Global
Science &
Technology
Fund | | | Heritage
Growth Fund | | | International
Growth
Fund | |
Ordinary income | | $ | 5,739,872 | | | $ | 29,720 | | | $ | — | | | $ | — | | | $ | 167,143 | | | $ | 466,090 | |
Capital gain | | | — | | | | — | | | | — | | | | — | | | | 220,964 | | | | — | |
| | | | |
Total | | $ | 5,739,872 | | | $ | 29,720 | | | $ | — | | | $ | — | | | $ | 388,107 | | | $ | 466,090 | |
| | | | |
| | | | | | |
| 2009 | | International
Opportunities
Fund | | | Micro
Cap
Fund | | | Micro Cap
Value
Fund | | | Small Cap
Growth
Fund | | | Small Cap
Value
Fund | | | Strategic
Income
Fund | |
Ordinary income | | $ | 168,034 | | | $ | 777,904 | | | $ | — | | | $ | — | | | $ | — | | | $ | 784,968 | |
Capital gain | | | — | | | | — | | | | — | | | | 1,539,215 | | | | — | | | | — | |
| | | | |
Total | | $ | 168,034 | | | $ | 777,904 | | | $ | — | | | $ | 1,539,215 | | | $ | — | | | $ | 784,968 | |
| | | | |
| | | | | | |
| 2009 | | Ultra
Growth
Fund | | | Wasatch-1st
Source Income
Equity
Fund | | | Wasatch-1st
Source
Long/Short
Fund | | | U.S.
Treasury
Fund | | | Wasatch-1st
Source Income
Fund | | | | |
Ordinary income | | $ | — | | | $ | 19,218,020 | | | $ | 2,025,005 | | | $ | 5,022,309 | | | $ | 3,433,282 | | | | | |
Capital gain | | | — | | | | — | | | | 110,509 | | | | — | | | | — | | | | | |
| | | | | | | | |
Total | | $ | — | | | $ | 19,218,020 | | | $ | 2,135,514 | | | $ | 5,022,309 | | | $ | 3,433,282 | | | | | |
| | | | | | | | |
| 1 | Inception date of the Fund was November 17, 2008. |
The tax character of distributions paid may differ from that shown in the Statements of Changes in Net Assets due to short-term gains being treated as ordinary income for tax purposes.
SUPPLEMENTAL TAX INFORMATION (UNAUDITED):
The Funds hereby designate the following amounts or maximum amounts allowable as long term capital gain dividends for the purpose of the dividends paid deduction. The amounts designated here include the utilization of earnings and profits distributed to shareholders on the redemption of shares.
| | | | |
| | | Amount | |
Global Opportunities Fund | | $ | 363,595 | |
U.S. Treasury Fund | | $ | 4,300,227 | |
For the fiscal year ended September 30, 2010, certain dividends paid by each Fund may be subject to a maximum
tax rate of 15% as provided for by the Jobs and Growth Tax Relief Reconciliation Act of 2003. To the extent dividends are paid during the calendar year 2010, complete information will be reported on shareholders’ 2010 Form 1099-DIV.
The amount designated as qualified dividend income for the year ended September 30, 2010 will be at the highest amount permitted by law.
Corporate shareholders should note for the year ended September 30, 2010, the percentage of the Funds’ investment income (i.e., net investment income plus short-term capital gains) that qualified for the corporate dividends received deductions are as follows:
| | | | |
| | | Percentage | |
Heritage Growth Fund | | | 48 | % |
Strategic Income Fund | | | 54 | % |
Wasatch-1st Source Income Equity Fund | | | 100 | % |
121
| | |
| WASATCH FUNDS — Notes to Financial Statements (continued) | | |
|
| |
| |
9. RELATED PARTY TRANSACTIONS
Investment Advisory Fees — As the Fund’s investment advisor, the Advisor receives a monthly fee calculated on average daily net assets. The Advisor has contractually agreed to waive its fees and/or reimburse a Fund should a Fund’s operating expenses exceed a specified annual limitation through at least January 31, 2012. Ordinary operating expenses exclude any interest, taxes, brokerage commissions, other investment-related costs and extraordinary expenses, such as litigation and other expenses not incurred in the ordinary course of the Fund’s business. The Wasatch Funds’ Board of Directors determined that the costs of the Proxy Statement related to the identification and shareholder approval of Director Nominees were extraordinary expenses. Investment advisory fees and fees waived, if any, for the year ended September 30, 2010 are disclosed in the Statements of Operations. Investment advisory fee and expense limitation annual rates are shown below.
| | | | | | | | | | | | | | | | | | | | | | | | |
| | | Core
Growth
Fund | | | Emerging
Markets
Small Cap
Fund | | | Global
Opportunities
Fund | | | Global
Science &
Technology
Fund | | | Heritage
Growth
Fund | | | International
Growth
Fund | |
Advisory Fee | | | 1.00 | % | | | 1.75 | % | | | 1.95 | % | | | 1.50 | % | | | 0.70 | % | | | 1.50 | % |
Expense Limitation | | | 1.50 | % | | | 2.05 | %1 | | | 2.25 | % | | | 1.95 | % | | | 0.95 | % | | | 1.95 | % |
| | | | | | |
| | | International
Opportunities
Fund | | | Micro
Cap
Fund | | | Micro Cap
Value
Fund | | | Small Cap
Growth
Fund | | | Small Cap
Value
Fund | | | Strategic
Income
Fund | |
Advisory Fee | | | 1.95 | % | | | 1.95 | % | | | 1.95 | % | | | 1.00 | % | | | 1.50 | % | | | 0.70 | % |
Expense Limitation | | | 2.25 | % | | | 2.25 | % | | | 2.25 | % | | | 1.50 | % | | | 1.95 | % | | | 0.95 | % |
| | | | | | |
| | | Ultra
Growth
Fund | | | Wasatch-1st
Source Income
Equity
Fund | | | Wasatch-1st
Source
Long/Short
Fund | | | U.S.
Treasury
Fund | | | Wasatch-1st
Source Income
Fund | | | | |
Advisory Fee | | | 1.25 | % | | | 0.90 | % | | | 1.10 | % | | | 0.50 | % | | | 0.55 | % | | | | |
Expense Limitation | | | 1.75 | % | | | 1.10 | % | | | — | | | | 0.75 | % | | | — | | | | | |
| 1 The | expense limitation for the Emerging Markets Small Cap Fund decreased from 2.10% to 2.05% when average daily net assets reached $50 million; decreased to 2.00% on 10/1/2010 when average daily net assets reached $100 million; and will decrease to 1.95% when average daily net assets reach $150 million. |
Affiliated Trades — Certain Funds are permitted to purchase or sell securities from or to certain related affiliated funds under specified conditions outlined in procedures adopted by the Board of Trustees. The procedures have been designed to ensure that any purchase or sale of securities by the Funds from or to another fund (or funds) that are, or could be, considered an affiliate by virtue of having a common investment advisor (or affiliated investment advisors), common Trustees and/or common officers complies with Rule 17a-7 of the 1940 Act. Further, each transaction is effected at the current market price, as that term is defined under the procedures. During the year ended September 30, 2010, the Funds below engaged in purchases and sales of securities pursuant to Rule 17a-7 of the 1940 Act:
| | | | | | | | |
| | | Purchases | | | Sales | |
International Growth Fund | | $ | 14,085 | | | $ | — | |
Small Cap Value Fund | | | — | | | | 50,085 | |
Strategic Income Fund | | | 36,000 | | | | — | |
Affiliated Interests — An officer of the Funds owns approximately 41% of the shares outstanding of the Strategic Income Fund, as of September 30, 2010.
Payments by Former Service Provider — BISYS Fund Services, Inc. (“BISYS”) is a former service provider to the Wasatch-1st Source Income Equity Fund, Wasatch-1st Source Long/Short Fund, and Wasatch-1st Source Income Fund. In August 2010, these funds received a one-time payment from the BISYS Fair Fund (a fund established pursuant to a settlement between the SEC and BISYS that requires, among other things, a distribution of settlement monies from the fair fund to benefit affected mutual funds). Receipt of these payments is shown as a reduction of total expenses on the Statements of Operations. The impact of these payments is reflected in the net expense ratios in the Financial Highlights.
122
10. TRANSACTIONSWITH AFFILIATES
If a Fund’s holding represents ownership of 5% or more of the voting securities of a company, the company is deemed to be an affiliate as defined by the 1940 Act. The following Funds conducted transactions during the year ended September 30, 2010 with “affiliated companies” as so defined:
| | | | | | | | | | | | | | | | | | | | | | | | |
| | | Share Activity | | | Dividends
Credited to
Income for the
Fiscal Year
ended 9/30/10 | | | Gain (Loss)
Realized on
Sale of Shares
for the
Fiscal Year
ended 9/30/10 | |
| | | Balance
9/30/09 | | | Purchases/
Additions | | | Sales/
Reductions | | | Balance
9/30/10 | | | |
Small Cap Growth Fund | | | | | | | | | | | | | | | | | | | | | | | | |
| | | | | | |
Peet’s Coffee & Tea, Inc. | | | 472,411 | | | | 221,384 | | | | — | | | | 693,795 | | | $ | — | | | $ | — | |
11. RESTRICTED SECURITIES
The Funds may own investments that were purchased through private placement transactions or under Rule 144A of the Securities Act of 1933 (the “Securities Act”) and cannot be sold without prior registration under the Securities Act or may be limited due to certain restrictions. These securities are generally deemed to be illiquid and are valued at fair value as determined by a designated Pricing Committee, comprised of personnel of the Advisor, with oversight by the Board of Trustees and in accordance with Board-approved Pricing Policies and Procedures. If and when such securities are registered, the costs of registering such securities are paid by the issuer. At September 30, 2010, the Funds held the following restricted securities:
| | | | | | | | | | | | | | | | | | |
| | | Security
Type | | Acquisition
Dates | | | Acquisition
Cost | | | Fair
Value | | | Value as %
of Net Assets | |
Global Opportunities Fund | | | | | | | | | | | | | | | | | | |
| | | | | |
Cardica, Inc. | | PIPE | | | 9/25/09 | | | $ | 95,200 | | | $ | 173,600 | | | | 0.07 | % |
Cardica, Inc. | | Warrants | | | 9/25/09 | | | | 5,000 | | | | 28,800 | | | | 0.01 | % |
| | | | | | | | | | |
| | | | | | | | $ | 100,200 | | | $ | 202,400 | | | | 0.08 | % |
|
| | |
Global Science & Technology Fund | | | | | | | | | | | | | | | | | | |
| | | | | |
BlueArc Corp., Series DD | | Preferred Stock | | | 6/6/06 | | | $ | 162,499 | | | $ | 120,108 | | | | 0.18 | % |
BlueArc Corp., Series DD-1 | | Preferred Stock | | | 6/6/06 | | | | 162,499 | | | | 126,781 | | | | 0.19 | % |
BlueArc Corp., Series FF | | Preferred Stock | | | 5/30/08 | | | | 314,033 | | | | 230,285 | | | | 0.35 | % |
BlueArc Corp., Series FF-1 | | Preferred Stock | | | 5/30/08 | | | | 314,033 | | | | 233,750 | | | | 0.36 | % |
BlueArc Corp., Series GG | | Preferred Stock | | | 7/9/10 | | | | 60,028 | | | | 60,028 | | | | 0.09 | % |
BlueArc Corp., Series FF | | Warrants | | | 5/30/08 | | | | — | | | | — | | | | — | |
BlueArc Corp., Series FF-1 | | Warrants | | | 5/30/08 | | | | — | | | | — | | | | — | |
BlueArc Corp., Series GG | | Warrants | | | 7/9/10 | | | | 8 | | | | 8 | | | | — | |
Cardica, Inc. | | PIPE | | | 9/25/09 | | | | 57,358 | | | | 104,594 | | | | 0.16 | % |
Cardica, Inc. | | Warrants | | | 9/25/09 | | | | 8,937 | | | | 51,480 | | | | 0.08 | % |
Greenspring Global Partners II-B, L.P. | | LP Interest | | | 10/10/03 - 9/1/10 | | | | 434,387 | | | | 421,896 | | | | 0.64 | % |
Xtera Communications, Inc. | | Common Stock | | | 9/3/03 | | | | 7,076 | | | | 65 | | | | — | |
| | | | | | | | | | |
| | | | | | | | $ | 1,520,858 | | | $ | 1,348,995 | | | | 2.05 | % |
|
| | |
Micro Cap Fund | | | | | | | | | | | | | | | | | | |
| | | | | |
Alexza Pharmaceuticals, Inc. | | PIPE | | | 9/29/09 | | | $ | 758,197 | | | $ | 1,035,985 | | | | 0.37 | % |
Alexza Pharmaceuticals, Inc. | | Warrants | | | 9/29/09 | | | | 36,766 | | | | 117,651 | | | | 0.04 | % |
Alexza Pharmaceuticals, Inc. | | Warrants | | | 8/4/10 | | | | — | | | | — | | | | — | |
Cardica, Inc. | | PIPE | | | 9/25/09 | | | | 405,790 | | | | 739,970 | | | | 0.26 | % |
Cardica, Inc. | | Warrants | | | 6/7/07 | | | | 19,380 | | | | — | | | | — | |
Cardica, Inc. | | Warrants | | | 9/25/09 | | | | 40,312 | | | | 232,200 | | | | 0.08 | % |
Goldwater Bank, N.A. | | Common Stock | | | 2/28/07 | | | | 1,540,000 | | | | 281,050 | | | | 0.10 | % |
| | | | | | | | | | |
| | | | | | | | $ | 2,800,445 | | | $ | 2,406,856 | | | | 0.85 | % |
123
| | |
| WASATCH FUNDS — Notes to Financial Statements (continued) | | |
|
| |
| |
| | | | | | | | | | | | | | | | | | |
| | | Security
Type | | Acquisition
Dates | | | Acquisition
Cost | | | Fair
Value | | | Value as %
of Net Assets | |
Micro Cap Value Fund | | | | | | | | | | | | | | | | | | |
| | | | | |
Cardica, Inc. | | PIPE | | | 9/25/09 | | | $ | 262,990 | | | $ | 479,570 | | | | 0.26 | % |
Cardica, Inc. | | Warrants | | | 6/7/07 | | | | 9,302 | | | | — | | | | — | |
Cardica, Inc. | | Warrants | | | 9/25/09 | | | | 13,813 | | | | 79,560 | | | | 0.04 | % |
Goldwater Bank, N.A. | | Common Stock | | | 2/28/07 | | | | 419,000 | | | | 76,468 | | | | 0.04 | % |
Idaho Trust Bancorp | | Common Stock | | | 8/30/06 | | | | 500,004 | | | | 215,002 | | | | 0.12 | % |
NeurogesX, Inc. | | PIPE | | | 12/28/07 | | | | 525,300 | | | | 587,350 | | | | 0.32 | % |
NeurogesX, Inc. | | Warrants | | | 12/28/07 | | | | 3,800 | | | | — | | | | — | |
| | | | | | | | | | |
| | | | | | | | $ | 1,734,209 | | | $ | 1,437,950 | | | | 0.78 | % |
|
| | |
Small Cap Growth Fund | | | | | | | | | | | | | | | | | | |
| | | | | |
Alexza Pharmaceuticals, Inc. | | PIPE | | | 9/29/09 | | | $ | 949,810 | | | $ | 1,297,801 | | | | 0.12 | % |
Alexza Pharmaceuticals, Inc. | | Warrants | | | 9/29/09 | | | | 46,058 | | | | 147,384 | | | | 0.01 | % |
Angies List, Series C | | Preferred Stock | | | 9/3/10 | | | | 4,254,284 | | | | 4,254,284 | | | | 0.38 | % |
Fluidigm Corp., Series E | | Preferred Stock | | | 12/22/06 - 11/18/09 | | | | 2,617,258 | | | | 2,617,258 | | | | 0.24 | % |
Fluidigm Corp. | | Warrants | | | 8/18/09 | | | | 11 | | | | 11 | | | | — | |
Greenspring Global Partners II-B, L.P. | | LP Interest | | | 10/10/03 - 7/23/10 | | | | 4,343,853 | | | | 4,218,951 | | | | 0.38 | % |
Greenspring Global Partners III-B, L.P. | | LP Interest | | | 3/16/06 - 9/1/10 | | | | 1,125,000 | | | | 1,034,896 | | | | 0.09 | % |
Nanosys, Inc., Series D | | Preferred Stock | | | 11/8/05 | | | | 2,000,000 | | | | 776,271 | | | | 0.07 | % |
Nanosys, Inc., Series E | | Preferred Stock | | | 8/13/10 | | | | 184,939 | | | | 184,939 | | | | 0.02 | % |
Orexigen Therapeutics, Inc., Series C | | PIPE | | | 11/21/06 | | | | 1,000,001 | | | | 866,960 | | | | 0.08 | % |
TargetRX, Inc. | | Common Stock | | | 4/8/05 | | | | 769,098 | | | | 3,628 | | | | — | |
Valera Pharmaceuticals, Inc. Ureteral Stent CSR | | Rights | | | 2/1/06 - 2/2/06 | | | | 162,615 | | | | — | | | | — | |
Valera Pharmaceuticals, Inc. VP003 (Octreotide Implant) CSR | | Rights | | | 2/1/06 - 2/2/06 | | | | 243,922 | | | | 214,781 | | | | 0.02 | % |
Zonare Medical Systems, Inc. | | Common Stock | | | 6/30/04 | | | | 1,500,000 | | | | 275,437 | | | | 0.02 | % |
Zonare Medical Systems, Inc. | | Warrants | | | 6/30/04 | | �� | | — | | | | — | | | | — | |
| | | | | | | | | | |
| | | | | | | | $ | 19,196,849 | | | $ | 15,892,601 | | | | 1.43 | % |
|
| | |
Strategic Income Fund | | | | | | | | | | | | | | | | | | |
| | | | | |
Redcorp Ventures Ltd., 13.00%, 7/11/12 | | Corporate Bond | | | 7/5/07 | | | $ | 231,017 | | | $ | 23,692 | | | | 0.12 | % |
Star Asia Finance Ltd. | | Common Stock | | | 2/22/07 - 3/19/10 | | | | 305,812 | | | | 177,857 | | | | 0.91 | % |
Star Asia SPV, LLC | | LLC Membership Interest | | | 3/19/10 | | | | 578,644 | | | | 225,655 | | | | 1.16 | % |
| | | | | | | | | | |
| | | | | | | | $ | 1,115,473 | | | $ | 427,204 | | | | 2.19 | % |
|
| | |
Ultra Growth Fund | | | | | | | | | | | | | | | | | | |
| | | | | |
Alexza Pharmaceuticals, Inc. | | PIPE | | | 9/29/09 | | | $ | 175,784 | | | $ | 240,188 | | | | 0.13 | % |
Alexza Pharmaceuticals, Inc. | | Warrants | | | 9/29/09 | | | | 8,524 | | | | 27,277 | | | | 0.02 | % |
Alexza Pharmaceuticals, Inc. | | Warrants | | | 8/4/10 | | | | — | | | | — | | | | — | |
Cardica, Inc. | | PIPE | | | 9/25/09 | | | | 392,700 | | | | 716,100 | | | | 0.40 | % |
Cardica, Inc. | | Warrants | | | 9/25/09 | | | | 20,625 | | | | 118,800 | | | | 0.07 | % |
Data Sciences International, Inc., Series B | | Preferred Stock | | | 1/20/06 | | | | 475,001 | | | | 807,502 | | | | 0.45 | % |
Greenspring Global Partners II-B, L.P. | | LP Interest | | | 10/10/03 - 7/23/10 | | | | 3,909,467 | | | | 3,797,055 | | | | 2.13 | % |
Greenspring Global Partners III-B, L.P. | | LP Interest | | | 3/16/06 - 9/1/10 | | | | 1,125,000 | | | | 1,034,896 | | | | 0.58 | % |
Nanosys, Inc., Series D | | Preferred Stock | | | 11/8/05 | | | | 500,001 | | | | 194,068 | | | | 0.11 | % |
Nanosys, Inc., Series E | | Preferred Stock | | | 8/13/10 | | | | 46,235 | | | | 46,235 | | | | 0.03 | % |
Ophthonix, Inc. | | Common Stock | | | 9/23/05 | | | | 500,000 | | | | 504 | | | | — | |
TargetRX, Inc. | | Common Stock | | | 4/8/05 | | | | 230,904 | | | | 1,089 | | | | — | |
TherOx, Inc., Series I | | Preferred Stock | | | 7/7/05 | | | | 1,000,000 | | | | 429,267 | | | | 0.24 | % |
Xtera Communications, Inc. | | Common Stock | | | 9/3/03 | | | | 99,065 | | | | 914 | | | | — | |
Zonare Medical Systems, Inc. | | Common Stock | | | 6/30/04 | | | | 1,000,000 | | | | 183,625 | | | | 0.10 | % |
Zonare Medical Systems, Inc. | | Warrants | | | 6/30/04 | | | | — | | | | — | | | | — | |
| | | | | | | | | | |
| | | | | | | | $ | 9,483,306 | | | $ | 7,597,520 | | | | 4.26 | % |
12. PURCHASE COMMITMENTS
In September 2003, the Global Science & Technology, Small Cap Growth and Ultra Growth Funds entered into subscription agreements to acquire limited partnership interests in Greenspring Global Partners II-B, L.P. The remaining commitment amounts at September 30, 2010 were $60,000, $600,000 and $540,000, respectively. Securities held by the Funds have been designated to meet these purchase commitments.
124
In December 2005, the Small Cap Growth and Ultra Growth Funds entered into subscription agreements to acquire limited partnership interests in Greenspring Global Partners III-B, L.P. The remaining commitment amounts at September 30, 2010 were $375,000 per Fund. Securities held by the Funds have been designated to meet these purchase commitments.
13. LINEOF CREDIT
The Equity Funds opened two lines of credit totaling $75,000,000, one of which is $25,000,000 uncommitted, and the other of which is $50,000,000 committed, with State Street Bank and Trust Company on June 4, 2007 (together, the “Line”). The Line is for temporary or emergency purposes such as to provide liquidity for shareholder redemptions. The Equity Funds incur commitment fees on the undrawn portion of the committed part of the Line, and interest expense to the extent of amounts drawn (borrowed) under the entire Line. Interest is based on the higher of (a) the Federal Funds rate as in effect on the date of borrowing, plus a margin, and (b) the overnight LIBOR rate as in effect on the date of borrowing, plus a margin. Commitment fees are pro-rated among the Equity Funds based upon relative average net assets. Interest expense is charged directly to the Fund based upon actual amounts borrowed by the Fund.
For the year ended September 30, 2010, the following Funds had borrowings:
| | | | | | | | | | | | | | | | | | | | |
| | | Average Daily
Borrowings | | | Number of
Days
Outstanding | | | Interest
Expense | | | Weighted
Average
Annualized
Interest Rate | | | Balance at
September 30, 2010 | |
International Growth | | | 240,625 | | | | 8 | | | | 63 | | | | 1.18 | % | | | — | |
Ultra Growth | | | 1,098,731 | | | | 67 | | | | 2,504 | | | | 1.22 | % | | | — | |
14. PRINCIPAL RISKS
Market and Credit Risk — In the normal course of business the Funds trade financial instruments and enter into financial transactions where risk of potential loss exists due to changes in the market (market risk) or failure of the other party to a transaction to perform (credit risk). Similar to credit risk, the Funds may be exposed to counterparty risk, or the risk that an institution or other entity with which the Funds have unsettled or open transactions will default. The potential loss could exceed the value of the financial assets recorded in the financial statements. Financial assets, which potentially expose the Funds to credit risk, consist principally of cash due from counterparties and investments. The extent of the Funds’ exposure to credit and counterparty risks with respect to these financial assets approximates their carrying value as recorded in the Funds’ Statements of Assets and Liabilities.
Inflation Risk — Inflation risk is the possibility that inflation will reduce the purchasing power of a currency, and subsequently reduce the value of a security or asset, and may result in rising interest rates. Inflation is the overall upward price movement of goods and services in an economy that causes the value of a currency to decline.
Interest Rate Risk — Interest rate risk is the risk that fixed income securities will decline in value because of changes in interest rates. A rise in interest rates typically causes a fall in values. Interest rate risk should be modest for shorter-term securities, moderate for intermediate-term securities and high for longer-term securities. Generally, an increase in the average maturity of a Fund will make it more sensitive to interest rate risk. The interest rate is the amount charged, expressed as a percentage of principal, by a lender to a borrower for the use of assets.
Foreign Currency Risk — If a Fund invests directly in foreign currencies or in securities that trade in, and receive revenues in, foreign currencies, or in derivatives that provide exposure to foreign currencies, it will be subject to the risk that those currencies will decline in value relative to the U.S. dollar. This also includes the risk associated with higher transaction costs, delayed settlements, currency controls and adverse economic developments related to foreign investments.
Region Risk — The Funds invest in equity and fixed income securities of non-U.S. issuers. Although the Funds maintain diversified investment portfolios, political or economic developments within a particular country or region may have an adverse effect on the ability of domiciled issuers to meet their obligations. Additionally, political or economic developments may have an adverse effect on the liquidity and volatility of portfolio securities and currency holdings.
Shareholder Concentration Risk — A significant portion of the net assets of the International Opportunities Fund is owned by a group of shareholders advised by a common investment advisor. If this group of shareholders simultaneously redeems on the advice of their investment advisor, Fund expenses may increase and performance may be materially affected. However, the Advisor has contractually agreed to waive its fees and/or reimburse the International Opportunities Fund should its operating expenses exceed 2.25% through at least January 31, 2012.
15. SECURITIES VALUATION
Equity Securities (common and preferred stock) — Securities are valued as of the close of the New York Stock Exchange (generally 4:00 p.m. Eastern Time) on the valuation date. Equity securities are valued using a commercial pricing service at the last quoted sales price taken from the primary market in which each security trades and, with respect to equity securities traded on
125
| | |
| WASATCH FUNDS — Notes to Financial Statements (continued) | | |
|
| |
| |
NASDAQ, such securities are valued using the NASDAQ Official Closing Price (“NOCP”) or last sales price if no NOCP is available. If there are no sales on the primary exchange or market on a given day, then the security is valued at the most recent bid price on the primary exchange or market as provided by a pricing service. To the extent that these securities are actively traded and valuation adjustments are not applied, they are categorized in level 1 of the fair value hierarchy. Additionally, a Fund’s investments are valued at fair value by the Pricing Committee if the Advisor determines that an event impacting the value of an investment occurred between the closing time of a security’s primary market or exchange (for example, a foreign exchange or market) and the time the Fund’s share price is calculated. Significant events include, but are not limited to the following: significant fluctuations in domestic markets, foreign markets or foreign currencies; occurrences not directly tied to the securities markets such as natural disasters, armed conflicts or significant governmental actions; and major announcements affecting a single issuer or an entire market or market sector. In responding to a significant event, the Pricing Committee determines the fair value of affected securities by considering factors including, but not limited to: index options and futures traded subsequent to the close; American Depositary Receipts (“ADRs”), Global Depositary Receipts (“GDRs”) or other related receipts; currency spot or forward markets that trade after pricing of the foreign exchange; other derivative securities traded after the close such as Standard & Poor’s Depositary Receipts (“SPDRs”) and other exchange traded funds (“ETFs”); and alternative market quotes on the affected securities. When applicable, the Funds use a systematic fair valuation model provided by an independent third party to assist in adjusting the valuation of foreign securities. When a Fund uses this fair value pricing method, the value assigned to the Fund’s foreign securities may not be the quoted or published prices of the investments on their primary markets or exchanges and the securities are categorized in level 2. These valuation procedures apply equally to long or short equity positions in a Fund.
Corporate debt securities — Investments are valued at current market value by a commercial pricing service, or by using the last sale or bid price based on observable inputs. Observable inputs may include benchmark yields, reported trades, broker/dealer quotes, issuer spreads, two-sided markets, benchmark securities, bids, offers and reference data including market research publications. Although most corporate bonds are categorized in level 2 of the fair value hierarchy, in instances where observable inputs are not available, they are categorized as level 3.
Short-term notes — Investments maturing in 60 days or less at time of purchase, are generally valued at amortized cost, unless it is determined that the amortized cost method would not represent fair value, in which case the securities are marked-to-market. To the extent the inputs are observable and timely, the values would be categorized in level 2 of the fair value hierarchy.
Asset-backed securities — Investments are priced using the closing bid as supplied by a commercial pricing service based on observable inputs. Observable inputs may include benchmark yields, reported trades, broker/dealer quotes, issuer spreads, two-sided markets, benchmark securities, bids, offers and reference data including market research publications, new issue data, monthly payment information and collateral performance. Although most asset-backed securities are categorized in level 2 of the fair value hierarchy, in instances where observable inputs are not available, they are categorized as level 3.
U.S. government issuers — Investments are priced using the closing bid as supplied by a commercial pricing service based on observable inputs. Observable inputs may include benchmark yields, reported trades, broker/dealer quotes, issuer spreads, two-sided markets, benchmark securities, bids, offers and reference data including market research publications. Although most U.S. government bonds are categorized in level 2 of the fair value hierarchy, in instances where observable inputs are not available, they are categorized as level 3.
Derivative instruments — Listed derivatives that are actively traded are valued based on quoted prices from the exchange and are categorized in level 1 of the fair value hierarchy. Exchange-traded options are valued at the last sale price in the market where they are principally traded. If there are no sales on the primary exchange or market on a given day, then the option is valued at the most recent bid price on the primary exchange or market as provided by a pricing service.
Restricted securities — If market quotations are not readily available for the Funds’ investments in securities such as restricted securities, private placements, securities for which trading has been halted or other illiquid securities, these investments are valued at fair value in accordance with Board-approved Pricing Policies and Procedures by the Joint Pricing Committee of the Advisor and the Funds (“Pricing Committee”) with oversight by the Board of Trustees. Fair value is defined as the price that would be received upon the sale of an asset, or paid to transfer a liability, in an orderly transaction between market participants at the measurement date under current market conditions. For each applicable investment that is fair valued, the Pricing Committee considers, to the extent applicable, various factors including, but not limited to, the financial condition of the company or limited partnership, operating results, prices paid in follow-on rounds, comparable companies in the public market, the nature and duration of the restrictions for holding the securities, and other relevant factors. Depending on the relative significance of valuation inputs, these instruments may be classified in either level 2 or level 3 of the fair value hierarchy.
126
As of September 30, 2010, the aggregate amount of fair valued securities, excluding any foreign securities fair valued pursuant to a systematic fair valuation model, as a percentage of net assets for the Funds was as follows:
| | | | |
Core Growth Fund | | | — | |
Emerging Markets Small Cap Fund | | | 0.16 | % |
Global Opportunities Fund | | | 0.02 | % |
Global Science & Technology Fund | | | 1.89 | % |
Heritage Growth Fund | | | — | |
International Growth Fund | | | 1.84 | % |
International Opportunities Fund | | | 0.03 | % |
Micro Cap Fund | | | 0.22 | % |
Micro Cap Value Fund | | | 0.20 | % |
Small Cap Growth Fund | | | 1.24 | % |
Small Cap Value Fund | | | — | |
Strategic Income Fund | | | 1.28 | % |
Ultra Growth Fund | | | 3.72 | % |
Wasatch-1st Source Income Equity Fund | | | — | |
Wasatch-1st Source Long/Short Fund | | | — | |
U.S. Treasury Fund | | | — | |
Wasatch-1st Source Income Fund | | | 0.51 | % |
16. FAIR VALUE MEASUREMENTS
The Funds use various methods to measure the fair value of most of their investments on a recurring basis. U.S. GAAP established a hierarchy that prioritizes inputs to valuation methods. The three levels of inputs are:
| | Ÿ | | Level 1 — Unadjusted quoted prices in active markets for identical assets or liabilities that the Funds have the ability to access. |
| | Ÿ | | Level 2 — Observable inputs other than quoted prices included in level 1 that are observable for the asset or liability, either directly or indirectly. The inputs may include quoted prices for the identical investment on an inactive market, prices for similar investments, interest rates, prepayment speeds, credit risk, yield curves, default rates and similar data. |
| | Ÿ | | Level 3 — Unobservable inputs for the asset or liability, to the extent relevant observable inputs are not available, representing the Funds’ own assumptions about the assumptions a market participant would use in valuing the asset or liability, and would be based on the best information available. |
The availability of observable inputs can vary from security to security and is affected by a wide variety of factors, including, for example, the type of security, whether a security is new and not yet established in the marketplace, the liquidity of markets, and other characteristics particular to the security. To the extent that valuation is based on models or inputs that are less observable or unobservable in the market, the determination of fair value requires more judgment. Accordingly, the degree of judgment exercised in determining fair value is greatest for instruments categorized in level 3.
The Funds’ policy is to recognize transfers between levels at the end of the reporting period.
The following is a summary of the fair valuations according to the inputs used as of September 30, 2010 in valuing the Funds’ assets and liabilities:
| | | | | | | | | | | | | | | | | | |
| Fund | | Category | | Quoted Prices
in Active Markets
for Identical
Investments
(Level 1) | | | Significant Other
Observable Inputs
(Level 2) | | | Significant
Unobservable
Inputs
(Level 3) | | | Value at
9/30/2010 | |
Core Growth Fund | | | | | | | | | | | | | | | | | | |
Assets | | | | | | | | | | | | | | | | | | |
Common Stocks | | | | $ | 394,874,393 | | | $ | — | | | $ | — | | | $ | 394,874,393 | |
Preferred Stocks | | | | | 6,172,869 | | | | — | | | | — | | | | 6,172,869 | |
Short-Term Investments | | | | | — | | | | 16,653,000 | | | | — | | | | 16,653,000 | |
| | | | | | |
| | | | $ | 401,047,262 | | | $ | 16,653,000 | | | $ | — | | | $ | 417,700,262 | |
| | | | | | |
127
| | |
| WASATCH FUNDS — Notes to Financial Statements (continued) | | |
|
| |
| |
| | | | | | | | | | | | | | | | | | |
| Fund | | Category | | Quoted Prices
in Active Markets
for Identical
Investments
(Level 1) | | | Significant Other
Observable Inputs
(Level 2) | | | Significant
Unobservable
Inputs
(Level 3) | | | Value at
9/30/2010 | |
Emerging Markets Small Cap Fund | | | | | | | | | | | | | | | | | | |
Assets | | | | | | | | | | | | | | | | | | |
Common Stocks | | Restaurants | | $ | 3,990,730 | | | $ | — | | | $ | 298 | | | $ | 3,991,028 | |
| | Other | | | 421,775,837 | | | | — | | | | — | | | | 421,775,837 | |
Preferred Stocks | | | | | 14,093,820 | | | | — | | | | — | | | | 14,093,820 | |
Limited Partnership Interest | | | | | 1,415,640 | | | | — | | | | — | | | | 1,415,640 | |
Warrants | | | | | 20,074 | | | | — | | | | — | | | | 20,074 | |
Short-Term Investments | | | | | — | | | | 14,721,000 | | | | — | | | | 14,721,000 | |
| | | | | | |
| | | | $ | 441,296,101 | | | $ | 14,721,000 | | | $ | 298 | | | $ | 456,017,399 | |
| | | | | | |
Global Opportunities Fund | | | | | | | | | | | | | | | | | | |
Assets | | | | | | | | | | | | | | | | | | |
Common Stocks | | Auto Parts & Equipment | | $ | 1,120,101 | | | $ | — | | | $ | 21,790 | | | $ | 1,141,891 | |
| | Other | | | 222,129,639 | | | | — | | | | — | | | | 222,129,639 | |
Preferred Stocks | | | | | 835,171 | | | | — | | | | — | | | | 835,171 | |
Limited Partnership Interest | | | | | 360,000 | | | | — | | | | — | | | | 360,000 | |
Warrants | | | | | 11,794 | | | | 28,800 | | | | — | | | | 40,594 | |
Short-Term Investments | | | | | — | | | | 10,658,000 | | | | — | | | | 10,658,000 | |
| | | | | | |
| | | | $ | 224,456,705 | | | $ | 10,686,800 | | | $ | 21,790 | | | $ | 235,165,295 | |
| | | | | | |
Global Science & Technology Fund | | | | | | | | | | | | | | | | | | |
Assets | | | | | | | | | | | | | | | | | | |
Common Stocks | | Internet Software & Services | | $ | 4,550,294 | | | $ | — | | | $ | 65 | | | $ | 4,550,359 | |
| | Other | | | 58,733,817 | | | | — | | | | — | | | | 58,733,817 | |
Preferred Stocks | | | | | — | | | | — | | | | 770,952 | | | | 770,952 | |
Limited Partnership Interest | | | | | — | | | | — | | | | 421,896 | | | | 421,896 | |
Warrants | | | | | — | | | | 51,480 | | | | 8 | | | | 51,488 | |
Short-Term Investments | | | | | — | | | | 1,179,000 | | | | — | | | | 1,179,000 | |
| | | | | | |
| | | | $ | 63,284,111 | | | $ | 1,230,480 | | | $ | 1,192,921 | | | $ | 65,707,512 | |
| | | | | | |
Heritage Growth Fund | | | | | | | | | | | | | | | | | | |
Assets | | | | | | | | | | | | | | | | | | |
Common Stocks | | | | $ | 75,342,566 | | | $ | — | | | $ | — | | | $ | 75,342,566 | |
Short-Term Investments | | | | | — | | | | 2,810,000 | | | | — | | | | 2,810,000 | |
| | | | | | |
| | | | $ | 75,342,566 | | | $ | 2,810,000 | | | $ | — | | | $ | 78,152,566 | |
| | | | | | |
International Growth Fund | | | | | | | | | | | | | | | | | | |
Assets | | | | | | | | | | | | | | | | | | |
Common Stocks | | | | $ | 267,953,681 | | | $ | — | | | $ | — | | | $ | 267,953,681 | |
Preferred Stocks | | | | | 3,594,384 | | | | — | | | | — | | | | 3,594,384 | |
Limited Partnership Interest | | | | | 1,182,280 | | | | — | | | | — | | | | 1,182,280 | |
Short-Term Investments | | | | | — | | | | 12,766,000 | | | | — | | | | 12,766,000 | |
| | | | | | |
| | | | $ | 272,730,345 | | | $ | 12,766,000 | | | $ | — | | | $ | 285,496,345 | |
| | | | | | |
International Opportunities Fund | | | | | | | | | | | | | | | | | | |
Assets | | | | | | | | | | | | | | | | | | |
Common Stocks | | Auto Parts & Equipment | | $ | 1,805,022 | | | $ | — | | | $ | 44,108 | | | $ | 1,849,130 | |
| | Education Services | | | 637,011 | | | | — | | | | 7,905 | | | | 644,916 | |
| | Restaurants | | | 1,956,634 | | | | — | | | | 750 | | | | 1,957,384 | |
| | Other | | | 139,521,548 | | | | — | | | | — | | | | 139,521,548 | |
Preferred Stocks | | | | | 1,324,503 | | | | — | | | | — | | | | 1,324,503 | |
Limited Partnership Interest | | | | | 826,552 | | | | — | | | | — | | | | 826,552 | |
Warrants | | | | | 17,778 | | | | — | | | | — | | | | 17,778 | |
Short-Term Investments | | | | | — | | | | 4,292,000 | | | | — | | | | 4,292,000 | |
| | | | | | |
| | | | $ | 146,089,048 | | | $ | 4,292,000 | | | $ | 52,763 | | | $ | 150,433,811 | |
| | | | | | |
Liabilities | | | | | | | | | | | | | | | | | | |
Foreign Exchange Contracts | | | | $ | — | | | $ | (95,860 | ) | | $ | — | | | $ | (95,860 | ) |
| | | | | | |
| | | | $ | — | | | $ | (95,860 | ) | | $ | — | | | $ | (95,860 | ) |
| | | | | | |
128
| | | | | | | | | | | | | | | | | | |
| Fund | | Category | | Quoted Prices
in Active Markets
for Identical
Investments
(Level 1) | | | Significant Other
Observable Inputs
(Level 2) | | | Significant
Unobservable
Inputs
(Level 3) | | | Value at
9/30/2010 | |
Micro Cap Fund | | | | | | | | | | | | | | | | | | |
Assets | | | | | | | | | | | | | | | | | | |
Common Stocks | | Specialized Finance | | $ | — | | | $ | — | | | $ | 281,050 | | | $ | 281,050 | |
| | Other | | | 272,663,057 | | | | — | | | | — | | | | 272,663,057 | |
Preferred Stocks | | | | | 3,318,326 | | | | — | | | | — | | | | 3,318,326 | |
Warrants | | | | | — | | | | 349,851 | | | | — | | | | 349,851 | |
Short-Term Investments | | | | | — | | | | 6,492,000 | | | | — | | | | 6,492,000 | |
| | | | | | |
| | | | $ | 275,981,383 | | | $ | 6,841,851 | | | $ | 281,050 | | | $ | 283,104,284 | |
| | | | | | |
Micro Cap Value Fund | | | | | | | | | | | | | | | | | | |
Assets | | | | | | | | | | | | | | | | | | |
Common Stocks | | Diversified Banks | | $ | 2,225,214 | | | $ | — | | | $ | 215,002 | | | $ | 2,440,216 | |
| | Specialized Finance | | | 1,333,800 | | | | — | | | | 76,468 | | | | 1,410,268 | |
| | Other | | | 154,584,914 | | | | — | | | | — | | | | 154,584,914 | |
Warrants | | | | | — | | | | 79,560 | | | | — | | | | 79,560 | |
Short-Term Investments | | | | | — | | | | 28,445,000 | | | | — | | | | 28,445,000 | |
| | | | | | |
| | | | $ | 158,143,928 | | | $ | 28,524,560 | | | $ | 291,470 | | | $ | 186,959,958 | |
| | | | | | |
Liabilities | | | | | | | | | | | | | | | | | | |
Equity Contracts | | | | $ | (449,000 | ) | | $ | — | | | $ | — | | | $ | (449,000 | ) |
| | | | | | |
| | | | $ | (449,000 | ) | | $ | — | | | $ | — | | | $ | (449,000 | ) |
| | | | | | |
Small Cap Growth | | | | | | | | | | | | | | | | | | |
Assets | | | | | | | | | | | | | | | | | | |
Common Stocks | | Health Care Equipment | | $ | 16,855,563 | | | $ | — | | | $ | 275,437 | | | $ | 17,131,000 | |
| | Health Care Services | | | 12,604,659 | | | | — | | | | 3,628 | | | | 12,608,287 | |
| | Other | | | 1,046,384,423 | | | | — | | | | — | | | | 1,046,384,423 | |
Preferred Stocks | | | | | — | | | | — | | | | 7,832,752 | | | | 7,832,752 | |
Limited Partnership Interest | | | | | — | | | | — | | | | 5,253,847 | | | | 5,253,847 | |
Warrants | | | | | — | | | | 147,384 | | | | 11 | | | | 147,395 | |
Rights | | | | | — | | | | — | | | | 214,781 | | | | 214,781 | |
Short-Term Investments | | | | | — | | | | 22,350,000 | | | | — | | | | 22,350,000 | |
| | | | | | |
| | | | $ | 1,075,844,645 | | | $ | 22,497,384 | | | $ | 13,580,456 | | | $ | 1,111,922,485 | |
| | | | | | |
Small Cap Value Fund | | | | | | | | | | | | | | | | | | |
Assets | | | | | | | | | | | | | | | | | | |
Common Stocks | | | | $ | 209,241,332 | | | $ | — | | | $ | — | | | $ | 209,241,332 | |
Short-Term Investments | | | | | — | | | | 2,096,000 | | | | — | | | | 2,096,000 | |
| | | | | | |
| | | | $ | 209,241,332 | | | $ | 2,096,000 | | | $ | — | | | $ | 211,337,332 | |
| | | | | | |
Strategic Income Fund | | | | | | | | | | | | | | | | | | |
Assets | | | | | | | | | | | | | | | | | | |
Common Stocks | | Diversified REITs | | $ | 233,662 | | | $ | 177,857 | | | $ | — | | | $ | 411,519 | |
| | Other | | | 16,270,456 | | | | — | | | | — | | | | 16,270,456 | |
Preferred Stocks | | | | | 417,725 | | | | — | | | | — | | | | 417,725 | |
Exchange Traded Funds | | | | | 353,438 | | | | — | | | | — | | | | 353,438 | |
Limited Liability Company Membership Interest | | | | | — | | | | — | | | | 225,655 | | | | 225,655 | |
Limited Partnership Interest | | | | | 395,838 | | | | — | | | | — | | | | 395,838 | |
Corporate Bonds | | | | | — | | | | — | | | | 23,692 | | | | 23,692 | |
Short-Term Investments | | | | | — | | | | 1,357,000 | | | | — | | | | 1,357,000 | |
| | | | | | |
| | | | $ | 17,671,119 | | | $ | 1,534,857 | | | $ | 249,347 | | | $ | 19,455,323 | |
| | | | | | |
Ultra Growth Fund | | | | | | | | | | | | | | | | | | |
Assets | | | | | | | | | | | | | | | | | | |
Common Stocks | | Health Care Equipment | | $ | 11,139,237 | | | $ | — | | | $ | 183,625 | | | $ | 11,322,862 | |
| | Health Care Services | | | 2,249,536 | | | | — | | | | 1,089 | | | | 2,250,625 | |
| | Internet Software & Services | | | 4,905,293 | | | | — | | | | 914 | | | | 4,906,207 | |
| | Personal Products | | | — | | | | — | | | | 504 | | | | 504 | |
| | Other | | | 134,071,917 | | | | — | | | | — | | | | 134,071,917 | |
Preferred Stocks | | | | | — | | | | — | | | | 1,477,072 | | | | 1,477,072 | |
Limited Partnership Interest | | | | | — | | | | — | | | | 4,831,951 | | | | 4,831,951 | |
Warrants | | | | | — | | | | 146,077 | | | | — | | | | 146,077 | |
Short-Term Investments | | | | | — | | | | 18,309,000 | | | | — | | | | 18,309,000 | |
| | | | | | |
| | | | $ | 152,365,983 | | | $ | 18,455,077 | | | $ | 6,495,155 | | | $ | 177,316,215 | |
| | | | | | |
129
| | |
| WASATCH FUNDS — Notes to Financial Statements (continued) | | |
|
| |
| |
| | | | | | | | | | | | | | | | | | |
| Fund | | Category | | Quoted Prices
in Active Markets
for Identical
Investments
(Level 1) | | | Significant Other
Observable Inputs
(Level 2) | | | Significant
Unobservable
Inputs
(Level 3) | | | Value at
9/30/2010 | |
Wasatch-1st Source Income Equity Fund | | | | | | | | | | | | | | | | | | |
Assets | | | | | | | | | | | | | | | | | | |
Common Stocks | | | | $ | 1,593,837,853 | | | $ | — | | | $ | — | | | $ | 1,593,837,853 | |
Short-Term Investments | | | | | — | | | | 34,508,000 | | | | — | | | | 34,508,000 | |
| | | | | | | | | | |
| | | | $ | 1,593,837,853 | | | $ | 34,508,000 | | | $ | — | | | $ | 1,628,345,853 | |
| | | | | | |
Wasatch-1st Source Long/Short Fund | | | | | | | | | | | | | | | | | | |
Assets | | | | | | | | | | | | | | | | | | |
Common Stocks | | | | $ | 272,620,473 | | | $ | — | | | $ | — | | | $ | 272,620,473 | |
Preferred Stocks | | | | | 5,760,750 | | | | — | | | | — | | | | 5,760,750 | |
Short-Term Investments | | | | | — | | | | 32,403,000 | | | | — | | | | 32,403,000 | |
| | | | | | |
| | | | $ | 278,381,223 | | | $ | 32,403,000 | | | $ | — | | | $ | 310,784,223 | |
| | | | | | |
Liabilities | | | | | | | | | | | | | | | | | | |
Equity Contracts | | | | $ | (4,172,550 | ) | | $ | — | | | $ | — | | | $ | (4,172,550 | ) |
Securities Sold Short | | | | | (28,748,307 | ) | | | — | | | | — | | | | (28,748,307 | ) |
| | | | | | |
| | | | $ | (32,920,857 | ) | | $ | — | | | $ | — | | | $ | (32,920,857 | ) |
| | | | | | |
U.S. Treasury Fund | | | | | | | | | | | | | | | | | | |
Assets | | | | | | | | | | | | | | | | | | |
U.S. Government Obligations | | | | $ | — | | | $ | 198,937,806 | | | $ | — | | | $ | 198,937,806 | |
Short-Term Investments | | | | | — | | | | 1,318,000 | | | | — | | | | 1,318,000 | |
| | | | | | |
| | | | $ | — | | | $ | 200,255,806 | | | $ | — | | | $ | 200,255,806 | |
| | | | | | |
Wasatch-1st Source Income Fund | | | | | | | | | | | | | | | | | | |
Assets | | | | | | | | | | | | | | | | | | |
Asset Backed Securities | | | | $ | — | | | $ | 3,212,771 | | | $ | — | | | $ | 3,212,771 | |
Collateralized Mortgage Obligations | | | | | — | | | | 35,466,853 | | | | — | | | | 35,466,853 | |
Corporate Bonds | | | | | — | | | | 39,775,065 | | | | — | | | | 39,775,065 | |
Municipal Bonds | | | | | — | | | | 1,265,472 | | | | — | | | | 1,265,472 | |
Mutual Funds | | | | | 870,390 | | | | — | | | | — | | | | 870,390 | |
Exchange Traded Funds | | | | | 1,357,080 | | | | — | | | | — | | | | 1,357,080 | |
U.S. Government Agency Securities | | | | | — | | | | 31,260,154 | | | | — | | | | 31,260,154 | |
U.S. Treasury Bonds | | | | | — | | | | 17,065,655 | | | | — | | | | 17,065,655 | |
U.S. Treasury Inflation Protected Securities | | | | | — | | | | 2,766,082 | | | | — | | | | 2,766,082 | |
Preferred Stocks | | | | | 1,027,300 | | | | — | | | | — | | | | 1,027,300 | |
Short-Term Investments | | | | | — | | | | 2,980,000 | | | | — | | | | 2,980,000 | |
| | | | | | |
| | | | $ | 3,254,770 | | | $ | 133,792,052 | | | $ | — | | | $ | 137,046,822 | |
| | | | | | |
The valuation techniques used by the Funds to measure fair value for the period ended September 30, 2010 maximized the use of observable inputs and minimized the use of unobservable inputs.
There were no significant transfers between level 1 and level 2 during the period.
The following is a reconciliation of the fair valuations using significant unobservable inputs (Level 3) for the Funds during the year ended September 30, 2010:
| | | | | | | | | | | | | | | | | | | | | | | | | | | | | | |
| Fund | | Market Value
Beginning
Balance
9/30/2009 | | Purchases
at Cost/
Sales
(Proceeds) | | | Realized
Gain/(Loss) | | | Change in
Unrealized
Appreciation
(Depreciation) | | | Transfers
in at
Market Value | | | Transfers
out at
Market Value | | | Market Value
Ending Balance
9/30/2010 | | | Net Change in
Unrealized
Appreciation
(Depreciation) on
Investments Held
at 9/30/2010 | |
Core Growth Fund | | | | | | | | | | | | | | | | | | | | | | | | | | | | | | |
Common Stocks | | $7,304,498 | | $ | — | | | $ | — | | | $ | 287,837 | | | $ | — | | | $ | (7,592,335 | ) | | $ | — | | | $ | — | |
| | | |
Emerging Markets Small Cap Fund | | | | | | | | | | | | | | | | | | | | | | | | | | | | | | |
Common Stocks | | 114,864 | | | — | | | | — | | | | (114,566 | ) | | | — | | | | — | | | | 298 | | | | (114,566 | ) |
| | | |
Global Opportunities Fund | | | | | | | | | | | | | | | | | | | | | | | | | | | | | | |
Common Stocks | | 140,400 | | | — | | | | (186,196 | ) | | | 241,186 | | | | — | | | | (173,600 | ) | | | 21,790 | | | | (7,293 | ) |
| | | |
130
| | | | | | | | | | | | | | | | | | | | | | | | | | | | | | |
| Fund | | Market Value
Beginning
Balance
9/30/2009 | | Purchases
at Cost/
Sales
(Proceeds) | | | Realized
Gain/(Loss) | | | Change in
Unrealized
Appreciation
(Depreciation) | | | Transfers
in at
Market Value | | | Transfers
out at
Market Value | | | Market Value
Ending Balance
9/30/2010 | | | Net Change in
Unrealized
Appreciation
(Depreciation) on
Investments Held
at 9/30/2010 | |
Global Science & Technology Fund | | | | | | | | | | | | | | | | | | | | | | | | | | | | | | |
Common Stocks | | 192,172 | | | (205,283 | ) | | | 92,471 | | | | 25,299 | | | | — | | | | (104,594 | ) | | | 65 | | | | (2,089 | ) |
Preferred Stocks | | 953,065 | | | 60,028 | | | | (139,219 | ) | | | (102,922 | ) | | | — | | | | — | | | | 770,952 | | | | (242,141 | ) |
Limited Partnership Interest | | 339,596 | | | 35,000 | | | | — | | | | 47,300 | | | | — | | | | — | | | | 421,896 | | | | 47,300 | |
Warrants | | — | | | 8 | | | | — | | | | — | | | | — | | | | — | | | | 8 | | | | — | |
| | | |
| | 1,484,833 | | | (110,247 | ) | | | (46,748 | ) | | | (30,323 | ) | | | — | | | | (104,594 | ) | | | 1,192,921 | | | | (196,930 | ) |
| | | |
International Opportunities Fund | | | | | | | | | | | | | | | | | | | | | | | | | | | | | | |
Common Stocks | | 363,405 | | | — | | | | (432,492 | ) | | | 121,850 | | | | — | | | | — | | | | 52,763 | | | | (302,118 | ) |
| | | |
Micro Cap Fund | | | | | | | | | | | | | | | | | | | | | | | | | | | | | | |
Common Stocks | | 2,645,451 | | | (558,103 | ) | | | 196,343 | | | | (226,686 | ) | | | — | | | | (1,775,955 | ) | | | 281,050 | | | | (830,830 | ) |
| | | |
Micro Cap Value Fund | | | | | | | | | | | | | | | | | | | | | | | | | | | | | | |
Common Stocks | | 2,403,636 | | | — | | | | 27,048 | | | | (396,044 | ) | | | — | | | | (1,743,170 | ) | | | 291,470 | | | | (257,162 | ) |
| | | |
Small Cap Growth Fund | | | | | | | | | | | | | | | | | | | | | | | | | | | | | | |
Common Stocks | | 1,045,515 | | | — | | | | — | | | | 531,352 | | | | — | | | | (1,297,802 | ) | | | 279,065 | | | | 81,011 | |
Preferred Stocks | | 3,037,223 | | | 4,556,487 | | | | (3,060,778 | ) | | | 3,299,820 | | | | — | | | | — | | | | 7,832,752 | | | | 239,042 | |
Limited Partnership Interest | | 4,205,345 | | | 530,000 | | | | — | | | | 518,502 | | | | — | | | | — | | | | 5,253,847 | | | | 518,502 | |
Convertible Note | | 113,374 | | | (113,374 | ) | | | — | | | | — | | | | — | | | | — | | | | — | | | | — | |
Warrants | | 11 | | | — | | | | — | | | | — | | | | — | | | | — | | | | 11 | | | | — | |
Rights | | — | | | — | | | | — | | | | 214,781 | | | | — | | | | — | | | | 214,781 | | | | 214,781 | |
| | | |
| | 8,401,468 | | | 4,973,113 | | | | (3,060,778 | ) | | | 4,564,455 | | | | — | | | | (1,297,802 | ) | | | 13,580,456 | | | | 1,053,336 | |
| | | |
Small Cap Value Fund | | | | | | | | | | | | | | | | | | | | | | | | | | | | | | |
Common Stocks | | $6,894,351 | | $ | — | | | $ | 276,328 | | | $ | (2,147,321 | ) | | $ | — | | | $ | (5,023,358 | ) | | $ | — | | | $ | — | |
| | | |
Strategic Income Fund | | | | | | | | | | | | | | | | | | | | | | | | | | | | | | |
Common Stocks | | 162,680 | | | — | | | | — | | | | 6,410 | | | | — | | | | (169,090 | ) | | | — | | | | — | |
Limited Liability Company Membership Interest | | — | | | 578,644 | | | | — | | | | (352,989 | ) | | | — | | | | — | | | | 225,655 | | | | (352,989 | ) |
Corporate Bonds | | — | | | (11,041 | ) | | | 80 | | | | 10,961 | | | | 23,692 | | | | — | | | | 23,692 | | | | 10,961 | |
| | | |
| | 162,680 | | | 567,603 | | | | 80 | | | | (335,618 | ) | | | 23,692 | | | | (169,090 | ) | | | 249,347 | | | | (342,028 | ) |
| | | |
Ultra Growth Fund | | | | | | | | | | | | | | | | | | | | | | | | | | | | | | |
Common Stocks | | 759,246 | | | — | | | | (2,531 | ) | | | 385,705 | | | | — | | | | (956,288 | ) | | | 186,132 | | | | 24,763 | |
Preferred Stocks | | 1,523,113 | | | 46,235 | | | | — | | | | (92,276 | ) | | | — | | | | — | | | | 1,477,072 | | | | (92,276 | ) |
Limited Partnership Interest | | 3,865,754 | | | 495,000 | | | | — | | | | 471,197 | | | | — | | | | — | | | | 4,831,951 | | | | 471,197 | |
| | | |
| | 6,148,113 | | | 541,235 | | | | (2,531 | ) | | | 764,626 | | | | — | | | | (956,288 | ) | | | 6,495,155 | | | | 403,684 | |
| | | |
Wasatch-1st Source Income Fund | | | | | | | | | | | | | | | | | | | | | | | | | | | | | | |
Municipal Bonds | | 1,578,555 | | | (1,650,000 | ) | | | — | | | | 71,445 | | | | — | | | | — | | | | — | | | | — | |
| | | |
17. FAIR VALUEOF DERIVATIVE INSTRUMENTS*
The following is a summary of the fair valuations of the Funds’ derivative instruments categorized by risk exposure:
WASATCH GLOBAL SCIENCE & TECHNOLOGY FUND
The Effect of Derivative Instruments on the Statement of Operations for the Year Ended September 30, 2010:
| | | | | | | | | | | | | | | | | | | | | | | | |
| | | Derivatives not accounted for as hedging instruments under Statement 133 | |
| | | Interest Rate
Contracts | | | Foreign Exchange
Contracts | | | Credit
Contracts | | | Equity
Contracts | | | Other
Contracts | | | Total | |
Realized Gain (Loss) on Derivatives Recognized in Income | | | | | | | | | | | | | | | | | | | | | | | | |
Net realized gain (loss) on investments and foreign currency translations | | $ | — | | | $ | — | | | $ | — | | | $ | (22,000 | ) | | $ | — | | | $ | (22,000 | ) |
| | | | |
131
| | |
| WASATCH FUNDS — Notes to Financial Statements (continued) | | |
|
| |
| |
WASATCH HERITAGE GROWTH FUND
The Effect of Derivative Instruments on the Statement of Operations for the Year Ended September 30, 2010:
| | | | | | | | | | | | | | | | | | | | | | | | |
| | | Derivatives not accounted for as hedging instruments under Statement 133 | |
| | | Interest Rate
Contracts | | | Foreign Exchange
Contracts | | | Credit
Contracts | | | Equity
Contracts | | | Other
Contracts | | | Total | |
Realized Gain (Loss) on Derivatives Recognized in Income | | | | | | | | | | | | | | | | | | | | | | | | |
Net realized gain on options written | | $ | — | | | $ | — | | | $ | — | | | $ | 630 | | | $ | — | | | $ | 630 | |
| | | | |
WASATCH INTERNATIONAL OPPORTUNITIES FUND
Fair Values of Derivative Instruments on the Statement of Assets and Liabilities as of September 30, 2010:
| | | | | | | | | | | | | | | | | | | | | | | | |
| | | Derivatives not accounted for as hedging instruments under Statement 133 | |
| | | Interest Rate
Contracts | | | Foreign Exchange
Contracts | | | Credit
Contracts | | | Equity
Contracts | | | Other
Contracts | | | Total | |
Liabilities Derivatives | | | | | | | | | | | | | | | | | | | | | | | | |
Unrealized depreciation on foreign currency contracts | | $ | — | | | $ | 95,860 | | | $ | — | | | $ | — | | | $ | — | | | $ | 95,860 | |
| | | | |
The Effect of Derivative Instruments on the Statement of Operations for the Year Ended September 30, 2010:
| | | | | | | | | | | | | | | | | | | | | | | | |
| | | Derivatives not accounted for as hedging instruments under Statement 133 | |
| | | Interest Rate
Contracts | | | Foreign Exchange
Contracts | | | Credit
Contracts | | | Equity
Contracts | | | Other
Contracts | | | Total | |
Realized Gain (Loss) on Derivatives Recognized in Income | | | | | | | | | | | | | | | | | | | | | | | | |
Net realized gain (loss) on investments and foreign currency translations | | $ | — | | | $ | (61,562 | ) | | $ | — | | | $ | — | | | $ | — | | | $ | (61,562 | ) |
| | | | |
| | | | | | |
Net Change in Unrealized Appreciation (Depreciation) on Derivatives Recognized in Income | | | | | | | | | | | | | | | | | | | | | | | | |
Change in unrealized appreciation (depreciation) on investments and foreign currency translations | | $ | — | | | $ | (95,860 | ) | | $ | — | | | $ | — | | | $ | — | | | $ | (95,860 | ) |
| | | | |
WASATCH MICRO CAP VALUE FUND
Fair Values of Derivative Instruments on the Statement of Assets and Liabilities as of September 30, 2010:
| | | | | | | | | | | | | | | | | | | | | | | | |
| | | Derivatives not accounted for as hedging instruments under Statement 133 | |
| | | Interest Rate
Contracts | | | Foreign Exchange
Contracts | | | Credit
Contracts | | | Equity
Contracts | | | Other
Contracts | | | Total | |
Liabilities Derivatives | | | | | | | | | | | | | | | | | | | | | | | | |
Call options written at value | | $ | — | | | $ | — | | | $ | — | | | $ | 449,000 | | | $ | — | | | $ | 449,000 | |
| | | | |
The Effect of Derivative Instruments on the Statement of Operations for the Year Ended September 30, 2010:
| | | | | | | | | | | | | | | | | | | | | | | | |
| | | Derivatives not accounted for as hedging instruments under Statement 133 | |
| | | Interest Rate
Contracts | | | Foreign Exchange
Contracts | | | Credit
Contracts | | | Equity
Contracts | | | Other
Contracts | | | Total | |
Realized Gain (Loss) on Derivatives Recognized in Income | | | | | | | | | | | | | | | | | | | | | | | | |
Net realized gain on investments and foreign currency translations | | $ | — | | | $ | (405,290 | ) | | $ | — | | | $ | — | | | $ | — | | | $ | (405,290 | ) |
Net realized gain on options written | | | — | | | | — | | | | — | | | | 866,253 | | | | — | | | | 866,253 | |
| | | | |
| | $ | — | | | $ | (405,290 | ) | | $ | — | | | $ | 866,253 | | | $ | — | | | $ | 460,963 | |
| | | | |
Net Change in Unrealized Appreciation (Depreciation) on Derivatives Recognized in Income | | | | | | | | | | | | | | | | | | | | | | | | |
Change in unrealized appreciation (depreciation) on investments, options written and foreign currency translations | | $ | — | | | $ | — | | | $ | — | | | $ | (74,872 | ) | | $ | — | | | $ | (74,872 | ) |
| | | | |
132
WASATCH STRATEGIC INCOME FUND
The Effect of Derivative Instruments on the Statement of Operations for the Year Ended September 30, 2010:
| | | | | | | | | | | | | | | | | | | | | | | | |
| | | Derivatives not accounted for as hedging instruments under Statement 133 | |
| | | Interest Rate
Contracts | | | Foreign Exchange
Contracts | | | Credit
Contracts | | | Equity
Contracts | | | Other
Contracts | | | Total | |
Realized Gain (Loss) on Derivatives Recognized in Income | | | | | | | | | | | | | | | | | | | | | | | | |
Net realized gain (loss) on investments and foreign currency translations | | $ | — | | | $ | — | | | $ | — | | | $ | 35,216 | | | $ | (179,841 | ) | | $ | (144,625 | ) |
Net realized gain on options written | | | — | | | | — | | | | — | | | | 18,481 | | | | — | | | | 18,481 | |
| | | | |
| | $ | — | | | $ | — | | | $ | — | | | $ | 53,697 | | | $ | (179,841 | ) | | $ | (126,144 | ) |
| | | | |
Net Change in Unrealized Appreciation (Depreciation) on Derivatives Recognized in Income | | | | | | | | | | | | | | | | | | | | | | | | |
Change in unrealized appreciation (depreciation) on investments, options written and foreign currency translations | | $ | — | | | $ | — | | | $ | — | | | $ | (8,532 | ) | | $ | 146,200 | | | $ | 137,668 | |
| | | | |
WASATCH-1ST SOURCE LONG/SHORT FUND
Fair Values of Derivative Instruments on the Statement of Assets and Liabilities as of September 30, 2010:
| | | | | | | | | | | | | | | | | | | | | | | | |
| | | Derivatives not accounted for as hedging instruments under Statement 133 | |
| | | Interest Rate
Contracts | | | Foreign Exchange
Contracts | | | Credit
Contracts | | | Equity
Contracts | | | Other
Contracts | | | Total | |
Liabilities Derivatives | | | | | | | | | | | | | | | | | | | | | | | | |
Call options written at value | | $ | — | | | $ | — | | | $ | — | | | $ | 4,172,550 | | | $ | — | | | $ | 4,172,550 | |
| | | | |
The Effect of Derivative Instruments on the Statement of Operations for the Year Ended September 30, 2010:
| | | | | | | | | | | | | | | | | | | | | | | | |
| | | Derivatives not accounted for as hedging instruments under Statement 133 | |
| | | Interest Rate
Contracts | | | Foreign Exchange
Contracts | | | Credit
Contracts | | | Equity
Contracts | | | Other
Contracts | | | Total | |
Realized Gain (Loss) on Derivatives Recognized in Income | | | | | | | | | | | | | | | | | | | | | | | | |
Net realized gain on options written | | $ | — | | | $ | — | | | $ | — | | | $ | 4,803,888 | | | $ | — | | | $ | 4,803,888 | |
| | | | |
Net Change in Unrealized Appreciation (Depreciation) on Derivatives Recognized in Income | | | | | | | | | | | | | | | | | | | | | | | | |
Change in unrealized appreciation (depreciation) on investments, options written and foreign currency translations | | $ | — | | | $ | — | | | $ | — | | | $ | (2,005,127 | ) | | $ | — | | | $ | (2,005,127 | ) |
| | | | |
| * | See Note 2 — Significant Accounting Policies for additional information. |
For the year ended September 30, 2010, the average monthly balance of outstanding derivative financial instruments was as follows:
| | | | | | | | | | | | | | | | | | | | | | | | |
| | | Global
Science &
Technology
Fund | | | Heritage
Growth
Fund | | | International
Opportunities
Fund | | | Micro Cap
Value
Fund | | | Strategic
Income
Fund | | | Wasatch-1st
Source
Long/Short
Fund | |
Forward currency contracts: | | | | | | | | | | | | | | | | | | | | | | | | |
Average number of contracts — U.S. dollars purchased | | $ | — | | | $ | — | | | $ | 1 | | | $ | 2 | | | $ | — | | | $ | — | |
Average U.S. dollar amounts purchased | | | — | | | | — | | | | 3,816,025 | | | | 9,182,238 | | | | — | | | | — | |
Option contracts: | | | | | | | | | | | | | | | | | | | | | | | | |
Average number of put contracts purchased | | | 21 | | | | — | | | | — | | | | — | | | | — | | | | — | |
Average number of call contracts purchased | | | — | | | | — | | | | — | | | | — | | | | 42 | | | | — | |
Average number of call contracts written | | | — | | | | 3 | | | | — | | | | 727 | | | | 18 | | | | 6,574 | |
Average value of put contracts purchased | | | 2,125 | | | | — | | | | — | | | | — | | | | — | | | | — | |
Average value of call contracts purchased | | | — | | | | — | | | | — | | | | — | | | | 4,229 | | | | — | |
Average value of call contracts written | | | — | | | | 496 | | | | — | | | | 86,003 | | | | 6,383 | | | | 1,459,582 | |
133
| | |
| WASATCH FUNDS — Notes to Financial Statements (continued) | | SEPTEMBER 30, 2010 |
|
| |
| |
18. SUBSEQUENT EVENTS
Management has evaluated the possibility of subsequent events and has determined that there are no additional events that would require adjustment to or additional disclosure in the Funds’ financial statements.
134
| | |
| WASATCH FUNDS — Report of Independent Registered Public Accounting Firm | | SEPTEMBER 30, 2010 |
|
| |
| |
To the Board of Trustees
and Shareholders of
Wasatch Funds Trust:
In our opinion, the accompanying statements of assets and liabilities, including the schedules of investments, and the related statements of operations and of changes in net assets and the financial highlights present fairly, in all material respects, the financial position of each of the funds constituting the Wasatch Funds Trust (hereafter referred to as the “Funds”) at September 30, 2010, the results of each of their operations for the year then ended, the changes in each of their net assets for each of the periods indicated, and the financial highlights for each of the periods indicated (except for the Wasatch-1st Source Income Equity Fund, Wasatch-1st Source Income Fund, and Wasatch-1st Source Long/Short Fund) and the financial highlights for the Wasatch-1st Source Income Equity Fund, Wasatch 1st-Source Income Fund, and Wasatch-1st Source Long/Short Fund for the two years in the period then ended, in conformity with accounting principles generally accepted in the United States of America. These financial statements and financial highlights (hereafter referred to as “financial statements”) are the responsibility of the Funds’ management; our responsibility is to express an opinion on these financial statements based on our audits. We conducted our audits of these financial statements in accordance with the standards of the Public Company Accounting Oversight Board (United States). Those standards require that we plan and perform the audit to obtain reasonable assurance about whether the financial statements are free of material misstatement. An audit includes examining, on a test basis, evidence supporting the amounts and disclosures in the financial statements, assessing the accounting principles used and significant estimates made by management, and evaluating the overall financial statement presentation. We believe that our audits, which included confirmation of securities at September 30, 2010 by correspondence with the custodian and brokers, provide a reasonable basis for our opinion. The financial statements of the Wasatch-1st Source Income Equity Fund, Wasatch-1st Source Income Fund, and Wasatch 1st Source Long/Short Fund as of September 30, 2008 and the financial highlights for the six months then ended were audited by other auditors, whose report dated November 26, 2008 expressed an unqualified opinion on those statements. The financial statements of the Wasatch-1st Source Income Equity Fund, Wasatch-1st Source Income Fund, and Wasatch-1st Source Long/Short Fund as of March 31, 2008 and the financial highlights for each of the three years in the period then ended, were audited by other auditors whose report dated May 22, 2008 expressed an unqualified opinion on those statements.
PricewaterhouseCoopers LLP
Kansas City, MO
November 24, 2010
135
| | |
| WASATCH FUNDS — Supplemental Information | | |
|
| |
| |
MANAGEMENTOFTHE COMPANY
Management Information. The business affairs of Wasatch Funds are supervised by its Board of Trustees. The Board consists of four trustees who are elected and serve until their successors are elected and qualified.
The trustees and executive officers of Wasatch Funds and their principal occupations for at least the last five years are set forth below.
| | | | | | | | | | | | |
| Name, Address and Age | | Position(s)
Held with
Wasatch Funds | | Term of Office1
and Length of
Time Served | | Principal Occupation(s)
During Past 5 Years | | Number of
Portfolios
in Fund
Complex
Overseen
by Trustee | | | Other Directorships Held
by Trustee2 |
Independent Trustees | | | | | | | | | | | | |
| | | | | |
James U. Jensen, J.D., MBA c/o Wasatch Funds 150 Social Hall Ave. 4th Floor Salt Lake City, Utah 84111 Age 66 | | Trustee and Chairman of the Board | | Indefinite Served as Chairman of the Board since 2004 and Trustee since 1986 | | Chief Executive Officer of Clearwater Governance Group (an operating board governance consulting company) July 2008 to present; Co-Founder and Chairman of the Board of Intelisum, Inc. (a company pursuing computer and measurement technology and products) 2001 to 2008; Consultant on corporate growth and technology transfer since 2004; Vice President, Corporate Development, Legal Affairs and General Counsel, and Secretary, NPS Pharmaceuticals, Inc. from 1991 to 2004. | | | 17 | | | Private companies and foundations. Director of Cognigen Networks, Inc. (Internet and relationship enabled marketing company) since December 2007. Director of Bayhill Capital Corp. (telephone communications) since December 2007. |
| | | | | |
William R. Swinyard, Ph.D. c/o Wasatch Funds 150 Social Hall Ave. 4th Floor Salt Lake City, Utah 84111 Age 70 | | Trustee and Chairman of the Audit Committee | | Indefinite Served as Chairman of the Audit Committee since 2004 and Trustee since 1986 | | Professor of Business Management and Holder of the Fred G. Meyer Chair of Marketing (Emeritus), Brigham Young University since 1978. | | | 17 | | | None |
| | | | | |
D. James Croft, Ph.D. c/o Wasatch Funds 150 Social Hall Ave. 4th Floor Salt Lake City, Utah 84111 Age 68 | | Trustee | | Indefinite Served as Trustee since 2005 | | Consultant since 2004 and Founder & Executive Director, Mortgage Asset Research Institute from 1990 to 2004. | | | 17 | | | None |
| | | | | |
Miriam M. Allison3 150 Social Hall Ave. 4th Floor Salt Lake City, UT 84111 Age 63 | | Trustee | | Indefinite Served as Trustee since 2010 | | Rancher since 2004. From 2001 to 2005, Chairman of UMB Fund Services, Inc. | | | 17 | | | Director, Northwestern Mutual Series Fund, Inc. (27 portfolios) since 2006. |
|
| |
Interested Trustee | | | | | | | | | | | | |
| | | | | |
Samuel S. Stewart, Jr., Ph.D. CFA4 150 Social Hall Ave. 4th Floor Salt Lake City, UT 84111 Age 68 | | President and Trustee | | Indefinite Served as President and Trustee since 1986 | | Chairman of the Board for the Advisor since 1975; Chief Investment Officer of the Advisor since 2004; Director of Research of the Advisor from 1975 to 2004; Chairman of the Board of Wasatch Funds from 1986 to 2004. | | | 17 | | | None |
|
| |
| 1 | A Trustee may serve until his/her death, resignation, removal or retirement. Each Independent Trustee shall retire as Trustee at the end of the calendar year in which (s)he attains the age of 72 years. |
| 2 | Directorships are those held by a Trustee in any company with a class of securities registered pursuant to Section 12 of the Securities Exchange Act of 1934 or subject to the requirements of Section 15(d) of the Securities Exchange Act or any company registered as an investment company under the 1940 Act. |
| 3 | Ms. Allison previously owned shares of UMB Financial Corp., the parent company of UMB Fund Services, Inc., the Funds’ transfer agent. As of the date of this statement, Ms. Allison no longer owns such shares. |
| 4 | Mr. Stewart is an Interested Trustee because he serves as a director and officer of the Advisor. |
136
| | |
| | SEPTEMBER 30, 2010 (UNAUDITED) |
|
| |
| |
| | | | | | |
Name, Address
and Age | | Position(s)
Held with
Wasatch Funds | | Term of Office and
Length of Time Served | | Principal Occupation(s)
during Past 5 Years |
Officers | | | | | | |
| | | |
Daniel D. Thurber 150 Social Hall Ave. 4th Floor Salt Lake City, UT 84111 Age 41 | | Vice President | | Indefinite Served as Vice President since February 2007 | | General Counsel, Chief Compliance Officer and Director of Compliance for the Advisor since 2006; Chief Compliance Officer and Secretary for Wasatch Funds from May 2006 to February 2007; Associate and Partner at Dorsey & Whitney LLP from 2001 to 2006. |
| | | |
Russell L. Biles 150 Social Hall Ave. 4th Floor Salt Lake City, UT 84111 Age 42 | | Chief Compliance Officer, Vice President and Secretary | | Indefinite Served as Chief Compliance Officer and Vice President since February 2007 and Secretary since November 2008 | | Chief Compliance Officer and Vice President for Wasatch Funds since February 2007; Counsel for the Advisor since October 2006; Senior Compliance Administrator for the Advisor from October 2005 to October 2006; Attorney and Managing Member of Nicholls Nicholls Biles & Bower, LLC from 2002 to 2005. |
| | | |
Eric Huefner 150 Social Hall Ave. 4th Floor Salt Lake City, UT 84111 Age 46 | | Vice President | | Indefinite Served as Vice President since February 2008 and Treasurer from November 2008 to May 2009 | | Vice President for Wasatch Funds since February 2008; Director of Mutual Funds for the Advisor since June 2006; Business Director, Campbell Soup Company, March 2003 to May 2006. |
| | | |
Cindy B. Firestone, CPA 150 Social Hall Ave. 4th Floor Salt Lake City, UT 84111 Age 52 | | Treasurer | | Indefinite Served as Treasurer since May 2009 | | Treasurer for Wasatch Funds since May 2009, Assistant Treasurer for Wasatch Funds from November 2008 to May 2009; Internal Auditor for the Advisor since December 2002. |
|
| |
Additional information about the Funds’ trustees is provided in the Statement of Additional Information and is available without charge, upon request, by calling 800.551.1700.
137
| | |
| WASATCH FUNDS — Supplemental Information (continued) | | |
|
| |
| |
SHAREHOLDER MEETING RESULTS
A Special Meeting of the Shareholders of the Funds (the “Shareholder Meeting”) was held on February 11, 2010. The purpose of the Shareholder Meeting was to ask shareholders:
| | 1. | To approve the election of Directors; |
| | 2. | To approve a new Advisory and Service Contract between the Company and Wasatch Advisors, Inc. (the “Advisor”); |
| | 3. | To approve a new Sub-Advisory Agreement between the Advisor and Hoisington Investment Management Company (“HIMCO”) with respect to the Wasatch-Hoisington U.S. Treasury Fund (the “U.S. Treasury Fund”); |
| | 4. | To approve a new Sub-Advisory Agreement between the Advisor and 1st Source Corporation Investment Advisors, Inc. (“1st Source”) with respect to the Wasatch-1st Source Income Fund (the “Income Fund”); |
| | 5. | To approve a proposed Agreement and Plan of Reorganization (the “Reorganization Agreement”), pursuant to which each series of the Company — Wasatch Core Growth Fund (the “Core Growth Fund”), Wasatch Emerging Markets Small Cap Fund (the “Emerging Markets Small Cap Fund”), Wasatch Global Opportunities Fund (the “Global Opportunities Fund”), Wasatch Global Science & Technology Fund (the “Global Science & Technology Fund”), Wasatch Heritage Growth Fund (the “Heritage Growth Fund”), Wasatch Heritage Value Fund (the “Heritage Value Fund”), Wasatch International Growth Fund (the “International Growth Fund”), Wasatch International Opportunities Fund, (the “International Opportunities Fund”), Wasatch Micro Cap Fund (the “Micro Cap Fund”), Wasatch Micro Cap Value Fund (the “Micro Cap Value Fund”), Wasatch Small Cap Growth Fund (the “Small Cap Growth Fund”), Wasatch Small Cap Value Fund (the “Small Cap Value Fund”), Wasatch Strategic Income Fund (the “Strategic Income Fund”), Wasatch Ultra Growth Fund (the “Ultra Growth Fund”), the U.S. Treasury Fund, the Income Fund, Wasatch-1st Source Income Equity Fund (the “Income Equity Fund”) and Wasatch-1st Source Long/Short Fund (the “Long/Short Fund”) (each a “Fund” and collectively, the “Funds”) would be reorganized as separate series of Wasatch Funds Trust, a newly-created Massachusetts business trust (the “Trust”) and the liquidation and dissolution of the Funds and the Company. |
At the February 11, 2010 Shareholder Meeting, the shareholders of each Fund approved the election of Directors. At that time, the Shareholder Meeting was adjourned and scheduled to reconvene on March 11, 2010 to allow further time to gather shareholder votes on the other proposals.
On March 11, 2010, the Shareholder Meeting reconvened. The shareholders of each Fund approved the new Advisory and Service Contract with the Advisor. The shareholders of
the U.S. Treasury Fund approved the new Sub-Advisory Agreement with HIMCO. The shareholders of the Income Fund approved the new Sub-Advisory Agreement with 1st Source. In addition, the shareholders of the Funds of the Company approved the reorganization of the Company from a Minnesota corporation to a Massachusetts business trust pursuant to the Reorganization Agreement. The Reorganization was effective as of the close of business on March 31, 2010.
The results of the votes are as set forth below.
Proposal 1
| | | | | | | | | | | | | | | | |
| | | Affirmative | | | Against | | | Abstain | | | Total | |
James U. Jensen | | | 405,954,645 | | | | — | | | | 13,471,464 | | | | 419,426,109 | |
William R. Swinyard | | | 405,846,801 | | | | — | | | | 13,579,307 | | | | 419,426,108 | |
D. James Croft | | | 405,787,730 | | | | — | | | | 13,638,379 | | | | 419,426,109 | |
Miriam M. Allison | | | 405,658,392 | | | | — | | | | 13,767,717 | | | | 419,426,109 | |
Samuel S. Stewart, Jr. | | | 405,750,124 | | | | — | | | | 13,674,985 | | | | 419,425,109 | |
Proposal 2
| | | | | | | | | | | | | | | | |
| Fund | | Affirmative | | | Against | | | Abstain | | | Total | |
Core Growth Fund | | | 7,597,501 | | | | 233,923 | | | | 233,190 | | | | 8,064,614 | |
Emerging Markets Small Cap Fund | | | 26,503,689 | | | | 683,168 | | | | 469,451 | | | | 27,656,308 | |
Global Opportunities Fund | | | 26,488,762 | | | | 202,710 | | | | 312,725 | | | | 27,004,197 | |
Global Science & Technology Fund | | | 2,959,174 | | | | 94,016 | | | | 70,829 | | | | 3,124,019 | |
Heritage Growth Fund | | | 4,692,125 | | | | 141,053 | | | | 115,114 | | | | 4,948,292 | |
Heritage Value Fund | | | 321,365 | | | | 5,968 | | | | 1,345 | | | | 328,678 | |
International Growth Fund | | | 6,642,811 | | | | 260,051 | | | | 193,567 | | | | 7,096,429 | |
International Opportunities Fund | | | 28,529,922 | | | | 551,033 | | | | 500,212 | | | | 29,581,167 | |
Micro Cap Fund | | | 42,326,200 | | | | 1,307,373 | | | | 1,068,337 | | | | 44,701,910 | |
Micro Cap Value Fund | | | 32,965,456 | | | | 880,158 | | | | 654,856 | | | | 34,500,470 | |
Small Cap Growth Fund | | | 17,993,079 | | | | 552,341 | | | | 362,421 | | | | 18,907,841 | |
Small Cap Value Fund | | | 48,983,138 | | | | 1,241,926 | | | | 1,019,041 | | | | 51,244,105 | |
Strategic Income Fund | | | 1,866,208 | | | | 33,408 | | | | 10,907 | | | | 1,910,523 | |
Ultra Growth Fund | | | 4,168,438 | | | | 113,461 | | | | 86,601 | | | | 4,368,500 | |
U.S. Treasury Fund | | | 4,910,255 | | | | 150,319 | | | | 206,607 | | | | 5,267,181 | |
Income Fund | | | 6,820,833 | | | | 150,887 | | | | 240,888 | | | | 7,212,608 | |
Income Equity Fund | | | 61,184,309 | | | | 1,319,897 | | | | 1,510,578 | | | | 64,014,784 | |
Long/Short Fund | | | 8,799,059 | | | | 72,161 | | | | 154,150 | | | | 9,025,370 | |
Proposal 3
| | | | | | | | | | | | | | |
| Affirmative | | | Against | | | Abstain | | | Total | |
| | 4,915,956 | | | | 151,079 | | | | 200,149 | | | | 5,267,184 | |
Proposal 4
| | | | | | | | | | | | | | |
| Affirmative | | | Against | | | Abstain | | | Total | |
| | 6,660,700 | | | | 323,929 | | | | 227,980 | | | | 7,212,609 | |
Proposal 5
| | | | | | | | | | | | | | | | |
| Fund | | Affirmative | | | Against | | | Abstain | | | Total | |
Core Growth Fund | | | 7,063,840 | | | | 722,738 | | | | 278,037 | | | | 8,064,615 | |
Emerging Markets Small Cap Fund | | | 25,587,148 | | | | 1,480,308 | | | | 588,854 | | | | 27,656,310 | |
Global Opportunities Fund | | | 23,555,840 | | | | 3,072,618 | | | | 375,738 | | | | 27,004,196 | |
Global Science & Technology Fund | | | 2,855,553 | | | | 140,258 | | | | 128,207 | | | | 3,124,018 | |
Heritage Growth Fund | | | 4,586,209 | | | | 234,316 | | | | 127,769 | | | | 4,948,294 | |
Heritage Value Fund | | | 320,183 | | | | 6,929 | | | | 1,566 | | | | 328,678 | |
138
| | |
| | SEPTEMBER 30, 2010 (UNAUDITED) |
|
| |
| |
| | | | | | | | | | | | | | | | |
| Fund | | Affirmative | | | Against | | | Abstain | | | Total | |
International Growth Fund | | | 6,361,878 | | | | 481,386 | | | | 253,163 | | | | 7,096,427 | |
International Opportunities Fund | | | 28,107,602 | | | | 893,785 | | | | 579,780 | | | | 29,581,167 | |
Micro Cap Fund | | | 41,451,562 | | | | 1,968,519 | | | | 1,281,827 | | | | 44,701,908 | |
Micro Cap Value Fund | | | 32,035,784 | | | | 1,497,087 | | | | 967,598 | | | | 34,500,469 | |
Small Cap Growth Fund | | | 14,903,920 | | | | 3,561,587 | | | | 442,330 | | | | 18,907,837 | |
Small Cap Value Fund | | | 44,883,530 | | | | 5,042,428 | | | | 1,318,147 | | | | 51,244,105 | |
Strategic Income Fund | | | 1,849,099 | | | | 50,251 | | | | 11,174 | | | | 1,910,524 | |
Ultra Growth Fund | | | 4,082,744 | | | | 165,542 | | | | 120,213 | | | | 4,368,499 | |
U.S. Treasury Fund | | | 4,857,861 | | | | 193,776 | | | | 215,547 | | | | 5,267,184 | |
Income Fund | | | 6,661,070 | | | | 306,322 | | | | 245,217 | | | | 7,212,609 | |
Income Equity Fund | | | 60,212,662 | | | | 1,877,566 | | | | 1,924,554 | | | | 64,014,782 | |
Long/Short Fund | | | 8,752,576 | | | | 101,638 | | | | 171,155 | | | | 9,025,369 | |
PROXY VOTING POLICIES, PROCEDURESAND RECORD
A description of the policies and procedures that Wasatch Advisors uses to vote proxies related to the Funds’ portfolio securities is set forth in the Funds’ Statement of Additional Information which is available without charge, upon
request, on the Funds’ website at www.wasatchfunds.com or by calling 800.551.1700 and on the Securities and Exchange Commission’s (SEC) website at www.sec.gov.
Wasatch Funds’ proxy voting record is available on the Funds’ website at www.wasatchfunds.com and the SEC’s website at www.sec.gov no later than August 31 for the prior 12 months ending June 30.
QUARTERLY PORTFOLIO HOLDINGS DISCLOSUREON FORM N-Q
The Funds file their complete schedules of investments with the SEC for their first and third fiscal quarters of each fiscal year, commencing with the quarter ended December 31, 2004, on Form N-Q. The Funds’ Form N-Q is available on the SEC’s website at www.sec.gov, and may be viewed at the SEC’s Public Reference Room in Washington, D.C. (information on the operation of the Public Reference Room may be obtained by calling 800.SEC.0330).
139
| | |
| WASATCH FUNDS — Service Providers | | SEPTEMBER 30, 2010 |
|
| |
| |
Investment Advisor
Wasatch Advisors, Inc.
150 Social Hall Avenue, 4th Floor
Salt Lake City, UT 84111
Sub-Advisor for the U.S. Treasury Fund
Hoisington Investment Management Co.
6836 Bee Caves Rd.
Building 2, Suite 100
Austin, TX 78746
Sub-Advisor for the Wasatch-1st Source Income Fund
1st Source Corporation Investment Advisors, Inc.
100 North Michigan Street
South Bend, IN 46601
Administrator and Fund Accountant
State Street Bank and Trust Company
801 Pennsylvania Avenue
Kansas City, MO 64105
Distributor
ALPS Distributors, Inc.
1290 Broadway, Suite 1100
Denver, CO 80203
Transfer Agent
UMB Fund Services, Inc.
803 West Michigan Street, Suite A
Milwaukee, WI 53233-2301
Custodian
State Street Bank and Trust Company
801 Pennsylvania Avenue
Kansas City, MO 64105
Legal Counsel to Wasatch Funds and Independent Directors
Chapman and Cutler, LLP
111 West Monroe Street
Chicago, IL 60603
Independent Registered Public Accounting Firm
PricewaterhouseCoopers LLP
1100 Walnut, Suite 1300
Kansas City, MO 64106
140
| | |
| WASATCH FUNDS — Guide to Understanding Financial Statements | | SEPTEMBER 30, 2010 |
|
| |
| |
Wasatch Funds provides reports to shareholders twice a year. The annual report is for the Funds’ fiscal year which ends September 30. The semi-annual report is for the six months or period ending March 31. Additionally, the Funds’ schedules of investments for the first and third quarters of each fiscal year are available to shareholders as described on page 139. These reports provide shareholders with important information that will help them evaluate the management and performance of their investments. It is the desire of Wasatch Funds to help shareholders stay in tune with their investments. If you have any questions about the information in this report, a shareholder services representative will be happy to assist you when you call 800.551.1700.
SCHEDULEOF INVESTMENTS
The holdings of each Wasatch Fund are detailed in the “Schedule of Investments.” This section provides a snapshot of the securities each Fund was invested in on the last day of the reporting period. The Wasatch Equity Funds invest primarily in Common Stocks of companies which are grouped together by industry. The U.S. Treasury Fund invests primarily in U.S. Treasury securities. The Wasatch-1st Source Income Fund invests primarily in fixed income securities. The Equity Funds will typically have only minor holdings in Short-Term Investments. At times the Funds may take temporary defensive positions by increasing cash or holdings in Short-Term Investments. Please see the prospectus under “Additional Information about the Funds.”
STATEMENTSOF ASSETSAND LIABILITIES
These financial statements show the Assets and Liabilities of a Fund on the last day of the reporting period. A Fund’s Assets include the value of securities owned, amounts receivable for purchases of Fund shares (capital shares receivable), securities sold, interest and dividends, prepaid expenses and other assets. Liabilities are amounts owed for shareholder redemptions (capital shares payable), securities purchased, investment advisory fees and other expenses. Totaling up the assets and subtracting the liabilities results in a Fund’s Net Assets.
Net Assets consist of capital stock, paid-in capital in excess of par, undistributed net investment income or loss, undistributed net realized gain or loss on investments and net unrealized appreciation or depreciation on investments. Capital stock is stock authorized by a company’s charter and having par value, stated value or no par value. Par value is set by the company issuing the shares and has no relation to Net Asset Value. The par value of one share of each Wasatch Fund is $.01. Paid-in capital in excess of par is capital received from shareholders in exchange for Fund shares that exceeds the par value of the shares. For example, if you bought one share of a Fund for $10, $.01 would show as “Capital stock” on the books of the Fund, and $9.99 would be accounted for under “Paid-in capital in excess of par.” Undistributed net investment income or loss is the amount of net investment income or loss of a Fund since inception that has not been paid to shareholders as a dividend.
Undistributed net realized gain (loss) on investments is the amount of net realized gains or losses generated by a Fund since inception that have not been distributed to shareholders in the form of a capital gain distribution. A gain or loss is realized when a security is sold by a Fund. Net unrealized appreciation (depreciation) on investments is the change in value from the purchase price of securities a Fund continues to hold.
The number of shares a Fund is authorized to sell can be found under Capital Stock, $.01 par value. Issued and outstanding indicates the number of shares owned by shareholders.
Net Asset Value (NAV), Redemption Price and Offering Price Per Share shows the value of one outstanding share of a Fund on the date of the report. A Fund’s share price (NAV) is calculated by dividing the value of all securities and other assets owned by a Fund, less the liabilities charged to that Fund, by the number of Fund shares outstanding. The share price is calculated at the close of business of the New York Stock Exchange on each day the Exchange is open for trading. Please see Wasatch Funds’ prospectus for more information about how share prices are calculated. Information about how the share price is affected by a Fund’s operation can be found under “Financial Highlights” on page 142.
STATEMENTSOF OPERATIONS
Statements of Operations show investment income and expenses for each Fund as well as realized gains or losses from securities sold and the appreciation or depreciation in the value of a Fund’s holdings during the reporting period.
Investment Income shows Interest and Dividends earned from interest-bearing and dividend-paying securities in a Fund’s portfolio.
Expenses show the various fees and expenses paid out of a Fund’s assets such as the fee paid to Wasatch Advisors, the Funds’ investment advisor. Additional fees include shareholder servicing, fund administration and accounting, custody of fund assets, federal and state registration, legal counsel, auditing and trustees’ fees and other expenses. The Funds pay for printing and mailing statements, prospectuses, annual reports and semi-annual reports to shareholders.
Net Investment Income (Loss) is the amount of dividends and interest income earned on securities held by a Fund, less the Fund’s expenses.
Net realized gain (loss) on investments and foreign currency translations is the net gain or loss on securities a Fund has sold. Change in unrealized appreciation (depreciation) on investments and foreign currency translations is the change in value of securities a Fund continues to hold.
Net gain (loss) on investments is the result of changes in the market value of securities a Fund has sold and securities it continues to hold.
STATEMENTSOF CHANGESIN NET ASSETS
Net Assets are a Fund’s remaining assets after taking into consideration any liabilities. Statements of Changes in Net
141
| | |
| WASATCH FUNDS — Guide to Understanding Financial Statements (continued) | | SEPTEMBER 30, 2010 |
|
| |
| |
Assets show the increase or decrease in a Fund’s net assets during the reporting period. Investment operations, dividends and capital share transactions affect a Fund’s net assets. Operations is a summary of the Statements of Operations. It includes investment income or loss, net realized gain or loss on investments and foreign currency translations a Fund has sold as well as appreciation or depreciation in the value of investments a Fund continues to hold.
Dividends are distributed by Wasatch Funds to sharehold-ers when Fund investments have earned income in excess of net expenses or when capital gains in excess of capital losses are realized from the sale of securities. Most shareholders choose to reinvest their dividends and capital gain distribu- tions. Each Fund is required by Internal Revenue Code regulations to distribute substantially all of its net investment income and capital gains to shareholders in order to retain its status as a “regulated investment company.”
Capital share transactions are any transactions involving shares of a Fund, including the selling of Fund shares, shares issued by a Fund to shareholders for the reinvestment of dividends, and share redemptions.
FINANCIAL HIGHLIGHTS
The Financial Highlights contain important historical operating information that you may find useful in making decisions or understanding the performance of your investment.
Net Asset Value (NAV) is defined under “Statements of Assets and Liabilities” on page 141. The difference between the Net asset value, beginning of period and the Net asset value, end of period in the Financial Highlights is the change in value of a Fund’s shares over the reporting period, but not its total return.
Income (loss) from investment operations shows how the share price was affected by a Fund’s operations on a per share basis. Net investment income (loss) is the per share
amount of dividends and interest income earned on securities held by a Fund, less the Fund’s expenses. Net realized and unrealized gains (losses) on securities is the per share increase or decrease in the value of securities a Fund holds or has sold during the reporting period. Gains or (losses) are realized when securities are sold. Gains or (losses) are unrealized when securities increase or decrease in value but are not sold.
Distributions are the per share amount that a Fund paid to shareholders from net investment income and net realized gains.
Total return is the percentage increase or decrease in the value of an investment over a stated period of time. A total return percentage includes both changes in unrealized and realized gains and income. For the purposes of calculating total return, it is assumed that dividends and distributions are reinvested at the share price on the ex-dividend date of the distribution. A FUND’S TOTAL RETURN CANNOT BE COMPUTED DIRECTLY FROM THE FINANCIAL HIGHLIGHTS.
Supplemental data and ratios are provided to help you better understand your investment. Net assets, end of period, are the net assets of a Fund on the reporting date. Ratio of expenses to average net assets shows the total of a Fund’s operating expenses divided by its average net assets for the stated period before and after waivers and reimbursements by the Advisor, if any. Ratio of net investment income (loss) to average net assets shows a Fund’s net investment income (loss) divided by its average net assets for the stated period before and after waivers and reimbursements by the Advisor, if any. Portfolio turnover rate measures a Fund’s buying and selling activity during the reporting period. It is computed by dividing total purchases or sales, whichever is less, by the average monthly market value of a Fund’s portfolio securities. This calculation does not include securities with a maturity date of less than 12 months.
TELEPHONE
800.551.1700
M - F, 7:00 a.m. to 7:00 p.m. CT
Automated Line, 24 Hours
U.S. MAIL
Wasatch Funds
P.O. Box 2172
Milwaukee, WI 53201-2172
OVERNIGHT MAIL
Wasatch Funds
803 West Michigan Street, Suite A
Milwaukee, WI 53233-2301
ONLINE
www.wasatchfunds.com
shareholderservice@wasatchfunds.com
142

Annual Report &
Commentaries
800.551.1700 • www.WasatchFunds.com
Annual Report & Commentaries
WASATCH
FUNDS
Deeper, Disciplined Investing
| (a) | Wasatch Funds Trust (the “Registrant”) has adopted a Code of Ethics that applies to the Registrant’s principal executive officer and principal financial officer. |
| (b) | No disclosures are required by this Item 2(b). |
| (c) | There have been no amendments to the Registrant’s Code of Ethics during the reporting period for this Form N-CSR. |
| (d) | There have been no waivers granted by the Registrant to individuals covered by the Registrant’s Code of Ethics during the reporting period for this Form N-CSR. |
| (f) | A copy of the Registrant’s Code of Ethics is attached as an exhibit to this Form N-CSR. |
| Item 3: | Audit Committee Financial Expert. |
| | | | |
(a) | | (1) | | The Board of Trustees of the Registrant has determined that the Registrant has at least one member serving on the Registrant’s Audit Committee that possesses the attributes identified in Instruction 2(b) of Item 3 to Form N-CSR to qualify as “audit committee financial expert.” |
| | |
| | (2) | | The name of the audit committee financial expert is Miriam M. Allison. Ms. Allison was deemed to be “independent” as that term is defined in Item 3(a)(2) of Form N-CSR. |
| | |
| | | | For the reporting period, the name of the audit committee financial expert was James U. Jensen. Mr. Jensen was deemed to be “independent” as that term is defined in Item 3(a)(2) of Form N-CSR. |
| Item 4. | Principal Accountant Fees and Services. |
(a) Audit Fees – The aggregate fees billed for professional services rendered by the independent registered public accounting firm for the audit of the Registrant’s annual financial statements or services normally provided in connection with statutory and regulatory filings or engagements for the last two fiscal years ended September 30, 2010 and September 30, 2009 were $283,100 and $296,600, respectively.
(b) Audit Related Fees – During the fiscal years ended September 30, 2010 and September 30, 2009, the Registrant was not billed any fees by the independent registered public accounting firm for assurance and related services rendered by the independent registered public accounting firm to the Registrant that are reasonably related to the performance of the audit of the Registrant’s financial statements and are not reported under paragraph (a) of this Item 4.
During the fiscal years ended September 30, 2010 and 2009, no fees for assurance and related services that relate directly to the operations and financial reporting of the Registrant were billed by the independent registered public accounting firm to the Registrant’s investment adviser or any other entity controlling, controlled by, or under common control with the investment adviser that provides ongoing services to the Registrant.
(c) Tax Fees – The aggregate fees billed for professional services rendered by the independent registered public accounting firm to the Registrant for tax compliance, tax advice, tax planning and tax return preparation for the last two fiscal years ended September 30, 2010 and September 30, 2009 were $78,000 and $76,000, respectively. These services consisted of the independent registered public accounting firm reviewing the Registrant’s excise tax returns, distribution requirements and RIC tax returns, as well as consultations regarding the tax consequences of specific investments.
During the fiscal years ended September 30, 2010 and 2009, no fees for tax compliance, tax advice or tax planning services that relate directly to the operations and financial reporting of the Registrant were billed by the independent registered public accounting firm to the Registrant’s investment adviser or any other entity controlling, controlled by, or under common control with the investment adviser that provides ongoing services to the Registrant.
(d) All Other Fees – During the fiscal years ended September 30, 2010 and 2009, there were no fees billed for products and services provided by the independent registered public accounting firm to the Registrant, other than the services reported in paragraph (a) – (c) of this Item 4.
During the fiscal years ended September 30, 2010 and 2009, no fees for other services that relate directly to the operations and financial reporting of the Registrant were billed by the independent registered public accounting firm to the Registrant’s investment adviser or any other entity controlling, controlled by, or under common control with the investment adviser that provides ongoing services to the Registrant.
(e) Pre-Approval Policies and Procedures
(1) Pursuant to the registrant’s Audit Committee Charter, the Audit Committee shall evaluate the independence of the independent public accountants, including evaluating whether the independent public accountants provide audit services or consulting services to the Registrant or consulting services to the investment adviser, and to receive the specific representations of the independent registered public accounting firm as to their independence. Specifically, the Audit Committee will be responsible for evaluating the provision of non-audit services to the Registrant as required by Section 201 of the Sarbanes-Oxley Act, any pre-approval requests submitted by the independent registered public accounting firm as required by Section 202 of the Sarbanes-Oxley Act or as otherwise required under Section 2-01 of Regulation S-X, and shall monitor the conflict of interest requirements in Section 206 of the Sarbanes-Oxley Act, and the prohibitions on improper influence on the conduct of audits in Section 303 of the Sarbanes-Oxley Act. The Audit Committee shall pre-approve any engagement of the independent registered public accounting firm to provide any services (other than prohibited non-audit services) including the fees and other compensation to be paid to the independent registered public accounting firm.
The independent registered public accounting firm is authorized by the Audit Committee to provide non-audit services to the extent allowable under the Sarbanes-Oxley Act of 2002 for the Registrant provided that (i) the fees payable with respect to such services do not exceed $5,000 in any calendar quarter and (ii) such fees are ratified by the Audit Committee at its next meeting. The fees payable with respect to non-audit services may be increased by the affirmative vote of a majority of the members of the Audit Committee.
(2) There were no pre-approval requirements waived for the services provided to the Registrant described in paragraphs (b)-(d) of Item 4 by the Audit Committee pursuant to paragraph (c)(7)(i)(C) of Rule 2-01 of Regulation S-X (the “De Minimis Rule”). There were no fees billed for services provided to the investment adviser described in paragraphs (b)-(d) of Item 4 that were required to be pre-approved by the Audit Committee as described in paragraph (e)(1) of Item 4.
(f) No disclosures are required by this Item 4(f).
(g) The independent registered public accounting firm did not bill the Registrant or the Registrant’s investment adviser for any other ongoing non-audit services for the fiscal years ended September 30, 2010 and 2009 for the Registrant other than as disclosed above.
(h) No disclosures are required by this Item 4(h).
| Item 5. | Audit Committee of Listed Registrants. |
Not applicable.
| Item 6. | Schedule of Investments. |
| (a) | Schedule of Investments is included as a part of the report to shareholders filed under Item 1 of this Form N-CSR. |
| Item 7. | Disclosure of Proxy Voting Policies and Procedures for Closed-End Management Investment Companies. |
Not applicable.
| Item 8. | Portfolio Managers of Closed-End Investment Companies. |
Not applicable.
| Item 9. | Purchases of Equity Securities by Closed-End Management Investment Company and Affiliated Purchasers. |
Not applicable.
| Item 10. | Submission of Matters to a Vote of Security Holders. |
The Board of Trustees has not adopted formal procedures by which shareholders may recommend nominees to the Board.
| Item 11. | Controls and Procedures. |
| (a) | The Registrant’s principal executive and principal financial officers have concluded that the Registrant’s disclosure controls and procedures (as defined in Rule 30a-3(c) under the Investment Company Act of 1940, as amended (the “1940 Act”) (17 CFR 270.30a-3(c)) are effective, as of a date within 90 days of the filing date of this Form N-CSR based on their evaluation of these controls and procedures required by Rule 30a-3(b) under the 1940 Act (17 CFR 270.30a-3(b)) and Rules 13a-15(b) or 15d-15(b) under the Securities Exchange Act of 1934 (17 CFR 240.13a-15(b) or 240.15d-15(b)). |
| (b) | There were no changes in the Registrant’s internal control over financial reporting (as defined in Rule 30a-3(d) under the 1940 Act (17 CFR 270.30a-3(d)) that occurred during the Registrant’s second fiscal quarter of the period covered by this report that has materially affected, or is reasonably likely to materially affect, the Registrant’s internal control over financial reporting. |
| | | | |
(a) | | (1) | | Code of Ethics is attached hereto. |
| | |
| | (2) | | The certifications required by Rule 30a-2(a) of the 1940 Act are attached hereto. |
| | |
| | (3) | | Not applicable. |
| (b) | The certifications required by Rule 30a-2(b) of the 1940 Act and Section 906 of the Sarbanes-Oxley Act of 2002 are attached hereto. |
SIGNATURES
Pursuant to the requirements of the Securities Exchange Act of 1934 and the Investment Company Act of 1940, the Registrant has duly caused this report to be signed on its behalf by the undersigned, thereunto duly authorized.
| | |
WASATCH FUNDS TRUST |
| |
By: | | /s/ SAMUEL S. STEWART, JR. |
| | Samuel S. Stewart, Jr. |
| | President (principal executive officer) of Wasatch Funds Trust |
Date: December 8, 2010
Pursuant to the requirements of the Securities Exchange Act of 1934 and the Investment Company Act of 1940, this report has been signed below by the following persons on behalf of the Registrant and in the capacities and on the dates indicated.
| | |
| |
By: | | /s/ SAMUEL S. STEWART, JR. |
| | Samuel S. Stewart, Jr. |
| | President (principal executive officer) of Wasatch Funds Trust |
Date: December 8, 2010
| | |
| |
By: | | /s/ CINDY B. FIRESTONE |
| | Cindy B. Firestone |
| | Treasurer (principal financial officer) of Wasatch Funds Trust |
Date: December 8, 2010